(17)(2)(ii) Prospectus dated March 1, 2011, as supplemented March 22, 2011, as supplemented through October 14, 2011
TRANSAMERICA FUNDS
Supplement to the Currently Effective Prospectuses
* * *
Transamerica AEGON High Yield Bond
The following replaces the information in the Prospectuses under the section entitled “Management – Portfolio Managers” relating to Transamerica AEGON High Yield Bond:
Portfolio Managers:
Bradley J. Beman, CFA, Lead Portfolio Manager since 1997
Kevin Bakker, CFA, Portfolio Manager since 2007
Benjamin D. Miller, CFA, Portfolio Manager since 2006
Jim Schaeffer, Portfolio Manager since 2011
The following replaces the information in the Prospectuses under the section entitled “Shareholder Information – Portfolio Manager(s)” relating to Transamerica AEGON High Yield Bond:
| | | | | | | | |
Name/Year Joined Fund | | Role | | Employer | | Positions Over Past Five Years | | |
| Bradley J. Beman, CFA/1997 | | Portfolio Manager (Lead) | | AUIM | | Chief Investment Officer, Senior Vice President, Director of High Yield | | |
| Kevin Bakker, CFA/2007 | | Portfolio Manager | | AUIM | | High Yield Portfolio Manager | | |
| Benjamin D. Miller, CFA/2006 | | Portfolio Manager | | AUIM | | High Yield Portfolio Manager | | |
| Jim Schaeffer/2011 | | Portfolio Manager | | AUIM | | Senior Vice President, Director of Distressed Debt | | |
* * *
Investors Should Retain this Supplement for Future Reference
October 14, 2011
Transamerica Funds
Supplement to the Currently Effective Prospectus, Summary Prospectus
and Statement of Additional Information, as supplemented
* * *
Transamerica Morgan Stanley Mid-Cap Growth
Transamerica WMC Diversified Growth (each a “Fund”)
The Board of Trustees has approved reorganizations pursuant to which each Fund’s assets would be acquired, and its liabilities would be assumed, by the Destination Fund listed opposite the Fund in the chart below in exchange for shares of the Destination Fund. The Fund would then be liquidated, and shares of the Destination Fund would be distributed to Fund shareholders.
| | |
Fund | | Destination Fund |
Transamerica Morgan Stanley Mid-Cap Growth | | Transamerica Morgan Stanley Growth
Opportunities |
Transamerica WMC Diversified Growth | | Transamerica WMC Diversified Equity |
Under each reorganization, Fund shareholders would receive shares of the Destination Fund with the same aggregate net asset value as their shares of the Fund. It is anticipated that no gain or loss for Federal income tax purposes would be recognized by Fund shareholders as a result of the reorganization.
Each reorganization does not require shareholder approval but is subject to the satisfaction of certain conditions. An information statement describing the reorganizations will be mailed to shareholders of the Funds in advance of the closing of the reorganizations, which is expected to occur in the first quarter of 2012. Prior to the reorganizations, shareholders can continue to purchase, redeem and exchange shares subject to the limitations described in the Prospectus.
* * *
Investors Should Retain this Supplement for Future Reference
October 13, 2011
TRANSAMERICA FUNDS
Supplement to the Currently Effective Class I2 Prospectus and
the Currently Effective Statement of Additional Information
* * *
Transamerica Clarion Global Real Estate Securities (the “Fund”)
The Fund’s sub-adviser, ING Clarion Real Estate Securities, LLC is now known as CBRE Clarion Securities LLC (“Clarion”). Accordingly, throughout the Fund’s Prospectus and Statement of Additional Information, all references to ING Clarion Real Estate Securities, LLC are changed to CBRE Clarion Securities LLC.
* * *
Investors Should Retain this Supplement for Future Reference
August 16, 2011
TRANSAMERICA FUNDS
Supplement to the Currently Effective Prospectuses
* * *
Transamerica AEGON Flexible Income
The following replaces the information in the Retail and Class I2 Prospectuses under the section entitled “Management – Portfolio Managers” relating to Transamerica AEGON Flexible Income:
Portfolio Managers:
Brian W. Westhoff, CFA, Portfolio Manager (Lead) since 2005
Greg Haendel, CFA, Portfolio Manager since 2005
Bradley J. Beman, CFA, CPA, Portfolio Manager since 2011
David Halfpap, Portfolio Manager since 2011
Rick Perry, Portfolio Manager since 2011
Jim Schaeffer, Portfolio Manager since 2011
The following replaces the information in the Retail and Class I2 Prospectuses under the section entitled “Shareholder Information – Portfolio Manager(s)” relating to Transamerica AEGON Flexible Income:
| | | | | | | | |
| Name/Year Joined Fund | | Role | | Employer | | Positions Over Past Five Years | | |
| Brian W. Westhoff, CFA/2005 | | Portfolio Manager (Lead) | | AUIM | | Portfolio Manager | | |
| Greg Haendel, CFA/2005 | | Portfolio Manager | | AUIM | | Portfolio Manager | | |
| Bradley J. Beman, CFA, CPA/2011 | | Portfolio Manager | | AUIM | | Senior Vice President, Director – High Yield | | |
| David Halfpap/2011 | | Portfolio Manager | | AUIM | | Executive Vice President, Portfolio Manager | | |
| Rick Perry/2011 | | Portfolio Manager | | AUIM | | Senior Vice President, Director of Investment Grade Credit | | |
| Jim Schaeffer/2011 | | Portfolio Manager | | AUIM | | Senior Vice President, Director of Distressed Debt | | |
* * *
Transamerica Asset Allocation – Conservative Portfolio
Transamerica Asset Allocation – Growth Portfolio
Transamerica Asset Allocation – Moderate Growth Portfolio
Transamerica Asset Allocation – Moderate Portfolio
Transamerica Multi-Manager Alternative Strategies Portfolio
Transamerica Multi-Manager International Portfolio
Effective April 1, 2011, the information under the section entitled “Shareholder Information – Advisory Fees – Portfolio Construction Manager Compensation” on page 106 of the Retail Prospectus is deleted and replaced with the following:
Portfolio Construction Manager Compensation†
For the fiscal year ended October 31, 2010, the portfolio construction manager received the following fees as a percentage of a fund’s average daily net assets:
| | |
Transamerica Asset Allocation – Conservative Portfolio | | 0.10% |
Transamerica Asset Allocation – Growth Portfolio | | 0.10% |
Transamerica Asset Allocation – Moderate Growth Portfolio | | 0.10% |
Transamerica Asset Allocation – Moderate Portfolio | | 0.10% |
Transamerica Multi-Manager Alternative Strategies Portfolio | | 0.20% |
Transamerica Multi-Manager International Portfolio | | 0.10% |
| | † | Effective April 1, 2011, the portfolio construction manager’s fee for each of the funds is 0.10% of the first $20 billion of average daily net assets; 0.09% of average daily net assets over $20 billion up to $30 billion; and 0.08% over $30 billion. The average daily net assets for the purpose of calculating fees will be determined on a combined basis with all series of Transamerica Series Trust for which Morningstar serves as the portfolio construction manager; and with all series of Transamerica Funds for which Morningstar serves as the portfolio construction manager except Transamerica Multi-Manager Alternative Strategies Portfolio. |
* * *
Transamerica AQR Managed Futures Strategy
The following replaces the information in the Class I2 Prospectus under the section entitled “Management – Portfolio Managers” relating to Transamerica AQR Managed Futures Strategy:
Portfolio Managers:
Clifford S. Asness, Portfolio Manager since 2010
John M. Liew, Portfolio Manager since 2010
Brian K. Hurst, Portfolio Manager since 2010
Yao Hua Ooi, Portfolio Manager since 2010
The following replaces the information in the Class I2 Prospectus under the section entitled “Shareholder Information – Portfolio Manager(s)” relating to Transamerica AQR Managed Futures Strategy:
| | | | | | | | |
| Name/Year Joined Fund | | Role | | Employer | | Positions Over Past Five Years | | |
| Clifford S. Asness/2010 | | Portfolio Manager | | AQR | | Portfolio Manager, Managing and Founding Principal | | |
| John M. Liew/2010 | | Portfolio Manager | | AQR | | Portfolio Manager, Founding Principal | | |
| Brian K. Hurst/2010 | | Portfolio Manager | | AQR | | Portfolio Manager, Principal | | |
| Yao Hua Ooi/2010 | | Portfolio Manager | | AQR | | Portfolio Manager, Vice President | | |
* * *
Transamerica Federated Market Opportunity
The following information supplements and amends information in the Retail and Class I2 Prospectuses:
Transamerica Federated Market Opportunity is deleted in its entirety from the Class I2 Prospectus.
References to Transamerica Federated Market Opportunity are deleted from the section entitled “List and Description of Certain Underlying Funds” in the Retail Prospectus.
* * *
Transamerica Multi-Manager Alternative Strategies Portfolio
The following information replaces information in the Fee Table portion of the section entitled “Fees and Expenses” relating to Transamerica Multi-Manager Alternative Strategies Portfolio in the Retail Prospectus:
| | | | | | |
| Shareholder Fees (fees paid directly from your investment) |
| | | Class of Shares |
| | | A | | C | | I |
| Maximum sales charge (load) imposed on purchases (as a % of offering price) | | 5.50% | | None | | None |
| Maximum deferred sales charge (load) (as a percentage of purchase price or redemption proceeds, whichever is lower) | | None | | 1.00% | | None |
| Annual Fund Operating Expenses (expenses that you pay each year as a percentage of the value of your investment) |
| | | Class of Shares |
| | | A | | C | | I |
Management fees | | 0.20% | | 0.20% | | 0.20% |
Distribution and service (12b-1) fees | | 0.35% | | 1.00% | | None |
Other expenses | | 0.25% | | 0.24% | | 0.30% |
Acquired Fund Fees and Expenses (fees and expenses of underlying funds) | | 1.15% | | 1.15% | | 1.15% |
Total annual fund operating expensesa | | 1.95% | | 2.59% | | 1.65% |
| | a | Fund operating expenses do not correlate to the ratios of expenses to average net assets in the financial highlights table, which do not include acquired (i.e., underlying) funds’ fees and expenses. |
2
The following information supplements and amends information in the section entitled “Example” relating to Transamerica Multi-Manager Alternative Strategies Portfolio in the Retail Prospectus:
Example: This Example is intended to help you compare the cost of investing in the fund with the cost of investing in other mutual funds. The Example assumes that you invest $10,000. The Example also assumes that your investment has a 5% return each year and that the fund’s operating expenses remain the same. Although your actual costs may be higher or lower, based on these assumptions your costs would be:
| | | | | | | | |
| |
If the shares are redeemed at the end of each period: |
Share Class | | 1 year | | 3 years | | 5 years | | 10 years |
A | | $737 | | $1,129 | | $1,544 | | $2,700 |
C | | $362 | | $ 805 | | $1,375 | | $2,925 |
I | | $168 | | $ 520 | | $ 897 | | $1,955 |
If the shares are not redeemed: |
Share Class | | 1 year | | 3 years | | 5 years | | 10 years |
A | | $737 | | $1,129 | | $1,544 | | $2,700 |
C | | $262 | | $ 805 | | $1,375 | | $2,925 |
I | | $168 | | $ 520 | | $ 897 | | $1,955 |
The Example does not reflect sales charges (loads) on reinvested dividends (and other distributions). If these sales charges (loads) were included, your costs would be higher.
* * *
Transamerica Water Island Arbitrage Strategy
The following information supplements and amends information in the section entitled “List and Description of Certain Underlying Funds” beginning on page 133 of the Retail Prospectus:
Effective May 1, 2011, Transamerica Water Island Arbitrage Strategy will be an underlying fund option for Transamerica Asset Allocation – Conservative Portfolio, Transamerica Asset Allocation – Growth Portfolio, Transamerica Asset Allocation – Moderate Growth Portfolio, Transamerica Asset Allocation – Moderate Portfolio and Transamerica Multi-Manager Alternative Strategies Portfolio.
The description of Transamerica Water Island Arbitrage Strategy is added as follows:
| | • | | Transamerica Water Island Arbitrage Strategy seeks to achieve capital growth by engaging in merger arbitrage. The fund invests, under normal circumstances, at least 80% of its net assets in equity securities and other investments with similar economic characteristics of companies (both domestic and foreign) that are involved in publicly announced mergers, takeovers, tender offers, leveraged buyouts, spin-offs, liquidations and other corporate reorganizations. Equity securities include common and preferred stock and options. The fund’s sub-adviser uses investment strategies designed to minimize market exposure including short selling and purchasing and selling options. The most common arbitrage activity, and the approach the fund generally will use, involves purchasing the shares of an announced acquisition target company at a discount to their expected value upon completion of the acquisition. The principal risks of investing in this underlying fund are: active trading; arbitrage; cash management and defensive investing; currency; currency hedging; derivatives; foreign securities; increase in expenses; leveraging; liquidity; market; merger arbitrage; portfolio selection; portfolio turnover; preferred stock; sector concentration; short sales; and stocks. |
* * *
All Funds
(except Transamerica AEGON Money Market)
The following paragraph replaces the risk disclosure labeled “Interest Rate” in the section of the Prospectuses entitled “Principal Risks” of each applicable fund:
| | n | Interest Rate – Debt securities have varying levels of sensitivity to changes in interest rates. In general, the price of a debt security tends to fall when interest rates rise and can rise when interest rates fall. Securities with longer maturities and mortgage securities can be more sensitive to interest rate changes. |
* * *
Investors Should Retain this Supplement for Future Reference
June 16, 2011
3
Transamerica Funds
Prospectus March 1, 2011, as supplemented March 22, 2011
Class I2 Shares

| | | | | | | | |
| Fund | | Ticker | | | | Fund | | Ticker |
| | | | |
| Transamerica AEGON Flexible Income | | None | | | | Transamerica Morgan Stanley Emerging Markets Debt | | None |
| Transamerica AEGON High Yield Bond | | None | | | | Transamerica Morgan Stanley Growth Opportunities | | None |
| Transamerica AEGON Money Market | | None | | | | Transamerica Morgan Stanley Mid-Cap Growth | | None |
| Transamerica AEGON Short-Term Bond | | None | | | | Transamerica Morgan Stanley Small Company Growth | | None |
| Transamerica AQR Managed Futures Strategy | | None | | | | Transamerica Multi-Managed Balanced | | None |
| Transamerica BlackRock Global Allocation | | None | | | | Transamerica Neuberger Berman International | | None |
| Transamerica BlackRock Large Cap Value | | None | | | | Transamerica Oppenheimer Developing Markets | | None |
| Transamerica Clarion Global Real Estate Securities | | TRSIX | | | | Transamerica Oppenheimer Small- & Mid-Cap Value | | None |
| Transamerica Federated Market Opportunity | | None | | | | Transamerica PIMCO Real Return TIPS | | None |
| Transamerica First Quadrant Global Macro | | None | | | | Transamerica PIMCO Total Return | | None |
| Transamerica Goldman Sachs Commodity Strategy | | None | | | | Transamerica Schroders International Small Cap | | None |
| Transamerica Hansberger International Value | | None | | | | Transamerica Systematic Small/Mid Cap Value | | TSMVX |
| Transamerica Jennison Growth | | TJNIX | | | | Transamerica Third Avenue Value | | None |
| Transamerica JPMorgan Core Bond | | None | | | | Transamerica Thornburg International Value | | None |
| Transamerica JPMorgan International Bond | | None | | | | Transamerica TS&W International Equity | | None |
| Transamerica JPMorgan Long/Short Strategy | | None | | | | Transamerica UBS Large Cap Value | | None |
| Transamerica JPMorgan Mid Cap Value | | None | | | | Transamerica WMC Diversified Equity | | None |
| Transamerica Loomis Sayles Bond | | None | | | | Transamerica WMC Diversified Growth | | None |
| Transamerica MFS International Equity | | None | | | | Transamerica WMC Emerging Markets | | TWMCX |
| | | | | | Transamerica WMC Quality Value | | TWQZX |
| | |
 | | Neither the U.S. Securities and Exchange Commission nor any state securities commission has approved or disapproved these securities or passed upon the adequacy or accuracy of this prospectus. Any representation to the contrary is a criminal offense. |
| | | | |
Not insured by FDIC or any federal government agency. | | May lose value. | | Not a deposit of or guaranteed by any bank, bank affiliate, or credit union. |
MPCAI20311-A
TABLE OF CONTENTS
| | | | |
| | | Page | |
| |
| Transamerica AEGON Flexible Income (formerly, Transamerica Flexible Income) | | | 1 | |
| |
| Transamerica AEGON High Yield Bond | | | 6 | |
| |
| Transamerica AEGON Money Market (formerly, Transamerica Money Market) | | | 10 | |
| |
| Transamerica AEGON Short-Term Bond (formerly, Transamerica Short-Term Bond) | | | 14 | |
| |
| Transamerica AQR Managed Futures Strategy | | | 18 | |
| |
| Transamerica BlackRock Global Allocation | | | 23 | |
| |
| Transamerica BlackRock Large Cap Value | | | 29 | |
| |
| Transamerica Clarion Global Real Estate Securities | | | 32 | |
| |
| Transamerica Federated Market Opportunity | | | 36 | |
| |
| Transamerica First Quadrant Global Macro | | | 41 | |
| |
| Transamerica Goldman Sachs Commodity Strategy (formerly, Transamerica BlackRock Natural Resources) | | | 46 | |
| |
| Transamerica Hansberger International Value (formerly, Transamerica AllianceBernstein International Value) | | | 52 | |
| |
| Transamerica Jennison Growth | | | 56 | |
| |
| Transamerica JPMorgan Core Bond | | | 59 | |
| |
| Transamerica JPMorgan International Bond | | | 63 | |
| |
| Transamerica JPMorgan Long/Short Strategy (formerly, Transamerica BNY Mellon Market Neutral Strategy) | | | 67 | |
| |
| Transamerica JPMorgan Mid Cap Value | | | 71 | |
| |
| Transamerica Loomis Sayles Bond | | | 75 | |
| |
| Transamerica MFS International Equity | | | 80 | |
| |
| Transamerica Morgan Stanley Emerging Markets Debt (formerly, Transamerica Van Kampen Emerging Markets Debt) | | | 84 | |
| |
| Transamerica Morgan Stanley Growth Opportunities (formerly, Transamerica Growth Opportunities) | | | 88 | |
| |
| Transamerica Morgan Stanley Mid-Cap Growth (formerly, Transamerica Van Kampen Mid-Cap Growth) | | | 93 | |
| |
| Transamerica Morgan Stanley Small Company Growth (formerly, Transamerica Van Kampen Small Company Growth) | | | 98 | |
| |
| Transamerica Multi-Managed Balanced (formerly, Transamerica Balanced) | | | 102 | |
| |
| Transamerica Neuberger Berman International | | | 108 | |
| |
| Transamerica Oppenheimer Developing Markets | | | 112 | |
| |
| Transamerica Oppenheimer Small- & Mid-Cap Value | | | 116 | |
| |
| Transamerica PIMCO Real Return TIPS | | | 120 | |
|
| TRANSAMERICA AEGON FLEXIBLE INCOME |
Investment Objective: Seeks to provide high total return through a combination of current income and capital appreciation.
Fees and Expenses: This table describes the fees and expenses that you may pay if you buy and hold shares of the fund. There are no sales charges (load) or other transaction fees.
| | |
| Annual Fund Operating Expenses (expenses that you pay each year as a percentage of the value of your investment)a |
| | |
Management fees | | 0.48% |
Distribution and service (12b-1) fees | | None |
Other expensesb | | 0.09% |
Total annual fund operating expenses | | 0.57% |
| a | Annual fund operating expenses have been restated to reflect current contractual advisory fees. |
| b | Other expenses do not include extraordinary expenses. If extraordinary expenses were included, other expenses would be 0.10%. |
Example: This Example is intended to help you compare the cost of investing in the fund with the cost of investing in other mutual funds. The Example assumes that you invest $10,000. The Example also assumes that your investment has a 5% return each year and that the fund’s operating expenses remain the same. Although your actual costs may be higher or lower, based on these assumptions your costs would be:
| | | | | | |
| 1 year | | 3 years | | 5 years | | 10 years |
$58 | | $183 | | $318 | | $714 |
Portfolio Turnover: The fund pays transaction costs, such as commissions, when it buys and sells securities (or “turns over” its portfolio). A higher portfolio turnover rate may indicate higher transaction costs and may result in higher taxes when fund shares are held in a taxable account. These costs, which are not reflected in annual fund operating expenses or in the Example, affect the fund’s performance. During the most recent fiscal year, the portfolio turnover rate was 120% of the average value of the fund’s portfolio.
Principal Investment Strategies: AEGON USA Investment Management, LLC (“AUIM”), the fund’s sub-adviser, invests, under normal circumstances, at least 80% of the fund’s net assets in fixed-income securities, including U.S. Government and foreign government bonds and notes (including emerging markets); mortgage-backed, commercial mortgage-backed, and asset-backed securities (including collateralized mortgage obligations); corporate bonds of issuers in the U.S. and foreign countries (including emerging markets); convertible bonds and other convertible securities; bank loans and loan participations; structured notes; and preferred securities.
Under normal circumstances, at least 50% of the value of the fund’s assets will be invested in (a) debt securities which have a rating within the four highest grades as determined by Moody’s Investors Services, Inc. (“Moody’s”) (“Aaa, Aa, A or Baa”) or Standard & Poor’s Corporation (“S&P”) (“AAA, AA, A or BBB”); (b) securities issued or guaranteed by the U.S. Government or its agencies or instrumentalities; (c) commercial paper rated Prime, Prime-1 or Prime-2 by NCO/Moody’s Commercial Paper Division, Moody’s or A-1 or A-2 by S&P; or (d) cash or cash equivalents. Up to 50% of the value of the fund’s assets may be invested in other debt securities which are not rated by Moody’s or S&P or, if so rated, are not within the grades or ratings referred to above. The fund may engage in options and futures transactions, foreign currency transactions, and swap transactions. The fund may invest up to 20% of its total assets in equity securities, such as common stocks, rights, warrants or preferred stock. The fund may invest in securities of any maturity and does not have a target average duration.
The fund may use short-term trading as a means of managing its portfolio to achieve its investment objectives.
By virtue of short-term trading, the fund may engage in greater buying and selling activity than investment companies which are not permitted to employ such a policy in seeking their investment objectives. Such activity can result in greater costs of operation than is the case with other investment companies, and risks of loss in portfolio value could be greater. Accordingly, an investment in fund shares may be more speculative than an investment in shares of an investment company which cannot engage in short-term trading.
The fund may invest its assets in cash, cash equivalent securities or short-term debt securities, repurchase agreements and money market instruments. Under adverse or unstable market, economic or political conditions, the fund may take temporary defensive positions in cash and short-term debt securities without limit.
Principal Risks: Many factors affect the fund’s performance. There is no assurance the fund will meet its investment objective. The value of your investment in the fund, as well as the amount of return you receive on your investment, may fluctuate significantly from day to day and over time. You may lose part or all of your investment in the fund or your
1
investment may not perform as well as other similar investments. The following is a summary of certain risks (in alphabetical order) of investing in the fund. You may lose money if you invest in this fund.
| • | | Active Trading – Certain funds are actively managed and, under appropriate circumstances, may purchase and sell securities without regard to the length of time held. A high portfolio turnover rate may have a negative impact on performance by increasing transaction costs and may generate greater tax liabilities for shareholders holding shares in taxable accounts. |
| • | | Cash Management and Defensive Investing – Money market instruments or short-term debt securities held by the fund for cash management or defensive investing purposes can fluctuate in value. Like other fixed income securities, they are subject to risk, including market, interest rate and credit risk. If the fund holds cash uninvested, the fund will not earn income on the cash and the fund’s yield will go down. If a significant amount of the fund’s assets are used for cash management or defensive investing purposes, it will be more difficult for the fund to achieve its objective. |
| • | | Convertible Securities – The market value of convertible securities tends to decline as interest rates increase. Convertible securities generally offer lower interest or dividend yields than non-convertible securities of similar quality. The fund could lose money if the issuer of a convertible security is unable to meet its financial obligations or goes bankrupt. |
| • | | Credit – If an issuer or guarantor of a security held by the fund or a counterparty to a financial contract with the fund defaults or is downgraded, or if the value of the assets underlying a security declines, the value of your investment will decline. Junk bonds have a higher risk of default and are considered speculative. A default or downgrade will have a greater impact on subordinated securities. |
| • | | Currency – When the fund invests in securities denominated in foreign currencies, the fund may incur currency conversion costs and may be affected favorably or unfavorably by changes in the rates of exchange between those currencies and the U.S. dollar. Currency exchange rates can be volatile and are affected by, among other factors, the general economics of a country, the actions of the U.S. and foreign governments or control banks, the imposition of currency controls, and speculation. |
| • | | Derivatives – Using derivatives can increase fund losses and reduce opportunities for gains when market prices, interest rates or the derivative instruments themselves behave in a way not anticipated by the fund. Using derivatives also can have a leveraging effect and increase fund volatility. Derivatives may be difficult to sell, unwind or value, and the counterparty may default on its obligations to the fund. The fund’s investments in derivative instruments may involve a small investment relative to the amount of investment exposure assumed and may result in losses exceeding the amounts invested in those instruments. Recent legislation calls for new regulation of the derivatives markets. The extent and impact of the regulation are not yet fully known and may not be for some time. New regulation of derivatives may make them more costly, may limit their availability, or may otherwise adversely affect their value or performance. |
| • | | Emerging Markets – Investing in the securities of issuers located in or principally doing business in emerging markets are subject to foreign securities risks. These risks are greater for investments in emerging markets. Emerging market countries tend to have economic, political and legal systems that are less fully developed and are less stable than those of more advanced countries. Low trading volumes may result in a lack of liquidity and in extreme price volatility. |
| • | | Fixed-Income Securities – The market prices of fixed-income securities may go up or down, sometimes rapidly or unpredictably due to general market conditions, such as real or perceived adverse economic or political conditions, inflation, changes in interest rates, lack of liquidity in the bond markets or adverse investor sentiment. When market prices fall, the value of your investment will go down. A rise in rates tends to have a greater impact on the prices of longer term or duration securities. |
If interest rates rise, repayments of fixed-income securities may occur more slowly than anticipated by the market. This may drive the prices of these securities down because their interest rates are lower than the current interest rate and they remain outstanding longer. This is sometimes referred to as extension risk.
Many issuers have a right to prepay their securities. If interest rates fall, an issuer may exercise this right. If this happens, the fund will be forced to reinvest prepayment proceeds at a time when yields on securities available in the market are lower than the yield on the prepaid security. This is sometimes referred to as prepayment or call risk.
| • | | Foreign Securities – Foreign securities are subject to a number of additional risks, including nationalization or expropriation of assets, imposition of currency controls or restrictions, confiscatory taxation, political or financial instability and other adverse economic or political developments. Lack of information and less market regulation also may affect the value of these securities. |
2
| • | | High-Yield Debt Securities – High-yield debt securities, or junk bonds, are securities that are rated below “investment grade” (that is, securities rated below Baa/BBB) or, if unrated, are considered by the sub-adviser to be of equivalent quality. Changes in interest rates, the market’s perception of the issuers and the creditworthiness of the issuers may significantly affect the value of these bonds. Junk bonds have a higher risk of default, tend to be less liquid and may be more difficult to value. |
| • | | Increase in Expenses – Your actual costs of investing in the fund may be higher than the expenses shown in “Annual Fund Operating Expenses” for a variety of reasons. For example, expense ratios may be higher than those shown if average net assets decrease. Net assets are more likely to decrease and fund expense ratios are more likely to increase when markets are volatile. |
| • | | Interest Rate – Fixed-income securities have varying levels of sensitivity to changes in interest rates. In general, the price of a fixed-income security tends to fall when interest rates rise and can rise when interest rates fall. A change in interest rates will not have the same impact on all fixed-income securities. Generally, the longer the maturity or duration of a fixed-income security, the greater the impact of a rise in interest rates on the security’s value. In addition, different interest rate measures (such as short- and long-term interest rates and U.S. and foreign interest rates), or interest rates on different types of securities or securities of different issuers, may not necessarily change in the same amount or in the same direction. When interest rates go down, the income received by the fund, and the fund’s yield, may decline. |
| • | | Liquidity – Some securities held by the fund may be difficult to sell, or illiquid, particularly during times of market turmoil. Illiquid securities may also be difficult to value. If the fund is forced to sell an illiquid asset to meet redemption requests or other cash needs, the fund may be forced to sell at a loss. |
| • | | Loans – Loans are subject to the credit risk of nonpayment of principal or interest. Economic downturns or increases in interest rates may cause an increase in defaults, interest rate risk and liquidity risk. Loans may or may not be collateralized at the time of acquisition, and any collateral may be relatively illiquid or lose all or substantially all of its value subsequent to investment. In the event of bankruptcy of a borrower, the fund could experience delays or limitations with respect to its ability to realize the benefits of any collateral securing a loan. The fund’s investments in loans are also subject to prepayment or call risk. |
| • | | Market – The market prices of the fund’s securities may go up or down, sometimes rapidly or unpredictably, due to general market conditions, such as real or perceived adverse economic or political conditions, inflation, changes in interest rates or currency rates, lack of liquidity in the markets or adverse investor sentiment. Market prices of securities also may go down due to events or conditions that affect particular sectors or issuers. When market prices fall, the value of your investment will go down. The fund may experience a substantial or complete loss on any individual security. The recent financial crisis has caused a significant decline in the value and liquidity of many securities. In response to the financial crisis, the U.S. and other governments and the Federal Reserve and certain foreign central banks have taken steps to support financial markets. The withdrawal of this support could negatively affect the value and liquidity of certain securities. In addition, legislation recently enacted in the U.S. calls for changes in many aspects of financial regulation. The impact of the legislation on the markets, and the practical implications for market participants, may not be fully known for some time. |
| • | | Mortgage-Related and Asset-Backed Securities – Mortgage-backed securities may be issued by private issuers, by government-sponsored entities such as Fannie Mae or Freddie Mac or by agencies of the U.S. government, such as Ginnie Mae. Mortgage-backed securities represent direct or indirect participations in, or are collateralized by and payable from, mortgage loans secured by real property. Unlike mortgage-related securities issued or guaranteed by agencies of the U.S. government or government-sponsored entities, mortgage-related securities issued by private issuers do not have a government or government-sponsored entity guarantee (but may have other credit enhancement), and may, and frequently do, have less favorable collateral, credit risk or other underwriting characteristics. Mortgage-backed securities are also particularly susceptible to prepayment and extension risks. Asset-backed securities represent participations in, or are secured by and payable from, assets such as installment sales or loan contracts, leases, credit card receivables and other categories of receivables. Certain asset-backed securities present a heightened level of risk because, in the event of default, the liquidation value of the underlying assets may be inadequate to pay any unpaid principal or interest. The value of mortgage-backed and asset-backed securities may be affected by changes in credit quality or value of the mortgage loans or other assets that support the securities. |
| • | | Portfolio Selection – The sub-adviser’s judgment about a particular security or issuer, or about the economy or a particular sector, region or market segment, or about an investment strategy, may prove to be incorrect. |
| • | | Preferred Stock – Preferred stock’s right to dividends and liquidation proceeds is junior to the rights of a company’s debt securities. The value of preferred stock may be subject to factors that affect fixed income and equity securities, including |
3
| | changes in interest rates and in a company’s creditworthiness. Shareholders of preferred stock may suffer a loss of value if dividends are not paid and have limited voting rights. |
| • | | Stocks – Stocks may be volatile – their prices may go up and down dramatically over the shorter term. These price movements may result from factors affecting individual companies, industries, the securities market as a whole or the overall economy. |
| • | | Structured Instruments – The fund may invest in various types of structured instruments, including securities that have demand, tender or put features, or interest rate reset features. Structured instruments are a type of derivative instrument and the payment and credit qualities of these instruments derive from the assets embedded in the structure from which they are issued. Structured instruments may behave in ways not anticipated by the fund, or they may not receive tax, accounting or regulatory treatment anticipated by the fund. |
| • | | Valuation – The sales price the fund could receive for any particular portfolio investment may differ from the fund’s valuation of the investment, particularly for securities that trade in thin or volatile markets or that are valued using a fair value methodology. |
| • | | Warrants and Rights – Warrants and rights may be considered more speculative than certain other types of investments because they do not entitle a holder to the dividends or voting rights for the securities that may be purchased. They do not represent any rights in the assets of the issuing company, and cease to have value if not exercised prior to the expiration date. |
Performance: The bar chart and the table below provide some indication of the risks of investing in the fund by showing you how the fund’s performance has varied from year to year, and how the fund’s Class I2 average annual total returns for different periods compare to the returns of a broad measure of market performance. The table shows average annual total returns for Class I2 shares of the fund. Absent any limitation of the fund’s expenses, total returns would be lower. As with all mutual funds, past performance (before and after taxes) is not a prediction of future results. Updated performance information is available on our website at www.transamericafunds.com or by calling 1-888-233-4339.
Prior to March 22, 2011, the fund was named Transamerica Flexible Income and had a different sub-adviser. The performance set forth prior to that date is attributable to the previous sub-adviser.
Annual Total Returns (calendar years ended December 31)

| | | | |
| | | Quarter Ended | | Return |
Best Quarter: | | 6/30/2009 | | 12.63% |
Worst Quarter: | | 12/31/2008 | | -12.67% |
Average Annual Total Returns (periods ended December 31, 2010)1
| | | | | | |
| | | 1 Year | | 5 Years | | 10 Years or
Inception* |
Class I2 (commenced operations on November 8, 2004) | | | | | | |
Return before taxes | | 12.98% | | 5.25% | | 4.68% |
Return after taxes on distributions2 | | 10.43% | | 3.05% | | 2.59% |
Return after taxes on distributions and sale of fund shares2 | | 8.37% | | 3.15% | | 2.73% |
| Barclays Capital U.S. Aggregate Bond Index (reflects no deduction for fees, expenses, or taxes) | | 6.54% | | 5.80% | | 5.21% |
| 1 | Actual returns may depend on the investor’s individual tax situation. After-tax returns may not be relevant if the investment is made through a tax-exempt or tax-deferred account, such as a 401(k) plan. |
| 2 | The after-tax returns are calculated using the historic highest individual federal marginal income tax rates and do not reflect the impact of state and local taxes. |
| * | Fund and Index returns are for past 10 years or since inception, whichever is less. |
4
Management:
| | |
| Investment Adviser: | | Sub-Adviser: |
| |
| Transamerica Asset Management, Inc. | | AEGON USA Investment Management, LLC |
| |
| | Portfolio Managers: |
| |
| | Brian W. Westhoff, CFA, Portfolio Manager (Lead) since 2005 |
| |
| | Bradley J. Beman, CFA, CPA, Portfolio Manager since 2011 |
| |
| | Jim Schaeffer, Portfolio Manager since 2011 |
| |
| | David Halfpap, Portfolio Manager since 2011 |
| |
| | Rick Perry, Portfolio Manager since 2011 |
Purchase and Sale of Fund Shares: Class I2 shares of the fund are currently primarily offered for investment in certain funds of funds (also referred to as “strategic asset allocation funds”). Class I2 shares of the fund are also made available to other investors, including institutional investors such as foreign insurers, domestic insurance companies and their separate accounts, and unaffiliated funds, high net worth individuals, and eligible retirement plans whose recordkeepers or financial service firm intermediaries have entered into agreements with Transamerica Funds or its agents. Investors who received Class I2 shares in connection with the reorganization of a Transamerica Premier Fund into a Transamerica Fund may continue to invest in Class I2 shares of that Transamerica Fund, but may not open new accounts. You buy and redeem shares at the fund’s next-determined net asset value (NAV) after receipt of your request in good order.
Tax Information: Fund distributions may be taxable as ordinary income or capital gains, except when your investment is in an IRA, 401(k) or other tax-advantaged investment plan.
Payments to Broker-Dealers and Other Financial Intermediaries: If you purchase the fund through a broker-dealer or other financial intermediary, the fund and/or its affiliates may pay the intermediary for the sale of fund shares and related services. These payments may create a conflict of interest by influencing the broker-dealer or other intermediary and your salesperson to recommend the fund over another investment. Ask your salesperson or visit your financial intermediary’s website for more information.
5
|
| TRANSAMERICA AEGON HIGH YIELD BOND |
Investment Objective: Seeks a high level of current income by investing in high-yield debt securities.
Fees and Expenses: This table describes the fees and expenses that you may pay if you buy and hold shares of the fund. There are no sales charges (load) or other transaction fees.
| | |
| Annual Fund Operating Expenses (expenses that you pay each year as a percentage of the value of your investment) |
| | |
Management fees | | 0.58% |
Distribution and service (12b-1) fees | | None |
Other expenses | | 0.08% |
Total annual fund operating expenses | | 0.66% |
Example: This Example is intended to help you compare the cost of investing in the fund with the cost of investing in other mutual funds. The Example assumes that you invest $10,000. The Example also assumes that your investment has a 5% return each year and that the fund’s operating expenses remain the same. Although your actual costs may be higher or lower, based on these assumptions your costs would be:
| | | | | | |
| 1 year | | 3 years | | 5 years | | 10 years |
$67 | | $211 | | $368 | | $822 |
Portfolio Turnover: The fund pays transaction costs, such as commissions, when it buys and sells securities (or “turns over” its portfolio). A higher portfolio turnover rate may indicate higher transaction costs and may result in higher taxes when fund shares are held in a taxable account. These costs, which are not reflected in annual fund operating expenses or in the Example, affect the fund’s performance. During the most recent fiscal year, the portfolio turnover rate was 91% of the average value of the fund’s portfolio.
Principal Investment Strategies: AEGON USA Investment Management, LLC (“AUIM”), the fund’s sub-adviser, seeks to achieve the fund’s objective by investing, under normal circumstances, at least 80% of the fund’s net assets in high-yield/high-risk bonds (commonly known as “junk bonds”).
Junk bonds are high risk debt securities rated in medium or lower rating categories or determined by AUIM to be of comparable quality. AUIM’s strategy is to seek to achieve yields as high as possible while seeking to manage risk. AUIM uses a “top-down/bottom-up” approach in managing the fund’s assets. The “top-down” approach is to adjust the risk profile of the fund. AUIM analyzes four factors that affect the movement of the fixed-income bond prices which include: economic indicators; technical indicators that are specific to the high-yield market; investor sentiment and valuation. Analysis of these factors assists AUIM in its decision regarding the fund’s portfolio allocations. In a “top-down” approach, the sub-adviser looks at broad market factors and chooses certain sectors or industries within the market, based on those factors. It then looks at individual companies within those sectors or industries.
AUIM has developed a proprietary credit model that is the foundation of its “bottom-up” analysis. The model tracks historical cash flow numbers and calculates credit financial ratios. Because high-yield companies are of higher financial risk, AUIM does a thorough credit analysis of all companies in the fund’s portfolio, as well as all potential acquisitions. A “bottom-up” approach is looking at individual companies against the context of broader market factors.
AUIM may sell fund securities when it determines there are changes in economic indicators, technical indicators or valuation.
The fund may invest its assets in cash, cash equivalent securities or short-term debt securities, repurchase agreements and money market instruments. Under adverse or unstable market, economic or political conditions, the fund may take temporary defensive positions in cash and short-term debt securities without limit.
Principal Risks: Many factors affect the fund’s performance. There is no assurance the fund will meet its investment objective. The value of your investment in the fund, as well as the amount of return you receive on your investment, may fluctuate significantly from day to day and over time. You may lose part or all of your investment in the fund or your investment may not perform as well as other similar investments. The following is a summary of certain risks (in alphabetical order) of investing in the fund. You may lose money if you invest in this fund.
| • | | Cash Management and Defensive Investing – Money market instruments or short-term debt securities held by the fund for cash management or defensive investing purposes can fluctuate in value. Like other fixed income securities, they are subject to risk, including market, interest rate and credit risk. If the fund holds cash uninvested, the fund will not earn income on the cash and the fund’s yield will go down. If a significant amount of the fund’s assets are used for cash management or defensive investing purposes, it will be more difficult for the fund to achieve its objective. |
6
| • | | Credit – If an issuer or guarantor of a security held by the fund or a counterparty to a financial contract with the fund defaults or is downgraded, or if the value of the assets underlying a security declines, the value of your investment will decline. Junk bonds have a higher risk of default and are considered speculative. A default or downgrade will have a greater impact on subordinated securities. |
| • | | Fixed-Income Securities – The market prices of fixed-income securities may go up or down, sometimes rapidly or unpredictably due to general market conditions, such as real or perceived adverse economic or political conditions, inflation, changes in interest rates, lack of liquidity in the bond markets or adverse investor sentiment. When market prices fall, the value of your investment will go down. A rise in rates tends to have a greater impact on the prices of longer term or duration securities. |
If interest rates rise, repayments of fixed-income securities may occur more slowly than anticipated by the market. This may drive the prices of these securities down because their interest rates are lower than the current interest rate and they remain outstanding longer. This is sometimes referred to as extension risk.
Many issuers have a right to prepay their securities. If interest rates fall, an issuer may exercise this right. If this happens, the fund will be forced to reinvest prepayment proceeds at a time when yields on securities available in the market are lower than the yield on the prepaid security. This is sometimes referred to as prepayment or call risk.
| • | | Foreign Securities – Foreign securities are subject to a number of additional risks, including nationalization or expropriation of assets, imposition of currency controls or restrictions, confiscatory taxation, political or financial instability and other adverse economic or political developments. Lack of information and less market regulation also may affect the value of these securities. |
| • | | High-Yield Debt Securities – High-yield debt securities, or junk bonds, are securities that are rated below “investment grade” (that is, securities rated below Baa/BBB) or, if unrated, are considered by the sub-adviser to be of equivalent quality. Changes in interest rates, the market’s perception of the issuers and the creditworthiness of the issuers may significantly affect the value of these bonds. Junk bonds have a higher risk of default, tend to be less liquid and may be more difficult to value. |
| • | | Increase in Expenses – Your actual costs of investing in the fund may be higher than the expenses shown in “Annual Fund Operating Expenses” for a variety of reasons. For example, expense ratios may be higher than those shown if average net assets decrease. Net assets are more likely to decrease and fund expense ratios are more likely to increase when markets are volatile. |
| • | | Interest Rate – Fixed-income securities have varying levels of sensitivity to changes in interest rates. In general, the price of a fixed-income security tends to fall when interest rates rise and can rise when interest rates fall. A change in interest rates will not have the same impact on all fixed-income securities. Generally, the longer the maturity or duration of a fixed-income security, the greater the impact of a rise in interest rates on the security’s value. In addition, different interest rate measures (such as short- and long-term interest rates and U.S. and foreign interest rates), or interest rates on different types of securities or securities of different issuers, may not necessarily change in the same amount or in the same direction. When interest rates go down, the income received by the fund, and the fund’s yield, may decline. |
| • | | Liquidity – Some securities held by the fund may be difficult to sell, or illiquid, particularly during times of market turmoil. Illiquid securities may also be difficult to value. If the fund is forced to sell an illiquid asset to meet redemption requests or other cash needs, the fund may be forced to sell at a loss. |
| • | | Market – The market prices of the fund’s securities may go up or down, sometimes rapidly or unpredictably, due to general market conditions, such as real or perceived adverse economic or political conditions, inflation, changes in interest rates or currency rates, lack of liquidity in the markets or adverse investor sentiment. Market prices of securities also may go down due to events or conditions that affect particular sectors or issuers. When market prices fall, the value of your investment will go down. The fund may experience a substantial or complete loss on any individual security. The recent financial crisis has caused a significant decline in the value and liquidity of many securities. In response to the financial crisis, the U.S. and other governments and the Federal Reserve and certain foreign central banks have taken steps to support financial markets. The withdrawal of this support could negatively affect the value and liquidity of certain securities. In addition, legislation recently enacted in the U.S. calls for changes in many aspects of financial regulation. The impact of the legislation on the markets, and the practical implications for market participants, may not be fully known for some time. |
| • | | Portfolio Selection – The sub-adviser’s judgment about a particular security or issuer, or about the economy or a particular sector, region or market segment, or about an investment strategy, may prove to be incorrect. |
7
| • | | Valuation – The sales price the fund could receive for any particular portfolio investment may differ from the fund’s valuation of the investment, particularly for securities that trade in thin or volatile markets or that are valued using a fair value methodology. |
Performance: The bar chart and the table below provide some indication of the risks of investing in the fund by showing you how the fund’s performance has varied from year to year, and how the fund’s Class I2 average annual total returns for different periods compare to the returns of a broad measure of market performance. The table shows average annual total returns for Class I2 shares of the fund. Absent any limitation of the fund’s expenses, total returns would be lower. As with all mutual funds, past performance (before and after taxes) is not a prediction of future results. Updated performance information is available on our website at www.transamericafunds.com or by calling 1-888-233-4339.
Annual Total Returns (calendar years ended December 31)

| | | | |
| | | Quarter Ended | | Return |
Best Quarter: | | 6/30/2009 | | 22.95% |
Worst Quarter: | | 12/31/2008 | | -16.73% |
Average Annual Total Returns (periods ended December 31, 2010)1
| | | | | | |
| | | 1 Year | | 5 Years | | 10 Years or Inception* |
Class I2 (commenced operations on November 8, 2004) | | | | | | |
Return before taxes2 | | 13.35% | | 8.61% | | 7.67% |
Return after taxes on distributions2 | | 10.34% | | 5.57% | | 4.77% |
Return after taxes on distributions and sale of fund shares2 | | 8.56% | | 5.48% | | 4.76% |
| Barclays Capital U.S. Corporate High Yield 2% Issuer Capped Index (reflects no deduction for fees, expenses, or taxes) | | 14.94% | | 8.90% | | 7.98% |
| Bank of America Merrill Lynch High Yield, Cash Pay Index (reflects no deduction for fees, expenses, or taxes)3 | | 15.24% | | 8.67% | | 7.80% |
| 1 | Actual returns may depend on the investor’s individual tax situation. After-tax returns may not be relevant if the investment is made through a tax-exempt or tax-deferred account, such as a 401(k) plan. |
| 2 | The after-tax returns are calculated using the historic highest individual federal marginal income tax rates and do not reflect the impact of state and local taxes. |
| 3 | This index served as the benchmark for the fund prior to January 15, 2011, at which time it was replaced with the Barclays Capital U. S. Corporate High Yield 2% Issuer Capped Index. This benchmark change was made to more accurately reflect the principal strategies of the fund. |
| * | Fund and Index returns are for past 10 years or since inception, whichever is less. |
Management:
| | |
| Investment Adviser: | | Sub-Adviser: |
| |
| Transamerica Asset Management, Inc. | | AEGON USA Investment Management, LLC |
| |
| | Portfolio Managers: |
| |
| | Kevin Bakker, CFA, Portfolio Manager since 2007 |
| |
| | Bradley J. Beman, CFA, CPA, Portfolio Manager since 1997 |
| |
| | Benjamin D. Miller, CFA, Portfolio Manager since 2006 |
8
Purchase and Sale of Fund Shares: Class I2 shares of the fund are currently primarily offered for investment in certain funds of funds (also referred to as “strategic asset allocation funds”). Class I2 shares of the fund are also made available to other investors, including institutional investors such as foreign insurers, domestic insurance companies and their separate accounts, and unaffiliated funds, high net worth individuals, and eligible retirement plans whose recordkeepers or financial service firm intermediaries have entered into agreements with Transamerica Funds or its agents. Investors who received Class I2 shares in connection with the reorganization of a Transamerica Premier Fund into a Transamerica Fund may continue to invest in Class I2 shares of that Transamerica Fund, but may not open new accounts. You buy and redeem shares at the fund’s next-determined net asset value (NAV) after receipt of your request in good order.
Tax Information: Fund distributions may be taxable as ordinary income or capital gains, except when your investment is in an IRA, 401(k) or other tax-advantaged investment plan.
Payments to Broker-Dealers and Other Financial Intermediaries: If you purchase the fund through a broker-dealer or other financial intermediary, the fund and/or its affiliates may pay the intermediary for the sale of fund shares and related services. These payments may create a conflict of interest by influencing the broker-dealer or other intermediary and your salesperson to recommend the fund over another investment. Ask your salesperson or visit your financial intermediary’s website for more information.
9
|
| TRANSAMERICA AEGON MONEY MARKET |
Investment Objective: Seeks maximum current income from money market securities consistent with liquidity and preservation of principal.
Fees and Expenses: This table describes the fees and expenses that you may pay if you buy and hold shares of the fund. There are no sales charges (load) or other transaction fees.
| | |
| Annual Fund Operating Expenses (expenses that you pay each year as a percentage of the value of your investment) |
| | | |
| Management fees | | 0.40% |
| Distribution and service (12b-1) fees | | None |
| Other expenses | | 0.10% |
| Total annual fund operating expenses | | 0.50% |
| Expense reductiona,b | | 0.02% |
| Total annual fund operating expenses after expense reduction | | 0.48% |
| a | Contractual arrangements have been made with the fund’s investment adviser, Transamerica Asset Management, Inc. (“TAM”), through March 1, 2012, to waive fees and/or reimburse fund expenses to the extent that the fund’s total operating expenses exceed 0.48%, excluding extraordinary expenses. TAM is entitled to reimbursement by the fund of fees waived or expenses reduced during any of the previous 36 months if on any day the estimated annualized fund operating expenses are less than the cap, excluding extraordinary expenses. |
| b | In addition to the contractual fee waiver, TAM or any of its affiliates may waive fees or reimburse expenses of one or more classes of the fund in order to avoid a negative yield. Any such waiver or expense reimbursement would be voluntary, could be discontinued at any time, and is subject in certain circumstances to reimbursement by the fund to TAM or its affiliates. There is no guarantee that the fund will be able to avoid a negative yield. |
Example: This Example is intended to help you compare the cost of investing in the fund with the cost of investing in other mutual funds. The Example assumes that you invest $10,000. The Example also assumes that your investment has a 5% return each year and that the fund’s operating expenses remain the same. Although your actual costs may be higher or lower, based on these assumptions your costs would be:
| | | | | | |
| 1 year | | 3 years | | 5 years | | 10 years |
$49 | | $158 | | $278 | | $626 |
Principal Investment Strategies: The fund’s sub-adviser, AEGON USA Investment Management, LLC (“AUIM”), invests the fund’s assets in the following high quality, short-term U.S. dollar-denominated money market instruments:
| • | | short-term corporate obligations, including commercial paper, notes and bonds |
| • | | obligations issued or guaranteed by the U.S. and foreign governments and their agencies and instrumentalities |
| • | | obligations of U.S. and foreign banks, or their foreign branches, and U.S. savings banks |
| • | | repurchase agreements involving any of the securities mentioned above |
Bank obligations purchased for the fund are limited to U.S. or foreign banks with total assets of $1.5 billion or more. Similarly, savings association obligations purchased for the fund are limited to U.S. savings association obligations issued by U.S. savings banks with total assets of $1.5 billion or more. Foreign securities purchased for the fund must be U.S. dollar-denominated and issued by foreign governments, agencies or instrumentalities, or banks that meet the minimum $1.5 billion capital requirement. These foreign obligations must also meet the same quality requirements as U.S. obligations. Each security, at the time of purchase by the fund, has been determined by the sub-adviser to present minimal credit risk.
As a money market fund, the fund tries to maintain a share price of $1.00, and must follow strict rules as to the credit quality, diversification, liquidity and maturity of its investments. If, after purchase, the credit rating on a security held by the fund is downgraded or the credit quality deteriorates, or if the maturity on a security is extended, the fund’s sub-adviser or Board of Trustees (where required by applicable regulations) will decide whether the security should be held or sold.
Principal Risks: An investment in the fund is not a bank deposit and is not insured or guaranteed by the Federal Deposit Insurance Corporation (“FDIC”) or any other government agency. Although the fund seeks to preserve the value of your investment at $1 per share, it is possible to lose money by investing in the fund.
There is no assurance that the fund will meet its investment objectives. The fund could underperform other short-term debt instruments or money market funds, or you could lose money.
In addition, you should be aware that there have been money market funds in other fund complexes that, in the past, have failed to pay investors $1.00 per share for their investment in those funds (this is referred to as “breaking the buck”), and any money market fund may do so in the future. You should also be aware that TAM and its affiliates are under no obligation to provide
10
financial support to the fund or take other measures to ensure that you receive $1.00 per share for your investment in the fund. You should not invest in the fund with the expectation that any such action will be taken.
The following is a summary of certain risks (in alphabetical order) of investing in the fund:
| • | | Bank Obligations – To the extent the fund invests in U.S. bank obligations, the fund will be more susceptible to adverse events affecting the U.S. banking industry. Banks are sensitive to changes in money market and general economic conditions, as well as decisions by regulators that can affect banks’ profitability. |
| • | | Credit – An issuer or obligor of a security held by the fund or a counterparty to a financial contract with the fund may default or its credit may be downgraded, or the value of assets underlying a security may decline. Subordinated securities will be disproportionately affected by a default or downgrade. |
| • | | Fixed-Income Securities – The market prices of fixed-income securities may go up or down, sometimes rapidly or unpredictably due to general market conditions, such as real or perceived adverse economic or political conditions, inflation, changes in interest rates, lack of liquidity in the bond markets or adverse investor sentiment. When market prices fall, the value of your investment will go down. A rise in rates tends to have a greater impact on the prices of longer term or duration securities. |
If interest rates rise, repayments of fixed-income securities may occur more slowly than anticipated by the market. This may drive the prices of these securities down because their interest rates are lower than the current interest rate and they remain outstanding longer. This is sometimes referred to as extension risk.
Many issuers have a right to prepay their securities. If interest rates fall, an issuer may exercise this right. If this happens, the fund will be forced to reinvest prepayment proceeds at a time when yields on securities available in the market are lower than the yield on the prepaid security. This is sometimes referred to as prepayment or call risk.
| • | | Foreign Securities – Foreign securities are subject to a number of additional risks, including nationalization or expropriation of assets, imposition of currency controls or restrictions, confiscatory taxation, political or financial instability and other adverse economic or political developments. Lack of information and less market regulation also may affect the value of these securities. |
| • | | Increase in Expenses – Your actual costs of investing in the fund may be higher than the expenses shown in “Annual Fund Operating Expenses” for a variety of reasons. For example, expense ratios may be higher than those shown if average net assets decrease. Net assets are more likely to decrease and fund expense ratios are more likely to increase when markets are volatile. |
| • | | Interest Rate – The interest rates on short-term obligations held in the fund will vary, rising or falling with short-term interest rates generally. The fund’s yield will tend to lag behind general changes in interest rates. The ability of the fund’s yield to reflect current market rates will depend on how quickly the obligations in its portfolio mature and how much money is available for investment at current market rates. |
| • | | Market – The market prices of the fund’s securities may go up or down, sometimes rapidly or unpredictably, due to general market conditions, such as real or perceived adverse economic or political conditions, inflation, changes in interest rates or currency rates, lack of liquidity in the markets or adverse investor sentiment. Market prices of securities also may go down due to events or conditions that affect particular sectors or issuers. When market prices fall, the value of your investment will go down. The fund may experience a substantial or complete loss on any individual security. The recent financial crisis has caused a significant decline in the value and liquidity of many securities. In response to the financial crisis, the U.S. and other governments and the Federal Reserve and certain foreign central banks have taken steps to support financial markets. The withdrawal of this support could negatively affect the value and liquidity of certain securities. In addition, legislation recently enacted in the U.S. calls for changes in many aspects of financial regulation. The impact of the legislation on the markets, and the practical implications for market participants, may not be fully known for some time. |
| • | | Redemption – The fund may experience periods of heavy redemptions that could cause the fund to liquidate its assets at inopportune times or at a loss or depressed value particularly during periods of declining or illiquid markets. Redemption risk is greater to the extent that the fund has investors with large shareholdings, short investment horizons, or unpredictable cash flow needs. The redemption by one or more large shareholders of their holdings in the fund could have an adverse impact on the remaining shareholders in the fund. In addition, the fund may suspend redemptions when permitted by applicable regulations. |
| • | | Repurchase Agreements – If the other party to a repurchase agreement defaults on its obligation, the fund may suffer delays and incur costs or lose money in exercising its rights under the agreement. If the seller fails to repurchase the security and the market value declines, the fund could lose money. If the seller becomes insolvent and subject to liquidation |
11
| | or reorganization under applicable bankruptcy or other laws, the fund’s ability to dispose of the underlying securities may be restricted. |
| • | | U.S. Government Agency Obligations – Government agency obligations have different levels of credit support and, therefore, different degrees of credit risk. Securities issued by agencies and instrumentalities of the U.S. government that are supported by the full faith and credit of the United States generally present a lesser degree of credit risk than securities issued by agencies and instrumentalities sponsored by the U.S. government that are supported only by the issuer’s right to borrow from the U.S. Treasury and securities issued by agencies and instrumentalities sponsored by the U.S. government that are supported only by the credit of the issuing agencies. |
| • | | Yield – The amount of income you receive from the fund will go up or down depending on day-to-day variations in short- term interest rates, and when interest rates are very low the fund’s expenses could absorb all or a significant portion of the fund’s income. If interest rates increase, the fund’s yield may not increase proportionately. For example, TAM or its affiliates may discontinue any temporary voluntary fee limitation or recoup expenses previously foregone or reimbursed. In addition, the recent adoption of more stringent regulations governing the management of money market funds could have a negative effect on yields. |
Performance: The bar chart and the table below provide some indication of the risks of investing in the fund by showing you how the fund’s performance and Class I2 average annual total returns have varied from year to year. The table shows average annual total returns for Class I2 shares of the fund. Performance reflects any fee waivers or expense reimbursements in effect during the relevant periods. Absent any limitation of the fund’s expenses, total returns would be lower. As with all mutual funds, past performance (before and after taxes) is not a prediction of future results. Updated performance information is available on our website at www.transamericafunds.com or by calling 1-888-233-4339.
Prior to March 22, 2011, the fund was named Transamerica Money Market and had a different sub-adviser. The performance set forth prior to that date is attributable to the previous sub-adviser.
Annual Total Returns (calendar years ended December 31)

7-DAY YIELD1
(as of December 31, 2010)
Class I2 = 0.02%
| | | | |
| | | Quarter Ended | | Return |
| Best Quarter: | | 12/31/2006 | | 1.24% |
| Worst Quarter: | | 9/30/2009 | | 0.00% |
Average Annual Total Returns (periods ended December 31, 2010)2
| | | | | | |
| | | 1 Year | | 5 Years | | 10 Years or
Inception* |
Class I2 (commenced operations on November 15, 2005) | | | | | | |
Return before taxes | | 0.02% | | 2.38% | | 2.42% |
| 1 | Call Customer Service (1-888-233-4339) for the current 7-day yield. |
| 2 | Actual returns may depend on the investor’s individual tax situation. |
| * | Fund and Index returns are for past 10 years or since inception, whichever is less. |
Management:
| | |
| Investment Adviser: | | Sub-Adviser: |
| |
| Transamerica Asset Management, Inc. | | AEGON USA Investment Management, LLC |
12
Purchase and Sale of Fund Shares: Class I2 shares of the fund are currently primarily offered for investment in certain funds of funds (also referred to as “strategic asset allocation funds”). Class I2 shares of the fund are also made available to other investors, including institutional investors such as foreign insurers, domestic insurance companies and their separate accounts, and unaffiliated funds, high net worth individuals, and eligible retirement plans whose recordkeepers or financial service firm intermediaries have entered into agreements with Transamerica Funds or its agents. Investors who received Class I2 shares in connection with the reorganization of a Transamerica Premier Fund into a Transamerica Fund may continue to invest in Class I2 shares of that Transamerica Fund, but may not open new accounts. You buy and redeem shares at the fund’s next-determined net asset value (NAV) after receipt of your request in good order.
Tax Information: Fund distributions may be taxable as ordinary income or capital gains, except when your investment is in an IRA, 401(k) or other tax-advantaged investment plan.
Payments to Broker-Dealers and Other Financial Intermediaries: If you purchase the fund through a broker-dealer or other financial intermediary, the fund and/or its affiliates may pay the intermediary for the sale of fund shares and related services. These payments may create a conflict of interest by influencing the broker-dealer or other intermediary and your salesperson to recommend the fund over another investment. Ask your salesperson or visit your financial intermediary’s website for more information.
13
|
| TRANSAMERICA AEGON SHORT-TERM BOND |
Investment Objective: Seeks a high level of income consistent with minimal fluctuation in principal value and liquidity.
Fees and Expenses: This table describes the fees and expenses that you may pay if you buy and hold shares of the fund. There are no sales charges (load) or other transaction fees.
| | |
| Annual Fund Operating Expenses (expenses that you pay each year as a percentage of the value of your investment)a |
| | |
Management fees | | 0.47% |
Distribution and service (12b-1) fees | | None |
Other expenses | | 0.06% |
Total annual fund operating expenses | | 0.53% |
| a | Annual fund operating expenses have been restated to reflect current contractual advisory fees. |
Example: This Example is intended to help you compare the cost of investing in the fund with the cost of investing in other mutual funds. The Example assumes that you invest $10,000. The Example also assumes that your investment has a 5% return each year and that the fund’s operating expenses remain the same. Although your actual costs may be higher or lower, based on these assumptions your costs would be:
| | | | | | |
1 year | | 3 years | | 5 years | | 10 years |
$54 | | $170 | | $296 | | $665 |
Portfolio Turnover: The fund pays transaction costs, such as commissions, when it buys and sells securities (or “turns over” its portfolio). A higher portfolio turnover rate may indicate higher transaction costs and may result in higher taxes when fund shares are held in a taxable account. These costs, which are not reflected in annual fund operating expenses or in the Example, affect the fund’s performance. During the most recent fiscal year, the portfolio turnover rate was 54% of the average value of the fund’s portfolio.
Principal Investment Strategies: AEGON USA Investment Management, LLC (“AUIM”), the fund’s sub-adviser, seeks to achieve the fund’s objective by investing, under normal circumstances, at least 80% of the fund’s net assets in fixed-income securities. Securities in which the fund may invest include:
| • | | short-term and intermediate-term, investment-grade corporate obligations |
| • | | obligations issued or guaranteed by the U.S. and foreign governments and their agencies and instrumentalities |
| • | | mortgage-backed securities |
| • | | asset-backed securities |
AUIM may also invest in bank obligations, collateralized mortgage obligations, foreign securities and hybrids.
Bank obligations purchased for the fund are limited to U.S. or foreign banks with total assets of $1.5 billion or more. Similarly, savings association obligations purchased for the fund are limited to U.S. savings association obligations issued by U.S. savings banks with total assets of $1.5 billion or more. Foreign government securities purchased for the fund must be U.S. dollar-denominated and issued by foreign governments, agencies or instrumentalities. These foreign obligations must also meet the same quality requirements as U.S. obligations. The commercial paper and other short-term corporate obligations AUIM buys for the fund are determined by the fund manager to present minimal credit risks.
The fund may invest its assets in cash, cash equivalent securities or short-term debt securities, repurchase agreements and money market instruments. Under adverse or unstable market, economic or political conditions, the fund may take temporary defensive positions in cash and short-term debt securities without limit.
Principal Risks: Many factors affect the fund’s performance. There is no assurance the fund will meet its investment objective. The value of your investment in the fund, as well as the amount of return you receive on your investment, may fluctuate significantly from day to day and over time. You may lose part or all of your investment in the fund or your investment may not perform as well as other similar investments. The following is a summary of certain risks (in alphabetical order) of investing in the fund. You may lose money if you invest in this fund.
| • | | Bank Obligations – To the extent the fund invests in U.S. bank obligations, the fund will be more susceptible to adverse events affecting the U.S. banking industry. Banks are sensitive to changes in money market and general economic conditions, as well as decisions by regulators that can affect banks’ profitability. |
14
| • | | Cash Management and Defensive Investing – Money market instruments or short-term debt securities held by the fund for cash management or defensive investing purposes can fluctuate in value. Like other fixed income securities, they are subject to risk, including market, interest rate and credit risk. If the fund holds cash uninvested, the fund will not earn income on the cash and the fund’s yield will go down. If a significant amount of the fund’s assets are used for cash management or defensive investing purposes, it will be more difficult for the fund to achieve its objective. |
| • | | Credit – If an issuer or guarantor of a security held by the fund or a counterparty to a financial contract with the fund defaults or is downgraded, or if the value of the assets underlying a security declines, the value of your investment will decline. Junk bonds have a higher risk of default and are considered speculative. A default or downgrade will have a greater impact on subordinated securities. |
| • | | Derivatives – Using derivatives can increase fund losses and reduce opportunities for gains when market prices, interest rates or the derivative instruments themselves behave in a way not anticipated by the fund. Using derivatives also can have a leveraging effect and increase fund volatility. Derivatives may be difficult to sell, unwind or value, and the counterparty may default on its obligations to the fund. The fund’s investments in derivative instruments may involve a small investment relative to the amount of investment exposure assumed and may result in losses exceeding the amounts invested in those instruments. Recent legislation calls for new regulation of the derivatives markets. The extent and impact of the regulation are not yet fully known and may not be for some time. New regulation of derivatives may make them more costly, may limit their availability, or may otherwise adversely affect their value or performance. |
| • | | Fixed-Income Securities – The market prices of fixed-income securities may go up or down, sometimes rapidly or unpredictably due to general market conditions, such as real or perceived adverse economic or political conditions, inflation, changes in interest rates, lack of liquidity in the bond markets or adverse investor sentiment. When market prices fall, the value of your investment will go down. A rise in rates tends to have a greater impact on the prices of longer term or duration securities. |
If interest rates rise, repayments of fixed-income securities may occur more slowly than anticipated by the market. This may drive the prices of these securities down because their interest rates are lower than the current interest rate and they remain outstanding longer. This is sometimes referred to as extension risk.
Many issuers have a right to prepay their securities. If interest rates fall, an issuer may exercise this right. If this happens, the fund will be forced to reinvest prepayment proceeds at a time when yields on securities available in the market are lower than the yield on the prepaid security. This is sometimes referred to as prepayment or call risk.
| • | | Foreign Securities – Foreign securities are subject to a number of additional risks, including nationalization or expropriation of assets, imposition of currency controls or restrictions, confiscatory taxation, political or financial instability and other adverse economic or political developments. Lack of information and less market regulation also may affect the value of these securities. |
| • | | Increase in Expenses – Your actual costs of investing in the fund may be higher than the expenses shown in “Annual Fund Operating Expenses” for a variety of reasons. For example, expense ratios may be higher than those shown if average net assets decrease. Net assets are more likely to decrease and fund expense ratios are more likely to increase when markets are volatile. |
| • | | Interest Rate – Fixed-income securities have varying levels of sensitivity to changes in interest rates. In general, the price of a fixed-income security tends to fall when interest rates rise and can rise when interest rates fall. A change in interest rates will not have the same impact on all fixed-income securities. Generally, the longer the maturity or duration of a fixed-income security, the greater the impact of a rise in interest rates on the security’s value. In addition, different interest rate measures (such as short- and long-term interest rates and U.S. and foreign interest rates), or interest rates on different types of securities or securities of different issuers, may not necessarily change in the same amount or in the same direction. When interest rates go down, the income received by the fund, and the fund’s yield, may decline. |
| • | | Liquidity – Some securities held by the fund may be difficult to sell, or illiquid, particularly during times of market turmoil. Illiquid securities may also be difficult to value. If the fund is forced to sell an illiquid asset to meet redemption requests or other cash needs, the fund may be forced to sell at a loss. |
| • | | Market – The market prices of the fund’s securities may go up or down, sometimes rapidly or unpredictably, due to general market conditions, such as real or perceived adverse economic or political conditions, inflation, changes in interest rates or currency rates, lack of liquidity in the markets or adverse investor sentiment. Market prices of securities also may go down due to events or conditions that affect particular sectors or issuers. When market prices fall, the value of your investment will go down. The fund may experience a substantial or complete loss on any individual security. The recent financial crisis has caused a significant decline in the value and liquidity of many securities. In response to the financial crisis, the U.S. and |
15
| | other governments and the Federal Reserve and certain foreign central banks have taken steps to support financial markets. The withdrawal of this support could negatively affect the value and liquidity of certain securities. In addition, legislation recently enacted in the U.S. calls for changes in many aspects of financial regulation. The impact of the legislation on the markets, and the practical implications for market participants, may not be fully known for some time. |
| • | | Mortgage-Related and Asset-Backed Securities – Mortgage-backed securities may be issued by private issuers, by government-sponsored entities such as Fannie Mae or Freddie Mac or by agencies of the U.S. government, such as Ginnie Mae. Mortgage-backed securities represent direct or indirect participations in, or are collateralized by and payable from, mortgage loans secured by real property. Unlike mortgage-related securities issued or guaranteed by agencies of the U.S. government or government-sponsored entities, mortgage-related securities issued by private issuers do not have a government or government-sponsored entity guarantee (but may have other credit enhancement), and may, and frequently do, have less favorable collateral, credit risk or other underwriting characteristics. Mortgage-backed securities are also particularly susceptible to prepayment and extension risks. Asset-backed securities represent participations in, or are secured by and payable from, assets such as installment sales or loan contracts, leases, credit card receivables and other categories of receivables. Certain asset-backed securities present a heightened level of risk because, in the event of default, the liquidation value of the underlying assets may be inadequate to pay any unpaid principal or interest. The value of mortgage-backed and asset-backed securities may be affected by changes in credit quality or value of the mortgage loans or other assets that support the securities. |
| • | | Portfolio Selection – The sub-adviser’s judgment about a particular security or issuer, or about the economy or a particular sector, region or market segment, or about an investment strategy, may prove to be incorrect. |
| • | | REITs – When the fund invests in Real Estate Investment Trusts (“REITs”), it is subject to risks generally associated with investing in real estate. A REIT’s performance depends on the types and locations of the properties it owns and how well it manages those properties or loan financings. REITs are subject to a highly technical tax structure; and the failure to qualify as a REIT could result in corporate-level taxation, significantly reducing the return on an investment to the fund. |
| • | | U.S. Government Agency Obligations – Government agency obligations have different levels of credit support and, therefore, different degrees of credit risk. Securities issued by agencies and instrumentalities of the U.S. government that are supported by the full faith and credit of the United States generally present a lesser degree of credit risk than securities issued by agencies and instrumentalities sponsored by the U.S. government that are supported only by the issuer’s right to borrow from the U.S. Treasury and securities issued by agencies and instrumentalities sponsored by the U.S. government that are supported only by the credit of the issuing agencies. |
| • | | Valuation – The sales price the fund could receive for any particular portfolio investment may differ from the fund’s valuation of the investment, particularly for securities that trade in thin or volatile markets or that are valued using a fair value methodology. |
| • | | Yield – The amount of income received by the fund will go up or down depending on day-to-day variations in short-term interest rates, and when interest rates are very low the fund’s expenses could absorb all or a significant portion of the fund’s income. |
Performance: The bar chart and the table below provide some indication of the risks of investing in the fund by showing you how the fund’s performance has varied from year to year, and how the fund’s Class I2 average annual total returns for different periods compare to the returns of a broad measure of market performance. The table shows average annual total returns for Class I2 shares of the fund. Absent any limitation of the fund’s expenses, total returns would be lower. As with all mutual funds, past performance (before and after taxes) is not a prediction of future results. Updated performance information is available on our website at www.transamericafunds.com or by calling 1-888-233-4339.
Prior to March 22, 2011, the fund was named Transamerica Short-Term Bond and had a different sub-adviser. The performance set forth prior to that date is attributable to the previous sub-adviser.
16
Annual Total Returns (calendar years ended December 31)

| | | | |
| | | Quarter Ended | | Return |
| Best Quarter: | | 6/30/2009 | | 4.82% |
| Worst Quarter: | | 12/31/2008 | | -2.28% |
Average Annual Total Returns (periods ended December 31, 2010)1
| | | | | | |
| | | 1 Year | | 5 Years | | 10 Years or
Inception* |
Class I2 (commenced operations on November 8, 2004) | | | | | | |
Return before taxes | | 6.31% | | 5.71% | | 4.82% |
Return after taxes on distributions2 | | 4.67% | | 4.02% | | 3.27% |
Return after taxes on distributions and sale of fund shares2 | | 4.14% | | 3.88% | | 3.20% |
| Bank of America Merrill Lynch U.S. Corporate & Government, 1-3 Years Index (reflects no deduction for fees, expenses or taxes) | | 2.82% | | 4.49% | | 3.94% |
| 1 | Actual returns may depend on the investor’s individual tax situation. After-tax returns may not be relevant if the investment is made through a tax-exempt or tax-deferred account, such as a 401(k) plan. |
| 2 | The after-tax returns are calculated using the historic highest individual federal marginal income tax rates and do not reflect the impact of state and local taxes. |
| * | Fund and Index returns are for past 10 years or since inception, whichever is less. |
Management:
| | |
| Investment Adviser: | | Sub-Adviser: |
| |
| Transamerica Asset Management, Inc. | | AEGON USA Investment Management, LLC |
| |
| | Portfolio Managers: |
| |
| | Greg Haendel, CFA, Portfolio Manager (Lead) since 2007 |
| |
| | Doug Weih, Portfolio Manager since 2011 |
| |
| | Garry Creed, Portfolio Manager since 2011 |
Purchase and Sale of Fund Shares: Class I2 shares of the fund are currently primarily offered for investment in certain funds of funds (also referred to as “strategic asset allocation funds”). Class I2 shares of the fund are also made available to other investors, including institutional investors such as foreign insurers, domestic insurance companies and their separate accounts, and unaffiliated funds, high net worth individuals, and eligible retirement plans whose recordkeepers or financial service firm intermediaries have entered into agreements with Transamerica Funds or its agents. Investors who received Class I2 shares in connection with the reorganization of a Transamerica Premier Fund into a Transamerica Fund may continue to invest in Class I2 shares of that Transamerica Fund, but may not open new accounts. You buy and redeem shares at the fund’s next-determined net asset value (NAV) after receipt of your request in good order.
Tax Information: Fund distributions may be taxable as ordinary income or capital gains, except when your investment is in an IRA, 401(k) or other tax-advantaged investment plan.
Payments to Broker-Dealers and Other Financial Intermediaries: If you purchase the fund through a broker-dealer or other financial intermediary, the fund and/or its affiliates may pay the intermediary for the sale of fund shares and related services. These payments may create a conflict of interest by influencing the broker-dealer or other intermediary and your salesperson to recommend the fund over another investment. Ask your salesperson or visit your financial intermediary’s website for more information.
17
|
| TRANSAMERICA AQR MANAGED FUTURES STRATEGY |
Investment Objective: Seeks to generate positive absolute returns.
Fees and Expenses: This table describes the fees and expenses that you may pay if you buy and hold shares of the fund. There are no sales charges (load) or other transaction fees.
| | |
Annual Fund Operating Expenses (expenses that you pay each year as a percentage of the value of your investment) a |
| | | |
Management fees | | 1.10% |
Distribution and service (12b-1) fees | | None |
Other expenses | | 0.10% |
Acquired fund fees and expenses (fees and expenses of underlying funds)b | | 0.30% |
Total annual fund operating expenses | | 1.50% |
Expense reductionb, c | | 0.28% |
Total annual fund operating expenses after expense reduction | | 1.22% |
| a | Annual fund operating expenses are based on estimates for the current fiscal year. |
| b | Acquired fund fees and expenses reflect the expenses (including the management fee) borne by the fund as the sole shareholder of the Subsidiary (as defined below). The Subsidiary has entered into a separate contract with the fund’s investment adviser, Transamerica Asset Management, Inc. (“TAM”), for the management of the Subsidiary portfolio pursuant to which the Subsidiary pays TAM a fee that is the same, as a percentage of net assets, as the management fee of the fund. TAM has contractually agreed to waive a portion of the fund’s management fee in an amount equal to the management fee paid to TAM by the Subsidiary. This management fee waiver, which is reflected in the “Expense reduction” line, may not be discontinued by TAM as long as its contract with the Subsidiary is in place. |
| c | Contractual arrangements have been made with TAM through March 1, 2012, to waive fees and/or reimburse fund expenses to the extent that the fund’s total operating expenses exceed 1.45%, excluding extraordinary expenses. TAM is entitled to reimbursement by the fund of fees waived or expenses reduced during any of the previous 36 months if on any day the estimated annualized fund operating expenses are less than the cap, excluding extraordinary expenses. The expense cap may be terminated by the fund’s Board of Trustees at any time. |
Example: This Example is intended to help you compare the cost of investing in the fund with the cost of investing in other mutual funds. The Example assumes that you invest $10,000. The Example also assumes that your investment has a 5% return each year and that the fund’s operating expenses remain the same. Although your actual costs may be higher or lower, based on these assumptions your costs would be:
| | | | | | |
1 year | | 3 years | | 5 years | | 10 years |
$124 | | $447 | | $792 | | $1,767 |
Portfolio Turnover: The fund pays transaction costs, such as commissions, when it buys and sells securities (or “turns over” its portfolio). A higher portfolio turnover rate may indicate higher transaction costs and may result in higher taxes when fund shares are held in a taxable account. These costs, which are not reflected in annual fund operating expenses or in the Example, affect the fund’s performance. During the most recent fiscal year, the portfolio turnover rate was 0% of the average value of the fund’s portfolio (instruments with remaining maturities of one year or less are excluded from the portfolio turnover rate).
Principal Investment Strategies: Under normal circumstances, the fund’s sub-adviser, AQR Capital Management, LLC (“AQR”), invests the fund’s assets primarily in a portfolio of futures contracts and futures-related instruments. The fund’s universe of investments currently includes more than 100 global developed and emerging market exchange-traded futures, futures-related instruments and forward contracts across four major asset classes (commodities, currencies, fixed-income and equities); however, this universe of investments is subject to change under varying market conditions and as these instruments evolve over time.
Generally, the fund invests in futures contracts and futures-related instruments including, but not limited to, global developed and emerging market equity index futures, global developed and emerging market currency forwards, commodity futures, swaps on commodity futures, global developed fixed-income futures, bond futures and swaps on bond futures (collectively, the “Instruments”), either by investing directly in those Instruments, or indirectly by investing up to 25% of its total assets in a wholly-owned subsidiary of the fund organized as a company under the laws of the Cayman Islands (the “Subsidiary”) that invests in those Instruments. There are no geographic limits on the market exposure of the fund’s assets. This flexibility allows AQR to look for investments or gain exposure to asset classes and markets around the world, including emerging markets, that it believes will enhance the fund’s ability to meet its objective.
The Subsidiary has the same investment objective as the fund and is advised by Transamerica Asset Management, Inc. and sub-advised by AQR. The Subsidiary, unlike the fund, may invest without limitation in commodities and other commodity-linked securities and derivative instruments, such as swaps and futures that provide exposure to the performance of the commodities markets. The Subsidiary is not registered under the Investment Company Act of 1940, as amended (the “1940 Act”), and is not subject to the investor protections of the 1940 Act. In addition, the Subsidiary may also invest in financial futures, option and
18
swap contracts, fixed income securities, pooled investment vehicles, including those that are not registered pursuant to the 1940 Act, and other investments intended to serve as margin or collateral for the Subsidiary’s derivative positions.
The fund’s return is expected to be derived principally from changes in the value of securities and its portfolio is expected to consist principally of securities.
AQR uses proprietary quantitative models to identify price trends in equity, fixed-income, currency and commodity Instruments. Once a trend is determined, the fund will take either a long or short position in the given Instrument. When taking a “long” position, the fund purchases an instrument outright; when taking a “short” position, the fund sells an instrument that it does not own and must borrow to meet its settlement obligations. A “long” position will benefit from an increase in price of the underlying Instrument, while a “short” position will benefit from a decrease in price of the underlying Instrument. The size of the position taken will relate to AQR’s confidence in the trend continuing as well as AQR’s estimate of the Instrument’s risk. AQR generally expects that the fund will have exposure in long and short positions across all four major asset classes (commodities, currencies, fixed income and equities), but at any one time the fund may emphasize one or two of the asset classes or a limited number of exposures within an asset class.
Futures and forward contracts are contractual agreements to buy or sell a particular currency, commodity or financial instrument at a pre-determined price in the future. The fund’s use of futures contracts, forward contracts, swaps and certain other Instruments will have the economic effect of financial leverage. Financial leverage magnifies exposure to the swings in prices of an asset class underlying an Instrument and results in increased volatility, which means the fund will have the potential for greater gains, as well as the potential for greater losses, than if the fund does not use Instruments that have a leveraging effect. Leveraging tends to magnify, sometimes significantly, the effect of any increase or decrease in the fund’s exposure to an asset class and may cause the fund’s NAV to be volatile. For example, if AQR seeks to gain enhanced exposure to a specific asset class through an Instrument providing leveraged exposure to the class and that Instrument increases in value, the gain to the fund will be magnified; however, if that investment decreases in value, the loss to the fund will be magnified. A decline in the fund’s assets due to losses magnified by the Instruments providing leveraged exposure may require the fund to liquidate portfolio positions to satisfy its obligations, to meet redemption requests or to meet asset segregation requirements when it may not be advantageous to do so. There is no assurance that the fund’s use of Instruments providing enhanced exposure will enable the fund to achieve its investment objective.
AQR expects the fund’s NAV over short-term periods to be volatile because of the significant use of Instruments that have a leveraging effect. Volatility is a statistical measurement of the magnitude of up and down asset price fluctuations over time. Rapid and dramatic price swings will result in high volatility. The fund’s returns are expected to be volatile; however, AQR, on average, will target an annualized volatility level for the fund of 10%. AQR expects that the fund’s targeted annualized forecasted volatility will typically range between 5% and 13%; however, the actual or realized volatility level for longer or shorter periods may be materially higher or lower depending on market conditions. Actual or realized volatility can and will differ from the forecasted or target volatility described above.
As a result of the fund’s strategy, the fund may have highly leveraged exposure to one or more asset classes at times. The 1940 Act and the rules and interpretations thereunder impose certain limitations on the fund’s ability to use leverage; however, the fund is not subject to any additional limitations on its net long and short exposures. For example, the fund could hold instruments that provide five times the net return of a broad or narrow-based securities index. The fund’s strategy will result in frequent portfolio trading and high portfolio turnover (typically greater than 300%).
The fund may invest a significant portion of its assets in cash, cash equivalent securities or short-term debt securities, repurchase agreements and money market instruments to serve as collateral for the positions the fund takes, to earn income, and for cash management purposes. Under adverse or unstable market, economic or political conditions, the fund may take temporary defensive positions in cash and short-term debt securities without limit.
This fund is non-diversified.
Principal Risks: Many factors affect the fund’s performance. There is no assurance the fund will meet its investment objective. The value of your investment in the fund, as well as the amount of return you receive on your investment, may fluctuate significantly from day to day and over time. You may lose part or all of your investment in the fund or your investment may not perform as well as other similar investments. The following is a summary of certain risks (in alphabetical order) of investing in the fund. You may lose money if you invest in this fund.
| • | | Cash Management and Defensive Investing – Money market instruments or short-term debt securities held by the fund for cash management or defensive investing purposes can fluctuate in value. Like other fixed income securities, they are subject to risk, including market, interest rate and credit risk. If the fund holds cash uninvested, the fund will not earn income on the cash and the fund’s yield will go down. If a significant amount of the fund’s assets are used for cash management or defensive investing purposes, it will be more difficult for the fund to achieve its objective. |
19
| • | | Commodities – The fund’s investment exposure to the commodities markets may subject the fund to greater volatility than investments in more traditional securities, such as stocks and bonds. The performance of commodity-linked derivative instruments may depend on the performance of the overall commodities markets and on other factors that affect the value of commodities, including weather, disease, and political, tax, and other regulatory developments. Commodity-linked investments may be leveraged. For example, a three-times leveraged note will change by a magnitude of three for every percentage change (positive or negative) in the value of the underlying index. Commodity-linked investments may be hybrid instruments that can have substantial risk of loss with respect to both principal and interest. Commodity-linked investments may be more volatile and less liquid than the underlying commodity, instruments, or measures, are subject to the credit risks associated with the issuer, and their values may decline substantially if the issuer’s creditworthiness deteriorates. As a result, returns of commodity-linked investments may deviate significantly from the return of the underlying commodity, instruments, or measures. The commodity-linked investments in which the fund invests may be issued by companies in the financial services sector, and events affecting the financial services sector may cause the fund’s share value to fluctuate. |
| • | | Counterparty – The fund will be subject to the credit risk (that is, where changes in an issuer’s financial strength or the credit rating of a financial instrument it issues may affect an instrument’s value) with respect to the amount it expects to receive from counterparties to derivatives and repurchase agreements entered into by the fund or held by special purpose or structured vehicles. If a counterparty becomes bankrupt or otherwise fails to perform its obligations due to financial difficulties, the value of your investment in the fund may decline. |
| • | | Credit – If an issuer or guarantor of a security held by the fund or a counterparty to a financial contract with the fund defaults or is downgraded, or if the value of the assets underlying a security declines, the value of your investment will decline. Junk bonds have a higher risk of default and are considered speculative. A default or downgrade will have a greater impact on subordinated securities. |
| • | | Currency – When the fund invests in securities denominated in foreign currencies, the fund may incur currency conversion costs and may be affected favorably or unfavorably by changes in the rates of exchange between those currencies and the U.S. dollar. Currency exchange rates can be volatile and are affected by, among other factors, the general economics of a country, the actions of the U.S. and foreign governments or control banks, the imposition of currency controls, and speculation. |
| • | | Currency Hedging – The fund may hedge its currency risk using currency futures, forwards or options. However, these instruments may not always work as intended, and a fund may be worse off than if it had not used a hedging instrument. |
| • | | Derivatives – Using derivatives can increase fund losses and reduce opportunities for gains when market prices, interest rates or the derivative instruments themselves behave in a way not anticipated by the fund. Using derivatives also can have a leveraging effect and increase fund volatility. Derivatives may be difficult to sell, unwind or value, and the counterparty may default on its obligations to the fund. The fund’s investments in derivative instruments may involve a small investment relative to the amount of investment exposure assumed and may result in losses exceeding the amounts invested in those instruments. Recent legislation calls for new regulation of the derivatives markets. The extent and impact of the regulation are not yet fully known and may not be for some time. New regulation of derivatives may make them more costly, may limit their availability, or may otherwise adversely affect their value or performance. |
| • | | Emerging Markets – Investing in the securities of issuers located in or principally doing business in emerging markets are subject to foreign securities risks. These risks are greater for investments in emerging markets. Emerging market countries tend to have economic, political and legal systems that are less fully developed and are less stable than those of more advanced countries. Low trading volumes may result in a lack of liquidity and in extreme price volatility. |
| • | | Foreign Securities – Foreign securities are subject to a number of additional risks, including nationalization or expropriation of assets, imposition of currency controls or restrictions, confiscatory taxation, political or financial instability and other adverse economic or political developments. Lack of information and less market regulation also may affect the value of these securities. |
| • | | Increase in Expenses – Your actual costs of investing in the fund may be higher than the expenses shown in “Annual Fund Operating Expenses” for a variety of reasons. For example, expense ratios may be higher than those shown if average net assets decrease. Net assets are more likely to decrease and fund expense ratios are more likely to increase when markets are volatile. |
| • | | Interest Rate – Debt securities have varying levels of sensitivity to changes in interest rates. In general, the price of a debt security tends to fall when interest rates rise and can rise when interest rates fall. Securities with longer maturities and mortgage securities can be more sensitive to interest rate changes. |
20
| • | | Investment Companies – To the extent that an underlying fund invests in other investment companies, such as exchange- traded funds, it is subject to the risks of these investment companies and bears its pro rata share of the investment companies’ expenses. |
| • | | Leveraging – The value of your investment may be more volatile if the fund borrows or uses derivatives that have a leveraging effect on the fund. Other risks also will be compounded. This is because leverage generally magnifies the effect of a change in the value of an asset and creates a risk of loss of value on a larger pool of assets than the fund would otherwise have had. The fund also may have to sell assets at inopportune times to satisfy its obligations. |
| • | | Liquidity – Some securities held by the fund may be difficult to sell, or illiquid, particularly during times of market turmoil. Illiquid securities may also be difficult to value. If the fund is forced to sell an illiquid asset to meet redemption requests or other cash needs, the fund may be forced to sell at a loss. |
| • | | Market – The market prices of the fund’s securities may go up or down, sometimes rapidly or unpredictably, due to general market conditions, such as real or perceived adverse economic or political conditions, inflation, changes in interest rates or currency rates, lack of liquidity in the markets or adverse investor sentiment. Market prices of securities also may go down due to events or conditions that affect particular sectors or issuers. When market prices fall, the value of your investment will go down. The fund may experience a substantial or complete loss on any individual security. The recent financial crisis has caused a significant decline in the value and liquidity of many securities. In response to the financial crisis, the U.S. and other governments and the Federal Reserve and certain foreign central banks have taken steps to support financial markets. The withdrawal of this support could negatively affect the value and liquidity of certain securities. In addition, legislation recently enacted in the U.S. calls for changes in many aspects of financial regulation. The impact of the legislation on the markets, and the practical implications for market participants, may not be fully known for some time. |
| • | | Non-Diversification – The fund is classified as “non-diversified,” which means it may invest in a larger percentage of its assets in one issuer than a diversified fund. To the extent the fund invests its assets in fewer issuers, the fund will be more susceptible to negative events affecting those issuers. |
| • | | Portfolio Selection – The sub-adviser’s judgment about a particular security or issuer, or about the economy or a particular sector, region or market segment, or about an investment strategy, may prove to be incorrect. |
| • | | Portfolio Turnover – The fund’s investment strategy may result in a high portfolio turnover rate. High portfolio turnover would result in a correspondingly greater brokerage commission expenses and may result in the distribution to shareholders of additional capital gains for tax purposes. These factors may negatively affect the fund’s performance. |
| • | | Short Sales – A short sale may be effected by selling a security that the fund does not own. If the price of the security sold short increases, the fund would incur a loss; conversely, if the price declines, the fund will realize a gain. Although the gain is limited by the price at which the security was sold short, the loss is potentially unlimited. The fund may also pay transaction costs and borrowing fees in connection with short sales. |
| • | | Structured Instruments – A fund may invest in various types of structured instruments, including securities that have demand, tender or put features, or interest rate rest features. Structured instruments may take the form of participation interests or receipts in underlying securities or other assets, and in some cases are backed by a financial institution serving as a liquidity provider. Some of these instruments may have an interest rate swap feature which substitutes a floating or variable interest rate for the fixed interest rate on an underlying security, and some may be asset-backed or mortgage- backed securities. Structured instruments are a type of derivative instrument and the payment and credit qualities of these instruments derive from the assets embedded in the structure from which they are issued. |
| • | | Subsidiary – By investing in the Subsidiary, the fund will be indirectly exposed to the risks associated with the Subsidiary’s investments. The derivatives and other investments that will be held by the Subsidiary are generally similar to those that are permitted to be held by the fund and will be subject to the same risks that apply to similar investments if held directly by the fund. There can be no assurance that the investment objective of the Subsidiary will be achieved. The Subsidiary is not registered under the Investment Company Act, and, unless otherwise noted in this prospectus, is not subject to the investor protections of the Investment Company Act. The fund relies on a private letter ruling from the Internal Revenue Service (the “IRS”) with respect to the investment in the Subsidiary. Changes in the laws of the United States and/or the Cayman Islands could result in the inability of the fund and/or the Subsidiary to operate as described in this prospectus and the SAI and could adversely affect the fund. |
| • | | Tax – The fund may seek to gain exposure to the commodity markets primarily through investments in commodity-linked notes and through investments in the Subsidiary. The tax treatment of commodity-linked notes, other commodity-linked derivatives and the fund’s investments in the Subsidiary may be adversely affected by future legislation, Treasury |
21
| | Regulations and/or guidance issued by the IRS that could, among other things, affect the character, timing and/or amount of the fund’s taxable income or gains and of distributions made by the fund. |
| • | | U.S. Government Agency Obligations – Government agency obligations have different levels of credit support and, therefore, different degrees of credit risk. Securities issued by agencies and instrumentalities of the U.S. government that are supported by the full faith and credit of the United States generally present a lesser degree of credit risk than securities issued by agencies and instrumentalities sponsored by the U.S. government that are supported only by the issuer’s right to borrow from the U.S. Treasury and securities issued by agencies and instrumentalities sponsored by the U.S. government that are supported only by the credit of the issuing agencies. |
| • | | Valuation – The sales price the fund could receive for any particular portfolio investment may differ from the fund’s valuation of the investment, particularly for securities that trade in thin or volatile markets or that are valued using a fair value methodology. |
Performance: No performance is shown for the fund. Performance information will appear in a future version of this prospectus once the fund has a full calendar year of performance information to report to investors.
Management:
| | |
| Investment Adviser: | | Sub-Adviser: |
| |
| Transamerica Asset Management, Inc. | | AQR Capital Management, LLC |
| |
| | Portfolio Managers: |
| |
| | Clifford S. Asness, Portfolio Manager since 2010 |
| |
| | John M. Liew, Portfolio Manager since 2010 |
| |
| | Brian K. Hurst, Portfolio Manager since 2010 |
| |
| | Lasse H. Pedersen, Portfolio Manager since 2010 |
| |
| | Yao Hua Ooi, Portfolio Manager since 2010 |
Purchase and Sale of Fund Shares: Class I2 shares of the fund are currently primarily offered for investment in certain funds of funds (also referred to as “strategic asset allocation funds”). Class I2 shares of the fund are also made available to other investors, including institutional investors such as foreign insurers, domestic insurance companies and their separate accounts, and unaffiliated funds, high net worth individuals, and eligible retirement plans whose recordkeepers or financial service firm intermediaries have entered into agreements with Transamerica Funds or its agents. Investors who received Class I2 shares in connection with the reorganization of a Transamerica Premier Fund into a Transamerica Fund may continue to invest in Class I2 shares of that Transamerica Fund, but may not open new accounts. You buy and redeem shares at the fund’s next-determined net asset value (NAV) after receipt of your request in good order.
Tax Information: Fund distributions may be taxable as ordinary income or capital gains, except when your investment is in an IRA, 401(k) or other tax-advantaged investment plan.
Payments to Broker-Dealers and Other Financial Intermediaries: If you purchase the fund through a broker-dealer or other financial intermediary, the fund and/or its affiliates may pay the intermediary for the sale of fund shares and related services. These payments may create a conflict of interest by influencing the broker-dealer or other intermediary and your salesperson to recommend the fund over another investment. Ask your salesperson or visit your financial intermediary’s website for more information.
22
|
| TRANSAMERICA BLACKROCK GLOBAL ALLOCATION |
Investment Objective: Seeks to provide high total investment return.
Fees and Expenses: This table describes the fees and expenses that you may pay if you buy and hold shares of the fund. There are no sales charges (load) or other transaction fees.
| | |
| Annual Fund Operating Expenses (expenses that you pay each year as a percentage of the value of your investment) |
| | |
| | | |
| Management fees | | 0.74% |
| Distribution and service (12b-1) fees | | None |
| Other expenses | | 0.13% |
| Acquired fund fees and expenses (fees and expenses of underlying funds) | | 0.01% |
| Total annual fund operating expenses a | | 0.88% |
| a | Total annual fund operating expenses do not correlate to the ratios of expenses to average net assets in the financial highlights table, which do not include acquired (i.e., underlying) funds’ fees and expenses. |
Example: This Example is intended to help you compare the cost of investing in the fund with the cost of investing in other mutual funds. The Example assumes that you invest $10,000. The Example also assumes that your investment has a 5% return each year and that the fund’s operating expenses remain the same. Although your actual costs may be higher or lower, based on these assumptions your costs would be:
| | | | | | |
| 1 year | | 3 years | | 5 years | | 10 years |
| $90 | | $281 | | $488 | | $1,084 |
Portfolio Turnover: The fund pays transaction costs, such as commissions, when it buys and sells securities (or “turns over” its portfolio). A higher portfolio turnover rate may indicate higher transaction costs and may result in higher taxes when fund shares are held in a taxable account. These costs, which are not reflected in annual fund operating expenses or in the Example, affect the fund’s performance. During the most recent fiscal year, the portfolio turnover rate was 43% of the average value of the fund’s portfolio.
Principal Investment Strategies: Under normal circumstances, the fund’s sub-adviser, BlackRock Investment Management, LLC (“BlackRock”), through a fully managed investment policy, utilizes United States and foreign equity securities, debt and money market securities, the combination of which may be varied from time to time both with respect to types of securities and markets in response to changing market and economic trends. The fund will invest its assets in issuers that are located in a number of countries throughout the world. There is no limit on the percentage of assets the fund can invest in a particular type of asset class. The fund generally seeks diversification across markets, industries and issuers as one of its strategies to reduce volatility. Except as described below, the fund has no geographic limits on where its investments may be located. The fund uses its investment flexibility to create a portfolio of assets that, over time, tends to be relatively balanced between equity and debt securities and that is widely diversified among many individual investments. At any given time, however, the fund may emphasize either debt securities or equity securities. The fund may also, from time to time, identify certain real assets, such as real estate or precious metals, that BlackRock believes will increase in value because of economic trends and cycles or political or other events. The fund may invest a portion of its assets in securities related to those real assets such as stock, fixed-income securities or convertible securities issued by real estate investment trusts or companies that mine precious metals. The fund can invest in all types of equity securities, including common stock, preferred stock, warrants and stock purchase rights of companies of any market capitalization. In selecting stocks and other securities that are convertible into stocks, BlackRock emphasizes stocks that it believes are undervalued.
The fund may also seek to invest in the stock of smaller or emerging growth companies that it expects will provide a higher total return that other equity investments. Investing in smaller or emerging growth companies involves greater risk than investing in more established companies. The fund can invest in all types of debt securities of varying maturities, including U.S. and foreign government bonds, corporate bonds and convertible bonds, mortgage and asset-backed securities, bank loans, and securities issued or guaranteed by certain international organizations such as the World Bank. The fund may engage in short sales. The fund may make short sales of securities, either as a hedge against potential declines in value of a portfolio security or to realize appreciation when a security that the fund does not own declines in value. The fund will not make a short sale if, after giving effect to such sale, the market value of all securities sold short exceeds 20% of the value of its total assets. The fund may also make short sales “against the box” without being subject to this limitation.
The fund may invest up to 35% of its total assets in “junk” bonds, corporate loans and distressed securities. The fund may use derivatives to seek to increase the return of the fund and to hedge (or protect) the value of its assets against adverse movements in currency exchange rates, interest rates and movements in the securities markets. The fund may invest in securities that provide a return based on fluctuations in a stock or other financial index. For example, the fund may invest in a security that
23
increases in value with the price of a particular securities index. In some cases, the return on the security may be inversely related to the price of the index. The fund may invest in cash, cash equivalent securities or short-term debt securities, repurchase agreements and money market instruments.
The fund may also gain exposure to the commodities markets by investing up to 25% of its total assets in a wholly-owned subsidiary of the fund organized as a company under the laws of the Cayman Islands (the “Subsidiary”). The Subsidiary has the same investment objective as the fund and is advised by Transamerica Asset Management, Inc. and sub-advised by BlackRock. The Subsidiary, unlike the fund, may invest without limitation in commodities, commodity index-linked securities (including leveraged and unleveraged structured notes) and other commodity-linked securities and derivative instruments, such as swaps and futures that provide exposure to the performance of the commodities markets. The Subsidiary may also invest in other instruments, including fixed income instruments, either as investments or to serve as margin or collateral for its derivative positions. The Subsidiary is not registered under the Investment Company Act of 1940, as amended (the “1940 Act”), and is not subject to the investor protections of the 1940 Act.
The fund, directly and/or through the Subsidiary, may gain commodities exposure through the use of swaps and other derivative instruments. The use of swaps is a highly specialized activity which involves investment techniques, risk analyses and tax planning different from those associated with ordinary portfolio securities transactions.
Under adverse or unstable market, economic or political conditions, the fund may take temporary defensive positions in cash and short-term debt securities without limit. Under normal circumstances, the fund anticipates it will continue to allocate a substantial amount (approximately 40% or more – unless market conditions are not deemed favorable by BlackRock, in which case the fund would invest at least 30%) – of its total assets in securities (i) of foreign government issuers; (ii) of issuers organized or located outside the U.S.; (iii) of issuers which primarily trade in a market located outside the U.S.; and (iv) of issuers doing a substantial amount of business outside the US., which the fund considers to be companies that derive at least 50% of their revenue or profits from business outside the U.S. or have at least 50% of their sales or assets outside the U.S. For temporary defensive purposes, the fund may deviate very substantially from the allocation described above.
Principal Risks: Many factors affect the fund’s performance. There is no assurance the fund will meet its investment objective. The value of your investment in the fund, as well as the amount of return you receive on your investment, may fluctuate significantly from day to day and over time. You may lose part or all of your investment in the fund or your investment may not perform as well as other similar investments. The following is a summary of certain risks (in alphabetical order) of investing in the fund. You may lose money if you invest in this fund.
| • | | Cash Management and Defensive Investing – Money market instruments or short-term debt securities held by the fund for cash management or defensive investing purposes can fluctuate in value. Like other fixed income securities, they are subject to risk, including market, interest rate and credit risk. If the fund holds cash uninvested, the fund will not earn income on the cash and the fund’s yield will go down. If a significant amount of the fund’s assets are used for cash management or defensive investing purposes, it will be more difficult for the fund to achieve its objective. |
| • | | Commodities – The fund’s investment exposure to the commodities markets may subject the fund to greater volatility than investments in more traditional securities, such as stocks and bonds. The performance of commodity-linked derivative instruments may depend on the performance of the overall commodities markets and on other factors that affect the value of commodities, including weather, disease, and political, tax, and other regulatory developments. Commodity-linked investments may be leveraged. For example, a three-times leveraged note will change by a magnitude of three for every percentage change (positive or negative) in the value of the underlying index. Commodity-linked investments may be hybrid instruments that can have substantial risk of loss with respect to both principal and interest. Commodity-linked investments may be more volatile and less liquid than the underlying commodity, instruments, or measures, are subject to the credit risks associated with the issuer, and their values may decline substantially if the issuer’s creditworthiness deteriorates. As a result, returns of commodity-linked investments may deviate significantly from the return of the underlying commodity, instruments, or measures. The commodity-linked investments in which the fund invests may be issued by companies in the financial services sector, and events affecting the financial services sector may cause the fund’s share value to fluctuate. |
| • | | Convertible Securities – The market value of convertible securities tends to decline as interest rates increase. Convertible securities generally offer lower interest or dividend yields than non-convertible securities of similar quality. The fund could lose money if the issuer of a convertible security is unable to meet its financial obligations or goes bankrupt. |
| • | | Credit – If an issuer or guarantor of a security held by the fund or a counterparty to a financial contract with the fund defaults or is downgraded, or if the value of the assets underlying a security declines, the value of your investment will decline. Junk bonds have a higher risk of default and are considered speculative. A default or downgrade will have a greater impact on subordinated securities. |
24
| • | | Currency – When the fund invests in securities denominated in foreign currencies, the fund may incur currency conversion costs and may be affected favorably or unfavorably by changes in the rates of exchange between those currencies and the U.S. dollar. Currency exchange rates can be volatile and are affected by, among other factors, the general economics of a country, the actions of the U.S. and foreign governments or control banks, the imposition of currency controls, and speculation. |
| • | | Currency Hedging – The fund may hedge its currency risk using currency futures, forwards or options. However, these instruments may not always work as intended, and a fund may be worse off than if it had not used a hedging instrument. |
| • | | Derivatives – Using derivatives can increase fund losses and reduce opportunities for gains when market prices, interest rates or the derivative instruments themselves behave in a way not anticipated by the fund. Using derivatives also can have a leveraging effect and increase fund volatility. Derivatives may be difficult to sell, unwind or value, and the counterparty may default on its obligations to the fund. The fund’s investments in derivative instruments may involve a small investment relative to the amount of investment exposure assumed and may result in losses exceeding the amounts invested in those instruments. Recent legislation calls for new regulation of the derivatives markets. The extent and impact of the regulation are not yet fully known and may not be for some time. New regulation of derivatives may make them more costly, may limit their availability, or may otherwise adversely affect their value or performance. |
| • | | Distressed Securities – The fund may invest in distressed securities, including securities that are, or may be, involved in reorganizations or other financial restructurings, either out of court or in bankruptcy. Distressed securities are speculative and involve substantial risks. The fund may suffer significant losses if the reorganization or restructuring is not completed as anticipated. The fund will generally not receive interest payments on the distressed securities and may incur costs to protect its investment. |
| • | | Emerging Markets – Investing in the securities of issuers located in or principally doing business in emerging markets are subject to foreign securities risks. These risks are greater for investments in emerging markets. Emerging market countries tend to have economic, political and legal systems that are less fully developed and are less stable than those of more advanced countries. Low trading volumes may result in a lack of liquidity and in extreme price volatility. |
| • | | Fixed-Income Securities – The market prices of fixed-income securities may go up or down, sometimes rapidly or unpredictably due to general market conditions, such as real or perceived adverse economic or political conditions, inflation, changes in interest rates, lack of liquidity in the bond markets or adverse investor sentiment. When market prices fall, the value of your investment will go down. A rise in rates tends to have a greater impact on the prices of longer term or duration securities. |
If interest rates rise, repayments of fixed-income securities may occur more slowly than anticipated by the market. This may drive the prices of these securities down because their interest rates are lower than the current interest rate and they remain outstanding longer. This is sometimes referred to as extension risk.
Many issuers have a right to prepay their securities. If interest rates fall, an issuer may exercise this right. If this happens, the fund will be forced to reinvest prepayment proceeds at a time when yields on securities available in the market are lower than the yield on the prepaid security. This is sometimes referred to as prepayment or call risk.
| • | | Foreign Securities – Foreign securities are subject to a number of additional risks, including nationalization or expropriation of assets, imposition of currency controls or restrictions, confiscatory taxation, political or financial instability and other adverse economic or political developments. Lack of information and less market regulation also may affect the value of these securities. |
| • | | High-Yield Debt Securities – High-yield debt securities, or junk bonds, are securities that are rated below “investment grade” (that is, securities rated below Baa/BBB) or, if unrated, are considered by the sub-adviser to be of equivalent quality. Changes in interest rates, the market’s perception of the issuers and the creditworthiness of the issuers may significantly affect the value of these bonds. Junk bonds have a higher risk of default, tend to be less liquid and may be more difficult to value. |
| • | | Increase in Expenses – Your actual costs of investing in the fund may be higher than the expenses shown in “Annual Fund Operating Expenses” for a variety of reasons. For example, expense ratios may be higher than those shown if average net assets decrease. Net assets are more likely to decrease and fund expense ratios are more likely to increase when markets are volatile. |
| • | | Liquidity – Some securities held by the fund may be difficult to sell, or illiquid, particularly during times of market turmoil. Illiquid securities may also be difficult to value. If the fund is forced to sell an illiquid asset to meet redemption requests or other cash needs, the fund may be forced to sell at a loss. |
25
| • | | Loans – Loans are subject to the credit risk of nonpayment of principal or interest. Economic downturns or increases in interest rates may cause an increase in defaults, interest rate risk and liquidity risk. Loans may or may not be collateralized at the time of acquisition, and any collateral may be relatively illiquid or lose all or substantially all of its value subsequent to investment. In the event of bankruptcy of a borrower, the fund could experience delays or limitations with respect to its ability to realize the benefits of any collateral securing a loan. The fund’s investments in loans are also subject to prepayment or call risk. |
| • | | Market – The market prices of the fund’s securities may go up or down, sometimes rapidly or unpredictably, due to general market conditions, such as real or perceived adverse economic or political conditions, inflation, changes in interest rates or currency rates, lack of liquidity in the markets or adverse investor sentiment. Market prices of securities also may go down due to events or conditions that affect particular sectors or issuers. When market prices fall, the value of your investment will go down. The fund may experience a substantial or complete loss on any individual security. The recent financial crisis has caused a significant decline in the value and liquidity of many securities. In response to the financial crisis, the U.S. and other governments and the Federal Reserve and certain foreign central banks have taken steps to support financial markets. The withdrawal of this support could negatively affect the value and liquidity of certain securities. In addition, legislation recently enacted in the U.S. calls for changes in many aspects of financial regulation. The impact of the legislation on the markets, and the practical implications for market participants, may not be fully known for some time. |
| • | | Portfolio Selection – The sub-adviser’s judgment about a particular security or issuer, or about the economy or a particular sector, region or market segment, or about an investment strategy, may prove to be incorrect. |
| • | | Precious Metals-Related Securities – Investments in precious metals-related securities are considered speculative and are affected by a variety of worldwide economic, financial and political factors. The price of precious metals may fluctuate sharply over short periods of time. The metals industry can be significantly affected by events relating to international political developments, the success of exploration projects, commodity prices and tax and government regulations. |
| • | | Preferred Stock – Preferred stock’s right to dividends and liquidation proceeds is junior to the rights of a company’s debt securities. The value of preferred stock may be subject to factors that affect fixed income and equity securities, including changes in interest rates and in a company’s creditworthiness. Shareholders of preferred stock may suffer a loss of value if dividends are not paid and have limited voting rights. |
| • | | Prepayment or Call – Many issuers have a right to prepay their securities. If interest rates fall, an issuer may exercise this right. If this happens, the fund will be forced to reinvest prepayment proceeds at a time when yields on securities available in the market are lower than the yield on the prepaid security. The fund also may lose any premium it paid on the security. |
| • | | Real Estate Securities – Investments in the real estate industry are subject to risks associated with direct investment in real estate. These risks include declines in the value of real estate, adverse general and local economic conditions, increased competition, overbuilding and changes in operating expenses, property taxes or interest rates. REITs are one type of real estate security. A REIT’s performance depends on the types and locations of the properties it owns and how well it manages those properties or loan financings. REITs are subject to a highly technical tax structure, and the failure to qualify as a REIT could result in corporate-level taxation, significantly reducing the return on an investment to the fund. |
| • | | Short Sales – A short sale may be effected by selling a security that the fund does not own. If the price of the security sold short increases, the fund would incur a loss; conversely, if the price declines, the fund will realize a gain. Although the gain is limited by the price at which the security was sold short, the loss is potentially unlimited. The fund may also pay transaction costs and borrowing fees in connection with short sales. |
| • | | Small- or Medium-Sized Companies – Small- or medium-sized companies may be more at risk than larger companies because, among other things, they may have limited product lines, operating history, market or financial resources, or because they may depend on a limited management group. |
| • | | Sovereign Debt – Sovereign debt instruments are subject to the risk that the governmental entity may delay or fail to pay interest or repay principal on its sovereign debt. If a governmental entity defaults, it may ask for more time in which to pay or for further loans. There may be no established legal process for collecting sovereign debt that a government does not pay, nor are there bankruptcy proceedings through which all or part of the sovereign debt that a governmental entity has not repaid may be collected. |
| • | | Stocks – Stocks may be volatile – their prices may go up and down dramatically over the shorter term. These price movements may result from factors affecting individual companies, industries, the securities market as a whole or the overall economy. |
26
| • | | Subsidiary – By investing in the Subsidiary, the fund will be indirectly exposed to the risks associated with the Subsidiary’s investments. The derivatives and other investments that will be held by the Subsidiary are generally similar to those that are permitted to be held by the fund and will be subject to the same risks that apply to similar investments if held directly by the fund. There can be no assurance that the investment objective of the Subsidiary will be achieved. The Subsidiary is not registered under the Investment Company Act, and, unless otherwise noted in this prospectus, is not subject to the investor protections of the Investment Company Act. The fund relies on a private letter ruling from the Internal Revenue Service (the “IRS”) with respect to the investment in the Subsidiary. Changes in the laws of the United States and/or the Cayman Islands could result in the inability of the fund and/or the Subsidiary to operate as described in this prospectus and the SAI and could adversely affect the fund. |
| • | | Tax – The fund may seek to gain exposure to the commodity markets primarily through investments in commodity-linked notes and through investments in the Subsidiary. The tax treatment of commodity-linked notes, other commodity-linked derivatives and the fund’s investments in the Subsidiary may be adversely affected by future legislation, Treasury Regulations and/or guidance issued by the IRS that could, among other things, affect the character, timing and/or amount of the fund’s taxable income or gains and of distributions made by the fund. |
| • | | Warrants and Rights – Warrants and rights may be considered more speculative than certain other types of investments because they do not entitle a holder to the dividends or voting rights for the securities that may be purchased. They do not represent any rights in the assets of the issuing company, and cease to have value if not exercised prior to the expiration date. |
Performance: The bar chart and the table below provide some indication of the risks of investing in the fund by showing you how the fund’s performance has varied from year to year, and how the fund’s Class I2 average annual total returns for different periods compare to the returns of a broad measure of market performance. The table shows average annual total returns for Class I2 shares of the fund. Absent any limitation of the fund’s expenses, total returns would be lower. As with all mutual funds, past performance (before and after taxes) is not a prediction of future results. Updated performance information is available on our website at www.transamericafunds.com or by calling 1-888-233-4339.
Annual Total Returns (calendar years ended December 31)

| | | | |
| | | Quarter Ended | | Return |
Best Quarter: | | 6/30/2009 | | 12.61% |
Worst Quarter: | | 9/30/2008 | | -12.40% |
Average Annual Total Returns (periods ended December 31, 2010)1
| | | | | | |
| | | 1 Year | | 5 Years | | 10 Years or
Inception* |
Class I2 (commenced operations on December 6, 2005) |
Return before taxes | | 10.06% | | 7.43% | | 7.50% |
Return after taxes on distributions2 | | 9.67% | | 6.12% | | 6.19% |
Return after taxes on distributions and sale of fund shares2 | | 6.72% | | 5.82% | | 5.88% |
| Financial Times Stock Exchange World Index (reflects no deduction for fees, expenses, or taxes) | | 12.73% | | 3.89% | | 4.01% |
| 1 | Actual returns may depend on the investor’s individual tax situation. After-tax returns may not be relevant if the investment is made through a tax-exempt or tax-deferred account, such as a 401(k) plan. |
| 2 | The after-tax returns are calculated using the historic highest individual federal marginal income tax rates and do not reflect the impact of state and local taxes. |
| * | Fund and Index returns are for past 10 years or since inception, whichever is less. |
27
| | |
| Management: | | |
| |
| Investment Adviser: | | Sub-Adviser: |
| |
| Transamerica Asset Management, Inc. | | BlackRock Investment Management, LLC |
| |
| | Portfolio Managers: |
| |
| | Dennis W. Stattman, Portfolio Manager since 2005 |
| |
| | Dan Chamby, Portfolio Manager since 2005 |
| |
| | Romualdo Roldan, Portfolio Manager since 2005 |
Purchase and Sale of Fund Shares: Class I2 shares of the fund are currently primarily offered for investment in certain funds of funds (also referred to as “strategic asset allocation funds”). Class I2 shares of the fund are also made available to other investors, including institutional investors such as foreign insurers, domestic insurance companies and their separate accounts, and unaffiliated funds, high net worth individuals, and eligible retirement plans whose recordkeepers or financial service firm intermediaries have entered into agreements with Transamerica Funds or its agents. Investors who received Class I2 shares in connection with the reorganization of a Transamerica Premier Fund into a Transamerica Fund may continue to invest in Class I2 shares of that Transamerica Fund, but may not open new accounts. You buy and redeem shares at the fund’s next-determined net asset value (NAV) after receipt of your request in good order.
Tax Information: Fund distributions may be taxable as ordinary income or capital gains, except when your investment is in an IRA, 401(k) or other tax-advantaged investment plan.
Payments to Broker-Dealers and Other Financial Intermediaries: If you purchase the fund through a broker-dealer or other financial intermediary, the fund and/or its affiliates may pay the intermediary for the sale of fund shares and related services. These payments may create a conflict of interest by influencing the broker-dealer or other intermediary and your salesperson to recommend the fund over another investment. Ask your salesperson or visit your financial intermediary’s website for more information.
28
|
| TRANSAMERICA BLACKROCK LARGE CAP VALUE |
Investment Objective: Seeks long-term capital growth.
Fees and Expenses: This table describes the fees and expenses that you may pay if you buy and hold shares of the fund. There are no sales charges (load) or other transaction fees.
| | |
| Annual Fund Operating Expenses (expenses that you pay each year as a percentage of the value of your investment) |
| | |
Management fees | | 0.78% |
Distribution and service (12b-1) fees | | None |
Other expenses | | 0.05% |
Total annual fund operating expenses | | 0.83% |
Example: This Example is intended to help you compare the cost of investing in the fund with the cost of investing in other mutual funds. The Example assumes that you invest $10,000. The Example also assumes that your investment has a 5% return each year and that the fund’s operating expenses remain the same. Although your actual costs may be higher or lower, based on these assumptions your costs would be:
| | | | | | |
| 1 year | | 3 years | | 5 years | | 10 years |
| $85 | | $265 | | $460 | | $1,025 |
Portfolio Turnover: The fund pays transaction costs, such as commissions, when it buys and sells securities (or “turns over” its portfolio). A higher portfolio turnover rate may indicate higher transaction costs and may result in higher taxes when fund shares are held in a taxable account. These costs, which are not reflected in annual fund operating expenses or in the Example, affect the fund’s performance. During the most recent fiscal year, the portfolio turnover rate was 124% of the average value of the fund’s portfolio.
Principal Investment Strategies: Under normal circumstances, the fund’s sub-adviser, BlackRock Investment Management, LLC (“BlackRock”), invests at least 80% of the fund’s net assets in equity securities of large cap companies. The fund considers a large cap company to be one which, at the time of purchase, has a market capitalization equal to or greater than the top 80% of the companies that comprise the Russell 1000® Value Index. As of December 31, 2010, the lowest market capitalization in this group was approximately $2.64 billion.
The fund may invest in foreign securities that are represented by American Depositary Receipts. The fund may invest in convertible securities, preferred stocks, illiquid securities, and U.S. government debt securities.
The fund may invest in cash, cash equivalent securities or short-term debt securities, repurchase agreements and money market instruments. Under adverse or unstable market, economic or political conditions, the fund may take temporary defensive positions in cash and short-term debt securities without limit.
Principal Risks: Many factors affect the fund’s performance. There is no assurance the fund will meet its investment objective. The value of your investment in the fund, as well as the amount of return you receive on your investment, may fluctuate significantly from day to day and over time. You may lose part or all of your investment in the fund or your investment may not perform as well as other similar investments. The following is a summary of certain risks (in alphabetical order) of investing in the fund. You may lose money if you invest in this fund.
| • | | Cash Management and Defensive Investing – Money market instruments or short-term debt securities held by the fund for cash management or defensive investing purposes can fluctuate in value. Like other fixed income securities, they are subject to risk, including market, interest rate and credit risk. If the fund holds cash uninvested, the fund will not earn income on the cash and the fund’s yield will go down. If a significant amount of the fund’s assets are used for cash management or defensive investing purposes, it will be more difficult for the fund to achieve its objective. |
| • | | Convertible Securities – The market value of convertible securities tends to decline as interest rates increase. Convertible securities generally offer lower interest or dividend yields than non-convertible securities of similar quality. The fund could lose money if the issuer of a convertible security is unable to meet its financial obligations or goes bankrupt. |
| • | | Fixed-Income Securities – The market prices of fixed-income securities may go up or down, sometimes rapidly or unpredictably due to general market conditions, such as real or perceived adverse economic or political conditions, inflation, changes in interest rates, lack of liquidity in the bond markets or adverse investor sentiment. When market prices fall, the value of your investment will go down. A rise in rates tends to have a greater impact on the prices of longer term or duration securities. |
29
If interest rates rise, repayments of fixed-income securities may occur more slowly than anticipated by the market. This may drive the prices of these securities down because their interest rates are lower than the current interest rate and they remain outstanding longer. This is sometimes referred to as extension risk.
Many issuers have a right to prepay their securities. If interest rates fall, an issuer may exercise this right. If this happens, the fund will be forced to reinvest prepayment proceeds at a time when yields on securities available in the market are lower than the yield on the prepaid security. This is sometimes referred to as prepayment or call risk.
| • | | Foreign Securities – Foreign securities are subject to a number of additional risks, including nationalization or expropriation of assets, imposition of currency controls or restrictions, confiscatory taxation, political or financial instability and other adverse economic or political developments. Lack of information and less market regulation also may affect the value of these securities. |
| • | | Increase in Expenses – Your actual costs of investing in the fund may be higher than the expenses shown in “Annual Fund Operating Expenses” for a variety of reasons. For example, expense ratios may be higher than those shown if average net assets decrease. Net assets are more likely to decrease and fund expense ratios are more likely to increase when markets are volatile. |
| • | | Liquidity – Some securities held by the fund may be difficult to sell, or illiquid, particularly during times of market turmoil. Illiquid securities may also be difficult to value. If the fund is forced to sell an illiquid asset to meet redemption requests or other cash needs, the fund may be forced to sell at a loss. |
| • | | Market – The market prices of the fund’s securities may go up or down, sometimes rapidly or unpredictably, due to general market conditions, such as real or perceived adverse economic or political conditions, inflation, changes in interest rates or currency rates, lack of liquidity in the markets or adverse investor sentiment. Market prices of securities also may go down due to events or conditions that affect particular sectors or issuers. When market prices fall, the value of your investment will go down. The fund may experience a substantial or complete loss on any individual security. The recent financial crisis has caused a significant decline in the value and liquidity of many securities. In response to the financial crisis, the U.S. and other governments and the Federal Reserve and certain foreign central banks have taken steps to support financial markets. The withdrawal of this support could negatively affect the value and liquidity of certain securities. In addition, legislation recently enacted in the U.S. calls for changes in many aspects of financial regulation. The impact of the legislation on the markets, and the practical implications for market participants, may not be fully known for some time. |
| • | | Portfolio Selection – The sub-adviser’s judgment about a particular security or issuer, or about the economy or a particular sector, region or market segment, or about an investment strategy, may prove to be incorrect. |
| • | | Preferred Stock – Preferred stock’s right to dividends and liquidation proceeds is junior to the rights of a company’s debt securities. The value of preferred stock may be subject to factors that affect fixed income and equity securities, including changes in interest rates and in a company’s creditworthiness. Shareholders of preferred stock may suffer a loss of value if dividends are not paid and have limited voting rights. |
| • | | Stocks – Stocks may be volatile – their prices may go up and down dramatically over the shorter term. These price movements may result from factors affecting individual companies, industries, the securities market as a whole or the overall economy. |
| • | | Value Investing – The prices of securities the sub-adviser believes are undervalued may not appreciate as anticipated or may go down. Value stocks as a group may be out of favor and underperform the overall equity market for a long period of time, for example, while the market favors “growth” stocks. |
| • | | U.S. Government Agency Obligations – Government agency obligations have different levels of credit support and, therefore, different degrees of credit risk. Securities issued by agencies and instrumentalities of the U.S. government that are supported by the full faith and credit of the United States generally present a lesser degree of credit risk than securities issued by agencies and instrumentalities sponsored by the U.S. government that are supported only by the issuer’s right to borrow from the U.S. Treasury and securities issued by agencies and instrumentalities sponsored by the U.S. government that are supported only by the credit of the issuing agencies. |
Performance: The bar chart and the table below provide some indication of the risks of investing in the fund by showing you how the fund’s performance has varied from year to year, and how the fund’s Class I2 average annual total returns for different periods compare to the returns of a broad measure of market performance. The table shows average annual total returns for Class I2 shares of the fund. Absent any limitation of the fund’s expenses, total returns would be lower. As with all mutual funds, past performance (before and after taxes) is not a prediction of future results. Updated performance information is available on our website at www.transamericafunds.com or by calling 1-888-233-4339.
30
Annual Total Returns (calendar years ended December 31)

| | | | |
| | | Quarter Ended | | Return |
| Best Quarter: | | 9/30/2009 | | 14.53% |
| Worst Quarter: | | 12/31/2008 | | -20.04% |
Average Annual Total Returns (periods ended December 31, 2010)1
| | | | | | |
| | | 1 Year | | 5 Years | | 10 Years or
Inception* |
Class I2 (commenced operations on November 15, 2005) |
Return before taxes | | 8.77% | | -1.08% | | -0.42% |
Return after taxes on distributions2 | | 8.56% | | -1.52% | | -0.85% |
Return after taxes on distributions and sale of fund shares2 | | 5.98% | | -0.86% | | -0.30% |
Russell 1000® Value Index (reflects no deduction for fees, expenses, or taxes) | | 15.51% | | 1.28% | | 1.61% |
| 1 | Actual returns may depend on the investor’s individual tax situation. After-tax returns may not be relevant if the investment is made through a tax-exempt or tax-deferred account, such as a 401(k) plan. |
| 2 | The after-tax returns are calculated using the historic highest individual federal marginal income tax rates and do not reflect the impact of state and local taxes. |
| * | Fund and Index returns are for past 10 years or since inception, whichever is less. |
Management:
| | |
| Investment Adviser: | | Sub-Adviser: |
| |
| Transamerica Asset Management, Inc. | | BlackRock Investment Management, LLC |
| |
| | Portfolio Managers: |
| |
| | Robert C. Doll, Jr., CFA, Portfolio Manager since 2005 |
| |
| | Daniel Hanson, CFA, Portfolio Manager since 2008 |
| |
| | Peter Stournaras, CFA, Portfolio Manager since 2010 |
Purchase and Sale of Fund Shares: Class I2 shares of the fund are currently primarily offered for investment in certain funds of funds (also referred to as “strategic asset allocation funds”). Class I2 shares of the fund are also made available to other investors, including institutional investors such as foreign insurers, domestic insurance companies and their separate accounts, and unaffiliated funds, high net worth individuals, and eligible retirement plans whose recordkeepers or financial service firm intermediaries have entered into agreements with Transamerica Funds or its agents. Investors who received Class I2 shares in connection with the reorganization of a Transamerica Premier Fund into a Transamerica Fund may continue to invest in Class I2 shares of that Transamerica Fund, but may not open new accounts. You buy and redeem shares at the fund’s next-determined net asset value (NAV) after receipt of your request in good order.
Tax Information: Fund distributions may be taxable as ordinary income or capital gains, except when your investment is in an IRA, 401(k) or other tax-advantaged investment plan.
Payments to Broker-Dealers and Other Financial Intermediaries: If you purchase the fund through a broker-dealer or other financial intermediary, the fund and/or its affiliates may pay the intermediary for the sale of fund shares and related services. These payments may create a conflict of interest by influencing the broker-dealer or other intermediary and your salesperson to recommend the fund over another investment. Ask your salesperson or visit your financial intermediary’s website for more information.
31
|
| TRANSAMERICA CLARION GLOBAL REAL ESTATE SECURITIES |
Investment Objective: Seeks long-term total return from investments primarily in equity securities of real estate companies. Total return consists of realized and unrealized capital gains and losses plus income.
Fees and Expenses: This table describes the fees and expenses that you may pay if you buy and hold shares of the fund. There are no sales charges (load) or other transaction fees.
| | |
| Annual Fund Operating Expenses (expenses that you pay each year as a percentage of the value of your investment) |
| | | |
| Management fees | | 0.80% |
| Distribution and service (12b-1) fees | | None |
| Other expenses | | 0.11% |
| Total annual fund operating expenses | | 0.91% |
Example: This Example is intended to help you compare the cost of investing in the fund with the cost of investing in other mutual funds. The Example assumes that you invest $10,000. The Example also assumes that your investment has a 5% return each year and that the fund’s operating expenses remain the same. Although your actual costs may be higher or lower, based on these assumptions your costs would be:
| | | | | | |
| 1 year | | 3 years | | 5 years | | 10 years |
| $93 | | $290 | | $504 | | $1,120 |
Portfolio Turnover: The fund pays transaction costs, such as commissions, when it buys and sells securities (or “turns over” its portfolio). A higher portfolio turnover rate may indicate higher transaction costs and may result in higher taxes when fund shares are held in a taxable account. These costs, which are not reflected in annual fund operating expenses or in the Example, affect the fund’s performance. During the most recent fiscal year, the portfolio turnover rate was 62% of the average value of the fund’s portfolio.
Principal Investment Strategies: Under normal conditions, the fund’s sub-adviser, ING Clarion Real Estate Securities, LLC (“Clarion”), will invest at least 80% of the fund’s net assets in equity securities of issuers that are principally engaged in the real estate industry. Clarion considers issuers principally engaged in the real estate industries to be companies that derive at least 50% of their total revenues or earnings from owning, operating, developing and/or managing real estate. The fund’s portfolio will be composed of investments in issuers that are economically tied to at least three different countries, including the United States. As a general matter, Clarion intends to invest in common stocks and convertible securities of real estate companies, including real estate investment trusts (“REITs”).
Clarion uses a disciplined two-step process for constructing the fund’s portfolio. First, Clarion selects sectors and geographic regions in which to invest, and determines the degree of representation of such sectors and regions, through a systematic evaluation of public and private property market trends and conditions. Second, Clarion uses an in-house valuation process to identify investments with superior current income and growth potential relative to their peers, through which it examines several factors, including value and property, capital structure, and management and strategy. Clarion may decide to sell investments held by the fund for a variety of reasons, such as to secure gains, limit losses, or redeploy fund investments into opportunities believed to be more promising. Clarion also may engage in frequent and active trading of fund investments to achieve the fund’s investment objective. The fund may also invest in debt securities of real estate and non-real estate companies, mortgage-backed securities such as pass through certificates, real estate mortgage investment conduit certificates, and collateralized mortgage obligations, or short-term debt obligations. However, the fund does not directly invest in real estate.
The fund may invest its assets in cash, cash equivalent securities or short-term debt securities, repurchase agreements and money market instruments. Under adverse or unstable market, economic or political conditions, the fund may take temporary defensive positions in cash and short-term debt securities without limit.
This fund is non-diversified.
Principal Risks: Many factors affect the fund’s performance. There is no assurance the fund will meet its investment objective. The value of your investment in the fund, as well as the amount of return you receive on your investment, may fluctuate significantly from day to day and over time. You may lose part or all of your investment in the fund or your investment may not perform as well as other similar investments. The following is a summary of certain risks (in alphabetical order) of investing in the fund. You may lose money if you invest in this fund.
| • | | Cash Management and Defensive Investing – Money market instruments or short-term debt securities held by the fund for cash management or defensive investing purposes can fluctuate in value. Like other fixed income securities, they are |
32
| | subject to risk, including market, interest rate and credit risk. If the fund holds cash uninvested, the fund will not earn income on the cash and the fund’s yield will go down. If a significant amount of the fund’s assets are used for cash management or defensive investing purposes, it will be more difficult for the fund to achieve its objective. |
| • | | Convertible Securities – The market value of convertible securities tends to decline as interest rates increase. Convertible securities generally offer lower interest or dividend yields than non-convertible securities of similar quality. The fund could lose money if the issuer of a convertible security is unable to meet its financial obligations or goes bankrupt. |
| • | | Currency – When the fund invests in securities denominated in foreign currencies, the fund may incur currency conversion costs and may be affected favorably or unfavorably by changes in the rates of exchange between those currencies and the U.S. dollar. Currency exchange rates can be volatile and are affected by, among other factors, the general economics of a country, the actions of the U.S. and foreign governments or control banks, the imposition of currency controls, and speculation. |
| • | | Emerging Markets – Investing in the securities of issuers located in or principally doing business in emerging markets are subject to foreign securities risks. These risks are greater for investments in emerging markets. Emerging market countries tend to have economic, political and legal systems that are less fully developed and are less stable than those of more advanced countries. Low trading volumes may result in a lack of liquidity and in extreme price volatility. |
| • | | Fixed-Income Securities – The market prices of fixed-income securities may go up or down, sometimes rapidly or unpredictably due to general market conditions, such as real or perceived adverse economic or political conditions, inflation, changes in interest rates, lack of liquidity in the bond markets or adverse investor sentiment. When market prices fall, the value of your investment will go down. A rise in rates tends to have a greater impact on the prices of longer term or duration securities. |
If interest rates rise, repayments of fixed-income securities may occur more slowly than anticipated by the market. This may drive the prices of these securities down because their interest rates are lower than the current interest rate and they remain outstanding longer. This is sometimes referred to as extension risk.
Many issuers have a right to prepay their securities. If interest rates fall, an issuer may exercise this right. If this happens, the fund will be forced to reinvest prepayment proceeds at a time when yields on securities available in the market are lower than the yield on the prepaid security. This is sometimes referred to as prepayment or call risk.
| • | | Foreign Securities – Foreign securities are subject to a number of additional risks, including nationalization or expropriation of assets, imposition of currency controls or restrictions, confiscatory taxation, political or financial instability and other adverse economic or political developments. Lack of information and less market regulation also may affect the value of these securities. |
| • | | Increase in Expenses – Your actual costs of investing in the fund may be higher than the expenses shown in “Annual Fund Operating Expenses” for a variety of reasons. For example, expense ratios may be higher than those shown if average net assets decrease. Net assets are more likely to decrease and fund expense ratios are more likely to increase when markets are volatile. |
| • | | Market – The market prices of the fund’s securities may go up or down, sometimes rapidly or unpredictably, due to general market conditions, such as real or perceived adverse economic or political conditions, inflation, changes in interest rates or currency rates, lack of liquidity in the markets or adverse investor sentiment. Market prices of securities also may go down due to events or conditions that affect particular sectors or issuers. When market prices fall, the value of your investment will go down. The fund may experience a substantial or complete loss on any individual security. The recent financial crisis has caused a significant decline in the value and liquidity of many securities. In response to the financial crisis, the U.S. and other governments and the Federal Reserve and certain foreign central banks have taken steps to support financial markets. The withdrawal of this support could negatively affect the value and liquidity of certain securities. In addition, legislation recently enacted in the U.S. calls for changes in many aspects of financial regulation. The impact of the legislation on the markets, and the practical implications for market participants, may not be fully known for some time. |
| • | | Mortgage-Related and Asset-Backed Securities – Mortgage-backed securities may be issued by private issuers, by government-sponsored entities such as Fannie Mae or Freddie Mac or by agencies of the U.S. government, such as Ginnie Mae. Mortgage-backed securities represent direct or indirect participations in, or are collateralized by and payable from, mortgage loans secured by real property. Unlike mortgage-related securities issued or guaranteed by agencies of the U.S. government or government-sponsored entities, mortgage-related securities issued by private issuers do not have a government or government-sponsored entity guarantee (but may have other credit enhancement), and may, and frequently do, have less favorable collateral, credit risk or other underwriting characteristics. Mortgage-backed securities are also particularly susceptible to prepayment and extension risks. Asset-backed securities represent participations in, or are |
33
| | secured by and payable from, assets such as installment sales or loan contracts, leases, credit card receivables and other categories of receivables. Certain asset-backed securities present a heightened level of risk because, in the event of default, the liquidation value of the underlying assets may be inadequate to pay any unpaid principal or interest. The value of mortgage-backed and asset-backed securities may be affected by changes in credit quality or value of the mortgage loans or other assets that support the securities. |
| • | | Non-Diversification – The fund is classified as “non-diversified,” which means it may invest in a larger percentage of its assets in one issuer than a diversified fund. To the extent the fund invests its assets in fewer issuers, the fund will be more susceptible to negative events affecting those issuers. |
| • | | Portfolio Selection – The sub-adviser’s judgment about a particular security or issuer, or about the economy or a particular sector, region or market segment, or about an investment strategy, may prove to be incorrect. |
| • | | Portfolio Turnover – The fund’s investment strategy may result in a high portfolio turnover rate. High portfolio turnover would result in a correspondingly greater brokerage commission expenses and may result in the distribution to shareholders of additional capital gains for tax purposes. These factors may negatively affect the fund’s performance. |
| • | | Real Estate Securities – Investments in the real estate industry are subject to risks associated with direct investment in real estate. These risks include declines in the value of real estate, adverse general and local economic conditions, increased competition, overbuilding and changes in operating expenses, property taxes or interest rates. REITs are one type of real estate security. A REIT’s performance depends on the types and locations of the properties it owns and how well it manages those properties or loan financings. REITs are subject to a highly technical tax structure, and the failure to qualify as a REIT could result in corporate-level taxation, significantly reducing the return on an investment to the fund. |
| • | | REITs – When the fund invests in Real Estate Investment Trusts (“REITs”), it is subject to risks generally associated with investing in real estate. A REIT’s performance depends on the types and locations of the properties it owns and how well it manages those properties or loan financings. REITs are subject to a highly technical tax structure; and the failure to qualify as a REIT could result in corporate-level taxation, significantly reducing the return on an investment to the fund. |
| • | | Small- or Medium-Sized Companies – Small- or medium-sized companies may be more at risk than larger companies because, among other things, they may have limited product lines, operating history, market or financial resources, or because they may depend on a limited management group. |
| • | | Stocks – Stocks may be volatile – their prices may go up and down dramatically over the shorter term. These price movements may result from factors affecting individual companies, industries, the securities market as a whole or the overall economy. |
Performance: The bar chart and the table below provide some indication of the risks of investing in the fund by showing you how the fund’s performance has varied from year to year, and how the fund’s Class I2 average annual total returns for different periods compare to the returns of a broad measure of market performance. The table shows average annual total returns for Class I2 shares of the fund. Absent any limitation of the fund’s expenses, total returns would be lower. As with all mutual funds, past performance (before and after taxes) is not a prediction of future results. Updated performance information is available on our website at www.transamericafunds.com or by calling 1-888-233-4339.
34
Annual Total Returns (calendar years ended December 31)

| | | | |
| | | Quarter Ended | | Return |
Best Quarter: | | 6/30/2009 | | 31.76% |
Worst Quarter: | | 12/31/2008 | | -29.19% |
Average Annual Total Returns (periods ended December 31, 2010)1
| | | | | | |
| | | 1 Year | | 5 Years | | 10 Years or
Inception* |
Class I2 (commenced operations on November 15, 2005) | | | | | | |
Return before taxes | | 16.10% | | 3.74% | | 5.12% |
Return after taxes on distributions2 | | 13.58% | | 1.40% | | 2.46% |
Return after taxes on distributions and sale of fund shares2 | | 10.42% | | 2.27% | | 3.36% |
S&P Developed Property Index (reflects no deduction for fees, expenses, or taxes) | | 21.54% | | 2.65% | | 3.80% |
| 1 | Actual returns may depend on the investor’s individual tax situation. After-tax returns may not be relevant if the investment is made through a tax-exempt or tax-deferred account, such as a 401(k) plan. |
| 2 | The after-tax returns are calculated using the historic highest individual federal marginal income tax rates and do not reflect the impact of state and local taxes. |
| * | Fund and Index returns are for past 10 years or since inception, whichever is less. |
Management:
| | |
| Investment Adviser: | | Sub-Adviser: |
| |
| Transamerica Asset Management, Inc. | | ING Clarion Real Estate Securities, LLC |
| |
| | Portfolio Managers: |
| |
| | T. Ritson Ferguson, CFA, Portfolio Manager since 2002 |
| |
| | Joseph P. Smith, CFA, Portfolio Manager since 2002 |
| |
| | Steven D. Burton, CFA, Portfolio Manager since 2002 |
Purchase and Sale of Fund Shares: Class I2 shares of the fund are currently primarily offered for investment in certain funds of funds (also referred to as “strategic asset allocation funds”). Class I2 shares of the fund are also made available to other investors, including institutional investors such as foreign insurers, domestic insurance companies and their separate accounts, and unaffiliated funds, high net worth individuals, and eligible retirement plans whose recordkeepers or financial service firm intermediaries have entered into agreements with Transamerica Funds or its agents. Investors who received Class I2 shares in connection with the reorganization of a Transamerica Premier Fund into a Transamerica Fund may continue to invest in Class I2 shares of that Transamerica Fund, but may not open new accounts. You buy and redeem shares at the fund’s next-determined net asset value (NAV) after receipt of your request in good order.
Tax Information: Fund distributions may be taxable as ordinary income or capital gains, except when your investment is in an IRA, 401(k) or other tax-advantaged investment plan.
Payments to Broker-Dealers and Other Financial Intermediaries: If you purchase the fund through a broker-dealer or other financial intermediary, the fund and/or its affiliates may pay the intermediary for the sale of fund shares and related services. These payments may create a conflict of interest by influencing the broker-dealer or other intermediary and your salesperson to recommend the fund over another investment. Ask your salesperson or visit your financial intermediary’s website for more information.
35
|
| TRANSAMERICA FEDERATED MARKET OPPORTUNITY |
Investment Objective: Seeks to provide absolute (positive) returns with low correlation to the U.S. equity market.
Fees and Expenses: This table describes the fees and expenses that you may pay if you buy and hold shares of the fund. There are no sales charges (load) or other transaction fees.
| | |
| Annual Fund Operating Expenses (expenses that you pay each year as a percentage of the value of your investment) |
| | | |
| Management fees | | 0.77% |
| Distribution and service (12b-1) fees | | None |
| Other expenses | | 0.12% |
| Acquired fund fees and expenses (fees and expenses of underlying funds ) | | 0.04% |
| Total annual fund operating expensesa | | 0.93% |
| a | Total fund operating expenses do not correlate to the ratios of expenses to average net assets in the financial highlights table, which do not include acquired (i.e., underlying) funds’ fees and expenses. |
Example: This Example is intended to help you compare the cost of investing in the fund with the cost of investing in other mutual funds. The Example assumes that you invest $10,000. The Example also assumes that your investment has a 5% return each year and that the fund’s operating expenses remain the same. Although your actual costs may be higher or lower, based on these assumptions your costs would be:
| | | | | | |
| 1 year | | 3 years | | 5 years | | 10 years |
$95 | | $296 | | $515 | | $1,143 |
Portfolio Turnover: The fund pays transaction costs, such as commissions, when it buys and sells securities (or “turns over” its portfolio). A higher portfolio turnover rate may indicate higher transaction costs and may result in higher taxes when fund shares are held in a taxable account. These costs, which are not reflected in annual fund operating expenses or in the Example, affect the fund’s performance. During the most recent fiscal year, the portfolio turnover rate was 194% of the average value of the fund’s portfolio.
Principal Investment Strategies: The fund’s sub-adviser, Federated Equity Management Company of Pennsylvania (“Federated”), invests, under normal circumstances, in domestic (including American Depository Receipts (ADRs)) and foreign securities (including emerging markets), both debt and equity, that Federated deems to be undervalued or out-of-favor, and other investments detailed in the strategy below which may include maintaining a cash position invested in traditional cash instruments. Federated may position the fund with respect to various asset classes or individual securities in a net long or net short position.
Federated’s investment management approach may be described as contrarian in nature because the sub-adviser anticipates that it will invest in out-of-favor securities, obtain short exposure on securities that are in favor, or deviate from the consensus view on markets in general, a sector, or individual securities.
The fund may invest in exchange-traded funds (“ETFs”), derivative contracts (such as options, swaps and futures contracts) and hybrid investments (such as notes linked to underlying securities, indices or commodities), or sell securities short in order to implement its investment strategy. The fund may buy or sell foreign currencies or enter into foreign currency forwards in lieu of or in addition to non-dollar denominated fixed-income securities in order to increase or decrease its exposure to foreign interest rate and/or currency markets. When investing the fixed-income portion of the fund, Federated is not constrained by any duration or maturity range or credit quality.
The fund may invest in commodities by investing in a derivative or other hybrid instrument whose price depends upon the movement of an underlying commodity or by the performance of a commodity index.
The fund may invest its assets in cash, cash equivalent securities or short-term debt securities, repurchase agreements and money market instruments. Under adverse or unstable market, economic or political conditions, the fund may take temporary defensive positions in cash and short-term debt securities without limit.
Principal Risks: Many factors affect the fund’s performance. There is no assurance the fund will meet its investment objective. The value of your investment in the fund, as well as the amount of return you receive on your investment, may fluctuate significantly from day to day and over time. You may lose part or all of your investment in the fund or your investment may not perform as well as other similar investments. The following is a summary of certain risks (in alphabetical order) of investing in the fund. You may lose money if you invest in this fund.
| • | | Cash Management and Defensive Investing – Money market instruments or short-term debt securities held by the fund for cash management or defensive investing purposes can fluctuate in value. Like other fixed income securities, they are |
36
| | subject to risk, including market, interest rate and credit risk. If the fund holds cash uninvested, the fund will not earn income on the cash and the fund’s yield will go down. If a significant amount of the fund’s assets are used for cash management or defensive investing purposes, it will be more difficult for the fund to achieve its objective. |
| • | | Commodities – To the extent the fund invests in instruments whose performance is linked to the price of an underlying commodity or commodity index, the fund will be subject to the risks of investing in physical commodities, including regulatory, economic and political developments, weather events and natural disasters and market disruptions. The fund’s investment exposure to the commodities markets may subject the fund to greater volatility than investments in more traditional securities, such as stocks and bonds. |
| • | | Convertible Securities – The market value of convertible securities tends to decline as interest rates increase. Convertible securities generally offer lower interest or dividend yields than non-convertible securities of similar quality. The fund could lose money if the issuer of a convertible security is unable to meet its financial obligations or goes bankrupt. |
| • | | Country, Sector or Industry Focus – To the extent the fund invests a significant portion of its assets in one or more countries, sectors or industries, the fund will be more susceptible to negative events affecting those countries, sectors or industries. |
| • | | Currency – When the fund invests in securities denominated in foreign currencies, the fund may incur currency conversion costs and may be affected favorably or unfavorably by changes in the rates of exchange between those currencies and the U.S. dollar. Currency exchange rates can be volatile and are affected by, among other factors, the general economics of a country, the actions of the U.S. and foreign governments or control banks, the imposition of currency controls, and speculation. |
| • | | Currency Hedging – The fund may hedge its currency risk using currency futures, forwards or options. However, these instruments may not always work as intended, and a fund may be worse off than if it had not used a hedging instrument. |
| • | | Derivatives – Using derivatives can increase fund losses and reduce opportunities for gains when market prices, interest rates or the derivative instruments themselves behave in a way not anticipated by the fund. Using derivatives also can have a leveraging effect and increase fund volatility. Derivatives may be difficult to sell, unwind or value, and the counterparty may default on its obligations to the fund. The fund’s investments in derivative instruments may involve a small investment relative to the amount of investment exposure assumed and may result in losses exceeding the amounts invested in those instruments. Recent legislation calls for new regulation of the derivatives markets. The extent and impact of the regulation are not yet fully known and may not be for some time. New regulation of derivatives may make them more costly, may limit their availability, or may otherwise adversely affect their value or performance. |
| • | | Emerging Markets – Investing in the securities of issuers located in or principally doing business in emerging markets are subject to foreign securities risks. These risks are greater for investments in emerging markets. Emerging market countries tend to have economic, political and legal systems that are less fully developed and are less stable than those of more advanced countries. Low trading volumes may result in a lack of liquidity and in extreme price volatility. |
| • | | Exchange Traded Funds – Equity-based ETFs are subject to risks similar to those of stocks; fixed income-based ETFs are subject to risks similar to those of bonds. ETF shares may trade at a premium or discount to NAV. ETFs are subject to secondary market trading risks. |
| • | | Fixed-Income Securities – The market prices of fixed-income securities may go up or down, sometimes rapidly or unpredictably due to general market conditions, such as real or perceived adverse economic or political conditions, inflation, changes in interest rates, lack of liquidity in the bond markets or adverse investor sentiment. When market prices fall, the value of your investment will go down. A rise in rates tends to have a greater impact on the prices of longer term or duration securities. |
If interest rates rise, repayments of fixed-income securities may occur more slowly than anticipated by the market. This may drive the prices of these securities down because their interest rates are lower than the current interest rate and they remain outstanding longer. This is sometimes referred to as extension risk.
Many issuers have a right to prepay their securities. If interest rates fall, an issuer may exercise this right. If this happens, the fund will be forced to reinvest prepayment proceeds at a time when yields on securities available in the market are lower than the yield on the prepaid security. This is sometimes referred to as prepayment or call risk.
| • | | Foreign Securities – Foreign securities are subject to a number of additional risks, including nationalization or expropriation of assets, imposition of currency controls or restrictions, confiscatory taxation, political or financial instability and other adverse economic or political developments. Lack of information and less market regulation also may affect the value of these securities. |
37
| • | | High-Yield Debt Securities – High-yield debt securities, or junk bonds, are securities that are rated below “investment grade” (that is, securities rated below Baa/BBB) or, if unrated, are considered by the sub-adviser to be of equivalent quality. Changes in interest rates, the market’s perception of the issuers and the creditworthiness of the issuers may significantly affect the value of these bonds. Junk bonds have a higher risk of default, tend to be less liquid and may be more difficult to value. |
| • | | Hybrid Instruments – The risks of investing in hybrid instruments include a combination of the risks of investing in securities, commodities, options, futures, and currencies. An investment in a hybrid instrument may entail significant risks in addition to those associated with traditional fixed-income or convertible securities. |
| • | | Increase in Expenses – Your actual costs of investing in the fund may be higher than the expenses shown in “Annual Fund Operating Expenses” for a variety of reasons. For example, expense ratios may be higher than those shown if average net assets decrease. Net assets are more likely to decrease and fund expense ratios are more likely to increase when markets are volatile. |
| • | | Investment Companies – To the extent that an underlying fund invests in other investment companies, such as exchange-traded funds, it is subject to the risks of these investment companies and bears its pro rata share of the investment companies’ expenses. |
| • | | Leveraging – The value of your investment may be more volatile if the fund borrows or uses derivatives that have a leveraging effect on the fund. Other risks also will be compounded. This is because leverage generally magnifies the effect of a change in the value of an asset and creates a risk of loss of value on a larger pool of assets than the fund would otherwise have had. The fund also may have to sell assets at inopportune times to satisfy its obligations. |
| • | | Liquidity – Some securities held by the fund may be difficult to sell, or illiquid, particularly during times of market turmoil. Illiquid securities may also be difficult to value. If the fund is forced to sell an illiquid asset to meet redemption requests or other cash needs, the fund may be forced to sell at a loss. |
| • | | Market – The market prices of the fund’s securities may go up or down, sometimes rapidly or unpredictably, due to general market conditions, such as real or perceived adverse economic or political conditions, inflation, changes in interest rates or currency rates, lack of liquidity in the markets or adverse investor sentiment. Market prices of securities also may go down due to events or conditions that affect particular sectors or issuers. When market prices fall, the value of your investment will go down. The fund may experience a substantial or complete loss on any individual security. The recent financial crisis has caused a significant decline in the value and liquidity of many securities. In response to the financial crisis, the U.S. and other governments and the Federal Reserve and certain foreign central banks have taken steps to support financial markets. The withdrawal of this support could negatively affect the value and liquidity of certain securities. In addition, legislation recently enacted in the U.S. calls for changes in many aspects of financial regulation. The impact of the legislation on the markets, and the practical implications for market participants, may not be fully known for some time. |
| • | | Portfolio Selection – The sub-adviser’s judgment about a particular security or issuer, or about the economy or a particular sector, region or market segment, or about an investment strategy, may prove to be incorrect. |
| • | | Portfolio Turnover – The fund’s investment strategy may result in a high portfolio turnover rate. High portfolio turnover would result in a correspondingly greater brokerage commission expenses and may result in the distribution to shareholders of additional capital gains for tax purposes. These factors may negatively affect the fund’s performance. |
| • | | REITs – When the fund invests in Real Estate Investment Trusts (“REITs”), it is subject to risks generally associated with investing in real estate. A REIT’s performance depends on the types and locations of the properties it owns and how well it manages those properties or loan financings. REITs are subject to a highly technical tax structure; and the failure to qualify as a REIT could result in corporate-level taxation, significantly reducing the return on an investment to the fund. |
| • | | Repurchase Agreements – If the other party to a repurchase agreement defaults on its obligation, the fund may suffer delays and incur costs or lose money in exercising its rights under the agreement. If the seller fails to repurchase the security and the market value declines, the fund could lose money. If the seller becomes insolvent and subject to liquidation or reorganization under applicable bankruptcy or other laws, the fund’s ability to dispose of the underlying securities may be restricted. |
| • | | Short Sales – A short sale may be effected by selling a security that the fund does not own. If the price of the security sold short increases, the fund would incur a loss; conversely, if the price declines, the fund will realize a gain. Although the gain is limited by the price at which the security was sold short, the loss is potentially unlimited. The fund may also pay transaction costs and borrowing fees in connection with short sales. |
38
| • | | Small- or Medium-Sized Companies – Small- or medium-sized companies may be more at risk than larger companies because, among other things, they may have limited product lines, operating history, market or financial resources, or because they may depend on a limited management group. |
| • | | Stocks – Stocks may be volatile – their prices may go up and down dramatically over the shorter term. These price movements may result from factors affecting individual companies, industries, the securities market as a whole or the overall economy. |
| • | | Tax – In order to qualify as a regulated investment company (“RIC”) under the Internal Revenue Code, the fund must meet certain requirements regarding, among other things, the source of its income. Any income the fund derives from investments in certain hard asset ETFs, such as certain commodity ETFs, and from other non-qualifying sources must be limited to a maximum of 10% of the fund’s gross income. If the fund fails to meet those requirements, the fund may be subject to federal income tax on its net income at regular corporate rates (without reduction for distributions to shareholders). When distributed, that income would also be taxable to shareholders as an ordinary dividend to the extent attributable to the fund’s earnings and profits. If the fund were to fail to qualify as a RIC shareholders of the fund could realize significantly diminished returns from their investment in the fund. |
| • | | Value Investing – The prices of securities the sub-adviser believes are undervalued may not appreciate as anticipated or may go down. Value stocks as a group may be out of favor and underperform the overall equity market for a long period of time, for example, while the market favors “growth” stocks. |
Performance: The bar chart and the table below provide some indication of the risks of investing in the fund by showing you how the fund’s performance has varied from year to year, and how the fund’s Class I2 average annual total returns for different periods compare to the returns of a broad measure of market performance, as well as comparison to a secondary index which has characteristics relevant to the fund’s investment strategies. The table shows average annual total returns for Class I2 shares of the fund. Absent any limitation of the fund’s expenses, total returns would be lower. As with all mutual funds, past performance (before and after taxes) is not a prediction of future results. Updated performance information is available on our website at www.transamericafunds.com or by calling 1-888-233-4339.
Annual Total Returns (calendar years ended December 31)

| | | | |
| | | Quarter Ended | | Return |
| Best Quarter: | | 6/30/2010 | | 5.19% |
| Worst Quarter: | | 12/31/2008 | | -5.23% |
Average Annual Total Returns (periods ended December 31, 2010)1
| | | | | | |
| | | 1 Year | | 5 Years | | 10 Years or
Inception* |
| Class I2 (commenced operations on December 6, 2005) | | | | | | |
| Return before taxes | | -0.62% | | 0.17% | | 0.18% |
| Return after taxes on distributions2 | | -0.90% | | -0.64% | | -0.64% |
| Return after taxes on distributions and sale of fund shares2 | | -0.30% | | -0.22% | | -0.22% |
| Russell 3000® Value Index (reflects no deduction for fees, expenses, or taxes) | | 16.23% | | 1.45% | | 1.30% |
| Bank of America Merrill Lynch 3-Month Treasury Bill Index (reflects no deduction for fees, expenses or taxes) | | 0.13% | | 2.43% | | 2.45% |
| 1 | Actual returns may depend on the investor’s individual tax situation. After-tax returns may not be relevant if the investment is made through a tax-exempt or tax-deferred account, such as a 401(k) plan. |
| 2 | The after-tax returns are calculated using the historic highest individual federal marginal income tax rates and do not reflect the impact of state and local taxes. |
| * | Fund and Index returns are for past 10 years or since inception, whichever is less. |
39
Management:
| | |
| Investment Adviser: | | Sub-Adviser: |
| |
| Transamerica Asset Management, Inc. | | Federated Equity Management Company of Pennsylvania |
| |
| | Portfolio Managers: |
| |
| | Douglas C. Noland, Senior Portfolio Manager since 2010 |
| |
| | Dana L. Meissner, CFA, Portfolio Manager since 2009 |
Purchase and Sale of Fund Shares: Class I2 shares of the fund are currently primarily offered for investment in certain funds of funds (also referred to as “strategic asset allocation funds”). Class I2 shares of the fund are also made available to other investors, including institutional investors such as foreign insurers, domestic insurance companies and their separate accounts, and unaffiliated funds, high net worth individuals, and eligible retirement plans whose recordkeepers or financial service firm intermediaries have entered into agreements with Transamerica Funds or its agents. Investors who received Class I2 shares in connection with the reorganization of a Transamerica Premier Fund into a Transamerica Fund may continue to invest in Class I2 shares of that Transamerica Fund, but may not open new accounts. You buy and redeem shares at the fund’s next-determined net asset value (NAV) after receipt of your request in good order.
Tax Information: Fund distributions may be taxable as ordinary income or capital gains, except when your investment is in an IRA, 401(k) or other tax-advantaged investment plan.
Payments to Broker-Dealers and Other Financial Intermediaries: If you purchase the fund through a broker-dealer or other financial intermediary, the fund and/or its affiliates may pay the intermediary for the sale of fund shares and related services. These payments may create a conflict of interest by influencing the broker-dealer or other intermediary and your salesperson to recommend the fund over another investment. Ask your salesperson or visit your financial intermediary’s website for more information.
40
|
| TRANSAMERICA FIRST QUADRANT GLOBAL MACRO |
Investment Objective: Seeks to achieve total return from investments in the global equity, fixed-income, and currency markets, independent of market direction.
Fees and Expenses: This table describes the fees and expenses that you may pay if you buy and hold shares of the fund. There are no sales charges (load) or other transaction fees.
| | |
| Annual Fund Operating Expenses (expenses that you pay each year as a percentage of the value of your investment) |
| | |
Management fees | | 1.40% |
Distribution and service (12b-1) fees | | None |
Other expenses | | 0.21% |
Total annual fund operating expenses | | 1.61% |
Example: This Example is intended to help you compare the cost of investing in the fund with the cost of investing in other mutual funds. The Example assumes that you invest $10,000. The Example also assumes that your investment has a 5% return each year and that the fund’s operating expenses remain the same. Although your actual costs may be higher or lower, based on these assumptions your costs would be:
| | | | | | |
| 1 year | | 3 years | | 5 years | | 10 years |
$164 | | $508 | | $876 | | $1,911 |
Portfolio Turnover: The fund pays transaction costs, such as commissions, when it buys and sells securities (or “turns over” its portfolio). A higher portfolio turnover rate may indicate higher transaction costs and may result in higher taxes when fund shares are held in a taxable account. These costs, which are not reflected in annual fund operating expenses or in the Example, affect the fund’s performance. During the most recent fiscal year, the portfolio turnover rate was 0% of the average value of the fund’s portfolio (instruments with remaining maturities of one year or less are excluded from the portfolio turnover rate).
Principal Investment Strategies: Under normal circumstances, the fund’s sub-adviser, First Quadrant, L.P. (“First Quadrant”), seeks to generate returns through risk-controlled exposure, long and short, to global equity, fixed-income, and currency markets through a wide range of derivative instruments and direct investments. The fund typically will make extensive use of derivative instruments, including futures contracts on global equity and fixed-income securities and security indices, options on futures contracts and equity indices, securities and security indices, swap contracts and forward contracts. The fund may also invest directly in global equity securities (including exchange traded funds (“ETFs”) and common and preferred stock of U.S. and non-U.S. companies) and fixed-income securities (including U.S. and non-U.S. corporate bonds and debt securities guaranteed by U.S. and non-U.S. governments, their agencies or instrumentalities or supranational organizations). There are no limits on the amount of fund assets that may be allocated to any one of the equity, bond and currency asset classes. Typically, the fund expects to diversify its exposure among at least ten different countries, including the United States. In selecting equity investments for the fund, First Quadrant is not constrained by any particular investment style or capitalization range. In selecting bond investments for the fund, First Quadrant will have the flexibility to invest in debt-related investments of any credit quality and with any duration. The fund will often use derivative instruments as its principal means to quickly and efficiently gain exposure to equity securities, fixed-income securities and foreign currencies in seeking to take advantage of value (and reduce exposure to risk) that First Quadrant identifies in the global equity, bond, and currency markets.
The fund may also invest its assets in cash, cash equivalent securities or short-term debt securities, repurchase agreements and money market instruments. Under adverse or unstable market, economic or political conditions, the portfolio may do so without limit.
The fund is non-diversified.
Principal Risks: Many factors affect the fund’s performance. There is no assurance the fund will meet its investment objective. The value of your investment in the fund, as well as the amount of return you receive on your investment, may fluctuate significantly from day to day and over time. You may lose part or all of your investment in the fund or your investment may not perform as well as other similar investments. The following is a summary of certain risks (in alphabetical order) of investing in the fund. You may lose money if you invest in this fund.
| • | | Active Trading – Certain funds are actively managed and, under appropriate circumstances, may purchase and sell securities without regard to the length of time held. A high portfolio turnover rate may have a negative impact on performance by increasing transaction costs and may generate greater tax liabilities for shareholders holding shares in taxable accounts. |
41
| • | | Cash Management and Defensive Investing – Money market instruments or short-term debt securities held by the fund for cash management or defensive investing purposes can fluctuate in value. Like other fixed income securities, they are subject to risk, including market, interest rate and credit risk. If the fund holds cash uninvested, the fund will not earn income on the cash and the fund’s yield will go down. If a significant amount of the fund’s assets are used for cash management or defensive investing purposes, it will be more difficult for the fund to achieve its objective. |
| • | | Convertible Securities – The market value of convertible securities tends to decline as interest rates increase. Convertible securities generally offer lower interest or dividend yields than non-convertible securities of similar quality. The fund could lose money if the issuer of a convertible security is unable to meet its financial obligations or goes bankrupt. |
| • | | Country, Sector or Industry Focus – To the extent the fund invests a significant portion of its assets in one or more countries, sectors or industries, the fund will be more susceptible to negative events affecting those countries, sectors or industries. |
| • | | Currency – When the fund invests in securities denominated in foreign currencies, the fund may incur currency conversion costs and may be affected favorably or unfavorably by changes in the rates of exchange between those currencies and the U.S. dollar. Currency exchange rates can be volatile and are affected by, among other factors, the general economics of a country, the actions of the U.S. and foreign governments or control banks, the imposition of currency controls, and speculation. |
| • | | Derivatives – Using derivatives can increase fund losses and reduce opportunities for gains when market prices, interest rates or the derivative instruments themselves behave in a way not anticipated by the fund. Using derivatives also can have a leveraging effect and increase fund volatility. Derivatives may be difficult to sell, unwind or value, and the counterparty may default on its obligations to the fund. The fund’s investments in derivative instruments may involve a small investment relative to the amount of investment exposure assumed and may result in losses exceeding the amounts invested in those instruments. Recent legislation calls for new regulation of the derivatives markets. The extent and impact of the regulation are not yet fully known and may not be for some time. New regulation of derivatives may make them more costly, may limit their availability, or may otherwise adversely affect their value or performance. |
| • | | Emerging Markets – Investing in the securities of issuers located in or principally doing business in emerging markets are subject to foreign securities risks. These risks are greater for investments in emerging markets. Emerging market countries tend to have economic, political and legal systems that are less fully developed and are less stable than those of more advanced countries. Low trading volumes may result in a lack of liquidity and in extreme price volatility. |
| • | | Fixed-Income Securities – The market prices of fixed-income securities may go up or down, sometimes rapidly or unpredictably due to general market conditions, such as real or perceived adverse economic or political conditions, inflation, changes in interest rates, lack of liquidity in the bond markets or adverse investor sentiment. When market prices fall, the value of your investment will go down. A rise in rates tends to have a greater impact on the prices of longer term or duration securities. |
If interest rates rise, repayments of fixed-income securities may occur more slowly than anticipated by the market. This may drive the prices of these securities down because their interest rates are lower than the current interest rate and they remain outstanding longer. This is sometimes referred to as extension risk.
Many issuers have a right to prepay their securities. If interest rates fall, an issuer may exercise this right. If this happens, the fund will be forced to reinvest prepayment proceeds at a time when yields on securities available in the market are lower than the yield on the prepaid security. This is sometimes referred to as prepayment or call risk.
| • | | Foreign Securities – Foreign securities are subject to a number of additional risks, including nationalization or expropriation of assets, imposition of currency controls or restrictions, confiscatory taxation, political or financial instability and other adverse economic or political developments. Lack of information and less market regulation also may affect the value of these securities. |
| • | | Growth Stocks – Returns on growth stocks may not move in tandem with returns on other categories of stocks or the market as a whole. Growth stocks may be particularly susceptible to rapid price swings or to adverse developments. Growth stocks as a group may be out of favor and underperform the overall equity market for a long period of time, for example, while the market favors “value” stocks. |
| • | | High-Yield Debt Securities – High-yield debt securities, or junk bonds, are securities that are rated below “investment grade” (that is, securities rated below Baa/BBB) or, if unrated, are considered by the sub-adviser to be of equivalent quality. Changes in interest rates, the market’s perception of the issuers and the creditworthiness of the issuers may significantly |
42
| | affect the value of these bonds. Junk bonds have a higher risk of default, tend to be less liquid and may be more difficult to value. |
| • | | Increase in Expenses – Your actual costs of investing in the fund may be higher than the expenses shown in “Annual Fund Operating Expenses” for a variety of reasons. For example, expense ratios may be higher than those shown if average net assets decrease. Net assets are more likely to decrease and fund expense ratios are more likely to increase when markets are volatile. |
| • | | Leveraging – The value of your investment may be more volatile if the fund borrows or uses derivatives that have a leveraging effect on the fund. Other risks also will be compounded. This is because leverage generally magnifies the effect of a change in the value of an asset and creates a risk of loss of value on a larger pool of assets than the fund would otherwise have had. The fund also may have to sell assets at inopportune times to satisfy its obligations. |
| • | | Liquidity – Some securities held by the fund may be difficult to sell, or illiquid, particularly during times of market turmoil. Illiquid securities may also be difficult to value. If the fund is forced to sell an illiquid asset to meet redemption requests or other cash needs, the fund may be forced to sell at a loss. |
| • | | Market – The market prices of the fund’s securities may go up or down, sometimes rapidly or unpredictably, due to general market conditions, such as real or perceived adverse economic or political conditions, inflation, changes in interest rates or currency rates, lack of liquidity in the markets or adverse investor sentiment. Market prices of securities also may go down due to events or conditions that affect particular sectors or issuers. When market prices fall, the value of your investment will go down. The fund may experience a substantial or complete loss on any individual security. The recent financial crisis has caused a significant decline in the value and liquidity of many securities. In response to the financial crisis, the U.S. and other governments and the Federal Reserve and certain foreign central banks have taken steps to support financial markets. The withdrawal of this support could negatively affect the value and liquidity of certain securities. In addition, legislation recently enacted in the U.S. calls for changes in many aspects of financial regulation. The impact of the legislation on the markets, and the practical implications for market participants, may not be fully known for some time. |
| • | | Non-Diversification – The fund is classified as “non-diversified,” which means it may invest in a larger percentage of its assets in one issuer than a diversified fund. To the extent the fund invests its assets in fewer issuers, the fund will be more susceptible to negative events affecting those issuers. |
| • | | Portfolio Selection – The sub-adviser’s judgment about a particular security or issuer, or about the economy or a particular sector, region or market segment, or about an investment strategy, may prove to be incorrect. |
| • | | Preferred Stock – Preferred stock’s right to dividends and liquidation proceeds is junior to the rights of a company’s debt securities. The value of preferred stock may be subject to factors that affect fixed income and equity securities, including changes in interest rates and in a company’s creditworthiness. Shareholders of preferred stock may suffer a loss of value if dividends are not paid and have limited voting rights. |
| • | | Prepayment or Call – Many issuers have a right to prepay their securities. If interest rates fall, an issuer may exercise this right. If this happens, the fund will be forced to reinvest prepayment proceeds at a time when yields on securities available in the market are lower than the yield on the prepaid security. The fund also may lose any premium it paid on the security. |
| • | | Short Sales – A short sale may be effected by selling a security that the fund does not own. If the price of the security sold short increases, the fund would incur a loss; conversely, if the price declines, the fund will realize a gain. Although the gain is limited by the price at which the security was sold short, the loss is potentially unlimited. The fund may also pay transaction costs and borrowing fees in connection with short sales. |
| • | | Small- or Medium-Sized Companies – Small- or medium-sized companies may be more at risk than larger companies because, among other things, they may have limited product lines, operating history, market or financial resources, or because they may depend on a limited management group. |
| • | | Stocks – Stocks may be volatile – their prices may go up and down dramatically over the shorter term. These price movements may result from factors affecting individual companies, industries, the securities market as a whole or the overall economy. |
| • | | U.S. Government Agency Obligations – Government agency obligations have different levels of credit support and, therefore, different degrees of credit risk. Securities issued by agencies and instrumentalities of the U.S. government that are supported by the full faith and credit of the United States generally present a lesser degree of credit risk than securities issued by agencies and instrumentalities sponsored by the U.S. government that are supported only by the issuer’s right to |
43
| | borrow from the U.S. Treasury and securities issued by agencies and instrumentalities sponsored by the U.S. government that are supported only by the credit of the issuing agencies. |
| • | | Value Investing – The prices of securities the sub-adviser believes are undervalued may not appreciate as anticipated or may go down. Value stocks as a group may be out of favor and underperform the overall equity market for a long period of time, for example, while the market favors “growth” stocks. |
Performance: The bar chart and the table below provide some indication of the risks of investing in the fund by showing you how the fund’s performance has varied from year to year, and how the fund’s Class I2 average annual total returns for different periods compare to the returns of a broad measure of market performance. The table shows average annual total returns for Class I2 shares of the fund. Absent any limitation of the fund’s expenses, total returns would be lower. As with all mutual funds, past performance (before and after taxes) is not a prediction of future results. Updated performance information is available on our website at www.transamericafunds.com or by calling 1-888-233-4339.
Prior to November 1, 2009, the fund was named Transamerica UBS Dynamic Alpha, had a different sub-adviser, a different investment objective and used different investment strategies. The performance set forth prior to that date is attributable to the previous sub-adviser.
Annual Total Returns (calendar years ended December 31)
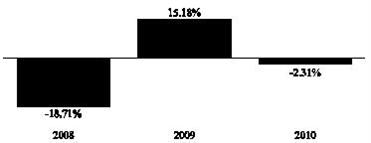
| | | | |
| | | Quarter Ended | | Return |
Best Quarter: | | 6/30/2009 | | 15.27% |
Worst Quarter: | | 12/31/2008 | | -15.48% |
Average Annual Total Returns (periods ended December 31, 2010)1
| | | | | | |
| | | 1 Year | | 5 Years | | 10 Years or Inception* |
| Class I2 (commenced operations on January 3, 2007) | | | | | | |
| Return before taxes | | -2.31% | | N/A | | -2.78% |
| Return after taxes on distributions2 | | -2.31% | | N/A | | -4.59% |
| Return after taxes on distributions and sale of fund shares2 | | -1.50% | | N/A | | -3.00% |
| Citigroup 1-Month Treasury Bill Index (reflects no deduction for fees, expenses, or taxes) | | 0.12% | | N/A | | 1.52% |
| 1 | Actual returns may depend on the investor’s individual tax situation. After-tax returns may not be relevant if the investment is made through a tax-exempt or tax-deferred account, such as a 401(k) plan. |
| 2 | The after-tax returns are calculated using the historic highest individual federal marginal income tax rates and do not reflect the impact of state and local taxes. |
| * | Fund and Index returns are for past 10 years or since inception, whichever is less. |
Management:
| | |
| Investment Adviser: | | Sub-Adviser: |
| |
| Transamerica Asset Management, Inc. | | First Quadrant, L.P. |
| |
| | Portfolio Managers: |
| |
| | Chuck Fannin, CFA, Portfolio Manager since 2009 |
| |
| | Kenneth J. Ferguson, Portfolio Manager since 2009 |
| |
| | Dori Levanoni, Portfolio Manager since 2009 |
44
Purchase and Sale of Fund Shares: Class I2 shares of the fund are currently primarily offered for investment in certain funds of funds (also referred to as “strategic asset allocation funds”). Class I2 shares of the fund are also made available to other investors, including institutional investors such as foreign insurers, domestic insurance companies and their separate accounts, and unaffiliated funds, high net worth individuals, and eligible retirement plans whose recordkeepers or financial service firm intermediaries have entered into agreements with Transamerica Funds or its agents. Investors who received Class I2 shares in connection with the reorganization of a Transamerica Premier Fund into a Transamerica Fund may continue to invest in Class I2 shares of that Transamerica Fund, but may not open new accounts. You buy and redeem shares at the fund’s next-determined net asset value (NAV) after receipt of your request in good order.
Tax Information: Fund distributions may be taxable as ordinary income or capital gains, except when your investment is in an IRA, 401(k) or other tax-advantaged investment plan.
Payments to Broker-Dealers and Other Financial Intermediaries: If you purchase the fund through a broker-dealer or other financial intermediary, the fund and/or its affiliates may pay the intermediary for the sale of fund shares and related services. These payments may create a conflict of interest by influencing the broker-dealer or other intermediary and your salesperson to recommend the fund over another investment. Ask your salesperson or visit your financial intermediary’s website for more information.
45
|
| TRANSAMERICA GOLDMAN SACHS COMMODITY STRATEGY |
Investment Objective: Seeks long-term total return.
Fees and Expenses: This table describes the fees and expenses that you may pay if you buy and hold shares of the fund. There are no sales charges (load) or other transaction fees.
| | |
Annual Fund Operating Expenses (expenses that you pay each year as a percentage of the value of your investment)a |
| | | |
| | | |
Management fees | | 0.60% |
Distribution and service (12b-1) fees | | None |
Other expenses | | 0.08% |
Acquired fund fees and expenses (fees and expenses of underlying funds)b | | 0.15% |
Total annual fund operating expenses | | 0.83% |
Expense reductionb, c | | 0.15% |
Total annual fund operating expenses after expense reduction | | 0.68% |
| a | Annual fund operating expenses have been restated to reflect expenses for the current fiscal year. |
| b | Acquired fund fees and expenses reflect the expenses (including the management fee) borne by the fund as the sole shareholder of the Subsidiary (as defined below). The Subsidiary has entered into a separate contract with the fund’s investment adviser, Transamerica Asset Management, Inc. (“TAM”), for the management of the Subsidiary portfolio pursuant to which the Subsidiary pays TAM a fee that is the same, as a percentage of net assets, as the management fee of the fund. TAM contractually has agreed to waive a portion of the fund’s management fee in an amount equal to the management fee paid to TAM by the Subsidiary. This management fee waiver, which is reflected in the “Expense reduction” line, may not be discontinued by TAM as long as its contract with the Subsidiary is in place. |
| c | Contractual arrangements have been made with TAM through March 1, 2012, to waive fees and/or reimburse fund expenses to the extent that the fund’s total operating expenses exceed 1.00%, excluding extraordinary expenses. TAM is entitled to reimbursement by the fund of fees waived or expenses reduced during any of the previous 36 months if on any day the estimated annualized fund operating expenses are less than the cap, excluding extraordinary expenses. The expense cap may be terminated by the fund’s Board of Trustees at any time. |
Example: This Example is intended to help you compare the cost of investing in the fund with the cost of investing in other mutual funds. The Example assumes that you invest $10,000. The Example also assumes that your investment has a 5% return each year and that the fund’s operating expenses remain the same. Although your actual costs may be higher or lower, based on these assumptions your costs would be:
| | | | | | |
| 1 year | | 3 years | | 5 years | | 10 years |
$69 | | $250 | | $446 | | $1,011 |
Portfolio Turnover: The fund pays transaction costs, such as commissions, when it buys and sells securities (or “turns over” its portfolio). A higher portfolio turnover rate may indicate higher transaction costs and may result in higher taxes when fund shares are held in a taxable account. These costs, which are not reflected in annual fund operating expenses or in the Example, affect the fund’s performance. During the most recent fiscal year, the portfolio turnover rate was 112% of the average value of the fund’s portfolio.
Principal Investment Strategies: The fund seeks to maintain substantial economic exposure to the performance of the commodities markets. Goldman Sachs Asset Management, L.P. (“GSAM”), the fund’s sub-adviser, invests the fund’s assets in a portfolio of commodity index-linked securities (including leveraged and unleveraged structured notes), other commodity-linked securities and derivative instruments and in other fixed-income and debt instruments. The fund may also gain exposure to the commodities markets by investing up to 25% of its total assets in a wholly-owned subsidiary of the fund organized as a company under the laws of the Cayman Islands (the “Subsidiary”).
The Subsidiary has the same investment objective as the fund and is advised by Transamerica Asset Management, Inc. and sub-advised by GSAM. The Subsidiary, unlike the fund, may invest without limitation in commodities, commodity index-linked securities (including leveraged and unleveraged structured notes) and other commodity-linked securities and derivative instruments, such as swaps and futures that provide exposure to the performance of the commodities markets. The Subsidiary may also invest in other instruments, including fixed income instruments, either as investments or to serve as margin or collateral for its derivative positions. The Subsidiary is not registered under the Investment Company Act of 1940, as amended (the “1940 Act”), and is not subject to the investor protections of the 1940 Act.
Commodity Investments. The fund may invest in commodity-linked notes, commodity-linked swaps and other commodity-linked derivative instruments, whose value is linked to the performance of commodities, commodities indices or baskets of futures contracts issued on all of the commodities in an index. Commodity-linked swaps are derivative instruments whereby the cash flows agreed upon between counterparties are dependant upon the price of the underlying commodity or commodity index over the life of the swap. The value of the swap will rise and fall in response to changes in the underlying commodity or commodity index. These swaps expose the fund economically to movements in commodity prices. The fund will pursue its objective without directly investing in commodities. The fund seeks to provide exposure to various commodities and
46
commodities sectors. Commodity-linked derivative instruments include commodity index-linked securities and other derivative instruments that provide exposure to the investment returns of the commodities markets.
It is expected that certain of the fund’s investments will produce leveraged exposure to the commodities markets.
The fund intends to gain exposure to commodities markets primarily by investing in securities and instruments whose returns are linked to commodities markets and commodities-related indices, including the Dow Jones - UBS Commodity Index (the “Index”). In pursuing its objective, the fund attempts to provide exposure to the returns of real assets that trade in the commodities markets without direct investment in physical commodities. Real assets include oil, gas, industrial and precious metals, livestock, and agricultural or meat products, or other items that have tangible properties. Commodity-linked investments may be more volatile and less liquid than the underlying commodities and their value may be affected by the performance of commodities as well as weather, tax, regulatory or political developments, overall market movements and other factors affecting the value of particular industries or commodities, such as disease, embargoes, acts of war or terrorism.
The fund will not invest 25% or more of its total assets in instruments issued by companies in any one industry. The fund’s portfolio will reflect greater than 25% exposure to the group of industries represented in the Index, however. If, in the future, industries are added to or removed from representation in the Index, the group of industries in which the fund’s exposure is concentrated will likewise change.
In pursuing its investment objective, the fund uses the Index as its performance benchmark and will attempt to produce returns that correspond to the performance of the Index, but the fund will not attempt to replicate the Index. The fund may, therefore, invest in securities or other instruments that are not included in the Index.
The fund, directly and/or through the Subsidiary, may gain commodities exposure through the use of swaps and other derivative instruments. The use of swaps is a highly specialized activity which involves investment techniques, risk analyses and tax planning different from those associated with ordinary portfolio securities transactions.
Fixed Income Investments. The fund invests in investment grade fixed income securities, and may invest up to 10% of its assets in non-investment grade fixed income securities. The fund may invest in corporate securities, U.S. Government securities, mortgage-backed securities, asset-backed securities, and municipal securities. The average duration will vary.
Other. The fund may invest up to 35% of its net assets in foreign securities.
The fund may invest its assets in cash, cash equivalent securities or short-term debt securities, repurchase agreements and money market securities. Under adverse or unstable market, economic or political conditions, the fund may take temporary defensive positions in cash and short-term debt securities without limit.
The fund is non-diversified.
Principal Risks: Many factors affect the fund’s performance. There is no assurance the fund will meet its investment objective. The value of your investment in the fund, as well as the amount of return you receive on your investment, may fluctuate significantly from day to day and over time. You may lose part or all of your investment in the fund or your investment may not perform as well as other similar investments. The following is a summary of certain risks (in alphabetical order) of investing in the fund. You may lose money if you invest in this fund.
| • | | Absence of Regulation –The fund engages in over-the-counter (“OTC”) transactions. In general, there is less governmental regulation and supervision of transactions in the OTC markets than of transactions entered into on organized exchanges. |
| • | | Cash Management and Defensive Investing – Money market instruments or short-term debt securities held by the fund for cash management or defensive investing purposes can fluctuate in value. Like other fixed income securities, they are subject to risk, including market, interest rate and credit risk. If the fund holds cash uninvested, the fund will not earn income on the cash and the fund’s yield will go down. If a significant amount of the fund’s assets are used for cash management or defensive investing purposes, it will be more difficult for the fund to achieve its objective. |
| • | | Commodities – The fund’s investment exposure to the commodities markets may subject the fund to greater volatility than investments in more traditional securities, such as stocks and bonds. The performance of commodity-linked derivative instruments may depend on the performance of the overall commodities markets and on other factors that affect the value of commodities, including weather, disease, and political, tax, and other regulatory developments. Commodity-linked investments may be leveraged. For example, a three-times leveraged note will change by a magnitude of three for every percentage change (positive or negative) in the value of the underlying index. Commodity-linked investments may be hybrid instruments that can have substantial risk of loss with respect to both principal and interest. Commodity-linked investments may be more volatile and less liquid than the underlying commodity, instruments, or measures, are subject to the credit risks associated with the issuer, and their values may decline substantially if the issuer’s creditworthiness deteriorates. As a result, returns of commodity-linked investments may deviate significantly from the return of the |
47
| | underlying commodity, instruments, or measures. The commodity-linked investments in which the fund invests may be issued by companies in the financial services sector, and events affecting the financial services sector may cause the fund’s share value to fluctuate. |
| • | | Counterparty – The fund will be subject to the credit risk (that is, where changes in an issuer’s financial strength or the credit rating of a financial instrument it issues may affect an instrument’s value) with respect to the amount it expects to receive from counterparties to derivatives and repurchase agreements entered into by the fund or held by special purpose or structured vehicles. If a counterparty becomes bankrupt or otherwise fails to perform its obligations due to financial difficulties, the value of your investment in the fund may decline. |
| • | | Credit – If an issuer or guarantor of a security held by the fund or a counterparty to a financial contract with the fund defaults or is downgraded, or if the value of the assets underlying a security declines, the value of your investment will decline. Junk bonds have a higher risk of default and are considered speculative. A default or downgrade will have a greater impact on subordinated securities. |
| • | | Derivatives – Using derivatives can increase fund losses and reduce opportunities for gains when market prices, interest rates or the derivative instruments themselves behave in a way not anticipated by the fund. Using derivatives also can have a leveraging effect and increase fund volatility. Derivatives may be difficult to sell, unwind or value, and the counterparty may default on its obligations to the fund. The fund’s investments in derivative instruments may involve a small investment relative to the amount of investment exposure assumed and may result in losses exceeding the amounts invested in those instruments. Recent legislation calls for new regulation of the derivatives markets. The extent and impact of the regulation are not yet fully known and may not be for some time. New regulation of derivatives may make them more costly, may limit their availability, or may otherwise adversely affect their value or performance. |
| • | | Emerging Markets – Investing in the securities of issuers located in or principally doing business in emerging markets are subject to foreign securities risks. These risks are greater for investments in emerging markets. Emerging market countries tend to have economic, political and legal systems that are less fully developed and are less stable than those of more advanced countries. Low trading volumes may result in a lack of liquidity and in extreme price volatility. |
| • | | Foreign Securities – Foreign securities are subject to a number of additional risks, including nationalization or expropriation of assets, imposition of currency controls or restrictions, confiscatory taxation, political or financial instability and other adverse economic or political developments. Lack of information and less market regulation also may affect the value of these securities. |
| • | | High-Yield Debt Securities – High-yield debt securities, or junk bonds, are securities that are rated below “investment grade” (that is, securities rated below Baa/BBB) or, if unrated, are considered by the sub-adviser to be of equivalent quality. Changes in interest rates, the market’s perception of the issuers and the creditworthiness of the issuers may significantly affect the value of these bonds. Junk bonds have a higher risk of default, tend to be less liquid and may be more difficult to value. |
| • | | Increase in Expenses – Your actual costs of investing in the fund may be higher than the expenses shown in “Annual Fund Operating Expenses” for a variety of reasons. For example, expense ratios may be higher than those shown if average net assets decrease. Net assets are more likely to decrease and fund expense ratios are more likely to increase when markets are volatile. |
| • | | Industry Concentration – The fund concentrates its investments in specific industry sectors that have historically experienced substantial price volatility. This concentration subjects the fund to greater risk of loss as a result of adverse economic, business or other developments than if its investments were diversified across different industry sectors. |
| • | | Interest Rate – Debt securities have varying levels of sensitivity to changes in interest rates. In general, the price of a debt security tends to fall when interest rates rise and can rise when interest rates fall. Securities with longer maturities and mortgage securities can be more sensitive to interest rate changes. |
| • | | Leveraging – When a fund engages in transactions that have a leveraging effect on it, the value of the fund will be more volatile and all other risks will tend to be compounded. This is because leverage generally magnifies the effect of any increase or decrease in the value of a fund’s underlying assets or creates investment risk with respect to a larger pool of assets than a fund would otherwise have. A fund may take on leveraging risk by, among other things, engaging in derivative, when-issued, delayed-delivery, forward commitment or forward roll transactions or reverse repurchase agreements. Engaging in such transactions may cause a fund to liquidate positions when it may not be advantageous to do so to satisfy its obligations or meet segregation requirements. |
48
| • | | Liquidity – Some securities held by the fund may be difficult to sell, or illiquid, particularly during times of market turmoil. Illiquid securities may also be difficult to value. If the fund is forced to sell an illiquid asset to meet redemption requests or other cash needs, the fund may be forced to sell at a loss. |
| • | | Market – The market prices of the fund’s securities may go up or down, sometimes rapidly or unpredictably, due to general market conditions, such as real or perceived adverse economic or political conditions, inflation, changes in interest rates or currency rates, lack of liquidity in the markets or adverse investor sentiment. Market prices of securities also may go down due to events or conditions that affect particular sectors or issuers. When market prices fall, the value of your investment will go down. The fund may experience a substantial or complete loss on any individual security. The recent financial crisis has caused a significant decline in the value and liquidity of many securities. In response to the financial crisis, the U.S. and other governments and the Federal Reserve and certain foreign central banks have taken steps to support financial markets. The withdrawal of this support could negatively affect the value and liquidity of certain securities. In addition, legislation recently enacted in the U.S. calls for changes in many aspects of financial regulation. The impact of the legislation on the markets, and the practical implications for market participants, may not be fully known for some time. |
| • | | Mortgage-Related and Asset-Backed Securities – Mortgage-backed securities may be issued by private issuers, by government-sponsored entities such as Fannie Mae or Freddie Mac or by agencies of the U.S. government, such as Ginnie Mae. Mortgage-backed securities represent direct or indirect participations in, or are collateralized by and payable from, mortgage loans secured by real property. Unlike mortgage-related securities issued or guaranteed by agencies of the U.S. government or government-sponsored entities, mortgage-related securities issued by private issuers do not have a government or government-sponsored entity guarantee (but may have other credit enhancement), and may, and frequently do, have less favorable collateral, credit risk or other underwriting characteristics. Mortgage-backed securities are also particularly susceptible to prepayment and extension risks. Asset-backed securities represent participations in, or are secured by and payable from, assets such as installment sales or loan contracts, leases, credit card receivables and other categories of receivables. Certain asset-backed securities present a heightened level of risk because, in the event of default, the liquidation value of the underlying assets may be inadequate to pay any unpaid principal or interest. The value of mortgage-backed and asset-backed securities may be affected by changes in credit quality or value of the mortgage loans or other assets that support the securities. |
| • | | Non-Diversification – The fund is classified as “non-diversified,” which means it may invest in a larger percentage of its assets in one issuer than a diversified fund. To the extent the fund invests its assets in fewer issuers, the fund will be more susceptible to negative events affecting those issuers. |
| • | | Portfolio Selection – The sub-adviser’s judgment about a particular security or issuer, or about the economy or a particular sector, region or market segment, or about an investment strategy, may prove to be incorrect. |
| • | | Prepayment or Call – Many issuers have a right to prepay their securities. If interest rates fall, an issuer may exercise this right. If this happens, the fund will be forced to reinvest prepayment proceeds at a time when yields on securities available in the market are lower than the yield on the prepaid security. The fund also may lose any premium it paid on the security. |
| • | | Sector – Sector risk is the risk that the fund concentration in the securities of companies in a specific market sector or industry will cause the fund to be more exposed to the price movements of companies in and developments affecting that sector or industry than a more broadly diversified fund. Because the fund invests primarily in one sector, there is the risk that the fund will perform poorly during a downturn in that sector. |
| • | | Structured Instruments – The fund may invest in various types of structured instruments, including securities that have demand, tender or put features, or interest rate reset features. Structured instruments are a type of derivative instrument and the payment and credit qualities of these instruments derive from the assets embedded in the structure from which they are issued. Structured instruments may behave in ways not anticipated by the fund, or they may not receive tax, accounting or regulatory treatment anticipated by the fund. |
| • | | Subsidiary – By investing in the Subsidiary, the fund will be indirectly exposed to the risks associated with the Subsidiary’s investments. The derivatives and other investments that will be held by the Subsidiary are generally similar to those that are permitted to be held by the fund and will be subject to the same risks that apply to similar investments if held directly by the fund. There can be no assurance that the investment objective of the Subsidiary will be achieved. The Subsidiary is not registered under the Investment Company Act, and, unless otherwise noted in this prospectus, is not subject to the investor protections of the Investment Company Act. The fund relies on a private letter ruling from the Internal Revenue Service (the “IRS”) with respect to the investment in the Subsidiary. Changes in the laws of the United States and/or the Cayman Islands could result in the inability of the fund and/or the Subsidiary to operate as described in this prospectus and the SAI and could adversely affect the fund. |
49
| • | | Tax – The fund may seek to gain exposure to the commodity markets primarily through investments in commodity-linked notes and through investments in the Subsidiary. The tax treatment of commodity-linked notes, other commodity-linked derivatives and the fund’s investments in the Subsidiary may be adversely affected by future legislation, Treasury Regulations and/or guidance issued by the IRS that could, among other things, affect the character, timing and/or amount of the fund’s taxable income or gains and of distributions made by the fund. |
| • | | U.S. Government Agency Obligations – Government agency obligations have different levels of credit support and, therefore, different degrees of credit risk. Securities issued by agencies and instrumentalities of the U.S. government that are supported by the full faith and credit of the United States generally present a lesser degree of credit risk than securities issued by agencies and instrumentalities sponsored by the U.S. government that are supported only by the issuer’s right to borrow from the U.S. Treasury and securities issued by agencies and instrumentalities sponsored by the U.S. government that are supported only by the credit of the issuing agencies. |
Performance: The bar chart and the table below provide some indication of the risks of investing in the fund by showing you how the fund’s performance has varied from year to year, and how the fund’s Class I2 average annual total returns for different periods compare to the returns of a broad measure of market performance. The table shows average annual total returns for Class I2 shares of the fund. Absent any limitation of the fund’s expenses, total returns would be lower. As with all mutual funds, past performance (before and after taxes) is not a prediction of future results. Updated performance information is available on our website at www.transamericafunds.com or by calling 1-888-233-4339.
Prior to September 30, 2010, the fund was named Transamerica BlackRock Natural Resources, had a different sub-adviser, a different investment objective and used different investment strategies. The performance set forth prior to that date is attributable to the previous sub-adviser.
Annual Total Returns (calendar years ended December 31)
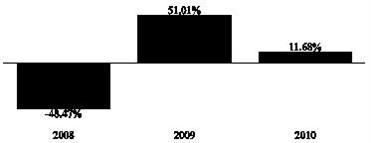
| | | | |
| | | Quarter Ended | | Return |
Best Quarter: | | 6/30/2009 | | 22.13% |
Worst Quarter: | | 12/31/2008 | | -34.42% |
Average Annual Total Returns (periods ended December 31, 2010)1
| | | | | | |
| | | 1 Year | | 5 Years | | 10 Years or
Inception* |
Class I2 (commenced operations on January 3, 2007) | | | | | | |
Return before taxes | | 11.68% | | N/A | | 5.11% |
Return after taxes on distributions2 | | 9.83% | | N/A | | 4.51% |
Return after taxes on distributions and sale of fund shares2 | | 7.79% | | N/A | | 4.07% |
| Dow Jones – UBS Commodity Index (Total Return) (reflects no deduction for fees, expenses or taxes) | | 16.67% | | N/A | | -0.63% |
| Morgan Stanley Capital International Natural Resources Index (reflects no deduction for fees, expenses or taxes)3 | | 16.18% | | N/A | | 5.20% |
| 1 | Actual returns may depend on the investor’s individual tax situation. After-tax returns may not be relevant if the investment is made through a tax-exempt or tax-deferred account, such as a 401(k) plan. |
| 2 | The after-tax returns are calculated using the historic highest individual federal marginal income tax rates and do not reflect the impact of state and local taxes. |
| 3 | This index served as the benchmark for the fund prior to September 30, 2010, at which time it was replaced with the Dow Jones – UBS Commodity Index (Total Return). This benchmark index change was made to more accurately reflect the principal strategies following the changes to the fund. |
| * | Fund and Index returns are for past 10 years or since inception, whichever is less. |
50
Management:
| | |
| Investment Adviser: | | Sub-Adviser: |
| |
| Transamerica Asset Management, Inc. | | Goldman Sachs Asset Management, L.P. |
| |
| | Portfolio Managers: |
| |
| | Stephen Lucas, Portfolio Manager since 2010 |
| |
| | Michael Johnson, Portfolio Manager since 2010 |
| |
| | John Calvaruso, Portfolio Manager since 2010 |
Purchase and Sale of Fund Shares: Class I2 shares of the fund are currently primarily offered for investment in certain funds of funds (also referred to as “strategic asset allocation funds”). Class I2 shares of the fund are also made available to other investors, including institutional investors such as foreign insurers, domestic insurance companies and their separate accounts, and unaffiliated funds, high net worth individuals, and eligible retirement plans whose recordkeepers or financial service firm intermediaries have entered into agreements with Transamerica Funds or its agents. Investors who received Class I2 shares in connection with the reorganization of a Transamerica Premier Fund into a Transamerica Fund may continue to invest in Class I2 shares of that Transamerica Fund, but may not open new accounts. You buy and redeem shares at the fund’s next-determined net asset value (NAV) after receipt of your request in good order.
Tax Information: Fund distributions may be taxable as ordinary income or capital gains, except when your investment is in an IRA, 401(k) or other tax-advantaged investment plan.
Payments to Broker-Dealers and Other Financial Intermediaries: If you purchase the fund through a broker-dealer or other financial intermediary, the fund and/or its affiliates may pay the intermediary for the sale of fund shares and related services. These payments may create a conflict of interest by influencing the broker-dealer or other intermediary and your salesperson to recommend the fund over another investment. Ask your salesperson or visit your financial intermediary’s website for more information.
51
|
| TRANSAMERICA HANSBERGER INTERNATIONAL VALUE |
Investment Objective: Seeks long-term growth of capital.
Fees and Expenses: This table describes the fees and expenses that you may pay if you buy and hold shares of the fund. There are no sales charges (load) or other transaction fees.
| | |
| Annual Fund Operating Expenses (expenses that you pay each year as a percentage of the value of your investment) |
| | |
| Management fees | | 0.86% |
| Distribution and service (12b-1) fees | | None |
| Other expenses | | 0.11% |
| Total annual fund operating expenses | | 0.97% |
Example: This Example is intended to help you compare the cost of investing in the fund with the cost of investing in other mutual funds. The Example assumes that you invest $10,000. The Example also assumes that your investment has a 5% return each year and that the fund’s operating expenses remain the same. Although your actual costs may be higher or lower, based on these assumptions your costs would be:
| | | | | | |
| 1 year | | 3 years | | 5 years | | 10 years |
| $99 | | $309 | | $536 | | $1,190 |
Portfolio Turnover: The fund pays transaction costs, such as commissions, when it buys and sells securities (or “turns over” its portfolio). A higher portfolio turnover rate may indicate higher transaction costs and may result in higher taxes when fund shares are held in a taxable account. These costs, which are not reflected in annual fund operating expenses or in the Example, affect the fund’s performance. During the most recent fiscal year, the portfolio turnover rate was 59% of the average value of the fund’s portfolio.
Principal Investment Strategies: Hansberger Global Investors, Inc. (“Hansberger”), the fund’s sub-adviser, seeks to achieve the fund’s investment objective by investing primarily in a diversified portfolio of stocks (including common stock, preferred stock and convertible securities) and debt obligations of companies and governments domiciled outside the U.S. which the sub-adviser believes are undervalued. Under normal market conditions, the fund will invest more than 80% of its assets (not including the cash position of the fund) in issuers located in at least three countries other than the U.S. In selecting investments for the fund, Hansberger, by engaging in its own research and by reviewing research obtained through outside sources, seeks to identify securities of companies that have a market value which it believes is less than the company’s intrinsic value based on its long-term potential. The sub-adviser’s portfolio investment decisions rely heavily on a fundamental analysis of securities with a long-term investment perspective. Hansberger will also consider other factors in making portfolio investment decisions, including country and political risks and economic and market conditions.
The sub-adviser seeks to broaden the scope and increase the effectiveness of this fundamental analysis by searching for undervalued securities in many countries around the world. The sub-adviser generally sells a security if the price target is met, the company’s fundamentals change or if the sub-adviser believes a better investment opportunity exists.
The fund may invest in cash, cash equivalent securities or short-term debt securities, repurchase agreements and money market instruments. Under adverse or unstable market, economic or political conditions, the fund may take temporary defensive positions in cash and short-term debt securities without limit.
Principal Risks: Many factors affect the fund’s performance. There is no assurance the fund will meet its investment objective. The value of your investment in the fund, as well as the amount of return you receive on your investment, may fluctuate significantly from day to day and over time. You may lose part or all of your investment in the fund or your investment may not perform as well as other similar investments. The following is a summary of certain risks (in alphabetical order) of investing in the fund. You may lose money if you invest in this fund.
| • | | Cash Management and Defensive Investing – Money market instruments or short-term debt securities held by the fund for cash management or defensive investing purposes can fluctuate in value. Like other fixed income securities, they are subject to risk, including market, interest rate and credit risk. If the fund holds cash uninvested, the fund will not earn income on the cash and the fund’s yield will go down. If a significant amount of the fund’s assets are used for cash management or defensive investing purposes, it will be more difficult for the fund to achieve its objective. |
| • | | Convertible Securities – The market value of convertible securities tends to decline as interest rates increase. Convertible securities generally offer lower interest or dividend yields than non-convertible securities of similar quality. The fund could lose money if the issuer of a convertible security is unable to meet its financial obligations or goes bankrupt. |
52
| • | | Currency – When the fund invests in securities denominated in foreign currencies, the fund may incur currency conversion costs and may be affected favorably or unfavorably by changes in the rates of exchange between those currencies and the U.S. dollar. Currency exchange rates can be volatile and are affected by, among other factors, the general economics of a country, the actions of the U.S. and foreign governments or control banks, the imposition of currency controls, and speculation. |
| • | | Emerging Markets – Investing in the securities of issuers located in or principally doing business in emerging markets are subject to foreign securities risks. These risks are greater for investments in emerging markets. Emerging market countries tend to have economic, political and legal systems that are less fully developed and are less stable than those of more advanced countries. Low trading volumes may result in a lack of liquidity and in extreme price volatility. |
| • | | Equity Securities – Equity securities include common and preferred stocks. Stock markets are volatile. The price of equity securities fluctuates based on changes in a company’s financial condition and overall market and economic conditions. |
| • | | Fixed-Income Securities – The market prices of fixed-income securities may go up or down, sometimes rapidly or unpredictably due to general market conditions, such as real or perceived adverse economic or political conditions, inflation, changes in interest rates, lack of liquidity in the bond markets or adverse investor sentiment. When market prices fall, the value of your investment will go down. A rise in rates tends to have a greater impact on the prices of longer term or duration securities. |
If interest rates rise, repayments of fixed-income securities may occur more slowly than anticipated by the market. This may drive the prices of these securities down because their interest rates are lower than the current interest rate and they remain outstanding longer. This is sometimes referred to as extension risk.
Many issuers have a right to prepay their securities. If interest rates fall, an issuer may exercise this right. If this happens, the fund will be forced to reinvest prepayment proceeds at a time when yields on securities available in the market are lower than the yield on the prepaid security. This is sometimes referred to as prepayment or call risk.
| • | | Foreign Securities – Foreign securities are subject to a number of additional risks, including nationalization or expropriation of assets, imposition of currency controls or restrictions, confiscatory taxation, political or financial instability and other adverse economic or political developments. Lack of information and less market regulation also may affect the value of these securities. |
| • | | Increase in Expenses – Your actual costs of investing in the fund may be higher than the expenses shown in “Annual Fund Operating Expenses” for a variety of reasons. For example, expense ratios may be higher than those shown if average net assets decrease. Net assets are more likely to decrease and fund expense ratios are more likely to increase when markets are volatile. |
| • | | Liquidity – Some securities held by the fund may be difficult to sell, or illiquid, particularly during times of market turmoil. Illiquid securities may also be difficult to value. If the fund is forced to sell an illiquid asset to meet redemption requests or other cash needs, the fund may be forced to sell at a loss. |
| • | | Market – The market prices of the fund’s securities may go up or down, sometimes rapidly or unpredictably, due to general market conditions, such as real or perceived adverse economic or political conditions, inflation, changes in interest rates or currency rates, lack of liquidity in the markets or adverse investor sentiment. Market prices of securities also may go down due to events or conditions that affect particular sectors or issuers. When market prices fall, the value of your investment will go down. The fund may experience a substantial or complete loss on any individual security. The recent financial crisis has caused a significant decline in the value and liquidity of many securities. In response to the financial crisis, the U.S. and other governments and the Federal Reserve and certain foreign central banks have taken steps to support financial markets. The withdrawal of this support could negatively affect the value and liquidity of certain securities. In addition, legislation recently enacted in the U.S. calls for changes in many aspects of financial regulation. The impact of the legislation on the markets, and the practical implications for market participants, may not be fully known for some time. |
| • | | Portfolio Selection – The sub-adviser’s judgment about a particular security or issuer, or about the economy or a particular sector, region or market segment, or about an investment strategy, may prove to be incorrect. |
| • | | Preferred Stock – Preferred stock’s right to dividends and liquidation proceeds is junior to the rights of a company’s debt securities. The value of preferred stock may be subject to factors that affect fixed income and equity securities, including changes in interest rates and in a company’s creditworthiness. Shareholders of preferred stock may suffer a loss of value if dividends are not paid and have limited voting rights. |
53
| • | | Prepayment or Call – Many issuers have a right to prepay their securities. If interest rates fall, an issuer may exercise this right. If this happens, the fund will be forced to reinvest prepayment proceeds at a time when yields on securities available in the market are lower than the yield on the prepaid security. The fund also may lose any premium it paid on the security. |
| • | | Small- or Medium-Sized Companies – Small- or medium-sized companies may be more at risk than larger companies because, among other things, they may have limited product lines, operating history, market or financial resources, or because they may depend on a limited management group. |
| • | | Stocks – Stocks may be volatile – their prices may go up and down dramatically over the shorter term. These price movements may result from factors affecting individual companies, industries, the securities market as a whole or the overall economy. |
| • | | Valuation – The sales price the fund could receive for any particular portfolio investment may differ from the fund’s valuation of the investment, particularly for securities that trade in thin or volatile markets or that are valued using a fair value methodology. |
| • | | Value Investing – The prices of securities the sub-adviser believes are undervalued may not appreciate as anticipated or may go down. Value stocks as a group may be out of favor and underperform the overall equity market for a long period of time, for example, while the market favors “growth” stocks. |
Performance: The bar chart and the table below provide some indication of the risks of investing in the fund by showing you how the fund’s performance has varied from year to year, and how the fund’s Class I2 average annual total returns for different periods compare to the returns of a broad measure of market performance. The table shows average annual total returns for Class I2 shares of the fund. Absent any limitation of the fund’s expenses, total returns would be lower. As with all mutual funds, past performance (before and after taxes) is not a prediction of future results. Updated performance information is available on our website at www.transamericafunds.com or by calling 1-888-233-4339.
Prior to December 15, 2010, the fund was named Transamerica AllianceBernstein International Value, had a different sub-adviser, a different investment objective and used different investment strategies. The performance set forth prior to that date is attributable to the previous sub-adviser.
Annual Total Returns (calendar years ended December 31)

| | | | |
| | | Quarter Ended | | Return |
Best Quarter: | | 6/30/2009 | | 25.66% |
Worst Quarter: | | 12/31/2008 | | -24.17% |
Average Annual Total Returns (periods ended December 31, 2010)1
| | | | | | |
| | | 1 Year | | 5 Years | | 10 Years or
Inception* |
Class I2 (commenced operations on December 6, 2005) |
Return before taxes | | 2.95% | | -0.55% | | -0.28% |
Return after taxes on distributions2 | | 2.43% | | -1.31% | | -1.05% |
Return after taxes on distributions and sale of fund shares2 | | 2.29% | | -0.53% | | -0.31% |
Morgan Stanley Capital International All Country World Index ex-U.S. (reflects no deduction for fees, expenses, or taxes) | | 11.60% | | 5.29% | | 5.77% |
Morgan Stanley Capital International-Europe, Australasia, Far East Index (reflects no deduction for fees, expenses, or taxes)3 | | 8.21% | | 2.94% | | 3.43% |
| 1 | Actual returns may depend on the investor’s individual tax situation. After-tax returns may not be relevant if the investment is made through a tax-exempt or tax-deferred account, such as a 401(k) plan. |
| 2 | The after-tax returns are calculated using the historic highest individual federal marginal income tax rates and do not reflect the impact of state and local taxes. |
| 3 | This index served as the benchmark for the fund prior to December 15, 2010, at which time it was replaced with the Morgan Stanley Capital International All Country World Index ex-U.S. This benchmark index change was made to more accurately reflect the principal strategies of the fund. |
54
| * | Fund and Index returns are for past 10 years or since inception, whichever is less. |
Management:
| | |
Investment Adviser: | | Sub-Adviser: |
| |
Transamerica Asset Management, Inc. | | Hansberger Global Investors, Inc. |
| |
| | Portfolio Managers: |
| |
| | Ronald W. Holt, CFA, Portfolio Manager since 2010 |
| |
| | Moira McLachlan, CFA, Portfolio Manager since 2010 |
| |
| | Lauretta (Retz) Reeves, CFA, Portfolio Manager since 2010 |
Purchase and Sale of Fund Shares: Class I2 shares of the fund are currently primarily offered for investment in certain funds of funds (also referred to as “strategic asset allocation funds”). Class I2 shares of the fund are also made available to other investors, including institutional investors such as foreign insurers, domestic insurance companies and their separate accounts, and unaffiliated funds, high net worth individuals, and eligible retirement plans whose recordkeepers or financial service firm intermediaries have entered into agreements with Transamerica Funds or its agents. Investors who received Class I2 shares in connection with the reorganization of a Transamerica Premier Fund into a Transamerica Fund may continue to invest in Class I2 shares of that Transamerica Fund, but may not open new accounts. You buy and redeem shares at the fund’s next-determined net asset value (NAV) after receipt of your request in good order.
Tax Information: Fund distributions may be taxable as ordinary income or capital gains, except when your investment is in an IRA, 401(k) or other tax-advantaged investment plan.
Payments to Broker-Dealers and Other Financial Intermediaries: If you purchase the fund through a broker-dealer or other financial intermediary, the fund and/or its affiliates may pay the intermediary for the sale of fund shares and related services. These payments may create a conflict of interest by influencing the broker-dealer or other intermediary and your salesperson to recommend the fund over another investment. Ask your salesperson or visit your financial intermediary’s website for more information.
55
|
| TRANSAMERICA JENNISON GROWTH |
Investment Objective: Seeks long-term growth of capital.
Fees and Expenses: This table describes the fees and expenses that you may pay if you buy and hold shares of the fund. There are no sales charges (load) or other transaction fees.
| | |
Annual Fund Operating Expenses (expenses that you pay each year as a percentage of the value of your investment) |
| | | |
Management fees | | 0.76% |
Distribution and service (12b-1) fees | | None |
Other expenses | | 0.05% |
Total annual fund operating expenses | | 0.81% |
Example: This Example is intended to help you compare the cost of investing in the fund with the cost of investing in other mutual funds. The Example assumes that you invest $10,000. The Example also assumes that your investment has a 5% return each year and that the fund’s operating expenses remain the same. Although your actual costs may be higher or lower, based on these assumptions your costs would be:
| | | | | | |
1 year | | 3 years | | 5 years | | 10 years |
$83 | | $259 | | $450 | | $1,002 |
Portfolio Turnover: The fund pays transaction costs, such as commissions, when it buys and sells securities (or “turns over” its portfolio). A higher portfolio turnover rate may indicate higher transaction costs and may result in higher taxes when fund shares are held in a taxable account. These costs, which are not reflected in annual fund operating expenses or in the Example, affect the fund’s performance. During the most recent fiscal year, the portfolio turnover rate was 83% of the average value of the fund’s portfolio.
Principal Investment Strategies: The fund’s sub-adviser, Jennison Associates LLC (“Jennison”), invests, under normal circumstances, at least 65% of the fund’s total assets in equity securities, principally common stocks, preferred stocks, warrants, rights and depositary receipts of U.S. companies with market capitalizations of at least $1 billion that Jennison considers to have above average prospects for growth. These companies are generally medium- to large-capitalization companies.
The sub-adviser uses a “bottom-up” approach, researching and evaluating individual company fundamentals rather than macroeconomic factors, to identify individual companies with earnings growth potential that may not be recognized by the market at large. A “bottom-up” approach is looking at individual companies against the context of broader market factors.
The fund may invest up to 20% of its assets in the securities of foreign issuers.
The fund may invest its assets in cash, cash equivalent securities or short-term debt securities, repurchase agreements and money market instruments. Under adverse or unstable market, economic or political conditions, the fund may take temporary defensive positions in cash and short-term debt securities without limit.
Principal Risks: Many factors affect the fund’s performance. There is no assurance the fund will meet its investment objective. The value of your investment in the fund, as well as the amount of return you receive on your investment, may fluctuate significantly from day to day and over time. You may lose part or all of your investment in the fund or your investment may not perform as well as other similar investments. The following is a summary of certain risks (in alphabetical order) of investing in the fund. You may lose money if you invest in this fund.
| • | | Cash Management and Defensive Investing – Money market instruments or short-term debt securities held by the fund for cash management or defensive investing purposes can fluctuate in value. Like other fixed income securities, they are subject to risk, including market, interest rate and credit risk. If the fund holds cash uninvested, the fund will not earn income on the cash and the fund’s yield will go down. If a significant amount of the fund’s assets are used for cash management or defensive investing purposes, it will be more difficult for the fund to achieve its objective. |
| • | | Currency – When the fund invests in securities denominated in foreign currencies, the fund may incur currency conversion costs and may be affected favorably or unfavorably by changes in the rates of exchange between those currencies and the U.S. dollar. Currency exchange rates can be volatile and are affected by, among other factors, the general economics of a country, the actions of the U.S. and foreign governments or control banks, the imposition of currency controls, and speculation. |
| • | | Foreign Securities – Foreign securities are subject to a number of additional risks, including nationalization or expropriation of assets, imposition of currency controls or restrictions, confiscatory taxation, political or financial instability |
56
| | and other adverse economic or political developments. Lack of information and less market regulation also may affect the value of these securities. |
| • | | Growth Stocks – Returns on growth stocks may not move in tandem with returns on other categories of stocks or the market as a whole. Growth stocks may be particularly susceptible to rapid price swings or to adverse developments. Growth stocks as a group may be out of favor and underperform the overall equity market for a long period of time, for example, while the market favors “value” stocks. |
| • | | Increase in Expenses – Your actual costs of investing in the fund may be higher than the expenses shown in “Annual Fund Operating Expenses” for a variety of reasons. For example, expense ratios may be higher than those shown if average net assets decrease. Net assets are more likely to decrease and fund expense ratios are more likely to increase when markets are volatile. |
| • | | Market – The market prices of the fund’s securities may go up or down, sometimes rapidly or unpredictably, due to general market conditions, such as real or perceived adverse economic or political conditions, inflation, changes in interest rates or currency rates, lack of liquidity in the markets or adverse investor sentiment. Market prices of securities also may go down due to events or conditions that affect particular sectors or issuers. When market prices fall, the value of your investment will go down. The fund may experience a substantial or complete loss on any individual security. The recent financial crisis has caused a significant decline in the value and liquidity of many securities. In response to the financial crisis, the U.S. and other governments and the Federal Reserve and certain foreign central banks have taken steps to support financial markets. The withdrawal of this support could negatively affect the value and liquidity of certain securities. In addition, legislation recently enacted in the U.S. calls for changes in many aspects of financial regulation. The impact of the legislation on the markets, and the practical implications for market participants, may not be fully known for some time. |
| • | | Medium-Sized Companies – Investing in medium-sized companies involves greater risk than is customarily associated with more established companies. Stocks of such companies generally are subject to more volatility in price than larger company securities. |
| • | | Portfolio Selection – The sub-adviser’s judgment about a particular security or issuer, or about the economy or a particular sector, region or market segment, or about an investment strategy, may prove to be incorrect. |
| • | | Preferred Stock – Preferred stock’s right to dividends and liquidation proceeds is junior to the rights of a company’s debt securities. The value of preferred stock may be subject to factors that affect fixed income and equity securities, including changes in interest rates and in a company’s creditworthiness. Shareholders of preferred stock may suffer a loss of value if dividends are not paid and have limited voting rights. |
| • | | Stocks – Stocks may be volatile – their prices may go up and down dramatically over the shorter term. These price movements may result from factors affecting individual companies, industries, the securities market as a whole or the overall economy. |
| • | | Warrants and Rights – Warrants and rights may be considered more speculative than certain other types of investments because they do not entitle a holder to the dividends or voting rights for the securities that may be purchased. They do not represent any rights in the assets of the issuing company, and cease to have value if not exercised prior to the expiration date. |
Performance: The bar chart and the table below provide some indication of the risks of investing in the fund by showing you how the fund’s performance has varied from year to year, and how the fund’s Class I2 average annual total returns for different periods compare to the returns of a broad measure of market performance. The table shows average annual total returns for Class I2 shares of the fund. Absent any limitation of the fund’s expenses, total returns would be lower. As with all mutual funds, past performance (before and after taxes) is not a prediction of future results. Updated performance information is available on our website at www.transamericafunds.com or by calling 1-888-233-4339.
57
Annual Total Returns (calendar years ended December 31)

| | | | |
| | | Quarter Ended | | Return |
Best Quarter: | | 6/30/2009 | | 15.15% |
Worst Quarter: | | 12/31/2008 | | -20.88% |
Average Annual Total Returns (periods ended December 31, 2010)1
| | | | | | |
| | | 1 Year | | 5 Years | | 10 Years or
Inception* |
Class I2 (commenced operations on November 15, 2005) | | | | | | |
Return before taxes | | 11.98% | | 2.59% | | 2.95% |
Return after taxes on distributions2 | | 11.96% | | 2.44% | | 2.74% |
Return after taxes on distributions and sale of fund shares2 | | 7.81% | | 2.19% | | 2.49% |
Russell 1000® Growth Index (reflects no deduction for fees, expenses, or taxes) | | 16.71% | | 3.75% | | 3.92% |
| 1 | Actual returns may depend on the investor’s individual tax situation. After-tax returns may not be relevant if the investment is made through a tax-exempt or tax-deferred account, such as a 401(k) plan. |
| 2 | The after-tax returns are calculated using the historic highest individual federal marginal income tax rates and do not reflect the impact of state and local taxes. |
| * | Fund and Index returns are for past 10 years or since inception, whichever is less. |
| | |
Management: | | |
| |
| Investment Adviser: | | Sub-Adviser: |
| |
| Transamerica Asset Management, Inc. | | Jennison Associates LLC |
| |
| | Portfolio Managers: |
| |
| | Michael A. Del Balso, Portfolio Manager since 2004 |
| |
| | Blair A. Boyer, Portfolio Manager since 2006 |
| |
| | Spiros “Sig” Segalas, Portfolio Manager since 2004 |
Purchase and Sale of Fund Shares: Class I2 shares of the fund are currently primarily offered for investment in certain funds of funds (also referred to as “strategic asset allocation funds”). Class I2 shares of the fund are also made available to other investors, including institutional investors such as foreign insurers, domestic insurance companies and their separate accounts, and unaffiliated funds, high net worth individuals, and eligible retirement plans whose recordkeepers or financial service firm intermediaries have entered into agreements with Transamerica Funds or its agents. Investors who received Class I2 shares in connection with the reorganization of a Transamerica Premier Fund into a Transamerica Fund may continue to invest in Class I2 shares of that Transamerica Fund, but may not open new accounts. You buy and redeem shares at the fund’s next-determined net asset value (NAV) after receipt of your request in good order.
Tax Information: Fund distributions may be taxable as ordinary income or capital gains, except when your investment is in an IRA, 401(k) or other tax-advantaged investment plan.
Payments to Broker-Dealers and Other Financial Intermediaries: If you purchase the fund through a broker-dealer or other financial intermediary, the fund and/or its affiliates may pay the intermediary for the sale of fund shares and related services. These payments may create a conflict of interest by influencing the broker-dealer or other intermediary and your salesperson to recommend the fund over another investment. Ask your salesperson or visit your financial intermediary’s website for more information.
58
|
| TRANSAMERICA JPMORGAN CORE BOND |
Investment Objective: Seeks total return, consisting of current income and capital appreciation.
Fees and Expenses: This table describes the fees and expenses that you may pay if you buy and hold shares of the fund. There are no sales charges (load) or other transaction fees.
| | |
| Annual Fund Operating Expenses (expenses that you pay each year as a percentage of the value of your investment) |
| | |
Management fees | | 0.44% |
Distribution and service (12b-1) fees | | None |
Other expenses | | 0.06% |
Total annual fund operating expenses | | 0.50% |
Example: This Example is intended to help you compare the cost of investing in the fund with the cost of investing in other mutual funds. The Example assumes that you invest $10,000. The Example also assumes that your investment has a 5% return each year and that the fund’s operating expenses remain the same. Although your actual costs may be higher or lower, based on these assumptions your costs would be:
| | | | | | |
1 year | | 3 years | | 5 years | | 10 years |
$51 | | $160 | | $280 | | $628 |
Portfolio Turnover: The fund pays transaction costs, such as commissions, when it buys and sells securities (or “turns over” its portfolio). A higher portfolio turnover rate may indicate higher transaction costs and may result in higher taxes when fund shares are held in a taxable account. These costs, which are not reflected in annual fund operating expenses or in the Example, affect the fund’s performance. During the most recent fiscal year, the portfolio turnover rate was 33% of the average value of the fund’s portfolio.
Principal Investment Strategies: The fund’s sub-adviser, J.P. Morgan Investment Management Inc. (“JPMorgan”) seeks to achieve the fund’s objective by investing, under normal circumstances, at least 80% of the fund’s assets in bonds, including (without limitation):
| • | | U.S. government securities, including Treasury obligations and government sponsored enterprises such as Fannie Mae, Ginnie Mae, Freddie Mac and securities issued by other government agencies and instrumentalities |
| • | | Medium- to high-quality corporate bonds |
| • | | Mortgage-backed securities, including U.S. agency and non-agency pass through and Collateralized Mortgage Obligations (“CMOs”) |
| • | | Asset-backed securities |
| • | | Commercial Mortgage-Backed Securities (“CMBS”) |
Generally, such bonds will have intermediate to long maturities.
To a lesser extent, it may invest in:
| • | | U.S. dollar-denominated foreign bonds |
| • | | Short-term securities, including agency discount notes, commercial paper and money market funds |
The fund may invest in bonds and other debt securities that are rated in the lowest investment grade category. The fund’s average weighted maturity will ordinarily range between four and 12 years. JPMorgan analyzes four major factors in managing and constructing the fund’s portfolio: duration, market sector, maturity concentrations and individual securities. JPMorgan looks for market sectors and individual securities that it believes will perform well over time. JPMorgan is value oriented and selects individual securities after performing a risk/reward analysis that includes an evaluation of interest rate risk, credit risk, and the complex legal and technical structure of the transaction. The fund may use futures contracts, options, swaps and other derivatives as tools in the management of fund assets. The fund may use derivatives as a substitute for various investments, to alter the investment characteristics of the fund, for risk management and/or to increase income or gain to the fund.
The fund may invest its assets in cash, cash equivalent securities or short-term debt securities, repurchase agreements and money market instruments. Under adverse or unstable market, economic or political conditions, the fund may take temporary defensive positions in cash and short-term debt securities without limit.
59
Principal Risks: Many factors affect the fund’s performance. There is no assurance the fund will meet its investment objective. The value of your investment in the fund, as well as the amount of return you receive on your investment, may fluctuate significantly from day to day and over time. You may lose part or all of your investment in the fund or your investment may not perform as well as other similar investments. The following is a summary of certain risks (in alphabetical order) of investing in the fund. You may lose money if you invest in this fund.
| • | | Cash Management and Defensive Investing – Money market instruments or short-term debt securities held by the fund for cash management or defensive investing purposes can fluctuate in value. Like other fixed income securities, they are subject to risk, including market, interest rate and credit risk. If the fund holds cash uninvested, the fund will not earn income on the cash and the fund’s yield will go down. If a significant amount of the fund’s assets are used for cash management or defensive investing purposes, it will be more difficult for the fund to achieve its objective. |
| • | | Credit – If an issuer or guarantor of a security held by the fund or a counterparty to a financial contract with the fund defaults or is downgraded, or if the value of the assets underlying a security declines, the value of your investment will decline. Junk bonds have a higher risk of default and are considered speculative. A default or downgrade will have a greater impact on subordinated securities. |
| • | | Currency – When the fund invests in securities denominated in foreign currencies, the fund may incur currency conversion costs and may be affected favorably or unfavorably by changes in the rates of exchange between those currencies and the U.S. dollar. Currency exchange rates can be volatile and are affected by, among other factors, the general economics of a country, the actions of the U.S. and foreign governments or control banks, the imposition of currency controls, and speculation. |
| • | | Derivatives – Using derivatives can increase fund losses and reduce opportunities for gains when market prices, interest rates or the derivative instruments themselves behave in a way not anticipated by the fund. Using derivatives also can have a leveraging effect and increase fund volatility. Derivatives may be difficult to sell, unwind or value, and the counterparty may default on its obligations to the fund. The fund’s investments in derivative instruments may involve a small investment relative to the amount of investment exposure assumed and may result in losses exceeding the amounts invested in those instruments. Recent legislation calls for new regulation of the derivatives markets. The extent and impact of the regulation are not yet fully known and may not be for some time. New regulation of derivatives may make them more costly, may limit their availability, or may otherwise adversely affect their value or performance. |
| • | | Fixed-Income Securities – The market prices of fixed-income securities may go up or down, sometimes rapidly or unpredictably due to general market conditions, such as real or perceived adverse economic or political conditions, inflation, changes in interest rates, lack of liquidity in the bond markets or adverse investor sentiment. When market prices fall, the value of your investment will go down. A rise in rates tends to have a greater impact on the prices of longer term or duration securities. |
If interest rates rise, repayments of fixed-income securities may occur more slowly than anticipated by the market. This may drive the prices of these securities down because their interest rates are lower than the current interest rate and they remain outstanding longer. This is sometimes referred to as extension risk.
Many issuers have a right to prepay their securities. If interest rates fall, an issuer may exercise this right. If this happens, the fund will be forced to reinvest prepayment proceeds at a time when yields on securities available in the market are lower than the yield on the prepaid security. This is sometimes referred to as prepayment or call risk.
| • | | Foreign Securities – Foreign securities are subject to a number of additional risks, including nationalization or expropriation of assets, imposition of currency controls or restrictions, confiscatory taxation, political or financial instability and other adverse economic or political developments. Lack of information and less market regulation also may affect the value of these securities. |
| • | | Increase in Expenses – Your actual costs of investing in the fund may be higher than the expenses shown in “Annual Fund Operating Expenses” for a variety of reasons. For example, expense ratios may be higher than those shown if average net assets decrease. Net assets are more likely to decrease and fund expense ratios are more likely to increase when markets are volatile. |
| • | | Interest Rate – Fixed-income securities have varying levels of sensitivity to changes in interest rates. In general, the price of a fixed-income security tends to fall when interest rates rise and can rise when interest rates fall. A change in interest rates will not have the same impact on all fixed-income securities. Generally, the longer the maturity or duration of a fixed-income security, the greater the impact of a rise in interest rates on the security’s value. In addition, different interest rate measures (such as short- and long-term interest rates and U.S. and foreign interest rates), or interest rates on different types |
60
| | of securities or securities of different issuers, may not necessarily change in the same amount or in the same direction. When interest rates go down, the income received by the fund, and the fund’s yield, may decline. |
| • | | Liquidity – Some securities held by the fund may be difficult to sell, or illiquid, particularly during times of market turmoil. Illiquid securities may also be difficult to value. If the fund is forced to sell an illiquid asset to meet redemption requests or other cash needs, the fund may be forced to sell at a loss. |
| • | | Market – The market prices of the fund’s securities may go up or down, sometimes rapidly or unpredictably, due to general market conditions, such as real or perceived adverse economic or political conditions, inflation, changes in interest rates or currency rates, lack of liquidity in the markets or adverse investor sentiment. Market prices of securities also may go down due to events or conditions that affect particular sectors or issuers. When market prices fall, the value of your investment will go down. The fund may experience a substantial or complete loss on any individual security. The recent financial crisis has caused a significant decline in the value and liquidity of many securities. In response to the financial crisis, the U.S. and other governments and the Federal Reserve and certain foreign central banks have taken steps to support financial markets. The withdrawal of this support could negatively affect the value and liquidity of certain securities. In addition, legislation recently enacted in the U.S. calls for changes in many aspects of financial regulation. The impact of the legislation on the markets, and the practical implications for market participants, may not be fully known for some time. |
| • | | Mortgage-Related and Asset-Backed Securities – Mortgage-backed securities may be issued by private issuers, by government-sponsored entities such as Fannie Mae or Freddie Mac or by agencies of the U.S. government, such as Ginnie Mae. Mortgage-backed securities represent direct or indirect participations in, or are collateralized by and payable from, mortgage loans secured by real property. Unlike mortgage-related securities issued or guaranteed by agencies of the U.S. government or government-sponsored entities, mortgage-related securities issued by private issuers do not have a government or government-sponsored entity guarantee (but may have other credit enhancement), and may, and frequently do, have less favorable collateral, credit risk or other underwriting characteristics. Mortgage-backed securities are also particularly susceptible to prepayment and extension risks. Asset-backed securities represent participations in, or are secured by and payable from, assets such as installment sales or loan contracts, leases, credit card receivables and other categories of receivables. Certain asset-backed securities present a heightened level of risk because, in the event of default, the liquidation value of the underlying assets may be inadequate to pay any unpaid principal or interest. The value of mortgage-backed and asset-backed securities may be affected by changes in credit quality or value of the mortgage loans or other assets that support the securities. |
| • | | Portfolio Selection – The sub-adviser’s judgment about a particular security or issuer, or about the economy or a particular sector, region or market segment, or about an investment strategy, may prove to be incorrect. |
| • | | Valuation – The sales price the fund could receive for any particular portfolio investment may differ from the fund’s valuation of the investment, particularly for securities that trade in thin or volatile markets or that are valued using a fair value methodology. |
Performance: The bar chart and the table below provide some indication of the risks of investing in the fund by showing you how the fund’s performance has varied from year to year, and how the fund’s Class I2 average annual total returns for different periods compare to the returns of a broad measure of market performance. The table shows average annual total returns for Class I2 shares of the fund. Absent any limitation of the fund’s expenses, total returns would be lower. As with all mutual funds, past performance (before and after taxes) is not a prediction of future results. Updated performance information is available on our website at www.transamericafunds.com or by calling 1-888-233-4339.
61
Annual Total Returns (calendar years ended December 31)

| | | | |
| | | Quarter Ended | | Return |
| Best Quarter: | | 6/30/2010 | | 3.40% |
| Worst Quarter: | | 12/31/2010 | | -1.13% |
Average Annual Total Returns (periods ended December 31, 2010)1
| | | | | | |
| | | 1 Year | | 5 Years | | 10 Years or
Inception* |
| Class I2 (commenced operations on July 1, 2009) |
| Return before taxes | | 6.52% | | N/A | | 5.15% |
| Return after taxes on distributions2 | | 5.07% | | N/A | | 3.87% |
| Return after taxes on distributions and sale of fund shares2 | | 4.23% | | N/A | | 3.64% |
| Barclays Capital U.S. Aggregate Bond Index (reflects no deduction for fees, expenses, or taxes) | | 6.54% | | N/A | | 7.03% |
| | 1 | Actual returns may depend on the investor’s individual tax situation. After-tax returns may not be relevant if the investment is made through a tax-exempt or tax-deferred account, such as a 401(k) plan. |
| | 2 | The after-tax returns are calculated using the historic highest individual federal marginal income tax rates and do not reflect the impact of state and local taxes. |
| | * | Fund and Index returns are for past 10 years or since inception, whichever is less. |
| | |
| Management: | | |
| |
| Investment Adviser: | | Sub-Adviser: |
| |
| Transamerica Asset Management, Inc. | | J.P. Morgan Investment Management Inc. |
| |
| | Portfolio Manager: |
| |
| | Douglas S. Swanson, Portfolio Manager since 2009 |
Purchase and Sale of Fund Shares: Class I2 shares of the fund are currently primarily offered for investment in certain funds of funds (also referred to as “strategic asset allocation funds”). Class I2 shares of the fund are also made available to other investors, including institutional investors such as foreign insurers, domestic insurance companies and their separate accounts, and unaffiliated funds, high net worth individuals, and eligible retirement plans whose recordkeepers or financial service firm intermediaries have entered into agreements with Transamerica Funds or its agents. Investors who received Class I2 shares in connection with the reorganization of a Transamerica Premier Fund into a Transamerica Fund may continue to invest in Class I2 shares of that Transamerica Fund, but may not open new accounts. You buy and redeem shares at the fund’s next-determined net asset value (NAV) after receipt of your request in good order.
Tax Information: Fund distributions may be taxable as ordinary income or capital gains, except when your investment is in an IRA, 401(k) or other tax-advantaged investment plan.
Payments to Broker-Dealers and Other Financial Intermediaries: If you purchase the fund through a broker-dealer or other financial intermediary, the fund and/or its affiliates may pay the intermediary for the sale of fund shares and related services. These payments may create a conflict of interest by influencing the broker-dealer or other intermediary and your salesperson to recommend the fund over another investment. Ask your salesperson or visit your financial intermediary’s website for more information.
62
|
| TRANSAMERICA JPMORGAN INTERNATIONAL BOND |
Investment Objective: Seeks high total return by investing in high-quality, non-dollar denominated government and corporate debt securities of foreign issuers.
Fees and Expenses: This table describes the fees and expenses that you may pay if you buy and hold shares of the fund. There are no sales charges (load) or other transaction fees.
| | |
| Annual Fund Operating Expenses (expenses that you pay each year as a percentage of the value of your investment) |
| | |
Management fees | | 0.52% |
Distribution and service (12b-1) fees | | None |
Other expenses | | 0.09% |
Total annual fund operating expenses | | 0.61% |
Example: This Example is intended to help you compare the cost of investing in the fund with the cost of investing in other mutual funds. The Example assumes that you invest $10,000. The Example also assumes that your investment has a 5% return each year and that the fund’s operating expenses remain the same. Although your actual costs may be higher or lower, based on these assumptions your costs would be:
| | | | | | |
1 year | | 3 years | | 5 years | | 10 years |
$62 | | $195 | | $340 | | $762 |
Portfolio Turnover: The fund pays transaction costs, such as commissions, when it buys and sells securities (or “turns over” its portfolio). A higher portfolio turnover rate may indicate higher transaction costs and may result in higher taxes when fund shares are held in a taxable account. These costs, which are not reflected in annual fund operating expenses or in the Example, affect the fund’s performance. During the most recent fiscal year, the portfolio turnover rate was 61% of the average value of the fund’s portfolio.
Principal Investment Strategies: The fund’s sub-adviser, J.P. Morgan Investment Management Inc. (“JPMorgan”), invests, under normal circumstances, at least 80% of the fund’s net assets in high-quality bonds with outstanding maturities of at least one year. A bond is deemed to be “high-quality” if it has a rating of AA- or higher from Standard & Poor’s Corporation (“S&P”) or Aa3 or higher from Moody’s Investors Services, Inc. (“Moody’s”) (or is an unrated security determined to be of comparable quality by the sub-adviser). Normally, the fund invests primarily in government and corporate debt securities of issuers that are economically tied to a number of countries throughout the world and expects to be invested in more than three different foreign countries. The fund may also invest up to 10% of its assets in emerging markets debt securities. JPMorgan determines whether to buy and sell securities for the fund by using a combination of fundamental research and bond and currency valuation models. Generally, the fund will purchase only bonds denominated in foreign currencies. The fund generally limits its use of hedging strategies that may minimize the effect of currency fluctuations. However, the fund may hedge up to 25% of its total assets in U.S. dollars when the portfolio manager considers the dollar to be attractive relative to foreign currencies. The fund may also invest in options, futures contracts, options on futures contracts, and swap agreements, provided that such investments are keeping with the fund’s investment objective.
The fund may invest its assets in cash, cash equivalent securities or short-term debt securities, repurchase agreements and money market instruments. Under adverse or unstable market, economic or political conditions, the fund may take temporary defensive positions in cash and short-term debt securities without limit.
This fund is non-diversified.
Principal Risks: Many factors affect the fund’s performance. There is no assurance the fund will meet its investment objective. The value of your investment in the fund, as well as the amount of return you receive on your investment, may fluctuate significantly from day to day and over time. You may lose part or all of your investment in the fund or your investment may not perform as well as other similar investments. The following is a summary of certain risks (in alphabetical order) of investing in the fund. You may lose money if you invest in this fund.
| • | | Cash Management and Defensive Investing – Money market instruments or short-term debt securities held by the fund for cash management or defensive investing purposes can fluctuate in value. Like other fixed income securities, they are subject to risk, including market, interest rate and credit risk. If the fund holds cash uninvested, the fund will not earn income on the cash and the fund’s yield will go down. If a significant amount of the fund’s assets are used for cash management or defensive investing purposes, it will be more difficult for the fund to achieve its objective. |
63
| • | | Country, Sector or Industry Focus – To the extent the fund invests a significant portion of its assets in one or more countries, sectors or industries, the fund will be more susceptible to negative events affecting those countries, sectors or industries. |
| • | | Currency – When the fund invests in securities denominated in foreign currencies, the fund may incur currency conversion costs and may be affected favorably or unfavorably by changes in the rates of exchange between those currencies and the U.S. dollar. Currency exchange rates can be volatile and are affected by, among other factors, the general economics of a country, the actions of the U.S. and foreign governments or control banks, the imposition of currency controls, and speculation. |
| • | | Currency Hedging – The fund may hedge its currency risk using currency futures, forwards or options. However, these instruments may not always work as intended, and a fund may be worse off than if it had not used a hedging instrument. |
| • | | Derivatives – Using derivatives can increase fund losses and reduce opportunities for gains when market prices, interest rates or the derivative instruments themselves behave in a way not anticipated by the fund. Using derivatives also can have a leveraging effect and increase fund volatility. Derivatives may be difficult to sell, unwind or value, and the counterparty may default on its obligations to the fund. The fund’s investments in derivative instruments may involve a small investment relative to the amount of investment exposure assumed and may result in losses exceeding the amounts invested in those instruments. Recent legislation calls for new regulation of the derivatives markets. The extent and impact of the regulation are not yet fully known and may not be for some time. New regulation of derivatives may make them more costly, may limit their availability, or may otherwise adversely affect their value or performance. |
| • | | Emerging Markets – Investing in the securities of issuers located in or principally doing business in emerging markets are subject to foreign securities risks. These risks are greater for investments in emerging markets. Emerging market countries tend to have economic, political and legal systems that are less fully developed and are less stable than those of more advanced countries. Low trading volumes may result in a lack of liquidity and in extreme price volatility. |
| • | | Fixed-Income Securities – The market prices of fixed-income securities may go up or down, sometimes rapidly or unpredictably due to general market conditions, such as real or perceived adverse economic or political conditions, inflation, changes in interest rates, lack of liquidity in the bond markets or adverse investor sentiment. When market prices fall, the value of your investment will go down. A rise in rates tends to have a greater impact on the prices of longer term or duration securities. |
If interest rates rise, repayments of fixed-income securities may occur more slowly than anticipated by the market. This may drive the prices of these securities down because their interest rates are lower than the current interest rate and they remain outstanding longer. This is sometimes referred to as extension risk.
Many issuers have a right to prepay their securities. If interest rates fall, an issuer may exercise this right. If this happens, the fund will be forced to reinvest prepayment proceeds at a time when yields on securities available in the market are lower than the yield on the prepaid security. This is sometimes referred to as prepayment or call risk.
| • | | Foreign Securities – Foreign securities are subject to a number of additional risks, including nationalization or expropriation of assets, imposition of currency controls or restrictions, confiscatory taxation, political or financial instability and other adverse economic or political developments. Lack of information and less market regulation also may affect the value of these securities. |
| • | | Increase in Expenses – Your actual costs of investing in the fund may be higher than the expenses shown in “Annual Fund Operating Expenses” for a variety of reasons. For example, expense ratios may be higher than those shown if average net assets decrease. Net assets are more likely to decrease and fund expense ratios are more likely to increase when markets are volatile. |
| • | | Interest Rate – Fixed-income securities have varying levels of sensitivity to changes in interest rates. In general, the price of a fixed-income security tends to fall when interest rates rise and can rise when interest rates fall. A change in interest rates will not have the same impact on all fixed-income securities. Generally, the longer the maturity or duration of a fixed-income security, the greater the impact of a rise in interest rates on the security’s value. In addition, different interest rate measures (such as short- and long-term interest rates and U.S. and foreign interest rates), or interest rates on different types of securities or securities of different issuers, may not necessarily change in the same amount or in the same direction. When interest rates go down, the income received by the fund, and the fund’s yield, may decline. |
| • | | Liquidity – Some securities held by the fund may be difficult to sell, or illiquid, particularly during times of market turmoil. Illiquid securities may also be difficult to value. If the fund is forced to sell an illiquid asset to meet redemption requests or other cash needs, the fund may be forced to sell at a loss. |
64
| • | | Market – The market prices of the fund’s securities may go up or down, sometimes rapidly or unpredictably, due to general market conditions, such as real or perceived adverse economic or political conditions, inflation, changes in interest rates or currency rates, lack of liquidity in the markets or adverse investor sentiment. Market prices of securities also may go down due to events or conditions that affect particular sectors or issuers. When market prices fall, the value of your investment will go down. The fund may experience a substantial or complete loss on any individual security. The recent financial crisis has caused a significant decline in the value and liquidity of many securities. In response to the financial crisis, the U.S. and other governments and the Federal Reserve and certain foreign central banks have taken steps to support financial markets. The withdrawal of this support could negatively affect the value and liquidity of certain securities. In addition, legislation recently enacted in the U.S. calls for changes in many aspects of financial regulation. The impact of the legislation on the markets, and the practical implications for market participants, may not be fully known for some time. |
| • | | Non-Diversification – The fund is classified as “non-diversified,” which means it may invest in a larger percentage of its assets in one issuer than a diversified fund. To the extent the fund invests its assets in fewer issuers, the fund will be more susceptible to negative events affecting those issuers. |
| • | | Portfolio Selection – The sub-adviser’s judgment about a particular security or issuer, or about the economy or a particular sector, region or market segment, or about an investment strategy, may prove to be incorrect. |
Performance: The bar chart and the table below provide some indication of the risks of investing in the fund by showing you how the fund’s performance has varied from year to year, and how the fund’s Class I2 average annual total returns for different periods compare to the returns of a broad measure of market performance. The table shows average annual total returns for Class I2 shares of the fund. Absent any limitation of the fund’s expenses, total returns would be lower. As with all mutual funds, past performance (before and after taxes) is not a prediction of future results. Updated performance information is available on our website at www.transamericafunds.com or by calling 1-888-233-4339.
Annual Total Returns (calendar years ended December 31)
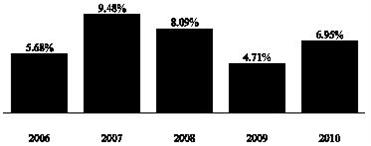
| | | | |
| | | Quarter Ended | | Return |
Best Quarter: | | 3/31/2008 | | 10.63% |
Worst Quarter: | | 3/31/2009 | | -6.18% |
Average Annual Total Returns (periods ended December 31, 2010)1
| | | | | | |
| | | 1 Year | | 5 Years | | 10 Years or Inception* |
| Class I2 (commenced operations on December 6, 2005) |
| Return before taxes | | 6.95% | | 6.97% | | 7.32% |
| Return after taxes on distributions2 | | 3.72% | | 5.01% | | 5.36% |
| Return after taxes on distributions and sale of fund shares2 | | 4.60% | | 4.87% | | 5.17% |
| JPMorgan Government Bond Index ex-U.S. unhedged (reflects no deduction for fees, expenses, or taxes) | | 6.78% | | 8.01% | | 8.23% |
| 1 | Actual returns may depend on the investor’s individual tax situation. After-tax returns may not be relevant if the investment is made through a tax-exempt or tax-deferred account, such as a 401(k) plan. |
| 2 | The after-tax returns are calculated using the historic highest individual federal marginal income tax rates and do not reflect the impact of state and local taxes. |
| * | Fund and Index returns are for past 10 years or since inception, whichever is less. |
65
| | |
| Management: | | |
| |
| Investment Adviser: | | Sub-Adviser: |
| |
| Transamerica Asset Management, Inc. | | J.P. Morgan Investment Management Inc. |
| |
| | Portfolio Manager: |
| |
| | Jon B. Jonsson, Portfolio Manager since 2005 |
Purchase and Sale of Fund Shares: Class I2 shares of the fund are currently primarily offered for investment in certain funds of funds (also referred to as “strategic asset allocation funds”). Class I2 shares of the fund are also made available to other investors, including institutional investors such as foreign insurers, domestic insurance companies and their separate accounts, and unaffiliated funds, high net worth individuals, and eligible retirement plans whose recordkeepers or financial service firm intermediaries have entered into agreements with Transamerica Funds or its agents. Investors who received Class I2 shares in connection with the reorganization of a Transamerica Premier Fund into a Transamerica Fund may continue to invest in Class I2 shares of that Transamerica Fund, but may not open new accounts. You buy and redeem shares at the fund’s next-determined net asset value (NAV) after receipt of your request in good order.
Tax Information: Fund distributions may be taxable as ordinary income or capital gains, except when your investment is in an IRA, 401(k) or other tax-advantaged investment plan.
Payments to Broker-Dealers and Other Financial Intermediaries: If you purchase the fund through a broker-dealer or other financial intermediary, the fund and/or its affiliates may pay the intermediary for the sale of fund shares and related services. These payments may create a conflict of interest by influencing the broker-dealer or other intermediary and your salesperson to recommend the fund over another investment. Ask your salesperson or visit your financial intermediary’s website for more information.
66
|
| TRANSAMERICA JPMORGAN LONG/SHORT STRATEGY |
Investment Objective: Seeks long-term capital appreciation.
Fees and Expenses: This table describes the fees and expenses that you may pay if you buy and hold shares of the fund.
There are no sales charges (load) or other transaction fees.
| | | | |
| Annual Fund Operating Expenses (expenses that you pay each year as a percentage of the value of your investment)a |
| | | | |
Management fees | | | | 1.30% |
Distribution and service (12b-1) fees | | | | None |
Other expenses | | | | 1.45% |
Dividend and interest expense on short securitiesb | | 1.35% | | |
Other expenses | | 0.10% | | |
| Total annual fund operating expenses | | | | 2.75% |
| a | Annual fund operating expenses have been restated to reflect current contractual advisory fees. |
| b | Income earned on an investment security that is sold short by the fund is required to pay an amount equal to the income earned to the party from whom the fund borrowed the investment security and to record the payment as an expense. |
Example: This Example is intended to help you compare the cost of investing in the fund with the cost of investing in other mutual funds. The Example assumes that you invest $10,000. The Example also assumes that your investment has a 5% return each year and that the fund’s operating expenses remain the same. Although your actual costs may be higher or lower, based on these assumptions your costs would be:
| | | | | | |
1 year | | 3 years | | 5 years | | 10 years |
$278 | | $853 | | $1,454 | | $3,080 |
Portfolio Turnover: The fund pays transaction costs, such as commissions, when it buys and sells securities (or “turns over” its portfolio). A higher portfolio turnover rate may indicate higher transaction costs and may result in higher taxes when fund shares are held in a taxable account. These costs, which are not reflected in annual fund operating expenses or in the Example, affect the fund’s performance. During the most recent fiscal year, the portfolio turnover rate was 303% of the average value of the fund’s portfolio.
Principal Investment Strategies: The fund’s sub-adviser, J.P. Morgan Investment Management Inc. (“JPMorgan”), employs a long-short equity strategy by investing the fund’s assets in long and short positions in equity securities selected from a universe of mid- to large capitalization stocks. The equity securities will have market characteristics and capitalizations similar to those included in the Russell 1000® Index and/or the Standard & Poor’s 500® Index at the time of purchase. In implementing its strategy, the fund invests primarily in common stocks, real estate investment trusts (REITs) and depositary receipts.
The fund purchases securities that the sub-adviser believes are undervalued and sells short securities that the sub-adviser believes are overvalued. The fund’s net equity market exposure will typically range from 20% to 30%; however, in response to market conditions, the fund may adjust its equity market exposure. Under normal market conditions, the fund’s net long equity market exposure will not exceed 50% and its net short equity market exposure will not exceed 20%. Further, the fund’s gross equity market exposure is limited to 200%. The fund may hold a substantial portion of its total assets in cash when it holds significant short positions. By taking both long and short positions, the fund seeks to provide some protection in down markets when compared to a fund that takes only long positions.
Selling stocks short allows the fund to more fully exploit insights into stocks that the fund’s sub-adviser expects to underperform. Short sales involve the sale of a security which the fund does not own in hopes of purchasing the same security at a later date at a lower price. To make delivery to the buyer, the fund must borrow the security, and the fund is obligated to return the security to the lender, which is accomplished by a later purchase of the security by the fund.
On behalf of the fund, the sub-adviser buys and sells, as well as shorts and covers shorts in, equity securities and derivatives on those securities according to its own policies, using the research and valuation rankings as a basis for its decisions. In general, the sub-adviser buys and covers shorts in equity securities that are identified as undervalued and considers selling or shorting them when they appear overvalued.
The fund may invest its assets in cash, cash equivalent securities or short-term debt securities, repurchase agreements and money market securities. Under adverse or unstable market, economic or political conditions, the fund may take temporary defensive positions in cash and short-term debt securities without limit.
67
Principal Risks: Many factors affect the fund’s performance. There is no assurance the fund will meet its investment objective. The value of your investment in the fund, as well as the amount of return you receive on your investment, may fluctuate significantly from day to day and over time. You may lose part or all of your investment in the fund or your investment may not perform as well as other similar investments. The following is a summary of certain risks (in alphabetical order) of investing in the fund. You may lose money if you invest in this fund.
| • | | Cash Management and Defensive Investing – Money market instruments or short-term debt securities held by the fund for cash management or defensive investing purposes can fluctuate in value. Like other fixed income securities, they are subject to risk, including market, interest rate and credit risk. If the fund holds cash uninvested, the fund will not earn income on the cash and the fund’s yield will go down. If a significant amount of the fund’s assets are used for cash management or defensive investing purposes, it will be more difficult for the fund to achieve its objective. |
| • | | Derivatives – Using derivatives can increase fund losses and reduce opportunities for gains when market prices, interest rates or the derivative instruments themselves behave in a way not anticipated by the fund. Using derivatives also can have a leveraging effect and increase fund volatility. Derivatives may be difficult to sell, unwind or value, and the counterparty may default on its obligations to the fund. The fund’s investments in derivative instruments may involve a small investment relative to the amount of investment exposure assumed and may result in losses exceeding the amounts invested in those instruments. Recent legislation calls for new regulation of the derivatives markets. The extent and impact of the regulation are not yet fully known and may not be for some time. New regulation of derivatives may make them more costly, may limit their availability, or may otherwise adversely affect their value or performance. |
| • | | Foreign Securities – Foreign securities are subject to a number of additional risks, including nationalization or expropriation of assets, imposition of currency controls or restrictions, confiscatory taxation, political or financial instability and other adverse economic or political developments. Lack of information and less market regulation also may affect the value of these securities. |
| • | | Growth Stocks – Returns on growth stocks may not move in tandem with returns on other categories of stocks or the market as a whole. Growth stocks may be particularly susceptible to rapid price swings or to adverse developments. Growth stocks as a group may be out of favor and underperform the overall equity market for a long period of time, for example, while the market favors “value” stocks. |
| • | | Increase in Expenses – Your actual costs of investing in the fund may be higher than the expenses shown in “Annual Fund Operating Expenses” for a variety of reasons. For example, expense ratios may be higher than those shown if average net assets decrease. Net assets are more likely to decrease and fund expense ratios are more likely to increase when markets are volatile. |
| • | | Interest Rate – Debt securities have varying levels of sensitivity to changes in interest rates. In general, the price of a debt security tends to fall when interest rates rise and can rise when interest rates fall. Securities with longer maturities and mortgage securities can be more sensitive to interest rate changes. |
| • | | Leveraging – The value of your investment may be more volatile if the fund borrows or uses derivatives that have a leveraging effect on the fund. Other risks also will be compounded. This is because leverage generally magnifies the effect of a change in the value of an asset and creates a risk of loss of value on a larger pool of assets than the fund would otherwise have had. The fund also may have to sell assets at inopportune times to satisfy its obligations. |
| • | | Liquidity – Some securities held by the fund may be difficult to sell, or illiquid, particularly during times of market turmoil. Illiquid securities may also be difficult to value. If the fund is forced to sell an illiquid asset to meet redemption requests or other cash needs, the fund may be forced to sell at a loss. |
| • | | Market – The market prices of the fund’s securities may go up or down, sometimes rapidly or unpredictably, due to general market conditions, such as real or perceived adverse economic or political conditions, inflation, changes in interest rates or currency rates, lack of liquidity in the markets or adverse investor sentiment. Market prices of securities also may go down due to events or conditions that affect particular sectors or issuers. When market prices fall, the value of your investment will go down. The fund may experience a substantial or complete loss on any individual security. The recent financial crisis has caused a significant decline in the value and liquidity of many securities. In response to the financial crisis, the U.S. and other governments and the Federal Reserve and certain foreign central banks have taken steps to support financial markets. The withdrawal of this support could negatively affect the value and liquidity of certain securities. In addition, legislation recently enacted in the U.S. calls for changes in many aspects of financial regulation. The impact of the legislation on the markets, and the practical implications for market participants, may not be fully known for some time. |
| • | | Real Estate Securities – Investments in the real estate industry are subject to risks associated with direct investment in real estate. These risks include declines in the value of real estate, adverse general and local economic conditions, increased |
68
| | competition, overbuilding and changes in operating expenses, property taxes or interest rates. REITs are one type of real estate security. A REIT’s performance depends on the types and locations of the properties it owns and how well it manages those properties or loan financings. REITs are subject to a highly technical tax structure, and the failure to qualify as a REIT could result in corporate-level taxation, significantly reducing the return on an investment to the fund. |
| • | | REITs – When the fund invests in Real Estate Investment Trusts (“REITs”), it is subject to risks generally associated with investing in real estate. A REIT’s performance depends on the types and locations of the properties it owns and how well it manages those properties or loan financings. REITs are subject to a highly technical tax structure; and the failure to qualify as a REIT could result in corporate-level taxation, significantly reducing the return on an investment to the fund. |
| • | | Short Sales – A short sale may be effected by selling a security that the fund does not own. If the price of the security sold short increases, the fund would incur a loss; conversely, if the price declines, the fund will realize a gain. Although the gain is limited by the price at which the security was sold short, the loss is potentially unlimited. The fund may also pay transaction costs and borrowing fees in connection with short sales. |
| • | | Stocks – Stocks may be volatile – their prices may go up and down dramatically over the shorter term. These price movements may result from factors affecting individual companies, industries, the securities market as a whole or the overall economy. |
| • | | Structured Instruments – The fund may invest in various types of structured instruments, including securities that have demand, tender or put features, or interest rate reset features. Structured instruments are a type of derivative instrument and the payment and credit qualities of these instruments derive from the assets embedded in the structure from which they are issued. Structured instruments may behave in ways not anticipated by the fund, or they may not receive tax, accounting or regulatory treatment anticipated by the fund. |
| • | | Valuation – The sales price the fund could receive for any particular portfolio investment may differ from the fund’s valuation of the investment, particularly for securities that trade in thin or volatile markets or that are valued using a fair value methodology. |
Performance: The bar chart and the table below provide some indication of the risks of investing in the fund by showing you how the fund’s performance has varied from year to year, and how the fund’s Class I2 average annual total returns for different periods compare to the returns of a broad measure of market performance, as well as comparison to a secondary index which has characteristics relevant to the fund’s investment strategies. The table shows average annual total returns for Class I2 shares of the fund. Absent any limitation of the fund’s expenses, total returns would be lower. As with all mutual funds, past performance (before and after taxes) is not a prediction of future results. Updated performance information is available on our website at www.transamericafunds.com or by calling 1-888-233-4339.
Prior to January 6, 2011, the fund was named Transamerica BNY Mellon Market Neutral Strategy, had a different sub-adviser and used different investment strategies. The performance set forth prior to that date is attributable to the previous sub-adviser.
Annual Total Returns (calendar years ended December 31)

| | | | |
| | | Quarter Ended | | Return |
Best Quarter: | | 6/30/2008 | | 2.98% |
Worst Quarter: | | 3/31/2009 | | -4.08% |
69
Average Annual Total Returns (periods ended December 31, 2010)1
| | | | | | |
| | | 1 Year | | 5 Years | | 10 Years or Inception* |
| Class I2 (commenced operations on January 3, 2007) |
| Return before taxes | | -1.68% | | N/A | | -3.10% |
| Return after taxes on distributions2 | | -1.68% | | N/A | | -3.65% |
| Return after taxes on distributions and sale of fund shares2 | | -1.09% | | N/A | | -2.88% |
| Bank of America Merrill Lynch 3-Month Treasury Bill Index (reflects no deduction for fees, expenses, or taxes) | | 0.13% | | N/A | | 1.83% |
| Standard & Poor’s 500® Index (reflects no deduction for fees, expenses, or taxes) | | 15.06% | | N/A | | -0.83% |
| Bank of America Merrill Lynch 3-Month Treasury Bill +3% Wrap (reflects no deduction for fees, expenses, or taxes)3 | | 3.17% | | N/A | | 4.93% |
| 1 | Actual returns may depend on the investor’s individual tax situation. After-tax returns may not be relevant if the investment is made through a tax-exempt or tax-deferred account, such as a 401(k) plan. |
| 2 | The after-tax returns are calculated using the historic highest individual federal marginal income tax rates and do not reflect the impact of state and local taxes. |
| 3 | This index served as the benchmark for the fund prior to January 6, 2011, at which time it was replaced with the Bank of Merrill Lynch 3-Month Treasury Bill Index and the Standard & Poor’s 500® Index (secondary). This benchmark index change was made to more accurately reflect the principal strategies of the fund. |
| * | Fund and Index returns are for past 10 years or since inception, whichever is less. |
| | |
| Management: | | |
| |
| Investment Adviser: | | Sub-Adviser: |
| |
| Transamerica Asset Management, Inc. | | J.P. Morgan Investment Management Inc. |
| |
| | Portfolio Manager: |
| |
| | Terance Chen, CFA, Portfolio Manager since 2011 |
Purchase and Sale of Fund Shares: Class I2 shares of the fund are currently primarily offered for investment in certain funds of funds (also referred to as “strategic asset allocation funds”). Class I2 shares of the fund are also made available to other investors, including institutional investors such as foreign insurers, domestic insurance companies and their separate accounts, and unaffiliated funds, high net worth individuals, and eligible retirement plans whose recordkeepers or financial service firm intermediaries have entered into agreements with Transamerica Funds or its agents. Investors who received Class I2 shares in connection with the reorganization of a Transamerica Premier Fund into a Transamerica Fund may continue to invest in Class I2 shares of that Transamerica Fund, but may not open new accounts. You buy and redeem shares at the fund’s next-determined net asset value (NAV) after receipt of your request in good order.
Tax Information: Fund distributions may be taxable as ordinary income or capital gains, except when your investment is in an IRA, 401(k) or other tax-advantaged investment plan.
Payments to Broker-Dealers and Other Financial Intermediaries: If you purchase the fund through a broker-dealer or other financial intermediary, the fund and/or its affiliates may pay the intermediary for the sale of fund shares and related services. These payments may create a conflict of interest by influencing the broker-dealer or other intermediary and your salesperson to recommend the fund over another investment. Ask your salesperson or visit your financial intermediary’s website for more information.
70
|
| TRANSAMERICA JPMORGAN MID CAP VALUE |
Investment Objective: Seeks growth from capital appreciation.
Note: The fund is currently closed to new investors.
Fees and Expenses: This table describes the fees and expenses that you may pay if you buy and hold shares of the fund. There are no sales charges (load) or other transaction fees.
| | |
| Annual Fund Operating Expenses (expenses that you pay each year as a percentage of the value of your investment) |
| | |
Management fees | | 0.83% |
Distribution and service (12b-1) fees | | None |
Other expenses | | 0.06% |
Total annual fund operating expenses | | 0.89% |
Example: This Example is intended to help you compare the cost of investing in the fund with the cost of investing in other mutual funds. The Example assumes that you invest $10,000. The Example also assumes that your investment has a 5% return each year and that the fund’s operating expenses remain the same. Although your actual costs may be higher or lower, based on these assumptions your costs would be:
| | | | | | |
1 year | | 3 years | | 5 years | | 10 years |
$91 | | $284 | | $493 | | $1,096 |
Portfolio Turnover: The fund pays transaction costs, such as commissions, when it buys and sells securities (or “turns over” its portfolio). A higher portfolio turnover rate may indicate higher transaction costs and may result in higher taxes when fund shares are held in a taxable account. These costs, which are not reflected in annual fund operating expenses or in the Example, affect the fund’s performance. During the most recent fiscal year, the portfolio turnover rate was 29% of the average value of the fund’s portfolio.
Principal Investment Strategies: The fund’s sub-adviser, J.P. Morgan Investment Management Inc. (“JPMorgan”), seeks to achieve the fund’s objective by investing, under normal circumstances, at least 80% of the fund’s net assets in common stocks of companies with market capitalizations of $1 billion to $20 billion at the time of purchase that JPMorgan believes to be undervalued. The fund will normally only purchase securities that are traded on registered exchanges or the over-the-counter market in the United States. The fund may invest in other equity securities, which include preferred stocks, convertible securities and foreign securities, which may take the form of depositary receipts. The fund may also invest up to 15% of its net assets in real estate investment trusts (“REITs”). Maximum weightings in any sector are double that of the benchmark or 25%, whichever is greater.
The fund may invest its assets in cash, cash equivalent securities or short-term debt securities, repurchase agreements and money market instruments without limit. Under adverse or unstable market, economic or political conditions, the fund may take temporary defensive positions in cash and short-term debt securities without limit.
Principal Risks: Many factors affect the fund’s performance. There is no assurance the fund will meet its investment objective. The value of your investment in the fund, as well as the amount of return you receive on your investment, may fluctuate significantly from day to day and over time. You may lose part or all of your investment in the fund or your investment may not perform as well as other similar investments. The following is a summary of certain risks (in alphabetical order) of investing in the fund. You may lose money if you invest in this fund.
| • | | Cash Management and Defensive Investing – Money market instruments or short-term debt securities held by the fund for cash management or defensive investing purposes can fluctuate in value. Like other fixed income securities, they are subject to risk, including market, interest rate and credit risk. If the fund holds cash uninvested, the fund will not earn income on the cash and the fund’s yield will go down. If a significant amount of the fund’s assets are used for cash management or defensive investing purposes, it will be more difficult for the fund to achieve its objective. |
| • | | Convertible Securities – The market value of convertible securities tends to decline as interest rates increase. Convertible securities generally offer lower interest or dividend yields than non-convertible securities of similar quality. The fund could lose money if the issuer of a convertible security is unable to meet its financial obligations or goes bankrupt. |
| • | | Currency – When the fund invests in securities denominated in foreign currencies, the fund may incur currency conversion costs and may be affected favorably or unfavorably by changes in the rates of exchange between those currencies and the U.S. dollar. Currency exchange rates can be volatile and are affected by, among other factors, the general economics of a |
71
| | country, the actions of the U.S. and foreign governments or control banks, the imposition of currency controls, and speculation. |
| • | | Derivatives – Using derivatives can increase fund losses and reduce opportunities for gains when market prices, interest rates or the derivative instruments themselves behave in a way not anticipated by the fund. Using derivatives also can have a leveraging effect and increase fund volatility. Derivatives may be difficult to sell, unwind or value, and the counterparty may default on its obligations to the fund. The fund’s investments in derivative instruments may involve a small investment relative to the amount of investment exposure assumed and may result in losses exceeding the amounts invested in those instruments. Recent legislation calls for new regulation of the derivatives markets. The extent and impact of the regulation are not yet fully known and may not be for some time. New regulation of derivatives may make them more costly, may limit their availability, or may otherwise adversely affect their value or performance. |
| • | | Foreign Securities – Foreign securities are subject to a number of additional risks, including nationalization or expropriation of assets, imposition of currency controls or restrictions, confiscatory taxation, political or financial instability and other adverse economic or political developments. Lack of information and less market regulation also may affect the value of these securities. |
| • | | Increase in Expenses – Your actual costs of investing in the fund may be higher than the expenses shown in “Annual Fund Operating Expenses” for a variety of reasons. For example, expense ratios may be higher than those shown if average net assets decrease. Net assets are more likely to decrease and fund expense ratios are more likely to increase when markets are volatile. |
| • | | Market – The market prices of the fund’s securities may go up or down, sometimes rapidly or unpredictably, due to general market conditions, such as real or perceived adverse economic or political conditions, inflation, changes in interest rates or currency rates, lack of liquidity in the markets or adverse investor sentiment. Market prices of securities also may go down due to events or conditions that affect particular sectors or issuers. When market prices fall, the value of your investment will go down. The fund may experience a substantial or complete loss on any individual security. The recent financial crisis has caused a significant decline in the value and liquidity of many securities. In response to the financial crisis, the U.S. and other governments and the Federal Reserve and certain foreign central banks have taken steps to support financial markets. |
The withdrawal of this support could negatively affect the value and liquidity of certain securities. In addition, legislation recently enacted in the U.S. calls for changes in many aspects of financial regulation. The impact of the legislation on the markets, and the practical implications for market participants, may not be fully known for some time.
| • | | Medium-Sized Companies – Investing in medium-sized companies involves greater risk than is customarily associated with more established companies. Stocks of such companies generally are subject to more volatility in price than larger company securities. |
| • | | Portfolio Selection – The sub-adviser’s judgment about a particular security or issuer, or about the economy or a particular sector, region or market segment, or about an investment strategy, may prove to be incorrect. |
| • | | Preferred Stock – Preferred stock’s right to dividends and liquidation proceeds is junior to the rights of a company’s debt securities. The value of preferred stock may be subject to factors that affect fixed income and equity securities, including changes in interest rates and in a company’s creditworthiness. Shareholders of preferred stock may suffer a loss of value if dividends are not paid and have limited voting rights. |
| • | | REITs – When the fund invests in Real Estate Investment Trusts (“REITs”), it is subject to risks generally associated with investing in real estate. A REIT’s performance depends on the types and locations of the properties it owns and how well it manages those properties or loan financings. REITs are subject to a highly technical tax structure; and the failure to qualify as a REIT could result in corporate-level taxation, significantly reducing the return on an investment to the fund. |
| • | | Stocks – Stocks may be volatile – their prices may go up and down dramatically over the shorter term. These price movements may result from factors affecting individual companies, industries, the securities market as a whole or the overall economy. |
| • | | Value Investing – The prices of securities the sub-adviser believes are undervalued may not appreciate as anticipated or may go down. Value stocks as a group may be out of favor and underperform the overall equity market for a long period of time, for example, while the market favors “growth” stocks. |
72
Performance: The bar chart and the table below provide some indication of the risks of investing in the fund by showing you how the fund’s performance has varied from year to year, and how the fund’s Class I2 average annual total returns for different periods compare to the returns of a broad measure of market performance. The table shows average annual total returns for Class I2 shares of the fund. Absent any limitation of the fund’s expenses, total returns would be lower. As with all mutual funds, past performance (before and after taxes) is not a prediction of future results. Updated performance information is available on our website at www.transamericafunds.com or by calling 1-888-233-4339.
Annual Total Returns (calendar years ended December 31)
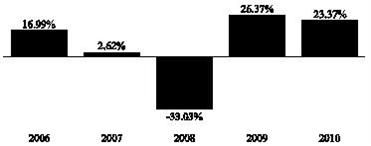
| | | | |
| | | Quarter Ended | | Return |
Best Quarter: | | 9/30/2009 | | 18.16% |
Worst Quarter: | | 12/31/2008 | | -21.96% |
Average Annual Total Returns (periods ended December 31, 2010)1
| | | | | | |
| | | 1 Year | | 5 Years | | 10 Years or
Inception* |
| Class I2 (commenced operations on November 15, 2005) |
| Return before taxes | | 23.37% | | 4.62% | | 5.15% |
| Return after taxes on distributions2 | | 23.13% | | 4.01% | | 4.51% |
| Return after taxes on distributions and sale of fund shares2 | | 15.50% | | 3.84% | | 4.30% |
| Russell Midcap® Value Index (reflects no deduction for fees, expenses, or taxes) | | 24.75% | | 4.08% | | 4.52% |
| 1 | Actual returns may depend on the investor’s individual tax situation. After-tax returns may not be relevant if the investment is made through a tax-exempt or tax-deferred account, such as a 401(k) plan. |
| 2 | The after-tax returns are calculated using the historic highest individual federal marginal income tax rates and do not reflect the impact of state and local taxes. |
| * | Fund and Index returns are for past 10 years or since inception, whichever is less. |
Note: The fund is offered solely to the strategic asset allocation funds and currently is closed to new investors. However, the asset allocation funds may rebalance their investments in the fund.
| | |
| Management: | | |
| |
| Investment Adviser: | | Sub-Adviser: |
| |
| Transamerica Asset Management, Inc. | | J.P. Morgan Investment Management Inc. |
| |
| | Portfolio Managers: |
| |
| | Gloria Fu, CFA, Portfolio Manager since 2006 |
| |
| | Lawrence Playford, CFA, Portfolio Manager since 2005 |
| |
| | Jonathan K.L. Simon, Portfolio Manager since 2005 |
Purchase and Sale of Fund Shares: Class I2 shares of the fund are currently primarily offered for investment in certain funds of funds (also referred to as “strategic asset allocation funds”). Class I2 shares of the fund are also made available to other investors, including institutional investors such as foreign insurers, domestic insurance companies and their separate accounts, and unaffiliated funds, high net worth individuals, and eligible retirement plans whose recordkeepers or financial service firm intermediaries have entered into agreements with Transamerica Funds or its agents. Investors who received Class I2 shares in connection with the reorganization of a Transamerica Premier Fund into a Transamerica Fund may continue to invest in Class I2 shares of that Transamerica Fund, but may not open new accounts. You buy and redeem shares at the fund’s next-determined net asset value (NAV) after receipt of your request in good order.
73
Tax Information: Fund distributions may be taxable as ordinary income or capital gains, except when your investment is in an IRA, 401(k) or other tax-advantaged investment plan.
Payments to Broker-Dealers and Other Financial Intermediaries: If you purchase the fund through a broker-dealer or other financial intermediary, the fund and/or its affiliates may pay the intermediary for the sale of fund shares and related services. These payments may create a conflict of interest by influencing the broker-dealer or other intermediary and your salesperson to recommend the fund over another investment. Ask your salesperson or visit your financial intermediary’s website for more information.
74
|
| TRANSAMERICA LOOMIS SAYLES BOND |
Investment Objective: Seeks high total investment return through a combination of current income and capital appreciation.
Fees and Expenses: This table describes the fees and expenses that you may pay if you buy and hold shares of the fund. There are no sales charges (load) or other transaction fees.
| | |
| Annual Fund Operating Expenses (expenses that you pay each year as a percentage of the value of your investment) |
| | |
Management fees | | 0.64% |
Distribution and service (12b-1) fees | | None |
Other expenses | | 0.06% |
Total annual fund operating expenses | | 0.70% |
Example: This Example is intended to help you compare the cost of investing in the fund with the cost of investing in other mutual funds. The Example assumes that you invest $10,000. The Example also assumes that your investment has a 5% return each year and that the fund’s operating expenses remain the same. Although your actual costs may be higher or lower, based on these assumptions your costs would be:
| | | | | | |
1 year | | 3 years | | 5 years | | 10 years |
$72 | | $224 | | $390 | | $871 |
Portfolio Turnover: The fund pays transaction costs, such as commissions, when it buys and sells securities (or “turns over” its portfolio). A higher portfolio turnover rate may indicate higher transaction costs and may result in higher taxes when fund shares are held in a taxable account. These costs, which are not reflected in annual fund operating expenses or in the Example, affect the fund’s performance. During the most recent fiscal year, the portfolio turnover rate was 79% of the average value of the fund’s portfolio.
Principal Investment Strategies: The fund’s sub-adviser, Loomis, Sayles & Company, L.P. (“Loomis”), invests, under normal circumstances, at least 80% of the fund’s assets in fixed-income securities. The fund invests primarily in investment grade fixed-income securities, although it may invest up to 35% of its assets in lower-rated fixed-income securities (“junk bonds”) and up to 20% of its assets in preferred stocks. The fund may invest in fixed-income securities of any maturity. The fund may also invest up to 10% of its assets in bank loans, which include senior secured and unsecured floating rate loans made by banks and other financial institutions to corporate customers. The fund may invest any portion of its assets in securities of Canadian issuers (denominated in any currency) and up to 20% of its assets in other foreign securities (excluding Canadian dollar denominated securities), including emerging market securities. The fund may invest without limit in obligations of supranational entities (e.g., the World Bank). The fixed-income securities in which the fund may invest include without limitation: corporate securities, U.S. Government securities, commercial paper, zero coupon securities, mortgage-backed securities, stripped mortgage-backed securities, collateralized mortgage obligations, foreign currency denominated securities, asset-backed securities, when issued securities, real estate investment trusts (“REITs”), Rule 144A securities, structured notes, repurchase agreements, and convertible securities. The fund may engage in options and futures transactions, foreign currency hedging transactions and swap transactions.
The fund may invest in structured notes, which are derivative debt instruments with principal and/or interest payments linked to the value of a commodity, a foreign currency, an index of securities, an interest rate, or other financial indicators. Structured notes can be used to increase a fund’s exposure to changes in the value of assets or to hedge the risks of other investments that a fund holds. The fund may also invest in equity securities, including common stocks, preferred stocks and similar securities.
The fund may invest in cash, cash equivalent securities or short-term debt securities, repurchase agreements and money market instruments. Under adverse or unstable market, economic or political conditions, the fund may take temporary defensive positions in cash and short-term debt securities without limit.
Principal Risks: Many factors affect the fund’s performance. There is no assurance the fund will meet its investment objective. The value of your investment in the fund, as well as the amount of return you receive on your investment, may fluctuate significantly from day to day and over time. You may lose part or all of your investment in the fund or your investment may not perform as well as other similar investments. The following is a summary of certain risks (in alphabetical order) of investing in the fund. You may lose money if you invest in this fund.
| • | | Bank Obligations – To the extent the fund invests in U.S. bank obligations, the fund will be more susceptible to adverse events affecting the U.S. banking industry. Banks are sensitive to changes in money market and general economic conditions, as well as decisions by regulators that can affect banks’ profitability. |
75
| • | | Cash Management and Defensive Investing – Money market instruments or short-term debt securities held by the fund for cash management or defensive investing purposes can fluctuate in value. Like other fixed income securities, they are subject to risk, including market, interest rate and credit risk. If the fund holds cash uninvested, the fund will not earn income on the cash and the fund’s yield will go down. If a significant amount of the fund’s assets are used for cash management or defensive investing purposes, it will be more difficult for the fund to achieve its objective. |
| • | | Convertible Securities – The market value of convertible securities tends to decline as interest rates increase. Convertible securities generally offer lower interest or dividend yields than non-convertible securities of similar quality. The fund could lose money if the issuer of a convertible security is unable to meet its financial obligations or goes bankrupt. |
| • | | Credit – If an issuer or guarantor of a security held by the fund or a counterparty to a financial contract with the fund defaults or is downgraded, or if the value of the assets underlying a security declines, the value of your investment will decline. Junk bonds have a higher risk of default and are considered speculative. A default or downgrade will have a greater impact on subordinated securities. |
| • | | Currency – When the fund invests in securities denominated in foreign currencies, the fund may incur currency conversion costs and may be affected favorably or unfavorably by changes in the rates of exchange between those currencies and the U.S. dollar. Currency exchange rates can be volatile and are affected by, among other factors, the general economics of a country, the actions of the U.S. and foreign governments or control banks, the imposition of currency controls, and speculation. |
| • | | Currency Hedging – The fund may hedge its currency risk using currency futures, forwards or options. However, these instruments may not always work as intended, and a fund may be worse off than if it had not used a hedging instrument. |
| • | | Derivatives – Using derivatives can increase fund losses and reduce opportunities for gains when market prices, interest rates or the derivative instruments themselves behave in a way not anticipated by the fund. Using derivatives also can have a leveraging effect and increase fund volatility. Derivatives may be difficult to sell, unwind or value, and the counterparty may default on its obligations to the fund. The fund’s investments in derivative instruments may involve a small investment relative to the amount of investment exposure assumed and may result in losses exceeding the amounts invested in those instruments. Recent legislation calls for new regulation of the derivatives markets. The extent and impact of the regulation are not yet fully known and may not be for some time. New regulation of derivatives may make them more costly, may limit their availability, or may otherwise adversely affect their value or performance. |
| • | | Emerging Markets – Investing in the securities of issuers located in or principally doing business in emerging markets are subject to foreign securities risks. These risks are greater for investments in emerging markets. Emerging market countries tend to have economic, political and legal systems that are less fully developed and are less stable than those of more advanced countries. Low trading volumes may result in a lack of liquidity and in extreme price volatility. |
| • | | Fixed-Income Securities – The market prices of fixed-income securities may go up or down, sometimes rapidly or unpredictably due to general market conditions, such as real or perceived adverse economic or political conditions, inflation, changes in interest rates, lack of liquidity in the bond markets or adverse investor sentiment. When market prices fall, the value of your investment will go down. A rise in rates tends to have a greater impact on the prices of longer term or duration securities. |
If interest rates rise, repayments of fixed-income securities may occur more slowly than anticipated by the market. This may drive the prices of these securities down because their interest rates are lower than the current interest rate and they remain outstanding longer. This is sometimes referred to as extension risk.
Many issuers have a right to prepay their securities. If interest rates fall, an issuer may exercise this right. If this happens, the fund will be forced to reinvest prepayment proceeds at a time when yields on securities available in the market are lower than the yield on the prepaid security. This is sometimes referred to as prepayment or call risk.
| • | | Foreign Securities – Foreign securities are subject to a number of additional risks, including nationalization or expropriation of assets, imposition of currency controls or restrictions, confiscatory taxation, political or financial instability and other adverse economic or political developments. Lack of information and less market regulation also may affect the value of these securities. |
| • | | High-Yield Debt Securities – High-yield debt securities, or junk bonds, are securities that are rated below “investment grade” (that is, securities rated below Baa/BBB) or, if unrated, are considered by the sub-adviser to be of equivalent quality. Changes in interest rates, the market’s perception of the issuers and the creditworthiness of the issuers may significantly affect the value of these bonds. Junk bonds have a higher risk of default, tend to be less liquid and may be more difficult to value. |
76
| • | | Increase in Expenses – Your actual costs of investing in the fund may be higher than the expenses shown in “Annual Fund Operating Expenses” for a variety of reasons. For example, expense ratios may be higher than those shown if average net assets decrease. Net assets are more likely to decrease and fund expense ratios are more likely to increase when markets are volatile. |
| • | | Interest Rate – Fixed-income securities have varying levels of sensitivity to changes in interest rates. In general, the price of a fixed-income security tends to fall when interest rates rise and can rise when interest rates fall. A change in interest rates will not have the same impact on all fixed-income securities. Generally, the longer the maturity or duration of a fixed-income security, the greater the impact of a rise in interest rates on the security’s value. In addition, different interest rate measures (such as short- and long-term interest rates and U.S. and foreign interest rates), or interest rates on different types of securities or securities of different issuers, may not necessarily change in the same amount or in the same direction. When interest rates go down, the income received by the fund, and the fund’s yield, may decline. |
| • | | Leveraging – The value of your investment may be more volatile if the fund borrows or uses derivatives that have a leveraging effect on the fund. Other risks also will be compounded. This is because leverage generally magnifies the effect of a change in the value of an asset and creates a risk of loss of value on a larger pool of assets than the fund would otherwise have had. The fund also may have to sell assets at inopportune times to satisfy its obligations. |
| • | | Liquidity – Some securities held by the fund may be difficult to sell, or illiquid, particularly during times of market turmoil. Illiquid securities may also be difficult to value. If the fund is forced to sell an illiquid asset to meet redemption requests or other cash needs, the fund may be forced to sell at a loss. |
| • | | Market – The market prices of the fund’s securities may go up or down, sometimes rapidly or unpredictably, due to general market conditions, such as real or perceived adverse economic or political conditions, inflation, changes in interest rates or currency rates, lack of liquidity in the markets or adverse investor sentiment. Market prices of securities also may go down due to events or conditions that affect particular sectors or issuers. When market prices fall, the value of your investment will go down. The fund may experience a substantial or complete loss on any individual security. The recent financial crisis has caused a significant decline in the value and liquidity of many securities. In response to the financial crisis, the U.S. and other governments and the Federal Reserve and certain foreign central banks have taken steps to support financial markets. The withdrawal of this support could negatively affect the value and liquidity of certain securities. In addition, legislation recently enacted in the U.S. calls for changes in many aspects of financial regulation. The impact of the legislation on the markets, and the practical implications for market participants, may not be fully known for some time. |
| • | | Mortgage-Related and Asset-Backed Securities – Mortgage-backed securities may be issued by private issuers, by government-sponsored entities such as Fannie Mae or Freddie Mac or by agencies of the U.S. government, such as Ginnie Mae. Mortgage-backed securities represent direct or indirect participations in, or are collateralized by and payable from, mortgage loans secured by real property. Unlike mortgage-related securities issued or guaranteed by agencies of the U.S. government or government-sponsored entities, mortgage-related securities issued by private issuers do not have a government or government-sponsored entity guarantee (but may have other credit enhancement), and may, and frequently do, have less favorable collateral, credit risk or other underwriting characteristics. Mortgage-backed securities are also particularly susceptible to prepayment and extension risks. Asset-backed securities represent participations in, or are secured by and payable from, assets such as installment sales or loan contracts, leases, credit card receivables and other categories of receivables. Certain asset-backed securities present a heightened level of risk because, in the event of default, the liquidation value of the underlying assets may be inadequate to pay any unpaid principal or interest. The value of mortgage-backed and asset-backed securities may be affected by changes in credit quality or value of the mortgage loans or other assets that support the securities. |
| • | | Portfolio Selection – The sub-adviser’s judgment about a particular security or issuer, or about the economy or a particular sector, region or market segment, or about an investment strategy, may prove to be incorrect. |
| • | | Preferred Stock – Preferred stock’s right to dividends and liquidation proceeds is junior to the rights of a company’s debt securities. The value of preferred stock may be subject to factors that affect fixed income and equity securities, including changes in interest rates and in a company’s creditworthiness. Shareholders of preferred stock may suffer a loss of value if dividends are not paid and have limited voting rights. |
| • | | REITs – When the fund invests in Real Estate Investment Trusts (“REITs”), it is subject to risks generally associated with investing in real estate. A REIT’s performance depends on the types and locations of the properties it owns and how well it manages those properties or loan financings. REITs are subject to a highly technical tax structure; and the failure to qualify as a REIT could result in corporate-level taxation, significantly reducing the return on an investment to the fund. |
77
| • | | Repurchase Agreements – If the other party to a repurchase agreement defaults on its obligation, the fund may suffer delays and incur costs or lose money in exercising its rights under the agreement. If the seller fails to repurchase the security and the market value declines, the fund could lose money. If the seller becomes insolvent and subject to liquidation or reorganization under applicable bankruptcy or other laws, the fund’s ability to dispose of the underlying securities may be restricted. |
| • | | Rule 144A and Privately Placed Securities – Rule 144A permits certain qualified institutional buyers, such as the fund, to trade in privately placed securities that have not been registered for sale to the public. Rule 144A and other privately placed securities may be deemed illiquid, and the fund might be unable to dispose of such securities promptly or at reasonable prices. |
| • | | Stocks – Stocks may be volatile – their prices may go up and down dramatically over the shorter term. These price movements may result from factors affecting individual companies, industries, the securities market as a whole or the overall economy. |
| • | | Structured Instruments – The fund may invest in various types of structured instruments, including securities that have demand, tender or put features, or interest rate reset features. Structured instruments are a type of derivative instrument and the payment and credit qualities of these instruments derive from the assets embedded in the structure from which they are issued. Structured instruments may behave in ways not anticipated by the fund, or they may not receive tax, accounting or regulatory treatment anticipated by the fund. |
| • | | Valuation – The sales price the fund could receive for any particular portfolio investment may differ from the fund’s valuation of the investment, particularly for securities that trade in thin or volatile markets or that are valued using a fair value methodology. |
Performance: The bar chart and the table below provide some indication of the risks of investing in the fund by showing you how the fund’s performance has varied from year to year, and how the fund’s Class I2 average annual total returns for different periods compare to the returns of a broad measure of market performance. The table shows average annual total returns for Class I2 shares of the fund. Absent any limitation of the fund’s expenses, total returns would be lower. As with all mutual funds, past performance (before and after taxes) is not a prediction of future results. Updated performance information is available on our website at www.transamericafunds.com or by calling 1-888-233-4339.
Annual Total Returns (calendar years ended December 31)

| | | | |
| | | Quarter Ended | | Return |
Best Quarter: | | 6/30/2009 | | 19.39% |
Worst Quarter: | | 9/30/2008 | | -10.47% |
Average Annual Total Returns (periods ended December 31, 2010)1
| | | | | | |
| | | 1 Year | | 5 Years | | 10 Years or
Inception* |
| Class I2 (commenced operations on January 3, 2007) |
| Return before taxes | | 15.38% | | N/A | | 8.42% |
| Return after taxes on distributions2 | | 12.58% | | N/A | | 6.08% |
| Return after taxes on distributions and sale of fund shares2 | | 10.33% | | N/A | | 5.82% |
| Barclays Capital U.S. Government/Credit Bond Index (reflects no deduction for fees, expenses or taxes) | | 6.59% | | N/A | | 5.98% |
| 1 | Actual returns may depend on the investor’s individual tax situation. After-tax returns may not be relevant if the investment is made through a tax-exempt or tax-deferred account, such as a 401(k) plan. |
| 2 | The after-tax returns are calculated using the historic highest individual federal marginal income tax rates and do not reflect the impact of state and local taxes. |
| * | Fund and Index returns are for past 10 years or since inception, whichever is less. |
78
| | |
| Management: | | |
| |
| Investment Adviser: | | Sub-Adviser: |
| |
| Transamerica Asset Management, Inc. | | Loomis, Sayles & Company, L.P. |
| |
| | Portfolio Managers: |
| |
| | Kathleen C. Gaffney, CFA, Lead Portfolio Manager since 2007 |
| |
| | Mathew J. Eagan, CFA, Co-Portfolio Manager since 2007 |
| |
| | Daniel J. Fuss, CFA, Co-Portfolio Manager since 2007 |
| |
| | Elaine M. Stokes, Co-Portfolio Manager since 2007 |
Purchase and Sale of Fund Shares: Class I2 shares of the fund are currently primarily offered for investment in certain funds of funds (also referred to as “strategic asset allocation funds”). Class I2 shares of the fund are also made available to other investors, including institutional investors such as foreign insurers, domestic insurance companies and their separate accounts, and unaffiliated funds, high net worth individuals, and eligible retirement plans whose recordkeepers or financial service firm intermediaries have entered into agreements with Transamerica Funds or its agents. Investors who received Class I2 shares in connection with the reorganization of a Transamerica Premier Fund into a Transamerica Fund may continue to invest in Class I2 shares of that Transamerica Fund, but may not open new accounts. You buy and redeem shares at the fund’s next-determined net asset value (NAV) after receipt of your request in good order.
Tax Information: Fund distributions may be taxable as ordinary income or capital gains, except when your investment is in an IRA, 401(k) or other tax-advantaged investment plan.
Payments to Broker-Dealers and Other Financial Intermediaries: If you purchase the fund through a broker-dealer or other financial intermediary, the fund and/or its affiliates may pay the intermediary for the sale of fund shares and related services. These payments may create a conflict of interest by influencing the broker-dealer or other intermediary and your salesperson to recommend the fund over another investment. Ask your salesperson or visit your financial intermediary’s website for more information.
79
|
| TRANSAMERICA MFS INTERNATIONAL EQUITY |
Investment Objective: Seeks capital growth.
Fees and Expenses: This table describes the fees and expenses that you may pay if you buy and hold shares of the fund. There are no sales charges (load) or other transaction fees.
| | |
| Annual Fund Operating Expenses (expenses that you pay each year as a percentage of the value of your investment) |
| | |
| Management fees | | 0.89% |
| Distribution and service (12b-1) fees | | None |
| Other expenses | | 0.10% |
| Total annual fund operating expenses | | 0.99% |
Example: This Example is intended to help you compare the cost of investing in the fund with the cost of investing in other mutual funds. The Example assumes that you invest $10,000. The Example also assumes that your investment has a 5% return each year and that the fund’s operating expenses remain the same. Although your actual costs may be higher or lower, based on these assumptions your costs would be:
| | | | | | |
1 year | | 3 years | | 5 years | | 10 years |
$101 | | $315 | | $547 | | $1,213 |
Portfolio Turnover: The fund pays transaction costs, such as commissions, when it buys and sells securities (or “turns over” its portfolio). A higher portfolio turnover rate may indicate higher transaction costs and may result in higher taxes when fund shares are held in a taxable account. These costs, which are not reflected in annual fund operating expenses or in the Example, affect the fund’s performance. During the most recent fiscal year, the portfolio turnover rate was 35% of the average value of the fund’s portfolio.
Principal Investment Strategies: The fund’s sub-adviser, MFS® Investment Management (“MFS”), invests, under normal circumstances, at least 80% of the fund’s net assets in common stocks and related equity securities, such as preferred stock, convertible securities and depositary receipts of issuers economically tied to a number of countries throughout the world, including emerging markets countries. The fund normally invests primarily in equity securities of foreign companies, including emerging market equity securities. MFS may invest a relatively large percentage of the fund’s assets in issuers in a single country, a small number of countries, or a particular geographic region. In selecting investments for the fund, MFS is not constrained to any particular investment style. MFS may invest the fund’s assets in the stocks of companies it believes to have above average earnings growth potential compared to other companies (growth companies), in the stocks of companies it believes are undervalued compared to their perceived worth (value companies), or in a combination of growth and value companies. MFS may invest the fund’s assets in companies of any size. MFS may use derivatives, such as futures, forward contracts, and options for any investment purpose. MFS uses a “bottom-up” investment approach to buying and selling investments for the fund. A “bottom-up” approach is looking at individual companies against the context of broader market factors. Investments are selected primarily based on fundamental analysis of individual issuers and their potential in light of their current financial, market, economic, political, and regulatory conditions. Factors considered may include analysis of an issuer’s earnings, cash flows, competitive position, and management ability. Quantitative models that systematically evaluate an issuer’s valuation, price, and earnings momentum, earnings quality, and other factors may also be considered. MFS may engage in active and frequent trading in pursuing the fund’s principal investment strategies.
The fund may invest in cash, cash equivalent securities or short-term debt securities, repurchase agreements and money market instruments. Under adverse or unstable market, economic or political conditions, the fund may take temporary defensive positions in cash and short-term debt securities without limit.
Principal Risks: Many factors affect the fund’s performance. There is no assurance the fund will meet its investment objective. The value of your investment in the fund, as well as the amount of return you receive on your investment, may fluctuate significantly from day to day and over time. You may lose part or all of your investment in the fund or your investment may not perform as well as other similar investments. The following is a summary of certain risks (in alphabetical order) of investing in the fund. You may lose money if you invest in this fund.
| • | | Active Trading – Certain funds are actively managed and, under appropriate circumstances, may purchase and sell securities without regard to the length of time held. A high portfolio turnover rate may have a negative impact on performance by increasing transaction costs and may generate greater tax liabilities for shareholders holding shares in taxable accounts. |
80
| • | | Cash Management and Defensive Investing – Money market instruments or short-term debt securities held by the fund for cash management or defensive investing purposes can fluctuate in value. Like other fixed income securities, they are subject to risk, including market, interest rate and credit risk. If the fund holds cash uninvested, the fund will not earn income on the cash and the fund’s yield will go down. If a significant amount of the fund’s assets are used for cash management or defensive investing purposes, it will be more difficult for the fund to achieve its objective. |
| • | | Convertible Securities – The market value of convertible securities tends to decline as interest rates increase. Convertible securities generally offer lower interest or dividend yields than non-convertible securities of similar quality. The fund could lose money if the issuer of a convertible security is unable to meet its financial obligations or goes bankrupt. |
| • | | Currency – When the fund invests in securities denominated in foreign currencies, the fund may incur currency conversion costs and may be affected favorably or unfavorably by changes in the rates of exchange between those currencies and the U.S. dollar. Currency exchange rates can be volatile and are affected by, among other factors, the general economics of a country, the actions of the U.S. and foreign governments or control banks, the imposition of currency controls, and speculation. |
| • | | Derivatives – Using derivatives can increase fund losses and reduce opportunities for gains when market prices, interest rates or the derivative instruments themselves behave in a way not anticipated by the fund. Using derivatives also can have a leveraging effect and increase fund volatility. Derivatives may be difficult to sell, unwind or value, and the counterparty may default on its obligations to the fund. The fund’s investments in derivative instruments may involve a small investment relative to the amount of investment exposure assumed and may result in losses exceeding the amounts invested in those instruments. Recent legislation calls for new regulation of the derivatives markets. The extent and impact of the regulation are not yet fully known and may not be for some time. New regulation of derivatives may make them more costly, may limit their availability, or may otherwise adversely affect their value or performance. |
| • | | Emerging Markets – Investing in the securities of issuers located in or principally doing business in emerging markets are subject to foreign securities risks. These risks are greater for investments in emerging markets. Emerging market countries tend to have economic, political and legal systems that are less fully developed and are less stable than those of more advanced countries. Low trading volumes may result in a lack of liquidity and in extreme price volatility. |
| • | | Foreign Securities – Foreign securities are subject to a number of additional risks, including nationalization or expropriation of assets, imposition of currency controls or restrictions, confiscatory taxation, political or financial instability and other adverse economic or political developments. Lack of information and less market regulation also may affect the value of these securities. |
| • | | Geographic – To the extent the fund invests a significant portion of its assets in issuers located in a single country, a small number of countries, or a particular geographic region, the fund will be more susceptible to negative events affecting those countries or that region, and could be more volatile than a more geographically diverse fund. Geographic risk is especially high in emerging markets. |
| • | | Growth Stocks – Returns on growth stocks may not move in tandem with returns on other categories of stocks or the market as a whole. Growth stocks may be particularly susceptible to rapid price swings or to adverse developments. Growth stocks as a group may be out of favor and underperform the overall equity market for a long period of time, for example, while the market favors “value” stocks. |
| • | | Increase in Expenses – Your actual costs of investing in the fund may be higher than the expenses shown in “Annual Fund Operating Expenses” for a variety of reasons. For example, expense ratios may be higher than those shown if average net assets decrease. Net assets are more likely to decrease and fund expense ratios are more likely to increase when markets are volatile. |
| • | | Leveraging – The value of your investment may be more volatile if the fund borrows or uses derivatives that have a leveraging effect on the fund. Other risks also will be compounded. This is because leverage generally magnifies the effect of a change in the value of an asset and creates a risk of loss of value on a larger pool of assets than the fund would otherwise have had. The fund also may have to sell assets at inopportune times to satisfy its obligations. |
| • | | Liquidity – Some securities held by the fund may be difficult to sell, or illiquid, particularly during times of market turmoil. Illiquid securities may also be difficult to value. If the fund is forced to sell an illiquid asset to meet redemption requests or other cash needs, the fund may be forced to sell at a loss. |
| • | | Market – The market prices of the fund’s securities may go up or down, sometimes rapidly or unpredictably, due to general market conditions, such as real or perceived adverse economic or political conditions, inflation, changes in interest rates or currency rates, lack of liquidity in the markets or adverse investor sentiment. Market prices of securities also may go down |
81
| | due to events or conditions that affect particular sectors or issuers. When market prices fall, the value of your investment will go down. The fund may experience a substantial or complete loss on any individual security. The recent financial crisis has caused a significant decline in the value and liquidity of many securities. In response to the financial crisis, the U.S. and other governments and the Federal Reserve and certain foreign central banks have taken steps to support financial markets. The withdrawal of this support could negatively affect the value and liquidity of certain securities. In addition, legislation recently enacted in the U.S. calls for changes in many aspects of financial regulation. The impact of the legislation on the markets, and the practical implications for market participants, may not be fully known for some time. |
| • | | Portfolio Selection – The sub-adviser’s judgment about a particular security or issuer, or about the economy or a particular sector, region or market segment, or about an investment strategy, may prove to be incorrect. |
| • | | Preferred Stock – Preferred stock’s right to dividends and liquidation proceeds is junior to the rights of a company’s debt securities. The value of preferred stock may be subject to factors that affect fixed income and equity securities, including changes in interest rates and in a company’s creditworthiness. Shareholders of preferred stock may suffer a loss of value if dividends are not paid and have limited voting rights. |
| • | | Small- or Medium-Sized Companies – Small- or medium-sized companies may be more at risk than larger companies because, among other things, they may have limited product lines, operating history, market or financial resources, or because they may depend on a limited management group. |
| • | | Stocks – Stocks may be volatile – their prices may go up and down dramatically over the shorter term. These price movements may result from factors affecting individual companies, industries, the securities market as a whole or the overall economy. |
| • | | Value Investing – The prices of securities the sub-adviser believes are undervalued may not appreciate as anticipated or may go down. Value stocks as a group may be out of favor and underperform the overall equity market for a long period of time, for example, while the market favors “growth” stocks. |
Performance: The bar chart and the table below provide some indication of the risks of investing in the fund by showing you how the fund’s performance has varied from year to year, and how the fund’s Class I2 average annual total returns for different periods compare to the returns of a broad measure of market performance. The table shows average annual total returns for Class I2 shares of the fund. Absent any limitation of the fund’s expenses, total returns would be lower. As with all mutual funds, past performance (before and after taxes) is not a prediction of future results. Updated performance information is available on our website at www.transamericafunds.com or by calling 1-888-233-4339.
Annual Total Returns (calendar years ended December 31)

| | | | |
| | | Quarter Ended | | Return |
Best Quarter: | | 9/30/2009 | | 21.17% |
Worst Quarter: | | 3/31/2009 | | -13.16% |
82
Average Annual Total Returns (periods ended December 31, 2010)1
| | | | | | |
| | | 1 Year | | 5 Years | | 10 Years or
Inception* |
| Class I2 (commenced operations on June 10, 2008) |
| Return before taxes | | 10.55% | | N/A | | -1.30% |
| Return after taxes on distributions2 | | 9.37% | | N/A | | -2.10% |
| Return after taxes on distributions and sale of fund shares2 | | 7.94% | | N/A | | -1.40% |
| Morgan Stanley Capital International-Europe, Australasia, Far East Index (reflects no deduction for fees, expenses or taxes) | | 8.21% | | N/A | | -5.79% |
| 1 | Actual returns may depend on the investor’s individual tax situation. After-tax returns may not be relevant if the investment is made through a tax-exempt or tax-deferred account, such as a 401(k) plan. |
| 2 | The after-tax returns are calculated using the historic highest individual federal marginal income tax rates and do not reflect the impact of state and local taxes. |
| * | Fund and Index returns are for past 10 years or since inception, whichever is less. |
| | |
| Management: | | |
| |
| Investment Adviser: | | Sub-Adviser: |
| |
| Transamerica Asset Management, Inc. | | MFS® Investment Management |
| |
| | Portfolio Managers: |
| |
| | Daniel Ling, Portfolio Manager since 2009 |
| |
| | Marcus L. Smith, Portfolio Manager since 2006 |
Purchase and Sale of Fund Shares: Class I2 shares of the fund are currently primarily offered for investment in certain funds of funds (also referred to as “strategic asset allocation funds”). Class I2 shares of the fund are also made available to other investors, including institutional investors such as foreign insurers, domestic insurance companies and their separate accounts, and unaffiliated funds, high net worth individuals, and eligible retirement plans whose recordkeepers or financial service firm intermediaries have entered into agreements with Transamerica Funds or its agents. Investors who received Class I2 shares in connection with the reorganization of a Transamerica Premier Fund into a Transamerica Fund may continue to invest in Class I2 shares of that Transamerica Fund, but may not open new accounts. You buy and redeem shares at the fund’s next-determined net asset value (NAV) after receipt of your request in good order.
Tax Information: Fund distributions may be taxable as ordinary income or capital gains, except when your investment is in an IRA, 401(k) or other tax-advantaged investment plan.
Payments to Broker-Dealers and Other Financial Intermediaries: If you purchase the fund through a broker-dealer or other financial intermediary, the fund and/or its affiliates may pay the intermediary for the sale of fund shares and related services. These payments may create a conflict of interest by influencing the broker-dealer or other intermediary and your salesperson to recommend the fund over another investment. Ask your salesperson or visit your financial intermediary’s website for more information.
83
|
| TRANSAMERICA MORGAN STANLEY EMERGING MARKETS DEBT |
Investment Objective: Seeks high total return by investing primarily in fixed-income securities of government and government-related issuers and, to a lesser extent, of corporate issuers in emerging market countries.
Fees and Expenses: This table describes the fees and expenses that you may pay if you buy and hold shares of the fund. There are no sales charges (load) or other transaction fees.
| | |
Annual Fund Operating Expenses (expenses that you pay each year as a percentage of the value of your investment) |
| | | |
Management fees | | 0.92% |
Distribution and service (12b-1) fees | | None |
Other expenses | | 0.08% |
Total annual fund operating expenses | | 1.00% |
Example: This Example is intended to help you compare the cost of investing in the fund with the cost of investing in other mutual funds. The Example assumes that you invest $10,000. The Example also assumes that your investment has a 5% return each year and that the fund’s operating expenses remain the same. Although your actual costs may be higher or lower, based on these assumptions your costs would be:
| | | | | | |
1 year | | 3 years | | 5 years | | 10 years |
$102 | | $318 | | $552 | | $1,225 |
Portfolio Turnover: The fund pays transaction costs, such as commissions, when it buys and sells securities (or “turns over” its portfolio). A higher portfolio turnover rate may indicate higher transaction costs and may result in higher taxes when fund shares are held in a taxable account. These costs, which are not reflected in annual fund operating expenses or in the Example, affect the fund’s performance. During the most recent fiscal year, the portfolio turnover rate was 100% of the average value of the fund’s portfolio.
Principal Investment Strategies: The fund’s sub-adviser is Morgan Stanley Investment Management Inc. (“MSIM”). Under normal circumstances, at least 80% of the net assets of the fund will be invested in debt securities of issuers located in emerging markets countries. The fund normally invests primarily in fixed-income securities of government and government-related issuers, and, to a lesser extent, of corporate issuers in emerging markets countries. MSIM seeks to identify developing countries that are believed to be undervalued and have attractive or improving fundamentals. After the country allocation is determined, the sector and security selection is made within each country.
The sub-adviser analyzes the global economic environment and its impact on emerging markets. The sub-adviser focuses on investing in countries that show signs of positive fundamental change.
In selecting securities, the sub-adviser first examines yield curves with respect to a country and then considers instrument-specific criteria, including (i) spread duration; (ii) real interest rates; and (iii) liquidity. The fund’s holdings may range in maturity from overnight to 30 years or more and will not be subject to any minimum credit rating standard. The sub-adviser may, when or if available, use certain strategies, including the use of derivatives, to protect the fund from overvalued currencies or to take advantage of undervalued currencies. The sub-adviser generally considers selling a portfolio holding when it determines that the holding no longer satisfies its investment criteria.
Emerging markets countries can include every nation in the world except the United States, Canada, Japan, Australia, New Zealand and most countries in Western Europe. The fund may also invest up to 25% of its assets in cross currency hedges, which involve the sale of one currency against the positive exposure to a different currency. Cross currency hedges may be used for hedging purposes or to establish an active exposure to the exchange rate between any two currencies.
The fund may invest its assets in cash, cash equivalent securities or short-term debt securities, repurchase agreements and money market instruments. Under adverse or unstable market, economic or political conditions, the fund may take temporary defensive positions in cash and short-term debt securities without limit.
This fund is non-diversified.
Principal Risks: Many factors affect the fund’s performance. There is no assurance the fund will meet its investment objective. The value of your investment in the fund, as well as the amount of return you receive on your investment, may fluctuate significantly from day to day and over time. You may lose part or all of your investment in the fund or your investment may not perform as well as other similar investments. The following is a summary of certain risks (in alphabetical order) of investing in the fund. You may lose money if you invest in this fund.
84
| • | | Cash Management and Defensive Investing – Money market instruments or short-term debt securities held by the fund for cash management or defensive investing purposes can fluctuate in value. Like other fixed income securities, they are subject to risk, including market, interest rate and credit risk. If the fund holds cash uninvested, the fund will not earn income on the cash and the fund’s yield will go down. If a significant amount of the fund’s assets are used for cash management or defensive investing purposes, it will be more difficult for the fund to achieve its objective. |
| • | | Credit – If an issuer or guarantor of a security held by the fund or a counterparty to a financial contract with the fund defaults or is downgraded, or if the value of the assets underlying a security declines, the value of your investment will decline. Junk bonds have a higher risk of default and are considered speculative. A default or downgrade will have a greater impact on subordinated securities. |
| • | | Currency – When the fund invests in securities denominated in foreign currencies, the fund may incur currency conversion costs and may be affected favorably or unfavorably by changes in the rates of exchange between those currencies and the U.S. dollar. Currency exchange rates can be volatile and are affected by, among other factors, the general economics of a country, the actions of the U.S. and foreign governments or control banks, the imposition of currency controls, and speculation. |
| • | | Currency Hedging – The fund may hedge its currency risk using currency futures, forwards or options. However, these instruments may not always work as intended, and a fund may be worse off than if it had not used a hedging instrument. |
| • | | Derivatives – Using derivatives can increase fund losses and reduce opportunities for gains when market prices, interest rates or the derivative instruments themselves behave in a way not anticipated by the fund. Using derivatives also can have a leveraging effect and increase fund volatility. Derivatives may be difficult to sell, unwind or value, and the counterparty may default on its obligations to the fund. The fund’s investments in derivative instruments may involve a small investment relative to the amount of investment exposure assumed and may result in losses exceeding the amounts invested in those instruments. Recent legislation calls for new regulation of the derivatives markets. The extent and impact of the regulation are not yet fully known and may not be for some time. New regulation of derivatives may make them more costly, may limit their availability, or may otherwise adversely affect their value or performance. |
| • | | Emerging Markets – Investing in the securities of issuers located in or principally doing business in emerging markets are subject to foreign securities risks. These risks are greater for investments in emerging markets. Emerging market countries tend to have economic, political and legal systems that are less fully developed and are less stable than those of more advanced countries. Low trading volumes may result in a lack of liquidity and in extreme price volatility. |
| • | | Fixed-Income Securities – The market prices of fixed-income securities may go up or down, sometimes rapidly or unpredictably due to general market conditions, such as real or perceived adverse economic or political conditions, inflation, changes in interest rates, lack of liquidity in the bond markets or adverse investor sentiment. When market prices fall, the value of your investment will go down. A rise in rates tends to have a greater impact on the prices of longer term or duration securities. |
If interest rates rise, repayments of fixed-income securities may occur more slowly than anticipated by the market. This may drive the prices of these securities down because their interest rates are lower than the current interest rate and they remain outstanding longer. This is sometimes referred to as extension risk.
Many issuers have a right to prepay their securities. If interest rates fall, an issuer may exercise this right. If this happens, the fund will be forced to reinvest prepayment proceeds at a time when yields on securities available in the market are lower than the yield on the prepaid security. This is sometimes referred to as prepayment or call risk.
| • | | Foreign Securities – Foreign securities are subject to a number of additional risks, including nationalization or expropriation of assets, imposition of currency controls or restrictions, confiscatory taxation, political or financial instability and other adverse economic or political developments. Lack of information and less market regulation also may affect the value of these securities. |
| • | | Increase in Expenses – Your actual costs of investing in the fund may be higher than the expenses shown in “Annual Fund Operating Expenses” for a variety of reasons. For example, expense ratios may be higher than those shown if average net assets decrease. Net assets are more likely to decrease and fund expense ratios are more likely to increase when markets are volatile. |
| • | | Interest Rate – Fixed-income securities have varying levels of sensitivity to changes in interest rates. In general, the price of a fixed-income security tends to fall when interest rates rise and can rise when interest rates fall. A change in interest rates will not have the same impact on all fixed-income securities. Generally, the longer the maturity or duration of a fixed-income security, the greater the impact of a rise in interest rates on the security’s value. In addition, different interest rate |
85
| | measures (such as short- and long-term interest rates and U.S. and foreign interest rates), or interest rates on different types of securities or securities of different issuers, may not necessarily change in the same amount or in the same direction. When interest rates go down, the income received by the fund, and the fund’s yield, may decline. |
| • | | Liquidity – Some securities held by the fund may be difficult to sell, or illiquid, particularly during times of market turmoil. Illiquid securities may also be difficult to value. If the fund is forced to sell an illiquid asset to meet redemption requests or other cash needs, the fund may be forced to sell at a loss. |
| • | | Market – The market prices of the fund’s securities may go up or down, sometimes rapidly or unpredictably, due to general market conditions, such as real or perceived adverse economic or political conditions, inflation, changes in interest rates or currency rates, lack of liquidity in the markets or adverse investor sentiment. Market prices of securities also may go down due to events or conditions that affect particular sectors or issuers. When market prices fall, the value of your investment will go down. The fund may experience a substantial or complete loss on any individual security. The recent financial crisis has caused a significant decline in the value and liquidity of many securities. In response to the financial crisis, the U.S. and other governments and the Federal Reserve and certain foreign central banks have taken steps to support financial markets. The withdrawal of this support could negatively affect the value and liquidity of certain securities. In addition, legislation recently enacted in the U.S. calls for changes in many aspects of financial regulation. The impact of the legislation on the markets, and the practical implications for market participants, may not be fully known for some time. |
| • | | Non-Diversification – The fund is classified as “non-diversified,” which means it may invest in a larger percentage of its assets in one issuer than a diversified fund. To the extent the fund invests its assets in fewer issuers, the fund will be more susceptible to negative events affecting those issuers. |
| • | | Portfolio Selection – The sub-adviser’s judgment about a particular security or issuer, or about the economy or a particular sector, region or market segment, or about an investment strategy, may prove to be incorrect. |
| • | | Sovereign Debt – Sovereign debt instruments are subject to the risk that the governmental entity may delay or fail to pay interest or repay principal on its sovereign debt. If a governmental entity defaults, it may ask for more time in which to pay or for further loans. There may be no established legal process for collecting sovereign debt that a government does not pay, nor are there bankruptcy proceedings through which all or part of the sovereign debt that a governmental entity has not repaid may be collected. |
| • | | Valuation – The sales price the fund could receive for any particular portfolio investment may differ from the fund’s valuation of the investment, particularly for securities that trade in thin or volatile markets or that are valued using a fair value methodology. |
Performance: The bar chart and the table below provide some indication of the risks of investing in the fund by showing you how the fund’s performance has varied from year to year, and how the fund’s Class I2 average annual total returns for different periods compare to the returns of a broad measure of market performance. The table shows average annual total returns for Class I2 shares of the fund. Absent any limitation of the fund’s expenses, total returns would be lower. As with all mutual funds, past performance (before and after taxes) is not a prediction of future results. Updated performance information is available on our website at www.transamericafunds.com or by calling 1-888-233-4339.
Annual Total Returns (calendar years ended December 31)

| | | | | | | | | | |
| | | Quarter Ended | | Return |
Best Quarter: | | 9/30/2009 | | 10.97% |
Worst Quarter: | | 12/31/2008 | | -8.44% |
86
Average Annual Total Returns (periods ended December 31, 2010)1
| | | | | | |
| | | 1 Year | | 5 Years | | 10 Years or
Inception* |
Class I2 (commenced operations on November 8, 2004) |
Return before taxes | | 10.25% | | 7.36% | | 8.06% |
Return after taxes on distributions2 | | 7.63% | | 4.80% | | 5.60% |
Return after taxes on distributions and sale of fund shares2 | | 7.15% | | 4.84% | | 5.51% |
| JPMorgan Emerging Markets Bond Index Global (reflects no deduction for fees,expenses or taxes) | | 12.03% | | 8.36% | | 9.09% |
| 1 | Actual returns may depend on the investor’s individual tax situation. After-tax returns may not be relevant if the investment is made through a tax-exempt or tax-deferred account, such as a 401(k) plan. |
| 2 | The after-tax returns are calculated using the historic highest individual federal marginal income tax rates and do not reflect the impact of state and local taxes. |
| * | Fund and Index returns are for past 10 years or since inception, whichever is less. |
| | |
Management: | | |
| |
| Investment Adviser: | | Sub-Adviser: |
| |
| Transamerica Asset Management, Inc. | | Morgan Stanley Investment Management Inc. |
| |
| | Portfolio Managers: |
| |
| | Eric J. Baurmeister, Portfolio Manager since 2004 |
| |
| | Federico L. Kaune, Portfolio Manager since 2004 |
Purchase and Sale of Fund Shares: Class I2 shares of the fund are currently primarily offered for investment in certain funds of funds (also referred to as “strategic asset allocation funds”). Class I2 shares of the fund are also made available to other investors, including institutional investors such as foreign insurers, domestic insurance companies and their separate accounts, and unaffiliated funds, high net worth individuals, and eligible retirement plans whose recordkeepers or financial service firm intermediaries have entered into agreements with Transamerica Funds or its agents. Investors who received Class I2 shares in connection with the reorganization of a Transamerica Premier Fund into a Transamerica Fund may continue to invest in Class I2 shares of that Transamerica Fund, but may not open new accounts. You buy and redeem shares at the fund’s next-determined net asset value (NAV) after receipt of your request in good order.
Tax Information: Fund distributions may be taxable as ordinary income or capital gains, except when your investment is in an IRA, 401(k) or other tax-advantaged investment plan.
Payments to Broker-Dealers and Other Financial Intermediaries: If you purchase the fund through a broker-dealer or other financial intermediary, the fund and/or its affiliates may pay the intermediary for the sale of fund shares and related services. These payments may create a conflict of interest by influencing the broker-dealer or other intermediary and your salesperson to recommend the fund over another investment. Ask your salesperson or visit your financial intermediary’s website for more information.
87
|
| TRANSAMERICA MORGAN STANLEY GROWTH OPPORTUNITIES |
Investment Objective: Seeks capital appreciation.
Fees and Expenses: This table describes the fees and expenses that you may pay if you buy and hold shares of the fund. There are no sales charges (load) or other transaction fees.
| | |
Annual Fund Operating Expenses (expenses that you pay each year as a percentage of the value of your investment) |
| | |
Management fees | | 0.79% |
Distribution and service (12b-1) fees | | None |
Other expenses | | 0.09% |
Total annual fund operating expenses | | 0.88% |
Example: This Example is intended to help you compare the cost of investing in the fund with the cost of investing in other mutual funds. The Example assumes that you invest $10,000. The Example also assumes that your investment has a 5% return each year and that the fund’s operating expenses remain the same. Although your actual costs may be higher or lower, based on these assumptions your costs would be:
| | | | | | |
1 year | | 3 years | | 5 years | | 10 years |
$90 | | $281 | | $488 | | $1,084 |
Portfolio Turnover: The fund pays transaction costs, such as commissions, when it buys and sells securities (or “turns over” its portfolio). A higher portfolio turnover rate may indicate higher transaction costs and may result in higher taxes when fund shares are held in a taxable account. These costs, which are not reflected in annual fund operating expenses or in the Example, affect the fund’s performance. During the most recent fiscal year, the portfolio turnover rate was 63% of the average value of the fund’s portfolio.
Principal Investment Strategies: The fund’s sub-adviser, Morgan Stanley Investment Management, Inc. (“MSIM”), under normal circumstances, invests at least 80% of the fund’s assets in common stocks of mid cap companies. MSIM seeks long-term capital growth by investing primarily in established and emerging companies with capitalizations within the range of companies included in the Russell Midcap® Growth Index, which as of December 31, 2010 was between $752 million and $22.1 billion. MSIM seeks to invest in high quality companies it believes have sustainable competitive advantages and the ability to redeploy capital at high rates of return. MSIM typically favors companies with rising returns on invested capital, above average business visibility, strong free cash flow generation and attractive risk/reward profile. MSIM generally considers selling an investment when it determines the company no longer satisfies its investment criteria.
The fund may also invest in common stocks and other equity securities of small- and large-sized companies, as well as preferred stocks, rights and warrants, and debt securities. The fund may purchase and sell certain derivative instruments, such as options, futures contracts and options on futures contracts, for various portfolio management purposes, including to earn income, facilitate portfolio management and mitigate risks. Derivative instruments used by the fund will be counted toward the 80% policy discussed above to the extent they have economic characteristics similar to the securities included within that policy.
MSIM may invest up to 25% of the fund’s assets in securities of foreign companies, including emerging market securities. MSIM considers an issuer to be from a particular country if (i) its principal securities trading market is in that country; (ii) alone or on a consolidated basis it derives 50% or more of its annual revenue from goods produced, sales made or services performed in that country; or (iii) it is organized under the laws of, or has a principal office in, that country. By applying these tests, it is possible that a particular company could be deemed to be from more than one country. The securities in which the fund may invest may be denominated in U.S. dollars or in currencies other than U.S. dollars. The fund may invest in privately placed securities and initial public offerings.
The fund may also invest up to 10% of its assets in real estate investment trusts (“REITs”).
The fund may invest its assets in cash, cash equivalent securities or short-term debt securities, repurchase agreements and money market instruments. Under adverse or unstable market, economic or political conditions, the fund may take temporary defensive positions in cash and short-term debt securities without limit.
Principal Risks: Many factors affect the fund’s performance. There is no assurance the fund will meet its investment objective. The value of your investment in the fund, as well as the amount of return you receive on your investment, may fluctuate significantly from day to day and over time. You may lose part or all of your investment in the fund or your
88
investment may not perform as well as other similar investments. The following is a summary of certain risks (in alphabetical order) of investing in the fund. You may lose money if you invest in this fund.
| • | | Cash Management and Defensive Investing – Money market instruments or short-term debt securities held by the fund for cash management or defensive investing purposes can fluctuate in value. Like other fixed income securities, they are subject to risk, including market, interest rate and credit risk. If the fund holds cash uninvested, the fund will not earn income on the cash and the fund’s yield will go down. If a significant amount of the fund’s assets are used for cash management or defensive investing purposes, it will be more difficult for the fund to achieve its objective. |
| • | | Convertible Securities – The market value of convertible securities tends to decline as interest rates increase. Convertible securities generally offer lower interest or dividend yields than non-convertible securities of similar quality. The fund could lose money if the issuer of a convertible security is unable to meet its financial obligations or goes bankrupt. |
| • | | Currency – When the fund invests in securities denominated in foreign currencies, the fund may incur currency conversion costs and may be affected favorably or unfavorably by changes in the rates of exchange between those currencies and the U.S. dollar. Currency exchange rates can be volatile and are affected by, among other factors, the general economics of a country, the actions of the U.S. and foreign governments or control banks, the imposition of currency controls, and speculation. |
| • | | Derivatives – Using derivatives can increase fund losses and reduce opportunities for gains when market prices, interest rates or the derivative instruments themselves behave in a way not anticipated by the fund. Using derivatives also can have a leveraging effect and increase fund volatility. Derivatives may be difficult to sell, unwind or value, and the counterparty may default on its obligations to the fund. The fund’s investments in derivative instruments may involve a small investment relative to the amount of investment exposure assumed and may result in losses exceeding the amounts invested in those instruments. Recent legislation calls for new regulation of the derivatives markets. The extent and impact of the regulation are not yet fully known and may not be for some time. New regulation of derivatives may make them more costly, may limit their availability, or may otherwise adversely affect their value or performance. |
| • | | Emerging Markets – Investing in the securities of issuers located in or principally doing business in emerging markets are subject to foreign securities risks. These risks are greater for investments in emerging markets. Emerging market countries tend to have economic, political and legal systems that are less fully developed and are less stable than those of more advanced countries. Low trading volumes may result in a lack of liquidity and in extreme price volatility. |
| • | | Fixed-Income Securities – The market prices of fixed-income securities may go up or down, sometimes rapidly or unpredictably due to general market conditions, such as real or perceived adverse economic or political conditions, inflation, changes in interest rates, lack of liquidity in the bond markets or adverse investor sentiment. When market prices fall, the value of your investment will go down. A rise in rates tends to have a greater impact on the prices of longer term or duration securities. |
If interest rates rise, repayments of fixed-income securities may occur more slowly than anticipated by the market. This may drive the prices of these securities down because their interest rates are lower than the current interest rate and they remain outstanding longer. This is sometimes referred to as extension risk.
Many issuers have a right to prepay their securities. If interest rates fall, an issuer may exercise this right. If this happens, the fund will be forced to reinvest prepayment proceeds at a time when yields on securities available in the market are lower than the yield on the prepaid security. This is sometimes referred to as prepayment or call risk.
| • | | Foreign Securities – Foreign securities are subject to a number of additional risks, including nationalization or expropriation of assets, imposition of currency controls or restrictions, confiscatory taxation, political or financial instability and other adverse economic or political developments. Lack of information and less market regulation also may affect the value of these securities. |
| • | | Growth Stocks – Returns on growth stocks may not move in tandem with returns on other categories of stocks or the market as a whole. Growth stocks may be particularly susceptible to rapid price swings or to adverse developments. Growth stocks as a group may be out of favor and underperform the overall equity market for a long period of time, for example, while the market favors “value” stocks. |
| • | | Increase in Expenses – Your actual costs of investing in the fund may be higher than the expenses shown in “Annual Fund Operating Expenses” for a variety of reasons. For example, expense ratios may be higher than those shown if average net assets decrease. Net assets are more likely to decrease and fund expense ratios are more likely to increase when markets are volatile. |
89
| • | | Investing Aggressively – The value of developing company stocks may be volatile, and can drop significantly in a short period of time. Rights, options and futures contracts may not be exercised and may expire worthless. Warrants and rights may be less liquid than stocks. Use of futures and other derivatives may make the fund more volatile. |
| • | | IPOs – Initial public offerings (“IPOs”) are subject to specific risks which include, among others: |
| | • | | no track record for consideration; |
| | • | | securities may be illiquid; and |
| | • | | earnings are less predictable. |
| • | | Market – The market prices of the fund’s securities may go up or down, sometimes rapidly or unpredictably, due to general market conditions, such as real or perceived adverse economic or political conditions, inflation, changes in interest rates or currency rates, lack of liquidity in the markets or adverse investor sentiment. Market prices of securities also may go down due to events or conditions that affect particular sectors or issuers. When market prices fall, the value of your investment will go down. The fund may experience a substantial or complete loss on any individual security. The recent financial crisis has caused a significant decline in the value and liquidity of many securities. In response to the financial crisis, the U.S. and other governments and the Federal Reserve and certain foreign central banks have taken steps to support financial markets. The withdrawal of this support could negatively affect the value and liquidity of certain securities. In addition, legislation recently enacted in the U.S. calls for changes in many aspects of financial regulation. The impact of the legislation on the markets, and the practical implications for market participants, may not be fully known for some time. |
| • | | Portfolio Selection – The sub-adviser’s judgment about a particular security or issuer, or about the economy or a particular sector, region or market segment, or about an investment strategy, may prove to be incorrect. |
| • | | Preferred Stock – Preferred stock’s right to dividends and liquidation proceeds is junior to the rights of a company’s debt securities. The value of preferred stock may be subject to factors that affect fixed income and equity securities, including changes in interest rates and in a company’s creditworthiness. Shareholders of preferred stock may suffer a loss of value if dividends are not paid and have limited voting rights. |
| • | | REITs – When the fund invests in Real Estate Investment Trusts (“REITs”), it is subject to risks generally associated with investing in real estate. A REIT’s performance depends on the types and locations of the properties it owns and how well it manages those properties or loan financings. REITs are subject to a highly technical tax structure; and the failure to qualify as a REIT could result in corporate-level taxation, significantly reducing the return on an investment to the fund. |
| • | | Rule 144A and Privately Placed Securities – Rule 144A permits certain qualified institutional buyers, such as the fund, to trade in privately placed securities that have not been registered for sale to the public. Rule 144A and other privately placed securities may be deemed illiquid, and the fund might be unable to dispose of such securities promptly or at reasonable prices. |
| • | | Small- or Medium-Sized Companies – Small- or medium-sized companies may be more at risk than larger companies because, among other things, they may have limited product lines, operating history, market or financial resources, or because they may depend on a limited management group. |
| • | | Stocks – Stocks may be volatile – their prices may go up and down dramatically over the shorter term. These price movements may result from factors affecting individual companies, industries, the securities market as a whole or the over- all economy. |
| • | | Value Investing – The prices of securities the sub-adviser believes are undervalued may not appreciate as anticipated or may go down. Value stocks as a group may be out of favor and underperform the overall equity market for a long period of time, for example, while the market favors “growth” stocks. |
| • | | Warrants and Rights – Warrants and rights may be considered more speculative than certain other types of investments because they do not entitle a holder to the dividends or voting rights for the securities that may be purchased. They do not represent any rights in the assets of the issuing company, and cease to have value if not exercised prior to the expiration date. |
Performance: The bar chart and the table below provide some indication of the risks of investing in the fund by showing you how the fund’s performance has varied from year to year, and how the fund’s Class I2 average annual total returns for different periods compare to the returns of a broad measure of market performance. The table shows average annual total returns for Class I2 shares of the fund. Absent any limitation of the fund’s expenses, total returns would be lower. As with all mutual
90
funds, past performance (before and after taxes) is not a prediction of future results. Updated performance information is available on our website at www.transamericafunds.com or by calling 1-888-233-4339.
Prior to March 22, 2011, the fund was named Transamerica Growth Opportunities, had a different sub-adviser, a different investment objective and used different investment strategies. The performance set forth prior to that date is attributable to the previous sub-adviser.
Annual Total Returns (calendar years ended December 31)

| | | | | | |
| | | Quarter Ended | | Return |
Best Quarter: | | 6/30/2009 | | 20.47% |
Worst Quarter: | | 12/31/2008 | | -23.67% |
Average Annual Total Returns (periods ended December 31, 2010)1
| | | | | | |
| | | 1 Year | | 5 Years | | 10 Years or
Inception* |
Class I2 (commenced operations on November 15, 2005) | | | | | | |
Return before taxes | | 35.90% | | 7.19% | | 7.70% |
Return after taxes on distributions2 | | 35.80% | | 7.17% | | 7.68% |
Return after taxes on distributions and sale of fund shares2 | | 23.46% | | 6.23% | | 6.68% |
Russell Midcap® Growth Index (reflects no deduction for fees, expenses or taxes) | | 26.38% | | 4.88% | | 5.48% |
| 1 | Actual returns may depend on the investor’s individual tax situation. After-tax returns may not be relevant if the investment is made through a tax-exempt or tax-deferred account, such as a 401(k) plan. |
| 2 | The after-tax returns are calculated using the historic highest individual federal marginal income tax rates and do not reflect the impact of state and local taxes. |
| * | Fund and Index returns are for past 10 years or since inception, whichever is less. |
| | |
Management: | | |
| |
| Investment Adviser: | | Sub-Adviser: |
| |
| Transamerica Asset Management, Inc. | | Morgan Stanley Investment Management Inc. |
| |
| | Portfolio Managers: |
| |
| | Dennis P. Lynch, Lead Portfolio Manager since 2011 |
| |
| | David S. Cohen, Portfolio Manager since 2011 |
| |
| | Sam G. Chainai, Portfolio Manager since 2011 |
| |
| | Armistead B. Nash, Portfolio Manager since 2011 |
| |
| | Alexander T. Norton, Portfolio Manager since 2011 |
| |
| | Jason C. Yeung, Portfolio Manager since 2011 |
Purchase and Sale of Fund Shares: Class I2 shares of the fund are currently primarily offered for investment in certain funds of funds (also referred to as “strategic asset allocation funds”). Class I2 shares of the fund are also made available to other investors, including institutional investors such as foreign insurers, domestic insurance companies and their separate accounts, and unaffiliated funds, high net worth individuals, and eligible retirement plans whose recordkeepers or financial service firm intermediaries have entered into agreements with Transamerica Funds or its agents. Investors who received Class I2 shares in connection with the reorganization of a Transamerica Premier Fund into a Transamerica Fund may continue to invest in Class I2 shares of that Transamerica Fund, but may not open new accounts. You buy and redeem shares at the fund’s next-determined net asset value (NAV) after receipt of your request in good order.
Tax Information: Fund distributions may be taxable as ordinary income or capital gains, except when your investment is in an IRA, 401(k) or other tax-advantaged investment plan.
91
Payments to Broker-Dealers and Other Financial Intermediaries: If you purchase the fund through a broker-dealer or other financial intermediary, the fund and/or its affiliates may pay the intermediary for the sale of fund shares and related services. These payments may create a conflict of interest by influencing the broker-dealer or other intermediary and your salesperson to recommend the fund over another investment. Ask your salesperson or visit your financial intermediary’s website for more information.
92
|
| TRANSAMERICA MORGAN STANLEY MID-CAP GROWTH |
Investment Objective: Seeks capital appreciation.
Fees and Expenses: This table describes the fees and expenses that you may pay if you buy and hold shares of the fund. There are no sales charges (load) or other transaction fees.
| | |
Annual Fund Operating Expenses (expenses that you pay each year as a percentage of the value of your investment) |
| | | |
Management fees | | 0.80% |
Distribution and service (12b-1) fees | | None |
Other expenses | | 0.06% |
Total annual fund operating expenses | | 0.86% |
Example: This Example is intended to help you compare the cost of investing in the fund with the cost of investing in other mutual funds. The Example assumes that you invest $10,000. The Example also assumes that your investment has a 5% return each year and that the fund’s operating expenses remain the same. Although your actual costs may be higher or lower, based on these assumptions your costs would be:
| | | | | | |
1 year | | 3 years | | 5 years | | 10 years |
$88 | | $274 | | $477 | | $1,061 |
Portfolio Turnover: The fund pays transaction costs, such as commissions, when it buys and sells securities (or “turns over” its portfolio). A higher portfolio turnover rate may indicate higher transaction costs and may result in higher taxes when fund shares are held in a taxable account. These costs, which are not reflected in annual fund operating expenses or in the Example, affect the fund’s performance. During the most recent fiscal year, the portfolio turnover rate was 50% of the average value of the fund’s portfolio.
Principal Investment Strategies: The fund’s sub-adviser, Morgan Stanley Investment Management, Inc. (“MSIM”), under normal circumstances, invests at least 80% of the fund’s assets in common stocks of mid cap companies. MSIM seeks long-term capital growth by investing primarily in established and emerging companies with capitalizations within the range of companies included in the Russell Midcap® Growth Index, which as of December 31, 2010 was between $752 million and $22.1 billion. MSIM seeks to invest in high quality companies it believes have sustainable competitive advantages and the ability to redeploy capital at high rates of return. MSIM typically favors companies with rising returns on invested capital, above average business visibility, strong free cash flow generation and attractive risk/reward profile. MSIM generally considers selling an investment when it determines the company no longer satisfies its investment criteria.
The fund may also invest in common stocks and other equity securities of small- and large-sized companies, as well as preferred stocks, rights and warrants, and debt securities. The fund may purchase and sell certain derivative instruments, such as options, futures contracts and options on futures contracts, for various portfolio management purposes, including to earn income, facilitate portfolio management and mitigate risks. Derivative instruments used by the fund will be counted toward the 80% policy discussed above to the extent they have economic characteristics similar to the securities included within that policy.
MSIM may invest up to 25% of the fund’s assets in securities of foreign companies, including emerging market securities. MSIM considers an issuer to be from a particular country if (i) its principal securities trading market is in that country; (ii) alone or on a consolidated basis it derives 50% or more of its annual revenue from goods produced, sales made or services performed in that country; or (iii) it is organized under the laws of, or has a principal office in, that country. By applying these tests, it is possible that a particular company could be deemed to be from more than one country. The securities in which the fund may invest may be denominated in U.S. dollars or in currencies other than U.S. dollars. The fund may invest in privately placed securities and initial public offerings.
The fund may also invest up to 10% of its assets in real estate investment trusts (“REITs”).
The fund may invest its assets in cash, cash equivalent securities or short-term debt securities, repurchase agreements and money market instruments. Under adverse or unstable market, economic or political conditions, the fund may take temporary defensive positions in cash and short-term debt securities without limit.
Principal Risks: Many factors affect the fund’s performance. There is no assurance the fund will meet its investment objective. The value of your investment in the fund, as well as the amount of return you receive on your investment, may fluctuate significantly from day to day and over time. You may lose part or all of your investment in the fund or your
93
investment may not perform as well as other similar investments. The following is a summary of certain risks (in alphabetical order) of investing in the fund. You may lose money if you invest in this fund.
| • | | Cash Management and Defensive Investing – Money market instruments or short-term debt securities held by the fund for cash management or defensive investing purposes can fluctuate in value. Like other fixed income securities, they are subject to risk, including market, interest rate and credit risk. If the fund holds cash uninvested, the fund will not earn income on the cash and the fund’s yield will go down. If a significant amount of the fund’s assets are used for cash management or defensive investing purposes, it will be more difficult for the fund to achieve its objective. |
| • | | Convertible Securities – The market value of convertible securities tends to decline as interest rates increase. Convertible securities generally offer lower interest or dividend yields than non-convertible securities of similar quality. The fund could lose money if the issuer of a convertible security is unable to meet its financial obligations or goes bankrupt. |
| • | | Currency – When the fund invests in securities denominated in foreign currencies, the fund may incur currency conversion costs and may be affected favorably or unfavorably by changes in the rates of exchange between those currencies and the U.S. dollar. Currency exchange rates can be volatile and are affected by, among other factors, the general economics of a country, the actions of the U.S. and foreign governments or control banks, the imposition of currency controls, and speculation. |
| • | | Derivatives – Using derivatives can increase fund losses and reduce opportunities for gains when market prices, interest rates or the derivative instruments themselves behave in a way not anticipated by the fund. Using derivatives also can have a leveraging effect and increase fund volatility. Derivatives may be difficult to sell, unwind or value, and the counterparty may default on its obligations to the fund. The fund’s investments in derivative instruments may involve a small investment relative to the amount of investment exposure assumed and may result in losses exceeding the amounts invested in those instruments. Recent legislation calls for new regulation of the derivatives markets. The extent and impact of the regulation are not yet fully known and may not be for some time. New regulation of derivatives may make them more costly, may limit their availability, or may otherwise adversely affect their value or performance. |
| • | | Emerging Markets – Investing in the securities of issuers located in or principally doing business in emerging markets are subject to foreign securities risks. These risks are greater for investments in emerging markets. Emerging market countries tend to have economic, political and legal systems that are less fully developed and are less stable than those of more advanced countries. Low trading volumes may result in a lack of liquidity and in extreme price volatility. |
| • | | Fixed-Income Securities – The market prices of fixed-income securities may go up or down, sometimes rapidly or unpredictably due to general market conditions, such as real or perceived adverse economic or political conditions, inflation, changes in interest rates, lack of liquidity in the bond markets or adverse investor sentiment. When market prices fall, the value of your investment will go down. A rise in rates tends to have a greater impact on the prices of longer term or duration securities. |
If interest rates rise, repayments of fixed-income securities may occur more slowly than anticipated by the market. This may drive the prices of these securities down because their interest rates are lower than the current interest rate and they remain outstanding longer. This is sometimes referred to as extension risk.
Many issuers have a right to prepay their securities. If interest rates fall, an issuer may exercise this right. If this happens, the fund will be forced to reinvest prepayment proceeds at a time when yields on securities available in the market are lower than the yield on the prepaid security. This is sometimes referred to as prepayment or call risk.
| • | | Foreign Securities – Foreign securities are subject to a number of additional risks, including nationalization or expropriation of assets, imposition of currency controls or restrictions, confiscatory taxation, political or financial instability and other adverse economic or political developments. Lack of information and less market regulation also may affect the value of these securities. |
| • | | Growth Stocks – Returns on growth stocks may not move in tandem with returns on other categories of stocks or the market as a whole. Growth stocks may be particularly susceptible to rapid price swings or to adverse developments. Growth stocks as a group may be out of favor and underperform the overall equity market for a long period of time, for example, while the market favors “value” stocks. |
| • | | Increase in Expenses – Your actual costs of investing in the fund may be higher than the expenses shown in “Annual Fund Operating Expenses” for a variety of reasons. For example, expense ratios may be higher than those shown if average net assets decrease. Net assets are more likely to decrease and fund expense ratios are more likely to increase when markets are volatile. |
94
| • | | Investing Aggressively – The value of developing company stocks may be volatile, and can drop significantly in a short period of time. Rights, options and futures contracts may not be exercised and may expire worthless. Warrants and rights may be less liquid than stocks. Use of futures and other derivatives may make the fund more volatile. |
| • | | IPOs – Initial public offerings (“IPOs”) are subject to specific risks which include, among others: |
| | • | | no track record for consideration; |
| | • | | securities may be illiquid; and |
| | • | | earnings are less predictable. |
| • | | Market – The market prices of the fund’s securities may go up or down, sometimes rapidly or unpredictably, due to general market conditions, such as real or perceived adverse economic or political conditions, inflation, changes in interest rates or currency rates, lack of liquidity in the markets or adverse investor sentiment. Market prices of securities also may go down due to events or conditions that affect particular sectors or issuers. When market prices fall, the value of your investment will go down. The fund may experience a substantial or complete loss on any individual security. The recent financial crisis has caused a significant decline in the value and liquidity of many securities. In response to the financial crisis, the U.S. and other governments and the Federal Reserve and certain foreign central banks have taken steps to support financial markets. The withdrawal of this support could negatively affect the value and liquidity of certain securities. In addition, legislation recently enacted in the U.S. calls for changes in many aspects of financial regulation. The impact of the legislation on the markets, and the practical implications for market participants, may not be fully known for some time. |
| • | | Portfolio Selection – The sub-adviser’s judgment about a particular security or issuer, or about the economy or a particular sector, region or market segment, or about an investment strategy, may prove to be incorrect. |
| • | | Preferred Stock – Preferred stock’s right to dividends and liquidation proceeds is junior to the rights of a company’s debt securities. The value of preferred stock may be subject to factors that affect fixed income and equity securities, including changes in interest rates and in a company’s creditworthiness. Shareholders of preferred stock may suffer a loss of value if dividends are not paid and have limited voting rights. |
| • | | Rule 144A and Privately Placed Securities – Rule 144A permits certain qualified institutional buyers, such as the fund, to trade in privately placed securities that have not been registered for sale to the public. Rule 144A and other privately placed securities may be deemed illiquid, and the fund might be unable to dispose of such securities promptly or at reasonable prices. |
| • | | REITs – When the fund invests in Real Estate Investment Trusts (“REITs”), it is subject to risks generally associated with investing in real estate. A REIT’s performance depends on the types and locations of the properties it owns and how well it manages those properties or loan financings. REITs are subject to a highly technical tax structure; and the failure to qualify as a REIT could result in corporate-level taxation, significantly reducing the return on an investment to the fund. |
| • | | Small- or Medium-Sized Companies – Small- or medium-sized companies may be more at risk than larger companies because, among other things, they may have limited product lines, operating history, market or financial resources, or because they may depend on a limited management group. |
| • | | Stocks – Stocks may be volatile – their prices may go up and down dramatically over the shorter term. These price movements may result from factors affecting individual companies, industries, the securities market as a whole or the overall economy. |
| • | | Value Investing – The prices of securities the sub-adviser believes are undervalued may not appreciate as anticipated or may go down. Value stocks as a group may be out of favor and underperform the overall equity market for a long period of time, for example, while the market favors “growth” stocks. |
| • | | Warrants and Rights – Warrants and rights may be considered more speculative than certain other types of investments because they do not entitle a holder to the dividends or voting rights for the securities that may be purchased. They do not represent any rights in the assets of the issuing company, and cease to have value if not exercised prior to the expiration date. |
95
Performance: The bar chart and the table below provide some indication of the risks of investing in the fund by showing you how the fund’s performance has varied from year to year, and how the fund’s Class I2 average annual total returns for different periods compare to the returns of a broad measure of market performance. The table shows average annual total returns for Class I2 shares of the fund. Absent any limitation of the fund’s expenses, total returns would be lower. As with all mutual funds, past performance (before and after taxes) is not a prediction of future results. Updated performance information is available on our website at www.transamericafunds.com or by calling 1-888-233-4339.
Annual Total Returns (calendar years ended December 31)

| | | | | | |
| | | Quarter Ended | | Return |
Best Quarter: | | 6/30/2009 | | 25.96% |
Worst Quarter: | | 12/31/2008 | | -25.98% |
Average Annual Total Returns (periods ended December 31, 2010)1
| | | | | | |
| | | 1 Year | | 5 Years | | 10 Years or
Inception* |
Class I2 (commenced operations on January 3, 2006) |
Return before taxes | | 33.98% | | N/A | | 8.49% |
Return after taxes on distributions2 | | 32.76% | | N/A | | 7.93% |
Return after taxes on distributions and sale of fund shares2 | | 23.68% | | N/A | | 7.21% |
Russell Midcap® Growth Index (reflects no deduction for fees, expenses or taxes) | | 26.38% | | N/A | | 4.89% |
| 1 | Actual returns may depend on the investor’s individual tax situation. After-tax returns may not be relevant if the investment is made through a tax-exempt or tax-deferred account, such as a 401(k) plan. |
| 2 | The after-tax returns are calculated using the historic highest individual federal marginal income tax rates and do not reflect the impact of state and local taxes. |
| * | Fund and Index returns are for past 10 years or since inception, whichever is less. |
| | |
Management: | | |
| |
Investment Adviser: | | Sub-Adviser: |
| |
Transamerica Asset Management, Inc. | | Morgan Stanley Investment Management Inc. |
| |
| | Portfolio Managers: |
| |
| | Dennis P. Lynch, Lead Portfolio Manager since 2006 |
| |
| | David S. Cohen, Portfolio Manager since 2006 |
| |
| | Sam G. Chainani, Portfolio Manager since 2006 |
| |
| | Alexander T. Norton, Portfolio Manager since 2006 |
| |
| | Jason C. Yeung, Portfolio Manager since 2007 |
| |
| | Armistead B. Nash, Portfolio Manager since 2008 |
Purchase and Sale of Fund Shares: Class I2 shares of the fund are currently primarily offered for investment in certain funds of funds (also referred to as “strategic asset allocation funds”). Class I2 shares of the fund are also made available to other investors, including institutional investors such as foreign insurers, domestic insurance companies and their separate accounts, and unaffiliated funds, high net worth individuals, and eligible retirement plans whose recordkeepers or financial service firm intermediaries have entered into agreements with Transamerica Funds or its agents. Investors who received Class I2 shares in connection with the reorganization of a Transamerica Premier Fund into a Transamerica Fund may continue to invest in Class I2 shares of that Transamerica Fund, but may not open new accounts. You buy and redeem shares at the fund’s next-determined net asset value (NAV) after receipt of your request in good order.
96
Tax Information: Fund distributions may be taxable as ordinary income or capital gains, except when your investment is in an IRA, 401(k) or other tax-advantaged investment plan.
Payments to Broker-Dealers and Other Financial Intermediaries: If you purchase the fund through a broker-dealer or other financial intermediary, the fund and/or its affiliates may pay the intermediary for the sale of fund shares and related services. These payments may create a conflict of interest by influencing the broker-dealer or other intermediary and your salesperson to recommend the fund over another investment. Ask your salesperson or visit your financial intermediary’s website for more information.
97
|
| TRANSAMERICA MORGAN STANLEY SMALL COMPANY GROWTH |
Investment Objective: Seeks long-term capital appreciation by investing primarily in growth-oriented equity securities of small capitalization companies.
Fees and Expenses: This table describes the fees and expenses that you may pay if you buy and hold shares of the fund. There are no sales charges (load) or other transaction fees.
| | |
Annual Fund Operating Expenses (expenses that you pay each year as a percentage of the value of your investment) |
| | | |
Management fees | | 0.95% |
Distribution and service (12b-1) fees | | None |
Other expenses | | 0.07% |
Total annual fund operating expenses | | 1.02% |
Example: This Example is intended to help you compare the cost of investing in the fund with the cost of investing in other mutual funds. The Example assumes that you invest $10,000. The Example also assumes that your investment has a 5% return each year and that the fund’s operating expenses remain the same. Although your actual costs may be higher or lower, based on these assumptions your costs would be:
| | | | | | |
1 year | | 3 years | | 5 years | | 10 years |
$104 | | $325 | | $563 | | $1,248 |
Portfolio Turnover: The fund pays transaction costs, such as commissions, when it buys and sells securities (or “turns over” its portfolio). A higher portfolio turnover rate may indicate higher transaction costs and may result in higher taxes when fund shares are held in a taxable account. These costs, which are not reflected in annual fund operating expenses or in the Example, affect the fund’s performance. During the most recent fiscal year, the portfolio turnover rate was 21% of the average value of the fund’s portfolio.
Principal Investment Strategies: The fund’s sub-adviser, Morgan Stanley Investment Management Inc. (“MSIM”), invests, under normal circumstances, at least 80% of the fund’s net assets in equity securities of small capitalization companies. A company is considered to be a small cap company if it has a total market capitalization at the time of purchase of $4 billion or less.
The fund seeks to invest in high quality companies it believes have sustainable competitive advantages and the ability to redeploy capital at high rates of return. MSIM typically favors companies with rising returns on invested capital, above average business visibility, strong free cash flow generation and attractive risk/reward profile. MSIM generally considers selling an investment when it determines the company no longer satisfies its investment criteria.
The fund may invest up to 25% of its net assets in securities of foreign issuers, including issuers located in emerging market or developing countries. MSIM considers an issuer to be from a particular country if (i) its principal securities trading market is in that country; (ii) alone or on a consolidated basis it drives 50% or more of its annual revenue from goods produced, sales made or services performed in that country; or (iii) it is organized under the laws of, or has a principal office in that country. By applying these tests, it is possible that a particular company could be deemed to be from more than one country. The securities in which the fund may invest may be denominated in U.S. dollars or in currencies other than U.S. dollars.
The fund may invest in privately placed securities and initial public offerings.
The fund may purchase and sell certain derivative instruments, such as options, futures contracts and options on futures contracts, for various portfolio management purposes, including to earn income, facilitate portfolio management and mitigate risks. Derivative instruments used by the fund will be counted toward the 80% policy discussed above to the extent they have economic characteristics similar to the securities included within that policy.
The fund may invest its assets in cash, cash equivalent securities or short-term debt securities, repurchase agreements and money market instruments. Under adverse or unstable market, economic or political conditions, the fund may take temporary defensive positions in cash and short-term debt securities without limit.
Principal Risks: Many factors affect the fund’s performance. There is no assurance the fund will meet its investment objective. The value of your investment in the fund, as well as the amount of return you receive on your investment, may fluctuate significantly from day to day and over time. You may lose part or all of your investment in the fund or your investment may not perform as well as other similar investments. The following is a summary of certain risks (in alphabetical order) of investing in the fund. You may lose money if you invest in this fund.
98
| • | | Cash Management and Defensive Investing – Money market instruments or short-term debt securities held by the fund for cash management or defensive investing purposes can fluctuate in value. Like other fixed income securities, they are subject to risk, including market, interest rate and credit risk. If the fund holds cash uninvested, the fund will not earn income on the cash and the fund’s yield will go down. If a significant amount of the fund’s assets are used for cash management or defensive investing purposes, it will be more difficult for the fund to achieve its objective. |
| • | | Convertible Securities – The market value of convertible securities tends to decline as interest rates increase. Convertible securities generally offer lower interest or dividend yields than non-convertible securities of similar quality. The fund could lose money if the issuer of a convertible security is unable to meet its financial obligations or goes bankrupt. |
| • | | Currency – When the fund invests in securities denominated in foreign currencies, the fund may incur currency conversion costs and may be affected favorably or unfavorably by changes in the rates of exchange between those currencies and the U.S. dollar. Currency exchange rates can be volatile and are affected by, among other factors, the general economics of a country, the actions of the U.S. and foreign governments or control banks, the imposition of currency controls, and speculation. |
| • | | Derivatives – Using derivatives can increase fund losses and reduce opportunities for gains when market prices, interest rates or the derivative instruments themselves behave in a way not anticipated by the fund. Using derivatives also can have a leveraging effect and increase fund volatility. Derivatives may be difficult to sell, unwind or value, and the counterparty may default on its obligations to the fund. The fund’s investments in derivative instruments may involve a small investment relative to the amount of investment exposure assumed and may result in losses exceeding the amounts invested in those instruments. Recent legislation calls for new regulation of the derivatives markets. The extent and impact of the regulation are not yet fully known and may not be for some time. New regulation of derivatives may make them more costly, may limit their availability, or may otherwise adversely affect their value or performance. |
| • | | Emerging Markets – Investing in the securities of issuers located in or principally doing business in emerging markets are subject to foreign securities risks. These risks are greater for investments in emerging markets. Emerging market countries tend to have economic, political and legal systems that are less fully developed and are less stable than those of more advanced countries. Low trading volumes may result in a lack of liquidity and in extreme price volatility. |
| • | | Fixed-Income Securities – The market prices of fixed-income securities may go up or down, sometimes rapidly or unpredictably due to general market conditions, such as real or perceived adverse economic or political conditions, inflation, changes in interest rates, lack of liquidity in the bond markets or adverse investor sentiment. When market prices fall, the value of your investment will go down. A rise in rates tends to have a greater impact on the prices of longer term or duration securities. |
If interest rates rise, repayments of fixed-income securities may occur more slowly than anticipated by the market. This may drive the prices of these securities down because their interest rates are lower than the current interest rate and they remain outstanding longer. This is sometimes referred to as extension risk.
Many issuers have a right to prepay their securities. If interest rates fall, an issuer may exercise this right. If this happens, the fund will be forced to reinvest prepayment proceeds at a time when yields on securities available in the market are lower than the yield on the prepaid security. This is sometimes referred to as prepayment or call risk.
| • | | Foreign Securities – Foreign securities are subject to a number of additional risks, including nationalization or expropriation of assets, imposition of currency controls or restrictions, confiscatory taxation, political or financial instability and other adverse economic or political developments. Lack of information and less market regulation also may affect the value of these securities. |
| • | | Growth Stocks – Returns on growth stocks may not move in tandem with returns on other categories of stocks or the market as a whole. Growth stocks may be particularly susceptible to rapid price swings or to adverse developments. Growth stocks as a group may be out of favor and underperform the overall equity market for a long period of time, for example, while the market favors “value” stocks. |
| • | | Increase in Expenses – Your actual costs of investing in the fund may be higher than the expenses shown in “Annual Fund Operating Expenses” for a variety of reasons. For example, expense ratios may be higher than those shown if average net assets decrease. Net assets are more likely to decrease and fund expense ratios are more likely to increase when markets are volatile. |
| • | | IPOs – Initial public offerings (“IPOs”) are subject to specific risks which include, among others: |
| | • | | no track record for consideration; |
99
| | • | | securities may be illiquid; and |
| | • | | earnings are less predictable. |
| • | | Market – The market prices of the fund’s securities may go up or down, sometimes rapidly or unpredictably, due to general market conditions, such as real or perceived adverse economic or political conditions, inflation, changes in interest rates or currency rates, lack of liquidity in the markets or adverse investor sentiment. Market prices of securities also may go down due to events or conditions that affect particular sectors or issuers. When market prices fall, the value of your investment will go down. The fund may experience a substantial or complete loss on any individual security. The recent financial crisis has caused a significant decline in the value and liquidity of many securities. In response to the financial crisis, the U.S. and other governments and the Federal Reserve and certain foreign central banks have taken steps to support financial markets. The withdrawal of this support could negatively affect the value and liquidity of certain securities. In addition, legislation recently enacted in the U.S. calls for changes in many aspects of financial regulation. The impact of the legislation on the markets, and the practical implications for market participants, may not be fully known for some time. |
| • | | Portfolio Selection – The sub-adviser’s judgment about a particular security or issuer, or about the economy or a particular sector, region or market segment, or about an investment strategy, may prove to be incorrect. |
| • | | Rule 144A and Privately Placed Securities – Rule 144A permits certain qualified institutional buyers, such as the fund, to trade in privately placed securities that have not been registered for sale to the public. Rule 144A and other privately placed securities may be deemed illiquid, and the fund might be unable to dispose of such securities promptly or at reasonable prices. |
| • | | Smaller Companies – Small companies may be more at risk than larger companies because, among other things, they may have limited product lines, operating history, market or financial resources, or because they may depend on limited management groups. |
| • | | Stocks – Stocks may be volatile – their prices may go up and down dramatically over the shorter term. These price movements may result from factors affecting individual companies, industries, the securities market as a whole or the overall economy. |
Performance: The bar chart and the table below provide some indication of the risks of investing in the fund by showing you how the fund’s performance has varied from year to year, and how the fund’s Class I2 average annual total returns for different periods compare to the returns of a broad measure of market performance. The table shows average annual total returns for Class I2 shares of the fund. Absent any limitation of the fund’s expenses, total returns would be lower. As with all mutual funds, past performance (before and after taxes) is not a prediction of future results. Updated performance information is available on our website at www.transamericafunds.com or by calling 1-888-233-4339.
Annual Total Returns (calendar years ended December 31)
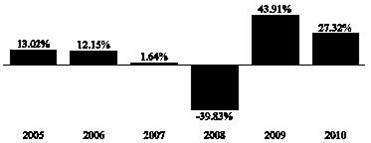
| | | | | | | | | | |
| | | Quarter Ended | | Return |
Best Quarter: | | 6/30/2009 | | 23.03% |
Worst Quarter: | | 12/31/2008 | | -21.77% |
100
Average Annual Total Returns (periods ended December 31, 2010)1
| | | | | | |
| | | 1 Year | | 5 Years�� | | 10 Years or
Inception* |
Class I2 (commenced operations on November 8, 2004) |
Return before taxes | | 27.32% | | 4.67% | | 6.87% |
Return after taxes on distributions2 | | 27.26% | | 3.98% | | 6.21% |
Return after taxes on distributions and sale of fund shares2 | | 17.83% | | 3.80% | | 5.74% |
Russell 2000® Growth Index (reflects no deduction for fees, expenses or taxes) | | 29.09% | | 5.30% | | 6.34% |
| 1 | Actual returns may depend on the investor’s individual tax situation. After-tax returns may not be relevant if the investment is made through a tax-exempt or tax-deferred account, such as a 401(k) plan. |
| 2 | The after-tax returns are calculated using the historic highest individual federal marginal income tax rates and do not reflect the impact of state and local taxes. |
| * | Fund and Index returns are for past 10 years or since inception, whichever is less. |
| | |
| Management: | | |
| |
| Investment Adviser: | | Sub-Adviser: |
| |
| Transamerica Asset Management, Inc. | | Morgan Stanley Investment Management Inc. |
| |
| | Portfolio Managers: |
| |
| | Dennis P. Lynch, Lead Portfolio Manager since 2004 |
| |
| | David S. Cohen, Portfolio Manager since 2004 |
| |
| | Sam G. Chainani, Portfolio Manager since 2004 |
| |
| | Alexander T. Norton, Portfolio Manager since 2005 |
| |
| | Jason C. Yeung, Portfolio Manager since 2007 |
| |
| | Armistead B. Nash, Portfolio Manager since 2008 |
Purchase and Sale of Fund Shares: Class I2 shares of the fund are currently primarily offered for investment in certain funds of funds (also referred to as “strategic asset allocation funds”). Class I2 shares of the fund are also made available to other investors, including institutional investors such as foreign insurers, domestic insurance companies and their separate accounts, and unaffiliated funds, high net worth individuals, and eligible retirement plans whose recordkeepers or financial service firm intermediaries have entered into agreements with Transamerica Funds or its agents. Investors who received Class I2 shares in connection with the reorganization of a Transamerica Premier Fund into a Transamerica Fund may continue to invest in Class I2 shares of that Transamerica Fund, but may not open new accounts. You buy and redeem shares at the fund’s next-determined net asset value (NAV) after receipt of your request in good order.
Tax Information: Fund distributions may be taxable as ordinary income or capital gains, except when your investment is in an IRA, 401(k) or other tax-advantaged investment plan.
Payments to Broker-Dealers and Other Financial Intermediaries: If you purchase the fund through a broker-dealer or other financial intermediary, the fund and/or its affiliates may pay the intermediary for the sale of fund shares and related services. These payments may create a conflict of interest by influencing the broker-dealer or other intermediary and your salesperson to recommend the fund over another investment. Ask your salesperson or visit your financial intermediary’s website for more information.
101
|
| TRANSAMERICA MULTI-MANAGED BALANCED |
Investment Objective: Seeks to provide a high total investment return through investments in a broadly diversified portfolio of stocks, bonds and money market instruments.
Fees and Expenses: This table describes the fees and expenses that you may pay if you buy and hold shares of the fund. There are no sales charges (load) or other transaction fees.
| | |
Annual Fund Operating Expenses (expenses that you pay each year as a percentage of the value of your investment)a |
Management fees | | 0.75% |
Distribution and service (12b-1) fees | | None |
Other expenses | | 0.09% |
Total annual fund operating expenses | | 0.84% |
| a | Annual fund operating expenses are based on estimates for the current fiscal year. |
Note: There were no Class I2 shares of the fund issued as of the fiscal year ended October 31, 2010.
Example: This Example is intended to help you compare the cost of investing in the fund with the cost of investing in other mutual funds. The Example assumes that you invest $10,000. The Example also assumes that your investment has a 5% return each year and that the fund’s operating expenses remain the same. Although your actual costs may be higher or lower, based on these assumptions your costs would be:
| | | | | | |
1 year | | 3 years | | 5 years | | 10 years |
$86 | | $268 | | $466 | | $1,037 |
Portfolio Turnover: The fund pays transaction costs, such as commissions, when it buys and sells securities (or “turns over” its portfolio). A higher portfolio turnover rate may indicate higher transaction costs and may result in higher taxes when fund shares are held in a taxable account. These costs, which are not reflected in annual fund operating expenses or in the Example, affect the fund’s performance. During the most recent fiscal year, the portfolio turnover rate was 99% of the average value of the fund’s portfolio.
Principal Investment Strategies:
The fund has two sub-advisers. J.P. Morgan Investment Management Inc. (“JPMorgan”) manages the equity component of the fund and BlackRock Financial Management, Inc. (“BlackRock”) manages the fixed-income component of the fund.
The fund varies the percentage of assets invested in any one type of security in accordance with its sub-advisers’ interpretation of economic and market conditions, fiscal and monetary policy, and underlying securities values. Generally, the fund invests approximately 60% of its assets in equity securities and 40% of its assets in fixed-income and money market securities (investing at least 25% of its assets in fixed-income senior securities, including debt securities and preferred stocks).
Equity component - JPMorgan seeks to achieve the fund’s objective by investing, under normal circumstances, at least 80% of the equity component’s net assets in equity securities of large- and medium-capitalization U.S. companies. The fund may invest in foreign companies. JPMorgan will normally keep the equity component as fully invested in equity securities as practicable. Industry by industry, the fund’s weightings are generally similar to those of the Standard & Poor’s 500® Index (“S&P 500 Index”). JPMorgan normally does not look to overweight or underweight industries. Holdings by industry sector will normally approximate those of the S&P 500 Index.
Fixed income component - The fixed income component of the fund is normally invested primarily in investment grade debt securities and U.S. government obligations, mortgage-backed securities guaranteed by U.S. government agencies and instrumentalities and mortgage-backed securities without government guarantees. Its dollar-weighted average effective maturity generally is between five and fifteen years (and does not exceed thirty years). The fund may also invest in U.S. Treasury and agency securities, municipal bonds, corporate bonds, asset-backed securities (including collateralized loan obligations, collateralized bond obligations and collateralized debt obligations), high quality, short-term obligations and repurchase agreements, and in securities of foreign issuers. The fund may invest in securities that are denominated in U.S. dollars and in foreign currencies. Up to 20% of the fixed income component may be invested in any or all of non-dollar securities, high yield debt securities and emerging market securities.
The fund may, but is not required to, engage in certain investment strategies involving derivatives, such as options, futures, swaps, and forward currency contracts. These investment strategies may be employed to attempt to alter investment characteristics of the fund’s portfolio.
102
The fund may invest its assets in cash, cash equivalent securities or short-term debt securities, repurchase agreements and money market securities. Under adverse or unstable market, economic or political conditions, the fund may take temporary defensive positions in cash and short-term debt securities without limit.
Principal Risks: Many factors affect the fund’s performance. There is no assurance the fund will meet its investment objective. The value of your investment in the fund, as well as the amount of return you receive on your investment, may fluctuate significantly from day to day and over time. You may lose part or all of your investment in the fund or your investment may not perform as well as other similar investments. The following is a summary of certain risks (in alphabetical order) of investing in the fund. You may lose money if you invest in this fund.
| • | | Active Trading – Certain funds are actively managed and, under appropriate circumstances, may purchase and sell securities without regard to the length of time held. A high portfolio turnover rate may have a negative impact on performance by increasing transaction costs and may generate greater tax liabilities for shareholders holding shares in taxable accounts. |
| • | | Cash Management and Defensive Investing – Money market instruments or short-term debt securities held by the fund for cash management or defensive investing purposes can fluctuate in value. Like other fixed income securities, they are subject to risk, including market, interest rate and credit risk. If the fund holds cash uninvested, the fund will not earn income on the cash and the fund’s yield will go down. If a significant amount of the fund’s assets are used for cash management or defensive investing purposes, it will be more difficult for the fund to achieve its objective. |
| • | | Credit – If an issuer or guarantor of a security held by the fund or a counterparty to a financial contract with the fund defaults or is downgraded, or if the value of the assets underlying a security declines, the value of your investment will decline. Junk bonds have a higher risk of default and are considered speculative. A default or downgrade will have a greater impact on subordinated securities. |
| • | | Currency – When the fund invests in securities denominated in foreign currencies, the fund may incur currency conversion costs and may be affected favorably or unfavorably by changes in the rates of exchange between those currencies and the U.S. dollar. Currency exchange rates can be volatile and are affected by, among other factors, the general economics of a country, the actions of the U.S. and foreign governments or control banks, the imposition of currency controls, and speculation. |
| • | | Derivatives – Using derivatives can increase fund losses and reduce opportunities for gains when market prices, interest rates or the derivative instruments themselves behave in a way not anticipated by the fund. Using derivatives also can have a leveraging effect and increase fund volatility. Derivatives may be difficult to sell, unwind or value, and the counterparty may default on its obligations to the fund. The fund’s investments in derivative instruments may involve a small investment relative to the amount of investment exposure assumed and may result in losses exceeding the amounts invested in those instruments. Recent legislation calls for new regulation of the derivatives markets. The extent and impact of the regulation are not yet fully known and may not be for some time. New regulation of derivatives may make them more costly, may limit their availability, or may otherwise adversely affect their value or performance. |
| • | | Emerging Markets – Investing in the securities of issuers located in or principally doing business in emerging markets are subject to foreign securities risks. These risks are greater for investments in emerging markets. Emerging market countries tend to have economic, political and legal systems that are less fully developed and are less stable than those of more advanced countries. Low trading volumes may result in a lack of liquidity and in extreme price volatility. |
| • | | Fixed-Income Securities – The market prices of fixed-income securities may go up or down, sometimes rapidly or unpredictably due to general market conditions, such as real or perceived adverse economic or political conditions, inflation, changes in interest rates, lack of liquidity in the bond markets or adverse investor sentiment. When market prices fall, the value of your investment will go down. A rise in rates tends to have a greater impact on the prices of longer term or duration securities. |
If interest rates rise, repayments of fixed-income securities may occur more slowly than anticipated by the market. This may drive the prices of these securities down because their interest rates are lower than the current interest rate and they remain outstanding longer. This is sometimes referred to as extension risk.
Many issuers have a right to prepay their securities. If interest rates fall, an issuer may exercise this right. If this happens, the fund will be forced to reinvest prepayment proceeds at a time when yields on securities available in the market are lower than the yield on the prepaid security. This is sometimes referred to as prepayment or call risk.
| • | | Foreign Securities – Foreign securities are subject to a number of additional risks, including nationalization or expropriation of assets, imposition of currency controls or restrictions, confiscatory taxation, political or financial instability |
103
| | and other adverse economic or political developments. Lack of information and less market regulation also may affect the value of these securities. |
| • | | Growth Stocks – Returns on growth stocks may not move in tandem with returns on other categories of stocks or the market as a whole. Growth stocks may be particularly susceptible to rapid price swings or to adverse developments. Growth stocks as a group may be out of favor and underperform the overall equity market for a long period of time, for example, while the market favors “value” stocks. |
| • | | High-Yield Debt Securities – High-yield debt securities, or junk bonds, are securities that are rated below “investment grade” (that is, securities rated below Baa/BBB) or, if unrated, are considered by the sub-adviser to be of equivalent quality. Changes in interest rates, the market’s perception of the issuers and the creditworthiness of the issuers may significantly affect the value of these bonds. Junk bonds have a higher risk of default, tend to be less liquid and may be more difficult to value. |
| • | | Increase in Expenses – Your actual costs of investing in the fund may be higher than the expenses shown in “Annual Fund Operating Expenses” for a variety of reasons. For example, expense ratios may be higher than those shown if average net assets decrease. Net assets are more likely to decrease and fund expense ratios are more likely to increase when markets are volatile. |
| • | | Inflation-Protected Securities – Inflation-protected debt securities may react differently from other types of debt securities and tend to react to changes in “real” interest rates. Real interest rates represent nominal (stated) interest rates reduced by the expected impact of inflation. In general, the price of an inflation-protected debt security can fall when real interest rates rise, and can rise when real interest rates fall. Interest payments on inflation-protected debt securities can be unpredictable and will vary as the principal and/or interest is adjusted for inflation. Also, the inflation index utilized by a particular inflation-protected security may not accurately reflect the true rate of inflation, in which case the market value of the security could be adversely affected. |
| • | | Interest Rate – Fixed-income securities have varying levels of sensitivity to changes in interest rates. In general, the price of a fixed-income security tends to fall when interest rates rise and can rise when interest rates fall. A change in interest rates will not have the same impact on all fixed-income securities. Generally, the longer the maturity or duration of a fixed-income security, the greater the impact of a rise in interest rates on the security’s value. In addition, different interest rate measures (such as short- and long-term interest rates and U.S. and foreign interest rates), or interest rates on different types of securities or securities of different issuers, may not necessarily change in the same amount or in the same direction. When interest rates go down, the income received by the fund, and the fund’s yield, may decline. |
| • | | Liquidity – Some securities held by the fund may be difficult to sell, or illiquid, particularly during times of market turmoil. Illiquid securities may also be difficult to value. If the fund is forced to sell an illiquid asset to meet redemption requests or other cash needs, the fund may be forced to sell at a loss. |
| • | | Loans – Loans are subject to the credit risk of nonpayment of principal or interest. Economic downturns or increases in interest rates may cause an increase in defaults, interest rate risk and liquidity risk. Loans may or may not be collateralized at the time of acquisition, and any collateral may be relatively illiquid or lose all or substantially all of its value subsequent to investment. In the event of bankruptcy of a borrower, the fund could experience delays or limitations with respect to its ability to realize the benefits of any collateral securing a loan. The fund’s investments in loans are also subject to prepayment or call risk. |
| • | | Market – The market prices of the fund’s securities may go up or down, sometimes rapidly or unpredictably, due to general market conditions, such as real or perceived adverse economic or political conditions, inflation, changes in interest rates or currency rates, lack of liquidity in the markets or adverse investor sentiment. Market prices of securities also may go down due to events or conditions that affect particular sectors or issuers. When market prices fall, the value of your investment will go down. The fund may experience a substantial or complete loss on any individual security. The recent financial crisis has caused a significant decline in the value and liquidity of many securities. In response to the financial crisis, the U.S. and other governments and the Federal Reserve and certain foreign central banks have taken steps to support financial markets. The withdrawal of this support could negatively affect the value and liquidity of certain securities. In addition, legislation recently enacted in the U.S. calls for changes in many aspects of financial regulation. The impact of the legislation on the markets, and the practical implications for market participants, may not be fully known for some time. |
| • | | Mortgage-Related and Asset-Backed Securities – Mortgage-backed securities may be issued by private issuers, by government-sponsored entities such as Fannie Mae or Freddie Mac or by agencies of the U.S. government, such as Ginnie Mae. Mortgage-backed securities represent direct or indirect participations in, or are collateralized by and payable from, mortgage loans secured by real property. Unlike mortgage-related securities issued or guaranteed by agencies of the U.S. |
104
| | government or government-sponsored entities, mortgage-related securities issued by private issuers do not have a government or government-sponsored entity guarantee (but may have other credit enhancement), and may, and frequently do, have less favorable collateral, credit risk or other underwriting characteristics. Mortgage-backed securities are also particularly susceptible to prepayment and extension risks. Asset-backed securities represent participations in, or are secured by and payable from, assets such as installment sales or loan contracts, leases, credit card receivables and other categories of receivables. Certain asset-backed securities present a heightened level of risk because, in the event of default, the liquidation value of the underlying assets may be inadequate to pay any unpaid principal or interest. The value of mortgage-backed and asset-backed securities may be affected by changes in credit quality or value of the mortgage loans or other assets that support the securities. |
| • | | Preferred Stock – Preferred stock’s right to dividends and liquidation proceeds is junior to the rights of a company’s debt securities. The value of preferred stock may be subject to factors that affect fixed income and equity securities, including changes in interest rates and in a company’s creditworthiness. Shareholders of preferred stock may suffer a loss of value if dividends are not paid and have limited voting rights. |
| • | | Portfolio Selection – The sub-adviser’s judgment about a particular security or issuer, or about the economy or a particular sector, region or market segment, or about an investment strategy, may prove to be incorrect. |
| • | | Repurchase Agreements – If the other party to a repurchase agreement defaults on its obligation, the fund may suffer delays and incur costs or lose money in exercising its rights under the agreement. If the seller fails to repurchase the security and the market value declines, the fund could lose money. If the seller becomes insolvent and subject to liquidation or reorganization under applicable bankruptcy or other laws, the fund’s ability to dispose of the underlying securities may be restricted. |
| • | | Small- or Medium-Sized Companies – Small- or medium-sized companies may be more at risk than larger companies because, among other things, they may have limited product lines, operating history, market or financial resources, or because they may depend on a limited management group. |
| • | | Stocks – Stocks may be volatile – their prices may go up and down dramatically over the shorter term. These price movements may result from factors affecting individual companies, industries, the securities market as a whole or the overall economy. |
| • | | U.S. Government Agency Obligations – Government agency obligations have different levels of credit support and, therefore, different degrees of credit risk. Securities issued by agencies and instrumentalities of the U.S. government that are supported by the full faith and credit of the United States generally present a lesser degree of credit risk than securities issued by agencies and instrumentalities sponsored by the U.S. government that are supported only by the issuer’s right to borrow from the U.S. Treasury and securities issued by agencies and instrumentalities sponsored by the U.S. government that are supported only by the credit of the issuing agencies. |
| • | | Valuation – The sales price the fund could receive for any particular portfolio investment may differ from the fund’s valuation of the investment, particularly for securities that trade in thin or volatile markets or that are valued using a fair value methodology. |
| • | | Value Investing – The prices of securities the sub-adviser believes are undervalued may not appreciate as anticipated or may go down. Value stocks as a group may be out of favor and underperform the overall equity market for a long period of time, for example, while the market favors “growth” stocks. |
Performance: The past performance information shown below is for Class A shares, which are not available through this prospectus. Although Class I2 shares would have substantially similar annual returns as Class A shares because the classes are invested in the same portfolio of securities, the returns for Class A shares will vary from Class I2 shares to the extent that the classes do not have the same expenses, and because Class I2 shares are not subject to sales charges (which are reflected in the performance information for Class A shares in the table).
The bar chart and the table below provide some indication of the risks of investing in the fund by showing you how the fund’s performance has varied from year to year, and how the fund’s average annual total returns for different periods compare to the returns of a broad measure of market performance, as well as comparison to a secondary index which is used to more closely reflect the principal strategies and policies of the fund. The bar chart does not reflect the impact of sales charges, which if reflected, would lower returns. The table includes deduction of applicable Class A sales charges. Absent any limitation of the fund’s expenses, total returns would be lower. As with all mutual funds, past performance (before and after taxes) is not a prediction of future results. Updated performance information is available on our website at www.transamericafunds.com or by calling 1-888-233-4339.
105
Prior to May 28, 2004, the fund had a different sub-adviser, a different investment objective and used different investment strategies. The performance set forth prior to that date is attributable to the previous sub-adviser.
Prior to March 22, 2011, the fund was named Transamerica Balanced, had a different sub-adviser, a different investment objective and used different investment strategies. The performance set forth prior to that date is attributable to the previous sub-adviser.
Annual Total Returns (calendar years ended December 31) – Class A

| | | | |
| | | Quarter Ended | | Return |
Best Quarter: | | 6/30/2009 | | 13.89% |
Worst Quarter: | | 12/31/2008 | | -16.46% |
Average Annual Total Returns (periods ended December 31, 2010)1
| | | | | | |
| | | 1 Year | | 5 Years | | 10 Years or Inception* |
| Class A (commenced operations on December 2, 1994) |
| Return before taxes | | 17.11% | | 4.15% | | 3.52% |
| Return after taxes on distributions2 | | 16.42% | | 3.52% | | 2.98% |
| Return after taxes on distributions and sale of fund shares2 | | 11.39% | | 3.33% | | 2.77% |
| Standard & Poor’s 500® Index (reflects no deduction for fees, expenses, or taxes) | | 15.06% | | 2.29% | | 1.41% |
| Barclays Capital U.S. Aggregate Bond Index (reflects no deduction for fees,expenses, or taxes) | | 6.54% | | 5.80% | | 5.84% |
| | 1 | Actual returns may depend on the investor’s individual tax situation. After-tax returns may not be relevant if the investment is made through a tax-exempt or tax-deferred account, such as a 401(k) plan. |
| | 2 | The after-tax returns are calculated using the historic highest individual federal marginal income tax rates and do not reflect the impact of state and local taxes. |
| | * | Fund and Index returns are for past 10 years or since inception, whichever is less. |
Management:
| | |
| Investment Adviser: | | Sub-Adviser: |
| |
| Transamerica Asset Management, Inc. | | BlackRock Financial Management, Inc. |
| |
| | Portfolio Managers: |
| |
| | Matthew Marra, Portfolio Manager since 2011 |
| |
| | Eric Pellicciaro, Portfolio Manager since 2011 |
| |
| | Rick Rieder, Portfolio Manager since 2011 |
| |
| | Sub-Adviser: |
| |
| | J.P. Morgan Investment Management Inc. |
| |
| | Portfolio Managers: |
| |
| | Scott Blasdell, CFA, Portfolio Manager since 2011 |
| |
| | Terance Chen, CFA, Portfolio Manager since 2011 |
| |
| | Raffaele Zingone, CFA, Portfolio Manager since 2011 |
Purchase and Sale of Fund Shares: Class I2 shares of the fund are currently primarily offered for investment in certain funds of funds (also referred to as “strategic asset allocation funds”). Class I2 shares of the fund are also made available to other investors, including institutional investors such as foreign insurers, domestic insurance companies and their separate accounts, and unaffiliated funds, high net worth individuals, and eligible retirement plans whose recordkeepers or financial service firm
106
intermediaries have entered into agreements with Transamerica Funds or its agents. Investors who received Class I2 shares in connection with the reorganization of a Transamerica Premier Fund into a Transamerica Fund may continue to invest in Class I2 shares of that Transamerica Fund, but may not open new accounts. You buy and redeem shares at the fund’s next-determined net asset value (NAV) after receipt of your request in good order.
Tax Information: Fund distributions may be taxable as ordinary income or capital gains, except when your investment is in an IRA, 401(k) or other tax-advantaged investment plan.
Payments to Broker-Dealers and Other Financial Intermediaries: If you purchase the fund through a broker-dealer or other financial intermediary, the fund and/or its affiliates may pay the intermediary for the sale of fund shares and related services. These payments may create a conflict of interest by influencing the broker-dealer or other intermediary and your salesperson to recommend the fund over another investment. Ask your salesperson or visit your financial intermediary’s website for more information.
107
|
| TRANSAMERICA NEUBERGER BERMAN INTERNATIONAL |
Investment Objective: Seeks long-term growth of capital.
Fees and Expenses: This table describes the fees and expenses that you may pay if you buy and hold shares of the fund. There are no sales charges (load) or other transaction fees.
| | |
Annual Fund Operating Expenses (expenses that you pay each year as a percentage of the value of your investment) |
| | | |
Management fees | | 0.96% |
Distribution and service (12b-1) fees | | None |
Other expenses | | 0.10% |
Total annual fund operating expenses | | 1.06% |
Example: This Example is intended to help you compare the cost of investing in the fund with the cost of investing in other mutual funds. The Example assumes that you invest $10,000. The Example also assumes that your investment has a 5% return each year and that the fund’s operating expenses remain the same. Although your actual costs may be higher or lower, based on these assumptions your costs would be:
| | | | | | |
1 year | | 3 years | | 5 years | | 10 years |
$108 | | $337 | | $585 | | $1,294 |
Portfolio Turnover: The fund pays transaction costs, such as commissions, when it buys and sells securities (or “turns over” its portfolio). A higher portfolio turnover rate may indicate higher transaction costs and may result in higher taxes when fund shares are held in a taxable account. These costs, which are not reflected in annual fund operating expenses or in the Example, affect the fund’s performance. During the most recent fiscal year, the portfolio turnover rate was 51% of the average value of the fund’s portfolio.
Principal Investment Strategies: The fund’s sub-adviser, Neuberger Berman Management LLC (“Neuberger”), invests, under normal circumstances, primarily in common stocks of foreign companies of any size, including companies that are economically tied to developed and emerging industrialized markets. The fund will normally invest in a number of countries throughout the world and expects to be investing in more than three different foreign countries.
The fund seeks to reduce risk by diversifying among many industries. Although the fund has the flexibility to invest a significant portion of its assets in one country or region, it generally intends to remain diversified across countries and geographical regions.
In picking stocks, Neuberger looks for well-managed and profitable companies that show growth potential and whose stock prices are undervalued.
Neuberger may seek to hedge a currency exposure resulting from securities positions when it finds the currency exposure unattractive.
The fund follows a disciplined selling strategy and may sell a stock when it reaches a target price, fails to perform as expected, or when other opportunities appear more attractive. The fund may also engage in borrowing and securities lending transactions and use derivatives.
The fund may invest in cash, cash equivalent securities or short-term debt securities, repurchase agreements and money market instruments. Under adverse or unstable market, economic or political conditions, the fund may take temporary defensive positions in cash and short-term debt securities without limit.
Principal Risks: Many factors affect the fund’s performance. There is no assurance the fund will meet its investment objective. The value of your investment in the fund, as well as the amount of return you receive on your investment, may fluctuate significantly from day to day and over time. You may lose part or all of your investment in the fund or your investment may not perform as well as other similar investments. The following is a summary of certain risks (in alphabetical order) of investing in the fund. You may lose money if you invest in this fund.
| • | | Cash Management and Defensive Investing – Money market instruments or short-term debt securities held by the fund for cash management or defensive investing purposes can fluctuate in value. Like other fixed income securities, they are subject to risk, including market, interest rate and credit risk. If the fund holds cash uninvested, the fund will not earn income on the cash and the fund’s yield will go down. If a significant amount of the fund’s assets are used for cash management or defensive investing purposes, it will be more difficult for the fund to achieve its objective. |
108
| • | | Country, Sector or Industry Focus – To the extent the fund invests a significant portion of its assets in one or more countries, sectors or industries, the fund will be more susceptible to negative events affecting those countries, sectors or industries. |
| • | | Currency – When the fund invests in securities denominated in foreign currencies, the fund may incur currency conversion costs and may be affected favorably or unfavorably by changes in the rates of exchange between those currencies and the U.S. dollar. Currency exchange rates can be volatile and are affected by, among other factors, the general economics of a country, the actions of the U.S. and foreign governments or control banks, the imposition of currency controls, and speculation. |
| • | | Currency Hedging – The fund may hedge its currency risk using currency futures, forwards or options. However, these instruments may not always work as intended, and a fund may be worse off than if it had not used a hedging instrument. |
| • | | Derivatives – Using derivatives can increase fund losses and reduce opportunities for gains when market prices, interest rates or the derivative instruments themselves behave in a way not anticipated by the fund. Using derivatives also can have a leveraging effect and increase fund volatility. Derivatives may be difficult to sell, unwind or value, and the counterparty may default on its obligations to the fund. The fund’s investments in derivative instruments may involve a small investment relative to the amount of investment exposure assumed and may result in losses exceeding the amounts invested in those instruments. Recent legislation calls for new regulation of the derivatives markets. The extent and impact of the regulation are not yet fully known and may not be for some time. New regulation of derivatives may make them more costly, may limit their availability, or may otherwise adversely affect their value or performance. |
| • | | Emerging Markets – Investing in the securities of issuers located in or principally doing business in emerging markets are subject to foreign securities risks. These risks are greater for investments in emerging markets. Emerging market countries tend to have economic, political and legal systems that are less fully developed and are less stable than those of more advanced countries. Low trading volumes may result in a lack of liquidity and in extreme price volatility. |
| • | | Foreign Securities – Foreign securities are subject to a number of additional risks, including nationalization or expropriation of assets, imposition of currency controls or restrictions, confiscatory taxation, political or financial instability and other adverse economic or political developments. Lack of information and less market regulation also may affect the value of these securities. |
| • | | Growth Stocks – Returns on growth stocks may not move in tandem with returns on other categories of stocks or the market as a whole. Growth stocks may be particularly susceptible to rapid price swings or to adverse developments. Growth stocks as a group may be out of favor and underperform the overall equity market for a long period of time, for example, while the market favors “value” stocks. |
| • | | Increase in Expenses – Your actual costs of investing in the fund may be higher than the expenses shown in “Annual Fund Operating Expenses” for a variety of reasons. For example, expense ratios may be higher than those shown if average net assets decrease. Net assets are more likely to decrease and fund expense ratios are more likely to increase when markets are volatile. |
| • | | Leveraging – The value of your investment may be more volatile if the fund borrows or uses derivatives that have a leveraging effect on the fund. Other risks also will be compounded. This is because leverage generally magnifies the effect of a change in the value of an asset and creates a risk of loss of value on a larger pool of assets than the fund would otherwise have had. The fund also may have to sell assets at inopportune times to satisfy its obligations. |
| • | | Liquidity – Some securities held by the fund may be difficult to sell, or illiquid, particularly during times of market turmoil. Illiquid securities may also be difficult to value. If the fund is forced to sell an illiquid asset to meet redemption requests or other cash needs, the fund may be forced to sell at a loss. |
| • | | Market – The market prices of the fund’s securities may go up or down, sometimes rapidly or unpredictably, due to general market conditions, such as real or perceived adverse economic or political conditions, inflation, changes in interest rates or currency rates, lack of liquidity in the markets or adverse investor sentiment. Market prices of securities also may go down due to events or conditions that affect particular sectors or issuers. When market prices fall, the value of your investment will go down. The fund may experience a substantial or complete loss on any individual security. The recent financial crisis has caused a significant decline in the value and liquidity of many securities. In response to the financial crisis, the U.S. and other governments and the Federal Reserve and certain foreign central banks have taken steps to support financial markets.The withdrawal of this support could negatively affect the value and liquidity of certain securities. In addition, legislation recently enacted in the U.S. calls for changes in many aspects of financial regulation. The impact of the legislation on the markets, and the practical implications for market participants, may not be fully known for some time. |
109
| • | | Portfolio Selection – The sub-adviser’s judgment about a particular security or issuer, or about the economy or a particular sector, region or market segment, or about an investment strategy, may prove to be incorrect. |
| • | | Small- or Medium-Sized Companies – Small- or medium-sized companies may be more at risk than larger companies because, among other things, they may have limited product lines, operating history, market or financial resources, or because they may depend on a limited management group. |
| • | | Stocks – Stocks may be volatile – their prices may go up and down dramatically over the shorter term. These price movements may result from factors affecting individual companies, industries, the securities market as a whole or the overall economy. |
| • | | Value Investing – The prices of securities the sub-adviser believes are undervalued may not appreciate as anticipated or may go down. Value stocks as a group may be out of favor and underperform the overall equity market for a long period of time, for example, while the market favors “growth” stocks. |
Performance: The bar chart and the table below provide some indication of the risks of investing in the fund by showing you how the fund’s performance has varied from year to year, and how the fund’s Class I2 average annual total returns for different periods compare to the returns of a broad measure of market performance. The table shows average annual total returns for Class I2 shares of the fund. Absent any limitation of the fund’s expenses, total returns would be lower. As with all mutual funds, past performance (before and after taxes) is not a prediction of future results. Updated performance information is available on our website at www.transamericafunds.com or by calling 1-888-233-4339.
Annual Total Returns (calendar years ended December 31)

| | | | |
| | | Quarter Ended | | Return |
Best Quarter: | | 6/30/2009 | | 23.76% |
Worst Quarter: | | 9/30/2008 | | -24.52% |
Average Annual Total Returns (periods ended December 31, 2010)1
| | | | | | |
| | | 1 Year | | 5 Years | | 10 Years or Inception* |
Class I2 (commenced operations on December 6, 2005) |
Return before taxes | | 18.30% | | 2.27% | | 2.56% |
Return after taxes on distributions2 | | 18.10% | | 1.47% | | 1.76% |
Return after taxes on distributions and sale of fund shares2 | | 12.17% | | 1.77% | | 2.01% |
| Morgan Stanley Capital International-Europe, Australasia, Far East Index (reflects no deduction for fees, expenses or taxes) | | 8.21% | | 2.94% | | 3.43% |
| | 1 | Actual returns may depend on the investor’s individual tax situation. After-tax returns may not be relevant if the investment is made through a tax-exempt or tax-deferred account, such as a 401(k) plan. |
| | 2 | The after-tax returns are calculated using the historic highest individual federal marginal income tax rates and do not reflect the impact of state and local taxes. |
| | * | Fund and Index returns are for past 10 years or since inception, whichever is less. |
Management:
| | |
| Investment Adviser: | | Sub-Adviser: |
| |
| Transamerica Asset Management, Inc. | | Neuberger Berman Management LLC |
| |
| | Portfolio Manager: |
| |
| | Benjamin Segal, CFA, Portfolio Manager since 2005 |
110
Purchase and Sale of Fund Shares: Class I2 shares of the fund are currently primarily offered for investment in certain funds of funds (also referred to as “strategic asset allocation funds”). Class I2 shares of the fund are also made available to other investors, including institutional investors such as foreign insurers, domestic insurance companies and their separate accounts, and unaffiliated funds, high net worth individuals, and eligible retirement plans whose recordkeepers or financial service firm intermediaries have entered into agreements with Transamerica Funds or its agents. Investors who received Class I2 shares in connection with the reorganization of a Transamerica Premier Fund into a Transamerica Fund may continue to invest in Class I2 shares of that Transamerica Fund, but may not open new accounts. You buy and redeem shares at the fund’s next-determined net asset value (NAV) after receipt of your request in good order.
Tax Information: Fund distributions may be taxable as ordinary income or capital gains, except when your investment is in an IRA, 401(k) or other tax-advantaged investment plan.
Payments to Broker-Dealers and Other Financial Intermediaries: If you purchase the fund through a broker-dealer or other financial intermediary, the fund and/or its affiliates may pay the intermediary for the sale of fund shares and related services. These payments may create a conflict of interest by influencing the broker-dealer or other intermediary and your salesperson to recommend the fund over another investment. Ask your salesperson or visit your financial intermediary’s website for more information.
111
|
| TRANSAMERICA OPPENHEIMER DEVELOPING MARKETS |
Investment Objective: Aggressively seeks capital appreciation.
Fees and Expenses: This table describes the fees and expenses that you may pay if you buy and hold shares of the fund. There are no sales charges (load) or other transaction fees.
| | |
Annual Fund Operating Expenses (expenses that you pay each year as a percentage of the value of your investment) |
| | |
Management fees | | 1.12% |
Distribution and service (12b-1) fees | | None |
Other expenses | | 0.19% |
Total annual fund operating expenses | | 1.31% |
Example: This Example is intended to help you compare the cost of investing in the fund with the cost of investing in other mutual funds. The Example assumes that you invest $10,000. The Example also assumes that your investment has a 5% return each year and that the fund’s operating expenses remain the same. Although your actual costs may be higher or lower, based on these assumptions your costs would be:
| | | | | | |
1 year | | 3 years | | 5 years | | 10 years |
$133 | | $415 | | $718 | | $1,579 |
Portfolio Turnover: The fund pays transaction costs, such as commissions, when it buys and sells securities (or “turns over” its portfolio). A higher portfolio turnover rate may indicate higher transaction costs and may result in higher taxes when fund shares are held in a taxable account. These costs, which are not reflected in annual fund operating expenses or in the Example, affect the fund’s performance. During the most recent fiscal year, the portfolio turnover rate was 54% of the average value of the fund’s portfolio.
Principal Investment Strategies: The fund’s sub-adviser, OppenheimerFunds, Inc. (“Oppenheimer”), invests, under normal circumstances, at least 80% of the fund’s net assets in equity securities of issuers that are economically tied to one or more emerging markets countries. The fund will normally invest in at least three different emerging markets countries. The fund can (but is not required to) invest up to 100% of its total assets in foreign securities. The fund will emphasize investments in common stocks and other equity securities. The fund will emphasize investments in growth companies, which can be in any market capitalization range.
In selecting securities for the fund, Oppenheimer looks primarily for foreign companies in developing markets with high growth potential. It uses fundamental analysis of a company’s financial statements, management structure, operations and product development, and considers the special factors and risks of the country in which the issuer operates.
Oppenheimer generally defines “developing markets” as countries outside the U.S. and most of Western Europe, Canada, Japan, Australia and New Zealand that have economies, industries and stock markets that it believes are growing and gaining more stability and offer attractive long-term investment prospects.
The fund may also invest in small, unseasoned companies, special situations and temporary defensive and interim investments.
The fund may invest its assets in cash, cash equivalent securities or short-term debt securities, repurchase agreements and money market instruments. Under adverse or unstable market, economic or political conditions, the fund may take temporary defensive positions in cash and short-term debt securities without limit.
Principal Risks: Many factors affect the fund’s performance. There is no assurance the fund will meet its investment objective. The value of your investment in the fund, as well as the amount of return you receive on your investment, may fluctuate significantly from day to day and over time. You may lose part or all of your investment in the fund or your investment may not perform as well as other similar investments. The following is a summary of certain risks (in alphabetical order) of investing in the fund. You may lose money if you invest in this fund.
| • | | Cash Management and Defensive Investing – Money market instruments or short-term debt securities held by the fund for cash management or defensive investing purposes can fluctuate in value. Like other fixed income securities, they are subject to risk, including market, interest rate and credit risk. If the fund holds cash uninvested, the fund will not earn income on the cash and the fund’s yield will go down. If a significant amount of the fund’s assets are used for cash management or defensive investing purposes, it will be more difficult for the fund to achieve its objective. |
112
| • | | Convertible Securities – The market value of convertible securities tends to decline as interest rates increase. Convertible securities generally offer lower interest or dividend yields than non-convertible securities of similar quality. The fund could lose money if the issuer of a convertible security is unable to meet its financial obligations or goes bankrupt. |
| • | | Country, Sector or Industry Focus – To the extent the fund invests a significant portion of its assets in one or more countries, sectors or industries, the fund will be more susceptible to negative events affecting those countries, sectors or industries. |
| • | | Currency – When the fund invests in securities denominated in foreign currencies, the fund may incur currency conversion costs and may be affected favorably or unfavorably by changes in the rates of exchange between those currencies and the U.S. dollar. Currency exchange rates can be volatile and are affected by, among other factors, the general economics of a country, the actions of the U.S. and foreign governments or control banks, the imposition of currency controls, and speculation. |
| • | | Currency Hedging – The fund may hedge its currency risk using currency futures, forwards or options. However, these instruments may not always work as intended, and a fund may be worse off than if it had not used a hedging instrument. |
| • | | Derivatives – Using derivatives can increase fund losses and reduce opportunities for gains when market prices, interest rates or the derivative instruments themselves behave in a way not anticipated by the fund. Using derivatives also can have a leveraging effect and increase fund volatility. Derivatives may be difficult to sell, unwind or value, and the counterparty may default on its obligations to the fund. The fund’s investments in derivative instruments may involve a small investment relative to the amount of investment exposure assumed and may result in losses exceeding the amounts invested in those instruments. Recent legislation calls for new regulation of the derivatives markets. The extent and impact of the regulation are not yet fully known and may not be for some time. New regulation of derivatives may make them more costly, may limit their availability, or may otherwise adversely affect their value or performance. |
| • | | Emerging Markets – Investing in the securities of issuers located in or principally doing business in emerging markets are subject to foreign securities risks. These risks are greater for investments in emerging markets. Emerging market countries tend to have economic, political and legal systems that are less fully developed and are less stable than those of more advanced countries. Low trading volumes may result in a lack of liquidity and in extreme price volatility. |
| • | | Fixed-Income Securities – The market prices of fixed-income securities may go up or down, sometimes rapidly or unpredictably due to general market conditions, such as real or perceived adverse economic or political conditions, inflation, changes in interest rates, lack of liquidity in the bond markets or adverse investor sentiment. When market prices fall, the value of your investment will go down. A rise in rates tends to have a greater impact on the prices of longer term or duration securities. |
If interest rates rise, repayments of fixed-income securities may occur more slowly than anticipated by the market. This may drive the prices of these securities down because their interest rates are lower than the current interest rate and they remain outstanding longer. This is sometimes referred to as extension risk.
Many issuers have a right to prepay their securities. If interest rates fall, an issuer may exercise this right. If this happens, the fund will be forced to reinvest prepayment proceeds at a time when yields on securities available in the market are lower than the yield on the prepaid security. This is sometimes referred to as prepayment or call risk.
| • | | Foreign Securities – Foreign securities are subject to a number of additional risks, including nationalization or expropriation of assets, imposition of currency controls or restrictions, confiscatory taxation, political or financial instability and other adverse economic or political developments. Lack of information and less market regulation also may affect the value of these securities. |
| • | | Growth Stocks – Returns on growth stocks may not move in tandem with returns on other categories of stocks or the market as a whole. Growth stocks may be particularly susceptible to rapid price swings or to adverse developments. Growth stocks as a group may be out of favor and underperform the overall equity market for a long period of time, for example, while the market favors “value” stocks. |
| • | | Increase in Expenses – Your actual costs of investing in the fund may be higher than the expenses shown in “Annual Fund Operating Expenses” for a variety of reasons. For example, expense ratios may be higher than those shown if average net assets decrease. Net assets are more likely to decrease and fund expense ratios are more likely to increase when markets are volatile. |
| • | | Liquidity – Some securities held by the fund may be difficult to sell, or illiquid, particularly during times of market turmoil. Illiquid securities may also be difficult to value. If the fund is forced to sell an illiquid asset to meet redemption requests or other cash needs, the fund may be forced to sell at a loss. |
113
| • | | Market – The market prices of the fund’s securities may go up or down, sometimes rapidly or unpredictably, due to general market conditions, such as real or perceived adverse economic or political conditions, inflation, changes in interest rates or currency rates, lack of liquidity in the markets or adverse investor sentiment. Market prices of securities also may go down due to events or conditions that affect particular sectors or issuers. When market prices fall, the value of your investment will go down. The fund may experience a substantial or complete loss on any individual security. The recent financial crisis has caused a significant decline in the value and liquidity of many securities. In response to the financial crisis, the U.S. and other governments and the Federal Reserve and certain foreign central banks have taken steps to support financial markets. The withdrawal of this support could negatively affect the value and liquidity of certain securities. In addition, legislation recently enacted in the U.S. calls for changes in many aspects of financial regulation. The impact of the legislation on the markets, and the practical implications for market participants, may not be fully known for some time. |
| • | | Portfolio Selection – The sub-adviser’s judgment about a particular security or issuer, or about the economy or a particular sector, region or market segment, or about an investment strategy, may prove to be incorrect. |
| • | | Portfolio Turnover – The fund’s investment strategy may result in a high portfolio turnover rate. High portfolio turnover would result in a correspondingly greater brokerage commission expenses and may result in the distribution to shareholders of additional capital gains for tax purposes. These factors may negatively affect the fund’s performance. |
| • | | Preferred Stock – Preferred stock’s right to dividends and liquidation proceeds is junior to the rights of a company’s debt securities. The value of preferred stock may be subject to factors that affect fixed income and equity securities, including changes in interest rates and in a company’s creditworthiness. Shareholders of preferred stock may suffer a loss of value if dividends are not paid and have limited voting rights. |
| • | | Small- or Medium-Sized Companies – Small- or medium-sized companies may be more at risk than larger companies because, among other things, they may have limited product lines, operating history, market or financial resources, or because they may depend on a limited management group. |
| • | | Stocks – Stocks may be volatile – their prices may go up and down dramatically over the shorter term. These price movements may result from factors affecting individual companies, industries, the securities market as a whole or the overall economy. |
| • | | Warrants and Rights – Warrants and rights may be considered more speculative than certain other types of investments because they do not entitle a holder to the dividends or voting rights for the securities that may be purchased. They do not represent any rights in the assets of the issuing company, and cease to have value if not exercised prior to the expiration date. |
Performance: The bar chart and the table below provide some indication of the risks of investing in the fund by showing you how the fund’s performance has varied from year to year, and how the fund’s Class I2 average annual total returns for different periods compare to the returns of a broad measure of market performance. The table shows average annual total returns for Class I2 shares of the fund. Absent any limitation of the fund’s expenses, total returns would be lower. As with all mutual funds, past performance (before and after taxes) is not a prediction of future results. Updated performance information is available on our website at www.transamericafunds.com or by calling 1-888-233-4339.
Annual Total Returns (calendar years ended December 31)

| | | | |
| | | Quarter Ended | | Return |
| Best Quarter: | | 6/30/2009 | | 38.39% |
| Worst Quarter: | | 12/31/2008 | | -28.14% |
114
Average Annual Total Returns (periods ended December 31, 2010)1
| | | | | | |
| | | 1 Year | | 5 Years | | 10 Years or
Inception* |
| Class I2 (commenced operations on December 6, 2005) | | | | | | |
| Return before taxes | | 26.22% | | 14.72% | | 15.03% |
| Return after taxes on distributions2 | | 26.17% | | 13.34% | | 13.64% |
| Return after taxes on distributions and sale of fund shares2 | | 17.10% | | 12.30% | | 12.57% |
| Morgan Stanley Capital International Emerging Markets Index (reflects no deduction for fees, expenses, or taxes) | | 19.20% | | 13.11% | | 13.71% |
| | 1 | Actual returns may depend on the investor’s individual tax situation. After-tax returns may not be relevant if the investment is made through a tax-exempt or tax-deferred account, such as a 401(k) plan. |
| | 2 | The after-tax returns are calculated using the historic highest individual federal marginal income tax rates and do not reflect the impact of state and local taxes. |
| | * | Fund and Index returns are for past 10 years or since inception, whichever is less. |
Management:
| | |
| Investment Adviser: | | Sub-Adviser: |
| |
| Transamerica Asset Management, Inc. | | OppenheimerFunds, Inc. |
| |
| | Portfolio Manager: |
| |
| | Justin Leverenz, CFA, Portfolio Manager since 2007 |
Purchase and Sale of Fund Shares: Class I2 shares of the fund are currently primarily offered for investment in certain funds of funds (also referred to as “strategic asset allocation funds”). Class I2 shares of the fund are also made available to other investors, including institutional investors such as foreign insurers, domestic insurance companies and their separate accounts, and unaffiliated funds, high net worth individuals, and eligible retirement plans whose recordkeepers or financial service firm intermediaries have entered into agreements with Transamerica Funds or its agents. Investors who received Class I2 shares in connection with the reorganization of a Transamerica Premier Fund into a Transamerica Fund may continue to invest in Class I2 shares of that Transamerica Fund, but may not open new accounts. You buy and redeem shares at the fund’s next-determined net asset value (NAV) after receipt of your request in good order.
Tax Information: Fund distributions may be taxable as ordinary income or capital gains, except when your investment is in an IRA, 401(k) or other tax-advantaged investment plan.
Payments to Broker-Dealers and Other Financial Intermediaries: If you purchase the fund through a broker-dealer or other financial intermediary, the fund and/or its affiliates may pay the intermediary for the sale of fund shares and related services. These payments may create a conflict of interest by influencing the broker-dealer or other intermediary and your salesperson to recommend the fund over another investment. Ask your salesperson or visit your financial intermediary’s website for more information.
115
|
| TRANSAMERICA OPPENHEIMER SMALL- & MID-CAP VALUE |
Investment Objective: Seeks capital appreciation.
Fees and Expenses: This table describes the fees and expenses that you may pay if you buy and hold shares of the fund. There are no sales charges (load) or other transaction fees.
| | |
| Annual Fund Operating Expenses (expenses that you pay each year as a percentage of the value of your investment) |
| | |
Management fees | | 0.91% |
Distribution and service (12b-1) fees | | None |
Other expenses | | 0.05% |
Total annual fund operating expenses | | 0.96% |
Example: This Example is intended to help you compare the cost of investing in the fund with the cost of investing in other mutual funds. The Example assumes that you invest $10,000. The Example also assumes that your investment has a 5% return each year and that the fund’s operating expenses remain the same. Although your actual costs may be higher or lower, based on these assumptions your costs would be:
| | | | | | |
1 year | | 3 years | | 5 years | | 10 years |
$98 | | $306 | | $531 | | $1,178 |
Portfolio Turnover: The fund pays transaction costs, such as commissions, when it buys and sells securities (or “turns over” its portfolio). A higher portfolio turnover rate may indicate higher transaction costs and may result in higher taxes when fund shares are held in a taxable account. These costs, which are not reflected in annual fund operating expenses or in the Example, affect the fund’s performance. During the most recent fiscal year, the portfolio turnover rate was 81% of the average value of the fund’s portfolio.
Principal Investment Strategies: The fund’s sub-adviser, OppenheimerFunds, Inc. (“Oppenheimer”), invests, under normal circumstances, at least 80% of the fund’s net assets in equity securities of small-cap and mid-cap domestic and foreign issuers. The fund focuses on stocks of U.S. issuers having a market capitalization up to $13 billion. The fund considers small cap stocks to be stocks of issuers having a market capitalization under $3 billion and mid cap stocks to be stocks of issuers having a market capitalization between $3 billion and $13 billion. The fund has no fixed ratio for small cap and mid cap stocks in its portfolio, and while its focus is on stocks of U.S. companies, it may invest in stocks of small and mid cap foreign issuers as well. The fund emphasizes investment in equity securities of companies that Oppenheimer believes are undervalued in the marketplace.
In selecting securities for purchase or sale by the fund, Oppenheimer uses a “value” approach to investing. The fund’s portfolio manager searches for securities of companies believed to be undervalued in the marketplace, in relation to factors such as a company’s book value, sales, earnings, growth potential and cash flows. The portfolio manager selects securities one at a time, looking primarily at individual companies against the context of broad market factors. This is called a “bottom up” approach, and the portfolio manager uses fundamental company analysis to focus on particular companies before considering industry trends. The portfolio manager considers the following factors in assessing a company’s prospects: favorable supply/demand conditions for key products; development of new products or businesses; quality of management; competitive position in the marketplace; and allocation of capital.
The fund may also invest in preferred stocks and securities convertible into common stocks. The fund can buy and sell futures contracts, put and call options, forward contracts and other derivatives. Some derivatives strategies could hedge the fund’s portfolio against price fluctuations. Other strategies would tend to increase the fund’s exposure to the securities market. Forward contracts could be used to try to manage foreign currency risks on the fund’s foreign investments. The fund may also invest in unseasoned companies and illiquid restricted securities. The fund may have a high portfolio turnover rate.
The fund may invest its assets in cash, cash equivalent securities or short-term debt securities, repurchase agreements and money market instruments. Under adverse or unstable market, economic or political conditions, the fund may take temporary defensive positions in cash and short-term debt securities without limit.
Principal Risks: Many factors affect the fund’s performance. There is no assurance the fund will meet its investment objective. The value of your investment in the fund, as well as the amount of return you receive on your investment, may fluctuate significantly from day to day and over time. You may lose part or all of your investment in the fund or your investment may not perform as well as other similar investments. The following is a summary of certain risks (in alphabetical order) of investing in the fund. You may lose money if you invest in this fund.
116
| • | | Cash Management and Defensive Investing – Money market instruments or short-term debt securities held by the fund for cash management or defensive investing purposes can fluctuate in value. Like other fixed income securities, they are subject to risk, including market, interest rate and credit risk. If the fund holds cash uninvested, the fund will not earn income on the cash and the fund’s yield will go down. If a significant amount of the fund’s assets are used for cash management or defensive investing purposes, it will be more difficult for the fund to achieve its objective. |
| • | | Convertible Securities – The market value of convertible securities tends to decline as interest rates increase. Convertible securities generally offer lower interest or dividend yields than non-convertible securities of similar quality. The fund could lose money if the issuer of a convertible security is unable to meet its financial obligations or goes bankrupt. |
| • | | Currency – When the fund invests in securities denominated in foreign currencies, the fund may incur currency conversion costs and may be affected favorably or unfavorably by changes in the rates of exchange between those currencies and the U.S. dollar. Currency exchange rates can be volatile and are affected by, among other factors, the general economics of a country, the actions of the U.S. and foreign governments or control banks, the imposition of currency controls, and speculation. |
| • | | Currency Hedging – The fund may hedge its currency risk using currency futures, forwards or options. However, these instruments may not always work as intended, and a fund may be worse off than if it had not used a hedging instrument. |
| • | | Derivatives – Using derivatives can increase fund losses and reduce opportunities for gains when market prices, interest rates or the derivative instruments themselves behave in a way not anticipated by the fund. Using derivatives also can have a leveraging effect and increase fund volatility. Derivatives may be difficult to sell, unwind or value, and the counterparty may default on its obligations to the fund. The fund’s investments in derivative instruments may involve a small investment relative to the amount of investment exposure assumed and may result in losses exceeding the amounts invested in those instruments. Recent legislation calls for new regulation of the derivatives markets. The extent and impact of the regulation are not yet fully known and may not be for some time. New regulation of derivatives may make them more costly, may limit their availability, or may otherwise adversely affect their value or performance. |
| • | | Fixed-Income Securities – The market prices of fixed-income securities may go up or down, sometimes rapidly or unpredictably due to general market conditions, such as real or perceived adverse economic or political conditions, inflation, changes in interest rates, lack of liquidity in the bond markets or adverse investor sentiment. When market prices fall, the value of your investment will go down. A rise in rates tends to have a greater impact on the prices of longer term or duration securities. |
If interest rates rise, repayments of fixed-income securities may occur more slowly than anticipated by the market. This may drive the prices of these securities down because their interest rates are lower than the current interest rate and they remain outstanding longer. This is sometimes referred to as extension risk.
Many issuers have a right to prepay their securities. If interest rates fall, an issuer may exercise this right. If this happens, the fund will be forced to reinvest prepayment proceeds at a time when yields on securities available in the market are lower than the yield on the prepaid security. This is sometimes referred to as prepayment or call risk.
| • | | Foreign Securities – Foreign securities are subject to a number of additional risks, including nationalization or expropriation of assets, imposition of currency controls or restrictions, confiscatory taxation, political or financial instability and other adverse economic or political developments. Lack of information and less market regulation also may affect the value of these securities. |
| • | | Increase in Expenses – Your actual costs of investing in the fund may be higher than the expenses shown in “Annual Fund Operating Expenses” for a variety of reasons. For example, expense ratios may be higher than those shown if average net assets decrease. Net assets are more likely to decrease and fund expense ratios are more likely to increase when markets are volatile. |
| • | | Liquidity – Some securities held by the fund may be difficult to sell, or illiquid, particularly during times of market turmoil. Illiquid securities may also be difficult to value. If the fund is forced to sell an illiquid asset to meet redemption requests or other cash needs, the fund may be forced to sell at a loss. |
| • | | Market – The market prices of the fund’s securities may go up or down, sometimes rapidly or unpredictably, due to general market conditions, such as real or perceived adverse economic or political conditions, inflation, changes in interest rates or currency rates, lack of liquidity in the markets or adverse investor sentiment. Market prices of securities also may go down due to events or conditions that affect particular sectors or issuers. When market prices fall, the value of your investment will go down. The fund may experience a substantial or complete loss on any individual security. The recent financial crisis has caused a significant decline in the value and liquidity of many securities. In response to the financial crisis, the U.S. and |
117
| | other governments and the Federal Reserve and certain foreign central banks have taken steps to support financial markets. The withdrawal of this support could negatively affect the value and liquidity of certain securities. In addition, legislation recently enacted in the U.S. calls for changes in many aspects of financial regulation. The impact of the legislation on the markets, and the practical implications for market participants, may not be fully known for some time. |
| • | | Portfolio Selection – The sub-adviser’s judgment about a particular security or issuer, or about the economy or a particular sector, region or market segment, or about an investment strategy, may prove to be incorrect. |
| • | | Portfolio Turnover – The fund’s investment strategy may result in a high portfolio turnover rate. High portfolio turnover would result in a correspondingly greater brokerage commission expenses and may result in the distribution to shareholders of additional capital gains for tax purposes. These factors may negatively affect the fund’s performance. |
| • | | Preferred Stock – Preferred stock’s right to dividends and liquidation proceeds is junior to the rights of a company’s debt securities. The value of preferred stock may be subject to factors that affect fixed income and equity securities, including changes in interest rates and in a company’s creditworthiness. Shareholders of preferred stock may suffer a loss of value if dividends are not paid and have limited voting rights. |
| • | | Small- or Medium-Sized Companies – Small- or medium-sized companies may be more at risk than larger companies because, among other things, they may have limited product lines, operating history, market or financial resources, or because they may depend on a limited management group. |
| • | | Stocks – Stocks may be volatile – their prices may go up and down dramatically over the shorter term. These price movements may result from factors affecting individual companies, industries, the securities market as a whole or the over- all economy. |
| • | | Value Investing – The prices of securities the sub-adviser believes are undervalued may not appreciate as anticipated or may go down. Value stocks as a group may be out of favor and underperform the overall equity market for a long period of time, for example, while the market favors “growth” stocks. |
Performance: The bar chart and the table below provide some indication of the risks of investing in the fund by showing you how the fund’s performance has varied from year to year, and how the fund’s Class I2 average annual total returns for different periods compare to the returns of a broad measure of market performance. The table shows average annual total returns for Class I2 shares of the fund. Absent any limitation of the fund’s expenses, total returns would be lower. As with all mutual funds, past performance (before and after taxes) is not a prediction of future results. Updated performance information is available on our website at www.transamericafunds.com or by calling 1-888-233-4339.
Annual Total Returns (calendar years ended December 31)

| | | | |
| | | Quarter Ended | | Return |
| Best Quarter: | | 6/30/2009 | | 23.01% |
| Worst Quarter: | | 12/31/2008 | | -30.46% |
Average Annual Total Returns (periods ended December 31, 2010)1
| | | | | | |
| | | 1 Year | | 5 Years | | 10 Years or
Inception* |
| Class I2 (commenced operations on August 1, 2006) | | | | | | |
| Return before taxes | | 20.88% | | N/A | | 2.71% |
| Return after taxes on distributions2 | | 20.85% | | N/A | | 2.05% |
| Return after taxes on distributions and sale of fund shares2 | | 13.60% | | N/A | | 2.03% |
| Russell 2500® Value Index (reflects no deduction for fees, expenses or taxes) | | 24.82% | | N/A | | 2.96% |
| | 1 | Actual returns may depend on the investor’s individual tax situation. After-tax returns may not be relevant if the investment is made through a tax-exempt or tax-deferred account, such as a 401(k) plan. |
| | 2 | The after-tax returns are calculated using the historic highest individual federal marginal income tax rates and do not reflect the impact of state and local taxes. |
118
| * | Fund and Index returns are for past 10 years or since inception, whichever is less. |
Management:
| | |
| Investment Adviser: | | Sub-Adviser: |
| |
| Transamerica Asset Management, Inc. | | OppenheimerFunds, Inc. |
| |
| | Portfolio Manager: |
| |
| | John Damian, Portfolio Manager since 2006 |
Purchase and Sale of Fund Shares: Class I2 shares of the fund are currently primarily offered for investment in certain funds of funds (also referred to as “strategic asset allocation funds”). Class I2 shares of the fund are also made available to other investors, including institutional investors such as foreign insurers, domestic insurance companies and their separate accounts, and unaffiliated funds, high net worth individuals, and eligible retirement plans whose recordkeepers or financial service firm intermediaries have entered into agreements with Transamerica Funds or its agents. Investors who received Class I2 shares in connection with the reorganization of a Transamerica Premier Fund into a Transamerica Fund may continue to invest in Class I2 shares of that Transamerica Fund, but may not open new accounts. You buy and redeem shares at the fund’s next-determined net asset value (NAV) after receipt of your request in good order.
Tax Information: Fund distributions may be taxable as ordinary income or capital gains, except when your investment is in an IRA, 401(k) or other tax-advantaged investment plan.
Payments to Broker-Dealers and Other Financial Intermediaries: If you purchase the fund through a broker-dealer or other financial intermediary, the fund and/or its affiliates may pay the intermediary for the sale of fund shares and related services. These payments may create a conflict of interest by influencing the broker-dealer or other intermediary and your salesperson to recommend the fund over another investment. Ask your salesperson or visit your financial intermediary’s website for more information.
119
|
| TRANSAMERICA PIMCO REAL RETURN TIPS |
Investment Objective: Seeks maximum real return consistent with preservation of real capital and prudent investment management.
Fees and Expenses: This table describes the fees and expenses that you may pay if you buy and hold shares of the fund. There are no sales charges (load) or other transaction fees.
| | |
| Annual Fund Operating Expenses (expenses that you pay each year as a percentage of the value of your investment) |
| | |
Management fees | | 0.66% |
Distribution and service (12b-1) fees | | None |
Other expenses | | 0.06% |
Total annual fund operating expenses | | 0.72% |
Example: This Example is intended to help you compare the cost of investing in the fund with the cost of investing in other mutual funds. The Example assumes that you invest $10,000. The Example also assumes that your investment has a 5% return each year and that the fund’s operating expenses remain the same. Although your actual costs may be higher or lower, based on these assumptions your costs would be:
| | | | | | |
1 year | | 3 years | | 5 years | | 10 years |
$74 | | $230 | | $401 | | $894 |
Portfolio Turnover: The fund pays transaction costs, such as commissions, when it buys and sells securities (or “turns over” its portfolio). A higher portfolio turnover rate may indicate higher transaction costs and may result in higher taxes when fund shares are held in a taxable account. These costs, which are not reflected in annual fund operating expenses or in the Example, affect the fund’s performance. During the most recent fiscal year, the portfolio turnover rate was 307% of the average value of the fund’s portfolio.
Principal Investment Strategies: The fund’s sub adviser, Pacific Investment Management Company LLC (“PIMCO”), invests, under normal circumstances, at least 80% of the fund’s net assets in Treasury Inflation Protected Securities or “TIPS” of varying maturities. Inflation-indexed bonds are fixed-income securities that are structured to provide protection against inflation. The value of the bond’s principal or the interest income paid on the bond is adjusted to track changes in an official inflation measure. The U.S. Treasury uses the Consumer Price Index for Urban Consumers as the inflation measure. Inflation-indexed bonds issued by a foreign government are generally adjusted to reflect a comparable inflation index, calculated by that government. “Real return” equals total return less the estimated cost of inflation, which is typically measured by the change in an official inflation measure. The average duration of the fund normally varies within three years (plus or minus) of the duration of the Barclays Capital Global Real U.S. Treasury Inflation Protected Securities Index, which as of December 31, 2010, was 3.96 years. Additional inflation protected investments may include inflation-indexed bonds issued by agencies of the U.S. government, government sponsored enterprises, non-U.S. governments, U.S. corporations and foreign companies. Other investments may include mortgage-related securities, including stripped mortgage-related securities; other fixed income securities, including corporate bonds and notes, asset-backed securities, money market instruments; and derivative instruments and forward commitments relating to the above securities.
PIMCO invests the fund’s assets primarily in investment grade debt securities, but may invest up to 10% of the assets in high yield securities (“junk bonds”) rated B or higher by Moody’s, Fitch, or S&P or, if unrated, determined by PIMCO to be of comparable quality. PIMCO may invest up to 30% of its assets in securities denominated in foreign currencies, and may invest beyond this limit in U.S. dollar denominated securities of foreign issuers. The fund may invest up to 15% of its total assets in securities and instruments that are economically tied to emerging markets countries. Foreign currency exposure (from non-U.S. dollar-denominated securities or currencies) normally will be limited to 20% of the fund’s total assets. The fund may also invest up to 10% of its total assets in preferred stocks.
The fund may invest, without limitation, in derivative instruments, such as options, futures contracts or swaps, subject to applicable law and any other restrictions described in the fund’s prospectus or SAI. The fund may lend its portfolio securities to brokers, dealers and other financial institutions to earn income. The fund may, without limitation, seek to obtain market exposure to the securities in which it primarily invests by entering into a series of purchase and sale contracts or by using other investment techniques (such as buy backs or dollar rolls).
The fund may invest its assets in cash, cash equivalent securities or short-term debt securities, repurchase agreements and money market instruments. Under adverse or unstable market, economic or political conditions, the fund may take temporary defensive positions in cash and short-term debt securities without limit.
120
This fund is non-diversified.
Principal Risks: Many factors affect the fund’s performance. There is no assurance the fund will meet its investment objective. The value of your investment in the fund, as well as the amount of return you receive on your investment, may fluctuate significantly from day to day and over time. You may lose part or all of your investment in the fund or your investment may not perform as well as other similar investments. The following is a summary of certain risks (in alphabetical order) of investing in the fund. You may lose money if you invest in this fund.
| • | | Cash Management and Defensive Investing – Money market instruments or short-term debt securities held by the fund for cash management or defensive investing purposes can fluctuate in value. Like other fixed income securities, they are subject to risk, including market, interest rate and credit risk. If the fund holds cash uninvested, the fund will not earn income on the cash and the fund’s yield will go down. If a significant amount of the fund’s assets are used for cash management or defensive investing purposes, it will be more difficult for the fund to achieve its objective. |
| • | | CPIU Measurement – The CPIU is a measurement of changes in the cost of living, made up of components such as housing, food, transportation and energy. There can be no assurance that the CPIU will accurately measure the real rate of inflation in the prices of goods and services. |
| • | | Credit – If an issuer or guarantor of a security held by the fund or a counterparty to a financial contract with the fund defaults or is downgraded, or if the value of the assets underlying a security declines, the value of your investment will decline. Junk bonds have a higher risk of default and are considered speculative. A default or downgrade will have a greater impact on subordinated securities. |
| • | | Currency – When the fund invests in securities denominated in foreign currencies, the fund may incur currency conversion costs and may be affected favorably or unfavorably by changes in the rates of exchange between those currencies and the U.S. dollar. Currency exchange rates can be volatile and are affected by, among other factors, the general economics of a country, the actions of the U.S. and foreign governments or control banks, the imposition of currency controls, and speculation. |
| • | | Currency Hedging – The fund may hedge its currency risk using currency futures, forwards or options. However, these instruments may not always work as intended, and a fund may be worse off than if it had not used a hedging instrument. |
| • | | Derivatives – Using derivatives can increase fund losses and reduce opportunities for gains when market prices, interest rates or the derivative instruments themselves behave in a way not anticipated by the fund. Using derivatives also can have a leveraging effect and increase fund volatility. Derivatives may be difficult to sell, unwind or value, and the counterparty may default on its obligations to the fund. The fund’s investments in derivative instruments may involve a small investment relative to the amount of investment exposure assumed and may result in losses exceeding the amounts invested in those instruments. Recent legislation calls for new regulation of the derivatives markets. The extent and impact of the regulation are not yet fully known and may not be for some time. New regulation of derivatives may make them more costly, may limit their availability, or may otherwise adversely affect their value or performance. |
| • | | Emerging Markets – Investing in the securities of issuers located in or principally doing business in emerging markets are subject to foreign securities risks. These risks are greater for investments in emerging markets. Emerging market countries tend to have economic, political and legal systems that are less fully developed and are less stable than those of more advanced countries. Low trading volumes may result in a lack of liquidity and in extreme price volatility. |
| • | | Fixed-Income Securities – The market prices of fixed-income securities may go up or down, sometimes rapidly or unpredictably due to general market conditions, such as real or perceived adverse economic or political conditions, inflation, changes in interest rates, lack of liquidity in the bond markets or adverse investor sentiment. When market prices fall, the value of your investment will go down. A rise in rates tends to have a greater impact on the prices of longer term or duration securities. |
If interest rates rise, repayments of fixed-income securities may occur more slowly than anticipated by the market. This may drive the prices of these securities down because their interest rates are lower than the current interest rate and they remain outstanding longer. This is sometimes referred to as extension risk.
Many issuers have a right to prepay their securities. If interest rates fall, an issuer may exercise this right. If this happens, the fund will be forced to reinvest prepayment proceeds at a time when yields on securities available in the market are lower than the yield on the prepaid security. This is sometimes referred to as prepayment or call risk.
| • | | Foreign Securities – Foreign securities are subject to a number of additional risks, including nationalization or expropriation of assets, imposition of currency controls or restrictions, confiscatory taxation, political or financial instability |
121
| | and other adverse economic or political developments. Lack of information and less market regulation also may affect the value of these securities. |
| • | | High-Yield Debt Securities – High-yield debt securities, or junk bonds, are securities that are rated below “investment grade” (that is, securities rated below Baa/BBB) or, if unrated, are considered by the sub-adviser to be of equivalent quality. Changes in interest rates, the market’s perception of the issuers and the creditworthiness of the issuers may significantly affect the value of these bonds. Junk bonds have a higher risk of default, tend to be less liquid and may be more difficult to value. |
| • | | Increase in Expenses – Your actual costs of investing in the fund may be higher than the expenses shown in “Annual Fund Operating Expenses” for a variety of reasons. For example, expense ratios may be higher than those shown if average net assets decrease. Net assets are more likely to decrease and fund expense ratios are more likely to increase when markets are volatile. |
| • | | Interest Rate – Fixed-income securities have varying levels of sensitivity to changes in interest rates. In general, the price of a fixed-income security tends to fall when interest rates rise and can rise when interest rates fall. A change in interest rates will not have the same impact on all fixed-income securities. Generally, the longer the maturity or duration of a fixed-income security, the greater the impact of a rise in interest rates on the security’s value. In addition, different interest rate measures (such as short- and long-term interest rates and U.S. and foreign interest rates), or interest rates on different types of securities or securities of different issuers, may not necessarily change in the same amount or in the same direction. When interest rates go down, the income received by the fund, and the fund’s yield, may decline. |
| • | | Leveraging – The value of your investment may be more volatile if the fund borrows or uses derivatives that have a leveraging effect on the fund. Other risks also will be compounded. This is because leverage generally magnifies the effect of a change in the value of an asset and creates a risk of loss of value on a larger pool of assets than the fund would otherwise have had. The fund also may have to sell assets at inopportune times to satisfy its obligations. |
| • | | Liquidity – Some securities held by the fund may be difficult to sell, or illiquid, particularly during times of market turmoil. Illiquid securities may also be difficult to value. If the fund is forced to sell an illiquid asset to meet redemption requests or other cash needs, the fund may be forced to sell at a loss. |
| • | | Market – The market prices of the fund’s securities may go up or down, sometimes rapidly or unpredictably, due to general market conditions, such as real or perceived adverse economic or political conditions, inflation, changes in interest rates or currency rates, lack of liquidity in the markets or adverse investor sentiment. Market prices of securities also may go down due to events or conditions that affect particular sectors or issuers. When market prices fall, the value of your investment will go down. The fund may experience a substantial or complete loss on any individual security. The recent financial crisis has caused a significant decline in the value and liquidity of many securities. In response to the financial crisis, the U.S. and other governments and the Federal Reserve and certain foreign central banks have taken steps to support financial markets. The withdrawal of this support could negatively affect the value and liquidity of certain securities. In addition, legislation recently enacted in the U.S. calls for changes in many aspects of financial regulation. The impact of the legislation on the markets, and the practical implications for market participants, may not be fully known for some time. |
| • | | Mortgage-Related and Asset-Backed Securities – Mortgage-backed securities may be issued by private issuers, by government-sponsored entities such as Fannie Mae or Freddie Mac or by agencies of the U.S. government, such as Ginnie Mae. Mortgage-backed securities represent direct or indirect participations in, or are collateralized by and payable from, mortgage loans secured by real property. Unlike mortgage-related securities issued or guaranteed by agencies of the U.S. government or government-sponsored entities, mortgage-related securities issued by private issuers do not have a government or government-sponsored entity guarantee (but may have other credit enhancement), and may, and frequently do, have less favorable collateral, credit risk or other underwriting characteristics. Mortgage-backed securities are also particularly susceptible to prepayment and extension risks. Asset-backed securities represent participations in, or are secured by and payable from, assets such as installment sales or loan contracts, leases, credit card receivables and other categories of receivables. Certain asset-backed securities present a heightened level of risk because, in the event of default, the liquidation value of the underlying assets may be inadequate to pay any unpaid principal or interest. The value of mortgage-backed and asset-backed securities may be affected by changes in credit quality or value of the mortgage loans or other assets that support the securities. |
| • | | Non-Diversification – The fund is classified as “non-diversified,” which means it may invest in a larger percentage of its assets in one issuer than a diversified fund. To the extent the fund invests its assets in fewer issuers, the fund will be more susceptible to negative events affecting those issuers. |
122
| • | | Portfolio Selection – The sub-adviser’s judgment about a particular security or issuer, or about the economy or a particular sector, region or market segment, or about an investment strategy, may prove to be incorrect. |
| • | | Portfolio Turnover – The fund’s investment strategy may result in a high portfolio turnover rate. High portfolio turnover would result in a correspondingly greater brokerage commission expenses and may result in the distribution to shareholders of additional capital gains for tax purposes. These factors may negatively affect the fund’s performance. |
| • | | Preferred Stock – Preferred stock’s right to dividends and liquidation proceeds is junior to the rights of a company’s debt securities. The value of preferred stock may be subject to factors that affect fixed income and equity securities, including changes in interest rates and in a company’s creditworthiness. Shareholders of preferred stock may suffer a loss of value if dividends are not paid and have limited voting rights. |
| • | | Prepayment or Call – Many issuers have a right to prepay their securities. If interest rates fall, an issuer may exercise this right. If this happens, the fund will be forced to reinvest prepayment proceeds at a time when yields on securities available in the market are lower than the yield on the prepaid security. The fund also may lose any premium it paid on the security. |
| • | | Repurchase Agreements – If the other party to a repurchase agreement defaults on its obligation, the fund may suffer delays and incur costs or lose money in exercising its rights under the agreement. If the seller fails to repurchase the security and the market value declines, the fund could lose money. If the seller becomes insolvent and subject to liquidation or reorganization under applicable bankruptcy or other laws, the fund’s ability to dispose of the underlying securities may be restricted. |
| • | | Rule 144A and Privately Placed Securities – Rule 144A permits certain qualified institutional buyers, such as the fund, to trade in privately placed securities that have not been registered for sale to the public. Rule 144A and other privately placed securities may be deemed illiquid, and the fund might be unable to dispose of such securities promptly or at reasonable prices. |
| • | | Sovereign Debt – Sovereign debt instruments are subject to the risk that the governmental entity may delay or fail to pay interest or repay principal on its sovereign debt. If a governmental entity defaults, it may ask for more time in which to pay or for further loans. There may be no established legal process for collecting sovereign debt that a government does not pay, nor are there bankruptcy proceedings through which all or part of the sovereign debt that a governmental entity has not repaid may be collected. |
| • | | Stocks – Stocks may be volatile – their prices may go up and down dramatically over the shorter term. These price movements may result from factors affecting individual companies, industries, the securities market as a whole or the over-all economy. |
| • | | U.S. Government Agency Obligations – Government agency obligations have different levels of credit support and, therefore, different degrees of credit risk. Securities issued by agencies and instrumentalities of the U.S. government that are supported by the full faith and credit of the United States generally present a lesser degree of credit risk than securities issued by agencies and instrumentalities sponsored by the U.S. government that are supported only by the issuer’s right to borrow from the U.S. Treasury and securities issued by agencies and instrumentalities sponsored by the U.S. government that are supported only by the credit of the issuing agencies. |
| • | | Valuation – The sales price the fund could receive for any particular portfolio investment may differ from the fund’s valuation of the investment, particularly for securities that trade in thin or volatile markets or that are valued using a fair value methodology. |
Performance: The bar chart and the table below provide some indication of the risks of investing in the fund by showing you how the fund’s performance has varied from year to year, and how the fund’s Class I2 average annual total returns for different periods compare to the returns of a broad measure of market performance. The table shows average annual total returns for Class I2 shares of the fund. Absent any limitation of the fund’s expenses, total returns would be lower. As with all mutual funds, past performance (before and after taxes) is not a prediction of future results. Updated performance information is available on our website at www.transamericafunds.com or by calling 1-888-233-4339.
123
Annual Total Returns (calendar years ended December 31)

| | | | |
| | | Quarter Ended | | Return |
Best Quarter: | | 3/31/2008 | | 5.65% |
Worst Quarter: | | 9/30/2008 | | -5.16% |
Average Annual Total Returns (periods ended December 31, 2010)1
| | | | | | |
| | | 1 Year | | 5 Years | | 10 Years or Inception* |
| Class I2 (commenced operations on November 8, 2004) |
| Return before taxes | | 7.27% | | 5.76% | | 5.38% |
| Return after taxes on distributions2 | | 5.56% | | 4.16% | | 3.70% |
| Return after taxes on distributions and sale of fund shares2 | | 5.36% | | 4.04% | | 3.65% |
| Barclays Capital Global Real U.S. Treasury Inflation Protected Securities Index (reflects no deduction for fees, expenses or taxes) | | 6.30% | | 5.33% | | 5.04% |
| 1 | Actual returns may depend on the investor’s individual tax situation. After-tax returns may not be relevant if the investment is made through a tax-exempt or tax-deferred account, such as a 401(k) plan. |
| 2 | The after-tax returns are calculated using the historic highest individual federal marginal income tax rates and do not reflect the impact of state and local taxes. |
| * | Fund and Index returns are for past 10 years or since inception, whichever is less. |
| | |
| Management: | | |
| |
| Investment Adviser: | | Sub-Adviser: |
| |
| Transamerica Asset Management, Inc. | | Pacific Investment Management Company LLC |
| |
| | Portfolio Manager: |
| |
| | Mihir Worah, Portfolio Manager since 2008 |
Purchase and Sale of Fund Shares: Class I2 shares of the fund are currently primarily offered for investment in certain funds of funds (also referred to as “strategic asset allocation funds”). Class I2 shares of the fund are also made available to other investors, including institutional investors such as foreign insurers, domestic insurance companies and their separate accounts, and unaffiliated funds, high net worth individuals, and eligible retirement plans whose recordkeepers or financial service firm intermediaries have entered into agreements with Transamerica Funds or its agents. Investors who received Class I2 shares in connection with the reorganization of a Transamerica Premier Fund into a Transamerica Fund may continue to invest in Class I2 shares of that Transamerica Fund, but may not open new accounts. You buy and redeem shares at the fund’s next-determined net asset value (NAV) after receipt of your request in good order.
Tax Information: Fund distributions may be taxable as ordinary income or capital gains, except when your investment is in an IRA, 401(k) or other tax-advantaged investment plan.
Payments to Broker-Dealers and Other Financial Intermediaries: If you purchase the fund through a broker-dealer or other financial intermediary, the fund and/or its affiliates may pay the intermediary for the sale of fund shares and related services. These payments may create a conflict of interest by influencing the broker-dealer or other intermediary and your salesperson to recommend the fund over another investment. Ask your salesperson or visit your financial intermediary’s website for more information.
124
|
| TRANSAMERICA PIMCO TOTAL RETURN |
Investment Objective: Seeks maximum total return consistent with preservation of capital and prudent investment management.
Fees and Expenses: This table describes the fees and expenses that you may pay if you buy and hold shares of the fund. There are no sales charges (load) or other transaction fees.
| | |
| Annual Fund Operating Expenses (expenses that you pay each year as a percentage of the value of your investment) |
| | |
Management fees | | 0.66% |
Distribution and service (12b-1) fees | | None |
Other expenses | | 0.08% |
Total annual fund operating expenses | | 0.74% |
Example: This Example is intended to help you compare the cost of investing in the fund with the cost of investing in other mutual funds. The Example assumes that you invest $10,000. The Example also assumes that your investment has a 5% return each year and that the fund’s operating expenses remain the same. Although your actual costs may be higher or lower, based on these assumptions your costs would be:
| | | | | | |
1 year | | 3 years | | 5 years | | 10 years |
$76 | | $237 | | $411 | | $918 |
Portfolio Turnover: The fund pays transaction costs, such as commissions, when it buys and sells securities (or “turns over” its portfolio). A higher portfolio turnover rate may indicate higher transaction costs and may result in higher taxes when fund shares are held in a taxable account. These costs, which are not reflected in annual fund operating expenses or in the Example, affect the fund’s performance. During the most recent fiscal year, the portfolio turnover rate was 222% of the average value of the fund’s portfolio.
Principal Investment Strategies: The fund’s sub-adviser, Pacific Investment Management Company LLC (“PIMCO”), invests, under normal circumstances, at least 65% of the fund’s net assets in fixed-income instruments of varying maturities. The average duration of this fund normally varies within two years (plus or minus) of the duration of the Barclays Capital U.S. Aggregate Bond Index, which as of December 31, 2010, was 4.98 years. Duration is a measure of the expected life of a fixed-income security that is used to determine the sensitivity of a security’s price to changes in interest rates.
PIMCO invests the fund’s assets primarily in investment grade debt securities, but may invest up to 10% of the fund’s total assets in high yield securities (“junk bonds”) rated B or higher by Moody’s, Fitch, or S&P or, if unrated, determined by PIMCO to be of comparable quality. PIMCO may invest up to 30% of the fund’s total assets in securities denominated in foreign currencies, and may invest beyond this limit in U.S. dollar-denominated securities of foreign issuers. The fund may invest up to 15% of its total assets in securities and instruments that are economically tied to emerging markets countries. Foreign currency exposure (from non-U.S. dollar-denominated securities or currencies) normally will be limited to 20% of the fund’s total assets. The fund may also invest up to 10% of its total assets in preferred stocks.
The fund may invest all of its assets in derivative instruments, such as options, futures contracts or swap agreements, or in mortgage- or asset-backed securities. The fund may engage in short sales. The fund may, without limitation, seek to obtain market exposure to the securities in which it primarily invests by entering into a series of purchase and sale contracts or by using other investment techniques (such as buy backs or dollar rolls). The “total return” sought by the fund consists of income earned on the fund’s investments, plus capital appreciation, if any, which generally arises from decreases in interest rates or improving credit fundamentals for a particular sector or security.
The fund may invest its assets in cash, cash equivalent securities or short-term debt securities, repurchase agreements and money market instruments. Under adverse or unstable market, economic or political conditions, the fund may take temporary defensive positions in cash and short-term debt securities without limit.
Principal Risks: Many factors affect the fund’s performance. There is no assurance the fund will meet its investment objective. The value of your investment in the fund, as well as the amount of return you receive on your investment, may fluctuate significantly from day to day and over time. You may lose part or all of your investment in the fund or your investment may not perform as well as other similar investments. The following is a summary of certain risks (in alphabetical order) of investing in the fund. You may lose money if you invest in this fund.
| • | | Cash Management and Defensive Investing – Money market instruments or short-term debt securities held by the fund for cash management or defensive investing purposes can fluctuate in value. Like other fixed income securities, they are |
125
| | subject to risk, including market, interest rate and credit risk. If the fund holds cash uninvested, the fund will not earn income on the cash and the fund’s yield will go down. If a significant amount of the fund’s assets are used for cash management or defensive investing purposes, it will be more difficult for the fund to achieve its objective. |
| • | | Credit – If an issuer or guarantor of a security held by the fund or a counterparty to a financial contract with the fund defaults or is downgraded, or if the value of the assets underlying a security declines, the value of your investment will decline. Junk bonds have a higher risk of default and are considered speculative. A default or downgrade will have a greater impact on subordinated securities. |
| • | | Currency – When the fund invests in securities denominated in foreign currencies, the fund may incur currency conversion costs and may be affected favorably or unfavorably by changes in the rates of exchange between those currencies and the U.S. dollar. Currency exchange rates can be volatile and are affected by, among other factors, the general economics of a country, the actions of the U.S. and foreign governments or control banks, the imposition of currency controls, and speculation. |
| • | | Currency Hedging – The fund may hedge its currency risk using currency futures, forwards or options. However, these instruments may not always work as intended, and a fund may be worse off than if it had not used a hedging instrument. |
| • | | Derivatives – Using derivatives can increase fund losses and reduce opportunities for gains when market prices, interest rates or the derivative instruments themselves behave in a way not anticipated by the fund. Using derivatives also can have a leveraging effect and increase fund volatility. Derivatives may be difficult to sell, unwind or value, and the counterparty may default on its obligations to the fund. The fund’s investments in derivative instruments may involve a small investment relative to the amount of investment exposure assumed and may result in losses exceeding the amounts invested in those instruments. Recent legislation calls for new regulation of the derivatives markets. The extent and impact of the regulation are not yet fully known and may not be for some time. New regulation of derivatives may make them more costly, may limit their availability, or may otherwise adversely affect their value or performance. |
| • | | Emerging Markets – Investing in the securities of issuers located in or principally doing business in emerging markets are subject to foreign securities risks. These risks are greater for investments in emerging markets. Emerging market countries tend to have economic, political and legal systems that are less fully developed and are less stable than those of more advanced countries. Low trading volumes may result in a lack of liquidity and in extreme price volatility. |
| • | | Fixed-Income Securities – The market prices of fixed-income securities may go up or down, sometimes rapidly or unpredictably due to general market conditions, such as real or perceived adverse economic or political conditions, inflation, changes in interest rates, lack of liquidity in the bond markets or adverse investor sentiment. When market prices fall, the value of your investment will go down. A rise in rates tends to have a greater impact on the prices of longer term or duration securities. |
If interest rates rise, repayments of fixed-income securities may occur more slowly than anticipated by the market. This may drive the prices of these securities down because their interest rates are lower than the current interest rate and they remain outstanding longer. This is sometimes referred to as extension risk.
Many issuers have a right to prepay their securities. If interest rates fall, an issuer may exercise this right. If this happens, the fund will be forced to reinvest prepayment proceeds at a time when yields on securities available in the market are lower than the yield on the prepaid security. This is sometimes referred to as prepayment or call risk.
| • | | Foreign Securities – Foreign securities are subject to a number of additional risks, including nationalization or expropriation of assets, imposition of currency controls or restrictions, confiscatory taxation, political or financial instability and other adverse economic or political developments. Lack of information and less market regulation also may affect the value of these securities. |
| • | | High-Yield Debt Securities – High-yield debt securities, or junk bonds, are securities that are rated below “investment grade” (that is, securities rated below Baa/BBB) or, if unrated, are considered by the sub-adviser to be of equivalent quality. Changes in interest rates, the market’s perception of the issuers and the creditworthiness of the issuers may significantly affect the value of these bonds. Junk bonds have a higher risk of default, tend to be less liquid and may be more difficult to value. |
| • | | Interest Rate – Debt securities have varying levels of sensitivity to changes in interest rates. In general, the price of a debt security tends to fall when interest rates rise and can rise when interest rates fall. Securities with longer maturities and mortgage securities can be more sensitive to interest rate changes. |
| • | | Increase in Expenses – Your actual costs of investing in the fund may be higher than the expenses shown in “Annual Fund Operating Expenses” for a variety of reasons. For example, expense ratios may be higher than those shown if average net |
126
| | assets decrease. Net assets are more likely to decrease and fund expense ratios are more likely to increase when markets are volatile. |
| • | | Leveraging – The value of your investment may be more volatile if the fund borrows or uses derivatives that have a leveraging effect on the fund. Other risks also will be compounded. This is because leverage generally magnifies the effect of a change in the value of an asset and creates a risk of loss of value on a larger pool of assets than the fund would otherwise have had. The fund also may have to sell assets at inopportune times to satisfy its obligations. |
| • | | Liquidity – Some securities held by the fund may be difficult to sell, or illiquid, particularly during times of market turmoil. Illiquid securities may also be difficult to value. If the fund is forced to sell an illiquid asset to meet redemption requests or other cash needs, the fund may be forced to sell at a loss. |
| • | | Market – The market prices of the fund’s securities may go up or down, sometimes rapidly or unpredictably, due to general market conditions, such as real or perceived adverse economic or political conditions, inflation, changes in interest rates or currency rates, lack of liquidity in the markets or adverse investor sentiment. Market prices of securities also may go down due to events or conditions that affect particular sectors or issuers. When market prices fall, the value of your investment will go down. The fund may experience a substantial or complete loss on any individual security. The recent financial crisis has caused a significant decline in the value and liquidity of many securities. In response to the financial crisis, the U.S. and other governments and the Federal Reserve and certain foreign central banks have taken steps to support financial markets. The withdrawal of this support could negatively affect the value and liquidity of certain securities. In addition, legislation recently enacted in the U.S. calls for changes in many aspects of financial regulation. The impact of the legislation on the markets, and the practical implications for market participants, may not be fully known for some time. |
| • | | Mortgage-Related and Asset-Backed Securities – Mortgage-backed securities may be issued by private issuers, by government-sponsored entities such as Fannie Mae or Freddie Mac or by agencies of the U.S. government, such as Ginnie Mae. Mortgage-backed securities represent direct or indirect participations in, or are collateralized by and payable from, mortgage loans secured by real property. Unlike mortgage-related securities issued or guaranteed by agencies of the U.S. government or government-sponsored entities, mortgage-related securities issued by private issuers do not have a government or government-sponsored entity guarantee (but may have other credit enhancement), and may, and frequently do, have less favorable collateral, credit risk or other underwriting characteristics. Mortgage-backed securities are also particularly susceptible to prepayment and extension risks. Asset-backed securities represent participations in, or are secured by and payable from, assets such as installment sales or loan contracts, leases, credit card receivables and other categories of receivables. Certain asset-backed securities present a heightened level of risk because, in the event of default, the liquidation value of the underlying assets may be inadequate to pay any unpaid principal or interest. The value of mortgage-backed and asset-backed securities may be affected by changes in credit quality or value of the mortgage loans or other assets that support the securities. |
| • | | Portfolio Selection – The sub-adviser’s judgment about a particular security or issuer, or about the economy or a particular sector, region or market segment, or about an investment strategy, may prove to be incorrect. |
| • | | Preferred Stock – Preferred stock’s right to dividends and liquidation proceeds is junior to the rights of a company’s debt securities. The value of preferred stock may be subject to factors that affect fixed income and equity securities, including changes in interest rates and in a company’s creditworthiness. Shareholders of preferred stock may suffer a loss of value if dividends are not paid and have limited voting rights. |
| • | | Prepayment or Call – Many issuers have a right to prepay their securities. If interest rates fall, an issuer may exercise this right. If this happens, the fund will be forced to reinvest prepayment proceeds at a time when yields on securities available in the market are lower than the yield on the prepaid security. The fund also may lose any premium it paid on the security. |
| • | | Repurchase Agreements – If the other party to a repurchase agreement defaults on its obligation, the fund may suffer delays and incur costs or lose money in exercising its rights under the agreement. If the seller fails to repurchase the security and the market value declines, the fund could lose money. If the seller becomes insolvent and subject to liquidation or reorganization under applicable bankruptcy or other laws, the fund’s ability to dispose of the underlying securities may be restricted. |
| • | | Rule 144A and Privately Placed Securities – Rule 144A permits certain qualified institutional buyers, such as the fund, to trade in privately placed securities that have not been registered for sale to the public. Rule 144A and other privately placed securities may be deemed illiquid, and the fund might be unable to dispose of such securities promptly or at reasonable prices. |
127
| • | | Short Sales – A short sale may be effected by selling a security that the fund does not own. If the price of the security sold short increases, the fund would incur a loss; conversely, if the price declines, the fund will realize a gain. Although the gain is limited by the price at which the security was sold short, the loss is potentially unlimited. The fund may also pay transaction costs and borrowing fees in connection with short sales. |
| • | | Sovereign Debt – Sovereign debt instruments are subject to the risk that the governmental entity may delay or fail to pay interest or repay principal on its sovereign debt. If a governmental entity defaults, it may ask for more time in which to pay or for further loans. There may be no established legal process for collecting sovereign debt that a government does not pay, nor are there bankruptcy proceedings through which all or part of the sovereign debt that a governmental entity has not repaid may be collected. |
| • | | Stocks – Stocks may be volatile – their prices may go up and down dramatically over the shorter term. These price movements may result from factors affecting individual companies, industries, the securities market as a whole or the overall economy. |
| • | | U.S. Government Agency Obligations – Government agency obligations have different levels of credit support and, therefore, different degrees of credit risk. Securities issued by agencies and instrumentalities of the U.S. government that are supported by the full faith and credit of the United States generally present a lesser degree of credit risk than securities issued by agencies and instrumentalities sponsored by the U.S. government that are supported only by the issuer’s right to borrow from the U.S. Treasury and securities issued by agencies and instrumentalities sponsored by the U.S. government that are supported only by the credit of the issuing agencies. |
| • | | Valuation – The sales price the fund could receive for any particular portfolio investment may differ from the fund’s valuation of the investment, particularly for securities that trade in thin or volatile markets or that are valued using a fair value methodology. |
Performance: The bar chart and the table below provide some indication of the risks of investing in the fund by showing you how the fund’s performance has varied from year to year, and how the fund’s Class I2 average annual total returns for different periods compare to the returns of a broad measure of market performance. The table shows average annual total returns for Class I2 shares of the fund. Absent any limitation of the fund’s expenses, total returns would be lower. As with all mutual funds, past performance (before and after taxes) is not a prediction of future results. Updated performance information is available on our website at www.transamericafunds.com or by calling 1-888-233-4339.
Annual Total Returns (calendar years ended December 31)

| | | | |
| | | Quarter Ended | | Return |
Best Quarter: | | 9/30/2009 | | 8.38% |
Worst Quarter: | | 9/30/2008 | | -3.40% |
Average Annual Total Returns (periods ended December 31, 2010)1
| | | | | | |
| | | 1 Year | | 5 Years | | 10 Years or Inception* |
| Class I2 (commenced operations on November 15, 2005) |
| Return before taxes | | 7.34% | | 7.07% | | 7.22% |
| Return after taxes on distributions2 | | 5.54% | | 4.57% | | 4.75% |
| Return after taxes on distributions and sale of fund shares2 | | 5.08% | | 4.59% | | 4.74% |
| Barclays Capital U.S. Aggregate Bond Index (reflects no deduction for fees, expenses or taxes) | | 6.54% | | 5.80% | | 5.98% |
| 1 | Actual returns may depend on the investor’s individual tax situation. After-tax returns may not be relevant if the investment is made through a tax-exempt or tax-deferred account, such as a 401(k) plan. |
| 2 | The after-tax returns are calculated using the historic highest individual federal marginal income tax rates and do not reflect the impact of state and local taxes. |
| * | Fund and Index returns are for past 10 years or since inception, whichever is less. |
128
| | |
| Management: | | |
| |
| Investment Adviser: | | Sub-Adviser: |
| |
| Transamerica Asset Management, Inc. | | Pacific Investment Management Company LLC |
| |
| | Portfolio Manager: |
| |
| | Chris P. Dialynas, Portfolio Manager since 2008 |
Purchase and Sale of Fund Shares: Class I2 shares of the fund are currently primarily offered for investment in certain funds of funds (also referred to as “strategic asset allocation funds”). Class I2 shares of the fund are also made available to other investors, including institutional investors such as foreign insurers, domestic insurance companies and their separate accounts, and unaffiliated funds, high net worth individuals, and eligible retirement plans whose recordkeepers or financial service firm intermediaries have entered into agreements with Transamerica Funds or its agents. Investors who received Class I2 shares in connection with the reorganization of a Transamerica Premier Fund into a Transamerica Fund may continue to invest in Class I2 shares of that Transamerica Fund, but may not open new accounts. You buy and redeem shares at the fund’s next-determined net asset value (NAV) after receipt of your request in good order.
Tax Information: Fund distributions may be taxable as ordinary income or capital gains, except when your investment is in an IRA, 401(k) or other tax-advantaged investment plan.
Payments to Broker-Dealers and Other Financial Intermediaries: If you purchase the fund through a broker-dealer or other financial intermediary, the fund and/or its affiliates may pay the intermediary for the sale of fund shares and related services. These payments may create a conflict of interest by influencing the broker-dealer or other intermediary and your salesperson to recommend the fund over another investment. Ask your salesperson or visit your financial intermediary’s website for more information.
129
|
| TRANSAMERICA SCHRODERS INTERNATIONAL SMALL CAP |
Investment Objective: Seeks to provide long-term capital appreciation.
Fees and Expenses: This table describes the fees and expenses that you may pay if you buy and hold shares of the fund. There are no sales charges (load) or other transaction fees.
| | |
| Annual Fund Operating Expenses (expenses that you pay each year as a percentage of the value of your investment) |
| | |
Management fees | | 1.04% |
Distribution and service (12b-1) fees | | None |
Other expenses | | 0.12% |
Total annual fund operating expenses | | 1.16% |
Example: This Example is intended to help you compare the cost of investing in the fund with the cost of investing in other mutual funds. The Example assumes that you invest $10,000. The Example also assumes that your investment has a 5% return each year and that the fund’s operating expenses remain the same. Although your actual costs may be higher or lower, based on these assumptions your costs would be:
| | | | | | |
1 year | | 3 years | | 5 years | | 10 years |
$118 | | $368 | | $638 | | $1,409 |
Portfolio Turnover: The fund pays transaction costs, such as commissions, when it buys and sells securities (or “turns over” its portfolio). A higher portfolio turnover rate may indicate higher transaction costs and may result in higher taxes when fund shares are held in a taxable account. These costs, which are not reflected in annual fund operating expenses or in the Example, affect the fund’s performance. During the most recent fiscal year, the portfolio turnover rate was 54% of the average value of the fund’s portfolio.
Principal Investment Strategies: Schroder Investment Management North America Inc. (“Schroders”), sub-adviser to the fund, under normal circumstances, invests at least 80% of the fund’s net assets, plus any borrowings for investment purposes, in small-capitalization companies (generally those with market capitalizations, based on the number of shares readily available in the market, of $4 billion or less at the time of investment) that it believes offer the potential for capital appreciation. The fund primarily invests in equity securities of small-cap companies located outside the United States.
Schroders employs a fundamental investment approach that considers macroeconomic factors while focusing primarily on company-specific factors. Schroders generally sells a security when its market price approaches the sub-adviser’s estimate of fair value or when the sub-adviser identifies a significantly more attractive investment candidate. The fund generally emphasizes developed markets in Europe and the Pacific, with a limited allocation to emerging markets. Stocks of emerging markets countries can be substantially more volatile and substantially less liquid than those of both U.S. and more developed foreign markets.
The fund may invest in preferred stocks and closed-end investment companies that invest primarily in foreign securities. The fund may also invest in convertible securities and warrants. The fund may invest, to a limited extent, in derivatives. Investments in derivatives may subject the fund to risks different from, and possibly greater than, those of the underlying securities, assets, or market indexes. The fund does not intend to use derivatives for speculation or for the purpose of leveraging, or magnifying, investment returns.
The fund may enter into forward foreign currency exchange contracts, which are a type of derivative contract.
The fund may invest its assets in cash, cash equivalent securities or short-term debt securities, repurchase agreements and money market instruments. Under adverse or unstable market, economic or political conditions, the fund may take temporary defensive positions in cash and short-term debt securities without limit.
Principal Risks: Many factors affect the fund’s performance. There is no assurance the fund will meet its investment objective. The value of your investment in the fund, as well as the amount of return you receive on your investment, may fluctuate significantly from day to day and over time. You may lose part or all of your investment in the fund or your investment may not perform as well as other similar investments. The following is a summary of certain risks (in alphabetical order) of investing in the fund. You may lose money if you invest in this fund.
| • | | Cash Management and Defensive Investing – Money market instruments or short-term debt securities held by the fund for cash management or defensive investing purposes can fluctuate in value. Like other fixed income securities, they are subject to risk, including market, interest rate and credit risk. If the fund holds cash uninvested, the fund will not earn |
130
| | income on the cash and the fund’s yield will go down. If a significant amount of the fund’s assets are used for cash management or defensive investing purposes, it will be more difficult for the fund to achieve its objective. |
| • | | Convertible Securities – The market value of convertible securities tends to decline as interest rates increase. Convertible securities generally offer lower interest or dividend yields than non-convertible securities of similar quality. The fund could lose money if the issuer of a convertible security is unable to meet its financial obligations or goes bankrupt. |
| • | | Country/Regional – Local events, such as political upheaval, financial troubles, or natural disasters may weaken a country’s or a region’s securities markets. Because the fund may invest a large portion of its assets in securities of companies located in any one country or region, its performance may be hurt disproportionately by the poor performance of its investments in that area. Country/regional risk is especially high in emerging markets. |
| • | | Currency – When the fund invests in securities denominated in foreign currencies, the fund may incur currency conversion costs and may be affected favorably or unfavorably by changes in the rates of exchange between those currencies and the U.S. dollar. Currency exchange rates can be volatile and are affected by, among other factors, the general economics of a country, the actions of the U.S. and foreign governments or control banks, the imposition of currency controls, and speculation. |
| • | | Derivatives – Using derivatives can increase fund losses and reduce opportunities for gains when market prices, interest rates or the derivative instruments themselves behave in a way not anticipated by the fund. Using derivatives also can have a leveraging effect and increase fund volatility. Derivatives may be difficult to sell, unwind or value, and the counterparty may default on its obligations to the fund. The fund’s investments in derivative instruments may involve a small investment relative to the amount of investment exposure assumed and may result in losses exceeding the amounts invested in those instruments. Recent legislation calls for new regulation of the derivatives markets. The extent and impact of the regulation are not yet fully known and may not be for some time. New regulation of derivatives may make them more costly, may limit their availability, or may otherwise adversely affect their value or performance. |
| • | | Emerging Markets – Investing in the securities of issuers located in or principally doing business in emerging markets are subject to foreign securities risks. These risks are greater for investments in emerging markets. Emerging market countries tend to have economic, political and legal systems that are less fully developed and are less stable than those of more advanced countries. Low trading volumes may result in a lack of liquidity and in extreme price volatility. |
| • | | Foreign Securities – Foreign securities are subject to a number of additional risks, including nationalization or expropriation of assets, imposition of currency controls or restrictions, confiscatory taxation, political or financial instability and other adverse economic or political developments. Lack of information and less market regulation also may affect the value of these securities. |
| • | | Growth Stocks – Returns on growth stocks may not move in tandem with returns on other categories of stocks or the market as a whole. Growth stocks may be particularly susceptible to rapid price swings or to adverse developments. Growth stocks as a group may be out of favor and underperform the overall equity market for a long period of time, for example, while the market favors “value” stocks. |
| • | | Increase in Expenses – Your actual costs of investing in the fund may be higher than the expenses shown in “Annual Fund Operating Expenses” for a variety of reasons. For example, expense ratios may be higher than those shown if average net assets decrease. Net assets are more likely to decrease and fund expense ratios are more likely to increase when markets are volatile. |
| • | | Investment Companies – To the extent that an underlying fund invests in other investment companies, such as exchange-traded funds, it is subject to the risks of these investment companies and bears its pro rata share of the investment companies’ expenses. |
| • | | Investment Style – Returns from foreign small-capitalization growth stocks may trail returns from the overall stock market. Historically, foreign small cap stocks have been more volatile in price than the large cap stocks that dominate the overall market, and they often perform quite differently. |
| • | | Liquidity – Some securities held by the fund may be difficult to sell, or illiquid, particularly during times of market turmoil. Illiquid securities may also be difficult to value. If the fund is forced to sell an illiquid asset to meet redemption requests or other cash needs, the fund may be forced to sell at a loss. |
| • | | Market – The market prices of the fund’s securities may go up or down, sometimes rapidly or unpredictably, due to general market conditions, such as real or perceived adverse economic or political conditions, inflation, changes in interest rates or currency rates, lack of liquidity in the markets or adverse investor sentiment. Market prices of securities also may go down |
131
| | due to events or conditions that affect particular sectors or issuers. When market prices fall, the value of your investment will go down. The fund may experience a substantial or complete loss on any individual security. The recent financial crisis has caused a significant decline in the value and liquidity of many securities. In response to the financial crisis, the U.S. and other governments and the Federal Reserve and certain foreign central banks have taken steps to support financial markets. The withdrawal of this support could negatively affect the value and liquidity of certain securities. In addition, legislation recently enacted in the U.S. calls for changes in many aspects of financial regulation. The impact of the legislation on the markets, and the practical implications for market participants, may not be fully known for some time. |
| • | | Portfolio Selection – The sub-adviser’s judgment about a particular security or issuer, or about the economy or a particular sector, region or market segment, or about an investment strategy, may prove to be incorrect. |
| • | | Preferred Stock – Preferred stock’s right to dividends and liquidation proceeds is junior to the rights of a company’s debt securities. The value of preferred stock may be subject to factors that affect fixed income and equity securities, including changes in interest rates and in a company’s creditworthiness. Shareholders of preferred stock may suffer a loss of value if dividends are not paid and have limited voting rights. |
| • | | Smaller Companies – Small companies may be more at risk than larger companies because, among other things, they may have limited product lines, operating history, market or financial resources, or because they may depend on limited management groups. |
| • | | Stocks – Stocks may be volatile – their prices may go up and down dramatically over the shorter term. These price movements may result from factors affecting individual companies, industries, the securities market as a whole or the overall economy. |
| • | | Warrants and Rights – Warrants and rights may be considered more speculative than certain other types of investments because they do not entitle a holder to the dividends or voting rights for the securities that may be purchased. They do not represent any rights in the assets of the issuing company, and cease to have value if not exercised prior to the expiration date. |
Performance: The bar chart and the table below provide some indication of the risks of investing in the fund by showing you how the fund’s performance has varied from year to year, and how the fund’s Class I2 average annual total returns for different periods compare to the returns of a broad measure of market performance. The table shows average annual total returns for Class I2 shares of the fund. Absent any limitation of the fund’s expenses, total returns would be lower. As with all mutual funds, past performance (before and after taxes) is not a prediction of future results. Updated performance information is available on our website at www.transamericafunds.com or by calling 1-888-233-4339.
Annual Total Returns (calendar years ended December 31)

| | | | |
| | | Quarter Ended | | Return |
Best Quarter: | | 6/30/2009 | | 31.88% |
Worst Quarter: | | 6/30/2010 | | -10.09% |
132
Average Annual Total Returns (periods ended December 31, 2010)1
| | | | | | |
| | | 1 Year | | 5 Years | | 10 Years or Inception* |
| Class I2 (commenced operations on March 1, 2008) |
| Return before taxes | | 22.68% | | N/A | | 1.89% |
| Return after taxes on distributions2 | | 22.38% | | N/A | | 1.68% |
| Return after taxes on distributions and sale of fund shares2 | | 15.12% | | N/A | | 1.56% |
| S&P SmallCap EuroPacific Index (reflects no deduction for fees, expenses or taxes) | | 19.35% | | N/A | | -1.25% |
| 1 | Actual returns may depend on the investor’s individual tax situation. After-tax returns may not be relevant if the investment is made through a tax-exempt or tax-deferred account, such as a 401(k) plan. |
| 2 | The after-tax returns are calculated using the historic highest individual federal marginal income tax rates and do not reflect the impact of state and local taxes. |
| * | Fund and Index returns are for past 10 years or since inception, whichever is less. |
| | |
| Management: | | |
| |
| Investment Adviser: | | Sub-Adviser: |
| |
| Transamerica Asset Management, Inc. | | Schroder Investment Management North America Inc. |
| |
| | Sub-Sub-Adviser |
| |
| | Schroder Investment Management North America Limited |
| |
| | Portfolio Manager: |
| |
| | Matthew Dobbs, Portfolio Manager since 2008 |
Purchase and Sale of Fund Shares: Class I2 shares of the fund are currently primarily offered for investment in certain funds of funds (also referred to as “strategic asset allocation funds”). Class I2 shares of the fund are also made available to other investors, including institutional investors such as foreign insurers, domestic insurance companies and their separate accounts, and unaffiliated funds, high net worth individuals, and eligible retirement plans whose recordkeepers or financial service firm intermediaries have entered into agreements with Transamerica Funds or its agents. Investors who received Class I2 shares in connection with the reorganization of a Transamerica Premier Fund into a Transamerica Fund may continue to invest in Class I2 shares of that Transamerica Fund, but may not open new accounts. You buy and redeem shares at the fund’s next-determined net asset value (NAV) after receipt of your request in good order.
Tax Information: Fund distributions may be taxable as ordinary income or capital gains, except when your investment is in an IRA, 401(k) or other tax-advantaged investment plan.
Payments to Broker-Dealers and Other Financial Intermediaries: If you purchase the fund through a broker-dealer or other financial intermediary, the fund and/or its affiliates may pay the intermediary for the sale of fund shares and related services. These payments may create a conflict of interest by influencing the broker-dealer or other intermediary and your salesperson to recommend the fund over another investment. Ask your salesperson or visit your financial intermediary’s website for more information.
133
|
| TRANSAMERICA SYSTEMATIC SMALL/MID CAP VALUE |
Investment Objective: Seeks to maximize total return.
Fees and Expenses: This table describes the fees and expenses that you may pay if you buy and hold shares of the fund. There are no sales charges (load) or other transaction fees.
| | |
Annual Fund Operating Expenses (expenses that you pay each year as a percentage of the value of your investment) |
| | |
Management fees | | 0.80% |
Distribution and service (12b-1) fees | | None |
Other expenses | | 0.08% |
Total annual fund operating expenses | | 0.88% |
Example: This Example is intended to help you compare the cost of investing in the fund with the cost of investing in other mutual funds. The Example assumes that you invest $10,000. The Example also assumes that your investment has a 5% return each year and that the fund’s operating expenses remain the same. Although your actual costs may be higher or lower, based on these assumptions your costs would be:
| | | | | | |
1 year | | 3 years | | 5 years | | 10 years |
$90 | | $281 | | $488 | | $1,084 |
Portfolio Turnover: The fund pays transaction costs, such as commissions, when it buys and sells securities (or “turns over” its portfolio). A higher portfolio turnover rate may indicate higher transaction costs and may result in higher taxes when fund shares are held in a taxable account. These costs, which are not reflected in annual fund operating expenses or in the Example, affect the fund’s performance. During the most recent fiscal year, the portfolio turnover rate was 57% of the average value of the fund’s portfolio.
Principal Investment Strategies: The fund’s sub-adviser, Systematic Financial Management L.P. (“Systematic”), seeks to achieve the fund’s objective by investing, under normal circumstances, at least 80% of the fund’s net assets in small- and mid-cap equity securities (U.S. equity securities, ADRs and foreign securities trading on U.S. markets). The fund defines small- and mid-cap equities as companies whose market capitalization falls within the range of $100 million to $20 billion or within the range of the Russell 2500® Index, whichever is broader at the time of purchase.
The fund generally will invest in small- and mid-cap equities with valuation characteristics including low price/earnings and price/cash flow ratios. Systematic’s security selection process generally favors companies with positive earnings dynamics, manageable debt levels and good cash flows. Trends in balance sheet items including inventories, accounts receivable, and payables are scrutinized as well. Systematic also reviews the company’s products/services, market position, industry condition, financial and accounting policies and quality of management. Securities of issuers that possess the greatest combination of the aforementioned attributes are then prioritized as candidates for purchase.
The fund may invest up to 10% of its total assets in the securities of foreign issuers, including ADRs and foreign securities trading on U.S. markets.
Systematic employs a fully invested strategy. Therefore, under normal market conditions, cash and cash equivalents are generally less than 5% of the portfolio value.
The fund may invest in cash, cash equivalent securities or short-term debt securities, repurchase agreements and money market instruments. Under adverse or unstable market, economic or political conditions, the fund may take temporary defensive positions in cash and short-term debt securities without limit.
Principal Risks: Many factors affect the fund’s performance. There is no assurance the fund will meet its investment objective. The value of your investment in the fund, as well as the amount of return you receive on your investment, may fluctuate significantly from day to day and over time. You may lose part or all of your investment in the fund or your investment may not perform as well as other similar investments. The following is a summary of certain risks (in alphabetical order) of investing in the fund. You may lose money if you invest in this fund.
| • | | Cash Management and Defensive Investing – Money market instruments or short-term debt securities held by the fund for cash management or defensive investing purposes can fluctuate in value. Like other fixed income securities, they are subject to risk, including market, interest rate and credit risk. If the fund holds cash uninvested, the fund will not earn income on the cash and the fund’s yield will go down. If a significant amount of the fund’s assets are used for cash management or defensive investing purposes, it will be more difficult for the fund to achieve its objective. |
134
| • | | Currency – When the fund invests in securities denominated in foreign currencies, the fund may incur currency conversion costs and may be affected favorably or unfavorably by changes in the rates of exchange between those currencies and the U.S. dollar. Currency exchange rates can be volatile and are affected by, among other factors, the general economics of a country, the actions of the U.S. and foreign governments or control banks, the imposition of currency controls, and speculation. |
| • | | Emerging Markets – Investing in the securities of issuers located in or principally doing business in emerging markets are subject to foreign securities risks. These risks are greater for investments in emerging markets. Emerging market countries tend to have economic, political and legal systems that are less fully developed and are less stable than those of more advanced countries. Low trading volumes may result in a lack of liquidity and in extreme price volatility. |
| • | | Foreign Securities – Foreign securities are subject to a number of additional risks, including nationalization or expropriation of assets, imposition of currency controls or restrictions, confiscatory taxation, political or financial instability and other adverse economic or political developments. Lack of information and less market regulation also may affect the value of these securities. |
| • | | Increase in Expenses – Your actual costs of investing in the fund may be higher than the expenses shown in “Annual Fund Operating Expenses” for a variety of reasons. For example, expense ratios may be higher than those shown if average net assets decrease. Net assets are more likely to decrease and fund expense ratios are more likely to increase when markets are volatile. |
| • | | Market – The market prices of the fund’s securities may go up or down, sometimes rapidly or unpredictably, due to general market conditions, such as real or perceived adverse economic or political conditions, inflation, changes in interest rates or currency rates, lack of liquidity in the markets or adverse investor sentiment. Market prices of securities also may go down due to events or conditions that affect particular sectors or issuers. When market prices fall, the value of your investment will go down. The fund may experience a substantial or complete loss on any individual security. The recent financial crisis has caused a significant decline in the value and liquidity of many securities. In response to the financial crisis, the U.S. and other governments and the Federal Reserve and certain foreign central banks have taken steps to support financial markets. The withdrawal of this support could negatively affect the value and liquidity of certain securities. In addition, legislation recently enacted in the U.S. calls for changes in many aspects of financial regulation. The impact of the legislation on the markets, and the practical implications for market participants, may not be fully known for some time. |
| • | | Portfolio Selection – The sub-adviser’s judgment about a particular security or issuer, or about the economy or a particular sector, region or market segment, or about an investment strategy, may prove to be incorrect. |
| • | | Small- or Medium-Sized Companies – Small- or medium-sized companies may be more at risk than larger companies because, among other things, they may have limited product lines, operating history, market or financial resources, or because they may depend on a limited management group. |
| • | | Stocks – Stocks may be volatile – their prices may go up and down dramatically over the shorter term. These price movements may result from factors affecting individual companies, industries, the securities market as a whole or the overall economy. |
| • | | Value Investing – The prices of securities the sub-adviser believes are undervalued may not appreciate as anticipated or may go down. Value stocks as a group may be out of favor and underperform the overall equity market for a long period of time, for example, while the market favors “growth” stocks. |
Performance: The bar chart and the table below provide some indication of the risks of investing in the fund by showing you how the fund’s performance has varied from year to year, and how the fund’s Class I2 average annual total returns for different periods compare to the returns of a broad measure of market performance. The table shows average annual total returns for Class I2 shares of the fund. Absent any limitation of the fund’s expenses, total returns would be lower. As with all mutual funds, past performance (before and after taxes) is not a prediction of future results. Updated performance information is available on our website at www.transamericafunds.com or by calling 1-888-233-4339.
Prior to March 22, 2011, the fund was named Transamerica Small/Mid Cap Value, had a different sub-adviser and used different investment strategies. The performance set forth prior to that date is attributable to the previous sub-adviser.
135
Annual Total Returns (calendar years ended December 31)

| | | | |
| | | Quarter Ended | | Return |
Best Quarter: | | 6/30/2009 | | 27.13% |
Worst Quarter: | | 12/31/2008 | | -25.08% |
Average Annual Total Returns (periods ended December 31, 2010)1
| | | | | | |
| | | 1 Year | | 5 Years | | 10 Years or
Inception* |
Class I2 (commenced operations on November 15, 2005) | | | | | | |
Return before taxes | | 30.17% | | 10.17% | | 10.45% |
Return after taxes on distributions2 | | 30.17% | | 9.40% | | 9.39% |
Return after taxes on distributions and sale of fund shares2 | | 19.61% | | 8.60% | | 8.70% |
Russell 2500® Value Index (reflects no deduction for fees, expenses or taxes) | | 24.82% | | 3.85% | | 4.14% |
| 1 | Actual returns may depend on the investor’s individual tax situation. After-tax returns may not be relevant if the investment is made through a tax-exempt or tax-deferred account, such as a 401(k) plan. |
| 2 | The after-tax returns are calculated using the historic highest individual federal marginal income tax rates and do not reflect the impact of state and local taxes. |
| * | Fund and Index returns are for past 10 years or since inception, whichever is less. |
| | |
Management: | | |
| |
Investment Adviser: | | Sub-Adviser: |
| |
Transamerica Asset Management, Inc. | | Systematic Financial Management L.P. |
| |
| | Portfolio Managers: |
| |
| | Kenneth Burgess, CFA, Portfolio Manager since 2011 |
| |
| | Ron Mushock, CFA, Portfolio Manager since 2011 |
Purchase and Sale of Fund Shares: Class I2 shares of the fund are currently primarily offered for investment in certain funds of funds (also referred to as “strategic asset allocation funds”). Class I2 shares of the fund are also made available to other investors, including institutional investors such as foreign insurers, domestic insurance companies and their separate accounts, and unaffiliated funds, high net worth individuals, and eligible retirement plans whose recordkeepers or financial service firm intermediaries have entered into agreements with Transamerica Funds or its agents. Investors who received Class I2 shares in connection with the reorganization of a Transamerica Premier Fund into a Transamerica Fund may continue to invest in Class I2 shares of that Transamerica Fund, but may not open new accounts. You buy and redeem shares at the fund’s next-determined net asset value (NAV) after receipt of your request in good order.
Tax Information: Fund distributions may be taxable as ordinary income or capital gains, except when your investment is in an IRA, 401(k) or other tax-advantaged investment plan.
Payments to Broker-Dealers and Other Financial Intermediaries: If you purchase the fund through a broker-dealer or other financial intermediary, the fund and/or its affiliates may pay the intermediary for the sale of fund shares and related services. These payments may create a conflict of interest by influencing the broker-dealer or other intermediary and your salesperson to recommend the fund over another investment. Ask your salesperson or visit your financial intermediary’s website for more information.
136
|
| TRANSAMERICA THIRD AVENUE VALUE |
Investment Objective: Seeks long-term capital appreciation.
Fees and Expenses: This table describes the fees and expenses that you may pay if you buy and hold shares of the fund. There are no sales charges (load) or other transaction fees.
| | |
Annual Fund Operating Expenses (expenses that you pay each year as a percentage of the value of your investment) |
| | |
Management fees | | 0.80% |
Distribution and service (12b-1) fees | | None |
Other expenses | | 0.07% |
Total annual fund operating expenses | | 0.87% |
Example: This Example is intended to help you compare the cost of investing in the fund with the cost of investing in other mutual funds. The Example assumes that you invest $10,000. The Example also assumes that your investment has a 5% return each year and that the fund’s operating expenses remain the same. Although your actual costs may be higher or lower, based on these assumptions your costs would be:
| | | | | | |
1 year | | 3 years | | 5 years | | 10 years |
$89 | | $278 | | $482 | | $1,073 |
Portfolio Turnover: The fund pays transaction costs, such as commissions, when it buys and sells securities (or “turns over” its portfolio). A higher portfolio turnover rate may indicate higher transaction costs and may result in higher taxes when fund shares are held in a taxable account. These costs, which are not reflected in annual fund operating expenses or in the Example, affect the fund’s performance. During the most recent fiscal year, the portfolio turnover rate was 0% of the average value of the fund’s portfolio (instruments with remaining maturities of one year or less are excluded from the portfolio turnover rate).
Principal Investment Strategies: The fund’s sub-adviser, Third Avenue Management LLC (“Third Avenue”), invests, under normal circumstances, at least 80% of the fund’s assets in common stocks of U.S. and non-U.S. issuers. The fund seeks to achieve its objective mainly by acquiring common stocks of well-financed companies (meaning companies with high-quality assets and a relative absence of liabilities) at a discount to what the sub-adviser believes is their intrinsic value. The fund also seeks to acquire senior securities, such as debt instruments (including high-yield and distressed securities that may be in default and may have any or no credit rating) that the sub-adviser believes are undervalued.
Third Avenue employs an opportunistic, “bottom-up” research process to identify companies that it believes to have strong balance sheets, competent managements, and understandable businesses, where equity securities are priced at a discount to its estimate of intrinsic value. A “bottom-up” approach is looking at individual companies against the context of broader market factors.
The fund invests in companies regardless of market capitalization. The mix of investments at any time will depend on the industries and types of securities believed to represent the best values, consistent with the fund’s investment strategies and restrictions. The fund may invest up to 15% of its assets in high-yield/high risk fixed-income securities and other types of debt securities.
The fund may invest in cash, cash equivalent securities or short-term debt securities, repurchase agreements and money market instruments. Under adverse or unstable market, economic or political conditions, the fund may take temporary defensive positions in cash and short-term debt securities without limit.
The fund is a non-diversified fund.
Principal Risks: Many factors affect the fund’s performance. There is no assurance the fund will meet its investment objective. The value of your investment in the fund, as well as the amount of return you receive on your investment, may fluctuate significantly from day to day and over time. You may lose part or all of your investment in the fund or your investment may not perform as well as other similar investments. The following is a summary of certain risks (in alphabetical order) of investing in the fund. You may lose money if you invest in this fund.
| • | | Cash Management and Defensive Investing – Money market instruments or short-term debt securities held by the fund for cash management or defensive investing purposes can fluctuate in value. Like other fixed income securities, they are subject to risk, including market, interest rate and credit risk. If the fund holds cash uninvested, the fund will not earn income on the cash and the fund’s yield will go down. If a significant amount of the fund’s assets are used for cash management or defensive investing purposes, it will be more difficult for the fund to achieve its objective. |
137
| • | | Currency – When the fund invests in securities denominated in foreign currencies, the fund may incur currency conversion costs and may be affected favorably or unfavorably by changes in the rates of exchange between those currencies and the U.S. dollar. Currency exchange rates can be volatile and are affected by, among other factors, the general economics of a country, the actions of the U.S. and foreign governments or control banks, the imposition of currency controls, and speculation. |
| • | | Emerging Markets – Investing in the securities of issuers located in or principally doing business in emerging markets are subject to foreign securities risks. These risks are greater for investments in emerging markets. Emerging market countries tend to have economic, political and legal systems that are less fully developed and are less stable than those of more advanced countries. Low trading volumes may result in a lack of liquidity and in extreme price volatility. |
| • | | Fixed-Income Securities – The market prices of fixed-income securities may go up or down, sometimes rapidly or unpredictably due to general market conditions, such as real or perceived adverse economic or political conditions, inflation, changes in interest rates, lack of liquidity in the bond markets or adverse investor sentiment. When market prices fall, the value of your investment will go down. A rise in rates tends to have a greater impact on the prices of longer term or duration securities. |
If interest rates rise, repayments of fixed-income securities may occur more slowly than anticipated by the market. This may drive the prices of these securities down because their interest rates are lower than the current interest rate and they remain outstanding longer. This is sometimes referred to as extension risk.
Many issuers have a right to prepay their securities. If interest rates fall, an issuer may exercise this right. If this happens, the fund will be forced to reinvest prepayment proceeds at a time when yields on securities available in the market are lower than the yield on the prepaid security. This is sometimes referred to as prepayment or call risk.
| • | | Foreign Securities – Foreign securities are subject to a number of additional risks, including nationalization or expropriation of assets, imposition of currency controls or restrictions, confiscatory taxation, political or financial instability and other adverse economic or political developments. Lack of information and less market regulation also may affect the value of these securities. |
| • | | High-Yield Debt Securities – High-yield debt securities, or junk bonds, are securities that are rated below “investment grade” (that is, securities rated below Baa/BBB) or, if unrated, are considered by the sub-adviser to be of equivalent quality. Changes in interest rates, the market’s perception of the issuers and the creditworthiness of the issuers may significantly affect the value of these bonds. Junk bonds have a higher risk of default, tend to be less liquid and may be more difficult to value. |
| • | | Increase in Expenses – Your actual costs of investing in the fund may be higher than the expenses shown in “Annual Fund Operating Expenses” for a variety of reasons. For example, expense ratios may be higher than those shown if average net assets decrease. Net assets are more likely to decrease and fund expense ratios are more likely to increase when markets are volatile. |
| • | | Market – The market prices of the fund’s securities may go up or down, sometimes rapidly or unpredictably, due to general market conditions, such as real or perceived adverse economic or political conditions, inflation, changes in interest rates or currency rates, lack of liquidity in the markets or adverse investor sentiment. Market prices of securities also may go down due to events or conditions that affect particular sectors or issuers. When market prices fall, the value of your investment will go down. The fund may experience a substantial or complete loss on any individual security. The recent financial crisis has caused a significant decline in the value and liquidity of many securities. In response to the financial crisis, the U.S. and other governments and the Federal Reserve and certain foreign central banks have taken steps to support financial markets. |
The withdrawal of this support could negatively affect the value and liquidity of certain securities. In addition, legislation recently enacted in the U.S. calls for changes in many aspects of financial regulation. The impact of the legislation on the markets, and the practical implications for market participants, may not be fully known for some time.
| • | | Non-Diversification – The fund is classified as “non-diversified,” which means it may invest in a larger percentage of its assets in one issuer than a diversified fund. To the extent the fund invests its assets in fewer issuers, the fund will be more susceptible to negative events affecting those issuers. |
| • | | Portfolio Selection – The sub-adviser’s judgment about a particular security or issuer, or about the economy or a particular sector, region or market segment, or about an investment strategy, may prove to be incorrect. |
| • | | Small- or Medium-Sized Companies – Small- or medium-sized companies may be more at risk than larger companies because, among other things, they may have limited product lines, operating history, market or financial resources, or because they may depend on a limited management group. |
138
| • | | Stocks – Stocks may be volatile – their prices may go up and down dramatically over the shorter term. These price movements may result from factors affecting individual companies, industries, the securities market as a whole or the overall economy. |
| • | | Value Investing – The prices of securities the sub-adviser believes are undervalued may not appreciate as anticipated or may go down. Value stocks as a group may be out of favor and underperform the overall equity market for a long period of time, for example, while the market favors “growth” stocks. |
Performance: The bar chart and the table below provide some indication of the risks of investing in the fund by showing you how the fund’s performance has varied from year to year, and how the fund’s Class I2 average annual total returns for different periods compare to the returns of a broad measure of market performance, as well as comparison to a secondary index which has characteristics relevant to the fund’s investment strategies. The table shows average annual total returns for Class I2 shares of the fund. Absent any limitation of the fund’s expenses, total returns would be lower. As with all mutual funds, past performance (before and after taxes) is not a prediction of future results. Updated performance information is available on our website at www.transamericafunds.com or by calling 1-888-233-4339.
Annual Total Returns (calendar years ended December 31)
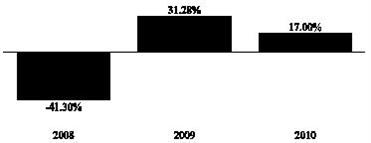
| | | | |
| | | Quarter Ended | | Return |
Best Quarter: | | 6/30/2009 | | 22.97% |
Worst Quarter: | | 12/31/2008 | | -27.60% |
Average Annual Total Returns (periods ended December 31, 2010)1
| | | | | | |
| | | 1 Year | | 5 Years | | 10 Years or
Inception* |
Class I2 (commenced operations on May 1, 2007) |
Return before taxes | | 17.00% | | N/A | | -3.93% |
Return after taxes on distributions2 | | 16.53% | | N/A | | -4.35% |
Return after taxes on distributions and sale of fund shares2 | | 11.37% | | N/A | | -3.49% |
Russell 3000® Value Index (reflects no deduction for fees, expenses or taxes) | | 16.23% | | N/A | | -4.69% |
Morgan Stanley Capital International World Index (reflects no deduction for fees,expenses or taxes) | | 12.34% | | N/A | | -2.94% |
| 1 | Actual returns may depend on the investor’s individual tax situation. After-tax returns may not be relevant if the investment is made through a tax-exempt or tax-deferred account, such as a 401(k) plan. |
| 2 | The after-tax returns are calculated using the historic highest individual federal marginal income tax rates and do not reflect the impact of state and local taxes. |
| * | Fund and Index returns are for past 10 years or since inception, whichever is less. |
139
| | |
| Management: | | |
| |
| Investment Adviser: | | Sub-Adviser: |
| |
| Transamerica Asset Management, Inc. | | Third Avenue Management LLC |
| |
| | Portfolio Managers: |
| |
| | Curtis R. Jensen, Co-Portfolio Manager since 2007 |
| |
| | Yang Lie, Co-Portfolio Manager since 2008 |
| |
| | Kathleen K. Crawford, Assistant Portfolio Manager since 2007 |
Purchase and Sale of Fund Shares: Class I2 shares of the fund are currently primarily offered for investment in certain funds of funds (also referred to as “strategic asset allocation funds”). Class I2 shares of the fund are also made available to other investors, including institutional investors such as foreign insurers, domestic insurance companies and their separate accounts, and unaffiliated funds, high net worth individuals, and eligible retirement plans whose recordkeepers or financial service firm intermediaries have entered into agreements with Transamerica Funds or its agents. Investors who received Class I2 shares in connection with the reorganization of a Transamerica Premier Fund into a Transamerica Fund may continue to invest in Class I2 shares of that Transamerica Fund, but may not open new accounts. You buy and redeem shares at the fund’s next-determined net asset value (NAV) after receipt of your request in good order.
Tax Information: Fund distributions may be taxable as ordinary income or capital gains, except when your investment is in an IRA, 401(k) or other tax-advantaged investment plan.
Payments to Broker-Dealers and Other Financial Intermediaries: If you purchase the fund through a broker-dealer or other financial intermediary, the fund and/or its affiliates may pay the intermediary for the sale of fund shares and related services. These payments may create a conflict of interest by influencing the broker-dealer or other intermediary and your salesperson to recommend the fund over another investment. Ask your salesperson or visit your financial intermediary’s website for more information.
140
|
| TRANSAMERICA THORNBURG INTERNATIONAL VALUE |
Investment Objective: Seeks to provide long-term capital appreciation. The secondary goal is to seek current income.
Fees and Expenses: This table describes the fees and expenses that you may pay if you buy and hold shares of the fund. There are no sales charges (load) or other transaction fees.
| | |
Annual Fund Operating Expenses (expenses that you pay each year as a percentage of the value of your investment) |
| | |
Management fees | | 0.99% |
Distribution and service (12b-1) fees | | None |
Other expenses | | 0.09% |
Total annual fund operating expenses | | 1.08% |
Example: This Example is intended to help you compare the cost of investing in the fund with the cost of investing in other mutual funds. The Example assumes that you invest $10,000. The Example also assumes that your investment has a 5% return each year and that the fund’s operating expenses remain the same. Although your actual costs may be higher or lower, based on these assumptions your costs would be:
| | | | | | |
1 year | | 3 years | | 5 years | | 10 years |
$110 | | $343 | | $595 | | $1,317 |
Portfolio Turnover: The fund pays transaction costs, such as commissions, when it buys and sells securities (or “turns over” its portfolio). A higher portfolio turnover rate may indicate higher transaction costs and may result in higher taxes when fund shares are held in a taxable account. These costs, which are not reflected in annual fund operating expenses or in the Example, affect the fund’s performance. During the most recent fiscal year, the portfolio turnover rate was 36% of the average value of the fund’s portfolio.
Principal Investment Strategies: The fund invests, under normal circumstances, at least 75% of its assets in foreign securities or depository receipts of foreign securities of issuers that are located in a number of countries throughout the world. The fund may invest in emerging markets.
The fund’s sub-adviser, Thornburg Investment Management, Inc. (“Thornburg”), intends to invest on an opportunistic basis, where it believes there is intrinsic value. The fund may invest in companies of any size, but invests primarily in the large and middle range of public company market capitalizations (i.e., companies with market capitalizations of $2 billion or more at the time of purchase). The fund may also invest in partnership interests.
The fund may use forward currency contracts to hedge against a decline in the value of existing investments, denominated in foreign currency. The fund may purchase debt obligations of any maturity and of any quality.
The fund may invest its assets in cash, cash equivalent securities or short-term debt securities, repurchase agreements and money market instruments. Under adverse or unstable market, economic or political conditions, the fund may take temporary defensive positions in cash and short-term debt securities without limit.
Principal Risks: Many factors affect the fund’s performance. There is no assurance the fund will meet its investment objective. The value of your investment in the fund, as well as the amount of return you receive on your investment, may fluctuate significantly from day to day and over time. You may lose part or all of your investment in the fund or your investment may not perform as well as other similar investments. The following is a summary of certain risks (in alphabetical order) of investing in the fund. You may lose money if you invest in this fund.
| • | | Cash Management and Defensive Investing – Money market instruments or short-term debt securities held by the fund for cash management or defensive investing purposes can fluctuate in value. Like other fixed income securities, they are subject to risk, including market, interest rate and credit risk. If the fund holds cash uninvested, the fund will not earn income on the cash and the fund’s yield will go down. If a significant amount of the fund’s assets are used for cash management or defensive investing purposes, it will be more difficult for the fund to achieve its objective. |
| • | | Currency – When the fund invests in securities denominated in foreign currencies, the fund may incur currency conversion costs and may be affected favorably or unfavorably by changes in the rates of exchange between those currencies and the U.S. dollar. Currency exchange rates can be volatile and are affected by, among other factors, the general economics of a country, the actions of the U.S. and foreign governments or control banks, the imposition of currency controls, and speculation. |
141
| • | | Currency Hedging – The fund may hedge its currency risk using currency futures, forwards or options. However, these instruments may not always work as intended, and a fund may be worse off than if it had not used a hedging instrument. |
| • | | Derivatives – Using derivatives can increase fund losses and reduce opportunities for gains when market prices, interest rates or the derivative instruments themselves behave in a way not anticipated by the fund. Using derivatives also can have a leveraging effect and increase fund volatility. Derivatives may be difficult to sell, unwind or value, and the counterparty may default on its obligations to the fund. The fund’s investments in derivative instruments may involve a small investment relative to the amount of investment exposure assumed and may result in losses exceeding the amounts invested in those instruments. Recent legislation calls for new regulation of the derivatives markets. The extent and impact of the regulation are not yet fully known and may not be for some time. New regulation of derivatives may make them more costly, may limit their availability, or may otherwise adversely affect their value or performance. |
| • | | Emerging Markets – Investing in the securities of issuers located in or principally doing business in emerging markets are subject to foreign securities risks. These risks are greater for investments in emerging markets. Emerging market countries tend to have economic, political and legal systems that are less fully developed and are less stable than those of more advanced countries. Low trading volumes may result in a lack of liquidity and in extreme price volatility. |
| • | | Fixed-Income Securities – The market prices of fixed-income securities may go up or down, sometimes rapidly or unpredictably due to general market conditions, such as real or perceived adverse economic or political conditions, inflation, changes in interest rates, lack of liquidity in the bond markets or adverse investor sentiment. When market prices fall, the value of your investment will go down. A rise in rates tends to have a greater impact on the prices of longer term or duration securities. |
If interest rates rise, repayments of fixed-income securities may occur more slowly than anticipated by the market. This may drive the prices of these securities down because their interest rates are lower than the current interest rate and they remain outstanding longer. This is sometimes referred to as extension risk.
Many issuers have a right to prepay their securities. If interest rates fall, an issuer may exercise this right. If this happens, the fund will be forced to reinvest prepayment proceeds at a time when yields on securities available in the market are lower than the yield on the prepaid security. This is sometimes referred to as prepayment or call risk.
| • | | Foreign Securities – Foreign securities are subject to a number of additional risks, including nationalization or expropriation of assets, imposition of currency controls or restrictions, confiscatory taxation, political or financial instability and other adverse economic or political developments. Lack of information and less market regulation also may affect the value of these securities. |
| • | | High-Yield Debt Securities – High-yield debt securities, or junk bonds, are securities that are rated below “investment grade” (that is, securities rated below Baa/BBB) or, if unrated, are considered by the sub-adviser to be of equivalent quality. Changes in interest rates, the market’s perception of the issuers and the creditworthiness of the issuers may significantly affect the value of these bonds. Junk bonds have a higher risk of default, tend to be less liquid and may be more difficult to value. |
| • | | Increase in Expenses – Your actual costs of investing in the fund may be higher than the expenses shown in “Annual Fund Operating Expenses” for a variety of reasons. For example, expense ratios may be higher than those shown if average net assets decrease. Net assets are more likely to decrease and fund expense ratios are more likely to increase when markets are volatile. |
| • | | Market – The market prices of the fund’s securities may go up or down, sometimes rapidly or unpredictably, due to general market conditions, such as real or perceived adverse economic or political conditions, inflation, changes in interest rates or currency rates, lack of liquidity in the markets or adverse investor sentiment. Market prices of securities also may go down due to events or conditions that affect particular sectors or issuers. When market prices fall, the value of your investment will go down. The fund may experience a substantial or complete loss on any individual security. The recent financial crisis has caused a significant decline in the value and liquidity of many securities. In response to the financial crisis, the U.S. and other governments and the Federal Reserve and certain foreign central banks have taken steps to support financial markets. The withdrawal of this support could negatively affect the value and liquidity of certain securities. In addition, legislation recently enacted in the U.S. calls for changes in many aspects of financial regulation. The impact of the legislation on the markets, and the practical implications for market participants, may not be fully known for some time. |
| • | | Portfolio Selection – The sub-adviser’s judgment about a particular security or issuer, or about the economy or a particular sector, region or market segment, or about an investment strategy, may prove to be incorrect. |
142
| • | | Small- or Medium-Sized Companies – Small- or medium-sized companies may be more at risk than larger companies because, among other things, they may have limited product lines, operating history, market or financial resources, or because they may depend on a limited management group. |
| • | | Stocks – Stocks may be volatile – their prices may go up and down dramatically over the shorter term. These price movements may result from factors affecting individual companies, industries, the securities market as a whole or the overall economy. |
| • | | Value Investing – The prices of securities the sub-adviser believes are undervalued may not appreciate as anticipated or may go down. Value stocks as a group may be out of favor and underperform the overall equity market for a long period of time, for example, while the market favors “growth” stocks. |
Performance: The bar chart and the table below provide some indication of the risks of investing in the fund by showing you how the fund’s performance has varied from year to year, and how the fund’s Class I2 average annual total returns for different periods compare to the returns of a broad measure of market performance. The table shows average annual total returns for Class I2 shares of the fund. Absent any limitation of the fund’s expenses, total returns would be lower. As with all mutual funds, past performance (before and after taxes) is not a prediction of future results. Updated performance information is available on our website at www.transamericafunds.com or by calling 1-888-233-4339.
Annual Total Returns (calendar years ended December 31)

| | | | |
| | | Quarter Ended | | Return |
Best Quarter: | | 6/30/2009 | | 22.40% |
Worst Quarter: | | 3/31/2009 | | -10.94% |
Average Annual Total Returns (periods ended December 31, 2010)1
| | | | | | |
| | | 1 Year | | 5 Years | | 10 Years or
Inception* |
Class I2 (commenced operations on September 15, 2008) |
Return before taxes | | 14.22% | | N/A | | 6.94% |
Return after taxes on distributions2 | | 14.02% | | N/A | | 6.73% |
Return after taxes on distributions and sale of fund shares2 | | 9.49% | | N/A | | 5.89% |
Morgan Stanley Capital International All Country World Index ex-U.S. (reflects no deduction for fees, expenses, or taxes) | | 11.60% | | N/A | | 5.40% |
| 1 | Actual returns may depend on the investor’s individual tax situation. After-tax returns may not be relevant if the investment is made through a tax-exempt or tax-deferred account, such as a 401(k) plan. |
| 2 | The after-tax returns are calculated using the historic highest individual federal marginal income tax rates and do not reflect the impact of state and local taxes. |
| * | Fund and Index returns are for past 10 years or since inception, whichever is less. |
| | |
| Management: | | |
| |
| Investment Adviser: | | Sub-Adviser: |
| |
| Transamerica Asset Management, Inc. | | Thornburg Investment Management, Inc. |
| |
| | Portfolio Managers: |
| |
| | William V. Fries, CFA, Co-Portfolio Manager since 2008 |
| |
| | Wendy Trevisani, Co-Portfolio Manager since 2008 |
| |
| | Lei Wang, CFA, Co-Portfolio Manager since 2008 |
143
Purchase and Sale of Fund Shares: Class I2 shares of the fund are currently primarily offered for investment in certain funds of funds (also referred to as “strategic asset allocation funds”). Class I2 shares of the fund are also made available to other investors, including institutional investors such as foreign insurers, domestic insurance companies and their separate accounts, and unaffiliated funds, high net worth individuals, and eligible retirement plans whose recordkeepers or financial service firm intermediaries have entered into agreements with Transamerica Funds or its agents. Investors who received Class I2 shares in connection with the reorganization of a Transamerica Premier Fund into a Transamerica Fund may continue to invest in Class I2 shares of that Transamerica Fund, but may not open new accounts. You buy and redeem shares at the fund’s next-determined net asset value (NAV) after receipt of your request in good order.
Tax Information: Fund distributions may be taxable as ordinary income or capital gains, except when your investment is in an IRA, 401(k) or other tax-advantaged investment plan.
Payments to Broker-Dealers and Other Financial Intermediaries: If you purchase the fund through a broker-dealer or other financial intermediary, the fund and/or its affiliates may pay the intermediary for the sale of fund shares and related services. These payments may create a conflict of interest by influencing the broker-dealer or other intermediary and your salesperson to recommend the fund over another investment. Ask your salesperson or visit your financial intermediary’s website for more information.
144
|
| TRANSAMERICA TS&W INTERNATIONAL EQUITY |
Investment Objective: Seeks maximum long-term total return, consistent with reasonable risk to principal, by investing in a diversified portfolio of common stocks of primarily non-U.S. issuers.
Fees and Expenses: This table describes the fees and expenses that you may pay if you buy and hold shares of the fund. There are no sales charges (load) or other transaction fees.
| | |
| Annual Fund Operating Expenses (expenses that you pay each year as a percentage of the value of your investment)a |
| | |
Management fees | | 0.80% |
Distribution and service (12b-1) fees | | None |
Other expenses | | 0.16% |
Total annual fund operating expenses | | 0.96% |
| a | Annual fund operating expenses are based on estimates for the current fiscal year. |
Example: This Example is intended to help you compare the cost of investing in the fund with the cost of investing in other mutual funds. The Example assumes that you invest $10,000. The Example also assumes that your investment has a 5% return each year and that the fund’s operating expenses remain the same. Although your actual costs may be higher or lower, based on these assumptions your costs would be:
Portfolio Turnover: The fund pays transaction costs, such as commissions, when it buys and sells securities (or “turns over” its portfolio). A higher portfolio turnover rate may indicate higher transaction costs and may result in higher taxes when fund shares are held in a taxable account. These costs, which are not reflected in annual fund operating expenses or in the Example, affect the fund performance. Portfolio turnover rate is not included because the fund did not commence operations until the date of this prospectus.
Principal Investment Strategies: Under normal circumstances, the fund seeks to achieve its investment objective by investing at least 80% of its net assets in equity securities of foreign companies representing at least three countries other than the United States. Thompson, Siegel & Walmsley LLC (“TS&W”), the fund’s sub-adviser, currently anticipates investing in at least 12 countries other than the United States. TS&W will emphasize established companies in individual foreign markets and will attempt to stress companies and markets that it believes are undervalued. The fund expects capital growth to be the predominant component of its total return.
Generally, the fund will invest primarily in common stocks of established companies listed on foreign securities exchanges, but it may also invest in securities traded over-the-counter. Although the fund will emphasize larger, more seasoned or established companies, it may invest in companies of varying size as measured by assets, sales or market capitalization. The fund will invest primarily in securities of companies domiciled in developed countries, but may invest up to 10% of its assets in securities of companies in developing countries. It is expected that investments will be diversified throughout the world and within markets in an effort to minimize specific country and currency risks.
TS&W employs a relative value process utilizing a combination of quantitative and qualitative methods based on a four-factor valuation screen designed to outperform the Morgan Stanley Capital International EAFE Index. TS&W’s analysts also perform rigorous fundamental analysis. A portfolio composed of 80-100 stocks is selected as a result of this process. TS&W generally limits its investment universe to those companies with a minimum of three years of operating history. TS&W employs a consistent sell discipline which includes a significant negative earnings revision, a stock being sold when the catalyst is no longer valid or another stock presents a more attractive opportunity.
The fund may invest its assets in cash, cash equivalent securities or short-term debt securities, repurchase agreements and money market instruments. Under adverse or unstable market, economic or political conditions, the fund may take temporary defensive positions in cash and short-term debt securities without limit.
Principal Risks: Many factors affect the fund’s performance. There is no assurance the fund will meet its investment objective. The value of your investment in the fund, as well as the amount of return you receive on your investment, may fluctuate significantly from day to day and over time. You may lose part or all of your investment in the fund or your investment may not perform as well as other similar investments. The following is a summary of certain risks (in alphabetical order) of investing in the fund. You may lose money if you invest in this fund.
| • | | Cash Management and Defensive Investing – Money market instruments or short-term debt securities held by the fund for cash management or defensive investing purposes can fluctuate in value. Like other fixed income securities, they are subject to risk, including market, interest rate and credit risk. If the fund holds cash uninvested, the fund will not earn |
145
| | income on the cash and the fund’s yield will go down. If a significant amount of the fund’s assets are used for cash management or defensive investing purposes, it will be more difficult for the fund to achieve its objective. |
| • | | Currency – When the fund invests in securities denominated in foreign currencies, the fund may incur currency conversion costs and may be affected favorably or unfavorably by changes in the rates of exchange between those currencies and the U.S. dollar. Currency exchange rates can be volatile and are affected by, among other factors, the general economics of a country, the actions of the U.S. and foreign governments or control banks, the imposition of currency controls, and speculation. |
| • | | Derivatives – Using derivatives can increase fund losses and reduce opportunities for gains when market prices, interest rates or the derivative instruments themselves behave in a way not anticipated by the fund. Using derivatives also can have a leveraging effect and increase fund volatility. Derivatives may be difficult to sell, unwind or value, and the counterparty may default on its obligations to the fund. The fund’s investments in derivative instruments may involve a small investment relative to the amount of investment exposure assumed and may result in losses exceeding the amounts invested in those instruments. Recent legislation calls for new regulation of the derivatives markets. The extent and impact of the regulation are not yet fully known and may not be for some time. New regulation of derivatives may make them more costly, may limit their availability, or may otherwise adversely affect their value or performance. |
| • | | Emerging Markets – Investing in the securities of issuers located in or principally doing business in emerging markets are subject to foreign securities risks. These risks are greater for investments in emerging markets. Emerging market countries tend to have economic, political and legal systems that are less fully developed and are less stable than those of more advanced countries. Low trading volumes may result in a lack of liquidity and in extreme price volatility. |
| • | | Foreign Securities – Foreign securities are subject to a number of additional risks, including nationalization or expropriation of assets, imposition of currency controls or restrictions, confiscatory taxation, political or financial instability and other adverse economic or political developments. Lack of information and less market regulation also may affect the value of these securities. |
| • | | Geographic – To the extent the fund invests a significant portion of its assets in issuers located in a single country, a small number of countries, or a particular geographic region, the fund will be more susceptible to negative events affecting those countries or that region, and could be more volatile than a more geographically diverse fund. Geographic risk is especially high in emerging markets. |
| • | | Increase in Expenses – Your actual costs of investing in the fund may be higher than the expenses shown in “Annual Fund Operating Expenses” for a variety of reasons. For example, expense ratios may be higher than those shown if average net assets decrease. Net assets are more likely to decrease and fund expense ratios are more likely to increase when markets are volatile. |
| • | | Liquidity – Some securities held by the fund may be difficult to sell, or illiquid, particularly during times of market turmoil. Illiquid securities may also be difficult to value. If the fund is forced to sell an illiquid asset to meet redemption requests or other cash needs, the fund may be forced to sell at a loss. |
| • | | Market – The market prices of the fund’s securities may go up or down, sometimes rapidly or unpredictably, due to general market conditions, such as real or perceived adverse economic or political conditions, inflation, changes in interest rates or currency rates, lack of liquidity in the markets or adverse investor sentiment. Market prices of securities also may go down due to events or conditions that affect particular sectors or issuers. When market prices fall, the value of your investment will go down. The fund may experience a substantial or complete loss on any individual security. The recent financial crisis has caused a significant decline in the value and liquidity of many securities. In response to the financial crisis, the U.S. and other governments and the Federal Reserve and certain foreign central banks have taken steps to support financial markets. The withdrawal of this support could negatively affect the value and liquidity of certain securities. In addition, legislation recently enacted in the U.S. calls for changes in many aspects of financial regulation. The impact of the legislation on the markets, and the practical implications for market participants, may not be fully known for some time. |
| • | | Portfolio Selection – The sub-adviser’s judgment about a particular security or issuer, or about the economy or a particular sector, region or market segment, or about an investment strategy, may prove to be incorrect. |
| • | | Small- or Medium-Sized Companies – Small- or medium-sized companies may be more at risk than larger companies because, among other things, they may have limited product lines, operating history, market or financial resources, or because they may depend on a limited management group. |
146
| • | | Stocks – Stocks may be volatile – their prices may go up and down dramatically over the shorter term. These price movements may result from factors affecting individual companies, industries, the securities market as a whole or the overall economy. |
| • | | Value Investing – The prices of securities the sub-adviser believes are undervalued may not appreciate as anticipated or may go down. Value stocks as a group may be out of favor and underperform the overall equity market for a long period of time, for example, while the market favors “growth” stocks. |
Performance: The bar chart and the table below provide some indication of the risks of investing in the fund by showing you how the fund’s performance has varied from year to year, and how the fund’s Class I average annual total returns for different periods compare to the returns of a broad measure of market performance. The table shows average annual total returns for Class I shares of the fund. Absent any limitation of the fund’s expenses, total returns would be lower. As with all mutual funds, past performance (before and after taxes) is not a prediction of future results. Updated performance information is available on our website at www.transamericafunds.com or by calling 1-888-233-4339.
The fund is newly organized. The fund acquired the assets and assumed the liabilities of TS&W International Equity Portfolio (the “predecessor fund”) on February 28, 2011, and the predecessor fund is the accounting and performance survivor of the reorganization. This means that the predecessor fund’s performance and financial history have been adopted by the fund and will be used going forward from the date of the reorganization. (The predecessor fund acquired the assets and assumed the historical performance of another fund on June 24, 2002. The performance shown prior to that date represents the performance of that fund.) In connection with the predecessor fund reorganization, former shareholders of the predecessor fund received Class I shares of the fund. Accordingly, the performance of Class I shares of the fund reflects the performance of the predecessor fund. Performance has not been restated to reflect the estimated annual operating expenses of Class I shares.
Although Class I2 shares would have similar annual returns to Class I shares because the classes are invested in the same portfolio of securities, the returns for Class I2 shares would be lower than Class I shares because of the lower expenses paid by Class I shares.
Annual Total Returns (calendar years ended December 31) – Class I

| | | | |
| Class I Shares | | Quarter Ended | | Return |
Best Quarter: | | 6/30/2009 | | 24.59% |
Worst Quarter: | | 9/30/2002 | | -21.31% |
Average Annual Total Returns (periods ended December 31, 2010) 1
| | | | | | |
| | | 1 Year | | 5 Years | | 10 Years or Inception* |
| Class I (predecessor fund commenced operations on December 18, 1992) |
Return before taxes | | 12.42% | | 4.04% | | 2.88% |
Return after taxes on distributions2 | | 11.89% | | 3.23% | | 2.55% |
Return after taxes on distributions and sale of fund shares2 | | 8.07% | | 3.64% | | 2.67% |
| Morgan Stanley Capital International EAFE Index (reflects no deduction for fees, expenses, or taxes) | | 7.75% | | 2.46% | | 3.50% |
| 1 | Actual returns may depend on the investor’s individual tax situation. After-tax returns may not be relevant if the investment is made through a tax-exempt or tax-deferred account, such as a 401(k) plan. |
| 2 | The after-tax returns are calculated using the historic highest individual federal marginal income tax rates and do not reflect the impact of state and local taxes. |
| * | Fund and Index returns are for past 10 years or since inception, whichever is less. |
147
| | |
| Management: | | |
| |
| Investment Adviser: | | Sub-Adviser: |
| |
| Transamerica Asset Management, Inc. | | Thompson, Siegel & Walmsley LLC |
| |
| | Portfolio Manager: |
| |
| | Brandon H. Harrell, CFA, Portfolio Manager since 2011 |
Purchase and Sale of Fund Shares: Class I2 shares of the fund are currently primarily offered for investment in certain funds of funds (also referred to as “strategic asset allocation funds”). Class I2 shares of the fund are also made available to other investors, including institutional investors such as foreign insurers, domestic insurance companies and their separate accounts, and unaffiliated funds, high net worth individuals, and eligible retirement plans whose recordkeepers or financial service firm intermediaries have entered into agreements with Transamerica Funds or its agents. Investors who received Class I2 shares in connection with the reorganization of a Transamerica Premier Fund into a Transamerica Fund may continue to invest in Class I2 shares of that Transamerica Fund, but may not open new accounts. You buy and redeem shares at the fund’s next-determined net asset value (NAV) after receipt of your request in good order.
Tax Information: Fund distributions may be taxable as ordinary income or capital gains, except when your investment is in an IRA, 401(k) or other tax-advantaged investment plan.
Payments to Broker-Dealers and Other Financial Intermediaries: If you purchase the fund through a broker-dealer or other financial intermediary, the fund and/or its affiliates may pay the intermediary for the sale of fund shares and related services. These payments may create a conflict of interest by influencing the broker-dealer or other intermediary and your salesperson to recommend the fund over another investment. Ask your salesperson or visit your financial intermediary’s website for more information.
148
|
| TRANSAMERICA UBS LARGE CAP VALUE |
Investment Objective: Seeks to maximize total return, consisting of capital appreciation and current income.
Fees and Expenses: This table describes the fees and expenses that you may pay if you buy and hold shares of the fund. There are no sales charges (load) or other transaction fees.
| | |
| Annual Fund Operating Expenses (expenses that you pay each year as a percentage of the value of your investment) |
| | |
Management fees | | 0.75% |
Distribution and service (12b-1) fees | | None |
Other expenses | | 0.04% |
Total annual fund operating expenses | | 0.79% |
Example: This Example is intended to help you compare the cost of investing in the fund with the cost of investing in other mutual funds. The Example assumes that you invest $10,000. The Example also assumes that your investment has a 5% return each year and that the fund’s operating expenses remain the same. Although your actual costs may be higher or lower, based on these assumptions your costs would be:
| | | | | | |
1 year | | 3 years | | 5 years | | 10 years |
$81 | | $252 | | $439 | | $978 |
Portfolio Turnover: The fund pays transaction costs, such as commissions, when it buys and sells securities (or “turns over” its portfolio). A higher portfolio turnover rate may indicate higher transaction costs and may result in higher taxes when fund shares are held in a taxable account. These costs, which are not reflected in annual fund operating expenses or in the Example, affect the fund’s performance. During the most recent fiscal year, the portfolio turnover rate was 56% of the average value of the fund’s portfolio.
Principal Investment Strategies: The fund’s sub-adviser, UBS Global Asset Management (Americas) Inc. (“UBS”), invests, under normal circumstances, at least 80% of the fund’s net assets in equity securities of U.S. large capitalization companies. UBS defines large capitalization companies as those with a market capitalization of at least $3 billion. The fund may invest up to 20% of its net assets in companies that have market capitalizations within the range of the fund’s benchmark, the Russell 1000® Value Index, but below $3 billion in market capitalization. In selecting securities, UBS focuses on, among other things, identifying discrepancies between a security’s fundamental value and its market price. Investments in equity securities may include, among others, dividend-paying securities, common stock, preferred stock, shares of investment companies, convertible securities, warrants and rights. The fund may use derivative instruments for risk management purposes or as part of the fund’s investment strategies. The fund may use derivatives to earn income and enhance returns, to manage or adjust the risk profile of the fund, to replace more traditional direct investments, or to obtain exposure to certain markets.
The fund may invest its assets in cash, cash equivalent securities or short-term debt securities, repurchase agreements and money market instruments. Under adverse or unstable market, economic or political conditions, the fund may take temporary defensive positions in cash and short-term debt securities without limit.
Principal Risks: Many factors affect the fund’s performance. There is no assurance the fund will meet its investment objective. The value of your investment in the fund, as well as the amount of return you receive on your investment, may fluctuate significantly from day to day and over time. You may lose part or all of your investment in the fund or your investment may not perform as well as other similar investments. The following is a summary of certain risks (in alphabetical order) of investing in the fund. You may lose money if you invest in this fund.
| • | | Cash Management and Defensive Investing – Money market instruments or short-term debt securities held by the fund for cash management or defensive investing purposes can fluctuate in value. Like other fixed income securities, they are subject to risk, including market, interest rate and credit risk. If the fund holds cash uninvested, the fund will not earn income on the cash and the fund’s yield will go down. If a significant amount of the fund’s assets are used for cash management or defensive investing purposes, it will be more difficult for the fund to achieve its objective. |
| • | | Convertible Securities – The market value of convertible securities tends to decline as interest rates increase. Convertible securities generally offer lower interest or dividend yields than non-convertible securities of similar quality. The fund could lose money if the issuer of a convertible security is unable to meet its financial obligations or goes bankrupt. |
| • | | Derivatives – Using derivatives can increase fund losses and reduce opportunities for gains when market prices, interest rates or the derivative instruments themselves behave in a way not anticipated by the fund. Using derivatives also can have a leveraging effect and increase fund volatility. Derivatives may be difficult to sell, unwind or value, and the counterparty |
149
| | may default on its obligations to the fund. The fund’s investments in derivative instruments may involve a small investment relative to the amount of investment exposure assumed and may result in losses exceeding the amounts invested in those instruments. Recent legislation calls for new regulation of the derivatives markets. The extent and impact of the regulation are not yet fully known and may not be for some time. New regulation of derivatives may make them more costly, may limit their availability, or may otherwise adversely affect their value or performance. |
| • | | Foreign Securities – Foreign securities are subject to a number of additional risks, including nationalization or expropriation of assets, imposition of currency controls or restrictions, confiscatory taxation, political or financial instability and other adverse economic or political developments. Lack of information and less market regulation also may affect the value of these securities. |
| • | | Increase in Expenses – Your actual costs of investing in the fund may be higher than the expenses shown in “Annual Fund Operating Expenses” for a variety of reasons. For example, expense ratios may be higher than those shown if average net assets decrease. Net assets are more likely to decrease and fund expense ratios are more likely to increase when markets are volatile. |
| • | | Investment Companies – To the extent that an underlying fund invests in other investment companies, such as exchange-traded funds, it is subject to the risks of these investment companies and bears its pro rata share of the investment companies’ expenses. |
| • | | Market – The market prices of the fund’s securities may go up or down, sometimes rapidly or unpredictably, due to general market conditions, such as real or perceived adverse economic or political conditions, inflation, changes in interest rates or currency rates, lack of liquidity in the markets or adverse investor sentiment. Market prices of securities also may go down due to events or conditions that affect particular sectors or issuers. When market prices fall, the value of your investment will go down. The fund may experience a substantial or complete loss on any individual security. The recent financial crisis has caused a significant decline in the value and liquidity of many securities. In response to the financial crisis, the U.S. and other governments and the Federal Reserve and certain foreign central banks have taken steps to support financial markets. The withdrawal of this support could negatively affect the value and liquidity of certain securities. In addition, legislation recently enacted in the U.S. calls for changes in many aspects of financial regulation. The impact of the legislation on the markets, and the practical implications for market participants, may not be fully known for some time. |
| • | | Portfolio Selection – The sub-adviser’s judgment about a particular security or issuer, or about the economy or a particular sector, region or market segment, or about an investment strategy, may prove to be incorrect. |
| • | | Preferred Stock – Preferred stock’s right to dividends and liquidation proceeds is junior to the rights of a company’s debt securities. The value of preferred stock may be subject to factors that affect fixed income and equity securities, including changes in interest rates and in a company’s creditworthiness. Shareholders of preferred stock may suffer a loss of value if dividends are not paid and have limited voting rights. |
| • | | Stocks – Stocks may be volatile – their prices may go up and down dramatically over the shorter term. These price movements may result from factors affecting individual companies, industries, the securities market as a whole or the overall economy. |
| • | | Value Investing – The prices of securities the sub-adviser believes are undervalued may not appreciate as anticipated or may go down. Value stocks as a group may be out of favor and underperform the overall equity market for a long period of time, for example, while the market favors “growth” stocks. |
| • | | Warrants and Rights – Warrants and rights may be considered more speculative than certain other types of investments because they do not entitle a holder to the dividends or voting rights for the securities that may be purchased. They do not represent any rights in the assets of the issuing company, and cease to have value if not exercised prior to the expiration date. |
Performance: The bar chart and the table below provide some indication of the risks of investing in the fund by showing you how the fund’s performance has varied from year to year, and how the fund’s Class I2 average annual total returns for different periods compare to the returns of a broad measure of market performance. The table shows average annual total returns for Class I2 shares of the fund. Absent any limitation of the fund’s expenses, total returns would be lower. As with all mutual funds, past performance (before and after taxes) is not a prediction of future results. Updated performance information is available on our website at www.transamericafunds.com or by calling 1-888-233-4339.
150
Annual Total Returns (calendar years ended December 31)

| | | | |
| | | Quarter Ended | | Return |
Best Quarter: | | 6/30/2009 | | 19.65% |
Worst Quarter: | | 12/31/2008 | | -25.33% |
Average Annual Total Returns (periods ended December 31, 2010)1
| | | | | | |
| | | 1 Year | | 5 Years | | 10 Years or
Inception* |
| Class I2 (commenced operations on November 8, 2004) |
| Return before taxes | | 11.02% | | -0.48% | | 1.84% |
| Return after taxes on distributions2 | | 10.75% | | -0.83% | | 1.46% |
| Return after taxes on distributions and sale of fund shares2 | | 7.51% | | -0.40% | | 1.55% |
| Russell 1000® Value Index (reflects no deduction for fees, expenses or taxes) | | 15.51% | | 1.28% | | 3.00% |
| 1 | Actual returns may depend on the investor’s individual tax situation. After-tax returns may not be relevant if the investment is made through a tax-exempt or tax-deferred account, such as a 401(k) plan. |
| 2 | The after-tax returns are calculated using the historic highest individual federal marginal income tax rates and do not reflect the impact of state and local taxes. |
| * | Fund and Index returns are for past 10 years or since inception, whichever is less. |
| | |
| Management: | | |
| |
| Investment Adviser: | | Sub-Adviser: |
| |
| Transamerica Asset Management, Inc. | | UBS Global Asset Management (Americas) Inc. |
| |
| | Portfolio Managers: |
| |
| | Thomas M. Cole, Portfolio Manager since 2004 |
| |
| | Thomas J. Digenan, Portfolio Manager since 2004 |
| |
| | John C. Leonard, Portfolio Manager since 2004 |
Purchase and Sale of Fund Shares: Class I2 shares of the fund are currently primarily offered for investment in certain funds of funds (also referred to as “strategic asset allocation funds”). Class I2 shares of the fund are also made available to other investors, including institutional investors such as foreign insurers, domestic insurance companies and their separate accounts, and unaffiliated funds, high net worth individuals, and eligible retirement plans whose recordkeepers or financial service firm intermediaries have entered into agreements with Transamerica Funds or its agents. Investors who received Class I2 shares in connection with the reorganization of a Transamerica Premier Fund into a Transamerica Fund may continue to invest in Class I2 shares of that Transamerica Fund, but may not open new accounts. You buy and redeem shares at the fund’s next-determined net asset value (NAV) after receipt of your request in good order.
Tax Information: Fund distributions may be taxable as ordinary income or capital gains, except when your investment is in an IRA, 401(k) or other tax-advantaged investment plan.
Payments to Broker-Dealers and Other Financial Intermediaries: If you purchase the fund through a broker-dealer or other financial intermediary, the fund and/or its affiliates may pay the intermediary for the sale of fund shares and related services. These payments may create a conflict of interest by influencing the broker-dealer or other intermediary and your salesperson to recommend the fund over another investment. Ask your salesperson or visit your financial intermediary’s website for more information.
151
|
| TRANSAMERICA WMC DIVERSIFIED EQUITY |
Investment Objective: Seeks to maximize long-term growth.
Fees and Expenses: This table describes the fees and expenses that you may pay if you buy and hold shares of the fund. There are no sales charges (load) or other transaction fees.
| | |
| Annual Fund Operating Expenses (expenses that you pay each year as a percentage of the value of your investment) |
| | |
Management fees | | 0.72% |
Distribution and service (12b-1) fees | | None |
Other expenses | | 0.09% |
Total annual fund operating expenses | | 0.81% |
Example: This Example is intended to help you compare the cost of investing in the fund with the cost of investing in other mutual funds. The Example assumes that you invest $10,000. The Example also assumes that your investment has a 5% return each year and that the fund’s operating expenses remain the same. Although your actual costs may be higher or lower, based on these assumptions your costs would be:
| | | | | | |
1 year | | 3 years | | 5 years | | 10 years |
$83 | | $259 | | $450 | | $1,002 |
Portfolio Turnover: The fund pays transaction costs, such as commissions, when it buys and sells securities (or “turns over” its portfolio). A higher portfolio turnover rate may indicate higher transaction costs and may result in higher taxes when fund shares are held in a taxable account. These costs, which are not reflected in annual fund operating expenses or in the Example, affect the fund’s performance. During the most recent fiscal year, the portfolio turnover rate was 79% of the average value of the fund’s portfolio.
Principal Investment Strategies: The fund invests, under normal circumstances, at least 80% of its net assets in domestic equity securities. The fund invests primarily in common stocks of growth-oriented companies. Each stock is evaluated and ranked on a consistent set of growth, valuation, and quality criteria and the fund will seek diversified sources of return from these criteria.
The fund’s sub-adviser, Wellington Management Company, LLP (“Wellington Management”), uses what is sometimes referred to as a “bottom-up” approach, which is the use of fundamental analysis to identify specific securities within industries or sectors for purchase or sale. A “bottom-up” approach is looking at individual companies against the context of broader market factors.
Wellington Management continually monitors every company in the fund’s portfolio for fundamental attractiveness. The fund typically sells an investment when the investment achieves its anticipated potential, the company begins to show deteriorating relative fundamentals or alternative investments become sufficiently more attractive.
Consistent with the fund’s objective and other policies, the fund may invest to a lesser extent in derivatives, including futures, forwards, options and swaps. The fund may invest up to 20% of its total assets in foreign securities (not including American Depositary Receipts, American Depositary Shares or U.S. dollar denominated securities of foreign issuers).
The fund may invest in cash, cash equivalent securities or short-term debt securities, repurchase agreements and money market instruments. Under adverse or unstable market, economic or political conditions, the fund may take temporary defensive positions in cash and short-term debt securities without limit.
Principal Risks: Many factors affect the fund’s performance. There is no assurance the fund will meet its investment objective. The value of your investment in the fund, as well as the amount of return you receive on your investment, may fluctuate significantly from day to day and over time. You may lose part or all of your investment in the fund or your investment may not perform as well as other similar investments. The following is a summary of certain risks (in alphabetical order) of investing in the fund. You may lose money if you invest in this fund.
| • | | Cash Management and Defensive Investing – Money market instruments or short-term debt securities held by the fund for cash management or defensive investing purposes can fluctuate in value. Like other fixed income securities, they are subject to risk, including market, interest rate and credit risk. If the fund holds cash uninvested, the fund will not earn income on the cash and the fund’s yield will go down. If a significant amount of the fund’s assets are used for cash management or defensive investing purposes, it will be more difficult for the fund to achieve its objective. |
152
| • | | Currency – When the fund invests in securities denominated in foreign currencies, the fund may incur currency conversion costs and may be affected favorably or unfavorably by changes in the rates of exchange between those currencies and the U.S. dollar. Currency exchange rates can be volatile and are affected by, among other factors, the general economics of a country, the actions of the U.S. and foreign governments or control banks, the imposition of currency controls, and speculation. |
| • | | Derivatives – Using derivatives can increase fund losses and reduce opportunities for gains when market prices, interest rates or the derivative instruments themselves behave in a way not anticipated by the fund. Using derivatives also can have a leveraging effect and increase fund volatility. Derivatives may be difficult to sell, unwind or value, and the counterparty may default on its obligations to the fund. The fund’s investments in derivative instruments may involve a small investment relative to the amount of investment exposure assumed and may result in losses exceeding the amounts invested in those instruments. Recent legislation calls for new regulation of the derivatives markets. The extent and impact of the regulation are not yet fully known and may not be for some time. New regulation of derivatives may make them more costly, may limit their availability, or may otherwise adversely affect their value or performance. |
| • | | Fixed-Income Securities – The market prices of fixed-income securities may go up or down, sometimes rapidly or unpredictably due to general market conditions, such as real or perceived adverse economic or political conditions, inflation, changes in interest rates, lack of liquidity in the bond markets or adverse investor sentiment. When market prices fall, the value of your investment will go down. A rise in rates tends to have a greater impact on the prices of longer term or duration securities. |
If interest rates rise, repayments of fixed-income securities may occur more slowly than anticipated by the market. This may drive the prices of these securities down because their interest rates are lower than the current interest rate and they remain outstanding longer. This is sometimes referred to as extension risk.
Many issuers have a right to prepay their securities. If interest rates fall, an issuer may exercise this right. If this happens, the fund will be forced to reinvest prepayment proceeds at a time when yields on securities available in the market are lower than the yield on the prepaid security. This is sometimes referred to as prepayment or call risk.
| • | | Focused Investing – To the extent the fund invests in a limited number of issuers, changes in the value of individual securities may have a significant impact on your investment. |
| • | | Foreign Securities – Foreign securities are subject to a number of additional risks, including nationalization or expropriation of assets, imposition of currency controls or restrictions, confiscatory taxation, political or financial instability and other adverse economic or political developments. Lack of information and less market regulation also may affect the value of these securities. |
| • | | Growth Stocks – Returns on growth stocks may not move in tandem with returns on other categories of stocks or the market as a whole. Growth stocks may be particularly susceptible to rapid price swings or to adverse developments. Growth stocks as a group may be out of favor and underperform the overall equity market for a long period of time, for example, while the market favors “value” stocks. |
| • | | Increase in Expenses – Your actual costs of investing in the fund may be higher than the expenses shown in “Annual Fund Operating Expenses” for a variety of reasons. For example, expense ratios may be higher than those shown if average net assets decrease. Net assets are more likely to decrease and fund expense ratios are more likely to increase when markets are volatile. |
| • | | Market – The market prices of the fund’s securities may go up or down, sometimes rapidly or unpredictably, due to general market conditions, such as real or perceived adverse economic or political conditions, inflation, changes in interest rates or currency rates, lack of liquidity in the markets or adverse investor sentiment. Market prices of securities also may go down due to events or conditions that affect particular sectors or issuers. When market prices fall, the value of your investment will go down. The fund may experience a substantial or complete loss on any individual security. The recent financial crisis has caused a significant decline in the value and liquidity of many securities. In response to the financial crisis, the U.S. and other governments and the Federal Reserve and certain foreign central banks have taken steps to support financial markets. The withdrawal of this support could negatively affect the value and liquidity of certain securities. In addition, legislation recently enacted in the U.S. calls for changes in many aspects of financial regulation. The impact of the legislation on the markets, and the practical implications for market participants, may not be fully known for some time. |
| • | | Portfolio Selection – The sub-adviser’s judgment about a particular security or issuer, or about the economy or a particular sector, region or market segment, or about an investment strategy, may prove to be incorrect. |
153
| • | | Small- or Medium-Sized Companies – Small- or medium-sized companies may be more at risk than larger companies because, among other things, they may have limited product lines, operating history, market or financial resources, or because they may depend on a limited management group. |
| • | | Stocks – Stocks may be volatile – their prices may go up and down dramatically over the shorter term. These price movements may result from factors affecting individual companies, industries, the securities market as a whole or the over-all economy. |
| • | | Value Investing – The prices of securities the sub-adviser believes are undervalued may not appreciate as anticipated or may go down. Value stocks as a group may be out of favor and underperform the overall equity market for a long period of time, for example, while the market favors “growth” stocks. |
Performance: The bar chart and the table below provide some indication of the risks of investing in the fund by showing you how the fund’s performance has varied from year to year, and how the fund’s Class I2 average annual total returns for different periods compare to the returns of a broad measure of market performance. The table shows average annual total returns for Class I2 shares of the fund. Absent any limitation of the fund’s expenses, total returns would be lower. As with all mutual funds, past performance (before and after taxes) is not a prediction of future results. Updated performance information is available on our website at www.transamericafunds.com or by calling 1-888-233-4339.
Prior to March 22, 2011, the fund was named Transamerica Diversified Equity, had a different sub-adviser, a different investment objective and used different investment strategies. The performance set forth prior to that date is attributable to the previous sub-adviser.
Annual Total Returns (calendar years ended December 31)

| | | | |
| | | Quarter Ended | | Return |
Best Quarter: | | 12/31/2010 | | 14.01% |
Worst Quarter: | | 6/30/2010 | | -12.02% |
Average Annual Total Returns (periods ended December 31, 2010)1
| | | | | | |
| | | 1 Year | | 5 Years | | 10 Years or
Inception* |
| Class I2 (commenced operations on November 13, 2009) |
| Return before taxes | | 19.13% | | N/A | | 19.24% |
| Return after taxes on distributions2 | | 18.83% | | N/A | | 18.94% |
| Return after taxes on distributions and sale of fund shares2 | | 12.83% | | N/A | | 16.37% |
| Russell 1000® Growth Index (reflects no deduction for fees, expenses, or taxes) | | 16.72% | | N/A | | 18.46% |
| Standard & Poor’s 500® Index (reflects no deduction for fees, expenses, or taxes)3 | | 15.06% | | N/A | | 16.00% |
| | 1 | Actual returns may depend on the investor’s individual tax situation. After-tax returns may not be relevant if the investment is made through a tax-exempt or tax-deferred account, such as a 401(k) plan. |
| | 2 | The after-tax returns are calculated using the historic highest individual federal marginal income tax rates and do not reflect the impact of state and local taxes. |
| | 3 | This index served as the benchmark for the fund prior to March 22, 2011, at which time it was replaced with the Russell 1000® Growth Index. This benchmark index change was made to more accurately reflect the principal strategies of the fund. |
| | * | Fund and Index returns are for past 10 years or since inception, whichever is less. |
Management:
| | |
| Investment Adviser: | | Sub-Adviser: |
| |
| Transamerica Asset Management, Inc. | | Wellington Management Company, LLP |
| |
| | Portfolio Manager: |
154
| | |
| | Paul E. Marrkand, CFA, Portfolio Manager since 2011 |
Purchase and Sale of Fund Shares: Class I2 shares of the fund are currently primarily offered for investment in certain funds of funds (also referred to as “strategic asset allocation funds”). Class I2 shares of the fund are also made available to other investors, including institutional investors such as foreign insurers, domestic insurance companies and their separate accounts, and unaffiliated funds, high net worth individuals, and eligible retirement plans whose recordkeepers or financial service firm intermediaries have entered into agreements with Transamerica Funds or its agents. Investors who received Class I2 shares in connection with the reorganization of a Transamerica Premier Fund into a Transamerica Fund may continue to invest in Class I2 shares of that Transamerica Fund, but may not open new accounts. You buy and redeem shares at the fund’s next-determined net asset value (NAV) after receipt of your request in good order.
Tax Information: Fund distributions may be taxable as ordinary income or capital gains, except when your investment is in an IRA, 401(k) or other tax-advantaged investment plan.
Payments to Broker-Dealers and Other Financial Intermediaries: If you purchase the fund through a broker-dealer or other financial intermediary, the fund and/or its affiliates may pay the intermediary for the sale of fund shares and related services. These payments may create a conflict of interest by influencing the broker-dealer or other intermediary and your salesperson to recommend the fund over another investment. Ask your salesperson or visit your financial intermediary’s website for more information.
155
|
| TRANSAMERICA WMC DIVERSIFIED GROWTH |
Investment Objective: Seeks to maximize long-term growth.
Fees and Expenses: This table describes the fees and expenses that you may pay if you buy and hold shares of the fund. There are no sales charges (load) or other transaction fees.
| | |
| Annual Fund Operating Expenses (expenses that you pay each year as a percentage of the value of your investment) |
| | | |
| Management fees | | 0.71% |
| Distribution and service (12b-1) fees | | None |
| Other expenses | | 0.07% |
| Total annual fund operating expenses | | 0.78% |
Example: This Example is intended to help you compare the cost of investing in the fund with the cost of investing in other mutual funds. The Example assumes that you invest $10,000. The Example also assumes that your investment has a 5% return each year and that the fund’s operating expenses remain the same. Although your actual costs may be higher or lower, based on these assumptions your costs would be:
| | | | | | |
1 year | | 3 years | | 5 years | | 10 years |
$80 | | $249 | | $433 | | $966 |
Portfolio Turnover: The fund pays transaction costs, such as commissions, when it buys and sells securities (or “turns over” its portfolio). A higher portfolio turnover rate may indicate higher transaction costs and may result in higher taxes when fund shares are held in a taxable account. These costs, which are not reflected in annual fund operating expenses or in the Example, affect the fund’s performance. During the most recent fiscal year, the portfolio turnover rate was 167% of the average value of the fund’s portfolio.
Principal Investment Strategies: The fund invests, under normal circumstances, at least 80% of its net assets in domestic common stocks. The fund invests primarily in common stocks of growth-oriented companies. Each stock is evaluated and ranked on a consistent set of growth, valuation, and quality criteria and the fund will seek diversified sources of return from these criteria.
The fund’s sub-adviser, Wellington Management Company, LLP (“Wellington Management”), uses what is sometimes referred to as a “bottom up” approach, which is the use of fundamental analysis to identify specific securities within industries or sectors for purchase or sale. A “bottom-up” approach is looking at individual companies against the context of broader market factors.
Wellington Management continually monitors every company in the fund’s portfolio for fundamental attractiveness. The fund typically sells an investment when the investment achieves its anticipated potential, the company begins to show deteriorating relative fundamentals or alternative investments become sufficiently more attractive.
Consistent with the fund’s objective and other policies, the fund may invest to a lesser extent in derivatives, including futures, forwards, options and swaps. The fund may invest up to 20% of its total assets in foreign securities (not including American Depositary Receipts, American Depositary Shares or U.S. dollar denominated securities of foreign issuers).
The fund may invest in cash, cash equivalent securities or short-term debt securities, repurchase agreements and money market instruments. Under adverse or unstable market, economic or political conditions, the fund may take temporary defensive positions in cash and short-term debt securities without limit.
Principal Risks: Many factors affect the fund’s performance. There is no assurance the fund will meet its investment objective. The value of your investment in the fund, as well as the amount of return you receive on your investment, may fluctuate significantly from day to day and over time. You may lose part or all of your investment in the fund or your investment may not perform as well as other similar investments. The following is a summary of certain risks (in alphabetical order) of investing in the fund. You may lose money if you invest in this fund.
| • | | Cash Management and Defensive Investing – Money market instruments or short-term debt securities held by the fund for cash management or defensive investing purposes can fluctuate in value. Like other fixed income securities, they are subject to risk, including market, interest rate and credit risk. If the fund holds cash uninvested, the fund will not earn income on the cash and the fund’s yield will go down. If a significant amount of the fund’s assets are used for cash management or defensive investing purposes, it will be more difficult for the fund to achieve its objective. |
| • | | Currency – When the fund invests in securities denominated in foreign currencies, the fund may incur currency conversion costs and may be affected favorably or unfavorably by changes in the rates of exchange between those currencies and the |
156
| | U.S. dollar. Currency exchange rates can be volatile and are affected by, among other factors, the general economics of a country, the actions of the U.S. and foreign governments or control banks, the imposition of currency controls, and speculation. |
| • | | Derivatives – Using derivatives can increase fund losses and reduce opportunities for gains when market prices, interest rates or the derivative instruments themselves behave in a way not anticipated by the fund. Using derivatives also can have a leveraging effect and increase fund volatility. Derivatives may be difficult to sell, unwind or value, and the counterparty may default on its obligations to the fund. The fund’s investments in derivative instruments may involve a small investment relative to the amount of investment exposure assumed and may result in losses exceeding the amounts invested in those instruments. Recent legislation calls for new regulation of the derivatives markets. The extent and impact of the regulation are not yet fully known and may not be for some time. New regulation of derivatives may make them more costly, may limit their availability, or may otherwise adversely affect their value or performance. |
| • | | Fixed-Income Securities – The market prices of fixed-income securities may go up or down, sometimes rapidly or unpredictably due to general market conditions, such as real or perceived adverse economic or political conditions, inflation, changes in interest rates, lack of liquidity in the bond markets or adverse investor sentiment. When market prices fall, the value of your investment will go down. A rise in rates tends to have a greater impact on the prices of longer term or duration securities. |
If interest rates rise, repayments of fixed-income securities may occur more slowly than anticipated by the market. This may drive the prices of these securities down because their interest rates are lower than the current interest rate and they remain outstanding longer. This is sometimes referred to as extension risk.
Many issuers have a right to prepay their securities. If interest rates fall, an issuer may exercise this right. If this happens, the fund will be forced to reinvest prepayment proceeds at a time when yields on securities available in the market are lower than the yield on the prepaid security. This is sometimes referred to as prepayment or call risk.
| • | | Focused Investing – To the extent the fund invests in a limited number of issuers, changes in the value of individual securities may have a significant impact on your investment. |
| • | | Foreign Securities – Foreign securities are subject to a number of additional risks, including nationalization or expropriation of assets, imposition of currency controls or restrictions, confiscatory taxation, political or financial instability and other adverse economic or political developments. Lack of information and less market regulation also may affect the value of these securities. |
| • | | Growth Stocks – Returns on growth stocks may not move in tandem with returns on other categories of stocks or the market as a whole. Growth stocks may be particularly susceptible to rapid price swings or to adverse developments. Growth stocks as a group may be out of favor and underperform the overall equity market for a long period of time, for example, while the market favors “value” stocks. |
| • | | Increase in Expenses – Your actual costs of investing in the fund may be higher than the expenses shown in “Annual Fund Operating Expenses” for a variety of reasons. For example, expense ratios may be higher than those shown if average net assets decrease. Net assets are more likely to decrease and fund expense ratios are more likely to increase when markets are volatile. |
| • | | Market – The market prices of the fund’s securities may go up or down, sometimes rapidly or unpredictably, due to general market conditions, such as real or perceived adverse economic or political conditions, inflation, changes in interest rates or currency rates, lack of liquidity in the markets or adverse investor sentiment. Market prices of securities also may go down due to events or conditions that affect particular sectors or issuers. When market prices fall, the value of your investment will go down. The fund may experience a substantial or complete loss on any individual security. The recent financial crisis has caused a significant decline in the value and liquidity of many securities. In response to the financial crisis, the U.S. and other governments and the Federal Reserve and certain foreign central banks have taken steps to support financial markets. The withdrawal of this support could negatively affect the value and liquidity of certain securities. In addition, legislation recently enacted in the U.S. calls for changes in many aspects of financial regulation. The impact of the legislation on the markets, and the practical implications for market participants, may not be fully known for some time. |
| • | | Portfolio Selection – The sub-adviser’s judgment about a particular security or issuer, or about the economy or a particular sector, region or market segment, or about an investment strategy, may prove to be incorrect. |
| • | | Small- or Medium-Sized Companies – Small- or medium-sized companies may be more at risk than larger companies because, among other things, they may have limited product lines, operating history, market or financial resources, or because they may depend on a limited management group. |
157
| • | | Stocks – Stocks may be volatile – their prices may go up and down dramatically over the shorter term. These price movements may result from factors affecting individual companies, industries, the securities market as a whole or the over- all economy. |
Performance: The bar chart and the table below provide some indication of the risks of investing in the fund by showing you how the fund’s performance has varied from year to year, and how the fund’s Class I2 average annual total returns for different periods compare to the returns of a broad measure of market performance. The table shows average annual total returns for Class I2 shares of the fund. Absent any limitation of the fund’s expenses, total returns would be lower. As with all mutual funds, past performance (before and after taxes) is not a prediction of future results. Updated performance information is available on our website at www.transamericafunds.com or by calling 1-888-233-4339.
Prior to April 9, 2010, the fund was named Transamerica Equity, had a different sub-adviser and used different investment strategies. The performance set forth prior to that date is attributable to the previous sub-adviser.
Annual Total Returns (calendar years ended December 31)
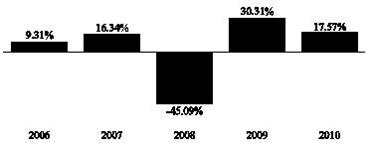
| | | | |
| | | Quarter Ended | | Return |
Best Quarter: | | 6/30/2009 | | 19.28% |
Worst Quarter: | | 12/31/2008 | | -23.92% |
Average Annual Total Returns (periods ended December 31, 2010)1
| | | | | | |
| | | 1 Year | | 5 Years | | 10 Years or
Inception* |
Class I2 (commenced operations on November 15, 2005) | | | | | | |
Return before taxes | | 17.57% | | 1.36% | | 1.63% |
Return after taxes on distributions2 | | 17.57% | | 1.29% | | 1.55% |
Return after taxes on distributions and sale of fund shares2 | | 11.42% | | 1.12% | | 1.36% |
Russell 1000® Growth Index (reflects no deduction for fees, expenses or taxes) | | 16.71% | | 3.75% | | 5.63% |
| | 1 | Actual returns may depend on the investor’s individual tax situation. After-tax returns may not be relevant if the investment is made through a tax-exempt or tax-deferred account, such as a 401(k) plan. |
| | 2 | The after-tax returns are calculated using the historic highest individual federal marginal income tax rates and do not reflect the impact of state and local taxes. |
| | * | Fund and Index returns are for past 10 years or since inception, whichever is less. |
| | |
| Management: | | |
| |
| Investment Adviser: | | Sub-Adviser: |
| |
| Transamerica Asset Management, Inc. | | Wellington Management Company, LLP |
| |
| | Portfolio Manager: |
| |
| | Paul E. Marrkand, CFA, Portfolio Manager since 2010 |
Purchase and Sale of Fund Shares: Class I2 shares of the fund are currently primarily offered for investment in certain funds of funds (also referred to as “strategic asset allocation funds”). Class I2 shares of the fund are also made available to other investors, including institutional investors such as foreign insurers, domestic insurance companies and their separate accounts, and unaffiliated funds, high net worth individuals, and eligible retirement plans whose recordkeepers or financial service firm intermediaries have entered into agreements with Transamerica Funds or its agents. Investors who received Class I2 shares in connection with the reorganization of a Transamerica Premier Fund into a Transamerica Fund may continue to invest in Class I2 shares of that Transamerica Fund, but may not open new accounts. You buy and redeem shares at the fund’s next-determined net asset value (NAV) after receipt of your request in good order.
158
Tax Information: Fund distributions may be taxable as ordinary income or capital gains, except when your investment is in an IRA, 401(k) or other tax-advantaged investment plan.
Payments to Broker-Dealers and Other Financial Intermediaries: If you purchase the fund through a broker-dealer or other financial intermediary, the fund and/or its affiliates may pay the intermediary for the sale of fund shares and related services. These payments may create a conflict of interest by influencing the broker-dealer or other intermediary and your salesperson to recommend the fund over another investment. Ask your salesperson or visit your financial intermediary’s website for more information.
159
|
| TRANSAMERICA WMC EMERGING MARKETS |
Investment Objective: Seeks long-term capital appreciation.
Fees and Expenses: This table describes the fees and expenses that you may pay if you buy and hold shares of the fund. There are no sales charges (load) or other transaction fees.
| | |
Annual Fund Operating Expenses (expenses that you pay each year as a percentage of the value of your investment) |
| | |
Management fees | | 1.15% |
Distribution and service (12b-1) fees | | None |
Other expenses | | 0.25% |
Acquired fund fees and expenses (fees and expenses of underlying funds) | | 0.01% |
Total annual fund operating expensesa | | 1.41% |
| | a | Total annual fund operating expenses do not correlate to the ratios of expenses to average net assets in the financial highlights, which do not include acquired (i.e., underlying) funds’ fees and expenses. |
Example: This Example is intended to help you compare the cost of investing in the fund with the cost of investing in other mutual funds. The Example assumes that you invest $10,000. The Example also assumes that your investment has a 5% return each year and that the fund’s operating expenses remain the same. Although your actual costs may be higher or lower, based on these assumptions your costs would be:
| | | | | | |
1 year | | 3 years | | 5 years | | 10 years |
$144 | | $446 | | $771 | | $1,691 |
Portfolio Turnover: The fund pays transaction costs, such as commissions, when it buys and sells securities (or “turns over” its portfolio). A higher portfolio turnover rate may indicate higher transaction costs and may result in higher taxes when fund shares are held in a taxable account. These costs, which are not reflected in annual fund operating expenses or in the Example, affect the fund’s performance. During the most recent fiscal year, the portfolio turnover rate was 147% of the average value of the fund’s portfolio.
Principal Investment Strategies: The fund’s sub-adviser, Wellington Management Company, LLP (“Wellington Management”), invests, under normal circumstances, at least 80% of the fund’s net assets in equity securities of companies that conduct their principal business activities in emerging markets, are organized under the laws of or maintain their principal place of business in emerging markets, or whose securities are traded principally on exchanges in emerging markets. The sub-adviser considers emerging markets to be markets with rapidly growing economies. Examples of emerging markets include China, India, Pakistan, Mexico, Brazil, Chile, much of Southeast Asia, countries in Eastern Europe, the Middle East, parts of Africa and Latin America. Wellington Management also seeks to earn returns in excess of the MSCI Emerging Markets Equity Index.
The fund generally sells a stock if the portfolio manager believes its target price has been reached, its earnings are disappointing, its revenue growth has slowed, its underlying fundamentals have deteriorated, or if there are deteriorating industry or country fundamentals. The fund may invest in all types of securities, many of which will be denominated in currencies other than the U.S. dollar. The securities may be listed on a U.S. or foreign stock exchange or traded in U.S. or foreign over-the-counter markets. The fund normally concentrates its investments in common stocks; however, it may invest in other types of equity securities, including securities convertible into or exchangeable for common stock, depositary receipts, and rights and warrants to purchase common stock. The fund also may invest up to 20% of its assets in preferred stock and investment-grade or comparable quality debt securities.
The fund may invest in initial public offerings (“IPOs”), which are subject to specific risks, including high volatility, no track record, illiquid securities and less predictable earnings.
The fund may invest up to 15% of its net assets in illiquid securities (i.e., securities that cannot be readily sold), and may from time to time enter into forward foreign currency exchange contracts in an attempt to manage the risk of adverse changes in currencies. The fund may also purchase put options in an attempt to hedge against a decline in the price of securities it holds in its portfolio. The fund may also invest in other types of derivatives.
The fund may invest its assets in cash, cash equivalent securities or short-term debt securities, repurchase agreements and money market instruments. Under adverse or unstable market, economic or political conditions, the fund may take temporary defensive positions in cash and short-term debt securities without limit.
Principal Risks: Many factors affect the fund’s performance. There is no assurance the fund will meet its investment objective. The value of your investment in the fund, as well as the amount of return you receive on your investment, may fluctuate significantly from day to day and over time. You may lose part or all of your investment in the fund or your
160
investment may not perform as well as other similar investments. The following is a summary of certain risks (in alphabetical order) of investing in the fund. You may lose money if you invest in this fund.
| • | | Cash Management and Defensive Investing – Money market instruments or short-term debt securities held by the fund for cash management or defensive investing purposes can fluctuate in value. Like other fixed income securities, they are subject to risk, including market, interest rate and credit risk. If the fund holds cash uninvested, the fund will not earn income on the cash and the fund’s yield will go down. If a significant amount of the fund’s assets are used for cash management or defensive investing purposes, it will be more difficult for the fund to achieve its objective. |
| • | | Convertible Securities – The market value of convertible securities tends to decline as interest rates increase. Convertible securities generally offer lower interest or dividend yields than non-convertible securities of similar quality. The fund could lose money if the issuer of a convertible security is unable to meet its financial obligations or goes bankrupt. |
| • | | Country, Sector or Industry Focus – To the extent the fund invests a significant portion of its assets in one or more countries, sectors or industries, the fund will be more susceptible to negative events affecting those countries, sectors or industries. |
| • | | Currency – When the fund invests in securities denominated in foreign currencies, the fund may incur currency conversion costs and may be affected favorably or unfavorably by changes in the rates of exchange between those currencies and the U.S. dollar. Currency exchange rates can be volatile and are affected by, among other factors, the general economics of a country, the actions of the U.S. and foreign governments or control banks, the imposition of currency controls, and speculation. |
| • | | Currency Hedging – The fund may hedge its currency risk using currency futures, forwards or options. However, these instruments may not always work as intended, and a fund may be worse off than if it had not used a hedging instrument. |
| • | | Derivatives – Using derivatives can increase fund losses and reduce opportunities for gains when market prices, interest rates or the derivative instruments themselves behave in a way not anticipated by the fund. Using derivatives also can have a leveraging effect and increase fund volatility. Derivatives may be difficult to sell, unwind or value, and the counterparty may default on its obligations to the fund. The fund’s investments in derivative instruments may involve a small investment relative to the amount of investment exposure assumed and may result in losses exceeding the amounts invested in those instruments. Recent legislation calls for new regulation of the derivatives markets. The extent and impact of the regulation are not yet fully known and may not be for some time. New regulation of derivatives may make them more costly, may limit their availability, or may otherwise adversely affect their value or performance. |
| • | | Emerging Markets – Investing in the securities of issuers located in or principally doing business in emerging markets are subject to foreign securities risks. These risks are greater for investments in emerging markets. Emerging market countries tend to have economic, political and legal systems that are less fully developed and are less stable than those of more advanced countries. Low trading volumes may result in a lack of liquidity and in extreme price volatility. |
| • | | Fixed-Income Securities – The market prices of fixed-income securities may go up or down, sometimes rapidly or unpredictably due to general market conditions, such as real or perceived adverse economic or political conditions, inflation, changes in interest rates, lack of liquidity in the bond markets or adverse investor sentiment. When market prices fall, the value of your investment will go down. A rise in rates tends to have a greater impact on the prices of longer term or duration securities. |
If interest rates rise, repayments of fixed-income securities may occur more slowly than anticipated by the market. This may drive the prices of these securities down because their interest rates are lower than the current interest rate and they remain outstanding longer. This is sometimes referred to as extension risk.
Many issuers have a right to prepay their securities. If interest rates fall, an issuer may exercise this right. If this happens, the fund will be forced to reinvest prepayment proceeds at a time when yields on securities available in the market are lower than the yield on the prepaid security. This is sometimes referred to as prepayment or call risk.
| • | | Foreign Securities – Foreign securities are subject to a number of additional risks, including nationalization or expropriation of assets, imposition of currency controls or restrictions, confiscatory taxation, political or financial instability and other adverse economic or political developments. Lack of information and less market regulation also may affect the value of these securities. |
| • | | Growth Stocks – Returns on growth stocks may not move in tandem with returns on other categories of stocks or the market as a whole. Growth stocks may be particularly susceptible to rapid price swings or to adverse developments. Growth stocks as a group may be out of favor and underperform the overall equity market for a long period of time, for example, while the market favors “value” stocks. |
161
| • | | Increase in Expenses – Your actual costs of investing in the fund may be higher than the expenses shown in “Annual Fund Operating Expenses” for a variety of reasons. For example, expense ratios may be higher than those shown if average net assets decrease. Net assets are more likely to decrease and fund expense ratios are more likely to increase when markets are volatile. |
| • | | IPOs – Initial public offerings (“IPOs”) are subject to specific risks which include, among others: |
| | • | | no track record for consideration; |
| | • | | securities may be illiquid; and |
| | • | | earnings are less predictable. |
| • | | Liquidity – Some securities held by the fund may be difficult to sell, or illiquid, particularly during times of market turmoil. Illiquid securities may also be difficult to value. If the fund is forced to sell an illiquid asset to meet redemption requests or other cash needs, the fund may be forced to sell at a loss. |
| • | | Market – The market prices of the fund’s securities may go up or down, sometimes rapidly or unpredictably, due to general market conditions, such as real or perceived adverse economic or political conditions, inflation, changes in interest rates or currency rates, lack of liquidity in the markets or adverse investor sentiment. Market prices of securities also may go down due to events or conditions that affect particular sectors or issuers. When market prices fall, the value of your investment will go down. The fund may experience a substantial or complete loss on any individual security. The recent financial crisis has caused a significant decline in the value and liquidity of many securities. In response to the financial crisis, the U.S. and other governments and the Federal Reserve and certain foreign central banks have taken steps to support financial markets. The withdrawal of this support could negatively affect the value and liquidity of certain securities. In addition, legislation recently enacted in the U.S. calls for changes in many aspects of financial regulation. The impact of the legislation on the markets, and the practical implications for market participants, may not be fully known for some time. |
| • | | Portfolio Selection – The sub-adviser’s judgment about a particular security or issuer, or about the economy or a particular sector, region or market segment, or about an investment strategy, may prove to be incorrect. |
| • | | Portfolio Turnover – The fund’s investment strategy may result in a high portfolio turnover rate. High portfolio turnover would result in a correspondingly greater brokerage commission expenses and may result in the distribution to shareholders of additional capital gains for tax purposes. These factors may negatively affect the fund’s performance. |
| • | | Preferred Stock – Preferred stock’s right to dividends and liquidation proceeds is junior to the rights of a company’s debt securities. The value of preferred stock may be subject to factors that affect fixed income and equity securities, including changes in interest rates and in a company’s creditworthiness. Shareholders of preferred stock may suffer a loss of value if dividends are not paid and have limited voting rights. |
| • | | Small- or Medium-Sized Companies – Small- or medium-sized companies may be more at risk than larger companies because, among other things, they may have limited product lines, operating history, market or financial resources, or because they may depend on a limited management group. |
| • | | Stocks – Stocks may be volatile – their prices may go up and down dramatically over the shorter term. These price movements may result from factors affecting individual companies, industries, the securities market as a whole or the over-all economy. |
| • | | Warrants and Rights – Warrants and rights may be considered more speculative than certain other types of investments because they do not entitle a holder to the dividends or voting rights for the securities that may be purchased. They do not represent any rights in the assets of the issuing company, and cease to have value if not exercised prior to the expiration date. |
Performance: The bar chart and the table below provide some indication of the risks of investing in the fund by showing you how the fund’s performance has varied from year to year, and how the fund’s Class I2 average annual total returns for different periods compare to the returns of a broad measure of market performance. The table shows average annual total returns for Class I2 shares of the fund. Absent any limitation of the fund’s expenses, total returns would be lower. As with all mutual funds, past performance (before and after taxes) is not a prediction of future results. Updated performance information is available on our website at www.transamericafunds.com or by calling 1-888-233-4339.
162
Annual Total Returns (calendar years ended December 31)

| | | | |
| | | Quarter Ended | | Return |
Best Quarter: | | 6/30/2009 | | 34.99% |
Worst Quarter: | | 6/30/2010 | | -10.13% |
Average Annual Total Returns (periods ended December 31, 2010)1
| | | | | | |
| | | 1 Year | | 5 Years | | 10 Years or
Inception* |
Class I2 (commenced operations on September 30, 2008) |
Return before taxes | | 15.42% | | N/A | | 20.28% |
Return after taxes on distributions2 | | 14.02% | | N/A | | 19.30% |
Return after taxes on distributions and sale of fund shares2 | | 10.79% | | N/A | | 17.10% |
| Morgan Stanley Capital International Emerging Markets Index (reflects nodeduction for fees, expenses, or taxes) | | 19.20% | | N/A | | 22.13% |
| | 1 | Actual returns may depend on the investor’s individual tax situation. After-tax returns may not be relevant if the investment is made through a tax-exempt or tax-deferred account, such as a 401(k) plan. |
| | 2 | The after-tax returns are calculated using the historic highest individual federal marginal income tax rates and do not reflect the impact of state and local taxes. |
| | * | Fund and Index returns are for past 10 years or since inception, whichever is less. |
| | |
| Management: | | |
| |
| Investment Adviser: | | Sub-Adviser: |
| |
| Transamerica Asset Management, Inc. | | Wellington Management Company, LLP |
| |
| | Portfolio Manager: |
| |
| | Vera M. Trojan, CFA, Portfolio Manager since 2008 |
Purchase and Sale of Fund Shares: Class I2 shares of the fund are currently primarily offered for investment in certain funds of funds (also referred to as “strategic asset allocation funds”). Class I2 shares of the fund are also made available to other investors, including institutional investors such as foreign insurers, domestic insurance companies and their separate accounts, and unaffiliated funds, high net worth individuals, and eligible retirement plans whose recordkeepers or financial service firm intermediaries have entered into agreements with Transamerica Funds or its agents. Investors who received Class I2 shares in connection with the reorganization of a Transamerica Premier Fund into a Transamerica Fund may continue to invest in Class I2 shares of that Transamerica Fund, but may not open new accounts. You buy and redeem shares at the fund’s next-determined net asset value (NAV) after receipt of your request in good order.
Tax Information: Fund distributions may be taxable as ordinary income or capital gains, except when your investment is in an IRA, 401(k) or other tax-advantaged investment plan.
Payments to Broker-Dealers and Other Financial Intermediaries: If you purchase the fund through a broker-dealer or other financial intermediary, the fund and/or its affiliates may pay the intermediary for the sale of fund shares and related services. These payments may create a conflict of interest by influencing the broker-dealer or other intermediary and your salesperson to recommend the fund over another investment. Ask your salesperson or visit your financial intermediary’s website for more information.
163
|
| TRANSAMERICA WMC QUALITY VALUE |
Investment Objective: Seeks to maximize long-term total return.
Fees and Expenses: This table describes the fees and expenses that you may pay if you buy and hold shares of the fund. There are no sales charges (load) or other transaction fees.
| | |
| Annual Fund Operating Expenses (expenses that you pay each year as a percentage of the value of your investment)a |
| | |
Management fees | | 0.70% |
Distribution and service (12b-1) fees | | None |
Other expenses | | 0.06% |
Total annual fund operating expenses | | 0.76% |
| | a | Annual fund operating expenses are based on estimates for the current fiscal year. |
Example: This Example is intended to help you compare the cost of investing in the fund with the cost of investing in other mutual funds. The Example assumes that you invest $10,000. The Example also assumes that your investment has a 5% return each year and that the fund’s operating expenses remain the same. Although your actual costs may be higher or lower, based on these assumptions your costs would be:
| | | | | | |
1 year | | 3 years | | 5 years | | 10 years |
$78 | | $243 | | $422 | | $942 |
Portfolio Turnover: The fund pays transaction costs, such as commissions, when it buys and sells securities (or “turns over” its portfolio). A higher portfolio turnover rate may indicate higher transaction costs and may result in higher taxes when fund shares are in a taxable account. These costs, which are not reflected in annual fund operating expenses or in the Example, affect the fund performance. Portfolio turnover rate is not included because the fund did not commence operations until November 15, 2010.
Principal Investment Strategies: Wellington Management Company, LLP (“Wellington Management”), the fund’s sub-adviser, invests the fund’s assets, under normal circumstances, primarily in common stock and depositary receipts. Generally, less than 5% of fund assets will be invested in cash and cash equivalents subject to a maximum of 10% of fund assets. The fund will normally invest at least 90% of its assets in U.S. securities. Generally, the fund invests primarily in companies with market capitalizations greater than $10 billion, but may invest in companies with capitalizations between $2 and $10 billion at the time of purchase. The fund will generally hold 65 to 85 stocks. The largest weightings are given to companies Wellington Management believes have the most upside return potential relative to downside risk.
Wellington Management employs a bottom-up stock selection process that utilizes Wellington Management’s proprietary, fundamental research in an effort to identify undervalued stocks that have the potential for significant longer-term rewards. The fund’s investment philosophy is based on the premise that high-quality companies in out-of-favor industries can generate strong returns on invested capital.
The fund may invest up to 10% of its assets in non-U.S. securities.
The fund may invest in cash, cash equivalent securities or short-term debt securities, repurchase agreements and money market instruments. Under adverse or unstable market, economic or political conditions, the fund may take temporary defensive positions in cash and short-term debt securities without limit.
Principal Risks: Many factors affect the fund’s performance. There is no assurance the fund will meet its investment objective. The value of your investment in the fund, as well as the amount of return you receive on your investment, may fluctuate significantly from day to day and over time. You may lose part or all of your investment in the fund or your investment may not perform as well as other similar investments. The following is a summary of certain risks (in alphabetical order) of investing in the fund. You may lose money if you invest in this fund.
| • | | Cash Management and Defensive Investing – Money market instruments or short-term debt securities held by the fund for cash management or defensive investing purposes can fluctuate in value. Like other fixed income securities, they are subject to risk, including market, interest rate and credit risk. If the fund holds cash uninvested, the fund will not earn income on the cash and the fund’s yield will go down. If a significant amount of the fund’s assets are used for cash management or defensive investing purposes, it will be more difficult for the fund to achieve its objective. |
| • | | Depositary Receipts – Depositary receipts may be less liquid than the underlying shares in their primary trading market. Any distributions paid to the holders of depositary receipts are usually subject to a fee charged by the depositary. Holders of depositary receipts may have limited voting rights, and investment restrictions in certain countries may adversely impact |
164
| | the value of depositary receipts because such restrictions may limit the ability to convert equity shares into depositary receipts and vice versa. Such restrictions may cause equity shares of the underlying issuer to trade at a discount or premium to the market price of the depositary receipts |
| • | | Foreign Securities – Foreign securities are subject to a number of additional risks, including nationalization or expropriation of assets, imposition of currency controls or restrictions, confiscatory taxation, political or financial instability and other adverse economic or political developments. Lack of information and less market regulation also may affect the value of these securities. |
| • | | Increase in Expenses – Your actual costs of investing in the fund may be higher than the expenses shown in “Annual Fund Operating Expenses” for a variety of reasons. For example, expense ratios may be higher than those shown if average net assets decrease. Net assets are more likely to decrease and fund expense ratios are more likely to increase when markets are volatile. |
| • | | Liquidity – Some securities held by the fund may be difficult to sell, or illiquid, particularly during times of market turmoil. Illiquid securities may also be difficult to value. If the fund is forced to sell an illiquid asset to meet redemption requests or other cash needs, the fund may be forced to sell at a loss. |
| • | | Market – The market prices of the fund’s securities may go up or down, sometimes rapidly or unpredictably, due to general market conditions, such as real or perceived adverse economic or political conditions, inflation, changes in interest rates or currency rates, lack of liquidity in the markets or adverse investor sentiment. Market prices of securities also may go down due to events or conditions that affect particular sectors or issuers. When market prices fall, the value of your investment will go down. The fund may experience a substantial or complete loss on any individual security. The recent financial crisis has caused a significant decline in the value and liquidity of many securities. In response to the financial crisis, the U.S. and other governments and the Federal Reserve and certain foreign central banks have taken steps to support financial markets. The withdrawal of this support could negatively affect the value and liquidity of certain securities. In addition, legislation recently enacted in the U.S. calls for changes in many aspects of financial regulation. The impact of the legislation on the markets, and the practical implications for market participants, may not be fully known for some time. |
| • | | Portfolio Selection – The sub-adviser’s judgment about a particular security or issuer, or about the economy or a particular sector, region or market segment, or about an investment strategy, may prove to be incorrect. |
| • | | Stocks – Stocks may be volatile – their prices may go up and down dramatically over the shorter term. These price movements may result from factors affecting individual companies, industries, the securities market as a whole or the over-all economy. |
| • | | Valuation – The sales price the fund could receive for any particular portfolio investment may differ from the fund’s valuation of the investment, particularly for securities that trade in thin or volatile markets or that are valued using a fair value methodology. |
| • | | Value Investing – The prices of securities the sub-adviser believes are undervalued may not appreciate as anticipated or may go down. Value stocks as a group may be out of favor and underperform the overall equity market for a long period of time, for example, while the market favors “growth” stocks. |
Performance: No performance is shown for the fund. Performance information will appear in a future version of this prospectus once the fund has a full calendar year of performance information to report to investors.
Management:
| | |
| Investment Adviser: | | Sub-Adviser: |
| |
| Transamerica Asset Management, Inc. | | Wellington Management Company, LLP |
| |
| | Portfolio Managers: |
| |
| | Matthew G. Baker, Portfolio Manager since 2010 |
| |
| | Edward P. Bousa, CFA, Portfolio Management and Securities Analysis since 2010 |
165
Purchase and Sale of Fund Shares: Class I2 shares of the fund are currently primarily offered for investment in certain funds of funds (also referred to as “strategic asset allocation funds”). Class I2 shares of the fund are also made available to other investors, including institutional investors such as foreign insurers, domestic insurance companies and their separate accounts, and unaffiliated funds, high net worth individuals, and eligible retirement plans whose recordkeepers or financial service firm intermediaries have entered into agreements with Transamerica Funds or its agents. Investors who received Class I2 shares in connection with the reorganization of a Transamerica Premier Fund into a Transamerica Fund may continue to invest in Class I2 shares of that Transamerica Fund, but may not open new accounts. You buy and redeem shares at the fund’s next-determined net asset value (NAV) after receipt of your request in good order.
Tax Information: Fund distributions may be taxable as ordinary income or capital gains, except when your investment is in an IRA, 401(k) or other tax-advantaged investment plan.
Payments to Broker-Dealers and Other Financial Intermediaries: If you purchase the fund through a broker-dealer or other financial intermediary, the fund and/or its affiliates may pay the intermediary for the sale of fund shares and related services. These payments may create a conflict of interest by influencing the broker-dealer or other intermediary and your salesperson to recommend the fund over another investment. Ask your salesperson or visit your financial intermediary’s website for more information.
166
|
| MORE ON THE FUNDS’ STRATEGIES AND INVESTMENTS |
The following provides additional information regarding the funds’ strategies and investments described at the front of the prospectus. Except as otherwise expressly stated for a particular fund in this prospectus or in the statement of additional information or as required by law, there is no limit on the amount of a fund’s assets that may be invested in a particular type of security or investment.
Transamerica AEGON Flexible Income: The fund’s sub-adviser, AEGON USA Investment Management, LLC (“AUIM”), uses a “bottom up” approach to investing and builds the fund’s portfolio one company at a time.
The fund will invest, under normal circumstances, at least 80% of net assets in fixed-income securities, including:
| • | | U.S. Government and foreign government bonds and notes (including emerging market countries); |
| • | | Mortgage-backed, commercial mortgage-backed, and asset-backed securities (including collateralized mortgage obligations); |
| • | | Corporate bonds of issuers in the U.S. and foreign countries (including emerging market countries); |
| • | | Convertible bonds and other convertible securities; |
| • | | Bank loans and loan participations: |
With respect to these investments:
| | 1. | Under normal circumstances, at least 50% of the value of the fund’s assets will be invested in (a) debt securities which have a rating within the four highest grades as determined by Moody’s Investors Service, Inc. (“Moody’s”) (“Aaa, Aa, A or Baa”) or Standard & Poor’s Corporation (“S&P”) (“AAA, AA, A or BBB”); (b) securities issued or guaranteed by the United States Government or its agencies or instrumentalities; (c) commercial paper rated Prime, Prime-1 or Prime-2 by NCO/Moody’s Commercial Paper Division, Moody’s, or A-1 or A-2 by S&P; or (d) cash or cash equivalents; |
| | 2. | Up to 50% of the value of the fund’s assets may be invested in other debt securities which are not rated by Moody’s or S&P or, if so rated, are not within the grades or ratings referred to above; and |
| | 3. | The fund may engage in options and futures transactions, foreign currency transactions, and swap transactions. |
The fund may invest up to 20% of its total assets in equity securities, such as common stocks, rights, warrants or preferred stock.
Ordinarily, the fund will purchase debt securities having call or refunding protection or securities which are not considered by the fund likely to be called or refunded in the near term, in order to preserve initial annual yields to the fund.
The fund may invest in securities of any maturity and does not have a target average duration.
Short-Term Trading
The fund may use short-term trading as a means of managing its portfolio to achieve its investment objectives. As used herein, “short-term trading” means selling securities held for a relatively brief period of time, usually less than three months. Short-term trading will be used by the fund primarily in two situations:
(a) Market Developments. A security may be sold to avoid depreciation in what the fund anticipates will be a market decline (a rise in interest rates), or a security may be purchased in anticipation of a market rise (a decline in interest rates) and later sold; and
(b) Yield Disparities. A security may be sold and another of comparable quality purchased at approximately the same time in order to take advantage of what the fund believes is a temporary disparity in the normal yield relationship between the two securities (a “yield disparity”).
Short-term trading to take advantage of a yield disparity may be undertaken even if levels of interest rates remain unchanged. Yield disparities occur frequently for reasons not directly related to the investment quality of the respective issues or the general movement of interest rates, but may result from changes in the overall demand for or supply of various types of bonds, changes in the investment objectives or the cash requirements of investors, and the requirements of dealers to correct long or short inventory positions.
Short-term trading techniques will be used principally in connection with higher quality, non-convertible debt securities, which are often better suited for short-term trading because the market in such securities is generally of greater depth and offers
167
greater liquidity than the market in debt securities of lower quality. It is anticipated that short-term trading will be less applicable to any convertible securities which the fund may own, since such securities will usually be purchased when the fund believes that the market value of the underlying equity security is likely to appreciate over a period of time.
The fund will engage in short-term trading if it believes the transactions, net of costs (including commission, if any), will result in improving the appreciation potential or income of its portfolio. Whether any improvement will be realized by short-term trading will depend upon the ability of the fund to evaluate particular securities and anticipate relevant market factors, including interest rate trends and variations from such trends. Short-term trading such as that contemplated by the fund places a premium upon the ability of the fund to obtain relevant information, evaluate it promptly, and take advantage of its evaluations by completing transactions on a favorable basis. By virtue of short-term trading, the fund may engage in greater buying and selling activity than investment companies which are not permitted to employ such a policy in seeking their investment objectives. Such activity can result in greater costs of operation than is the case with other investment companies, and risks of loss in portfolio value could be greater. Accordingly, an investment in fund shares may be more speculative than an investment in shares of an investment company which cannot engage in short-term trading.
The sub-adviser may sell the fund’s securities when its expectations regarding market interest rates change or the quality or return changes on investment.
The fund may invest its assets in cash, cash equivalent securities or short-term debt securities, repurchase agreements and money market instruments. Under adverse or unstable market, economic or political conditions, the fund may do so without limit. Although the fund would do this only in seeking to avoid losses, the fund may be unable to pursue its investment objective during that time, and it could reduce the benefit from any upswing in the market. To the extent that the fund has any uninvested cash, the fund would also be subject to risk with respect to the depository institution holding the cash.
Transamerica AEGON High Yield Bond: The fund’s sub-adviser, AEGON USA Investment Management, LLC (“AUIM”), seeks to achieve the fund’s objective by investing, under normal circumstances, at least 80% of the fund’s net assets in high-yield/high-risk bonds (commonly known as “junk bonds”).
Junk bonds are high risk debt securities rated in medium or lower rating categories or determined by AUIM to be of comparable quality.
AUIM’s strategy is to seek to achieve yields as high as possible while seeking to manage risk. AUIM uses a “top-down/bottom-up” approach in managing the fund’s assets. The “top-down” approach is to adjust the risk profile of the fund. AUIM analyzes four factors that affect the movement of fixed-income bond prices which include: economic indicators; technical indicators that are specific to the high-yield market; investor sentiment and valuation. Analysis of these factors assists AUIM in its decision regarding the fund’s portfolio allocations.
AUIM has developed a proprietary credit model that is the foundation of its “bottom-up” analysis. The model tracks historical cash flow numbers and calculates credit financial ratios. Because high-yield companies are of higher financial risk, AUIM does a thorough credit analysis of all companies in the fund’s portfolio, as well as all potential acquisitions.
Each potential buy and sell candidate is analyzed by AUIM from both the “top-down” and “bottom-up” strategies. An industry may look attractive in one area, but not the other. They can review the results of their analysis and decide whether or not to proceed with a transaction.
AUIM may sell fund securities when it determines there are changes in economic indicators, technical indicators or valuation.
The fund may invest its assets in cash, cash equivalent securities or short-term debt securities, repurchase agreements and money market instruments. Under adverse or unstable market, economic or political conditions, the fund may do so without limit. Although the fund would do this only in seeking to avoid losses, the fund may be unable to pursue its investment objective during that time, and it could reduce the benefit from any upswing in the market. To the extent that the fund has any uninvested cash, the fund would also be subject to risk with respect to the depository institution holding the cash.
Transamerica AEGON Money Market: The fund’s sub-adviser, AEGON USA Investment Management, LLC (“AUIM”), seeks to achieve the fund’s objective by investing the fund’s assets in the following high quality, short-term U.S. dollar-denominated money market instruments:
| • | | short-term corporate obligations, including commercial paper, notes and bonds |
| • | | obligations issued or guaranteed by the U.S. and foreign governments and their agencies and instrumentalities |
| • | | obligations of U.S. and foreign banks, or their foreign branches, and U.S. savings banks |
| • | | repurchase agreements involving any of the securities mentioned above |
Bank obligations purchased for the fund are limited to U.S. or foreign banks with total assets of $1.5 billion or more. Similarly, savings association obligations purchased for the fund are limited to U.S. savings association obligations issued by U.S. savings
168
banks with total assets of $1.5 billion or more. Foreign securities purchased for the fund must be U.S. dollar-denominated and issued by foreign governments, agencies or instrumentalities, or banks that meet the minimum $1.5 billion capital requirement. These foreign obligations must also meet the same quality requirements as U.S. obligations. Each security, at the time of purchase by the fund, has been determined by the sub-adviser to present minimal credit risk.
As a money market fund, the fund tries to maintain a share price of $1.00, and must follow strict rules as to the credit quality, diversification and maturity of its investments. The fund invests in securities that, at the time of purchase, have remaining maturities of 397 days or less. The fund maintains a dollar-weighted average portfolio maturity of 60 days or less. If, after purchase, the credit rating on a security held by the fund is downgraded or the credit quality deteriorates, or if the maturity on a security is extended, the fund’s sub-adviser or Board (where required by applicable regulations) will decide whether the security should be held or sold. To the extent that the fund has any uninvested cash, the fund would also be subject to risk with respect to the depository institution holding the cash.
Transamerica AEGON Short-Term Bond: The fund’s sub-adviser, AEGON USA Investment Management, LLC (“AUIM”), seeks to achieve the fund’s objective by investing, under normal circumstances, at least 80% of the fund’s net assets in fixed-income securities. Securities in which the fund may invest include:
| • | | short-term and intermediate-term investment-grade corporate obligations |
| • | | obligations issued or guaranteed by the U.S. and foreign governments and their agencies and instrumentalities |
| • | | mortgage-backed securities |
| • | | asset-backed securities |
AUIM may also invest in bank obligations, collateralized mortgage obligations, foreign securities and hybrids.
Bank obligations purchased for the fund are limited to U.S. or foreign banks with total assets of $1.5 billion or more. Similarly, savings association obligations purchased for the fund are limited to U.S. savings association obligations issued by U.S. savings banks with total assets of $1.5 billion or more. Foreign government securities purchased for the fund must be U.S. dollar-denominated and issued by foreign governments, agencies or instrumentalities. These foreign obligations must also meet the same quality requirements as U.S. obligations. The commercial paper and other short-term corporate obligations AUIM buys for the fund are determined by the fund manager to present minimal credit risks.
The fund may invest its assets in cash, cash equivalent securities or short-term debt securities, repurchase agreements and money market instruments. Under adverse or unstable market, economic or political conditions, the fund may do so without limit. Although the fund would do this only in seeking to avoid losses, the fund may be unable to pursue its investment objective during that time, and it could reduce the benefit from any upswing in the market. To the extent that the fund has any uninvested cash, the fund would also be subject to risk with respect to the depository institution holding the cash.
Transamerica AQR Managed Futures Strategy: Under normal circumstances, the fund’s sub-adviser, AQR Capital Management, LLC, (“AQR”) invests the fund’s assets primarily in a portfolio of futures contracts and futures-related instruments. The fund’s universe of investments currently includes more than 100 global developed and emerging market exchange-traded futures, futures-related instruments and forward contracts across four major asset classes (commodities, currencies, fixed income and equities); however, this universe of investments is subject to change under varying market conditions and as these instruments evolve over time.
The use of the term “positive absolute return” in the fund’s investment objective is intended to distinguish its investment objective from the relative returns sought by other mutual funds. Funds seeking relative returns are generally managed with a goal of outperforming an index of securities or an index of competitive funds. As a result, even if these funds are successful in achieving their investment objectives, their investment returns may be positive or negative and will tend to reflect the general direction of the securities markets. A “positive absolute return” seeks to earn a positive total return over a reasonable period of time regardless of market conditions or general market direction.
Generally, the fund invests in futures contracts and futures-related instruments including, but not limited to, global developed and emerging market equity index futures, global developed and emerging market currency forwards, commodity futures, swaps on commodity futures, global developed fixed income futures, bond futures and swaps on bond futures (collectively, the “Instruments”), either by investing directly in those Instruments, or indirectly by investing up to 25% of its total assets in a wholly-owned subsidiary of the fund organized as a company under the laws of the Cayman Islands (the “Subsidiary”) that invests in those Instruments. There are no geographic limits on the market exposure of the fund’s assets. This flexibility allows AQR to look for investments or gain exposure to asset classes and markets around the world, including emerging markets, that it believes will enhance the fund’s ability to meet its objective.
The Subsidiary has the same investment objective as the fund and is advised by Transamerica Asset Management, Inc. and sub-advised by AQR. The Subsidiary, unlike the fund, may invest without limitation in commodities and other commodity-linked
169
securities and derivative instruments, such as swaps and futures that provide exposure to the performance of the commodities markets. The Subsidiary is not registered under the Investment Company Act of 1940, as amended (the “1940 Act”), and is not subject to the investor protections of the 1940 Act. In addition, the Subsidiary may also invest in financial futures, option and swap contracts, fixed income securities, pooled investment vehicles, including those that are not registered pursuant to the 1940 Act, and other investments intended to serve as margin or collateral for the Subsidiary’s derivative positions.
The fund’s return is expected to be derived principally from changes in the value of securities and its portfolio is expected to consist principally of securities.
AQR uses proprietary quantitative models to identify price trends in equity, fixed-income, currency and commodity Instruments. Once a trend is determined, the fund will take either a long or short position in the given Instrument. When taking a “long” position, the fund purchases an instrument outright; when taking a “short” position, the fund sells an instrument that it does not own and must borrow to meet its settlement obligations. A “long” position will benefit from an increase in price of the underlying Instrument, while a “short” position will benefit from a decrease in price of the underlying Instrument. The size of the position taken will relate to AQR’s confidence in the trend continuing as well as AQR’s estimate of the Instrument’s risk. AQR generally expects that the fund will have exposure in long and short positions across all four major asset classes (commodities, currencies, fixed income and equities), but at any one time the fund may emphasize one or two of the asset classes or a limited number of exposures within an asset class.
Futures and forward contracts are contractual agreements to buy or sell a particular currency, commodity or financial instrument at a pre-determined price in the future. The fund’s use of futures contracts, forward contracts, swaps and certain other Instruments will have the economic effect of financial leverage. Financial leverage magnifies exposure to the swings in prices of an asset class underlying an Instrument and results in increased volatility, which means the fund will have the potential for greater gains, as well as the potential for greater losses, than if the fund does not use Instruments that have a leveraging effect. Leveraging tends to magnify, sometimes significantly, the effect of any increase or decrease in the fund’s exposure to an asset class and may cause the fund’s NAV to be volatile. For example, if AQR seeks to gain enhanced exposure to a specific asset class through an Instrument providing leveraged exposure to the class and that Instrument increases in value, the gain to the fund will be magnified; however, if that investment decreases in value, the loss to the fund will be magnified. A decline in the fund’s assets due to losses magnified by the Instruments providing leveraged exposure may require the fund to liquidate portfolio positions to satisfy its obligations, to meet redemption requests or to meet asset segregation requirements when it may not be advantageous to do so. There is no assurance that the fund’s use of Instruments providing enhanced exposure will enable the fund to achieve its investment objective.
AQR expects the fund’s NAV over short-term periods to be volatile because of the significant use of Instruments that have a leveraging effect. Volatility is a statistical measurement of the magnitude of up and down asset price fluctuations over time. Rapid and dramatic price swings will result in high volatility. The fund’s returns are expected to be volatile; however, AQR, on average, will target an annualized volatility level for the fund of 10%. AQR expects that the fund’s targeted annualized forecasted volatility will typically range between 5% and 13%; however, the actual or realized volatility level for longer or shorter periods may be materially higher or lower depending on market conditions. Actual or realized volatility can and will differ from the forecasted or target volatility described above.
As a result of the fund’s strategy, the fund may have highly leveraged exposure to one or more asset classes at times. The 1940 Act and the rules and interpretations thereunder impose certain limitations on the fund’s ability to use leverage; however, the fund is not subject to any additional limitations on its net long and short exposures. For example, the fund could hold instruments that provide five times the net return of a broad or narrow-based securities index. The fund’s strategy will result in frequent portfolio trading and high portfolio turnover (typically greater than 300%).
The fund may invest a significant portion of its assets in cash, cash equivalent securities or short-term debt securities, repurchase agreements and money market instruments to serve as collateral for the positions the fund takes, to earn income, and for cash management purposes. Under adverse or unstable market, economic or political conditions, the fund may take temporary defensive positions in cash and short-term debt securities without limit.
This fund is non-diversified.
Transamerica BlackRock Global Allocation: Under normal circumstances, the fund’s sub-adviser, BlackRock Investment Management, LLC (“BlackRock”), seeks to achieve the fund’s objective through a fully managed investment policy utilizing United States and foreign equity securities, debt and money market securities, the combination of which may be varied from time to time both with respect to types of securities and markets in response to changing market and economic trends. The fund will invest its assets in issuers that are located in a number of countries throughout the world. There is no limit on the percentage of assets the fund can invest in a particular type of asset class. The fund generally seeks diversification across markets, industries and issuers as one of its strategies to reduce volatility. Except as described below, the fund has no
170
geographic limits on where its investments may be located. This flexibility allows fund management to look for investments in markets around the world that it believes will provide the best relative asset allocation to meet the fund’s objective.
The fund uses its investment flexibility to create a portfolio of assets that, over time, tends to be relatively balanced between equity and debt securities and that is widely diversified among many individual investments. At any given time, however, the fund may emphasize either debt securities or equity securities. The fund may invest in both developed and emerging markets. BlackRock tries to identify the long term trends and changes that could benefit particular markets and/or industries relative to other markets and industries. BlackRock will consider such factors as the rate of economic growth, natural resources, capital reinvestment and the social and political environment when selecting a market. In deciding between equity and debt investments, BlackRock looks at a number of factors, including the relative opportunity for capital appreciation, capital recovery risk, dividend yields and the level of interest rates paid on debt securities of different maturities.
The fund may also, from time to time, identify certain real assets, such as real estate or precious metals, that BlackRock believes will increase in value because of economic trends and cycles or political or other events. The fund may invest a portion of its assets in securities related to those real assets such as stock, fixed-income securities or convertible securities issued by real estate investment trusts or companies that mine precious metals.
The fund can invest in all types of equity securities, including common stock, preferred stock, warrants and stock purchase rights of companies of any market capitalization. In selecting stocks and other securities that are convertible into stocks, BlackRock emphasizes stocks that it believes are undervalued. BlackRock places particular emphasis on companies with below average price/earnings ratios or that may pay above average dividends. The fund may also seek to invest in the stock of smaller or emerging growth companies that it expects will provide a higher total return than other equity investments. Investing in smaller or emerging growth companies involves greater risk than investing in more established companies.
The fund can invest in all types of debt securities of varying maturities, including U.S. and foreign government bonds, corporate bonds and convertible bonds, mortgage and asset backed securities, bank loans, and securities issued or guaranteed by certain international organizations such as the World Bank.
The fund may engage in short sales. The fund may make short sales of securities, either as a hedge against potential declines in value of a portfolio security or to realize appreciation when a security that the fund does not own declines in value. The fund will not make a short sale if, after giving effect to such sale, the market value of all securities sold short exceeds 20% of the value of its total assets. The fund may also make short sales “against the box” without being subject to this limitation. In this type of short sale, at the time of the sale, the fund owns or has the immediate and unconditional right to acquire the identical securities at no additional cost.
The fund may invest up to 35% of its total assets in “junk” bonds, corporate loans and distressed securities. Junk bonds are bonds that are rated below investment grade by independent rating agencies or are bonds that are not rated but which BlackRock considers to be of comparable quality. Corporate loans are direct obligations of U.S. or foreign corporations that are purchased by the fund in the secondary market. Distressed securities are securities that are in default on payments of interest or principal at the time the fund buys the securities or are issued by a bankrupt entity. These securities offer the possibility of relatively higher returns but are significantly riskier than higher rated debt securities. The fund will invest in these securities only when BlackRock believes that they will provide an attractive total return, relative to their risk, as compared to higher quality debt securities.
The fund may use derivatives to seek to increase the return of the fund and to hedge (or protect) the value of its assets against adverse movements in currency exchange rates, interest rates and movements in the securities markets.
The fund may invest in securities that provide a return based on fluctuations in a stock or other financial index. For example, the fund may invest in a security that increases in value with the price of a particular securities index. In some cases, the return on the security may be inversely related to the price of the index. This means that the value of the security will rise as the price of the index falls and vice versa. Although these types of securities may make it easier for the fund to access other markets or hedge risks of other assets held by the fund these securities are subject to the risks related to the underlying index or other assets.
The fund may also lend its portfolio securities, may hold non-US dollar cash investments, and may invest uninvested cash balances in affiliated money market funds.
The fund’s internal composite reference benchmark has at all times since the fund’s formation included a 40% weighting in non-U.S. securities. Throughout its history, the fund has maintained a weighting in non-U.S. securities, often exceeding the 40% benchmark weighting and rarely falling below this allocation. Under normal circumstances, the fund anticipates it will continue to allocate a substantial amount (approximately 40% or more – unless market conditions are not deemed favorable by BlackRock, in which case the fund would invest at least 30%) – of its total assets in securities (i) of foreign government issuers; (ii) of issuers organized or located outside the U.S.; (iii) of issuers which primarily trade in a market located outside the U.S.;
171
and (iv) of issuers doing a substantial amount of business outside the U.S., which the fund considers to be companies that derive at least 50% of their revenue or profits from business outside the U.S. or have at least 50% of their sales or assets outside the U.S. For temporary defensive purposes the fund may deviate very substantially from the allocation described above.
The fund may also gain exposure to the commodities markets by investing up to 25% of its total assets in a wholly-owned subsidiary of the fund organized as a company under the laws of the Cayman Islands (the “Subsidiary”).
The Subsidiary has the same investment objective as the fund and is advised by Transamerica Asset Management, Inc. and sub-advised by BlackRock. The Subsidiary, unlike the fund, may invest without limitation in commodities, commodity index-linked securities (including leveraged and unleveraged structured notes) and other commodity-linked securities and derivative instruments, such as swaps and futures that provide exposure to the performance of the commodities markets. The Subsidiary may also invest in other instruments, including fixed income instruments, either as investments or to serve as margin or collateral for its derivative positions. The Subsidiary is not registered under the Investment Company Act of 1940, as amended (the “1940 Act”), and is not subject to the investor protections of the 1940 Act.
The fund, directly and/or through the Subsidiary, may gain commodities exposure through the use of swaps and other derivative instruments. The use of swaps is a highly specialized activity which involves investment techniques, risk analyses and tax planning different from those associated with ordinary portfolio securities transactions.
The fund may invest its assets in cash, cash equivalent securities or short-term debt securities, repurchase agreements and money market instruments. Under adverse or unstable market, economic or political conditions, the fund may do so without limit. Although the fund would do this only in seeking to avoid losses, the fund may be unable to pursue its investment objective during that time, and it could reduce the benefit from any upswing in the market. To the extent that the fund has any uninvested cash, the fund would also be subject to risk with respect to the depository institution holding the cash.
Transamerica BlackRock Large Cap Value: The fund’s sub-adviser, BlackRock Investment Management, LLC (“BlackRock”), seeks to achieve the fund’s objective by investing, under normal circumstances, at least 80% of the fund’s net assets in equity securities of large cap companies. The fund considers a large cap company to be one which, at the time of purchase, has a market capitalization equal to or greater than the top 80% of the companies that comprise the Russell 1000® Value Index. As of December 31, 2010, the lowest market capitalization in this group was approximately $2.64 billion.
The fund may invest in foreign securities that are represented by American Depositary Receipts. The fund may invest in convertible securities, preferred stocks, illiquid securities, and U.S. government debt securities.
The fund will seek to outperform the Russell 1000® Value Index by investing in equity securities that BlackRock believes are selling at below normal valuations. The fund emphasizes value-oriented investments.
In selecting securities for the fund from its benchmark universe, BlackRock uses a proprietary multi-factor quantitative model. The factors employed by the model include stock valuation, quality of earnings and potential future earnings growth. BlackRock looks for strong relative earnings growth, earnings quality and good relative valuation.
A company’s stock price relative to its earnings and book value, among other factors, is also examined—if BlackRock believes that a company is overvalued, it will not be considered as an investment for any fund. After the initial screening is done, BlackRock relies on fundamental analysis, using both internal and external research, to optimize its quantitative model to choose companies BlackRock believes have strong, sustainable earnings growth with current momentum at attractive price valuations. “Fundamental analysis” is a method of stock market analysis that concentrates on “fundamental” information about the company (such as its income statement, balance sheet, earnings and sales history, products and management) to attempt to forecast future stock value.
Because the fund generally will not hold all the stocks in its index, and because its investments may be allocated in amounts that vary from the proportional weightings of the various stocks in that index, the fund is not an “index” fund. In seeking to outperform the benchmark, however, BlackRock reviews potential investments using certain criteria that are based on the securities in the relevant index. These criteria currently include the following:
| • | | Relative price to earnings and price to book ratios |
| • | | Stability and quality of earnings |
| • | | Earnings momentum and growth |
| • | | Weighted median market capitalization of the portfolio |
| • | | Allocation among the economic sectors of the portfolio as compared to the applicable index |
| • | | Weighted individual stocks within the applicable index |
172
The fund may invest its assets in cash, cash equivalent securities or short-term debt securities, repurchase agreements and money market instruments. Under adverse or unstable market, economic or political conditions, the fund may do so without limit. Although the fund would do this only in seeking to avoid losses, the fund may be unable to pursue its investment objective during that time, and it could reduce the benefit from any upswing in the market. To the extent that the fund has any uninvested cash, the fund would also be subject to the risk with respect to the depository institution holding the cash.
Transamerica Clarion Global Real Estate Securities: Under normal circumstances, the fund’s sub-adviser, ING Clarion Real Estate Securities, LLC (“Clarion”), will invest at least 80% of the fund’s net assets in a portfolio of equity securities of issuers that are principally engaged in the real estate industry. Clarion considers issuers principally engaged in the real estate industries to be companies that derive at least 50% of their total revenues or earnings from owning, operating, developing and/or managing real estate. The fund’s portfolio will be composed of investments in issuers that are economically tied to at least three different countries, including the United States. An issuer generally will be deemed to be economically tied to the country (or countries) in which the issuer has at least 50% of its assets or from which it derives at least 50% of its revenues or profits, or in whose securities markets its securities principally trade. As a general matter, these investments are expected to be in equity securities of real estate companies which include common stocks of large-, mid- and small-sized issuers, including real estate investment trusts (“REITs”), and convertible securities.
Clarion uses a disciplined two-step process for constructing the fund’s portfolio. First, Clarion selects sectors and geographic regions in which to invest, and determines the degree of representation of such sectors and regions, through a systematic evaluation of public and private property market trends and conditions. Second, Clarion uses an in-house valuation process to identify investments with superior current income and growth potential relative to their peers, through which it examines several factors, including value and property, capital structure, and management and strategy. Clarion may decide to sell investments held by the fund for a variety of reasons, such as to secure gains, limit losses, or redeploy fund investments into opportunities believed to be more promising. Clarion also may engage in frequent and active trading of fund investments to achieve the fund’s investment objective.
The fund may also invest in debt securities of real estate and non-real estate companies, mortgage-backed securities such as pass through certificates, real estate mortgage investment conduit (“REMIC”) certificates, and collateralized mortgage obligations (“CMOs”), or short-term debt obligations. However, the fund does not directly invest in real estate.
The fund may invest its assets in cash, cash equivalent securities or short-term debt securities, repurchase agreements and money market instruments. Under adverse or unstable market, economic or political conditions, the fund may do so without limit. Although the fund would do this only in seeking to avoid losses, the fund may be unable to pursue its investment objective during that time, and it could reduce the benefit from any upswing in the market. To the extent that the fund has any uninvested cash, the fund would also be subject to risk with respect to the depository institution holding the cash.
This fund is non-diversified.
Transamerica Federated Market Opportunity: The fund’s sub-adviser, Federated Equity Management Company of Pennsylvania (“Federated”), pursues the fund’s investment objective by investing, under normal circumstances, in domestic (including American Depository Receipts (ADRs)) and foreign securities (including emerging markets), both debt and equity, that Federated deems to be undervalued or out-of-favor, and other investments detailed in the strategy below which may include maintaining a cash position invested in traditional cash instruments. Federated can position the fund with respect to various asset classes or individual securities in a net long or a net short position.
Federated’s investment management approach may be described as contrarian in nature because the sub-adviser anticipates that it will invest in out-of-favor securities or deviate from the consensus view on markets in general, a sector, or individual securities.
The fund’s asset allocation is based on valuation, sentiment, and technical considerations. The fund generally will favor asset categories that are undervalued relative to historical norms, as well as those which are out of favor based on market sentiment measures, and assets which have lagged other categories or declined sharply in price. The assumption is that valuations, sentiment, and prices will return to normal relationships, or “revert to the mean.”
With regard to equity securities, Federated primarily uses the “value” style of investing and selects securities primarily utilizing a “bottom-up” approach to security analysis but also secondarily considers “top-down” analysis and sector allocation. Federated does not generally consider the composition of market indices in its selection of equity securities. Federated’s use of the “value” style of investing seeks to identify and select securities that, in Federated’s opinion, are trading at a lower valuation relative to one of the following two measurements: (i) the historic valuation of the securities; (ii) valuations of the issuer’s industry peers; or (iii) absolute valuation levels. Historically, undervalued securities have generally had lower share price volatility, and a higher yield, when compared with other equity securities. The fund may invest in both foreign and domestic equity securities.
173
Primarily using the bottom-up approach to security analysis, Federated searches for equity securities that appear to be undervalued or out-of-favor. In searching for securities that meet this criteria, Federated utilizes a global stock selection process which screens for and rates stocks based upon various factors such as valuation, financial strength and the company’s management. Federated may also consider the sustainability of the business in which it invests by assessing business conduct and the company’s products.
As a secondary matter, using top-down analysis, Federated considers current economic, financial market, and industry factors and societal trends that may affect the issuing company. Lastly, Federated assembles a portfolio of equity securities by considering sector allocations. Sectors are broad categories of companies with similar characteristics. Federated determines the sector allocation of the fund’s portfolio primarily based upon its opinion as to which sectors are, as a whole, priced at a low market valuation when compared with other sectors, and which are currently out-of-favor. Depending on its outlook, Federated may take a short position in a particular asset class, security or other investment.
Federated uses technical analysis of the market as an aid in timing purchases and sales. Federated sells a portfolio security if it determines that the issuer does not continue to meet its stock selection criteria.
Federated may increase the fund’s cash position if Federated is unable to find a sufficient number of attractive securities. Additionally, Federated anticipates normally keeping a portion of the fund’s portfolio in cash in order to readily take advantage of buying opportunities or in an effort to preserve capital. The fund’s cash position will normally be invested in traditional cash investments such as money market funds, U.S. Treasury Bills or repurchase agreements.
When investing in fixed-income securities, Federated invests in asset classes within the fixed-income market that it believes offer the best relative value. When searching for asset classes within the fixed-income market, Federated places an emphasis on historical yield spreads and investing contrary to prevailing market sentiment with regard to an asset class. Such asset classes may include non-investment-grade fixed-income securities, emerging market debt and foreign non-dollar denominated fixed-income securities issued by foreign governmental entities or corporations, as well as U.S. Treasury securities and other investment-grade securities. With regard to non-dollar denominated fixed-income securities, Federated also considers the currency appreciation potential of a given market. The fund may buy or sell foreign currencies in lieu of or in addition to non-dollar denominated fixed-income securities in order to increase or decrease its exposure to foreign interest rate and/or currency markets. Federated is not constrained by any duration or maturity range or credit quality when investing the fixed-income portion of the fund.
In addition to investing in equity and fixed-income securities, the fund may invest in the following in attempting to achieve its investment objective:
| • | | derivative contracts or hybrid instruments; |
| • | | investments which give the fund exposure to the price of movement of gold, silver or other precious metals. The fund may also purchase shares of ETFs in order to achieve exposure to a specific region, country, commodity or market sector, or for other reasons consistent with its investment strategy. |
The fund may invest in hybrid instruments or derivative contracts, such as swaps, options and futures contracts, to efficiently implement its overall investment strategies. The fund may, for example, use derivative contracts to:
| • | | seek to benefit from anticipated changes in the volatility of designated assets or instruments, such as indices, currencies and interest rates (volatility is a measure of the frequency and level of changes in the value of an asset or instrument without regard to the direction of such changes); |
| • | | obtain premiums from the sale of derivative contracts (e.g., write a put option on a security); |
| • | | realize gains from trading a derivative contract (e.g., buy a put option in anticipation of a decrease in an underlying security); or |
| • | | hedge against potential losses. For example, the fund may buy put options on stock indices or individual stocks (even if the stocks are not held by the fund) in an attempt to hedge against a decline in stock price. |
There can be no assurance that the fund’s use of derivative contracts or hybrid instruments will work as intended.
The fund may gain exposure to commodities by investing in hybrid instruments. For example, the fund may invest in hybrid instruments which are structured as interest-bearing notes whose amount paid at maturity is determined by the price of an underlying commodity or by the performance of a commodity index. Such commodities may include precious metals (e.g., gold, silver), industrial metals, (e.g., copper, nickel), agricultural and livestock commodities (e.g., wheat, pork), and energy related commodities (e.g., crude oil and natural gas).
174
Finally, the fund may invest in derivatives contracts as part of its hedging strategies. For example, the fund may use the derivative contracts and/or hybrid instruments to increase or decrease the portfolio’s exposure to the investment(s) underlying derivative or hybrid in an attempt to benefit from changes in the value of the underlying investment(s). First, the fund may invest in a hybrid instrument which is structured as a note that pays a fixed dividend and at maturity either converts into shares of an equity security or returns a payment to the fund based on the change in value of the underlying equity security. Second, the fund may use derivative contracts or hybrid instruments to increase or decrease the allocation of the portfolio to securities, currencies, markets or indices or types of securities in which the fund may invest directly.
The fund may invest its assets in cash, cash equivalent securities or short-term debt securities, repurchase agreements and money market instruments. Under adverse or unstable market, economic or political conditions, the fund may do so without limit. Although the fund would do this only in seeking to avoid losses, the fund may be unable to pursue its investment objective during that time, and it could reduce the benefit from any upswing in the market. To the extent that the fund has any uninvested cash, the fund would also be subject to risk with respect to the depository institution holding the cash.
Transamerica First Quadrant Global Macro: Under normal circumstances, the fund seeks to generate returns through risk-controlled exposure, long and short, to global equity, fixed-income, and currency markets through a wide range of derivative instruments and direct investments. The fund typically will make extensive use of derivative instruments, including futures contracts on global equity and fixed-income securities and security indices, options on futures contracts and equity indices, securities and security indices, swap contracts and forward contracts. The fund may also invest directly in global equity securities (including exchange traded funds (“ETFs”) and common and preferred stock of U.S. and non-U.S. companies) and fixed-income securities (including U.S. and non-U.S. corporate bonds and debt securities guaranteed by U.S. and non-US. Governments, their agencies or instrumentalities or supranational organizations).
The fund’s investment process involves an analysis of returns based on the (i) relative returns derived from global asset class performance (for example, how global stocks perform relative to global bonds and cash); (ii) relative returns within the equity asset class based on country (for example, how U.S. equities performed relative to other global equities); (iii) relative returns within the fixed-income asset class based on country (for example, how U.S. bonds performed relative to other global bonds); (iv) risks associated with currencies; and (v) relative pricing of equity index options. There are no limits on the amount of fund assets that may be allocated to any one of the equity, bond, and currency asset classes. Typically, the fund expects to diversify its exposure among at least ten different countries, including the United States. In selecting equity investments for the fund, First Quadrant L.P. (“First Quadrant”), the fund’s sub-adviser, is not constrained by any particular investment style or any particular investment style or capitalization range. In selecting bond investments for the fund, First Quadrant will have the flexibility to invest in debt-related investments of any credit quality and with any duration.
First Quadrant applies a global view to portfolio construction for the fund. Recognizing that the world’s economies are connected, the fund’s investments in the global equity, bond, currency, and options markets will be mutually dependent. The fund’s portfolio will reflect the First Quadrant’s assessment of the combination of local market and economic factors, global equity, fixed income or currency market factors and changes in global interest rates. As a result, the relationship between a change in the price of a stock or fixed income market, or a change in a currency exchange rate in one market, may influence the decision to take or adjust positions in other instruments with exposure to other markets or other market types. Because changes in the global equity, bond, and currency markets occur rapidly, it will often be difficult to respond quickly to such changes by investing directly in global equity securities, fixed income securities and currencies. Direct investments may also involve costs that would diminish or eliminate value that First Quadrant identifies in the global equity, bond and currency markets. Therefore, the fund will often use derivative instruments as its principal means to quickly and efficiently gain exposure to equity securities, fixed income securities, and foreign currencies in seeking to take advantage of value (and reduce exposure to risks) that First Quadrant identifies in the global equity, bond, and current markets.
The fund is subject to rigorous ongoing risk management to attempt to minimize volatility and achieve a high correlation between the positions taken and the desired exposures. The fund may enter into short sales of securities (including ETFs). A short sale involves the sale of a security that is borrowed from a broker or other institution to complete the sale.
As a general matter, when the fund established certain derivative instrument positions, such as certain futures, options and forward contract positions, or enters into a short sale, it will segregate liquid assets equivalent to the fund’s outstanding obligations under the contract or in connection with the short position.
Transamerica Goldman Sachs Commodity Strategy: The fund seeks to maintain substantial economic exposure to the performance of the commodities markets. Goldman Sachs Asset Management, L.P. (“GSAM”), the fund’s sub-adviser, invests the fund’s assets in a portfolio of commodity index-linked securities (including leveraged and unleveraged structured notes), other commodity-linked securities and derivative instruments and in other fixed-income and debt instruments. The fund may also gain exposure to the commodities markets by investing up to 25% of its total assets in a wholly-owned subsidiary of the fund organized as a company under the laws of the Cayman Islands (the “Subsidiary”).
175
The Subsidiary has the same investment objective as the fund and is advised by Transamerica Asset Management, Inc. and sub-advised by GSAM. The Subsidiary, unlike the fund, may invest without limitation in commodities, commodity index-linked securities (including leveraged and unleveraged structured notes) and other commodity-linked securities and derivative instruments, such as swaps and futures that provide exposure to the performance of the commodities markets. The Subsidiary may also invest in other instruments, including fixed income instruments, either as investments or to serve as margin or collateral for its derivative positions. The Subsidiary is not registered under the Investment Company Act of 1940, as amended (the “1940 Act”), and is not subject to the investor protections of the 1940 Act.
Commodity Investments. The fund may invest in commodity-linked notes, commodity-linked swaps and other commodity-linked derivative instruments, whose value is linked to the performance of commodities, commodities indices or baskets of futures contracts issued on all of the commodities in an index. Commodity-linked swaps are derivative instruments whereby the cash flows agreed upon between counterparties are dependant upon the price of the underlying commodity or commodity index over the life of the swap. The value of the swap will rise and fall in response to changes in the underlying commodity or commodity index. These swaps expose the fund economically to movements in commodity prices. The fund will pursue its objective without directly investing in commodities. The fund seeks to provide exposure to various commodities and commodities sectors. Commodity-linked derivative instruments include commodity index-linked securities and other derivative instruments that provide exposure to the investment returns of the commodities markets.
It is expected that certain of the fund’s investments will produce leveraged exposure to the commodities markets.
The fund intends to gain exposure to commodities markets primarily by investing in securities and instruments whose returns are linked to commodities markets and commodities-related indices, including the Dow Jones - UBS Commodity Index (the “Index”). In pursuing its objective, the fund attempts to provide exposure to the returns of real assets that trade in the commodities markets without direct investment in physical commodities. Real assets include oil, gas, industrial and precious metals, livestock, and agricultural or meat products, or other items that have tangible properties. Commodity-linked investments may be more volatile and less liquid than the underlying commodities and their value may be affected by the performance of commodities as well as weather, tax, regulatory or political developments, overall market movements and other factors affecting the value of particular industries or commodities, such as disease, embargoes, acts of war or terrorism.
The fund will not invest 25% or more of its total assets in instruments issued by companies in any one industry. The fund’s portfolio will reflect greater than 25% exposure to the group of industries represented in the Index, however. If, in the future, industries are added to or removed from representation in the Index, the group of industries in which the fund’s exposure is concentrated will likewise change.
In pursuing its investment objective, the fund uses the Index as its performance benchmark and will attempt to produce returns that correspond to the performance of the Index, but the fund will not attempt to replicate the Index. The fund may, therefore, invest in securities or other instruments that are not included in the Index.
The fund, directly and/or through the Subsidiary, may gain commodities exposure through the use of swaps and other derivative instruments. The use of swaps is a highly specialized activity which involves investment techniques, risk analyses and tax planning different from those associated with ordinary portfolio securities transactions.
Fixed Income Investments. The fund invests in investment grade fixed income securities, and may invest up to 10% of its assets in non-investment grade fixed income securities. The fund may invest in corporate securities, U.S. Government securities, mortgage-backed securities, asset-backed securities, and municipal securities. The average duration will vary.
Other. The fund may invest up to 35% of its net assets in foreign securities.
The fund may invest its assets in cash, cash equivalent securities or short-term debt securities, repurchase agreements and money market securities. Under adverse or unstable market, economic or political conditions, the fund may take temporary defensive positions in cash and short-term debt securities without limit.
The fund is non-diversified.
Transamerica Hansberger International Value: Hansberger Global Investors, Inc. (“Hansberger”), the fund’s sub-adviser, seeks to achieve the fund’s investment objective by investing primarily in a diversified portfolio of stocks (including common stock, preferred stock and convertible securities) and debt obligations of companies and governments domiciled outside the U.S. which the sub-adviser believes are undervalued. Under normal market conditions, the fund will invest more than 80% of its assets (not including the cash position of the fund) in issuers located in at least three countries other than the U.S. In selecting investments for the fund, Hansberger, by engaging in its own research and by reviewing research obtained through outside sources, seeks to identify securities of companies that have a market value which it believes is less than the company’s intrinsic value based on its long-term potential. The sub-adviser’s portfolio investment decisions rely heavily on a fundamental analysis of securities with a long-term investment perspective. Hansberger will also consider other factors in making portfolio investment decisions, including country and political risks and economic and market conditions.
176
The sub-adviser seeks to broaden the scope and increase the effectiveness of this fundamental analysis by searching for undervalued securities in many countries around the world. The sub-adviser generally sells a security if the price target is met, the company’s fundamentals change or if the sub-adviser believes a better investment opportunity exists.
The fund may invest its assets in cash, cash equivalent securities or short-term debt securities, repurchase agreements and money market instruments. Under adverse or unstable market, economic or political conditions, the fund may do so without limit. Although the fund would do this only in seeking to avoid losses, the fund may be unable to pursue its investment objective during that time, and it could reduce the benefit from any upswing in the market. To the extent that the fund has any uninvested cash, the fund would also be subject to risk with respect to the depository institution holding the cash.
Transamerica Jennison Growth: The fund’s sub-adviser, Jennison Associates LLC (“Jennison”), seeks to achieve the fund’s objective by investing, under normal circumstances, at least 65% of the fund’s total assets in equity securities, principally common stocks, preferred stocks, warrants, rights and depositary receipts, of U.S. companies with market capitalizations of at least $1 billion that Jennison considers to have above average prospects for growth. These companies are generally medium- to large-capitalization companies.
The sub-adviser uses a “bottom up” approach, researching and evaluating individual companies, to manage the fund’s investments. Jennison looks primarily at individual company fundamentals rather than at macro-economic factors to identify individual companies with earnings growth potential that may not be recognized by the market at large.
When a sub-adviser uses a “bottom-up” approach, it looks primarily at individual companies against the context of broader market factors.
In selecting stocks for the fund, the sub-adviser looks for companies with the following financial characteristics:
| • | | superior absolute and relative earnings growth |
| • | | above average revenue and earnings per share growth |
| • | | sustainable or improving profitability |
In addition, Jennison looks for companies that have actually achieved or exceeded expected earnings results and are attractively valued relative to their growth prospects. Earnings predictability and confidence in earnings forecasts are important parts of the selection process. Securities in which the fund invests have historically been more volatile than the Standard & Poor’s 500® Index (“S&P 500 Index”). In addition, companies that have an earnings growth ratio higher than that of the average S&P 500 Index company tend to reinvest their earnings rather than distribute them, so the fund is not likely to receive significant dividend income on its investments. The sub-adviser focuses on stocks of companies that have distinct attributes such as:
| • | | strong market position with a defensible franchise |
| • | | unique marketing competence |
| • | | strong research and development leading to superior new product flow |
| • | | capable and disciplined management |
Such companies generally trade at high prices relative to their current earnings.
The fund may invest up to 20% of its assets in the securities of foreign issuers.
The fund may invest its assets in cash, cash equivalent securities or short-term debt securities, repurchase agreements and money market instruments. Under adverse or unstable market, economic or political conditions, the fund may do so without limit. Although the fund would do this only in seeking to avoid losses, the fund may be unable to pursue its investment objective during that time, and it could reduce the benefit from any upswing in the market. To the extent that the fund has any uninvested cash, the fund would also be subject to risk with respect to the depository institution holding the cash.
Transamerica JPMorgan Core Bond: The fund’s sub-adviser, J.P. Morgan Investment Management Inc. (“JPMorgan”) seeks to achieve the fund’s objective by investing, under normal circumstances, at least 80% of the fund’s assets in bonds, including (without limitation):
| • | | U.S. government securities, including Treasury obligations and government sponsored enterprises such as Fannie Mae, Ginnie Mae, Freddie Mac and securities issued by other government agencies and instrumentalities |
| • | | Medium- to high-quality corporate bonds |
| • | | Mortgage-backed securities, including U.S. agency and non-agency pass through and Collateralized Mortgage Obligations (“CMOs”) |
177
| • | | Asset-backed securities |
| • | | Commercial Mortgage Backed Securities (“CMBS”) |
Generally, such bonds will have intermediate to long maturities.
To a lesser extent it may invest in:
| • | | U.S. dollar-denominated foreign bonds |
| • | | Short-term securities, including agency discount notes, commercial paper and money market funds |
The fund may invest in bonds and other debt securities that are rated in the lowest investment trade category. The fund’s average weighted maturity will ordinarily range between four and 12 years, although the fund may shorten its average weighted maturity if deemed appropriate for temporary defensive purposes. Average weighted maturity is the average of all the current maturities (that is, the term of the securities) of the individual bonds in the fund calculated so as to come most heavily those securities with the highest dollar value. Average weighted maturity is important to investors as an indication of the fund’s sensitivity to changes in interest rates. Usually, the longer the average weighted maturity, the more fluctuation in share price you can expect. Mortgage-related securities are subject to prepayment of principal, which can shorten the average weighted maturity of the fund’s portfolio. Therefore, in the case of the fund, which may hold mortgage-backed securities, its average weighted maturity is equivalent to its weighted average life. Weighted average life is the average weighted maturity of the cash flows in the securities held by the fund given certain prepayment assumptions.
JPMorgan analyzes four major factors in managing and constructing the fund’s portfolio: duration, market sector, maturity concentrations and individual securities. JPMorgan looks for market sectors and individual securities that it believes will perform well over time. JPMorgan is value oriented and selects individuals securities after performing a risk/reward analysis that includes an evaluation of interest rate risk, credit risk, and the complex legal and technical structure of the transaction.
Derivatives, which are instruments that have a value based on another instrument, exchange rate or index, may be used as substitutes for securities in which the fund can invest. The fund may use futures contracts, options, swaps and other derivatives as tools in the management of fund assets. The fund may use derivatives as a substitute for various investments, to alter the investments characteristics of the portfolio, for risk management and/or to increase income or gain to the fund.
The fund may invest its assets in cash, cash equivalent securities or short-term debt securities, repurchase agreements and money market instruments. Under adverse or unstable market economic or political conditions, the fund may do so without limit. Although the fund would do this only in seeking to avoid losses, the fund may be unable to pursue its investment objective during that time, and it could reduce the benefit from any upswing in the market. To the extent that the fund has any uninvested cash, the fund would also be subject to risk with respect to the depository institution holding the cash.
Transamerica JPMorgan International Bond: The fund’s sub-adviser, J.P. Morgan Investment Management Inc. (“JPMorgan”), seeks to achieve the fund’s objective by investing, under normal circumstances, at least 80% of the fund’s net assets in high-quality bonds (with outstanding maturities of at least one year). A bond is deemed to be “high-quality” if it has a rating of AA- or higher from Standard & Poor’s Corporation (“S&P”) or Aa3 or higher from Moody’s Investors Service, Inc. (“Moody’s”) (or is an unrated security determined to be of comparable quality by the sub-adviser). In the case of split-rated securities, the sub-adviser will apply the highest of the ratings from S&P, Moody’s and any other nationally recognized rating agency when assigning credit ratings to the fixed-income securities in the fund. If the credit quality of an investment declines after initial purchase, the fund may continue to hold the investment at the discretion of the sub-adviser. Normally, the fund will primarily invest in government and corporate debt securities of issuers that are economically tied to a number of countries throughout the world and expects to be invested in more than three different foreign countries. The fund may also invest up to 10% of its assets in emerging markets debt securities.
JPMorgan determines whether to buy and sell securities for the fund by using a combination of fundamental research and bond and currency valuation models, including:
| • | | Economic/Political Fundamentals. JPMorgan evaluates each country’s economic climate and political discipline for controlling deficits and inflation. |
| • | | Expected Return. Using economic forecasts, JPMorgan projects the expected return for each country. |
| • | | Relative Value. By contrasting expected risks and returns for investments in each country, JPMorgan selects those countries expected to produce the best return at reasonable risk. |
Generally, the fund will purchase only bonds denominated in foreign currencies. The fund generally limits its use of hedging strategies that may minimize the effect of currency fluctuations. However, the fund may hedge up to 25% of its total assets into U.S. dollars when the portfolio manager considers the dollar to be attractive relative to foreign currencies.
178
The fund also may invest in options, futures contracts, options on futures contracts, and swap agreements, provided that such investments are in keeping with the fund’s investment objective.
The fund may invest its assets in cash, cash equivalent securities or short-term debt securities, repurchase agreements and money market instruments. Under adverse or unstable market, economic or political conditions, the fund may do so without limit. Although the fund would do this only in seeking to avoid losses, the fund may be unable to pursue its investment objective during that time, and it could reduce the benefit from any upswing in the market. To the extent that the fund has any uninvested cash, the fund would also be subject to risk with respect to the depository institution holding the cash.
This fund is non-diversified.
Transamerica JPMorgan Long/Short Strategy: J.P. Morgan Investment Management Inc. (“JPMorgan”), the fund’s sub-adviser, employs a long-short equity strategy by investing the fund’s assets in long and short positions in equity securities selected from a universe of mid- to large capitalization stocks. The equity securities will have market characteristics and capitalizations similar to those included in the Russell 1000® Index and/or the Standard & Poor’s 500® Index at the time of purchase. In implementing its strategy, the fund invests primarily in common stocks, real estate investment trusts (REITs) and depositary receipts.
The fund purchases securities that the sub-adviser believes are undervalued and sells short securities that the sub-adviser believes are overvalued. The fund’s net equity market exposure will typically range from 20% to 30%; however, in response to market conditions, the fund may adjust its equity market exposure. Under normal market conditions, the fund’s net long equity market exposure will not exceed 50% and its net short equity market exposure will not exceed 20%. Further, the fund’s gross equity market exposure is limited to 200%. The fund may hold a substantial portion of its total assets in cash when it holds significant short positions. By taking both long and short positions, the fund seeks to provide some protection in down markets when compared to a fund that takes only long positions.
Selling stocks short allows the fund to more fully exploit insights into stocks that the fund’s sub-adviser expects to underperform. Short sales involve the sale of a security which the fund does not own in hopes of purchasing the same security at a later date at a lower price. To make delivery to the buyer, the fund must borrow the security, and the fund is obligated to return the security to the lender, which is accomplished by a later purchase of the security by the fund.
On behalf of the fund, the sub-adviser buys and sells, as well as shorts and covers shorts in, equity securities and derivatives on those securities according to its own policies, using the research and valuation rankings as a basis for its decisions. In general, the sub-adviser buys and covers shorts in equity securities that are identified as undervalued and considers selling or shorting them when they appear overvalued.
The fund may invest its assets in cash, cash equivalent securities or short-term debt securities, repurchase agreements and money market securities. Under adverse or unstable market, economic or political conditions, the fund may take temporary defensive positions in cash and short-term debt securities without limit. Although the fund would do this only in seeking to avoid losses, the fund may be unable to pursue its investment objective during that time, and it could reduce the benefit from any upswing in the market. To the extent that the fund has any uninvested cash, the fund would also be subject to risk with respect to the depository institution holding the cash.
Transamerica JPMorgan Mid Cap Value: The fund’s sub-adviser, J.P. Morgan Investment Management Inc. (“JPMorgan”), seeks to achieve the fund’s objective by investing, under normal circumstances, at least 80% of net assets in common stocks of companies with market capitalizations of $1 billion to $20 billion at the time of purchase that JPMorgan believes to be undervalued.
The fund will normally only purchase securities that are traded on registered exchanges or the over-the-counter market in the United States. The fund may invest in other equity securities, which include preferred stocks, convertible securities and foreign securities, which may take the form of depositary receipts.
JPMorgan may use derivatives to hedge various market risks or to increase the fund’s income. The fund may also invest in master limited partnerships, although their use will not be a principal investment strategy. The fund may invest up to 15% of its net assets in real estate investment trusts (“REITs”).
The fund may invest its assets in cash, cash equivalent securities or short-term debt securities, repurchase agreements and money market instruments. Under adverse or unstable market, economic or political conditions, the fund may do so without limit. Although the fund would do this only in seeking to avoid losses, the fund may be unable to pursue its investment objective during that time, and it could reduce the benefit from any upswing in the market. To the extent that the fund has any uninvested cash, the fund would also be subject to risk with respect to the depository institution holding the cash.
179
Transamerica Loomis Sayles Bond: The fund’s sub-adviser, Loomis, Sayles & Company, L.P. (“Loomis”), seeks to achieve the fund’s objective by investing, under normal circumstances, at least 80% of the fund’s net assets in fixed-income securities, primarily in investment-grade fixed-income securities.
The fund invests up to 35% of its assets in lower-rated fixed-income securities (“junk bonds”) and up to 20% of its assets in preferred stocks. Generally, at least 65% of the fund’s assets will be invested in investment grade securities rated BBB-or higher by Standard & Poor’s Ratings Group (“S&P”) or Baa3 by Moody’s Investors Service, Inc. (“Moody’s”), as determined at the time of purchase. The fund may invest in fixed-income securities of any maturity. The fund may also invest up to 10% of its assets in bank loans, which include senior secured and unsecured floating rate loans made by banks and other financial institutions to corporate customers. These loans generally will not be rated investment-grade.
Loomis performs extensive credit analyses, relying on its in-house team of more than 30 fixed-income analysts to cover a broad universe of industries, companies, and markets. The portfolio managers take advantage of these extensive resources to seek bonds trading at attractive levels from a risk/return perspective. In deciding which securities to buy and sell, Loomis considers, among other things, the financial strength of the issuer, current interest rates, expectations regarding general trends in interest rates, and comparisons of the level of risk associated with the potential return of those investments. Three themes typically drive the fund’s investment approach. First, the fund generally seeks securities of issuers whose credit profiles are improving. Second, the fund makes significant use of non-market related securities, which are securities that may not have a direct correlation with changes in interest rates. Loomis believes that the fund may generate positive returns by having a portion of assets invested in non-market related securities, rather than by relying primarily on changes in interest rates to produce returns. Third, Loomis analyzes different sectors of the economy and differences in the yields of various fixed income securities in an effort to find securities that it believes may produce attractive returns for the fund in comparison to their risk.
The fund may invest any portion of its assets in securities of Canadian issuers (denominated in any currency) and up to 20% of its assets in other foreign securities (excluding Canadian dollar denominated securities), including emerging market securities. The fund may invest without limit in obligations of supranational entities (e.g., the World Bank).
The fixed-income securities in which the fund may invest include without limitation: corporate securities, U.S. Government securities, commercial paper, zero coupon securities, mortgage-backed securities, stripped mortgage-backed securities, collateralized mortgage obligations, foreign currency denominated securities, asset-backed securities, when-issued securities, real estate investment trusts (“REITS”), Rule 144A securities, structured notes, repurchase agreements, and convertible securities. The fund may engage in options and futures transactions, foreign currency hedging transactions and swap transactions.
The fund may invest in structured notes, which are derivative debt instruments with principal and/or interest payments linked to the value of a commodity, a foreign currency, an index of securities, an interest rate, or other financial indicators (“reference instruments”). The payments on a structured note may vary based on changes in one or more specified reference instruments, such as a floating interest rate compared to a fixed interest rate, the exchange rates between two currencies or a securities or commodities index. A structured note may be positively or negatively indexed. For example, its principal amount and/or interest rate may increase or decrease if the value of the reference instrument increases, depending upon the terms of the instrument. The change in the principal amount payable with respect to, or the interest rate of, a structured note may be a multiple of the percentage change (positive or negative) in the value of the underlying reference instrument or instruments. Structured notes can be used to increase a fund’s exposure to changes in the value of assets or to hedge the risks of other investments that a fund holds. The fund may also invest in equity securities, including common stocks, preferred stocks and similar securities.
The fund may invest its assets in cash, cash equivalent securities or short-term debt securities, repurchase agreements and money market instruments. Under adverse or unstable market, economic or political conditions, the fund may do so without limit. Although the fund would do this only in seeking to avoid losses, the fund may be unable to pursue its investment objective during that time, and it could reduce the benefit from any upswing in the market. To the extent that the fund has any uninvested cash, the fund would also be subject to risk with respect to the depository institution holding the cash.
Transamerica MFS International Equity: The fund’s sub-adviser, MFS® Investment Management (“MFS”), seeks to achieve the fund’s objective (capital growth) by investing, under normal circumstances, at least 80% of the fund’s net assets in common stocks and related equity securities, such as preferred stock, convertible securities and depositary receipts of issuers economically tied to a number of countries throughout the world, including emerging markets countries.
The fund normally invests primarily in equity securities of foreign companies, including emerging market equity securities. The fund may invest a relatively large percentage of its assets in issuers in a single country, a small number of countries, or a particular geographic region.
In selecting investments for the fund, MFS is not constrained to any particular investment style. MFS may invest the fund’s assets in the stocks of companies it believes to have above average earnings growth potential compared to other companies
180
(growth companies) in the stocks of companies it believes are undervalued compared to their perceived worth (value companies), or in a combination of growth and value companies.
MFS may invest the fund’s assets in companies of any size. MFS may use derivatives for different purposes, including to earn income and enhance returns, to increase or decrease exposure to a particular market, to manage or adjust the risk profile of the fund, or as alternatives to direct investments.
MFS uses a “bottom-up” investment approach to buying and selling investments for the fund. Investments are selected primarily based on fundamental analysis of individual issuers and their potential in light of their current financial, market, economic, political, and regulatory conditions. Factors considered may include analysis of an issuer’s earnings, cash flows, competitive position, and management ability. Quantitative models that systematically evaluate an issuer’s valuation, price and earnings momentum, earnings quality, and other factors may also be considered.
The issuer of a security or other investment is generally deemed to be economically tied to a particular country if (a) the security or other investment is issued or guaranteed by the government of that country or any of its agencies, authorities or instrumentalities; (b) the issuer is organized under the laws of, and maintains a principal office in, that country; (c) the issuer has its principal securities trading market in that country; (d) the issuer derives 50% or more of its total revenues from goods sold or services performed in that country; (e) the issuer has 50% or more of its assets in that country; (f) the issuer is included in an index which is representative of that country; or (g) the issuer is exposed to the economic fortunes and risks of that country.
MFS may engage in active and frequent trading in pursuing the fund’s principal investment strategies.
The fund may invest its assets in cash, cash equivalent securities or short-term debt securities, repurchase agreements and money market instruments. Under adverse or unstable market, economic or political conditions, the fund may do so without limit. Although the fund would do this only in seeking to avoid losses, the fund may be unable to pursue its investment objective during that time, and it could reduce the benefit from any upswing in the market. To the extent that the fund has any uninvested cash, the fund would also be subject to risk with respect to the depository institution holding the cash.
Transamerica Morgan Stanley Emerging Markets Debt: The fund’s sub-adviser, Morgan Stanley Investment Management Inc. (“MSIM”), invests under normal circumstances, at least 80% of the fund’s net assets in debt securities of issuers located in emerging markets countries. An issuer is located in an emerging markets country if:
| • | | its principal securities trading market is in an emerging markets country; |
| • | | alone or on a consolidated basis, it derives 50% or more of its annual revenue from goods produced, sales made or services performed in emerging markets; or |
| • | | it is organized under the laws of, or has a principal office in, an emerging markets or developing country. |
MSIM seeks to achieve the fund’s objective by normally investing primarily in fixed-income securities of government and government-related issuers and, to a lesser extent, of corporate issuers in emerging markets countries. Using macroeconomic and fundamental analysis, MSIM seeks to identify developing countries that are believed to be undervalued and have attractive or improving fundamentals. After the country allocation is determined, the sector and security selection is made within each country.
The sub-adviser analyzes the global economic environment and its impact on emerging markets. The sub-adviser focuses on investing in countries that show signs of positive fundamental change. This analysis considers macroeconomic factors, such as GDP growth, inflation, monetary policy, fiscal policy and interest rates and sociopolitical factors, such as political risk, leadership, social stability and commitment to reform.
In selecting securities, the sub-adviser first examines yield curves with respect to a country and then considers instrument-specific criteria, including (i) spread duration; (ii) real interest rates; and (iii) liquidity. The fund’s holdings may range in maturity from overnight to 30 years or more and will not be subject to any minimum credit rating standard. The sub-adviser may, when or if available, use certain strategies, including the use of derivatives, to protect the fund from overvalued currencies or to take advantage of undervalued currencies. Derivative instruments used by the fund will be counted toward the 80% policy discussed below to the extent they have economic characteristics similar to the securities included within that policy. The sub-adviser generally considers selling a portfolio holding when it determines that the holding no longer satisfies its investment criteria.
Emerging markets or developing countries are countries that major international financial institutions, such as the World Bank, generally consider to be less economically mature than developed nations such as the United States or most nations in Western Europe. Emerging markets countries can include every nation in the world except the United States, Canada, Japan, Australia, New Zealand and most countries in Western Europe.
181
The fund may also invest up to 25% of its assets in cross currency hedges, which involve the sale of one currency against the positive exposure to a different currency. Cross currency hedges may be used for hedging purposes or to establish an active exposure to the exchange rate between any two currencies.
The fund may invest its assets in cash, cash equivalent securities or short-term debt securities, repurchase agreements and money market instruments. Under adverse or unstable market, economic or political conditions, the fund may do so without limit. Although the fund would do this only in seeking to avoid losses, the fund may be unable to pursue its investment objective during that time, and it could reduce the benefit from any upswing in the market. To the extent that the fund has any uninvested cash, the fund would also be subject to risk with respect to the depository institution holding the cash.
This fund is non-diversified.
Transamerica Morgan Stanley Growth Opportunities: The fund’s sub-adviser, Morgan Stanley Investment Management Inc. (“MSIM”), under normal circumstances, invests at least 80% of the fund’s assets in common stocks of mid cap companies. MSIM seeks long-term capital growth by investing primarily in established and emerging companies with capitalizations within the range of companies included in the Russell Midcap® Growth Index, which as of December 31, 2010 was between $752 million and $22.1 billion.
MSIM seeks to invest in high quality companies it believes have sustainable competitive advantages and the ability to redeploy capital at high rates of return. MSIM typically favors companies with rising returns on invested capital, above average business visibility, strong free cash flow generation and attractive risk/reward profile. MSIM generally considers selling an investment when it determines the company no longer satisfies its investment criteria.
The fund may also invest in common stocks and other equity securities of small-and large-sized companies, as well as preferred stocks, rights and warrants, and debt securities. The fund may purchase and sell certain derivative instruments, such as options, futures contracts and options on futures contracts, for various portfolio management purposes, including to earn income, facilitate portfolio management and mitigate risks. Derivative instruments used by the fund will be counted toward the 80% policy discussed above to the extent they have economic characteristics similar to the securities included within that policy.
MSIM may invest up to 25% of the fund’s assets in securities of foreign companies, including issuers located in emerging market or developing countries. MSIM considers an issuer to be from a particular country if (i) its principal securities trading market is in that country; (ii) alone or on a consolidated basis it derives 50% or more of its annual revenue from goods produced, sales made or services performed in that country; or (iii) it is organized under the laws of, or has a principal office in that country. By applying these tests, it is possible that a particular company could be deemed to be from more than one country. The securities in which the fund may invest may be denominated by U.S. dollars or in currencies other than U.S. dollars.
The fund may invest in privately placed securities and initial public offerings.
The fund may also invest up to 10% of its assets in real estate investment trusts (“REITs”).
In times of stable or rising stock prices, the fund generally seeks to be fully invested in the instruments described above except that at least a small portion of fund assets generally will be held as cash, repurchase agreements, or cash equivalents to honor redemption requests and for other short-term needs. To the extent that fund assets are invested in cash equivalents, in times of rising market prices, the fund may underperform the market in proportion to the amount of cash equivalents in its portfolio. By purchasing stock index futures contracts, stock index call options, or call options on stock index futures contracts, however, the fund can seek to “equitize” the cash portion of its assets and obtain performance that is equivalent to investing directly in equity securities.
The fund may invest its assets in cash, cash equivalent securities or short-term debt securities, repurchase agreements and money market instruments. Under adverse or unstable market, economic or political conditions, the fund may do so without limit. Although the fund would do this only in seeking to avoid losses, the fund may be unable to pursue its investment objective during that time, and it could reduce the benefit from any upswing in the market. To the extent that the fund has any uninvested cash, the fund would also be subject to risk with respect to the depository institution holding the cash.
Transamerica Morgan Stanley Mid-Cap Growth: The fund’s sub-adviser, Morgan Stanley Investment Management Inc. (“MSIM”), under normal circumstances, invests at least 80% of the fund’s assets in common stocks of mid cap companies. MSIM seeks long-term capital growth by investing primarily in established and emerging companies with capitalizations within the range of companies included in the Russell Midcap® Growth Index, which as of December 31, 2010 was between $752 million and $22.1 billion.
MSIM seeks to invest in high quality companies it believes have sustainable competitive advantages and the ability to redeploy capital at high rates of return. MSIM typically favors companies with rising returns on invested capital, above average business
182
visibility, strong free cash flow generation and attractive risk/reward profile. MSIM generally considers selling an investment when it determines the company no longer satisfies its investment criteria.
The fund may also invest in common stocks and other equity securities of small-and large-sized companies, as well as preferred stocks, rights and warrants, and debt securities. The fund may purchase and sell certain derivative instruments, such as options, futures contracts and options on futures contracts, for various portfolio management purposes, including to earn income, facilitate portfolio management and mitigate risks. Derivative instruments used by the fund will be counted toward the 80% policy discussed above to the extent they have economic characteristics similar to the securities included within that policy.
MSIM may invest up to 25% of the fund’s assets in securities of foreign companies, including issuers located in emerging market or developing countries. MSIM considers an issuer to be from a particular country if (i) its principal securities trading market is in that country; (ii) alone or on a consolidated basis it derives 50% or more of its annual revenue from goods produced, sales made or services performed in that country; or (iii) it is organized under the laws of, or has a principal office in that country. By applying these tests, it is possible that a particular company could be deemed to be from more than one country. The securities in which the fund may invest may be denominated by U.S. dollars or in currencies other than U.S. dollars.
The fund may invest in privately placed securities and initial public offerings.
The fund may also invest up to 10% of its assets in real estate investment trusts (“REITs”).
In times of stable or rising stock prices, the fund generally seeks to be fully invested in the instruments described above except that at least a small portion of fund assets generally will be held as cash, repurchase agreements, or cash equivalents to honor redemption requests and for other short-term needs. To the extent that fund assets are invested in cash equivalents, in times of rising market prices, the fund may underperform the market in proportion to the amount of cash equivalents in its portfolio. By purchasing stock index futures contracts, stock index call options, or call options on stock index futures contracts, however, the fund can seek to “equitize” the cash portion of its assets and obtain performance that is equivalent to investing directly in equity securities.
The fund may invest its assets in cash, cash equivalent securities or short-term debt securities, repurchase agreements and money market instruments. Under adverse or unstable market, economic or political conditions, the fund may do so without limit. Although the fund would do this only in seeking to avoid losses, the fund may be unable to pursue its investment objective during that time, and it could reduce the benefit from any upswing in the market. To the extent that the fund has any uninvested cash, the fund would also be subject to risk with respect to the depository institution holding the cash.
Transamerica Morgan Stanley Small Company Growth: The fund’s sub-adviser, Morgan Stanley Investment Management Inc. (“MSIM”), invests, under normal circumstances, at least 80% of the fund’s net assets in equity securities of small capitalization companies. A company is considered to be a small cap company if it has a total market capitalization at the time of purchase of $4 billion or less. The market capitalization limit is subject to adjustment annually based upon MSIM’s assessment as to the capitalization range of companies which possess the fundamental characteristics of small cap companies.
MSIM seeks long-term capital appreciation by normally investing primarily in growth-oriented equity securities of small U.S. and foreign companies. MSIM selects issues from a universe comprised of small cap companies, most with market capitalizations of generally less than $4 billion.
The sub-adviser invests in companies that it believes exhibit some or all of the following characteristics: (i) superior growth prospects, (ii) rising trend in return on invested capital, and (iii) sustainable competitive advantages.
The fund seeks to invest in high quality companies it believes have sustainable competitive advantages and the ability to redeploy capital at high rates of return. MSIM typically favors companies with rising returns on invested capital, above average business visibility, strong free cash flow generation and attractive risk/reward. MSIM generally considers selling an investment when it determines the company no longer satisfies its investment criteria.
The fund may invest up to 25% of it’s net assets in securities of foreign issuers including emerging market issuers or developing countries. MSIM considers an issuer to be from a particular country if (i) its principal securities trading market is in that country; (ii) alone or on a consolidated basis it drives 50% or more of its annual revenue from goods produced, sales made or services performed in that country; or (iii) it is organized under the laws of, or has a principal office in that country. By applying these tests, it is possible that a particular company could be deemed to be from more than one country. The securities in which the fund may invest may be denominated in U.S. dollars or in currencies other than U.S. dollars.
In anticipation of, or in response to, adverse market conditions or for cash management purposes, the fund may purchase and sell certain derivative instruments, such as options, futures and options on futures. Derivative instruments used by the fund will be counted toward the 80% policy discussed above to the extent they have economic characteristics similar to the securities included within that policy.
183
The fund may invest its assets in cash, cash equivalent securities or short-term debt securities, repurchase agreements and money market instruments. Under adverse or unstable market, economic or political conditions, the fund may do so without limit. Although the fund would do this only in seeking to avoid losses, the fund may be unable to pursue its investment objective during that time, and it could reduce the benefit from any upswing in the market. To the extent that the fund has any uninvested cash, the fund would also be subject to risk with respect to the depository institution holding the cash.
Transamerica Multi-Managed Balanced: The fund’s sub-advisers, BlackRock Financial Management, Inc. (“BlackRock”) and J.P. Morgan Investment Management Inc. (“JPMorgan”), seek to achieve the fund’s objective by investing approximately 60% of its assets in equity securities and 40% of its assets in fixed-income and money market securities (investing at least 25% of its assets in fixed-income senior securities, including debt securities and preferred stocks).
Equity component - JPMorgan seeks to achieve the fund’s objective by investing, under normal circumstances, at least 80% of the equity component’s net assets in equity securities of large- and medium-capitalization U.S. companies. The fund may invest in foreign companies. JPMorgan will normally keep the equity component as fully invested in equity securities as practicable. Industry by industry, the fund’s weightings are generally similar to those of the Standard & Poor’s 500® Index (“S&P 500 Index”). JPMorgan normally does not look to overweight or underweight industries. Holdings by industry sector will normally approximate those of the S&P 500 Index.
Fixed income component - The fixed income component of the fund is normally invested primarily in investment grade debt securities and U.S. government obligations, mortgage-backed securities guaranteed by U.S. government agencies and instrumentalities and mortgage-backed securities without government guarantees. Its dollar-weighted average effective maturity generally is between five and fifteen years (and does not exceed thirty years). The fund may also invest in U.S. Treasury and agency securities, municipal bonds, corporate bonds, asset-backed securities (including collateralized loan obligations, collateralized bond obligations and collateralized debt obligations), high quality, short-term obligations and repurchase agreements, and in securities of foreign issuers. The fund may invest in securities that are denominated in U.S. dollars and in foreign currencies. Up to 20% of the fixed income component may be invested in any or all of non-dollar securities, high yield debt securities and emerging market securities.
The fund may, but is not required to, engage in certain investment strategies involving derivatives, such as options, futures, swaps, and forward currency contracts. These investment strategies may be employed to attempt to alter investment characteristics of the fund’s portfolio.
The fund may invest its assets in cash, cash equivalent securities or short-term debt securities, repurchase agreements and money market instruments. Under adverse or unstable market, economic or political conditions, the fund may do so without limit. Although the fund would do this only in seeking to avoid losses, the fund may be unable to pursue its investment objective during that time, and it could reduce the benefit from any upswing in the market. To the extent that the fund has any uninvested cash, the fund would also be subject to risk with respect to the depository institution holding the cash.
Transamerica Neuberger Berman International: The fund’s sub-adviser, Neuberger Berman Management LLC (“Neuberger”), seeks to achieve the fund’s objective by investing the assets of the fund, under normal circumstances, primarily in common stocks of foreign companies of any size, including companies that are economically tied to developed and emerging industrialized markets. The fund will normally invest in a number of countries throughout the world and expects to be investing in more than three different foreign countries. An issuer generally will be deemed to be economically tied to the country (or countries) in which the issuer has at least 50% of its assets or from which it derives at least 50% of its revenues or profits, or in whose securities markets its securities principally trade.
The fund seeks to reduce risk by diversifying among many industries. Although it has the flexibility to invest a significant portion of its assets in one country or region, it generally intends to remain diversified across countries and geographical regions.
In picking stocks, the fund looks for well-managed and profitable companies that show growth potential and whose stock prices are undervalued. Factors in identifying these firms may include strong fundamentals, such as attractive cash flows and balance sheets, as well as prices that are reasonable in light of projected returns. The fund also considers the outlooks for various countries and regions around the world, examining economic, market, social, and political conditions.
The fund follows a disciplined selling strategy and may sell a stock when it reaches a target price, fails to perform as expected, or when other opportunities appear more attractive.
Neuberger may seek to hedge a currency exposure resulting from securities positions when it finds the currency exposure unattractive. To the extent authorized by laws and regulations, the fund may also engage in borrowing and securities lending transactions and use derivatives.
The fund may invest its assets in cash, cash equivalent securities or short-term debt securities, repurchase agreements and money market instruments. Under adverse or unstable market, economic or political conditions, the fund may do so without
184
limit. Although the fund would do this only in seeking to avoid losses, the fund may be unable to pursue its investment objective during that time, and it could reduce the benefit from any upswing in the market. To the extent that the fund has any uninvested cash, the fund would also be subject to risk with respect to the depository institution holding the cash.
Transamerica Oppenheimer Developing Markets: The fund’s sub-adviser, OppenheimerFunds, Inc. (“Oppenheimer”), seeks to achieve the fund’s objective by investing, under normal circumstances, at least 80% of the fund’s net assets in equity securities of issuers that are economically tied to one or more emerging markets countries. The fund will normally invest in at least three different emerging markets countries.
| • | | The fund can (but is not required to) invest up to 100% of its total assets in foreign securities. |
| • | | The fund will emphasize investments in common stocks and other equity securities. |
| • | | The fund will emphasize investments in growth companies, which can be in any market capitalization range. |
In selecting securities for the fund, Oppenheimer looks primarily for foreign companies in developing markets with high growth potential. It uses fundamental analysis of a company’s financial statements, management structure, operations and product development, and considers the special factors and risks of the country in which the issuer operates. In seeking broad diversification of the fund’s portfolio, Oppenheimer currently seeks:
| • | | Companies of different capitalization ranges with strong market positions and the ability to take advantage of barriers to entry in their industry, such as high start-up costs. |
| • | | Companies with management that has a proven record. |
| • | | Companies with newer or established businesses that are entering into a growth cycle. |
| • | | Companies with strong earnings growth whose stock is selling at a reasonable price. |
In applying these and other selection criteria, the fund will consider the effect of worldwide trends on the growth of various business sectors, and look for companies that may benefit from four main global trends: development of new technologies, corporate restructuring, the growth of mass affluence and demographic changes. This strategy may change over time.
Oppenheimer generally defines “developing markets” as countries outside the U.S. and most of Western Europe, Canada, Japan, Australia and New Zealand that have economies, industries and stock markets that it believes are growing and gaining more stability and offer attractive long-term investment prospects. To determine if an issuer is economically tied to an emerging market, it considers a number of factors, such as where the issuer is organized, the principal trading market for its securities, the sources of its revenues and the location of its assets.
The fund looks for stocks of companies that have growth potential. Growth companies may be companies that are developing new products or services, that have relatively favorable prospects, or that are expanding into new and growing markets. Growth companies include established companies that are entering a growth cycle, they can also include newer companies, whose securities pose greater risks of loss and can result in greater volatility in the fund’s share prices.
To seek its investment objective, the fund can also use the investment techniques and strategies described below:
| • | | Other Equity Securities. While the fund mainly buys common stocks, it can also buy preferred stocks and securities convertible into common stock and can hold rights and warrants. |
| • | | Hedging. The fund can buy and sell futures contracts, put and call options, and forward contracts. Some hedging strategies could hedge the fund’s portfolio against price fluctuations. Other hedging strategies would tend to increase the fund’s exposure to the securities market. Forward contracts could be used to try to manage foreign currency risks on the fund’s foreign investments. |
| • | | Portfolio Turnover. The fund’s investment process may cause the fund to engage in active and frequent trading. Therefore, the fund may engage in short-term trading while trying to achieve its objective. |
| • | | Debt/Fixed-Income Securities. The fund can invest in debt securities, including convertible securities, which can include securities of foreign companies and governments. |
| • | | Illiquid and Restricted Securities. The fund will not invest more than 15% of its net assets in illiquid or restricted securities. |
| • | | Derivatives. The fund can invest in a number of different derivative instruments to hedge investment risks or to seek increased returns. |
The fund may also invest in small, unseasoned companies, special situations and temporary defensive and interim investments.
185
The allocation of the fund’s portfolio among different investments will vary over time based upon an evaluation of economic and market trends. The fund’s portfolio might not always include all of the different types of investments described in this prospectus.
The fund may invest its assets in cash, cash equivalent securities or short-term debt securities, repurchase agreements and money market instruments. Under adverse or unstable market, economic or political conditions, the fund may do so without limit. Although the fund would do this only in seeking to avoid losses, the fund may be unable to pursue its investment objective during that time, and it could reduce the benefit from any upswing in the market. To the extent that the fund has any uninvested cash, the fund would also be subject to risk with respect to the depository institution holding the cash.
Transamerica Oppenheimer Small- & Mid-Cap Value: The fund’s sub-adviser, OppenheimerFunds, Inc. (“Oppenheimer”) seeks to achieve the fund’s objective by investing, under normal circumstances, at least 80% of the fund’s net assets in equity securities of small-cap and mid-cap domestic and foreign issuers. The fund focuses on stocks of U.S. issuers having a market capitalization up to $13 billion. The fund considers small cap stocks to be stocks of issuers having a market capitalization under $3 billion and mid cap stocks to be stocks of issuers having a market capitalization between $3 billion and $13 billion. The fund has no fixed ratio for small cap and mid cap stocks in its portfolio, and while its focus is on stocks of U.S. companies, it may invest in stocks of small and mid cap foreign issuers as well. The fund emphasizes investment in equity securities of companies that Oppenheimer believes are undervalued in the marketplace.
In selecting securities for purchase or sale by the fund, Oppenheimer uses a “value” approach to investing. The fund’s portfolio manager searches for securities of companies believed to be undervalued in the marketplace, in relation to factors such as a company’s book value, sales, earnings, growth potential and cash flows. The portfolio manager selects securities one at a time, looking primarily at individual companies against the context of broad market factors. This is called a “bottom up” approach, and the portfolio manager uses fundamental company analysis to focus on particular companies before considering industry trends. The portfolio manager considers the following factors in assessing a company’s prospects: favorable supply/demand conditions for key products; development of new products or businesses; quality of management; competitive position in the marketplace; and allocation of capital.
The fund may also invest in preferred stocks and securities convertible into common stocks. Although they are debt securities, the sub-adviser considers some convertible securities to be “equity equivalents” because of the conversion feature, and their credit rating has less impact on the investment decision than in the case of other debt securities. Nevertheless, convertible securities are subject to both credit risk and interest rate risk. To the extent that the fund buys convertible securities (or other debt securities), it will focus primarily on investment grade securities, which pose less credit risk than other lower-grade securities.
At times, the fund may increase the relative emphasis of its investments in a particular industry or industrial sector and it will then be subject to industry focus risk. To some extent, this risk is limited by the fund’s policy of not concentrating its assets in investments in any one industry.
To seek its investment objective, the fund can buy and sell futures contracts, put and call options, forward contracts and other derivatives. Some derivatives strategies could hedge the fund’s portfolio against price fluctuations. Other strategies would tend to increase the fund’s exposure to the securities market. Forward contracts could be used to try to manage foreign currency risks on the fund’s foreign investments.
The fund may also invest in unseasoned companies and illiquid, restricted securities. The fund may have a high portfolio turnover rate.
The fund may invest its assets in cash, cash equivalent securities or short-term debt securities, repurchase agreements and money market instruments. Under adverse or unstable market, economic or political conditions, the fund may do so without limit. Although the fund would do this only in seeking to avoid losses, the fund may be unable to pursue its investment objective during that time, and it could reduce the benefit from any upswing in the market. To the extent that the fund has any uninvested cash, the fund would also be subject to risk with respect to the depository institution holding the cash.
Transamerica PIMCO Real Return TIPS: The fund’s sub adviser, Pacific Investment Management Company LLC (“PIMCO”), seeks to achieve the fund’s objective by investing, under normal circumstances, at least 80% of the fund’s net assets in Treasury Inflation Indexed Securities (also referred to as Treasury Inflation Protected Securities or “TIPS”) of varying maturities.
Inflation protected indexed bonds are fixed-income securities that are structured to provide protection against inflation. The value of the bond’s principal or the interest income paid on the bond is adjusted to track changes in an official inflation measure. The U.S. Treasury uses the Consumer Price Index for Urban Consumers (“CPIU”) as the inflation measure. “Real return” equals total return less the estimated cost of inflation, which is typically measured by the change in an official inflation measure. The average portfolio duration of this fund normally varies within three years (plus or minus) of the duration of the
186
Barclays Capital U.S. TIPS Index, which as of December 31, 2010 was 3.96 years. Additional inflation protected investments may include inflation indexed bonds issued by agencies of the U.S. government, government sponsored enterprises, non U.S. governments, U.S. corporations and foreign companies.
Other investments may include mortgage-related securities, including stripped mortgage-related securities; and other fixed-income securities, including corporate bonds and notes, asset backed securities, money market instruments; and derivative instruments and forward commitments relating to the above securities.
PIMCO invests the fund’s assets primarily in investment grade debt securities, but may invest up to 10% of the assets in high yield securities (“junk bonds”) rated B or higher by Moody’s, Fitch, or S&P or, if unrated, determined by PIMCO to be of comparable quality. PIMCO may invest up to 30% of its assets in securities denominated in foreign currencies, and may invest beyond this limit in U.S. dollar denominated securities of foreign issuers. The fund may invest up to 15% of its total assets in securities and instruments that are economically tied to emerging markets countries. Foreign currency exposure (from non-U.S. dollar-denominated securities or currencies) normally will be limited to 20% of the fund’s total assets. The fund may also invest up to 10% of its total assets in preferred stocks.
The fund may invest , without limitation, in derivative instruments, such as options, futures contracts or swaps, subject to applicable law and any other restrictions described in the fund’s prospectus or SAI. The fund may lend its portfolio securities to brokers, dealers and other financial institutions to earn income. The fund may, without limitation, seek to obtain market exposure to the securities in which it primarily invests by entering into a series of purchase and sale contracts or by using other investment techniques (such as buy backs or dollar rolls).
The fund may invest its assets in cash, cash equivalent securities or short-term debt securities, repurchase agreements and money market instruments. Under adverse or unstable market, economic or political conditions, the fund may do so without limit. Although the fund would do this only in seeking to avoid losses, the fund may be unable to pursue its investment objective during that time, and it could reduce the benefit from any upswing in the market. To the extent that the fund has any uninvested cash, the fund would also be subject to risk with respect to the depository institution holding the cash.
Transamerica PIMCO Total Return: The fund’s sub-adviser, Pacific Investment Management Company LLC (“PIMCO”), seeks to achieve the fund’s objective by investing, under normal circumstances, at least 65% of the fund’s net assets in fixed-income securities of varying maturities.
The average duration of this fund normally varies within two years (plus or minus) of the duration of the Barclays Capital U.S. Aggregate Index, which as of December 31, 2010, was 4.98 years.
PIMCO invests the fund’s assets primarily in investment grade debt securities, but may invest up to 10% of the total assets in high yield securities (“junk bonds”) rated B or higher by Moody’s, Fitch, or S&P or, if unrated, determined by PIMCO to be of comparable quality. PIMCO may invest up to 30% of the fund’s total assets in securities denominated in foreign currencies, and may invest beyond this limit in U.S. dollar-denominated securities of foreign issuers. The fund may invest up to 15% of its total assets in securities and instruments that are economically tied to emerging markets countries. Foreign currency exposure (from non-U.S. dollar-denominated securities or currencies) normally will be limited to 20% of the fund’s total assets. The fund may also invest up to 10% of its total assets in preferred stocks.
The fund may invest all of its assets in derivative instruments, such as options, futures contracts or swap agreements, or in mortgage-or asset-backed securities. The fund may lend its portfolio securities to brokers, dealers and other financial institutions to earn income. The fund may engage in short sales. The fund may, without limitation, seek to obtain market exposure to the securities in which it primarily invests by entering into a series of purchase and sale contracts or by using other investment techniques (such as buy backs or dollar rolls). The “total return” sought by the fund consists of income earned on the fund’s investments, plus capital appreciation, if any, which generally arises from decreases in interest rates or improving credit fundamentals for a particular sector or security.
The fund may invest its assets in cash, cash equivalent securities or short-term debt securities, repurchase agreements and money market instruments. Under adverse or unstable market, economic or political conditions, the fund may do so without limit. Although the fund would do this only in seeking to avoid losses, the fund may be unable to pursue its investment objective during that time, and it could reduce the benefit from any upswing in the market. To the extent that the fund has any uninvested cash, the fund would also be subject to risk with respect to the depository institution holding the cash.
Transamerica Schroders International Small Cap: Schroder Investment Management North America Inc. (“Schroders”), sub-adviser to the fund, invests, under normal circumstances, at least 80% of the fund’s net assets, plus any borrowings for investment purposes, in small-capitalization companies (generally those with market capitalizations, based on the number of shares readily available in the market, of $4 billion or less at the time of investment) that it believes offer the potential for capital appreciation. The fund invests primarily in the equity securities of small-cap companies located outside the United States.
187
Schroders employs a fundamental investment approach that considers macroeconomic factors while focusing primarily on company-specific factors. These company-specific factors include the company’s potential for long-term growth, financial condition, quality of management, and sensitivity to cyclical factors, as well as the relative value of the company’s securities compared with those of other companies and the market as a whole. In selecting investments for the fund, Schroders considers, among other things, whether a company is likely to have above-average earnings growth, whether its securities are attractively valued, and whether the company has any proprietary advantages. Schroders generally sells a security when its market price approaches the sub-adviser’s estimate of fair value or when the sub-adviser identifies a significantly more attractive investment candidate.
The fund generally emphasizes developed markets in Europe and the Pacific, with a limited allocation to emerging markets. Stocks of emerging-markets countries can be substantially more volatile and substantially less liquid than those of both U.S. and more developed foreign markets.
The fund invests in companies that are smaller and less well-known than larger, more widely held companies. Small companies tend to be more vulnerable to adverse developments than larger companies. Small companies may have limited product lines, markets, or financial resources, or they may depend on a limited management group. Their securities may trade infrequently and in limited volumes. As a result, the prices of these securities may fluctuate more than the prices of securities of larger, more widely traded companies. Also, there may be less publicly available information about small companies or less market interest in their securities as compared with larger companies, and it may take longer for the prices of these securities to reflect the full value of their issuers’ earnings potential or assets.
It is important to note that market capitalization ranges change over time, and interpretations of size vary. Therefore, there is no standard definition of “small-cap” and definitions may change over time.
Besides investing in stocks of foreign companies, the fund may make other kinds of investments to achieve its objective.
The fund may invest in preferred stocks and closed-end investment companies that invest primarily in foreign securities. The fund may also invest in convertible securities and warrants.
The fund may invest, to a limited extent, in derivatives. Investments in derivatives may subject the fund to risks different from, and possibly greater than, those of the underlying securities, assets, or market indexes. The fund does not intend to use derivatives for speculation or for the purpose of leveraging, or magnifying, investment returns.
The fund may enter into forward foreign currency exchange contracts, which are a type of derivative contracts.
The fund may invest its assets in cash, cash equivalent securities or short-term debt securities, repurchase agreements and money market instruments. Under adverse or unstable market, economic or political conditions, the fund may do so without limit. Although the fund would do this only in seeking to avoid losses, the fund may be unable to pursue its investment objective during that time, and it could reduce the benefit from any upswing in the market. To the extent that the fund has any uninvested cash, the fund would also be subject to risk with respect to the depository institution holding the cash.
Transamerica Systematic Small/Mid Cap Value: The fund’s sub-adviser, Systematic Financial Management L.P. (“Systematic”), seeks to achieve the fund’s objective by investing, under normal circumstances, at least 80% of the fund’s net assets in small- and mid-cap equity securities (U.S. Equity securities, ADRs and foreign securities trading on U.S. markets). The fund defines small- and mid-cap equities as companies whose market capitalization falls within the range of $100 million to $20 billion or within the range of the Russell 2500® Index, whichever is broader at the time of purchase.
The fund generally will invest in small- and mid-cap equities with valuation characteristics including low price/earnings and price/cash flow ratios. Systematic’s security selection process generally favors companies with positive earnings dynamics, manageable debt levels and good cash flows. Trends in balance sheet items including inventories, accounts receivable, and payables are scrutinized as well. Systematic also reviews the company’s products/services, market position, industry condition, financial and accounting policies and quality of management. Securities of issuers that possess the greatest combination of the aforementioned attributes are then prioritized as candidates for purchase.
The fund may invest up to 10% of its total assets in the securities of foreign issuers, including ADRs and foreign securities trading on U.S. markets.
Systematic employs a fully invested strategy. Therefore, under normal market conditions, cash and cash equivalents are generally less than 5% of the portfolio value.
The fund may invest its assets in cash, cash equivalent securities or short-term debt securities, repurchase agreements and money market instruments. Under adverse or unstable market, economic or political conditions, the fund may do so without limit. Although the fund would do this only in seeking to avoid losses, the fund may be unable to pursue its investment objective during that time, and it could reduce the benefit from any upswing in the market. To the extent that the fund has any uninvested cash, the fund would also be subject to risk with respect to the depository institution holding the cash.
188
Transamerica Third Avenue Value: The fund’s sub-adviser, Third Avenue Management LLC (“Third Avenue”), seeks to achieve the fund’s investment objective by investing, under normal circumstances, at least 80% of the fund’s assets in common stocks of U.S. and non-U.S. issuers.
Third Avenue employs an opportunistic, “bottom-up” research process to identify companies that it believes to have strong balance sheets, competent managements, and understandable businesses, where equity securities are priced at a discount to its estimate of intrinsic value.
The fund invests in companies regardless of market capitalization. The mix of investments at any time will depend on the industries and types of securities believed to represent the best values, consistent with the fund’s investment strategies and restrictions.
Third Avenue seeks to invest the fund’s assets in attractive equity investments, which generally exhibit four essential characteristics:
| • | | Strong Finances — the issuing company has a strong financial position, as evidenced by high-quality assets and a relative absence of significant liabilities. |
| • | | Competent Management — the company’s management has a good track record as both owners and operators, and shares a common interest with outside, passive minority shareholders. |
| • | | Understandable Business — comprehensive and meaningful financial and related information is available, providing reliable benchmarks to aid in understanding the company, its value and its dynamics. |
| • | | Discount to Private Market Value — the market price lies substantially below a conservative valuation of the business as a private entity, or as a takeover candidate. |
The fund may invest up to 15% of its assets in high-yield/high-risk fixed-income securities and other types of debt securities.
The fund may invest its assets in cash, cash equivalent securities or short-term debt securities, repurchase agreements and money market instruments. Under adverse or unstable market, economic or political conditions, the fund may do so without limit. Although the fund would do this only in seeking to avoid losses, the fund may be unable to pursue its investment objective during that time, and it could reduce the benefit from any upswing in the market. To the extent that the fund has any uninvested cash, the fund would also be subject to risk with respect to the depository institution holding the cash.
The fund is a non-diversified fund.
Transamerica Thornburg International Value: The fund invests, under normal market circumstances, at least 75% of its assets in foreign securities or depository receipts of foreign securities of issuers that are located in a number of countries throughout the world. Foreign securities are issued by companies that conduct their principal business activities outside the United States, are organized under the laws of or maintain their principal place of business outside the United States, or whose securities are traded principally on exchanges outside the United States. The fund may invest in emerging markets.
The fund’s sub-adviser, Thornburg Investment Management, Inc. (“Thornburg”), intends to invest on an opportunistic basis, where it believes there is intrinsic value. The fund’s principal focus will be on traditional or basic value stocks. However, the fund’s portfolio may include stocks that Thornburg believes provide value in a broader or different context. The relative proportions of these different types of securities will vary over time. The fund ordinarily invests in stocks that may be depressed or reflect unfavorable market perceptions of company or industry fundamentals. The fund may invest in companies of any size, but invests primarily in the large and middle range of public company market capitalizations (i.e., companies with market capitalizations of $2 billion or more at the time of purchase). The fund may also invest in partnership interests.
Thornburg primarily uses individual issuer and industry analysis to make investment decisions. Value, for purposes of the fund’s selection criteria, relates both to current and to projected measures. Among the specific factors considered by Thornburg in identifying undervalued securities for inclusion in the fund are:
| • | | security and consistency of revenue stream |
189
| • | | relative earnings growth potential |
| • | | industry growth potential |
| • | | dividend growth potential |
| • | | potential for favorable developments |
The fund typically makes equity investments in the following three types of companies:
| • | | Basic Value companies which, in Thornburg’s opinion, are financially sound companies with well established businesses whose stock is selling at low valuations relative to the companies’ net assets or potential earning power. These stocks may include energy and commodity companies. |
| • | | Consistent Earner companies with steady earnings and dividend growth that are selling at attractive value and are priced below historical norms. Stocks in the category sometimes sell at premium valuations and sometimes at discount valuations. These stocks may include blue chip companies. |
| • | | Emerging Franchises are value-priced companies that, in Thornburg’s opinion, are in the process of establishing a leading position in a product, service or market and which Thornburg expects will grow, or continue to grow, at an above-average rate. Under normal conditions, the proportion of the fund invested in companies of this type will be less than the proportions of the fund invested in Basic Value or Consistent Earner companies as described above. These stocks may include cellular technologies in emerging markets. |
The fund may use forward currency contracts to hedge against a decline in the value of existing investments denominated in foreign currency. The fund may conduct foreign currency transactions on a spot basis or by entering into forward contracts to purchase or sell foreign currencies at a future date and price. The fund may also invest in other types of derivative instruments.
Debt obligations will be considered for investment when Thornburg believes them to be more attractive than equity alternatives. The fund may purchase debt obligations of any maturity and of any quality.
The fund may invest its assets in cash, cash equivalent securities or short-term debt securities, repurchase agreements and money market instruments. Under adverse or unstable market, economic or political conditions, the fund may do so without limit. Although the fund would do this only in seeking to avoid losses, the fund may be unable to pursue its investment objective during that time, and it could reduce the benefit from any upswing in the market. To the extent that the fund has any uninvested cash, the fund would also be subject to risk with respect to the depository institution holding the cash.
Transamerica TS&W International Equity: Under normal circumstances, the fund seeks to achieve its investment objective by investing at least 80% of its net assets in equity securities of foreign companies representing at least three countries other than the United States. Thompson, Siegel & Walmsley LLC (“TS&W”), the fund’s sub-adviser, currently anticipates investing in at least 12 countries other than the United States. TS&W will emphasize established companies in individual foreign markets and will attempt to stress companies and markets that it believes are undervalued. The fund expects capital growth to be the predominant component of its total return.
Generally, the fund will invest primarily in common stocks of established companies listed on foreign securities exchanges, but it may also invest in securities traded over-the-counter. Although the fund will emphasize larger, more seasoned or established companies, it may invest in companies of varying size as measured by assets, sales or market capitalization. The fund will invest primarily in securities of companies domiciled in developed countries, but may also invest in developing countries. The fund may invest up to 10% of its assets in securities of companies in developing countries. It is expected that investments will be diversified throughout the world and within markets in an effort to minimize specific country and currency risks.
TS&W employs a relative value process utilizing a combination of quantitative and qualitative methods based on a four-factor valuation screen designed to outperform the Morgan Stanley Capital International EAFE Index. The initial universe consists of approximately 3,000 actively traded non-U.S. stocks. Parts one and two of the screen attempt to assess a company’s attractiveness based on cash flows relative to other international stocks and as compared to their industry or sector peers. The third factor considers the relative earnings prospects of the company. The fourth factor involves looking at the company’s recent price action. From the model, approximately 300 stocks are identified for further research. These are the stocks that rank the highest on the basis of these four factors combined. TS&W generally limits its investment universe to those companies with a minimum of three years of operating history.
190
TS&W’s analysts also perform rigorous fundamental analysis, exploring numerous factors that may affect the outlook for a company. They evaluate publicly available information including sell-side research, company filings, and trade periodicals. The analysts may speak with company management to hear their perspectives and outlook on pertinent business issues. They apply a consistent and disciplined review in a team environment that encourages critical thinking and analysis for each company considered for investment. A portfolio composed of 80-100 stocks is selected as a result of this process.
Established positions in the fund are ranked daily and are reviewed regularly in the same manner to re-examine their fundamental and valuation characteristics. The product team meets periodically to discuss each stock’s place in the fund. TS&W employs a consistent sell discipline which includes a significant negative earnings revision, a stock being sold when the catalyst is no longer valid or another stock presents a more attractive opportunity.
TS&W may use derivatives for a variety of purposes, including to earn income and enhance returns, to increase or decrease exposure to a particular market, to manage or adjust the risk profile of the fund, or as alternatives to direct investments.
The fund may invest its assets in cash, cash equivalent securities or short-term debt securities, repurchase agreements and money market instruments. Under adverse or unstable market, economic or political conditions, the fund may do so without limit. Although the fund would do this only in seeking to avoid losses, the fund may be unable to pursue its investment objective during that time, and it could reduce the benefit from any upswing in the market. To the extent that the fund has any uninvested cash, the fund would also be subject to risk with respect to the depository institution holding the cash.
Transamerica UBS Large Cap Value: The fund’s sub-adviser, UBS Global Asset Management (Americas) Inc. (“UBS”), seeks to achieve the fund’s objective by investing, under normal circumstances, at least 80% of the fund’s net assets in equity securities of U.S. large capitalization companies. UBS defines large capitalization companies as those with a market capitalization of at least $3 billion. The fund may invest up to 20% of its net assets in companies that have market capitalizations within the range of the fund’s benchmark, the Russell 1000® Value Index, but below $3 billion in market capitalization. Investments in equity securities may include, among others, dividend-paying securities, common stock, preferred stock, shares of investment companies, convertible securities, warrants and rights.
In selecting securities, the sub-adviser focuses on, among other things, identifying discrepancies between a security’s fundamental value and its market price. In this context, the fundamental value of a given security is the sub-adviser’s assessment of what a security is worth. The fund will select a security whose fundamental value it estimates to be greater than its market value at any given time. For each stock under analysis, the sub-adviser bases its estimates of value upon economic, industry and company analysis, as well as upon a company’s management team, competitive advantage and core competencies. The sub-adviser then compares its assessment of a security’s value against the prevailing market prices with the aim of constructing a portfolio of stocks with attractive relative price/value characteristics.
The fund may, but is not required to, use derivative instruments for risk management purposes or as part of the fund’s investment strategies. Generally, derivatives are financial contracts whose value depends upon, or is derived from, the value of an underlying asset, reference rate, or index, and may relate to stocks, bonds, interest rates, currencies or currency exchange rates, and related indexes. Examples of derivatives include options and futures. The fund may use derivatives to earn income and enhance returns, to manage or adjust the risk profile of the fund, to replace more traditional direct investments, or to obtain exposure to certain markets.
The fund may invest its assets in cash, cash equivalent securities or short-term debt securities, repurchase agreements and money market instruments. Under adverse or unstable market, economic or political conditions, the fund may do so without limit. Although the fund would do this only in seeking to avoid losses, the fund may be unable to pursue its investment objective during that time, and it could reduce the benefit from any upswing in the market. To the extent that the fund has any uninvested cash, the fund would also be subject to risk with respect to the depository institution holding the cash.
Transamerica WMC Diversified Equity: The fund invests, under normal circumstances, at least 80% of its net assets in domestic equity securities. The fund invests primarily in common stocks of growth-oriented companies. Each stock is evaluated and ranked on a consistent set of growth, valuation, and quality criteria and the fund will seek diversified sources of return from these criteria.
The fund’s sub-adviser, Wellington Management Company, LLP (“Wellington Management”), uses what is sometimes referred to as a “bottom up” approach, which is the use of fundamental analysis to identify specific securities within industries or sectors for purchase or sale. Fundamental analysis involves the assessment of a company’s business environment, market share, management, global expansion plans, balance sheet, income statement, anticipated earnings, revenues, and other related measures of value.
Wellington Management continually monitors every company in the fund’s portfolio for fundamental attractiveness. The fund typically sells an investment when the investment achieves its anticipated potential, the company begins to show deteriorating relative fundamentals or alternative investments become sufficiently more attractive.
191
Consistent with the fund’s objective and other policies, the fund may invest to a lesser extent in derivatives, including futures, forwards, options and swaps. The fund may invest up to 20% of its total assets in foreign securities (not including American Depositary Receipts, American Depositary Shares or U.S. dollar denominated securities of foreign issuers).
The fund may invest its assets in cash, cash equivalent securities or short-term debt securities, repurchase agreements and money market instruments. Under adverse or unstable market, economic or political conditions, the fund may do so without limit. Although the fund would do this only in seeking to avoid losses, the fund may be unable to pursue its investment objective during that time, and it could reduce the benefit from any upswing in the market. To the extent that the fund has any uninvested cash, the fund would also be subject to risk with respect to the depository institution holding the cash.
Transamerica WMC Diversified Growth: The fund invests, under normal circumstances, at least 80% of its net assets in domestic common stocks. The fund invests primarily in common stocks of growth-oriented companies. Each stock is evaluated and ranked on a consistent set of growth, valuation, and quality criteria and the fund will seek diversified sources of return from these criteria.
The fund’s sub-adviser, Wellington Management Company, LLP (“Wellington Management”), uses what is sometimes referred to as a “bottom up” approach, which is the use of fundamental analysis to identify specific securities within industries or sectors for purchase or sale. A “bottom-up” approach is looking at individual companies against the context of broader market factors. Fundamental analysis involves the assessment of a company’s business environment, market share, management, global expansion plans, balance sheet, income statement, anticipated earnings, revenues, and other related measures of value.
Wellington Management continually monitors every company in the fund’s portfolio for fundamental attractiveness. The fund typically sells an investment when the investment achieves its anticipated potential, the company begins to show deteriorating relative fundamentals or alternative investments become sufficiently more attractive.
Consistent with the fund’s objective and other policies, the fund may invest to a lesser extent in derivatives, including futures, forwards, options and swaps. The fund may invest up to 20% of its total assets in foreign securities (not including American Depositary Receipts, American Depositary Shares or U.S. dollar denominated securities of foreign issuers).
The fund may invest its assets in cash, cash equivalent securities or short-term debt securities, repurchase agreements and money market instruments. Under adverse or unstable market, economic or political conditions, the fund may do so without limit. Although the fund would do this only in seeking to avoid losses, the fund may be unable to pursue its investment objective during that time, and it could reduce the benefit from any upswing in the market. To the extent that the fund has any uninvested cash, the fund would also be subject to risk with respect to the depository institution holding the cash.
Transamerica WMC Emerging Markets: The fund’s sub-adviser, Wellington Management Company, LLP (“Wellington Management”), seeks to achieve the fund’s objective by investing, under normal circumstances, at least 80% of the fund’s net assets in equity securities of companies that conduct their principal business activities in emerging markets, are organized under the laws of or maintain their principal place of business in emerging markets, or whose securities are traded principally on exchanges in emerging markets. The sub-adviser considers emerging markets to be markets with rapidly growing economies. Examples of emerging markets include China, India, Pakistan, Mexico, Brazil, Chile, much of Southeast Asia, countries in Eastern Europe, the Middle East, parts of Africa and Latin America. Wellington Management also seeks to earn returns in excess of the MSCI Emerging Markets Equity Index.
The fund will focus its investments in those emerging markets in which the portfolio manager believes the economies are developing strongly and markets are becoming more liquid, or other emerging markets that meet the portfolio manager’s criteria for investment. The fund seeks to benefit from policies of economic development being adopted in many emerging markets. These policies include domestic price reform, reducing internal budget deficits, privatization, encouraging foreign investments, and developing capital markets.
The fund employs an integrated approach to investing. This means that the portfolio manager combines country, sector, and stock level analysis into the decision making process.
In selecting individual securities, the sub-adviser looks to identify companies that it believes display one or more of the following characteristics:
| • | | Operate in growing markets |
| • | | Attractive valuations relative to cash earnings forecasts or other valuation criteria |
| • | | Unique sustainable competitive advantages (e.g., market share, proprietary products) |
| • | | Improving industry or country fundamentals |
Factors considered in the top down analysis include:
| • | | Relative economic growth potential of the various economies and securities markets |
192
| • | | Political, financial, and social conditions influencing investment opportunities |
| • | | Relative rates of earnings growth |
| • | | Interest rate outlook and expected levels of inflation |
| • | | Market prices relative to historic averages |
The fund generally sells a stock if the portfolio manager believes its target price has been reached, its earnings are disappointing, its revenue growth has slowed, its underlying fundamentals have deteriorated, or if there are deteriorating industry or country fundamentals. The fund may also sell or trim a stock if the portfolio manager believes, from a risk control perspective, the stock’s position size is too large for the fund’s portfolio. Also, stocks may be sold when negative country, currency, or general industry factors affect a company’s outlook, or to meet cash requirements.
The fund may invest in all types of securities, many of which will be denominated in currencies other than the U.S. dollar. The securities may be listed on a U.S. or foreign stock exchange or traded in U.S. or foreign over-the-counter markets. The fund normally concentrates its investments in common stocks; however, it may invest in other types of equity securities, including securities convertible into or exchangeable for common stock, depositary receipts, and rights and warrants to purchase common stock. The fund also may invest up to 20% of its assets in preferred stock and investment-grade or comparable quality debt securities.
The fund may invest in initial public offerings (“IPOs”), which are subject to specific risks, including high volatility, no track record, illiquid securities and less predictable earnings.
The fund may invest up to 15% of its net assets in illiquid securities (i.e., securities that cannot be readily sold), and may from time to time enter into forward foreign currency exchange contracts in an attempt to manage the risk of adverse changes in currencies. The fund may also purchase put options in an attempt to hedge against a decline in the price of securities it holds in its portfolio. A put option gives the fund the right to sell an underlying security at a particular price during a fixed period of time. Forward foreign currency exchange contracts and put options on securities may not be available to the fund on reasonable terms in many situations, and the fund may frequently choose not to enter into such contracts or purchase such options even when they are available. The fund may also invest in other types of derivatives.
The fund may invest its assets in cash, cash equivalent securities or short-term debt securities, repurchase agreements and money market instruments. Under adverse or unstable market, economic or political conditions, the fund may do so without limit. Although the fund would do this only in seeking to avoid losses, the fund may be unable to pursue its investment objective during that time, and it could reduce the benefit from any upswing in the market. To the extent that the fund has any uninvested cash, the fund would also be subject to risk with respect to the depository institution holding the cash.
Transamerica WMC Quality Value: The fund’s sub-adviser, Wellington Management Company, LLP (“Wellington Management”), invests the fund’s assets, under normal circumstances, primarily in common stock and depositary receipts. Generally, less than 5% of fund assets will be invested in cash and cash equivalents subject to a maximum of 10% of fund assets. The fund will normally invest at least 90% of its assets in U.S. securities. Generally, the fund invests primarily in companies with market capitalizations greater than $10 billion, but may invest in companies with capitalizations between $2 and $10 billion at the time of purchase. The fund will generally hold 65 to 85 stocks. The largest weightings are given to companies Wellington Management believes have the most upside return potential relative to downside risk.
Wellington Management employs a bottom-up stock selection process that utilizes Wellington Management’s proprietary, fundamental research in an effort to identify undervalued stocks that have the potential for significant longer-term rewards. The fund’s investment philosophy is based on the premise that high-quality companies in out-of-favor industries can generate strong returns on invested capital. Over the long term, these companies may drive strong performance with lower downside risk than the overall market. Wellington Management believes that capital will typically leave out-of-favor industries. Over time, high-quality companies in out-of-favor industries can increase their market share at the expense of their weaker competitors and consolidate their industry. This may enable such companies to generate above-average return on capital and earnings growth with much less variability than other areas of the market. Since these companies are in out-of-favor industries, the market share leaders typically can be purchased at a discount to the market.
The investment process begins with an evaluation of capital spending relative to sales growth in the different industries in the market. Wellington Management’s approach focuses on those industries where capital spending in the industry is below the growth rate in sales. The approach then intensively evaluates all the large cap companies (greater than $2 billion in market capitalization) in the industry. Wellington Management focuses on the industry market share leaders and consolidators. From a financial perspective, the approach seeks to identify companies with a below-average debt/capital ratio relative to their industry, higher-than-average and improving return on capital, and market share leadership and trends. From a qualitative perspective, the approach emphasizes the strength and depth of management and a strong sustainable advantage in the form of a cost, customer, or competitive advantage. All companies that meet Wellington Management’s valuation criteria (including, but not
193
limited to, dividend yield and the potential for dividend increases, price/earnings ratio, price/sales ratio, book value, free cash flow, return on invested capital, and potential for improving return on invested capital) are ranked on a similar basis. In order to evaluate each company, all stocks are rated on the basis of upside return potential relative to downside risk over a 12- to 24- month period based on the fundamental and qualitative analysis of each company. Stocks are purchased when the upside return potential is estimated to be at least twice the downside risk. Stocks are generally sold when the upside return potential is estimated to be less than the downside risk.
The fund may invest up to 10% of its assets in non-U.S. securities.
The fund may invest its assets in cash, cash equivalent securities or short-term debt securities, repurchase agreements and money market instruments. Under adverse or unstable market, economic or political conditions, the fund may do so without limit. Although the fund would do this only in seeking to avoid losses, the fund may be unable to pursue its investment objective during that time, and it could reduce the benefit from any upswing in the market. To the extent that the fund has any uninvested cash, the fund would also be subject to risk with respect to the depository institution holding the cash.
194
|
| MORE ON RISKS OF INVESTING IN THE FUNDS |
Principal Investment Risks: The following provides additional information regarding the risks of investing in the funds as described at the front of the prospectus.
Absence of Regulation: Certain funds may engage in over-the-counter (“OTC”) transactions. In general, there is less governmental regulation and supervision of transactions in the OTC markets than of transactions entered into on organized exchanges.
Active Trading: Certain funds are actively managed and, under appropriate circumstances, may purchase and sell securities without regard to the length of time held. A high portfolio turnover rate may have a negative impact on performance by increasing transaction costs and may generate greater tax liabilities for shareholders holding shares in taxable accounts.
Bank Obligations: If a fund concentrates in U.S. bank obligations, a fund will be particularly sensitive to adverse events affecting U.S. banks. Banks are sensitive to changes in money market and general economic conditions, as well as decisions by regulators that can affect banks’ profitability.
Cash Management and Defensive Investing: Money market instruments or short-term debt securities held by the fund for cash management or defensive investing purposes can fluctuate in value. Like other fixed income securities, they are subject to risk, including market, interest rate and credit risk. If the fund holds cash uninvested, the fund will not earn income on the cash and the fund’s yield will go down. If a significant amount of the fund’s assets are used for cash management or defensive investing purposes, it will be more difficult for the fund to achieve its objective.
Commodities: Because a fund may invest in instruments whose performance is linked to the price of an underlying commodity or commodity index, a fund may be subject to the risks of investing in physical commodities. These types of risks include regulatory, economic and political developments, weather events and natural disasters, pestilence, market disruptions and the fact that commodity prices may have greater volatility than investments in traditional securities.
Convertible Securities: Convertible securities may include corporate notes or preferred stock, but ordinarily are a long-term debt obligation of the issuer convertible at a stated exchange rate into common stock of the issuer. As with most debt securities, the market value of convertible securities tends to decline as interest rates increase and, conversely, to increase as interest rates decline. Convertible securities generally offer lower interest or dividend yields than non-convertible securities of similar quality. However, when the market price of the common stock underlying a convertible security exceeds the conversion price, the price of the convertible security tends to reflect the value of the underlying common stock.
Counterparty: The fund will be subject to the credit risk (that is, where changes in an issuer’s financial strength or the credit rating of a financial instrument it issues may affect an instrument’s value) with respect to the amount it expects to receive from counterparties to derivatives and repurchase agreements entered into by the fund or held by special purpose or structured vehicles. If a counterparty becomes bankrupt or otherwise fails to perform its obligations due to financial difficulties, the value of your investment in the fund may decline.
Country/Regional: Local events, such as political upheaval, financial troubles, or natural disasters may weaken a country’s or a region’s securities markets. Because a fund may invest a large portion of its assets in securities of companies located in any one country or region, its performance may be hurt disproportionately by the poor performance of its investments in that area. Country/regional risk is especially high in emerging markets.
Country, Sector or Industry Focus: To the extent a fund invests a significant portion of its assets in one or more countries, sectors or industries at any time, the fund will face a greater risk of loss due to factors affecting the single country, sector or industry than if a fund always maintained wide diversity among the countries, sectors and industries in which it invests. For example, technology companies involve risks due to factors such as the rapid pace of product change, technological developments and new competition. Their stocks historically have been volatile in price, especially over the short term, often without regard to the merits of individual companies. Banks and financial institutions are subject to potentially restrictive governmental controls and regulations that may limit or adversely affect profitability and share price. In addition, securities in that sector may be very sensitive to interest rate changes throughout the world.
CPIU Measurement: The CPIU is a measurement of changes in the cost of living, made up of components such as housing, food, transportation and energy. There can be no assurance that the CPIU will accurately measure the real rate of inflation in the prices of goods and services.
Credit: If an obligor (such as the issuer itself or a party offering credit enhancement) for a security held by the fund fails to pay, otherwise defaults, becomes insolvent or files for bankruptcy or is perceived to be less creditworthy, or a security’s credit rating is downgraded or the credit quality or value of any underlying assets declines, the value of your investment in the fund could decline. The fund may incur expenses to protect the fund’s interest in securities experiencing these events. If the fund enters into financial contracts (such as certain derivatives, repurchase agreements, reverse repurchase agreements, and when-
195
issued, delayed delivery and forward commitment transactions), the fund will be subject to the credit risk presented by the counterparty. Credit risk is broadly gauged by the credit ratings of the securities in which the fund invests. However, ratings are only the opinions of the companies issuing them and are not guarantees as to quality. The fund is subject to greater levels of credit risk to the extent it invests in junk bonds. These securities have a higher risk of issuer default, are considered speculative and may involve significant risk of exposure to adverse conditions. These securities may be in default or in danger of default as to principal and interest. Unrated securities of comparable quality share these risks. The fund may invest in securities which are subordinated to more senior securities of the issuer, or which represent interests in pools of such subordinated securities. Subordinated securities are more likely to suffer a credit loss than non-subordinated securities of the same issuer, any loss incurred by the subordinated securities is likely to be proportionately greater, and any recovery of interest or principal may take more time. As a result, even a perceived decline in creditworthiness of the issuer is likely to have a greater impact on them.
Currency: When a fund invests in securities denominated in foreign currencies, it is subject to the risk that those currencies will decline in value relative to the U.S. dollar, or, in the case of hedging positions, that the U.S. dollar will decline in value relative to the currency being hedged. Currency rates in foreign countries may fluctuate significantly over short periods of time for reasons such as changes in interest rates, government intervention or political developments. As a result, a fund’s investments in foreign currency denominated securities may reduce the returns of a fund.
Currency Hedging: A fund may enter into forward foreign currency contracts to hedge against declines in the value of securities denominated in, or whose value is tied to, a currency other than the U.S. dollar or to reduce the impact of currency fluctuation on purchases and sales of such securities. Shifting a fund’s currency exposure from one currency to another may remove a fund’s opportunity to profit from the original currency and involves a risk of increased losses for a fund if the sub-adviser’s projection of future exchange rates is inaccurate.
Derivatives: Derivatives involve special risks and costs and may result in losses to the fund. Using derivatives can have a leveraging effect which may increase investment losses and may increase fund volatility. Even a small investment in derivatives can have a disproportionate impact on a fund. Using derivatives can increase losses and reduce opportunities for gains when market prices, interest rates or currencies, or the derivative instruments themselves, behave in a way not anticipated by a fund, especially in abnormal market conditions. The other parties to certain derivative contracts present the same types of credit risk as issuers of fixed-income securities. Derivatives also tend to involve greater liquidity risk. The fund may be unable to terminate or sell its derivative positions. In fact, many over-the-counter derivative instruments will not have liquidity beyond the counterparty to the instrument. The fund’s use of derivatives may also increase the amount of taxes payable by shareholders. Recent legislation calls for new regulation of the derivatives markets. The extent and impact of the regulation are not yet fully known and may not be for some time. New regulation of derivatives may make them more costly, may limit their availability, or may otherwise adversely affect their value or performance.
Using derivatives, especially for non-hedging purposes, may involve greater risks to the fund than investing directly in securities, particularly as these instruments may be very complex and may not behave in the manner anticipated by the fund. Risks associated with the use of derivatives are magnified to the extent that a large portion of the fund’s assets are committed to derivatives in general or are invested in just one or a few types of derivatives.
When the fund enters into derivative transactions, it may be required to segregate assets, or enter into offsetting positions, in accordance with applicable regulations. Such segregation will not limit the fund’s exposure to loss, however, and the fund will have investment risk with respect to both the derivative itself and the assets that have been segregated to cover the fund’s derivative exposure. If the segregated assets represent a large portion of the fund’s portfolio, this may impede portfolio management or the fund’s ability to meet redemption requests or other current obligations.
Some derivatives may be difficult to value, or may be subject to the risk that changes in the value of the instrument may not correlate well with the underlying asset, rate or index. In addition, derivatives may be subject to market risk, interest rate risk and credit risk. A fund could lose the entire amount of its investment in a derivative and, in some cases, could lose more than the principal amount invested. Also, suitable derivative instruments may not be available in all circumstances or at reasonable prices. A fund’s sub-adviser may not make use of derivatives for a variety of reasons.
Distressed Securities: A fund may invest in distressed securities, including securities of issuers in bankruptcy. Distressed securities are speculative and involve substantial risks. Generally, a fund will invest in distressed securities when the sub-adviser believes they offer significant potential for higher returns or can be exchanged for other securities that offer this potential. However, there can be no assurance that a fund will achieve these returns or that the issuer will make an exchange offer or adopt a plan of reorganization. A fund will generally not receive interest payments on the distressed securities and may incur costs to protect its investment. In addition, distressed securities involve the substantial risk that principal will not be repaid. Distressed securities and any securities received in an exchange for such securities may be subject to restrictions on resale.
196
Emerging Markets: Investing in the securities of issuers located in or principally doing business in emerging markets bear foreign risks. In addition, the risks associated with investing in emerging markets are often greater than investing in developed foreign markets. Specifically, the economic structures in emerging markets countries are less diverse and mature than those in developed countries, and their political systems are less stable. Investments in emerging markets countries may be affected by national policies that restrict foreign investments. Emerging markets countries tend to have economic, political and legal systems that are less fully developed and are less stable than those of more advanced countries. Low trading volumes may result in a lack of liquidity and in extreme price volatility. As a result, a fund investing in emerging markets countries may be required to establish special custody or other arrangements before investing.
Equity Securities: Equity securities include common and preferred stocks. Stock markets are volatile. The price of equity securities fluctuates based on changes in a company’s financial condition and overall market and economic conditions.
Exchange Traded Funds (“ETFs”): ETFs are pooled investment vehicles, such as registered investment companies and grantor trusts, whose shares are listed and traded on U.S. stock exchanges or otherwise traded in the over-the-counter market. ETFs typically seek to track an index, a commodity or a basket of assets like an index fund, but trade like a stock on an exchange. An investment in an ETF generally presents the same primary risks as an investment in a conventional fund (i.e., one that is not exchange-traded) that has the same investment objectives, strategies and policies. The price of an ETF can fluctuate up and down, and the portfolio could lose money investing in an ETF if the prices of the securities owned by the ETF go down. In addition, ETFs are subject to the following risks that do not apply to conventional funds: (i) the market price of an ETF’s shares may be above or below the shares’ net asset value; (ii) an active trading market for an ETF’s share may not develop or be maintained; or (iii) trading of an ETF’s share may be halted if the listing exchange’s officials deem such action appropriate, the shares are delisted from the exchange or the activation of market-wide “circuit breakers” (which are tied to large decreases in stock prices) halts stock trading generally.
Fixed-Income Securities: The value of fixed-income securities may change daily based on changes in interest rates, and other market conditions and factors. Risks include, without limitation:
| • | | market risk: fluctuations in market value |
| • | | interest rate risk: the value of a fixed-income security generally decreases as interest rates rise. This may also be the case for dividend paying stocks. Increases in interest rates may cause the value of your investment to go down. The longer the maturity or duration, the more sensitive the value of a fixed-income security is to fluctuations in interest rates |
| • | | prepayment or call risk: declining interest rates may cause issuers of securities held by the fund to pay principal earlier than scheduled or to exercise a right to call the securities, forcing a fund to reinvest in lower yielding securities |
| • | | extension risk: rising interest rates may result in slower than expected principal prepayments, which effectively lengthens the maturity of affected securities, making them more sensitive to interest rate changes |
| • | | credit risk: issuers (or guarantors) defaulting on their obligations to pay interest or return principal, becoming insolvent or filing for bankruptcy, being perceived as being less creditworthy or having a credit rating downgraded, or the credit quality or value of any underlying asset declines. A fund may incur expenses to protect the fund’s interest in securities experiencing these events. A fund is subject to more credit risk to the extent it invests in junk bonds. These securities have a higher risk of issuer default, are considered speculative and may involve significant risk of exposure to adverse conditions. These securities may be in default or in danger of default as to principal and interest. If a fund invests in securities that are subordinated to other securities, or which represent interests in pools of such subordinated securities, those investments may be more greatly affected by a default or even a perceived decline in creditworthiness of the issuer. |
If, after purchase, the credit rating on a security is downgraded or the credit quality deteriorates, or if the maturity is extended, a fund’s sub-adviser will decide whether the security should be held or sold. Upon the occurrence of certain triggering events or defaults on a security held by a fund, or if an issuer of such a security has difficulty meeting its obligations, a fund may become the holder of a restructured security or of underlying assets. In that case, a fund may become the holder of securities or other assets that it could not otherwise purchase at a time when those assets may be difficult to sell or can be sold only at a loss.
Focused Investing: To the extent a fund invests in a limited number of issuers, its performance may be more volatile than funds that hold a greater variety of securities.
Foreign Securities: Investments in foreign securities, including foreign securities represented by American Depositary Receipts (“ADRs”), Global Depositary Receipts (“GDRs”), and European Depositary Receipts (“EDRs”), involve risks relating to political, social and economic developments abroad, as well as risks resulting from the differences between the regulations to which U.S. and foreign issuer markets are subject. These risks include, without limitation:
| • | | different accounting and reporting practices |
| • | | less information available to the public |
197
| • | | less (or different) regulation of securities markets |
| • | | more complex business negotiations |
| • | | more fluctuations in prices |
| • | | delays in settling foreign securities transactions |
| • | | higher costs for holding shares (custodial fees) |
| • | | higher transaction costs |
| • | | vulnerability to seizure and taxes |
| • | | political or financial instability and small markets |
| • | | different market trading days |
Geographic: Because a fund may invest a relatively large percentage of its assets in issuers located in a single country, a small number of countries, or a particular geographic region, a fund’s performance could be closely tied to the market, currency, economic, political, or regulatory conditions and developments in those countries or that region, and could be more volatile than the performance of more geographically-diversified funds.
Growth Stocks: Growth stocks can be volatile for several reasons. Since growth companies usually reinvest a high proportion of their earnings in their own businesses, they may lack the dividends often associated with the value stocks that could cushion their decline in a falling market. Also, since investors buy growth stocks because of their expected superior earnings growth, earnings disappointments often result in sharp price declines. Certain types of growth stocks, particularly technology stocks, can be extremely volatile and subject to greater price swings than the broader market.
High-Yield Debt Securities: High-yield debt securities, or junk bonds, are securities that are rated below “investment grade” (that is, securities rated below Baa/BBB) or, if unrated, are considered by the sub-adviser to be of equivalent quality. High-yield debt securities range from those for which the prospect for repayment of principal and interest is predominantly speculative to those which are currently in default on principal or interest payments or in bankruptcy. A fund with high-yield debt securities may be more susceptible to credit risk and market risk than a fund that invests only in higher quality debt securities because these lower-rated debt securities are less secure financially and more sensitive to downturns in the economy. In addition, the secondary market for such securities may not be as liquid as that for more highly rated debt securities. As a result, a fund’s sub-adviser may find it more difficult to sell these securities or may have to sell them at lower prices. High-yield securities are not generally meant for short-term investing.
Hybrid Instruments: Hybrid instruments combine elements of derivative contracts with those of another security (typically a fixed-income security). All or a portion of the interest or principal payable on a hybrid security is determined by reference to changes in the price of an underlying asset or by reference to another benchmark (such as interest rates, currency exchange rates or indices). Hybrid instruments also include convertible securities with conversion terms related to an underlying asset or benchmark. The risks of investing in hybrid instruments may reflect a combination of the risks of investing in securities, commodities, options, futures, and currencies. Thus, an investment in a hybrid instrument may entail significant risks in addition to those associated with traditional fixed-income or convertible securities. Hybrid instruments are also potentially more volatile and may carry greater interest rate risks than traditional instruments. Moreover, depending on the structure of the particular hybrid, it may expose a fund to leverage risks or carry liquidity risks.
Increase in Expenses: Your actual costs of investing in the fund may be higher than the expenses shown in “Annual Fund Operating Expenses” for a variety of reasons. For example, expense ratios may be higher than those shown if average net assets decrease. Net assets are more likely to decrease and fund expense ratios are more likely to increase when markets are volatile.
Industry Concentration: Certain funds may concentrate their investments in specific industry sectors that have historically experienced substantial price volatility. This concentration may subject such a fund to greater risk of loss as a result of adverse economic, business or other developments than if its investments were diversified across different industry sectors.
Inflation-Protected Securities: Inflation-protected debt securities may react differently from other types of debt securities and tend to react to changes in “real” interest rates. Real interest rates represent nominal (stated) interest rates reduced by the expected impact of inflation. In general, the price of an inflation-protected debt security can fall when real interest rates rise, and can rise when real interest rates fall. Interest payments on inflation-protected debt securities can be unpredictable and will vary as the principal and/or interest is adjusted for inflation. Also, the inflation index utilized by a particular inflation-protected security may not accurately reflect the true rate of inflation, in which case the market value of the security could be adversely affected.
198
Interest Rate: Fixed-income securities have varying levels of sensitivity to changes in interest rates. In general, the price of a fixed-income security tends to fall when interest rates rise and can rise when interest rates fall. A change in interest rates will not have the same impact on all fixed-income securities. Generally, the longer the maturity or duration of a fixed-income security, the greater the impact of a rise in interest rates on the security’s value. In addition, different interest rate measures (such as short- and long-term interest rates and U.S. and foreign interest rates), or interest rates on different types of securities or securities of different issuers, may not necessarily change in the same amount or in the same direction. When interest rates go down, the income received by the fund, and the fund’s yield, may decline.
Certain fixed-income securities pay interest at variable or floating rates. Variable rate securities tend to reset at specified intervals, while floating rate securities may reset whenever there is a change in a specified index rate. In most cases, these reset provisions reduce the impact of changes in market interest rates on the value of the security. However, some securities do not track the underlying index directly, but reset based on formulas that may produce a leveraging effect; others may also provide for interest payments that vary inversely with market rates. The market prices of these securities may fluctuate significantly when interest rates change. The fund’s yield may decline due to a decrease in market interest rates.
Inflation protected debt securities may react differently from other types of debt securities and tend to react to changes in “real” interest rates. Real interest rates represent nominal (stated) interest rates reduced by the expected impact of inflation. In general, the price of an inflation protected debt security can fall when real interest rates rise, and can rise when real interest rates fall. Interest payments on inflation protected debt securities can be unpredictable and will vary as the principal and/or interest is adjusted for inflation.
Interest Rate (Transamerica AEGON Money Market): The interest rates on short-term obligations held in a fund’s portfolio will vary, rising or falling with short-term interest rates generally. A fund’s yield will tend to lag behind general changes in interest rates.
The ability of a fund’s yield to reflect current market rates will depend on how quickly the obligations in its portfolio mature and how much money is available for investment at current market rates.
Investing Aggressively: The value of developing-company stocks may be very volatile, and can drop significantly in a short period of time. Rights, options and futures contracts may not be exercised and may expire worthless. Warrants and rights may be less liquid than stocks. Use of futures and other derivatives may make a fund more volatile.
Investment Companies: To the extent that an underlying fund invests in other investment companies such as Exchange-Traded Funds (“ETFs”), it bears its pro rata share of these investment companies’ expenses, and is subject to the effects of the business and regulatory developments that affect these investment companies and the investment company industry generally.
Investment Style: Returns from foreign small-capitalization growth stocks may trail returns from the overall stock market. Historically, foreign small cap stocks have been more volatile in price than the large cap stocks that dominate the overall market, and they often perform quite differently.
IPOs: Initial public offerings (“IPOs”) are subject to specific risks which include, among others:
| | • | | no track record for consideration; |
| | • | | securities may be illiquid; and |
| | • | | earnings are less predictable. |
Leveraging: When a fund engages in transactions that have a leveraging effect on it, the value of the fund will be more volatile and all other risks will tend to be compounded. This is because leverage generally magnifies the effect of any increase or decrease in the value of a fund’s underlying assets or creates investment risk with respect to a larger pool of assets than a fund would otherwise have. A fund may take on leveraging risk by, among other things, engaging in derivative, when-issued, delayed-delivery, forward commitment or forward roll transactions or reverse repurchase agreements. Engaging in such transactions may cause a fund to liquidate positions when it may not be advantageous to do so to satisfy its obligations or meet segregation requirements.
Liquidity: Liquidity risk exists when particular investments are difficult to sell. Although most of a fund’s securities must be liquid at the time of investment, securities may become illiquid after purchase by a fund, particularly during periods of market turmoil. When a fund holds illiquid investments, a fund may be harder to value, especially in changing markets, and if a fund is forced to sell these investments to meet redemptions or for other cash needs, a fund may suffer a loss. In addition, when there is illiquidity in the market for certain securities, a fund, due to limitations on investments in illiquid securities, may be unable to achieve its desired level of exposure to a certain sector.
Loans: A fund may invest in certain commercial loans, including loans generally known as “syndicated bank loans,” by acquiring participations or assignments in such loans. The lack of a liquid secondary market for such securities may have an adverse impact on the value of the securities and a fund’s ability to dispose of particular assignments or participations when
199
necessary to meet redemptions of shares or to meet a fund’s liquidity needs. When purchasing a participation, a fund may be subject to the credit risks of both the borrower and the lender that is selling the participation. When purchasing a loan assignment, a fund acquires direct rights against the borrowers, but only to the extent of those held by the assigning lender. Investment in loans through a direct assignment from the financial institution’s interests with respect to a loan may involve additional risks to a fund. It is also unclear whether loans and other forms of direct indebtedness offer securities law protections against fraud and misrepresentation. In the absence of definitive regulatory guidance, a fund relies on its sub-adviser’s research in an attempt to avoid situations where fraud or misrepresentation could adversely affect a fund.
Market and Selection: Market risk is the risk that one or more markets in which the fund invests may go down in value. Selection risk is the risk that the securities selected by fund management may underperform the market or other securities selected by other funds. This means you lose money.
Market: The market prices of the fund’s securities may go up or down, sometimes rapidly or unpredictably. If the market prices of the securities owned by the fund fall, the value of your investment in the fund will decline. The value of a security may fall due to general market conditions, such as real or perceived adverse economic or political conditions, inflation, changes in interest rates or currency rates, lack of liquidity in the markets or adverse investor sentiment. Market prices of securities also may go down due to events or conditions that affect particular sectors or issuers. The fund may experience a substantial or complete loss on any individual security. The equity and debt capital markets in the U.S. and internationally have experienced unprecedented volatility. The financial crisis has caused a significant decline in the value and liquidity of many securities. In response to the crisis, the U.S. and other governments and the Federal Reserve and certain foreign central banks have taken various steps to support financial markets. The withdrawal of this support could negatively affect the value and liquidity of certain securities. In addition, legislation recently enacted in the U.S. calls for changes in many aspects of financial regulation. The impact of the legislation on the markets, and the practical implications for market participants, may not be fully known for some time.
Changes in market conditions will not have the same impact on all types of securities. The value of a security may also fall due to specific conditions that affect a particular sector of the securities market or a particular issuer.
Medium-Sized Companies: Investing in medium-sized companies involves greater risk than is customarily associated with more established companies. Stocks of such companies, particularly developing companies, generally are subject to more volatility in price than larger company securities. Among the reasons for the greater price volatility are the less certain growth prospects of smaller companies, the lower degree of liquidity in the markets for such securities, and the greater sensitivity of smaller companies to changing economic conditions. Such companies usually do not pay significant dividends that could cushion returns in a falling market.
Mortgage-Related and Asset-Backed Securities: Mortgage-backed securities may be issued by private issuers, by government-sponsored entities such as Fannie Mae (formally known as Federal National Mortgage Association) or Freddie Mac (formally known as Federal Home Loan Mortgage Corporation) or by agencies of the U.S. government, such as the Government National Mortgage Association (“Ginnie Mae”). Mortgage-backed securities represent direct or indirect participations in, or are collateralized by and payable from, mortgage loans secured by real property. Unlike mortgage-related securities issued or guaranteed by agencies of the U.S. government or government-sponsored entities, mortgage-related securities issued by private issuers do not have a government or government-sponsored entity guarantee (but may have other credit enhancement), and may, and frequently do, have less favorable collateral, credit risk or other underwriting characteristics. Mortgage-backed securities are also particularly susceptible to prepayment and extension risks, because prepayments on the underlying mortgages tend to increase when interest rates fall and decrease when interest rates rise.
Asset-backed securities represent participations in, or are secured by and payable from, assets such as installment sales or loan contracts, leases, credit card receivables and other categories of receivables. Certain asset-backed securities present a heightened level of risk because, in the event of default, the liquidation value of the underlying assets may be inadequate to pay any unpaid principal or interest.
The value of mortgage-backed and asset-backed securities may be affected by changes in credit quality or value of the mortgage loans or other assets that support the securities. In addition, for mortgage-backed securities, when market conditions result in an increase in the default rates on the underlying mortgages and the foreclosure values of the underlying real estate are below the outstanding amount of the underlying mortgages, collection of the full amount of accrued interest and principal on these investments may be doubtful.
Non-Diversification: Focusing investments in a small number of issuers, industries or foreign currencies increases risk. Because a fund is non-diversified, it may be more susceptible to risks associated with a single economic, political or regulatory occurrence than a more diversified fund might be.
200
Portfolio Selection: The value of your investment may decrease if the sub-adviser’s judgment about the attractiveness, quality, relative yield, value or market trends affecting a particular security, industry or sector, or about interest rates, is incorrect.
Portfolio Turnover: A fund may engage in a significant number of short-term transactions, which may adversely affect a fund’s performance. Increased turnover results in higher brokerage costs or mark-up charges for a fund. A fund ultimately passes these costs on to shareholders. Short-term trading may also result in short-term capital gains, which are taxed as ordinary income when distributed to shareholders.
Precious Metals-Related Securities: Prices of precious metals and of precious metals-related securities historically have been very volatile. The high volatility of precious metals prices may adversely affect the financial condition of companies involved with precious metals. The production and sale of precious metals by governments or central banks or other larger holders can be affected by various economic, financial social and political factors, which may be unpredictable and may have a significant impact on the prices of precious metals. Other factors that may affect the prices of precious metals and securities related to them include changes in inflation, the outlook for inflation and changes in industrial and commercial demand for precious metals.
Preferred Stock: Preferred stock represents an interest in a company that generally entitles the holder to receive, in preference to the holders of the company’s common stock, dividends and a fixed share of the proceeds resulting from any liquidation of the company. Preferred stock’s right to dividends and liquidation proceeds is junior to the rights of a company’s debt securities. Preferred stocks may pay fixed or adjustable rates of return. The value of preferred stock may be subject to factors that affect fixed income and equity securities, including changes in interest rates and in a company’s creditworthiness. Shareholders of preferred stock may suffer a loss of value if dividends are not paid. Preferred stock does not generally carry voting rights.
Prepayment or Call: Borrowers may pay back principal before the scheduled due date. Borrowers may find it advantageous to prepay principal due to a decline in interest rates or an excess in cash flow. Such prepayments may require the fund to replace a corporate loan, corporate debt security or other investment with a lower yielding security. This may adversely affect the fund’s net asset value.
Real Estate Investment Trusts (“REITS”): Equity REITs can be affected by any changes in the value of the properties owned. A REIT’s performance depends on the types and locations of the properties it owns and on how well it manages those properties or loan financings. A decline in rental income could occur because of extended vacancies, increased competition from other properties, tenants’ failure to pay rent or poor management. A REIT’s performance also depends on the company’s ability to finance property purchases and renovations and manage its cash flows. Because REITs are typically invested in a limited number of projects or in a particular market segment, they are more susceptible to adverse developments affecting a single project or market segment than more broadly diversified investments. Loss of status as a qualified REIT or changes in the treatment of REITs under the federal tax law, could adversely affect the value of a particular REIT or the market for REITs as a whole.
Real Estate Securities: Investments in the real estate industry are subject to risks associated with direct investment in real estate. These risks may include, without limitation:
| • | | declining real estate value |
| • | | risks relating to general and local economic conditions |
| • | | increased competition for assets in local and regional markets |
| • | | increases in property taxes |
| • | | increases in operating expenses or interest rates |
| • | | change in neighborhood value or the appeal of properties to tenants |
| • | | insufficient levels of occupancy |
| • | | inadequate rents to cover operating expenses |
The performance of securities issued by companies in the real estate industry also may be affected by prudent management of insurance risks, adequacy of financing available in capital markets, competent management, changes in applicable laws and government regulations (including taxes) and social and economic trends.
Redemption (Transamerica AEGON Money Market): The fund may experience periods of heavy redemptions that could cause the fund to liquidate its assets at inopportune times or at a loss or depressed value particularly during periods of
201
declining or illiquid markets. Redemption risk is greater to the extent that the fund has investors with large shareholdings, short investment horizons, or unpredictable cash flow needs. The redemption by one or more large shareholders of their holdings in the fund could have an adverse impact on the remaining shareholders in the fund. If the fund is forced to liquidate its assets under unfavorable conditions or at inopportune times, the fund’s ability to maintain a stable $1.00 share price may be affected. In addition, the fund may suspend redemptions when permitted by applicable regulations.
Repurchase Agreements: Under a repurchase agreement, the seller agrees to repurchase a security at a mutually agreed-upon time and price. If the other party to a repurchase agreement defaults on its obligation, a fund may suffer delays and incur costs or lose money in exercising its rights under the agreement. If the seller fails to repurchase the security and the market value declines, a fund could lose money.
Rule 144A and Privately Placed Securities: “Rule 144A” and other privately placed securities are securities that are not registered for sale to the public and thus are considered “restricted.” They may only be resold to certain qualified institutional buyers. An insufficient number of qualified institutional buyers interested in purchasing a Rule 144A security held by a fund could adversely affect the marketability of such security and a fund might be unable to dispose of such security promptly or at reasonable prices.
Securities Lending: Each fund, except AEGON Transamerica Money Market and each of the asset allocation funds, may lend securities to other financial institutions that provide cash or other securities as collateral. Securities lending involves the risk that the borrower may fail to return the securities in a timely manner or at all. As a result, a fund may lose money and there may be a delay in recovering the loaned securities. A fund could also lose money if it does not recover the securities and/or the value of the collateral falls, including the value of investments made with cash collateral. These events could trigger adverse tax consequences for a fund.
Sector: Sector risk is the risk that the fund concentration in the securities of companies in a specific market sector or industry will cause the fund to be more exposed to the price movements of companies in and developments affecting that sector or industry than a more broadly diversified fund. Because the fund invests primarily in one sector, there is the risk that the fund will perform poorly during a downturn in that sector.
Short Sales: A short sale may be effected by selling a security that a fund does not own. In order to deliver the security to the purchaser, a fund borrows the security, typically from a broker-dealer or an institutional investor. A fund later closes out the position by returning the security to the lender. If the price of the security sold short increases, a fund would incur a loss; conversely, if the price declines, a fund will realize a gain. Although the gain is limited by the price at which the security was sold short, the loss is potentially unlimited. A fund’s use of short sales in an attempt to improve performance or to reduce overall portfolio risk may not be successful and may result in greater losses or lower positive returns than if a fund held only long positions. A fund may be unable to close out a short position at an acceptable price, and may have to sell related long positions at disadvantageous times to produce cash to unwind a short position. Short selling involves higher transaction costs than typical long-only investing.
A short sale may also be effected “against the box” if, at all times when the short position is open, a fund contemporaneously owns or has the right to obtain at no additional cost securities identical to those sold short. In the event that a fund were to sell securities short “against the box” and the price of such securities were to then increase rather than decrease, a fund would forego the potential realization of the increased value of the shares sold short.
Smaller Companies: Investing in smaller companies involves greater risk than is customarily associated with more established companies. Stocks of such companies, particularly developing companies, generally are subject to more volatility in price than larger company securities. Among the reasons for the greater price volatility are the less certain growth prospects of smaller companies, the lower degree of liquidity in the markets for such securities, and the greater sensitivity of smaller companies to changing economic conditions. Smaller companies often have limited product lines, markets, or financial resources and their management may lack depth and experience. Such companies usually do not pay significant dividends that could cushion returns in a falling market.
Small- or Medium-Sized Companies: Investing in small- and medium-sized companies involves greater risk than is customarily associated with more established companies. Stocks of such companies, particularly developing companies, generally are subject to more volatility in price than larger company securities. Among the reasons for the greater price volatility are the less certain growth prospects of smaller companies, the lower degree of liquidity in the markets for such securities, and the greater sensitivity of smaller companies to changing economic conditions. Smaller companies often have limited product lines, markets, or financial resources and their management may lack depth and experience. Such companies usually do not pay significant dividends that could cushion returns in a falling market.
Sovereign Debt: Sovereign debt instruments, which are debt obligations issued or guaranteed by a foreign governmental entity, are subject to the risk that the governmental entity may delay or fail to pay interest or repay principal on debt that it has issued or guaranteed, due, for example, to cash flow problems, insufficient foreign currency reserves, political considerations,
202
relationships with other lenders such as commercial banks, the relative size of the governmental entity’s debt position in relation to the economy or the failure to put in place economic reforms required by the International Monetary Fund or other multilateral agencies. If a governmental entity defaults, it may ask for more time in which to pay or for further loans, or it may ask for forgiveness of interest or principal on its existing debt. On the other hand, a governmental entity may be unwilling to renegotiate the terms of its sovereign debt. There may be no established legal process for a U.S. bondholder (such as the fund) to enforce its rights against a governmental entity that does not fulfill its obligations, nor are there bankruptcy proceedings through which all or part of the sovereign debt that a governmental entity has not repaid may be collected.
Stocks: Stocks may be volatile – their prices may go up and down dramatically over the shorter term. These price movements may result from factors affecting individual companies, industries, the securities market as a whole or the overall economy. Because the stocks a fund holds fluctuate in price, the value of your investment in a fund will go up and down.
Structured Instruments: A fund may invest in various types of structured instruments, including securities that have demand, tender or put features, or interest rate reset features. These may include instruments issued by structured investment or special purpose vehicles or conduits, and may be asset-backed or mortgage-backed securities. Structured instruments may take the form of participation interests or receipts in underlying securities or other assets, and in some cases are backed by a financial institution serving as a liquidity provider. Some of these instruments may have an interest rate swap feature which substitutes a floating or variable interest rate for the fixed interest rate on an underlying security, and some may be asset-backed or mortgage-backed securities. Structured instruments are a type of derivative instrument and the payment and credit qualities of these instruments derive from the assets embedded in the structure from which they are issued. For structured securities that have embedded leverage features, small changes in interest or prepayment rates may cause large and sudden price movements. Structured instruments are often subject to heightened liquidity risk.
Subsidiary: By investing in the Subsidiary, the fund will be indirectly exposed to the risks associated with the Subsidiary’s investments. The derivatives and other investments that will be held by the Subsidiary are generally similar to those that are permitted to be held by the fund and will be subject to the same risks that apply to similar investments if held directly by the fund. There can be no assurance that the investment objective of the Subsidiary will be achieved. The Subsidiary is not registered under the Investment Company Act, and, unless otherwise noted in this prospectus, is not subject to the investor protections of the Investment Company Act. The fund relies on a private letter ruling from the Internal Revenue Service (the “IRS”) with respect to the investment in the Subsidiary. Changes in the laws of the United States and/or the Cayman Islands could result in the inability of the fund and/or the Subsidiary to operate as described in this prospectus and the SAI and could adversely affect the fund.
Tax: In order to qualify as a regulated investment company (“RIC”) under the Internal Revenue Code, the fund must meet certain requirements regarding, among other things, the source of its income. Any income the fund derives from investments in certain hard asset ETFs, such as certain commodity ETFs, and from other non-qualifying sources must be limited to a maximum of 10% of the fund’s gross income. If the fund fails to meet those requirements, the fund may be subject to federal income tax on its net income at regular corporate rates (without reduction for distributions to shareholders). When distributed, that income would also be taxable to shareholders as an ordinary dividend to the extent attributable to the fund’s earnings and profits. If the fund were to fail to qualify as a RIC, shareholders of the fund could realize significantly diminished returns from their investment in the fund.
U.S. Government Agency Obligations: Government agency obligations have different levels of credit support and, therefore, different degrees of credit risk. Securities issued by agencies and instrumentalities of the U.S. government that are supported by the full faith and credit of the United States, such as the Federal Housing Administration and Ginnie Mae, present little credit risk. Other securities issued by agencies and instrumentalities sponsored by the U.S. government that are supported only by the issuer’s right to borrow from the U.S. Treasury, subject to certain limitations, such as securities issued by Federal Home Loan Banks and securities issued by agencies and instrumentalities sponsored by the U.S. government that are supported only by the credit of the issuing agencies, such as Freddie Mac and Fannie Mae, are subject to a greater degree of credit risk.
Valuation: Many factors may influence the price at which the fund could sell any particular portfolio investment. The sales price may well differ—higher or lower—from the fund’s last valuation, and such differences could be significant, particularly for illiquid securities, securities that trade in relatively thin markets and/or markets that experience extreme volatility. If market conditions make it difficult to value some investments, the fund may value these investments using more subjective methods, such as fair value methodologies. Investors who purchase or redeem fund shares on days when the fund is holding fair-valued securities may receive a greater or lesser number of shares, or greater or lower redemption proceeds, than they would have received if the fund had not fair-valued the security or had used a different valuation methodology.
Value Investing: The value approach carries the risk that the market will not recognize a security’s intrinsic value for a long time, or that a stock considered to be undervalued may actually be appropriately priced. A fund may underperform other equity funds that use different investing styles. A fund may also underperform other equity funds using the value style.
203
Warrants and Rights: Warrants and rights may be considered more speculative than certain other types of investments because they do not entitle a holder to the dividends or voting rights for the securities that may be purchased. They do not represent any rights in the assets of the issuing company. Also, the value of a warrant or right does not necessarily change with the value of the underlying securities. A warrant or right ceases to have value if it is not exercised prior to the expiration date.
Yield (Transamerica AEGON Money Market): The fund invests in short-term money market instruments. As a result, the amount of income received by the fund will go up or down depending on day-to-day variations in short-term interest rates. Investing in high quality, short-term instruments may result in a lower yield (the income on your investment) than investing in lower quality or longer-term instruments. When interest rates are very low, the fund’s expenses could absorb all or a significant portion of the fund’s income, and, if a fund’s expenses exceed the fund’s income, a fund may be unable to maintain its $1.00 share price. If interest rates increase, a fund’s yield may not increase proportionately. For example, TAM may discontinue any temporary voluntary fee limitation or recoup expenses previously forgone or reimbursed. The recent adoption of more stringent regulations governing the management of money market funds could have a negative effect on a fund’s yield. Under these new regulations, the fund may be required to maintain greater liquidity based on characteristics and anticipated liquidity needs of its shareholders and may have a lower yield than money market funds with a different shareholder base.
Please note that there are other factors that could adversely affect your investment in a fund and that could prevent the fund from achieving its investment objective. More information about risks appears in the Statement of Additional Information. Before investing, you should carefully consider the risks that you will assume.
204
Investment Adviser
Transamerica Funds’ Board of Trustees is responsible for overseeing the management and business affairs of Transamerica Funds. It oversees the operation of Transamerica Funds by its officers. It also reviews the management of the funds’ assets by the investment adviser and sub-advisers. Information about the Trustees and executive officers of Transamerica Funds is contained in the Statement of Additional Information (“SAI”).
Transamerica Asset Management, Inc. (“TAM”), located at 570 Carillon Parkway, St. Petersburg, FL 33716, serves as investment adviser for Transamerica Funds. The investment adviser hires investment sub-advisers to furnish investment advice and recommendations and has entered into sub-advisory agreements with each fund’s sub-adviser. The investment adviser also monitors the sub-advisers’ buying and selling of portfolio securities and administration of the funds. For these services, TAM is paid investment advisory fees. These fees are calculated on the average daily net assets of each fund.
TAM is directly owned by Western Reserve Life Assurance Co. of Ohio (77%) (“Western Reserve”) and AUSA Holding Company (23%) (“AUSA”), both of which are indirect, wholly owned subsidiaries of AEGON NV. AUSA is wholly owned by AEGON USA, LLC (“AEGON USA”), a financial services holding company whose primary emphasis is on life and health insurance, and annuity and investment products. AEGON USA is owned by AEGON US Holding Corporation, which is owned by Transamerica Corporation (DE). Transamerica Corporation (DE) is owned by The AEGON Trust, which is owned by AEGON International B.V., which is owned by AEGON NV, a Netherlands corporation, and a publicly traded international insurance group.
AEGON USA Investment Management, LLC is an affiliate of TAM and Transamerica Funds.
The funds may rely on an Order from the SEC (Release IC- 23379 dated August 5, 1998) that permits Transamerica Funds and its investment adviser, TAM, subject to certain conditions, and without the approval of shareholders to:
(1) employ a new unaffiliated sub-adviser for a fund pursuant to the terms of a new investment sub-advisory agreement, either as a replacement for an existing sub-adviser or as an additional sub-adviser;
(2) materially change the terms of any sub-advisory agreement; and
(3) continue the employment of an existing sub-adviser on sub-advisory contract terms where a contract has been assigned because of a change of control of the sub-adviser.
Pursuant to the Order, the funds have agreed to provide certain information about new sub-advisers and new sub-advisory agreements to their shareholders.
Advisory Fees
TAM receives compensation from each fund, calculated daily and paid monthly, based on an annual percentage of each fund’s average daily net assets.
Advisory Fees Paid in 2010
For the fiscal year ended October 31, 2010, each fund paid the following advisory fee as a percentage of the fund’s average daily net assets:
| | |
Name of Fund | | Advisory Fee |
Transamerica AEGON Flexible Income1 | | 0.54% |
Transamerica AEGON High Yield Bond | | 0.58% |
Transamerica AEGON Money Market | | 0.40% |
Transamerica AEGON Short-Term Bond2 | | 0.51% |
Transamerica AQR Managed Futures Strategy | | 1.10% |
Transamerica BlackRock Global Allocation | | 0.74% |
Transamerica BlackRock Large Cap Value | | 0.78% |
Transamerica Clarion Global Real Estate Securities | | 0.80% |
Transamerica Federated Market Opportunity | | 0.77% |
Transamerica First Quadrant Global Macro | | 1.40% |
Transamerica Goldman Sachs Commodity Strategy3 | | 0.78% |
Transamerica Hansberger International Value | | 0.86% |
Transamerica Jennison Growth | | 0.76% |
Transamerica JPMorgan Core Bond | | 0.44% |
205
| | |
Name of Fund | | Advisory Fee |
Transamerica JPMorgan International Bond | | 0.52% |
Transamerica JPMorgan Long/Short Strategy4 | | 1.40% |
Transamerica JPMorgan Mid Cap Value | | 0.83% |
Transamerica Loomis Sayles Bond | | 0.64% |
Transamerica MFS International Equity | | 0.89% |
Transamerica Morgan Stanley Emerging Markets Debt | | 0.92% |
Transamerica Morgan Stanley Growth Opportunities | | 0.79% |
Transamerica Morgan Stanley Mid-Cap Growth | | 0.80% |
Transamerica Morgan Stanley Small Company Growth | | 0.95% |
Transamerica Multi-Managed Balanced5 | | 0.75% |
Transamerica Neuberger Berman International | | 0.96% |
Transamerica Oppenheimer Developing Markets | | 1.12% |
Transamerica Oppenheimer Small- & Mid-Cap Value | | 0.91% |
Transamerica PIMCO Real Return TIPS | | 0.66% |
Transamerica PIMCO Total Return | | 0.66% |
Transamerica Schroders International Small Cap | | 1.04% |
Transamerica Systematic Small/Mid Cap Value | | 0.80% |
Transamerica Third Avenue Value | | 0.80% |
Transamerica Thornburg International Value | | 0.99% |
Transamerica TS&W International Equity6 | | N/A |
Transamerica UBS Large Cap Value | | 0.75% |
Transamerica WMC Diversified Equity | | 0.72% |
Transamerica WMC Diversified Growth7 | | 0.71% |
Transamerica WMC Emerging Markets | | 1.15% |
Transamerica WMC Quality Value8 | | N/A |
| 1 | Effective February 1, 2010, the advisory fee is 0.475% of the first $250 million of average daily net assets; 0.425% of average daily net assets over $250 million up to $350 million; and 0.40% of average daily net assets in excess of $350 million. Prior to February 1, 2010, the advisory fee was 0.725% of the first $250 million of average daily net assets; 0.675% of average daily net assets over $250 million up to $350 million; and 0.625% of average daily net assets in excess of $350 million. |
| 2 | Effective May 1, 2010, the advisory fee is 0.55% of the first $250 million of average daily net assets; 0.50% of average daily net assets over $250 million up to $500 million; 0.475% of average daily net assets over $500 million up to $1 billion; and 0.45% of average daily net assets in excess of $1 billion. Prior to May 1, 2010, the advisory fee was 0.65% of the first $250 million of average daily net assets; 0.60% of average daily net assets over $250 million up to $500 million; 0.575% of average daily net assets over $500 million up to $1 billion; and 0.55% of average daily net assets in excess of $1 billion. |
| 3 | Effective September 30, 2010, the advisory fee is 0.61% of the first $200 million of average daily net assets; 0.59% of average daily net assets over $200 million up to $1 billion; and 0.56% of average daily net assets in excess of $1 billion. Prior to September 30, 2010, the advisory fee was 0.80% of the first $250 million of average daily net assets; 0.775% of average daily net assets over $250 million up to $500 million; and 0.75% of average daily net assets in excess of $500 million. |
| 4 | Effective January 6, 2011, the advisory fee is 1.30% of the fund’s of average daily net assets. Prior to January 6, 2011, the advisory fee was 1.40% of the fund’s of average daily net assets. |
| 5 | Effective November 13, 2009, the advisory fee is 0.75% of the first $500 million of average daily net assets; 0.65% of average daily net assets over $500 million up to $1 billion; and 0.60% of average daily net assets in excess of $1 billion. Prior to November 13, 2009, the advisory fee was 0.80% of the first $250 million of average daily net assets; 0.75% of average daily net assets over $250 million up to $500 million; 0.70% of average daily net assets over $500 million up to $1.5 billion; and 0.625% of average daily net assets in excess of $1.5 billion. |
| 6 | The fund commenced operations on March 1, 2011, and as such, there were no advisory fees paid as of October 31, 2010. The advisory fee is 0.80% for the first $250 million of average daily net assets; 0.75% of average daily net assets over $250 million up to $500 million; 0.725% of average daily net assets over $500 million up to $1 billion; and 0.70% of average daily net assets in excess of $1 billion. |
| 7 | Effective November 13, 2009, the advisory fee is 0.73% of the first $500 million of average daily net assets; 0.70% of average daily net assets over $500 million up to $2.5 billion; and 0.65% of average daily net assets in excess of $2.5 billion. Prior to November 13, 2009, the advisory fee was 0.75% of the first $500 million of average daily net assets; 0.70% of average daily net assets over $500 million up to $2.5 billion; and 0.65% of average daily net assets in excess of $2.5 billion. |
| 8 | The fund commenced operations on November 15, 2010, and as such, there were no advisory fees paid as of October 31, 2010. The advisory fee is 0.70% for the first $1 billion of average daily net assets; and 0.68% of average daily net assets in excess of $1 billion. |
A discussion regarding the Board of Trustees’ approval of each fund’s advisory arrangements is available in each fund’s annual report for the fiscal year ended October 31, 2010, except Transamerica JPMorgan Core Bond, Transamerica TS&W International Equity, Transamerica WMC Diversified Equity and Transamerica WMC Quality Value. A discussion regarding the Board of Trustees’ approval for Transamerica WMC Quality Value and Transamerica TS&W International Equity will be available in each fund’s semi-annual report for the fiscal period ending April 30, 2011. A discussion regarding the Board of Trustees’ approval for Transamerica JPMorgan Core Bond and Transamerica WMC Diversified Equity is available in Transamerica WMC Diversified Equity’s semi-annual report for the fiscal period ended April 30, 2010, and Transamerica JPMorgan Core Bond’s annual report for the fiscal year ended October 31, 2009.
206
Sub-Advisers
The name and address of the sub-advisers are listed below. Pursuant to Investment Sub-advisory Agreements between TAM and each sub-adviser on behalf of the respective funds, each sub-adviser shall make investment decisions, buy and sell securities for the funds, conduct research that leads to these purchase and sale decisions, and pay broker-dealers a commission for these trades (which can include payments for research and brokerage services).
The sub-advisers listed below receive compensation, calculated daily and paid monthly , from TAM. For the fiscal year ended October 31, 2010, the sub-advisers received the following sub-advisory fees as a percentage of a fund’s average daily net assets:
| | | | |
| Fund | | Sub-Advisory Fee | | Name and Address of Sub-Adviser |
Transamerica AEGON Flexible Income1 Transamerica AEGON High Yield Bond Transamerica AEGON Money Market1 Transamerica AEGON Short-Term Bond2 | | 0.21% 0.26% 0.09% 0.16% | | AEGON USA Investment Management, LLC (“AUIM”) 4333 Edgewood Road NE Cedar Rapids, IA 52499 |
| Transamerica AQR Managed Futures Strategy | | 0.65% | | AQR Capital Management, LLC (“AQR”) Two Greenwich Plaza. 3rd Floor Greenwich, CT 06830 |
| Transamerica Multi-Managed Balanced3 | | 0.27% | | BlackRock Financial Management, Inc. (“BlackRock”) 55 East 52nd Street New York, NY 10055 |
Transamerica BlackRock Global Allocation Transamerica BlackRock Large Cap Value | | 0.35% 0.29% | | BlackRock Investment Management, LLC (“BlackRock”) 800 Scudders Mill Road Plainsboro, NJ 08536 |
| Transamerica Clarion Global Real Estate Securities | | 0.40% | | ING Clarion Real Estate Securities, LLC (“Clarion”) 201 King of Prussia Road Suite 600 Radnor, PA 19087 |
| Transamerica Federated Market Opportunity | | 0.35% | | Federated Equity Management Company of Pennsylvania (“Federated”) 1001 Liberty Avenue Pittsburgh, PA 15222 |
| Transamerica First Quadrant Global Macro | | 0.75% | | First Quadrant, L.P. (“FQ”) 800 E. Colorado Boulevard Suite 900 Pasadena, CA 91101 |
| Transamerica Goldman Sachs Commodity Strategy4 | | 0.25% | | Goldman Sachs Asset Management, L.P. (“GSAM”) 200 West Street New York, NY 10282 |
| Transamerica Hansberger International Value5 | | 0.42% | | Hansberger Global Investors, Inc. (“Hansberger”) 401 East Las Olas Blvd., Suite 1700 Ft. Lauderdale, FL 33301 |
| Transamerica Jennison Growth | | 0.30% | | Jennison Associates LLC (“Jennison”) 466 Lexington Avenue New York, NY 10017 |
Transamerica JPMorgan Core Bond Transamerica JPMorgan International Bond Transamerica JPMorgan Long/Short Strategy6 Transamerica JPMorgan Mid Cap Value Transamerica Multi-Managed Balanced3 | | 0.19% 0.17% 0.90% 0.40% 0.27% | | J.P. Morgan Investment Management Inc. (“JPMorgan”) 245 Park Avenue New York, NY 10167 |
207
| | | | |
| Fund | | Sub-Advisory Fee | | Name and Address of Sub-Adviser |
| Transamerica Loomis Sayles Bond | | 0.31% | | Loomis, Sayles & Company, L.P. (“Loomis”) One Financial Center Boston, MA 02111 |
| Transamerica MFS International Equity | | 0.43% | | MFS® Investment Management (“MFS”) 500 Boylston Street Boston, MA 02116 |
| Transamerica Morgan Stanley Emerging Markets Debt | | 0.42% | | Morgan Stanley Investment Management Inc. |
| Transamerica Morgan Stanley Growth Opportunities 7 | | 0.35% | | (“MSIM”) 522 Fifth Avenue |
| Transamerica Morgan Stanley Mid-Cap Growth | | 0.40% | | New York, NY 10036 |
| Transamerica Morgan Stanley Small Company Growth | | 0.45% | | |
| Transamerica Neuberger Berman International | | 0.46% | | Neuberger Berman Management LLC (“Neuberger”) 605 Third Avenue, 2nd Floor New York, NY 10158 |
| Transamerica Oppenheimer Developing Markets | | 0.62% | | OppenheimerFunds, Inc. (“Oppenheimer”) |
| Transamerica Oppenheimer Small- & Mid- Cap Value | | 0.40% | | Two World Financial Center 225 Liberty Street 11th Floor New York, NY 10281 |
| Transamerica PIMCO Real Return TIPS | | 0.25% | | Pacific Investment Management |
| Transamerica PIMCO Total Return | | 0.24% | | Company LLC (“PIMCO”) 840 Newport Center Drive Newport Beach, CA 92660 |
| Transamerica Schroders International Small Cap | | 0.58% | | Schroder Investment Management North America Inc. (“Schroders”) 875 Third Avenue 22nd Floor New York, NY 10022 |
| Transamerica Systematic Small/Mid Cap Value8 | | 0.37% | | Systematic Financial Management L.P. (“Systematic”) 300 Frank W. Burr Blvd. Glenpointe East 7th Floor Teaneck, NJ 07666 |
| Transamerica Third Avenue Value | | 0.40% | | Third Avenue Management LLC (“Third Avenue”) 622 Third Avenue 32nd Floor New York, NY 10017 |
| Transamerica Thornburg International Value | | 0.41% | | Thornburg Investment Management, Inc. (“Thornburg”) 2300 North Ridgetop Road Santa Fe, NM 87506 |
| Transamerica TS&W International Equity9 | | N/A | | Thompson, Siegel & Walmsley LLC (« TS&W ») 6806 Paragon Place Suite 300 |
208
| | | | |
| Fund | | Sub-Advisory Fee | | Name and Address of Sub-Adviser |
| | | | | Richmond, VA 23230 |
| Transamerica UBS Large Cap Value | | 0.30% | | UBS Global Asset Management |
| | | | | (Americas) Inc. (“UBS”) |
| | | | | One North Wacker Drive |
| | | | | Chicago, IL 60606 |
| Transamerica WMC Diversified Equity10 | | 0.26% | | Wellington Management |
| Transamerica WMC Diversified Growth | | 0.25% | | Company, LLP |
| Transamerica WMC Emerging Markets | | 0.70% | | (“Wellington Management”) |
| Transamerica WMC Quality Value11 | | N/A | | 280 Congress Street |
| | | | | Boston, MA 02210 |
| | 1 | Fees shown were paid to the previous sub-adviser. |
| | 2 | Fees shown were paid to the previous sub-adviser. Effective September 7, 2010, the sub-advisory fee is 0.20% of the first $250 million of average daily net assets; 0.15% of average daily net assets over $250 million up to $500 million; 0.125% of average daily net assets over $500 million up to $1 billion; and 0.10% of average daily net assets in excess of $1 billion. Prior to September 7, 2010, the sub-advisory fee was 0.25% of the first $250 million of average daily net assets; 0.20% of average daily net assets over $250 million up to $500 million; 0.175% of average daily net assets over $500 million up to $1 billion; and 0.15% of average daily net assets in excess of $1 billion. |
| | 3 | Fees shown were paid to the previous sub-adviser. Effective March 22, 2011, the sub-advisory fee is 0.25% of average daily net assets (JPMorgan) and 0.12% of the first $1 billion of average daily net assets; and 0.05% of average daily net assets in excess of $1 billion (BlackRock). For the JPMorgan portion of fees, the average daily net assets for the purpose of calculating sub-advisory fees will be determined on a combined basis with similar mandates of Transamerica Series Trust and Transamerica Partners funds managed by JPMorgan. |
| | 4 | Effective September 30, 2010, the sub-advisory fee is 0.25% of the first $200 million of average daily net assets; 0.23% of average daily net assets over $200 million up to $1 billion; and 0.20% of average daily net assets in excess of $1 billion. Prior to September 30, 2010, the sub-advisory fee was 0.40% of the first $250 million of average daily net assets; 0.375% of average daily net assets over $250 million up to $500 million; and 0.35% of average daily net assets in excess of $500 million. |
| | 5 | Fees shown were paid to the previous sub-adviser. Effective December 15, 2010, the sub-advisory fee is 0.45% of the first $200 million of average daily net assets; 0.36% of average daily net assets over $200 million up to $500 million; and 0.32% of average daily net assets in excess of $500 million. |
| | 6 | Fees shown were paid to the previous sub-adviser. Effective January 6, 2011, the sub-advisory fee is 0.90% of average daily net assets. |
| | 7 | Fees shown were paid to the previous sub-adviser. Effective March 22, 2011, the sub-advisory fee is 0.40% of the first $1 billion of average daily net assets; and 0.375% of average daily net assets in excess of $1 billion. The average daily net assets for the purpose of calculating sub-advisory fees will be aggregated with similar mandates of Transamerica Funds and Transamerica Series Trust managed by MSIM. Prior to March 22, 2010, the sub-advisory fee was 0.40% of the first $100 million of average daily net assets; and 0.35% of average daily net assets in excess of $100 million. |
| | 8 | Fees shown were paid to the previous sub-adviser. Effective March 22, 2011, the sub-advisory fee is 0.45% of the first $100 million of average daily net assets; 0.40% over $100 million up to $350 million of average daily net assets; 0.35% over $350 million up to $1 billion of average daily net assets; and 0.30% of average daily net assets in excess of $1 billion. The average daily net assets for the purpose of calculating sub-advisory fees will be aggregated with a similar mandate of Transamerica Series Trust managed by Systematic. Prior to March 22, 2010, the sub-advisory fee was 0.375% of the first $500 million of average daily net assets; and 0.325% of average daily net assets in excess of $500 million. |
| | 9 | The fund commenced operations on March 1, 2011, and as such, there were no sub-advisory fees paid as of October 31, 2010. The sub-advisory fee is 0.40% of the first $250 million of average daily net assets; 0.35% of average daily net assets over $250 million up to $500 million; 0.325% of average daily net assets over $500 million up to $1 billion; and 0.30% of average daily net assets in excess of $1 billion. |
| | 10 | Fees shown were paid to the previous sub-adviser. Effective March 22, 2011, the sub-advisory fee is 0.28% of the first $2 billion of average daily net assets; 0.25% over $2 billion up to $5 billion of average daily net assets; and 0.225% of average daily net assets in excess of $5 billion. The average daily net assets for the purpose of calculating sub-advisory fees will be aggregated with similar mandates of Transamerica Funds, Transamerica Series Trust and Transamerica Partners funds managed by Wellington Management. Prior to March 22, 2010, the sub-advisory fee was 0.35% of the first $500 million of average daily net assets; 0.30% over $500 million up to $2.5 billion of average daily net assets; and 0.25% of average daily net assets in excess of $2.5 billion. |
| | 11 | The fund commenced operations on November 15, 2010, and as such, there were no sub-advisory fees paid as of October 31, 2010. The sub-advisory fee is 0.25% of the first $1 billion of average daily net assets; and 0.225% of average daily net assets in excess of $1 billion. |
Portfolio Manager(s)
The following funds are managed by the portfolio manager(s) listed below. The SAI provides additional information about the portfolio manager(s)’ compensation, other accounts managed by the portfolio manager(s), and the portfolio manager(s)’ ownership in each fund they manage.
Transamerica AEGON Flexible Income
| | | | | | |
| Name/Year Joined Fund | | Role | | Employer | | Positions Over Past Five Years |
| Brian W. Westhoff, CFA/2005 | | Portfolio Manager (Lead) | | AUIM | | Portfolio Manager |
| Bradley J. Beman, CFA/2011 | | Portfolio Manager | | AUIM | | Senior Vice President, Director – High Yield |
| David Halfpap/2011 | | Portfolio Manager | | AUIM | | Executive Vice President, Portfolio Manager |
| Rick Perry/2011 | | Portfolio Manager | | AUIM | | Senior Vice President, Director of Investment Grade Credit |
| Jim Schaeffer/2011 | | Portfolio Manager | | AUIM | | Senior Vice President, Director of Distressed Debt |
209
Transamerica AEGON High Yield Bond
| | | | | | |
| Name/Year Joined Fund | | Role | | Employer | | Positions Over Past Five Years |
| Bradley J. Beman, CFA/1997 | | Portfolio Manager | | AUIM | | Senior Vice President, Director – High Yield |
| Kevin Bakker, CFA/2007 | | Portfolio Manager | | AUIM | | High Yield Portfolio Manager |
| Benjamin D. Miller, CFA/2006 | | Portfolio Manager | | AUIM | | High Yield Portfolio Manager |
Transamerica AEGON Short-Term Bond
| | | | | | |
| Name/Year Joined Fund | | Role | | Employer | | Positions Over Past Five Years |
| Greg D. Haendel, CFA/2007 | | Portfolio Manager (Lead) | | AUIM | | Portfolio Manager |
| Garry Creed/2011 | | Portfolio Manager | | AUIM | | Senior Vice President, Director of Credit Research |
| Doug Weih/2011 | | Portfolio Manager | | AUIM | | Senior Vice President, Director of Public Securitized |
Transamerica AQR Managed Futures Strategy
| | | | | | |
| Name/Year Joined Fund | | Role | | Employer | | Positions Over Past Five Years |
| Clifford S. Asness/2010 | | Portfolio Manager | | AQR | | Portfolio Manager, Managing and Founding Principal |
| John M. Liew/2010 | | Portfolio Manager | | AQR | | Portfolio Manager, Founding Principal |
| Brian K. Hurst/2010 | | Portfolio Manager | | AQR | | Portfolio Manager, Principal |
| Lasse H. Pedersen/2010 | | Portfolio Manager | | AQR | | Portfolio Manager, Principal, Chaired Professor of Finance at NYU Stern School of Business since 2007; Associate Professor of Finance with Tenure from 2005-2007. |
| Yao Hua Ooi/2010 | | Portfolio Manager | | AQR | | Portfolio Manager, Vice President |
Transamerica BlackRock Global Allocation
| | | | | | |
| Name/Year Joined Fund | | Role | | Employer | | Positions Over Past Five Years |
| Dennis W. Stattman/2005 | | Portfolio Manager | | BlackRock | | Managing Director |
| Dan Chamby/2005 | | Portfolio Manager | | BlackRock | | Managing Director |
| Romualdo Roldan/2005 | | Portfolio Manager | | BlackRock | | Managing Director |
Transamerica BlackRock Large Cap Value
| | | | | | |
| Name/Year Joined Fund | | Role | | Employer | | Positions Over Past Five Years |
| Robert C. Doll, Jr., CFA/2005 | | Senior Portfolio Manager | | BlackRock | | Vice Chairman, Chief Equity Strategist |
| Daniel Hanson, CFA/2008 | | Associate Portfolio Manager | | BlackRock | | Managing Director |
| Peter Stournaras, CFA/2010 | | Portfolio Manager | | BlackRock | | Managing Director since |
210
| | | | | | |
| Name/Year Joined Fund | | Role | | Employer | | Positions Over Past Five Years |
| | | | | | | 2010; Director at Northern Trust Company from 2006 to 2010; Portfolio Manager at Smith Barney/Legg Mason from 2005 to 2006 |
Transamerica Clarion Global Real Estate Securities
| | | | | | |
| Name/Year Joined Fund | | Role | | Employer | | Positions Over Past Five Years |
| Steven D. Burton, CFA/2002 | | Portfolio Manager | | Clarion | | Managing Director |
| T. Ritson Ferguson, CFA/2002 | | Portfolio Manager | | Clarion | | Chief Investment Officer |
| Joseph P. Smith, CFA/2002 | | Portfolio Manager | | Clarion | | Managing Director |
Transamerica Federated Market Opportunity
| | | | | | |
| Name/Year Joined Fund | | Role | | Employer | | Positions Over Past Five Years |
| Douglas C. Noland/2010 | | Senior Portfolio Manager | | Federated | | Senior Vice President, Senior Portfolio Manager |
| Dana L. Meissner, CFA/2009 | | Portfolio Manager | | Federated | | Vice President, Senior Investment Analyst, Portfolio Manager |
Transamerica First Quadrant Global Macro
| | | | | | |
| Name/Year Joined Fund | | Role | | Employer | | Positions Over Past Five Years |
| Chuck Fannin, CFA/2009 | | Portfolio Manager | | FQ | | Director of Global Options Strategies |
| Kenneth J. Ferguson/2009 | | Portfolio Manager | | FQ | | Partner |
| Dori Levanoni/2009 | | Portfolio Manager | | FQ | | Partner |
Transamerica Goldman Sachs Commodity Strategy
| | | | | | |
| Name/Year Joined Fund | | Role | | Employer | | Positions Over Past Five Years |
| Stephen Lucas/2010 | | Portfolio Manager | | GSAM | | Portfolio Manager, Head of Commodities Management for the Goldman Global Fixed Income Team, Member of the Duration Team, Head of the Quantitative Strategies Team |
| Michael Johnson/2010 | | Portfolio Manager | | GSAM | | Portfolio Manager and Member of the Commodities Team and the Alternatives Team |
| John Calvaruso /2010 | | Portfolio Manager | | GSAM | | Portfolio Manager and Member of the Commodities Team and the Alternatives Team |
211
Transamerica Hansberger International Value
| | | | | | |
| Name/Year Joined Fund | | Role | | Employer | | Positions Over Past Five Years |
| Ronald W. Holt, CFA/2010 | | Portfolio Manager | | Hansberger | | President, CEO & Co-Chief Investment Officer (Value Team), Portfolio Manager |
| Moira McLachlan, CFA/2010 | | Portfolio Manager | | Hansberger | | Senior Vice President (Value Team), Portfolio Manager |
| Lauretta (Retz) Reeves, CFA/2010 | | Portfolio Manager | | Hansberger | | Co-Chief Investment Officer (Value Team), Portfolio Manager |
Transamerica Jennison Growth
| | | | | | |
| Name/Year Joined Fund | | Role | | Employer | | Positions Over Past Five Years |
| Michael A. Del Balso/2009 | | Portfolio Manager | | Jennison | | Managing Director and Director of Research for Growth Equity |
| Blair A. Boyer/2009 | | Portfolio Manager | | Jennison | | Managing Director |
| Spiros “Sig” Segalas/2009 | | Portfolio Manager | | Jennison | | Director, President and Chief Investment Officer |
Transamerica JPMorgan Core Bond
| | | | | | |
| Name/Year Joined Fund | | Role | | Employer | | Positions Over Past Five Years |
| Douglas S. Swanson/2009 | | Portfolio Manager | | JPMorgan | | Managing Director and Portfolio Manager |
Transamerica JPMorgan International Bond
| | | | | | |
| Name/Year Joined Fund | | Role | | Employer | | Positions Over Past Five Years |
| Jon Jonsson/2005 | | Portfolio Manager | | JPMorgan | | Managing Director and Portfolio Manager |
Transamerica JPMorgan Long/Short Strategy
| | | | | | |
| Name/Year Joined Fund | | Role | | Employer | | Positions Over Past Five Years |
| Terance Chen, CFA/2011 | | Portfolio Manager | | JPMorgan | | Vice President and Portfolio Manager |
Transamerica JPMorgan Mid Cap Value
| | | | | | |
| Name/Year Joined Fund | | Role | | Employer | | Positions Over Past Five Years |
| Jonathan K.L. Simon/2005 | | Portfolio Manager | | JPMorgan | | Portfolio Manager and Managing Director |
| Lawrence Playford, CFA/2005 | | Portfolio Manager | | JPMorgan | | Portfolio Manager and Executive Director |
| Gloria Fu, CFA/2006 | | Portfolio Manager | | JPMorgan | | Portfolio Manager and Executive Director |
212
Transamerica Loomis Sayles Bond
| | | | | | |
| Name/Year Joined Fund | | Role | | Employer | | Positions Over Past Five Years |
| Kathleen C. Gaffney, CFA/2007 | | Lead Portfolio Manager | | Loomis | | Vice President, Portfolio Manager |
| Daniel J. Fuss, CFA/2007 | | Co-Portfolio Manager | | Loomis | | Executive Vice President, Vice Chairman, Senior Portfolio Manager |
| Elaine M. Stokes/2007 | | Co-Portfolio Manager | | Loomis | | Vice President, Portfolio Manager |
| Mathew J. Eagan, CFA/2007 | | Co-Portfolio Manager | | Loomis | | Vice President, Portfolio Manager |
Transamerica MFS International Equity
| | | | | | |
| Name/Year Joined Fund | | Role | | Employer | | Positions Over Past Five Years |
| Daniel Ling/2009 | | Portfolio Manager | | MFS | | Investment Officer, Investment Manager, Lion Capital Management, Singapore |
| Marcus L. Smith/2006 | | Portfolio Manager | | MFS | | Investment Officer |
Transamerica Morgan Stanley Emerging Markets Debt
| | | | | | |
| Name/Year Joined Fund | | Role | | Employer | | Positions Over Past Five Years |
| Eric J. Baurmeister/2004 | | Portfolio Manager | | MSIM | | Managing Director |
| Federico L. Kaune/2004 | | Portfolio Manager | | MSIM | | Managing Director |
Transamerica Morgan Stanley Growth Opportunities
| | | | | | |
| Name/Year Joined Fund | | Role | | Employer | | Positions Over Past Five Years |
| Dennis P. Lynch/2011 | | Lead Portfolio Manager | | MSIM | | Managing Director |
| David S. Cohen/2011 | | Portfolio Manager | | MSIM | | Managing Director |
| Sam G. Chainani/2011 | | Portfolio Manager | | MSIM | | Managing Director |
| Alexander T. Norton/2011 | | Portfolio Manager | | MSIM | | Executive Director |
| Jason C. Yeung/2011 | | Portfolio Manager | | MSIM | | Managing Director |
| Armistead B. Nash/2011 | | Portfolio Manager | | MSIM | | Executive Director |
Transamerica Morgan Stanley Mid-Cap Growth
| | | | | | |
| Name/Year Joined Fund | | Role | | Employer | | Positions Over Past Five Years |
| Dennis P. Lynch/2006 | | Lead Portfolio Manager | | MSIM | | Managing Director |
| David S. Cohen/2006 | | Portfolio Manager | | MSIM | | Managing Director |
| Sam G. Chainani/2006 | | Portfolio Manager | | MSIM | | Managing Director |
| Alexander T. Norton/2006 | | Portfolio Manager | | MSIM | | Executive Director |
| Jason C. Yeung/2007 | | Portfolio Manager | | MSIM | | Executive Director |
| Armistead B. Nash/2008 | | Portfolio Manager | | MSIM | | Executive Director |
Transamerica Morgan Stanley Small Company Growth
| | | | | | |
| Name/Year Joined Fund | | Role | | Employer | | Positions Over Past Five Years |
| Dennis P. Lynch/2004 | | Lead Portfolio Manager | | MSIM | | Managing Director |
213
| | | | | | |
| Name/Year Joined Fund | | Role | | Employer | | Positions Over Past Five Years |
| David S. Cohen/2004 | | Portfolio Manager | | MSIM | | Managing Director |
| Sam G. Chainani/2004 | | Portfolio Manager | | MSIM | | Managing Director |
| Alexander T. Norton/2005 | | Portfolio Manager | | MSIM | | Executive Director |
| Jason C. Yeung/2007 | | Portfolio Manager | | MSIM | | Executive Director |
| Armistead B. Nash/2008 | | Portfolio Manager | | MSIM | | Executive Director |
|
| Transamerica Multi-Managed Balanced |
| Name/Year Joined Fund | | Role | | Employer | | Positions Over Past Five Years |
| Matthew Marra/2011 | | Portfolio Manager | | BlackRock | | Managing Director |
| Eric Pellicciaro/2011 | | Portfolio Manager | | BlackRock | | Managing Director |
| Rick Rieder/2011 | | Portfolio Manager | | BlackRock | | Chief Investment Officer of Fixed Income, Fundamental Portfolios, and head of Corporate Credit and Multi- Sector and Mortgage Groups; President and Chief Executive Officer of R3 Capital Partners from 2008 to 2009; Head of Global Principal Strategies team and Credit Businesses at Lehman Brothers from 1987 to 2008 |
| Scott Blasdell, CFA/2011 | | Portfolio Manager | | JPMorgan | | Portfolio Manager |
| Terance Chen, CFA/2011 | | Portfolio Manager | | JPMorgan | | Vice President and Portfolio Manager |
| Raffaele Zingone, CFA/2011 | | Portfolio Manager | | JPMorgan | | Portfolio Manager |
|
| Transamerica Neuberger Berman International |
| Name/Year Joined Fund | | Role | | Employer | | Positions Over Past Five Years |
| Benjamin Segal, CFA/2005 | | Portfolio Manager | | Neuberger | | Vice President and Managing Director |
|
| Transamerica Oppenheimer Developing Markets |
| Name/Year Joined Fund | | Role | | Employer | | Positions Over Past Five Years |
| Justin Leverenz, CFA/2007 | | Portfolio Manager | | Oppenheimer | | Vice President and Senior Analyst |
|
| Transamerica Oppenheimer Small- & Mid-Cap Value |
| Name/Year Joined Fund | | Role | | Employer | | Positions Over Past Five Years |
| John Damian/2006 | | Portfolio Manager | | Oppenheimer | | Vice President |
|
| Transamerica PIMCO Real Return TIPS |
| Name/Year Joined Fund | | Role | | Employer | | Positions Over Past Five Years |
| Mihir Worah/2008 | | Portfolio Manager | | PIMCO | | Managing Director |
214
| | | | | | |
| Transamerica PIMCO Total Return |
| Name/Year Joined Fund | | Role | | Employer | | Positions Over Past Five Years |
| Chris P. Dialynas/2008 | | Portfolio Manager | | PIMCO | | Managing Director |
|
| Transamerica Schroders International Small Cap |
| Name/Year Joined Fund | | Role | | Employer | | Positions Over Past Five Years |
| Matthew Dobbs/2008 | | Portfolio Manager | | Schroders | | Head of Global Small Cap Equities |
|
| Transamerica Systematic Small/Mid Cap Value |
| Name/Year Joined Fund | | Role | | Employer | | Positions Over Past Five Years |
| Kenneth Burgess, CFA/2011 | | Portfolio Manager | | Systematic | | Portfolio Manager, Partner |
| Ron Mushock, CFA/2011 | | Portfolio Manager | | Systematic | | Portfolio Manager, Partner |
|
| Transamerica Third Avenue Value |
| Name/Year Joined Fund | | Role | | Employer | | Positions Over Past Five Years |
| Curtis R. Jensen/2007 | | Co-Portfolio Manager | | Third Avenue | | Co-Chief Investment Officer |
| Yang Lie/2008 | | Co-Portfolio Manager | | Third Avenue | | Director of Research |
| Kathleen K. Crawford/2007 | | Assistant Portfolio Manager | | Third Avenue | | Research Analyst |
|
| Transamerica Thornburg International Value |
| Name/Year Joined Fund | | Role | | Employer | | Positions Over Past Five Years |
| William V. Fries, CFA/2008 | | Portfolio Manager (Co) | | Thornburg | | Managing Director |
| Wendy Trevisani/2008 | | Portfolio Manager (Co) | | Thornburg | | Managing Director |
| Lei Wang, CFA/2008 | | Portfolio Manager (Co) | | Thornburg | | Managing Director |
|
| Transamerica TS&W International Equity |
| Name/Year Joined Fund | | Role | | Employer | | Positions Over Past Five Years |
| Brandon H. Harrell, CFA/2011 | | Portfolio Manager | | TS&W | | Officer and International Portfolio Manager |
|
| Transamerica UBS Large Cap Value |
| Name/Year Joined Fund | | Role | | Employer | | Positions Over Past Five Years |
| Thomas M. Cole/2004 | | Portfolio Manager | | UBS | | Head and Research Director of North American Equities and Managing Director |
| Thomas J. Digenan/2004 | | Portfolio Manager | | UBS | | North American Equity Strategist and Managing Director |
| John C. Leonard/2004 | | Portfolio Manager | | UBS | | Global Head of Equities |
215
| | | | | | |
| Transamerica WMC Diversified Equity |
| Name/Year Joined Fund | | Role | | Employer | | Positions Over Past Five Years |
| Paul E. Marrkand, CFA/2011 | | Portfolio Manager | | Wellington Management | | Senior Vice President and Equity Portfolio Manager |
|
| Transamerica WMC Diversified Growth |
| Name/Year Joined Fund | | Role | | Employer | | Positions Over Past Five Years |
| Paul E. Marrkand, CFA/2010 | | Portfolio Manager | | Wellington Management | | Senior Vice President and Equity Portfolio Manager |
|
| Transamerica WMC Emerging Markets |
| Name/Year Joined Fund | | Role | | Employer | | Positions Over Past Five Years |
| Vera M. Trojan, CFA/2008 | | Co-Portfolio Manager | | WMC | | Senior Vice President and Equity Portfolio Manager |
|
| Transamerica WMC Quality Value |
| Name/Year Joined Fund | | Role | | Employer | | Positions Over Past Five Years |
| Matthew G. Baker/2010 | | Portfolio Manager | | Wellington Management | | Equity Portfolio Manager, Vice President |
| Edward P. Bousa, CFA/2010 | | Portfolio Management and Securities Analysis | | Wellington Management | | Equity Portfolio Manager, Senior Vice President |
Disclosure of Portfolio Holdings: A detailed description of the funds’ policies and procedures with respect to the disclosure of the funds’ portfolio holdings is available in the SAI. The funds publish their top ten holdings on the Transamerica Funds website at www.transamericafunds.com within two weeks after the end of each month. In addition, the funds publish all holdings on the website approximately 25 days after the end of each calendar quarter. Such information will generally remain online for six months or as otherwise consistent with applicable regulations.
Prior Performance for Similar Accounts
Transamerica WMC Diversified Equity, Transamerica WMC Diversified Growth and Transamerica WMC Quality Value. The performance information shown below represents composites of the prior performance of certain discretionary accounts (the “Other Accounts”) managed by Wellington Management. The Wellington Management Diversified Growth Composite reflects other accounts having investment objectives, policies and strategies substantially similar to Transamerica WMC Diversified Equity and Transamerica WMC Diversified Growth while the Wellington Management Quality Value Composite reflects other accounts having investment objectives, policies and strategies substantially similar to Transamerica WMC Quality Value. Wellington Management has prepared the historical performance shown for each composite in compliance with the Global Investment Performance Standards. This methodology differs from the guidelines of the Securities and Exchange Commission for calculating performance of mutual funds.
The past performance of the Other Accounts is not indicative of future rates of return, nor is that past performance an indication of future performance of the funds. Each fund’s actual performance may vary significantly from the past performance of the relevant composite. Differences in asset size and cash flows may result in different security selections, differences in relative weightings of securities or differences in prices paid for particular portfolio holdings. In addition, the Other Accounts were not subject to certain investment limitations and other restrictions imposed by the Investment Company Act of 1940 and the Internal Revenue Code, which, if applicable, may have adversely affected the performance results of the composites.
The composite performance presented below is shown on both a gross and net basis. The gross performance results do not reflect the deduction of management fees and other charges applicable to the accounts that make up the composites. The net performance results have been adjusted to reflect the operating expenses of Class A shares of the funds. The composite net performance results do not reflect Class A sales charges. If they did, returns would be lower. The net performance for other share classes will vary due to differences in sales charge structure and class expenses. The bar charts illustrate the variability of
216
the returns of the respective composite. The tables compare the investment results for the respective composite to that of an index measuring the broad market over different periods of time.
The composite performance is not that of the funds, should not be interpreted as indicative of the funds’ future performance, and should not be considered a substitute for the funds’ performance.
Year-by-Year Total Return as of 12/31 each year (%)
Wellington Management Diversified Growth Composite

Wellington Management Quality Value Composite

217
Average Annual Total Returns (for periods ended December 31, 2010)
| | | | | | |
| | | 1 Year | | 5 Years | | 10 Years |
| Wellington Management Diversified Growth Composite (gross of expenses) | | 20.65% | | 6.09% | | 4.01% |
| Wellington Management Diversified Growth Composite (net of expenses) | | 18.86% | | 4.49% | | 2.45% |
| Russell 1000® Growth Index | | 16.71% | | 3.75% | | 0.02% |
|
| Average Annual Total Returns (for periods ended December 31, 2010) |
| | | 1 Year | | 5 Years | | 10 Years |
| Wellington Management Quality Value Composite (gross of expenses) | | 15.06% | | 5.82% | | 6.05% |
| Wellington Management Quality Value Composite (net of expenses) | | 13.65% | | 4.52% | | 4.75% |
| Russell 1000® Value Index | | 15.51% | | 1.28% | | 3.26% |
Prior Performance for Similar Accounts
Transamerica Morgan Stanley Growth Opportunities. The performance information shown below represents the prior performance of Transamerica Morgan Stanley Mid-Cap Growth, a mutual fund also sub-advised by Morgan Stanley Investment Management Inc. (“MSIM”). Transamerica Morgan Stanley Mid-Cap Growth has an investment objective, policies and strategies that are substantially similar to Transamerica Morgan Stanley Growth Opportunities (the “Fund”). MSIM has served as the sub-adviser to Transamerica Morgan Stanley Mid-Cap Growth since the fund’s inception on January 3, 2006.
The past performance of Transamerica Morgan Stanley Mid-Cap Growth is not indicative of future rates of return, nor is that past performance an indication of future performance of the Fund. The Fund’s actual performance may vary significantly from the past performance of Transamerica Morgan Stanley Mid-Cap Growth. Differences in asset size and cash flows may result in different security selections, differences in relative weightings of securities or differences in prices paid for particular portfolio holdings. The Fund’s performance may differ due to other factors, such as differences in fees and expenses.
The performance results of Class I2 shares of Transamerica Morgan Stanley Mid-Cap Growth have been adjusted to reflect the operating expenses of Class A shares of the Fund. The performance results do not reflect Class A sales charges. If they did, returns would be lower. The performance for other share classes will vary due to differences in sales charge structure and class expenses. The bar chart illustrates the variability of the returns of Transamerica Morgan Stanley Mid-Cap Growth. The table compares the investment results for Transamerica Morgan Stanley Mid-Cap Growth to that of an index measuring the broad market over different periods of time.
The performance of Transamerica Morgan Stanley Mid-Cap Growth is not that of the Fund, should not be interpreted as indicative of the Fund’s future performance, and should not be considered a substitute for the Fund’s performance.
Year-by-Year Total Return as of 12/31 each year (%) – Class I2

218
Average Annual Total Returns (periods ended December 31,2010)
| | | | |
| | | 1 Year | | Inception |
| Transamerica Morgan Stanley Mid-Cap Growth - Class I2 (commenced operations on January 3, 2006) | | 32.81% | | 7.57% |
| Russell Midcap® Growth Index | | 26.38% | | 4.89% |
TO CONTACT TRANSAMERICA FUNDS
| | |
| Customer Service: | | 1-888-233-4339 |
| |
| Internet: | | www.transamericafunds.com |
| |
| Fax: | | 1-888-329-4339 |
| |
| Mailing Address: | | Transamerica Fund Services, Inc. |
| |
| | P.O. Box 219945 |
| |
| | Kansas City, MO 64121-9945 |
| |
| Overnight Address: | | Transamerica Fund Services, Inc. |
| |
| | 330 W. 9th Street |
| |
| | Kansas City, MO 64105 |
BUYING SHARES
Class I2 shares of the funds in this prospectus are currently primarily offered for investment in certain funds of funds (also referred to as “strategic asset allocation funds”). Class I2 shares of the funds are also made available to other investors, including institutional investors such as foreign insurers, domestic insurance companies and their separate accounts, and unaffiliated funds, high net worth individuals, and eligible retirement plans whose recordkeepers or financial service firm intermediaries have entered into agreements with Transamerica Funds or its agents. Investors who received Class I2 shares in connection with the reorganization of a Transamerica Premier Fund into a Transamerica Fund may continue to invest in Class I2 shares of that Transamerica Fund, but may not open new accounts. Purchase requests initiated through an automated service that exceed $50,000 per day are not permitted and must be submitted by check or via bank wire.
By Check
| • | | Make your check payable and mail to Transamerica Fund Services, Inc. |
| • | | If you are purchasing shares in an existing account(s), please reference your account number(s) and the Transamerica Fund(s) in which you wish to invest. If you do not specify the fund(s) in which you wish to invest, and your referenced account is invested in one fund, your check will be deposited into such fund. |
| • | | Redemption proceeds will be withheld for 15 calendar days from the date of purchase for funds to clear. Certain exceptions may apply. |
| • | | Transamerica Funds does not accept money orders, traveler’s checks, starter checks, credit card convenience checks or cash. Cashier’s checks and third-party checks may be accepted, subject to approval by Transamerica Funds. |
By Automatic Investment Plan
| • | | With an Automatic Investment Plan (“AIP”), a level dollar amount is invested monthly and payment is deducted electronically from your bank account. Due to your bank’s requirements, please allow up to 30 days for your AIP to begin. Investments may be made between the 3rd and 28th of each month only, and will occur on the 15th if no selection is made. Call Customer Service for information on how to establish an AIP or visit our website to obtain an AIP request form. |
By Telephone
| • | | You may request an electronic transfer of funds from your bank account to your Transamerica Funds account. The electronic bank link option must be established in advance before Automated Clearing House (“ACH”) purchases will be accepted. Call Customer Service or visit our website for information on how to establish an electronic bank link. Due to your bank’s requirements, please allow up to 30 days to establish this option. |
219
Through an Authorized Dealer
| • | | If your dealer has already established your account for you, no additional documentation is needed. Call your dealer to place your order. Transamerica Funds must receive your payment within three business days after your order is accepted. |
By the Internet
| • | | You may request an electronic transfer of funds from your bank account to your Transamerica Funds account. The electronic bank link option must be established in advance before ACH purchases will be accepted. Call Customer Service or visit our website for information on how to establish an electronic bank link. |
By Payroll Deduction
| • | | You may have money transferred regularly from your payroll to your Transamerica Funds account. Call Customer Service to establish this option. |
By Wire Transfer
| • | | You may request that your bank wire funds to your Transamerica Funds account (note that your bank may charge a fee for such service). You must have an existing account to make a payment by wire transfer. Ask your bank to send your payment to: |
Bank of America, NA, Charlotte, NC, ABA# 0260-0959-3, Credit: Transamerica Funds Account# 3600622064. Provide shareholder name, fund and account numbers.
| • | | Shares will be purchased at the next determined NAV after receipt of your wire if you have supplied all other required information. |
Other Information
If your check, draft or electronic transfer is returned unpaid by your bank, you will be charged a fee of $20 for each item that has been returned.
Transamerica Funds reserves the right to terminate your electronic draft privileges if the drafts are returned unpaid by your bank.
Transamerica Funds or its agents may reject a request for purchase of shares at any time, in whole or in part, including any purchase under the exchange privilege. To the extent authorized by law, Transamerica Funds and each of the funds reserve the right to discontinue offering shares at any time, to merge or liquidate a class of shares or to cease operations entirely.
SELLING SHARES
Shares may be sold (or “redeemed”) at any time. Proceeds from the redemption of shares will usually be sent to the redeeming shareholder within three business days after receipt in good order of a request for redemption. However, Transamerica Funds has the right to take up to seven days to pay redemption proceeds, and may postpone payment under certain circumstances, as authorized by law. Shares will normally be redeemed for cash, although each fund retains the right to redeem its shares in kind. Please see the SAI for more details.
In cases where shares have recently been purchased and the purchase money is not yet available, redemption proceeds will be withheld for 15 calendar days from the date of purchase for funds to clear. Certain exceptions may apply. Shares purchased by wire are immediately available and are not subject to the 15 day holding period.
Please note that redemption requests greater than $50,000 per day must be submitted in writing. In addition, amounts greater than $50,000 cannot be sent via ACH (check or federal funds wire only). Additionally, requests totaling more than $100,000 must be in writing with an original signature guarantee for all shareholders.
The electronic bank link option must be established in advance for payments made electronically to your bank such as ACH or expedited wire redemptions. Call Customer Service to verify this feature is in place on your account or to obtain information on how to establish the electronic bank link.
To Request Your Redemption and Receive Payment By:
Direct Deposit – ACH
| • | | You may request an “ACH redemption” in writing or by phone or by internet access to your account. Payment should usually be received by your bank account 2-4 banking days after your request is received in good order. Transamerica Funds does not charge for this payment option. Certain IRAs and qualified retirement plans may not be eligible via the internet. |
220
Direct Deposit – Wire
| • | | You may request an expedited wire redemption in writing or by phone. The electronic bank link option must be established in advance. Otherwise, an original signature guarantee will be required. Wire redemptions have a minimum of $1,000 per wire. Payment should be received by your bank account the next banking day after your request is received in good order. Transamerica Funds charges $10 for this service. Your bank may charge a fee as well. |
Check to Address of Record
| • | | Written Request: Send a letter requesting a withdrawal to Transamerica Funds. Specify the fund, account number and dollar amount or number of shares you wish to redeem. Be sure to include all shareholders’ signatures and any additional documents, as well as an original signature guarantee(s) if required. If you are requesting a distribution from an IRA, federal tax withholding of 10% will apply unless you elect otherwise. If you elect to withhold, the minimum tax withholding rate is 10%. |
| • | | Telephone or Internet Request: You may request your redemption by phone or internet. Certain IRAs and qualified retirement plans may not be eligible. |
Check to Another Party/Address
| • | | This request must be in writing, regardless of amount, signed by all account owners, with an original signature guarantee. |
Systematic Withdrawal Plan (by Direct Deposit ACH or Check)
| • | | You can establish a Systematic Withdrawal Plan (“SWP”) either at the time you open your account or at a later date. Call Customer Service for information on how to establish a SWP or visit our website to obtain the appropriate form to complete. |
Through an Authorized Dealer
| • | | You may redeem your shares through an authorized dealer. (They may impose a service charge). Contact your Registered Representative or call Customer Service for assistance. |
Your Request to Sell Your Shares and Receive Payment May Be Subject To:
| • | | The type of account you have and if there is more than one shareholder. |
| • | | The dollar amount you are requesting; redemptions over $50,000 must be in writing and those redemptions totaling more than $100,000 require a written request with an original signature guarantee for all shareholders on the account. |
| • | | A written request and original signature guarantee may be required if there have been recent changes made to your account (such as an address change) or other such circumstances. For your protection, if an address change was made in the last 10 days, Transamerica Funds requires a redemption request in writing, signed by all account owners with an original signature guarantee. |
| • | | When redeeming all shares from an account with an active AIP, your AIP will automatically be stopped. Please contact Customer Service if you wish to re-activate your AIP. |
| • | | Each fund reserves the right to refuse a telephone redemption request if it is believed it is advisable to do so. The telephone redemption option may be suspended or terminated at any time without advance notice. |
| • | | Redemption proceeds will be withheld for 15 calendar days from the date of purchase for funds to clear. Certain exceptions may apply. |
| • | | If you request that a withdrawal check be delivered overnight, a $20 overnight fee will be charged; for Saturday delivery, a $30 overnight fee will be charged. |
| • | | Please see additional information relating to signature guarantees later in this prospectus. |
Involuntary Redemptions
Each fund reserves the right, to the fullest extent permitted by law, to close your account if the account value falls below the fund’s minimum account balance, including solely due to declines in NAV, or you are deemed to engage in activities that are illegal (such as late trading) or otherwise believed to be detrimental to the fund (such as market timing or frequent small redemptions).
EXCHANGING SHARES
Transamerica WMC Diversified Equity and Transamerica WMC Diversified Growth Class I2 shareholders who received their shares in connection with the reorganization of a Transamerica Premier Fund into a Transamerica Fund may exchange their
221
shares between Transamerica WMC Diversified Equity and Transamerica WMC Diversified Growth. Transamerica AEGON High Yield Bond Class I2 shareholders who received their shares in the manner described above have no exchange privileges.
In certain circumstances, shares of one class of a fund may be exchanged directly for shares of another class of the same fund, as described in the Statement of Additional Information.
PRICING OF SHARES
How Share Price Is Determined
The price at which shares are purchased or redeemed is the net asset value per share (“NAV”) that is next calculated following receipt and acceptance of a purchase order in good order or receipt of a redemption order in good order by the fund, an authorized intermediary, or the mail processing center located in Kansas City, Missouri.
When Share Price Is Determined
The NAV of each fund (or class thereof) is determined on each day the New York Stock Exchange (“NYSE”) is open for business. The NAV is not determined on days when the NYSE is closed (generally New Year’s Day, Martin Luther King Jr. Day, Presidents’ Day, Good Friday, Memorial Day, Independence Day, Labor Day, Thanksgiving and Christmas). Foreign securities may trade in their primary markets on weekends or other days when a fund does not price its shares (therefore, the NAV of a fund holding foreign securities may change on days when shareholders will not be able to buy or sell shares of the funds).
Purchase orders received in good order and accepted, and redemption orders received in good order, before the close of business on the NYSE, usually 4:00 p.m. Eastern Time, receive the NAV determined as of the close of the NYSE that day. Purchase and redemption requests received after the NYSE is closed receive the NAV determined as of the close of the NYSE the next day the NYSE is open.
Purchase orders for shares of the Transamerica asset allocation funds that are received in good order and accepted before the close of business on the NYSE receive the NAV determined as of the close of the NYSE that day. For direct purchases, corresponding orders for shares of the underlying constituent funds are priced on the same day that orders for shares of the asset allocation funds are received and accepted. For purchases of shares of the Transamerica asset allocation funds through the NSCC, orders for shares of the underlying constituent funds will be placed after the receipt and acceptance of the settled purchase order for shares of the asset allocation funds. For investments in separate accounts of insurance companies that invest in Class I2 shares of the funds, orders for Class I2 shares will be placed after the receipt and acceptance of the investment in the insurance company separate account.
How NAV Is Calculated
The NAV of each fund (or class thereof) is calculated by taking the value of its net assets and dividing by the number of shares of the fund (or class) that are then outstanding.
The Board of Trustees has approved procedures to be used to value the funds’ securities for the purposes of determining the funds’ NAV. The valuation of the securities of the funds is determined in good faith by or under the direction of the Board. The Board has delegated certain valuation functions for the funds to TAM.
In general, securities and other investments (including shares of ETFs) are valued based on market prices at the close of regular trading on the NYSE. Fund securities (including shares of ETFs) listed or traded on domestic securities exchanges or the NASDAQ/NMS, including dollar-dominated foreign securities or ADRs, are valued at the closing price on the exchange or system where the security is principally traded. With respect to securities traded on the NASDAQ/NMS, such closing price may be the last reported sale price or the NASDAQ Official Closing Price (“NOCP”). If there have been no sales for that day on the exchange or system where the security is principally traded, then the value should be determined with reference to the last sale price, or the NOCP, if applicable, on any other exchange or system. If there have been no sales for that day on any exchange or system, a security is valued at the closing bid quotes on the exchange or system where the security is principally traded, or at the NOCP, if applicable. Foreign securities traded on U.S. exchanges are generally priced using last sale price regardless of trading activity. Securities traded over-the-counter are valued at the mean of the last bid and asked prices. The market price for debt obligations is generally the price supplied by an independent third party pricing service, which may use market prices or quotations or a variety of fair value techniques and methodologies. Short-term debt obligations that will mature in 60 days or less are valued at amortized cost, unless it is determined that using this method would not reflect an investment’s fair value. The prices that the fund uses may differ from the amounts that would be realized if the investments were sold and the differences could be significant, particularly for securities that trade in relatively thin markets and/or markets that experience extreme volatility. Foreign securities generally are valued based on quotations from the primary market in which they are traded, and are converted from the local currency into U.S. dollars using current exchange rates. Market quotations for securities prices may be obtained from automated pricing services. Shares of open-end funds (other than ETF shares) are generally valued at the net
222
asset value per share reported by that investment company. ETF shares are valued at the most recent sale price or official closing price on the exchange on which they are traded.
When a market quotation for a security is not readily available (which may include closing prices deemed to be unreliable because of the occurrence of a subsequent event), a valuation committee appointed by the Board of Trustees may, in good faith, establish a value for the security in accordance with fair valuation procedures adopted by the Board. The types of securities for which such fair value pricing may be required include, but are not limited to: foreign securities, where a significant event occurs after the close of the foreign market on which such security principally trades that is likely to have changed the value of such security, or the closing value is otherwise deemed unreliable; securities of an issuer that has entered into a restructuring; securities whose trading has been halted or suspended; fixed-income securities that have gone into default and for which there is no current market value quotation; and securities that are restricted as to transfer or resale. The funds use a fair value model developed by an independent third party pricing service to price foreign equity securities on days when there is a certain percentage change in the value of a domestic equity security index, as such percentage may be determined by TAM from time to time.
Valuing securities in accordance with fair value procedures involves greater reliance on judgment than valuing securities based on readily available market quotations. The valuation committee makes fair value determinations in good faith in accordance with the funds’ valuation procedures. Fair value determinations can also involve reliance on quantitative models employed by a fair value pricing service. There can be no assurance that a fund could obtain the fair value assigned to a security if it were to sell the security at approximately the time at which the fund determines its NAV per share.
FEATURES AND POLICIES
Market Timing/Excessive Trading
Some investors try to profit from various short-term or frequent trading strategies known as market timing. Examples of market timing include switching money into funds when their share prices are expected to rise and taking money out when their share prices are expected to fall, and switching from one fund to another and then back again after a short period of time. As money is shifted in and out, a fund may incur expenses for buying and selling securities. Excessive purchases, redemptions or exchanges of fund shares may disrupt portfolio management, hurt fund performance and drive fund expenses higher. For example, a fund may be forced to liquidate investments as a result of short term trading and incur increased brokerage costs or realize taxable capital gains without attaining any investment advantage. These costs are generally borne by all shareholders, including long-term investors who do not generate these costs.
Transamerica Funds’ Board of Trustees has approved policies and procedures that are designed to discourage market timing or excessive trading which include limitations on the number of transactions in fund shares. If you intend to engage in such practices, we request that you do not purchase shares of any of the funds. Each fund reserves the right to reject any request to purchase shares, including purchases in connection with an exchange transaction, which the fund reasonably believes to be in connection with market timing or excessive trading.
However, because the shares of the funds may be sold to strategic asset allocation funds, other investors (including institutional investors such as foreign insurers, domestic insurance companies, and their separate accounts), and eligible retirement plans whose recordkeepers or financial service firm intermediaries have entered into agreements with Transamerica Funds or its agents, the funds’ policies and procedures to discourage market timing or excessive trading are enforced by those entities, as appropriate, rather than the funds. Additional information about the asset allocation funds’ policies and procedures are available in the prospectus of the asset allocation funds. Furthermore, reallocations in the funds by an asset allocation fund in furtherance of a fund’s investment objective are not considered to be market timing or excessive trading.
Orders to purchase, redeem or exchange shares forwarded by accounts maintained on behalf of institutional investors or insurers (for example, separate accounts of insurance companies) with respect to their accounts with Transamerica Funds will not be considered to be market timing or excessive trading for purposes of Transamerica Funds’ policies. However, the market timing and excessive trading policies of these investors/insurers (or their accounts) may apply to transactions by persons who, in turn, invest through these investors/insurers (or through their accounts).
Asset Allocation Funds
The asset allocation funds that invest in certain series of Transamerica Funds may own a significant portion of the shares of a Transamerica Funds fund. Transactions by a fund of funds may be disruptive to an underlying Transamerica Fund.
Customer Service
Occasionally, Transamerica Funds experiences high call volume due to unusual market activity or other events that may make it difficult for you to reach a Customer Service Representative by telephone. If you are unable to reach Transamerica Funds by
223
telephone, please consider visiting our website at www.transamericafunds.com. You may also send instructions by mail or by fax.
Uncashed Checks Issued on Your Account
If any check Transamerica Funds issues is returned by the Post Office as undeliverable, or remains outstanding (uncashed) for six months, we reserve the right to reinvest check proceeds back into your account at the net asset value next calculated after reinvestment. If applicable, we will also change your account distribution option from cash to reinvest. Interest does not accrue on amounts represented by uncashed checks. In cases where we are unable to reinvest check proceeds in the fund that you held, for example, if the fund has been liquidated or is closed to new investments, we reserve the right to reinvest the proceeds in another Transamerica Fund, such as the Transamerica AEGON Money Market.
Minimum Dividend Check Amounts
To control costs associated with issuing and administering dividend checks, we reserve the right not to issue checks under a specified amount. For accounts with the cash by check dividend distribution option, if the dividend payment total is less than $10, the distribution will be reinvested into the account and no check will be issued.
Telephone Transactions
Transamerica Funds and its transfer agent, Transamerica Fund Services, Inc. (“TFS”) are not liable for complying with telephone instructions that are deemed by them to be genuine. Transamerica Funds and TFS will employ reasonable procedures to help ensure telephone instructions are genuine. These procedures may include requiring personal identification, providing written confirmation of transactions and tape recording conversations. In situations where Transamerica Funds or TFS reasonably believe they were acting on genuine telephone instructions, you bear the risk of loss. Transamerica Funds reserves the right to modify the telephone redemption privilege at any time.
Retirement and ESA State Street Account Maintenance Fees
Retirement plan and Coverdell ESA State Street accounts are subject to an annual custodial fee of $15 per fund account, with a maximum fee of $30 per Social Security Number. For example, an IRA in two fund accounts would normally be subject to a $30 annual custodial fee. The fee is waived if the total of the retirement plan and ESA account(s)’s value per Social Security Number is more than $50,000.
Professional Fees
Your financial professional may charge a fee for his or her services. This fee will be in addition to any fees charged by Transamerica Funds. Your financial professional will answer any questions that you may have regarding such fees.
Signature Guarantee
An original signature guarantee assures that a signature is genuine so that you are protected from unauthorized account transactions. Notarization is not an acceptable substitute. Acceptable guarantors only include participants in the Securities Transfer Agents Medallion Program (“STAMP2000”). Participants in STAMP2000 may include financial institutions such as banks, savings and loan associations, trust companies, credit unions, broker-dealers and member firms of a national securities exchange.
An original signature guarantee is required if any of the following is applicable:
| • | | You request a redemption or distribution transaction totaling more than $100,000 or, in the case of an IRA with a market value in excess of $100,000, you request a custodian to custodian transfer. |
| • | | You would like a check made payable to anyone other than the shareholder(s) of record. |
| • | | You would like a check mailed to an address which has been changed within 10 days of the redemption request. |
| • | | You would like a check mailed to an address other than the address of record. |
| • | | You would like your redemption proceeds wired to a bank account other than a bank account of record. |
| • | | You are adding or removing a shareholder from an account. |
| • | | You are changing ownership of an account. |
| • | | When establishing an electronic bank link, if the Transamerica Funds account holder’s name does not appear on the check. |
The funds reserve the right to require an original signature guarantee under other circumstances or to reject or delay a redemption on certain legal grounds.
An original signature guarantee may be refused if any of the following is applicable:
224
| • | | It does not appear valid or in good form. |
| • | | The transaction amount exceeds the surety bond limit of the signature guarantee. |
| • | | The guarantee stamp has been reported as stolen, missing or counterfeit. |
E-mail Communications
As e-mail communications may not be secure, and because we are unable to take reasonable precautions to verify your shareholder and transaction information, we cannot respond to account-specific requests received via email. For your protection, we ask that all transaction requests be submitted only via telephone, mail or through the secure link on our website.
Statements and Reports
Transamerica Funds will send you a confirmation statement after every transaction that affects your account balance or registration, with the exception of systematic transactions or transactions necessary to assess account fees. Systematic transactions and fees will be shown on your next regularly scheduled quarterly statement. Information regarding these fees is disclosed in this prospectus. Please review the confirmation statement carefully and promptly notify Transamerica Funds of any error. Information about the tax status of income dividends and capital gains distributions will be mailed to shareholders early each year.
Please retain your statements. If you require historical statements, Transamerica Funds may charge $10 per statement year up to a maximum of $50 per Social Security Number. Financial reports for the funds, which include a list of the holdings, will be mailed twice a year to all shareholders.
Investment Policy Changes
A fund that has a policy of investing, under normal circumstances, at least 80% of its assets (defined as net assets plus the amount of any borrowings for investment purposes) in the particular type of securities implied by its name will provide its shareholders with at least 60 days’ prior written notice before making changes to such policy. Such notice will comply with the conditions set forth in any applicable SEC rules then in effect.
Unless expressly designated as fundamental, all policies and procedures of the funds, including their investment objectives, may be changed at any time by the Board of Trustees without shareholder approval. The investment strategies employed by a fund may also be changed without shareholder approval.
To the extent authorized by law, Transamerica Funds and each of the funds reserve the right to discontinue offering shares at any time, to merge or liquidate a class of shares or to cease operations entirely.
Asset Allocation Funds
The asset allocation funds, Transamerica Asset Allocation – Conservative Portfolio, Transamerica Asset Allocation – Growth Portfolio, Transamerica Asset Allocation – Moderate Growth Portfolio, Transamerica Asset Allocation – Moderate Portfolio, Transamerica Multi-Manager Alternative Strategies Portfolio and Transamerica Multi-Manager International Portfolio, as well as Transamerica Asset Allocation – Conservative VP, Transamerica Asset Allocation – Growth VP, Transamerica Asset Allocation – Moderate Growth VP, Transamerica Asset Allocation – Moderate VP and Transamerica International Moderate Growth VP, each separate series of Transamerica Series Trust, may own a significant portion of the shares of a Transamerica fund. Transactions by the asset allocation funds may be disruptive to the management of an underlying Transamerica fund.
Distribution of Shares
Underwriting Agreement
Transamerica Funds has an Underwriting Agreement with Transamerica Capital, Inc. (“TCI”), located at 4600 South Syracuse Street, Suite 1100, Denver, CO 80237. TCI is an affiliate of TAM and Transamerica Funds. Under this agreement, TCI underwrites and distributes all classes of fund shares and bears the expenses of offering these shares to the public.
Other Distribution or Service Arrangements
TCI, TAM and their affiliates may enter into arrangements with affiliated entities that provide administrative, recordkeeping and other services with respect to one or more of the funds. Payment for these services is made by TCI, TAM and their affiliates out of past profits and other available sources and may take the form of internal credit, recognition or cash payments. TCI, TAM and their affiliates may also enter into similar arrangements with unaffiliated entities.
TCI engages in wholesaling activities designed to support, maintain, and increase the number of financial intermediaries who sell shares of Transamerica Funds. Wholesaling activities include, but are not limited to, recommending and promoting, directly or through intermediaries, Transamerica Funds to financial intermediaries and providing sales training, retail broker support and
225
other services. Payment for these activities is made by TCI, TAM and their affiliates out of past profits and other available sources, including revenue sharing payments from others.
TCI (in connection with, or in addition to, wholesaling services), TAM and fund sub-advisers, directly or through TCI, out of their past profits and other available sources, provide cash payments or non-cash compensation to some, but not all, brokers and other financial intermediaries who have sold shares of the funds, promote the distribution of the funds, or render investor services to fund shareholders. Such payments and compensation are in addition to the sales charges, Rule 12b-1 Plan fees, service fees and other fees that may be paid, directly or indirectly, to such brokers and other financial intermediaries. These arrangements are sometimes referred to as “revenue sharing” arrangements. The amount of revenue sharing payments is substantial and may be substantial to any given recipient. The presence of these payments and the basis on which an intermediary compensates its registered representatives or salespersons may create an incentive for a particular intermediary, registered representative or salesperson to highlight, feature or recommend the funds, at least in part, based on the level of compensation paid. Revenue sharing arrangements are separately negotiated. Revenue sharing is not an expense of the funds, is not reflected in the fees and expenses sections of this prospectus and does not change the price paid by investors for the purchase of a fund’s shares or the amount received by a shareholder as proceeds from the redemption of fund shares.
Such additional cash payments may be made to brokers and other financial intermediaries that provide services to Transamerica Funds and/or shareholders in Transamerica Funds, including (without limitation) shareholder servicing, marketing support and/or access to meetings and/or events, sales representatives and management representatives of the broker or other financial intermediaries. Cash compensation may also be paid to brokers and other financial intermediaries for inclusion of a Transamerica fund on a sales list, including a preferred or select sales list, in other sales programs, or as an expense reimbursement or compensation in cases where the broker or other financial intermediary provides services to fund shareholders. To the extent permitted by applicable law, TCI and other parties may pay or allow other incentives and compensation to brokers and other financial intermediaries. TCI and the other parties making these payments generally assess the advisability of continuing making these payments periodically.
These cash payments may take a variety of forms, including (without limitation) reimbursement of ticket charges, additional compensation for sales, fees for shareholder servicing and maintenance of investor accounts, and finder’s fees that vary depending on the fund or share class and the dollar amount of shares sold. Revenue sharing payments can be calculated: (i) as a percentage of gross or net sales; (ii) as a percentage of gross or net assets under management; and/or (iii) as a fixed or negotiated flat fee dollar amount. As of December 31, 2010, TCI may make periodic revenue sharing payments to brokers and other financial intermediaries, such as monthly or quarterly. These periodic payments are equal to a percentage of periodic sales, ranging from 5 basis points (0.05%) to 45 basis points (0.45%) or equal to a percentage of assets under management ranging from 2.5 basis points (0.025%) to 20 basis points (0.20%). In 2010, TCI paid flat fees ranging from $0 to $100,000, which may include at times a series of meetings, activities and/or events of other broker-dealers and banks.
As of December 31, 2010, TCI had such revenue sharing arrangements with at least 16 brokers and other financial intermediaries, of which some of the more significant include: Compass Brokerage, Inc.; Hantz Financial Services, Inc.; US Bancorp Investments, Inc.; Suntrust Investments Services; CCO Investments Services Corp.; LPL Financial; Raymond James Financial Services; Ameriprise Financial Services, Inc.; Bank of America – Merrill Lynch; Citigroup-Morgan Stanley Smith Barney; PNC Investments; Raymond James and Associates; Raymond James Financial Services; UBS Financial Services; Wells Fargo Advisors, LLC); and Prudential Financial. For the calendar year ended December 31, 2010, TCI paid or expects to pay approximately $5,303,000 to various brokers and other financial intermediaries in connection with revenue sharing arrangements.
For the same period, TCI received revenue sharing payments totaling $1,502,560 from the following financial services firms to participate in functions, events and meetings, among other things: Alliance Bernstein, BlackRock, Clarion, Federated, Jennison Associates, JP Morgan, Neuberger Berman Management LLC, MFS Investment Management, NATIXIS, Oppenheimer Funds, PIMCO, Schroders, Transamerica Investment Management and Wellington Management Capital. TAM also serves as investment adviser to certain fund of funds that are underlying investment options for Transamerica insurance products. TCI and its affiliates receive revenue sharing payments from affiliates of certain underlying unaffiliated funds for the provision of services to investors and distribution activities.
In addition, while TCI typically pays most of the sales charge applicable to the sale of fund shares to brokers and other financial intermediaries through which purchases are made, TCI may, on occasion, pay the entire sales charge. (Additional information about payments of sales charges to brokers is available in the section titled “Dealer Reallowances” of the SAI.)
As of the date of this prospectus, TAM has agreed to pay Universal Life Insurance Company (“Universal Life”) a fee equal, on an annual basis, to 0.25% of the average daily net assets attributable to investments by Universal Life’s separate accounts in the Class I2 shares of the funds for administrative and other services provided or procured by Universal Life in connection with such investments in the funds. Investors may be able to obtain more information about these arrangements from their financial intermediaries.
226
From time to time, TCI, its affiliates and/or TAM and/or fund sub-advisers may also pay non-cash compensation to brokers and other financial intermediaries and their sales representatives in the form of, for example: (i) occasional gifts; (ii) occasional meals, tickets or other entertainment; and/or (iii) sponsorship support of broker marketing events or activities. For example such non-cash compensation may include in part, assistance with the costs and expenses associated with travel, lodging, educational meetings, seminars, meetings and conferences, entertainment and meals to the extent permitted by law.
The non-cash compensation to sales representatives and compensation or reimbursement received by brokers and other financial intermediaries through sales charges, other fees payable from the funds, and/or revenue sharing arrangements for selling shares of the funds may be more or less than the overall compensation or reimbursement on similar or other products and may influence your broker or other financial intermediary to present and recommend the funds over other investment options available in the marketplace. In addition, depending on the arrangements in place at any particular time, your broker or other financial intermediary may have a financial incentive for recommending a particular class of fund shares over other share classes.
Shareholders may obtain more information about these arrangements, including the conflicts of interests that such arrangements may create, from their brokers and other financial intermediaries, and should so inquire if they would like additional information. A shareholder may ask his/her broker or financial intermediary how he/she will be compensated for investments made in the funds. Revenue sharing payments, as well as payments under the shareholder services and distribution plan (where applicable), also benefit TAM, TCI and their affiliates to the extent the payments result in more assets being invested in the funds on which fees are being charged.
Although a fund may use financial firms that sell fund shares to effect transactions for the fund’s portfolio, the fund and its investment adviser or sub-adviser will not consider the sale of fund shares as a factor when choosing financial firms to effect those transactions.
DISTRIBUTIONS AND TAXES
Taxes on Distributions in General
Each fund will distribute all or substantially all of its net investment income and net capital gains to its shareholders each year. Although a fund will not have to pay income tax on amounts it distributes to shareholders, shareholders will generally be taxed on amounts they receive, whether the distributions are paid in cash or are reinvested in additional shares. If a fund declares a dividend in October, November, or December, payable to shareholders of record in such a month, and pays it in the following January, shareholders will be taxed on the dividend as if they received it in the year in which it was declared. Each fund generally pays any dividends annually, except the following: Transamerica Clarion Global Real Estate Securities, Transamerica Multi-Managed Balanced, Transamerica Loomis Sayles Bond and Transamerica WMC Quality Value pay quarterly; Transamerica Federated Market Opportunity, Transamerica JPMorgan Core Bond, Transamerica JPMorgan International Bond, Transamerica PIMCO Real Return TIPS, Transamerica PIMCO Total Return, Transamerica AEGON Flexible Income, Transamerica AEGON High Yield Bond and Transamerica Morgan Stanley Emerging Markets Debt pay monthly; Transamerica AEGON Money Market and Transamerica AEGON Short-Term Bond declare dividends daily and pay monthly. If necessary, each fund may make distributions at other times as well.
The following are guidelines for how certain distributions by a fund are generally taxed to non-corporate shareholders under current federal income tax law:
| • | | Distributions of net capital gain (i.e., the excess of net long-term capital gain over net short-term capital loss) will be taxed as long-term capital gains at a maximum rate of 15% (0% for individuals in the 10% and 15% federal tax brackets). |
| • | | Distributions reported by a fund as “qualified dividend income” will also be taxed at a maximum rate of 15% (0% for individuals in the 10% and 15% federal tax brackets). Qualified dividend income generally is income derived from certain dividends from U.S. corporations or certain foreign corporations that are either incorporated in a U.S. possession or eligible for tax benefits under certain U.S. income tax treaties. In addition, dividends that a fund receives in respect of stock of certain foreign corporations will be qualified dividend income if that stock is readily tradable on an established U.S. securities market. Note that a shareholder (and the fund in which the shareholder invests) will have to satisfy certain holding period requirements in order to obtain the benefit of the lower tax rate applicable to qualified dividend income. |
| • | | Other distributions generally will be taxed at the ordinary income tax rate applicable to the shareholder. |
The tax rates in the first two bullets above do not apply to corporate shareholders. For taxable years beginning on or after January 1, 2013, distributions of net capital gains will be taxable to non-corporate shareholders at a maximum rate of 20%, and distributions of a fund’s dividend income will be taxable to shareholders at ordinary income tax rates.
227
The funds will send you a tax report annually summarizing the amount and tax aspects of your distributions. If you buy shares of a fund shortly before it makes a distribution (other than regularly monthly distributions paid by Transamerica AEGON Money Market or Transamerica AEGON Short-Term Bond), the distribution will be taxable to you even though it may actually be a return of a portion of your investment. This is known as “buying a dividend.”
Investors who invest through tax-deferred accounts, such as IRAs, 403(b) accounts, and qualified retirement plans, will ordinarily not be subject to tax until a distribution is made from the account, at which time such distribution is generally taxed as ordinary income. These accounts are subject to complex tax rules, and tax-deferred account investors should therefore consult their tax advisers regarding their investments in a tax-deferred account.
Funds that invest in other funds (“asset allocation funds”) may recognize income on distributions from underlying funds in which they invest and may also recognize gains and losses if they redeem shares in underlying funds. Distributions of net capital gains, for taxable years beginning before January 1, 2013, qualified dividend income of either the asset allocation funds or underlying funds will generally be taxed at long-term capital gain rates when distributed to shareholders of the asset allocation funds. Other distributions, including short-term capital gains, generally will be taxed as ordinary income. The structure of the asset allocation funds and the reallocation of investments among underlying funds could affect the amount, timing and character of distributions.
Taxes on the Sale or Exchange of Shares
If you sell shares of a fund or exchange them for shares of another fund, you generally will have a capital gain or loss, which will generally be a long-term capital gain or loss if you held the shares for more than one year; otherwise it will generally be a short-term capital gain or loss. Any loss recognized on shares held for six months or less will be treated as a long-term capital loss to the extent of any amounts treated as distributions of long-term capital gain that were received with respect to the shares.
Any gain or loss on the sale or exchange of shares is computed by subtracting your tax basis in the shares from the redemption proceeds in the case of a sale or the value of the shares received in the case of an exchange. Because your tax basis depends on the original purchase price and on the price at which any dividends may have been reinvested, you should be sure to keep account statements so that you or your tax return preparer will be able to determine whether a sale will result in a taxable gain or loss.
Note that money market funds typically maintain a stable net asset value of $1.00 per share. Assuming Transamerica AEGON Money Market maintains a stable net asset value, you will typically not recognize gain or loss upon the sale, redemption, or exchange of shares of this fund.
Withholding Taxes
A fund in which you invest may be required to apply backup withholding of U.S. federal income tax on all distributions payable to you if you fail to provide the funds with your correct taxpayer identification number or to make required certifications, or if you have been notified by the IRS that you are subject to backup withholding. The backup withholding rate is currently 28% and is scheduled to increase to 31% in 2013. Backup withholding is not an additional tax, but is a method by which the IRS ensures that it will collect taxes otherwise due. Any amounts withheld may be credited against your U.S. federal income tax liability.
Non-Resident Alien Withholding
If you are a non-U.S. investor, you must provide a U.S. mailing address to establish an account unless your broker-dealer firm submits your account through the National Securities Clearing Corporation. Your broker-dealer will be required to submit a foreign certification form. Investors changing a mailing address to a non-U.S. address will be required to have a foreign certification form completed by their broker-dealer and returned to us before future purchases can be accepted. Shareholders that are not U.S. persons under the federal tax laws may be subject to U.S. withholding taxes on certain distributions and are generally subject to U.S. tax certification requirements. Additionally, those shareholders will need to provide an appropriate tax form (generally, Form W-8BEN) and documentary evidence and letter of explanation.
Other Tax Information
This tax discussion is for general information only. In addition to federal income taxes, you may be subject to state, local or foreign taxes on payments received from, and investments made in shares of, a Transamerica fund. More information is provided in the SAI of the funds. You should also consult your own tax adviser for information regarding all tax consequences applicable to your investments in Transamerica Funds.
228
FINANCIAL HIGHLIGHTS
The Financial Highlights table is intended to help you understand a fund’s performance for the past five years or since its inception if less than five years. Certain information reflects financial results for a single fund share. The total returns in the table represent the rate an investor would have earned (or lost) on an investment in the fund for the period shown, assuming reinvestment of all dividends and distributions. Information subsequent to October 31, 2009 has been derived from financial statements audited by Ernst & Young LLP, an Independent Registered Public Accounting firm, whose report, along with the fund’s financial statements, is included in the October 31, 2010 Annual Report, which is available to you upon request.
The Financial Highlights information on and prior to October 31, 2009 has been derived from financial statements audited by PricewaterhouseCoopers, LLP, an Independent Registered Certified Public Accounting firm, whose report, along with the fund’s financial statements, is included in the previous October 31st ended Annual Reports, which are available upon request.
Information is not shown for Transamerica Multi-Managed Balanced as there were no Class I2 shares of the fund issued as of the fiscal year ended October 31, 2010.
Information is not shown for Transamerica WMC Quality Value and Transamerica TS&W International Equity as those funds had not commenced operations as of October 31, 2010.
| | | | | | | | | | | | | | | | | | | | |
| For a share outstanding throughout each period | | Transamerica AEGON High Yield Bond(bb),(cc) | |
| | | October 31,
2010 | | | October 31,
2009 | | | October 31,
2008 | | | October 31,
2007 | | | October 31,
2006 | |
Net asset value | | | | | | | | | | | | | | | | | | | | |
Beginning of period/year | | | $8.50 | | | | $6.35 | | | | $9.17 | | | | $9.24 | | | | $9.02 | |
| | | | | |
Investment operations | | | | | | | | | | | | | | | | | | | | |
Net investment income(b) | | | 0.71 | | | | 0.69 | | | | 0.69 | | | | 0.65 | | | | 0.67 | |
Net realized and unrealized gain (loss) on investments | | | 0.73 | | | | 2.16 | | | | (2.85) | | | | (0.07) | | | | 0.18 | |
Total from investment operations | | | 1.44 | | | | 2.85 | | | | (2.16) | | | | 0.58 | | | | 0.85 | |
| | | | | |
Distributions | | | | | | | | | | | | | | | | | | | | |
Net investment income | | | (0.72) | | | | (0.70) | | | | (0.66) | | | | (0.65) | | | | (0.63) | |
Total distributions | | | (0.72) | | | | (0.70) | | | | (0.66) | | | | (0.65) | | | | (0.63) | |
| | | | | |
Net asset value | | | | | | | | | | | | | | | | | | | | |
End of year | | | $9.22 | | | | $8.50 | | | | $6.35 | | | | $9.17 | | | | $9.24 | |
Total return(c) | | | 17.74% | | | | 48.39% | | | | (25.05%) | | | | 6.39% | | | | 9.81% | |
Net assets end of year (000’s) | | $ | 408,505 | | | $ | 472,936 | | | $ | 418,923 | | | $ | 331,300 | | | $ | 315,252 | |
| | | | | |
Ratio and supplemental data | | | | | | | | | | | | | | | | | | | | |
Expenses to average net assets | | | | | | | | | | | | | | | | | | | | |
After reimbursement/fee waiver | | | 0.66% | | | | 0.67% | | | | 0.65% | | | | 0.65% | | | | 0.66% | |
Before reimbursement/fee waiver | | | 0.66% | | | | 0.67% | | | | 0.65% | | | | 0.65% | | | | 0.66% | |
Net investment income, to average net assets(dd) | | | 8.11% | | | | 9.96% | | | | 8.34% | | | | 6.96% | | | | 7.29% | |
Portfolio turnover rate | | | 91% | | | | 58% | | | | 38% | | | | 80% | | | | 73% | |
| | | | | | | | | | | | | | | | | | | | |
| For a share outstanding throughout each period | | Transamerica AllianceBernstein International Value(kk) | |
| | | October 31, 2010 | | | October 31, 2009 | | | October 31, 2008 | | | October 31, 2007 | | | October 31, 2006(a) | |
Net asset value | | | | | | | | | | | | | | | | | | | | |
Beginning of year | | | $7.79 | | | | $6.61 | | | | $14.88 | | | | $12.35 | | | | $10.00 | |
| | | | | |
Investment operations | | | | | | | | | | | | | | | | | | | | |
Net investment income(b) | | | 0.15 | | | | 0.16 | | | | 0.30 | | | | 0.25 | | | | 0.20 | |
Net realized and unrealized gain (loss) on investments | | | 0.29 | | | | 1.37 | | | | (7.43) | | | | 2.65 | | | | 2.16 | |
Total from investment operations | | | 0.44 | | | | 1.53 | | | | (7.13) | | | | 2.90 | | | | 2.36 | |
| | | | | |
Distributions | | | | | | | | | | | | | | | | | | | | |
Net investment income | | | (0.16) | | | | (0.35) | | | | (0.21) | | | | (0.15) | | | | (0.01) | |
Net realized gains on investments | | | – | | | | – | | | | (0.93) | | | | (0.22) | | | | – | |
Total distributions | | | (0.16) | | | | (0.35) | | | | (1.14) | | | | (0.37) | | | | (0.01) | |
| | | | | |
Net asset value | | | | | | | | | | | | | | | | | | | | |
End of year | | | $8.07 | | | | $7.79 | | | | $6.61 | | | | $14.88 | | | | $12.35 | |
| | | | | |
Total return(c) | | | 5.61% | | | | 24.32% | | | | (51.72%) | | | | 23.99% | | | | 23.67% | (d) |
| | | | | |
Net assets end of year (000’s) | | $ | 298,751 | | | $ | 316,068 | | | $ | 248,337 | | | $ | 519,217 | | | $ | 376,531 | |
| | | | | |
Ratio and supplemental data | | | | | | | | | | | | | | | | | | | | |
Expenses to average net assets: | | | | | | | | | | | | | | | | | | | | |
After reimbursement/recapture | | | 0.97% | | | | 0.97% | | | | 0.94% | | | | 0.93% | | | | 0.99% | (e) |
Before reimbursement/recapture | | | 0.97% | | | | 0.97% | | | | 0.94% | | | | 0.93% | | | | 0.99% | (e) |
Net investment income, to average net assets | | | 2.00% | | | | 2.39% | | | | 2.71% | | | | 1.82% | | | | 1.91% | (e) |
Portfolio turnover rate | | | 59% | | | | 59% | | | | 33% | | | | 36% | | | | 22% | (d) |
229
| | | | | | | | | | | | | | | | | | | | |
| For a share outstanding throughout each period | | Transamerica AQR Managed Futures Strategy October 31, 2010(w) | | | | | | | | | | | | | |
Net asset value | | | | | | | | | | | | | | | | | | | | |
Beginning of year | | $ | 10.00 | | | | | | | | | | | | | | | | | |
| | | | | |
Investment operations | | | | | | | | | | | | | | | | | | | | |
Net investment loss (b) | | | (0.01 | ) | | | | | | | | | | | | | | | | |
Net realized and unrealized gain on investments | | | 0.17 | | | | | | | | | | | | | | | | | |
Total from investment operations | | | 0.16 | | | | | | | | | | | | | | | | | |
| | | | | |
Distributions | | | | | | | | | | | | | | | | | | | | |
Net investment income | | | – | | | | | | | | | | | | | | | | | |
Net realized gains on investments | | | – | | | | | | | | | | | | | | | | | |
Total distributions | | | – | | | | | | | | | | | | | | | | | |
| | | | | |
Net asset value | | | | | | | | | | | | | | | | | | | | |
End of year | | $ | 10.16 | | | | | | | | | | | | | | | | | |
| | | | | |
Total return(c) | | | 1.60 | %(d) | | | | | | | | | | | | | | | | |
| | | | | |
Net assets end of year (000’s) | | $ | 257,887 | | | | | | | | | | | | | | | | | |
| | | | | |
Ratio and supplemental data | | | | | | | | | | | | | | | | | | | | |
Expenses to average net assets: | | | | | | | | | | | | | | | | | | | | |
After reimbursement/recapture | | | 1.38 | %(e) | | | | | | | | | | | | | | | | |
Before reimbursement/recapture | | | 1.38 | %(e) | | | | | | | | | | | | | | | | |
Net investment loss, to average net assets | | | (1.22 | %)(e) | | | | | | | | | | | | | | | | |
Portfolio turnover rate | | | – | %(d) | | | | | | | | | | | | | | | | |
| | | | | | | | | | | | | | | | | | | | |
| | |
| For a share outstanding throughout each period | | Transamerica BlackRock Global Allocation | |
| | | October 31, 2010 | | | October 31, 2009 | | | October 31, 2008 | | | October 31, 2007 | | | October 31,
2006(a) | |
Net asset value | | | | | | | | | | | | | | | | | | | | |
Beginning of year | | $ | 9.99 | | | $ | 9.32 | | | $ | 13.23 | | | $ | 11.23 | | | $ | 10.00 | |
| | | | | | |
Investment operations | | | | | | | | | | | | | | | | | | | | |
Net investment income(b) | | | 0.20 | | | | 0.19 | | | | 0.27 | | | | 0.24 | | | | 0.19 | |
Net realized and unrealized gain (loss) on investments | | | 0.93 | | | | 1.55 | | | | (3.25 | ) | | | 2.15 | | | | 1.06 | |
Total from investment operations | | | 1.13 | | | | 1.74 | | | | (2.98 | ) | | | 2.39 | | | | 1.25 | |
| | | | | | |
Distributions | | | | | | | | | | | | | | | | | | | | |
Net investment income | | | (0.21 | ) | | | (0.55 | ) | | | (0.35 | ) | | | (0.20 | ) | | | (0.02 | ) |
Net realized gains on investments | | | – | | | | (0.52 | ) | | | (0.58 | ) | | | (0.19 | ) | | | – | |
Total distributions | | | (0.21 | ) | | | (1.07 | ) | | | (0.93 | ) | | | (0.39 | ) | | | (0.02 | ) |
| | | | | | |
Net asset value | | | | | | | | | | | | | | | | | | | | |
End of year | | $ | 10.91 | | | $ | 9.99 | | | $ | 9.32 | | | $ | 13.23 | | | $ | 11.23 | |
| | | | | | |
Total return(c) | | | 11.40 | % | | | 20.57 | % | | | (24.23 | %) | | | 21.95 | % | | | 12.45 | %(d) |
| | | | | | |
Net assets end of year (000’s) | | $ | 497,305 | | | $ | 448,979 | | | $ | 377,781 | | | $ | 520,484 | | | $ | 490,941 | |
| | | | | | |
Ratio and supplemental data | | | | | | | | | | | | | | | | | | | | |
Expenses to average net assets: | | | | | | | | | | | | | | | | | | | | |
After reimbursement/recapture | | | 0.87 | % | | | 0.90 | % | | | 0.88 | % | | | 0.85 | % | | | 0.90 | %(e) |
Before reimbursement/recapture | | | 0.87 | % | | | 0.90 | % | | | 0.88 | % | | | 0.85 | % | | | 0.90 | %(e) |
Net investment income, to average net assets | | | 1.96 | % | | | 2.08 | % | | | 2.25 | % | | | 2.04 | % | | | 2.02 | %(e) |
Portfolio turnover rate | | | 43 | % | | | 43 | % | | | 49 | % | | | 30 | % | | | 31 | %(d) |
230
| | | | | | | | | | |
| For a share outstanding throughout each period | | | | Transamerica BlackRock Large Cap Value | | |
| | | October 31, 2010 | | October 31, 2009 | | October 31, 2008 | | October 31, 2007 | | October 31, 2006(f) |
| | | | | | |
Net asset value | | | | | | | | | | |
Beginning of year | | $7.81 | | $7.61 | | $13.08 | | $12.15 | | $10.47 |
| | | | | |
Investment operations | | | | | | | | | | |
Net investment income(b) | | 0.10 | | 0.13 | | 0.13 | | 0.12 | | 0.07 |
Net realized and unrealized gain (loss) on investments | | 0.54 | | 0.20 | | (4.78) | | 1.27 | | 1.64 |
Total from investment operations | | 0.64 | | 0.33 | | (4.65) | | 1.39 | | 1.71 |
| | | | | |
Distributions | | | | | | | | | | |
Net investment income | | (0.11) | | (0.13) | | (0.09) | | (0.09) | | (0.03) |
Net realized gains on investments | | – | | – | | (0.73) | | (0.37) | | – |
Total distributions | | (0.11) | | (0.13) | | (0.82) | | (0.46) | | (0.03) |
| | | | | |
Net asset value | | | | | | | | | | |
End of year | | $8.34 | | $7.81 | | $7.61 | | $13.08 | | $12.15 |
| | | | | |
Total return(c) | | 8.16% | | 4.50% | | (37.76%) | | 11.80% | | 16.36%(d) |
| | | | | |
Net assets end of year (000’s) | | $ 702,205 | | $ 633,675 | | $ 461,816 | | $ 610,135 | | $ 506,529 |
| | | | | |
Ratio and supplemental data | | | | | | | | | | |
Expenses to average net assets: | | | | | | | | | | |
After reimbursement/recapture | | 0.83% | | 0.83% | | 0.83% | | 0.84% | | 0.84%(e) |
Before reimbursement/recapture | | 0.83% | | 0.83% | | 0.83% | | 0.84% | | 0.84%(e) |
Net investment income, to average net assets | | 1.21% | | 1.87% | | 1.21% | | 0.96% | | 0.62%(e) |
Portfolio turnover rate | | 124% | | 130% | | 71% | | 69% | | 56%(d) |
| | | | | | | | | | |
| For a share outstanding throughout each period | | Transamerica BNY Mellon Market Neutral Strategy(ll) |
| | | October 31, 2010 | | October 31, 2009 | | October 31, 2008 | | October 31, 2007(g) | | |
Net asset value | | | | | | | | | |
Beginning of year | | $8.43 | | $9.51 | | $9.78 | | $10.00 | |
Investment operations | | | | | | | | | |
Net investment income (loss)(b) | | (0.13) | | (0.17) | | 0.10 | | 0.23 | |
Net realized and unrealized gain (loss) on investments | | 0.02 | | (0.80) | | 0.20 | | (0.45) | |
Total from investment operations | | (0.11) | | (0.97) | | 0.30 | | 0.22 | |
Distributions | | | | | | | | | |
Net investment income | | – | | – | | (0.57) | | – | |
Return of capital | | – | | (0.11) | | – | | – | |
Total distributions | | – | | (0.11) | | (0.57) | | – | |
Net asset value | | | | | | | | | |
End of year | | $8.32 | | $8.43 | | $9.51 | | $9.78 | |
Total return(c) | | (1.30%) | | (10.27%) | | 3.30% | | (2.20%)(d) | |
Net assets end of year (000’s) | | $ 108,342 | | $ 86,682 | | $ 121,348 | | $ 112,394 | |
Ratio and supplemental data | | | | | | | | | |
Expenses to average net assets: | | | | | | | | | |
After reimbursement/recapture | | 2.85%(h) | | 3.61%(h) | | 2.79%(h) | | 3.05%(e),(h) | |
Before reimbursement/recapture | | 2.85%(h) | | 3.61%(h) | | 2.79%(h) | | 3.05%(e),(h) | |
Net investment income (loss), to average net assets | | (1.61%)(h) | | (1.87%)(h) | | 1.05%(h) | | 2.77%(e),(h) | |
Portfolio turnover rate | | 303% | | 463% | | 192% | | 119%(d) | |
231
| | | | | | | | | | | | | | | | | | | | |
| For a share outstanding throughout each period | | | | | Transamerica Clarion Global Real Estate Securities | | | | |
| | | October 31,
2010 | | | October 31,
2009 | | | October 31,
2008 | | | October 31,
2007 | | | October 31,
2006(f) | |
Net asset value | | | | | | | | | | | | | | | | | | | | |
Beginning of year | | | $10.77 | | | | $9.52 | | | | $20.48 | | | | $20.25 | | | | $15.85 | |
| | | | | |
Investment operations | | | | | | | | | | | | | | | | | | | | |
Net investment income(b) | | | 0.26 | | | | 0.29 | | | | 0.32 | | | | 0.36 | | | | 0.21 | |
Net realized and unrealized gain (loss) on investments | | | 1.98 | | | | 1.15 | | | | (8.33 | ) | | | 2.45 | | | | 5.85 | |
Total from investment operations | | | 2.24 | | | | 1.44 | | | | (8.01 | ) | | | 2.81 | | | | 6.06 | |
| | | | | |
Distributions | | | | | | | | | | | | | | | | | | | | |
Net investment income | | | (0.73 | ) | | | (0.19 | ) | | | (0.90 | ) | | | (0.80 | ) | | | (0.28 | ) |
Net realized gains on investments | | | – | | | | – | | | | (2.05 | ) | | | (1.78 | ) | | | (1.38 | ) |
Total distributions | | | (0.73 | ) | | | (0.19 | ) | | | (2.95 | ) | | | (2.58 | ) | | | (1.66 | ) |
| | | | | |
Net asset value | | | | | | | | | | | | | | | | | | | | |
End of year | | | $12.28 | | | | $10.77 | | | | $9.52 | | | | $20.48 | | | | $20.25 | |
| | | | | |
Total return(c) | | | 21.70 | % | | | 15.72 | % | | | (44.82 | %) | | | 15.11 | % | | | 41.43 | %(d) |
| | | | | |
Net assets end of year (000’s) | | $ | 319,368 | | | $ | 285,502 | | | $ | 232,115 | | | $ | 367,750 | | | $ | 331,620 | |
| | | | | |
Ratio and supplemental data | | | | | | | | | | | | | | | | | | | | |
Expenses to average net assets | | | 0.91 | % | | | 0.93 | % | | | 0.89 | % | | | 0.88 | % | | | 0.91 | %(e) |
Net investment income, to average net assets | | | 2.31 | % | | | 3.30 | % | | | 2.29 | % | | | 1.29 | % | | | 1.27 | %(e) |
Portfolio turnover rate | | | 62 | % | | | 61 | % | | | 41 | % | | | 72 | % | | | 76 | %(d) |
| | | | | | | | | | | | | | | | | | | | |
| For a share outstanding throughout each period | | Transamerica
Diversified
Equity(cc) | | | | | | | | | | | | | |
| | | October 31,
2010 (ee) | | | | | | | | | | | | | |
Net asset value | | | | | | | | | | | | | | | | | | | | |
Beginning of period/year | | | $12.85 | | | | | | | | | | | | | | | | | |
| | | | | |
Investment operations | | | | | | | | | | | | | | | | | | | | |
Net investment income(b) | | | 0.26 | | | | | | | | | | | | | | | | | |
Net realized and unrealized gain on investments | | | 1.30 | | | | | | | | | | | | | | | | | |
Total from investment operations | | | 1.56 | | | | | | | | | | | | | | | | | |
| | | | | |
Distributions | | | | | | | | | | | | | | | | | | | | |
Net investment income | | | (0.03 | ) | | | | | | | | | | | | | | | | |
Total distributions | | | (0.03 | ) | | | | | | | | | | | | | | | | |
| | | | | |
Net asset value | | | | | | | | | | | | | | | | | | | | |
End of year | | | $14.38 | | | | | | | | | | | | | | | | | |
| | | | | |
Total return(c) | | | 12.12 | %(d) | | | | | | | | | | | | | | | | |
Net assets end of year (000’s) | | $ | 358,714 | | | | | | | | | | | | | | | | | |
| | | | | |
Ratio and supplemental data | | | | | | | | | | | | | | | | | | | | |
Expenses to average net assets | | | | | | | | | | | | | | | | | | | | |
After reimbursement/fee waiver | | | 0.81 | %(e) | | | | | | | | | | | | | | | | |
Before reimbursement/fee waiver | | | 0.81 | %(e) | | | | | | | | | | | | | | | | |
Net investment income, to average net assets(dd) | | | 2.02 | %(e) | | | | | | | | | | | | | | | | |
Portfolio turnover rate | | | 79 | %(d) | | | | | | | | | | | | | | | | |
232
| | | | | | | | | | | | | | | | | | | | |
| For a share outstanding throughout each period | | | | | Transamerica Federated Market Opportunity | | | | |
| | | October 31, 2010 | | | October 31, 2009 | | | October 31, 2008 | | | October 31, 2007 | | | October 31, 2006(a) | |
Net asset value | | | | | | | | | | | | | | | | | | | | |
Beginning of year | | | $8.99 | | | | $8.56 | | | | $9.33 | | | | $9.71 | | | | $10.00 | |
| | | | | |
Investment operations | | | | | | | | | | | | | | | | | | | | |
Net investment income(b) | | | 0.06 | | | | 0.05 | | | | 0.11 | | | | 0.24 | | | | 0.27 | |
Net realized and unrealized gain (loss) on investments | | | (0.25) | | | | 1.03 | | | | (0.77) | | | | (0.34) | | | | (0.30) | |
Total from investment operations | | | (0.19) | | | | 1.08 | | | | (0.66) | | | | (0.10) | | | | (0.03) | |
| | | | | |
Distributions | | | | | | | | | | | | | | | | | | | | |
Net investment income | | | (0.07) | | | | (0.01) | | | | (0.11) | | | | (0.28) | | | | (0.26) | |
Net realized gains on investments | | | – | | | | (0.49) | | | | – | | | | – | | | | – | |
Return of capital | | | – | | | | (0.15) | | | | – | | | | – | | | | – | |
Total distributions | | | (0.07) | | | | (0.65) | | | | (0.11) | | | | (0.28) | | | | (0.26) | |
| | | | | |
Net asset value | | | | | | | | | | | | | | | | | | | | |
End of year | | | $8.73 | | | | $8.99 | | | | $8.56 | | | | $9.33 | | | | $9.71 | |
| | | | | |
Total return(c) | | | (2.11%) | | | | 13.01% | | | | (7.16%) | | | | (1.03%) | | | | (0.35%)(d) | |
| | | | | |
Net assets end of year (000’s) | | $ | 92,472 | | | $ | 85,562 | | | $ | 74,480 | | | $ | 53,747 | | | $ | 83,188 | |
| | | | | |
Ratio and supplemental data | | | | | | | | | | | | | | | | | | | | |
Expenses to average net assets: | | | | | | | | | | | | | | | | | | | | |
After reimbursement/recapture | | | 0.89% | | | | 0.89% | | | | 0.88% | | | | 0.93% | | | | 0.88%(e) | |
Before reimbursement/recapture | | | 0.89% | | | | 0.89% | | | | 0.88% | | | | 0.93% | | | | 0.88%(e) | |
Net investment income, to average net assets | | | 0.65% | | | | 0.56% | | | | 1.13% | | | | 2.49% | | | | 2.97%(e) | |
Portfolio turnover rate | | | 194% | | | | 180% | | | | 195% | | | | 97% | | | | 72%(d) | |
| | |
| For a share outstanding throughout each period | | Transamerica First Quadrant Global Macro(i) | | | | |
| | | October 31, 2010 | | | October 31, 2009 | | | October 31, 2008 | | | October 31, 2007(g) | | | | |
Net asset value | | | | | | | | | | | | | | | | | | | | |
Beginning of year | | | $6.08 | | | | $8.60 | | | | $9.83 | | | | $10.00 | | | | | |
| | | | | |
Investment operations | | | | | | | | | | | | | | | | | | | | |
Net investment income (loss)(b) | | | (0.10) | | | | 0.02 | | | | 0.18 | | | | 0.09 | | | | | |
Net realized and unrealized gain (loss) on investments | | | 0.14 | | | | (0.04) | | | | (1.30) | | | | (0.26) | | | | | |
Total from investment operations | | | 0.04 | | | | (0.02) | | | | (1.12) | | | | (0.17) | | | | | |
| | | | | |
Distributions | | | | | | | | | | | | | | | | | | | | |
Net investment income | | | – | | | | (0.03) | | | | (0.11) | | | | – | | | | | |
Net realized gains on investments | | | – | | | | (2.40) | | | | – | | | | – | | | | | |
Return of capital | | | – | | | | (0.07) | | | | – | | | | – | | | | | |
Total distributions | | | – | | | | (2.50) | | | | (0.11) | | | | – | | | | | |
| | | | | |
Net asset value | | | | | | | | | | | | | | | | | | | | |
End of year | | | $6.12 | | | | $6.08 | | | | $8.60 | | | | $9.83 | | | | | |
| | | | | |
Total return(c) | | | 0.66% | | | | 5.34% | | | | (11.55%) | | | | (1.70%)(d) | | | | | |
| | | | | |
Net assets end of year (000’s) | | $ | 126,142 | | | $ | 107,017 | | | $ | 165,567 | | | $ | 209,382 | | | | | |
| | | | | |
Ratio and supplemental data | | | | | | | | | | | | | | | | | | | | |
Expenses to average net assets: | | | | | | | | | | | | | | | | | | | | |
After reimbursement/recapture | | | 1.61% | | | | 1.58% | | | | 1.51% | | | | 1.51%(e) | | | | | |
Before reimbursement/recapture | | | 1.61% | | | | 1.58% | | | | 1.51% | | | | 1.51%(e) | | | | | |
Net investment income (loss), to average net assets | | | (1.56%) | | | | 0.32% | | | | 1.81% | | | | 1.16%(e) | | | | | |
Portfolio turnover rate | | | –% | | | | 358% | | | | 84% | | | | 45%(d) | | | | | |
233
| | | | | | | | | | | | | | | | | | |
| For a share outstanding throughout each period | | Transamerica Flexible Income(cc) |
| | | October 31, 2010 | | | October 31, 2009 | | | October 31, 2008 | | | October 31, 2007 | | | October 31, 2006 |
| | | | | |
Net asset value | | | | | | | | | | | | | | | | | | |
Beginning of year | | | $8.37 | | | | $7.25 | | | | $9.17 | | | | $9.42 | | | $9.35 |
| | | | | |
Investment operations | | | | | | | | | | | | | | | | | | |
Net investment income (b) | | | 0.53 | | | | 0.50 | | | | 0.50 | | | | 0.53 | | | 0.50 |
Net realized and unrealized gain (loss) on investments | | | 0.71 | | | | 1.10 | | | | (1.90) | | | | (0.26) | | | 0.05 |
Total from investment operations | | | 1.24 | | | | 1.60 | | | | (1.40) | | | | 0.27 | | | 0.55 |
| | | | | |
Distributions | | | | | | | | | | | | | | | | | | |
Net investment income | | | (0.58) | | | | (0.48) | | | | (0.52) | | | | (0.52) | | | (0.48) |
Total distributions | | | (0.58) | | | | (0.48) | | | | (0.52) | | | | (0.52) | | | (0.48) |
| | | | | |
Net asset value | | | | | | | | | | | | | | | | | | |
End of year | | | $9.03 | | | | $8.37 | | | | $7.25 | | | | $9.17 | | | $9.42 |
| | | | | |
Total return(c) | | | 15.39% | | | | 23.16% | | | | (16.02%) | | | | 2.93% | | | 6.04% |
| | | | | |
Net assets end of year (000’s) | | $ | 146,631 | | | $ | 132,177 | | | $ | 128,108 | | | $ | 370,611 | | | $221,116 |
| | | | | |
Ratio and supplemental data | | | | | | | | | | | | | | | | | | |
Expenses to average net assets | | | | | | | | | | | | | | | | | | |
After reimbursement/fee waiver | | | 0.64% | (ff) | | | 0.85% | | | | 0.77% | | | | 0.80% | | | 0.86% |
Before reimbursement/fee waiver | | | 0.64% | (ff) | | | 0.85% | | | | 0.77% | | | | 0.80% | | | 0.86% |
Net investment income, to average net assets(dd) | | | 6.18% | | | | 6.64% | | | | 5.67% | | | | 5.71% | | | 5.35% |
Portfolio turnover rate | | | 120% | | | | 169% | | | | 98% | | | | 108% | | | 110% |
| | | | | | | | | | | | | | | | | | |
| For a share outstanding throughout each period | | Transamerica Goldman Sachs Commodity Strategy(x) | | | |
| | | October 31, 2010 | | | October 31, 2009 | | | October 31, 2008 | | | October 31, 2007(y) | | | |
Net asset value | | | | | | | | | | | | | | | | | | |
Beginning of year | | | $10.03 | | | | $8.11 | | | | $14.11 | | | | $10.00 | | | |
| | | | | |
Investment operations | | | | | | | | | | | | | | | | | | |
Net investment income (b) | | | 0.04 | | | | 0.05 | | | | 0.03 | | | | 0.04 | | | |
Net realized and unrealized gain (loss) on investments | | | 1.22 | | | | 1.91 | | | | (5.85) | | | | 4.07 | | | |
Total from investment operations | | | 1.26 | | | | 1.96 | | | | (5.82) | | | | 4.11 | | | |
| | | | | |
Distributions | | | | | | | | | | | | | | | | | | |
Net investment income | | | (0.05) | | | | (0.04) | | | | (0.03) | | | | – | | | |
Net realized gains on investments | | | – | | | | – | (k) | | | (0.15) | | | | – | | | |
Total distributions | | | (0.05) | | | | (0.04) | | | | (0.18) | | | | – | | | |
| | | | | |
Net asset value | | | | | | | | | | | | | | | | | | |
End of year | | | $11.24 | | | | $10.03 | | | | $8.11 | | | | $14.11 | | | |
| | | | | |
Total return(c) | | | 12.61% | | | | 24.41% | | | | (41.77%) | | | | 41.10% | (d) | | |
| | | | | |
Net assets end of year (000’s) | | $ | 146,976 | | | $ | 121,342 | | | $ | 87,252 | | | $ | 156,779 | | | |
| | | | | |
Ratio and supplemental data | | | | | | | | | | | | | | | | | | |
Expenses to average net assets: | | | | | | | | | | | | | | | | | | |
After reimbursement/recapture | | | 0.86% | | | | 0.89% | | | | 0.86% | | | | 0.89% | (e) | | |
Before reimbursement/recapture | | | 0.86% | | | | 0.89% | | | | 0.86% | | | | 0.89% | (e) | | |
Net investment income, to average net assets | | | 0.38% | | | | 0.63% | | | | 0.21% | | | | 0.39% | (e) | | |
Portfolio turnover rate | | | 112% | (z) | | | 5% | | | | 4% | | | | 7% | (d) | | |
234
| | | | | | | | | | | | | | | | | | | | |
| For a share outstanding throughout each period | | | | | Transamerica Growth Opportunities(cc) | | | | |
| | | October 31, 2010 | | | October 31, 2009 | | | October 31, 2008 | | | October 31, 2007 | | | October 31, 2006 (f) | |
Net asset value | | | | | | | | | | | | | | | | | | | | |
Beginning of period/year | | | $7.78 | | | | $6.74 | | | | $11.59 | | | | $8.43 | | �� | | $7.99 | |
| | | | | |
Investment operations | | | | | | | | | | | | | | | | | | | | |
Net investment income (loss)(b) | | | 0.03 | | | | 0.01 | | | | 0.01 | | | | (0.01 | ) | | | – | (k) |
Net realized and unrealized gain (loss) on investments | | | 2.42 | | | | 1.03 | | | | (4.86 | ) | | | 3.17 | | | | 0.44 | |
Total from investment operations | | | 2.45 | | | | 1.04 | | | | (4.85 | ) | | | 3.16 | | | | 0.44 | |
| | | | | |
Net asset value | | | | | | | | | | | | | | | | | | | | |
End of year | | | $10.23 | | | | $7.78 | | | | $6.74 | | | | $11.59 | | | | $8.43 | |
| | | | | |
Total return(c) | | | 31.49 | % | | | 15.43 | % | | | (41.85 | %) | | | 37.49 | % | | | 5.51 | %(d) |
| | | | | |
Net assets end of year (000’s) | | $ | 106,970 | | | $ | 111,402 | | | $ | 86,425 | | | $ | 206,863 | | | $ | 214,775 | |
| | | | | |
Ratio and supplemental data | | | | | | | | | | | | | | | | | | | | |
Expenses to average net assets | | | | | | | | | | | | | | | | | | | | |
After reimbursement/fee waiver | | | 0.88 | % | | | 0.91 | % | | | 0.86 | % | | | 0.88 | % | | | 0.88 | %(e) |
Before reimbursement/fee waiver | | | 0.88 | % | | | 0.91 | % | | | 0.86 | % | | | 0.88 | % | | | 0.88 | %(e) |
Net investment income (loss), to average net assets(dd) | | | 0.32 | % | | | 0.15 | % | | | 0.15 | % | | | (0.15 | %) | | | (0.06 | %)(e) |
Portfolio turnover rate | | | 63 | % | | | 71 | % | | | 45 | % | | | 85 | % | | | 59 | %(d) |
| | | | | | | | | | | | | | | | | | | | |
| For a share outstanding throughout each period | | | | | Transamerica Jennison Growth | | | | |
| | | October 31,
2010 | | | October 31,
2009 | | | October 31,
2008 | | | October 31,
2007 | | | October 31,
2006(f) | |
Net asset value | | | | | | | | | | | | | | | | | | | | |
Beginning of year | | | $10.17 | | | | $8.37 | | | | $13.05 | | | | $11.40 | | | | $11.43 | |
| | | | | |
Investment operations | | | | | | | | | | | | | | | | | | | | |
Net investment income(b) | | | 0.01 | | | | 0.01 | | | | 0.02 | | | | 0.03 | | | | – | (k) |
Net realized and unrealized gain (loss) on investments | | | 1.61 | | | | 1.81 | | | | (4.68 | ) | | | 2.08 | | | | 0.18 | |
Total from investment operations | | | 1.62 | | | | 1.82 | | | | (4.66 | ) | | | 2.11 | | | | 0.18 | |
| | | | | |
Distributions | | | | | | | | | | | | | | | | | | | | |
Net investment income | | | (0.01 | ) | | | (0.02 | ) | | | (0.02 | ) | | | – | | | | – | |
Net realized gains on investments | | | – | | | | – | | | | – | | | | (0.46 | ) | | | (0.21 | ) |
Total distributions | | | (0.01 | ) | | | (0.02 | ) | | | (0.02 | ) | | | (0.46 | ) | | | (0.21 | ) |
| | | | | |
Net asset value | | | | | | | | | | | | | | | | | | | | |
End of year | | | $11.78 | | | | $10.17 | | | | $8.37 | | | | $13.05 | | | | $11.40 | |
| | | | | |
Total return(c) | | | 15.96 | % | | | 21.79 | % | | | (35.77 | %) | | | 19.14 | % | | | 1.50 | %(d) |
| | | | | |
Net assets end of year (000’s) | | $ | 726,732 | | | $ | 654,610 | | | $ | 184,981 | | | $ | 160,815 | | | $ | 96,273 | |
| | | | | |
Ratio and supplemental data | | | | | | | | | | | | | | | | | | | | |
Expenses to average net assets | | | 0.81 | % | | | 0.85 | % | | | 0.85 | % | | | 0.87 | % | | | 0.89 | %(e) |
Net investment income (loss), to average net assets | | | 0.09 | % | | | 0.16 | % | | | 0.21 | % | | | 0.22 | % | | | (0.02 | %)(e) |
Portfolio turnover rate | | | 83 | % | | | 82 | % | | | 70 | % | | | 63 | % | | | 80 | %(d) |
235
| | | | | | | | |
| For a share outstanding throughout each period | | Transamerica JPMorgan Core Bond | |
| | | October 31, 2010 | | | October 31, 2009(j) | |
Net asset value | | | | | | | | |
Beginning of year | | | $10.08 | | | | $10.00 | |
Investment operations | | | | | | | | |
Net investment income(b) | | | 0.28 | | | | 0.07 | |
Net realized and unrealized gain (loss) on investments | | | 0.53 | | | | 0.06 | |
Total from investment operations | | | 0.81 | | | | 0.13 | |
Distributions | | | | | | | | |
Net investment income | | | (0.33) | | | | (0.05) | |
Net realized gains on investments | | | – | | | | – | |
Return of capital | | | – | | | | – | |
Total distributions | | | (0.33) | | | | (0.05) | |
Net asset value | | | | | | | | |
End of year | | | $10.56 | | | | $10.08 | |
Total return(c) | | | 8.16% | | | | 1.34% | (d) |
Net assets end of year (000’s) | | $ | 1,063,458 | | | $ | 215,816 | |
Ratio and supplemental data | | | | | | | | |
Expenses to average net assets: | | | | | | | | |
After reimbursement/recapture | | | 0.50% | | | | 0.55% | (e) |
Before reimbursement/recapture | | | 0.50% | | | | 0.55% | (e) |
Net investment income, to average net assets | | | 2.73% | | | | 2.15% | (e) |
Portfolio turnover rate | | | 33% | | | | 3% | (d) |
| | | | | | | | | | | | | | | | | | | | |
| For a share outstanding throughout each period | | | | | Transamerica JPMorgan International Bond | | | | |
| | | October 31, 2010 | | | October 31, 2009 | | | October 31, 2008 | | | October 31, 2007 | | | October 31, 2006(a) | |
Net asset value | | | | | | | | | | | | | | | | | | | | |
Beginning of year | | | $11.64 | | | | $10.56 | | | | $11.00 | | | | $10.51 | | | | $10.00 | |
Investment operations | | | | | | | | | | | | | | | | | | | | |
Net investment income(b) | | | 0.24 | | | | 0.26 | | | | 0.29 | | | | 0.28 | | | | 0.22 | |
Net realized and unrealized gain (loss) on investments | | | 0.71 | | | | 1.59 | | | | (0.29) | | | | 0.59 | | | | 0.49 | |
Total from investment operations | | | 0.95 | | | | 1.85 | | | | – | (k) | | | 0.87 | | | | 0.71 | |
Distributions | | | | | | | | | | | | | | | | | | | | |
Net investment income | | | (0.39) | | | | (0.68) | | | | (0.44) | | | | (0.38) | | | | (0.20) | |
Net realized gains on investments | | | (0.12) | | | | (0.09) | | | | – | | | | – | | | | – | |
Total distributions | | | (0.51) | | | | (0.77) | | | | (0.44) | | | | (0.38) | | | | (0.20) | |
Net asset value | | | | | | | | | | | | | | | | | | | | |
End of year | | | $12.08 | | | | $11.64 | | | | $10.56 | | | | $11.00 | | | | $10.51 | |
Total return(c) | | | 8.54% | | | | 17.90% | | | | (0.14%) | | | | 8.55% | | | | 7.12% | (d) |
Net assets end of year (000’s) | | $ | 447,141 | | | $ | 732,964 | | | $ | 699,078 | | | $ | 761,827 | | | $ | 682,254 | |
Ratio and supplemental data | | | | | | | | | | | | | | | | | | | | |
Expenses to average net assets: | | | | | | | | | | | | | | | | | | | | |
After reimbursement/recapture | | | 0.61% | | | | 0.60% | | | | 0.61% | | | | 0.61% | | | | 0.64% | (e) |
Before reimbursement/recapture | | | 0.61% | | | | 0.60% | | | | 0.61% | | | | 0.61% | | | | 0.64% | (e) |
Net investment income, to average net assets | | | 2.16% | | | | 2.38% | | | | 2.55% | | | | 2.68% | | | | 2.34% | (e) |
Portfolio turnover rate | | | 61% | | | | 53% | | | | 74% | | | | 86% | | | | 145% | (d) |
236
| | | | | | | | | | | | | | | | | | | | |
For a share outstanding throughout each period | | Transamerica JPMorgan Mid Cap Value | |
| | | October 31, 2010 | | | October 31, 2009 | | | October 31, 2008 | | | October 31, 2007 | | | October 31, 2006(f) | |
Net asset value | | | | | | | | | | | | | | | | | | | | |
Beginning of year | | | $8.28 | | | | $7.54 | | | | $12.32 | | | | $11.67 | | | | $10.09 | |
Investment operations | | | | | | | | | | | | | | | | | | | | |
Net investment income(b) | | | 0.12 | | | | 0.15 | | | | 0.13 | | | | 0.13 | | | | 0.11 | |
Net realized and unrealized gain (loss) on investments | | | 1.93 | | | | 0.82 | | | | (4.20) | | | | 1.13 | | | | 1.57 | |
Total from investment operations | | | 2.05 | | | | 0.97 | | | | (4.07) | | | | 1.26 | | | | 1.68 | |
Distributions | | | | | | | | | | | | | | | | | | | | |
Net investment income | | | (0.16) | | | | (0.17) | | | | (0.10) | | | | (0.11) | | | | (0.05) | |
Net realized gains on investments | | | – | | | | (0.06) | | | | (0.61) | | | | (0.50) | | | | (0.05) | |
Total distributions | | | (0.16) | | | | (0.23) | | | | (0.71) | | | | (0.61) | | | | (0.10) | |
Net asset value | | | | | | | | | | | | | | | | | | | | |
End of year | | | $10.17 | | | | $8.28 | | | | $7.54 | | | | $12.32 | | | | $11.67 | |
Total return(c) | | | 25.08% | | | | 13.39% | | | | (34.92%) | | | | 11.07% | | | | 16.71% | (d) |
Net assets end of year (000’s) | | $ | 163,612 | | | $ | 165,838 | | | $ | 147,772 | | | $ | 270,661 | | | $ | 245,188 | |
Ratio and supplemental data | | | | | | | | | | | | | | | | | | | | |
Expenses to average net assets: | | | | | | | | | | | | | | | | | | | | |
After reimbursement/recapture | | | 0.89% | | | | 0.90% | | | | 0.87% | | | | 0.87% | | | | 0.88% | (e) |
Before reimbursement/recapture | | | 0.89% | | | | 0.90% | | | | 0.87% | | | | 0.87% | | | | 0.88% | (e) |
Net investment income, to average net assets | | | 1.33% | | | | 2.05% | | | | 1.22% | | | | 0.98% | | | | 1.10% | (e) |
Portfolio turnover rate | | | 29% | | | | 43% | | | | 45% | | | | 50% | | | | 46% | (d) |
| | | | | | | | | | | | | | | | |
For a share outstanding throughout each period | | Transamerica Loomis Sayles Bond | |
| | | October 31, 2010 | | | October 31, 2009 | | | October 31, 2008 | | | October 31, 2007(g) | |
Net asset value | | | | | | | | | | | | | | | | |
Beginning of year | | | $9.93 | | | | $7.34 | | | | $10.19 | | | | $10.00 | |
Investment operations | | | | | | | | | | | | | | | | |
Net investment income(b) | | | 0.57 | | | | 0.60 | | | | 0.60 | | | | 0.45 | |
Net realized and unrealized gain (loss) on investments | | | 1.23 | | | | 2.61 | | | | (2.88) | | | | (0.01) | |
Total from investment operations | | | 1.80 | | | | 3.21 | | | | (2.28) | | | | 0.44 | |
Distributions | | | | | | | | | | | | | | | | |
Net investment income | | | (0.59) | | | | (0.57) | | | | (0.57) | | | | (0.25) | |
Net realized gains on investments | | | – | | | | (0.05) | | | | – | | | | – | |
Total distributions | | | (0.59) | | | | (0.62) | | | | (0.57) | | | | (0.25) | |
Net asset value | | | | | | | | | | | | | | | | |
End of year | | | $11.14 | | | | $9.93 | | | | $7.34 | | | | $10.19 | |
Total return(c) | | | 18.69% | | | | 46.27% | | | | (23.56%) | | | | 4.50% | (d) |
Net assets end of year (000’s) | | $ | 594,220 | | | $ | 812,252 | | | $ | 577,368 | | | $ | 513,249 | |
Ratio and supplemental data | | | | | | | | | | | | | | | | |
Expenses to average net assets: | | | | | | | | | | | | | | | | |
After reimbursement/recapture | | | 0.70% | | | | 0.69% | | | | 0.69% | | | | 0.73% | (e) |
Before reimbursement/recapture | | | 0.70% | | | | 0.69% | | | | 0.69% | | | | 0.73% | (e) |
Net investment income, to average net assets | | | 5.49% | | | | 7.22% | | | | 6.34% | | | | 5.42% | (e) |
Portfolio turnover rate | | | 79% | | | | 42% | | | | 24% | | | | 18% | (d) |
237
| | | | | | | | | | | | | | | | | | | | |
| For a share outstanding throughout each period | | Transamerica MFS International Equity | | | | | | | |
| | October 31,
2010 | | | October 31,
2009 | | | October 31,
2008(aa) | | | | | | | |
Net asset value | | | | | | | | | | | | | | | | | | | | |
Beginning of year | | | $8.16 | | | | $6.58 | | | | $10.00 | | | | | | | | | |
Investment operations | | | | | | | | | | | | | | | | | | | | |
Net investment income(b) | | | 0.12 | | | | 0.12 | | | | 0.02 | | | | | | | | | |
Net realized and unrealized gain (loss) on investments | | | 1.09 | | | | 1.46 | | | | (3.44 | ) | | | | | | | | |
Total from investment operations | | | 1.21 | | | | 1.58 | | | | (3.42 | ) | | | | | | | | |
| | | | | |
Distributions | | | | | | | | | | | | | | | | | | | | |
Net investment income | | | (0.06 | ) | | | – | | | | – | | | | | | | | | |
Net realized gains on investments | | | (0.20 | ) | | | – | | | | – | | | | | | | | | |
Total distributions | | | (0.26 | ) | | | – | | | | – | | | | | | | | | |
| | | | | |
Net asset value | | | | | | | | | | | | | | | | | | | | |
End of year | | | $9.11 | | | | $8.16 | | | | $6.58 | | | | | | | | | |
| | | | | |
Total return(c) | | | 15.16 | % | | | 24.01 | % | | | (34.20 | %)(d) | | | | | | | | |
| | | | | |
Net assets end of year (000’s) | | $ | 536,181 | | | $ | 396,754 | | | $ | 40,997 | | | | | | | | | |
| | | | | |
Ratio and supplemental data | | | | | | | | | | | | | | | | | | | | |
Expenses to average net assets | | | 0.99 | % | | | 1.09 | % | | | 1.23 | %(e) | | | | | | | | |
Net investment income, to average net assets | | | 1.47 | % | | | 1.78 | % | | | 0.71 | %(e) | | | | | | | | |
Portfolio turnover rate | | | 35 | % | | | 24 | % | | | 37 | %(d) | | | | | | | | |
| | | |
| | | | | | | | | | |
| | | |
| For a share outstanding throughout each period | | | | | Transamerica Money Market (cc) | | | | |
| | | October 31,
2010 | | | October 31,
2009 | | | October 31,
2008 | | | October
31,
2007 | | | October
31,
2006 (f) | |
Net asset value | | | | | | | | | | | | | | | | | | | | |
Beginning of period/year | | | $1.00 | | | | $1.00 | | | | $1.00 | | | | $1.00 | | | | $1.00 | |
| | | | | |
Investment operations | | | | | | | | | | | | | | | | | | | | |
Net investment income(b) | | | – | (k) | | | – | (k) | | | 0.03 | | | | 0.05 | | | | 0.04 | |
Net realized and unrealized gain on investments | | | – | (k) | | | – | (k) | | | – | (k) | | | – | | | | – | |
Total from investment operations | | | – | (k) | | | – | (k) | | | 0.03 | | | | 0.05 | | | | 0.04 | |
| | | | | |
Net equalization and credits | | | – | (k) | | | – | | | | – | | | | – | | | | – | |
| | | | | |
Distributions | | | | | | | | | | | | | | | | | | | | |
Net investment income | | | – | (k) | | | – | (k) | | | (0.03 | ) | | | (0.05 | ) | | | (0.04 | ) |
Net realized gains on investments | | | – | | | | – | | | | – | | | | – | (k) | | | – | |
Total distributions | | | – | (k) | | | – | (k) | | | (0.03 | ) | | | (0.05 | ) | | | (0.04 | ) |
| | | | | |
Net asset value | | | | | | | | | | | | | | | | | | | | |
End of year | | | $1.00 | | | | $1.00 | | | | $1.00 | | | | $1.00 | | | | $1.00 | |
| | | | | |
Total return(c) | | | 0.01 | % | | | 0.35 | % | | | 2.84 | % | | | 4.98 | % | | | 4.30 | %(d) |
| | | | | |
Net assets end of year (000’s) | | $ | 21,773 | | | $ | 34,119 | | | $ | 29,327 | | | $ | 34,673 | | | $ | 26,466 | |
| | | | | |
Ratio and supplemental data | | | | | | | | | | | | | | | | | | | | |
Expenses to average net assets | | | | | | | | | | | | | | | | | | | | |
After reimbursement/fee waiver | | | 0.21 | %(gg) | | | 0.45 | %(gg) | | | 0.48 | % | | | 0.48 | % | | | 0.48 | %(e) |
Before reimbursement/fee waiver | | | 0.50 | % | | | 0.53 | % | | | 0.49 | % | | | 0.52 | % | | | 0.51 | %(e) |
Net investment income, to average net assets(dd) | | | 0.01 | % | | | 0.36 | % | | | 2.89 | % | | | 4.88 | % | | | 4.39 | %(e) |
238
| | | | | | | | | | | | | | | | | | | | |
| For a share outstanding throughout each period | | | | | Transamerica Morgan Stanley Emerging Markets Debt(l) | | | | |
| | | October 31,
2010 | | | October 31, 2009 | | | October 31,
2008 | | | October 31, 2007 | | | October 31, 2006 | |
Net asset value | | | | | | | | | | | | | | | | | | | | |
Beginning of year | | | $10.23 | | | | $7.98 | | | | $11.23 | | | | $10.91 | | | | $10.45 | |
| | | | | |
Investment operations | | | | | | | | | | | | | | | | | | | | |
Net investment income(b) | | | 0.62 | | | | 0.60 | | | | 0.61 | | | | 0.59 | | | | 0.55 | |
Net realized and unrealized gain (loss) on investments | | | 1.07 | | | | 2.18 | | | | (2.72 | ) | | | 0.46 | | | | 0.52 | |
Total from investment operations | | | 1.69 | | | | 2.78 | | | | (2.11 | ) | | | 1.05 | | | | 1.07 | |
| | | | | |
Distributions | | | | | | | | | | | | | | | | | | | | |
Net investment income | | | (0.63 | ) | | | (0.53 | ) | | | (0.79 | ) | | | (0.63 | ) | | | (0.54 | ) |
Net realized gains on investments | | | – | | | | – | | | | (0.35 | ) | | | (0.10 | ) | | | (0.07 | ) |
Total distributions | | | (0.63 | ) | | | (0.53 | ) | | | (1.14 | ) | | | (0.73 | ) | | | (0.61 | ) |
| | | | | |
Net asset value | | | | | | | | | | | | | | | | | | | | |
End of year | | | $11.29 | | | | $10.23 | | | | $7.98 | | | | $11.23 | | | | $10.91 | |
| | | | | |
Total return(c) | | | 17.16 | % | | | 36.29 | % | | | (20.81 | %) | | | 9.94 | % | | | 10.61 | % |
| | | | | |
Net assets end of year (000’s) | | | $302,576 | | | | $382,618 | | | | $320,350 | | | | $317,328 | | | | $425,726 | |
| | | | | |
Ratio and supplemental data | | | | | | | | | | | | | | | | | | | | |
Expenses to average net assets: | | | | | | | | | | | | | | | | | | | | |
After reimbursement/recapture | | | 1.00 | % | | | 0.98 | % | | | 0.98 | % | | | 1.03 | % | | | 1.03 | % |
Before reimbursement/recapture | | | 1.00 | % | | | 0.98 | % | | | 0.98 | % | | | 1.03 | % | | | 1.03 | % |
Net investment income, to average net assets | | | 5.89 | % | | | 6.67 | % | | | 5.92 | % | | | 5.36 | % | | | 5.24 | % |
Portfolio turnover rate | | | 100 | % | | | 118 | % | | | 81 | % | | | 79 | % | | | 79 | % |
| | | | | | | | | | | | | | | | | | | | |
| For a share outstanding throughout each period | | | | | Transamerica Morgan Stanley Mid-Cap Growth(m) | | | | |
| | | October 31,
2010 | | | October 31, 2009 | | | October 31, 2008 | | | October 31, 2007 | | | October 31, 2006(n) | |
Net asset value | | | | | | | | | | | | | | | | | | | | |
Beginning of year | | | $9.58 | | | | $7.42 | | | | $14.16 | | | | $10.33 | | | | $10.00 | |
| | | | | |
Investment operations | | | | | | | | | | | | | | | | | | | | |
Net investment income(b) | | | 0.04 | | | | – | (k) | | | 0.02 | | | | 0.04 | | | | 0.01 | |
Net realized and unrealized gain (loss) on investments | | | 3.47 | | | | 2.17 | | | | (5.90 | ) | | | 3.81 | | | | 0.32 | |
Total from investment operations | | | 3.51 | | | | 2.17 | | | | (5.88 | ) | | | 3.85 | | | | 0.33 | |
| | | | | |
Distributions | | | | | | | | | | | | | | | | | | | | |
Net investment income | | | (0.02 | ) | | | (0.01 | ) | | | (0.02 | ) | | | (0.02 | ) | | | – | |
Net realized gains on investments | | | – | | | | – | | | | (0.84 | ) | | | – | | | | – | |
Total distributions | | | (0.02 | ) | | | (0.01 | ) | | | (0.86 | ) | | | (0.02 | ) | | | – | |
| | | | | |
Net asset value | | | | | | | | | | | | | | | | | | | | |
End of year | | | $13.07 | | | | $9.58 | | | | $7.42 | | | | $14.16 | | | | $10.33 | |
| | | | | |
Total return(c) | | | 36.64 | % | | | 29.29 | % | | | (43.99 | %) | | | 37.32 | % | | | 3.30 | %(d) |
| | | | | |
Net assets end of year (000’s) | | $ | 292,575 | | | $ | 256,212 | | | $ | 98,141 | | | $ | 125,380 | | | $ | 75,092 | |
| | | | | |
Ratio and supplemental data | | | | | | | | | | | | | | | | | | | | |
Expenses to average net assets: | | | | | | | | | | | | | | | | | | | | |
After reimbursement/recapture | | | 0.86 | % | | | 0.88 | % | | | 0.87 | % | | | 0.90 | % | | | 0.92 | %(e) |
Before reimbursement/recapture | | | 0.86 | % | | | 0.88 | % | | | 0.87 | % | | | 0.90 | % | | | 0.92 | %(e) |
Net investment income (loss), to average net assets | | | 0.37 | % | | | (0.06 | %) | | | 0.19 | % | | | 0.32 | % | | | 0.11 | %(e) |
Portfolio turnover rate | | | 50 | % | | | 38 | % | | | 40 | % | | | 74 | % | | | 50 | %(d) |
239
| | | | | | | | | | | | | | | | | | | | |
| For a share outstanding throughout each period | | | | | Transamerica Morgan Stanley Small Company Growth(o) | | | | |
| | | October 31,
2010 | | | October 31, 2009 | | | October 31, 2008 | | | October 31, 2007 | | | October 31, 2006 | |
Net asset value | | | | | | | | | | | | | | | | | | | | |
Beginning of year | | | $8.82 | | | | $7.39 | | | | $14.14 | | | | $12.78 | | | | $11.29 | |
| | | | | |
Investment operations | | | | | | | | | | | | | | | | | | | | |
Net investment income (loss)(b) | | | – | (k) | | | (0.02 | ) | | | 0.10 | | | | 0.02 | | | | (0.02 | ) |
Net realized and unrealized gain (loss) on investments | | | 2.12 | | | | 1.62 | | | | (5.50 | ) | | | 1.81 | | | | 1.69 | |
Total from investment operations | | | 2.12 | | | | 1.60 | | | | (5.40 | ) | | | 1.83 | | | | 1.67 | |
| | | | | |
Distributions | | | | | | | | | | | | | | | | | | | | |
Net investment income | | | – | | | | (0.15 | ) | | | (0.02 | ) | | | – | | | | (0.01 | ) |
Net realized gains on investments | | | – | | | | – | | | | (1.33 | ) | | | (0.47 | ) | | | (0.17 | ) |
Return of capital | | | – | | | | (0.02 | ) | | | – | | | | – | | | | – | |
Total distributions | | | – | | | | (0.17 | ) | | | (1.35 | ) | | | (0.47 | ) | | | (0.18 | ) |
| | | | | |
Net asset value | | | | | | | | | | | | | | | | | | | | |
End of year | | | $10.94 | | | | $8.82 | | | | $7.39 | | | | $14.14 | | | | $12.78 | |
| | | | | |
Total return(c) | | | 24.04 | % | | | 22.43 | % | | | (41.72 | %) | | | 14.75 | % | | | 14.92 | % |
| | | | | |
Net assets end of year (000’s) | | $ | 181,460 | | | $ | 129,889 | | | $ | 61,214 | | | $ | 188,347 | | | $ | 301,649 | |
| | | | | |
Ratio and supplemental data | | | | | | | | | | | | | | | | | | | | |
Expenses to average net assets: | | | | | | | | | | | | | | | | | | | | |
After reimbursement/recapture | | | 1.02 | % | | | 1.04 | % | | | 1.02 | % | | | 1.01 | % | | | 1.01 | % |
Before reimbursement/recapture | | | 1.02 | % | | | 1.04 | % | | | 1.02 | % | | | 1.01 | % | | | 1.01 | % |
Net investment income (loss), to average net assets | | | (0.02 | %) | | | (0.19 | %) | | | 0.89 | % | | | 0.13 | % | | | (0.19 | %) |
Portfolio turnover rate | | | 21 | % | | | 40 | % | | | 44 | % | | | 71 | % | | | 67 | % |
| | | | | | | | | | | | | | | | | | | | |
| For a share outstanding throughout each period | | | | | Transamerica Neuberger Berman International | | | | |
| | | October 31,
2010 | | | October 31, 2009 | | | October 31, 2008 | | | October 31, 2007 | | | October 31,
2006(a) | |
Net asset value | | | | | | | | | | | | | | | | | | | | |
Beginning of year | | | $7.57 | | | | $5.95 | | | | $13.55 | | | | $11.74 | | | | $10.00 | |
| | | | | |
Investment operations | | | | | | | | | | | | | | | | | | | | |
Net investment income(b) | | | 0.10 | | | | 0.10 | | | | 0.19 | | | | 0.15 | | | | 0.12 | |
Net realized and unrealized gain (loss) on investments | | | 1.34 | | | | 1.69 | | | | (6.63 | ) | | | 2.37 | | | | 1.64 | |
Total from investment operations | | | 1.44 | | | | 1.79 | | | | (6.44 | ) | | | 2.52 | | | | 1.76 | |
| | | | | |
Distributions | | | | | | | | | | | | | | | | | | | | |
Net investment income | | | (0.07 | ) | | | (0.17 | ) | | | (0.13 | ) | | | (0.13 | ) | | | (0.02 | ) |
Net realized gains on investments | | | – | | | | – | | | | (1.03 | ) | | | (0.58 | ) | | | – | |
Total distributions | | | (0.07 | ) | | | (0.17 | ) | | | (1.16 | ) | | | (0.71 | ) | | | (0.02 | ) |
| | | | | |
Net asset value | | | | | | | | | | | | | | | | | | | | |
End of year | | | $8.94 | | | | $7.57 | | | | $5.95 | | | | $13.55 | | | | $11.74 | |
| | | | | |
Total return(c) | | | 19.16 | % | | | 30.83 | % | | | (51.66 | %) | | | 22.37 | % | | | 17.61 | %(d) |
| | | | | |
Net assets end of year (000’s) | | $ | 584,849 | | | $ | 485,803 | | | $ | 307,981 | | | $ | 596,488 | | | $ | 459,996 | |
| | | | | |
Ratio and supplemental data | | | | | | | | | | | | | | | | | | | | |
Expenses to average net assets: | | | | | | | | | | | | | | | | | | | | |
After reimbursement/recapture | | | 1.06 | % | | | 1.09 | % | | | 1.06 | % | | | 1.06 | % | | | 1.07 | %(e) |
Before reimbursement/recapture | | | 1.06 | % | | | 1.09 | % | | | 1.06 | % | | | 1.06 | % | | | 1.07 | %(e) |
Net investment income, to average net assets | | | 1.22 | % | | | 1.62 | % | | | 1.87 | % | | | 1.21 | % | | | 1.21 | %(e) |
Portfolio turnover rate | | | 51 | % | | | 75 | % | | | 72 | % | | | 57 | % | | | 52 | %(d) |
240
| | | | | | | | | | |
| For a share outstanding throughout each period | | Transamerica Oppenheimer Developing Markets |
| | | October 31, 2010 | | October 31, 2009 | | October 31, 2008 | | October 31, 2007 | | October 31,
2006(a) |
| | | | | |
Net asset value | | | | | | | | | | |
Beginning of year | | $10.12 | | $8.20 | | $17.07 | | $11.41 | | $10.00 |
| | | | | |
Investment operations | | | | | | | | | | |
Net investment income(b) | | 0.05 | | 0.06 | | 0.19 | | 0.12 | | 0.09 |
Net realized and unrealized gain (loss) on investments | | 3.22 | | 3.51 | | (7.65) | | 5.99 | | 1.37 |
Total from investment operations | | 3.27 | | 3.57 | | (7.46) | | 6.11 | | 1.46 |
| | | | | |
Distributions | | | | | | | | | | |
Net investment income | | (0.05) | | (0.16) | | (0.09) | | (0.06) | | (0.05) |
Net realized gains on investments | | – | | (1.49) | | (1.32) | | (0.39) | | – |
Total distributions | | (0.05) | | (1.65) | | (1.41) | | (0.45) | | (0.05) |
| | | | | |
Net asset value | | | | | | | | | | |
End of year | | $13.34 | | $10.12 | | $8.20 | | $17.07 | | $11.41 |
| | | | | |
Total return(c) | | 32.43% | | 56.01% | | (47.48%) | | 55.27% | | 14.64%(d) |
| | | | | |
Net assets end of year (000’s) | | $ 610,212 | | $ 495,636 | | $ 317,973 | | $ 674,561 | | $ 362,080 |
| | | | | |
Ratio and supplemental data | | | | | | | | | | |
Expenses to average net assets: | | | | | | | | | | |
After reimbursement/recapture | | 1.31% | | 1.35% | | 1.32% | | 1.34% | | 1.45%(e) |
Before reimbursement/recapture | | 1.31% | | 1.35% | | 1.32% | | 1.34% | | 1.45%(e) |
Net investment income, to average net assets | | 0.48% | | 0.77% | | 1.42% | | 0.87% | | 0.89%(e) |
Portfolio turnover rate | | 54% | | 50% | | 67% | | 59% | | 77%(d) |
| | | |
| For a share outstanding throughout each period | | Transamerica Oppenheimer Small- & Mid-Cap Value |
| | | October 31, 2010 | | October 31, 2009 | | October 31, 2008 | | October 31, 2007 | | October 31, 2006(p) |
| | | | | |
Net asset value | | | | | | | | | | |
Beginning of year | | $7.72 | | $6.30 | | $13.18 | | $10.94 | | $10.00 |
| | | | | |
Investment operations | | | | | | | | | | |
Net investment income(b) | | 0.02 | | 0.03 | | 0.04 | | – | | 0.02 |
Net realized and unrealized gain (loss) on investments | | 1.63 | | 1.41 | | (5.98) | | 2.44 | | 0.92 |
Total from investment operations | | 1.65 | | 1.44 | | (5.94) | | 2.44 | | 0.94 |
| | | | | |
Distributions | | | | | | | | | | |
Net investment income | | (0.04) | | (0.02) | | –(k) | | (0.02) | | – |
Net realized gains on investments | | – | | – | | (0.94) | | (0.18) | | – |
Total distributions | | (0.04) | | (0.02) | | (0.94) | | (0.20) | | – |
| | | | | |
Net asset value | | | | | | | | | | |
End of year | | $9.33 | | $7.72 | | $6.30 | | $13.18 | | $10.94 |
| | | | | |
Total return(c) | | 21.44% | | 22.99% | | (48.36%) | | 22.57% | | 9.40%(d) |
| | | | | |
Net assets end of year (000’s) | | $ 299,225 | | $ 269,281 | | $ 127,886 | | $ 183,126 | | $ 91,899 |
| | | | | |
Ratio and supplemental data | | | | | | | | | | |
Expenses to average net assets: | | | | | | | | | | |
After reimbursement/recapture | | 0.96% | | 0.98% | | 1.00% | | 1.03%(q) | | 1.15%(e) |
Before reimbursement/recapture | | 0.96% | | 0.98% | | 1.00% | | 1.03%(q) | | 1.22%(e) |
Net investment income, to average net assets | | 0.19% | | 0.43% | | 0.34% | | –% | | 0.74%(e) |
Portfolio turnover rate | | 81% | | 110% | | 102% | | 118% | | 33%(d) |
241
| | | | | | | | | | |
| For a share outstanding throughout each period | | Transamerica PIMCO Real Return TIPS |
| | | October 31,
2010 | | October 31,
2009 | | October 31,
2008 | | October 31,
2007 | | October 31,
2006 |
| | | | | |
Net asset value | | | | | | | | | | |
Beginning of year | | $10.72 | | $9.21 | | $10.21 | | $10.05 | | $10.25 |
| | | | | |
Investment operations | | | | | | | | | | |
Net investment income(b) | | 0.25 | | 0.32 | | 0.47 | | 0.38 | | 0.48 |
Net realized and unrealized gain (loss) on investments | | 1.04 | | 1.58 | | (0.96) | | 0.16 | | (0.22) |
Total from investment operations | | 1.29 | | 1.90 | | (0.49) | | 0.54 | | 0.26 |
| | | | | |
Distributions | | | | | | | | | | |
Net investment income | | (0.40) | | (0.33) | | (0.51) | | (0.38) | | (0.45) |
Net realized gains on investments | | – | | (0.06) | | – | | – | | (0.01) |
Total distributions | | (0.40) | | (0.39) | | (0.51) | | (0.38) | | (0.46) |
| | | | | |
Net asset value | | | | | | | | | | |
End of year | | $11.61 | | $10.72 | | $9.21 | | $10.21 | | $10.05 |
| | | | | |
Total return(c) | | 12.40% | | 21.00% | | (5.29%) | | 5.54% | | 2.55% |
| | | | | |
Net assets end of year (000’s) | | $ 845,965 | | $ 752,723 | | $ 621,092 | | $ 690,942 | | $ 603,597 |
| | | | | |
Ratio and supplemental data | | | | | | | | | | |
Expenses to average net assets | | 0.72% | | 0.74% | | 0.74% | | 0.73% | | 0.73% |
Net investment income, to average net assets | | 2.32% | | 3.23% | | 4.47% | | 3.82% | | 4.79% |
Portfolio turnover rate | | 307% | | 583% | | 1,028% | | 375% | | 384% |
| | | | | | | | | | |
| For a share outstanding throughout each period | | Transamerica PIMCO Total Return |
| | | October 31,
2010 | | October 31,
2009 | | October 31,
2008 | | October 31,
2007 | | October 31,
2006(f) |
| | | | | |
Net asset value | | | | | | | | | | |
Beginning of year | | $10.85 | | $9.58 | | $10.47 | | $10.28 | | $10.12 |
| | | | | |
Investment operations | | | | | | | | | | |
Net investment income(b) | | 0.35 | | 0.49 | | 0.49 | | 0.46 | | 0.41 |
Net realized and unrealized gain (loss) on investments | | 0.67 | | 1.64 | | (0.88) | | 0.18 | | 0.12 |
Total from investment operations | | 1.02 | | 2.13 | | (0.39) | | 0.64 | | 0.53 |
| | | | | |
Distributions | | | | | | | | | | |
Net investment income | | (0.34) | | (0.67) | | (0.44) | | (0.44) | | (0.37) |
Net realized gains on investments | | (0.73) | | (0.19) | | (0.06) | | (0.01) | | – |
Total distributions | | (1.07) | | (0.86) | | (0.50) | | (0.45) | | (0.37) |
| | | | | |
Net asset value | | | | | | | | | | |
End of year | | $10.80 | | $10.85 | | $9.58 | | $10.47 | | $10.28 |
| | | | | |
Total return(c) | | 10.25% | | 23.74% | | (4.04%) | | 6.33% | | 5.33%(d) |
| | | | | |
Net assets end of year (000’s) | | $ 667,721 | | $ 505,329 | | $ 555,428 | | $ 540,310 | | $ 268,173 |
| | | | | |
Ratio and supplemental data | | | | | | | | | | |
Expenses to average net assets | | 0.74%(jj) | | 0.74% | | 0.75% | | 0.75% | | 0.80%(e) |
Net investment income, to average net assets | | 3.30%(jj) | | 4.95% | | 4.66% | | 4.39% | | 4.18%(e) |
Portfolio turnover rate | | 222% | | 841% | | 751% | | 756% | | 544%(d) |
242
| | | | | | |
| For a share outstanding throughout each period | | Transamerica Schroders International Small Cap |
| | | October 31,
2010 | | October 31,
2009 | | October 31,
2008(r) |
| | | |
Net asset value | | | | | | |
Beginning of year | | $8.22 | | $5.82 | | $10.00 |
| | | |
Investment operations | | | | | | |
Net investment income(b) | | 0.08 | | 0.08 | | 0.12 |
Net realized and unrealized gain (loss) on investments | | 1.42 | | 2.41 | | (4.30) |
Total from investment operations | | 1.50 | | 2.49 | | (4.18) |
| | | |
Distributions | | | | | | |
Net investment income | | (0.05) | | (0.09) | | – |
Total distributions | | (0.05) | | (0.09) | | – |
| | | |
Net asset value | | | | | | |
End of year | | $9.67 | | $8.22 | | $5.82 |
| | | |
Total return(c) | | 18.29% | | 43.56% | | (41.80%)(d) |
| | | |
Net assets end of year (000’s) | | $ 548,288 | | $ 543,673 | | $ 108,655 |
| | | |
Ratio and supplemental data | | | | | | |
Expenses to average net assets: | | | | | | |
After reimbursement/recapture | | 1.16% | | 1.23% | | 1.27%(e) |
Before reimbursement/recapture | | 1.16% | | 1.21% | | 1.30%(e) |
Net investment income, to average net assets | | 0.97% | | 1.23% | | 1.96%(e) |
Portfolio turnover rate | | 54% | | 46% | | 14%(d) |
| | | | | | | | | | | | | | | | | | | | |
| For a share outstanding throughout each period | | Transamerica Short-Term Bond(cc) | |
| | | October 31,
2010 | | | October 31,
2009 | | | October 31,
2008 | | | October 31,
2007 | | | October 31, 2006 | |
| | | | | |
Net asset value | | | | | | | | | | | | | | | | | | | | |
Beginning of period/year | | | $10.08 | | | | $9.28 | | | | $9.82 | | | | $9.84 | | | | $9.79 | |
| | | | | |
Investment operations | | | | | | | | | | | | | | | | | | | | |
Net investment income(b) | | | 0.46 | | | | 0.50 | | | | 0.43 | | | | 0.47 | | | | 0.40 | |
Net realized and unrealized gain (loss) on investments | | | 0.27 | | | | 0.80 | | | | (0.54) | | | | (0.04) | | | | 0.05 | |
Total from investment operations | | | 0.73 | | | | 1.30 | | | | (0.11) | | | | 0.43 | | | | 0.45 | |
| | | | | |
Distributions | | | | | | | | | | | | | | | | | | | | |
Net investment income | | | (0.47) | | | | (0.50) | | | | (0.43) | | | | (0.45) | | | | (0.40) | |
Total distributions | | | (0.47) | | | | (0.50) | | | | (0.43) | | | | (0.45) | | | | (0.40) | |
| | | | | |
Net asset value | | | | | | | | | | | | | | | | | | | | |
End of year | | | $10.34 | | | | $10.08 | | | | $9.28 | | | | $9.82 | | | | $9.84 | |
| | | | | |
Total return(c) | | | 7.37% | | | | 14.44% | | | | (1.22%) | | | | 4.45% | | | | 4.72% | |
| | | | | |
Net assets end of year (000’s) | | | $ 999,064 | | | | $ 710,660 | | | | $ 492,333 | | | | $ 563,889 | | | | $ 379,442 | |
| | | | | |
Ratio and supplemental data | | | | | | | | | | | | | | | | | | | | |
Expenses to average net assets | | | | | | | | | | | | | | | | | | | | |
After reimbursement/fee waiver | | | 0.53% | | | | 0.63% | | | | 0.68% | | | | 0.67% | | | | 0.70% | |
Before reimbursement/fee waiver | | | 0.58% | | | | 0.69% | | | | 0.68% | | | | 0.67% | | | | 0.70% | |
Net investment income, to average net assets(dd) | | | 4.52% | | | | 5.14% | | | | 4.38% | | | | 4.81% | | | | 4.10% | |
Portfolio turnover rate | | | 54% | | | | 77% | | | | 67% | | | | 117% | | | | 100% | |
243
| | | | | | | | | | |
| For a share outstanding throughout each period | | Transamerica Small/Mid Cap Value(cc) |
| | | October 31,
2010 | | October 31, 2009 | | October 31, 2008 | | October 31, 2007 | | October 31, 2006 (f) |
Net asset value | | | | | | | | | | |
Beginning of period/year | | $14.82 | | $12.81 | | $23.91 | | $17.87 | | $16.84 |
Investment operations | | | | | | | | | | |
Net investment income(b) | | 0.08 | | 0.11 | | 0.30 | | 0.26 | | 0.18 |
Net realized and unrealized gain (loss) on investments | | 4.23 | | 2.31 | | (8.67) | | 6.32 | | 1.97 |
Total from investment operations | | 4.31 | | 2.42 | | (8.37) | | 6.58 | | 2.15 |
Distributions | | | | | | | | | | |
Net investment income | | – | | (0.41) | | (0.24) | | (0.23) | | – |
Net realized gains on investments | | – | | – | | (2.49) | | (0.31) | | (1.12) |
Total distributions | | – | | (0.41) | | (2.73) | | (0.54) | | (1.12) |
Net asset value | | | | | | | | | | |
End of year | | $19.13 | | $14.82 | | $12.81 | | $23.91 | | $17.87 |
Total return(c) | | 29.00% | | 19.85% | | (39.11%) | | 37.78% | | 13.30%(d) |
Net assets end of year (000’s) | | $ 15,893 | | $ 10,746 | | $ 214,351 | | $ 487,605 | | $ 478,728 |
Ratio and supplemental data | | | | | | | | | | |
Expenses to average net assets | | | | | | | | | | |
After reimbursement/fee waiver | | 0.88% | | 0.91% | | 0.85% | | 0.85% | | 0.86%(e) |
Before reimbursement/fee waiver | | 0.88% | | 0.91% | | 0.85% | | 0.85% | | 0.86%(e) |
Net investment income, to average net assets(dd) | | 0.47% | | 0.89% | | 1.58% | | 1.30% | | 1.05%(e) |
Portfolio turnover rate | | 57% | | 101% | | 48% | | 22% | | 21%(d) |
| | | | | | | | |
| For a share outstanding throughout each period | | Transamerica Third Avenue Value |
| | | October 31, 2010 | | October 31, 2009 | | October 31, 2008 | | October 31, 2007(s) |
Net asset value | | | | | | | | |
Beginning of year | | $18.44 | | $16.93 | | $28.93 | | $28.01 |
Investment operations | | | | | | | | |
Net investment income(b) | | 0.19 | | 0.15 | | 0.24 | | 0.14 |
Net realized and unrealized gain (loss) on investments | | 3.20 | | 1.36 | | (11.45) | | 0.78 |
Total from investment operations | | 3.39 | | 1.51 | | (11.21) | | 0.92 |
Distributions | | | | | | | | |
Net investment income | | (0.27) | | – | | (0.42) | | – |
Net realized gains on investments | | – | | – | | (0.37) | | – |
Total distributions | | (0.27) | | – | | (0.79) | | – |
Net asset value | | | | | | | | |
End of year | | $21.56 | | $18.44 | | $16.93 | | $28.93 |
Total return(c) | | 18.53% | | 8.92% | | (39.75%) | | 3.28%(d) |
Net assets end of year (000’s) | | $ 383,134 | | $ 423,550 | | $ 336,845 | | $ 678,578 |
Ratio and supplemental data | | | | | | | | |
Expenses to average net assets: | | | | | | | | |
After reimbursement/recapture | | 0.87% | | 0.87% | | 0.86% | | 0.86%(e) |
Before reimbursement/recapture | | 0.87% | | 0.87% | | 0.86% | | 0.86%(e) |
Net investment income, to average net assets | | 0.98% | | 0.91% | | 1.00% | | 0.98%(e) |
Portfolio turnover rate | | –%(v) | | 17% | | 29% | | 11%(d) |
244
| | | | | | |
| For a share outstanding throughout each period | | Transamerica Thornburg International Value |
| | | October 31, 2010 | | October 31, 2009 | | October 31,
2008(t) |
Net asset value | | | | | | |
Beginning of year | | $9.69 | | $7.98 | | $10.00 |
Investment operations | | | | | | |
Net investment income(b) | | 0.10 | | 0.10 | | –(k) |
Net realized and unrealized gain (loss) on investments | | 1.42 | | 1.66 | | (2.02) |
Total from investment operations | | 1.52 | | 1.76 | | (2.02) |
Distributions | | | | | | |
Net investment income | | (0.06) | | – | | – |
Net realized gains on investments | | (0.03) | | (0.05) | | – |
Total distributions | | (0.09) | | (0.05) | | – |
Net asset value | | | | | | |
End of year | | $11.12 | | $9.69 | | $7.98 |
Total return(c) | | 15.75% | | 22.21% | | (20.20%)(d) |
Net assets end of year (000’s) | | $ 778,484 | | $ 591,539 | | $ 79,516 |
Ratio and supplemental data | | | | | | |
Expenses to average net assets: | | | | | | |
After reimbursement/recapture | | 1.08% | | 1.17% | | 1.35%(e) |
Before reimbursement/recapture | | 1.08% | | 1.15% | | 1.76%(e) |
Net investment income (loss), to average net assets | | 0.97% | | 1.14% | | (0.18%)(e) |
Portfolio turnover rate | | 36% | | 39% | | 5%(d) |
| | | | | | | | | | |
| For a share outstanding throughout each period | | Transamerica UBS Large Cap Value |
| | | October 31, 2010 | | October 31, 2009 | | October 31,
2008 | | October 31, 2007 | | October 31, 2006 |
Net asset value | | | | | | | | | | |
Beginning of year | | $8.44 | | $8.05 | | $13.79 | | $12.73 | | $10.95 |
Investment operations | | | | | | | | | | |
Net investment income(b) | | 0.11 | | 0.14 | | 0.21 | | 0.19 | | 0.14 |
Net realized and unrealized gain (loss) on investments | | 0.74 | | 0.44 | | (5.64) | | 1.36 | | 1.92 |
Total from investment operations | | 0.85 | | 0.58 | | (5.43) | | 1.55 | | 2.06 |
Distributions | | | | | | | | | | |
Net investment income | | (0.11) | | (0.19) | | (0.15) | | (0.13) | | (0.10) |
Net realized gains on investments | | – | | – | | (0.16) | | (0.36) | | (0.18) |
Total distributions | | (0.11) | | (0.19) | | (0.31) | | (0.49) | | (0.28) |
Net asset value | | | | | | | | | | |
End of year | | $9.18 | | $8.44 | | $8.05 | | $13.79 | | $12.73 |
Total return(c) | | 10.09% | | 7.56% | | (40.19%) | | 12.48% | | 19.19% |
Net assets end of year (000’s) | | $ 1,125,533 | | $ 1,002,628 | | $ 701,997 | | $ 880,922 | | $ 226,782 |
Ratio and supplemental data | | | | | | | | | | |
Expenses to average net assets: | | | | | | | | | | |
After reimbursement/recapture | | 0.79% | | 0.81% | | 0.80% | | 0.81% | | 0.88% |
Before reimbursement/recapture | | 0.79% | | 0.81% | | 0.80% | | 0.81% | | 0.88% |
Net investment income, to average net assets | | 1.26% | | 1.80% | | 1.86% | | 1.41% | | 1.21% |
Portfolio turnover rate | | 56% | | 66% | | 47% | | 27% | | 32% |
245
| | | | | | | | | | | | | | | | | | | | |
| For a share outstanding throughout each period | | Transamerica WMC Diversified Growth(hh),(cc) | |
| | | October 31,
2010 | | | October 31,
2009 | | | October 31,
2008 | | | October 31,
2007 | | | October 31,
2006 (f) | |
Net asset value | | | | | | | | | | | | | | | | | | | | |
Beginning of period/year | | | $7.69 | | | | $6.99 | | | | $12.23 | | | | $9.90 | | | | $9.17 | |
Investment operations | | | | | | | | | | | | | | | | | | | | |
Net investment income(b) | | | 0.04 | | | | 0.05 | | | | 0.06 | | | | 0.01 | | | | –(k) | |
Net realized and unrealized gain (loss) on investments | | | 1.41 | | | | 0.69 | | | | (5.30) | | | | 2.32 | | | | 0.81 | |
Total from investment operations | | | 1.45 | | | | 0.74 | | | | (5.24) | | | | 2.33 | | | | 0.81 | |
Distributions | | | | | | | | | | | | | | | | | | | | |
Net investment income | | | (0.04) | | | | (0.04) | | | | – | | | | – | | | | – | |
Net realized gains on investments | | | – | | | | – | | | | – | | | | – | | | | (0.08) | |
Total distributions | | | (0.04) | | | | (0.04) | | | | – | | | | – | | | | (0.08) | |
Net asset value | | | | | | | | | | | | | | | | | | | | |
End of year | | | $9.10 | | | | $7.69 | | | | $6.99 | | | | $12.23 | | | | $9.90 | |
Total return(c) | | | 18.94% | | | | 10.73% | | | | (42.85%) | | | | 23.54% | | | | 8.83%(d) | |
Net assets end of year (000’s) | | $ | 425,431 | | | $ | 637,103 | | | $ | 500,722 | | | $ | 888,019 | | | $ | 714,803 | |
Ratio and supplemental data | | | | | | | | | | | | | | | | | | | | |
Expenses to average net assets | | | | | | | | | | | | | | | | | | | | |
After reimbursement/fee waiver | | | 0.78% | | | | 0.82%(ii) | | | | 0.75% | | | | 0.78% | | | | 0.81%(e) | |
Before reimbursement/fee waiver | | | 0.78% | | | | 0.82%(ii) | | | | 0.75% | | | | 0.78% | | | | 0.81%(e) | |
Net investment income, to average net assets(dd) | | | 0.51% | | | | 0.72% | | | | 0.55% | | | | 0.13% | | | | 0.02%(e) | |
Portfolio turnover rate | | | 167% | | | | 53% | | | | 33% | | | | 62% | | | | 19%(d) | |
| | | | | | |
| For a share outstanding throughout each period | | Transamerica WMC Emerging Markets |
| | | October 31, 2010 | | October 31, 2009 | | October 31, 2008(u) |
Net asset value | | | | | | |
Beginning of year | | $12.06 | | $7.66 | | $10.00 |
Investment operations | | | | | | |
Net investment income(b) | | 0.10 | | 0.09 | | –(k) |
Net realized and unrealized gain (loss) on investments | | 2.41 | | 4.31 | | (2.34) |
Total from investment operations | | 2.51 | | 4.40 | | (2.34) |
Distributions | | | | | | |
Net investment income | | (0.06) | | – | | – |
Net realized gains on investments | | (0.23) | | – | | – |
Total distributions | | (0.29) | | – | | – |
Net asset value | | | | | | |
End of year | | $14.28 | | $12.06 | | $7.66 |
Total return(c) | | 21.08% | | 57.44% | | (23.40%)(d) |
Net assets end of year (000’s) | | $ 411,311 | | $ 178,592 | | $ 76,127 |
Ratio and supplemental data | | | | | | |
Expenses to average net assets: | | | | | | |
After reimbursement/recapture | | 1.40% | | 1.40% | | 1.40%(e) |
Before reimbursement/recapture | | 1.40% | | 1.43% | | 2.26%(e) |
Net investment income, to average net assets | | 0.78% | | 0.89% | | 0.15%(e) |
Portfolio turnover rate | | 147% | | 141% | | 10%(d) |
| | (a) | Commenced operations on December 6, 2005. |
| | (b) | Calculated based on average number of shares outstanding. |
| | (c) | Total return has been calculated for the applicable period without deduction of a sales load, if any, on an initial purchase. |
246
| | (f) | Commenced operations on November 15, 2005. |
| | (g) | Commenced operations on January 3, 2007. |
| | (h) | Includes dividends and interest on securities sold short (representing 1.35%, 2.09%, 1.30%, and 1.56% of average net assets for 2010, 2009, 2008, and 2007, respectively). |
| | (i) | Formerly, Transamerica UBS Dynamic Alpha. |
| | (j) | Commenced operations on July 1, 2009. |
| | (k) | Rounds to less than $(0.01) or $0.01. |
| | (l) | Formerly, Transamerica Van Kampen Emerging Markets Debt. |
| | (m) | Formerly, Transamerica Van Kampen Mid-Cap Growth. |
| | (n) | Commenced operations on January 3, 2006. |
| | (o) | Formerly, Transamerica Van Kampen Small Company Growth. |
| | (p) | Commenced operations on August 1, 2006. |
| | (q) | Includes recaptured expenses by the investment adviser. The impact of recaptured expenses was 0.01%. |
| | (r) | Commenced operations on March 1, 2008. |
| | (s) | Commenced operations on May 1, 2007. |
| | (t) | Commenced operations on September 15, 2008. |
| | (u) | Commenced operations on September 30, 2008. |
| | (v) | Rounds to less than (1)% or 1%. |
| | (w) | Commenced operations on September 30, 2010. |
| | (x) | Formerly, Transamerica BlackRock Natural Resources. |
| | (y) | Commenced operations on January 3, 2007. |
| | (z) | Increase in portfolio turnover was triggered by a change in the fund’s objective. |
| | (aa) | Commenced operations on June 10, 2008. |
| | (bb) | Formerly, Transamerica High Yield Bond. |
| | (cc) | Effective November 30, 2009, all previously existing Class I shares were re-designated as Class I2 shares. |
| | (dd) | Includes Redemption Fees, if any. The impact of Redemption Fees is less than 0.01%. |
| | (ee) | Commenced operations on November 13, 2009. |
| | (ff) | Includes extraordinary expenses. The impact of the expenses was 0.01%. |
| | (gg) | Transamerica Asset Management, Inc. or any of its affiliates waive fees or reimburse expenses in order to avoid a negative yield. |
| | (hh) | Formerly, Transamerica Equity. |
| | (ii) | Includes non recurring reorganization expenses. The impact of the expenses was less than 0.01%. |
| | (jj) | Includes dividends and/or interest on securities sold short representing less than 0.01% of average net assets for 2010. |
| | (kk) | Effective December 15, 2010, the fund’s name changed to Transamerica Hansberger International Value. |
| | (ll) | Effective January 6, 2011, the fund’s name changed to Transamerica JPMorgan Long/Short Strategy. |
247
Notice of Privacy Policy
Protecting your privacy is very important to us. We want you to understand what information we collect and how we use it. We collect and use “nonpublic personal information” in connection with providing our customers with a broad range of financial products and services as effectively and conveniently as possible. We treat nonpublic personal information in accordance with our Privacy Policy.
What Information We Collect and From Whom We Collect It
We may collect nonpublic personal information about you from the following sources:
| • | | Information we receive from you on applications or other forms, such as your name, address, and account number; |
| • | | Information about your transactions with us, our affiliates, or others, such as your account balance and purchase/redemption history; and |
| • | | Information we receive from non-affiliated third parties, including consumer reporting agencies. |
What Information We Disclose and To Whom We Disclose It
We do not disclose any nonpublic personal information about current or former customers to anyone without their express consent, except as permitted by law. We may disclose the nonpublic personal information we collect, as described above, to persons or companies that perform services on our behalf and to other financial institutions with which we have joint marketing agreements. We will require these companies to protect the confidentiality of your nonpublic personal information and to use it only to perform the services for which we have hired them.
Our Security Procedures
We restrict access to your nonpublic personal information and only allow disclosures to persons and companies as permitted by law to assist in providing products or services to you. We maintain physical, electronic, and procedural safeguards to protect your nonpublic personal information and to safeguard the disposal of certain consumer information.
If you have any questions about our Privacy Policy, please call 1-888-233-4339 on any business day between 8 a.m. and 7 p.m. Eastern Time.
Note: This Privacy Policy applies only to customers that have a direct relationship with us or our affiliates. If you own shares of our funds in the name of a third party such as a bank or broker-dealer, its privacy policy may apply to you instead of ours.
248
Both the investment returns and principal value of mutual funds will fluctuate over time so that shares, when redeemed, may be worth more or less than their original cost.
Transamerica Funds
P.O. Box 9012
Clearwater, FL 33758-9012
Customer Service: 1-888-233-4339
Shareholder inquiries and transaction requests should be mailed to:
Transamerica Fund Services, Inc.
P.O. Box 219945
Kansas City, MO 64121-9945
ADDITIONAL INFORMATION about these funds is contained in the Statement of Additional Information, dated March 1, 2011, as supplemented from time to time, and in the annual and semi-annual reports to shareholders. The Statement of Additional Information is incorporated by reference into this prospectus. Other information about these funds has been filed with and is available from the U.S. Securities and Exchange Commission (“SEC”). Information about the funds (including the Statement of Additional Information) can be reviewed and copied at the SEC’s Public Reference Room in Washington, DC. Information on the operation of the public reference room may be obtained by calling the SEC at 1-202-551-8090. Copies of this information may be obtained upon payment of a duplication fee, by electronic request at the following e-mail address, publicinfo@sec.gov, or by writing to the Public Reference Section of the SEC, Washington, DC 20549-1520. Reports and other information about the funds are also available on the SEC’s Internet site at http://www.sec.gov.
To obtain a copy of the Statement of Additional Information or the annual and semi-annual reports, without charge, or to request other information or make other inquiries about these funds, call or write to Transamerica Funds at the phone number or address above or visit Transamerica Funds’ website at www.transamericafunds.com. In the Transamerica Funds’ annual report, you will find a discussion of the market conditions and investment strategies that significantly affected the funds’ performance during the last fiscal year.
The Investment Company Act File Number for Transamerica Funds is 811-04556.
| | |
www.transamericafunds.com Sales Support: 1-800-851-7555 Distributor: Transamerica Capital, Inc. | |
|