As filed with the SEC on January 4, 2013.
SECURITIES AND EXCHANGE COMMISSION
WASHINGTON, D.C. 20549
FORM N-CSR
CERTIFIED SHAREHOLDER REPORT OF REGISTERED
MANAGEMENT INVESTMENT COMPANIES
Investment Company Act file number: 811-04556
TRANSAMERICA FUNDS
(Exact Name of Registrant as Specified in Charter)
570 Carillon Parkway, St. Petersburg, Florida 33716
(Address of Principal Executive Offices) (Zip Code)
Registrant’s Telephone Number, including Area Code: (727) 299-1800
Dennis P. Gallagher, Esq. P.O. Box 9012, Clearwater, Florida 33758-9771
(Name and Address of Agent for Service)
Date of fiscal year end: October 31
Date of reporting period: November 1, 2011- October 31, 2012
Item 1: Report(s) to Shareholders. The Annual Report is attached.

Fund of Funds
Annual Report
October 31, 2012
www.transamericainvestments.com
Customer Service 1-888-233-4339
P.O. Box 9012 • Clearwater, FL 33758-9012
Distributor: Transamerica Capital, Inc.
Dear Fellow Shareholder,
On behalf of Transamerica Funds, we would like to thank you for your continued support and confidence in our products as we look forward to continuing to serve you and your financial adviser in the future. We value the trust you have placed in us.
This annual report is provided to you with the intent of presenting a comprehensive review of the investments of each of your funds. The Securities and Exchange Commission requires that annual and semi-annual reports be sent to all shareholders, and we believe this report to be an important part of the investment process. In addition to providing a comprehensive review, this report also provides a discussion of accounting policies as well as matters presented to shareholders that may have required their vote.
We believe it is important to understand market conditions over the last year in order to provide a context for reading this report. One year ago, fears that a sovereign default or a large bank failure in Europe would precipitate a global crisis had driven U.S. and many international markets down. In late 2011, the European Central Bank responded by making unlimited loans available to European banks, which used this money to honor deposits and to purchase sovereign bonds. Market fears subsided and global economies improved modestly, helping markets to rally strongly throughout the first three months of 2012.
Then, in early spring, positive economic trends in both the United States and abroad faded, causing most equity markets to dip from their March 2012 highs. The onset of summer brought resurgence in both U.S. economics and markets and, at the same time, economic weakness in Europe and Asia moderated. These events, combined with additional easing by global central banks, helped to drive most international equities higher through the end of summer. In September, unlimited quantitative easing was announced by the Federal Reserve which pushed U.S. markets to their highs for the year. In October, disappointing corporate earnings caused U.S. markets to retreat modestly, leaving the Standard & Poor’s 500® Index up 15.21% for the year ended October 31, 2012. During this same period, the Morgan Stanley Capital International—Europe, Australasia, Far East Index (“MSCI-EAFE”), a measure of international stock returns, gained 5.15% and the Barclays U.S. Aggregate Bond Index gained 5.25%. Please keep in mind it is important to maintain a diversified portfolio as investment returns have historically been difficult to predict.
In addition to your active involvement in the investment process, we firmly believe that a financial adviser is a key resource to help you build a complete picture of your current and future financial needs. Financial advisers are familiar with the market’s history, including long-term returns and volatility of various asset classes. With your financial adviser, you can develop an investment program that incorporates factors such as your goals, your investment timeline, and your risk tolerance.
Please contact your financial adviser if you have any questions about the contents of this report, and thanks again for the confidence you have placed in us.
Sincerely,
| | |
Thomas A. Swank President & Chief Executive Officer Transamerica Funds | | Christopher A. Staples Vice President & Chief Investment Officer Transamerica Funds |
The views expressed in this report reflect those of the portfolio managers only and may not necessarily represent the views of Transamerica Funds. These views are subject to change based upon market conditions. These views should not be relied upon as investment advice and are not indicative of trading intent on behalf of Transamerica Funds.
Transamerica Asset Allocation—Conservative Portfolio
(unaudited)
MARKET ENVIRONMENT
The November 1, 2011 to October 31, 2012 reporting period encompassed an overall rising market for U.S. and international stocks, but with downdrafts in November 2011 and again in the spring of 2012. As the period began, the Standard & Poor’s 500® Index (“S&P 500®) posted a small loss in November 2011, but the Morgan Stanley Capital International-Europe, Australasia, and Far East Index (“MSCI-EAFE”) of developed-market foreign stocks dropped 4.83% amid volatility surrounding the eurozone sovereign debt crisis. The Morgan Stanley Capital International Emerging Markets Index (“MSCI-EMI”) plummeted 6.66% in November. Although U.S. stocks recovered ground in December, the international indices fell further.
The mood brightened in 2012’s first quarter. The U.S. economy showed some vigor with U.S. Gross Domestic Product (“GDP”) growth initially being reported at 3.0% (later revised down to 1.9%). Meanwhile, the European Central Bank’s (“ECB”) Long Term Refinancing Operations flooded the eurozone with liquidity by lending nearly $1.3 trillion to European banks, a move that comforted international equity markets. Both U.S. and international stocks enjoyed double-digit gains in 2012’s first quarter.
The eurozone crisis returned to haunt markets in the spring; however, as Spanish and Italian bond yields climbed and Spain’s government requested a large bailout for its banks from the European Union. Meanwhile, other data indicated deepening recessions in several European countries. Stocks sold off globally in April and May, with the S&P 500® losing 6.60% over those two months and the MSCI-EAFE plunging 12.99%. The MSCI-EMI fell 12.20%.
Following the spring selloff, the markets began a sustained climb through the summer on the back of a number of moves and announcements by European and U.S. policymakers. A late June Euro Area Summit ended with a positive statement from the participants supporting the future establishment of a eurozone banking supervisor and the recapitalization of Spanish banks. In a July speech from London, ECB president Mario Draghi said the ECB would do “whatever it takes to preserve the Euro. And believe me, it will be enough.” This statement helped assuage the nervous markets. In August and September global equity markets rose further, boosted by an expectation that the ECB would buy Spanish and Italian bonds in the open market to hold down the bonds’ yields, and thus hold down the countries’ borrowing costs. The equity markets were also bolstered by anticipation that the U.S. Federal Reserve Board (“Fed”) would launch a third round of quantitative easing dubbed “QE3”. When the ECB did indeed announce a bond-buying program in early September, and the Fed followed with formally launching QE3 a few days later, the markets rallied some more.
Overall, the S&P 500® returned 15.21% for the 12-month period. But Europe’s troubles took a toll; the MSCI-EAFE rose only 5.15% for the 12-month period. Emerging markets performed even worse with only a 2.98% return for the MSCI-EMI. Amid the market volatility, higher-quality bonds delivered decent gains; the Barclays U.S. Aggregate Bond Index (“Barclays U.S. Aggregate Bond”) notched a 5.25% return for the 12-month period. Credit-sensitive bonds were up more strongly, having benefited from the overall positive environment for equities; the Barclays U.S. Corporate High Yield Index gained 13.61%.
PERFORMANCE
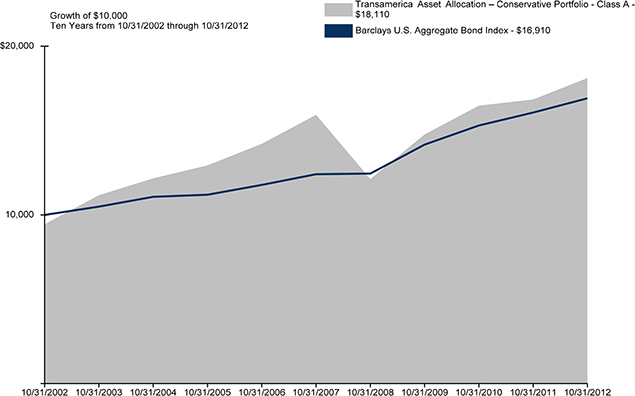
For the year ended October 31, 2012, Transamerica Asset Allocation—Conservative Portfolio, Class A returned 7.55% after all expenses. Its primary and secondary benchmarks, the Barclays U.S. Aggregate Bond and the Wilshire 5000® Total Market Index, returned 5.25% and 14.30%, respectively.
STRATEGY REVIEW
The goal of the Transamerica Asset Allocation Portfolios is to provide investors one-stop participation in the broad financial markets. Transamerica Asset Allocation—Conservative Portfolio is designed to provide a mix of approximately 65% fixed-income securities and 35% equity over time. The fixed-income part of the portfolio includes investment-grade and credit-sensitive holdings, as well as international bonds. The equity side covers both domestic and international markets across the entire range of investment styles, including both value and growth stocks and large and small companies. The portfolio also diversifies into emerging markets, global real estate, commodities, and alternative strategies. Our specific asset-class targets are derived from years of asset-allocation modeling—research that consistently indicates that the mix we target is close to optimal in terms of expected long-term returns per unit of risk taken. While this strategic blueprint forms the backbone of our asset allocation, we may actively over- and underweight asset classes relative to the normal targets as we deem prudent in response to present or expected market conditions. We endeavor to find and use quality money managers specializing in each asset class and investment style. We carefully monitor these underlying managers for performance and style issues, and adjust their weightings both to manage our asset-class exposures and to reflect the managers’ relative merit.
The fixed-income portion of the portfolio performed well during the November 1, 2011 – October 31, 2012 reporting period. Eight of the nine underlying bond funds that were owned for the entire period outpaced the Barclays U.S. Aggregate Bond (“the Index”). Even Transamerica Short-Term Bond, which targets shorter-term maturities, managed to outpace the Index. Transamerica Emerging Markets Debt and Transamerica High Yield Bond were the clear winners among the bond funds. Those are modest positions in the portfolio, but the two anchor funds—Transamerica Total Return and Transamerica Core Bond—both also beat the Index. Meanwhile, the portfolio’s two multi-sector bond funds, Transamerica Bond and Transamerica Flexible Income posted double-digit returns. The bond portfolio’s sole laggard relative to the Index was Transamerica International Bond, but its position size is small given that Transamerica Total Return and the two multi-sector funds have international stakes that already contribute a good amount toward our international bond target.
| | | | |
| Transamerica Funds | | | | Annual Report 2012 |
| | Page 1 | | |
Transamerica Asset Allocation—Conservative Portfolio
(unaudited)
STRATEGY REVIEW (continued)
As outlined above, international equities underperformed U.S. equities during the reporting period. The portfolio’s built-in diversification into international equities, including both developed and emerging markets, was thus a drag relative to its U.S. exposure. We significantly underweighted developed foreign markets during the year, holding that weighting at only about two thirds of the normal target for much of the period, and also maintained an underweight in emerging markets in 2012. Even so, more than a fifth of the portfolio’s equity was in foreign developed and emerging markets equity as of October 31, 2012. The U.S. portion of the equity portfolio naturally enjoyed stronger returns, although its smaller-cap exposure diluted the gains somewhat. Significantly, the portfolio’s three main underlying U.S. large-cap growth funds, which are fairly sizable positions, lagged the S&P 500® in a meaningful way. While the S&P 500® was up 15.21% for the 12-month period, Transamerica Capital Growth eked out a small gain as a number of its Internet-related stocks struggled. Transamerica Diversified Equity and Transamerica Growth gained as well but lagged the S&P 500®. By contrast, the portfolio’s three U.S. large-cap value funds performed more in line with the S&P 500® .
During the year we worked to upgrade the roster of underlying managers. Transamerica Asset Management, Inc. (“TAM”) added what we consider an excellent large-cap value manager, Levin Capital Strategies, L.P., to run Transamerica Large Cap Value. TAM also added a pair of small-cap managers: Lombardia Capital Partners, LLC manages the new Transamerica Small Cap Value, and Ranger Investment Management, L.P. now runs Transamerica Small Cap Growth. Finally, we eliminated a couple of poor-performing international funds that we had been underweighting, and reallocated the assets to other managers in the same styles.
We still see macroeconomic events driving the markets more than the types of company fundamentals our underlying managers tend to emphasize in their security selection. Regarding the macroeconomic picture, we believe the U.S. economy is in a trend of gradual improvement while Europe is fighting to stave off a regional recession in 2013. Meanwhile, emerging markets have been hampered by slowing growth rates in heavyweights China, India, and Brazil. We; therefore, remain positioned with an international-equity underweight relative to our normal targets, and an overweight to the U.S. Valuations abroad have become somewhat attractive to us, however, so we must continuously weigh the economic risks abroad against the buying opportunity. In general, we have been and will continue to be flexible in this evolving environment.
Jon Hale, CFA
Dan McNeela, CFA
Michael Stout, CFA
Co-Portfolio Managers
Morningstar Associates, LLC
| | | | |
| Transamerica Funds | | | | Annual Report 2012 |
| | Page 2 | | |
Transamerica Asset Allocation—Conservative Portfolio
(unaudited)
Average Annual Total Return for Periods Ended 10/31/2012
| | | | | | | | | | | | | | | | |
| | | 1 Year | | | 5 Years | | | 10 Years or
Life of Class | | | Inception Date | |
Class A (NAV) | | | 7.55 | % | | | 2.60 | % | | | 6.73 | % | | | 03/01/2002 | |
Class A (POP) | | | 1.64 | % | | | 1.45 | % | | | 6.12 | % | | | 03/01/2002 | |
Barclays U.S. Aggregate Bond * | | | 5.25 | % | | | 6.38 | % | | | 5.39 | % | | | | |
Wilshire 5000 * | | | 14.30 | % | | | 0.77 | % | | | 7.79 | % | | | | |
| | | | | | | | | | | | | | | | |
Class B (NAV) | | | 6.81 | % | | | 1.92 | % | | | 6.17 | % | | | 03/01/2002 | |
Class B (POP) | | | 1.81 | % | | | 1.75 | % | | | 6.17 | % | | | 03/01/2002 | |
| | | | | | | | | | | | | | | | |
Class C (NAV) | | | 6.90 | % | | | 1.98 | % | | | 6.06 | % | | | 11/11/2002 | |
Class C (POP) | | | 5.90 | % | | | 1.98 | % | | | 6.06 | % | | | 11/11/2002 | |
| | | | | | | | | | | | | | | | |
Class I (NAV) | | | 7.87 | % | | | N/A | | | | 6.68 | % | | | 11/30/2009 | |
| | | | | | | | | | | | | | | | |
Class R (NAV) | | | 7.30 | % | | | 2.37 | % | | | 4.51 | % | | | 06/15/2006 | |
| | | | | | | | | | | | | | | | |
NOTES
| * | The Barclays U.S. Aggregate Bond Index (“Barclays U.S. Aggregate Bond”) and the Wilshire 5000® Total Market Index (“Wilshire 5000”) are unmanaged indices used as a general measure of market performance. Calculations assume dividends and capital gains are reinvested and do not include any managerial expenses. The 10 Years or Life of Class calculation is based on the previous 10 years or since the inception date of the class, whichever is more recent. You cannot invest directly in an index. |
The performance data presented represents past performance; future results may vary. Performance data does not reflect the deduction of taxes that would be paid on fund distributions or the redemption of fund shares. Investment return and principal value will fluctuate so that an investor’s shares, when redeemed, may be worth more or less than their original cost. Current performance may be lower or higher than performance quoted. Please see www.transamericafunds.com for performance data current to the most recent month-end. Net Asset Value (“NAV”) returns include the reinvestment of dividends and capital gains but do not reflect any sales charges. Public Offering Price (“POP”) returns include the reinvestment of dividends and capital gains and reflect the maximum sales charge of 5.5% for Class A shares or the maximum applicable contingent deferred sales charge (5% in the 1st year, decreasing to 0% after 6 years) for Class B shares and 1% (during the first 12 months) for Class C shares. Shares purchased prior to March 1, 2004 are subject to a maximum applicable contingent deferred sales charge (5% in the 1st year, decreasing to 0% after 7 years) for Class B shares and (2% in the 1st year, decreasing to 0% after 2 years) for Class C shares. There are no sales charges on Class I and R shares.
Performance figures reflect any fee waivers and/or expense reimbursements by the Investment Adviser. Without such waivers and/or reimbursements, the performance would be lower. Future waivers and/or reimbursements are at the discretion of the Investment Adviser.
Asset allocation does not ensure a profit or protect against a loss. An investment in the fund is subject to all of the risks associated with the underlying funds. This material must be preceded or accompanied by a current prospectus, which includes specific contents regarding the investment objectives and policies of this fund.
| | | | |
| Transamerica Funds | | | | Annual Report 2012 |
| | Page 3 | | |
Transamerica Asset Allocation—Growth Portfolio
(unaudited)
MARKET ENVIRONMENT
The November 1, 2011 to October 31, 2012 reporting period encompassed an overall rising market for U.S. and international stocks, but with downdrafts in November 2011 and again in the spring of 2012. As the period began, the Standard & Poor’s 500® Index (“S&P 500®) posted a small loss in November 2011, but the Morgan Stanley Capital International-Europe, Australasia, and Far East Index (“MSCI-EAFE”) of developed-market foreign stocks dropped 4.83% amid volatility surrounding the eurozone sovereign debt crisis. The Morgan Stanley Capital International Emerging Markets Index (“MSCI-EMI”) plummeted 6.66% in November. Although U.S. stocks recovered ground in December, the international indices fell further.
The mood brightened in 2012’s first quarter. The U.S. economy showed some vigor with U.S. Gross Domestic Product (“GDP”) growth initially being reported at 3.0% (later revised down to 1.9%). Meanwhile, the European Central Bank’s (“ECB”) Long Term Refinancing Operations flooded the eurozone with liquidity by lending nearly $1.3 trillion to European banks, a move that comforted international equity markets. Both U.S. and international stocks enjoyed double-digit gains in 2012’s first quarter.
The eurozone crisis returned to haunt markets in the spring; however, as Spanish and Italian bond yields climbed and Spain’s government requested a large bailout for its banks from the European Union. Meanwhile, other data indicated deepening recessions in several European countries. Stocks sold off globally in April and May, with the S&P 500® losing 6.60% over those two months and the MSCI-EAFE plunging 12.99%. The MSCI-EMI fell 12.20%.
Following the spring selloff, the markets began a sustained climb through the summer on the back of a number of moves and announcements by European and U.S. policymakers. A late June Euro Area Summit ended with a positive statement from the participants supporting the future establishment of a eurozone banking supervisor and the recapitalization of Spanish banks. In a July speech from London, ECB president Mario Draghi said the ECB would do “whatever it takes to preserve the Euro. And believe me, it will be enough.” This statement helped assuage the nervous markets. In August and September global equity markets rose further, boosted by an expectation that the ECB would buy Spanish and Italian bonds in the open market to hold down the bonds’ yields, and thus hold down the countries’ borrowing costs. The equity markets were also bolstered by anticipation that the U.S. Federal Reserve Board (“Fed”) would launch a third round of quantitative easing dubbed “QE3”. When the ECB did indeed announce a bond-buying program in early September, and the Fed followed with formally launching QE3 a few days later, the markets rallied some more.
Overall, the S&P 500® returned 15.21% for the 12-month period. But Europe’s troubles took a toll; the MSCI-EAFE rose only 5.15% for the 12-month period. Emerging markets performed even worse with only a 2.98% return for the MSCI-EMI. Amid the market volatility, higher-quality bonds delivered decent gains; the Barclays U.S. Aggregate Bond Index notched a 5.25% return for the 12-month period. Credit-sensitive bonds were up more strongly, having benefited from the overall positive environment for equities; the Barclays U.S. Corporate High Yield Index gained 13.61%.
PERFORMANCE
For the year ended October 31, 2012, Transamerica Asset Allocation – Growth Portfolio, Class A returned 8.96% after all expenses. Its benchmark, the Wilshire 5000® Total Market Index, returned 14.30%.
STRATEGY REVIEW
The goal of the Transamerica Asset Allocation Portfolios is to provide investors one-stop participation in the broad financial markets. Transamerica Asset Allocation—Growth Portfolio, which is meant for aggressive investors, exclusively targets equity securities and alternative strategies. It is designed to provide diversified, global coverage of equities. It includes domestic and international markets, and spans the entire range of investment styles, including both large and small companies and value and growth stocks. The portfolio incorporates emerging markets, global real estate, commodities, and several alternative strategies. Our specific asset-class targets are derived from years of asset-allocation modeling–research that consistently indicates that the mix we target is close to optimal in terms of expected long-term returns per unit of risk taken. While this strategic blueprint forms the backbone of our asset allocation, we may actively over- and underweight asset classes relative to the normal targets as we deem prudent in response to present or expected market conditions. We endeavor to find and use quality money managers specializing in each asset class and investment style. We carefully monitor these underlying managers for performance and style issues, and adjust their weightings both to manage our asset-class exposures and to reflect the managers’ relative merit.
During the reporting period, international equities underperformed U.S. equities as outlined above. The portfolio’s built-in diversification into international equities, including both developed and emerging markets, was thus a drag relative to its U.S. exposure. We significantly underweighted developed foreign markets during the year, holding that weighting at only about two thirds of the normal target for much of the period, and also maintained an underweight in emerging markets in 2012. Even so, about 22.8% of the portfolio was in foreign developed- and emerging-markets equity as of October 31, 2012. U.S. stocks made up about 69% of assets, with an overweight toward large-cap stocks. The U.S. portion of the portfolio naturally enjoyed stronger returns, although its smaller-cap exposure diluted the gains somewhat (the 12.08% return of the Russell 2000® Index of smaller companies lagged the S&P 500®).
Significantly, the portfolio’s three main underlying U.S. large-cap growth funds, which constitute major positions, lagged the S&P 500® in a meaningful way. While the S&P 500® was up 15.21% for the 12-month period, Transamerica Capital Growth eked out a small gain as a number of its Internet-related stocks struggled. Transamerica Diversified Equity and Transamerica Growth gained as well but lagged the S&P 500® . The portfolio’s three U.S. large-cap value funds performed more in line with the S&P 500® .
| | | | |
| Transamerica Funds | | | | Annual Report 2012 |
| | Page 4 | | |
Transamerica Asset Allocation—Growth Portfolio
(unaudited)
STRATEGY REVIEW (continued)
However, the roughly 4% stake in alternative strategies was a drag on performance amid the period’s rising market. As absolute-return strategies designed to exhibit reduced correlation with the equity market, none of those funds could be expected to keep up with the U.S. market’s sharp gains, and a couple funds even posted negative returns. In addition, Transamerica Commodity Strategy (1.5% of assets as of October 31, 2012) detracted from performance as a result of weakness in commodities prices throughout the year.
Over the course of the year we worked to upgrade the roster of underlying managers. Transamerica Asset Management, Inc. (“TAM”) added what we consider an excellent large-cap value manager, Levin Capital Strategies, L.P., to run Transamerica Large Cap Value. TAM also added a pair of small-cap managers: Lombardia Capital Partners, LLC manages the new Transamerica Small Cap Value, and Ranger Investment Management, L.P. now runs Transamerica Small Cap Growth. Finally, we eliminated a couple of poor-performing international funds that we had been underweighting, and reallocated the assets to other managers in the same styles.
We still see macroeconomic events driving the markets more than the types of company fundamentals our underlying managers tend to emphasize in their security selection. Regarding the macroeconomic picture, we believe the U.S. economy is in a trend of gradual improvement while Europe is fighting to stave off a regional recession in 2013. Meanwhile, emerging markets have been hampered by slowing growth rates in heavyweights China, India, and Brazil. We; therefore, remain positioned with an international-equity underweight relative to our normal targets, and an overweight to the U.S. Valuations abroad have become somewhat attractive to us, however, so we must continuously weigh the economic risks abroad against the buying opportunity. In general, we have been and will continue to be flexible in this evolving environment.
Jon Hale, CFA
Dan McNeela, CFA
Michael Stout, CFA
Co-Portfolio Managers
Morningstar Associates, LLC
| | | | |
| Transamerica Funds | | | | Annual Report 2012 |
| | Page 5 | | |
Transamerica Asset Allocation—Growth Portfolio
(unaudited)

Average Annual Total Return for Periods Ended 10/31/2012
| | | | | | | | | | | | | | | | |
| | | 1 Year | | | 5 Years | | | 10 Years or
Life of Class | | | Inception
Date | |
Class A (NAV) | | | 8.96 | % | | | (2.80 | )% | | | 6.51 | % | | | 03/01/2002 | |
Class A (POP) | | | 2.96 | % | | | (3.90 | )% | | | 5.91 | % | | | 03/01/2002 | |
Wilshire 5000 * | | | 14.30 | % | | | 0.77 | % | | | 7.79 | % | | | | |
| | | | | | | | | | | | | | | | |
Class B (NAV) | | | 8.08 | % | | | (3.47 | )% | | | 5.96 | % | | | 03/01/2002 | |
Class B (POP) | | | 3.08 | % | | | (3.66 | )% | | | 5.96 | % | | | 03/01/2002 | |
| | | | | | | | | | | | | | | | |
Class C (NAV) | | | 8.22 | % | | | (3.40 | )% | | | 5.95 | % | | | 11/11/2002 | |
Class C (POP) | | | 7.22 | % | | | (3.40 | )% | | | 5.95 | % | | | 11/11/2002 | |
| | | | | | | | | | | | | | | | |
Class I (NAV) | | | 9.28 | % | | | N/A | | | | 7.65 | % | | | 11/30/2009 | |
| | | | | | | | | | | | | | | | |
Class R (NAV) | | | 8.76 | % | | | (2.94 | )% | | | 2.00 | % | | | 06/15/2006 | |
| | | | | | | | | | | | | | | | |
NOTES
| * | The Wilshire 5000® Total Market Index (“Wilshire 5000”) is an unmanaged index used as a general measure of market performance. Calculations assume dividends and capital gains are reinvested and do not include any managerial expenses. The 10 Years or Life of Class calculation is based on the previous 10 years or since the inception date of the class, whichever is more recent. You cannot invest directly in an index. |
The performance data presented represents past performance; future results may vary. Performance data does not reflect the deduction of taxes that would be paid on fund distributions or the redemption of fund shares. Investment return and principal value will fluctuate so that an investor’s shares, when redeemed, may be worth more or less than their original cost. Current performance may be lower or higher than performance quoted. Please see www.transamericafunds.com for performance data current to the most recent month-end. Net Asset Value (“NAV”) returns include the reinvestment of dividends and capital gains but do not reflect any sales charges. Public Offering Price (“POP”) returns include the reinvestment of dividends and capital gains and reflect the maximum sales charge of 5.5% for Class A shares or the maximum applicable contingent deferred sales charge (5% in the 1st year, decreasing to 0% after 6 years) for Class B shares and 1% (during the first 12 months) for Class C shares. Shares purchased prior to March 1, 2004 are subject to a maximum applicable contingent deferred sales charge (5% in the 1st year, decreasing to 0% after 7 years) for Class B shares and (2% in the 1st year, decreasing to 0% after 2 years) for Class C shares. There are no sales charges on Class I and R shares.
Performance figures reflect any fee waivers and/or expense reimbursements by the Investment Adviser. Without such waivers and/or reimbursements, the performance would be lower. Future waivers and/or reimbursements are at the discretion of the Investment Adviser.
Asset allocation does not ensure a profit or protect against a loss. An investment in the fund is subject to all of the risks associated with the underlying funds. This material must be preceded or accompanied by a current prospectus, which includes specific contents regarding the investment objectives and policies of this fund.
| | | | |
| Transamerica Funds | | | | Annual Report 2012 |
| | Page 6 | | |
Transamerica Asset Allocation—Moderate Growth Portfolio
(unaudited)
MARKET ENVIRONMENT
The November 1, 2011 to October 31, 2012 reporting period encompassed an overall rising market for U.S. and international stocks, but with downdrafts in November 2011 and again in the spring of 2012. As the period began, the Standard & Poor’s 500® Index (“S&P 500®”) posted a small loss in November 2011, but the Morgan Stanley Capital International-Europe, Australasia, and Far East Index (“MSCI-EAFE”) of developed-market foreign stocks dropped 4.83% amid volatility surrounding the eurozone sovereign debt crisis. The Morgan Stanley Capital International Emerging Markets Index (“MSCI-EMI”) plummeted 6.66% in November. Although U.S. stocks recovered ground in December, the international indices fell further.
The mood brightened in 2012’s first quarter. The U.S. economy showed some vigor with U.S, Gross Domestic Product (“GDP”) growth initially being reported at 3.0% (later revised down to 1.9%). Meanwhile, the European Central Bank’s (“ECB”) Long Term Refinancing Operations flooded the eurozone with liquidity by lending nearly $1.3 trillion to European banks, a move that comforted international equity markets. Both U.S. and international stocks enjoyed double-digit gains in 2012’s first quarter.
The eurozone crisis returned to haunt markets in the spring; however, as Spanish and Italian bond yields climbed and Spain’s government requested a large bailout for its banks from the European Union. Meanwhile, other data indicated deepening recessions in several European countries. Stocks sold off globally in April and May, with the S&P 500® losing 6.60% over those two months and the MSCI-EAFE plunging 12.99%. The MSCI-EMI fell 12.20%.
Following the spring selloff, the markets began a sustained climb through the summer on the back of a number of moves and announcements by European and U.S. policymakers. A late June Euro Area Summit ended with a positive statement from the participants supporting the future establishment of a eurozone banking supervisor and the recapitalization of Spanish banks. In a July speech from London, ECB president Mario Draghi said the ECB would do “whatever it takes to preserve the Euro. And believe me, it will be enough.” This statement helped assuage the nervous markets. In August and September global equity markets rose further, boosted by an expectation that the ECB would buy Spanish and Italian bonds in the open market to hold down the bonds’ yields, and thus hold down the countries’ borrowing costs. The equity markets were also bolstered by anticipation that the U.S. Federal Reserve Board (“Fed”) would launch a third round of quantitative easing dubbed “QE3”. When the ECB did indeed announce a bond-buying program in early September, and the Fed followed with formally launching QE3 a few days later, the markets rallied some more.
Overall, the S&P 500® returned 15.21% for the 12-month period. But Europe’s troubles took a toll; the MSCI-EAFE rose only 5.15% for the 12-month period. Emerging markets performed even worse with only a 2.98% return for the MSCI-EMI. Amid the market volatility, higher-quality bonds delivered decent gains; the Barclays U.S. Aggregate Bond Index (“Barclays U.S. Aggregate Bond”) notched a 5.25% return for the 12-month period. Credit-sensitive bonds were up more strongly, having benefited from the overall positive environment for equities; the Barclays U.S. Corporate High Yield Index gained 13.61%.
PERFORMANCE
For the year ended October 31, 2012, Transamerica Asset Allocation—Moderate Growth Portfolio, Class A returned 8.48% after all expenses. Its primary and secondary benchmarks, the Wilshire 5000® Total Market Index and the Barclays U.S. Aggregate Bond, returned 14.30% and 5.25%, respectively.
STRATEGY REVIEW
The goal of the Transamerica Asset Allocation Portfolios is to provide investors one-stop participation in the broad financial markets. Transamerica Asset Allocation—Moderate Growth Portfolio is designed to provide a mix of approximately 70% equity and 30% fixed-income securities over time. The equity side covers both domestic and international markets across the entire range of investment styles, including both value and growth stocks and large and small companies. The fixed-income portion includes investment-grade and credit-sensitive holdings, as well as international bonds. The portfolio also diversifies into emerging markets, global real estate, commodities, and alternative strategies. Our specific asset-class targets are derived from years of asset-allocation modeling – research that consistently indicates that the mix we target is close to optimal in terms of expected long-term returns per unit of risk taken. While this strategic blueprint forms the backbone of our asset allocation, we may actively over- and underweight asset classes relative to the normal targets as we deem prudent in response to present or expected market conditions. We endeavor to find and use quality money managers specializing in each asset class and investment style. We carefully monitor these underlying managers for performance and style issues, and adjust their weightings both to manage our asset-class exposures and to reflect the managers’ relative merit.
During the reporting period, international equities underperformed U.S. equities as outlined above. The portfolio’s built-in diversification into international equities, including both developed and emerging markets, was thus a drag relative to its U.S. exposure. We significantly underweighted developed foreign markets during the year, holding that weighting at only about two thirds of the normal target for much of the period, and also maintained an underweight in emerging markets in 2012. Even so, about 16% of the portfolio was in foreign developed- and emerging-markets equity as of October 31, 2012. U.S. stocks made up about 51.3% of assets, with an overweight toward large-cap stocks. The U.S. portion of the portfolio naturally enjoyed stronger returns, although its smaller-cap exposure diluted the gains somewhat (the 12.08% return of the Russell 2000® Index of smaller companies lagged the S&P 500®). Significantly, the portfolio’s three main underlying U.S. large-cap growth funds, which constitute major positions, lagged the S&P 500® in a meaningful way. While the S&P 500® was up 15.21% for the 12-month period, Transamerica Capital Growth eked out a small gain as a number of its Internet-related stocks struggled. Transamerica Diversified Equity and Transamerica Growth gained as well, but lagged the S&P 500®. By contrast, the portfolio’s three U.S. large-cap value funds performed more in line with the S&P 500®.
| | | | |
| Transamerica Funds | | | | Annual Report 2012 |
| | Page 7 | | |
Transamerica Asset Allocation—Moderate Growth Portfolio
(unaudited)
STRATEGY REVIEW (continued)
The fixed-income portion of the portfolio fared better. Seven of the eight underlying bond funds that were owned for the entire period outpaced the Barclays U.S. Aggregate Bond. Transamerica Emerging Markets Debt and Transamerica High Yield Bond were the clear winners. The two anchor bond funds—Transamerica Total Return and Transamerica Core Bond—both also beat the Barclays U.S. Aggregate Bond’s return. Meanwhile, the multi-sector Transamerica Bond notched a 14.24% gain.
During the year we worked to upgrade the roster of underlying managers. Transamerica Asset Management, Inc. (“TAM”) added what we consider an excellent large-cap value manager, Levin Capital Strategies, L.P., to run Transamerica Large Cap Value. TAM also added a pair of small-cap managers: Lombardia Capital Partners, LLC manages the new Transamerica Small Cap Value, and Ranger Investment Management, L.P. now runs Transamerica Small Cap Growth. Finally, we eliminated a couple of poor-performing international funds that we had been underweighting, and reallocated the assets to other managers in the same styles.
We still see macroeconomic events driving the markets more than the types of company fundamentals our underlying managers tend to emphasize in their security selection. Regarding the macroeconomic picture, we believe the U.S. economy is in a trend of gradual improvement while Europe is fighting to stave off a regional recession in 2013. Meanwhile, emerging markets have been hampered by slowing growth rates in heavyweights China, India, and Brazil. We; therefore, remain positioned with an international-equity underweight relative to our normal targets, and an overweight to the U.S. Valuations abroad have become somewhat attractive to us, however, so we must continuously weigh the economic risks abroad against the buying opportunity. In general, we have been and will continue to be flexible in this evolving environment.
Jon Hale, CFA
Dan McNeela, CFA
Michael Stout, CFA
Co-Portfolio Managers
Morningstar Associates, LLC
| | | | |
| Transamerica Funds | | | | Annual Report 2012 |
| | Page 8 | | |
Transamerica Asset Allocation—Moderate Growth Portfolio
(unaudited)

Average Annual Total Return for Periods Ended 10/31/2012
| | | | | | | | | | | | | | | | |
| | | 1 Year | | | 5 Years | | | 10 Years or
Life of Class | | | Inception Date | |
Class A (NAV) | | | 8.48 | % | | | (0.57 | )% | | | 6.76 | % | | | 03/01/2002 | |
Class A (POP) | | | 2.53 | % | | | (1.69 | )% | | | 6.16 | % | | | 03/01/2002 | |
Wilshire 5000 * | | | 14.30 | % | | | 0.77 | % | | | 7.79 | % | | | | |
Barclays U.S. Aggregate Bond * | | | 5.25 | % | | | 6.38 | % | | | 5.39 | % | | | | |
| | | | | | | | | | | | | | | | |
Class B (NAV) | | | 7.73 | % | | | (1.23 | )% | | | 6.20 | % | | | 03/01/2002 | |
Class B (POP) | | | 2.73 | % | | | (1.41 | )% | | | 6.20 | % | | | 03/01/2002 | |
| | | | | | | | | | | | | | | | |
Class C (NAV) | | | 7.74 | % | | | (1.19 | )% | | | 6.15 | % | | | 11/11/2002 | |
Class C (POP) | | | 6.74 | % | | | (1.19 | )% | | | 6.15 | % | | | 11/11/2002 | |
| | | | | | | | | | | | | | | | |
Class I (NAV) | | | 8.82 | % | | | N/A | | | | 7.17 | % | | | 11/30/2009 | |
| | | | | | | | | | | | | | | | |
Class R (NAV) | | | 8.21 | % | | | (0.72 | )% | | | 3.13 | % | | | 06/15/2006 | |
| | | | | | | | | | | | | | | | |
NOTES
| * | The Wilshire 5000® Total Market Index (“Wilshire 5000”) and the Barclays U.S. Aggregate Bond Index (“Barclays U.S. Aggregate Bond”) are unmanaged indices used as a general measure of market performance. Calculations assume dividends and capital gains are reinvested and do not include any managerial expenses. The 10 Years or Life of Class calculation is based on the previous 10 years or since the inception date of the class, whichever is more recent. You cannot invest directly in an index. |
The performance data presented represents past performance; future results may vary. Performance data does not reflect the deduction of taxes that would be paid on fund distributions or the redemption of fund shares. Investment return and principal value will fluctuate so that an investor’s shares, when redeemed, may be worth more or less than their original cost. Current performance may be lower or higher than performance quoted. Please see www.transamericafunds.com for performance data current to the most recent month-end. Net Asset Value (“NAV”) returns include the reinvestment of dividends and capital gains but do not reflect any sales charges. Public Offering Price (“POP”) returns include the reinvestment of dividends and capital gains and reflect the maximum sales charge of 5.5% for Class A shares or the maximum applicable contingent deferred sales charge (5% in the 1st year, decreasing to 0% after 6 years) for Class B shares and 1% (during the first 12 months) for Class C shares. Shares purchased prior to March 1, 2004 are subject to a maximum applicable contingent deferred sales charge (5% in the 1st year, decreasing to 0% after 7 years) for Class B shares and (2% in the 1st year, decreasing to 0% after 2 years) for Class C shares. There are no sales charges on Class I and R shares.
Performance figures reflect any fee waivers and/or expense reimbursements by the Investment Adviser. Without such waivers and/or reimbursements, the performance would be lower. Future waivers and/or reimbursements are at the discretion of the Investment Adviser.
Asset allocation does not ensure a profit or protect against a loss. An investment in the fund is subject to all of the risks associated with the underlying funds. This material must be preceded or accompanied by a current prospectus, which includes specific contents regarding the investment objectives and policies of this fund.
| | | | |
| Transamerica Funds | | | | Annual Report 2012 |
| | Page 9 | | |
Transamerica Asset Allocation—Moderate Portfolio
(unaudited)
MARKET ENVIRONMENT
The November 1, 2011 to October 31, 2012 reporting period encompassed an overall rising market for U.S. and international stocks, but with downdrafts in November 2011 and again in the spring of 2012. As the period began, the Standard & Poor’s 500® Index (“S&P 500®) posted a small loss in November 2011, but the Morgan Stanley Capital International-Europe, Australasia, and Far East Index (“MSCI-EAFE”) of developed-market foreign stocks dropped 4.83% amid volatility surrounding the eurozone sovereign debt crisis. The Morgan Stanley Capital International Emerging Markets Index (“MSCI-EMI”) plummeted 6.66% in November. Although U.S. stocks recovered ground in December, the international indices fell further.
The mood brightened in 2012’s first quarter. The U.S. economy showed some vigor with U.S. Gross Domestic Product (“GDP”) growth initially being reported at 3.0% (later revised down to 1.9%). Meanwhile, the European Central Bank’s (“ECB”) Long Term Refinancing Operations flooded the eurozone with liquidity by lending nearly $1.3 trillion to European banks, a move that comforted international equity markets. Both U.S. and international stocks enjoyed double-digit gains in 2012’s first quarter.
The eurozone crisis returned to haunt markets in the spring; however, as Spanish and Italian bond yields climbed and Spain’s government requested a large bailout for its banks from the European Union. Meanwhile, other data indicated deepening recessions in several European countries. Stocks sold off globally in April and May, with the S&P 500® losing 6.60% over those two months and the MSCI-EAFE plunging 12.99%. The MSCI-EMI fell 12.20%.
Following the spring selloff, the markets began a sustained climb through the summer on the back of a number of moves and announcements by European and U.S. policymakers. A late June Euro Area Summit ended with a positive statement from the participants supporting the future establishment of a eurozone banking supervisor and the recapitalization of Spanish banks. In a July speech from London, ECB president Mario Draghi said the ECB would do “whatever it takes to preserve the Euro. And believe me, it will be enough.” This statement helped assuage the nervous markets. In August and September global equity markets rose further, boosted by an expectation that the ECB would buy Spanish and Italian bonds in the open market to hold down the bonds’ yields, and thus hold down the countries’ borrowing costs. The equity markets were also bolstered by anticipation that the U.S. Federal Reserve Board (“Fed”) would launch a third round of quantitative easing dubbed “QE3”. When the ECB did indeed announce a bond-buying program in early September, and the Fed followed with formally launching QE3 a few days later, the markets rallied some more.
Overall, the S&P 500® returned 15.21% for the 12-month period. But Europe’s troubles took a toll; the MSCI-EAFE Index rose only 5.15% for the 12-month period. Emerging markets performed even worse with only a 2.98% return for the MSCI EMI. Amid the market volatility, higher-quality bonds delivered decent gains; the Barclays U.S. Aggregate Bond Index (“Barclays U.S. Aggregate Bond”) notched a 5.25% return for the 12-month period. Credit-sensitive bonds were up more strongly, having benefited from the overall positive environment for equities; the Barclays U.S. Corporate High Yield Index gained 13.61%.
PERFORMANCE
For the year ended October 31, 2012, Transamerica Asset Allocation—Moderate Portfolio, Class A returned 7.95% after all expenses. Its primary and secondary benchmarks, the Wilshire 5000® Total Market Index and the Barclays U.S. Aggregate Bond, returned 14.30% and 5.25%, respectively.
STRATEGY REVIEW
The goal of the Transamerica Asset Allocation Portfolios is to provide investors one-stop participation in the broad financial markets. Transamerica Asset Allocation—Moderate Portfolio is designed to provide a mix of approximately 50% equity and 50% fixed-income securities over time. The equity side covers both domestic and international markets across the entire range of investment styles, including both value and growth stocks and large and small companies. The fixed-income portion includes investment-grade and credit-sensitive holdings, as well as international bonds. The portfolio also diversifies into emerging markets, global real estate, commodities, and alternative strategies. Our specific asset-class targets are derived from years of asset-allocation modeling—research that consistently indicates that the mix we target is close to optimal in terms of expected long-term returns per unit of risk taken. While this strategic blueprint forms the backbone of our asset allocation, we may actively over- and underweight asset classes relative to the normal targets as we deem prudent in response to present or expected market conditions. We endeavor to find and use quality money managers specializing in each asset class and investment style. We carefully monitor these underlying managers for performance and style issues, and adjust their weightings both to manage our asset-class exposures and to reflect the managers’ relative merit.
During the reporting period, international equities underperformed U.S. equities as outlined above. The portfolio’s built-in diversification into international equities, including both developed and emerging markets, was thus a drag relative to its U.S. exposure. We significantly underweighted developed foreign markets during the year, holding that weighting at only about two thirds of the normal target for much of the period, and also maintained an underweight in emerging markets in 2012. Even so, about 10.2% of the portfolio was in foreign developed- and emerging-markets equity as of October 31, 2012. U.S. stocks made up about 38.8% of assets, with an overweight toward large-cap stocks. The U.S. portion of the fund naturally enjoyed stronger returns, although its smaller-cap exposure diluted the gains somewhat (the 12.08% return of the Russell 2000® Index of smaller companies lagged the S&P 500®). Significantly, the portfolio’s three main underlying U.S. large-cap growth funds, which constitute major positions, lagged the S&P 500® in a meaningful way. While the S&P 500® was up 15.21% for the 12-month period, Transamerica Capital Growth eked out a small gain as a number of its Internet-related stocks struggled. Transamerica Diversified Equity and Transamerica Growth gained as well but lagged the S&P 500®. By contrast, the portfolio’s three U.S. large-cap value funds performed more in line with the S&P 500®.
| | | | |
| Transamerica Funds | | | | Annual Report 2012 |
| | Page 10 | | |
Transamerica Asset Allocation—Moderate Portfolio
(unaudited)
STRATEGY REVIEW (continued)
The fixed-income half of the portfolio fared better. Eight of the nine underlying bond funds that were owned for the entire period outpaced the Barclays U.S. Aggregate Bond. Transamerica Emerging Markets Debt and Transamerica High Yield Bond were the clear winners. Those are modest positions in the portfolio, but the two anchor bond funds—Transamerica Total Return and Transamerica Core Bond—both also beat the Barclays U.S. Aggregate Bond’s return. Meanwhile, the portfolio’s two multi-sector bond funds, Transamerica Bond and Transamerica Flexible Income posted double-digit returns.
During the year we worked to upgrade the roster of underlying managers. Transamerica Asset Management, Inc. (“TAM”) added what we consider an excellent large-cap value manager, Levin Capital Strategies, L.P., to run Transamerica Large Cap Value. TAM also added a pair of small-cap managers: Lombardia Capital Partners, LLC manages the new Transamerica Small Cap Value, and Ranger Investment Management, L.P. now runs Transamerica Small Cap Growth. Finally, we eliminated a couple of poor-performing international funds that we had been underweighting, and reallocated the assets to other managers in the same styles.
We still see macroeconomic events driving the markets more than the types of company fundamentals our underlying managers tend to emphasize in their security selection. Regarding the macroeconomic picture, we believe the U.S. economy is in a trend of gradual improvement while Europe is fighting to stave off a regional recession in 2013. Meanwhile, emerging markets have been hampered by slowing growth rates in heavyweights China, India, and Brazil. We; therefore, remain positioned with an international-equity underweight relative to our normal targets, and an overweight to the U.S. Valuations abroad have become somewhat attractive to us, however, so we must continuously weigh the economic risks abroad against the buying opportunity. In general, we have been and will continue to be flexible in this evolving environment.
Jon Hale, CFA
Dan McNeela, CFA
Michael Stout, CFA
Co-Portfolio Managers
Morningstar Associates, LLC
| | | | |
| Transamerica Funds | | | | Annual Report 2012 |
| | Page 11 | | |
Transamerica Asset Allocation—Moderate Portfolio
(unaudited)

Average Annual Total Return for Periods Ended 10/31/2012
| | | | | | | | | | | | | | | | |
| | | 1 Year | | | 5 Years | | | 10 Years or
Life of Class | | | Inception Date | |
Class A (NAV) | | | 7.95 | % | | | 1.35 | % | | | 6.94 | % | | | 03/01/2002 | |
Class A (POP) | | | 1.97 | % | | | 0.21 | % | | | 6.34 | % | | | 03/01/2002 | |
Wilshire 5000 * | | | 14.30 | % | | | 0.77 | % | | | 7.79 | % | | | | |
Barclays U.S. Aggregate Bond * | | | 5.25 | % | | | 6.38 | % | | | 5.39 | % | | | | |
| | | | | | | | | | | | | | | | |
Class B (NAV) | | | 7.06 | % | | | 0.65 | % | | | 6.39 | % | | | 03/01/2002 | |
Class B (POP) | | | 2.06 | % | | | 0.47 | % | | | 6.39 | % | | | 03/01/2002 | |
| | | | | | | | | | | | | | | | |
Class C (NAV) | | | 7.17 | % | | | 0.71 | % | | | 6.31 | % | | | 11/11/2002 | |
Class C (POP) | | | 6.17 | % | | | 0.71 | % | | | 6.31 | % | | | 11/11/2002 | |
| | | | | | | | | | | | | | | | |
Class I (NAV) | | | 8.26 | % | | | N/A | | | | 7.07 | % | | | 11/30/2009 | |
| | | | | | | | | | | | | | | | |
Class R (NAV) | | | 7.72 | % | | | 1.15 | % | | | 4.07 | % | | | 06/15/2006 | |
| | | | | | | | | | | | | | | | |
NOTES
| * | The Wilshire 5000® Total Market Index (“Wilshire 5000”) and the Barclays U.S. Aggregate Bond Index (“Barclays U.S. Aggregate Bond”) are unmanaged indices used as a general measure of market performance. Calculations assume dividends and capital gains are reinvested and do not include any managerial expenses. The 10 Years or Life of Class calculation is based on the previous 10 years or since the inception date of the class, whichever is more recent. You cannot invest directly in an index. |
The performance data presented represents past performance; future results may vary. Performance data does not reflect the deduction of taxes that would be paid on fund distributions or the redemption of fund shares. Investment return and principal value will fluctuate so that an investor’s shares, when redeemed, may be worth more or less than their original cost. Current performance may be lower or higher than performance quoted. Please see www.transamericafunds.com for performance data current to the most recent month-end. Net Asset Value (“NAV”) returns include the reinvestment of dividends and capital gains but do not reflect any sales charges. Public Offering Price (“POP”) returns include the reinvestment of dividends and capital gains and reflect the maximum sales charge of 5.5% for Class A shares or the maximum applicable contingent deferred sales charge (5% in the 1st year, decreasing to 0% after 6 years) for Class B shares and 1% (during the first 12 months) for Class C shares. Shares purchased prior to March 1, 2004 are subject to a maximum applicable contingent deferred sales charge (5% in the 1st year, decreasing to 0% after 7 years) for Class B shares and (2% in the 1st year, decreasing to 0% after 2 years) for Class C shares. There are no sales charges on Class I and R shares.
Performance figures reflect any fee waivers and/or expense reimbursements by the Investment Adviser. Without such waivers and/or reimbursements, the performance would be lower. Future waivers and/or reimbursements are at the discretion of the Investment Adviser.
Asset allocation does not ensure a profit or protect against a loss. An investment in the fund is subject to all of the risks associated with the underlying funds. This material must be preceded or accompanied by a current prospectus, which includes specific contents regarding the investment objectives and policies of this fund.
| | | | |
| Transamerica Funds | | | | Annual Report 2012 |
| | Page 12 | | |
Transamerica Multi-Manager Alternative Strategies Portfolio
(unaudited)
MARKET ENVIRONMENT
The November 1, 2011 to October 31, 2012 reporting period encompassed very different market environments. In the beginning of the period, fears of a European sovereign default continued to plague the markets. Concerns about poor job growth in the U.S., Greek elections and a slowing economy in China also weighed on investors. In response to deteriorating conditions, central bankers around the world continued to pump additional liquidity into financial markets throughout the year. The U.S. Federal Reserve Board (“Fed”) announced a third round of quantitative easing, with a focus on purchasing mortgages. The European Central Bank (“ECB”) removed liquidity concerns from the region’s debt crisis by providing banks with unlimited access to loans from the central bank, and also announced an aggressive bond-buying program. Similarly, the Bank of Japan, Bank of England, and the People’s Bank of China enacted plans to boost liquidity. The net result was higher asset prices across asset classes.
PERFORMANCE
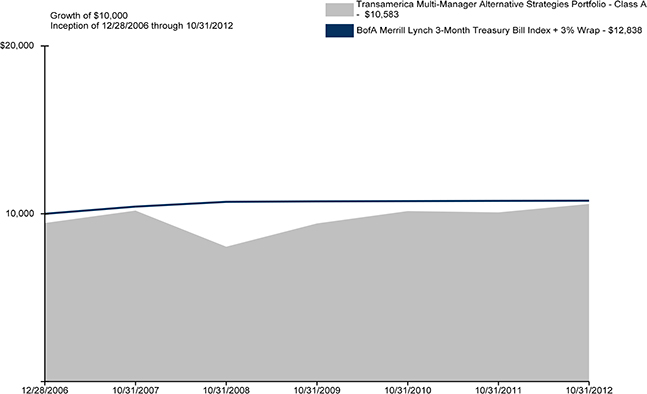
For the year ended October 31, 2012, Transamerica Multi-Manager Alternative Strategies Portfolio, Class A, returned 4.95%. By comparison, its primary and secondary benchmarks, the Bank of America Merrill Lynch 3-Month Treasury Bill + 3% Wrap Index and the Hedge Fund Research (“HFRX”) Global Hedge Fund Index, returned 3.12% and 0.84%, respectively.
STRATEGY REVIEW
Transamerica Multi-Manager Alternative Strategies Portfolio is designed to provide diversification relative to a core stock/bond portfolio. A reference benchmark for the strategy is the HFRX Global Hedge Fund Index. The portfolio’s allocations can be broken into four broad HFRX categories: Equity Hedge, Event Driven, Macro, and Relative Value.
The fund outperformed its reference benchmark for the period, largely due to gains in Relative Value and Equity Hedge strategies, which benefited from a general return to risk and tightening of spreads. These gains were only partially offset by allocations in Macro and Event Driven, as commodity prices declined and merger arbitrage deal volatility increased. The largest contributors included Transamerica Bond, Transamerica Emerging Markets Debt, Transamerica Developing Markets Debt, and Transamerica Global Real Estate Securities. The largest detractors included Transamerica Commodity Strategy and Transamerica Arbitrage Strategy.
Throughout the year, we continued to stay true to our dynamic investment philosophy, which benefited the strategy as we tactically reallocated assets between categories and within categories. For instance, we built up our non-U.S. dollar exposure in Equity Hedge and Relative Value as we saw signs of further monetary easing and weakening of the U.S. dollar. We also reduced our exposure to trend-following strategy as we saw volatility rising across asset classes, and we reduced our exposure to arbitrage strategies in response to lower rates and an unfavorable risk/return profile. We took a “barbell risk” investment approach at times throughout the year, investing in strategies that complement each other and providing investors a smoother ride than tactical shifts between “risk on” and “risk off”.
Going forward, we continue to be cautious about growth and market directions. Much of the fundamental data about manufacturing, job creation, and commodity prices point to soft demand and make economic growth slow and elusive. Yield curves and rates around the world also tell a similar story: record low rates in Germany, Japan, and the U.S. point to a massive risk-off appetite. That said, the rate cutting in Europe and China and continued policy intervention is likely to get markets (if not economies) moving. The risk of being completely defensive or short with much stimulus potential is not prudent. Rallies tend to be fierce and brief and we do not want to be in a position to chase a temporarily rising market just to catch it at the top. We remain broadly allocated and believe we can provide protection on the downside while still participating on the upside.
Tim Galbraith
Portfolio Manager
Transamerica Asset Management, Inc.
| | | | |
| Transamerica Funds | | | | Annual Report 2012 |
| | Page 13 | | |
Transamerica Multi-Manager Alternative Strategies Portfolio
(unaudited)
Average Annual Total Return for Periods Ended 10/31/2012
| | | | | | | | | | | | | | | | |
| | | 1 Year | | | 5 Years | | | 10 Years or
Life of Class | | | Inception Date | |
Class A (NAV) | | | 4.95 | % | | | 0.76 | % | | | 1.95 | % | | | 12/28/2006 | |
Class A (POP) | | | (0.79 | )% | | | (0.38 | )% | | | 0.98 | % | | | 12/28/2006 | |
BofA Merrill Lynch 3-Month Treasury Bill Index + 3% Wrap * | | | 3.12 | % | | | 3.72 | % | | | 4.37 | % | | | | |
HFRX Global Hedge Fund * | | | 0.84 | % | | | (3.65 | )% | | | (1.98 | )% | | | | |
| | | | | | | | | | | | | | | | |
Class C (NAV) | | | 4.21 | % | | | 0.11 | % | | | 1.30 | % | | | 12/28/2006 | |
Class C (POP) | | | 3.21 | % | | | 0.11 | % | | | 1.30 | % | | | 12/28/2006 | |
| | | | | | | | | | | | | | | | |
Class I (NAV) | | | 5.34 | % | | | N/A | | | | 3.91 | % | | | 11/30/2009 | |
| | | | | | | | | | | | | | | | |
NOTES
| * | The Bank of America Merrill Lynch 3-Month Treasury Bill Index + 3% Wrap Fee (“BofA Merrill Lynch 3-Month Treasury Bill Index + 3% Wrap”) is an unmanaged index used as a general measure of market performance. The Hedge Fund Research Global Hedge Fund Index (“HFRX Global Hedge Fund”) is a passively-managed index that is compiled by Hedge Fund Research, Inc. It is designed to measure the daily performance of the overall composition of the hedge fund universe. It is comprised of all eligible hedge fund strategies; including but not limited to convertible arbitrage, distressed securities, equity hedge, equity market neutral, event driven, macro, merger arbitrage, and relative value arbitrage. The strategies are asset weighted based on the distribution of assets in the hedge fund industry. Returns of funds within the composition of the HFRX Global Hedge Fund presented are net of underlying manager fees, but do not reflect the deduction of management fees, taxes and other expenses. Calculations for the BofA Merrill Lynch 3-Month Treasury Bill Index + 3% Wrap assume dividends and capital gains are reinvested and do not include any managerial expenses. The 10 Years or Life of Class calculation is based on the inception date of the class. You cannot invest directly in an index. |
The performance data presented represents past performance; future results may vary. Performance data does not reflect the deduction of taxes that would be paid on fund distributions or the redemption of fund shares. Investment return and principal value will fluctuate so that an investor’s shares, when redeemed, may be worth more or less than their original cost. Current performance may be lower or higher than performance quoted. Please see www.transamericafunds.com for performance data current to the most recent month-end. Net Asset Value (“NAV”) returns include the reinvestment of dividends and capital gains but do not reflect any sales charges. Public Offering Price (“POP”) returns include the reinvestment of dividends and capital gains and reflect the maximum sales charge of 2.5% for Class A shares or the maximum applicable contingent deferred sales charge and 1% (during the first 12 months) for Class C shares. There are no sales charges on Class I shares.
Performance figures reflect any fee waivers and/or expense reimbursements by the Investment Adviser. Without such waivers and/or reimbursements, the performance would be lower. Future waivers and/or reimbursements are at the discretion of the Investment Adviser.
Alternative strategies are not suitable for all investors. Many alternative strategies use sophisticated and aggressive investment techniques. Certain alternative strategies may be tied to hard assets such as commodities, currencies and real estate and may be subject to greater volatility as they may be affected by overall market movements, changes in interest rates or factors affecting a particular industry, commodity or currency, and international economic, political, and regulatory developments. This material must be preceded or accompanied by a current prospectus, which includes specific contents regarding the investment objectives and policies of this portfolio.
| | | | |
| Transamerica Funds | | | | Annual Report 2012 |
| | Page 14 | | |
Transamerica Multi-Manager International Portfolio
(unaudited)
MARKET ENVIRONMENT
The November 1, 2011 to October 31, 2012 reporting period encompassed an overall rising market for U.S. and international stocks, but with downdrafts in November 2011 and again in the spring of 2012. As the period began, the Standard & Poor’s 500® Index (“S&P 500®) posted a small loss in November 2011, but the Morgan Stanley Capital International World ex-U.S. Index (“MSCI World ex-U.S.”) of developed-market foreign stocks dropped 4.59% amid volatility surrounding the eurozone sovereign debt crisis. The Morgan Stanley Capital International Emerging Markets Index (“MSCI-EMI”) plummeted 6.66% in November. Although U.S. stocks recovered ground in December, the international indices fell further.
The mood brightened in 2012’s first quarter. The U.S. economy showed some vigor and the European Central Bank’s (“ECB”) Long Term Refinancing Operations flooded the eurozone with liquidity by lending nearly $1.3 trillion to European banks, a move that comforted international equity markets. Both U.S. and international stocks enjoyed double-digit gains in 2012’s first quarter. The MSCI World ex-U.S. rose 10.50% while the MSCI-EMI added 14.13%.
The eurozone crisis returned to haunt markets in the spring; however, as Spanish and Italian bond yields climbed and Spain’s government requested a large bailout for its banks from the European Union. Meanwhile, other data indicated deepening recessions in several European countries. Stocks sold off globally in April and May, with the S&P 500® losing 6.60% over those two months and the MSCI World ex-U.S. plunging 12.69%. The MSCI-EMI fell 12.20%.
Following the spring selloff, the markets began a sustained climb through the summer on the back of a number of moves and announcements by European and U.S. policymakers. A late-June Euro Area Summit ended with a positive statement from the participants supporting the future establishment of a eurozone banking supervisor and the recapitalization of Spanish banks. In a July speech from London, ECB president Mario Draghi said the ECB would do “whatever it takes to preserve the Euro. And believe me, it will be enough.” This statement helped assuage the nervous markets. In August and September global equity markets rose further, boosted by an expectation that the ECB would buy Spanish and Italian bonds in the open market to hold down the bonds’ yields, and thus hold down the countries’ borrowing costs. The equity markets were also bolstered by anticipation that the U.S. Federal Reserve Board (“Fed”) would launch a third round of quantitative easing dubbed “QE3”. When the ECB did indeed announce a bond-buying program in early September, and the Fed followed with formally launching QE3 a few days later, the markets rallied some more. Thanks to this string of policy developments, from June 1 to October 31, 2012 the S&P 500® rose 8.69% and the MSCI World ex-U.S. gained 15.27%. The MSCI-EMI was up a little less, at 11.43%.
Overall, the S&P 500® returned 15.21% for the 12-month period as a whole. But Europe’s troubles took a toll; the MSCI World ex-U.S. Index rose only 4.96% for the one-year period. Emerging markets performed even worse, with a 2.98% return for the MSCI-EMI.
PERFORMANCE
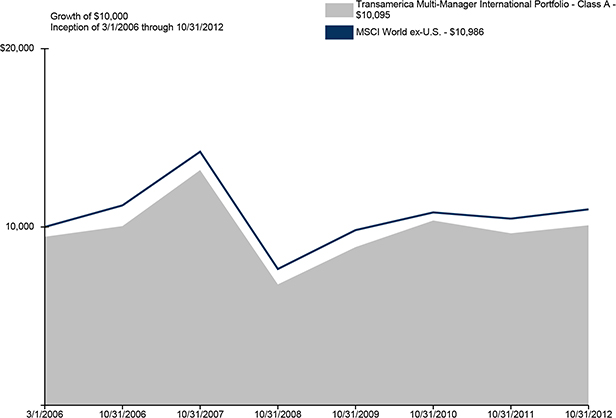
For the year ended October 31, 2012, Transamerica Multi-Manager International Portfolio, Class A returned 4.65% after all expenses. Its benchmark, the MSCI World ex-U.S., returned 4.96%.
STRATEGY REVIEW
The goal of the Transamerica Multi-Manager International Portfolio is to provide broad coverage of international equity markets. The 10 underlying funds in the portfolio cover a range of international investing styles, including foreign large-cap value, blend, and growth stocks, as well as mid-cap and small-cap stocks; emerging-markets stocks; global real estate; and global tactical asset allocation. The portfolio normally targets approximately three fourths of assets in developed markets and a fourth in emerging markets. Large-cap stocks typically make up about two thirds of assets, with mid- and small-cap stocks comprising the other third. The portfolio also often contains smaller positions of 4% to 5% each in global real estate and global tactical asset-allocation funds. Its objective is to provide investors with comprehensive coverage of international markets in a single investment vehicle. As a result, the portfolio is more broadly diversified than most international funds or indexes. While we generally hew closely to our strategic targets, we will actively over- and underweight asset classes as we feel necessary in response to shorter-term market conditions. We endeavor to find and use quality money managers specializing in each asset class and style. We carefully monitor these underlying managers for performance and style issues, and adjust their weightings both to manage our style exposures and to reflect the managers’ relative merit.
Given the economic challenges in Europe and slowing growth in emerging markets, the portfolio was positioned somewhat defensively for much of the year. Throughout the period, the portfolio’s positions in Transamerica Global Allocation (a hybrid stock/bond fund) and Transamerica Global Macro (a long/short absolute-return strategy) helped lessen the fund’s losses during the downturns and mute overall volatility, but they also diluted upside returns. As it happened, most of our underlying pure-equity funds were able to match or beat the MSCI World ex-U.S.’s (“the Index”) 4.96% return. All three of the main large-cap diversified funds that were owned for the full year surpassed the Index’s return, with Transamerica International (run by Neuberger Berman Management LLC) and Transamerica International Equity Opportunities (managed by MFS® Investment Management) both roughly doubling the Index’s gain. Transamerica International Value Opportunities (run by Thornburg Investment Management, Inc.) posted the smallest gain, but was still outpaced the Index by a few basis points. A fourth large-cap holding, Transamerica International Equity (managed by Thompson, Siegel & Walmsley LLC), boasts the best full-period return among the large-cap funds, but it was not owned in the fund the entire time.
Overall, the portfolio’s strongest performer was Transamerica Global Real Estate (managed by CBRE Clarion Securities LLC). Riding a global rally in real-estate investment trusts—spurred in part by investors’ search for yield in a low-rate environment.
| | | | |
| Transamerica Funds | | | | Annual Report 2012 |
| | Page 15 | | |
Transamerica Multi-Manager International Portfolio
(unaudited)
STRATEGY REVIEW (continued)
Over the course of the year we eliminated a couple of poor-performing funds. One was a foreign large-cap value fund called Transamerica International Value, run by Hansberger Global Investors, Inc. That fund was liquidated. The other liquidation was Transamerica Emerging Markets, run by Wellington Management Company, LLP. At the time there were three emerging-markets funds. One was this Wellington-run fund. Another was Transamerica Developing Markets Equity, managed by OppenhiemerFunds, Inc., which we view as a strong performer and which continues to merit the bulk of our emerging-markets assets. We had also added a third fund in May run by ClariVest Asset Management, LLC called Transamerica Emerging Markets Equity. We thus had a surplus of emerging-markets funds, and as the Wellington fund was the least impressive to us.
We still see macroeconomic events driving the markets more than the types of company fundamentals our underlying managers tend to emphasize in their security selection. Regarding the macroeconomic picture, we believe that while the U.S. economy is in a trend of gradual improvement, Europe is fighting to stave off a regional recession in 2013. Meanwhile, emerging markets have been hampered by slowing growth rates in heavyweights China, India, and Brazil. As of October 31, 2012; therefore, the fund remained somewhat defensively positioned. It was near its normal emerging-markets target because, while growth rates have slowed in emerging markets, they are still greater than those of most developed markets. However, the portfolio remains underweight foreign developed markets owing to our view of Europe’s present economy, with the offset taken up by modest positions in Transamerica Global Allocation, Transamerica Global Macro, and residual cash and domestic stocks within some of the underlying equity funds. In all, about 94% of assets were in equity at the period’s end (90% being foreign equity). We are also overweighting large-cap stocks in the fund and underweighting small caps. Given Europe’s difficult economic environment, we find larger companies with global revenue streams to be less vulnerable than smaller companies focused more on their local and regional markets.
While we are very much aware of the challenges facing the major European economies, valuations abroad have become more attractive in our estimation. We therefore continuously weigh the economic risks against the buying opportunity. In general, we have been and will remain flexible in this evolving environment.
Jon Hale, CFA
Dan McNeela, CFA
Michael Stout, CFA
Co-Portfolio Managers
Morningstar Associates, LLC
| | | | |
| Transamerica Funds | | | | Annual Report 2012 |
| | Page 16 | | |
Transamerica Multi-Manager International Portfolio
(unaudited)
Average Annual Total Return for Periods Ended 10/31/2012
| | | | | | | | | | | | | | | | |
| | | 1 Year | | | 5 Years | | | 10 Years or
Life of Class | | | Inception Date | |
Class A (NAV) | | | 4.65 | % | | | (5.21 | )% | | | 0.99 | % | | | 03/01/2006 | |
Class A (POP) | | | (1.12 | )% | | | (6.28 | )% | | | 0.14 | % | | | 03/01/2006 | |
MSCI World ex-U.S. * | | | 4.96 | % | | | (5.03 | )% | | | 1.42 | % | | | | |
| | | | | | | | | | | | | | | | |
Class B (NAV) | | | 3.92 | % | | | (5.90 | )% | | | 0.27 | % | | | 03/01/2006 | |
Class B (POP) | | | (1.08 | )% | | | (6.08 | )% | | | 0.27 | % | | | 03/01/2006 | |
| | | | | | | | | | | | | | | | |
Class C (NAV) | | | 3.87 | % | | | (5.83 | )% | | | 0.33 | % | | | 03/01/2006 | |
Class C (POP) | | | 2.87 | % | | | (5.83 | )% | | | 0.33 | % | | | 03/01/2006 | |
| | | | | | | | | | | | | | | | |
Class I (NAV) | | | 5.07 | % | | | N/A | | | | 3.70 | % | | | 11/30/2009 | |
| | | | | | | | | | | | | | | | |
NOTES
| * | The Morgan Stanley Capital International World ex-U.S. Index (“MSCI World ex-U.S.”) is an unmanaged index used as a general measure of market performance. Calculations assume dividends and capital gains are reinvested and do not include any managerial expenses. The 10 Years or Life of Class calculation is based on the inception date of the class. You cannot invest directly in an index. |
The performance data presented represents past performance; future results may vary. Performance data does not reflect the deduction of taxes that would be paid on fund distributions or the redemption of portfolio shares. Investment return and principal value will fluctuate so that an investor’s shares, when redeemed, may be worth more or less than their original cost. Current performance may be lower or higher than performance quoted. Please see www.transamericafunds.com for performance data current to the most recent month-end. Net Asset Value (“NAV”) returns include the reinvestment of dividends and capital gains but do not reflect any sales charges. Public Offering Price (“POP”) returns include the reinvestment of dividends and capital gains and reflect the maximum sales charge of 5.5% for Class A shares or the maximum applicable contingent deferred sales charge (5% in the 1st year, decreasing to 0% after 6 years) for Class B shares and 1% (during the first 12 months) for Class C shares. There are no sales charges on Class I shares.
Performance figures reflect any fee waivers and/or expense reimbursements by the Investment Adviser. Without such waivers and/or reimbursements, the performance would be lower. Future waivers and/or reimbursements are at the discretion of the Investment Adviser.
Asset allocation does not ensure a profit or protect against a loss. Investments in global/international markets involve risks not associated with U.S. markets, such as currency fluctuations, adverse social and political developments, and the relatively small size and lesser liquidity of the markets. This material must be preceded or accompanied by a current prospectus, which includes specific contents regarding the investment objectives and policies of this portfolio.
| | | | |
| Transamerica Funds | | | | Annual Report 2012 |
| | Page 17 | | |
Understanding Your Funds’ Expenses
(unaudited)
SHAREHOLDER EXPENSES
Fund shareholders may incur two types of costs: (1) transaction costs, including sales charges (loads) on purchases, contingent deferred sales charges on redemptions; and (2) ongoing costs, including management fees, and other fund expenses.
The following examples are intended to help you understand your ongoing costs (in dollars and cents) of investing in the funds and to compare these costs with the ongoing costs of investing in other funds.
The examples are based on an investment of $1,000 invested at May 1, 2012 and held for the entire period until October 31, 2012.
ACTUAL EXPENSES
The information in the table under the heading “Actual Expenses” provides information about actual account values and actual expenses. You may use the information in these columns, together with the amount you invested, to estimate the expenses that you paid over the period. Simply divide your account value by $1,000 (for example, an $8,600 account value divided by $1,000 = $8.6), then multiply the result by the number in the appropriate column for your share class titled “Expenses Paid During Period” to estimate the expenses you paid on your account during this period. If your account is an IRA, your expenses could have included a $15 annual fee. The amount of any fee paid through your account would increase the estimate of expenses you paid during the period and decrease your ending account value.
HYPOTHETICAL EXAMPLES FOR COMPARISON PURPOSES
The information in the table under the heading “Hypothetical Expenses” provides information about hypothetical account values and hypothetical expenses based on the funds’ actual expense ratios and an assumed rate of return of 5% per year before expenses, which are not the funds’ actual returns. The hypothetical account values and expenses may not be used to estimate the actual ending account balance or expenses you paid for the period. You may use this information to compare the ongoing costs of investing in your funds and other funds. To do so, compare this 5% hypothetical example with the 5% hypothetical examples that appear in the shareholder reports of the other funds. As in the case of the actual expense example, if your account is subject to an IRA fee, the amount of the fee paid through your account would increase the hypothetical expenses you would have paid during the period and decrease the hypothetical ending account value.
Please note that the expenses shown in the table are meant to highlight your ongoing costs only and do not reflect any transactional costs, such as sales charges and brokerage commissions paid on purchases and sales of fund shares. Therefore, the information under the heading “Hypothetical Expenses” is useful in comparing ongoing costs only, and will not help you determine the relative total costs of owning different funds. If any of these transaction costs were included, your costs would be higher. The expenses shown in the table do not reflect any fees that may be charged to you by brokers, financial intermediaries or other financial institutions.
Expense ratios may vary period to period because of various factors, such as an increase in expenses that are not a part of the advisory and administrative fees. Examples of such expenses are fees and expenses of trustees and their counsel, extraordinary expenses and interest expense.
| | | | | | | | | | | | | | | | | | | | | | | | |
| | | | | | Actual Expenses | | | Hypothetical Expenses(A) | | | | |
Fund Name | | Beginning
Account Value | | | Ending Account
Value | | | Expenses Paid
During Period(B) | | | Ending Account
Value | | | Expenses Paid
During Period(B) | | | Annualized
Expense Ratio(C) | |
Transamerica Asset Allocation-Conservative Portfolio | | | | | | | | | | | | | | | | | | | | | | | | |
Class A | | $ | 1,000.00 | | | $ | 1,020.40 | | | $ | 2.95 | | | $ | 1,022.22 | | | $ | 2.95 | | | | 0.58 | % |
Class B | | | 1,000.00 | | | | 1,015.80 | | | | 6.44 | | | | 1,018.75 | | | | 6.44 | | | | 1.27 | |
Class C | | | 1,000.00 | | | | 1,016.30 | | | | 6.23 | | | | 1,018.95 | | | | 6.24 | | | | 1.23 | |
Class I | | | 1,000.00 | | | | 1,021.30 | | | | 1.22 | | | | 1,023.93 | | | | 1.22 | | | | 0.24 | |
Class R | | | 1,000.00 | | | | 1,018.80 | | | | 4.01 | | | | 1,021.17 | | | | 4.01 | | | | 0.79 | |
Transamerica Asset Allocation-Growth Portfolio | | | | | | | | | | | | | | | | | | | | | | | | |
Class A | | | 1,000.00 | | | | 993.60 | | | | 3.16 | | | | 1,021.97 | | | | 3.20 | | | | 0.63 | |
Class B | | | 1,000.00 | | | | 989.30 | | | | 6.85 | | | | 1,018.25 | | | | 6.95 | | | | 1.37 | |
Class C | | | 1,000.00 | | | | 990.20 | | | | 6.50 | | | | 1,018.60 | | | | 6.60 | | | | 1.30 | |
Class I | | | 1,000.00 | | | | 995.20 | | | | 1.25 | | | | 1,023.88 | | | | 1.27 | | | | 0.25 | |
Class R | | | 1,000.00 | | | | 991.92 | | | | 3.96 | | | | 1,021.17 | | | | 4.01 | | | | 0.79 | |
Transamerica Asset Allocation-Moderate Growth Portfolio | | | | | | | | | | | | | | | | | | | | | | | | |
Class A | | | 1,000.00 | | | | 1,003.30 | | | | 2.97 | | | | 1,022.17 | | | | 3.00 | | | | 0.59 | |
Class B | | | 1,000.00 | | | | 1,000.00 | | | | 6.64 | | | | 1,018.50 | | | | 6.70 | | | | 1.32 | |
Class C | | | 1,000.00 | | | | 1,000.00 | | | | 6.33 | | | | 1,018.80 | | | | 6.39 | | | | 1.26 | |
Class I | | | 1,000.00 | | | | 1,005.70 | | | | 1.21 | | | | 1,023.93 | | | | 1.22 | | | | 0.24 | |
Class R | | | 1,000.00 | | | | 1,002.50 | | | | 3.88 | | | | 1,021.27 | | | | 3.91 | | | | 0.77 | |
Transamerica Asset Allocation-Moderate Portfolio | | | | | | | | | | | | | | | | | | | | | | | | |
Class A | | | 1,000.00 | | | | 1,009.90 | | | | 2.83 | | | | 1,022.32 | | | | 2.85 | | | | 0.56 | |
Class B | | | 1,000.00 | | | | 1,006.60 | | | | 6.56 | | | | 1,018.60 | | | | 6.60 | | | | 1.30 | |
Class C | | | 1,000.00 | | | | 1,006.60 | | | | 6.20 | | | | 1,018.95 | | | | 6.24 | | | | 1.23 | |
Class I | | | 1,000.00 | | | | 1,012.40 | | | | 1.21 | | | | 1,023.93 | | | | 1.22 | | | | 0.24 | |
Class R | | | 1,000.00 | | | | 1,009.10 | | | | 3.84 | | | | 1,021.32 | | | | 3.86 | | | | 0.76 | |
Transamerica Multi-Manager Alternative Strategies Portfolio | | | | | | | | | | | | | | | | | | | | | | | | |
Class A | | | 1,000.00 | | | | 1,024.80 | | | | 3.77 | | | | 1,021.42 | | | | 3.76 | | | | 0.74 | |
Class C | | | 1,000.00 | | | | 1,020.80 | | | | 7.31 | | | | 1,017.90 | | | | 7.30 | | | | 1.44 | |
Class I | | | 1,000.00 | | | | 1,025.80 | | | | 1.94 | | | | 1,023.23 | | | | 1.93 | | | | 0.38 | |
| | | | |
| Transamerica Funds | | | | Annual Report 2012 |
| | Page 18 | | |
Understanding Your Funds’ Expenses (continued)
(unaudited)
| | | | | | | | | | | | | | | | | | | | | | | | |
| | | | | | Actual Expenses | | | Hypothetical Expenses(A) | | | | |
Fund Name | | Beginning
Account Value | | | Ending Account
Value | | | Expenses Paid
During Period(B) | | | Ending Account
Value | | | Expenses Paid
During Period(B) | | | Annualized
Expense Ratio(C) | |
Transamerica Multi-Manager International Portfolio | | | | | | | | | | | | | | | | | | | | | | | | |
Class A | | $ | 1,000.00 | | | $ | 993.50 | | | $ | 3.26 | | | $ | 1,021.87 | | | $ | 3.30 | | | | 0.65 | % |
Class B | | | 1,000.00 | | | | 990.30 | | | | 7.25 | | | | 1,017.85 | | | | 7.35 | | | | 1.45 | |
Class C | | | 1,000.00 | | | | 990.30 | | | | 6.85 | | | | 1,018.25 | | | | 6.95 | | | | 1.37 | |
Class I | | | 1,000.00 | | | | 996.80 | | | | 1.25 | | | | 1,023.88 | | | | 1.27 | | | | 0.25 | |
| (A) | 5% return per year before expenses. |
| (B) | Expenses are calculated using the funds’ annualized expense ratios (as disclosed in the table), multiplied by the average account value for the period, multiplied by the number of days in the period (184 days), and divided by the number of days in the year (366 days). |
| (C) | Expense ratios do not include expenses of the investment companies in which the funds invest. |
| | | | |
| Transamerica Funds | | | | Annual Report 2012 |
| | Page 19 | | |
Schedules of Investments Composition
At October 31, 2012
(The following charts summarize the Schedules of Investments of each fund by asset type)
(unaudited)
| | | | |
Transamerica Asset Allocation—Conservative Portfolio | | % of Net
Assets | |
Fixed Income | | | 52.2 | % |
U.S. Equity | | | 23.0 | |
Tactical and Specialty | | | 14.3 | |
Inflation-Protected Securities | | | 6.1 | |
Global/International Equity | | | 4.5 | |
Other Assets and Liabilities—Net | | | (0.1 | ) |
| | | | |
Total | | | 100.0 | % |
| | | | |
| |
| | | % of Net | |
Transamerica Asset Allocation—Growth Portfolio | | Assets | |
U.S. Equity | | | 75.3 | % |
Global/International Equity | | | 16.6 | |
Tactical and Specialty | | | 8.2 | |
Fixed Income | | | 0.0 | (A) |
Other Assets and Liabilities—Net | | | (0.1 | ) |
| | | | |
Total | | | 100.0 | % |
| | | | |
| |
Transamerica Asset Allocation—Moderate Growth Portfolio | | % of Net
Assets | |
U.S. Equity | | | 54.5 | % |
Fixed Income | | | 19.7 | |
Tactical and Specialty | | | 12.0 | |
Global/International Equity | | | 10.9 | |
Inflation-Protected Securities | | | 3.0 | |
Other Assets and Liabilities—Net | | | (0.1 | ) |
| | | | |
Total | | | 100.0 | % |
| | | | |
| |
| | | % of Net | |
Transamerica Asset Allocation—Moderate Portfolio | | Assets | |
U.S. Equity | | | 40.1 | % |
Fixed Income | | | 36.6 | |
Tactical and Specialty | | | 13.4 | |
Global/International Equity | | | 6.3 | |
Inflation-Protected Securities | | | 3.7 | |
Other Assets and Liabilities—Net | | | (0.1 | ) |
| | | | |
Total | | | 100.0 | % |
| | | | |
| |
Transamerica Multi-Manager Alternative Strategies Portfolio | | % of Net
Assets | |
Tactical and Specialty | | | 69.2 | % |
Fixed Income | | | 17.1 | |
Global/International Equity | | | 9.3 | |
Inflation-Protected Securities | | | 4.1 | |
Other Assets and Liabilities—Net | | | 0.3 | |
| | | | |
Total | | | 100.0 | % |
| | | | |
| |
| | | % of Net | |
Transamerica Multi-Manager International Portfolio | | Assets | |
Global/International Equity | | | 89.7 | % |
Tactical and Specialty | | | 10.6 | |
Other Assets and Liabilities—Net | | | (0.3 | ) |
| | | | |
Total | | | 100.0 | % |
| | | | |
| (A) | Amount rounds to less than 0.1%. |
| | | | |
| Transamerica Funds | | | | Annual Report 2012 |
| | Page 20 | | |
Transamerica Asset Allocation—Conservative Portfolio
SCHEDULE OF INVESTMENTS
At October 31, 2012
| | | | | | | | |
| | | | | | Value | |
| | | Shares | | | (000’s) | |
INVESTMENT COMPANIES—100.1% | | | | | | | | |
Fixed Income—52.2% | | | | | | | | |
Transamerica Core Bond p | | | 19,942,243 | | | $ | 216,573 | |
Transamerica Emerging Markets Debt p | | | 1,739,177 | | | | 20,105 | |
Transamerica Flexible Income p | | | 1,852,875 | | | | 17,380 | |
Transamerica High Yield Bond p | | | 3,094,093 | | | | 29,920 | |
Transamerica International Bond p | | | 1,072,039 | | | | 11,289 | |
Transamerica Money Market p | | | 5,175,039 | | | | 5,175 | |
Transamerica Short-Term Bond p | | | 8,993,505 | | | | 92,813 | |
Transamerica Total Return p | | | 20,111,013 | | | | 219,008 | |
Global/International Equity—4.5% | | | | | | | | |
Transamerica Developing Markets Equity p | | | 540,925 | | | | 6,486 | |
Transamerica Emerging Markets Equity p ‡ | | | 78,957 | | | | 745 | |
Transamerica International p | | | 778,438 | | | | 7,053 | |
Transamerica International Equity p | | | 160,051 | | | | 2,345 | |
Transamerica International Equity Opportunities p | | | 775,550 | | | | 5,755 | |
Transamerica International Small Cap p | | | 625,579 | | | | 4,942 | |
Transamerica International Value Opportunities p | | | 712,369 | | | | 6,304 | |
Transamerica Value p | | | 830,281 | | | | 18,963 | |
Inflation-Protected Securities—6.1% | | | | | | | | |
Transamerica Real Return TIPS p | | | 6,058,859 | | | | 71,131 | |
Tactical and Specialty—14.3% | | | | | | | | |
Transamerica Arbitrage Strategy p | | | 1,988,814 | | | | 19,669 | |
Transamerica Bond p | | | 6,745,147 | | | | 72,174 | |
Transamerica Commodity Strategy p | | | 1,203,138 | | | | 11,634 | |
Transamerica Global Allocation p | | | 1,926,436 | | | | 21,268 | |
Transamerica Global Macro p ‡ | | | 1,681,149 | | | | 9,700 | |
Transamerica Global Real Estate Securities p | | | 78,978 | | | | 1,017 | |
Transamerica Long/Short Strategy p ‡ | | | 1,210,386 | | | | 9,877 | |
Transamerica Managed Futures Strategy p | | | 2,354,178 | | | | 22,035 | |
| | | | | | | | |
| | | | | | Value | |
| | | Shares | | | (000’s) | |
U.S. Equity—23.0% | | | | | | | | |
Transamerica Capital Growth p | | | 1,178,926 | | | $ | 12,732 | |
Transamerica Diversified Equity p | | | 3,308,633 | | | | 44,964 | |
Transamerica Growth p | | | 3,261,210 | | | | 43,765 | |
Transamerica Growth Opportunities p | | | 1,790,150 | | | | 15,539 | |
Transamerica Large Cap Growth p ‡ | | | 308,457 | | | | 3,048 | |
Transamerica Large Cap Value p | | | 4,538,965 | | | | 53,561 | |
Transamerica Large Company p | | | 3,794,736 | | | | 37,985 | |
Transamerica Mid Cap Value p | | | 661,417 | | | | 8,618 | |
Transamerica Select Equity p | | | 3,272,899 | | | | 37,475 | |
Transamerica Small Cap Growth p ‡ | | | 821,811 | | | | 7,700 | |
Transamerica Small Cap Value p ‡ | | | 453,017 | | | | 4,458 | |
Transamerica Small Company Growth Liquidating Trust ‡ d Ə § D | | | 20,842 | | | | 208 | |
| | | | | | | | |
Total Investment Companies (cost $1,065,466) P | | | | | | | 1,173,414 | |
| | | | | | | | |
Other Assets and Liabilities—Net | | | | | | | (1,252 | ) |
| | | | | | | | |
Net Assets | | | | | | $ | 1,172,162 | |
| | | | | | | | |
NOTES TO SCHEDULE OF INVESTMENTS (all amounts in thousands):
| p | The fund invests its assets in the Class I2 shares of the affiliated series of Transamerica Funds. |
| ‡ | Non-income producing security. |
| d | Investment in affiliated company of Transamerica Asset Management, Inc. |
| Ə | Fair valued as determined in good faith in accordance with procedures established by the Board of Trustees. Total aggregate market value of fair valued securities is $208, or 0.02% of the fund’s net assets. |
| P | Aggregate cost for federal income tax purposes is $1,071,293. Aggregate gross unrealized appreciation/depreciation for all securities in which there is an excess of value over tax cost were $108,597 and $6,476, respectively. Net unrealized appreciation for tax purposes is $102,121. |
| § | Illiquid. Total aggregate market value of illiquid securities is $208, or 0.02% of the fund’s net assets. |
| D | Restricted Security. At 10/31/2012, the fund owned the respective securities which were restricted as to public resale: |
| | | | | | | | | | | | | | | | | | |
| | | | | Acquisition | | | | | | | | | Value as % of | |
Investment Security | | Description | | Date | | | Cost | | | Value | | | Net Assets | |
Investment Companies | | Transamerica Small Company | | | 10/26/2012 | | | $ | 208 | | | $ | 208 | | | | 0.02 | % |
| | Growth Liquidating Trust | | | | | | | | | | | | | | | | |
VALUATION SUMMARY (all amounts in thousands): '
| | | | | | | | | | | | | | | | |
| | | | | | Level 2 - | | | | | | | |
| | | | | | Other | | | Level 3 - | | | | |
| | | Level 1 - | | | Significant | | | Significant | | | | |
| | | Quoted Prices | | | Observable Inputs | | | Unobservable Inputs | | | Value at 10/31/2012 | |
Investment Companies | | $ | 1,173,206 | | | $ | — | | | $ | 208 | | | $ | 1,173,414 | |
| | | | |
| The notes to the financial statements are an integral part of this report. | | |
| Transamerica Funds | | | | Annual Report 2012 |
| | Page 21 | | |
Transamerica Asset Allocation—Conservative Portfolio
SCHEDULE OF INVESTMENTS (continued)
At October 31, 2012
VALUATION SUMMARY (all amounts in thousands) (continued): '
Level 3 Rollforward—Investment Securities
| | | | | | | | | | | | | | | | | | | | | | | | | | | | | | | | | | | | | | | | |
Securities | | Beginning
Balance at
10/31/2011 | | | Purchases | | | Sales | | | Accrued
Discounts
(Premiums) | | | Total
Realized
Gain
(Loss) | | | Net Change in
Unrealized
Appreciation
(Depreciation) | | | Transfers
into
Level 3 | | | Transfers
out of
Level 3 | | | Ending
Balance at
10/31/2012 ₪ | | | Net Change in Unrealized
Appreciation
(Depreciation) on
Investments Held at
10/31/2012 | |
Investment Companies | | $ | — | | | $ | 208 | | | $ | — | | | $ | — | | | $ | — | | | $ | — | | | $ | — | | | $ | — | | | $ | 208 | | | $ | — | |
| ' | Transfers between levels are considered to have occurred at the end of the reporting period. There were no transfers into or out of Levels 1 and 2 during the period ended 10/31/2012. See the notes to the financial statements for more information regarding pricing inputs and valuation techniques. |
| ₪ | Inputs used in the valuation of the Level 3 securities were not considered significant unobservable inputs. |
| | | | |
| The notes to the financial statements are an integral part of this report. | | |
| Transamerica Funds | | | | Annual Report 2012 |
| | Page 22 | | |
Transamerica Asset Allocation—Growth Portfolio
SCHEDULE OF INVESTMENTS
At October 31, 2012
| | | | | | | | |
| | | | | | Value | |
| | | Shares | | | (000’s) | |
INVESTMENT COMPANIES—100.1% | | | | | | | | |
Fixed Income—0.0% ¥ | | | | | | | | |
Transamerica Money Market p | | | 60,260 | | | $ | 60 | |
Global/International Equity—16.6% | | | | | | | | |
Transamerica Developing Markets Equity p | | | 4,207,392 | | | | 50,446 | |
Transamerica Emerging Markets Equity p ‡ | | | 1,142,882 | | | | 10,789 | |
Transamerica International p | | | 3,864,956 | | | | 35,017 | |
Transamerica International Equity p | | | 2,427,903 | | | | 35,569 | |
Transamerica International Equity Opportunities p | | | 1,233,191 | | | | 9,150 | |
Transamerica International Small Cap p | | | 2,216,053 | | | | 17,507 | |
Transamerica International Value Opportunities p | | | 2,373,751 | | | | 21,008 | |
Transamerica Value p | | | 1,975,222 | | | | 45,114 | |
Tactical and Specialty—8.2% | | | | | | | | |
Transamerica Arbitrage Strategy p | | | 271,102 | | | | 2,681 | |
Transamerica Commodity Strategy p | | | 2,065,499 | | | | 19,973 | |
Transamerica Global Allocation p | | | 991,014 | | | | 10,941 | |
Transamerica Global Real Estate Securities p | | | 2,895,008 | | | | 37,288 | |
Transamerica Managed Futures Strategy p | | | 4,315,569 | | | | 40,394 | |
| | | | | | | | |
| | | | | | Value | |
| | | Shares | | | (000’s) | |
U.S. Equity—75.3% | | | | | | | | |
Transamerica Capital Growth p | | | 6,180,246 | | | $ | 66,747 | |
Transamerica Diversified Equity p | | | 10,782,616 | | | | 146,535 | |
Transamerica Growth p | | | 10,679,349 | | | | 143,317 | |
Transamerica Growth Opportunities p | | | 5,046,162 | | | | 43,801 | |
Transamerica Large Cap Growth p ‡ | | | 1,015,815 | | | | 10,036 | |
Transamerica Large Cap Value p | | | 17,367,257 | | | | 204,933 | |
Transamerica Large Company p | | | 14,404,394 | | | | 144,188 | |
Transamerica Mid Cap Value p | | | 4,605,183 | | | | 60,006 | |
Transamerica Select Equity p | | | 12,746,673 | | | | 145,948 | |
Transamerica Small Cap Growth p ‡ | | | 2,746,911 | | | | 25,739 | |
Transamerica Small Cap Value p ‡ | | | 3,074,160 | | | | 30,250 | |
Transamerica Small Company Growth Liquidating Trust ‡ d Ə § D | | | 69,664 | | | | 697 | |
| | | | | | | | |
Total Investment Companies (cost $1,133,381) P | | | | | | | 1,358,134 | |
Other Assets and Liabilities—Net | | | | | | | (1,954 | ) |
| | | | | | | | |
Net Assets | | | | | | $ | 1,356,180 | |
| | | | | | | | |
NOTES TO SCHEDULE OF INVESTMENTS (all amounts in thousands):
| p | The fund invests its assets in the Class I2 shares of the affiliated series of Transamerica Funds. |
| ¥ | Percentage rounds to less than 0.1%. |
| ‡ | Non-income producing security. |
| d | Investment in affiliated company of Transamerica Asset Management, Inc. |
| Ə | Fair valued as determined in good faith in accordance with procedures established by the Board of Trustees. Total aggregate market value of fair valued securities is $697, or 0.05% of the fund’s net assets. |
| P | Aggregate cost for federal income tax purposes is $1,146,465. Aggregate gross unrealized appreciation/depreciation for all securities in which there is an excess of value over tax cost were $216,354 and $4,685, respectively. Net unrealized appreciation for tax purposes is $211,669. |
| § | Illiquid. Total aggregate market value of illiquid securities is $697, or 0.05% of the fund’s net assets. |
| D | Restricted Security. At 10/31/2012, the fund owned the respective securities which were restricted as to public resale: |
| | | | | | | | | | |
| | | | | Acquisition | | | | | | Value as % of |
Investment Security | | Description | | Date | | Cost | | Value | | Net Assets |
Investment Companies | | Transamerica Small Company | | 10/26/2012 | | $697 | | $697 | | 0.05% |
| | Growth Liquidating Trust | | | | | | | | |
VALUATION SUMMARY (all amounts in thousands): '
| | | | | | | | | | | | | | | | |
| | | | | | Level 2 - | | | | | | | |
| | | | | | Other | | | Level 3 - | | | | |
| | | Level 1 - | | | Significant | | | Significant | | | | |
| | | Quoted | | | Observable | | | Unobservable | | | Value at | |
| | | Prices | | | Inputs | | | Inputs | | | 10/31/2012 | |
Investment Companies | | $ | 1,357,437 | | | $ | — | | | $ | 697 | | | $ | 1,358,134 | |
Level 3 Rollforward—Investment Securities
| | | | | | | | | | | | | | | | | | | | | | | | | | | | | | | | | | | | | | | | |
Securities | | Beginning
Balance at
10/31/2011 | | | Purchases | | | Sales | | | Accrued
Discounts
(Premiums) | | | Total
Realized
Gain (Loss) | | | Net Change in
Unrealized
Appreciation
(Depreciation) | | | Transfers
into
Level 3 | | | Transfers
out of
Level 3 | | | Ending
Balance at
10/31/2012 ₪ | | | Net Change in Unrealized
Appreciation
(Depreciation) on
Investments Held at
10/31/2012 | |
Investment Companies | | $ | — | | | $ | 697 | | | $
| —
|
| | $ | — | | | $ | — | | | $ | — | | | $ | — | | | $ | — | | | $ | 697 | | | $ | — | |
| ' | Transfers between levels are considered to have occurred at the end of the reporting period. There were no transfers into or out of Levels 1 and 2 during the period ended 10/31/2012. See the notes to the financial statements for more information regarding pricing inputs and valuation techniques. |
| ₪ | Inputs used in the valuation of the Level 3 securities were not considered significant unobservable inputs. |
| | | | |
| The notes to the financial statements are an integral part of this report. | | |
| Transamerica Funds | | | | Annual Report 2012 |
| | Page 23 | | |
Transamerica Asset Allocation—Moderate Growth Portfolio
SCHEDULE OF INVESTMENTS
At October 31, 2012
| | | | | | | | |
| | | Shares | | | Value
(000’s) | |
INVESTMENT COMPANIES—100.1% | | | | | | | | |
Fixed Income—19.7% | | | | | | | | |
Transamerica Core Bond p | | | 18,002,960 | | | $ | 195,512 | |
Transamerica Emerging Markets Debt p | | | 1,849,285 | | | | 21,378 | |
Transamerica High Yield Bond p | | | 5,249,767 | | | | 50,765 | |
Transamerica International Bond p | | | 2,027,180 | | | | 21,346 | |
Transamerica Short-Term Bond p | | | 6,429 | | | | 66 | |
Transamerica Total Return p | | | 24,422,571 | | | | 265,962 | |
Global/International Equity – 10.9% | | | | | | | | |
Transamerica Developing Markets Equity p | | | 4,352,926 | | | | 52,192 | |
Transamerica Emerging Markets Equity p ‡ | | | 1,361,509 | | | | 12,853 | |
Transamerica International p | | | 6,799,258 | | | | 61,601 | |
Transamerica International Equity p | | | 1,978,284 | | | | 28,982 | |
Transamerica International Equity Opportunities p | | | 1,991,650 | | | | 14,778 | |
Transamerica International Small Cap p | | | 3,289,805 | | | | 25,989 | |
Transamerica International Value Opportunities p | | | 3,865,844 | | | | 34,213 | |
Transamerica Value p | | | 3,323,286 | | | | 75,903 | |
Inflation-Protected Securities—3.0% | | | | | | | | |
Transamerica Real Return TIPS p | | | 7,107,881 | | | | 83,447 | |
Tactical and Specialty—12.0% | | | | | | | | |
Transamerica Arbitrage Strategy p | | | 2,738,804 | | | | 27,087 | |
Transamerica Bond p | | | 5,285,310 | | | | 56,553 | |
Transamerica Commodity Strategy p | | | 5,315,642 | | | | 51,402 | |
Transamerica Global Allocation p | | | 6,088,248 | | | | 67,214 | |
Transamerica Global Real Estate Securities p | | | 4,148,694 | | | | 53,435 | |
Transamerica Managed Futures Strategy p | | | 8,835,925 | | | | 82,705 | |
| | | | | | | | |
| | | Shares | | | Value
(000’s) | |
U.S. Equity—54.5% | | | | | | | | |
Transamerica Capital Growth p | | | 7,874,938 | | | $ | 85,049 | |
Transamerica Diversified Equity p | | | 16,363,016 | | | | 222,373 | |
Transamerica Growth p | | | 15,840,935 | | | | 212,585 | |
Transamerica Growth Opportunities p | | | 9,571,982 | | | | 83,085 | |
Transamerica Large Cap Growth p ‡ | | | 1,477,358 | | | | 14,596 | |
Transamerica Large Cap Value p | | | 26,794,866 | | | | 316,180 | |
Transamerica Large Company p | | | 22,513,616 | | | | 225,362 | |
Transamerica Mid Cap Value p | | | 7,202,840 | | | | 93,853 | |
Transamerica Select Equity p | | | 19,249,256 | | | | 220,404 | |
Transamerica Small Cap Growth p ‡ | | | 2,504,451 | | | | 23,467 | |
Transamerica Small Cap Value p ‡ | | | 3,706,107 | | | | 36,468 | |
Transamerica Small Company Growth Liquidating Trust ‡ d Ə § D | | | 63,515 | | | | 635 | |
| | | | | | | | |
Total Investment Companies (cost $2,445,812) P | | | | | | | 2,817,440 | |
Other Assets and Liabilities—Net | | | | | | | (3,918 | ) |
| | | | | | | | |
Net Assets | | | | | | $ | 2,813,522 | |
| | | | | | | | |
NOTES TO SCHEDULE OF INVESTMENTS (all amounts in thousands):
| p | The fund invests its assets in the Class I2 shares of the affiliated series of Transamerica Funds. |
| ‡ | Non-income producing security. |
| d | Investment in affiliated company of Transamerica Asset Management, Inc. |
| Ə | Fair valued as determined in good faith in accordance with procedures established by the Board of Trustees. Total aggregate market value of fair valued securities is $635, or 0.02% of the fund’s net assets. |
| P | Aggregate cost for federal income tax purposes is $2,473,287. Aggregate gross unrealized appreciation/depreciation for all securities in which there is an excess of value over tax cost were $353,174 and $9,021, respectively. Net unrealized appreciation for tax purposes is $344,153. |
| § | Illiquid. Total aggregate market value of illiquid securities is $635, or 0.02% of the fund’s net assets. |
| D | Restricted Security. At 10/31/2012, the fund owned the respective securities which were restricted as to public resale: |
| | | | | | | | | | | | | | | | | | |
Investment Security | | Description | | Acquisition
Date | | | Cost | | | Value | | | Value as % of
Net Assets | |
Investment Companies | | Transamerica Small Company Growth Liquidating Trust | | | 10/26/2012 | | | $ | 635 | | | $ | 635 | | | | 0.02 | % |
VALUATION SUMMARY (all amounts in thousands): '
| | | | | | | | | | | | | | | | |
| | | Level 1 -
Quoted
Prices | | | Level 2 -
Other
Significant
Observable
Inputs | | | Level 3 -
Significant
Unobservable
Inputs | | | Value at
10/31/2012 | |
Investment Companies | | $ | 2,816,805 | | | $ | — | | | $ | 635 | | | $ | 2,817,440 | |
| | | | |
| The notes to the financial statements are an integral part of this report. | | |
| Transamerica Funds | | | | Annual Report 2012 |
| | Page 24 | | |
Transamerica Asset Allocation—Moderate Growth Portfolio
SCHEDULE OF INVESTMENTS (continued)
At October 31, 2012
VALUATION SUMMARY (all amounts in thousands) (continued): '
Level 3 Rollforward—Investment Securities
| | | | | | | | | | | | | | | | | | | | | | | | | | | | | | | | | | | | | | | | |
Securities | | Beginning
Balance at
10/31/2011 | | | Purchases | | | Sales | | | Accrued
Discounts
(Premiums) | | | Total
Realized
Gain
(Loss) | | | Net Change in
Unrealized
Appreciation
(Depreciation) | | | Transfers
into
Level 3 | | | Transfers
out of
Level 3 | | | Ending
Balance at
10/31/2012 ₪ | | | Net Change in Unrealized
Appreciation
(Depreciation) on
Investments Held at
10/31/2012 | |
Investment Companies | | $ | — | | | $ | 635 | | | $ | — | | | $ | — | | | $ | — | | | $ | — | | | $ | — | | | $ | — | | | $ | 635 | | | $ | — | |
| ' | Transfers between levels are considered to have occurred at the end of the reporting period. There were no transfers into or out of Levels 1 and 2 during the period ended 10/31/2012. See the notes to the financial statements for more information regarding pricing inputs and valuation techniques. |
| ₪ | Inputs used in the valuation of the Level 3 securities were not considered significant unobservable inputs. |
| | | | |
| | |
| Transamerica Funds | | | | Annual Report 2012 |
| | Page 25 | | |
Transamerica Asset Allocation—Moderate Portfolio
SCHEDULE OF INVESTMENTS
At October 31, 2012
| | | | | | | | |
| | | Shares | | | Value
(000’s) | |
INVESTMENT COMPANIES—100.1% | | | | | | | | |
Fixed Income—36.6% | | | | | | | | |
Transamerica Core Bond p | | | 17,834,313 | | | $ | 193,681 | |
Transamerica Emerging Markets Debt p | | | 2,769,784 | | | | 32,019 | |
Transamerica Flexible Income p | | | 4,708,939 | | | | 44,170 | |
Transamerica High Yield Bond p | | | 3,765,022 | | | | 36,408 | |
Transamerica International Bond p | | | 2,537,925 | | | | 26,724 | |
Transamerica Money Market p | | | 3,864,656 | | | | 3,865 | |
Transamerica Short-Term Bond p | | | 13,855,980 | | | | 142,994 | |
Transamerica Total Return p | | | 26,291,042 | | | | 286,308 | |
Global/International Equity—6.3% | | | | | | | | |
Transamerica Developing Markets Equity p | | | 1,530,310 | | | | 18,348 | |
Transamerica Emerging Markets Equity p ‡ | | | 238,797 | | | | 2,254 | |
Transamerica International p | | | 2,310,225 | | | | 20,931 | |
Transamerica International Equity p | | | 704,565 | | | | 10,322 | |
Transamerica International Equity Opportunities p | | | 2,030,978 | | | | 15,070 | |
Transamerica International Small Cap p | | | 1,710,857 | | | | 13,516 | |
Transamerica International Value Opportunities p | | | 1,791,371 | | | | 15,854 | |
Transamerica Value p | | | 1,596,182 | | | | 36,456 | |
Inflation-Protected Securities—3.7% | | | | | | | | |
Transamerica Real Return TIPS p | | | 6,678,826 | | | | 78,409 | |
Tactical and Specialty—13.4% | | | | | | | | |
Transamerica Arbitrage Strategy p | | | 3,427,007 | | | | 33,893 | |
Transamerica Bond p | | | 8,800,213 | | | | 94,162 | |
Transamerica Commodity Strategy p | | | 3,053,731 | | | | 29,530 | |
Transamerica Global Allocation p | | | 3,739,477 | | | | 41,284 | |
Transamerica Global Macro p ‡ | | | 2,254,487 | | | | 13,008 | |
Transamerica Global Real Estate Securities p | | | 1,156,367 | | | | 14,894 | |
Transamerica Long/Short Strategy p ‡ | | | 1,731,547 | | | | 14,129 | |
Transamerica Managed Futures Strategy p | | | 4,302,310 | | | | 40,270 | |
| | | | | | | | |
| | | Shares | | | Value
(000’s) | |
U.S. Equity—40.1% | | | | | | | | |
Transamerica Capital Growth p | | | 3,717,081 | | | $ | 40,144 | |
Transamerica Diversified Equity p | | | 10,662,846 | | | | 144,908 | |
Transamerica Growth p | | | 10,183,804 | | | | 136,667 | |
Transamerica Growth Opportunities p | | | 5,075,278 | | | | 44,053 | |
Transamerica Large Cap Growth p ‡ | | | 911,315 | | | | 9,004 | |
Transamerica Large Cap Value p | | | 13,708,560 | | | | 161,762 | |
Transamerica Large Company p | | | 11,145,454 | | | | 111,566 | |
Transamerica Mid Cap Value p | | | 3,261,005 | | | | 42,491 | |
Transamerica Select Equity p | | | 9,562,415 | | | | 109,490 | |
Transamerica Small Cap Growth p ‡ | | | 1,551,497 | | | | 14,538 | |
Transamerica Small Cap Value p ‡ | | | 2,233,451 | | | | 21,977 | |
Transamerica Small Company Growth Liquidating Trust ‡ d Ə § D | | | 39,347 | | | | 393 | |
| | | | | | | | |
Total Investment Companies (cost $1,864,735) P | | | | | | | 2,095,492 | |
Other Assets and Liabilities—Net | | | | | | | (2,833 | ) |
| | | | | | | | |
Net Assets | | | | | | $ | 2,092,659 | |
| | | | | | | | |
NOTES TO SCHEDULE OF INVESTMENTS (all amounts in thousands):
| p | The fund invests its assets in the Class I2 shares of the affiliated series of Transamerica Funds. |
| ‡ | Non-income producing security. |
| d | Investment in affiliated company of Transamerica Asset Management, Inc. |
| Ә | Fair valued as determined in good faith in accordance with procedures established by the Board of Trustees. Total aggregate market value of fair valued securities is $393, or 0.02% of the fund’s net assets. |
| P | Aggregate cost for federal income tax purposes is $1,876,988. Aggregate gross unrealized appreciation/depreciation for all securities in which there is an excess of value over tax cost were $233,215 and $14,711, respectively. Net unrealized appreciation for tax purposes is $218,504. |
| § | Illiquid. Total aggregate market value of illiquid securities is $393, or 0.02% of the fund’s net assets |
| D | Restricted Security. At 10/31/2012, the fund owned the respective securities which were restricted as to public resale: |
| | | | | | | | | | | | | | | | | | |
Investment Security | | Description | | Acquisition
Date | | | Cost | | | Value | | | Value as % of
Net Assets | |
Investment Companies | | Transamerica Small Company Growth Liquidating Trust | | | 10/26/2012 | | | $ | 393 | | | $ | 393 | | | | 0.02 | % |
VALUATION SUMMARY (all amounts in thousands): '
| | | | | | | | | | | | | | | | |
| | | Level 1 -
Quoted
Prices | | | Level 2 -
Other
Significant
Observable
Inputs | | | Level 3 -
Significant
Unobservable
Inputs | | | Value at
10/31/2012 | |
Investment Companies | | $ | 2,095,099 | | | $ | — | | | $ | 393 | | | $ | 2,095,492 | |
| | | | |
| The notes to the financial statements are an integral part of this report. | | |
| Transamerica Funds | | | | Annual Report 2012 |
| | Page 26 | | |
Transamerica Asset Allocation—Moderate Portfolio
SCHEDULE OF INVESTMENTS (continued)
At October 31, 2012
VALUATION SUMMARY (all amounts in thousands) (continued): '
Level 3 Rollforward—Investment Securities
| | | | | | | | | | | | | | | | | | | | | | | | | | | | | | | | | | | | | | | | |
Securities | | Beginning
Balance at
10/31/2011 | | | Purchases | | | Sales | | | Accrued
Discounts
(Premiums) | | | Total
Realized
Gain
(Loss) | | | Net Change in
Unrealized
Appreciation
(Depreciation) | | | Transfers
into
Level 3 | | | Transfers
out of
Level 3 | | | Ending
Balance at
10/31/2012 ₪ | | | Net Change in
Unrealized
Appreciation
(Depreciation) on
Investments Held at
10/31/2012 | |
Investment Companies | | $ | — | | | $ | 393 | | | $ | — | | | $ | — | | | $ | — | | | $ | — | | | $ | — | | | $ | — | | | $ | 393 | | | $ | — | |
| ' | Transfers between levels are considered to have occurred at the end of the reporting period. There were no transfers into or out of Levels 1 and 2 during the period ended 10/31/2012. See the notes to the financial statements for more information regarding pricing inputs and valuation techniques. |
| ₪ | Inputs used in the valuation of the Level 3 securities were not considered significant unobservable inputs. |
| | | | |
| Transamerica Funds | | | | Annual Report 2012 |
| | Page 27 | | |
Transamerica Multi-Manager Alternative Strategies Portfolio
SCHEDULE OF INVESTMENTS
At October 31, 2012
| | | | | | | | |
| | | Shares | | | Value
(000’s) | |
INVESTMENT COMPANIES—99.7% p | | | | | | | | |
Fixed Income—17.1% | | | | | | | | |
Transamerica Emerging Markets Debt | | | 3,951,985 | | | $ | 45,685 | |
Transamerica Money Market | | | 3,081,716 | | | | 3,082 | |
Transamerica Short-Term Bond | | | 3,458,532 | | | | 35,692 | |
Global/International Equity—9.3% | | | | | | | | |
Transamerica Developing Markets Equity | | | 1,508,568 | | | | 18,088 | |
Transamerica International Small Cap | | | 3,528,606 | | | | 27,876 | |
Inflation-Protected Securities—4.1% | | | | | | | | |
Transamerica Real Return TIPS | | | 1,747,323 | | | | 20,514 | |
Tactical and Specialty—69.2% | | | | | | | | |
Transamerica Arbitrage Strategy | | | 3,330,604 | | | | 32,940 | |
Transamerica Bond | | | 5,940,606 | | | | 63,564 | |
Transamerica Commodity Strategy | | | 3,832,827 | | | | 37,063 | |
Transamerica Global Macro ‡ | | | 13,071,141 | | | | 75,419 | |
Transamerica Global Real Estate Securities | | | 2,688,967 | | | | 34,634 | |
Transamerica Long/Short Strategy ‡ | | | 8,219,834 | | | | 67,074 | |
Transamerica Managed Futures Strategy | | | 3,405,397 | | | | 31,875 | |
| | | | | | | | |
Total Investment Companies (cost $491,657) P | | | | | | | 493,506 | |
Other Assets and Liabilities—Net | | | | | | | 1,596 | |
| | | | | | | | |
Net Assets | | | | | | $ | 495,102 | |
| | | | | | | | |
NOTES TO SCHEDULE OF INVESTMENTS (all amounts in thousands):
| p | The fund invests its assets in the Class I2 shares of the affiliated series of Transamerica Funds. |
| ‡ | Non-income producing security. |
| P | Aggregate cost for federal income tax purposes is $496,041. Aggregate gross unrealized appreciation/depreciation for all securities in which there is an excess of value over tax cost were $11,924 and $14,457, respectively. Net unrealized depreciation for tax purposes is $2,533. |
VALUATION SUMMARY (all amounts in thousands): '
| | | | | | | | | | | | | | | | |
| | | Level 1 -
Quoted
Prices | | | Level 2 -
Other
Significant
Observable
Inputs | | | Level 3 -
Significant
Unobservable
Inputs | | | Value at
10/31/2012 | |
Investment Companies | | $ | 493,506 | | | $ | — | | | $ | — | | | $ | 493,506 | |
| ' | Transfers between levels are considered to have occurred at the end of the reporting period. There were no transfers into or out of Levels 1 and 2 during the period ended 10/31/2012. See the notes to the financial statements for more information regarding pricing inputs and valuation techniques. |
| | | | |
| The notes to the financial statements are an integral part of this report. | | |
| Transamerica Funds | | | | Annual Report 2012 |
| | Page 28 | | |
Transamerica Multi-Manager International Portfolio
SCHEDULE OF INVESTMENTS
At October 31, 2012
| | | | | | | | |
| | | Shares | | | Value
(000’s) | |
INVESTMENT COMPANIES—100.3% p | | | | | | | | |
Global/International Equity—89.7% | | | | | | | | |
Transamerica Developing Markets Equity | | | 2,196,264 | | | $ | 26,333 | |
Transamerica Emerging Markets Equity ‡ | | | 1,723,043 | | | | 16,266 | |
Transamerica International | | | 4,467,007 | | | | 40,472 | |
Transamerica International Equity | | | 1,845,338 | | | | 27,034 | |
Transamerica International Equity Opportunities | | | 4,546,541 | | | | 33,735 | |
Transamerica International Small Cap | | | 1,467,098 | | | | 11,590 | |
Transamerica International Value Opportunities | | | 4,435,871 | | | | 39,257 | |
Tactical and Specialty—10.6% | | | | | | | | |
Transamerica Global Allocation | | | 992,247 | | | | 10,955 | |
Transamerica Global Macro ‡ | | | 645,605 | | | | 3,725 | |
Transamerica Global Real Estate Securities | | | 655,310 | | | | 8,440 | |
| | | | | | | | |
Total Investment Companies (cost $217,855) P | | | | | | | 217,807 | |
Other Assets and Liabilities—Net | | | | | | | (626 | ) |
| | | | | | | | |
Net Assets | | | | | | $ | 217,181 | |
| | | | | | | | |
NOTES TO SCHEDULE OF INVESTMENTS (all amounts in thousands):
| p | The fund invests its assets in the Class I2 shares of the affiliated series of Transamerica Funds. |
| ‡ | Non-income producing security. |
| P | Aggregate cost for federal income tax purposes is $221,306. Aggregate gross unrealized appreciation/depreciation for all securities in which there is an excess of value over tax cost were $4,694 and $8,193, respectively. Net unrealized depreciation for tax purposes is $3,499. |
VALUATION SUMMARY (all amounts in thousands): '
| | | | | | | | | | | | | | | | |
| | | Level 1 -
Quoted
Prices | | | Level 2 -
Other
Significant
Observable
Inputs | | | Level 3 -
Significant
Unobservable
Inputs | | | Value at
10/31/2012 | |
Investment Companies | | $ | 217,807 | | | $ | — | | | $ | — | | | $ | 217,807 | |
| ' | Transfers between levels are considered to have occurred at the end of the reporting period. There were no transfers into or out of Levels 1 and 2 during the period ended 10/31/2012. See the notes to the financial statements for more information regarding pricing inputs and valuation techniques. |
| | | | |
| The notes to the financial statements are an integral part of this report. | | |
| Transamerica Funds | | | | Annual Report 2012 |
| | Page 29 | | |
STATEMENTS OF ASSETS AND LIABILITIES
At October 31, 2012
(all amounts except per share amounts in thousands)
| | | | | | | | | | | | | | | | | | | | | | | | |
| | | Transamerica
Asset
Allocation -
Conservative
Portfolio | | | Transamerica
Asset
Allocation -
Growth
Portfolio | | | Transamerica
Asset
Allocation -
Moderate
Growth
Portfolio | | | Transamerica
Asset
Allocation -
Moderate
Portfolio | | | Transamerica
Multi-Manager
Alternative
Strategies
Portfolio | | | Transamerica
Multi-Manager
International
Portfolio | |
Assets: | | | | | | | | | | | | | | | | | | | | | | | | |
Investments in affiliated investment companies, at value | | $ | 1,173,414 | | | $ | 1,358,134 | | | $ | 2,817,440 | | | $ | 2,095,492 | | | $ | 493,506 | | | $ | 217,807 | |
Cash | | | — | (A) | | | — | (A) | | | — | | | | 1 | | | | — | | | | — | |
Receivables: | | | | | | | | | | | | | | | | | | | | | | | | |
Affiliated investment securities sold | | | 1,164 | | | | 1,167 | | | | 2,232 | | | | 3,447 | | | | — | | | | 307 | |
Shares of beneficial interest sold | | | 2,415 | | | | 1,217 | | | | 3,452 | | | | 2,588 | | | | 4,064 | | | | 317 | |
Dividends | | | 38 | | | | — | (A) | | | — | (A) | | | 58 | | | | 14 | | | | — | |
Prepaid expenses | | | 4 | | | | 5 | | | | 10 | | | | 7 | | | | 2 | | | | 1 | |
| | | | | | | | | | | | | | | | | | | | | | | | |
| | $ | 1,177,035 | | | $ | 1,360,523 | | | $ | 2,823,134 | | | $ | 2,101,593 | | | $ | 497,586 | | | $ | 218,432 | |
| | | | | | | | | | | | | | | | | | | | | | | | |
Liabilities: | | | | | | | | | | | | | | | | | | | | | | | | |
Accounts payable and accrued liabilities: | | | | | | | | | | | | | | | | | | | | | | | | |
Affiliated investment securities purchased | | $ | — | | | $ | — | | | $ | — | | | $ | — | | | $ | 959 | | | $ | — | |
Shares of beneficial interest redeemed | | | 3,818 | | | | 3,013 | | | | 6,969 | | | | 7,031 | | | | 1,138 | | | | 1,028 | |
Management and advisory fees | | | 106 | | | | 125 | | | | 258 | | | | 191 | | | | 88 | | | | 22 | |
Distribution and service fees | | | 725 | | | | 846 | | | | 1,788 | | | | 1,323 | | | | 176 | | | | 117 | |
Trustees fees | | | 4 | | | | 5 | | | | 10 | | | | 7 | | | | 1 | | | | 1 | |
Transfer agent fees | | | 101 | | | | 203 | | | | 316 | | | | 186 | | | | 53 | | | | 36 | |
Administration fees | | | 19 | | | | 22 | | | | 45 | | | | 34 | | | | 8 | | | | 4 | |
Due to custodian | | | — | | | | — | | | | 1 | | | | — | | | | — | (A) | | | — | (A) |
Other | | | 100 | | | | 129 | | | | 225 | | | | 162 | | | | 61 | | | | 43 | |
| | | | | | | | | | | | | | | | | | | | | | | | |
| | $ | 4,873 | | | $ | 4,343 | | | $ | 9,612 | | | $ | 8,934 | | | $ | 2,484 | | | $ | 1,251 | |
| | | | | | | | | | | | | | | | | | | | | | | | |
Net assets | | $ | 1,172,162 | | | $ | 1,356,180 | | | $ | 2,813,522 | | | $ | 2,092,659 | | | $ | 495,102 | | | $ | 217,181 | |
| | | | | | | | | | | | | | | | | | | | | | | | |
Net assets consist of: | | | | | | | | | | | | | | | | | | | | | | | | |
Shares of beneficial interest, unlimited shares authorized, no par value | | $ | 1,065,282 | | | $ | 1,340,836 | | | $ | 2,686,774 | | | $ | 1,890,634 | | | $ | 501,447 | | | $ | 319,921 | |
Undistributed (accumulated) net investment income (loss) | | | 560 | | | | (5,372 | ) | | | 3,137 | | | | 11,924 | | | | 2,795 | | | | (1,730 | ) |
Accumulated net realized loss from investments in affiliated investment companies | | | (1,628 | ) | | | (204,037 | ) | | | (248,017 | ) | | | (40,656 | ) | | | (10,989 | ) | | | (100,962 | ) |
Net unrealized appreciation (depreciation) on investments in affiliated investment companies | | | 107,948 | | | | 224,753 | | | | 371,628 | | | | 230,757 | | | | 1,849 | | | | (48 | ) |
| | | | | | | | | | | | | | | | | | | | | | | | |
Net assets | | $ | 1,172,162 | | | $ | 1,356,180 | | | $ | 2,813,522 | | | $ | 2,092,659 | | | $ | 495,102 | | | $ | 217,181 | |
| | | | | | | | | | | | | | | | | | | | | | | | |
Net assets by class: | | | | | | | | | | | | | | | | | | | | | | | | |
Class A | | $ | 495,444 | | | $ | 601,498 | | | $ | 1,181,926 | | | $ | 866,505 | | | $ | 176,808 | | | $ | 86,834 | |
Class B | | | 65,549 | | | | 106,594 | | | | 213,032 | | | | 115,595 | | | | | | | | 9,847 | |
Class C | | | 584,283 | | | | 629,208 | | | | 1,379,454 | | | | 1,069,033 | | | | 142,788 | | | | 92,050 | |
Class I | | | 24,297 | | | | 17,219 | | | | 34,145 | | | | 36,572 | | | | 175,506 | | | | 28,450 | |
Class R | | | 2,589 | | | | 1,661 | | | | 4,965 | | | | 4,954 | | | | | | | | | |
Shares outstanding: | | | | | | | | | | | | | | | | | | | | | | | | |
Class A | | | 42,246 | | | | 48,643 | | | | 95,773 | | | | 70,671 | | | | 17,824 | | | | 9,416 | |
Class B | | | 5,620 | | | | 8,830 | | | | 17,298 | | | | 9,426 | | | | | | | | 1,075 | |
Class C | | | 50,179 | | | | 52,184 | | | | 112,535 | | | | 87,840 | | | | 14,538 | | | | 10,060 | |
Class I | | | 2,067 | | | | 1,390 | | | | 2,764 | | | | 2,979 | | | | 17,653 | | | | 3,084 | |
Class R | | | 219 | | | | 135 | | | | 404 | | | | 406 | | | | | | | | | |
Net asset value per share: | | | | | | | | | | | | | | | | | | | | | | | | |
Class A | | $ | 11.73 | | | $ | 12.37 | | | $ | 12.34 | | | $ | 12.26 | | | $ | 9.92 | | | $ | 9.22 | |
Class B | | | 11.66 | | | | 12.07 | | | | 12.32 | | | | 12.26 | | | | | | | | 9.16 | |
Class C | | | 11.64 | | | | 12.06 | | | | 12.26 | | | | 12.17 | | | | 9.82 | | | | 9.15 | |
Class I | | | 11.75 | | | | 12.39 | | | | 12.36 | | | | 12.28 | | | | 9.94 | | | | 9.23 | |
Class R | | | 11.81 | | | | 12.27 | | | | 12.28 | | | | 12.20 | | | | | | | | | |
Maximum offering price per share: (B) | | | | | | | | | | | | | | | | | | | | | | | | |
Class A | | $ | 12.41 | | | $ | 13.09 | | | $ | 13.06 | | | $ | 12.97 | | | $ | 10.50 | | | $ | 9.76 | |
| | | | | | | | | | | | | | | | | | | | | | | | |
Investments in affiliated investment companies, at cost | | $ | 1,065,466 | | | $ | 1,133,381 | | | $ | 2,445,812 | | | $ | 1,864,735 | | | $ | 491,657 | | | $ | 217,855 | |
| | | | | | | | | | | | | | | | | | | | | | | | |
| (A) | Rounds to less than $1. |
| (B) | Includes the maximum selling commission (represented as a percentage of offering price) which is reduced on certain levels of sales as set forth in the Prospectus. Net asset value per share for Classes B, C, I, and R shares represents offering price. The redemption price for Classes B and C shares equals net asset value less any applicable contingent deferred sales charge. |
| | | | |
| The notes to the financial statements are an integral part of this report. | | |
| Transamerica Funds | | | | Annual Report 2012 |
| | Page 30 | | |
STATEMENTS OF OPERATIONS
For the year ended October 31, 2012
(all amounts in thousands)
| | | | | | | | | | | | | | | | | | | | | | | | |
| | | Transamerica
Asset Allocation
- Conservative
Portfolio | | | Transamerica
Asset Allocation
- Growth
Portfolio | | | Transamerica
Asset Allocation
- Moderate
Growth Portfolio | | | Transamerica
Asset Allocation
- Moderate
Portfolio | | | Transamerica
Multi-Manager
Alternative
Strategies
Portfolio | | | Transamerica
Multi-Manager
International
Portfolio | |
Investment income: | | | | | | | | | | | | | | | | | | | | | | | | |
Dividend income from affiliated investment companies | | $ | 34,993 | | | $ | 17,095 | | | $ | 55,337 | | | $ | 53,406 | | | $ | 13,009 | | | $ | 5,844 | |
| | | | | | | | | | | | | | | | | | | | | | | | |
Expenses: | | | | | | | | | | | | | | | | | | | | | | | | |
Management and advisory | | | 1,170 | | | | 1,412 | | | | 2,898 | | | | 2,129 | | | | 913 | | | | 240 | |
Distribution and service: | | | | | | | | | | | | | | | | | | | | | | | | |
Class A | | | 1,559 | | | | 1,936 | | | | 3,762 | | | | 2,781 | | | | 529 | | | | 318 | |
Class B | | | 715 | | | | 1,226 | | | | 2,449 | | | | 1,314 | | | | | | | | 113 | |
Class C | | | 5,842 | | | | 6,581 | | | | 14,305 | | | | 10,816 | | | | 1,426 | | | | 1,021 | |
Class R | | | 12 | | | | 13 | | | | 26 | | | | 24 | | | | | | | | | |
Transfer agent: | | | | | | | | | | | | | | | | | | | | | | | | |
Class A | | | 632 | | | | 1,115 | | | | 1,634 | | | | 1,035 | | | | 265 | | | | 188 | |
Class B | | | 95 | | | | 282 | | | | 450 | | | | 219 | | | | | | | | 41 | |
Class C | | | 432 | | | | 959 | | | | 1,588 | | | | 905 | | | | 218 | | | | 203 | |
Class I | | | 20 | | | | 18 | | | | 30 | | | | 33 | | | | 159 | | | | 29 | |
Class R | | | 5 | | | | 4 | | | | 7 | | | | 7 | | | | | | | | | |
Printing and shareholder reports | | | 130 | | | | 218 | | | | 382 | | | | 241 | | | | 114 | | | | 58 | |
Custody | | | 50 | | | | 50 | | | | 91 | | | | 73 | | | | 16 | | | | 12 | |
Administration | | | 185 | | | | 224 | | | | 459 | | | | 338 | | | | 73 | | | | 38 | |
Legal | | | 39 | | | | 46 | | | | 94 | | | | 70 | | | | 16 | | | | 7 | |
Audit and tax | | | 17 | | | | 17 | | | | 19 | | | | 18 | | | | 16 | | | | 16 | |
Trustees | | | 23 | | | | 27 | | | | 56 | | | | 41 | | | | 9 | | | | 5 | |
Registration | | | 68 | | | | 69 | | | | 85 | | | | 76 | | | | 26 | | | | 42 | |
Other | | | 21 | | | | 26 | | | | 51 | | | | 37 | | | | 8 | | | | 7 | |
| | | | | | | | | | | | | | | | | | | | | | | | |
Total expenses | | | 11,015 | | | | 14,223 | | | | 28,386 | | | | 20,157 | | | | 3,788 | | | | 2,338 | |
| | | | | | | | | | | | | | | | | | | | | | | | |
Reimbursement of class expenses: | | | | | | | | | | | | | | | | | | | | | | | | |
Class B | | | — | | | | — | | | | — | | | | — | | | | | | | | (10 | ) |
| | | | | | | | | | | | | | | | | | | | | | | | |
Total reimbursed expenses | | | — | | | | — | | | | — | | | | — | | | | — | | | | (10 | ) |
| | | | | | | | | | | | | | | | | | | | | | | | |
Net expenses | | | 11,015 | | | | 14,223 | | | | 28,386 | | | | 20,157 | | | | 3,788 | | | | 2,328 | |
| | | | | | | | | | | | | | | | | | | | | | | | |
Net investment income | | | 23,978 | | | | 2,872 | | | | 26,951 | | | | 33,249 | | | | 9,221 | | | | 3,516 | |
| | | | | | | | | | | | | | | | | | | | | | | | |
Net realized and change in unrealized gain (loss) on investments in affiliated investment companies: | | | | | | | | | | | | | | | | | | | | | | | | |
Realized gain (loss) from investments in affiliated investment companies | | | 5,846 | | | | (2,145 | ) | | | (1,340 | ) | | | 9,659 | | | | (7,327 | ) | | | (27,540 | ) |
Realized gain distributions from investments in affiliated investment companies | | | 23,368 | | | | 51,539 | | | | 84,831 | | | | 55,030 | | | | 6,407 | | | | 20,778 | |
| | | | | | | | | | | | | | | | | | | | | | | | |
Net realized gain (loss) | | | 29,214 | | | | 49,394 | | | | 83,491 | | | | 64,689 | | | | (920 | ) | | | (6,762 | ) |
| | | | | | | | | | | | | | | | | | | | | | | | |
Net change in unrealized appreciation (depreciation) on investments in affiliated investment companies | | | 28,221 | | | | 63,301 | | | | 113,226 | | | | 56,231 | | | | 13,547 | | | | 11,889 | |
| | | | | | | | | | | | | | | | | | | | | | | | |
Net realized and change in unrealized gain on investments in affiliated investment companies | | | 57,435 | | | | 112,695 | | | | 196,717 | | | | 120,920 | | | | 12,627 | | | | 5,127 | |
| | | | | | | | | | | | | | | | | | | | | | | | |
Net increase in net assets resulting from operations | | $ | 81,413 | | | $ | 115,567 | | | $ | 223,668 | | | $ | 154,169 | | | $ | 21,848 | | | $ | 8,643 | |
| | | | | | | | | | | | | | | | | | | | | | | | |
| | | | |
| The notes to the financial statements are an integral part of this report. | | |
| Transamerica Funds | | | | Annual Report 2012 |
| | Page 31 | | |
STATEMENTS OF CHANGES IN NET ASSETS
For the years ended:
(all amounts in thousands)
| | | | | | | | | | | | | | | | | | | | | | | | |
| | | Transamerica Asset
Allocation - Conservative
Portfolio | | | Transamerica Asset
Allocation - Growth
Portfolio | | | Transamerica Asset
Allocation - Moderate
Growth Portfolio | |
| | | October 31,
2012 | | | October 31,
2011 | | | October 31,
2012 | | | October 31,
2011 | | | October 31,
2012 | | | October 31,
2011 | |
From operations: | | | | | | | | | | | | | | | | | | | | | | | | |
Net investment income | | $ | 23,978 | | | $ | 27,617 | | | $ | 2,872 | | | $ | 3,963 | | | $ | 26,951 | | | $ | 39,736 | |
Net realized gain (loss) on investments in affiliated investment companies | | | 29,214 | | | | 11,302 | | | | 49,394 | | | | (34,168 | ) | | | 83,491 | | | | (57,374 | ) |
Net change in unrealized appreciation (depreciation) on investments in affiliated investment companies | | | 28,221 | | | | (16,757 | ) | | | 63,301 | | | | 57,335 | | | | 113,226 | | | | 48,265 | |
| | | | | | | | | | | | | | | | | | | | | | | | |
Net increase in net assets resulting from operations | | | 81,413 | | | | 22,162 | | | | 115,567 | | | | 27,130 | | | | 223,668 | | | | 30,627 | |
| | | | | | | | | | | | | | | | | | | | | | | | |
Distributions to shareholders: | | | | | | | | | | | | | | | | | | | | | | | | |
From net investment income: | | | | | | | | | | | | | | | | | | | | | | | | |
Class A | | | (11,562 | ) | | | (12,895 | ) | | | (6,830 | ) | | | (2,961 | ) | | | (16,912 | ) | | | (17,502 | ) |
Class B | | | (1,279 | ) | | | (2,083 | ) | | | (369 | ) | | | — | | | | (1,425 | ) | | | (2,633 | ) |
Class C | | | (10,476 | ) | | | (12,537 | ) | | | (3,104 | ) | | | — | | | | (10,880 | ) | | | (13,326 | ) |
Class I | | | (475 | ) | | | (351 | ) | | | (225 | ) | | | (118 | ) | | | (422 | ) | | | (311 | ) |
Class R | | | (47 | ) | | | (70 | ) | | | (29 | ) | | | (15 | ) | | | (64 | ) | | | (75 | ) |
| | | | | | | | | | | | | | | | | | | | | | | | |
Total distributions to shareholders | | | (23,839 | ) | | | (27,936 | ) | | | (10,557 | ) | | | (3,094 | ) | | | (29,703 | ) | | | (33,847 | ) |
| | | | | | | | | | | | | | | | | | | | | | | | |
Capital share transactions: | | | | | | | | | | | | | | | | | | | | | | | | |
Proceeds from shares sold: | | | | | | | | | | | | | | | | | | | | | | | | |
Class A | | | 90,435 | | | | 120,880 | | | | 61,007 | | | | 109,105 | | | | 113,425 | | | | 207,685 | |
Class B | | | 3,681 | | | | 4,193 | | | | 2,794 | | | | 4,441 | | | | 4,091 | | | | 7,642 | |
Class C | | | 88,716 | | | | 128,569 | | | | 49,556 | | | | 90,581 | | | | 121,872 | | | | 220,453 | |
Class I | | | 13,492 | | | | 8,692 | | | | 7,880 | | | | 6,839 | | | | 17,355 | | | | 14,825 | |
Class R | | | 1,719 | | | | 1,155 | | | | 592 | | | | 1,067 | | | | 2,032 | | | | 2,072 | |
| | | | | | | | | | | | | | | | | | | | | | | | |
| | | 198,043 | | | | 263,489 | | | | 121,829 | | | | 212,033 | | | | 258,775 | | | | 452,677 | |
| | | | | | | | | | | | | | | | | | | | | | | | |
Dividends and distributions reinvested: | | | | | | | | | | | | | | | | | | | | | | | | |
Class A | | | 10,842 | | | | 11,905 | | | | 6,504 | | | | 2,805 | | | | 16,008 | | | | 16,525 | |
Class B | | | 1,043 | | | | 1,667 | | | | 342 | | | | — | | | | 1,327 | | | | 2,389 | |
Class C | | | 8,162 | | | | 9,441 | | | | 2,625 | | | | — | | | | 8,889 | | | | 10,584 | |
Class I | | | 299 | | | | 124 | | | | 150 | | | | 69 | | | | 270 | | | | 141 | |
Class R | | | 37 | | | | 51 | | | | 24 | | | | 12 | | | | 53 | | | | 54 | |
| | | | | | | | | | | | | | | | | | | | | | | | |
| | | 20,383 | | | | 23,188 | | | | 9,645 | | | | 2,886 | | | | 26,547 | | | | 29,693 | |
| | | | | | | | | | | | | | | | | | | | | | | | |
Cost of shares redeemed: | | | | | | | | | | | | | | | | | | | | | | | | |
Class A | | | (129,090 | ) | | | (142,522 | ) | | | (144,552 | ) | | | (170,151 | ) | | | (261,040 | ) | | | (276,893 | ) |
Class B | | | (13,890 | ) | | | (23,572 | ) | | | (24,640 | ) | | | (35,823 | ) | | | (45,906 | ) | | | (70,998 | ) |
Class C | | | (119,271 | ) | | | (158,188 | ) | | | (154,676 | ) | | | (194,816 | ) | | | (314,988 | ) | | | (367,790 | ) |
Class I | | | (5,497 | ) | | | (4,425 | ) | | | (6,628 | ) | | | (5,399 | ) | | | (8,632 | ) | | | (7,575 | ) |
Class R | | | (1,711 | ) | | | (1,850 | ) | | | (2,904 | ) | | | (1,180 | ) | | | (2,767 | ) | | | (2,206 | ) |
| | | | | | | | | | | | | | | | | | | | | | | | |
| | | (269,459 | ) | | | (330,557 | ) | | | (333,400 | ) | | | (407,369 | ) | | | (633,333 | ) | | | (725,462 | ) |
| | | | | | | | | | | | | | | | | | | | | | | | |
Automatic conversions: | | | | | | | | | | | | | | | | | | | | | | | | |
Class A | | | 9,442 | | | | 15,890 | | | | 22,305 | | | | 15,759 | | | | 47,512 | | | | 40,728 | |
Class B | | | (9,442 | ) | | | (15,890 | ) | | | (22,305 | ) | | | (15,759 | ) | | | (47,512 | ) | | | (40,728 | ) |
| | | | | | | | | | | | | | | | | | | | | | | | |
| | | — | | | | — | | | | — | | | | — | | | | — | | | | — | |
| | | | | | | | | | | | | | | | | | | | | | | | |
Net decrease in net assets resulting from capital shares transactions | | | (51,033 | ) | | | (43,880 | ) | | | (201,926 | ) | | | (192,450 | ) | | | (348,011 | ) | | | (243,092 | ) |
| | | | | | | | | | | | | | | | | | | | | | | | |
Net increase (decrease) in net assets | | | 6,541 | | | | (49,654 | ) | | | (96,916 | ) | | | (168,414 | ) | | | (154,046 | ) | | | (246,312 | ) |
| | | | | | | | | | | | | | | | | | | | | | | | |
Net assets: | | | | | | | | | | | | | | | | | | | | | | | | |
Beginning of year | | $ | 1,165,621 | | | $ | 1,215,275 | | | $ | 1,453,096 | | | $ | 1,621,510 | | | $ | 2,967,568 | | | $ | 3,213,880 | |
| | | | | | | | | | | �� | | | | | | | | | | | | | |
End of year | | $ | 1,172,162 | | | $ | 1,165,621 | | | $ | 1,356,180 | | | $ | 1,453,096 | | | $ | 2,813,522 | | | $ | 2,967,568 | |
| | | | | | | | | | | | | | | | | | | | | | | | |
Undistributed (accumulated) net investment income (loss) | | $ | 560 | | | $ | 421 | | | $ | (5,372 | ) | | $ | 2,302 | | | $ | 3,137 | | | $ | 5,889 | |
| | | | | | | | | | | | | | | | | | | | | | | | |
| | | | |
| The notes to the financial statements are an integral part of this report. | | |
| Transamerica Funds | | | | Annual Report 2012 |
| | Page 32 | | |
STATEMENTS OF CHANGES IN NET ASSETS (continued)
For the years ended:
(all amounts in thousands)
| | | | | | | | | | | | | | | | | | | | | | | | |
| | | Transamerica Asset
Allocation -
Conservative Portfolio | | | Transamerica Asset
Allocation - Growth
Portfolio | | | Transamerica Asset
Allocation - Moderate
Growth Portfolio | |
| | | October 31,
2012 | | | October 31,
2011 | | | October 31,
2012 | | | October 31,
2011 | | | October 31,
2012 | | | October 31,
2011 | |
Share activity: | | | | | | | | | | | | | | | | | | | | | | | | |
Shares issued: | | | | | | | | | | | | | | | | | | | | | | | | |
Class A | | | 7,916 | | | | 10,680 | | | | 5,107 | | | | 9,083 | | | | 9,485 | | | | 17,330 | |
Class B | | | 326 | | | | 374 | | | | 240 | | | | 378 | | | | 343 | | | | 639 | |
Class C | | | 7,849 | | | | 11,414 | | | | 4,238 | | | | 7,687 | | | | 10,259 | | | | 18,447 | |
Class I | | | 1,173 | | | | 767 | | | | 657 | | | | 567 | | | | 1,441 | | | | 1,247 | |
Class R | | | 148 | | | | 101 | | | | 50 | | | | 90 | | | | 171 | | | | 173 | |
| | | | | | | | | | | | | | | | | | | | | | | | |
| | | 17,412 | | | | 23,336 | | | | 10,292 | | | | 17,805 | | | | 21,699 | | | | 37,836 | |
| | | | | | | | | | | | | | | | | | | | | | | | |
Shares issued- reinvested from dividends and distributions: | | | | | | | | | | | | | | | | | | | | | | | | |
Class A | | | 974 | | | | 1,065 | | | | 609 | | | | 237 | | | | 1,471 | | | | 1,409 | |
Class B | | | 95 | | | | 150 | | | | 32 | | | | — | | | | 122 | | | | 203 | |
Class C | | | 740 | | | | 850 | | | | 250 | | | | — | | | | 818 | | | | 905 | |
Class I | | | 26 | | | | 11 | | | | 14 | | | | 6 | | | | 25 | | | | 12 | |
Class R | | | 3 | | | | 5 | | | | 2 | | | | 1 | | | | 5 | | | | 5 | |
| | | | | | | | | | | | | | | | | | | | | | | | |
| | | 1,838 | | | | 2,081 | | | | 907 | | | | 244 | | | | 2,441 | | | | 2,534 | |
| | | | | | | | | | | | | | | | | | | | | | | | |
Shares redeemed: | | | | | | | | | | | | | | | | | | | | | | | | |
Class A | | | (11,289 | ) | | | (12,591 | ) | | | (12,098 | ) | | | (14,322 | ) | | | (21,897 | ) | | | (23,275 | ) |
Class B | | | (1,227 | ) | | | (2,085 | ) | | | (2,105 | ) | | | (3,055 | ) | | | (3,845 | ) | | | (5,948 | ) |
Class C | | | (10,524 | ) | | | (14,060 | ) | | | (13,259 | ) | | | (16,611 | ) | | | (26,547 | ) | | | (30,978 | ) |
Class I | | | (479 | ) | | | (393 | ) | | | (551 | ) | | | (454 | ) | | | (724 | ) | | | (640 | ) |
Class R | | | (148 | ) | | | (161 | ) | | | (244 | ) | | | (98 | ) | | | (234 | ) | | | (185 | ) |
| | | | | | | | | | | | | | | | | | | | | | | | |
| | | (23,667 | ) | | | (29,290 | ) | | | (28,257 | ) | | | (34,540 | ) | | | (53,247 | ) | | | (61,026 | ) |
| | | | | | | | | | | | | | | | | | | | | | | | |
Automatic conversions: | | | | | | | | | | | | | | | | | | | | | | | | |
Class A | | | 831 | | | | 1,400 | | | | 1,876 | | | | 1,322 | | | | 4,002 | | | | 3,431 | |
Class B | | | (835 | ) | | | (1,407 | ) | | | (1,916 | ) | | | (1,353 | ) | | | (4,001 | ) | | | (3,438 | ) |
| | | | | | | | | | | | | | | | | | | | | | | | |
| | | (4 | ) | | | (7 | ) | | | (40 | ) | | | (31 | ) | | | 1 | | | | (7 | ) |
| | | | | | | | | | | | | | | | | | | | | | | | |
Net increase (decrease) in shares outstanding: | | | | | | | | | | | | | | | | | | | | | | | | |
Class A | | | (1,568 | ) | | | 554 | | | | (4,506 | ) | | | (3,680 | ) | | | (6,939 | ) | | | (1,105 | ) |
Class B | | | (1,641 | ) | | | (2,968 | ) | | | (3,749 | ) | | | (4,030 | ) | | | (7,381 | ) | | | (8,544 | ) |
Class C | | | (1,935 | ) | | | (1,796 | ) | | | (8,771 | ) | | | (8,924 | ) | | | (15,470 | ) | | | (11,626 | ) |
Class I | | | 720 | | | | 385 | | | | 120 | | | | 119 | | | | 742 | | | | 619 | |
Class R | | | 3 | | | | (55 | ) | | | (192 | ) | | | (7 | ) | | | (58 | ) | | | (7 | ) |
| | | | | | | | | | | | | | | | | | | | | | | | |
| | | (4,421 | ) | | | (3,880 | ) | | | (17,098 | ) | | | (16,522 | ) | | | (29,106 | ) | | | (20,663 | ) |
| | | | | | | | | | | | | | | | | | | | | | | | |
| | | | |
| The notes to the financial statements are an integral part of this report. | | |
| Transamerica Funds | | | | Annual Report 2012 |
| | Page 33 | | |
STATEMENTS OF CHANGES IN NET ASSETS (continued)
For the years ended:
(all amounts in thousands)
| | | | | | | | | | | | | | | | | | | | | | | | |
| | | Transamerica Asset
Allocation - Moderate
Portfolio | | | Transamerica Multi-
Manager Alternative
Strategies Portfolio | | | Transamerica Multi-
Manager International
Portfolio | |
| | | October 31,
2012 | | | October 31,
2011 | | | October 31,
2012 | | | October 31,
2011 | | | October 31,
2012 | | | October 31,
2011 | |
From operations: | | | | | | | | | | | | | | | | | | | | | | | | |
Net investment income | | $ | 33,249 | | | $ | 42,880 | | | $ | 9,221 | | | $ | 4,715 | | | $ | 3,516 | | | $ | 1,659 | |
Net realized gain (loss) on investments in affiliated investment companies | | | 64,689 | | | | (12,582 | ) | | | (920 | ) | | | 515 | | | | (6,762 | ) | | | 185 | |
Net change in unrealized appreciation (depreciation) on investments in affiliated investment companies | | | 56,231 | | | | 10,813 | | | | 13,547 | | | | (12,134 | ) | | | 11,889 | | | | (24,184 | ) |
| | | | | | | | | | | | | | | | | | | | | | | | |
Net increase (decrease) in net assets resulting from operations | | | 154,169 | | | | 41,111 | | | | 21,848 | | | | (6,904 | ) | | | 8,643 | | | | (22,340 | ) |
| | | | | | | | | | | | | | | | | | | | | | | | |
Distributions to shareholders: | | | | | | | | | | | | | | | | | | | | | | | | |
From net investment income: | | | | | | | | | | | | | | | | | | | | | | | | |
Class A | | | (17,705 | ) | | | (17,338 | ) | | | (3,927 | ) | | | (884 | ) | | | (3,129 | ) | | | (1,063 | ) |
Class B | | | (1,546 | ) | | | (2,599 | ) | | | | | | | | | | | (241 | ) | | | (2 | ) |
Class C | | | (14,760 | ) | | | (16,101 | ) | | | (2,403 | ) | | | (101 | ) | | | (2,300 | ) | | | (264 | ) |
Class I | | | (618 | ) | | | (434 | ) | | | (3,398 | ) | | | (428 | ) | | | (853 | ) | | | (367 | ) |
Class R | | | (83 | ) | | | (83 | ) | | | | | | | | | | | | | | | | |
| | | | | | | | | | | | | | | | | | | | | | | | |
Total distributions to shareholders | | | (34,712 | ) | | | (36,555 | ) | | | (9,728 | ) | | | (1,413 | ) | | | (6,523 | ) | | | (1,696 | ) |
| | | | | | | | | | | | | | | | | | | | | | | | |
Capital share transactions: | | | | | | | | | | | | | | | | | | | | | | | | |
Proceeds from shares sold: | | | | | | | | | | | | | | | | | | | | | | | | |
Class A | | | 112,835 | | | | 184,563 | | | | 79,008 | | | | 108,121 | | | | 13,297 | | | | 37,207 | |
Class B | | | 2,781 | | | | 4,936 | | | | | | | | | | | | 208 | | | | 588 | |
Class C | | | 126,029 | �� | | | 200,075 | | | | 31,436 | | | | 62,110 | | | | 5,925 | | | | 18,319 | |
Class I | | | 17,785 | | | | 15,868 | | | | 109,257 | | | | 118,372 | | | | 15,564 | | | | 21,249 | |
Class R | | | 2,805 | | | | 2,487 | | | | | | | | | | | | | | | | | |
| | | | | | | | | | | | | | | | | | | | | | | | |
| | | 262,235 | | | | 407,929 | | | | 219,701 | | | | 288,603 | | | | 34,994 | | | | 77,363 | |
| | | | | | | | | | | | | | | | | | | | | | | | |
Dividends and distributions reinvested: | | | | | | | | | | | | | | | | | | | | | | | | |
Class A | | | 16,590 | | | | 16,143 | | | | 3,362 | | | | 777 | | | | 2,856 | | | | 961 | |
Class B | | | 1,400 | | | | 2,297 | | | | | | | | | | | | 209 | | | | 2 | |
Class C | | | 11,685 | | | | 12,286 | | | | 2,026 | | | | 82 | | | | 1,783 | | | | 197 | |
Class I | | | 403 | | | | 225 | | | | 2,236 | | | | 240 | | | | 315 | | | | 93 | |
Class R | | | 54 | | | | 49 | | | | | | | | | | | | | | | | | |
| | | | | | | | | | | | | | | | | | | | | | | | |
| | | 30,132 | | | | 31,000 | | | | 7,624 | | | | 1,099 | | | | 5,163 | | | | 1,253 | |
| | | | | | | | | | | | | | | | | | | | | | | | |
Cost of shares redeemed: | | | | | | | | | | | | | | | | | | | | | | | | |
Class A | | | (215,867 | ) | | | (216,548 | ) | | | (81,245 | ) | | | (62,089 | ) | | | (48,777 | ) | | | (45,790 | ) |
Class B | | | (23,056 | ) | | | (41,778 | ) | | | | | | | | | | | (3,560 | ) | | | (3,842 | ) |
Class C | | | (217,870 | ) | | | (267,702 | ) | | | (35,618 | ) | | | (32,869 | ) | | | (34,618 | ) | | | (35,689 | ) |
Class I | | | (9,692 | ) | | | (7,433 | ) | | | (60,925 | ) | | | (29,816 | ) | | | (16,190 | ) | | | (18,017 | ) |
Class R | | | (3,477 | ) | | | (1,514 | ) | | | | | | | | | | | | | | | | |
| | | | | | | | | | | | | | | | | | | | | | | | |
| | | (469,962 | ) | | | (534,975 | ) | | | (177,788 | ) | | | (124,774 | ) | | | (103,145 | ) | | | (103,338 | ) |
| | | | | | | | | | | | | | | | | | | | | | | | |
Automatic conversions: | | | | | | | | | | | | | | | | | | | | | | | | |
Class A | | | 25,725 | | | | 35,441 | | | | — | | | | — | | | | 476 | | | | 746 | |
Class B | | | (25,725 | ) | | | (35,441 | ) | | | | | | | | | | | (476 | ) | | | (746 | ) |
| | | | | | | | | | | | | | | | | | | | | | | | |
| | | — | | | | — | | | | — | | | | — | | | | — | | | | — | |
| | | | | | | | | | | | | | | | | | | | | | | | |
Net increase (decrease) in net assets resulting from capital shares transactions | | | (177,595 | ) | | | (96,046 | ) | | | 49,537 | | | | 164,928 | | | | (62,988 | ) | | | (24,722 | ) |
| | | | | | | | | | | | | | | | | | | | | | | | |
Net increase (decrease) in net assets | | | (58,138 | ) | | | (91,490 | ) | | | 61,657 | | | | 156,611 | | | | (60,868 | ) | | | (48,758 | ) |
| | | | | | | | | | | | | | | | | | | | | | | | |
Net assets: | | | | | | | | | | | | | | | | | | | | | | | | |
Beginning of year | | $ | 2,150,797 | | | $ | 2,242,287 | | | $ | 433,445 | | | $ | 276,834 | | | $ | 278,049 | | | $ | 326,807 | |
| | | | | | | | | | | | | | | | | | | | | | | | |
End of year | | $ | 2,092,659 | | | $ | 2,150,797 | | | $ | 495,102 | | | $ | 433,445 | | | $ | 217,181 | | | $ | 278,049 | |
| | | | | | | | | | | | | | | | | | | | | | | | |
Undistributed (accumulated) net investment income (loss) | | $ | 11,924 | | | $ | 13,387 | | | $ | 2,795 | | | $ | 3,302 | | | $ | (1,730 | ) | | $ | 1,277 | |
| | | | | | | | | | | | | | | | | | | | | | | | |
| | | | |
| The notes to the financial statements are an integral part of this report. | | |
| Transamerica Funds | | | | Annual Report 2012 |
| | Page 34 | | |
STATEMENTS OF CHANGES IN NET ASSETS (continued)
For the years ended:
(all amounts in thousands)
| | | | | | | | | | | | | | | | | | | | | | | | |
| | | Transamerica Asset
Allocation - Moderate
Portfolio | | | Transamerica Multi-
Manager Alternative
Strategies Portfolio | | | Transamerica Multi-
Manager International
Portfolio | |
| | | October 31,
2012 | | | October 31,
2011 | | | October 31,
2012 | | | October 31,
2011 | | | October 31,
2012 | | | October 31,
2011 | |
Share activity: | | | | | | | | | | | | | | | | | | | | | | | | |
Shares issued: | | | | | | | | | | | | | | | | | | | | | | | | |
Class A | | | 9,514 | | | | 15,643 | | | | 8,164 | | | | 10,915 | | | | 1,489 | | | | 3,714 | |
Class B | | | 235 | | | | 418 | | | | | | | | | | | | 24 | | | | 60 | |
Class C | | | 10,685 | | | | 17,023 | | | | 3,261 | | | | 6,315 | | | | 678 | | | | 1,838 | |
Class I | | | 1,496 | | | | 1,341 | | | | 11,313 | | | | 11,963 | | | | 1,730 | | | | 2,122 | |
Class R | | | 237 | | | | 214 | | | | | | | | | | | | | | | | | |
| | | | | | | | | | | | | | | | | | | | | | | | |
| | | 22,167 | | | | 34,639 | | | | 22,738 | | | | 29,193 | | | | 3,921 | | | | 7,734 | |
| | | | | | | | | | | | | | | | | | | | | | | | |
Shares issued-reinvested from dividends and distributions: | | | | | | | | | | | | | | | | | | | | | | | | |
Class A | | | 1,507 | | | | 1,400 | | | | 365 | | | | 79 | | | | 358 | | | | 97 | |
Class B | | | 126 | | | | 198 | | | | | | | | | | | | 26 | | | | — | (A) |
Class C | | | 1,063 | | | | 1,069 | | | | 221 | | | | 9 | | | | 223 | | | | 20 | |
Class I | | | 37 | | | | 19 | | | | 243 | | | | 25 | | | | 39 | | | | 9 | |
Class R | | | 5 | | | | 4 | | | | | | | | | | | | | | | | | |
| | | | | | | | | | | | | | | | | | | | | | | | |
| | | 2,738 | | | | 2,690 | | | | 829 | | | | 113 | | | | 646 | | | | 126 | |
| | | | | | | | | | | | | | | | | | | | | | | | |
Shares redeemed: | | | | | | | | | | | | | | | | | | | | | | | | |
Class A | | | (18,178 | ) | | | (18,400 | ) | | | (8,434 | ) | | | (6,308 | ) | | | (5,467 | ) | | | (4,678 | ) |
Class B | | | (1,940 | ) | | | (3,537 | ) | | | | | | | | | | | (406 | ) | | | (393 | ) |
Class C | | | (18,458 | ) | | | (22,830 | ) | | | (3,695 | ) | | | (3,354 | ) | | | (3,926 | ) | | | (3,634 | ) |
Class I | | | (819 | ) | | | (633 | ) | | | (6,322 | ) | | | (3,036 | ) | | | (1,841 | ) | | | (1,821 | ) |
Class R | | | (296 | ) | | | (129 | ) | | | | | | | | | | | | | | | | |
| | | | | | | | | | | | | | | | | | | | | | | | |
| | | (39,691 | ) | | | (45,529 | ) | | | (18,451 | ) | | | (12,698 | ) | | | (11,640 | ) | | | (10,526 | ) |
| | | | | | | | | | | | | | | | | | | | | | | | |
Automatic conversions: | | | | | | | | | | | | | | | | | | | | | | | | |
Class A | | | 2,178 | | | | 3,007 | | | | — | | | | — | | | | 54 | | | | 75 | |
Class B | | | (2,172 | ) | | | (3,007 | ) | | | | | | | | | | | (54 | ) | | | (75 | ) |
| | | | | | | | | | | | | | | | | | | | | | | | |
| | | 6 | | | | — | | | | — | | | | — | | | | — | | | | — | |
| | | | | | | | | | | | | | | | | | | | | | | | |
Net increase (decrease) in shares outstanding: | | | | | | | | | | | | | | | | | | | | | | | | |
Class A | | | (4,979 | ) | | | 1,650 | | | | 95 | | | | 4,686 | | | | (3,566 | ) | | | (792 | ) |
Class B | | | (3,751 | ) | | | (5,928 | ) | | | | | | | | | | | (410 | ) | | | (408 | ) |
Class C | | | (6,710 | ) | | | (4,738 | ) | | | (213 | ) | | | 2,970 | | | | (3,025 | ) | | | (1,776 | ) |
Class I | | | 714 | | | | 727 | | | | 5,234 | | | | 8,952 | | | | (72 | ) | | | 310 | |
Class R | | | (54 | ) | | | 89 | | | | | | | | | | | | | | | | | |
| | | | | | | | | | | | | | | | | | | | | | | | |
| | | (14,780 | ) | | | (8,200 | ) | | | 5,116 | | | | 16,608 | | | | (7,073 | ) | | | (2,666 | ) |
| | | | | | | | | | | | | | | | | | | | | | | | |
| (A) | Rounds to less than 1 share. |
| | | | |
| The notes to the financial statements are an integral part of this report. | | |
| Transamerica Funds | | | | Annual Report 2012 |
| | Page 35 | | |
FINANCIAL HIGHLIGHTS
For the period or years ended:
| | | | | | | | | | | | | | | | | | | | |
| | | Transamerica Asset Allocation - Conservative Portfolio | |
| | | Class A | |
For a share outstanding throughout each period | | October 31,
2012 | | | October 31,
2011 | | | October 31,
2010 | | | October 31,
2009 | | | October 31,
2008 | |
Net asset value | | | | | | | | | | | | | | | | | | | | |
Beginning of year | | $ | 11.17 | | | $ | 11.22 | | | $ | 10.42 | | | $ | 8.99 | | | $ | 12.40 | |
| | | | | | | | | | | | | | | | | | | | |
Investment operations | | | | | | | | | | | | | | | | | | | | |
From net investment income(A),(B) | | | 0.28 | | | | 0.30 | | | | 0.35 | | | | 0.40 | | | | 0.36 | |
From net realized and unrealized gain (loss) on affiliated investments | | | 0.55 | | | | (0.06 | ) | | | 0.83 | | | | 1.46 | | | | (3.21 | ) |
| | | | | | | | | | | | | | | | | | | | |
Total from investment operations | | | 0.83 | | | | 0.24 | | | | 1.18 | | | | 1.86 | | | | (2.85 | ) |
| | | | | | | | | | | | | | | | | | | | |
Distributions | | | | | | | | | | | | | | | | | | | | |
Net investment income | | | (0.27 | ) | | | (0.29 | ) | | | (0.38 | ) | | | (0.43 | ) | | | (0.32 | ) |
Net realized gains on affiliated investments | | | — | | | | — | | | | — | | | | — | | | | (0.24 | ) |
| | | | | | | | | | | | | | | | | | | | |
Total distributions | | | (0.27 | ) | | | (0.29 | ) | | | (0.38 | ) | | | (0.43 | ) | | | (0.56 | ) |
| | | | | | | | | | | | | | | | | | | | |
Net asset value | | | | | | | | | | | | | | | | | | | | |
End of year | | $ | 11.73 | | | $ | 11.17 | | | $ | 11.22 | | | $ | 10.42 | | | $ | 8.99 | |
| | | | | | | | | | | | | | | | | | | | |
Total return(C) | | | 7.55 | % | | | 2.20 | % | | | 11.59 | % | | | 21.76 | % | | | (23.86 | )% |
| | | | | | | | | | | | | | | | | | | | |
Net assets end of year (000’s) | | $ | 495,444 | | | $ | 489,240 | | | $ | 485,473 | | | $ | 360,558 | | | $ | 268,516 | |
| | | | | | | | | | | | | | | | | | | | |
Ratio and supplemental data | | | | | | | | | | | | | | | | | | | | |
| | | | | |
Expenses to average net assets:(D) | | | | | | | | | | | | | | | | | | | | |
After reimbursement/recapture | | | 0.59 | % | | | 0.62 | % | | | 0.63 | % | | | 0.65 | % | | | 0.62 | % |
Before reimbursement/recapture | | | 0.59 | % | | | 0.62 | % | | | 0.63 | % | | | 0.65 | % | | | 0.62 | % |
Net investment income to average net assets(B) | | | 2.40 | % | | | 2.63 | % | | | 3.28 | % | | | 4.27 | % | | | 3.22 | % |
Portfolio turnover rate(E) | | | 20 | % | | | 31 | % | | | 16 | % | | | 27 | % | | | 10 | % |
| |
| | | Transamerica Asset Allocation - Conservative Portfolio | |
| | | Class B | |
For a share outstanding throughout each period | | October 31,
2012 | | | October 31,
2011 | | | October 31,
2010 | | | October 31,
2009 | | | October 31,
2008 | |
Net asset value | | | | | | | | | | | | | | | | | | | | |
Beginning of year | | $ | 11.11 | | | $ | 11.17 | | | $ | 10.38 | | | $ | 8.97 | | | $ | 12.36 | |
| | | | | | | | | | | | | | | | | | | | |
Investment operations | | | | | | | | | | | | | | | | | | | | |
From net investment income(A),(B) | | | 0.20 | | | | 0.24 | | | | 0.30 | | | | 0.35 | | | | 0.31 | |
From net realized and unrealized gain (loss) on affiliated investments | | | 0.55 | | | | (0.07 | ) | | | 0.80 | | | | 1.45 | | | | (3.22 | ) |
| | | | | | | | | | | | | | | | | | | | |
Total from investment operations | | | 0.75 | | | | 0.17 | | | | 1.10 | | | | 1.80 | | | | (2.91 | ) |
| | | | | | | | | | | | | | | | | | | | |
Distributions | | | | | | | | | | | | | | | | | | | | |
Net investment income | | | (0.20 | ) | | | (0.23 | ) | | | (0.31 | ) | | | (0.39 | ) | | | (0.24 | ) |
Net realized gains on affiliated investments | | | — | | | | — | | | | — | | | | — | | | | (0.24 | ) |
| | | | | | | | | | | | | | | | | | | | |
Total distributions | | | (0.20 | ) | | | (0.23 | ) | | | (0.31 | ) | | | (0.39 | ) | | | (0.48 | ) |
| | | | | | | | | | | | | | | | | | | | |
Net asset value | | | | | | | | | | | | | | | | | | | | |
End of year | | $ | 11.66 | | | $ | 11.11 | | | $ | 11.17 | | | $ | 10.38 | | | $ | 8.97 | |
| | | | | | | | | | | | | | | | | | | | |
Total return(C) | | | 6.81 | % | | | 1.50 | % | | | 10.82 | % | | | 21.01 | % | | | (24.36 | )% |
| | | | | | | | | | | | | | | | | | | | |
Net assets end of year (000’s) | | $ | 65,549 | | | $ | 80,696 | | | $ | 114,303 | | | $ | 111,706 | | | $ | 93,268 | |
| | | | | | | | | | | | | | | | | | | | |
Ratio and supplemental data | | | | | | | | | | | | | | | | | | | | |
| | | | | |
Expenses to average net assets:(D) | | | | | | | | | | | | | | | | | | | | |
After reimbursement/recapture | | | 1.28 | % | | | 1.27 | % | | | 1.26 | % | | | 1.28 | % | | | 1.24 | % |
Before reimbursement/recapture | | | 1.28 | % | | | 1.27 | % | | | 1.26 | % | | | 1.28 | % | | | 1.24 | % |
Net investment income to average net assets(B) | | | 1.78 | % | | | 2.08 | % | | | 2.81 | % | | | 3.71 | % | | | 2.72 | % |
Portfolio turnover rate(E) | | | 20 | % | | | 31 | % | | | 16 | % | | | 27 | % | | | 10 | % |
| | | | |
| The notes to the financial statements are an integral part of this report. | | |
| Transamerica Funds | | | | Annual Report 2012 |
| | Page 36 | | |
FINANCIAL HIGHLIGHTS (continued)
For the period or years ended:
| | | | | | | | | | | | | | | | | | | | |
| | | Transamerica Asset Allocation - Conservative Portfolio | |
| | | Class C | |
For a share outstanding throughout each period | | October 31,
2012 | | | October 31,
2011 | | | October 31,
2010 | | | October 31,
2009 | | | October 31,
2008 | |
Net asset value | | | | | | | | | | | | | | | | | | | | |
Beginning of year | | $ | 11.09 | | | $ | 11.16 | | | $ | 10.37 | | | $ | 8.96 | | | $ | 12.35 | |
| | | | | | | | | | | | | | | | | | | | |
Investment operations | | | | | | | | | | | | | | | | | | | | |
From net investment income(A),(B) | | | 0.20 | | | | 0.23 | | | | 0.29 | | | | 0.34 | | | | 0.29 | |
From net realized and unrealized gain (loss) on affiliated investments | | | 0.55 | | | | (0.06 | ) | | | 0.82 | | | | 1.46 | | | | (3.19 | ) |
| | | | | | | | | | | | | | | | | | | | |
Total from investment operations | | | 0.75 | | | | 0.17 | | | | 1.11 | | | | 1.80 | | | | (2.90 | ) |
| | | | | | | | | | | | | | | | | | | | |
Distributions | | | | | | | | | | | | | | | | | | | | |
Net investment income | | | (0.20 | ) | | | (0.24 | ) | | | (0.32 | ) | | | (0.39 | ) | | | (0.25 | ) |
Net realized gains on affiliated investments | | | — | | | | — | | | | — | | | | — | | | | (0.24 | ) |
| | | | | | | | | | | | | | | | | | | | |
Total distributions | | | (0.20 | ) | | | (0.24 | ) | | | (0.32 | ) | | | (0.39 | ) | | | (0.49 | ) |
| | | | | | | | | | | | | | | | | | | | |
Net asset value | | | | | | | | | | | | | | | | | | | | |
End of year | | $ | 11.64 | | | $ | 11.09 | | | $ | 11.16 | | | $ | 10.37 | | | $ | 8.96 | |
| | | | | | | | | | | | | | | | | | | | |
Total return(C) | | | 6.90 | % | | | 1.50 | % | | | 10.92 | % | | | 21.09 | % | | | (24.30 | )% |
| | | | | | | | | | | | | | | | | | | | |
Net assets end of year (000’s) | | $ | 584,283 | | | $ | 578,193 | | | $ | 601,625 | | | $ | 488,315 | | | $ | 364,153 | |
| | | | | | | | | | | | | | | | | | | | |
Ratio and supplemental data | | | | | | | | | | | | | | | | | | | | |
| | | | | |
Expenses to average net assets:(D) | | | | | | | | | | | | | | | | | | | | |
After reimbursement/recapture | | | 1.22 | % | | | 1.21 | % | | | 1.22 | % | | | 1.23 | % | | | 1.22 | % |
Before reimbursement/recapture | | | 1.22 | % | | | 1.21 | % | | | 1.22 | % | | | 1.23 | % | | | 1.22 | % |
Net investment income to average net assets(B) | | | 1.77 | % | | | 2.04 | % | | | 2.75 | % | | | 3.69 | % | | | 2.61 | % |
Portfolio turnover rate(E) | | | 20 | % | | | 31 | % | | | 16 | % | | | 27 | % | | | 10 | % |
| | | | | | | | | | | | |
| | | Transamerica Asset Allocation - Conservative
Portfolio | |
| | | Class I | |
For a share outstanding throughout each period | | October 31,
2012 | | | October 31,
2011 | | | October 31,
2010(F) | |
Net asset value | | | | | | | | | | | | |
Beginning of period/year | | $ | 11.19 | | | $ | 11.24 | | | $ | 10.69 | |
| | | | | | | | | | | | |
Investment operations | | | | | | | | | | | | |
From net investment income(A),(B) | | | 0.30 | | | | 0.32 | | | | 0.22 | |
From net realized and unrealized gain (loss) on affiliated investments | | | 0.56 | | | | (0.04 | ) | | | 0.75 | |
| | | | | | | | | | | | |
Total from investment operations | | | 0.86 | | | | 0.28 | | | | 0.97 | |
| | | | | | | | | | | | |
Distributions | | | | | | | | | | | | |
Net investment income | | | (0.30 | ) | | | (0.33 | ) | | | (0.42 | ) |
| | | |
Net asset value | | | | | | | | | | | | |
End of year | | $ | 11.75 | | | $ | 11.19 | | | $ | 11.24 | |
| | | | | | | | | | | | |
Total return(C) | | | 7.87 | % | | | 2.52 | % | | | 9.39 | %(G) |
| | | | | | | | | | | | |
Net assets end of year (000’s) | | $ | 24,297 | | | $ | 15,067 | | | $ | 10,813 | |
| | | | | | | | | | | | |
Ratio and supplemental data | | | | | | | | | | | | |
| | | |
Expenses to average net assets:(D) | | | | | | | | | | | | |
After reimbursement/recapture | | | 0.25 | % | | | 0.26 | % | | | 0.28 | %(H) |
Before reimbursement/recapture | | | 0.25 | % | | | 0.26 | % | | | 0.28 | %(H) |
Net investment income to average net assets(B) | | | 2.58 | % | | | 2.83 | % | | | 2.24 | %(H) |
Portfolio turnover rate(E) | | | 20 | % | | | 31 | % | | | 16 | %(G) |
| | | | |
| The notes to the financial statements are an integral part of this report. | | |
| Transamerica Funds | | | | Annual Report 2012 |
| | Page 37 | | |
FINANCIAL HIGHLIGHTS (continued)
For the period or years ended:
| | | | | | | | | | | | | | | | | | | | |
| | | Transamerica Asset Allocation - Conservative Portfolio | |
| | | Class R | |
For a share outstanding throughout each period | | October 31,
2012 | | | October 31,
2011 | | | October 31,
2010 | | | October 31,
2009 | | | October 31,
2008 | |
Net asset value | | | | | | | | | | | | | | | | | | | | |
Beginning of year | | $ | 11.24 | | | $ | 11.29 | | | $ | 10.49 | | | $ | 9.05 | | | $ | 12.47 | |
| | | | | | | | | | | | | | | | | | | | |
Investment operations | | | | | | | | | | | | | | | | | | | | |
From net investment income(A),(B) | | | 0.26 | | | | 0.28 | | | | 0.27 | | | | 0.37 | | | | 0.35 | |
From net realized and unrealized gain (loss) on affiliated investments | | | 0.55 | | | | (0.07 | ) | | | 0.88 | | | | 1.49 | | | | (3.23 | ) |
| | | | | | | | | | | | | | | | | | | | |
Total from investment operations | | | 0.81 | | | | 0.21 | | | | 1.15 | | | | 1.86 | | | | (2.88 | ) |
| | | | | | | | | | | | | | | | | | | | |
Distributions | | | | | | | | | | | | | | | | | | | | |
Net investment income | | | (0.24 | ) | | | (0.26 | ) | | | (0.35 | ) | | | (0.42 | ) | | | (0.30 | ) |
Net realized gains on affiliated investments | | | — | | | | — | | | | — | | | | — | | | | (0.24 | ) |
| | | | | | | | | | | | | | | | | | | | |
Total distributions | | | (0.24 | ) | | | (0.26 | ) | | | (0.35 | ) | | | (0.42 | ) | | | (0.54 | ) |
| | | | | | | | | | | | | | | | | | | | |
Net asset value | | | | | | | | | | | | | | | | | | | | |
End of year | | $ | 11.81 | | | $ | 11.24 | | | $ | 11.29 | | | $ | 10.49 | | | $ | 9.05 | |
| | | | | | | | | | | | | | | | | | | | |
Total return(C) | | | 7.30 | % | | | 1.90 | % | | | 11.23 | % | | | 21.59 | % | | | (23.98 | )% |
| | | | | | | | | | | | | | | | | | | | |
Net assets end of year (000’s) | | $ | 2,589 | | | $ | 2,425 | | | $ | 3,061 | | | $ | 1,509 | | | $ | 1,089 | |
| | | | | | | | | | | | | | | | | | | | |
Ratio and supplemental data | | | | | | | | | | | | | | | | | | | | |
| | | | | |
Expenses to average net assets:(D) | | | | | | | | | | | | | | | | | | | | |
After reimbursement/recapture | | | 0.85 | % | | | 0.90 | % | | | 0.88 | % | | | 0.89 | % | | | 0.82 | % |
Before reimbursement/recapture | | | 0.85 | % | | | 0.90 | % | | | 0.88 | % | | | 0.89 | % | | | 0.82 | % |
Net investment income to average net assets(B) | | | 2.23 | % | | | 2.50 | % | | | 2.56 | % | | | 3.97 | % | | | 3.14 | % |
Portfolio turnover rate(E) | | | 20 | % | | | 31 | % | | | 16 | % | | | 27 | % | | | 10 | % |
| |
| | | Transamerica Asset Allocation - Growth Portfolio | |
| | | Class A | |
For a share outstanding throughout each period | | October 31,
2012 | | | October 31,
2011 | | | October 31,
2010 | | | October 31,
2009 | | | October 31,
2008 | |
Net asset value | | | | | | | | | | | | | | | | | | | | |
Beginning of year | | $ | 11.49 | | | $ | 11.36 | | | $ | 9.92 | | | $ | 8.87 | | | $ | 15.46 | |
| | | | | | | | | | | | | | | | | | | | |
Investment operations | | | | | | | | | | | | | | | | | | | | |
From net investment income(A),(B) | | | 0.07 | | | | 0.07 | | | | 0.05 | | | | 0.12 | | | | 0.15 | |
From net realized and unrealized gain (loss) on affiliated investments | | | 0.94 | | | | 0.11 | | | | 1.48 | | | | 1.12 | | | | (6.29 | ) |
| | | | | | | | | | | | | | | | | | | | |
Total from investment operations | | | 1.01 | | | | 0.18 | | | | 1.53 | | | | 1.24 | | | | (6.14 | ) |
| | | | | | | | | | | | | | | | | | | | |
Distributions | | | | | | | | | | | | | | | | | | | | |
Net investment income | | | (0.13 | ) | | | (0.05 | ) | | | (0.09 | ) | | | (0.19 | ) | | | (0.02 | ) |
Net realized gains on affiliated investments | | | — | | | | — | | | | — | | | | — | | | | (0.43 | ) |
| | | | | | | | | | | | | | | | | | | | |
Total distributions | | | (0.13 | ) | | | (0.05 | ) | | | (0.09 | ) | | | (0.19 | ) | | | (0.45 | ) |
| | | | | | | | | | | | | | | | | | | | |
Net asset value | | | | | | | | | | | | | | | | | | | | |
End of year | | $ | 12.37 | | | $ | 11.49 | | | $ | 11.36 | | | $ | 9.92 | | | $ | 8.87 | |
| | | | | | | | | | | | | | | | | | | | |
Total return(C) | | | 8.96 | % | | | 1.59 | % | | | 15.55 | % | | | 14.46 | % | | | (40.75 | )% |
| | | | | | | | | | | | | | | | | | | | |
Net assets end of year (000’s) | | $ | 601,498 | | | $ | 610,951 | | | $ | 645,459 | | | $ | 574,500 | | | $ | 495,257 | |
| | | | | | | | | | | | | | | | | | | | |
Ratio and supplemental data | | | | | | | | | | | | | | | | | | | | |
| | | | | |
Expenses to average net assets:(D) | | | | | | | | | | | | | | | | | | | | |
After reimbursement/recapture | | | 0.65 | % | | | 0.67 | % | | | 0.68 | % | | | 0.73 | % | | | 0.65 | % |
Before reimbursement/recapture | | | 0.65 | % | | | 0.67 | % | | | 0.68 | % | | | 0.73 | % | | | 0.65 | % |
Net investment income to average net assets(B) | | | 0.56 | % | | | 0.58 | % | | | 0.45 | % | | | 1.41 | % | | | 1.20 | % |
Portfolio turnover rate(E) | | | 21 | % | | | 30 | % | | | 10 | % | | | 47 | % | | | 12 | % |
| | | | |
| The notes to the financial statements are an integral part of this report. | | |
| Transamerica Funds | | | | Annual Report 2012 |
| | Page 38 | | |
FINANCIAL HIGHLIGHTS (continued)
For the period or years ended:
| | | | | | | | | | | | | | | | | | | | |
| | | Transamerica Asset Allocation - Growth Portfolio | |
| | | Class B | |
For a share outstanding throughout each period | | October 31,
2012 | | | October 31,
2011 | | | October 31,
2010 | | | October 31,
2009 | | | October 31,
2008 | |
Net asset value | | | | | | | | | | | | | | | | | | | | |
Beginning of year | | $ | 11.20 | | | $ | 11.09 | | | $ | 9.70 | | | $ | 8.63 | | | $ | 15.13 | |
| | | | | | | | | | | | | | | | | | | | |
Investment operations | | | | | | | | | | | | | | | | | | | | |
From net investment income (loss)(A),(B) | | | (0.01 | ) | | | — | (I) | | | (0.02 | ) | | | 0.07 | | | | 0.08 | |
From net realized and unrealized gain (loss) on affiliated investments | | | 0.91 | | | | 0.11 | | | | 1.44 | | | | 1.10 | | | | (6.15 | ) |
| | | | | | | | | | | | | | | | | | | | |
Total from investment operations | | | 0.90 | | | | 0.11 | | | | 1.42 | | | | 1.17 | | | | (6.07 | ) |
| | | | | | | | | | | | | | | | | | | | |
Distributions | | | | | | | | | | | | | | | | | | | | |
Net investment income | | | (0.03 | ) | | | — | | | | (0.03 | ) | | | (0.10 | ) | | | — | |
Net realized gains on affiliated investments | | | — | | | | — | | | | — | | | | — | | | | (0.43 | ) |
| | | | | | | | | | | | | | | | | | | | |
Total distributions | | | (0.03 | ) | | | — | | | | (0.03 | ) | | | (0.10 | ) | | | (0.43 | ) |
| | | | | | | | | | | | | | | | | | | | |
Net asset value | | | | | | | | | | | | | | | | | | | | |
End of year | | $ | 12.07 | | | $ | 11.20 | | | $ | 11.09 | | | $ | 9.70 | | | $ | 8.63 | |
| | | | | | | | | | | | | | | | | | | | |
Total return(C) | | | 8.08 | % | | | 0.99 | % | | | 14.65 | % | | | 13.78 | % | | | (41.15 | )% |
| | | | | | | | | | | | | | | | | | | | |
Net assets end of year (000’s) | | $ | 106,594 | | | $ | 140,909 | | | $ | 184,263 | | | $ | 192,054 | | | $ | 196,817 | |
| | | | | | | | | | | | | | | | | | | | |
Ratio and supplemental data | | | | | | | | | | | | | | | | | | | | |
| | | | | |
Expenses to average net assets:(D) | | | | | | | | | | | | | | | | | | | | |
After reimbursement/recapture | | | 1.38 | % | | | 1.36 | % | | | 1.35 | % | | | 1.40 | % | | | 1.30 | % |
Before reimbursement/recapture | | | 1.38 | % | | | 1.36 | % | | | 1.35 | % | | | 1.40 | % | | | 1.30 | % |
Net investment income (loss) to average net assets(B) | | | (0.12 | )% | | | (0.02 | )% | | | (0.18 | )% | | | 0.84 | % | | | 0.67 | % |
Portfolio turnover rate(E) | | | 21 | % | | | 30 | % | | | 10 | % | | | 47 | % | | | 12 | % |
| |
| | | Transamerica Asset Allocation - Growth Portfolio | |
| | | Class C | |
For a share outstanding throughout each period | | October 31,
2012 | | | October 31,
2011 | | | October 31,
2010 | | | October 31,
2009 | | | October 31,
2008 | |
Net asset value | | | | | | | | | | | | | | | | | | | | |
Beginning of year | | $ | 11.20 | | | $ | 11.09 | | | $ | 9.69 | | | $ | 8.64 | | | $ | 15.13 | |
| | | | | | | | | | | | | | | | | | | | |
Investment operations | | | | | | | | | | | | | | | | | | | | |
From net investment income (loss)(A),(B) | | | (0.01 | ) | | | — | (I) | | | (0.01 | ) | | | 0.08 | | | | 0.08 | |
From net realized and unrealized gain (loss) on affiliated investments | | | 0.92 | | | | 0.11 | | | | 1.45 | | | | 1.08 | | | | (6.14 | ) |
| | | | | | | | | | | | | | | | | | | | |
Total from investment operations | | | 0.91 | | | | 0.11 | | | | 1.44 | | | | 1.16 | | | | (6.06 | ) |
| | | | | | | | | | | | | | | | | | | | |
Distributions | | | | | | | | | | | | | | | | | | | | |
Net investment income | | | (0.05 | ) | | | — | | | | (0.04 | ) | | | (0.11 | ) | | | — | |
Net realized gains on affiliated investments | | | — | | | | — | | | | — | | | | — | | | | (0.43 | ) |
| | | | | | | | | | | | | | | | | | | | |
Total distributions | | | (0.05 | ) | | | — | | | | (0.04 | ) | | | (0.11 | ) | | | (0.43 | ) |
| | | | | | | | | | | | | | | | | | | | |
Net asset value | | | | | | | | | | | | | | | | | | | | |
End of year | | $ | 12.06 | | | $ | 11.20 | | | $ | 11.09 | | | $ | 9.69 | | | $ | 8.64 | |
| | | | | | | | | | | | | | | | | | | | |
Total return(C) | | | 8.22 | % | | | 0.99 | % | | | 14.86 | % | | | 13.72 | % | | | (41.08 | )% |
| | | | | | | | | | | | | | | | | | | | |
Net assets end of year (000’s) | | $ | 629,208 | | | $ | 682,872 | | | $ | 774,914 | | | $ | 763,086 | | | $ | 751,881 | |
| | | | | | | | | | | | | | | | | | | | |
Ratio and supplemental data | | | | | | | | | | | | | | | | | | | | |
| | | | | |
Expenses to average net assets:(D) | | | | | | | | | | | | | | | | | | | | |
After reimbursement/recapture | | | 1.29 | % | | | 1.29 | % | | | 1.29 | % | | | 1.33 | % | | | 1.26 | % |
Before reimbursement/recapture | | | 1.29 | % | | | 1.29 | % | | | 1.29 | % | | | 1.33 | % | | | 1.26 | % |
Net investment income (loss) to average net assets(B) | | | (0.08 | )% | | | — | %(J) | | | (0.12 | )% | | | 0.90 | % | | | 0.62 | % |
Portfolio turnover rate(E) | | | 21 | % | | | 30 | % | | | 10 | % | | | 47 | % | | | 12 | % |
| | | | |
| The notes to the financial statements are an integral part of this report. | | |
| Transamerica Funds | | | | Annual Report 2012 |
| | Page 39 | | |
FINANCIAL HIGHLIGHTS (continued)
For the period or years ended:
| | | | | | | | | | | | |
| | | Transamerica Asset Allocation - Growth
Portfolio | |
| | | Class I | |
For a share outstanding throughout each period | | October 31,
2012 | | | October 31,
2011 | | | October 31,
2010(F) | |
Net asset value | | | | | | | | | | | | |
Beginning of period/year | | $ | 11.53 | | | $ | 11.39 | | | $ | 10.35 | |
| | | | | | | | | | | | |
Investment operations | | | | | | | | | | | | |
From net investment income (loss)(A),(B) | | | 0.10 | | | | 0.11 | | | | (0.02 | ) |
From net realized and unrealized gain on affiliated investments | | | 0.94 | | | | 0.13 | | | | 1.20 | |
| | | | | | | | | | | | |
Total from investment operations | | | 1.04 | | | | 0.24 | | | | 1.18 | |
| | | | | | | | | | | | |
Distributions | | | | | | | | | | | | |
Net investment income | | | (0.18 | ) | | | (0.10 | ) | | | (0.14 | ) |
| | | |
Net asset value | | | | | | | | | | | | |
End of year | | $ | 12.39 | | | $ | 11.53 | | | $ | 11.39 | |
| | | | | | | | | | | | |
Total return(C) | | | 9.28 | % | | | 2.10 | % | | | 11.57 | %(G) |
| | | | | | | | | | | | |
Net assets end of year (000’s) | | $ | 17,219 | | | $ | 14,642 | | | $ | 13,112 | |
| | | | | | | | | | | | |
Ratio and supplemental data | | | | | | | | | | | | |
| | | |
Expenses to average net assets:(D) | | | | | | | | | | | | |
After reimbursement/recapture | | | 0.25 | % | | | 0.27 | % | | | 0.30 | %(H) |
Before reimbursement/recapture | | | 0.25 | % | | | 0.27 | % | | | 0.30 | %(H) |
Net investment income (loss) to average net assets(B) | | | 0.86 | % | | | 0.93 | % | | | (0.15 | )%(H) |
Portfolio turnover rate(E) | | | 21 | % | | | 30 | % | | | 10 | %(G) |
| | | | | | | | | | | | | | | | | | | | |
| | | Transamerica Asset Allocation - Growth Portfolio | |
| | | Class R | |
For a share outstanding throughout each period | | October 31,
2012 | | | October 31,
2011 | | | October 31,
2010 | | | October 31,
2009 | | | October 31,
2008 | |
Net asset value | | | | | | | | | | | | | | | | | | | | |
Beginning of year | | $ | 11.39 | | | $ | 11.27 | | | $ | 9.85 | | | $ | 8.84 | | | $ | 15.40 | |
| | | | | | | | | | | | | | | | | | | | |
Investment operations | | | | | | | | | | | | | | | | | | | | |
From net investment income(A),(B) | | | 0.06 | | | | 0.05 | | | | 0.01 | | | | 0.10 | | | | 0.07 | |
From net realized and unrealized gain (loss) on affiliated investments | | | 0.92 | | | | 0.11 | | | | 1.49 | | | | 1.12 | | | | (6.20 | ) |
| | | | | | | | | | | | | | | | | | | | |
Total from investment operations | | | 0.98 | | | | 0.16 | | | | 1.50 | | | | 1.22 | | | | (6.13 | ) |
| | | | | | | | | | | | | | | | | | | | |
Distributions | | | | | | | | | | | | | | | | | | | | |
Net investment income | | | (0.10 | ) | | | (0.04 | ) | | | (0.08 | ) | | | (0.21 | ) | | | — | |
Net realized gains on affiliated investments | | | — | | | | — | | | | — | | | | — | | | | (0.43 | ) |
| | | | | | | | | | | | | | | | | | | | |
Total distributions | | | (0.10 | ) | | | (0.04 | ) | | | (0.08 | ) | | | (0.21 | ) | | | (0.43 | ) |
| | | | | | | | | | | | | | | | | | | | |
Net asset value | | | | | | | | | | | | | | | | | | | | |
End of year | | $ | 12.27 | | | $ | 11.39 | | | $ | 11.27 | | | $ | 9.85 | | | $ | 8.84 | |
| | | | | | | | | | | | | | | | | | | | |
Total return(C) | | | 8.76 | % | | | 1.45 | % | | | 15.35 | % | | | 14.35 | % | | | (40.81 | )% |
| | | | | | | | | | | | | | | | | | | | |
Net assets end of year (000’s) | | $ | 1,661 | | | $ | 3,722 | | | $ | 3,762 | | | $ | 2,704 | | | $ | 1,570 | |
| | | | | | | | | | | | | | | | | | | | |
Ratio and supplemental data | | | | | | | | | | | | | | | | | | | | |
| | | | | |
Expenses to average net assets:(D) | | | | | | | | | | | | | | | | | | | | |
After reimbursement/recapture | | | 0.82 | % | | | 0.82 | % | | | 0.84 | % | | | 0.85 | % | | | 0.83 | % |
Before reimbursement/recapture | | | 0.82 | % | | | 0.82 | % | | | 0.84 | % | | | 0.85 | % | | | 0.83 | % |
Net investment income to average net assets(B) | | | 0.52 | % | | | 0.44 | % | | | 0.15 | % | | | 1.09 | % | | | 0.57 | % |
Portfolio turnover rate(E) | | | 21 | % | | | 30 | % | | | 10 | % | | | 47 | % | | | 12 | % |
| | | | |
| The notes to the financial statements are an integral part of this report. | | |
| Transamerica Funds | | | | Annual Report 2012 |
| | Page 40 | | |
FINANCIAL HIGHLIGHTS (continued)
For the period or years ended:
| | | | | | | | | | | | | | | | | | | | |
| | | Transamerica Asset Allocation - Moderate Growth Portfolio | |
| | | Class A | |
For a share outstanding throughout each period | | October 31,
2012 | | | October 31,
2011 | | | October 31,
2010 | | | October 31,
2009 | | | October 31,
2008 | |
Net asset value | | | | | | | | | | | | | | | | | | | | |
Beginning of year | | $ | 11.55 | | | $ | 11.59 | | | $ | 10.39 | | | $ | 9.20 | | | $ | 14.58 | |
| | | | | | | | | | | | | | | | | | | | |
Investment operations | | | | | | | | | | | | | | | | | | | | |
From net investment income(A),(B) | | | 0.16 | | | | 0.19 | | | | 0.19 | | | | 0.28 | | | | 0.26 | |
From net realized and unrealized gain (loss) on affiliated investments | | | 0.80 | | | | (0.06 | ) | | | 1.27 | | | | 1.25 | | | | (5.04 | ) |
| | | | | | | | | | | | | | | | | | | | |
Total from investment operations | | | 0.96 | | | | 0.13 | | | | 1.46 | | | | 1.53 | | | | (4.78 | ) |
| | | | | | | | | | | | | | | | | | | | |
Distributions | | | | | | | | | | | | | | | | | | | | |
Net investment income | | | (0.17 | ) | | | (0.17 | ) | | | (0.23 | ) | | | (0.34 | ) | | | (0.19 | ) |
Net realized gains on affiliated investments | | | — | | | | — | | | | — | | | | — | | | | (0.41 | ) |
From return of capital | | | — | | | | — | | | | (0.03 | ) | | | — | | | | — | |
| | | | | | | | | | | | | | | | | | | | |
Total distributions | | | (0.17 | ) | | | (0.17 | ) | | | (0.26 | ) | | | (0.34 | ) | | | (0.60 | ) |
| | | | | | | | | | | | | | | | | | | | |
Net asset value | | | | | | | | | | | | | | | | | | | | |
End of year | | $ | 12.34 | | | $ | 11.55 | | | $ | 11.59 | | | $ | 10.39 | | | $ | 9.20 | |
| | | | | | | | | | | | | | | | | | | | |
Total return(C) | | | 8.48 | % | | | 1.09 | % | | | 14.35 | % | | | 17.47 | % | | | (34.01 | )% |
| | | | | | | | | | | | | | | | | | | | |
Net assets end of year (000’s) | | $ | 1,181,926 | | | $ | 1,186,790 | | | $ | 1,202,885 | | | $ | 1,044,810 | | | $ | 901,766 | |
| | | | | | | | | | | | | | | | | | | | |
Ratio and supplemental data | | | | | | | | | | | | | | | | | | | | |
| | | | | |
Expenses to average net assets:(D) | | | | | | | | | | | | | | | | | | | | |
After reimbursement/recapture | | | 0.60 | % | | | 0.62 | % | | | 0.62 | % | | | 0.66 | % | | | 0.60 | % |
Before reimbursement/recapture | | | 0.60 | % | | | 0.62 | % | | | 0.62 | % | | | 0.66 | % | | | 0.60 | % |
Net investment income to average net assets(B) | | | 1.30 | % | | | 1.58 | % | | | 1.80 | % | | | 2.99 | % | | | 2.12 | % |
Portfolio turnover rate(E) | | | 25 | % | | | 35 | % | | | 17 | % | | | 37 | % | | | 13 | % |
| |
| | | Transamerica Asset Allocation - Moderate Growth Portfolio | |
| | | Class B | |
For a share outstanding throughout each period | | October 31,
2012 | | | October 31,
2011 | | | October 31,
2010 | | | October 31,
2009 | | | October 31,
2008 | |
Net asset value | | | | | | | | | | | | | | | | | | | | |
Beginning of year | | $ | 11.50 | | | $ | 11.53 | | | $ | 10.34 | | | $ | 9.12 | | | $ | 14.45 | |
| | | | | | | | | | | | | | | | | | | | |
Investment operations | | | | | | | | | | | | | | | | | | | | |
From net investment income(A),(B) | | | 0.08 | | | | 0.12 | | | | 0.13 | | | | 0.22 | | | | 0.19 | |
From net realized and unrealized gain (loss) on affiliated investments | | | 0.80 | | | | (0.07 | ) | | | 1.25 | | | | 1.24 | | | | (5.01 | ) |
| | | | | | | | | | | | | | | | | | | | |
Total from investment operations | | | 0.88 | | | | 0.05 | | | | 1.38 | | | | 1.46 | | | | (4.82 | ) |
| | | | | | | | | | | | | | | | | | | | |
Distributions | | | | | | | | | | | | | | | | | | | | |
Net investment income | | | (0.06 | ) | | | (0.08 | ) | | | (0.16 | ) | | | (0.24 | ) | | | (0.10 | ) |
Net realized gains on affiliated investments | | | — | | | | — | | | | — | | | | — | | | | (0.41 | ) |
From return of capital | | | — | | | | — | | | | (0.03 | ) | | | — | | | | — | |
| | | | | | | | | | | | | | | | | | | | |
Total distributions | | | (0.06 | ) | | | (0.08 | ) | | | (0.19 | ) | | | (0.24 | ) | | | (0.51 | ) |
| | | | | | | | | | | | | | | | | | | | |
Net asset value | | | | | | | | | | | | | | | | | | | | |
End of year | | $ | 12.32 | | | $ | 11.50 | | | $ | 11.53 | | | $ | 10.34 | | | $ | 9.12 | |
| | | | | | | | | | | | | | | | | | | | |
Total return(C) | | | 7.73 | % | | | 0.43 | % | | | 13.57 | % | | | 16.69 | % | | | (34.44 | )% |
| | | | | | | | | | | | | | | | | | | | |
Net assets end of year (000’s) | | $ | 213,032 | | | $ | 283,905 | | | $ | 383,062 | | | $ | 394,275 | | | $ | 389,429 | |
| | | | | | | | | | | | | | | | | | | | |
Ratio and supplemental data | | | | | | | | | | | | | | | | | | | | |
| | | | | |
Expenses to average net assets:(D) | | | | | | | | | | | | | | | | | | | | |
After reimbursement/recapture | | | 1.33 | % | | | 1.31 | % | | | 1.30 | % | | | 1.33 | % | | | 1.27 | % |
Before reimbursement/recapture | | | 1.33 | % | | | 1.31 | % | | | 1.30 | % | | | 1.33 | % | | | 1.27 | % |
Net investment income to average net assets(B) | | | 0.65 | % | | | 1.02 | % | | | 1.19 | % | | | 2.39 | % | | | 1.54 | % |
Portfolio turnover rate(E) | | | 25 | % | | | 35 | % | | | 17 | % | | | 37 | % | | | 13 | % |
| | | | |
| The notes to the financial statements are an integral part of this report. | | |
| Transamerica Funds | | | | Annual Report 2012 |
| | Page 41 | | |
FINANCIAL HIGHLIGHTS (continued)
For the period or years ended:
| | | | | | | | | | | | | | | | | | | | |
| | | Transamerica Asset Allocation - Moderate Growth Portfolio | |
| | | Class C | |
For a share outstanding throughout each period | | October 31,
2012 | | | October 31,
2011 | | | October 31,
2010 | | | October 31,
2009 | | | October 31,
2008 | |
Net asset value | | | | | | | | | | | | | | | | | | | | |
Beginning of year | | $ | 11.47 | | | $ | 11.50 | | | $ | 10.32 | | | $ | 9.11 | | | $ | 14.45 | |
| | | | | | | | | | | | | | | | | | | | |
Investment operations | | | | | | | | | | | | | | | | | | | | |
From net investment income(A),(B) | | | 0.08 | | | | 0.12 | | | | 0.13 | | | | 0.22 | | | | 0.18 | |
From net realized and unrealized gain (loss) on affiliated investments | | | 0.80 | | | | (0.05 | ) | | | 1.25 | | | | 1.25 | | | | (5.00 | ) |
| | | | | | | | | | | | | | | | | | | | |
Total from investment operations | | | 0.88 | | | | 0.07 | | | | 1.38 | | | | 1.47 | | | | (4.82 | ) |
| | | | | | | | | | | | | | | | | | | | |
Distributions | | | | | | | | | | | | | | | | | | | | |
Net investment income | | | (0.09 | ) | | | (0.10 | ) | | | (0.17 | ) | | | (0.26 | ) | | | (0.11 | ) |
Net realized gains on affiliated investments | | | — | | | | — | | | | — | | | | — | | | | (0.41 | ) |
From return of capital | | | — | | | | — | | | | (0.03 | ) | | | — | | | | — | |
| | | | | | | | | | | | | | | | | | | | |
Total distributions | | | (0.09 | ) | | | (0.10 | ) | | | (0.20 | ) | | | (0.26 | ) | | | (0.52 | ) |
| | | | | | | | | | | | | | | | | | | | |
Net asset value | | | | | | | | | | | | | | | | | | | | |
End of year | | $ | 12.26 | | | $ | 11.47 | | | $ | 11.50 | | | $ | 10.32 | | | $ | 9.11 | |
| | | | | | | | | | | | | | | | | | | | |
Total return(C) | | | 7.74 | % | | | 0.56 | % | | | 13.58 | % | | | 16.77 | % | | | (34.44 | )% |
| | | | | | | | | | | | | | | | | | | | |
Net assets end of year (000’s) | | $ | 1,379,454 | | | $ | 1,468,164 | | | $ | 1,606,227 | | | $ | 1,513,954 | | | $ | 1,455,012 | |
| | | | | | | | | | | | | | | | | | | | |
Ratio and supplemental data | | | | | | | | | | | | | | | | | | | | |
| | | | | |
Expenses to average net assets:(D) | | | | | | | | | | | | | | | | | | | | |
After reimbursement/recapture | | | 1.25 | % | | | 1.25 | % | | | 1.25 | % | | | 1.28 | % | | | 1.23 | % |
Before reimbursement/recapture | | | 1.25 | % | | | 1.25 | % | | | 1.25 | % | | | 1.28 | % | | | 1.23 | % |
Net investment income to average net assets(B) | | | 0.66 | % | | | 0.99 | % | | | 1.20 | % | | | 2.43 | % | | | 1.49 | % |
Portfolio turnover rate(E) | | | 25 | % | | | 35 | % | | | 17 | % | | | 37 | % | | | 13 | % |
| | | | | | | | | | | | |
| | | Transamerica Asset Allocation - Moderate
Growth Portfolio | |
| | | Class I | |
For a share outstanding throughout each period | | October 31,
2012 | | | October 31,
2011 | | | October 31,
2010(F) | |
Net asset value | | | | | | | | | | | | |
Beginning of period/year | | $ | 11.58 | | | $ | 11.61 | | | $ | 10.76 | |
| | | | | | | | | | | | |
Investment operations | | | | | | | | | | | | |
From net investment income(A),(B) | | | 0.18 | | | | 0.21 | | | | 0.09 | |
From net realized and unrealized gain (loss) on affiliated investments | | | 0.81 | | | | (0.03 | ) | | | 1.07 | |
| | | | | | | | | | | | |
Total from investment operations | | | 0.99 | | | | 0.18 | | | | 1.16 | |
| | | | | | | | | | | | |
Distributions | | | | | | | | | | | | |
Net investment income | | | (0.21 | ) | | | (0.21 | ) | | | (0.28 | ) |
From return of capital | | | — | | | | — | | | | (0.03 | ) |
| | | | | | | | | | | | |
Total distributions | | | (0.21 | ) | | | (0.21 | ) | | | (0.31 | ) |
| | | | | | | | | | | | |
Net asset value | | | | | | | | | | | | |
End of year | | $ | 12.36 | | | $ | 11.58 | | | $ | 11.61 | |
| | | | | | | | | | | | |
Total return(C) | | | 8.82 | % | | | 1.54 | % | | | 11.07 | %(G) |
| | | | | | | | | | | | |
Net assets end of year (000’s) | | $ | 34,145 | | | $ | 23,403 | | | $ | 16,293 | |
| | | | | | | | | | | | |
Ratio and supplemental data | | | | | | | | | | | | |
| | | |
Expenses to average net assets:(D) | | | | | | | | | | | | |
After reimbursement/recapture | | | 0.25 | % | | | 0.26 | % | | | 0.29 | %(H) |
Before reimbursement/recapture | | | 0.25 | % | | | 0.26 | % | | | 0.29 | %(H) |
Net investment income to average net assets(B) | | | 1.53 | % | | | 1.74 | % | | | 0.89 | %(H) |
Portfolio turnover rate(E) | | | 25 | % | | | 35 | % | | | 17 | %(G) |
| | | | |
| The notes to the financial statements are an integral part of this report. | | |
| Transamerica Funds | | | | Annual Report 2012 |
| | Page 42 | | |
FINANCIAL HIGHLIGHTS (continued)
For the period or years ended:
| | | | | | | | | | | | | | | | | | | | |
| | | Transamerica Asset Allocation - Moderate Growth Portfolio | |
| | | Class R | |
For a share outstanding throughout each period | | October 31,
2012 | | | October 31,
2011 | | | October 31,
2010 | | | October 31,
2009 | | | October 31,
2008 | |
Net asset value | | | | | | | | | | | | | | | | | | | | |
Beginning of year | | $ | 11.50 | | | $ | 11.53 | | | $ | 10.36 | | | $ | 9.18 | | | $ | 14.54 | |
| | | | | | | | | | | | | | | | | | | | |
Investment operations | | | | | | | | | | | | | | | | | | | | |
From net investment income(A),(B) | | | 0.14 | | | | 0.17 | | | | 0.15 | | | | 0.25 | | | | 0.22 | |
From net realized and unrealized gain (loss) on affiliated investments | | | 0.79 | | | | (0.04 | ) | | | 1.28 | | | | 1.26 | | | | (5.00 | ) |
| | | | | | | | | | | | | | | | | | | | |
Total from investment operations | | | 0.93 | | | | 0.13 | | | | 1.43 | | | | 1.51 | | | | (4.78 | ) |
| | | | | | | | | | | | | | | | | | | | |
Distributions | | | | | | | | | | | | | | | | | | | | |
Net investment income | | | (0.15 | ) | | | (0.16 | ) | | | (0.23 | ) | | | (0.33 | ) | | | (0.17 | ) |
Net realized gains on affiliated investments | | | — | | | | — | | | | — | | | | — | | | | (0.41 | ) |
From return of capital | | | — | | | | — | | | | (0.03 | ) | | | — | | | | — | |
| | | | | | | | | | | | | | | | | | | | |
Total distributions | | | (0.15 | ) | | | (0.16 | ) | | | (0.26 | ) | | | (0.33 | ) | | | (0.58 | ) |
| | | | | | | | | | | | | | | | | | | | |
Net asset value | | | | | | | | | | | | | | | | | | | | |
End of year | | $ | 12.28 | | | $ | 11.50 | | | $ | 11.53 | | | $ | 10.36 | | | $ | 9.18 | |
| | | | | | | | | | | | | | | | | | | | |
Total return(C) | | | 8.21 | % | | | 1.06 | % | | | 14.08 | % | | | 17.29 | % | | | (34.08 | )% |
| | | | | | | | | | | | | | | | | | | | |
Net assets end of year (000’s) | | $ | 4,965 | | | $ | 5,306 | | | $ | 5,413 | | | $ | 2,873 | | | $ | 1,969 | |
| | | | | | | | | | | | | | | | | | | | |
Ratio and supplemental data | | | | | | | | | | | | | | | | | | | | |
| | | | | |
Expenses to average net assets:(D) | | | | | | | | | | | | | | | | | | | | |
After reimbursement/recapture | | | 0.77 | % | | | 0.77 | % | | | 0.79 | % | | | 0.82 | % | | | 0.76 | % |
Before reimbursement/recapture | | | 0.77 | % | | | 0.77 | % | | | 0.79 | % | | | 0.82 | % | | | 0.76 | % |
Net investment income to average net assets(B) | | | 1.14 | % | | | 1.43 | % | | | 1.43 | % | | | 2.68 | % | | | 1.74 | % |
Portfolio turnover rate(E) | | | 25 | % | | | 35 | % | | | 17 | % | | | 37 | % | | | 13 | % |
| |
| | | Transamerica Asset Allocation - Moderate Portfolio | |
| | | Class A | |
For a share outstanding throughout each period | | October 31,
2012 | | | October 31,
2011 | | | October 31,
2010 | | | October 31,
2009 | | | October 31,
2008 | |
Net asset value | | | | | | | | | | | | | | | | | | | | |
Beginning of year | | $ | 11.60 | | | $ | 11.59 | | | $ | 10.62 | | | $ | 9.29 | | | $ | 13.69 | |
| | | | | | | | | | | | | | | | | | | | |
Investment operations | | | | | | | | | | | | | | | | | | | | |
From net investment income(A),(B) | | | 0.23 | | | | 0.26 | | | | 0.30 | | | | 0.36 | | | | 0.33 | |
From net realized and unrealized gain (loss) on affiliated investments | | | 0.67 | | | | (0.02 | ) | | | 1.04 | | | | 1.40 | | | | (4.05 | ) |
| | | | | | | | | | | | | | | | | | | | |
Total from investment operations | | | 0.90 | | | | 0.24 | | | | 1.34 | | | | 1.76 | | | | (3.72 | ) |
| | | | | | | | | | | | | | | | | | | | |
Distributions | | | | | | | | | | | | | | | | | | | | |
Net investment income | | | (0.24 | ) | | | (0.23 | ) | | | (0.37 | ) | | | (0.43 | ) | | | (0.28 | ) |
Net realized gains on affiliated investments | | | — | | | | — | | | | — | | | | — | | | | (0.40 | ) |
| | | | | | | | | | | | | | | | | | | | |
Total distributions | | | (0.24 | ) | | | (0.23 | ) | | | (0.37 | ) | | | (0.43 | ) | | | (0.68 | ) |
| | | | | | | | | | | | | | | | | | | | |
Net asset value | | | | | | | | | | | | | | | | | | | | |
End of year | | $ | 12.26 | | | $ | 11.60 | | | $ | 11.59 | | | $ | 10.62 | | | $ | 9.29 | |
| | | | | | | | | | | | | | | | | | | | |
Total return(C) | | | 7.95 | % | | | 2.10 | % | | | 12.95 | % | | | 19.99 | % | | | (28.41 | )% |
| | | | | | | | | | | | | | | | | | | | |
Net assets end of year (000’s) | | $ | 866,505 | | | $ | 877,866 | | | $ | 857,469 | | | $ | 694,532 | | | $ | 545,646 | |
| | | | | | | | | | | | | | | | | | | | |
Ratio and supplemental data | | | | | | | | | | | | | | | | | | | | |
| | | | | |
Expenses to average net assets:(D) | | | | | | | | | | | | | | | | | | | | |
After reimbursement/recapture | | | 0.58 | % | | | 0.61 | % | | | 0.61 | % | | | 0.63 | % | | | 0.59 | % |
Before reimbursement/recapture | | | 0.58 | % | | | 0.61 | % | | | 0.61 | % | | | 0.63 | % | | | 0.59 | % |
Net investment income to average net assets(B) | | | 1.93 | % | | | 2.23 | % | | | 2.78 | % | | | 3.76 | % | | | 2.79 | % |
Portfolio turnover rate(E) | | | 22 | % | | | 30 | % | | | 16 | % | | | 30 | % | | | 12 | % |
| | | | |
| The notes to the financial statements are an integral part of this report. | | |
| Transamerica Funds | | | | Annual Report 2012 |
| | Page 43 | | |
FINANCIAL HIGHLIGHTS (continued)
For the period or years ended:
| | | | | | | | | | | | | | | | | | | | |
| | | Transamerica Asset Allocation - Moderate Portfolio | |
| | | Class B | |
For a share outstanding throughout each period | | October 31,
2012 | | | October 31,
2011 | | | October 31,
2010 | | | October 31,
2009 | | | October 31,
2008 | |
Net asset value | | | | | | | | | | | | | | | | | | | | |
Beginning of year | | $ | 11.58 | | | $ | 11.55 | | | $ | 10.59 | | | $ | 9.23 | | | $ | 13.59 | |
| | | | | | | | | | | | | | | | | | | | |
Investment operations | | | | | | | | | | | | | | | | | | | | |
From net investment income(A),(B) | | | 0.15 | | | | 0.20 | | | | 0.24 | | | | 0.30 | | | | 0.27 | |
From net realized and unrealized gain (loss) on affiliated investments | | | 0.65 | | | | (0.03 | ) | | | 1.02 | | | | 1.39 | | | | (4.05 | ) |
| | | | | | | | | | | | | | | | | | | | |
Total from investment operations | | | 0.80 | | | | 0.17 | | | | 1.26 | | | | 1.69 | | | | (3.78 | ) |
| | | | | | | | | | | | | | | | | | | | |
Distributions | | | | | | | | | | | | | | | | | | | | |
Net investment income | | | (0.12 | ) | | | (0.14 | ) | | | (0.30 | ) | | | (0.33 | ) | | | (0.18 | ) |
Net realized gains on affiliated investments | | | — | | | | — | | | | — | | | | — | | | | (0.40 | ) |
| | | | | | | | | | | | | | | | | | | | |
Total distributions | | | (0.12 | ) | | | (0.14 | ) | | | (0.30 | ) | | | (0.33 | ) | | | (0.58 | ) |
| | | | | | | | | | | | | | | | | | | | |
Net asset value | | | | | | | | | | | | | | | | | | | | |
End of year | | $ | 12.26 | | | $ | 11.58 | | | $ | 11.55 | | | $ | 10.59 | | | $ | 9.23 | |
| | | | | | | | | | | | | | | | | | | | |
Total return(C) | | | 7.06 | % | | | 1.49 | % | | | 12.13 | % | | | 19.16 | % | | | (28.87 | )% |
| | | | | | | | | | | | | | | | | | | | |
Net assets end of year (000’s) | | $ | 115,595 | | | $ | 152,538 | | | $ | 220,658 | | | $ | 228,151 | | | $ | 223,209 | |
| | | | | | | | | | | | | | | | | | | | |
Ratio and supplemental data | | | | | | | | | | | | | | | | | | | | |
| | | | | |
Expenses to average net assets:(D) | | | | | | | | | | | | | | | | | | | | |
After reimbursement/recapture | | | 1.31 | % | | | 1.28 | % | | | 1.28 | % | | | 1.30 | % | | | 1.25 | % |
Before reimbursement/recapture | | | 1.31 | % | | | 1.28 | % | | | 1.28 | % | | | 1.30 | % | | | 1.25 | % |
Net investment income to average net assets(B) | | | 1.28 | % | | | 1.69 | % | | | 2.24 | % | | | 3.23 | % | | | 2.26 | % |
Portfolio turnover rate(E) | | | 22 | % | | | 30 | % | | | 16 | % | | | 30 | % | | | 12 | % |
| |
| | | Transamerica Asset Allocation - Moderate Portfolio | |
| | | Class C | |
For a share outstanding throughout each period | | October 31,
2012 | | | October 31,
2011 | | | October 31,
2010 | | | October 31,
2009 | | | October 31,
2008 | |
Net asset value | | | | | | | | | | | | | | | | | | | | |
Beginning of year | | $ | 11.52 | | | $ | 11.50 | | | $ | 10.55 | | | $ | 9.21 | | | $ | 13.58 | |
| | | | | | | | | | | | | | | | | | | | |
Investment operations | | | | | | | | | | | | | | | | | | | | |
From net investment income(A),(B) | | | 0.15 | | | | 0.19 | | | | 0.24 | | | | 0.30 | | | | 0.26 | |
From net realized and unrealized gain (loss) on affiliated investments | | | 0.66 | | | | (0.01 | ) | | | 1.02 | | | | 1.39 | | | | (4.03 | ) |
| | | | | | | | | | | | | | | | | | | | |
Total from investment operations | | | 0.81 | | | | 0.18 | | | | 1.26 | | | | 1.69 | | | | (3.77 | ) |
| | | | | | | | | | | | | | | | | | | | |
Distributions | | | | | | | | | | | | | | | | | | | | |
Net investment income | | | (0.16 | ) | | | (0.16 | ) | | | (0.31 | ) | | | (0.35 | ) | | | (0.20 | ) |
Net realized gains on affiliated investments | | | — | | | | — | | | | — | | | | — | | | | (0.40 | ) |
| | | | | | | | | | | | | | | | | | | | |
Total distributions | | | (0.16 | ) | | | (0.16 | ) | | | (0.31 | ) | | | (0.35 | ) | | | (0.60 | ) |
| | | | | | | | | | | | | | | | | | | | |
Net asset value | | | | | | | | | | | | | | | | | | | | |
End of year | | $ | 12.17 | | | $ | 11.52 | | | $ | 11.50 | | | $ | 10.55 | | | $ | 9.21 | |
| | | | | | | | | | | | �� | | | | | | | | |
Total return(C) | | | 7.17 | % | | | 1.50 | % | | | 12.22 | % | | | 19.24 | % | | | (28.87 | )% |
| | | | | | | | | | | | | | | | | | | | |
Net assets end of year (000’s) | | $ | 1,069,033 | | | $ | 1,088,747 | | | $ | 1,142,029 | | | $ | 997,766 | | | $ | 876,977 | |
| | | | | | | | | | | | | | | | | | | | |
Ratio and supplemental data | | | | | | | | | | | | | | | | | | | | |
| | | | | |
Expenses to average net assets:(D) | | | | | | | | | | | | | | | | | | | | |
After reimbursement/recapture | | | 1.23 | % | | | 1.22 | % | | | 1.22 | % | | | 1.24 | % | | | 1.21 | % |
Before reimbursement/recapture | | | 1.23 | % | | | 1.22 | % | | | 1.22 | % | | | 1.24 | % | | | 1.21 | % |
Net investment income to average net assets(B) | | | 1.28 | % | | | 1.64 | % | | | 2.21 | % | | | 3.25 | % | | | 2.21 | % |
Portfolio turnover rate(E) | | | 22 | % | | | 30 | % | | | 16 | % | | | 30 | % | | | 12 | % |
| | | | |
| The notes to the financial statements are an integral part of this report. | | |
| Transamerica Funds | | | | Annual Report 2012 |
| | Page 44 | | |
FINANCIAL HIGHLIGHTS (continued)
For the period or years ended:
| | | | | | | | | | | | |
| | | Transamerica Asset Allocation -
Moderate Portfolio | |
| | | Class I | |
For a share outstanding throughout each period | | October 31,
2012 | | | October 31,
2011 | | | October 31,
2010(F) | |
Net asset value | | | | | | | | | | | | |
Beginning of period/year | | $ | 11.63 | | | $ | 11.61 | | | $ | 10.94 | |
| | | | | | | | | | | | |
Investment operations | | | | | | | | | | | | |
From net investment income(A),(B) | | | 0.25 | | | | 0.28 | | | | 0.17 | |
From net realized and unrealized gain on affiliated investments | | | 0.68 | | | | 0.01 | | | | 0.91 | |
| | | | | | | | | | | | |
Total from investment operations | | | 0.93 | | | | 0.29 | | | | 1.08 | |
| | | | | | | | | | | | |
Distributions | | | | | | | | | | | | |
Net investment income | | | (0.28 | ) | | | (0.27 | ) | | | (0.41 | ) |
| | | |
Net asset value | | | | | | | | | | | | |
End of year | | $ | 12.28 | | | $ | 11.63 | | | $ | 11.61 | |
| | | | | | | | | | | | |
Total return(C) | | | 8.26 | % | | | 2.53 | % | | | 10.27 | %(G) |
| | | | | | | | | | | | |
Net assets end of year (000’s) | | $ | 36,572 | | | $ | 26,332 | | | $ | 17,853 | |
| | | | | | | | | | | | |
Ratio and supplemental data | | | | | | | | | | | | |
| | | |
Expenses to average net assets:(D) | | | | | | | | | | | | |
After reimbursement/recapture | | | 0.25 | % | | | 0.26 | % | | | 0.28 | %(H) |
Before reimbursement/recapture | | | 0.25 | % | | | 0.26 | % | | | 0.28 | %(H) |
Net investment income to average net assets(B) | | | 2.11 | % | | | 2.42 | % | | | 1.73 | %(H) |
Portfolio turnover rate(E) | | | 22 | % | | | 30 | % | | | 16 | %(G) |
| | | | | | | | | | | | | | | | | | | | |
| | | Transamerica Asset Allocation - Moderate Portfolio | |
| | | Class R | |
For a share outstanding throughout each period | | October 31,
2012 | | | October 31,
2011 | | | October 31,
2010 | | | October 31,
2009 | | | October 31,
2008 | |
Net asset value | | | | | | | | | | | | | | | | | | | | |
Beginning of year | | $ | 11.54 | | | $ | 11.53 | | | $ | 10.58 | | | $ | 9.28 | | | $ | 13.65 | |
| | | | | | | | | | | | | | | | | | | | |
Investment operations | | | | | | | | | | | | | | | | | | | | |
From net investment income(A),(B) | | | 0.20 | | | | 0.23 | | | | 0.24 | | | | 0.32 | | | | 0.28 | |
From net realized and unrealized gain (loss) on affiliated investments | | | 0.67 | | | | — | (I) | | | 1.06 | | | | 1.42 | | | | (4.02 | ) |
| | | | | | | | | | | | | | | | | | | | |
Total from investment operations | | | 0.87 | | | | 0.23 | | | | 1.30 | | | | 1.74 | | | | (3.74 | ) |
| | | | | | | | | | | | | | | | | | | | |
Distributions | | | | | | | | | | | | | | | | | | | | |
Net investment income | | | (0.21 | ) | | | (0.22 | ) | | | (0.35 | ) | | | (0.44 | ) | | | (0.23 | ) |
Net realized gains on affiliated investments | | | — | | | | — | | | | — | | | | — | | | | (0.40 | ) |
| | | | | | | | | | | | | | | | | | | | |
Total distributions | | | (0.21 | ) | | | (0.22 | ) | | | (0.35 | ) | | | (0.44 | ) | | | (0.63 | ) |
| | | | | | | | | | | | | | | | | | | | |
Net asset value | | | | | | | | | | | | | | | | | | | | |
End of year | | $ | 12.20 | | | $ | 11.54 | | | $ | 11.53 | | | $ | 10.58 | | | $ | 9.28 | |
| | | | | | | | | | | | | | | | | | | | |
Total return(C) | | | 7.72 | % | | | 2.01 | % | | | 12.60 | % | | | 19.81 | % | | | (28.57 | )% |
| | | | | | | | | | | | | | | | | | | | |
Net assets end of year (000’s) | | $ | 4,954 | | | $ | 5,314 | | | $ | 4,278 | | | $ | 2,211 | | | $ | 959 | |
| | | | | | | | | | | | | | | | | | | | |
Ratio and supplemental data | | | | | | | | | | | | | | | | | | | | |
| | | | | |
Expenses to average net assets:(D) | | | | | | | | | | | | | | | | | | | | |
After reimbursement/recapture | | | 0.79 | % | | | 0.82 | % | | | 0.83 | % | | | 0.86 | % | | | 0.87 | % |
Before reimbursement/recapture | | | 0.79 | % | | | 0.82 | % | | | 0.83 | % | | | 0.86 | % | | | 0.87 | % |
Net investment income to average net assets(B) | | | 1.71 | % | | | 2.00 | % | | | 2.23 | % | | | 3.38 | % | | | 2.37 | % |
Portfolio turnover rate(E) | | | 22 | % | | | 30 | % | | | 16 | % | | | 30 | % | | | 12 | % |
| | | | |
| The notes to the financial statements are an integral part of this report. | | |
| Transamerica Funds | | | | Annual Report 2012 |
| | Page 45 | | |
FINANCIAL HIGHLIGHTS (continued)
For the period or years ended:
| | | | | | | | | | | | | | | | | | | | |
| | | Transamerica Multi-Manager Alternative Strategies Portfolio | |
| | | Class A | |
For a share outstanding throughout each period | | October 31,
2012 | | | October 31,
2011 | | | October 31,
2010 | | | October 31,
2009 | | | October 31,
2008 | |
Net asset value | | | | | | | | | | | | | | | | | | | | |
Beginning of year | | $ | 9.68 | | | $ | 9.82 | | | $ | 9.35 | | | $ | 8.30 | | | $ | 10.78 | |
| | | | | | | | | | | | | | | | | | | | |
Investment operations | | | | | | | | | | | | | | | | | | | | |
From net investment income(A),(B) | | | 0.21 | | | | 0.15 | | | | 0.14 | | | | 0.29 | | | | 0.20 | |
From net realized and unrealized gain (loss) on affiliated investments | | | 0.25 | | | | (0.23 | ) | | | 0.58 | | | | 1.08 | | | | (2.43 | ) |
| | | | | | | | | | | | | | | | | | | | |
Total from investment operations | | | 0.46 | | | | (0.08 | ) | | | 0.72 | | | | 1.37 | | | | (2.23 | ) |
| | | | | | | | | | | | | | | | | | | | |
Distributions | | | | | | | | | | | | | | | | | | | | |
Net investment income | | | (0.22 | ) | | | (0.06 | ) | | | (0.15 | ) | | | (0.32 | ) | | | (0.25 | ) |
From return of capital | | | — | | | | — | | | | (0.10 | ) | | | — | | | | — | |
| | | | | | | | | | | | | | | | | | | | |
Total distributions | | | (0.22 | ) | | | (0.06 | ) | | | (0.25 | ) | | | (0.32 | ) | | | (0.25 | ) |
| | | | | | | | | | | | | | | | | | | | |
Net asset value | | | | | | | | | | | | | | | | | | | | |
End of year | | $ | 9.92 | | | $ | 9.68 | | | $ | 9.82 | | | $ | 9.35 | | | $ | 8.30 | |
| | | | | | | | | | | | | | | | | | | | |
Total return(C) | | | 4.95 | % | | | (0.77 | )% | | | 7.83 | % | | | 17.21 | % | | | (21.08 | )% |
| | | | | | | | | | | | | | | | | | | | |
Net assets end of year (000’s) | | $ | 176,808 | | | $ | 171,567 | | | $ | 128,041 | | | $ | 119,693 | | | $ | 97,482 | |
| | | | | | | | | | | | | | | | | | | | |
Ratio and supplemental data | | | | | | | | | | | | | | | | | | | | |
| | | | | |
Expenses to average net assets:(D) | | | | | | | | | | | | | | | | | | | | |
After reimbursement/recapture | | | 0.74 | % | | | 0.76 | % | | | 0.80 | % | | | 0.81 | % | | | 0.84 | % |
Before reimbursement/recapture | | | 0.74 | % | | | 0.76 | % | | | 0.80 | % | | | 0.81 | % | | | 0.77 | % |
Net investment income to average net assets(B) | | | 2.19 | % | | | 1.53 | % | | | 1.51 | % | | | 3.43 | % | | | 1.98 | % |
Portfolio turnover rate(E) | | | 62 | % | | | 31 | % | | | 35 | % | | | 18 | % | | | 5 | % |
| |
| | | Transamerica Multi-Manager Alternative Strategies Portfolio | |
| | | Class C | |
For a share outstanding throughout each period | | October 31,
2012 | | | October 31,
2011 | | | October 31,
2010 | | | October 31,
2009 | | | October 31,
2008 | |
Net asset value | | | | | | | | | | | | | | | | | | | | |
Beginning of year | | $ | 9.59 | | | $ | 9.73 | | | $ | 9.27 | | | $ | 8.23 | | | $ | 10.72 | |
| | | | | | | | | | | | | | | | | | | | |
Investment operations | | | | | | | | | | | | | | | | | | | | |
From net investment income(A),(B) | | | 0.14 | | | | 0.09 | | | | 0.08 | | | | 0.24 | | | | 0.15 | |
From net realized and unrealized gain (loss) on affiliated investments | | | 0.25 | | | | (0.22 | ) | | | 0.57 | | | | 1.06 | | | | (2.42 | ) |
| | | | | | | | | | | | | | | | | | | | |
Total from investment operations | | | 0.39 | | | | (0.13 | ) | | | 0.65 | | | | 1.30 | | | | (2.27 | ) |
| | | | | | | | | | | | | | | | | | | | |
Distributions | | | | | | | | | | | | | | | | | | | | |
Net investment income | | | (0.16 | ) | | | (0.01 | ) | | | (0.09 | ) | | | (0.26 | ) | | | (0.22 | ) |
From return of capital | | | — | | | | — | | | | (0.10 | ) | | | — | | | | — | |
| | | | | | | | | | | | | | | | | | | | |
Total distributions | | | (0.16 | ) | | | (0.01 | ) | | | (0.19 | ) | | | (0.26 | ) | | | (0.22 | ) |
| | | | | | | | | | | | | | | | | | | | |
Net asset value | | | | | | | | | | | | | | | | | | | | |
End of year | | $ | 9.82 | | | $ | 9.59 | | | $ | 9.73 | | | $ | 9.27 | | | $ | 8.23 | |
| | | | | | | | | | | | | | | | | | | | |
Total return(C) | | | 4.21 | % | | | (1.35 | )% | | | 7.12 | % | | | 16.37 | % | | | (21.52 | )% |
| | | | | | | | | | | | | | | | | | | | |
Net assets end of year (000’s) | | $ | 142,788 | | | $ | 141,413 | | | $ | 114,662 | | | $ | 96,376 | | | $ | 89,701 | |
| | | | | | | | | | | | | | | | | | | | |
Ratio and supplemental data | | | | | | | | | | | | | | | | | | | | |
| | | | | |
Expenses to average net assets:(D) | | | | | | | | | | | | | | | | | | | | |
After reimbursement/recapture | | | 1.41 | % | | | 1.42 | % | | | 1.44 | % | | | 1.45 | % | | | 1.52 | % |
Before reimbursement/recapture | | | 1.41 | % | | | 1.42 | % | | | 1.44 | % | | | 1.45 | % | | | 1.43 | % |
Net investment income to average net assets(B) | | | 1.47 | % | | | 0.91 | % | | | 0.82 | % | | | 2.92 | % | | | 1.53 | % |
Portfolio turnover rate(E) | | | 62 | % | | | 31 | % | | | 35 | % | | | 18 | % | | | 5 | % |
| | | | |
| The notes to the financial statements are an integral part of this report. | | |
| Transamerica Funds | | | | Annual Report 2012 |
| | Page 46 | | |
FINANCIAL HIGHLIGHTS (continued)
For the period or years ended:
| | | | | | | | | | | | |
| | | Transamerica Multi-Manager Alternative
Strategies Portfolio | |
| | | Class I | |
For a share outstanding throughout each period | | October 31,
2012 | | | October 31,
2011 | | | October 31,
2010(F) | |
Net asset value | | | | | | | | | | | | |
Beginning of period/year | | $ | 9.70 | | | $ | 9.84 | | | $ | 9.49 | |
| | | | | | | | | | | | |
Investment operations | | | | | | | | | | | | |
From net investment income(A),(B) | | | 0.23 | | | | 0.15 | | | | 0.07 | |
From net realized and unrealized gain (loss) on affiliated investments | | | 0.27 | | | | (0.19 | ) | | | 0.57 | |
| | | | | | | | | | | | |
Total from investment operations | | | 0.50 | | | | (0.04 | ) | | | 0.64 | |
| | | | | | | | | | | | |
Distributions | | | | | | | | | | | | |
Net investment income | | | (0.26 | ) | | | (0.10 | ) | | | (0.19 | ) |
From return of capital | | | — | | | | — | | | | (0.10 | ) |
| | | | | | | | | | | | |
Total distributions | | | (0.26 | ) | | | (0.10 | ) | | | (0.29 | ) |
| | | | | | | | | | | | |
Net asset value | | | | | | | | | | | | |
End of year | | $ | 9.94 | | | $ | 9.70 | | | $ | 9.84 | |
| | | | | | | | | | | | |
Total return(C) | | | 5.34 | % | | | (0.47 | )% | | | 6.90 | %(G) |
| | | | | | | | | | | | |
Net assets end of year (000’s) | | $ | 175,506 | | | $ | 120,465 | | | $ | 34,131 | |
| | | | | | | | | | | | |
Ratio and supplemental data | | | | | | | | | | | | |
| | | |
Expenses to average net assets:(D) | | | | | | | | | | | | |
After reimbursement/recapture | | | 0.37 | % | | | 0.40 | % | | | 0.50 | %(H) |
Before reimbursement/recapture | | | 0.37 | % | | | 0.40 | % | | | 0.50 | %(H) |
Net investment income to average net assets(B) | | | 2.37 | % | | | 1.56 | % | | | 0.82 | %(H) |
Portfolio turnover rate(E) | | | 62 | % | | | 31 | % | | | 35 | %(G) |
| | | | | | | | | | | | | | | | | | | | |
| | | Transamerica Multi-Manager International Portfolio | |
| | | Class A | |
For a share outstanding throughout each period | | October 31,
2012 | | | October 31,
2011 | | | October 31,
2010 | | | October 31,
2009 | | | October 31,
2008 | |
Net asset value | | | | | | | | | | | | | | | | | | | | |
Beginning of year | | $ | 9.09 | | | $ | 9.84 | | | $ | 8.53 | | | $ | 6.57 | | | $ | 13.24 | |
| | | | | | | | | | | | | | | | | | | | |
Investment operations | | | | | | | | | | | | | | | | | | | | |
From net investment income(A),(B) | | | 0.16 | | | | 0.08 | | | | 0.09 | | | | 0.17 | | | | 0.27 | |
From net realized and unrealized gain (loss) on affiliated investments | | | 0.22 | | | | (0.75 | ) | | | 1.33 | | | | 1.84 | | | | (6.53 | ) |
| | | | | | | | | | | | | | | | | | | | |
Total from investment operations | | | 0.38 | | | | (0.67 | ) | | | 1.42 | | | | 2.01 | | | | (6.26 | ) |
| | | | | | | | | | | | | | | | | | | | |
Distributions | | | | | | | | | | | | | | | | | | | | |
Net investment income | | | (0.25 | ) | | | (0.08 | ) | | | (0.11 | ) | | | (0.05 | ) | | | (0.32 | ) |
Net realized gains on affiliated investments | | | — | | | | — | | | | — | | | | — | | | | (0.09 | ) |
| | | | | | | | | | | | | | | | | | | | |
Total distributions | | | (0.25 | ) | | | (0.08 | ) | | | (0.11 | ) | | | (0.05 | ) | | | (0.41 | ) |
| | | | | | | | | | | | | | | | | | | | |
Net asset value | | | | | | | | | | | | | | | | | | | | |
End of year | | $ | 9.22 | | | $ | 9.09 | | | $ | 9.84 | | | $ | 8.53 | | | $ | 6.57 | |
| | | | | | | | | | | | | | | | | | | | |
Total return(C) | | | 4.65 | % | | | (6.90 | )% | | | 16.80 | % | | | 30.86 | % | | | (48.61 | )% |
| | | | | | | | | | | | | | | | | | | | |
Net assets end of year (000’s) | | $ | 86,834 | | | $ | 118,070 | | | $ | 135,479 | | | $ | 134,751 | | | $ | 103,077 | |
| | | | | | | | | | | | | | | | | | | | |
| | | | | |
Ratio and supplemental data | | | | | | | | | | | | | | | | | | | | |
| | | | | |
Expenses to average net assets:(D) | | | | | | | | | | | | | | | | | | | | |
After reimbursement/recapture | | | 0.68 | % | | | 0.67 | % | | | 0.70 | % | | | 0.74 | % | | | 0.65 | % |
Before reimbursement/recapture | | | 0.68 | % | | | 0.67 | % | | | 0.70 | % | | | 0.74 | % | | | 0.65 | % |
Net investment income to average net assets(B) | | | 1.79 | % | | | 0.77 | % | | | 1.04 | % | | | 2.35 | % | | | 2.59 | % |
Portfolio turnover rate(E) | | | 41 | % | | | 13 | % | | | 11 | % | | | 32 | % | | | 38 | % |
| | | | |
| The notes to the financial statements are an integral part of this report. | | |
| | |
| Transamerica Funds | | | | Annual Report 2012 |
| | |
| | Page 47 | | |
FINANCIAL HIGHLIGHTS (continued)
For the period or years ended:
| | | | | | | | | | | | | | | | | | | | |
| | | Transamerica Multi-Manager International Portfolio | |
| | | Class B | |
For a share outstanding throughout each period | | October 31,
2012 | | | October 31,
2011 | | | October 31,
2010 | | | October 31,
2009 | | | October 31,
2008 | |
Net asset value | | | | | | | | | | | | | | | | | | | | |
Beginning of year | | $ | 9.00 | | | $ | 9.74 | | | $ | 8.45 | | | $ | 6.50 | | | $ | 13.13 | |
| | | | | | | | | | | | | | | | | | | | |
Investment operations | | | | | | | | | | | | | | | | | | | | |
From net investment income(A),(B) | | | 0.09 | | | | 0.01 | | | | 0.02 | | | | 0.01 | | | | 0.21 | |
From net realized and unrealized gain (loss) on affiliated investments | | | 0.24 | | | | (0.75 | ) | | | 1.32 | | | | 1.94 | | | | (6.50 | ) |
| | | | | | | | | | | | | | | | | | | | |
Total from investment operations | | | 0.33 | | | | (0.74 | ) | | | 1.34 | | | | 1.95 | | | | (6.29 | ) |
| | | | | | | | | | | | | | | | | | | | |
Distributions | | | | | | | | | | | | | | | | | | | | |
Net investment income | | | (0.17 | ) | | | — | (I) | | | (0.05 | ) | | | — | | | | (0.25 | ) |
Net realized gains on affiliated investments | | | — | | | | — | | | | — | | | | — | | | | (0.09 | ) |
| | | | | | | | | | | | | | | | | | | | |
Total distributions | | | (0.17 | ) | | | — | (I) | | | (0.05 | ) | | | — | | | | (0.34 | ) |
| | | | | | | | | | | | | | | | | | | | |
Net asset value | | | | | | | | | | | | | | | | | | | | |
End of year | | $ | 9.16 | | | $ | 9.00 | | | $ | 9.74 | | | $ | 8.45 | | | $ | 6.50 | |
| | | | | | | | | | | | | | | | | | | | |
Total return(C) | | | 3.92 | % | | | (7.59 | )% | | | 15.95 | % | | | 30.00 | % | | | (49.04 | )% |
| | | | | | | | | | | | | | | | | | | | |
Net assets end of year (000’s) | | $ | 9,847 | | | $ | 13,373 | | | $ | 18,432 | | | $ | 18,010 | | | $ | 15,781 | |
| | | | | | | | | | | | | | | | | | | | |
| | | | | |
Ratio and supplemental data | | | | | | | | | | | | | | | | | | | | |
| | | | | |
Expenses to average net assets:(D) | | | | | | | | | | | | | | | | | | | | |
After reimbursement/recapture | | | 1.45 | % | | | 1.45 | % | | | 1.45 | % | | | 1.45 | % | | | 1.42 | % |
Before reimbursement/recapture | | | 1.54 | % | | | 1.48 | % | | | 1.49 | % | | | 1.57 | % | | | 1 .42 | % |
Net investment income to average net assets(B) | | | 1.05 | % | | | 0.11 | % | | | 0.19 | % | | | 0.08 | % | | | 1.95 | % |
Portfolio turnover rate(E) | | | 41 | % | | | 13 | % | | | 11 | % | | | 32 | % | | | 38 | % |
| | | | | | | | | | | | | | | | | | | | |
| | | Transamerica Multi-Manager International Portfolio | |
| | | Class C | |
For a share outstanding throughout each period | | October 31,
2012 | | | October 31,
2011 | | | October 31,
2010 | | | October 31,
2009 | | | October 31,
2008 | |
Net asset value | | | | | | | | | | | | | | | | | | | | |
Beginning of year | | $ | 9.01 | | | $ | 9.75 | | | $ | 8.45 | | | $ | 6.50 | | | $ | 13.13 | |
| | | | | | | | | | | | | | | | | | | | |
Investment operations | | | | | | | | | | | | | | | | | | | | |
From net investment income(A),(B) | | | 0.09 | | | | 0.02 | | | | 0.02 | | | | 0.03 | | | | 0.21 | |
From net realized and unrealized gain (loss) on affiliated investments | | | 0.23 | | | | (0.74 | ) | | | 1.33 | | | | 1.92 | | | | (6.49 | ) |
| | | | | | | | | | | | | | | | | | | | |
Total from investment operations | | | 0.32 | | | | (0.72 | ) | | | 1.35 | | | | 1.95 | | | | (6.28 | ) |
| | | | | | | | | | | | | | | | | | | | |
Distributions | | | | | | | | | | | | | | | | | | | | |
Net investment income | | | (0.18 | ) | | | (0.02 | ) | | | (0.05 | ) | | | — | | | | (0.26 | ) |
Net realized gains on affiliated investments | | | — | | | | — | | | | — | | | | — | | | | (0.09 | ) |
| | | | | | | | | | | | | | | | | | | | |
Total distributions | | | (0.18 | ) | | | (0.02 | ) | | | (0.05 | ) | | | — | | | | (0.35 | ) |
| | | | | | | | | | | | | | | | | | | | |
Net asset value | | | | | | | | | | | | | | | | | | | | |
End of year | | $ | 9.15 | | | $ | 9.01 | | | $ | 9.75 | | | $ | 8.45 | | | $ | 6.50 | |
| | | | | | | | | | | | | | | | | | | | |
Total return(C) | | | 3.87 | % | | | (7.42 | )% | | | 16.10 | % | | | 30.00 | % | | | (48.98 | )% |
| | | | | | | | | | | | | | | | | | | | |
Net assets end of year (000’s) | | $ | 92,050 | | | $ | 117,858 | | | $ | 144,849 | | | $ | 132,777 | | | $ | 128,742 | |
| | | | | | | | | | | | | | | | | | | | |
| | | | | |
Ratio and supplemental data | | | | | | | | | | | | | | | | | | | | |
| | | | | |
Expenses to average net assets:(D) | | | | | | | | | | | | | | | | | | | | |
After reimbursement/recapture | | | 1.38 | % | | | 1.34 | % | | | 1.36 | % | | | 1.43 | % | | | 1.31 | % |
Before reimbursement/recapture | | | 1.38 | % | | | 1.34 | % | | | 1.36 | % | | | 1.43 | % | | | 1.31 | % |
Net investment income to average net assets(B) | | | 1.07 | % | | | 0.16 | % | | | 0.27 | % | | | 0.50 | % | | | 2.01 | % |
Portfolio turnover rate(E) | | | 41 | % | | | 13 | % | | | 11 | % | | | 32 | % | | | 38 | % |
| | | | |
| The notes to the financial statements are an integral part of this report. | | |
| | |
| Transamerica Funds | | | | Annual Report 2012 |
| | |
| | Page 48 | | |
FINANCIAL HIGHLIGHTS (continued)
For the period or years ended:
| | | | | | | | | | | | |
| | | Transamerica Multi-Manager International Portfolio | |
| | | Class I | |
For a share outstanding throughout each period | | October 31,
2012 | | | October 31,
2011 | | | October 31,
2010(F) | |
Net asset value | | | | | | | | | | | | |
Beginning of period/year | | $ | 9.11 | | | $ | 9.86 | | | $ | 8.84 | |
| | | | | | | | | | | | |
Investment operations | | | | | | | | | | | | |
From net investment income (loss)(A),(B) | | | 0.16 | | | | 0.11 | | | | (0.02 | ) |
From net realized and unrealized gain (loss) on affiliated investments | | | 0.25 | | | | (0.74 | ) | | | 1.19 | |
| | | | | | | | | | | | |
Total from investment operations | | | 0.41 | | | | (0.63 | ) | | | 1.17 | |
| | | | | | | | | | | | |
Distributions | | | | | | | | | | | | |
Net investment income | | | (0.29 | ) | | | (0.12 | ) | | | (0.15 | ) |
Net asset value | | | | | | | | | | | | |
End of year | | $ | 9.23 | | | $ | 9.11 | | | $ | 9.86 | |
| | | | | | | | | | | | |
Total return(C) | | | 5.07 | % | | | (6.49 | )% | | | 13.41 | %(G) |
| | | | | | | | | | | | |
Net assets end of year (000’s) | | $ | 28,450 | | | $ | 28,748 | | | $ | 28,047 | |
| | | | | | | | | | | | |
Ratio and supplemental data | | | | | | | | | | | | |
| | | |
Expenses to average net assets:(D) | | | | | | | | | | | | |
After reimbursement/recapture | | | 0.28 | % | | | 0.29 | % | | | 0.34 | %(H) |
Before reimbursement/recapture | | | 0.28 | % | | | 0.29 | % | | | 0.34 | %(H) |
Net investment income (loss) to average net assets(B) | | | 1.87 | % | | | 1.12 | % | | | (0.21 | )%(H) |
Portfolio turnover rate(E) | | | 41 | % | | | 13 | % | | | 11 | %(G) |
| (A) | Calculated based on average number of shares outstanding. |
| (B) | Recognition of net investment income by the fund is affected by the timing of the declaration of dividends by the underlying affiliated investment companies in which the fund invests. |
| (C) | Total return has been calculated for the applicable period without deduction of a sales load, if any, on an initial purchase. |
| (D) | Does not include expenses of the investment companies in which the fund invests. |
| (E) | Does not include the portfolio activity of the underlying affiliated funds. |
| (F) | Commenced operations on November 30, 2009. |
| (I) | Rounds to less than $0.01 or $(0.01). |
| (J) | Rounds to less than 0.01% or (0.01)%. |
Note: Prior to November 1, 2009, all of the financial highlights were audited by another independent registered public accounting firm.
| | | | |
| The notes to the financial statements are an integral part of this report. | | |
| | |
| Transamerica Funds | | | | Annual Report 2012 |
| | |
| | Page 49 | | |
NOTES TO FINANCIAL STATEMENTS
At October 31, 2012
(all amounts in thousands)
NOTE 1. ORGANIZATION AND SIGNIFICANT ACCOUNTING POLICIES
Transamerica Funds (the “Trust”) is an open-end management investment company registered under the Investment Company Act of 1940, as amended (the “1940 Act”). Transamerica Asset Allocation—Conservative Portfolio, Transamerica Asset Allocation—Growth Portfolio, Transamerica Asset Allocation—Moderate Growth Portfolio, Transamerica Asset Allocation—Moderate Portfolio, Transamerica Multi-Manager Alternative Strategies Portfolio, and Transamerica Multi-Manager International Portfolio (each, a “Fund”; and collectively, the “Funds”) are part of the Trust.
The Funds, with the exception of Transamerica Multi-Manager Alternative Strategies Portfolio and Transamerica Multi-Manager International Portfolio, currently offer five classes of shares; Class A, Class B, Class C, Class I, and Class R. Transamerica Multi-Manager Alternative Strategies Portfolio currently offers three classes of shares; Class A, Class C, and Class I. Transamerica Multi-Manager International Portfolio currently offers four classes of shares; Class A, Class B, Class C, and Class I. Each class has a public offering price that reflects different sales charges, if any, and expense levels. Class B shares will convert to Class A shares eight years after purchase. Effective July 15, 2010, Class B shares were no longer offered for purchase.
Each Fund, a “fund of fund”, invests the majority of its assets among certain affiliated series of the Trust (hereafter referred to as “Underlying Funds”). The financial statements of the Underlying Funds, including the Schedules of Investments, should be read in conjunction with the Funds’ financial statements. The Underlying Funds’ shareholder reports are available without charge at www.transamericainvestments.com and on the Securities and Exchange Commission’s (“SEC”) website at http://www.sec.gov, or at the SEC’s Public Reference Room in Washington, D.C. The Underlying Funds’ shareholder reports are not covered by this report.
This report should be read in conjunction with the Funds’ current prospectus, which contains more complete information about the Funds, including investment objectives and strategies.
In the normal course of business, the Funds enter into contracts that contain a variety of representations that provide general indemnifications. The Funds’ maximum exposure under these arrangements is unknown, as this would involve future claims that may be made against the Funds and/or their affiliates that have not yet occurred. However, based on experience, the Funds expect the risk of loss to be remote.
In preparing the Funds’ financial statements in accordance with accounting principles generally accepted in the United States of America (“GAAP”), estimates or assumptions (which could differ from actual results) may be used that affect reported amounts and disclosures. The following is a summary of significant accounting policies followed by the Funds.
Cash overdraft: Throughout the year, the Funds may have cash overdraft balances. A fee is incurred on these overdrafts, calculated by multiplying the overdraft by a rate based on the federal funds rate. Payables, if any, are reflected as Due to Custodian in the Statements of Assets and Liabilities. Expenses from cash overdrafts are included in Other in the Statements of Operations.
Security transactions and investment income: Security transactions are recorded on the trade date. Security gains and losses are calculated on the specific identification basis. Interest income is accrued as earned. Dividend income and capital gain distributions from affiliated investment companies, if any, are recorded on the ex-dividend date. Dividends and net realized gain (loss) for the Funds are from investments in shares of affiliated investment companies.
Multiple class operations, income, and expenses: Income, non-class specific expenses and realized and unrealized gains and losses are allocated daily to each class, based upon net assets. Each class bears its own specific expenses in addition to the non-class specific expenses.
Dividend distributions: Distributions to shareholders are recorded on the ex-dividend date and are determined in accordance with federal income tax regulations which may differ from GAAP.
NOTE 2. SECURITY VALUATIONS
All investments in securities are recorded at their estimated fair value. The Funds value their investments at the close of the New York Stock Exchange (“NYSE”), normally 4 p.m. Eastern Time, each day the NYSE is open for business. The Funds utilize various methods to measure the fair value of their investments on a recurring basis. GAAP establishes a hierarchy that prioritizes inputs to valuation methods. The inputs or methodology used for valuing securities are not necessarily an indication of the risk associated with investing in those securities. The three Levels of inputs of the fair value hierarchy are defined as follows:
Level 1—Unadjusted quoted prices in active markets for identical securities.
Level 2—Inputs, other than quoted prices included in Level 1, that are observable, either directly or indirectly. These inputs may include quoted prices for the identical instrument on an inactive market, prices for similar instruments, interest rates, prepayment speeds, credit risk, yield curves, default rates and similar data.
| | | | |
| Transamerica Funds | | | | Annual Report 2012 |
| | Page 50 | | |
NOTES TO FINANCIAL STATEMENTS (continued)
At October 31, 2012
(all amounts in thousands)
NOTE 2 (continued)
Level 3—Unobservable inputs, which may include Transamerica Asset Management, Inc.’s (“TAM”) Valuation Committee’s own assumptions in determining the fair value of investments. Factors considered in making this determination may include, but are not limited to, information obtained by contacting the sub-adviser, issuer, analysts, or the appropriate stock exchange (for exchange-traded securities), analysis of the issuer’s financial statements or other available documents and, if necessary, available information concerning other securities in similar circumstances.
The Funds’ Board of Trustees has delegated the valuation functions on a day-to-day basis to TAM, subject to board oversight. TAM has formed an internal valuation committee (the “Valuation Committee”) to monitor and implement the fair valuation policies and procedures as approved by the Board of Trustees. These policies and procedures are reviewed at least annually by the Board of Trustees. The Valuation Committee, among other tasks, monitors for when market quotations are not readily available or are unreliable and determines in good faith the fair value of the portfolio investments. For instances in which daily market quotes are not readily available, securities may be valued, pursuant to procedures adopted by the Board of Trustees, with reference to other instruments or indices. Depending on the relative significance of valuation inputs, these instruments may be classified in either Level 2 or Level 3 of the fair value hierarchy. The Valuation Committee may employ a market-based approach which may use related or comparable assets or liabilities, recent transactions, market multiples, book values, and other relevant information for the security to determine the fair value of the security. An income-based valuation approach may also be used in which the anticipated future cash flows of the security are discounted to calculate fair value. Discounts may also be applied due to the nature or duration of any restrictions on the disposition of the securities. When the Funds use fair value methods that rely on significant unobservable inputs to determine a security’s value, the Valuation Committee will choose the method that is believed to accurately reflect fair value. These securities are categorized as Level 3 of the fair value hierarchy. The Valuation Committee reviews fair value measurements on a regular and ad hoc basis and may, as deemed appropriate, update the investment valuations as well as the fair valuation guidelines.
The availability of observable inputs can vary from security to security and is affected by a wide variety of factors, including, but not limited to, the type of security, whether the security is new and not yet established in the marketplace, the liquidity of markets, and other characteristics particular to the security. To the extent that valuation is based on models or inputs that are less observable or unobservable in the market, the determination of fair value requires more judgment. Accordingly, the degree of judgment exercised in determining fair value is generally greatest for instruments categorized in Level 3. Due to the inherent uncertainty of valuation, TAM’s Valuation Committee’s determination of values may differ significantly from values that would have been realized had a ready market for investments existed and the differences could be material. The Valuation Committee employs various methods for calibrating these valuation approaches including a regular review of valuation methodologies, key inputs and assumptions, transactional back-testing and reviews of any market related activity.
The inputs used to measure fair value may fall into different Levels of the fair value hierarchy. In such cases, for disclosure purposes, the Level in the fair value hierarchy that is assigned to the fair value measurement of a security is determined based on the lowest Level input that is significant to the fair value measurement in its entirety.
Fair value measurements: Descriptions of the valuation techniques applied to the Funds’ major categories of assets and liabilities measured at fair value on a recurring basis are as follows:
Investment company securities: Investment company securities are valued at the net asset value of the underlying fund. These securities are actively traded and no valuation adjustments are applied. Exchange Traded Funds are stated at the last reported sale price or closing price on the day of valuation taken from the primary exchange where the security is principally traded. They are categorized in Level 1 of the fair value hierarchy. Investments in privately held investment funds with significant restrictions on redemptions where the inputs of NAVs are unobservable will be valued based upon the NAVs of such investments and are categorized as Level 3 of the fair value hierarchy.
The hierarchy classification of inputs used to value the Funds’ investments, at October 31, 2012, is disclosed in the Valuation Summary of each Fund’s Schedule of Investments.
NOTE 3. RELATED PARTY TRANSACTIONS
TAM, the Funds’ investment adviser, is directly owned by Western Reserve Life Assurance Co. of Ohio and AUSA Holding Company (“AUSA”), both of which are indirect, wholly owned subsidiaries of AEGON NV. AUSA is wholly owned by AEGON USA, LLC (“AEGON USA”), a financial services holding company whose primary emphasis is on life and health insurance, and annuity and investment products. AEGON USA is owned by AEGON US Holding Corporation, which is owned by Transamerica Corporation (DE). Transamerica Corporation (DE) is owned by The AEGON Trust, which is owned by AEGON International B.V., which is owned by AEGON NV, a Netherlands corporation, and a publicly traded international insurance group.
Transamerica Fund Services, Inc. (“TFS”) is the Funds’ administrator and transfer agent. Transamerica Capital, Inc. (“TCI”) is the Funds’ distributor/principal underwriter. TAM, TFS, and TCI are affiliates of AEGON NV.
Certain officers and trustees of the Funds are also officers and/or directors of TAM, TFS, and TCI. No interested trustee receives compensation from the Funds.
| | | | |
| Transamerica Funds | | Page 51 | | Annual Report 2012 |
NOTES TO FINANCIAL STATEMENTS (continued)
At October 31, 2012
(all amounts in thousands)
NOTE 3. (continued)
Because the Underlying Funds have varied expense and fee levels and the Funds may own different proportions of Underlying Funds at different times, the amount of fees and expenses incurred indirectly by the Funds will vary. Fund expenses do not include expenses of the investment companies in which the Funds invest. The Funds have material ownership interests in the Underlying Funds.
As of October 31, 2012, TAM had investments in the Funds as follows:
| | | | | | | | |
Fund Name | | Market
Value | | | % of Fund’s
Net Assets | |
Transamerica Multi-Manager Alternative Strategies Portfolio
Class C | | | 270 | | | | 0.05 | % |
Investment advisory fees: The Funds pay management fees to TAM based on average daily net assets (“ANA”) at the following breakpoints and/or rates:
| | | | |
Fund Name/Breakpoint | | Rate | |
Transamerica Asset Allocation—Conservative Portfolio | | | | |
ANA | | | 0.10 | % |
Transamerica Asset Allocation—Growth Portfolio | | | | |
ANA | | | 0.10 | |
Transamerica Asset Allocation—Moderate Growth Portfolio | | | | |
ANA | | | 0.10 | |
Transamerica Asset Allocation—Moderate Portfolio | | | | |
ANA | | | 0.10 | |
Transamerica Multi-Manager Alternative Strategies Portfolio | | | | |
First $500 million | | | 0.20 | |
Over $500 million up to $1 billion | | | 0.19 | |
Over $1 billion | | | 0.18 | |
Transamerica Multi-Manager International Portfolio | | | | |
ANA | | | 0.10 | |
TAM has contractually agreed to waive fees and/or reimburse Fund expenses to the extent that the operating expenses excluding, as applicable, 12b-1 fees, acquired fund fees and expenses, interest, taxes, brokerage commissions, dividend and interest expenses on securities sold short, extraordinary expenses and other expenses not incurred in the ordinary course of the Funds’ business, exceed the following stated annual limit:
| | | | |
Fund Name | | Expense Limit | | Maximum Operating Expense Limit
Effective Through |
Transamerica Asset Allocation—Conservative Portfolio | | 0.45% | | March 1, 2013 |
Transamerica Asset Allocation—Growth Portfolio | | 0.45 | | March 1, 2013 |
Transamerica Asset Allocation—Moderate Growth Portfolio | | 0.45 | | March 1, 2013 |
Transamerica Asset Allocation—Moderate Portfolio | | 0.45 | | March 1, 2013 |
Transamerica Multi-Manager Alternative Strategies Portfolio | | 0.55 | | March 1, 2013 |
Transamerica Multi-Manager International Portfolio | | 0.45 | | March 1, 2013 |
TAM is entitled to reimbursement by the Fund of fees waived and/or expenses reduced during any of the previous 36 months if on any day or month the estimated annualized Fund operating expenses are less than the stated annual limit.
There were no amounts recaptured for the year ended October 31, 2012.
The following amounts were available for recapture by TAM as of October 31, 2012:
| | | | | | | | | | | | |
Fund Name/Class | | Amount
Available | | | Year
Reimbursed | | | Available
Through | |
Transamerica Multi-Manager International Portfolio | | | | | | | | | | | | |
Class B | | $ | 6 | | | | 2011 | | | | 10/31/2013 | |
| | | 10 | | | | 2012 | | | | 10/31/2014 | |
Distribution and service fees: The Funds have 12b-1 distribution plans under the 1940 Act pursuant to which an annual fee, based on ANA, is paid to the distributor for various disbursements such as broker-dealer account servicing fees and other promotional expenses of the Funds. Pursuant to the distribution plan, the Trust entered into a distribution agreement with TCI as the Funds’ distributor. The Funds are authorized under the 12b-1 plans to pay fees on each available class up to the following limits: 0.30% for Class A (effective March 1, 2012); 1.00% for Class B; 1.00% for Class C; and 0.50% for Class R. 12b-1 fees are not applicable for Class I. Prior to March 1, 2012, Class A was authorized under the 12b-1 plan to pay a 0.35% fee. Amounts paid are included in the Statements of Operations.
| | | | |
| Transamerica Funds | | | | Annual Report 2012 |
| | Page 52 | | |
NOTES TO FINANCIAL STATEMENTS (continued)
At October 31, 2012
(all amounts in thousands)
NOTE 3. (continued)
Underwriter commissions relate to front-end sales charges imposed for Class A shares and contingent deferred sales charges from Class B, Class C, and certain Class A share redemptions. For the year ended October 31, 2012 the underwriter commissions were as follows:
| | | | |
Transamerica Asset Allocation—Conservative Portfolio | |
Received by Underwriter | | $ | 1,776 | |
Retained by Underwriter | | | 292 | |
Contingent Deferred Sales Charge | | | 143 | |
Transamerica Asset Allocation—Growth Portfolio | | | | |
Received by Underwriter | | $ | 1,585 | |
Retained by Underwriter | | | 239 | |
Contingent Deferred Sales Charge | | | 177 | |
Transamerica Asset Allocation—Moderate Growth Portfolio | | | | |
Received by Underwriter | | $ | 3,233 | |
Retained by Underwriter | | | 493 | |
Contingent Deferred Sales Charge | | | 404 | |
| | | | |
Transamerica Asset Allocation—Moderate Portfolio | |
Received by Underwriter | | $ | 2,606 | |
Retained by Underwriter | | | 416 | |
Contingent Deferred Sales Charge | | | 245 | |
Transamerica Multi-Manager Alternative Strategies Portfolio | | | | |
Received by Underwriter | | $ | 741 | |
Retained by Underwriter | | | 113 | |
Contingent Deferred Sales Charge | | | 45 | |
Transamerica Multi-Manager International Portfolio | | | | |
Received by Underwriter | | $ | 76 | |
Retained by Underwriter | | | 12 | |
Contingent Deferred Sales Charge | | | 23 | |
Administrative services: The Funds have entered into an agreement with TFS for financial and legal fund administration services. Effective March 1, 2012, the Funds pay TFS an annual fee of 0.0175% of ANA. Prior to March 1, 2012, the Funds paid TFS an annual fee of 0.0125% of ANA. The Legal fees in the Statement of Operations are for fees paid to external legal counsel.
Transfer agent fees: Pursuant to a Transfer Agency Agreement, as amended, the Funds pay TFS a fee for providing transfer agent services. Fees paid and the amounts due to TFS for the year ended October 31, 2012 are as follows:
| | | | | | | | |
Fund Name | | Fees Paid to TFS | | | Due to TFS | |
Transamerica Asset Allocation—Conservative Portfolio | | $ | 1,150 | | | $ | 94 | |
Transamerica Asset Allocation—Growth Portfolio | | | 2,308 | | | | 186 | |
Transamerica Asset Allocation—Moderate Growth Portfolio | | | 3,597 | | | | 292 | |
Transamerica Asset Allocation—Moderate Portfolio | | | 2,136 | | | | 174 | |
Transamerica Multi-Manager Alternative Strategies Portfolio | | | 634 | | | | 52 | |
Transamerica Multi-Manager International Portfolio | | | 453 | | | | 35 | |
Deferred compensation plan: Under a non-qualified deferred compensation plan effective January 1, 1996, as amended and restated (the “Deferred Compensation Plan”), available to the Trustees, compensation may be deferred that would otherwise be payable by the Trust to an Independent Trustee on a current basis for services rendered as Trustee. Deferred compensation amounts will accumulate based on the value of Class A (or comparable) shares of a series of Transamerica Funds (without imposition of sales charge), or investment options under Transamerica Partners Institutional Funds and Transamerica Institutional Asset Allocation Funds, as elected by the Trustee.
NOTE 4. INVESTMENT TRANSACTIONS
The cost of affiliated investments purchased and proceeds from affiliated investments sold (excluding short-term securities) for the year ended October 31, 2012 were as follows:
| | | | | | | | | | | | | | | | |
| | | Purchases of affiliated
investments: | | | Proceeds from maturities and
sales of affiliated investments: | |
Fund Name | | Long-term | | | U.S.
Government | | | Long-term | | | U.S.
Government | |
Transamerica Asset Allocation—Conservative Portfolio | | $ | 231,232 | | | $ | — | | | $ | 257,689 | | | $ | — | |
Transamerica Asset Allocation—Growth Portfolio | | | 303,634 | | | | — | | | | 462,270 | | | | — | |
Transamerica Asset Allocation—Moderate Growth Portfolio | | | 714,530 | | | | — | | | | 981,486 | | | | — | |
Transamerica Asset Allocation—Moderate Portfolio | | | 474,238 | | | | — | | | | 597,841 | | | | — | |
Transamerica Multi-Manager Alternative Strategies Portfolio | | | 339,922 | | | | — | | | | 284,830 | | | | — | |
Transamerica Multi-Manager International Portfolio | | | 98,252 | | | | — | | | | 143,492 | | | | — | |
| | | | |
| Transamerica Funds | | | | Annual Report 2012 |
| | Page 53 | | |
NOTES TO FINANCIAL STATEMENTS (continued)
At October 31, 2012
(all amounts in thousands)
NOTE 5. FEDERAL INCOME TAX MATTERS
The Funds have not made any provision for federal income or excise taxes due to its policy to distribute all of their taxable income and capital gains to their shareholders and otherwise qualify as a regulated investment company under Subchapter M of the Internal Revenue Code. The Funds recognize the tax benefits of uncertain tax positions only where the position is “more likely than not” to be sustained assuming examination by tax authorities. Management has evaluated the Funds’ tax provisions taken or expected to be taken for all open tax years 2009-2012, and has concluded that no provision for income tax is required in the Funds’ financial statements. If applicable, the Funds recognize interest accrued related to unrecognized tax benefits in interest and penalties expense in Other in the Statement of Operations. The Funds identify their major tax jurisdictions as U.S. Federal, the state of Florida, and foreign jurisdictions where the Funds make significant investments; however, the Funds are not aware of any tax positions for which it is reasonably possible that the total amounts of unrecognized tax benefits will change materially in the next twelve months. Income and capital gain distributions are determined in accordance with income tax regulations, which may differ from GAAP. These differences are primarily due to differing treatment for items including, but not limited to, wash sales, net operating losses, and capital loss carryforwards.
Therefore, distributions determined in accordance with tax regulations may differ significantly in amount or character from net investment income and realized gains for financial reporting purposes. Financial reporting records are adjusted for permanent book/tax differences to reflect tax character. These reclassifications have no impact on net assets or results of operations. Financial records are not adjusted for temporary differences. These reclassifications are as follows:
| | | | | | | | | | | | |
Fund Name | | Shares of
beneficial
interest,
unlimited shares
authorized | | | Undistributed
(accumulated)
net investment
income (loss) | | | Undistributed
(accumulated)
net realized gain (loss)
from investment
securities | |
Transamerica Asset Allocation—Growth Portfolio | | $ | (11 | ) | | $ | 11 | | | $ | — | |
At October 31, 2012, the Funds had capital loss carryforwards available to offset future realized gains through the periods listed below:
| | | | | | |
Fund Name | | Capital Loss
Carryforwards | | | Available Through |
Transamerica Asset Allocation—Growth Portfolio | | $ | 130,148 | | | October 31, 2017 |
Transamerica Asset Allocation—Growth Portfolio | | | 25,849 | | | October 31, 2018 |
Transamerica Asset Allocation—Growth Portfolio | | | 34,956 | | | October 31, 2019 |
Transamerica Asset Allocation—Moderate Growth Portfolio | | | 138,547 | | | October 31, 2017 |
Transamerica Asset Allocation—Moderate Growth Portfolio | | | 26,155 | | | October 31, 2018 |
Transamerica Asset Allocation—Moderate Growth Portfolio | | | 55,840 | | | October 31, 2019 |
Transamerica Asset Allocation—Moderate Portfolio | | | 4,324 | | | October 31, 2017 |
Transamerica Asset Allocation—Moderate Portfolio | | | 13,272 | | | October 31, 2018 |
Transamerica Asset Allocation—Moderate Portfolio | | | 10,807 | | | October 31, 2019 |
Transamerica Multi-Manager Alternative Strategies Portfolio | | | 2,826 | | | October 31, 2017 |
Transamerica Multi-Manager Alternative Strategies Portfolio | | | 3,781 | | | October 31, 2018 |
Transamerica Multi-Manager International Portfolio | | | 35,954 | | | October 31, 2016 |
Transamerica Multi-Manager International Portfolio | | | 51,739 | | | October 31, 2017 |
Transamerica Multi-Manager International Portfolio | | | 4,935 | | | October 31, 2018 |
Transamerica Multi-Manager International Portfolio | | | 341 | | | Short-Term Indefinitely |
Transamerica Multi-Manager International Portfolio | | | 4,542 | | | Long-Term Indefinitely |
The capital loss carryforwards utilized or expired during the year ended October 31, 2012 were as follows:
| | |
Fund Name | | Capital Loss
Carryforwards
Utilized/Expired During
the Year Ended October
31, 2012 |
Transamerica Asset Allocation—Conservative Portfolio | | $25,243 |
Transamerica Asset Allocation—Growth Portfolio | | 46,260 |
Transamerica Asset Allocation—Moderate Growth Portfolio | | 81,340 |
Transamerica Asset Allocation—Moderate Portfolio | | 65,623 |
Transamerica Multi-Manager Alternative Strategies Portfolio | | 267 |
| | | | |
| Transamerica Funds | | | | Annual Report 2012 |
| | Page 54 | | |
NOTES TO FINANCIAL STATEMENTS (continued)
At October 31, 2012
(all amounts in thousands)
NOTE 5. FEDERAL INCOME TAX MATTERS (continued)
The tax character of distributions paid may differ from the character of distributions shown in the Statements of Changes in Net Assets due to short-term gains being treated as ordinary income for tax purposes. The tax character of distributions paid during 2012 and 2011 was as follows:
| | | | | | | | | | | | | | | | | | | | | | | | |
| | | 2012 Distributions Paid From | | | 2011 Distributions Paid From | |
| | | Ordinary
income | | | Long-term
Capital Gain | | | Return of
Capital | | | Ordinary
income | | | Long-term
Capital Gain | | | Return of
Capital | |
Transamerica Asset Allocation—Conservative Portfolio | | $ | 23,839 | | | $ | — | | | $ | — | | | $ | 27,936 | | | $ | — | | | $ | — | |
Transamerica Asset Allocation—Growth Portfolio | | | 10,557 | | | | — | | | | — | | | | 3,094 | | | | — | | | | — | |
Transamerica Asset Allocation—Moderate Growth Portfolio | | | 29,703 | | | | — | | | | — | | | | 33,847 | | | | — | | | | — | |
Transamerica Asset Allocation—Moderate Portfolio | | | 34,712 | | | | — | | | | — | | | | 36,555 | | | | — | | | | — | |
Transamerica Multi-Manager Alternative Strategies Portfolio | | | 9,728 | | | | — | | | | — | | | | 1,413 | | | | — | | | | — | |
Transamerica Multi-Manager International Portfolio | | | 6,523 | | | | — | | | | — | | | | 1,696 | | | | — | | | | — | |
The tax basis components of distributable earnings as of October 31, 2012 are as follows:
| | | | | | | | | | | | | | | | | | | | |
Fund Name | | Undistributed
Ordinary
income | | | Undistributed
Long-term
Capital Gain | | | Capital Loss
Carryforward | | | Other
Temporary
Differences | | | Net Unrealized
Appreciation
(Depreciation)* | |
Transamerica Asset Allocation—Conservative Portfolio | | $ | 560 | | | $ | 4,199 | | | $ | — | | | $ | — | | | $ | 102,121 | |
Transamerica Asset Allocation—Growth Portfolio | | | — | | | | — | | | | (190,953 | ) | | | (5,372 | )^ | | | 211,669 | |
Transamerica Asset Allocation—Moderate Growth Portfolio | | | 3,137 | | | | — | | | | (220,542 | ) | | | — | | | | 344,153 | |
Transamerica Asset Allocation—Moderate Portfolio | | | 11,924 | | | | — | | | | (28,403 | ) | | | — | | | | 218,504 | |
Transamerica Multi-Manager Alternative Strategies Portfolio | | | 2,795 | | | | — | | | | (6,607 | ) | | | — | | | | (2,533 | ) |
Transamerica Multi-Manager International Portfolio | | | — | | | | — | | | | (97,511 | ) | | | (1,730 | )^ | | | (3,499 | ) |
| * | Amounts include unrealized gain/loss from wash sales, if applicable. |
| ^ | Amounts include qualified ordinary late-year loss deferral. |
NOTE 6. SUBSEQUENT EVENTS
Management has evaluated subsequent events through the date of issuance of the financial statements, and determined that no other material events or transactions would require recognition or disclosure in the Funds’ financial statements.
| | | | |
| Transamerica Funds | | | | Annual Report 2012 |
| | Page 55 | | |
Report of Independent Registered Public Accounting Firm
To the Board of Trustees & Shareholders of Transamerica Funds:
We have audited the accompanying statements of assets and liabilities of Transamerica Asset Allocation—Conservative Portfolio, Transamerica Asset Allocation—Growth Portfolio, Transamerica Asset Allocation—Moderate Growth Portfolio, Transamerica Asset Allocation—Moderate Portfolio, Transamerica Multi-Manager Alternative Strategies Portfolio, and Transamerica Multi-Manager International Portfolio, (collectively, the “Funds”) (six of the Funds of the Transamerica Funds), including the schedules of investments, as of October 31, 2012, and the related statements of operations for the year then ended, the statements of changes in net assets for each of the two years in the period then ended, and the financial highlights for each of the periods indicated therein. These financial statements and financial highlights are the responsibility of the Funds’ management. Our responsibility is to express an opinion on these financial statements and financial highlights based on our audits. The financial highlights for periods ended prior to November 1, 2009 were audited by another independent registered public accounting firm whose report, dated December 21, 2009, expressed an unqualified opinion on those financial highlights.
We conducted our audits in accordance with the standards of the Public Company Accounting Oversight Board (United States). Those standards require that we plan and perform the audits to obtain reasonable assurance about whether the financial statements and financial highlights are free of material misstatement. We were not engaged to perform an audit of the Funds’ internal control over financial reporting. Our audits included consideration of internal control over financial reporting as a basis for designing audit procedures that are appropriate in the circumstances, but not for the purpose of expressing an opinion on the effectiveness of the Funds’ internal control over financial reporting. Accordingly, we express no such opinion. An audit also includes examining, on a test basis, evidence supporting the amounts and disclosures in the financial statements and financial highlights, assessing the accounting principles used and significant estimates made by management, and evaluating the overall financial statement presentation. Our procedures included confirmation of securities owned as of October 31, 2012, by correspondence with the custodian and others or by other appropriate auditing procedures where replies from others were not received. We believe that our audits provide a reasonable basis for our opinion.
In our opinion, the financial statements and financial highlights referred to above present fairly, in all material respects, the financial position of the aforementioned six Funds of the Transamerica Funds at October 31, 2012, the results of their operations for the year then ended, the changes in their net assets for each of the two years in the period then ended and the financial highlights for each of the periods indicated therein, in conformity with U.S. generally accepted accounting principles.

Boston, Massachusetts
December 26, 2012
| | | | |
| Transamerica Funds | | | | Annual Report 2012 |
| | Page 56 | | |
TRANSAMERICA FUNDS
INVESTMENT ADVISORY AND SUB-ADVISORY AGREEMENTS—CONTRACT RENEWAL
(unaudited)
At a meeting of the Board of Trustees of Transamerica Funds (the “Board”) held on June 13-14, 2012, the Board reviewed and considered the renewal of the investment advisory agreements (each an “Investment Advisory Agreement” and collectively the “Investment Advisory Agreements”) between each of the following funds (each a “Portfolio” and collectively the “Portfolios”) and Transamerica Asset Management, Inc. (“TAM”):
| | |
| Transamerica Asset Allocation—Conservative Portfolio | | Transamerica Asset Allocation—Moderate Portfolio |
| Transamerica Asset Allocation—Growth Portfolio | | Transamerica Multi-Manager Alternative Strategies Portfolio |
| Transamerica Asset Allocation—Moderate Growth Portfolio | | Transamerica Multi-Manager International Portfolio |
For each Portfolio except Transamerica Multi-Manager Alternative Strategies Portfolio, the Board also reviewed and considered the renewal of an investment sub-advisory agreement (each a “Sub-Advisory Agreement” and collectively the “Sub-Advisory Agreements”) between TAM and Morningstar Associates, LLC (the “Sub-Adviser”).
Following their review and consideration, the Trustees determined that the terms of each Investment Advisory Agreement and Sub-Advisory Agreement are reasonable and that the renewal of each agreement is in the best interests of the applicable Portfolio and its shareholders. The Board, including the independent members of the Board (the “Independent Trustees”), unanimously approved the renewal of each Investment Advisory Agreement and Sub-Advisory Agreement through June 30, 2013. In reaching their decision, the Trustees requested and received from TAM and the Sub-Adviser such information as they deemed reasonably necessary to evaluate the agreements, including, to the extent applicable, information about fees and performance of comparable funds and/or accounts managed by the Sub-Adviser. The Trustees also considered information they had previously received from TAM and the Sub-Adviser as part of their regular oversight of each Portfolio, as well as comparative fee, expense, and performance information prepared by Lipper Inc. (“Lipper”), an independent provider of mutual fund performance information, and fee and expense information and profitability data prepared by TAM.
In their deliberations, the Independent Trustees had the opportunity to meet privately without representatives of TAM or the Sub-Adviser present and were represented throughout the process by independent legal counsel. In considering the proposed continuation of each Investment Advisory Agreement and Sub-Advisory Agreement, the Trustees evaluated a number of considerations that they believed, in light of the legal advice furnished to them by independent legal counsel and their own business judgment, to be relevant. They based their decisions on the considerations discussed below, among others, although they did not identify any consideration or particular information that was controlling of their decisions, and each Trustee may have attributed different weights to the various factors.
Nature, Extent and Quality of the Services Provided
The Board considered the nature, extent and quality of the services provided by TAM and the Sub-Adviser to the applicable Portfolio in the past and the services anticipated to be provided in the future. The Board also considered the investment approach for each Portfolio; the experience, capability and integrity of TAM’s senior management; the financial resources of TAM and the Sub-Adviser; TAM’s management oversight process or the professional qualifications of TAM’s portfolio management team, as applicable to a particular Portfolio; and the professional qualifications of the portfolio management team of the Sub-Adviser.
With respect to Portfolios for which day-to-day portfolio management is provided by the Sub-Adviser, the Board also considered the services provided by TAM for the portion of the management fee it retains after payment of the sub-advisory fee. The Board noted that these services include not only the services TAM provides to all Transamerica funds in the form of oversight of the services provided by the funds’ administrator, custodian and transfer agent and supervision of the performance of recordkeeping, shareholder relations, regulatory reporting and compliance functions of the funds, but also the “manager of managers” services TAM provides to sub-advised funds in the form of selection and oversight of the sub-adviser(s).
Based on these considerations, the Board determined that TAM and the Sub-Adviser can provide investment and related services that are appropriate in scope and extent in light of the applicable Portfolio’s operations, the competitive landscape of the investment company business and investor needs.
Investment Performance
The Board considered the short- and longer-term performance of each Portfolio in light of its investment objective, policies and strategies, including relative performance against (i) a peer universe of comparable mutual funds, as prepared by Lipper, and (ii) the Portfolio’s benchmark(s), in each case for various trailing periods ended December 31, 2011.
Transamerica Asset Allocation – Conservative Portfolio. The Board noted that the performance of Class A of the Portfolio was below the median for its peer universe for the past 1- and 5-year periods and above the median for the past 3-year period. The Board also noted that the performance of Class A of the Portfolio was below its primary benchmark for the past 1- and 5-year periods and above its primary benchmark for the past 3-year period. The Trustees discussed the reasons for the underperformance with TAM and agreed to continue to monitor the performance of the Portfolio. The Trustees also noted that the performance of the Portfolio had improved during 2012.
| | | | |
| Transamerica Funds | | | | Annual Report 2012 |
| | Page 57 | | |
TRANSAMERICA FUNDS
INVESTMENT ADVISORY AND SUB-ADVISORY AGREEMENTS – CONTRACT RENEWAL (continued)
(unaudited)
Investment Performance (continued)
Transamerica Asset Allocation—Growth Portfolio. The Board noted that the performance of Class A of the Portfolio was below the median for its peer universe for the past 1-, 3- and 5-year periods. The Board also noted that the performance of Class A of the Portfolio was below its benchmark for the past 1-, 3- and 5-year periods. The Trustees discussed the reasons for the underperformance with TAM and agreed to continue to monitor the performance of the Portfolio. The Trustees also noted that the performance of the Portfolio had improved during 2012.
Transamerica Asset Allocation—Moderate Growth Portfolio. The Board noted that the performance of Class A of the Portfolio was below the median for its peer universe for the past 1-, 3- and 5-year periods. The Board also noted that the performance of Class A of the Portfolio was below its primary benchmark for the past 1-, 3- and 5-year periods. The Trustees discussed the reasons for the underperformance with TAM and agreed to continue to monitor the performance of the Portfolio. The Trustees also noted that the performance of the Portfolio had improved during 2012.
Transamerica Asset Allocation—Moderate Portfolio. The Board noted that the performance of Class A of the Portfolio was below the median for its peer universe for the past 1-year period and in line with the median for the past 3- and 5-year periods. The Board also noted that the performance of Class A of the Portfolio was below its primary benchmark for the past 1- and 3-year periods and above its primary benchmark for the past 5-year period. The Trustees discussed the reasons for the underperformance with TAM and agreed to continue to monitor the performance of the Portfolio. The Trustees also noted that the performance of the Portfolio had improved during 2012.
Transamerica Multi-Manager Alternative Strategies Portfolio. The Board noted that the performance of Class A of the Portfolio was above the median for its peer universe for the past 1-year period, below the median for the past 3-year period and in line with the median for the past 5-year period. The Board also noted that the performance of Class A of the Portfolio was below its benchmark for the past 1- and 5-year periods and above its benchmark for the past 3-year period. The Board noted that the Portfolio’s assets had until recently been managed by a sub-adviser and that the Portfolio’s performance reflected the sub-adviser’s portfolio management.
Transamerica Multi-Manager International Portfolio. The Board noted that the performance of Class A of the Portfolio was below the median for its peer universe for the past 1-year period, above the median for the past 3-year period and in line with the median for the past 5-year period. The Board also noted that the performance of Class A of the Portfolio was below its benchmark for the past 1-year period and above its benchmark for the past 3- and 5-year periods. The Trustees discussed the reasons for the underperformance with TAM and agreed to continue to monitor the performance of the Portfolio.
On the basis of this information and the Board’s assessment of the nature, extent and quality of the services to be provided or procured by TAM and the Sub-Adviser, the Board concluded that TAM and the Sub-Adviser are capable of generating a level of investment performance that is appropriate in light of the applicable Portfolio’s investment objectives, policies and strategies and competitive with other investment companies.
Management and Sub-Advisory Fees and Total Expense Ratios
The Board considered the management fee and total expense ratio of each Portfolio, including information provided by Lipper comparing the management fee and total expense ratio of each Portfolio to the management fees and total expense ratios of other investment companies in both a peer group and broader peer universe compiled by Lipper. The Board also considered the fees charged by the Sub-Adviser for sub-advisory services as well as, where applicable, the portion of a Portfolio’s management fee retained by TAM following payment of the sub-advisory fee.
Transamerica Asset Allocation—Conservative Portfolio. The Board noted that the Portfolio’s contractual management fee was in line with the medians for its peer group and peer universe and that the actual total expenses (i.e., expenses reflecting any waivers and/or reimbursements) of Class A of the Portfolio were above the medians for its peer group and peer universe. The Board also noted that TAM has entered into an expense limitation arrangement with the Portfolio, which may result in TAM waiving fees for the benefit of shareholders.
Transamerica Asset Allocation—Growth Portfolio. The Board noted that the Portfolio’s contractual management fee was in line with the medians for its peer group and peer universe and that the actual total expenses (i.e., expenses reflecting any waivers and/or reimbursements) of Class A of the Portfolio were above the medians for its peer group and peer universe. The Board also noted that TAM has entered into an expense limitation arrangement with the Portfolio, which may result in TAM waiving fees for the benefit of shareholders.
| | | | |
| Transamerica Funds | | | | Annual Report 2012 |
| | Page 58 | | |
TRANSAMERICA FUNDS
INVESTMENT ADVISORY AND SUB-ADVISORY AGREEMENTS—CONTRACT RENEWAL (continued)
(unaudited)
Management and Sub-Advisory Fees and Total Expense Ratios (continued)
Transamerica Asset Allocation—Moderate Growth Portfolio. The Board noted that the Portfolio’s contractual management fee was in line with the medians for its peer group and peer universe and that the actual total expenses (i.e., expenses reflecting any waivers and/or reimbursements) of Class A of the Portfolio were above the medians for its peer group and peer universe. The Board also noted that TAM has entered into an expense limitation arrangement with the Portfolio, which may result in TAM waiving fees for the benefit of shareholders.
Transamerica Asset Allocation—Moderate Portfolio. The Board noted that the Portfolio’s contractual management fee was in line with the median for its peer group and below the median for its peer universe and that the actual total expenses (i.e., expenses reflecting any waivers and/or reimbursements) of Class A of the Portfolio were above the medians for its peer group and peer universe. The Board also noted that TAM has entered into an expense limitation arrangement with the Portfolio, which may result in TAM waiving fees for the benefit of shareholders.
Transamerica Multi-Manager Alternative Strategies Portfolio. The Board noted that the Portfolio’s contractual management fee was in line with the medians for its peer group and peer universe and that the actual total expenses (i.e., expenses reflecting any waivers and/or reimbursements) of Class A of the Portfolio were above the medians for its peer group and peer universe. The Board also noted that TAM has entered into an expense limitation arrangement with the Portfolio, which may result in TAM waiving fees for the benefit of shareholders.
Transamerica Multi-Manager International Portfolio. The Board noted that the Portfolio’s contractual management fee was above the medians for its peer group and peer universe and that the actual total expenses (i.e., expenses reflecting any waivers and/or reimbursements) of Class A of the Portfolio were above the medians for its peer group and peer universe. The Board also noted that TAM has entered into an expense limitation arrangement with the Portfolio, which may result in TAM waiving fees for the benefit of shareholders.
On the basis of these considerations, together with the other information it considered, the Board determined that the management and sub-advisory fees to be received by TAM and the Sub-Adviser under the Investment Advisory Agreements and Sub-Advisory Agreements are reasonable in light of the services provided.
Cost of Services Provided and Level of Profitability
The Board reviewed information provided by TAM about the cost of providing and/or procuring fund management services, as applicable, as well as the costs of the provision of administration, transfer agency and other services, to each Portfolio and to Transamerica Funds as a whole by TAM and its affiliates. The Board considered the profitability of TAM and its affiliates in providing these services for each Portfolio and Transamerica Funds as a whole, as well as the allocation methodology used for calculating profitability.
With respect to the Sub-Adviser, the Board noted that the sub-advisory fees are the product of arm’s-length negotiation between TAM and the Sub-Adviser and are paid by TAM and not the applicable Portfolio. As a result, the Board principally considered the profitability of TAM and its affiliates with respect to the applicable Portfolio.
Based on this information, the Board determined that the profitability of TAM and its affiliates from their relationships with the Portfolios was not excessive.
Economies of Scale
The Board considered economies of scale with respect to the management of each Portfolio, whether the Portfolio had appropriately benefited from any economies of scale, and whether there was the potential for realization of any further economies of scale. The Board also considered the existence of economies of scale with respect to management of the Transamerica funds overall and the extent to which the Portfolios benefited from these economies of scale. The Board considered each Portfolio’s management fee schedule and the existence of breakpoints, if any, and also considered the extent to which TAM shared economies of scale with the Portfolios through investments in capabilities and services. The Trustees concluded that each Portfolio’s fee structure reflected economies of scale to date but noted that they will have the opportunity to periodically reexamine whether each Portfolio has achieved economies of scale, and the appropriateness of management fees payable to TAM and fees paid to the Sub-Adviser, in the future.
Benefits to TAM, its Affiliates, or the Sub-Adviser from their Relationships with the Portfolios
The Board considered any other benefits derived by TAM, its affiliates, and the Sub-Adviser from their relationships with the Portfolios. The Board noted that TAM does not realize soft dollar benefits from its relationships with the Portfolios and that TAM believes that any use of soft dollars by the Sub-Adviser is generally appropriate and in the best interests of the Portfolios.
| | | | |
| Transamerica Funds | | | | Annual Report 2012 |
| | Page 59 | | |
TRANSAMERICA FUNDS
INVESTMENT ADVISORY AND SUB-ADVISORY AGREEMENTS—CONTRACT RENEWAL (continued)
(unaudited)
Other Considerations
The Board noted that TAM has made a substantial commitment to the recruitment and retention of high quality personnel, and maintains the financial, compliance and operational resources reasonably necessary to manage each Portfolio in a professional manner that is consistent with the best interests of the Portfolio and its shareholders. In this regard, the Board favorably considered the procedures and policies TAM has in place to enforce compliance with applicable laws and regulations and oversee the portfolio management activities of the Sub-Adviser. The Board also noted that TAM has made a significant entrepreneurial commitment to the management and success of the Portfolios.
Conclusion
After consideration of the factors described above, as well as other factors, the Trustees, including all of the Independent Trustees, concluded that the renewal of each Investment Advisory Agreement and Sub-Advisory Agreement is in the best interests of the applicable Portfolio and its shareholders and voted to approve the renewal of each Investment Advisory Agreement and Sub-Advisory Agreement.
| | | | |
| Transamerica Funds | | | | Annual Report 2012 |
| | Page 60 | | |
SUPPLEMENTAL INFORMATION (unaudited)
TAX INFORMATION
For Dividends paid during the year ended October 31, 2012, the Funds designated the following maximum amounts of qualified dividend income:
| | | | |
Fund | | Qualified Dividend
Income (000’s) | |
Transamerica Asset Allocation—Conservative Portfolio | | $ | 23,839 | |
Transamerica Asset Allocation—Growth Portfolio | | | 10,557 | |
Transamerica Asset Allocation—Moderate Growth Portfolio | | | 29,703 | |
Transamerica Asset Allocation—Moderate Portfolio | | | 34,712 | |
Transamerica Multi-Manger Alternative Strategies Portfolio | | | 9,728 | |
Transamerica Multi-Manger International Portfolio | | | 6,523 | |
For corporate shareholders, investment income (dividend income plus short-term gains, if any) qualifies for the maximum dividends received deductions as follows:
| | | | |
Fund | | Dividend Received
Deduction Percentage | |
Transamerica Asset Allocation Conservative—Portfolio | | | 100 | % |
Transamerica Asset Allocation Growth—Portfolio | | | 100 | |
Transamerica Asset Allocation Moderate—Growth Portfolio | | | 100 | |
Transamerica Asset Allocation Moderate—Portfolio | | | 100 | |
Transamerica Multi-Manger Alternative Strategies Portfolio | | | 100 | |
Transamerica Multi-Manger International Portfolio | | | 100 | |
For tax purpose, there were no Long-Term Capital Gain Designations for the year ended October 31, 2012.
The information and distributions reported herein may differ from the information and distributions taxable to the shareholders for the calendar year ending December 31, 2012. Complete information will be computed and reported in conjunction with your 2012 Form 1099-DIV.
| | | | |
| Transamerica Funds | | | | Annual Report 2012 |
| | Page 61 | | |
TRANSAMERICA FUNDS
SUPPLEMENTAL SHAREHOLDER INFORMATION (unaudited)
At a meeting held on August 2, 2012, the Board of Trustees of the funds approved certain initiatives that are intended to move the fund complex to a more modern and efficient operating platform. The Board authorized seeking shareholder approval for these measures where required. A proxy statement asking fund shareholders to elect Trustees, approve a new investment advisory agreement between Transamerica Asset Management, Inc. and their funds, and approve changes to their fund’s fundamental investment policies was mailed in September 2012. If shareholder approval is obtained, these initiatives are expected to be implemented during the fourth quarter of 2012 or the first quarter of 2013. Shareholders of certain funds have already approved these proposals.
| | | | |
| Transamerica Funds | | | | Annual Report 2012 |
| | Page 62 | | |
TRANSAMERICA FUNDS
Management of the Funds
(unaudited)
Interested Board Member means a board member who may be deemed an “interested person” (as that term is defined in the 1940 Act) of the Trust because of his current or former service with TAM or an affiliate of TAM. Interested Board Members may also be referred to herein as “Interested Trustees.” Independent Board Member means a Board Member who is not an “interested person” (as defined under the 1940 Act) of the Trust and may also be referred to herein as an “Independent Trustee.”
The Board governs each fund and is responsible for protecting the interests of the shareholders. The Board Members are experienced executives who meet periodically throughout the year to oversee the business affairs of each fund and the operation of each fund by its officers. The Board also reviews the management of each fund’s assets by the investment adviser and its respective sub-adviser.
The Funds are among the funds advised and sponsored by TAM (collectively, “Transamerica Asset Management Group”). Transamerica Asset Management Group (“TAMG”) consists of Transamerica Funds, Transamerica Series Trust (“TST”), Transamerica Income Shares, Inc. (“TIS”), Transamerica Partners Funds Group (“TPFG”), Transamerica Partners Funds Group II (“TPFG II”), Transamerica Partners Portfolios (“TPP”) and Transamerica Asset Allocation Variable Funds (“TAAVF”) and consists of 161 funds as of the mailing of this annual report.
The mailing address of each Board Member is c/o Secretary, 570 Carillon Parkway, St. Petersburg, Florida 33716.
The Board Members, their year of birth, their positions with the Trust, and their principal occupations for the past five years (their titles may have varied during that period), the number of funds in TAMG the Board oversees, and other board memberships they hold are set forth in the table below.
| | | | | | | | | | |
Name and Year of Birth | | Position(s) Held with Trust | | Term of Office and Length of Time Served* | | Principal Occupation(s)
During Past Five Years | | Number of
Funds in
Complex
Overseen
by Board
Member | | Other Directorships During the Past Five Years |
INTERESTED BOARD MEMBER | | | | |
| | | | | |
Thomas A. Swank (1960) | | Board Member | | Since 2012 | | President and Chief Executive Officer, Transamerica Individual Savings & Retirement (2010 – present); President and Chief Executive Officer, Transamerica Capital Management (2009 –present); Board Member (November 2012 – present), President and Chief Executive Officer, Transamerica Funds, TST, TIS, (May 2012 – present); President and Chief Executive Officer, TPP, TPFG, TPFG II and TAAVF (May 2012 – present); Director, Chairman of the Board, Chief Executive Officer and President, Transamerica Asset Management, Inc. (“TAM”) (May 2012 – present); Director, Chairman of the Board, Chief Executive Officer and President, Transamerica Fund Services, Inc. (“TFS”) (May 2012 – present); | | 101
| | N/A |
| | | | |
| Transamerica Funds | | | | Annual Report 2012 |
| | Page 63 | | |
| | | | | | | | | | |
Name and Year of Birth | | Position(s) Held with Trust | | Term of Office and Length of Time Served* | | Principal Occupation(s)
During Past Five Years | | Number of
Funds in
Complex
Overseen
by Board
Member | | Other Directorships During the Past Five Years |
INTERESTED BOARD MEMBER—continued |
| | | | | |
Thomas A. Swank (continued) | | | | | | Director and Trust Officer, Massachusetts Fidelity Trust Company (May 2012 – present); Supervisory Board Member, AEGON Sony Life Insurance Co., LTD. (2011 – present); | | | | |
| | | | | |
| | | | | | Division President, Monumental Life Insurance Company (2011 – present); | | | | |
| | | | | |
| | | | | | Division President, Western Reserve Life Assurance Co. of Ohio (2011 – present); | | | | |
| | | | | |
| | | | | | Vice President, Money Services, Inc. (2011 – present); | | | | |
| | | | | |
| | | | | | Director, AEGON Financial Services Group, Inc. (2010 – present); | | | | |
| | | | | |
| | | | | | Director, AFSG Securities Corporation (2010 – present); | | | | |
| | | | | | Director and President, Transamerica Advisors Life Insurance Company (2010 – present); | | | | |
| | | | | |
| | | | | | Director, Chairman of the Board and President, Transamerica Advisors Life Insurance Company of New York (2010 – present); | | | | |
| | | | | |
| | | | | | Director and President, Transamerica Resources, Inc. (2010 – present); | | | | |
| | | | | |
| | | | | | Executive Vice President, Transamerica Life Insurance Company (2010 – present); | | | | |
| | | | | |
| | | | | | Executive Vice President, Transamerica Financial Life Insurance Company (2009 – present); | | | | |
| | | | | |
| | | | | | Director, Transamerica Capital, Inc. (2009 – present); and | | | | |
| | | | | |
| | | | | | President and Chief Operating Officer (2007 – 2009), Senior Vice President, Chief Marketing Officer (2006 – 2007), Senior Vice President, Chief Financial Officer (2003 – 2006), Senior Vice President, Chief Risk Officer (2000 – 2003), Senior Vice President, Chief Investment Officer (1997 – 2000) and High Yield Portfolio Manager (1992 – 1997), Security Benefit Corporation | | | | |
| | | | |
| Transamerica Funds | | | | Annual Report 2012 |
| | Page 64 | | |
| | | | | | | | | | |
Name and Year of Birth | | Position(s) Held with Trust | | Term of Office and Length of Time Served* | | Principal Occupation(s) During Past Five Years | | Number of
Funds in
Complex
Overseen
by Board
Member | | Other Directorships During the Past Five Years |
INTERESTED BOARD MEMBER—continued |
| | | | | |
| Alan F. Warrick (1948) | | Board Member | | Since 2012 | | Board Member, Transamerica Funds, TST, TIS, TPP, TPFG, TPFG II and TAAVF (January 2012 – present); Consultant, AEGON USA (2010 – present); Senior Advisor, Lovell Minnick Equity Partners (2010 – present); Retired (2010 – present); and Managing Director for Strategic Business Development, AEGON USA (1994 – 2010). | | 161 | | N/A |
INDEPENDENT BOARD MEMBERS |
| | | | | |
| Sandra N. Bane (1952) | | Board Member | | Since 2008 | | Retired (1999 – present); Board Member, Transamerica Funds, TST, TIS, TPP, TPFG, TPFG II and TAAVF (2008 – present); Board Member, TII (2003 – 2010); and Partner, KPMG (1975 – 1999). | | 161 | | Big 5 Sporting Goods (2002 – present); AGL Resources, Inc. (energy services holding company) (2008 – present) |
| Leo J. Hill (1956) | | Lead Independent Board Member | | Since 2002 | | Principal, Advisor Network Solutions, LLC (business consulting) (2006 – present); Board Member, TST (2001 – present); Board Member, Transamerica Funds and TIS (2002 – present); Board Member, TPP, TPFG, TPFG II and TAAVF (2007 – present); Board Member, TII (2008 – 2010); President, L. J. Hill & Company (a holding company for privately- held assets) (1999 – present); Market President, Nations Bank of Sun Coast Florida (1998 – 1999); Chairman, President and Chief Executive Officer, Barnett Banks of Treasure Coast Florida (1994 – 1998); | | 161 | | N/A |
| | | | |
| Transamerica Funds | | | | Annual Report 2012 |
| | Page 65 | | |
| | | | | | | | | | |
Name and Year of Birth | | Position(s) Held with Trust | | Term of Office and Length of Time Served* | | Principal Occupation(s)
During Past Five Years | | Number of
Funds in
Complex
Overseen
by Board
Member | | Other Directorships During the Past Five Years |
INDEPENDENT BOARD MEMBERS—continued | | | | |
| | | | | |
Leo J. Hill (continued) | | | | | | Executive Vice President and Senior Credit Officer, Barnett Banks of Jacksonville, Florida (1991 – 1994); and Senior Vice President and Senior Loan Administration Officer, Wachovia Bank of Georgia (1976 – 1991). | | | | |
| | | | | |
David W. Jennings (1946) | | Board Member | | Since 2009 | | Board Member, Transamerica Funds, TST, TIS, TPP, TPFG, TPFG II and TAAVF (2009 – present); Board Member, TII (2009 – 2010); Managing Director, Hilton Capital (2010 – present); Principal, Maxam Capital Management, LLC (2006 – 2008); and Principal, Cobble Creek Management LP (2004 – 2006). | | 161 | | N/A |
| | | | | |
Russell A. Kimball, Jr. (1944) | | Board Member | | 1986 – 1990 and Since 2002 | | General Manager, Sheraton Sand Key Resort (1975 – present); Board Member, TST (1986 – present); Board Member, Transamerica Funds, (1986 – 1990), (2002 – present); Board Member, TIS (2002 – present); Board Member, TPP, TPFG, TPFG II and TAAVF (2007 – present); and Board Member, TII (2008 – 2010). | | 161 | | N/A |
| | | | | |
Eugene M. Mannella (1954) | | Board Member | | Since 2007 | | Chief Executive Officer, HedgeServ Corporation (hedge fund administration) (2008 – present); Self-employed consultant (2006 – present); Managing Member and Chief Compliance Officer, HedgeServ Investment Services, LLC (limited purpose broker-dealer) (2011 – present); | | 161 | | N/A |
| | | | |
| Transamerica Funds | | | | Annual Report 2012 |
| | Page 66 | | |
| | | | | | | | | | |
Name and Year of Birth | | Position(s) Held with Trust | | Term of Office and Length of Time Served* | | Principal Occupation(s)
During Past Five Years | | Number of
Funds in
Complex
Overseen
by Board
Member | | Other Directorships During the Past Five Years |
INDEPENDENT BOARD MEMBERS—continued | | | | | | |
| | | | | |
| Eugene M. Mannella (continued) | | | | | | President, ARAPAHO Partners LLC (limited purpose broker- dealer) (1998 – 2008); Board Member, TPP, TPFG, TPFG II and TAAVF (1993 – present); Board Member, Transamerica Funds, TST and TIS (2007 – present); Board Member, TII (2008 – 2010); and President, International Fund Services (alternative asset administration) (1993 – 2005). | | | | |
| | | | | |
Norman R. Nielsen, Ph.D. (1939) | | Board Member | | Since 2006 | | Retired (2005 – present); Board Member, Transamerica Funds, TST and TIS (2006 – present); Board Member, TPP, TPFG, TPFG II and TAAVF (2007 – present); Board Member, TII (2008 – 2010); Director, Aspire Resources Inc. (formerly, Iowa Student Loan Service Corporation) (2006 – present); Director, League for Innovation in the Community Colleges (1985 – 2005); Director, Iowa Health Systems (1994 – 2003); Director, U.S. Bank (1985 – 2006); and President, Kirkwood Community College (1985 – 2005). | | 161 | | Buena Vista University Board of Trustees (2004 – present) |
| | | | | |
| Joyce G. Norden (1939) | | Board Member | | Since 2007 | | Retired (2004 – present); Board Member, TPFG, TPFG II and TAAVF (1993 – present); Board Member, TPP (2002 – present); Board Member, Transamerica Funds, TST and TIS (2007 – present); | | 161 | | Board of Governors, Reconstructionist Rabbinical College (2007 – present) |
| | | | |
| Transamerica Funds | | | | Annual Report 2012 |
| | Page 67 | | |
| | | | | | | | | | |
Name and Year of Birth | | Position(s) Held with Trust | | Term of Office and Length of Time Served* | | Principal Occupation(s)
During Past Five Years | | Number of
Funds in
Complex
Overseen
by Board
Member | | Other Directorships During the Past Five Years |
INDEPENDENT BOARD MEMBERS—continued | | | | | | |
| | | | | |
Joyce G. Norden (continued) | | | | | | Board Member, TII (2008 – 2010); and Vice President, Institutional Advancement, Reconstructionist Rabbinical College (1996 – 2004). | | | | |
| | | | | |
Patricia L. Sawyer (1950) | | Board Member | | Since 2007 | | Retired (2007 – present); President/Founder, Smith & Sawyer LLC (management consulting) (1989 – 2007); Board Member, Transamerica Funds, TST and TIS (2007 – present); Board Member, TII (2008 – 2010); Board Member, TPP, TPFG, TPFG II and TAAVF (1993 – present); Trustee, Chair of Finance Committee and Chair of Nominating Committee (1987 – 1996), Bryant University; Vice President, American Express (1987 – 1989); Vice President, The Equitable (1986 – 1987); and Strategy Consultant, Booz, Allen & Hamilton (1982 – 1986). | | 161 | | Honorary Trustee, Bryant University (1996 – present) |
| | | | | |
John W. Waechter (1952) | | Board Member | | Since 2005 | | Attorney, Englander and Fischer, LLP (2008 – present); Retired (2004 – 2008); Board Member, TST and TIS (2004 – present); Board Member, Transamerica Funds (2005 – present); Board Member, TPP, TPFG, TPFG II and TAAVF (2007 – present); Board Member, TII (2008 – 2010); Employee, RBC Dain Rauscher (securities dealer) (2004); | | | | |
| | | | |
| Transamerica Funds | | | | Annual Report 2012 |
| | Page 68 | | |
| | | | | | | | | | |
Name and Year of Birth | | Position(s) Held with Trust | | Term of Office and Length of Time Served* | | Principal Occupation(s)
During Past Five Years | | Number of
Funds in
Complex
Overseen
by Board
Member | | Other Directorships During the Past Five Years |
INDEPENDENT BOARD MEMBERS—continued | | | | | | |
| | | | | |
| John W. Waechter (continued) | | Board Member | | Since 2005 | | Executive Vice President, Chief Financial Officer and Chief Compliance Officer, William R. Hough & Co. (securities dealer) (1979 – 2004); and Treasurer, The Hough Group of Funds (1993 – 2004). | | 161 | | Operation PAR, Inc. (2008 – present); West Central Florida Council – Boy Scouts of America (2008 – present) |
| * | Each Board Member shall hold office until: 1) his or her successor is elected and qualified or 2) he or she resigns, retires or his or her term as a Board Member is terminated in accordance with the Trust’s Declaration of Trust. |
| | | | |
| Transamerica Funds | | | | Annual Report 2012 |
| | Page 69 | | |
OFFICERS
The mailing address of each officer is c/o Secretary, 570 Carillon Parkway, St. Petersburg, Florida 33716. The following table shows information about the officers, including their year of birth, their positions held with the Trust and their principal occupations during the past five years (their titles may have varied during that period). Each officer will hold office until his or her successor has been duly elected or appointed or until his or her earlier death, resignation or removal.
| | | | | | |
Name and Year of Birth | | Position | | Term of Office and Length of Time Served* | | Principal Occupation(s) or Employment During Past Five Years |
| Thomas A. Swank (1960) | | Board Member, President and Chief Executive Officer | | Since 2012 | | See table above. |
| | | |
| Timothy S. Galbraith (1964) | | Vice President and Chief Investment Officer, Alternative Investments | | Since 2012 | | Vice President and Chief Investment Officer, Alternative Investments, Transamerica Funds, TST, TIS, TPP, TPFG, TPFG II and TAAVF (April 2012 – present); Senior Vice President and Chief Investment Officer, Alternative Investments (March 2012 – present), TAM; Head of Alternative Investment Strategies, Morningstar Associates, LLC (2009 – March 2012); and Managing Director, Bear Stearns Asset Management (2001 – 2009). |
| | | |
| Dennis P. Gallagher (1970) | | Vice President, General Counsel and Secretary | | Since 2006 | | Vice President, General Counsel and Secretary, Transamerica Funds, TST and TIS (2006 – present); Vice President, General Counsel and Secretary, TPP, TPFG, TPFG II and TAAVF (2007 – present); Vice President, General Counsel and Secretary, TII, (2006 – 2010); Director, Senior Vice President, General Counsel, Operations and Secretary, TAM (2006 – present); Director, Senior Vice President, General Counsel, Chief Administrative Officer and Secretary, TFS (2006 – present); Assistant Vice President, TCI (2007 – present); Director, Deutsche Asset Management (1998 – 2006); and Corporate Associate, Ropes & Gray LLP (1995 – 1998). |
| | | |
Todd R. Porter (1961) | | Vice President and Chief Investment Officer, Asset Allocation | | Since 2012 | | Vice President and Chief Investment Officer, Asset Allocation, Transamerica Funds, TST, TIS, TPP, TPFG, TPFG II and TAAVF (April 2012 – present); Senior Vice President and Chief Investment Officer, Asset Allocation (April 2012 – present), TAM; Chief Investment Officer, Fund Architects, LLC (2007 – 2012); and Chief Investment Strategist, Morningstar Associates, LLC (1999 – 2006). |
| | | | |
| Transamerica Funds | | | | Annual Report 2012 |
| | Page 70 | | |
| | | | | | |
Name and Year of Birth | | Position | | Term of Office and Length of Time Served* | | Principal Occupation(s) or Employment During Past Five Years |
Christopher A. Staples (1970) | | Vice President and Chief Investment Officer, Advisory Services | | Since 2005 | | Vice President and Chief Investment Officer, Advisory Services (2007 – present), Senior Vice President – Investment Management (2006 – 2007), Vice President – Investment Management (2005 – 2006), Transamerica Funds, TST and TIS; Vice President and Chief Investment Officer, Advisory Services, TPP, TPFG, TPFG II and TAAVF (2007 – present); Vice President and Chief Investment Officer (2007 – 2010); Vice President – Investment Administration (2005 – 2007), TII; Director (2005 – present), Senior Vice President (2006 – present) and Chief Investment Officer, Advisory Services (2007 – present), TAM; Director, TFS (2005 – present); and Assistant Vice President, Raymond James & Associates (1999 – 2004). |
| | | |
Elizabeth Strouse (1974) | | Vice President, Treasurer and Principal Financial Officer | | Since 2010 | | Vice President, Treasurer and Principal Financial Officer (2011 – present), Assistant Treasurer (2010 – 2011), Transamerica Funds, TST, TIS, TPP, TPFG, TPFG II and TAAVF; Vice President, TAM and TFS (2009 – present); Director, Fund Administration, TIAA-CREF (2007 – 2009); and Manager (2006 – 2007) and Senior (2003 – 2006) Accounting and Assurance, PricewaterhouseCoopers, LLC. |
| | | |
Robert S. Lamont, Jr. (1973) | | Vice President, Chief Compliance Officer and Conflicts of Interest Officer | | Since 2010 | | Vice President, Chief Compliance Officer and Conflicts of Interest Officer, Transamerica Funds, TST, TIS, TPP, TPFG, TPFG II and TAAVF (2010 – present); Vice President and Senior Counsel, TAM and TFS (2007 – present); Senior Counsel, United States Securities and Exchange Commission (2004 – 2007); and Associate, Dechert, LLP (1999 – 2004). |
| | | |
Bradley O. Ackerman (1966) | | Deputy Chief Compliance Officer and Anti-Money Laundering Officer | | Since 2007 | | Deputy Chief Compliance Officer, Transamerica Funds, TST, TIS, TPP, TPFG, TPFG II and TAAVF (January 2012 – present); Anti-Money Laundering Officer, TPP, TPFG, TPFG II and TAAVF (2009 – present); Anti-Money Laundering Officer, Transamerica Funds, TST and TIS (2007 – present); Senior Compliance Officer, TAM (2007 – present); and Director, Institutional Services, Rydex Investments (2002 – 2007). |
| | | | |
| Transamerica Funds | | | | Annual Report 2012 |
| | Page 71 | | |
| | | | | | |
Name and Year of Birth | | Position | | Term of Office and Length of Time Served* | | Principal Occupation(s) or Employment During Past Five Years |
Sarah L. Bertrand (1967) | | Assistant Secretary | | Since 2009 | | Assistant Secretary, Transamerica Funds, TST, TIS, TPP, TPFG, TPFG II and TAAVF (2009 – present); Assistant Secretary, TII (2009 – 2010); Assistant Vice President and Director, Legal Administration, TAM and TFS (2007 – present); Assistant Secretary and Chief Compliance Officer, 40|86 Series Trust and 40|86 Strategic Income Fund (2000 – 2007); and Second Vice President and Assistant Secretary, Legal and Compliance, 40|86 Capital Management, Inc. (1994 – 2007). |
| | | |
Timothy J. Bresnahan (1968) | | Assistant Secretary | | Since 2009 | | Assistant Secretary, Transamerica Funds, TST, TIS, TPP, TPFG, TPFG II and TAAVF (2009 – present); Assistant Secretary, TII (2009 – 2010); Vice President and Senior Counsel, TAM (2008 – present); Counsel (contract), Massachusetts Financial Services, Inc. (2007); Assistant Counsel, BISYS Fund Services Ohio, Inc. (2005 – 2007); and Associate, Greenberg Traurig, P.A. (2004 – 2005). |
| | | |
Margaret A. Cullem-Fiore (1957) | | Assistant Secretary | | Since 2010 | | Assistant Secretary, Transamerica Funds, TST, TIS, TPP, TPFG, TPFG II and TAAVF (2010 – present); Assistant Vice President, TCI (2009 – present); Vice President and Assistant General Counsel, TAM and TFS (2006 – present); Vice President and Senior Counsel, Transamerica Financial Advisors, Inc. (2004 – 2007); and Vice President and Senior Counsel, Western Reserve Life Assurance Co. of Ohio (2006). |
| * | Elected and serves at the pleasure of the Board of the Trust. |
If an officer has held offices for different funds for different periods of time, the earliest applicable date is shown. No officer of the Trust, except for the Chief Compliance Officer, receives any compensation from the Trust.
Additional information about the Funds’ Board Members can be found in the Statement of Additional Information, available, without charge, upon request, by calling toll free 1-800-233-4339 or on the Trust’s website at www.transamericainvestments.com.
| | | | |
| Transamerica Funds | | | | Annual Report 2012 |
| | Page 72 | | |
PROXY VOTING POLICIES AND PROCEDURES AND QUARTERLY PORTFOLIO HOLDINGS
(unaudited)
A description of the Transamerica Funds’ proxy voting policies and procedures is available in the Statement of Additional Information of the Funds, available without charge upon request by calling 1-888-233-4339 (toll free) or on the Securities and Exchange Commission’s (“SEC”) website at http://www.sec.gov.
In addition, the Funds are required to file Form N-PX, with their complete proxy voting records for the 12 months ended June 30th, no later than August 31st of each year. The Form is available without charge: (1) from the Funds, upon request by calling 1-888-233-4339; and (2) on the SEC’s website at http://www.sec.gov.
The Funds file their complete schedule of portfolio holdings with the SEC for the first and third quarter of each fiscal year on Form N-Q, which is available on the SEC’s website at http://www.sec.gov. The Funds’ Form N-Q may be reviewed and copied at the SEC’s Public Reference Room in Washington, D.C. Information on the operation of the Public Reference Room may be obtained by calling 1-800-SEC-0330.
You may also visit the Trust’s website at www.transamericainvestments.com for this and other information about the Funds and the Trust.
Important Notice Regarding Delivery of Shareholder Documents
Every year we send shareholders informative materials such as the Transamerica Funds Annual Report, the Transamerica Funds Prospectus, and other required documents that keep you informed regarding your Funds. Transamerica Funds will only send one piece per mailing address, a method that saves your Funds money by reducing mailing and printing costs. We will continue to do this unless you tell us not to. To elect to receive individual mailings, simply call a Transamerica Customer Service Representative toll free at 1-888-233-4339, 8 a.m. to 7 p.m. Eastern Time, Monday–Friday. Your request will take effect within 30 days.
| | | | |
| Transamerica Funds | | | | Annual Report 2012 |
| | Page 73 | | |
NOTICE OF PRIVACY POLICY
(unaudited)
Your privacy is very important to us. We want you to understand what information we collect and how we use it. We collect and use “nonpublic personal information” in connection with providing our customers with a broad range of financial products and services as effectively and conveniently as possible. We treat nonpublic personal information in accordance with our Privacy Policy.
What Information We Collect and From Whom We Collect It
We may collect nonpublic personal information about you from the following sources:
| • | Information we receive from you on applications or other forms, such as your name, address, and account number; |
| • | Information about your transactions with us, our affiliates, or others, such as your account balance and purchase/redemption history; and |
| • | Information we receive from non-affiliated third parties, including consumer reporting agencies. |
What Information We Disclose and To Whom We Disclose It
We do not disclose any nonpublic personal information about current or former customers to anyone without their express consent, except as permitted by law. We may disclose the nonpublic personal information we collect, as described above, to persons or companies that perform services on our behalf and to other financial institutions with which we have joint marketing agreements. We will require these companies to protect the confidentiality of your nonpublic personal information and to use it only to perform the services for which we have hired them.
Our Security Procedures
We restrict access to your nonpublic personal information and only allow disclosures to persons and companies as permitted by law to assist in providing products or services to you. We maintain physical, electronic, and procedural safeguards to protect your nonpublic personal information and to safeguard the disposal of certain consumer information.
If you have any questions about our Privacy Policy, please call 1-888-233-4339 on any business day between 8 a.m. and 7 p.m. Eastern Time.
Note: This Privacy Policy applies only to customers that have a direct relationship with us or our affiliates. If you own shares of our funds in the name of a third party such as a bank or broker-dealer, its privacy policy may apply to you instead of ours.
| | | | |
| Transamerica Funds | | | | Annual Report 2012 |
| | Page 74 | | |

Customer Service 1-888-233-4339
P.O. Box 9012 • Clearwater, FL 33758-9012
Distributor: Transamerica Capital, Inc.
Open Funds
Annual Report
October 31, 2012
www.transamericainvestments.com
Customer Service 1-888-233-4339
P.O. Box 9012 • Clearwater, FL 33758-9012
Distributor: Transamerica Capital, Inc.
Dear Fellow Shareholder,
On behalf of Transamerica Funds, we would like to thank you for your continued support and confidence in our products as we look forward to continuing to serve you and your financial adviser in the future. We value the trust you have placed in us.
This annual report is provided to you with the intent of presenting a comprehensive review of the investments of each of your funds. The Securities and Exchange Commission requires that annual and semi-annual reports be sent to all shareholders, and we believe this report to be an important part of the investment process. In addition to providing a comprehensive review, this report also provides a discussion of accounting policies as well as matters presented to shareholders that may have required their vote.
We believe it is important to understand market conditions over the last year in order to provide a context for reading this report. One year ago, fears that a sovereign default or a large bank failure in Europe would precipitate a global crisis had driven U.S. and many international markets down. In late 2011, the European Central Bank responded by making unlimited loans available to European banks, which used this money to honor deposits and to purchase sovereign bonds. Market fears subsided and global economies improved modestly, helping markets to rally strongly throughout the first three months of 2012.
Then, in early spring, positive economic trends in both the United States and abroad faded, causing most equity markets to dip from their March 2012 highs. The onset of summer brought resurgence in both U.S. economics and markets and, at the same time, economic weakness in Europe and Asia moderated. These events, combined with additional easing by global central banks, helped to drive most international equities higher through the end of summer. In September, unlimited quantitative easing was announced by the Federal Reserve which pushed U.S. markets to their highs for the year. In October, disappointing corporate earnings caused U.S. markets to retreat modestly, leaving the Standard & Poor’s 500® Index up 15.21% for the year ended October 31, 2012. During this same period, the Morgan Stanley Capital International—Europe, Australasia, Far East Index (“MSCI-EAFE”), a measure of international stock returns, gained 5.15% and the Barclays U.S. Aggregate Bond Index gained 5.25%. Please keep in mind it is important to maintain a diversified portfolio as investment returns have historically been difficult to predict.
In addition to your active involvement in the investment process, we firmly believe that a financial adviser is a key resource to help you build a complete picture of your current and future financial needs. Financial advisers are familiar with the market’s history, including long-term returns and volatility of various asset classes. With your financial adviser, you can develop an investment program that incorporates factors such as your goals, your investment timeline, and your risk tolerance.
Please contact your financial adviser if you have any questions about the contents of this report, and thanks again for the confidence you have placed in us.
Sincerely,
| | |
| Thomas A. Swank | | Christopher A. Staples |
| President & Chief Executive Officer | | Vice President & Chief Investment Officer |
| Transamerica Funds | | Transamerica Funds |
The views expressed in this report reflect those of the portfolio managers only and may not necessarily represent the views of Transamerica Funds. These views are subject to change based upon market conditions. These views should not be relied upon as investment advice and are not indicative of trading intent on behalf of Transamerica Funds.
Transamerica Capital Growth
(formerly, Transamerica Morgan Stanley Capital Growth)
(unaudited)
MARKET ENVIRONMENT
The stock market continued to be influenced primarily by sentiment about the economy and policy actions from the Federal Reserve (“Fed”) and other central banks around the world. Although the tone of economic data in the U.S. remained mixed in the first half of the period, investors were optimistic about globally coordinated monetary policy efforts intended to shore up confidence in Europe’s ailing banks and a set of proposals from European Union leaders to address the debt crisis. However, in the spring, the equity market turned more volatile as the U.S. economy appeared to hit a soft patch, the pace of job growth slackened, and worries about Spain’s solvency surfaced. Economic growth in Europe and China weakened as well. Although these risks persisted, investor sentiment turned more upbeat in July with a pledge by the European Central Bank (“ECB”) president to do “whatever it takes” to save the Euro. Anticipation of another round of quantitative easing by the Fed also buoyed confidence. These expectations were fulfilled in September with the announcement of a new bond-buying program by the ECB and a third round of asset purchases by the Fed. Although October saw stronger labor and housing market data, corporate earnings reports for the third quarter were less robust than in recent quarters and uncertainties about the U.S. “fiscal cliff” (the expiration of certain tax cuts and government spending programs) at year’s end and ongoing European debt crisis remained.
PERFORMANCE
For the year ended October 31, 2012, Transamerica Capital Growth Class A returned 2.38%. By comparison, its benchmark, the Russell 1000® Growth Index, returned 13.02%.
STRATEGY REVIEW
The investment team looks for high-quality growth companies that they believe have these attributes: sustainable competitive advantages, business visibility, rising return on invested capital, free cash flow and a favorable risk/reward profile. We find these companies through intense fundamental research. Our emphasis is on secular growth, and as a result short-term market events are not as meaningful in the stock selection process.
The fund’s underperformance relative to the Russell 1000® Growth Index (the “Index”) was driven largely by stock selection in the technology sector. The fund’s two largest detractors from relative performance, social networking service Facebook and online deals provider Groupon, Inc., came from this sector. Another area of relative weakness was stock selection in the energy sector. Although the fund’s relative underweight to the sector helped offset negative performance, the few energy stocks the fund did hold were laggards. Stock selection in the producer durables sector also dampened relative results, primarily due to Li & Fung, a Chinese global consumer products trading firm not represented in the Index, and Expeditors International of Washington, a global logistics company.
Positive relative performance was driven almost exclusively by stock selection in the health care sector. Holdings in medical equipment stocks Illumina, Inc., which makes tools and systems for use in genetic analysis, and Intuitive Surgical, Inc., which designs surgical systems for a variety of procedures, were among the fund’s top three contributing stocks during the period. The largest contributor to relative performance was a position in Apple, Inc., the consumer electronics, personal computer, and software maker.
Dennis P. Lynch
David S. Cohen
Sam G. Chainani, CFA
Alexander T. Norton
Jason C. Yeung, CFA
Armistead B. Nash
Co-Portfolio Managers
Morgan Stanley Investment Management Inc.
| | | | |
| Transamerica Funds | | | | Annual Report 2012 |
| | Page 1 | | |
Transamerica Capital Growth
(formerly, Transamerica Morgan Stanley Capital Growth)
(unaudited)
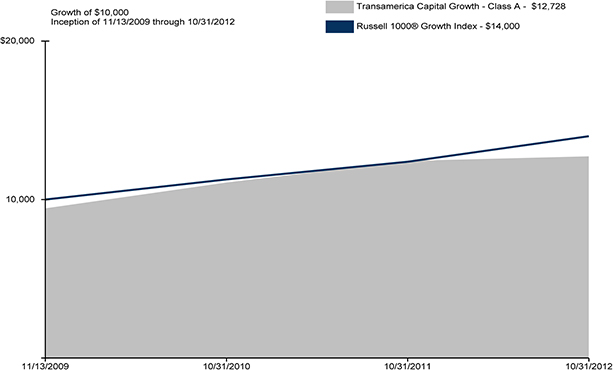
Average Annual Total Return for Periods Ended 10/31/2012
| | | | | | | | | | | | |
| | | 1 Year | | | 10 Years or
Life of Class | | | Inception Date | |
Class A (NAV) | | | 2.38 | % | | | 10.58 | % | | | 11/13/2009 | |
Class A (POP) | | | (3.25 | )% | | | 8.48 | % | | | 11/13/2009 | |
Russell 1000® Growth * | | | 13.02 | % | | | 12.02 | % | | | | |
| | | | | | | | | | | | |
Class B (NAV) | | | 1.65 | % | | | 9.84 | % | | | 11/13/2009 | |
Class B (POP) | | | (3.26 | )% | | | 8.99 | % | | | 11/13/2009 | |
| | | | | | | | | | | | |
Class C (NAV) | | | 1.80 | % | | | 9.88 | % | | | 11/13/2009 | |
Class C (POP) | | | 0.82 | % | | | 9.88 | % | | | 11/13/2009 | |
| | | | | | | | | | | | |
Class I (NAV) | | | 2.96 | % | | | 11.70 | % | | | 11/30/2009 | |
| | | | | | | | | | | | |
Class I2 (NAV) | | | 3.11 | % | | | 11.94 | % | | | 09/30/2011 | |
| | | | | | | | | | | | |
NOTES
| * | The Russell 1000® Growth Index (“Russell 1000® Growth”) is an unmanaged index used as a general measure of market performance. Calculations assume dividends and capital gains are reinvested and do not include any managerial expenses. The 10 Years or Life of Class calculation is based on the inception date of the class. You cannot invest directly in an index. |
The performance data presented represents past performance; future results may vary. Performance data does not reflect the deduction of taxes that would be paid on fund distributions or the redemption of fund shares. Investment return and principal value will fluctuate so that an investor’s shares, when redeemed, may be worth more or less than their original cost. Current performance may be lower or higher than performance quoted. Please see www.transamericainvestments.com for performance data current to the most recent month-end. Net Asset Value (“NAV”) returns include the reinvestment of dividends and capital gains but do not reflect any sales charges. Public Offering Price (“POP”) returns include the reinvestment of dividends and capital gains and reflect the maximum sales charge of 5.5% for A shares or the maximum applicable contingent deferred sales charge (5% in the 1st year, decreasing to 0% after 6 years) for Class B shares and 1% (during the first 12 months) for Class C shares. There are no sales charges on Class I and I2 shares.
Performance figures reflect any fee waivers and/or expense reimbursements by the Investment Adviser. Without such waivers and/or reimbursements, the performance would be lower. Future waivers and/or reimbursements are at the discretion of the Investment Adviser.
Returns on growth stocks may not move in tandem with returns on other categories of stocks or the market as a whole. Growth stocks may be particularly susceptible to larger price swings or to adverse developments. Growth stocks as a group may be out of favor and underperform the overall equity market for a long period of time, for example, while the market favors “value” stocks.
Russell Investment Group is the source and owner of the trademarks, service marks, and copyrights related to the Russell indexes. Russell® is a trademark of Russell Investment Group.
| | | | |
| Transamerica Funds | | | | Annual Report 2012 |
| | Page 2 | | |
Transamerica Diversified Equity
(formerly, Transamerica WMC Diversified Equity)
(unaudited)
MARKET ENVIRONMENT
Global equities were volatile during the one-year period ended October 31, 2012, moving higher early in the period on the back of strong corporate earnings and generally favorable economic data before succumbing in the second quarter to escalating global growth concerns and challenges in Europe. Equity markets rebounded in the third quarter and continued their ascent through the end of the period, as improving optimism about the global economy and a tidal wave of global liquidity outweighed investors’ concerns about sovereign debt troubles in Europe.
In this environment, all ten sectors in the Russell 1000® Growth Index posted positive returns during the period. The telecommunication services and health care sectors led the Russell 1000® Growth Index, while utilities and materials posted more modest gains relative to the broader Index return.
PERFORMANCE
For the year ended October 31, 2012, Transamerica Diversified Equity Class A returned 7.04%. By comparison, its benchmark, the Russell 1000® Growth Index, returned 13.02%.
STRATEGY REVIEW
The fund’s investment process leverages the extensive research resources of Wellington Management and emphasizes a balance of growth, quality, and valuation criteria in selecting stocks. We utilize risk analysis tools to help maintain the fund’s emphasis on stock selection and minimize other sources of relative risk. With this bottom-up approach incorporating diversified sources of alpha and effective risk analysis, our goal is to generate consistent outperformance over time.
During the period, less favorable security selection in the information technology, consumer discretionary, and industrials sectors were the main drivers of relative underperformance. An underweight position in the relatively strong consumer staples sector also detracted from relative results. Positive results from security selection within energy and consumer staples helped relative performance, as did an overweight to energy and an underweight to industrials.
The fund’s largest relative detractors during the period included California-based network equipment company Cisco Systems, Inc., provider of postsecondary degree programs ITT Educational Services, Inc., and programmable logic devices manufacturer Altera Corp.
The fund’s largest contributors to relative performance during the period included biotechnology medicines company Amgen, online global commerce platform eBay, Inc., and paint manufacturer and distributor Sherwin-Williams Co. Not owning weak performing benchmark stock Intel, a designer and manufacturer of integrated digital technology platforms, and Schlumberger, an oilfield services company, also contributed positively to benchmark relative performance.
As of the end of the period, the fund was most overweight the information technology sector, and most underweight the industrials sector relative to the Index.
Paul E. Marrkand, CFA
Portfolio Manager
Wellington Management Company, LLP
| | | | |
| Transamerica Funds | | | | Annual Report 2012 |
| | Page 3 | | |
Transamerica Diversified Equity
(formerly, Transamerica WMC Diversified Equity)
(unaudited)
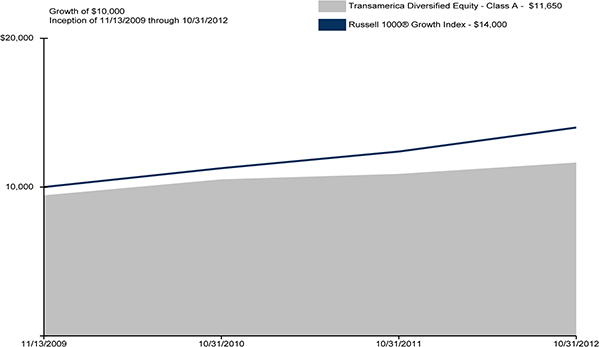
Average Annual Total Return for Periods Ended 10/31/2012
| | | | | | | | | | | | |
| | | | | | 10 Years or | | | | |
| | | 1 Year | | | Life of Class | | | Inception Date | |
Class A (NAV) | | | 7.04 | % | | | 7.32 | % | | | 11/13/2009 | |
Class A (POP) | | | 1.16 | % | | | 5.29 | % | | | 11/13/2009 | |
Russell 1000® Growth * | | | 13.02 | % | | | 12.02 | % | | | | |
| | | | | | | | | | | | |
Class B (NAV) | | | 6.29 | % | | | 6.60 | % | | | 11/13/2009 | |
Class B (POP) | | | 1.74 | % | | | 5.70 | % | | | 11/13/2009 | |
| | | | | | | | | | | | |
Class C (NAV) | | | 6.22 | % | | | 6.59 | % | | | 11/13/2009 | |
Class C (POP) | | | 5.32 | % | | | 6.59 | % | | | 11/13/2009 | |
| | | | | | | | | | | | |
Class I (NAV) | | | 7.62 | % | | | 8.52 | % | | | 11/30/2009 | |
| | | | | | | | | | | | |
Class I2 (NAV) | | | 7.79 | % | | | 8.10 | % | | | 11/13/2009 | |
| | | | | | | | | | | | |
Class T (NAV) | | | N/A | | | | (0.04 | )% | | | 02/10/2012 | |
Class T (POP) | | | N/A | | | | (8.54 | )% | | | 02/10/2012 | |
| | | | | | | | | | | | |
NOTES
| * | The Russell 1000® Growth Index (“Russell 1000® Growth”) is an unmanaged index used as a general measure of market performance. Calculations assume dividends and capital gains are reinvested and do not include any managerial expenses. The 10 Years or Life of Class calculation is based on the inception date of the class. You cannot invest directly in an index. |
The performance data presented represents past performance; future results may vary. Performance data does not reflect the deduction of taxes that would be paid on fund distributions or the redemption of fund shares. Investment return and principal value will fluctuate so that an investor’s shares, when redeemed, may be worth more or less than their original cost. Current performance may be lower or higher than performance quoted. Please see www.transamericainvestments.com for performance data current to the most recent month-end. Net Asset Value (“NAV”) returns include the reinvestment of dividends and capital gains but do not reflect any sales charges. Public Offering Price (“POP”) returns include the reinvestment of dividends and capital gains and reflect the maximum sales charge of 5.5% for A shares or the maximum applicable contingent deferred sales charge (5% in the 1st year, decreasing to 0% after 6 years) for Class B shares or 1% (during the first 12 months) for Class C shares and the maximum sales charge of 8.5% for Class T shares. There are no sales charges on Class I and I2 shares.
Performance figures reflect any fee waivers and/or expense reimbursements by the Investment Adviser. Without such waivers and/or reimbursements, the performance would be lower. Future waivers and/or reimbursements are at the discretion of the Investment Adviser.
Growth stocks can be volatile and experience sharp price declines and certain types of stocks, especially technology, can be extremely volatile and subject to greater price swings than the broader market. Value approach carries the risk that the market will not recognize a security’s intrinsic value for a long time or that an undervalued stock is actually appropriately priced. This material must be preceded or accompanied by a current prospectus, which includes specific contents regarding the investment objectives and policies of this fund.
Russell Investment Group is the source and owner of the trademarks, service marks, and copyrights related to the Russell indexes. Russell® is a trademark of Russell Investment Group.
| | | | |
| Transamerica Funds | | | | Annual Report 2012 |
| | Page 4 | | |
Transamerica Emerging Markets Debt
(formerly, Transamerica Logan Circle Emerging Markets Debt)
(unaudited)
MARKET ENVIRONMENT
During the course of the past fiscal year, we witnessed significant global political, policy, and economic uncertainty. It began late last year, when there were serious concerns that Greece would exit the Eurozone and lead to a disorderly unwind of risk due to financial interconnectivity within Europe and its major trading partners. The European struggles eventually led to questions regarding Spanish and Italian debt sustainability wherein we observed rising peripheral yields throughout the first half of the year. The worsening European story resulted in contagion effects globally as we felt the effects of softer growth in China and the U.S. Eventually the worsening economic outlook was met with a commensurate policy response by the European Central Bank (“ECB”) in the form of Outright Monetary Transactions (“OMT”) along with the Federal Reserve’s (“Fed”) adoption of a much more open ended QE III program. The result of these two significant policy responses was lower risk premiums across the spectrum in the second half of 2012.
The Fed’s actions, in conjunction with fears that the U.S. economy was slowing, drove U.S. Treasury yields lower in July 2012 from their 2012 peak in March. Since July, ten-year Treasuries have oscillated within a tight range.
With Treasury yields hovering near their lows, as well as strong central bank commitments to maintain lower yields, investors sought to obtain additional yield by investing in higher risk assets such as emerging market debt. As a result, Emerging Markets Bond Index (“EMBI”) and Corporate Emerging Market Bond Index (“CEMBI”) spreads tightened over the relevant horizon; and JPMorgan Government Bond Index-Emerging Markets (“GBI-EM”) yields declined. This contributed to a positive year for emerging market assets.
PERFORMANCE
For the year ended October 31, 2012, Transamerica Emerging Markets Debt Class A returned 21.07%. By comparison, its benchmark, the J.P. Morgan Emerging Markets Bond Global Index, returned 16.33%.
STRATEGY REVIEW
Transamerica Emerging Market Debt outperformed the JPMorgan Emerging Markets Bond Global Index over the period. Over the past year, the fund has been very active in its positioning versus the opportunity set. Within local currency markets the fund’s weightings have varied considerably with a bias toward lower volatility areas in late 2011 and higher volatility positions throughout much of 2012. Positioning in emerging market corporates has been fairly static, but the quality bias remained dynamic based on both underlying fundamentals and valuations. U.S. dollar sovereign debt continued to represent a significant weighting in the fund with much of the allocation focused on higher yielding special situation credits with lesser exposures to duration sensitive investment grade sovereigns.
In U.S. dollar sovereigns, country exposure in areas like Venezuela, Senegal, and Belarus all generated significant excess returns. Senegal offered one of the better relative value opportunities as the market penalized the country for an upcoming election and focused more on other regional players without political uncertainty. A bias towards a barbell strategy within emerging market corporates also benefitted returns, as the fund invested in both high yield names like Jamaica’s Digicel Group, Ltd., as well as higher quality duration sensitive assets like Abu Dhabi’s International Petroleum Investment Company (“IPIC”). Finally, the local currency decision was also value added as the fund increased positions in the Mexican Peso and Russian Ruble, post the ECB’s President Mario Draghi’s comments in July that reduced European tail risk from the market.
Transamerica Emerging Markets Debt uses forward foreign currency contracts to adjust the portion of the portfolio that is exposed to foreign exchange risk. Forward foreign currency contracts are also used to separate bond risk from currency risk when a country’s rates offer attractive opportunities, but the currency is not appealing and vice versa. The forward foreign currency contracts had a minimal impact on performance.
Todd Howard, CFA
Scott Moses, CFA
Co-Portfolio Managers
Logan Circle Partners, LP
| | | | |
| Transamerica Funds | | | | Annual Report 2012 |
| | Page 5 | | |
Transamerica Emerging Markets Debt
(formerly, Transamerica Logan Circle Emerging Markets Debt)
(unaudited)
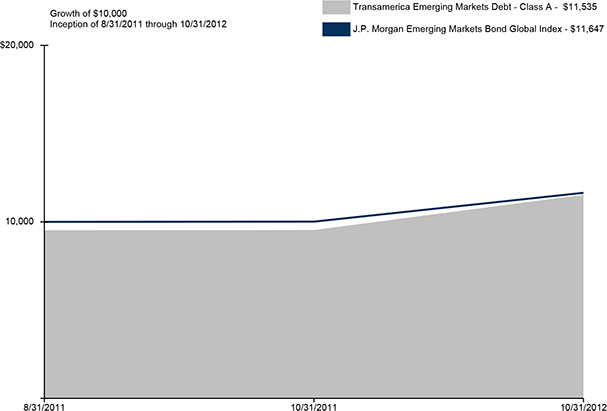
Average Annual Total Return for Periods Ended 10/31/2012
| | | | | | | | | | | | |
| | | 1 Year | | | 10 Years or
Life of Class | | | Inception Date | |
Class A (NAV) | | | 21.07 | % | | | 17.84 | % | | | 08/31/2011 | |
Class A (POP) | | | 15.31 | % | | | 13.01 | % | | | 08/31/2011 | |
J.P. Morgan Emerging Markets Bond Global * | | | 16.33 | % | | | 13.95 | % | | | | |
| | | | | | | | | | | | |
Class C (NAV) | | | 20.24 | % | | | 17.02 | % | | | 08/31/2011 | |
Class C (POP) | | | 19.24 | % | | | 17.02 | % | | | 08/31/2011 | |
| | | | | | | | | | | | |
Class I (NAV) | | | 21.40 | % | | | 18.22 | % | | | 08/31/2011 | |
| | | | | | | | | | | | |
Class I2 (NAV) | | | 21.50 | % | | | 18.30 | % | | | 08/31/2011 | |
| | | | | | | | | | | | |
NOTES
| * | The J.P. Morgan Emerging Markets Bond Global Index (“J.P. Morgan Emerging Markets Bond Global”) is an unmanaged index used as a general measure of market performance. Calculations assume dividends and capital gains are reinvested and do not include any managerial expenses. The 10 Years or Life of Class calculation is based on the inception date of the class. You cannot invest directly in an index. |
The performance data presented represents past performance; future results may vary. Performance data does not reflect the deduction of taxes that would be paid on fund distributions or the redemption of fund shares. Investment return and principal value will fluctuate so that an investor’s shares, when redeemed, may be worth more or less than their original cost. Current performance may be lower or higher than performance quoted. Please see www.transamericainvestments.com for performance data current to the most recent month-end. Net Asset Value (“NAV”) returns include the reinvestment of dividends and capital gains but do not reflect any sales charges. Public Offering Price (“POP”) returns include the reinvestment of dividends and capital gains and reflect the maximum sales charge of 4.75% for A shares or the maximum applicable contingent deferred sales charge and 1% (during the first 12 months) for Class C shares. There are no sales charges on Class I and I2 shares.
Performance figures reflect any fee waivers and/or expense reimbursements by the Investment Adviser. Without such waivers and/or reimbursements, the performance would be lower. Future waiver and/or reimbursements are at the discretion of the Investment Adviser.
The risks of investing in foreign securities are magnified in emerging markets. These may include risks related to market and currency volatility, adverse social and political developments, and the relatively small size and lesser liquidity of these markets. Debt investing is subject to credit risk, inflation risk, and interest rate risk. This material must be preceded or accompanied by a current prospectus, which includes specific contents regarding the investment objectives and policies of this fund.
| | | | |
| Transamerica Funds | | | | Annual Report 2012 |
| | Page 6 | | |
Transamerica Emerging Markets Equity
(unaudited)
MARKET ENVIRONMENT
The market environment for fiscal year 2012 since the fund’s inception was notably volatile.
During the start of the period, much of the news focused on Europe, as economic developments disappointed investors and sentiment around the globe worsened. Specifically, concerns about Greece remaining in the Eurozone and the financial shape of the Spanish banking sector depressed global markets. Analysts began revising global Gross Domestic Product (“GDP”) growth estimates downward. As a result, commodity prices fell sharply. Emerging market equities suffered strong losses in the month of May and but partially recovered over the next two months.
Subsequently, the Federal Reserve (“Fed”) decided to initiate a third round of quantitative easing. The latest iteration is different from the others in that the operation will be open-ended and will continue for as long as the Fed deems necessary to improve the labor market. While some form of quantitative easing was expected, the extent announced surprised the market. As a result, stock prices rose sharply during September.
Supporting the “risk-on” mentality during the quarter, Japan increased the size of its asset-buying program by $126 billion, the European Central Bank (“ECB”) announced a plan of unlimited bond buying to cut eurozone borrowing costs, China promised to continue a “proactive fiscal policy”, the German court approved the eurozone rescue fund, and central banks around the globe continued to cut interest rates.
PERFORMANCE
For the period from inception April 30, 2012 through October 31, 2012, Transamerica Emerging Markets Equity Class A returned (5.80)%. By comparison, its benchmark, the Morgan Stanley Capital International Emerging Markets Index, returned (1.01)%.
STRATEGY REVIEW
The fund continues to be positioned in line with our overall philosophy. ClariVest employs a strategy of aggressively identifying and investing in the securities of firms entering or extending a fundamental growth cycle. We manage this aggressive strategy by marrying it with a disciplined approach to portfolio construction. We maintain a balanced profile of growth and value, as demonstrated by a positive exposure to recent earnings growth relative to benchmark, as well as a positive exposure to valuation (via such measures as earnings to price) relative to benchmark.
The fund underperformed this fiscal year, with stock selection being the major factor. An underweight in financials and information technology contributed to underperformance, while an overweight in health care and consumer staples helped performance. Stock selection within financials and consumer discretionary was also negative. Underweight positions in Turkey, as well as stock selection within Taiwan and India detracted from performance. Stock selection within Brazil and Thailand was a positive for the fund.
From a security standpoint, KIA Motors Corp. detracted from performance as they missed third quarter profit forecasts due in part to a labor dispute. Gazprom OAO also hurt performance as oil prices fell 17% in the month of May. Samsung Electronics Co., Ltd. augmented performance as they have seen strong growth in their mobile headset division with the launch of the Galaxy S3. AngloGold Ashanti, Africa’s largest gold miner, also helped performance as their first quarter earnings beat expectations due to increased margins and higher gold prices.
David R. Vaughn, CFA
Alex Turner, CFA
Co-Portfolio Managers
ClariVest Asset Management LLC
| | | | |
| Transamerica Funds | | | | Annual Report 2012 |
| | Page 7 | | |
Transamerica Emerging Markets Equity
(unaudited)
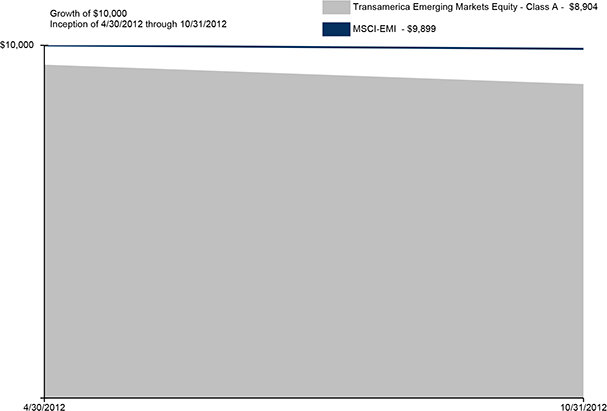
Average Annual Total Return for Periods Ended 10/31/2012
| | | | | | | | |
| | | 10 Years or
Life of Class | | | Inception Date | |
Class A (NAV) | | | (5.80 | )%(A) | | | 04/30/2012 | |
Class A (POP) | | | (10.96 | )% (A) | | | 04/30/2012 | |
MSCI-EMI * | | | (1.01 | )%(A) | | | | |
| | | | | | | | |
Class C (NAV) | | | (6.10 | )%(A) | | | 04/30/2012 | |
Class C (POP) | | | (7.04 | )%(A) | | | 04/30/2012 | |
| | | | | | | | |
Class I (NAV) | | | (5.70 | )%(A) | | | 04/30/2012 | |
| | | | | | | | |
Class I2 (NAV) | | | (5.60 | )%(A) | | | 04/30/2012 | |
| | | | | | | | |
NOTES
| * | The Morgan Stanley Capital International Emerging Markets Index (“MSCI-EMI”) is an unmanaged index used as a general measure of market performance. Calculations assume dividends and capital gains are reinvested and do not include any managerial expenses. The 10 Years or Life of Fund calculation is based on the inception date of the class. You cannot invest directly in an index. |
The performance data presented represents past performance; future results may vary. Performance data does not reflect the deduction of taxes that would be paid on fund distributions or the redemption of fund shares. Investment return and principal value will fluctuate so that an investor’s shares, when redeemed, may be worth more or less than their original cost. Current performance may be lower or higher than performance quoted. Please see www.transamericainvestments.com for performance data current to the most recent month-end. Net Asset Value (“NAV”) returns include the reinvestment of dividends and capital gains but do not reflect any sales charges. Public Offering Price (“POP”) returns include the reinvestment of dividends and capital gains and reflect the maximum sales charge of 5.5% for A shares or the maximum applicable contingent deferred sales charge and 1% (during the first 12 months) for Class C shares. There are no sales charges on Class I and I2 shares.
Performance figures reflect any fee waivers and/or expense reimbursements by the Investment Adviser. Without such waivers and/or reimbursements, the performance would be lower. Future waivers and/or reimbursements are at the discretion of the Investment Adviser.
The risks of investing in foreign securities are magnified in emerging markets. These may include risks related to market and currency volatility, adverse social and political developments and the relatively small size and less liquidity of these markets. This material must be preceded or accompanied by a current prospectus, which includes specific contents regarding the investment objectives and policies of this fund.
| | | | |
| Transamerica Funds | | | | Annual Report 2012 |
| | Page 8 | | |
Transamerica Flexible Income
(formerly, Transamerica AEGON Flexible Income)
(unaudited)
MARKET ENVIRONMENT
The fiscal year ended October 31, 2012 much like it began the year; numerous issues continuing to weigh on investors’ minds both domestically and abroad. Despite these concerns, risk assets continued to do well for the year with credit spreads tightening across all fixed income classes, with U.S. Treasury rates continuing their downward trend, and with equity prices moderately higher per the Standard & Poor’s 500® Index (“S&P 500”).
Early in the fiscal year, the European sovereign and banking crisis was the primary concern. Despite the crisis being nearly a year-and-a-half old, policymakers continued to wrestle with an appropriate response. Finally, with significant pressure from the markets, policymakers introduced new facilities to relieve pressure on the financial system; tough fiscal austerity measures were to continue in exchange for more robust bank funding facilities. Unfortunately, this did nothing more than defer the resolution of the problem without addressing the real issues of the European Monetary Union. Europe’s economy continued to slip deeper into recession throughout the fiscal year putting even further pressure on an already strained banking system. Ultimately, with strains once again too strong to ignore, the European Central Bank (“ECB”) late in the fiscal year stepped up once again declaring; “we will do what it takes to support the system”.
Throughout the fiscal year 2012 the U.S. economy continued its slow to moderate grow path, with numerous cries from various economic pundits that a recession was just around the corner. The Federal Reserve (“Fed”), already on the heels of two prior quantitative easing programs, announced late in the year that a third program, with a targeted unemployment rate, was what the economy needed. The monetary response, coupled with an extension of the payroll tax holiday, kept the consumer with adequate resources to continue their spending trend. Housing prices finally found a bid during the fiscal year as low interest rates and valuations more in line with history, created an excellent time to be a home buyer.
A new concern developed in fiscal 2012; a slowing global economy, led by concerns of growth in China, and its ultimate impact on the rest of the world. Moving toward the end of the fiscal year, numerous central banks around the world responded with even more aggressive accommodation, which looks to have slowed the pace of deceleration of worldwide growth, and in fact signs are accumulating that a turn in global growth may be at hand.
A common theme prevalent around the world during the fiscal year has been the response by numerous central banks and the more accommodative stance to help slowing economies and stressed banking systems. This liquidity has found its way into financial markets promoting better financial conditions and thus lower risk premiums for many risk assets. For now many solvency and liquidity issues that had cropped up around the world, have calmed.
As this letter began, macroeconomic issues have not gone away; some new ones have appeared on the horizon while some of the old ones will no doubt resurface. In the U.S., fears of the Fiscal Cliff, uncertainty surrounding future fiscal policies, and a continued tepid employment market, will weigh on investors’ minds. In Europe, while the ECB has calmed matters there for the time being, policymakers still have a significant task ahead of them in trying to integrate the Union more politically. Growth in China has been decelerating, leading some pundits to look for even lower growth rates than the consensus now believes.
Despite all of the macroeconomic concerns, the prevailing theme of accommodative central banks will continue. This has already produced global PMIs (also known as Purchasing Managers Index) and leading indicators of worldwide growth to stabilize and in fact show signs of revitalizing growth. The combination of better economic growth along with continued stimulus from central banks should provide positive tailwinds for risk assets throughout fiscal year 2013.
PERFORMANCE
For the year ended October 31, 2012, Transamerica Flexible Income Class A returned 11.60%. By comparison, its benchmark, the Barclays U.S. Aggregate Bond Index (“BCAB”), returned 5.25%.
STRATEGY REVIEW
Transamerica Flexible Income achieved a higher total return than the benchmark through capital appreciation and higher yield. Our overweighting of various spread products, notably corporate bonds (investment grade and high yield), were the main contributors to performance. Investments in non-agency residential mortgage backed securities (“RMBS”), emerging markets, non-dollar securities, and name and sector selection added to our performance. Our underweighting to U.S. Treasuries and Agency securities also contributed to performance given their minimal carry and lack of spread compression potential, while our short duration positioning detracted from performance.
Corporate bonds remained our largest overweight and continued to benefit from central bank induced risk premium contraction, improving corporate fundamentals, and a strong market technical. Corporates really were the big winner out of the Great Recession as their balance sheets improved, they got great access to liquidity, and they have the ability to invest overseas or in other growth markets. These positive factors are not affecting other fixed income sectors such as municipals, mortgage back securities, or Treasuries to the same degree. Within our corporate bond allocation, we were overweight to financials as wider spreads and stabilizing credit fundamentals provided opportunities.
| | | | |
| Transamerica Funds | | | | Annual Report 2012 |
| | Page 9 | | |
Transamerica Flexible Income
(formerly, Transamerica AEGON Flexible Income)
(unaudited)
STRATEGY REVIEW (continued)
Within other spread sectors, we increased allocation to non-agency RMBS for yield and total return opportunities. Given the previous move in home prices from the peak, the decline in mortgage rates, and improved sentiment housing appears to have bottomed and be showing slight gains. As the underlying fundamentals for housing improved, these securities added to performance. Additionally, our investments in the non-U.S. dollar markets of Mexico, Canada, Brazil, Chile, and the Philippines added to performance for through yield and appreciating currency movements. Although we are cautious on volatility of the foreign exchange markets, we continue to believe these are some select markets which can add yield and risk adjusted return.
Our duration, which was shorter than the BCAB, detracted from performance during the year as though shorter maturity U.S. Treasury rates remained relatively unchanged, while longer maturity rates rallied. Given the concerns that developed during the year over which assets were truly risk-free in Europe and continued effects from the Fed’s balance sheet management operations which have removed duration from the Treasury market, longer maturity rates rallied. With interest rates so low, and plenty of other good opportunities to pick up yield, we want to minimize the risk that the back up in interest rates could cause to bond prices. We continue to prefer exposure to credit risk over duration risk.
Brian W. Westhoff, CFA
Bradley J. Beman, CFA
Greg Haendel, CFA
David Halfpap, CFA
Rick Perry, CFA
Jim Schaeffer
Co-Portfolio Managers
AEGON USA Investment Management, LLC
| | | | |
| Transamerica Funds | | | | Annual Report 2012 |
| | Page 10 | | |
Transamerica Flexible Income
(formerly, Transamerica AEGON Flexible Income)
(unaudited)
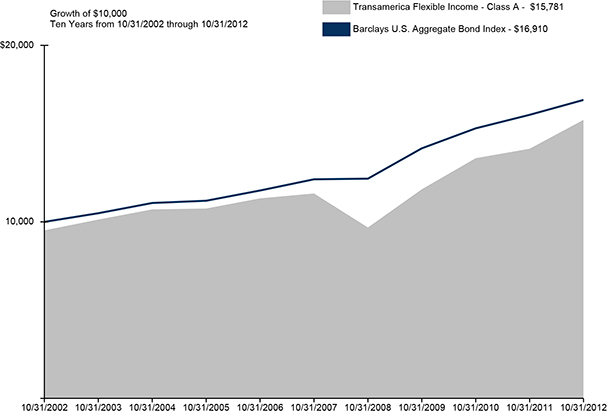
Average Annual Total Return for Periods Ended 10/31/2012
| | | | | | | | | | | | | | | | |
| | | 1 Year | | | 5 Years | | | 10 Years or
Life of Class | | | Inception Date | |
Class A (NAV) | | | 11.60 | % | | | 6.34 | % | | | 5.18 | % | | | 06/29/1987 | |
Class A (POP) | | | 6.30 | % | | | 5.30 | % | | | 4.67 | % | | | 06/29/1987 | |
Barclays U.S. Aggregate Bond * | | | 5.25 | % | | | 6.38 | % | | | 5.39 | % | | | | |
| | | | | | | | | | | | | | | | |
Class B (NAV) | | | 10.69 | % | | | 5.53 | % | | | 4.60 | % | | | 10/01/1995 | |
Class B (POP) | | | 5.69 | % | | | 5.37 | % | | | 4.60 | % | | | 10/01/1995 | |
| | | | | | | | | | | | | | | | |
Class C (NAV) | | | 10.71 | % | | | 5.64 | % | | | 4.45 | % | | | 11/11/2002 | |
Class C (POP) | | | 9.71 | % | | | 5.64 | % | | | 4.45 | % | | | 11/11/2002 | |
| | | | | | | | | | | | | | | | |
Class I (NAV) | | | 11.87 | % | | | N/A | | | | 9.94 | % | | | 11/30/2009 | |
| | | | | | | | | | | | | | | | |
Class I2 (NAV) | | | 11.85 | % | | | 6.85 | % | | | 5.50 | % | | | 11/08/2004 | |
| | | | | | | | | | | | | | | | |
NOTES
| * | The Barclays U.S. Aggregate Bond Index (“Barclays U.S. Aggregate Bond”) is an unmanaged index used as a general measure of market performance. Calculations assume dividends and capital gains are reinvested and do not include any managerial expenses. The 10 Years or Life of Class calculation is based on the previous 10 years or since the inception date of the class, whichever is more recent. You cannot invest directly in an index. |
The performance data presented represents past performance; future results may vary. Performance data does not reflect the deduction of taxes that would be paid on fund distributions or the redemption of fund shares. Investment return and principal value will fluctuate so that an investor’s shares, when redeemed, may be worth more or less than their original cost. Current performance may be lower or higher than performance quoted. Please see www.transamericainvestments.com for performance data current to the most recent month-end. Net Asset Value (“NAV”) returns include the reinvestment of dividends and capital gains but do not reflect any sales charges. Public Offering Price (“POP”) returns include the reinvestment of dividends and capital gains and reflect the maximum sales charge of 4.75% for A shares or the maximum applicable contingent deferred sales charge (5% in the 1st year, decreasing to 0% after 6 years) for Class B shares and 1% (during the first 12 months) for Class C shares. Shares purchased prior to March 1, 2004 are subject to a maximum applicable contingent deferred sales charge (5% in the 1st year, decreasing to 0% after 7 years) for Class B shares and (2% in the 1st year, decreasing to 0% after 2 years) for Class C shares. There are no sales charges on Class I and I2 shares.
Performance figures reflect any fee waivers and/or expense reimbursements by the Investment Adviser. Without such waivers and/or reimbursements, the performance would be lower. Future waivers and/or reimbursements are at the discretion of the Investment Adviser.
Investing in bond funds entails interest rate and credit risk as well as additional risks in that the fund may invest in high-yield/high-risk bonds and is subject to greater levels of liquidity risk, which are described in more detail in the prospectus. This material must be preceded or accompanied by a current prospectus, which includes specific contents regarding the investment objectives and policies of this fund.
| | | | |
| Transamerica Funds | | | | Annual Report 2012 |
| | Page 11 | | |
Transamerica Growth Opportunities
(formerly, Transamerica Morgan Stanley Growth Opportunities)
(unaudited)
MARKET ENVIRONMENT
The stock market continued to be influenced primarily by sentiment about the economy and policy actions from the Federal Reserve (“Fed”) and other central banks around the world. Although the tone of economic data in the U.S. remained mixed in the first half of the period, investors were optimistic about globally coordinated monetary policy efforts intended to shore up confidence in Europe’s ailing banks and a set of proposals from European Union leaders to address the debt crisis. However, in the spring, the equity market turned more volatile as the U.S. economy appeared to hit a soft patch, the pace of job growth slackened, and worries about Spain’s solvency surfaced. Economic growth in Europe and China weakened as well. Although these risks persisted, investor sentiment turned more upbeat in July with a pledge by the European Central Bank (“ECB”) president to do “whatever it takes” to save the Euro. Anticipation of another round of quantitative easing by the Fed also buoyed confidence. These expectations were fulfilled in September with the announcement of a new bond-buying program by the ECB and a third round of asset purchases by the Fed. Although October saw stronger labor and housing market data, corporate earnings reports for the third quarter were less robust than in recent quarters and uncertainties about the U.S. “fiscal cliff” (the expiration of certain tax cuts and government spending programs) at year’s end and ongoing European debt crisis remained.
PERFORMANCE
For the year ended October 31, 2012, Transamerica Growth Opportunities Class A returned (3.79)%. By comparison, its benchmark, the Russell Midcap® Growth Index, returned 9.09%.
STRATEGY REVIEW
The investment team looks for high-quality growth companies that they believe have these attributes: sustainable competitive advantages, business visibility, rising return on invested capital, free cash flow, and a favorable risk/reward profile. We find these companies through intense fundamental research. Our emphasis is on secular growth, and as a result short-term market events are not as meaningful in the stock selection process.
The fund underperformed the Russell Midcap® Growth Index (the “Index”) for the year ended October 31, 2012. Stock selection in the technology sector was by far the largest detractor from relative performance. Holdings in online deals provider Groupon, Inc. and social networking games developer Zynga, Inc. were the main drags on performance both within the sector and the fund overall. Stock selection in the consumer discretionary sector was disadvantageous, with disappointing results from several holdings not represented in the Index as well as a lack of exposure to some of the sector’s better-performing areas. Also dampening relative performance was stock selection in the materials and processing sector. Mineral miners Lynas Corp. and Molycorp, Inc. and potash producer Intrepid Potash, Inc. led the sector lower.
However, the fund benefited from both stock selection and an overweight in the health care sector. Holdings in medical equipment stocks Illumina, Inc. which makes tools and systems for use in genetic analysis, and Intuitive Surgical, Inc., which designs surgical systems for a variety of procedures, were among the fund’s top three contributing stocks during the period. Despite the somewhat negative effect of an overweight in the utilities sector, stock selection there bolstered performance. Relative gains in the sector were driven entirely by the fund’s position in Brookfield Infrastructure Partners LP, a manager of infrastructure operations.
Dennis P. Lynch
David S. Cohen
Sam G. Chainani, CFA
Alexander T. Norton
Jason C. Yeung, CFA
Armistead Nash
Co-Portfolio Managers
Morgan Stanley Investment Management Inc.
| | | | |
| Transamerica Funds | | | | Annual Report 2012 |
| | Page 12 | | |
Transamerica Growth Opportunities
(formerly, Transamerica Morgan Stanley Growth Opportunities)
(unaudited)
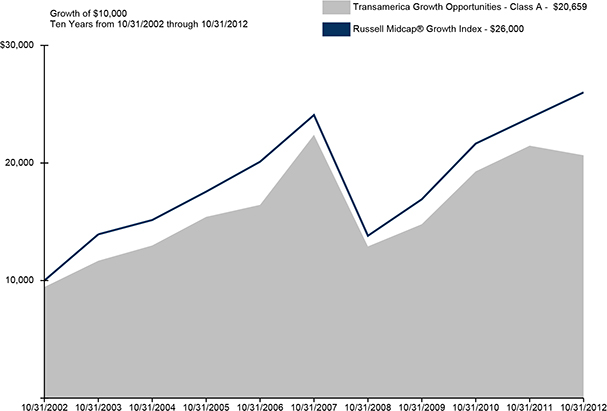
Average Annual Total Return for Periods Ended 10/31/2012
| | | | | | | | | | | | | | | | |
| | | 1 Year | | | 5 Years | | | 10 Years or
Life of Class | | | Inception Date | |
Class A (NAV) | | | (3.79 | )% | | | (1.60 | )% | | | 8.14 | % | | | 03/01/2000 | |
Class A (POP) | | | (9.11 | )% | | | (2.70 | )% | | | 7.53 | % | | | 03/01/2000 | |
Russell Midcap® Growth * | | | 9.09 | % | | | 1.55 | % | | | 10.03 | % | | | | |
| | | | | | | | | | | | | | | | |
Class B (NAV) | | | (4.47 | )% | | | (2.26 | )% | | | 7.51 | % | | | 03/01/2000 | |
Class B (POP) | | | (8.08 | )% | | | (2.41 | )% | | | 7.51 | % | | | 03/01/2000 | |
| | | | | | | | | | | | | | | | |
Class C (NAV) | | | (4.46 | )% | | | (2.22 | )% | | | 7.61 | % | | | 11/11/2002 | |
Class C (POP) | | | (5.19 | )% | | | (2.22 | )% | | | 7.61 | % | | | 11/11/2002 | |
| | | | | | | | | | | | | | | | |
Class I (NAV) | | | (3.16 | )% | | | N/A | | | | 11.53 | % | | | 11/30/2009 | |
| | | | | | | | | | | | | | | | |
Class I2 (NAV) | | | (2.97 | )% | | | (0.78 | )% | | | 4.90 | % | | | 11/15/2005 | |
| | | | | | | | | | | | | | | | |
NOTES
| * | The Russell Midcap® Growth Index (“Russell Midcap® Growth”) is an unmanaged index used as a general measure of market performance. Calculations assume dividends and capital gains are reinvested and do not include any managerial expenses. The 10 Years or Life of Class calculation is based on the previous 10 years or since the inception date of the class, whichever is more recent. You cannot invest directly in an index. |
The performance data presented represents past performance; future results may vary. Performance data does not reflect the deduction of taxes that would be paid on fund distributions or the redemption of fund shares. Investment return and principal value will fluctuate so that an investor’s shares, when redeemed, may be worth more or less than their original cost. Current performance may be lower or higher than performance quoted. Please see www.transamericainvestments.com for performance data current to the most recent month-end. Net Asset Value (“NAV”) returns include the reinvestment of dividends and capital gains but do not reflect any sales charges. Public Offering Price (“POP”) returns include the reinvestment of dividends and capital gains and reflect the maximum sales charge of 5.5% for A shares or the maximum applicable contingent deferred sales charge (5% in the 1st year, decreasing to 0% after 6 years) for Class B shares and 1% (during the first 12 months) for Class C shares. Shares purchased prior to March 1, 2004 are subject to a maximum applicable contingent deferred sales charge (5% in the 1st year, decreasing to 0% after 7 years) for Class B shares and (2% in the 1st year, decreasing to 0% after 2 years) for Class C shares. There are no sales charges on Class I and I2 shares.
Performance figures reflect any fee waivers and/or expense reimbursements by the Investment Adviser. Without such waivers and/or reimbursements, the performance would be lower. Future waivers and/or reimbursements are at the discretion of the Investment Adviser.
Investing in small and medium-size companies involves greater risk than is customarily associated with more established companies. The securities of small and mid capitalization companies are subject to higher volatility than larger, more established companies. This material must be preceded or accompanied by a current prospectus, which includes specific contents regarding the investment objectives and policies of this fund.
Russell Investment Group is the source and owner of the trademarks, service marks, and copyrights related to the Russell indexes. Russell® is a trademark of Russell Investment Group.
| | | | |
| Transamerica Funds | | | | Annual Report 2012 |
| | Page 13 | | |
Transamerica High Yield Bond
(formerly, Transamerica AEGON High Yield Bond)
(unaudited)
MARKET ENVIRONMENT
The fiscal year ended October 31, 2012 much like it began. Numerous issues continue to weigh on investors’ minds both domestically and abroad. Despite these concerns, risk assets continued to do well for the year with credit spreads tightening across fixed income classes, U.S. Treasury rates continuing their downward trend, and equity prices moderately higher.
Early in the fiscal year, the European sovereign and banking crisis was the primary concern. Despite the crisis being over a year old, policymakers continued to wrestle with an appropriate response. With significant pressure from the markets, policymakers introduced new funding facilities to relieve pressure on the financial system in exchange for tough fiscal austerity measures. However, we believe that these measures do not address the real issues facing the Monetary Union.
Throughout the fiscal year, the U.S. economy continued a slow to moderate growth path. The U.S. Federal Reserve Board (“Fed”), already on the heels of two prior quantitative easing programs, announced a third program targeted at lowering the unemployment rate. The monetary response, coupled with an extension of the payroll tax holiday, kept the consumer with adequate resources to continue their spending trend. In addition, housing prices finally found a bid during the fiscal year due to low interest rates.
Concerns about global economic growth increased due to a slowdown in China and its ultimate impact on the rest of the world. Moving toward the end of the fiscal year, numerous central banks around the world responded with even more aggressive accommodation. The easing appears to have reduced the risks of a sharp slowdown.
The liquidity provided by central banks around the world continues to promote improved financial conditions and lower risk premiums for many risk assets. For now many solvency and liquidity issues, which cropped up around the world, have calmed.
However, many macroeconomic issues remain. In the U.S. fears of the “fiscal cliff”, uncertainty surrounding future fiscal policies, and a tepid employment market weigh on investors’ minds. In Europe, policymakers still have a significant task ahead of them in trying to integrate the Union more politically. A slowdown in China’s growth also remains a concern.
Despite all of the macroeconomic concerns, we believe the prevailing theme of accommodative central banks is likely to continue, which may provide positive tailwinds for risk assets throughout fiscal year 2013.
PERFORMANCE
For the year ended October 31, 2012, Transamerica High Yield Bond Class A returned 14.57%. By comparison, its benchmark, the Barclays U.S. Corporate High Yield 2% Issuer Capped Index, returned 13.58%.
STRATEGY REVIEW
Transamerica High Yield Bond outperformed its benchmark for the fiscal year ended October 31, 2012. The Consumer Cyclical sector provided the greatest contribution to performance as an overweight to Home Construction industry benefitted from the modest rebound in new home sales. The fund also benefited from being underweight the Energy sector, which was one of the lowest returning sectors in the High Yield market. Security selection was also a notable positive as bonds owned by the fund in the Financial, Technology, and Communications sectors materially outperformed the underlying indices.
The individual positions which had the greatest positive impact on performance included bonds issued by Sprint Nextel Corp., First Data Corp., Beazer Homes USA, Inc., KB Home, and Edison Mission Energy. Notable detractors from performance included the securities of Dynegy, Inc., Caesars Entertainment Operating Co., Inc., Clearwire, Unisys Corp., and EnergySolutions, Inc./EnergySolutions LLC In addition, the fund’s modest allocation to cash pulled down overall performance.
We believe high yield is positioned to outperform other fixed income assets over the next six to twelve months, albeit total returns may not exceed the coupons generated on the fund. Fundamentals remain strong as companies are profitable, balance sheets are conservative, default rates remain low, and global monetary stimuli remain supportive.
Bradley J. Beman, CFA
Kevin Bakker, CFA
Benjamin D. Miller, CFA
Jim Schaeffer
Co-Portfolio Managers
AEGON USA Investment Management, LLC
| | | | |
| Transamerica Funds | | | | Annual Report 2012 |
| | Page 14 | | |
Transamerica High Yield Bond
(formerly, Transamerica AEGON High Yield Bond)
(unaudited)
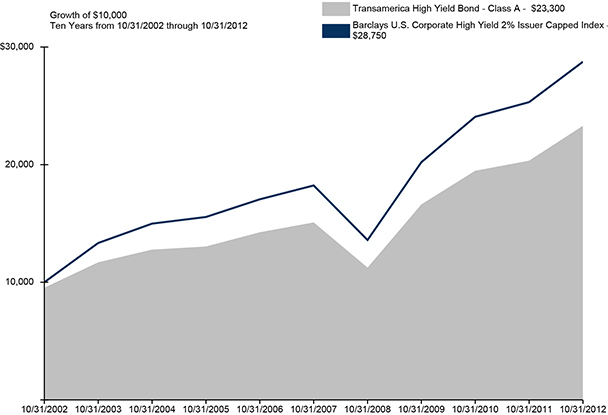
Average Annual Total Return for Periods Ended 10/31/2012
| | | | | | | | | | | | | | | | |
| | | 1 Year | | | 5 Years | | | 10 Years or
Life of Class | | | Inception Date | |
Class A (NAV) | | | 14.57 | % | | | 9.08 | % | | | 9.35 | % | | | 06/14/1985 | |
Class A (POP) | | | 9.08 | % | | | 8.03 | % | | | 8.83 | % | | | 06/14/1985 | |
Barclays U.S. Corporate High Yield 2% Issuer Capped * | | | 13.58 | % | | | 9.54 | % | | | 11.14 | % | | | | |
| | | | | | | | | | | | | | | | |
Class B (NAV) | | | 13.77 | % | | | 8.32 | % | | | 8.74 | % | | | 10/01/1995 | |
Class B (POP) | | | 8.77 | % | | | 8.17 | % | | | 8.74 | % | | | 10/01/1995 | |
| | | | | | | | | | | | | | | | |
Class C (NAV) | | | 13.81 | % | | | 8.40 | % | | | 8.43 | % | | | 11/11/2002 | |
Class C (POP) | | | 12.81 | % | | | 8.40 | % | | | 8.43 | % | | | 11/11/2002 | |
| | | | | | | | | | | | | | | | |
Class I (NAV) | | | 15.05 | % | | | N/A | | | | 12.26 | % | | | 11/30/2009 | |
| | | | | | | | | | | | | | | | |
Class I2 (NAV) | | | 15.01 | % | | | 9.61 | % | | | 8.32 | % | | | 11/08/2004 | |
| | | | | | | | | | | | | | | | |
NOTES
| * | The Barclays U.S. Corporate High Yield 2% Issuer Capped Index (“Barclays U.S. Corporate High Yield 2% Issuer Capped”) is an unmanaged index used as a general measure of market performance. Calculations assume dividends and capital gains are reinvested and do not include any managerial expenses. The 10 Years or Life of Class calculation is based on the previous 10 years or since the inception date of the class, whichever is more recent. You cannot invest directly in an index. |
The performance data presented represents past performance; future results may vary. Performance data does not reflect the deduction of taxes that would be paid on fund distributions or the redemption of fund shares. Investment return and principal value will fluctuate so that an investor’s shares, when redeemed, may be worth more or less than their original cost. Current performance may be lower or higher than performance quoted. Please see www.transamericainvestments.com for performance data current to the most recent month-end. Net Asset Value (“NAV”) returns include the reinvestment of dividends and capital gains but do not reflect any sales charges. Public Offering Price (“POP”) returns include the reinvestment of dividends and capital gains and reflect the maximum sales charge of 4.75% for A shares or the maximum applicable contingent deferred sales charge (5% in the 1st year, decreasing to 0% after 6 years) for Class B shares and 1% (during the first 12 months) for Class C shares. Shares purchased prior to March 1, 2004 are subject to a maximum applicable contingent deferred sales charge (5% in the 1st year, decreasing to 0% after 7 years) for Class B shares and (2% in the 1st year, decreasing to 0% after 2 years) for Class C shares. There are no sales charges on Class I and I2 shares.
Performance figures reflect any fee waivers and/or expense reimbursements by the Investment Adviser. Without such waivers and/or reimbursements, the performance would be lower. Future waivers and/or reimbursements are at the discretion of the Investment Adviser.
Investments in high-yield bonds (“junk bonds”) may be subject to greater volatility and risks as the income derived from these securities is not guaranteed and may be unpredictable and the value of these securities tends to decline when the interest rate increases. This material must be preceded or accompanied by a current prospectus, which includes specific contents regarding the investment objectives and policies of this fund.
| | | | |
| Transamerica Funds | | | | Annual Report 2012 |
| | Page 15 | | |
Transamerica International Bond
(formerly, Transamerica JPMorgan International Bond)
(unaudited)
MARKET ENVIRONMENT
Over the past 12 months, our base-case market outlook has remained relatively consistent and assigned a high probability to the “muddle-through” anemic recovery scenario. However, we believe that central bank intervention globally has mitigated the tail risk resulting from fears of a eurozone crisis. The combined actions of the five major central banks – the Federal Reserve (“Fed”), the European Central Bank (“ECB”), the U.K.’s Monetary Policy Committee, the Bank of Japan, and the People’s Bank of China – have reduced downside economic risks and further entrenched our base-case for a sub-trend recovery. The positive surprises in these central bank actions were that the Fed changed its reaction function from reactive to proactive, and the ECB overcame German objections to offer unlimited and pari passu (without partiality) bond purchases. The open-ended nature of these policies is powerful. Central banks now appear to have done what they can, and the onus for generating an economic recovery has shifted to fiscal policy. It is clear that for the central banks, the priority for inflation targeting has given way to growth generation over the intermediate horizon. While economic downside risks have been mitigated, the upside has not materially improved. The amount of deleveraging yet to occur is a massive inhibitor of growth. Although the ECB has provided a sufficient liquidity backdrop to stabilize sovereign funding, agreements on integration and reform have yet to be reached. The slowdown in China looms as an ominous headwind for Pacific Rim countries. The outcome of the U.S. elections seems less important than any immediate bipartisan agreement to reduce the fiscal cliff that would otherwise occur in 2013. Central bank asset purchases, or quantitative easing, are more likely to inflate asset prices than to generate economic growth, unless emerging market growth exceeds forecasts. Despite record-low yields across markets, bonds continue to be supported by policy intervention, and spread sectors are well supported.
PERFORMANCE
For the year ended October 31, 2012, Transamerica International Bond Class I2 returned 2.71%. By comparison its benchmark, the J.P. Morgan Government Bond ex-U.S. Unhedged Index, returned 1.68%.
STRATEGY REVIEW
Accommodative monetary policy globally has bolstered market sentiment over the period and has created an ideal environment for fixed income, particularly as some of the more extreme fat tail-risk scenarios have receded. Our exposure to investment-grade corporate credit, given the significant tightening experienced in credit spreads, has been additive. Our exposure to covered bonds has also enhanced performance, particularly our allocation to euro-denominated covered bonds where we retain high conviction. In rates, we added a long position in five-year Spanish bonds as peripheral bonds rallied following the ECB’s Outright Monetary Transactions (“OMT”) announcement. Earlier in the period, the fund was positioned neutral in headline duration versus its benchmark, with overweighs in the U.K. and underweights in Germany, Spain and Italy. Later in the period, we also added duration in 10-year Japanese government bonds with the expectation of ongoing economic weakness in the eurozone and growing tensions between China and Japan. Yields in core government bonds are currently at record lows, and yet central banks continue to ease policy rates, and the fund has held overweights in highly rated government agencies, supranationals and covered bonds as substitutes for core government bonds over the period. We expect the spread on these assets to narrow as low risk-free rates encourage investors to look for alternative forms of yield. Looking forward, our base-case remains one of a sub-trend recovery that continues into 2013. As developed markets are forced to go through public and private austerity, coordinated central bank action will provide the liquidity to prevent a downward spiral. The fund’s positioning should benefit from yields remaining low and narrowing of higher-rated credit spreads.
We use government bond futures for duration management, active and index replication. We use forward foreign currency contracts for currency management, active and index replication. Active management in duration and foreign exchange contributed positively to performance, and exceeded management’s expectations.
Jon B. Jonsson
Portfolio Manager
J.P. Morgan Investment Management Inc.
| | | | |
| Transamerica Funds | | | | Annual Report 2012 |
| | Page 16 | | |
Transamerica International Bond
(formerly, Transamerica JPMorgan International Bond)
(unaudited)
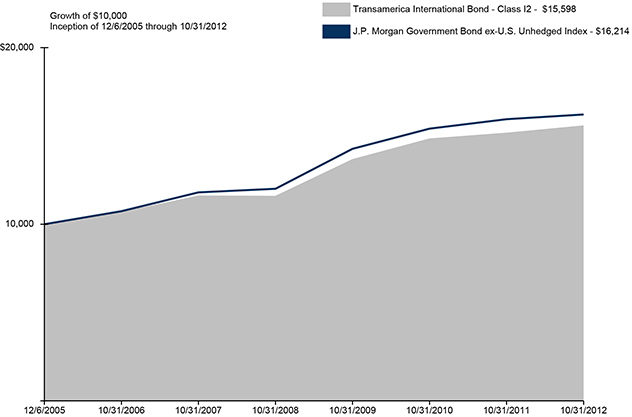
Average Annual Total Return for Periods Ended 10/31/2012
| | | | | | | | | | | | | | | | |
| | | | | | | | | 10 Years or | | | | |
| | | 1 Year | | | 5 Years | | | Life of Class | | | Inception Date | |
Class I2 (NAV) | | | 2.71 | % | | | 6.05 | % | | | 6.65 | % | | | 12/06/2005 | |
J.P. Morgan Government Bond ex-U.S. Unhedged * | | | 1.68 | % | | | 6.55 | % | | | 7.25 | % | | | | |
| | | | | | | | | | | | | | | | |
Class A (NAV) | | | N/A | | | | N/A | | | | 2.52 | %(A) | | | 03/01/2012 | |
Class A (POP) | | | N/A | | | | N/A | | | | (2.32 | )%(A) | | | 03/01/2012 | |
| | | | | | | | | | | | | | | | |
Class C (NAV) | | | N/A | | | | N/A | | | | 2.03 | %(A) | | | 03/01/2012 | |
Class C (POP) | | | N/A | | | | N/A | | | | 1.03 | %(A) | | | 03/01/2012 | |
| | | | | | | | | | | | | | | | |
Class I (NAV) | | | N/A | | | | N/A | | | | 2.75 | %(A) | | | 03/01/2012 | |
| | | | | | | | | | | | | | | | |
NOTES
| * | The J.P. Morgan Government Bond ex-U.S. unhedged Index (“J.P. Morgan Government Bond ex-U.S. Unhedged”) is an unmanaged index used as a general measure of market performance. Calculations assumed dividends and capital gains are reinvested and do not include any managerial expenses. The 10 Years or Life of Fund calculation is based on inception date of the class. You cannot invest directly in an index. |
The performance data presented represents past performance; future results may vary. Performance data does not reflect the deduction of taxes that would be paid on fund distributions or the redemption of fund shares. Investment return and principal value will fluctuate so that an investor’s shares, when redeemed, may be worth more or less than their original cost. Current performance may be lower or higher than performance quoted. Please see www.transamericainvestments.com for performance data current to the most recent month-end. Net Asset Value (“NAV”) returns include the reinvestment of dividends and capital gains but do not reflect any sales charges. Public Offering Price (“POP”) returns include the reinvestment of dividends and capital gains and reflect the maximum sales charge of 4.75% for A shares or the maximum applicable contingent deferred sales charge 1% (during the first 12 months) for Class C shares. There are no sales charges on Class I and I2 shares.
Performance figures reflect any fee waivers and/or expense reimbursements by the Investment Adviser. Without such waivers and/or reimbursements, the performance would be lower. Future waivers and/or reimbursements are at the discretion of the Investment Adviser.
Investing in bond funds entails interest rate and credit risk as well as additional risks in that the fund may invest in high-yield/high-risk bonds and is subject to greater levels of liquidity risk, which are described in more detail in the prospectus. Investments in global/international markets involve risks not associated with U.S. markets, such as currency fluctuations, adverse social and political developments, and the relatively small size and lesser liquidity of the markets. This material must be preceded or accompanied by a current prospectus, which includes specific contents regarding the investment objectives and policies of this fund.
| | | | |
| Transamerica Funds | | | | Annual Report 2012 |
| | Page 17 | | |
Transamerica International Equity
(formerly, Transamerica TS&W International Equity)
(unaudited)
MARKET ENVIRONMENT
Non-U.S. stocks produced positive returns for investors in the twelve months ended October 31, 2012, but only after two strong market rallies were interrupted by a sharp springtime correction. The European sovereign debt crisis and its broader impact on global economic growth was the focal point for investors for the second consecutive year. While it is tempting to describe this pattern of performance as more of the “risk on/risk off” dynamic frequently invoked over the last three years, we believe markets exhibit evidence of a slow awakening to the attractive value and income characteristics available from many stocks relative to expensive fixed income alternatives.
Stocks began the year in a downdraft as Spain, Portugal, Italy, and Greece (Europe’s weakest economies) confronted the need for bailouts, debt restructuring or perhaps a disorderly exit from the common currency regime, and China grappled with slowing economic growth. Fear gave way to optimism in late November, however, as positive moves by Europe’s political leadership raised the possibility of solutions to the debt crisis. With stocks valued at generational lows relative to profits, cash flow and dividends; these political maneuvers, along with aggressive global monetary policy, produced a strong rally that lasted until late March. Stocks reached another low in early June, but once again low valuations and monetary stimulus triggered a rally that was ongoing as the fund’s fiscal year ended.
Sluggish global economic growth, an unfortunate side effect of the inescapable need to reduce debt, is likely to keep stock markets volatile over the next year. Many companies will struggle to grow sales and maintain profit margins, but much of this uncertainty is already reflected in stock valuations. We believe the current environment favors the disciplined, value investment strategy that we pursue because periodic flare-ups of macro-economic pessimism result in attractive entry points for stocks.
PERFORMANCE
For the year ended October 31, 2012, Transamerica International Equity Class I returned 11.58%. By comparison, its benchmark, the Morgan Stanley Capital International - Europe, Australasia, Far East Index, returned 5.15%.
STRATEGY REVIEW
Transamerica International Equity produced a strong result over the past year by maintaining a disciplined focus on valuation and a farsighted investment time horizon. Europe, the focus of so much anxiety over the past year, was the top contributor to fund performance over the last twelve months. Although Europe is in the midst of a recession, or close to it, European stocks began the year at very inexpensive valuation levels, suggesting that expectations were low. Many of these companies do business globally, meaning they were able to find opportunities outside their home region. While all geographic regions produced a positive relative return for the fund over the past year, stocks outside the benchmark, representing emerging markets and Canada, were the least positive contributors. With good values available in developed markets, the allocation to emerging markets was below our 10% maximum limitation throughout the year.
The Materials sector, which includes economically sensitive companies in a diverse collection of businesses from mining and chemicals to packaging and building materials, produced the largest contribution to fund return, followed closely by consumer discretionary stocks, another diverse group. Smurfit Kappa Group PLC, a producer of boxes and other paper packaging based in Ireland, was the top stock in the fund over the last year, rebounding from the dubious honor of being the worst contributor the year before. Our investment thesis for Smurfit Kappa Group PLC is based on industry and financial improvements that are expected to play out over a number of years, so this reversal was not a big surprise. Other top contributors included Grifols, a Spanish medical technology firm, and WPP PLC, a global advertising giant based in the U.K.
The Financial sector, in which we have been underweight for some time, was the only economic sector to detract from fund performance over the past year. Although valuations continue to appear low in this sector, we remain concerned about the lack of regulatory clarity and the need for many companies to boost the amount of capital they hold in reserve. Fujitsu, Ltd., a Japanese technology giant, was the most significant detractor from performance over the last year. Like many large Japanese electronics firms, Fujitsu, Ltd. is struggling to restructure its business to meet a rapidly changing landscape for enterprise technology. BinckBank, a Netherlands-based brokerage and financial services firm, was the second-largest detractor for the year.
Brandon H. Harrell, CFA
Portfolio Manager
Thompson, Siegel & Walmsley LLC
| | | | |
| Transamerica Funds | | | | Annual Report 2012 |
| | Page 18 | | |
Transamerica International Equity
(formerly, Transamerica TS&W International Equity)
(unaudited)

Average Annual Total Return for Periods Ended 10/31/2012
| | | | | | | | | | | | | | | | |
| | | | | | | | | 10 Years or | | | | |
| | | 1 Year | | | 5 Years | | | Life of Class | | | Inception Date | |
Class I (NAV) | | | 11.58 | % | | | (3.20 | )% | | | 8.49 | % | | | 12/18/1992 | |
MSCI-EAFE * | | | 5.15 | % | | | (5.35 | )% | | | 8.21 | % | | | | |
| | | | | | | | | | | | | | | | |
Class A (NAV) | | | 11.10 | % | | | N/A | | | | (0.26 | )% | | | 03/01/2011 | |
Class A (POP) | | | 5.01 | % | | | N/A | | | | (3.57 | )% | | | 03/01/2011 | |
| | | | | | | | | | | | | | | | |
Class C (NAV) | | | 10.49 | % | | | N/A | | | | (0.89 | )% | | | 03/01/2011 | |
Class C (POP) | | | 9.49 | % | | | N/A | | | | (0.89 | )% | | | 03/01/2011 | |
| | | | | | | | | | | | | | | | |
Class I2 (NAV) | | | 11.64 | % | | | N/A | | | | 0.21 | % | | | 03/01/2011 | |
| | | | | | | | | | | | | | | | |
NOTES
| * | The Morgan Stanley Capital International Europe, Australasia, Far East Index (“MSCI-EAFE”) is an unmanaged index used as a general measure of market performance. Calculations assume dividends and capital gains are reinvested and do not include any managerial expenses. The 10 Years or Life of Class calculation is based on the previous 10 years or since the inception date of the class, whichever is more recent. You cannot invest directly in an index. |
The performance data presented represents past performance; future results may vary. Performance data does not reflect the deduction of taxes that would be paid on fund distributions or the redemption of fund shares. Investment return and principal value will fluctuate so that an investor’s shares, when redeemed, may be worth more or less than their original cost. Current performance may be lower or higher than performance quoted. Please see www.transamericainvestments.com for performance data current to the most recent month-end. Net Asset Value (“NAV”) returns include the reinvestment of dividends and capital gains but do not reflect any sales charges. Public Offering Price (“POP”) returns include the reinvestment of dividends and capital gains and reflect the maximum sales charge of 5.5% for A shares or the maximum applicable contingent deferred sales charge 1% (during the first 12 months) for Class C shares. There are no sales charges on Class I and I2 shares.
Performance figures reflect any fee waivers and/or expense reimbursements by the Investment Adviser. Without such waivers and/or reimbursements, the performance would be lower. Future waivers and/or reimbursements are at the discretion of the Investment Adviser.
The prices of securities the sub-adviser believes are undervalued may not appreciate as anticipated or may go down. Investments in global/international markets involve risks not associated with U.S. markets, such as currency fluctuations, adverse social and political developments, and the relatively small size and lesser liquidity of the markets. This material must be preceded or accompanied by a current prospectus, which includes specific contents regarding the investment objectives and policies of this fund.
| | | | |
| Transamerica Funds | | | | Annual Report 2012 |
| | Page 19 | | |
Transamerica Large Cap Growth
(unaudited)
MARKET ENVIRONMENT
In some ways, 2012 has played out in a similar manner to 2010 and 2011, in that we experienced a rally to start the year followed by a period of weakness driven by a volatile global macro-economic environment. However, the key difference was the calm markets we experienced over the summer this year. After the summer fireworks of the last few years, it was a welcome respite. Mario Draghi, president of the European Central Bank (“ECB”), calmed markets in late July with his comment that the ECB would do “whatever it takes” to save the Euro, setting markets up for a nice rally.
Then markets were helped by the Federal Reserve (“Fed”). After hinting that it was ready to act to jump-start the recovery again, a series of weak employment reports pushed the Fed to announce its third major round of bond buying. The hope is that the purchases will help lower mortgage rates even further and help boost the housing sector. The markets have also been helped by improved consumer confidence and strong corporate earnings.
PERFORMANCE
For the period from inception April 30, 2012 through October 31, 2012, Transamerica Large Cap Growth Class A returned (1.40)%. By comparison, its benchmark, the Russell 1000® Growth Index, returned (0.98)%.
STRATEGY REVIEW
The fund was launched April 30, 2012. The following month, May, was a difficult month for the market. The culprits weighing down the market were nothing new - namely mixed domestic economic progress and continued political and economic uncertainty in Europe. However, the market then rallied for the next four months before pausing in October. Against this market environment, the fund performed in-line with the Russell 1000® Growth Index benchmark. The fund continues to be positioned with a sector neutral approach in order to ensure that our stock selection will drive our results. Stock selection in the consumer discretionary and materials sectors was the key contributor to our success, while our holdings in the health care sector underperformed.
Our consumer discretionary stocks provided strong returns led by media/cable provider Comcast Corp., apparel retailer Foot Locker, Inc., and specialty retailer PetSmart, Inc. Comcast Corp. traded higher after reports of higher subscriber rates for their cable business. PetSmart, Inc. shares rose after the pet-supplies retailer posted better-than-expected earnings and raised its full-year outlook. We also achieved strong results in the materials sector as Eastman Chemical Co., Monsanto, and Ball Corp. each gained ground.
We achieved mixed results in the technology sector. Our holding in Google, Inc. outperformed after the company reported quarterly earnings that, for the first time, included results from recently acquired Motorola Mobility. In Google’s core advertising businesses, revenue grew versus 2011, a result of its continued leadership in Internet search and display markets on the back of strong secular growth in online advertising. These positive results, however, were offset by our holding in VeriFone Systems, Inc., which had fiscal third-quarter income rise as the electronic-payments company’s revenue strengthened, led by its services business. Still, shares dropped after the company predicted weak fourth-quarter revenue.
Our holdings in the health care sector underperformed after Agilent Technologies Inc. shares fell, as investors reacted negatively to the company’s weak third-quarter report and fourth-quarter outlook.
James P. Haynie, CFA
Mark Stoeckle
Co-Portfolio Managers
BNP Paribas Asset Management, Inc.
| | | | |
| Transamerica Funds | | | | Annual Report 2012 |
| | Page 20 | | |
Transamerica Large Cap Growth
(unaudited)
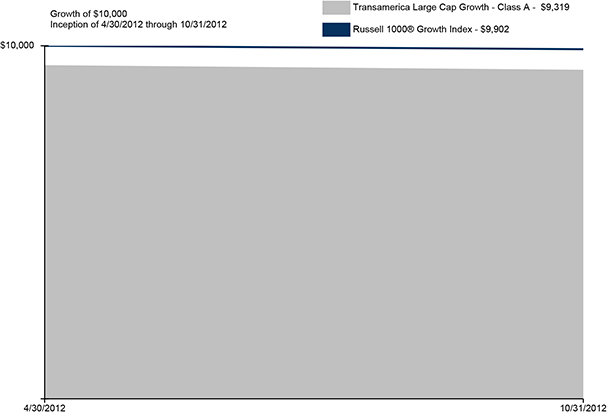
Average Annual Total Return for Periods Ended 10/31/2012
| | | | | | | | |
| | | 10 Years or
Life of Class | | | Inception Date | |
Class A (NAV) | | | (1.40 | )% (A) | | | 04/30/2012 | |
Class A (POP) | | | (6.81 | )% (A) | | | 04/30/2012 | |
Russell 1000® Growth * | | | (0.98 | )% (A) | | | | |
| | | | | | | | |
Class C (NAV) | | | (1.80 | )% (A) | | | 04/30/2012 | |
Class C (POP) | | | (2.78 | )% (A) | | | 04/30/2012 | |
| | | | | | | | |
Class I (NAV) | | | (1.30 | )% (A) | | | 04/30/2012 | |
| | | | | | | | |
Class I2 (NAV) | | | (1.20 | )% (A) | | | 04/30/2012 | |
| | | | | | | | |
NOTES
| * | The Russell 1000® Growth Index (“Russell 1000® Growth”) is an unmanaged index used as a general measure of market performance. Calculations assume dividends and capital gains are reinvested and do not include any managerial expenses. The 10 Years or Life of Class calculation is based on the inception date of the class. You cannot invest directly in an index. |
The performance data presented represents past performance; future results may vary. Performance data does not reflect the deduction of taxes that would be paid on fund distributions or the redemption of fund shares. Investment return and principal value will fluctuate so that an investor’s shares, when redeemed, may be worth more or less than their original cost. Current performance may be lower or higher than performance quoted. Please see www.transamericainvestments.com for performance data current to the most recent month-end. Net Asset Value (“NAV”) returns include the reinvestment of dividends and capital gains but do not reflect any sales charges. Public Offering Price (“POP”) returns include the reinvestment of dividends and capital gains and reflect the maximum sales charge of 5.5% for A shares or the maximum applicable contingent deferred sales charge and 1% (during the first 12 months) for Class C shares. There are no sales charges on Class I and I2 shares.
Performance figures reflect any fee waivers and/or expense reimbursements by the Investment Adviser. Without such waivers and/or reimbursements, the performance would be lower. Future waivers and/or reimbursements are at the discretion of the Investment Adviser.
The price of equity securities may rise or fall because of changes in the market or changes in a company’s financial condition. Equities are subject to market risk meaning that stock prices in general may decline over short or extended periods of time. This material must be preceded or accompanied by a current prospectus, which includes specific contents regarding the investment objectives and policies of this fund.
Russell Investment Group is the source and owner of the trademarks, service marks, and copyrights related to the Russell indexes. Russell® is a trademark of Russell Investment Group.
| | | | |
| Transamerica Funds | | | | Annual Report 2012 |
| | Page 21 | | |
Transamerica Large Cap Value
(formerly, Transamerica Quality Value)
(unaudited)
MARKET ENVIRONMENT
During the third quarter, investors’ appetite for risk appeared to increase, leading to a rebound in equity markets. Keys to the sentiment improvement were the concerted measures taken by the world’s central bankers. In the U.S., Federal Reserve Board Chairman Ben Bernanke announced the third round of quantitative easing and set expectations on the direction of interest rates, stating the intention to keep them close to zero through 2015. In Europe, European Central Bank (“ECB”) president Mario Draghi expressed his commitment to keeping the eurozone together, announcing an aggressive bond buying plan (commonly known as OMT) in attempts to stabilize stressed debt markets in the region. All in all these promises are hardly guarantees of economic growth restoration in the near future, but they did appear to have reduced the perceived probability of a left tail event.
In early October, U.S. markets continued to advance, primarily due to better than expected U.S. unemployment data and the tailwind from the developments in Europe. However, the optimism was short-lived as investors stepped to the sidelines amidst mixed sentiment surrounding earnings expectations for Q3 2012 and in upcoming 2013, leading to a sell-off during the second week. As the month progressed, relatively positive news on two of the three major macro overhangs - slightly better economic data from China and the developments in Europe leading to a reduced linkage between Europe and U.S. markets, shifted investors’ focus to the third major overhang - the uncertainty surrounding the fiscal cliff and the upcoming elections in the U.S. As little clarity was obtained, market activity remained tepid during the second half of the month, even as the markets reopened after hurricane Sandy for the last trading day of the month.
On all fronts, our stance has been cautious throughout the entire period. While certain equity valuations are compelling, we have reasons to believe the economy and the macroeconomic issues affecting it continue to be real and concerning. We have tried to minimize the risk of our funds to these factors and prefer to focus on cash return profiles and company specific catalysts.
PERFORMANCE
For the year ended October 31, 2012, Transamerica Large Cap Value Class A returned 16.40%. By comparison, its benchmark, the Russell 1000® Value Index, returned 16.89%.
Prior to July 31, 2012, the fund was named Transamerica Quality Value and had a different sub-adviser.
STRATEGY REVIEW
Our strategy implements a value-oriented approach rooted in rigorous bottom-up research and emphasis on downside protection. Fundamentally, we look for good companies with overly discounted valuations on both absolute and relative bases, and a catalyst which could drive share price appreciation.
Given the macroeconomic backdrop, we have leaned away from economically sensitive sectors since inception in August 1, 2012. A slowing China can ultimately mean less demand for energy, commodities, and technology. We are underweight in those sectors and have a mix of low beta positions (e.g. Chevron Corp., Exxon Mobile Corp.) and underappreciated catalysts (e.g. Halliburton Co., EMC Corp.). We have no strong view on national healthcare, but we do like a number of bottom-up stories in healthcare and have a slight overweight in the sector (e.g. Medtronic, Inc., Cigna Corp.). We also have an overweight in consumer, both staples and discretionary. In both cases we are primarily interested in the more domestic plays in which future catalysts can unlock value (e.g. Macy’s, Inc., Ralcorp Holdings, Inc.). However, we are also looking at global market leaders with good cash returns that have experienced short-term underperformance. Procter & Gamble Co. is a good example of such a company.
As expected, stock selection contributed to the strategy’s outperformance whereas sector allocation detracted mainly due to our cash balance. The financial sector was the largest contributor to benchmark returns as investors sought exposure to the mortgage industry. Despite our underweight to the sector, positive stock selection contributed to performance both on an absolute and relative basis. Three of our top 5 relative contributors were financial stocks: Suntrust Banks, Inc., MetLife, Inc., and JPMorgan Chase & Co Materials was the largest detracting sector on both absolute and relative terms. However, the main factor to the strategy’s underperformance within the sector was the poor stock selection, primarily driven by our position in DuPont, which detracted in relative performance during the period. Additional noteworthy underperforming names were Willis Group Holdings PLC and Halliburton Co., which detracted from our relative performance.
Jack Murphy
John Levin
Co-Portfolio Managers
Levin Capital Strategies, L.P.
| | | | |
| Transamerica Funds | | | | Annual Report 2012 |
| | Page 22 | | |
Transamerica Large Cap Value
(formerly, Transamerica Quality Value)
(unaudited)
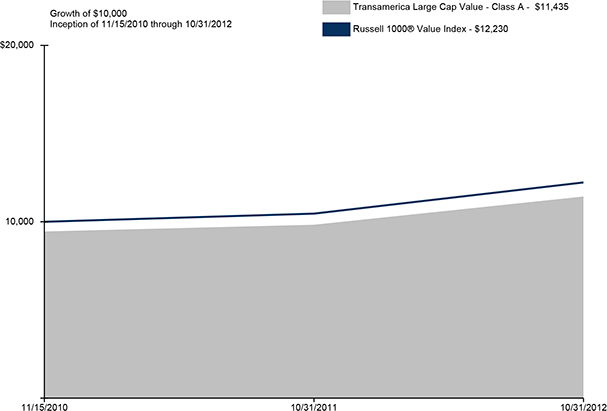
Average Annual Total Return for Periods Ended 10/31/2012
| | | | | | | | | | | | |
| | | 1 Year | | | 10 Years or
Life of Class | | | Inception Date | |
Class A (NAV) | | | 16.40 | % | | | 10.21 | % | | | 11/15/2010 | |
Class A (POP) | | | 9.99 | % | | | 7.08 | % | | | 11/15/2010 | |
Russell 1000® Value * | | | 16.89 | % | | | 10.82 | % | | | | |
| | | | | | | | | | | | |
Class C (NAV) | | | 15.64 | % | | | 9.55 | % | | | 11/15/2010 | |
| | | | | | | | | | | | |
Class C (POP) | | | 8.32 | % | | | 6.44 | % | | | 11/15/2010 | |
| | | | | | | | | | | | |
Class I (NAV) | | | 17.00 | % | | | 10.71 | % | | | 11/15/2010 | |
| | | | | | | | | | | | |
Class I2 (NAV) | | | 16.90 | % | | | 10.81 | % | | | 11/15/2010 | |
| | | | | | | | | | | | |
NOTES
| * | The Russell 1000® Value Index (“Russell 1000® Value”) is an unmanaged index used as a general measure of market performance. Calculations assume dividends and capital gains are reinvested and do not include any managerial expenses. The 10 Years or Life of Class calculation is based on the inception date of the class. You cannot invest directly in an index. |
The performance data presented represents past performance; future results may vary. Performance data does not reflect the deduction of taxes that would be paid on fund distributions or the redemption of fund shares. Investment return and principal value will fluctuate so that an investor’s shares, when redeemed, may be worth more or less than their original cost. Current performance may be lower or higher than performance quoted. Please see www.transamericainvestments.com for performance data current to the most recent month-end. Net Asset Value (“NAV”) returns include the reinvestment of dividends and capital gains but do not reflect any sales charges. Public Offering Price (“POP”) returns include the reinvestment of dividends and capital gains and reflect the maximum sales charge of 5.5% for A shares or the maximum applicable contingent deferred sales charge 1% (during the first 12 months) for Class C shares. There are no sales charges on Class I and I2 shares.
Performance figures reflect any fee waivers and/or expense reimbursements by the Investment Adviser. Without such waivers and/or reimbursements, the performance would be lower. Future waivers and/or reimbursements are at the discretion of the Investment Adviser.
Growth stocks can be volatile and experience sharp price declines and certain types of stocks, especially technology, can be extremely volatile and subject to greater price swings than the broader market. Value approach carries the risk that the market will not recognize a security’s intrinsic value for a long time or that an undervalued stock is actually appropriately priced. This material must be preceded or accompanied by a current prospectus, which includes specific contents regarding the investment objectives and policies of this fund.
Russell Investment Group is the source and owner of the trademarks, service marks, and copyrights related to the Russell indexes. Russell® is a trademark of Russell Investment Group.
| | | | |
| Transamerica Funds | | | | Annual Report 2012 |
| | Page 23 | | |
Transamerica Multi-Managed Balanced
(unaudited)
MARKET ENVIRONMENT
BlackRock Financial Management, Inc.
The first half of the reporting period was dominated by concerns about debt problems in Europe; the latter half was dominated by uncertainty around monetary policy in both the United States and Europe. In September, accommodative policy actions from the U.S. and European central banks alleviated anxiety and increased investors’ risk appetite, despite lackluster fundamental economic data in the United States and the continuation of severe debt problems in Spain.
The fund’s outperformance versus the Barclays U.S. Aggregate Bond Index (“BCAB”) was attributable to diversified exposure to high-quality spread sectors, which performed well despite heightened investor anxiety during the period. The fund benefited mostly from exposure to securitized assets, including an overweight relative to the BCAB in commercial mortgage-backed securities (“CMBS”) and an allocation to non-agency residential mortgage-backed securities (“MBS”), which are not represented in the BCAB. Within CMBS, the fund favored recently issued higher-quality multi-family securities, which performed well as the underlying fundamentals continued to improve in a strong rental market. Also contributing positively to performance was out-of-index exposure to high yield debt, an overweight to investment grade credit and security selection within industrials. Additional positive return contributions came from active trading in agency MBS and tactical exposures to sovereign debt and credit names in Europe.
Slightly detracting from performance were currency hedges designed to provide the fund with downside protection against a global economic slowdown and volatility resulting from European debt concerns.
J.P. Morgan Investment Management Inc.
2012 began with a return to normality both in terms of the markets and our investment process. In regards to the markets, improved U.S. economic forecasts, combined with the Long-term Refinancing Operations (“LTROs”) funding program for European banks caused the U.S. markets to rally during the first quarter. As investors became less focused on macro factors, the correlations amongst stocks dropped which created an environment which was more agreeable to stock pickers.
The second quarter of 2012 saw a reversal of the normality experienced during the first quarter of 2012. The U.S. market declined for the quarter, as European uncertainty once again dominated the headlines. Markets became more volatile and investors became more focused on macro factors, and risk averse. The second quarter 2012 proved to be a disadvantageous environment for active managers, with fundamentals taking a backseat as correlations amongst stocks rose. The widening spread between overvalued and undervalued stocks during the second quarter 2012 echoed the extreme valuation conditions we witnessed in the fourth quarter of 2011.
The third quarter of 2012 saw a reversion to the normality experienced during the first quarter 2012. The U.S. market advanced on the heels of aggressive central bank actions highlighted by both the European Central Bank (“ECB”) and the U.S. Federal Reserve Board (“Fed”). Markets became less volatile and investors focused less on macro factors, risk adverse.
PERFORMANCE
For the year ended October 31, 2012, Transamerica Multi-Managed Balanced Class A returned 11.27%. By comparison, its primary and secondary benchmarks, the Standard & Poor’s 500® Index (“S&P 500”)and the Barclays U.S. Aggregate Bond Index, returned 15.21% and 5.25%, respectively.
STRATEGY REVIEW
BlackRock Financial Management, Inc.
Throughout the 12-month period, the fund actively managed duration while maintaining a slightly short duration bias. Near the end of the period, the fund maintained a yield curve-flattening bias versus its benchmark.
The fund tactically managed its corporate credit exposure throughout the period, cautiously seeking to take advantage of relative value opportunities in industrials and financials. However, following good performance in corporate credit early in 2012, the fund began reducing exposure to the sector toward period end while adding to its securitized credit allocation. The fund also added a small position in Italian sovereign debt as it could potentially benefit from future ECB monetary policy support.
The fund added exposure to CMBS, which continues to benefit from improving commercial real estate markets. Given a relative lack of liquidity in certain segments of the securitized market, the fund reduced its non-agency MBS holdings and added exposure to the more liquid sectors such as auto loan asset-backed securities (“ABS”). The fund reduced its agency MBS allocation while shifting its positioning within the space toward lower-coupon and call-protected issues in light of increased refinancing activity in the mortgage market.
| | | | |
| Transamerica Funds | | | | Annual Report 2012 |
| | Page 24 | | |
Transamerica Multi-Managed Balanced
(unaudited)
STRATEGY REVIEW (continued)
As of period end, the fund maintains a slightly more cautious stance given the likelihood of financial market volatility increasing from the recent historically low levels. Headwinds for the remainder of 2012 include uncertainty around U.S. political elections and the “fiscal cliff” (i.e., automatic tax increases and federal-spending cuts at the turn of the year) as well as uncertainty around bailouts for the eurozone’s most debt-laden countries; however, the U.S. economy appears well supported by monetary policy and resilient enough to grow at a modest pace.
Relative to the BCAB, the fund remained generally underweight to government-related sectors in favor of non-government spread sectors. Among spread sectors, the fund held a slight underweight allocation to investment grade credit, an overweight to CMBS and ABS and held out-of-index exposures to high yield corporate credit and non-agency MBS. Within the government space, the fund maintained an underweight in U.S. Treasuries and agency debentures, while holding an overweight in agency MBS. The fund ended the period with a slightly short duration versus the BCAB.
The fund uses interest rate derivative instruments, which includes futures contracts or options, mainly for the purpose of managing risks relating to portfolio duration and yield curve positioning. The fund also trades forward foreign currency contracts or uses foreign currency derivatives to manage currency risk in the fund. During the period, derivatives had a minimal impact on performance.
J.P. Morgan Investment Management Inc.
Transamerica Multi-Managed Balanced outperformed its benchmark, the S&P 500, for the trailing 12 months. The retail, systems and network hardware, and consumer cyclical sectors contributed to performance while the basic materials, industrial cyclicals and energy sectors detracted. At the security level, PulteGroup, Inc., Apple, Inc. (“Apple”) and Hewlett-Packard Co. were the largest contributors while Baker Hughes, Inc., CSX Corp., and Norfolk Southern Corp. were the largest detractors.
Within the consumer cyclical sector, PulteGroup, Inc. reported better-than expected profit and a significant increase in new orders, as U.S. homebuilders are becoming more profitable, given record low mortgage rates and stabilizing prices that attract new home buyers. Additionally, reducing expenses after the acquisition of Centex and selling out of older, less profitable communities also benefited earnings.
Within the systems hardware sector, a long position in Apple paired with a short position in Hewlett-Packard Co. continued to work well. Apple benefitted from strong tablet sales, especially with the recent launch of the iPad 3, and smartphone sales, beating expectations and continuing to gain market share in both segments. We believe Apple is a relatively inexpensive stock on normalized earnings with sustainable gross margins and upside to estimates. Additionally, Apple reported strong quarterly performance with a year over year increase in net income and in net sales. Further, shares advanced in the third quarter of 2012 following its triumph over Samsung on the patent infringement ruling expectations and a positive reaction to the launch of the iPhone 5. Meanwhile, Hewlett-Packard Co. reported a weak top line and softer services margin, continuing to lag its peers amid structural shifts and should face challenges in long-term growth. The stock looks attractive based on valuation but does not sufficiently justify as a buying opportunity, so the strategy remains underweight in the name.
On the negative side, within industrials, Baker Hughes, Inc., the maker of drill bits and other gear for oil and gas firms, warned that its first-quarter profit will be below expectation as North American pressure pumping issues and an early Canadian breakup season impacted margins. International issues including seasonality and project delays in Latin American also weighed on the stock.
Within the industrial cyclicals space, an overweight position in CSX Corp. detracted from performance in the third quarter. The stock declined during the quarter on the back of tepid earnings and expectations that the railroad company may not see domestic coal volume pick up until 2013. Analysts are also wary about the company’s export revenues as coal exports are expected to moderate on the back of a Chinese slowdown. Given the continued headwinds in the utility coal market, we believe that the company remains on track for earnings growth for the full year of 2012.
Within autos and transportation, our overweight in Norfolk Southern Corp. detracted from performance. Shares of the eastern U.S. railroad tumbled as the company projected earnings below expectations, citing volume declines and lower revenues, and seemed to face more headwinds than its peers. Over the long term however, Norfolk Southern Corp. still looks attractive on normalized valuations and should benefit over the long term from favorable pricing power and improved operational efficiency, sustaining share shifts from truckers.
| | |
| Matthew Marra | | Scott Blasdell, CFA |
| Eric Pelliccaro | | Terance Chen, CFA |
| Rick Rieder | | Raffaele Zingone, CFA |
| Bob Miller | | |
| |
| Co-Portfolio Managers | | Co-Portfolio Managers |
| BlackRock Financial Management, Inc. | | J.P. Morgan Investment Management Inc. |
| | | | |
| Transamerica Funds | | | | Annual Report 2012 |
| | Page 25 | | |
Transamerica Multi-Managed Balanced
(unaudited)
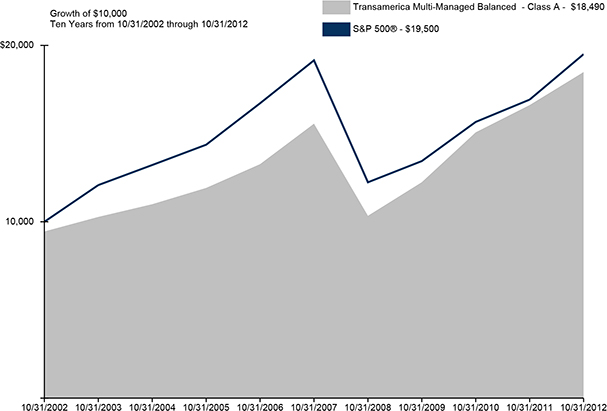
Average Annual Total Return for Periods Ended 10/31/2012
| | | | | | | | | | | | | | | | |
| | | 1 Year | | | 5 Years | | | 10 Years or
Life of Class | | | Inception Date | |
Class A (NAV) | | | 11.27 | % | | | 3.51 | % | | | 6.94 | % | | | 12/02/1994 | |
Class A (POP) | | | 5.14 | % | | | 2.34 | % | | | 6.34 | % | | | 12/02/1994 | |
S&P 500 * | | | 15.21 | % | | | 0.36 | % | | | 6.91 | % | | | | |
Barclays U.S. Aggregate Bond * | | | 5.25 | % | | | 6.38 | % | | | 5.39 | % | | | | |
| | | | | | | | | | | | | | | | |
Class B (NAV) | | | 10.30 | % | | | 2.72 | % | | | 6.38 | % | | | 10/01/1995 | |
Class B (POP) | | | 5.56 | % | | | 2.56 | % | | | 6.38 | % | | | 10/01/1995 | |
| | | | | | | | | | | | | | | | |
Class C (NAV) | | | 10.63 | % | | | 2.94 | % | | | 6.33 | % | | | 11/11/2002 | |
Class C (POP) | | | 9.68 | % | | | 2.94 | % | | | 6.33 | % | | | 11/11/2002 | |
| | | | | | | | | | | | | | | | |
Class I (NAV) | | | 11.76 | % | | | N/A | | | | 14.20 | % | | | 11/30/2009 | |
| | | | | | | | | | | | | | | | |
NOTES
| * | The Standard & Poor’s 500® Index (“S&P 500”) and the Barclays U.S. Aggregate Bond Index (“Barclays U.S. Aggregate Bond”) are unmanaged indices used as a general measure of market performance. Calculations assume dividends and capital gains are reinvested and do not include any managerial expenses. The 10 Years or Life of Class calculation is based on the previous 10 years or since the inception date of the class, whichever is more recent. You cannot invest directly in an index. |
The performance data presented represents past performance; future results may vary. Performance data does not reflect the deduction of taxes that would be paid on fund distributions or the redemption of fund shares. Investment return and principal value will fluctuate so that an investor’s shares, when redeemed, may be worth more or less than their original cost. Current performance may be lower or higher than performance quoted. Please see www.transamericainvestments.com for performance data current to the most recent month-end. Net Asset Value (“NAV”) returns include the reinvestment of dividends and capital gains but do not reflect any sales charges. Public Offering Price (“POP”) returns include the reinvestment of dividends and capital gains and reflect the maximum sales charge of 5.5% for A shares or the maximum applicable contingent deferred sales charge (5% in the 1st year, decreasing to 0% after 6 years) for Class B shares and 1% (during the first 12 months) for Class C shares. Shares purchased prior to March 1, 2004 are subject to a maximum applicable contingent deferred sales charge (5% in the 1st year, decreasing to 0% after 7 years) for Class B shares and (2% in the 1st year, decreasing to 0% after 2 years) for Class C shares. There are no sales charges on Class I shares.
Performance figures reflect any fee waivers and/or expense reimbursements by the Investment Adviser. Without such waivers and/or reimbursements, the performance would be lower. Future waivers and/or reimbursements are at the discretion of the Investment Adviser.
Equity securities tend to go up and down more dramatically over the short term and price movements may result from many individual factors as well as the market as a whole. Fixed income securities have several risks including fluctuations in market value, changes in interest rates as the value will decrease as interest rates rise, and issuers defaulting on their obligations to pay interest or return principal. This material must be preceded or accompanied by a current prospectus, which includes specific contents regarding the investment objectives and policies of this fund.
| | | | |
| Transamerica Funds | | | | Annual Report 2012 |
| | Page 26 | | |
Transamerica Short-Term Bond
(formerly, Transamerica AEGON Short-Term Bond)
(unaudited)
MARKET ENVIRONMENT
The fiscal year ended October 31, 2012 much like it began the year; numerous issues continuing to weigh on investors’ minds both domestically and abroad. Despite these concerns, risk assets continued to do well for the year with credit spreads tightening across all fixed income classes, U.S. Treasury rates continuing their downward trend, and equity prices moved higher.
Early in the fiscal year, the European sovereign and banking crisis was the primary concern. Despite the crisis being nearly a year-and-a-half old, policymakers continued to wrestle with an appropriate response. Finally, with significant pressure from the markets, policymakers introduced several new facilities to relieve pressure on the financial system; tough fiscal austerity measures were to continue in exchange for more robust bank funding facilities. Unfortunately, this did nothing more than defer the resolution of the problem without addressing the real issues of the Monetary Union. Europe’s economy continued to slip deeper into recession throughout the fiscal year putting even further pressure on an already strained banking system. Ultimately, with strains once again too strong to ignore, the European Central Bank (“ECB”) late in the fiscal year stepped up once again announcing new facilities and declaring; “we will do what it takes to support the system”.
Throughout the fiscal year 2012, the U.S. economy continued its slow to moderate grow path, with numerous cries from various economic pundits that a recession was just around the corner. The U.S. Federal Reserve Board (“Fed”), already on the heels of two prior quantitative easing programs, announced late in the year that a third program, with a targeted unemployment rate, was what the economy needed. The monetary response, coupled with an extension of the payroll tax holiday, kept the consumer with adequate resources to continue their spending trend. Housing prices finally found a bid during the fiscal year as low interest rates and valuations more in line with history created an excellent opportunity for home buyers.
A new concern developed in fiscal 2012; a slowing global economy, led by concerns of growth in China, and its ultimate impact on the rest of the world. Moving toward the end of the fiscal year, numerous central banks around the world responded with even more aggressive accommodation, which looks to have slowed the pace of deceleration of worldwide growth, and in fact signs are accumulating that a turn in global growth may be at hand.
A common theme prevalent around the world during the fiscal year has been the response by numerous central banks and the more accommodative stance to help slowing economies and stressed banking systems. This liquidity has found its way into financial markets promoting better financial conditions and thus lower risk premiums for many risk assets. For now many solvency and liquidity issues that had cropped up around the world have calmed.
As this letter began, macroeconomic issues have not gone away; some new ones have appeared on the horizon while some of the old ones will no doubt resurface. In the U.S., fears of the “fiscal cliff”, uncertainty surrounding future fiscal policies, and a continued tepid employment market will weigh on investors’ minds. In Europe, while the ECB has calmed matters there for the time being, policymakers still have a significant task ahead of them in trying to integrate the Union more politically. Growth in China has been decelerating, leading some pundits to look for even lower growth rates than the consensus now believes.
Despite all of the macroeconomic concerns, the prevailing theme of accommodative central banks will continue. This has already led to global Purchasing Managers’ Indexes (“PMI”) and leading indicators of worldwide growth to stabilize and in fact show signs of revitalizing growth. The combination of better economic growth along with continued stimulus from central banks should provide positive tailwinds for risk assets throughout fiscal year 2013.
PERFORMANCE
For the year ended October 31, 2012, Transamerica Short-Term Bond Class I2 returned 6.31%. By comparison, its benchmark, the Bank of America Merrill Lynch U.S. Corporate & Government 1-3 Years Index, returned 1.33%.
STRATEGY REVIEW
Transamerica Short Term Bond maintained a higher yield and achieved a higher total return than the benchmark index due to overweighting various spread products and underweighting U.S. Treasury and Agency securities. Our overweighting to corporate bonds, asset backed securities (“ABS”), commercial mortgage backed securities (“CMBS”), and non-agency mortgage backed securities (“RMBS”) as well as our excess carry, curve roll down, and name and sector selection added to our performance. Our underweighting to U.S. Treasuries and Agency securities also benefited performance given their minimal carry and lack of spread compression potential.
Corporate bonds remained our largest overweight and continued to benefit from central bank induced risk premium contraction, improving corporate fundamentals, and a strong market technical. While our weighting to investment grade corporate bonds remained steady, we increased our allocation to industrials, emphasizing communications and transportation, while also modestly increasing our allocation to utilities. We reduced our allocation to metals, mining and materials due to our concerns over slowing global growth while we reduced our allocation to financials in search of increased portfolio diversity, although we remained overweight the industry. Our underweight to consumer cyclicals was a performance drag while our overweight to financials was our largest positive corporate performance driver during the year with industrials and utilities also contributing. Our weighting to high yield remained steady although we increased our allocation to various high yield bank loans while reducing our allocation to unsecured high yield debt given the more favorable risk adjusted return attributes of the secured bank loans.
| | | | |
| Transamerica Funds | | | | Annual Report 2012 |
| | Page 27 | | |
Transamerica Short-Term Bond
(formerly, Transamerica AEGON Short-Term Bond)
(unaudited)
STRATEGY REVIEW (continued)
Within securitized sectors, we increased our allocation to ABS and CMBS while passively reducing our allocation to RMBS. However, we remained overweight all three which benefited from central bank induced risk premium contraction, a strong technical bid, and modestly improving consumer, housing, and lending fundamentals. Specifically, we increased our allocation to niche ABS sectors such as time shares and mortgage servicer advances while reducing our allocation to on-the-run sectors such as auto loans which no longer offered compelling investment opportunities. We continued find opportunities in short senior multi and single borrow CMBS.
Although we continued to find significant value in non-agency RMBS, specifically re-Real Estate Mortgage Investment Conduits (“REMICs”), a lack of supply prevented us from fully replacing the natural amortization within our bonds thereby causing our allocation to decrease. However, our overweight to non-agency RMBS was our largest favorable securitized performance driver during the year given the stabilization in the housing market although CMBS and ABS also contributed.
Our duration, which was initially modestly shorter than the benchmark index, had little impact on performance as short maturity Treasury rates remain relatively unchanged while longer maturity rates rallied. However, as the year moved forward we extended our duration to roughly equal that of the index given our outlook for stable short maturity rates for an extended period as well as our desire to capture additional yield and take advantage of further curve roll down opportunities.
Greg Haendel, CFA
Doug Weih, CFA
Gary Creed, CFA
Co-Portfolio Managers
AEGON USA Investment Management, LLC
| | | | |
| Transamerica Funds | | | | Annual Report 2012 |
| | Page 28 | | |
Transamerica Short-Term Bond
(formerly, Transamerica AEGON Short-Term Bond)
(unaudited)
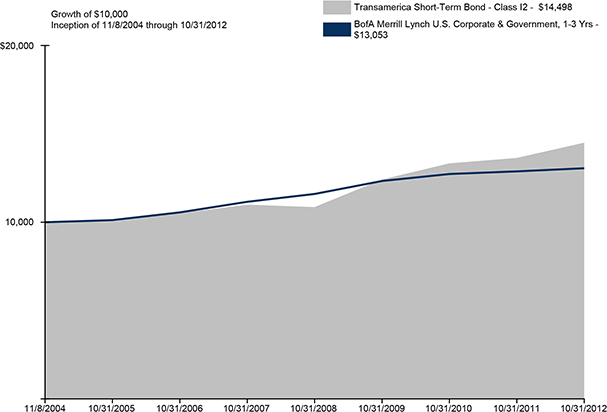
Average Annual Total Return for Periods Ended 10/31/2012
| | | | | | | | | | | | | | | | |
| | | 1 Year | | | 5 Years | | | 10 Years or
Life of Class | | | Inception Date | |
Class I2 (NAV) | | | 6.31 | % | | | 5.70 | % | | | 4.77 | % | | | 11/08/2004 | |
BofA Merrill Lynch U.S. Corporate & Government, 1-3 Yrs * | | | 1.33 | % | | | 3.19 | % | | | 3.40 | % | | | | |
| | | | | | | | | | | | | | | | |
Class A (NAV) | | | 5.95 | % | | | N/A | | | | 5.35 | % | | | 11/01/2007 | |
Class A (POP) | | | 3.35 | % | | | N/A | | | | 4.82 | % | | | 11/01/2007 | |
| | | | | | | | | | | | | | | | |
Class C (NAV) | | | 5.15 | % | | | N/A | | | | 4.58 | % | | | 11/01/2007 | |
Class C (POP) | | | 4.15 | % | | | N/A | | | | 4.58 | % | | | 11/01/2007 | |
| | | | | | | | | | | | | | | | |
Class I (NAV) | | | 6.21 | % | | | N/A | | | | 5.02 | % | | | 11/30/2009 | |
| | | | | | | | | | | | | | | | |
NOTES
| * | The Bank of America Merrill Lynch U.S. Corporate & Government 1-3 Years Index (“BofA Merrill Lynch U.S. Corporate & Government 1-3 Yrs”) is an unmanaged index used as a general measure of market performance. Calculations assume dividends and capital gains are reinvested and do not include any managerial expenses. The 10 Years or Life of Class calculation is based on the inception date of the class. You cannot invest directly in an index. |
The performance data presented represents past performance; future results may vary. Performance data does not reflect the deduction of taxes that would be paid on fund distributions or the redemption of fund shares. Investment return and principal value will fluctuate so that an investor’s shares, when redeemed, may be worth more or less than their original cost. Current performance may be lower or higher than performance quoted. Please see www.transamericainvestments.com for performance data current to the most recent month-end. Net Asset Value (“NAV”) returns include the reinvestment of dividends and capital gains but do not reflect any sales charges. Public Offering Price (“POP”) returns include the reinvestment of dividends and capital gains and reflect the maximum sales charge of 2.5% for A shares or the maximum applicable contingent deferred sales charge and 1% (during the first 12 months) for Class C shares. There are no sales charges on Class I and I2 shares.
Performance figures reflect any fee waivers and/or expense reimbursements by the Investment Adviser. Without such waivers and/or reimbursements, the performance would be lower. Future waivers and/or reimbursements are at the discretion of the Investment Adviser.
Short-term bond funds are exposed to many of the same risks that longer-term bond funds are subject to, including credit risk, inflation risk, interest rate risk and also foreign securities and mortgage-backed securities risk. This material must be preceded or accompanied by a current prospectus, which includes specific contents regarding the investment objectives and policies of this fund.
| | | | |
| Transamerica Funds | | | | Annual Report 2012 |
| | Page 29 | | |
Transamerica Small Cap Growth
(unaudited)
MARKET ENVIRONMENT
Domestic investors in the fall of 2012 focused on the presidential election, the upcoming “Fiscal Cliff”, and continued financial instability in Europe. Since both the Fiscal Cliff and European financial issues have the potential to lead to market volatility in the short term, we sought to reduce your exposure to these risks in the fund. We have limited our investment in stocks that generate significant revenue from Europe, as well as to those that are at risk due to changes in government related healthcare spending and potential sequestration cuts.
PERFORMANCE
For the period from inception August 31, 2012 through October 31,2012, Transamerica Small Cap Growth Class A returned (6.20)%. By comparison, its benchmark, the Russell 2000® Growth Index, returned (0.20)%.
STRATEGY REVIEW
The technology and healthcare sectors were the largest detractors from performance during this period. Within technology two factors weighed on the sector. First, a slowdown in business capital spending for technology products has resulted in lower revenues, and led to a decrease in the valuation multiple investors are willing to pay for technology stocks. Additionally, this sector, more than most of the others in the small cap space, has exposure to Europe and its economic challenges. While we tried to limit your exposure to Europe, we didn’t eliminate it entirely which affects performance. In the healthcare sector near term demand has been erratic due to the uncertainty in government and this created delays in new program spending. Post the election, healthcare business trends should stabilize once again. We are currently less exposed to the technology and healthcare sectors and these specific issues, but certain holdings namely from these two sectors negatively impacted the fund.
The largest detractors from performance during this period were IPC The Hospitalist Co., Inc. (“IPC”), Athenahealth, Inc. (“Athena”), HMS Holdings Corp. (“HMS”), Inphi Corp., and Genesco, Inc. The recent weakness at IPC was due to lower volumes at hospitals. Athena’s stock responded to slower sales of their software and the announcement that a business partner is being acquired by a competitor. HMS’s weakness was due to a slowdown in Medicaid spending and processing delays of claims information. Inphi Corp.’s weak stock performance was due to slower technology spending on computer servers, for which Inphi Corp. builds semiconductor chips. Genesco, Inc.’s stock fell due to worries over potential slowdown in winter boot sales.
The financial services and producer durables sectors were the largest contributors to performance during the period. Our focus on strong regional banks and industrial companies in niche markets benefited the fund. The top performing stock in each of these sectors was Signature Bank, a New York-based regional bank, and Triumph Group, Inc., an aircraft parts manufacturer. Signature Bank benefited in October from strong loan and deposit growth, while Triumph Group, Inc. outperformed as third quarter results showed improved margins.
With the significant market appreciation this year, and the uncertainty caused by the upcoming Fiscal Cliff, we would not be surprised to see a short term pullback in the market. This pullback could be shorter in duration given the significant amount of liquidity created by the Federal Reserve and the fact that election results may give the market an implied direction on how the Fiscal Cliff will be solved.
For the intermediate and longer term we like the opportunities for domestic equities. Despite the broad market indices being up 15% on a trailing twelve month basis, we believe that stocks as an asset class remain relatively attractive versus other asset classes. It is apparent that the valuation between bonds and equities is out of parity and in our opinion unsustainable. As earnings stabilize and we move through the above mentioned momentary issues, equities should perform well again. We believe our focus on high quality companies whose businesses are experiencing demand growth regardless of the macro environment will prove to be a successful strategy through this shorter term volatile market condition.
W. Conrad Doenges
Portfolio Manager
Ranger Investment Management, L.P.
| | | | |
| Transamerica Funds | | | | Annual Report 2012 |
| | Page 30 | | |
Transamerica Small Cap Growth
(unaudited)
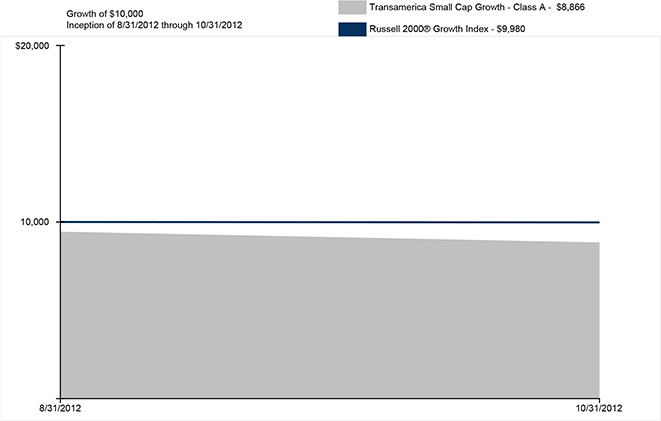
Average Annual Total Return for Periods Ended 10/31/2012
| | | | | | | | |
| | | 10 Years or
Life of Class | | | Inception Date | |
Class A (NAV) | | | (6.20 | )%(A) | | | 08/31/2012 | |
Class A (POP) | | | (11.34 | )%(A) | | | 08/31/2012 | |
Russell 2000® Growth * | | | (0.20 | )%(A) | | | | |
| | | | | | | | |
Class C (NAV) | | | (6.30 | )%(A) | | | 08/31/2012 | |
Class C (POP) | | | (7.24 | )%(A) | | | 08/31/2012 | |
| | | | | | | | |
Class I (NAV) | | | (6.10 | )%(A) | | | 08/31/2012 | |
| | | | | | | | |
Class I2 (NAV) | | | (6.10 | )%(A) | | | 08/31/2012 | |
| | | | | | | | |
NOTES
| * | The Russell 2000® Growth Index (“Russell 2000® Growth”) is an unmanaged index used as a general measure of market performance. Calculations assume dividends and capital gains are reinvested and do not include any managerial expenses. The 10 Years or Life of Class calculation is based on the inception date of the class. You cannot invest directly in an index. |
The performance data presented represents past performance; future results may vary. Performance data does not reflect the deduction of taxes that would be paid on fund distributions or the redemption of fund shares. Investment return and principal value will fluctuate so that an investor’s shares, when redeemed, may be worth more or less than their original cost. Current performance may be lower or higher than performance quoted. Please see www.transamericainvestments.com for performance data current to the most recent month-end. Net Asset Value (“NAV”) returns include the reinvestment of dividends and capital gains but do not reflect any sales charges. Public Offering Price (“POP”) returns include the reinvestment of dividends and capital gains and reflect the maximum sales charge of 5.5% for A shares or the maximum applicable contingent deferred sales charge and 1% (during the first 12 months) for Class C shares. There are no sales charges on Class I and I2 shares.
Performance figures reflect any fee waivers and/or expense reimbursements by the Investment Adviser. Without such waivers and/or reimbursements, the performance would be lower. Future waivers and/or reimbursements are at the discretion of the Investment Adviser.
Investing in small-sized companies involves greater risk than is customarily associated with more established companies. The securities of small capitalization companies are subject to higher volatility than larger, more established companies. This material must be preceded or accompanied by a current prospectus, which includes specific contents regarding the investment objectives and policies of this fund.
Russell Investment Group is the source and owner of the trademarks, service marks, and copyrights related to the Russell indexes. Russell® is a trademark of Russell Investment Group.
| | | | |
| Transamerica Funds | | | | Annual Report 2012 |
| | Page 31 | | |
Transamerica Small Cap Value
(unaudited)
MARKET ENVIRONMENT
We would characterize the investor over the past year as having fragile optimism. Evidence that the U.S. economy was recovering and several doses of Federal Reserve (“Fed”)-induced quantitative easing more than offset headwinds from: the never ending saga in Europe where it is believed eleven countries are now in a recession; stubbornly high U.S. unemployment; a slowdown in earnings growth; and uncertainty over the U.S. presidential election. Quarterly U.S. Gross Domestic Product (“GDP”) growth beginning Q4 2011 through Q3 2012 came in at 3%, 1.9%, 1.3%, and 2%, respectively, indicating relatively healthy economic growth.
Beginning October 2011, the market began rewarding higher beta, lower market cap, lower priced, and lower return-on-equity stocks, resulting in a “low quality rally.” This environment is challenging for our fund. The strategy emphasizes stock selection through a bottom-up research process that focuses on low price-to-earnings multiple stocks, companies with strong balance sheets, businesses that generate strong cash flow, and slightly higher market cap stocks. In addition, the beginning of 2012 marked the start of a difficult period of performance for active managers relative to their benchmarks.
PERFORMANCE
For the period from inception April 30, 2012 through October 31,2012, Transamerica Small Cap Value Class A returned (1.70)%. By comparison, its benchmark, the Russell 2000® Value Index, returned 2.69%.
STRATEGY REVIEW
The fund seeks to outperform the Russell 2000® Value Index by 3% in the long term. The fund seeks capital appreciation through value-oriented stock selection, and employs a bottom-up strategy of buying stocks below intrinsic value and selling stocks as they become fully price, have a change in thesis, or if a better opportunity exists.
The low quality rally helped contribute to the underperformance of the fund from the period May 1, 2012 through October 31, 2012. Our process, which has delivered positive relative performance in past market cycles, has remained consistent. During this period, the team continued to emphasize: high quality; above average earnings consistency; strong balance sheets and free cash flows; low price-to-earnings multiples; and above average growth prospects. We believe that our strategy and fundamental research strengths will result in solid relative investment performance over future market cycles.
For the period of May 1, 2012 through October 31, 2012, the fund underperformed the Russell 2000® Value benchmark. During the period, the fund’s stock selection was negative. Stock selection was positive/neutral in four of ten sectors, with consumer discretionary, energy, and telecommunication services performing the best. This was offset by negative stock selection in six of ten sectors, with financials, industrials, and materials performing the worst. Sector selection was negative, detracting during the period.
Best Performing Stocks:
The largest contributor to stock selection on an individual basis came from Deluxe Corp. (“DLX”), who provides printed and electronic marketing to financial institutions and small business customers. Medical Properties Trust, Inc. (“MPW”), a self-advised real estate investment trust (“REIT”), also added materially to stock selection. The third best contributor to stock selection was Meredith Corp. (“MDP”), a media and marketing company.
Worst Performing Stocks:
The largest detractor to stock selection during the period came from Tutor Perini Corp. (“TPC”), a leading civil and commercial construction company. The second largest detracted was Knight Cap Group Inc. (“KCG”), a global financial services firm that provides access to the capital markets. Tower Group, Inc. (“TWGP”), a provider of property and casualty insurance products, also detracted from stock selection.
Alvin W. Marley, CFA
Andrew Absler
Co-Portfolio Managers
Lombardia Capital Partners, LLC
| | | | |
| Transamerica Funds | | | | Annual Report 2012 |
| | Page 32 | | |
Transamerica Small Cap Value
(unaudited)
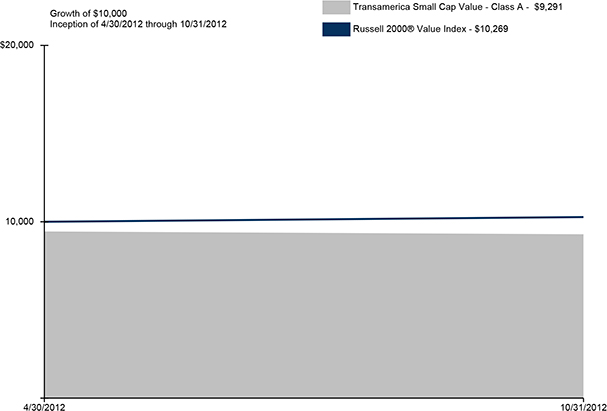
Average Annual Total Return for Periods Ended 10/31/2012
| | | | | | | | |
| | | 10 Years or
Life of Class | | | Inception Date | |
Class A (NAV) | | | (1.70 | )% (A) | | | 04/30/2012 | |
Class A (POP) | | | (7.09 | )% (A) | | | 04/30/2012 | |
Russell 2000® Value * | | | 2.69 | % (A) | | | | |
| | | | | | | | |
Class C (NAV) | | | (2.10 | )% (A) | | | 04/30/2012 | |
Class C (POP) | | | (3.08 | )% (A) | | | 04/30/2012 | |
| | | | | | | | |
Class I (NAV) | | | (1.60 | )% (A) | | | 04/30/2012 | |
| | | | | | | | |
Class I2 (NAV) | | | (1.60 | )% (A) | | | 04/30/2012 | |
| | | | | | | | |
NOTES
| * | The Russell 2000® Value Index (“Russell 2000® Value”) is an unmanaged index used as a general measure of market performance. Calculations assume dividends and capital gains are reinvested and do not include any managerial expenses. The 10 Years or Life of Class calculation is based on the inception date of the class. You cannot invest directly in an index. |
The performance data presented represents past performance; future results may vary. Performance data does not reflect the deduction of taxes that would be paid on fund distributions or the redemption of fund shares. Investment return and principal value will fluctuate so that an investor’s shares, when redeemed, may be worth more or less than their original cost. Current performance may be lower or higher than performance quoted. Please see www.transamericainvestments.com for performance data current to the most recent month-end. Net Asset Value (“NAV”) returns include the reinvestment of dividends and capital gains but do not reflect any sales charges. Public Offering Price (“POP”) returns include the reinvestment of dividends and capital gains and reflect the maximum sales charge of 5.5% for A shares or the maximum applicable contingent deferred sales charge and 1% (during the first 12 months) for Class C shares. There are no sales charges on Class I and I2 shares.
Performance figures reflect any fee waivers and/or expense reimbursements by the Investment Adviser. Without such waivers and/or reimbursements, the performance would be lower. Future waivers and/or reimbursements are at the discretion of the Investment Adviser.
Investing in small-sized companies involves greater risk than is customarily associated with more established companies. The securities of small capitalization companies are subject to higher volatility than larger, more established companies. This material must be preceded or accompanied by a current prospectus, which includes specific contents regarding the investment objectives and policies of this fund.
Russell Investment Group is the source and owner of the trademarks, service marks, and copyrights related to the Russell indexes. Russell® is a trademark of Russell Investment Group.
| | | | |
| Transamerica Funds | | | | Annual Report 2012 |
| | Page 33 | | |
Transamerica Small/Mid Cap Value
(formerly, Transamerica Systematic Small/Mid Cap Value)
(unaudited)
MARKET ENVIRONMENT
For the one-year period ending October 31, 2012, Transamerica Small/Mid Cap Value trailed the Russell 2500® Value Index. The strong absolute gain was derived on the heels of a generally favorable environment for equities, which were pushed higher primarily by strong earnings expansion, offset by some mild valuation multiple compression. Indeed, earnings among the Russell 2500® Value Index (“the Index”) components were on pace to grow just under 20% in the last four reported quarters. The Index advanced moderately less than that due to investors’ willingness to pay less of an earnings multiple on the higher level of profits, reflecting their ongoing skepticism and uncertainty with respect to various geopolitical events and the sustainability of economic growth. Indeed, the U.S. and global economies did show a mid-year deceleration much like in 2011, and the ongoing fiscal sagas at home and abroad have certainly contributed to market volatility and have capped investor returns.
The volatile market environment has been challenging for many fundamental-based, active investment strategies, including ours. As has periodically been the case in recent years, correlations among individual stock returns have remained elevated, spiking again this summer after normalizing earlier in 2012. This created a headwind for the fund from a relative performance perspective, as our focus on bottom-up company fundamentals is less likely to be rewarded when investors buy and sell stocks based on broader market considerations and not individual company earnings dynamics.
PERFORMANCE
For the year ended October 31, 2012, Transamerica Small/Mid Cap Value Class A returned 12.28%. By comparison, its benchmark, the Russell 2500® Value Index, returned 15.55%.
STRATEGY REVIEW
Our bottom-up focus on company fundamentals resulted in a generally pro-cyclical fund over the period. Our sector allocation kept mostly in-line with the constitution of the Russell 2500® Value Index, with the exception of material underweights to utilities and financials. On average, we decreased the cyclicality of the fund over the course of the year, taking profits where prudent and eliminating our exposure to companies with deteriorating earnings and cash flows.
From an attribution standpoint, both stock selection and sector allocation detracted from performance relative to the benchmark. Sector allocation detracted, primarily due to our overweight to information technology and energy. Conversely, our overweight to consumer discretionary helped to offset some of these losses.
In terms of stock selection, the fund outperformed or was neutral in six of nine sectors (the fund held no investments within telecommunications), led primarily by selection within the financials and energy sectors. However, despite outperforming in the majority of sectors, there was too much headwind to overcome from our unfavorable selection in health care, information technology, and industrials.
A top-performing stock for the period was Discover Financial Services, a credit card provider. The company has been seeing delinquency trends move lower, suggesting that charge-offs and loan-loss expense will also continue to decline, sustaining a trend of more than two years. Meanwhile, spending trends are on the rise, allowing the company to finally see long-awaited growth in its card portfolio. Discover Financial Services’ exceedingly strong capital position is also enabling management to move the company deeper into the student loan market, providing another avenue for growth.
Detracting from results for the period was Express, Inc., a specialty retailer offering both women’s and men’s merchandise to the 20- to 30-year-old customer demographic. Unfortunately, in the first half of 2012, the company had its share of planning and merchandising challenges. Due to fashion missteps, it cut prices in women’s wear to move unsold inventory, hurting margins. In other categories, while sales were positive, Express, Inc. did not meet expectations, leaving additional excess inventory to be sold at a discount. Finally, early sweater reads were weak. As a result, management was forced to lower its earnings outlook twice, and we sold the shares accordingly.
In closing, we continue to manage the fund in accordance with our investment discipline. As we embark upon the new year, the fund is positioned with better than average valuation and fundamental company-level performance, attributes that have historically fared rather well on Wall Street over the long haul.
Kenneth Burgess, CFA
Ron Mushock, CFA
Co-Portfolio Managers
Systematic Financial Management L.P.
| | | | |
| Transamerica Funds | | | | Annual Report 2012 |
| | Page 34 | | |
Transamerica Small/Mid Cap Value
(formerly, Transamerica Systematic Small/Mid Cap Value)
(unaudited)
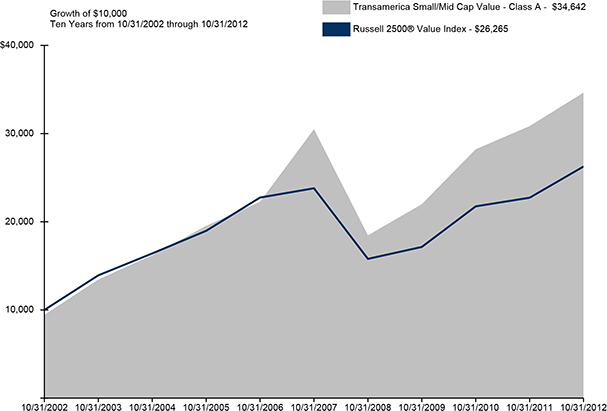
Average Annual Total Return for Periods Ended 10/31/2012
| | | | | | | | | | | | | | | | |
| | | 1 Year | | | 5 Years | | | 10 Years or
Life of Class | | | Inception Date | |
Class A (NAV) | | | 12.28 | % | | | 2.58 | % | | | 13.87 | % | | | 04/02/2001 | |
Class A (POP) | | | 6.12 | % | | | 1.43 | % | | | 13.23 | % | | | 04/02/2001 | |
Russell 2500® Value * | | | 15.55 | % | | | 1.99 | % | | | 10.14 | % | | | | |
| | | | | | | | | | | | | | | | |
Class B (NAV) | | | 11.58 | % | | | 1.92 | % | | | 13.28 | % | | | 04/02/2001 | |
Class B (POP) | | | 6.58 | % | | | 1.75 | % | | | 13.28 | % | | | 04/02/2001 | |
| | | | | | | | | | | | | | | | |
Class C (NAV) | | | 11.60 | % | | | 1.96 | % | | | 13.15 | % | | | 11/11/2002 | |
Class C (POP) | | | 10.60 | % | | | 1.96 | % | | | 13.15 | % | | | 11/11/2002 | |
| | | | | | | | | | | | | | | | |
Class I (NAV) | | | 12.75 | % | | | N/A | | | | 15.76 | % | | | 11/30/2009 | |
| | | | | | | | | | | | | | | | |
Class I2 (NAV) | | | 12.90 | % | | | 3.18 | % | | | 9.03 | % | | | 11/15/2005 | |
| | | | | | | | | | | | | | | | |
NOTES
| * | The Russell 2500® Value Index (“Russell 2500® Value”) is an unmanaged index used as a general measure of market performance. Calculations assume dividends and capital gains are reinvested and do not include any managerial expenses. The 10 Years or Life of Class calculation is based on the previous 10 years or since the inception date of the class, whichever is more recent. You cannot invest directly in an index. |
The performance data presented represents past performance; future results may vary. Performance data does not reflect the deduction of taxes that would be paid on fund distributions or the redemption of fund shares. Investment return and principal value will fluctuate so that an investor’s shares, when redeemed, may be worth more or less than their original cost. Current performance may be lower or higher than performance quoted. Please see www.transamericainvestments.com for performance data current to the most recent month-end. Net Asset Value (“NAV”) returns include the reinvestment of dividends and capital gains but do not reflect any sales charges. Public Offering Price (“POP”) returns include the reinvestment of dividends and capital gains and reflect the maximum sales charge of 5.5% for A shares or the maximum applicable contingent deferred sales charge (5% in the 1st year, decreasing to 0% after 6 years) for Class B shares and 1% (during the first 12 months) for Class C shares. Shares purchased prior to March 1, 2004 are subject to a maximum applicable contingent deferred sales charge (5% in the 1st year, decreasing to 0% after 7 years) for Class B shares and (2% in the 1st year, decreasing to 0% after 2 years) for Class C shares. There are no sales charges on Class I and I2 shares.
Performance figures reflect any fee waivers and/or expense reimbursements by the Investment Adviser. Without such waivers and/or reimbursements, the performance would be lower. Future waivers and/or reimbursements are at the discretion of the Investment Adviser.
Investing in small- and medium-size companies involves greater risk than is customarily associated with more established companies. The securities of small and mid capitalization companies are subject to higher volatility than larger, more established companies. This material must be preceded or accompanied by a current prospectus, which includes specific contents regarding the investment objectives and policies of this fund.
Russell Investment Group is the source and owner of the trademarks, service marks, and copyrights related to the Russell indexes. Russell® is a trademark of Russell Investment Group.
| | | | |
| Transamerica Funds | | | | Annual Report 2012 |
| | Page 35 | | |
Transamerica Tactical Income
(unaudited)
MARKET ENVIRONMENT
The fiscal year ended October 31, 2012 much like it began the year; numerous issues continuing to weigh on investors’ minds both domestically and abroad. Despite these concerns, risk assets continued to do well for the year with credit spreads tightening across all fixed income classes, U.S. Treasury rates continuing their downward trend, and equity prices moderately higher.
Early in the fiscal year, the European sovereign and banking crisis was the primary concern. Despite the crisis being nearly a year-and-a-half old, policymakers continued to wrestle with an appropriate response. Finally, with significant pressure from the markets, policymakers introduced new facilities to relieve pressure on the financial system; tough fiscal austerity measures were to continue in exchange for more robust bank funding facilities. Unfortunately, this did nothing more than defer the resolution of the problem without addressing the real issues of the Monetary Union. Europe’s economy continued to slip deeper into recession throughout the fiscal year putting even further pressure on an already strained banking system. Ultimately, with strains once again too strong to ignore, the European Central Bank (“ECB”) late in the fiscal year stepped up once again declaring; “we will do what it takes to support the system”.
Throughout the fiscal year 2012, the U.S. economy continued its slow to moderate grow path, with numerous cries from various economic pundits that a recession was just around the corner. The U.S. Federal Reserve Board (“Fed”), already on the heels of two prior quantitative easing programs, announced late in the year that a third program, with a targeted unemployment rate, was what the economy needed. The monetary response, coupled with an extension of the payroll tax holiday, kept the consumer with adequate resources to continue their spending trend. Housing prices finally found a bid during the fiscal year as low interest rates and valuations more in line with history, created an excellent time to be a home buyer.
A new concern developed in fiscal 2012; a slowing global economy, led by concerns of growth in China, and its ultimate impact on the rest of the world. Moving toward the end of the fiscal year, numerous central banks around the world responded with even more aggressive accommodation, which looks to have slowed the pace of deceleration of worldwide growth, and in fact signs are accumulating that a turn in global growth may be at hand.
A common theme prevalent around the world during the fiscal year has been the response by numerous central banks and the more accommodative stance to help slowing economies and stressed banking systems. This liquidity has found its way into financial markets promoting better financial conditions and thus lower risk premiums for many risk assets. For now many solvency and liquidity issues that had cropped up around the world have calmed.
As this letter began, macroeconomic issues have not gone away; some new ones have appeared on the horizon while some of the old ones will no doubt resurface. In the U.S., fears of the “fiscal cliff”, uncertainty surrounding future fiscal policies, and a continued tepid employment market, will weigh on investors’ minds. In Europe, while the ECB has calmed matters there for the time being, policymakers still have a significant task ahead of them in trying to integrate the Union more politically. Growth in China has been decelerating, leading some pundits to look for even lower growth rates than the consensus now believes.
Despite all of the macroeconomic concerns, the prevailing theme of accommodative central banks will continue. This has already led to global Purchasing Mangers’ Indexes (“PMI”) and leading indicators of worldwide growth to stabilize and in fact show signs of revitalizing growth. The combination of better economic growth along with continued stimulus from central banks should provide positive tailwinds for risk assets throughout fiscal year 2013.
PERFORMANCE
For the year ended October 31, 2012, Transamerica Tactical Income Class A returned 8.02%. By comparison, its primary and secondary benchmarks, the iBoxx $ Liquid High Yield Index and the Transamerica Tactical Income Blended Benchmark, returned 12.20% and 11.08%, respectively.
STRATEGY REVIEW
Transamerica Tactical Income (“TTI”) is a conservative asset allocation fund with a very diversified asset base with at least six different asset classes at any time. TTI’s primary objective is high current income (4% - 7% gross yield distributed monthly). This implies that the asset allocation is guided by the need to stay invested in asset classes that generate high income with limited regard to the price return from that asset class. The fund management is assisted by a quantitative model that utilizes several economic and market indicators to over/under weight asset classes. Asset classes are tracked using Exchange Traded Funds
(“ETFs”) which possess risks of tracking error versus their benchmark, especially negative tracking (underperformance) due to trading at a discount due to demand and supply dynamics in the markets. In spite of this drawback, ETFs provide the flexibility to over/underweight asset classes at a low cost and market impact.
In addition to high income, the fund is focused on reducing downside risk i.e. sharp drop in NAV due to economy related effects. That is achieved by assigning a neutral position to each asset class and assigning a tactical range around it. The asset classes are positioned to be over/under/neutral weight with reference to the neutral position.
| | | | |
| Transamerica Funds | | | | Annual Report 2012 |
| | Page 36 | | |
Transamerica Tactical Income
(unaudited)
STRATEGY REVIEW (continued)
It is challenging to create a benchmark that can truly capture the performance of all the asset classes in the fund unless it is a very complicated and changing benchmark of several blended indices. While a composite benchmark has been defined, comparison with that benchmark provides limited value since it does not represent the asset classes or asset characteristics (beta, duration, etc.) of the asset classes held in the benchmark. Comparison with the peer group (Morningstar Conservative Allocation Category) is generally more useful.
TTI met its objectives of high current income and strong downside protection with a low standard deviation. It beat the peer group on a total returns, yield and risk-adjusted returns basis. It underperformed its custom benchmark on a total returns basis but did exceed the benchmark’s current income which is its primary objective. The underperformance primary came from the fact that equities rallied in Q1 of 2012 while High Yield did not participate in the rally. The fund was underweight equities for part of that time and the allocation to high yield did not track the rally in equities.
1 Year ending October 31, 2012
| | | | | | | | | | | | |
| Fund Statistics | | TTI Class A | | | Peer Group | | | Custom Benchmark | |
Net Yield | | | 5.18 | % | | | 4.57 | % | | | 3.1 | % |
Total Returns | | | 8.02 | % | | | 7.86 | % | | | 11.08 | % |
Standard Deviation | | | 4.17 | % | | | 5.12 | % | | | 5.34 | % |
Sharpe Ratio | | | 1.90 | | | | 1.57 | | | | 2.1 | |
Downside Risk | | | 2.92 | % | | | N/A | | | | 3.83 | % |
Source: Bloomberg & Morningstar Direct
TTI started the fiscal year underweight in equities and high yield and overweight in long duration credit and Treasuries. By the end of January 2012, the economic indicators supporting high yield had improved sufficiently to cause the model to recommend a neutral weight on high yield and duration. However, the global economic indicators were still quite weak and risks in emerging markets were also rising. By the end of February, the fund was positioned with a slight overweight in high yield and neutral weighted in equities. By April, the model recommended reducing duration as indicators pertaining to inflation expectations spiked. That process of duration reduction continued and the pace increased during July - September 2012. In that same period the indicators for equities improved and by October, equities were overweighted.
TTI has completed its first year and we do not have performance attribution on this fund. However, the following observations can throw some light on how the performance was affected by various investment decisions:
1) Underweight in equities during the first quarter of the year affected returns negatively as equities rallied.
2) Overweight in duration (around 7 years versus benchmark duration of 4 years) helped the fund’s performance
3) Reduction in duration from approximately 6 years to 4.3 years between August and October 2012 also helped performance as long duration bonds had negative returns during that period.
4) Underperformance versus its benchmark in high yield ETFs (especially HYG) affected returns negatively.
Sridip Mukhopadhyaya, CFA
Dave Halfpap, CFA
Frank Rybinksi, CFA
Jeffery Whitehead, CFA
Co-Portfolio Managers
AEGON USA Investment Management, LLC
| | | | |
| Transamerica Funds | | | | Annual Report 2012 |
| | Page 37 | | |
Transamerica Tactical Income
(unaudited)
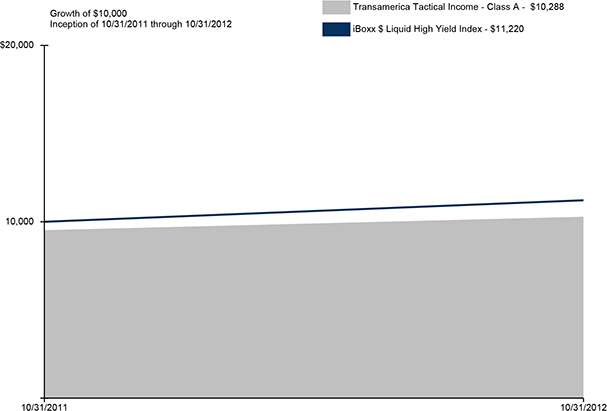
Average Annual Total Return for Periods Ended 10/31/2012
| | | | | | | | | | | | |
| | | 1 Year | | | 10 Years or
Life of Class | | | Inception Date | |
Class A (NAV) | | | 8.02 | % | | | 8.02 | % | | | 10/31/2011 | |
Class A (POP) | | | 2.88 | % | | | 2.88 | % | | | 10/31/2011 | |
iBoxx $ Liquid High Yield * | | | 12.20 | % | | | 12.20 | % | | | | |
Transamerica Tactical Income Blended Benchmark * | | | 11.08 | % | | | 11.08 | % | | | | |
| | | | | | | | | | | | |
Class C (NAV) | | | 7.26 | % | | | 7.26 | % | | | 10/31/2011 | |
Class C (POP) | | | 6.26 | % | | | 6.26 | % | | | 10/31/2011 | |
| | | | | | | | | | | | |
Class I (NAV) | | | 8.35 | % | | | 8.35 | % | | | 10/31/2011 | |
| | | | | | | | | | | | |
NOTES
| * | The iBoxx $ Liquid High Yield Index (“iBoxx $ Liquid High Yield”) and the Transamerica Tactical Income Blended Benchmark are unmanaged indices used as a general measure of market performance. The Transamerica Tactical Income Blended Benchmark is composed of the following benchmarks: Standard & Poor’s 500® Index, 30%, Barclays U.S. Aggregate Bond Index, 30%, and the iBoxx $ Liquid High Yield, 40%. Calculations assume dividends and capital gains are reinvested and do not include any managerial expenses. The 10 Years or Life of Fund calculation is based on the inception date of the class. You cannot invest directly in an Index. |
The performance data presented represents past performance; future results may vary. Performance data does not reflect the deduction of taxes that would be paid on fund distributions or the redemption of fund shares. Investment return and principal value will fluctuate so that an investor’s shares, when redeemed, may be worth more or less than their original cost. Current performance may be lower or higher than performance quoted. Please see www.transamericainvestments.com for performance data current to the most recent month-end. Net Asset Value (“NAV”) returns include the reinvestment of dividends and capital gains but do not reflect any sales charges. Public Offering Price (“POP”) returns include the reinvestment of dividends and capital gains and reflect the maximum sales charge of 4.75% for A shares or the maximum applicable contingent deferred sales charge and 1% (during the first 12 months) for Class C shares. There are no sales charges on Class I shares.
Performance figures reflect any fee waivers and/or expense reimbursements by the Investment Adviser. Without such waivers and/or reimbursements, the performance would be lower. Future waivers and/or reimbursements are at the discretion of the Investment Adviser.
The selection of a Tactical Asset Allocation portfolio will not guarantee a profit nor protect against a loss. This material must be preceded or accompanied by a current prospectus, which includes specific contents regarding the investment objectives and policies of this fund.
| | | | |
| Transamerica Funds | | | | Annual Report 2012 |
| | Page 38 | | |
Understanding Your Funds’ Expenses
(unaudited)
SHAREHOLDER EXPENSES
Fund shareholders may incur two types of costs: (1) transaction costs, including sales charges (loads) on purchases, contingent deferred sales charges on redemptions; and (2) ongoing costs, including management fees, dividend expense on short-sales, and other fund expenses.
The following examples are intended to help you understand your ongoing costs (in dollars and cents) of investing in the funds and to compare these costs with the ongoing costs of investing in other funds.
The examples are based on an investment of $1,000 invested at May 1, 2012 and held for the entire period until October 31, 2012.
ACTUAL EXPENSES
The information in the table under the heading “Actual Expenses” provides information about actual account values and actual expenses. You may use the information in these columns, together with the amount you invested, to estimate the expenses that you paid over the period. Simply divide your account value by $1,000 (for example, an $8,600 account value divided by $1,000 = $8.60), then multiply the result by the number in the appropriate column for your share class titled “Expenses Paid During Period” to estimate the expenses you paid on your account during this period. If your account is an IRA, your expenses could have included a $15 annual fee. The amount of any fee paid through your account would increase the estimate of expenses you paid during the period and decrease your ending account value.
HYPOTHETICAL EXAMPLE FOR COMPARISON PURPOSES
The information in the table under the heading “Hypothetical Expenses” provides information about hypothetical account values and hypothetical expenses based on the fund’s actual expense ratio and an assumed rate of return of 5% per year before expenses, which is not the fund’s actual return. The hypothetical account values and expenses may not be used to estimate the actual ending account balance or expenses you paid for the period. You may use this information to compare the ongoing costs of investing in your fund versus other funds. To do so, compare this 5% hypothetical example with the 5% hypothetical examples that appear in the shareholder reports of the other funds. As in the case of the actual expense example, if your account is subject to an IRA fee, the amount of the fee paid through your account would increase the hypothetical expenses you would have paid during the period and decrease the hypothetical ending account value.
Please note that the expenses shown in the table are meant to highlight your ongoing costs only and do not reflect any transactional costs. Therefore, the information under the heading “Hypothetical Expenses” is useful in comparing ongoing costs only, and will not help you determine the relative total costs of owning different funds. In addition, if these transaction costs were included, your costs would have been higher. The expenses shown in the table do not reflect any fees that may be charged to you by brokers, financial intermediaries, or other financial institutions.
Expense ratios may vary period to period because of various factors, such as an increase in expenses that are not a part of by the advisory and administrative fees. Examples of such fees and expenses of the trustees and their counsel, extraordinary expenses, and interest expense.
| | | | |
| Transamerica Funds | | | | Annual Report 2012 |
| | Page 39 | | |
Understanding Your Funds’ Expenses (continued)
(unaudited)
| | | | | | | | | | | | | | | | | | | | | | | | |
| | | | | | Actual Expenses | | | Hypothetical Expenses(A) | | | | |
| | | Beginning | | | Ending Account | | | Expenses Paid | | | Ending Account | | | Expenses Paid | | | Annualized | |
Fund Name(B) | | Account Value | | | Value | | | During Period | | | Value | | | During Period(C) | | | Expense Ratio | |
Transamerica Capital Growth | | | | | | | | | | | | | | | | | | | | | | | | |
Class A | | $ | 1,000.00 | | | $ | 927.40 | | | $ | 7.27 | (C) | | $ | 1,017.60 | | | $ | 7.61 | | | | 1.50 | % |
Class B | | | 1,000.00 | | | | 923.30 | | | | 10.64 | (C) | | | 1,014.08 | | | | 11.14 | | | | 2.20 | |
Class C | | | 1,000.00 | | | | 923.90 | | | | 9.96 | (C) | | | 1,014.78 | | | | 10.43 | | | | 2.06 | |
Class I | | | 1,000.00 | | | | 929.70 | | | | 4.51 | (C) | | | 1,020.46 | | | | 4.72 | | | | 0.93 | |
Class I2 | | | 1,000.00 | | | | 930.20 | | | | 4.08 | (C) | | | 1,020.91 | | | | 4.27 | | | | 0.84 | |
| | | | | | |
Transamerica Diversified Equity | | | | | | | | | | | | | | | | | | | | | | | | |
Class A | | | 1,000.00 | | | | 955.80 | | | | 7.13 | (C) | | | 1,017.85 | | | | 7.35 | | | | 1.45 | |
Class B | | | 1,000.00 | | | | 952.60 | | | | 10.65 | (C) | | | 1,014.23 | | | | 10.99 | | | | 2.17 | |
Class C | | | 1,000.00 | | | | 952.40 | | | | 10.70 | (C) | | | 1,014.18 | | | | 11.04 | | | | 2.18 | |
Class I | | | 1,000.00 | | | | 959.10 | | | | 4.48 | (C) | | | 1,020.56 | | | | 4.62 | | | | 0.91 | |
Class I2 | | | 1,000.00 | | | | 959.70 | | | | 3.84 | (C) | | | 1,021.22 | | | | 3.96 | | | | 0.78 | |
Class T | | | 1,000.00 | | | | 959.20 | | | | 4.19 | (C) | | | 1,020.86 | | | | 4.32 | | | | 0.85 | |
| | | | | | |
Transamerica Emerging Markets Debt | | | | | | | | | | | | | | | | | | | | | | | | |
Class A | | | 1,000.00 | | | | 1,104.30 | | | | 6.35 | (C) | | | 1,019.10 | | | | 6.09 | | | | 1.20 | |
Class C | | | 1,000.00 | | | | 1,100.00 | | | | 9.82 | (C) | | | 1,015.79 | | | | 9.42 | | | | 1.86 | |
Class I | | | 1,000.00 | | | | 1,105.70 | | | | 4.45 | (C) | | | 1,020.91 | | | | 4.27 | | | | 0.84 | |
Class I2 | | | 1,000.00 | | | | 1,106.10 | | | | 3.92 | (C) | | | 1,021.42 | | | | 3.76 | | | | 0.74 | |
| | | | | | |
Transamerica Emerging Markets Equity | | | | | | | | | | | | | | | | | | | | | | | | |
Class A | | | 1,000.00 | | | | 942.00 | | | | 9.03 | (C) | | | 1,015.84 | | | | 9.37 | | | | 1.85 | |
Class C | | | 1,000.00 | | | | 939.00 | | | | 12.28 | (C) | | | 1,012.47 | | | | 12.75 | | | | 2.52 | |
Class I | | | 1,000.00 | | | | 943.00 | | | | 7.81 | (C) | | | 1,017.09 | | | | 8.11 | | | | 1.60 | |
Class I2 | | | 1,000.00 | | | | 944.00 | | | | 7.28 | (C) | | | 1,017.65 | | | | 7.56 | | | | 1.49 | |
| | | | | | |
Transamerica Flexible Income | | | | | | | | | | | | | | | | | | | | | | | | |
Class A | | | 1,000.00 | | | | 1,055.60 | | | | 4.91 | (C) | | | 1,020.36 | | | | 4.82 | | | | 0.95 | |
Class B | | | 1,000.00 | | | | 1,051.50 | | | | 9.02 | (C) | | | 1,016.34 | | | | 8.87 | | | | 1.75 | |
Class C | | | 1,000.00 | | | | 1,051.40 | | | | 8.51 | (C) | | | 1,016.84 | | | | 8.36 | | | | 1.65 | |
Class I | | | 1,000.00 | | | | 1,057.50 | | | | 3.41 | (C) | | | 1,021.82 | | | | 3.35 | | | | 0.66 | |
Class I2 | | | 1,000.00 | | | | 1,056.70 | | | | 2.95 | (C) | | | 1,022.27 | | | | 2.90 | | | | 0.57 | |
| | | | | | |
Transamerica Growth Opportunities | | | | | | | | | | | | | | | | | | | | | | | | |
Class A | | | 1,000.00 | | | | 907.60 | | | | 7.67 | (C) | | | 1,017.09 | | | | 8.11 | | | | 1.60 | |
Class B | | | 1,000.00 | | | | 904.60 | | | | 10.77 | (C) | | | 1,013.83 | | | | 11.39 | | | | 2.25 | |
Class C | | | 1,000.00 | | | | 904.00 | | | | 10.96 | (C) | | | 1,013.62 | | | | 11.59 | | | | 2.29 | |
Class I | | | 1,000.00 | | | | 910.10 | | | | 4.80 | (C) | | | 1,020.11 | | | | 5.08 | | | | 1.00 | |
Class I2 | | | 1,000.00 | | | | 911.80 | | | | 4.08 | (C) | | | 1,020.86 | | | | 4.32 | | | | 0.85 | |
| | | | | | |
Transamerica High Yield Bond | | | | | | | | | | | | | | | | | | | | | | | | |
Class A | | | 1,000.00 | | | | 1,063.50 | | | | 5.39 | (C) | | | 1,019.91 | | | | 5.28 | | | | 1.04 | |
Class B | | | 1,000.00 | | | | 1,060.20 | | | | 9.48 | (C) | | | 1,015.94 | | | | 9.27 | | | | 1.83 | |
Class C | | | 1,000.00 | | | | 1,060.80 | | | | 9.22 | (C) | | | 1,016.19 | | | | 9.02 | | | | 1.78 | |
Class I | | | 1,000.00 | | | | 1,066.70 | | | | 4.05 | (C) | | | 1,021.22 | | | | 3.96 | | | | 0.78 | |
Class I2 | | | 1,000.00 | | | | 1,066.00 | | | | 3.53 | (C) | | | 1,021.72 | | | | 3.46 | | | | 0.68 | |
| | | | | | |
Transamerica International Bond | | | | | | | | | | | | | | | | | | | | | | | | |
Class A | | | 1,000.00 | | | | 1,017.10 | | | | 5.32 | (C) | | | 1,019.86 | | | | 5.33 | | | | 1.05 | |
Class C | | | 1,000.00 | | | | 1,013.70 | | | | 8.86 | (C) | | | 1,016.34 | | | | 8.87 | | | | 1.75 | |
Class I | | | 1,000.00 | | | | 1,019.20 | | | | 3.81 | (C) | | | 1,021.37 | | | | 3.81 | | | | 0.75 | |
Class I2 | | | 1,000.00 | | | | 1,019.30 | | | | 3.60 | (C) | | | 1,021.57 | | | | 3.61 | | | | 0.71 | |
| | | | | | |
Transamerica International Equity | | | | | | | | | | | | | | | | | | | | | | | | |
Class A | | | 1,000.00 | | | | 1,039.20 | | | | 7.54 | (C) | | | 1,017.75 | | | | 7.46 | | | | 1.47 | |
Class C | | | 1,000.00 | | | | 1,035.80 | | | | 10.44 | (C) | | | 1,014.88 | | | | 10.33 | | | | 2.04 | |
Class I | | | 1,000.00 | | | | 1,042.00 | | | | 5.29 | (C) | | | 1,019.96 | | | | 5.23 | | | | 1.03 | |
Class I2 | | | 1,000.00 | | | | 1,042.00 | | | | 4.88 | (C) | | | 1,020.36 | | | | 4.82 | | | | 0.95 | |
| | | | | | |
Transamerica Large Cap Growth | | | | | | | | | | | | | | | | | | | | | | | | |
Class A | | | 1,000.00 | | | | 986.00 | | | | 6.24 | (C) | | | 1,018.85 | | | | 6.34 | | | | 1.25 | |
Class C | | | 1,000.00 | | | | 982.00 | | | | 9.57 | (C) | | | 1,015.48 | | | | 9.73 | | | | 1.92 | |
Class I | | | 1,000.00 | | | | 987.00 | | | | 4.74 | (C) | | | 1,020.36 | | | | 4.82 | | | | 0.95 | |
Class I2 | | | 1,000.00 | | | | 988.00 | | | | 4.35 | (C) | | | 1,020.76 | | | | 4.42 | | | | 0.87 | |
| | | | | | |
Transamerica Large Cap Value | | | | | | | | | | | | | | | | | | | | | | | | |
Class A | | | 1,000.00 | | | | 1,048.10 | | | | 6.74 | (C) | | | 1,018.55 | | | | 6.65 | | | | 1.31 | |
Class C | | | 1,000.00 | | | | 1,045.60 | | | | 9.56 | (C) | | | 1,015.79 | | | | 9.42 | | | | 1.86 | |
Class I | | | 1,000.00 | | | | 1,052.30 | | | | 4.13 | (C) | | | 1,021.11 | | | | 4.06 | | | | 0.80 | |
Class I2 | | | 1,000.00 | | | | 1,051.00 | | | | 3.71 | (C) | | | 1,021.52 | | | | 3.66 | | | | 0.72 | |
| | | | | | |
Transamerica Money Market | | | | | | | | | | | | | | | | | | | | | | | | |
Class A | | | 1,000.00 | | | | 1,000.00 | | | | 1.41 | (C) | | | 1,023.73 | | | | 1.42 | | | | 0.28 | |
Class B | | | 1,000.00 | | | | 1,000.00 | | | | 1.41 | (C) | | | 1,023.73 | | | | 1.42 | | | | 0.28 | |
Class C | | | 1,000.00 | | | | 1,000.00 | | | | 1.41 | (C) | | | 1,023.73 | | | | 1.42 | | | | 0.28 | |
Class I | | | 1,000.00 | | | | 1,000.10 | | | | 1.36 | (C) | | | 1,023.78 | | | | 1.37 | | | | 0.27 | |
Class I2 | | | 1,000.00 | | | | 1,000.10 | | | | 1.26 | (C) | | | 1,023.88 | | | | 1.27 | | | | 0.25 | |
| | | | | | |
Transamerica Multi-Managed Balanced | | | | | | | | | | | | | | | | | | | | | | | | |
Class A | | | 1,000.00 | | | | 1,025.70 | | | | 7.18 | (C) | | | 1,018.05 | | | | 7.15 | | | | 1.41 | |
Class B | | | 1,000.00 | | | | 1,021.40 | | | | 11.33 | (C) | | | 1,013.93 | | | | 11.29 | | | | 2.23 | |
Class C | | | 1,000.00 | | | | 1,022.80 | | | | 10.27 | (C) | | | 1,014.98 | | | | 10.23 | | | | 2.02 | |
Class I | | | 1,000.00 | | | | 1,027.90 | | | | 4.89 | (C) | | | 1,020.31 | | | | 4.88 | | | | 0.96 | |
| | | | |
| Transamerica Funds | | | | Annual Report 2012 |
| | Page 40 | | |
Understanding Your Funds’ Expenses (continued)
(unaudited)
| | | | | | | | | | | | | | | | | | | | | | | | |
| | | | | | Actual Expenses | | | Hypothetical Expenses(A) | | | | |
| | | Beginning | | | Ending Account | | | Expenses Paid | | | Ending Account | | | Expenses Paid | | | Annualized | |
Fund Name(B) | | Account Value | | | Value | | | During Period | | | Value | | | During Period(C) | | | Expense Ratio | |
Transamerica Short-Term Bond | | | | | | | | | | | | | | | | | | | | | | | | |
Class A | | $ | 1,000.00 | | | $ | 1,029.60 | | | $ | 4.23 | (C) | | $ | 1,020.96 | | | $ | 4.22 | | | | 0.83 | % |
Class C | | | 1,000.00 | | | | 1,025.70 | | | | 8.15 | (C) | | | 1,017.09 | | | | 8.11 | | | | 1.60 | |
Class I | | | 1,000.00 | | | | 1,031.00 | | | | 3.22 | (C) | | | 1,021.97 | | | | 3.20 | | | | 0.63 | |
Class I2 | | | 1,000.00 | | | | 1,030.40 | | | | 2.70 | (C) | | | 1,022.47 | | | | 2.69 | | | | 0.53 | |
| | | | | | |
Transamerica Small Cap Growth | | | | | | | | | | | | | | | | | | | | | | | | |
Class A | | | 1,000.00 | | | | 936.00 | | | | 2.34 | (D) | | | 1,017.85 | | | | 7.35 | | | | 1.45 | |
Class C | | | 1,000.00 | | | | 935.00 | | | | 3.47 | (D) | | | 1,014.33 | | | | 10.89 | | | | 2.15 | |
Class I | | | 1,000.00 | | | | 937.00 | | | | 1.86 | (D) | | | 1,019.36 | | | | 5.84 | | | | 1.15 | |
Class I2 | | | 1,000.00 | | | | 937.00 | | | | 1.86 | (D) | | | 1,019.36 | | | | 5.84 | | | | 1.15 | |
| | | | | | |
Transamerica Small Cap Value | | | | | | | | | | | | | | | | | | | | | | | | |
Class A | | | 1,000.00 | | | | 983.00 | | | | 6.78 | (C) | | | 1,018.30 | | | | 6.90 | | | | 1.36 | |
Class C | | | 1,000.00 | | | | 979.00 | | | | 10.15 | (C) | | | 1,014.88 | | | | 10.33 | | | | 2.04 | |
Class I | | | 1,000.00 | | | | 984.00 | | | | 5.59 | (C) | | | 1,019.51 | | | | 5.69 | | | | 1.12 | |
Class I2 | | | 1,000.00 | | | | 984.00 | | | | 5.04 | (C) | | | 1,020.06 | | | | 5.13 | | | | 1.01 | |
| | | | | | |
Transamerica Small/Mid Cap Value | | | | | | | | | | | | | | | | | | | | | | | | |
Class A | | | 1,000.00 | | | | 999.10 | | | | 7.09 | (C) | | | 1,018.05 | | | | 7.15 | | | | 1.41 | |
Class B | | | 1,000.00 | | | | 995.60 | | | | 10.43 | (C) | | | 1,014.68 | | | | 10.53 | | | | 2.08 | |
Class C | | | 1,000.00 | | | | 996.10 | | | | 10.29 | (C) | | | 1,014.83 | | | | 10.38 | | | | 2.05 | |
Class I | | | 1,000.00 | | | | 1,001.30 | | | | 4.88 | (C) | | | 1,020.26 | | | | 4.93 | | | | 0.97 | |
Class I2 | | | 1,000.00 | | | | 1,001.80 | | | | 4.43 | (C) | | | 1,020.71 | | | | 4.47 | | | | 0.88 | |
| | | | | | |
Transamerica Tactical Income | | | | | | | | | | | | | | | | | | | | | | | | |
Class A | | | 1,000.00 | | | | 1,034.70 | | | | 4.71 | (C) | | | 1,020.51 | | | | 4.67 | | | | 0.92 | |
Class C | | | 1,000.00 | | | | 1,031.60 | | | | 8.53 | (C) | | | 1,016.74 | | | | 8.47 | | | | 1.67 | |
Class I | | | 1,000.00 | | | | 1,037.10 | | | | 3.43 | (C) | | | 1,021.77 | | | | 3.40 | | | | 0.67 | |
| (A) | 5% return per year before expenses. |
| (B) | See the Notes to the Financial Statements for information regarding name changes for the funds. |
| (C) | Expenses are calculated using the fund’s annualized expense ratio (as disclosed in the table), multiplied by the average account value for the period, multiplied by the number of days in the period (184 days), and divided by the number of days in the year (366 days). |
| (D) | Expenses are calculated using the funds’ annualized expense ratios (as disclosed in the table), multiplied by the average account values for the period, multiplied by the number of days in the period (61) days, and divided by the number of days in the year (366 days). |
| | | | |
| Transamerica Funds | | | | Annual Report 2012 |
| | Page 41 | | |
Schedules of Investments Composition
At October 31, 2012
(The following charts summarize the Schedule of Investments of each fund by asset type)
(unaudited)
| | | | |
Transamerica Capital Growth | | % of Net
Assets | |
Common Stocks | | | 96.0 | % |
Securities Lending Collateral | | | 9.1 | |
Repurchase Agreement | | | 4.1 | |
Preferred Stock | | | 0.0 | (A) |
Other Assets and Liabilities—Net | | | (9.2 | ) |
| | | | |
Total | | | 100.0 | % |
| | | | |
| |
Transamerica Diversified Equity | | % of Net
Assets | |
Common Stocks | | | 97.0 | % |
Repurchase Agreement | | | 3.1 | |
Securities Lending Collateral | | | 3.1 | |
Other Assets and Liabilities—Net | | | (3.2 | ) |
| | | | |
Total | | | 100.0 | % |
| | | | |
| |
Transamerica Emerging Markets Debt | | % of Net
Assets | |
Foreign Government Obligations | | | 51.3 | % |
Corporate Debt Securities | | | 41.0 | |
Securities Lending Collateral | | | 13.2 | |
Repurchase Agreement | | | 5.7 | |
Structured Notes Debt | | | 0.3 | |
Other Assets and Liabilities—Net(B) | | | (11.5 | ) |
| | | | |
Total | | | 100.0 | % |
| | | | |
| |
Transamerica Emerging Markets Equity | | % of Net
Assets | |
Common Stocks | | | 95.2 | % |
Preferred Stocks | | | 2.8 | |
Repurchase Agreement | | | 1.1 | |
Other Assets and Liabilities—Net | | | 0.9 | |
| | | | |
Total | | | 100.0 | % |
| | | | |
| |
Transamerica Flexible Income | | % of Net
Assets | |
Corporate Debt Securities | | | 56.0 | % |
U.S. Government Obligations | | | 21.2 | |
Securities Lending Collateral | | | 10.3 | |
Mortgage-Backed Securities | | | 7.4 | |
Foreign Government Obligations | | | 3.4 | |
Asset-Backed Securities | | | 2.9 | |
Preferred Stocks | | | 1.5 | |
Municipal Government Obligations | | | 1.2 | |
Repurchase Agreement | | | 1.1 | |
Preferred Corporate Debt Security | | | 1.1 | |
Common Stock | | | 1.0 | |
Loan Assignment | | | 0.5 | |
Warrant | | | 0.4 | |
Convertible Bond | | | 0.3 | |
U.S. Government Agency Obligations | | | 0.2 | |
Other Assets and Liabilities—Net | | | (8.5 | ) |
| | | | |
Total | | | 100.0 | % |
| | | | |
| |
Transamerica Growth Opportunities | | % of Net
Assets | |
Common Stocks | | | 95.7 | % |
Securities Lending Collateral | | | 17.9 | |
Repurchase Agreement | | | 3.7 | |
Preferred Stocks | | | 0.8 | |
Convertible Preferred Stocks | | | 0.1 | |
Other Assets and Liabilities—Net | | | (18.2 | ) |
| | | | |
Total | | | 100.0 | % |
| | | | |
| | | | |
Transamerica High Yield Bond | | % of Net
Assets | |
Corporate Debt Securities | | | 90.4 | % |
Securities Lending Collateral | | | 15.0 | |
Repurchase Agreement | | | 5.0 | |
Preferred Stocks | | | 2.3 | |
Common Stocks | | | 1.1 | |
Structured Notes Debt | | | 0.8 | |
Loan Assignments | | | 0.7 | |
Warrants | | | 0.0 | (A) |
Other Assets and Liabilities—Net | | | (15.3 | ) |
| | | | |
Total | | | 100.0 | % |
| | | | |
| |
Transamerica International Bond | | % of Net
Assets | |
Foreign Government Obligations | | | 72.9 | % |
Corporate Debt Securities | | | 21.9 | |
Repurchase Agreement | | | 1.9 | |
Mortgage-Backed Security | | | 1.4 | |
Securities Lending Collateral | | | 1.1 | |
Other Assets and Liabilities—Net(B) | | | 0.8 | |
| | | | |
Total | | | 100.0 | % |
| | | | |
| |
Transamerica International Equity | | % of Net
Assets | |
Common Stocks | | | 96.9 | % |
Securities Lending Collateral | | | 6.4 | |
Repurchase Agreement | | | 1.8 | |
Preferred Stock | | | 0.8 | |
Other Assets and Liabilities—Net | | | (5.9 | ) |
| | | | |
Total | | | 100.0 | % |
| | | | |
| |
Transamerica Large Cap Growth | | % of Net
Assets | |
Common Stocks | | | 97.7 | % |
Investment Companies | | | 2.1 | |
Repurchase Agreement | | | 0.2 | |
Other Assets and Liabilities—Net | | | (0.0 | )(A) |
| | | | |
Total | | | 100.0 | % |
| | | | |
| |
Transamerica Large Cap Value | | % of Net
Assets | |
Common Stocks | | | 96.1 | % |
Securities Lending Collateral | | | 3.8 | |
Repurchase Agreement | | | 3.8 | |
Other Assets and Liabilities—Net | | | (3.7 | ) |
| | | | |
Total | | | 100.0 | % |
| | | | |
| |
Transamerica Money Market | | % of Net
Assets | |
Repurchase Agreements | | | 53.0 | % |
Commercial Paper | | | 28.7 | |
Short-Term U.S. Government Obligations | | | 13.2 | |
Certificates of Deposit | | | 2.7 | |
Corporate Debt Securities | | | 1.8 | |
Demand Note | | | 0.6 | |
Other Assets and Liabilities—Net | | | (0.0 | )(A) |
| | | | |
Total | | | 100.0 | % |
| | | | |
| | | | |
| Transamerica Funds | | | | Annual Report 2012 |
| | Page 42 | | |
Schedules of Investments Composition (continued)
At October 31, 2012
(The following charts summarize the Schedule of Investments of each fund by asset type)
(unaudited)
| | | | |
Transamerica Multi-Managed Balanced | | % of Net
Assets | |
Common Stocks | | | 59.8 | % |
U.S. Government Agency Obligations | | | 16.6 | |
Corporate Debt Securities | | | 9.9 | |
Mortgage-Backed Securities | | | 6.0 | |
Securities Lending Collateral | | | 5.5 | |
U.S. Government Obligations | | | 5.4 | |
Asset-Backed Securities | | | 3.7 | |
Foreign Government Obligations | | | 1.9 | |
Repurchase Agreement | | | 1.2 | |
Short-Term Investment Company | | | 1.0 | |
Preferred Corporate Debt Securities | | | 0.2 | |
Structured Notes Debt | | | 0.2 | |
Short-Term U.S. Government Obligation | | | 0.1 | |
Preferred Stock | | | 0.0 | (A) |
Other Assets and Liabilities—Net(B) | | | (11.5 | ) |
| | | | |
Total | | | 100.0 | % |
| | | | |
| |
Transamerica Short-Term Bond | | % of Net
Assets | |
Corporate Debt Securities | | | 63.4 | % |
Mortgage-Backed Securities | | | 22.4 | |
Asset-Backed Securities | | | 8.4 | |
Securities Lending Collateral | | | 4.2 | |
Loan Assignments | | | 3.3 | |
Repurchase Agreement | | | 3.2 | |
Municipal Government Obligation | | | 0.5 | |
U.S. Government Agency Obligation | | | 0.0 | (A) |
Other Assets and Liabilities—Net | | | (5.4 | ) |
| | | | |
Total | | | 100.0 | % |
| | | | |
| |
Transamerica Small Cap Growth | | % of Net
Assets | |
Common Stocks | | | 91.8 | % |
Repurchase Agreement | | | 29.4 | |
Other Assets and Liabilities—Net | | | (21.2 | ) |
| | | | |
Total | | | 100.0 | % |
| | | | |
| | | | |
Transamerica Small Cap Value | | % of Net
Assets | |
Common Stocks | | | 96.3 | % |
Repurchase Agreement | | | 3.3 | |
Other Assets and Liabilities—Net | | | 0.4 | |
| | | | |
Total | | | 100.0 | % |
| | | | |
| |
Transamerica Small/Mid Cap Value | | % of Net
Assets | |
Common Stocks | | | 97.9 | % |
Securities Lending Collateral | | | 13.4 | |
Repurchase Agreement | | | 1.7 | |
Other Assets and Liabilities—Net | | | (13.0 | ) |
| | | | |
Total | | | 100.0 | % |
| | | | |
| |
Transamerica Tactical Income | | % of Net
Assets | |
Investment Companies | | | 98.3 | % |
Repurchase Agreement | | | 0.6 | |
Other Assets and Liabilities—Net | | | 1.1 | |
| | | | |
Total | | | 100.0 | % |
| | | | |
| (A) | Amount rounds to less than 0.1%. |
| (B) | The Other Assets and Liabilities - Net category may include, but is not limited to, Forward Foreign Currency Contracts, Futures Contracts, Swap Agreements, Written Options and Swaptions, TBA Short Commitments, and Cash Collateral. |
| | | | |
| Transamerica Funds | | | | Annual Report 2012 |
| | Page 43 | | |
Transamerica Capital Growth
(formerly, Transamerica Morgan Stanley Capital Growth)
SCHEDULE OF INVESTMENTS
At October, 31 2012
| | | | | | | | |
| | | Shares | | | Value
(000’s) | |
PREFERRED STOCK—0.0% ¥ | | | | | | | | |
Automobiles—0.0% ¥ | | | | | | | | |
Better Place—Series C ‡ Ə § D | | | 1,099,962 | | | $ | 110 | |
Total Preferred Stock (cost $4,994) | | | | | | | | |
| | |
COMMON STOCKS—96.0% | | | | | | | | |
Beverages—1.5% | | | | | | | | |
Anheuser-Busch InBev NV ADR | | | 130,932 | | | | 10,972 | |
Capital Markets—1.6% | | | | | | | | |
BlackRock, Inc.—Class A | | | 60,401 | | | | 11,457 | |
Chemicals—2.9% | | | | | | | | |
Monsanto Co. | | | 239,827 | | | | 20,642 | |
Commercial Services & Supplies—3.6% | | | | | | | | |
Edenred | | | 880,309 | | | | 25,473 | |
Communications Equipment—3.7% | | | | | | | | |
Motorola Solutions, Inc. | | | 514,305 | | | | 26,579 | |
Computers & Peripherals—8.9% | | | | | | | | |
Apple, Inc. | | | 106,928 | | | | 63,633 | |
Diversified Financial Services—2.6% | | | | | | | | |
CME Group, Inc.—Class A | | | 194,014 | | | | 10,852 | |
MSCI, Inc.—Class A ‡ | | | 280,826 | | | | 7,565 | |
Electrical Equipment—2.3% | | | | | | | | |
First Solar, Inc. ‡ ^ | | | 308,564 | | | | 7,501 | |
Sensata Technologies Holding NV ‡ ^ | | | 330,024 | | | | 9,297 | |
Food Products—3.6% | | | | | | | | |
DE Master Blenders 1753 NV ‡ | | | 1,503,725 | | | | 18,378 | |
Mead Johnson Nutrition Co.—Class A | | | 119,269 | | | | 7,354 | |
Health Care Equipment & Supplies—3.2% | | | | | | | | |
Intuitive Surgical, Inc. ‡ | | | 42,604 | | | | 23,101 | |
Hotels, Restaurants & Leisure—2.3% | | | | | | | | |
Starbucks Corp. | | | 363,026 | | | | 16,663 | |
Insurance—2.7% | | | | | | | | |
Progressive Corp. | | | 858,479 | | | | 19,144 | |
Internet & Catalog Retail—11.2% | | | | | | | | |
Amazon.com, Inc. ‡ | | | 241,199 | | | | 56,156 | |
Groupon, Inc.—Class A ‡ ^ | | | 981,319 | | | | 4,043 | |
priceline.com, Inc. ‡ | | | 34,682 | | | | 19,899 | |
Internet Software & Services—16.3% | | | | | | | | |
Baidu, Inc. ADR ‡ | | | 190,621 | | | | 20,324 | |
Facebook, Inc.—Class A ‡ ^ | | | 784,270 | | | | 16,560 | |
Facebook, Inc.—Class B ‡ Ə § D | | | 764,836 | | | | 15,878 | |
Google, Inc.—Class A ‡ | | | 67,415 | | | | 45,827 | |
LinkedIn Corp.—Class A ‡ | | | 90,938 | | | | 9,724 | |
Yandex NV—Class A ‡ | | | 343,084 | | | | 7,987 | |
IT Services—7.0% | | | | | | | | |
Mastercard, Inc.—Class A | | | 53,911 | | | | 24,849 | |
Visa, Inc.—Class A | | | 183,421 | | | | 25,452 | |
Life Sciences Tools & Services—2.5% | | | | | | | | |
Illumina, Inc. ‡ ^ | | | 381,940 | | | | 18,146 | |
Media—3.2% | | | | | | | | |
McGraw-Hill Cos., Inc. | | | 213,163 | | | | 11,783 | |
Naspers, Ltd.—Class N | | | 170,647 | | | | 11,079 | |
Metals & Mining—0.4% | | | | | | | | |
Molycorp, Inc. ‡ ^ | | | 261,169 | | | | 2,716 | |
Oil, Gas & Consumable Fuels—2.5% | | | | | | | | |
Range Resources Corp. | | | 155,108 | | | | 10,137 | |
Ultra Petroleum Corp. ‡ ^ | | | 355,835 | | | | 8,117 | |
Pharmaceuticals—1.4% | | | | | | | | |
Valeant Pharmaceuticals International, Inc. ‡ | | | 183,437 | | | | 10,260 | |
Professional Services—3.1% | | | | | | | | |
Intertek Group PLC | | | 250,085 | | | | 11,377 | |
Verisk Analytics, Inc.—Class A ‡ | | | 214,761 | | | | 10,953 | |
Real Estate Management & Development—3.6% | | | | | | | | |
Brookfield Asset Management, Inc.—Class A ^ | | | 755,190 | | | | 26,009 | |
| | | | | | | | |
| | | Shares | | | Value
(000’s) | |
Software—4.3% | | | | | | | | |
Salesforce.com, Inc. ‡ | | | 116,752 | | | $ | 17,044 | |
VMware, Inc.—Class A ‡ | | | 92,325 | | | | 7,826 | |
Workday, Inc.—Class A ‡ | | | 87,658 | | | | 4,251 | |
Zynga, Inc.—Class A ‡ | | | 843,549 | | | | 1,898 | |
Textiles, Apparel & Luxury Goods—1.6% | | | | | | | | |
Coach, Inc. | | | 200,061 | | | | 11,213 | |
| | | | | | | | |
Total Common Stocks (cost $664,104) | | | | | | | 688,119 | |
| | | | | | | | |
SECURITIES LENDING COLLATERAL—9.1% | | | | | | | | |
State Street Navigator Securities Lending Trust—Prime Portfolio, 0.31% p | | | 65,332,484 | | | | 65,332 | |
Total Securities Lending Collateral (cost $65,332) | | | | | | | | |
| | |
| | | Principal
(000’s) | | | Value
(000’s) | |
REPURCHASE AGREEMENT—4.1% | | | | | | | | |
State Street Bank & Trust Co. 0.03% p, dated 10/31/2012, to be repurchased at $29,546 on 11/01/2012. Collateralized by a U.S. Government Agency Obligation, 3.00%, due 12/01/2026, and with a value of $30,141. | | $ | 29,546 | | | | 29,546 | |
| | | | | | | | |
Total Repurchase Agreement (cost $29,546) | | | | | | | | |
Total Investment Securities (cost $763,976) P | | | | | | | 783,107 | |
Other Assets and Liabilities—Net | | | | | | | (66,202 | ) |
| | | | | | | | |
Net Assets | | | | | | $ | 716,905 | |
| | | | | | | | |
| | | | |
| The notes to the financial statements are an integral part of this report. | | |
| Transamerica Funds | | | | Annual Report 2012 |
| | Page 44 | | |
Transamerica Capital Growth
(formerly, Transamerica Morgan Stanley Capital Growth)
SCHEDULE OF INVESTMENTS (continued)
At October 31, 2012
NOTES TO SCHEDULE OF INVESTMENTS (all amounts in thousands):
| ¥ | Percentage rounds to less than 0.1%. |
| Ə | Fair valued as determined in good faith in accordance with procedures established by the Board of Trustees. Total aggregate market value of fair valued securities is $15,988, or 2.23% of the fund’s net assets. |
| ‡ | Non-income producing security. |
| § | Illiquid. Total aggregate market value of illiquid securities is $15,988, or 2.23% of the fund’s net assets. |
| ^ | All or a portion of this security is on loan. The value of all securities on loan is $63,628. |
| p | Rate shown reflects the yield at 10/31/2012. |
| P | Aggregate cost for federal income tax purposes is $764,941. Aggregate gross unrealized appreciation/depreciation for all securities in which there is an excess of value over tax cost were $87,556 and $69,390, respectively. Net unrealized appreciation for tax purposes is $18,166. |
| D | Restricted Security. At 10/31/2012, the fund owned the respective securities which were restricted as to public resale: |
| | | | | | | | | | | | | | | | | | |
Investment Securities | | Description | | Acquisition
Date | | | Cost | | | Value | | | Value as % of Net
Assets | |
Preferred Stock | | Better Place—Series C | | | 11/11/2011 | | | $ | 4,994 | | | $ | 110 | | | | 0.02 | % |
Common Stocks | | Facebook, Inc.—Class B | | | 03/06/2012 | | | | 23,328 | | | | 15,878 | | | | 2.21 | |
| | | | | | | | | | | | | | | | | | |
| | | | | | | | $ | 28,322 | | | $ | 15,988 | | | | 2.23 | % |
| | | | | | | | | | | | | | | | | | |
DEFINITION:
| ADR | American Depositary Receipt |
VALUATION SUMMARY (all amounts in thousands): '
| | | | | | | | | | | | | | | | |
Investment Securities | | Level 1 -
Quoted
Prices | | | Level 2 -
Other
Significant
Observable
Inputs | | | Level 3 -
Significant
Unobservable
Inputs | | | Value at
10/31/2012 | |
Common Stocks | | $ | 605,934 | | | $ | 66,307 | | | $ | 15,878 | | | $ | 688,119 | |
Preferred Stock | | | — | | | | — | | | | 110 | | | | 110 | |
Repurchase Agreement | | | — | | | | 29,546 | | | | — | | | | 29,546 | |
Securities Lending Collateral | | | 65,332 | | | | — | | | | — | | | | 65,332 | |
| | | | | | | | | | | | | | | | |
Total | | $ | 671,266 | | | $ | 95,853 | | | $ | 15,988 | | | $ | 783,107 | |
| | | | | | | | | | | | | | | | |
Level 3 Rollforward—Investment Securities
| | | | | | | | | | | | | | | | | | | | | | | | | | | | | | | | | | | | | | | | |
Securities | | Beginning
Balance at
10/31/2011 | | | Purchases | | | Sales | | | Accrued
Discounts/
(Premiums) | | | Total
Realized
Gain/(Loss) | | | Net Change in
Unrealized
Appreciation/
(Depreciation) ƒ | | | Transfers
into
Level 3 | | | Transfers
out of
Level 3 | | | Ending
Balance at
10/31/2012₪ | | | Net Change in Unrealized
Appreciation/(Depreciation)
on Investments Held at
10/31/2012 ƒ | |
Common Stocks | | $ | — | | | $ | 23,328 | | | $ | — | | | $ | — | | | $ | — | | | $ | (7,450 | ) | | $ | — | | | $ | — | | | $ | 15,878 | | | $ | (7,450 | ) |
Preferred Stocks | | | — | | | | 4,994 | | | | — | | | | — | | | | — | | | | (4,884 | ) | | | — | | | | — | | | | 110 | | | | (4,884 | ) |
| | | | | | | | | | | | | | | | | | | | | | | | | | | | | | | | | | | | | | | | |
Total | | $ | — | | | $ | 28,322 | | | $ | — | | | $ | — | | | $ | — | | | $ | (12,334 | ) | | $ | — | | | $ | — | | | $ | 15,988 | | | $ | (12,334 | ) |
| | | | | | | | | | | | | | | | | | | | | | | | | | | | | | | | | | | | | | | | |
| ' | Transfers between levels are considered to have occurred at the end of the reporting period. There were no transfers into or out of Levels 1 and 2 during the period ended 10/31/2012. See the notes to the financial statements for more information regarding pricing inputs and valuation techniques. |
| ƒ | Any difference between Net Change in Unrealized Appreciation/(Depreciation) and Net Change in Unrealized Appreciation/(Depreciation) on Investments Held at 10/31/2012 may be due to an investment no longer held or categorized as Level 3 at period end. |
| ₪ | Total aggregate market value of Level 3 is 2.23% of the fund’s net assets. Quantitative information about significant unobservable inputs used in the fair value measurement are disclosed in the table on the following page. |
| | | | |
| The notes to the financial statements are an integral part of this report. | | |
| Transamerica Funds | | | | Annual Report 2012 |
| | Page 45 | | |
Transamerica Capital Growth
(formerly, Transamerica Morgan Stanley Capital Growth)
SCHEDULE OF INVESTMENTS (continued)
At October 31, 2012
VALUATION SUMMARY (continued):
Quantitative Information about Significant Unobservable Inputs (Level 3):
| | | | | | | | | | | | | | | | | | |
Investment Securities | | Fair Value at
10/31/2012
(000’s) | | | Valuation Technique(s) | | Unobservable Input | | Range | | Weighted
Average | | | Impact to
Valuation from an
Increase in input |
Common Stock | | $ | 15,878 | | | Discount for illiquidity | | Illiquidity discount
amortized over the lockup period | | 1.67% | | 1.67% | | | 1.67 | % | | Decrease |
Preferred Stock | | $ | 110 | | | Discounted Cash Flow | | Net Tangible Assets | | $0.10 | | $0.10 | | $ | 0.10 | | | Increase |
| | | | |
| The notes to the financial statements are an integral part of this report. |
| Transamerica Funds | | | | Annual Report 2012 |
| | Page 46 | | |
Transamerica Diversified Equity
(formerly, Transamerica WMC Diversified Equity)
SCHEDULE OF INVESTMENTS
At October 31, 2012
| | | | | | | | |
| | | | | | Value | |
| | | Shares | | | (000’s) | |
COMMON STOCKS—97.0% | | | | | | | | |
Aerospace & Defense—2.9% | | | | | | | | |
Boeing Co. | | | 294,670 | | | $ | 20,757 | |
Honeywell International, Inc. | | | 342,877 | | | | 20,997 | |
Beverages—2.7% | | | | | | | | |
Coca-Cola Co. | | | 1,065,444 | | | | 39,613 | |
Biotechnology—6.1% | | | | | | | | |
Amgen, Inc. | | | 381,004 | | | | 32,974 | |
Biogen Idec, Inc. ‡ | | | 137,889 | | | | 19,059 | |
Celgene Corp. ‡ | | | 247,993 | | | | 18,183 | |
Gilead Sciences, Inc. ‡ | | | 273,979 | | | | 18,400 | |
Chemicals—3.4% | | | | | | | | |
CF Industries Holdings, Inc. | | | 92,443 | | | | 18,968 | |
Monsanto Co. | | | 244,935 | | | | 21,082 | |
Sherwin-Williams Co. | | | 63,639 | | | | 9,074 | |
Commercial Services & Supplies—0.8% | | | | | | | | |
ADT Corp. ‡ | | | 149,643 | | | | 6,212 | |
Tyco International, Ltd. | | | 207,929 | | | | 5,587 | |
Communications Equipment—6.7% | | | | | | | | |
Cisco Systems, Inc. | | | 3,882,166 | | | | 66,540 | |
Emulex Corp. ‡ | | | 537,760 | | | | 3,743 | |
F5 Networks, Inc. ‡ | | | 53,761 | | | | 4,434 | |
QUALCOMM, Inc. | | | 303,799 | | | | 17,795 | |
Riverbed Technology, Inc. ‡ | | | 262,626 | | | | 4,851 | |
Computers & Peripherals—9.0% | | | | | | | | |
Apple, Inc. | | | 177,778 | | | | 105,795 | |
EMC Corp. ‡ | | | 566,161 | | | | 13,826 | |
NetApp, Inc. ‡ | | | 359,743 | | | | 9,677 | |
QLogic Corp. ‡ | | | 334,371 | | | | 3,136 | |
Consumer Finance—1.2% | | | | | | | | |
American Express Co. | | | 301,069 | | | | 16,851 | |
Diversified Consumer Services—0.2% | | | | | | | | |
ITT Educational Services, Inc. ‡ ^ | | | 149,481 | | | | 3,212 | |
Diversified Financial Services—2.1% | | | | | | | | |
Bank of America Corp. | | | 2,346,924 | | | | 21,873 | |
JPMorgan Chase & Co. | | | 192,027 | | | | 8,004 | |
Diversified Telecommunication Services—2.5% | | | | | | | | |
Verizon Communications, Inc. | | | 827,655 | | | | 36,947 | |
Energy Equipment & Services—4.2% | | | | | | | | |
Core Laboratories NV | | | 52,592 | | | | 5,452 | |
Diamond Offshore Drilling, Inc. ^ | | | 228,834 | | | | 15,844 | |
National Oilwell Varco, Inc. | | | 218,492 | | | | 16,103 | |
Oceaneering International, Inc. | | | 233,891 | | | | 12,240 | |
Transocean, Ltd. | | | 244,172 | | | | 11,156 | |
Food & Staples Retailing—4.9% | | | | | | | | |
Costco Wholesale Corp. | | | 180,902 | | | | 17,806 | |
CVS Caremark Corp. | | | 351,343 | | | | 16,302 | |
Wal-Mart Stores, Inc. | | | 494,424 | | | | 37,092 | |
Food Products—0.2% | | | | | | | | |
Green Mountain Coffee Roasters, Inc. ‡ ^ | | | 115,299 | | | | 2,786 | |
Health Care Equipment & Supplies—1.8% | | | | | | | | |
Edwards Lifesciences Corp. ‡ | | | 84,408 | | | | 7,329 | |
Hologic, Inc. ‡ | | | 485,541 | | | | 10,012 | |
Zimmer Holdings, Inc. | | | 127,897 | | | | 8,212 | |
Health Care Providers & Services—2.3% | | | | | | | | |
Aetna, Inc. | | | 228,022 | | | | 9,965 | |
UnitedHealth Group, Inc. | | | 411,064 | | | | 23,019 | |
Hotels, Restaurants & Leisure—0.3% | | | | | | | | |
Yum! Brands, Inc. | | | 57,831 | | | | 4,055 | |
Industrial Conglomerates—1.3% | | | | | | | | |
General Electric Co. | | | 866,144 | | | | 18,241 | |
Internet & Catalog Retail—1.6% | | | | | | | | |
Amazon.com, Inc. ‡ | | | 87,007 | | | | 20,257 | |
priceline.com, Inc. ‡ | | | 4,756 | | | | 2,729 | |
Internet Software & Services—5.0% | | | | | | | | |
eBay, Inc. ‡ | | | 358,766 | | | | 17,325 | |
Google, Inc.—Class A ‡ | | | 53,428 | | | | 36,318 | |
| | | | | | | | |
| | | | | | Value | |
| | | Shares | | | (000’s) | |
Internet Software & Services (continued) | | | | | | | | |
IAC/InterActiveCorp | | | 399,312 | | | $ | 19,307 | |
IT Services—3.9% | | | | | | | | |
International Business Machines Corp. | | | 203,952 | | | | 39,674 | |
Visa, Inc.—Class A | | | 126,366 | | | | 17,535 | |
Life Sciences Tools & Services—0.5% | | | | | | | | |
Bruker Corp. ‡ | | | 373,760 | | | | 4,519 | |
Life Technologies Corp. ‡ | | | 61,775 | | | | 3,021 | |
Machinery—1.5% | | | | | | | | |
Dover Corp. | | | 55,713 | | | | 3,244 | |
Illinois Tool Works, Inc. | | | 86,194 | | | | 5,286 | |
Parker Hannifin Corp. | | | 163,340 | | | | 12,848 | |
Pentair, Ltd. | | | 9,036 | | | | 382 | |
Media—4.5% | | | | | | | | |
Comcast Corp.—Class A | | | 611,884 | | | | 22,952 | |
News Corp.—Class A | | | 551,600 | | | | 13,194 | |
Omnicom Group, Inc. | | | 334,478 | | | | 16,025 | |
Sirius XM Radio, Inc. ‡ | | | 4,505,329 | | | | 12,615 | |
Metals & Mining—2.1% | | | | | | | | |
Allied Nevada Gold Corp. ‡^ | | | 149,330 | | | | 5,513 | |
Cliffs Natural Resources, Inc. ^ | | | 186,953 | | | | 6,781 | |
Freeport-McMoRan Copper & Gold, Inc. | | | 375,868 | | | | 14,614 | |
Walter Energy, Inc. | | | 99,056 | | | | 3,463 | |
Multiline Retail—0.5% | | | | | | | | |
Dollar Tree, Inc. ‡ | | | 185,993 | | | | 7,416 | |
Oil, Gas & Consumable Fuels—2.5% | | | | | | | | |
Exxon Mobil Corp. | | | 277,804 | | | | 25,327 | |
Occidental Petroleum Corp. | | | 5,935 | | | | 469 | |
Valero Energy Corp. | | | 345,808 | | | | 10,063 | |
Pharmaceuticals—3.8% | | | | | | | | |
Abbott Laboratories | | | 340,387 | | | | 22,302 | |
Eli Lilly & Co. | | | 244,472 | | | | 11,889 | |
Merck & Co., Inc. | | | 452,864 | | | | 20,664 | |
Semiconductors & Semiconductor Equipment—1.7% | | | | | | | | |
Altera Corp. | | | 493,237 | | | | 15,034 | |
Xilinx, Inc. | | | 312,260 | | | | 10,230 | |
Software—7.8% | | | | | | | | |
Autodesk, Inc. ‡ | | | 4,441 | | | | 141 | |
BMC Software, Inc. ‡ | | | 139,918 | | | | 5,695 | |
Check Point Software Technologies, Ltd. ‡ | | | 233,441 | | | | 10,395 | |
Citrix Systems, Inc. ‡ | | | 14,852 | | | | 918 | |
Microsoft Corp. | | | 1,811,588 | | | | 51,694 | |
NetSuite, Inc. ‡^ | | | 79,956 | | | | 5,078 | |
Oracle Corp. | | | 968,405 | | | | 30,069 | |
Red Hat, Inc. ‡ | | | 224,190 | | | | 11,023 | |
Specialty Retail—5.7% | | | | | | | | |
Bed Bath & Beyond, Inc. ‡ | | | 121,931 | | | | 7,033 | |
Buckle, Inc. ^ | | | 191,921 | | | | 8,669 | |
Home Depot, Inc. | | | 289,636 | | | | 17,777 | |
Lowe’s Cos., Inc. | | | 495,920 | | | | 16,058 | |
O’Reilly Automotive, Inc. ‡ | | | 100,860 | | | | 8,642 | |
PetSmart, Inc. | | | 175,167 | | | | 11,629 | |
Ross Stores, Inc. | | | 74,332 | | | | 4,531 | |
TJX Cos., Inc. | | | 209,647 | | | | 8,728 | |
Textiles, Apparel & Luxury Goods—0.6% | | | | | | | | |
Coach, Inc. | | | 13,997 | | | | 785 | |
Lululemon Athletica, Inc. ‡ | | | 106,055 | | | | 7,318 | |
Tobacco—2.7% | | | | | | | | |
Philip Morris International, Inc. | | | 449,675 | | | | 39,823 | |
| | | | | | | | |
Total Common Stocks (cost $1,177,275) | | | | | | | 1,410,206 | |
| | | | | | | | |
SECURITIES LENDING COLLATERAL—3.1% | | | | | | | | |
State Street Navigator Securities
Lending Trust—Prime Portfolio, 0.31% | | | 44,873,196 | | | | 44,873 | |
Total Securities Lending Collateral (cost $44,873) | | | | | |
| | | | |
| The notes to the financial statements are an integral part of this report. | | |
| Transamerica Funds | | | | Annual Report 2012 |
| | Page 47 | | |
Transamerica Diversified Equity
(formerly, Transamerica WMC Diversified Equity)
SCHEDULE OF INVESTMENTS (continued)
At October 31, 2012
| | | | | | | | |
| | | Principal | | | Value | |
| | | (000’s) | | | (000’s) | |
REPURCHASE AGREEMENT—3.1% | | | | | | | | |
State Street Bank & Trust Co.
0.03% , dated 10/31/2012, to be repurchased at $44,997 on 11/01/2012. Collateralized by a U.S. Government Agency Obligation, 3.00%, due 12/01/2026, and with a value of $45,901. | | $ | 44,997 | | | $ | 44,997 | |
| | | | | | | | |
Total Repurchase Agreement (cost $44,997) | | | | | | | | |
Total Investment Securities (cost $1,267,145) P | | | | | | | 1,500,076 | |
Other Assets and Liabilities—Net | | | | | | | (46,581 | ) |
| | | | | | | | |
Net Assets | | | | | | $ | 1,453,495 | |
| | | | | | | | |
NOTES TO SCHEDULE OF INVESTMENTS (all amounts in thousands):
| ‡ | Non-income producing security. |
| ^ | All or a portion of this security is on loan. The value of all securities on loan is $43,874. |
| | Rate shown reflects the yield at 10/31/2012. |
| P | Aggregate cost for federal income tax purposes is $1,275,635. Aggregate gross unrealized appreciation/depreciation for all securities in which there is an excess of value over tax cost were $259,869 and $35,428, respectively. Net unrealized appreciation for tax purposes is $224,441. |
VALUATION SUMMARY (all amounts in thousands): '
| | | | | | | | | | | | | | | | |
| | | | | | Level 2 - | | | | | | | |
| | | | | | Other | | | Level 3 - | | | | |
| | | Level 1 - | | | Significant | | | Significant | | | | |
| | | Quoted | | | Observable | | | Unobservable | | | Value at | |
Investment Securities | | Prices | | | Inputs | | | Inputs | | | 10/31/2012 | |
Common Stocks | | $ | 1,399,050 | | | $ | 11,156 | | | $ | — | | | $ | 1,410,206 | |
Repurchase Agreement | | | — | | | | 44,997 | | | | — | | | | 44,997 | |
Securities Lending Collateral | | | 44,873 | | | | — | | | | — | | | | 44,873 | |
| | | | | | | | | | | | | | | | |
Total | | $ | 1,443,923 | | | $ | 56,153 | | | $ | — | | | $ | 1,500,076 | |
| | | | | | | | | | | | | | | | |
| ' | Transfers between levels are considered to have occurred at the end of the reporting period. There were no transfers into or out of Levels 1 and 2 during the period ended 10/31/2012. See the notes to the financial statements for more information regarding pricing inputs and valuation techniques. |
| | | | |
| The notes to the financial statements are an integral part of this report. | | |
| Transamerica Funds | | | | Annual Report 2012 |
| | Page 48 | | |
Transamerica Emerging Markets Debt
(formerly, Transamerica Logan Circle Emerging Markets Debt)
SCHEDULE OF INVESTMENTS
At October 31, 2012
| | | | | | | | |
| | | Principal
(000’s) | | | Value
(000’s) | |
FOREIGN GOVERNMENT OBLIGATIONS—51.3% | | | | | | | | |
Argentina—2.0% | | | | | | | | |
Argentine Republic Government International Bond | | | | | | | | |
8.28%, 12/31/2033 | | $ | 1,311 | | | $ | 898 | |
Provincia de Cordoba | | | | | | | | |
12.38%, 08/17/2017—Reg S | | | 5,460 | | | | 4,068 | |
Republic of Argentina | | | | | | | | |
2.50%, 12/31/2038 * ^ | | | 22,620 | | | | 7,352 | |
Belarus—0.6% | | | | | | | | |
Republic of Belarus | | | | | | | | |
8.75%, 08/03/2015—Reg S | | | 1,000 | | | | 1,000 | |
8.95%, 01/26/2018—Reg S | | | 2,500 | | | | 2,494 | |
Brazil—0.6% | | | | | | | | |
Brazilian Government International Bond | | | | | | | | |
8.50%, 01/05/2024 | | BRL | 6,600 | | | | 3,802 | |
Chile—1.9% | | | | | | | | |
Republic of Chile | | | | | | | | |
5.50%, 08/05/2020 | | CLP | 5,156,000 | | | | 11,620 | |
Colombia—3.5% | | | | | | | | |
Colombia Government International Bond | | | | | | | | |
4.38%, 03/21/2023 | | COP | 20,954,000 | | | | 11,381 | |
6.13%, 01/18/2041 | | $ | 5,000 | | | | 6,825 | |
Republic of Colombia | | | | | | | | |
7.38%, 03/18/2019 | | | 3,000 | | | | 3,960 | |
Cote d’Ivoire—2.0% | | | | | | | | |
Ivory Coast Government International Bond | | | | | | | | |
3.75%, 12/31/2032—144A | | | 3,000 | | | | 2,694 | |
Republic of The Ivory Coast | | | | | | | | |
3.75%, 12/31/2032—Reg S | | | 10,790 | | | | 9,711 | |
Croatia—0.8% | | | | | | | | |
Croatia Government International Bond | | | | | | | | |
6.25%, 04/27/2017—144A | | | 4,300 | | | | 4,726 | |
Georgia—0.3% | | | | | | | | |
Georgia Government International Bond | | | | | | | | |
6.88%, 04/12/2021—144A ^ | | | 1,585 | | | | 1,819 | |
Guatemala—0.3% | | | | | | | | |
Guatemala Government Bond | | | | | | | | |
5.75%, 06/06/2022—144A | | | 1,700 | | | | 1,938 | |
Hungary—0.7% | | | | | | | | |
Hungary Government Bond | | | | | | | | |
6.50%, 06/24/2019 | | HUF | 1,000,000 | | | | 4,530 | |
Indonesia—2.0% | | | | | | | | |
Indonesia Government International Bond | | | | | | | | |
3.75%, 04/25/2022—144A | | $ | 2,500 | | | | 2,644 | |
4.88%, 05/05/2021—144A | | | 2,050 | | | | 2,337 | |
5.25%, 01/17/2042—144A ^ | | | 6,300 | | | | 7,261 | |
Latvia—0.6% | | | | | | | | |
Republic of Latvia | | | | | | | | |
5.25%, 06/16/2021—Reg S ^ | | | 3,300 | | | | 3,746 | |
Mexico—6.2% | | | | | | | | |
Mexican Bonos | | | | | | | | |
6.00%, 06/18/2015 | | MXN | 107,490 | | | | 8,397 | |
6.25%, 06/16/2016 | | | 53,050 | | | | 4,203 | |
6.50%, 06/10/2021 | | | 67,690 | | | | 5,512 | |
Mexico Government International Bond | | | | | | | | |
4.75%, 03/08/2044 | | $ | 14,790 | | | | 16,416 | |
United Mexican States | | | | | | | | |
5.63%, 01/15/2017 | | | 4,500 | | | | 5,261 | |
| | | | | | | | |
| | | Principal
(000’s) | | | Value
(000’s) | |
Peru—2.4% | | | | | | | | |
Peruvian Government International Bond | | | | | | | | |
7.84%, 08/12/2020—144A | | PEN | 11,250 | | | $ | 5,372 | |
8.60%, 08/12/2017—Reg S | | | 3,690 | | | | 1,758 | |
8.60%, 08/12/2017—144A | | | 6,500 | | | | 3,098 | |
Republic of Peru | | | | | | | | |
7.35%, 07/21/2025 | | $ | 3,000 | | | | 4,365 | |
Philippines—0.6% | | | | | | | | |
Philippine Government International Bond | | | | | | | | |
6.25%, 01/14/2036 | | PHP | 135,000 | | | | 3,833 | |
Poland—4.1% | | | | | | | | |
Poland Government Bond | | | | | | | | |
4.75%, 04/25/2017 | | PLN | 26,900 | | | | 8,646 | |
5.75%, 10/25/2021 | | | 4,900 | | | | 1,673 | |
Poland Government International Bond | | | | | | | | |
3.00%, 03/17/2023 | | $ | 13,610 | | | | 13,413 | |
Republic of Poland | | | | | | | | |
6.38%, 07/15/2019 | | | 1,000 | | | | 1,245 | |
Qatar—1.4% | | | | | | | | |
Qatar Government International Bond | | | | | | | | |
4.50%, 01/20/2022—144A | | | 5,110 | | | | 5,851 | |
5.75%, 01/20/2042—144A ^ | | | 2,420 | | | | 3,122 | |
Romania—1.5% | | | | | | | | |
Romanian Government International Bond | | | | | | | | |
6.75%, 02/07/2022—144A | | | 8,315 | | | | 9,604 | |
Russian Federation—0.8% | | | | | | | | |
Russian Foreign Bond—Eurobond | | | | | | | | |
4.50%, 04/04/2022—144A | | | 4,270 | | | | 4,777 | |
Slovenia—1.9% | | | | | | | | |
Slovenia Government Bond | | | | | | | | |
4.63%, 09/09/2024 | | EUR | 4,600 | | | | 5,314 | |
Slovenia Government International Bond | | | | | | | | |
5.50%, 10/26/2022—144A | | $ | 6,400 | | | | 6,470 | |
South Africa—2.3% | | | | | | | | |
Republic of South Africa | | | | | | | | |
5.50%, 03/09/2020 | | | 6,400 | | | | 7,477 | |
13.50%, 09/15/2015 | | ZAR | 25,900 | | | | 3,616 | |
South Africa Government Bond | | | | | | | | |
10.50%, 12/21/2026 | | | 23,300 | | | | 3,321 | |
Sri Lanka—0.7% | | | | | | | | |
Sri Lanka Government International Bond | | | | | | | | |
6.25%, 07/27/2021—144A | | $ | 3,720 | | | | 4,160 | |
Supranational—1.7% | | | | | | | | |
Eastern and Southern African Trade and Development Bank | | | | | | | | |
6.88%, 01/09/2016 ^ | | | 4,650 | | | | 4,702 | |
Eurasian Development Bank | | | | | | | | |
4.77%, 09/20/2022—144A ^ | | | 5,423 | | | | 5,552 | |
Turkey—4.7% | | | | | | | | |
Turkey Government Bond | | | | | | | | |
6.34%, 05/15/2013 | | TRY | 16,688 | | | | 9,004 | |
9.50%, 01/12/2022 | | | 23,415 | | | | 14,303 | |
Turkey Government International Bond | | | | | | | | |
6.25%, 09/26/2022 | | $ | 5,000 | | | | 6,058 | |
Ukraine—1.8% | | | | | | | | |
Republic of Ukraine | | | | | | | | |
6.88%, 09/23/2015—144A | | | 4,600 | | | | 4,594 | |
Ukraine Government International Bond | | | | | | | | |
9.25%, 07/24/2017—144A | | | 6,410 | | | | 6,991 | |
Uruguay—1.8% | | | | | | | | |
Uruguay Government International Bond | | | | | | | | |
5.00%, 09/14/2018 | | UYU | 195,617 | | | | 11,325 | |
| | | | |
| The notes to the financial statements are an integral part of this report. | | |
| Transamerica Funds | | | | Annual Report 2012 |
| | Page 49 | | |
Transamerica Emerging Markets Debt
(formerly, Transamerica Logan Circle Emerging Markets Debt)
SCHEDULE OF INVESTMENTS (continued)
At October 31, 2012
| | | | | | | | |
| | | Principal
(000’s) | | | Value
(000’s) | |
Venezuela—4.1% | | | | | | | | |
Republic of Venezuela | | | | | | | | |
6.00%, 12/09/2020—Reg S^ | | $ | 14,240 | | | $ | 10,858 | |
Venezuela Government International Bond | | | | | | | | |
11.75%, 10/21/2026—Reg S^ | | | 6,955 | | | | 7,042 | |
11.95%, 08/05/2031—Reg S^ | | | 7,650 | | | | 7,822 | |
| | | | | | | | |
Total Foreign Government Obligations (cost $311,964) | | | | | | | 319,961 | |
| | | | | | | | |
CORPORATE DEBT SECURITIES—41.0% | | | | | | | | |
Barbados—1.0% | | | | | | | | |
Columbus International, Inc. | | | | | | | | |
11.50%, 11/20/2014—144A | | | 5,320 | | | | 5,958 | |
Bermuda—1.2% | | | | | | | | |
Digicel Group, Ltd. | | | | | | | | |
8.25%, 09/30/2020—144A | | | 3,550 | | | | 3,825 | |
Noble Group, Ltd. | | | | | | | | |
6.63%, 08/05/2020—144A | | | 3,670 | | | | 3,841 | |
Brazil—2.6% | | | | | | | | |
Banco BMG SA | | | | | | | | |
8.00%, 04/15/2018—144A | | | 2,725 | | | | 2,575 | |
Itau Unibanco Holding SA | | | | | | | | |
5.50%, 08/06/2022—144A^ | | | 5,160 | | | | 5,418 | |
Samarco Mineracao SA | | | | | | | | |
4.13%, 11/01/2022—144A | | | 4,555 | | | | 4,552 | |
Vale SA | | | | | | | | |
5.63%, 09/11/2042 | | | 3,670 | | | | 3,932 | |
Canada—0.2% | | | | | | | | |
Pacific Rubiales Energy Corp. | | | | | | | | |
8.75%, 11/10/2016—144A^ | | | 1,000 | | | | 1,135 | |
Cayman Islands—5.4% | | | | | | | | |
Dubai Holding Commercial Operations MTN, Ltd. | | | | | | | | |
4.75%, 01/30/2014 | | EUR | 3,600 | | | | 4,573 | |
Grupo Aval, Ltd. | | | | | | | | |
4.75%, 09/26/2022—144A^ | | $ | 7,170 | | | | 7,170 | |
Industrial Senior Trust | | | | | | | | |
5.50%, 11/01/2022—144A | | | 4,600 | | | | 4,617 | |
IPIC GMTN, Ltd. | | | | | | | | |
5.50%, 03/01/2022—144A | | | 6,110 | | | | 7,042 | |
KWG Property Holding, Ltd. | | | | | | | | |
12.75%, 03/30/2016—Reg S^ | | | 1,840 | | | | 2,015 | |
13.25%, 03/22/2017—Reg S^ | | | 2,000 | | | | 2,238 | |
Odebrecht Finance, Ltd. | | | | | | | | |
7.13%, 06/26/2042—144A | | | 6,000 | | | | 6,945 | |
Colombia—1.6% | | | | | | | | |
Banco GNB Sudameris SA | | | | | | | | |
7.50%, 07/30/2022—144A | | | 3,250 | | | | 3,591 | |
Bancolombia SA | | | | | | | | |
5.13%, 09/11/2022 | | | 3,440 | | | | 3,595 | |
6.13%, 07/26/2020 | | | 2,460 | | | | 2,755 | |
Indonesia—1.4% | | | | | | | | |
Berau Coal Energy PT | | | | | | | | |
7.25%, 03/13/2017—144A^ | | | 2,800 | | | | 2,625 | |
Pertamina Persero PT | | | | | | | | |
4.88%, 05/03/2022—144A^ | | | 2,000 | | | | 2,175 | |
6.00%, 05/03/2042—144A | | | 3,750 | | | | 4,238 | |
Ireland—1.1% | | | | | | | | |
ALFA Bank OJSC Via ALFA Bond Issuance PLC | | | | | | | | |
7.50%, 09/26/2019—144A^ | | | 2,800 | | | | 2,881 | |
7.75%, 04/28/2021—Reg S^ | | | 2,900 | | | | 3,158 | |
7.75%, 04/28/2021—144A | | | 675 | | | | 735 | |
| | | | | | | | |
| | | Principal
(000’s) | | | Value
(000’s) | |
Luxembourg—5.0% | | | | | | | | |
Gazprom Neft OAO Via GPN Capital SA | | | | | | | | |
4.38%, 09/19/2022—144A^ | | $ | 4,770 | | | $ | 4,781 | |
Russian Agricultural Bank OJSC Via RSHB Capital SA | | | | | | | | |
8.63%, 02/17/2017—144A^ | | RUB | 336,000 | | | | 11,006 | |
TMK OAO Via TMK Capital SA | | | | | | | | |
7.75%, 01/27/2018—Reg S | | $ | 3,600 | | | | 3,708 | |
VTB Bank OJSC Via VTB Capital SA | | | | | | | | |
6.00%, 04/12/2017—144A | | | 4,500 | | | | 4,697 | |
6.95%, 10/17/2022—144A | | | 6,200 | | | | 6,404 | |
Mexico—2.0% | | | | | | | | |
BBVA Bancomer SA | | | | | | | | |
6.75%, 09/30/2022—Reg S^ | | | 3,800 | | | | 4,304 | |
Cemex SAB de CV | | | | | | | | |
9.50%, 06/15/2018—144A^ | | | 3,360 | | | | 3,570 | |
Desarrolladora Homex SAB de CV | | | | | | | | |
9.75%, 03/25/2020—144A^ | | | 1,840 | | | | 1,859 | |
Urbi Desarrollos Urbanos SAB de CV | | | | | | | | |
9.50%, 01/21/2020—144A^ | | | 1,670 | | | | 1,536 | |
9.75%, 02/03/2022—144A^ | | | 1,000 | | | | 930 | |
Netherlands—2.3% | | | | | | | | |
Aerospace Satellite Corp. Holding BV | | | | | | | | |
12.75%, 11/16/2015—144A | | | 5,500 | | | | 6,037 | |
Hyva Global BV | | | | | | | | |
8.63%, 03/24/2016—144A | | | 3,500 | | | | 3,264 | |
LUKOIL International Finance BV | | | | | | | | |
7.25%, 11/05/2019—144A | | | 4,800 | | | | 5,785 | |
Panama—1.2% | | | | | | | | |
ENA Norte Trust | | | | | | | | |
4.95%, 04/25/2023—144A^ | | | 2,500 | | | | 2,575 | |
Global Bank Corp. | | | | | | | | |
4.75%, 10/05/2017—144A^ | | | 4,780 | | | | 4,704 | |
Singapore—0.2% | | | | | | | | |
Temasek Financial I, Ltd. | | | | | | | | |
4.30%, 10/25/2019—144A | | | 1,000 | | | | 1,142 | |
Sweden—0.8% | | | | | | | | |
PKO Finance AB | | | | | | | | |
4.63%, 09/26/2022—144A | | | 5,030 | | | | 5,186 | |
Thailand—2.3% | | | | | | | | |
Bangkok Bank PCL | | | | | | | | |
3.88%, 09/27/2022—144A | | | 6,250 | | | | 6,347 | |
PTT Global Chemical PCL | | | | | | | | |
4.25%, 09/19/2022—144A | | | 8,120 | | | | 8,354 | |
Turkey—2.5% | | | | | | | | |
Akbank TAS | | | | | | | | |
5.00%, 10/24/2022—144A^ | | | 6,010 | | | | 6,112 | |
Turkiye Garanti Bankasi AS | | | | | | | | |
5.25%, 09/13/2022—144A^ | | | 4,550 | | | | 4,709 | |
Turkiye Halk Bankasi AS | | | | | | | | |
4.88%, 07/19/2017—144A | | | 600 | | | | 612 | |
Turkiye Is Bankasi | | | | | | | | |
6.00%, 10/24/2022—144A^ | | | 3,800 | | | | 3,876 | |
United Arab Emirates—1.9% | | | | | | | | |
Abu Dhabi National Energy Co. | | | | | | | | |
5.88%, 12/13/2021—144A | | | 3,050 | | | | 3,630 | |
DP World, Ltd. | | | | | | | | |
6.85%, 07/02/2037—144A | | | 7,480 | | | | 8,200 | |
United Kingdom—2.4% | | | | | | | | |
Afren PLC | | | | | | | | |
10.25%, 04/08/2019—144A^ | | | 2,770 | | | | 3,172 | |
Nord Anglia Education UK Holdings PLC | | | | | | | | |
10.25%, 04/01/2017—144A | | | 4,690 | | | | 5,118 | |
| | | | |
| The notes to the financial statements are an integral part of this report. | | |
| Transamerica Funds | | | | Annual Report 2012 |
| | Page 50 | | |
Transamerica Emerging Markets Debt
(formerly, Transamerica Logan Circle Emerging Markets Debt)
SCHEDULE OF INVESTMENTS (continued)
At October 31, 2012
| | | | | | | | |
| | | Principal
(000’s) | | | Value
(000’s) | |
United Kingdom (continued) | | | | | | | | |
Vedanta Resources PLC | | | | | | | | |
8.25%, 06/07/2021—144A^ | | $ | 5,780 | | | $ | 5,938 | |
United States—2.9% | | | | | | | | |
Braskem America Finance Co. | | | | | | | | |
7.13%, 07/22/2041—144A | | | 2,800 | | | | 3,150 | |
CEDC Finance Corp. International, Inc. | | | | | | | | |
9.13%, 12/01/2016—144A | | | 3,250 | | | | 2,113 | |
Cemex Finance LLC | | | | | | | | |
9.38%, 10/12/2022—144A | | | 5,350 | | | | 5,591 | |
JBS USA LLC / JBS USA Finance, Inc. | | | | | | | | |
7.25%, 06/01/2021—144A | | | 4,650 | | | | 4,548 | |
NII Capital Corp. | | | | | | | | |
7.63%, 04/01/2021 | | | 3,900 | | | | 3,081 | |
Venezuela—2.2% | | | | | | | | |
Petroleos de Venezuela SA | | | | | | | | |
5.00%, 10/28/2015 | | | 2,900 | | | | 2,538 | |
8.50%, 11/02/2017—Reg S^ | | | 3,145 | | | | 2,823 | |
9.75%, 05/17/2035—Reg S ^ | | | 9,120 | | | | 7,455 | |
Virgin Islands, British—0.8% | | | | | | | | |
Arcos Dorados Holdings, Inc. | | | | | | | | |
10.25%, 07/13/2016—144A^ | | BRL | 9,620 | | | | 5,068 | |
| | | | | | | | |
Total Corporate Debt Securities (cost $249,995) | | | | | | | 255,512 | |
| | | | | | | | |
STRUCTURED NOTES DEBT—0.3% | | | | | | | | |
Singapore—0.3% | | | | | | | | |
DBS Bank, Ltd. | | | | | | | | |
3.63%, 09/21/2022—144A *^ | | $ | 1,800 | | | | 1,856 | |
Total Structured Notes Debt (cost $1,868) | | | | | | | | |
| | | | | | | | |
| | | Shares | | | Value
(000’s) | |
SECURITIES LENDING COLLATERAL—13.2% | | | | | |
State Street Navigator Securities Lending Trust—Prime Portfolio, 0.31% | | | 81,954,139 | | | $ | 81,954 | |
Total Securities Lending Collateral (cost $81,954) | | | | | | | | |
| | | Principal
(000’s) | | | Value
(000’s) | |
REPURCHASE AGREEMENT—5.7% | | | | | | | | |
State Street Bank & Trust Co.
0.03% , dated 10/31/2012, to be repurchased at $35,317 on 11/01/2012. Collateralized by a U.S. Government Agency Obligation, 3.50%, due 11/25/2038, and with a value of $36,024. | | $ | 35,317 | | | | 35,317 | |
| | | | | | | | |
Total Repurchase Agreement (cost $35,317) | | | | | | | | |
Total Investment Securities (cost $681,098) P | | | | 694,600 | |
Other Assets and Liabilities—Net | | | | | | | (71,484 | ) |
| | | | | | | | |
Net Assets | | | | | | $ | 623,116 | |
| | | | | | | | |
FORWARD FOREIGN CURRENCY CONTRACTS:
| | | | | | | | | | | | | | | | | | |
Currency | | Counterparty | | Contracts
Bought
(Sold)
(000’s) | | | Settlement Date | | | Amount in U.S.
Dollars Bought
(Sold)
(000’s) | | | Net Unrealized
Appreciation
(Depreciation)
(000’s) | |
BRL | | BCLY | | | 17,972 | | | | 11/05/2012 | | | $ | 8,810 | | | $ | 33 | |
BRL | | BCLY | | | (17,972) | | | | 11/05/2012 | | | | (8,848) | | | | 5 | |
CLP | | BCLY | | | 1,701,900 | | | | 11/05/2012 | | | | 3,600 | | | | (65) | |
CLP | | BCLY | | | (1,701,900) | | | | 11/05/2012 | | | | (3,545) | | | | 11 | |
CNY | | JPM | | | 75,804 | | | | 11/16/2012 | | | | 12,000 | | | | 135 | |
CNY | | JPM | | | 36,171 | | | | 11/19/2012 | | | | 5,740 | | | | 49 | |
COP | | BCLY | | | (7,600,000) | | | | 11/01/2012 | | | | (4,206) | | | | 57 | |
COP | | BCLY | | | 7,600,000 | | | | 11/01/2012 | | | | 4,153 | | | | (5) | |
EUR | | JPM | | | (9,670) | | | | 12/04/2012 | | | | (12,472) | | | | (65) | |
HUF | | JPM | | | (638,764) | | | | 12/04/2012 | | | | (2,878) | | | | (30) | |
INR | | JPM | | | 181,128 | | | | 11/15/2012 | | | | 3,232 | | | | 125 | |
INR | | JPM | | | 147,391 | | | | 11/15/2012 | | | | 2,709 | | | | 23 | |
MXN | | BOA | | | ¨ | | | | 12/04/2012 | | | | ¨ | | | | ¨ | |
PLN | | RBS | | | (27,898) | | | | 11/28/2012 | | | | (8,850) | | | | 141 | |
PLN | | BOA | | | (5,611) | | | | 12/04/2012 | | | | (1,739) | | | | (12) | |
TRY | | BOA | | | 3,957 | | | | 12/04/2012 | | | | 2,183 | | | | 14 | |
ZAR | | BOA | | | (60,103) | | | | 12/04/2012 | | | | (6,883) | | | | (15) | |
| | | | | | | | | | | | | | | | | | |
| | | | | | | | | | | | | | | | $ | 401 | |
| | | | | | | | | | | | | | | | | | |
| | | | |
| The notes to the financial statements are an integral part of this report. | | |
| Transamerica Funds | | | | Annual Report 2012 |
| | Page 51 | | |
Transamerica Emerging Markets Debt
(formerly, Transamerica Logan Circle Emerging Markets Debt)
SCHEDULE OF INVESTMENTS (continued)
At October 31, 2012
Collateral (Received) Pledged for OTC Financial Derivative Instruments
The following is a summary by counterparty of the market value of OTC financial derivative instruments and collateral (received) pledged as of 10/31/2012:
| | | | | | | | | | | | |
| | | Total Market Value of | | | Collateral | | | | |
| | | OTC Derivatives | | | (Received) Pledged | | | Net Exposures (1) | |
Counterparty | | (000’s) | | | (000’s) | | | (000’s) | |
BCLY | | $ | 36 | | | $ | — | | | $ | 36 | |
BOA | | | (13 | ) | | | — | | | | (13 | ) |
JPM | | | 237 | | | | — | | | | 237 | |
RBS | | | 141 | | | | — | | | | 141 | |
| (1) | Net exposure represents the net receivable (payable) that would be due from/to the counterparty in the event of default. |
| | | | | | | | |
| | | Percentage of | | | | |
| | | Total Investment | | | Value | |
INVESTMENTS BY INDUSTRY (unaudited): | | Securities | | | (000’s) | |
Foreign Government Obligation | | | 46.1 | % | | $ | 319,961 | |
Commercial Banks | | | 12.8 | | | | 89,138 | |
Oil, Gas & Consumable Fuels | | | 5.3 | | | | 36,728 | |
Metals & Mining | | | 2.1 | | | | 14,423 | |
Media | | | 1.7 | | | | 11,995 | |
Chemicals | | | 1.7 | | | | 11,504 | |
Transportation Infrastructure | | | 1.5 | | | | 10,775 | |
Construction Materials | | | 1.3 | | | | 9,161 | |
Capital Markets | | | 1.2 | | | | 8,311 | |
Diversified Financial Services | | | 1.0 | | | | 7,042 | |
Construction & Engineering | | | 1.0 | | | | 6,945 | |
Wireless Telecommunication Services | | | 1.0 | | | | 6,906 | |
Diversified Consumer Services | | | 0.7 | | | | 5,118 | |
Hotels, Restaurants & Leisure | | | 0.7 | | | | 5,068 | |
Commercial Services & Supplies | | | 0.7 | | | | 4,573 | |
Food Products | | | 0.7 | | | | 4,548 | |
Household Durables | | | 0.6 | | | | 4,325 | |
Real Estate Management & Development | | | 0.6 | | | | 4,253 | |
Trading Companies & Distributors | | | 0.6 | | | | 3,841 | |
Machinery | | | 0.5 | | | | 3,708 | |
Multi-Utilities | | | 0.5 | | | | 3,629 | |
Auto Components | | | 0.5 | | | | 3,264 | |
Beverages | | | 0.3 | | | | 2,113 | |
| | | | | | | | |
Investment Securities, at Value | | | 83.1 | | | | 577,329 | |
Short-Term Investments | | | 16.9 | | | | 117,271 | |
| | | | | | | | |
Total Investments | | | 100.0 | % | | $ | 694,600 | |
| | | | | | | | |
NOTES TO SCHEDULE OF INVESTMENTS (all amounts in thousands):
| ^ | All or a portion of this security is on loan. The value of all securities on loan is $79,307. |
| | Rate shown reflects the yield at 10/31/2012. |
| * | Floating or variable rate note. Rate is listed as of 10/31/2012. |
| ¨ | Amount rounds to less than 1. |
| P | Aggregate cost for federal income tax purposes is $681,664. Aggregate gross unrealized appreciation/depreciation for all securities in which there is an excess of value over tax cost were $15,351 and $2,415, respectively. Net unrealized appreciation for tax purposes is $12,936. |
DEFINITIONS (all amounts in thousands):
| | |
144A | | 144A Securities are registered pursuant to Rule 144A of the Securities Act of 1933. These securities are deemed to be liquid for purposes of compliance limitations on holdings of illiquid securities and may be resold as transactions exempt from registration, normally to qualified institutional buyers. At 10/31/2012, these securities aggregated $294,203, or 47.21% of the fund’s net assets. |
BCLY | | Barclays Bank PLC |
BOA | | Bank of America |
GMTN | | Global Medium Term Note |
JPM | | JPMorgan Chase & Co. |
MTN | | Medium Term Note |
OJSC | | Open Joint Stock Company |
OTC | | Over the Counter |
RBS | | Royal Bank of Scotland PLC |
| | | | |
| The notes to the financial statements are an integral part of this report. | | |
| Transamerica Funds | | | | Annual Report 2012 |
| | Page 52 | | |
Transamerica Emerging Markets Debt
(formerly, Transamerica Logan Circle Emerging Markets Debt)
SCHEDULE OF INVESTMENTS (continued)
At October 31, 2012
CURRENCY ABBREVIATIONS:
| | |
BRL | | Brazilian Real |
CLP | | Chilean Peso |
CNY | | Chinese Yuan |
COP | | Columbian Peso |
EUR | | Euro |
HUF | | Hungarian Forint |
INR | | Indian Rupee |
MXN | | Mexican Peso |
PEN | | Peru Nuevo Sol |
PHP | | Philippines Peso |
PLN | | Polish Zloty |
RUB | | Russian Ruble |
TRY | | Turkish New Lira |
UYU | | Uruguayan Peso |
ZAR | | South African Rand |
VALUATION SUMMARY (all amounts in thousands): '
| | | | | | | | | | | | | | | | |
| | | | | | Level 2 - | | | | | | | |
| | | | | | Other | | | Level 3 - | | | | |
| | | Level 1 - | | | Significant | | | Significant | | | | |
| | | Quoted | | | Observable | | | Unobservable | | | Value at | |
Investment Securities | | Prices | | | Inputs | | | Inputs | | | 10/31/2012 | |
Corporate Debt Securities | | $ | — | | | $ | 255,512 | | | $ | — | | | $ | 255,512 | |
Foreign Government Obligations | | | — | | | | 319,961 | | | | — | | | | 319,961 | |
Repurchase Agreement | | | — | | | | 35,317 | | | | — | | | | 35,317 | |
Securities Lending Collateral | | | 81,954 | | | | — | | | | — | | | | 81,954 | |
Structured Notes Debt | | | — | | | | 1,856 | | | | — | | | | 1,856 | |
| | | | | | | | | | | | | | | | |
Total | | $ | 81,954 | | | $ | 612,646 | | | $ | — | | | $ | 694,600 | |
| | | | | | | | | | | | | | | | |
| | | | |
| | | | | | Level 2 - | | | | | | | |
| | | | | | Other | | | Level 3 - | | | | |
| | | Level 1 - | | | Significant | | | Significant | | | | |
| | | Quoted | | | Observable | | | Unobservable | | | Value at | |
Other Financial Instruments ₣ | | Prices | | | Inputs | | | Inputs | | | 10/31/2012 | |
Forward Foreign Currency Contracts - Appreciation | | $ | — | | | $ | 593 | | | $ | — | | | $ | 593 | |
Forward Foreign Currency Contracts - Depreciation | | | — | | | | (192 | ) | | | — | | | | (192 | ) |
| | | | | | | | | | | | | | | | |
Total | | $ | — | | | $ | 401 | | | $ | — | | | $ | 401 | |
| | | | | | | | | | | | | | | | |
| ' | Transfers between levels are considered to have occurred at the end of the reporting period. There were no transfers into or out of Levels 1 and 2 during the period ended 10/31/2012. See the notes to the financial statements for more information regarding pricing inputs and valuation techniques. |
| ₣ | Other financial instruments are derivative instruments that are valued at unrealized appreciation (depreciation) on the instrument. |
| | | | |
| The notes to the financial statements are an integral part of this report. | | |
| Transamerica Funds | | | | Annual Report 2012 |
| | Page 53 | | |
Transamerica Emerging Markets Equity
SCHEDULE OF INVESTMENTS
At October 31, 2012
| | | | | | | | |
| | | Shares | | | Value
(000’s) | |
PREFERRED STOCKS p—2.8% | | | | | | | | |
Brazil—2.8% | | | | | | | | |
Centrais Eletricas Brasileiras SA, 10.33% | | | 142,200 | | | $ | 1,131 | |
Investimentos Itau SA, 3.50% | | | 90,200 | | | | 395 | |
Klabin SA, 2.49% | | | 163,000 | | | | 957 | |
Marcopolo SA, 3.21% | | | 95,300 | | | | 559 | |
| | | | | | | | |
Total Preferred Stocks (cost $2,924) | | | | | | | 3,042 | |
| | | | | | | | |
COMMON STOCKS—95.2% | | | | | | | | |
Brazil—12.5% | | | | | | | | |
BRF—Brasil Foods SA ADR ‡ | | | 36,834 | | | | 675 | |
Cia de Bebidas das Americas ADR | | | 52,236 | | | | 2,131 | |
Cia de Saneamento Basico do Estado de Sao Paulo ADR ‡ | | | 19,239 | | | | 1,616 | |
Cielo SA | | | 17,400 | | | | 430 | |
Even Construtora e Incorporadora SA | | | 149,300 | | | | 595 | |
Hypermarcas SA ‡ | | | 148,700 | | | | 1,182 | |
M Dias Branco SA ‡ | | | 8,600 | | | | 289 | |
Natura Cosmeticos SA | | | 25,000 | | | | 667 | |
Obrascon Huarte Lain Brasil SA | | | 88,000 | | | | 828 | |
Petroleo Brasileiro SA ADR | | | 89,873 | | | | 1,907 | |
Petroleo Brasileiro SA—Class A ADR | | | 32,453 | | | | 666 | |
Vale SA—Class B ADR | | | 142,843 | | | | 2,541 | |
China—3.3% | | | | | | | | |
China Petroleum & Chemical Corp. ADR | | | 20,410 | | | | 2,147 | |
China Vanke Co., Ltd. | | | 285,022 | | | | 372 | |
Huaneng Power International, Inc. ADR | | | 28,016 | | | | 892 | |
Luthai Textile Co., Ltd. | | | 228,730 | | | | 200 | |
Colombia—0.4% | | | | | | | | |
Bancolombia SA ADR | | | 6,513 | | | | 417 | |
Czech Republic—0.3% | | | | | | | | |
Komercni Banka AS | | | 1,391 | | | | 284 | |
Hong Kong—16.5% | | | | | | | | |
Bank of China, Ltd. | | | 6,977,000 | | | | 2,873 | |
BBMG Corp. | | | 434,500 | | | | 374 | |
Beijing Capital International Airport Co., Ltd. | | | 326,000 | | | | 210 | |
China Agri-Industries Holdings, Ltd. | | | 1,218,000 | | | | 765 | |
China Citic Bank Corp., Ltd. | | | 1,869,000 | | | | 955 | |
China Communications Construction Co., Ltd.—Class H | | | 2,183,000 | | | | 2,053 | |
China Construction Bank Corp.—Class H | | | 2,732,000 | | | | 2,063 | |
China Merchants Bank Co., Ltd.—Class H | | | 790,500 | | | | 1,477 | |
China Minsheng Banking Corp., Ltd. | | | 447,000 | | | | 407 | |
China Mobile, Ltd. ADR | | | 15,818 | | | | 876 | |
China Resources Power Holdings Co., Ltd. | | | 122,000 | | | | 263 | |
China Shanshui Cement Group, Ltd. | | | 510,000 | | | | 379 | |
Citic Resources Holdings, Ltd. ‡ | | | 758,000 | | | | 116 | |
Country Garden Holdings Co., Ltd. | | | 966,000 | | | | 388 | |
Datang International Power Generation Co., Ltd.—Class H | | | 870,000 | | | | 310 | |
Harbin Electric Co., Ltd. | | | 294,000 | | | | 243 | |
Huadian Power International Co. ‡ | | | 828,000 | | | | 210 | |
Industrial & Commercial Bank of China—Class H | | | 1,682,000 | | | | 1,113 | |
Kingboard Chemical Holdings, Ltd. | | | 237,500 | | | | 708 | |
KWG Property Holding, Ltd. | | | 741,500 | | | | 440 | |
Shanghai Pharmaceuticals Holding Co., Ltd. | | | 222,900 | | | | 414 | |
Sinofert Holdings, Ltd. | | | 2,002,000 | | | | 424 | |
Sinopharm Group Co., Ltd.—Class H | | | 118,800 | | | | 400 | |
TPV Technology, Ltd. | | | 550,000 | | | | 123 | |
Yuexiu Property Co., Ltd. | | | 1,334,000 | | | | 367 | |
Hungary—0.6% | | | | | | | | |
Magyar Telekom | | | 327,894 | | | | 607 | |
India—4.9% | | | | | | | | |
Dr. Reddy’s Laboratories, Ltd. ADR | | | 39,869 | | | | 1,297 | |
| | | | | | | | |
| | | Shares | | | Value
(000’s) | |
India (continued) | | | | | | | | |
HDFC Bank, Ltd. ADR | | | 15,861 | | | $ | 593 | |
Infosys, Ltd. ADR | | | 23,335 | | | | 1,013 | |
Tata Motors, Ltd. ADR | | | 91,035 | | | | 2,199 | |
Wipro, Ltd. ADR | | | 29,174 | | | | 225 | |
Indonesia—2.0% | | | | | | | | |
Charoen Pokphand Indonesia PT | | | 1,007,500 | | | | 328 | |
Indofood CBP Sukses Makmur PT | | | 741,000 | | | | 551 | |
Kalbe Farma PT | | | 4,732,500 | | | | 478 | |
Media Nusantara Citra PT | | | 2,052,217 | | | | 604 | |
Perusahaan Perkebunan London Sumatra Indonesia PT | | | 741,500 | | | | 179 | |
Korea, Republic of—16.3% | | | | | | | | |
Daeduck Electronics Co. | | | 46,450 | | | | 393 | |
Daelim Industrial Co., Ltd. | | | 5,524 | | | | 384 | |
Hana Financial Group, Inc. | | | 70,890 | | | | 2,064 | |
Handsome Co., Ltd. | | | 20,570 | | | | 522 | |
Hyundai Motor Co. | | | 13,925 | | | | 2,866 | |
ISU Chemical Co., Ltd. | | | 9,230 | | | | 179 | |
KIA Motors Corp. | | | 37,558 | | | | 2,087 | |
KT&G Corp. | | | 8,661 | | | | 660 | |
LG Corp. | | | 10,033 | | | | 613 | |
LG International Corp. | | | 9,440 | | | | 343 | |
LG Uplus Corp. | | | 92,850 | | | | 593 | |
NongShim Co., Ltd. | | | 951 | | | | 225 | |
Poongsan Corp. | | | 18,170 | | | | 530 | |
Samsung Electronics Co., Ltd. | | | 3,539 | | | | 4,251 | |
SK Corp. | | | 8,452 | | | | 1,178 | |
Woori Finance Holdings Co., Ltd. | | | 78,770 | | | | 744 | |
Malaysia—2.7% | | | | | | | | |
AirAsia Bhd | | | 1,078,300 | | | | 1,073 | |
Genting Malaysia Bhd | | | 206,800 | | | | 244 | |
Tenaga Nasional Bhd | | | 211,600 | | | | 483 | |
UMW Holdings Bhd | | | 331,700 | | | | 1,086 | |
Mexico—7.5% | | | | | | | | |
Alfa SAB de CV—Class A | | | 183,900 | | | | 338 | |
America Movil SAB de CV—Series L ADR | | | 74,498 | | | | 1,884 | |
Desarrolladora Homex SAB de CV ADR ‡ | | | 18,181 | | | | 241 | |
Fomento Economico Mexicano SAB de CV ADR | | | 33,126 | | | | 3,001 | |
Grupo Financiero Banorte SAB de CV—Class O | | | 417,300 | | | | 2,320 | |
OHL Mexico SAB de CV ‡ | | | 161,600 | | | | 267 | |
Poland—1.3% | | | | | | | | |
KGHM Polska Miedz SA | | | 28,602 | | | | 1,441 | |
Russian Federation—5.0% | | | | | | | | |
Gazprom OAO ADR | | | 359,225 | | | | 3,283 | |
MMC Norilsk Nickel OJSC ADR | | | 136,010 | | | | 2,086 | |
South Africa—10.5% | | | | | | | | |
Aspen Pharmacare Holdings, Ltd. ‡ | | | 132,102 | | | | 2,408 | |
AVI, Ltd. | | | 74,571 | | | | 492 | |
Barloworld, Ltd. | | | 43,190 | | | | 350 | |
Bidvest Group, Ltd. | | | 30,581 | | | | 730 | |
Exxaro Resources, Ltd. | | | 16,266 | | | | 325 | |
Gold Fields, Ltd. ADR | | | 77,490 | | | | 969 | |
Harmony Gold Mining Co., Ltd. ADR | | | 28,302 | | | | 235 | |
Imperial Holdings, Ltd. | | | 30,520 | | | | 693 | |
Life Healthcare Group Holdings, Ltd. | | | 131,307 | | | | 497 | |
Nedbank Group, Ltd. | | | 52,782 | | | | 1,090 | |
Sappi, Ltd. ‡ | | | 181,121 | | | | 512 | |
Shoprite Holdings, Ltd. | | | 91,283 | | | | 1,877 | |
Telkom SA, Ltd. ‡ | | | 155,314 | | | | 327 | |
Tiger Brands, Ltd. | | | 25,676 | | | | 816 | |
Taiwan—7.4% | | | | | | | | |
China Petrochemical Development Corp. | | | 889,000 | | | | 618 | |
Chinatrust Financial Holding Co., Ltd. | | | 996,776 | | | | 549 | |
E.Sun Financial Holding Co., Ltd. | | | 664,400 | | | | 333 | |
| | | | |
| The notes to the financial statements are an integral part of this report. | | |
| Transamerica Funds | | | | Annual Report 2012 |
| | Page 54 | | |
Transamerica Emerging Markets Equity
SCHEDULE OF INVESTMENTS (continued)
At October 31, 2012
| | | | | | | | |
| | | Shares | | | Value
(000’s) | |
Taiwan (continued) | | | | | | | | |
Far EasTone Telecommunications Co., Ltd. | | | 451,000 | | | $ | 1,041 | |
Giant Manufacturing Co., Ltd. | | | 45,000 | | | | 233 | |
Highwealth Construction Corp. Ə § | | | 263,000 | | | | 383 | |
Hon Hai Precision Industry Co., Ltd. | | | 578,000 | | | | 1,754 | |
Huaku Development Co., Ltd. | | | 276,980 | | | | 564 | |
Pou Chen Corp. | | | 323,000 | | | | 327 | |
Ruentex Development Co., Ltd. | | | 374,000 | | | | 628 | |
SinoPac Financial Holdings Co., Ltd. | | | 850,346 | | | | 329 | |
Vanguard International Semiconductor Corp. | | | 383,000 | | | | 248 | |
Zhen Ding Technology Holding, Ltd. | | | 372,000 | | | | 983 | |
Thailand—2.9% | | | | | | | | |
Advanced Info Service PCL | | | 78,900 | | | | 508 | |
Airports of Thailand PCL | | | 242,100 | | | | 647 | |
Asian Property Development PCL | | | 1,109,000 | | | | 315 | |
Bangkok Expressway PCL | | | 658,946 | | | | 597 | |
Home Product Center PCL | | | 1,110,200 | | | | 413 | |
Thanachart Capital PCL | | | 506,800 | | | | 612 | |
| | | | | | | | |
| | | Shares | | | Value
(000’s) | |
Turkey—0.4% | | | | | | | | |
Aygaz AS | | | 89,663 | | | $ | 413 | |
United Kingdom—0.7% | | | | | | | | |
NovaTek OAO GDR | | | 6,375 | | | | 727 | |
| | | | | | | | |
Total Common Stocks (cost $100,904) | | | | | | | 102,786 | |
| | | | | | | | |
| | |
| | | Principal
(000’s) | | | Value
(000’s) | |
REPURCHASE AGREEMENT—1.1% | | | | | | | | |
State Street Bank & Trust Co.
0.03% p , dated 10/31/2012, to be repurchased at $1,214 on 11/01/2012. Collateralized by a U.S. Government Agency Obligation, 3.50%, due 11/25/2038, and with a value of $1,240. | | $ | 1,214 | | | | 1,214 | |
| | | | | | | | |
Total Repurchase Agreement (cost $1,214) | | | | | | | | |
Total Investment Securities (cost $105,042) P | | | | | | | 107,042 | |
Other Assets and Liabilities—Net | | | | | | | 998 | |
| | | | | | | | |
Net Assets | | | | | | $ | 108,040 | |
| | | | | | | | |
| | | | | | | | |
INVESTMENTS BY INDUSTRY (unaudited): | | Percentage of
Total Investment
Securities | | | Value
(000’s) | |
Commercial Banks | | | 17.4 | % | | $ | 18,616 | |
Oil, Gas & Consumable Fuels | | | 8.5 | | | | 9,055 | |
Automobiles | | | 7.7 | | | | 8,239 | |
Metals & Mining | | | 7.3 | | | | 7,802 | |
Beverages | | | 4.8 | | | | 5,132 | |
Wireless Telecommunication Services | | | 4.6 | | | | 4,903 | |
Semiconductors & Semiconductor Equipment | | | 4.2 | | | | 4,499 | |
Food Products | | | 4.0 | | | | 4,321 | |
Pharmaceuticals | | | 3.9 | | | | 4,183 | |
Electronic Equipment & Instruments | | | 3.6 | | | | 3,839 | |
Real Estate Management & Development | | | 3.2 | | | | 3,457 | |
Industrial Conglomerates | | | 2.7 | | | | 2,859 | |
Transportation Infrastructure | | | 2.4 | | | | 2,548 | |
Construction & Engineering | | | 2.3 | | | | 2,438 | |
Food & Staples Retailing | | | 1.7 | | | | 1,877 | |
Personal Products | | | 1.7 | | | | 1,849 | |
Independent Power Producers & Energy Traders | | | 1.6 | | | | 1,675 | |
IT Services | | | 1.6 | | | | 1,669 | |
Water Utilities | | | 1.5 | | | | 1,616 | |
Electric Utilities | | | 1.5 | | | | 1,614 | |
Health Care Providers & Services | | | 1.2 | | | | 1,310 | |
Chemicals | | | 1.1 | | | | 1,220 | |
Airlines | | | 1.0 | | | | 1,073 | |
Textiles, Apparel & Luxury Goods | | | 1.0 | | | | 1,048 | |
Containers & Packaging | | | 0.9 | | | | 957 | |
Diversified Telecommunication Services | | | 0.9 | | | | 934 | |
Household Durables | | | 0.8 | | | | 836 | |
Trading Companies & Distributors | | | 0.8 | | | | 809 | |
Construction Materials | | | 0.7 | | | | 753 | |
Distributors | | | 0.6 | | | | 693 | |
Tobacco | | | 0.6 | | | | 660 | |
Media | | | 0.6 | | | | 604 | |
Machinery | | | 0.5 | | | | 559 | |
Paper & Forest Products | | | 0.5 | | | | 512 | |
Specialty Retail | | | 0.4 | | | | 413 | |
Gas Utilities | | | 0.4 | | | | 413 | |
Hotels, Restaurants & Leisure | | | 0.2 | | | | 244 | |
Electrical Equipment | | | 0.2 | | | | 243 | |
Leisure Equipment & Products | | | 0.2 | | | | 233 | |
Computers & Peripherals | | | 0.1 | | | | 123 | |
| | | | | | | | |
Investment Securities, at Value | | | 98.9 | | | | 105,828 | |
Short-Term Investments | | | 1.1 | | | | 1,214 | |
| | | | | | | | |
Total Investments | | | 100.0 | % | | $ | 107,042 | |
| | | | | | | | |
| | | | |
| The notes to the financial statements are an integral part of this report. | | |
| Transamerica Funds | | | | Annual Report 2012 |
| | Page 55 | | |
Transamerica Emerging Markets Equity
SCHEDULE OF INVESTMENTS (continued)
At October 31, 2012
NOTES TO SCHEDULE OF INVESTMENTS (all amounts in thousands):
| | Rate shown reflects the yield at 10/31/2012. |
| ‡ | Non-income producing security. |
| Ə | Fair valued as determined in good faith in accordance with procedures established by the Board of Trustees. Total aggregate market value of fair valued securities is $383, or 0.35% of the fund’s net assets. |
| § | Illiquid. Total aggregate market value of illiquid securities is $383, or 0.35% of the fund’s net assets. |
| P | Aggregate cost for federal income tax purposes is $105,494. Aggregate gross unrealized appreciation/depreciation for all securities in which there is an excess of value over tax cost were $5,175 and $3,627, respectively. Net unrealized appreciation for tax purposes is $1,548. |
DEFINITIONS:
| ADR | American Depositary Receipt |
| GDR | Global Depositary Receipt |
| OAO | Otkrytoe Aktsionernoe Obschestvo (Russian: Joint Stock Exchange) |
| OJSC | Open Joint Stock Company |
VALUATION SUMMARY (all amounts in thousands): '
| | | | | | | | | | | | | | | | |
Investment Securities | | Level 1 -
Quoted
Prices | | | Level 2 -
Other
Significant
Observable
Inputs | | | Level 3 -
Significant
Unobservable
Inputs | | | Value at
10/31/2012 | |
Common Stocks | | $ | 38,538 | | | $ | 64,248 | | | $ | — | | | $ | 102,786 | |
Preferred Stocks | | | 3,042 | | | | — | | | | — | | | | 3,042 | |
Repurchase Agreement | | | — | | | | 1,214 | | | | — | | | | 1,214 | |
| | | | | | | | | | | | | | | | |
Total | | $ | 41,580 | | | $ | 65,462 | | | $ | — | | | $ | 107,042 | |
| | | | | | | | | | | | | | | | |
| ' | Transfers between levels are considered to have occurred at the end of the reporting period. There were no transfers into or out of Levels 1 and 2 during the period ended 10/31/2012. See the notes to the financial statements for more information regarding pricing inputs and valuation techniques. |
| | | | |
| The notes to the financial statements are an integral part of this report. | | |
| Transamerica Funds | | | | Annual Report 2012 |
| | Page 56 | | |
Transamerica Flexible Income
(formerly, Transamerica AEGON Flexible Income)
SCHEDULE OF INVESTMENTS
At October 31, 2012
| | | | | | |
| | | Principal
(000’s) | | Value
(000’s) | |
U.S. GOVERNMENT OBLIGATIONS—21.2% | | | | | | |
U.S. Treasury Inflation Indexed Bond | | | | | | |
2.50%, 01/15/2029 | | $ 2,253 | | $ | 3,256 | |
U.S. Treasury Note | | | | | | |
0.25%, 08/15/2015 | | 8,500 | | | 8,473 | |
0.50%, 07/31/2017 | | 5,000 | | | 4,958 | |
0.63%, 05/31/2017—09/30/2017 | | 19,245 | | | 19,189 | |
1.25%, 09/30/2015 | | 10,475 | | | 10,738 | |
1.38%, 05/15/2013 | | 1,230 | | | 1,238 | |
1.75%, 05/15/2022 | | 6,280 | | | 6,342 | |
2.00%, 11/15/2021—02/15/2022 | | 5,985 | | | 6,204 | |
2.13%, 02/29/2016 | | 3,065 | | | 3,235 | |
2.63%, 11/15/2020 | | 2,565 | | | 2,817 | |
3.50%, 05/15/2020 | | 2,150 | | | 2,503 | |
| | | | | | |
Total U.S. Government Obligations (cost $67,064) | | | | | 68,953 | |
| | | | | | |
U.S. GOVERNMENT AGENCY OBLIGATION—0.2% | | | | | | |
Freddie Mac, IO | | | | | | |
5.00%, 08/01/2035 | | 4,529 | | | 626 | |
Total U.S. Government Agency Obligation (cost $1,312) | | | | | | |
| | |
FOREIGN GOVERNMENT OBLIGATIONS—3.4% | | | | | | |
Canada Housing Trust No. 1 | | | | | | |
3.15%, 06/15/2015—144A | | CAD2,500 | | | 2,624 | |
Mexican Bonos | | | | | | |
7.00%, 06/19/2014 | | MXN18,000 | | | 1,419 | |
7.25%, 12/15/2016 | | 28,500 | | | 2,348 | |
Republic of Chile | | | | | | |
5.50%, 08/05/2020 | | CLP994,500 | | | 2,242 | |
Republic of The Philippines | | | | | | |
4.95%, 01/15/2021 | | PHP90,000 | | | 2,403 | |
| | | | | | |
Total Foreign Government Obligations (cost $10,066) | | | | | 11,036 | |
| | | | | | |
MORTGAGE-BACKED SECURITIES—7.4% | | | | | | |
7 WTC Depositor LLC Trust | | | | | | |
Series 2012-7WTC, Class A | | | | | | |
4.08%, 03/13/2031—144A | | 660 | | | 697 | |
American General Mortgage Loan Trust | | | | | | |
Series 2009-1, Class A6 | | | | | | |
5.75%, 09/25/2048—144A * | | 1,785 | | | 1,822 | |
American Tower Trust | | | | | | |
Series 2007-1A, Class D | | | | | | |
5.96%, 04/15/2037—144A | | 1,950 | | | 2,008 | |
BCAP LLC Trust | | | | | | |
Series 2009-RR3, Class 2A1 | | | | | | |
4.85%, 05/26/2037—144A * | | 137 | | | 139 | |
Series 2009-RR6, Class 2A1 | | | | | | |
2.97%, 08/26/2035—144A * | | 867 | | | 788 | |
Series 2009-RR10, Class 2A1 | | | | | | |
3.12%, 08/26/2035—144A * | | 603 | | | 596 | |
Series 2009-RR14, Class 1A1 | | | | | | |
6.05%, 05/26/2037—144A * | | 1,123 | | | 1,199 | |
Series 2010-RR1, Class 12A1 | | | | | | |
5.25%, 08/26/2036—144A * | | 1,184 | | | 1,231 | |
Countrywide Alternative Loan Trust | | | | | | |
Series 2004-3T1, Class A3 | | | | | | |
5.00%, 05/25/2034 | | 951 | | | 979 | |
Series 2006-OC1, Class 2A3A | | | | | | |
0.53%, 03/25/2036 * | | 2,900 | | | 1,522 | |
Credit Suisse Mortgage Capital Certificates | | | | | | |
Series 2010-18R, Class 1A11 | | | | | | |
3.75%, 08/26/2035—144A * | | 693 | | | 690 | |
| | | | | | | | |
| | | Principal
(000’s) | | | Value
(000’s) | |
MORTGAGE-BACKED SECURITIES (continued) | | | | | | | | |
Impac CMB Trust | | | | | | | | |
Series 2007-A, Class A | | | | | | | | |
0.46%, 05/25/2037 * | | $ | 1,411 | | | $ | 1,353 | |
Jefferies & Co., Inc. | | | | | | | | |
Series 2009-R2, Class 2A | | | | | | | | |
3.06%, 12/26/2037—144A * | | | 350 | | | | 352 | |
Series 2009-R7, Class 10A3 | | | | | | | | |
6.00%, 12/26/2036—144A | | | 264 | | | | 274 | |
Series 2009-R7, Class 12A1 | | | | | | | | |
5.08%, 08/26/2036—144A * | | | 289 | | | | 286 | |
Series 2009-R7, Class 1A1 | | | | | | | | |
3.95%, 02/26/2036—144A * | | | 638 | | | | 617 | |
Series 2009-R7, Class 4A1 | | | | | | | | |
2.92%, 09/26/2034—144A * | | | 563 | | | | 541 | |
Series 2009-R9, Class 1A1 | | | | | | | | |
2.73%, 08/26/2046—144A * | | | 625 | | | | 621 | |
JPMorgan Chase Commercial Mortgage Securities Corp. | | | | | | | | |
Series 2007-LD11, Class ASB | | | | | | | | |
5.81%, 06/15/2049 * | | | 1,025 | | | | 1,124 | |
JPMorgan Re-REMIC | | | | | | | | |
Series 2009-7, Class 8A1 | | | | | | | | |
5.41%, 01/27/2047—144A * | | | 466 | | | | 476 | |
LSTAR Commercial Mortgage Trust | | | | | | | | |
Series 2011-1, Class A | | | | | | | | |
3.91%, 06/25/2043—144A | | | 863 | | | | 901 | |
Morgan Stanley Re-REMIC Trust | | | | | | | | |
Series 2010-GG10, Class A4A | | | | | | | | |
5.79%, 08/15/2045—144A * | | | 1,740 | | | | 2,049 | |
Series 2010-R4, Class 3A | | | | | | | | |
5.50%, 08/26/2047—144A | | | 1,240 | | | | 1,317 | |
ORES NPL LLC | | | | | | | | |
Series 2012-LV1, Class A | | | | | | | | |
4.00%, 09/25/2044—144A | | | 1,269 | | | | 1,276 | |
RREF 2012 LT1 LLC | | | | | | | | |
Series 2012-LT1A, Class A | | | | | | | | |
4.75%, 02/15/2025—144A | | | 82 | | | | 82 | |
S2 Hospitality LLC | | | | | | | | |
Series 2012-LV1, Class A | | | | | | | | |
4.50%, 04/15/2025—144A | | | 584 | | | | 587 | |
Wells Fargo Mortgage Backed Securities Trust | | | | | | | | |
Series 2003-G, Class A1 | | | | | | | | |
4.10%, 06/25/2033 * | | | 246 | | | | 250 | |
Series 2003-L, Class 1A2 | | | | | | | | |
4.49%, 11/25/2033 * | | | 181 | | | | 184 | |
| | | | | | | | |
Total Mortgage-Backed Securities (cost $22,805) | | | | | | | 23,961 | |
| | | | | | | | |
ASSET-BACKED SECURITIES—2.9% | | | | | | | | |
Countrywide Asset-Backed Certificates | | | | | | | | |
Series 2006-6, Class 2A3 | | | | | | | | |
0.49%, 09/25/2036 * | | | 3,600 | | | | 1,410 | |
GSAA Trust | | | | | | | | |
Series 2006-1, Class A3 | | | | | | | | |
0.54%, 01/25/2036 * | | | 2,288 | | | | 1,492 | |
GSAMP Trust | | | | | | | | |
Series 2006-HE1, Class A2D | | | | | | | | |
0.52%, 01/25/2036 * | | | 2,270 | | | | 1,794 | |
HLSS Servicer Advance Receivables Backed Notes | | | | | | | | |
Series 2012-T2, Class C1 | | | | | | | | |
3.22%, 10/15/2043—144A Ə | | | 518 | | | | 518 | |
| | | | |
| The notes to the financial statements are an integral part of this report. | | |
| Transamerica Funds | | | | Annual Report 2012 |
| | Page 57 | | |
Transamerica Flexible Income
(formerly, Transamerica AEGON Flexible Income)
SCHEDULE OF INVESTMENTS (continued)
At October 31, 2012
| | | | | | | | |
| | | Principal
(000’s) | | | Value
(000’s) | |
ASSET-BACKED SECURITIES (continued) | | | | | | | | |
HSBC Home Equity Loan Trust | | | | | | | | |
Series 2006-3, Class A4 | | | | | | | | |
0.45%, 03/20/2036 * | | $ | 1,510 | | | $ | 1,380 | |
Lehman XS Trust | | | | | | | | |
Series 2005-8, Class 1A3 | | | | | | | | |
0.56%, 12/25/2035 * | | | 2,595 | | | | 1,407 | |
Popular ABS Mortgage Pass-Through Trust | |
Series 2006-A, Class A4 | | | | | | | | |
0.53%, 02/25/2036 * | | | 1,562 | | | | 1,406 | |
| | | | | | | | |
Total Asset-Backed Securities (cost $8,339) | | | | | | | 9,407 | |
| | | | | | | | |
MUNICIPAL GOVERNMENT OBLIGATIONS—1.2% | |
Rhode Island Economic Development Corp. | | | | | | | | |
6.00%, 11/01/2015 § | | | 1,545 | | | | 1,621 | |
State of California | | | | | | | | |
7.95%, 03/01/2036 | | | 1,820 | | | | 2,180 | |
| | | | | | | | |
Total Municipal Government Obligations (cost $3,367) | | | | | | | 3,801 | |
| | | | | | | | |
PREFERRED CORPORATE DEBT SECURITY—1.1% | | | | | | | | |
Diversified Financial Services—1.1% | | | | | | | | |
ZFS Finance USA Trust II | | | | | | | | |
6.45%, 12/15/2065—144A * | | | 3,300 | | | | 3,548 | |
Total Preferred Corporate Debt Security (cost $2,835) | | | | | | | | |
| | |
CORPORATE DEBT SECURITIES—56.0% | | | | | | | | |
Airlines—1.1% | | | | | | | | |
America West Airlines Pass-Through Trust | | | | | | | | |
Series 2000-1, Class G | | | | | | | | |
8.06%, 07/02/2020 | | | 959 | | | | 1,028 | |
Continental Airlines Pass-Through Trust | | | | | | | | |
Series 1997-1, Class A | | | | | | | | |
7.46%, 04/01/2015 | | | 466 | | | | 480 | |
UAL Pass-Through Trust | | | | | | | | |
Series 2009-1 | | | | | | | | |
10.40%, 11/01/2016 | | | 1,674 | | | | 1,924 | |
Beverages—0.4% | | | | | | | | |
Anheuser-Busch InBev Worldwide, Inc. | | | | | | | | |
9.75%, 11/17/2015 | | | BRL2,200 | | | | 1,219 | |
Building Products—0.6% | | | | | | | | |
Owens Corning | | | | | | | | |
4.20%, 12/15/2022 ^ | | $ | 1,910 | | | | 1,931 | |
Capital Markets—0.7% | | | | | | | | |
Macquarie Group, Ltd. | | | | | | | | |
6.25%, 01/14/2021—144A | | | 1,275 | | | | 1,407 | |
Morgan Stanley | | | | | | | | |
5.75%, 01/25/2021 | | | 750 | | | | 839 | |
Commercial Banks—5.6% | | | | | | | | |
Barclays Bank PLC | | | | | | | | |
10.18%, 06/12/2021—144A | | | 1,480 | | | | 1,963 | |
BBVA Bancomer SA | | | | | | | | |
6.50%, 03/10/2021—144A | | | 1,400 | | | | 1,598 | |
CIT Group, Inc. | | | | | | | | |
4.75%, 02/15/2015—144A ^ | | | 570 | | | | 590 | |
M&I Marshall & Ilsley Bank | | | | | | | | |
5.00%, 01/17/2017 | | | 1,550 | | | | 1,722 | |
Rabobank Nederland NV | | | | | | | | |
11.00%, 06/30/2019—144A * Ž | | | 1,695 | | | | 2,267 | |
Regions Bank | | | | | | | | |
7.50%, 05/15/2018 | | | 1,660 | | | | 1,999 | |
Royal Bank of Scotland Group PLC | | | | | | | | |
5.05%, 01/08/2015 ^ | | | 1,000 | | | | 1,035 | |
| | | | | | | | |
| | | Principal
(000’s) | | | Value
(000’s) | |
Commercial Banks (continued) | | | | | | | | |
UBS AG | | | | | | | | |
7.63%, 08/17/2022 ^ | | $ | 990 | | | $ | 1,068 | |
Wells Fargo & Co.—Series K | | | | | | | | |
7.98%, 03/15/2018 * Ž ^ | | | 2,400 | | | | 2,837 | |
Zions Bancorporation | | | | | | | | |
7.75%, 09/23/2014 | | | 2,500 | | | | 2,755 | |
Commercial Services & Supplies—1.4% | | | | | | | | |
EnergySolutions, Inc. / EnergySolutions LLC | | | | | | | | |
10.75%, 08/15/2018 ^ | | | 855 | | | | 793 | |
HDTFS, Inc. | | | | | | | | |
5.88%, 10/15/2020—144A | | | 270 | | | | 273 | |
KAR Auction Services, Inc. | | | | | | | | |
4.31%, 05/01/2014 * | | | 1,965 | | | | 1,964 | |
Steelcase, Inc. | | | | | | | | |
6.38%, 02/15/2021 | | | 1,385 | | | | 1,483 | |
Construction Materials—0.7% | | | | | | | | |
Cemex Finance LLC | | | | | | | | |
9.50%, 12/14/2016—144A ^ | | | 1,330 | | | | 1,411 | |
Voto-Votorantim Overseas Trading | | | | | | | | |
Operations NV | | | | | | | | |
6.63%, 09/25/2019—144A ^ | | | 840 | | | | 987 | |
Consumer Finance—1.0% | | | | | | | | |
Ally Financial, Inc. | | | | | | | | |
4.63%, 06/26/2015 | | | 1,350 | | | | 1,402 | |
Springleaf Finance Corp. | | | | | | | | |
6.90%, 12/15/2017 | | | 2,070 | | | | 1,822 | |
Containers & Packaging—1.0% | | | | | | | | |
Exopack Holding Corp. | | | | | | | | |
10.00%, 06/01/2018 | | | 1,280 | | | | 1,184 | |
Graphic Packaging International, Inc. | | | | | | | | |
9.50%, 06/15/2017 | | | 1,635 | | | | 1,786 | |
Sealed Air Corp. | | | | | | | | |
8.13%, 09/15/2019—144A | | | 195 | | | | 213 | |
Distributors—0.6% | | | | | | | | |
Glencore Funding LLC | | | | | | | | |
6.00%, 04/15/2014—144A | | | 2,000 | | | | 2,094 | |
Diversified Financial Services—6.7% | | | | | | | | |
Bank of America Corp. | | | | | | | | |
6.50%, 08/01/2016 | | | 1,905 | | | | 2,216 | |
Citigroup, Inc. | | | | | | | | |
5.95%, 01/30/2023 * Ž | | | 1,290 | | | | 1,330 | |
CNH Capital LLC | | | | | | | | |
3.88%, 11/01/2015—144A | | | 340 | | | | 349 | |
Fibria Overseas Finance, Ltd. | | | | | | | | |
6.75%, 03/03/2021—144A ^ | | | 1,245 | | | | 1,376 | |
Ford Motor Credit Co., LLC | | | | | | | | |
3.88%, 01/15/2015 | | | 780 | | | | 813 | |
4.25%, 09/20/2022 ^ | | | 775 | | | | 803 | |
General Electric Capital Corp.—Series A | | | | | | | | |
7.13%, 06/15/2022 * Ž | | | 1,300 | | | | 1,487 | |
International Lease Finance Corp. | | | | | | | | |
6.25%, 05/15/2019 ^ | | | 1,310 | | | | 1,412 | |
6.50%, 09/01/2014—144A | | | 1,040 | | | | 1,118 | |
6.75%, 09/01/2016—144A | | | 1,495 | | | | 1,689 | |
Marina District Finance Co., Inc. | | | | | | | | |
9.50%, 10/15/2015 ^ | | | 1,391 | | | | 1,407 | |
Oaktree Capital Management, LP | | | | | | | | |
6.75%, 12/02/2019—144A | | | 1,950 | | | | 2,133 | |
Permanent TSB PLC | | | | | | | | |
3.60%, 01/14/2013—144A | | | 1,700 | | | | 1,700 | |
Unison Ground Lease Funding LLC | | | | | | | | |
6.39%, 04/15/2020—144A | | | 2,615 | | | | 3,047 | |
| | | | |
| The notes to the financial statements are an integral part of this report. | | |
| Transamerica Funds | | | | Annual Report 2012 |
| | Page 58 | | |
Transamerica Flexible Income
(formerly, Transamerica AEGON Flexible Income)
SCHEDULE OF INVESTMENTS (continued)
At October 31, 2012
| | | | | | | | |
| | | Principal
(000’s) | | | Value
(000’s) | |
Diversified Financial Services (continued) | | | | | | | | |
Vesey Street Investment Trust I | | | | | | | | |
4.40%, 09/01/2016 * ^ | | $ | 670 | | | $ | 726 | |
Diversified Telecommunication Services—1.8% | | | | | | | | |
CenturyLink, Inc. | | | | | | | | |
5.80%, 03/15/2022 | | | 1,345 | | | | 1,416 | |
GTP Towers Issuer LLC | | | | | | | | |
4.44%, 02/15/2015—144A | | | 2,295 | | | | 2,380 | |
Hughes Satellite Systems Corp. | | | | | | | | |
6.50%, 06/15/2019 | | | 400 | | | | 428 | |
7.63%, 06/15/2021 | | | 130 | | | | 145 | |
Level 3 Communications, Inc. | | | | | | | | |
8.88%, 06/01/2019—144A ^ | | | 180 | | | | 189 | |
West Corp. | | | | | | | | |
7.88%, 01/15/2019 | | | 320 | | | | 326 | |
Wind Acquisition Finance SA | | | | | | | | |
7.25%, 02/15/2018—144A | | | 700 | | | | 683 | |
11.75%, 07/15/2017—144A | | | 200 | | | | 195 | |
Electric Utilities—0.6% | | | | | | | | |
InterGen NV | | | | | | | | |
9.00%, 06/30/2017—144A | | | 2,075 | | | | 1,966 | |
Electrical Equipment—1.6% | | | | | | | | |
Anixter, Inc. | | | | | | | | |
5.95%, 03/01/2015 | | | 2,300 | | | | 2,432 | |
Polypore International, Inc. | | | | | | | | |
7.50%, 11/15/2017 ^ | | | 2,560 | | | | 2,765 | |
Energy Equipment & Services—1.8% | | | | | | | | |
Drill Rigs Holdings, Inc. | | | | | | | | |
6.50%, 10/01/2017—144A ^ | | | 340 | | | | 338 | |
Enterprise Products Operating LLC—Series A | | | | | | | | |
8.38%, 08/01/2066 * | | | 1,150 | | | | 1,311 | |
Seadrill, Ltd. | | | | | | | | |
5.63%, 09/15/2017—144A | | | 675 | | | | 675 | |
Transocean, Inc. | | | | | | | | |
6.38%, 12/15/2021 | | | 1,935 | | | | 2,355 | |
Weatherford International, Ltd. | | | | | | | | |
9.63%, 03/01/2019 | | | 945 | | | | 1,252 | |
Food & Staples Retailing—1.5% | | | | | | | | |
C&S Group Enterprises LLC | | | | | | | | |
8.38%, 05/01/2017—144A ^ | | | 1,253 | | | | 1,320 | |
Ingles Markets, Inc. | | | | | | | | |
8.88%, 05/15/2017 ^ | | | 2,140 | | | | 2,304 | |
Stater Bros Holdings, Inc. | | | | | | | | |
7.38%, 11/15/2018 | | | 65 | | | | 70 | |
SUPERVALU, Inc. | | | | | | | | |
7.50%, 11/15/2014 ^ | | | 1,290 | | | | 1,243 | |
Food Products—1.0% | | | | | | | | |
Arcor SAIC | | | | | | | | |
7.25%, 11/09/2017—144A | | | 1,285 | | | | 1,320 | |
Michael Foods Group, Inc. | | | | | | | | |
9.75%, 07/15/2018 | | | 1,200 | | | | 1,335 | |
Post Holdings, Inc. | | | | | | | | |
7.38%, 02/15/2022—144A | | | 618 | | | | 656 | |
Health Care Equipment & Supplies—0.2% | | | | | | | | |
Hologic, Inc. | | | | | | | | |
6.25%, 08/01/2020—144A | | | 590 | | | | 625 | |
Health Care Providers & Services—0.8% | | | | | | | | |
CHS/Community Health Systems, Inc. | | | | | | | | |
7.13%, 07/15/2020 | | | 1,000 | | | | 1,058 | |
Express Scripts Holding Co. | | | | | | | | |
4.75%, 11/15/2021—144A | | | 1,220 | | | | 1,423 | |
| | | | | | | | |
| | | Principal
(000’s) | | | Value
(000’s) | |
Hotels, Restaurants & Leisure—0.9% | | | | | | | | |
GWR Operating Partnership LLP | | | | | | | | |
10.88%, 04/01/2017 | | $ | 1,500 | | | $ | 1,710 | |
WMG Acquisition Corp. | | | | | | | | |
6.00%, 01/15/2021—144A | | | 1,348 | | | | 1,351 | |
Household Durables—0.4% | | | | | | | | |
Beazer Homes USA, Inc. | | | | | | | | |
6.63%, 04/15/2018—144A | | | 1,340 | | | | 1,434 | |
Household Products—0.8% | | | | | | | | |
Reynolds Group Issuer, Inc. / Reynolds Group | | | | | | | | |
Issuer LLC / Reynolds Group Issuer Lu | | | | | | | | |
5.75%, 10/15/2020—144A ^ | | | 1,360 | | | | 1,374 | |
9.88%, 08/15/2019 | | | 1,100 | | | | 1,152 | |
Independent Power Producers & Energy Traders—0.6% | | | | | | | | |
NRG Energy, Inc. | | | | | | | | |
7.63%, 05/15/2019 ^ | | | 640 | | | | 682 | |
7.88%, 05/15/2021 | | | 1,280 | | | | 1,401 | |
Insurance—4.9% | | | | | | | | |
American Financial Group, Inc. | | | | | | | | |
9.88%, 06/15/2019 | | | 1,100 | | | | 1,440 | |
Chubb Corp. | | | | | | | | |
6.38%, 03/29/2067 * | | | 1,500 | | | | 1,628 | |
Fidelity National Financial, Inc. | | | | | | | | |
6.60%, 05/15/2017 | | | 2,580 | | | | 2,902 | |
Hanover Insurance Group, Inc. | | | | | | | | |
6.38%, 06/15/2021 | | | 1,515 | | | | 1,723 | |
ING US, Inc. | | | | | | | | |
5.50%, 07/15/2022—144A | | | 955 | | | | 1,038 | |
Liberty Mutual Group, Inc. | | | | | | | | |
4.95%, 05/01/2022—144A ^ | | | 820 | | | | 895 | |
Oil Insurance, Ltd. | | | | | | | | |
3.34%, 12/17/2012—144A * Ž | | | 1,245 | | | | 1,112 | |
Reinsurance Group of America, Inc. | | | | | | | | |
6.75%, 12/15/2065 * | | | 2,760 | | | | 2,792 | |
Stone Street Trust | | | | | | | | |
5.90%, 12/15/2015—144A | | | 2,450 | | | | 2,568 | |
IT Services—0.7% | | | | | | | | |
Cardtronics, Inc. | | | | | | | | |
8.25%, 09/01/2018 | | | 1,890 | | | | 2,117 | |
Machinery—0.4% | | | | | | | | |
American Railcar Industries, Inc. | | | | | | | | |
7.50%, 03/01/2014 | | | 1,180 | | | | 1,192 | |
Marine—0.5% | | | | | | | | |
Martin Midstream Partners LP | | | | | | | | |
8.88%, 04/01/2018 ^ | | | 1,663 | | | | 1,744 | |
Media—1.0% | | | | | | | | |
Clear Channel Worldwide Holdings, Inc. | | | | | | | | |
7.63%, 03/15/2020—03/15/2020 | | | 1,305 | | | | 1,242 | |
Lions Gate Entertainment, Inc. | | | | | | | | |
10.25%, 11/01/2016—144A | | | 1,010 | | | | 1,131 | |
Nara Cable Funding, Ltd. | | | | | | | | |
8.88%, 12/01/2018—144A | | | 1,100 | | | | 1,040 | |
Metals & Mining—1.4% | | | | | | | | |
Anglo American Capital PLC | | | | | | | | |
9.38%, 04/08/2019—144A | | | 890 | | | | 1,188 | |
ArcelorMittal | | | | | | | | |
6.50%, 02/25/2022 ^ | | | 1,965 | | | | 1,930 | |
FMG Resources August 2006 Pty, Ltd. | | | | | | | | |
7.00%, 11/01/2015—144A ^ | | | 160 | | | | 162 | |
Rio Tinto Finance USA, Ltd. | | | | | | | | |
9.00%, 05/01/2019 | | | 1,000 | | | | 1,373 | |
| | | | |
| The notes to the financial statements are an integral part of this report. | | |
| Transamerica Funds | | | | Annual Report 2012 |
| | Page 59 | | |
Transamerica Flexible Income
(formerly, Transamerica AEGON Flexible Income)
SCHEDULE OF INVESTMENTS (continued)
At October 31, 2012
| | | | | | | | |
| | | Principal
(000’s) | | | Value
(000’s) | |
Multi-Utilities—0.7% | | | | | | | | |
Black Hills Corp. | | | | | | | | |
5.88%, 07/15/2020 | | $ | 1,200 | | | $ | 1,415 | |
9.00%, 05/15/2014 | | | 690 | | | | 767 | |
Oil, Gas & Consumable Fuels—5.3% | | | | | | | | |
Chesapeake Energy Corp. | | | | | | | | |
6.50%, 08/15/2017 ^ | | | 1,325 | | | | 1,406 | |
6.78%, 03/15/2019 ^ | | | 1,300 | | | | 1,303 | |
Connacher Oil and Gas, Ltd. | | | | | | | | |
8.50%, 08/01/2019—144A ^ | | | 616 | | | | 507 | |
Energy Transfer Equity, LP | | | | | | | | |
7.50%, 10/15/2020 | | | 320 | | | | 364 | |
Energy Transfer Partners, LP | | | | | | | | |
5.20%, 02/01/2022 | | | 1,045 | | | | 1,200 | |
Gazprom OAO Via GAZ Capital SA | | | | | | | | |
8.13%, 07/31/2014—144A | | | 1,560 | | | | 1,710 | |
Linn Energy LLC / Linn Energy Finance Corp. | | | | | | | | |
6.25%, 11/01/2019—144A ^ | | | 1,305 | | | | 1,305 | |
Lukoil International Finance BV | | | | | | | | |
6.38%, 11/05/2014—144A | | | 1,280 | | | | 1,389 | |
PDC Energy, Inc. | | | | | | | | |
12.00%, 02/15/2018 | | | 1,000 | | | | 1,093 | |
Petrobras International Finance Co. | | | | | | | | |
5.38%, 01/27/2021 | | | 1,040 | | | | 1,179 | |
Petrohawk Energy Corp. | | | | | | | | |
7.25%, 08/15/2018 | | | 1,050 | | | | 1,197 | |
Petroleum Co., of Trinidad & Tobago, Ltd. | | | | | | | | |
9.75%, 08/14/2019—144A | | | 876 | | | | 1,156 | |
Ras Laffan Liquefied Natural Gas Co., Ltd. III | | | | | | | | |
6.75%, 09/30/2019—144A ^ | | | 1,545 | | | | 1,938 | |
TNK-BP Finance SA | | | | | | | | |
6.25%, 02/02/2015—144A | | | 1,250 | | | | 1,341 | |
Paper & Forest Products—0.5% | | | | | | | | |
Ainsworth Lumber Co., Ltd. | | | | | | | | |
11.00%, 07/29/2015—144A  | | | 724 | | | | 705 | |
Boise Cascade LLC/Boise Cascade Finance Corp. | | | | | | | | |
6.38%, 11/01/2020—144A | | | 1,020 | | | | 1,035 | |
Pharmaceuticals—0.2% | | | | | | | | |
Watson Pharmaceuticals, Inc. | | | | | | | | |
3.25%, 10/01/2022 | | | 715 | | | | 737 | |
Professional Services—0.4% | | | | | | | | |
Block Financial LLC | | | | | | | | |
5.13%, 10/30/2014 ^ | | | 1,300 | | | | 1,366 | |
Real Estate Investment Trusts—1.7% | | | | | | | | |
Entertainment Properties Trust | | | | | | | | |
7.75%, 07/15/2020 | | | 2,335 | | | | 2,711 | |
Kilroy Realty, LP | | | | | | | | |
6.63%, 06/01/2020 | | | 2,440 | | | | 2,964 | |
Real Estate Management & Development—0.4% | | | | | | | | |
Algeco Scotsman Global Finance PLC | | | | | | | | |
8.50%, 10/15/2018—144A ^ | | | 1,370 | | | | 1,411 | |
Road & Rail—0.9% | | | | | | | | |
Aviation Capital Group Corp. | | | | | | | | |
7.13%, 10/15/2020—144A | | | 2,700 | | | | 2,837 | |
Semiconductors & Semiconductor Equipment—0.2% | | | | | | | | |
Sensata Technologies BV | | | | | | | | |
6.50%, 05/15/2019—144A ^ | | | 575 | | | | 607 | |
Software—0.6% | | | | | | | | |
First Data Corp. | | | | | | | | |
6.75%, 11/01/2020—144A | | | 1,350 | | | | 1,350 | |
7.38%, 06/15/2019—144A | | | 630 | | | | 652 | |
| | | | | | | | |
| | | Principal
(000’s) | | | Value
(000’s) | |
Specialty Retail—0.8% | | | | | | | | |
Claire’s Stores, Inc. | | | | | | | | |
9.00%, 03/15/2019—144A | | $ | 1,315 | | | $ | 1,372 | |
Michaels Stores, Inc. | | | | | | | | |
11.38%, 11/01/2016 ^ | | | 1,200 | | | | 1,253 | |
Textiles, Apparel & Luxury Goods—0.2% | | | | | | | | |
Jones Group, Inc. / Apparel Group Hold / Apparel Group USA / Footwear Acc Retail | | | | | | | | |
6.88%, 03/15/2019 | | | 510 | | | | 528 | |
Tobacco—0.5% | | | | | | | | |
Lorillard Tobacco Co. | | | | | | | | |
8.13%, 06/23/2019 | | | 1,235 | | | | 1,589 | |
Wireless Telecommunication Services—2.9% | | | | | | | | |
Crown Castle Towers LLC | | | | | | | | |
4.88%, 08/15/2020—144A | | | 1,550 | | | | 1,771 | |
6.11%, 01/15/2020—144A | | | 1,650 | | | | 2,008 | |
SBA Tower Trust | | | | | | | | |
5.10%, 04/17/2017—144A | | | 2,365 | | | | 2,627 | |
Sprint Nextel Corp. | | | | | | | | |
9.00%, 11/15/2018—144A | | | 292 | | | | 361 | |
WCP Wireless Site Funding / WCP Wireless Site RE Funding / WCP Wireless Site Non | | | | | | | | |
6.83%, 11/15/2015—144A | | | 2,570 | | | | 2,691 | |
| | | | | | | | |
Total Corporate Debt Securities (cost $167,491) | | | | | | | 182,056 | |
| | | | | | | | |
CONVERTIBLE BOND—0.3% | | | | | | | | |
Automobiles—0.3% | | | | | | | | |
Ford Motor Co. | | | | | | | | |
4.25%, 11/15/2016 | | | 730 | | | | 1,074 | |
Total Convertible Bond (cost $730) | | | | | | | | |
LOAN ASSIGNMENT—0.5% | | | | | | | | |
Paper & Forest Products—0.5% | | | | | | | | |
Ainsworth Lumber Co., Ltd. | | | | | | | | |
5.25%, 06/26/2014 * ‡ | | | 1,651 | | | | 1,634 | |
Total Loan Assignment (cost $1,572) | | | | | | | | |
| | | | | | | | |
| | | Shares | | | Value
(000’s) | |
PREFERRED STOCKS—1.5% | | | | | | | | |
Commercial Banks—0.3% | | | | | | | | |
CoBank ACB, 6.25%—144A * ‡ | | | 9,770 | | | | 1,021 | |
Consumer Finance—0.6% | | | | | | | | |
Ally Financial, Inc., 8.50% * | | | 75,200 | | | | 1,884 | |
Diversified Telecommunication Services—0.6% | | | | | | | | |
Centaur Funding Corp., 9.08%—144A | | | 1,661 | | | | 1,997 | |
| | | | | | | | |
Total Preferred Stocks (cost $5,010) | | | | | | | 4,902 | |
| | | | | | | | |
COMMON STOCK—1.0% | | | | | | | | |
Diversified Telecommunication Services—1.0% | | | | | | | | |
Verizon Communications, Inc. ^ | | | 75,000 | | | | 3,348 | |
Total Common Stock (cost $2,349) | | | | | | | | |
| | |
WARRANT—0.4% | | | | | | | | |
Commercial Banks—0.4% | | | | | | | | |
Wells Fargo & Co. ‡ | | | | | | | | |
Expiration: 10/28/2018 | | | | | | | | |
Exercise Price: $34.01 | | | 148,210 | | | | 1,418 | |
Total Warrant (cost $1,141) | | | | | | | | |
| | |
SECURITIES LENDING COLLATERAL—10.3% | | | | | | | | |
State Street Navigator Securities Lending Trust—Prime Portfolio, 0.31% p | | | 33,571,178 | | | | 33,571 | |
Total Securities Lending Collateral (cost $33,571) | | | | | | | | |
| | | | |
| The notes to the financial statements are an integral part of this report. | | |
| Transamerica Funds | | | | Annual Report 2012 |
| | Page 60 | | |
Transamerica Flexible Income
(formerly, Transamerica AEGON Flexible Income)
SCHEDULE OF INVESTMENTS (continued)
At October 31, 2012
| | | | | | | | |
| | | Principal
(000’s) | | | Value
(000’s) | |
REPURCHASE AGREEMENT—1.1% | | | | | | | | |
State Street Bank & Trust Co. 0.03% p, dated 10/31/2012, to be repurchased at $3,738 on 11/01/2012. Collateralized by a U.S. Government Agency Obligation, 4.00%, due 08/01/2026, and with a value of $3,813. | | $ | 3,738 | | | $ | 3,738 | |
| | | | | | | | |
Total Repurchase Agreement (cost $3,738) | | | | | | | | |
| | |
Total Investment Securities (cost $331,390) P | | | | | | | 353,073 | |
Other Assets and Liabilities—Net | | | | | | | (27,503 | ) |
| | | | | | | | |
Net Assets | | | | | | $ | 325,570 | |
| | | | | | | | |
NOTES TO SCHEDULE OF INVESTMENTS (all amounts in thousands):
| * | Floating or variable rate note. Rate is listed as of 10/31/2012. |
| ^ | All or a portion of this security is on loan. The value of all securities on loan is $32,872. |
| ž | The security has a perpetual maturity. The date shown is the next call date. |
| Ə | Fair valued as determined in good faith in accordance with procedures established by the Board of Trustees. Total aggregate market value of fair valued securities is $518, or 0.16% of the fund’s net assets. |
| Payment in-kind. Securities pay interest or dividends in the form of additional bonds or preferred stock. |
| § | Illiquid. Total aggregate market value of illiquid securities is $1,621, or 0.50% of the fund’s net assets. |
| ‡ | Non-income producing security. |
| p | Rate shown reflects the yield at 10/31/2012. |
| P | Aggregate cost for federal income tax purposes is $331,390. Aggregate gross unrealized appreciation/depreciation for all securities in which there is an excess of value over tax cost were $23,447 and $1,764, respectively. Net unrealized appreciation for tax purposes is $21,683. |
DEFINITIONS (all amounts in thousands):
| | |
| 144A | | 144A Securities are registered pursuant to Rule 144A of the Securities Act of 1933. These securities are deemed to be liquid for purposes of compliance limitations on holdings of illiquid securities and may be resold as transactions exempt from registration, normally to qualified institutional buyers. At 10/31/2012, these securities aggregated $106,308, or 32.65% of the fund’s net assets. |
| IO | | Interest Only |
| OAO | | Otkrytoe Aktsionernoe Obschestvo (Russian: Open Joint Stock Corporation) |
| REMIC | | Real Estate Mortgage Investment Conduits (consist of a fixed pool of mortgages broken apart and marketed to investors as individual securities) |
CURRENCY ABBREVIATIONS:
| | |
| BRL | | Brazilian Real |
| CAD | | Canadian Dollar |
| CLP | | Chilean Peso |
| MXN | | Mexican Peso |
| PHP | | Philippines Peso |
| | | | |
| The notes to the financial statements are an integral part of this report. | | |
| Transamerica Funds | | | | Annual Report 2012 |
| | Page 61 | | |
Transamerica Flexible Income
(formerly, Transamerica AEGON Flexible Income)
SCHEDULE OF INVESTMENTS (continued)
At October 31, 2012
VALUATION SUMMARY (all amounts in thousands): '
| | | | | | | | | | | | | | | | |
| | | | | | Level 2 - | | | | | | | |
| | | | | | Other | | | Level 3 - | | | | |
| | | Level 1 - | | | Significant | | | Significant | | | | |
| | | Quoted | | | Observable | | | Unobservable | | | Value at | |
Investment Securities | | Prices | | | Inputs | | | Inputs | | | 10/31/2012 | |
Asset-Backed Securities | | $ | — | | | $ | 9,407 | | | $ | — | | | $ | 9,407 | |
Common Stock | | | 3,348 | | | | — | | | | — | | | | 3,348 | |
Convertible Bond | | | — | | | | 1,074 | | | | — | | | | 1,074 | |
Corporate Debt Securities | | | — | | | | 182,056 | | | | — | | | | 182,056 | |
Foreign Government Obligations | | | — | | | | 11,036 | | | | — | | | | 11,036 | |
Loan Assignment | | | — | | | | 1,634 | | | | — | | | | 1,634 | |
Mortgage-Backed Securities | | | — | | | | 23,961 | | | | — | | | | 23,961 | |
Municipal Government Obligations | | | — | | | | 3,801 | | | | — | | | | 3,801 | |
Preferred Corporate Debt Security | | | — | | | | 3,548 | | | | — | | | | 3,548 | |
Preferred Stocks | | | 4,902 | | | | — | | | | — | | | | 4,902 | |
Repurchase Agreement | | | — | | | | 3,738 | | | | — | | | | 3,738 | |
Securities Lending Collateral | | | 33,571 | | | | — | | | | — | | | | 33,571 | |
U.S. Government Agency Obligation | | | — | | | | 626 | | | | — | | | | 626 | |
U.S. Government Obligations | | | — | | | | 68,953 | | | | — | | | | 68,953 | |
Warrant | | | 1,418 | | | | — | | | | — | | | | 1,418 | |
| | | | | | | | | | | | | | | | |
Total | | $ | 43,239 | | | $ | 309,834 | | | $ | — | | | $ | 353,073 | |
| | | | | | | | | | | | | | | | |
Level 3 Rollforward—Investment Securities
| | | | | | | | | | | | | | | | | | | | | | | | | | | | | | | | | | | | | | | | |
Securities | | Beginning
Balance at
10/31/2011 | | | Purchases | | | Sales | | | Accrued
Discounts/
(Premiums) | | | Total
Realized
Gain/(Loss) | | | Net Change in
Unrealized
Appreciation/
(Depreciation) ƒ | | | Transfers
into
Level 3 | | | Transfers
out of
Level 3 | | | Ending
Balance at
10/31/2012 | | | Net Change in
Unrealized
Appreciation/
(Depreciation) on
Investments Held at
10/31/2012 ƒ | |
Corporate Debt Securities | | $ | ¿ | | | $ | — | | | $ | (¿ | ) | | $ | — | | | $ | (684 | ) | | $ | 684 | | | $ | — | | | $ | — | | | $ | — | | | $ | — | |
| ' | Transfers between levels are considered to have occurred at the end of the reporting period. There were no transfers into or out of Levels 1 and 2 during the period ended 10/31/2012. See the notes to the financial statements for more information regarding pricing inputs and valuation techniques. |
| ƒ | Any difference between Net Change in Unrealized Appreciation/(Depreciation) and Net Change in Unrealized Appreciation/(Depreciation) on Investments Held at 10/31/2012 may be due to an investment no longer held or categorized as Level 3 at period end. |
| ¿ | Amount rounds to less than 1. |
| | | | |
| The notes to the financial statements are an integral part of this report. | | |
| Transamerica Funds | | | | Annual Report 2012 |
| | Page 62 | | |
Transamerica Growth Opportunities
(formerly, Transamerica Morgan Stanley Growth Opportunities)
SCHEDULE OF INVESTMENTS
At October 31, 2012
| | | | | | | | |
| | | | | | Value | |
| | | Shares | | | (000’s) | |
CONVERTIBLE PREFERRED STOCKS—0.1% | | | | | | | | |
Automobiles—0.0% ¥ | | | | | | | | |
Better Place ‡ Ə § D | | | 666,891 | | | $ | 67 | |
Internet Software & Services—0.1% | | | | | | | | |
Dropbox, Inc. ‡ Ə § D | | | 34,602 | | | | 313 | |
| | | | | | | | |
Total Convertible Preferred Stocks (cost $1,980) | | | | | | | 380 | |
| | | | | | | | |
PREFERRED STOCKS—0.8% | | | | | | | | |
Automobiles—0.0% ¥ | | | | | | | | |
Better Place—Series C ‡ Ə § D | | | 581,653 | | | | 58 | |
Internet Software & Services—0.1% | | | | | | | | |
Peixe Urbano, Inc. ‡ Ə § D | | | 50,890 | | | | 356 | |
Software—0.7% | | | | | | | | |
Palantir Technologies, Inc. ‡ Ə § D | | | 355,382 | | | | 1,087 | |
Workday, Inc. ‡ Ə § D | | | 70,664 | | | | 3,085 | |
| | | | | | | | |
Total Preferred Stocks (cost $6,341) | | | | | | | 4,586 | |
| | | | | | | | |
COMMON STOCKS—95.7% | | | | | | | | |
Automobiles—0.5% | | | | | | | | |
Tesla Motors, Inc. ‡ ^ | | | 103,734 | | | | 2,918 | |
Beverages—0.8% | | | | | | | | |
Monster Beverage Corp. ‡ | | | 107,499 | | | | 4,802 | |
Biotechnology—0.7% | | | | | | | | |
Ironwood Pharmaceuticals, Inc.—Class A ‡ ^ | | | 348,558 | | | | 4,054 | |
Capital Markets—0.9% | | | | | | | | |
Greenhill & Co., Inc. ^ | | | 109,291 | | | | 5,215 | |
Chemicals—2.8% | | | | | | | | |
Intrepid Potash, Inc. ‡^ | | | 317,441 | | | | 6,898 | |
Rockwood Holdings, Inc. | | | 209,435 | | | | 9,613 | |
Commercial Services & Supplies—7.5% | | | | | | | | |
Covanta Holding Corp. | | | 444,939 | | | | 8,089 | |
Edenred ^ | | | 752,113 | | | | 21,764 | |
Stericycle, Inc. ‡ ^ | | | 148,939 | | | | 14,113 | |
Communications Equipment—3.7% | | | | | | | | |
Motorola Solutions, Inc. | | | 419,022 | | | | 21,655 | |
Construction Materials—1.3% | | | | | | | | |
Martin Marietta Materials, Inc. ^ | | | 90,463 | | | | 7,446 | |
Diversified Consumer Services—3.3% | | | | | | | | |
New Oriental Education & Technology Group ADR ^ | | | 349,638 | | | | 5,895 | |
Weight Watchers International, Inc. ^ | | | 268,509 | | | | 13,492 | |
Diversified Financial Services—3.9% | | | | | | | | |
IntercontinentalExchange, Inc. ‡ | | | 68,908 | | | | 9,027 | |
MSCI, Inc.—Class A ‡ | | | 516,117 | | | | 13,904 | |
Electric Utilities—3.7% | | | | | | | | |
Brookfield Infrastructure Partners, LP | | | 625,978 | | | | 21,502 | |
Electrical Equipment—2.6% | | | | | | | | |
First Solar, Inc. ‡ ^ | | | 262,267 | | | | 6,376 | |
Sensata Technologies Holding NV ‡ | | | 314,093 | | | | 8,848 | |
Food Products—3.8% | | | | | | | | |
DE Master Blenders 1753 NV ‡ | | | 1,205,269 | | | | 14,730 | |
Mead Johnson Nutrition Co.—Class A | | | 118,516 | | | | 7,308 | |
Health Care Equipment & Supplies—5.5% | | | | | | | | |
IDEXX Laboratories, Inc. ‡ ^ | | | 130,441 | | | | 12,548 | |
Intuitive Surgical, Inc. ‡ | | | 36,376 | | | | 19,724 | |
Health Care Providers & Services—1.9% | | | | | | | | |
Qualicorp SA ‡ | | | 1,100,864 | | | | 11,296 | |
Health Care Technology—1.6% | | | | | | | | |
athenahealth, Inc. ‡ ^ | | | 148,561 | | | | 9,551 | |
Hotels, Restaurants & Leisure—1.5% | | | | | | | | |
Dunkin’ Brands Group, Inc. | | | 280,793 | | | | 8,705 | |
Insurance—2.7% | | | | | | | | |
Progressive Corp. | | | 716,657 | | | | 15,981 | |
Internet & Catalog Retail—1.0% | | | | | | | | |
Groupon, Inc.—Class A ‡ ^ | | | 1,465,302 | | | | 6,037 | |
Internet Software & Services—9.9% | | | | | | | | |
Akamai Technologies, Inc. ‡ | | | 235,570 | | | | 8,949 | |
Dropbox, Inc. ‡ Ə § D | | | 327,298 | | | | 2,962 | |
| | | | | | | | |
| | | | | | Value | |
| | | Shares | | | (000’s) | |
Internet Software & Services (continued) | | | | | | | | |
LinkedIn Corp.—Class A ‡ | | | 127,318 | | | $ | 13,614 | |
MercadoLibre, Inc. ^ | | | 83,931 | | | | 7,048 | |
SINA Corp. ‡ | | | 58,187 | | | | 3,179 | |
Yandex NV—Class A ‡ | | | 616,898 | | | | 14,361 | |
Youku Tudou, Inc. ADR ‡ | | | 408,125 | | | | 8,081 | |
IT Services—2.4% | | | | | | | | |
Gartner, Inc. ‡ | | | 308,682 | | | | 14,326 | |
Life Sciences Tools & Services—4.5% | | | | | | | | |
Illumina, Inc. ‡ ^ | | | 379,527 | | | | 18,031 | |
Techne Corp. | | | 125,040 | | | | 8,423 | |
Media—2.2% | | | | | | | | |
McGraw-Hill Cos., Inc. | | | 235,407 | | | | 13,013 | |
Metals & Mining—0.8% | | | | | | | | |
Lynas Corp., Ltd. ‡ ^ | | | 2,367,240 | | | | 1,794 | |
Molycorp, Inc. ‡ ^ | | | 265,094 | | | | 2,757 | |
Oil, Gas & Consumable Fuels—3.6% | | | | | | | | |
Range Resources Corp. | | | 215,155 | | | | 14,063 | |
Ultra Petroleum Corp. ‡ ^ | | | 303,302 | | | | 6,918 | |
Pharmaceuticals—1.7% | | | | | | | | |
Valeant Pharmaceuticals International, Inc. ‡ | | | 182,279 | | | | 10,195 | |
Professional Services—7.3% | | | | | | | | |
IHS, Inc.—Class A ‡ | | | 122,572 | | | | 10,344 | |
Intertek Group PLC | | | 344,686 | | | | 15,680 | |
Verisk Analytics, Inc.—Class A ‡ | | | 332,080 | | | | 16,936 | |
Software—10.3% | | | | | | | | |
Citrix Systems, Inc. ‡ | | | 118,426 | | | | 7,320 | |
FactSet Research Systems, Inc. ^ | | | 95,397 | | | | 8,638 | |
Red Hat, Inc. ‡ | | | 155,124 | | | | 7,627 | |
Salesforce.com, Inc. ‡ | | | 106,462 | | | | 15,542 | |
Solera Holdings, Inc. | | | 300,851 | | | | 14,083 | |
Workday, Inc.—Class A ‡ | | | 71,712 | | | | 3,478 | |
Zynga, Inc.—Class A ‡ | | | 1,415,822 | | | | 3,186 | |
Textiles, Apparel & Luxury Goods—1.6% | | | | | | | | |
Coach, Inc. | | | 166,277 | | | | 9,320 | |
Trading Companies & Distributors—1.7% | | | | | | | | |
Fastenal Co. | | | 216,578 | | | | 9,681 | |
| | | | | | | | |
Total Common Stocks (cost $554,289) | | | | | | | 561,040 | |
| | | | | | | | |
SECURITIES LENDING COLLATERAL—17.9% | | | | | | | | |
State Street Navigator Securities Lending Trust—Prime Portfolio, 0.31% p | | | 104,881,803 | | | | 104,882 | |
Total Securities Lending Collateral (cost $104,882) | | | | | | | | |
| | |
| | | Principal | | | Value | |
| | | (000’s) | | | (000’s) | |
REPURCHASE AGREEMENT—3.7% | | | | | | | | |
State Street Bank & Trust Co. 0.03% p, dated 10/31/2012, to be repurchased at $21,900 on 11/01/2012. Collateralized by U.S. Government Agency Obligations, 3.00%—4.00%, due 08/01/2026—12/01/2026, and with a total value of $22,340. | | $ | 21,900 | | | | 21,900 | |
| | | | | | | | |
Total Repurchase Agreement (cost $21,900) | | | | | | | | |
| | |
Total Investment Securities (cost $689,392) P | | | | | | | 692,788 | |
Other Assets and Liabilities—Net | | | | | | | (106,849 | ) |
| | | | | | | | |
Net Assets | | | | | | $ | 585,939 | |
| | | | | | | | |
| | | | |
| The notes to the financial statements are an integral part of this report. | | |
| Transamerica Funds | | | | Annual Report 2012 |
| | Page 63 | | |
Transamerica Growth Opportunities
(formerly, Transamerica Morgan Stanley Growth Opportunities)
SCHEDULE OF INVESTMENTS (continued)
At October 31, 2012
NOTES TO SCHEDULE OF INVESTMENTS (all amounts in thousands):
| ¥ | Percentage rounds to less than 0.1%. |
| Ə | Fair valued as determined in good faith in accordance with procedures established by the Board of Trustees. Total aggregate market value of fair valued securities is $7,928, or 1.35% of the fund’s net assets. |
| ‡ | Non-income producing security. |
| ^ | All or a portion of this security is on loan. The value of all securities on loan is $102,308. |
| § | Illiquid. Total aggregate market value of illiquid securities is $7,928, or 1.35% of the fund’s net assets. |
| p | Rate shown reflects the yield at 10/31/2012. |
| P | Aggregate cost for federal income tax purposes is $689,831. Aggregate gross unrealized appreciation/depreciation for all securities in which there is an excess of value over tax cost were $89,397 and $86,440, respectively. Net unrealized appreciation for tax purposes is $2,957. |
| D | Restricted Security. At 10/31/2012, the fund owned the respective securities which were restricted as to public resale: |
| | | | | | | | | | | | | | | | | | |
| | | | | Acquisition | | | | | | | | | Value as % of | |
Investment Securities | | Description | | Date | | | Cost | | | Value | | | Net Assets | |
Convertible Preferred Stocks | | Better Place | | | 01/25/2010 | | | $ | 1,667 | | | $ | 67 | | | | 0.01 | % |
Convertible Preferred Stocks | | Dropbox, Inc. | | | 05/25/2012 | | | | 313 | | | | 313 | | | | 0.05 | |
Preferred Stocks | | Better Place—Series C | | | 11/11/2011 | | | | 2,641 | | | | 58 | | | | 0.01 | |
Preferred Stocks | | Peixe Urbano, Inc. | | | 12/02/2011 | | | | 1,675 | | | | 356 | | | | 0.06 | |
Preferred Stocks | | Palantir Technologies, Inc. | | | 07/19/2012 | | | | 1,087 | | | | 1,087 | | | | 0.19 | |
Preferred Stocks | | Workday, Inc. | | | 10/12/2011 | | | | 937 | | | | 3,085 | | | | 0.53 | |
Common Stocks | | Dropbox, Inc. | | | 05/01/2012 | | | | 2,962 | | | | 2,962 | | | | 0.50 | |
| | | | | | | | | | | | | | | | | | |
| | | | | | | | $ | 11,282 | | | $ | 7,928 | | | | 1.35 | % |
| | | | | | | | | | | | | | | | | | |
DEFINITION:
| ADR | American Depositary Receipt |
VALUATION SUMMARY (all amounts in thousands): '
| | | | | | | | | | | | | | | | |
| | | | | | Level 2 - | | | | | | | |
| | | | | | Other | | | Level 3 - | | | | |
| | | Level 1 - | | | Significant | | | Significant | | | | |
| | | Quoted | | | Observable | | | Unobservable | | | Value at | |
Investment Securities | | Prices | | | Inputs | | | Inputs | | | 10/31/2012 | |
Common Stocks | | $ | 504,110 | | | $ | 53,968 | | | $ | 2,962 | | | $ | 561,040 | |
Convertible Preferred Stocks | | | — | | | | — | | | | 380 | | | | 380 | |
Preferred Stocks | | | — | | | | — | | | | 4,586 | | | | 4,586 | |
Repurchase Agreement | | | — | | | | 21,900 | | | | — | | | | 21,900 | |
Securities Lending Collateral | | | 104,882 | | | | — | | | | — | | | | 104,882 | |
| | | | | | | | | | | | | | | | |
Total | | $ | 608,992 | | | $ | 75,868 | | | $ | 7,928 | | | $ | 692,788 | |
| | | | | | | | | | | | | | | | |
Level 3 Rollforward—Investment Securities
| | | | | | | | | | | | | | | | | | | | | | | | | | | | | | | | | | | | | | | | |
| | | Beginning
Balance at | | | | | | | | | Accrued Discounts/ | | | Total Realized | | | Net Change in Unrealized
Appreciation/ | | | Transfers
into | | | Transfers out of | | | Ending Balance at
10/31/2012 | | | Net Change in Unrealized Appreciation/(Depreciation)
on Investments Held at | |
Securities | | 10/31/2011 | | | Purchases | | | Sales | | | (Premiums) | | | Gain/(Loss) | | | (Depreciation) ƒ | | | Level 3 | | | Level 3 | | | ₪ | | | 10/31/2012 ƒ | |
Common Stocks | | $ | 4,458 | | | $ | 2,962 | | | $ | — | | | $ | — | | | $ | — | | | $ | — | | | $ | — | | | $ | (4,458 | ) | | $ | 2,962 | | | | — | |
Convertible Preferred Stocks | | | 1,667 | | | | 313 | | | | — | | | | — | | | | — | | | | (1,600 | ) | | | — | | | | — | | | | 380 | | | | (1,600 | ) |
Preferred Stocks | | | 3,161 | | | | 5,403 | | | | — | | | | — | | | | — | | | | (1,754 | ) | | | — | | | | (2,224 | ) | | | 4,586 | | | | (1,754 | ) |
| | | | | | | | | | | | | | | | | | | | | | | | | | | | | | | | | | | | | | | | |
Total | | $ | 9,286 | | | $ | 8,678 | | | $ | — | | | $ | — | | | $ | — | | | $ | (3,354 | ) | | $ | — | | | $ | (6,682 | ) | | $ | 7,928 | | | | (3,354 | ) |
| | | | | | | | | | | | | | | | | | | | | | | | | | | | | | | | | | | | | | | | |
| ' | Transfers between levels are considered to have occurred at the end of the reporting period. There were no transfers into or out of Levels 1 and 2 during the period ended 10/31/2012. See the notes to the financial statements for more information regarding pricing inputs and valuation techniques. |
| ƒ | Any difference between Net Change in Unrealized Appreciation/(Depreciation) and Net Change in Unrealized Appreciation/(Depreciation) on Investments Held at 10/31/2012 may be due to an investment no longer held or categorized as Level 3 at period end. |
| ₪ | Total aggregate market value of Level 3 securities is 1.35% of the fund’s net assets. Quantitative information about significant unobservable inputs used in the fair value measurement are disclosed in the table on the following page. |
| | | | |
| The notes to the financial statements are an integral part of this report. | | |
| Transamerica Funds | | | | Annual Report 2012 |
| | Page 64 | | |
Transamerica Growth Opportunities
(formerly, Transamerica Morgan Stanley Growth Opportunities)
SCHEDULE OF INVESTMENTS (continued)
At October 31, 2012
VALUATION SUMMARY (continued):
Quantitative Information about Significant Unobservable Inputs (Level 3):
| | | | | | | | | | | | | | | | | | | | | | |
| | | | | | | | | | | | | | | | | | | Impact to |
| | | Fair Value | | | | | | | | | | | | | | | | Valuation |
| | | at | | | | | | | | | | | | | | | | from an |
| Investment | | 10/31/2012 | | | | | | | | | | | | | Weighted | | | Increase in |
Securities | | (000’s) | | | Valuation Technique(s) | | Unobservable Input | | Range | | | Average | | | Input |
Common Stock | | $ | 2,962 | | | Market Comparable Companies | | Enterprise Value / Revenue | | | 6.3x | | | | 9.1x | | | | 7.7x | | | Increase |
| | | | | | | | Discount for Lack of Marketability | | | 10.0 | % | | | 10.0 | % | | | 10.0 | % | | Decrease |
| | | | | | Discounted Cash Flow | | Weighted Average Cost of Capital | | | 16.0 | % | | | 20.0 | % | | | 18.0 | % | | Decrease |
| | | | | | | | Perpetual Growth Rate | | | 2.0 | % | | | 3.0 | % | | | 2.5 | % | | Increase |
Convertible Preferred Stocks | | | 380 | | | Asset Approach | | Net Tangible Assets | | $ | 0.10 | �� | | $ | 0.10 | | | $ | 0.10 | | | Increase |
| | | | | | | |
| | | | | | Market Comparable Companies | | Enterprise Value / Revenue | | | 6.3x | | | | 9.1x | | | | 7.7x | | | Increase |
| | | | | | | |
| | | | | | Discounted Cash Flow | | Discounted for Lack of Marketability | | | 10.0 | % | | | 10.0 | % | | | 10.0 | % | | Decrease |
| | | | | | | | Weighted Average Cost of Capital | | | 16.0 | % | | | 20.0 | % | | | 18.0 | % | | Decrease |
| | | | | | | | Perpetual Growth Rate | | | 2.0 | % | | | 30.0 | % | | | 2.5 | % | | Increase |
Preferred Stocks | | | 4,586 | | | Asset Approach | | Net Tangible Assets | | $ | 0.10 | | | $ | 0.10 | | | $ | 0.10 | | | Increase |
| | | | | | Discount for Illiquidity | | Illiquidity discount amortized over the | | | | | | | | | | | | | | |
| | | | | | | | lockup period | | | 10.0 | % | | | 10.0 | % | | | 10.0 | % | | Decrease |
| | | | | | Market Comparable Companies | | Enterprise Value / Revenue | | | 1.3x | | | | 21.2x | | | | 12.3x | | | Increase |
| | | | | | | | Discount for Lack of Marketability | | | 10.0 | % | | | 15.0 | % | | | 14.4 | % | | Decrease |
| | | | | | Discounted Cash Flow | | Weighted Average Cost of Capital | | | 15.0 | % | | | 30.0 | % | | | 18.4 | % | | Decrease |
| | | | | | | | Perpetual Growth Rate | | | 2.0 | % | | | 6.0 | % | | | 2.9 | % | | Increase |
| | | | |
| The notes to the financial statements are an integral part of this report. |
| Transamerica Funds | | | | Annual Report 2012 |
| | Page 65 | | |
Transamerica High Yield Bond
(formerly, Transamerica AEGON High Yield Bond)
SCHEDULE OF INVESTMENTS
At October 31, 2012
| | | | | | | | |
| | | Principal
(000’s) | | | Value
(000’s) | |
CORPORATE DEBT SECURITIES—90.4% | | | | | | | | |
Aerospace & Defense—1.0% | | | | | | | | |
Bombardier, Inc. | | | | | | | | |
7.50%, 03/15/2018—144A | | $ | 450 | | | $ | 515 | |
7.75%, 03/15/2020—144A ^ | | | 1,300 | | | | 1,519 | |
Spirit Aerosystems, Inc. | | | | | | | | |
6.75%, 12/15/2020 | | | 920 | | | | 957 | |
7.50%, 10/01/2017 | | | 1,945 | | | | 2,067 | |
Triumph Group, Inc. | | | | | | | | |
8.63%, 07/15/2018 | | | 2,000 | | | | 2,244 | |
Airlines—1.1% | | | | | | | | |
Continental Airlines Pass-Through Trust | | | | | | | | |
Series 2007-1, Class B | | | | | | | | |
6.90%, 04/19/2022 | | | 2,162 | | | | 2,308 | |
Series 2012-2, Class B | | | | | | | | |
5.50%, 10/29/2020 | | | 1,080 | | | | 1,127 | |
Delta Air Lines, Inc., Pass-Through Trust | | | | | | | | |
Series 2010-1, Class B | | | | | | | | |
6.38%, 01/02/2016 | | | 1,180 | | | | 1,215 | |
Series 2010-2, Class B | | | | | | | | |
6.75%, 11/23/2015 | | | 1,325 | | | | 1,378 | |
U.S. Airways Pass-Through Trust | | | | | | | | |
Series 2010-1, Class A | | | | | | | | |
6.25%, 04/22/2023 | | | 1,806 | | | | 1,933 | |
Automobiles—0.9% | | | | | | | | |
Chrysler Group LLC / CG Co.-Issuer, Inc. | | | | | | | | |
8.00%, 06/15/2019 | | | 2,518 | | | | 2,678 | |
8.25%, 06/15/2021 ^ | | | 1,070 | | | | 1,144 | |
General Motors Corp. (Escrow Shares) | | | | | | | | |
7.20%, 01/15/2049 Ə | | | 2,825 | | | | ¿ | |
Jaguar Land Rover PLC | | | | | | | | |
7.75%, 05/15/2018—144A | | | 650 | | | | 692 | |
8.13%, 05/15/2021—144A | | | 1,660 | | | | 1,789 | |
Beverages—1.7% | | | | | | | | |
Constellation Brands, Inc. | | | | | | | | |
7.25%, 09/01/2016 ^ | | | 4,650 | | | | 5,371 | |
7.25%, 05/15/2017 | | | 1,050 | | | | 1,236 | |
Cott Beverages, Inc. | | | | | | | | |
8.13%, 09/01/2018 | | | 1,445 | | | | 1,604 | |
8.38%, 11/15/2017 ^ | | | 3,370 | | | | 3,690 | |
Building Products—2.7% | | | | | | | | |
Associated Materials LLC / AMH New Finance, Inc. | | | | | | | | |
9.13%, 11/01/2017 ^ | | | 4,782 | | | | 4,734 | |
Euramax International, Inc. | | | | | | | | |
9.50%, 04/01/2016 | | | 4,484 | | | | 4,125 | |
Ply Gem Industries, Inc. | | | | | | | | |
8.25%, 02/15/2018 ^ | | | 8,197 | | | | 8,750 | |
9.38%, 04/15/2017—144A | | | 1,330 | | | | 1,397 | |
Capital Markets—0.2% | | | | | | | | |
Morgan Stanley | | | | | | | | |
4.88%, 11/01/2022 ^ | | | 1,650 | | | | 1,668 | |
Chemicals—1.5% | | | | | | | | |
Huntsman International LLC | | | | | | | | |
8.63%, 03/15/2020 | | | 1,600 | | | | 1,804 | |
8.63%, 03/15/2021 ^ | | | 1,790 | | | | 2,036 | |
Momentive Performance Materials, Inc. | | | | | | | | |
10.00%, 10/15/2020—144A ^ | | | 540 | | | | 518 | |
| | | | | | | | |
| | | Principal
(000’s) | | | Value
(000’s) | |
Chemicals (continued) | | | | | | | | |
MPM Escrow LLC / MPM Finance Escrow Corp. | | | | | | | | |
8.88%, 10/15/2020—144A | | $ | 3,210 | | | $ | 3,146 | |
NOVA Chemicals Corp. | | | | | | | | |
8.63%, 11/01/2019 | | | 2,650 | | | | 3,001 | |
Commercial Banks—0.6% | | | | | | | | |
CIT Group, Inc. | | | | | | | | |
4.25%, 08/15/2017 | | | 1,500 | | | | 1,539 | |
5.00%, 05/15/2017—08/15/2022 | | | 2,260 | | | | 2,350 | |
5.25%, 03/15/2018 | | | 583 | | | | 619 | |
Commercial Services & Supplies—2.7% | | | | | | | | |
Ceridian Corp. | | | | | | | | |
8.88%, 07/15/2019—144A ^ | | | 5,306 | | | | 5,624 | |
11.25%, 11/15/2015 ^ | | | 3,330 | | | | 3,247 | |
12.25%, 11/15/2015 W | | | 892 | | | | 877 | |
EnergySolutions, Inc. / EnergySolutions LLC | | | | | | | | |
10.75%, 08/15/2018 | | | 2,920 | | | | 2,708 | |
HDTFS, Inc. | | | | | | | | |
5.88%, 10/15/2020—144A ^ | | | 663 | | | | 670 | |
KAR Auction Services, Inc. | | | | | | | | |
4.31%, 05/01/2014 * | | | 1,925 | | | | 1,925 | |
United Rentals North America, Inc. | | | | | | | | |
6.13%, 06/15/2023 | | | 700 | | | | 709 | |
UR Merger Sub Corp. | | | | | | | | |
7.38%, 05/15/2020—144A | | | 1,884 | | | | 2,039 | |
8.25%, 02/01/2021 | | | 850 | | | | 939 | |
Computers & Peripherals—0.7% | | | | | | | | |
Seagate HDD Cayman | | | | | | | | |
6.88%, 05/01/2020 | | | 4,371 | | | | 4,557 | |
Construction & Engineering—0.8% | | | | | | | | |
K. Hovnanian Enterprises, Inc. | | | | | | | | |
7.25%, 10/15/2020—144A | | | 1,990 | | | | 2,100 | |
7.50%, 05/15/2016 | | | 503 | | | | 479 | |
8.63%, 01/15/2017 | | | 1,146 | | | | 1,097 | |
9.13%, 11/15/2020—144A | | | 2,017 | | | | 2,098 | |
Consumer Finance—3.0% | | | | | | | | |
Ally Financial, Inc. | | | | | | | | |
4.63%, 06/26/2015 | | | 1,390 | | | | 1,444 | |
5.50%, 02/15/2017 | | | 3,928 | | | | 4,157 | |
6.75%, 12/01/2014 ^ | | | 2,350 | | | | 2,532 | |
Springleaf Finance Corp. | | | | | | | | |
5.40%, 12/01/2015 | | | 1,040 | | | | 972 | |
6.90%, 12/15/2017 ^ | | | 13,255 | | | | 11,664 | |
Containers & Packaging—1.9% | | | | | | | | |
Graphic Packaging International, Inc. | | | | | | | | |
7.88%, 10/01/2018 | | | 3,150 | | | | 3,481 | |
9.50%, 06/15/2017 | | | 1,300 | | | | 1,420 | |
Packaging Dynamics Corp. | | | | | | | | |
8.75%, 02/01/2016—144A | | | 3,110 | | | | 3,273 | |
Sealed Air Corp. | | | | | | | | |
8.13%, 09/15/2019—144A | | | 2,340 | | | | 2,556 | |
Tekni-Plex, Inc. | | | | | | | | |
9.75%, 06/01/2019—144A | | | 2,252 | | | | 2,410 | |
Diversified Consumer Services—0.6% | | | | | | | | |
Service Corp., International | | | | | | | | |
6.75%, 04/01/2015—04/01/2016 | | | 860 | | | | 949 | |
7.00%, 06/15/2017—05/15/2019 | | | 2,800 | | | | 3,128 | |
Diversified Financial Services—3.7% | | | | | | | | |
Bank of America Corp.—Series K | | | | | | | | |
8.00%, 01/30/2018 * ž | | | 2,951 | | | | 3,287 | |
| | | | |
| The notes to the financial statements are an integral part of this report. | | |
| Transamerica Funds | | | | Annual Report 2012 |
| | Page 66 | | |
Transamerica High Yield Bond
(formerly, Transamerica AEGON High Yield Bond)
SCHEDULE OF INVESTMENTS (continued)
At October 31, 2012
| | | | | | | | |
| | | Principal
(000’s) | | | Value
(000’s) | |
Diversified Financial Services (continued) | | | | | | | | |
Citigroup, Inc. | | | | | | | | |
5.95%, 01/30/2023 * ž | | $ | 3,450 | | | $ | 3,555 | |
CNH Capital LLC | | | | | | | | |
3.88%, 11/01/2015—144A | | | 414 | | | | 424 | |
Ford Motor Credit Co., LLC | | | | | | | | |
5.00%, 05/15/2018 | | | 950 | | | | 1,048 | |
General Motors Financial Co., Inc. | | | | | | | | |
4.75%, 08/15/2017—144A ^ | | | 1,884 | | | | 1,929 | |
International Lease Finance Corp. | | | | | | | | |
8.63%, 09/15/2015 | | | 5,500 | | | | 6,192 | |
JPMorgan Chase & Co.—Series 1 | | | | | | | | |
7.90%, 04/30/2018 * ž | | | 2,780 | | | | 3,202 | |
Marina District Finance Co., Inc. | | | | | | | | |
9.50%, 10/15/2015 ^ | | | 2,044 | | | | 2,067 | |
Nuveen Investments, Inc. | | | | | | | | |
9.13%, 10/15/2017—144A | | | 990 | | | | 989 | |
9.50%, 10/15/2020—144A | | | 1,980 | | | | 1,995 | |
Rivers Pittsburgh Borrower, LP/Rivers Pittsburgh Finance Corp. | | | | | | | | |
9.50%, 06/15/2019—144A | | | 970 | | | | 1,048 | |
Diversified Telecommunication Services—6.6% | | | | | | | | |
Cincinnati Bell, Inc. | | | | | | | | |
8.38%, 10/15/2020 ^ | | | 3,639 | | | | 3,912 | |
Frontier Communications Corp. | | | | | | | | |
9.00%, 08/15/2031 | | | 7,849 | | | | 8,378 | |
Hughes Satellite Systems Corp. | | | | | | | | |
6.50%, 06/15/2019 | | | 2,225 | | | | 2,381 | |
7.63%, 06/15/2021 | | | 1,050 | | | | 1,168 | |
Intelsat Jackson Holdings SA | | | | | | | | |
8.50%, 11/01/2019 | | | 1,320 | | | | 1,482 | |
Level 3 Communications, Inc. | | | | | | | | |
8.88%, 06/01/2019—144A ^ | | | 300 | | | | 315 | |
Level 3 Financing, Inc. | | | | | | | | |
8.13%, 07/01/2019 § | | | 6,440 | | | | 6,875 | |
PAETEC Holding Corp. | | | | | | | | |
8.88%, 06/30/2017 | | | 4,065 | | | | 4,380 | |
Sprint Capital Corp. | | | | | | | | |
8.75%, 03/15/2032 | | | 6,192 | | | | 7,306 | |
Wind Acquisition Finance SA | | | | | | | | |
7.25%, 02/15/2018—144A | | | 2,130 | | | | 2,077 | |
11.75%, 07/15/2017—144A | | | 500 | | | | 488 | |
Windstream Corp. | | | | | | | | |
7.50%, 04/01/2023 | | | 5,139 | | | | 5,409 | |
7.75%, 10/15/2020 | | | 2,441 | | | | 2,630 | |
Electric Utilities—3.0% | | | | | | | | |
Elwood Energy LLC | | | | | | | | |
8.16%, 07/05/2026 | | | 4,517 | | | | 4,625 | |
Homer City Funding LLC | | | | | | | | |
8.14%, 10/01/2019 Џ | | | 1,260 | | | | 1,379 | |
8.73%, 10/01/2026 Џ | | | 6,075 | | | | 6,653 | |
InterGen NV | | | | | | | | |
9.00%, 06/30/2017—144A | | | 2,000 | | | | 1,895 | |
LSP Energy, LP / LSP Batesville Funding Corp. | | | | | | | | |
7.16%, 01/15/2014 Ə Џ | | | 1,666 | | | | 1,666 | |
8.16%, 07/15/2025 Ə Џ | | | 750 | | | | 750 | |
Red Oak Power LLC—Series B | | | | | | | | |
9.20%, 11/30/2029 | | | 3,440 | | | | 3,732 | |
Electrical Equipment—0.3% | | | | | | | | |
Belden, Inc. | | | | | | | | |
5.50%, 09/01/2022—144A | | | 2,000 | | | | 2,035 | |
| | | | | | | | |
| | | Principal
(000’s) | | | Value
(000’s) | |
Electronic Equipment & Instruments—0.7% | | | | | | | | |
NXP BV / NXP Funding LLC | | | | | | | | |
9.75%, 08/01/2018—144A | | $ | 3,925 | | | $ | 4,582 | |
Energy Equipment & Services—2.6% | | | | | | | | |
Drill Rigs Holdings, Inc. | | | | | | | | |
6.50%, 10/01/2017—144A | | | 752 | | | | 748 | |
NuStar Logistics, LP | | | | | | | | |
4.80%, 09/01/2020 | | | 3,020 | | | | 2,957 | |
7.90%, 04/15/2018 | | | 4,101 | | | | 4,656 | |
Regency Energy Partners, LP / Regency Energy Finance Corp. | | | | | | | | |
6.88%, 12/01/2018 | | | 1,823 | | | | 1,960 | |
Seadrill, Ltd. | | | | | | | | |
5.63%, 09/15/2017—144A | | | 1,750 | | | | 1,750 | |
Stallion Oilfield Holdings, Ltd. | | | | | | | | |
10.50%, 02/15/2015 | | | 5,655 | | | | 6,023 | |
Food & Staples Retailing—1.2% | | | | | | | | |
Rite Aid Corp. | | | | | | | | |
7.50%, 03/01/2017 | | | 2,000 | | | | 2,055 | |
7.70%, 02/15/2027 | | | 721 | | | | 595 | |
10.25%, 10/15/2019 | | | 1,575 | | | | 1,799 | |
10.38%, 07/15/2016 ^ | | | 3,400 | | | | 3,587 | |
Food Products—1.2% | | | | | | | | |
Dole Food Co., Inc. | | | | | | | | |
8.00%, 10/01/2016—144A | | | 4,170 | | | | 4,352 | |
Harmony Foods Corp. | | | | | | | | |
10.00%, 05/01/2016—144A | | | 571 | | | | 608 | |
Post Holdings, Inc. | | | | | | | | |
7.38%, 02/15/2022—144A ^ | | | 1,920 | | | | 2,038 | |
Simmons Foods, Inc. | | | | | | | | |
10.50%, 11/01/2017—144A | | | 1,497 | | | | 1,276 | |
Gas Utilities—0.2% | | | | | | | | |
Star Gas Partners, LP / Star Gas Finance Co. | | | | | | | | |
8.88%, 12/01/2017 | | | 1,046 | | | | 1,088 | |
Health Care Equipment & Supplies—1.4% | | | | | | | | |
Accellent, Inc. | | | | | | | | |
10.00%, 11/01/2017 | | | 975 | | | | 746 | |
Biomet, Inc. | | | | | | | | |
6.50%, 08/01/2020—144A | | | 3,518 | | | | 3,632 | |
Hologic, Inc. | | | | | | | | |
6.25%, 08/01/2020—144A | | | 2,811 | | | | 2,980 | |
Kinetic Concepts, Inc. / KCI USA, Inc. | | | | | | | | |
10.50%, 11/01/2018—144A | | | 2,479 | | | | 2,640 | |
Health Care Providers & Services—6.0% | | | | | | | | |
CHS/Community Health Systems, Inc. | | | | | | | | |
7.13%, 07/15/2020 | | | 2,490 | | | | 2,633 | |
8.00%, 11/15/2019 | | | 7,900 | | | | 8,521 | |
DaVita, Inc. | | | | | | | | |
6.38%, 11/01/2018 ^ | | | 4,500 | | | | 4,804 | |
Fresenius Medical Care U.S. Finance II, Inc. | | | | | | | | |
5.63%, 07/31/2019—144A | | | 2,525 | | | | 2,658 | |
5.88%, 01/31/2022—144A | | | 700 | | | | 745 | |
GCB U.S. Oncology, Inc. (Escrow Shares) | | | | | | | | |
08/15/2017 | | | 4,970 | | | | 112 | |
HCA Holdings, Inc. | | | | | | | | |
7.75%, 05/15/2021 ^ | | | 1,499 | | | | 1,615 | |
HCA, Inc. | | | | | | | | |
6.50%, 02/15/2020 | | | 1,300 | | | | 1,437 | |
7.50%, 02/15/2022 | | | 6,074 | | | | 6,787 | |
7.88%, 02/15/2020 | | | 2,750 | | | | 3,073 | |
| | | | |
| The notes to the financial statements are an integral part of this report. | | |
| Transamerica Funds | | | | Annual Report 2012 |
| | Page 67 | | |
Transamerica High Yield Bond
(formerly, Transamerica AEGON High Yield Bond)
SCHEDULE OF INVESTMENTS (continued)
At October 31, 2012
| | | | | | | | |
| | | Principal
(000’s) | | | Value
(000’s) | |
Health Care Providers & Services (continued) | | | | | | | | |
HealthSouth Corp. | | | | | | | | |
7.75%, 09/15/2022 | | $ | 4,574 | | | $ | 5,009 | |
LifePoint Hospitals, Inc. | | | | | | | | |
6.63%, 10/01/2020 ^ | | | 4,200 | | | | 4,536 | |
Hotels, Restaurants & Leisure—6.4% | | | | | | | | |
Ameristar Casinos, Inc. | | | | | | | | |
7.50%, 04/15/2021—144A | | | 372 | | | | 398 | |
7.50%, 04/15/2021 ^ | | | 4,275 | | | | 4,574 | |
Caesars Entertainment Operating Co., Inc. | | | | | | | | |
10.00%, 12/15/2018 | | | 3,725 | | | | 2,328 | |
12.75%, 04/15/2018 | | | 6,500 | | | | 4,713 | |
CityCenter Holdings LLC / CityCenter Finance Corp. | | | | | | | | |
10.75%, 01/15/2017 ^ | | | 1,749 | | | | 1,849 | |
GWR Operating Partnership LLP | | | | | | | | |
10.88%, 04/01/2017 | | | 5,465 | | | | 6,230 | |
Mashantucket Western Pequot Tribe | | | | | | | | |
8.50%, 11/15/2015—144A Џ ‡ | | | 6,600 | | | | 792 | |
MGM Resorts International | | | | | | | | |
10.00%, 11/01/2016 ^ | | | 3,575 | | | | 4,076 | |
11.38%, 03/01/2018 | | | 7,814 | | | | 9,182 | |
Royal Caribbean Cruises, Ltd. | | | | | | | | |
7.25%, 06/15/2016 ^ | | | 1,475 | | | | 1,667 | |
Seneca Gaming Corp. | | | | | | | | |
8.25%, 12/01/2018—144A | | | 1,000 | | | | 1,054 | |
Viking Cruises, Ltd. | | | | | | | | |
8.50%, 10/15/2022—144A | | | 2,071 | | | | 2,138 | |
WMG Acquisition Corp. | | | | | | | | |
6.00%, 01/15/2021—144A | | | 2,918 | | | | 2,925 | |
Wynn Las Vegas LLC | | | | | | | | |
7.75%, 08/15/2020 ^ | | | 2,502 | | | | 2,808 | |
Household Durables—3.8% | | | | | | | | |
Beazer Homes USA, Inc. | | | | | | | | |
6.63%, 04/15/2018—144A | | | 3,100 | | | | 3,317 | |
9.13%, 06/15/2018 | | | 5,310 | | | | 5,570 | |
Jarden Corp. | | | | | | | | |
7.50%, 05/01/2017—01/15/2020 | | | 4,512 | | | | 4,991 | |
KB Home | | | | | | | | |
9.10%, 09/15/2017 | | | 3,816 | | | | 4,398 | |
Meritage Homes Corp. | | | | | | | | |
7.15%, 04/15/2020 | | | 3,646 | | | | 3,992 | |
Standard Pacific Corp. | | | | | | | | |
8.38%, 05/15/2018 ^ | | | 675 | | | | 786 | |
8.38%, 01/15/2021 | | | 2,725 | | | | 3,161 | |
Household Products—1.1% | | | | | | | | |
Reynolds Group Issuer, Inc. / Reynolds Group Issuer LLC / Reynolds Group Issuer Lu | | | | | | | | |
5.75%, 10/15/2020—144A | | | 745 | | | | 752 | |
6.88%, 02/15/2021 | | | 300 | | | | 319 | |
7.13%, 04/15/2019 | | | 5,923 | | | | 6,308 | |
Independent Power Producers & Energy Traders—2.1% | | | | | | | | |
Calpine Corp. | | | | | | | | |
7.25%, 10/15/2017—144A | | | 4,365 | | | | 4,626 | |
7.88%, 07/31/2020—144A | | | 1,725 | | | | 1,889 | |
Edison Mission Energy | | | | | | | | |
7.20%, 05/15/2019 | | | 3,650 | | | | 1,789 | |
NRG Energy, Inc. | | | | | | | | |
7.63%, 05/15/2019 | | | 1,950 | | | | 2,077 | |
7.88%, 05/15/2021 | | | 2,250 | | | | 2,464 | |
8.25%, 09/01/2020 ^ | | | 1,900 | | | | 2,095 | |
| | | | | | | | |
| | | Principal
(000’s) | | | Value
(000’s) | |
Insurance—1.6% | | | | | | | | |
Genworth Financial, Inc. | | | | | | | | |
6.15%, 11/15/2066 * | | $ | 3,584 | | | $ | 2,455 | |
Lincoln National Corp. | | | | | | | | |
7.00%, 05/17/2066 *^ | | | 8,350 | | | | 8,559 | |
IT Services—1.4% | | | | | | | | |
SunGard Data Systems, Inc. | | | | | | | | |
6.63%, 11/01/2019—144A | | | 1,000 | | | | 1,009 | |
7.38%, 11/15/2018 | | | 2,275 | | | | 2,448 | |
7.63%, 11/15/2020 ^ | | | 4,960 | | | | 5,388 | |
Unisys Corp. | | | | | | | | |
6.25%, 08/15/2017 ^ | | | 758 | | | | 792 | |
Media—7.4% | | | | | | | | |
Cablevision Systems Corp. | | | | | | | | |
7.75%, 04/15/2018 ^ | | | 2,225 | | | | 2,473 | |
8.63%, 09/15/2017 | | | 3,745 | | | | 4,372 | |
CCO Holdings LLC / CCO Holdings Capital Corp. | | | | | | | | |
6.50%, 04/30/2021 ^ | | | 800 | | | | 850 | |
7.00%, 01/15/2019 | | | 2,500 | | | | 2,688 | |
7.25%, 10/30/2017 ^ | | | 2,500 | | | | 2,731 | |
7.38%, 06/01/2020 ^ | | | 1,500 | | | | 1,680 | |
7.88%, 04/30/2018 ^ | | | 450 | | | | 486 | |
Cequel Communications Escrow 1 LLC / Cequel Communications Escrow Capital Corp. | | | | | | | | |
6.38%, 09/15/2020—144A | | | 755 | | | | 764 | |
Cequel Communications Holdings I LLC / Cequel Capital Corp. | | | | | | | | |
8.63%, 11/15/2017—144A | | | 3,000 | | | | 3,210 | |
Clear Channel Worldwide Holdings, Inc. | | | | | | | | |
7.63%, 03/15/2020 ^ | | | 5,851 | | | | 5,573 | |
9.25%, 12/15/2017 | | | 475 | | | | 509 | |
Clear Channel Worldwide Holdings, Inc.
Series A | | | | | | | | |
7.63%, 03/15/2020 | | | 500 | | | | 471 | |
Clear Channel Worldwide Holdings, Inc.
Series B | | | | | | | | |
9.25%, 12/15/2017 | | | 6,250 | | | | 6,703 | |
DISH DBS Corp. | | | | | | | | |
4.63%, 07/15/2017 | | | 5,072 | | | | 5,231 | |
5.88%, 07/15/2022 | | | 983 | | | | 1,032 | |
7.13%, 02/01/2016 | | | 1,000 | | | | 1,118 | |
7.75%, 05/31/2015 ^ | | | 468 | | | | 527 | |
7.88%, 09/01/2019 | | | 1,700 | | | | 1,993 | |
Nara Cable Funding, Ltd. | | | | | | | | |
8.88%, 12/01/2018—144A | | | 1,510 | | | | 1,427 | |
ONO Finance II PLC | | | | | | | | |
10.88%, 07/15/2019—144A | | | 1,500 | | | | 1,305 | |
Univision Communications, Inc. | | | | | | | | |
7.88%, 11/01/2020—144A | | | 2,915 | | | | 3,090 | |
8.50%, 05/15/2021—144A ^ | | | 3,985 | | | | 4,005 | |
Metals & Mining—0.7% | | | | | | | | |
AK Steel Corp. | | | | | | | | |
8.38%, 04/01/2022 ^ | | | 2,467 | | | | 2,085 | |
American Gilsonite Co. | | | | | | | | |
11.50%, 09/01/2017—144A | | | 565 | | | | 588 | |
FMG Resources August 2006 Pty, Ltd. | | | | | | | | |
8.25%, 11/01/2019—144A ^ | | | 2,490 | | | | 2,489 | |
Multiline Retail—0.7% | | | | | | | | |
JC Penney Corp., Inc. | | | | | | | | |
7.13%, 11/15/2023 ^ | | | 3,375 | | | | 3,312 | |
7.40%, 04/01/2037 | | | 1,350 | | | | 1,286 | |
| | | | |
| The notes to the financial statements are an integral part of this report. | | |
| Transamerica Funds | | | | Annual Report 2012 |
| | Page 68 | | |
Transamerica High Yield Bond
(formerly, Transamerica AEGON High Yield Bond)
SCHEDULE OF INVESTMENTS (continued)
At October 31, 2012
| | | | | | | | |
| | | Principal
(000’s) | | | Value
(000’s) | |
Oil, Gas & Consumable Fuels—6.1% | | | | | | | | |
Chesapeake Energy Corp. | | | | | | | | |
6.63%, 08/15/2020 § | | $ | 2,035 | | | $ | 2,137 | |
Connacher Oil and Gas, Ltd. | | | | | | | | |
8.50%, 08/01/2019—144A ^ | | | 1,680 | | | | 1,382 | |
CONSOL Energy, Inc. | | | | | | | | |
6.38%, 03/01/2021 ^ | | | 540 | | | | 537 | |
8.00%, 04/01/2017 ^ | | | 750 | | | | 793 | |
8.25%, 04/01/2020 ^ | | | 2,000 | | | | 2,120 | |
Continental Resources, Inc. | | | | | | | | |
7.13%, 04/01/2021 | | | 650 | | | | 731 | |
8.25%, 10/01/2019 | | | 2,460 | | | | 2,774 | |
El Paso LLC | | | | | | | | |
7.25%, 06/01/2018 | | | 5,475 | | | | 6,322 | |
Energy Transfer Equity, LP | | | | | | | | |
7.50%, 10/15/2020 ^ | | | 5,121 | | | | 5,825 | |
Kinder Morgan Finance Co., ULC | | | | | | | | |
5.70%, 01/05/2016 | | | 2,160 | | | | 2,365 | |
Linn Energy LLC / Linn Energy Finance Corp. | | | | | | | | |
6.25%, 11/01/2019—144A ^ | | | 2,300 | | | | 2,300 | |
7.75%, 02/01/2021 | | | 1,740 | | | | 1,857 | |
8.63%, 04/15/2020 | | | 2,340 | | | | 2,559 | |
Newfield Exploration Co. | | | | | | | | |
5.63%, 07/01/2024 | | | 677 | | | | 723 | |
6.88%, 02/01/2020 | | | 1,238 | | | | 1,340 | |
7.13%, 05/15/2018 | | | 295 | | | | 310 | |
Plains Exploration & Production Co. | | | | | | | | |
6.13%, 06/15/2019 | | | 1,960 | | | | 1,955 | |
6.50%, 11/15/2020 ^ | | | 2,118 | | | | 2,118 | |
6.75%, 02/01/2022 | | | 1,215 | | | | 1,221 | |
SM Energy Co. | | | | | | | | |
6.50%, 11/15/2021—01/01/2023 | | | 2,890 | | | | 3,037 | |
Paper & Forest Products—0.5% | | | | | | | | |
Ainsworth Lumber Co., Ltd. | | | | | | | | |
11.00%, 07/29/2015—144A | | | 1,044 | | | | 1,016 | |
Boise Cascade LLC/Boise Cascade Finance Corp. | | | | | | | | |
6.38%, 11/01/2020—144A ^ | | | 2,698 | | | | 2,738 | |
Pharmaceuticals—1.3% | | | | | | | | |
Mylan, Inc. | | | | | | | | |
6.00%, 11/15/2018—144A | | | 2,355 | | | | 2,507 | |
7.88%, 07/15/2020—144A | | | 1,695 | | | | 1,913 | |
Valeant Pharmaceuticals International, Inc. | | | | | | | | |
6.75%, 08/15/2021—144A ^ | | | 2,170 | | | | 2,306 | |
6.88%, 12/01/2018—144A | | | 1,100 | | | | 1,173 | |
7.00%, 10/01/2020—144A | | | 900 | | | | 969 | |
Real Estate Investment Trusts—1.1% | | | | | | | | |
Entertainment Properties Trust | | | | | | | | |
5.75%, 08/15/2022 | | | 2,686 | | | | 2,815 | |
Host Hotels & Resorts, LP | | | | | | | | |
5.88%, 06/15/2019 | | | 700 | | | | 770 | |
6.00%, 10/01/2021 | | | 3,000 | | | | 3,480 | |
9.00%, 05/15/2017 | | | 450 | | | | 488 | |
Real Estate Management & Development—1.0% | | | | | | | | |
Algeco Scotsman Global Finance PLC | | | | | | | | |
8.50%, 10/15/2018—144A ^ | | | 3,415 | | | | 3,518 | |
Realogy Corp. | | | | | | | | |
11.50%, 04/15/2017 § | | | 2,890 | | | | 3,121 | |
Road & Rail—1.8% | | | | | | | | |
Aviation Capital Group Corp. | | | | | | | | |
6.75%, 04/06/2021—144A | | | 2,497 | | | | 2,594 | |
7.13%, 10/15/2020—144A | | | 1,255 | | | | 1,319 | |
| | | | | | | | |
| | | Principal
(000’s) | | | Value
(000’s) | |
Road & Rail (continued) | | | | | | | | |
Avis Budget Car Rental LLC / Avis Budget Finance, Inc. | | | | | | | | |
8.25%, 01/15/2019 ^ | | $ | 1,035 | | | $ | 1,129 | |
9.75%, 03/15/2020 | | | 3,605 | | | | 4,105 | |
Hertz Corp. | | | | | | | | |
6.75%, 04/15/2019 ^ | | | 2,000 | | | | 2,123 | |
7.50%, 10/15/2018 | | | 900 | | | | 977 | |
Semiconductors & Semiconductor Equipment—0.8% | | | | | | | | |
Freescale Semiconductor, Inc. | | | | | | | | |
9.25%, 04/15/2018—144A | | | 2,900 | | | | 3,103 | |
10.13%, 03/15/2018—144A | | | 2,138 | | | | 2,309 | |
Software—1.6% | | | | | | | | |
First Data Corp. | | | | | | | | |
6.75%, 11/01/2020—144A | | | 3,650 | | | | 3,650 | |
8.75%, 01/15/2022—144A ^ | | | 2,717 | | | | 2,744 | |
12.63%, 01/15/2021 | | | 4,418 | | | | 4,562 | |
Specialty Retail—1.0% | | | | | | | | |
Brookstone Co., Inc. | | | | | | | | |
13.00%, 10/15/2014—144A | | | 1,570 | | | | 1,450 | |
Claire’s Stores, Inc. | | | | | | | | |
9.00%, 03/15/2019—144A | | | 3,628 | | | | 3,788 | |
9.25%, 06/01/2015 | | | 135 | | | | 122 | |
9.63%, 06/01/2015 | | | 1,968 | | | | 1,788 | |
Textiles, Apparel & Luxury Goods—1.6% | | | | | | | | |
Jones Group, Inc. | | | | | | | | |
6.13%, 11/15/2034 | | | 6,897 | | | | 5,803 | |
Levi Strauss & Co. | | | | | | | | |
6.88%, 05/01/2022 ^ | | | 3,985 | | | | 4,139 | |
PVH Corp. | | | | | | | | |
7.38%, 05/15/2020 ^ | | | 1,175 | | | | 1,316 | |
Tobacco—0.1% | | | | | | | | |
North Atlantic Trading Co. | | | | | | | | |
11.50%, 07/15/2016—144A | | | 370 | | | | 374 | |
Wireless Telecommunication Services—2.0% | | | | | | | | |
Cricket Communications, Inc. | | | | | | | | |
7.75%, 05/15/2016 | | | 3,508 | | | | 3,710 | |
7.75%, 10/15/2020 ^ | | | 2,257 | | | | 2,328 | |
SBA Communications Corp. | | | | | | | | |
5.63%, 10/01/2019—144A | | | 575 | | | | 584 | |
Sprint Nextel Corp. | | | | | | | | |
8.38%, 08/15/2017 ^ | | | 6,040 | | | | 7,006 | |
| | | | | | | | |
Total Corporate Debt Securities (cost $607,058) | | | | | | | 629,643 | |
| | | | | | | | |
STRUCTURED NOTES DEBT—0.8% | | | | | | | | |
Commercial Banks—0.8% | | | | | | | | |
Goldman Sachs Capital II | | | | | | | | |
4.00%, 06/01/2043 * | | | 6,795 | | | | 5,371 | |
Total Structured Notes Debt (cost $4,603) | | | | | | | | |
| | |
LOAN ASSIGNMENTS—0.7% | | | | | | | | |
Communications Equipment—0.1% | | | | | | | | |
Sorenson Communications, Inc. | | | | | | | | |
6.00%, 08/16/2013 * § | | | 952 | | | | 935 | |
Diversified Telecommunication Services—0.4% | | | | | | | | |
Level 3 Financing, Inc. | | | | | | | | |
4.75%, 02/01/2016 * | | | 2,600 | | | | 2,631 | |
Oil, Gas & Consumable Fuels—0.1% | | | | | | | | |
Chesapeake Energy Corp. | | | | | | | | |
8.50%, 12/01/2017 * | | | 610 | | | | 610 | |
| | | | |
| The notes to the financial statements are an integral part of this report. | | |
| Transamerica Funds | | | | Annual Report 2012 |
| | Page 69 | | |
Transamerica High Yield Bond
(formerly, Transamerica AEGON High Yield Bond)
SCHEDULE OF INVESTMENTS (continued)
At October 31, 2012
| | | | | | | | |
| | | Principal
(000’s) | | | Value
(000’s) | |
Real Estate Management & Development—0.1% | | | | | | | | |
Realogy Corp. | | | | | | | | |
—, 10/10/2016 * ь | | $ | 900 | | | $ | 897 | |
| | | | | | | | |
Total Loan Assignments (cost $4,997) | | | | | | | 5,073 | |
| | | | | | | | |
| | |
| | | Shares | | | Value
(000’s) | |
PREFERRED STOCKS—2.3% | | | | | | | | |
Consumer Finance—1.1% | | | | | | | | |
Ally Financial, Inc., 7.00%—144A | | | 3,053 | | | | 2,942 | |
Ally Financial, Inc., 8.50% * | | | 199,750 | | | | 5,004 | |
Diversified Financial Services—0.5% | | | | | | | | |
GMAC Capital Trust I, 8.13% * | | | 132,475 | | | | 3,463 | |
Insurance—0.7% | | | | | | | | |
Hartford Financial Services Group, Inc., | | | | | | | | |
7.88% * ‡ ^ | | | 164,681 | | | | 4,672 | |
| | | | | | | | |
Total Preferred Stocks (cost $13,646) | | | | | | | 16,081 | |
| | | | | | | | |
COMMON STOCKS—1.1% | | | | | | | | |
Automobiles—0.1% | | | | | | | | |
General Motors Co. ‡ ^ | | | 11,558 | | | | 295 | |
Motors Liquidation Co. GUC Trust ‡ | | | 2,901 | | | | 58 | |
Independent Power Producers & Energy Traders—0.8% | | | | | | | | |
Dynegy, Inc. ‡ ^ | | | 341,179 | | | | 6,379 | |
IT Services—0.2% | | | | | | | | |
Unisys Corp. ‡ ^ | | | 61,972 | | | | 1,057 | |
| | | | | | | | |
Total Common Stocks (cost $13,045) | | | | | | | 7,789 | |
| | | | | | | | |
| | | | | | | | |
| | | Shares | | | Value
(000’s) | |
WARRANTS—0.0% ¥ | | | | | | | | |
Automobiles—0.0% ¥ | | | | | | | | |
General Motors Co. ‡ | | | | | | | | |
Expiration: 07/10/2019 | | | | | | | | |
Exercise Price: $18.33 | | | 203 | | | $ | 2 | |
General Motors Co. ‡ | | | | | | | | |
Expiration: 07/10/2016 | | | | | | | | |
Exercise Price: $10.00 | | | 203 | | | | 3 | |
| | | | | | | | |
Total Warrants (cost $—) | | | | | | | 5 | |
| | | | | | | | |
SECURITIES LENDING COLLATERAL—15.0% | | | | | | | | |
State Street Navigator Securities Lending Trust—Prime Portfolio, 0.31% p | | | 104,412,013 | | | | 104,412 | |
Total Securities Lending Collateral (cost $104,412) | | | | | |
| | |
| | | Principal
(000’s) | | | Value
(000’s) | |
REPURCHASE AGREEMENT—5.0% | | | | | | | | |
State Street Bank & Trust Co. 0.03% p, dated 10/31/2012, to be repurchased at $34,635 on 11/01/2012. Collateralized by a U.S. Government Agency Obligation, 4.00%, due 08/01/2026, and with a value of $35,329. | | $ | 34,635 | | | | 34,635 | |
| | | | | | | | |
| | |
Total Repurchase Agreement (cost $34,635) | | | | | | | | |
Total Investment Securities (cost $782,396) P | | | | | | | 803,009 | |
Other Assets and Liabilities—Net | | | | | | | (106,586 | ) |
| | | | | | | | |
Net Assets | | | | | | $ | 696,423 | |
| | | | | | | | |
NOTES TO SCHEDULE OF INVESTMENTS (all amounts in thousands):
| ^ | All or a portion of this security is on loan. The value of all securities on loan is $102,073. |
| Ə | Fair valued as determined in good faith in accordance with procedures established by the Board of Trustees. Total aggregate market value of fair valued securities is $2,416, or 0.35% of the fund’s net assets. |
| * | Floating or variable rate note. Rate is listed as of 10/31/2012. |
| ž | The security has a perpetual maturity. The date shown is the next call date. |
| ‡ | Non-income producing security. |
| ¥ | Percentage rounds to less than 0.1%. |
| p | Rate shown reflects the yield at 10/31/2012. |
| Payment in-kind. Securities pay interest or dividends in the form of additional bonds or preferred stock. |
| ¿ | Amount rounds to less than 1. |
| § | Illiquid. Total aggregate market value of illiquid securities is $13,068, or 1.88% of the fund’s net assets. |
| ь | All or a portion of this security represents unsettled loan commitment at 10/31/2012 where the rate will be determined at time of settlement. |
| P | Aggregate cost for federal income tax purposes is $782,498. Aggregate gross unrealized appreciation/depreciation for all securities in which there is an excess of value over tax cost were $37,794 and 17,283, respectively. Net unrealized appreciation for tax purposes is $20,511. |
DEFINITION (all amounts in thousands):
| | |
144A | | 144A Securities are registered pursuant to Rule 144A of the Securities Act of 1933. These securities are deemed to be liquid for purposes of compliance limitations on holdings of illiquid securities and may be resold as transactions exempt from registration, normally to qualified institutional buyers. At 10/31/2012, these securities aggregated $152,007, or 21.83% of the fund’s net assets. |
| | | | |
| The notes to the financial statements are an integral part of this report. | | |
| Transamerica Funds | | | | Annual Report 2012 |
| | Page 70 | | |
Transamerica High Yield Bond
(formerly, Transamerica AEGON High Yield Bond)
SCHEDULE OF INVESTMENTS (continued)
At October 31, 2012
VALUATION SUMMARY (all amounts in thousands): '
| | | | | | | | | | | | | | | | |
Investment Securities | | Level 1 -
Quoted
Prices | | | Level 2 -
Other
Significant
Observable
Inputs | | | Level 3 -
Significant
Unobservable
Inputs | | | Value at
10/31/2012 | |
Common Stocks | | $ | 7,789 | | | $ | — | | | $ | — | | | $ | 7,789 | |
Corporate Debt Securities | | | — | | | | 629,643 | | | | ¿ | | | | 629,643 | |
Loan Assignments | | | — | | | | 5,073 | | | | — | | | | 5,073 | |
Preferred Stocks | | | 16,081 | | | | — | | | | — | | | | 16,081 | |
Repurchase Agreement | | | — | | | | 34,635 | | | | — | | | | 34,635 | |
Securities Lending Collateral | | | 104,412 | | | | — | | | | — | | | | 104,412 | |
Structured Notes Debt | | | — | | | | 5,371 | | | | — | | | | 5,371 | |
Warrants | | | 5 | | | | — | | | | — | | | | 5 | |
| | | | | | | | | | | | | | | | |
Total | | $ | 128,287 | | | $ | 674,722 | | | $ | — | | | $ | 803,009 | |
| | | | | | | | | | | | | | | | |
Level 3 Rollforward—Investment Securities
| | | | | | | | | | | | | | | | | | | | | | | | | | | | | | | | | | | | | | | | |
Securities | | Beginning
Balance at
10/31/2011 | | | Purchases | | | Sales | | | Accrued
Discounts/
(Premiums) | | | Total
Realized
Gain/
(Loss) | | | Net Change in
Unrealized
Appreciation/
(Depreciation) ƒ | | | Transfers
into
Level 3 | | | Transfers
out of
Level 3 | | | Ending
Balance at
10/31/2012
₪ | | | Net Change in
Unrealized
Appreciation/
(Depreciation)
on Investments
Held at
10/31/2012 ƒ | |
Corporate Debt Securities | | $ | ¿ | | | $ | — | | | $ | — | | | $ | — | | | $ | — | | | $ | — | | | $ | — | | | $ | — | | | $ | ¿ | | | $ | — | |
| ' | Transfers between levels are considered to have occurred at the end of the reporting period. There were no transfers into or out of Levels 1 and 2 during the period ended 10/31/2012. See the notes to the financial statements for more information regarding pricing inputs and valuation techniques. |
| ƒ | Any difference between Net Change in Unrealized Appreciation/(Depreciation) and Net Change in Unrealized Appreciation/(Depreciation) on Investments Held at 10/31/2012 may be due to an investment no longer held or categorized as Level 3 at period end. |
| ₪ | Inputs used in the valuation of the Level 3 securities were not considered significant unobservable inputs. |
| | | | |
| The notes to the financial statements are an integral part of this report. | | |
| Transamerica Funds | | | | Annual Report 2012 |
| | Page 71 | | |
Transamerica International Bond
(formerly, Transamerica JPMorgan International Bond)
SCHEDULE OF INVESTMENTS
At October 31, 2012
| | | | | | | | |
| | | Principal
(000’s) | | | Value
(000’s) | |
FOREIGN GOVERNMENT OBLIGATIONS—72.9% | | | | | |
Australia—1.4% | | | | | | | | |
New South Wales Treasury Corp. | | | | | | | | |
5.50%, 03/01/2017 | | | AUD2,450 | | | $ | 2,782 | |
Austria—1.7% | | | | | | | | |
Austria Government Bond | | | | | | | | |
3.20%, 02/20/2017—144A | | | EUR2,330 | | | | 3,339 | |
Belgium—2.9% | | | | | | | | |
Belgium Government Bond | | | | | | | | |
4.00%, 03/28/2018 | | | 2,470 | | | | 3,646 | |
4.25%, 09/28/2021 | | | 1,350 | | | | 2,033 | |
Brazil—1.4% | | | | | | | | |
Brazil Notas do Tesouro Nacional | | | | | | | | |
10.00%, 01/01/2013 | | | BRL5,480 | | | | 2,708 | |
Canada—4.6% | | | | | | | | |
Canadian Government Bond | | | | | | | | |
2.50%, 06/01/2015 | | | CAD900 | | | | 933 | |
3.25%, 06/01/2021 | | | 5,670 | | | | 6,394 | |
5.00%, 06/01/2037 | | | 590 | | | | 874 | |
5.75%, 06/01/2033 | | | 383 | | | | 596 | |
Denmark—1.0% | | | | | | | | |
Denmark Government Bond | | | | | | | | |
4.00%, 11/15/2019 | | | DKK9,050 | | | | 1,909 | |
France—7.3% | | | | | | | | |
Caisse d’Amortissement de la Dette Sociale | | | | | | | | |
3.75%, 09/08/2014 | | | GBP1,000 | | | | 1,697 | |
3.75%, 10/25/2020 | | | EUR1,220 | | | | 1,789 | |
France Government Bond O.A.T. | | | | | | | | |
3.00%, 04/25/2022 | | | EUR4,100 | | | | 5,700 | |
4.50%, 04/25/2041 | | | 1,600 | | | | 2,591 | |
5.75%, 10/25/2032 | | | 1,368 | | | | 2,510 | |
Germany—8.3% | | | | | | | | |
Bundesrepublik Deutschland | | | | | | | | |
1.75%, 07/04/2022 | | | 8,700 | | | | 11,588 | |
4.00%, 01/04/2037 | | | 2,600 | | | | 4,462 | |
Italy—8.3% | | | | | | | | |
Italy Buoni Poliennali del Tesoro | | | | | | | | |
4.00%, 09/01/2020—02/01/2037 | | | 8,525 | | | | 10,365 | |
4.25%, 08/01/2014 | | | 2,500 | | | | 3,346 | |
5.25%, 08/01/2017 | | | 1,800 | | | | 2,487 | |
Japan—20.4% | | | | | | | | |
10-Year Japan Government Bond | | | | | | | | |
1.10%, 06/20/2021 | | | JPY330,000 | | | | 4,298 | |
Japan Government Bond | | | | | | | | |
1.30%, 03/20/2015 | | | 1,024,000 | | | | 13,191 | |
2.10%, 12/20/2026—09/20/2028 | | | 799,900 | | | | 11,067 | |
2.20%, 09/20/2039—03/20/2041 | | | 812,000 | | | | 10,821 | |
Mexico—0.5% | | | | | | | | |
United Mexican States | | | | | | | | |
9.50%, 12/18/2014 | | | MXN11,000 | | | | 916 | |
Netherlands—2.5% | | | | | | | | |
Netherlands Government Bond | | | | | | | | |
3.25%, 07/15/2015—07/15/2021—144A | | | EUR2,160 | | | | 3,107 | |
3.75%, 01/15/2042—144A | | | 335 | | | | 548 | |
4.50%, 07/15/2017—144A | | | 560 | | | | 852 | |
5.50%, 01/15/2028—144A | | | 175 | | | | 322 | |
Spain—4.1% | | | | | | | | |
Spain Government Bond | | | | | | | | |
3.00%, 04/30/2015 | | | 1,300 | | | | 1,670 | |
3.15%, 01/31/2016 | | | 500 | | | | 636 | |
4.60%, 07/30/2019 | | | 3,030 | | | | 3,851 | |
4.90%, 07/30/2040 | | | 710 | | | | 738 | |
5.50%, 07/30/2017 | | | 750 | | | | 1,017 | |
| | | | | | | | |
| | | Principal
(000’s) | | | Value
(000’s) | |
Supranational—3.5% | | | | | | | | |
European Investment Bank | | | | | | | | |
3.13%, 10/15/2015 | | | EUR1,900 | | | $ | 2,662 | |
4.25%, 10/15/2014 | | | 2,875 | | | | 4,022 | |
Sweden—1.2% | | | | | | | | |
Sweden Government Bond | | | | | | | | |
4.50%, 08/12/2015 | | | SEK14,000 | | | | 2,322 | |
United Kingdom—3.8% | | | | | | | | |
United Kingdom Gilt | | | | | | | | |
4.25%, 06/07/2032 | | | GBP615 | | | | 1,222 | |
4.50%, 12/07/2042 | | | 3,030 | | | | 6,211 | |
| | | | | | | | |
Total Foreign Government Obligations (cost $135,372) | | | | | | | 141,222 | |
| | | | | | | | |
MORTGAGE-BACKED SECURITY—1.4% | | | | | | | | |
Spain—1.4% | | | | | | | | |
Union de Creditos Inmobiliarios | | | | | | | | |
Series 15, Class A—Reg S | | | | | | | | |
0.39%, 12/18/2048 * § | | | EUR3,401 | | | | 2,773 | |
Total Mortgage-Backed Security (cost $4,617) | | | | | | | | |
CORPORATE DEBT SECURITIES—21.9% | | | | | |
Australia—2.1% | | | | | | | | |
Commonwealth Bank of Australia | | | | | | | | |
2.63%, 01/12/2017—Reg S | | | 1,400 | | | | 1,939 | |
Suncorp-Metway, Ltd. | | | | | | | | |
4.00%, 01/16/2014 | | | GBP1,290 | | | | 2,164 | |
Canada—0.4% | | | | | | | | |
Toronto-Dominion Bank | | | | | | | | |
5.38%, 05/14/2015 | | | EUR600 | | | | 866 | |
Finland—1.1% | | | | | | | | |
Nordea Bank Finland PLC | | | | | | | | |
2.25%, 11/16/2015 | | | 1,600 | | | | 2,174 | |
France—2.4% | | | | | | | | |
BNP Paribas Home Loan SFH | | | | | | | | |
3.38%, 01/12/2017 | | | 1,600 | | | | 2,278 | |
Cie de Financement Foncier SA | | | | | | | | |
4.75%, 06/25/2015 ^ | | | 1,600 | | | | 2,286 | |
Germany—3.8% | | | | | | | | |
KFW | | | | | | | | |
2.05%, 02/16/2026 | | | JPY99,000 | | | | 1,381 | |
2.60%, 06/20/2037 | | | 112,000 | | | | 1,609 | |
5.50%, 12/07/2015 | | | GBP2,350 | | | | 4,338 | |
Netherlands—4.1% | | | | | | | | |
Fortis Bank Nederland NV | | | | | | | | |
3.38%, 05/19/2014 | | | EUR2,200 | | | | 2,989 | |
ING Bank NV | | | | | | | | |
3.00%, 09/30/2014 | | | 1,550 | | | | 2,105 | |
LeasePlan Corp. NV | | | | | | | | |
3.25%, 05/22/2014 | | | 2,050 | | | | 2,779 | |
Norway—2.1% | | | | | | | | |
Sparebank 1 Boligkreditt AS | | | | | | | | |
2.50%, 06/23/2015 | | | 1,500 | | | | 2,042 | |
Sparebanken Vest Boligkreditt AS | | | | | | | | |
2.50%, 06/09/2015 | | | 1,400 | | | | 1,898 | |
Sweden—1.4% | | | | | | | | |
Stadshypotek AB | | | | | | | | |
2.75%, 04/30/2015 | | | 2,000 | | | | 2,735 | |
Switzerland—1.2% | | | | | | | | |
Credit Suisse AG | | | | | | | | |
2.63%, 12/01/2015 | | | 1,700 | | | | 2,341 | |
United Kingdom—3.3% | | | | | | | | |
Abbey National Treasury Services PLC | | | | | | | | |
3.38%, 06/08/2015 | | | 1,250 | | | | 1,726 | |
| | | | |
| The notes to the financial statements are an integral part of this report. | | |
| Transamerica Funds | | | | Annual Report 2012 |
| | Page 72 | | |
Transamerica International Bond
(formerly, Transamerica JPMorgan International Bond)
SCHEDULE OF INVESTMENTS (continued)
At October 31, 2012
| | | | | | | | |
| | | Principal
(000’s) | | | Value
(000’s) | |
United Kingdom (continued) | | | | | | | | |
Bank of Scotland PLC | | | | | | | | |
4.75%, 01/26/2015 | | | EUR800 | | | $ | 1,132 | |
Barclays Bank PLC | | | | | | | | |
3.63%, 04/13/2016 | | | 1,400 | | | | 1,992 | |
Royal Bank of Scotland PLC | | | | | | | | |
4.00%, 03/15/2016—Reg S | | | 1,150 | | | | 1,644 | |
| | | | | | | | |
Total Corporate Debt Securities (cost $41,395) | | | | | | | 42,418 | |
| | | | | | | | |
SECURITIES LENDING COLLATERAL—1.1% | | | | | | | | |
State Street Navigator Securities Lending Trust—Prime Portfolio, 0.31% | | | 2,223,150 | | | | 2,223 | |
Total Securities Lending Collateral (cost $2,223) | | | | | | | | |
| | | | | | | | |
| | | Principal
(000’s) | | | Value
(000’s) | |
REPURCHASE AGREEMENT—1.9% | | | | | | | | |
State Street Bank & Trust Co. 0.03% , dated 10/31/2012, to be repurchased at $3,685 on 11/01/2012. Collateralized by a U.S. Government Agency Obligation, 3.00%, due 12/01/2026, and with a value of $3,763. | | $ | 3,685 | | | $ | 3,685 | |
| | | | | | | | |
Total Repurchase Agreement (cost $34,635) | | | | | | | | |
Total Investment Securities (cost $187,292) P | | | | | | | 192,321 | |
Other Assets and Liabilities—Net | | | | | | | 1,459 | |
| | | | | | | | |
Net Assets | | | | | | $ | 193,780 | |
| | | | | | | | |
| | | | | | | | |
INVESTMENTS BY INDUSTRY (unaudited): | | Percentage of
Total Investment
Securities | | | Value
(000’s) | |
Foreign Government Obligations | | | 73.4 | % | | $ | 141,222 | |
Commercial Banks | | | 16.1 | | | | 30,958 | |
Diversified Financial Services | | | 4 .8 | | | | 9,296 | |
Mortgage-Backed Security | | | 1 .5 | | | | 2,773 | |
Insurance | | | 1 .1 | | | | 2,164 | |
| | | | | | | | |
Investment Securities, at Value | | | 96.9 | | | | 186,413 | |
Short-Term Investments | | | 3 .1 | | | | 5,908 | |
| | | | | | | | |
Total Investments | | | 100.0 | % | | $ | 192,321 | |
| | | | | | | | |
FUTURES CONTRACTS: g
| | | | | | | | | | | | | | | | |
Description | | Type | | | Contracts | | | Expiration
Date | | | Unrealized
Appreciation
(Depreciation)
(000’s) | |
10-Year Government of Canada Bond | | | Short | | | | (38 | ) | | | 12/18/2012 | | | $ | (40 | ) |
10-Year Japan Government Bond | | | Long | | | | 23 | | | | 12/11/2012 | | | | 91 | |
3-Year Australian Treasury Bond | | | Long | | | | 4 | | | | 12/17/2012 | | | | ¨ | |
German Euro BOBL | | | Short | | | | (24 | ) | | | 12/06/2012 | | | | (¨ | ) |
German Euro Bund | | | Short | | | | (98 | ) | | | 12/06/2012 | | | | 68 | |
German Euro Schatz | | | Short | | | | (223 | ) | | | 12/06/2012 | | | | 41 | |
U.K. Long Gilt Bond | | | Long | | | | 51 | | | | 12/27/2012 | | | | (91 | ) |
| | | | | | | | | | | | | | | | |
| | | | | | | | | | | | | | $ | 69 | |
| | | | | | | | | | | | | | | | |
FORWARD FOREIGN CURRENCY CONTRACTS:
| | | | | | | | | | | | | | | | | | |
Currency | | Counterparty | | Contracts
Bought
(Sold)
(000’s) | | | Settlement
Date | | | Amount in U.S.
Dollars Bought
(Sold)
(000’s) | | | Net Unrealized
Appreciation
(Depreciation)
(000’s) | |
AUD | | BCLY | | | 324 | | | | 12/06/2012 | | | $ | 333 | | | $ | 2 | |
AUD | | GSC | | | (2,553 | ) | | | 12/06/2012 | | | | (2,639 | ) | | | (3 | ) |
BRL | | CITI | | | (6,494 | ) | | | 12/06/2012 | | | | (3,172 | ) | | | (10 | ) |
CAD | | TDB | | | (1,123 | ) | | | 12/06/2012 | | | | (1,143 | ) | | | 20 | |
DKK | | RBS | | | (1,950 | ) | | | 12/06/2012 | | | | (338 | ) | | | (1 | ) |
EUR | | BNP | | | 2,300 | | | | 12/06/2012 | | | | 2,969 | | | | 13 | |
EUR | | CITI | | | (36,097 | ) | | | 12/06/2012 | | | | (46,674 | ) | | | (129 | ) |
EUR | | CITI | | | (338 | ) | | | 12/06/2012 | | | | (437 | ) | | | (1 | ) |
EUR | | DUB | | | (212 | ) | | | 12/06/2012 | | | | (274 | ) | | | (¨ | ) |
GBP | | SSB | | | 3,681 | | | | 12/06/2012 | | | | 5,959 | | | | (20 | ) |
JPY | | GSC | | | 3,678,035 | | | | 12/06/2012 | | | | 47,409 | | | | (1,321 | ) |
JPY | | UBS | | | (99,643 | ) | | | 12/06/2012 | | | | (1,269 | ) | | | 20 | |
JPY | | UBS | | | 99,404 | | | | 12/06/2012 | | | | 1,240 | | | | 6 | |
JPY | | UBS | | | 108,709 | | | | 12/06/2012 | | | | 1,363 | | | | (1 | ) |
MXN | | GSC | | | (12,567 | ) | | | 12/06/2012 | | | | (972 | ) | | | 16 | |
NOK | | RBC | | | (1,746 | ) | | | 12/06/2012 | | | | (306 | ) | | | ¨ | |
NOK | | RBS | | | 6,783 | | | | 12/06/2012 | | | | 1,187 | | | | 1 | |
NOK | | CSFB | | | (1,584 | ) | | | 12/06/2012 | | | | (275 | ) | | | (3 | ) |
NZD | | WBC | | | 3,652 | | | | 12/06/2012 | | | | 3,026 | | | | (30 | ) |
SEK | | RBS | | | (15,145 | ) | | | 12/06/2012 | | | | (2,314 | ) | | | 34 | |
| | | | | | | | | | | | | | | | | | |
| | | | | | | | | | | | | | | | $ | (1,407 | ) |
| | | | | | | | | | | | | | | | | | |
| | | | |
| The notes to the financial statements are an integral part of this report. | | |
| Transamerica Funds | | | | Annual Report 2012 |
| | Page 73 | | |
Transamerica International Bond
(formerly, Transamerica JPMorgan International Bond)
SCHEDULE OF INVESTMENTS (continued)
At October 31, 2012
FORWARD FOREIGN CROSS CURRENCY CONTRACTS:
| | | | | | | | | | | | | | | | | | |
Currency | | Counterparty | | Contracts Bought
(Sold) (000’s) | | | Settlement
Date | | | Amount in U.S.
Dollars Bought
(Sold) (000’s) | | | Net Unrealized
Appreciation
(Depreciation)
(000’s) | |
AUD | | SSB | | | 592 | | | | 12/06/2012 | | | $ | 614 | | | $ | (1 | ) |
NOK | | SSB | | | (3,453 | ) | | | 12/06/2012 | | | | (614 | ) | | | 9 | |
AUD | | RBC | | | 1,355 | | | | 12/06/2012 | | | | 1,406 | | | | (4 | ) |
CAD | | RBC | | | (1,385 | ) | | | 12/06/2012 | | | | (1,406 | ) | | | 20 | |
AUD | | DUB | | | 1,379 | | | | 12/06/2012 | | | | 1,407 | | | | 20 | |
NZD | | DUB | | | (1,728 | ) | | | 12/06/2012 | | | | (1,407 | ) | | | (10 | ) |
AUD | | UBS | | | 1,433 | | | | 12/06/2012 | | | | 1,466 | | | | 17 | |
NZD | | UBS | | | (1,806 | ) | | | 12/06/2012 | | | | (1,466 | ) | | | (16 | ) |
EUR | | DUB | | | 1,042 | | | | 12/06/2012 | | | | 1,365 | | | | (13 | ) |
CAD | | DUB | | | (1,349 | ) | | | 12/06/2012 | | | | (1,365 | ) | | | 15 | |
EUR | | UBS | | | 1,163 | | | | 12/06/2012 | | | | 1,515 | | | | (7 | ) |
CAD | | UBS | | | (1,498 | ) | | | 12/06/2012 | | | | (1,515 | ) | | | 16 | |
EUR | | DUB | | | 1,169 | | | | 12/06/2012 | | | | 1,504 | | | | 12 | |
GBP | | DUB | | | (934 | ) | | | 12/06/2012 | | | | (1,504 | ) | | | (3 | ) |
JPY | | CITI | | | 27,737 | | | | 12/06/2012 | | | | 346 | | | | 2 | |
EUR | | CITI | | | (268 | ) | | | 12/06/2012 | | | | (346 | ) | | | (2 | ) |
MXN | | UBS | | | 12,567 | | | | 12/06/2012 | | | | 990 | | | | (34 | ) |
EUR | | UBS | | | (753 | ) | | | 12/06/2012 | | | | (990 | ) | | | 14 | |
| | | | | | | | | | | | | | | | | | |
| | | | | | | | | | | | | | | | $ | 35 | |
| | | | | | | | | | | | | | | | | | |
Collateral (Received) Pledged for OTC Financial Derivative Instruments
The following is a summary by counterparty of the market value of OTC financial derivative instruments and collateral (received) pledged as of 10/31/2012:
| | | | | | | | | | | | |
Counterparty | | Total Market Value of
OTC Derivatives
(000’s) | | | Collateral
(Received) Pledged
(000’s) | | | Net Exposures (1)
(000’s) | |
BCLY | | $ | 2 | | | $ | — | | | $ | 2 | |
BNP | | | 13 | | | | — | | | | 13 | |
CITI | | | (140 | ) | | | — | | | | (140 | ) |
CSFB | | | (3 | ) | | | — | | | | (3 | ) |
DUB | | | 21 | | | | — | | | | 21 | |
GSC | | | (1,308 | ) | | | — | | | | (1,308 | ) |
RBC | | | 16 | | | | — | | | | 16 | |
RBS | | | 34 | | | | — | | | | 34 | |
SSB | | | (12 | ) | | | — | | | | (12 | ) |
TDB | | | 20 | | | | — | | | | 20 | |
UBS | | | 12 | | | | — | | | | 12 | |
| (1) | Net exposure represents the net receivable (payable) that would be due from/to the counterparty in the event of default. |
NOTES TO SCHEDULE OF INVESTMENTS (all amounts in thousands):
| * | Floating or variable rate note. Rate is listed as of 10/31/2012. |
| § | Illiquid. Total aggregate market value of illiquid securities is $2,773, or 1.43% of the fund’s net assets. |
| ^ | All or a portion of this security is on loan. The value of all securities on loan is $2,180. |
| | Rate shown reflects the yield at 10/31/2012. |
| g | Cash, in the amount of $1,098, has been segregated as collateral with the broker to cover margin requirements for open futures contracts. |
| ¨ | Amount rounds to less than 1. |
| P | Aggregate cost for federal income tax purposes is $187,374. Aggregate gross unrealized appreciation/depreciation for all securities in which there is an excess of value over tax cost were $9,259 and $4,312, respectively. Net unrealized appreciation for tax purposes is $4,947. |
| | | | |
| The notes to the financial statements are an integral part of this report. | | |
| Transamerica Funds | | | | Annual Report 2012 |
| | Page 74 | | |
Transamerica International Bond
(formerly, Transamerica JPMorgan International Bond)
SCHEDULE OF INVESTMENTS (continued)
At October 31, 2012
DEFINITIONS (all amounts in thousands):
| | |
| 144A | | 144A Securities are registered pursuant to Rule 144A of the Securities Act of 1933. These securities are deemed to be liquid for purposes of compliance limitations on holdings of illiquid securities and may be resold as transactions exempt from registration, normally to qualified institutional buyers. At 10/31/2012, these securities aggregated $8,168, or 4.22% of the fund’s net assets. |
| BCLY | | Barclays Bank PLC |
| BNP | | BNP Paribas Bank |
| CITI | | Citigroup, Inc. |
| CSFB | | Credit Suisse First Boston |
| DUB | | Deutsche Bank AG |
| GSC | | Goldman Sachs & Co. |
| RBC | | Royal Bank of Canada |
| RBS | | Royal Bank of Scotland Group PLC |
| SSB | | State Street Bank |
| TDB | | Toronto Dominion Bank |
| UBS | | UBS Warburg LLC |
| WBC | | Westpac Banking Corporation |
CURRENCY ABBREVIATIONS:
| | |
| AUD | | Australian Dollar |
| BRL | | Brazilian Real |
| CAD | | Canadian Dollar |
| DKK | | Danish Krone |
| EUR | | Euro |
| GBP | | Pound Sterling |
| JPY | | Japanese Yen |
| MXN | | Mexican Peso |
| NOK | | Norwegian Krone |
| NZD | | New Zealand Dollar |
| SEK | | Swedish Krona |
VALUATION SUMMARY (all amounts in thousands): '
| | | | | | | | | | | | | | | | |
Investment Securities | | Level 1 -
Quoted
Prices | | | Level 2 -
Other
Significant
Observable
Inputs | | | Level 3 -
Significant
Unobservable
Inputs | | | Value at
10/31/2012 | |
Corporate Debt Securities | | $ | — | | | $ | 42,418 | | | $ | — | | | $ | 42,418 | |
Foreign Government Obligations | | | — | | | | 141,222 | | | | — | | | | 141,222 | |
Mortgage-Backed Security | | | — | | | | 2,773 | | | | — | | | | 2,773 | |
Repurchase Agreement | | | — | | | | 3,685 | | | | — | | | | 3,685 | |
Securities Lending Collateral | | | 2,223 | | | | — | | | | — | | | | 2,223 | |
| | | | | | | | | | | | | | | | |
Total | | $ | 2,223 | | | $ | 190,098 | | | $ | — | | | $ | 192,321 | |
| | | | | | | | | | | | | | | | |
| | | | | | | | | | | | | | | | |
Other Financial Instruments ₣ | | Level 1 -
Quoted
Prices | | | Level 2 -
Other
Significant
Observable
Inputs | | | Level 3 -
Significant
Unobservable
Inputs | | | Value at
10/31/2012 | |
Futures Contracts—Appreciation | | $ | 200 | | | $ | — | | | $ | — | | | $ | 200 | |
Futures Contracts—Depreciation | | | (131 | ) | | | — | | | | — | | | | (131 | ) |
Forward Foreign Cross Currency Contracts—Appreciation | | | — | | | | 125 | | | | — | | | | 125 | |
Forward Foreign Cross Currency Contracts—Depreciation | | | — | | | | (90 | ) | | | — | | | | (90 | ) |
Forward Foreign Currency Contracts—Appreciation | | | — | | | | 112 | | | | — | | | | 112 | |
Forward Foreign Currency Contracts—Depreciation | | | — | | | | (1,519 | ) | | | — | | | | (1,519 | ) |
| | | | | | | | | | | | | | | | |
Total | | $ | 69 | | | $ | (1,372 | ) | | $ | — | | | $ | (1,303 | ) |
| | | | | | | | | | | | | | | | |
| ' | Transfers between levels are considered to have occurred at the end of the reporting period. There were no transfers into or out of Levels 1 and 2 during the period ended 10/31/2012. See the notes to the financial statements for more information regarding pricing inputs and valuation techniques. |
| ₣ | Other financial instruments are derivative instruments that are valued at unrealized appreciation (depreciation) on the instrument. |
| | | | |
| The notes to the financial statements are an integral part of this report. | | |
| Transamerica Funds | | | | Annual Report 2012 |
| | Page 75 | | |
Transamerica International Equity
(formerly, Transamerica TS&W International Equity)
SCHEDULE OF INVESTMENTS
At October 31, 2012
| | | | | | | | |
| | | | | | Value | |
| | | Shares | | | (000’s) | |
PREFERRED STOCK—0.8% | | | | | | | | |
Russian Federation—0.8% | | | | | | | | |
Sberbank of Russia, 3.65% p | | | 1,074,100 | | | $ | 2,207 | |
Total Preferred Stock (cost $2,508) | | | | | | | | |
| | |
COMMON STOCKS—96.9% | | | | | | | | |
Australia—2.6% | | | | | | | | |
APA Group ^ | | | 585,900 | | | | 3,138 | |
Computershare, Ltd. | | | 418,700 | | | | 3,777 | |
Belgium—0.9% | | | | | | | | |
Anheuser-Busch InBev NV | | | 26,900 | | | | 2,249 | |
Canada—1.2% | | | | | | | | |
Barrick Gold Corp. | | | 76,200 | | | | 3,082 | |
France—7.9% | | | | | | | | |
Arkema SA | | | 40,000 | | | | 3,648 | |
Cie Generale des Etablissements Michelin—Class B | | | 24,200 | | | | 2,078 | |
Etablissements Maurel et Prom ^ | | | 64,500 | | | | 898 | |
Euler Hermes SA | | | 35,200 | | | | 2,426 | |
Lagardere SCA | | | 141,200 | | | | 3,858 | |
Sanofi | | | 45,100 | | | | 3,965 | |
Societe Generale SA ‡ | | | 24,800 | | | | 788 | |
Vivendi SA | | | 163,383 | | | | 3,343 | |
Germany—8.8% | | | | | | | | |
Adidas AG | | | 23,900 | | | | 2,036 | |
Allianz SE | | | 28,900 | | | | 3,584 | |
Bayer AG | | | 30,165 | | | | 2,627 | |
Gerresheimer AG ‡ | | | 26,200 | | | | 1,300 | |
HeidelbergCement AG | | | 44,400 | | | | 2,353 | |
Hochtief AG ‡ | | | 24,700 | | | | 1,225 | |
Rheinmetall AG | | | 25,895 | | | | 1,236 | |
Siemens AG | | | 50,900 | | | | 5,115 | |
TUI AG ‡ ^ | | | 379,700 | | | | 3,559 | |
Hong Kong—4.0% | | | | | | | | |
First Pacific Co. | | | 2,672,600 | | | | 2,976 | |
Guangdong Investment, Ltd. ^ | | | 4,592,600 | | | | 3,763 | |
HSBC Holdings PLC | | | 409,824 | | | | 4,041 | |
Ireland—2.9% | | | | | | | | |
Ryanair Holdings PLC ADR ‡ | | | 95,000 | | | | 3,064 | |
Smurfit Kappa Group PLC | | | 401,400 | | | | 4,407 | |
Israel—0.8% | | | | | | | | |
Teva Pharmaceutical Industries, Ltd. ADR | | | 52,000 | | | | 2,102 | |
Italy—4.5% | | | | | | | | |
ENI SpA | | | 167,200 | | | | 3,838 | |
Exor SpA | | | 100,300 | | | | 2,584 | |
Pirelli & C. SpA ^ | | | 165,000 | | | | 1,911 | |
Prysmian SpA | | | 181,801 | | | | 3,497 | |
Japan—18.6% | | | | | | | | |
Air Water, Inc. | | | 253,800 | | | | 3,179 | |
Aisin Seiki Co., Ltd. | | | 116,800 | | | | 3,398 | |
Daito Trust Construction Co., Ltd. | | | 25,400 | | | | 2,564 | |
Fujitsu, Ltd. | | | 586,200 | | | | 2,254 | |
Fukuoka Financial Group, Inc. | | | 680,300 | | | | 2,659 | |
Hitachi, Ltd. | | | 762,300 | | | | 4,039 | |
Japan Petroleum Exploration Co. | | | 43,200 | | | | 1,626 | |
Jupiter Telecommunications Co., Ltd. ^ | | | 2,561 | | | | 3,481 | |
Kintetsu World Express, Inc. ^ | | | 83,700 | | | | 2,357 | |
Kirin Holdings Co., Ltd. | | | 242,000 | | | | 3,038 | |
Komatsu, Ltd. | | | 99,500 | | | | 2,084 | |
Kuraray Co., Ltd. ^ | | | 234,700 | | | | 2,725 | |
Mitsubishi Corp. | | | 143,800 | | | | 2,567 | |
Nippon Telegraph & Telephone Corp. | | | 101,600 | | | | 4,626 | |
Nitori Holdings Co., Ltd. | | | 32,200 | | | | 2,630 | |
ORIX Corp. ^ | | | 41,000 | | | | 4,211 | |
USS Co., Ltd. ^ | | | 23,480 | | | | 2,468 | |
Korea, Republic of—3.1% | | | | | | | | |
Hyundai Home Shopping Network Corp. | | | 14,400 | | | | 1,710 | |
Kangwon Land, Inc. | | | 141,300 | | | | 3,291 | |
| | | | | | | | |
| | | | | | Value | |
| | | Shares | | | (000’s) | |
Korea, Republic of (continued) | | | | | | | | |
SK Telecom Co., Ltd. | | | 24,300 | | | $ | 3,420 | |
Netherlands—3.4% | | | | | | | | |
Heineken Holding NV | | | 54,100 | | | | 2,745 | |
Koninklijke Philips Electronics NV | | | 165,900 | | | | 4,148 | |
Wolters Kluwer NV | | | 103,900 | | | | 2,011 | |
Russian Federation—0.5% | | | | | | | | |
Gazprom OAO ADR | | | 140,200 | | | | 1,281 | |
Singapore—1.8% | | | | | | | | |
Noble Group, Ltd. | | | 1,665,000 | | | | 1,788 | |
SIA Engineering Co., Ltd. | | | 847,500 | | | | 2,918 | |
Spain—1.6% | | | | | | | | |
Amadeus IT Holding SA—Class A | | | 162,700 | | | | 4,028 | |
Sweden—5.1% | | | | | | | | |
Investment AB Kinnevik—Class B | | | 140,100 | | | | 2,676 | |
Investor AB—Class B | | | 201,800 | | | | 4,452 | |
Saab AB | | | 119,293 | | | | 2,266 | |
Svenska Cellulosa AB—Class B | | | 207,500 | | | | 4,042 | |
Switzerland—6.4% | | | | | | | | |
Aryzta AG ‡ | | | 58,600 | | | | 2,926 | |
GAM Holding AG ‡ | | | 213,700 | | | | 2,983 | |
Nestle SA | | | 49,000 | | | | 3,110 | |
Novartis AG | | | 84,900 | | | | 5,109 | |
Zurich Insurance Group AG ‡ | | | 11,400 | | | | 2,809 | |
Thailand—0.7% | | | | | | | | |
Bangkok Bank PCL | | | 312,300 | | | | 1,803 | |
United Kingdom—19.8% | | | | | | | | |
AstraZeneca PLC | | | 41,100 | | | | 1,909 | |
BHP Billiton PLC ADR ^ | | | 42,500 | | | | 2,719 | |
BP PLC ADR | | | 75,700 | | | | 3,247 | |
British Sky Broadcasting Group PLC | | | 227,000 | | | | 2,597 | |
Imperial Tobacco Group PLC | | | 100,900 | | | | 3,810 | |
Inchcape PLC | | | 515,800 | | | | 3,346 | |
Inmarsat PLC | | | 224,300 | | | | 2,051 | |
Johnson Matthey PLC | | | 56,845 | | | | 2,063 | |
Kingfisher PLC | | | 867,800 | | | | 4,054 | |
National Grid PLC | | | 342,900 | | | | 3,909 | |
Resolution, Ltd. | | | 672,400 | | | | 2,369 | |
Rexam PLC | | | 506,624 | | | | 3,652 | |
Royal Dutch Shell PLC—Class A | | | 119,200 | | | | 4,087 | |
Unilever PLC | | | 155,700 | | | | 5,806 | |
Vodafone Group PLC | | | 1,424,700 | | | | 3,868 | |
WPP PLC | | | 180,200 | | | | 2,325 | |
United States—2.3% | | | | | | | | |
Flextronics International, Ltd. ‡ ^ | | | 388,905 | | | | 2,244 | |
Noble Corp. ^ | | | 100,800 | | | | 3,804 | |
| | | | | | | | |
Total Common Stocks (cost $244,160) | | | | | | | 255,750 | |
| | | | | | | | |
SECURITIES LENDING COLLATERAL—6.4% | | | | | | | | |
State Street Navigator Securities Lending Trust—Prime Portfolio, 0.31% p | | | 16,796,939 | | | | 16,797 | |
Total Securities Lending Collateral (cost $16,797) | |
| | | | |
| The notes to the financial statements are an integral part of this report. | | |
| Transamerica Funds | | | | Annual Report 2012 |
| | Page 76 | | |
Transamerica International Equity
(formerly, Transamerica TS&W International Equity)
SCHEDULE OF INVESTMENTS (continued)
At October 31, 2012
| | | | | | | | |
| | | Principal | | | Value | |
| | | (000’s) | | | (000’s) | |
REPURCHASE AGREEMENT—1.8% | | | | | | | | |
State Street Bank & Trust Co. 0.03% p, dated 10/31/2012, to be repurchased at $4,724 on 11/01/2012. Collateralized by a U.S. Government Agency Obligation, 3.00%, due 12/01/2026, and with a value of $4,822. | | $ | 4,724 | | | $ | 4,724 | |
| | | | | | | | |
Total Repurchase Agreement (cost $4,724) | | | | | | | | |
| | |
Total Investment Securities (cost $268,189) P | | | | | | | 279,478 | |
Other Assets and Liabilities—Net | | | | | | | (15,496 | ) |
| | | | | | | | |
Net Assets | | | | | | $ | 263,982 | |
| | | | | | | | |
| | | | | | | | |
| | | Percentage of | | | | |
| | | Total Investment | | | Value | |
INVESTMENTS BY INDUSTRY (unaudited): | | Securities | | | (000’s) | |
Media | | | 6.3 | % | | $ | 17,615 | |
Pharmaceuticals | | | 5.6 | | | | 15,712 | |
Oil, Gas & Consumable Fuels | | | 5.4 | | | | 14,977 | |
Diversified Financial Services | | | 4.5 | | | | 12,688 | |
Food Products | | | 4.2 | | | | 11,842 | |
Chemicals | | | 4.2 | | | | 11,615 | |
Commercial Banks | | | 4.1 | | | | 11,498 | |
Insurance | | | 4.0 | | | | 11,188 | |
Industrial Conglomerates | | | 3.8 | | | | 10,499 | |
Specialty Retail | | | 3.3 | | | | 9,152 | |
Containers & Packaging | | | 2.9 | | | | 8,059 | |
Beverages | | | 2.9 | | | | 8,032 | |
IT Services | | | 2.8 | | | | 7,805 | |
Auto Components | | | 2.6 | | | | 7,387 | |
Wireless Telecommunication Services | | | 2.6 | | | | 7,288 | |
Hotels, Restaurants & Leisure | | | 2.5 | | | | 6,850 | |
Diversified Telecommunication Services | | | 2.4 | | | | 6,677 | |
Electronic Equipment & Instruments | | | 2.3 | | | | 6,283 | |
Metals & Mining | | | 2.1 | | | | 5,801 | |
Trading Companies & Distributors | | | 1.6 | | | | 4,355 | |
Consumer Finance | | | 1.5 | | | | 4,211 | |
Household Products | | | 1.4 | | | | 4,042 | |
Multi-Utilities | | | 1.4 | | | | 3,909 | |
Tobacco | | | 1.4 | | | | 3,810 | |
Energy Equipment & Services | | | 1.4 | | | | 3,804 | |
Water Utilities | | | 1.3 | | | | 3,763 | |
Electrical Equipment | | | 1.3 | | | | 3,497 | |
Distributors | | | 1.2 | | | | 3,346 | |
Gas Utilities | | | 1.1 | | | | 3,138 | |
Airlines | | | 1.1 | | | | 3,064 | |
Capital Markets | | | 1.1 | | | | 2,983 | |
Transportation Infrastructure | | | 1.0 | | | | 2,918 | |
Real Estate Management & Development | | | 0.9 | | | | 2,564 | |
Air Freight & Logistics | | | 0.8 | | | | 2,357 | |
Construction Materials | | | 0.8 | | | | 2,353 | |
Aerospace & Defense | | | 0.8 | | | | 2,266 | |
Computers & Peripherals | | | 0.8 | | | | 2,254 | |
Machinery | | | 0.7 | | | | 2,084 | |
Textiles, Apparel & Luxury Goods | | | 0.7 | | | | 2,036 | |
Internet & Catalog Retail | | | 0.6 | | | | 1,710 | |
Life Sciences Tools & Services | | | 0.5 | | | | 1,300 | |
Construction & Engineering | | | 0.4 | | | | 1,225 | |
| | | | | | | | |
Investment Securities, at Value | | | 92.3 | | | | 257,957 | |
Short-Term Investments | | | 7 .7 | | | | 21,521 | |
| | | | | | | | |
Total Investments | | | 100.0 | % | | $ | 279,478 | |
| | | | | | | | |
| | | | |
| The notes to the financial statements are an integral part of this report. | | |
| Transamerica Funds | | | | Annual Report 2012 |
| | Page 77 | | |
Transamerica International Equity
(formerly, Transamerica TS&W International Equity)
SCHEDULE OF INVESTMENTS (continued)
At October 31, 2012
NOTES TO SCHEDULE OF INVESTMENTS (all amounts in thousands):
| p | Rate shown reflects the yield at 10/31/2012. |
| ^ | All or a portion of this security is on loan. The value of all securities on loan is $15,990. |
| ‡ | Non-income producing security. |
| P | Aggregate cost for federal income tax purposes is $270,364. Aggregate gross unrealized appreciation/depreciation for all securities in which there is an excess of value over tax cost were $16,899 and $7,785, respectively. Net unrealized appreciation for tax purposes is $9,114. |
DEFINITIONS:
| ADR | American Depositary Receipt |
| OAO | Otkrytoe Aktsionernoe Obschesto (Russian: Open Stock Corporation) |
VALUATION SUMMARY (all amounts in thousands): '
| | | | | | | | | | | | | | | | |
| | | | | | Level 2 - | | | | | | | |
| | | | | | Other | | | Level 3 - | | | | |
| | | Level 1 - | | | Significant | | | Significant | | | | |
| | | Quoted | | | Observable | | | Unobservable | | | Value at | |
Investment Securities | | Prices | | | Inputs | | | Inputs | | | 10/31/2012 | |
Common Stocks | | $ | 21,543 | | | $ | 234,207 | | | $ | — | | | $ | 255,750 | |
Preferred Stock | | | — | | | | 2,207 | | | | — | | | | 2,207 | |
Repurchase Agreement | | | — | | | | 4,724 | | | | — | | | | 4,724 | |
Securities Lending Collateral | | | 16,797 | | | | — | | | | — | | | | 16,797 | |
| | | | | | | | | | | | | | | | |
Total | | $ | 38,340 | | | $ | 241,138 | | | $ | — | | | $ | 279,478 | |
| | | | | | | | | | | | | | | | |
| ' | Transfers between levels are considered to have occurred at the end of the reporting period. There were no transfers into or out of Levels 1 and 2 during the period ended 10/31/2012. See the notes to the financial statements for more information regarding pricing inputs and valuation techniques. |
| | | | |
| The notes to the financial statements are an integral part of this report. | | |
| Transamerica Funds | | | | Annual Report 2012 |
| | Page 78 | | |
Transamerica Large Cap Growth
SCHEDULE OF INVESTMENTS
At October 31, 2012
| | | | | | | | |
| | | | | | Value | |
| | | Shares | | | (000’s) | |
COMMON STOCKS—97.7% | | | | | | | | |
Aerospace & Defense—3.4% | | | | | | | | |
Honeywell International, Inc. | | | 36,417 | | | $ | 2,230 | |
United Technologies Corp. | | | 32,360 | | | | 2,530 | |
Airlines—0.7% | | | | | | | | |
Delta Air Lines, Inc. ‡ | | | 92,436 | | | | 890 | |
Beverages—3.3% | | | | | | | | |
Coca-Cola Co. | | | 121,446 | | | | 4,515 | |
Biotechnology—2.1% | | | | | | | | |
Biogen Idec, Inc. ‡ | | | 6,688 | | | | 924 | |
Celgene Corp. ‡ | | | 25,803 | | | | 1,892 | |
Capital Markets—1.1% | | | | | | | | |
BlackRock, Inc.—Class A | | | 7,597 | | | | 1,441 | |
Chemicals—2.9% | | | | | | | | |
Eastman Chemical Co. | | | 32,605 | | | | 1,932 | |
Monsanto Co. | | | 23,669 | | | | 2,037 | |
Commercial Services & Supplies—2.1% | | | | | | | | |
ADT Corp. ‡ | | | 14,280 | | | | 593 | |
Stericycle, Inc. ‡ | | | 15,632 | | | | 1,481 | |
Tyco International, Ltd. | | | 28,561 | | | | 767 | |
Computers & Peripherals—10.6% | | | | | | | | |
Apple, Inc. | | | 20,538 | | | | 12,223 | |
EMC Corp. ‡ | | | 93,406 | | | | 2,281 | |
Construction & Engineering—0.8% | | | | | | | | |
Fluor Corp. | | | 20,149 | | | | 1,125 | |
Consumer Finance—1.3% | | | | | | | | |
American Express Co. | | | 13,441 | | | | 752 | |
Discover Financial Services | | | 25,043 | | | | 1,028 | |
Containers & Packaging—1.6% | | | | | | | | |
Ball Corp. | | | 49,972 | | | | 2,140 | |
Diversified Financial Services—0.5% | | | | | | | | |
NASDAQ OMX Group, Inc. | | | 27,524 | | | | 655 | |
Diversified Telecommunication Services—1.9% | | | | | | | | |
Verizon Communications, Inc. | | | 57,267 | | | | 2,556 | |
Energy Equipment & Services—2.6% | | | | | | | | |
Cameron International Corp. ‡ | | | 39,440 | | | | 1,997 | |
Halliburton Co. | | | 47,168 | | | | 1,523 | |
Food & Staples Retailing—1.9% | | | | | | | | |
Costco Wholesale Corp. | | | 26,418 | | | | 2,600 | |
Food Products—1.1% | | | | | | | | |
ConAgra Foods, Inc. | | | 54,257 | | | | 1,511 | |
Health Care Equipment & Supplies—1.4% | | | | | | | | |
Covidien PLC | | | 33,938 | | | | 1,865 | |
Health Care Providers & Services—2.6% | | | | | | | | |
Express Scripts Holding Co. ‡ | | | 44,433 | | | | 2,735 | |
UnitedHealth Group, Inc. | | | 14,973 | | | | 838 | |
Hotels, Restaurants & Leisure—4.2% | | | | | | | | |
Brinker International, Inc. | | | 52,119 | | | | 1,605 | |
Las Vegas Sands Corp. | | | 55,053 | | | | 2,557 | |
Marriott International, Inc.—Class A | | | 45,493 | | | | 1,660 | |
Industrial Conglomerates—1.4% | | | | | | | | |
Danaher Corp. | | | 36,081 | | | | 1,866 | |
Insurance—0.6% | | | | | | | | |
ACE, Ltd. | | | 11,309 | | | | 889 | |
Internet & Catalog Retail—2.3% | | | | | | | | |
Amazon.com, Inc. ‡ | | | 13,660 | | | | 3,180 | |
Internet Software & Services—3.0% | | | | | | | | |
eBay, Inc. ‡ | | | 25,052 | | | | 1,210 | |
Google, Inc.—Class A ‡ | | | 4,299 | | | | 2,922 | |
IT Services—7.4% | | | | | | | | |
Accenture PLC—Class A | | | 27,273 | | | | 1,838 | |
International Business Machines Corp. | | | 13,424 | | | | 2,611 | |
Mastercard, Inc.—Class A | | | 6,814 | | | | 3,141 | |
Teradata Corp. ‡ | | | 20,599 | | | | 1,407 | |
VeriFone Systems, Inc. ‡ | | | 39,597 | | | | 1,174 | |
Life Sciences Tools & Services—1.0% | | | | | | | | |
Agilent Technologies, Inc. | | | 39,883 | | | | 1,435 | |
| | | | | | | | |
| | | | | | Value | |
| | | Shares | | | (000’s) | |
Machinery—1.6% | | | | | | | | |
Cummins, Inc. | | | 20,059 | | | $ | 1,878 | |
Pentair, Ltd. | | | 6,853 | | | | 289 | |
Media—4.0% | | | | | | | | |
Comcast Corp.—Class A | | | 84,445 | | | | 3,168 | |
DIRECTV—Class A ‡ | | | 44,032 | | | | 2,250 | |
Oil, Gas & Consumable Fuels—2.4% | | | | | | | | |
Occidental Petroleum Corp. | | | 23,292 | | | | 1,839 | |
Pioneer Natural Resources Co. | | | 14,289 | | | | 1,510 | |
Personal Products—1.0% | | | | | | | | |
Herbalife, Ltd. | | | 25,852 | | | | 1,328 | |
Pharmaceuticals—3.9% | | | | | | | | |
Abbott Laboratories | | | 54,299 | | | | 3,558 | |
Allergan, Inc. | | | 20,218 | | | | 1,818 | |
Road & Rail—2.3% | | | | | | | | |
JB Hunt Transport Services, Inc. | | | 30,019 | | | | 1,762 | |
Union Pacific Corp. | | | 11,272 | | | | 1,387 | |
Semiconductors & Semiconductor Equipment—2.1% | | | | | | | | |
Broadcom Corp.—Class A ‡ | | | 58,200 | | | | 1,835 | |
Intel Corp. | | | 46,463 | | | | 1,005 | |
Software—7.8% | | | | | | | | |
Intuit, Inc. | | | 23,758 | | | | 1,412 | |
Microsoft Corp. | | | 107,226 | | | | 3,060 | |
Oracle Corp. | | | 151,159 | | | | 4,694 | |
VMware, Inc.—Class A ‡ | | | 18,418 | | | | 1,561 | |
Specialty Retail—6.1% | | | | | | | | |
Dick’s Sporting Goods, Inc. | | | 44,767 | | | | 2,238 | |
Foot Locker, Inc. | | | 59,692 | | | | 2,000 | |
Lowe’s Cos., Inc. | | | 71,086 | | | | 2,302 | |
PetSmart, Inc. | | | 28,451 | | | | 1,889 | |
Tobacco—4.7% | | | | | | | | |
Altria Group, Inc. | | | 73,595 | | | | 2,340 | |
Philip Morris International, Inc. | | | 45,924 | | | | 4,067 | |
| | | | | | | | |
Total Common Stocks (cost $134,691) | | | | | | | 133,746 | |
| | | | | | | | |
INVESTMENT COMPANIES—2.1% | | | | | | | | |
Capital Markets—2.1% | | | | | | | | |
iShares Dow Jones US Real Estate Index Fund | | | 22,718 | | | | 1,454 | |
iShares Russell 1000 Growth Index Fund | | | 21,291 | | | | 1,379 | |
| | | | | | | | |
Total Investment Companies (cost $2,850) | | | | | | | 2,833 | |
| | | | | | | | |
| | |
| | | Principal | | | Value | |
| | | (000’s) | | | (000’s) | |
REPURCHASE AGREEMENT—0.2% | | | | | | | | |
State Street Bank & Trust Co. 0.03% p, dated 10/31/2012, to be repurchased at $243 on 11/01/2012. Collateralized by a U.S. Government Agency Obligation, 3.50%, due 11/25/2038, and with a value of $248. | | $ | 243 | | | | 243 | |
| | | | | | | | |
Total Repurchase Agreement (cost $243) | | | | | | | | |
Total Investment Securities (cost $137,784) P | | | | | | | 136,822 | |
Other Assets and Liabilities—Net | | | | | | | (32 | ) |
| | | | | | | | |
Net Assets | | | | | | $ | 136,790 | |
| | | | | | | | |
| | | | |
| The notes to the financial statements are an integral part of this report. | | |
| Transamerica Funds | | | | Annual Report 2012 |
| | Page 79 | | |
Transamerica Large Cap Growth
SCHEDULE OF INVESTMENTS (continued)
At October 31, 2012
NOTES TO SCHEDULE OF INVESTMENTS (all amounts in thousands):
| ‡ | Non-income producing security. |
| p | Rate shown reflects the yield at 10/31/2012. |
| P | Aggregate cost for federal income tax purposes is $137,799. Aggregate gross unrealized appreciation/depreciation for all securities in which there is an excess of value over tax cost were $4,004 and $4,981, respectively. Net unrealized depreciation for tax purposes is $977. |
VALUATION SUMMARY (all amounts in thousands): '
| | | | | | | | | | | | | | | | |
Investment Securities | | Level 1 -
Quoted
Prices | | | Level 2 -
Other
Significant
Observable
Inputs | | | Level 3 -
Significant
Unobservable
Inputs | | | Value at
10/31/2012 | |
Common Stocks | | $ | 133,746 | | | $ | — | | | $ | — | | | $ | 133,746 | |
Investment Companies | | | 2,833 | | | | — | | | | — | | | | 2,833 | |
Repurchase Agreement | | | — | | | | 243 | | | | — | | | | 243 | |
| | | | | | | | | | | | | | | | |
Total | | $ | 136,579 | | | $ | 243 | | | $ | — | | | $ | 136,822 | |
| | | | | | | | | | | | | | | | |
| ' | Transfers between levels are considered to have occurred at the end of the reporting period. There were no transfers into or out of Levels 1 and 2 during the period ended 10/31/2012. See the notes to the financial statements for more information regarding pricing inputs and valuation techniques. |
| | | | |
| The notes to the financial statements are an integral part of this report. | | |
| Transamerica Funds | | | | Annual Report 2012 |
| | Page 80 | | |
Transamerica Large Cap Value
(formerly, Transamerica Quality Value)
SCHEDULE OF INVESTMENTS
At October 31, 2012
| | | | | | | | |
| | | | | | Value | |
| | | Shares | | | (000’s) | |
COMMON STOCKS—96.1% | | | | | | | | |
Aerospace & Defense—2.7% | | | | | | | | |
Exelis, Inc. | | | 1,548,769 | | | $ | 17,129 | |
Honeywell International, Inc. | | | 304,568 | | | | 18,652 | |
Beverages—2.6% | | | | | | | | |
Molson Coors Brewing Co.—Class B | | | 507,499 | | | | 21,894 | |
PepsiCo, Inc. | | | 173,200 | | | | 11,992 | |
Capital Markets—2.9% | | | | | | | | |
State Street Corp. | | | 862,015 | | | | 38,420 | |
Chemicals—1.8% | | | | | | | | |
E.I. du Pont de Nemours & Co. | | | 529,005 | | | | 23,551 | |
Commercial Banks—1.4% | | | | | | | | |
CIT Group, Inc. ‡ | | | 512,355 | | | | 19,070 | |
Commercial Services & Supplies—1.1% | | | | | | | | |
Tyco International, Ltd. | | | 551,619 | | | | 14,822 | |
Computers & Peripherals—2.2% | | | | | | | | |
EMC Corp. ‡ | | | 1,201,155 | | | | 29,332 | |
Diversified Financial Services—6.5% | | | | | | | | |
Citigroup, Inc. | | | 572,962 | | | | 21,423 | |
JPMorgan Chase & Co. | | | 1,568,900 | | | | 65,392 | |
Diversified Telecommunication Services—3.7% | | | | | | | | |
Verizon Communications, Inc. | | | 1,088,275 | | | | 48,581 | |
Electric Utilities—6.7% | | | | | | | | |
American Electric Power Co., Inc. | | | 893,174 | | | | 39,693 | |
Exelon Corp. | | | 1,367,140 | | | | 48,916 | |
Electrical Equipment—1.5% | | | | | | | | |
Rockwell Automation, Inc. | | | 284,308 | | | | 20,203 | |
Energy Equipment & Services—4.0% | | | | | | | | |
Halliburton Co. | | | 1,626,306 | | | | 52,513 | |
Food Products—5.2% | | | | | | | | |
Kraft Foods Group, Inc. ‡ | | | 233,968 | | | | 10,641 | |
Ralcorp Holdings, Inc. ‡ | | | 531,037 | | | | 38,335 | |
Unilever NV—Reg S | | | 539,925 | | | | 19,810 | |
Health Care Equipment & Supplies—3.3% | | | | | | | | |
Medtronic, Inc. | | | 1,061,895 | | | | 44,154 | |
Health Care Providers & Services—2.6% | | | | | | | | |
CIGNA Corp. | | | 670,575 | | | | 34,199 | |
Hotels, Restaurants & Leisure—1.2% | | | | | | | | |
McDonald’s Corp. | | | 182,581 | | | | 15,848 | |
Household Products—1.7% | | | | | | | | |
Procter & Gamble Co. | | | 322,508 | | | | 22,330 | |
Industrial Conglomerates—1.7% | | | | | | | | |
General Electric Co. | | | 1,056,650 | | | | 22,253 | |
Insurance—8.2% | | | | | | | | |
MetLife, Inc. | | | 1,452,255 | | | | 51,541 | |
Principal Financial Group, Inc. | | | 1,036,100 | | | | 28,534 | |
Willis Group Holdings PLC | | | 844,175 | | | | 28,423 | |
Life Sciences Tools & Services—0.7% | | | | | | | | |
Affymetrix, Inc. ‡ ^ | | | 2,742,645 | | | | 8,694 | |
Machinery—4.0% | | | | | | | | |
Briggs & Stratton Corp. ^ | | | 306,978 | | | | 6,063 | |
Eaton Corp. ^ | | | 1,005,134 | | | | 47,462 | |
Metals & Mining—0.5% | | | | | | | | |
Allegheny Technologies, Inc. | | | 247,780 | | | | 6,529 | |
Multiline Retail—8.6% | | | | | | | | |
Kohl’s Corp. | | | 388,665 | | | | 20,708 | |
Macy’s, Inc. | | | 1,202,900 | | | | 45,794 | |
Target Corp. | | | 750,640 | | | | 47,854 | |
Oil, Gas & Consumable Fuels—11.3% | | | | | | | | |
Anadarko Petroleum Corp. | | | 214,983 | | | | 14,793 | |
Chevron Corp. | | | 506,350 | | | | 55,806 | |
Exxon Mobil Corp. | | | 398,193 | | | | 36,303 | |
Occidental Petroleum Corp. | | | 164,140 | | | | 12,960 | |
Williams Cos., Inc. | | | 914,054 | | | | 31,983 | |
Pharmaceuticals—7.9% | | | | | | | | |
Merck & Co., Inc. | | | 952,320 | | | | 43,454 | |
Pfizer, Inc. | | | 2,460,720 | | | | 61,198 | |
| | | | | | | | |
| | | | | | Value | |
| | | Shares | | | (000’s) | |
Software—2.1% | | | | | | | | |
Microsoft Corp. | | | 969,601 | | | $ | 27,668 | |
| | | | | | | | |
Total Common Stocks (cost $1,196,350) | | | | | | | 1,274,920 | |
| | | | | | | | |
SECURITIES LENDING COLLATERAL—3.8% | | | | | |
State Street Navigator Securities Lending Trust—Prime Portfolio, 0.31% p | | | 51,001,562 | | | | 51,002 | |
Total Securities Lending Collateral (cost $51,002) | | | | | | | | |
| | |
| | | Principal | | | Value | |
| | | (000’s) | | | (000’s) | |
REPURCHASE AGREEMENT—3.8% | | | | | | | | |
State Street Bank & Trust Co. 0.03% p, dated 10/31/2012, to be repurchased at $50,441 on 11/01/2012. Collateralized by U.S. Government Agency Obligations, 4.00%, due 12/25/2038—08/15/2039, and with a total value of $51,451. | | $ | 50,441 | | | | 50,441 | |
| | | | | | | | |
Total Repurchase Agreement (cost $50,441) | | | | | | | | |
| | |
Total Investment Securities (cost $1,297,793) P | | | | | | | 1,376,363 | |
Other Assets and Liabilities—Net | | | | | | | (49,137 | ) |
| | | | | | | | |
Net Assets | | | | | | $ | 1,327,226 | |
| | | | | | | | |
| | | | |
| The notes to the financial statements are an integral part of this report. | | |
| Transamerica Funds | | | | Annual Report 2012 |
| | Page 81 | | |
Transamerica Large Cap Value
(formerly, Transamerica Quality Value)
SCHEDULE OF INVESTMENTS (continued)
At October 31, 2012
NOTES TO SCHEDULE OF INVESTMENTS (all amounts in thousands):
| ‡ | Non-income producing security. |
| ^ | All or a portion of this security is on loan. The value of all securities on loan is $49,903. |
| p | Rate shown reflects the yield at 10/31/2012. |
| P | Aggregate cost for federal income tax purposes is $1,298,766. Aggregate gross unrealized appreciation/depreciation for all securities in which there is an excess of value over tax cost were $98,263 and $20,666, respectively. Net unrealized appreciation for tax purposes is $77,597. |
DEFINITION:
| ADR | American Depository Receipt |
VALUATION SUMMARY (all amounts in thousands): '
| | | | | | | | | | | | | | | | |
Investment Securities | | Level 1 -
Quoted
Prices | | | Level 2 -
Other
Significant
Observable
Inputs | | | Level 3 -
Significant
Unobservable
Inputs | | | Value at
10/31/2012 | |
Common Stocks | | $ | 1,274,920 | | | $ | — | | | $ | — | | | $ | 1,274,920 | |
Repurchase Agreement | | | — | | | | 50,441 | | | | — | | | | 50,441 | |
Securities Lending Collateral | | | 51,002 | | | | — | | | | — | | | | 51,002 | |
| | | | | | | | | | | | | | | | |
Total | | $ | 1,325,922 | | | $ | 50,441 | | | $ | — | | | $ | 1,376,363 | |
| | | | | | | | | | | | | | | | |
| ' | Transfers between levels are considered to have occurred at the end of the reporting period. There were no transfers into or out of Levels 1 and 2 during the period ended 10/31/2012. See the notes to the financial statements for more information regarding pricing inputs and valuation techniques. |
| | | | |
| The notes to the financial statements are an integral part of this report. | | |
| Transamerica Funds | | | | Annual Report 2012 |
| | Page 82 | | |
Transamerica Money Market
(formerly, Transamerica AEGON Money Market)
SCHEDULE OF INVESTMENTS
At October 31, 2012
| | | | | | | | |
| | | Principal
(000’s) | | | Value
(000’s) | |
COMMERCIAL PAPER —28.7% | | | | | | | | |
Automobiles—0.5% | | | | | | | | |
VW Credit, Inc. | | | | | | | | |
0.33%, 11/13/2012—144A | | $ | 1,750 | | | $ | 1,750 | |
0.34%, 11/15/2012—144A | | | 2,000 | | | | 2,000 | |
Beverages—0.5% | | | | | | | | |
Coca-Cola Co. | | | | | | | | |
0.21%, 12/19/2012—144A | | | 4,100 | | | | 4,099 | |
Capital Markets—1.6% | | | | | | | | |
Royal Park Investments Funding Corp. | | | | | | | | |
0.75%, 01/14/2013—144A | | | 6,100 | | | | 6,091 | |
0.84%, 12/03/2012—144A | | | 7,000 | | | | 6,994 | |
Chemicals—0.2% | | | | | | | | |
Ecolab, Inc. | | | | | | | | |
0.19%, 11/02/2012—144A | | | 1,750 | | | | 1,750 | |
Commercial Banks—9.5% | | | | | | | | |
Barclays US Funding Corp. | | | | | | | | |
0.16%, 11/01/2012 | | | 26,600 | | | | 26,600 | |
DNB Bank ASA | | | | | | | | |
0.29%, 03/22/2013—144A | | | 4,000 | | | | 3,995 | |
Mizuho Funding LLC | | | | | | | | |
0.33%, 11/06/2012—144A | | | 3,000 | | | | 3,000 | |
0.34%, 03/18/2013—144A | | | 5,000 | | | | 4,994 | |
Skandinaviska Enskilda Banken AB | | | | | | | | |
0.55%, 12/12/2012—144A | | | 3,000 | | | | 2,998 | |
Societe Generale North America, Inc. | | | | | | | | |
0.31%, 11/01/2012 | | | 10,000 | | | | 10,000 | |
Standard Chartered Bank | | | | | | | | |
0.34%, 01/07/2013—144A | | | 3,000 | | | | 2,998 | |
0.41%, 11/13/2012—144A | | | 2,000 | | | | 2,000 | |
Sumitomo Mitsui Banking Corp. | | | | | | | | |
0.36%, 04/12/2013—144A | | | 8,000 | | | | 7,987 | |
Swedbank AB | | | | | | | | |
0.27%, 03/20/2013 | | | 5,000 | | | | 4,995 | |
0.42%, 12/03/2012 | | | 2,700 | | | | 2,699 | |
0.49%, 11/15/2012 | | | 5,000 | | | | 4,999 | |
Consumer Finance—0.2% | | | | | | | | |
Toyota Motor Credit Corp. | | | | | | | | |
0.24%, 11/23/2012 | | | 2,000 | | | | 2,000 | |
Diversified Financial Services—14.6% | | | | | | | | |
CAFCO LLC | | | | | | | | |
0.16%, 11/02/2012—144A | | | 2,000 | | | | 2,000 | |
0.20%, 11/05/2012—144A | | | 25,000 | | | | 24,998 | |
0.34%, 12/04/2012—144A | | | 4,000 | | | | 3,999 | |
0.64%, 11/01/2012—144A | | | 1,250 | | | | 1,250 | |
General Electric Capital Corp. | | | | | | | | |
0.34%, 12/17/2012 | | | 3,000 | | | | 2,999 | |
Kells Funding LLC | | | | | | | | |
0.18%, 11/05/2012 | | | 2,000 | | | | 2,000 | |
0.22%, 11/13/2012 | | | 7,000 | | | | 6,999 | |
0.52%, 02/22/2013 | | | 5,000 | | | | 4,992 | |
0.53%, 01/30/2013 | | | 3,500 | | | | 3,495 | |
Mont Blanc Capital Corp. | | | | | | | | |
0.28%, 01/22/2013—01/28/2013—144A | | | 12,000 | | | | 11,992 | |
0.33%, 01/03/2013—144A | | | 1,263 | | | | 1,262 | |
0.36%, 11/08/2012—144A | | | 1,000 | | | | 1,000 | |
0.37%, 11/07/2012—144A | | | 8,000 | | | | 7,999 | |
Rabobank USA Financial Corp. | | | | | | | | |
0.31%, 11/08/2012 | | | 1,400 | | | | 1,400 | |
0.48%, 02/01/2013 | | | 3,000 | | | | 2,996 | |
| | | | | | | | |
| | | Principal
(000’s) | | | Value
(000’s) | |
Diversified Financial Services (continued) | | | | | | | | |
Rabobank USA Financial Corp. (continued) | | | | | | | | |
0.50%, 01/25/2013 | | $ | 3,000 | | | $ | 2,996 | |
Regency Markets NO. 1 LLC | | | | | | | | |
0.27%, 01/15/2013—144A | | | 7,500 | | | | 7,496 | |
0.31%, 11/15/2012—144A | | | 2,000 | | | | 2,000 | |
Royal Park Investments | | | | | | | | |
0.39%, 11/21/2012 | | | 8,520 | | | | 8,518 | |
Salisbury Receivables Co. LLC | | | | | | | | |
0.35%, 01/18/2013—144A | | | 3,000 | | | | 2,998 | |
Sheffield Receivables Corp. | | | | | | | | |
0.39%, 01/08/2013—144A | | | 7,400 | | | | 7,395 | |
Straight-A Funding LLC | | | | | | | | |
0.14%, 11/21/2012—144A | | | 3,800 | | | | 3,800 | |
0.15%, 12/18/2012—144A | | | 5,200 | | | | 5,199 | |
Energy Equipment & Services—0.5% | | | | | | | | |
Spectra Energy Capital LLC | | | | | | | | |
0.35%, 11/01/2012—144A | | | 3,750 | | | | 3,750 | |
Multi-Utilities—0.2% | | | | | | | | |
Dominion Resources | | | | | | | | |
0.33%, 11/07/2012—144A | | | 1,400 | | | | 1,400 | |
Oil, Gas & Consumable Fuels—0.9% | | | | | | | | |
Devon Energy Corp. | | | | | | | | |
0.31%, 11/14/2012—11/26/2012—144A | | | 3,250 | | | | 3,250 | |
Kinder Morgan Energy Partners, LP | | | | | | | | |
0.37%, 11/08/2012—144A | | | 1,250 | | | | 1,250 | |
0.40%, 11/09/2012—144A | | | 2,500 | | | | 2,499 | |
| | | | | | | | |
Total Commercial Paper (cost $233,881) | | | | | | | 233,881 | |
| | | | | | | | |
CERTIFICATES OF DEPOSIT —2.7% | | | | | | | | |
Commercial Banks—2.7% | | | | | | | | |
Barclays Bank PLC | | | | | | | | |
0.91%, 04/02/2013—144A § | | | 4,500 | | | | 4,500 | |
Mitsubishi UFJ Trust & Banking Corp. | | | | | | | | |
0.34%, 04/29/2013 | | | 7,000 | | | | 7,000 | |
Skandinaviska Enskilda Banken AB | | | | | | | | |
0.60%, 06/07/2013 | | | 6,000 | | | | 6,000 | |
Svenska Handelsbanken | | | | | | | | |
0.58%, 09/25/2013 | | | 4,300 | | | | 4,317 | |
| | | | | | | | |
Total Certificates of Deposit (cost $21,817) | | | | | | | 21,817 | |
| | | | | | | | |
CORPORATE DEBT SECURITIES—1.8% | | | | | | | | |
Commercial Banks—1.8% | | | | | | | | |
Deutsche Bank AG | | | | | | | | |
0.98%, 01/18/2013 * | | | 5,000 | | | | 5,006 | |
ING Bank NV | | | | | | | | |
1.44%, 03/15/2013—144A * | | | 5,000 | | | | 5,016 | |
2.65%, 01/14/2013—144A | | | 5,000 | | | | 5,022 | |
| | | | | | | | |
Total Corporate Debt Securities (cost $15,044) | | | | | | | 15,044 | |
| | | | | | | | |
DEMAND NOTE—0.6% | | | | | | | | |
Capital Markets—0.6% | | | | | | | | |
Goldman Sachs Co. Promissory Note | | | | | | | | |
0.56%, 12/21/2012 § | | | 4,500 | | | | 4,500 | |
Total Demand Note (cost $4,500) | | | | | | | | |
| | |
SHORT-TERM U.S. GOVERNMENT OBLIGATIONS—13.2% | | | | | | | | |
Freddie Mac | | | | | | | | |
0.13%, 11/23/2012 | | | 23,600 | | | | 23,598 | |
U.S. Treasury Bill | | | | | | | | |
0.10%, 11/08/2012 | | | 7,300 | | | | 7,300 | |
| | | | |
| The notes to the financial statements are an integral part of this report. | | |
| Transamerica Funds | | | | Annual Report 2012 |
| | Page 83 | | |
Transamerica Money Market
(formerly, Transamerica AEGON Money Market)
SCHEDULE OF INVESTMENTS (continued)
At October 31, 2012
| | | | | | | | |
| | | Principal
(000’s) | | | Value
(000’s) | |
SHORT-TERM U.S. GOVERNMENT OBLIGATIONS (continued) | | | | | | | | |
U.S. Treasury Bill (continued) | | | | | | | | |
0.12%, 11/23/2012 | | $ | 70,600 | | | $ | 70,594 | |
0.13%, 03/28/2013 | | | 5,723 | | | | 5,720 | |
| | | | | | | | |
Total Short-Term U.S. Government Obligations (cost $107,212) | | | | | | | 107,212 | |
| | | | | | | | |
REPURCHASE AGREEMENTS—53.0% | | | | | | | | |
Barclays 0.32% , dated 10/31/2012, to be repurchased at $200,002 on 11/01/2012. Collateralized by U.S. Government Agency Obligations, 2.60%—3.00%, due 06/20/2039—07/15/2042, and with a total value of $204,000. | | | 200,000 | | | | 200,000 | |
Goldman Sachs 0.23%, dated 10/31/2012, to be repurchased at $57,000 on 11/01/2012. Collateralized by U.S. Government Agency Obligations, 2.50%—4.50%, due 11/01/2027—06/01/2039, and with a total value of $58,140. | | | 57,000 | | | | 57,000 | |
| | | | | | | | |
| | | Principal
(000’s) | | | Value
(000’s) | |
REPURCHASE AGREEMENTS (continued) | | | | | | | | |
JPMorgan Securities, Inc.
0.25%, dated 10/31/2012, to be repurchased at $174,901 on 11/01/2012. Collateralized by U.S. Government Agency Obligations, 2.50%—7.00%, due 06/01/2017—10/01/2042, and with a total value of $174,905. | | $ | 174,900 | | | $ | 174,900 | |
State Street Bank & Trust Co.
0.03%, dated 10/31/2012, to be repurchased at $317 on 11/01/2012. Collateralized by a U.S. Government Agency Obligation, 3.05%, due 01/01/2042, and with a value of $328. | | | 317 | | | | 317 | |
| | | | | | | | |
Total Repurchase Agreements (cost $432,217) | | | | | | | 432,217 | |
Total Investment Securities (cost $814,671) P | | | | | | | 814,671 | |
| | | | | | | | |
Other Assets and Liabilities—Net | | | | | | | (265 | ) |
| | | | | | | | |
Net Assets | | | | | | $ | 814,406 | |
| | | | | | | | |
NOTES TO SCHEDULE OF INVESTMENTS (all amounts in thousands):
| | Rate shown reflects the yield at 10/31/2012. |
| * | Floating or variable rate note. Rate is listed as of 10/31/2012. |
| § | Illiquid. Total aggregate market value of illiquid securities is $9,000, or 1.11% of the fund’s net assets. |
| P | Aggregate cost for federal income tax purposes is $814,671. |
DEFINITION (all amounts in thousands):
| 144A | 144A Securities are registered pursuant to Rule 144A of the Securities Act of 1933. These securities are deemed to be liquid for purposes of compliance limitations on holdings of illiquid securities and may be resold as transactions exempt from registration, normally to qualified institutional buyers. At 10/31/2012, these securities aggregated $160,731, or 19.74% of the fund’s net assets. |
VALUATION SUMMARY (all amounts in thousands): '
| | | | | | | | | | | | | | | | |
Investment Securities | | Level 1 -
Quoted
Prices | | | Level 2 -
Other
Significant
Observable
Inputs | | | Level 3 -
Significant
Unobservable
Inputs | | | Value at
10/31/2012 | |
Certificates of Deposit | | $ | — | | | $ | 21,817 | | | $ | — | | | $ | 21,817 | |
Commercial Paper | | | — | | | | 233,881 | | | | — | | | | 233,881 | |
Corporate Debt Securities | | | — | | | | 15,044 | | | | — | | | | 15,044 | |
Demand Note | | | — | | | | 4,500 | | | | — | | | | 4,500 | |
| | | | | | | | | | | | | | | | |
Repurchase Agreements | | | — | | | | 432,217 | | | | — | | | | 432,217 | |
Short-Term U.S. Government Obligations | | | — | | | | 107,212 | | | | — | | | | 107,212 | |
| | | | | | | | | | | | | | | | |
Total | | $ | — | | | $ | 814,671 | | | $ | — | | | $ | 814,671 | |
| | | | | | | | | | | | | | | | |
| ' | Transfers between levels are considered to have occurred at the end of the reporting period. There were no transfers into or out of Levels 1 and 2 during the period ended 10/31/2012. See the notes to the financial statements for more information regarding pricing inputs and valuation techniques. |
| | | | |
| The notes to the financial statements are an integral part of this report. | | |
| Transamerica Funds | | | | Annual Report 2012 |
| | Page 84 | | |
Transamerica Multi-Managed Balanced
SCHEDULE OF INVESTMENTS
At October 31, 2012
| | | | | | | | |
| | | Principal
(000’s) | | | Value
(000’s) | |
U.S. GOVERNMENT OBLIGATIONS—5.4% | | | | | | | | |
U.S. Treasury Bond | | | | | | | | |
2.75%, 08/15/2042 | | $ | 5,917 | | | $ | 5,797 | |
3.00%, 05/15/2042 | | | 125 | | | | 129 | |
U.S. Treasury Inflation Indexed Bond | | | | | | | | |
2.13%, 02/15/2041 g | | | 79 | | | | 118 | |
U.S. Treasury Inflation Indexed Note | | | | | | | | |
0.13%, 04/15/2017 | | | 1,222 | | | | 1,311 | |
U.S. Treasury Note | | | | | | | | |
0.25%, 09/30/2014—10/15/2015 | | | 1,250 | | | | 1,247 | |
0.63%, 09/30/2017 ^ | | | 1,900 | | | | 1,893 | |
0.75%, 10/31/2017 | | | 4,125 | | | | 4,132 | |
1.00%, 08/31/2019 | | | 100 | | | | 99 | |
1.00%, 09/30/2019 ^ | | | 1,565 | | | | 1,553 | |
1.25%, 10/31/2019 | | | 345 | | | | 348 | |
1.63%, 08/15/2022 ^ | | | 3,618 | | | | 3,598 | |
| | | | | | | | |
Total U.S. Government Obligations (cost $20,107) | | | | | | | 20,225 | |
| | | | | | | | |
U.S. GOVERNMENT AGENCY OBLIGATIONS—16.6% | | | | | |
Fannie Mae | | | | | | | | |
1.97%, 10/09/2019 | | | 435 | | | | 381 | |
3.33%, 06/01/2041 * | | | 242 | | | | 256 | |
3.48%, 09/01/2041 * | | | 174 | | | | 184 | |
3.50%, 01/01/2027—10/01/2042 | | | 5,071 | | | | 5,422 | |
4.00%, 02/01/2025—06/01/2042 | | | 4,014 | | | | 4,314 | |
4.50%, 02/01/2025—08/01/2041 | | | 8,954 | | | | 9,724 | |
5.00%, 05/01/2018—02/01/2036 | | | 3,087 | | | | 3,310 | |
5.50%, 07/01/2019—11/01/2038 | | | 4,226 | | | | 4,708 | |
6.00%, 08/01/2036—10/01/2040 | | | 1,839 | | | | 2,051 | |
6.50%, 05/01/2040 | | | 1,183 | | | | 1,344 | |
Fannie Mae, TBA | | | | | | | | |
2.50% | | | 100 | | | | 105 | |
3.00% | | | 200 | | | | 210 | |
3.50% | | | 500 | | | | 533 | |
4.00% | | | 400 | | | | 428 | |
4.50% | | | 500 | | | | 539 | |
5.50% | | | 600 | | | | 658 | |
6.00% | | | 1,300 | | | | 1,441 | |
Freddie Mac | | | | | | | | |
2.87%, 12/25/2021 | | | 670 | | | | 715 | |
3.97%, 01/25/2021 * | | | 420 | | | | 485 | |
4.50%, 10/01/2041 | | | 1,800 | | | | 1,836 | |
5.00%, 04/01/2018—03/01/2038 | | | 210 | | | | 227 | |
5.50%, 09/01/2018—11/01/2018 | | | 55 | | | | 59 | |
Freddie Mac, IO | | | | | | | | |
1.52%, 06/25/2022 * | | | 1,800 | | | | 203 | |
1.56%, 12/25/2018 * | | | 851 | | | | 69 | |
1.79%, 05/25/2019 * | | | 719 | | | | 70 | |
Freddie Mac, TBA | | | | | | | | |
3.50% | | | 5,600 | | | | 5,952 | |
4.00% | | | 1,800 | | | | 1,919 | |
4.50% | | | 2,200 | | | | 2,357 | |
FREMF Mortgage Trust | | | | | | | | |
4.02%, 11/25/2044—144A * | | | 55 | | | | 54 | |
Ginnie Mae | | | | | | | | |
4.00%, 09/15/2040—07/15/2042 | | | 872 | | | | 955 | |
4.50%, 05/20/2040—02/15/2042 | | | 3,944 | | | | 4,345 | |
Ginnie Mae, IO | | | | | | | | |
1.01%, 02/16/2053 * | | | 1,005 | | | | 86 | |
Ginnie Mae, TBA | | | | | | | | |
4.00% | | | 2,700 | | | | 2,947 | |
4.50% | | | 600 | | | | 652 | |
| | | | | | | | |
| | | Principal
(000’s) | | | Value
(000’s) | |
U.S. GOVERNMENT AGENCY OBLIGATIONS (continued) | | | | | | | | |
Ginnie Mae, TBA (continued) | | | | | | | | |
5.00% | | $ | 2,700 | | | $ | 2,957 | |
| | | | | | | | |
Total U.S. Government Agency Obligations (cost $60,843) | | | | | | | 61,496 | |
| | | | | | | | |
FOREIGN GOVERNMENT OBLIGATIONS—1.9% | | | | | | | | |
Deutsche Bundesrepublik Inflation Linked Bond | | | | | | | | |
0.10%, 04/15/2023 | | | EUR1,448 | | | | 1,958 | |
Italy Buoni Poliennali del Tesoro | | | | | | | | |
2.10%, 09/15/2021 | | | 319 | | | | 374 | |
2.55%, 09/15/2041 | | | 85 | | | | 87 | |
4.75%, 06/01/2017 | | | 1,730 | | | | 2,337 | |
5.25%, 08/01/2017 | | | 365 | | | | 504 | |
Republic of Brazil | | | | | | | | |
7.13%, 01/20/2037 | | $ | 100 | | | | 151 | |
Republic of Poland | | | | | | | | |
6.38%, 07/15/2019 | | | 80 | | | | 100 | |
Republic of South Africa | | | | | | | | |
5.50%, 03/09/2020 | | | 180 | | | | 210 | |
Republic of Turkey | | | | | | | | |
5.63%, 03/30/2021 | | | 145 | | | | 169 | |
7.00%, 03/11/2019 | | | 100 | | | | 123 | |
Russian Federation | | | | | | | | |
7.50%, 03/31/2030—Reg S | | | 496 | | | | 628 | |
Turkey Government International Bond | | | | | | | | |
6.25%, 09/26/2022 | | | 200 | | | | 242 | |
United Mexican States | | | | | | | | |
5.13%, 01/15/2020 | | | 340 | | | | 406 | |
| | | | | | | | |
Total Foreign Government Obligations (cost $6,961) | | | | | | | 7,289 | |
| | | | | | | | |
MORTGAGE-BACKED SECURITIES—6.0% | | | | | | | | |
American General Mortgage Loan Trust | | | | | | | | |
Series 2009-1, Class A6 | | | | | | | | |
5.75%, 09/25/2048—144A * | | | 1,060 | | | | 1,082 | |
American Tower Trust | | | | | | | | |
Series 2007-1A, Class AFX | | | | | | | | |
5.42%, 04/15/2037—144A | | | 910 | | | | 953 | |
Series 2007-1A, Class C | | | | | | | | |
5.62%, 04/15/2037—144A | | | 1,080 | | | | 1,113 | |
Banc of America Large Loan, Inc. | | | | | | | | |
Series 2010-HLTN, Class HLTN | | | | | | | | |
1.96%, 11/15/2015—144A * | | | 489 | | | | 488 | |
Series 2010-UB4, Class A4A | | | | | | | | |
5.01%, 12/20/2041—144A * | | | 315 | | | | 331 | |
Banc of America Merrill Lynch Commercial Mortgage, Inc. | | | | | | | | |
Series 2007-1, Class AMFX | | | | | | | | |
5.48%, 01/15/2049 * | | | 20 | | | | 21 | |
Series 2007-3, Class AM | | | | | | | | |
5.54%, 06/10/2049 * | | | 170 | | | | 183 | |
Banc of America Re-REMIC Trust | | | | | | | | |
Series 2012-CLRN, Class A | | | | | | | | |
1.36%, 08/15/2029—144A * | | | 122 | | | | 123 | |
BCAP LLC Trust | | | | | | | | |
Series 2009-RR3, Class 2A1 | | | | | | | | |
4.85%, 05/26/2037—144A * | | | 115 | | | | 116 | |
Series 2009-RR6, Class 2A1 | | | | | | | | |
2.97%, 08/26/2035—144A * | | | 344 | | | | 312 | |
Series 2009-RR10, Class 2A1 | | | | | | | | |
3.12%, 08/26/2035—144A * | | | 496 | | | | 490 | |
| | | | |
| The notes to the financial statements are an integral part of this report. | | |
| Transamerica Funds | | | | Annual Report 2012 |
| | Page 85 | | |
Transamerica Multi-Managed Balanced
SCHEDULE OF INVESTMENTS (continued)
At October 31, 2012
| | | | | | | | |
| | | Principal
(000’s) | | | Value
(000’s) | |
MORTGAGE-BACKED SECURITIES (continued) | | | | | | | | |
BCAP LLC Trust (continued) | | | | | | | | |
Series 2009-RR13, Class 13A3 | | | | | | | | |
5.25%, 03/26/2037—144A * | | $ | 187 | | | $ | 188 | |
Series 2009-RR14, Class 1A1 | | | | | | | | |
6.05%, 05/26/2037—144A * | | | 505 | | | | 540 | |
Series 2010-RR1, Class 12A1 | | | | | | | | |
5.25%, 08/26/2036—144A * | | | 532 | | | | 553 | |
Series 2010-RR6, Class 1A5 | | | | | | | | |
5.00%, 08/26/2022—144A * | | | 188 | | | | 192 | |
Commercial Mortgage Pass-Through Certificates | | | | | | | | |
Series 2006-C8, Class AM | | | | | | | | |
5.35%, 12/10/2046 | | | 190 | | | | 210 | |
Series 2012-LTRT, Class A2 | | | | | | | | |
3.40%, 10/05/2030—144A | | | 380 | | | | 398 | |
Commercial Mortgage Pass-Through Certificates, IO | | | | | | | | |
Series 2012-CR1, Class XA | | | | | | | | |
2.27%, 05/15/2045 * | | | 1,845 | | | | 260 | |
Credit Suisse Mortgage Capital Certificates | | | | | | | | |
Series 2006-C4, Class A3 | | | | | | | | |
5.47%, 09/15/2039 | | | 600 | | | | 684 | |
Series 2007-C4, Class A3 | | | | | | | | |
5.76%, 09/15/2039 * | | | 765 | | | | 799 | |
Series 2009-16R, Class 11A1 | | | | | | | | |
7.00%, 08/26/2036—144A | | | 242 | | | | 252 | |
Series 2010-15R, Class 2A1 | | | | | | | | |
3.50%, 05/26/2036—144A * | | | 337 | | | | 352 | |
Series 2010-18R, Class 3A1 | | | | | | | | |
4.00%, 03/26/2037—144A | | | 277 | | | | 283 | |
Series 2010-RR1, Class 2A | | | | | | | | |
5.70%, 09/15/2040—144A * | | | 585 | | | | 681 | |
DBRR Trust | | | | | | | | |
Series 2011-C32, Class A3A | | | | | | | | |
5.75%, 06/17/2049—144A * | | | 150 | | | | 174 | |
Series 2012-EZ1, Class A | | | | | | | | |
0.95%, 09/25/2045—144A | | | 654 | | | | 656 | |
Extended Stay America Trust | | | | | | | | |
Series 2010-ESHA, Class B | | | | | | | | |
4.22%, 11/05/2027—144A | | | 350 | | | | 351 | |
Series 2010-ESHA, Class C | | | | | | | | |
4.86%, 11/05/2027—144A | | | 100 | | | | 101 | |
Series 2010-ESHA, Class D | | | | | | | | |
5.50%, 11/05/2027—144A | | | 195 | | | | 196 | |
Greenwich Capital Commercial Funding Corp. | | | | | | | | |
Series 2007-GG11, Class A4 | | | | | | | | |
5.74%, 12/10/2049 | | | 80 | | | | 94 | |
GS Mortgage Securities Corp. II | | | | | | | | |
Series 2006-GG8, Class AJ | | | | | | | | |
5.62%, 11/10/2039 | | | 150 | | | | 133 | |
Series 2006-GG8, Class AM | | | | | | | | |
5.59%, 11/10/2039 | | | 60 | | | | 67 | |
Jefferies & Co., Inc. | | | | | | | | |
Series 2009-R2, Class 2A | | | | | | | | |
3.06%, 12/26/2037—144A * | | | 313 | | | | 315 | |
Series 2009-R7, Class 10A3 | | | | | | | | |
6.00%, 12/26/2036—144A | | | 233 | | | | 242 | |
Series 2009-R7, Class 12A1 | | | | | | | | |
5.08%, 08/26/2036—144A * | | | 252 | | | | 249 | |
Series 2009-R7, Class 1A1 | | | | | | | | |
3.95%, 02/26/2036—144A * | | | 520 | | | | 503 | |
Series 2009-R7, Class 4A1 | | | | | | | | |
2.92%, 09/26/2034—144A * | | | 455 | | | | 437 | |
| | | | | | | | |
| | | Principal
(000’s) | | | Value
(000’s) | |
MORTGAGE-BACKED SECURITIES (continued) | | | | | | | | |
Jefferies & Co., Inc. (continued) | | | | | | | | |
Series 2009-R9, Class 1A1 | | | | | | | | |
2.73%, 08/26/2046—144A * | | $ | 336 | | | $ | 334 | |
Series 2010-R2, Class 1A1 | | | | | | | | |
6.00%, 05/26/2036—144A | | | 433 | | | | 452 | |
Series 2010-R3, Class 1A1 | | | | | | | | |
3.03%, 03/21/2036—144A * | | | 282 | | | | 289 | |
Series 2010-R6, Class 1A1 | | | | | | | | |
4.00%, 09/26/2037—144A | | | 192 | | | | 195 | |
JPMorgan Chase Commercial Mortgage Securities Corp. | | | | | | | | |
Series 2004-CB8, Class A1A | | | | | | | | |
4.16%, 01/12/2039—144A | | | 668 | | | | 691 | |
Series 2004-LN2, Class A2 | | | | | | | | |
5.12%, 07/15/2041 | | | 500 | | | | 530 | |
Series 2006-CB14, Class AM | | | | | | | | |
5.45%, 12/12/2044 * | | | 100 | | | | 109 | |
Series 2007-CB20, Class AM | | | | | | | | |
5.88%, 02/12/2051 * | | | 360 | | | | 413 | |
Series 2008-C2, Class ASB | | | | | | | | |
6.13%, 02/12/2051 * | | | 207 | | | | 227 | |
Series 2010-C1, Class B | | | | | | | | |
5.95%, 06/15/2043—144A | | | 370 | | | | 442 | |
JPMorgan Chase Commercial Mortgage Securities Corp., IO | | | | | | | | |
Series 2012-CBX, Class XA | | | | | | | | |
2.06%, 06/15/2045 * | | | 996 | | | | 117 | |
JPMorgan Re-REMIC | | | | | | | | |
Series 2009-7, Class 8A1 | | | | | | | | |
5.41%, 01/27/2047—144A * | | | 222 | | | | 227 | |
Series 2010-4, Class 7A1 | | | | | | | | |
1.87%, 08/26/2035—144A * | | | 344 | | | | 340 | |
LB-UBS Commercial Mortgage Trust | | | | | | | | |
Series 2004-C8, Class C | | | | | | | | |
4.93%, 12/15/2039 * | | | 605 | | | | 647 | |
Series 2007-C1, Class AM | | | | | | | | |
5.46%, 02/15/2040 | | | 115 | | | | 128 | |
Series 2007-C6, Class A4 | | | | | | | | |
5.86%, 07/15/2040 * | | | 130 | | | | 154 | |
Series 2007-C7, Class A3 | | | | | | | | |
5.87%, 09/15/2045 * | | | 160 | | | | 192 | |
Merrill Lynch/Countrywide Commercial Mortgage Trust | | | | | | | | |
Series 2007-9, Class A4 | | | | | | | | |
5.70%, 09/12/2049 | | | 720 | | | | 845 | |
Morgan Stanley Bank of America Merrill Lynch Trust | | | | | | | | |
Series 2012-CKSV, Class A2 | | | | | | | | |
3.28%, 10/15/2030—144A | | | 120 | | | | 123 | |
Morgan Stanley Capital I Trust | | | | | | | | |
Series 2007-HQ12, Class AM | | | | | | | | |
5.58%, 04/12/2049 * | | | 65 | | | | 67 | |
Series 2007-IQ15, Class AM | | | | | | | | |
5.88%, 06/11/2049 * | | | 190 | | | | 206 | |
Morgan Stanley Capital I, Inc. | | | | | | | | |
Series 2007-HQ12, Class A2FX | | | | | | | | |
5.58%, 04/12/2049 * | | | 266 | | | | 276 | |
Series 2012-C4, Class XA, IO | | | | | | | | |
2.70%, 03/15/2045—144A * | | | 1,592 | | | | 238 | |
Morgan Stanley Re-REMIC Trust | | | | | | | | |
2.00%, 07/27/2049 | | | 234 | | | | 236 | |
Series 2011-IO, Class A | | | | | | | | |
2.50%, 03/23/2051—144A | | | 75 | | | | 76 | |
| | | | |
| The notes to the financial statements are an integral part of this report. | | |
| Transamerica Funds | | | | Annual Report 2012 |
| | Page 86 | | |
Transamerica Multi-Managed Balanced
SCHEDULE OF INVESTMENTS (continued)
At October 31, 2012
| | | | | | | | |
| | | Principal
(000’s) | | | Value
(000’s) | |
MORTGAGE-BACKED SECURITIES (continued) | | | | | | | | |
S2 Hospitality LLC | | | | | | | | |
Series 2012-LV1, Class A | | | | | | | | |
4.50%, 04/15/2025—144A | | $ | 179 | | | $ | 180 | |
Wachovia Bank Commercial Mortgage Trust | | | | | | | | |
Series 2007-C33, Class A4 | | | | | | | | |
5.92%, 02/15/2051 * | | | 230 | | | | 273 | |
Wells Fargo Re-REMIC Trust | | | | | | | | |
Series 2012-IO, Class A | | | | | | | | |
1.75%, 08/20/2021—144A | | | 265 | | | | 265 | |
WF-RBS Commercial Mortgage Trust, IO | | | | | | | | |
Series 2012-C9, Class XA | | | | | | | | |
2.45%, 11/15/2045—144A * | | | 1,445 | | | | 211 | |
| | | | | | | | |
Total Mortgage-Backed Securities (cost $21,744) | | | | | | | 22,605 | |
| | | | | | | | |
ASSET-BACKED SECURITIES—3.7% | | | | | | | | |
AH Mortgage Advance Co., Ltd. | | | | | | | | |
Series SART-3, Class 1A1 | | | | | | | | |
2.98%, 03/13/2043—144A | | | 210 | | | | 211 | |
AH Mortgage Advance Trust | | | | | | | | |
Series SART-1, Class A1R | | | | | | | | |
2.23%, 05/10/2043—144A | | | 250 | | | | 251 | |
AmeriCredit Automobile Receivables Trust | | | | | | | | |
Series 2011-5, Class C | | | | | | | | |
3.44%, 10/08/2017 | | | 200 | | | | 211 | |
Series 2012-2, Class C | | | | | | | | |
2.64%, 10/10/2017 | | | 125 | | | | 128 | |
Series 2012-2, Class D | | | | | | | | |
3.38%, 04/09/2018 | | | 170 | | | | 174 | |
Series 2012-3, Class C | | | | | | | | |
2.42%, 05/08/2018 | | | 120 | | | | 124 | |
Series 2012-3, Class D | | | | | | | | |
3.03%, 07/09/2018 ^ | | | 80 | | | | 81 | |
Series 2012-4, Class B | | | | | | | | |
1.31%, 11/08/2017 | | | 75 | | | | 75 | |
Series 2012-4, Class C | | | | | | | | |
1.93%, 08/08/2018 | | | 125 | | | | 125 | |
Series 2012-4, Class D | | | | | | | | |
2.68%, 10/09/2018 | | | 45 | | | | 45 | |
CarMax Auto Owner Trust | | | | | | | | |
Series 2012-1, Class B | | | | | | | | |
1.76%, 08/15/2017 | | | 70 | | | | 72 | |
Series 2012-1, Class C | | | | | | | | |
2.20%, 10/16/2017 | | | 40 | | | | 41 | |
Series 2012-1, Class D | | | | | | | | |
3.09%, 08/15/2018 | | | 50 | | | | 51 | |
Chesapeake Funding LLC | | | | | | | | |
Series 2012-1A, Class B | | | | | | | | |
1.82%, 11/07/2023—144A * | | | 200 | | | | 200 | |
Credit Acceptance Auto Loan Trust | | | | | | | | |
Series 2012-2A, Class A | | | | | | | | |
1.52%, 03/16/2020—144A | | | 250 | | | | 250 | |
DT Auto Owner Trust | | | | | | | | |
Series 2012-1A, Class B | | | | | | | | |
2.26%, 10/16/2017—144A | | | 250 | | | | 251 | |
Series 2012-1A, Class C | | | | | | | | |
3.38%, 10/16/2017—144A | | | 250 | | | | 251 | |
Series 2012-1A, Class D | | | | | | | | |
4.94%, 07/16/2018—144A | | | 250 | | | | 254 | |
Ford Credit Floorplan Master Owner Trust | | | | | | | | |
Series 2010-5, Class C | | | | | | | | |
2.07%, 09/15/2015—144A | | | 110 | | | | 111 | |
Series 2010-5, Class D | | | | | | | | |
2.41%, 09/15/2015—144A | | | 60 | | | | 61 | |
| | | | | | | | |
| | | Principal
(000’s) | | | Value
(000’s) | |
ASSET-BACKED SECURITIES (continued) | | | | | | | | |
Ford Credit Floorplan Master Owner Trust (continued) | | | | | | | | |
Series 2011-2, Class C | | | | | | | | |
2.37%, 09/15/2015 | | $ | 140 | | | $ | 140 | |
Series 2011-2, Class D | | | | | | | | |
2.86%, 09/15/2015 | | | 95 | | | | 95 | |
Series 2012-1, Class C | | | | | | | | |
1.71%, 01/15/2016 * | | | 160 | | | | 161 | |
Series 2012-1, Class D | | | | | | | | |
2.31%, 01/15/2016 * | | | 145 | | | | 146 | |
Series 2012-2, Class D | | | | | | | | |
3.50%, 01/15/2019 | | | 100 | | | | 102 | |
Series 2012-4, Class C | | | | | | | | |
1.39%, 09/15/2016 | | | 100 | | | | 100 | |
Series 2012-4, Class D | | | | | | | | |
2.09%, 09/15/2016 | | | 155 | | | | 155 | |
Series 2012-5, Class C | | | | | | | | |
2.14%, 09/15/2019 | | | 100 | | | | 100 | |
Series 2012-5, Class D | | | | | | | | |
2.73%, 09/15/2019 | | | 130 | | | | 130 | |
HLSS Servicer Advance Receivables Backed Notes | | | | | | | | |
Series 2012-T2, Class A1 | | | | | | | | |
1.34%, 10/15/2043—144A | | | 100 | | | | 100 | |
Series 2012-T2, Class A2 | | | | | | | | |
1.99%, 10/15/2045—144A | | | 100 | | | | 101 | |
Hyundai Auto Receivables Trust | | | | | | | | |
Series 2012-A, Class D | | | | | | | | |
2.61%, 05/15/2018 | | | 95 | | | | 96 | |
Nelnet Student Loan Trust | | | | | | | | |
Series 2008-3, Class A4 | | | | | | | | |
2.08%, 11/25/2024 * | | | 205 | | | | 215 | |
PFS Financing Corp. | | | | | | | | |
Series 2012-AA, Class A | | | | | | | | |
1.41%, 02/15/2016—144A * | | | 160 | | | | 161 | |
Santander Drive Auto Receivables Trust | | | | | | | | |
Series 2011-1, Class D | | | | | | | | |
4.01%, 02/15/2017 | | | 310 | | | | 326 | |
Series 2011-S1A, Class B | | | | | | | | |
1.48%, 07/15/2013—144A | | | 383 | | | | 384 | |
Series 2011-S2A, Class C | | | | | | | | |
2.86%, 06/15/2017—144A | | | 273 | | | | 276 | |
Series 2012-1, Class B | | | | | | | | |
2.72%, 05/16/2016 | | | 80 | | | | 82 | |
Series 2012-1, Class C | | | | | | | | |
3.78%, 11/15/2017 | | | 110 | | | | 115 | |
Series 2012-2, Class C | | | | | | | | |
3.20%, 02/15/2018 | | | 310 | | | | 320 | |
Series 2012-2, Class D | | | | | | | | |
3.87%, 02/15/2018 | | | 185 | | | | 194 | |
Series 2012-3, Class B | | | | | | | | |
1.94%, 12/15/2016 | | | 255 | | | | 258 | |
Series 2012-3, Class C | | | | | | | | |
3.01%, 04/16/2018 | | | 350 | | | | 361 | |
Series 2012-3, Class D | | | | | | | | |
3.64%, 05/15/2018 | | | 285 | | | | 296 | |
Series 2012-4, Class C | | | | | | | | |
2.94%, 12/15/2017 | | | 230 | | | | 237 | |
Series 2012-4, Class D | | | | | | | | |
3.50%, 06/15/2018 | | | 310 | | | | 320 | |
Series 2012-5, Class B | | | | | | | | |
1.56%, 08/15/2018 | | | 290 | | | | 291 | |
| | | | |
| The notes to the financial statements are an integral part of this report. | | |
| Transamerica Funds | | | | Annual Report 2012 |
| | Page 87 | | |
Transamerica Multi-Managed Balanced
SCHEDULE OF INVESTMENTS (continued)
At October 31, 2012
| | | | | | | | |
| | | Principal
(000’s) | | | Value
(000’s) | |
ASSET-BACKED SECURITIES (continued) | | | | | | | | |
Santander Drive Auto Receivables Trust (continued) | | | | | | | | |
Series 2012-5, Class C | | | | | | | | |
2.70%, 08/15/2018 | | $ | 140 | | | $ | 143 | |
Series 2012-5, Class D | | | | | | | | |
3.30%, 09/17/2018 | | | 120 | | | | 124 | |
Series 2012-6, Class B | | | | | | | | |
1.33%, 05/15/2017 | | | 150 | | | | 150 | |
Series 2012-6, Class C | | | | | | | | |
1.94%, 03/15/2018 | | | 105 | | | | 105 | |
SLM Student Loan Trust | | | | | | | | |
Series 2004-B, Class A2 | | | | | | | | |
0.59%, 06/15/2021 * | | | 550 | | | | 537 | |
Series 2005-A, Class A3 | | | | | | | | |
0.59%, 06/15/2023 * | | | 340 | | | | 304 | |
Series 2005-B, Class A2 | | | | | | | | |
0.57%, 03/15/2023 * | | | 366 | | | | 358 | |
Series 2011-C, Class A2B | | | | | | | | |
4.54%, 10/17/2044—144A | | | 140 | | | | 153 | |
Series 2012-A, Class A1 | | | | | | | | |
1.61%, 08/15/2025—144A * | | | 105 | | | | 106 | |
Series 2012-A, Class A2 | | | | | | | | |
3.83%, 01/17/2045—144A | | | 120 | | | | 130 | |
Series 2012-B, Class A2 | | | | | | | | |
3.48%, 10/15/2030—144A | | | 400 | | | | 424 | |
Series 2012-C, Class A1 | | | | | | | | |
1.31%, 08/15/2023—144A * | | | 249 | | | | 250 | |
Series 2012-C, Class A2 | | | | | | | | |
3.31%, 10/15/2046—144A | | | 430 | | | | 453 | |
Series 2012-D, Class A2 | | | | | | | | |
2.95%, 02/15/2046—144A | | | 520 | | | | 541 | |
Series 2012-E, Class A1 | | | | | | | | |
0.96%, 10/16/2023—144A * | | | 240 | | | | 240 | |
TAL Advantage LLC | | | | | | | | |
Series 2011-1A, Class A | | | | | | | | |
4.60%, 01/20/2026—144A | | | 945 | | | | 999 | |
World Financial Network Credit Card Master Trust | | | | | | | | |
Series 2012-C, Class A | | | | | | | | |
2.23%, 08/15/2022 | | | 360 | | | | 361 | |
Series 2012-D, Class A | | | | | | | | |
2.15%, 04/17/2023 | | | 365 | | | | 364 | |
| | | | | | | | |
Total Asset-Backed Securities (cost $13,693) | | | | | | | 13,971 | |
| | | | | | | | |
PREFERRED CORPORATE DEBT SECURITIES—0.2% | | | | | | | | |
Commercial Banks—0.1% | | | | | | | | |
Capital One Capital VI | | | | | | | | |
8.88%, 05/15/2040 | | | 225 | | | | 231 | |
Fifth Third Capital Trust IV | | | | | | | | |
6.50%, 04/15/2037 * | | | 155 | | | | 155 | |
Insurance—0.1% | | | | | | | | |
MetLife Capital Trust IV | | | | | | | | |
7.88%, 12/15/2037—144A | | | 375 | | | | 453 | |
| | | | | | | | |
Total Preferred Corporate Debt Securities (cost $789) | | | | | | | 839 | |
| | | | | | | | |
CORPORATE DEBT SECURITIES—9.9% | | | | | | | | |
Aerospace & Defense—0.0% ¥ | | | | | | | | |
Sequa Corp. | | | | | | | | |
11.75%, 12/01/2015—144A | | | 100 | | | | 103 | |
Beverages—0.2% | | | | | | | | |
Anheuser-Busch InBev Worldwide, Inc. | | | | | | | | |
2.50%, 07/15/2022 | | | 120 | | | | 122 | |
| | | | | | | | |
| | | Principal
(000’s) | | | Value
(000’s) | |
Beverages (continued) | | | | | | | | |
Heineken NV | | | | | | | | |
1.40%, 10/01/2017—144A | | $ | 45 | | | $ | 45 | |
2.75%, 04/01/2023—144A | | | 285 | | | | 288 | |
Pernod-Ricard SA | | | | | | | | |
4.45%, 01/15/2022—144A | | | 150 | | | | 168 | |
Capital Markets—0.3% | | | | | | | | |
Goldman Sachs Group, Inc. | | | | | | | | |
5.75%, 01/24/2022 ^ | | | 1,028 | | | | 1,193 | |
Chemicals—0.1% | | | | | | | | |
CF Industries, Inc. | | | | | | | | |
7.13%, 05/01/2020 ^ | | | 410 | | | | 520 | |
Commercial Banks—0.4% | | | | | | | | |
Credit Suisse | | | | | | | | |
5.40%, 01/14/2020 | | | 33 | | | | 37 | |
Discover Bank | | | | | | | | |
7.00%, 04/15/2020 | | | 420 | | | | 515 | |
HSBC Bank Brasil SA—Banco Multiplo | | | | | | | | |
4.00%, 05/11/2016—144A | | | 610 | | | | 635 | |
HSBC Bank PLC | | | | | | | | |
3.10%, 05/24/2016—144A | | | 300 | | | | 317 | |
Commercial Services & Supplies—0.1% | | | | | | | | |
UR Merger Sub Corp. | | | | | | | | |
7.63%, 04/15/2022—144A | | | 290 | | | | 318 | |
Containers & Packaging—0.3% | | | | | | | | |
Rexam PLC | | | | | | | | |
6.75%, 06/01/2013—144A | | | 1,121 | | | | 1,138 | |
Rock-Tenn Co. | | | | | | | | |
4.00%, 03/01/2023—144A | | | 160 | | | | 165 | |
Diversified Financial Services—1.3% | | | | | | | | |
Bank of America Corp. | | | | | | | | |
3.88%, 03/22/2017 | | | 195 | | | | 210 | |
5.70%, 01/24/2022 ^ | | | 850 | | | | 1,012 | |
7.63%, 06/01/2019 | | | 125 | | | | 159 | |
Bank of America Corp.—Series MTNL | | | | | | | | |
5.65%, 05/01/2018 | | | 245 | | | | 285 | |
Citigroup, Inc. | | | | | | | | |
4.45%, 01/10/2017 | | | 80 | | | | 88 | |
4.59%, 12/15/2015 | | | 1,270 | | | | 1,386 | |
Ford Motor Credit Co., LLC | | | | | | | | |
6.63%, 08/15/2017 | | | 200 | | | | 234 | |
JPMorgan Chase & Co. | | | | | | | | |
3.25%, 09/23/2022 | | | 270 | | | | 277 | |
Northern Rock Asset Management PLC | | | | | | | | |
5.63%, 06/22/2017—144A | | | 200 | | | | 227 | |
Permanent TSB PLC | | | | | | | | |
3.60%, 01/14/2013—144A | | | 990 | | | | 990 | |
Swiss Re Capital I LP | | | | | | | | |
6.85%, 05/25/2016—144A * Ž | | | 240 | | | | 250 | |
Diversified Telecommunication Services—0.2% | | | | | | | | |
AT&T, Inc. | | | | | | | | |
5.35%, 09/01/2040 | | | 175 | | | | 215 | |
Intelsat Jackson Holdings SA | | | | | | | | |
7.25%, 04/01/2019 ^ | | | 170 | | | | 182 | |
Sprint Capital Corp. | | | | | | | | |
6.88%, 11/15/2028 | | | 135 | | | | 138 | |
Verizon Communications, Inc. | | | | | | | | |
6.40%, 02/15/2038 | | | 100 | | | | 139 | |
Electric Utilities—1.2% | | | | | | | | |
Alabama Power Co. | | | | | | | | |
3.95%, 06/01/2021 | | | 200 | | | | 225 | |
Cleveland Electric Illuminating Co. | | | | | | | | |
5.95%, 12/15/2036 | | | 117 | | | | 139 | |
8.88%, 11/15/2018 ^ | | | 25 | | | | 34 | |
| | | | |
| The notes to the financial statements are an integral part of this report. | | |
| Transamerica Funds | | | | Annual Report 2012 |
| | Page 88 | | |
Transamerica Multi-Managed Balanced
SCHEDULE OF INVESTMENTS (continued)
At October 31, 2012
| | | | | | | | |
| | | Principal
(000’s) | | | Value
(000’s) | |
Electric Utilities (continued) | | | | | | | | |
Duke Energy Carolinas LLC | | | | | | | | |
4.25%, 12/15/2041 | | $ | 125 | | | $ | 142 | |
Energy Future Intermediate Holding Co. LLC / EFIH Finance, Inc. | | | | | | | | |
10.00%, 12/01/2020 ^ | | | 500 | | | | 546 | |
Florida Power & Light Co. | | | | | | | | |
5.95%, 02/01/2038 | | | 150 | | | | 207 | |
Georgia Power Co. | | | | | | | | |
3.00%, 04/15/2016 ^ | | | 365 | | | | 391 | |
Hydro-Quebec | | | | | | | | |
8.05%, 07/07/2024 | | | 1,900 | | | | 2,807 | |
Jersey Central Power & Light Co. | | | | | | | | |
7.35%, 02/01/2019 ^ | | | 105 | | | | 136 | |
Energy Equipment & Services—0.5% | | | | | | | | |
El Paso Pipeline Partners Operating Co., LLC | | | | | | | | |
6.50%, 04/01/2020 | | | 305 | | | | 373 | |
Transocean, Inc. | | | | | | | | |
2.50%, 10/15/2017 | | | 310 | | | | 314 | |
3.80%, 10/15/2022 | | | 232 | | | | 237 | |
5.05%, 12/15/2016 | | | 280 | | | | 314 | |
6.00%, 03/15/2018 | | | 440 | | | | 519 | |
Food Products—0.2% | | | | | | | | |
Kraft Foods Group, Inc. | | | | | | | | |
3.50%, 06/06/2022—144A | | | 184 | | | | 199 | |
5.00%, 06/04/2042—144A | | | 149 | | | | 174 | |
Mondelez International, Inc. | | | | | | | | |
6.50%, 02/09/2040 | | | 185 | | | | 261 | |
Health Care Equipment & Supplies—0.1% | | | | | | | | |
Boston Scientific Corp. | | | | | | | | |
6.25%, 11/15/2015 | | | 433 | | | | 489 | |
Health Care Providers & Services—0.2% | | | | | | | | |
Coventry Health Care, Inc. | | | | | | | | |
5.45%, 06/15/2021 | | | 130 | | | | 152 | |
HCA, Inc. | | | | | | | | |
7.25%, 09/15/2020 | | | 150 | | | | 166 | |
Tenet Healthcare Corp. | | | | | | | | |
6.25%, 11/01/2018 ^ | | | 165 | | | | 178 | |
UnitedHealth Group, Inc. | | | | | | | | |
3.38%, 11/15/2021 | | | 55 | | | | 59 | |
WellPoint, Inc. | | | | | | | | |
3.30%, 01/15/2023 | | | 108 | | | | 112 | |
Hotels, Restaurants & Leisure—0.2% | | | | | | | | |
Caesars Entertainment Operating Co., Inc. | | | | | | | | |
11.25%, 06/01/2017 | | | 410 | | | | 444 | |
Wyndham Worldwide Corp. | | | | | | | | |
4.25%, 03/01/2022 | | | 240 | | | | 250 | |
Independent Power Producers & Energy Traders—0.0% ¥ | | | | | | | | |
Exelon Generation Co. LLC | | | | | | | | |
4.25%, 06/15/2022—144A | | | 60 | | | | 64 | |
Industrial Conglomerates—0.1% | | | | | | | | |
General Electric Co. | | | | | | | | |
2.70%, 10/09/2022 | | | 283 | | | | 284 | |
4.13%, 10/09/2042 | | | 100 | | | | 105 | |
Insurance—0.9% | | | | | | | | |
Allianz Finance II BV | | | | | | | | |
5.75%, 07/08/2041 * | | | 100 | | | | 137 | |
American International Group, Inc. | | | | | | | | |
3.80%, 03/22/2017 | | | 296 | | | | 319 | |
4.88%, 06/01/2022 ^ | | | 235 | | | | 265 | |
5.45%, 05/18/2017 | | | 165 | | | | 189 | |
8.18%, 05/15/2058 * | | | 25 | | | | 31 | |
AXA SA | | | | | | | | |
5.25%, 04/16/2040 * | | | 100 | | | | 124 | |
| | | | | | | | |
| | | Principal
(000’s) | | | Value
(000’s) | |
Insurance (continued) | | | | | | | | |
Lincoln National Corp. | | | | | | | | |
7.00%, 06/15/2040 | | $ | 115 | | | $ | 149 | |
Metropolitan Life Global Funding I | | | | | | | | |
3.88%, 04/11/2022—144A | | | 650 | | | | 717 | |
Muenchener Rueckversicherungs AG | | | | | | | | |
6.00%, 05/26/2041 * | | | 100 | | | | 141 | |
Prudential Financial, Inc. | | | | | | | | |
4.75%, 09/17/2015 | | | 560 | | | | 619 | |
5.38%, 06/21/2020 ^ | | | 210 | | | | 246 | |
5.88%, 09/15/2042 * | | | 308 | | | | 324 | |
XL Group PLC | | | | | | | | |
6.50%, 04/15/2017 * Ž | | | 100 | | | | 93 | |
Media—1.0% | | | | | | | | |
CBS Corp. | | | | | | | | |
4.63%, 05/15/2018 | | | 70 | | | | 79 | |
8.88%, 05/15/2019 | | | 220 | | | | 303 | |
CCH II LLC | | | | | | | | |
13.50%, 11/30/2016 | | | 41 | | | | 44 | |
Clear Channel Worldwide Holdings, Inc.—Series B | | | | | | | | |
9.25%, 12/15/2017 | | | 590 | | | | 633 | |
Comcast Corp. | | | | | | | | |
4.65%, 07/15/2042 | | | 712 | | | | 772 | |
COX Communications, Inc. | | | | | | | | |
8.38%, 03/01/2039—144A | | | 200 | | | | 317 | |
DIRECTV Holdings LLC / DIRECTV Financing Co., Inc. | | | | | | | | |
5.15%, 03/15/2042 | | | 75 | | | | 78 | |
NBCUniversal Media LLC | | | | | | | | |
2.88%, 01/15/2023 | | | 359 | | | | 362 | |
4.38%, 04/01/2021 | | | 175 | | | | 200 | |
5.15%, 04/30/2020 | | | 175 | | | | 210 | |
Time Warner Cable, Inc. | | | | | | | | |
4.50%, 09/15/2042 | | | 442 | | | | 454 | |
5.50%, 09/01/2041 | | | 130 | | | | 152 | |
Metals & Mining—0.1% | | | | | | | | |
Novelis, Inc. | | | | | | | | |
8.75%, 12/15/2020 | | | 250 | | | | 276 | |
Multiline Retail—0.2% | | | | | | | | |
Macy’s Retail Holdings, Inc. | | | | | | | | |
5.90%, 12/01/2016 | | | 175 | | | | 206 | |
7.45%, 07/15/2017 | | | 315 | | | | 391 | |
Multi-Utilities—0.2% | | | | | | | | |
Dominion Resources, Inc. | | | | | | | | |
1.95%, 08/15/2016 | | | 235 | | | | 243 | |
MidAmerican Energy Holdings Co. | | | | | | | | |
5.95%, 05/15/2037 | | | 435 | | | | 560 | |
Oil, Gas & Consumable Fuels—1.0% | | | | | | | | |
Anadarko Petroleum Corp. | | | | | | | | |
5.95%, 09/15/2016 ^ | | | 392 | | | | 455 | |
Energy Transfer Partners, LP | | | | | | | | |
6.50%, 02/01/2042 | | | 340 | | | | 427 | |
EOG Resources, Inc. | | | | | | | | |
2.63%, 03/15/2023 | | | 107 | | | | 110 | |
Kinder Morgan Energy Partners, LP | | | | | | | | |
5.95%, 02/15/2018 | | | 500 | | | | 610 | |
Laredo Petroleum, Inc. | | | | | | | | |
7.38%, 05/01/2022 | | | 180 | | | | 196 | |
Linn Energy LLC / Linn Energy Finance Corp. | | | | | | | | |
6.25%, 11/01/2019—144A ^ | | | 240 | | | | 240 | |
MEG Energy Corp. | | | | | | | | |
6.38%, 01/30/2023—144A | | | 65 | | | | 70 | |
6.50%, 03/15/2021—144A | | | 150 | | | | 161 | |
| | | | |
| The notes to the financial statements are an integral part of this report. | | |
| Transamerica Funds | | | | Annual Report 2012 |
| | Page 89 | | |
Transamerica Multi-Managed Balanced
SCHEDULE OF INVESTMENTS (continued)
At October 31, 2012
| | | | | | | | |
| | | Principal
(000’s) | | | Value
(000’s) | |
Oil, Gas & Consumable Fuels (continued) | | | | | | | | |
Nexen, Inc. | | | | | | | | |
5.88%, 03/10/2035 | | $ | 10 | | | $ | 12 | |
6.40%, 05/15/2037 | | | 90 | | | | 115 | |
7.50%, 07/30/2039 | | | 175 | | | | 251 | |
Peabody Energy Corp. | | | | | | | | |
6.25%, 11/15/2021 ^ | | | 135 | | | | 139 | |
Range Resources Corp. | | | | | | | | |
5.75%, 06/01/2021 | | | 40 | | | | 43 | |
7.25%, 05/01/2018 | | | 300 | | | | 317 | |
Valero Energy Corp. | | | | | | | | |
6.63%, 06/15/2037 | | | 90 | | | | 112 | |
Western Gas Partners, LP | | | | | | | | |
4.00%, 07/01/2022 ^ | | | 153 | | | | 162 | |
5.38%, 06/01/2021 | | | 282 | | | | 325 | |
Paper & Forest Products—0.2% | | | | | | | | |
International Paper Co. | | | | | | | | |
4.75%, 02/15/2022 ^ | | | 445 | | | | 506 | |
6.00%, 11/15/2041 | | | 115 | | | | 141 | |
Pharmaceuticals—0.1% | | | | | | | | |
Teva Pharmaceutical Finance Co., BV | | | | | | | | |
3.65%, 11/10/2021 | | | 70 | | | | 76 | |
Teva Pharmaceutical Finance IV BV | | | | | | | | |
3.65%, 11/10/2021 ^ | | | 170 | | | | 185 | |
Real Estate Investment Trusts—0.1% | | | | | | | | |
Ventas Realty, LP | | | | | | | | |
4.75%, 06/01/2021 | | | 120 | | | | 134 | |
Vornado Realty, LP | | | | | | | | |
5.00%, 01/15/2022 ^ | | | 250 | | | | 283 | |
Real Estate Management & Development—0.1% | | | | | | | | |
Realogy Corp. | | | | | | | | |
7.88%, 02/15/2019—144A | | | 270 | | | | 290 | |
Road & Rail—0.0% ¥ | | | | | | | | |
Burlington Northern Santa Fe LLC | | | | | | | | |
3.05%, 09/01/2022 | | | 50 | | | | 52 | |
Specialty Retail—0.0% ¥ | | | | | | | | |
QVC, Inc. | | | | | | | | |
7.50%, 10/01/2019—144A | | | 145 | | | | 160 | |
Wireless Telecommunication Services—0.6% | | | | | | | | |
America Movil SAB de CV | | | | | | | | |
2.38%, 09/08/2016 ^ | | | 300 | | | | 314 | |
4.38%, 07/16/2042 | | | 200 | | | | 209 | |
Crown Castle Towers LLC | | | | | | | | |
6.11%, 01/15/2020—144A | | | 545 | | | | 663 | |
MetroPCS Wireless, Inc. | | | | | | | | |
7.88%, 09/01/2018 ^ | | | 12 | | | | 13 | |
SBA Tower Trust | | | | | | | | |
5.10%, 04/17/2017—144A | | | 650 | | | | 722 | |
Sprint Nextel Corp. | | | | | | | | |
9.00%, 11/15/2018—144A | | | 305 | | | | 377 | |
| | | | | | | | |
Total Corporate Debt Securities (cost $34,892) | | | | | | | 37,181 | |
| | | | | | | | |
STRUCTURED NOTES DEBT—0.2% | | | | | | | | |
Diversified Financial Services—0.2% | | | | | | | | |
Tiers Trust | | | | | | | | |
2.19%, 05/12/2014—144A * | | | 740 | | | | 744 | |
Total Structured Notes Debt (cost $740) | | | | | | | | |
SHORT-TERM U.S. GOVERNMENT OBLIGATION—0.1% | | | | | | | | |
U.S. Treasury Bill | | | | | | | | |
0.15%, 05/30/2013 p g | | | 340 | | | | 340 | |
Total Short-Term U.S. Government Obligation (cost $340) | | | | | | | | |
| | | | | | | | |
| | | Shares | | | Value
(000’s) | |
PREFERRED STOCK—0.0% ¥ | | | | | | | | |
Diversified Financial Services—0.0% ¥ | | | | | | | | |
Citigroup Capital XIII, 7.88% * | | | 5,463 | | | $ | 152 | |
Total Preferred Stock (cost $144) | | | | | | | | |
COMMON STOCKS—59.8% | | | | | | | | |
Aerospace & Defense—1.2% | | | | | | | | |
Honeywell International, Inc. | | | 21,402 | | | | 1,311 | |
Northrop Grumman Corp. | | | 4,650 | | | | 319 | |
United Technologies Corp. | | | 37,836 | | | | 2,957 | |
Air Freight & Logistics—0.6% | | | | | | | | |
United Parcel Service, Inc.—Class B | | | 30,616 | | | | 2,243 | |
Airlines—0.1% | | | | | | | | |
Southwest Airlines Co. | | | 25,938 | | | | 229 | |
Auto Components—0.2% | | | | | | | | |
Delphi Automotive PLC ‡ | | | 7,130 | | | | 224 | |
Johnson Controls, Inc. | | | 17,866 | | | | 460 | |
Automobiles—0.3% | | | | | | | | |
Ford Motor Co. | | | 33,070 | | | | 369 | |
General Motors Co. ‡ | | | 29,034 | | | | 740 | |
Beverages—2.2% | | | | | | | | |
Beam, Inc. | | | 4,640 | | | | 258 | |
Coca-Cola Co. | | | 113,940 | | | | 4,237 | |
Coca-Cola Enterprises, Inc. | | | 30,727 | | | | 966 | |
Constellation Brands, Inc.—Class A ‡ | | | 2,359 | | | | 83 | |
Dr. Pepper Snapple Group, Inc. ^ | | | 12,302 | | | | 527 | |
PepsiCo, Inc. | | | 33,196 | | | | 2,298 | |
Biotechnology—1.1% | | | | | | | | |
Biogen Idec, Inc. ‡ | | | 14,879 | | | | 2,056 | |
Celgene Corp. ‡ | | | 24,778 | | | | 1,817 | |
Vertex Pharmaceuticals, Inc. ‡ | | | 8,701 | | | | 420 | |
Building Products—0.2% | | | | | | | | |
Masco Corp. | | | 38,896 | | | | 587 | |
Capital Markets—1.5% | | | | | | | | |
Ameriprise Financial, Inc. | | | 11,903 | | | | 695 | |
Franklin Resources, Inc. | | | 2,414 | | | | 309 | |
Goldman Sachs Group, Inc. | | | 4,202 | | | | 514 | |
Invesco, Ltd. | | | 56,507 | | | | 1,374 | |
Morgan Stanley | | | 39,882 | | | | 693 | |
State Street Corp. | | | 42,236 | | | | 1,882 | |
Chemicals—1.2% | | | | | | | | |
Air Products & Chemicals, Inc. | | | 15,247 | | | | 1,183 | |
CF Industries Holdings, Inc. | | | 2,173 | | | | 446 | |
Dow Chemical Co. | | | 27,932 | | | | 818 | |
E.I. du Pont de Nemours & Co. | | | 16,228 | | | | 722 | |
Georgia Gulf Corp. | | | 6,369 | | | | 225 | |
LyondellBasell Industries NV—Class A | | | 6,801 | | | | 363 | |
Monsanto Co. | | | 7,804 | | | | 672 | |
Commercial Banks—1.9% | | | | | | | | |
Comerica, Inc. | | | 6,918 | | | | 206 | |
Huntington Bancshares, Inc. ^ | | | 35,570 | | | | 227 | |
KeyCorp | | | 43,824 | | | | 369 | |
PNC Financial Services Group, Inc. | | | 2,806 | | | | 163 | |
Regions Financial Corp. | | | 24,338 | | | | 159 | |
SunTrust Banks, Inc. | | | 26,241 | | | | 714 | |
Wells Fargo & Co. | | | 153,698 | | | | 5,178 | |
Commercial Services & Supplies—0.2% | | | | | | | | |
Tyco International, Ltd. | | | 31,301 | | | | 841 | |
Communications Equipment—1.2% | | | | | | | | |
Cisco Systems, Inc. | | | 150,474 | | | | 2,580 | |
QUALCOMM, Inc. | | | 33,469 | | | | 1,960 | |
Computers & Peripherals—3.3% | | | | | | | | |
Apple, Inc. | | | 18,855 | | | | 11,220 | |
Hewlett-Packard Co. | | | 67,916 | | | | 941 | |
NetApp, Inc. ‡ | | | 7,615 | | | | 205 | |
Construction & Engineering—0.5% | | | | | | | | |
Fluor Corp. | | | 33,370 | | | | 1,864 | |
| | | | |
| The notes to the financial statements are an integral part of this report. | | |
| Transamerica Funds | | | | Annual Report 2012 |
| | Page 90 | | |
Transamerica Multi-Managed Balanced
SCHEDULE OF INVESTMENTS (continued)
At October 31, 2012
| | | | | | | | |
| | | Shares | | | Value
(000’s) | |
Consumer Finance—0.8% | | | | | | | | |
American Express Co. | | | 21,000 | | | $ | 1,175 | |
Capital One Financial Corp. | | | 25,458 | | | | 1,532 | |
SLM Corp. | | | 8,318 | | | | 146 | |
Containers & Packaging—0.1% | | | | | | | | |
Crown Holdings, Inc. ‡ | | | 8,756 | | | | 335 | |
Diversified Consumer Services—0.1% | | | | | | | | |
H&R Block, Inc. ^ | | | 18,640 | | | | 330 | |
Diversified Financial Services—1.6% | | | | | | | | |
Bank of America Corp. | | | 253,059 | | | | 2,359 | |
Citigroup, Inc. | | | 79,496 | | | | 2,971 | |
CME Group, Inc.—Class A | | | 13,796 | | | | 772 | |
Diversified Telecommunication Services—1.3% | | | | | | | | |
AT&T, Inc. | | | 50,604 | | | | 1,750 | |
Verizon Communications, Inc. | | | 68,477 | | | | 3,057 | |
Electric Utilities—1.1% | | | | | | | | |
American Electric Power Co., Inc. | | | 28,112 | | | | 1,249 | |
NextEra Energy, Inc. | | | 30,705 | | | | 2,151 | |
NV Energy, Inc. | | | 39,440 | | | | 750 | |
Electrical Equipment—0.5% | | | | | | | | |
Emerson Electric Co. | | | 40,421 | | | | 1,958 | |
Energy Equipment & Services—1.5% | | | | | | | | |
Baker Hughes, Inc. | | | 16,399 | | | | 688 | |
Ensco PLC—Class A | | | 19,051 | | | | 1,102 | |
Halliburton Co. | | | 43,192 | | | | 1,395 | |
National Oilwell Varco, Inc. | | | 13,075 | | | | 964 | |
Schlumberger, Ltd. | | | 22,024 | | | | 1,530 | |
Food & Staples Retailing—0.8% | | | | | | | | |
CVS Caremark Corp. | | | 22,223 | | | | 1,031 | |
Kroger Co. | | | 18,795 | | | | 474 | |
Walgreen Co. | | | 1,032 | | | | 36 | |
Wal-Mart Stores, Inc. | | | 14,705 | | | | 1,104 | |
Whole Foods Market, Inc. | | | 2,770 | | | | 262 | |
Food Products—1.6% | | | | | | | | |
Archer-Daniels-Midland Co. | | | 35,851 | | | | 962 | |
ConAgra Foods, Inc. | | | 16,220 | | | | 452 | |
General Mills, Inc. | | | 39,944 | | | | 1,601 | |
Kellogg Co. | | | 3,634 | | | | 190 | |
Mondelez International, Inc.—Class A ‡ | | | 90,100 | | | | 2,391 | |
Smithfield Foods, Inc. ‡ | | | 12,064 | | | | 247 | |
Gas Utilities—0.1% | | | | | | | | |
AGL Resources, Inc. | | | 4,974 | | | | 203 | |
UGI Corp. | | | 7,636 | | | | 247 | |
Health Care Equipment & Supplies—1.1% | | | | | | | | |
Baxter International, Inc. | | | 18,913 | | | | 1,185 | |
CareFusion Corp. ‡ | | | 47,988 | | | | 1,275 | |
Covidien PLC | | | 28,739 | | | | 1,578 | |
Hologic, Inc. ‡ | | | 5,142 | | | | 106 | |
St. Jude Medical, Inc. | | | 2,220 | | | | 85 | |
Health Care Providers & Services—1.3% | | | | | | | | |
Aetna, Inc. | | | 50 | | | | 2 | |
AmerisourceBergen Corp.—Class A | | | 22,410 | | | | 884 | |
CIGNA Corp. | | | 4,625 | | | | 236 | |
DaVita, Inc. ‡ | | | 4,830 | | | | 543 | |
Humana, Inc. | | | 15,779 | | | | 1,172 | |
UnitedHealth Group, Inc. | | | 39,235 | | | | 2,197 | |
Hotels, Restaurants & Leisure—0.1% | | | | | | | | |
Carnival Corp. ^ | | | 7,797 | | | | 295 | |
Household Durables—0.4% | | | | | | | | |
D.R. Horton, Inc. ^ | | | 10,595 | | | | 222 | |
Lennar Corp.—Class A ^ | | | 7,185 | | | | 269 | |
PulteGroup, Inc. ‡ ^ | | | 64,583 | | | | 1,120 | |
Household Products—0.8% | | | | | | | | |
Clorox Co. | | | 5,438 | | | | 393 | |
Energizer Holdings, Inc. ^ | | | 4,533 | | | | 331 | |
Procter & Gamble Co. | | | 31,894 | | | | 2,208 | |
Independent Power Producers & Energy Traders—0.0% ¥ | | | | | | | | |
AES Corp. | | | 10,770 | | | | 113 | |
| | | | | | | | |
| | | Shares | | | Value
(000’s) | |
Industrial Conglomerates—0.5% | | | | | | | | |
General Electric Co. | | | 82,446 | | | $ | 1,736 | |
Insurance—2.0% | | | | | | | | |
ACE, Ltd. | | | 17,747 | | | | 1,396 | |
Axis Capital Holdings, Ltd. | | | 3,037 | | | | 110 | |
Berkshire Hathaway, Inc.—Class B ‡ | | | 26,017 | | | | 2,247 | |
Everest RE Group, Ltd. | | | 2,024 | | | | 225 | |
Hartford Financial Services Group, Inc. ^ | | | 20,310 | | | | 441 | |
MetLife, Inc. | | | 51,207 | | | | 1,817 | |
PartnerRe, Ltd. | | | 11,175 | | | | 905 | |
Prudential Financial, Inc. | | | 9,119 | | | | 520 | |
Internet & Catalog Retail—0.5% | | | | | | | | |
Amazon.com, Inc. ‡ | | | 6,681 | | | | 1,556 | |
Expedia, Inc. | | | 8,190 | | | | 484 | |
Internet Software & Services—1.4% | | | | | | | | |
eBay, Inc. ‡ | | | 21,168 | | | | 1,022 | |
Google, Inc.—Class A ‡ | | | 5,871 | | | | 3,991 | |
LinkedIn Corp.—Class A ‡ | | | 1,138 | | | | 122 | |
IT Services—1.7% | | | | | | | | |
Cognizant Technology Solutions Corp.— Class A ‡ | | | 8,319 | | | | 554 | |
Fidelity National Information Services, Inc. | | | 17,121 | | | | 563 | |
International Business Machines Corp. | | | 19,499 | | | | 3,793 | |
Visa, Inc.—Class A | | | 10,160 | | | | 1,410 | |
Life Sciences Tools & Services—0.1% | | | | | | | | |
Mettler-Toledo International, Inc. ‡ | | | 1,317 | | | | 223 | |
Machinery—0.6% | | | | | | | | |
PACCAR, Inc. ^ | | | 28,859 | | | | 1,251 | |
Pentair, Ltd. | | | 9,557 | | | | 404 | |
SPX Corp. | | | 6,727 | | | | 461 | |
Stanley Black & Decker, Inc. | | | 2,897 | | | | 201 | |
Media—2.5% | | | | | | | | |
CBS Corp.—Class B | | | 60,757 | | | | 1,969 | |
Comcast Corp.—Class A | | | 53,490 | | | | 2,006 | |
DIRECTV ‡ | | | 5,752 | | | | 294 | |
DISH Network Corp.—Class A | | | 7,017 | | | | 250 | |
Time Warner Cable, Inc. | | | 22,095 | | | | 2,190 | |
Time Warner, Inc. | | | 50,907 | | | | 2,212 | |
Walt Disney Co. | | | 5,180 | | | | 254 | |
Metals & Mining—0.6% | | | | | | | | |
Alcoa, Inc. | | | 43,074 | | | | 369 | |
Freeport-McMoRan Copper & Gold, Inc. | | | 21,146 | | | | 823 | |
Newmont Mining Corp. | | | 8,748 | | | | 477 | |
U.S. Steel Corp. ^ | | | 10,567 | | | | 215 | |
Walter Energy, Inc. ^ | | | 6,135 | | | | 214 | |
Multiline Retail—1.0% | | | | | | | | |
Big Lots, Inc. ‡ | | | 1,010 | | | | 29 | |
Kohl’s Corp. | | | 3,770 | | | | 201 | |
Macy’s, Inc. | | | 13,030 | | | | 496 | |
Nordstrom, Inc. | | | 6,550 | | | | 372 | |
Target Corp. | | | 43,479 | | | | 2,772 | |
Multi-Utilities—0.9% | | | | | | | | |
NiSource, Inc. | | | 8,845 | | | | 225 | |
OGE Energy Corp. | | | 739 | | | | 43 | |
PG&E Corp. | | | 30,239 | | | | 1,286 | |
Sempra Energy | | | 25,060 | | | | 1,748 | |
Oil, Gas & Consumable Fuels—5.2% | | | | | | | | |
Anadarko Petroleum Corp. | | | 8,593 | | | | 591 | |
Apache Corp. | | | 13,230 | | | | 1,095 | |
Chesapeake Energy Corp. ^ | | | 11,360 | | | | 230 | |
Chevron Corp. | | | 47,641 | | | | 5,252 | |
ConocoPhillips | | | 8,891 | | | | 514 | |
Denbury Resources, Inc. ‡ | | | 6,670 | | | | 102 | |
Devon Energy Corp. | | | 6,930 | | | | 403 | |
EOG Resources, Inc. | | | 12,500 | | | | 1,457 | |
Exxon Mobil Corp. | | | 56,118 | | | | 5,117 | |
Kinder Morgan, Inc. | | | 33,748 | | | | 1,171 | |
Marathon Petroleum Corp. | | | 5,880 | | | | 323 | |
| | | | |
| The notes to the financial statements are an integral part of this report. | | |
| Transamerica Funds | | | | Annual Report 2012 |
| | Page 91 | | |
Transamerica Multi-Managed Balanced
SCHEDULE OF INVESTMENTS (continued)
At October 31, 2012
| | | | | | | | |
| | | Shares | | | Value
(000’s) | |
Oil, Gas & Consumable Fuels (continued) | | | | | | | | |
Occidental Petroleum Corp. | | | 14,019 | | | $ | 1,107 | |
Peabody Energy Corp. ^ | | | 21,893 | | | | 611 | |
Phillips 66 | | | 4,800 | | | | 226 | |
Valero Energy Corp. | | | 34,578 | | | | 1,006 | |
Pharmaceuticals—3.7% | | | | | | | | |
Abbott Laboratories | | | 32,895 | | | | 2,155 | |
Allergan, Inc. | | | 9,857 | | | | 886 | |
Johnson & Johnson ^ | | | 14,114 | | | | 1,000 | |
Merck & Co., Inc. | | | 102,362 | | | | 4,672 | |
Mylan, Inc. ‡ | | | 25,154 | | | | 637 | |
Pfizer, Inc. | | | 149,773 | | | | 3,726 | |
Valeant Pharmaceuticals International, Inc. ‡ | | | 3,780 | | | | 211 | |
Real Estate Investment Trusts—1.4% | | | | | | | | |
American Tower Corp.—Class A | | | 2,377 | | | | 179 | |
Apartment Investment & Management Co.—Class A | | | 13,228 | | | | 353 | |
CBL & Associates Properties, Inc. | | | 16,965 | | | | 380 | |
Equity Lifestyle Properties, Inc. | �� | | 1,484 | | | | 100 | |
Essex Property Trust, Inc. ^ | | | 1,944 | | | | 292 | |
Highwoods Properties, Inc. ^ | | | 5,996 | | | | 193 | |
Home Properties, Inc. | | | 5,300 | | | | 322 | |
Host Hotels & Resorts, Inc. | | | 12,370 | | | | 179 | |
LaSalle Hotel Properties ^ | | | 11,671 | | | | 279 | |
Liberty Property Trust | | | 4,784 | | | | 168 | |
National Retail Properties, Inc. ^ | | | 6,325 | | | | 200 | |
Pennsylvania Real Estate Investment Trust ‡ | | | 13,500 | | | | 223 | |
Plum Creek Timber Co., Inc. ^ | | | 13,237 | | | | 581 | |
Post Properties, Inc. | | | 927 | | | | 45 | |
Public Storage | | | 2,440 | | | | 338 | |
Simon Property Group, Inc. | | | 5,170 | | | | 788 | |
Weyerhaeuser Co. | | | 19,029 | | | | 527 | |
Road & Rail—1.7% | | | | | | | | |
CSX Corp. | | | 110,860 | | | | 2,269 | |
Norfolk Southern Corp. | | | 15,735 | | | | 965 | |
Union Pacific Corp. | | | 26,741 | | | | 3,291 | |
Semiconductors & Semiconductor Equipment—1.2% | | | | | | | | |
Altera Corp. | | | 19,173 | | | | 584 | |
Broadcom Corp.—Class A ‡ | | | 15,116 | | | | 477 | |
Intel Corp. | | | 30,627 | | | | 662 | |
KLA-Tencor Corp. | | | 6,982 | | | | 325 | |
LAM Research Corp. ‡ | | | 52,243 | | | | 1,849 | |
LSI Corp. ‡ | | | 79,060 | | | | 542 | |
Marvell Technology Group, Ltd. | | | 22,833 | | | | 180 | |
Software—2.6% | | | | | | | | |
Adobe Systems, Inc. ‡ | | | 18,509 | | | | 629 | |
Citrix Systems, Inc. ‡ | | | 6,345 | | | | 392 | |
Microsoft Corp. | | | 169,551 | | | | 4,838 | |
Oracle Corp. | | | 118,810 | | | | 3,689 | |
Zynga, Inc.—Class A ‡ | | | 63,801 | | | | 144 | |
Specialty Retail—1.7% | | | | | | | | |
AutoZone, Inc. ‡ | | | 3,743 | | | | 1,404 | |
Home Depot, Inc. | | | 41,489 | | | | 2,546 | |
Lowe’s Cos., Inc. | | | 47,713 | | | | 1,545 | |
O’Reilly Automotive, Inc. ‡ | | | 2,030 | | | | 174 | |
Staples, Inc. ^ | | | 11,940 | | | | 137 | |
TJX Cos., Inc. | | | 12,633 | | | | 526 | |
Textiles, Apparel & Luxury Goods—0.8% | | | | | | | | |
Coach, Inc. | | | 21,097 | | | | 1,182 | |
V.F. Corp. | | | 11,518 | | | | 1,803 | |
Tobacco—0.7% | | | | | | | | |
Philip Morris International, Inc. | | | 29,199 | | | | 2,586 | |
Trading Companies & Distributors—0.1% | | | | | | | | |
WW Grainger, Inc. ^ | | | 2,364 | | | | 476 | |
| | | | | | | | |
| | | Shares | | | Value
(000’s) | |
Wireless Telecommunication Services—0.0% ¥ | | | | | | | | |
MetroPCS Communications, Inc. ‡ | | | 15,810 | | | $ | 161 | |
| | | | | | | | |
Total Common Stocks (cost $194,413) | | | | | | | 223,144 | |
| | | | | | | | |
SHORT-TERM INVESTMENT COMPANY—1.0% | | | | | |
Capital Markets—1.0% | | | | | | | | |
BlackRock Provident TempFund 24 à | | | 3,580,515 | | | | 3,581 | |
Total Short-Term Investment Company (cost $3,581) | | | | | | | | |
| | |
SECURITIES LENDING COLLATERAL—5.5% | | | | | | | | |
State Street Navigator Securities Lending | | | | | | | | |
Trust—Prime Portfolio, 0.31% | | | 20,733,562 | | | | 20,734 | |
Total Securities Lending Collateral (cost $20,734) | | | | | | | | |
| | |
| | | Principal
(000’s) | | | Value
(000’s) | |
REPURCHASE AGREEMENT—1.2% | | | | | | | | |
State Street Bank & Trust Co. 0.03% , dated 10/31/2012, to be repurchased at $4,519 on 11/01/2012. Collateralized by a U.S. Government Agency Obligation, 3.00%, due 12/01/2026, and with a value of $4,610. | | $ | 4,519 | | | | 4,519 | |
| | | | | | | | |
Total Repurchase Agreement (cost $4,519) | | | | | | | | |
Total Investment Securities (cost $383,500) P | | | | | | | 416,820 | |
Other Assets and Liabilities—Net | | | | | | | (42,903 | ) |
| | | | | | | | |
Net Assets | | | | | | $ | 373,917 | |
| | | | | | | | |
| | |
| | | Principal
(000’s) | | | Value
(000’s) | |
TBA SHORT COMMITMENTS—(4.8%) | | | | | | | | |
U.S. Government Agency Obligations—(4.8%) | | | | | | | | |
Fannie Mae, TBA | | | | | | | | |
3.50% | | $ | (3,700 | ) | | $ | (3,937 | ) |
4.00% | | | (2,600 | ) | | | (2,781 | ) |
4.50% | | | (6,300 | ) | | | (6,796 | ) |
5.50% | | | (1,200 | ) | | | (1,316 | ) |
Ginnie Mae, TBA | | | | | | | | |
4.00% | | | (800 | ) | | | (875 | ) |
4.50% | | | (2,100 | ) | | | (2,303 | ) |
| | | | | | | | |
Total TBA Short Commitments (proceeds $(18,036)) | | | | | | | (18,008 | ) |
| | | | | | | | |
| | | | |
| The notes to the financial statements are an integral part of this report. | | |
| Transamerica Funds | | | | Annual Report 2012 |
| | Page 92 | | |
Transamerica Multi-Managed Balanced
SCHEDULE OF INVESTMENTS (continued)
At October 31, 2012
FORWARD FOREIGN CURRENCY CONTRACTS:
| | | | | | | | | | | | | | | | | | | | |
Currency | | Counterparty | | | Contracts
(Sold)
(000’s) | | | Settlement Date | | | Amount in U.S.
Dollars (Sold)
(000’s) | | | Net Unrealized
Appreciation
(000’s) | |
EUR | | | UBS | | | | (3,911 | ) | | | 01/23/2013 | | | $ | (5,136 | ) | | $ | 63 | |
EUR | | | UBS | | | | (332 | ) | | | 01/23/2013 | | | | (434 | ) | | | 3 | |
| | | | | | | | | | | | | | | | | | | | |
| | | | | | | | | | | | | | | | | | $ | 66 | |
| | | | | | | | | | | | | | | | | | | | |
FUTURES CONTRACTS:
| | | | | | | | | | | | | | | | |
Description | | Type | | | Contracts | | | Expiration Date | | | Net Unrealized
Appreciation
(Depreciation)
(000’s) | |
10-Year Australian Treasury Bond | | | Long | | | | 20 | | | | 12/17/2012 | | | $ | 28 | |
10-Year U.S. Treasury Note | | | Short | | | | (77 | ) | | | 12/19/2012 | | | | (1 | ) |
2-Year U.S. Treasury Note | | | Long | | | | 71 | | | | 12/31/2012 | | | | (1 | ) |
30-Year U.S. Treasury Bond | | | Long | | | | 12 | | | | 12/19/2012 | | | | 3 | |
3-Year Australian Treasury Bond | | | Short | | | | (45 | ) | | | 12/17/2012 | | | | (19 | ) |
5-Year U.S. Treasury Note | | | Long | | | | 97 | | | | 12/31/2012 | | | | 11 | |
90- Austrilan Bank Bill | | | Short | | | | (19 | ) | | | 03/07/2013 | | | | 5 | |
German Euro Bund | | | Short | | | | (14 | ) | | | 12/06/2012 | | | | (15 | ) |
S&P 500 E-Mini Index | | | Long | | | | 69 | | | | 12/21/2012 | | | | (122 | ) |
| | | | | | | | | | | | | | | | |
| | | | | | | | | | | | | | $ | (111 | ) |
| | | | | | | | | | | | | | | | |
Collateral (Received) Pledged for OTC Financial Derivative Instruments
The following is a summary by counterparty of the market value of OTC financial derivative instruments and collateral (received) pledged as of 10/31/2012:
| | | | | | | | | | | | |
Counterparty | | Total Market Value of
OTC Derivatives
(000’s) | | | Collateral (Received)
Pledged
(000’s) | | | Net Exposures (1)
(000’s) | |
UBS | | $ | 66 | | | $ | — | | | $ | 66 | |
| (1) | Net exposure represents the net receivable (payable) that would be due from/to the counterparty in the event of default. |
NOTES TO SCHEDULE OF INVESTMENTS (all amounts in thousands):
| ^ | All or a portion of this security is on loan. The value of all securities on loan is $20,292. |
| g | A portion of these securities, in the amount of $442, has been segregated as collateral with the broker to cover margin requirements for open futures contracts. |
| | Rate shown reflects the yield at 10/31/2012. |
| * | Floating or variable rate note. Rate is listed as of 10/31/2012. |
| ¥ | Percentage rounds to less than 0.1%. |
| Ž | The security has a perpetual maturity. The date shown is the next call date. |
| ‡ | Non-income producing security. |
| à | The investment issuer is affiliated with a sub-adviser of the fund. |
| P | Aggregate cost for federal income tax purposes is $387,585. Aggregate gross unrealized appreciation/depreciation for all securities in which there is an excess of value over tax cost were $32,430 and $3,195, respectively. Net unrealized appreciation for tax purposes is $29,235. |
DEFINITIONS (all amounts in thousands):
| | |
| 144A | | 144A Securities are registered pursuant to Rule 144A of the Securities Act of 1933. These securities are deemed to be liquid for purposes of compliance limitations on holdings of illiquid securities and may be resold as transactions exempt from registration, normally to qualified institutional buyers. At 10/31/2012, these securities aggregated $31,941 or 8.54% of the fund’s net assets. |
| IO | | Interest Only |
| OTC | | Over the Counter |
| REMIC | | Real Estate Mortgage Investment Conduits (consist of a fixed pool of mortgages broken apart and marketed to investors as individual securities) |
| TBA | | To Be Announced |
| UBS | | UBS Warburg LLC |
|
| CURRENCY ABBREVIATION: |
| |
| EUR | | Euro |
| | | | |
| The notes to the financial statements are an integral part of this report. | | |
| Transamerica Funds | | | | Annual Report 2012 |
| | Page 93 | | |
Transamerica Multi-Managed Balanced
SCHEDULE OF INVESTMENTS (continued)
At October 31, 2012
VALUATION SUMMARY (all amounts in thousands): '
| | | | | | | | | | | | | | | | |
Investment Securities | | Level 1 -
Quoted
Prices | | | Level 2 -
Other
Significant
Observable
Inputs | | | Level 3 -
Significant
Unobservable
Inputs | | | Value at
10/31/2012 | |
Asset-Backed Securities | | $ | — | | | $ | 13,971 | | | $ | — | | | $ | 13,971 | |
Common Stocks | | | 223,144 | | | | — | | | | — | | | | 223,144 | |
Corporate Debt Securities | | | — | | | | 37,181 | | | | — | | | | 37,181 | |
Foreign Government Obligations | | | — | | | | 7,289 | | | | — | | | | 7,289 | |
Mortgage-Backed Securities | | | — | | | | 22,605 | | | | — | | | | 22,605 | |
Preferred Corporate Debt Securities | | | — | | | | 839 | | | | — | | | | 839 | |
Preferred Stock | | | 152 | | | | — | | | | — | | | | 152 | |
Repurchase Agreement | | | — | | | | 4,519 | | | | — | | | | 4,519 | |
Securities Lending Collateral | | | 20,734 | | | | — | | | | — | | | | 20,734 | |
Short-Term Investment Company | | | 3,581 | | | | — | | | | — | | | | 3,581 | |
Short-Term U.S. Government Obligation | | | — | | | | 340 | | | | — | | | | 340 | |
Structured Notes Debt | | | — | | | | 744 | | | | — | | | | 744 | |
U.S. Government Agency Obligations | | | — | | | | 61,496 | | | | — | | | | 61,496 | |
U.S. Government Obligations | | | — | | | | 20,225 | | | | — | | | | 20,225 | |
| | | | | | | | | | | | | | | | |
Total | | $ | 247,611 | | | $ | 169,209 | | | $ | — | | | $ | 416,820 | |
| | | | | | | | | | | | | | | | |
| | | | | | | | | | | | | | | | |
TBA Short Commitments | | Level 1 -
Quoted
Prices | | | Level 2 -
Other
Significant
Observable
Inputs | | | Level 3 -
Significant
Unobservable
Inputs | | | Value at
10/31/2012 | |
U.S. Government Agency Obligations | | $ | — | | | $ | (18,008 | ) | | $ | — | | | $ | (18,008 | ) |
| | | | | | | | | | | | | | | | |
Other Financial Instruments ₣ | | Level 1 -
Quoted
Prices | | | Level 2 -
Other
Significant
Observable
Inputs | | | Level 3 -
Significant
Unobservable
Inputs | | | Value at
10/31/2012 | |
Futures Contracts—Appreciation | | $ | 47 | | | $ | — | | | $ | — | | | $ | 47 | |
Futures Contracts—Depreciation | | | (158 | ) | | | — | | | | — | | | | (158 | ) |
Forward Foreign Currency Contracts—Appreciation | | | — | | | | 66 | | | | — | | | | 66 | |
| | | | | | | | | | | | | | | | |
Total | | $ | (111 | ) | | $ | 66 | | | $ | — | | | $ | (45 | ) |
| | | | | | | | | | | | | | | | |
| ' | Transfers between levels are considered to have occurred at the end of the reporting period. There were no transfers into or out of Levels 1 and 2 during the period ended 10/31/2012. See the notes to the financial statements for more information regarding pricing inputs and valuation techniques. |
| ₣ | Other financial instruments are derivative instruments that are valued at unrealized appreciation (depreciation) on the instrument. |
| | | | |
| The notes to the financial statements are an integral part of this report. | | |
| Transamerica Funds | | | | Annual Report 2012 |
| | Page 94 | | |
Transamerica Short-Term Bond
(formerly, Transamerica AEGON Short-Term Bond)
SCHEDULE OF INVESTMENTS
At October 31, 2012
| | | | | | | | |
| | | Principal
(000’s) | | | Value
(000’s) | |
U.S. GOVERNMENT AGENCY OBLIGATION—0.0% ¥ | | | | | | | | |
Freddie Mac | | | | | | | | |
2.89%, 08/01/2037 * | | $ | 663 | | | $ | 714 | |
Total U.S. Government Agency Obligation (cost $672) | | | | | | | | |
MORTGAGE-BACKED SECURITIES—22.4% | | | | | | | | |
7 WTC Depositor LLC Trust | | | | | | | | |
Series 2012-7WTC, Class A | | | | | | | | |
4.08%, 03/13/2031—144A | | | 6,895 | | | | 7,281 | |
American General Mortgage Loan Trust | | | | | | | | |
Series 2009-1, Class A5 | | | | | | | | |
5.75%, 09/25/2048—144A * | | | 13,311 | | | | 13,442 | |
Series 2009-1, Class A6 | | | | | | | | |
5.75%, 09/25/2048—144A * | | | 20,611 | | | | 21,040 | |
American Tower Trust | | | | | | | | |
Series 2007-1A, Class AFX | | | | | | | | |
5.42%, 04/15/2037—144A | | | 22,047 | | | | 23,083 | |
Series 2007-1A, Class B | | | | | | | | |
5.54%, 04/15/2037—144A | | | 4,750 | | | | 4,902 | |
Series 2007-1A, Class C | | | | | | | | |
5.62%, 04/15/2037—144A | | | 14,550 | | | | 14,981 | |
Series 2007-1A, Class D | | | | | | | | |
5.96%, 04/15/2037—144A | | | 9,755 | | | | 10,045 | |
Banc of America Funding Corp. | | | | | | | | |
Series 2010-R4, Class 1A1 | | | | | | | | |
5.50%, 07/26/2036—144A | | | 4,905 | | | | 5,094 | |
Series 2010-R6, Class 3A1 | | | | | | | | |
6.25%, 09/26/2037—144A | | | 4,409 | | | | 4,618 | |
Series 2010-R6, Class 4A1 | | | | | | | | |
2.97%, 07/26/2035—144A * | | | 3,263 | | | | 3,238 | |
Series 2011-R1, Class A1 | | | | | | | | |
4.00%, 08/26/2036—144A * | | | 1,591 | | | | 1,600 | |
Banc of America Large Loan, Inc. | | | | | | | | |
Series 2007-BMB1, Class A2 | | | | | | | | |
0.96%, 08/15/2029—144A * | | | 13,700 | | | | 13,504 | |
BCAP LLC Trust | | | | | | | | |
Series 2006-RR1, Class PD | | | | | | | | |
5.00%, 11/25/2036 | | | 8,540 | | | | 8,687 | |
Series 2009-RR3, Class 1A2 | | | | | | | | |
6.00%, 11/26/2036—144A * | | | 1,498 | | | | 1,539 | |
Series 2009-RR3, Class 2A1 | | | | | | | | |
4.85%, 05/26/2037—144A * | | | 3,605 | | | | 3,647 | |
Series 2009-RR6, Class 2A1 | | | | | | | | |
2.97%, 08/26/2035—144A * | | | 8,119 | | | | 7,384 | |
Series 2009-RR10, Class 2A1 | | | | | | | | |
3.12%, 08/26/2035—144A * | | | 3,147 | | | | 3,108 | |
Series 2009-RR13, Class 13A3 | | | | | | | | |
5.25%, 03/26/2037—144A * | | | 4,436 | | | | 4,473 | |
Series 2009-RR13, Class 14A1 | | | | | | | | |
5.25%, 03/26/2037—144A * | | | 2,178 | | | | 2,214 | |
Series 2009-RR13, Class 2A3 | | | | | | | | |
5.52%, 02/26/2036—144A * | | | 4,421 | | | | 4,566 | |
Series 2009-RR13, Class 3A3 | | | | | | | | |
5.35%, 05/26/2036—144A * | | | 9,722 | | | | 9,980 | |
Series 2009-RR14, Class 1A1 | | | | | | | | |
6.05%, 05/26/2037—144A * | | | 11,706 | | | | 12,505 | |
Series 2010-RR1, Class 12A1 | | | | | | | | |
5.25%, 08/26/2036—144A * | | | 7,150 | | | | 7,436 | |
Series 2010-RR6, Class 15A5 | | | | | | | | |
5.50%, 12/26/2036—144A * | | | 3,236 | | | | 3,271 | |
Series 2010-RR6, Class 16A5 | | | | | | | | |
5.50%, 04/26/2036—144A * | | | 2,292 | | | | 2,344 | |
| | | | | | | | |
| | | Principal
(000’s) | | | Value
(000’s) | |
MORTGAGE-BACKED SECURITIES (continued) | | | | | | | | |
BCAP LLC Trust (continued) | | | | | | | | |
Series 2010-RR6, Class 1A5 | | | | | | | | |
5.00%, 08/26/2022—144A * | | $ | 6,867 | | | $ | 7,005 | |
Series 2010-RR6, Class 20A1 | | | | | | | | |
4.50%, 11/26/2035—144A * | | | 2,313 | | | | 2,317 | |
Series 2010-RR7, Class 5A6 | | | | | | | | |
5.50%, 10/26/2036—144A | | | 8,718 | | | | 9,049 | |
Series 2011-RR1, Class 5A1 | | | | | | | | |
3.00%, 09/28/2036—144A * | | | 1,407 | | | | 1,407 | |
Series 2012-RR2, Class 7A3 | | | | | | | | |
2.62%, 09/26/2035—144A * | | | 9,060 | | | | 9,241 | |
Series 2012-RR4, Class 2A5 | | | | | | | | |
2.41%, 04/26/2037—144A * | | | 11,621 | | | | 11,671 | |
Series 2012-RR5, Class 6A1 | | | | | | | | |
3.10%, 10/26/2035 * | | | 11,897 | | | | 11,856 | |
Bear Stearns Commercial Mortgage Securities | | | | | | | | |
Series 2007-PW17, Class AAB | | | | | | | | |
5.70%, 06/11/2050 | | | 9,198 | | | | 9,798 | |
BNPP Mortgage Securities LLC | | | | | | | | |
Series 2009-1, Class A1 | | | | | | | | |
6.00%, 08/27/2037—144A | | | 9,024 | | | | 9,464 | |
Capmark Military Housing Trust | | | | | | | | |
Series 2008-AMCW, Class A2 | | | | | | | | |
5.91%, 03/10/2015—144A | | | 4,900 | | | | 5,013 | |
Citigroup Mortgage Loan Trust, Inc. | | | | | | | | |
Series 2003-HE3, Class A | | | | | | | | |
0.59%, 12/25/2033 * | | | 6,615 | | | | 6,024 | |
Series 2009-10, Class 6A1 | | | | | | | | |
5.47%, 09/25/2034—144A * | | | 4,365 | | | | 4,553 | |
Series 2010-8, Class 5A6 | | | | | | | | |
4.00%, 11/25/2036—144A | | | 16,965 | | | | 17,483 | |
Series 2010-8, Class 6A6 | | | | | | | | |
4.50%, 12/25/2036—144A | | | 15,005 | | | | 15,620 | |
Series 2010-8, Class 6A62 | | | | | | | | |
3.50%, 12/25/2036—144A | | | 9,259 | | | | 9,566 | |
Countrywide Home Loan Mortgage Pass- Through Trust | | | | | | | | |
Series 2002-35, Class 1A3 | | | | | | | | |
5.00%, 02/25/2018 | | | 6,384 | | | | 6,527 | |
Credit Suisse Mortgage Capital Certificates | | | | | | | | |
Series 2007-C1, Class AAB | | | | | | | | |
5.34%, 02/15/2040 | | | 12,212 | | | | 12,818 | |
Series 2007-C4, Class AAB | | | | | | | | |
5.76%, 09/15/2039 * | | | 11,383 | | | | 12,437 | |
Series 2009-12R, Class 36A1 | | | | | | | | |
5.09%, 06/27/2036—144A * | | | 5,378 | | | | 5,406 | |
Series 2009-16R, Class 11A1 | | | | | | | | |
7.00%, 08/26/2036—144A | | | 4,208 | | | | 4,377 | |
Series 2010-1R, Class 28A1 | | | | | | | | |
5.00%, 02/27/2047—144A | | | 15,770 | | | | 15,628 | |
Series 2010-1R, Class 40A1 | | | | | | | | |
5.00%, 04/27/2036—144A | | | 1,931 | | | | 1,968 | |
Series 2010-12R, Class 10A1 | | | | | | | | |
4.50%, 11/26/2036—144A * | | | 3,258 | | | | 3,278 | |
Series 2010-15R, Class 2A1 | | | | | | | | |
3.50%, 05/26/2036—144A * | | | 9,369 | | | | 9,761 | |
Series 2010-15R, Class 4A1 | | | | | | | | |
3.50%, 04/26/2035—144A * | | | 12,674 | | | | 12,809 | |
Series 2010-15R, Class 6A1 | | | | | | | | |
3.50%, 10/26/2046—144A * | | | 6,396 | | | | 6,462 | |
Series 2010-18R, Class 1A11 | | | | | | | | |
3.75%, 08/26/2035—144A * | | | 7,733 | | | | 7,703 | |
| | | | |
| The notes to the financial statements are an integral part of this report. | | |
| Transamerica Funds | | | | Annual Report 2012 |
| | Page 95 | | |
Transamerica Short-Term Bond
(formerly, Transamerica AEGON Short-Term Bond)
SCHEDULE OF INVESTMENTS (continued)
At October 31, 2012
| | | | | | | | |
| | | Principal
(000’s) | | | Value
(000’s) | |
MORTGAGE-BACKED SECURITIES (continued) | | | | | | | | |
Credit Suisse Mortgage Capital Certificates (continued) | | | | | | | | |
Series 2010-18R, Class 3A1 | | | | | | | | |
4.00%, 03/26/2037—144A | | $ | 7,650 | | | $ | 7,836 | |
Series 2010-RR4, Class 2B | | | | | | | | |
5.47%, 09/18/2039—144A * | | | 8,250 | | | | 8,761 | |
GS Mortgage Securities Corp. II | | | | | | | | |
Series 2007-EOP, Class A3 | | | | | | | | |
1.46%, 03/06/2020—144A * | | | 5,780 | | | | 5,779 | |
Series 2007-EOP, Class B | | | | | | | | |
1.73%, 03/06/2020—144A * | | | 11,300 | | | | 11,298 | |
Series 2007-EOP, Class E | | | | | | | | |
2.48%, 03/06/2020—144A * | | | 31,300 | | | | 31,301 | |
Impac CMB Trust | | | | | | | | |
Series 2007-A, Class A | | | | | | | | |
0.46%, 05/25/2037 * | | | 12,629 | | | | 12,117 | |
Jefferies & Co., Inc. | | | | | | | | |
Series 2009-R2, Class 2A | | | | | | | | |
3.06%, 12/26/2037—144A * | | | 3,717 | | | | 3,738 | |
Series 2009-R2, Class 3A | | | | | | | | |
2.79%, 01/26/2047—144A * | | | 2,357 | | | | 2,363 | |
Series 2009-R7, Class 10A3 | | | | | | | | |
6.00%, 12/26/2036—144A | | | 1,542 | | | | 1,605 | |
Series 2009-R7, Class 11A1 | | | | | | | | |
2.76%, 03/26/2037—144A * | | | 3,403 | | | | 3,309 | |
Series 2009-R7, Class 12A1 | | | | | | | | |
5.08%, 08/26/2036—144A * | | | 1,747 | | | | 1,729 | |
Series 2009-R7, Class 1A1 | | | | | | | | |
3.95%, 02/26/2036—144A * | | | 1,869 | | | | 1,809 | |
Series 2009-R7, Class 4A1 | | | | | | | | |
2.92%, 09/26/2034—144A * | | | 2,365 | | | | 2,271 | |
Series 2009-R9, Class 1A1 | | | | | | | | |
2.73%, 08/26/2046—144A * | | | 9,860 | | | | 9,796 | |
Series 2010-R2, Class 1A1 | | | | | | | | |
6.00%, 05/26/2036—144A | | | 7,796 | | | | 8,126 | |
Series 2010-R3, Class 1A1 | | | | | | | | |
3.03%, 03/21/2036—144A * | | | 5,867 | | | | 6,029 | |
Series 2010-R6, Class 1A1 | | | | | | | | |
4.00%, 09/26/2037—144A | | | 6,034 | | | | 6,111 | |
Series 2010-R8, Class 2A1 | | | | | | | | |
5.00%, 10/26/2036—144A | | | 4,849 | | | | 4,903 | |
JPMorgan Chase Commercial Mortgage Securities Corp. | | | | | | | | |
Series 2007-C1, Class ASB | | | | | | | | |
5.86%, 02/15/2051 | | | 6,788 | | | | 7,371 | |
Series 2007-CB19, Class ASB | | | | | | | | |
5.71%, 02/12/2049 * | | | 8,993 | | | | 9,908 | |
Series 2007-LD11, Class ASB | | | | | | | | |
5.81%, 06/15/2049 * | | | 15,502 | | | | 17,000 | |
JPMorgan Re-REMIC | | | | | | | | |
Series 2009-7, Class 8A1 | | | | | | | | |
5.41%, 01/27/2047—144A * | | | 2,631 | | | | 2,689 | |
Series 2009-11, Class 1A1 | | | | | | | | |
2.89%, 02/26/2037—144A * | | | 6,897 | | | | 6,752 | |
Series 2010-4, Class 7A1 | | | | | | | | |
1.87%, 08/26/2035—144A * | | | 9,048 | | | | 8,960 | |
Series 2010-5, Class 2A2 | | | | | | | | |
4.50%, 07/26/2035—144A * | | | 10,510 | | | | 10,661 | |
LB-UBS Commercial Mortgage Trust | | | | | | | | |
Series 2004-C8, Class B | | | | | | | | |
4.91%, 12/15/2039 * | | | 12,585 | | | | 13,474 | |
| | | | | | | | |
| | | Principal
(000’s) | | | Value
(000’s) | |
MORTGAGE-BACKED SECURITIES (continued) | | | | | | | | |
LSTAR Commercial Mortgage Trust | | | | | | | | |
Series 2011-1, Class A | | | | | | | | |
3.91%, 06/25/2043—144A | | $ | 9,443 | | | $ | 9,855 | |
Morgan Stanley Re-REMIC Trust | | | | | | | | |
Series 2010-R4, Class 3A | | | | | | | | |
5.50%, 08/26/2047—144A | | | 26,526 | | | | 28,184 | |
Mortgage Equity Conversion Asset Trust | | | | | | | | |
Series 2010-1A, Class A | | | | | | | | |
4.00%, 07/25/2060—144A | | | 14,296 | | | | 13,725 | |
ORES NPL LLC | | | | | | | | |
Series 2012-LV1, Class A | | | | | | | | |
4.00%, 09/25/2044—144A | | | 15,443 | | | | 15,528 | |
RBSCF Trust | | | | | | | | |
Series 2010-RR3, Class CSCA | | | | | | | | |
5.47%, 09/16/2039—144A * | | | 13,000 | | | | 14,874 | |
RBSSP Resecuritization Trust | | | | | | | | |
Series 2009-1, Class 10A1 | | | | | | | | |
6.50%, 07/26/2037—144A | | | 9,435 | | | | 9,936 | |
RREF 2012 LT1 LLC | | | | | | | | |
Series 2012-LT1A, Class A | | | | | | | | |
4.75%, 02/15/2025—144A | | | 763 | | | | 763 | |
S2 Hospitality LLC | | | | | | | | |
Series 2012-LV1, Class A | | | | | | | | |
4.50%, 04/15/2025—144A | | | 6,288 | | | | 6,317 | |
Wachovia Bank Commercial Mortgage Trust | | | | | | | | |
Series 2006-WL7A, Class A2 | | | | | | | | |
0.33%, 09/15/2021—144A * | | | 17,000 | | | | 16,429 | |
Wells Fargo Mortgage Backed Securities Trust | | | | | | | | |
Series 2003-G, Class A1 | | | | | | | | |
4.10%, 06/25/2033 * | | | 1,265 | | | | 1,286 | |
Wells Fargo Mortgage Loan Trust | | | | | | | | |
Series 2010-RR2, Class 1A1 | | | | | | | | |
3.10%, 09/27/2035—144A * | | | 7,444 | | | | 7,436 | |
Series 2010-RR4, Class 1A1 | | | | | | | | |
5.15%, 12/27/2046—144A * | | | 7,216 | | | | 7,328 | |
Series 2011-RR3, Class A1 | | | | | | | | |
2.82%, 03/27/2037—144A * | | | 16,420 | | | | 16,301 | |
WFDB Commercial Mortgage Trust | | | | | | | | |
Series 2011-BXR, Class A | | | | | | | | |
3.66%, 07/05/2024—144A | | | 15,000 | | | | 15,383 | |
| | | | | | | | |
Total Mortgage-Backed Securities (cost $781,187) | | | | | | | 792,264 | |
| | | | | | | | |
ASSET-BACKED SECURITIES - 8.4% | | | | | | | | |
AH Mortgage Advance Trust | | | | | | | | |
Series SART-1, Class A2 | | | | | | | | |
3.37%, 05/10/2043—144A | | | 28,890 | | | | 28,890 | |
Series SART-2, Class A1 | | | | | | | | |
3.27%, 09/15/2043—144A | | | 20,300 | | | | 20,558 | |
AmeriCredit Automobile Receivables Trust | | | | | | | | |
Series 2012-2, Class C | | | | | | | | |
2.64%, 10/10/2017 | | | 7,500 | | | | 7,668 | |
BXG Receivables Note Trust | | | | | | | | |
Series 2012-A, Class A | | | | | | | | |
2.66%, 12/02/2027—144A | | | 19,056 | | | | 19,018 | |
ColumbusNova CLO Ltd | | | | | | | | |
Series 2007-I | | | | | | | | |
0.69%, 05/16/2019—144A * | | | 4,870 | | | | 4,724 | |
DT Auto Owner Trust | | | | | | | | |
Series 2009-1, Class C | | | | | | | | |
10.75%, 10/15/2015—144A | | | 1,633 | | | | 1,637 | |
| | | | |
| The notes to the financial statements are an integral part of this report. | | |
| Transamerica Funds | | | | Annual Report 2012 |
| | Page 96 | | |
Transamerica Short-Term Bond
(formerly, Transamerica AEGON Short-Term Bond)
SCHEDULE OF INVESTMENTS (continued)
At October 31, 2012
| | | | | | | | |
| | | Principal
(000’s) | | | Value
(000’s) | |
ASSET-BACKED SECURITIES (continued) | | | | | | | | |
HLSS Servicer Advance Receivables Backed Notes | | | | | | | | |
Series 2012-T2, Class A2 | | | | | | | | |
1.99%, 10/15/2045—144A | | $ | 34,900 | | | $ | 35,171 | |
HSBC Home Equity Loan Trust | | | | | | | | |
Series 2006-3, Class A4 | | | | | | | | |
0.45%, 03/20/2036 * | | | 23,721 | | | | 21,673 | |
Series 2007-1, Class A4 | | | | | | | | |
0.57%, 03/20/2036 * | | | 9,352 | | | | 8,248 | |
Marriott Vacation Club Owner Trust | | | | | | | | |
Series 2012-1A, Class A | | | | | | | | |
2.51%, 05/20/2030—144A | | | 18,012 | | | | 18,332 | |
Mountain View Funding CLO | | | | | | | | |
Series 2007-3A, Class A1 | | | | | | | | |
0.55%, 04/16/2021—144A * Ə | | | 4,931 | | | | 4,790 | |
Orange Lake Timeshare Trust | | | | | | | | |
Series 2012-AA, Class A | | | | | | | | |
3.45%, 03/10/2027—144A | | | 5,719 | | | | 5,810 | |
Prestige Auto Receivables Trust | | | | | | | | |
Series 2012-1A, Class C | | | | | | | | |
3.25%, 07/15/2019—144A | | | 5,000 | | | | 5,131 | |
Sierra Receivables Funding Co., LLC | | | | | | | | |
Series 2007-1A, Class A2 | | | | | | | | |
0.36%, 03/20/2019—144A * | | | 1,678 | | | | 1,665 | |
Series 2011-2A, Class A | | | | | | | | |
3.26%, 05/20/2028—144A | | | 5,248 | | | | 5,357 | |
Series 2011-3A, Class A | | | | | | | | |
3.37%, 07/20/2028—144A | | | 6,842 | | | | 7,031 | |
Series 2012-2A, Class A | | | | | | | | |
2.38%, 03/20/2029—144A | | | 11,556 | | | | 11,761 | |
Series 2012-3A, Class A | | | | | | | | |
1.87%, 08/20/2029—144A | | | 20,000 | | | | 19,773 | |
SVO VOI Mortgage Corp. | | | | | | | | |
Series 2012-AA, Class A | | | | | | | | |
2.00%, 09/20/2029—144A | | | 24,000 | | | | 24,001 | |
TAL Advantage LLC | | | | | | | | |
Series 2011-1A, Class A | | | | | | | | |
4.60%, 01/20/2026—144A | | | 17,267 | | | | 18,277 | |
Tax Liens Securitization Trust | | | | | | | | |
Series 2010-1A, Class 2A2 | | | | | | | | |
2.00%, 04/15/2018—144A | | | 885 | | | | 886 | |
Trafigura Securitisation Finance PLC | | | | | | | | |
Series 2012-1A, Class A | | | | | | | | |
2.61%, 10/15/2015—144A * | | | 25,520 | | | | 25,935 | |
| | | | | | | | |
Total Asset-Backed Securities (cost $291,909) | | | | | | | 296,336 | |
| | | | | | | | |
MUNICIPAL GOVERNMENT OBLIGATION—0.5% | | | | | | | | |
Rhode Island Economic Development Corp. | | | | | | | | |
6.00%, 11/01/2015 § | | | 16,950 | | | | 17,782 | |
Total Municipal Government Obligations (cost $16,950) | | | | | | | | |
| | |
CORPORATE DEBT SECURITIES—63.4% | | | | | | | | |
Aerospace & Defense—0.8% | | | | | | | | |
Exelis, Inc. | | | | | | | | |
4.25%, 10/01/2016 | | | 27,920 | | | | 29,128 | |
Airlines—3.3% | | | | | | | | |
AirTran Airways Pass-Through Trust | | | | | | | | |
Series 1999-1 | | | | | | | | |
10.41%, 04/01/2017—144A | | | 21,728 | | | | 25,530 | |
America West Airlines Pass-Through Trust | | | | | | | | |
Series 1999-1, Class G | | | | | | | | |
7.93%, 01/02/2019 | | | 3,314 | | | | 3,563 | |
| | | | | | | | |
| | | Principal
(000’s) | | | Value
(000’s) | |
Airlines (continued) | | | | | | | | |
America West Airlines Pass-Through Trust (continued) | | | | | | | | |
Series 2000-1, Class G | | | | | | | | |
8.06%, 07/02/2020 | | $ | 11,495 | | | $ | 12,328 | |
Continental Airlines Pass-Through Trust | | | | | | | | |
Series 1997-1, Class A | | | | | | | | |
7.46%, 04/01/2015 ^ | | | 6,087 | | | | 6,277 | |
Delta Air Lines, Inc., Pass-Through Trust | | | | | | | | |
Series 2010-1, Class 1A | | | | | | | | |
6.20%, 07/02/2018 ^ | | | 31,675 | | | | 35,160 | |
Northwest Airlines Pass-Through Trust | | | | | | | | |
Series 2002-1, Class G1 | | | | | | | | |
1.18%, 05/20/2014 * ^ | | | 712 | | | | 704 | |
Series 2002-1, Class G2 | | | | | | | | |
6.26%, 11/20/2021 | | | 2,263 | | | | 2,391 | |
UAL Pass-Through Trust | | | | | | | | |
Series 2009-1 | | | | | | | | |
10.40%, 11/01/2016 | | | 27,212 | | | | 31,261 | |
Beverages—0.6% | | | | | | | | |
Anheuser-Busch InBev Worldwide, Inc. | | | | | | | | |
9.75%, 11/17/2015 | | | BRL21,570 | | | | 11,948 | |
Coca-Cola Bottling Co. Consolidated | | | | | | | | |
5.00%, 06/15/2016 | | $ | 7,650 | | | | 8,441 | |
Capital Markets—1.8% | | | | | | | | |
Macquarie Group, Ltd. | | | | | | | | |
7.30%, 08/01/2014—144A | | | 25,590 | | | | 27,796 | |
Morgan Stanley | | | | | | | | |
0.82%, 10/15/2015 * | | | 21,060 | | | | 20,304 | |
4.00%, 07/24/2015 ^ | | | 14,850 | | | | 15,479 | |
Commercial Banks—8.6% | | | | | | | | |
Banco Santander Chile | | | | | | | | |
2.88%, 11/13/2012—144A | | | 26,595 | | | | 26,598 | |
Bank of America NA | | | | | | | | |
6.00%, 06/15/2016 ^ | | | 10,000 | | | | 11,373 | |
BBVA US Senior SAU | | | | | | | | |
2.56%, 05/16/2014 * | | | 10,990 | | | | 10,851 | |
3.25%, 05/16/2014 ^ | | | 14,558 | | | | 14,561 | |
BNP Paribas / BNP Paribas US Medium- Term Note Program LLC | | | | | | | | |
5.13%, 01/15/2015—144A | | | 9,960 | | | | 10,358 | |
BNP Paribas SA | | | | | | | | |
2.38%, 09/14/2017 ^ | | | 8,220 | | | | 8,280 | |
CIT Group, Inc. | | | | | | | | |
4.75%, 02/15/2015—144A ^ | | | 14,580 | | | | 15,090 | |
Export-Import Bank of Korea | | | | | | | | |
4.00%, 01/11/2017 ^ | | | 13,900 | | | | 15,206 | |
First Horizon National Corp. | | | | | | | | |
5.38%, 12/15/2015 | | | 11,645 | | | | 12,765 | |
First Tennessee Bank NA | | | | | | | | |
5.05%, 01/15/2015 | | | 16,535 | | | | 17,281 | |
ING Bank NV | | | | | | | | |
2.00%, 09/25/2015—144A | | | 3,500 | | | | 3,528 | |
2.01%, 09/25/2015—144A * ^ | | | 31,510 | | | | 31,682 | |
JPMorgan Chase Bank NA | | | | | | | | |
5.88%, 06/13/2016 ^ | | | 9,750 | | | | 11,081 | |
Korea Development Bank | | | | | | | | |
8.00%, 01/23/2014 | | | 3,000 | | | | 3,244 | |
Nordea Bank AB | | | | | | | | |
2.25%, 03/20/2015—144A | | | 15,800 | | | | 16,184 | |
Regions Financial Corp. | | | | | | | | |
7.75%, 11/10/2014 ^ | | | 13,000 | | | | 14,333 | |
Royal Bank of Scotland Group PLC | | | | | | | | |
5.00%, 10/01/2014 | | | 9,820 | | | | 10,104 | |
| | | | |
| The notes to the financial statements are an integral part of this report. | | |
| Transamerica Funds | | | | Annual Report 2012 |
| | Page 97 | | |
Transamerica Short-Term Bond
(formerly, Transamerica AEGON Short-Term Bond)
SCHEDULE OF INVESTMENTS (continued)
At October 31, 2012
| | | | | | | | |
| | | Principal
(000’s) | | | Value
(000’s) | |
Commercial Banks (continued) | | | | | | | | |
Royal Bank of Scotland Group PLC (continued) | | | | | | | | |
5.05%, 01/08/2015 ^ | | $ | 6,285 | | | $ | 6,506 | |
US Bancorp | | | | | | | | |
3.44%, 02/01/2016 ^ | | | 30,000 | | | | 31,514 | |
Wachovia Corp. | | | | | | | | |
0.65%, 10/28/2015 * | | | 17,745 | | | | 17,488 | |
Zions Bancorporation | | | | | | | | |
7.75%, 09/23/2014 | | | 19,356 | | | | 21,327 | |
Commercial Services & Supplies—0.7% | | | | | | | | |
Hutchison Whampoa International 11, Ltd. | | | | | | | | |
3.50%, 01/13/2017—144A ^ | | | 9,600 | | | | 10,198 | |
KAR Auction Services, Inc. | | | | | | | | |
4.31%, 05/01/2014 * | | | 14,785 | | | | 14,785 | |
Construction Materials—0.6% | | | | | | | | |
CRH America, Inc. | | | | | | | | |
5.30%, 10/15/2013 | | | 4,600 | | | | 4,771 | |
6.00%, 09/30/2016 | | | 15,000 | | | | 16,813 | |
Vulcan Materials Co. | | | | | | | | |
6.30%, 06/15/2013 | | | 2 | | | | 2 | |
Consumer Finance—0.4% | | | | | | | | |
Ally Financial, Inc. | | | | | | | | |
6.75%, 12/01/2014 ^ | | | 13,360 | | | | 14,395 | |
Containers & Packaging—0.5% | | | | | | | | |
Rexam PLC | | | | | | | | |
6.75%, 06/01/2013—144A | | | 16,424 | | | | 16,672 | |
Distributors—0.9% | | | | | | | | |
Glencore Funding LLC | | | | | | | | |
6.00%, 04/15/2014—144A | | | 29,555 | | | | 30,951 | |
Diversified Financial Services—6.9% | | | | | | | | |
Bank of America Corp. | | | | | | | | |
5.63%, 10/14/2016 ^ | | | 24,940 | | | | 28,436 | |
Citigroup, Inc. | | | | | | | | |
2.25%, 08/07/2015 ^ | | | 17,220 | | | | 17,666 | |
2.65%, 03/02/2015 ^ | | | 15,000 | | | | 15,466 | |
CNH Capital LLC | | | | | | | | |
3.88%, 11/01/2015—144A | | | 18,000 | | | | 18,450 | |
Ford Motor Credit Co. LLC | | | | | | | | |
3.98%, 06/15/2016 | | | 3,700 | | | | 3,922 | |
4.21%, 04/15/2016 | | | 23,700 | | | | 25,241 | |
7.00%, 04/15/2015 ^ | | | 7,900 | | | | 8,789 | |
Harley-Davidson Funding Corp. | | | | | | | | |
5.75%, 12/15/2014—144A | | | 10,013 | | | | 11,003 | |
International Lease Finance Corp. | | | | | | | | |
6.50%, 09/01/2014—144A | | | 10,475 | | | | 11,261 | |
6.75%, 09/01/2016—144A | | | 18,390 | | | | 20,781 | |
Lazard Group LLC | | | | | | | | |
7.13%, 05/15/2015 | | | 5,974 | | | | 6,588 | |
Marina District Finance Co., Inc. | | | | | | | | |
9.50%, 10/15/2015 ^ | | | 10,547 | | | | 10,666 | |
Murray Street Investment Trust I | | | | | | | | |
4.65%, 03/09/2017 * ^ | | | 34,866 | | | | 37,832 | |
NASDAQ OMX Group, Inc. | | | | | | | | |
4.00%, 01/15/2015 | | | 5,000 | | | | 5,245 | |
Permanent TSB PLC | | | | | | | | |
3.60%, 01/14/2013—144A | | | 17,085 | | | | 17,085 | |
PTTEP Australia International Finance Pty, Ltd. | | | | | | | | |
4.15%, 07/19/2015—144A | | | 6,000 | | | | 6,332 | |
| | | | | | | | |
| | | Principal
(000’s) | | | Value
(000’s) | |
Diversified Telecommunication Services—2.9% | | | | | | | | |
GTP Towers Issuer LLC | | | | | | | | |
4.44%, 02/15/2015—144A | | $ | 25,765 | | | $ | 26,729 | |
Qwest Corp. | | | | | | | | |
8.38%, 05/01/2016 | | | 7,832 | | | | 9,388 | |
Telecom Italia Capital SA | | | | | | | | |
4.95%, 09/30/2014 | | | 5,238 | | | | 5,448 | |
6.18%, 06/18/2014 | | | 26,189 | | | | 27,777 | |
Telefonica Emisiones SAU | | | | | | | | |
3.73%, 04/27/2015 | | | 31,930 | | | | 32,568 | |
Electric Utilities—0.7% | | | | | | | | |
Iberdrola Finance Ireland, Ltd. | | | | | | | | |
3.80%, 09/11/2014—144A | | | 24,822 | | | | 25,566 | |
Electronic Equipment & Instruments—0.6% | | | | | | | | |
Avnet, Inc. | | | | | | | | |
6.00%, 09/01/2015 | | | 7,000 | | | | 7,627 | |
6.63%, 09/15/2016 | | | 11,279 | | | | 12,744 | |
Energy Equipment & Services—2.4% | | | | | | | | |
Boardwalk Pipelines, LP | | | | | | | | |
5.88%, 11/15/2016 | | | 2,300 | | | | 2,585 | |
DCP Midstream Operating, LP | | | | | | | | |
3.25%, 10/01/2015 ^ | | | 24,545 | | | | 25,386 | |
Korea National Oil Corp. | | | | | | | | |
5.38%, 07/30/2014—144A | | | 15,830 | | | | 16,909 | |
NuStar Pipeline Operating Partnership, LP | | | | | | | | |
5.88%, 06/01/2013 ^ | | | 3,000 | | | | 3,046 | |
Sunoco Logistics Partners Operations, LP | | | | | | | | |
6.13%, 05/15/2016 | | | 17,646 | | | | 19,936 | |
Transocean, Inc. | | | | | | | | |
5.05%, 12/15/2016 | | | 13,975 | | | | 15,652 | |
Health Care Equipment & Supplies—0.3% | | | | | | | | |
Boston Scientific Corp. | | | | | | | | |
6.25%, 11/15/2015 | | | 8,603 | | | | 9,718 | |
Health Care Providers & Services—0.2% | | | | | | | | |
Owens & Minor, Inc. | | | | | | | | |
6.35%, 04/15/2016 | | | 4,890 | | | | 5,454 | |
Hotels, Restaurants & Leisure—0.5% | | | | | | | | |
MGM Resorts International | | | | | | | | |
10.00%, 11/01/2016 ^ | | | 15,460 | | | | 17,624 | |
Household Durables—1.0% | | | | | | | | |
Maytag Corp. | | | | | | | | |
6.45%, 08/15/2014 | | | 21,506 | | | | 23,451 | |
Whirlpool Corp. | | | | | | | | |
7.75%, 07/15/2016 | | | 9,970 | | | | 11,976 | |
Independent Power Producers & Energy Traders—0.9% | | | | | | | | |
TransAlta Corp. | | | | | | | | |
4.75%, 01/15/2015 | | | 29,451 | | | | 31,158 | |
Insurance—3.9% | | | | | | | | |
21st Century Insurance Group | | | | | | | | |
5.90%, 12/15/2013 | | | 6,570 | | | | 6,847 | |
Aspen Insurance Holdings, Ltd. | | | | | | | | |
6.00%, 08/15/2014 ^ | | | 10,281 | | | | 11,019 | |
Liberty Mutual Group, Inc. | | | | | | | | |
5.75%, 03/15/2014—144A | | | 19,200 | | | | 20,097 | |
Prudential Covered Trust 2012-1 | | | | | | | | |
3.00%, 09/30/2015—144A | | | 28,500 | | | | 29,592 | |
State Auto Financial Corp. | | | | | | | | |
6.25%, 11/15/2013 | | | 10,730 | | | | 11,087 | |
Stone Street Trust | | | | | | | | |
5.90%, 12/15/2015—144A | | | 29,415 | | | | 30,832 | |
Transatlantic Holdings, Inc. | | | | | | | | |
5.75%, 12/14/2015 | | | 25,760 | | | | 28,673 | |
| | | | |
| The notes to the financial statements are an integral part of this report. | | |
| Transamerica Funds | | | | Annual Report 2012 |
| | Page 98 | | |
Transamerica Short-Term Bond
(formerly, Transamerica AEGON Short-Term Bond)
SCHEDULE OF INVESTMENTS (continued)
At October 31, 2012
| | | | | | | | |
| | | Principal
(000’s) | | | Value
(000’s) | |
IT Services—1.2% | | | | | | | | |
Affiliated Computer Services, Inc. | | | | | | | | |
5.20%, 06/01/2015 ^ | | $ | 16,300 | | | $ | 17,588 | |
Computer Sciences Corp. | | | | | | | | |
2.50%, 09/15/2015 | | | 25,615 | | | | 26,163 | |
Metals & Mining—2.6% | | | | | | | | |
Anglo American Capital PLC | | | | | | | | |
9.38%, 04/08/2014—144A | | | 12,156 | | | | 13,493 | |
ArcelorMittal | | | | | | | | |
4.25%, 02/25/2015 ^ | | | 20,000 | | | | 20,003 | |
Kinross Gold Corp. | | | | | | | | |
3.63%, 09/01/2016 | | | 7,160 | | | | 7,249 | |
Vale Overseas, Ltd. | | | | | | | | |
6.25%, 01/11/2016 ^ | | | 27,000 | | | | 30,597 | |
Xstrata Finance Canada, Ltd. | | | | | | | | |
2.85%, 11/10/2014—144A | | | 19,960 | | | | 20,479 | |
Multi-Utilities—0.4% | | | | | | | | |
Black Hills Corp. | | | | | | | | |
9.00%, 05/15/2014 | | | 12,521 | | | | 13,927 | |
Oil, Gas & Consumable Fuels—7.9% | | | | | | | | |
Anadarko Petroleum Corp. | | | | | | | | |
5.95%, 09/15/2016 | | | 17,450 | | | | 20,270 | |
Chesapeake Energy Corp. | | | | | | | | |
9.50%, 02/15/2015 ^ § | | | 14,465 | | | | 16,201 | |
Empresa Nacional del Petroleo | | | | | | | | |
6.75%, 11/15/2012—144A | | | 12,938 | | | | 12,956 | |
Energy Transfer Partners, LP | | | | | | | | |
8.50%, 04/15/2014 | | | 9,428 | | | | 10,365 | |
Gazprom OAO Via GAZ Capital SA | | | | | | | | |
8.13%, 07/31/2014—144A | | | 30,395 | | | | 33,326 | |
KazMunayGas National Co. | | | | | | | | |
8.38%, 07/02/2013—144A | | | 23,000 | | | | 23,950 | |
Lukoil International Finance BV | | | | | | | | |
6.38%, 11/05/2014—144A | | | 31,270 | | | | 33,944 | |
Petrobras International Finance Co.—Pifco | | | | | | | | |
2.88%, 02/06/2015 ^ | | | 11,930 | | | | 12,297 | |
3.50%, 02/06/2017 ^ | | | 17,000 | | | | 17,967 | |
Petrohawk Energy Corp. | | | | | | | | |
7.25%, 08/15/2018 | | | 29,270 | | | | 33,367 | |
Ras Laffan Liquefied Natural Gas Co., Ltd. III | | | | | | | | |
5.83%, 09/30/2016—144A | | | 25,636 | | | | 28,290 | |
Tengizchevoil Finance Co., SARL | | | | | | | | |
6.12%, 11/15/2014—144A | | | 13,363 | | | | 13,897 | |
TNK-BP Finance SA | | | | | | | | |
6.25%, 02/02/2015—144A | | | 25,000 | | | | 26,824 | |
Paper & Forest Products—0.3% | | | | | | | | |
Celulosa Arauco y Constitucion SA | | | | | | | | |
5.13%, 07/09/2013 ^ | | | 9,400 | | | | 9,604 | |
Pharmaceuticals—0.8% | | | | | | | | |
Hospira, Inc. | | | | | | | | |
6.40%, 05/15/2015 ^ | | | 15,244 | | | | 17,058 | |
Watson Pharmaceuticals, Inc. | | | | | | | | |
1.88%, 10/01/2017 ^ | | | 10,000 | | | | 10,136 | |
Professional Services—0.8% | | | | | | | | |
Block Financial LLC | | | | | | | | |
7.88%, 01/15/2013 ^ | | | 26,495 | | | | 26,589 | |
Real Estate Investment Trusts—3.6% | | | | | | | | |
BRE Properties, Inc. | | | | | | | | |
4.70%, 03/17/2014 | | | 7,000 | | | | 7,308 | |
Digital Realty Trust, LP | | | | | | | | |
4.50%, 07/15/2015 | | | 14,200 | | | | 15,250 | |
Healthcare Realty Trust, Inc. | | | | | | | | |
5.13%, 04/01/2014 | | | 13,456 | | | | 14,144 | |
| | | | | | | | |
| | | Principal
(000’s) | | | Value
(000’s) | |
Real Estate Investment Trusts (continued) | | | | | | | | |
Hospitality Properties Trust | | | | | | | | |
7.88%, 08/15/2014 | | $ | 10,000 | | | $ | 10,785 | |
Kilroy Realty, LP | | | | | | | | |
5.00%, 11/03/2015 ^ | | | 14,130 | | | | 15,429 | |
National Retail Properties, Inc. | | | | | | | | |
6.15%, 12/15/2015 | | | 14,850 | | | | 16,878 | |
6.25%, 06/15/2014 | | | 9,958 | | | | 10,727 | |
UDR, Inc. | | | | | | | | |
5.13%, 01/15/2014 | | | 4,900 | | | | 5,114 | |
5.50%, 04/01/2014 | | | 5,500 | | | | 5,810 | |
6.05%, 06/01/2013 | | | 6,080 | | | | 6,258 | |
WEA Finance LLC / WT Finance AUST Pty, Ltd. | | | | | | | | |
5.75%, 09/02/2015—144A | | | 17,000 | | | | 18,942 | |
Real Estate Management & Development—1.4% | | | | | | | | |
First Industrial, LP | | | | | | | | |
5.75%, 01/15/2016 ^ | | | 10,140 | | | | 10,771 | |
6.42%, 06/01/2014 | | | 2,691 | | | | 2,823 | |
Post Apartment Homes, LP | | | | | | | | |
6.30%, 06/01/2013 | | | 17,965 | | | | 18,487 | |
Retail Property Trust | | | | | | | | |
7.18%, 09/01/2013—144A | | | 16,445 | | | | 17,227 | |
Road & Rail—0.1% | | | | | | | | |
GATX Financial Corp. | | | | | | | | |
5.80%, 03/01/2016 | | | 4,000 | | | | 4,464 | |
Trading Companies & Distributors—0.7% | | | | | | | | |
Noble Group, Ltd. | | | | | | | | |
8.50%, 05/30/2013—144A | | | 24,175 | | | | 25,021 | |
Transportation Infrastructure—1.7% | | | | | | | | |
Heathrow Funding, Ltd. | | | | | | | | |
2.50%, 06/25/2015—144A ^ | | | 24,000 | | | | 24,789 | |
Penske Truck Leasing Co., LP / PTL Finance Corp. | | | | | | | | |
2.50%, 07/11/2014—144A | | | 3,000 | | | | 3,033 | |
3.13%, 05/11/2015—144A | | | 30,070 | | | | 30,688 | |
Wireless Telecommunication Services—3.4% | | | | | | | | |
Crown Castle Towers LLC | | | | | | | | |
3.21%, 08/15/2015—144A | | | 12,000 | | | | 12,499 | |
4.52%, 01/15/2015—144A | | | 15,870 | | | | 16,806 | |
Richland Towers Funding LLC / Management Funding / RTM Boston / Seattle Funding | | | | | | | | |
4.61%, 03/15/2016—144A | | | 11,546 | | | | 12,430 | |
SBA Tower Trust | | | | | | | | |
4.25%, 04/15/2015—144A | | | 29,090 | | | | 30,575 | |
Sprint Nextel Corp. | | | | | | | | |
8.38%, 08/15/2017 ^ | | | 18,000 | | | | 20,880 | |
WCP Wireless Site Funding / WCP Wireless Site RE Funding / WCP Wireless Site Non | | | | | | | | |
4.14%, 11/15/2015—144A | | | 27,307 | | | | 28,221 | |
| | | | | | | | |
Total Corporate Debt Securities (cost $2,188,871) | | | | | | | 2,243,802 | |
| | | | | | | | |
LOAN ASSIGNMENTS—3.3% | | | | | | | | |
Diversified Telecommunication Services—0.3% | | | | | | | | |
Windstream Corp., Tranche B2 3.09%, 12/17/2015 * § | | | 9,974 | | | | 9,946 | |
Food Products—0.4% | | | | | | | | |
Michael Foods Group, Inc. | | | | | | | | |
4.25%, 02/23/2018 * § | | | 14,541 | | | | 14,596 | |
Health Care Providers & Services—0.4% | | | | | | | | |
HCA, Inc. | | | | | | | | |
3.61%, 03/31/2017 * § | | | 13,500 | | | | 13,505 | |
| | | | |
| The notes to the financial statements are an integral part of this report. | | |
| Transamerica Funds | | | | Annual Report 2012 |
| | Page 99 | | |
Transamerica Short-Term Bond
(formerly, Transamerica AEGON Short-Term Bond)
SCHEDULE OF INVESTMENTS (continued)
At October 31, 2012
| | | | | | | | |
| | | Principal
(000’s) | | | Value
(000’s) | |
Hotels, Restaurants & Leisure—0.8% | | | | | | | | |
Dunkin’ Brands, Inc. | | | | | | | | |
4.00%, 11/23/2017 * § | | $ | 15,957 | | | $ | 15,991 | |
Scientific Games International, Inc., Tranche B1 | | | | | | | | |
2.97%, 06/30/2015 * § | | | 11,900 | | | | 11,837 | |
IT Services—0.4% | | | | | | | | |
SunGard Data Systems, Inc. | | | | | | | | |
3.71%, 02/28/2014 * § | | | 8,503 | | | | 8,511 | |
SunGard Data Systems, Inc., Tranche B | | | | | | | | |
3.90%, 02/26/2016 * § | | | 6,000 | | | | 6,008 | |
Media—0.7% | | | | | | | | |
CSC Holdings, Inc., Tranche B2 | | | | | | | | |
1.96%, 03/29/2016 * § | | | 12,036 | | | | 12,028 | |
Sinclair Broadcast Group, Inc., Tranche B
| | | | | | | | |
—, 10/28/2016 * ь § | | | 8,982 | | | | 9,012 | |
Visant Corp., Tranche B | | | | | | | | |
5.25%, 12/22/2016 * § | | | 3,208 | | | | 3,084 | |
Oil, Gas & Consumable Fuels—0.0% ¥ | | | | | | | | |
Chesapeake Energy Corp. | | | | | | | | |
8.50%, 12/01/2017 * | | | 1,372 | | | | 1,373 | |
Personal Products—0.3% | | | | | | | | |
Revlon Consumer Products Corp., Tranche B | | | | | | | | |
4.75%, 11/17/2017 * § | | | 9,925 | | | | 9,929 | |
| | | | | | | | |
Total Loan Assignments (cost $114,951) | | | | | | | 115,820 | |
| | | | | | | | |
| | | | | | | | |
| | | Shares | | | Value
(000’s) | |
SECURITIES LENDING COLLATERAL—4.2% | | | | | | | | |
State Street Navigator Securities Lending Trust—Prime Portfolio, 0.31% p | | | 149,240,598 | | | $ | 149,241 | |
Total Securities Lending Collateral (cost $149,241) | | | | | | | | |
| | | | | | | | |
| | | Principal
(000’s) | | | Value
(000’s) | |
REPURCHASE AGREEMENT—3.2% | | | | | | | | |
State Street Bank & Trust Co. 0.03% p, dated 10/31/2012, to be repurchased at $114,637 on 11/01/2012. Collateralized by U.S. Government Agency Obligations, 3.00%—4.00%, due 09/25/2039—01/01/2042, and with a total value of $116,930. | | $ | 114,637 | | | | 114,637 | |
| | | | | | | | |
Total Repurchase Agreement (cost $114,637) | | | | | | | | |
Total Investment Securities (cost $3,658,418) P | | | | | | | 3,730,596 | |
Other Assets and Liabilities—Net | | | | | | | (189,568 | ) |
| | | | | | | | |
Net Assets | | | | | | $ | 3,541,028 | |
| | | | | | | | |
NOTES TO SCHEDULE OF INVESTMENTS (all amounts in thousands):
| ¥ | Percentage rounds to less than 0.1%. |
| * | Floating or variable rate note. Rate is listed as of 10/31/2012. |
| Ə | Fair valued as determined in good faith in accordance with procedures established by the Board of Trustees. Total aggregate market value of fair valued securities is $4,790, or 0.14% of the fund’s net assets. |
| ^ | All or a portion of this security is on loan. The value of all securities on loan is $146,148. |
| ь | All or a portion of this security represents unsettled loan commitment at 10/31/2012 where the rate will be determined at time of settlement. |
| p | Rate shown reflects the yield at 10/31/2012. |
| § | Illiquid. Total aggregate market value of illiquid securities is $148,430, or 4.19% of the fund’s net assets. |
| P | Aggregate cost for federal income tax purposes is $3,658,444. Aggregate gross unrealized appreciation/depreciation for all securities in which there is an excess of value over tax cost were $77,434 and $5,282, respectively. Net unrealized appreciation for tax purposes is $72,152. |
DEFINITIONS (all amounts in thousands):
| 144A | 144A Securities are registered pursuant to Rule 144A of the Securities Act of 1933. These securities are deemed to be liquid for purposes of compliance limitations on holdings of illiquid securities and may be resold as transactions exempt from registration, normally to qualified institutional buyers. At 10/31/2012, these securities aggregated $1,798,322, or 50.79% of the fund's net assets. |
| CLO | Collateralized Loan Obligation |
| OAO | Otkrytoe Aktsionernoe Obschestvo (Russian: Open Joint Stock Exchange) |
| REMIC | Real Estate Mortgage Investment Conduits (consist of a fixed pool of mortgages broken apart and marketed to investors as individual securities) |
| | | | |
| The notes to the financial statements are an integral part of this report. | | |
| Transamerica Funds | | | | Annual Report 2012 |
| | Page 100 | | |
Transamerica Short-Term Bond
(formerly, Transamerica AEGON Short-Term Bond)
SCHEDULE OF INVESTMENTS (continued)
At October 31, 2012
VALUATION SUMMARY (all amounts in thousands): '
| | | | | | | | | | | | | | | | |
| | | | | | Level 2 - | | | | | | | |
| | | | | | Other | | | Level 3 - | | | | |
| | | Level 1 - | | | Significant | | | Significant | | | | |
| | | Quoted | | | Observable | | | Unobservable | | | Value at | |
Investment Securities | | Prices | | | Inputs | | | Inputs | | | 10/31/2012 | |
Asset-Backed Securities | | $ | — | | | $ | 296,336 | | | $ | — | | | $ | 296,336 | |
Corporate Debt Securities | | | — | | | | 2,243,802 | | | | — | | | | 2,243,802 | |
Loan Assignments | | | — | | | | 115,820 | | | | — | | | | 115,820 | |
Mortgage-Backed Securities | | | — | | | | 792,264 | | | | — | | | | 792,264 | |
Municipal Government Obligation | | | — | | | | 17,782 | | | | — | | | | 17,782 | |
Repurchase Agreement | | | — | | | | 114,637 | | | | — | | | | 114,637 | |
Securities Lending Collateral | | | 149,241 | | | | — | | | | — | | | | 149,241 | |
U.S. Government Agency Obligation | | | — | | | | 714 | | | | — | | | | 714 | |
| | | | | | | | | | | | | | | | |
Total | | $ | 149,241 | | | $ | 3,581,355 | | | $ | — | | | $ | 3,730,596 | |
| | | | | | | | | | | | | | | | |
| ' | Transfers between levels are considered to have occurred at the end of the reporting period. There were no transfers into or out of Levels 1 and 2 during the period ended 10/31/2012. See the notes to the financial statements for more information regarding pricing inputs and valuation techniques. |
| | | | |
| The notes to the financial statements are an integral part of this report. | | |
| Transamerica Funds | | | | Annual Report 2012 |
| | Page 101 | | |
Transamerica Small Cap Growth
SCHEDULE OF INVESTMENTS
At October 31, 2012
| | | | | | | | |
| | | | | | Value | |
| | | Shares | | | (000’s) | |
COMMON STOCKS—91.8% | | | | | | | | |
Aerospace & Defense—2.4% | | | | | | | | |
Triumph Group, Inc. | | | 86,310 | | | $ | 5,646 | |
Air Freight & Logistics—1.1% | | | | | | | | |
Hub Group, Inc.—Class A ‡ | | | 84,720 | | | | 2,627 | |
Chemicals—2.6% | | | | | | | | |
Kraton Performance Polymers, Inc. ‡ | | | 202,030 | | | | 4,408 | |
TPC Group, Inc. ‡ | | | 38,947 | | | | 1,752 | |
Commercial Banks—11.7% | | | | | | | | |
Bank of the Ozarks, Inc. | | | 81,823 | | | | 2,679 | |
Home Bancshares, Inc. | | | 113,097 | | | | 3,918 | |
PrivateBancorp, Inc.—Class A | | | 335,480 | | | | 5,422 | |
Prosperity Bancshares, Inc. | | | 62,930 | | | | 2,634 | |
Signature Bank ‡ | | | 57,980 | | | | 4,130 | |
SVB Financial Group ‡ | | | 83,750 | | | | 4,739 | |
Texas Capital Bancshares, Inc. ‡ | | | 97,744 | | | | 4,640 | |
Commercial Services & Supplies—3.0% | | | | | | | | |
Healthcare Services Group Inc. | | | 302,286 | | | | 7,225 | |
Diversified Consumer Services—1.0% | | | | | | | | |
Coinstar, Inc. ‡ | | | 53,010 | | | | 2,488 | |
Diversified Financial Services—1.2% | | | | | | | | |
MarketAxess Holdings, Inc. | | | 88,440 | | | | 2,763 | |
Electronic Equipment & Instruments—0.9% | | | | | | | | |
InvenSense, Inc.—Class A ‡ | | | 196,269 | | | | 2,198 | |
Energy Equipment & Services—1.7% | | | | | | | | |
Pacific Drilling SA ‡ | | | 407,970 | | | | 4,153 | |
Food Products—3.4% | | | | | | | | |
Annie’s, Inc. ‡ | | | 115,920 | | | | 4,579 | |
TreeHouse Foods, Inc. ‡ | | | 65,760 | | | | 3,521 | |
Health Care Providers & Services—7.2% | | | | | | | | |
Air Methods Corp. ‡ | | | 63,713 | | | | 6,985 | |
Centene Corp. ‡ | | | 67,640 | | | | 2,569 | |
HMS Holdings Corp. ‡ | | | 230,920 | | | | 5,332 | |
IPC The Hospitalist Co., Inc. ‡ | | | 69,251 | | | | 2,388 | |
Health Care Technology—4.9% | | | | | | | | |
athenahealth, Inc. ‡ | | | 63,510 | | | | 4,083 | |
Computer Programs & Systems, Inc. | | | 69,902 | | | | 3,412 | |
Medidata Solutions, Inc. ‡ | | | 21,853 | | | | 916 | |
Vocera Communications, Inc. ‡ | | | 121,987 | | | | 3,280 | |
Hotels, Restaurants & Leisure—3.8% | | | | | | | | |
Buffalo Wild Wings, Inc. ‡ | | | 72,320 | | | | 5,493 | |
Red Robin Gourmet Burgers, Inc. ‡ | | | 12,378 | | | | 413 | |
Sonic Corp. ‡ | | | 324,842 | | | | 3,239 | |
Internet Software & Services—2.4% | | | | | | | | |
LivePerson, Inc. ‡ | | | 199,391 | | | | 3,129 | |
SPS Commerce, Inc. ‡ | | | 73,940 | | | | 2,680 | |
IT Services—1.5% | | | | | | | | |
MAXIMUS, Inc. | | | 65,860 | | | | 3,634 | |
Machinery—5.3% | | | | | | | | |
Chart Industries, Inc. ‡ | | | 57,680 | | | | 4,083 | |
Wabtec Corp. | | | 104,490 | | | | 8,558 | |
Oil, Gas & Consumable Fuels—4.2% | | | | | | | | |
Approach Resources, Inc. ‡ | | | 247,903 | | | | 6,106 | |
Callon Petroleum Co. ‡ | | | 315,190 | | | | 1,803 | |
Goodrich Petroleum Corp. ‡ | | | 178,176 | | | | 2,197 | |
Pharmaceuticals—5.5% | | | | | | | | |
Akorn, Inc. ‡ | | | 410,833 | | | | 4,934 | |
Impax Laboratories, Inc. ‡ | | | 389,537 | | | | 8,278 | |
Professional Services—3.7% | | | | | | | | |
Acacia Research Corp. ‡ | | | 102,010 | | | | 2,649 | |
Advisory Board Co. ‡ | | | 132,803 | | | | 6,308 | |
Semiconductors & Semiconductor Equipment—0.8% | | | | | | | | |
Inphi Corp. ‡ | | | 239,588 | | | | 2,005 | |
Software—6.3% | | | | | | | | |
Allot Communications, Ltd. ‡ | | | 152,220 | | | | 3,556 | |
QLIK Technologies, Inc. ‡ | | | 159,301 | | | | 2,933 | |
Sourcefire, Inc. ‡ | | | 60,600 | | | | 2,593 | |
Synchronoss Technologies, Inc. ‡ | | | 192,098 | | | | 3,937 | |
| | | | | | | | |
| | | | | | Value | |
| | | Shares | | | (000’s) | |
Software (continued) | | | | | | | | |
Tangoe, Inc. ‡ | | | 143,146 | | | $ | 1,849 | |
Specialty Retail—14.1% | | | | | | | | |
America’s Car-Mart, Inc. ‡ | | | 48,937 | | | | 2,049 | |
Asbury Automotive Group, Inc. ‡ | | | 118,550 | | | | 3,760 | |
Finish Line, Inc.—Class A | | | 113,730 | | | | 2,366 | |
Francesca’s Holdings Corp. ‡ | | | 167,050 | | | | 4,933 | |
Genesco, Inc. ‡ | | | 61,289 | | | | 3,512 | |
Group 1 Automotive, Inc. | | | 76,640 | | | | 4,752 | |
Hibbett Sports, Inc. ‡ | | | 45,270 | | | | 2,444 | |
Pier 1 Imports, Inc. | | | 498,080 | | | | 10,161 | |
Textiles, Apparel & Luxury Goods—2.4% | | | | | | | | |
Steven Madden, Ltd. ‡ | | | 136,290 | | | | 5,850 | |
Transportation Infrastructure—0.7% | | | | | | | | |
WESCO Aircraft Holdings, Inc. ‡ | | | 134,120 | | | | 1,791 | |
| | | | | | | | |
Total Common Stocks (cost $229,361) | | | | | | | 220,482 | |
| | | | | | | | |
| | |
| | | Principal | | | Value | |
| | | (000’s) | | | (000’s) | |
REPURCHASE AGREEMENT—29.4% | | | | | | | | |
State Street Bank & Trust Co. 0.03% , dated 10/31/2012, to be repurchased at $70,616 on 11/01/2012. Collateralized by U.S. Government Agency Obligations, 4.00%—5.50%, due 12/15/2017—04/01/2025, and with a total value of $72,030. | | $ | 70,616 | | | | 70,616 | |
| | | | | | | | |
Total Repurchase Agreement (cost $70,616) | | | | | | | | |
Total Investment Securities (cost $299,977) P | | | | | | | 291,098 | |
Other Assets and Liabilities—Net | | | | | | | (50,998 | ) |
| | | | | | | | |
Net Assets | | | | | | $ | 240,100 | |
| | | | | | | | |
| | | | |
| The notes to the financial statements are an integral part of this report. | | |
| Transamerica Funds | | | | Annual Report 2012 |
| | Page 102 | | |
Transamerica Small Cap Growth
SCHEDULE OF INVESTMENTS (continued)
At October 31, 2012
NOTES TO SCHEDULE OF INVESTMENTS (all amounts in thousands):
| ‡ | Non-income producing security. |
| | Rate shown reflects the yield at 10/31/2012. |
| P | Aggregate cost for federal income tax purposes is $301,242. Aggregate gross unrealized appreciation/depreciation for all securities in which there is an excess of value over tax cost were $2,044 and $12,188, respectively. Net unrealized depreciation for tax purposes is $10,144. |
VALUATION SUMMARY (all amounts in thousands): '
| | | | | | | | | | | | | | | | |
Investment Securities | | Level 1 -
Quoted
Prices | | | Level 2 -
Other
Significant
Observable
Inputs | | | Level 3 -
Significant
Unobservable
Inputs | | | Value at
10/31/2012 | |
Common Stocks | | $ | 220,482 | | | $ | — | | | $ | — | | | $ | 220,482 | |
Repurchase Agreement | | | — | | | | 70,616 | | | | — | | | | 70,616 | |
| | | | | | | | | | | | | | | | |
Total | | $ | 220,482 | | | $ | 70,616 | | | $ | — | | | $ | 291,098 | |
| | | | | | | | | | | | | | | | |
| ' | Transfers between levels are considered to have occurred at the end of the reporting period. There were no transfers into or out of Levels 1 and 2 during the period ended 10/31/2012. See the notes to the financial statements for more information regarding pricing inputs and valuation techniques. |
| | | | |
| The notes to the financial statements are an integral part of this report. | | |
| Transamerica Funds | | | | Annual Report 2012 |
| | Page 103 | | |
Transamerica Small Cap Value
SCHEDULE OF INVESTMENTS
At October 31, 2012
| | | | | | | | |
| | | | | | Value | |
| | | Shares | | | (000’s) | |
COMMON STOCKS—96.3% | | | | | | | | |
Air Freight & Logistics—0.6% | | | | | | | | |
Air Transport Services Group, Inc. ‡ | | | 437,363 | | | $ | 1,684 | |
Airlines—0.8% | | | | | | | | |
SkyWest, Inc. | | | 208,708 | | | | 2,285 | |
Automobiles—1.3% | | | | | | | | |
Thor Industries, Inc. | | | 97,121 | | | | 3,694 | |
Capital Markets—5.0% | | | | | | | | |
Ares Capital Corp. | | | 445,785 | | | | 7,784 | |
Investment Technology Group, Inc. ‡ | | | 136,876 | | | | 1,155 | |
Waddell & Reed Financial, Inc.—Class A | | | 167,872 | | | | 5,595 | |
Chemicals—2.1% | | | | | | | | |
RPM International, Inc. | | | 108,567 | | | | 2,894 | |
Sensient Technologies Corp. | | | 93,588 | | | | 3,406 | |
Commercial Banks—10.8% | | | | | | | | |
BancorpSouth, Inc. | | | 216,049 | | | | 3,057 | |
Bank of Hawaii Corp. | | | 78,994 | | | | 3,488 | |
BBCN Bancorp, Inc. ‡ | | | 381,247 | | | | 4,549 | |
Community Bank System, Inc. | | | 83,678 | | | | 2,309 | |
Cullen/Frost Bankers, Inc. | | | 12,471 | | | | 690 | |
East-West Bancorp, Inc. | | | 164,114 | | | | 3,494 | |
First Niagara Financial Group, Inc. | | | 428,042 | | | | 3,544 | |
FNB Corp. | | | 328,664 | | | | 3,527 | |
Hancock Holding Co. | | | 138,438 | | | | 4,373 | |
Trustmark Corp. | | | 88,038 | | | | 2,066 | |
Commercial Services & Supplies—4.0% | | | | | | | | |
ACCO Brands Corp. ‡ | | | 219,021 | | | | 1,586 | |
American Reprographics Co. ‡ | | | 369,676 | | | | 1,416 | |
Deluxe Corp. | | | 209,611 | | | | 6,604 | |
Ennis, Inc. | | | 125,986 | | | | 1,928 | |
Communications Equipment—3.4% | | | | | | | | |
ADTRAN, Inc. | | | 32,252 | | | | 545 | |
Black Box Corp. | | | 153,198 | | | | 3,358 | |
Oplink Communications, Inc. ‡ | | | 243,981 | | | | 3,625 | |
Plantronics, Inc. | | | 74,865 | | | | 2,429 | |
Construction & Engineering—2.2% | | | | | | | | |
Aegion Corp.—Class A ‡ | | | 84,968 | | | | 1,569 | |
Granite Construction, Inc. | | | 32,914 | | | | 994 | |
Tutor Perini Corp. ‡ | | | 378,257 | | | | 3,836 | |
Consumer Finance—1.8% | | | | | | | | |
World Acceptance Corp. ‡ | | | 79,828 | | | | 5,329 | |
Containers & Packaging—1.9% | | | | | | | | |
Greif, Inc.—Class A | | | 60,727 | | | | 2,548 | |
Sonoco Products Co. | | | 93,072 | | | | 2,897 | |
Diversified Financial Services—0.9% | | | | | | | | |
Fifth Street Finance Corp. | | | 234,937 | | | | 2,563 | |
Electric Utilities—2.7% | | | | | | | | |
Empire District Electric Co. | | | 160,442 | | | | 3,483 | |
Portland General Electric Co. | | | 167,594 | | | | 4,593 | |
Electrical Equipment—3.0% | | | | | | | | |
EnerSys, Inc. ‡ | | | 83,876 | | | | 2,892 | |
Franklin Electric Co., Inc. | | | 41,621 | | | | 2,412 | |
GrafTech International, Ltd. ‡ | | | 310,597 | | | | 3,264 | |
Electronic Equipment & Instruments—4.7% | | | | | | | | |
Anixter International, Inc. | | | 39,768 | | | | 2,331 | |
Benchmark Electronics, Inc. ‡ | | | 150,644 | | | | 2,233 | |
CTS Corp. | | | 263,762 | | | | 2,184 | |
Park Electrochemical Corp. | | | 147,250 | | | | 3,655 | |
Plexus Corp. ‡ | | | 81,495 | | | | 2,193 | |
ScanSource, Inc. ‡ | | | 34,098 | | | | 997 | |
Energy Equipment & Services—2.4% | | | | | | | | |
Bristow Group, Inc. | | | 46,093 | | | | 2,301 | |
Tidewater, Inc. | | | 95,141 | | | | 4,520 | |
Food & Staples Retailing—0.8% | | | | | | | | |
Nash Finch Co. | | | 125,953 | | | | 2,422 | |
Gas Utilities—1.6% | | | | | | | | |
Atmos Energy Corp. | | | 125,422 | | | | 4,511 | |
Health Care Equipment & Supplies—2.5% | | | | | | | | |
Hill-Rom Holdings, Inc. | | | 156,711 | | | | 4,402 | |
| | | | | | | | |
| | | | | | Value | |
| | | Shares | | | (000’s) | |
Health Care Equipment & Supplies (continued) | | | | | | | | |
Symmetry Medical, Inc. ‡ | | | 327,877 | | | $ | 3,003 | |
Health Care Providers & Services—2.2% | | | | | | | | |
Amsurg Corp.—Class A ‡ | | | 57,294 | | | | 1,634 | |
Kindred Healthcare, Inc. ‡ | | | 477,224 | | | | 4,677 | |
Hotels, Restaurants & Leisure—1.9% | | | | | | | | |
Cracker Barrel Old Country Store, Inc. | | | 63,446 | | | | 4,038 | |
Ruth’s Hospitality Group, Inc. ‡ | | | 198,946 | | | | 1,323 | |
Insurance—8.0% | | | | | | | | |
American Equity Investment Life Holding Co. | | | 322,538 | | | | 3,712 | |
Donegal Group, Inc.—Class A | | | 74,966 | | | | 972 | |
FBL Financial Group, Inc.—Class A | | | 52,285 | | | | 1,784 | |
Hanover Insurance Group, Inc. | | | 58,306 | | | | 2,105 | |
HCC Insurance Holdings, Inc. | | | 184,339 | | | | 6,571 | |
Tower Group, Inc. | | | 271,311 | | | | 4,889 | |
Validus Holdings, Ltd. | | | 89,506 | | | | 3,204 | |
IT Services—2.0% | | | | | | | | |
CACI International, Inc.—Class A ‡ | | | 115,189 | | | | 5,809 | |
Media—0.7% | | | | | | | | |
Meredith Corp. | | | 60,688 | | | | 2,031 | |
Metals & Mining—1.5% | | | | | | | | |
Kaiser Aluminum Corp. | | | 70,195 | | | | 4,252 | |
Office Electronics—1.5% | | | | | | | | |
Zebra Technologies Corp.—Class A ‡ | | | 118,735 | | | | 4,266 | |
Oil, Gas & Consumable Fuels—3.5% | | | | | | | | |
Berry Petroleum Co.—Class A | | | 154,607 | | | | 5,954 | |
Callon Petroleum Co. ‡ | | | 356,921 | | | | 2,042 | |
Stone Energy Corp. ‡ | | | 90,136 | | | | 2,126 | |
Paper & Forest Products—0.7% | | | | | | | | |
P.H. Glatfelter Co. | | | 106,775 | | | | 1,902 | |
Personal Products—3.0% | | | | | | | | |
Nu Skin Enterprises, Inc.—Class A | | | 181,646 | | | | 8,597 | |
Professional Services—4.4% | | | | | | | | |
Barrett Business Services, Inc. | | | 54,191 | | | | 1,617 | |
CBIZ, Inc. ‡ | | | 522,503 | | | | 2,884 | |
FTI Consulting, Inc. ‡ | | | 151,821 | | | | 3,941 | |
Korn/Ferry International ‡ | | | 327,176 | | | | 4,381 | |
Real Estate Investment Trusts—6.6% | | | | | | | | |
First Potomac Realty Trust | | | 119,642 | | | | 1,425 | |
Glimcher Realty Trust | | | 89,996 | | | | 960 | |
Hersha Hospitality Trust—Class A | | | 601,987 | | | | 2,751 | |
Medical Properties Trust, Inc. | | | 523,124 | | | | 6,006 | |
Omega Healthcare Investors, Inc. | | | 239,072 | | | | 5,484 | |
Ramco-Gershenson Properties Trust | | | 186,065 | | | | 2,411 | |
Semiconductors & Semiconductor Equipment—0.6% | | | | | | | | |
Integrated Silicon Solution, Inc. ‡ | | | 190,551 | | | | 1,629 | |
Software—0.9% | | | | | | | | |
American Software, Inc.—Class A | | | 328,565 | | | | 2,691 | |
Specialty Retail—5.3% | | | | | | | | |
Ascena Retail Group, Inc. ‡ | | | 207,957 | | | | 4,118 | |
JOS A. Bank Clothiers, Inc. ‡ | | | 52,987 | | | | 2,479 | |
Rent-A-Center, Inc. | | | 197,451 | | | | 6,581 | |
Sonic Automotive, Inc.—Class A | | | 126,203 | | | | 2,448 | |
Textiles, Apparel & Luxury Goods—1.0% | | | | | | | | |
Iconix Brand Group, Inc. ‡ | | | 152,864 | | | | 2,830 | |
| | | | | | | | |
Total Common Stocks (cost $275,904) | | | | | | | 278,741 | |
| | | | | | | | |
| | | | |
| The notes to the financial statements are an integral part of this report. | | |
| Transamerica Funds | | | | Annual Report 2012 |
| | Page 104 | | |
Transamerica Small Cap Value
SCHEDULE OF INVESTMENTS (continued)
At October 31, 2012
| | | | | | | | |
| | | Principal | | | Value | |
| | | (000’s) | | | (000’s) | |
REPURCHASE AGREEMENT—3.3% | | | | | | | | |
State Street Bank & Trust Co. 0.03% p, dated 10/31/2012, to be repurchased at $9,604 on 11/01/2012. Collateralized by a U.S. Government Agency Obligation, 3.50%, due 11/25/2038, and with a value of $9,797. | | $ | 9,604 | | | $ | 9,604 | |
| | | | | | | | |
Total Repurchase Agreement (cost $9,604) | | | | | | | | |
Total Investment Securities (cost $285,508) P | | | | | | | 288,345 | |
Other Assets and Liabilities—Net | | | | | | | 1,209 | |
| | | | | | | | |
Net Assets | | | | | | $ | 289,554 | |
| | | | | | | | |
NOTES TO SCHEDULE OF INVESTMENTS (all amounts in thousands):
| ‡ | Non-income producing security. |
| p | Rate shown reflects the yield at 10/31/2012. |
| P | Aggregate cost for federal income tax purposes is $286,528. Aggregate gross unrealized appreciation/depreciation for all securities in which there is an excess of value over tax cost were $12,484 and $10,667, respectively. Net unrealized appreciation for tax purposes is $1,817. |
VALUATION SUMMARY (all amounts in thousands): '
| | | | | | | | | | | | | | | | |
| | | | | | Level 2 - | | | | | | | |
| | | | | | Other | | | Level 3 - | | | | |
| | | Level 1 - | | | Significant | | | Significant | | | | |
| | | Quoted | | | Observable | | | Unobservable | | | Value at | |
Investment Securities | | Prices | | | Inputs | | | Inputs | | | 10/31/2012 | |
Common Stocks | | $ | 278,741 | | | $ | — | | | $ | — | | | $ | 278,741 | |
Repurchase Agreement | | | — | | | | 9,604 | | | | — | | | | 9,604 | |
| | | | | | | | | | | | | | | | |
Total | | $ | 278,741 | | | $ | 9,604 | | | $ | — | | | $ | 288,345 | |
| | | | | | | | | | | | | | | | |
| ' | Transfers between levels are considered to have occurred at the end of the reporting period. There were no transfers into or out of Levels 1 and 2 during the period ended 10/31/2012. See the notes to the financial statements for more information regarding pricing inputs and valuation techniques. |
| | | | |
| The notes to the financial statements are an integral part of this report. | | |
| Transamerica Funds | | | | Annual Report 2012 |
| | Page 105 | | |
Transamerica Small/Mid Cap Value
(formerly, Transamerica Systematic Small/Mid Cap Value)
SCHEDULE OF INVESTMENTS
At October 31, 2012
| | | | | | | | |
| | | | | | Value | |
| | | Shares | | | (000’s) | |
COMMON STOCKS—97.9% | | | | | | | | |
Aerospace & Defense—1.7% | | | | | | | | |
Aerovironment, Inc. ‡ ^ | | | 89,400 | | | $ | 1,966 | |
American Science & Engineering, Inc. | | | 17,800 | | | | 1,132 | |
Curtiss-Wright Corp. | | | 36,500 | | | | 1,127 | |
Triumph Group, Inc. | | | 114,450 | | | | 7,487 | |
Air Freight & Logistics—0.4% | | | | | | | | |
Atlas Air Worldwide Holdings, Inc. ‡ | | | 53,840 | | | | 2,961 | |
Auto Components—0.7% | | | | | | | | |
Dana Holding Corp. ^ | | | 148,663 | | | | 1,956 | |
Delphi Automotive PLC ‡ | | | 79,525 | | | | 2,501 | |
Automobiles—0.4% | | | | | | | | |
Thor Industries, Inc. ^ | | | 80,275 | | | | 3,053 | |
Beverages—1.2% | | | | | | | | |
Coca-Cola Enterprises, Inc. | | | 130,125 | | | | 4,091 | |
Molson Coors Brewing Co.—Class B | | | 88,425 | | | | 3,815 | |
Building Products—0.9% | | | | | | | | |
A.O. Smith Corp. ^ | | | 42,400 | | | | 2,577 | |
American Woodmark Corp. ‡ ^ | | | 14,398 | | | | 331 | |
Fortune Brands Home & Security, Inc. ‡ | | | 46,700 | | | | 1,328 | |
Gibraltar Industries, Inc. ‡ ^ | | | 162,319 | | | | 2,022 | |
Capital Markets—2.3% | | | | | | | | |
Duff & Phelps Corp.—Class A | | | 103,500 | | | | 1,287 | |
LPL Financial Holdings, Inc. | | | 43,000 | | | | 1,256 | |
Raymond James Financial, Inc. | | | 226,734 | | | | 8,647 | |
Stifel Financial Corp. ‡ ^ | | | 58,000 | | | | 1,839 | |
Waddell & Reed Financial, Inc.—Class A | | | 78,400 | | | | 2,612 | |
Chemicals—2.2% | | | | | | | | |
Agrium, Inc. | | | 13,225 | | | | 1,396 | |
Ashland, Inc. | | | 70,252 | | | | 4,998 | |
CF Industries Holdings, Inc. | | | 7,290 | | | | 1,496 | |
Cytec Industries, Inc. | | | 33,975 | | | | 2,338 | |
PPG Industries, Inc. | | | 41,875 | | | | 4,903 | |
Commercial Banks—7.6% | | | | | | | | |
City National Corp. ^ | | | 25,400 | | | | 1,298 | |
Comerica, Inc. | | | 301,100 | | | | 8,975 | |
Fifth Third Bancorp | | | 201,300 | | | | 2,925 | |
First Citizens BancShares, Inc.—Class A | | | 28,413 | | | | 4,794 | |
First Community Bancshares, Inc. ^ | | | 151,740 | | | | 2,273 | |
First Niagara Financial Group, Inc. | | | 180,070 | | | | 1,491 | |
KeyCorp | | | 487,025 | | | | 4,101 | |
Lakeland Bancorp, Inc. ^ | | | 52,848 | | | | 525 | |
Regions Financial Corp. | | | 1,341,375 | | | | 8,745 | |
Sandy Spring Bancorp, Inc. ^ | | | 118,000 | | | | 2,256 | |
SunTrust Banks, Inc. | | | 161,975 | | | | 4,406 | |
Texas Capital Bancshares, Inc. ‡ ^ | | | 44,000 | | | | 2,089 | |
Umpqua Holdings Corp. ^ | | | 190,000 | | | | 2,297 | |
Union First Market Bankshares Corp. ^ | | | 27,300 | | | | 429 | |
Washington Trust Bancorp, Inc. ^ | | | 55,921 | | | | 1,509 | |
Webster Financial Corp. | | | 168,500 | | | | 3,707 | |
Commercial Services & Supplies—0.3% | | | | | | | | |
HNI Corp. ^ | | | 72,200 | | | | 1,987 | |
Communications Equipment—1.4% | | | | | | | | |
KVH Industries, Inc. ‡ ^ | | | 184,983 | | | | 2,556 | |
Polycom, Inc. ‡ | | | 121,700 | | | | 1,219 | |
Riverbed Technology, Inc. ‡ | | | 300,025 | | | | 5,542 | |
Construction & Engineering—1.4% | | | | | | | | |
Chicago Bridge & Iron Co. NV | | | 23,800 | | | | 894 | |
EMCOR Group, Inc. | | | 66,500 | | | | 2,139 | |
Foster Wheeler AG ‡ | | | 57,200 | | | | 1,274 | |
KBR, Inc. | | | 187,650 | | | | 5,227 | |
Construction Materials—0.5% | | | | | | | | |
Caesar Stone Sdot Yam, Ltd. ‡ | | | 209,900 | | | | 3,367 | |
Consumer Finance—2.0% | | | | | | | | |
Discover Financial Services | | | 239,850 | | | | 9,834 | |
SLM Corp. | | | 208,525 | | | | 3,666 | |
| | | | | | | | |
| | | | | | Value | |
| | | Shares | | | (000’s) | |
Electric Utilities—2.0% | | | | | | | | |
Cleco Corp. | | | 178,525 | | | $ | 7,703 | |
MGE Energy, Inc. ^ | | | 31,500 | | | | 1,658 | |
PPL Corp. | | | 146,400 | | | | 4,331 | |
Electrical Equipment—0.3% | | | | | | | | |
PowerSecure International, Inc. ‡ ^ | | | 334,061 | | | | 2,158 | |
Electronic Equipment & Instruments—1.6% | | | | | | | | |
FEI Co. ^ | | | 83,118 | | | | 4,575 | |
Orbotech, Ltd. ‡ | | | 177,600 | | | | 1,467 | |
Park Electrochemical Corp. ^ | | | 59,786 | | | | 1,484 | |
Rofin-Sinar Technologies, Inc. ‡ ^ | | | 52,000 | | | | 947 | |
Universal Display Corp. ‡ ^ | | | 21,100 | | | | 692 | |
Vishay Intertechnology, Inc. ‡ ^ | | | 194,800 | | | | 1,613 | |
Energy Equipment & Services—1.6% | | | | | | | | |
Dresser-Rand Group, Inc. ‡ | | | 35,600 | | | | 1,834 | |
Helix Energy Solutions Group, Inc. ‡ | | | 22,300 | | | | 386 | |
Noble Corp. | | | 110,275 | | | | 4,162 | |
Oil States International, Inc. ‡ | | | 64,000 | | | | 4,678 | |
Food Products—1.6% | | | | | | | | |
Hain Celestial Group, Inc. ‡ ^ | | | 45,675 | | | | 2,640 | |
J&J Snack Foods Corp. | | | 25,145 | | | | 1,440 | |
JM Smucker Co. | | | 83,075 | | | | 7,115 | |
Health Care Equipment & Supplies—1.6% | | | | | | | | |
AngioDynamics, Inc. ‡ | | | 105,300 | | | | 1,130 | |
Greatbatch, Inc. ‡ ^ | | | 78,657 | | | | 1,729 | |
Sirona Dental Systems, Inc. ‡ | | | 137,900 | | | | 7,896 | |
Health Care Providers & Services—1.0% | | | | | | | | |
Coventry Health Care, Inc. | | | 67,000 | | | | 2,924 | |
HealthSouth Corp. ‡ ^ | | | 52,900 | | | | 1,171 | |
WellCare Health Plans, Inc. ‡ | | | 60,125 | | | | 2,862 | |
Health Care Technology—0.4% | | | | | | | | |
Omnicell, Inc. ‡ | | | 165,000 | | | | 2,406 | |
Hotels, Restaurants & Leisure—1.3% | | | | | | | | |
Brinker International, Inc. ^ | | | 40,500 | | | | 1,247 | |
Churchill Downs, Inc. ^ | | | 41,100 | | | | 2,685 | |
Wyndham Worldwide Corp. | | | 99,575 | | | | 5,019 | |
Household Durables—1.8% | | | | | | | | |
Harman International Industries, Inc. | | | 42,000 | | | | 1,761 | |
Helen of Troy, Ltd. ‡ | | | 43,400 | | | | 1,312 | |
La-Z-Boy, Inc. ‡ | | | 128,200 | | | | 2,079 | |
MDC Holdings, Inc. ^ | | | 45,775 | | | | 1,750 | |
Newell Rubbermaid, Inc. | | | 177,775 | | | | 3,669 | |
Ryland Group, Inc. ^ | | | 55,700 | | | | 1,887 | |
Household Products—0.6% | | | | | | | | |
Spectrum Brands Holdings, Inc. ‡ ^ | | | 97,300 | | | | 4,426 | |
Independent Power Producers & Energy Traders—0.5% | | | | | | | | |
Calpine Corp. ‡ | | | 194,575 | | | | 3,425 | |
Insurance—6.8% | | | | | | | | |
Alleghany Corp. ‡ | | | 9,000 | | | | 3,128 | |
Allstate Corp. | | | 109,000 | | | | 4,358 | |
Aspen Insurance Holdings, Ltd. | | | 92,500 | | | | 2,992 | |
HCC Insurance Holdings, Inc. | | | 66,700 | | | | 2,377 | |
Lincoln National Corp. | | | 446,325 | | | | 11,064 | |
Selective Insurance Group, Inc. ^ | | | 254,721 | | | | 4,710 | |
United Fire Group, Inc. | | | 237,943 | | | | 5,656 | |
Validus Holdings, Ltd. | | | 330,550 | | | | 11,834 | |
Internet Software & Services—1.9% | | | | | | | | |
AOL, Inc. ‡ | | | 100,800 | | | | 3,460 | |
Blucora, Inc. ‡ | | | 56,600 | | | | 993 | |
IAC/InterActiveCorp | | | 47,500 | | | | 2,297 | |
ValueClick, Inc. ‡ ^ | | | 258,916 | | | | 4,317 | |
XO Group, Inc. ‡ | | | 195,900 | | | | 1,577 | |
IT Services—0.9% | | | | | | | | |
Fidelity National Information Services, Inc. | | | 129,800 | | | | 4,266 | |
Global Payments, Inc. | | | 41,000 | | | | 1,753 | |
Leisure Equipment & Products—0.4% | | | | | | | | |
LeapFrog Enterprises, Inc.—Class A ‡ ^ | | | 303,400 | | | | 2,682 | |
| | | | |
| The notes to the financial statements are an integral part of this report. | | |
| Transamerica Funds | | | | Annual Report 2012 |
| | Page 106 | | |
Transamerica Small/Mid Cap Value
(formerly, Transamerica Systematic Small/Mid Cap Value)
SCHEDULE OF INVESTMENTS (continued)
At October 31, 2012
| | | | | | | | |
| | | | | | Value | |
| | | Shares | | | (000’s) | |
Life Sciences Tools & Services—1.5% | | | | | | | | |
Charles River Laboratories International, Inc. ‡ | | | 137,611 | | | $ | 5,136 | |
PerkinElmer, Inc. | | | 169,260 | | | | 5,235 | |
Machinery—4.7% | | | | | | | | |
AGCO Corp. ‡ | | | 107,550 | | | | 4,895 | |
Altra Holdings, Inc. | | | 135,400 | | | | 2,440 | |
CIRCOR International, Inc. | | | 89,500 | | | | 3,087 | |
Columbus McKinnon Corp. ‡ | | | 50,500 | | | | 756 | |
Crane Co. | | | 32,000 | | | | 1,343 | |
Eaton Corp. | | | 152,550 | | | | 7,202 | |
Mueller Industries, Inc. | | | 62,000 | | | | 2,716 | |
NN, Inc. ‡ ^ | | | 145,370 | | | | 1,204 | |
Oshkosh Corp. ‡ | | | 37,400 | | | | 1,121 | |
Sauer-Danfoss, Inc. | | | 48,300 | | | | 1,935 | |
Snap-on, Inc. | | | 35,094 | | | | 2,714 | |
Wabash National Corp. ‡ ^ | | | 161,600 | | | | 1,020 | |
Woodward, Inc. ^ | | | 46,300 | | | | 1,551 | |
Media—0.2% | | | | | | | | |
Madison Square Garden Co. ‡ | | | 25,000 | | | | 1,029 | |
Metals & Mining—1.2% | | | | | | | | |
Kaiser Aluminum Corp. ^ | | | 23,500 | | | | 1,424 | |
Noranda Aluminum Holding Corp. | | | 117,900 | | | | 723 | |
Nucor Corp. | | | 152,200 | | | | 6,107 | |
Multiline Retail—0.6% | | | | | | | | |
Macy’s, Inc. | | | 115,050 | | | | 4,380 | |
Multi-Utilities—3.3% | | | | | | | | |
CMS Energy Corp. | | | 351,700 | | | | 8,553 | |
NiSource, Inc. | | | 359,425 | | | | 9,155 | |
NorthWestern Corp. | | | 135,000 | | | | 4,834 | |
Oil, Gas & Consumable Fuels—6.2% | | | | | | | | |
Cloud Peak Energy, Inc. ‡ | | | 45,500 | | | | 960 | |
Energen Corp. | | | 243,725 | | | | 11,371 | |
HollyFrontier Corp. | | | 231,250 | | | | 8,933 | |
Marathon Petroleum Corp. | | | 33,775 | | | | 1,855 | |
Peabody Energy Corp. | | | 151,700 | | | | 4,232 | |
Plains Exploration & Production Co. ‡ | | | 235,525 | | | | 8,399 | |
SM Energy Co. | | | 46,000 | | | | 2,480 | |
W&T Offshore, Inc. ^ | | | 107,575 | | | | 1,823 | |
Western Refining, Inc. ^ | | | 93,600 | | | | 2,328 | |
Paper & Forest Products—1.0% | | | | | | | | |
Domtar Corp. | | | 26,600 | | | | 2,121 | |
MeadWestvaco Corp. | | | 91,175 | | | | 2,707 | |
P.H. Glatfelter Co. | | | 122,500 | | | | 2,182 | |
Personal Products—1.0% | | | | | | | | |
Herbalife, Ltd. ^ | | | 76,775 | | | | 3,942 | |
Nu Skin Enterprises, Inc.—Class A ^ | | | 58,875 | | | | 2,787 | |
Pharmaceuticals—1.3% | | | | | | | | |
Impax Laboratories, Inc. ‡ | | | 222,875 | | | | 4,736 | |
Jazz Pharmaceuticals PLC ‡ | | | 23,033 | | | | 1,238 | |
Nektar Therapeutics ‡ ^ | | | 306,233 | | | | 2,756 | |
Professional Services—0.6% | | | | | | | | |
FTI Consulting, Inc. ‡ | | | 50,200 | | | | 1,303 | |
On Assignment, Inc. ‡ ^ | | | 159,400 | | | | 3,042 | |
Real Estate Investment Trusts—8.3% | | | | | | | | |
BioMed Realty Trust, Inc. | | | 421,475 | | | | 8,058 | |
Brandywine Realty Trust ^ | | | 1,003,375 | | | | 11,638 | |
CBL & Associates Properties, Inc. | | | 262,725 | | | | 5,876 | |
DiamondRock Hospitality Co. | | | 368,700 | | | | 3,127 | |
Digital Realty Trust, Inc. | | | 34,275 | | | | 2,106 | |
DuPont Fabros Technology, Inc. | | | 83,000 | | | | 1,781 | |
Equity One, Inc. ^ | | | 128,000 | | | | 2,675 | |
Excel Trust, Inc. ^ | | | 312,019 | | | | 3,838 | |
Home Properties, Inc. | | | 51,850 | | | | 3,152 | |
Kilroy Realty Corp. | | | 113,175 | | | | 5,026 | |
National Retail Properties, Inc. ^ | | | 107,700 | | | | 3,412 | |
Realty Income Corp. ^ | | | 18,000 | | | | 707 | |
| | | | | | | | |
| | | | | | Value | |
| | | Shares | | | (000’s) | |
Real Estate Investment Trusts (continued) | | | | | | | | |
Weingarten Realty Investors | | | 88,800 | | | $ | 2,398 | |
Weyerhaeuser Co. | | | 78,175 | | | | 2,165 | |
Road & Rail—1.4% | | | | | | | | |
Hertz Global Holdings, Inc. ‡ ^ | | | 292,400 | | | | 3,880 | |
Ryder System, Inc. | | | 125,425 | | | | 5,659 | |
Semiconductors & Semiconductor Equipment—4.3% | | | | | | | | |
Broadcom Corp.—Class A ‡ | | | 190,600 | | | | 6,011 | |
Brooks Automation, Inc. | | | 228,000 | | | | 1,646 | |
Entegris, Inc. ‡ | | | 261,600 | | | | 2,148 | |
LTX-Credence Corp. ‡ ^ | | | 410,500 | | | | 2,286 | |
MKS Instruments, Inc. | | | 56,000 | | | | 1,323 | |
NXP Semiconductor NV ‡ | | | 112,700 | | | | 2,734 | |
OmniVision Technologies, Inc. ‡ ^ | | | 189,600 | | | | 2,711 | |
Skyworks Solutions, Inc. ‡ | | | 260,700 | | | | 6,101 | |
TriQuint Semiconductor, Inc. ‡ ^ | | | 496,194 | | | | 2,332 | |
Veeco Instruments, Inc. ‡ ^ | | | 55,200 | | | | 1,695 | |
Software—2.2% | | | | | | | | |
Cadence Design Systems, Inc. ‡ | | | 682,875 | | | | 8,645 | |
Electronic Arts, Inc. ‡ | | | 193,800 | | | | 2,393 | |
Progress Software Corp. ‡ ^ | | | 123,200 | | | | 2,430 | |
Websense, Inc. ‡ ^ | | | 98,200 | | | | 1,298 | |
Specialty Retail—6.2% | | | | | | | | |
Abercrombie & Fitch Co.—Class A ^ | | | 43,200 | | | | 1,321 | |
Aeropostale, Inc. ‡ ^ | | | 154,600 | | | | 1,847 | |
American Eagle Outfitters, Inc. | | | 160,000 | | | | 3,339 | |
ANN, Inc. ‡ | | | 96,601 | | | | 3,396 | |
Children's Place Retail Stores, Inc. ‡ ^ | | | 32,100 | | | | 1,876 | |
Express, Inc. ‡ | | | 89,900 | | | | 1,001 | |
Finish Line, Inc.—Class A | | | 186,500 | | | | 3,880 | |
Foot Locker, Inc. | | | 366,175 | | | | 12,268 | |
GNC Holdings, Inc.—Class A | | | 194,550 | | | | 7,523 | |
Pier 1 Imports, Inc. ^ | | | 281,575 | | | | 5,744 | |
Textiles, Apparel & Luxury Goods—1.7% | | | | | | | | |
G-III Apparel Group, Ltd. ‡ ^ | | | 54,500 | | | | 2,014 | |
Oxford Industries, Inc. ^ | | | 32,000 | | | | 1,775 | |
PVH Corp. | | | 49,925 | | | | 5,492 | |
Steven Madden, Ltd. ‡ | | | 53,000 | | | | 2,275 | |
Thrifts & Mortgage Finance—3.1% | | | | | | | | |
Berkshire Hills Bancorp, Inc. ^ | | | 130,331 | | | | 3,060 | |
Brookline Bancorp, Inc. ^ | | | 177,000 | | | | 1,501 | |
Dime Community Bancshares, Inc. | | | 119,700 | | | | 1,736 | |
Northwest Bancshares, Inc. | | | 137,000 | | | | 1,630 | |
Oritani Financial Corp. ^ | | | 71,000 | | | | 1,085 | |
Provident Financial Services, Inc. ^ | | | 116,500 | | | | 1,748 | |
Provident New York Bancorp ^ | | | 282,100 | | | | 2,576 | |
TrustCo Bank Corp. NY ^ | | | 224,500 | | | | 1,253 | |
United Financial Bancorp, Inc. ^ | | | 140,685 | | | | 2,162 | |
ViewPoint Financial Group, Inc. ^ | | | 46,300 | | | | 963 | |
Washington Federal, Inc. | | | 215,000 | | | | 3,607 | |
Trading Companies & Distributors—1.4% | | | | | | | | |
United Rentals, Inc. ‡ | | | 239,575 | | | | 9,741 | |
Water Utilities—0.4% | | | | | | | | |
American Water Works Co., Inc. | | | 79,175 | | | | 2,909 | |
| | | | | | | | |
Total Common Stocks (cost $624,059) | | | | | | | 667,097 | |
| | | | | | | | |
SECURITIES LENDING COLLATERAL—13.4% | | | | | | | | |
State Street Navigator Securities Lending Trust—Prime Portfolio, 0.31% p | | | 91,134,945 | | | | 91,135 | |
Total Securities Lending Collateral (cost $91,135) | | | | | | | | |
| | | | |
| The notes to the financial statements are an integral part of this report. | | |
| Transamerica Funds | | | | Annual Report 2012 |
| | Page 107 | | |
Transamerica Small/Mid Cap Value
(formerly, Transamerica Systematic Small/Mid Cap Value)
SCHEDULE OF INVESTMENTS (continued)
At October 31, 2012
| | | | | | | | |
| | | Principal | | | Value | |
| | | (000’s) | | | (000’s) | |
REPURCHASE AGREEMENT—1.7% | | | | | | | | |
State Street Bank & Trust Co. 0.03% p , dated 10/31/2012, to be repurchased at $11,550 on 11/01/2012. Collateralized by a U.S. Government Agency Obligation, 3.00%, due 12/01/2026, and with a value of $11,782. | | $ | 11,550 | | | $ | 11,550 | |
| | | | | | | | |
Total Repurchase Agreement (cost $11,550) | | | | | | | | |
Total Investment Securities (cost $726,744) P | | | | | | | 769,782 | |
Other Assets and Liabilities—Net | | | | | | | (88,517 | ) |
| | | | | | | | |
Net Assets | | | | | | $ | 681,265 | |
| | | | | | | | |
NOTES TO SCHEDULE OF INVESTMENTS (all amounts in thousands):
| ^ | All or a portion of this security is on loan. The value of all securities on loan is $88,613. |
| ‡ | Non-income producing security. |
| p | Rate shown reflects the yield at 10/31/2012. |
| P | Aggregate cost for federal income tax purposes is $728,516. Aggregate gross unrealized appreciation/depreciation for all securities in which there is an excess of value over tax cost were $74,338 and $33,072, respectively. Net unrealized appreciation for tax purposes is $41,266. |
VALUATION SUMMARY (all amounts in thousands): '
| | | | | | | | | | | | | | | | |
| | | | | | Level 2 - | | | | | | | |
| | | | | | Other | | | Level 3 - | | | | |
| | | Level 1 - | | | Significant | | | Significant | | | | |
| | | Quoted | | | Observable | | | Unobservable | | | Value at | |
Investment Securities | | Prices | | | Inputs | | | Inputs | | | 10/31/2012 | |
Common Stocks | | $ | 667,097 | | | $ | — | | | $ | — | | | $ | 667,097 | |
Repurchase Agreement | | | — | | | | 11,550 | | | | — | | | | 11,550 | |
Securities Lending Collateral | | | 91,135 | | | | — | | | | — | | | | 91,135 | |
| | | | | | | | | | | | | | | | |
Total | | $ | 758,232 | | | $ | 11,550 | | | $ | — | | | $ | 769,782 | |
| | | | | | | | | | | | | | | | |
| ' | Transfers between levels are considered to have occurred at the end of the reporting period. There were no transfers into or out of Levels 1 and 2 during the period ended 10/31/2012. See the notes to the financial statements for more information regarding pricing inputs and valuation techniques. |
| | | | |
| The notes to the financial statements are an integral part of this report. | | |
| Transamerica Funds | | | | Annual Report 2012 |
| | Page 108 | | |
Transamerica Tactical Income
SCHEDULE OF INVESTMENTS
At October 31, 2012
| | | | | | | | |
| | | | | | Value | |
| | | Shares | | | (000’s) | |
INVESTMENT COMPANIES—98.3% | | | | | | | | |
Capital Markets—87.9% | | | | | | | | |
Guggenheim BulletShares 2015 High Yield Corporate Bond ETF | | | 525,093 | | | $ | 13,946 | |
iShares Barclays 20+ Year Treasury Bond Fund | | | 200,363 | | | | 24,717 | |
iShares iBoxx $ High Yield Corporate Bond Fund | | | 965,513 | | | | 89,436 | |
iShares iBoxx Investment Grade Corporate Bond Fund | | | 171,869 | | | | 21,143 | |
iShares JPMorgan USD Emerging Markets Bond Fund | | | 259,024 | | | | 31,500 | |
iShares S&P U.S. Preferred Stock Index Fund | | | 2,228,398 | | | | 89,248 | |
ProShares UltraShort 20+ Year Treasury | | | 87,079 | | | | 5,444 | |
ProShares VIX Mid-Term Futures ETF | | | 391,937 | | | | 15,184 | |
SPDR Barclays High Yield Bond ETF | | | 4,170,162 | | | | 168,184 | |
SPDR Barclays Long Term Corporate Bond ETF | | | 426,108 | | | | 18,135 | |
SPDR Barclays TIPS ETF | | | 517,013 | | | | 31,621 | |
SPDR Dow Jones International Real Estate ETF | | | 644,401 | | | | 26,253 | |
SPDR S&P International Dividend ETF | | | 847,111 | | | | 38,450 | |
SPDR Wells Fargo Preferred Stock ETF | | | 432,305 | | | | 19,838 | |
Vanguard Extended Duration Treasury ETF | | | 9,849 | | | | 1,226 | |
Vanguard Intermediate-Term Bond ETF | | | 369,338 | | | | 33,351 | |
Vanguard Long-Term Bond ETF | | | 445,168 | | | | 43,110 | |
Vanguard REIT ETF | | | 155,334 | | | | 10,000 | |
Growth—Large Cap—4.6% | | | | | | | | |
Vanguard Growth ETF | | | 508,687 | | | | 35,674 | |
Value—Large Cap—5.8% | | | | | | | | |
Vanguard Value ETF | | | 771,515 | | | | 45,126 | |
| | | | | | | | |
Total Investment Companies (cost $760,449) | | | | | | | 761,586 | |
| | | | | | | | |
| | | | | | | | |
| | | Principal | | | Value | |
| | | (000’s) | | | (000’s) | |
REPURCHASE AGREEMENT—0.6% | | | | | | | | |
State Street Bank & Trust Co. 0.03% p, dated 10/31/2012, to be repurchased at $4,419 on 11/01/2012. Collateralized by a U.S. Government Agency Obligation, 3.50%, due 11/25/2038, and with a value of $4,508. | | $ | 4,419 | | | $ | 4,419 | |
| | | | | | | | |
Total Repurchase Agreement (cost $4,419) | | | | | | | | |
Total Investment Securities (cost $764,868) P | | | | | | | 766,005 | |
Other Assets and Liabilities—Net | | | | | | | 8,825 | |
| | | | | | | | |
Net Assets | | | | | | $ | 774,830 | |
| | | | | | | | |
NOTES TO SCHEDULE OF INVESTMENTS (all amounts in thousands):
| p | Rate shown reflects the yield at 10/31/2012. |
| P | Aggregate cost for federal income tax purposes is $767,254. Aggregate gross unrealized appreciation/depreciation for all securities in which there is an excess of value over tax cost were $5,258 and $6,507, respectively. Net unrealized depreciation for tax purposes is $1,249. |
DEFINITION:
VALUATION SUMMARY (all amounts in thousands): '
| | | | | | | | | | | | | | | | |
| | | | | | Level 2 - | | | | | | | |
| | | | | | Other | | | Level 3 - | | | | |
| | | Level 1 - | | | Significant | | | Significant | | | | |
| | | Quoted | | | Observable | | | Unobservable | | | Value at | |
Investment Securities | | Prices | | | Inputs | | | Inputs | | | 10/31/2012 | |
Investment Companies | | $ | 761,586 | | | $ | — | | | $ | — | | | $ | 761,586 | |
Repurchase Agreement | | | — | | | | 4,419 | | | | — | | | | 4,419 | |
| | | | | | | | | | | | | | | | |
Total | | $ | 761,586 | | | $ | 4,419 | | | $ | — | | | $ | 766,005 | |
| | | | | | | | | | | | | | | | |
| ' | Transfers between levels are considered to have occurred at the end of the reporting period. There were no transfers into or out of Levels 1 and 2 during the period ended 10/31/2012. See the notes to the financial statements for more information regarding pricing inputs and valuation techniques. |
| | | | |
| The notes to the financial statements are an integral part of this report. | | |
| Transamerica Funds | | | | Annual Report 2012 |
| | Page 109 | | |
STATEMENTS OF ASSETS AND LIABILITIES
At October 31, 2012
(all amounts except per share amounts in thousands)
| | | | | | | | | | | | | | | | | | | | | | | | |
| | | | | | Transamerica | | | Transamerica | | | Transamerica | | | | | | Transamerica | |
| | | Transamerica | | | Diversified | | | Emerging | | | Emerging | | | Transamerica | | | Growth | |
| | | Capital Growth | | | Equity | | | Markets Debt | | | Markets Equity | | | Flexible Income | | | Opportunities | |
Assets: | | | | | | | | | | | | | | | | | | | | | | | | |
Investment securities, at value | | $ | 753,561 | | | $ | 1,455,079 | | | $ | 659,283 | | | $ | 105,828 | | | $ | 349,335 | | | $ | 670,888 | |
Repurchase agreement, at value | | | 29,546 | | | | 44,997 | | | | 35,317 | | | | 1,214 | | | | 3,738 | | | | 21,900 | |
Foreign currency, at value | | | 127 | | | | — | | | | 211 | | | | 1,064 | | | | — | | | | — | |
Receivables: | | | | | | | | | | | | | | | | | | | | | | | | |
Investment securities sold | | | — | | | | 162 | | | | 2,312 | | | | — | | | | 1,701 | | | | — | |
Shares of beneficial interest sold | | | 101 | | | | 134 | | | | 9,928 | | | | 1 | | | | 2,889 | | | | 75 | |
Interest | | | — | (A) | | | — | (A) | | | 8,177 | | | | — | (A) | | | 3,824 | | | | — | (A) |
Securities lending income (net) | | | 87 | | | | 114 | | | | 18 | | | | — | | | | 19 | | | | 142 | |
Dividends | | | 155 | | | | 1,177 | | | | — | | | | 117 | | | | 79 | | | | 118 | |
Dividend reclaims | | | 1 | | | | 510 | | | | — | (A) | | | 1 | | | | — | | | | 67 | |
12b-1 waiver | | | — | | | | — | | | | — | | | | — | | | | 3 | | | | — | |
Prepaid expenses | | | 3 | | | | 7 | | | | 1 | | | | — | | | | 1 | | | | 3 | |
Unrealized appreciation on forward foreign currency contracts | | | — | | | | — | | | | 593 | | | | — | | | | — | | | | — | |
| | | | | | | | | | | | | | | | | | | | | | | | |
| | $ | 783,581 | | | $ | 1,502,180 | | | $ | 715,840 | | | $ | 108,225 | | | $ | 361,589 | | | $ | 693,193 | |
| | | | | | | | | | | | | | | | | | | | | | | | |
Liabilities: | | | | | | | | | | | | | | | | | | | | | | | | |
Due to custodian | | | — | | | | — | | | | 2,312 | | | | — | | | | — | | | | — | |
Accounts payable and accrued liabilities: | | | | | | | | | | | | | | | | | | | | | | | | |
Investment securities purchased | | | — | | | | — | | | | 7,450 | | | | — | | | | 1,564 | | | | — | |
Shares of beneficial interest redeemed | | | 615 | | | | 1,940 | | | | 319 | | | | — | (A) | | | 572 | | | | 1,644 | |
Management and advisory fees | | | 552 | | | | 1,258 | | | | 324 | | | | 93 | | | | 134 | | | | 536 | |
Distribution and service fees | | | 42 | | | | 178 | | | | 22 | | | | — | | | | 97 | | | | 41 | |
Trustees fees | | | 2 | | | | 5 | | | | 2 | | | | – | (A) | | | 1 | | | | 2 | |
Transfer agent fees | | | 41 | | | | 215 | | | | 13 | | | | 1 | | | | 18 | | | | 56 | |
Administration fees | | | 18 | | | | 34 | | | | 14 | | | | 3 | | | | 7 | | | | 14 | |
Due to advisor | | | — | | | | — | | | | 34 | | | | — | | | | — | | | | — | |
Foreign capital gains tax | | | — | | | | — | | | | — | | | | 37 | | | | — | | | | — | |
Other | | | 74 | | | | 182 | | | | 88 | | | | 51 | | | | 55 | | | | 79 | |
Collateral for securities on loan | | | 65,332 | | | | 44,873 | | | | 81,954 | | | | — | | | | 33,571 | | | | 104,882 | |
Unrealized depreciation on forward foreign currency contracts | | | — | | | | — | | | | 192 | | | | — | | | | — | | | | — | |
| | | | | | | | | | | | | | | | | | | | | | | | |
| | | 66,676 | | | | 48,685 | | | | 92,724 | | | | 185 | | | | 36,019 | | | | 107,254 | |
| | | | | | | | | | | | | | | | | | | | | | | | |
Net assets | | $ | 716,905 | | | $ | 1,453,495 | | | $ | 623,116 | | | $ | 108,040 | | | $ | 325,570 | | | $ | 585,939 | |
| | | | | | | | | | | | | | | | | | | | | | | | |
Net assets consist of: | | | | | | | | | | | | | | | | | | | | | | | | |
Shares of beneficial interest, unlimited shares authorized,no par value | | $ | 672,855 | | | $ | 1,618,520 | | | $ | 591,024 | | | $ | 110,593 | | | $ | 382,844 | | | $ | 574,218 | |
Undistributed net investment income | | | 3,752 | | | | 6,531 | | | | 3,948 | | | | 710 | | | | 814 | | | | 3,377 | |
Undistributed (accumulated) net realized gain (loss) from investments | | | 21,167 | | | | (404,613 | ) | | | 14,246 | | | | (5,233 | ) | | | (79,771 | ) | | | 4,949 | |
Net unrealized appreciation (depreciation) on: | | | | | | | | | | | | | | | | | | | | | �� | | | |
Investment securities | | | 19,131 | | | | 232,931 | | | | 13,502 | | | | 2,000 | | | | 21,683 | | | | 3,396 | |
Translation of assets and liabilities denominated in foreign currencies | | | — | (A) | | | 126 | | | | 396 | | | | (30 | ) | | | — | (A) | | | (1 | ) |
| | | | | | | | | | | | | | | | | | | | | | | | |
Net assets | | $ | 716,905 | | | $ | 1,453,495 | | | $ | 623,116 | | | $ | 108,040 | | | $ | 325,570 | | | $ | 585,939 | |
| | | | | | | | | | | | | | | | | | | | | | | | |
Net assets by class: | | | | | | | | | | | | | | | | | | | | | | | | |
Class A | | $ | 65,782 | | | $ | 420,504 | | | $ | 60,754 | | | $ | 302 | | | $ | 77,291 | | | $ | 91,110 | |
Class B | | | 5,596 | | | | 20,668 | | | | | | | | | | | | 6,641 | | | | 5,582 | |
Class C | | | 19,809 | | | | 42,637 | | | | 10,543 | | | | 253 | | | | 81,874 | | | | 10,943 | |
Class I | | | 80,083 | | | | 310,170 | | | | 46,190 | | | | 302 | | | | 31,480 | | | | 80,359 | |
Class I2 | | | 545,635 | | | | 577,540 | | | | 505,629 | | | | 107,183 | | | | 128,284 | | | | 397,945 | |
Class T | | | | | | | 81,976 | | | | | | | | | | | | | | | | | |
Shares outstanding: | | | | | | | | | | | | | | | | | | | | | | | | |
Class A | | | 4,290 | | | | 31,356 | | | | 5,264 | | | | 32 | | | | 8,251 | | | | 11,173 | |
Class B | | | 401 | | | | 1,560 | | | | | | | | | | | | 709 | | | | 774 | |
Class C | | | 1,419 | | | | 3,224 | | | | 916 | | | | 27 | | | | 8,794 | | | | 1,509 | |
Class I | | | 5,132 | | | | 22,813 | | | | 3,995 | | | | 32 | | | | 3,357 | | | | 9,331 | |
Class I2 | | | 50,536 | | | | 42,511 | | | | 43,729 | | | | 11,358 | | | | 13,669 | | | | 45,855 | |
Class T | | | | | | | 2,858 | | | | | | | | | | | | | | | | | |
Net asset value per share: | | | | | | | | | | | | | | | | | | | | | | | | |
Class A | | $ | 15.34 | | | $ | 13.41 | | | $ | 11.54 | | | $ | 9.42 | | | $ | 9.37 | | | $ | 8.15 | |
Class B | | | 13.96 | | | | 13.25 | | | | | | | | | | | | 9.37 | | | | 7.21 | |
Class C | | | 13.96 | | | | 13.22 | | | | 11.51 | | | | 9.39 | | | | 9.31 | | | | 7.25 | |
Class I | | | 15.61 | | | | 13.60 | | | | 11.56 | | | | 9.43 | | | | 9.38 | | | | 8.61 | |
Class I2 | | | 10.80 | | | | 13.59 | | | | 11.56 | | | | 9.44 | | | | 9.38 | | | | 8.68 | |
Class T | | | | | | | 28.69 | | | | | | | | | | | | | | | | | |
Maximum offering price per share (B) | | | | | | | | | | | | | | | | | | | | | | | | |
Class A | | $ | 16.23 | | | $ | 14.19 | | | $ | 12.12 | | | $ | 9.97 | | | $ | 9.84 | | | $ | 8.62 | |
Class T | | | | | | | 31.36 | | | | | | | | | | | | | | | | | |
| | | | | | | | | | | | | | | | | | | | | | | | |
Investment securities, at cost | | $ | 734,430 | | | $ | 1,222,148 | | | $ | 645,781 | | | $ | 103,828 | | | $ | 327,652 | | | $ | 667,492 | |
| | | | | | | | | | | | | | | | | | | | | | | | |
Repurchase agreement, at cost | | $ | 29,546 | | | $ | 44,997 | | | $ | 35,317 | | | $ | 1,214 | | | $ | 3,738 | | | $ | 21,900 | |
| | | | | | | | | | | | | | | | | | | | | | | | |
Foreign currency, at cost | | $ | 127 | | | $ | — | | | $ | 211 | | | $ | 1,058 | | | $ | — | | | $ | — | |
| | | | | | | | | | | | | | | | | | | | | | | | |
Securities loaned, at value | | $ | 63,628 | | | $ | 43,874 | | | $ | 79,307 | | | $ | — | | | $ | 32,872 | | | $ | 102,308 | |
| | | | | | | | | | | | | | | | | | | | | | | | |
| | | | |
| The notes to the financial statements are an integral part of this report. | | |
| Transamerica Funds | | | | Annual Report 2012 |
| | Page 110 | | |
STATEMENTS OF ASSETS AND LIABILITIES (continued)
At October 31, 2012
(all amounts except per share amounts in thousands)
| | | | | | | | | | | | | | | | | | | | | | | | |
| | | | | | Transamerica | | | Transamerica | | | Transamerica | | | | | | | |
| | | Transamerica | | | International | | | International | | | Large Cap | | | Transamerica | | | Transamerica | |
| | | High Yield Bond | | | Bond | | | Equity | | | Growth | | | Large Cap Value | | | Money Market | |
Assets: | | | | | | | | | | | | | | | | | | | | | | | | |
Investment securities, at value | | $ | 768,374 | | | $ | 188,636 | | | $ | 274,754 | | | $ | 136,579 | | | $ | 1,325,922 | | | $ | 382,454 | |
Repurchase agreements, at value | | | 34,635 | | | | 3,685 | | | | 4,724 | | | | 243 | | | | 50,441 | | | | 432,217 | |
Cash on deposit with broker | | | — | | | | 1,098 | | | | — | | | | — | | | | — | | | | — | |
Foreign currency, at value | | | — | | | | 1,972 | | | | — | | | | — | | | | — | | | | — | |
Receivables: | | | | | | | | | | | | | | | | | | | | | | | | |
Investment securities sold | | | 80 | | | | — | | | | 629 | | | | — | | | | — | | | | — | |
Shares of beneficial interest sold | | | 1,282 | | | | 27 | | | | 984 | | | | — | | | | 2,664 | | | | 729 | |
Interest | | | 12,274 | | | | 2,204 | | | | — | (A) | | | — | (A) | | | — | (A) | | | 67 | |
Securities lending income (net) | | | 40 | | | | — | (A) | | | 10 | | | | — | | | | 12 | | | | — | |
Dividends | | | 159 | | | | — | | | | 619 | | | | 136 | | | | 817 | | | | — | |
Dividend reclaims | | | — | | | | — | | | | 112 | | | | 2 | | | | 56 | | | | — | |
12b-1 waiver | | | — | | | | — | | | | — | | | | — | | | | — | | | | 62 | |
Other | | | — | | | | 29 | | | | — | | | | — | | | | — | | | | — | |
Prepaid expenses | | | 3 | | | | 1 | | | | 1 | | | | — | | | | 8 | | | | 1 | |
Unrealized appreciation on forward foreign currency contracts | | | — | | | | 237 | | | | — | | | | — | | | | — | | | | — | |
| | | | | | | | | | | | | | | | | | | | | | | | |
| | $ | 816,847 | | | $ | 197,889 | | | $ | 281,833 | | | $ | 136,960 | | | $ | 1,379,920 | | | $ | 815,530 | |
| | | | | | | | | | | | | | | | | | | | | | | | |
Liabilities: | | | | | | | | | | | | | | | | | | | | | | | | |
Accounts payable and accrued liabilities: | | | | | | | | | | | | | | | | | | | | | | | | |
Investment securities purchased | | | 5,737 | | | | — | | | | 714 | | | | — | | | | — | | | | — | |
Shares of beneficial interest redeemed | | | 9,590 | | | | 72 | | | | 80 | | | | 39 | | | | 781 | | | | 796 | |
Management and advisory fees | | | 365 | | | | 114 | | | | 186 | | | | 85 | | | | 764 | | | | 57 | |
Distribution and service fees | | | 147 | | | | — | | | | 5 | | | | — | | | | 2 | | | | 151 | |
Trustees fees | | | 2 | | | | 1 | | | | 1 | | | | 1 | | | | 5 | | | | 2 | |
Transfer agent fees | | | 36 | | | | 1 | | | | 10 | | | | 1 | | | | 10 | | | | 48 | |
Administration fees | | | 16 | | | | 4 | | | | 6 | | | | 3 | | | | 30 | | | | 10 | |
Due to advisor | | | 32 | | | | — | | | | — | | | | — | | | | — | | | | — | |
Distribution payable | | | — | | | | — | | | | — | | | | — | | | | — | | | | 1 | |
Variation margin | | | — | | | | 40 | | | | — | | | | — | | | | — | | | | — | |
Other | | | 87 | | | | 45 | | | | 52 | | | | 41 | | | | 100 | | | | 59 | |
Collateral for securities on loan | | | 104,412 | | | | 2,223 | | | | 16,797 | | | | — | | | | 51,002 | | | | — | |
Unrealized depreciation on forward foreign currency contracts | | | — | | | | 1,609 | | | | — | | | | — | | | | — | | | | — | |
| | | | | | | | | | | | | | | | | | | | | | | | |
| | | 120,424 | | | | 4,109 | | | | 17,851 | | | | 170 | | | | 52,694 | | | | 1,124 | |
| | | | | | | | | | | | | | | | | | | | | | | | |
Net assets | | $ | 696,423 | | | $ | 193,780 | | | $ | 263,982 | | | $ | 136,790 | | | $ | 1,327,226 | | | $ | 814,406 | |
| | | | | | | | | | | | | | | | | | | | | | | | |
Net assets consist of: | | | | | | | | | | | | | | | | | | | | | | | | |
Shares of beneficial interest, unlimited shares authorized, no par value | | $ | 676,649 | | | $ | 192,576 | | | $ | 250,591 | | | $ | 138,549 | | | $ | 1,174,599 | | | $ | 814,406 | |
Undistributed (accumulated) net investment income (loss) | | | 1,012 | | | | (4,057 | ) | | | 3,926 | | | | 750 | | | | 1,451 | | | | — | (A) |
Undistributed (accumulated) net realized gain (loss) from investments | | | (1,851 | ) | | | 1,509 | | | | (1,809 | ) | | | (1,547 | ) | | | 72,606 | | | | — | |
Net unrealized appreciation (depreciation) on: | | | | | | | | | | | | | | | | | | | | | | | | |
Investment securities | | | 20,613 | | | | 5,029 | | | | 11,289 | | | | (962 | ) | | | 78,570 | | | | — | |
Futures contracts | | | — | | | | 69 | | | | — | | | | — | | | | — | | | | — | |
Translation of assets and liabilities denominated in foreign currencies | | | — | | | | (1,346 | ) | | | (15 | ) | | | — | | | | — | | | | — | |
| | | | | | | | | | | | | | | | | | | | | | | | |
Net assets | | $ | 696,423 | | | $ | 193,780 | | | $ | 263,982 | | | $ | 136,790 | | | $ | 1,327,226 | | | $ | 814,406 | |
| | | | | | | | | | | | | | | | | | | | | | | | |
Net assets by class: | | | | | | | | | | | | | | | | | | | | | | | | |
Class A | | $ | 256,099 | | | $ | 165 | | | $ | 2,999 | | | $ | 419 | | | $ | 1,949 | | | $ | 95,801 | |
Class B | | | 9,236 | | | | | | | | | | | | | | | | | | | | 9,289 | |
Class C | | | 76,995 | | | | 199 | | | | 4,886 | | | | 280 | | | | 1,716 | | | | 31,391 | |
Class I | | | 103,181 | | | | 103 | | | | 90,012 | | | | 786 | | | | 3,550 | | | | 25,460 | |
Class I2 | | | 250,912 | | | | 193,313 | | | | 166,085 | | | | 135,305 | | | | 1,320,011 | | | | 652,465 | |
Shares outstanding: | | | | | | | | | | | | | | | | | | | | | | | | |
Class A | | | 26,692 | | | | 16 | | | | 206 | | | | 43 | | | | 165 | | | | 95,800 | |
Class B | | | 962 | | | | | | | | | | | | | | | | | | | | 9,289 | |
Class C | | | 8,054 | | | | 19 | | | | 338 | | | | 29 | | | | 146 | | | | 31,387 | |
Class I | | | 10,686 | | | | 10 | | | | 6,146 | | | | 80 | | | | 301 | | | | 25,460 | |
Class I2 | | | 25,939 | | | | 18,360 | | | | 11,337 | | | | 13,700 | | | | 111,827 | | | | 652,465 | |
Net asset value per share: | | | | | | | | | | | | | | | | | | | | | | | | |
Class A | | $ | 9.59 | | | $ | 10.51 | | | $ | 14.57 | | | $ | 9.86 | | | $ | 11.77 | | | $ | 1.00 | |
Class B | | | 9.60 | | | | | | | | | | | | | | | | | | | | 1.00 | |
Class C | | | 9.56 | | | | 10.47 | | | | 14.45 | | | | 9.82 | | | | 11.76 | | | | 1.00 | |
Class I | | | 9.66 | | | | 10.53 | | | | 14.65 | | | | 9.87 | | | | 11.81 | | | | 1.00 | |
Class I2 | | | 9.67 | | | | 10.53 | | | | 14.65 | | | | 9.88 | | | | 11.80 | | | | 1.00 | |
Maximum offering price per share (B) | | | | | | | | | | | | | | | | | | | | | | | | |
Class A | | $ | 10.07 | | | $ | 11.03 | | | $ | 15.42 | | | $ | 10.43 | | | $ | 12.46 | | | $ | 1.00 | |
| | | | | | | | | | | | | | | | | | | | | | | | |
Investment securities, at cost | | $ | 747,761 | | | $ | 183,607 | | | $ | 263,465 | | | $ | 137,541 | | | $ | 1,247,352 | | | $ | 382,454 | |
| | | | | | | | | | | | | | | | | | | | | | | | |
Repurchase agreement, at cost | | $ | 34,635 | | | $ | 3,685 | | | $ | 4,724 | | | $ | 243 | | | $ | 50,441 | | | $ | 432,217 | |
| | | | | | | | | | | | | | | | | | | | | | | | |
Foreign currency, at cost | | $ | — | | | $ | 1,976 | | | $ | — | | | $ | — | | | $ | — | | | $ | — | |
| | | | | | | | | | | | | | | | | | | | | | | | |
Securities loaned, at value | | $ | 102,073 | | | $ | 2,180 | | | $ | 15,990 | | | $ | — | | | $ | 49,903 | | | $ | — | |
| | | | | | | | | | | | | | | | | | | | | | | | |
| | | | |
| The notes to the financial statements are an integral part of this report. | | |
| Transamerica Funds | | | | Annual Report 2012 |
| | Page 111 | | |
STATEMENTS OF ASSETS AND LIABILITIES (continued)
At October 31, 2012
(all amounts except per share amounts in thousands)
| | | | | | | | | | | | | | | | | | | | | | | | |
| | | Transamerica | | | Transamerica | | | Transamerica | | | | | | Transamerica | | | | |
| | | Multi-Managed | | | Short-Term | | | Small Cap | | | Transamerica | | | Small/Mid Cap | | | Transamerica | |
| | | Balanced | | | Bond | | | Growth | | | Small Cap Value | | | Value | | | Tactical Income | |
Assets: | | | | | | | | | | | | | | | | | | | | | | | | |
Investment securities, at value | | $ | 412,301 | | | $ | 3,615,959 | | | $ | 220,482 | | | $ | 278,741 | | | $ | 758,232 | | | $ | 761,586 | |
Repurchase agreement, at value | | | 4,519 | | | | 114,637 | | | | 70,616 | | | | 9,604 | | | | 11,550 | | | | 4,419 | |
Cash | | | — | | | | 416 | | | | — | | | | — | | | | — | | | | — | |
Receivables: | | | | | | | | | | | | | | | | | | | | | | | | |
Investment securities sold | | | 44,323 | | | | 1,852 | | | | 332 | | | | — | | | | — | | | | 15,468 | |
Shares of beneficial interest sold | | | 922 | | | | 12,041 | | | | 5 | | | | 1,325 | | | | 5,264 | | | | 15,399 | |
Interest | | | 968 | | | | 33,272 | | | | — | (A) | | | — | (A) | | | — | (A) | | | — | (A) |
Securities lending income (net) | | | 4 | | | | 48 | | | | — | | | | — | | | | 18 | | | | — | |
Dividends | | | 223 | | | | — | | | | 37 | | | | 295 | | | | 426 | | | | — | |
Dividend reclaims | | | 1 | | | | — | | | | — | | | | — | | | | — | | | | — | |
12b-1 waiver | | | — | | | | 35 | | | | — | | | | — | | | | — | | | | 11 | |
Variation margin | | | 16 | | | | — | | | | — | | | | — | | | | — | | | | — | |
Other | | | — | | | | — | (A) | | | — | | | | — | | | | — | | | | — | |
Prepaid expenses | | | 1 | | | | 9 | | | | — | | | | — | | | | 2 | | | | — | (A) |
Unrealized appreciation on forward foreign currency contracts | | | 66 | | | | — | | | | — | | | | — | | | | — | | | | — | |
| | | | | | | | | | | | | | | | | | | | | | | | |
| | $ | 463,344 | | | $ | 3,778,269 | | | $ | 291,472 | | | $ | 289,965 | | | $ | 775,492 | | | $ | 796,883 | |
| | | | | | | | | | | | | | | | | | | | | | | | |
Liabilities: | | | | | | | | | | | | | | | | | | | | | | | | |
Accounts payable and accrued liabilities: | | | | | | | | | | | | | | | | | | | | | | | | |
Investment securities purchased | | | 49,237 | | | | 76,729 | | | | 51,200 | | | | — | | | | — | | | | 19,583 | |
Shares of beneficial interest redeemed | | | 841 | | | | 7,102 | | | | — | (A) | | | 123 | | | | 2,096 | | | | 1,724 | |
Management and advisory fees | | | 254 | | | | 1,422 | | | | 126 | | | | 222 | | | | 487 | | | | 281 | |
Distribution and service fees | | | 98 | | | | 982 | | | | — | | | | — | | | | 299 | | | | 298 | |
Trustees fees | | | 1 | | | | 11 | | | | 1 | | | | 1 | | | | 2 | | | | 2 | |
Transfer agent fees | | | 55 | | | | 123 | | | | 1 | | | | 2 | | | | 103 | | | | 43 | |
Administration fees | | | 8 | | | | 77 | | | | 4 | | | | 7 | | | | 15 | | | | 16 | |
Due to advisor | | | 92 | | | | — | | | | — | | | | — | | | | — | | | | — | |
Interest from TBA short commitments | | | 29 | | | | — | | | | — | | | | — | | | | — | | | | — | |
Distribution payable | | | — | | | | 1,273 | | | | — | | | | — | | | | — | | | | — | |
Other | | | 70 | | | | 281 | | | | 40 | | | | 56 | | | | 90 | | | | 106 | |
Collateral for securities on loan | | | 20,734 | | | | 149,241 | | | | — | | | | — | | | | 91,135 | | | | — | |
TBA short commitments, at value | | | 18,008 | | | | — | | | | — | | | | — | | | | — | | | | — | |
| | | | | | | | | | | | | | | | | | | | | | | | |
| | | 89,427 | | | | 237,241 | | | | 51,372 | | | | 411 | | | | 94,227 | | | | 22,053 | |
| | | | | | | | | | | | | | | | | | | | | | | | |
Net assets | | $ | 373,917 | | | $ | 3,541,028 | | | $ | 240,100 | | | $ | 289,554 | | | $ | 681,265 | | | $ | 774,830 | |
| | | | | | | | | | | | | | | | | | | | | | | | |
Net assets consist of: | | | | | | | | | | | | | | | | | | | | | | | | |
Shares of beneficial interest, unlimited shares authorized, no par value | | $ | 333,432 | | | $ | 3,453,093 | | | $ | 251,397 | | | $ | 286,005 | | | $ | 649,826 | | | $ | 769,529 | |
Undistributed (accumulated) net investment income (loss) | | | 290 | | | | (1,273 | ) | | | (183 | ) | | | 1,657 | | | | 2,352 | | | | (31 | ) |
Undistributed (accumulated) net realized gain (loss) from investments | | | 6,892 | | | | 17,030 | | | | (2,235 | ) | | | (945 | ) | | | (13,951 | ) | | | 4,195 | |
Net unrealized appreciation (depreciation) on: | | | | | | | | | | | | | | | | | | | | | | | | |
Investment securities | | | 33,320 | | | | 72,178 | | | | (8,879 | ) | | | 2,837 | | | | 43,038 | | | | 1,137 | |
Futures contracts | | | (111 | ) | | | — | | | | — | | | | — | | | | — | | | | — �� | |
Translation of assets and liabilities denominated in foreign currencies | | | 66 | | | | — | (A) | | | — | | | | — | | | | — | | | | — | |
TBA short commitments | | | 28 | | | | — | | | | — | | | | — | | | | — | | | | — | |
| | | | | | | | | | | | | | | | | | | | | | | | |
Net assets | | $ | 373,917 | | | $ | 3,541,028 | | | $ | 240,100 | | | $ | 289,554 | | | $ | 681,265 | | | $ | 774,830 | |
| | | | | | | | | | | | | | | | | | | | | | | | |
Net assets by class: | | | | | | | | | | | | | | | | | | | | | | | | |
Class A | | $ | 125,266 | | | $ | 793,493 | | | $ | 236 | | | $ | 268 | | | $ | 332,085 | | | $ | 254,763 | |
Class B | | | 9,074 | | | | | | | | | | | | | | | | 29,615 | | | | | |
Class C | | | 62,789 | | | | 857,435 | | | | 234 | | | | 251 | | | | 198,356 | | | | 279,728 | |
Class I | | | 176,788 | | | | 368,296 | | | | 235 | | | | 371 | | | | 105,664 | | | | 240,339 | |
Class I2 | | | | | | | 1,521,804 | | | | 239,395 | | | | 288,664 | | | | 15,545 | | | | | |
Shares outstanding: | | | | | | | | | | | | | | | | | | | | | | | | |
Class A | | | 5,656 | | | | 75,496 | | | | 25 | | | | 27 | | | | 15,190 | | | | 24,844 | |
Class B | | | 412 | | | | | | | | | | | | | | | | 1,441 | | | | | |
Class C | | | 2,874 | | | | 81,735 | | | | 25 | | | | 26 | | | | 9,757 | | | | 27,367 | |
Class I | | | 7,955 | | | | 35,653 | | | | 25 | | | | 38 | | | | 4,720 | | | | 23,430 | |
Class I2 | | | | | | | 147,412 | | | | 25,500 | | | | 29,332 | | | | 694 | | | | | |
Net asset value per share: | | | | | | | | | | | | | | | | | | | | | | | | |
Class A | | $ | 22.15 | | | $ | 10.51 | | | $ | 9.38 | | | $ | 9.83 | | | $ | 21.86 | | | $ | 10.25 | |
Class B | | | 22.01 | | | | | | | | | | | | | | | | 20.55 | | | | | |
Class C | | | 21.85 | | | | 10.49 | | | | 9.37 | | | | 9.79 | | | | 20.33 | | | | 10.22 | |
Class I | | | 22.22 | | | | 10.33 | | | | 9.39 | | | | 9.84 | | | | 22.38 | | | | 10.26 | |
Class I2 | | | | | | | 10.32 | | | | 9.39 | | | | 9.84 | | | | 22.41 | | | | | |
Maximum offering price per share (B) | | | | | | | | | | | | | | | | | | | | | | | | |
Class A | | $ | 23.44 | | | $ | 10.78 | | | $ | 9.93 | | | $ | 10.40 | | | $ | 23.13 | | | $ | 10.76 | |
| | | | | | | | | | | | | | | | | | | | | | | | |
Investment securities, at cost | | $ | 378,981 | | | $ | 3,543,781 | | | $ | 229,361 | | | $ | 275,904 | | | $ | 715,194 | | | $ | 760,449 | |
| | | | | | | | | | | | | | | | | | | | | | | | |
Repurchase agreement, at cost | | $ | 4,519 | | | $ | 114,637 | | | $ | 70,616 | | | $ | 9,604 | | | $ | 11,550 | | | $ | 4,419 | |
| | | | | | | | | | | | | | | | | | | | | | | | |
Securities loaned, at value | | $ | 20,292 | | | $ | 146,148 | | | $ | — | | | $ | — | | | $ | 88,613 | | | $ | — | |
| | | | | | | | | | | | | | | | | | | | | | | | |
Proceeds received from TBA short commitments | | $ | 18,036 | | | $ | — | | | $ | — | | | $ | — | | | $ | — | | | $ | — | |
| | | | | | | | | | | | | | | | | | | | | | | | |
| (A) | Rounds to less than $1. |
| (B) | Includes the maximum selling commission (represented as a percentage of offering price) which is reduced on certain levels of sales as set forth in the Prospectus. Net asset value per share for Classes B, C, I and I2 shares represents offering price. The redemption price for Classes B and C shares equals net asset value less any applicable contingent deferred sales charge. |
| | | | |
| The notes to the financial statements are an integral part of this report. | | |
| Transamerica Funds | | | | Annual Report 2012 |
| | Page 112 | | |
STATEMENTS OF OPERATIONS
For the year ended October 31, 2012
(all amounts in thousands)
| | | | | | | | | | | | | | | | | | | | |
| | | | | | | | | Transamerica | | | Transamerica | | | | |
| | | | | | Transamerica | | | Emerging | | | Emerging | | | | |
| | | Transamerica
Capital Growth | | | Diversified
Equity | | | Markets
Debt | | | Markets
Equity (B) | | | Transamerica
Flexible Income | |
Investment income: | | | | | | | | | | | | | | | | | | | | |
Dividend income | | $ | 8,249 | | | $ | 17,805 | | | $ | — | | | $ | 1,415 | | | $ | 581 | |
Withholding taxes on foreign income | | | (194 | ) | | | (16 | ) | | | (65 | ) | | | (158 | ) | | | (4 | ) |
Interest income | | | 3 | | | | 2 | | | | 13,753 | | | | 1 | | | | 15,632 | |
Securities lending income (net) | | | 2,757 | | | | 2,060 | | | | 81 | | | | — | | | | 188 | |
| | | | | | | | | | | | | | | | | | | | |
Total investment income | | | 10,815 | | | | 19,851 | | | | 13,769 | | | | 1,258 | | | | 16,397 | |
| | | | | | | | | | | | | | | | | | | | |
Expenses: | | | | | | | | | | | | | | | | | | | | |
Management and advisory | | | 5,465 | | | | 9,156 | | | | 1,250 | | | | 335 | | | | 1,308 | |
Distribution and service: | | | | | | | | | | | | | | | | | | | | |
Class A | | | 210 | | | | 1,063 | | | | 71 | | | | — | (A) | | | 222 | |
Class B | | | 66 | | | | 184 | | | | | | | | | | | | 66 | |
Class C | | | 183 | | | | 366 | | | | 52 | | | | 1 | | | | 613 | |
Class P | | | 43 | | | | 116 | | | | | | | | | | | | | |
Transfer agent: | | | | | | | | | | | | | | | | | | | | |
Class A | | | 213 | | | | 1,070 | | | | 36 | | | | — | (A) | | | 96 | |
Class B | | | 33 | | | | 78 | | | | | | | | | | | | 15 | |
Class C | | | 42 | | | | 142 | | | | 6 | | | | — | (A) | | | 53 | |
Class I | | | 64 | | | | 318 | | | | 12 | | | | — | (A) | | | 27 | |
Class I2 | | | 41 | | | | 40 | | | | 13 | | | | 3 | | | | 9 | |
Class P | | | 37 | | | | 178 | | | | | | | | | | | | | |
Class T | | | | | | | 84 | | | | | | | | | | | | | |
Printing and shareholder reports | | | 82 | | | | 144 | | | | 29 | | | | 16 | | | | 35 | |
Custody | | | 138 | | | | 190 | | | | 101 | | | | 88 | | | | 64 | |
Administration | | | 168 | | | | 310 | | | | 50 | | | | 9 | | | | 65 | |
Legal | | | 28 | | | | 45 | | | | 15 | | | | 3 | | | | 10 | |
Audit and tax | | | 17 | | | | 21 | | | | 16 | | | | 17 | | | | 20 | |
Trustees | | | 14 | | | | 25 | | | | 5 | | | | 1 | | | | 6 | |
Registration | | | 49 | | | | 34 | | | | 65 | | | | 51 | | | | 48 | |
Other | | | 12 | | | | 25 | | | | 3 | | | | 3 | | | | 6 | |
| | | | | | | | | | | | | | | | | | | | |
Total expenses | | | 6,905 | | | | 13,589 | | | | 1,724 | | | | 527 | | | | 2,663 | |
| | | | | | | | | | | | | | | | | | | | |
Fund expenses recaptured or (reimbursed)/(waived) | | | — | | | | — | | | | 35 | | | | — | | | | — | |
Class expense recaptured or (reimbursed)/(waived): | | | | | | | | | | | | | | | | | | | | |
Class A | | | 31 | | | | 275 | | | | — | (A) | | | — | | | | (46 | ) |
Class B | | | (9 | ) | | | (4 | ) | | | | | | | | | | | — | |
Class C | | | 4 | | | | 5 | | | | — | (A) | | | — | | | | — | |
Class I | | | — | | | | 1 | | | | — | (A) | | | — | (A) | | | — | |
Class I2 | | | — | | | | — | | | | 1 | | | | — | | | | — | |
Class P | | | 20 | | | | (132 | ) | | | | | | | | | | | | |
| | | | | | | | | | | | | | | | | | | | |
Total expense recaptured (reimbursed)/(waived) | | | 46 | | | | 145 | | | | 36 | | | | — | | | | (46 | ) |
| | | | | | | | | | | | | | | | | | | | |
Net expenses | | | 6,951 | | | | 13,734 | | | | 1,760 | | | | 527 | | | | 2,617 | |
| | | | | | | | | | | | | | | | | | | | |
Net investment income | | | 3,864 | | | | 6,117 | | | | 12,009 | | | | 731 | | | | 13,780 | |
| | | | | | | | | | | | | | | | | | | | |
Net realized gain (loss) on transactions from: | | | | | | | | | | | | | | | | | | | | |
Investment securities | | | 21,125 | | | | 43,579 | | | | 14,044 | | | | (5,251 | )(C) | | | 2,021 | |
Foreign currency transactions | | | (25 | ) | | | 2 | | | | 623 | | | | (29 | ) | | | (43 | ) |
| | | | | | | | | | | | | | | | | | | | |
Net realized gain (loss) | | | 21,100 | | | | 43,581 | | | | 14,667 | | | | (5,280 | ) | | | 1,978 | |
| | | | | | | | | | | | | | | | | | | | |
Net change in unrealized appreciation (depreciation) on: | | | | | | | | | | | | | | | | | | | | |
Investment securities | | | (5,495 | ) | | | (8,449 | ) | | | 14,132 | | | | 2,000 | | | | 14,820 | |
Translation of assets and liabilities denominated in foreign currencies | | | (29 | ) | | | 111 | | | | 389 | | | | (30 | ) | | | 10 | |
| | | | | | | | | | | | | | | | | | | | |
Net change in unrealized appreciation (depreciation) | | | (5,524 | ) | | | (8,338 | ) | | | 14,521 | | | | 1,970 | | | | 14,830 | |
| | | | | | | | | | | | | | | | | | | | |
Net realized and change in unrealized gain (loss): | | | 15,576 | | | | 35,243 | | | | 29,188 | | | | (3,310 | ) | | | 16,808 | |
| | | | | | | | | | | | | | | | | | | | |
Net increase (decrease) in net assets resulting from operations | | $ | 19,440 | | | $ | 41,360 | | | $ | 41,197 | | | $ | (2,579 | ) | | $ | 30,588 | |
| | | | | | | | | | | | | | | | | | | | |
| | | | |
| The notes to the financial statements are an integral part of this report. | | |
| Transamerica Funds | | | | Annual Report 2012 |
| | Page 113 | | |
STATEMENTS OF OPERATIONS (continued)
For the year ended October 31, 2012
(all amounts in thousands)
| | | | | | | | | | | | | | | | | | | | |
| | | Transamerica
Growth
Opportunities | | | Transamerica
High
Yield Bond | | | Transamerica
International
Bond | | | Transamerica
International
Equity | | | Transamerica
Large
Cap Growth(B) | |
Investment income: | | | | | | | | | | | | | | | | | | | | |
Dividend income | | $ | 6,998 | | | $ | 1,188 | | | $ | — | | | $ | 6,468 | | | $ | 1,323 | |
Withholding taxes on foreign income | | | (143 | ) | | | — | | | | (22 | ) | | | (518 | ) | | | (2 | ) |
Interest income | | | 5 | | | | 50,024 | | | | 6,521 | | | | 1 | | | | — | |
Securities lending income (net) | | | 2,976 | | | | 676 | | | | — | (A) | | | 194 | | | | — | |
| | | | | | | | | | | | | | | | | | | | |
Total investment income | | | 9,836 | | | | 51,888 | | | | 6,499 | | | | 6,145 | | | | 1,321 | |
| | | | | | | | | | | | | | | | | | | | |
Expenses: | | | | | | | | | | | | | | | | | | | | |
Management and advisory | | | 4,142 | | | | 4,027 | | | | 1,407 | | | | 1,402 | | | | 458 | |
Distribution and service: | | | | | | | | | | | | | | | | | | | | |
Class A | | | 312 | | | | 725 | | | | — | (A) | | | 3 | | | | 1 | |
Class B | | | 71 | | | | 91 | | | | | | | | | | | | | |
Class C | | | 128 | | | | 621 | | | | 1 | | | | 12 | | | | 1 | |
Class P | | | 64 | | | | 12 | | | | | | | | | | | | | |
Transfer agent: | | | | | | | | | | | | | | | | | | | | |
Class A | | | 373 | | | | 187 | | | | — | (A) | | | 2 | | | | — | (A) |
Class B | | | 33 | | | | 16 | | | | | | | | | | | | | |
Class C | | | 56 | | | | 64 | | | | — | (A) | | | 1 | | | | — | (A) |
Class I | | | 109 | | | | 83 | | | | — | (A) | | | 84 | | | | — | (A) |
Class I2 | | | 24 | | | | 23 | | | | 20 | | | | 7 | | | | 5 | |
Class P | | | 73 | | | | 6 | | | | | | | | | | | | | |
Printing and shareholder reports | | | 60 | | | | 101 | | | | 16 | | | | 16 | | | | 26 | |
Custody | | | 139 | | | | 104 | | | | 211 | | | | 122 | | | | 10 | |
Administration | | | 129 | | | | 161 | | | | 60 | | | | 42 | | | | 17 | |
Legal | | | 19 | | | | 24 | | | | 4 | | | | 8 | | | | 4 | |
Audit and tax | | | 19 | | | | 20 | | | | 18 | | | | 18 | | | | 17 | |
Trustees | | | 11 | | | | 13 | | | | 4 | | | | 4 | | | | 2 | |
Registration | | | 55 | | | | 107 | | | | 53 | | | | 41 | | | | 52 | |
Other | | | 10 | | | | 14 | | | | 7 | | | | 4 | | | | 3 | |
| | | | | | | | | | | | | | | | | | | | |
Total expenses | | | 5,827 | | | | 6,399 | | | | 1,801 | | | | 1,766 | | | | 596 | |
| | | | | | | | | | | | | | | | | | | | |
Fund expenses recaptured or (reimbursed)/(waived) | | | — | | | | 32 | | | | — | | | | — | | | | — | |
Class expense recaptured or (reimbursed)/(waived): | | | | | | | | | | | | | | | | | | | | |
Class A | | | 123 | | | | — | | | | — | (A) | | | — | (A) | | | — | (A) |
Class B | | | 1 | | | | — | | | | | | | | | | | | | |
Class C | | | 1 | | | | — | | | | — | (A) | | | — | | | | — | |
Class I | | | — | | | | — | | | | — | (A) | | | — | | | | — | (A) |
Class P | | | (2 | ) | | | (6 | ) | | | | | | | | | | | | |
| | | | | | | | | | | | | | | | | | | | |
Total expense recaptured (reimbursed)/(waived) | | | 123 | | | | 26 | | | | — | (A) | | | — | (A) | | | — | (A) |
| | | | | | | | | | | | | | | | | | | | |
Net expenses | | | 5,950 | | | | 6,425 | | | | 1,801 | | | | 1,766 | | | | 596 | |
| | | | | | | | | | | | | | | | | | | | |
Net investment income | | | 3,886 | | | | 45,463 | | | | 4,698 | | | | 4,379 | | | | 725 | |
| | | | | | | | | | | | | | | | | | | | |
Net realized gain (loss) on transactions from: | | | | | | | | | | | | | | | | | | | | |
Investment securities | | | 5,488 | | | | 22,752 | | | | 650 | | | | 904 | | | | (1,547 | ) |
Futures contracts | | | — | | | | — | | | | (547 | ) | | | — | | | | — | |
Foreign currency transactions | | | (81 | ) | | | — | | | | 819 | | | | (171 | ) | | | (1 | ) |
| | | | | | | | | | | | | | | | | | | | |
Net realized gain (loss) | | | 5,407 | | | | 22,752 | �� | | | 922 | | | | 733 | | | | (1,548 | ) |
| | | | | | | | | | | | | | | | | | | | |
Net change in unrealized appreciation (depreciation) on: | | | | | | | | | | | | | | | | | | | | |
Investment securities | | | (43,451 | ) | | | 24,399 | | | | (4,266 | ) | | | 14,693 | | | | (962 | ) |
Translation of assets and liabilities denominated in foreign currencies | | | (1 | ) | | | — | | | | 2,802 | | | | 18 | | | | — | |
| | | | | | | | | | | | | | | | | | | | |
Net change in unrealized appreciation (depreciation) | | | (43,452 | ) | | | 24,399 | | | | (1,464 | ) | | | 14,711 | | | | (962 | ) |
| | | | | | | | | | | | | | | | | | | | |
Net realized and change in unrealized gain (loss): | | | (38,045 | ) | | | 47,151 | | | | (542 | ) | | | 15,444 | | | | (2,510 | ) |
| | | | | | | | | | | | | | | | | | | | |
Net increase (decrease) in net assets resulting from operations | | $ | (34,159 | ) | | $ | 92,614 | | | $ | 4,156 | | | $ | 19,823 | | | $ | (1,785 | ) |
| | | | | | | | | | | | | | | | | | | | |
| | | | |
| The notes to the financial statements are an integral part of this report. | | |
| Transamerica Funds | | | | Annual Report 2012 |
| | Page 114 | | |
STATEMENTS OF OPERATIONS (continued)
For the year ended October 31, 2012
(all amounts in thousands)
| | | | | | | | | | | | | | | | | | | | |
| | | Transamerica
Large
Cap Value | | | Transamerica
Money Market | | | Transamerica
Multi-Managed
Balanced | | | Transamerica
Short-Term
Bond | | | Transamerica
Small Cap
Growth(D) | |
Investment income: | | | | | | | | | | | | | | | | | | | | |
Dividend income | | $ | 39,777 | | | $ | — | | | $ | 4,485 | | | $ | — | | | $ | 76 | |
Withholding taxes on foreign income | | | (398 | ) | | | — | | | | — | | | | — | | | | — | |
Interest income | | | 11 | | | | 704 | | | | 4,834 | | | | 121,397 | | | | 1 | |
Securities lending income (net) | | | 228 | | | | — | | | | 93 | | | | 605 | | | | — | |
| | | | | | | | | | | | | | | | | | | | |
Total investment income | | | 39,618 | | | | 704 | | | | 9,412 | | | | 122,002 | | | | 77 | |
| | | | | | | | | | | | | | | | | | | | |
Expenses: | | | | | | | | | | | | | | | | | | | | |
Management and advisory | | | 9,693 | | | | 1,015 | | | | 2,640 | | | | 14,084 | | | | 228 | |
Distribution and service: | | | | | | | | | | | | | | | | | | | | |
Class A | | | 5 | | | | 324 | | | | 369 | | | | 2,398 | | | | — | (A) |
Class B | | | | | | | 119 | | | | 94 | | | | | | | | | |
Class C | | | 18 | | | | 324 | | | | 497 | | | | 8,391 | | | | 1 | |
Class P | | | | | | | — | | | | 112 | | | | | | | | | |
Transfer agent: | | | | | | | | | | | | | | | | | | | | |
Class A | | | 4 | | | | 351 | | | | 300 | | | | 436 | | | | — | (A) |
Class B | | | | | | | 39 | | | | 40 | | | | | | | | | |
Class C | | | 3 | | | | 52 | | | | 72 | | | | 586 | | | | — | (A) |
Class I | | | 8 | | | | 42 | | | | 133 | | | | 337 | | | | — | (A) |
Class I2 | | | 106 | | | | 6 | | | | | | | | 83 | | | | 2 | |
Class P | | | | | | | 13 | | | | 117 | | | | | | | | | |
Printing and shareholder reports | | | 86 | | | | 30 | | | | 51 | | | | 269 | | | | 9 | |
Custody | | | 111 | | | | 65 | | | | 162 | | | | 334 | | | | 7 | |
Administration | | | 334 | | | | 60 | | | | 82 | | | | 708 | | | | 7 | |
Legal | | | 47 | | | | 11 | | | | 12 | | | | 108 | | | | 4 | |
Audit and tax | | | 18 | | | | 15 | | | | 19 | | | | 22 | | | | 16 | |
Trustees | | | 28 | | | | 5 | | | | 7 | | | | 59 | | | | 1 | |
Registration | | | 20 | | | | 67 | | | | 46 | | | | 111 | | | | 53 | |
Other | | | 22 | | | | 13 | | | | 8 | | | | 49 | | | | 3 | |
| | | | | | | | | | | | | | | | | | | | |
Total expenses | | | 10,503 | | | | 2,551 | | | | 4,761 | | | | 27,975 | | | | 331 | |
| | | | | | | | | | | | | | | | | | | | |
Fund expenses recaptured or (reimbursed)/(waived) | | | — | | | | (660 | ) | | | 92 | | | | — | | | | (15 | ) |
Class expense recaptured or (reimbursed)/(waived): | | | | | | | | | | | | | | | | | | | | |
Class A | | | — | | | | (644 | ) | | | — | | | | (505 | ) | | | — | (A) |
Class B | | | | | | | (154 | ) | | | — | | | | | | | | | |
Class C | | | — | | | | (367 | ) | | | — | | | | — | | | | — | (A) |
Class I | | | — | | | | (42 | ) | | | — | | | | — | | | | — | (A) |
Class I2 | | | — | | | | (1 | ) | | | | | | | — | | | | (2 | ) |
Class P | | | | | | | (13 | ) | | | (116 | ) | | | | | | | | |
| | | | | | | | | | | | | | | | | | | | |
Total expense recaptured (reimbursed)/(waived) | | | — | | | | (1,881 | ) | | | (24 | ) | | | (505 | ) | | | (17 | ) |
| | | | | | | | | | | | | | | | | | | | |
Net expenses | | | 10,503 | | | | 670 | | | | 4,737 | | | | 27,470 | | | | 314 | |
| | | | | | | | | | | | | | | | | | | | |
Net investment income (loss) | | | 29,115 | | | | 34 | | | | 4,675 | | | | 94,532 | | | | (237 | ) |
| | | | | | | | | | | | | | | | | | | | |
Net realized gain (loss) on transactions from: | | | | | | | | | | | | | | | | | | | | |
Investment securities | | | 89,724 | | | | — | | | | 12,107 | | | | 21,790 | | | | (2,235 | ) |
Futures contracts | | | — | | | | — | | | | 732 | | | | — | | | | — | |
Written option & swaption contracts | | | — | | | | — | | | | 55 | | | | — | | | | — | |
TBA short commitments | | | — | | | | — | | | | (41 | ) | | | — | | | | — | |
Foreign currency transactions | | | — | | | | — | | | | (131 | ) | | | (90 | ) | | | — | |
| | | | | | | | | | | | | | | | | | | | |
Net realized gain (loss) | | | 89,724 | | | | — | | | | 12,722 | | | | 21,700 | | | | (2,235 | ) |
| | | | | | | | | | | | | | | | | | | | |
Net change in unrealized appreciation (depreciation) on: | | | | | | | | | | | | | | | | | | | | |
Investment securities | | | 76,147 | | | | — | | | | 20,257 | | | | 59,055 | | | | (8,879 | ) |
Futures contracts | | | — | | | | — | | | | (237 | ) | | | — | | | | — | |
Written option and swaption contracts | | | — | | | | — | | | | (31 | ) | | | — | | | | — | |
Translation of assets and liabilities denominated in foreign currencies | | | — | | | | — | | | | 67 | | | | 24 | | | | — | |
TBA short commitments | | | — | | | | — | | | | 86 | | | | — | | | | — | |
| | | | | | | | | | | | | | | | | | | | |
Net change in unrealized appreciation (depreciation) | | | 76,147 | | | | — | | | �� | 20,142 | | | | 59,079 | | | | (8,879 | ) |
| | | | | | | | | | | | | | | | | | | | |
Net realized and change in unrealized gain (loss): | | | 165,871 | | | | — | | | | 32,864 | | | | 80,779 | | | | (11,114 | ) |
| | | | | | | | | | | | | | | | | | | | |
Net increase (decrease) in net assets resulting from operations | | $ | 194,986 | | | $ | 34 | | | $ | 37,539 | | | $ | 175,311 | | | $ | (11,351 | ) |
| | | | | | | | | | | | | | | | | | | | |
| | | | |
| The notes to the financial statements are an integral part of this report. | | |
| Transamerica Funds | | | | Annual Report 2012 |
| | Page 115 | | |
STATEMENTS OF OPERATIONS (continued)
For the year ended October 31, 2012
(all amounts in thousands)
| | | | | | | | | | | | |
| | | Transamerica Small Cap | | | Transamerica
Small/Mid Cap | | | Transamerica | |
| | | Value(B) | | | Value | | | Tactical Income | |
Investment income: | | | | | | | | | | | | |
Dividend income | | $ | 2,901 | | | $ | 12,310 | | | $ | 11,035 | |
Withholding taxes on foreign income | | | — | | | | (4 | ) | | | — | |
Interest income | | | 2 | | | | 4 | | | | 3 | |
Securities lending income (net) | | | — | | | | 242 | | | | — | |
| | | | | | | | | | | | |
Total investment income | | | 2,903 | | | | 12,552 | | | | 11,038 | |
| | | | | | | | | | | | |
Expenses: | | | | | | | | | | | | |
Management and advisory | | | 1,077 | | | | 5,166 | | | | 1,232 | |
Distribution and service: | | | | | | | | | | | | |
Class A | | | 1 | | | | 1,029 | | | | 265 | |
Class B | | | | | | | 321 | | | | | |
Class C | | | 1 | | | | 1,923 | | | | 857 | |
Transfer agent: | | | | | | | | | | | | |
Class A | | | — | (A) | | | 750 | | | | 61 | |
Class B | | | | | | | 69 | | | | | |
Class C | | | — | (A) | | | 339 | | | | 63 | |
Class I | | | — | (A) | | | 100 | | | | 99 | |
Class I2 | | | 9 | | | | 1 | | | | | |
Printing and shareholder reports | | | 44 | | | | 126 | | | | 69 | |
Custody | | | 24 | | | | 99 | | | | 33 | |
Administration | | | 31 | | | | 153 | | | | 65 | |
Legal | | | 9 | | | | 23 | | | | 21 | |
Audit and tax | | | 16 | | | | 16 | | | | 20 | |
Trustees | | | 3 | | | | 13 | | | | 7 | |
Registration | | | 54 | | | | 59 | | | | 147 | |
Other | | | 3 | | | | 13 | | | | 5 | |
| | | | | | | | | | | | |
Total expenses | | | 1,272 | | | | 10,200 | | | | 2,944 | |
| | | | | | | | | | | | |
Class expense recaptured or (reimbursed)/(waived): | | | | | | | | | | | | |
Class A | | | — | | | | — | | | | (55 | ) |
Class C | | | — | | | | — | | | | (13 | ) |
Class I | | | — | | | | — | | | | (44 | ) |
| | | | | | | | | | | | |
Total expense recaptured (reimbursed)/(waived) | | | — | | | | — | | | | (112 | ) |
| | | | | | | | | | | | |
Net expenses | | | 1,272 | | | | 10,200 | | | | 2,832 | |
| | | | | | | | | | | | |
Net investment income | | | 1,631 | | | | 2,352 | | | | 8,206 | |
| | | | | | | | | | | | |
Net realized gain (loss) on transactions from: | | | | | | | | | | | | |
Investment securities | | | (945 | ) | | | (11,852 | ) | | | 8,876 | |
| | | | | | | | | | | | |
Net realized gain (loss) | | | (945 | ) | | | (11,852 | ) | | | 8,876 | |
| | | | | | | | | | | | |
Net change in unrealized appreciation (depreciation) on: | | | | | | | | | | | | |
Investment securities | | | 2,837 | | | | 82,860 | | | | 1,137 | |
| | | | | | | | | | | | |
Net change in unrealized appreciation (depreciation) | | | 2,837 | | | | 82,860 | | | | 1,137 | |
| | | | | | | | | | | | |
Net realized and change in unrealized gain: | | | 1,892 | | | | 71,008 | | | | 10,013 | |
| | | | | | | | | | | | |
Net increase in net assets resulting from operations | | $ | 3,523 | | | $ | 73,360 | | | $ | 18,219 | |
| | | | | | | | | | | | |
| (A) | Rounds to less than $1. |
| (B) | Commenced operations on April 30, 2012. |
| (C) | Net of foreign capital gains tax of $18. |
| (D) | Commenced operations on August 31, 2012. |
| | | | |
| The notes to the financial statements are an integral part of this report. | | |
| Transamerica Funds | | | | Annual Report 2012 |
| | Page 116 | | |
STATEMENTS OF CHANGES IN NET ASSETS
For the years ended:
(all amounts in thousands)
| | | | | | | | | | | | | | | | | | | | | | | | |
| | | Transamerica Capital
Growth | | | Transamerica
Diversified Equity | | | Transamerica Emerging Markets
Debt | |
| | | October 31,
2012 | | | October 31,
2011 | | | October 31,
2012 | | | October 31,
2011 | | | October 31,
2012 | | | October 31,
2011 (B) | |
From operations: | | | | | | | | | | | | | | | | | | | | | | | | |
Net investment income (loss) | | $ | 3,864 | | | $ | (1,376 | ) | | $ | 6,117 | | | $ | 444 | | | $ | 12,009 | | | $ | 735 | |
Net realized gain(A) | | | 21,100 | | | | 39,569 | | | | 43,581 | | | | 110,535 | | | | 14,667 | | | | 152 | |
Net change in unrealized appreciation (depreciation) | | | (5,524 | ) | | | (10,620 | ) | | | (8,338 | ) | | | (76,621 | ) | | | 14,521 | | | | (623 | ) |
| | | | | | | | | | | | | | | | | | | | | | | | |
Net increase in net assets resulting from operations | | | 19,440 | | | | 27,573 | | | | 41,360 | | | | 34,358 | | | | 41,197 | | | | 264 | |
| | | | | | | | | | | | | | | | | | | | | | | | |
Net equilization credit and charges | | | | | | | | | | | | | | | (5,091 | ) | | | | | | | | |
| | | | | | |
Distributions to shareholders: | | | | | | | | | | | | | | | | | | | | | | | | |
From net investment income: | | | | | | | | | | | | | | | | | | | | | | | | |
Class A | | | — | | | | — | | | | — | | | | (914 | ) | | | (883 | ) | | | — | (C) |
Class B | | | — | (C) | | | — | | | | — | (C) | | | (19 | ) | | | | | | | | |
Class C | | | — | (C) | | | — | | | | — | (C) | | | (61 | ) | | | (179 | ) | | | — | (C) |
Class I | | | (9 | ) | | | — | | | | — | | | | (7 | ) | | | (428 | ) | | | (1 | ) |
Class I2 | | | (19 | ) | | | — | | | | (359 | ) | | | (6,482 | ) | | | (7,885 | ) | | | (41 | ) |
Class P | | | — | (C) | | | — | | | | — | (C) | | | (4,645 | ) | | | — | | | | — | |
| | | | | | | | | | | | | | | | | | | | | | | | |
| | | (28 | ) | | | — | | | | (359 | ) | | | (12,128 | ) | | | (9,375 | ) | | | (42 | ) |
| | | | | | | | | | | | | | | | | | | | | | | | |
From net realized gains: | | | | | | | | | | | | | | | | | | | | | | | | |
Class A | | | (1,847 | ) | | | — | | | | (10,446 | ) | | | — | | | | — | | | | — | |
Class B | | | (232 | ) | | | — | | | | (711 | ) | | | — | | | | | | | | | |
Class C | | | (510 | ) | | | — | | | | (1,806 | ) | | | — | | | | — | | | | — | |
Class I | | | (349 | ) | | | — | | | | (145 | ) | | | — | | | | — | | | | — | |
Class I2 | | | (19,816 | ) | | | — | | | | (36,688 | ) | | | — | | | | — | | | | — | |
Class P | | | (1,888 | ) | | | — | | | | (23,251 | ) | | | — | | | | | | | | | |
| | | | | | | | | | | | | | | | | | | | | | | | |
| | | (24,642 | ) | | | — | | | | (73,047 | ) | | | — | | | | — | | | | — | |
| | | | | | | | | | | | | | | | | | | | | | | | |
Total distributions to shareholders | | | (24,670 | ) | | | — | | | | (73,406 | ) | | | (12,128 | ) | | | (9,375 | ) | | | (42 | ) |
| | | | | | | | | | | | | | | | | | | | | | | | |
Capital share transactions: | | | | | | | | | | | | | | | | | | | | | | | | |
Proceeds from shares sold: | | | | | | | | | | | | | | | | | | | | | | | | |
Class A | | | 21,615 | | | | 23,000 | | | | 11,281 | | | | 2,457 | | | | 60,496 | | | | 2,312 | |
Class B | | | 660 | | | | 838 | | | | 1,167 | | | | 391 | | | | | | | | | |
Class C | | | 7,542 | | | | 5,007 | | | | 1,559 | | | | 505 | | | | 9,144 | | | | 996 | |
Class I | | | 33,443 | | | | 12,513 | | | | 167,680 | | | | 1,072 | | | | 44,858 | | | | 2,018 | |
Class I2 | | | 169,765 | | | | 398,989 | | | | 19,675 | | | | 60,732 | | | | 404,842 | | | | 95,239 | |
Class P | | | 4,374 | | | | 11,925 | | | | 1,546 | | | | 49,683 | | | | | | | | | |
Class T | | | | | | | | | | | 551 | | | | | | | | | | | | | |
| | | | | | | | | | | | | | | | | | | | | | | | |
| | | 237,399 | | | | 452,272 | | | | 203,459 | | | | 114,840 | | | | 519,340 | | | | 100,565 | |
| | | | | | | | | | | | | | | | | | | | | | | | |
Issued from fund acquisition: | | | | | | | | | | | | | | | | | | | | | | | | |
Class A | | | — | | | | — | | | | 387,425 | | | | — | | | | — | | | | — | |
Class B | | | — | | | | — | | | | 21,028 | | | | — | | | | | | | | | |
Class C | | | — | | | | — | | | | 33,859 | | | | — | | | | — | | | | — | |
Class I | | | — | | | | — | | | | 174,606 | | | | — | | | | — | | | | — | |
Class I2 | | | — | | | | — | | | | 371,097 | | | | — | | | | — | | | | — | |
Class T | | | | | | | | | | | 89,251 | | | | | | | | | | | | | |
| | | | | | | | | | | | | | | | | | | | | | | | |
| | | — | | | | — | | | | 1,077,266 | | | | — | | | | — | | | | — | |
| | | | | | | | | | | | | | | | | | | | | | | | |
Dividends and distributions reinvested: | | | | | | | | | | | | | | | | | | | | | | | | |
Class A | | | 1,768 | | | | — | | | | 10,117 | | | | 882 | | | | 756 | | | | — | (C) |
Class B | | | 223 | | | | — | | | | 698 | | | | 18 | | | | | | | | | |
Class C | | | 467 | | | | — | | | | 1,685 | | | | 57 | | | | 148 | | | | — | (C) |
Class I | | | 138 | | | | — | | | | 142 | | | | 6 | | | | 362 | | | | 1 | |
Class I2 | | | 19,835 | | | | — | | | | 37,047 | | | | 6,482 | | | | 7,885 | | | | 41 | |
Class P | | | 1,863 | | | | — | | | | 23,224 | | | | 2,688 | | | | | | | | | |
| | | | | | | | | | | | | | | | | | | | | | | | |
| | | 24,294 | | | | — | | | | 72,913 | | | | 10,133 | | | | 9,151 | | | | 42 | |
| | | | | | | | | | | | | | | | | | | | | | | | |
Cost of shares redeemed: | | | | | | | | | | | | | | | | | | | | | | | | |
Class A | | | (24,775 | ) | | | (13,729 | ) | | | (64,948 | ) | | | (14,152 | ) | | | (6,621 | ) | | | (117 | ) |
Class B | | | (1,040 | ) | | | (1,726 | ) | | | (2,555 | ) | | | (1,115 | ) | | | | | | | | |
Class C | | | (4,091 | ) | | | (3,013 | ) | | | (6,581 | ) | | | (2,596 | ) | | | (631 | ) | | | — | (C) |
Class I | | | (16,599 | ) | | | (1,164 | ) | | | (80,333 | ) | | | (314 | ) | | | (2,967 | ) | | | — | (C) |
Class I2 | | | (47,640 | ) | | | (1,581 | ) | | | (127,461 | ) | | | (134,434 | ) | | | (27,547 | ) | | | (143 | ) |
Class P | | | (21,302 | ) | | | (24,833 | ) | | | (142,181 | ) | | | (220,859 | ) | | | | | | | | |
Class T | | | | | | | | | | | (7,920 | ) | | | | | | | | | | | | |
| | | | | | | | | | | | | | | | | | | | | | | | |
| | | (115,447 | ) | | | (46,046 | ) | | | (431,979 | ) | | | (373,470 | ) | | | (37,766 | ) | | | (260 | ) |
| | | | | | | | | | | | | | | | | | | | | | | | |
Automatic conversions: | | | | | | | | | | | | | | | | | | | | | | | | |
Class A | | | 1,945 | | | | 2,418 | | | | 4,567 | | | | 1,868 | | | | — | | | | — | |
Class B | | | (1,945 | ) | | | (2,418 | ) | | | (4,567 | ) | | | (1,868 | ) | | | | | | | | |
| | | | | | | | | | | | | | | | | | | | | | | | |
| | | — | | | | — | | | | — | | | | — | | | | — | | | | — | |
| | | | | | | | | | | | | | | | | | | | | | | | |
Class level conversions: | | | | | | | | | | | | | | | | | | | | | | | | |
Class I | | �� | 52,090 | | | | — | | | | 46,486 | | | | — | | | | — | | | | — | |
Class P | | | (52,090 | ) | | | — | | | | (46,486 | ) | | | — | | | | | | | | | |
| | | | | | | | | | | | | | | | | | | | | | | | |
| | | — | | | | — | | | | — | | | | — | | | | — | | | | — | |
| | | | |
| The notes to the financial statements are an integral part of this report. | | |
| Transamerica Funds | | | | Annual Report 2012 |
| | Page 117 | | |
STATEMENTS OF CHANGES IN NET ASSETS (continued)
For the years ended:
(all amounts in thousands)
| | | | | | | | | | | | | | | | | | | | | | | | |
| | | Transamerica Capital Growth | | | Transamerica Diversified Equity | | | Transamerica Emerging Markets
Debt | |
| | | October 31,
2012 | | | October 31,
2011 | | | October 31,
2012 | | | October 31,
2011 | | | October 31,
2012 | | | October 31,
2011 (B) | |
Fair fund settlement: | | | | | | | | | | | | | | | | | | | | | | | | |
Class A | | | — | | | | — | | | | 113 | | | | — | (C) | | | — | | | | — | |
Class B | | | — | | | | — | | | | 8 | | | | — | (C) | | | | | | | | |
Class C | | | — | | | | — | | | | 19 | | | | — | (C) | | | — | | | | — | |
Class I | | | — | | | | — | | | | 2 | | | | — | (C) | | | — | | | | — | |
Class I2 | | | — | | | | — | | | | 401 | | | | 2 | | | | — | | | | — | |
Class P | | | — | | | | — | | | | 253 | | | | 2 | | | | | | | | | |
| | | | | | | | | | | | | | | | | | | | | | | | |
| | | — | | | | — | | | | 796 | | | | 4 | | | | — | | | | — | |
| | | | | | | | | | | | | | | | | | | | | | | | |
Net income equalization | | | — | | | | — | | | | — | | | | 5,091 | | | | — | | | | — | |
| | | | | | | | | | | | | | | | | | | | | | | | |
Net increase (decrease) in net assets resulting from capital shares transactions | | | | | | | | | | | | | | | | | | | | | | | | |
| | | 146,246 | | | | 406,226 | | | | 922,455 | | | | (243,402 | ) | | | 490,725 | | | | 100,347 | |
| | | | | | | | | | | | | | | | | | | | | | | | |
Net increase (decrease) in net assets | | | 141,016 | | | | 433,799 | | | | 890,409 | | | | (226,263 | ) | | | 522,547 | | | | 100,569 | |
| | | | | | | | | | | | | | | | | | | | | | | | |
Net assets: | | | | | | | | | | | | | | | | | | | | | | | | |
Beginning of year | | $ | 575,889 | | | $ | 142,090 | | | $ | 563,086 | | | $ | 789,349 | | | $ | 100,569 | | | $ | — | |
| | | | | | | | | | | | | | | | | | | | | | | | |
End of year | | $ | 716,905 | | | $ | 575,889 | | | $ | 1,453,495 | | | $ | 563,086 | | | $ | 623,116 | | | $ | 100,569 | |
| | | | | | | | | | | | | | | | | | | | | | | | |
Undistributed net investment income | | $ | 3,752 | | | $ | — | | | $ | 6,531 | | | $ | — | | | $ | 3,948 | | | $ | 1,010 | |
| | | | | | | | | | | | | | | | | | | | | | | | |
Share activity: | | | | | | | | | | | | | | | | | | | | | | | | |
Shares issued: | | | | | | | | | | | | | | | | | | | | | | | | |
Class A | | | 1,373 | | | | 1,461 | | | | 829 | | | | 165 | | | | 5,572 | | | | 237 | |
Class B | | | 46 | | | | 58 | | | | 87 | | | | 26 | | | | | | | | | |
Class C | | | 527 | | | | 347 | | | | 116 | | | | 33 | | | | 858 | | | | 103 | |
Class I | | | 2,120 | | | | 794 | | | | 12,267 | | | | 68 | | | | 4,030 | | | | 206 | |
Class I2 | | | 15,630 | | | | 37,298 | | | | 1,412 | | | | 3,930 | | | | 36,094 | | | | 9,526 | |
Class P | | | 293 | | | | 766 | | | | 116 | | | | 3,227 | | | | | | | | | |
Class T | | | | | | | | | | | 20 | | | | | | | | | | | | | |
| | | | | | | | | | | | | | | | | | | | | | | | |
| | | 19,989 | | | | 40,724 | | | | 14,847 | | | | 7,449 | | | | 46,554 | | | | 10,072 | |
| | | | | | | | | | | | | | | | | | | | | | | | |
Shares issued on fund acquisition: | | | | | | | | | | | | | | | | | | | | | | | | |
Class A | | | — | | | | — | | | | 28,762 | | | | — | | | | — | | | | — | |
Class B | | | — | | | | — | | | | 1,572 | | | | — | | | | | | | | | |
Class C | | | — | | | | — | | | | 2,536 | | | | — | | | | — | | | | — | |
Class I | | | — | | | | — | | | | 12,839 | | | | — | | | | — | | | | — | |
Class I2 | | | — | | | | — | | | | 27,327 | | | | — | | | | — | | | | — | |
Class T | | | | | | | | | | | 3,110 | | | | | | | | | | | | | |
| | | | | | | | | | | | | | | | | | | | | | | | |
| | | — | | | | — | | | | 76,146 | | | | — | | | | — | | | | — | |
| | | | | | | | | | | | | | | | | | | | | | | | |
Shares issued-reinvested from dividends and distributions: | | | | | | | | | | | | | | | | | | | | | | | | |
Class A | | | 129 | | | | — | | | | 853 | | | | 58 | | | | 71 | | | | — | (D) |
Class B | | | 18 | | | | — | | | | 59 | | | | 1 | | | | | | | | | |
Class C | | | 37 | | | | — | | | | 143 | | | | 4 | | | | 14 | | | | — | (D) |
Class I | | | 10 | | | | — | | | | 12 | | | | – | (D) | | | 34 | | | | — | (D) |
Class I2 | | | 2,064 | | | | — | | | | 3,103 | | | | 427 | | | | 745 | | | | 4 | |
Class P | | | 136 | | | | — | | | | 1,950 | | | | 177 | | | | | | | | | |
| | | | | | | | | | | | | | | | | | | | | | | | |
| | | 2,394 | | | | — | | | | 6,120 | | | | 667 | | | | 864 | | | | 4 | |
| | | | | | | | | | | | | | | | | | | | | | | | |
Shares redeemed: | | | | | | | | | | | | | | | | | | | | | | | | |
Class A | | | (1,608 | ) | | | (869 | ) | | | (4,702 | ) | | | (933 | ) | | | (604 | ) | | | (12 | ) |
Class B | | | (74 | ) | | | (119 | ) | | | (189 | ) | | | (74 | ) | | | | | | | | |
Class C | | | (289 | ) | | | (209 | ) | | | (491 | ) | | | (173 | ) | | | (59 | ) | | | — | (D) |
Class I | | | (1,045 | ) | | | (73 | ) | | | (5,799 | ) | | | (21 | ) | | | (275 | ) | | | — | (D) |
Class I2 | | | (4,311 | ) | | | (145 | ) | | | (9,120 | ) | | | (9,517 | ) | | | (2,625 | ) | | | (15 | ) |
Class P | | | (1,403 | ) | | | (1,566 | ) | | | (10,523 | ) | | | (14,091 | ) | | | | | | | | |
Class T | | | | | | | | | | | (272 | ) | | | | | | | | | | | | |
| | | | | | | | | | | | | | | | | | | | | | | | |
| | | (8,730 | ) | | | (2,981 | ) | | | (31,096 | ) | | | (24,809 | ) | | | (3,563 | ) | | | (27 | ) |
| | | | | | | | | | | | | | | | | | | | | | | | |
Automatic conversions: | | | | | | | | | | | | | | | | | | | | | | | | |
Class A | | | 125 | | | | 156 | | | | 338 | | | | 125 | | | | — | | | | — | |
Class B | | | (137 | ) | | | (169 | ) | | | (341 | ) | | | (125 | ) | | | | | | | | |
| | | | | | | | | | | | | | | | | | | | | | | | |
| | | (12 | ) | | | (13 | ) | | | (3 | ) | | | — | | | | — | | | | — | |
| | | | | | | | | | | | | | | | | | | | | | | | |
Class level conversions: | | | | | | | | | | | | | | | | | | | | | | | | |
Class I | | | 3,295 | | | | — | | | | 3,418 | | | | — | | | | — | | | | — | |
Class P | | | (3,328 | ) | | | — | | | | (3,435 | ) | | | — | | | | | | | | | |
| | | | | | | | | | | | | | | | | | | | | | | | |
| | | (33 | ) | | | — | | | | (17 | ) | | | — | | | | — | | | | — | |
| | | | | | | | | | | | | | | | | | | | | | | | |
Net increase (decrease) in shares outstanding: | | | | | | | | | | | | | | | | | | | | | | | | |
Class A | | | 19 | | | | 748 | | | | 26,080 | | | | (585 | ) | | | 5,039 | | | | 225 | |
Class B | | | (147 | ) | | | (230 | ) | | | 1,188 | | | | (172 | ) | | | | | | | | |
Class C | | | 275 | | | | 138 | | | | 2,304 | | | | (136 | ) | | | 813 | | | | 103 | |
Class I | | | 4,380 | | | | 721 | | | | 22,737 | | | | 47 | | | | 3,789 | | | | 206 | |
Class I2 | | | 13,383 | | | | 37,153 | | | | 22,722 | | | | (5,160 | ) | | | 34,214 | | | | 9,515 | |
Class P | | | (4,302 | ) | | | (800 | ) | | | (11,892 | ) | | | (10,687 | ) | | | | | | | | |
Class T | | | | | | | | | | | 2,858 | | | | | | | | | | | | | |
| | | | | | | | | | | | | | | | | | | | | | | | |
| | | 13,608 | | | | 37,730 | | | | 65,997 | | | | (16,693 | ) | | | 43,855 | | | | 10,049 | |
| | | | | | | | | | | | | | | | | | | | | | | | |
| | | | |
| The notes to the financial statements are an integral part of this report. | | |
| Transamerica Funds | | | | Annual Report 2012 |
| | Page 118 | | |
STATEMENTS OF CHANGES IN NET ASSETS (continued)
For the years ended:
(all amounts in thousands)
| | | | | | | | | | | | | | | | | | | | |
| | | Transamerica
Emerging
Markets Equity | | | Transamerica Flexible Income | | | Transamerica Growth
Opportunities | |
| | | October 31,
2012(E) | | | October 31,
2012 | | | October 31,
2011 | | | October 31,
2012 | | | October 31,
2011 | |
From operations: | | | | | | | | | | | | | | | | | | | | |
Net investment income (loss) | | $ | 731 | | | $ | 13,780 | | | $ | 14,340 | | | $ | 3,886 | | | $ | (1,496 | ) |
Net realized gain (loss)(A) | | | (5,280 | ) | | | 1,978 | | | | 3,676 | | | | 5,407 | | | | 117,550 | |
Net change in unrealized appreciation (depreciation) | | | 1,970 | | | | 14,830 | | | | (8,701 | ) | | | (43,452 | ) | | | (80,212 | ) |
| | | | | | | | | | | | | | | | | | | | |
Net increase (decrease) in net assets resulting from operations | | | (2,579 | ) | | | 30,588 | | | | 9,315 | | | | (34,159 | ) | | | 35,842 | |
| | | | | | | | | | | | | | | | | | | | |
Distributions to shareholders: | | | | | | | | | | | | | | | | | | | | |
From net investment income: | | | | | | | | | | | | | | | | | | | | |
Class A | | | — | | | | (3,528 | ) | | | (3,489 | ) | | | (2 | ) | | | — | |
Class B | | | | | | | (279 | ) | | | (416 | ) | | | — | (C) | | | — | |
Class C | | | — | | | | (2,684 | ) | | | (2,181 | ) | | | — | | | | — | |
Class I | | | — | | | | (1,385 | ) | | | (987 | ) | | | (18 | ) | | | (8 | ) |
Class I2 | | | — | | | | (6,246 | ) | | | (7,295 | ) | | | (252 | ) | | | (576 | ) |
Class P | | | | | | | | | | | | | | | — | (C) | | | (112 | ) |
| | | | | | | | | | | | | | | | | | | | |
| | | — | | | | (14,122 | ) | | | (14,368 | ) | | | (272 | ) | | | (696 | ) |
| | | | | | | | | | | | | | | | | | | | |
From net realized gains: | | | | | | | | | | | | | | | | | | | | |
Class A | | | — | | | | — | | | | — | | | | (21,108 | ) | | | — | |
Class B | | | | | | | — | | | | — | | | | (2,053 | ) | | | — | |
Class C | | | — | | | | — | | | | — | | | | (3,164 | ) | | | — | |
Class I | | | — | | | | — | | | | — | | | | (1,977 | ) | | | — | |
Class I2 | | | — | | | | — | | | | — | | | | (21,956 | ) | | | — | |
Class P | | | | | | | | | | | | | | | (20,068 | ) | | | — | |
| | | | | | | | | | | | | | | | | | | | |
| | | — | | | | — | | | | — | | | | (70,326 | ) | | | — | |
| | | | | | | | | | | | | | | | | | | | |
Total distributions to shareholders | | | — | | | | (14,122 | ) | | | (14,368 | ) | | | (70,598 | ) | | | (696 | ) |
| | | | | | | | | | | | | | | | | | | | |
Capital share transactions: | | | | | | | | | | | | | | | | | | | | |
Proceeds from shares sold: | | | | | | | | | | | | | | | | | | | | |
Class A | | | 317 | | | | 25,018 | | | | 37,059 | | | | 10,257 | | | | 53,115 | |
Class B | | | | | | | 1,286 | | | | 1,645 | | | | 446 | | | | 805 | |
Class C | | | 269 | | | | 48,106 | | | | 34,498 | | | | 1,066 | | | | 3,521 | |
Class I | | | 317 | | | | 19,263 | | | | 22,523 | | | | 54,794 | | | | 12,282 | |
Class I2 | | | 110,540 | | | | 16,945 | | | | 419 | | | | 87,358 | | | | 1,151 | |
Class P | | | | | | | | | | | | | | | 2,658 | | | | 12,809 | |
| | | | | | | | | | | | | | | | | | | | |
| | | 111,443 | | | | 110,618 | | | | 96,144 | | | | 156,579 | | | | 83,683 | |
| | | | | | | | | | | | | | | | | | | | |
Issued from fund acquisition: | | | | | | | | | | | | | | | | | | | | |
Class I2 | | | — | | | | — | | | | — | | | | 274,998 | | | | — | |
| | | | | | | | | | | | | | | | | | | | |
| | | — | | | | — | | | | — | | | | 274,998 | | | | — | |
| | | | | | | | | | | | | | | | | | | | |
Dividends and distributions reinvested: | | | | | | | | | | | | | | | | | | | | |
Class A | | | — | | | | 2,991 | | | | 2,848 | | | | 20,745 | | | | — | |
Class B | | | | | | | 237 | | | | 308 | | | | 2,006 | | | | — | |
Class C | | | — | | | | 1,514 | | | | 1,242 | | | | 2,974 | | | | — | |
Class I | | | — | | | | 708 | | | | 542 | | | | 1,687 | | | | 3 | |
Class I2 | | | — | | | | 6,246 | | | | 7,295 | | | | 22,208 | | | | 576 | |
Class P | | | | | | | | | | | | | | | 19,936 | | | | 112 | |
| | | | | | | | | | | | | | | | | | | | |
| | | — | | | | 11,696 | | | | 12,235 | | | | 69,556 | | | | 691 | |
| | | | | | | | | | | | | | | | �� | | | | |
Cost of shares redeemed: | | | | | | | | | | | | | | | | | | | | |
Class A | | | (4 | ) | | | (21,494 | ) | | | (30,886 | ) | | | (21,695 | ) | | | (18,918 | ) |
Class B | | | | | | | (1,126 | ) | | | (2,689 | ) | | | (1,132 | ) | | | (1,941 | ) |
Class C | | | — | | | | (21,718 | ) | | | (20,629 | ) | | | (3,648 | ) | | | (3,362 | ) |
Class I | | | — | | | | (10,012 | ) | | | (12,507 | ) | | | (28,552 | ) | | | (3,328 | ) |
Class I2 | | | (820 | ) | | | (10,677 | ) | | | (43,197 | ) | | | (50,947 | ) | | | (8,256 | ) |
Class P | | | | | | | | | | | | | | | (53,917 | ) | | | (31,828 | ) |
| | | | | | | | | | | | | | | | | | | | |
| | | (824 | ) | | | (65,027 | ) | | | (109,908 | ) | | | (159,891 | ) | | | (67,633 | ) |
| | | | | | | | | | | | | | | | | | | | |
Automatic conversions: | | | | | | | | | | | | | | | | | | | | |
Class A | | | — | | | | 1,208 | | | | 2,688 | | | | 2,959 | | | | 3,139 | |
Class B | | | | | | | (1,208 | ) | | | (2,688 | ) | | | (2,959 | ) | | | (3,139 | ) |
| | | | | | | | | | | | | | | | | | | | |
| | | — | | | | — | | | | — | | | | — | | | | — | |
| | | | | | | | | | | | | | | | | | | | |
Class level conversions: | | | | | | | | | | | | | | | | | | | | |
Class I | | | — | | | | — | | | | — | | | | 50,880 | | | | — | |
Class P | | | | | | | | | | | | | | | (50,880 | ) | | | — | |
| | | | | | | | | | | | | | | | | | | | |
| | | — | | | | — | | | | — | | | | — | | | | — | |
| | | | | | | | | | | | | | | | | | | | |
| | | | |
| The notes to the financial statements are an integral part of this report. | | |
| Transamerica Funds | | | | Annual Report 2012 |
| | Page 119 | | |
STATEMENTS OF CHANGES IN NET ASSETS (continued)
For the years ended:
(all amounts in thousands)
| | | | | | | | | | | | | | | | | | | | |
| | | Transamerica
Emerging
Markets Equity | | | Transamerica Flexible Income | | | Transamerica Growth
Opportunities | |
| | | October 31,
2012(E) | | | October 31,
2012 | | | October 31,
2011 | | | October 31,
2012 | | | October 31,
2011 | |
Fair fund settlement: | | | | | | | | | | | | | | | | | | | | |
Class A | | | — | | | | — | | | | — | | | | 9 | | | | 1 | |
Class B | | | | | | | | | | | | | | | 1 | | | | — | (C) |
Class C | | | — | | | | — | | | | — | | | | 1 | | | | — | C) |
Class I | | | — | | | | — | | | | — | | | | 1 | | | | — | (C) |
Class I2 | | | — | | | | — | | | | — | | | | 9 | | | | 2 | |
Class P | | | | | | | | | | | | | | | 8 | | | | 1 | |
| | | | | | | | | | | | | | | | | | | | |
| | | — | | | | — | | | | — | | | | 29 | | | | 4 | |
| | | | | | | | | | | | | | | | | | | | |
Net increase (decrease) in net assets resulting from capital shares transactions | | | | | | | | | | | | | | | | | | | | |
| | | 110,619 | | | | 57,287 | | | | (1,529 | ) | | | 341,271 | | | | 16,745 | |
| | | | | | | | | | | | | | | | | | | | |
Net increase (decrease) in net assets | | | 108,040 | | | | 73,753 | | | | (6,582 | ) | | | 236,514 | | | | 51,891 | |
| | | | | | | | | | | | | | | | | | | | |
Net assets: | | | | | | | | | | | | | | | | | | | | |
Beginning of year | | $ | — | | | $ | 251,817 | | | $ | 258,399 | | | $ | 349,425 | | | $ | 297,534 | |
| | | | | | | | | | | | | | | | | | | | |
End of year | | $ | 108,040 | | | $ | 325,570 | | | $ | 251,817 | | | $ | 585,939 | | | $ | 349,425 | |
| | | | | | | | | | | | | | | | | | | | |
Undistributed net investment income | | $ | 710 | | | $ | 814 | | | $ | 876 | | | $ | 3,377 | | | $ | — | |
| | | | | | | | | | | | | | | | | | | | |
Share activity: | | | | | | | | | | | | | | | | | | | | |
Shares issued: | | | | | | | | | | | | | | | | | | | | |
Class A | | | 32 | | | | 2,761 | | | | 4,106 | | | | 1,193 | | | | 4,731 | |
Class B | | | | | | | 142 | | | | 183 | | | | 58 | | | | 77 | |
Class C | | | 27 | | | | 5,309 | | | | 3,846 | | | | 137 | | | | 334 | |
Class I | | | 32 | | | | 2,121 | | | | 2,493 | | | | 5,949 | | | | 1,070 | |
Class I2 | | | 11,448 | | | | 1,842 | | | | 46 | | | | 9,113 | | | | 97 | |
Class P | | | | | | | | | | | | | | | 299 | | | | 1,121 | |
| | | | | | | | | | | | | | | | | | | | |
| | | 11,539 | | | | 12,175 | | | | 10,674 | | | | 16,749 | | | | 7,430 | |
| | | | | | | | | | | | | | | | | | | | |
Shares issued on fund acquisition: | | | | | | | | | | | | | | | | | | | | |
Class I2 | | | — | | | | — | | | | — | | | | 29,633 | | | | — | |
| | | | | | | | | | | | | | | | | | | | |
| | | — | | | | — | | | | — | | | | 29,633 | | | | — | |
| | | | | | | | | | | | | | | | | | | | |
Shares issued-reinvested from dividends and distributions: | | | | | | | | | | | | | | | | | | | | |
Class A | | | — | | | | 332 | | | | 318 | | | | 2,691 | | | | — | |
Class B | | | | | | | 26 | | | | 34 | | | | 292 | | | | — | |
Class C | | | — | | | | 169 | | | | 139 | | | | 431 | | | | — | |
Class I | | | — | | | | 78 | | | | 60 | | | | 208 | | | | — | (D) |
Class I2 | | | — | | | | 691 | | | | 812 | | | | 2,725 | | | | 51 | |
Class P | | | | | | | | | | | | | | | 2,562 | | | | 10 | |
| | | | | | | | | | | | | | | | | | | | |
| | | — | | | | 1,296 | | | | 1,363 | | | | 8,909 | | | | 61 | |
| | | | | | | | | | | | | | | | | | | | |
Shares redeemed: | | | | | | | | | | | | | | | | | | | | |
Class A | | | — | (D) | | | (2,379 | ) | | | (3,446 | ) | | | (2,496 | ) | | | (1,647 | ) |
Class B | | | | | | | (125 | ) | | | (300 | ) | | | (147 | ) | | | (187 | ) |
Class C | | | — | | | | (2,410 | ) | | | (2,308 | ) | | | (481 | ) | | | (319 | ) |
Class I | | | — | | | | (1,101 | ) | | | (1,379 | ) | | | (3,219 | ) | | | (275 | ) |
Class I2 | | | (90 | ) | | | (1,178 | ) | | | (4,790 | ) | | | (5,504 | ) | | | (713 | ) |
Class P | | | | | | | | | | | | | | | (6,140 | ) | | | (2,751 | ) |
| | | | | | | | | | | | | | | | | | | | |
| | | (90 | ) | | | (7,193 | ) | | | (12,223 | ) | | | (17,987 | ) | | | (5,892 | ) |
| | | | | | | | | | | | | | | | | | | | |
Automatic conversions: | | | | | | | | | | | | | | | | | | | | |
Class A | | | — | | | | 134 | | | | 298 | | | | 349 | | | | 274 | |
| | | | | | | | | | | | | | | | | | | | |
Class B | | | | | | | (134 | ) | | | (297 | ) | | | (392 | ) | | | (299 | ) |
| | | | | | | | | | | | | | | | | | | | |
| | | — | | | | — | | | | 1 | | | | (43 | ) | | | (25 | ) |
| | | | | | | | | | | | | | | | | | | | |
Class level conversions: | | | | | | | | | | | | | | | | | | | | |
Class I | | | — | | | | — | | | | — | | | | 5,518 | | | | — | |
Class P | | | | | | | | | | | | | | | (5,748 | ) | | | — | |
| | | | | | | | | | | | | | | | | | | | |
| | | — | | | | — | | | | — | | | | (230 | ) | | | — | |
| | | | | | | | | | | | | | | | | | | | |
Net increase (decrease) in shares outstanding: | | | | | | | | | | | | | | | | | | | | |
Class A | | | 32 | | | | 848 | | | | 1,276 | | | | 1,737 | | | | 3,358 | |
Class B | | | | | | | (91 | ) | | | (380 | ) | | | (189 | ) | | | (409 | ) |
Class C | | | 27 | | | | 3,068 | | | | 1,677 | | | | 87 | | | | 15 | |
Class I | | | 32 | | | | 1,098 | | | | 1,174 | | | | 8,456 | | | | 795 | |
Class I2 | | | 11,358 | | | | 1,355 | | | | (3,932 | ) | | | 35,967 | | | | (565 | ) |
Class P | | | | | | | | | | | | | | | (9,027 | ) | | | (1,620 | ) |
| | | | | | | | | | | | | | | | | | | | |
| | | 11,449 | | | | 6,278 | | | | (185 | ) | | | 37,031 | | | | 1,574 | |
| | | | | | | | | | | | | | | | | | | | |
| | | | |
| The notes to the financial statements are an integral part of this report. | | |
| Transamerica Funds | | | | Annual Report 2012 |
| | Page 120 | | |
STATEMENTS OF CHANGES IN NET ASSETS (continued)
For the years ended:
(all amounts in thousands)
| | | | | | | | | | | | | | | | | | | | | | | | |
| | | Transamerica High Yield Bond | | | Transamerica International Bond | | | Transamerica International Equity | |
| | | October 31,
2012 | | | October 31,
2011 | | | October 31,
2012 | | | October 31,
2011 | | | October 31,
2012 | | | October 31,
2011 (F) | |
From operations: | | | | | | | | | | | | | | | | | | | | | | | | |
Net investment income | | $ | 45,463 $ | | | | 50,875 | | | $ | 4,698 $ | | | | 7,687 | | | $ | 4,379 $ | | | | 3,183 | |
Net realized gain(A) | | | 22,752 | | | | 28,507 | | | | 922 | | | | 32,094 | | | | 733 | | | | 1,747 | |
Net change in unrealized appreciation (depreciation) | | | 24,399 | | | | (47,639 | ) | | | (1,464 | ) | | | (43,769 | ) | | | 14,711 | | | | (10,477 | ) |
| | | | | | | | | | | | | | | | | | | | | | | | |
Net increase (decrease) in net assets resulting from operations | | | 92,614 | | | | 31,743 | | | | 4,156 | | | | (3,988 | ) | | | 19,823 | | | | (5,547 | ) |
| | | | | | | | | | | | | | | | | | | | | | | | |
Distributions to shareholders: | | | | | | | | | | | | | | | | | | | | | | | | |
From net investment income: | | | | | | | | | | | | | | | | | | | | | | | | |
Fund Level | | | — | | | | — | | | | — | | | | — | | | | — | | | | (1,049 | ) |
Class A | | | (15,588 | ) | | | (12,399 | ) | | | (1 | ) | | | | | | | (12 | ) | | | — | |
Class B | | | (536 | ) | | | (682 | ) | | | | | | | | | | | | | | | | |
Class C | | | (3,732 | ) | | | (2,837 | ) | | | — | (C) | | | | | | | (5 | ) | | | — | |
Class I | | | (5,331 | ) | | | (2,173 | ) | | | — | (C) | | | | | | | (2,013 | ) | | | — | |
Class I2 | | | (21,624 | ) | | | (30,575 | ) | | | (31,208 | ) | | | (32,153 | ) | | | (1,247 | ) | | | | |
Class P | | | (255 | ) | | | (1,368 | ) | | | | | | | | | | | | | | | | |
| | | | | | | | | | | | | | | | | | | | | | | | |
| | | (47,066 | ) | | | (50,034 | ) | | | (31,209 | ) | | | (32,153 | ) | | | (3,277 | ) | | | (1,049 | ) |
| | | | | | | | | | | | | | | | | | | | | | | | |
From net realized gains: | | | | | | | | | | | | | | | | | | | | | | | | |
Class I2 | | | — | | | | — | | | | (2,784 | ) | | | (3,267 | ) | | | — | | | | — | |
| | | | | | | | | | | | | | | | | | | | | | | | |
Total distributions to shareholders | | | (47,066 | ) | | | (50,034 | ) | | | (33,993 | ) | | | (35,420 | ) | | | (3,277 | ) | | | (1,049 | ) |
| | | | | | | | | | | | | | | | | | | | | | | | |
Capital share transactions: | | | | | | | | | | | | | | | | | | | | | | | | |
Proceeds from shares sold: | | | | | | | | | | | | | | | | | | | | | | | | |
Fund Level | | | — | | | | — | | | | — | | | | — | | | | — | | | | 1,812 | |
Class A | | | 217,329 | | | | 170,969 | | | | 192 | | | | | | | | 2,573 | | | | 458 | |
Class B | | | 1,152 | | | | 872 | | | | | | | | | | | | | | | | | |
Class C | | | 36,684 | | | | 18,711 | | | | 195 | | | | | | | | 4,565 | | | | 28 | |
Class I | | | 96,650 | | | | 77,275 | | | | 100 | | | | | | | | 10,863 | | | | 7,302 | |
Class I2 | | | 27,611 | | | | 117,637 | | | | 31,860 | | | | 282,605 | | | | 128,849 | | | | 50,397 | |
Class P | | | 15,313 | | | | 37,103 | | | | | | | | | | | | | | | | | |
| | | | | | | | | | | | | | | | | | | | | | | | |
| | | 394,739 | | | | 422,567 | | | | 32,347 | | | | 282,605 | | | | 146,850 | | | | 59,997 | |
| | | | | | | | | | | | | | | | | | | | | | | | |
Issued from fund acquisition: | | | | | | | | | | | | | | | | | | | | | | | | |
Class A | | | — | | | | — | | | | — | | | | | | | | — | | | | 100 | |
Class C | | | — | | | | — | | | | — | | | | | | | | — | | | | 100 | |
Class I | | | — | | | | — | | | | — | | | | | | | | — | | | | 83,612 | |
Class I2 | | | — | | | | — | | | | — | | | | — | | | | — | | | | — | (C) |
| | | | | | | | | | | | | | | | | | | | | | | | |
| | | — | | | | — | | | | — | | | | — | | | | — | | | | 83,812 | |
| | | | | | | | | | | | | | | | | | | | | | | | |
Dividends and distributions reinvested: | | | | | | | | | | | | | | | | | | | | | | | | |
Fund Level | | | — | | | | — | | | | — | | | | — | | | | — | | | | 1,003 | |
Class A | | | 13,362 | | | | 10,773 | | | | 1 | | | | | | | | 11 | | | | — | |
Class B | | | 462 | | | | 479 | | | | | | | | | | | | | | | | | |
Class C | | | 2,808 | | | | 1,883 | | | | — | (C) | | | | | | | 5 | | | | — | |
Class I | | | 4,106 | | | | 1,397 | | | | — | (C) | | | | | | | 1,883 | | | | — | |
Class I2 | | | 21,624 | | | | 30,575 | | | | 33,992 | | | | 35,420 | | | | 1,247 | | | | — | |
Class P | | | 247 | | | | 1,322 | | | | | | | | | | | | | | | | | |
| | | | | | | | | | | | | | | | | | | | | | | | |
| | | 42,609 | | | | 46,429 | | | | 33,993 | | | | 35,420 | | | | 3,146 | | | | 1,003 | |
| | | | | | | | | | | | | | | | | | | | | | | | |
Redeemed due to acquisition: | | | | | | | | | | | | | | | | | | | | | | | | |
Fund Level | | | — | | | | — | | | | — | | | | — | | | | — | | | | (83,612 | ) |
| | | | | | | | | | | | | | | | | | | | | | | | |
Cost of shares redeemed: | | | | | | | | | | | | | | | | | | | | | | | | |
Fund Level | | | — | | | | — | | | | — | | | | — | | | | — | | | | (1,336 | ) |
Class A | | | (219,318 | ) | | | (146,735 | ) | | | (31 | ) | | | | | | | (219 | ) | | | (40 | ) |
Class B | | | (1,219 | ) | | | (2,719 | ) | | | | | | | | | | | | | | | | |
Class C | | | (15,610 | ) | | | (12,369 | ) | | | — | | | | | | | | (64 | ) | | | (1 | ) |
Class I | | | (109,609 | ) | | | (23,545 | ) | | | — | | | | | | | | (8,533 | ) | | | (2,844 | ) |
Class I2 | | | (208,758 | ) | | | (153,205 | ) | | | (317,984 | ) | | | (250,466 | ) | | | (19,398 | ) | | | — | (C) |
Class P | | | (9,724 | ) | | | (40,924 | ) | | | | | | | | | | | | | | | | |
| | | | | | | | | | | | | | | | | | | | | | | | |
| | | (564,238 | ) | | | (379,497 | ) | | | (318,015 | ) | | | (250,466 | ) | | | (28,214 | ) | | | (4,221 | ) |
| | | | | | | | | | | | | | | | | | | | | | | | |
Automatic conversions: | | | | | | | | | | | | | | | | | | | | | | | | |
Class A | | | 1,219 | | | | 2,901 | | | | — | | | | | | | | — | | | | — | |
Class B | | | (1,219 | ) | | | (2,901 | ) | | | | | | | | | | | | | | | | |
| | | | | | | | | | | | | | | | | | | | | | | | |
| | | — | | | | — | | | | — | | | | — | | | | — | | | | — | |
| | | | | | | | | | | | | | | | | | | | | | | | |
Class level conversions: | | | | | | | | | | | | | | | | | | | | | | | | |
Class I | | | 25,615 | | | | — | | | | — | | | | | | | | — | | | | — | |
Class P | | | (25,615 | ) | | | — | | | | | | | | | | | | | | | | | |
| | | | | | | | | | | | | | | | | | | | | | | | |
| | | — | | | | — | | | | — | | | | — | | | | — | | | | — | |
| | | | | | | | | | | | | | | | | | | | | | | | |
| | | | |
| The notes to the financial statements are an integral part of this report. | | |
| Transamerica Funds | | | | Annual Report 2012 |
| | Page 121 | | |
STATEMENTS OF CHANGES IN NET ASSETS (continued)
For the years ended:
(all amounts in thousands)
| | | | | | | | | | | | | | | | | | | | | | | | |
| | | Transamerica High Yield Bond | | | Transamerica International Bond | | | Transamerica International Equity | |
| | | October 31,
2012 | | | October 31,
2011 | | | October 31,
2012 | | | October 31,
2011 | | | October 31,
2012 | | | October 31,
2011 (F) | |
Fair fund settlement: | | | | | | | | | | | | | | | | | | | | | | | | |
Class A | | | 1 | | | | — | | | | — | | | | | | | | — | | | | — | |
Class B | | | — | (C) | | | — | | | | | | | | | | | | | | | | | |
Class C | | | — | (C) | | | — | | | | — | | | | | | | | — | | | | — | |
Class I | | | — | (C) | | | — | | | | — | | | | | | | | — | | | | — | |
Class I2 | | | 2 | | | | — | | | | — | | | | — | | | | — | | | | — | |
Class P | | | — | (C) | | | — | | | | | | | | | | | | | | | | | |
| | | | | | | | | | | | | | | | | | | | | | | | |
| | | 3 | | | | — | | | | — | | | | — | | | | — | | | | — | |
| | | | | | | | | | | | | | | | | | | | | | | | |
Net increase (decrease) in net assets resulting from capital shares transactions | | | | | | | | | | | | | | | | | | | | | | | | |
| | | (126,887 | ) | | | 89,499 | | | | (251,675 | ) | | | 67,559 | | | | 121,782 | | | | 56,979 | |
| | | | | | | | | | | | | | | | | | | | | | | | |
Net increase (decrease) in net assets | | | (81,339 | ) | | | 71,208 | | | | (281,512 | ) | | | 28,151 | | | | 138,328 | | | | 50,383 | |
| | | | | | | | | | | | | | | | | | | | | | | | |
Net assets: | | | | | | | | | | | | | | | | | | | | | | | | |
Beginning of year | | $ | 777,762 | | | $ | 706,554 | | | $ | 475,292 | | | $ | 447,141 | | | $ | 125,654 | | | $ | 75,271 | |
| | | | | | | | | | | | | | | | | | | | | | | | |
End of year | | $ | 696,423 | | | $ | 777,762 | | | $ | 193,780 | | | $ | 475,292 | | | $ | 263,982 | | | $ | 125,654 | |
| | | | | | | | | | | | | | | | | | | | | | | | |
Undistributed (accumulated) net investment income (loss) | | $ | 1,012 | | | $ | 2,568 | | | $ | (4,057 | ) | | $ | 23,705 | | | $ | 3,926 | | | $ | 3,001 | |
| | | | | | | | | | | | | | | | | | | | | | | | |
Share activity: | | | | | | | | | | | | | | | | | | | | | | | | |
Shares issued: | | | | | | | | | | | | | | | | | | | | | | | | |
Fund Level | | | — | | | | — | | | | — | | | | — | | | | — | | | | 136 | |
Class A | | | 23,583 | | | | 19,065 | | | | 19 | | | | | | | | 185 | | | | 32 | |
Class B | | | 123 | | | | 96 | | | | | | | | | | | | | | | | | |
Class C | | | 3,984 | | | | 2,054 | | | | 19 | | | | | | | | 334 | | | | 1 | |
Class I | | | 10,433 | | | | 8,701 | | | | 10 | | | | | | | | 783 | | | | 526 | |
Class I2 | | | 2,963 | | | | 12,683 | | | | 3,057 | | | | 24,524 | | | | 9,235 | | | | 3,429 | |
Class P | | | 1,704 | | | | 4,043 | | | | | | | | | | | | | | | | | |
| | | | | | | | | | | | | | | | | | | | | | | | |
| | | 42,790 | | | | 46,642 | | | | 3,105 | | | | 24,524 | | | | 10,537 | | | | 4,124 | |
| | | | | | | | | | | | | | | | | | | | | | | | |
Shares issued on fund acquisition: | | | | | | | | | | | | | | | | | | | | | | | | |
Class A | | | — | | | | — | | | | — | | | | | | | | — | | | | 7 | |
Class C | | | — | | | | — | | | | — | | | | | | | | — | | | | 7 | |
Class I | | | — | | | | — | | | | — | | | | | | | | — | | | | 5,502 | |
Class I2 | | | — | | | | — | | | | — | | | | — | | | | — | | | | — | (D) |
| | | | | | | | | | | | | | | | | | | | | | | | |
| | | — | | | | — | | | | — | | | | — | | | | — | | | | 5,516 | |
| | | | | | | | | | | | | | | | | | | | | | | | |
Shares issued-reinvested from dividends and distributions: | | | | | | | | | | | | | | | | | | | | | | | | |
Fund Level | | | — | | | | — | | | | — | | | | — | | | | — | | | | 71 | |
Class A | | | 1,452 | | | | 1,183 | | | | — | (D) | | | | | | | 1 | | | | — | |
Class B | | | 50 | | | | 53 | | | | | | | | | | | | | | | | | |
Class C | | | 305 | | | | 208 | | | | — | (D) | | | | | | | — | (D) | | | — | |
Class I | | | 442 | | | | 154 | | | | — | (D) | | | | | | | 153 | | | | — | |
Class I2 | | | 2,345 | | | | 3,340 | | | | 3,365 | | | | 3,358 | | | | 101 | | | | — | |
Class P | | | 28 | | | | 145 | | | | | | | | | | | | | | | | | |
| | | | | | | | | | | | | | | | | | | | | | | | |
| | | 4,622 | | | | 5,083 | | | | 3,365 | | | | 3,358 | | | | 255 | | | | 71 | |
| | | | | | | | | | | | | | | | | | | | | | | | |
Shares redeemed due to acquisition: | | | | | | | | | | | | | | | | | | | | | | | | |
Fund Level | | | — | | | | — | | | | — | | | | — | | | | — | | | | (5,502 | ) |
| | | | | | | | | | | | | | | | | | | | | | | | |
Shares redeemed: | | | | | | | | | | | | | | | | | | | | | | | | |
Fund Level | | | — | | | | — | | | | — | | | | — | | | | — | | | | (94 | ) |
Class A | | | (24,048 | ) | | | (16,105 | ) | | | (3 | ) | | | | | | | (16 | ) | | | (3 | ) |
Class B | | | (132 | ) | | | (297 | ) | | | | | | | | | | | | | | | | |
Class C | | | (1,705 | ) | | | (1,373 | ) | | | — | | | | | | | | (4 | ) | | | — | (D) |
Class I | | | (12,141 | ) | | | (2,603 | ) | | | — | | | | | | | | (623 | ) | | | (195 | ) |
Class I2 | | | (22,453 | ) | | | (17,227 | ) | | | (30,348 | ) | | | (22,601 | ) | | | (1,428 | ) | | | — | (D) |
Class P | | | (1,107 | ) | | | (4,435 | ) | | | | | | | | | | | | | | | | |
| | | | | | | | | | | | | | | | | | | | | | | | |
| | | (61,586 | ) | | | (42,040 | ) | | | (30,351 | ) | | | (22,601 | ) | | | (2,071 | ) | | | (292 | ) |
| | | | | | | | | | | | | | | | | | | | | | | | |
Automatic conversions: | | | | | | | | | | | | | | | | | | | | | | | | |
Class A | | | 133 | | | | 315 | | | | — | | | | | | | | — | | | | — | |
Class B | | | (133 | ) | | | (315 | ) | | | | | | | | | | | | | | | | |
| | | | | | | | | | | | | | | | | | | | | | | | |
| | | — | | | | — | | | | — | | | | — | | | | — | | | | — | |
| | | | | | | | | | | | | | | | | | | | | | | | |
Class level conversions: | | | | | | | | | | | | | | | | | | | | | | | | |
Class I | | | 2,760 | | | | — | | | | — | | | | | | | | — | | | | — | |
Class P | | | (2,775 | ) | | | — | | | | | | | | | | | | | | | | | |
| | | | | | | | | | | | | | | | | | | | | | | | |
| | | (15 | ) | | | — | | | | — | | | | — | | | | — | | | | — | |
| | | | | | | | | | | | | | | | | | | | | | | | |
Net increase (decrease) in shares outstanding: | | | | | | | | | | | | | | | | | | | | | | | | |
Fund Level | | | — | | | | — | | | | — | | | | — | | | | — | | | | (5,839 | ) |
Class A | | | 1,120 | | | | 4,458 | | | | 16 | | | | | | | | 170 | | | | 36 | |
Class B | | | (92 | ) | | | (463 | ) | | | | | | | | | | | | | | | | |
Class C | | | 2,584 | | | | 889 | | | | 19 | | | | | | | | 330 | | | | 8 | |
Class I | | | 1,494 | | | | 6,252 | | | | 10 | | | | | | | | 313 | | | | 5,833 | |
Class I2 | | | (17,145 | ) | | | (1,204 | ) | | | (23,926 | ) | | | 5,281 | | | | 7,908 | | | | 3,429 | |
Class P | | | (2,150 | ) | | | (247 | ) | | | | | | | | | | | | | | | | |
| | | | | | | | | | | | | | | | | | | | | | | | |
| | | (14,189 | ) | | | 9,685 | | | | (23,881 | ) | | | 5,281 | | | | 8,721 | | | | 3,917 | |
| | | | | | | | | | | | | | | | | | | | | | | | |
| | | | |
| The notes to the financial statements are an integral part of this report. | | |
| Transamerica Funds | | | | Annual Report 2012 |
| | Page 122 | | |
STATEMENTS OF CHANGES IN NET ASSETS (continued)
For the years ended:
(all amounts in thousands)
| | | | | | | | | | | | | | | | | | | | |
| | | Transamerica
Large Cap
Growth | | | Transamerica Large Cap Value | | | Transamerica Money Market | |
| | | October 31,
2012(E) | | | October 31,
2012 | | | October 31,
2011(G) | | | October 31,
2012 | | | October 31,
2011 | |
From operations: | | | | | | | | | | | | | | | | | | | | |
Net investment income | | $ | 725 | | | $ | 29,115 | | | $ | 18,749 | | | $ | 34 | | | $ | 14 | |
Net realized gain (loss)(A) | | | (1,548 | ) | | | 89,724 | | | | (17,118 | ) | | | — | | | | — | |
Net change in unrealized appreciation (depreciation) | | | (962 | ) | | | 76,147 | | | | 2,423 | | | | — | | | | — | |
| | | | | | | | | | | | | | | | | | | | |
Net increase (decrease) in net assets resulting from operations | | | (1,785 | ) | | | 194,986 | | | | 4,054 | | | | 34 | | | | 14 | |
| | | | | | | | | | | | | | | | | | | | |
Distributions to shareholders: | | | | | | | | | | | | | | | | | | | | |
From net investment income: | | | | | | | | | | | | | | | | | | | | |
Class A | | | — | | | | (29 | ) | | | (8 | ) | | | (3 | ) | | | (3 | ) |
Class B | | | | | | | | | | | | | | | — | (C) | | | (1 | ) |
Class C | | | — | | | | (21 | ) | | | (7 | ) | | | (1 | ) | | | (1 | ) |
Class I | | | — | | | | (174 | ) | | | (7 | ) | | | (3 | ) | | | — | (C) |
Class I2 | | | — | | | | (29,944 | ) | | | (16,285 | ) | | | (22 | ) | | | (4 | ) |
Class P | | | | | | | | | | | | | | | (5 | ) | | | (5 | ) |
| | | | | | | | | | | | | | | | | | | | |
Total distributions to shareholders | | | — | | | | (30,168 | ) | | | (16,307 | ) | | | (34 | ) | | | (14 | ) |
| | | | | | | | | | | | | | | | | | | | |
Capital share transactions: | | | | | | | | | | | | | | | | | | | | |
Proceeds from shares sold: | | | | | | | | | | | | | | | | | | | | |
Class A | | | 421 | | | | 1,416 | | | | 1,252 | | | | 83,736 | | | | 96,642 | |
Class B | | | | | | | | | | | | | | | 3,377 | | | | 9,304 | |
Class C | | | 286 | | | | 402 | | | | 1,967 | | | | 22,813 | | | | 32,873 | |
Class I | | | 802 | | | | 4,172 | | | | 7,832 | | | | 22,049 | | | | — | |
Class I2 | | | 140,050 | | | | 259,850 | | | | 1,510,101 | | | | 829,533 | | | | 19,769 | |
Class P | | | | | | | | | | | | | | | 1,489 | | | | 7,531 | |
| | | | | | | | | | | | | | | | | | | | |
| | | 141,559 | | | | 265,840 | | | | 1,521,152 | | | | 962,997 | | | | 166,119 | |
| | | | | | | | | | | | | | | | | | | | |
Dividends and distributions reinvested: | | | | | | | | | | | | | | | | | | | | |
Class A | | | — | | | | 29 | | | | 7 | | | | 3 | | | | 3 | |
Class B | | | | | | | | | | | | | | | — | (C) | | | 1 | |
Class C | | | — | | | | 16 | | | | 6 | | | | 1 | | | | 1 | |
Class I | | | — | | | | 174 | | | | 7 | | | | 3 | | | | — | (C) |
Class I2 | | | — | | | | 29,944 | | | | 16,285 | | | | 22 | | | | 4 | |
Class P | | | | | | | | | | | | | | | 5 | | | | 5 | |
| | | | | | | | | | | | | | | | | | | | |
| | | — | | | | 30,163 | | | | 16,305 | | | | 34 | | | | 14 | |
| | | | | | | | | | | | | | | | | | | | |
Cost of shares redeemed: | | | | | | | | | | | | | | | | | | | | |
Class A | | | — | | | | (718 | ) | | | (186 | ) | | | (102,999 | ) | | | (106,542 | ) |
Class B | | | | | | | | | | | | | | | (6,836 | ) | | | (10,784 | ) |
Class C | | | — | | | | (690 | ) | | | (131 | ) | | | (27,501 | ) | | | (30,595 | ) |
Class I | | | (10 | ) | | | (9,171 | ) | | | (330 | ) | | | (21,964 | ) | | | — | (C) |
Class I2 | | | (2,974 | ) | | | (462,112 | ) | | | (185,461 | ) | | | (194,701 | ) | | | (23,936 | ) |
Class P | | | | | | | | | | | | | | | (3,464 | ) | | | (12,309 | ) |
| | | | | | | | | | | | | | | | | | | | |
| | | (2,984 | ) | | | (472,691 | ) | | | (186,108 | ) | | | (357,465 | ) | | | (184,162 | ) |
| | | | | | | | | | | | | | | | | | | | |
Automatic conversions: | | | | | | | | | | | | | | | | | | | | |
Class A | | | — | | | | — | | | | — | | | | 2,570 | | | | 2,643 | |
Class B | | | | | | | | | | | | | | | (2,570 | ) | | | (2,643 | ) |
| | | | | | | | | | | | | | | | | | | | |
| | | — | | | | — | | | | — | | | | — | | | | — | |
| | | | | | | | | | | | | | | | | | | | |
Class level conversions: | | | | | | | | | | | | | | | | | | | | |
Class I | | | — | | | | — | | | | — | | | | 25,317 | | | | — | |
Class P | | | | | | | | | | | | | | | (25,317 | ) | | | — | |
| | | | | | | | | | | | | | | | | | | | |
| | | — | | | | — | | | | — | | | | — | | | | — | |
| | | | | | | | | | | | | | | | | | | | |
Net increase (decrease) in net assets resulting from capital shares transactions | | | | | | | | | | | | | | | | | | | | |
| | | 138,575 | | | | (176,688 | ) | | | 1,351,349 | | | | 605,566 | | | | (18,033 | ) |
| | | | | | | | | | | | | | | | | | | | |
Net increase (decrease) in net assets | | | 136,790 | | | | (11,870 | ) | | | 1,339,096 | | | | 605,566 | | | | (18,033 | ) |
| | | | | | | | | | | | | | | | | | | | |
Net assets: | | | | | | | | | | | | | | | | | | | | |
Beginning of year | | $ | — | | | $ | 1,339,096 | | | $ | — | | | $ | 208,840 | | | $ | 226,873 | |
| | | | | | | | | | | | | | | | | | | | |
End of year | | $ | 136,790 | | | $ | 1,327,226 | | | $ | 1,339,096 | | | $ | 814,406 | | | $ | 208,840 | |
| | | | | | | | | | | | | | | | | | | | |
Undistributed (accumulated) net investment income (loss) | | $ | 750 | | | $ | 1,451 | | | $ | 2,504 | | | $ | — | | | $ | — | |
| | | | | | | | | | | | | | | | | | | | |
| | | | |
| The notes to the financial statements are an integral part of this report. | | |
| Transamerica Funds | | | | Annual Report 2012 |
| | Page 123 | | |
STATEMENTS OF CHANGES IN NET ASSETS (continued)
For the years ended:
(all amounts in thousands)
| | | | | | | | | | | | | | | | | | | | |
| | | Transamerica
Large Cap
Growth | | | Transamerica Large Cap Value | | | Transamerica Money
Market | |
| | | October 31,
2012(E) | | | October 31,
2012 | | | October 31,
2011(G) | | | October 31,
2012 | | | October 31,
2011 | |
Share activity: | | | | | | | | | | | | | | | | | | | | |
Shares issued: | | | | | | | | | | | | | | | | | | | | |
Class A | | | 43 | | | | 125 | | | | 115 | | | | 83,736 | | | | 96,642 | |
Class B | | | | | | | | | | | | | | | 3,377 | | | | 9,304 | |
Class C | | | 29 | | | | 36 | | | | 182 | | | | 22,813 | | | | 32,873 | |
Class I | | | 81 | | | | 369 | | | | 791 | | | | 22,049 | | | | — | |
Class I2 | | | 14,005 | | | | 23,896 | | | | 145,726 | | | | 829,533 | | | | 19,769 | |
Class P | | | | | | | | | | | | | | | 1,489 | | | | 7,531 | |
| | | | | | | | | | | | | | | | | | | | |
| | | 14,158 | | | | 24,426 | | | | 146,814 | | | | 962,997 | | | | 166,119 | |
| | | | | | | | | | | | | | | | | | | | |
Shares issued-reinvested from dividends and distributions: | | | | | | | | | | | | | | | | | | | | |
Class A | | | — | | | | 3 | | | | 1 | | | | 3 | | | | 3 | |
Class B | | | | | | | | | | | | | | | — | (D) | | | — | (D) |
Class C | | | — | | | | 2 | | | | — | (D) | | | 1 | | | | 1 | |
Class I | | | — | | | | 16 | | | | 1 | | | | 3 | | | | — | (D) |
Class I2 | | | — | | | | 2,750 | | | | 1,557 | | | | 22 | | | | 4 | |
Class P | | | | | | | | | | | | | | | 5 | | | | 6 | |
| | | | | | | | | | | | | | | | | | | | |
| | | — | | | | 2,771 | | | | 1,559 | | | | 34 | | | | 14 | |
| | | | | | | | | | | | | | | | | | | | |
Shares redeemed: | | | | | | | | | | | | | | | | | | | | |
Class A | | | — | | | | (62 | ) | | | (17 | ) | | | (102,999 | ) | | | (106,542 | ) |
Class B | | | | | | | | | | | | | | | (6,836 | ) | | | (10,784 | ) |
Class C | | | — | | | | (62 | ) | | | (12 | ) | | | (27,501 | ) | | | (30,595 | ) |
Class I | | | (1 | ) | | | (845 | ) | | | (31 | ) | | | (21,964 | ) | | | — | (D) |
Class I2 | | | (305 | ) | | | (43,605 | ) | | | (18,497 | ) | | | (194,701 | ) | | | (23,936 | ) |
Class P | | | | | | | | | | | | | | | (3,464 | ) | | | (12,308 | ) |
| | | | | | | | | | | | | | | | | | | | |
| | | (306 | ) | | | (44,574 | ) | | | (18,557 | ) | | | (357,465 | ) | | | (184,166 | ) |
| | | | | | | | | | | | | | | | | | | | |
Automatic conversions: | | | | | | | | | | | | | | | | | | | | |
Class A | | | — | | | | — | | | | — | | | | 2,570 | | | | 2,643 | |
Class B | | | | | | | | | | | | | | | (2,570 | ) | | | (2,643 | ) |
| | | | | | | | | | | | | | | | | | | | |
| | | — | | | | — | | | | — | | | | — | | | | — | |
| | | | | | | | | | | | | | | | | | | | |
Automatic conversions: | | | | | | | | | | | | | | | | | | | | |
Class A | | | — | | | | — | | | | — | | | | 25,317 | | | | 2,643 | |
Class B | | | | | | | | | | | | | | | (25,317 | ) | | | (2,643 | ) |
| | | | | | | | | | | | | | | | | | | | |
| | | — | | | | — | | | | — | | | | — | | | | — | |
| | | | | | | | | | | | | | | | | | | | |
Net increase (decrease) in shares outstanding: | | | | | | | | | | | | | | | | | | | | |
Class A | | | 43 | | | | 66 | | | | 99 | | | | (16,690 | ) | | | (7,254 | ) |
Class B | | | | | | | | | | | | | | | (6,029 | ) | | | (4,123 | ) |
Class C | | | 29 | | | | (24 | ) | | | 170 | | | | (4,687 | ) | | | 2,279 | |
Class I | | | 80 | | | | (460 | ) | | | 761 | | | | 25,405 | | | | — | |
Class I2 | | | 13,700 | | | | (16,959 | ) | | | 128,786 | | | | 634,854 | | | | (4,163 | ) |
Class P | | | | | | | | | | | | | | | (27,287 | ) | | | (4,772 | ) |
| | | | | | | | | | | | | | | | | | | | |
| | | 13,852 | | | | (17,377 | ) | | | 129,816 | | | | 605,566 | | | | (18,033 | ) |
| | | | | | | | | | | | | | | | | | | | |
| | | | |
| The notes to the financial statements are an integral part of this report. | | |
| Transamerica Funds | | | | Annual Report 2012 |
| | Page 124 | | |
STATEMENTS OF CHANGES IN NET ASSETS (continued)
For the years ended:
(all amounts in thousands)
| | | | | | | | | | | | | | | | | | | | | | | | |
| | | Transamerica Multi-Managed
Balanced | | | Transamerica Short-Term Bond | | | Transamerica
Small Cap
Growth | | | Transamerica
Small Cap Value | |
| | | October 31,
2012 | | | October 31,
2011 | | | October 31,
2012 | | | October 31,
2011 | | | October 31,
2012 (H) | | | October 31,
2012 (E) | |
From operations: | | | | | | | | | | | | | | | | | | | | | | | | |
Net investment income (loss) | | $ | 4,675 | | | $ | 4,612 | | | $ | 94,532 | | | $ | 99,140 | | | $ | (237 | ) | | $ | 1,631 | |
Net realized gain (loss)(A) | | | 12,722 | | | | 78,904 | | | | 21,700 | | | | 20,987 | | | | (2,235 | ) | | | (945 | ) |
Net change in unrealized appreciation (depreciation) | | | 20,142 | | | | (48,531 | ) | | | 59,079 | | | | (66,942 | ) | | | (8,879 | ) | | | 2,837 | |
| | | | | | | | | | | | | | | | | | | | | | | | |
Net increase (decrease) in net assets resulting from operations | | | 37,539 | | | | 34,985 | | | | 175,311 | | | | 53,185 | | | | (11,351 | ) | | | 3,523 | |
| | | | | | | | | | | | | | | | | | | | | | | | |
Net equalization credit and charges | | | — | | | | (14,794 | ) | | | — | | | | — | | | | — | | | | — | |
| | | | | | | | | | | | | | | | | | | | | | | | |
Distributions to shareholders: | | | | | | | | | | | | | | | | | | | | | | | | |
From net investment income: | | | | | | | | | | | | | | | | | | | | | | | | |
Class A | | | (1,654 | ) | | | (1,337 | ) | | | (25,260 | ) | | | (30,442 | ) | | | — | | | | — | |
Class B | | | (61 | ) | | | (46 | ) | | | | | | | | | | | | | | | | |
Class C | | | (484 | ) | | | (239 | ) | | | (21,624 | ) | | | (24,518 | ) | | | — | | | | — | |
Class I | | | (2,454 | ) | | | (95 | ) | | | (11,280 | ) | | | (9,068 | ) | | | — | | | | — | |
Class I2 | | | | | | | | | | | (39,814 | ) | | | (37,865 | ) | | | — | | | | — | |
Class P | | | (657 | ) | | | (2,803 | ) | | | | | | | | | | | | | | | | |
| | | | | | | | | | | | | | | | | | | | | | | | |
| | | (5,310 | ) | | | (4,520 | ) | | | (97,978 | ) | | | (101,893 | ) | | | — | | | | — | |
| | | | | | | | | | | | | | | | | | | | | | | | |
From net realized gains: | | | | | | | | | | | | | | | | | | | | | | | | |
Class A | | | (14,336 | ) | | | — | | | | (5,501 | ) | | | (1,873 | ) | | | — | | | | — | |
Class B | | | (1,301 | ) | | | — | | | | | | | | | | | | | | | | | |
Class C | | | (5,406 | ) | | | — | | | | (6,009 | ) | | | (1,877 | ) | | | — | | | | — | |
Class I | | | (1,677 | ) | | | — | | | | (1,936 | ) | | | (450 | ) | | | — | | | | — | |
Class I2 | | | | | | | | | | | (6,847 | ) | | | (2,237 | ) | | | — | | | | — | |
Class P | | | (21,641 | ) | | | — | | | | | | | | | | | | | | | | | |
| | | | | | | | | | | | | | | | | | | | | | | | |
| | | (44,361 | ) | | | — | | | | (20,293 | ) | | | (6,437 | ) | | | — | | | | — | |
| | | | | | | | | | | | | | | | | | | | | | | | |
Total distributions to shareholders | | | (49,671 | ) | | | (4,520 | ) | | | (118,271 | ) | | | (108,330 | ) | | | — | | | | — | |
| | | | | | | | | | | | | | | | | | | | | | | | |
Capital share transactions: | | | | | | | | | | | | | | | | | | | | | | | | |
Proceeds from shares sold: | | | | | | | | | | | | | | | | | | | | | | | | |
Class A | | | 24,778 | | | | 58,119 | | | | 307,909 | | | | 359,599 | | | | 252 | | | | 272 | |
Class B | | | 2,416 | | | | 1,366 | | | | | | | | | | | | | | | | | |
Class C | | | 28,526 | | | | 19,491 | | | | 194,377 | | | | 268,987 | | | | 250 | | | | 257 | |
Class I | | | 89,462 | | | | 15,514 | | | | 253,607 | | | | 245,690 | | | | 250 | | | | 369 | |
Class I2 | | | | | | | | | | | 763,722 | | | | 181,462 | | | | 250,747 | | | | 293,480 | |
Class P | | | 3,612 | | | | 21,072 | | | | | | | | | | | | | | | | | |
| | | | | | | | | | | | | | | | | | | | | | | | |
| | | 148,794 | | | | 115,562 | | | | 1,519,615 | | | | 1,055,738 | | | | 251,499 | | | | 294,378 | |
| | | | | | | | | | | | | | | | | | | | | | | | |
Dividends and distributions reinvested: | | | | | | | | | | | | | | | | | | | | | | | | |
Class A | | | 15,186 | | | | 1,253 | | | | 26,299 | | | | 25,781 | | | | — | | | | — | |
Class B | | | 1,316 | | | | 45 | | | | | | | | | | | | | | | | | |
Class C | | | 5,150 | | | | 208 | | | | 22,189 | | | | 18,792 | | | | — | | | | — | |
Class I | | | 2,682 | | | | 49 | | | | 8,680 | | | | 4,400 | | | | — | | | | — | |
Class I2 | | | | | | | | | | | 47,638 | | | | 40,262 | | | | — | | | | — | |
Class P | | | 22,142 | | | | 2,782 | | | | | | | | | | | | | | | | | |
| | | | | | | | | | | | | | | | | | | | | | | | |
| | | 46,476 | | | | 4,337 | | | | 104,806 | | | | 89,235 | | | | — | | | | — | |
| | | | | | | | | | | | | | | | | | | | | | | | |
Cost of shares redeemed: | | | | | | | | | | | | | | | | | | | | | | | | |
Class A | | | (21,285 | ) | | | (60,819 | ) | | | (332,998 | ) | | | (446,889 | ) | | | — | | | | — | |
Class B | | | (1,197 | ) | | | (2,492 | ) | | | | | | | | | | | | | | | | |
Class C | | | (8,690 | ) | | | (7,139 | ) | | | (220,416 | ) | | | (259,670 | ) | | | — | | | | — | |
Class I | | | (21,460 | ) | | | (3,914 | ) | | | (170,843 | ) | | | (173,095 | ) | | | — | | | | (3 | ) |
Class I2 | | | | | | | | | | | (237,265 | ) | | | (278,428 | ) | | | (48 | ) | | | (8,344 | ) |
Class P | | | (93,138 | ) | | | (73,052 | ) | | | | | | | | | | | | | | | | |
| | | | | | | | | | | | | | | | | | | | | | | | |
| | | (145,770 | ) | | | (147,416 | ) | | | (961,522 | ) | | | (1,158,082 | ) | | | (48 | ) | | | (8,347 | ) |
| | | | | | | | | | | | | | | | | | | | | | | | |
Automatic conversions: | | | | | | | | | | | | | | | | | | | | | | | | |
Class A | | | 3,039 | | | | 4,839 | | | | — | | | | — | | | | — | | | | — | |
Class B | | | (3,039 | ) | | | (4,839 | ) | | | | | | | | | | | | | | | | |
| | | | | | | | | | | | | | | | | | | | | | | | |
| | | — | | | | — | | | | — | | | | — | | | | — | | | | — | |
| | | | | | | | | | | | | | | | | | | | | | | | |
Class level conversions: | | | | | | | | | | | | | | | | | | | | | | | | |
Class I | | | 86,888 | | | | — | | | | — | | | | — | | | | — | | | | — | |
Class P | | | (86,888 | ) | | | — | | | | | | | | | | | | | | | | | |
| | | | | | | | | | | | | | | | | | | | | | | | |
| | | — | | | | — | | | | — | | | | — | | | | — | | | | — | |
| | | | | | | | | | | | | | | | | | | | | | | | |
Net income equalization | | | — | | | | 14,794 | | | | — | | | | — | | | | — | | | | — | |
| | | | | | | | | | | | | | | | | | | | | | | | |
Net increase (decrease) in net assets resulting from capital shares transactions | | | | | | | | | | | | | | | | | | | | | | | | |
| | | 49,500 | | | | (12,723 | ) | | | 662,899 | | | | (13,109 | ) | | | 251,451 | | | | 286,031 | |
| | | | | | | | | | | | | | | | | | | | | | | | |
Net increase (decrease) in net assets | | | 37,368 | | | | 2,948 | | | | 719,939 | | | | (68,254 | ) | | | 240,100 | | | | 289,554 | |
| | | | | | | | | | | | | | | | | | | | | | | | |
Net assets: | | | | | | | | | | | | | | | | | | | | | | | | |
Beginning of year | | $ | 336,549 | | | $ | 333,601 | | | $ | 2,821,089 | | | $ | 2,889,343 | | | $ | — | | | $ | — | |
| | | | | | | | | | | | | | | | | | | | | | | | |
End of year | | $ | 373,917 | | | $ | 336,549 | | | $ | 3,541,028 | | | $ | 2,821,089 | | | $ | 240,100 | | | $ | 289,554 | |
| | | | | | | | | | | | | | | | | | | | | | | | |
Undistributed (accumulated) net investment income (loss) | | $ | 290 | | | $ | 556 | | | $ | (1,273 | ) | | $ | (2,420 | ) | | $ | (183 | ) | | $ | 1,657 | |
| | | | | | | | | | | | | | | | | | | | | | | | |
| | | | |
| The notes to the financial statements are an integral part of this report. | | |
| Transamerica Funds | | | | Annual Report 2012 |
| | Page 125 | | |
STATEMENTS OF CHANGES IN NET ASSETS (continued)
For the years ended:
(all amounts in thousands)
| | | | | | | | | | | | | | | | | | | | | | | | |
| | | Transamerica Multi-Managed
Balanced | | | Transamerica Short-Term Bond | | | Transamerica
Small Cap
Growth | | | Transamerica
Small Cap Value | |
| | | October 31,
2012 | | | October 31,
2011 | | | October 31,
2012 | | | October 31,
2011 | | | October 31,
2012 (H) | | | October 31,
2012 (E) | |
Share activity: | | | | | | | | | | | | | | | | | | | | | | | | |
Shares issued: | | | | | | | | | | | | | | | | | | | | | | | | |
Class A | | | 1,145 | | | | 2,540 | | | | 29,711 | | | | 34,402 | | | | 25 | | | | 27 | |
Class B | | | 113 | | | | 59 | | | | | | | | | | | | | | | | | |
Class C | | | 1,339 | | | | 846 | | | | 18,799 | | | | 25,782 | | | | 25 | | | | 26 | |
Class I | | | 4,199 | | | | 669 | | | | 24,916 | | | | 23,932 | | | | 25 | | | | 38 | |
Class I2 | | | | | | | | | | | 74,830 | | | | 17,710 | | | | 25,505 | | | | 30,201 | |
Class P | | | 170 | | | | 914 | | | | | | | | | | | | | | | | | |
| | | | | | | | | | | | | | | | | | | | | | | | |
| | | 6,966 | | | | 5,028 | | | | 148,256 | | | | 101,826 | | | | 25,580 | | | | 30,292 | |
| | | | | | | | | | | | | | | | | | | | | | | | |
Shares issued-reinvested from dividends and distributions: | | | | | | | | | | | | | | | | | | | | | | | | |
Class A | | | 764 | | | | 55 | | | | 2,548 | | | | 2,470 | | | | — | | | | — | |
Class B | | | 67 | | | | 2 | | | | | | | | | | | | | | | | | |
Class C | | | 262 | | | | 9 | | | | 2,156 | | | | 1,804 | | | | — | | | | — | |
Class I | | | 125 | | | | 2 | | | | 855 | | | | 429 | | | | — | | | | — | |
Class I2 | | | | | | | | | | | 4,693 | | | | 3,925 | | | | — | | | | — | |
Class P | | | 1,122 | | | | 121 | | | | | | | | | | | | | | | | | |
| | | | | | | | | | | | | | | | | | | | | | | | |
| | | 2,340 | | | | 189 | | | | 10,252 | | | | 8,628 | | | | — | | | | — | |
| | | | | | | | | | | | | | | | | | | | | | | | |
Shares redeemed: | | | | | | | | | | | | | | | | | | | | | | | | |
Class A | | | (985 | ) | | | (2,664 | ) | | | (32,204 | ) | | | (42,838 | ) | | | — | | | | — | |
Class B | | | (56 | ) | | | (108 | ) | | | | | | | | | | | | | | | | |
Class C | | | (411 | ) | | | (312 | ) | | | (21,345 | ) | | | (24,915 | ) | | | — | | | | — | |
Class I | | | (983 | ) | | | (166 | ) | | | (16,781 | ) | | | (16,874 | ) | | | — | | | | — | (D) |
Class I2 | | | | | | | | | | | (23,289 | ) | | | (27,058 | ) | | | (5 | ) | | | (869 | ) |
Class P | | | (4,403 | ) | | | (3,127 | ) | | | | | | | | | | | | | | | | |
| | | | | | | | | | | | | | | | | | | | | | | | |
| | | (6,838 | ) | | | (6,377 | ) | | | (93,619 | ) | | | (111,685 | ) | | | (5 | ) | | | (869 | ) |
| | | | | | | | | | | | | | | | | | | | | | | | |
Automatic conversions: | | | | | | | | | | | | | | | | | | | | | | | | |
Class A | | | 141 | | | | 209 | | | | — | | | | — | | | | — | | | | — | |
Class B | | | (142 | ) | | | (210 | ) | | | | | | | | | | | | | | | | |
| | | | | | | | | | | | | | | | | | | | | | | | |
| | | (1 | ) | | | (1 | ) | | | — | | | | — | | | | — | | | | — | |
| | | | | | | | | | | | | | | | | | | | | | | | |
Class level conversions: | | | | | | | | | | | | | | | | | | | | | | | | |
Class I | | | 4,097 | | | | 209 | | | | — | | | | — | | | | — | | | | — | |
Class P | | | (4,107 | ) | | | (210 | ) | | | | | | | | | | | | | | | | |
| | | | | | | | | | | | | | | | | | | | | | | | |
| | | (10 | ) | | | (1 | ) | | | — | | | | — | | | | — | | | | — | |
| | | | | | | | | | | | | | | | | | | | | | | | |
Net increase (decrease) in shares outstanding: | | | | | | | | | | | | | | | | | | | | | | | | |
Class A | | | 1,065 | | | | 140 | | | | 55 | | | | (5,966 | ) | | | 25 | | | | 27 | |
Class B | | | (18 | ) | | | (257 | ) | | | | | | | | | | | | | | | | |
Class C | | | 1,190 | | | | 543 | | | | (390 | ) | | | 2,671 | | | | 25 | | | | 26 | |
Class I | | | 7,438 | | | | 505 | | | | 8,990 | | | | 7,487 | | | | 25 | | | | 38 | |
Class I2 | | | | | | | | | | | 56,234 | | | | (5,423 | ) | | | 25,500 | | | | 29,332 | |
Class P | | | (7,218 | ) | | | (2,092 | ) | | | | | | | | | | | | | | | | |
| | | | | | | | | | | | | | | | | | | | | | | | |
| | | 2,457 | | | | (1,161 | ) | | | 64,889 | | | | (1,231 | ) | | | 25,575 | | | | 29,423 | |
| | | | | | | | | | | | | | | | | | | | | | | | |
| | | | |
| The notes to the financial statements are an integral part of this report. | | |
| Transamerica Funds | | | | Annual Report 2012 |
| | Page 126 | | |
STATEMENTS OF CHANGES IN NET ASSETS (continued)
For the years ended:
(all amounts in thousands)
| | | | | | | | | | | | |
| | | Transamerica Small/Mid Cap Value | | | Transamerica
Tactical Income(I) | |
| | | October 31,
2012 | | | October 31,
2011 | | | October 31,
2012 | |
From operations: | | | | | | | | | | | | |
Net investment income (loss) | | $ | 2,352 | | | $ | (2,856 | ) | | $ | 8,206 | |
Net realized gain (loss)(A) | | | (11,852 | ) | | | 193,786 | | | | 8,876 | |
Net change in unrealized appreciation | | | | | | | | | | | | |
(depreciation) | | | 82,860 | | | | (151,551 | ) | | | 1,137 | |
| | | | | | | | | | | | |
Net increase in net assets resulting from operations | | | 73,360 | | | | 39,379 | | | | 18,219 | |
| | | | | | | | | | | | |
Distributions to shareholders: | | | | | | | | | | | | |
From net investment income: | | | | | | | | | | | | |
Class A | | | — | (C) | | | — | | | | (4,419 | ) |
Class B | | | — | (C) | | | — | | | | | |
Class C | | | — | (C) | | | — | | | | (3,696 | ) |
Class I | | | — | (C) | | | — | | | | (4,820 | ) |
| | | | | | | | | | | | |
| | | — | (C) | | | — | | | | (12,935 | ) |
| | | | | | | | | | | | |
From net realized gains: | | | | | | | | | | | | |
Class A | | | (17,683 | ) | | | — | | | | — | |
Class B | | | (1,904 | ) | | | — | | | | | |
Class C | | | (10,530 | ) | | | — | | | | — | |
Class I | | | (3,750 | ) | | | — | | | | — | |
Class I2 | | | (699 | ) | | | — | | | | | |
| | | | | | | | | | | | |
| | | (34,566 | ) | | | — | | | | — | |
| | | | | | | | | | | | |
Total distributions to shareholders | | | (34,566 | ) | | | — | | | | (12,935 | ) |
| | | | | | | | | | | | |
Capital share transactions: | | | | | | | | | | | | |
Proceeds from shares sold: | | | | | | | | | | | | |
Class A | | | 81,627 | | | | 144,418 | | | | 264,641 | |
Class B | | | 1,054 | | | | 1,532 | | | | | |
Class C | | | 34,234 | | | | 48,478 | | | | 281,913 | |
Class I | | | 64,607 | | | | 67,684 | | | | 265,934 | |
Class I2 | | | 2,230 | | | | 905 | | | | | |
| | | | | | | | | | | | |
| | | 183,752 | | | | 263,017 | | | | 812,488 | |
| | | | | | | | | | | | |
Dividends and distributions reinvested: | | | | | | | | | | | | |
Class A | | | 16,432 | | | | — | | | | 3,871 | |
Class B | | | 1,625 | | | | — | | | | | |
Class C | | | 8,584 | | | | — | | | | 3,148 | |
Class I | | | 2,089 | | | | — | | | | 4,120 | |
Class I2 | | | 699 | | | | — | | | | | |
| | | | | | | | | | | | |
| | | 29,429 | | | | — | | | | 11,139 | |
| | | | | | | | | | | | |
Cost of shares redeemed: | | | | | | | | | | | | |
Class A | | | (112,261 | ) | | | (128,843 | ) | | | (15,688 | ) |
Class B | | | (5,810 | ) | | | (6,989 | ) | | | | |
Class C | | | (36,170 | ) | | | (50,447 | ) | | | (7,215 | ) |
Class I | | | (35,288 | ) | | | (38,074 | ) | | | (31,178 | ) |
Class I2 | | | (1,357 | ) | | | (5,604 | ) | | | | |
| | | | | | | | | | | | |
| | | (190,886 | ) | | | (229,957 | ) | | | (54,081 | ) |
| | | | | | | | | | | | |
Automatic conversions: | | | | | | | | | | | | |
Class A | | | 2,739 | | | | 2,578 | | | | — | |
Class B | | | (2,739 | ) | | | (2,578 | ) | | | | |
| | | | | | | | | | | | |
| | | — | | | | — | | | | — | |
| | | | | | | | | | | | |
Net increase in net assets resulting from capital shares transactions | | | 22,295 | | | | 33,060 | | | | 769,546 | |
| | | | | | | | | | | | |
Net increase in net assets | | | 61,089 | | | | 72,439 | | | | 774,830 | |
| | | | | | | | | | | | |
Net assets: | | | | | | | | | | | | |
Beginning of year | | $ | 620,176 | | | $ | 547,737 | | | $ | — | |
| | | | | | | | | | | | |
End of year | | $ | 681,265 | | | $ | 620,176 | | | $ | 774,830 | |
| | | | | | | | | | | | |
Undistributed (accumulated) net investment income (loss) | | $ | 2,352 | | | $ | — | | | $ | (31 | ) |
| | | | | | | | | | | | |
| | | | |
| The notes to the financial statements are an integral part of this report. | | |
| Transamerica Funds | | | | Annual Report 2012 |
| | Page 127 | | |
STATEMENTS OF CHANGES IN NET ASSETS (continued)
For the years ended:
(all amounts in thousands)
| | | | | | | | | | | | |
| | | | | | | | | Transamerica | |
| | | Transamerica Small/Mid Cap Value | | | Tactical Income(I) | |
| | | October 31,
2012 | | | October 31,
2011 | | | October 31,
2012 | |
Share activity: | | | | | | | | | | | | |
Shares issued: | | | | | | | | | | | | |
Class A | | | 3,856 | | | | 6,627 | | | | 26,004 | |
Class B | | | 54 | | | | 74 | | | | | |
Class C | | | 1,742 | | | | 2,347 | | | | 27,764 | |
Class I | | | 2,987 | | | | 2,999 | | | | 26,092 | |
Class I2 | | | 106 | | | | 40 | | | | | |
| | | | | | | | | | | | |
| | | 8,745 | | | | 12,087 | | | | 79,860 | |
| | | | | | | | | | | | |
Shares issued-reinvested from dividends and distributions: | | | | | | | | | | | | |
Class A | | | 877 | | | | — | | | | 382 | |
Class B | | | 92 | | | | — | | | | | |
Class C | | | 490 | | | | — | | | | 311 | |
Class I | | | 109 | | | | — | | | | 407 | |
Class I2 | | | 36 | | | | — | | | | | |
| | | | | | | | | | | | |
| | | 1,604 | | | | — | | | | 1,100 | |
| | | | | | | | | | | | |
Shares redeemed: | | | | | | | | | | | | |
Class A | | | (5,324 | ) | | | (6,093 | ) | | | (1,542 | ) |
Class B | | | (292 | ) | | | (345 | ) | | | | |
Class C | | | (1,845 | ) | | | (2,491 | ) | | | (708 | ) |
Class I | | | (1,634 | ) | | | (1,848 | ) | | | (3,069 | ) |
Class I2 | | | (63 | ) | | | (256 | ) | | | | |
| | | | | | | | | | | | |
| | | (9,158 | ) | | | (11,033 | ) | | | (5,319 | ) |
| | | | | | | | | | | | |
Automatic conversions: | | | | | | | | | | | | |
Class A | | | 131 | | | | 122 | | | | — | |
Class B | | | (139 | ) | | | (128 | ) | | | | |
| | | | | | | | | | | | |
| | | (8 | ) | | | (6 | ) | | | — | |
| | | | | | | | | | | | |
Net increase (decrease) in shares outstanding: | | | | | | | | | | | | |
Class A | | | (460 | ) | | | 656 | | | | 24,844 | |
Class B | | | (285 | ) | | | (399 | ) | | | | |
Class C | | | 387 | | | | (144 | ) | | | 27,367 | |
Class I | | | 1,462 | | | | 1,151 | | | | 23,430 | |
Class I2 | | | 79 | | | | (216 | ) | | | | |
| | | | | | | | | | | | |
| | | 1,183 | | | | 1,048 | | | | 75,641 | |
| | | | | | | | | | | | |
| (A) | Net realized gain (loss) includes all items as listed in the Statement of Operations. |
| (B) | Commenced operations August 31, 2011. |
| (C) | Rounds to less than $1. |
| (D) | Rounds to less than 1 share. |
| (E) | Commenced operations April 30, 2012. |
| (F) | For this period, information is based on 120 days as TS&W International Equity Portfolio and 245 days as Transamerica TS&W International Equity. The 120 days represents Fund Level activity, which reflects activity of the predecessor’s fund. |
| (G) | Commenced operations November 15, 2010. |
| (H) | Commenced operations August 31, 2012. |
| (I) | Includes information from inception date of October 31, 2011 through period end. |
| | | | |
| The notes to the financial statements are an integral part of this report. | | |
| Transamerica Funds | | | | Annual Report 2012 |
| | Page 128 | | |
FINANCIAL HIGHLIGHTS
For the period or years ended:
| | | | | | | | | | | | | | | | | | | | | | | | |
| | | Transamerica Capital Growth | |
| | | Class A | | | Class B | |
| | | October 31, | | | October 31, | | | October 31, | | | October 31, | | | October 31, | | | October 31, | |
For a share outstanding throughout each period | | 2012 | | | 2011 | | | 2010(A) | | | 2012 | | | 2011 | | | 2010(A) | |
Net asset value | | | | | | | | | | | | | | | | | | | | | | | | |
Beginning of period/year | | $ | 15.47 | | | $ | 13.78 | | | $ | 11.77 | | | $ | 14.22 | | | $ | 12.75 | | | $ | 10.95 | |
| | | | | | | | | | | | | | | | | | | | | | | | |
Investment operations | | | | | | | | | | | | | | | | | | | | | | | | |
Net investment loss(B) | | | — | (C) | | | (0.12 | ) | | | (0.09 | ) | | | (0.10 | ) | | | (0.20 | ) | | | (0.15 | ) |
Net realized and change in unrealized gain on investments | | | 0.32 | | | | 1.81 | | | | 2.12 | | | | 0.29 | | | | 1.67 | | | | 1.96 | |
| | | | | | | | | | | | | | | | | | | | | | | | |
Total from investment operations | | | 0.32 | | | | 1.69 | | | | 2.03 | | | | 0.19 | | | | 1.47 | | | | 1.81 | |
| | | | | | | | | | | | | | | | | | | | | | | | |
Distributions | | | | | | | | | | | | | | | | | | | | | | | | |
Net investment income | | | — | | | | — | | | | (0.02 | ) | | | — | (C) | | | — | | | | (0.01 | ) |
Net realized gains on investments | | | (0.45 | ) | | | — | | | | — | | | | (0.45 | ) | | | — | | | | — | |
| | | | | | | | | | | | | | | | | | | | | | | | |
Total distributions | | | (0.45 | ) | | | — | | | | (0.02 | ) | | | (0.45 | ) | | | — | | | | (0.01 | ) |
| | | | | | | | | | | | | | | | | | | | | | | | |
Net asset value | | | | | | | | | | | | | | | | | | | | | | | | |
End of year | | $ | 15.34 | | | $ | 15.47 | | | $ | 13.78 | | | $ | 13.96 | | | $ | 14.22 | | | $ | 12.75 | |
| | | | | | | | | | | | | | | | | | | | | | | | |
Total return(D) | | | 2.38 | % | | | 12.34 | % | | | 17.24 | %(E) | | | 1.65 | % | | | 11.61 | % | | | 16.51 | %(E) |
| | | | | | | | | | | | | | | | | | | | | | | | |
Net assets end of year (000’s) | | $ | 65,782 | | | $ | 66,058 | | | $ | 48,547 | | | $ | 5,596 | | | $ | 7,786 | | | $ | 9,916 | |
| | | | | | | | | | | | | | | | | | | | | | | | |
Ratio and supplemental data | | | | | | | | | | | | | | | | | | | | | | | | |
Expenses to average net assets | | | | | | | | | | | | | | | | | | | | | | | | |
After reimbursement/waiver or recapture | | | 1 .52 | % | | | 1 .55 | % | | | 1.55 | %(F) | | | 2.20 | % | | | 2.20 | % | | | 2.20 | %(F) |
Before reimbursement/waiver or recapture | | | 1 .47 | % | | | 1 .63 | % | | | 1.78 | %(F) | | | 2.33 | % | | | 2.45 | % | | | 2.51 | %(F) |
Net investment income (loss) to average net assets(G) | | | 0 .01 | % | | | (0.76 | )% | | | (0.75 | )%(F) | | | (0.73 | )% | | | (1.41 | )% | | | (1.36 | )%(F) |
Portfolio turnover rate | | | 52 | % | | | 90 | % | | | 57 | %(E) | | | 52 | % | | | 90 | % | | | 57 | %(E) |
| | | | | | | | | | | | | | | | | | | | | | | | |
| | | Transamerica Capital Growth | |
| | | Class C | | | Class I | |
| | | October 31, | | | October 31, | | | October 31, | | | October 31, | | | October 31, | | | October 31, | |
For a share outstanding throughout each period | | 2012 | | | 2011 | | | 2010(A) | | | 2012 | | | 2011 | | | 2010(H) | |
Net asset value | | | | | | | | | | | | | | | | | | | | | | | | |
Beginning of period/year | | $ | 14.20 | | | $ | 12.74 | | | $ | 10.94 | | | $ | 15.66 | | | $ | 13.89 | | | $ | 11.64 | |
| | | | | | | | | | | | | | | | | | | | | | | | |
Investment operations | | | | | | | | | | | | | | | | | | | | | | | | |
Net investment income (loss)(B) | | | (0.08 | ) | | | (0.20 | ) | | | (0.15 | ) | | | 0.11 | | | | (0.06 | ) | | | (0.06 | ) |
Net realized and change in unrealized gain on investments | | | 0.29 | | | | 1.66 | | | | 1.96 | | | | 0.30 | | | | 1.83 | | | | 2.33 | |
| | | | | | | | | | | | | | | | | | | | | | | | |
Total from investment operations | | | 0.21 | | | | 1.46 | | | | 1.81 | | | | 0.41 | | | | 1.77 | | | | 2.27 | |
| | | | | | | | | | | | | | | | | | | | | | | | |
Distributions | | | | | | | | | | | | | | | | | | | | | | | | |
Net investment income | | | — | (C) | | | — | | | | (0.01 | ) | | | (0.01 | ) | | | — | | | | (0.02 | ) |
Net realized gains on investments | | | (0.45 | ) | | | — | | | | — | | | | (0.45 | ) | | | — | | | | — | |
| | | | | | | | | | | | | | | | | | | | | | | | |
Total distributions | | | (0.45 | ) | | | — | | | | (0.01 | ) | | | (0.46 | ) | | | — | | | | (0.02 | ) |
| | | | | | | | | | | | | | | | | | | | | | | | |
Net asset value | | | | | | | | | | | | | | | | | | | | | | | | |
End of year | | $ | 13.96 | | | $ | 14.20 | | | $ | 12.74 | | | $ | 15.61 | | | $ | 15.66 | | | $ | 13.89 | |
| | | | | | | | | | | | | | | | | | | | | | | | |
Total return(D) | | | 1 .80 | % | | | 11.62 | % | | | 16.53 | %(E) | | | 2 .96 | % | | | 12.81 | % | | | 19.58 | %(E) |
| | | | | | | | | | | | | | | | | | | | | | | | |
Net assets end of year (000’s) | | $ | 19,809 | | | $ | 16,252 | | | $ | 12,814 | | | $ | 80,083 | | | $ | 11,767 | | | $ | 434 | |
| | | | | | | | | | | | | | | | | | | | | | | | |
Ratio and supplemental data | | | | | | | | | | | | | | | | | | | | | | | | |
Expenses to average net assets | | | | | | | | | | | | | | | | | | | | | | | | |
After reimbursement/waiver or recapture | | | 2 .08 | % | | | 2 .20 | % | | | 2.20 | %(F) | | | 0 .94 | % | | | 1 .13 | % | | | 1.20 | %(F) |
Before reimbursement/waiver or recapture | | | 2 .06 | % | | | 2 .18 | % | | | 2.26 | %(F) | | | 0 .94 | % | | | 1 .10 | % | | | 1.85 | %(F) |
Net investment income (loss) to average net assets(G) | | | (0.54 | )% | | | (1.41 | )% | | | (1.39 | )%(F) | | | 0 .66 | % | | | (0.37 | )% | | | (0.51 | )%(F) |
Portfolio turnover rate | | | 52 | % | | | 90 | % | | | 57 | %(E) | | | 52 | % | | | 90 | % | | | 57 | %(E) |
| | | | |
| The notes to the financial statements are an integral part of this report. Transamerica Funds | | Annual Report 2012 |
| | Page 129 | | |
FINANCIAL HIGHLIGHTS (continued)
For the period or years ended:
| | | | | | | | | | | | | | | | | | | | |
| | | Transamerica Capital Growth | | | Transamerica Diversified Equity | |
| | | Class I2 | | | Class A | |
| | | October 31, | | | October 31, | | | October 31, | | | October 31, | | | October 31, | |
For a share outstanding throughout each period | | 2012 | | | 2011(J) | | | 2012 | | | 2011 | | | 2010(A) | |
Net asset value | | | | | | | | | | | | | | | | | | | | |
Beginning of period/year | | $ | 10.96 | | | $ | 10.00 | | | $ | 14.63 | | | $ | 14.29 | | | $ | 12.85 | |
| | | | | | | | | | | | | | | | | | | | |
Investment operations | | | | | | | | | | | | | | | | | | | | |
Net investment income (loss)(B) | | | 0.07 | | | | — | (C) | | | 0.01 | | | | (0.06 | ) | | | 0.15 | |
Net realized and change in unrealized gain on investments | | | 0.22 | | | | 0.96 | | | | 0.76 | (K) | | | 0.56 | | | | 1.31 | |
| | | | | | | | | | | | | | | | | | | | |
Total from investment operations | | | 0.29 | | | | 0.96 | | | | 0.77 | | | | 0.50 | | | | 1.46 | |
| | | | | | | | | | | | | | | | | | | | |
Distributions | | | | | | | | | | | | | | | | | | | | |
Net investment income | | | — | (C) | | | — | | | | — | | | | (0.16 | ) | | | (0.02 | ) |
Net realized gains on investments | | | (0.45 | ) | | | — | | | | (1.99 | ) | | | — | | | | — | |
| | | | | | | | | | | | | | | | | | | | |
Total distributions | | | (0.45 | ) | | | — | | | | (1.99 | ) | | | (0.16 | ) | | | (0.02 | ) |
| | | | | | | | | | | | | | | | | | | | |
Net asset value | | | | | | | | | | | | | | | | | | | | |
End of year | | $ | 10.80 | | | $ | 10.96 | | | $ | 13.41 | | | $ | 14.63 | | | $ | 14.29 | |
| | | | | | | | | | | | | | | | | | | | |
Total return(D) | | | 3.11 | % | | | 9.70 | %(E) | | | 7.04 | %(K) | | | 3.44 | % | | | 11.32 | %(E) |
| | | | | | | | | | | | | | | | | | | | |
Net assets end of year (000’s) | | $ | 545,635 | | | $ | 407,302 | | | $ | 420,504 | | | $ | 77,197 | | | $ | 83,766 | |
| | | | | | | | | | | | | | | | | | | | |
Ratio and supplemental data | | | | | | | | | | | | | | | | | | | | |
Expenses to average net assets | | | | | | | | | | | | | | | | | | | | |
After reimbursement/waiver or recapture | | | 0.84 | % | | | 1.09 | %(F) | | | 1.47 | % | | | 1.52 | % | | | 1.52 | %(F) |
Before reimbursement/waiver or recapture | | | 0.84 | % | | | 1.09 | %(F) | | | 1.39 | % | | | 1.66 | % | | | 1.72 | %(F) |
Net investment income (loss) to average net assets(G) | | | 0.67 | % | | | (0.48 | )%(F) | | | 0.08 | % | | | (0.42 | )% | | | 1.14 | %(F) |
Portfolio turnover rate | | | 52 | % | | | 90 | %(E) | | | 80 | % | | | 141 | % | | | 79 | %(E) |
| | | | | | | | | | | | | | | | | | | | | | | | |
| | | Transamerica Diversified Equity | |
| | | Class B | | | Class C | |
| | | October 31, | | | October 31, | | | October 31, | | | October 31, | | | October 31, | | | October 31, | |
For a share outstanding throughout each period | | 2012 | | | 2011 | | | 2010(A) | | | 2012 | | | 2011 | | | 2010(A) | |
Net asset value | | | | | | | | | | | | | | | | | | | | | | | | |
Beginning of period/year | | $ | 14.57 | | | $ | 14.22 | | | $ | 12.85 | | | $ | 14.55 | | | $ | 14.22 | | | $ | 12.85 | |
Investment operations | | | | | | | | | | | | | | | | | | | | | | | | |
Net investment income (loss)(B) | | | (0.09 | ) | | | (0.16 | ) | | | 0.06 | | | | (0.08 | ) | | | (0.16 | ) | | | 0.06 | |
Net realized and change in unrealized gain on investments | | | 0.76 | (K) | | | 0.55 | | | | 1.32 | | | | 0.74 | (K) | | | 0.55 | | | | 1.32 | |
| | | | | | | | | | | | | | | | | | | | | | | | |
Total from investment operations | | | 0.67 | | | | 0.39 | | | | 1.38 | | | | 0.66 | | | | 0.39 | | | | 1.38 | |
| | | | | | | | | | | | | | | | | | | | | | | | |
Distributions | | | | | | | | | | | | | | | | | | | | | | | | |
Net investment income | | | — | (C) | | | (0.04 | ) | | | (0.01 | ) | | | — | (C) | | | (0.06 | ) | | | (0.01 | ) |
Net realized gains on investments | | | (1.99 | ) | | | — | | | | — | | | | (1.99 | ) | | | — | | | | — | |
| | | | | | | | | | | | | | | | | | | | | | | | |
Total distributions | | | (1.99 | ) | | | (0.04 | ) | | | (0.01 | ) | | | (1.99 | ) | | | (0.06 | ) | | | (0.01 | ) |
| | | | | | | | | | | | | | | | | | | | | | | | |
Net asset value | | | | | | | | | | | | | | | | | | | | | | | | |
End of year | | $ | 13.25 | | | $ | 14.57 | | | $ | 14.22 | | | $ | 13.22 | | | $ | 14.55 | | | $ | 14.22 | |
| | | | | | | | | | | | | | | | | | | | | | | | |
Total return(D) | | | 6.29 | %(K) | | | 2.71 | % | | | 10.68 | %(E) | | | 6.22 | %(K) | | | 2 .72 | % | | | 10.68 | %(E) |
| | | | | | | | | | | | | | | | | | | | | | | | |
Net assets end of year (000’s) | | $ | 20,668 | | | $ | 5,420 | | | $ | 7,375 | | | $ | 42,637 | | | $ | 13,393 | | | $ | 15,013 | |
| | | | | | | | | | | | | | | | | | | | | | | | |
Ratio and supplemental data | | | | | | | | | | | | | | | | | | | | | | | | |
Expenses to average net assets | | | | | | | | | | | | | | | | | | | | | | | | |
After reimbursement/waiver or recapture | | | 2.17 | % | | | 2.17 | % | | | 2.17 | %(F) | | | 2.17 | % | | | 2.17 | % | | | 2.17 | %(F) |
Before reimbursement/waiver or recapture | | | 2.19 | % | | | 2.30 | % | | | 2.44 | %(F) | | | 2.16 | % | | | 2.25 | % | | | 2.31 | %(F) |
Net investment income (loss) to average net assets(G) | | | (0.63 | )% | | | (1.07 | )% | | | 0.40 | %(F) | | | (0.63 | )% | | | (1.07 | )% | | | 0.48 | %(F) |
Portfolio turnover rate | | | 80 | % | | | 141 | % | | | 79 | %(E) | | | 80 | % | | | 141 | % | | | 79 | %(E) |
| | | | |
| The notes to the financial statements are an integral part of this report. | | |
| Transamerica Funds | | | | Annual Report 2012 |
| | Page 130 | | |
FINANCIAL HIGHLIGHTS (continued)
For the period or years ended:
| | | | | | | | | | | | | | | | | | | | | | | | |
| | | Transamerica Diversified Equity | |
| | | Class I | | | Class I2(I) | |
| | | October 31, | | | October 31, | | | October 31, | | | October 31, | | | October 31, | | | October 31, | |
For a share outstanding throughout each period | | 2012 | | | 2011 | | | 2010(H) | | | 2012 | | | 2011 | | | 2010(A) | |
Net asset value | | | | | | | | | | | | | | | | | | | | | | | | |
Beginning of period/year | | $ | 14.74 | | | $ | 14.41 | | | $ | 12.65 | | | $ | 14.73 | | | $ | 14.38 | | | $ | 12.85 | |
| | | | | | | | | | | | | | | | | | | | | | | | |
Investment operations | | | | | | | | | | | | | | | | | | | | | | | | |
Net investment income(B) | | | 0.09 | | | | — | (C) | | | 0.26 | | | | 0.10 | | | | 0.04 | | | | 0.26 | |
Net realized and change in unrealized gain on investments | | | 0.76 | (K) | | | 0.56 | | | | 1.53 | | | | 0.77 | (K) | | | 0.57 | | | | 1.30 | |
| | | | | | | | | | | | | | | | | | | | | | | | |
Total from investment operations | | | 0.85 | | | | 0.56 | | | | 1.79 | | | | 0.87 | | | | 0.61 | | | | 1.56 | |
| | | | | | | | | | | | | | | | | | | | | | | | |
Distributions | | | | | | | | | | | | | | | | | | | | | | | | |
Net investment income | | | — | | | | (0.23 | ) | | | (0.03 | ) | | | (0.02 | ) | | | (0.26 | ) | | | (0.03 | ) |
Net realized gains on investments | | | (1.99 | ) | | | — | | | | — | | | | (1.99 | ) | | | — | | | | — | |
| | | | | | | | | | | | | | | | | | | | | | | | |
Total distributions | | | (1.99 | ) | | | (0.23 | ) | | | (0.03 | ) | | | (2.01 | ) | | | (0.26 | ) | | | (0.03 | ) |
| | | | | | | | | | | | | | | | | | | | | | | | |
Net asset value | | | | | | | | | | | | | | | | | | | | | | | | |
End of year | | $ | 13.60 | | | $ | 14.74 | | | $ | 14.41 | | | $ | 13.59 | | | $ | 14.73 | | | $ | 14.38 | |
| | | | | | | | | | | | | | | | | | | | | | | | |
Total return(D) | | | 7.62 | %(K) | | | 3.82 | % | | | 14.16 | %(E) | | | 7.79 | %(K) | | | 4.19 | % | | | 12.12 | %(E) |
| | | | | | | | | | | | | | | | | | | | | | | | |
Net assets end of year (000’s) | | $ | 310,170 | | | $ | 1,127 | | | $ | 421 | | | $ | 577,540 | | | $ | 291,409 | | | $ | 358,714 | |
| | | | | | | | | | | | | | | | | | | | | | | | |
Ratio and supplemental data | | | | | | | | | | | | | | | | | | | | | | | | |
Expenses to average net assets | | | | | | | | | | | | | | | | | | | | | | | | |
After reimbursement/waiver or recapture | | | 0.90 | % | | | 1.17 | % | | | 1.17 | %(F) | | | 0.78 | % | | | 0.80 | % | | | 0.81 | %(F) |
Before reimbursement/waiver or recapture | | | 0.90 | % | | | 1.15 | % | | | 1.81 | %(F) | | | 0.78 | % | | | 0.80 | % | | | 0.81 | %(F) |
Net investment income to average net assets(G) | | | 0.67 | % | | | 0.01 | % | | | 2.14 | %(F) | | | 0.75 | % | | | 0.30 | % | | | 2.02 | %(F) |
Portfolio turnover rate | | | 80 | % | | | 141 | % | | | 79 | %(E) | | | 80 | % | | | 141 | % | | | 79 | %(E) |
| | | | | | | | | | | | | | | | | | | | |
| | | Transamerica | | | | | | | | | | | | | |
| | | Diversified | | | | | | | | | | | | | |
| | | Equity | | | Transamerica Emerging Markets Debt | |
| | | Class T | | | Class A | | | Class C | |
| | | October 31, | | | October 31, | | | October 31, | | | October 31, | | | October 31, | |
For a share outstanding throughout each period | | 2012(L) | | | 2012 | | | 2011(M) | | | 2012 | | | 2011(M) | |
Net asset value | | | | | | | | | | | | | | | | | | | | |
Beginning of period/year | | $ | 28.70 | | | $ | 10.00 | | | $ | 10.00 | | | $ | 9.99 | | | $ | 10.00 | |
| | | | | | | | | | | | | | | | | | | | |
Investment operations | | | | | | | | | | | | | | | | | | | | |
Net investment income(B) | | | 0.14 | | | | 0.59 | | | | 0.08 | | | | 0.52 | | | | 0.07 | |
Net realized and change in unrealized gain (loss) on investments | | | (0.15 | )(K) | | | 1.45 | | | | (0.08 | ) | | | 1.44 | | | | (0.08 | ) |
| | | | | | | | | | | | | | | | | | | | |
Total from investment operations | | | (0.01 | ) | | | 2.04 | | | | — | | | | 1.96 | | | | (0.01 | ) |
| | | | | | | | | | | | | | | | | | | | |
Distributions | | | | | | | | | | | | | | | | | | | | |
Net investment income | | | — | | | | (0.50 | ) | | | — | (C) | | | (0.44 | ) | | | — | (C) |
| | | | | | | | | | | | | | | | | | | | |
Total distributions | | | — | | | | (0.50 | ) | | | — | (C) | | | (0.44 | ) | | | — | (C) |
| | | | | | | | | | | | | | | | | | | | |
Net asset value | | | | | | | | | | | | | | | | | | | | |
End of year | | $ | 28.69 | | | $ | 11.54 | | | $ | 10.00 | | | $ | 11.51 | | | $ | 9.99 | |
| | | | | | | | | | | | | | | | | | | | |
Total return(D) | | | (0.04 | )%(E),(K) | | | 21.07 | % | | | 0.04 | %(E) | | | 20.24 | % | | | (0.08 | )%(E) |
| | | | | | | | | | | | | | | | | | | | |
Net assets end of year (000’s) | | $ | 81,976 | | | $ | 60,754 | | | $ | 2,247 | | | $ | 10,543 | | | $ | 1,025 | |
| | | | | | | | | | | | | | | | | | | | |
Ratio and supplemental data | | | | | | | | | | | | | | | | | | | | |
Expenses to average net assets | | | | | | | | | | | | | | | | | | | | |
After reimbursement/waiver or recapture | | | 0.90 | %(F) | | | 1.21 | % | | | 1.35 | %(F) | | | 1.87 | % | | | 2.00 | %(F) |
Before reimbursement/waiver or recapture | | | 0.90 | %(F) | | | 1.19 | % | | | 1.65 | %(F) | | | 1.86 | % | | | 2.29 | %(F) |
Net investment income to average net assets(G) | | | 0.65 | %(F) | | | 5.47 | % | | | 5.24 | %(F) | | | 4.87 | % | | | 4.35 | %(F) |
Portfolio turnover rate | | | 80 | %(E) | | | 305 | % | | | 31 | %(E) | | | 305 | % | | | 31 | %(E) |
| | | | |
| The notes to the financial statements are an integral part of this report. | | |
| Transamerica Funds | | | | Annual Report 2012 |
| | Page 131 | | |
FINANCIAL HIGHLIGHTS (continued)
For the period or years ended:
| | | | | | | | | | | | | | | | | | | | | | | | |
| | | | | | | | | | | | | | | Transamerica Emerging | |
| | | Transamerica Emerging Markets Debt | | | Markets Equity | |
| | | Class I | | | Class I2 | | | Class A | | | Class C | |
| | | October 31, | | | October 31, | | | October 31, | | | October 31, | | | October 31, | | | October 31, | |
For a share outstanding throughout each period | | 2012 | | | 2011(M) | | | 2012 | | | 2011(M) | | | 2012(N) | | | 2012(N) | |
Net asset value | | | | | | | | | | | | | | | | | | | | | | | | |
Beginning of period/year | | $ | 10.01 | | | $ | 10.00 | | | $ | 10.01 | | | $ | 10.00 | | | $ | 10.00 | | | $ | 10.00 | |
| | | | | | | | | | | | | | | | | | | | | | | | |
Investment operations | | | | | | | | | | | | | | | | | | | | | | | | |
Net investment income(B) | | | 0.63 | | | | 0.09 | | | | 0.63 | | | | 0.07 | | | | 0.09 | | | | 0.07 | |
Net realized and change in unrealized gain (loss) on investments | | | 1.44 | | | | (0.08 | ) | | | 1.45 | | | | (0.06 | ) | | | (0.67 | ) | | | (0.68 | ) |
| | | | | | | | | | | | | | | | | | | | | | | | |
Total from investment operations | | | 2.07 | | | | 0.01 | | | | 2.08 | | | | 0.01 | | | | (0.58 | ) | | | (0.61 | ) |
| | | | | | | | | | | | | | | | | | | | | | | | |
Distributions | | | | | | | | | | | | | | | | | | | | | | | | |
Net investment income | | | (0.52 | ) | | | — | (C) | | | (0.53 | ) | | | — | (C) | | | — | | | | — | |
| | | | | | | | | | | | | | | | | | | | | | | | |
Total distributions | | | (0.52 | ) | | | — | (C) | | | (0.53 | ) | | | — | (C) | | | — | | | | — | |
| | | | | | | | | | | | | | | | | | | | | | | | |
Net asset value | | | | | | | | | | | | | | | | | | | | | | | | |
End of year | | $ | 11.56 | | | $ | 10.01 | | | $ | 11.56 | | | $ | 10.01 | | | $ | 9.42 | | | $ | 9.39 | |
| | | | | | | | | | | | | | | | | | | | | | | | |
Total return(D) | | | 21.40 | % | | | 0.14 | %(E) | | | 21 .50 | % | | | 0.14 | %(E) | | | (5.80 | )%(E) | | | (6.10 | )%(E) |
| | | | | | | | | | | | | | | | | | | | | | | | |
Net assets end of year (000’s) | | $ | 46,190 | | | $ | 2,064 | | | $ | 505,629 | | | $ | 95,233 | | | $ | 302 | | | $ | 253 | |
| | | | | | | | | | | | | | | | | | | | | | | | |
Ratio and supplemental data | | | | | | | | | | | | | | | | | | | | | | | | |
Expenses to average net assets | | | | | | | | | | | | | | | | | | | | | | | | |
After reimbursement/waiver or recapture | | | 0.86 | % | | | 1.00 | %(F) | | | 0.76 | % | | | 1.00 | %(F) | | | 1.85 | %(F) | | | 2.52 | %(F) |
Before reimbursement/waiver or recapture | | | 0.84 | % | | | 1.34 | %(F) | | | 0.74 | % | | | 1.23 | %(F) | | | 1.85 | %(F) | | | 2.52 | %(F) |
Net investment income to average net assets(G) | | | 5.68 | % | | | 5.46 | %(F) | | | 5.82 | % | | | 4.63 | %(F) | | | 1.97 | %(F) | | | 1.43 | %(F) |
Portfolio turnover rate | | | 305 | % | | | 31 | %(E) | | | 305 | % | | | 31 | %(E) | | | 76 | %(E) | | | 76 | %(E) |
| | | | | | | | |
| | | Transamerica Emerging | |
| | | Markets Equity | |
| | | Class I | | | Class I2 | |
| | | October 31, | | | October 31, | |
For a share outstanding throughout each period | | 2012(N) | | | 2012(N) | |
Net asset value | | | | | | | | |
Beginning of period/year | | $ | 10.00 | | | $ | 10.00 | |
| | | | | | | | |
Investment operations | | | | | | | | |
Net investment income(B) | | | 0.11 | | | | 0.10 | |
Net realized and change in unrealized loss on investments | | | (0.68 | ) | | | (0.66 | ) |
| | | | | | | | |
Total from investment operations | | | (0.57 | ) | | | (0.56 | ) |
| | | | | | | | |
Net asset value | | | | | | | | |
End of year | | $ | 9.43 | | | $ | 9.44 | |
| | | | | | | | |
Total return(D) | | | (5.70 | )%(E) | | | (5.60 | )%(E) |
| | | | | | | | |
Net assets end of year (000’s) | | $ | 302 $ | | | | 107,183 | |
| | | | | | | | |
Ratio and supplemental data | | | | | | | | |
Expenses to average net assets | | | | | | | | |
After reimbursement/waiver or recapture | | | 1.60 | %(F) | | | 1 .49 | %(F) |
Before reimbursement/waiver or recapture | | | 1.60 | %(F) | | | 1 .49 | %(F) |
Net investment income to average net assets(G) | | | 2.26 | %(F) | | | 2 .06 | %(F) |
Portfolio turnover rate | | | 76 | %(E) | | | 76 | %(E) |
| | | | |
| The notes to the financial statements are an integral part of this report. | | |
| Transamerica Funds | | | | Annual Report 2012 |
| | Page 132 | | |
FINANCIAL HIGHLIGHTS (continued)
For the period or years ended:
| | | | | | | | | | | | | | | | | | | | |
| | | Transamerica Flexible Income | |
| | | Class A | |
| | | October 31, | | | October 31, | | | October 31, | | | October 31, | | | October 31, | |
For a share outstanding throughout each period | | 2012 | | | 2011 | | | 2010 | | | 2009 | | | 2008 | |
Net asset value | | | | | | | | | | | | | | | | | | | | |
Beginning of year | | $ | 8.83 | | | $ | 8.99 | | | $ | 8.33 | | | $ | 7.22 | | | $ | 9.14 | |
| | | | | | | | | | | | | | | | | | | | |
Investment operations | | | | | | | | | | | | | | | | | | | | |
Net investment income(B) | | | 0.45 | | | | 0.51 | | | | 0.50 | | | | 0.46 | | | | 0.44 | |
Net realized and change in unrealized gain (loss) on investments | | | 0.55 | | | | (0.16 | ) | | | 0.70 | | | | 1.08 | | | | (1.89 | ) |
| | | | | | | | | | | | | | | | | | | | |
Total from investment operations | | | 1.00 | | | | 0.35 | | | | 1.20 | | | | 1.54 | | | | (1.45 | ) |
| | | | | | | | | | | | | | | | | | | | |
Distributions | | | | | | | | | | | | | | | | | | | | |
Net investment income | | | (0.46 | ) | | | (0.51 | ) | | | (0.54 | ) | | | (0.43 | ) | | | (0.47 | ) |
| | | | | | | | | | | | | | | | | | | | |
Total distributions | | | (0.46 | ) | | | (0.51 | ) | | | (0.54 | ) | | | (0.43 | ) | | | (0.47 | ) |
| | | | | | | | | | | | | | | | | | | | |
Net asset value | | | | | | | | | | | | | | | | | | | | |
End of year | | $ | 9.37 | | | $ | 8.83 | | | $ | 8.99 | | | $ | 8.33 | | | $ | 7.22 | |
| | | | | | | | | | | | | | | | | | | | |
Total return(D) | | | 11.60 | % | | | 3 .93 | % | | | 14.89 | % | | | 22.30 | % | | | (16.57 | )% |
| | | | | | | | | | | | | | | | | | | | |
Net assets end of year (000’s) | | $ | 77,291 | | | $ | 65,393 | | | $ | 55,103 | | | $ | 24,173 | | | $ | 13,360 | |
| | | | | | | | | | | | | | | | | | | | |
Ratio and supplemental data | | | | | | | | | | | | | | | | | | | | |
Expenses to average net assets | | | | | | | | | | | | | | | | | | | | |
After reimbursement/waiver or recapture | | | 0.95 | % | | | 0.97 | % | | | 1.07 | %(O) | | | 1.47 | % | | | 1.39 | % |
Before reimbursement/waiver or recapture | | | 1.01 | % | | | 1.07 | % | | | 1.15 | %(O) | | | 1.47 | % | | | 1.39 | % |
Net investment income to average net assets(G) | | | 4.95 | % | | | 5.70 | % | | | 5.79 | % | | | 6.03 | % | | | 5.12 | % |
Portfolio turnover rate | | | 35 | % | | | 42 | % | | | 120 | % | | | 169 | % | | | 98 | % |
| | | | | | | | | | | | | | | | | | | | |
| | | Transamerica Flexible Income | |
| | | Class B | |
| | | October 31, | | | October 31, | | | October 31, | | | October 31, | | | October 31, | |
For a share outstanding throughout each period | | 2012 | | | 2011 | | | 2010 | | | 2009 | | | 2008 | |
Net asset value | | | | | | | | | | | | | | | | | | | | |
Beginning of year | | $ | 8.83 | | | $ | 9.00 | | | $ | 8.34 | | | $ | 7.23 | | | $ | 9.14 | |
| | | | | | | | | | | | | | | | | | | | |
Investment operations | | | | | | | | | | | | | | | | | | | | |
Net investment income(B) | | | 0.37 | | | | 0.44 | | | | 0.43 | | | | 0.40 | | | | 0.38 | |
Net realized and change in unrealized gain (loss) on investments | | | 0.55 | | | | (0.18 | ) | | | 0.71 | | | | 1.09 | | | | (1.88 | ) |
| | | | | | | | | | | | | | | | | | | | |
Total from investment operations | | | 0.92 | | | | 0.26 | | | | 1.14 | | | | 1.49 | | | | (1.50 | ) |
| | | | | | | | | | | | | | | | | | | | |
Distributions | | | | | | | | | | | | | | | | | | | | |
Net investment income | | | (0.38 | ) | | | (0.43 | ) | | | (0.48 | ) | | | (0.38 | ) | | | (0.41 | ) |
| | | | | | | | | | | | | | | | | | | | |
Total distributions | | | (0.38 | ) | | | (0.43 | ) | | | (0.48 | ) | | | (0.38 | ) | | | (0.41 | ) |
| | | | | | | | | | | | | | | | | | | | |
Net asset value | | | | | | | | | | | | | | | | | | | | |
End of year | | $ | 9.37 | | | $ | 8.83 | | | $ | 9.00 | | | $ | 8.34 | | | $ | 7.23 | |
| | | | | | | | | | | | | | | | | | | | |
Total return(D) | | | 10.69 | % | | | 2.96 | % | | | 14.02 | % | | | 21.39 | % | | | (17.03 | )% |
| | | | | | | | | | | | | | | | | | | | |
Net assets end of year (000’s) | | $ | 6,641 | | | $ | 7,066 | | | $ | 10,614 | | | $ | 8,161 | | | $ | 8,628 | |
| | | | | | | | | | | | | | | | | | | | |
Ratio and supplemental data | | | | | | | | | | | | | | | | | | | | |
Expenses to average net assets | | | | | | | | | | | | | | | | | | | | |
After reimbursement/waiver or recapture | | | 1.79 | % | | | 1.82 | % | | | 1.88 | %(O) | | | 2.16 | % | | | 2.05 | % |
Before reimbursement/waiver or recapture | | | 1.79 | % | | | 1.82 | % | | | 1.88 | %(O) | | | 2.16 | % | | | 2.05 | % |
Net investment income to average net assets(G) | | | 4.13 | % | | | 4.87 | % | | | 4.97 | % | | | 5.36 | % | | | 4.42 | % |
Portfolio turnover rate | | | 35 | % | | | 42 | % | | | 120 | % | | | 169 | % | | | 98 | % |
| | | | |
| The notes to the financial statements are an integral part of this report. | | |
| Transamerica Funds | | | | Annual Report 2012 |
| | Page 133 | | |
FINANCIAL HIGHLIGHTS (continued)
For the period or years ended:
| | | | | | | | | | | | | | | | | | | | |
| | | Transamerica Flexible Income | |
| | | Class C | |
| | | October 31, | | | October 31, | | | October 31, | | | October 31, | | | October 31, | |
For a share outstanding throughout each period | | 2012 | | | 2011 | | | 2010 | | | 2009 | | | 2008 | |
Net asset value | | | | | | | | | | | | | | | | | | | | |
Beginning of year | | $ | 8.79 | | | $ | 8.96 | | | $ | 8.31 | | | $ | 7.21 | | | $ | 9.12 | |
| | | | | | | | | | | | | | | | | | | | |
Investment operations | | | | | | | | | | | | | | | | | | | | |
Net investment income(B) | | | 0.38 | | | | 0.45 | | | | 0.44 | | | | 0.41 | | | | 0.39 | |
Net realized and change in unrealized gain (loss) on investments | | | 0.54 | | | | (0.17 | ) | | | 0.70 | | | | 1.08 | | | | (1.88 | ) |
| | | | | | | | | | | | | | | | | | | | |
Total from investment operations | | | 0.92 | | | | 0.28 | | | | 1.14 | | | | 1.49 | | | | (1.49 | ) |
| | | | | | | | | | | | | | | | | | | | |
Distributions | | | | | | | | | | | | | | | | | | | | |
Net investment income | | | (0.40 | ) | | | (0.45 | ) | | | (0.49 | ) | | | (0.39 | ) | | | (0.42 | ) |
| | | | | | | | | | | | | | | | | | | | |
Total distributions | | | (0.40 | ) | | | (0.45 | ) | | | (0.49 | ) | | | (0.39 | ) | | | (0.42 | ) |
| | | | | | | | | | | | | | | | | | | | |
Net asset value | | | | | | | | | | | | | | | | | | | | |
End of year | | $ | 9.31 | | | $ | 8.79 | | | $ | 8.96 | | | $ | 8.31 | | | $ | 7.21 | |
| | | | | | | | | | | | | | | | | | | | |
Total return(D) | | | 10.71 | % | | | 3.21 | % | | | 14.15 | % | | | 21.50 | % | | | (16.98 | )% |
| | | | | | | | | | | | | | | | | | | | |
Net assets end of year (000’s) | | $ | 81,874 | | | $ | 50,314 | | | $ | 36,264 | | | $ | 12,978 | | | $ | 5,981 | |
| | | | | | | | | | | | | | | | | | | | |
Ratio and supplemental data | | | | | | | | | | | | | | | | | | | | |
Expenses to average net assets | | | | | | | | | | | | | | | | | | | | |
After reimbursement/waiver or recapture | | | 1.65 | % | | | 1.68 | % | | | 1.74 | %(O) | | | 2.06 | % | | | 1.97 | % |
Before reimbursement/waiver or recapture | | | 1.65 | % | | | 1.68 | % | | | 1.74 | %(O) | | | 2.06 | % | | | 1.97 | % |
Net investment income to average net assets(G) | | | 4.22 | % | | | 4.98 | % | | | 5.14 | % | | | 5.43 | % | | | 4.52 | % |
Portfolio turnover rate | | | 35 | % | | | 42 | % | | | 120 | % | | | 169 | % | | | 98 | % |
| | | | | | | | | | | | |
| | | Transamerica Flexible Income | |
| | | Class I | |
| | | October 31, | | | October 31, | | | October 31, | |
For a share outstanding throughout each period | | 2012 | | | 2011 | | | 2010(H) | |
Net asset value | | | | | | | | | | | | |
Beginning of period/year | | $ | 8.85 | | | $ | 9.02 | | | $ | 8.48 | |
| | | | | | | | | | | | |
Investment operations | | | | | | | | | | | | |
Net investment income(B) | | | 0.47 | | | | 0.53 | | | | 0.50 | |
Net realized and change in unrealized gain (loss) on investments | | | 0.55 | | | | (0.16 | ) | | | 0.57 | |
| | | | | | | | | | | | |
Total from investment operations | | | 1.02 | | | | 0.37 | | | | 1.07 | |
| | | | | | | | | | | | |
Distributions | | | | | | | | | | | | |
Net investment income | | | (0.49 | ) | | | (0.54 | ) | | | (0.53 | ) |
| | | | | | | | | | | | |
Total distributions | | | (0.49 | ) | | | (0.54 | ) | | | (0.53 | ) |
| | | | | | | | | | | | |
Net asset value | | | | | | | | | | | | |
End of year | | $ | 9.38 | | | $ | 8.85 | | | $ | 9.02 | |
| | | | | | | | | | | | |
Total return(D) | | | 11.87 | % | | | 4 .19 | % | | | 13.10 | %(E) |
| | | | | | | | | | | | |
Net assets end of year (000’s) | | $ | 31,480 | | | $ | 19,992 | | | $ | 9,787 | |
| | | | | | | | | | | | |
Ratio and supplemental data | | | | | | | | | | | | |
Expenses to average net assets | | | | | | | | | | | | |
After reimbursement/waiver or recapture | | | 0.67 | % | | | 0.69 | % | | | 0.76 | %(F),(O) |
Before reimbursement/waiver or recapture | | | 0.67 | % | | | 0.69 | % | | | 0.76 | %(F),(O) |
Net investment income to average net assets(G) | | | 5.20 | % | | | 5.93 | % | | | 6.25 | %(F) |
Portfolio turnover rate | | | 35 | % | | | 42 | % | | | 120 | %(E) |
| | | | |
| The notes to the financial statements are an integral part of this report. | | |
| Transamerica Funds | | | | Annual Report 2012 |
| | Page 134 | | |
FINANCIAL HIGHLIGHTS (continued)
For the period or years ended:
| | | | | | | | | | | | | | | | | | | | |
| | | Transamerica Flexible Income | |
| | | Class I2(I) | |
| | | October 31, | | | October 31, | | | October 31, | | | October 31, | | | October 31, | |
For a share outstanding throughout each period | | 2012 | | | 2011 | | | 2010 | | | 2009 | | | 2008 | |
Net asset value | | | | | | | | | | | | | | | | | | | | |
Beginning of year | | $ | 8.86 | | | $ | 9.03 | | | $ | 8.37 | | | $ | 7.25 | | | $ | 9.17 | |
| | | | | | | | | | | | | | | | | | | | |
Investment operations | | | | | | | | | | | | | | | | | | | | |
Net investment income(B) | | | 0.48 | | | | 0.55 | | | | 0.53 | | | | 0.50 | | | | 0.50 | |
Net realized and change in unrealized gain (loss) on investments | | | 0.54 | | | | (0.17 | ) | | | 0.71 | | | | 1.10 | | | | (1.90 | ) |
| | | | | | | | | | | | | | | | | | | | |
Total from investment operations | | | 1.02 | | | | 0.38 | | | | 1.24 | | | | 1.60 | | | | (1.40 | ) |
| | | | | | | | | | | | | | | | | | | | |
Distributions | | | | | | | | | | | | | | | | | | | | |
Net investment income | | | (0.50 | ) | | | (0.55 | ) | | | (0.58 | ) | | | (0.48 | ) | | | (0.52 | ) |
| | | | | | | | | | | | | | | | | | | | |
Total distributions | | | (0.50 | ) | | | (0.55 | ) | | | (0.58 | ) | | | (0.48 | ) | | | (0.52 | ) |
| | | | | | | | | | | | | | | | | | | | |
Net asset value | | | | | | | | | | | | | | | | | | | | |
End of year | | $ | 9.38 | | | $ | 8.86 | | | $ | 9.03 | | | $ | 8.37 | | | $ | 7.25 | |
| | | | | | | | | | | | | | | | | | | | |
Total return(D) | | | 11.85 | % | | | 4.31 | % | | | 15.39 | % | | | 23.16 | % | | | (16.02 | )% |
| | | | | | | | | | | | | | | | | | | | |
Net assets end of year (000’s) | | $ | 128,284 | | | $ | 109,052 | | | $ | 146,631 | | | $ | 132,177 | | | $ | 128,108 | |
| | | | | | | | | | | | | | | | | | | | |
Ratio and supplemental data | | | | | | | | | | | | | | | | | | | | |
Expenses to average net assets | | | | | | | | | | | | | | | | | | | | |
After reimbursement/waiver or recapture | | | 0.57 | % | | | 0.58 | % | | | 0.64 | %(O) | | | 0.85 | % | | | 0.77 | % |
Before reimbursement/waiver or recapture | | | 0.57 | % | | | 0.58 | % | | | 0.64 | %(O) | | | 0.85 | % | | | 0.77 | % |
Net investment income to average net assets(G) | | | 5.32 | % | | | 6.10 | % | | | 6.18 | % | | | 6.64 | % | | | 5.67 | % |
Portfolio turnover rate | | | 35 | % | | | 42 | % | | | 120 | % | | | 169 | % | | | 98 | % |
| |
| | | Transamerica Growth Opportunities | |
| | | Class A | |
| | | October 31, | | | October 31, | | | October 31, | | | October 31, | | | October 31, | |
For a share outstanding throughout each period | | 2012 | | | 2011 | | | 2010 | | | 2009 | | | 2008 | |
Net asset value | | | | | | | | | | | | | | | | | | | | |
Beginning of year | | $ | 10.93 | | | $ | 9.82 | | | $ | 7.54 | | | $ | 6.57 | | | $ | 11.40 | |
| | | | | | | | | | | | | | | | | | | | |
Investment operations | | | | | | | | | | | | | | | | | | | | |
Net investment income (loss)(B) | | | 0.01 | | | | (0.10 | ) | | | (0.05 | ) | | | (0.05 | ) | | | (0.06 | ) |
Net realized and change in unrealized gain (loss) on investments | | | (0.55 | ) | | | 1.21 | | | | 2.33 | | | | 1.02 | | | | (4.77 | ) |
| | | | | | | | | | | | | | | | | | | | |
Total from investment operations | | | (0.54 | ) | | | 1.11 | | | | 2.28 | | | | 0.97 | | | | (4.83 | ) |
| | | | | | | | | | | | | | | | | | | | |
Distributions | | | | | | | | | | | | | | | | | | | | |
Net investment income | | | — | (C) | | | — | | | | — | | | | — | | | | — | |
Net realized gains on investments | | | (2.24 | ) | | | — | | | | — | | | | — | | | | — | |
| | | | | | | | | | | | | | | | | | | | |
Total distributions | | | (2.24 | ) | | | — | | | | — | | | | — | | | | — | |
| | | | | | | | | | | | | | | | | | | | |
Net asset value | | | | | | | | | | | | | | | | | | | | |
End of year | | $ | 8.15 | | | $ | 10.93 | | | $ | 9.82 | | | $ | 7.54 | | | $ | 6.57 | |
| | | | | | | | | | | | | | | | | | | | |
Total return(D) | | | (3.79 | )% | | | 11.30 | % | | | 30.41 | % | | | 14.76 | % | | | (42.37 | )% |
| | | | | | | | | | | | | | | | | | | | |
Net assets end of year (000’s) | | $ | 91,110 | | | $ | 103,177 | | | $ | 59,685 | | | $ | 48,788 | | | $ | 41,005 | |
| | | | | | | | | | | | | | | | | | | | |
Ratio and supplemental data | | | | | | | | | | | | | | | | | | | | |
Expenses to average net assets | | | | | | | | | | | | | | | | | | | | |
After reimbursement/waiver or recapture | | | 1.67 | % | | | 1.75 | % | | | 1.75 | % | | | 1.75 | % | | | 1.75 | % |
Before reimbursement/waiver or recapture | | | 1.54 | % | | | 1.64 | % | | | 1.98 | % | | | 2.23 | % | | | 1.81 | % |
Net investment income (loss) to average net assets(G) | | | 0.10 | % | | | (0.83 | )% | | | (0.56 | )% | | | (0.68 | )% | | | (0.69 | )% |
Portfolio turnover rate | | | 38 | % | | | 125 | % | | | 63 | % | | | 71 | % | | | 45 | % |
| | | | |
| The notes to the financial statements are an integral part of this report. | | |
| Transamerica Funds | | | | Annual Report 2012 |
| | Page 135 | | |
FINANCIAL HIGHLIGHTS (continued)
For the period or years ended:
| | | | | | | | | | | | | | | | | | | | |
| | | Transamerica Growth Opportunities | |
| | | Class B | |
| | | October 31, | | | October 31, | | | October 31, | | | October 31, | | | October 31, | |
For a share outstanding throughout each period | | 2012 | | | 2011 | | | 2010 | | | 2009 | | | 2008 | |
Net asset value | | | | | | | | | | | | | | | | | | | | |
Beginning of year | | $ | 10.01 | | | $ | 9.05 | | | $ | 6.99 | | | $ | 6.13 | | | $ | 10.72 | |
| | | | | | | | | | | | | | | | | | | | |
Investment operations | | | | | | | | | | | | | | | | | | | | |
Net investment loss(B) | | | (0.04 | ) | | | (0.15 | ) | | | (0.10 | ) | | | (0.08 | ) | | | (0.12 | ) |
Net realized and change in unrealized gain (loss) on investments | | | (0.52 | ) | | | 1.11 | | | | 2.16 | | | | 0.94 | | | | (4.47 | ) |
| | | | | | | | | | | | | | | | | | | | |
Total from investment operations | | | (0.56 | ) | | | 0.96 | | | | 2.06 | | | | 0.86 | | | | (4.59 | ) |
| | | | | | | | | | | | | | | | | | | | |
Distributions | | | | | | | | | | | | | | | | | | | | |
Net investment income | | | — | (C) | | | — | | | | — | | | | — | | | | — | |
Net realized gains on investments | | | (2.24 | ) | | | — | | | | — | | | | — | | | | — | |
| | | | | | | | | | | | | | | | | | | | |
Total distributions | | | (2.24 | ) | | | — | | | | — | | | | — | | | | — | |
| | | | | | | | | | | | | | | | | | | | |
Net asset value | | | | | | | | | | | | | | | | | | | | |
End of year | | $ | 7.21 | | | $ | 10.01 | | | $ | 9.05 | | | $ | 6.99 | | | $ | 6.13 | |
| | | | | | | | | | | | | | | | | | | | |
Total return(D) | | | (4.47 | )% | | | 10.61 | % | | | 29.47 | % | | | 14.03 | % | | | (42.82 | )% |
| | | | | | | | | | | | | | | | | | | | |
Net assets end of year (000’s) | | $ | 5,582 | | | $ | 9,636 | | | $ | 12,406 | | | $ | 14,067 | | | $ | 20,823 | |
| | | | | | | | | | | | | | | | | | | | |
Ratio and supplemental data | | | | | | | | | | | | | | | | | | | | |
Expenses to average net assets | | | | | | | | | | | | | | | | | | | | |
After reimbursement/waiver or recapture | | | 2.32 | % | | | 2.40 | % | | | 2.40 | % | | | 2.40 | % | | | 2.40 | % |
Before reimbursement/waiver or recapture | | | 2.31 | % | | | 2.29 | % | | | 2.41 | % | | | 2.71 | % | | | 2.46 | % |
Net investment loss to average net assets(G) | | | (0.56 | )% | | | (1.40 | )% | | | (1.21 | )% | | | (1.25 | )% | | | (1.39 | )% |
Portfolio turnover rate | | | 38 | % | | | 125 | % | | | 63 | % | | | 71 | % | | | 45 | % |
| | | | | | | | | | | | | | | | | | | | |
| | | Transamerica Growth Opportunities | |
| | | Class C | |
| | | October 31, | | | October 31, | | | October 31, | | | October 31, | | | October 31, | |
For a share outstanding throughout each period | | 2012 | | | 2011 | | | 2010 | | | 2009 | | | 2008 | |
Net asset value | | | | | | | | | | | | | | | | | | | | |
Beginning of year | | $ | 10.05 | | | $ | 9.08 | | | $ | 7.01 | | | $ | 6.16 | | | $ | 10.74 | |
| | | | | | | | | | | | | | | | | | | | |
Investment operations | | | | | | | | | | | | | | | | | | | | |
Net investment loss(B) | | | (0.04 | ) | | | (0.15 | ) | | | (0.10 | ) | | | (0.08 | ) | | | (0.11 | ) |
Net realized and change in unrealized gain (loss) on investments | | | (0.52 | ) | | | 1.12 | | | | 2.17 | | | | 0.93 | | | | (4.47 | ) |
| | | | | | | | | | | | | | | | | | | | |
Total from investment operations | | | (0.56 | ) | | | 0.97 | | | | 2.07 | | | | 0.85 | | | | (4.58 | ) |
| | | | | | | | | | | | | | | | | | | | |
Distributions | | | | | | | | | | | | | | | | | | | | |
Net realized gains on investments | | | (2.24 | ) | | | — | | | | — | | | | — | | | | — | |
| | | | | | | | | | | | | | | | | | | | |
Total distributions | | | (2.24 | ) | | | — | | | | — | | | | — | | | | — | |
| | | | | | | | | | | | | | | | | | | | |
Net asset value | | | | | | | | | | | | | | | | | | | | |
End of year | | $ | 7.25 | | | $ | 10.05 | | | $ | 9.08 | | | $ | 7.01 | | | $ | 6.16 | |
| | | | | | | | | | | | | | | | | | | | |
Total return(D) | | | (4.46 | )% | | | 10.68 | % | | | 29.53 | % | | | 13.80 | % | | | (42.64 | )% |
| | | | | | | | | | | | | | | | | | | | |
Net assets end of year (000’s) | | $ | 10,943 | | | $ | 14,288 | | | $ | 12,781 | | | $ | 10,774 | | | $ | 10,619 | |
| | | | | | | | | | | | | | | | | | | | |
Ratio and supplemental data | | | | | | | | | | | | | | | | | | | | |
Expenses to average net assets | | | | | | | | | | | | | | | | | | | | |
After reimbursement/waiver or recapture | | | 2.28 | % | | | 2.40 | % | | | 2.40 | % | | | 2.40 | % | | | 2.34 | % |
Before reimbursement/waiver or recapture | | | 2.28 | % | | | 2.28 | % | | | 2.41 | % | | | 2.62 | % | | | 2.34 | % |
Net investment loss to average net assets(G) | | | (0.51 | )% | | | (1.43 | )% | | | (1.21 | )% | | | (1.31 | )% | | | (1.29 | )% |
Portfolio turnover rate | | | 38 | % | | | 125 | % | | | 63 | % | | | 71 | % | | | 45 | % |
| | | | |
| The notes to the financial statements are an integral part of this report. | | |
| Transamerica Funds | | | | Annual Report 2012 |
| | Page 136 | | |
FINANCIAL HIGHLIGHTS (continued)
For the period or years ended:
| | | | | | | | | | | | |
| | | Transamerica Growth Opportunities | |
| | | Class I | |
| | | October 31, | | | October 31, | | | October 31, | |
For a share outstanding throughout each period | | 2012 | | | 2011 | | | 2010(H) | |
Net asset value | | | | | | | | | | | | |
Beginning of period/year | | $ | 11.37 | | | $ | 10.19 | | | $ | 8.04 | |
| | | | | | | | | | | | |
Investment operations | | | | | | | | | | | | |
Net investment income (loss)(B) | | | 0.08 | | | | (0.02 | ) | | | (0.02 | ) |
Net realized and change in unrealized gain (loss) on investments | | | (0.58 | ) | | | 1.24 | | | | 2.17 | |
| | | | | | | | | | | | |
Total from investment operations | | | (0.50 | ) | | | 1.22 | | | | 2.15 | |
| | | | | | | | | | | | |
Distributions | | | | | | | | | | | | |
Net investment income | | | (0.02 | ) | | | (0.04 | ) | | | — | |
Net realized gains on investments | | | (2.24 | ) | | | — | | | | — | |
| | | | | | | | | | | | |
Total distributions | | | (2.26 | ) | | | (0.04 | ) | | | — | |
| | | | | | | | | | | | |
Net asset value | | | | | | | | | | | | |
End of year | | $ | 8.61 | | | $ | 11.37 | | | $ | 10.19 | |
| | | | | | | | | | | | |
Total return(D) | | | (3.16 | )% | | | 12.01 | % | | | 26.74 | %(E) |
| | | | | | | | | | | | |
Net assets end of year (000’s) | | $ | 80,359 | | | $ | 9,954 | | | $ | 815 | |
| | | | | | | | | | | | |
Ratio and supplemental data | | | | | | | | | | | | |
Expenses to average net assets | | | | | | | | | | | | |
After reimbursement/waiver or recapture | | | 0.99 | % | | | 1.08 | % | | | 1.40 | %(F) |
Before reimbursement/waiver or recapture | | | 0.99 | % | | | 1.08 | % | | | 1.48 | %(F) |
Net investment income (loss) to average net assets(G) | | | 0.90 | % | | | (0.20 | )% | | | (0.23 | )%(F) |
Portfolio turnover rate | | | 38 | % | | | 125 | % | | | 63 | %(E) |
| | | | | | | | | | | | | | | | | | | | |
| | | Transamerica Growth Opportunities | |
| | | Class I2(I) | |
| | | October 31, | | | October 31, | | | October 31, | | | October 31, | | | October 31, | |
For a share outstanding throughout each period | | 2012 | | | 2011 | | | 2010 | | | 2009 | | | 2008 | |
Net asset value | | | | | | | | | | | | | | | | | | | | |
Beginning of year | | $ | 11.43 | | | $ | 10.23 | | | $ | 7.78 | | | $ | 6.74 | | | $ | 11.59 | |
| | | | | | | | | | | | | | | | | | | | |
Investment operations | | | | | | | | | | | | | | | | | | | | |
Net investment income(B) | | | 0.09 | | | | 0.01 | | | | 0.03 | | | | 0.01 | | | | 0.01 | |
Net realized and change in unrealized gain (loss) on investments | | | (0.58 | ) | | | 1.25 | | | | 2.42 | | | | 1.03 | | | | (4.86 | ) |
| | | | | | | | | | | | | | | | | | | | |
Total from investment operations | | | (0.49 | ) | | | 1.26 | | | | 2.45 | | | | 1.04 | | | | (4.85 | ) |
| | | | | | | | | | | | | | | | | | | | |
Distributions | | | | | | | | | | | | | | | | | | | | |
Net investment income | | | (0.02 | ) | | | (0.06 | ) | | | — | | | | — | | | | — | |
Net realized gains on investments | | | (2.24 | ) | | | — | | | | — | | | | — | | | | — | |
| | | | | | | | | | | | | | | | | | | | |
Total distributions | | | (2.26 | ) | | | (0.06 | ) | | | — | | | | — | | | | — | |
| | | | | | | | | | | | | | | | | | | | |
Net asset value | | | | | | | | | | | | | | | | | | | | |
End of year | | $ | 8.68 | | | $ | 11.43 | | | $ | 10.23 | | | $ | 7.78 | | | $ | 6.74 | |
| | | | | | | | | | | | | | | | | | | | |
Total return(D) | | | (2.97 | )% | | | 12.28 | % | | | 31.49 | % | | | 15.43 | % | | | (41.85 | )% |
| | | | | | | | | | | | | | | | | | | | |
Net assets end of year (000’s) | | $ | 397,945 | | | $ | 113,057 | | | $ | 106,970 | | | $ | 111,402 | | | $ | 86,425 | |
| | | | | | | | | | | | | | | | | | | | |
Ratio and supplemental data | | | | | | | | | | | | | | | | | | | | |
Expenses to average net assets | | | | | | | | | | | | | | | | | | | | |
After reimbursement/waiver or recapture | | | 0.85 | % | | | 0.89 | % | | | 0.88 | % | | | 0.91 | % | | | 0.86 | % |
Before reimbursement/waiver or recapture | | | 0.85 | % | | | 0.89 | % | | | 0.88 | % | | | 0.91 | % | | | 0.86 | % |
Net investment income to average net assets(G) | | | 0.99 | % | | | 0.09 | % | | | 0.32 | % | | | 0.15 | % | | | 0.15 | % |
Portfolio turnover rate | | | 38 | % | | | 125 | % | | | 63 | % | | | 71 | % | | | 45 | % |
| | | | |
| The notes to the financial statements are an integral part of this report. | | |
| Transamerica Funds | | | | Annual Report 2012 |
| | Page 137 | | |
FINANCIAL HIGHLIGHTS (continued)
For the period or years ended:
| | | | | | | | | | | | | | | | | | | | |
| | | Transamerica High Yield Bond | |
| | | Class A | |
| | | October 31, | | | October 31, | | | October 31, | | | October 31, | | | October 31, | |
For a share outstanding throughout each period | | 2012 | | | 2011 | | | 2010 | | | 2009 | | | 2008 | |
Net asset value | | | | | | | | | | | | | | | | | | | | |
Beginning of year | | $ | 8.95 | | | $ | 9.16 | | | $ | 8.45 | | | $ | 6.31 | | | $ | 9.12 | |
| | | | | | | | | | | | | | | | | | | | |
Investment operations | | | | | | | | | | | | | | | | | | | | |
Net investment income(B) | | | 0.59 | | | | 0.61 | | | | 0.66 | | | | 0.65 | | | | 0.64 | |
Net realized and change in unrealized gain (loss) on investments | | | 0.67 | | | | (0.21 | ) | | | 0.73 | | | | 2.14 | | | | (2.83 | ) |
| | | | | | | | | | | | | | | | | | | | |
Total from investment operations | | | 1.26 | | | | 0.40 | | | | 1.39 | | | | 2.79 | | | | (2.19 | ) |
| | | | | | | | | | | | | | | | | | | | |
Distributions | | | | | | | | | | | | | | | | | | | | |
Net investment income | | | (0.62 | ) | | | (0.61 | ) | | | (0.68 | ) | | | (0.66 | ) | | | (0.62 | ) |
| | | | | | | | | | | | | | | | | | | | |
Total distributions | | | (0.62 | ) | | | (0.61 | ) | | | (0.68 | ) | | | (0.66 | ) | | | (0.62 | ) |
| | | | | | | | | | | | | | | | | | | | |
Net asset value | | | | | | | | | | | | | | | | | | | | |
End of year | | $ | 9.59 | | | $ | 8.95 | | | $ | 9.16 | | | $ | 8.45 | | | $ | 6.31 | |
| | | | | | | | | | | | | | | | | | | | |
Total return(D) | | | 14.57 | % | | | 4.41 | % | | | 17.21 | % | | | 47.58 | % | | | (25.46 | )% |
| | | | | | | | | | | | | | | | | | | | |
Net assets end of year (000’s) | | $ | 256,099 | | | $ | 228,920 | | | $ | 193,332 | | | $ | 67,290 | | | $ | 24,506 | |
| | | | | | | | | | | | | | | | | | | | |
Ratio and supplemental data | | | | | | | | | | | | | | | | | | | | |
Expenses to average net assets | | | | | | | | | | | | | | | | | | | | |
After reimbursement/waiver or recapture | | | 1.06 | % | | | 1.17 | % | | | 1.15 | % | | | 1.19 | % | | | 1.16 | % |
Before reimbursement/waiver or recapture | | | 1.06 | % | | | 1.17 | % | | | 1.15 | % | | | 1.19 | % | | | 1.16 | % |
Net investment income to average net assets(G) | | | 6.44 | % | | | 6.65 | % | | | 7.52 | % | | | 9.08 | % | | | 7.65 | % |
Portfolio turnover rate | | | 78 | % | | | 93 | % | | | 91 | % | | | 58 | % | | | 38 | % |
| |
| | | Transamerica High Yield Bond | |
| | | Class B | |
| | | October 31, | | | October 31, | | | October 31, | | | October 31, | | | October 31, | |
For a share outstanding throughout each period | | 2012 | | | 2011 | | | 2010 | | | 2009 | | | 2008 | |
Net asset value | | | | | | | | | | | | | | | | | | | | |
Beginning of year | | $ | 8.95 | | | $ | 9.15 | | | $ | 8.44 | | | $ | 6.30 | | | $ | 9.11 | |
| | | | | | | | | | | | | | | | | | | | |
Investment operations | | | | | | | | | | | | | | | | | | | | |
Net investment income(B) | | | 0.52 | | | | 0.55 | | | | 0.61 | | | | 0.60 | | | | 0.58 | |
Net realized and change in unrealized gain (loss) on investments | | | 0.67 | | | | (0.21 | ) | | | 0.72 | | | | 2.15 | | | | (2.83 | ) |
| | | | | | | | | | | | | | | | | | | | |
Total from investment operations | | | 1.19 | | | | 0.34 | | | | 1.33 | | | | 2.75 | | | | (2.25 | ) |
| | | | | | | | | | | | | | | | | | | | |
Distributions | | | | | | | | | | | | | | | | | | | | |
Net investment income | | | (0.54 | ) | | | (0.54 | ) | | | (0.62 | ) | | | (0.61 | ) | | | (0.56 | ) |
| | | | | | | | | | | | | | | | | | | | |
Total distributions | | | (0.54 | ) | | | (0.54 | ) | | | (0.62 | ) | | | (0.61 | ) | | | (0.56 | ) |
| | | | | | | | | | | | | | | | | | | | |
Net asset value | | | | | | | | | | | | | | | | | | | | |
End of year | | $ | 9.60 | | | $ | 8.95 | | | $ | 9.15 | | | $ | 8.44 | | | $ | 6.30 | |
| | | | | | | | | | | | | | | | | | | | |
Total return(D) | | | 13.77 | % | | | 3.81 | % | | | 16.38 | % | | | 46.69 | % | | | (26.04 | )% |
| | | | | | | | | | | | | | | | | | | | |
Net assets end of year (000’s) | | $ | 9,236 | | | $ | 9,431 | | | $ | 13,887 | | | $ | 11,898 | | | $ | 9,091 | |
| | | | | | | | | | | | | | | | | | | | |
Ratio and supplemental data | | | | | | | | | | | | | | | | | | | | |
Expenses to average net assets | | | | | | | | | | | | | | | | | | | | |
After reimbursement/waiver or recapture | | | 1.84 | % | | | 1.83 | % | | | 1.83 | % | | | 1.91 | % | | | 1.85 | % |
Before reimbursement/waiver or recapture | | | 1.83 | % | | | 1.84 | % | | | 1.83 | % | | | 1.91 | % | | | 1.85 | % |
Net investment income to average net assets(G) | | | 5.69 | % | | | 5.99 | % | | | 6.93 | % | | | 8.56 | % | | | 6.83 | % |
Portfolio turnover rate | | | 78 | % | | | 93 | % | | | 91 | % | | | 58 | % | | | 38 | % |
| | | | |
| The notes to the financial statements are an integral part of this report. | | |
| Transamerica Funds | | | | Annual Report 2012 |
| | Page 138 | | |
FINANCIAL HIGHLIGHTS (continued)
For the period or years ended:
| | | | | | | | | | | | | | | | | | | | |
| | | Transamerica High Yield Bond | |
| | | Class C | |
For a share outstanding throughout each period | �� | October 31,
2012 | | | October 31,
2011 | | | October 31,
2010 | | | October 31,
2009 | | | October 31,
2008 | |
Net asset value | | | | | | | | | | | | | | | | | | | | |
Beginning of year | | $ | 8.92 | | | $ | 9.13 | | | $ | 8.42 | | | $ | 6.30 | | | $ | 9.10 | |
| | | | | | | | | | | | | | | | | | | | |
Investment operations | | | | | | | | | | | | | | | | | | | | |
Net investment income(B) | | | 0.53 | | | | 0.55 | | | | 0.61 | | | | 0.60 | | | | 0.58 | |
Net realized and change in unrealized gain (loss) on investments | | | 0.66 | | | | (0.21 | ) | | | 0.73 | | | | 2.14 | | | | (2.82 | ) |
| | | | | | | | | | | | | | | | | | | | |
Total from investment operations | | | 1.19 | | | | 0.34 | | | | 1.34 | | | | 2.74 | | | | (2.24 | ) |
| | | | | | | | | | | | | | | | | | | | |
Distributions | | | | | | | | | | | | | | | | | | | | |
Net investment income | | | (0.55 | ) | | | (0.55 | ) | | | (0.63 | ) | | | (0.62 | ) | | | (0.56 | ) |
| | | | | | | | | | | | | | | | | | | | |
Total distributions | | | (0.55 | ) | | | (0.55 | ) | | | (0.63 | ) | | | (0.62 | ) | | | (0.56 | ) |
| | | | | | | | | | | | | | | | | | | | |
Net asset value | | | | | | | | | | | | | | | | | | | | |
End of year | | $ | 9.56 | | | $ | 8.92 | | | $ | 9.13 | | | $ | 8.42 | | | $ | 6.30 | |
| | | | | | | | | | | | | | | | | | | | |
Total return(D) | | | 13.81 | % | | | 3.84 | % | | | 16.54 | % | | | 46.63 | % | | | (25.89 | )% |
| | | | | | | | | | | | | | | | | | | | |
Net assets end of year (000’s) | | $ | 76,995 | | | $ | 48,789 | | | $ | 41,810 | | | $ | 19,548 | | | $ | 5,429 | |
| | | | | | | | | | | | | | | | | | | | |
Ratio and supplemental data | | | | | | | | | | | | | | | | | | | | |
Expenses to average net assets | | | | | | | | | | | | | | | | | | | | |
After reimbursement/waiver or recapture | | | 1.77 | % | | | 1.76 | % | | | 1.77 | % | | | 1.81 | % | | | 1.80 | % |
Before reimbursement/waiver or recapture | | | 1.77 | % | | | 1.76 | % | | | 1.77 | % | | | 1.81 | % | | | 1.80 | % |
Net investment income to average net assets(G) | | | 5.73 | % | | | 6.07 | % | | | 6.96 | % | | | 8.23 | % | | | 6.93 | % |
Portfolio turnover rate | | | 78 | % | | | 93 | % | | | 91 | % | | | 58 | % | | | 38 | % |
| | | | | | | | | | | | |
| | | Transamerica High Yield Bond | |
| | | Class I | |
For a share outstanding throughout each period | | October 31,
2012 | | | October 31,
2011 | | | October 31,
2010(H) | |
Net asset value | | | | | | | | | | | | |
Beginning of period/year | | $ | 9.00 | | | $ | 9.20 | | | $ | 8.55 | |
| | | | | | | | | | | | |
Investment operations | | | | | | | | | | | | |
Net investment income(B) | | | 0.62 | | | | 0.65 | | | | 0.63 | |
Net realized and change in unrealized gain (loss) on investments | | | 0.68 | | | | (0.21 | ) | | | 0.68 | |
| | | | | | | | | | | | |
Total from investment operations | | | 1.30 | | | | 0.44 | | | | 1.31 | |
| | | | | | | | | | | | |
Distributions | | | | | | | | | | | | |
Net investment income | | | (0.64 | ) | | | (0.64 | ) | | | (0.66 | ) |
| | | | | | | | | | | | |
Total distributions | | | (0.64 | ) | | | (0.64 | ) | | | (0.66 | ) |
| | | | | | | | | | | | |
Net asset value | | | | | | | | | | | | |
End of year | | $ | 9.66 | | | $ | 9.00 | | | $ | 9.20 | |
| | | | | | | | | | | | |
Total return(D) | | | 15.05 | % | | | 4.95 | % | | | 15.92 | %(E) |
| | | | | | | | | | | | |
Net assets end of year (000’s) | | $ | 103,181 | | | $ | 82,736 | | | $ | 27,057 | |
| | | | | | | | | | | | |
Ratio and supplemental data | | | | | | | | | | | | |
Expenses to average net assets | | | | | | | | | | | | |
After reimbursement/waiver or recapture | | | 0.78 | % | | | 0.77 | % | | | 0.83 | %(F) |
Before reimbursement/waiver or recapture | | | 0.78 | % | | | 0.78 | % | | | 0.83 | %(F) |
Net investment income to average net assets(G) | | | 6.64 | % | | | 7.09 | % | | | 7.71 | %(F) |
Portfolio turnover rate | | | 78 | % | | | 93 | % | | | 91 | %(E) |
| | | | |
| The notes to the financial statements are an integral part of this report. | | |
| Transamerica Funds | | | | Annual Report 2012 |
| | Page 139 | | |
FINANCIAL HIGHLIGHTS (continued)
For the period or years ended:
| | | | | | | | | | | | | | | | | | | | | | | | |
| | | Transamerica High Yield Bond | | | Transamerica
International
Bond | |
| | | Class I2(I) | | | Class A | |
For a share outstanding throughout each period | | October 31,
2012 | | | October 31,
2011 | | | October 31,
2010 | | | October 31,
2009 | | | October 31,
2008 | | | October 31,
2012(P) | |
Net asset value | | | | | | | | | | | | | | | | | | | | | | | | |
Beginning of period/year | | $ | 9.02 | | | $ | 9.22 | | | $ | 8.50 | | | $ | 6.35 | | | $ | 9.17 | | | $ | 10.29 | |
| | | | | | | | | | | | | | | | | | | | | | | | |
Investment operations | | | | | | | | | | | | | | | | | | | | | | | | |
Net investment income(B) | | | 0.64 | | | | 0.66 | | | | 0.71 | | | | 0.69 | | | | 0.69 | | | | 0.09 | |
Net realized and change in unrealized gain (loss) on investments | | | 0.66 | | | | (0.21 | ) | | | 0.73 | | | | 2.16 | | | | (2.85 | ) | | | 0.17 | |
| | | | | | | | | | | | | | | | | | | | | | | | |
Total from investment operations | | | 1.30 | | | | 0.45 | | | | 1.44 | | | | 2.85 | | | | (2.16 | ) | | | 0.26 | |
| | | | | | | | | | | | | | | | | | | | | | | | |
Distributions | | | | | | | | | | | | | | | | | | | | | | | | |
Net investment income | | | (0.65 | ) | | | (0.65 | ) | | | (0.72 | ) | | | (0.70 | ) | | | (0.66 | ) | | | (0.04 | ) |
| | | | | | | | | | | | | | | | | | | | | | | | |
Total distributions | | | (0.65 | ) | | | (0.65 | ) | | | (0.72 | ) | | | (0.70 | ) | | | (0.66 | ) | | | (0.04 | ) |
| | | | | | | | | | | | | | | | | | | | | | | | |
Net asset value | | | | | | | | | | | | | | | | | | | | | | | | |
End of year | | $ | 9.67 | | | $ | 9.02 | | | $ | 9.22 | | | $ | 8.50 | | | $ | 6.35 | | | $ | 10.51 | |
| | | | | | | | | | | | | | | | | | | | | | | | |
Total return(D) | | | 15.01 | % | | | 5.06 | % | | | 17.74 | % | | | 48.39 | % | | | (25.05 | )% | | | 2.52 | %(E) |
| | | | | | | | | | | | | | | | | | | | | | | | |
Net assets end of year (000’s) | | $ | 250,912 | | | $ | 388,633 | | | $ | 408,505 | | | $ | 472,936 | | | $ | 418,923 | | | $ | 165 | |
| | | | | | | | | | | | | | | | | | | | | | | | |
Ratio and supplemental data | | | | | | | | | | | | | | | | | | | | | | | | |
Expenses to average net assets | | | | | | | | | | | | | | | | | | | | | | | | |
After reimbursement/waiver or recapture | | | 0.67 | % | | | 0.66 | % | | | 0.66 | % | | | 0.67 | % | | | 0.65 | % | | | 1.05 | %(F) |
Before reimbursement/waiver or recapture | | | 0.67 | % | | | 0.66 | % | | | 0.66 | % | | | 0.67 | % | | | 0.65 | % | | | 1.18 | %(F) |
Net investment income to average net assets(G) | | | 6.88 | % | | | 7.16 | % | | | 8.11 | % | | | 9.96 | % | | | 8.34 | % | | | 1.34 | %(F) |
Portfolio turnover rate | | | 78 | % | | | 93 | % | | | 91 | % | | | 58 | % | | | 38 | % | | | 47 | %(E) |
| | | | | | | | |
| | | Transamerica International
Bond | |
| | | Class C | | | Class I | |
For a share outstanding throughout each period | | October 31,
2012(P) | | | October 31,
2012(P) | |
Net asset value | | | | | | | | |
Beginning of period/year | | $ | 10.29 | | | $ | 10.29 | |
| | | | | | | | |
Investment operations | | | | | | | | |
Net investment income(B) | | | 0.05 | | | | 0.11 | |
Net realized and change in unrealized gain on investments | | | 0.16 | | | | 0.17 | |
| | | | | | | | |
Total from investment operations | | | 0.21 | | | | 0.28 | |
| | | | | | | | |
Distributions | | | | | | | | |
Net investment income | | | (0.03 | ) | | | (0.04 | ) |
| | | | | | | | |
Total distributions | | | (0.03 | ) | | | (0.04 | ) |
| | | | | | | | |
Net asset value | | | | | | | | |
End of year | | $ | 10.47 | | | $ | 10.53 | |
| | | | | | | | |
Total return(D) | | | 2.03 | %(E) | | | 2.75 | %(E) |
| | | | | | | | |
Net assets end of year (000’s) | | $ | 199 | | | $ | 103 | |
| | | | | | | | |
Ratio and supplemental data | | | | | | | | |
Expenses to average net assets | | | | | | | | |
After reimbursement/waiver or recapture | | | 1.75 | %(F) | | | 0.75 | %(F) |
Before reimbursement/waiver or recapture | | | 1.83 | %(F) | | | 0.87 | %(F) |
Net investment income to average net assets(G) | | | 0.65 | %(F) | | | 1.65 | %(F) |
Portfolio turnover rate | | | 47 | %(E) | | | 47 | %(E) |
| | | | |
| The notes to the financial statements are an integral part of this report. | | |
| Transamerica Funds | | | | Annual Report 2012 |
| | Page 140 | | |
FINANCIAL HIGHLIGHTS (continued)
For the period or years ended:
| | | | | | | | | | | | | | | | | | | | |
| | | Transamerica International Bond | |
| | | Class I2(I) | |
For a share outstanding throughout each period | | October 31,
2012 | | | October 31,
2011 | | | October 31,
2010 | | | October 31,
2009 | | | October 31,
2008 | |
Net asset value | | | | | | | | | | | | | | | | | | | | |
Beginning of year | | $ | 11.24 | | | $ | 12.08 | | | $ | 11.64 | | | $ | 10.56 | | | $ | 11.00 | |
| | | | | | | | | | | | | | | | | | | | |
Investment operations | | | | | | | | | | | | | | | | | | | | |
Net investment income(B) | | | 0.19 | | | | 0.23 | | | | 0.24 | | | | 0.26 | | | | 0.29 | |
Net realized and change in unrealized gain (loss) on investments | | | 0.07 | | | | (0.05 | ) | | | 0.71 | | | | 1.59 | | | | (0.29 | ) |
| | | | | | | | | | | | | | | | | | | | |
Total from investment operations | | | 0.26 | | | | 0.18 | | | | 0.95 | | | | 1.85 | | | | — | (C) |
| | | | | | | | | | | | | | | | | | | | |
Distributions | | | | | | | | | | | | | | | | | | | | |
Net investment income | | | (0.89 | ) | | | (0.93 | ) | | | (0.39 | ) | | | (0.68 | ) | | | (0.44 | ) |
Net realized gains on investments | | | (0.08 | ) | | | (0.09 | ) | | | (0.12 | ) | | | (0.09 | ) | | | — | |
| | | | | | | | | | | | | | | | | | | | |
Total distributions | | | (0.97 | ) | | | (1.02 | ) | | | (0.51 | ) | | | (0.77 | ) | | | (0.44 | ) |
| | | | | | | | | | | | | | | | | | | | |
Net asset value | | | | | | | | | | | | | | | | | | | | |
End of year | | $ | 10.53 | | | $ | 11.24 | | | $ | 12.08 | | | $ | 11.64 | | | $ | 10.56 | |
| | | | | | | | | | | | | | | | | | | | |
Total return(D) | | | 2.71 | % | | | 2.20 | % | | | 8.54 | % | | | 17.90 | % | | | (0.14 | )% |
| | | | | | | | | | | | | | | | | | | | |
Net assets end of year (000’s) | | $ | 193,313 | | | $ | 475,292 | | | $ | 447,141 | | | $ | 732,964 | | | $ | 699,078 | |
| | | | | | | | | | | | | | | | | | | | |
Ratio and supplemental data | | | | | | | | | | | | | | | | | | | | |
Expenses to average net assets | | | | | | | | | | | | | | | | | | | | |
After reimbursement/waiver or recapture | | | 0.68 | % | | | 0.63 | % | | | 0.61 | % | | | 0.60 | % | | | 0.61 | % |
Before reimbursement/waiver or recapture | | | 0.68 | % | | | 0.63 | % | | | 0.61 | % | | | 0.60 | % | | | 0.61 | % |
Net investment income to average net assets(G) | | | 1.77 | % | | | 2.09 | % | | | 2.16 | % | | | 2.38 | % | | | 2.55 | % |
Portfolio turnover rate | | | 47 | % | | | 98 | % | | | 61 | % | | | 53 | % | | | 74 | % |
| | | | | | | | | | | | | | | | |
| | | Transamerica International Equity | |
| | | Class A | | | Class C | |
| | | October 31, | | | October 31, | | | October 31, | | | October 31, | |
For a share outstanding throughout each period | | 2012 | | | 2011(Q) | | | 2012 | | | 2011(Q) | |
Net asset value | | | | | | | | | | | | | | | | |
Beginning of period/year | | $ | 13.47 | | | $ | 15.03 | | | $ | 13.40 | | | $ | 15.03 | |
| | | | | | | | | | | | | | | | |
Investment operations | | | | | | | | | | | | | | | | |
Net investment income(B) | | | 0.24 | | | | 0.15 | | | | 0.11 | | | | 0.16 | |
Net realized and change in unrealized gain (loss) on investments | | | 1.19 | | | | (1.71 | ) | | | 1.24 | | | | (1.79 | ) |
| | | | | | | | | | | | | | | | |
Total from investment operations | | | 1.43 | | | | (1.56 | ) | | | 1.35 | | | | (1.63 | ) |
| | | | | | | | | | | | | | | | |
Distributions | | | | | | | | | | | | | | | | |
Net investment income | | | (0.33 | ) | | | — | | | | (0.30 | ) | | | — | |
| | | | | | | | | | | | | | | | |
Total distributions | | | (0.33 | ) | | | — | | | | (0.30 | ) | | | — | |
| | | | | | | | | | | | | | | | |
Net asset value | | | | | | | | | | | | | | | | |
End of year | | $ | 14.57 | | | $ | 13.47 | | | $ | 14.45 | | | $ | 13.40 | |
| | | | | | | | | | | | | | | | |
Total return(D) | | | 11.10 | % | | | (10.38 | )%(E) | | | 10.49 | % | | | (10.84 | )%(E) |
| | | | | | | | | | | | | | | | |
Net assets end of year (000’s) | | $ | 2,999 | | | $ | 490 | | | $ | 4,886 | | | $ | 113 | |
| | | | | | | | | | | | | | | | |
Ratio and supplemental data | | | | | | | | | | | | | | | | |
Expenses to average net assets | | | | | | | | | | | | | | | | |
After reimbursement/waiver or recapture | | | 1.46 | % | | | 1.50 | %(F) | | | 2.04 | % | | | 2.14 | %(F) |
Before reimbursement/waiver or recapture | | | 1.51 | % | | | 1.52 | %(F) | | | 2.04 | % | | | 2.14 | %(F) |
Net investment income to average net assets(G) | | | 1.76 | % | | | 1.56 | %(F) | | | 0.82 | % | | | 1.64 | %(F) |
Portfolio turnover rate | | | 33 | % | | | 16 | %(E) | | | 33 | % | | | 16 | %(E) |
| | | | |
| The notes to the financial statements are an integral part of this report. | | |
| Transamerica Funds | | | | Annual Report 2012 |
| | Page 141 | | |
FINANCIAL HIGHLIGHTS (continued)
For the period or years ended:
| | | | | | | | | | | | | | | | | | | | |
| | | Transamerica International Equity | |
| | | Class I(R) | |
| | | October 31, | | | October 31, | | | October 31, | | | October 31, | | | October 31, | |
For a share outstanding throughout each period | | 2012 | | | 2011 | | | 2010 | | | 2009 | | | 2008 | |
Net asset value | | | | | | | | | | | | | | | | | | | | |
Beginning of year | | $ | 13.50 | | | $ | 13.97 | | | $ | 12.55 | | | $ | 9.94 | | | $ | 21.16 | |
| | | | | | | | | | | | | | | | | | | | |
Investment operations | | | | | | | | | | | | | | | | | | | | |
Net investment income(B) | | | 0.33 | | | | 0.40 | | | | 0.22 | | | | 0.19 | | | | 0.26 | |
Net realized and change in unrealized gain (loss) on investments | | | 1.17 | | | | (0.68 | ) | | | 1.36 | | | | 2.61 | | | | (8.99 | ) |
| | | | | | | | | | | | | | | | | | | | |
Total from investment operations | | | 1.50 | | | | (0.28 | ) | | | 1.58 | | | | 2.80 | | | | (8.73 | ) |
| | | | | | | | | | | | | | | | | | | | |
Distributions | | | | | | | | | | | | | | | | | | | | |
Net investment income | | | (0.35 | ) | | | (0.19 | ) | | | (0.16 | ) | | | (0.19 | ) | | | (0.20 | ) |
Net realized gains on investments | | | — | | | | — | | | | — | | | | — | | | | (2.29 | ) |
| | | | | | | | | | | | | | | | | | | | |
Total distributions | | | (0.35 | ) | | | (0.19 | ) | | | (0.16 | ) | | | (0.19 | ) | | | (2.49 | ) |
| | | | | | | | | | | | | | | | | | | | |
Net asset value | | | | | | | | | | | | | | | | | | | | |
End of year | | $ | 14.65 | | | $ | 13.50 | | | $ | 13.97 | | | $ | 12.55 | | | $ | 9.94 | |
| | | | | | | | | | | | | | | | | | | | |
Total return(D) | | | 11.58 | % | | | (2.05 | )% | | | 12.73 | % | | | 28.58 | % | | | (46.36 | )% |
| | | | | | | | | | | | | | | | | | | | |
Net assets end of year (000’s) | | $ | 90,012 | | | $ | 78,738 | | | $ | 75,271 | | | $ | 64,600 | | | $ | 51,529 | |
| | | | | | | | | | | | | | | | | | | | |
Ratio and supplemental data | | | | | | | | | | | | | | | | | | | | |
Expenses to average net assets | | | | | | | | | | | | | | | | | | | | |
After reimbursement/waiver or recapture | | | 1.05 | % | | | 1.16 | % | | | 1.43 | % | | | 1.67 | % | | | 1.52 | % |
Before reimbursement/waiver or recapture | | | 1.05 | % | | | 1.16 | % | | | 1.43 | % | | | 1.67 | % | | | 1.53 | % |
Net investment income to average net assets(G) | | | 2.39 | % | | | 2.79 | % | | | 1.76 | % | | | 1.87 | % | | | 1.67 | % |
Portfolio turnover rate | | | 33 | % | | | 16 | % | | | 43 | % | | | 42 | % | | | 40 | % |
| | | | | | | | | | | | | | | | | | | | | | | | |
| | | Transamerica International
Equity | | | Transamerica Large Cap Growth | |
| | | Class I2 | | | Class A | | | Class C | | | Class I | | | Class I2 | |
| | | October 31, | | | October 31, | | | October 31, | | | October 31, | | | October 31, | | | October 31, | |
For a share outstanding throughout each period | | 2012 | | | 2011(Q) | | | 2012(N) | | | 2012(N) | | | 2012(N) | | | 2012(N) | |
Net asset value | | | | | | | | | | | | | | | | | | | | | | | | |
Beginning of period/year | | $ | 13.51 | | | $ | 15.03 | | | $ | 10.00 | | | $ | 10.00 | | | $ | 10.00 | | | $ | 10.00 | |
| | | | | | | | | | | | | | | | | | | | | | | | |
Investment operations | | | | | | | | | | | | | | | | | | | | | | | | |
Net investment income(B) | | | 0.36 | | | | 0.29 | | | | 0.03 | | | | — | (C) | | | 0.04 | | | | 0.05 | |
Net realized and change in unrealized gain (loss) on investments | | | 1.14 | | | | (1.81 | ) | | | (0.17 | ) | | | (0.18 | ) | | | (0.17 | ) | | | (0.17 | ) |
| | | | | | | | | | | | | | | | | | | | | | | | |
Total from investment operations | | | 1.50 | | | | (1.52 | ) | | | (0.14 | ) | | | (0.18 | ) | | | (0.13 | ) | | | (0.12 | ) |
| | | | | | | | | | | | | | | | | | | | | | | | |
Distributions | | | | | | | | | | | | | | | | | | | | | | | | |
Net investment income | | | (0.36 | ) | | | — | | | | — | | | | — | | | | — | | | | — | |
| | | | | | | | | | | | | | | | | | | | | | | | |
Total distributions | | | (0.36 | ) | | | — | | | | — | | | | — | | | | — | | | | — | |
| | | | | | | | | | | | | | | | | | | | | | | | |
Net asset value | | | | | | | | | | | | | | | | | | | | | | | | |
End of year | | $ | 14.65 | | | $ | 13.51 | | | $ | 9.86 | | | $ | 9.82 | | | $ | 9.87 | | | $ | 9.88 | |
| | | | | | | | | | | | | | | | | | | | | | | | |
Total return(D) | | | 11.64 | % | | | (10.11 | )%(E) | | | (1.40 | )%(E) | | | (1.80 | )%(E) | | | (1.30 | )%(E) | | | (1.20 | )%(E) |
| | | | | | | | | | | | | | | | | | | | | | | | |
Net assets end of year (000’s) | | $ | 166,085 | | | $ | 46,313 | | | $ | 419 | | | $ | 280 | | | $ | 786 | | | $ | 135,305 | |
| | | | | | | | | | | | | | | | | | | | | | | | |
Ratio and supplemental data | | | | | | | | | | | | | | | | | | | | | | | | |
Expenses to average net assets | | | | | | | | | | | | | | | | | | | | | | | | |
After reimbursement/waiver or recapture | | | 0.95 | % | | | 1.02 | %(F) | | | 1.25 | %(F) | | | 1.92 | %(F) | | | 0.95 | %(F) | | | 0.87 | %(F) |
Before reimbursement/waiver or recapture | | | 0.95 | % | | | 1.02 | %(F) | | | 1.26 | %(F) | | | 1.92 | %(F) | | | 0.98 | %(F) | | | 0.87 | %(F) |
Net investment income to average net assets(G) | | | 2.62 | % | | | 3.07 | %(F) | | | 0.65 | %(F) | | | — | %(F),(S) | | | 0.75 | %(F) | | | 1.07 | %(F) |
Portfolio turnover rate | | | 33 | % | | | 16 | %(E) | | | 24 | %(E) | | | 24 | %(E) | | | 24 | %(E) | | | 24 | %(E) |
| | | | |
| The notes to the financial statements are an integral part of this report. | | |
| Transamerica Funds | | | | Annual Report 2012 |
| | Page 142 | | |
FINANCIAL HIGHLIGHTS (continued)
For the period or years ended:
| | | | | | | | | | | | | | | | | | | | | | | | |
| | | Transamerica Large Cap Value | |
| | | Class A | | | Class C | | | Class I | |
| | | October 31, | | | October 31, | | | October 31, | | | October 31, | | | October 31, | | | October 31, | |
For a share outstanding throughout each period | | 2012 | | | 2011(T) | | | 2012 | | | 2011(T) | | | 2012 | | | 2011(T) | |
Net asset value | | | | | | | | | | | | | | | | | | | | | | | | |
Beginning of period/year | | $ | 10.30 | | | $ | 10.00 | | | $ | 10.29 | | | $ | 10.00 | | | $ | 10.31 | | | $ | 10.00 | |
| | | | | | | | | | | | | | | | | | | | | | | | |
Investment operations | | | | | | | | | | | | | | | | | | | | | | | | |
Net investment income(B) | | | 0.16 | | | | 0.11 | | | | 0.10 | | | | 0.06 | | | | 0.22 | | | | 0.13 | |
Net realized and change in unrealized gain on investments | | | 1.51 | | | | 0.28 | | | | 1.50 | | | | 0.28 | | | | 1.51 | | | | 0.30 | |
| | | | | | | | | | | | | | | | | | | | | | | | |
Total from investment operations | | | 1.67 | | | | 0.39 | | | | 1.60 | | | | 0.34 | | | | 1.73 | | | | 0.43 | |
| | | | | | | | | | | | | | | | | | | | | | | | |
Distributions | | | | | | | | | | | | | | | | | | | | | | | | |
Net investment income | | | (0.20 | ) | | | (0.09 | ) | | | (0.13 | ) | | | (0.05 | ) | | | (0.23 | ) | | | (0.12 | ) |
| | | | | | | | | | | | | | | | | | | | | | | | |
Total distributions | | | (0.20 | ) | | | (0.09 | ) | | | (0.13 | ) | | | (0.05 | ) | | | (0.23 | ) | | | (0.12 | ) |
| | | | | | | | | | | | | | | | | | | | | | | | |
Net asset value | | | | | | | | | | | | | | | | | | | | | | | | |
End of year | | $ | 11.77 | | | $ | 10.30 | | | $ | 11.76 | | | $ | 10.29 | | | $ | 11.81 | | | $ | 10.31 | |
| | | | | | | | | | | | | | | | | | | | | | | | |
Total return(D) | | | 16.40 | % | | | 3.94 | %(E) | | | 15.64 | % | | | 3.38 | %(E) | | | 17.00 | % | | | 4.31 | %(E) |
| | | | | | | | | | | | | | | | | | | | | | | | |
Net assets end of year (000’s) | | $ | 1,949 | | | $ | 1,021 | | | $ | 1,716 | | | $ | 1,752 | | | $ | 3,550 | | | $ | 7,855 | |
| | | | | | | | | | | | | | | | | | | | | | | | |
Ratio and supplemental data | | | | | | | | | | | | | | | | | | | | | | | | |
Expenses to average net assets | | | | | | | | | | | | | | | | | | | | | | | | |
After reimbursement/waiver or recapture | | | 1.26 | % | | | 1.32 | %(F) | | | 1.87 | % | | | 1.91 | %(F) | | | 0.83 | % | | | 0.95 | %(F) |
Before reimbursement/waiver or recapture | | | 1.26 | % | | | 1.32 | %(F) | | | 1.87 | % | | | 1.91 | %(F) | | | 0.83 | % | | | 0.95 | %(F) |
Net investment income to average net assets(G) | | | 1.45 | % | | | 1.09 | %(F) | | | 0.90 | % | | | 0.49 | %(F) | | | 2.01 | % | | | 1.38 | %(F) |
Portfolio turnover rate | | | 117 | % | | | 35 | %(E) | | | 117 | % | | | 35 | %(E) | | | 117 | % | | | 35 | %(E) |
| | | | | | | | |
| | | Transamerica Large Cap Value | |
| | | Class I2 | |
| | | October 31, | | | October 31, | |
For a share outstanding throughout each period | | 2012 | | | 2011(T) | |
Net asset value | | | | | | | | |
Beginning of period/year | | $ | 10.32 | | | $ | 10.00 | |
| | | | | | | | |
Investment operations | | | | | | | | |
Net investment income(B) | | | 0.23 | | | | 0.16 | |
Net realized and change in unrealized gain on investments | | | 1.49 | | | | 0.30 | |
| | | | | | | | |
Total from investment operations | | | 1.72 | | | | 0.46 | |
| | | | | | | | |
Distributions | | | | | | | | |
Net investment income | | | (0.24 | ) | | | (0.14 | ) |
| | | | | | | | |
Total distributions | | | (0.24 | ) | | | (0.14 | ) |
| | | | | | | | |
Net asset value | | | | | | | | |
End of year | | $ | 11.80 | | | $ | 10.32 | |
| | | | | | | | |
Total return(D) | | | 16.90 | % | | | 4.60 | %(E) |
| | | | | | | | |
Net assets end of year (000’s) | | $ | 1,320,011 | | | $ | 1,328,468 | |
| | | | | | | | |
Ratio and supplemental data | | | | | | | | |
Expenses to average net assets | | | | | | | | |
After reimbursement/waiver or recapture | | | 0.73 | % | | | 0.76 | %(F) |
Before reimbursement/waiver or recapture | | | 0.73 | % | | | 0.76 | %(F) |
Net investment income to average net assets(G) | | | 2.04 | % | | | 1.61 | %(F) |
Portfolio turnover rate | | | 117 | % | | | 35 | %(E) |
| | | | |
| The notes to the financial statements are an integral part of this report. | | |
| Transamerica Funds | | | | Annual Report 2012 |
| | Page 143 | | |
FINANCIAL HIGHLIGHTS (continued)
For the period or years ended:
| | | | | | | | | | | | | | | | | | | | |
| | | Transamerica Money Market | |
| | | Class A | |
| | | October 31, | | | October 31, | | | October 31, | | | October 31, | | | October 31, | |
For a share outstanding throughout each period | | 2012 | | | 2011 | | | 2010 | | | 2009 | | | 2008 | |
Net asset value | | | | | | | | | | | | | | | | | | | | |
Beginning of year | | $ | 1.00 | | | $ | 1.00 | | | $ | 1.00 | | | $ | 1.00 | | | $ | 1.00 | |
| | | | | | | | | | | | | | | | | | | | |
Investment operations | | | | | | | | | | | | | | | | | | | | |
Net investment income(B) | | | — | (C) | | | — | (C) | | | — | (C) | | | — | (C) | | | 0.02 | |
Net realized and change in unrealized gain on investments | | | — | | | | — | | | | — | (C) | | | — | (C) | | | — | (C) |
| | | | | | | | | | | | | | | | | | | | |
Total from investment operations | | | — | (C) | | | — | (C) | | | — | (C) | | | — | (C) | | | 0.02 | |
| | | | | | | | | | | | | | | | | | | | |
Net Equalization credits and charges | | | — | | | | — | | | | — | (C) | | | — | | | | | |
Distributions | | | | | | | | | | | | | | | | | | | | |
Net investment income | | | — | (C) | | | — | (C) | | | — | (C) | | | — | (C) | | | (0.02 | ) |
| | | | | | | | | | | | | | | | | | | | |
Total distributions | | | — | (C) | | | — | (C) | | | — | (C) | | | — | (C) | | | (0.02 | ) |
| | | | | | | | | | | | | | | | | | | | |
Net asset value | | | | | | | | | | | | | �� | | | | | | | |
End of year | | $ | 1.00 | | | $ | 1.00 | | | $ | 1.00 | | | $ | 1.00 | | | $ | 1.00 | |
| | | | | | | | | | | | | | | | | | | | |
Total return(D) | | | 0.01 | % | | | — | %(S) | | | 0.01 | % | | | 0.21 | % | | | 2.52 | % |
| | | | | | | | | | | | | | | | | | | | |
Net assets end of year (000’s) | | $ | 95,801 | | | $ | 112,490 | | | $ | 119,744 | | | $ | 146,598 | | | $ | 142,456 | |
| | | | | | | | | | | | | | | | | | | | |
Ratio and supplemental data | | | | | | | | | | | | | | | | | | | | |
Expenses to average net assets | | | | | | | | | | | | | | | | | | | | |
After reimbursement/waiver or recapture | | | 0.27 | %(U) | | | 0.20 | %(U) | | | 0.22 | %(U) | | | 0.60 | %(U) | | | 0.83 | % |
Before reimbursement/waiver or recapture | | | 1.17 | % | | | 1.26 | % | | | 1.19 | % | | | 1.11 | % | | | 1.08 | % |
Net investment income to average net assets(G) | | | — | %(S) | | | — | %(S) | | | — | %(S) | | | 0.20 | % | | | 2.40 | % |
| | | | | | | | | | | | | | | | | | | | |
| | | Transamerica Money Market | |
| | | Class B | |
| | | October 31, | | | October 31, | | | October 31, | | | October 31, | | | October 31, | |
For a share outstanding throughout each period | | 2012 | | | 2011 | | | 2010 | | | 2009 | | | 2008 | |
Net asset value | | | | | | | | | | | | | | | | | | | | |
Beginning of year | | $ | 1.00 | | | $ | 1.00 | | | $ | 1.00 | | | $ | 1.00 | | | $ | 1.00 | |
| | | | | | | | | | | | | | | | | | | | |
Investment operations | | | | | | | | | | | | | | | | | | | | |
Net investment income(B) | | | — | (C) | | | — | (C) | | | — | (C) | | | — | (C) | | | 0.02 | |
Net realized and change in unrealized gain on investments | | | — | | | | — | | | | — | (C) | | | — | (C) | | | — | (C) |
| | | | | | | | | | | | | | | | | | | | |
Total from investment operations | | | — | (C) | | | — | (C) | | | — | (C) | | | — | (C) | | | 0.02 | |
| | | | | | | | | | | | | | | | | | | | |
Net Equalization credits and charges | | | — | | | | — | | | | — | (C) | | | — | | | | | |
Distributions | | | | | | | | | | | | | | | | | | | | |
Net investment income | | | — | (C) | | | — | (C) | | | — | (C) | | | — | (C) | | | (0.02 | ) |
| | | | | | | | | | | | | | | | | | | | |
Total distributions | | | — | (C) | | | — | (C) | | | — | (C) | | | — | (C) | | | (0.02 | ) |
| | | | | | | | | | | | | | | | | | | | |
Net asset value | | | | | | | | | | | | | | | | | | | | |
End of year | | $ | 1.00 | | | $ | 1.00 | | | $ | 1.00 | | | $ | 1.00 | | | $ | 1.00 | |
| | | | | | | | | | | | | | | | | | | | |
Total return(D) | | | 0.01 | % | | | — | %(S) | | | 0.01 | % | | | 0.08 | % | | | 1.83 | % |
| | | | | | | | | | | | | | | | | | | | |
Net assets end of year (000’s) | | $ | 9,289 | | | $ | 15,318 | | | $ | 19,442 | | | $ | 35,612 | | | $ | 40,110 | |
| | | | | | | | | | | | | | | | | | | | |
Ratio and supplemental data | | | | | | | | | | | | | | | | | | | | |
Expenses to average net assets | | | | | | | | | | | | | | | | | | | | |
After reimbursement/waiver or recapture | | | 0.27 | %(U) | | | 0.20 | %(U) | | | 0.21 | %(U) | | | 0.73 | %(U) | | | 1.48 | % |
Before reimbursement/waiver or recapture | | | 1.84 | % | | | 1.89 | % | | | 1.81 | % | | | 1.75 | % | | | 1.75 | % |
Net investment income to average net assets(G) | | | — | %(S) | | | — | %(S) | | | — | %(S) | | | 0.08 | % | | | 1.75 | % |
| | | | |
| The notes to the financial statements are an integral part of this report. | | |
| Transamerica Funds | | | | Annual Report 2012 |
| | Page 144 | | |
FINANCIAL HIGHLIGHTS (continued)
For the period or years ended:
| | | | | | | | | | | | | | | | | | | | |
| | | Transamerica Money Market | |
| | | Class C | |
| | | October 31, | | | October 31, | | | October 31, | | | October 31, | | | October 31, | |
For a share outstanding throughout each period | | 2012 | | | 2011 | | | 2010 | | | 2009 | | | 2008 | |
Net asset value | | | | | | | | | | | | | | | | | | | | |
Beginning of year | | $ | 1.00 | | | $ | 1.00 | | | $ | 1.00 | | | $ | 1.00 | | | $ | 1.00 | |
| | | | | | | | | | | | | | | | | | | | |
Investment operations | | | | | | | | | | | | | | | | | | | | |
Net investment income(B) | | | — | (C) | | | — | (C) | | | — | (C) | | | — | (C) | | | 0.02 | |
Net realized and change in unrealized gain on investments | | | — | | | | — | | | | — | (C) | | | — | (C) | | | — | (C) |
| | | | | | | | | | | | | | | | | | | | |
Total from investment operations | | | — | (C) | | | — | (C) | | | — | (C) | | | — | (C) | | | 0.02 | |
| | | | | | | | | | | | | | | | | | | | |
Net Equalization credits and charges | | | — | | | | — | | | | — | (C) | | | — | | | | | |
Distributions | | | | | | | | | | | | | | | | | | | | |
Net investment income | | | — | (C) | | | — | (C) | | | — | (C) | | | — | (C) | | | (0.02 | ) |
| | | | | | | | | | | | | | | | | | | | |
Total distributions | | | — | (C) | | | — | (C) | | | — | (C) | | | — | (C) | | | (0.02 | ) |
| | | | | | | | | | | | | | | | | | | | |
Net asset value | | | | | | | | | | | | | | | | | | | | |
End of year | | $ | 1.00 | | | $ | 1.00 | | | $ | 1.00 | | | $ | 1.00 | | | $ | 1.00 | |
| | | | | | | | | | | | | | | | | | | | |
Total return(D) | | | — | %(S) | | | — | %(S) | | | 0.01 | % | | | 0.07 | % | | | 1.86 | % |
| | | | | | | | | | | | | | | | | | | | |
Net assets end of year (000’s) | | $ | 31,391 | | | $ | 36,078 | | | $ | 33,800 | | | $ | 46,177 | | | $ | 59,991 | |
| | | | | | | | | | | | | | | | | | | | |
Ratio and supplemental data | | | | | | | | | | | | | | | | | | | | |
Expenses to average net assets | | | | | | | | | | | | | | | | | | | | |
After reimbursement/waiver or recapture | | | 0.27 | %(U) | | | 0.20 | %(U) | | | 0.22 | %(U) | | | 0.76 | %(U) | | | 1.48 | % |
Before reimbursement/waiver or recapture | | | 1.67 | % | | | 1.73 | % | | | 1.66 | % | | | 1.64 | % | | | 1.67 | % |
Net investment income to average net assets(G) | | | — | %(S) | | | — | %(S) | | | — | %(S) | | | 0.07 | % | | | 1.65 | % |
| | | | | | | | | | | | |
| | | Transamerica Money Market | |
| | | Class I | |
| | | October 31, | | | October 31, | | | October 31, | |
For a share outstanding throughout each period | | 2012 | | | 2011 | | | 2010(H) | |
Net asset value | | | | | | | | | | | | |
Beginning of period/year | | $ | 1.00 | | | $ | 1.00 | | | $ | 1.00 | |
| | | | | | | | | | | | |
Investment operations | | | | | | | | | | | | |
Net investment income(B) | | | — | (C) | | | — | (C) | | | — | (C) |
Net realized and change in unrealized gain on investments | | | — | | | | — | | | | — | (C) |
| | | | | | | | | | | | |
Total from investment operations | | | — | (C) | | | — | (C) | | | — | (C) |
| | | | | | | | | | | | |
Net Equalization credits and charges | | | — | | | | — | | | | — | (C) |
Distributions | | | | | | | | | | | | |
Net investment income | | | — | (C) | | | — | (C) | | | — | (C) |
| | | | | | | | | | | | |
Total distributions | | | — | (C) | | | — | (C) | | | — | (C) |
| | | | | | | | | | | | |
Net asset value | | | | | | | | | | | | |
End of year | | $ | 1.00 | | | $ | 1.00 | | | $ | 1.00 | |
| | | | | | | | | | | | |
Total return(D) | | | 0.02 | % | | | 0.01 | % | | | 0.01 | %(E) |
| | | | | | | | | | | | |
Net assets end of year (000’s) | | $ | 25,460 | | | $ | 55 | | | $ | 55 | |
| | | | | | | | | | | | |
Ratio and supplemental data | | | | | | | | | | | | |
Expenses to average net assets | | | | | | | | | | | | |
After reimbursement/waiver or recapture | | | 0.26 | %(U) | | | 0.19 | %(U) | | | 0.22 | %(F),(U) |
Before reimbursement/waiver or recapture | | | 0.72 | % | | | 3.60 | % | | | 3.17 | %(F) |
Net investment income to average net assets(G) | | | 0.02 | % | | | 0.02 | % | | | 0.01 | %(F) |
| | | | |
| The notes to the financial statements are an integral part of this report. | | |
| Transamerica Funds | | | | Annual Report 2012 |
| | Page 145 | | |
FINANCIAL HIGHLIGHTS (continued)
For the period or years ended:
| | | | | | | | | | | | | | | | | | | | |
| | | Transamerica Money Market | |
| | | Class I2(I) | |
| | | October 31, | | | October 31, | | | October 31, | | | October 31, | | | October 31, | |
For a share outstanding throughout each period | | 2012 | | | 2011 | | | 2010 | | | 2009 | | | 2008 | |
Net asset value | | | | | | | | | | | | | | | | | | | | |
Beginning of year | | $ | 1.00 | | | $ | 1.00 | | | $ | 1.00 | | | $ | 1.00 | | | $ | 1.00 | |
| | | | | | | | | | | | | | | | | | | | |
Investment operations | | | | | | | | | | | | | | | | | | | | |
Net investment income(B) | | | — | (C) | | | — | (C) | | | — | (C) | | | — | (C) | | | 0.03 | |
Net realized and change in unrealized gain on investments | | | — | | | | — | | | | — | (C) | | | — | (C) | | | — | (C) |
| | | | | | | | | | | | | | | | | | | | |
Total from investment operations | | | — | (C) | | | — | (C) | | | — | (C) | | | — | (C) | | | 0.03 | |
| | | | | | | | | | | | | | | | | | | | |
Net Equalization credits and charges | | | — | | | | — | | | | — | (C) | | | — | | | | | |
Distributions | | | | | | | | | | | | | | | | | | | | |
Net investment income | | | — | (C) | | | — | (C) | | | — | (C) | | | — | (C) | | | (0.03 | ) |
| | | | | | | | | | | | | | | | | | | | |
Total distributions | | | — | (C) | | | — | (C) | | | — | (C) | | | — | (C) | | | (0.03 | ) |
| | | | | | | | | | | | | | | | | | | | |
Net asset value | | | | | | | | | | | | | | | | | | | | |
End of year | | $ | 1.00 | | | $ | 1.00 | | | $ | 1.00 | | | $ | 1.00 | | | $ | 1.00 | |
| | | | | | | | | | | | | | | | | | | | |
Total return(D) | | | 0.03 | % | | | 0.01 | % | | | 0.01 | % | | | 0.35 | % | | | 2.84 | % |
| | | | | | | | | | | | | | | | | | | | |
Net assets end of year (000’s) | | $ | 652,465 | | | $ | 17,612 | | | $ | 21,773 | | | $ | 34,119 | | | $ | 29,327 | |
| | | | | | | | | | | | | | | | | | | | |
Ratio and supplemental data | | | | | | | | | | | | | | | | | | | | |
Expenses to average net assets | | | | | | | | | | | | | | | | | | | | |
After reimbursement/waiver or recapture | | | 0.25 | %(U) | | | 0.19 | %(U) | | | 0.21 | %(U) | | | 0.45 | %(U) | | | 0.48 | % |
Before reimbursement/waiver or recapture | | | 0.50 | % | | | 0.55 | % | | | 0.50 | % | | | 0.53 | % | | | 0.49 | % |
Net investment income to average net assets(G) | | | 0.03 | % | | | 0.02 | % | | | 0.01 | % | | | 0.36 | % | | | 2.89 | % |
| | | | | | | | | | | | | | | | | | | | |
| | | Transamerica Multi-Managed Balanced | |
| | | Class A | |
| | | October 31, | | | October 31, | | | October 31, | | | October 31, | | | October 31, | |
For a share outstanding throughout each period | | 2012 | | | 2011 | | | 2010 | | | 2009 | | | 2008 | |
Net asset value | | | | | | | | | | | | | | | | | | | | |
Beginning of year | | $ | 23.34 | | | $ | 21.40 | | | $ | 17.85 | | | $ | 16.44 | | | $ | 25.70 | |
| | | | | | | | | | | | | | | | | | | | |
Investment operations | | | | | | | | | | | | | | | | | | | | |
Net investment income(B) | | | 0.26 | | | | 0.25 | | | | 0.52 | | | | 0.28 | | | | 0.28 | |
Net realized and change in unrealized gain (loss) on investments | | | 1.94 | | | | 1.94 | | | | 3.55 | | | | 2.47 | | | | (8.64 | ) |
| | | | | | | | | | | | | | | | | | | | |
Total from investment operations | | | 2.20 | | | | 2.19 | | | | 4.07 | | | | 2.75 | | | | (8.36 | ) |
| | | | | | | | | | | | | | | | | | | | |
Distributions | | | | | | | | | | | | | | | | | | | | |
Net investment income | | | (0.31 | ) | | | (0.25 | ) | | | (0.52 | ) | | | (0.31 | ) | | | (0.24 | ) |
Net realized gains on investments | | | (3.08 | ) | | | — | | | | — | | | | (1.03 | ) | | | (0.66 | ) |
| | | | | | | | | | | | | | | | | | | | |
Total distributions | | | (3.39 | ) | | | (0.25 | ) | | | (0.52 | ) | | | (1.34 | ) | | | (0.90 | ) |
| | | | | | | | | | | | | | | | | | | | |
Net asset value | | | | | | | | | | | | | | | | | | | | |
End of year | | $ | 22.15 | | | $ | 23.34 | | | $ | 21.40 | | | $ | 17.85 | | | $ | 16.44 | |
| | | | | | | | | | | | | | | | | | | | |
Total return(D) | | | 11.27 | % | | | 10.26 | % | | | 23.08 | % | | | 18.43 | % | | | (33.55 | )% |
| | | | | | | | | | | | | | | | | | | | |
Net assets end of year (000’s) | | $ | 125,266 | | | $ | 107,146 | | | $ | 95,258 | | | $ | 60,279 | | | $ | 49,917 | |
| | | | | | | | | | | | | | | | | | | | |
Ratio and supplemental data | | | | | | | | | | | | | | | | | | | | |
Expenses to average net assets | | | | | | | | | | | | | | | | | | | | |
After reimbursement/waiver or recapture | | | 1.47 | % | | | 1.46 | % | | | 1.56 | %(V) | | | 1.73 | %(V) | | | 1.52 | % |
Before reimbursement/waiver or recapture | | | 1.43 | % | | | 1.49 | % | | | 1.56 | %(V) | | | 1.73 | %(V) | | | 1.52 | % |
Net investment income to average net assets(G) | | | 1.20 | % | | | 1.09 | % | | | 2.67 | % | | | 1.72 | % | | | 1.27 | % |
Portfolio turnover rate | | | 153 | % | | | 263 | % | | | 99 | % | | | 100 | % | | | 52 | % |
| | | | |
| The notes to the financial statements are an integral part of this report. | | |
| Transamerica Funds | | | | Annual Report 2012 |
| | Page 146 | | |
FINANCIAL HIGHLIGHTS (continued)
For the period or years ended:
| | | | | | | | | | | | | | | | | | | | |
| | | Transamerica Multi-Managed Balanced | |
| | | Class B | |
| | | October 31, | | | October 31, | | | October 31, | | | October 31, | | | October 31, | |
For a share outstanding throughout each period | | 2012 | | | 2011 | | | 2010 | | | 2009 | | | 2008 | |
Net asset value | | | | | | | | | | | | | | | | | | | | |
Beginning of year | | $ | 23.23 | | | $ | 21.34 | | | $ | 17.79 | | | $ | 16.37 | | | $ | 25.58 | |
| | | | | | | | | | | | | | | | | | | | |
Investment operations | | | | | | | | | | | | | | | | | | | | |
Net investment income(B) | | | 0.08 | | | | 0.06 | | | | 0.33 | | | | 0.16 | | | | 0.13 | |
Net realized and change in unrealized gain (loss) on investments | | | 1.92 | | | | 1.92 | | | | 3.58 | | | | 2.45 | | | | (8.58 | ) |
| | | | | | | | | | | | | | | | | | | | |
Total from investment operations | | | 2.00 | | | | 1.98 | | | | 3.91 | | | | 2.61 | | | | (8.45 | ) |
| | | | | | | | | | | | | | | | | | | | |
Distributions | | | | | | | | | | | | | | | | | | | | |
Net investment income | | | (0.14 | ) | | | (0.09 | ) | | | (0.36 | ) | | | (0.17 | ) | | | (0.10 | ) |
Net realized gains on investments | | | (3.08 | ) | | | — | | | | — | | | | (1.03 | ) | | | (0.66 | ) |
| | | | | | | | | | | | | | | | | | | | |
Total distributions | | | (3.22 | ) | | | (0.09 | ) | | | (0.36 | ) | | | (1.20 | ) | | | (0.76 | ) |
| | | | | | | | | | | | | | | | | | | | |
Net asset value | | | | | | | | | | | | | | | | | | | | |
End of year | | $ | 22.01 | | | $ | 23.23 | | | $ | 21.34 | | | $ | 17.79 | | | $ | 16.37 | |
| | | | | | | | | | | | | | | | | | | | |
Total return(D) | | | 10.30 | % | | | 9.33 | % | | | 22.15 | % | | | 17.50 | % | | | (33.95 | )% |
| | | | | | | | | | | | | | | | | | | | |
Net assets end of year (000’s) | | $ | 9,074 | | | $ | 9,996 | | | $ | 14,658 | | | $ | 17,787 | | | $ | 32,469 | |
| | | | | | | | | | | | | | | | | | | | |
Ratio and supplemental data | | | | | | | | | | | | | | | | | | | | |
Expenses to average net assets | | | | | | | | | | | | | | | | | | | | |
After reimbursement/waiver or recapture | | | 2.33 | % | | | 2.29 | % | | | 2.34 | %(V) | | | 2.46 | %(V) | | | 2.15 | % |
Before reimbursement/waiver or recapture | | | 2.29 | % | | | 2.32 | % | | | 2.34 | %(V) | | | 2.46 | %(V) | | | 2.15 | % |
Net investment income to average net assets(G) | | | 0.36 | % | | | 0.25 | % | | | 1.73 | % | | | 1.02 | % | | | 0.59 | % |
Portfolio turnover rate | | | 153 | % | | | 263 | % | | | 99 | % | | | 100 | % | | | 52 | % |
| | | | | | | | | | | | | | | | | | | | |
| | | Transamerica Multi-Managed Balanced | |
| | | Class C | |
| | | October 31, | | | October 31, | | | October 31, | | | October 31, | | | October 31, | |
For a share outstanding throughout each period | | 2012 | | | 2011 | | | 2010 | | | 2009 | | | 2008 | |
Net asset value | | | | | | | | | | | | | | | | | | | | |
Beginning of year | | $ | 23.09 | | | $ | 21.20 | | | $ | 17.69 | | | $ | 16.30 | | | $ | 25.50 | |
| | | | | | | | | | | | | | | | | | | | |
Investment operations | | | | | | | | | | | | | | | | | | | | |
Net investment income(B) | | | 0.13 | | | | 0.13 | | | | 0.40 | | | | 0.18 | | | | 0.15 | |
Net realized and change in unrealized gain (loss) on investments | | | 1.92 | | | | 1.91 | | | | 3.53 | | | | 2.46 | | | | (8.56 | ) |
| | | | | | | | | | | | | | | | | | | | |
Total from investment operations | | | 2.05 | | | | 2.04 | | | | 3.93 | | | | 2.64 | | | | (8.41 | ) |
| | | | | | | | | | | | | | | | | | | | |
Distributions | | | | | | | | | | | | | | | | | | | | |
Net investment income | | | (0.21 | ) | | | (0.15 | ) | | | (0.42 | ) | | | (0.22 | ) | | | (0.13 | ) |
Net realized gains on investments | | | (3.08 | ) | | | — | | | | — | | | | (1.03 | ) | | | (0.66 | ) |
| | | | | | | | | | | | | | | | | | | | |
Total distributions | | | (3.29 | ) | | | (0.15 | ) | | | (0.42 | ) | | | (1.25 | ) | | | (0.79 | ) |
| | | | | | | | | | | | | | | | | | | | |
Net asset value | | | | | | | | | | | | | | | | | | | | |
End of year | | $ | 21.85 | | | $ | 23.09 | | | $ | 21.20 | | | $ | 17.69 | | | $ | 16.30 | |
| | | | | | | | | | | | | | | | | | | | |
Total return(D) | | | 10.63 | % | | | 9.63 | % | | | 22.43 | % | | | 17.80 | % | | | (33.92 | )% |
| | | | | | | | | | | | | | | | | | | | |
Net assets end of year (000’s) | | $ | 62,789 | | | $ | 38,868 | | | $ | 24,194 | | | $ | 16,933 | | | $ | 17,719 | |
| | | | | | | | | | | | | | | | | | | | |
Ratio and supplemental data | | | | | | | | | | | | | | | | | | | | |
Expenses to average net assets | | | | | | | | | | | | | | | | | | | | |
After reimbursement/waiver or recapture | | | 2.04 | % | | | 2.03 | % | | | 2.11 | %(V) | | | 2.27 | %(V) | | | 2.08 | % |
Before reimbursement/waiver or recapture | | | 2.01 | % | | | 2.05 | % | | | 2.11 | %(V) | | | 2.27 | %(V) | | | 2.08 | % |
Net investment income to average net assets(G) | | | 0.61 | % | | | 0.55 | % | | | 2.09 | % | | | 1.15 | % | | | 0.69 | % |
Portfolio turnover rate | | | 153 | % | | | 263 | % | | | 99 | % | | | 100 | % | | | 52 | % |
| | | | |
| The notes to the financial statements are an integral part of this report. | | |
| Transamerica Funds | | | | Annual Report 2012 |
| | Page 147 | | |
FINANCIAL HIGHLIGHTS (continued)
For the period or years ended:
| | | | | | | | | | | | |
| | | Transamerica Multi-Managed Balanced | |
| | | Class I | |
| | | October 31, | | | October 31, | | | October 31, | |
For a share outstanding throughout each period | | 2012 | | | 2011 | | | 2010(H) | |
Net asset value | | | | | | | | | | | | |
Beginning of period/year | | $ | 23.40 | | | $ | 21.46 | | | $ | 18.49 | |
| | | | | | | | | | | | |
Investment operations | | | | | | | | | | | | |
Net investment income(B) | | | 0.36 | | | | 0.38 | | | | 0.57 | |
Net realized and change in unrealized gain on investments | | | 1.94 | | | | 1.91 | | | | 2.98 | |
| | | | | | | | | | | | |
Total from investment operations | | | 2.30 | | | | 2.29 | | | | 3.55 | |
| | | | | | | | | | | | |
Distributions | | | | | | | | | | | | |
Net investment income | | | (0.40 | ) | | | (0.35 | ) | | | (0.58 | ) |
Net realized gains on investments | | | (3.08 | ) | | | — | | | | — | |
| | | | | | | | | | | | |
Total distributions | | | (3.48 | ) | | | (0.35 | ) | | | (0.58 | ) |
| | | | | | | | | | | | |
Net asset value | | | | | | | | | | | | |
End of year | | $ | 22.22 | | | $ | 23.40 | | | $ | 21.46 | |
| | | | | | | | | | | | |
Total return(D) | | | 11.76 | % | | | 10.70 | % | | | 19.52 | %(E) |
| | | | | | | | | | | | |
Net assets end of year (000’s) | | $ | 176,788 | | | $ | 12,086 | | | $ | 265 | |
| | | | | | | | | | | | |
Ratio and supplemental data | | | | | | | | | | | | |
Expenses to average net assets | | | | | | | | | | | | |
After reimbursement/waiver or recapture | | | 0.99 | % | | | 1.00 | % | | | 1.46 | %(F),(V) |
Before reimbursement/waiver or recapture | | | 0.96 | % | | | 1.01 | % | | | 2.01 | %(F),(V) |
Net investment income to average net assets(G) | | | 1.63 | % | | | 1.61 | % | | | 3.15 | %(F) |
Portfolio turnover rate | | | 153 | % | | | 263 | % | | | 99 | %(E) |
| | | | | | | | | | | | | | | | | | | | |
| | | Transamerica Short-Term Bond | |
| | | Class A | |
| | | October 31, | | | October 31, | | | October 31, | | | October 31, | | | October 31, | |
For a share outstanding throughout each period | | 2012 | | | 2011 | | | 2010 | | | 2009 | | | 2008(Y) | |
Net asset value | | | | | | | | | | | | | | | | | | | | |
Beginning of period/year | | $ | 10.33 | | | $ | 10.53 | | | $ | 10.26 | | | $ | 9.44 | | | $ | 10.00 | |
| | | | | | | | | | | | | | | | | | | | |
Investment operations | | | | | | | | | | | | | | | | | | | | |
Net investment income(B) | | | 0.33 | | | | 0.37 | | | | 0.43 | | | | 0.51 | | | | 0.38 | |
Net realized and change in unrealized gain (loss) on investments | | | 0.27 | | | | (0.16 | ) | | | 0.29 | | | | 0.78 | | | | (0.54 | ) |
| | | | | | | | | | | | | | | | | | | | |
Total from investment operations | | | 0.60 | | | | 0.21 | | | | 0.72 | | | | 1.29 | | | | (0.16 | ) |
| | | | | | | | | | | | | | | | | | | | |
Distributions | | | | | | | | | | | | | | | | | | | | |
Net investment income | | | (0.35 | ) | | | (0.39 | ) | | | (0.45 | ) | | | (0.47 | ) | | | (0.40 | ) |
Net realized gains on investments | | | (0.07 | ) | | | (0.02 | ) | | | — | | | | — | | | | — | |
| | | | | | | | | | | | | | | | | | | | |
Total distributions | | | (0.42 | ) | | | (0.41 | ) | | | (0.45 | ) | | | (0.47 | ) | | | (0.40 | ) |
| | | | | | | | | | | | | | | | | | | | |
Net asset value | | | | | | | | | | | | | | | | | | | | |
End of year | | $ | 10.51 | | | $ | 10.33 | | | $ | 10.53 | | | $ | 10.26 | | | $ | 9.44 | |
| | | | | | | | | | | | | | | | | | | | |
Total return(D) | | | 5.95 | % | | | 2.01 | % | | | 7.15 | % | | | 13.40 | % | | | (1.70 | )%(E) |
| | | | | | | | | | | | | | | | | | | | |
Net assets end of year (000’s) | | $ | 793,493 | | | $ | 779,041 | | | $ | 856,959 | | | $ | 289,879 | | | $ | 5,663 | |
| | | | | | | | | | | | | | | | | | | | |
Ratio and supplemental data | | | | | | | | | | | | | | | | | | | | |
Expenses to average net assets | | | | | | | | | | | | | | | | | | | | |
After reimbursement/waiver or recapture | | | 0.83 | % | | | 0.82 | % | | | 0.83 | % | | | 0.91 | % | | | 1.11 | %(F) |
Before reimbursement/waiver or recapture | | | 0.89 | % | | | 0.92 | % | | | 0.97 | % | | | 1.09 | % | | | 1.11 | %(F) |
Net investment income to average net assets(G) | | | 3.22 | % | | | 3.58 | % | | | 4.16 | % | | | 5.14 | % | | | 3.92 | %(F) |
Portfolio turnover rate | | | 61 | % | | | 51 | % | | | 54 | % | | | 77 | % | | | 67 | %(E) |
| | | | |
| The notes to the financial statements are an integral part of this report. | | |
| Transamerica Funds | | | | Annual Report 2012 |
| | Page 148 | | |
FINANCIAL HIGHLIGHTS (continued)
For the period or years ended:
| | | | | | | | | | | | | | | | | | | | |
| | | Transamerica Short-Term Bond | |
| | | Class C | |
| | | October 31, | | | October 31, | | | October 31, | | | October 31, | | | October 31, | |
For a share outstanding throughout each period | | 2012 | | | 2011 | | | 2010 | | | 2009 | | | 2008(Y) | |
Net asset value | | | | | | | | | | | | | | | | | | | | |
Beginning of period/year | | $ | 10.31 | | | $ | 10.51 | | | $ | 10.24 | | | $ | 9.42 | | | $ | 10.00 | |
| | | | | | | | | | | | | | | | | | | | |
Investment operations | | | | | | | | | | | | | | | | | | | | |
Net investment income(B) | | | 0.25 | | | | 0.29 | | | | 0.36 | | | | 0.43 | | | | 0.32 | |
Net realized and change in unrealized gain (loss) on investments | | | 0.27 | | | | (0.17 | ) | | | 0.28 | | | | 0.80 | | | | (0.55 | ) |
| | | | | | | | | | | | | | | | | | | | |
Total from investment operations | | | 0.52 | | | | 0.12 | | | | 0.64 | | | | 1.23 | | | | (0.23 | ) |
| | | | | | | | | | | | | | | | | | | | |
Distributions | | | | | | | | | | | | | | | | | | | | |
Net investment income | | | (0.27 | ) | | | (0.30 | ) | | | (0.37 | ) | | | (0.41 | ) | | | (0.35 | ) |
Net realized gains on investments | | | (0.07 | ) | | | (0.02 | ) | | | — | | | | — | | | | — | |
| | | | | | | | | | | | | | | | | | | | |
Total distributions | | | (0.34 | ) | | | (0.32 | ) | | | (0.37 | ) | | | (0.41 | ) | | | (0.35 | ) |
| | | | | | | | | | | | | | | | | | | | |
Net asset value | | | | | | | | | | | | | | | | | | | | |
End of year | | $ | 10.49 | | | $ | 10.31 | | | $ | 10.51 | | | $ | 10.24 | | | $ | 9.42 | |
| | | | | | | | | | | | | | | | | | | | |
Total return(D) | | | 5.15 | % | | | 1.23 | % | | | 6.32 | % | | | 12.74 | % | | | (2.43 | )%(E) |
| | | | | | | | | | | | | | | | | | | | |
Net assets end of year (000’s) | | $ | 857,435 | | | $ | 846,464 | | | $ | 834,859 | | | $ | 317,130 | | | $ | 7,263 | |
| | | | | | | | | | | | | | | | | | | | |
Ratio and supplemental data | | | | | | | | | | | | | | | | | | | | |
Expenses to average net assets | | | | | | | | | | | | | | | | | | | | |
After reimbursement/waiver or recapture | | | 1.59 | % | | | 1.59 | % | | | 1.59 | % | | | 1.65 | % | | | 1.76 | %(F) |
Before reimbursement/waiver or recapture | | | 1.59 | % | | | 1.59 | % | | | 1.63 | % | | | 1.74 | % | | | 1.76 | %(F) |
Net investment income to average net assets(G) | | | 2.46 | % | | | 2.81 | % | | | 3.40 | % | | | 4.38 | % | | | 3.28 | %(F) |
Portfolio turnover rate | | | 61 | % | | | 51 | % | | | 54 | % | | | 77 | % | | | 67 | %(E) |
| | | | | | | | | | | | |
| | | Transamerica Short-Term Bond | |
| | | Class I | |
| | | October 31, | | | October 31, | | | October 31, | |
For a share outstanding throughout each period | | 2012 | | | 2011 | | | 2010(H) | |
Net asset value | | | | | | | | | | | | |
Beginning of period/year | | $ | 10.15 | | | $ | 10.35 | | | $ | 10.14 | |
| | | | | | | | | | | | |
Investment operations | | | | | | | | | | | | |
Net investment income(B) | | | 0.35 | | | | 0.38 | | | | 0.39 | |
Net realized and change in unrealized gain (loss) on investments | | | 0.26 | | | | (0.16 | ) | | | 0.24 | |
| | | | | | | | | | | | |
Total from investment operations | | | 0.61 | | | | 0.22 | | | | 0.63 | |
| | | | | | | | | | | | |
Distributions | | | | | | | | | | | | |
Net investment income | | | (0.36 | ) | | | (0.40 | ) | | | (0.42 | ) |
Net realized gains on investments | | | (0.07 | ) | | | (0.02 | ) | | | — | |
| | | | | | | | | | | | |
Total distributions | | | (0.43 | ) | | | (0.42 | ) | | | (0.42 | ) |
| | | | | | | | | | | | |
Net asset value | | | | | | | | | | | | |
End of year | | $ | 10.33 | | | $ | 10.15 | | | $ | 10.35 | |
| | | | | | | | | | | | |
Total return(D) | | | 6.21 | % | | | 2.16 | % | | | 6.34 | %(E) |
| | | | | | | | | | | | |
Net assets end of year (000’s) | | $ | 368,296 | | | $ | 270,667 | | | $ | 198,461 | |
| | | | | | | | | | | | |
Ratio and supplemental data | | | | | | | | | | | | |
Expenses to average net assets | | | | | | | | | | | | |
After reimbursement/waiver or recapture | | | 0.63 | % | | | 0.64 | % | | | 0.65 | %(F) |
Before reimbursement/waiver or recapture | | | 0.63 | % | | | 0.64 | % | | | 0.67 | %(F) |
Net investment income to average net assets(G) | | | 3.40 | % | | | 3.75 | % | | | 4.17 | %(F) |
Portfolio turnover rate | | | 61 | % | | | 51 | % | | | 54 | %(E) |
| | | | |
| The notes to the financial statements are an integral part of this report. | | |
| Transamerica Funds | | | | Annual Report 2012 |
| | Page 149 | | |
FINANCIAL HIGHLIGHTS (continued)
For the period or years ended:
| | | | | | | | | | | | | | | | | | | | | | | | |
| | | | | | | | | | | | | | | | | | Transamerica
Small Cap | |
| | | Transamerica Short-Term Bond | | | Growth | |
| | | Class I2(I) | | | Class A | |
| | | October 31, | | | October 31, | | | October 31, | | | October 31, | | | October 31, | | | October 31, | |
For a share outstanding throughout each period | | 2012 | | | 2011 | | | 2010 | | | 2009 | | | 2008 | | | 2012(W) | |
Net asset value | | | | | | | | | | | | | | | | | | | | | | | | |
Beginning of period/year | | $ | 10.14 | | | $ | 10.34 | | | $ | 10.08 | | | $ | 9.28 | | | $ | 9.82 | | | $ | 10.00 | |
| | | | | | | | | | | | | | | | | | | | | | | | |
Investment operations | | | | | | | | | | | | | | | | | | | | | | | | |
Net investment income (loss)(B) | | | 0.36 | | | | 0.40 | | | | 0.46 | | | | 0.50 | | | | 0.43 | | | | (0.02 | ) |
Net realized and change in unrealized gain (loss) on investments | | | 0.26 | | | | (0.17 | ) | | | 0.27 | | | | 0.80 | | | | (0.54 | ) | | | (0.60 | ) |
| | | | | | | | | | | | | | | | | | | | | | | | |
Total from investment operations | | | 0.62 | | | | 0.23 | | | | 0.73 | | | | 1.30 | | | | (0.11 | ) | | | (0.62 | ) |
| | | | | | | | | | | | | | | | | | | | | | | | |
Distributions | | | | | | | | | | | | | | | | | | | | | | | | |
Net investment income | | | (0.37 | ) | | | (0.41 | ) | | | (0.47 | ) | | | (0.50 | ) | | | (0.43 | ) | | | — | |
Net realized gains on investments | | | (0.07 | ) | | | (0.02 | ) | | | — | | | | — | | | | — | | | | — | |
| | | | | | | | | | | | | | | | | | | | | | | | |
Total distributions | | | (0.44 | ) | | | (0.43 | ) | | | (0.47 | ) | | | (0.50 | ) | | | (0.43 | ) | | | — | |
| | | | | | | | | | | | | | | | | | | | | | | | |
Net asset value | | | | | | | | | | | | | | | | | | | | | | | | |
End of year | | $ | 10.32 | | | $ | 10.14 | | | $ | 10.34 | | | $ | 10.08 | | | $ | 9.28 | | | $ | 9.38 | |
| | | | | | | | | | | | | | | | | | | | | | | | |
Total return(D) | | | 6.31 | % | | | 2.28 | % | | | 7.37 | % | | | 14.44 | % | | | (1.22 | )% | | | (6.20 | )%(E) |
| | | | | | | | | | | | | | | | | | | | | | | | |
Net assets end of year (000’s) | | $ | 1,521,804 | | | $ | 924,917 | | | $ | 999,064 | | | $ | 710,660 | | | $ | 492,333 | | | $ | 236 | |
| | | | | | | | | | | | | | | | | | | | | | | | |
Ratio and supplemental data | | | | | | | | | | | | | | | | | | | | | | | | |
Expenses to average net assets | | | | | | | | | | | | | | | | | | | | | | | | |
After reimbursement/waiver or recapture | | | 0.53 | % | | | 0.53 | % | | | 0.53 | % | | | 0.63 | % | | | 0.68 | % | | | 1.45 | %(F) |
Before reimbursement/waiver or recapture | | | 0.53 | % | | | 0.53 | % | | | 0.58 | % | | | 0.69 | % | | | 0.68 | % | | | 1.52 | %(F) |
Net investment income (loss) to average
net assets(G) | | | 3.50 | % | | | 3.87 | % | | | 4.52 | % | | | 5.14 | % | | | 4.38 | % | | | (1.17 | )%(F) |
Portfolio turnover rate | | | 61 | % | | | 51 | % | | | 54 | % | | | 77 | % | | | 67 | % | | | 11 | %(E) |
| | |
| | | Transamerica Small Cap Growth | | | Transamerica Small Cap Value | |
| | | Class C | | | Class I | | | Class I2 | | | Class A | | | Class C | | | Class I | |
| | | October 31, | | | October 31, | | | October 31, | | | October 31, | | | October 31, | | | October 31, | |
For a share outstanding throughout each period | | 2012(W) | | | 2012(W) | | | 2012(W) | | | 2012(N) | | | 2012(N) | | | 2012(N) | |
Net asset value | | | | | | | | | | | | | | | | | | | | | | | | |
Beginning of period/year | | $ | 10.00 | | | $ | 10.00 | | | $ | 10.00 | | | $ | 10.00 | | | $ | 10.00 | | | $ | 10.00 | |
| | | | | | | | | | | | | | | | | | | | | | | | |
Investment operations | | | | | | | | | | | | | | | | | | | | | | | | |
Net investment income (loss)(B) | | | (0.03 | ) | | | (0.01 | ) | | | (0.01 | ) | | | 0.04 | | | | 0.01 | | | | 0.06 | |
Net realized and change in unrealized loss on investments | | | (0.60 | ) | | | (0.60 | ) | | | (0.60 | ) | | | (0.21 | ) | | | (0.22 | ) | | | (0.22 | ) |
| | | | | | | | | | | | | | | | | | | | | | | | |
Total from investment operations | | | (0.63 | ) | | | (0.61 | ) | | | (0.61 | ) | | | (0.17 | ) | | | (0.21 | ) | | | (0.16 | ) |
| | | | | | | | | | | | | | | | | | | | | | | | |
Net asset value | | | | | | | | | | | | | | | | | | | | | | | | |
End of year | | $ | 9.37 | | | $ | 9.39 | | | $ | 9.39 | | | $ | 9.83 | | | $ | 9.79 | | | $ | 9.84 | |
| | | | | | | | | | | | | | | | | | | | | | | | |
Total return(D) | | | (6.30 | )%(E) | | | (6.10 | )%(E) | | | (6.10 | )%(E) | | | (1.70 | )%(E) | | | (2.10 | )%(E) | | | (1.60 | )%(E) |
| | | | | | | | | | | | | | | | | | | | | | | | |
Net assets end of year (000’s) | | $ | 234 | | | $ | 235 | | | $ | 239,395 | | | $ | 268 | | | $ | 251 | | | $ | 371 | |
| | | | | | | | | | | | | | | | | | | | | | | | |
Ratio and supplemental data | | | | | | | | | | | | | | | | | | | | | | | | |
Expenses to average net assets | | | | | | | | | | | | | | | | | | | | | | | | |
After reimbursement/waiver or
recapture | | | 2.15 | %(F) | | | 1.15 | %(F) | | | 1.15 | %(F) | | | 1.36 | %(F) | | | 2.04 | %(F) | | | 1.12 | %(F) |
Before reimbursement/waiver or
recapture | | | 2.21 | %(F) | | | 1.31 | %(F) | | | 1.21 | %(F) | | | 1.36 | %(F) | | | 2.04 | %(F) | | | 1.12 | %(F) |
Net investment income (loss) to average net assets(G) | | | (1.89 | )%(F) | | | (0.89 | )%(F) | | | (0.87 | )%(F) | | | 0.91 | %(F) | | | 0.24 | %(F) | | | 1.17 | %(F) |
Portfolio turnover rate | | | 11 | %(E) | | | 11 | %(E) | | | 11 | %(E) | | | 22 | %(E) | | | 22 | %(E) | | | 22 | %(E) |
| | | | |
| The notes to the financial statements are an integral part of this report. | | |
| Transamerica Funds | | | | Annual Report 2012 |
| | Page 150 | | |
FINANCIAL HIGHLIGHTS (continued)
For the period or years ended:
| | | | | | | | | | | | | | | | | | | | | | | | |
| | | Transamerica
Small Cap
Value | | | Transamerica Small/Mid Cap Value | |
| | | Class I2 | | | Class A | |
| | | October 31, | | | October 31, | | | October 31, | | | October 31, | | | October 31, | | | October 31, | |
For a share outstanding throughout each period | | 2012(N) | | | 2012 | | | 2011 | | | 2010 | | | 2009 | | | 2008 | |
Net asset value | | | | | | | | | | | | | | | | | | | | | | | | |
Beginning of period/year | | $ | 10.00 | | | $ | 20.65 | | | $ | 18.89 | | | $ | 14.72 | | | $ | 12.70 | | | $ | 23.78 | |
| | | | | | | | | | | | | | | | | | | | | | | | |
Investment operations | | | | | | | | | | | | | | | | | | | | | | | | |
Net investment income (loss)(B) | | | 0.06 | | | | 0.11 | | | | (0.06 | ) | | | (0.02 | ) | | | — | (C) | | | 0.21 | |
Net realized and change in unrealized gain (loss) on investments | | | (0.22 | ) | | | 2.24 | | | | 1.82 | | | | 4.19 | | | | 2.33 | | | | (8.64 | ) |
| | | | | | | | | | | | | | | | | | | | | | | | |
Total from investment operations | | | (0.16 | ) | | | 2.35 | | | | 1.76 | | | | 4.17 | | | | 2.33 | | | | (8.43 | ) |
| | | | | | | | | | | | | | | | | | | | | | | | |
Distributions | | | | | | | | | | | | | | | | | | | | | | | | |
Net investment income | | | — | | | | — | (C) | | | — | | | | — | | | | (0.31 | ) | | | (0.16 | ) |
Net realized gains on investments | | | — | | | | (1.14 | ) | | | — | | | | — | | | | — | | | | (2.49 | ) |
| | | | | | | | | | | | | | | | | | | | | | | | |
Total distributions | | | — | | | | (1.14 | ) | | | — | | | | — | | | | (0.31 | ) | | | (2.65 | ) |
| | | | | | | | | | | | | | | | | | | | | | | | |
Net asset value | | | | | | | | | | | | | | | | | | | | | | | | |
End of year | | $ | 9.84 | | | $ | 21.86 | | | $ | 20.65 | | | $ | 18.89 | | | $ | 14.72 | | | $ | 12.70 | |
| | | | | | | | | | | | | | | | | | | | | | | | |
Total return(D) | | | (1.60 | )%(E) | | | 12.28 | % | | | 9.32 | % | | | 28.33 | % | | | 19.12 | % | | | (39.47 | )% |
| | | | | | | | | | | | | | | | | | | | | | | | |
Net assets end of year (000’s) | | $ | 288,664 | | | $ | 332,085 | | | $ | 323,147 | | | $ | 283,240 | | | $ | 201,569 | | | $ | 199,210 | |
| | | | | | | | | | | | | | | | | | | | | | | | |
Ratio and supplemental data | | | | | | | | | | | | | | | | | | | | | | | | |
Expenses to average net assets | | | | | | | | | | | | | | | | | | | | | | | | |
After reimbursement/waiver or recapture | | | 1.01 | %(F) | | | 1.41 | % | | | 1.43 | % | | | 1.47 | % | | | 1.59 | % | | | 1.41 | % |
Before reimbursement/waiver or recapture | | | 1.01 | %(F) | | | 1.41 | % | | | 1.43 | % | | | 1.47 | % | | | 1.59 | % | | | 1.41 | % |
Net investment income (loss) to average net assets(G) | | | 1.30 | %(F) | | | 0.50 | % | | | (0.27 | )% | | | (0.12 | )% | | | — | %(S) | | | 1.18 | % |
Portfolio turnover rate | | | 22 | %(E) | | | 74 | % | | | 174 | % | | | 57 | % | | | 101 | % | | | 48 | % |
| | | | | | | | | | | | | | | | | | | | |
| | | Transamerica Small/Mid Cap Value | |
| | | Class B | |
| | | October 31, | | | October 31, | | | October 31, | | | October 31, | | | October 31, | |
For a share outstanding throughout each period | | 2012 | | | 2011 | | | 2010 | | | 2009 | | | 2008 | |
Net asset value | | | | | | | | | | | | | | | | | | | | |
Beginning of year | | $ | 19.60 | | | $ | 18.05 | | | $ | 14.16 | | | $ | 12.19 | | | $ | 22.89 | |
| | | | | | | | | | | | | | | | | | | | |
Investment operations | | | | | | | | | | | | | | | | | | | | |
Net investment income (loss)(B) | | | (0.03 | ) | | | (0.20 | ) | | | (0.12 | ) | | | (0.08 | ) | | | 0.06 | |
Net realized and change in unrealized gain (loss) on investments | | | 2.12 | | | | 1.75 | | | | 4.01 | | | | 2.26 | | | | (8.27 | ) |
| | | | | | | | | | | | | | | | | | | | |
Total from investment operations | | | 2.09 | | | | 1.55 | | | | 3.89 | | | | 2.18 | | | | (8.21 | ) |
| | | | | | | | | | | | | | | | | | | | |
Distributions | | | | | | | | | | | | | | | | | | | | |
Net investment income | | | — | (C) | | | — | | | | — | | | | (0.21 | ) | | | — | |
Net realized gains on investments | | | (1.14 | ) | | | — | | | | — | | | | — | | | | (2.49 | ) |
| | | | | | | | | | | | | | | | | | | | |
Total distributions | | | (1.14 | ) | | | — | | | | — | | | | (0.21 | ) | | | (2.49 | ) |
| | | | | | | | | | | | | | | | | | | | |
Net asset value | | | | | | | | | | | | | | | | | | | | |
End of year | | $ | 20.55 | | | $ | 19.60 | | | $ | 18.05 | | | $ | 14.16 | | | $ | 12.19 | |
| | | | | | | | | | | | | | | | | | | | |
Total return(D) | | | 11.58 | % | | | 8 .59 | % | | | 27.47 | % | | | 18.37 | % | | | (39.85 | )% |
| | | | | | | | | | | | | | | | | | | | |
Net assets end of year (000’s) | | $ | 29,615 | | | $ | 33,830 | | | $ | 38,355 | | | $ | 34,573 | | | $ | 31,716 | |
| | | | | | | | | | | | | | | | | | | | |
Ratio and supplemental data | | | | | | | | | | | | | | | | | | | | |
Expenses to average net assets | | | | | | | | | | | | | | | | | | | | |
After reimbursement/waiver or recapture | | | 2.08 | % | | | 2.09 | % | | | 2.12 | % | | | 2.24 | % | | | 2.07 | % |
Before reimbursement/waiver or recapture | | | 2.08 | % | | | 2.09 | % | | | 2.12 | % | | | 2.24 | % | | | 2.07 | % |
Net investment income (loss) to average net assets(G) | | | (0.16 | )% | | | (0.95 | )% | | | (0.74 | )% | | | (0.66 | )% | | | 0.34 | % |
Portfolio turnover rate | | | 74 | % | | | 174 | % | | | 57 | % | | | 101 | % | | | 48 | % |
| | | | |
| The notes to the financial statements are an integral part of this report. | | |
| Transamerica Funds | | | | Annual Report 2012 |
| | Page 151 | | |
FINANCIAL HIGHLIGHTS (continued)
For the period or years ended:
| | | | | | | | | | | | | | | | | | | | |
| | | Transamerica Small/Mid Cap Value | |
| | | Class C | |
| | | October 31, | | | October 31, | | | October 31, | | | October 31, | | | October 31, | |
For a share outstanding throughout each period | | 2012 | | | 2011 | | | 2010 | | | 2009 | | | 2008 | |
Net asset value | | | | | | | | | | | | | | | | | | | | |
Beginning of year | | $ | 19.40 | | | $ | 17.86 | | | $ | 14.00 | | | $ | 12.10 | | | $ | 22.81 | |
| | | | | | | | | | | | | | | | | | | | |
Investment operations | | | | | | | | | | | | | | | | | | | | |
Net investment income (loss)(B) | | | (0.02 | ) | | | (0.18 | ) | | | (0.12 | ) | | | (0.08 | ) | | | 0.09 | |
Net realized and change in unrealized gain (loss) on investments | | | 2.09 | | | | 1.72 | | | | 3.98 | | | | 2.23 | | | | (8.24 | ) |
| | | | | | | | | | | | | | | | | | | | |
Total from investment operations | | | 2.07 | | | | 1.54 | | | | 3.86 | | | | 2.15 | | | | (8.15 | ) |
| | | | | | | | | | | | | | | | | | | | |
Distributions | | | | | | | | | | | | | | | | | | | | |
Net investment income | | | — | (C) | | | — | | | | — | | | | (0.25 | ) | | | (0.07 | ) |
Net realized gains on investments | | | (1.14 | ) | | | — | | | | — | | | | — | | | | (2.49 | ) |
| | | | | | | | | | | | | | | | | | | | |
Total distributions | | | (1.14 | ) | | | — | | | | — | | | | (0.25 | ) | | | (2.56 | ) |
| | | | | | | | | | | | | | | | | | | | |
Net asset value | | | | | | | | | | | | | | | | | | | | |
End of year | | $ | 20.33 | | | $ | 19.40 | | | $ | 17.86 | | | $ | 14.00 | | | $ | 12.10 | |
| | | | | | | | | | | | | | | | | | | | |
Total return(D) | | | 11.60 | % | | | 8.62 | % | | | 27.57 | % | | | 18.42 | % | | | (39.84 | )% |
| | | | | | | | | | | | | | | | | | | | |
Net assets end of year (000’s) | | $ | 198,356 | | | $ | 181,765 | | | $ | 169,903 | | | $ | 115,960 | | | $ | 95,729 | |
| | | | | | | | | | | | | | | | | | | | |
Ratio and supplemental data | | | | | | | | | | | | | | | | | | | | |
Expenses to average net assets | | | | | | | | | | | | | | | | | | | | |
After reimbursement/waiver or recapture | | | 2.04 | % | | | 2.05 | % | | | 2.07 | % | | | 2.20 | % | | | 2.04 | % |
Before reimbursement/waiver or recapture | | | 2.04 | % | | | 2.05 | % | | | 2.07 | % | | | 2.20 | % | | | 2.04 | % |
Net investment income (loss) to average net assets(G) | | | (0.13 | )% | | | (0.89 | )% | | | (0.73 | )% | | | (0.63 | )% | | | 0.52 | % |
Portfolio turnover rate | | | 74 | % | | | 174 | % | | | 57 | % | | | 101 | % | | | 48 | % |
| | | | | | | | | | | | |
| | | Transamerica Small/Mid Cap Value | |
| | | Class I | |
| | | October 31, | | | October 31, | | | October 31, | |
For a share outstanding throughout each period | | 2012 | | | 2011 | | | 2010(H) | |
Net asset value | | | | | | | | | | | | |
Beginning of period/year | | $ | 21.03 | | | $ | 19.15 | | | $ | 15.44 | |
| | | | | | | | | | | | |
Investment operations | | | | | | | | | | | | |
Net investment income (loss)(B) | | | 0.20 | | | | 0.05 | | | | (0.02 | ) |
Net realized and change in unrealized gain on investments | | | 2.29 | | | | 1.83 | | | | 3.73 | |
| | | | | | | | | | | | |
Total from investment operations | | | 2.49 | | | | 1.88 | | | | 3.71 | |
| | | | | | | | | | | | |
Distributions | | | | | | | | | | | | |
Net investment income | | | — | (C) | | | — | | | | — | |
Net realized gains on investments | | | (1.14 | ) | | | — | | | | — | |
| | | | | | | | | | | | |
Total distributions | | | (1.14 | ) | | | — | | | | — | |
| | | | | | | | | | | | |
Net asset value | | | | | | | | | | | | |
End of year | | $ | 22.38 | | | $ | 21.03 | | | $ | 19.15 | |
| | | | | | | | | | | | |
Total return(D) | | | 12.75 | % | | | 9.82 | % | | | 24.03 | %(E) |
| | | | | | | | | | | | |
Net assets end of year (000’s) | | $ | 105,664 | | | $ | 68,499 | | | $ | 40,346 | |
| | | | | | | | | | | | |
Ratio and supplemental data | | | | | | | | | | | | |
Expenses to average net assets | | | | | | | | | | | | |
After reimbursement/waiver or recapture | | | 0.97 | % | | | 1.00 | % | | | 1.04 | %(F) |
Before reimbursement/waiver or recapture | | | 0.97 | % | | | 1.00 | % | | | 1.04 | %(F) |
Net investment income (loss) to average net assets(G) | | | 0.93 | % | | | 0.24 | % | | | (0.11 | )%(F) |
Portfolio turnover rate | | | 74 | % | | | 174 | % | | | 57 | %(E) |
| | | | |
| The notes to the financial statements are an integral part of this report. | | |
| Transamerica Funds | | | | Annual Report 2012 |
| | Page 152 | | |
FINANCIAL HIGHLIGHTS (continued)
For the period or years ended:
| | | | | | | | | | | | | | | | | | | | |
| | | Transamerica Small/Mid Cap Value | |
| | | Class I2(I) | |
| | | October 31, | | | October 31, | | | October 31, | | | October 31, | | | October 31, | |
For a share outstanding throughout each period | | 2012 | | | 2011 | | | 2010 | | | 2009 | | | 2008 | |
Net asset value | | | | | | | | | | | | | | | | | | | | |
Beginning of year | | $ | 21.03 | | | $ | 19.13 | | | $ | 14.82 | | | $ | 12.81 | | | $ | 23.91 | |
| | | | | | | | | | | | | | | | | | | | |
Investment operations | | | | | | | | | | | | | | | | | | | | |
Net investment income(B) | | | 0.22 | | | | 0.06 | | | | 0.08 | | | | 0.11 | | | | 0.30 | |
Net realized and change in unrealized gain (loss) on investments | | | 2.30 | | | | 1.84 | | | | 4.23 | | | | 2.31 | | | | (8.67 | ) |
| | | | | | | | | | | | | | | | | | | | |
Total from investment operations | | | 2.52 | | | | 1.90 | | | | 4.31 | | | | 2.42 | | | | (8.37 | ) |
| | | | | | | | | | | | | | | | | | | | |
Distributions | | | | | | | | | | | | | | | | | | | | |
Net investment income | | | — | (C) | | | — | | | | — | | | | (0.41 | ) | | | (0.24 | ) |
Net realized gains on investments | | | (1.14 | ) | | | — | | | | — | | | | — | | | | (2.49 | ) |
| | | | | | | | | | | | | | | | | | | | |
Total distributions | | | (1.14 | ) | | | — | | | | — | | | | (0.41 | ) | | | (2.73 | ) |
| | | | | | | | | | | | | | | | | | | | |
Net asset value | | | | | | | | | | | | | | | | | | | | |
End of year | | $ | 22.41 | | | $ | 21.03 | | | $ | 19.13 | | | $ | 14.82 | | | $ | 12.81 | |
| | | | | | | | | | | | | | | | | | | | |
Total return(D) | | | 12.90 | % | | | 9.93 | % | | | 29.00 | % | | | 19.85 | % | | | (39.11 | )% |
| | | | | | | | | | | | | | | | | | | | |
Net assets end of year (000’s) | | $ | 15,545 | | | $ | 12,935 | | | $ | 15,893 | | | $ | 10,746 | | | $ | 214,351 | |
| | | | | | | | | | | | | | | | | | | | |
Ratio and supplemental data | | | | | | | | | | | | | | | | | | | | |
Expenses to average net assets | | | | | | | | | | | | | | | | | | | | |
After reimbursement/waiver or recapture | | | 0.87 | % | | | 0.88 | % | | | 0.88 | % | | | 0.91 | % | | | 0.85 | % |
Before reimbursement/waiver or recapture | | | 0.87 | % | | | 0.88 | % | | | 0.88 | % | | | 0.91 | % | | | 0.85 | % |
Net investment income to average net assets(G) | | | 1.03 | % | | | 0.26 | % | | | 0.47 | % | | | 0.89 | % | | | 1.58 | % |
Portfolio turnover rate | | | 74 | % | | | 174 | % | | | 57 | % | | | 101 | % | | | 48 | % |
| | | | | | | | | | | | |
| | | Transamerica Tactical Income | |
| | | Class A | | | Class C | | | Class I | |
| | | October 31, | | | October 31, | | | October 31, | |
For a share outstanding throughout each period | | 2012(X) | | | 2012(X) | | | 2012(X) | |
Net asset value | | | | | | | | | | | | |
Beginning of period/year | | $ | 10.00 | | | $ | 10.00 | | | $ | 10.00 | |
| | | | | | | | | | | | |
Investment operations | | | | | | | | | | | | |
Net investment income(B) | | | 0.33 | | | | 0.25 | | | | 0.37 | |
Net realized and change in unrealized gain on investments | | | 0.45 | | | | 0.46 | | | | 0.44 | |
| | | | | | | | | | | | |
Total from investment operations | | | 0.78 | | | | 0.71 | | | | 0.81 | |
| | | | | | | | | | | | |
Distributions | | | | | | | | | | | | |
Net investment income | | | (0.53 | ) | | | (0.49 | ) | | | (0.55 | ) |
| | | | | | | | | | | | |
Total distributions | | | (0.53 | ) | | | (0.49 | ) | | | (0.55 | ) |
| | | | | | | | | | | | |
Net asset value | | | | | | | | | | | | |
End of year | | $ | 10.25 | | | $ | 10.22 | | | $ | 10.26 | |
| | | | | | | | | | | | |
Total return(D) | | | 8.02 | % | | | 7.26 | % | | | 8.35 | % |
| | | | | | | | | | | | |
Net assets end of year (000’s) | | $ | 254,763 | | | $ | 279,728 | | | $ | 240,339 | |
| | | | | | | | | | | | |
Ratio and supplemental data | | | | | | | | | | | | |
Expenses to average net assets | | | | | | | | | | | | |
After reimbursement/waiver or recapture | | | 0.92 | % | | | 1.67 | % | | | 0.67 | % |
Before reimbursement/waiver or recapture | | | 0.98 | % | | | 1.68 | % | | | 0.72 | % |
Net investment income to average net assets(G) | | | 3.27 | % | | | 2.48 | % | | | 3.61 | % |
Portfolio turnover rate | | | 142 | % | | | 142 | % | | | 142 | % |
| | | | |
| The notes to the financial statements are an integral part of this report. | | |
| Transamerica Funds | | | | Annual Report 2012 |
| | Page 153 | | |
FINANCIAL HIGHLIGHTS (continued)
| (A) | Commenced operations November 13, 2009. |
| (B) | Calculation is based on average number of shares outstanding. |
| (C) | Rounds to less than $0.01 or $(0.01). |
| (D) | Total return has been calculated for the applicable period without deduction of a sales load, if any, on an initial purchase. |
| (G) | Includes Redemption Fees, if any. The impact of Redemption Fees is less than 0.01% for Class A, Class B, Class C, and Class I2, respectively. |
| (H) | Commenced operations November 30, 2009. |
| (I) | Effective November 30, 2009, all previously existing Class I shares were re-designated as Class I2 Shares. |
| (J) | Commenced operations September 30, 2011. |
| (K) | Includes fair fund settlement. The impacts were $0.01 to Net realized and change in unrealized gain on investments and 0.08% to Total return. |
| (L) | Commenced operations February 10, 2012. |
| (M) | Commenced operations August 31, 2011. |
| (N) | Commenced operations April 30, 2012. |
| (O) | Includes extraordinary expenses. The impact of the extraordinary expenses was 0.01%. |
| (P) | Commenced operations March 1, 2012. |
| (Q) | Commenced operations March 1, 2011. |
| (R) | Prior to March 1, 2010, information provided in previous periods reflects TS&W International Equity Portfolio, which is the accounting survivor pursuant to a Plan of Reorganization. Prior to November 1, 2010, the financial highlights were audited by another independent registered public accounting firm. |
| (S) | Rounds to less than 0.01% or (0.01)%. |
| (T) | Commenced operations November 15, 2010. |
| (U) | Transamerica Asset Management, Inc. or any of its affiliates waive fees or reimburse expenses in order to avoid a negative yield. Refer to the notes to the financial statements for details. |
| (V) | Includes extraordinary expenses. The impact of the extraordinary expenses were 0.01% and 0.02% for 2010 and 2009, respectively. |
| (W) | Commenced operations August 31, 2012. |
| (X) | Commenced operations October 31, 2011. Includes information from inception date of October 31, 2011 through period end. |
| (Y) | Commenced operations November 1, 2007. |
Note: Prior to November 1, 2009, all financial highlights, with the exception of Transamerica International Equity, were audited by another independent registered public accounting firm.
| | | | |
| The notes to the financial statements are an integral part of this report. | | |
| Transamerica Funds | | | | Annual Report 2012 |
| | Page 154 | | |
NOTES TO FINANCIAL STATEMENTS
At October 31, 2012
(all amounts in thousands)
NOTE 1. ORGANIZATION AND SIGNIFICANT ACCOUNTING POLICIES
Transamerica Funds (the “Trust”) is an open-end management investment company registered under the Investment Company Act of 1940, as amended (the “1940 Act”). Transamerica Tactical Income commenced operations on October 31, 2011. Effective March 1, 2012, the following name changes occurred:
| | |
Fund Name | | Formerly Known As |
| Transamerica Capital Growth | | Transamerica Morgan Stanley Capital Growth |
| Transamerica Diversified Equity | | Transamerica WMC Diversified Equity |
| Transamerica Emerging Markets Debt | | Transamerica Logan Circle Emerging Markets Debt |
| Transamerica Flexible Income | | Transamerica AEGON Flexible Income |
| Transamerica Growth Opportunities | | Transamerica Morgan Stanley Growth Opportunities |
| Transamerica High Yield Bond | | Transamerica AEGON High Yield Bond |
| Transamerica International Bond | | Transamerica JPMorgan International Bond |
| Transamerica International Equity | | Transamerica TS&W International Equity |
| Transamerica Money Market | | Transamerica AEGON Money Market |
| Transamerica Quality Value | | Transamerica WMC Quality Value |
| Transamerica Short-Term Bond | | Transamerica AEGON Short-Term Bond |
| Transamerica Small/Mid Cap Value | | Transamerica Systematic Small/Mid Cap Value |
Effective July 31, 2012, Transamerica Quality Value changed its name to Transamerica Large Cap Value. Transamerica Emerging Markets Equity, Transamerica Large Cap Growth, and Transamerica Small Cap Value commenced operations on April 30, 2012. Transamerica Small Cap Growth commenced operations on August 31, 2012.
Transamerica Capital Growth, Transamerica Diversified Equity, Transamerica Emerging Markets Debt, Transamerica Emerging Markets Equity, Transamerica Flexible Income, Transamerica Growth Opportunities, Transamerica High Yield Bond, Transamerica International Bond, Transamerica International Equity, Transamerica Large Cap Growth, Transamerica Large Cap Value, Transamerica Money Market, Transamerica Multi-Managed Balanced, Transamerica Short-Term Bond, Transamerica Small Cap Growth, Transamerica Small Cap Value, Transamerica Small/Mid Cap Value, and Transamerica Tactical Income (each, a “Fund”; collectively, the “Funds”) are part of the Trust.
Transamerica Emerging Markets Debt and Transamerica International Bond are “non-diversified” under the 1940 Act.
Effective February 10, 2012 Class P shares of the following funds were converted into Class I shares: Transamerica High Yield Bond, Transamerica Money Market, Transamerica Capital Growth, Transamerica Growth Opportunities, Transamerica Multi-Managed Balanced, and Transamerica Diversified Equity. Effective March 1, 2012, Transamerica International Bond offers three new classes of shares; Class A, Class C, and Class I.
Transamerica Diversified Equity has six classes of shares; Class A, Class B, Class C, Class I, Class I2, and Class T. Transamerica Capital Growth, Transamerica Flexible Income, Transamerica Growth Opportunities, Transamerica High Yield Bond, Transamerica Money Market, and Transamerica Small/Mid Cap Value currently have five classes of shares; Class A, Class B, Class C, Class I, and Class I2. Transamerica Multi-Managed Balanced currently has four classes of shares; Class A, Class B, Class C, and Class I. Transamerica Emerging Markets Debt, Transamerica Emerging Markets Equity, Transamerica International Bond, Transamerica International Equity, Transamerica Large Cap Growth, Transamerica Large Cap Value, Transamerica Short-Term Bond, Transamerica Small Cap Growth, and Transamerica Small Cap Value currently have four classes of shares; Class A, Class C, Class I, and Class I2. Transamerica Tactical Income currently has three classes of shares; Class A, Class C, and Class I. Each of the above classes has a public offering price that reflects different sales charges, if any, and expense levels. Class B shares will convert to Class A shares eight years after purchase. Effective July 15, 2010, Class B shares of each Fund were no longer offered for purchase.
This report should be read in conjunction with the Funds’ current prospectuses, which contain more complete information about the Funds including investment objectives and strategies.
In the normal course of business, the Funds enter into contracts that contain a variety of representations that provide general indemnifications. The Funds’ maximum exposure under these arrangements is unknown, as this would involve future claims that may be made against the Funds and/or their affiliates that have not yet occurred. However, based on experience, the Funds expect the risk of loss to be remote.
In preparing the Funds’ financial statements in accordance with accounting principles generally accepted in the United States of America (“GAAP”), estimates or assumptions (which could differ from actual results) may be used that affect reported amounts and disclosures. The following is a summary of significant accounting policies followed by the Funds.
| | | | |
| Transamerica Funds | | | | Annual Report 2012 |
| | Page 155 | | |
NOTES TO FINANCIAL STATEMENTS (continued)
At October 31, 2012
(all amounts in thousands)
NOTE 1. (continued)
Securities lending: Securities are lent to qualified financial institutions and brokers. The lending of Funds' securities exposes the Funds to risks such as the following: (i) the borrowers may fail to return the loaned securities; (ii) the borrowers may not be able to provide additional collateral; (iii) the Funds may experience delays in recovery of the loaned securities or delays in access to collateral; or (iv) the Funds may experience losses related to the investment collateral. To minimize certain risks, loan counterparties pledge cash collateral equal to at least the market value of the securities loaned. Cash collateral received is invested in the State Street Navigator Securities Lending Trust-Prime Portfolio, a money market mutual fund registered under the 1940 Act. By lending such securities, the Funds seek to increase their net investment income through the receipt of interest and fees.
Such income is reflected separately in the Statements of Operations. The value of loaned securities and related collateral outstanding at October 31, 2012 are shown in the Schedules of Investments and Statements of Assets and Liabilities.
Income from loaned securities in the Statements of Operations is net of fees and rebates earned by the lending agent for its services.
Repurchase agreements: Securities purchased subject to a repurchase agreement are held at the Funds' custodian, or designated sub-custodian related to tri-party repurchase agreements, and, pursuant to the terms of the repurchase agreement, must be collateralized by securities with an aggregate market value greater than or equal to 100% of the resale price. The Funds will bear the risk of value fluctuations until the securities can be sold and may encounter delays and incur costs in liquidating the securities. In the event of bankruptcy or insolvency of the seller, delays and costs may be incurred.
Foreign currency denominated investments: The accounting records of the Funds are maintained in U.S. dollars. Securities and other assets and liabilities denominated in foreign currencies are translated into U.S. dollars at the closing exchange rate each day. The cost of foreign securities is translated at the exchange rates in effect when the investment was acquired. Each Fund combines fluctuations from currency exchange rates and fluctuations in value when computing net realized and unrealized gains or losses from investments.
Net foreign currency gains and losses resulting from changes in exchange rates include: 1) foreign currency fluctuations between trade date and settlement date of investment security transactions; 2) gains and losses on forward foreign currency contracts; and 3) the difference between the receivable amounts of interest and dividends recorded in the accounting records in U.S. dollars and the amounts actually received.
Foreign currency denominated assets may involve risks not typically associated with domestic transactions. These risks include revaluation of currencies, adverse fluctuations in foreign currency values, and possible adverse political, social, and economic developments, including those particular to a specific industry, country, or region.
Foreign taxes: The Funds may be subjected to taxes imposed by the countries in which they invest, with respect to their investments in issuers existing or operating in such countries. The Funds may also be subject to foreign taxes on income, gains on investments or currency repatriation, a portion of which may be recoverable. The Funds accrue such taxes and recoveries as applicable, when the related income or capital gains are earned and based upon the current interpretation of tax rules and regulations that exist in the markets in which the Funds invest. Some countries require governmental approval for the repatriation of investment income, capital, or the proceeds of sales earned by foreign investors. In addition, if there is deterioration in a country’s balance of payments or for other reasons, a country may impose temporary restrictions of foreign capital remittances abroad.
Forward foreign currency contracts: The Funds are subject to foreign currency exchange rate risk exposure in the normal course of pursuing their investment objectives. The Funds, with the exception of Transamerica Money Market (“Money Market”), enter into forward foreign currency contracts to hedge against exchange rate risk arising from investments in securities denominated in foreign currencies. Forward foreign currency contracts are marked to market daily, with the change in value recorded as an unrealized gain or loss. When the contracts are settled, a realized gain or loss is incurred. Risks may arise from changes in market value of the underlying currencies and from the possible inability of counterparties to meet the terms of their contracts.
Open forward foreign currency contracts at October 31, 2012 are listed in the Schedules of Investments.
Option contracts: The Funds are subject to equity price risk, interest rate risk, and foreign currency exchange rate risk in the normal course of pursuing their investment objectives. The Funds, with the exception of Money Market, enter into option contracts to manage exposure to various market fluctuations. Funds purchase or write put and call options on U.S. securities, indices, futures, swaps (“swaptions”), commodities, and currency transactions. Options are valued at the average of the bid and ask (“Mean Quote”) established each day at the close of the board of trade or exchange on which they are traded. Options are marked-to-market daily to reflect the current value of the option. Premiums paid for purchasing options or premiums received from writing options which expire are treated as realized losses or realized gains, respectively. Realized gains or losses are reflected in the realized gains or losses of investment securities in the Statements of Operations. The primary risks associated with options are an imperfect correlation between the change in value of the securities held and the prices of the option contracts, the possibility of an illiquid market, and an inability of the counterparty to meet the contract terms.
| | | | |
| Transamerica Funds | | | | Annual Report 2012 |
| | Page 156 | | |
NOTES TO FINANCIAL STATEMENTS (continued)
At October 31, 2012
(all amounts in thousands)
NOTE 1. (continued)
Purchased options: Purchasing call options tends to increase a Fund’s exposure to the underlying instrument. Purchasing put options tends to decrease a Fund’s exposure to the underlying instrument. The Funds pay premiums, which are included in the Statement of Assets and Liabilities as an investment and subsequently marked-to-market to reflect the current value of the option. The risk associated with purchasing put and call options is limited to the premium paid. Premiums paid from options which expire are treated as realized losses. Premiums paid for purchasing options which are exercised or closed are added to the amounts paid or offset against the proceeds on the underlying U.S. security, index, future, swaption, commodity, or currency transaction to determine the realized gain or loss.
Written options: Writing call options tends to decrease a Fund’s exposure to the underlying investment. When a Fund writes a covered call or put option, the premium received is recorded as a liability in the Statement of Assets and Liabilities and is subsequently marked-to-market to reflect the current market value of the option written. Premiums received from written options which expire unexercised are treated as realized gains. Premiums received from writing options/swaptions which are exercised or closed are added to the proceeds or offset against amounts paid on the underlying U.S. security, index, future, swaption, commodity, or currency transaction to determine the realized gain or loss. In writing an option, a Fund bears the market risk of an unfavorable change in the price of the security or currency underlying the written option. Exercise of an option written by the Fund could result in a Fund selling or buying a security or currency at a price different from the current market value.
Inflation-capped options: A Fund purchases or writes inflation-capped options to enhance returns or for hedging opportunities. The purpose of purchasing inflation-capped options is to protect a Fund from inflation erosion above a certain rate on a given notional exposure. A floor can be used to give downside protection to the investments in inflation-linked products.
Straddle swaption contracts: The Funds enter into straddle swaption contracts. A straddle swaption is an investment strategy that consists of two swaptions, each with a different underlying swap, wherein the holder buys both a payer and receiver option on the same floating rate. If the floating rate falls, the holder receives the fixed rate, and if the floating rate rises, the holder pays the fixed rate.
The underlying face amounts of open option and swaption contracts at October 31, 2012 are listed in the Schedules of Investments.
Transactions in written options were as follows:
| | | | | | | | |
Transamerica Multi-Managed Balanced | | Premium | | | Notional
Amount | |
Balance at October 31, 2011 | | $ | 42 | | | $ | 66 | |
Sales | | | 65 | | | | 1,387 | |
Closing Buys | | | (31 | ) | | | (890 | ) |
Expirations | | | (76 | ) | | | (563 | ) |
Exercised | | | — | | | | — | |
| | | | | | | | |
Balance at October 31, 2012 | | $ | — | | | $ | — | |
| | | | | | | | |
There were no transactions in written swaptions during the year ended October 31, 2012.
Futures contracts: The Funds are subject to equity and commodity price risks, interest rate risk, and foreign currency exchange rate risk in the normal course of pursuing their investment objectives. The Funds, with the exception of Money Market, use futures contracts to gain exposure to, or hedge against, changes in the value of equities and commodities, interest rates, or foreign currencies. A futures contract represents a commitment for the future purchase or sale of an asset at a specified price on a specified date. Upon entering into such contracts, the Funds are required to deposit with the broker, either in cash or in securities, an initial margin in an amount equal to a certain percentage of the contract amount. Subsequent payments (variation margin) are paid or received by the Funds each day, depending on the daily fluctuations in the value of the contract, and are recorded for financial statement purposes as unrealized gains or losses by the Funds. Upon entering into such contracts, the Funds bear the risk of equity and commodity prices, interest rates, or exchange rates moving unexpectedly, in which case, the Funds may not achieve the anticipated benefits of the futures contracts and may realize losses. With futures, there is minimal counterparty credit risk to the Funds since futures are exchange traded and the exchange’s clearinghouse, as counterparty to all exchange traded futures, guarantees the futures against default.
The open futures contracts at October 31, 2012 are listed in the Schedules of Investments. The variation margin receivable or payable, as applicable, is included in the Statements of Assets and Liabilities.
Cash overdraft: Throughout the year, the Funds may have cash overdraft balances. A fee is incurred on these overdrafts, calculated by multiplying the overdraft by a rate based on the federal funds rate. Payables, if any, are reflected as Due to Custodian in the Statements of Assets and Liabilities. Expenses from cash overdrafts are included in Other in the Statements of Operations.
To be announced (“TBA”) purchase commitments: TBA purchase commitments are entered into to purchase securities for a fixed price at a future date, typically not to exceed 45 days. They are considered securities in themselves, and involve a risk of loss if the value of the security to be purchased declines prior to settlement date, in addition to the risk of decline in the value of the Funds' other assets. Unsettled TBA purchase commitments are valued at the current value of the underlying securities, according to the procedures described under Security Valuations. Open balances are included in the payable or receivable for investments purchase or sold.
| | | | |
| Transamerica Funds | | | | Annual Report 2012 |
| | Page 157 | | |
NOTES TO FINANCIAL STATEMENTS (continued)
At October 31, 2012
(all amounts in thousands)
NOTE 1. (continued)
Payment in-kind securities (“PIKs”): PIKs give the issuer the option at each interest payment date of making interest payments in either cash or additional debt securities. Those additional debt securities usually have the same terms, including maturity dates and interest rates, and associated risks as the original bonds. The daily market quotations of the original bonds may include the accrued interest (referred to as a “dirty price”) and require a pro-rata adjustment from unrealized appreciation or depreciation on investments to interest receivable in the Statements of Assets and Liabilities.
The PIKs at October 31, 2012 are listed in the Schedules of Investments.
Restricted and illiquid securities: The Funds may invest in unregulated or restricted securities. Restricted and illiquid securities are subject to legal or contractual restrictions on resale or are illiquid. Restricted securities generally may be resold in transactions exempt from registration. A security may be considered illiquid if it lacks a readily available market or if its valuation has not changed for a certain year of time. Disposal of these securities may involve time-consuming negotiations and expense, and prompt sale at the current valuation may be difficult.
The restricted and illiquid securities at October 31, 2012 are listed in the Schedules of Investments.
Commission recapture: The sub-adviser, to the extent consistent with the best execution and usual commission rate policies and practices, has elected to place security transactions of the Funds with broker/dealers with which Transamerica Funds has established a Commission Recapture Program. A Commission Recapture Program is any arrangement under which a broker/dealer applies a portion of the commissions received by such broker/dealer on the security transactions to the Funds. In no event will commissions paid by the Funds be used to pay expenses that would otherwise be borne by any other funds within Transamerica Funds, or by any other party.
Commissions recaptured for the year ended October 31, 2012, are included in net realized gain (loss) in the Statements of Operations and are summarized as follows:
| | | | |
Fund Name | | Commissions | |
Transamerica Capital Growth | | $ | 56 | |
Transamerica Diversified Equity | | | — | (A) |
Transamerica Growth Opportunities | | | 49 | |
Transamerica International Equity | | | 1 | |
Transamerica Large Cap Value | | | 27 | |
Transamerica Multi-Managed Balanced | | | 14 | |
Transamerica Small/Mid Cap Value | | | 135 | |
| (A) | Amount rounds to less than 1. |
Security transactions and investment income: Security transactions are recorded on the trade date. Security gains and losses are calculated on the specific identification basis. Dividend income, if any, is recorded on the ex-dividend date or, in the case of foreign securities, as soon as the Funds are informed of the ex-dividend dates, net of foreign taxes. Interest income, including accretion of discounts and amortization of premiums, is recorded on the accrual basis commencing on the settlement date.
Real estate investment trust (“REITs”): Dividend income related to a Real Estate Investment Trust is recorded at management’s estimate of the income included in distributions from the REIT investments. Distributions received in excess of the estimated amount are recorded as a reduction of the cost of investments. The actual amounts of income, return of capital, and capital gains are only determined by each REIT after the fiscal year end and may differ from the estimated amounts.
There are certain additional risks involved in investing in REITs. These include, but are not limited to, economical conditions, changes in zoning laws, real estate values, property taxes, and interest rates.
Multiple class operations, income, and expenses: Income, non-class specific expenses and realized and unrealized gains and losses are allocated daily to each class, based upon net assets. Each class bears its own specific expenses in addition to the non-class specific expenses.
Dividend distributions: Distributions to shareholders are recorded on the ex-dividend date and are determined in accordance with federal income tax regulations which may differ from GAAP.
The Funds follow the accounting practice known as “Equalization” by which a portion of the proceeds from sales and costs of reacquiring Fund shares, equivalent on a per share basis to the amount of distributable net investment income on the date of the transaction, is credited or charged to undistributed net investment income. As a result, undistributed net investment income per share is unaffected by sales or reacquisition of Fund shares. Amounts related to Equalization can be found in the Statements of Changes in Net Assets.
| | | | |
| Transamerica Funds | | | | Annual Report 2012 |
| | Page 158 | | |
NOTES TO FINANCIAL STATEMENTS (continued)
At October 31, 2012
(all amounts in thousands)
NOTE 1. (continued)
Redemption fees: Prior to March 1, 2011, TS&W International Equity Portfolio, the predecessor fund of Transamerica International Equity, retained a redemption fee of 1.00% on redemptions of capital shares held for less than 60 days. The redemption fees received are disclosed in the Fund’s Statement of Changes in Net Assets. Effective March 1, 2011, Transamerica International Equity no longer charges redemption fees.
Fair funds settlement: The Securities and Exchange Commission (“SEC”) had investigated several companies and found that there were some companies that conducted rapid in and out trading of mutual funds, known as market timing, through deceptive means. Through a SEC order the companies found to be market timing against mutual funds were required to pay amounts to compensate for the market timing activity. Amounts received as a result of the SEC order are included in the Statements of Changes in Net Assets.
NOTE 2. SECURITY VALUATIONS
All investments in securities are recorded at their estimated fair value. The Funds value their investments at the close of the New York Stock Exchange (“NYSE”), normally 4 p.m. Eastern Time, each day the NYSE is open for business. The Funds utilize various methods to measure the fair value of their investments on a recurring basis. GAAP establishes a hierarchy that prioritizes inputs to valuation methods. The inputs or methodology used for valuing securities are not necessarily an indication of the risk associated with investing in those securities. The three Levels of inputs of the fair value hierarchy are defined as follows:
Level 1—Unadjusted quoted prices in active markets for identical securities.
Level 2—Inputs, other than quoted prices included in Level 1, that are observable, either directly or indirectly. These inputs may include quoted prices for the identical instrument on an inactive market, prices for similar instruments, interest rates, prepayment speeds, credit risk, yield curves, default rates and similar data.
Level 3—Unobservable inputs, which may include Transamerica Asset Management, Inc.’s (“TAM”) Valuation Committee’s own assumptions in determining the fair value of investments. Factors considered in making this determination may include, but are not limited to, information obtained by contacting the sub-adviser, issuer, analysts, or the appropriate stock exchange (for exchange-traded securities), analysis of the issuer’s financial statements or other available documents and, if necessary, available information concerning other securities in similar circumstances.
The Funds’ Board of Trustees has delegated the valuation functions on a day-to-day basis to TAM, subject to board oversight. TAM has formed an internal valuation committee (the “Valuation Committee”) to monitor and implement the fair valuation policies and procedures as approved by the Board of Trustees. These policies and procedures are reviewed at least annually by the Board of Trustees. The Valuation Committee, among other tasks, monitors for when market quotations are not readily available or are unreliable and determines in good faith the fair value of portfolio investments. For instances which daily market quotes are not readily available, securities may be valued, pursuant to procedures adopted by the Board of Trustees, with reference to other instruments or indices. Depending on the relative significance of valuation inputs, these instruments may be classified in either Level 2 or Level 3 of the fair value hierarchy. The Valuation Committee may employ a market-based approach which may use related or comparable assets or liabilities, recent transactions, market multiples, book values, and other relevant information for the security to determine the fair value of the security. An income-based valuation approach may also be used in which the anticipated future cash flows of the security are discounted to calculate fair value. Discounts may also be applied due to the nature or duration of any restrictions on the disposition of the securities. When the Funds use fair value methods that rely on significant unobservable inputs to determine a security’s value, the Valuation Committee will choose the method that is believed to accurately reflect fair market value. These securities are categorized as Level 3 of the fair value hierarchy. The Valuation Committee reviews fair value measurements on a regular and ad hoc basis and may, as deemed appropriate, update the security valuations as well as the fair valuation guidelines.
The availability of observable inputs can vary from security to security and is affected by a wide variety of factors, including, but not limited to, the type of security, whether the security is new and not yet established in the marketplace, the liquidity of markets, and other characteristics particular to the security. To the extent that valuation is based on models or inputs that are less observable or unobservable in the market, the determination of fair value requires more judgment. Accordingly, the degree of judgment exercised in determining fair value is generally greatest for instruments categorized in Level 3. Due to the inherent uncertainty of valuation, TAM’s Valuation Committee’s determination of values may differ significantly from values that would have been realized had a ready market for investments existed and the differences could be material. The Valuation Committee employs various methods for calibrating these valuation approaches including a regular review of valuation methodologies, key inputs and assumptions, transactional back-testing and reviews of any market related activity.
The inputs used to measure fair value may fall into different Levels of the fair value hierarchy. In such cases, for disclosure purposes, the Level in the fair value hierarchy that is assigned to the fair value measurement of a security is determined based on the lowest Level input that is significant to the fair value measurement in its entirety.
For assets and liabilities for which significant unobservable inputs (Level 3) were used, a reconciliation of the beginning to the ending balances for reported market values that presents changes attributed to total realized and unrealized gains or losses, purchases and sales, and transfers in/out of the Level 3 category during the year. The Level 3 reconciliation, if any, is disclosed in the Valuation Summary of each Fund’s Schedule of Investments.
| | | | |
| Transamerica Funds | | | | Annual Report 2012 |
| | Page 159 | | |
NOTES TO FINANCIAL STATEMENTS (continued)
At October 31, 2012
(all amounts in thousands)
NOTE 2. (continued)
Fair value measurements: Descriptions of the valuation techniques applied to the Funds’ major categories of assets and liabilities measured at fair value on a recurring basis are as follows:
Equity securities (common and preferred stocks): Securities are stated at the last reported sales price or closing price on the day of valuation taken from the primary exchange where the security is principally traded. To the extent these securities are actively traded and valuation adjustments are not applied, they are categorized in Level 1 of the fair value hierarchy.
Foreign securities, in which the primary trading market closes at the same time or after the NYSE, are valued based on quotations from the primary market in which they are traded and are categorized in Level 1. Because many foreign securities markets and exchanges close prior to the close of the NYSE, closing prices for foreign securities in those markets or on those exchanges do not reflect the events that occur after that close. Certain foreign securities may be fair valued using a pricing service that considers the correlation of the trading patterns of the foreign security to the intraday trading in the U.S. markets for investments such as American Depositary Receipts, financial futures, Exchange Traded Funds, and the movement of the certain indices of securities based on a statistical analysis of their historical relationship; such valuations generally are categorized in Level 2.
Preferred stock, repurchase agreements, and other equities traded on inactive markets or valued by reference to similar instruments are also generally categorized in Level 2 or Level 3 if inputs are unobservable.
Securities lending collateral: Securities lending collateral is invested in a money market fund which is valued at the net asset value of the underlying securities and no valuation adjustments are applied. It is categorized in Level 1 of the fair value hierarchy.
Corporate bonds: The fair value of corporate bonds is estimated using various techniques, which consider recently executed transactions in securities of the issuer or comparable issuers, market price quotations (where observable), bond spreads, fundamental data relating to the issuer, and credit default swap spreads adjusted for any basis difference between cash and derivative instruments. While most corporate bonds are categorized in Level 2 of the fair value hierarchy, in instances where lower relative weight is placed on transaction prices, quotations, or similar observable inputs, they are categorized in Level 3.
Asset backed securities: The fair value of asset backed securities is estimated based on models that consider the estimated cash flows of each tranche of the entity, establish a benchmark yield, and develop an estimated tranche specific spread to the benchmark yield based on the unique attributes of the tranche. To the extent the inputs are observable and timely, the values would generally be categorized in Level 2 of the fair value hierarchy; otherwise they would be categorized as Level 3.
Short-term notes: Short-term notes are valued using amortized cost, which approximates fair value. To the extent the inputs are observable and timely, the values would be generally categorized in Level 2 of the fair value hierarchy; otherwise they would be categorized as Level 3.
Government securities: Government securities are normally valued using a model that incorporates market observable data such as reported sales of similar securities, broker quotes, yields, bids, offers, and reference data. Certain securities are valued by principally using dealer quotations. Government securities generally are categorized in Level 2 of the fair value hierarchy or Level 3 if inputs are unobservable.
U.S. government agency securities: U.S. government agency securities are comprised of two main categories consisting of agency issued debt and mortgage pass-throughs. Generally, agency issued debt securities are valued in a manner similar to U.S. government securities. Mortgage pass-throughs include to be announced (“TBA”) securities and mortgage pass-through certificates. Generally, TBA securities and mortgage pass-throughs are valued using dealer quotations. Depending on market activity levels and whether quotations or other observable data are used, these securities are typically categorized in Level 2 of the fair value hierarchy; otherwise they would be categorized as Level 3.
Restricted securities (equity and debt): The Funds may invest in unregulated or otherwise restricted securities. Restricted securities for which quotations are not readily available are valued at fair value as determined in good faith by TAM’s Valuation Committee under the supervision of the Funds’ Board of Trustees. Restricted securities issued by publicly traded companies are generally valued at a discount to similar publicly traded securities. Restricted securities issued by nonpublic entities may be valued by reference to comparable public entities and/or fundamental data relating to the issuer. Depending on the relative significance of observable valuation inputs, these instruments may be classified in either Level 2 or Level 3 of the fair value hierarchy.
Derivative instruments: Listed derivatives that are actively traded are valued based on quoted prices from the exchange and are categorized in level 1 of the fair value hierarchy. Over the counter (“OTC”) derivative contracts include forward, swap, swaption, and option contracts related to interest rates, foreign currencies, credit standing of reference entities, equity prices, or commodity prices. Depending on the product and the terms of the transaction, the fair value of the OTC derivative products are modeled taking into account the counterparties’ creditworthiness and using a series of techniques, including simulation models.
| | | | |
| Transamerica Funds | | | | Annual Report 2012 |
| | Page 160 | | |
NOTES TO FINANCIAL STATEMENTS (continued)
At October 31, 2012
(all amounts in thousands)
NOTE 2. (continued)
Many pricing models do not entail material subjectivity because the methodologies employed do not necessitate significant judgments and the pricing inputs are observed from actively quoted markets, as is the case of interest rate swap and option contracts. A substantial majority of OTC derivative products valued by the Funds using pricing models fall into this category and are categorized within level 2 of the fair value hierarchy or Level 3 if inputs are unobservable.
The hierarchy classification of inputs used to value the Funds’ investments, at October 31, 2012, is disclosed in the Valuation Summary of each Fund's Schedule of Investments.
NOTE 3. RELATED PARTY TRANSACTIONS
TAM, the Funds’ investment adviser, is directly owned by Western Reserve Life Assurance Co. of Ohio and AUSA Holding Company (“AUSA”), both of which are indirect, wholly owned subsidiaries of AEGON NV. AUSA is wholly owned by AEGON USA, LLC (“AEGON USA”), a financial services holding company whose primary emphasis is on life and health insurance, and annuity and investment products. AEGON USA is owned by AEGON US Holding Corporation, which is owned by Transamerica Corporation (DE). Transamerica Corporation (DE) is owned by The AEGON Trust, which is owned by AEGON International B.V., which is owned by AEGON NV, a Netherlands corporation, and a publicly traded international insurance group.
AEGON USA Investment Management, LLC (“AUIM”) is both an affiliate and sub-adviser of Transamerica Flexible Income, Transamerica High Yield Bond, Transamerica Money Market, Transamerica Short-Term Bond, and Transamerica Tactical Income.
Transamerica Fund Services, Inc. (“TFS”) is the Funds’ administrator and transfer agent. Transamerica Capital, Inc. (“TCI”) is the Funds’ distributor/principal underwriter. TAM, AUIM, TFS, and TCI are affiliates of AEGON NV.
Certain officers and trustees of the Funds are also officers and/or directors of TAM, AUIM, TFS, and TCI. No interested trustee receives compensation from the Funds.
At the commencement of operations, TAM invested in the Funds. As of October 31, 2012, TAM had investments in the Funds as follows:
| | | | | | | | |
Fund Name | | Market
Value | | | % of Fund’s
Net Assets | |
Transamerica Emerging Markets Equity | | | | | | | | |
Class A | | | $236 | | | | 0.22 | % |
Class C | | | 235 | | | | 0.22 | |
Class I | | | 236 | | | | 0.22 | |
| | | | | | | | |
Transamerica International Bond | | | | | | | | |
Class A | | | 103 | | | | 0.05 | |
Class C | | | 102 | | | | 0.05 | |
Class I | | | 103 | | | | 0.05 | |
| | | | | | | | |
Transamerica International Equity | | | | | | | | |
Class A | | | 100 | | | | 0.04 | |
Class C | | | 99 | | | | 0.04 | |
| | | | | | | | |
Transamerica Large Cap Growth | | | | | | | | |
Class A | | | 247 | | | | 0.18 | |
Class C | | | 246 | | | | 0.18 | |
Class I | | | 247 | | | | 0.18 | |
| | | | | | | | |
Transamerica Large Cap Value | | | | | | | | |
Class A | | | 302 | | | | 0.02 | |
Class C | | | 299 | | | | 0.02 | |
| | | | | | | | |
Transamerica Small Cap Growth | | | | | | | | |
Class A | | | 234 | | | | 0.10 | |
Class C | | | 234 | | | | 0.10 | |
Class I | | | 234 | | | | 0.10 | |
| | | | | | | | |
Transamerica Small Cap Value | | | | | | | | |
Class A | | | 246 | | | | 0.08 | |
Class C | | | 245 | | | | 0.08 | |
Class I | | | 246 | | | | 0.08 | |
| | | | | | | | |
| | | | |
| Transamerica Funds | | | | Annual Report 2012 |
| | Page 161 | | |
NOTES TO FINANCIAL STATEMENTS (continued)
At October 31, 2012
(all amounts in thousands)
NOTE 3. (continued)
The following schedule reflects the percentage of each Fund’s assets owned by affiliated investment companies at October 31, 2012:
| | | | | | | | |
| | | Market | | | % of Net | |
Transamerica Capital Growth | | Value | | | Assets | |
Transamerica Asset Allocation-Conservative Portfolio | | $ | 12,732 | | | | 1.78 | % |
Transamerica Asset Allocation-Growth Portfolio | | | 66,747 | | | | 9.31 | |
Transamerica Asset Allocation-Moderate Portfolio | | | 40,144 | | | | 5.60 | |
Transamerica Asset Allocation-Moderate Growth Portfolio | | | 85,049 | | | | 11.86 | |
Transamerica Asset Allocation-Conservative VP | | | 41,778 | | | | 5.83 | |
Transamerica Asset Allocation-Growth VP | | | 46,034 | | | | 6.42 | |
Transamerica Asset Allocation-Moderate Growth VP | | | 147,082 | | | | 20.52 | |
Transamerica Asset Allocation-Moderate VP | | | 100,474 | | | | 14.01 | |
| | | | | | | | |
Total | | $ | 540,040 | | | | 75.33 | % |
| | | | | | | | |
| | |
Transamerica Diversified Equity | | Market
Value | | | % of Net
Assets | |
Transamerica Asset Allocation-Conservative Portfolio | | $ | 44,964 | | | | 3.09 | % |
Transamerica Asset Allocation-Growth Portfolio | | | 146,535 | | | | 10.08 | |
Transamerica Asset Allocation-Moderate Portfolio | | | 144,908 | | | | 9.97 | |
Transamerica Asset Allocation-Moderate Growth Portfolio | | | 222,373 | | | | 15.30 | |
| | | | | | | | |
Total | | $ | 558,780 | | | | 38.44 | % |
| | | | | | | | |
| | |
Transamerica Emerging Markets Debt | | Market
Value | | | % of Net
Assets | |
Transamerica Asset Allocation-Conservative Portfolio | | $ | 20,105 | | | | 3.23 | % |
Transamerica Asset Allocation-Moderate Portfolio | | | 32,019 | | | | 5.14 | |
Transamerica Asset Allocation-Moderate Growth Portfolio | | | 21,378 | | | | 3.43 | |
Transamerica Multi-Manager Alternative Strategies Portfolio | | | 45,685 | | | | 7.33 | |
Transamerica Asset Allocation-Conservative VP | | | 67,791 | | | | 10.88 | |
Transamerica Asset Allocation-Growth VP | | | 1,360 | | | | 0.22 | |
Transamerica Asset Allocation-Moderate Growth VP | | | 126,137 | | | | 20.24 | |
Transamerica Asset Allocation-Moderate VP | | | 179,574 | | | | 28.82 | |
Transamerica International Moderate Growth VP | | | 8,306 | | | | 1.33 | |
| | | | | | | | |
Total | | $ | 502,355 | | | | 80.62 | % |
| | | | | | | | |
| | | | | | | | |
| | | Market | | | % of Net | |
Transamerica Emerging Markets Equity | | Value | | | Assets | |
Transamerica Asset Allocation-Conservative Portfolio | | $ | 745 | | | | 0.69 | % |
Transamerica Asset Allocation-Growth Portfolio | | | 10,789 | | | | 9.99 | |
Transamerica Asset Allocation-Moderate Portfolio | | | 2,254 | | | | 2.09 | |
Transamerica Asset Allocation-Moderate Growth Portfolio | | | 12,853 | | | | 11.90 | |
Transamerica Multi-Manager International Portfolio | | | 16,266 | | | | 15.05 | |
Transamerica Asset Allocation-Growth VP | | | 23,600 | | | | 21.84 | |
Transamerica Asset Allocation-Moderate Growth VP | | | 15,998 | | | | 14.81 | |
Transamerica Asset Allocation-Moderate VP | | | 22,820 | | | | 21.12 | |
| | | | | | | | |
Total | | $ | 105,325 | | | | 97.49 | % |
| | | | | | | | |
| | |
Transamerica Flexible Income | | Market
Value | | | % of Net
Assets | |
Transamerica Asset Allocation-Conservative Portfolio | | $ | 17,380 | | | | 5.34 | % |
Transamerica Asset Allocation-Moderate Portfolio | | | 44,170 | | | | 13.57 | |
Transamerica Asset Allocation-Conservative VP | | | 23,034 | | | | 7.07 | |
Transamerica Asset Allocation-Moderate Growth VP | | | 17,610 | | | | 5.41 | |
Transamerica Asset Allocation-Moderate VP | | | 25,883 | | | | 7.95 | |
| | | | | | | | |
Total | | $ | 128,077 | | | | 39.34 | % |
| | | | | | | | |
| | |
Transamerica Growth Opportunities | | Market
Value | | | % of Net
Assets | |
Transamerica Asset Allocation-Conservative Portfolio | | $ | 15,539 | | | | 2.65 | % |
Transamerica Asset Allocation-Growth Portfolio | | | 43,801 | | | | 7.48 | |
Transamerica Asset Allocation-Moderate Portfolio | | | 44,053 | | | | 7.52 | |
Transamerica Asset Allocation-Moderate Growth Portfolio | | | 83,085 | | | | 14.18 | |
Transamerica Asset Allocation-Conservative VP | | | 19,796 | | | | 3.38 | |
Transamerica Asset Allocation-Growth VP | | | 22,714 | | | | 3.88 | |
Transamerica Asset Allocation-Moderate Growth VP | | | 115,322 | | | | 19.68 | |
Transamerica Asset Allocation-Moderate VP | | | 50,363 | | | | 8.59 | |
| | | | | | | | |
Total | | $ | 394,673 | | | | 67.36 | % |
| | | | | | | | |
| | | | |
| Transamerica Funds | | | | Annual Report 2012 |
| | Page 162 | | |
NOTES TO FINANCIAL STATEMENTS (continued)
At October 31, 2012
(all amounts in thousands)
NOTE 3. (continued)
| | | | | | | | |
Transamerica High Yield Bond | | Market
Value | | | % of Net
Assets | |
Transamerica Asset Allocation-Conservative Portfolio | | $ | 29,920 | | | | 4.30 | % |
Transamerica Asset Allocation-Moderate Portfolio | | | 36,408 | | | | 5.23 | |
Transamerica Asset Allocation-Moderate Growth Portfolio | | | 50,765 | | | | 7.29 | |
Transamerica Asset Allocation-Conservative VP | | | 14,696 | | | | 2.11 | |
Transamerica Asset Allocation-Moderate Growth VP | | | 25,316 | | | | 3.63 | |
Transamerica Asset Allocation-Moderate VP | | | 40,284 | | | | 5.78 | |
| | | | | | | | |
Total | | $ | 197,389 | | | | 28.34 | % |
| | | | | | | | |
| | |
Transamerica International Bond | | Market
Value | | | % of Net
Assets | |
Transamerica Asset Allocation-Conservative Portfolio | | $ | 11,289 | | | | 5.82 | % |
Transamerica Asset Allocation-Moderate Portfolio | | | 26,724 | | | | 13.79 | |
Transamerica Asset Allocation-Moderate Growth Portfolio | | | 21,346 | | | | 11.02 | |
Transamerica Asset Allocation-Conservative VP | | | 24,740 | | | | 12.77 | |
Transamerica Asset Allocation-Moderate Growth VP | | | 62,046 | | | | 32.02 | |
Transamerica Asset Allocation-Moderate VP | | | 44,572 | | | | 23.00 | |
| | | | | | | | |
Total | | $ | 190,717 | | | | 98.42 | % |
| | | | | | | | |
| | |
Transamerica International Equity | | Market
Value | | | % of Net
Assets | |
Transamerica Asset Allocation-Conservative Portfolio | | $ | 2,345 | | | | 0.89 | % |
Transamerica Asset Allocation-Growth Portfolio | | | 35,569 | | | | 13.47 | |
Transamerica Asset Allocation-Moderate Portfolio | | | 10,322 | | | | 3.91 | |
Transamerica Asset Allocation-Moderate Growth Portfolio | | | 28,982 | | | | 10.98 | |
Transamerica Multi-Manager International Portfolio | | | 27,034 | | | | 10.24 | |
Transamerica International Moderate Growth VP | | | 60,236 | | | | 22.82 | |
| | | | | | | | |
Total | | $ | 164,488 | | | | 62.31 | % |
| | | | | | | | |
| | |
Transamerica Large Cap Growth | | Market
Value | | | % of Net
Assets | |
Transamerica Asset Allocation-Conservative Portfolio | | $ | 3,048 | | | | 2.23 | % |
Transamerica Asset Allocation-Growth Portfolio | | | 10,036 | | | | 7.34 | |
Transamerica Asset Allocation-Moderate Portfolio | | | 9,004 | | | | 6.58 | |
Transamerica Asset Allocation-Moderate Growth Portfolio | | | 14,596 | | | | 10.67 | |
Transamerica Asset Allocation-Moderate Growth VP | | | 98,673 | | | | 72.13 | |
| | | | | | | | |
Total | | $ | 135,357 | | | | 98.95 | % |
| | | | | | | | |
| | | | | | | | |
Transamerica Large Cap Value | | Market
Value | | | % of Net
Assets | |
Transamerica Asset Allocation-Conservative Portfolio | | $ | 53,561 | | | | 4.04 | % |
Transamerica Asset Allocation-Growth Portfolio | | | 204,933 | | | | 15.44 | |
Transamerica Asset Allocation-Moderate Portfolio | | | 161,762 | | | | 12.19 | |
Transamerica Asset Allocation-Moderate Growth Portfolio | | | 316,180 | | | | 23.82 | |
Transamerica Asset Allocation-Conservative VP | | | 688 | | | | 0.05 | |
Transamerica Asset Allocation-Growth VP | | | 124,914 | | | | 9.41 | |
Transamerica Asset Allocation-Moderate Growth VP | | | 313,789 | | | | 23.64 | |
Transamerica Asset Allocation-Moderate VP | | | 126,090 | | | | 9.50 | |
| | | | | | | | |
Total | | $ | 1,301,917 | | | | 98.09 | % |
| | | | | | | | |
| | |
Transamerica Money Market | | Market
Value | | | % of Net
Assets | |
Transamerica Asset Allocation-Conservative Portfolio | | $ | 5,175 | | | | 0.63 | % |
Transamerica Asset Allocation-Growth Portfolio | | | 60 | | | | 0.01 | |
Transamerica Asset Allocation-Moderate Portfolio | | | 3,865 | | | | 0.47 | |
Transamerica Multi-Manager Alternative Strategies Portfolio | | | 3,082 | | | | 0.38 | |
Transamerica Asset Allocation-Conservative VP | | | 236,415 | | | | 29.03 | |
Transamerica Asset Allocation-Growth VP | | | 39,000 | | | | 4.79 | |
Transamerica Asset Allocation-Moderate Growth VP | | | 200,003 | | | | 24.56 | |
Transamerica Asset Allocation-Moderate VP | | | 150,002 | | | | 18.42 | |
Transamerica International Moderate Growth VP | | | 11,643 | | | | 1.43 | |
| | | | | | | | |
Total | | $ | 649,245 | | | | 79.72 | % |
| | | | | | | | |
| | |
Transamerica Short-Term Bond | | Market
Value | | | % of Net
Assets | |
Transamerica Asset Allocation-Conservative Portfolio | | $ | 92,813 | | | | 2.62 | % |
Transamerica Asset Allocation-Moderate Portfolio | | | 142,994 | | | | 4.04 | |
Transamerica Asset Allocation-Moderate Growth Portfolio | | | 66 | | | | — | (A) |
Transamerica Multi-Manager Alternative Strategies Portfolio | | | 35,692 | | | | 1.01 | |
Transamerica Asset Allocation-Conservative VP | | | 364,737 | | | | 10.30 | |
Transamerica Asset Allocation-Growth VP | | | 45,004 | | | | 1.27 | |
Transamerica Asset Allocation-Moderate Growth VP | | | 250,041 | | | | 7.06 | |
Transamerica Asset Allocation-Moderate VP | | | 521,544 | | | | 14.73 | |
Transamerica International Moderate Growth VP | | | 55,626 | | | | 1.57 | |
| | | | | | | | |
Total | | $ | 1,508,517 | | | | 42.60 | % |
| | | | | | | | |
| | | | |
| Transamerica Funds | | | | Annual Report 2012 |
| | Page 163 | | |
NOTES TO FINANCIAL STATEMENTS (continued)
At October 31, 2012
(all amounts in thousands)
NOTE 3. (continued)
| | | | | | | | |
Transamerica Small Cap Growth | | Market
Value | | | % of Net
Assets | |
Transamerica Asset Allocation-Conservative Portfolio | | $ | 7,700 | | | | 3.21 | % |
Transamerica Asset Allocation-Growth Portfolio | | | 25,739 | | | | 10.72 | |
Transamerica Asset Allocation-Moderate Portfolio | | | 14,538 | | | | 6.05 | |
Transamerica Asset Allocation-Moderate Growth Portfolio | | | 23,467 | | | | 9.77 | |
Transamerica Asset Allocation-Conservative VP | | | 11,242 | | | | 4.68 | |
Transamerica Asset Allocation-Growth VP | | | 18,274 | | | | 7.61 | |
Transamerica Asset Allocation-Moderate Growth VP | | | 91,443 | | | | 38.09 | |
Transamerica Asset Allocation-Moderate VP | | | 42,494 | | | | 17.70 | |
| | | | | | | | |
Total | | $ | 234,897 | | | | 97.83 | % |
| | | | | | | | |
| | | | | | | | |
Transamerica Small Cap Value | | Market
Value | | | % of Net
Assets | |
Transamerica Asset Allocation-Conservative Portfolio | | $ | 4,458 | | | | 1.54 | % |
Transamerica Asset Allocation-Growth Portfolio | | | 30,250 | | | | 10.45 | |
Transamerica Asset Allocation-Moderate Portfolio | | | 21,977 | | | | 7.59 | |
Transamerica Asset Allocation-Moderate Growth Portfolio | | | 36,468 | | | | 12.59 | |
Transamerica Asset Allocation-Conservative VP | | | 18,440 | | | | 6.37 | |
Transamerica Asset Allocation-Growth VP | | | 27,910 | | | | 9.64 | |
Transamerica Asset Allocation-Moderate Growth VP | | | 91,940 | | | | 31.75 | |
Transamerica Asset Allocation-Moderate VP | | | 52,866 | | | | 18.26 | |
| | | | | | | | |
Total | | $ | 284,309 | | | | 98.19 | % |
| | | | | | | | |
| (A) | Rounds to less than 0.01%. |
Investment advisory fees: The Funds pay management fees to TAM based on average daily net assets (“ANA”) at the following breakpoints and/or rates:
| | | | |
Fund Name/Breakpoint | | Rate | |
Transamerica Capital Growth | | | | |
First $500 million | | | 0.80 | % |
Over $500 million | | | 0.675 | |
Transamerica Diversified Equity | | | | |
First $500 million | | | 0.73 | % |
Over $500 million up to $2.5 billion | | | 0.70 | |
Over $2.5 billion | | | 0.65 | |
Transamerica Emerging Markets Debt | | | | |
First $400 million | | | 0.60 | % |
Over $400 million | | | 0.58 | |
Transamerica Emerging Markets Equity | | | | |
First $250 million | | | 0.95 | % |
Over $250 million up to $500 million | | | 0.93 | |
Over $500 million | | | 0.90 | |
Transamerica Flexible Income | | | | |
First $250 million | | | 0.475 | % |
Over $250 million up to $350 million | | | 0.425 | |
Over $350 million | | | 0.40 | |
Transamerica Growth Opportunities | | | | |
First $250 million | | | 0.80 | % |
Over $250 million up to $500 million | | | 0.75 | |
Over $500 million | | | 0.70 | |
Transamerica High Yield Bond | | | | |
First $400 million | | | 0.59 | % |
Over $400 million up to $750 million | | | 0.575 | |
Over $750 million | | | 0.55 | |
Transamerica International Bond | | | | |
First $100 million | | | 0.55 | % |
Over $100 million up to $250 million | | | 0.52 | |
Over $250 million up to $500 million | | | 0.51 | |
Over $500 million up to $1 billion | | | 0.50 | |
Over $1 billion | | | 0.47 | |
| | | | |
Fund Name/Breakpoint | | Rate | |
Transamerica International Equity | | | | |
First $250 million | | | 0.80 | % |
Over $250 million up to $500 million | | | 0.75 | |
Over $500 million up to $1 billion | | | 0.725 | |
Over $1 billion | | | 0.70 | |
Transamerica Large Cap Growth | | | | |
First $250 million | | | 0.675 | % |
Over $250 million up to $1 billion | | | 0.65 | |
Over $1 billion | | | 0.60 | |
Transamerica Large Cap Value (Effective July 31, 2012) | | | | |
First $750 million | | | 0.65 | % |
Over $750 million up to $1 billion | | | 0.62 | |
Over $1 billion | | | 0.60 | |
Transamerica Large Cap Value (Prior to July 31, 2012) | | | | |
First $1 billion | | | 0.70 | % |
Over $1 billion | | | 0.675 | |
Transamerica Money Market | | | | |
ANA | | | 0.40 | % |
Transamerica Multi-Managed Balanced | | | | |
First $500 million | | | 0.75 | % |
Over $500 million up to $1 billion | | | 0.65 | |
Over $1 billion | | | 0.60 | |
Transamerica Short-Term Bond | | | | |
First $250 million | | | 0.55 | % |
Over $250 million up to $500 million | | | 0.50 | |
Over $500 million up to $1 billion | | | 0.475 | |
Over $1 billion | | | 0.45 | |
Transamerica Small Cap Growth | | | | |
First $300 million | | | 0.84 | % |
Over $300 million | | | 0.80 | |
| | | | |
| Transamerica Funds | | | | Annual Report 2012 |
| | Page 164 | | |
NOTES TO FINANCIAL STATEMENTS (continued)
At October 31, 2012
(all amounts in thousands)
NOTE 3. (continued)
| | | | |
Fund Name/Breakpoint | | Rate | |
Transamerica Small Cap Value | | | | |
First $250 million | | | 0.86 | % |
Over $250 million | | | 0.84 | |
Transamerica Small/Mid Cap Value | | | | |
First $500 million | | | 0.80 | % |
Over $500 million | | | 0.75 | |
| | | | |
Fund Name/Breakpoint | | Rate | |
Transamerica Tactical Income | | | | |
First $1 billion | | | 0.47 | % |
Over $1 billion up to $2 billion | | | 0.45 | |
Over $2 billion | | | 0.43 | |
TAM has contractually agreed to waive fees and/or reimburse Fund expenses to the extent that the operating expenses excluding, as applicable, 12b-1 fees, acquired fund fees and expenses, interest, taxes, brokerage commissions, dividend and interest expenses on securities sold short, extraordinary expenses and other expenses not incurred in the ordinary course of the Funds' business, exceed the following stated annual limit:
| | | | |
Fund Name | | Expense Limit | | Maximum Operating Expense
Limit Effective Through |
Transamerica Capital Growth | | 1.20% | | March 1, 2013 |
Transamerica Diversified Equity | | 1.17 | | March 1, 2013 |
Transamerica Emerging Markets Debt | | 1.00 | | March 1, 2013 |
Transamerica Emerging Markets Equity | | 1.60 | | May 1, 2013 |
Transamerica Flexible Income | | 1.00 | | March 1, 2013 |
Transamerica Growth Opportunities | | 1.40 | | March 1, 2013 |
Transamerica High Yield Bond | | 0.95 | | March 1, 2013 |
Transamerica International Bond | | 0.75 | | March 1, 2013 |
Transamerica International Equity | | 1.15 | | March 1, 2013 |
Transamerica Large Cap Growth | | 0.95 | | May 1, 2013 |
Transamerica Large Cap Value | | 1.00 | | March 1, 2013 |
Transamerica Money Market | | 0.48 | | March 1, 2013 |
Transamerica Multi-Managed Balanced | | 1.45 | | March 1, 2013 |
Transamerica Short Term Bond | | 0.85 | | March 1, 2013 |
Transamerica Small Cap Growth | | 1.15 | | August 31, 2013 |
Transamerica Small Cap Value | | 1.15 | | May 1, 2013 |
Transamerica Small/Mid Cap Value | | 1.25 | | March 1, 2013 |
Transamerica Tactical Income | | 0.67 | | March 1, 2013 |
TAM is entitled to reimbursement by the Fund of fees waived and/or expenses reduced during any of the previous 36 months if on any day or month the estimated annualized Fund operating expenses are less than the stated annual limit.
Amounts recaptured by TAM during the year ended October 31, 2012 were as follows:
| | | | |
Fund Name | | Recaptured
Amount | |
Transamerica Capital Growth | | | | |
Class A | | $ | 31 | |
Class C | | | 4 | |
Class P | | | 20 | |
| | | | |
Transamerica Diversified Equity | | | | |
Class A | | | 275 | |
Class C | | | 5 | |
Class I | | | 1 | |
| | | | |
Transamerica Emerging Markets Debt | | | | |
Fund Level | | | 35 | |
Class A | | | — | (A) |
Class C | | | — | (A) |
Class I | | | — | (A) |
Class I2 | | | 1 | |
| | | | |
Transamerica Growth Opportunities | | | | |
Class A | | | 123 | |
Class B | | | 1 | |
Class C | | | 1 | |
| | | | |
| | | | |
| Transamerica Funds | | | | Annual Report 2012 |
| | Page 165 | | |
NOTES TO FINANCIAL STATEMENTS (continued)
At October 31, 2012
(all amounts in thousands)
NOTE 3. (continued)
| | | | |
Fund Name | | Recaptured
Amount | |
Transamerica High Yield Bond | | | | |
Fund Level | | $ | 32 | |
| | | | |
Transamerica Multi-Managed Balanced | | | | |
Fund Level | | | 92 | |
| | | | |
| (A) | Rounds to less than $1. |
The following amounts were available for recapture as of October 31, 2012:
| | | | | | | | | | | | |
Fund Name | | Amount
Available | | | Year
Reimbursed | | | Available
Through | |
Transamerica Capital Growth | | | | | | | | | | | | |
Class A | | $ | 51 | | | | 2011 | | | | 10/31/2013 | |
Class B | | | 23 | | | | 2011 | | | | 10/31/2013 | |
| | | 9 | | | | 2012 | | | | 10/31/2014 | |
| | | | | | | | | | | | |
Transamerica Diversified Equity | | | | | | | | | | | | |
Class B | | | 9 | | | | 2011 | | | | 10/31/2013 | |
| | | 4 | | | | 2012 | | | | 10/31/2014 | |
Class C | | | 11 | | | | 2011 | | | | 10/31/2013 | |
| | | | | | | | | | | | |
Transamerica Emerging Markets Equity | | | | | | | | | | | | |
Class I | | | — | (A) | | | 2012 | | | | 10/31/2014 | |
| | | | | | | | | | | | |
Transamerica International Bond | | | | | | | | | | | | |
Class A | | | — | (A) | | | 2012 | | | | 10/31/2014 | |
Class C | | | — | (A) | | | 2012 | | | | 10/31/2014 | |
Class I | | | — | (A) | | | 2012 | | | | 10/31/2014 | |
| | | | | | | | | | | | |
Transamerica International Equity | | | | | | | | | | | | |
Class A | | | — | (A) | | | 2011 | | | | 10/31/2013 | |
Class A | | | — | (A) | | | 2012 | | | | 10/31/2014 | |
| | | | | | | | | | | | |
Transamerica Large Cap Growth | | | | | | | | | | | | |
Class A | | | — | (A) | | | 2012 | | | | 10/31/2014 | |
Class I | | | — | (A) | | | 2012 | | | | 10/31/2014 | |
| | | | | | | | | | | | |
Transamerica Money Market | | | | | | | | | | | | |
Core | | | 749 | | | | 2011 | | | | 10/31/2013 | |
| | | 660 | | | | 2012 | | | | 10/31/2014 | |
Class A | | | 783 | | | | 2011 | | | | 10/31/2013 | |
| | | 644 | | | | 2012 | | | | 10/31/2014 | |
Class B | | | 213 | | | | 2011 | | | | 10/31/2013 | |
| | | 154 | | | | 2012 | | | | 10/31/2014 | |
Class C | | | 376 | | | | 2011 | | | | 10/31/2013 | |
| | | 367 | | | | 2012 | | | | 10/31/2014 | |
Class I | | | 2 | | | | 2011 | | | | 10/31/2013 | |
| | | 42 | | | | 2012 | | | | 10/31/2014 | |
Class I2 | | | 1 | | | | 2011 | | | | 10/31/2013 | |
| | | 1 | | | | 2012 | | | | 10/31/2014 | |
| | | | | | | | | | | | |
Transamerica Small Cap Growth | | | | | | | | | | | | |
Core | | | 15 | | | | 2012 | | | | 10/31/2014 | |
Class A | | | — | (A) | | | 2012 | | | | 10/31/2014 | |
Class C | | | — | (A) | | | 2012 | | | | 10/31/2014 | |
Class I | | | — | (A) | | | 2012 | | | | 10/31/2014 | |
Class I2 | | | 2 | | | | 2012 | | | | 10/31/2014 | |
| | | | | | | | | | | | |
Transamerica Tactical Income | | | | | | | | | | | | |
Class A | | | 10 | | | | 2012 | | | | 10/31/2014 | |
Class C | | | 13 | | | | 2012 | | | | 10/31/2014 | |
Class I | | | 44 | | | | 2012 | | | | 10/31/2014 | |
| | | | | | | | | | | | |
| (A) | Rounds to less than $1. |
In addition to the advisory fee waiver for Transamerica Money Market, TAM or any of its affiliates waive fees or reimburse expenses of one or more classes of Transamerica Money Market in order to avoid a negative yield. At any point in which Transamerica Money Market, or any classes thereof, achieves a positive yield, the expenses previously waived or reimbursed within the succeeding 36 months pursuant to this paragraph may be reimbursed to TAM, to the extent that such reimbursement does not cause classes of Transamerica Money Market to experience a negative yield. Waived expenses related to the maintenance of the yield are included in the Statements of Operations, within the class expense (reimbursed). For the years ended October 31, 2012 and October 31, 2011, the amounts waived were as follows:
| | | | |
| Transamerica Funds | | | | Annual Report 2012 |
| | Page 166 | | |
NOTES TO FINANCIAL STATEMENTS (continued)
At October 31, 2012
(all amounts in thousands)
NOTE 3. (continued)
| | | | | | | | | | | | | | | | |
Fund/Class | | 2012 Amount Waived ($) | | | 2012 Amount Waived
(Basis Points) | | | 2011 Amount Waived ($) | | | 2011 Amount Waived
(Basis Points) | |
Fund | | $ | 577 | | | | 23 | | | $ | 610 | | | | 29 | |
A | | | 294 | | | | 29 | | | | 375 | | | | 33 | |
B | | | 115 | | | | 97 | | | | 157 | | | | 98 | |
C | | | 315 | | | | 97 | | | | 319 | | | | 98 | |
Distribution and service fees: The Funds have 12b-1 distribution plans under the 1940 Act pursuant to which an annual fee, based on ANA, is paid to the distributor for various disbursements such as broker-dealer account servicing fees and other promotional expenses of the Funds. Pursuant to the distribution plan, the Trust entered into a distribution agreement with TCI as the Funds’ distributor. The Funds are authorized under the 12b-1 plans to pay fees on each class up to the following limits: 0.30% for Class A (effective March 1, 2012), 1.00% for Class B, and 1.00% for Class C. 12b-1 fees are not applicable for Class I, Class I2, and Class T. Prior to March 1, 2012, Class A was authorized under the 12b-1 plan to pay a 0.35% fee. Effective March 1, 2012, TAM has contractually agreed to waive 0.05% of 12b-1 fees on Class A shares of Transamerica Flexible Income, Transamerica Short-Term Bond, and Transamerica Tactical Income through March 1, 2013. Prior to March 1, 2012, TAM had contractually agreed to waive 0.10% of 12b-1 fees on Class A shares of Transamerica Flexible Income, Transamerica Short-Term Bond, and Transamerica Tactical Income.
Underwriter commissions relate to front-end sales charges imposed for Class A shares and contingent deferred sales charges from Class B, Class C, and certain Class A share redemptions. For the year ended October 31, 2012, the underwriter commissions were as follows:
| | | | |
Transamerica Capital Growth | | | | |
Received by Underwriter | | $ | 461 | |
Retained by Underwriter | | | 68 | |
Contingent Deferred Sales Charge | | | 14 | |
Transamerica Diversified Equity | | | | |
Received by Underwriter | | $ | 222 | |
Retained by Underwriter | | | 33 | |
Contingent Deferred Sales Charge | | | 25 | |
Transamerica Emerging Markets Debt | | | | |
Received by Underwriter | | $ | 119 | |
Retained by Underwriter | | | 21 | |
Contingent Deferred Sales Charge | | | 1 | |
Transamerica Flexible Income | | | | |
Received by Underwriter | | $ | 270 | |
Retained by Underwriter | | | 50 | |
Contingent Deferred Sales Charge | | | 21 | |
Transamerica Growth Opportunities | | | | |
Received by Underwriter | | $ | 60 | |
Retained by Underwriter | | | 9 | |
Contingent Deferred Sales Charge | | | 7 | |
Transamerica High Yield Bond | | | | |
Received by Underwriter | | $ | 792 | |
Retained by Underwriter | | | 146 | |
Contingent Deferred Sales Charge | | | 25 | |
Transamerica International Bond | | | | |
Received by Underwriter | | $ | 1 | |
Retained by Underwriter | | | — | |
Contingent Deferred Sales Charge | | | — | |
Transamerica International Equity | | | | |
Received by Underwriter | | $ | 5 | |
Retained by Underwriter | | | — | |
Contingent Deferred Sales Charge | | | — | |
| | | | |
Transamerica Large Cap Growth | | | | |
Received by Underwriter | | $ | 5 | |
Retained by Underwriter | | | 1 | |
Contingent Deferred Sales Charge | | | — | |
Transamerica Large Cap Value | | | | |
Received by Underwriter | | $ | 6 | |
Retained by Underwriter | | | 1 | |
Contingent Deferred Sales Charge | | | — | |
Transamerica Money Market | | | | |
Received by Underwriter | | $ | — | |
Retained by Underwriter | | | — | |
Contingent Deferred Sales Charge | | | 52 | |
Transamerica Multi-Managed Balanced | | | | |
Received by Underwriter | | $ | 459 | |
Retained by Underwriter | | | 71 | |
Contingent Deferred Sales Charge | | | 13 | |
Transamerica Short-Term Bond | | | | |
Received by Underwriter | | $ | 772 | |
Retained by Underwriter | | | 156 | |
Contingent Deferred Sales Charge | | | 237 | |
Transamerica Small/Mid Cap Value | | | | |
Received by Underwriter | | $ | 422 | |
Retained by Underwriter | | | 64 | |
Contingent Deferred Sales Charge | | | 76 | |
Transamerica Tactical Income | | | | |
Received by Underwriter | | $ | 4,446 | |
Retained by Underwriter | | | 815 | |
Contingent Deferred Sales Charge | | | 28 | |
| | | | |
| Transamerica Funds | | | | Annual Report 2012 |
| | Page 167 | | |
NOTES TO FINANCIAL STATEMENTS (continued)
At October 31, 2012
(all amounts in thousands)
NOTE 3. (continued)
Administrative services: The Funds have entered into an agreement with TFS for financial and legal fund administration services. Effective March 1, 2012, the Funds pay TFS an annual fee of 0.025% of ANA. Prior to March 1, 2012, the Funds paid TFS an annual fee of 0.02% of ANA. The Legal fees on the Statement of Operations are for fees paid to external legal counsel.
Transfer agent fees: Pursuant to a Transfer Agency Agreement, as amended, the Funds pay TFS a fee for providing transfer agent services. Fees paid and the amounts due to TFS for the year ended October 31, 2012 are as follows:
| | | | | | | | |
Fund Name | | Fees Paid to TFS | | | Fees Due to TFS | |
Transamerica Capital Growth | | $ | 417 | | | $ | 37 | |
Transamerica Diversified Equity | | | 1,829 | | | | 180 | |
Transamerica Emerging Markets Debt | | | 67 | | | | 12 | |
Transamerica Emerging Markets Equity | | | 3 | | | | 1 | |
Transamerica Flexible Income | | | 194 | | | | 17 | |
Transamerica Growth Opportunities | | | 645 | | | | 50 | |
Transamerica High Yield Bond | | | 370 | | | | 34 | |
Transamerica International Bond | | | 20 | | | | 1 | |
Transamerica International Equity | | | 94 | | | | 10 | |
Transamerica Large Cap Growth | | | 5 | | | | 1 | |
Transamerica Large Cap Value | | | 121 | | | | 10 | |
Transamerica Money Market | | | 478 | | | | 40 | |
Transamerica Multi-Managed Balanced | | | 643 | | | | 49 | |
Transamerica Short-Term Bond | | | 1,408 | | | | 119 | |
Transamerica Small Cap Growth | | | 2 | | | | 1 | |
Transamerica Small Cap Value | | | 9 | | | | 2 | |
Transamerica Small/Mid Cap Value | | | 1,245 | | | | 101 | |
Transamerica Tactical Income | | | 222 | | | | 43 | |
Deferred compensation plan: Under a non-qualified deferred compensation plan effective January 1, 1996, as amended and restated January 1, 2010 (the “Deferred Compensation Plan”), available to the Trustees, compensation may be deferred that would otherwise be payable by the Trust to an Independent Trustee on a current basis for services rendered as Trustee. Deferred compensation amounts will accumulate based on the value of Class A (or comparable) shares of a series of Transamerica Funds (without imposition of a sales charge), or investment options under Transamerica Partners Institutional Funds and Transamerica Institutional Asset Allocation Funds, as elected by the Trustee.
Brokerage commissions: There were no brokerage commissions incurred on security transactions placed with affiliates of the adviser or sub-advisers for the year ended October 31, 2012.
NOTE 4. INVESTMENT TRANSACTIONS
The cost of securities purchased and proceeds from securities sold (excluding short-term securities) for the year ended October 31, 2012 were as follows:
| | | | | | | | | | | | | | | | |
| | | Purchases of securities: | | | Proceeds from maturities and sales of
securities: | |
Fund Name | | Long-term | | | U.S. Government | | | Long-term | | | U.S. Government | |
Transamerica Capital Growth | | $ | 472,547 | | | $ | — | | | $ | 355,914 | | | $ | — | |
Transamerica Diversified Equity | | | 1,602,353 | | | | — | | | | 996,840 | | | | — | |
Transamerica Emerging Markets Debt | | | 1,096,112 | | | | 501 | | | | 638,718 | | | | 501 | |
Transamerica Emerging Markets Equity | | | 163,934 | | | | — | | | | 54,873 | | | | — | |
Transamerica Flexible Income | | | 91,807 | | | | 58,649 | | | | 85,308 | | | | 10,158 | |
Transamerica Growth Opportunities | | | 206,692 | | | | — | | | | 199,860 | | | | — | |
Transamerica High Yield Bond | | | 505,427 | | | | — | | | | 594,904 | | | | — | |
Transamerica International Bond | | | 120,721 | | | | — | | | | 381,550 | | | | — | |
Transamerica International Equity | | | 176,804 | | | | — | | | | 57,788 | | | | — | |
Transamerica Large Cap Growth | | | 172,191 | | | | — | | | | 33,104 | | | | — | |
Transamerica Large Cap Value | | | 1,629,122 | | | | — | | | | 1,826,129 | | | | — | |
Transamerica Money Market | | | — | | | | — | | | | — | | | | — | |
Transamerica Multi-Managed Balanced | | | 296,038 | | | | 306,901 | | | | 300,555 | | | | 256,296 | |
Transamerica Short-Term Bond | | | 2,475,595 | | | | — | | | | 1,823,509 | | | | — | |
Transamerica Small Cap Growth | | | 253,656 | | | | — | | | | 22,060 | | | | — | |
Transamerica Small Cap Value | | | 332,160 | | | | — | | | | 55,225 | | | | — | |
Transamerica Small/Mid Cap Value | | | 472,663 | | | | — | | | | 471,675 | | | | — | |
Transamerica Tactical Income | | | 1,158,838 | | | | — | | | | 407,217 | | | | — | |
| | | | |
| Transamerica Funds | | | | Annual Report 2012 |
| | Page 168 | | |
NOTES TO FINANCIAL STATEMENTS (continued)
At October 31, 2012
(all amounts in thousands)
NOTE 5. DERIVATIVE FINANCIAL INSTRUMENTS
Transamerica Emerging Markets Debt:
The Fund is subject to various risks in the normal course of pursuing its investment objective. The volume of forward foreign currency contracts held throughout the year decreased, starting with 21 contracts and decreasing to 17 contracts by year end. The tables below highlight the types of risks and the derivative instruments used to mitigate the risks:
Fair Values of Derivative Instruments in the Statement of Assets and Liabilities as of October 31, 2012:
Derivatives not accounted for as hedging instruments
| | | | |
Location | | Foreign
exchange
contracts | |
Asset derivatives | | | | |
Unrealized appreciation on forward foreign currency contracts | | $ | 593 | |
Liability derivatives | | | | |
Unrealized depreciation on forward foreign currency contracts | | | (192 | ) |
| | | | |
Total | | $ | 401 | |
| | | | |
Effect of Derivative Instruments in the Statement of Operations for the year ended October 31, 2012:
Derivatives not accounted for as hedging instruments
| | | | |
Location | | Foreign
exchange
contracts | |
Net Realized Gain (Loss) on derivatives recognized in income | | | | |
Net realized gain (loss) on forward foreign currency contracts ~ | | $ | 724 | |
Net change in Unrealized Appreciation (Depreciation) on derivatives recognized in income | | | | |
Net change in unrealized appreciation (depreciation) on forward foreign currency transactions | | | 410 | |
| | | | |
Total | | $ | 1,134 | |
| | | | |
| ~ | Included within net realized gain (loss) on transactions from foreign currency transactions. |
| Included within net increase (decrease) in unrealized appreciation (depreciation) on translation of the assets and liabilities denominated in foreign currencies. |
For non-exchange traded derivatives (forward foreign currency contracts), under standard derivatives agreements, the Fund may be required to post collateral on derivatives if the Fund is in a net liability position with the counterparty exceeding certain amounts. Additionally, counterparties may immediately terminate derivatives contracts if the Fund fails to maintain sufficient asset coverage for its contracts or its net assets decline by stated percentages.
Transamerica International Bond:
The Fund is subject to various risks in the normal course of pursuing its investment objective. The volume of futures contracts held increased during the year, starting at 6 contracts and ending at 7 contracts. The volume of forward foreign currency contracts held averaged 92 throughout the year, with an overall decrease from 76 contracts at the beginning of the year to 38 contracts at the end of the year. The tables below highlight the types of risks and the derivative instruments used to mitigate the risks:
Fair Values of Derivative Instruments in the Statement of Assets and Liabilities as of October 31, 2012:
Derivatives not accounted for as hedging instruments
| | | | | | | | | | | | |
Location | | Interest rate
contracts | | | Foreign
exchange
contracts | | | Total | |
Asset derivatives | | | | | | | | | | | | |
Unrealized appreciation on futures contracts * | | $ | 200 | | | $ | — | | | $ | 200 | |
Unrealized appreciation on forward foreign currency contracts | | | — | | | | 237 | | | | 237 | |
Liability derivatives | | | | | | | | | | | | |
Unrealized depreciation on futures contracts * | | | (131 | ) | | | — | | | | (131 | ) |
Unrealized depreciation on forward foreign currency contracts | | | — | | | | (1,609 | ) | | | (1,609 | ) |
| | | | | | | | | | | | |
Total | | $ | 69 | | | $ | (1,372 | ) | | $ | (1,303 | ) |
| | | | | | | | | | | | |
| * | Includes cumulative appreciation/depreciation of futures contracts as reported in the Schedule of Investments. Only current day's variation margin is reported within the Statement of Assets and Liabilities. |
| | | | |
| Transamerica Funds | | | | Annual Report 2012 |
| | Page 169 | | |
NOTES TO FINANCIAL STATEMENTS (continued)
At October 31, 2012
(all amounts in thousands)
NOTE 5. (continued)
Transamerica International Bond (continued):
Effect of Derivative Instruments in the Statement of Operations for the year ended October 31, 2012:
Derivatives not accounted for as hedging instruments
| | | | | | | | | | | | |
Location | | Interest rate
contracts | | | Foreign
exchange
contracts | | | Total | |
Net Realized Gain (Loss) on derivatives recognized in income | | | | | | | | | | | | |
Net realized gain (loss) on futures contracts | | $ | (547 | ) | | $ | — | | | $ | (547 | ) |
Net realized gain (loss) on forward foreign currency contracts ~ | | | — | | | | 1,287 | | | | 1,287 | |
Net change in Unrealized Appreciation (Depreciation) on derivatives recognized in income | | | | | | | | | | | | |
Net change in unrealized appreciation (depreciation) on forward foreign currency transactions | | | — | | | | 2,734 | | | | 2,734 | |
| | | | | | | | | | | | |
Total | | $ | (547 | ) | | $ | 4,021 | | | $ | 3,474 | |
| | | | | | | | | | | | |
| ~ | Included within net realized gain (loss) on transactions from foreign currency transactions. |
| Included within net increase (decrease) in unrealized appreciation (depreciation) on translation of the assets and liabilities denominated in foreign currencies. |
For non-exchange traded derivatives (forward foreign currency contracts), under standard derivatives agreements, the Fund may be required to post collateral on derivatives if the Fund is in a net liability position with the counterparty exceeding certain amounts. Additionally, counterparties may immediately terminate derivatives contracts if the Fund fails to maintain sufficient asset coverage for its contracts or its net assets decline by stated percentages.
Transamerica Multi-Managed Balanced:
The Fund is subject to various risks in the normal course of pursuing its investment objective. The volume of futures and forward foreign currency contracts held throughout the year increased, starting with 8 and zero contracts, respectively, and ending at 9 and 2 contracts, respectively. The volume of written options/swaptions and purchase options held decreased during the year, starting at 2 and 5 contracts, respectively, and both ending at zero contracts at the end of the year. The tables below highlight the types of risks and the derivative instruments used to mitigate the risks:
Fair Values of Derivative Instruments in the Statement of Assets and Liabilities as of October 31, 2012:
Derivatives not accounted for as hedging instruments
| | | | | | | | | | | | | | | | |
Location | | Interest rate
contracts | | | Foreign
exchange
contracts | | | Equity
contracts | | | Total | |
Asset derivatives | | | | | | | | | | | | | | | | |
Unrealized appreciation on futures contracts * | | $ | 47 | | | $ | — | | | $ | — | | | $ | 47 | |
Unrealized appreciation on forward foreign currency contracts | | | — | | | | 66 | | | | — | | | | 66 | |
Liability derivatives | | | | | | | | | | | | | | | | |
Unrealized depreciation on futures contracts * | | | (36 | ) | | | — | | | | (122 | ) | | | (158 | ) |
| | | | | | | | | | | | | | | | |
Total | | $ | 11 | | | $ | 66 | | | $ | (122 | ) | | $ | (45 | ) |
| | | | | | | | | | | | | | | | |
| * | Includes cumulative appreciation/depreciation of futures contracts as reported in the Schedule of Investments. Only current day's variation margin is reported within the Statement of Assets and Liabilities. |
| | | | |
| Transamerica Funds | | | | Annual Report 2012 |
| | Page 170 | | |
NOTES TO FINANCIAL STATEMENTS (continued)
At October 31, 2012
(all amounts in thousands)
NOTE 5. (continued)
Transamerica Multi-Managed Balanced (continued):
Effect of Derivative Instruments in the Statement of Operations for the year ended October 31, 2012:
Derivatives not accounted for as hedging instruments
| | | | | | | | | | | | | | | | |
Location | | Interest
rate
contracts | | | Foreign
exchange
contracts | | | Equity
contracts | | | Total | |
Net Realized Gain (Loss) on derivatives recognized in income | | | | | | | | | | | | | | | | |
Net realized gain (loss) on purchased options and swaptions ^ | | $ | (98 | ) | | $ | — | | | $ | — | | | $ | (98 | ) |
Net realized gain (loss) on written options and swaptions | | | 55 | | | | — | | | | — | | | | 55 | |
Net realized gain (loss) on futures contracts | | | 97 | | | | — | | | | 635 | | | | 732 | |
Net realized gain (loss) on forward foreign currency contracts ~ | | | — | | | | (86 | ) | | | — | | | | (86 | ) |
Net change in Unrealized Appreciation (Depreciation) on derivatives recognized in income | | | | | | | | | | | | | | | | |
Net change in unrealized appreciation (depreciation) on purchased options and swaptions | | | 71 | | | | — | | | | — | | | | 71 | |
Net change in unrealized appreciation (depreciation) on written options and swaptions | | | (31 | ) | | | — | | | | — | | | | (31 | ) |
Net change in unrealized appreciation (depreciation) on futures contracts | | | (71 | ) | | | — | | | | (166 | ) | | | (237 | ) |
Net change in unrealized appreciation (depreciation) on forward foreign currency transactions | | | — | | | | 66 | | | | — | | | | 66 | |
| | | | | | | | | | | | | | | | |
Total | | $ | 23 | | | $ | (20 | ) | | $ | 469 | | | $ | 472 | |
| | | | | | | | | | | | | | | | |
| ^ | Included within net realized gain (loss) on transactions from Investment securities. |
| ~ | Included within net realized gain (loss) on transactions from foreign currency transactions. |
| Included within net increase (decrease) in unrealized appreciation (depreciation) on Investment securities. |
| Included within net increase (decrease) in unrealized appreciation (depreciation) on translation of the assets and liabilities denominated in foreign currencies. |
For non-exchange traded derivatives (swaps and forward foreign currency contracts), under standard derivatives agreements, the Fund may be required to post collateral on derivatives if the Fund is in a net liability position with the counterparty exceeding certain amounts. Additionally, counterparties may immediately terminate derivatives contracts if the Fund fails to maintain sufficient asset coverage for its contracts or its net assets decline by stated percentages.
NOTE 6. FEDERAL INCOME TAX MATTERS
The Funds have not made any provision for federal income or excise taxes due to its policy to distribute all of their taxable income and capital gains to their shareholders and otherwise qualify as a regulated investment company under Subchapter M of the Internal Revenue Code. The Funds recognize the tax benefits of uncertain tax positions only where the position is “more likely than not” to be sustained assuming examination by tax authorities. Management has evaluated the Funds’ tax provisions taken or expected to be taken for all open tax years 2009-2012, and has concluded that no provision for income tax is required in the Funds’ financial statements. If applicable, the Funds recognize interest accrued related to unrecognized tax benefits in interest and penalties expense in Other on the Statement of Operations. The Funds identify their major tax jurisdictions as U.S. Federal, the state of Florida, and foreign jurisdictions where the Funds make significant investments; however, the Funds are not aware of any tax positions for which it is reasonably possible that the total amounts of unrecognized tax benefits will change materially in the next twelve months. Income and capital gain distributions are determined in accordance with income tax regulations, which may differ from GAAP. These differences are primarily due to differing treatment for items including, but not limited to, wash sales, structured notes, foreign bonds, net operating losses, distribution reclasses for REITs, passive foreign investment companies, foreign currency transactions, and capital loss carryforwards.
Therefore, distributions determined in accordance with tax regulations may differ significantly in amount or character from net investment income and realized gains for financial reporting purposes. Financial reporting records are adjusted for permanent book/tax differences to reflect tax character. These reclassifications have no impact on net assets or results of operations. Financial records are not adjusted for temporary differences. These reclassifications are as follows:
| | | | |
| Transamerica Funds | | | | Annual Report 2012 |
| | Page 171 | | |
NOTES TO FINANCIAL STATEMENTS (continued)
At October 31, 2012
(all amounts in thousands)
NOTE 6. (continued)
| | | | | | | | | | | | |
Fund Name | | Shares of beneficial
interest, unlimited shares
authorized | | | Undistributed
(accumulated) net
investment income (loss) | | | Undistributed
(accumulated) net realized
gain (loss) from
investment securities | |
Transamerica Capital Growth | | $ | — | | | $ | (84 | ) | | $ | 84 | |
Transamerica Diversified Equity | | | 422,819 | | | | 773 | | | | (423,592 | ) |
Transamerica Emerging Markets Debt | | | — | | | | 304 | | | | (304 | ) |
Transamerica Emerging Markets Equity | | | (26 | ) | | | (21 | ) | | | 47 | |
Transamerica Flexible Income | | | — | | | | 280 | | | | (280 | ) |
Transamerica Growth Opportunities | | | 695 | | | | (237 | ) | | | (458 | ) |
Transamerica High Yield Bond | | | — | | | | 47 | | | | (47 | ) |
Transamerica International Bond | | | — | | | | (1,251 | ) | | | 1,251 | |
Transamerica International Equity | | | — | | | | (177 | ) | | | 177 | |
Transamerica Large Cap Growth | | | (26 | ) | | | 25 | | | | 1 | |
Transamerica Multi-Managed Balanced | | | — | | | | 369 | | | | (369 | ) |
Transamerica Short-Term Bond | | | — | | | | 4,593 | | | | (4,593 | ) |
Transamerica Small Cap Growth | | | (54 | ) | | | 54 | | | | — | |
Transamerica Small Cap Value | | | (26 | ) | | | 26 | | | | — | |
Transamerica Small/Mid Cap Value | | | — | (A) | | | — | (A) | | | — | (A) |
Transamerica Tactical Income | | | (17 | ) | | | 4,698 | | | | (4,681 | ) |
| (A) | Amount rounds to less than $1. |
At October 31, 2012, the Funds had capital loss carryforwards available to offset future realized gains through the years listed below:
| | | | | | |
Fund Name | | Capital Loss Carryforwards | | | AvailableThrough |
Transamerica Diversified Equity | | $ | 390,073 | | | October 31, 2016 |
Transamerica Diversified Equity | | | 6,050 | | | October 31, 2017 |
Transamerica Emerging Markets Equity | | | 4,788 | | | Short-Term Indefinitely |
Transamerica Flexible Income | | | 7,723 | | | October 31, 2015 |
Transamerica Flexible Income | | | 51,526 | | | October 31, 2016 |
Transamerica Flexible Income | | | 20,524 | | | October 31, 2017 |
Transamerica High Yield Bond | | | 1,750 | | | October 31, 2017 |
Transamerica International Equity | | | 708 | | | October 31, 2017 |
Transamerica Large Cap Growth | | | 1,532 | | | Short-Term Indefinitely |
Transamerica Money Market | | | 1 | | | October 31, 2013 |
Transamerica Money Market | | | 1 | | | October 31, 2014 |
Transamerica Money Market | | | — | (A) | | October 31, 2015 |
Transamerica Money Market | | | — | (A) | | October 31, 2017 |
Transamerica Multi-Managed Balanced | | | 2,021 | | | October 31, 2017 |
Transamerica Small Cap Growth | | | 971 | | | Short-Term Indefinitely |
Transamerica Small/Mid Cap Value | | | 12,179 | | | Short-Term Indefinitely |
| (A) | Amount rounds to less than $1. |
The capital loss carryforwards utilized or expired during the year ended October 31, 2012 were as follows:
| | | | |
Fund Name | | Capital Loss Carryforwards
Utilized/Expired During the
Year Ended October 31,2012 | |
Transamerica Diversified Equity | | $ | 33,714 | |
Transamerica Emerging Markets Debt | | | 65 | |
Transamerica Flexible Income | | | 1,697 | |
Transamerica High Yield Bond | | | 22,749 | |
Transamerica International Equity | | | 1,178 | |
Transamerica Large Cap Value | | | 14,538 | |
Transamerica Multi-Managed Balanced | | | 3,354 | |
Funds not listed in the table above do not have capital loss carryforwards utilized or expired.
| | | | |
| Transamerica Funds | | | | Annual Report 2012 |
| | Page 172 | | |
NOTES TO FINANCIAL STATEMENTS (continued)
At October 31, 2012
(all amounts in thousands)
NOTE 6. (continued)
The tax character of distributions paid may differ from the character of distributions shown in the Statements of Changes in Net Assets due to short-term gains being treated as ordinary income for tax purposes. The tax character of distributions paid during 2012 and 2011 was as follows:
| | | | | | | | | | | | | | | | |
| | | 2012 Distributions Paid From | | | 2011 Distributions Paid From | |
| | | Ordinary
income | | | Long-term
Capital Gain | | | Ordinary
income | | | Long-term
Capital Gain | |
Transamerica Capital Growth | | $ | 782 | | | $ | 23,888 | | | $ | — | | | $ | — | |
Transamerica Diversified Equity | | | 357 | | | | 73,049 | | | | 11,530 | | | | 598 | |
Transamerica Emerging Markets Debt | | | 9,375 | | | | — | | | | 42 | | | | — | |
Transamerica Flexible Income | | | 14,122 | | | | — | | | | 14,368 | | | | — | |
Transamerica Growth Opportunities | | | 271 | | | | 70,327 | | | | — | | | | 696 | |
Transamerica High Yield Bond | | | 47,066 | | | | — | | | | 50,034 | | | | — | |
Transamerica International Bond | | | 29,846 | | | | 4,147 | | | | 32,484 | | | | 2,936 | |
Transamerica International Equity | | | 3,277 | | | | — | | | | 1,049 | | | | — | |
Transamerica Large Cap Value | | | 30,168 | | | | — | | | | 16,307 | | | | — | |
Transamerica Money Market | | | 34 | | | | — | | | | 14 | | | | — | |
Transamerica Multi-Managed Balanced | | | 8,189 | | | | 41,482 | | | | 4,520 | | | | — | |
Transamerica Short-Term Bond | | | 102,413 | | | | 15,858 | | | | 101,888 | | | | 6,442 | |
Transamerica Small/Mid Cap Value | | | — | | | | 34,566 | | | | — | | | | — | |
Transamerica Tactical Income | | | 12,891 | | | | 44 | | | | — | | | | — | |
The tax basis components of distributable earnings as of October 31, 2012 are as follows:
| | | | | | | | | | | | | | | | | | | | |
Fund Name | | Undistributed
Ordinary income | | | Undistributed
Long-term
Capital Gain | | | Capital Loss
Carryforward | | | Other
Temporary
Differences (A) | | | Net Unrealized
Appreciation
(Depreciation) (B) | |
Transamerica Capital Growth | | $ | 3,753 | | | $ | 22,131 | | | $ | — | | | $ | — | | | $ | 18,166 | |
Transamerica Diversified Equity | | | 6,532 | | | | — | | | | (396,123 | ) | | | — | | | | 224,566 | |
Transamerica Emerging Markets Debt | | | 18,830 | | | | 536 | | | | — | | | | (354 | ) | | | 13,080 | |
Transamerica Emerging Markets Equity | | | 744 | | | | — | | | | (4,788 | ) | | | (27 | ) | | | 1,518 | |
Transamerica Flexible Income | | | 816 | | | | — | | | | (79,773 | ) | | | — | | | | 21,683 | |
Transamerica Growth Opportunities | | | 3,288 | | | | 5,476 | | | | — | | | | — | | | | 2,957 | |
Transamerica High Yield Bond | | | 1,109 | | | | — | | | | (1,750 | ) | | | (96 | ) | | | 20,511 | |
Transamerica International Bond | | | — | | | | 1,449 | | | | — | | | | (5,379 | ) | | | 5,134 | |
Transamerica International Equity | | | 5,003 | | | | — | | | | (708 | ) | | | — | | | | 9,096 | |
Transamerica Large Cap Growth | | | 781 | | | | — | | | | (1,532 | ) | | | (31 | ) | | | (977 | ) |
Transamerica Large Cap Value | | | 16,630 | | | | 58,400 | | | | — | | | | — | | | | 77,597 | |
Transamerica Money Market | | | 2 | | | | — | | | | (2 | ) | | | — | | | | — | |
Transamerica Multi-Managed Balanced | | | 6,753 | | | | 6,562 | | | | (2,021 | ) | | | (68 | ) | | | 29,259 | |
Transamerica Short-Term Bond | | | 5,013 | | | | 12,043 | | | | — | | | | (1,273 | ) | | | 72,152 | |
Transamerica Small Cap Growth | | | — | | | | — | | | | (971 | ) | | | (182 | ) | | | (10,144 | ) |
Transamerica Small Cap Value | | | 1,760 | | | | 10 | | | | — | | | | (38 | ) | | | 1,817 | |
Transamerica Small/Mid Cap Value | | | 2,352 | | | | — | | | | (12,179 | ) | | | — | | | | 41,266 | |
Transamerica Tactical Income | | | 6,581 | | | | — | | | | — | | | | (31 | ) | | | (1,249 | ) |
| (A) | Amounts include qualified ordinary late-year loss deferral, if applicable. |
| (B) | Amounts include unrealized gain/loss from wash sales, foreign currency, securities sold short, and derivative instruments, if applicable. |
NOTE 7. ACCOUNTING PRONOUNCEMENTS
In December 2011, the Financial Accounting Standards Board issued the authoritative guidance that will enhance disclosures related to financial instruments and derivative instruments that are either offset in the statement of assets and liabilities or subject to an enforceable master netting arrangement or similar agreement. This information will enable users of the Funds’ financial statements to evaluate the effect or potential effect of netting arrangements on the Funds’ financial position. The adoption of this disclosure requirement is effective for financial statements interim and annual years beginning on or after January 1, 2013. Management is currently evaluating the implication of the additional disclosure requirements and its impact on the Funds' financial statements.
| | | | |
| Transamerica Funds | | | | Annual Report 2012 |
| | Page 173 | | |
NOTES TO FINANCIAL STATEMENTS (continued)
At October 31, 2012
(all amounts in thousands)
NOTE 8. REORGANIZATION
Transamerica Diversified Equity:
On February 10, 2012, Transamerica Diversified Equity (formerly, Transamerica WMC Diversified Equity) acquired all of the net assets of Transamerica WMC Diversified Growth pursuant to a Plan of Reorganization. Transamerica Diversified Equity is the accounting survivor. The purpose of the transaction was to achieve a more cohesive, focused, and streamlined fund complex. The acquisition was accomplished by a tax-free exchange of 76,146 shares of Transamerica Diversified Equity for 100,301 shares of Transamerica WMC Diversified Growth outstanding on February 10, 2012. Transamerica WMC Diversified Growth’s net assets at that date, $1,077,266, including $208,961 unrealized appreciation, were combined with those of Transamerica Diversified Equity. The aggregate net assets of Transamerica Diversified Equity immediately before the acquisition were $592,948; the combined net assets of Transamerica Diversified Equity immediately after the acquisition were $1,670,214. Shares issued with the acquisition were as follows:
Transamerica WMC Diversified Growth
| | | | | | | | |
| Class | | Shares | | | Amount | |
A | | | 28,762 | | | $ | 387,425 | |
B | | | 1,572 | | | | 21,028 | |
C | | | 2,536 | | | | 33,859 | |
I | | | 12,839 | | | | 174,606 | |
I2 | | | 27,327 | | | | 371,097 | |
T | | | 3,110 | | | | 89,251 | |
The exchange ratios of the reorganization for the Fund is as follows (Transamerica Diversified Equity shares issuable/Transamerica WMC Diversified Growth):
Transamerica WMC Diversified Growth
| | | | |
| Classes | | Exchange Ratio | |
A | | | 0.75 | |
B | | | 0.69 | |
C | | | 0.70 | |
I | | | 0.74 | |
I2 | | | 0.77 | |
T | | | 1.00 | |
Assuming the reorganization had been completed on November 1, 2011, the beginning of the annual reporting year of the Fund, the Fund’s pro forma result of operations for the year ended October 31, 2012 are as follows:
| | | | |
Net investment income | | $ | 6,820 | |
Net realized and unrealized gain | | | 111,077 | |
Net increase in net assets resulting from operations | | | 117,897 | |
Because the combined investment portfolios have been managed as a single integrated portfolio since the acquisition was completed, it is not practical to separate the amounts of revenue and earnings of Transamerica WMC Diversified Growth that have been included on the Fund’s Statement of Operations since February 10, 2012.
Transamerica Growth Opportunities:
On February 10, 2012, Transamerica Growth Opportunities (formerly, Transamerica Morgan Stanley Growth Opportunities) acquired all of the net assets of Transamerica Morgan Stanley Mid-Cap Growth pursuant to a Plan of Reorganization. Transamerica Growth Opportunities is the accounting survivor. The purpose of the transaction was to achieve a more cohesive, focused, and streamlined fund complex. The acquisition was accomplished by a tax-free exchange of 29,633 shares of Transamerica Growth Opportunities for 24,617 shares of Transamerica Morgan Stanley Mid-Cap Growth outstanding on February 10, 2012. Transamerica Morgan Stanley Mid-Cap Growth’s net assets at that date, $274,998, including $54,483 unrealized appreciation, were combined with those of Transamerica Growth Opportunities. The aggregate net assets of Transamerica Growth Opportunities immediately before the acquisition were $348,798; the combined net assets of Transamerica Growth Opportunities immediately after the acquisition were $623,796. Shares issued with the acquisition were as follows:
| | | | |
| Transamerica Funds | | | | Annual Report 2012 |
| | Page 174 | | |
NOTES TO FINANCIAL STATEMENTS (continued)
At October 31, 2012
(all amounts in thousands)
NOTE 8. (continued)
Transamerica Morgan Stanley Mid-Cap Growth
| | | | | | | | |
| Class | | Shares | | | Amount | |
I2 | | | 29,633 | | | $ | 274,998 | |
The exchange ratio of the reorganization for the Fund is as follows (Transamerica Growth Opportunities shares issuable/ Transamerica Morgan Stanley Mid-Cap Growth):
Transamerica Morgan Stanley Mid-Cap Growth
| | | | |
| Class | | Exchange Ratio | |
I2 | | | 1.20 | |
Assuming the reorganization had been completed on November 1, 2011, the beginning of the annual reporting year of the Fund, the Fund’s pro forma results of operations for the year ended October 31, 2012 are as follows:
| | | | |
Net investment income | | $ | 4,124 | |
Net realized and unrealized (loss) | | | (27,328 | ) |
Net (decrease) in net assets resulting from operations | | | (23,204 | ) |
Because the combined investment portfolios have been managed as a single integrated portfolio since the acquisition was completed, it is not practical to separate the amounts of revenue and earnings of Transamerica Morgan Stanley Mid-Cap Growth that have been included in the Fund’s Statement of Operations since February 10, 2012.
Transamerica International Equity:
On March 1, 2011, Transamerica International Equity (formerly, Transamerica TS&W International Equity) acquired all of the net assets of TS&W International Equity Portfolio pursuant to a Plan of Reorganization. TS&W International Equity Portfolio is the accounting survivor. The purpose of the transaction was to achieve additional international exposure with a new client base within the Trust. The acquisition was accomplished by a tax-free exchange of 5,502 shares of Transamerica International Equity for 5,502 shares of TS&W International Equity Portfolio outstanding on March 1, 2011. Transamerica International Equity’s net assets at that date were $200, which were combined with those of TS&W International Equity Portfolio. The aggregate net assets of TS&W International Equity Portfolio were $83,612; the combined net assets of Transamerica International Equity immediately after the acquisition were $83,812.
Shares issued with the acquisition were as follows:
| | | | | | | | |
| TS&W International Equity Portfolio | | | | | | |
| | |
| Class | | Shares | | | Amount | |
I | | | 5,512 | | | $ | 83,612 | |
| | | | | | | | |
| Transamerica International Equity | | | | | | |
| | |
| Class | | Shares | | | Amount | |
A | | | 7 | | | $ | 100 | |
C | | | 7 | | | | 100 | |
I | | | (a | ) | | | (a | ) |
I2 | | | (a | ) | | | (a | ) |
| (a) | Classes I and I2 held less 1 share and $1 at time of acquisition. |
The exchange ratios of the reorganization for each class are as follows (Transamerica International Equity shares issuable/TS&W International Equity Portfolio):
| | | | |
| TS&W International Equity Portfolio | | | |
| |
| Class | | Exchange Ratio | |
I | | | 1.00 | |
| | | | |
| Transamerica International Equity | | | |
| |
| Class | | Exchange Ratio | |
A | | | 1.00 | |
C | | | 1.00 | |
I | | | 1.00 | |
I2 | | | 1.00 | |
| | | | |
| Transamerica Funds | | | | Annual Report 2012 |
| | Page 175 | | |
NOTES TO FINANCIAL STATEMENTS (continued)
At October 31, 2012
(all amounts in thousands)
NOTE 9. SUBSEQUENT EVENTS
Management has evaluated subsequent events through the date of issuance of the financial statements, and determined that no other material events or transactions would require recognition or disclosure in the Funds’ financial statements.
| | | | |
| Transamerica Funds | | | | Annual Report 2012 |
| | Page 176 | | |
Report of Independent Registered Public Accounting Firm
To the Board of Trustees & Shareholders of Transamerica Funds:
We have audited the accompanying statements of assets and liabilities of Transamerica Capital Growth (formerly “Transamerica Morgan Stanley Capital Growth”), Transamerica Diversified Equity (formerly “Transamerica WMC Diversified Equity”), Transamerica Emerging Markets Debt (formerly “Transamerica Logan Circle Emerging Markets Debt”), Transamerica Emerging Markets Equity, Transamerica Flexible Income (formerly “Transamerica AEGON Flexible Income”), Transamerica Growth Opportunities (formerly “Transamerica Morgan Stanley Growth Opportunities”), Transamerica High Yield Bond (formerly “Transamerica AEGON High Yield Bond”), Transamerica International Bond (formerly “Transamerica JPMorgan International Bond”), Transamerica International Equity (formerly “Transamerica TS&W International Equity”), Transamerica Large Cap Growth, Transamerica Large Cap Value (formerly “Transamerica WMC Quality Value”), Transamerica Money Market (formerly “Transamerica AEGON Money Market”), Transamerica Multi-Managed Balanced, Transamerica Short-Term Bond (formerly “Transamerica AEGON Short-Term Bond”), Transamerica Small Cap Growth, Transamerica Small Cap Value, Transamerica Small/Mid Cap Value (formerly “Transamerica Systematic Small/Mid Cap Value”), and Transamerica Tactical Income, (collectively, the “Funds”) (eighteen of the funds of the Transamerica Funds), including the schedules of investments, as of October 31, 2012, and the related statements of operations and changes in net assets and the financial highlights for each of the periods indicated therein. These financial statements and financial highlights are the responsibility of the Funds’ management. Our responsibility is to express an opinion on these financial statements and financial highlights based on our audits. The financial highlights of Transamerica International Equity for the periods ended prior to November 1, 2010, as well as the financial highlights of all other Funds for the periods ended prior to November 1, 2009, were audited by another independent registered public accounting firm, whose reports dated December 17, 2010 and December 21, 2009, respectively, expressed unqualified opinions on those financial highlights.
We conducted our audits in accordance with the standards of the Public Company Accounting Oversight Board (United States). Those standards require that we plan and perform the audits to obtain reasonable assurance about whether the financial statements and financial highlights are free of material misstatement. We were not engaged to perform an audit of the Funds’ internal control over financial reporting. Our audits included consideration of internal control over financial reporting as a basis for designing audit procedures that are appropriate in the circumstances, but not for the purpose of expressing an opinion on the effectiveness of the Funds’ internal control over financial reporting. Accordingly, we express no such opinion. An audit also includes examining, on a test basis, evidence supporting the amounts and disclosures in the financial statements and financial highlights, assessing the accounting principles used and significant estimates made by management, and evaluating the overall financial statement presentation. Our procedures included confirmation of securities owned as of October 31, 2012, by correspondence with the custodian and others or by other appropriate auditing procedures where replies from others were not received. We believe that our audits provide a reasonable basis for our opinion.
In our opinion, the financial statements and financial highlights referred to above present fairly, in all material respects, the financial position of the aforementioned eighteen Funds of the Transamerica Funds at October 31, 2012, the results of their operations, the changes in their net assets and the financial highlights for each of the periods indicated therein, in conformity with U.S. generally accepted accounting principles.
|
 |
|
Boston, Massachusetts December 26, 2012 |
| | | | |
| Transamerica Funds | | | | Annual Report 2012 |
| | Page 177 | | |
TRANSAMERICA FUNDS
INVESTMENT ADVISORY AND SUB-ADVISORY AGREEMENTS—CONTRACT RENEWAL
(unaudited)
At a meeting of the Board of Trustees of Transamerica Funds (the “Board”) held on June 13-14, 2012, the Board reviewed and considered the renewal of the investment advisory agreements (each an “Investment Advisory Agreement” and collectively the “Investment Advisory Agreements”) between each of the following funds (each a “Fund” and collectively the “Funds”) and Transamerica Asset Management, Inc. (“TAM”):
| | |
| Transamerica Capital Growth | | Transamerica International Equity |
| Transamerica Diversified Equity | | Transamerica Large Cap Value (then named Transamerica Quality Value) |
| Transamerica Flexible Income | | Transamerica Money Market |
| Transamerica Growth Opportunities | | Transamerica Multi-Managed Balanced |
| Transamerica High Yield Bond | | Transamerica Short-Term Bond |
| Transamerica International Bond | | Transamerica Small/Mid Cap Value |
For the Funds listed in the left-hand column below, the Board also reviewed and considered the renewal of the investment sub-advisory agreements (each a “Sub-Advisory Agreement” and collectively the “Sub-Advisory Agreements”) between TAM and the corresponding sub-advisers listed in the right-hand column below (each a “Sub-Adviser” and collectively the “Sub-Advisers”).
| | |
Fund | | Sub-Adviser(s) |
| Transamerica Capital Growth | | Morgan Stanley Investment Management Inc. |
| Transamerica Diversified Equity | | Wellington Management Company, LLP |
| Transamerica Flexible Income | | AEGON USA Investment Management, LLC |
| Transamerica Growth Opportunities | | Morgan Stanley Investment Management Inc. |
| Transamerica High Yield Bond | | AEGON USA Investment Management, LLC |
| Transamerica International Bond | | J.P. Morgan Investment Management Inc. |
| Transamerica International Equity | | Thompson, Siegel & Walmsley LLC |
| Transamerica Large Cap Value (then named Transamerica Quality Value) | | Wellington Management Company, LLP |
| Transamerica Money Market | | AEGON USA Investment Management, LLC |
| Transamerica Multi-Managed Balanced | | BlackRock Financial Management, Inc. J.P. Morgan Investment Management Inc. |
| Transamerica Short-Term Bond | | AEGON USA Investment Management, LLC |
| Transamerica Small/Mid Cap Value | | Systematic Financial Management L.P. |
Following their review and consideration, the Trustees determined that the terms of each Investment Advisory Agreement and Sub-Advisory Agreement are reasonable and that the renewal of each agreement is in the best interests of the applicable Fund and its shareholders. The Board, including the independent members of the Board (the “Independent Trustees”), unanimously approved the renewal of each Investment Advisory Agreement and Sub-Advisory Agreement through June 30, 2013. In reaching their decision, the Trustees requested and received from TAM and each Sub-Adviser such information as they deemed reasonably necessary to evaluate the agreements, including, to the extent applicable, information about fees and performance of comparable funds and/or accounts managed by each Sub-Adviser. The Trustees also considered information they had previously received from TAM and each Sub-Adviser as part of their regular oversight of each Fund, as well as comparative fee, expense, and performance information prepared by Lipper Inc. (“Lipper”), an independent provider of mutual fund performance information, and fee and expense information and profitability data prepared by TAM.
In their deliberations, the Independent Trustees had the opportunity to meet privately without representatives of TAM or any Sub-Adviser present and were represented throughout the process by independent legal counsel. In considering the proposed continuation of each Investment Advisory Agreement and Sub-Advisory Agreement, the Trustees evaluated a number of considerations that they believed, in light of the legal advice furnished to them by independent legal counsel and their own business judgment, to be relevant. They based their decisions on the considerations discussed below, among others, although they did not identify any consideration or particular information that was controlling of their decisions, and each Trustee may have attributed different weights to the various factors.
Nature, Extent and Quality of the Services Provided
The Board considered the nature, extent and quality of the services provided by TAM and each Sub-Adviser to the applicable Fund in the past and the services anticipated to be provided in the future. The Board also considered the investment approach for each Fund; the experience, capability and integrity of TAM’s senior management; the financial resources of TAM and each Sub-Adviser; TAM’s management oversight process; and the professional qualifications of the portfolio management team of each Sub-Adviser. The Trustees noted that they receive, on a quarterly basis, an execution analysis from Capital Institutional Services, Inc. (CAPIS), an independent provider of trade analyses, for each applicable Sub-Adviser and a comparison of trading results against a peer universe of managers.
| | | | |
| Transamerica Funds | | | | Annual Report 2012 |
| | Page 178 | | |
TRANSAMERICA FUNDS
INVESTMENT ADVISORY AND SUB-ADVISORY AGREEMENTS—CONTRACT RENEWAL (continued)
(unaudited)
The Board also considered the services provided by TAM for the portion of the management fee it retains after payment of the sub-advisory fee(s) for each Fund. The Board noted that these services include not only the services TAM provides to all Transamerica funds in the form of oversight of the services provided by the funds’ administrator, custodian and transfer agent and supervision of the performance of recordkeeping, shareholder relations, regulatory reporting and compliance functions of the funds, but also the “manager of managers” services TAM provides to sub-advised funds in the form of selection and oversight of the sub-adviser(s).
With respect to Transamerica Large Cap Value, the Board noted that in May 2012 it had approved a sub-adviser change for the Fund, together with changes to the Fund’s investment objective and strategy, such that Wellington Management Company, LLP would only continue to serve as the Fund’s sub-adviser for a limited period of time to the extent that the applicable Sub-Advisory Agreement were renewed.
Based on these considerations, the Board determined that TAM and each Sub-Adviser can provide investment and related services that are appropriate in scope and extent in light of the applicable Fund’s operations, the competitive landscape of the investment company business and investor needs.
Investment Performance
The Board considered the short- and longer-term performance, as applicable, of each Fund in light of its investment objective, policies and strategies, including relative performance against (i) a peer universe of comparable mutual funds, as prepared by Lipper, and (ii) the Fund’s benchmark(s), in each case for various trailing periods ended December 31, 2011.
Transamerica Capital Growth. The Board noted that the performance of Class A of the Fund was below the median for its peer universe for the past 1-year period and above the median for the past 2-year period. The Board also noted that the performance of Class A of the Fund was below its benchmark for the past 1-year period and above its benchmark for the past 2-year period. The Board noted that the Fund’s performance included the management of the Fund’s previous sub-adviser in accordance with different investment strategies. The Trustees discussed the reasons for the underperformance with TAM and agreed to continue to monitor the performance of the Fund. The Trustees also noted that the performance of the Fund had improved during 2012.
Transamerica Diversified Equity. The Board noted that the performance of Class A of the Fund was below the median for its peer universe for the past 1- and 2-year periods. The Board also noted that the performance of Class A of the Fund was below its benchmark for the past 1- and 2-year periods. The Board noted that the Fund’s performance included the management of the Fund’s previous sub-adviser in accordance with different investment strategies. The Trustees discussed the reasons for the underperformance with TAM and agreed to continue to monitor the performance of the Fund. The Trustees also noted that the performance of the Fund had improved during 2012.
Transamerica Flexible Income. The Board noted that the performance of Class A of the Fund was below the median for its peer universe for the past 1-, 5- and 10-year periods and above the median for the past 3-year period. The Board also noted that the performance of Class A of the Fund was below its benchmark for the past 1-, 5- and 10-year periods and above its benchmark for the past 3-year period.
Transamerica Growth Opportunities. The Board noted that the performance of Class A of the Fund was below the median for its peer universe for the past 1- and 3-year periods and above the median for the past 5- and 10-year periods. The Board also noted that the performance of Class A of the Fund was below its benchmark for the past 1- and 3-year periods and above its benchmark for the past 5- and 10-year periods. The Board noted that the Fund’s performance included the management of the Fund’s previous sub-adviser in accordance with different investment strategies. The Trustees discussed the reasons for the underperformance with TAM and agreed to continue to monitor the performance of the Fund. The Trustees also noted that the performance of the Fund had improved during 2012.
Transamerica High Yield Bond. The Board noted that the performance of Class A of the Fund was above the median for its peer universe for the past 1-, 3- and 5-year periods and in line with the median for the past 10-year period. The Board also noted that the performance of Class A of the Fund was below its benchmark for the past 1-, 3-, 5- and 10-year periods.
Transamerica International Bond. The Board noted that the performance of Class I2 of the Fund was above the median for its peer universe for the past 1- and 5-year periods and in line with the median for the past 3-year period. The Board also noted that the performance of Class I2 of the Fund was below its benchmark for the past 1- and 5-year periods and above its benchmark for the past 3-year period.
Transamerica International Equity. The Board noted that the performance of Class I of the Fund was above the median for its peer universe for the past 1-, 3- and 5-year periods and in line with the median for the past 10-year period. The Board also noted that the performance of Class I of the Fund was above its benchmark for the past 1-, 3- and 5-year periods and below its benchmark for the past 10-year period.
| | | | |
| Transamerica Funds | | | | Annual Report 2012 |
| | Page 179 | | |
TRANSAMERICA FUNDS
INVESTMENT ADVISORY AND SUB-ADVISORY AGREEMENTS—CONTRACT RENEWAL (continued)
(unaudited)
Transamerica Large Cap Value. The Board noted that the performance of Class A of the Fund was above the median for its peer universe for the past 1-year period. The Board also noted that the performance of Class A of the Fund was below its benchmark for the past 1-year period.
Transamerica Money Market. The Board noted that the performance of Class A of the Fund was above the median for its peer universe for the past 1-year period and below the median for the past 3- and 5-year periods.
Transamerica Multi-Managed Balanced. The Board noted that the performance of Class A of the Fund was above the median for its peer universe for the past 1-, 3-, 5- and 10-year periods. The Board also noted that the performance of Class A of the Fund was above its primary benchmark for the past 1-, 3-, 5- and 10-year periods. The Board noted that the Fund’s performance included the management of the Fund’s previous sub-adviser in accordance with different investment strategies.
Transamerica Short-Term Bond. The Board noted that the performance of Class A of the Fund was below the median for its peer universe for the past 1-year period and above the median for the past 3-year period. The Board also noted that the performance of Class A of the Fund was above its benchmark for the past 1- and 3-year periods. The Trustees discussed the reasons for the underperformance with TAM and agreed to continue to monitor the performance of the Fund.
Transamerica Small/Mid Cap Value. The Board noted that the performance of Class A of the Fund was in line with the median for its peer universe for the past 1-year period and above the median for the past 3-, 5- and 10-year periods. The Board also noted that the performance of Class A of the Fund was above its benchmark for the past 1-, 3-, 5- and 10-year periods. The Board noted that the Fund’s performance included the management of the Fund’s previous sub-adviser in accordance with different investment strategies.
On the basis of this information and the Board’s assessment of the nature, extent and quality of the services to be provided or procured by TAM and the Sub-Advisers, the Board concluded that TAM and each Sub-Adviser are capable of generating a level of investment performance that is appropriate in light of the applicable Fund’s investment objectives, policies and strategies and competitive with other investment companies.
Management and Sub-Advisory Fees and Total Expense Ratios
The Board considered the management fee and total expense ratio of each Fund, including information provided by Lipper comparing the management fee and total expense ratio of each Fund to the management fees and total expense ratios of other investment companies in both a peer group and broader peer universe compiled by Lipper. The Board also considered the fees charged by the Sub-Advisers for sub-advisory services as well as the portion of a Fund’s management fee retained by TAM following payment of the sub-advisory fee(s).
Transamerica Capital Growth. The Board noted that the Fund’s contractual management fee was in line with the median for its peer group and above the median for its peer universe and that the actual total expenses (i.e., expenses reflecting any waivers and/or reimbursements) of Class A of the Fund were above the medians for its peer group and peer universe. The Board also noted that TAM has entered into an expense limitation arrangement with the Fund, which may result in TAM waiving fees for the benefit of shareholders.
Transamerica Diversified Equity. The Board noted that the Fund’s contractual management fee was in line with the medians for its peer group and peer universe and that the actual total expenses (i.e., expenses reflecting any waivers and/or reimbursements) of Class A of the Fund were above the medians for its peer group and peer universe. The Board also noted that TAM has entered into an expense limitation arrangement with the Fund, which may result in TAM waiving fees for the benefit of shareholders.
Transamerica Flexible Income. The Board noted that the Fund’s contractual management fee was below the medians for its peer group and peer universe and that the actual total expenses (i.e., expenses reflecting any waivers and/or reimbursements) of Class A of the Fund were above the median for its peer group and in line with the median for its peer universe. The Board also noted that TAM has entered into an expense limitation arrangement with the Fund, which may result in TAM waiving fees for the benefit of shareholders.
Transamerica Growth Opportunities. The Board noted that the Fund’s contractual management fee was in line with the medians for its peer group and peer universe and that the actual total expenses (i.e., expenses reflecting any waivers and/or reimbursements) of Class A of the Fund were above the medians for its peer group and peer universe. The Board also noted that TAM has entered into an expense limitation arrangement with the Fund, which may result in TAM waiving fees for the benefit of shareholders.
| | | | |
| Transamerica Funds | | | | Annual Report 2012 |
| | Page 180 | | |
TRANSAMERICA FUNDS
INVESTMENT ADVISORY AND SUB-ADVISORY AGREEMENTS—CONTRACT RENEWAL (continued)
(unaudited)
Transamerica High Yield Bond. The Board noted that the Fund’s contractual management fee was below the median for its peer group and in line with the median for its peer universe and that the actual total expenses (i.e., expenses reflecting any waivers and/or reimbursements) of Class A of the Fund were above the medians for its peer group and peer universe. The Board also noted that TAM has entered into an expense limitation arrangement with the Fund, which may result in TAM waiving fees for the benefit of shareholders.
Transamerica International Bond. The Board noted that the Fund’s contractual management fee was in line with the medians for its peer group and peer universe and that the actual total expenses (i.e., expenses reflecting any waivers and/or reimbursements) of Class I2 of the Fund were below the medians for its peer group and peer universe. The Board also noted that TAM has entered into an expense limitation arrangement with the Fund, which may result in TAM waiving fees for the benefit of shareholders.
Transamerica International Equity. The Board noted that the Fund’s contractual management fee was below the median for its peer group and in line with the median for its peer universe and that the actual total expenses (i.e., expenses reflecting any waivers and/or reimbursements) of Class I of the Fund were in line with the median for its peer group and above the median for its peer universe. The Board also noted that TAM has entered into an expense limitation arrangement with the Fund, which may result in TAM waiving fees for the benefit of shareholders.
Transamerica Large Cap Value. The Board noted that the Fund’s contractual management fee was below the median for its peer group and in line with the median for its peer universe and that the actual total expenses (i.e., expenses reflecting any waivers and/or reimbursements) of Class A of the Fund were above the medians for its peer group and peer universe. The Board noted that the Fund’s management fee rate would be reduced in connection with the sub-adviser change approved for the Fund in May 2012. The Board also noted that TAM has entered into an expense limitation arrangement with the Fund, which may result in TAM waiving fees for the benefit of shareholders.
Transamerica Money Market. The Board noted that the Fund’s contractual management fee was below the median for its peer group and above the median for its peer universe and that the actual total expenses (i.e., expenses reflecting any waivers and/or reimbursements) of Class A of the Fund were below the medians for its peer group and peer universe. The Board also noted that TAM has entered into an expense limitation arrangement with the Fund, which may result in TAM waiving fees for the benefit of shareholders.
Transamerica Multi-Managed Balanced. The Board noted that the Fund’s contractual management fee was above the medians for its peer group and peer universe and that the actual total expenses (i.e., expenses reflecting any waivers and/or reimbursements) of Class A of the Fund were above the medians for its peer group and peer universe. The Board also noted that TAM has entered into an expense limitation arrangement with the Fund, which may result in TAM waiving fees for the benefit of shareholders.
Transamerica Short-Term Bond. The Board noted that the Fund’s contractual management fee was above the medians for its peer group and peer universe and that the actual total expenses (i.e., expenses reflecting any waivers and/or reimbursements) of Class A of the Fund were in line with the medians for its peer group and peer universe. The Board also noted that TAM has entered into an expense limitation arrangement with the Fund, which may result in TAM waiving fees for the benefit of shareholders.
Transamerica Small/Mid Cap Value. The Board noted that the Fund’s contractual management fee was below the medians for its peer group and peer universe and that the actual total expenses (i.e., expenses reflecting any waivers and/or reimbursements) of Class A of the Fund were above the median for its peer group and in line with the median for its peer universe. The Board also noted that TAM has entered into an expense limitation arrangement with the Fund, which may result in TAM waiving fees for the benefit of shareholders.
On the basis of these considerations, together with the other information it considered, the Board determined that the management and sub-advisory fees to be received by TAM and the Sub-Advisers under the Investment Advisory Agreements and Sub-Advisory Agreements are reasonable in light of the services provided.
Cost of Services Provided and Level of Profitability
The Board reviewed information provided by TAM about the cost of providing and/or procuring fund management services, as applicable, as well as the costs of the provision of administration, transfer agency and other services, to each Fund and to Transamerica Funds as a whole by TAM and its affiliates. The Board considered the profitability of TAM and its affiliates in providing these services for each Fund and Transamerica Funds as a whole, as well as the allocation methodology used for calculating profitability.
| | | | |
| Transamerica Funds | | | | Annual Report 2012 |
| | Page 181 | | |
TRANSAMERICA FUNDS
INVESTMENT ADVISORY AND SUB-ADVISORY AGREEMENTS—CONTRACT RENEWAL (continued)
(unaudited)
With respect to the Sub-Advisers, the Board noted that the sub-advisory fees are the product of arm’s-length negotiation between TAM and the applicable Sub-Adviser (with the exception of those fees paid to AEGON USA Investment Management, LLC (“AUIM”)) and are paid by TAM and not the applicable Fund. As a result, for those Funds not sub-advised by AUIM, the Board principally considered the profitability of TAM and its affiliates with respect to the applicable Fund. For each Fund sub-advised by AUIM, the Board noted that information about AUIM’s revenues and expenses was incorporated into TAM’s profitability analysis for the Fund. As a result, for those Funds the Board principally considered profitability information for TAM and AUIM in the aggregate.
Based on this information, the Board determined that the profitability of TAM and its affiliates from their relationships with the Funds was not excessive.
Economies of Scale
The Board considered economies of scale with respect to the management of each Fund, whether the Fund had appropriately benefited from any economies of scale, and whether there was the potential for realization of any further economies of scale. The Board also considered the existence of economies of scale with respect to management of the Transamerica funds overall and the extent to which the Funds benefited from these economies of scale. The Board considered each Fund’s management fee schedule and the existence of breakpoints, if any, and also considered the extent to which TAM shared economies of scale with the Funds through investments in capabilities and services. The Trustees concluded that each Fund’s fee structure reflected economies of scale to date but noted that they will have the opportunity to periodically reexamine whether each Fund has achieved economies of scale, and the appropriateness of management fees payable to TAM and fees paid to the Sub-Advisers, in the future.
Benefits to TAM, its Affiliates, or the Sub-Advisers from their Relationships with the Funds
The Board considered any other benefits derived by TAM, its affiliates, and the Sub-Advisers from their relationships with the Funds. The Board noted that TAM does not realize soft dollar benefits from its relationships with the Funds and that TAM believes that any use of soft dollars by the Sub-Advisers is generally appropriate and in the best interests of the Funds. The Board also noted that certain Sub-Advisers are participating in a brokerage program pursuant to which a portion of brokerage commissions paid by each applicable Fund is recaptured for the benefit of the Fund and its shareholders, thus limiting the amount of soft dollar arrangements the Sub-Adviser may engage in with respect to a Fund’s brokerage transactions.
Other Considerations
The Board noted that TAM has made a substantial commitment to the recruitment and retention of high quality personnel, and maintains the financial, compliance and operational resources reasonably necessary to manage each Fund in a professional manner that is consistent with the best interests of the Fund and its shareholders. In this regard, the Board favorably considered the procedures and policies TAM has in place to enforce compliance with applicable laws and regulations and oversee the portfolio management activities of the Sub-Advisers. The Board also noted that TAM has made a significant entrepreneurial commitment to the management and success of the Funds.
Conclusion
After consideration of the factors described above, as well as other factors, the Trustees, including all of the Independent Trustees, concluded that the renewal of each Investment Advisory Agreement and Sub-Advisory Agreement is in the best interests of the applicable Fund and its shareholders and voted to approve the renewal of each Investment Advisory Agreement and Sub-Advisory Agreement.
| | | | |
| Transamerica Funds | | | | Annual Report 2012 |
| | Page 182 | | |
TRANSAMERICA SMALL CAP GROWTH
APPROVAL OF INVESTMENT ADVISORY AND SUB-ADVISORY AGREEMENTS
(unaudited)
At a meeting of the Board of Trustees of Transamerica Funds (the “Board”) held on May 24, 2012, the Board reviewed and considered the approval of a proposed mandate to establish Transamerica Small Cap Growth as a new series of Transamerica Funds (the “Trust”). The Board reviewed and considered the proposed investment advisory agreement (the “Investment Advisory Agreement”) between Transamerica Small Cap Growth (the “Fund” or “New Series”) and Transamerica Asset Management, Inc. (“TAM”), as well as the proposed investment sub-advisory agreement (the “Sub-Advisory Agreement”) of the Fund between TAM and Ranger Investment Management, L.P. (“Ranger”) (the “Sub-Adviser”), to determine whether the agreements should be approved for an initial two-year period.
Following their review and consideration, the Board determined that the proposed Investment Advisory Agreement and the proposed Sub-Advisory Agreement will enable shareholders of the Fund to obtain high quality services at a cost that is appropriate, fair, and in the best interests of its shareholders. The Board, including the independent members of the Board, unanimously approved the proposed Investment Advisory Agreement and Sub-Advisory Agreement.
In reaching their decision, the Board requested and obtained from TAM and Ranger such information as they deemed reasonably necessary to evaluate the proposed agreements. In considering the proposed approval of Investment Advisory Agreement and Sub- Advisory Agreement, the Board evaluated a number of considerations that they believed, in light of the legal advice furnished to them by independent legal counsel and their own business judgment, to be relevant. The Board based their decisions on the following considerations, among others, although they did not identify any consideration or particular information that was controlling of their decisions and each member of the Board may have attributed different weights to the various factors.
The nature, extent and quality of the advisory services to be provided. The Board considered the nature, extent and quality of the services expected to be provided by TAM and Ranger. The Board considered the proposed investment approach for the New Series; the experience, capability and integrity of TAM’s senior management; the financial resources of TAM and Ranger; TAM’s management oversight process; and the professional qualifications of the portfolio management team of Ranger. The Board also considered the services to be provided by TAM for the portion of the management fee it will retain after payment of the sub-advisory fee for the New Series. The Board noted that these services include not only the services TAM provides to all Transamerica funds in the form of oversight of the services provided by the funds’ administrator, custodian and transfer agent and supervision of the performance of recordkeeping, shareholder relations, regulatory reporting and compliance functions of the funds, but also the “manager of managers” services TAM provides to sub-advised funds in the form of selection and oversight of the sub-adviser(s). Based on these considerations, the Board Members determined that TAM and Ranger can provide investment and related services that are appropriate in scope and extent in light of the New Series’ operations, the competitive landscape of the investment company business and investor needs.
The investment performance of the New Series. The New Series is not yet in existence and therefore had no historical performance for the Board to review. However, the Board Members were provided performance data for Ranger’s Small Cap Growth composite, which has substantially similar investment objectives, policies and strategies as the New Series, as compared against the proposed benchmark and a peer universe for the New Series for the 1-, 3-, 5-year periods ended March 31, 2012 (annualized). It was noted that the performance of the Ranger composite compared favorably to that of the benchmark and peer universe for the 1-, 3-, and 5-year periods ended March 31, 2012. On the basis of this information and the Board Members’ assessment of the nature, extent and quality of advisory services to be provided or procured by TAM and Ranger, the Board Members concluded that TAM and Ranger are capable of generating a level of investment performance that is appropriate in light of the New Series’ proposed investment objectives, policies and strategies.
Management fees and total expense ratios. The Board considered the proposed management fee and anticipated total expense ratio of the New Series, including information comparing the management fee and total expense ratio of the New Series to the management fees and total expense ratios of other investment companies in a Lipper peer universe. The Board also considered the fee to be charged by Ranger for sub-advisory services as well as the portion of the New Series’ management fee to be retained by TAM following payment of the sub-advisory fee. The Board Members noted that the proposed management fee for the New Series was slightly lower than its Lipper category median. The Board Members also noted that the anticipated total expense ratio of Class A shares of the New Series was higher than the Lipper category median. The Board also noted that TAM proposed to enter into an expense limitation arrangement with the New Series, which may result in TAM waiving fees for the benefit of shareholders. On the basis of these considerations, together with the other information it considered, the Board determined that the management and sub- advisory fees to be received by TAM and Ranger under the investment advisory and sub-advisory agreements are reasonable in light of the services to be provided.
| | | | |
| Transamerica Funds | | | | Annual Report 2012 |
| | Page 183 | | |
TRANSAMERICA SMALL CAP GROWTH
APPROVAL OF INVESTMENT ADVISORY AND SUB-ADVISORY AGREEMENTS (continued)
(unaudited)
The cost of advisory services provided and the level of profitability. The New Series was not yet in existence and therefore no revenue, cost or profitability data was available for the Board to review. However, the Board reviewed projected profitability information regarding TAM’s costs of procuring portfolio management services as well as the costs of providing administration, transfer agency and other services to the New Series by TAM and its affiliates. The Board noted that the sub-advisory fee is the product of arm’s-length negotiation between TAM and Ranger. As a result, the Board considered profitability information for TAM and its affiliates with respect to the New Series. Based on this information, the Board determined that the profitability of TAM and its affiliates from their relationships with the New Series was not anticipated to be excessive.
Whether fee levels reflect economies of scale and the extent to which economies of scale would be realized as the New Series grows. In evaluating the extent to which the management fees payable under the new investment advisory and sub-advisory agreements reflect economies of scale or will permit economies of scale to be realized in the future, the Board took note of TAM’s and Ranger’s pricing schedules and the proposed advisory and sub-advisory fee breakpoints, as detailed in the materials provided to the Board, and noted each fee breakpoint with respect to the various asset levels to be achieved by the New Series. The Board concluded that the proposed fees and breakpoints may benefit investors by permitting economies of scale in the form of lower management fees as the level of assets grows for the New Series. The Board Members also noted that, in the future, they would have the opportunity to periodically reexamine whether the New Series has achieved economies of scale and the appropriateness of management fees payable to TAM and fees payable by TAM to Ranger.
Benefits to TAM, its affiliates, or Ranger from their relationship with the New Series. The Board considered any other benefits derived by TAM, its affiliates, and Ranger from their relationships with the New Series. The Board Members noted that TAM would not realize soft dollar benefits from its relationship with the New Series, and that Ranger may engage in soft dollar arrangements consistent with applicable law and “best execution” requirements.
Other considerations. The Board considered the investment objective of the New Series and its investment strategy and noted that TAM believes that investment in the New Series would enhance the Transamerica Funds’ retail product line-up as well as the investment options for the asset allocation funds. The Board noted that TAM has made a substantial commitment to the recruitment and retention of high quality personnel, and maintains the financial, compliance and operational resources reasonably necessary to manage the New Series in a professional manner that is consistent with the best interests of the New Series and its shareholders. In this regard, the Board Members favorably considered TAM’s procedures and policies to enforce compliance with applicable laws and regulations and oversee the portfolio management activities of Ranger. The Board Members also noted that TAM has made a significant entrepreneurial commitment to the management and success of the New Series.
Conclusion. After consideration of the factors described above, as well as other factors, the Board Members, including all of the Independent Board Members, conclude that the approval of the Investment Advisory and Sub-Advisory Agreements is in the best interest of the Fund and its shareholders and voted to approve the Investment Advisory and Sub-Advisory Agreements.
| | | | |
| Transamerica Funds | | | | Annual Report 2012 |
| | Page 184 | | |
TRANSAMERICA LARGE CAP VALUE
(FORMERLY, TRANSAMERICA QUALITY VALUE)
APPROVAL OF NEW INVESTMENT SUB-ADVISORY AGREEMENT
(unaudited)
At a meeting of the Boards of Trustees of Transamerica Funds (the “Board” or the “Board Members”) held on May 24, 2012, the Board considered the termination of Wellington Management Company, LLP (“Wellington”) as sub-adviser to Transamerica Quality Value (the “Fund”), a series of Transamerica Funds and approval of a new investment sub-advisory agreement (the “New Sub-Advisory Agreement”) for the Fund between Transamerica Asset Management, Inc. (“TAM”) and Levin Capital Strategies, LP (“LCS”), the Fund’s proposed new sub-adviser.
Following their review and consideration, the Trustees determined that the terms of the New Sub-Advisory Agreement are reasonable and that the termination of Wellington as sub-adviser to the Fund and approval of the New Sub-Advisory Agreement is in the best interests of the Fund and its shareholders. The Board, including the independent members of the Board (the “Independent Trustees”), unanimously approved the New Sub-Advisory Agreement for an initial two-year period and authorized TAM to terminate the sub-advisory agreement with Wellington.
To assist the Trustees in their consideration of the New Sub-Advisory Agreement, the Trustees received in advance of their meeting certain materials and information. In addition, the Independent Trustees consulted with their independent legal counsel, discussing, among other things, the legal standards and certain other considerations relevant to the Trustees’ deliberations.
Among other matters, the Board considered:
(a) that TAM advised the Board that the appointment of LCS is not expected to result in any diminution in the nature, extent and quality of services provided to the Fund and its shareholders, including compliance services;
(b) that LCS is an experienced and respected asset management firm and that LCS has the capabilities, resources and personnel necessary to provide sub-advisory services to the Fund;
© the proposed responsibilities of LCS for the Fund and the services expected to be provided by it;
(d) the fact that the sub-advisory fee payable to LCS would be paid by TAM and not the Fund;
(e) that the management fee rate paid by the Fund would be reduced in connection with the sub-adviser change, and that the sub-advisory fee to be paid by TAM to LCS is reasonable in light of the services to be provided; and
(f) that TAM recommended to the Board that LCS be appointed as sub-adviser to the Fund based on its desire to engage an investment sub-adviser that utilizes a more unique investment strategy that can be offered both to retail investors and utilized in the asset allocation funds.
A discussion followed that included additional consideration of these and other matters.
In their deliberations, the Board Members evaluated a number of considerations that they believed, in light of the legal advice furnished to them by independent legal counsel and their own business judgment, to be relevant. They based their decisions on the considerations discussed here, among others, although they did not identify any consideration or particular information that was controlling of their decisions, and each Board Member may have attributed different weights to the various factors.
Nature, Extent and Quality of the Services to be Provided. In evaluating the nature, extent and quality of the services to be provided by LCS under the LCS Sub-Advisory Agreement, the Board considered, among other things, information and assurances provided by TAM and LCS as to the operations, facilities, organization and personnel of LCS, the anticipated ability of LCS to perform its duties under the New Sub-Advisory Agreement, and the anticipated changes to the current investment program and other practices of the Fund. The Board considered the proposed changes to the Fund’s investment objective and principal investment strategies, as well as the change to the Fund’s name. The Board considered that TAM has advised the Board that the appointment of LCS is not expected to result in any diminution in the nature, extent and quality of services provided to the Fund and its shareholders, including compliance services. The Board considered that LCS is an experienced and respected asset management firm and that TAM believes that LCS has the capabilities, resources and personnel necessary to provide sub-advisory services to the Fund.
Based on their review of the materials provided and the assurances they had received from TAM, the Board determined that LCS can provide sub-advisory services that are appropriate in scope and extent in light of the proposed investment program for the Fund and that LCS’s appointment is not expected to adversely affect the nature, extent and quality of services provided to the Fund.
| | | | |
| Transamerica Funds | | | | Annual Report 2012 |
| | Page 185 | | |
TRANSAMERICA LARGE CAP VALUE
(FORMERLY, TRANSAMERICA QUALITY VALUE)
APPROVAL OF NEW INVESTMENT SUB-ADVISORY AGREEMENT (continued)
(unaudited)
Investment Performance. The Board reviewed the performance of the Fund as compared to the composite performance of the strategy to be followed by LCS in providing services to the Fund (the “LCS Composite”), and also reviewed the performance of the LCS Composite as compared to the composite performance of the strategy followed by Wellington Management in providing services to the Fund (the “Wellington Composite”). The Board noted that the performance of the LCS Composite compared favorably to that of the Fund for the year-to-date period ended April 30, 2012, although the LCS Composite underperformed the Fund for the 1-year and since inception periods ended April 30, 2012. The Board also noted that the performance of the LCS Composite compared favorably to that of the Wellington Composite and the Fund’s benchmark for the year-to-date and 3-, 5- and 10-year periods ended March 31, 2012, although the LCS Composite underperformed the Wellington Composite and benchmark for the 1-year period ended March 31, 2012. The Board further noted that TAM believes that the appointment of LCS could benefit shareholders by offering them the potential for improved performance based on the historical comparisons, but were unable to predict what effect execution of the LCS Sub-Advisory Agreement would actually have on the future performance of the Fund.
On the basis of this information and the Board’s assessment of the nature, extent and quality of the services to be provided by LCS, the Board concluded that LCS is capable of generating a level of investment performance that is appropriate in light of the Fund’s investment objectives, policies and strategies.
Sub-Advisory Fee, Cost of Services Provided and Profitability. The Board considered the proposed sub-advisory fee rate under the New Sub-Advisory Agreement. The Board noted that the management fee rate payable by the Fund would be reduced in connection with the sub-adviser change, which would benefit the Fund and its shareholders. The Board further noted that, in light of the management fee reduction and sub-advisory fee payable to LCS, there would be no change in the amount of the Fund’s management fee retained by TAM following payment of the sub-advisory fee as a result of the implementation of the New Sub-Advisory Agreement. The Board also noted that the Fund does not pay the sub-advisory fee. On the basis of these considerations, together with the other information it considered, the Board determined that the sub-advisory fee to be received by LCS under the New Sub-Advisory Agreement is reasonable in light of the services to be provided.
With respect to LCS’s costs and profitability in providing services to the Fund, the Board noted that the sub-advisory fee is the product of arm’s-length negotiation between TAM and LCS. As a result, the Board did not consider LCS’s anticipated profitability as material to its decision to approve the LCS Sub-Advisory Agreement.
Economies of Scale. The Board considered the sub-advisory fee schedule and the existence of breakpoints, noting that a breakpoint would be added to the management fee schedule in connection with the sub-adviser change. The Board Members concluded that they would have the opportunity to periodically reexamine whether the Fund has achieved economies of scale, and the appropriateness of management fees payable to TAM and fees payable by TAM to LCS, in the future.
Fall-Out Benefits. The Board considered any other benefits to be derived by LCS from its relationship with the Fund. The Board noted that TAM would not realize soft dollar benefits from its relationship with LCS, and that LCS may engage in soft dollar arrangements consistent with applicable law and “best execution” requirements.
Conclusion. After consideration of the factors described above, as well as other factors, the Board Members, including all of the Independent Board Members, concluded that the approval of the New Sub-Advisory Agreement is in the best interests of the Fund and its shareholders and voted to approve the New Sub-Advisory Agreement.
| | | | |
| Transamerica Funds | | | | Annual Report 2012 |
| | Page 186 | | |
SUPPLEMENTAL INFORMATION (unaudited)
TAX INFORMATION
For dividends paid during the year ended October 31, 2012, the Funds designated the following as qualified dividend income:
| | | | |
| | | Qualified Dividend | |
Fund | | Income (000’s) | |
Transamerica Capital Growth | | $ | 730 | |
Transamerica Diversified Equity | | | 357 | |
Transamerica Growth Opportunities | | | 235 | |
Transamerica International Equity | | | 2,372 | |
Transamerica Large Cap Value | | | 22,539 | |
Transamerica Multi-Managed Balanced | | | 1,590 | |
Transamerica Tactical Income | | | 12,891 | |
For corporate shareholders, investment income (dividend income plus short-term gains, if any) qualifies for the dividends received deductions as follows:
| | | | |
| | | Dividend Received | |
Fund | | Deduction Percentage | |
Transamerica Capital Growth | | | 100.00 | % |
Transamerica Diversified Equity | | | 100.00 | |
Transamerica Growth Opportunities | | | 100.00 | |
Transamerica Large Cap Value | | | 71.00 | |
Transamerica Multi-Managed Balanced | | | 20.00 | |
Transamerica Tactical Income | | | 100.00 | |
For tax purposes, the Long-Term Capital Gain Designations for the year ended October 31, 2012 were as follows:
| | | | |
| | | Long-Term Capital Gain | |
Fund | | Designation | |
Transamerica Capital Growth | | $ | 23,888 | |
Transamerica Diversified Equity | | | 73,049 | |
Transamerica Growth Opportunities | | | 70,327 | |
Transamerica International Bond | | | 4,147 | |
Transamerica Multi-Managed Balanced | | | 41,482 | |
Transamerica Short-Term Bond | | | 15,858 | |
Transamerica Small/Mid Cap Value | | | 34,566 | |
Transamerica Tactical Income | | | 44 | |
The amounts which represent income derived from sources within, and taxes paid to, foreign countries or possessions of the United States are as follows:
| | | | | | | | |
Fund | | Foreign Source Income (000’s) | | | Foreign Taxes (000’s) | |
Transamerica Emerging Markets Equity | | $ | 1,416 | | | $ | 174 | |
Transamerica International Equity | | | 6,663 | | | | 524 | |
The information and distributions reported herein may differ from the information and distributions taxable to the shareholders for the calendar year ending December 31, 2012. Complete information will be computed and reported in conjunction with your 2012 Form 1099-DIV.
| | | | |
| Transamerica Funds | | | | Annual Report 2012 |
| | Page 187 | | |
TRANSAMERICA FUNDS
SUPPLEMENTAL SHAREHOLDER INFORMATION (unaudited)
At a meeting held on August 2, 2012, the Board of Trustees of the funds approved certain initiatives that are intended to move the fund complex to a more modern and efficient operating platform. The Board authorized seeking shareholder approval for these measures where required. A proxy statement asking fund shareholders to elect Trustees, approve a new investment advisory agreement between Transamerica Asset Management, Inc. and their funds, and approve changes to their fund’s fundamental investment policies was mailed in September 2012. If shareholder approval is obtained, these initiatives are expected to be implemented during the fourth quarter of 2012 or the first quarter of 2013. Shareholders of certain funds have already approved these proposals.
| | | | |
| Transamerica Funds | | | | Annual Report 2012 |
| | Page 188 | | |
TRANSAMERICA FUNDS
Management of the Funds
(unaudited)
Interested Board Member means a board member who may be deemed an “interested person” (as that term is defined in the 1940 Act) of the Trust because of his current or former service with TAM or an affiliate of TAM. Interested Board Members may also be referred to herein as “Interested Trustees.” Independent Board Member means a Board Member who is not an “interested person” (as defined under the 1940 Act) of the Trust and may also be referred to herein as an “Independent Trustee.”
The Board governs each fund and is responsible for protecting the interests of the shareholders. The Board Members are experienced executives who meet periodically throughout the year to oversee the business affairs of each fund and the operation of each fund by its officers. The Board also reviews the management of each fund’s assets by the investment adviser and its respective sub-adviser.
The Funds are among the funds advised and sponsored by TAM (collectively, “Transamerica Asset Management Group”). Transamerica Asset Management Group (“TAMG”) consists of Transamerica Funds, Transamerica Series Trust (“TST”), Transamerica Income Shares, Inc. (“TIS”), Transamerica Partners Funds Group (“TPFG”), Transamerica Partners Funds Group II (“TPFG II”), Transamerica Partners Portfolios (“TPP”) and Transamerica Asset Allocation Variable Funds (“TAAVF”) and consists of 161 funds as of the mailing of this annual report.
The mailing address of each Board Member is c/o Secretary, 570 Carillon Parkway, St. Petersburg, Florida 33716.
The Board Members, their year of birth, their positions with the Trust, and their principal occupations for the past five years (their titles may have varied during that period), the number of funds in TAMG the Board oversees, and other board memberships they hold are set forth in the table below.
| | | | | | | | | | |
| | | | | | | | | Number of | | |
| | | | | Term of | | | | Funds in | | |
| | | | | Office and | | | | Complex | | Other |
| | | Position(s) | | Length | | | | Overseen | | Directorships |
| Name and | | Held with | | of Time | | Principal Occupation(s) | | by Board | | During the Past |
Year of Birth | | Trust | | Served* | | During Past Five Years | | Member | | Five Years |
INTERESTED BOARD MEMBER | | | | | | | | |
| | | | | |
Thomas A. Swank (1960 ) | | Board Member | | Since 2012 | | President and Chief Executive Officer, Transamerica Individual Savings & Retirement (2010 – present); | | 101 | | N/A |
| | | | | |
| | | | | | President and Chief Executive Officer, Transamerica Capital Management (2009 – present); | | | | |
| | | | | |
| | | | | | Board Member (November 2012 – present), President and Chief Executive Officer, Transamerica Funds, TST, TIS, (May 2012 – present); | | | | |
| | | | | |
| | | | | | President and Chief Executive Officer, TPP, TPFG, TPFG II and TAAVF (May 2012 – present); | | | | |
| | | | | |
| | | | | | Director, Chairman of the Board, Chief Executive Officer and President, Transamerica Asset Management, Inc. (“TAM”) (May 2012 – present); | | | | |
| | | | | |
| | | | | | Director, Chairman of the Board, Chief Executive Officer and President, Transamerica Fund Services, Inc. (“TFS”) (May 2012 – present); | | | | |
| | | | |
| Transamerica Funds | | | | Annual Report 2012 |
| | Page 189 | | |
| | | | | | | | | | |
| | | | | | | | | Number of | | |
| | | | | Term of | | | | Funds in | | |
| | | | | Office and | | | | Complex | | Other |
| | | Position(s) | | Length | | | | Overseen | | Directorships |
| Name and | | Held with | | of Time | | Principal Occupation(s) | | by Board | | During the Past |
Year of Birth | | Trust | | Served* | | During Past Five Years | | Member | | Five Years |
INTERESTED BOARD MEMBER—continued | | | | |
| | | | | |
Thomas A. Swank (continued) | | | | | | Director and Trust Officer, Massachusetts Fidelity Trust Company (May 2012 – present); Supervisory Board Member, AEGON Sony Life Insurance Co., LTD. (2011 – present); | | | | |
| | | | | |
| | | | | | Division President, Monumental Life Insurance Company (2011 – present) ; | | | | |
| | | | | |
| | | | | | Division President, Western Reserve Life Assurance Co. of Ohio (2011 – present); | | | | |
| | | | | |
| | | | | | Vice President, Money Services, Inc. (2011 – present); | | | | |
| | | | | |
| | | | | | Director, AEGON Financial Services Group, Inc. (2010 – present); | | | | |
| | | | | |
| | | | | | Director, AFSG Securities Corporation (2010 – present); Director and President, Transamerica Advisors Life Insurance Company (2010 – present); | | | | |
| | | | | |
| | | | | | Director, Chairman of the Board and President, Transamerica Advisors Life Insurance Company of New York (2010 – present); | | | | |
| | | | | |
| | | | | | Director and President, Transamerica Resources, Inc. (2010 – present); | | | | |
| | | | | |
| | | | | | Executive Vice President, Transamerica Life Insurance Company (2010 – present); | | | | |
| | | | | |
| | | | | | Executive Vice President, Transamerica Financial Life Insurance Company (2009 – present); | | | | |
| | | | | |
| | | | | | Director, Transamerica Capital, Inc. (2009 – present); and | | | | |
| | | | | |
| | | | | | President and Chief Operating Officer (2007 – 2009), Senior Vice President, Chief Marketing Officer (2006 – 2007), Senior Vice President, Chief Financial Officer (2003 – 2006), Senior Vice President, Chief Risk Officer (2000 – 2003), Senior Vice President, Chief Investment Officer (1997 – 2000) and High Yield Portfolio Manager (1992 – 1997), Security Benefit Corporation | | | | |
| | | | |
| Transamerica Funds | | | | Annual Report 2012 |
| | Page 190 | | |
| | | | | | | | | | |
| | | | | | | | | Number of | | |
| | | | | Term of | | | | Funds in | | |
| | | | | Office and | | | | Complex | | Other |
| | | Position(s) | | Length | | | | Overseen | | Directorships |
| Name and | | Held with | | of Time | | Principal Occupation(s) | | by Board | | During the Past |
Year of Birth | | Trust | | Served* | | During Past Five Years | | Member | | Five Years |
INTERESTED BOARD MEMBER—continued | | | | | | |
| | | | | |
Alan F. Warrick (1948 ) | | Board Member | | Since 2012 | | Board Member, Transamerica Funds, TST, TIS, TPP, TPFG, TPFG II and TAAVF (January 2012 – present); | | 161 | | N/A |
| | | | | |
| | | | | | Consultant, AEGON USA (2010 – present); | | | | |
| | | | | |
| | | | | | Senior Advisor, Lovell Minnick Equity Partners (2010 – present); | | | | |
| | | | | |
| | | | | | Retired (2010 – present); and | | | | |
| | | | | |
| | | | | | Managing Director for Strategic Business Development, AEGON USA (1994 – 2010). | | | | |
INDEPENDENT BOARD MEMBERS | | | | |
| | | | | |
Sandra N. Bane (1952 ) | | Board Member | | Since 2008 | | Retired (1999 – present); | | 161 | | Big 5 Sporting
Goods (2002 – |
| | | | | | Board Member, Transamerica | | | | present); |
| | | | | | Funds, TST, TIS, TPP, TPFG, | | | | AGL Resources, |
| | | | | | TPFG II and TAAVF | | | | Inc. (energy |
| | | | | | (2008 – present); | | | | services holding |
| | | | | | | | | | company) (2008 |
| | | | | | Board Member, TII | | | | – present) |
| | | | | | (2003 – 2010); and | | | | |
| | | | | |
| | | | | | Partner, KPMG (1975 – 1999). | | | | |
| | | | | |
Leo J. Hill (1956 ) | | Lead Independent Board Member | | Since 2002 | | Principal, Advisor Network Solutions, LLC (business consulting) (2006 – present); | | 161 | | N/A |
| | | | | |
| | | | | | Board Member, TST | | | | |
| | | | | | (2001 – present); | | | | |
| | | | | |
| | | | | | Board Member, Transamerica Funds and TIS (2002 – present); | | | | |
| | | | | |
| | | | | | Board Member, TPP, TPFG, | | | | |
| | | | | | TPFG II and TAAVF | | | | |
| | | | | | (2007 – present); | | | | |
| | | | | |
| | | | | | Board Member, TII | | | | |
| | | | | | (2008 – 2010); | | | | |
| | | | | |
| | | | | | President, L. J. Hill & Company (a holding company for privately- held assets) (1999 – present); | | | | |
| | | | | |
| | | | | | Market President, Nations Bank of Sun Coast Florida (1998 – 1999); | | | | |
| | | | | |
| | | | | | Chairman, President and Chief Executive Officer, Barnett Banks of Treasure Coast Florida (1994 – 1998); | | | | |
| | | | |
| Transamerica Funds | | | | Annual Report 2012 |
| | Page 191 | | |
| | | | | | | | | | |
| | | | | | | | | Number of | | |
| | | | | Term of | | | | Funds in | | |
| | | | | Office and | | | | Complex | | Other |
| | | Position(s) | | Length | | | | Overseen | | Directorships |
| Name and | | Held with | | of Time | | Principal Occupation(s) | | by Board | | During the Past |
Year of Birth | | Trust | | Served* | | During Past Five Years | | Member | | Five Years |
INDEPENDENT BOARD MEMBERS—continued | | |
| | | | | |
Leo J. Hill (continued) | | | | | | Executive Vice President and Senior Credit Officer, Barnett Banks of Jacksonville, Florida (1991 – 1994); and | | | | |
| | | | | |
| | | | | | Senior Vice President and Senior Loan Administration Officer, Wachovia Bank of Georgia (1976 – 1991). | | | | |
| | | | | |
David W. Jennings (1946 ) | | Board Member | | Since 2009 | | Board Member, Transamerica Funds, TST, TIS, TPP, TPFG, TPFG II and TAAVF (2009 – present); | | 161 | | N/A |
| | | | | |
| | | | | | Board Member, TII | | | | |
| | | | | | (2009 – 2010); | | | | |
| | | | | |
| | | | | | Managing Director, Hilton | | | | |
| | | | | | Capital (2010 – present); | | | | |
| | | | | |
| | | | | | Principal, Maxam Capital | | | | |
| | | | | | Management, LLC (2006 – 2008); and | | | | |
| | | | | |
| | | | | | Principal, Cobble Creek Management LP (2004 – 2006). | | | | |
| | | | | |
Russell A. Kimball, Jr. (1944 ) | | Board Member | | 1986 – 1990 and
Since 2002 | | General Manager, Sheraton Sand Key Resort (1975 – present); | | 161 | | N/A |
| | | | | |
| | | | | | Board Member, TST | | | | |
| | | | | | (1986 – present); | | | | |
| | | | | |
| | | | | | Board Member, Transamerica | | | | |
| | | | | | Funds, (1986 – 1990), | | | | |
| | | | | | (2002 – present); | | | | |
| | | | | |
| | | | | | Board Member, TIS | | | | |
| | | | | | (2002 – present); | | | | |
| | | | | |
| | | | | | Board Member, TPP, TPFG, | | | | |
| | | | | | TPFG II and TAAVF | | | | |
| | | | | | (2007 – present); and | | | | |
| | | | | |
| | | | | | Board Member, TII | | | | |
| | | | | | (2008 – 2010). | | | | |
| | | | | |
Eugene M. Mannella (1954 ) | | Board Member | | Since 2007 | | Chief Executive Officer, HedgeServ Corporation (hedge fund administration) (2008 – present); | | 161 | | N/A |
| | | | | |
| | | | | | Self-employed consultant (2006 – present); | | | | |
| | | | | |
| | | | | | Managing Member and Chief Compliance Officer, HedgeServ Investment Services, LLC (limited purpose broker-dealer) (2011 – present); | | | | |
| | | | |
| Transamerica Funds | | | | Annual Report 2012 |
| | Page 192 | | |
| | | | | | | | | | |
| | | | | | | | | Number of | | |
| | | | | Term of | | | | Funds in | | |
| | | | | Office and | | | | Complex | | Other |
| | | Position(s) | | Length | | | | Overseen | | Directorships |
| Name and | | Held with | | of Time | | Principal Occupation(s) | | by Board | | During the Past |
Year of Birth | | Trust | | Served* | | During Past Five Years | | Member | | Five Years |
INDEPENDENT BOARD MEMBERS—continued | | | | |
| | | | | |
Eugene M. Mannella (continued) | | | | | | President, ARAPAHO Partners LLC (limited purpose broker- dealer) (1998 – 2008); | | | | |
| | | | | |
| | | | | | Board Member, TPP, TPFG, TPFG II and TAAVF (1993 – present); | | | | |
| | | | | |
| | | | | | Board Member, Transamerica Funds, TST and TIS (2007 – present); | | | | |
| | | | | |
| | | | | | Board Member, TII (2008 – 2010); and | | | | |
| | | | | |
| | | | | | President, International Fund Services (alternative asset administration) (1993 – 2005). | | | | |
| | | | | |
Norman R. Nielsen, | | Board | | Since 2006 | | Retired (2005 – present); | | 161 | | Buena Vista |
Ph.D. | | Member | | | | | | | | University Board |
(1939 ) | | | | | | Board Member, Transamerica | | | | of Trustees |
| | | | | | Funds, TST and TIS | | | | (2004 – present) |
| | | | | | (2006 – present); | | | | |
| | | | | |
| | | | | | Board Member, TPP, TPFG, | | | | |
| | | | | | TPFG II and TAAVF | | | | |
| | | | | | (2007 – present); | | | | |
| | | | | |
| | | | | | Board Member, TII | | | | |
| | | | | | (2008 – 2010); | | | | |
| | | | | |
| | | | | | Director, Aspire Resources Inc. | | | | |
| | | | | | (formerly, Iowa Student Loan | | | | |
| | | | | | Service Corporation) | | | | |
| | | | | | (2006 – present); | | | | |
| | | | | |
| | | | | | Director, League for Innovation in | | | | |
| | | | | | the Community Colleges | | | | |
| | | | | | (1985 – 2005); | | | | |
| | | | | |
| | | | | | Director, Iowa Health Systems | | | | |
| | | | | | (1994 – 2003); | | | | |
| | | | | |
| | | | | | Director, U.S. Bank | | | | |
| | | | | | (1985 –2006); and | | | | |
| | | | | |
| | | | | | President, Kirkwood Community | | | | |
| | | | | | College (1985 –2005). | | | | |
| | | | | |
Joyce G. Norden | | Board | | Since 2007 | | Retired (2004 – present); | | 161 | | Board of |
(1939 ) | | Member | | | | | | | | Governors, |
| | | | | | Board Member, TPFG, TPFG II | | | | Reconstructionist |
| | | | | | and TAAVF (1993 –present); | | | | Rabbinical |
| | | | | | | | | | College |
| | | | | | Board Member, TPP | | | | (2007 – present) |
| | | | | | (2002 – present); | | | | |
| | | | | |
| | | | | | Board Member, Transamerica | | | | |
| | | | | | Funds, TST and TIS | | | | |
| | | | | | (2007 – present); | | | | |
| | | | |
| Transamerica Funds | | | | Annual Report 2012 |
| | Page 193 | | |
| | | | | | | | | | | | |
| | | | | | | | | Number of | | | |
| | | | | Term of | | | | Funds in | | | |
| | | | | Office and | | | | Complex | | | Other |
| | | Position(s) | | Length | | | | Overseen | | | Directorships |
| Name and | | Held with | | of Time | | Principal Occupation(s) | | by Board | | | During the Past |
Year of Birth | | Trust | | Served* | | During Past Five Years | | Member | | | Five Years |
INDEPENDENT BOARD MEMBERS—continued | | | |
| | | | | |
Joyce G. Norden (continued) | | | | | | Board Member, TII (2008 – 2010); and | | | | | | |
| | | | | |
| | | | | | Vice President, Institutional Advancement, Reconstructionist Rabbinical College (1996 – 2004). | | | | | | |
| | | | | |
Patricia L. Sawyer | | Board | | Since 2007 | | Retired (2007 – present); | | | 161 | | | Honorary |
(1950 ) | | Member | | | | | | | | | | Trustee, Bryant |
| | | | | | President/Founder, Smith & | | | | | | University (1996 |
| | | | | | Sawyer LLC (management | | | | | | – present) |
| | | | | | consulting) (1989 – 2007); | | | | | | |
| | | | | |
| | | | | | Board Member, Transamerica | | | | | | |
| | | | | | Funds, TST and TIS | | | | | | |
| | | | | | (2007 – present); | | | | | | |
| | | | | |
| | | | | | Board Member, TII (2008 – 2010); | | | | | | |
| | | | | |
| | | | | | Board Member, TPP, TPFG, | | | | | | |
| | | | | | TPFG II and TAAVF | | | | | | |
| | | | | | (1993 – present); | | | | | | |
| | | | | |
| | | | | | Trustee, Chair of Finance | | | | | | |
| | | | | | Committee and Chair of | | | | | | |
| | | | | | Nominating Committee | | | | | | |
| | | | | | (1987 – 1996), Bryant University; | | | | | | |
| | | | | |
| | | | | | Vice President, American Express | | | | | | |
| | | | | | (1987 – 1989); | | | | | | |
| | | | | |
| | | | | | Vice President, The Equitable | | | | | | |
| | | | | | (1986 – 1987); and | | | | | | |
| | | | | |
| | | | | | Strategy Consultant, Booz, Allen | | | | | | |
| | | | | | & Hamilton (1982 –1986). | | | | | | |
| | | | | |
John W. Waechter | | Board | | Since 2005 | | Attorney, Englander and Fischer, | | | | | | |
(1952 ) | | Member | | | | LLP (2008 – present); | | | | | | |
| | | | | | Retired (2004 – 2008); | | | | | | |
| | | | | |
| | | | | | Board Member, TST and TIS | | | | | | |
| | | | | | (2004 – present); | | | | | | |
| | | | | |
| | | | | | Board Member, Transamerica | | | | | | |
| | | | | | Funds (2005 – present); | | | | | | |
| | | | | |
| | | | | | Board Member, TPP, TPFG, | | | | | | |
| | | | | | TPFG II and TAAVF | | | | | | |
| | | | | | (2007 – present); | | | | | | |
| | | | | |
| | | | | | Board Member, TII (2008 – 2010); | | | | | | |
| | | | | |
| | | | | | Employee, RBC Dain Rauscher | | | | | | |
| | | | | | (securities dealer) (2004); | | | | | | |
| | | | |
| Transamerica Funds | | | | Annual Report 2012 |
| | Page 194 | | |
| | | | | | | | | | |
| | | | | | | | | Number of | | |
| | | | | Term of | | | | Funds in | | |
| | | | | Office and | | | | Complex | | Other |
| | | Position(s) | | Length | | | | Overseen | | Directorships |
| Name and | | Held with | | of Time | | Principal Occupation(s) | | by Board | | During the Past |
Year of Birth | | Trust | | Served* | | During Past Five Years | | Member | | Five Years |
INDEPENDENT BOARD MEMBERS—continued | | | | |
| | | | | |
John W. Waechter (continued) | | Board Member | | Since 2005 | | Executive Vice President, Chief Financial Officer and Chief Compliance Officer, William R. Hough & Co. (securities dealer) (1979 – 2004); and | | 161 | | Operation PAR, Inc. (2008 – present); West Central Florida Council – Boy Scouts of America (2008 – present) |
| | | | | | Treasurer, The Hough Group of Funds (1993 – 2004). | | | |
| * | Each Board Member shall hold office until: 1) his or her successor is elected and qualified or 2) he or she resigns, retires or his or her term as a Board Member is terminated in accordance with the Trust’s Declaration of Trust. |
| | | | |
| Transamerica Funds | | | | Annual Report 2012 |
| | Page 195 | | |
OFFICERS
The mailing address of each officer is c/o Secretary, 570 Carillon Parkway, St. Petersburg, Florida 33716. The following table shows information about the officers, including their year of birth, their positions held with the Trust and their principal occupations during the past five years (their titles may have varied during that period). Each officer will hold office until his or her successor has been duly elected or appointed or until his or her earlier death, resignation or removal.
| | | | | | |
| | | | | Term of Office | | |
| Name and | | | | and Length of | | Principal Occupation(s) or Employment |
Year of Birth | | Position | | Time Served* | | During Past Five Years |
Thomas A. Swank (1960) | | Board Member, President and Chief Executive Officer | | Since 2012 | | See table above. |
| | | |
Timothy S. Galbraith (1964) | | Vice President and Chief Investment Officer, Alternative Investments | | Since 2012 | | Vice President and Chief Investment Officer, Alternative Investments, Transamerica Funds, TST, TIS, TPP, TPFG, TPFG II and TAAVF (April 2012 – present); |
| | | |
| | | | | | Senior Vice President and Chief Investment Officer, Alternative Investments (March 2012 – present), TAM; |
| | | |
| | | | | | Head of Alternative Investment Strategies, Morningstar Associates, LLC (2009 – March 2012); and |
| | | |
| | | | | | Managing Director, Bear Stearns Asset Management (2001 – 2009). |
| | | |
Dennis P. Gallagher (1970) | | Vice President, General Counsel and Secretary | | Since 2006 | | Vice President, General Counsel and Secretary, Transamerica Funds, TST and TIS (2006 – present); |
| | | |
| | | | | | Vice President, General Counsel and Secretary, |
| | | | | | TPP, TPFG, TPFG II and TAAVF |
| | | | | | (2007 – present); |
| | | |
| | | | | | Vice President, General Counsel and Secretary, |
| | | | | | TII, (2006 – 2010); |
| | | |
| | | | | | Director, Senior Vice President, General |
| | | | | | Counsel, Operations and Secretary, TAM |
| | | | | | (2006 – present); |
| | | |
| | | | | | Director, Senior Vice President, General |
| | | | | | Counsel, Chief Administrative Officer and |
| | | | | | Secretary, TFS (2006 – present); |
| | | |
| | | | | | Assistant Vice President, TCI (2007 – present); |
| | | |
| | | | | | Director, Deutsche Asset Management |
| | | | | | (1998 – 2006); and |
| | | |
| | | | | | Corporate Associate, Ropes & Gray LLP |
| | | | | | (1995 – 1998). |
| | | |
Todd R. Porter (1961) | | Vice President and Chief Investment Officer, Asset Allocation | | Since 2012 | | Vice President and Chief Investment Officer, Asset Allocation, Transamerica Funds, TST, TIS, TPP, TPFG, TPFG II and TAAVF (April 2012 – present); Senior Vice President and Chief Investment Officer, Asset Allocation (April 2012 – present), TAM; |
| | | |
| | | | | | Chief Investment Officer, Fund Architects, LLC |
| | | | | | (2007 – 2012); and |
| | | |
| | | | | | Chief Investment Strategist, Morningstar |
| | | | | | Associates, LLC (1999 – 2006). |
| | | | |
| Transamerica Funds | | | | Annual Report 2012 |
| | Page 196 | | |
| | | | | | |
| | | | | Term of Office | | |
| Name and | | | | and Length of | | Principal Occupation(s) or Employment |
Year of Birth | | Position | | Time Served* | | During Past Five Years |
Christopher A. Staples (1970) | | Vice President and Chief Investment Officer, Advisory Services | | Since 2005 | | Vice President and Chief Investment Officer, Advisory Services (2007 – present), Senior Vice President – Investment Management (2006 – 2007), Vice President – Investment Management (2005 – 2006), Transamerica Funds, TST and TIS; |
| | | |
| | | | | | Vice President and Chief Investment Officer, Advisory Services, TPP, TPFG, TPFG II and TAAVF (2007 – present); |
| | | |
| | | | | | Vice President and Chief Investment Officer (2007 – 2010); Vice President – Investment Administration (2005 – 2007), TII; |
| | | |
| | | | | | Director (2005 – present), Senior Vice President (2006 – present) and Chief Investment Officer, Advisory Services (2007 – present), TAM; |
| | | |
| | | | | | Director, TFS (2005 – present); and Assistant Vice President, Raymond James & Associates (1999 – 2004). |
| | | |
Elizabeth Strouse (1974) | | Vice President, Treasurer and Principal Financial Officer | | Since 2010 | | Vice President, Treasurer and Principal Financial Officer (2011 – present), Assistant Treasurer (2010 – 2011), Transamerica Funds, TST, TIS, TPP, TPFG, TPFG II and TAAVF; |
| | | |
| | | | | | Vice President, TAM and TFS (2009 – present); |
| | | |
| | | | | | Director, Fund Administration, TIAA-CREF |
| | | | | | (2007 – 2009); and |
| | | |
| | | | | | Manager (2006 – 2007) and Senior (2003 – |
| | | | | | 2006) Accounting and Assurance, |
| | | | | | PricewaterhouseCoopers, LLC. |
| | | |
Robert S. Lamont, Jr. (1973) | | Vice President, Chief Compliance Officer and Conflicts of Interest Officer | | Since 2010 | | Vice President, Chief Compliance Officer and Conflicts of Interest Officer, Transamerica Funds, TST, TIS, TPP, TPFG, TPFG II and TAAVF (2010 – present); |
| | | |
| | | | | | Vice President and Senior Counsel, TAM and |
| | | | | | TFS (2007 – present); |
| | | |
| | | | | | Senior Counsel, United States Securities and |
| | | | | | Exchange Commission (2004 – 2007); and |
| | | |
| | | | | | Associate, Dechert, LLP (1999 – 2004). |
| | | |
Bradley O. Ackerman (1966) | | Deputy Chief Compliance Officer and Anti-Money Laundering Officer | | Since 2007 | | Deputy Chief Compliance Officer, Transamerica Funds, TST, TIS, TPP, TPFG, TPFG II and TAAVF (January 2012 – present); |
| | | |
| | | | | | Anti-Money Laundering Officer, TPP, TPFG, TPFG II and TAAVF (2009 – present); |
| | | |
| | | | | | Anti-Money Laundering Officer, Transamerica Funds, TST and TIS (2007 – present); |
| | | |
| | | | | | Senior Compliance Officer, TAM |
| | | | | | (2007 – present); and |
| | | |
| | | | | | Director, Institutional Services, Rydex |
| | | | | | Investments (2002 – 2007). |
| | | | |
| Transamerica Funds | | | | Annual Report 2012 |
| | Page 197 | | |
| | | | | | |
| | | | | Term of Office | | |
| Name and | | | | and Length of | | Principal Occupation(s) or Employment |
Year of Birth | | Position | | Time Served* | | During Past Five Years |
Sarah L. Bertrand (1967) | | Assistant Secretary | | Since 2009 | | Assistant Secretary, Transamerica Funds, TST, TIS, TPP, TPFG, TPFG II and TAAVF (2009 – present); |
| | | |
| | | | | | Assistant Secretary, TII (2009 – 2010); |
| | | |
| | | | | | Assistant Vice President and Director, Legal |
| | | | | | Administration, TAM and TFS (2007 – present); |
| | | |
| | | | | | Assistant Secretary and Chief Compliance |
| | | | | | Officer, 40|86 Series Trust and 40|86 Strategic |
| | | | | | Income Fund (2000 – 2007); and |
| | | |
| | | | | | Second Vice President and Assistant |
| | | | | | Secretary, Legal and Compliance, 40|86 |
| | | | | | Capital Management, Inc. (1994 – 2007). |
| | | |
Timothy J. Bresnahan | | Assistant Secretary | | Since 2009 | | Assistant Secretary, Transamerica Funds, TST, |
(1968) | | | | | | TIS, TPP, TPFG, TPFG II and TAAVF |
| | | | | | (2009 – present); |
| | | |
| | | | | | Assistant Secretary, TII (2009 – 2010); |
| | | | | | Vice President and Senior Counsel, TAM |
| | | | | | (2008 – present); |
| | | |
| | | | | | Counsel (contract), Massachusetts Financial |
| | | | | | Services, Inc. (2007); |
| | | |
| | | | | | Assistant Counsel, BISYS Fund Services Ohio, |
| | | | | | Inc. (2005 – 2007); and |
| | | |
| | | | | | Associate, Greenberg Traurig, P.A. |
| | | | | | (2004 – 2005). |
| | | |
Margaret A. Cullem-Fiore | | Assistant Secretary | | Since 2010 | | Assistant Secretary, Transamerica Funds, TST, |
(1957) | | | | | | TIS, TPP, TPFG, TPFG II and TAAVF |
| | | | | | (2010 – present); |
| | | |
| | | | | | Assistant Vice President, TCI (2009 – present); |
| | | |
| | | | | | Vice President and Assistant General Counsel, |
| | | | | | TAM and TFS (2006 – present); |
| | | |
| | | | | | Vice President and Senior Counsel, |
| | | | | | Transamerica Financial Advisors, Inc. |
| | | | | | (2004 – 2007); and |
| | | |
| | | | | | Vice President and Senior Counsel, Western |
| | | | | | Reserve Life Assurance Co. of Ohio (2006). |
| * | Elected and serves at the pleasure of the Board of the Trust. |
If an officer has held offices for different funds for different periods of time, the earliest applicable date is shown. No officer of the Trust, except for the Chief Compliance Officer, receives any compensation from the Trust.
Additional information about the Funds’ Board Members can be found in the Statement of Additional Information, available, without charge, upon request, by calling toll free 1-800-233-4339 or on the Trust’s website at www.transamericainvestments.com.
| | | | |
| Transamerica Funds | | | | Annual Report 2012 |
| | Page 198 | | |
PROXY VOTING POLICIES AND PROCEDURES AND QUARTERLY PORTFOLIO HOLDINGS
(unaudited)
A description of the Transamerica Funds’ proxy voting policies and procedures is available in the Statement of Additional Information of the Portfolios, available without charge upon request by calling 1-888-233-4339 (toll free) or on the Securities and Exchange Commission’s (“SEC”) website at http://www.sec.gov.
In addition, the Funds are required to file Form N-PX, with their complete proxy voting records for the 12 months ended June 30th, no later than August 31st of each year. The Form is available without charge: (1) from the Funds, upon request by calling 1-888-233-4339; and (2) on the SEC’s website at http://www.sec.gov.
The Funds file their complete schedule of portfolio holdings with the SEC for the first and third quarter of each fiscal year on Form N-Q, which is available on the SEC’s website at http://www.sec.gov. The Funds’ Form N-Q may be reviewed and copied at the SEC’s Public Reference Room in Washington, D.C. Information on the operation of the Public Reference Room may be obtained by calling 1-800-SEC-0330.
You may also visit the Trust’s website at www.transamericainvestments.com for this and other information about the Funds and the Trust.
Important Notice Regarding Delivery of Shareholder Documents
Every year we send shareholders informative materials such as the Transamerica Funds Annual Report, the Transamerica Funds Prospectus, and other required documents that keep you informed regarding your Funds. Transamerica Funds will only send one piece per mailing address, a method that saves your Funds money by reducing mailing and printing costs. We will continue to do this unless you tell us not to. To elect to receive individual mailings, simply call a Transamerica Customer Service Representative toll free at 1-888-233-4339, 8 a.m. to 7 p.m. Eastern Time, Monday–Friday. Your request will take effect within 30 days.
| | | | |
| Transamerica Funds | | | | Annual Report 2012 |
| | Page 199 | | |
NOTICE OF PRIVACY POLICY
(unaudited)
Protecting your privacy is very important to us. We want you to understand what information we collect and how we use it. We collect and use “nonpublic personal information” in connection with providing our customers with a broad range of financial products and services as effectively and conveniently as possible. We treat nonpublic personal information in accordance with our Privacy Policy.
What Information We Collect and From Whom We Collect It
We may collect nonpublic personal information about you from the following sources:
| | • | | Information we receive from you on applications or other forms, such as your name, address, and account number; |
| | • | | Information about your transactions with us, our affiliates, or others, such as your account balance and purchase/redemption history; and |
| | • | | Information we receive from non-affiliated third parties, including consumer reporting agencies. |
What Information We Disclose and To Whom We Disclose It
We do not disclose any nonpublic personal information about current or former customers to anyone without their express consent, except as permitted by law. We may disclose the nonpublic personal information we collect, as described above, to persons or companies that perform services on our behalf and to other financial institutions with which we have joint marketing agreements. We will require these companies to protect the confidentiality of your nonpublic personal information and to use it only to perform the services for which we have hired them.
Our Security Procedures
We restrict access to your nonpublic personal information and only allow disclosures to persons and companies as permitted by law to assist in providing products or services to you. We maintain physical, electronic, and procedural safeguards to protect your nonpublic personal information and to safeguard the disposal of certain consumer information.
If you have any questions about our Privacy Policy, please call 1-888-233-4339 on any business day between 8 a.m. and 7 p.m. Eastern Time.
Note: This Privacy Policy applies only to customers that have a direct relationship with us or our affiliates. If you own shares of our funds in the name of a third party such as a bank or broker-dealer, its privacy policy may apply to you instead of ours.
| | | | |
| Transamerica Funds | | | | Annual Report 2012 |
| | Page 200 | | |
Customer Service 1-888-233-4339
P.O. Box 9012 • Clearwater, FL 33758-9012
Distributor: Transamerica Capital, Inc.

Class I2 Funds
Annual Report
October 31, 2012
www.transamericainvestments.com
Customer Service 1-888-233-4339
P.O. Box 9012 • Clearwater, FL 33758-9012
Distributor: Transamerica Capital, Inc.
Dear Fellow Shareholder,
On behalf of Transamerica Funds, we would like to thank you for your continued support and confidence in our products as we look forward to continuing to serve you and your financial adviser in the future. We value the trust you have placed in us.
This annual report is provided to you with the intent of presenting a comprehensive review of the investments of each of your funds. The Securities and Exchange Commission requires that annual and semi-annual reports be sent to all shareholders, and we believe this report to be an important part of the investment process. In addition to providing a comprehensive review, this report also provides a discussion of accounting policies as well as matters presented to shareholders that may have required their vote.
We believe it is important to understand market conditions over the last year in order to provide a context for reading this report. One year ago, fears that a sovereign default or a large bank failure in Europe would precipitate a global crisis had driven U.S. and many international markets down. In late 2011, the European Central Bank responded by making unlimited loans available to European banks, which used this money to honor deposits and to purchase sovereign bonds. Market fears subsided and global economies improved modestly, helping markets to rally strongly throughout the first three months of 2012.
Then, in early spring, positive economic trends in both the United States and abroad faded, causing most equity markets to dip from their March 2012 highs. The onset of summer brought resurgence in both U.S. economics and markets and, at the same time, economic weakness in Europe and Asia moderated. These events, combined with additional easing by global central banks, helped to drive most international equities higher through the end of summer. In September, unlimited quantitative easing was announced by the Federal Reserve which pushed U.S. markets to their highs for the year. In October, disappointing corporate earnings caused U.S. markets to retreat modestly, leaving the Standard & Poor’s 500® Index up 15.21% for the year ended October 31, 2012. During this same period, the Morgan Stanley Capital International—Europe, Australasia, Far East Index (“MSCI-EAFE”), a measure of international stock returns, gained 5.15% and the Barclays U.S. Aggregate Bond Index gained 5.25%. Please keep in mind it is important to maintain a diversified portfolio as investment returns have historically been difficult to predict.
In addition to your active involvement in the investment process, we firmly believe that a financial adviser is a key resource to help you build a complete picture of your current and future financial needs. Financial advisers are familiar with the market’s history, including long-term returns and volatility of various asset classes. With your financial adviser, you can develop an investment program that incorporates factors such as your goals, your investment timeline, and your risk tolerance.
Please contact your financial adviser if you have any questions about the contents of this report, and thanks again for the confidence you have placed in us.
Sincerely,
| | |
| Thomas A. Swank | | Christopher A. Staples |
| President & Chief Executive Officer | | Vice President & Chief Investment Officer |
| Transamerica Funds | | Transamerica Funds |
The views expressed in this report reflect those of the portfolio managers only and may not necessarily represent the views of Transamerica Funds. These views are subject to change based upon market conditions. These views should not be relied upon as investment advice and are not indicative of trading intent on behalf of Transamerica Funds.
Transamerica Arbitrage Strategy
(formerly, Transamerica Water Island Arbitrage Strategy)
(unaudited)
MARKET ENVIRONMENT
For the prior twelve months, investors have oscillated between bullish and bearish sentiments while seeking clarity on unresolved questions—including problems in Europe, the underwhelming U.S. economic recovery, the looming fiscal cliff, and a slowing Chinese economy. Meanwhile, central banks across the globe have unanimously stepped into the political leadership voids with pro-growth monetary strategies: money-printing, pro-inflationary backstops meant to prop up insolvent or weak economic institutions. While we cannot predict the outcome of this dynamic, we do suspect these easy money policies are as likely to create unintended problems as they are intended solutions.
In contrast to the uncertain macroeconomic picture, corporate fundamentals appeared quite strong during the fiscal year. Cash flow remained high with margins at pre-crisis levels. Many industries materially reduced capacity and have stable, profitable business at current levels of activity. Balance sheets are stronger than in recent years, often significantly so, and supply chains are much leaner. As a reflection of the large amount of cash on corporate balance sheets, merger and acquisition transactions with a cash-only payment method accounted for the majority of global mergers and acquisitions volume.
PERFORMANCE
For the year ended October 31, 2012, Transamerica Arbitrage Strategy Class I2 returned (2.67)%. By comparison, its benchmark, the Bank of America Merrill Lynch US Dollar LIBOR 3-Month Constant Maturity Index, returned 0.48%.
STRATEGY REVIEW
Merger arbitrage seeks to profit from investing in securities that are involved in mergers and acquisitions. Typically a low volatility strategy pursued by absolute-return-minded investors, our goal is to capture a return stream with low correlation to the overall markets.
Within the market environment described above, our discipline continues to focus on building a diversified global fund of deals—each having a sound strategic rationale—across all sectors, market capitalizations, and jurisdictions. For the period from November 1, 2011 through October 31, 2012, Transamerica Arbitrage Strategy underperformed its benchmark. The main source of this underperformance stems from an unusually high number of transactions within our fund that encountered terminations or delays. Additionally, many of our holdings have recently sold off in an increasingly fearful marketplace showcasing investors raising cash in their portfolios and exiting many of our high conviction holdings. Where possible, we have been adding to these positions on weakness.
While fairly widespread, we have seen this selling emphasized around deals subject to regulatory scrutiny or other uncertainties related to timing. Industrial, consumer discretionary, and energy sectors have had the greatest and most recent negative impacts on performance, with the majority of the underperformance occurring in the last two months of the fiscal year. This volatility in arbitrage situations has been widespread and the selling pressures have not been limited to any particular region, although they recently coalesced in Europe and North America. In recent months, these sectors and geographic locations impacted our fund negatively due to deal delays brought on by politics and nationalistic attitudes. These deal delays triggered forced or panicked selling by some market participants, but we believe patience will be rewarded, and we have been adding opportunistically to our high conviction positions in this environment.
Examples of transactions that have thus negatively impacted our fund to date include United Parcel Service Inc.’s purchase of Netherlands-based TNT Express NV, which has been hampered by regulatory delays, and Hertz Global Holdings Inc.’s purchase of Dollar Thrifty Automotive Group, Inc.
Performance contributors during the period included El Paso Corporation’s purchase by Kinder Morgan Inc., United Technologies Corporations ongoing acquisition of Goodrich Corporation, and the completed takeover of Progress Energy Inc. by Duke Energy. The information technology, utilities, financials, healthcare, and consumer staples sectors also contributed to returns.
While this was a challenging year, it is not unlike other periods of time we have encountered in the past twelve years. In retrospect, it is evident these are the years which have been the most formative for our team and its culture as we continually refine our investment process. Today, regarding our highest conviction ideas, we have performed meticulous fundamental analysis on specific deal valuations, we have assessed the backdrop of deal rationales and potential obstacles, and we are positioned to be opportunistic. While it is impossible to predict when this current phase of uncertainty will end, we are working to position ourselves properly and navigate through this volatile but opportunistic episode.
| | | | |
| Transamerica Funds | | | | Annual Report 2012 |
| | Page 1 | | |
Transamerica Arbitrage Strategy
(formerly, Transamerica Water Island Arbitrage Strategy)
(unaudited)
STRATEGY REVIEW (continued)
Within this context, Water Island Capital, LLC has continued to upgrade its infrastructure in order to take advantage of the many consolidation opportunities witnessed across the globe. Elevated deal flow in the Asia-Pacific region has led to the addition of investment professionals who are dedicated to the area. We’ve also added professionals to our London based team focused on investments in the Europe, the Middle East and Africa region.
In many, but not all, situations, we utilize derivatives such as options to hedge both deal-specific and market risks. Short selling is also employed to hedge “stock for stock” merger transactions. When investing overseas we often invest in swaps, but we hedge currency risks at all times with currency forwards to achieve a dollar-neutral portfolio. As a whole, these hedging strategies serve an important role in providing long-term downside protection, but these hedges typically are modest detractors from our performance. During the fiscal year, this category as a whole modestly detracted from returns with foreign currency hedges being the largest detractor.
John S. Orrico, CFA
Todd W. Munn
Roger P. Foltynowicz
Co-Portfolio Managers
Water Island Capital, LLC
| | | | |
| Transamerica Funds | | | | Annual Report 2012 |
| | Page 2 | | |
Transamerica Arbitrage Strategy
(formerly, Transamerica Water Island Arbitrage Strategy)
(unaudited)
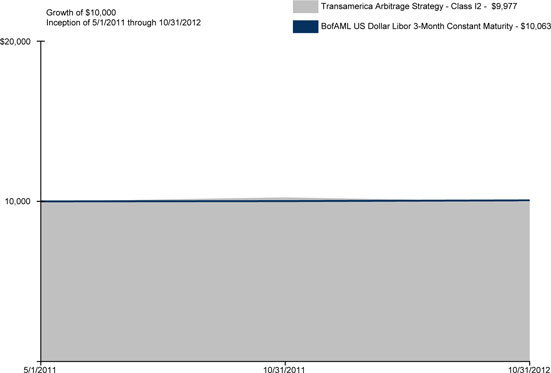
Average Annual Total Return for Periods Ended 10/31/2012
| | | | | | | | | | | | |
| | | 1 Year | | | 10 Years or
Life of Fund | | | Inception Date | |
Class I2 (NAV) | | | (2.67 | )% | | | (0.16 | )% | | | 05/01/2011 | |
BofAML US Dollar Libor 3-Month Constant Maturity * | | | 0.48 | % | | | 0.42 | % | | | | |
NOTES
| * | Bank of America Merrill Lynch US Dollar LIBOR 3-Month Constant Maturity Index (“BofAML US Dollar Libor 3-Month Constant Maturity”) is an unmanaged index used as a general measure of market performance. Calculations assume dividends and capital gains are reinvested and do not include any managerial expenses. The 10 Years or Life of Fund calculation is based on the inception date of the class. You cannot invest directly in an index. |
The performance data presented represents past performance; future results may vary. Performance data does not reflect the deduction of taxes that would be paid on fund distributions or the redemption of fund shares. Investment return and principal value will fluctuate so that an investor’s shares, when redeemed, may be worth more or less than their original cost. Current performance may be lower or higher than performance quoted. Please see www.transamericainvestments.com for performance data current to the most recent month-end. Net Asset Value (“NAV”) returns include the reinvestment of dividends and capital gains. Fund shares are sold without a sales load.
Performance figures reflect any fee waivers and/or expense reimbursements by the Investment Adviser. Without such waivers and/or reimbursements, the performance would be lower. Future waivers and/or reimbursements are at the discretion of the Investment Adviser.
Securities purchased for an arbitrage strategy are intended to take advantage of a perceived relationship between the value of two securities and may not perform as expected. This material must be preceded or accompanied by a current prospectus, which includes specific contents regarding the investment objectives and policies of this fund. This fund is only available in Class I2 shares, which are not available for direct investment by the public.
| | | | |
| Transamerica Funds | | | | Annual Report 2012 |
| | Page 3 | | |
Transamerica Bond
(formerly, Transamerica Loomis Sayles Bond)
(unaudited)
MARKET ENVIRONMENT
Over the past year, markets have experienced on and off bouts of volatility, primarily driven by global macroeconomic events. Despite the presence of volatility during the year, fixed income markets generally rallied across most asset classes. Risk assets have been supported by central bank interventions around the world, most notable include actions taken by the U.S. Federal Reserve Board (“Fed”) to extend its “Operation Twist” program and the announcement of “QE3”, while the European Central Bank (“ECB”) took an affirmative stand to save the Euro at all costs by implementing a bond-buying program of its own. These expansionary policies have buoyed the prices of many risk assets including corporate bonds, securitized assets, and equities.
PERFORMANCE
For the year ended October 31, 2012, Transamerica Bond Class I2 returned 14.24%. By comparison, its benchmark, the Barclays U.S. Government/Credit Bond Index, returned 5.90%.
STRATEGY REVIEW
This strategy utilizes a multi-sector approach, which opportunistically uses various sectors within the fixed income market depending upon valuations. The fund has been kept well diversified and security selection has continued to be a key focus of the full discretion team.
During the 1-year period, Transamerica Bond outperformed the Barclays U.S. Government/Credit Bond Index. The fund was able to achieve significant alpha during the period, attributable to its multi-sector approach which can strategically utilize a number of out-of-benchmark sectors. High yield corporate, which represented over 20% of the fund on average, had the greatest impact on relative performance, contributing strongly to excess return. Strong security selection within the investment grade corporate space also provided a significant contribution to excess return. The fund maintained a significant underweight to U.S. Treasuries, which proved beneficial as the high quality asset class lagged higher beta assets given the rally in risk assets. Other positions including securitized assets, international positions, and equity and convertible holdings all aided relative performance during the year.
The strategy is positioned for slow but positive domestic growth and ongoing instability stemming from global macroeconomic factors. Corporate balance sheets remain sanguine and corresponding fundamentals are extremely strong. The full discretion team feels we are well-positioned longer term using our fundamental bottom-up approach. We do not view the short term volatility as exit points. Instead, we consider these opportunities to buy where we see value. We expect elevated levels of volatility to continue due to the current level of geopolitical risk, uncertainty surrounding the upcoming U.S. presidential election and domestic fiscal reform, and the continued potential for a ‘hard landing’ in China.
Matthew J. Eagan, CFA
Daniel J. Fuss, CFA
Elaine M. Stokes
Co-Portfolio Managers
Loomis, Sayles & Company, L.P.
| | | | |
| Transamerica Funds | | | | Annual Report 2012 |
| | Page 4 | | |
Transamerica Bond
(formerly, Transamerica Loomis Sayles Bond)
(unaudited)
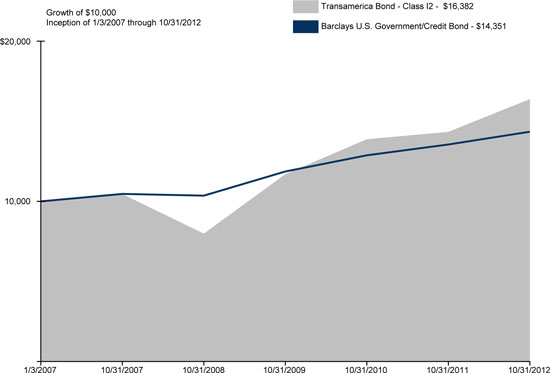
Average Annual Total Return for Periods Ended 10/31/2012
| | | | | | | | | | | | | | | | |
| | | 1 Year | | | 5 Years | | | 10 Years or
Life of Fund | | | Inception Date | |
Class I2 (NAV) | | | 14.24 | % | | | 9.41 | % | | | 8.84 | % | | | 01/03/2007 | |
Barclays U.S. Government/Credit Bond * | | | 5.90 | % | | | 6.52 | % | | | 6.40 | % | | | | |
NOTES
| * | The Barclays U.S. Government/Credit Bond Index (“Barclays U.S. Government/Credit Bond”) is an unmanaged index used as a general measure of market performance. Calculations assume dividends and capital gains are reinvested and do not include any managerial expenses. The 10 Years or Life of Fund calculation is based on the inception date of the class. You cannot invest directly in an index. |
The performance data presented represents past performance; future results may vary. Performance data does not reflect the deduction of taxes that would be paid on fund distributions or the redemption of fund shares. Investment return and principal value will fluctuate so that an investor’s shares, when redeemed, may be worth more or less than their original cost. Current performance may be lower or higher than performance quoted. Please see www.transamericainvestments.com for performance data current to the most recent month-end. Net Asset Value (“NAV”) returns include the reinvestment of dividends and capital gains. Fund shares are sold without a sales load.
Performance figures reflect any fee waivers and/or expense reimbursements by the Investment Adviser. Without such waivers and/or reimbursements, the performance would be lower. Future waivers and/or reimbursements are at the discretion of the Investment Adviser.
Fixed income investing is subject to credit risk, inflation risk, and interest rate risk. Credit risk is the risk that the issuer of a bond won’t meet their payments. Inflation risk is the risk that inflation could outpace a bond’s interest income. Interest rate risk is the risk that fluctuations in interest rates will affect the price of a bond. This material must be preceded or accompanied by a current prospectus, which includes specific contents regarding the investment objectives and policies of this fund. This fund is only available in Class I2 shares, which are not available for direct investment by the public.
| | | | |
| Transamerica Funds | | | | Annual Report 2012 |
| | Page 5 | | |
Transamerica Core Bond
(formerly, Transamerica JPMorgan Core Bond)
(unaudited)
MARKET ENVIRONMENT
The year began and ended with central bank relief as the global economy faced growing debt concerns, lower growth prospects and higher unemployment. The year started with European Union policymakers announcing an increase to the European Financial Stability Fund (“EFSF”) capacity to €1 trillion, and a verdict on Greek bonds, which included a 50% loss, or “haircut,” for private bondholders in converting their existing bonds into new loans. Risk assets then rallied towards the end of the fiscal year as global central banks (the European Central Bank, Federal Reserve and Bank of Japan) showed their commitment to remain accommodative by announcing additional quantitative easing programs.
The U.S. Congressional ‘super-committee’ on deficit reduction was tasked in 2011 to arrive at an agreement prior to its November 23rd deadline, but was unsuccessful. As a result, $1.2 trillion in automatic spending cuts for defense and entitlement programs were scheduled to take place beginning in 2013. This, along with expiring tax breaks, was dubbed the “fiscal cliff” and there are now talks to extend portions of this legislation.
The U.S. unemployment rate continued to be above the Federal Reserve (“Fed”) comfort zone during the year; however, it has slowly declined. Lowering unemployment was major focus for the Fed and a key reason for announcing the third round of quantitative easing (“QE3”). The unemployment rate stood at 7.9% at the end of October 2012, down from 8.9% in October 2011; however, the labor force participation rate continued to fall, according to the U.S. Bureau of Labor Statistics, resulting in a rosier unemployment picture than reality.
Data through August 2012 showed that the U.S. housing market improved in most areas over the twelve months, based on Case-Shiller index data. As housing market data continues to funnel in, some believe that the market has stabilized and is now entering a recovery. We remain cautious; however, this positive sentiment, in addition to a vibrant renters’ market, has helped stabilize the mortgage market for now.
In Europe, austerity measures took a bite out of growth, pushing the peripherals into a recession and threatening to do the same to the core. Growth in Asia, and China in particular, has been below expectations, and the Bank of China has not been as aggressive in stimulating the economy as investors had hoped.
While the downside risks have been mitigated, the upside to the economy has not materially improved. The amount of deleveraging yet to occur could inhibit growth going forward. Although major central banks have provided a liquidity backdrop to stabilize the economy, there is still work to be done. In Europe, sovereign funding and the German constitutional court have given the green light for the European Stability Mechanism (ESM); however, agreements on integration and reform have yet to be reached.
PERFORMANCE
For the year ended October 31, 2012, Transamerica Core Bond Class I2 returned 6.12%. By comparison, its benchmark, the Barclays U.S. Aggregate Bond Index (“Barclays U.S. Aggregate Bond”), returned 5.25%.
STRATEGY REVIEW
The fund remained overweight in seasoned AAA-rated mortgage-backed securities (MBS), with most of its exposure in seasoned collateralized mortgage obligations (“CMOs”). We continued to favor seasoned agency CMOs, along with select high-quality non-agency structures.
U.S. Treasury yields were mixed during the fiscal year, with the curve between two- and 10-year maturities flattening 46 basis points (bps), as the spread fell from 187 bps to 141 bps. Specifically, the yield of the two-year note rose 4 bps, ending at 0.28%, while the yield of the 10-year bond fell 42 bps to 1.69%, according to Bloomberg. During this time, our underweight in Treasury debt was a positive as Treasuries were the worst-performing sector in the index in the Barclays U.S. Aggregate Bond.
Corporate earnings have remained strong but have appeared to have leveled off, as the business efficiencies produced over the last few years seem to be maximized. Balance sheets remain strong and corporations continue to hold record amounts of cash and cash equivalents on balance sheet in preparation for the unknown. Despite the economic and political uncertainty, 2012 stands to be one of the busiest years in recent history for new corporate issuance, with companies looking to capitalize on historically cheap rates. As such, the credit sector outperformed comparable-duration Treasuries by 525 bps, with financial names being among the best performers in the index.
The fund’s sector allocations did not change dramatically throughout the year. We remained overweight in mortgage securities, slightly overweight in agency debentures and modestly underweight in corporate bonds.
| | | | |
| Transamerica Funds | | | | Annual Report 2012 |
| | Page 6 | | |
Transamerica Core Bond
(formerly, Transamerica JPMorgan Core Bond)
(unaudited)
STRATEGY REVIEW (continued)
From a ratings perspective, lower credit-quality issues outperformed AAA issues, as investors looked to add incremental risk and yield to their portfolios. Government policies, such as QE3 and Operation Twist, were also effective tools to push investors down the quality spectrum. Specifically, A and BBB securities produced 525 and 634 bps of excess returns versus duration-neutral AAA issues. The fund’s underweight in the BBB segment of the market was a slight detractor from performance for the period; however, the below-investment-grade issues held benefited results.
Douglas S. Swanson
Portfolio Manager
J.P. Morgan Investment Management, Inc.
| | | | |
| Transamerica Funds | | | | Annual Report 2012 |
| | Page 7 | | |
Transamerica Core Bond
(formerly, Transamerica JPMorgan Core Bond)
(unaudited)
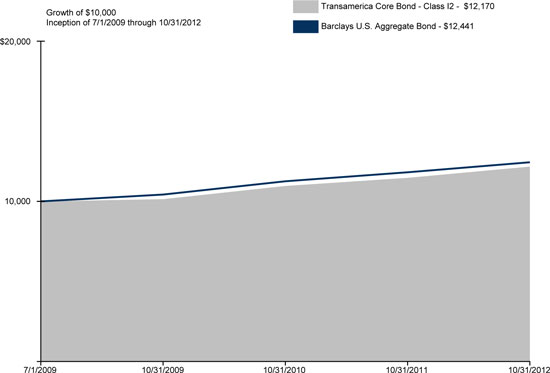
Average Annual Total Return for Periods Ended 10/31/2012
| | | | | | | | | | | | |
| | | 1 Year | | | 10 Years or
Life of Fund | | | Inception Date | |
Class I2 (NAV) | | | 6.12 | % | | | 6.07 | % | | | 07/01/2009 | |
Barclays U.S. Aggregate Bond * | | | 5.25 | % | | | 6.77 | % | | | | |
NOTES
| * | The Barclays U.S. Aggregate Bond Index (“Barclays U.S. Aggregate Bond”) is an unmanaged index used as a general measure of market performance. Calculations assume dividends and capital gains are reinvested and do not include any managerial expenses. The 10 Years or Life of Fund calculation is based on the inception date of the class. You cannot invest directly in an index. |
The performance data presented represents past performance; future results may vary. Performance data does not reflect the deduction of taxes that would be paid on fund distributions or the redemption of fund shares. Investment return and principal value will fluctuate so that an investor’s shares, when redeemed, may be worth more or less than their original cost. Current performance may be lower or higher than performance quoted. Please see www.transamericainvestments.com for performance data current to the most recent month-end. Net Asset Value (“NAV”) returns include the reinvestment of dividends and capital gains. Fund shares are sold without a sales load.
Performance figures reflect any fee waivers and/or expense reimbursements by the Investment Adviser. Without such waivers and/or reimbursements, the performance would be lower. Future waivers and/or reimbursements are at the discretion of the Investment Adviser.
Investing in bond funds entails interest rate and credit risk as well as additional risks in that the fund may invest in high-yield/high-risk bonds and is subject to greater levels of liquidity risk, which are described in more detail in the prospectus. This material must be preceded or accompanied by a current prospectus, which includes specific contents regarding the investment objectives and policies of this fund. This fund is only available in Class I2 shares, which are not available for direct investment by the public.
| | | | |
| Transamerica Funds | | | | Annual Report 2012 |
| | Page 8 | | |
Transamerica Developing Markets Equity
(formerly, Transamerica Oppenheimer Developing Markets)
(unaudited)
MARKET ENVIRONMENT
In the emerging markets, potentially slowing growth in China and efforts to stall rising inflation were of concern to global markets, as China has been the major engine of worldwide growth. Countries such as India, Brazil and Australia struggled with how to tackle sovereign debt and weak economic growth. Adding to market volatility were swings in the currency markets, which significantly strengthened the U.S. dollar and weakened other currencies. Growing tensions in the Middle East resulted in volatility in oil prices and added geopolitical uncertainty.
The overhang of the sovereign debt crisis in Europe continued to produce market jitters. Persistent high unemployment and unwieldy sovereign debt in countries such as Spain, Greece and Italy led risk markets lower as did worries about the future of the eurozone and the Euro. However, the period closed on a positive note for the risk markets. The results of elections in Greece and continued efforts by European policymakers to stabilize the situation in the region appeared to help calm market fears.
PERFORMANCE
For the year ended October 31, 2012, Transamerica Developing Markets Equity Class I2 returned 8.07%. By comparison, its benchmark the Morgan Stanley Capital International Emerging Markets Index (“MSCI-EMI”), returned 2.98%.
STRATEGY REVIEW
In the midst of a tumultuous environment for developing market equities, Transamerica Developing Markets Equity outperformed the MSCI-EMI (the “Index”). The fund outperformed the Index primarily in Consumer Discretionary and Financials as a result of better relative stock selection. Conversely, the fund underperformed in Information Technology as a result of a few weaker performing securities. The fund outperformed the Index in several regions, including Latin America (in particular securities domiciled in Brazil), as well as better relative stock selection in Emerging Europe, mainly due to successes in Turkey and Russia. The fund underperformed the Index in Asia with underperformance concentrated in China where a few laggards hurt performance. South Africa also hurt performance.
The strongest performing stocks for the fund this period were SM Prime Holdings, Inc., Fomento Economico Mexicano SAB de CV (“FEMSA”), and Magnit. SM Prime Holdings continued to expand by opening new malls throughout Asia and increasing sales in existing stores on robust consumer spending and strong economic fundamentals. FEMSA owns and operates OXXO, the largest convenience store chain in Latin America and continued to perform well as sales increased across its businesses, and demand grew for FEMSA’s line of soft drink products throughout Latin America, the United States and Mexico. Magnit is one of Russian’s largest food retailers, with nearly 5,000 retail outlets. During the period, the company experienced increased sales and its stock price exceeded its peak level from early 2011.
The fund’s top performance detractors included HTC Corp., Infosys, Ltd., and Ctrip.com International, Ltd. HTC is a Taiwan-based designer and manufacturer of Android phones. Shares suffered during the period as HTC experienced declines amid fiercer competition from Apple and Samsung. A weak economy in India and ongoing problems around the need for economic and political reform pushed many Indian securities lower, including Infosys. Ctrip is a dominant travel aggregator in China, participating in a highly fragmented travel and hotel property market but its margins were lower as a result of aggressive investment in sales, marketing and research and development.
At period end, the fund was primarily overweight Consumer Staples, as well as Consumer Discretionary and Information Technology and underweight the other sectors. We remain optimistic regarding the emerging markets and the fund despite short-term volatility. It is our opinion that the emerging markets will remain the engines of global growth, with the sizable majority of global growth coming out of them. Growth deceleration and the sharp retreat in risk-taking behavior as a result of investor trepidation signals to us valuations almost across the board in the emerging markets are not just fair, in our opinion, but attractive for our long-term investment horizon.
Justin Leverenz, CFA
Portfolio Manager
OppenheimerFunds, Inc.
| | | | |
| Transamerica Funds | | | | Annual Report 2012 |
| | Page 9 | | |
Transamerica Developing Markets Equity
(formerly, Transamerica Oppenheimer Developing Markets)
(unaudited)
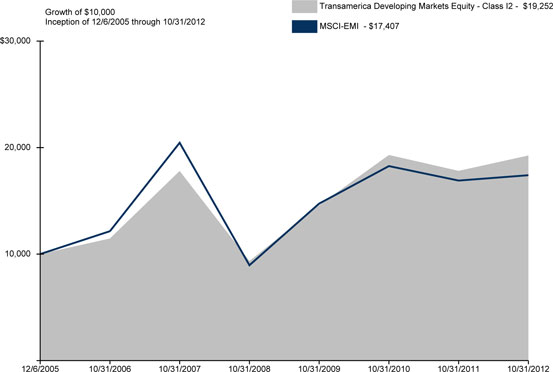
Average Annual Total Return for Periods Ended 10/31/2012
| | | | | | | | | | | | | | | | |
| | | 1 Year | | | 5 Years | | | 10 Years or
Life of Fund | | | Inception Date | |
Class I2 (NAV) | | | 8.07 | % | | | 1.58 | % | | | 9.96 | % | | | 12/06/2005 | |
MSCI-EMI * | | | 2.98 | % | | | (3.17 | )% | | | 8.36 | % | | | | |
NOTES
| * | The Morgan Stanley Capital International Emerging Markets Index (“MSCI-EMI”) is an unmanaged index used as a general measure of market performance. Calculations assume dividends and capital gains are reinvested and do not include any managerial expenses. The 10 Years or Life of Fund calculation is based on the inception date of the class. You cannot invest directly in an index. |
The performance data presented represents past performance; future results may vary. Performance data does not reflect the deduction of taxes that would be paid on fund distributions or the redemption of fund shares. Investment return and principal value will fluctuate so that an investor’s shares, when redeemed, may be worth more or less than their original cost. Current performance may be lower or higher than performance quoted. Please see www.transamericainvestments.com for performance data current to the most recent month-end. Net Asset Value (“NAV”) returns include the reinvestment of dividends and capital gains. Fund shares are sold without a sales load.
Performance figures reflect any fee waivers and/or expense reimbursements by the Investment Adviser. Without such waivers and/or reimbursements, the performance would be lower. Future waivers and/or reimbursements are at the discretion of the Investment Adviser.
Investing in emerging and developing markets involves special considerations. These may include risks related to market and currency volatility, adverse social and political developments, and the relatively small size and lesser liquidity of these markets. This material must be preceded or accompanied by a current prospectus, which includes specific contents regarding the investment objectives and policies of this fund. This fund is only available in Class I2 shares, which are not available for direct investment by the public.
| | | | |
| Transamerica Funds | | | | Annual Report 2012 |
| | Page 10 | | |
Transamerica Global Macro
(formerly, Transamerica First Quadrant Global Macro)
(unaudited)
MARKET ENVIRONMENT
Throughout the fiscal year, markets were dominated by political and macro-economic news. As investors had less faith in long-term fundamentals, such as valuations, they tried instead to project broad political and economic outcomes on all securities.
The fiscal year began with an increase in risk sentiment as signs of a global economic recovery emerged and European leaders fueled optimism that the debt crisis could be resolved. Volatility fell and risky markets rose. As the year progressed, global economies began to show evidence of a “soft patch”, Europe was in outright recession, and the eurozone debt crisis worsened. Despite an overwhelming abundance of poor economic news, investors reacted positively to any modest drop in uncertainty and risky assets outperformed mid-year as most global central banks embarked on another monetary easing journey to revive their economies.
The gap between the glum state of the global economy and the buoyant mood of the markets prevailed in the latter part of the year as risk sentiment trended higher on expectations that disappointing economic data would warrant continued easing. These expectations were indeed realized as several central banks delivered another round of liquidity injections in September. The optimism was broadly manifested across market segments as positive returns accrued for most asset classes.
The last month the fiscal year was more subdued in terms of large macro policy shifts. However, there was a large amount of data that pointed to a deteriorating political and economic climate in Europe, a mild pick up in economic activity in the U.S. and China, and a divergent consumer versus business outlook in the U.S. In light of the lack of major policy announcements, investor optimism dimmed and markets became driven more by the fundamentals and less by expectations of a “next” announcement.
PERFORMANCE
For the year ended October 31, 2012, Transamerica Global Macro Class I2 returned (0.86)%. By comparison, its benchmark, the Citigroup 1-Month Treasury Bill Index, returned 0.04%.
STRATEGY REVIEW
The strategy seeks consistent returns by combining multiple uncorrelated strategies. With an appreciation of the cyclical nature of risk, the strategy increases risk where opportunities for profit are greater while reallocating risk away from markets where gains have been realized and future gains are less likely.
The currency selection strategy was the largest contributor for the period, primarily driven by the Japanese yen short, British pound long, and Swiss franc short. The persistent Australian dollar short dampened the overall positive results as investors seemed to favor this higher yielding currency.
The stock country selection ended the year on a strong note, finishing the last two-thirds of the year with good results. During the third quarter, when a majority of the returns were realized, most positions added value with the only exceptions being long positions in Canada and the UK. The short position to Japan delivered the strongest performance.
The volatility management sleeve delivered positive results for the year as a mild downdraft during the first half of the year was more than recovered in the latter half.
The global asset class selection strategy was unprofitable over the period as a long position in stocks hurt the fund during the mid-summer dip in the equity markets.
The bond country selection strategy struggled over the period as both the German Euro Bund long and Australian bond short positions dominated the strategy’s overall results. Japanese bonds helped dampen the loss as the short position in the latter half of the year added value.
Derivatives are an essential and integral part of the fund management processes and consists primarily of exchange traded futures and options contracts, synthetic bond futures, and over-the-counter currency forwards.
Derivatives are used to achieve the following primary objectives: achieve transactional efficiency and desired exposure while minimizing transaction costs.
Kenneth J. Ferguson
Dori Levanoni
Edgar E. Peters
Co-Portfolio Managers
First Quadrant, L.P.
| | | | |
| Transamerica Funds | | | | Annual Report 2012 |
| | Page 11 | | |
Transamerica Global Macro
(formerly, Transamerica First Quadrant Global Macro)
(unaudited)
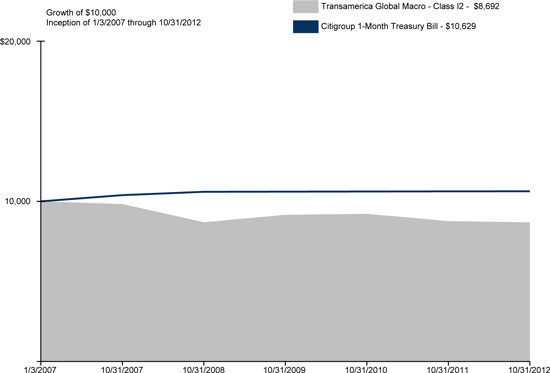
Average Annual Total Return for Periods Ended 10/31/2012
| | | | | | | | | | | | | | | | |
| | | 1 Year | | | 5 Years | | | 10 Years or
Life of Fund | | | Inception Date | |
Class I2 (NAV) | | | (0.86 | )% | | | (2.43 | )% | | | (2.38 | )% | | | 01/03/2007 | |
Citigroup 1-Month Treasury Bill * | | | 0.04 | % | | | 0.46 | % | | | 1.05 | % | | | | |
NOTES
| * | The Citigroup 1-Month Treasury Bill Index (“Citigroup 1-Month Treasury Bill”) is an unmanaged index used as a general measure of market performance. Calculations assume dividends and capital gains are reinvested and do not include any managerial expenses. The 10 Years or Life of Fund calculation is based on inception date of the class. You cannot invest directly in an index. |
The performance data presented represents past performance; future results may vary. Performance data does not reflect the deduction of taxes that would be paid on fund distributions or the redemption of fund shares. Investment return and principal value will fluctuate so that an investor’s shares, when redeemed, may be worth more or less than their original cost. Current performance may be lower or higher than performance quoted. Please see www.transamericainvestments.com for performance data current to the most recent month-end. Net Asset Value (“NAV”) returns include the reinvestment of dividends and capital gains. Fund shares are sold without a sales load.
Performance figures reflect any fee waivers and/or expense reimbursements by the Investment Adviser. Without such waivers and/or reimbursements, the performance would be lower. Future waivers and/or reimbursements are at the discretion of the Investment Adviser.
Global, foreign, and emerging market investing involves special considerations, including risks related to market and currency volatility, adverse social and political developments, and the relatively small size and lesser liquidity of these markets. This material must be preceded or accompanied by a current prospectus, which includes specific contents regarding the investment objectives and policies of this fund. This fund is only available in Class I2 shares, which are not available for direct investment by the public.
| | | | |
| Transamerica Funds | | | | Annual Report 2012 |
| | Page 12 | | |
Transamerica Global Real Estate Securities
(formerly, Transamerica Clarion Global Real Estate Securities)
(unaudited)
MARKET ENVIRONMENT
Global real estate stocks have generated a positive total return over the past twelve months as property fundamentals have gradually improved. Property companies have benefited from stability in the equity markets, a sense of diminished “tail risk” in global macroeconomic conditions and accommodative capital markets. This led to an increasingly active transactions market for property companies fueled by access to attractively priced equity and debt capital.
PERFORMANCE
For the year ended October 31, 2012, Transamerica Global Real Estate Securities Class I2 returned 14.57%. By comparison, its benchmark, the S&P Developed Property Index (“S&P Developed Property”), returned 17.39%.
STRATEGY REVIEW
Transamerica Global Real Estate Securities offers a global strategy for real estate securities investors in the U.S. The fund generally owns between 80-110 real estate stocks with the goal of outperforming the S&P Developed Property. The fund seeks to invest in attractively priced stocks that own property in markets with favorable underlying real estate fundamentals. The global universe of public real estate companies is approximately three times the size of the U.S. public company universe, which offers additional choices and diversification opportunities to the manager.
During the period, the fund trailed its benchmark primarily due to sub-par stock selection. While stock selection added value in Europe, the benefit was more than offset by the relative underperformance of holdings in the U.S., Japan and Hong Kong. In the U.S., stock selection in the hotel and apartment sector accounted for a majority of the relative shortfall during the period, overshadowing the value added by favorable stock selection in the mall sector. In Japan, the relative fund positioning in Tokyo office companies was the primary source of underperformance during the period. In Hong Kong, an underweight exposure to the outperforming residential developers hurt relative performance. Asset allocation decisions were essentially flat during the period as the benefit of an underweight to the underperforming European region was offset by allocation decisions in Singapore and Hong Kong.
We continue to be overweight property companies and geographies that provide a combination of yield and growth at reasonable valuations. In the U.S., we remain positive on the retail mall and apartment sectors and remain cautious on suburban office, health care and net lease sectors. In Europe, we remain underweight with a few exceptions where we have identified opportunity. We favor office companies that focus on London’s West End submarket, and prefer dominant retail mall companies with exposure to western and northern Europe. In the Asia-Pacific region, we remain overweight the Australian Real Estate Investment Trusts (“REITs”) and companies with significant exposure to Tokyo offices, where occupancies are improving. We continue to focus on companies that are attractively valued with investment characteristics that include high quality management, strong and flexible balance sheets, well-positioned properties and focused business plans.
The rationale for a global listed property strategy remains very much intact including diversification via low long-term correlation to broad equities and bonds, attractive current yield, reasonable valuations and the continued, gradual spread of the REIT structure globally. Real estate fundamentals will, as always, reflect improving economic conditions on a lagged basis as a result of the underlying lease structures.
We appreciate your continued faith and confidence in our portfolio management team.
T. Ritson Ferguson, CFA
Steven D. Burton, CFA
Joseph P. Smith, CFA
Co-Portfolio Managers
CBRE Clarion Securities LLC
| | | | |
| Transamerica Funds | | | | Annual Report 2012 |
| | Page 13 | | |
Transamerica Global Real Estate Securities
(formerly, Transamerica Clarion Global Real Estate Securities)
(unaudited)
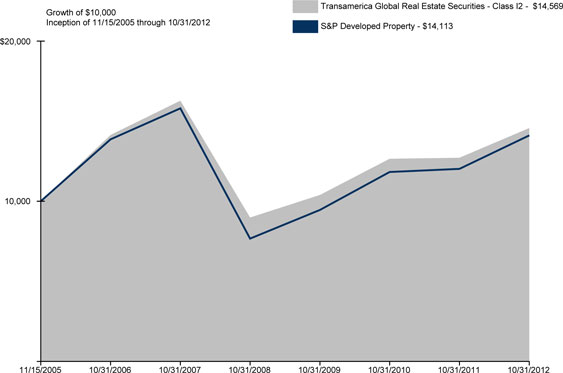
Average Annual Total Return for Periods Ended 10/31/2012
| | | | | | | | | | | | | | | | |
| | | 1 Year | | | 5 Years | | | 10 Years or
Life of Fund | | | Inception Date | |
Class I2 (NAV) | | | 14.57 | % | | | (2.20 | )% | | | 5.56 | % | | | 11/15/2005 | |
S&P Developed Property * | | | 17.39 | % | | | (2.23 | )% | | | 5.08 | % | | | | |
NOTES
| * | The S&P Developed Property Index (“S&P Developed Property”) is an unmanaged index used as a general measure of market performance. Calculations assume dividends and capital gains are reinvested and do not include any managerial expenses. The 10 Years or Life of Fund calculation is based on the inception date of the class. You cannot invest directly in an index. |
The performance data presented represents past performance; future results may vary. Performance data does not reflect the deduction of taxes that would be paid on fund distributions or the redemption of fund shares. Investment return and principal value will fluctuate so that an investor’s shares, when redeemed, may be worth more or less than their original cost. Current performance may be lower or higher than performance quoted. Please see www.transamericainvestments.com for performance data current to the most recent month-end. Net Asset Value (“NAV”) returns include the reinvestment of dividends and capital gains. Fund shares are sold without a sales load.
Performance figures reflect any fee waivers and/or expense reimbursements by the Investment Adviser. Without such waivers and/or reimbursements, the performance would be lower. Future waivers and/or reimbursements are at the discretion of the Investment Adviser.
Investments in real estate securities and real estate investment trusts (“REITs”) involve special risks, such as the possible decline in value of real estate, extended vacancies, and uninsured damages from natural disasters. This material must be preceded or accompanied by a current prospectus, which includes specific contents regarding the investment objectives and policies of this fund. This fund is only available in Class I2 shares, which are not available for direct investment by the public.
| | | | |
| Transamerica Funds | | | | Annual Report 2012 |
| | Page 14 | | |
Transamerica Growth
(formerly, Transamerica Jennison Growth)
(unaudited)
MARKET ENVIRONMENT
Equity markets were highly volatile in the 12 months ended October 31, 2012, up strongly in the first five months, down sharply in May, then back on an upward trajectory beginning in June. The gyrations reflected swings in sentiment around European sovereign debt issues and uncertainty about global growth. Stock prices rose and fell as sentiment veered between optimism and pessimism, often based on short-term data. U.S. economic growth proceeded at a subpar pace, and unemployment remained high as the job market expanded at a meager pace. Personal income and spending increased at generally lackluster rates, and business and housing indicators were inconsistent. With the implementation of austerity measures, many European economies contracted. Growth in China, a key engine of global economic expansion, slowed. Volatile raw materials, commodities, food, and energy prices reflected shifts in economic expectations.
PERFORMANCE
For the year ended October 31, 2012, Transamerica Growth Class I2 returned 8.19%. By comparison, its benchmark, the Russell 1000® Growth Index, returned 13.02%.
STRATEGY REVIEW
The fund is built from the bottom up, based on the fundamentals of individual companies. Stocks held in consumer discretionary and health care lagged market returns in these sectors. Consumer holdings Amazon.com, Ralph Lauren, and Coach, which coming into the period had performed solidly on strong company-specific fundamentals, failed to keep pace with the meaningful rebound in economically sensitive specialty retail and media stocks. Amazon’s accelerated business investment is positioning the company, we believe, for robust longer-term growth not only in the core retail business but through the proliferation of digital commerce via the mobile market. Our long-term growth assumptions for Ralph Lauren are predicated on opportunities in Europe and Asia, in categories such as accessories and shoes, and in the online channel. We believe that Coach’s handbag and accessory markets continue to grow at a solid pace.
In health care, when investor risk appetite revived, biotechnology stocks, including holding Alexion Pharmaceuticals, benefited more than other subsectors. Alexion reported strong sales of its key product, Soliris, which treats rare, genetic, and potentially life-threatening blood disorders. The company is pursuing opportunities in other autoimmune and inflammatory disease settings with high unmet medical needs. Bristol-Myers Squibb and Shire, which earlier had been rewarded for attractive business opportunities, lagged the biotech surge. We expect Shire’s strong product pipeline to continue to generate strong revenue growth. We believe Bristol-Myers will benefit from product momentum, new product launches, pipeline data, and strong business development deals.
Consumer staples stocks, especially Whole Foods Market and Estée Lauder Cos., Inc.—Class A (“Estée Lauder”), contributed significantly to fund performance. Whole Foods reported strong sales and earnings, with solid operating margins and continued capital discipline. Estée Lauder’s revenue and earnings were fueled by successful product launches and increased market penetration, particularly in emerging markets.
Information technology holdings, including Apple, Google, and LinkedIn Corp., also contributed meaningfully to return. Apple reported continued impressive sales of iPhones, iPads, and Mac personal computers. We believe Apple’s creativity and innovation in product development, design, and marketing will continue to drive share gains. We consider Google’s technological lead and dominant position in Internet search a unique strength that has enabled the company to monetize search traffic at a meaningfully higher rate than its competitors. LinkedIn’s global online professional network has altered the talent-recruiting market and provides what we consider unique access to a scale database of active and passive job candidates.
The fund continues to hold stocks of companies believed to have above-average growth prospects at reasonable valuations.
Michael A. Del Balso
Blair A. Boyer
Spiro “Sig” Segalas
Portfolio Managers
Jennison Associates LLC
| | | | |
| Transamerica Funds | | | | Annual Report 2012 |
| | Page 15 | | |
Transamerica Growth
(formerly, Transamerica Jennison Growth)
(unaudited)
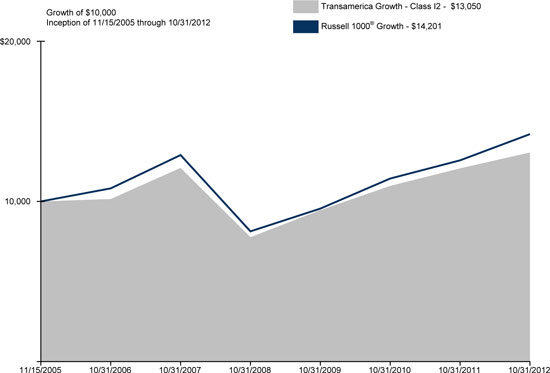
Average Annual Total Return for Periods Ended 10/31/2012
| | | | | | | | | | | | | | | | |
| | | 1 Year | | | 5 Years | | | 10 Years or
Life of Fund | | | Inception Date | |
Class I2 (NAV) | | | 8.19 | % | | | 1.54 | % | | | 3.90 | % | | | 11/15/2005 | |
Russell 1000® Growth * | | | 13.02 | % | | | 1.95 | % | | | 5.17 | % | | | | |
NOTES
| * | The Russell 1000® Growth Index (“Russell 1000® Growth”) is an unmanaged index used as a general measure of market performance. Calculations assume dividends and capital gains are reinvested and do not include any managerial expenses. The 10 Years or Life of Fund calculation is based on the inception date of the class. You cannot invest directly in an index. |
The performance data presented represents past performance; future results may vary. Performance data does not reflect the deduction of taxes that would be paid on fund distributions or the redemption of fund shares. Investment return and principal value will fluctuate so that an investor’s shares, when redeemed, may be worth more or less than their original cost. Current performance may be lower or higher than performance quoted. Please see www.transamericainvestments.com for performance data current to the most recent month-end. Net Asset Value (“NAV”) returns include the reinvestment of dividends and capital gains. Fund shares are sold without a sales load.
Performance figures reflect any fee waivers and/or expense reimbursements by the Investment Adviser. Without such waivers and/or reimbursements, the performance would be lower. Future waivers and/or reimbursements are at the discretion of the Investment Adviser.
Growth stocks can be volatile and experience sharp price declines and certain types of stocks, especially technology, can be extremely volatile and subject to greater price swings than the broader market. This material must be preceded or accompanied by a current prospectus, which includes specific contents regarding the investment objectives and policies of this fund. This fund is only available in Class I2 shares, which are not available for direct investment by the public.
Russell Investment Group is the source and owner of the trademarks, service marks, and copyrights related to the Russell indexes. Russell® is a trademark of Russell Investment Group.
| | | | |
| Transamerica Funds | | | | Annual Report 2012 |
| | Page 16 | | |
Transamerica International
(formerly, Transamerica Neuberger Berman International)
(unaudited)
MARKET ENVIRONMENT
International markets focused on the macro-economic uncertainty surrounding most major economic regions for the past year. As Europe enters the third year of its sovereign debt crisis, and other international developed economies, like Japan, have sluggish growth, the market mainly reacted to central bank monetary policy rather than underlying business fundamentals. European Central Bank’s policy announcements boosted sentiment that the European Union (“EU”) sovereign debt crisis could be managed—driving markets higher from December into the first quarter of 2012, and then again in the third quarter of 2012. While markets rallied on these announcements, they fell in the intervening period as the market recognized that the underlying economies continued to struggle. International markets did end the fiscal period with a 5% gain. The supportive monetary policy news drove the Financial sector up over 10% for the time period, as eurozone banks would be the most immediate beneficiaries. The rest of the sector indices varied with Health Care leading the pack, rising close to 17%, and IT trailing, falling over 8%. Given their deepening recession, Greece was the worst-performing country market, down over 27%. Other countries’ returns varied greatly from positive to negative.
The most recent central bank policy announcements come at a time of weak fundamentals—U.S. manufacturing has weakened as we approach the end-of-2012 “fiscal cliff”, and ongoing austerity in Europe undermines both the investment and consumption outlook there. Reduced demand for imports has in turn impacted the Chinese economy, itself experiencing a reduction in investment spending.
PERFORMANCE
For the year ended October 31, 2012, Transamerica International Class I2 returned 8.65%. By comparison its benchmark, the Morgan Stanley Capital International—Europe, Australasia, and Far East Index, returned 5.15%.
STRATEGY REVIEW
Given this weak global economic backdrop, and despite the expansive policies of the major central banks, we remain focused on businesses less dependent on a cyclical rebound. Our philosophy and process utilizes fundamental analyses to identify quality businesses trading at reasonable prices. These businesses should be growing, generating high returns, and not be financed by high-levels of debt. This disciplined focus has enabled us to construct an international fund of best of breed companies, with innovative technologies, unique brands and strong managements that we believe will enable them to grow in an environment of economic uncertainty.
The fund outperformed its benchmark for the last year with high-single-digit percentage gains. The fund’s Health Care, Industrials and Materials holdings outperformed their respective peer groups, while the Financials sector holdings, with no exposure to eurozone banks, have trailed the market. Central Banks’ policies have driven a rally in banks and insurers, where we remain underweight. While these initiatives may postpone the challenges for developed markets, we believe higher capital requirements and weak demand limit the attractiveness of the Financials sector firms. Our leading sector overweight is Materials where we remain focused on specialty chemical companies with pricing power and relatively stable end markets. Industrials is our second largest sector overweight, where we hold more distribution businesses with strong recurring revenue streams rather than manufacturers exposed to a slowing capital expenditure cycle. Japanese holdings contributed most to returns, while French holdings held back relative returns the most. The fund has no Southern European (Portugal, Italy, Greece and Spain) domiciled holdings.
The fund’s leading contributors include Jupiter Telecommunication, the Japanese cable TV provider that recently received a takeover bid; Nihon Kohden, a Japanese health care equipment manufacturer, and CSL, the Australian-based global blood-products provider. The fund’s leading detractors were Chemring, the British defense company, which we sold after losing conviction in the company’s earnings growth potential, Alcatel-Lucent, the French telecom equipment supplier, and Credit Suisse Group, the Swiss global private wealth manager and investment bank, which we also sold.
Benjamin Segal, CFA
Portfolio Manager
Nueberger Berman Management LLC
| | | | |
| Transamerica Funds | | | | Annual Report 2012 |
| | Page 17 | | |
Transamerica International
(formerly, Transamerica Neuberger Berman International)
(unaudited)
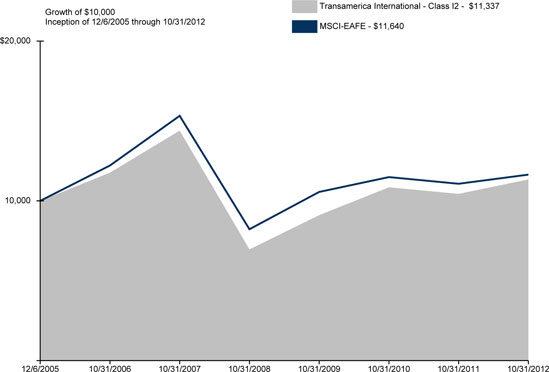
Average Annual Total Return for Periods Ended 10/31/2012
| | | | | | | | | | | | | | | | |
| | | 1 Year | | | 5 Years | | | 10 Years or
Life of Fund | | | Inception Date | |
Class I2 (NAV) | | | 8.65 | % | | | (4.66 | )% | | | 1.83 | % | | | 12/06/2005 | |
MSCI-EAFE * | | | 5.15 | % | | | (5.35 | )% | | | 2.22 | % | | | | |
NOTES
| * | The Morgan Stanley Capital International—Europe, Australasia, and Far East Index (“MSCI-EAFE”) is an unmanaged index used as a general measure of market performance. Calculations assume dividends and capital gains are reinvested and do not include any managerial expenses. The 10 Years or Life of Fund calculation is based on the inception date of the class. You cannot invest directly in an index. |
The performance data presented represents past performance; future results may vary. Performance data does not reflect the deduction of taxes that would be paid on fund distributions or the redemption of fund shares. Investment return and principal value will fluctuate so that an investor’s shares, when redeemed, may be worth more or less than their original cost. Current performance may be lower or higher than performance quoted. Please see www.transamericainvestments.com for performance data current to the most recent month-end. Net Asset Value (“NAV”) returns include the reinvestment of dividends and capital gains. Fund shares are sold without a sales load.
Performance figures reflect any fee waivers and/or expense reimbursements by the Investment Adviser. Without such waivers and/or reimbursements, the performance would be lower. Future waivers and/or reimbursements are at the discretion of the Investment Adviser.
Investments in global/international markets involve risks not associated with U.S. markets, such as currency fluctuations, adverse social and political developments, and the relatively small size and lesser liquidity of the markets. Investments in developing markets involve greater risks than investments in developed markets. This material must be preceded or accompanied by a current prospectus, which includes specific contents regarding the investment objectives and policies of this fund. This fund is only available in Class I2 shares, which are not available for direct investment by the public.
| | | | |
| Transamerica Funds | | | | Annual Report 2012 |
| | Page 18 | | |
Transamerica International Equity Opportunities
(formerly, Transamerica MFS International Equity)
(unaudited)
MARKET ENVIRONMENT
Just prior to the beginning of the reporting period, markets were roiled by several global concerns. These included the aftermath of the U.S. sovereign debt-ceiling debacle, the path of eurozone integration and the scope of its bailout facilities, and the likelihood of a Chinese hard landing. Amidst this turmoil, global equity markets had declined sharply and credit spreads widened. At the same time, global consumer and producer sentiment indicators had fallen precipitously, while highly-rated sovereign bond yields hit multi-decade lows.
During the first half of the period, however, additional liquidity from the U.S. Federal Reserve Board (“Fed”) (in the form of “Operation Twist”) and the European Central Bank (“ECB”) (in the form of 3-year, Long Term Refinancing Operations, or “LTROs”), coupled with healthier global macroeconomic conditions led by moderate but sustained U.S. growth, ushered in improved market dynamics.
During the latter part of the period, market trends were more mixed. Worsening conditions were driven by broadly weaker global macroeconomic indicators, as well as renewed concerns over the eurozone’s capacity and determination to address its ongoing crisis. However, broad market sentiment remained relatively resilient, as equity markets generally maintained gains and credit spreads did not indicate deterioration. A new round of monetary easing by the Fed (“QE3”) and the ECB (rate cut and a new bond purchase facility) towards the end of the period instilled additional confidence in risk markets. Nonetheless, towards the end of the period, weaker equity earnings reports and declining forward guidance caused market sentiment to soften.
PERFORMANCE
For the year ended October 31, 2012, Transamerica International Equity Opportunities Class I2 returned 8.00%. By comparison, its benchmark, the Morgan Stanley Capital International-Europe, Australasia, Far East Index (“MSCI-EAFE”), returned 5.15%.
STRATEGY REVIEW
A combination of an overweight position and, to a lesser extent, security selection in the consumer staples sector contributed to performance relative to the MSCI-EAFE. Within this sector, holdings of alcoholic beverage producer Diageo PLC (United Kingdom), Dutch brewer Heineken NV, and skin and beauty care products maker Beiersdorf AG (Germany) benefited relative returns as all three stocks turned in strong performance during the reporting period.
Security selection in the technology and basic materials sectors also aided relative performance. Within the technology sector, the fund’s holdings of South Korean microchip and electronics manufacturer Samsung Electronics Co, Ltd. strengthened relative results. There were no individual securities within the basic materials sector that were among the fund’s top relative contributors for the reporting period.
Elsewhere, the fund’s overweight allocation to healthcare products maker Bayer AG (Germany), convenience store chain Lawson, Inc. (Japan), travel and leisure IT firm Amadeus IT Holding SA—Class A (Spain), contract foodservice company Compass Group PLC (United Kingdom), advertising and marketing firm WPP PLC (United Kingdom), and pharmaceutical company Merck KGaA (Germany) benefited relative returns as all six stocks traded significantly higher during the period.
Stock selection in the financial services sector were a primary detractor from relative performance. However, there were no individual stocks within this sector that were among the fund’s top relative detractors for the period.
Stocks in other sectors that held back relative performance included printers and computer peripherals maker Canon Inc. (Japan), oil and gas exploration company IINPEX Corp. (Japan), telecommunications services company Tim Participacoes SA (Brazil), export trading company Li & Fung, Ltd. (Hong Kong), food and beverage producer Danone SA (France), electronics maker HTC (Taiwan), supermarkets and convenient stores operator Tesco (United Kingdom), telecommunications service provider China Unicom, Ltd. (Hong Kong), and Israeli-headquartered security software provider Check Point Software Technologies Ltd.
During the reporting period, the fund’s relative currency exposure, resulting primarily from differences between the fund’s and the benchmark’s exposures to holdings of securities denominated in foreign currencies, was another detractor from relative performance. All of our investment decisions are driven by the fundamentals of each individual opportunity and as such, it is common for our funds to have different currency exposure than the benchmark.
The fund’s cash and/or cash equivalents position was also a detractor from relative performance. The fund strives to be fully invested and only holds cash to buy new holdings and to provide liquidity. In a period when equity markets rose, as measured by the fund’s benchmark, holding cash hurt performance versus the benchmark, which has no cash position.
Daniel Ling
Marcus L. Smith
Co-Portfolio Managers
MFS® Investment Management
| | | | |
| Transamerica Funds | | | | Annual Report 2012 |
| | Page 19 | | |
Transamerica International Equity Opportunities
(formerly, Transamerica MFS International Equity)
(unaudited)
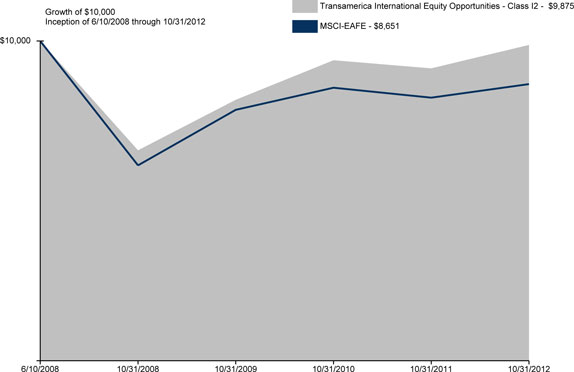
Average Annual Total Return for Periods Ended 10/31/2012
| | | | | | | | | | | | |
| | | 1 Year | | | 10 Years or
Life of Fund | | | Inception Date | |
Class I2 (NAV) | | | 8.00 | % | | | (0.29 | )% | | | 06/10/2008 | |
MSCI-EAFE * | | | 5.15 | % | | | (3.25 | )% | | | | |
NOTES
| * | The Morgan Stanley Capital International-Europe, Australasia, Far East Index (“MSCI-EAFE”) is an unmanaged index used as a general measure of market performance. Calculations assume dividends and capital gains are reinvested and do not include any managerial expenses. The 10 Years or Life of Fund calculation is based on the inception date of the class. You cannot invest directly in an index. |
The performance data presented represents past performance; future results may vary. Performance data does not reflect the deduction of taxes that would be paid on fund distributions or the redemption of fund shares. Investment return and principal value will fluctuate so that an investor’s shares, when redeemed, may be worth more or less than their original cost. Current performance may be lower or higher than performance quoted. Please see www.transamericainvestments.com for performance data current to the most recent month-end. Net Asset Value (“NAV”) returns include the reinvestment of dividends and capital gains. Fund shares are sold without a sales load.
Performance figures reflect any fee waivers and/or expense reimbursements by the Investment Adviser. Without such waivers and/or reimbursements, the performance would be lower. Future waivers and/or reimbursements are at the discretion of the Investment Adviser.
Investments in global/international markets involve risks not associated with U.S. markets, such as currency fluctuations, adverse social and political developments, and the relatively small size and lesser liquidity of the markets. Investments in developing markets involve greater risks than investments in developed markets. This material must be preceded or accompanied by a current prospectus, which includes specific contents regarding the investment objectives and policies of this fund. This fund is only available in Class I2 shares, which are not available for direct investment by the public.
| | | | |
| Transamerica Funds | | | | Annual Report 2012 |
| | Page 20 | | |
Transamerica International Small Cap
(formerly, Transamerica Schroders International Small Cap)
(unaudited)
MARKET ENVIRONMENT
International small cap equities made modest positive progress over the year with the S&P Euro Pacific SmallCap Index (“S&P EPAC SmallCap”) rising 5.9%, marginally outperforming larger peers which rose 5.2% as represented by the S&P EPAC Large/Midcap Index. Equities have struggled to make progress amidst challenging global developments, particularly the continued bouts of uncertainty over the future of the euro with the focus shifting from the smaller economies of Greece and Portugal to the systemically more critical cases of Spain and Italy.
While Europe has tended to grab the headlines, sluggish growth in the United States also contributed to the subdued sentiment though America’s economic performance has been respectable compared to other developed economies due to stabilization of private consumption and improvement in the net trade position. Meanwhile, Emerging and Asian economies have generally been slowing, led by China, which has also impacted commodity related sectors, with energy and materials among the weakest areas.
In term of regional divergences, the United Kingdom was the outstanding performer of major markets with small cap substantially outperforming large companies, led by consumer discretionary, telecom and information technology sectors. In other regions such as continental Europe and Pacific ex Japan, returns overall were lower, and small cap returns were inferior to large cap returns. In these areas, defensive sectors such as consumer staples and health care outperformed.
PERFORMANCE
For the year ended October 31, 2012, Transamerica International Small Cap Class I2 returned 4.57%. By comparison, its benchmark, the S&P EPAC SmallCap, returned 5.92%.
STRATEGY REVIEW
Performance has lagged the benchmark over the period, primarily due to stock selection in Japan and the Pacific ex Japan markets. In Japan the shortfalls have been primarily in the consumer discretionary (particularly auto part related such as Musashi Seimitsu and Unipres) and industrial sectors (Toyo Tanso, Asahi Diamond), with sentiment generally subdued on cyclical exporters given the slowdown in major trading partners and the political tensions with China. In the rest of Asia, weak spots have been among energy stocks (Dart Energy) and China-exposed cyclicals (Leoch International Technology, Ports Design, Comba Telecom Systems Holdings). A lesser headwind has been stock selection in the United Kingdom, with selection shortfalls in energy (Lamprell due to cost overruns in some contracts) and information technology (SDL, TT Electronics) more than offsetting positive selection among industrials (Ashtead on strong US performance, Hamworthy which was bid for, and Keller).
Areas of positive impact included continental Europe, where financials selection was strong (Azimut Holdings), with lesser benefit from telecommunications (Freenet) and consumer discretionary (Tom Tailor Holdings, Forbo Holdings). The fund’s emerging market stocks also did well, with notable contributions from Merida Industry (Taiwanese bicycle manufacturer), Hemaraj Land and Development (Thai industrial parks) and Ciputra Property (Indonesian real estate).
Our focus remains upon identifying companies offering sustainable and superior long-term growth prospects accompanied by strong management and sound financials. However, the positioning of the fund has reflected our belief that, in most markets, cyclical growth stocks and sectors offer attractive value compared to very defensive stocks and sectors. This has proved an unrewarding stance in most markets as investors have continued to seek safe havens at the expense of long-term value. However, we see no reason to change our stance, reflected in sector overweightings in consumer discretionary, information technology and energy and underweights in consumer staples and utilities.
In regional terms, we have continued to place emphasis on Pacific ex Japan and Emerging markets, reflecting our belief in their superior long-term growth prospects. The major underweights have been Europe (including the peripheral markets such as Spain, Portugal and Greece), the United Kingdom and Japan.
Matthew Dobbs
Portfolio Manager
Schroder Investment Management North America Inc.
| | | | |
| Transamerica Funds | | | | Annual Report 2012 |
| | Page 21 | | |
Transamerica International Small Cap
(formerly, Transamerica Schroders International Small Cap)
(unaudited)
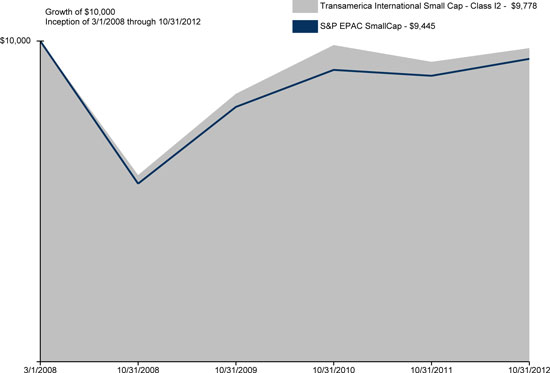
Average Annual Total Return for Periods Ended 10/31/2012
| | | | | | | | | | | | |
| | | 1 Year | | | 10 Years or
Life of Fund | | | Inception Date | |
Class I2 (NAV) | | | 4.57 | % | | | (0.48 | )% | | | 03/01/2008 | |
S&P EPAC SmallCap * | | | 5.92 | % | | | (1.22 | )% | | | | |
NOTES
| * | The S&P Euro Pacific SmallCap Index (“S&P EPAC SmallCap”) is an unmanaged index used as a general measure of market performance. |
Calculations assume dividends and capital gains are reinvested and do not include any managerial expenses. The 10 Years or Life of Fund calculation is based on the inception date of the class. You cannot invest directly in an index.
The performance data presented represents past performance; future results may vary. Performance data does not reflect the deduction of taxes that would be paid on fund distributions or the redemption of fund shares. Investment return and principal value will fluctuate so that an investor’s shares, when redeemed, may be worth more or less than their original cost. Current performance may be lower or higher than performance quoted. Please see www.transamericainvestments.com for performance data current to the most recent month-end. Net Asset Value (“NAV”) returns include the reinvestment of dividends and capital gains. Fund shares are sold without a sales load.
Performance figures reflect any fee waivers and/or expense reimbursements by the Investment Adviser. Without such waivers and/or reimbursements, the performance would be lower. Future waivers and/or reimbursements are at the discretion of the Investment Adviser.
Investments in global/international markets involve risks not associated with U.S. markets, such as currency fluctuations, adverse social and political developments, and the relatively small size and lesser liquidity of the markets. Investing in small size companies involves greater risk than is customarily associated with more established companies. This material must be preceded or accompanied by a current prospectus, which includes specific contents regarding the investment objectives and policies of this fund. This fund is only available in Class I2 shares, which are not available for direct investment by the public.
| | | | |
| Transamerica Funds | | | | Annual Report 2012 |
| | Page 22 | | |
Transamerica International Value Opportunities
(formerly, Transamerica Thornburg International Value)
(unaudited)
MARKET ENVIRONMENT
International equity markets were volatile during the annual reporting period November 1, 2011 through October 31, 2012, dominated by uncertainty and concerns about negative outcomes in the eurozone, slowing growth in China, and a muted U.S. economic recovery. This led investors to seek safety in more defensively oriented stocks and dividend oriented companies. Renewed vigor from European policy makers and “QE3” in the U.S. outweighed concerns over global economic weakness, leading markets to recover at the end of the period.
As the European Union (“EU”) continues to struggle toward financial union, and the harsh realities of fiscal austerity reverberate from the periphery throughout Europe and the world, the prospects for continued economic malaise in the region are sobering. Meanwhile, signs of economic recovery in the U.S. are mixed, and China’s policies for dealing with a slowing economy will not be known until after the transition of leadership. Against these elevated market uncertainties, we maintain a focus on financially sound companies, modest exposure to the European financial sector, emphasis on exporters within our European holdings, and broad geographic diversification across the fund. Our approach is intended to mitigate near term volatility while positioning for long-term capital appreciation.
PERFORMANCE
For the year ended October 31, 2012, Transamerica International Value Opportunities Class I2 returned 4.44%. By comparison, its benchmark the Morgan Stanley Capital International All Country World ex-U.S. (“MSCI ACWI ex-U.S.”), returned 4.48%.
STRATEGY REVIEW
The fund modestly underperformed relative to the MSCI ACWI ex-U.S. during the period, due in part to stock selection as well as an underweight allocation within the financials sector. Currency hedging contributed positively during the year.
Stock selection in the consumer discretionary sector and an underweight allocation to the materials sector contributed positively to relative performance. On a country basis, top relative contributors included Japan and Denmark. Top individual contributors included Novo Nordisk A/S—Class B (“Novo”), Natura Cosmeticos SA, and Reckitt Benckiser Group PLC.
Novo continues to execute well, gaining share in the diabetes market through ongoing success of novel drugs like Victoza as well as existing products. Recent excitement regarding the possibility of Federal Drug Administration approval for Victoza in the treatment of obesity also lifted the stock. Natura Cosmeticos SA, the leading health and beauty company in Brazil, benefited from the increase in disposable income in Brazil and market share gains resulting from innovation, productivity, and efficiency measures. Reckitt Benckiser performed well due to its defensive posture and market share gains in the household and personal care segment. Additionally, the company has been successful in transitioning patients from their off-patent tablet formulation of opiate dependency drug Suboxone to a novel film version, in efforts to protect this high margin franchise.
Stock selection in the financials and industrials sectors was the primary driver of negative relative performance. Taiwan and the United Kingdom lead the detractors on a country basis. Individual detractors included HTC Corp., Tesco PLC, and Canon.
Mobile phone manufacturer HTC Corp. was sold during the period as patent litigation issues and a loss of market share, partially attributed to product cycle and poor shipment development in the U.S., weighed on the stock. Tesco PLC’s Chief Executive Officer announced a new plan to regain market share through restructuring and increased spending, which has had a dampening effect on margins in the near term. Japanese exporter Canon was pressured by the ongoing strength of the Japanese yen and has been increasingly challenged by a heightened competitive landscape, including potential smart phone cannibalization of their compact digital camera business. We sold the stock during the year.
William V. Fries, CFA
Wendy Trevisani
Lei Wang
Co-Portfolio Managers
Thornburg Investment Management, Inc.
| | | | |
| Transamerica Funds | | | | Annual Report 2012 |
| | Page 23 | | |
Transamerica International Value Opportunities
(formerly, Transamerica Thornburg International Value)
(unaudited)
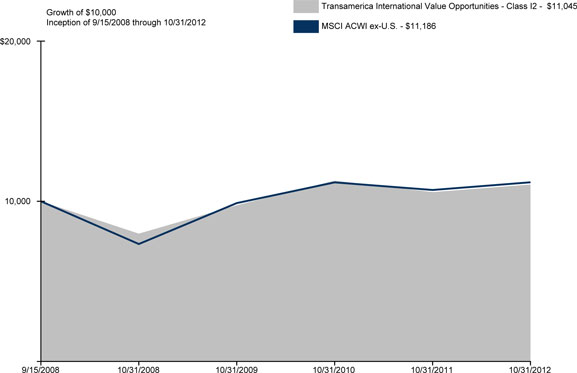
Average Annual Total Return for Periods Ended 10/31/2012
| | | | | | | | | | | | |
| | | 1 Year | | | 10 Years or
Life of Fund | | | Inception Date | |
Class I2 (NAV) | | | 4.44 | % | | | 2.44 | % | | | 09/15/2008 | |
MSCI ACWI ex-U.S * | | | 4.48 | % | | | 2.75 | % | | | | |
NOTES
| * | The Morgan Stanley Capital International All Country World ex-U.S. Index (“MSCI ACWI ex-U.S.”) is an unmanaged index used as a general measure of market performance. Calculations assume dividends and capital gains are reinvested and do not include any managerial expenses. The 10 Years or Life of Fund calculation is based on the inception date of the class. You cannot invest directly in an index. |
The performance data presented represents past performance; future results may vary. Performance data does not reflect the deduction of taxes that would be paid on fund distributions or the redemption of fund shares. Investment return and principal value will fluctuate so that an investor’s shares, when redeemed, may be worth more or less than their original cost. Current performance may be lower or higher than performance quoted. Please see www.transamericainvestments.com for performance data current to the most recent month-end. Net Asset Value (“NAV”) returns include the reinvestment of dividends and capital gains. Fund shares are sold without a sales load.
Performance figures reflect any fee waivers and/or expense reimbursements by the Investment Adviser. Without such waivers and/or reimbursements, the performance would be lower. Future waivers and/or reimbursements are at the discretion of the Investment Adviser.
Investments in global/international markets involve risks not associated with U.S. markets, such as currency fluctuations, adverse social and political developments, and the relatively small size and lesser liquidity of the markets. This material must be preceded or accompanied by a current prospectus, which includes specific contents regarding the investment objectives and policies of this fund. This fund is only available in Class I2 shares, which are not available for direct investment by the public.
| | | | |
| Transamerica Funds | | | | Annual Report 2012 |
| | Page 24 | | |
Transamerica Large Company
(formerly, Transamerica Large Cap Value)
(unaudited)
MARKET ENVIRONMENT
In the last few months of 2011 we experienced improving economic data and more concerted efforts among European leaders toward stemming the region’s debt crisis, gradually drawing investors back to the markets. Improving sentiment carried over into early 2012 as investors felt some relief from the world’s financial woes. Volatility abated and risk assets (including stocks, commodities and high yield bonds) moved boldly higher through the first two months of 2012, while climbing Treasury yields pressured higher-quality fixed income assets.
Markets reversed course in the spring when Europe’s debt problems boiled over once again. High levels of volatility returned as political instability in Greece threatened the country’s membership in the eurozone. Spain faced severe deficit issues while the nation’s banks clamored for liquidity. Yields on Spanish and Italian government debt rose to levels deemed unsustainable. European leaders conferred and debated vehemently over the need for fiscal integration among the 17 nations comprising the Euro currency bloc as a means to resolve the crisis for the long term.
Alongside the drama in Europe, investors were discouraged by gloomy economic reports from various parts of the world. A slowdown in China, a key powerhouse for global growth, became particularly worrisome. In the United States, disappointing jobs reports dealt a crushing blow to sentiment. Risk assets sold off in the second quarter as investors again retreated to safe haven assets.
Despite ongoing concerns about the health of the global economy and the debt crisis in Europe, most asset classes enjoyed a robust summer rally powered mainly by expectations for policy stimulus from central banks in Europe and United States. Although global economic data continued to be mixed, the spate of downside surprises seen in the second quarter had receded and, outside of Europe, the risk of recession largely subsided. Additionally, in response to growing debt pressures, the European Central Bank (“ECB”) allayed investors’ fears by stating its conviction to hold the eurozone together. Early in September, the ECB announced a plan to purchase sovereign debt in the eurozone’s most troubled nations. Later that month, the U.S. Federal Reserve Board (“Fed”) announced its long-awaited—and surprisingly aggressive—stimulus program, committing to purchase $40 billion of agency mortgage-backed securities per month until the U.S. economy exhibits enough strength to sustain real growth and improving labor market conditions. These central bank actions boosted risk assets globally as investors increased their risk appetites in their search for higher returns.
After a strong summer, stock market momentum faded in the last weeks of the reporting period. The positive momentum from the launch of the Fed’s third round of stimulus faded and investors began to focus on a relatively weak outlook for earnings and profits.
PERFORMANCE
For the year ended October 31, 2012, Transamerica Large Company Class I2 returned 14.26%. By comparison, its benchmark the Russell 1000® Value Index, returned 16.89%.
STRATEGY REVIEW
Overall allocation and selection decisions detracted from the fund’s performance for the period. At the sector level, the largest detractor was the fund’s overweight to information technology (“IT”), followed by stock selection in health care and an overweight to energy. Within IT, the fund was biased toward commodity-exposed hardware securities, which underperformed on weakness in enterprise and PC demand. Stocks such as Hewlett-Packard Co. (“Hewlett-Packard”) (the largest individual detractor to overall fund returns), Dell Inc. (“Dell”), and Cisco Systems Inc. (“Cisco”) were the most significant detractors in the sector. The fund exited its positions in Dell and Cisco and reduced its holdings in Hewlett-Packard to a more neutral weighting relative to the benchmark index by the end of the reporting period. In health care, weakness was most notable among HMOs, which lagged as rising medical cost trends and pressure from the health care overhaul threatens to keep a lid on earnings in the near term. This negative performance overshadowed strong results from the fund’s pharmaceutical holdings. The fund has since reduced holdings within HMOs and distributors (including the sale of Aetna) and reallocated the monies to select pharmaceuticals. In energy, the fund’s overweight and selection in refiners (Tesoro and Valero) and select integrated companies (Murphy Oil) negatively impacted performance. The fund sold its positions in Tesoro, Valero and Murphy Oil by the end of the period.
On the positive side, selection in materials and financials were the greatest contributors to performance. Within the materials sector, the majority of positive performance came from a sector overweight and a position in CF Industries Holdings, Inc., a key fertilizer holding whose profit margins (and, hence, its share price) soared during the period as a result of lower input costs (i.e., natural gas) and rising demand and output prices for its nitrogen-based crop nutrients. LyondellBasel Industries N.V., a commodity chemical producer, also benefited from lower natural gas prices.
| | | | |
| Transamerica Funds | | | | Annual Report 2012 |
| | Page 25 | | |
Transamerica Large Company
(formerly, Transamerica Large Cap Value)
(unaudited)
STRATEGY REVIEW (continued)
Outperformance in financials was almost entirely due to stock selection, with the largest contribution coming from the fund’s overweight in diversified financials including Citigroup, Inc. These holdings surged during the reporting period on a combination of factors, including diminished tail risk in Europe, improvement in the housing market and better-than-expected capital markets activity. Selection in the consumer finance industry also aided relative results, with Discover Financial Services benefiting from higher sales volumes and reduced charge-offs in its credit card business.
Chris Leavy, CFA
Peter Stournaras, CFA
Co-Portfolio Managers
BlackRock Investment Management, LLC.
| | | | |
| Transamerica Funds | | | | Annual Report 2012 |
| | Page 26 | | |
Transamerica Large Company
(formerly, Transamerica Large Cap Value)
(unaudited)
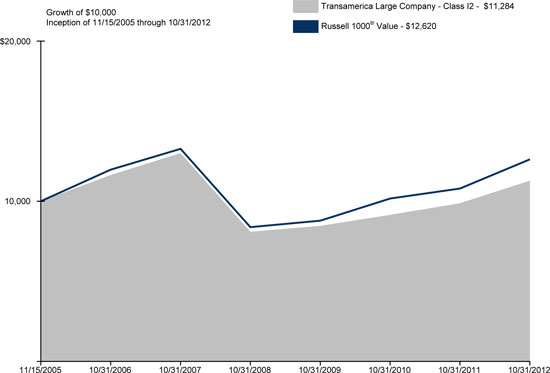
Average Annual Total Return for Periods Ended 10/31/2012
| | | | | | | | | | | | | | | | |
| | | 1 Year | | | 5 Years | | | 10 Years or
Life of Fund | | | Inception Date | |
Class I2 (NAV) | | | 14.26 | % | | | (2.81 | )% | | | 1.75 | % | | | 11/15/2005 | |
Russell 1000® Value * | | | 16.89 | % | | | (1.00 | )% | | | 3.40 | % | | | | |
NOTES
| * | The Russell 1000® Value Index (“Russell 1000® Value”) is an unmanaged index used as a general measure of market performance. Calculations assume dividends and capital gains are reinvested and do not include any managerial expenses. The 10 Years or Life of Fund calculation is based on the inception date of the class. You cannot invest directly in an index. |
The performance data presented represents past performance; future results may vary. Performance data does not reflect the deduction of taxes that would be paid on fund distributions or the redemption of fund shares. Investment return and principal value will fluctuate so that an investor’s shares, when redeemed, may be worth more or less than their original cost. Current performance may be lower or higher than performance quoted. Please see www.transamericainvestments.com for performance data current to the most recent month-end. Net Asset Value (“NAV”) returns include the reinvestment of dividends and capital gains. Fund shares are sold without a sales load.
Performance figures reflect any fee waivers and/or expense reimbursements by the Investment Adviser. Without such waivers and/or reimbursements, the performance would be lower. Future waivers and/or reimbursements are at the discretion of the Investment Adviser.
Stock markets, especially foreign markets, are volatile and can decline significantly. Value stocks can perform differently from other types of stocks and can continue to be undervalued by the market for long periods of time. This material must be preceded or accompanied by a current prospectus, which includes specific contents regarding the investment objectives and policies of this fund. This fund is only available in Class I2 shares, which are not available for direct investment by the public.
Russell Investment Group is the source and owner of the trademarks, service marks, and copyrights related to the Russell indexes. Russell® is a trademark of Russell Investment Group.
| | | | |
| Transamerica Funds | | | | Annual Report 2012 |
| | Page 27 | | |
Transamerica Long/Short Strategy
(formerly, Transamerica JPMorgan Long/Short Strategy)
(unaudited)
MARKET ENVIRONMENT
The year began with a return to normality both in terms of the markets and our investment process. With regards to the markets, improved U.S. economic forecasts, combined with the Long Term Refinancing Operations (“LTROs”) funding program for European banks caused the U.S. markets to rally. As investors became less focused on macro factors, the correlations amongst stocks dropped, which created an environment which was more agreeable to stock pickers.
The second quarter of 2012 saw a reversal of the normality experienced during the first quarter of 2012. Markets declined as European uncertainty once again dominated headlines. Markets became more volatile and investors became more focused on macro factors. The second quarter 2012 proved to be a disadvantageous environment for active managers, with fundamentals taking a backseat as correlations amongst stocks rose. The widening spread between overvalued and undervalued stocks during the second quarter 2012 echoed the extreme valuation conditions we witnessed in the fourth quarter of 2011.
The third quarter of 2012 saw a reversion to the normality experienced during the first quarter 2012. The U.S. market advanced on the heels of aggressive central bank actions highlighted by both the European Central Bank and the Federal Reserve. Markets became less volatile and investors focused less on macro factors.
PERFORMANCE
For the year ended October 31, 2012, Transamerica Long/Short Strategy Class I2 returned 3.82%. By comparison its primary and secondary benchmarks, the Bank of America Merrill Lynch 3-Month Treasury Bill Index and Standard & Poor’s 500® Index, returned 0.08% and 15.21%, respectively.
STRATEGY REVIEW
Transamerica Long/Short Strategy outperformed its primary benchmark for the trailing twelve months. The consumer cyclical, media and pharmaceutical/medical technology sectors contributed to performance while the semiconductors, industrial cyclicals and energy sectors detracted from performance. At the security level, long positions in Merck and Apple, and short positions in Cliff Natural Resources were the largest contributors while short positions in Lockheed Martin and Hershey were the largest detractors.
Within the pharmacy/medical technology space, an overweight in Merck contributed to performance. The stock gained on the back of better than expected second-quarter numbers. Expectations that the company’s recent launches would start contributing to its topline in the forthcoming quarters also helped the share price. Additionally, the company also has an agreement for an exclusive worldwide license for development and commercialization of CMX157, an investigational oral nucleoside reverse transcriptase inhibitor (antiviral drug for treatment of HIV and hepatitis C).
Within the systems hardware sector, a long position in Apple paired with a short position in Hewlett-Packard continued to work well. Apple benefitted from strong tablet sales, especially with the recent launch of the iPad 3, and smartphone sales, beating expectations and continuing to gain market share in both segments. We believe Apple is a relatively inexpensive stock on normalized earnings with sustainable gross margins and upside to estimates. Additionally, Apple reported strong quarterly performance with a year on year increase in net income and net sales. Further, shares advanced in the third quarter of 2012 following its triumph over Samsung on the patent infringement ruling expectations and a positive reaction to the launch of the iPhone 5. Meanwhile, Hewlett-Packard reported a weak top line and softer services margin, continuing to lag its peers amid structural shifts and should face challenges in long-term growth. The stock looks attractive based on valuation but does not sufficiently justify as a buying opportunity, so the strategy remains underweight in the name.
Within the basic materials sector, a short position in iron ore producer Cliff Natural Resources contributed to returns during the quarter as rising mining costs, labor and transportation fuel expenses, increased dramatically during the quarter and hurt top-line growth. Additionally, slowing Chinese growth has caused concerns of weaker demand throughout the metals sector.
Alternatively, within industrials, our short position in Lockheed detracted as that stock rose after the company raised its fiscal-year earnings-per-share guidance.
Within the consumer staples sector, a short position in Hershey detracted from performance as the confectionery company reported earnings that were ahead of consensus estimates, driven by better pricing and better-than-expected seasonal sales volumes. The company also raised its 2012 net sales and earnings estimates, and prioritized acquisitions for its cash reserves.
Terance Chen, CFA
Portfolio Manager
J.P. Morgan Investment Management Inc.
| | | | |
| Transamerica Funds | | | | Annual Report 2012 |
| | Page 28 | | |
Transamerica Long/Short Strategy
(formerly, Transamerica JPMorgan Long/Short Strategy)
(unaudited)
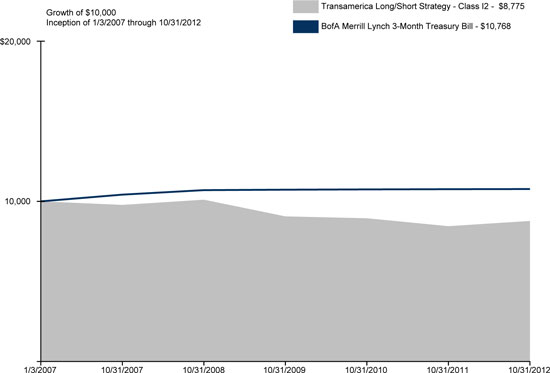
Average Annual Total Return for Periods Ended 10/31/2012
| | | | | | | | | | | | | | | | |
| | | 1 Year | | | 5 Years | | | 10 Years or
Life of Fund | | | Inception Date | |
Class I2 (NAV) | | | 3.82 | % | | | (2.15 | )% | | | (2.22 | )% | | | 01/03/2007 | |
BofA Merrill Lynch 3-Month Treasury Bill * | | | 0.08 | % | | | 0.66 | % | | | 1.28 | % | | | | |
S&P 500 * | | | 15.21 | % | | | 0.36 | % | | | 2.12 | % | | | | |
NOTES
| * | The Bank of America Merrill Lynch 3-Month Treasury Bill Index (“BofA Merrill Lynch 3-Month Treasury Bill”) and the Standard & Poor’s 500® Index (“S&P 500”) are unmanaged indices used as a general measure of market performance. Calculations assume dividends and capital gains are reinvested and do not include any managerial expenses. The 10 Years or Life of Fund calculation is based on the inception date of the class. You cannot invest directly in an index. |
The performance data presented represents past performance; future results may vary. Performance data does not reflect the deduction of taxes that would be paid on fund distributions or the redemption of fund shares. Investment return and principal value will fluctuate so that an investor’s shares, when redeemed, may be worth more or less than their original cost. Current performance may be lower or higher than performance quoted. Please see www.transamericainvestments.com for performance data current to the most recent month-end. Net Asset Value (“NAV”) returns include the reinvestment of dividends and capital gains. Fund shares are sold without a sales load.
Performance figures reflect any fee waivers and/or expense reimbursements by the Investment Adviser. Without such waivers and/or reimbursements, the performance would be lower. Future waivers and/or reimbursements are at the discretion of the Investment Adviser.
Securities purchased for an arbitrage strategy are intended to take advantage of a perceived relationship between the value of two securities and may not perform as expected. This material must be preceded or accompanied by a current prospectus, which includes specific contents regarding the investment objectives and policies of this fund. The fund is only available in Class I2 shares, which are not available for direct investment by the public.
| | | | |
| Transamerica Funds | | | | Annual Report 2012 |
| | Page 29 | | |
Transamerica Mid Cap Value
(formerly, Transamerica JPMorgan Mid Cap Value)
(unaudited)
MARKET ENVIRONMENT
U.S. equity markets rallied sharply in the fourth quarter of 2011. Investor confidence improved as economic data supported the fact that the U.S. did not appear headed towards a recession and European policymakers took bolder actions in their efforts to stave off a sovereign debt crisis.
As the quarter drew to a close, the U.S. continued to see stronger-than-expected economic data on several fronts. Positive economic surprises included an encouraging Institute for Supply Management (“ISM”) manufacturing survey, a solid increase in the number of housing starts and continued declines in initial jobless claims. The November ISM manufacturing survey posted a reading of 52.7. A reading above 50 indicates the manufacturing sector is in expansion. While the reading was not much above the neutral level of 50, it was the highest reading since June. Housing starts for November came in at an annualized rate of 685,000. Most of the strength was in the construction of multi-family units. However, this is far below the long term average of 1.46 million homes built per year since 1975.
In the first quarter of 2012, U.S. equity markets advanced sharply as the S&P 500® Index posted its strongest first-quarter gain since 1998. Performance was driven by an easing of the sovereign debt crisis in Europe, central banks across the globe becoming even more accommodative and continued momentum in U.S. economic data. Developments in Europe provided a significant tailwind for U.S. equities.
U.S. equity markets turned more volatile in the second quarter, with moderate losses highlighted by continued concerns over the future of the European Currency Union (“ECU”) and the increasing prospects of a global economic slowdown. Market declines were cut almost in half on the last trading day of the quarter as European policymakers made initial steps towards forming a banking union, which investors met with guarded optimism. European elections consumed the headlines during much of the quarter.
Another sharp advance characterized U.S. equity markets in the third quarter on the heels of aggressive central bank actions, highlighted by both the European Central Bank (“ECB”) and the U.S. Federal Reserve Board (“Fed”). Equity markets came under pressure in the quarter’s final weeks on a combination of downbeat earnings forecasts from industrial bellwethers FedEx and Caterpillar as well as increasingly disappointing economic data.
PERFORMANCE
For the year ended October 31, 2012, Transamerica Mid Cap Value Class I2 returned 20.57%. By comparison its benchmark, the Russell Midcap® Value Index (“Russell Midcap® Value”), returned 14.99%.
STRATEGY REVIEW
Transamerica Mid Cap Value outperformed the Russell Midcap® Value. Stock selection in the industrials sector and a combination of stock selection and an overweight in the consumer discretionary sector contributed to returns. An underweight in the energy and telecommunication services sectors detracted from performance.
At the individual stock level, Lincare Holdings was the top fund contributor. We have long believed that Lincare, the largest provider of an essential service (i.e., oxygen in the home), would fare well regardless of the outcome of healthcare reform. Linde’s acquisition of the company at a significant premium confirmed that assessment, and unlocked the stock’s value sooner than expected.
Tiffany & Co. (“Tiffany”) got off to a slow start as jewelry spending was soft for part of 2012. In addition to weaker sales, the competitive environment was difficult—management noted that discounting is pervasive across the industry, including smaller “mom & pop” stores, and Tiffany does not offer discounts. We continue to view the stock favorably. Other than the timeless brand Tiffany brings, we believe the company will continue to grow domestically, benefitting from the glacial pace of consolidation in the U.S. jewelry business and from what we regard as an underpenetrated store base. Furthermore, Tiffany continues to expand internationally where it can benefit from the higher returns of smaller, higher-productivity stores, as well as the favorable economics of its Asian business.
Gloria Fu, CFA
Lawrence E. Playford, CFA
Jonathan K. L. Simon
Co-Portfolio Managers
J.P. Morgan Investment Management Inc.
| | | | |
| Transamerica Funds | | | | Annual Report 2012 |
| | Page 30 | | |
Transamerica Mid Cap Value
(formerly, Transamerica JPMorgan Mid Cap Value)
(unaudited)
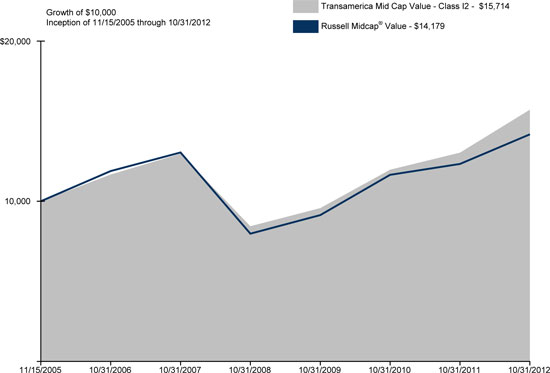
Average Annual Total Return for Periods Ended 10/31/2012
| | | | | | | | | | | | | | | | |
| | | 1 Year | | | 5 Years | | | 10 Years or
Life of Fund | | | Inception Date | |
Class I2 (NAV) | | | 20.57 | % | | | 3.91 | % | | | 6.71 | % | | | 11/15/2005 | |
Russell Midcap® Value * | | | 14.99 | % | | | 1.68 | % | | | 5.15 | % | | | | |
NOTES
| * | The Russell Midcap® Value Index (“Russell Midcap® Value”) is an unmanaged index used as a general measure of market performance. Calculations assume dividends and capital gains are reinvested and do not include any managerial expenses. The 10 Years or Life of Fund calculation is based on inception date of the class. You cannot invest directly in an index. |
The performance data presented represents past performance; future results may vary. Performance data does not reflect the deduction of taxes that would be paid on fund distributions or the redemption of fund shares. Investment return and principal value will fluctuate so that an investor’s shares, when redeemed, may be worth more or less than their original cost. Current performance may be lower or higher than performance quoted. Please see www.transamericainvestments.com for performance data current to the most recent month-end. Net Asset Value (“NAV”) returns include the reinvestment of dividends and capital gains. Fund shares are sold without a sales load.
Performance figures reflect any fee waivers and/or expense reimbursements by the Investment Adviser. Without such waivers and/or reimbursements, the performance would be lower. Future waivers and/or reimbursements are at the discretion of the Investment Adviser.
Growth stocks can be volatile and experience sharp price declines and certain types of stocks, especially technology, can be extremely volatile and subject to greater price swings than the broader market. Value approach carries the risk that the market will not recognize a security’s intrinsic value for a long time or that an undervalued stock is actually appropriately priced. This material must be preceded or accompanied by a current prospectus, which includes specific contents regarding the investment objectives and policies of this fund. This fund is only available in Class I2 shares, which are not available for direct investment by the public.
Russell Investment Group is the source and owner of the trademarks, service marks, and copyrights related to the Russell indexes. Russell® is a trademark of Russell Investment Group.
| | | | |
| Transamerica Funds | | | | Annual Report 2012 |
| | Page 31 | | |
Transamerica Real Return TIPS
(formerly, Transamerica PIMCO Real Return TIPS)
(unaudited)
MARKET ENVIRONMENT
During the last months of 2011, policy initiatives were the major market drivers. In its December meeting, the Federal Open Market Committee (“FOMC”) left the federal funds rate unchanged and maintained its existing policy of extending the average maturity of its holdings and reinvesting its principal payments. The FOMC noted that the “economy has been expanding moderately, notwithstanding some apparent slowing in global growth,” and highlighted the recent improvement in overall labor markets and household spending. On the outlook, the FOMC noted that it “continues to expect a moderate pace of economic growth over coming quarters and consequently anticipates that the unemployment rate will decline only gradually,” but pointed to the continued downside risks due to the ongoing pressures in the global financial markets.
Entering 2012, after posting a revised 2.0 percent growth rate for the first quarter, the U.S. economy grew at a 1.5 percent annual rate during the second quarter, as consumer spending and business investment slowed, according to gross domestic product data released in July. Personal consumption expenditures increased by only 1.5 percent, the smallest gain in a year, from April through June, with spending on durable goods, particularly automobiles, slowing. The Conference Board’s consumer confidence index surprised observers by increasing for the first time since February, from a revised 62.7 in June to 65.9 in July as consumers grew more optimistic about the near-term prospects for business conditions and the labor market. Despite this positive report, July’s unemployment rate increased slightly to 8.3 percent. Fewer consumers are expecting an increase in their incomes in the short-term. In spite of the slight uptick in the jobless rate, non-farm payrolls rose by 163,000 during the month, beating forecasts and alleviating some concerns of a slowing U.S. economy. After falling 0.3 percent in May, the headline consumer price index remained unchanged in June at a 1.7 percent increase over the past 12 months, in line with expectations. Energy costs fell during June by 1.4 percent as gasoline prices decreased for the third straight month; however, food prices increased by 0.2 percent from May this year.
Risk appetite returned to financial markets during the last part of the fiscal year as investors responded to additional unconventional monetary policies. The European Central Bank (“ECB”) President, Mario Draghi, delivered on his pledge to do “whatever it takes” to support the Euro and the eurozone by unveiling the ECB’s Outright Monetary Transactions (“OMT”). The program entails unlimited, but conditional, purchases of eurozone government bonds with maturities of one to three years in the secondary market. Sovereign yields in both Spain and Italy fell during the quarter, following renewed investor confidence in European policymakers’ ability and willingness to support the eurozone. The FOMC met and confirmed their stance on rates, open-ended quantitative easing and “Operation Twist”. Finally, the threat of extreme weather in the U.S. eastern seaboard from hurricane Sandy and the contentious U.S. election triggered some safe-haven buying and gave the markets a risk-off tone.
PERFORMANCE
For the year ended October 31, 2012, Transamerica Real Return TIPS Class I2 returned 9.07%. By comparison, its benchmark, the Barclays U.S. Treasury Inflation Protected Securities Index, returned 8.03%.
STRATEGY REVIEW
Exposure to non-U.S. developed real interest rates, particularly Australia, added to performance as rates fell on fears of a global economic slowdown. Additionally, exposure to select emerging market local rates, such as Brazil added to performance as the central bank cut rates to spur economic growth. An underweight to U.S. real yields was negative for performance as real yields fell. On the spread sector front, exposure to bonds of financial companies was positive for returns. A modest allocation of senior commercial mortgage-backed securities and senior non-agency mortgages added to returns as these securities outperformed like-duration Treasuries during the year. Exposure to select emerging market external debt, especially Brazil and Mexico, was also positive for performance.
We used government bond futures for duration management, substitution for direct investment, and hedging/risk management. We used interest rates swaps for duration management, substitution for direct interest rate exposure, and hedging/risk management. We used swaptions for hedging/risk management, income (for written positions), and substitution for direct credit investment. We used money market futures for duration management and substitute for direct investment. We used foreign-exchange forwards for currency management and hedging/risk management. An underweight to U.S. duration, partially implemented via interest rate swaps, detracted from returns as interest rates fell across the curve. However, duration exposure through money market futures partially offset this negative impact. Currency positioning in various currencies using foreign-exchange forwards was positive for performance.
Mihir Worah
Portfolio Manager
Pacific Investment Management Company LLC
| | | | |
| Transamerica Funds | | | | Annual Report 2012 |
| | Page 32 | | |
Transamerica Real Return TIPS
(formerly, Transamerica PIMCO Real Return TIPS)
(unaudited)
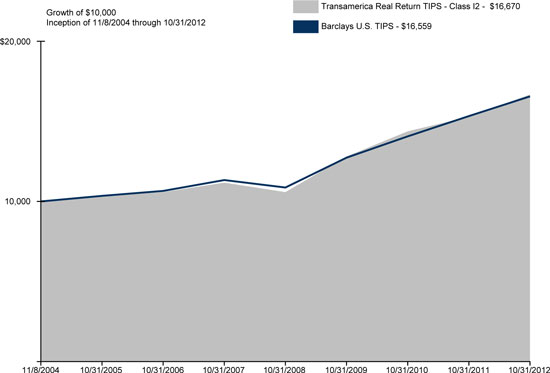
Average Annual Total Return for Periods Ended 10/31/2012
| | | | | | | | | | | | | | | | |
| | | 1 Year | | | 5 Years | | | 10 Years or
Life of Fund | | | Inception Date | |
Class I2 (NAV) | | | 9.07 | % | | | 8.34 | % | | | 6.62 | % | | | 11/08/2004 | |
Barclays U.S. TIPS * | | | 8.03 | % | | | 7.88 | % | | | 6.53 | % | | | | |
NOTES
| * | The Barclays U.S. Treasury Inflation Protected Securities Index (“Barclays U.S. TIPS”) is an unmanaged index used as a general measure of market performance. Calculations assume dividends and capital gains are reinvested and do not include any managerial expenses. The 10 Years or Life of Fund calculation is based on the inception date of the class. You cannot invest directly in an index. |
The performance data presented represents past performance; future results may vary. Performance data does not reflect the deduction of taxes that would be paid on fund distributions or the redemption of fund shares. Investment return and principal value will fluctuate so that an investor’s shares, when redeemed, may be worth more or less than their original cost. Current performance may be lower or higher than performance quoted. Please see www.transamericainvestments.com for performance data current to the most recent month-end. Net Asset Value (“NAV”) returns include the reinvestment of dividends and capital gains. Fund shares are sold without a sales load.
Performance figures reflect any fee waivers and/or expense reimbursement by the Investment Adviser. Without such waivers and/or reimbursements, the performance would be lower. Future waivers and/or reimbursements are at the discretion of the Investment Adviser.
This fund invests in inflation-indexed bonds of varying maturities. It may invest in non-U.S. securities. The fund may also invest in mortgage related securities as well as a portion in high-yield securities. Inflation-indexed bonds issued by the U.S. Government, known as TIPS, are fixed-income securities whose principal value is periodically adjusted according to the rate of inflation, which will affect the interest payable on them. This material must be preceded or accompanied by a current prospectus, which includes specific contents regarding the investment objectives and policies of this fund. This fund is only available in Class I2 shares, which are not available for direct investment by the public.
| | | | |
| Transamerica Funds | | | | Annual Report 2012 |
| | Page 33 | | |
Transamerica Select Equity
(formerly, Transamerica ICAP Select Equity)
(unaudited)
MARKET ENVIRONMENT
During the twelve-month period ending October 31, 2012, U.S. equity market returns were broadly positive, with volatility reduced compared to recent prior periods. While uncertainty over economic growth, fiscal policy and the European sovereign debt crisis continues to influence investors’ outlooks, there have been signs of stabilization during the period.
Global economic activity appears to have slowed since the spring as signs of softness have broadened around the globe. We remain somewhat cautious in our outlook for the economy given several key risks. First, in Europe, interrelated economic, fiscal, banking, and balance of payments crises are feeding on one another; increased fiscal and political integration is required to break this downward spiral. There are some early signs of progress but high political and fiscal costs will continue to present challenges. Second, activity in China is slowing as authorities try to temper credit growth and transition from investment-driven to consumption-led growth. Last, in the United States, major budget issues must be addressed in order to avoid a sharp tightening of fiscal policy; the political environment could create gridlock and prevent sensible policy adjustments from being implemented.
New positives have developed due to lower energy prices and increased policy stimulus; however, it remains to be seen whether these will be sustained and whether they will be adequate to improve the pace of economic activity. For example, energy prices have fallen sharply since their first-quarter highs, but we remain concerned about the potential for geopolitical instability in the Middle East. Also, monetary policy is easing around the world; still, interest rates are already very low so there may be little incremental benefit from recent measures. Overall, we continue to believe that the global economy will expand at a moderate pace this year, though the potential range of outcomes remains wide.
PERFORMANCE
For the period ended October 31, 2012, Transamerica Select Equity Class I2 returned 14.29%. By comparison, its benchmark, the Russell 1000® Value Index (“Russell 1000® Value”), returned 16.89%.
STRATEGY REVIEW
Overall, the fund is built on a stock-by-stock basis and reflects the individual names that we believe have a combination of attractive valuation and catalysts likely to trigger appreciation over a 12-18 months time frame. Stock-specific catalysts can be related to a company’s management, a restructuring, a problem-fixing situation, a new product or pricing flexibility.
During the period, two themes were in place that we believe are timely in an environment of slow economic growth. One, the “strong will get stronger” theme was maintained. The fund seeks to emphasize companies with strong operational and financial characteristics. We believe these companies can gain share from weaker competitors and thus improve their earnings. Two, the theme of “earn and return cash” was also maintained. We believe stocks of companies that can both grow earning and provide significant cash returns to shareholders should be attractive to many investors.
During the period, the fund underperformed the Russell 1000® Value, driven by several key factors. In the consumer durables sector, stock selection detracted from relative performance as auto parts manufacturer Johnson Controls underperformed due to slowing auto sales in its European business and higher than expected product launch costs. The position remained in the fund as we believe significant turnaround potential exists. In the communications sector, wireless communications provider Vodafone lagged due to a slowdown in its Southern European units. We believe the stock is attractively valued and strength in its U.S. and emerging market businesses should allow the firm to continue to return cash to shareholders. Overweighting the technology sector also negatively impacted relative performance. Semi-conductor maker Texas Instruments and network equipment manufacturer Cisco Systems were notable underperformers in that sector. Both remained in the fund as we believe they possess a combination of attractive valuation and investment catalysts.
Stock selection in the financial sector added value, led by diversified financial services firm Citigroup and consumer finance company Capital One Financial. In the energy sector, refiner Phillips 66 was a top contributor to relative performance. Improved operating margins at the company helped the refining and chemical units beat expectations, and the firm also announced a $1 billion stock repurchase plan. Media company Time Warner and pharmaceutical firm Pfizer also added significant value during the period. Relative performance also benefited from avoiding the utilities sector.
Jerrold K. Senser, CFA
Thomas M. Cole, CFA
Thomas R. Wenzel, CFA
Co-Portfolio Managers
Institutional Capital LLC
| | | | |
| Transamerica Funds | | | | Annual Report 2012 |
| | Page 34 | | |
Transamerica Select Equity
(formerly, Transamerica ICAP Select Equity)
(unaudited)
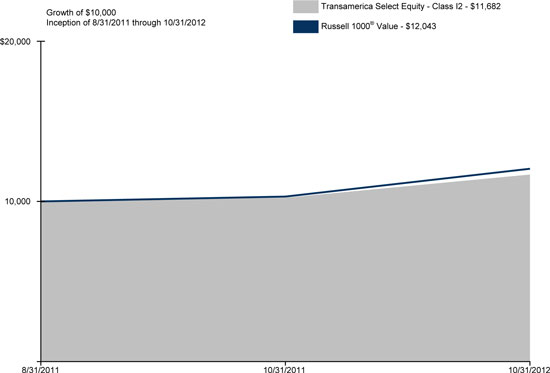
Average Annual Total Return for Periods Ended 10/31/2012
| | | | | | | | | | | | |
| | | 1 Year | | | 10 Years or
Life of Fund | | | Inception Date | |
Class I2 (NAV) | | | 14.29 | % | | | 14.25 | % | | | 08/31/2011 | |
Russell 1000® Value * | | | 16.89 | % | | | 17.26 | % | | | | |
NOTES
| * | The Russell 1000® Value Index (“Russell 1000® Value”) is an unmanaged index used as a general measure of market performance. Calculations assume dividends and capital gains are reinvested and do not include any managerial expenses. The 10 Years or Life of Fund calculation is based on the inception date of the class. You cannot invest directly in an index. |
The performance data presented represents past performance; future results may vary. Performance data does not reflect the deduction of taxes that would be paid on fund distributions or the redemption of fund shares. Investment return and principal value will fluctuate so that an investor’s shares, when redeemed, may be worth more or less than their original cost. Current performance may be lower or higher than performance quoted. Please see www.transamericainvestments.com for performance data current to the most recent month-end. Net Asset Value (“NAV”) returns include the reinvestment of dividends and capital gains. Fund shares are sold without a sales load.
Performance figures reflect any fee waivers and/or expense reimbursements by the Investment Adviser. Without such waivers and/or reimbursements, the performance would be lower. Future waivers and/or reimbursements are at the discretion of the Investment Adviser.
Stocks may be volatile, their prices may go up and down dramatically over the shorter term. The prices of the securities the sub-adviser believes are undervalued may not appreciate as anticipated, or may go down. Value stocks as a group may be out of favor and underperform the overall equity market for a long period of time, for example, while the market favors “growth” stocks. This material must be preceded or accompanied by a current prospectus, which includes specific contents regarding the investment objectives and policies of this fund. This fund is only available in Class I2 shares, which are not available for direct investment by the public.
Russell Investment Group is the source and owner of the trademarks, service marks, and copyrights related to the Russell indexes. Russell® is a trademark of Russell Investment Group.
| | | | |
| Transamerica Funds | | | | Annual Report 2012 |
| | Page 35 | | |
Transamerica Total Return
(formerly, Transamerica PIMCO Total Return)
(unaudited)
MARKET ENVIRONMENT
During the last months of 2011, policy initiatives were the major market drivers. In its December meeting, the Federal Open Market Committee (“FOMC”) left the federal funds rate unchanged and maintained its existing policy of extending the average maturity of its holdings and reinvesting its principal payments. The FOMC noted that the “economy has been expanding moderately, notwithstanding some apparent slowing in global growth,” and highlighted the recent improvement in overall labor markets and household spending. On the outlook, the FOMC noted that it “continues to expect a moderate pace of economic growth over coming quarters and consequently anticipates that the unemployment rate will decline only gradually,” but pointed to the continued downside risks due to the ongoing pressures in the global financial markets.
Entering 2012, after posting a revised 2.0 percent growth rate for the first quarter, the U.S. economy grew at a 1.5 percent annual rate during the second quarter, as consumer spending and business investment slowed, according to gross domestic product data released in July. Personal consumption expenditures increased by only 1.5 percent, the smallest gain in a year, from April through June, with spending on durable goods, particularly automobiles, slowing. The Conference Board’s consumer confidence index surprised observers by increasing for the first time since February, from a revised 62.7 in June to 65.9 in July as consumers grew more optimistic about the near-term prospects for business conditions and the labor market. Despite this positive report, July’s unemployment rate increased slightly to 8.3 percent. Fewer consumers are expecting an increase in their incomes in the short-term. In spite of the slight uptick in the jobless rate, non-farm payrolls rose by 163,000 during the month, beating forecasts and alleviating some concerns of a slowing U.S. economy. After falling 0.3 percent in May, the headline consumer price index remained unchanged in June at a 1.7 percent increase over the past 12 months, in line with expectations. Energy costs fell during June by 1.4 percent as gasoline prices decreased for the third straight month; however, food prices increased by 0.2 percent from May this year.
Risk appetite returned to financial markets during the last part of the fiscal year as investors responded to additional unconventional monetary policies. The European Central Bank (“ECB”) President, Mario Draghi, delivered on his pledge to do “whatever it takes” to support the euro and the eurozone by unveiling the ECB’s Outright Monetary Transactions (“OMT”). The program entails unlimited, but conditional, purchases of eurozone government bonds with maturities of one to three years in the secondary market. Sovereign yields in both Spain and Italy fell during the quarter, following renewed investor confidence in European policymakers’ ability and willingness to support the eurozone. The FOMC met and confirmed their stance on rates, open-ended quantitative easing and Operation Twist. Finally, the threat of extreme weather in the U.S. eastern seaboard from hurricane Sandy and the contentious U.S. election triggered some safe-haven buying and gave the markets a risk-off tone.
PERFORMANCE
For the year ended October 31, 2012, Transamerica Total Return Class I2 returned 8.30%. By comparison, its benchmark, the Barclays U.S. Aggregate Bond Index (“Barclays U.S. Aggregate Bond”), returned 5.25%.
STRATEGY REVIEW
The Transamerica Total Return outperformed the Barclays U.S. Aggregate Bond for the fiscal year ending October 31, 2012. An underweight to U.S. duration for most of the period, particularly the long-end of the yield curve, detracted from performance as interest rates fell across the curve. Conversely, exposure to non-U.S. developed interest rates, particularly core Europe and Australia, added to performance as rates fell on fears of a global economic slowdown. Additionally, exposure to local rates in Brazil added to performance as the central bank cut the main policy rate multiple times to help stimulate growth. On the spread sector front, exposure to Agency and non-agency mortgage-backed securities was positive for performance as the Federal Reserve remains committed to accommodative policies to support the U.S. housing market. In addition, exposure to non-taxable municipal bonds also added to returns as technical factors improved, causing spreads to narrow.
We used government bond futures for duration management, substitution for direct investment, and hedging/risk management. We used interest rates swaps for duration management, substitution for direct interest rate exposure, and hedging/risk management. We used credit default swaps for credit quality management, hedging/risk management, liquidity management, income (for sell protection positions), and substitution for direct credit investment. We used swaptions for hedging/risk management, income (for written positions), and substitution for direct credit investment. We used money market futures for duration management and substitute for direct investment. We used foreign-exchange forwards for currency management and hedging/risk management. An underweight to U.S. duration, partially implemented via government bond futures, detracted from returns as interest rates fell across the curve. Yield curve positioning, partially implemented using money market futures, added to returns. An underweight to the overall corporate market, partly through the use of credit default swaps, was negative for returns as corporates outperformed like-duration Treasuries. Exposure to Emerging Markets, particularly Brazil and Mexico, partly through the use of interest rate swaps contributed to performance. Currency positioning in various currencies using foreign-exchange forwards was positive for performance.
Chris P. Dialynas
Portfolio Manager
Pacific Investment Management Company LLC
| | | | |
| Transamerica Funds | | | | Annual Report 2012 |
| | Page 36 | | |
Transamerica Total Return
(formerly, Transamerica PIMCO Total Return)
(unaudited)
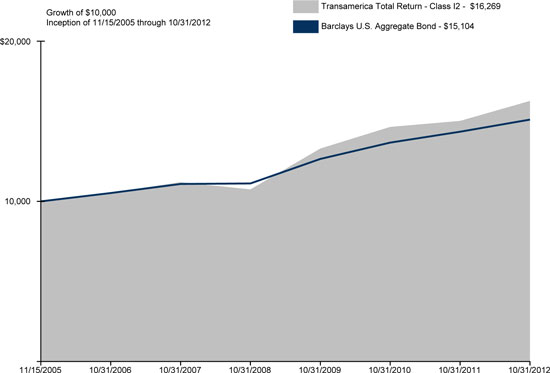
Average Annual Total Return for Periods Ended 10/31/2012
| | | | | | | | | | | | | | | | |
| | | 1 Year | | | 5 Years | | | 10 Years or
Life of Fund | | | Inception Date | |
Class I2 (NAV) | | | 8.30 | % | | | 7.75 | % | | | 7.24 | % | | | 11/15/2005 | |
Barclays U.S. Aggregate Bond * | | | 5.25 | % | | | 6.38 | % | | | 6.10 | % | | | | |
NOTES
| * | The Barclays U.S Aggregate Bond Index (“Barclays U.S. Aggregate Bond”) is an unmanaged index used as a general measure of market performance. Calculations assume dividends and capital gains are reinvested and do not include any managerial expenses. The 10 Years or Life of Fund calculation is based on the inception date of the class. You cannot invest directly in an index. |
The performance data presented represents past performance; future results may vary. Performance data does not reflect the deduction of taxes that would be paid on fund distributions or the redemption of fund shares. Investment return and principal value will fluctuate so that an investor’s shares, when redeemed, may be worth more or less than their original cost. Current performance may be lower or higher than performance quoted. Please see www.transamericainvestments.com for performance data current to the most recent month-end. Net Asset Value (“NAV”) returns include the reinvestment of dividends and capital gains. Fund shares are sold without a sales load.
Performance figures reflect any fee waivers and/or expenses reimbursements by the Investment Adviser. Without such waivers and/or reimbursements, the performance would be lower. Future waivers and/or reimbursements are at the discretion of the Investment Adviser.
This fund will normally invest its assets in a diversified portfolio of fixed-income securities. The fund may invest in non-U.S. securities and may invest a portion of its assets in high-yield securities. Investing in non-U.S. securities may entail risk due to foreign economic and political developments; this risk may be enhanced when investing in emerging markets. This material must be preceded or accompanied by a current prospectus, which includes specific contents regarding the investment objectives and policies of this fund. This fund is only available in Class I2 shares, which are not available for direct investment by the public.
| | | | |
| Transamerica Funds | | | | Annual Report 2012 |
| | Page 37 | | |
Transamerica Value
(formerly, Transamerica Third Avenue Value)
(unaudited)
MARKET ENVIRONMENT
During the fourth calendar quarter of 2011 we reported to Transamerica that, “(the) global markets recovery favored large, U.S.-based, dividend paying blue chip companies. It is our belief that this “safety trade” has created the opportunity for more long-term value in the generally overlooked and under-followed companies in which we invest.” Since writing that, we have seen the market largely vindicate our interpretation. Through calendar 2012, equity markets have risen worldwide, though conditions remained volatile as investors watched Europe edge towards resolution of its sovereign debt issues and tried to measure the slowing growth in the U.S. and China.
PERFORMANCE
For the year ended October 31, 2012, Transamerica Value Class I2 returned 10.42%. By comparison, its primary and secondary benchmarks, the Russell 3000® Value Index and the Morgan Stanley Capital International World Index (“MSCI World”), returned 16.70% and 10.11%, respectively.
STRATEGY REVIEW
As always, we managed the fund with an eye towards generating superior, long-term results while minimizing investment risk. We invested in companies trading at significant discount to net asset value (“NAV”) that have capacity to grow over time. During the year, we identified eight new investments and sold eleven positions. Two holdings (Viterra and Pharmaceutical Products Development) were subject to, or are pending, take over.
During the year, we had an average 47% exposure to North America and 16.4% exposure to Hong Kong, with just under 10% cash. We found opportunities for buying and selling across industries and around the world and though financials (a broad GICS sector that includes not just banks but insurance, real estate and holding companies) were the largest collective performance contributors, we saw gains spread widely across the fund. On a country basis our Canadian stocks were the largest performance contributors, largely due to the pending take over bid for Viterra, which is based in Calgary, Alberta.
Viterra, a grain storage and handling company with operations in Western Canada and Australia, was the strongest performance contributor during the year as it is subject to a takeover bid by Glencore International. A takeover of this type was a possible exit that we had included in our investment thesis. Viterra had built the most sophisticated grain network in western Canada. As the region was deregulated, we expected that other agricultural firms would want access. It would have been very difficult for a competitor to build its own resources with Viterra dominating the market.
The next strongest performance contributor was a German specialty chemical company Lanxess AG. Lanxess executed extremely well all year and despite volatility owing to it being domiciled in troubled Europe, it proved that its revenues were protected by its global customer base, including major inroads recently made into emerging markets. Over the last twelve months we’ve trimmed this position as the stock price has appreciated.
The largest detractor from performance this year was AVX Corp (“AVX”). AVX, which is majority owned by Kyocera Electronics, makes passive electronic components. AVX has been operating in a difficult environment for technology spending and is in the process of finalizing an environmental liability, but it has a solid competitive position and a rich balance sheet. We believe that AVX has the flexibility and strength to deliver strong returns over time, despite present challenges.
Curtis R. Jensen
Yang Lie
Ian Lapey
Michael Lehman
Portfolio Manager
Third Avenue Management LLC
| | | | |
| Transamerica Funds | | | | Annual Report 2012 |
| | Page 38 | | |
Transamerica Value
(formerly, Transamerica Third Avenue Value)
(unaudited)
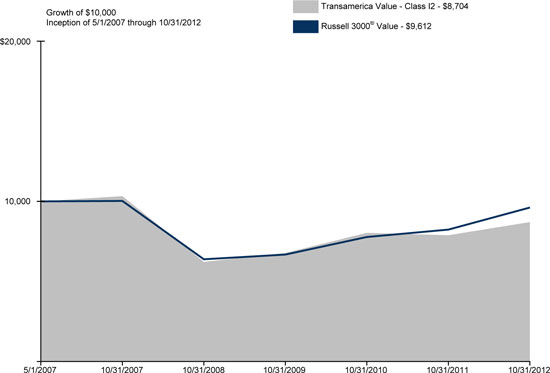
Average Annual Total Return for Periods Ended 10/31/2012
| | | | | | | | | | | | | | | | |
| | | 1 Year | | | 5 Years | | | 10 Years or
Life of Fund | | | Inception Date | |
Class I2 (NAV) | | | 10.42 | % | | | (3.36 | )% | | | (2.49 | )% | | | 05/01/2007 | |
Russell 3000® Value * | | | 16.70 | % | | | (0.85 | )% | | | (0.72 | )% | | | | |
MSCI World * | | | 10.11 | % | | | (2.30 | )% | | | (0.71 | )% | | | | |
NOTES
| * | The Russell 3000® Value Index (“Russell 3000® Value”) and the Morgan Stanley Capital International World Index (“MSCI World”) are unmanaged indices used as a general measure of market performance. Calculations assume dividends and capital gains are reinvested and do not include any managerial expenses. The 10 Years or Life of Fund calculation is based on the inception date of the class. You cannot invest directly in an index. |
The performance data presented represents past performance; future results may vary. Performance data does not reflect the deduction of taxes that would be paid on fund distributions or the redemption of fund shares. Investment return and principal value will fluctuate so that an investor’s shares, when redeemed, may be worth more or less than their original cost. Current performance may be lower or higher than performance quoted. Please see www.transamericainvestments.com for performance data current to the most recent month-end. Net Asset Value (“NAV”) returns include the reinvestment of dividends and capital gains. Fund shares are sold without a sales load.
Performance figures reflect any fee waivers and/or expense reimbursements by the Investment Adviser. Without such waivers and/or reimbursements, the performance would be lower. Future waivers and/or reimbursements are at the discretion of the Investment Adviser.
Growth stocks can be volatile and experience sharp price declines and certain types of stocks, especially technology, can be extremely volatile and subject to greater price swings than the broader market. Value approach carries the risk that the market will not recognize a security’s intrinsic value for a long time or that an undervalued stock is actually appropriately priced. This material must be preceded or accompanied by a current prospectus, which includes specific contents regarding the investment objectives and policies of this fund. This fund is only available in Class I2 shares, which are not available for direct investment by the public.
Russell Investment Group is the source and owner of the trademarks, service marks, and copyrights related to the Russell indexes. Russell® is a trademark of Russell Investment Group.
| | | | |
| Transamerica Funds | | | | Annual Report 2012 |
| | Page 39 | | |
Understanding Your Funds’ Expenses
(unaudited)
SHAREHOLDER EXPENSES
Fund shareholders may incur two types of costs: (1) transaction costs, including sales charges (loads) on purchases, contingent deferred sales charges on redemptions; and (2) ongoing costs, including management fees, dividend expense on short-sales, and other fund expenses.
The following examples are intended to help you understand your ongoing costs (in dollars and cents) of investing in the funds and to compare these costs with the ongoing costs of investing in other funds.
The examples are based on an investment of $1,000 invested at May 1, 2012 and held for the entire period until October 31, 2012.
ACTUAL EXPENSES
The information in the table under the heading “Actual Expenses” provides information about actual account values and actual expenses. You may use the information in these columns, together with the amount you invested, to estimate the expenses that you paid over the period. Simply divide your account value by $1,000 (for example, an $8,600 account value divided by $1,000 = $8.60), then multiply the result by the number in the appropriate column for your share class titled “Expenses Paid During Period” to estimate the expenses you paid on your account during this period.
HYPOTHETICAL EXAMPLE FOR COMPARISON PURPOSES
The information in the table under the heading “Hypothetical Expenses” provides information about hypothetical account values and hypothetical expenses based on the funds’ actual expense ratios and an assumed rate of return of 5% per year before expenses, which is not the funds’ actual returns. The hypothetical account values and expenses may not be used to estimate the actual ending account balance or expenses you paid for the period. You may use this information to compare the ongoing costs of investing in your fund versus other funds. To do so, compare this 5% hypothetical example with the 5% hypothetical examples that appear in the shareholder reports of the other funds.
Please note that the expenses shown in the table are meant to highlight your ongoing costs only and do not reflect any transactional costs. Therefore, the information under the heading “Hypothetical Expenses” is useful in comparing ongoing costs only, and will not help you determine the relative total costs of owning different funds. In addition, if these transaction costs were included, your costs would have been higher. The expenses shown in the table do not reflect any fees that may be charged to you by brokers, financial intermediaries or other financial institutions.
Expense ratios may vary period to period because of various factors, such as an increase in expenses that are not a part of the advisory and administrative fees, such as fees and expenses of the trustees and their counsel, extraordinary expenses and interest expense.
| | | | | | | | | | | | | | | | | | | | | | | | |
| | | | | | Actual Expenses | | | Hypothetical Expenses(A) | | | | |
Fund Name(B) | | Beginning
Account Value | | | Ending Account
Value | | | Expenses Paid
During Period(C) | | | Ending Account
Value | | | Expenses Paid
During Period(C) | | | Annualized
Expense Ratio | |
Transamerica Arbitrage Strategy | | $ | 1,000.00 | | | $ | 966.80 | | | $ | 9.00 | | | $ | 1,015.99 | | | $ | 9.22 | | | | 1.82 | %(D) |
Transamerica Bond | | | 1,000.00 | | | | 1,074.70 | | | | 3.65 | | | | 1,021.62 | | | | 3.56 | | | | 0.70 | |
Transamerica Core Bond | | | 1,000.00 | | | | 1,030.30 | | | | 2.40 | | | | 1,022.77 | | | | 2.39 | | | | 0.47 | |
Transamerica Developing Markets Equity | | | 1,000.00 | | | | 1,017.80 | | | | 6.75 | | | | 1,018.45 | | | | 6.75 | | | | 1.33 | |
Transamerica Global Macro | | | 1,000.00 | | | | 1,003.50 | | | | 7.55 | | | | 1,017.60 | | | | 7.61 | | | | 1.50 | |
Transamerica Global Real Estate Securities | | | 1,000.00 | | | | 1,047.80 | | | | 4.99 | | | | 1,020.26 | | | | 4.93 | | | | 0.97 | |
Transamerica Growth | | | 1,000.00 | | | | 947.10 | | | | 4.06 | | | | 1,020.96 | | | | 4.22 | | | | 0.83 | |
Transamerica International | | | 1,000.00 | | | | 1,022.60 | | | | 5.24 | | | | 1,019.96 | | | | 5.23 | | | | 1.03 | |
Transamerica International Equity Opportunities | | | 1,000.00 | | | | 1,010.90 | | | | 5.46 | | | | 1,019.71 | | | | 5.48 | | | | 1.08 | |
Transamerica International Small Cap | | | 1,000.00 | | | | 965.80 | | | | 5.68 | | | | 1,019.36 | | | | 5.84 | | | | 1.15 | |
Transamerica International Value Opportunities | | | 1,000.00 | | | | 993.30 | | | | 5.41 | | | | 1,019.71 | | | | 5.48 | | | | 1.08 | |
Transamerica Large Company | | | 1,000.00 | | | | 1,020.40 | | | | 4.27 | | | | 1,020.91 | | | | 4.27 | | | | 0.84 | |
Transamerica Long/Short Strategy | | | 1,000.00 | | | | 1,021.30 | | | | 17.58 | | | | 1,007.74 | | | | 17.46 | | | | 3.46 | (E) |
Transamerica Mid Cap Value | | | 1,000.00 | | | | 1,055.90 | | | | 4.60 | | | | 1,020.66 | | | | 4.52 | | | | 0.89 | |
Transamerica Real Return TIPS | | | 1,000.00 | | | | 1,046.70 | | | | 3.55 | | | | 1,021.67 | | | | 3.51 | | | | 0.69 | |
Transamerica Select Equity | | | 1,000.00 | | | | 1,017.90 | | | | 3.91 | | | | 1,021.27 | | | | 3.91 | | | | 0.77 | |
Transamerica Total Return | | | 1,000.00 | | | | 1,040.50 | | | | 3.80 | | | | 1,021.42 | | | | 3.76 | | | | 0.74 | |
Transamerica Value | | | 1,000.00 | | | | 1,031.60 | | | | 4.44 | | | | 1,020.76 | | | | 4.42 | | | | 0.87 | |
| (A) | 5% return per year before expenses. |
| (B) | See the Notes to the Financial Statements for information regarding name changes for the funds. |
| (C) | Expenses are calculated using the fund’s annualized expense ratios (as disclosed in the table), multiplied by the average account value for the period, multiplied by the number of days in the period (184 days), and divided by the number of days in the year (366 days). |
| (D) | Includes dividends and interest on securities sold short (representing 0.57% of average net assets). |
| (E) | Includes dividends and interest on securities sold short (representing 2.00% of average net assets). |
| | | | |
| Transamerica Funds | | | | Annual Report 2012 |
| | Page 40 | | |
Schedules of Investments Composition
At October 31, 2012
(The following charts summarize the Schedules of Investments of the funds by asset type)
(unaudited)
| | | | |
Transamerica Arbitrage Strategy | | % of Net
Assets | |
Common Stocks | | | 81.1 | % |
Repurchase Agreement | | | 12.3 | |
Purchased Options | | | 0.1 | |
Other Assets and Liabilities—Net (A) | | | 6.5 | |
| | | | |
Total | | | 100.0 | % |
| | | | |
| |
Transamerica Bond | | % of Net
Assets | |
Corporate Debt Securities | | | 55.6 | % |
Foreign Government Obligations | | | 13.3 | |
Securities Lending Collateral | | | 12.8 | |
Convertible Bonds | | | 6.9 | |
Mortgage-Backed Securities | | | 5.5 | |
U.S. Government Obligations | | | 5.4 | |
U.S. Government Agency Obligation | | | 5.2 | |
Convertible Preferred Stocks | | | 2.5 | |
Preferred Stocks | | | 1.6 | |
Common Stocks | | | 1.0 | |
Repurchase Agreement | | | 0.9 | |
Asset-Backed Securities | | | 0.6 | |
Preferred Corporate Debt Security | | | 0.1 | |
Other Assets and Liabilities—Net | | | (11.4 | ) |
| | | | |
Total | | | 100.0 | % |
| | | | |
| |
Transamerica Core Bond | | % of Net
Assets | |
U.S. Government Agency Obligations | | | 45.1 | % |
Corporate Debt Securities | | | 18.4 | |
U.S. Government Obligations | | | 16.5 | |
Mortgage-Backed Securities | | | 11.2 | |
Asset-Backed Securities | | | 4.7 | |
Securities Lending Collateral | | | 3.7 | |
Foreign Government Obligations | | | 2.0 | |
Repurchase Agreement | | | 1.5 | |
Municipal Government Obligations | | | 0.3 | |
Other Assets and Liabilities—Net | | | (3.4 | ) |
| | | | |
Total | | | 100.0 | % |
| | | | |
| |
Transamerica Developing Markets Equity | | % of Net
Assets | |
Common Stocks | | | 93.8 | % |
Securities Lending Collateral | | | 10.4 | |
Repurchase Agreement | | | 4.1 | |
Preferred Stocks | | | 2.0 | |
Other Assets and Liabilities—Net | | | (10.3 | ) |
| | | | |
Total | | | 100.0 | % |
| | | | |
| |
Transamerica Global Macro | | % of Net
Assets | |
Short-Term U.S. Government Obligations | | | 60.6 | % |
Repurchase Agreement | | | 39.8 | |
Purchased Options | | | 0.6 | |
Other Assets and Liabilities—Net (A) | | | (1.0 | ) |
| | | | |
Total | | | 100.0 | % |
| | | | |
| |
Transamerica Global Real Estate Securities | | % of Net
Assets | |
Common Stocks | | | 99.1 | % |
Securities Lending Collateral | | | 13.8 | |
Repurchase Agreement | | | 0.8 | |
Other Assets and Liabilities—Net | | | (13.7 | ) |
| | | | |
Total | | | 100.0 | % |
| | | | |
| | | | |
Transamerica Growth | | % of Net
Assets | |
Common Stocks | | | 99.1 | % |
Securities Lending Collateral | | | 8.3 | |
Repurchase Agreement | | | 1.1 | |
Other Assets and Liabilities—Net | | | (8.5 | ) |
| | | | |
Total | | | 100.0 | % |
| | | | |
| |
Transamerica International | | % of Net
Assets | |
Common Stocks | | | 96.9 | % |
Securities Lending Collateral | | | 10.3 | |
Repurchase Agreement | | | 3.0 | |
Other Assets and Liabilities—Net | | | (10.2 | ) |
| | | | |
Total | | | 100.0 | % |
| | | | |
| |
Transamerica International Equity Opportunities | | % of Net
Assets | |
Common Stocks | | | 99.1 | % |
Securities Lending Collateral | | | 3.4 | |
Repurchase Agreement | | | 0.7 | |
Right | | | 0.0 | (B) |
Other Assets and Liabilities—Net | | | (3.2 | ) |
| | | | |
Total | | | 100.0 | % |
| | | | |
| |
Transamerica International Small Cap | | % of Net
Assets | |
Common Stocks | | | 96.0 | % |
Securities Lending Collateral | | | 9.0 | |
Repurchase Agreement | | | 3.1 | |
Preferred Stocks | | | 0.4 | |
Other Assets and Liabilities—Net | | | (8.5 | ) |
| | | | |
Total | | | 100.0 | % |
| | | | |
| |
Transamerica International Value Opportunities | | % of Net
Assets | |
Common Stocks | | | 95.2 | % |
Securities Lending Collateral | | | 4.9 | |
Repurchase Agreement | | | 2.3 | |
Preferred Stocks | | | 2.0 | |
Other Assets and Liabilities—Net (A) | | | (4.4 | ) |
| | | | |
Total | | | 100.0 | % |
| | | | |
| |
Transamerica Large Company | | % of Net
Assets | |
Common Stocks | | | 97.7 | % |
Securities Lending Collateral | | | 3.2 | |
Short-Term Investment Company | | | 2.4 | |
Other Assets and Liabilities—Net | | | (3.3 | ) |
| | | | |
Total | | | 100.0 | % |
| | | | |
| |
Transamerica Long/Short Strategy | | % of Net
Assets | |
Common Stocks | | | 100.2 | % |
Repurchase Agreement | | | 0.2 | |
Other Assets and Liabilities—Net (A) | | | (0.4 | ) |
| | | | |
Total | | | 100.0 | % |
| | | | |
| | | | |
| Transamerica Funds | | | | Annual Report 2012 |
| | Page 41 | | |
Schedules of Investments Composition (continued)
At October 31, 2012
(The following charts summarize the Schedules of Investments of the funds by asset type)
(unaudited)
| | | | |
Transamerica Mid Cap Value | | % of Net
Assets | |
Common Stocks | | | 98.8 | % |
Securities Lending Collateral | | | 10.2 | |
Repurchase Agreement | | | 1.3 | |
Other Assets and Liabilities—Net | | | (10.3 | ) |
| | | | |
Total | | | 100.0 | % |
| | | | |
| |
Transamerica Real Return TIPS | | % of Net
Assets | |
U.S. Government Obligations | | | 98.7 | % |
Foreign Government Obligations | | | 8.9 | |
Corporate Debt Securities | | | 4.3 | |
Mortgage-Backed Securities | | | 1.5 | |
Commercial Paper | | | 0.6 | |
Loan Assignments | | | 0.5 | |
Securities Lending Collateral | | | 0.4 | |
Asset-Backed Securities | | | 0.4 | |
U.S. Government Agency Obligations | | | 0.2 | |
Municipal Government Obligations | | | 0.1 | |
Repurchase Agreement | | | 0.0 | (B) |
Purchased Straddle Swaptions | | | 0.0 | (B) |
Purchased Swaptions | | | 0.0 | (B) |
Other Assets and Liabilities—Net (A) | | | (15.6 | ) |
| | | | |
Total | | | 100.0 | % |
| | | | |
| |
Transamerica Select Equity | | % of Net
Assets | |
Common Stocks | | | 98.8 | % |
Securities Lending Collateral | | | 11.2 | |
Repurchase Agreement | | | 1.2 | |
Other Assets and Liabilities—Net | | | (11.2 | ) |
| | | | |
Total | | | 100.0 | % |
| | | | |
| |
Transamerica Total Return | | % of Net
Assets | |
U.S. Government Agency Obligations | | | 32.4 | % |
U.S. Government Obligations | | | 21.0 | |
Corporate Debt Securities | | | 16.3 | |
Short-Term U.S. Government Obligations | | | 13.4 | |
Repurchase Agreements | | | 10.1 | |
Mortgage-Backed Securities | | | 7.5 | |
Municipal Government Obligations | | | 6.4 | |
Foreign Government Obligations | | | 5.8 | |
Asset-Backed Securities | | | 4.8 | |
Commercial Papers | | | 1.5 | |
Certificate of Deposit | | | 1.0 | |
Convertible Preferred Stock | | | 0.2 | |
Securities Lending Collateral | | | 0.2 | |
Preferred Stock | | | 0.1 | |
Purchased Swaption | | | 0.0 | (B) |
Other Assets and Liabilities—Net (A) | | | (20.7 | ) |
| | | | |
Total | | | 100.0 | % |
| | | | |
| | | | |
Transamerica Value | | % of Net
Assets | |
Common Stocks | | | 86.7 | % |
Repurchase Agreement | | | 13.4 | |
Securities Lending Collateral | | | 5.7 | |
Other Assets and Liabilities—Net | | | (5.8 | ) |
| | | | |
Total | | | 100.0 | % |
| | | | |
|
(A) The Other Assets and Liabilities—Net category may include, but is not limited to, Reverse Repurchase Agreements, Forward Foreign Currency Contracts, Futures Contracts, Swap Agreements, Written Options and Swaptions, Securities Sold Short, TBA Short Commitments, and Cash Collateral. (B) Amount rounds to less than 0.1%. |
| | | | |
| Transamerica Funds | | | | Annual Report 2012 |
| | Page 42 | | |
Transamerica Arbitrage Strategy
(formerly, Transamerica Water Island Arbitrage Strategy)
SCHEDULE OF INVESTMENTS
At October 31, 2012
| | | | | | | | |
| | | Shares | | | Value
(000’s) | |
COMMON STOCKS—81.1% | | | | | | | | |
Aerospace & Defense—0.6% | | | | | | | | |
Ceradyne, Inc. | | | 19,135 | | | $ | 669 | |
Air Freight & Logistics—5.1% | | | | | | | | |
TNT Express NV | | | 561,346 | | | | 5,912 | |
Beverages—1.7% | | | | | | | | |
Grupo Modelo SAB de CV | | | 219,253 | | | | 1,932 | |
Biotechnology—0.4% | | | | | | | | |
Devgen ‡ | | | 20,580 | | | | 424 | |
Chemicals—0.3% | | | | | | | | |
Spartech Corp. ‡ | | | 45,681 | | | | 391 | |
Commercial Banks—0.9% | | | | | | | | |
Citizens Republic Bancorp, Inc. ‡ | | | 31,094 | | | | 564 | |
West Coast Bancorp | | | 19,849 | | | | 437 | |
Construction & Engineering—3.6% | | | | | | | | |
Chicago Bridge & Iron Co. NV—Class Y Ŏ | | | 16,386 | | | | 615 | |
Shaw Group, Inc. ‡ Ŏ | | | 80,852 | | | | 3,541 | |
Distributors—0.0% ¥ | | | | | | | | |
CFAO SA | | | 716 | | | | 35 | |
Diversified Financial Services—0.2% | | | | | | | | |
Osaka Securities Exchange Co., Ltd. | | | 62 | | | | 231 | |
Electrical Equipment—6.5% | | | | | | | | |
Cooper Industries PLC—Class A Ŏ | | | 100,832 | | | | 7,556 | |
Energy Equipment & Services—0.1% | | | | | | | | |
Union Drilling, Inc. ‡ | | | 16,224 | | | | 105 | |
Food Products—5.8% | | | | | | | | |
Viterra, Inc. | | | 427,815 | | | | 6,742 | |
Health Care Equipment & Supplies—1.4% | | | | | | | | |
China Kanghui Holdings, Inc. ADR ‡ | | | 54,494 | | | | 1,668 | |
Health Care Providers & Services—8.5% | | | | | | | | |
AMERIGROUP Corp. ‡ Ŏ | | | 47,913 | | | | 4,377 | |
Coventry Health Care, Inc. Ŏ | | | 99,799 | | | | 4,356 | |
PSS World Medical, Inc. ‡ | | | 3,396 | | | | 97 | |
Sunrise Senior Living, Inc. ‡ | | | 83,105 | | | | 1,196 | |
Health Care Technology—0.3% | | | | | | | | |
Mediware Information Systems ‡ | | | 13,761 | | | | 302 | |
Hotels, Restaurants & Leisure—0.4% | | | | | | | | |
KFC Holdings Malaysia Bhd ‡ | | | 275,094 | | | | 352 | |
QSR Brands Bhd ‡ | | | 74,840 | | | | 162 | |
Independent Power Producers & Energy Traders—3.0% | |
GenOn Energy, Inc. ‡ Ŏ | | | 1,378,480 | | | | 3,543 | |
Industrial Conglomerates—0.5% | | | | | | | | |
Fraser and Neave, Ltd. | | | 69,783 | | | | 524 | |
Insurance—0.8% | | | | | | | | |
Flagstone Reinsurance Holdings SA | | | 23,432 | | | | 207 | |
SeaBright Holdings, Inc. | | | 60,736 | | | | 666 | |
Machinery—3.7% | | | | | | | | |
Cascade Corp. | | | 9,388 | | | | 610 | |
Industrea, Ltd. | | | 602,695 | | | | 788 | |
Robbins & Myers, Inc. | | | 48,896 | | | | 2,899 | |
Media—4.1% | | | | | | | | |
Astral Media, Inc.—Class A | | | 115,816 | | | | 4,740 | |
Metals & Mining—3.8% | | | | | | | | |
BC Iron, Ltd. | | | 39,583 | | | | 114 | |
CGA Mining, Ltd. ‡ | | | 100,209 | | | | 304 | |
Flinders Mines, Ltd. ‡ | | | 3,711,505 | | | | 331 | |
Nippon Steel & Sumitomo Metal Corp. | | | 5,160 | | | | 11 | |
Sundance Resources, Ltd. ‡ | | | 5,145,440 | | | | 1,896 | |
Talison Lithium, Ltd. ‡ | | | 237,895 | | | | 1,532 | |
Yancoal Australia, Ltd.—Class CVR ‡ | | | 83,718 | | | | 209 | |
Multi-Utilities—0.3% | | | | | | | | |
CH Energy Group, Inc. | | | 5,965 | | | | 388 | |
Oil, Gas & Consumable Fuels—12.0% | | | | | | | | |
Celtic Exploration, Ltd. ‡ | | | 144,375 | | | | 3,770 | |
| | | | | | | | |
| | | Shares | | | Value
(000’s) | |
Oil, Gas & Consumable Fuels (continued) | | | | | | | | |
Nexen, Inc. Ŏ | | | 187,509 | | | $ | 4,482 | |
Progress Energy Resources Corp. | | | 271,746 | | | | 5,475 | |
Whitehaven Coal, Ltd. | | | 125,073 | | | | 396 | |
Personal Products—0.0% ¥ | | | | | | | | |
Physicians Formula Holdings, Inc. ‡ | | | 9,249 | | | | 45 | |
Pharmaceuticals—4.0% | | | | | | | | |
Medicis Pharmaceutical Corp.—Class A Ŏ | | | 106,291 | | | | 4,614 | |
Real Estate Investment Trusts—0.3% | | | | | | | | |
American Realty Capital Trust, Inc. | | | 31,583 | | | | 356 | |
Road & Rail—4.1% | | | | | | | | |
Dollar Thrifty Automotive Group, Inc. ‡ | | | 61,226 | | | | 4,714 | |
Semiconductors & Semiconductor Equipment—0.3% | |
Cymer, Inc. ‡ | | | 3,871 | | | | 308 | |
Software—3.1% | | | | | | | | |
Kenexa Corp. ‡ | | | 77,618 | | | | 3,567 | |
Specialty Retail—0.9% | | | | | | | | |
Douglas Holding AG | | | 10,752 | | | | 525 | |
PEP Boys-Manny Moe & Jack | | | 49,364 | | | | 493 | |
Thrifts & Mortgage Finance—2.4% | | | | | | | | |
Hudson City Bancorp, Inc. | | | 333,559 | | | | 2,830 | |
Wireless Telecommunication Services—2.0% | | | | | | | | |
MetroPCS Communications, Inc. ‡ Ŏ | | | 125,672 | | | | 1,283 | |
Sprint Nextel Corp. ‡ | | | 194,420 | | | | 1,077 | |
| | | | | | | | |
Total Common Stocks (cost $96,612) | | | | | | | 94,361 | |
| | | | | | | | |
| | |
| | | Notional
Amount
(000’s) | | | Value
(000’s) | |
PURCHASED OPTIONS—0.1% | | | | | | | | |
Call Option—0.0% ¥ | | | | | | | | |
MetroPCS Communications, Inc. | | $ | 17 | | | | 5 | |
Strike Price $ 12.50 | | | | | | | | |
Expires 01/19/2013 | | | | | | | | |
Put Options—0.1% | | | | | | | | |
Aetna, Inc. | | | 1 | | | | ¨ | |
Strike Price $ 40.00 | | | | | | | | |
Expires 11/17/2012 | | | | | | | | |
Aetna, Inc. | | | 1 | | | | 1 | |
Strike Price $ 42.00 | | | | | | | | |
Expires 11/17/2012 | | | | | | | | |
Chicago Bridge & Iron Co. NV | | | 5 | | | | 10 | |
Strike Price $ 38.00 | | | | | | | | |
Expires 01/19/2013 | | | | | | | | |
Chicago Bridge & Iron Co. NV | | | 2 | | | | 6 | |
Strike Price $ 39.00 | | | | | | | | |
Expires 01/19/2013 | | | | | | | | |
Dollar Thrifty Automotive Group, Inc. | | | 2 | | | | 7 | |
Strike Price $ 75.00 | | | | | | | | |
Expires 12/22/2012 | | | | | | | | |
MetroPCS Communications, Inc. | | | 85 | | | | 115 | |
Strike Price $ 11.00 | | | | | | | | |
Expires 01/19/2013 | | | | | | | | |
Peet’s Coffee & Tea, Inc. Ә | | | 1 | | | | ¨ | |
Strike Price $ 70.00 | | | | | | | | |
Expires 12/22/2012 | | | | | | | | |
Shaw Group, Inc. | | | 30 | | | | 14 | |
Strike Price $ 35.00 | | | | | | | | |
Expires 01/19/2013 | | | | | | | | |
SPDR S&P 500 ETF Trust | | | 1 | | | | 1 | |
Strike Price $ 138.00 | | | | | | | | |
Expires 11/17/2012 | | | | | | | | |
The notes to the financial statements are an integral part of this report.
| | | | |
| Transamerica Funds | | | | Annual Report 2012 |
| | Page 43 | | |
Transamerica Arbitrage Strategy
(formerly, Transamerica Water Island Arbitrage Strategy)
SCHEDULE OF INVESTMENTS (continued)
At October 31, 2012
| | | | | | | | |
| | | Notional
Amount
(000’s) | | | Value
(000’s) | |
Put Options (continued) | | | | | | | | |
SPDR S&P 500 ETF Trust | | $ | 7 | | | $ | 12 | |
Strike Price $ 140.00 | | | | | | | | |
Expires 11/17/2012 | | | | | | | | |
| | | | | | | | |
Total Purchased Options (cost $219) | | | | | | | 171 | |
| | | | | | | | |
| | |
| | | Principal
(000’s) | | | Value
(000’s) | |
REPURCHASE AGREEMENT—12.3% | | | | | | | | |
State Street Bank & Trust Co. 0.03% p, dated 10/31/2012, to be repurchased at $14,259 on 11/01/2012. Collateralized by a U.S. Government Agency Obligation, 4.00%, due 12/15/2017, and with a value of $14,544. | | | 14,259 | | | | 14,259 | |
Total Repurchase Agreement (cost $14,259) | | | | | |
| | | | | | | | |
Total Investment Securities (cost $111,090) Õ | | | | | | | 108,791 | |
Other Assets and Liabilities—Net | | | | | | | 7,512 | |
| | | | | | | | |
Net Assets | | | | | | $ | 116,303 | |
| | | | | | | | |
| | |
| | | Shares | | | Value
(000’s) | |
SECURITIES SOLD SHORT—(12.0%) | | | | | | | | |
COMMON STOCKS—(12.0%) | | | | | | | | |
Chemicals—(0.2%) | | | | | | | | |
PolyOne Corp. | | | (14,467) | | | $ | (274) | |
Commercial Banks—(2.9%) | | | | | | | | |
Columbia Banking System, Inc. | | | (11,944) | | | | (212) | |
FirstMerit Corp. | | | (19,581) | | | | (271) | |
M&T Bank Corp. | | | (28,028) | | | | (2,918) | |
Gas Utilities—0.0% | | | | | | | | |
APA Group | | | (2) | | | | (¨) | |
Health Care Providers & Services—(1.3%) | | | | | | | | |
Aetna, Inc. | | | (35,435) | | | | (1,549) | |
Independent Power Producers & Energy Traders—(3.1%) | |
NRG Energy, Inc. | | | (167,623) | | | | (3,613) | |
Insurance—(0.1%) | | | | | | | | |
Validus Holdings, Ltd. | | | (4,532) | | | | (162) | |
Machinery—(3.3%) | | | | | | | | |
Eaton Corp. | | | (78,124) | | | | (3,688) | |
Metals & Mining—(0.3%) | | | | | | | | |
B2Gold Corp. ‡ | | | (74,155) | | | | (307) | |
Oil, Gas & Consumable Fuels—(0.2%) | | | | | | | | |
Celtic Exploration, Ltd. ‡ ξ | | | (55,420) | | | | (222) | |
Energy Transfer Partners, LP | | | (953) | | | | (41) | |
Real Estate Investment Trusts—(0.3%) | | | | | | | | |
Realty Income Corp. | | | (9,057) | | | | (356) | |
Semiconductors & Semiconductor Equipment—(0.3%) | | | | | | | | |
ASML Holding NV | | | (5,782) | | | | (318) | |
Wireless Telecommunication Services—0.0% | |
Sprint Nextel Corp. ‡ | | | (100) | | | | (1) | |
| | | | | | | | |
Total Securities Sold Short (proceeds $(12,931)) | | | | (13,932) | |
| | | | | | | | |
| | | | | | | | |
| | | Notional
Amount
(000’s) | | | Value
(000’s) | |
WRITTEN OPTIONS—(0.1%) | | | | | | | | |
Call Options—0.0% ¥ | | | | | | | | |
Aetna, Inc.
Strike Price $ 40.00
Expires 11/17/2012 | | $ | ¨ | | | $ | (1) | |
Aetna, Inc.
Strike Price $ 41.00
Expires 11/17/2012 | | | 4 | | | | (10) | |
Aetna, Inc.
Strike Price $ 42.00
Expires 11/17/2012 | | | 2 | | | | (4) | |
Aetna, Inc.
Strike Price $ 45.00
Expires 11/17/2012 | | | 1 | | | | (1) | |
Ceradyne, Inc.
Strike Price $ 35.00
Expires 11/17/2012 | | | 7 | | | | (¨) | |
Ceradyne, Inc.
Strike Price $ 35.00
Expires 12/22/2012 | | | 9 | | | | (1) | |
Dollar Thrifty Automotive Group, Inc.
Strike Price $ 85.00
Expires 01/19/2013 | | | 2 | | | | (2) | |
FirstMerit Corp. Ә
Strike Price $ 15.00
Expires 11/17/2012 | | | 3 | | | | (¨) | |
FirstMerit Corp.
Strike Price $ 15.00
Expires 12/22/2012 | | | 8 | | | | (1) | |
Medicis Pharmaceutical Corp.
Strike Price $ 44.00
Expires 12/22/2012 | | | 8 | | | | (1) | |
MetroPCS Communications, Inc.
Strike Price $ 12.00
Expires 11/17/2012 | | | 9 | | | | (¨) | |
MetroPCS Communications, Inc. Ә
Strike Price $ 14.00
Expires 11/17/2012 | | | 4 | | | | (¨) | |
MetroPCS Communications, Inc. Ә
Strike Price $ 15.00
Expires 11/17/2012 | | | 55 | | | | (3) | |
MetroPCS Communications, Inc.
Strike Price $ 14.00
Expires 01/19/2013 | | | 33 | | | | (8) | |
Peet’s Coffee & Tea, Inc. Ә
Strike Price $ 75.00
Expires 12/22/2012 | | | ¨ | | | | ¨ | |
Peet’s Coffee & Tea, Inc. Ә
Strike Price $ 80.00
Expires 12/22/2012 | | | 1 | | | | ¨ | |
Robbins & Myers, Inc.
Strike Price $ 60.00
Expires 11/17/2012 | | | 3 | | | | (¨) | |
Robbins & Myers, Inc.
Strike Price $ 60.00
Expires 01/19/2013 | | | 4 | | | | (¨) | |
Shaw Group, Inc.
Strike Price $ 43.00
Expires 01/19/2013 | | | 22 | | | | (47) | |
Shaw Group, Inc.
Strike Price $ 44.00
Expires 01/19/2013 | | | 1 | | | | (1) | |
The notes to the financial statements are an integral part of this report.
| | | | |
| Transamerica Funds | | | | Annual Report 2012 |
| | Page 44 | | |
Transamerica Arbitrage Strategy
(formerly, Transamerica Water Island Arbitrage Strategy)
SCHEDULE OF INVESTMENTS (continued)
At October 31, 2012
| | | | | | | | |
| | | Notional
Amount
(000’s) | | | Value
(000’s) | |
Call Options (continued) | | | | | | | | |
Sprint Nextel Corp.
Strike Price $ 5.00
Expires 11/17/2012 | | | $30 | | | | $(17) | |
Sprint Nextel Corp.
Strike Price $ 5.50
Expires 11/17/2012 | | | 34 | | | | (4) | |
Sprint Nextel Corp.
Strike Price $ 6.00
Expires 11/17/2012 | | | 49 | | | | (1) | |
Put Options—(0.1%) | | | | | | | | |
Dollar Thrifty Automotive Group, Inc.
Strike Price $ 67.50
Expires 01/19/2013 | | | 2 | | | | (4) | |
FirstMerit Corp.
Strike Price $ 15.00
Expires 11/17/2012 | | | 3 | | | | (3) | |
FirstMerit Corp.
Strike Price $ 15.00
Expires 12/22/2012 | | | 7 | | | | (10) | |
| | | | | | | | |
| | | Notional
Amount
(000’s) | | | Value
(000’s) | |
Put Options (continued) | | | | | | | | |
MetroPCS Communications, Inc.
Strike Price $ 10.00
Expires 11/17/2012 | | | $52 | | | | $(16) | |
MetroPCS Communications, Inc.
Strike Price $ 11.00
Expires 11/17/2012 | | | 3 | | | | (3) | |
MetroPCS Communications, Inc.
Strike Price $ 10.00
Expires 12/22/2012 | | | 33 | | | | (18) | |
Shaw Group, Inc. Ә
Strike Price $ 27.00
Expires 01/19/2013 | | | 1 | | | | (¨) | |
SPDR S&P 500 ETF Trust
Strike Price $ 130.00
Expires 11/17/2012 | | | 1 | | | | (¨) | |
Sprint Nextel Corp.
Strike Price $ 5.50
Expires 11/17/2012 | | | 75 | | | | (5) | |
| | | | | | | | |
Total Written Options (premiums: $(152)) | | | | | | | (161) | |
| | | | | | | | |
FORWARD FOREIGN CURRENCY CONTRACTS:
| | | | | | | | | | | | | | | | | | |
Currency | | Counterparty | | Contracts
Bought
(Sold)
(000’s) | | | Settlement Date | | | Amount in U.S.
Dollars Bought
(Sold)
(000’s) | | | Net Unrealized
Appreciation
(Depreciation)
(000’s) | |
AUD | | GSC | | | (45 | ) | | | 12/14/2012 | | | $ | (46 | ) | | $ | (¨ | ) |
AUD | | GSC | | | (50 | ) | | | 12/14/2012 | | | | (52 | ) | | | (¨ | ) |
AUD | | GSC | | | (40 | ) | | | 12/14/2012 | | | | (42 | ) | | | ¨ | |
AUD | | GSC | | | 54 | | | | 12/14/2012 | | | | 55 | | | | 1 | |
AUD | | GSC | | | 42 | | | | 12/14/2012 | | | | 44 | | | | (¨ | ) |
AUD | | GSC | | | 56 | | | | 12/14/2012 | | | | 59 | | | | (1 | ) |
AUD | | GSC | | | (55 | ) | | | 12/14/2012 | | | | (56 | ) | | | (1 | ) |
AUD | | GSC | | | (25 | ) | | | 12/14/2012 | | | | (25 | ) | | | (1 | ) |
AUD | | GSC | | | (9 | ) | | | 12/14/2012 | | | | (9 | ) | | | (¨ | ) |
AUD | | GSC | | | (8 | ) | | | 12/14/2012 | | | | (8 | ) | | | ¨ | |
AUD | | GSC | | | (2 | ) | | | 12/14/2012 | | | | (2 | ) | | | (¨ | ) |
AUD | | GSC | | | (25 | ) | | | 12/14/2012 | | | | (26 | ) | | | ¨ | |
AUD | | GSC | | | (10 | ) | | | 12/14/2012 | | | | (10 | ) | | | (¨ | ) |
AUD | | GSC | | | (15 | ) | | | 12/14/2012 | | | | (16 | ) | | | ¨ | |
AUD | | GSC | | | (3,834 | ) | | | 12/14/2012 | | | | (3,966 | ) | | | 1 | |
AUD | | GSC | | | (27 | ) | | | 12/14/2012 | | | | (28 | ) | | | ¨ | |
AUD | | GSC | | | 23 | | | | 12/14/2012 | | | | 24 | | | | ¨ | |
AUD | | GSC | | | 23 | | | | 12/14/2012 | | | | 23 | | | | ¨ | |
AUD | | GSC | | | 5 | | | | 12/14/2012 | | | | 5 | | | | ¨ | |
AUD | | GSC | | | 50 | | | | 12/14/2012 | | | | 52 | | | | ¨ | |
AUD | | GSC | | | 590 | | | | 12/14/2012 | | | | 610 | | | | ¨ | |
AUD | | GSC | | | (20 | ) | | | 12/14/2012 | | | | (21 | ) | | | ¨ | |
AUD | | GSC | | | (140 | ) | | | 12/14/2012 | | | | (147 | ) | | | 2 | |
AUD | | GSC | | | (60 | ) | | | 12/14/2012 | | | | (62 | ) | | | (¨ | ) |
AUD | | GSC | | | (1 | ) | | | 12/14/2012 | | | | (1 | ) | | | (¨ | ) |
AUD | | GSC | | | (13 | ) | | | 12/14/2012 | | | | (13 | ) | | | (¨ | ) |
BRL | | GSC | | | 950 | | | | 12/14/2012 | | | | 465 | | | | (¨ | ) |
BRL | | GSC | | | 403 | | | | 12/14/2012 | | | | 197 | | | | ¨ | |
BRL | | GSC | | | 66 | | | | 12/14/2012 | | | | 32 | | | | ¨ | |
BRL | | GSC | | | (2,819 | ) | | | 12/14/2012 | | | | (1,378 | ) | | | (2 | ) |
BRL | | GSC | | | 190 | | | | 12/14/2012 | | | | 93 | | | | (¨ | ) |
BRL | | GSC | | | 190 | | | | 12/14/2012 | | | | 93 | | | | ¨ | |
BRL | | GSC | | | 150 | | | | 12/14/2012 | | | | 73 | | | | ¨ | |
BRL | | GSC | | | 500 | | | | 12/14/2012 | | | | 245 | | | | (1 | ) |
BRL | | GSC | | | 160 | | | | 12/14/2012 | | | | 78 | | | | ¨ | |
BRL | | GSC | | | 210 | | | | 12/14/2012 | | | | 102 | | | | ¨ | |
The notes to the financial statements are an integral part of this report.
| | | | |
| Transamerica Funds | | | | Annual Report 2012 |
| | Page 45 | | |
Transamerica Arbitrage Strategy
(formerly, Transamerica Water Island Arbitrage Strategy)
SCHEDULE OF INVESTMENTS (continued)
At October 31, 2012
FORWARD FOREIGN CURRENCY CONTRACTS (continued):
| | | | | | | | | | | | | | | | | | |
Currency | | Counterparty | | Contracts
Bought
(Sold)
(000’s) | | | Settlement Date | | | Amount in U.S.
Dollars Bought
(Sold)
(000’s) | | | Net Unrealized
Appreciation
(Depreciation)
(000’s) | |
CAD | | GSC | | | (235 | ) | | | 12/14/2012 | | | $ | (240 | ) | | $ | 5 | |
CAD | | GSC | | | 800 | | | | 12/14/2012 | | | | 804 | | | | (4 | ) |
CAD | | GSC | | | (1,100 | ) | | | 12/14/2012 | | | | (1,106 | ) | | | 5 | |
CAD | | GSC | | | (1,050 | ) | | | 12/14/2012 | | | | (1,064 | ) | | | 14 | |
CAD | | GSC | | | 20 | | | | 12/14/2012 | | | | 20 | | | | (¨ | ) |
CAD | | GSC | | | 60 | | | | 12/14/2012 | | | | 62 | | | | (2 | ) |
CAD | | GSC | | | 15 | | | | 12/14/2012 | | | | 15 | | | | (¨ | ) |
CAD | | GSC | | | 245 | | | | 12/14/2012 | | | | 251 | | | | (5 | ) |
CAD | | GSC | | | 33 | | | | 12/14/2012 | | | | 34 | | | | (1 | ) |
CAD | | GSC | | | 46 | | | | 12/14/2012 | | | | 47 | | | | (1 | ) |
CAD | | GSC | | | (60 | ) | | | 12/14/2012 | | | | (60 | ) | | | 1 | |
CAD | | GSC | | | 450 | | | | 12/14/2012 | | | | 452 | | | | (2 | ) |
CAD | | GSC | | | (1,100 | ) | | | 12/14/2012 | | | | (1,106 | ) | | | 6 | |
CAD | | GSC | | | (65 | ) | | | 12/14/2012 | | | | (66 | ) | | | 1 | |
CAD | | GSC | | | (20 | ) | | | 12/14/2012 | | | | (20 | ) | | | ¨ | |
CAD | | GSC | | | (18 | ) | | | 12/14/2012 | | | | (18 | ) | | | ¨ | |
CAD | | GSC | | | (300 | ) | | | 12/14/2012 | | | | (300 | ) | | | (¨ | ) |
CAD | | GSC | | | (160 | ) | | | 12/14/2012 | | | | (163 | ) | | | 2 | |
CAD | | GSC | | | (100 | ) | | | 12/14/2012 | | | | (102 | ) | | | 2 | |
CAD | | GSC | | | (100 | ) | | | 12/14/2012 | | | | (101 | ) | | | 1 | |
CAD | | GSC | | | (40 | ) | | | 12/14/2012 | | | | (41 | ) | | | 1 | |
CAD | | GSC | | | 550 | | | | 12/14/2012 | | | | 560 | | | | (9 | ) |
CAD | | GSC | | | 720 | | | | 12/14/2012 | | | | 735 | | | | (15 | ) |
CAD | | GSC | | | 160 | | | | 12/14/2012 | | | | 163 | | | | (3 | ) |
CAD | | GSC | | | 150 | | | | 12/14/2012 | | | | 150 | | | | ¨ | |
CAD | | GSC | | | 500 | | | | 12/14/2012 | | | | 501 | | | | (1 | ) |
CAD | | GSC | | | (21,570 | ) | | | 12/14/2012 | | | | (22,135 | ) | | | 558 | |
EUR | | GSC | | | (90 | ) | | | 12/14/2012 | | | | (117 | ) | | | ¨ | |
EUR | | GSC | | | (140 | ) | | | 12/14/2012 | | | | (183 | ) | | | 1 | |
EUR | | GSC | | | (4,888 | ) | | | 12/14/2012 | | | | (6,286 | ) | | | (52 | ) |
EUR | | GSC | | | 170 | | | | 12/14/2012 | | | | 221 | | | | (1 | ) |
EUR | | GSC | | | (210 | ) | | | 12/14/2012 | | | | (271 | ) | | | (1 | ) |
EUR | | GSC | | | (40 | ) | | | 12/14/2012 | | | | (52 | ) | | | (¨ | ) |
EUR | | GSC | | | 14 | | | | 12/14/2012 | | | | 18 | | | | (¨ | ) |
EUR | | GSC | | | 115 | | | | 12/14/2012 | | | | 151 | | | | (2 | ) |
EUR | | GSC | | | 54 | | | | 12/14/2012 | | | | 70 | | | | ¨ | |
EUR | | GSC | | | 76 | | | | 12/14/2012 | | | | 100 | | | | (1 | ) |
EUR | | GSC | | | 87 | | | | 12/14/2012 | | | | 114 | | | | (1 | ) |
EUR | | GSC | | | 45 | | | | 12/14/2012 | | | | 59 | | | | (¨ | ) |
EUR | | GSC | | | (130 | ) | | | 12/14/2012 | | | | (169 | ) | | | ¨ | |
EUR | | GSC | | | (160 | ) | | | 12/14/2012 | | | | (209 | ) | | | 1 | |
EUR | | GSC | | | (79 | ) | | | 12/14/2012 | �� | | | (102 | ) | | | (1 | ) |
EUR | | GSC | | | (110 | ) | | | 12/14/2012 | | | | (143 | ) | | | ¨ | |
EUR | | GSC | | | (35 | ) | | | 12/14/2012 | | | | (45 | ) | | | (¨ | ) |
EUR | | GSC | | | (270 | ) | | | 12/14/2012 | | | | (350 | ) | | | (¨ | ) |
EUR | | GSC | | | (22 | ) | | | 12/14/2012 | | | | (28 | ) | | | (¨ | ) |
EUR | | GSC | | | (189 | ) | | | 12/14/2012 | | | | (246 | ) | | | 1 | |
EUR | | GSC | | | (600 | ) | | | 12/14/2012 | | | | (776 | ) | | | (2 | ) |
EUR | | GSC | | | 6 | | | | 12/14/2012 | | | | 8 | | | | ¨ | |
EUR | | GSC | | | 45 | | | | 12/14/2012 | | | | 58 | | | | ¨ | |
EUR | | GSC | | | 10 | | | | 12/14/2012 | | | | 13 | | | | ¨ | |
EUR | | GSC | | | 25 | | | | 12/14/2012 | | | | 32 | | | | ¨ | |
EUR | | GSC | | | 740 | | | | 12/14/2012 | | | | 955 | | | | 5 | |
EUR | | GSC | | | 78 | | | | 12/14/2012 | | | | 100 | | | | 1 | |
EUR | | GSC | | | 100 | | | | 12/14/2012 | | | | 130 | | | | (1 | ) |
EUR | | GSC | | | 53 | | | | 12/14/2012 | | | | 69 | | | | (1 | ) |
JPY | | GSC | | | (200 | ) | | | 12/14/2012 | | | | (3 | ) | | | ¨ | |
JPY | | GSC | | | 280 | | | | 12/14/2012 | | | | 3 | | | | ¨ | |
JPY | | GSC | | | (2,300 | ) | | | 12/14/2012 | | | | (29 | ) | | | ¨ | |
JPY | | GSC | | | (380 | ) | | | 12/14/2012 | | | | (5 | ) | | | ¨ | |
JPY | | GSC | | | 1,490 | | | | 12/14/2012 | | | | 19 | | | | (¨ | ) |
JPY | | GSC | | | (200 | ) | | | 12/14/2012 | | | | (3 | ) | | | ¨ | |
JPY | | GSC | | | 450 | | | | 12/14/2012 | | | | 6 | | | | (¨ | ) |
JPY | | GSC | | | 2,500 | | | | 12/14/2012 | | | | 32 | | | | (1 | ) |
JPY | | GSC | | | 150 | | | | 12/14/2012 | | | | 2 | | | | (¨ | ) |
JPY | | GSC | | | (200 | ) | | | 12/14/2012 | | | | (3 | ) | | | (¨ | ) |
The notes to the financial statements are an integral part of this report.
| | | | |
| Transamerica Funds | | | | Annual Report 2012 |
| | Page 46 | | |
Transamerica Arbitrage Strategy
(formerly, Transamerica Water Island Arbitrage Strategy)
SCHEDULE OF INVESTMENTS (continued)
At October 31, 2012
FORWARD FOREIGN CURRENCY CONTRACTS (continued):
| | | | | | | | | | | | | | | | | | |
Currency | | Counterparty | | Contracts
Bought
(Sold)
(000’s) | | | Settlement Date | | | Amount in U.S.
Dollars Bought
(Sold)
(000’s) | | | Net Unrealized
Appreciation
(Depreciation)
(000’s) | |
JPY | | GSC | | | (2,400 | ) | | | 12/14/2012 | | | $ | (31 | ) | | $ | 1 | |
JPY | | GSC | | | (2,300 | ) | | | 12/14/2012 | | | | (29 | ) | | | 1 | |
JPY | | GSC | | | (1,500 | ) | | | 12/14/2012 | | | | (19 | ) | | | ¨ | |
JPY | | GSC | | | (280 | ) | | | 12/14/2012 | | | | (4 | ) | | | ¨ | |
JPY | | GSC | | | (76,341 | ) | | | 12/14/2012 | | | | (982 | ) | | | 26 | |
JPY | | GSC | | | 60,150 | | | | 12/14/2012 | | | | 775 | | | | (21 | ) |
JPY | | GSC | | | 275 | | | | 12/14/2012 | | | | 4 | | | | (¨ | ) |
JPY | | GSC | | | 550 | | | | 12/14/2012 | | | | 7 | | | | (¨ | ) |
JPY | | GSC | | | 370 | | | | 12/14/2012 | | | | 5 | | | | (¨ | ) |
JPY | | GSC | | | 300 | | | | 12/14/2012 | | | | 4 | | | | (¨ | ) |
JPY | | GSC | | | 90 | | | | 12/14/2012 | | | | 1 | | | | (¨ | ) |
JPY | | GSC | | | 1,000 | | | | 12/14/2012 | | | | 13 | | | | (¨ | ) |
JPY | | GSC | | | 600 | | | | 12/14/2012 | | | | 8 | | | | (¨ | ) |
JPY | | GSC | | | (1,300 | ) | | | 12/14/2012 | | | | (17 | ) | | | ¨ | |
MYR | | GSC | | | (18 | ) | | | 12/14/2012 | | | | (6 | ) | | | (¨ | ) |
MYR | | GSC | | | (17 | ) | | | 12/14/2012 | | | | (6 | ) | | | (¨ | ) |
MYR | | GSC | | | 16 | | | | 12/14/2012 | | | | 5 | | | | ¨ | |
MYR | | GSC | | | (1,535 | ) | | | 12/14/2012 | | | | (496 | ) | | | (7 | ) |
MYR | | GSC | | | (20 | ) | | | 12/14/2012 | | | | (7 | ) | | | (¨ | ) |
NZD | | GSC | | | (4 | ) | | | 12/14/2012 | | | | (3 | ) | | | ¨ | |
NZD | | GSC | | | 2 | | | | 12/14/2012 | | | | 1 | | | | ¨ | |
NZD | | GSC | | | 27 | | | | 12/14/2012 | | | | 22 | | | | ¨ | |
NZD | | GSC | | | 7 | | | | 12/14/2012 | | | | 6 | | | | ¨ | |
NZD | | GSC | | | (28 | ) | | | 12/14/2012 | | | | (23 | ) | | | ¨ | |
NZD | | GSC | | | (14 | ) | | | 12/14/2012 | | | | (12 | ) | | | ¨ | |
NZD | | GSC | | | 11 | | | | 12/14/2012 | | | | 9 | | | | ¨ | |
SGD | | GSC | | | (29 | ) | | | 12/14/2012 | | | | (24 | ) | | | (¨ | ) |
SGD | | GSC | | | (156 | ) | | | 12/14/2012 | | | | (127 | ) | | | (1 | ) |
SGD | | GSC | | | 8 | | | | 12/14/2012 | | | | 7 | | | | (¨ | ) |
SGD | | GSC | | | (48 | ) | | | 12/14/2012 | | | | (39 | ) | | | (¨ | ) |
SGD | | GSC | | | 1 | | | | 12/14/2012 | | | | 1 | | | | ¨ | |
SGD | | GSC | | | (416 | ) | | | 12/14/2012 | | | | (339 | ) | | | (2 | ) |
| | | | | | | | | | | | | | | | | | |
| | | | | | | | | | | | | | | | $ | 493 | |
| | | | | | | | | | | | | | | | | | |
OVER THE COUNTER SWAP AGREEMENTS: p
TOTAL RETURN SWAP AGREEMENTS—PAYABLE: (A)
| | | | | | | | | | | | | | | | | | | | | | | | | | |
Reference Entity | | Floating Rate | | | Termination
Date | | | Counterparty | | Notional
Amount
(000’s) | | | Market
Value
(000’s) | | | Premiums
Paid
(Received)
(000’s) | | | Unrealized
Appreciation
(Depreciation)
(000’s) | |
Agis Group PLC Ә | | | GBP-1M-LIBOR-BBA | | | | 01/16/2013 | | | UBS | | $ | 5,408 | | | $ | (14 | ) | | $ | — | | | $ | (14 | ) |
CFAO SA Ә | | | EUR-1M-LIBOR-BBA | | | | 09/30/2013 | | | UBS | | | 3,127 | | | | (2 | ) | | | — | | | | (2 | ) |
Consolidated Media Holdings, Ltd. Ә | | | AUD-1M-LIBOR-BBA | | | | 01/16/2013 | | | UBS | | | 1,134 | | | | — | | | | — | | | | — | |
Dollar Thrifty Automotive Group, Inc. Ә | | | USD-1M-LIBOR-BBA | | | | 10/02/2017 | | | UBS | | | 251 | | | | (7 | ) | | | — | | | | (7 | ) |
Flinders Mines, Ltd. Ә | | | AUD-1M-LIBOR-BBA | | | | 01/16/2013 | | | UBS | | | 265 | | | | (3 | ) | | | — | | | | (3 | ) |
Gloucester Coal, Ltd. Ә | | | AUD-1M-LIBOR-BBA | | | | 01/16/2013 | | | UBS | | | 2,409 | | | | — | | | | — | | | | — | |
Nexen, Inc. Ә | | | USD-1M-LIBOR-BBA | | | | 10/02/2017 | | | UBS | | | 846 | | | | 18 | | | | — | | | | 18 | |
Progress Energy Resources Corp. Ә | | | CAD-1M-LIBOR-BBA | | | | 10/02/2017 | | | UBS | | | 360 | | | | 32 | | | | — | | | | 32 | |
Viterra, Inc. Ә | | | CAD-1M-LIBOR-BBA | | | | 10/02/2017 | | | UBS | | | 1,146 | | | | 7 | | | | — | | | | 7 | |
Yancoal Australia, Ltd. Ә | | | AUD-1M-LIBOR-BBA | | | | 01/16/2013 | | | UBS | | | 556 | | | | — | | | | — | | | | — | |
Yancoal Australia, Ltd.—CVR Ә | | | AUD-1M-LIBOR-BBA | | | | 01/16/2013 | | | UBS | | | 1,861 | | | | — | | | | — | | | | — | |
| | | | | | | | | | | | | | | | | | | | | | | | | | |
| | | | | | | | | | | | | | | | $ | 31 | | | $ | — | | | $ | 31 | |
| | | | | | | | | | | | | | | | | | | | | | | | | | |
The notes to the financial statements are an integral part of this report.
| | | | |
| Transamerica Funds | | | | Annual Report 2012 |
| | Page 47 | | |
Transamerica Arbitrage Strategy
(formerly, Transamerica Water Island Arbitrage Strategy)
SCHEDULE OF INVESTMENTS (continued)
At October 31, 2012
Collateral (Received) Pledged for OTC Financial Derivative Instruments
The following is a summary by counterparty of the market value of OTC financial derivative instruments and collateral (received) pledged as of 10/31/2012:
| | | | | | | | | | | | |
Counterparty | | Total Market Value
of OTC Derivatives
(000’s) | | | Collateral
(Received) Pledged
(000’s) | | | Net Exposures (1)
(000’s) | |
GSC | | $ | 493 | | | $ | — | | | $ | 493 | |
UBS | | | 31 | | | | 7,450 | | | | 7,481 | |
| (1) | Net exposure represents the net receivable (payable) that would be due from/to the counterparty in the event of default. |
NOTES TO SCHEDULE OF INVESTMENTS (all amounts in thousands):
| ‡ | Non-income producing security. |
| Ŏ | All or a portion of these securities has been segregated with the broker for options and short position contracts. Total value of securities segregated for options and short position contracts is $27,206. |
| ¥ | Percentage rounds to less than 0.1%. |
| Ә | Fair valued as determined in good faith in accordance with procedures established by the Board of Trustees. Total aggregate market value of fair valued securities is less than $1, or less than 0.01% of the fund’s net assets, and total aggregate market value of fair valued derivatives is $28, or 0.02% of the fund’s net assets. |
| | Rate shown reflects the yield at 10/31/2012. |
| P | Aggregate cost for federal income tax purposes is $112,999. Net unrealized depreciation for tax purposes is $4,208. |
| p | Cash in the amount of $7,450 has been segregated as collateral with the broker for open swaps and forward foreign currency contracts. |
| (A) | At the termination date, a net cash flow is exchanged where the total return is equivalent to the return of the reference index less a financing rate, if any. As a receiver, the fund would receive payments based on any positive total return and would owe payments in the event of a negative total return. As the payer, the fund would owe payments on any net positive total return, and would receive payment in the event of a negative total return. |
DEFINITIONS:
| | |
ADR | | American Depositary Receipt |
BBA | | British Banker’s Association |
CVR | | Contingent Value Right |
ETF | | Exchange-Traded Fund |
GSC | | Goldman Sachs & Co. |
LIBOR | | London Interbank Offered Rate |
OTC | | Over the Counter |
SPDR | | Standard & Poor’s Depositary Receipt |
UBS | | UBS Warburg LLC |
CURRENCY ABBREVIATIONS:
| | |
AUD | | Australian Dollar |
BRL | | Brazilian Real |
CAD | | Canadian Dollar |
EUR | | Euro |
GBP | | Pound Sterling |
JPY | | Japanese Yen |
MYR | | Malaysian Ringgit |
NZD | | New Zealand Dollar |
SGD | | Singapore Dollar |
USD | | United States Dollar |
VALUATION SUMMARY (all amounts in thousands): '
| | | | | | | | | | | | | | | | |
Investment Securities | | Level 1 -
Quoted
Prices | | | Level 2 -
Other
Significant
Observable
Inputs | | | Level 3 -
Significant
Unobservable
Inputs | | | Value at
10/31/2012 | |
Common Stocks | | $ | 82,451 | | | $ | 11,910 | | | $ | — | | | $ | 94,361 | |
Purchased Options | | | 171 | | | | — | | | | — | | | | 171 | |
Repurchase Agreement | | | — | | | | 14,259 | | | | — | | | | 14,259 | |
| | | | | | | | | | | | | | | | |
Total | | $ | 82,622 | | | $ | 26,169 | | | $ | — | | | $ | 108,791 | |
| | | | | | | | | | | | | | | | |
The notes to the financial statements are an integral part of this report.
| | | | |
| Transamerica Funds | | | | Annual Report 2012 |
| | Page 48 | | |
Transamerica Arbitrage Strategy
(formerly, Transamerica Water Island Arbitrage Strategy)
SCHEDULE OF INVESTMENTS (continued)
At October 31, 2012
VALUATION SUMMARY (all amounts in thousands) (continued): '
| | | | | | | | | | | | | | | | |
Securities Sold Short | | Level 1 -
Quoted
Prices | | | Level 2 -
Other
Significant
Observable
Inputs | | | Level 3 -
Significant
Unobservable
Inputs | | | Value at
10/31/2012 | |
Common Stocks | | $ | (13,932 | ) | | $ | (¨ | ) | | $ | — | | | $ | (13,932 | ) |
| | | | | | | | | | | | | | | | |
Other Financial Instruments | | Level 1 -
Quoted
Prices | | | Level 2 -
Other
Significant
Observable
Inputs | | | Level 3 -
Significant
Unobservable
Inputs | | | Value at
10/31/2012 | |
Written Options | | $ | (158 | ) | | $ | (3 | ) | | $ | — | | | $ | (161 | ) |
| | | | | | | | | | | | | | | | |
Other Financial Instruments ₣ | | Level 1 -
Quoted
Prices | | | Level 2 -
Other
Significant
Observable
Inputs | | | Level 3 -
Significant
Unobservable
Inputs | | | Value at
10/31/2012 | |
Forward Foreign Currency Contracts—Appreciation | | $ | — | | | $ | 637 | | | $ | — | | | $ | 637 | |
Forward Foreign Currency Contracts—Depreciation | | | — | | | | (144 | ) | | | — | | | | (144 | ) |
Total Return Swaps—Appreciation | | | — | | | | 57 | | | | — | | | | 57 | |
Total Return Swaps—Depreciation | | | — | | | | (26 | ) | | | — | | | | (26 | ) |
| | | | | | | | | | | | | | | | |
Total | | $ | — | | | $ | 524 | | | $ | — | | | $ | 524 | |
| | | | | | | | | | | | | | | | |
| ' | Transfers between levels are considered to have occurred at the end of the reporting period. There were no transfers into or out of Levels 1 and 2 during the period ended 10/31/2012. See the notes to the financial statements for more information regarding pricing inputs and valuation techniques. |
| ₣ | Other financial instruments are derivative instruments that are valued at unrealized appreciation (depreciation) on the instrument. |
The notes to the financial statements are an integral part of this report.
| | | | |
| Transamerica Funds | | | | Annual Report 2012 |
| | Page 49 | | |
Transamerica Bond
(formerly, Transamerica Loomis Sayles Bond)
SCHEDULE OF INVESTMENTS
At October 31, 2012
| | | | | | | | |
| | | Principal
(000’s) | | | Value
(000’s) | |
U.S. GOVERNMENT OBLIGATIONS—5.4% | |
United States—5.4% | | | | | | | | |
U.S. Treasury Note | | | | | | | | |
0.25%, 03/31/2014 | | $ | 9,315 | | | $ | 9,315 | |
0.88%, 01/31/2017 | | | 29,905 | | | | 30,256 | |
| | | | | | | | |
Total U.S. Government Obligations (cost $39,293) | | | | 39,571 | |
| | | | | | | | |
U.S. GOVERNMENT AGENCY OBLIGATION—5.2% | |
United States—5.2% | | | | | | | | |
Fannie Mae | | | | | | | | |
3.50%, 06/01/2042 | | | 36,169 | | | | 38,581 | |
Total U.S. Government Agency Obligation (cost $37,973) | | | | | |
FOREIGN GOVERNMENT OBLIGATIONS—13.3% | |
Australia—0.8% | | | | | | | | |
Queensland Treasury Corp. | | | | | | | | |
7.13%, 09/18/2017—144A | | NZD | 5,865 | | | | 5,546 | |
Brazil—1.8% | | | | | | | | |
Brazilian Government International Bond | | | | | | | | |
8.50%, 01/05/2024 | | BRL | 9,100 | | | | 5,242 | |
Republic of Brazil | | | | | | | | |
10.25%, 01/10/2028 | | | 12,250 | | | | 7,811 | |
Canada—6.5% | | | | | | | | |
Canada Housing Trust No. 1 | | | | | | | | |
3.60%, 06/15/2013—144A | | CAD | 19,980 | | | | 20,312 | |
Canadian Government Bond | | | | | | | | |
4.25%, 06/01/2018 | | | 1,600 | | | | 1,846 | |
Province of Ontario Canada | | | | | | | | |
2.95%, 02/05/2015 ^ | | $ | 15,610 | | | | 16,457 | |
4.20%, 03/08/2018—06/02/2020 | | CAD | 6,965 | | | | 7,845 | |
Province of Quebec Canada | | | | | | | | |
6.75%, 11/09/2015 | | NZD | 2,825 | | | | 2,542 | |
Ireland—0.5% | | | | | | | | |
Ireland Government Bond | | | | | | | | |
5.00%, 10/18/2020 | | EUR | 285 | | | | 375 | |
5.40%, 03/13/2025 | | | 2,060 | | | | 2,722 | |
Italy—0.1% | | | | | | | | |
Italy Buoni Poliennali del Tesoro | | | | | | | | |
5.75%, 02/01/2033 | | | 560 | | | | 742 | |
Mexico—1.9% | | | | | | | | |
United Mexican States | | | | | | | | |
8.00%, 12/07/2023 | | MXN | 150,800 | | | | 13,776 | |
Philippines—0.2% | | | | | | | | |
Republic of The Philippines | | | | | | | | |
4.95%, 01/15/2021 | | PHP | 50,000 | | | | 1,335 | |
Portugal—0.1% | | | | | | | | |
Portugal Obrigacoes do Tesouro OT | | | | | | | | |
4.95%, 10/25/2023—Reg S | | EUR | 910 | | | | 911 | |
Spain—0.8% | | | | | | | | |
Spain Government Bond | | | | | | | | |
4.65%, 07/30/2025 | | | 5,005 | | | | 5,641 | |
Supranational—0.4% | | | | | | | | |
Asian Development Bank | | | | | | | | |
2.50%, 03/15/2016 ^ | | $ | 2,845 | | | | 3,030 | |
Uruguay—0.2% | | | | | | | | |
Uruguay Government International Bond | | | | | | | | |
4.38%, 12/15/2028 | | UYU | 30,672 | | | | 1,834 | |
| | | | | | | | |
Total Foreign Government Obligations (cost $88,873) | | | | 97,967 | |
| | | | | | | | |
| | | | | | | | |
| | | Principal
(000’s) | | | Value
(000’s) | |
MORTGAGE-BACKED SECURITIES—5.5% | | | | | | | | |
United States—5.5% | | | | | | | | |
American Home Mortgage Investment Trust | | | | | | | | |
Series 2004-3, Class 3A 2.56%, 10/25/2034 * | | $ | 444 | | | $ | 374 | |
Banc of America Funding Corp. | | | | | | | | |
Series 2006-I, Class 1A1 2.72%, 12/20/2036 * | | | 187 | | | | 187 | |
Banc of America Merrill Lynch Commercial Mortgage, Inc. | | | | | | | | |
Series 2007-2, Class A4 5.63%, 04/10/2049 * | | | 500 | | | | 581 | |
Bear Stearns Adjustable Rate Mortgage Trust | | | | | | | | |
Series 2004-3, Class 2A 2.96%, 07/25/2034 * | | | 224 | | | | 214 | |
Series 2004-10, Class 11A1 3.03%, 01/25/2035 * | | | 76 | | | | 70 | |
Citicorp Mortgage Securities, Inc. | | | | | | | | |
Series 2006-5, Class 1A2 6.00%, 10/25/2036 | | | 442 | | | | 446 | |
Countrywide Home Loan Mortgage Pass-Through Trust | | | | | | | | |
Series 2004-HYB4, Class 2A1 2.78%, 09/20/2034 * | | | 566 | | | | 514 | |
Series 2005-11, Class 4A1 0.48%, 04/25/2035 * | | | 828 | | | | 582 | |
Credit Suisse First Boston Mortgage Securities Corp. | | | | | | | | |
Series 2005-1, Class 3A4 5.25%, 05/25/2028 | | | 296 | | | | 298 | |
Credit Suisse Mortgage Capital Certificates | | | | | | | | |
Series 2007-C3, Class A4 5.68%, 06/15/2039 * | | | 2,410 | | | | 2,740 | |
Series 2007-C4, Class A4 5.76%, 09/15/2039 * | | | 1,200 | | | | 1,380 | |
Series 2007-C5, Class A4 5.70%, 09/15/2040 * | | | 4,785 | | | | 5,515 | |
Series 2008-C1, Class A3 6.07%, 02/15/2041 * | | | 1,540 | | | | 1,799 | |
CW Capital Cobalt, Ltd. | | | | | | | | |
Series 2006-C1, Class AM 5.25%, 08/15/2048 | | | 950 | | | | 985 | |
Extended Stay America Trust | | | | | | | | |
Series 2010-ESHA, Class D 5.50%, 11/05/2027—144A | | | 4,035 | | | | 4,063 | |
GMAC Mortgage Corp., Loan Trust | | | | | | | | |
Series 2005-AR4, Class 3A1 3.56%, 07/19/2035 * | | | 1,710 | | | | 1,530 | |
Greenwich Capital Commercial Funding Corp. | | | | | | | | |
Series 2007-GG11, Class A4 5.74%, 12/10/2049 | | | 3,100 | | | | 3,647 | |
GS Mortgage Securities Corp. II | | | | | | | | |
Series 2007-GG10, Class AM 5.79%, 08/10/2045 * | | | 3,110 | | | | 2,987 | |
GSR Mortgage Loan Trust | | | | | | | | |
Series 2004-14, Class 3A1 2.94%, 12/25/2034 * | | | 286 | | | | 245 | |
IndyMac Index Mortgage Loan Trust | | | | | | | | |
Series 2005-16IP, Class A1 0.53%, 07/25/2045 * | | | 326 | | | | 249 | |
JPMorgan Chase Commercial Mortgage Securities Corp. | | | | | | | | |
Series 2007-LDPX, Class AM 5.46%, 01/15/2049 * | | | 400 | | | | 422 | |
| | | | |
| The notes to the financial statements are an integral part of this report. |
| Transamerica Funds | | | | Annual Report 2012 |
| | Page 50 | | |
Transamerica Bond
(formerly, Transamerica Loomis Sayles Bond)
SCHEDULE OF INVESTMENTS (continued)
At October 31, 2012
| | | | | | | | |
| | | Principal
(000’s) | | | Value
(000’s) | |
United States (continued) | | | | | | | | |
JPMorgan Mortgage Trust | | | | | | | | |
Series 2007-A1, Class 4A2 2.99%, 07/25/2035 * | | $ | 275 | | | $ | 279 | |
Series 2007-A1, Class 5A1 2.98%, 07/25/2035 * | | | 882 | | | | 880 | |
Merrill Lynch/Countrywide Commercial Mortgage Trust | | | | | | | | |
Series 2007-9, Class AM 5.86%, 09/12/2049 * | | | 650 | | | | 686 | |
Morgan Stanley Capital I Trust | | | | | | | | |
Series 2007-HQ12, Class AM 5.58%, 04/12/2049 * | | | 875 | | | | 898 | |
Morgan Stanley Mortgage Loan Trust | | | | | | | | |
Series 2005-7, Class 7A5 5.50%, 11/25/2035 | | | 1,575 | | | | 1,513 | |
Morgan Stanley Re-REMIC Trust | | | | | | | | |
Series 2009-GG10, Class A4B 5.79%, 08/12/2045—144A * | | | 2,900 | | | | 3,193 | |
Wachovia Bank Commercial Mortgage Trust | | | | | | | | |
Series 2006-C28, Class AM 5.60%, 10/15/2048 * | | | 2,200 | | | | 2,379 | |
WaMu Mortgage Pass-Through Certificates | | | | | | | | |
Series 2006-AR17, Class 1A1A 0.96%, 12/25/2046 * | | | 300 | | | | 256 | |
Series 2007-OA3, Class 2A1A 0.91%, 04/25/2047 * | | | 569 | | | | 467 | |
Wells Fargo Mortgage Backed Securities Trust | | | | | | | | |
Series 2005-AR2, Class 2A2 2.62%, 03/25/2035 * | | | 822 | | | | 811 | |
Series 2005-AR4, Class 2A2 2.69%, 04/25/2035 * | | | 529 | | | | 535 | |
| | | | | | | | |
Total Mortgage-Backed Securities (cost $33,744) | | | | | | | 40,725 | |
| | | | | | | | |
ASSET-BACKED SECURITIES—0.6% | | | | | | | | |
United States—0.6% | | | | | | | | |
Chesapeake Funding LLC | | | | | | | | |
Series 2009-2A, Class B 1.96%, 09/15/2021—144A * | | | 1,000 | | | | 1,009 | |
Series 2009-2A, Class C 1.96%, 09/15/2021—144A * | | | 1,200 | | | | 1,207 | |
Countrywide Asset-Backed Certificates | | | | | | | | |
Series 2004-13, Class AF5B 5.10%, 05/25/2035 * | | | 625 | | | | 524 | |
Diamond Resorts Owner Trust | | | | | | | | |
Series 2009-1, Class A 9.31%, 03/20/2026—144A | | | 458 | | | | 482 | |
DSC Floorplan Master Owner Trust | | | | | | | | |
Series 2011-1, Class B 8.11%, 03/15/2016—144A | | | 850 | | | | 860 | |
| | | | | | | | |
Total Asset-Backed Securities (cost $3,663) | | | | | | | 4,082 | |
| | | | | | | | |
PREFERRED CORPORATE DEBT SECURITY—0.1% | |
United States—0.1% | | | | | | | | |
Hercules, Inc. | | | | | | | | |
6.50%, 06/30/2029 | | | 1,260 | | | | 1,008 | |
Total Preferred Corporate Debt Security (cost $1,072) | | | | | |
| | | | | | | | |
| | | Principal
(000’s) | | | Value
(000’s) | |
CORPORATE DEBT SECURITIES—55.6% | | | | | | | | |
Australia—0.7% | | | | | | | | |
Newcrest Finance Pty, Ltd. | | | | | | | | |
4.20%, 10/01/2022—144A | | $ | 4,795 | | | $ | 4,918 | |
Austria—0.7% | | | | | | | | |
OGX Austria GmbH | | | | | | | | |
8.38%, 04/01/2022—144A | | | 6,100 | | | | 5,123 | |
8.50%, 06/01/2018—144A ^ | | | 800 | | | | 698 | |
Belgium—0.1% | | | | | | | | |
Delhaize Group SA | | | | | | | | |
5.70%, 10/01/2040 | | | 500 | | | | 471 | |
Canada—0.6% | | | | | | | | |
Bell Canada | | | | | | | | |
6.10%, 03/16/2035—144A | | CAD | 475 | | | | 574 | |
Bombardier, Inc. | | | | | | | | |
7.45%, 05/01/2034—144A | | $ | 800 | | | | 825 | |
Connacher Oil and Gas, Ltd. | | | | | | | | |
8.50%, 08/01/2019—144A ^ | | | 2,325 | | | | 1,912 | |
Methanex Corp. | | | | | | | | |
5.25%, 03/01/2022 | | | 350 | | | | 382 | |
Cayman Islands—0.4% | | | | | | | | |
Odebrecht Drilling Norbe VIII/IX, Ltd. | | | | | | | | |
6.35%, 06/30/2021—144A ^ | | | 1,067 | | | | 1,230 | |
Schahin II Finance Co. SPV, Ltd. | | | | | | | | |
5.88%, 09/25/2022—144A ^ | | | 1,400 | | | | 1,484 | |
Chile—0.0% ¥ | | | | | | | | |
Banco Santander Chile | | | | | | | | |
6.50%, 09/22/2020—144A | | CLP | 100,000 | | | | 204 | |
France—0.0% ¥ | | | | | | | | |
Societe Generale SA | | | | | | | | |
5.20%, 04/15/2021—144A ^ | | $ | 200 | | | | 220 | |
Isle of Man—0.3% | | | | | | | | |
AngloGold Ashanti Holdings PLC | | | | | | | | |
5.13%, 08/01/2022 ^ | | | 2,450 | | | | 2,499 | |
Korea, Republic of—1.5% | | | | | | | | |
Export-Import Bank of Korea | | | | | | | | |
4.00%, 11/26/2015—144A | | PHP | 386,300 | | | | 9,852 | |
Hyundai Capital Services, Inc. | | | | | | | | |
3.50%, 09/13/2017—144A ^ | | $ | 800 | | | | 846 | |
Luxembourg—3.3% | | | | | | | | |
ArcelorMittal | | | | | | | | |
5.75%, 08/05/2020 ^ | | | 835 | | | | 805 | |
6.00%, 03/01/2021 ^ | | | 1,490 | | | | 1,439 | |
6.50%, 02/25/2022 | | | 175 | | | | 172 | |
7.25%, 03/01/2041 ^ | | | 4,715 | | | | 4,319 | |
7.25%, 10/15/2039 | | | 6,975 | | | | 6,475 | |
Telecom Italia Capital SA | | | | | | | | |
6.00%, 09/30/2034 | | | 7,180 | | | | 6,749 | |
6.38%, 11/15/2033 | | | 4,240 | | | | 4,092 | |
Mexico—0.6% | | | | | | | | |
America Movil SAB de CV | | | | | | | | |
8.46%, 12/18/2036 | | MXN | 50,000 | | | | 4,005 | |
Mexichem SAB de CV | | | | | | | | |
4.88%, 09/19/2022—144A ^ | | $ | 800 | | | | 846 | |
Netherlands—2.5% | | | | | | | | |
Cooperatieve Centrale Raiffeisen-
Boerenleenbank BA | | | | | | | | |
3.38%, 01/19/2017 ^ | | | 1,030 | | | | 1,108 | |
3.88%, 02/08/2022 | | | 1,810 | | | | 1,958 | |
The notes to the financial statements are an integral part of this report.
| | | | |
| Transamerica Funds | | | | Annual Report 2012 |
| | Page 51 | | |
Transamerica Bond
(formerly, Transamerica Loomis Sayles Bond)
SCHEDULE OF INVESTMENTS (continued)
At October 31, 2012
| | | | | | | | |
| | | Principal
(000’s) | | | Value
(000’s) | |
Netherlands (continued) | | | | | | | | |
EDP Finance BV | | | | | | | | |
4.90%, 10/01/2019—144A | | $ | 3,200 | | | $ | 3,104 | |
6.00%, 02/02/2018—144A | | | 200 | | | | 204 | |
Enel Finance International NV | | | | | | | | |
5.13%, 10/07/2019—144A | | | 800 | | | | 847 | |
6.00%, 10/07/2039—144A | | | 11,190 | | | | 10,840 | |
6.80%, 09/15/2037—144A | | | 100 | | | | 105 | |
Spain—1.2% | | | | | | | | |
Telefonica Emisiones SAU | | | | | | | | |
7.05%, 06/20/2036 | | | 8,925 | | | | 9,192 | |
United Kingdom—1.2% | | | | | | | | |
Barclays Bank PLC | | | | | | | | |
6.00%, 01/14/2021—Series EMTN | | EUR | 2,950 | | | | 4,026 | |
HBOS PLC | | | | | | | | |
6.00%, 11/01/2033—144A | | $ | 200 | | | | 176 | |
6.75%, 05/21/2018—144A | | | 3,600 | | | | 3,816 | |
Lloyds TSB Bank PLC | | | | | | | | |
6.50%, 03/24/2020 ^ | | EUR | 1,300 | | | | 1,777 | |
United States—42.5% | | | | | | | | |
Alcatel-Lucent USA, Inc. | | | | | | | | |
6.45%, 03/15/2029 | | $ | 3,050 | | | | 1,929 | |
6.50%, 01/15/2028 ^ | | | 1,275 | | | | 800 | |
Ally Financial, Inc. | | | | | | | | |
4.63%, 06/26/2015 | | | 7,195 | | | | 7,475 | |
American International Group, Inc. | | | | | | | | |
6.25%, 03/15/2037 | | | 4,900 | | | | 5,059 | |
8.18%, 05/15/2058 * | | | 5,210 | | | | 6,500 | |
American Tower Corp. | | | | | | | | |
4.70%, 03/15/2022 | | | 3,330 | | | | 3,679 | |
Arch Coal, Inc. | | | | | | | | |
7.25%, 06/15/2021 ^ | | | 2,215 | | | | 1,955 | |
Aviation Capital Group Corp. | | | | | | | | |
6.75%, 04/06/2021—144A | | | 1,055 | | | | 1,096 | |
Bank of America Corp.—Series K | | | | | | | | |
8.00%, 01/30/2018 * Ž ^ | | | 215 | | | | 239 | |
Beazer Homes USA, Inc. | | | | | | | | |
9.13%, 05/15/2019 | | | 1,890 | | | | 1,985 | |
Boyd Acquisition Sub LLC/Boyd Acquisition
Finance Corp. | | | | | |
8.38%, 02/15/2018—144A ^ | | | 830 | | | | 849 | |
Braskem America Finance Co. | | | | | | | | |
7.13%, 07/22/2041—144A | | | 2,765 | | | | 3,111 | |
Bruce Mansfield Unit | | | | | | | | |
6.85%, 06/01/2034 | | | 2,599 | | | | 2,770 | |
CCO Holdings LLC / CCO Holdings Capital Corp. | | | | | | | | |
7.38%, 06/01/2020 ^ | | | 350 | | | | 392 | |
CenturyLink, Inc. | | | | | | | | |
7.20%, 12/01/2025 | | | 595 | | | | 657 | |
7.60%, 09/15/2039 | | | 5,435 | | | | 5,571 | |
Chesapeake Energy Corp. | | | | | | | | |
6.63%, 08/15/2020 | | | 75 | | | | 79 | |
6.88%, 08/15/2018 ^ | | | 500 | | | | 525 | |
6.88%, 11/15/2020 | | | 490 | | | | 519 | |
CHS/Community Health Systems, Inc. | | | | | | | | |
8.00%, 11/15/2019 ^ | | | 2,675 | | | | 2,886 | |
Citigroup, Inc. | | | | | | | | |
6.00%, 10/31/2033 | | | 11,785 | | | | 12,660 | |
CommScope, Inc. | | | | | | | | |
8.25%, 01/15/2019—144A | | | 635 | | | | 684 | |
| | | | | | | | |
| | | Principal
(000’s) | | | Value
(000’s) | |
United States (continued) | | | | | | | | |
Continental Airlines Pass-Through Trust | | | | | | | | |
Series 2001-1, Class A1 | | | | | | | | |
6.70%, 06/15/2021 | | $ | 694 | | | $ | 755 | |
Series 2012-1, Class B | | | | | | | | |
6.25%, 04/11/2020 | | | 300 | | | | 317 | |
Series 2012-2, Class B | | | | | | | | |
5.50%, 10/29/2020 | | | 840 | | | | 877 | |
CVS Pass-Through Trust | | | | | | | | |
6.94%, 01/10/2030 | | | 1,181 | | | | 1,494 | |
DDR Corp. | | | | | | | | |
7.88%, 09/01/2020 | | | 1,585 | | | | 2,061 | |
Delta Air Lines, Inc., Pass-Through Trust | | | | | | | | |
Series 2007-1, Class A | | | | | | | | |
6.82%, 08/10/2022 | | | 2,133 | | | | 2,396 | |
Series 2007-1, Class B | | | | | | | | |
8.02%, 08/10/2022 | | | 1,790 | | | | 1,947 | |
Dillard’s, Inc. | | | | | | | | |
7.13%, 08/01/2018 | | | 990 | | | | 1,090 | |
Dynegy Holdings LLC | | | | | | | | |
7.75%, 06/01/2019 Ә | | | 650 | | | | ¿ | |
Energy Future Holdings Corp.—Series P | | | | | | | | |
5.55%, 11/15/2014 ^ | | | 6,735 | | | | 3,906 | |
Energy Future Holdings Corp.—Series Q | | | | | | | | |
6.50%, 11/15/2024 ^ | | | 1,110 | | | | 436 | |
Energy Future Holdings Corp.—Series R | | | | | | | | |
6.55%, 11/15/2034 ^ | | | 305 | | | | 116 | |
Energy Transfer Partners, LP | | | | | | | | |
5.20%, 02/01/2022 | | | 1,095 | | | | 1,257 | |
First Data Corp. | | | | | | | | |
6.75%, 11/01/2020—144A | | | 2,275 | | | | 2,275 | |
7.38%, 06/15/2019—144A | | | 1,285 | | | | 1,330 | |
Ford Motor Co. | | | | | | | | |
7.50%, 08/01/2026 | | | 115 | | | | 135 | |
Forethought Financial Group, Inc. | | | | | | | | |
8.63%, 04/15/2021—144A | | | 1,430 | | | | 1,818 | |
Frontier Communications Corp. | | | | | | | | |
7.88%, 01/15/2027 | | | 2,160 | | | | 2,176 | |
General Electric Capital Corp.—Series A | | | | | | | | |
7.13%, 06/15/2022 * Ž | | | 6,600 | | | | 7,551 | |
General Electric Capital Corp.—Series GMTN | | | | | | | | |
5.50%, 02/01/2017 | | NZD | 230 | | | | 200 | |
7.63%, 12/10/2014 | | | 320 | | | | 284 | |
Goldman Sachs Group, Inc. | | | | | | | | |
6.45%, 05/01/2036 | | $ | 4,950 | | | | 5,284 | |
Goodyear Tire & Rubber Co. | | | | | | | | |
7.00%, 05/15/2022 ^ | | | 620 | | | | 650 | |
HCA, Inc. | | | | | | | | |
7.05%, 12/01/2027 | | | 105 | | | | 99 | |
7.50%, 12/15/2023—11/06/2033 | | | 3,655 | | | | 3,621 | |
7.58%, 09/15/2025 | | | 1,020 | | | | 1,020 | |
7.69%, 06/15/2025 | | | 1,545 | | | | 1,560 | |
7.75%, 07/15/2036 ^ | | | 125 | | | | 125 | |
8.36%, 04/15/2024 | | | 190 | | | | 198 | |
IFM US Colonial Pipeline 2 LLC | | | | | | | | |
6.45%, 05/01/2021—144A | | | 2,300 | | | | 2,522 | |
International Lease Finance Corp. | | | | | | | | |
5.88%, 04/01/2019 ^ | | | 4,345 | | | | 4,603 | |
6.25%, 05/15/2019 ^ | | | 610 | | | | 657 | |
The notes to the financial statements are an integral part of this report.
| | | | |
| Transamerica Funds | | | | Annual Report 2012 |
| | Page 52 | | |
Transamerica Bond
(formerly, Transamerica Loomis Sayles Bond)
SCHEDULE OF INVESTMENTS (continued)
At October 31, 2012
| | | | | | | | |
| | | Principal
(000’s) | | | Value
(000’s) | |
United States (continued) | | | | | | | | |
International Lease Finance Corp. (continued) | | | | | |
8.25%, 12/15/2020 ^ | | $ | 710 | | | $ | 837 | |
8.63%, 01/15/2022 | | | 3,555 | | | | 4,297 | |
JC Penney Corp., Inc. | | | | | | | | |
6.38%, 10/15/2036 ^ | | | 2,232 | | | | 1,839 | |
7.40%, 04/01/2037 | | | 1,355 | | | | 1,291 | |
7.63%, 03/01/2097 ^ | | | 430 | | | | 373 | |
Jefferies Group, Inc. | | | | | | | | |
6.25%, 01/15/2036 | | | 3,210 | | | | 3,226 | |
6.45%, 06/08/2027 | | | 275 | | | | 288 | |
6.88%, 04/15/2021 | | | 1,385 | | | | 1,513 | |
KB Home | | | | | | | | |
7.25%, 06/15/2018 ^ | | | 945 | | | | 1,035 | |
7.50%, 09/15/2022 ^ | | | 2,210 | | | | 2,401 | |
8.00%, 03/15/2020 ^ | | | 1,280 | | | | 1,430 | |
Ladder Capital Finance Holdings LLLP / Ladder Capital Finance Corp. | | | | | | | | |
7.38%, 10/01/2017—144A | | | 1,020 | | | | 1,033 | |
Level 3 Financing, Inc. | | | | | | | | |
8.63%, 07/15/2020 ^ | | | 985 | | | | 1,074 | |
9.38%, 04/01/2019 | | | 100 | | | | 112 | |
Mackinaw Power LLC | | | | | | | | |
6.30%, 10/31/2023—144A § D | | | 1,250 | | | | 1,317 | |
Macy’s Retail Holdings, Inc. | | | | | | | | |
6.79%, 07/15/2027 | | | 1,065 | | | | 1,239 | |
Masco Corp. | | | | | | | | |
5.85%, 03/15/2017 | | | 2,440 | | | | 2,663 | |
6.50%, 08/15/2032 ^ | | | 895 | | | | 925 | |
7.13%, 03/15/2020 | | | 1,505 | | | | 1,745 | |
7.75%, 08/01/2029 | | | 360 | | | | 412 | |
Meccanica Holdings USA, Inc. | | | | | | | | |
6.25%, 07/15/2019—01/15/2040—144A | | | 2,700 | | | | 2,487 | |
7.38%, 07/15/2039—144A | | | 5,400 | | | | 5,167 | |
Merrill Lynch & Co., Inc. | | | | | | | | |
6.05%, 05/16/2016 —06/01/2034 | | | 920 | | | | 956 | |
6.11%, 01/29/2037 | | | 8,010 | | | | 8,768 | |
MGM Resorts International | | | | | | | | |
6.75%, 10/01/2020—144A ^ | | | 2,180 | | | | 2,164 | |
7.50%, 06/01/2016 | | | 2,395 | | | | 2,538 | |
8.63%, 02/01/2019—144A ^ | | | 620 | | | | 670 | |
Morgan Stanley | | | | | | | | |
5.50%, 01/26/2020—07/24/2020 | | | 4,460 | | | | 4,924 | |
5.75%, 01/25/2021 | | | 6,000 | | | | 6,714 | |
8.00%, 05/09/2017 | | AUD | 2,470 | | | | 2,823 | |
Morgan Stanley—Series GMTN | | | | | | | | |
7.60%, 08/08/2017 | | NZD | 1,350 | | | | 1,184 | |
New Albertsons, Inc. | | | | | | | | |
6.63%, 06/01/2028 | | $ | 4,210 | | | | 2,247 | |
7.45%, 08/01/2029 | | | 1,305 | | | | 781 | |
7.75%, 06/15/2026 | | | 680 | | | | 414 | |
8.00%, 05/01/2031 | | | 905 | | | | 532 | |
NGPL PipeCo LLC | | | | | | | | |
7.77%, 12/15/2037—144A ^ | | | 2,000 | | | | 2,054 | |
9.63%, 06/01/2019—144A | | | 760 | | | | 874 | |
NLV Financial Corp. | | | | | | | | |
7.50%, 08/15/2033—144A | | | 190 | | | | 204 | |
Northwest Airlines Pass-Through Trust | | | | | | | | |
Series 2007-1, Class A | | | | | | | | |
7.03%, 11/01/2019 | | | 6,035 | | | | 6,668 | |
| | | | | | | | |
| | | Principal
(000’s) | | | Value
(000’s) | |
United States (continued) | | | | | | | | |
Owens Corning, Inc. | | | | | | | | |
7.00%, 12/01/2036 | | $ | 4,585 | | | $ | 5,279 | |
Parker Drilling Co. | | | | | | | | |
9.13%, 04/01/2018 | | | 325 | | | | 348 | |
PulteGroup, Inc. | | | | | | | | |
6.00%, 02/15/2035 | | | 305 | | | | 282 | |
6.38%, 05/15/2033 | | | 1,850 | | | | 1,795 | |
7.88%, 06/15/2032 | | | 3,500 | | | | 3,744 | |
Qwest Capital Funding, Inc. | | | | | | | | |
6.88%, 07/15/2028 ^ | | | 1,510 | | | | 1,552 | |
7.63%, 08/03/2021 | | | 1,000 | | | | 1,128 | |
Qwest Corp. | | | | | | | | |
6.88%, 09/15/2033 | | | 2,770 | | | | 2,784 | |
7.20%, 11/10/2026 ^ | | | 895 | | | | 904 | |
7.25%, 10/15/2035 ^ | | | 290 | | | | 300 | |
Ralcorp Holdings, Inc. | | | | | | | | |
6.63%, 08/15/2039 | | | 3,060 | | | | 3,298 | |
Reliance Holdings USA, Inc. | | | | | | | | |
5.40%, 02/14/2022—144A | | | 500 | | | | 556 | |
Residential Capital LLC | | | | | | | | |
9.63%, 05/15/2015 Џ ‡ | | | 930 | | | | 963 | |
Reynolds Group Issuer, Inc. / Reynolds Group Issuer LLC / Reynolds Group Issuer Lu | | | | | | | | |
8.25%, 02/15/2021 | | | 4,400 | | | | 4,323 | |
9.00%, 04/15/2019 | | | 500 | | | | 506 | |
9.88%, 08/15/2019 | | | 400 | | | | 419 | |
RR Donnelley & Sons Co. | | | | | | | | |
6.13%, 01/15/2017 ^ | | | 205 | | | | 202 | |
7.25%, 05/15/2018 ^ | | | 2,550 | | | | 2,534 | |
7.63%, 06/15/2020 ^ | | | 60 | | | | 59 | |
8.25%, 03/15/2019 ^ | | | 360 | | | | 371 | |
SandRidge Energy, Inc. | | | | | | | | |
7.50%, 02/15/2023—144A | | | 415 | | | | 430 | |
8.13%, 10/15/2022—144A | | | 1,370 | | | | 1,473 | |
SLM Corp. | | | | | | | | |
5.00%, 06/15/2018 | | | 175 | | | | 174 | |
5.63%, 08/01/2033 | | | 3,904 | | | | 3,650 | |
7.25%, 01/25/2022 ^ | | | 6,665 | | | | 7,348 | |
8.45%, 06/15/2018 | | | 4,030 | | | | 4,789 | |
Southwestern Energy Co. | | | | | | | | |
4.10%, 03/15/2022—144A ^ | | | 1,570 | | | | 1,699 | |
Springleaf Finance Corp. | | | | | | | | |
5.40%, 12/01/2015 | | | 110 | | | | 103 | |
6.90%, 12/15/2017 ^ | | | 7,760 | | | | 6,829 | |
Sprint Capital Corp. | | | | | | | | |
6.88%, 11/15/2028 | | | 8,800 | | | | 8,998 | |
6.90%, 05/01/2019 | | | 70 | | | | 76 | |
8.75%, 03/15/2032 | | | 660 | | | | 779 | |
Sprint Nextel Corp. | | | | | | | | |
9.00%, 11/15/2018—144A | | | 1,090 | | | | 1,346 | |
Toys “R” Us, Inc. | | | | | | | | |
7.38%, 10/15/2018 | | | 3,880 | | | | 3,453 | |
U.S. Steel Corp. | | | | | | | | |
6.65%, 06/01/2037 ^ | | | 6,345 | | | | 5,425 | |
UAL Pass-Through Trust | | | | | | | | |
Series 2007-1, Class A | | | | | | | | |
6.64%, 07/02/2022 | | | 5,909 | | | | 6,323 | |
The notes to the financial statements are an integral part of this report.
| | | | |
| Transamerica Funds | | | | Annual Report 2012 |
| | Page 53 | | |
Transamerica Bond
(formerly, Transamerica Loomis Sayles Bond)
SCHEDULE OF INVESTMENTS (continued)
At October 31, 2012
| | | | | | | | |
| | | Principal
(000’s) | | | Value
(000’s) | |
United States (continued) | | | | | | | | |
US Airways Pass-Through Trust | | | | | | | | |
Series 2012-1, Class A | | | | | | | | |
5.90%, 10/01/2024 ^ | | $ | 1,835 | | | $ | 2,000 | |
Series 2012-1, Class B | | | | | | | | |
8.00%, 10/01/2019 ^ | | | 1,640 | | | | 1,714 | |
USG Corp. | | | | | | | | |
6.30%, 11/15/2016 | | | 4,585 | | | | 4,665 | |
9.75%, 01/15/2018 ^ | | | 1,070 | | | | 1,169 | |
Valeant Pharmaceuticals International | | | | | | | | |
6.38%, 10/15/2020—144A | | | 1,520 | | | | 1,600 | |
6.75%, 08/15/2021—144A | | | 1,670 | | | | 1,774 | |
7.25%, 07/15/2022—144A ^ | | | 1,395 | | | | 1,510 | |
VPI Escrow Corp. | | | | | | | | |
6.38%, 10/15/2020—144A | | | 5,725 | | | | 6,026 | |
Westvaco Corp. | | | | | | | | |
7.95%, 02/15/2031 | | | 1,135 | | | | 1,504 | |
8.20%, 01/15/2030 | | | 2,985 | | | | 4,035 | |
Weyerhaeuser Co. | | | | | | | | |
6.88%, 12/15/2033 | | | 4,740 | | | | 5,874 | |
6.95%, 10/01/2027 ^ | | | 130 | | | | 158 | |
7.38%, 03/15/2032 | | | 1,530 | | | | 1,947 | |
| | | | | | | | |
Total Corporate Debt Securities (cost $378,114) | | | | 410,910 | |
| | | | | | | | |
CONVERTIBLE BONDS—6.9% | | | | | | | | |
United States—6.9% | | | | | | | | |
Chesapeake Energy Corp. | | | | | | | | |
2.50%, 05/15/2037 ^ | | | 935 | | | | 865 | |
2.75%, 11/15/2035 | | | 145 | | | | 140 | |
Ciena Corp. | | | | | | | | |
0.88%, 06/15/2017 ^ | | | 4,510 | | | | 3,788 | |
3.75%, 10/15/2018—144A | | | 4,125 | | | | 4,174 | |
Ford Motor Co. | | | | | | | | |
4.25%, 11/15/2016 | | | 3,715 | | | | 5,468 | |
Illumina, Inc. | | | | | | | | |
0.25%, 03/15/2016—144A | | | 265 | | | | 249 | |
Intel Corp. | | | | | | | | |
2.95%, 12/15/2035 ^ | | | 1,645 | | | | 1,785 | |
3.25%, 08/01/2039 | | | 5,700 | | | | 6,929 | |
Jefferies Group, Inc. | | | | | | | | |
3.88%, 11/01/2029 | | | 3,445 | | | | 3,318 | |
LAM Research Corp. | | | | | | | | |
1.25%, 05/15/2018 ^ | | | 655 | | | | 639 | |
Lennar Corp. | | | | | | | | |
2.00%, 12/01/2020—144A | | | 65 | | | | 93 | |
2.75%, 12/15/2020—144A | | | 75 | | | | 135 | |
Level 3 Communications, Inc. | | | | | | | | |
7.00%, 03/15/2015—144A § D | | | 2,110 | | | | 2,441 | |
Liberty Interactive LLC | | | | | | | | |
3.50%, 01/15/2031 | | | 93 | | | | 44 | |
Micron Technology, Inc. | | | | | | | | |
1.88%, 08/01/2031 | | | 2,465 | | | | 2,074 | |
2.38%, 05/01/2032—144A | | | 2,260 | | | | 1,996 | |
3.13%, 05/01/2032—144A ^ | | | 175 | | | | 156 | |
Old Republic International Corp. | | | | | | | | |
3.75%, 03/15/2018 ^ | | | 1,790 | | | | 1,835 | |
| | | | | | | | |
| | | Principal
(000’s) | | | Value
(000’s) | |
United States (continued) | | | | | | | | |
Peabody Energy Corp. | | | | | | | | |
4.75%, 12/15/2041 ^ | | $ | 2,079 | | | $ | 1,884 | |
Ryland Group, Inc. | | | | | | | | |
1.63%, 05/15/2018 | | | 1,715 | | | | 2,208 | |
Standard Pacific Corp. | | | | | | | | |
1.25%, 08/01/2032 ^ | | | 1,140 | | | | 1,289 | |
Steel Dynamics, Inc. | | | | | | | | |
5.13%, 06/15/2014 | | | 355 | | | | 377 | |
Trinity Industries, Inc. | | | | | | | | |
3.88%, 06/01/2036 ^ | | | 3,050 | | | | 3,235 | |
Vertex Pharmaceuticals, Inc. | | | | | | | | |
3.35%, 10/01/2015 | | | 4,530 | | | | 5,396 | |
| | | | | | | | |
Total Convertible Bonds (cost $43,947) | | | | | | | 50,518 | |
| | | | | | | | |
| | |
| | | Shares | | | Value
(000’s) | |
CONVERTIBLE PREFERRED STOCKS—2.5% | | | | | |
United States—2.5% | | | | | | | | |
AES Trust III, 6.75% ^ | | | 10,950 | | | | 544 | |
Bank of America Corp., 7.25% | | | 960 | | | | 1,070 | |
El Paso Energy Capital Trust I, 4.75% | | | 6,300 | | | | 345 | |
General Motors Co., 4.75% ^ | | | 229,000 | | | | 9,302 | |
Goodyear Tire & Rubber Co., 5.88% ^ | | | 28,250 | | | | 1,188 | |
Health Care REIT, Inc., 6.50% ^ | | | 19,300 | | | | 1,087 | |
Lucent Technologies Capital Trust I, 7.75% | | | 4,900 | | | | 2,781 | |
United Rentals Trust I, 6.50% | | | 3,243 | | | | 169 | |
Wells Fargo & Co., 7.50% | | | 1,340 | | | | 1,675 | |
| | | | | | | | |
Total Convertible Preferred Stocks (cost $21,548) | | | | 18,161 | |
| | | | | | | | |
PREFERRED STOCKS—1.6% | | | | | | | | |
United States—1.6% | | | | | | | | |
Ally Financial, Inc., 7.00%—144A | | | 5,495 | | | | 5,296 | |
Ally Financial, Inc., 8.50% * | | | 93,825 | | | | 2,350 | |
Countrywide Capital IV, 6.75% | | | 88,375 | | | | 2,222 | |
SLM Corp., 6.00% ^ | | | 78,825 | | | | 1,923 | |
| | | | | | | | |
Total Preferred Stocks (cost $9,156) | | | | | | | 11,791 | |
| | | | | | | | |
COMMON STOCKS—1.0% | | | | | | | | |
United States—1.0% | | | | | | | | |
Dynegy, Inc. ‡ ^ | | | 11,969 | | | | 224 | |
Ford Motor Co. ^ | | | 7,110 | | | | 79 | |
KB Home ^ | | | 181,675 | | | | 2,903 | |
National Fuel Gas Co. ^ | | | 69,815 | | | | 3,680 | |
Owens-Illinois, Inc. ‡ ^ | | | 10,796 | | | | 210 | |
| | | | | | | | |
Total Common Stocks (cost $5,796) | | | | 7,096 | |
| | | | | | | | |
SECURITIES LENDING COLLATERAL—12.8% | | | | | |
State Street Navigator Securities Lending Trust—Prime Portfolio, 0.31% | | | 94,623,740 | | | | 94,624 | |
Total Securities Lending Collateral (cost $94,624) | | | | | |
The notes to the financial statements are an integral part of this report.
| | | | |
| Transamerica Funds | | | | Annual Report 2012 |
| | Page 54 | | |
Transamerica Bond
(formerly, Transamerica Loomis Sayles Bond)
SCHEDULE OF INVESTMENTS (continued)
At October 31, 2012
| | | | | | | | |
| | | Principal
(000’s) | | | Value
(000’s) | |
REPURCHASE AGREEMENT—0.9% | | | | | | | | |
State Street Bank & Trust Co.
0.03% , dated 10/31/2012, to be repurchased at $6,283 on 11/01/2012. Collateralized by a U.S. Government Agency Obligation, 3.00%, due 12/01/2026, and with a value of $6,410. | | $ | 6,283 | | | $ | 6,283 | |
Total Repurchase Agreement (cost $6,283) | | | | | | | | |
| | | | | | | | |
Total Investment Securities (cost $764,086) P | | | | | | | 821,317 | |
Other Assets and Liabilities—Net | | | | | | | (84,237 | ) |
| | | | | | | | |
Net Assets | | | | | | $ | 737,080 | |
| | | | | | | | |
| | | | | | | | |
INVESTMENTS BY INDUSTRY (unaudited): | | Percentage of
Total Investment
Securities | | | Value
(000’s) | |
Foreign Government Obligations | | | 11.9 | % | | $ | 97,967 | |
Diversified Financial Services | | | 6.2 | | | | 50,741 | |
Diversified Telecommunication Services | | | 6.0 | | | | 49,159 | |
Mortgage-Backed Securities | | | 5.0 | | | | 40,725 | |
Consumer Finance | | | 4.9 | | | | 39,937 | |
U.S. Government Obligations | | | 4.8 | | | | 39,571 | |
U.S. Government Agency Obligation | | | 4.7 | | | | 38,581 | |
Capital Markets | | | 3.6 | | | | 29,274 | |
Metals & Mining | | | 3.2 | | | | 26,430 | |
Commercial Banks | | | 3.0 | | | | 24,812 | |
Airlines | | | 2.8 | | | | 22,997 | |
Oil, Gas & Consumable Fuels | | | 2.7 | | | | 21,983 | |
Household Durables | | | 2.3 | | | | 19,300 | |
Electric Utilities | | | 2.2 | | | | 17,771 | |
Building Products | | | 2.1 | | | | 16,858 | |
Insurance | | | 1.9 | | | | 15,415 | |
Automobiles | | | 1.8 | | | | 14,984 | |
Real Estate Investment Trusts | | | 1.8 | | | | 14,805 | |
Semiconductors & Semiconductor Equipment | | | 1.7 | | | | 13,578 | |
Communications Equipment | | | 1.4 | | | | 11,376 | |
Pharmaceuticals | | | 1.3 | | | | 10,910 | |
Health Care Providers & Services | | | 1.2 | | | | 9,509 | |
Aerospace & Defense | | | 1.0 | | | | 8,479 | |
Hotels, Restaurants & Leisure | | | 0.8 | | | | 6,221 | |
Food & Staples Retailing | | | 0.7 | | | | 5,939 | |
Multiline Retail | | | 0.7 | | | | 5,832 | |
Paper & Forest Products | | | 0.7 | | | | 5,539 | |
Biotechnology | | | 0.7 | | | | 5,396 | |
Wireless Telecommunication Services | | | 0.7 | | | | 5,351 | |
Chemicals | | | 0.7 | | | | 5,347 | |
Household Products | | | 0.6 | | | | 5,248 | |
Energy Equipment & Services | | | 0.5 | | | | 4,507 | |
Commercial Services & Supplies | | | 0.5 | | | | 4,367 | |
Asset-Backed Securities | | | 0.5 | | | | 4,082 | |
Gas Utilities | | | 0.4 | | | | 3,679 | |
Software | | | 0.4 | | | | 3,605 | |
Independent Power Producers & Energy Traders | | | 0.4 | | | | 3,539 | |
Specialty Retail | | | 0.4 | | | | 3,453 | |
Food Products | | | 0.4 | | | | 3,298 | |
Machinery | | | 0.4 | | | | 3,235 | |
Electronic Equipment & Instruments | | | 0.3 | | | | 2,781 | |
Auto Components | | | 0.2 | | | | 1,838 | |
Road & Rail | | | 0.1 | | | | 1,096 | |
Media | | | 0.1 | | | | 436 | |
Life Sciences Tools & Services | | | 0.0 | ¥ | | | 249 | |
Containers & Packaging | | | 0.0 | ¥ | | | 210 | |
| | | | | | | | |
Investment Securities, at Value | | | 87.7 | | | | 720,410 | |
Short-Term Investments | | | 12.3 | | | | 100,907 | |
| | | | | | | | |
Total Investments | | | 100.0 | % | | $ | 821,317 | |
| | | | | | | | |
The notes to the financial statements are an integral part of this report.
| | | | |
| Transamerica Funds | | | | Annual Report 2012 |
| | Page 55 | | |
Transamerica Bond
(formerly, Transamerica Loomis Sayles Bond)
SCHEDULE OF INVESTMENTS (continued)
At October 31, 2012
NOTES TO SCHEDULE OF INVESTMENTS (all amounts in thousands):
| ^ | All or a portion of this security is on loan. The value of all securities on loan is $92,617. |
| * | Floating or variable rate note. Rate is listed as of 10/31/2012. |
| ¥ | Percentage rounds to less than 0.1%. |
| Ž | The security has a perpetual maturity. The date shown is the next call date. |
| Ә | Fair valued as determined in good faith in accordance with procedures established by the Board of Trustees. Total aggregate market value of fair valued securities is less than $1, or less than 0.01% of the fund’s net assets. |
| ‡ | Non-income producing security. |
| § | Illiquid. Total aggregate market value of illiquid securities is $3,758, or 0.51% of the fund’s net assets. |
| | Rate shown reflects the yield at 10/31/2012. |
| P | Aggregate cost for federal income tax purposes is $764,086. Aggregate gross unrealized appreciation/depreciation for all securities in which there is an excess of value over tax cost were $71,659 and $14,428, respectively. Net unrealized appreciation for tax purposes is $57,231. |
| D | Restricted. At 10/31/2012, the fund owned the respective securities which were restricted to public resale: |
| | | | | | | | | | | | | | | | | | |
Investment Securities | | Description | | Acquisition
Date | | | Cost | | | Value | | | Value as % of
Net Assets | |
Corporate Debt Securities | | Mackinaw Power LLC | | | 06/15/2007 | | | $ | 1,250 | | | $ | 1,317 | | | | 0.18 | % |
Convertible Bonds | | Level 3 Communications, Inc. | | | 06/22/2009 | | | | 2,090 | | | | 2,441 | | | | 0.33 | |
| | | | | | | | | | | | | | | | | | |
| | | | | | | | $ | 3,340 | | | $ | 3,758 | | | | 0.51 | % |
| | | | | | | | | | | | | | | | | | |
DEFINITIONS (all amounts in thousands):
| | |
| 144A | | 144A Securities are registered pursuant to Rule 144A of the Securities Act of 1933. These securities are deemed to be liquid for purposes of compliance limitations on holdings of illiquid securities and may be resold as transactions exempt from registration, normally to qualified institutional buyers. At 10/31/2012, these securities aggregated $145,105, or 19.69% of the fund’s net assets. |
| REIT | | Real Estate Investment Trust |
| REMIC | | Real Estate Mortgage Investment Conduits (consist of a fixed pool of mortgages broken apart and marketed to investors as individual securities) |
CURRENCY ABBREVIATIONS:
| | |
AUD | | Australian Dollar |
BRL | | Brazilian Real |
CAD | | Canadian Dollar |
CLP | | Chilean Peso |
EUR | | Euro |
MXN | | Mexican Peso |
NZD | | New Zealand Dollar |
PHP | | Philippines Peso |
UYU | | Uruguayan Peso |
VALUATION SUMMARY (all amounts in thousands): '
| | | | | | | | | | | | | | | | |
Investment Securities | | Level 1 -
Quoted
Prices | | | Level 2 -
Other
Significant
Observable
Inputs | | | Level 3 -
Significant
Unobservable
Inputs | | | Value at
10/31/2012 | |
Asset-Backed Securities | | $ | — | | | $ | 4,082 | | | $ | — | | | $ | 4,082 | |
Common Stocks | | | 7,096 | | | | — | | | | — | | | | 7,096 | |
Convertible Bonds | | | — | | | | 50,518 | | | | — | | | | 50,518 | |
Convertible Preferred Stocks | | | 18,161 | | | | — | | | | — | | | | 18,161 | |
Corporate Debt Securities | | | — | | | | 410,910 | | | | ¿ | | | | 410,910 | |
Foreign Government Obligations | | | — | | | | 97,967 | | | | — | | | | 97,967 | |
Mortgage-Backed Securities | | | — | | | | 40,725 | | | | — | | | | 40,725 | |
Preferred Corporate Debt Security | | | — | | | | 1,008 | | | | — | | | | 1,008 | |
Preferred Stocks | | | 11,791 | | | | — | | | | — | | | | 11,791 | |
Repurchase Agreement | | | — | | | | 6,283 | | | | — | | | | 6,283 | |
Securities Lending Collateral | | | 94,624 | | | | — | | | | — | | | | 94,624 | |
U.S. Government Agency Obligation | | | — | | | | 38,581 | | | | — | | | | 38,581 | |
U.S. Government Obligations | | | — | | | | 39,571 | | | | — | | | | 39,571 | |
| | | | | | | | | | | | | | | | |
Total | | $ | 131,672 | | | $ | 689,645 | | | $ | ¿ | | | $ | 821,317 | |
| | | | | | | | | | | | | | | | |
The notes to the financial statements are an integral part of this report.
| | | | |
| Transamerica Funds | | | | Annual Report 2012 |
| | Page 56 | | |
Transamerica Bond
(formerly, Transamerica Loomis Sayles Bond)
SCHEDULE OF INVESTMENTS (continued)
At October 31, 2012
VALUATION SUMMARY (all amounts in thousands) (continued): '
Level 3 Rollforward—Investment Securities
| | | | | | | | | | | | | | | | | | | | | | | | | | | | | | | | | | | | | | | | |
Security | | Beginning
Balance at
10/31/2011 | | | Purchases | | | Sales | | | Accrued
Discounts/
(Premiums) | | | Total
Realized
Gain/
(Loss) | | | Net Change in
Unrealized
Appreciation
/(Depreciation) | | | Transfers
into
Level 3 | | | Transfers
out of
Level 3 | | | Ending
Balance at
10/31/2012 ₪ | | | Net Change in
Unrealized
Appreciation/
(Depreciation) on
Investments Held
at 10/31/2012 | |
Corporate Debt Securities | | $ | — | | | $ | ¿ | | | $ | — | | | $ | — | | | $ | — | | | $ | — | | | $ | — | | | $ | — | | | $ | ¿ | | | $ | — | |
| ' | Transfers between levels are considered to have occurred at the end of the reporting period. There were no transfers into or out of Levels 1 and 2 during the period ended 10/31/2012. See the notes to the financial statements for more information regarding pricing inputs and valuation techniques. |
| ₪ | Inputs used in the valuation of the Level 3 securities were not considered significant unobservable inputs. |
The notes to the financial statements are an integral part of this report.
| | | | |
| Transamerica Funds | | | | Annual Report 2012 |
| | Page 57 | | |
Transamerica Core Bond
(formerly, Transamerica JPMorgan Core Bond)
SCHEDULE OF INVESTMENTS
At October 31, 2012
| | | | | | | | |
| | | Principal
(000’s) | | | Value
(000’s) | |
U.S. GOVERNMENT OBLIGATIONS—16.5% | | | | | |
U.S. Treasury Bond | | | | | | | | |
4.50%, 02/15/2036 | | $ | 9,450 | | | $ | 12,574 | |
4.75%, 02/15/2037 | | | 1,850 | | | | 2,553 | |
5.38%, 02/15/2031 | | | 2,500 | | | | 3,603 | |
5.50%, 08/15/2028 | | | 800 | | | | 1,141 | |
6.00%, 02/15/2026 | | | 200 | | | | 291 | |
6.13%, 11/15/2027—08/15/2029 | | | 1,600 | | | | 2,437 | |
6.25%, 05/15/2030 | | | 1,200 | | | | 1,873 | |
6.38%, 08/15/2027 | | | 50 | | | | 76 | |
6.63%, 02/15/2027 | | | 150 | | | | 233 | |
6.75%, 08/15/2026 ^ | | | 250 | | | | 389 | |
7.50%, 11/15/2016 | | | 8,250 | | | | 10,535 | |
8.50%, 02/15/2020 | | | 50 | | | | 76 | |
8.75%, 05/15/2020 | | | 1,240 | | | | 1,918 | |
11.25%, 02/15/2015 ^ | | | 12,700 | | | | 15,856 | |
U.S. Treasury Inflation Indexed Bond | | | | | | | | |
2.50%, 01/15/2029 | | | 2,682 | | | | 3,876 | |
U.S. Treasury Inflation Indexed Note | | | | | | | | |
0.13%, 04/15/2016 | | | 1,044 | | | | 1,100 | |
0.50%, 04/15/2015 | | | 5,314 | | | | 5,552 | |
0.63%, 04/15/2013 | | | 1,090 | | | | 1,094 | |
1.13%, 01/15/2021 | | | 2,106 | | | | 2,490 | |
1.25%, 04/15/2014 | | | 3,047 | | | | 3,151 | |
2.00%, 01/15/2014 | | | 2,493 | | | | 2,586 | |
U.S. Treasury Note | | | | | | | | |
1.50%, 08/31/2018 | | | 3,500 | | | | 3,620 | |
2.00%, 04/30/2016 ^ | | | 3,000 | | | | 3,159 | |
2.13%, 12/31/2015 | | | 2,200 | | | | 2,317 | |
2.38%, 02/28/2015 | | | 300 | | | | 314 | |
2.63%, 04/30/2016—08/15/2020 | | | 11,315 | | | | 12,331 | |
2.75%, 05/31/2017 | | | 5,580 | | | | 6,114 | |
2.88%, 03/31/2018 | | | 1,425 | | | | 1,582 | |
3.00%, 09/30/2016 | | | 1,000 | | | | 1,095 | |
3.13%, 04/30/2017 | | | 7,500 | | | | 8,327 | |
3.25%, 12/31/2016 ^ | | | 5,450 | | | | 6,050 | |
3.25%, 03/31/2017 | | | 2,300 | | | | 2,564 | |
4.13%, 05/15/2015 | | | 3,100 | | | | 3,396 | |
4.25%, 11/15/2017 | | | 8,250 | | | | 9,688 | |
4.50%, 02/15/2016—05/15/2017 | | | 8,180 | | | | 9,512 | |
4.75%, 08/15/2017 | | | 1,630 | | | | 1,943 | |
U.S. Treasury STRIPS | | | | | | | | |
0.50%, 05/15/2016 ^ | | | 200 | | | | 196 | |
0.62%, 11/15/2016 ^ | | | 1,150 | | | | 1,122 | |
0.66%, 02/15/2017 ^ | | | 3,960 | | | | 3,852 | |
0.76%, 08/15/2017 | | | 300 | | | | 290 | |
0.81%, 11/15/2017 | | | 3,625 | | | | 3,483 | |
0.88%, 02/15/2018 ^ | | | 2,500 | | | | 2,390 | |
0.97%, 08/15/2018 | | | 550 | | | | 521 | |
1.13%, 05/15/2019 | | | 3,090 | | | | 2,877 | |
1.19%, 08/15/2019 | | | 2,550 | | | | 2,360 | |
1.31%, 02/15/2020 ^ | | | 2,000 | | | | 1,823 | |
1.37%, 05/15/2020 | | | 64,423 | | | | 58,308 | |
1.42%, 08/15/2020 ^ | | | 29,550 | | | | 26,549 | |
1.46%, 11/15/2020 ^ | | | 2,745 | | | | 2,450 | |
1.53%, 02/15/2021 | | | 4,455 | | | | 3,941 | |
1.59%, 05/15/2021 | | | 10,300 | | | | 9,036 | |
1.64%, 08/15/2021 ^ | | | 9,900 | | | | 8,612 | |
| | | | | | | | |
| | | Principal
(000’s) | | | Value
(000’s) | |
U.S. GOVERNMENT OBLIGATIONS (continued) | |
U.S. Treasury STRIPS (continued) | | | | | | | | |
1.75%, 02/15/2022 | | $ | 400 | | | $ | 342 | |
2.00%, 05/15/2023 | | | 1,000 | | | | 815 | |
2.14%, 02/15/2024 | | | 75 | | | | 59 | |
2.17%, 05/15/2024 | | | 300 | | | | 235 | |
2.21%, 08/15/2024 | | | 975 | | | | 756 | |
2.25%, 11/15/2024 | | | 1,600 | | | | 1,229 | |
2.29%, 02/15/2025 | | | 1,150 | | | | 875 | |
2.33%, 05/15/2025 | | | 700 | | | | 527 | |
2.43%, 02/15/2026 ^ | | | 500 | | | | 365 | |
2.46%, 05/15/2026 | | | 600 | | | | 434 | |
2.49%, 08/15/2026 | | | 1,900 | | | | 1,362 | |
2.55%, 02/15/2027 | | | 4,900 | | | | 3,442 | |
2.57%, 05/15/2027 | | | 850 | | | | 592 | |
2.59%, 08/15/2027 | | | 100 | | | | 69 | |
2.61%, 11/15/2027 | | | 1,350 | | | | 922 | |
2.63%, 02/15/2028 | | | 1,250 | | | | 846 | |
2.65%, 05/15/2028 | | | 100 | | | | 67 | |
2.67%, 08/15/2028 | | | 1,000 | | | | 664 | |
2.69%, 11/15/2028 | | | 2,600 | | | | 1,710 | |
2.71%, 02/15/2029 | | | 2,950 | | | | 1,923 | |
2.72%, 05/15/2029 ^ | | | 100 | | | | 65 | |
2.73%, 08/15/2029 | | | 3,800 | | | | 2,435 | |
2.75%, 11/15/2029 | | | 1,500 | | | | 953 | |
2.76%, 02/15/2030 | | | 4,350 | | | | 2,738 | |
2.78%, 05/15/2030—08/15/2030 | | | 2,775 | | | | 1,725 | |
2.79%, 11/15/2030 | | | 900 | | | | 552 | |
2.81%, 05/15/2031 ^ | | | 650 | | | | 391 | |
2.84%, 11/15/2031 ^ | | | 100 | | | | 59 | |
2.85%, 02/15/2032 ^ | | | 650 | | | | 381 | |
2.86%, 05/15/2032 ^ | | | 2,000 | | | | 1,162 | |
2.88%, 11/15/2032 | | | 3,350 | | | | 1,910 | |
2.90%, 05/15/2033 ^ | | | 4,350 | | | | 2,438 | |
2.91%, 08/15/2033 | | | 5,000 | | | | 2,776 | |
2.92%, 11/15/2033 | | | 600 | | | | 330 | |
2.93%, 02/15/2034 | | | 1,300 | | | | 709 | |
2.94%, 05/15/2034 | | | 400 | | | | 216 | |
2.95%, 08/15/2034 | | | 400 | | | | 214 | |
2.97%, 02/15/2035 | | | 1,700 | | | | 893 | |
3.00%, 05/15/2036 | | | 100 | | | | 50 | |
| | | | | | | | |
Total U.S. Government Obligations (cost $283,387) | | | | 310,457 | |
| | | | | | | | |
U.S. GOVERNMENT AGENCY OBLIGATIONS—45.1% | |
Fannie Mae | | | | | | | | |
0.41%, 10/27/2037 * | | | 1,600 | | | | 1,591 | |
0.43%, 02/25/2036—03/25/2045 * | | | 545 | | | | 543 | |
0.45%, 10/25/2046 * | | | 534 | | | | 532 | |
0.46%, 06/27/2036—09/25/2036 * | | | 3,464 | | | | 3,444 | |
0.47%, 11/25/2046 * | | | 3,922 | | | | 3,907 | |
0.50%, 07/25/2036 * | | | 513 | | | | 515 | |
0.51%, 03/25/2036 * | | | 401 | | | | 403 | |
0.53%, 03/25/2037 * | | | 3,767 | | | | 3,779 | |
0.56%, 08/25/2036 * | | | 751 | | | | 753 | |
0.61%, 06/25/2037—05/25/2042 * | | | 918 | | | | 916 | |
0.66%, 07/25/2034 * | | | 55 | | | | 55 | |
0.74%, 08/25/2019 * | | | 1,399 | | | | 1,411 | |
0.76%, 08/25/2041—08/25/2042 * | | | 3,635 | | | | 3,661 | |
The notes to the financial statements are an integral part of this report.
| | | | |
| Transamerica Funds | | | | Annual Report 2012 |
| | Page 58 | | |
Transamerica Core Bond
(formerly, Transamerica JPMorgan Core Bond)
SCHEDULE OF INVESTMENTS (continued)
At October 31, 2012
| | | | | | | | |
| | | Principal
(000’s) | | | Value
(000’s) | |
U.S. GOVERNMENT AGENCY OBLIGATIONS (continued) | |
Fannie Mae (continued) | | | | | | | | |
0.78%, 08/01/2022 * | | $ | 997 | | | $ | 1,004 | |
0.81%, 04/25/2040 * | | | 2,063 | | | | 2,083 | |
0.97%, 01/01/2019 * | | | 1,089 | | | | 1,095 | |
1.01%, 07/05/2014 | | | 4,000 | | | | 3,943 | |
1.34%, 06/01/2017 | | | 800 | | | | 765 | |
1.99%, 01/01/2017 | | | 1,500 | | | | 1,527 | |
2.03%, 08/01/2019 | | | 2,233 | | | | 2,310 | |
2.07%, 07/01/2037 * | | | 199 | | | | 213 | |
2.19%, 09/01/2036 * | | | 121 | | | | 129 | |
2.22%, 02/01/2037 * | | | 238 | | | | 252 | |
2.27%, 02/01/2037 * | | | 102 | | | | 107 | |
2.49%, 10/01/2036 * | | | 202 | | | | 217 | |
2.62%, 11/01/2037 * | | | 222 | | | | 239 | |
2.66%, 12/01/2036 * | | | 220 | | | | 236 | |
2.75%, 09/01/2036 * | | | 332 | | | | 355 | |
2.80%, 12/01/2036 * | | | 496 | | | | 529 | |
2.83%, 06/01/2036—04/01/2037 * | | | 359 | | | | 385 | |
2.84%, 07/01/2037 * | | | 170 | | | | 183 | |
2.86%, 09/01/2037 * | | | 15 | | | | 16 | |
2.89%, 07/01/2037 * | | | 143 | | | | 153 | |
2.95%, 09/01/2036 * | | | 95 | | | | 102 | |
2.97%, 11/01/2018 | | | 1,452 | | | | 1,570 | |
2.98%, 05/01/2036 * | | | 436 | | | | 466 | |
3.03%, 11/01/2036 * | | | 100 | | | | 107 | |
3.12%, 01/01/2022 | | | 2,000 | | | | 2,167 | |
3.23%, 11/01/2020 | | | 700 | | | | 765 | |
3.24%, 12/25/2039 * | | | 853 | | | | 913 | |
3.25%, 03/01/2036 * | | | 1,161 | | | | 1,239 | |
3.27%, 11/01/2020 | | | 2,000 | | | | 2,188 | |
3.38%, 01/01/2018 | | | 4,000 | | | | 4,401 | |
3.43%, 11/01/2020 | | | 4,800 | | | | 5,296 | |
3.43%, 03/01/2036 * | | | 426 | | | | 457 | |
3.50%, 09/01/2020 | | | 1,940 | | | | 2,147 | |
3.52%, 01/01/2018—12/01/2020 | | | 11,614 | | | | 12,892 | |
3.54%, 01/01/2018 | | | 3,901 | | | | 4,296 | |
3.55%, 11/01/2037 * | | | 218 | | | | 234 | |
3.59%, 10/01/2021 | | | 2,000 | | | | 2,230 | |
3.63%, 01/01/2018 | | | 1,500 | | | | 1,661 | |
3.64%, 06/01/2018 | | | 6,000 | | | | 6,671 | |
3.73%, 06/25/2021 | | | 3,500 | | | | 3,947 | |
3.74%, 06/01/2018 | | | 1,979 | | | | 2,241 | |
3.76%, 06/25/2021—07/25/2021 | | | 10,500 | | | | 11,757 | |
3.77%, 01/01/2021 | | | 1,500 | | | | 1,690 | |
3.79%, 08/01/2037 * | | | 271 | | | | 293 | |
3.80%, 03/01/2018 | | | 1,956 | | | | 2,183 | |
3.86%, 07/01/2021 | | | 1,965 | | | | 2,229 | |
3.87%, 08/01/2021 | | | 1,972 | | | | 2,237 | |
3.87%, 11/01/2036 * | | | 414 | | | | 445 | |
3.88%, 09/01/2021 | | | 3,152 | | | | 3,595 | |
3.89%, 07/01/2021 | | | 6,000 | | | | 6,819 | |
3.92%, 08/01/2021 | | | 2,300 | | | | 2,620 | |
3.95%, 07/01/2021 | | | 7,000 | | | | 7,984 | |
3.97%, 06/01/2021 | | | 2,465 | | | | 2,812 | |
3.98%, 08/01/2021 | | | 4,891 | | | | 5,568 | |
3.99%, 07/01/2021—07/01/2026 | | | 6,672 | | | | 7,562 | |
4.00%, 04/01/2020—06/01/2023 | | | 1,551 | | | | 1,655 | |
| | | | | | | | |
| | | Principal
(000’s) | | | Value
(000’s) | |
U.S. GOVERNMENT AGENCY OBLIGATIONS (continued) | |
Fannie Mae (continued) | | | | | | | | |
4.02%, 08/01/2021 | | $ | 3,918 | | | $ | 4,487 | |
4.05%, 01/01/2021 | | | 6,065 | | | | 6,961 | |
4.06%, 07/01/2021 | | | 6,000 | | | | 6,889 | |
4.07%, 07/01/2020 | | | 1,794 | | | | 2,057 | |
4.13%, 08/01/2021 | | | 1,478 | | | | 1,704 | |
4.16%, 03/01/2021 | | | 2,445 | | | | 2,820 | |
4.18%, 12/01/2019 | | | 4,801 | | | | 5,500 | |
4.22%, 07/01/2021 | | | 8,300 | | | | 9,617 | |
4.23%, 03/01/2020 | | | 4,758 | | | | 5,468 | |
4.24%, 06/01/2021 | | | 3,000 | | | | 3,479 | |
4.25%, 04/01/2021—04/01/2021 | | | 2,500 | | | | 2,908 | |
4.26%, 07/01/2021 | | | 2,500 | | | | 2,906 | |
4.28%, 01/01/2020 | | | 1,441 | | | | 1,658 | |
4.30%, 01/01/2021 | | | 1,470 | | | | 1,721 | |
4.31%, 06/01/2021 | | | 9,825 | | | | 11,453 | |
4.32%, 06/01/2021 | | | 2,462 | | | | 2,872 | |
4.34%, 06/01/2021 | | | 7,000 | | | | 8,198 | |
4.36%, 05/01/2021 | | | 2,000 | | | | 2,337 | |
4.37%, 04/01/2020 | | | 971 | | | | 1,131 | |
4.38%, 01/01/2021—04/01/2021 | | | 4,446 | | | | 5,193 | |
4.39%, 05/01/2021 | | | 1,000 | | | | 1,171 | |
4.40%, 02/01/2020 | | | 2,000 | | | | 2,324 | |
4.45%, 07/01/2026 | | | 1,479 | | | | 1,738 | |
4.48%, 06/01/2021 | | | 2,180 | | | | 2,578 | |
4.50%, 09/25/2018—10/25/2039 | | | 13,957 | | | | 15,477 | |
4.54%, 01/01/2020 | | | 965 | | | | 1,129 | |
4.55%, 06/25/2043 | | | 255 | | | | 283 | |
4.65%, 03/01/2021 | | | 3,584 | | | | 4,243 | |
4.75%, 09/25/2018 | | | 707 | | | | 755 | |
5.00%, 04/25/2016—09/25/2040 | | | 15,287 | | | | 16,831 | |
5.24%, 05/01/2017 | | | 5,971 | | | | 6,740 | |
5.50%, 01/01/2018—10/25/2040 | | | 64,807 | | | | 72,785 | |
5.53%, 05/01/2018 | | | 943 | | | | 1,086 | |
5.61%, 01/25/2032 * | | | 229 | | | | 250 | |
5.75%, 08/25/2034 | | | 1,000 | | | | 1,115 | |
5.85%, 05/25/2051 * | | | 1,380 | | | | 1,500 | |
5.87%, 04/01/2036—09/01/2037 * | | | 508 | | | | 549 | |
5.94%, 06/25/2040 * | | | 550 | | | | 625 | |
6.00%, 03/01/2019—12/25/2049 | | | 59,580 | | | | 66,340 | |
6.16%, 02/25/2040 * | | | 712 | | | | 786 | |
6.19%, 08/01/2036 * | | | 90 | | | | 98 | |
6.25%, 09/25/2038 | | | 466 | | | | 519 | |
6.45%, 03/25/2040 * | | | 655 | | | | 752 | |
6.50%, 06/01/2023—07/25/2042 | | | 12,697 | | | | 14,454 | |
6.75%, 04/25/2037 | | | 566 | | | | 620 | |
6.99%, 12/25/2042 * | | | 237 | | | | 278 | |
7.00%, 12/25/2033—02/25/2044 | | | 24,189 | | | | 28,725 | |
7.50%, 05/17/2024—12/25/2045 | | | 3,170 | | | | 3,751 | |
8.00%, 02/25/2023—10/01/2031 | | | 2,183 | | | | 2,624 | |
8.47%, 11/25/2037 * | | | 1,014 | | | | 1,209 | |
12.24%, 03/25/2040 * | | | 1,082 | | | | 1,362 | |
15.78%, 01/25/2034 * | | | 110 | | | | 146 | |
16.35%, 08/25/2035—10/25/2035 * | | | 409 | | | | 550 | |
16.96%, 04/25/2040 * | | | 398 | | | | 620 | |
17.30%, 09/25/2024 * | | | 573 | | | | 781 | |
18.95%, 05/25/2034 * | | | 389 | | | | 581 | |
The notes to the financial statements are an integral part of this report.
| | | | |
| Transamerica Funds | | | | Annual Report 2012 |
| | Page 59 | | |
Transamerica Core Bond
(formerly, Transamerica JPMorgan Core Bond)
SCHEDULE OF INVESTMENTS (continued)
At October 31, 2012
| | | | | | | | |
| | | Principal
(000’s) | | | Value
(000’s) | |
U.S. GOVERNMENT AGENCY OBLIGATIONS (continued) | |
Fannie Mae (continued) | | | | | | | | |
19.55%, 05/25/2035 * | | $ | 683 | | | $ | 1,015 | |
21.96%, 04/25/2037 * | | | 448 | | | | 646 | |
23.79%, 11/25/2035 * | | | 335 | | | | 542 | |
Fannie Mae, IO | | | | | | | | |
0.64%, 10/25/2016 * | | | 631 | | | | 7 | |
3.00%, 01/25/2021 | | | 3,211 | | | | 213 | |
3.12%, 01/25/2038 * | | | 262 | | | | 18 | |
4.00%, 10/25/2014 | | | 1,653 | | | | 77 | |
4.23%, 11/25/2040 * | | | 4,072 | | | | 416 | |
4.62%, 04/25/2041 * | | | 2,783 | | | | 205 | |
4.79%, 07/25/2040 * | | | 4,936 | | | | 904 | |
5.00%, 07/25/2039 | | | 483 | | | | 59 | |
5.50%, 10/25/2039 | | | 1,037 | | | | 145 | |
5.69%, 10/25/2039 * | | | 758 | | | | 92 | |
5.79%, 02/25/2038—06/25/2039 * | | | 6,849 | | | | 821 | |
5.97%, 12/25/2039 * | | | 180 | | | | 21 | |
6.04%, 01/25/2040 * | | | 2,364 | | | | 306 | |
6.14%, 12/25/2037 * | | | 3,760 | | | | 598 | |
6.19%, 07/25/2037—05/25/2040 * | | | 5,434 | | | | 786 | |
6.21%, 04/25/2040 * | | | 1,244 | | | | 169 | |
6.24%, 10/25/2037—12/25/2037 * | | | 1,622 | | | | 278 | |
6.41%, 07/25/2037 * | | | 1,814 | | | | 239 | |
6.44%, 10/25/2026—03/25/2039 * | | | 4,174 | | | | 588 | |
6.49%, 03/25/2036 * | | | 3,494 | | | | 775 | |
6.78%, 03/25/2038 * | | | 889 | | | | 134 | |
6.89%, 02/25/2040 * | | | 993 | | | | 138 | |
Fannie Mae, PO | | | | | | | | |
10/25/2023—07/25/2040 | | | 14,931 | | | | 14,157 | |
Fannie Mae STRIPS | | | | | | | | |
2.53%, 11/15/2021 | | | 1,000 | | | | 814 | |
Fannie Mae STRIPS, PO | | | | | | | | |
12/01/2024—08/01/2032 | | | 1,715 | | | | 1,585 | |
Federal Farm Credit Banks | | | | | | | | |
5.13%, 11/15/2018 | | | 2,000 | | | | 2,456 | |
Financing Corp. Fico STRIPS | | | | | | | | |
2.00%, 09/26/2019 | | | 500 | | | | 444 | |
Freddie Mac | | | | | | | | |
0.46%, 08/15/2023 * | | | 867 | | | | 867 | |
0.51%, 06/15/2024—03/15/2036 * | | | 1,592 | | | | 1,596 | |
0.56%, 07/15/2034 * | | | 1,244 | | | | 1,249 | |
0.61%, 02/15/2033 * | | | 1,504 | | | | 1,503 | |
0.63%, 07/15/2037 * | | | 2,780 | | | | 2,793 | |
0.71%, 08/15/2042 * | | | 1,493 | | | | 1,502 | |
0.76%, 07/15/2042 * | | | 1,989 | | | | 2,000 | |
1.41%, 07/15/2039 * | | | 556 | | | | 560 | |
2.30%, 04/01/2037 * | | | 46 | | | | 48 | |
2.31%, 05/01/2037 * | | | 209 | | | | 223 | |
2.47%, 10/01/2036 * | | | 240 | | | | 258 | |
2.50%, 11/01/2036 * | | | 232 | | | | 246 | |
2.52%, 12/01/2036 * | | | 549 | | | | 589 | |
2.55%, 10/01/2037 * | | | 131 | | | | 140 | |
2.66%, 12/01/2036 * | | | 523 | | | | 562 | |
2.76%, 05/01/2037 * | | | 167 | | | | 179 | |
2.89%, 11/01/2036 * | | | 57 | | | | 61 | |
2.91%, 09/01/2037 * | | | 109 | | | | 118 | |
3.11%, 05/01/2037 * | | | 239 | | | | 256 | |
3.14%, 05/01/2038 * | | | 134 | | | | 143 | |
| | | | | | | | |
| | | Principal
(000’s) | | | Value
(000’s) | |
U.S. GOVERNMENT AGENCY OBLIGATIONS (continued) | |
Freddie Mac (continued) | | | | | | | | |
3.17%, 04/01/2037 * | | $ | 127 | | | $ | 136 | |
3.22%, 03/01/2037 * | | | 325 | | | | 347 | |
3.29%, 11/01/2036—05/01/2037 * | | | 1,403 | | | | 1,497 | |
3.35%, 12/01/2031 * | | | 806 | | | | 873 | |
3.43%, 05/01/2036 * | | | 186 | | | | 199 | |
3.47%, 10/25/2037 * | | | 901 | | | | 912 | |
3.50%, 06/15/2021—07/15/2042 | | | 6,968 | | | | 7,535 | |
3.50%, 03/01/2036 * | | | 975 | | | | 1,059 | |
4.00%, 01/15/2018—12/15/2041 | | | 3,637 | | | | 3,936 | |
4.25%, 10/15/2030 | | | 86 | | | | 86 | |
4.50%, 07/01/2014—05/01/2041 | | | 46,428 | | | | 50,585 | |
4.90%, 02/01/2036 * | | | 2,036 | | | | 2,191 | |
5.00%, 10/01/2018—07/15/2041 | | | 19,805 | | | | 22,286 | |
5.03%, 01/01/2035 * | | | 1,606 | | | | 1,737 | |
5.08%, 07/01/2036 * | | | 1,415 | | | | 1,530 | |
5.23%, 05/25/2043 | | | 1,657 | | | | 1,853 | |
5.30%, 01/15/2033 | | | 1,521 | | | | 1,674 | |
5.50%, 02/01/2018—01/15/2039 | | | 27,103 | | | | 29,782 | |
5.50%, 05/15/2041 * | | | 3,705 | | | | 4,004 | |
5.64%, 06/01/2037 * | | | 241 | | | | 261 | |
5.69%, 10/15/2038 * | | | 1,403 | | | | 1,545 | |
5.75%, 10/15/2035 | | | 959 | | | | 1,014 | |
5.88%, 04/01/2037 * | | | 48 | | | | 52 | |
6.00%, 05/01/2017—06/15/2038 | | | 16,475 | | | | 18,032 | |
6.25%, 10/15/2023 | | | 811 | | | | 842 | |
6.45%, 02/01/2037 * | | | 134 | | | | 146 | |
6.48%, 10/01/2037 * | | | 247 | | | | 274 | |
6.50%, 08/15/2021—02/25/2043 | | | 11,492 | | | | 13,014 | |
6.50%, 09/25/2043 * | | | 233 | | | | 265 | |
6.79%, 11/15/2021 * | | | 1,022 | | | | 1,102 | |
7.00%, 12/15/2036—07/25/2043 | | | 2,819 | | | | 3,424 | |
7.16%, 11/15/2046 * | | | 2,298 | | | | 2,575 | |
7.50%, 11/15/2036—09/25/2043 | | | 4,027 | | | | 4,711 | |
8.00%, 06/15/2035 * | | | 308 | | | | 339 | |
8.50%, 09/01/2015 | | | 70 | | | | 75 | |
8.75%, 11/15/2033 * | | | 274 | | | | 304 | |
8.83%, 10/15/2033 * | | | 66 | | | | 67 | |
10.00%, 03/17/2026—10/01/2030 | | | 1,011 | | | | 1,150 | |
11.00%, 02/17/2021 | | | 339 | | | | 357 | |
14.46%, 06/15/2033 * | | | 151 | | | | 188 | |
15.91%, 10/15/2033 * | | | 15 | | | | 15 | |
16.05%, 10/15/2033 * | | | 36 | | | | 37 | |
16.79%, 02/15/2040 * | | | 500 | | | | 786 | |
16.92%, 02/15/2038 * | | | 85 | | | | 114 | |
19.58%, 07/15/2035 * | | | 112 | | | | 160 | |
20.37%, 08/15/2031 * | | | 165 | | | | 288 | |
21.14%, 05/15/2035 * | | | 132 | | | | 184 | |
23.79%, 06/15/2035 * | | | 127 | | | | 194 | |
Freddie Mac, IO | | | | | | | | |
3.50%, 09/15/2024 | | | 1,599 | | | | 90 | |
4.00%, 11/15/2029—10/15/2037 | | | 14,205 | | | | 1,011 | |
4.14%, 01/15/2040 * | | | 2,918 | | | | 144 | |
4.50%, 12/15/2024—07/15/2037 | | | 6,277 | | | | 605 | |
5.00%, 04/15/2032—08/15/2040 | | | 7,015 | | | | 1,017 | |
5.50%, 07/15/2037 | | | 458 | | | | 38 | |
5.79%, 11/15/2037—10/15/2040 * | | | 4,620 | | | | 1,010 | |
The notes to the financial statements are an integral part of this report.
| | | | |
| Transamerica Funds | | | | Annual Report 2012 |
| | Page 60 | | |
Transamerica Core Bond
(formerly, Transamerica JPMorgan Core Bond)
SCHEDULE OF INVESTMENTS (continued)
At October 31, 2012
| | | | | | | | |
| | | Principal
(000’s) | | | Value
(000’s) | |
U.S. GOVERNMENT AGENCY OBLIGATIONS (continued) | |
Freddie Mac, IO (continued) | | | | | | | | |
5.84%, 05/15/2038 * | | $ | 2,194 | | | $ | 265 | |
5.89%, 05/15/2039 * | | | 1,797 | | | | 227 | |
6.04%, 12/15/2039 * | | | 2,289 | | | | 363 | |
6.13%, 12/15/2039 * | | | 1,658 | | | | 447 | |
6.19%, 01/15/2037 * | | | 1,034 | | | | 168 | |
6.24%, 11/15/2037 * | | | 155 | | | | 22 | |
6.49%, 01/15/2019 * | | | 510 | | | | 16 | |
6.59%, 09/15/2039 * | | | 1,031 | | | | 188 | |
7.49%, 08/15/2036 * | | | 3,378 | | | | 432 | |
Freddie Mac, PO | | | | | | | | |
03/15/2019—01/15/2040 | | | 14,744 | | | | 14,092 | |
Freddie Mac STRIPS, PO | | | | | | | | |
04/01/2028 | | | 482 | | | | 426 | |
Ginnie Mae | | | | | | | | |
0.41%, 04/16/2037 * | | | 184 | | | | 184 | |
0.69%, 03/20/2060 * | | | 1,004 | | | | 1,003 | |
0.88%, 05/20/2061 * | | | 1,500 | | | | 1,512 | |
0.93%, 05/20/2061 * | | | 1,681 | | | | 1,695 | |
5.50%, 05/16/2019—09/20/2039 | | | 9,797 | | | | 11,289 | |
5.54%, 07/20/2040 * | | | 5,229 | | | | 5,979 | |
5.75%, 02/20/2036—10/20/2037 | | | 10,549 | | | | 11,467 | |
5.85%, 10/20/2033 * | | | 678 | | | | 770 | |
6.00%, 04/20/2020—12/20/2039 | | | 11,410 | | | | 12,985 | |
6.13%, 06/16/2031 | | | 1,584 | | | | 1,802 | |
6.50%, 04/20/2028—12/15/2035 | | | 3,538 | | | | 4,085 | |
7.00%, 09/15/2031—10/16/2040 | | | 2,786 | | | | 3,320 | |
7.00%, 09/20/2034 * | | | 56 | | | | 61 | |
7.43%, 03/17/2033 * | | | 207 | | | | 227 | |
7.50%, 09/16/2035—10/15/2037 | | | 866 | | | | 1,008 | |
8.79%, 04/20/2034 * | | | 313 | | | | 344 | |
14.31%, 11/17/2032 * | | | 97 | | | | 126 | |
16.89%, 02/20/2034 * | | | 73 | | | | 110 | |
22.54%, 04/20/2037 * | | | 607 | | | | 862 | |
Ginnie Mae, IO | | | | | | | | |
4.00%, 09/16/2037 | | | 4,265 | | | | 493 | |
5.62%, 02/20/2038 * | | | 334 | | | | 46 | |
5.69%, 09/20/2038 * | | | 2,507 | | | | 334 | |
5.74%, 02/20/2039—06/20/2039 * | | | 1,118 | | | | 153 | |
5.79%, 02/20/2038 * | | | 3,168 | | | | 458 | |
5.83%, 02/20/2039 * | | | 373 | | | | 51 | |
5.84%, 08/16/2039 * | | | 2,082 | | | | 262 | |
5.88%, 09/20/2039 * | | | 2,299 | | | | 377 | |
5.89%, 11/20/2034—08/20/2039 * | | | 6,316 | | | | 828 | |
5.94%, 07/20/2038 * | | | 2,181 | | | | 365 | |
5.99%, 03/20/2037—06/20/2038 * | | | 5,007 | | | | 734 | |
6.09%, 03/20/2039 * | | | 374 | | | | 41 | |
6.19%, 12/20/2038—11/16/2039 * | | | 3,875 | | | | 534 | |
6.32%, 12/20/2037 * | | | 161 | | | | 26 | |
6.34%, 11/16/2033—11/20/2037 * | | | 489 | | | | 92 | |
6.39%, 05/20/2041 * | | | 1,616 | | | | 273 | |
6.44%, 09/20/2033 * | | | 1,594 | | | | 117 | |
6.47%, 07/20/2037 * | | | 1,465 | | | | 230 | |
6.49%, 06/20/2037 * | | | 2,489 | | | | 406 | |
6.50%, 03/20/2039 | | | 217 | | | | 42 | |
7.09%, 12/20/2038 * | | | 1,692 | | | | 296 | |
7.39%, 09/20/2038 * | | | 196 | | | | 31 | |
| | | | | | | | |
| | | Principal
(000’s) | | | Value
(000’s) | |
U.S. GOVERNMENT AGENCY OBLIGATIONS (continued) | |
Ginnie Mae, IO (continued) | | | | | | | | |
7.49%, 04/16/2038 * | | $ | 119 | | | $ | 20 | |
Ginnie Mae, PO | | | | | | | | |
12/20/2032—12/20/2040 | | | 5,592 | | | | 5,258 | |
Government Trust Certificate
Zero Coupon, 04/01/2016—04/01/2020 | | | 15,890 | | | | 14,029 | |
0.97%, 10/01/2015 | | | 4,000 | | | | 3,850 | |
NCUA Guaranteed Notes | | | | | | | | |
0.57%, 12/07/2020 * | | | 224 | | | | 225 | |
0.78%, 12/08/2020 * | | | 858 | | | | 862 | |
2.40%, 12/08/2020 | | | 375 | | | | 384 | |
2.65%, 10/29/2020 | | | 2,956 | | | | 3,109 | |
Residual Funding Corp., Principal STRIPS, PO | |
1.95%, 10/15/2019 | | | 2,500 | | | | 2,263 | |
1.96%, 07/15/2020 | | | 1,400 | | | | 1,233 | |
2.16%, 10/15/2020 | | | 1,000 | | | | 873 | |
Tennessee Valley Authority | | | | | | | | |
4.63%, 09/15/2060 | | | 236 | | | | 289 | |
5.25%, 09/15/2039 | | | 40 | | | | 54 | |
5.88%, 04/01/2036 | | | 2,325 | | | | 3,272 | |
Tennessee Valley Authority Generic STRIPS | |
1.77%, 05/01/2019 | | | 500 | | | | 445 | |
Tennessee Valley Authority Principal STRIPS | | | | | |
3.39%, 11/01/2025 | | | 2,000 | | | | 1,348 | |
| | | | | | | | |
Total U.S. Government Agency Obligations
(cost $810,556) | | | | 847,795 | |
| | | | | | | | |
FOREIGN GOVERNMENT OBLIGATIONS—2.0% | |
African Development Bank | | | | | | | | |
8.80%, 09/01/2019 | | | 500 | | | | 665 | |
Corp. Andina de Fomento | | | | | | | | |
3.75%, 01/15/2016 | | | 795 | | | | 835 | |
Israel Government AID Bond | | | | | | | | |
1.61%, 08/15/2018 | | | 1,500 | | | | 1,388 | |
1.75%, 09/15/2019 | | | 10,000 | | | | 9,099 | |
1.82%, 09/15/2020 | | | 7,996 | | | | 6,917 | |
1.88%, 09/15/2019 | | | 7,500 | | | | 6,720 | |
1.98%, 02/15/2020 | | | 6,500 | | | | 5,738 | |
3.04%, 02/15/2025 | | | 2,250 | | | | 1,583 | |
3.23%, 11/15/2026 | | | 1,400 | | | | 913 | |
Mexico Government International Bond | |
4.75%, 03/08/2044 | | | 688 | | | | 764 | |
5.75%, 10/12/2110 | | | 550 | | | | 646 | |
Province of Manitoba Canada | | | | | | | | |
2.13%, 04/22/2013 | | | 100 | | | | 101 | |
Province of Ontario Canada | | | | | | | | |
1.65%, 09/27/2019 | | | 780 | | | | 780 | |
2.95%, 02/05/2015 | | | 515 | | | | 543 | |
Province of Quebec Canada | | | | | | | | |
6.35%, 01/30/2026 | | | 285 | | | | 386 | |
| | | | | | | | |
Total Foreign Government Obligations (cost $35,159) | | | | 37,078 | |
| | | | | | | | |
MORTGAGE-BACKED SECURITIES—11.2% | |
A10 Securitization LLC | | | | | | | | |
Series 2012-1, Class A
3.49%, 04/15/2024—144A | | | 1,416 | | | | 1,424 | |
American General Mortgage Loan Trust | |
Series 2006-1, Class A5
5.75%, 12/25/2035—144A * | | | 308 | | | | 322 | |
Series 2009-1, Class A4
5.75%, 09/25/2048—144A * | | | 1,333 | | | | 1,338 | |
The notes to the financial statements are an integral part of this report.
| | | | |
| Transamerica Funds | | | | Annual Report 2012 |
| | Page 61 | | |
Transamerica Core Bond
(formerly, Transamerica JPMorgan Core Bond)
SCHEDULE OF INVESTMENTS (continued)
At October 31, 2012
| | | | | | | | |
| | | Principal
(000’s) | | | Value
(000’s) | |
MORTGAGE-BACKED SECURITIES (continued) | |
American General Mortgage Loan Trust (continued) | |
Series 2009-1, Class A5 5.75%, 09/25/2048—144A * | | $ | 1,100 | | | $ | 1,111 | |
Series 2009-1, Class A7 5.75%, 09/25/2048—144A * | | | 1,900 | | | | 1,939 | |
Series 2010-1A, Class A1 5.15%, 03/25/2058—144A * | | | 764 | | | | 790 | |
Series 2010-1A, Class A3 5.65%, 03/25/2058—144A * | | | 1,140 | | | | 1,186 | |
ASG Resecuritization Trust | | | | | | | | |
Series 2009-1, Class A60 2.47%, 06/26/2037—144A * | | | 123 | | | | 121 | |
Series 2009-2, Class A55 5.13%, 05/24/2036—144A * | | | 184 | | | | 188 | |
Series 2009-2, Class G60 5.13%, 05/24/2036—144A * | | | 400 | | | | 411 | |
Series 2009-3, Class A65 2.58%, 03/26/2037—144A * | | | 1,116 | | | | 1,118 | |
Series 2009-4, Class A60 6.00%, 06/28/2037—144A | | | 171 | | | | 175 | |
Series 2010-3, Class 2A22 0.41%, 10/28/2036—144A * | | | 373 | | | | 370 | |
Series 2010-4, Class 2A20 0.36%, 11/28/2036—144A * | | | 267 | | | | 263 | |
Series 2011-1, Class 3A50 2.73%, 11/28/2035—144A * | | | 475 | | | | 464 | |
Banc of America Alternative Loan Trust | |
Series 2003-7, Class 2A4 5.00%, 09/25/2018 | | | 358 | | | | 366 | |
Series 2003-9, Class 1CB2 5.50%, 11/25/2033 | | | 165 | | | | 169 | |
Series 2003-11, Class 1A1 6.00%, 01/25/2034 | | | 149 | | | | 156 | |
Series 2003-11, Class 2A1 6.00%, 01/25/2034 | | | 194 | | | | 202 | |
Series 2004-1, Class 1A1 6.00%, 02/25/2034 | | | 610 | | | | 626 | |
Series 2004-1, Class 5A1 5.50%, 02/25/2019 | | | 74 | | | | 76 | |
Series 2004-6, Class 3A2 6.00%, 07/25/2034 | | | 194 | | | | 198 | |
Series 2004-8, Class 3A1 5.50%, 09/25/2019 | | | 97 | | | | 99 | |
Banc of America Funding Corp. | | | | | | | | |
Series 2004-3, Class 1A1 5.50%, 10/25/2034 | | | 700 | | | | 717 | |
Series 2004-C, Class 1A1 5.06%, 12/20/2034 * | | | 164 | | | | 165 | |
Series 2005-E, Class 4A1 2.67%, 03/20/2035 * | | | 2,345 | | | | 2,315 | |
Series 2010-R4, Class 5A1 0.37%, 07/26/2036—144A * | | | 164 | | | | 161 | |
Series 2010-R5, Class 1A1 5.50%, 10/26/2037—144A | | | 880 | | | | 920 | |
Series 2010-R11A, Class 1A6 5.36%, 08/26/2035—144A * | | | 764 | | | | 811 | |
Banc of America Merrill Lynch Commercial Mortgage, Inc. | |
Series 2005-3, Class A4 4.67%, 07/10/2043 | | | 300 | | | | 328 | |
| | | | | | | | |
| | | Principal
(000’s) | | | Value
(000’s) | |
MORTGAGE-BACKED SECURITIES (continued) | |
Banc of America Merrill Lynch Commercial | | | | | |
Mortgage, Inc. (continued) | | | | | | | | |
Series 2005-3, Class AM 4.73%, 07/10/2043 | | $ | 800 | | | $ | 857 | |
Series 2005-5, Class A4 5.12%, 10/10/2045 * | | | 200 | | | | 224 | |
Series 2006-3, Class A4 5.89%, 07/10/2044 * | | | 600 | | | | 687 | |
Series 2006-4, Class A4 5.63%, 07/10/2046 | | | 500 | | | | 574 | |
Series 2006-5, Class A4 5.41%, 09/10/2047 | | | 225 | | | | 256 | |
Banc of America Mortgage Securities, Inc. | |
Series 2003-3, Class 2A1 0.76%, 05/25/2018 * | | | 86 | | | | 82 | |
Series 2003-4, Class 2A1 0.76%, 06/25/2018 * | | | 322 | | | | 314 | |
Series 2003-6, Class 2A1 0.66%, 08/25/2018 * | | | 132 | | | | 127 | |
Series 2003-C, Class 3A1 3.09%, 04/25/2033 * | | | 299 | | | | 306 | |
Series 2003-E, Class 2A2 3.13%, 06/25/2033 * | | | 425 | | | | 428 | |
Series 2004-3, Class 1A26 5.50%, 04/25/2034 | | | 1,300 | | | | 1,329 | |
Series 2004-3, Class 3A1 5.00%, 04/25/2019 | | | 110 | | | | 113 | |
Series 2004-5, Class 4A1 4.75%, 06/25/2019 | | | 77 | | | | 80 | |
Series 2004-C, Class 2A2 3.14%, 04/25/2034 * | | | 845 | | | | 849 | |
BCAP LLC Trust | | | | | | | | |
Series 2009-RR5, Class 8A1 5.50%, 11/26/2034—144A | | | 429 | | | | 441 | |
Series 2009-RR10, Class 17A1 5.75%, 06/26/2037—144A | | | 114 | | | | 116 | |
Series 2009-RR13, Class 17A2 5.50%, 04/26/2037—144A * | | | 482 | | | | 509 | |
Series 2009-RR14, Class 3A2 2.92%, 08/26/2035—144A * | | | 500 | | | | 464 | |
Series 2010-RR4, Class 12A1 4.00%, 07/26/2036—144A * | | | 506 | | | | 505 | |
Series 2010-RR5, Class 2A5 5.25%, 04/26/2037—144A * | | | 722 | | | | 725 | |
Series 2010-RR6, Class 22A3 4.90%, 06/26/2036—144A * | | | 554 | | | | 563 | |
Series 2010-RR6, Class 5A1 5.19%, 11/26/2037—144A * | | | 204 | | | | 204 | |
Series 2010-RR7, Class 15A1 1.01%, 01/26/2036—144A * | | | 329 | | | | 313 | |
Series 2010-RR7, Class 16A1 0.85%, 02/26/2047—144A * | | | 525 | | | | 505 | |
Series 2010-RR7, Class 1A5 5.00%, 04/26/2035—144A * | | | 698 | | | | 685 | |
Series 2010-RR7, Class 2A1 2.69%, 07/26/2045—144A * | | | 1,046 | | | | 991 | |
Series 2010-RR8, Class 3A3 5.06%, 05/26/2035—144A * | | | 417 | | | | 423 | |
Series 2010-RR8, Class 3A4 5.06%, 05/26/2035—144A * | | | 773 | | | | 712 | |
The notes to the financial statements are an integral part of this report.
| | | | |
| Transamerica Funds | | | | Annual Report 2012 |
| | Page 62 | | |
Transamerica Core Bond
(formerly, Transamerica JPMorgan Core Bond)
SCHEDULE OF INVESTMENTS (continued)
At October 31, 2012
| | | | | | | | |
| | | Principal
(000’s) | | | Value
(000’s) | |
MORTGAGE-BACKED SECURITIES (continued) | |
BCAP LLC Trust (continued) | | | | | | | | |
Series 2010-RR12, Class 2A5 4.50%, 01/26/2036—144A * | | $ | 668 | | | $ | 680 | |
Series 2011-RR4, Class 6A3 5.00%, 08/26/2037—144A * | | | 847 | | | | 825 | |
Series 2011-RR5, Class 11A3 0.36%, 05/28/2036—144A * | | | 988 | | | | 881 | |
Series 2011-RR5, Class 14A3 2.93%, 07/26/2036—144A * | | | 771 | | | | 748 | |
Series 2011-RR10, Class 2A1 3.26%, 09/26/2037—144A * | | | 2,233 | | | | 1,990 | |
Series 2012-RR2, Class 1A1 0.39%, 08/26/2036—144A * | | | 1,361 | | | | 1,300 | |
Series 2012-RR3, Class 2A5 4.93%, 05/26/2037—144A | | | 1,735 | | | | 1,713 | |
Series 2012-RR10 1.00%, 05/26/2036 | | | 1,001 | | | | 923 | |
Bear Stearns Adjustable Rate Mortgage Trust | | | | | |
Series 2003-4, Class 3A1 5.00%, 07/25/2033 * | | | 182 | | | | 186 | |
Series 2004-2, Class 14A 5.09%, 05/25/2034 * | | | 227 | | | | 234 | |
Series 2005-5, Class A1 2.24%, 08/25/2035 * | | | 324 | | | | 326 | |
Bear Stearns Alt-A Trust | | | | | | | | |
Series 2005-2, Class 1A1 0.71%, 03/25/2035 * | | | 424 | | | | 408 | |
Bear Stearns Commercial Mortgage Securities | |
Series 2004-PWR4, Class A3 5.47%, 06/11/2041 * | | | 863 | | | | 915 | |
Series 2006-PW11, Class A4 5.45%, 03/11/2039 * | | | 200 | | | | 227 | |
Bear Stearns Commercial Mortgage Securities, IO | |
Series 2005-PWR8, Class X1 0.25%, 06/11/2041—144A * | | | 13,863 | | | | 191 | |
Chase Mortgage Finance Corp. | | | | | | | | |
Series 2004-S3, Class 2A5 5.50%, 03/25/2034 | | | 704 | | | | 735 | |
Series 2007-A1, Class 1A3 3.01%, 02/25/2037 * | | | 2,545 | | | | 2,543 | |
Series 2007-A1, Class 2A1 3.00%, 02/25/2037 * | | | 580 | | | | 593 | |
Series 2007-A1, Class 7A1 2.94%, 02/25/2037 * | | | 439 | | | | 441 | |
Series 2007-A1, Class 9A1 2.98%, 02/25/2037 * | | | 190 | | | | 194 | |
Series 2007-A2, Class 1A1 3.08%, 07/25/2037 * | | | 124 | | | | 123 | |
Series 2007-A2, Class 2A1 2.97%, 07/25/2037 * | | | 754 | | | | 758 | |
Chase Mortgage Finance Corp., PO | | | | | | | | |
Series 2003-S9, Class AP 10/25/2018 | | | 47 | | | | 47 | |
Citicorp Mortgage Securities, Inc. | | | | | | | | |
Series 2004-4, Class A4 5.50%, 06/25/2034 | | | 655 | | | | 686 | |
Citigroup Commercial Mortgage Trust | |
Series 2005-C3, Class AM 4.83%, 05/15/2043 * | | | 440 | | | | 471 | |
| | | | | | | | |
| | | Principal
(000’s) | | | Value
(000’s) | |
MORTGAGE-BACKED SECURITIES (continued) | |
Citigroup Commercial Mortgage Trust (continued) | | | | | |
Series 2006-C5, Class A4 5.43%, 10/15/2049 | | $ | 500 | | | $ | 577 | |
Citigroup Mortgage Loan Trust, Inc. | | | | | | | | |
Series 2003-1, Class 3A4 5.25%, 09/25/2033 | | | 521 | | | | 551 | |
Series 2005-2, Class 2A11 5.50%, 05/25/2035 | | | 366 | | | | 375 | |
Series 2008-AR4, Class 1A1A 3.03%, 11/25/2038—144A * | | | 1,295 | | | | 1,320 | |
Series 2009-10, Class 1A1 2.45%, 09/25/2033—144A * | | | 882 | | | | 894 | |
Series 2009-11, Class 3A1 5.75%, 05/25/2037—144A * | | | 953 | | | | 999 | |
Series 2010-7, Class 10A1 2.61%, 02/25/2035—144A * | | | 358 | | | | 365 | |
Series 2010-8, Class 5A6 4.00%, 11/25/2036—144A | | | 7,342 | | | | 7,565 | |
Series 2010-8, Class 6A6 4.50%, 12/25/2036—144A | | | 6,385 | | | | 6,647 | |
Series 2011-3, Class 1A1 0.29%, 02/25/2047—144A * | | | 282 | | | | 280 | |
Series 2011-10, Class 4A1 0.41%, 02/25/2046—144A * | | | 1,119 | | | | 1,066 | |
Citigroup/Deutsche Bank Commercial Mortgage Trust, IO | |
Series 2007-CD4, Class XC 0.15%, 12/11/2049—144A * | | | 40,610 | | | | 315 | |
Commercial Mortgage Asset Trust | | | | | | | | |
Series 1999-C1, Class D 7.35%, 01/17/2032 * | | | 1,000 | | | | 1,051 | |
Commercial Mortgage Pass-Through Certificates, IO | |
Series 2012-CR2, Class XA 1.98%, 08/15/2045 * | | | 2,252 | | | | 290 | |
Countrywide Alternative Loan Trust, PO | |
Series 2002-7 08/25/2032 | | | 113 | | | | 83 | |
Countrywide Home Loan Mortgage Pass-Through Trust | |
Series 2003-39, Class A6 5.00%, 10/25/2033 | | | 700 | | | | 725 | |
Series 2003-50, Class A1 5.00%, 11/25/2018 | | | 414 | | | | 426 | |
Series 2003-J13, Class 1A7 5.25%, 01/25/2034 | | | 1,262 | | | | 1,304 | |
Series 2004-3, Class A26 5.50%, 04/25/2034 | | | 609 | | | | 631 | |
Series 2004-3, Class A4 5.75%, 04/25/2034 | | | 914 | | | | 945 | |
Series 2004-5, Class 1A4 5.50%, 06/25/2034 | | | 813 | | | | 847 | |
Series 2004-8, Class 2A1 4.50%, 06/25/2019 | | | 78 | | | | 79 | |
Series 2004-J4, Class 2A1 5.00%, 05/25/2019 | | | 153 | | | | 157 | |
Credit Suisse First Boston Mortgage Securities Corp. | | | | | | | | |
Series 2003-21, Class 1A4 5.25%, 09/25/2033 | | | 296 | | | | 309 | |
The notes to the financial statements are an integral part of this report.
| | | | |
| Transamerica Funds | | | | Annual Report 2012 |
| | Page 63 | | |
Transamerica Core Bond
(formerly, Transamerica JPMorgan Core Bond)
SCHEDULE OF INVESTMENTS (continued)
At October 31, 2012
| | | | | | | | |
| | | Principal
(000’s) | | | Value
(000’s) | |
MORTGAGE-BACKED SECURITIES (continued) | | | | | |
Credit Suisse First Boston Mortgage Securities Corp. (continued) | | | | | | | | |
Series 2003-27, Class 5A3 5.25%, 11/25/2033 | | $ | 651 | | | $ | 670 | |
Series 2003-27, Class 5A4 5.25%, 11/25/2033 | | | 429 | | | | 445 | |
Series 2003-29, Class 5A1 7.00%, 12/25/2033 | | | 261 | | | | 279 | |
Series 2003-29, Class 8A1 6.00%, 11/25/2018 | | | 113 | | | | 115 | |
Series 2003-AR15, Class 3A1 3.00%, 06/25/2033 * | | | 370 | | | | 355 | |
Series 2004-4, Class 2A4 5.50%, 09/25/2034 | | | 690 | | | | 739 | |
Series 2004-5, Class 3A1 5.25%, 08/25/2019 | | | 405 | | | | 416 | |
Series 2004-8, Class 1A4 5.50%, 12/25/2034 | | | 703 | | | | 739 | |
Series 2004-8, Class 3A5 5.50%, 12/25/2034 | | | 318 | | | | 327 | |
Series 2005-C3, Class AM 4.73%, 07/15/2037 | | | 400 | | | | 432 | |
Credit Suisse Mortgage Capital Certificates | | | | | | | | |
Series 2006-C2, Class A3 5.67%, 03/15/2039 * | | | 1,600 | | | | 1,801 | |
Series 2009-3R, Class 19A3 6.00%, 01/27/2038—144A | | | 352 | | | | 357 | |
Series 2010-16, Class A3 3.86%, 06/25/2050—144A * | | | 400 | | | | 385 | |
Series 2010-16, Class A4 3.86%, 06/25/2050—144A * | | | 1,000 | | | | 932 | |
Series 2010-1R, Class 5A1 5.00%, 01/27/2036—144A * | | | 436 | | | | 454 | |
Series 2010-11R, Class A6 1.32%, 06/28/2047—144A * | | | 2,000 | | | | 1,902 | |
Series 2010-12R, Class 14A1 2.94%, 09/26/2046—144A * | | | 412 | | | | 411 | |
Series 2010-15R, Class 7A1 1.45%, 10/26/2037—144A * | | | 86 | | | | 85 | |
Series 2010-17R, Class 1A1 2.72%, 06/26/2036—144A * | | | 337 | | | | 348 | |
Series 2011-1R, Class A1 1.22%, 02/27/2047—144A * | | | 1,051 | | | | 1,042 | |
Series 2011-6R, Class 3A1 2.97%, 07/28/2036—144A * | | | 662 | | | | 625 | |
Series 2011-7R, Class A1 1.47%, 08/28/2047—144A * | | | 1,390 | | | | 1,376 | |
Series 2011-9R, Class A1 2.22%, 03/27/2046—144A * | | | 2,991 | | | | 2,966 | |
Series 2011-16R, Class 7A3 3.50%, 12/27/2036—144A * | | | 698 | | | | 692 | |
Series 2012-3R, Class 1A1 3.25%, 07/27/2037—144A * | | | 1,728 | | | | 1,735 | |
CW Capital Cobalt, Ltd. | | | | | | | | |
Series 2006-C1, Class A4 5.22%, 08/15/2048 | | | 600 | | | | 673 | |
Series 2006-C1, Class AM 5.25%, 08/15/2048 | | | 1,000 | | | | 1,037 | |
CW Capital Cobalt, Ltd., IO | | | | | | | | |
Series 2006-C1 0.75%, 08/15/2048 * | | | 27,092 | | | | 641 | |
| | | | | | | | |
| | | Principal
(000’s) | | | Value
(000’s) | |
MORTGAGE-BACKED SECURITIES (continued) | | | | | |
DBRR Trust, IO | | | | | | | | |
Series 2011-C32, Class A3X1 2.02%, 06/17/2049—144A * | | $ | 6,000 | | | $ | 451 | |
Deutsche ALT-A Securities, Inc., Alternate Loan Trust | | | | | | | | |
Series 2005-1, Class 2A1 5.62%, 02/25/2020 * | | | 250 | | | | 257 | |
Deutsche Mortgage Securities, Inc. | | | | | | | | |
Series 2009-RS2, Class 4A1 0.35%, 04/26/2037—144A * | | | 230 | | | | 224 | |
Series 2010-RS2, Class A1 1.46%, 06/28/2047—144A * | | | 166 | | | | 165 | |
FDIC Structured Sale Guaranteed Notes | | | | | | | | |
Series 2010-C1, Class A 2.98%, 12/06/2020—144A | | | 982 | | | | 1,033 | |
First Horizon Asset Securities, Inc. | | | | | | | | |
Series 2003-8, Class 2A1 4.50%, 09/25/2018 | | | 105 | | | | 108 | |
Series 2004-AR2, Class 2A1 2.63%, 05/25/2034 * | | | 702 | | | | 695 | |
Fontainebleau Miami Beach Trust | | | | | | | | |
Series 2012-FBLU, Class A 2.89%, 05/05/2027—144A | | | 1,146 | | | | 1,182 | |
GE Capital Commercial Mortgage Corp. | | | | | | | | |
Series 2005-C1, Class AJ 4.83%, 06/10/2048 * | | | 1,000 | | | | 1,053 | |
GMAC Mortgage Corp., Loan Trust | | | | | | | | |
Series 2003-AR1, Class A4 3.42%, 10/19/2033 * | | | 206 | | | | 212 | |
Series 2003-AR2, Class 2A4 3.39%, 12/19/2033 * | | | 1,165 | | | | 1,182 | |
Series 2004-J5, Class A7 6.50%, 01/25/2035 | | | 1,782 | | | | 1,838 | |
Series 2004-J6, Class 1A1 5.00%, 01/25/2020 | | | 190 | | | | 195 | |
Greenwich Capital Commercial Funding Corp. | | | | | | | | |
Series 2005-GG3, Class AJ 4.86%, 08/10/2042 * | | | 220 | | | | 233 | |
GS Mortgage Securities Corp. II | | | | | | | | |
Series 2004-GG2, Class A6 5.40%, 08/10/2038 * | | | 1,000 | | | | 1,068 | |
GS Mortgage Securities Corp. II, IO | | | | | | | | |
Series 2006-GG8, Class X 0.60%, 11/10/2039—144A * | | | 10,805 | | | | 206 | |
GSMPS Mortgage Loan Trust | | | | | | | | |
Series 2005-RP3, Class 1AF 0.56%, 09/25/2035—144A * | | | 1,482 | | | | 1,202 | |
GSMPS Mortgage Loan Trust, IO | | | | | | | | |
Series 2005-RP3, Class 1AS 5.05%, 09/25/2035—144A * | | | 1,111 | | | | 164 | |
GSR Mortgage Loan Trust | | | | | | | | |
Series 2003-7F, Class 1A4 5.25%, 06/25/2033 | | | 1,623 | | | | 1,617 | |
Series 2004-8F, Class 2A3 6.00%, 09/25/2034 | | | 1,668 | | | | 1,745 | |
Series 2005-5F, Class 8A3 0.71%, 06/25/2035 * | | | 167 | | | | 159 | |
Impac CMB Trust | | | | | | | | |
Series 2005-4, Class 2A1 0.51%, 05/25/2035 * | | | 398 | | | | 392 | |
The notes to the financial statements are an integral part of this report.
| | | | |
| Transamerica Funds | | | | Annual Report 2012 |
| | Page 64 | | |
Transamerica Core Bond
(formerly, Transamerica JPMorgan Core Bond)
SCHEDULE OF INVESTMENTS (continued)
At October 31, 2012
| | | | | | | | |
| | | Principal
(000’s) | | | Value
(000’s) | |
MORTGAGE-BACKED SECURITIES (continued) | |
Impac Secured Assets CMN Owner Trust | | | | | | | | |
Series 2003-2, Class A1 5.50%, 08/25/2033 | | $ | 122 | | | $ | 128 | |
Series 2006-1, Class 2A1 0.56%, 05/25/2036 * | | | 861 | | | | 851 | |
Series 2006-2, Class 2A1 0.56%, 08/25/2036 * | | | 812 | | | | 818 | |
JPMorgan Chase Commercial Mortgage
Securities Corp. | |
Series 2004-CB8, Class A4 4.40%, 01/12/2039 | | | 1,000 | | | | 1,040 | |
Series 2004-CB9, Class A4 5.59%, 06/12/2041 * | | | 1,000 | | | | 1,073 | |
Series 2005-CB11, Class AJ 5.36%, 08/12/2037 * | | | 700 | | | | 753 | |
Series 2005-CB13, Class A4 5.29%, 01/12/2043 * | | | 385 | | | | 426 | |
Series 2006-CB15, Class A4 5.81%, 06/12/2043 * | | | 1,500 | | | | 1,726 | |
Series 2006-CB16, Class A4 5.55%, 05/12/2045 | | | 100 | | | | 115 | |
Series 2006-LDP9, Class A3SF 0.37%, 05/15/2047 * | | | 1,000 | | | | 952 | |
JPMorgan Chase Commercial Mortgage
Securities Corp., IO | |
Series 2006-CB15, Class X1 0.07%, 06/12/2043 * | | | 51,000 | | | | 355 | |
JPMorgan Mortgage Trust | | | | | | | | |
Series 2004-A3, Class 4A1 3.05%, 07/25/2034 * | | | 144 | | | | 145 | |
Series 2004-A4, Class 1A1 3.04%, 09/25/2034 * | | | 164 | | | | 168 | |
Series 2004-S1, Class 1A7 5.00%, 09/25/2034 | | | 65 | | | | 66 | |
Series 2005-A1, Class 3A4 5.00%, 02/25/2035 * | | | 606 | | | | 623 | |
Series 2005-A1, Class 5A1 4.43%, 02/25/2035 * | | | 12 | | | | 12 | |
Series 2006-A2, Class 4A1 3.01%, 08/25/2034 * | | | 462 | | | | 467 | |
Series 2006-A2, Class 5A3 2.86%, 11/25/2033 * | | | 1,070 | | | | 1,083 | |
Series 2006-A3, Class 6A1 3.01%, 08/25/2034 * | | | 113 | | | | 111 | |
JPMorgan Re-REMIC | | | | | | | | |
Series 2009-6, Class 4A1 5.48%, 09/26/2036—144A * | | | 375 | | | | 372 | |
Series 2010-4, Class 7A1 1.87%, 08/26/2035—144A * | | | 412 | | | | 408 | |
LB-UBS Commercial Mortgage Trust | | | | | | | | |
Series 2004-C2, Class A4 4.37%, 03/15/2036 | | | 1,110 | | | | 1,158 | |
Series 2006-C1, Class A4 5.16%, 02/15/2031 | | | 150 | | | | 168 | |
Series 2006-C4, Class A4 5.87%, 06/15/2038 * | | | 400 | | | | 463 | |
LB-UBS Commercial Mortgage Trust, IO | | | | | | | | |
Series 2006-C1, Class XCL 0.14%, 02/15/2041—144A * | | | 23,687 | | | | 243 | |
| | | | | | | | |
| | | Principal
(000’s) | | | Value
(000’s) | |
MORTGAGE-BACKED SECURITIES (continued) | |
LVII Resecuritization Trust | | | | | | | | |
Series 2009-2, Class A5 3.00%, 09/27/2037—144A * | | $ | 902 | | | $ | 900 | |
Series 2009-3, Class M3 5.55%, 11/27/2037—144A * | | | 600 | | | | 628 | |
MASTR Adjustable Rate Mortgages Trust | | | | | | | | |
Series 2004-13, Class 2A1 2.66%, 04/21/2034 * | | | 1,222 | | | | 1,234 | |
Series 2004-13, Class 3A6 2.63%, 11/21/2034 * | | | 41 | | | | 41 | |
Series 2004-13, Class 3A7 2.63%, 11/21/2034 * | | | 700 | | | | 716 | |
MASTR Alternative Loans Trust | | | | | | | | |
Series 2003-9, Class 2A1 6.00%, 12/25/2033 | | | 148 | | | | 157 | |
Series 2004-5, Class 5A1 4.75%, 06/25/2019 | | | 183 | | | | 186 | |
MASTR Asset Securitization Trust | | | | | | | | |
Series 2003-2, Class 1A1 5.00%, 03/25/2018 | | | 94 | | | | 97 | |
Series 2003-3, Class 3A18 5.50%, 04/25/2033 | | | 271 | | | | 279 | |
Series 2003-11, Class 9A6 5.25%, 12/25/2033 | | | 1,117 | | | | 1,165 | |
Series 2004-P7, Class A6 5.50%, 12/27/2033—144A | | | 510 | | | | 537 | |
MASTR Resecuritization Trust, PO | | | | | | | | |
Series 2005, Class 3 05/28/2035—144A | | | 193 | | | | 154 | |
Merrill Lynch Mortgage Investors, Inc. | | | | | | | | |
Series 2003-A4, Class 2A 2.75%, 07/25/2033 * | | | 159 | | | | 163 | |
Series 2003-A5, Class 2A6 2.68%, 08/25/2033 * | | | 168 | | | | 171 | |
Series 2004-A4, Class A2 2.58%, 08/25/2034 * | | | 274 | | | | 278 | |
Merrill Lynch Mortgage Trust | | | | | | | | |
Series 2005-LC1, Class AJ 5.38%, 01/12/2044 * | | | 500 | | | | 546 | |
Series 2006-C1, Class A4 5.69%, 05/12/2039 * | | | 730 | | | | 838 | |
Merrill Lynch/Countrywide Commercial
Mortgage Trust, IO | |
Series 2006-4, Class XC 0.20%, 12/12/2049—144A * | | | 15,402 | | | | 191 | |
MLCC Mortgage Investors, Inc. | | | | | | | | |
Series 2004-1, Class 2A1 2.52%, 12/25/2034 * | | | 587 | | | | 604 | |
Series 2004-D, Class A2 1.43%, 09/25/2029 * | | | 407 | | | | 393 | |
Morgan Stanley Capital I, Inc. | | | | | | | | |
Series 2004-HQ4, Class A7 4.97%, 04/14/2040 | | | 2,500 | | | | 2,646 | |
Series 2006-T21, Class A4 5.16%, 10/12/2052 * | | | 200 | | | | 224 | |
Series 2007-T27, Class A4 5.65%, 06/11/2042 * | | | 200 | | | | 238 | |
Series 2011-C3, Class A3 4.05%, 07/15/2049 | | | 637 | | | | 717 | |
The notes to the financial statements are an integral part of this report.
| | | | |
| Transamerica Funds | | | | Annual Report 2012 |
| | Page 65 | | |
Transamerica Core Bond
(formerly, Transamerica JPMorgan Core Bond)
SCHEDULE OF INVESTMENTS (continued)
At October 31, 2012
| | | | | | | | |
| | | Principal
(000’s) | | | Value
(000’s) | |
MORTGAGE-BACKED SECURITIES (continued) | |
Morgan Stanley Capital I, Inc., IO | | | | | | | | |
Series 2006-IQ12, Class X1 0.13%, 12/15/2043—144A * | | $ | 37,378 | | | $ | 524 | |
Series 2006-T21, Class X 0.18%, 10/12/2052—144A * | | | 90,429 | | | | 641 | |
Series 2007-HQ11, Class X 0.23%, 02/12/2044—144A * | | | 67,963 | | | | 424 | |
Morgan Stanley Mortgage Loan Trust | | | | | | | | |
Series 2004-3, Class 4A 5.67%, 04/25/2034 * | | | 609 | | | | 620 | |
Morgan Stanley Re-REMIC Trust | | | | | | | | |
0.25%, 07/27/2049 | | | 500 | | | | 373 | |
2.00%, 07/27/2049 | | | 2,252 | | | | 2,272 | |
Series 2009-IO, Class A1 3.00%, 07/17/2056—144A | | | 72 | | | | 72 | |
Series 2009-IO, Class A2 5.00%, 07/17/2056—144A | | | 2,500 | | | | 2,555 | |
Series 2010-C30A, Class A3A 3.25%, 12/17/2043—144A | | | 670 | | | | 669 | |
Series 2010-HQ4B, Class A7A 4.97%, 04/16/2040—144A | | | 1,400 | | | | 1,479 | |
Series 2011-IO, Class A 2.50%, 03/23/2051—144A | | | 1,504 | | | | 1,517 | |
Prime Mortgage Trust | | | | | | | | |
Series 2004-CL1, Class 1A1 6.00%, 02/25/2034 | | | 250 | | | | 263 | |
Prime Mortgage Trust, PO | | | | | | | | |
Series 2004-CL1, Class 1 02/25/2034 | | | 22 | | | | 21 | |
Provident Funding Mortgage Loan Trust | | | | | | | | |
Series 2005-1, Class 2A1 2.84%, 05/25/2035 * | | | 515 | | | | 519 | |
RALI Trust | | | | | | | | |
Series 2003-QS1, Class A6 4.25%, 01/25/2033 | | | 131 | | | | 133 | |
Series 2003-QS13, Class A5 0.86%, 07/25/2033 * | | | 418 | | | | 379 | |
Series 2003-QS15, Class A7 5.50%, 08/25/2033 | | | 1,323 | | | | 1,365 | |
Series 2003-QS18, Class A1 5.00%, 09/25/2018 | | | 135 | | | | 140 | |
Series 2004-QS7, Class A4 5.50%, 05/25/2034 | | | 397 | | | | 366 | |
RAMP Trust | | | | | | | | |
Series 2004-RS6, Class AI4 5.46%, 05/25/2032 * | | | 239 | | | | 242 | |
Series 2004-RZ1, Class M1 4.32%, 03/25/2034 * | | | 571 | | | | 495 | |
Series 2004-SL2, Class A3 7.00%, 10/25/2031 | | | 412 | | | | 430 | |
Series 2005-EFC5, Class A3 0.55%, 10/25/2035 * | | | 600 | | | | 554 | |
Series 2006-RZ1, Class A3 0.51%, 03/25/2036 * | | | 1,000 | | | | 881 | |
RBSSP Resecuritization Trust | | | | | | | | |
Series 2009-1, Class 1A1 6.50%, 02/26/2036—144A | | | 579 | | | | 621 | |
Series 2010-9, Class 7A5 4.00%, 05/26/2037—144A * | | | 796 | | | | 796 | |
| | | | | | | | |
| | | Principal
(000’s) | | | Value
(000’s) | |
MORTGAGE-BACKED SECURITIES (continued) | |
Residential Asset Securitization Trust | | | | | | | | |
Series 2002-A13, Class A4 5.25%, 12/25/2017 | | $ | 67 | | | $ | 68 | |
RFMSI Trust | | | | | | | | |
Series 2003-S4, Class A4 5.75%, 03/25/2033 | | | 549 | | | | 561 | |
Series 2003-S20, Class 2A1 4.75%, 12/25/2018 | | | 105 | | | | 108 | |
Salomon Brothers Mortgage Securities VII, Inc. | |
Series 2003-HYB1, Class A 3.10%, 09/25/2033 * | | | 517 | | | | 525 | |
Series 2003-UP1, Class A 3.95%, 04/25/2032—144A * | | | 40 | | | | 39 | |
Sequoia Mortgage Trust | | | | | | | | |
Series 2004-11, Class A1 0.51%, 12/20/2034 * | | | 695 | | | | 642 | |
Series 2004-11, Class A3 0.51%, 12/20/2034 * | | | 797 | | | | 785 | |
Series 2004-12, Class A3 1.06%, 01/20/2035 * | | | 455 | | | | 367 | |
Springleaf Mortgage Loan Trust | | | | | | | | |
Series 2011-1A, Class A1 4.05%, 01/25/2058—144A * | | | 1,771 | | | | 1,825 | |
Series 2011-1A, Class A2 5.45%, 01/25/2058—144A * | | | 1,500 | | | | 1,583 | |
Series 2012-1A, Class A 2.67%, 09/25/2057—144A * | | | 689 | | | | 698 | |
Series 2012-1A, Class M3 6.00%, 09/25/2057—144A * | | | 1,000 | | | | 988 | |
Series 2012-2A, Class A 2.22%, 10/25/2057—144A * | | | 2,296 | | | | 2,308 | |
Series 2012-2A, Class M4 6.00%, 10/25/2057—144A * | | | 1,200 | | | | 1,200 | |
Series 2012-3A, Class A 1.57%, 12/25/2059—144A | | | 1,031 | | | | 1,034 | |
Series 2012-3A, Class M1 2.66%, 12/25/2059—144A | | | 534 | | | | 535 | |
Series 2012-3A, Class M2 3.56%, 12/25/2059—144A | | | 471 | | | | 472 | |
Series 2012-3A, Class M3 4.44%, 12/25/2059—144A | | | 253 | | | | 253 | |
Series 2012-3A, Class M4 5.30%, 12/25/2059—144A | | | 146 | | | | 146 | |
Structured Adjustable Rate Mortgage Loan Trust | |
Series 2004-6, Class 5A4 4.90%, 06/25/2034 * | | | 800 | | | | 807 | |
Structured Asset Mortgage Investments, Inc. | | | | | | | | |
Series 2004-AR5, Class 1A1 0.87%, 10/19/2034 * | | | 595 | | | | 565 | |
Thornburg Mortgage Securities Trust | | | | | |
Series 2003-4, Class A1 0.85%, 09/25/2043 * | | | 476 | | | | 474 | |
Series 2004-1, Class II2A 1.91%, 03/25/2044 * | | | 224 | | | | 220 | |
TIAA Seasoned Commercial Mortgage Trust | |
Series 2007-C4, Class A3 5.59%, 08/15/2039 * | | | 650 | | | | 691 | |
The notes to the financial statements are an integral part of this report.
| | | | |
| Transamerica Funds | | | | Annual Report 2012 |
| | Page 66 | | |
Transamerica Core Bond
(formerly, Transamerica JPMorgan Core Bond)
SCHEDULE OF INVESTMENTS (continued)
At October 31, 2012
| | | | | | | | |
| | | Principal
(000’s) | | | Value
(000’s) | |
MORTGAGE-BACKED SECURITIES (continued) | |
UBS-BAMLL Trust | | | | | | | | |
Series 2012-WRM, Class A 3.66%, 06/10/2030—144A | | $ | 1,386 | | | $ | 1,490 | |
UBS-Barclays Commercial Mortgage Trust | | | | | | | | |
Series 2012-C2, Class A4 3.53%, 05/10/2063 | | | 650 | | | | 709 | |
UBS-Barclays Commercial Mortgage Trust, IO | | | | | | | | |
Series 2012-C2, Class XA 1.83%, 05/10/2063—144A * | | | 6,224 | | | | 666 | |
Vendee Mortgage Trust | | | | | | | | |
Series 1993-1, Class ZB 7.25%, 02/15/2023 | | | 387 | | | | 456 | |
Series 1998-2, Class 1G 6.75%, 06/15/2028 | | | 692 | | | | 841 | |
Vericrest Opportunity Loan Transferee | | | | | | | | |
Series 2011-NL2A, Class A2 9.32%, 06/25/2051—144A * | | | 1,234 | | | | 1,237 | |
Series 2011-NL3A, Class A1 5.19%, 09/25/2051—144A * | | | 423 | | | | 423 | |
Series 2011-NL3A, Class A2 9.32%, 09/25/2051—144A * | | | 614 | | | | 615 | |
Series 2012-NL1A, Class A1 4.21%, 03/25/2049—144A * | | | 168 | | | | 169 | |
Series 2012-NL2A, Class A1 2.49%, 02/26/2052—144A | | | 681 | | | | 683 | |
Wachovia Bank Commercial Mortgage Trust | | | | | | | | |
Series 2003-C9, Class A4 5.01%, 12/15/2035 * | | | 1,441 | | | | 1,492 | |
Series 2004-C11, Class A5 5.22%, 01/15/2041 * | | | 1,118 | | | | 1,186 | |
Wachovia Bank Commercial Mortgage Trust, IO | | | | | | | | |
Series 2006-C24, Class XC 0.05%, 03/15/2045—144A * | | | 143,358 | | | | 605 | |
WaMu Mortgage Pass-Through Certificates | | | | | | | | |
Series 2003-AR6, Class A1 2.44%, 06/25/2033 * | | | 924 | | | | 949 | |
Series 2003-AR7, Class A7 2.32%, 08/25/2033 * | | | 340 | | | | 341 | |
Series 2003-AR8, Class A 2.46%, 08/25/2033 * | | | 118 | | | | 121 | |
Series 2003-AR9, Class 1A6 2.45%, 09/25/2033 * | | | 592 | | | | 604 | |
Series 2003-S3, Class 1A4 5.50%, 06/25/2033 | | | 623 | | | | 651 | |
Series 2003-S4, Class 2A10 16.88%, 06/25/2033 * | | | 39 | | | | 44 | |
Series 2003-S8, Class A4 4.50%, 09/25/2018 | | | 60 | | | | 60 | |
Series 2003-S9, Class A8 5.25%, 10/25/2033 | | | 487 | | | | 511 | |
Series 2004-AR3, Class A1 2.58%, 06/25/2034 * | | | 79 | | | | 80 | |
Series 2004-AR3, Class A2 2.58%, 06/25/2034 * | | | 809 | | | | 824 | |
Series 2004-CB2, Class 7A 5.50%, 08/25/2019 | | | 437 | | | | 456 | |
Series 2004-CB3, Class 4A 6.00%, 10/25/2019 | | | 489 | | | | 509 | |
| | | | | | | | |
| | | Principal
(000’s) | | | Value
(000’s) | |
MORTGAGE-BACKED SECURITIES (continued) | |
WaMu Mortgage Pass-Through Certificates (continued) | |
Series 2004-S1, Class 1A3 0.61%, 03/25/2034 * | | $ | 88 | | | $ | 86 | |
Series 2004-S2, Class 2A4 5.50%, 06/25/2034 | | | 635 | | | | 669 | |
Washington Mutual MSC Mortgage Pass-Through Certificates | |
Series 2003-MS2, Class 1A1 5.75%, 02/25/2033 | | | 369 | | | | 386 | |
Series 2004-RA2, Class 2A 7.00%, 07/25/2033 | | | 153 | | | | 167 | |
Wells Fargo Mortgage Backed Securities Trust | |
Series 2003-11, Class 1A10 4.75%, 10/25/2018 | | | 730 | | | | 751 | |
Series 2003-11, Class 2A1 4.75%, 10/25/2018 | | | 593 | | | | 612 | |
Series 2003-15, Class 1A1 4.75%, 12/25/2018 | | | 132 | | | | 137 | |
Series 2003-J, Class 2A5 4.43%, 10/25/2033 * | | | 9 | | | | 9 | |
Series 2003-K, Class 1A1 4.44%, 11/25/2033 * | | | 54 | | | | 55 | |
Series 2004-4, Class A9 5.50%, 05/25/2034 | | | 561 | | | | 579 | |
Series 2004-7, Class 2A2 5.00%, 07/25/2019 | | | 184 | | | | 190 | |
Series 2004-EE, Class 2A1 2.63%, 12/25/2034 * | | | 439 | | | | 452 | |
Series 2004-EE, Class 2A2 2.63%, 12/25/2034 * | | | 110 | | | | 113 | |
Series 2004-EE, Class 3A1 3.04%, 12/25/2034 * | | | 101 | | | | 105 | |
Series 2004-EE, Class 3A2 3.04%, 12/25/2034 * | | | 152 | | | | 158 | |
Series 2004-I, Class 1A1 2.77%, 07/25/2034 * | | | 1,451 | | | | 1,466 | |
Series 2004-P, Class 2A1 2.62%, 09/25/2034 * | | | 2,456 | | | | 2,482 | |
Series 2004-R, Class 2A1 2.62%, 09/25/2034 * | | | 1,280 | | | | 1,300 | |
Series 2004-U, Class A1 2.80%, 10/25/2034 * | | | 1,404 | | | | 1,418 | |
Series 2004-V, Class 1A1 2.65%, 10/25/2034 * | | | 256 | | | | 262 | |
Series 2004-V, Class 1A2 2.65%, 10/25/2034 * | | | 114 | | | | 118 | |
Series 2004-W, Class A9 2.70%, 11/25/2034 * | | | 366 | | | | 372 | |
Series 2005-1, Class 2A1 5.00%, 01/25/2020 | | | 245 | | | | 257 | |
Series 2005-13, Class A1 5.00%, 11/25/2020 | | | 125 | | | | 133 | |
Series 2005-AR8, Class 2A1 2.73%, 06/25/2035 * | | | 576 | | | | 584 | |
Series 2005-AR9, Class 2A1 2.74%, 10/25/2033 * | | | 227 | | | | 231 | |
Wells Fargo Mortgage Loan Trust | | | | | | | | |
Series 2012-RR1, Class A1 2.85%, 08/27/2037—144A * | | | 804 | | | | 808 | |
The notes to the financial statements are an integral part of this report.
| | | | |
| Transamerica Funds | | | | Annual Report 2012 |
| | Page 67 | | |
Transamerica Core Bond
(formerly, Transamerica JPMorgan Core Bond)
SCHEDULE OF INVESTMENTS (continued)
At October 31, 2012
| | | | | | | | |
| | | Principal
(000’s) | | | Value
(000’s) | |
MORTGAGE-BACKED SECURITIES (continued) | | | | | |
Wells Fargo Re-REMIC Trust | | | | | | | | |
Series 2012-IO, Class A 1.75%, 08/20/2021—144A | | $ | 2,643 | | | $ | 2,639 | |
WF-RBS Commercial Mortgage Trust | | | | | | | | |
Series 2011-C3, Class A4 4.38%, 03/15/2044—144A | | | 550 | | | | 630 | |
| | | | | | | | |
Total Mortgage-Backed Securities (cost $204,732) | | | | 210,173 | |
| | | | | | | | |
ASSET-BACKED SECURITIES—4.7% | | | | | |
Academic Loan Funding Trust | | | | | | | | |
Series 2012-1A, Class A1 1.01%, 12/27/2022—144A * | | | 1,295 | | | | 1,299 | |
AH Mortgage Advance Co., Ltd. | | | | | | | | |
Series SART-3, Class 1A1 2.98%, 03/13/2043—144A | | | 1,035 | | | | 1,041 | |
Series SART-3, Class 1A2 3.72%, 03/13/2044—144A | | | 1,969 | | | | 2,022 | |
AH Mortgage Advance Trust | | | | | | | | |
Series SART-1, Class A1R 2.23%, 05/10/2043—144A | | | 1,230 | | | | 1,235 | |
Series SART-1, Class A2 3.37%, 05/10/2043—144A | | | 4,434 | | | | 4,433 | |
Series SART-2, Class A1 3.27%, 09/15/2043—144A | | | 2,134 | | | | 2,160 | |
Series SART-2, Class B1 6.90%, 09/15/2043—144A | | | 800 | | | | 800 | |
Ally Auto Receivables Trust | | | | | | | | |
Series 2010-1, Class A3 1.45%, 05/15/2014 | | | 45 | | | | 45 | |
Series 2010-3, Class A3 1.11%, 10/15/2014 | | | 532 | | | | 534 | |
Series 2010-3, Class A4 1.55%, 08/17/2015 | | | 357 | | | | 362 | |
Series 2010-4, Class A3 0.91%, 11/17/2014 | | | 218 | | | | 219 | |
Series 2011-1, Class A3 1.38%, 01/15/2015 | | | 218 | | | | 220 | |
American Credit Acceptance Receivables Trust | |
Series 2012-1, Class A1 1.96%, 01/15/2014—144A | | | 46 | | | | 46 | |
Series 2012-1, Class A2 3.04%, 10/15/2015—144A | | | 512 | | | | 513 | |
Series 2012-2, Class A 1.89%, 07/15/2016—144A | | | 1,423 | | | | 1,424 | |
AmeriCredit Automobile Receivables Trust | | | | | |
Series 2010-3, Class A3 1.14%, 04/08/2015 | | | 348 | | | | 349 | |
Series 2010-4, Class A3 1.27%, 04/08/2015 | | | 117 | | | | 118 | |
Series 2011-1, Class A2 0.84%, 06/09/2014 | | | 1 | | | | 1 | |
Series 2011-1, Class A3 1.39%, 09/08/2015 | | | 200 | | | | 201 | |
Series 2011-3, Class A2 0.84%, 11/10/2014 | | | 258 | | | | 258 | |
Series 2011-4, Class A2 0.92%, 03/09/2015 | | | 366 | | | | 366 | |
Series 2011-4, Class A3 1.17%, 05/09/2016 | | | 1,885 | | | | 1,899 | |
| | | | | | | | |
| | | Principal
(000’s) | | | Value
(000’s) | |
ASSET-BACKED SECURITIES (continued) | |
AmeriCredit Automobile Receivables Trust (continued) | |
Series 2011-5, Class A3 1.55%, 07/08/2016 | | $ | 1,593 | | | $ | 1,617 | |
Series 2012-1, Class A2 0.91%, 10/08/2015 | | | 348 | | | | 349 | |
Series 2012-3, Class A2 0.71%, 12/08/2015 | | | 900 | | | | 902 | |
Series 2012-3, Class A3 0.96%, 01/09/2017 | | | 448 | | | | 451 | |
Series 2012-4, Class A2 0.49%, 04/08/2016 | | | 545 | | | | 545 | |
Asset Backed Funding Certificates | | | | | | | | |
Series 2005-AQ1, Class A4 5.01%, 06/25/2035 * | | | 683 | | | | 692 | |
Bank of America Auto Trust | | | | | | | | |
Series 2010-2, Class A3 1.31%, 07/15/2014 | | | 53 | | | | 53 | |
Series 2010-2, Class A4 1.94%, 06/15/2017 | | | 510 | | | | 516 | |
Series 2010-1A, Class A4 2.18%, 02/15/2017—144A | | | 175 | | | | 176 | |
BMW Vehicle Lease Trust | | | | | | | | |
Series 2012-1, Class A3 0.75%, 02/20/2015 | | | 311 | | | | 313 | |
BXG Receivables Note Trust | | | | | | | | |
Series 2012-A, Class A 2.66%, 12/02/2027—144A | | | 975 | | | | 973 | |
CarMax Auto Owner Trust | | | | | | | | |
Series 2010-1, Class A3 1.56%, 07/15/2014 | | | 35 | | | | 35 | |
Series 2011-1, Class A4 2.16%, 09/15/2016 | | | 530 | | | | 546 | |
Series 2011-3, Class A3 1.07%, 06/15/2016 | | | 1,552 | | | | 1,566 | |
Chase Funding Mortgage Loan Asset-Backed Certificates | |
Series 2003-2, Class 2A2 0.77%, 02/25/2033 * | | | 575 | | | | 522 | |
Series 2003-5, Class 1A4 4.40%, 02/25/2030 | | | 161 | | | | 162 | |
Series 2003-6, Class 1A4 4.50%, 11/25/2034 | | | 250 | | | | 254 | |
Series 2003-6, Class 1A5 5.35%, 11/25/2034 * | | | 500 | | | | 468 | |
Chrysler Financial Auto Securitization Trust | | | | | | | | |
Series 2010-A, Class A3 0.91%, 08/08/2013 | | | 72 | | | | 72 | |
Series 2010-A, Class B 1.65%, 11/08/2013 | | | 2,000 | | | | 2,002 | |
Citigroup Mortgage Loan Trust, Inc. | | | | | | | | |
Series 2011-5, Class 1A1 0.40%, 02/25/2046—144A * | | | 658 | | | | 609 | |
CNH Equipment Trust | | | | | | | | |
Series 2011-A, Class A4 2.04%, 10/17/2016 | | | 267 | | | | 275 | |
CPS Auto Trust | | | | | | | | |
Series 2011-C, Class A 4.21%, 03/15/2019—144A | | | 932 | | | | 975 | |
Series 2012-A, Class A 2.78%, 06/17/2019—144A | | | 271 | | | | 272 | |
The notes to the financial statements are an integral part of this report.
| | | | |
| Transamerica Funds | | | | Annual Report 2012 |
| | Page 68 | | |
Transamerica Core Bond
(formerly, Transamerica JPMorgan Core Bond)
SCHEDULE OF INVESTMENTS (continued)
At October 31, 2012
| | | | | | | | |
| | | Principal
(000’s) | | | Value
(000’s) | |
ASSET-BACKED SECURITIES (continued) | | | | | | | | |
CPS Auto Trust (continued) | | | | | | | | |
Series 2012-B, Class A 2.52%, 09/16/2019—144A | | $ | 1,922 | | | $ | 1,929 | |
Series 2012-C, Class A 1.82%, 12/16/2019—144A | | | 1,271 | | | | 1,272 | |
Credit Acceptance Auto Loan Trust | | | | | | | | |
Series 2011-1, Class A 2.61%, 03/15/2019—144A | | | 860 | | | | 872 | |
Series 2012-2A, Class A 1.52%, 03/16/2020—144A | | | 907 | | | | 907 | |
DT Auto Owner Trust | | | | | | | | |
Series 2012-2A, Class A 0.91%, 11/16/2015—144A | | | 675 | | | | 676 | |
Exeter Automobile Receivables Trust | | | | | | | | |
Series 2012-2A, Class A 1.30%, 06/15/2017—144A | | | 1,250 | | | | 1,250 | |
First Investors Auto Owner Trust | | | | | | | | |
Series 2012-2A, Class A2 1.47%, 05/15/2018—144A | | | 800 | | | | 802 | |
Ford Credit Auto Lease Trust | | | | | | | | |
Series 2011-A, Class A2 0.74%, 09/15/2013 | | | 547 | | | | 548 | |
Ford Credit Auto Owner Trust | | | | | | | | |
Series 2011-B, Class A2 0.68%, 01/15/2014 | | | 43 | | | | 43 | |
Series 2012-B, Class A3 0.72%, 12/15/2016 | | | 400 | | | | 402 | |
Fortress Opportunities Residential Transaction | | | | | | | | |
Series 2011-1A, Class A1 7.21%, 10/25/2047—144A * | | | 1,448 | | | | 1,459 | |
Freedom Trust | | | | | | | | |
Series 2011-1, Class A13 0.38%, 11/30/2037—144A * | | | 215 | | | | 213 | |
GE Equipment Midticket LLC | | | | | | | | |
Series 2012-1, Class A4 0.78%, 09/22/2020 | | | 300 | | | | 300 | |
HLSS Servicer Advance Receivables Backed Notes | |
Series 2012-T2, Class A1 1.34%, 10/15/2043—144A | | | 580 | | | | 581 | |
Series 2012-T2, Class A2 1.99%, 10/15/2045—144A | | | 487 | | | | 491 | |
HSBC Home Equity Loan Trust | | | | | | | | |
Series 2005-2, Class A1 0.48%, 01/20/2035 * | | | 74 | | | | 72 | |
Series 2006-1, Class A1 0.37%, 01/20/2036 * | | | 138 | | | | 134 | |
Series 2007-1, Class A2F 5.60%, 03/20/2036 * | | | 72 | | | | 73 | |
Series 2007-1, Class AS 0.41%, 03/20/2036 * | | | 146 | | | | 140 | |
Series 2007-3, Class APT 1.41%, 11/20/2036 * | | | 103 | | | | 101 | |
Huntington Auto Trust | | | | | | | | |
Series 2011-1A, Class A2 0.76%, 04/15/2014—144A | | | 1,031 | | | | 1,032 | |
Series 2011-1A, Class A3 1.01%, 01/15/2016—144A | | | 2,000 | | | | 2,011 | |
Series 2011-1A, Class A4 1.31%, 11/15/2016—144A | | | 1,500 | | | | 1,523 | |
| | | | | | | | |
| | | Principal
(000’s) | | | Value
(000’s) | |
ASSET-BACKED SECURITIES (continued) | | | | | | | | |
Huntington Auto Trust (continued) | | | | | | | | |
Series 2012-2, Class A2 0.38%, 09/15/2015 | | $ | 343 | | | $ | 343 | |
Hyundai Auto Receivables Trust | | | | | | | | |
Series 2010-B, Class A3 0.97%, 04/15/2015 | | | 192 | | | | 193 | |
Series 2010-B, Class A4 1.63%, 03/15/2017 | | | 375 | | | | 383 | |
Series 2011-A, Class A3 1.16%, 04/15/2015 | | | 255 | | | | 256 | |
Series 2011-A, Class A4 1.78%, 12/15/2015 | | | 310 | | | | 317 | |
Series 2011-B, Class A3 1.04%, 09/15/2015 | | | 257 | | | | 259 | |
Series 2011-B, Class A4 1.65%, 02/15/2017 | | | 288 | | | | 294 | |
LAI Vehicle Lease Securitization Trust | | | | | | | | |
Series 2010-A, Class A 2.55%, 09/15/2016—144A | | | 189 | | | | 189 | |
Lake Country Mortgage Loan Trust | | | | | | | | |
Series 2006-HE1, Class A3 0.56%, 07/25/2034—144A * | | | 524 | | | | 517 | |
Madison Avenue Manufactured Housing Contract | | | | | |
Series 2002-A, Class M2 2.46%, 03/25/2032 * | | | 1,103 | | | | 1,025 | |
Mercedes-Benz Auto Receivables Trust | | | | | | | | |
Series 2010-1, Class A3 1.42%, 08/15/2014 | | | 74 | | | | 74 | |
MMCA Automobile Trust | | | | | | | | |
Series 2012-A, Class A4 1.57%, 08/15/2017—144A | | | 2,000 | | | | 2,024 | |
Morgan Stanley ABS Capital I | | | | | | | | |
Series 2004-WMC3, Class M1 0.96%, 01/25/2035 * | | | 13 | | | | 13 | |
Newcastle Investment Trust | | | | | | | | |
Series 2011-MH1, Class A 2.45%, 12/10/2033—144A | | | 194 | | | | 196 | |
Nissan Auto Receivables Owner Trust | | | | | | | | |
Series 2010-A, Class A3 0.87%, 07/15/2014 | | | 235 | | | | 235 | |
Series 2010-A, Class A4 1.31%, 09/15/2016 | | | 300 | | | | 303 | |
PennyMac Loan Trust | | | | | | | | |
Series 2011-NPL1, Class A 5.25%, 09/25/2051—144A * | | | 573 | | | | 573 | |
Series 2012-NPL1, Class A 3.42%, 05/28/2052—144A * | | | 1,143 | | | | 1,143 | |
RASC Trust | | | | | | | | |
Series 2005-KS9, Class A3 0.58%, 10/25/2035 * | | | 337 | | | | 329 | |
Residential Credit Solutions Trust | | | | | | | | |
Series 2011-1, Class A1 6.00%, 03/25/2041—144A | | | 783 | | | | 785 | |
RFA | | | | | | | | |
Series 2012-1, Class A1 6.25%, 07/05/2018 | | | 2,654 | | | | 2,654 | |
RMAT | | | | | | | | |
Series 2012-1A, Class A1 2.73%, 08/26/2052—144A * | | | 1,129 | | | | 1,137 | |
The notes to the financial statements are an integral part of this report.
| | | | |
| Transamerica Funds | | | | Annual Report 2012 |
| | Page 69 | | |
Transamerica Core Bond
(formerly, Transamerica JPMorgan Core Bond)
SCHEDULE OF INVESTMENTS (continued)
At October 31, 2012
| | | | | | | | |
| | | Principal
(000’s) | | | Value
(000’s) | |
ASSET-BACKED SECURITIES (continued) | | | | | | | | |
Santander Drive Auto Receivables Trust | |
Series 2010-A, Class A4 2.39%, 06/15/2017—144A | | $ | 400 | | | $ | 410 | |
Series 2011-S2A, Class B 2.06%, 06/15/2017—144A | | | 114 | | | | 114 | |
Series 2011-S2A, Class D 3.35%, 06/15/2017—144A | | | 227 | | | | 228 | |
Series 2012-1, Class A2 1.25%, 04/15/2015 | | | 879 | | | | 883 | |
Series 2012-1, Class A3 1.49%, 10/15/2015 | | | 411 | | | | 416 | |
Series 2012-5, Class A3 0.83%, 12/15/2016 | | | 360 | | | | 362 | |
Saxon Asset Securities Trust | | | | | | | | |
Series 2003-1, Class AF6 4.80%, 06/25/2033 * | | | 259 | | | | 259 | |
SNAAC Auto Receivables Trust | | | | | | | | |
Series 2012-1A, Class A 1.78%, 06/15/2016—144A | | | 299 | | | | 299 | |
Stanwich Mortgage Loan Trust | | | | | | | | |
Series 2012-NPL3, Class A 4.21%, 05/15/2042—144A | | | 238 | | | | 239 | |
Series 2012-NPL4, Class A 2.98%, 09/15/2042—144A | | | 2,106 | | | | 2,107 | |
Structured Asset Investment Loan Trust | |
Series 2005-5, Class A9 0.48%, 06/25/2035 * | | | 284 | | | | 282 | |
Structured Asset Securities Corp. | | | | | | | | |
Series 2002-AL1, Class A2 3.45%, 02/25/2032 | | | 254 | | | | 250 | |
Series 2003-16, Class A3 0.71%, 06/25/2033 * | | | 85 | | | | 82 | |
Series 2003-32, Class 1A1 5.33%, 11/25/2033 * | | | 163 | | | | 173 | |
Series 2003-35, Class 3A1 0.71%, 12/25/2033 * | | | 414 | | | | 401 | |
Series 2003-33H, Class 1A1 5.50%, 10/25/2033 | | | 162 | | | | 163 | |
Series 2003-37A, Class 2A 4.99%, 12/25/2033 * | | | 238 | | | | 244 | |
Series 2004-5H, Class A4 5.54%, 12/25/2033 | | | 773 | | | | 771 | |
Series 2004-4XS, Class 1A5 5.49%, 02/25/2034 * | | | 700 | | | | 714 | |
Series 2004-6XS, Class A5A 5.53%, 03/25/2034 * | | | 570 | | | | 573 | |
Series 2004-6XS, Class A5B 5.55%, 03/25/2034 * | | | 570 | | | | 573 | |
Series 2005-NC1, Class A11 4.69%, 02/25/2035 * | | | 1,120 | | | | 1,110 | |
Toyota Auto Receivables Owner Trust | | | | | | | | |
Series 2010-C, Class A3 0.77%, 04/15/2014 | | | 28 | | | | 28 | |
Series 2011-A, Class A3 0.98%, 10/15/2014 | | | 686 | | | | 688 | |
Trafigura Securitisation Finance PLC | | | | | | | | |
Series 2012-1A, Class A 2.61%, 10/15/2015—144A * | | | 2,219 | | | | 2,254 | |
USAA Auto Owner Trust | | | | | | | | |
Series 2009-2, Class A4 2.53%, 06/17/2013 | | | 91 | | | | 91 | |
| | | | | | | | |
| | | Principal
(000’s) | | | Value
(000’s) | |
ASSET-BACKED SECURITIES (continued) | | | | | | | | |
USAA Auto Owner Trust (continued) | | | | | | | | |
Series 2012-1, Class A2 0.38%, 06/15/2015 | | $ | 206 | | | $ | 206 | |
Volkswagen Auto Lease Trust | | | | | | | | |
Series 2012-A, Class A3 0.87%, 07/20/2015 | | | 935 | | | | 945 | |
VOLT LLC | | | | | | | | |
Series 2012-1A, Class A1 4.95%, 04/25/2017—144A * | | | 3,044 | | | | 3,043 | |
Series 2012-RP2A, Class A1 4.70%, 06/26/2017—144A | | | 1,375 | | | | 1,396 | |
Series 2012-RP2A, Class A2 8.84%, 06/26/2017—144A | | | 150 | | | | 155 | |
Westgate Resorts LLC | | | | | | | | |
Series 2012-1, Class A 4.50%, 09/20/2025—144A | | | 1,636 | | | | 1,652 | |
Series 2012-2A, Class A 3.00%, 01/20/2025—144A | | | 1,650 | | | | 1,654 | |
Westlake Automobile Receivables Trust | | | | | | | | |
Series 2011-1A, Class A3 1.49%, 06/16/2014—144A | | | 230 | | | | 231 | |
World Omni Auto Receivables Trust | | | | | | | | |
Series 2010-A, Class A4 2.21%, 05/15/2015 | | | 255 | | | | 258 | |
Series 2012-A, Class A3 0.64%, 02/15/2017 | | | 585 | | | | 588 | |
World Omni Automobile Lease Securitization Trust | | | | | | | | |
Series 2012-A, Class A2 0.71%, 01/15/2015 | | | 488 | | | | 489 | |
Series 2012-A, Class A3 0.93%, 11/16/2015 | | | 218 | | | | 219 | |
| | | | | | | | |
Total Asset-Backed Securities (cost $87,772) | | | | 88,513 | |
| | | | | | | | |
MUNICIPAL GOVERNMENT OBLIGATIONS—0.3% | |
American Municipal Power, Inc. | | | | | | | | |
7.50%, 02/15/2050 | | | 640 | | | | 873 | |
New York State Dormitory Authority, Revenue Bond | | | | | | | | |
5.60%, 03/15/2040 | | | 280 | | | | 349 | |
Ohio State University | | | | | | | | |
4.80%, 06/01/2111 | | | 1,370 | | | | 1,556 | |
Port Authority of New York & New Jersey | | | | | | | | |
4.46%, 10/01/2062 | | | 970 | | | | 958 | |
5.65%, 11/01/2040 | | | 485 | | | | 603 | |
State of California—Build America Bonds | | | | | | | | |
7.30%, 10/01/2039 | | | 520 | | | | 706 | |
State of Illinois | | | | | | | | |
5.10%, 06/01/2033 | | | 85 | | | | 84 | |
| | | | | | | | |
Total Municipal Government Obligations (cost $4,490) | | | | 5,129 | |
| | | | | | | | |
CORPORATE DEBT SECURITIES—18.4% | |
Aerospace & Defense—0.1% | | | | | | | | |
BAE Systems Holdings, Inc. | | | | | | | | |
5.20%, 08/15/2015—144A | | | 380 | | | | 418 | |
BAE Systems PLC | | | | | | | | |
5.80%, 10/11/2041—144A | | | 439 | | | | 535 | |
Lockheed Martin Corp. | | | | | | | | |
2.13%, 09/15/2016 | | | 320 | | | | 333 | |
4.25%, 11/15/2019 ^ | | | 150 | | | | 171 | |
4.85%, 09/15/2041 | | | 190 | | | | 219 | |
The notes to the financial statements are an integral part of this report.
| | | | |
| Transamerica Funds | | | | Annual Report 2012 |
| | Page 70 | | |
Transamerica Core Bond
(formerly, Transamerica JPMorgan Core Bond)
SCHEDULE OF INVESTMENTS (continued)
At October 31, 2012
| | | | | | | | |
| | | Principal
(000’s) | | | Value
(000’s) | |
Aerospace & Defense (continued) | | | | | | | | |
Lockheed Martin Corp. (continued) | | | | | | | | |
5.72%, 06/01/2040 | | $ | 108 | | | $ | 136 | |
United Technologies Corp. | | | | | | | | |
4.50%, 06/01/2042 | | | 257 | | | | 296 | |
8.88%, 11/15/2019 | | | 250 | | | | 343 | |
Air Freight & Logistics—0.0% ¥ | | | | | | | | |
United Parcel Service of America, Inc. | | | | | | | | |
8.38%, 04/01/2020 | | | 60 | | | | 83 | |
8.38%, 04/01/2030 * | | | 200 | | | | 305 | |
United Parcel Service, Inc. | | | | | | | | |
2.45%, 10/01/2022 | | | 186 | | | | 190 | |
Airlines—0.1% | | | | | | | | |
American Airlines Pass-Through Trust | | | | | | | | |
Series 2011-1, Class A 5.25%, 01/31/2021 | | | 103 | | | | 109 | |
American Airlines Pass-Through Trust | |
Series 2011-2, Class A 8.63%, 04/15/2023 | | | 590 | | | | 618 | |
Continental Airlines Pass-Through Trust | |
Series 2007-1A, Class A 5.98%, 04/19/2022 | | | 268 | | | | 299 | |
Continental Airlines Pass-Through Trust | |
Series 2012-2, Class A 4.00%, 10/29/2024 | | | 255 | | | | 265 | |
Delta Air Lines, Inc., Pass-Through Trust | |
Series 2010-2, Class A 4.95%, 05/23/2019 | | | 257 | | | | 277 | |
Delta Air Lines, Inc., Pass-Through Trust | |
Series 2011-1, Class A 5.30%, 04/15/2019 | | | 80 | | | | 87 | |
Delta Air Lines, Inc., Pass-Through Trust | |
Series 2012-1, Class A 4.75%, 05/07/2020 | | | 143 | | | | 151 | |
Auto Components—0.1% | | | | | | | | |
Johnson Controls, Inc. | | | | | | | | |
3.75%, 12/01/2021 ^ | | | 571 | | | | 607 | |
4.25%, 03/01/2021 | | | 335 | | | | 369 | |
5.25%, 12/01/2041 | | | 970 | | | | 1,106 | |
Automobiles—0.1% | | | | | | | | |
Daimler Finance North America LLC | |
2.63%, 09/15/2016—144A | | | 778 | | | | 812 | |
2.95%, 01/11/2017—144A | | | 1,100 | | | | 1,154 | |
6.50%, 11/15/2013 | | | 80 | | | | 85 | |
Volkswagen International Finance NV | |
1.63%, 08/12/2013—144A | | | 116 | | | | 117 | |
Beverages—0.2% | | | | | | | | |
Anheuser-Busch InBev Worldwide, Inc. | |
1.50%, 07/14/2014 | | | 136 | | | | 138 | |
7.75%, 01/15/2019 | | | 650 | | | | 881 | |
8.20%, 01/15/2039 | | | 240 | | | | 404 | |
Diageo Capital PLC | | | | | | | | |
1.50%, 05/11/2017 | | | 189 | | | | 193 | |
4.83%, 07/15/2020 | | | 90 | | | | 108 | |
5.75%, 10/23/2017 | | | 230 | | | | 280 | |
Diageo Finance BV | | | | | | | | |
5.50%, 04/01/2013 | | | 290 | | | | 296 | |
Heineken NV | | | | | | | | |
1.40%, 10/01/2017—144A | | | 400 | | | | 402 | |
PepsiCo, Inc. | | | | | | | | |
1.25%, 08/13/2017 | | | 625 | | | | 633 | |
3.00%, 08/25/2021 | | | 250 | | | | 268 | |
7.90%, 11/01/2018 | | | 21 | | | | 29 | |
| | | | | | | | |
| | | Principal
(000’s) | | | Value
(000’s) | |
Beverages (continued) | | | | | | | | |
SABMiller Holdings, Inc. | | | | | | | | |
3.75%, 01/15/2022—144A | | $ | 200 | | | $ | 220 | |
SABMiller PLC | | | | | | | | |
5.50%, 08/15/2013—144A | | | 180 | | | | 187 | |
5.70%, 01/15/2014—144A | | | 330 | | | | 349 | |
Biotechnology—0.2% | | | | | | | | |
Amgen, Inc. | | | | | | | | |
3.45%, 10/01/2020 | | | 400 | | | | 428 | |
3.88%, 11/15/2021 ^ | | | 435 | | | | 478 | |
4.50%, 03/15/2020 | | | 56 | | | | 63 | |
5.15%, 11/15/2041 | | | 1,075 | | | | 1,240 | |
5.65%, 06/15/2042 | | | 252 | | | | 309 | |
5.75%, 03/15/2040 | | | 165 | | | | 201 | |
Celgene Corp. | | | | | | | | |
1.90%, 08/15/2017 | | | 659 | | | | 669 | |
Capital Markets—1.3% | | | | | | | | |
Bank of New York Mellon Corp. | |
2.40%, 01/17/2017 | | | 994 | | | | 1,049 | |
3.10%, 01/15/2015 ^ | | | 125 | | | | 132 | |
3.55%, 09/23/2021 | | | 509 | | | | 558 | |
4.60%, 01/15/2020 ^ | | | 40 | | | | 47 | |
5.45%, 05/15/2019 | | | 200 | | | | 240 | |
BlackRock, Inc. | | | | | | | | |
3.38%, 06/01/2022 | | | 174 | | | | 186 | |
6.25%, 09/15/2017 ^ | | | 635 | | | | 778 | |
Charles Schwab Corp. | | | | | | | | |
3.23%, 09/01/2022—144A | | | 100 | | | | 101 | |
Credit Suisse USA, Inc. | | | | | | | | |
5.13%, 08/15/2015 | | | 170 | | | | 189 | |
Goldman Sachs Group, Inc. | | | | | | | | |
3.63%, 02/07/2016 ^ | | | 255 | | | | 270 | |
3.70%, 08/01/2015 | | | 308 | | | | 324 | |
5.38%, 03/15/2020 | | | 390 | | | | 441 | |
6.00%, 06/15/2020 | | | 1,047 | | | | 1,229 | |
6.25%, 09/01/2017 | | | 650 | | | | 764 | |
6.75%, 10/01/2037 | | | 200 | | | | 220 | |
7.50%, 02/15/2019 ^ | | | 3,875 | | | | 4,838 | |
Jefferies Group, Inc. | | | | | | | | |
3.88%, 11/09/2015 | | | 171 | | | | 174 | |
6.25%, 01/15/2036 | | | 260 | | | | 261 | |
6.45%, 06/08/2027 | | | 180 | | | | 189 | |
8.50%, 07/15/2019 ^ | | | 1,720 | | | | 2,012 | |
Macquarie Group, Ltd. | | | | | | | | |
6.00%, 01/14/2020—144A | | | 450 | | | | 491 | |
6.25%, 01/14/2021—144A | | | 525 | | | | 579 | |
7.30%, 08/01/2014—144A | | | 700 | | | | 760 | |
7.63%, 08/13/2019—144A | | | 1,150 | | | | 1,358 | |
Morgan Stanley | | | | | | | | |
4.20%, 11/20/2014 | | | 156 | | | | 163 | |
5.63%, 09/23/2019 | | | 2,610 | | | | 2,898 | |
5.95%, 12/28/2017 | | | 700 | | | | 794 | |
7.30%, 05/13/2019 | | | 1,800 | | | | 2,166 | |
Morgan Stanley—Series F | | | | | | | | |
5.55%, 04/27/2017 | | | 170 | | | | 189 | |
6.25%, 08/28/2017 | | | 450 | | | | 513 | |
Nomura Holdings, Inc. | | | | | | | | |
4.13%, 01/19/2016 ^ | | | 200 | | | | 208 | |
5.00%, 03/04/2015 ^ | | | 350 | | | | 370 | |
6.70%, 03/04/2020 | | | 543 | | | | 627 | |
The notes to the financial statements are an integral part of this report.
| | | | |
| Transamerica Funds | | | | Annual Report 2012 |
| | Page 71 | | |
Transamerica Core Bond
(formerly, Transamerica JPMorgan Core Bond)
SCHEDULE OF INVESTMENTS (continued)
At October 31, 2012
| | | | | | | | |
| | | Principal
(000’s) | | | Value
(000’s) | |
Chemicals—0.4% | | | | | | | | |
Dow Chemical Co. | | | | | | | | |
4.13%, 11/15/2021 ^ | | $ | 438 | | | $ | 479 | |
4.25%, 11/15/2020 | | | 174 | | | | 193 | |
5.25%, 11/15/2041 | | | 283 | | | | 324 | |
7.60%, 05/15/2014 | | | 640 | | | | 706 | |
8.55%, 05/15/2019 | | | 456 | | | | 618 | |
E.I. du Pont de Nemours & Co. | | | | | |
1.95%, 01/15/2016 | | | 173 | | | | 179 | |
4.90%, 01/15/2041 | | | 125 | | | | 153 | |
5.60%, 12/15/2036 | | | 550 | | | | 717 | |
Ecolab, Inc. | | | | | | | | |
5.50%, 12/08/2041 | | | 570 | | | | 712 | |
Mosaic Co. | | | | | | | | |
3.75%, 11/15/2021 | | | 209 | | | | 226 | |
4.88%, 11/15/2041 | | | 253 | | | | 285 | |
Potash Corp. of Saskatchewan, Inc. | | | | | |
6.50%, 05/15/2019 ^ | | | 260 | | | | 329 | |
PPG Industries, Inc. | | | | | | | | |
5.75%, 03/15/2013 | | | 120 | | | | 122 | |
6.65%, 03/15/2018 | | | 470 | | | | 591 | |
7.40%, 08/15/2019 | | | 300 | | | | 372 | |
9.00%, 05/01/2021 | | | 310 | | | | 421 | |
Praxair, Inc. | | | | | | | | |
4.38%, 03/31/2014 | | | 375 | | | | 395 | |
5.20%, 03/15/2017 | | | 150 | | | | 176 | |
Union Carbide Corp. | | | | | | | | |
7.50%, 06/01/2025 | | | 400 | | | | 491 | |
7.75%, 10/01/2096 | | | 210 | | | | 255 | |
Commercial Banks—2.7% | | | | | | | | |
ANZ National Int’l, Ltd. | | | | | | | | |
3.13%, 08/10/2015—144A | | | 105 | | | | 110 | |
Australia & New Zealand Banking Group, Ltd. | |
2.40%, 11/23/2016—144A ^ | | | 997 | | | | 1,049 | |
3.25%, 03/01/2016—144A ^ | | | 130 | | | | 139 | |
4.88%, 01/12/2021—144A | | | 137 | | | | 158 | |
Bank of Nova Scotia | | | | | | | | |
1.65%, 10/29/2015—144A ^ | | | 359 | | | | 370 | |
2.55%, 01/12/2017 ^ | | | 855 | | | | 905 | |
3.40%, 01/22/2015 | | | 405 | | | | 430 | |
Bank of Tokyo-Mitsubishi UFJ, Ltd. | |
2.35%, 02/23/2017—144A | | | 785 | | | | 816 | |
3.85%, 01/22/2015—144A | | | 227 | | | | 241 | |
Barclays Bank PLC | | | | | | | | |
2.25%, 05/10/2017—144A ^ | | | 276 | | | | 285 | |
2.50%, 01/23/2013 | | | 150 | | | | 151 | |
2.50%, 09/21/2015—144A ^ | | | 510 | | | | 531 | |
2.75%, 02/23/2015 | | | 1,120 | | | | 1,158 | |
5.00%, 09/22/2016 | | | 100 | | | | 113 | |
5.20%, 07/10/2014 | | | 125 | | | | 134 | |
BB&T Corp. | | | | | | | | |
3.38%, 09/25/2013 | | | 220 | | | | 226 | |
3.95%, 04/29/2016 ^ | | | 515 | | | | 568 | |
4.90%, 06/30/2017 | | | 550 | | | | 625 | |
5.20%, 12/23/2015 | | | 250 | | | | 280 | |
5.25%, 11/01/2019 ^ | | | 90 | | | | 104 | |
5.70%, 04/30/2014 | | | 195 | | | | 210 | |
6.85%, 04/30/2019 | | | 250 | | | | 318 | |
Comerica, Inc. | | | | | | | | |
3.00%, 09/16/2015 | | | 150 | | | | 159 | |
| | | | | | | | |
| | | Principal
(000’s) | | | Value
(000’s) | |
Commercial Banks (continued) | | | | | | | | |
Commonwealth Bank of Australia | | | | | | | | |
2.25%, 03/16/2017—144A ^ | | $ | 530 | | | $ | 553 | |
Cooperatieve Centrale Raiffeisen—Boerenleenbank BA | |
3.38%, 01/19/2017 | | | 205 | | | | 220 | |
4.50%, 01/11/2021 | | | 300 | | | | 340 | |
5.80%, 09/30/2110—144A | | | 300 | | | | 356 | |
Deutsche Bank AG | | | | | | | | |
2.38%, 01/11/2013 | | | 250 | | | | 251 | |
3.25%, 01/11/2016 ^ | | | 400 | | | | 424 | |
3.88%, 08/18/2014 ^ | | | 100 | | | | 106 | |
6.00%, 09/01/2017 ^ | | | 190 | | | | 228 | |
DNB Boligkreditt AS | | | | | | | | |
2.10%, 10/14/2015—144A | | | 1,057 | | | | 1,097 | |
HSBC Bank PLC | | | | | | | | |
3.10%, 05/24/2016—144A | | | 262 | | | | 277 | |
3.50%, 06/28/2015—144A | | | 1,175 | | | | 1,251 | |
4.13%, 08/12/2020—144A | | | 275 | | | | 305 | |
HSBC Holdings PLC | | | | | | | | |
4.88%, 01/14/2022 ^ | | | 1,520 | | | | 1,765 | |
5.10%, 04/05/2021 | | | 911 | | | | 1,074 | |
ING Bank NV | | | | | | | | |
2.00%, 09/25/2015—144A | | | 270 | | | | 272 | |
3.75%, 03/07/2017—144A | | | 943 | | | | 999 | |
KeyBank NA | | | | | | | | |
5.70%, 11/01/2017 ^ | | | 245 | | | | 276 | |
5.80%, 07/01/2014 | | | 250 | | | | 269 | |
Manufacturers & Traders Trust Co. | | | | | |
6.63%, 12/04/2017 | | | 250 | | | | 302 | |
National Australia Bank, Ltd. | | | | | | | | |
2.00%, 06/20/2017—144A ^ | | | 580 | | | | 600 | |
2.75%, 09/28/2015—144A | | | 280 | | | | 293 | |
3.00%, 07/27/2016—144A ^ | | | 1,730 | | | | 1,839 | |
3.75%, 03/02/2015—144A | | | 280 | | | | 297 | |
National Bank of Canada | | | | | | | | |
1.65%, 01/30/2014—144A | | | 271 | | | | 275 | |
National City Corp. | | | | | | | | |
4.90%, 01/15/2015 | | | 165 | | | | 180 | |
Nordea Bank AB | | | | | | | | |
1.75%, 10/04/2013—144A | | | 200 | | | | 202 | |
3.13%, 03/20/2017—144A | | | 1,070 | | | | 1,127 | |
4.88%, 05/13/2021—144A ^ | | | 384 | | | | 406 | |
Oversea-Chinese Banking Corp., Ltd. | | | | | |
1.63%, 03/13/2015—144A | | | 598 | | | | 604 | |
PNC Bank NA | | | | | | | | |
6.88%, 04/01/2018 | | | 1,600 | | | | 2,027 | |
PNC Funding Corp. | | | | | | | | |
2.70%, 09/19/2016 | | | 720 | | | | 764 | |
3.00%, 05/19/2014 | | | 180 | | | | 187 | |
4.38%, 08/11/2020 | | | 433 | | | | 500 | |
5.13%, 02/08/2020 | | | 250 | | | | 300 | |
5.25%, 11/15/2015 | | | 130 | | | | 146 | |
5.63%, 02/01/2017 | | | 130 | | | | 151 | |
6.70%, 06/10/2019 ^ | | | 150 | | | | 194 | |
Rabobank Nederland NV | | | | | | | | |
2.13%, 10/13/2015 | | | 105 | | | | 108 | |
3.20%, 03/11/2015—144A | | | 500 | | | | 525 | |
Royal Bank of Canada | | | | | | | | |
1.20%, 09/19/2017 | | | 1,873 | | | | 1,882 | |
The notes to the financial statements are an integral part of this report.
| | | | |
| Transamerica Funds | | | | Annual Report 2012 |
| | Page 72 | | |
Transamerica Core Bond
(formerly, Transamerica JPMorgan Core Bond)
SCHEDULE OF INVESTMENTS (continued)
At October 31, 2012
| | | | | | | | |
| | | Principal
(000’s) | | | Value
(000’s) | |
Commercial Banks (continued) | | | | | | | | |
Royal Bank of Canada (continued) | | | | | | | | |
2.30%, 07/20/2016 ^ | | $ | 800 | | | $ | 837 | |
Stadshypotek AB | | | | | | | | |
1.88%, 10/02/2019—144A | | | 530 | | | | 530 | |
Svenska Handelsbanken AB | | | | | | | | |
3.13%, 07/12/2016 | | | 388 | | | | 412 | |
Toronto-Dominion Bank | | | | | | | | |
2.50%, 07/14/2016 | | | 718 | | | | 758 | |
U.S. Bancorp | | | | | | | | |
2.45%, 07/27/2015 | | | 540 | | | | 566 | |
2.88%, 11/20/2014 ^ | | | 121 | | | | 127 | |
3.00%, 03/15/2022 | | | 233 | | | | 247 | |
4.13%, 05/24/2021 | | | 133 | | | | 154 | |
7.50%, 06/01/2026 | | | 111 | | | | 146 | |
UBS AG | | | | | | | | |
2.25%, 08/12/2013 | | | 250 | | | | 253 | |
3.88%, 01/15/2015 | | | 600 | | | | 636 | |
4.88%, 08/04/2020 | | | 525 | | | | 603 | |
5.88%, 12/20/2017 | | | 110 | | | | 130 | |
US Bancorp | | | | | | | | |
1.65%, 05/15/2017 | | | 384 | | | | 393 | |
Wachovia Bank NA | | | | | | | | |
0.72%, 03/15/2016 * | | | 450 | | | | 443 | |
5.00%, 08/15/2015 | | | 500 | | | | 544 | |
6.00%, 11/15/2017 | | | 3,100 | | | | 3,702 | |
Wachovia Corp. | | | | | | | | |
5.75%, 06/15/2017 ^ | | | 970 | | | | 1,160 | |
5.75%, 02/01/2018 | | | 1,200 | | | | 1,448 | |
Wells Fargo & Co. | | | | | | | | |
2.63%, 12/15/2016 | | | 995 | | | | 1,051 | |
3.68%, 06/15/2016 * | | | 390 | | | | 423 | |
5.63%, 12/11/2017 | | | 550 | | | | 658 | |
Westpac Banking Corp. | | | | | | | | |
2.45%, 11/28/2016—144A ^ | | | 600 | | | | 633 | |
4.88%, 11/19/2019 ^ | | | 750 | | | | 867 | |
Commercial Services & Supplies—0.1% | | | | | | | | |
ADT Corp. | | | | | | | | |
3.50%, 07/15/2022—144A ^ | | | 124 | | | | 126 | |
4.88%, 07/15/2042—144A | | | 147 | | | | 157 | |
ERAC USA Finance LLC | | | | | | | | |
2.25%, 01/10/2014—144A | | | 257 | | | | 260 | |
2.75%, 03/15/2017—144A | | | 65 | | | | 68 | |
4.50%, 08/16/2021—144A | | | 175 | | | | 192 | |
5.63%, 03/15/2042—144A | | | 141 | | | | 161 | |
6.70%, 06/01/2034—144A | | | 331 | | | | 412 | |
Pitney Bowes, Inc. | | | | | | | | |
4.88%, 08/15/2014 | | | 350 | | | | 367 | |
5.00%, 03/15/2015 ^ | | | 250 | | | | 267 | |
5.60%, 03/15/2018 ^ | | | 100 | | | | 109 | |
Waste Management, Inc. | | | | | | | | |
4.75%, 06/30/2020 | | | 319 | | | | 370 | |
Communications Equipment—0.0% ¥ | | | | | | | | |
Cisco Systems, Inc. | | | | | | | | |
4.45%, 01/15/2020 | | | 150 | | | | 177 | |
5.50%, 01/15/2040 | | | 250 | | | | 326 | |
5.90%, 02/15/2039 | | | 100 | | | | 135 | |
Computers & Peripherals—0.1% | | | | | | | | |
Dell, Inc. | | | | | | | | |
3.10%, 04/01/2016 | | | 184 | | | | 195 | |
| | | | | | | | |
| | | Principal
(000’s) | | | Value
(000’s) | |
Computers & Peripherals (continued) | | | | | | | | |
Hewlett-Packard Co. | | | | | | | | |
2.60%, 09/15/2017 ^ | | $ | 225 | | | $ | 219 | |
4.05%, 09/15/2022 ^ | | | 97 | | | | 93 | |
4.30%, 06/01/2021 | | | 200 | | | | 197 | |
4.38%, 09/15/2021 | | | 312 | | | | 308 | |
4.65%, 12/09/2021 ^ | | | 440 | | | | 440 | |
6.00%, 09/15/2041 ^ | | | 1,360 | | | | 1,340 | |
Construction & Engineering—0.1% | | | | | | | | |
ABB Finance USA, Inc. | | | | | | | | |
1.63%, 05/08/2017 | | | 210 | | | | 214 | |
2.88%, 05/08/2022 | | | 152 | | | | 157 | |
4.38%, 05/08/2042 | | | 128 | | | | 144 | |
Fluor Corp. | | | | | | | | |
3.38%, 09/15/2021 ^ | | | 547 | | | | 588 | |
Construction Materials—0.0% ¥ | | | | | | | | |
CRH America, Inc. | | | | | | | | |
6.00%, 09/30/2016 | | | 221 | | | | 248 | |
Consumer Finance—0.7% | | | | | | | | |
American Express Co. | | | | | | | | |
7.00%, 03/19/2018 | | | 700 | | | | 888 | |
American Express Credit Corp. | | | | | | | | |
2.38%, 03/24/2017 | | | 277 | | | | 291 | |
2.80%, 09/19/2016 ^ | | | 1,617 | | | | 1,722 | |
5.13%, 08/25/2014 | | | 350 | | | | 378 | |
7.30%, 08/20/2013 | | | 200 | | | | 211 | |
American Express Credit Corp.—Series C | | | | | | | | |
5.88%, 05/02/2013 | | | 150 | | | | 154 | |
Capital One Bank USA NA | | | | | | | | |
8.80%, 07/15/2019 | | | 1,300 | | | | 1,730 | |
Capital One Financial Corp. | | | | | | | | |
2.15%, 03/23/2015 | | | 400 | | | | 411 | |
4.75%, 07/15/2021 ^ | | | 625 | | | | 717 | |
6.75%, 09/15/2017 | | | 730 | | | | 898 | |
7.38%, 05/23/2014 | | | 75 | | | | 82 | |
Caterpillar Financial Services Corp. | | | | | | | | |
7.15%, 02/15/2019 | | | 100 | | | | 133 | |
Caterpillar Financial Services Corp.— Series F | | | | | | | | |
5.85%, 09/01/2017 | | | 150 | | | | 182 | |
7.05%, 10/01/2018 | | | 150 | | | | 195 | |
HSBC Finance Corp. | | | | | | | | |
4.75%, 07/15/2013 | | | 165 | | | | 169 | |
5.00%, 06/30/2015 ^ | | | 455 | | | | 497 | |
5.50%, 01/19/2016 | | | 260 | | | | 289 | |
John Deere Capital Corp. | | | | | | | | |
1.20%, 10/10/2017 | | | 306 | | | | 308 | |
2.25%, 04/17/2019 | | | 333 | | | | 347 | |
2.75%, 03/15/2022 | | | 153 | | | | 159 | |
3.15%, 10/15/2021 | | | 290 | | | | 313 | |
5.75%, 09/10/2018 | | | 100 | | | | 124 | |
PACCAR Financial Corp. | | | | | | | | |
1.55%, 09/29/2014 | | | 497 | | | | 506 | |
1.60%, 03/15/2017 ^ | | | 197 | | | | 200 | |
Toyota Motor Credit Corp. | | | | | | | | |
2.00%, 09/15/2016 | | | 1,675 | | | | 1,738 | |
Diversified Financial Services—2.6% | | | | | | | | |
Allstate Life Global Funding Trust | | | | | | | | |
5.38%, 04/30/2013 | | | 200 | | | | 205 | |
American Honda Finance Corp. | | | | | | | | |
1.50%, 09/11/2017—144A | | | 200 | | | | 201 | |
The notes to the financial statements are an integral part of this report.
| | | | |
| Transamerica Funds | | | | Annual Report 2012 |
| | Page 73 | | |
Transamerica Core Bond
(formerly, Transamerica JPMorgan Core Bond)
SCHEDULE OF INVESTMENTS (continued)
At October 31, 2012
| | | | | | | | |
| | | Principal
(000’s) | | | Value
(000’s) | |
Diversified Financial Services (continued) | |
American Honda Finance Corp. (continued) | |
2.60%, 09/20/2016—144A ^ | | $ | 902 | | | $ | 946 | |
7.63%, 10/01/2018—144A | | | 300 | | | | 381 | |
Aon Corp. | | | | | | | | |
3.13%, 05/27/2016 | | | 235 | | | | 249 | |
3.50%, 09/30/2015 | | | 46 | | | | 49 | |
6.25%, 09/30/2040 | | | 83 | | | | 109 | |
ASIF Global Financing XIX | | | | | | | | |
4.90%, 01/17/2013—144A | | | 2,236 | | | | 2,252 | |
Associates Corp. | | | | | | | | |
6.95%, 11/01/2018 | | | 1,934 | | | | 2,336 | |
Bank of America Corp. | | | | | | | | |
5.00%, 05/13/2021 | | | 75 | | | | 85 | |
5.63%, 07/01/2020 | | | 3,840 | | | | 4,480 | |
5.75%, 12/01/2017 | | | 220 | | | | 255 | |
5.88%, 02/07/2042 | | | 400 | | | | 492 | |
6.50%, 08/01/2016 | | | 633 | | | | 736 | |
Bank of America Corp.—Series MTNL | |
5.65%, 05/01/2018 | | | 770 | | | | 896 | |
Blackstone Holdings Finance Co., LLC | |
6.25%, 08/15/2042—144A | | | 289 | | | | 317 | |
5.88%, 03/15/2021—144A | | | 1,205 | | | | 1,345 | |
Caisse Centrale Desjardins du Quebec | |
2.55%, 03/24/2016—144A ^ | | | 580 | | | | 616 | |
Citigroup, Inc. | | | | | | | | |
4.45%, 01/10/2017 | | | 1,080 | | | | 1,193 | |
4.59%, 12/15/2015 | | | 485 | | | | 529 | |
4.75%, 05/19/2015 | | | 892 | | | | 967 | |
5.38%, 08/09/2020 | | | 355 | | | | 415 | |
6.00%, 12/13/2013—08/15/2017 | | | 1,820 | | | | 2,118 | |
6.01%, 01/15/2015 | | | 420 | | | | 462 | |
6.13%, 11/21/2017 | | | 345 | | | | 409 | |
6.38%, 08/12/2014 | | | 310 | | | | 338 | |
6.50%, 08/19/2013 | | | 110 | | | | 115 | |
6.88%, 03/05/2038 | | | 340 | | | | 453 | |
8.13%, 07/15/2039 | | | 100 | | | | 153 | |
8.50%, 05/22/2019 | | | 550 | | | | 733 | |
CME Group, Inc. | | | | | | | | |
3.00%, 09/15/2022 | | | 640 | | | | 657 | |
5.75%, 02/15/2014 | | | 196 | | | | 209 | |
Countrywide Financial Corp. | | | | | | | | |
6.25%, 05/15/2016 ^ | | | 550 | | | | 606 | |
Ford Motor Credit Co. LLC | | | | | | | | |
3.00%, 06/12/2017 ^ | | | 314 | | | | 321 | |
3.98%, 06/15/2016 | | | 555 | | | | 588 | |
4.21%, 04/15/2016 | | | 401 | | | | 427 | |
4.25%, 09/20/2022 | | | 332 | | | | 344 | |
General Electric Capital Corp. | | | | | | | | |
4.38%, 09/16/2020 | | | 1,190 | | | | 1,332 | |
4.65%, 10/17/2021 | | | 1,300 | | | | 1,471 | |
5.40%, 02/15/2017 ^ | | | 400 | | | | 461 | |
5.50%, 01/08/2020 | | | 1,140 | | | | 1,356 | |
5.63%, 09/15/2017—05/01/2018 | | | 5,513 | | | | 6,548 | |
6.00%, 08/07/2019 | | | 1,420 | | | | 1,739 | |
6.75%, 03/15/2032 | | | 485 | | | | 645 | |
Goldman Sachs Group, LP | | | | | | | | |
8.00%, 03/01/2013—144A | | | 325 | | | | 332 | |
| | | | | | | | |
| | | Principal
(000’s) | | | Value
(000’s) | |
Diversified Financial Services (continued) | |
Macquarie Bank, Ltd. | | | | | | | | |
5.00%, 02/22/2017—144A ^ | | $ | 1,092 | | | $ | 1,186 | |
MassMutual Global Funding II | | | | | | | | |
2.00%, 04/05/2017—144A | | | 370 | | | | 378 | |
2.88%, 04/21/2014—144A | | | 100 | | | | 103 | |
Merrill Lynch & Co., Inc. | | | | | | | | |
6.88%, 04/25/2018 | | | 600 | | | | 724 | |
Merrill Lynch & Co., Inc.—Series C | | | | | | | | |
6.40%, 08/28/2017 | | | 2,325 | | | | 2,742 | |
National Rural Utilities Cooperative Finance Corp. | |
10.38%, 11/01/2018 | | | 250 | | | | 372 | |
Diversified Telecommunication Services—1.1% | |
AT&T Corp. | | | | | | | | |
8.00%, 11/15/2031 | | | 27 | | | | 42 | |
AT&T, Inc. | | | | | | | | |
5.35%, 09/01/2040 | | | 898 | | | | 1,101 | |
5.80%, 02/15/2019 ^ | | | 1,300 | | | | 1,633 | |
6.30%, 01/15/2038 | | | 500 | | | | 669 | |
BellSouth Capital Funding Corp. | | | | | | | | |
7.12%, 07/15/2097 | | | 335 | | | | 435 | |
BellSouth Corp. | | | | | | | | |
6.55%, 06/15/2034 | | | 500 | | | | 604 | |
6.88%, 10/15/2031 | | | 270 | | | | 341 | |
BellSouth Telecommunications, Inc. | |
6.30%, 12/15/2015 | | | 110 | | | | 116 | |
7.00%, 10/01/2025 | | | 300 | | | | 382 | |
British Telecommunications PLC | | | | | | | | |
5.95%, 01/15/2018 ^ | | | 200 | | | | 240 | |
9.63%, 12/15/2030 | | | 180 | | | | 294 | |
Centel Capital Corp. | | | | | | | | |
9.00%, 10/15/2019 | | | 450 | | | | 539 | |
CenturyLink, Inc. | | | | | | | | |
6.45%, 06/15/2021 | | | 540 | | | | 592 | |
7.60%, 09/15/2039 | | | 360 | | | | 369 | |
Deutsche Telekom International Finance BV | | | | | |
6.00%, 07/08/2019 | | | 395 | | | | 487 | |
8.75%, 06/15/2030 | | | 330 | | | | 509 | |
France Telecom SA | | | | | | | | |
2.75%, 09/14/2016 ^ | | | 350 | | | | 370 | |
8.50%, 03/01/2031 | | | 430 | | | | 660 | |
GTE Corp. | | | | | | | | |
6.84%, 04/15/2018 | | | 1,792 | | | | 2,247 | |
8.75%, 11/01/2021 | | | 250 | | | | 358 | |
GTP Acquisition Partners I LLC | | | | | | | | |
4.35%, 06/15/2016—144A | | | 758 | | | | 798 | |
Nippon Telegraph & Telephone Corp. | |
1.40%, 07/18/2017 | | | 400 | | | | 403 | |
Qwest Corp. | | | | | | | | |
6.75%, 12/01/2021 | | | 1,296 | | | | 1,551 | |
Telecom Italia Capital SA | | | | | | | | |
4.95%, 09/30/2014 | | | 250 | | | | 260 | |
6.18%, 06/18/2014 | | | 281 | | | | 298 | |
7.00%, 06/04/2018 | | | 250 | | | | 285 | |
Telefonica Emisiones SAU | | | | | | | | |
5.46%, 02/16/2021 | | | 91 | | | | 92 | |
6.22%, 07/03/2017 | | | 650 | | | | 702 | |
6.42%, 06/20/2016 ^ | | | 380 | | | | 412 | |
Verizon Communications, Inc. | | | | | | | | |
6.10%, 04/15/2018 | | | 411 | | | | 515 | |
The notes to the financial statements are an integral part of this report.
| | | | |
| Transamerica Funds | | | | Annual Report 2012 |
| | Page 74 | | |
Transamerica Core Bond
(formerly, Transamerica JPMorgan Core Bond)
SCHEDULE OF INVESTMENTS (continued)
At October 31, 2012
| | | | | | | | |
| | | Principal
(000’s) | | | Value
(000’s) | |
Diversified Telecommunication Services (continued) | |
Verizon Communications, Inc. (continued) | |
8.75%, 11/01/2018 ^ | | $ | 1,000 | | | $ | 1,395 | |
8.95%, 03/01/2039 | | | 520 | | | | 919 | |
Verizon Global Funding Corp. | | | | | | | | |
5.85%, 09/15/2035 | | | 175 | | | | 228 | |
7.75%, 12/01/2030 | | | 525 | | | | 795 | |
Verizon Maryland, Inc. | | | | | | | | |
7.15%, 05/01/2023 | | | 600 | | | | 615 | |
Verizon Pennsylvania, Inc. | | | | | | | | |
8.35%, 12/15/2030 | | | 240 | | | | 332 | |
Electric Utilities—1.3% | | | | | | | | |
AEP Texas Central Co. | | | | | | | | |
6.65%, 02/15/2033 | | | 100 | | | | 130 | |
Alabama Power Co. | | | | | | | | |
6.00%, 03/01/2039 | | | 248 | | | | 334 | |
6.13%, 05/15/2038 | | | 77 | | | | 105 | |
Alabama Power Co.—Series S | | | | | | | | |
5.88%, 12/01/2022 | | | 370 | | | | 466 | |
Appalachian Power Co. | | | | | | | | |
5.95%, 05/15/2033 | | | 50 | | | | 58 | |
6.38%, 04/01/2036 | | | 200 | | | | 254 | |
6.70%, 08/15/2037 | | | 425 | | | | 563 | |
Arizona Public Service Co. | | | | | | | | |
4.50%, 04/01/2042 | | | 121 | | | | 133 | |
5.05%, 09/01/2041 ^ | | | 303 | | | | 358 | |
Carolina Power & Light Co. | | | | | | | | |
3.00%, 09/15/2021 | | | 610 | | | | 650 | |
5.30%, 01/15/2019 ^ | | | 80 | | | | 98 | |
Cleveland Electric Illuminating Co. | | | | | | | | |
7.88%, 11/01/2017 | | | 180 | | | | 226 | |
8.88%, 11/15/2018 | | | 337 | | | | 452 | |
Comision Federal de Electricidad | | | | | | | | |
4.88%, 05/26/2021—144A | | | 261 | | | | 293 | |
Detroit Edison Co. | | | | | | | | |
2.65%, 06/15/2022 | | | 68 | | | | 71 | |
3.95%, 06/15/2042 | | | 101 | | | | 107 | |
Duke Energy Carolinas LLC | | | | | | | | |
3.90%, 06/15/2021 | | | 260 | | | | 297 | |
4.25%, 12/15/2041 | | | 264 | | | | 299 | |
4.30%, 06/15/2020 ^ | | | 156 | | | | 181 | |
6.00%, 01/15/2038 | | | 133 | | | | 178 | |
6.45%, 10/15/2032 | | | 100 | | | | 133 | |
Duke Energy Corp. | | | | | | | | |
3.55%, 09/15/2021 | | | 348 | | | | 373 | |
Duke Energy Indiana, Inc. | | | | | | | | |
3.75%, 07/15/2020 | | | 200 | | | | 223 | |
Enel Finance International NV | | | | | | | | |
5.13%, 10/07/2019—144A | | | 450 | | | | 476 | |
Florida Power & Light Co. | | | | | | | | |
5.13%, 06/01/2041 ^ | | | 112 | | | | 143 | |
5.95%, 10/01/2033 ^ | | | 425 | | | | 572 | |
Great Plains Energy, Inc. | | | | | | | | |
4.85%, 06/01/2021 | | | 26 | | | | 30 | |
Hydro-Quebec | | | | | | | | |
8.40%, 01/15/2022 | | | 420 | | | | 604 | |
9.40%, 02/01/2021 | | | 100 | | | | 149 | |
Indiana Michigan Power Co. | | | | | | | | |
7.00%, 03/15/2019 | | | 338 | | | | 419 | |
| | | | | | | | |
| | | Principal
(000’s) | | | Value
(000’s) | |
Electric Utilities (continued) | | | | | | | | |
Jersey Central Power & Light Co. | | | | | | | | |
7.35%, 02/01/2019 ^ | | $ | 330 | | | $ | 428 | |
John Sevier Combined Cycle Generation LLC | | | | | | | | |
4.63%, 01/15/2042 | | | 500 | | | | 566 | |
Kansas City Power & Light Co. | | | | | | | | |
5.30%, 10/01/2041 | | | 1,040 | | | | 1,214 | |
Massachusetts Electric Co. | | | | | | | | |
5.90%, 11/15/2039—144A | | | 55 | | | | 73 | |
MidAmerican Energy Co. | | | | | | | | |
5.30%, 03/15/2018 | | | 500 | | | | 603 | |
Nevada Power Co. | | | | | | | | |
5.38%, 09/15/2040 | | | 52 | | | | 65 | |
5.45%, 05/15/2041 ^ | | | 400 | | | | 516 | |
6.50%, 08/01/2018 | | | 910 | | | | 1,156 | |
Nevada Power Co.—Series V | | | | | | | | |
7.13%, 03/15/2019 | | | 100 | | | | 131 | |
NextEra Energy Capital Holdings, Inc. | | | | | | | | |
1.20%, 06/01/2015 ^ | | | 78 | | | | 78 | |
Niagara Mohawk Power Corp. | | | | | | | | |
4.88%, 08/15/2019—144A | | | 50 | | | | 59 | |
NiSource Finance Corp. | | | | | | | | |
5.80%, 02/01/2042 | | | 1,119 | | | | 1,338 | |
6.80%, 01/15/2019 | | | 604 | | | | 739 | |
Northern States Power Co. | | | | | | | | |
5.35%, 11/01/2039 | | | 19 | | | | 25 | |
6.25%, 06/01/2036 ^ | | | 100 | | | | 141 | |
Oncor Electric Delivery Co., LLC | | | | | | | | |
6.80%, 09/01/2018 | | | 775 | | | | 959 | |
7.00%, 09/01/2022 | | | 175 | | | | 222 | |
Pacific Gas & Electric Co. | | | | | | | | |
2.45%, 08/15/2022 ^ | | | 181 | | | | 183 | |
3.25%, 09/15/2021 ^ | | | 159 | | | | 172 | |
4.45%, 04/15/2042 | | | 167 | | | | 186 | |
4.50%, 12/15/2041 | | | 540 | | | | 606 | |
5.40%, 01/15/2040 | | | 42 | | | | 53 | |
6.05%, 03/01/2034 | | | 60 | | | | 80 | |
8.25%, 10/15/2018 ^ | | | 395 | | | | 540 | |
PacifiCorp | | | | | | | | |
5.50%, 01/15/2019 | | | 125 | | | | 153 | |
5.65%, 07/15/2018 | | | 100 | | | | 124 | |
6.25%, 10/15/2037 | | | 360 | | | | 507 | |
Pennsylvania Electric Co. | | | | | | | | |
6.05%, 09/01/2017 | | | 150 | | | | 174 | |
PPL Capital Funding, Inc. | | | | | | | | |
4.20%, 06/15/2022 | | | 165 | | | | 177 | |
PPL Energy Supply LLC | | | | | | | | |
4.60%, 12/15/2021 | | | 460 | | | | 503 | |
Progress Energy, Inc. | | | | | | | | |
3.15%, 04/01/2022 | | | 156 | | | | 161 | |
4.40%, 01/15/2021 | | | 140 | | | | 158 | |
4.88%, 12/01/2019 | | | 200 | | | | 232 | |
6.00%, 12/01/2039 | | | 50 | | | | 63 | |
7.75%, 03/01/2031 | | | 150 | | | | 213 | |
Public Service Co., of Colorado | | | | | | | | |
2.25%, 09/15/2022 ^ | | | 137 | | | | 139 | |
3.20%, 11/15/2020 | | | 56 | | | | 62 | |
Public Service Co., of Oklahoma | | | | | | | | |
5.15%, 12/01/2019 | | | 133 | | | | 154 | |
The notes to the financial statements are an integral part of this report.
| | | | |
| Transamerica Funds | | | | Annual Report 2012 |
| | Page 75 | | |
Transamerica Core Bond
(formerly, Transamerica JPMorgan Core Bond)
SCHEDULE OF INVESTMENTS (continued)
At October 31, 2012
| | | | | | | | |
| | | Principal
(000’s) | | | Value
(000’s) | |
Electric Utilities (continued) | | | | | | | | |
Public Service Electric & Gas Co. | | | | | | | | |
2.70%, 05/01/2015 ^ | | $ | 150 | | | $ | 157 | |
3.65%, 09/01/2042 ^ | | | 288 | | | | 300 | |
5.38%, 11/01/2039 | | | 28 | | | | 36 | |
Southern California Edison Co. | | | | | | | | |
3.90%, 12/01/2041 ^ | | | 660 | | | | 704 | |
5.50%, 03/15/2040 | | | 130 | | | | 170 | |
6.65%, 04/01/2029 | | | 300 | | | | 402 | |
Southern Co. | | | | | | | | |
1.95%, 09/01/2016 ^ | | | 254 | | | | 263 | |
Southwestern Public Service Co.—Series G | | | | | | | | |
8.75%, 12/01/2018 | | | 405 | | | | 552 | |
Virginia Electric and Power Co. | | | | | | | | |
2.95%, 01/15/2022 ^ | | | 157 | | | | 167 | |
Wisconsin Electric Power Co. | | | | | | | | |
2.95%, 09/15/2021 | | | 26 | | | | 28 | |
Electronic Equipment & Instruments—0.0% ¥ | | | | | | | | |
Arrow Electronics, Inc. | | | | | | | | |
3.38%, 11/01/2015 | | | 75 | | | | 79 | |
6.00%, 04/01/2020 | | | 385 | | | | 438 | |
6.88%, 07/01/2013—06/01/2018 | | | 252 | | | | 275 | |
Energy Equipment & Services—0.4% | | | | | | | | |
ANR Pipeline Co. | | | | | | | | |
9.63%, 11/01/2021 | | | 200 | | | | 308 | |
Halliburton Co. | | | | | | | | |
6.15%, 09/15/2019 | | | 70 | | | | 89 | |
7.60%, 08/15/2096—144A | | | 160 | | | | 252 | |
Nabors Industries, Inc. | | | | | | | | |
6.15%, 02/15/2018 | | | 205 | | | | 243 | |
9.25%, 01/15/2019 ^ | | | 400 | | | | 537 | |
Noble Holding International, Ltd. | | | | | | | | |
3.95%, 03/15/2022 | | | 87 | | | | 93 | |
5.25%, 03/15/2042 | | | 253 | | | | 284 | |
Schlumberger Investment SA | | | | | | | | |
3.30%, 09/14/2021—144A | | | 344 | | | | 372 | |
Spectra Energy Capital LLC | | | | | | | | |
6.20%, 04/15/2018 | | | 325 | | | | 396 | |
7.50%, 09/15/2038 ^ | | | 125 | | | | 173 | |
8.00%, 10/01/2019 | | | 490 | | | | 656 | |
Texas Eastern Transmission, LP | | | | | | | | |
2.80%, 10/15/2022—144A | | | 462 | | | | 465 | |
TransCanada PipeLines, Ltd. | | | | | | | | |
2.50%, 08/01/2022 | | | 250 | | | | 254 | |
6.50%, 08/15/2018 | | | 175 | | | | 218 | |
7.13%, 01/15/2019 | | | 400 | | | | 515 | |
Transocean, Inc. | | | | | | | | |
6.38%, 12/15/2021 | | | 161 | | | | 196 | |
6.50%, 11/15/2020 | | | 500 | | | | 607 | |
7.35%, 12/15/2041 | | | 124 | | | | 166 | |
7.50%, 04/15/2031 | | | 200 | | | | 252 | |
Weatherford International, Ltd. | | | | | | | | |
5.95%, 04/15/2042 | | | 105 | | | | 115 | |
9.88%, 03/01/2039 | | | 655 | | | | 941 | |
Food & Staples Retailing—0.2% | | | | | | | | |
CVS Caremark Corp. | | | | | | | | |
4.13%, 05/15/2021 | | | 360 | | | | 414 | |
6.13%, 09/15/2039 | | | 150 | | | | 201 | |
CVS Pass—Through Trust | | | | | | | | |
5.93%, 01/10/2034—144A | | | 656 | | | | 800 | |
| | | | | | | | |
| | | Principal
(000’s) | | | Value
(000’s) | |
Food & Staples Retailing (continued) | | | | | | | | |
Kroger Co. | | | | | | | | |
2.20%, 01/15/2017 | | $ | 123 | | | $ | 126 | |
3.40%, 04/15/2022 ^ | | | 700 | | | | 747 | |
5.40%, 07/15/2040 | | | 51 | | | | 59 | |
6.15%, 01/15/2020 | | | 300 | | | | 370 | |
7.50%, 04/01/2031 | | | 100 | | | | 134 | |
8.00%, 09/15/2029 | | | 175 | | | | 237 | |
Walgreen Co. | | | | | | | | |
3.10%, 09/15/2022 | | | 516 | | | | 525 | |
Food Products—0.4% | | | | | | | | |
Bunge, Ltd. Finance Corp. | | | | | | | | |
5.88%, 05/15/2013 | | | 400 | | | | 411 | |
8.50%, 06/15/2019 | | | 310 | | | | 400 | |
Cargill, Inc. | | | | | | | | |
3.30%, 03/01/2022—144A | | | 1,260 | | | | 1,310 | |
6.00%, 11/27/2017—144A | | | 220 | | | | 265 | |
7.35%, 03/06/2019—144A | | | 250 | | | | 317 | |
ConAgra Foods, Inc. | | | | | | | | |
2.10%, 03/15/2018 | | | 200 | | | | 202 | |
Kraft Foods Group, Inc. | | | | | | | | |
3.50%, 06/06/2022—144A | | | 214 | | | | 232 | |
5.00%, 06/04/2042—144A | | | 156 | | | | 182 | |
5.38%, 02/10/2020—144A | | | 318 | | | | 390 | |
6.13%, 08/23/2018—144A | | | 225 | | | | 279 | |
6.50%, 02/09/2040—144A | | | 645 | | | | 904 | |
6.88%, 01/26/2039—144A | | | 196 | | | | 279 | |
Mondelez International, Inc. | | | | | | | | |
5.38%, 02/10/2020 | | | 291 | | | | 357 | |
6.50%, 08/11/2017 | | | 1,171 | | | | 1,446 | |
Gas Utilities—0.2% | | | | | | | | |
AGL Capital Corp. | | | | | | | | |
3.50%, 09/15/2021 | | | 601 | | | | 656 | |
4.45%, 04/15/2013 | | | 300 | | | | 305 | |
5.25%, 08/15/2019 | | | 100 | | | | 120 | |
5.88%, 03/15/2041 | | | 109 | | | | 146 | |
6.38%, 07/15/2016 | | | 300 | | | | 355 | |
Atmos Energy Corp. | | | | | | | | |
4.95%, 10/15/2014 | | | 200 | | | | 216 | |
8.50%, 03/15/2019 | | | 44 | | | | 58 | |
Boston Gas Co. | | | | | | | | |
4.49%, 02/15/2042—144A | | | 330 | | | | 362 | |
CenterPoint Energy Resources Corp. | | | | | | | | |
4.50%, 01/15/2021 | | | 352 | | | | 403 | |
5.95%, 01/15/2014 | | | 150 | | | | 159 | |
6.13%, 11/01/2017 | | | 630 | | | | 767 | |
Health Care Providers & Services—0.2% | | | | | | | | |
Aetna, Inc. | | | | | | | | |
4.50%, 05/15/2042 ^ | | | 153 | | | | 160 | |
6.75%, 12/15/2037 | | | 305 | | | | 414 | |
Medco Health Solutions, Inc. | | | | | | | | |
2.75%, 09/15/2015 ^ | | | 140 | | | | 146 | |
7.13%, 03/15/2018 | | | 250 | | | | 318 | |
UnitedHealth Group, Inc. | | | | | | | | |
3.38%, 11/15/2021 | | | 412 | | | | 441 | |
WellPoint, Inc. | | | | | | | | |
3.13%, 05/15/2022 | | | 492 | | | | 501 | |
3.30%, 01/15/2023 | | | 105 | | | | 109 | |
4.63%, 05/15/2042 | | | 400 | | | | 425 | |
4.65%, 01/15/2043 | | | 38 | | | | 41 | |
The notes to the financial statements are an integral part of this report.
| | | | |
| Transamerica Funds | | | | Annual Report 2012 |
| | Page 76 | | |
Transamerica Core Bond
(formerly, Transamerica JPMorgan Core Bond)
SCHEDULE OF INVESTMENTS (continued)
At October 31, 2012
| | | | | | | | |
| | | Principal
(000’s) | | | Value
(000’s) | |
Health Care Providers & Services (continued) | | | | | | | | |
WellPoint, Inc. (continued) | | | | | | | | |
5.88%, 06/15/2017 | | $ | 650 | | | $ | 770 | |
Household Durables—0.0% ¥ | | | | | | | | |
Newell Rubbermaid, Inc. | | | | | | | | |
4.70%, 08/15/2020 | | | 183 | | | | 204 | |
Household Products—0.0% ¥ | | | | | | | | |
Kimberly-Clark Corp. | | | | | | | | |
2.40%, 03/01/2022 ^ | | | 68 | | | | 69 | |
Independent Power Producers & Energy Traders—0.2% | |
Exelon Generation Co., LLC | | | | | | | | |
4.00%, 10/01/2020 | | | 600 | | | | 647 | |
5.75%, 10/01/2041 | | | 86 | | | | 99 | |
6.20%, 10/01/2017 | | | 940 | | | | 1,119 | |
PSEG Power LLC | | | | | | | | |
4.15%, 09/15/2021 | | | 417 | | | | 455 | |
5.13%, 04/15/2020 | | | 151 | | | | 175 | |
5.32%, 09/15/2016 | | | 800 | | | | 914 | |
5.50%, 12/01/2015 | | | 100 | | | | 113 | |
Southern Power Co. | | | | | | | | |
5.15%, 09/15/2041 | | | 360 | | | | 421 | |
Industrial Conglomerates—0.1% | | | | | | | | |
Danaher Corp. | | | | | | | | |
3.90%, 06/23/2021 | | | 261 | | | | 294 | |
Koninklijke Philips Electronics NV | | | | | | | | |
3.75%, 03/15/2022 ^ | | | 606 | | | | 671 | |
7.20%, 06/01/2026 | | | 500 | | | | 683 | |
Insurance—1.2% | | | | | | | | |
ACE INA Holdings, Inc. | | | | | | | | |
5.60%, 05/15/2015 | | | 425 | | | | 477 | |
Aflac, Inc. | | | | | | | | |
4.00%, 02/15/2022 ^ | | | 466 | | | | 518 | |
6.45%, 08/15/2040 | | | 108 | | | | 138 | |
8.50%, 05/15/2019 | | | 235 | | | | 319 | |
AIG SunAmerica Global Financing X | | | | | | | | |
6.90%, 03/15/2032—144A | | | 800 | | | | 1,067 | |
Allstate Corp. | | | | | | | | |
5.00%, 08/15/2014 | | | 70 | | | | 75 | |
7.45%, 05/16/2019 ^ | | | 100 | | | | 133 | |
Berkshire Hathaway Finance Corp. | | | | | | | | |
2.45%, 12/15/2015 | | | 187 | | | | 197 | |
3.00%, 05/15/2022 ^ | | | 850 | | | | 894 | |
4.40%, 05/15/2042 ^ | | | 268 | | | | 282 | |
5.40%, 05/15/2018 ^ | | | 1,000 | | | | 1,206 | |
5.75%, 01/15/2040 | | | 100 | | | | 125 | |
Berkshire Hathaway, Inc. | | | | | | | | |
3.75%, 08/15/2021 ^ | | | 727 | | | | 814 | |
CNA Financial Corp. | | | | | | | | |
5.85%, 12/15/2014 | | | 200 | | | | 218 | |
5.88%, 08/15/2020 | | | 282 | | | | 332 | |
Jackson National Life Global Funding | | | | | | | | |
4.70%, 06/01/2018—144A | | | 1,400 | | | | 1,538 | |
5.38%, 05/08/2013—144A | | | 950 | | | | 974 | |
Liberty Mutual Group, Inc. | | | | | | | | |
4.95%, 05/01/2022—144A | | | 183 | | | | 200 | |
Lincoln National Corp. | | | | | | | | |
4.20%, 03/15/2022 ^ | | | 53 | | | | 56 | |
4.85%, 06/24/2021 | | | 58 | | | | 64 | |
Massachusetts Mutual Life Insurance Co. | | | | | | | | |
5.38%, 12/01/2041—144A | | | 297 | | | | 351 | |
| | | | | | | | |
| | | Principal
(000’s) | | | Value
(000’s) | |
Insurance (continued) | | | | | | | | |
MetLife, Inc. | | | | | | | | |
6.75%, 06/01/2016 | | $ | 580 | | | $ | 693 | |
Metropolitan Life Global Funding I | | | | | | | | |
2.50%, 09/29/2015—144A | | | 2,200 | | | | 2,298 | |
3.65%, 06/14/2018—144A ^ | | | 520 | | | | 571 | |
3.88%, 04/11/2022—144A | | | 720 | | | | 794 | |
Nationwide Mutual Insurance Co. | | | | | | | | |
6.60%, 04/15/2034—144A | | | 260 | | | | 263 | |
9.38%, 08/15/2039—144A | | | 1,425 | | | | 2,066 | |
New York Life Global Funding | | | | | | | | |
1.30%, 01/12/2015—144A ^ | | | 420 | | | | 426 | |
3.00%, 05/04/2015—144A | | | 600 | | | | 633 | |
4.65%, 05/09/2013—144A | | | 150 | | | | 153 | |
Pacific Life Global Funding | | | | | | | | |
5.00%, 05/15/2017—144A | | | 100 | | | | 107 | |
5.15%, 04/15/2013—144A | | | 280 | | | | 286 | |
Pacific Life Insurance Co. | | | | | | | | |
9.25%, 06/15/2039—144A | | | 1,350 | | | | 1,910 | |
Principal Life Income Funding Trusts | | | | | | | | |
5.10%, 04/15/2014 | | | 385 | | | | 409 | |
5.30%, 12/14/2012 | | | 260 | | | | 261 | |
5.30%, 04/24/2013 ^ | | | 250 | | | | 256 | |
Prudential Insurance Co. of America | | | | | | | | |
8.30%, 07/01/2025—144A | | | 900 | | | | 1,217 | |
Travelers Property Casualty Corp. | | | | | | | | |
7.75%, 04/15/2026 | | | 450 | | | | 635 | |
Internet Software & Services—0.0% ¥ | | | | | | | | |
eBay, Inc. | | | | | | | | |
2.60%, 07/15/2022 ^ | | | 117 | | | | 120 | |
3.25%, 10/15/2020 ^ | | | 420 | | | | 458 | |
4.00%, 07/15/2042 ^ | | | 133 | | | | 133 | |
IT Services—0.1% | | | | | | | | |
HP Enterprise Services LLC | | | | | | | | |
7.45%, 10/15/2029 | | | 500 | | | | 587 | |
International Business Machines Corp. | | | | | | | | |
1.25%, 02/06/2017 | | | 315 | | | | 321 | |
1.88%, 05/15/2019 ^ | | | 420 | | | | 435 | |
1.95%, 07/22/2016 | | | 264 | | | | 276 | |
4.00%, 06/20/2042 | | | 169 | | | | 185 | |
7.00%, 10/30/2025 ^ | | | 508 | | | | 749 | |
Machinery—0.2% | | | | | | | | |
Caterpillar, Inc. | | | | | | | | |
1.50%, 06/26/2017 | | | 115 | | | | 117 | |
2.60%, 06/26/2022 ^ | | | 123 | | | | 127 | |
7.90%, 12/15/2018 ^ | | | 250 | | | | 340 | |
Deere & Co. | | | | | | | | |
2.60%, 06/08/2022 | | | 119 | | | | 123 | |
3.90%, 06/09/2042 | | | 107 | | | | 113 | |
Eaton Corp. | | | | | | | | |
7.63%, 04/01/2024 | | | 500 | | | | 657 | |
Illinois Tool Works, Inc. | | | | | | | | |
3.90%, 09/01/2042 | | | 1,624 | | | | 1,726 | |
Media—0.9% | | | | | | | | |
CBS Corp. | | | | | | | | |
4.85%, 07/01/2042 | | | 320 | | | | 347 | |
5.50%, 05/15/2033 | | | 150 | | | | 167 | |
5.75%, 04/15/2020 | | | 63 | | | | 76 | |
7.88%, 07/30/2030 | | | 130 | | | | 183 | |
8.88%, 05/15/2019 | | | 100 | | | | 138 | |
The notes to the financial statements are an integral part of this report.
| | | | |
| Transamerica Funds | | | | Annual Report 2012 |
| | Page 77 | | |
Transamerica Core Bond
(formerly, Transamerica JPMorgan Core Bond)
SCHEDULE OF INVESTMENTS (continued)
At October 31, 2012
| | | | | | | | |
| | | Principal
(000’s) | | | Value
(000’s) | |
Media (continued) | | | | | | | | |
Comcast Cable Communications LLC | | | | | | | | |
8.88%, 05/01/2017 | | $ | 250 | | | $ | 328 | |
Comcast Cable Holdings LLC | | | | | | | | |
10.13%, 04/15/2022 | | | 414 | | | | 615 | |
Comcast Corp. | | | | | | | | |
6.45%, 03/15/2037 | | | 100 | | | | 132 | |
6.50%, 11/15/2035 | | | 100 | | | | 132 | |
7.05%, 03/15/2033 | | | 1,300 | | | | 1,750 | |
COX Communications, Inc. | | | | | | | | |
5.45%, 12/15/2014 | | | 50 | | | | 55 | |
COX Enterprises, Inc. | | | | | | | | |
7.38%, 07/15/2027—144A | | | 200 | | | | 257 | |
DIRECTV Holdings LLC / DIRECTV | | | | | | | | |
Financing Co., Inc. | | | | | | | | |
3.80%, 03/15/2022 | | | 910 | | | | 947 | |
4.60%, 02/15/2021 | | | 400 | | | | 443 | |
6.00%, 08/15/2040 | | | 700 | | | | 805 | |
6.38%, 03/01/2041 | | | 240 | | | | 289 | |
Discovery Communications LLC | | | | | | | | |
4.38%, 06/15/2021 | | | 344 | | | | 389 | |
Historic TW, Inc. | | | | | | | | |
9.15%, 02/01/2023 | | | 200 | | | | 286 | |
NBCUniversal Media LLC | | | | | | | | |
4.38%, 04/01/2021 | | | 1,000 | | | | 1,144 | |
5.95%, 04/01/2041 | | | 210 | | | | 262 | |
News America, Inc. | | | | | | | | |
6.20%, 12/15/2034 | | | 250 | | | | 312 | |
6.65%, 11/15/2037 | | | 600 | | | | 792 | |
7.25%, 05/18/2018 | | | 155 | | | | 195 | |
7.30%, 04/30/2028 | | | 130 | | | | 170 | |
7.70%, 10/30/2025 | | | 300 | | | | 407 | |
8.88%, 04/26/2023 | | | 200 | | | | 272 | |
TCI Communications, Inc. | | | | | | | | |
7.13%, 02/15/2028 | | | 100 | | | | 135 | |
Thomson Reuters Corp. | | | | | | | | |
3.95%, 09/30/2021 ^ | | | 1,005 | | | | 1,106 | |
4.70%, 10/15/2019 | | | 75 | | | | 86 | |
Time Warner Cable, Inc. | | | | | | | | |
5.50%, 09/01/2041 | | | 388 | | | | 453 | |
6.55%, 05/01/2037 | | | 700 | | | | 911 | |
6.75%, 07/01/2018 | | | 40 | | | | 51 | |
7.30%, 07/01/2038 | | | 90 | | | | 126 | |
8.25%, 02/14/2014—04/01/2019 | | | 930 | | | | 1,155 | |
8.75%, 02/14/2019 | | | 380 | | | | 522 | |
Time Warner Entertainment Co., LP | | | | | | | | |
8.38%, 07/15/2033 | | | 250 | | | | 371 | |
Time Warner, Inc. | | | | | | | | |
4.75%, 03/29/2021 | | | 140 | | | | 164 | |
5.38%, 10/15/2041 | | | 112 | | | | 132 | |
6.20%, 03/15/2040 | | | 100 | | | | 128 | |
6.25%, 03/29/2041 | | | 87 | | | | 113 | |
7.63%, 04/15/2031 | | | 300 | | | | 430 | |
7.70%, 05/01/2032 | | | 100 | | | | 147 | |
Viacom, Inc. | | | | | | | | |
3.88%, 12/15/2021 ^ | | | 606 | | | | 665 | |
Metals & Mining—0.2% | | | | | | | | |
BHP Billiton Finance USA, Ltd. | | | | | | | | |
3.25%, 11/21/2021 | | | 670 | | | | 722 | |
4.13%, 02/24/2042 | | | 300 | | | | 325 | |
| | | | | | | | |
| | | Principal
(000’s) | | | Value
(000’s) | |
Metals & Mining (continued) | | | | | | | | |
BHP Billiton Finance USA, Ltd. (continued) | | | | | | | | |
6.50%, 04/01/2019 | | $ | 270 | | | $ | 347 | |
Placer Dome, Inc. | | | | | | | | |
6.45%, 10/15/2035 | | | 399 | | | | 485 | |
Rio Tinto Finance USA, Ltd. | | | | | | | | |
3.50%, 11/02/2020 | | | 80 | | | | 85 | |
3.75%, 09/20/2021 | | | 941 | | | | 1,020 | |
8.95%, 05/01/2014 ^ | | | 400 | | | | 448 | |
Multiline Retail—0.1% | | | | | | | | |
Kohl’s Corp. | | | | | | | | |
4.00%, 11/01/2021 ^ | | | 262 | | | | 285 | |
Macy’s Retail Holdings, Inc. | | | | | | | | |
3.88%, 01/15/2022 ^ | | | 203 | | | | 223 | |
5.13%, 01/15/2042 | | | 100 | | | | 113 | |
6.90%, 04/01/2029 | | | 200 | | | | 244 | |
7.45%, 07/15/2017 | | | 240 | | | | 298 | |
Nordstrom, Inc. | | | | | | | | |
4.00%, 10/15/2021 ^ | | | 301 | | | | 337 | |
Target Corp. | | | | | | | | |
7.00%, 01/15/2038 | | | 140 | | | | 210 | |
Multi-Utilities—0.3% | | | | | | | | |
CenterPoint Energy, Inc. | | | | | | | | |
6.50%, 05/01/2018 | | | 180 | | | | 219 | |
Consolidated Edison Co., of New York, Inc. | | | | | | | | |
5.70%, 06/15/2040 | | | 154 | | | | 206 | |
Consumers Energy Co. | | | | | | | | |
2.85%, 05/15/2022 | | | 121 | | | | 128 | |
6.70%, 09/15/2019 | | | 100 | | | | 130 | |
Delmarva Power & Light Co. | | | | | | | | |
4.00%, 06/01/2042 | | | 294 | | | | 311 | |
Dominion Resources, Inc. | | | | | | | | |
4.90%, 08/01/2041 | | | 103 | | | | 122 | |
5.25%, 08/01/2033 | | | 500 | | | | 580 | |
6.00%, 11/30/2017 | | | 450 | | | | 547 | |
6.40%, 06/15/2018 | | | 170 | | | | 213 | |
MidAmerican Energy Holdings Co. | | | | | | | | |
6.13%, 04/01/2036 | | | 310 | | | | 408 | |
San Diego Gas & Electric Co. | | | | | | | | |
3.95%, 11/15/2041 | | | 376 | | | | 404 | |
6.00%, 06/01/2026 | | | 320 | | | | 439 | |
Sempra Energy | | | | | | | | |
2.00%, 03/15/2014 | | | 110 | | | | 112 | |
2.88%, 10/01/2022 | | | 227 | | | | 233 | |
6.00%, 10/15/2039 | | | 150 | | | | 197 | |
8.90%, 11/15/2013 | | | 180 | | | | 195 | |
9.80%, 02/15/2019 | | | 764 | | | | 1,084 | |
Xcel Energy, Inc. | | | | | | | | |
4.70%, 05/15/2020 | | | 50 | | | | 59 | |
4.80%, 09/15/2041 ^ | | | 116 | | | | 137 | |
Office Electronics—0.1% | | | | | | | | |
Xerox Corp. | | | | | | | | |
4.50%, 05/15/2021 ^ | | | 80 | | | | 85 | |
5.63%, 12/15/2019 | | | 535 | | | | 606 | |
6.75%, 02/01/2017 | | | 330 | | | | 388 | |
8.25%, 05/15/2014 | | | 90 | | | | 99 | |
Oil, Gas & Consumable Fuels—1.2% | | | | | | | | |
Alberta Energy Co., Ltd. | | | | | | | | |
7.38%, 11/01/2031 | | | 500 | | | | 663 | |
The notes to the financial statements are an integral part of this report.
| | | | |
| Transamerica Funds | | | | Annual Report 2012 |
| | Page 78 | | |
Transamerica Core Bond
(formerly, Transamerica JPMorgan Core Bond)
SCHEDULE OF INVESTMENTS (continued)
At October 31, 2012
| | | | | | | | |
| | | Principal
(000’s) | | | Value
(000’s) | |
Oil, Gas & Consumable Fuels (continued) | | | | | | | | |
Anadarko Finance Co.—Series B | | | | | | | | |
7.50%, 05/01/2031 | | $ | 530 | | | $ | 724 | |
Anadarko Holding Co. | | | | | | | | |
7.15%, 05/15/2028 | | | 552 | | | | 680 | |
Anadarko Petroleum Corp. | | | | | | | | |
7.63%, 03/15/2014 | | | 400 | | | | 435 | |
8.70%, 03/15/2019 | | | 150 | | | | 205 | |
Apache Corp. | | | | | | | | |
3.25%, 04/15/2022 | | | 152 | | | | 166 | |
4.75%, 04/15/2043 | | | 268 | | | | 317 | |
6.90%, 09/15/2018 | | | 180 | | | | 231 | |
BG Energy Capital PLC | | | | | | | | |
5.13%, 10/15/2041—144A | | | 200 | | | | 242 | |
BP Capital Markets PLC | | | | | | | | |
1.85%, 05/05/2017 | | | 429 | | | | 442 | |
3.25%, 05/06/2022 | | | 462 | | | | 496 | |
3.88%, 03/10/2015 | | | 675 | | | | 725 | |
4.74%, 03/11/2021 ^ | | | 100 | | | | 118 | |
Burlington Resources Finance Co. | | | | | | | | |
7.40%, 12/01/2031 | | | 290 | | | | 424 | |
Canadian Natural Resources, Ltd. | | | | | | | | |
6.45%, 06/30/2033 | | | 150 | | | | 198 | |
Cenovus Energy, Inc. | | | | | | | | |
3.00%, 08/15/2022 | | | 91 | | | | 94 | |
4.45%, 09/15/2042 | | | 223 | | | | 241 | |
ConocoPhillips | | | | | | | | |
6.00%, 01/15/2020 | | | 105 | | | | 134 | |
6.65%, 07/15/2018 ^ | | | 350 | | | | 448 | |
Devon Energy Corp. | | | | | | | | |
3.25%, 05/15/2022 | | | 337 | | | | 356 | |
4.75%, 05/15/2042 ^ | | | 224 | | | | 253 | |
6.30%, 01/15/2019 | | | 600 | | | | 755 | |
EnCana Corp. | | | | | | | | |
6.50%, 05/15/2019—08/15/2034 | | | 610 | | | | 760 | |
ENI SpA | | | | | | | | |
5.70%, 10/01/2040—144A | | | 900 | | | | 957 | |
EOG Resources, Inc. | | | | | | | | |
2.63%, 03/15/2023 | | | 236 | | | | 242 | |
4.10%, 02/01/2021 ^ | | | 300 | | | | 344 | |
Hess Corp. | | | | | | | | |
7.88%, 10/01/2029 | | | 620 | | | | 892 | |
Kerr-McGee Corp. | | | | | | | | |
7.88%, 09/15/2031 | | | 300 | | | | 412 | |
Occidental Petroleum Corp. | | | | | | | | |
1.75%, 02/15/2017 | | | 208 | | | | 215 | |
2.70%, 02/15/2023 | | | 882 | | | | 917 | |
Petrobras International Finance Co. | | | | | | | | |
5.38%, 01/27/2021 | | | 400 | | | | 454 | |
Petro-Canada | | | | | | | | |
5.35%, 07/15/2033 | | | 100 | | | | 117 | |
6.05%, 05/15/2018 | | | 312 | | | | 383 | |
7.88%, 06/15/2026 | | | 100 | | | | 149 | |
Phillips 66 | | | | | | | | |
2.95%, 05/01/2017—144A | | | 161 | | | | 172 | |
4.30%, 04/01/2022—144A | | | 130 | | | | 146 | |
Shell International Finance BV | | | | | | | | |
3.10%, 06/28/2015 | | | 478 | | | | 510 | |
4.30%, 09/22/2019 ^ | | | 300 | | | | 354 | |
4.38%, 03/25/2020 | | | 410 | | | | 485 | |
| | | | | | | | |
| | | Principal
(000’s) | | | Value
(000’s) | |
Oil, Gas & Consumable Fuels (continued) | | | | | | | | |
Shell International Finance BV (continued) | | | | | | | | |
6.38%, 12/15/2038 | | $ | 100 | | | $ | 147 | |
Statoil ASA | | | | | | | | |
3.13%, 08/17/2017 | | | 200 | | | | 219 | |
3.15%, 01/23/2022 | | | 313 | | | | 337 | |
4.25%, 11/23/2041 | | | 236 | | | | 264 | |
5.25%, 04/15/2019 | | | 1,130 | | | | 1,370 | |
Suncor Energy, Inc. | | | | | | | | |
5.95%, 12/01/2034 | | | 400 | | | | 501 | |
6.10%, 06/01/2018 | | | 250 | | | | 308 | |
Talisman Energy, Inc. | | | | | | | | |
7.75%, 06/01/2019 | | | 385 | | | | 497 | |
Tosco Corp. | | | | | | | | |
7.80%, 01/01/2027 | | | 160 | | | | 239 | |
8.13%, 02/15/2030 | | | 230 | | | | 352 | |
Total Capital International SA | | | | | | | | |
0.75%, 01/25/2016 | | | 102 | | | | 102 | |
1.55%, 06/28/2017 | | | 187 | | | | 191 | |
2.88%, 02/17/2022 ^ | | | 688 | | | | 724 | |
Total Capital SA | | | | | | | | |
2.30%, 03/15/2016 | | | 400 | | | | 419 | |
4.13%, 01/28/2021 | | | 82 | | | | 94 | |
Pharmaceuticals—0.1% | | | | | | | | |
Merck & Co., Inc. | | | | | | | | |
2.40%, 09/15/2022 | | | 288 | | | | 293 | |
Novartis Capital Corp. | | | | | | | | |
2.40%, 09/21/2022 | | | 360 | | | | 366 | |
Pharmacia Corp. | | | | | | | | |
6.50%, 12/01/2018 | | | 260 | | | | 335 | |
Teva Pharmaceutical Finance Co., BV | | | | | | | | |
3.65%, 11/10/2021 | | | 830 | | | | 903 | |
Watson Pharmaceuticals, Inc. | | | | | | | | |
3.25%, 10/01/2022 | | | 162 | | | | 167 | |
Real Estate Investment Trusts—0.3% | | | | | | | | |
CommonWealth REIT | | | | | | | | |
5.88%, 09/15/2020 ^ | | | 400 | | | | 436 | |
6.25%, 08/15/2016 | | | 400 | | | | 437 | |
6.65%, 01/15/2018 | | | 215 | | | | 239 | |
ERP Operating, LP | | | | | | | | |
4.63%, 12/15/2021 | | | 479 | | | | 549 | |
5.25%, 09/15/2014 | | | 860 | | | | 928 | |
5.75%, 06/15/2017 | | | 120 | | | | 142 | |
HCP, Inc. | | | | | | | | |
3.75%, 02/01/2019 | | | 232 | | | | 246 | |
5.38%, 02/01/2021 | | | 105 | | | | 122 | |
Simon Property Group, LP | | | | | | | | |
4.13%, 12/01/2021 | | | 404 | | | | 454 | |
4.38%, 03/01/2021 ^ | | | 210 | | | | 237 | |
5.65%, 02/01/2020 | | | 247 | | | | 297 | |
6.13%, 05/30/2018 | | | 280 | | | | 344 | |
6.75%, 05/15/2014 | | | 50 | | | | 54 | |
10.35%, 04/01/2019 | | | 220 | | | | 317 | |
WEA Finance LLC | | | | | | | | |
7.13%, 04/15/2018—144A | | | 260 | | | | 320 | |
WEA Finance LLC / WT Finance AUST Pty, Ltd. | | | | | | | | |
3.38%, 10/03/2022—144A ^ | | | 363 | | | | 368 | |
6.75%, 09/02/2019—144A | | | 580 | | | | 718 | |
The notes to the financial statements are an integral part of this report.
| | | | |
| Transamerica Funds | | | | Annual Report 2012 |
| | Page 79 | | |
Transamerica Core Bond
(formerly, Transamerica JPMorgan Core Bond)
SCHEDULE OF INVESTMENTS (continued)
At October 31, 2012
| | | | | | | | |
| | | Principal
(000’s) | | | Value
(000’s) | |
Road & Rail—0.4% | | | | | | | | |
Burlington Northern Santa Fe LLC | | | | | | | | |
3.05%, 09/01/2022 | | $ | 180 | | | $ | 188 | |
3.45%, 09/15/2021 | | | 176 | | | | 189 | |
3.60%, 09/01/2020 | | | 125 | | | | 137 | |
4.38%, 09/01/2042 ^ | | | 100 | | | | 109 | |
4.70%, 10/01/2019 | | | 75 | | | | 87 | |
5.40%, 06/01/2041 | | | 175 | | | | 215 | |
5.65%, 05/01/2017 | | | 387 | | | | 461 | |
5.75%, 05/01/2040 | | | 500 | | | | 640 | |
7.29%, 06/01/2036 | | | 90 | | | | 126 | |
Canadian National Railway Co. | | | | | | | | |
5.85%, 11/15/2017 | | | 180 | | | | 218 | |
CSX Corp. | | | | | | | | |
4.25%, 06/01/2021 ^ | | | 65 | | | | 73 | |
6.25%, 04/01/2015 ^ | | | 125 | | | | 141 | |
6.25%, 03/15/2018 | | | 160 | | | | 197 | |
7.38%, 02/01/2019 | | | 350 | | | | 448 | |
7.90%, 05/01/2017 | | | 400 | | | | 506 | |
Norfolk Southern Corp. | | | | | | | | |
3.25%, 12/01/2021 | | | 166 | | | | 174 | |
3.95%, 10/01/2042 | | | 140 | | | | 143 | |
6.00%, 03/15/2105—05/23/2111 | | | 944 | | | | 1,191 | |
Ryder System, Inc. | | | | | | | | |
2.50%, 03/01/2017 | | | 440 | | | | 448 | |
3.60%, 03/01/2016 | | | 132 | | | | 140 | |
Union Pacific Corp. | | | | | | | | |
2.95%, 01/15/2023 | | | 43 | | | | 45 | |
4.16%, 07/15/2022 | | | 306 | | | | 348 | |
4.30%, 06/15/2042 | | | 148 | | | | 163 | |
5.78%, 07/15/2040 | | | 300 | | | | 393 | |
Semiconductors & Semiconductor Equipment—0.1% | |
Intel Corp. | | | | | | | | |
3.30%, 10/01/2021 | | | 586 | | | | 644 | |
4.80%, 10/01/2041 | | | 535 | | | | 632 | |
National Semiconductor Corp. | | | | | | | | |
3.95%, 04/15/2015 | | | 500 | | | | 540 | |
6.60%, 06/15/2017 | | | 200 | | | | 248 | |
Software—0.1% | | | | | | | | |
Intuit, Inc. | | | | | | | | |
5.75%, 03/15/2017 | | | 70 | | | | 81 | |
Microsoft Corp. | | | | | | | | |
4.50%, 10/01/2040 | | | 70 | | | | 84 | |
Oracle Corp. | | | | | | | | |
5.00%, 07/08/2019 | | | 100 | | | | 122 | |
5.38%, 07/15/2040 | | | 123 | | | | 160 | |
6.13%, 07/08/2039 | | | 731 | | | | 1,032 | |
6.50%, 04/15/2038 | | | 200 | | | | 288 | |
Specialty Retail—0.1% | | | | | | | | |
Gap, Inc. | | | | | | | | |
5.95%, 04/12/2021 | | | 913 | | | | 1,037 | |
Lowe’s Cos., Inc. | | | | | | | | |
4.65%, 04/15/2042 ^ | | | 443 | | | | 499 | |
5.13%, 11/15/2041 | | | 189 | | | | 226 | |
5.50%, 10/15/2035 | | | 140 | | | | 169 | |
7.11%, 05/15/2037 | | | 120 | | | | 168 | |
Staples, Inc. | | | | | | | | |
9.75%, 01/15/2014 | | | 80 | | | | 88 | |
| | | | | | | | |
| | | Principal
(000’s) | | | Value
(000’s) | |
Transportation Infrastructure—0.0% ¥ | | | | | |
Penske Truck Leasing Co., LP / PTL Finance Corp. | | | | | |
4.88%, 07/11/2022—144A | | $ | 500 | | | $ | 511 | |
Water Utilities—0.0% ¥ | | | | | | | | |
American Water Capital Corp. | | | | | | | | |
6.09%, 10/15/2017 | | | 780 | | | | 925 | |
Wireless Telecommunication Services—0.1% | | | | | |
America Movil SAB de CV | | | | | | | | |
2.38%, 09/08/2016 | | | 421 | | | | 440 | |
3.13%, 07/16/2022 | | | 236 | | | | 243 | |
Crown Castle Towers LLC | | | | | | | | |
3.21%, 08/15/2015—144A | | | 290 | | | | 302 | |
Vodafone Group PLC | | | | | | | | |
1.63%, 03/20/2017 | | | 470 | | | | 480 | |
5.45%, 06/10/2019 | | | 75 | | | | 92 | |
| | | | | | | | |
Total Corporate Debt Securities (cost $316,204) | | | | 346,464 | |
| | | | | | | | |
| | |
| | | Shares | | | Value
(000’s) | |
SECURITIES LENDING COLLATERAL—3.7% | | | | | |
State Street Navigator Securities Lending Trust—Prime Portfolio, 0.31% | | | 69,981,080 | | | | 69,981 | |
Total Securities Lending Collateral (cost $69,981) | |
| | |
| | | Principal
(000’s) | | | Value
(000’s) | |
REPURCHASE AGREEMENT—1.5% | | | | | |
State Street Bank & Trust Co. 0.03% , dated 10/31/2012, to be repurchased at $27,436 on 11/01/2012. Collateralized by a U.S. Government Agency Obligation, 3.00%, due 12/01/2026, and with a value of $27,986. | | $ | 27,436 | | | | 27,436 | |
Total Repurchase Agreement (cost $27,436) | | | | | |
| | | | | | | | |
Total Investment Securities (cost $1,839,717) P | | | | 1,943,026 | |
Other Assets and Liabilities—Net | | | | | | | (63,832 | ) |
| | | | | | | | |
Net Assets | | | | | | $ | 1,879,194 | |
| | | | | | | | |
The notes to the financial statements are an integral part of this report.
| | | | |
| Transamerica Funds | | | | Annual Report 2012 |
| | Page 80 | | |
Transamerica Core Bond
(formerly, Transamerica JPMorgan Core Bond)
SCHEDULE OF INVESTMENTS (continued)
At October 31, 2012
NOTES TO SCHEDULE OF INVESTMENTS (all amounts in thousands):
| ^ | All or a portion of this security is on loan. The value of all securities on loan is $68,551. |
| | Rate shown reflects the yield at 10/31/2012. |
| * | Floating or variable rate note. Rate is listed as of 10/31/2012. |
| ¥ | Percentage rounds to less than 0.1%. |
| P | Aggregate cost for federal income tax purposes is $1,839,717. Aggregate gross unrealized appreciation/depreciation for all securities in which there is an excess of value over tax cost were $107,738 and $4,429, respectively. Net unrealized appreciation for tax purposes is $103,309. |
DEFINITIONS (all amounts in thousands):
| 144A | 144A Securities are registered pursuant to Rule 144A of the Securities Act of 1933. These securities are deemed to be liquid for purposes of compliance limitations on holdings of illiquid securities and may be resold as transactions exempt from registration, normally to qualified institutional buyers. At 10/31/2012, these securities aggregated $213,114, or 11.34% of the fund’s net assets. |
| REMIC | Real Estate Mortgage Investment Conduits (consist of a fixed pool of mortgages broken apart and marketed to investors as individual securities) |
| STRIPS | Separate Trading of Registered Interest and Principal of Securities |
VALUATION SUMMARY (all amounts in thousands): '
| | | | | | | | | | | | | | | | |
Investment Securities | | Level 1 -
Quoted
Prices | | | Level 2 -
Other
Significant
Observable
Inputs | | | Level 3 -
Significant
Unobservable
Inputs | | | Value at
10/31/2012 | |
Asset-Backed Securities | | $ | — | | | $ | 88,513 | | | $ | — | | | $ | 88,513 | |
Corporate Debt Securities | | | — | | | | 346,464 | | | | — | | | | 346,464 | |
Foreign Government Obligations | | | — | | | | 37,078 | | | | — | | | | 37,078 | |
Mortgage-Backed Securities | | | — | | | | 210,173 | | | | — | | | | 210,173 | |
Municipal Government Obligations | | | — | | | | 5,129 | | | | — | | | | 5,129 | |
Repurchase Agreement | | | — | | | | 27,436 | | | | — | | | | 27,436 | |
Securities Lending Collateral | | | 69,981 | | | | — | | | | — | | | | 69,981 | |
U.S. Government Agency Obligations | | | — | | | | 847,795 | | | | — | | | | 847,795 | |
U.S. Government Obligations | | | — | | | | 310,457 | | | | — | | | | 310,457 | |
| | | | | | | | | | | | | | | | |
Total | | $ | 69,981 | | | $ | 1,873,045 | | | $ | — | | | $ | 1,943,026 | |
| | | | | | | | | | | | | | | | |
| ' | Transfers between levels are considered to have occurred at the end of the reporting period. There were no transfers into or out of Levels 1 and 2 during the period ended 10/31/2012. See the notes to the financial statements for more information regarding pricing inputs and valuation techniques. |
The notes to the financial statements are an integral part of this report.
| | | | |
| Transamerica Funds | | | | Annual Report 2012 |
| | Page 81 | | |
Transamerica Developing Markets Equity
(formerly, Transamerica Oppenheimer Developing Markets)
SCHEDULE OF INVESTMENTS
At October 31, 2012
| | | | | | | | |
| | | Shares | | | Value
(000’s) | |
PREFERRED STOCKS—2.0% | | | | | | | | |
Brazil—1.5% | | | | | | | | |
Lojas Americanas SA , 0.52% | | | 588,634 | | | $ | 4,927 | |
Colombia—0.5% | | | | | | | | |
Banco Davivienda SA , 2.12% | | | 148,331 | | | | 1,830 | |
| | | | | | | | |
Total Preferred Stocks (cost $5,510) | | | | | | | 6,757 | |
| | | | | | | | |
COMMON STOCKS—93.8% | | | | | | | | |
Brazil—9.8% | | | | | | | | |
Amil Participacoes SA | | | 32,800 | | | | 493 | |
B2W Cia Global Do Varejo ‡ | | | 154,216 | | | | 750 | |
Banco Bradesco SA ADR | | | 109,400 | | | | 1,713 | |
BM&FBovespa SA | | | 1,010,846 | | | | 6,471 | |
Cia Brasileira de Distribuicao Grupo Pao de Acucar ADR | | | 71,060 | | | | 3,321 | |
Cia de Bebidas das Americas ADR | | | 80,900 | | | | 3,300 | |
Embraer SA ADR ‡ | | | 102,190 | | | | 2,852 | |
Estacio Participacoes SA | | | 136,900 | | | | 2,609 | |
Kroton Educacional SA ‡ | | | 145,104 | | | | 2,901 | |
Natura Cosmeticos SA | | | 146,700 | | | | 3,911 | |
Petroleo Brasileiro SA—Class A ADR | | | 123,400 | | | | 2,533 | |
Vale SA—Class B ADR | | | 151,880 | | | | 2,702 | |
Chile—0.2% | | | | | | | | |
Banco Santander Chile | | | 11,673,585 | | | | 807 | |
China—6.4% | | | | | | | | |
Baidu, Inc. ADR ‡ | | | 96,120 | | | | 10,248 | |
Ctrip.com International, Ltd. ADR ‡ ^ | | | 173,120 | | | | 3,464 | |
Home Inns & Hotels Management, Inc. ADR ‡ | | | 54,930 | | | | 1,618 | |
NetEase, Inc. ADR ‡ | | | 57,530 | | | | 3,107 | |
New Oriental Education & Technology Group ADR ^ | | | 133,560 | | | | 2,252 | |
Youku Tudou, Inc. ADR ‡ | | | 62,530 | | | | 1,238 | |
Colombia—1.4% | | | | | | | | |
Almacenes Exito SA | | | 158,328 | | | | 3,019 | |
Bancolombia SA ADR | | | 27,260 | | | | 1,745 | |
Cementos Argos SA | | | 21,755 | | | | 104 | |
Denmark—2.4% | | | | | | | | |
Carlsberg AS—Class B | | | 77,036 | | | | 6,646 | |
FLSmidth & Co. A/S ^ | | | 25,290 | | | | 1,494 | |
Egypt—0.7% | | | | | | | | |
Commercial International Bank Egypt SAE | | | 372,222 | | | | 2,314 | |
France—0.2% | | | | | | | | |
Technip SA | | | 5,280 | | | | 595 | |
Hong Kong—11.7% | | | | | | | | |
AIA Group, Ltd. | | | 945,800 | | | | 3,740 | |
China Oilfield Services, Ltd.—Class H | | | 410,000 | | | | 776 | |
China Shenhua Energy Co., Ltd.—Class H | | | 432,500 | | | | 1,842 | |
CNOOC, Ltd. | | | 1,547,000 | | | | 3,209 | |
Hang Lung Group, Ltd. | | | 241,750 | | | | 1,427 | |
Hang Lung Properties, Ltd. | | | 772,549 | | | | 2,692 | |
Hong Kong Exchanges and Clearing, Ltd. ^ | | | 286,887 | | | | 4,723 | |
Prada SpA | | | 496,000 | | | | 4,048 | |
Shandong Weigao Group Medical Polymer Co., Ltd. ^ | | | 267,000 | | | | 361 | |
Sinopharm Group Co., Ltd.—Class H ^ | | | 412,600 | | | | 1,390 | |
Soho China, Ltd. ^ | | | 1,301,500 | | | | 885 | |
Sun Art Retail Group, Ltd. ^ | | | 48,000 | | | | 65 | |
Tencent Holdings, Ltd. | | | 149,400 | | | | 5,294 | |
Tingyi Cayman Islands Holding Corp. ^ | | | 1,731,000 | | | | 5,159 | |
Want Want China Holdings, Ltd. | | | 3,043,000 | | | | 4,162 | |
India—13.0% | | | | | | | | |
Ambuja Cements, Ltd. | | | 156,325 | | | | 589 | |
Asian Paints, Ltd. | | | 24,392 | | | | 1,748 | |
Cipla, Ltd. | | | 162,226 | | | | 1,101 | |
Colgate-Palmolive India, Ltd. | | | 92,950 | | | | 2,203 | |
| | | | | | | | |
| | | Shares | | | Value
(000’s) | |
India (continued) | | | | | | | | |
HDFC Bank, Ltd. ADR | | | 118,980 | | | $ | 4,449 | |
Hindustan Unilever, Ltd. | | | 353,776 | | | | 3,600 | |
Housing Development Finance Corp. | | | 476,966 | | | | 6,722 | |
ICICI Bank, Ltd. ADR | | | 97,130 | | | | 3,812 | |
Infosys, Ltd. | | | 222,272 | | | | 9,773 | |
Marico, Ltd. | | | 396,106 | | | | 1,549 | |
Sun Pharmaceuticals Industries, Ltd. | | | 72,614 | | | | 938 | |
Sun TV Network, Ltd. | | | 173,356 | | | | 1,057 | |
Tata Consultancy Services, Ltd. | | | 141,542 | | | | 3,460 | |
Ultratech Cement, Ltd. | | | 6,454 | | | | 239 | |
Zee Entertainment Enterprises, Ltd. | | | 1,033,209 | | | | 3,629 | |
Indonesia—1.8% | | | | | | | | |
Astra International PT | | | 4,437,000 | | | | 3,718 | |
Semen Gresik Persero PT | | | 114,500 | | | | 178 | |
Unilever Indonesia PT | | | 767,000 | | | | 2,080 | |
Italy—0.5% | | | | | | | | |
Saipem SpA | | | 10,289 | | | | 462 | |
Salvatore Ferragamo Italia SpA | | | 58,679 | | | | 1,192 | |
Korea, Republic of—3.9% | | | | | | | | |
E-Mart Co., Ltd. ^ | | | 18,750 | | | | 4,066 | |
MegaStudy Co., Ltd. | | | 4,614 | | | | 286 | |
NHN Corp. ^ | | | 31,683 | | | | 7,336 | |
Shinsegae Co., Ltd. | | | 9,006 | | | | 1,610 | |
Luxembourg—1.1% | | | | | | | | |
Tenaris SA ADR | | | 97,450 | | | | 3,666 | |
Malaysia—0.4% | | | | | | | | |
Genting Bhd | | | 433,300 | | | | 1,259 | |
Mexico—8.5% | | | | | | | | |
America Movil SAB de CV—Series L ADR | | | 475,270 | | | | 12,019 | |
Fomento Economico Mexicano SAB de CV ADR | | | 56,230 | | | | 5,095 | |
Fomento Economico Mexicano SAB de CV ^ | | | 564,613 | | | | 5,084 | |
Grupo Financiero Inbursa SAB de CV—Class O ^ | | | 673,778 | | | | 1,791 | |
Grupo Televisa SAB ADR | | | 74,420 | | | | 1,682 | |
Wal-Mart de Mexico SAB de CV—Series V | | | 1,119,021 | | | | 3,293 | |
Philippines—3.0% | | | | | | | | |
Jollibee Foods Corp. | | | 704,130 | | | | 1,807 | |
SM Investments Corp. | | | 161,530 | | | | 3,149 | |
SM Prime Holdings, Inc. | | | 14,589,163 | | | | 5,134 | |
Russian Federation—2.3% | | | | | | | | |
Magnit OJSC Ә | | | 55,399 | | | | 7,877 | |
Singapore—1.0% | | | | | | | | |
Dairy Farm International Holdings, Ltd. | | | 76,215 | | | | 851 | |
Genting Singapore PLC ^ | | | 1,909,000 | | | | 2,081 | |
Jardine Strategic Holdings, Ltd. ^ | | | 17,000 | | | | 619 | |
South Africa—3.0% | | | | | | | | |
Anglo American Platinum, Ltd. ^ | | | 17,391 | | | | 808 | |
Impala Platinum Holdings, Ltd. ^ | | | 156,521 | | | | 2,816 | |
MTN Group, Ltd. ^ | | | 263,111 | | | | 4,744 | |
Standard Bank Group, Ltd. | | | 140,021 | | | | 1,730 | |
Taiwan—2.4% | | | | | | | | |
Epistar Corp. | | | 760,500 | | | | 1,211 | |
HTC Corp. | | | 80,263 | | | | 580 | |
Synnex Technology International Corp. | | | 905,801 | | | | 1,916 | |
Taiwan Semiconductor Manufacturing Co., Ltd. | | | 1,522,459 | | | | 4,622 | |
Thailand—0.6% | | | | | | | | |
Siam Commercial Bank PCL ^ | | | 400,200 | | | | 2,102 | |
Turkey—5.0% | | | | | | | | |
Akbank TAS | | | 504,295 | | | | 2,431 | |
Anadolu Efes Biracilik Ve Malt Sanayii AS | | | 180,112 | | | | 2,703 | |
BIM Birlesik Magazalar AS | | | 50,576 | | | | 2,349 | |
Enka Insaat ve Sanayi AS | | | 743,815 | | | | 1,975 | |
Haci OMER Sabanci Holding AS | | | 984,296 | | | | 5,194 | |
Turkiye Garanti Bankasi AS | | | 510,292 | | | | 2,437 | |
The notes to the financial statements are an integral part of this report.
| | | | |
| Transamerica Funds | | | | Annual Report 2012 |
| | Page 82 | | |
Transamerica Developing Markets Equity
(formerly, Transamerica Oppenheimer Developing Markets)
SCHEDULE OF INVESTMENTS (continued)
At October 31, 2012
| | | | | | | | |
| | | Shares | | | Value
(000’s) | |
United Kingdom—11.6% | | | | | | | | |
Anglo American PLC | | | 194,173 | | | $ | 5,962 | |
BG Group PLC | | | 238,050 | | | | 4,408 | |
Burberry Group PLC | | | 75,040 | | | | 1,412 | |
Eurasia Drilling Co., Ltd.—Reg S GDR | | | 53,604 | | | | 1,855 | |
Magnit OJSC—Reg S GDR ^ | | | 54,470 | | | | 1,934 | |
Mail.ru Group, Ltd.—Reg S GDR | | | 43,000 | | | | 1,434 | |
NovaTek OAO—Reg S GDR | | | 54,600 | | | | 6,224 | |
Rio Tinto PLC | | | 20,270 | | | | 1,016 | |
SABMiller PLC | | | 113,110 | | | | 4,845 | |
Tullow Oil PLC | | | 294,780 | | | | 6,680 | |
Unilever PLC | | | 102,998 | | | | 3,841 | |
United States—2.9% | | | | | | | | |
Almacenes Exito SA—144A GDR | | | 135,400 | | | | 2,572 | |
Credicorp, Ltd. | | | 10,080 | | | | 1,304 | |
Inretail Peru Corp.—144A ‡ Ә | | | 55,400 | | | | 1,072 | |
MercadoLibre, Inc. ^ | | | 8,260 | | | | 694 | |
Yandex NV—Class A ‡ ^ | | | 184,770 | | | | 4,301 | |
| | | | | | | | |
Total Common Stocks (cost $300,652) | | | | | | | 320,356 | |
| | | | | | | | |
| | | | | | | | |
| | | Shares | | | Value
(000’s) | |
SECURITIES LENDING COLLATERAL—10.4% | |
State Street Navigator Securities Lending Trust—Prime Portfolio, 0.31% | | | 35,535,356 | | | $ | 35,535 | |
Total Securities Lending Collateral (cost $35,535) | |
| | |
| | | Principal
(000’s) | | | Value
(000’s) | |
REPURCHASE AGREEMENT—4.1% | | | | | | | | |
State Street Bank & Trust Co. 0.03% , dated 10/31/2012, to be repurchased at $13,968 on 11/01/2012. Collateralized by U.S. Government Agency Obligations, 3.00%, due 12/01/2026, and with a total value of $14,249. | | $ | 13,968 | | | | 13,968 | |
Total Repurchase Agreement (cost $13,968) | |
| | | | | | | | |
Total Investment Securities (cost $355,665) P | | | | 376,616 | |
Other Assets and Liabilities—Net | | | | | | | (35,254 | ) |
| | | | | | | | |
Net Assets | | | | | | $ | 341,362 | |
| | | | | | | | |
| | | | | | | | |
INVESTMENTS BY INDUSTRY (unaudited): | | Percentage of
Total Investment
Securities | | | Value
(000’s) | |
Internet Software & Services | | | 8.9 | % | | $ | 33,651 | |
Food & Staples Retailing | | | 8.5 | | | | 32,029 | |
Commercial Banks | | | 7.6 | | | | 28,464 | |
Beverages | | | 7.3 | | | | 27,673 | |
Oil, Gas & Consumable Fuels | | | 6.6 | | | | 24,896 | |
Wireless Telecommunication Services | | | 4.5 | | | | 16,764 | |
Diversified Financial Services | | | 4.4 | | | | 16,388 | |
Metals & Mining | | | 3.5 | | | | 13,305 | |
IT Services | | | 3.5 | | | | 13,232 | |
Food Products | | | 3.5 | | | | 13,163 | |
Hotels, Restaurants & Leisure | | | 2.7 | | | | 10,229 | |
Real Estate Management & Development | | | 2.7 | | | | 10,139 | |
Diversified Consumer Services | | | 2.1 | | | | 8,047 | |
Household Products | | | 2.1 | | | | 7,884 | |
Energy Equipment & Services | | | 2.0 | | | | 7,353 | |
Thrifts & Mortgage Finance | | | 1.8 | | | | 6,722 | |
Textiles, Apparel & Luxury Goods | | | 1.8 | | | | 6,652 | |
Media | | | 1.7 | | | | 6,368 | |
Semiconductors & Semiconductor Equipment | | | 1.5 | | | | 5,833 | |
Industrial Conglomerates | | | 1.5 | | | | 5,743 | |
Personal Products | | | 1.4 | | | | 5,460 | |
Multiline Retail | | | 1.3 | | | | 4,927 | |
Insurance | | | 1.0 | | | | 3,740 | |
Automobiles | | | 1.0 | | | | 3,719 | |
Aerospace & Defense | | | 0.8 | | | | 2,852 | |
Pharmaceuticals | | | 0.5 | | | | 2,039 | |
Electronic Equipment & Instruments | | | 0.5 | | | | 1,916 | |
Health Care Providers & Services | | | 0.5 | | | | 1,883 | |
Chemicals | | | 0.5 | | | | 1,748 | |
Construction & Engineering | | | 0.4 | | | | 1,494 | |
Construction Materials | | | 0.3 | | | | 1,109 | |
Internet & Catalog Retail | | | 0.2 | | | | 750 | |
Communications Equipment | | | 0.2 | | | | 580 | |
Health Care Equipment & Supplies | | | 0.1 | | | | 361 | |
| | | | | | | | |
Investment Securities, at Value | | | 86.9 | | | | 327,113 | |
Short-Term Investments | | | 13.1 | | | | 49,503 | |
| | | | | | | | |
Total Investments | | | 100.0 | % | | $ | 376,616 | |
| | | | | | | | |
The notes to the financial statements are an integral part of this report.
| | | | |
| Transamerica Funds | | | | Annual Report 2012 |
| | Page 83 | | |
Transamerica Developing Markets Equity
(formerly, Transamerica Oppenheimer Developing Markets)
SCHEDULE OF INVESTMENTS (continued)
At October 31, 2012
NOTES TO SCHEDULE OF INVESTMENTS (all amounts in thousands):
| | Rate shown reflects the yield at 10/31/2012. |
| ‡ | Non-income producing security. |
| ^ | All or a portion of this security is on loan. The value of all securities on loan is $33,954. |
| Ә | Fair valued as determined in good faith in accordance with procedures established by the Board of Trustees. Total aggregate market value of fair valued securities is $8,949, or 2.62% of the fund’s net assets. |
| P | Aggregate cost for federal income tax purposes is $360,580. Aggregate gross unrealized appreciation/depreciation for all securities in which there is an excess of value over tax cost were $39,529 and $23,493, respectively. Net unrealized appreciation for tax purposes is $16,036. |
DEFINITIONS (all amounts in thousands):
| | |
| 144A | | 144A Securities are registered pursuant to Rule 144A of the Securities Act of 1933. These securities are deemed to be liquid for purposes of compliance limitations on holdings of illiquid securities and may be resold as transactions exempt from registration, normally to qualified institutional buyers. At 10/31/2012, these securities aggregated $3,644, or 1.07% of the fund’s net assets. |
| ADR | | American Depositary Receipt |
| GDR | | Global Depositary Receipt |
| OJSC | | Open Joint Stock Company |
| OAO | | Otkrytoe Aktsionernoe Obschestvo (Russian: Open Joint Stock Corporation) |
VALUATION SUMMARY (all amounts in thousands): '
| | | | | | | | | | | | | | | | |
Investment Securities | | Level 1 -
Quoted
Prices | | | Level 2 -
Other
Significant
Observable
Inputs | | | Level 3 -
Significant
Unobservable
Inputs | | | Value at
10/31/2012 | |
Common Stocks | | $ | 116,619 | | | $ | 203,737 | | | $ | — | | | $ | 320,356 | |
Preferred Stocks | | | 6,757 | | | | — | | | | — | | | | 6,757 | |
Repurchase Agreement | | | — | | | | 13,968 | | | | — | | | | 13,968 | |
Securities Lending Collateral | | | 35,535 | | | | — | | | | — | | | | 35,535 | |
| | | | | | | | | | | | | | | | |
Total | | $ | 158,911 | | | $ | 217,705 | | | $ | — | | | $ | 376,616 | |
| | | | | | | | | | | | | | | | |
Level 3 Rollforward—Investment Securities
| | | | | | | | | | | | | | | | | | | | | | | | | | | | | | | | | | | | | | | | |
Securities | | Beginning
Balance at
10/31/2011 | | | Purchases | | | Sales | | | Accrued
Discounts/
(Premiums) | | | Total
Realized
Gain/(Loss) | | | Net Change in
Unrealized
Appreciation/
(Depreciation) ƒ | | | Transfers
into Level 3 | | | Transfers
out of Level 3 | | | Ending
Balance at
10/31/2012 ₪ | | | Net Change in
Unrealized
Appreciation/
(Depreciation) on
Investments Held
at 10/31/2012 ƒ | |
Rights | | $ | ¿ | | | $ | 1 | | | $ | (1 | ) ∂ | | $ | — | | | $ | — | | | $ | — | | | $ | — | | | $ | — | | | $ | — | | | $ | — | |
| ' | Transfers between levels are considered to have occurred at the end of the reporting period. There were no transfers into or out of Levels 1 and 2 during the period ended 10/31/2012. See the notes to the financial statements for more information regarding pricing inputs and valuation techniques. |
| ƒ | Any difference between Net Change in Unrealized Appreciation/(Depreciation) and Net Change in Unrealized Appreciation/(Depreciation) on Investments Held at 10/31/2012 may be due to an investment no longer held or categorized as Level 3 at period end. |
| ∂ | Rights exercised on 11/10/2011. |
| ₪ | Inputs used in the valuation of the Level 3 securities were not considered significant unobservable inputs. |
The notes to the financial statements are an integral part of this report.
| | | | |
| Transamerica Funds | | | | Annual Report 2012 |
| | Page 84 | | |
Transamerica Global Macro
(formerly, Transamerica First Quadrant Global Macro)
SCHEDULE OF INVESTMENTS
At October 31, 2012
| | | | | | | | |
| | | Principal
(000’s) | | | Value
(000’s) | |
SHORT-TERM U.S. GOVERNMENT OBLIGATIONS—60.6% | |
U.S. Treasury Bill | | | | | | | | |
0.05%, 11/15/2012 n | | $ | 7,000 | | | $ | 7,000 | |
0.07%, 12/06/2012 n g | | | 23,500 | | | | 23,497 | |
0.08%, 12/20/2012 - 12/27/2012 n | | | 37,500 | | | | 37,494 | |
| | | | | | | | |
Total Short-Term U.S. Government Obligations (cost $67,991) | | | | | | | 67,991 | |
| | | | | | | | |
| | |
| | | Notional
Amount
(000’s) | | | Value
(000’s) | |
PURCHASED OPTIONS—0.6% | | | | | |
Call Options—0.1% | | | | | | | | |
S&P 500 Index
Index Value 1,570.00
Expires 11/17/2012 | | | 6 | | | | ¿ | |
S&P 500 Index
Index Value 1,575.00
Expires 11/17/2012 | | | 6 | | | | ¿ | |
S&P 500 Index
Index Value 1,405.00
Expires 12/22/2012 | | | 2 | | | | 63 | |
S&P 500 Index
Index Value 1,430.00
Expires 12/22/2012 | | | 1 | | | | 11 | |
S&P 500 Index
Index Value 1,435.00
Expires 12/22/2012 | | | 1 | | | | 26 | |
S&P 500 Index
Index Value 1,445.00
Expires 12/22/2012 | | | 1 | | | | 18 | |
S&P 500 Index
Index Value 1,450.00
Expires 12/22/2012 | | | 1 | | | | 14 | |
S&P 500 Index
Index Value 1,455.00
Expires 12/22/2012 | | | 1 | | | | 17 | |
S&P 500 Index
Index Value 1,465.00
Expires 12/22/2012 | | | ¿ | | | | 3 | |
Put Options—0.5% | | | | | | | | |
S&P 500 Index
Index Value 1,410.00
Expires 12/22/2012 | | | ¿ | | | | 11 | |
S&P 500 Index
Index Value 1,150.00
Expires 11/17/2012 | | | 28 | | | | 4 | |
S&P 500 Index
Index Value 1,170.00
Expires 11/17/2012 | | | 38 | | | | 6 | |
S&P 500 Index
Index Value 1,175.00
Expires 11/17/2012 | | | 18 | | | | 4 | |
S&P 500 Index
Index Value 1,180.00
Expires 11/17/2012 | | | 36 | | | | 13 | |
S&P 500 Index
Index Value 1,200.00
Expires 11/17/2012 | | | 146 | | | | 44 | |
| | | | | | | | |
| | | Notional
Amount
(000’s) | | | Value
(000’s) | |
Put Options (continued) | | | | | | | | |
S&P 500 Index
Index Value 1,220.00
Expires 11/17/2012 | | $ | 68 | | | $ | 24 | |
S&P 500 Index
Index Value 1,230.00
Expires 11/17/2012 | | | 20 | | | | 8 | |
S&P 500 Index
Index Value 1,240.00
Expires 11/17/2012 | | | 40 | | | | 18 | |
S&P 500 Index
Index Value 1,370.00
Expires 11/17/2012 | | | 6 | | | | 55 | |
S&P 500 Index
Index Value 1,400.00
Expires 11/17/2012 | | | 8 | | | | 145 | |
S&P 500 Index
Index Value 1,420.00
Expires 11/17/2012 | | | 8 | | | | 195 | |
S&P 500 Index
Index Value 1,460.00
Expires 12/22/2012 | | | 1 | | | | 62 | |
| | | | | | | | |
Total Purchased Options (cost $1,100) | | | | | | | 741 | |
| | | | | | | | |
| | | | | | | | |
| | | Principal
(000’s) | | | Value
(000’s) | |
REPURCHASE AGREEMENT—39.8% | | | | | |
State Street Bank & Trust Co. 0.03% , dated 10/31/2012, to be repurchased at $44,637 on 11/01/2012. Collateralized by a U.S. Government Agency Obligation, 3.00%, due 12/01/2026, and with a value of $45,529. | | | 44,637 | | | | 44,637 | |
Total Repurchase Agreement (cost $44,637) | | | | | | | | |
| | | | | | | | |
Total Investment Securities (cost $113,728) P | | | | | | | 113,369 | |
Other Assets and Liabilities—Net | | | | | | | (1,108 | ) |
| | | | | | | | |
Net Assets | | | | | | $ | 112,261 | |
| | | | | | | | |
| | | | | | | | |
| | | Notional
Amount
(000’s) | | | Value
(000’s) | |
WRITTEN OPTIONS—(0.8%) | | | | | |
Call Options—(0.1%) | | | | | | | | |
S&P 500 Index
Index Value 1,420.00
Expires 11/17/2012 | | | $ (2) | | | | $ (26) | |
S&P 500 Index
Index Value 1,410.00
Expires 12/22/2012 | | | (¿) | | | | (10) | |
S&P 500 Index
Index Value 1,460.00
Expires 11/17/2012 | | | (6) | | | | (16) | |
S&P 500 Index
Index Value 1,470.00
Expires 11/17/2012 | | | (16) | | | | (31) | |
S&P 500 Index
Index Value 1,480.00
Expires 11/17/2012 | | | (8) | | | | (8) | |
The notes to the financial statements are an integral part of this report.
| | | | |
| Transamerica Funds | | | | Annual Report 2012 |
| | Page 85 | | |
Transamerica Global Macro
(formerly, Transamerica First Quadrant Global Macro)
SCHEDULE OF INVESTMENTS (continued)
At October 31, 2012
| | | | | | | | |
| | | Notional
Amount
(000’s) | | | Value
(000’s) | |
Call Options (continued) | | | | | | | | |
S&P 500 Index
Index Value 1,490.00
Expires 11/17/2012 | | $ | (24 | ) | | $ | (17 | ) |
S&P 500 Index
Index Value 1,500.00
Expires 11/17/2012 | | | (16 | ) | | | (8 | ) |
S&P 500 Index
Index Value 1,520.00
Expires 11/17/2012 | | | (8 | ) | | | (2 | ) |
S&P 500 Index
Index Value 1,525.00
Expires 11/17/2012 | | | (6 | ) | | | (1 | ) |
S&P 500 Index
Index Value 1,540.00
Expires 11/17/2012 | | | (6 | ) | | | (1 | ) |
S&P 500 Index
Index Value 1,460.00
Expires 12/22/2012 | | | (1 | ) | | | (10 | ) |
S&P 500 Index
Index Value 1,550.00
Expires 12/22/2012 | | | (4 | ) | | | (2 | ) |
Put Options—(0.7%) | | | | | | | | |
S&P 100 Index
Index Value 1,435.00
Expires 12/22/2012 | | | (1 | ) | | | (61 | ) |
S&P 500 Index
Index Value 1,270.00
Expires 11/17/2012 | | | (28 | ) | | | (28 | ) |
S&P 500 Index
Index Value 1,275.00
Expires 11/17/2012 | | | (54 | ) | | | (54 | ) |
S&P 500 Index
Index Value 1,280.00
Expires 11/17/2012 | | | (54 | ) | | | (70 | ) |
| | | | | | | | |
| | | Notional
Amount
(000’s) | | | Value
(000’s) | |
Put Options (continued) | | | | | | | | |
S&P 500 Index
Index Value 1,300.00
Expires 11/17/2012 | | | $ (42) | | | | $ (76) | |
S&P 500 Index
Index Value 1,310.00
Expires 11/17/2012 | | | (36) | | | | (72) | |
S&P 500 Index
Index Value 1,320.00
Expires 11/17/2012 | | | (23) | | | | (69) | |
S&P 500 Index
Index Value 1,405.00
Expires 12/22/2012 | | | (2) | | | | (59) | |
S&P 500 Index
Index Value 1,430.00
Expires 12/22/2012 | | | (1) | | | | (24) | |
S&P 500 Index
Index Value 1,445.00
Expires 12/22/2012 | | | (1) | | | | (58) | |
S&P 500 Index
Index Value 1,450.00
Expires 12/22/2012 | | | (1) | | | | (66) | |
S&P 500 Index
Index Value 1,455.00
Expires 12/22/2012 | | | (1) | | | | (84) | |
S&P 500 Index
Index Value 1,465.00
Expires 12/22/2012 | | | (¿) | | | | (21) | |
| | | | | | | | |
Total Written Options (premiums: $(1,260)) | | | | | | | (874) | |
| | | | | | | | |
FORWARD FOREIGN CURRENCY CONTRACTS:
| | | | | | | | | | | | | | | | |
Currency | | Counterparty | | Contracts
Bought
(Sold)
(000’s) | | | Settlement Date | | Amount in U.S.
Dollars Bought
(Sold)
(000’s) | | | Net Unrealized
Appreciation
(Depreciation)
(000’s) | |
AUD | | MSC | | | 1,364 | | | 12/19/2012 | | $ | 1,415 | | | $ | (5 | ) |
AUD | | MSC | | | 3,413 | | | 12/19/2012 | | | 3,515 | | | | 14 | |
AUD | | MSC | | | 274 | | | 12/19/2012 | | | 282 | | | | 1 | |
AUD | | MSC | | | (17,057 | ) | | 12/19/2012 | | | (17,213 | ) | | | (420 | ) |
AUD | | MSC | | | (1,774 | ) | | 12/19/2012 | | | (1,797 | ) | | | (37 | ) |
AUD | | MSC | | | (2,924 | ) | | 12/19/2012 | | | (3,043 | ) | | | 20 | |
AUD | | MSC | | | (872 | ) | | 12/19/2012 | | | (901 | ) | | | (1 | ) |
AUD | | MSC | | | (1,128 | ) | | 12/19/2012 | | | (1,156 | ) | | | (10 | ) |
AUD | | MSC | | | (1,127 | ) | | 12/19/2012 | | | (1,144 | ) | | | (21 | ) |
AUD | | MSC | | | (1,083 | ) | | 12/19/2012 | | | (1,102 | ) | | | (18 | ) |
AUD | | MSC | | | (1,727 | ) | | 12/19/2012 | | | (1,775 | ) | | | (11 | ) |
AUD | | MSC | | | (753 | ) | | 12/19/2012 | | | (768 | ) | | | (10 | ) |
CAD | | MSC | | | 1,185 | | | 12/19/2012 | | | 1,215 | | | | (30 | ) |
CAD | | MSC | | | 2,011 | | | 12/19/2012 | | | 2,009 | | | | 3 | |
CAD | | MSC | | | 852 | | | 12/19/2012 | | | 866 | | | | (13 | ) |
CAD | | MSC | | | 256 | | | 12/19/2012 | | | 261 | | | | (5 | ) |
CAD | | MSC | | | (1,843 | ) | | 12/19/2012 | | | (1,868 | ) | | | 24 | |
CAD | | MSC | | | (2,932 | ) | | 12/19/2012 | | | (3,007 | ) | | | 74 | |
CAD | | MSC | | | (1,568 | ) | | 12/19/2012 | | | (1,609 | ) | | | 40 | |
CAD | | MSC | | | (1,118 | ) | | 12/19/2012 | | | (1,145 | ) | | | 27 | |
The notes to the financial statements are an integral part of this report.
| | | | |
| Transamerica Funds | | | | Annual Report 2012 |
| | Page 86 | | |
Transamerica Global Macro
(formerly, Transamerica First Quadrant Global Macro)
SCHEDULE OF INVESTMENTS (continued)
At October 31, 2012
FORWARD FOREIGN CURRENCY CONTRACTS (continued):
| | | | | | | | | | | | | | | | |
Currency | | Counterparty | | Contracts
Bought
(Sold)
(000’s) | | | Settlement Date | | Amount in U.S.
Dollars Bought
(Sold)
(000’s) | | | Net Unrealized
Appreciation
(Depreciation)
(000’s) | |
CAD | | MSC | | | (10,462 | ) | | 12/19/2012 | | $ | (10,560 | ) | | $ | 96 | |
EUR | | MSC | | | 11,552 | | | 12/19/2012 | | | 14,906 | | | | 76 | |
EUR | | MSC | | | 13,219 | | | 12/19/2012 | | | 16,643 | | | | 500 | |
EUR | | MSC | | | 2,703 | | | 12/19/2012 | | | 3,413 | | | | 92 | |
EUR | | MSC | | | 1,285 | | | 12/19/2012 | | | 1,663 | | | | 4 | |
EUR | | MSC | | | 1,529 | | | 12/19/2012 | | | 1,968 | | | | 14 | |
EUR | | MSC | | | (1,760 | ) | | 12/19/2012 | | | (2,280 | ) | | | (3 | ) |
EUR | | MSC | | | 1,581 | | | 12/19/2012 | | | 2,077 | | | | (26 | ) |
EUR | | MSC | | | (10,228 | ) | | 12/19/2012 | | | (13,092 | ) | | | (172 | ) |
EUR | | MSC | | | (230 | ) | | 12/19/2012 | | | (296 | ) | | | (2 | ) |
EUR | | MSC | | | (1,551 | ) | | 12/19/2012 | | | (2,000 | ) | | | (12 | ) |
EUR | | MSC | | | (1,649 | ) | | 12/19/2012 | | | (2,147 | ) | | | 8 | |
EUR | | MSC | | | 2,004 | | | 12/19/2012 | | | 2,534 | | | | 65 | |
GBP | | MSC | | | 1,776 | | | 12/19/2012 | | | 2,846 | | | | 19 | |
GBP | | MSC | | | 712 | | | 12/19/2012 | | | 1,155 | | | | (6 | ) |
GBP | | MSC | | | 720 | | | 12/19/2012 | | | 1,164 | | | | (3 | ) |
GBP | | MSC | | | (1,785 | ) | | 12/19/2012 | | | (2,876 | ) | | | (5 | ) |
GBP | | MSC | | | 338 | | | 12/19/2012 | | | 548 | | | | (3 | ) |
GBP | | MSC | | | 5,884 | | | 12/19/2012 | | | 9,360 | | | | 134 | |
GBP | | MSC | | | 567 | | | 12/19/2012 | | | 913 | | | | 1 | |
JPY | | MSC | | | 189,814 | | | 12/19/2012 | | | 2,435 | | | | (56 | ) |
JPY | | MSC | | | 2,000 | | | 12/19/2012 | | | 26 | | | | (1 | ) |
JPY | | MSC | | | 27,446 | | | 12/19/2012 | | | 352 | | | | (8 | ) |
JPY | | MSC | | | 27,187 | | | 12/19/2012 | | | 347 | | | | (6 | ) |
JPY | | MSC | | | (157,788 | ) | | 12/19/2012 | | | (2,015 | ) | | | 37 | |
JPY | | MSC | | | (110,429 | ) | | 12/19/2012 | | | (1,405 | ) | | | 21 | |
JPY | | MSC | | | (1,057,369 | ) | | 12/19/2012 | | | (13,493 | ) | | | 241 | |
JPY | | MSC | | | (39,021 | ) | | 12/19/2012 | | | (493 | ) | | | 4 | |
JPY | | MSC | | | (262,102 | ) | | 12/19/2012 | | | (3,367 | ) | | | 82 | |
NOK | | MSC | | | 12,095 | | | 12/19/2012 | | | 2,116 | | | | 2 | |
NOK | | MSC | | | 10,245 | | | 12/19/2012 | | | 1,788 | | | | 6 | |
NOK | | MSC | | | 37,361 | | | 12/19/2012 | | | 6,402 | | | | 139 | |
NOK | | MSC | | | 2,017 | | | 12/19/2012 | | | 352 | | | | 1 | |
NOK | | MSC | | | 13,815 | | | 12/19/2012 | | | 2,403 | | | | 16 | |
NOK | | MSC | | | 1,275 | | | 12/19/2012 | | | 222 | | | | 1 | |
NOK | | MSC | | | (6,263 | ) | | 12/19/2012 | | | (1,066 | ) | | | (30 | ) |
NZD | | MSC | | | (2,783 | ) | | 12/19/2012 | | | (2,308 | ) | | | 27 | |
NZD | | MSC | | | (1,273 | ) | | 12/19/2012 | | | (1,007 | ) | | | (36 | ) |
NZD | | MSC | | | (10,485 | ) | | 12/19/2012 | | | (8,260 | ) | | | (335 | ) |
NZD | | MSC | | | (1,509 | ) | | 12/19/2012 | | | (1,243 | ) | | | 6 | |
NZD | | MSC | | | 852 | | | 12/19/2012 | | | 703 | | | | (5 | ) |
NZD | | MSC | | | 1,639 | | | 12/19/2012 | | | 1,344 | | | | (1 | ) |
SEK | | MSC | | | (14,840 | ) | | 12/19/2012 | | | (2,197 | ) | | | (37 | ) |
SEK | | MSC | | | 8,587 | | | 12/19/2012 | | | 1,274 | | | | 19 | |
SGD | | MSC | | | (1,867 | ) | | 12/19/2012 | | | (1,527 | ) | | | (3 | ) |
SGD | | MSC | | | 1,006 | | | 12/19/2012 | | | 822 | | | | 3 | |
SGD | | MSC | | | (11,332 | ) | | 12/19/2012 | | | (9,082 | ) | | | (208 | ) |
| | | | | | | | | | | | | | | | |
| | | | | | | | | | | | | | $ | 278 | |
| | | | | | | | | | | | | | | | |
FUTURES CONTRACTS:
| | | | | | | | | | | | |
Description | | Type | | Contracts | | | Expiration Date | | Unrealized
Appreciation
(Depreciation)
(000’s) | |
10-Year Australian Treasury Bond | | Short | | | (91 | ) | | 12/17/2012 | | $ | 25 | |
10-Year Government of Canada Bond | | Short | | | (218 | ) | | 12/18/2012 | | | (217 | ) |
10-Year JGB Mini | | Short | | | (239 | ) | | 12/10/2012 | | | (132 | ) |
10-Year U.S. Treasury Note | | Long | | | 244 | | | 12/19/2012 | | | 64 | |
AEX Index | | Long | | | 51 | | | 11/16/2012 | | | (9 | ) |
ASX SPI 200 Index | | Long | | | 3 | | | 12/20/2012 | | | 2 | |
CAC 40 Index | | Short | | | (263 | ) | | 11/16/2012 | | | 264 | |
DAX Index | | Long | | | 10 | | | 12/21/2012 | | | (18 | ) |
FTSE 100 Index | | Long | | | 50 | | | 12/21/2012 | | | (24 | ) |
FTSE MIB Index | | Short | | | (108 | ) | | 12/21/2012 | | | 162 | |
The notes to the financial statements are an integral part of this report.
| | | | |
| Transamerica Funds | | | | Annual Report 2012 |
| | Page 87 | | |
Transamerica Global Macro
(formerly, Transamerica First Quadrant Global Macro)
SCHEDULE OF INVESTMENTS (continued)
At October 31, 2012
FUTURES CONTRACTS (continued)
| | | | | | | | | | | | | | | | |
Description | | Type | | | Contracts | | | Expiration Date | | | Unrealized
Appreciation
(Depreciation)
(000’s) | |
German Euro Bund | | | Long | | | | 78 | | | | 12/06/2012 | | | $ | 39 | |
Hang Seng Index Futures | | | Long | | | | 14 | | | | 11/29/2012 | | | | (9 | ) |
IBEX 35 Index | | | Long | | | | 3 | | | | 11/16/2012 | | | | (5 | ) |
S&P 500 E-Mini Index | | | Long | | | | 166 | | | | 12/21/2012 | | | | (127 | ) |
S&P TSE 60 Index | | | Long | | | | 65 | | | | 12/20/2012 | | | | 61 | |
U.K. Long Gilt Bond | | | Long | | | | 190 | | | | 12/27/2012 | | | | (255 | ) |
TOPIX Index | | | Short | | | | (54 | ) | | | 12/14/2012 | | | | (108 | ) |
| | | | | | | | | | | | | | | | |
| | | | | | | | | | | | | | $ | (287 | ) |
| | | | | | | | | | | | | | | | |
Collateral (Received) Pledged for OTC Financial Derivative Instruments
The following is a summary by counterparty of the market value of OTC financial derivative instruments and collateral (received) pledged as of 10/31/2012:
| | | | | | | | | | | | |
Counterparty | | Total Market Value of
OTC Derivatives
(000’s) | | | Collateral (Received)
Pledged
(000’s) | | | Net Exposures (1)
(000’s) | |
MSC | | $ | 278 | | | $ | — | | | $ | 278 | |
| (1) | Net exposure represents the net receivable/(payable) that would be due from/to the counterparty in the event of default. |
NOTES TO SCHEDULE OF INVESTMENTS (all amounts in thousands):
| g | A portion of this security in the amount of $6,999 has been segregated as collateral with the broker to cover margin requirements for open futures contracts. |
| | Rate shown reflects the yield at 10/31/2012. |
| ¾ | A portion of these securities in the amount of $44,794 has been segregated with the broker to cover open written options. |
| P | Aggregate cost for federal income tax purposes is $113,728. Aggregate gross unrealized appreciation/depreciation for all securities in which there is an excess of value over tax cost were $157 and $516, respectively. Net unrealized depreciation for tax purposes is $359. |
DEFINITIONS:
| | |
| MSC | | Morgan Stanley |
| OTC | | Over the Counter |
CURRENCY ABBREVIATIONS:
| | |
| AUD | | Australian Dollar |
| CAD | | Canadian Dollar |
| EUR | | Euro |
| GBP | | Pound Sterling |
| JPY | | Japanese Yen |
| NOK | | Norwegian Krone |
| NZD | | New Zealand Dollar |
| SEK | | Swedish Krona |
| SGD | | Singapore Dollar |
VALUATION SUMMARY (all amounts in thousands): '
| | | | | | | | | | | | | | | | |
Investment Securities | | Level 1 -
Quoted
Prices | | | Level 2 -
Other
Significant
Observable
Inputs | | | Level 3 -
Significant
Unobservable
Inputs | | | Value at
10/31/2012 | |
Purchased Options | | $ | 730 | | | $ | 11 | | | $ | — | | | $ | 741 | |
Repurchase Agreement | | | — | | | | 44,637 | | | | — | | | | 44,637 | |
Short-Term U.S. Government Obligations | | | — | | | | 67,991 | | | | — | | | | 67,991 | |
| | | | | | | | | | | | | | | | |
Total | | $ | 730 | | | $ | 112,639 | | | $ | — | | | $ | 113,369 | |
| | | | | | | | | | | | | | | | |
| | | | | | | | | | | | | | | | |
Other Financial Instruments | | Level 1 -
Quoted
Prices | | | Level 2 -
Other
Significant
Observable
Inputs | | | Level 3 -
Significant
Unobservable
Inputs | | | Value at
10/31/2012 | |
Written Options | | $ | (838 | ) | | $ | (36 | ) | | $ | — | | | $ | (874 | ) |
The notes to the financial statements are an integral part of this report.
| | | | |
| Transamerica Funds | | | | Annual Report 2012 |
| | Page 88 | | |
Transamerica Global Macro
(formerly, Transamerica First Quadrant Global Macro)
SCHEDULE OF INVESTMENTS (continued)
At October 31, 2012
VALUATION SUMMARY (all amounts in thousands) (continued): '
| | | | | | | | | | | | | | | | |
Other Financial Instruments ₣ | | Level 1 -
Quoted
Prices | | | Level 2 -
Other
Significant
Observable
Inputs | | | Level 3 -
Significant
Unobservable
Inputs | | | Value at
10/31/2012 | |
Futures Contracts—Appreciation | | $ | 617 | | | $ | — | | | $ | — | | | $ | 617 | |
Futures Contracts—Depreciation | | | (904 | ) | | | — | | | | — | | | | (904 | ) |
Forward Foreign Currency Contracts—Appreciation | | | — | | | | 1,817 | | | | — | | | | 1,817 | |
Forward Foreign Currency Contracts—Depreciation | | | — | | | | (1,539 | ) | | | — | | | | (1,539 | ) |
| | | | | | | | | | | | | | | | |
Total | | $ | (287 | ) | | $ | 278 | | | $ | — | | | $ | (9 | ) |
| | | | | | | | | | | | | | | | |
| ' | Transfers between levels are considered to have occurred at the end of the reporting period. There were no transfers into or out of Levels 1 and 2 during the period ended 10/31/2012. See the notes to the financial statements for more information regarding pricing inputs and valuation techniques. |
| ₣ | Other financial instruments are derivative instruments that are valued at unrealized appreciation (depreciation) on the instrument. |
The notes to the financial statements are an integral part of this report.
| | | | |
| Transamerica Funds | | | | Annual Report 2012 |
| | Page 89 | | |
Transamerica Global Real Estate Securities
(formerly, Transamerica Clarion Global Real Estate Securities)
SCHEDULE OF INVESTMENTS
At October 31, 2012
| | | | | | | | |
| | | Shares | | | Value
(000’s) | |
COMMON STOCKS—99.1% | | | | | | | | |
Australia—10.0% | | | | | | | | |
Centro Retail Australia REIT | | | 579,227 | | | $ | 1,293 | |
Dexus Property Group REIT | | | 2,066,591 | | | | 2,113 | |
Goodman Group REIT | | | 305,711 | | | | 1,406 | |
GPT Group REIT | | | 270,001 | �� | | | 998 | |
Investa Office Fund REIT | | | 315,900 | | | | 974 | |
Mirvac Group REIT | | | 828,551 | | | | 1,294 | |
Westfield Group REIT | | | 435,548 | | | | 4,819 | |
Westfield Retail Trust REIT | | | 994,579 | | | | 3,201 | |
Brazil—0.1% | | | | | | | | |
Sonae Sierra Brasil SA | | | 10,900 | | | | 182 | |
Canada—2.0% | | | | | | | | |
Boardwalk Real Estate Investment Trust | | | 14,600 | | | | 940 | |
Calloway Real Estate Investment Trust | | | 10,100 | | | | 293 | |
Canadian Real Estate Investment Trust | | | 11,100 | | | | 463 | |
Primaris Retail Real Estate Investment Trust | | | 20,000 | | | | 469 | |
RioCan Real Estate Investment Trust | | | 33,300 | | | | 908 | |
France—4.9% | | | | | | | | |
Fonciere Des Regions REIT | | | 11,697 | | | | 940 | |
ICADE REIT ^ | | | 7,820 | | | | 704 | |
Klepierre REIT | | | 35,830 | | | | 1,328 | |
Societe Immobiliere de Location pour
I’Industrie et le Commerce REIT | | | 4,605 | | | | 516 | |
Unibail—Rodamco SE REIT ^ | | | 19,577 | | | | 4,410 | |
Germany—0.9% | | | | | | | | |
Deutsche Wohnen AG | | | 9,180 | | | | 168 | |
GSW Immobilien AG | | | 29,607 | | | | 1,218 | |
Hong Kong—11.8% | | | | | | | | |
Cheung Kong Holdings, Ltd. | | | 260,090 | | | | 3,843 | |
China Overseas Land & Investment, Ltd. ^ | | | 531,000 | | | | 1,398 | |
Great Eagle Holdings, Ltd. | | | 158,400 | | | | 469 | |
Hang Lung Group, Ltd. ^ | | | 120,848 | | | | 713 | |
Hang Lung Properties, Ltd. | | | 311,748 | | | | 1,086 | |
Kerry Properties, Ltd. ^ | | | 283,000 | | | | 1,408 | |
Link Real Estate Investment Trust | | | 566,300 | | | | 2,813 | |
New World Development Co., Ltd. | | | 359,400 | | | | 556 | |
Sino Land Co., Ltd. ^ | | | 959,528 | | | | 1,723 | |
Sun Hung Kai Properties, Ltd. | | | 191,245 | | | | 2,663 | |
Swire Properties, Ltd. | | | 219,000 | | | | 680 | |
Wharf Holdings, Ltd. | | | 214,405 | | | | 1,472 | |
Japan—14.0% | | | | | | | | |
Advance Residence Investment Corp.—Class A REIT | | | 161 | | | | 349 | |
Daito Trust Construction Co., Ltd. | | | 20,200 | | | | 2,039 | |
Daiwa House Industry Co., Ltd. | | | 33,000 | | | | 500 | |
Japan Real Estate Investment Corp. REIT | | | 217 | | | | 2,172 | |
Japan Retail Fund Investment Corp.—Class A REIT | | | 684 | | | | 1,247 | |
Kenedix Realty Investment Corp.—Class A REIT ^ | | | 100 | | | | 342 | |
Mitsubishi Estate Co., Ltd. | | | 313,936 | | | | 6,210 | |
Mitsui Fudosan Co., Ltd. | | | 254,946 | | | | 5,151 | |
Nippon Accommodations Fund, Inc.—Class A REIT | | | 69 | | | | 490 | |
Nippon Building Fund, Inc. REIT | | | 88 | | | | 945 | |
Sumitomo Realty & Development Co., Ltd. | | | 42,600 | | | | 1,176 | |
Tokyo Tatemono Co., Ltd. ‡^ | | | 260,000 | | | | 1,068 | |
United Urban Investment Corp.—Class A REIT ^ | | | 592 | | | | 712 | |
Netherlands—0.2% | | | | | | | | |
Eurocommercial Properties NV REIT | | | 8,338 | | | | 327 | |
Singapore—5.1% | | | | | | | | |
Ascendas Real Estate Investment Trust | | | 97,000 | | | | 188 | |
CapitaCommercial Trust REIT ^ | | | 1,607,000 | | | | 2,068 | |
| | | | | | | | |
| | | Shares | | | Value
(000’s) | |
Singapore (continued) | | | | | | | | |
CapitaLand, Ltd. | | | 674,950 | | | $ | 1,809 | |
CapitaMall Trust REIT | | | 901,114 | | | | 1,559 | |
Frasers Centrepoint Trust REIT | | | 124,100 | | | | 199 | |
Global Logistic Properties, Ltd.—Class L | | | 666,200 | | | | 1,404 | |
Hongkong Land Holdings, Ltd. | | | 54,797 | | | | 348 | |
Keppel Land, Ltd. ^ | | | 224,000 | | | | 624 | |
Sweden—0.7% | | | | | | | | |
Castellum AB | | | 48,230 | | | | 646 | |
Hufvudstaden AB—Class A | | | 39,504 | | | | 502 | |
Switzerland—0.6% | | | | | | | | |
PSP Swiss Property AG ‡ | | | 10,550 | | | | 969 | |
United Kingdom—5.3% | | | | | | | | |
British Land Co., PLC REIT | | | 78,368 | | | | 668 | |
Derwent London PLC REIT | | | 37,539 | | | | 1,249 | |
Great Portland Estates PLC REIT | | | 153,960 | | | | 1,162 | |
Hammerson PLC REIT | | | 300,987 | | | | 2,292 | |
Land Securities Group PLC REIT | | | 216,253 | | | | 2,806 | |
Safestore Holdings PLC | | | 197,600 | | | | 348 | |
United States—43.5% | | | | | | | | |
American Tower Corp.—Class A REIT | | | 20,000 | | | | 1,506 | |
AvalonBay Communities, Inc. REIT | | | 21,025 | | | | 2,850 | |
Boston Properties, Inc. REIT | | | 40,900 | | | | 4,348 | |
BRE Properties, Inc. REIT | | | 33,800 | | | | 1,634 | |
DDR Corp. REIT ^ | | | 115,900 | | | | 1,780 | |
Douglas Emmett, Inc. REIT ^ | | | 60,300 | | | | 1,414 | |
Equity Residential REIT | | | 38,600 | | | | 2,216 | |
Essex Property Trust, Inc. REIT ^ | | | 14,600 | | | | 2,190 | |
Federal Realty Investment Trust REIT | | | 14,600 | | | | 1,574 | |
General Growth Properties, Inc. REIT | | | 168,290 | | | | 3,309 | |
HCP, Inc. REIT | | | 66,900 | | | | 2,964 | |
Health Care REIT, Inc. | | | 33,400 | | | | 1,985 | |
Highwoods Properties, Inc. REIT ^ | | | 23,500 | | | | 758 | |
Host Hotels & Resorts, Inc. REIT ^ | | | 253,177 | | | | 3,661 | |
Kilroy Realty Corp. REIT ^ | | | 40,500 | | | | 1,799 | |
Kimco Realty Corp. REIT ^ | | | 124,000 | | | | 2,420 | |
Liberty Property Trust REIT | | | 56,000 | | | | 1,967 | |
Macerich Co. REIT | | | 60,307 | | | | 3,437 | |
Pebblebrook Hotel Trust REIT | | | 26,100 | | | | 554 | |
Post Properties, Inc. REIT | | | 36,600 | | | | 1,786 | |
ProLogis, Inc. REIT | | | 90,613 | | | | 3,107 | |
Public Storage REIT | | | 17,100 | | | | 2,371 | |
Simon Property Group, Inc. REIT | | | 48,563 | | | | 7,391 | |
SL Green Realty Corp. REIT ^ | | | 39,700 | | | | 2,989 | |
Starwood Hotels & Resorts Worldwide, Inc. | | | 6,800 | | | | 353 | |
Tanger Factory Outlet Centers REIT | | | 29,100 | | | | 916 | |
Taubman Centers, Inc. REIT | | | 28,300 | | | | 2,223 | |
UDR, Inc. REIT ^ | | | 110,683 | | | | 2,686 | |
Ventas, Inc. REIT | | | 38,435 | | | | 2,432 | |
Vornado Realty Trust REIT | | | 15,737 | | | | 1,262 | |
| | | | | | | | |
Total Common Stocks (cost $120,115) | | | | | | | 158,912 | |
| | | | | | | | |
SECURITIES LENDING COLLATERAL—13.8% | |
State Street Navigator Securities Lending
Trust—Prime Portfolio, 0.31% | | | 22,050,879 | | | | 22,051 | |
Total Securities Lending Collateral (cost $22,051) | |
The notes to the financial statements are an integral part of this report.
| | | | |
| Transamerica Funds | | | | Annual Report 2012 |
| | Page 90 | | |
Transamerica Global Real Estate Securities
(formerly, Transamerica Clarion Global Real Estate Securities)
SCHEDULE OF INVESTMENTS (continued)
At October 31, 2012
| | | | | | | | |
| | | Principal
(000’s) | | | Value
(000’s) | |
REPURCHASE AGREEMENT—0.8% | | | | | | | | |
State Street Bank & Trust Co.
0.03% p, dated 10/31/2012, to be repurchased at $1,343 on 11/01/2012. Collateralized by a U.S. Government Agency Obligation, 3.00%, due 12/01/2026, and with a value of $1,373. | | $ | 1,343 | | | $ | 1,343 | |
Total Repurchase Agreement (cost $1,343) | | | | | | | | |
| | | | | | | | |
Total Investment Securities (cost $143,509) P | | | | | | | 182,306 | |
Other Assets and Liabilities—Net | | | | | | | (21,976 | ) |
| | | | | | | | |
Net Assets | | | | | | $ | 160,330 | |
| | | | | | | | |
| | | | | | | | |
INVESTMENTS BY INDUSTRY (unaudited): | | Percentage of
Total Investment
Securities | | | Value
(000’s) | |
Real Estate Investment Trusts | | | 64.8 | % | | $ | 118,186 | |
Real Estate Management & Development | | | 22.2 | | | | 40,373 | |
Hotels, Restaurants & Leisure | | | 0.2 | | | | 353 | |
| | | | | | | | |
Investment Securities, at Value | | | 87.2 | | | | 158,912 | |
Short-Term Investments | | | 12.8 | | | | 23,394 | |
| | | | | | | | |
Total Investments | | | 100.0 | % | | $ | 182,306 | |
| | | | | | | | |
NOTES TO SCHEDULE OF INVESTMENTS (all amounts in thousands):
| ^ | All or a portion of this security is on loan. The value of all securities on loan is $21,245. |
| ‡ | Non-income producing security. |
| | Rate shown reflects the yield at 10/31/2012. |
| P | Aggregate cost for federal income tax purposes is $156,645. Aggregate gross unrealized appreciation/depreciation for all securities in which there is an excess of value over tax cost were $26,354 and $693, respectively. Net unrealized appreciation for tax purposes is $25,661. |
DEFINITION:
| | |
REIT | | Real Estate Investment Trust (includes domestic REITs and Foreign Real Estate Investment Companies) |
VALUATION SUMMARY (all amounts in thousands): '
| | | | | | | | | | | | | | | | |
Investment Securities | | Level 1 -
Quoted
Prices | | | Level 2 -
Other
Significant
Observable
Inputs | | | Level 3 -
Significant
Unobservable
Inputs | | | Value at
10/31/2012 | |
Common Stocks | | $ | 73,137 | | | $ | 85,775 | | | $ | — | | | $ | 158,912 | |
Repurchase Agreement | | | — | | | | 1,343 | | | | — | | | | 1,343 | |
Securities Lending Collateral | | | 22,051 | | | | — | | | | — | | | | 22,051 | |
| | | | | | | | | | | | | | | | |
Total | | $ | 95,188 | | | $ | 87,118 | | | $ | — | | | $ | 182,306 | |
| | | | | | | | | | | | | | | | |
| ' | Transfers between levels are considered to have occurred at the end of the reporting period. There were no transfers into or out of Levels 1 and 2 during the period ended 10/31/2012. See the notes to the financial statements for more information regarding pricing inputs and valuation techniques. |
The notes to the financial statements are an integral part of this report.
| | | | |
| Transamerica Funds | | | | Annual Report 2012 |
| | Page 91 | | |
Transamerica Growth
(formerly, Transamerica Jennison Growth)
SCHEDULE OF INVESTMENTS
At October 31, 2012
| | | | | | | | |
| | | Shares | | | Value
(000’s) | |
COMMON STOCKS—99.1% | | | | | | | | |
Aerospace & Defense—5.5% | | | | | | | | |
Boeing Co. | | | 132,579 | | | $ | 9,339 | |
Precision Castparts Corp. | | | 74,969 | | | | 12,974 | |
United Technologies Corp. | | | 100,930 | | | | 7,889 | |
Auto Components—0.8% | | | | | | | | |
BorgWarner, Inc. ‡^ | | | 63,941 | | | | 4,209 | |
Biotechnology—4.4% | | | | | | | | |
Alexion Pharmaceuticals, Inc. ‡ | | | 81,496 | | | | 7,366 | |
Biogen Idec, Inc. ‡ | | | 42,413 | | | | 5,862 | |
Gilead Sciences, Inc. ‡ | | | 66,767 | | | | 4,484 | |
Vertex Pharmaceuticals, Inc. ‡ | | | 137,639 | | | | 6,640 | |
Capital Markets—2.6% | | | | | | | | |
Goldman Sachs Group, Inc. | | | 114,720 | | | | 14,041 | |
Chemicals—1.8% | | | | | | | | |
Monsanto Co. | | | 112,625 | | | | 9,694 | |
Communications Equipment—1.1% | | | | | | | | |
QUALCOMM, Inc. | | | 100,423 | | | | 5,882 | |
Computers & Peripherals—9.0% | | | | | | | | |
Apple, Inc. | | | 61,248 | | | | 36,447 | |
EMC Corp. ‡ | | | 502,080 | | | | 12,261 | |
NetApp, Inc. ‡ | | | 34,870 | | | | 938 | |
Electrical Equipment—0.5% | | | | | | | | |
Roper Industries, Inc. | | | 26,127 | | | | 2,852 | |
Energy Equipment & Services—1.5% | | | | | | | | |
National Oilwell Varco, Inc. | | | 110,620 | | | | 8,153 | |
Food & Staples Retailing—3.5% | | | | | | | | |
Costco Wholesale Corp. | | | 104,244 | | | | 10,261 | |
Whole Foods Market, Inc. | | | 96,393 | | | | 9,131 | |
Food Products—2.5% | | | | | | | | |
Kraft Foods Group, Inc. ‡ | | | 63,982 | | | | 2,910 | |
Mead Johnson Nutrition Co.—Class A | | | 83,717 | | | | 5,162 | |
Mondelez International, Inc.—Class A | | | 210,955 | | | | 5,599 | |
Health Care Providers & Services—2.9% | | | | | | | | |
Express Scripts Holding Co. ‡ | | | 166,522 | | | | 10,248 | |
UnitedHealth Group, Inc. | | | 100,785 | | | | 5,644 | |
Hotels, Restaurants & Leisure—3.7% | | | | | | | | |
Chipotle Mexican Grill, Inc.—Class A ‡^ | | | 23,153 | | | | 5,893 | |
Dunkin’ Brands Group, Inc. ^ | | | 178,880 | | | | 5,545 | |
Yum! Brands, Inc. | | | 125,359 | | | | 8,789 | |
Internet & Catalog Retail—4.4% | | | | | | | | |
Amazon.com, Inc. ‡ | | | 70,423 | | | | 16,396 | |
priceline.com, Inc. ‡ | | | 13,504 | | | | 7,748 | |
Internet Software & Services—9.1% | | | | | | | | |
Baidu, Inc. ADR ‡ | | | 60,280 | | | | 6,427 | |
eBay, Inc. ‡ | | | 78,460 | | | | 3,789 | |
Facebook, Inc.—Class A ‡^ | | | 185,933 | | | | 3,926 | |
Google, Inc.—Class A ‡ | | | 24,805 | | | | 16,863 | |
LinkedIn Corp.—Class A ‡ | | | 79,446 | | | | 8,495 | |
Rackspace Hosting, Inc. ‡^ | | | 76,668 | | | | 4,883 | |
Tencent Holdings, Ltd. | | | 156,539 | | | | 5,546 | |
Youku Tudou, Inc. ADR ‡ | | | 36,586 | | | | 724 | |
IT Services—7.6% | | | | | | | | |
International Business Machines Corp. | | | 58,304 | | | | 11,342 | |
Mastercard, Inc.—Class A | | | 39,657 | | | | 18,279 | |
Teradata Corp. ‡ | | | 31,458 | | | | 2,149 | |
Visa, Inc.—Class A | | | 74,052 | | | | 10,275 | |
Life Sciences Tools & Services—0.7% | | | | | | | | |
Illumina, Inc. ‡^ | | | 77,858 | | | | 3,699 | |
Media—1.6% | | | | | | | | |
Walt Disney Co. | | | 174,264 | | | | 8,551 | |
Multiline Retail—0.6% | | | | | | | | |
Family Dollar Stores, Inc. ^ | | | 51,865 | | | | 3,421 | |
Oil, Gas & Consumable Fuels—1.7% | | | | | | | | |
Concho Resources, Inc. ‡ | | | 71,188 | | | | 6,131 | |
EOG Resources, Inc. | | | 29,042 | | | | 3,383 | |
Personal Products—1.7% | | | | | | | | |
Estee Lauder Cos., Inc.—Class A | | | 148,397 | | | | 9,144 | |
| | | | | | | | |
| | | Shares | | | Value
(000’s) | |
Pharmaceuticals—7.9% | | | | | | | | |
Abbott Laboratories | | | 79,704 | | | $ | 5,222 | |
Allergan, Inc. | | | 92,514 | | | | 8,319 | |
Bristol—Myers Squibb Co. | | | 198,175 | | | | 6,589 | |
Novo Nordisk A/S ADR | | | 66,526 | | | | 10,664 | |
Perrigo Co. ^ | | | 39,656 | | | | 4,561 | |
Shire PLC ADR | | | 96,432 | | | | 8,138 | |
Real Estate Investment Trusts—1.9% | | | | | | | | |
American Tower Corp.—Class A | | | 140,606 | | | | 10,586 | |
Road & Rail—1.6% | | | | | | | | |
Union Pacific Corp. | | | 72,342 | | | | 8,900 | |
Semiconductors & Semiconductor Equipment—2.6% | | | | | |
ARM Holdings PLC ADR ^ | | | 144,803 | | | | 4,684 | |
Avago Technologies, Ltd. | | | 143,030 | | | | 4,724 | |
Broadcom Corp.—Class A ‡ | | | 159,270 | | | | 5,023 | |
Software—6.0% | | | | | | | | |
Intuit, Inc. | | | 86,884 | | | | 5,163 | |
Red Hat, Inc. ‡ | | | 158,175 | | | | 7,777 | |
Salesforce.com, Inc. ‡^ | | | 70,858 | | | | 10,344 | |
Splunk, Inc. ‡ | | | 54,707 | | | | 1,535 | |
VMware, Inc.—Class A ‡ | | | 87,299 | | | | 7,400 | |
Workday, Inc.—Class A ‡^ | | | 17,156 | | | | 832 | |
Specialty Retail—4.0% | | | | | | | | |
Inditex SA ^ | | | 101,128 | | | | 12,903 | |
TJX Cos., Inc. | | | 213,637 | | | | 8,894 | |
Textiles, Apparel & Luxury Goods—6.9% | | | | | | | | |
Burberry Group PLC | | | 189,486 | | | | 3,565 | |
Coach, Inc. | | | 139,358 | | | | 7,811 | |
Lululemon Athletica, Inc. ‡ | | | 110,130 | | | | 7,600 | |
NIKE, Inc.—Class B | | | 112,571 | | | | 10,288 | |
Ralph Lauren Corp.—Class A | | | 57,969 | | | | 8,909 | |
Wireless Telecommunication Services—1.0% | | | | | | | | |
Crown Castle International Corp. ‡ | | | 78,726 | | | | 5,255 | |
| | | | | | | | |
Total Common Stocks (cost $395,868) | | | | | | | 545,070 | |
| | | | | | | | |
SECURITIES LENDING COLLATERAL—8.3% | | | | | |
State Street Navigator Securities Lending
Trust—Prime Portfolio, 0.31% | | | 45,671,016 | | | | 45,671 | |
Total Securities Lending Collateral (cost $45,671) | |
| | |
| | | Principal
(000’s) | | | Value
(000’s) | |
REPURCHASE AGREEMENT—1.1% | | | | | | | | |
State Street Bank & Trust Co. 0.03% , dated 10/31/2012, to be repurchased at $6,203 on 11/01/2012. Collateralized by a U.S. Government Agency Obligation, 3.00%, due 12/01/2026, and with a value of $6,328. | | $ | 6,203 | | | | 6,203 | |
Total Repurchase Agreement (cost $6,203) | | | | | | | | |
| | | | | | | | |
Total Investment Securities (cost $447,742) P | | | | | | | 596,944 | |
Other Assets and Liabilities—Net | | | | | | | (46,737 | ) |
| | | | | | | | |
Net Assets | | | | | | $ | 550,207 | |
| | | | | | | | |
The notes to the financial statements are an integral part of this report.
| | | | |
| Transamerica Funds | | | | Annual Report 2012 |
| | Page 92 | | |
Transamerica Growth
(formerly, Transamerica Jennison Growth)
SCHEDULE OF INVESTMENTS (continued)
At October 31, 2012
NOTES TO SCHEDULE OF INVESTMENTS (all amounts in thousands):
| ^ | All or a portion of this security is on loan. The value of all securities on loan is $44,407. |
| ‡ | Non-income producing security. |
| | Rate shown reflects the yield at 10/31/2012. |
| P | Aggregate cost for federal income tax purposes is $450,677. Aggregate gross unrealized appreciation/depreciation for all securities in which there is an excess of value over tax cost were $152,506 and $6,239, respectively. Net unrealized appreciation for tax purposes is $146,267. |
DEFINITION:
| | |
ADR | | American Depositary Receipt |
VALUATION SUMMARY (all amounts in thousands): '
| | | | | | | | | | | | | | | | |
Investment Securities | | Level 1 -
Quoted
Prices | | | Level 2 -
Other
Significant
Observable
Inputs | | | Level 3 -
Significant
Unobservable
Inputs | | | Value at
10/31/2012 | |
Common Stocks | | $ | 523,056 | | | $ | 22,014 | | | $ | — | | | $ | 545,070 | |
Repurchase Agreement | | | — | | | | 6,203 | | | | — | | | | 6,203 | |
Securities Lending Collateral | | | 45,671 | | | | — | | | | — | | | | 45,671 | |
| | | | | | | | | | | | | | | | |
Total | | $ | 568,727 | | | $ | 28,217 | | | $ | — | | | $ | 596,944 | |
| | | | | | | | | | | | | | | | |
| ' | Transfers between levels are considered to have occurred at the end of the reporting period. There were no transfers into or out of Levels 1 and 2 during the period ended 10/31/2012. See the notes to the financial statements for more information regarding pricing inputs and valuation techniques. |
The notes to the financial statements are an integral part of this report.
| | | | |
| Transamerica Funds | | | | Annual Report 2012 |
| | Page 93 | | |
Transamerica International
(formerly, Transamerica Neuberger Berman International)
SCHEDULE OF INVESTMENTS
At October 31, 2012
| | | | | | | | |
| | | Shares | | | Value
(000’s) | |
COMMON STOCKS—96.9% | | | | | | | | |
Australia—1.8% | | | | | | | | |
CSL, Ltd. | | | 48,725 | | | $ | 2,403 | |
Iluka Resources, Ltd. ^ | | | 217,455 | | | | 2,239 | |
Imdex, Ltd. | | | 679,485 | | | | 945 | |
Belgium—1.9% | | | | | | | | |
Anheuser-Busch InBev NV | | | 31,295 | | | | 2,617 | |
Anheuser-Busch InBev NV—STRIP VVPR ‡ | | | 130,726 | | | | ¨ | |
Colruyt SA ^ | | | 66,155 | | | | 3,022 | |
Canada—8.4% | | | | | | | | |
Cenovus Energy, Inc. | | | 64,963 | | | | 2,292 | |
Corus Entertainment, Inc.—Class B ^ | | | 156,560 | | | | 3,544 | |
Goldcorp, Inc. | | | 95,400 | | | | 4,313 | |
Home Capital Group, Inc.—Class B | | | 45,000 | | | | 2,291 | |
MacDonald Dettwiler & Associates, Ltd. | | | 56,415 | | | | 3,163 | |
New Gold, Inc. ‡ | | | 368,800 | | | | 4,317 | |
Silver Wheaton Corp. | | | 91,300 | | | | 3,679 | |
Vermilion Energy, Inc. ^ | | | 50,700 | | | | 2,424 | |
Chile—1.0% | | | | | | | | |
Sociedad Quimica y Minera de Chile SA ADR | | | 55,485 | | | | 3,210 | |
Czech Republic—0.6% | | | | | | | | |
Komercni Banka AS | | | 8,531 | | | | 1,741 | |
Denmark—2.5% | | | | | | | | |
Novo Nordisk A/S—Class B | | | 14,247 | | | | 2,296 | |
Sydbank A/S ‡ | | | 125,365 | | | | 2,294 | |
Tryg A/S | | | 52,960 | | | | 3,460 | |
France—6.8% | | | | | | | | |
Alcatel-Lucent ‡^ | | | 1,653,405 | | | | 1,682 | |
Arkema SA | | | 40,895 | | | | 3,728 | |
CFAO SA | | | 82,681 | | | | 3,988 | |
Eutelsat Communications SA | | | 69,553 | | | | 2,227 | |
Pernod-Ricard SA | | | 20,960 | | | | 2,256 | |
Rexel SA | | | 162,596 | | | | 2,943 | |
Sodexo | | | 57,375 | | | | 4,415 | |
Germany—8.2% | | | | | | | | |
Brenntag AG | | | 31,635 | | | | 3,987 | |
Continental AG | | | 16,025 | | | | 1,606 | |
Deutsche Boerse AG | | | 61,455 | | | | 3,326 | |
Deutsche Telekom AG | | | 200,775 | | | | 2,293 | |
Fresenius Medical Care AG & Co., KGaA | | | 62,771 | | | | 4,409 | |
Gerresheimer AG ‡ | | | 62,483 | | | | 3,100 | |
Linde AG | | | 25,394 | | | | 4,271 | |
NORMA Group AG | | | 92,605 | | | | 2,559 | |
Hong Kong—1.5% | | | | | | | | |
China Liansu Group Holdings, Ltd. ^ | | | 3,007,900 | | | | 1,773 | |
China Mobile, Ltd. ADR | | | 52,565 | | | | 2,912 | |
Indonesia—0.5% | | | | | | | | |
Bank Mandiri Persero PT | | | 1,794,900 | | | | 1,542 | |
Ireland—0.7% | | | | | | | | |
DCC PLC | | | 71,926 | | | | 2,057 | |
Israel—0.5% | | | | | | | | |
Bezeq Israeli Telecommunication Corp., Ltd. | | | 1,347,600 | | | | 1,643 | |
Japan—13.5% | | | | | | | | |
Daikin Industries, Ltd. | | | 58,300 | | | | 1,613 | |
FANUC Corp. | | | 14,000 | | | | 2,229 | |
Jupiter Telecommunications Co., Ltd. | | | 6,394 | | | | 8,690 | |
Kansai Paint Co., Ltd. ^ | | | 307,800 | | | | 3,312 | |
Kenedix Realty Investment Corp.—Class A REIT ^ | | | 806 | | | | 2,754 | |
Keyence Corp. | | | 8,700 | | | | 2,309 | |
Nihon Kohden Corp. ^ | | | 122,800 | | | | 4,564 | |
Pigeon Corp. ^ | | | 49,300 | | | | 2,273 | |
SMC Corp. | | | 16,200 | | | | 2,553 | |
Softbank Corp. | | | 38,000 | | | | 1,203 | |
Sugi Holdings Co., Ltd. ^ | | | 77,300 | | | | 2,794 | |
Sundrug Co., Ltd. ^ | | | 126,600 | | | | 4,660 | |
| | | | | | | | |
| | | Shares | | | Value
(000’s) | |
Japan (continued) | | | | | | | | |
Toyota Motor Corp. | | | 74,100 | | | $ | 2,845 | |
Korea, Republic of—3.3% | | | | | | | | |
Hyundai Mobis | | | 11,590 | | | | 2,955 | |
Samsung Electronics Co., Ltd. | | | 3,862 | | | | 4,639 | |
Shinhan Financial Group Co., Ltd. | | | 72,095 | | | | 2,476 | |
Netherlands—5.4% | | | | | | | | |
Akzo Nobel NV | | | 57,995 | | | | 3,155 | |
Koninklijke Ahold NV | | | 255,313 | | | | 3,250 | |
Nutreco NV | | | 49,522 | | | | 3,707 | |
Royal Imtech NV | | | 60,785 | | | | 1,525 | |
Unilever NV ^ | | | 133,021 | | | | 4,884 | |
Norway—3.5% | | | | | | | | |
DNB ASA | | | 298,100 | | | | 3,722 | |
Norwegian Property ASA | | | 198,511 | | | | 298 | |
ProSafe SE ^ | | | 358,780 | | | | 2,988 | |
Subsea 7 SA ^ | | | 150,653 | | | | 3,306 | |
Russian Federation—0.9% | | | | | | | | |
Sberbank of Russia ADR | | | 241,100 | | | | 2,809 | |
Singapore—1.0% | | | | | | | | |
United Overseas Bank, Ltd. | | | 201,000 | | | | 3,010 | |
Sweden—2.6% | | | | | | | | |
Axfood AB | | | 19,596 | | | | 726 | |
Elekta AB—Class B | | | 235,368 | | | | 3,353 | |
Nordea Bank AB | | | 150,820 | | | | 1,370 | |
Telefonaktiebolaget LM Ericsson—Class B | | | 300,725 | | | | 2,644 | |
Switzerland—11.7% | | | | | | | | |
Bucher Industries AG | | | 16,797 | | | | 3,147 | |
Givaudan SA ‡ | | | 3,939 | | | | 3,942 | |
Nestle SA | | | 56,318 | | | | 3,574 | |
Novartis AG | | | 49,436 | | | | 2,975 | |
Partners Group Holding AG | | | 10,995 | | | | 2,327 | |
Roche Holding AG | | | 26,864 | | | | 5,167 | |
SGS SA | | | 2,374 | | | | 5,027 | |
Sika AG | | | 1,489 | | | | 3,107 | |
Sulzer AG | | | 39,821 | | | | 5,764 | |
Turkey—0.5% | | | | | | | | |
Sinpas Gayrimenkul Yatirim Ortakligi AS REIT | | | 2,006,118 | | | | 1,410 | |
United Kingdom—17.1% | | | | | | | | |
Afren PLC ‡ | | | 1,070,900 | | | | 2,380 | |
Amlin PLC | | | 649,296 | | | | 3,911 | |
BG Group PLC | | | 128,400 | | | | 2,378 | |
BHP Billiton PLC | | | 100,735 | | | | 3,228 | |
Bunzl PLC | | | 218,855 | | | | 3,620 | |
Cairn Energy PLC ‡ | | | 399,980 | | | | 1,809 | |
Diploma PLC § | | | 271,950 | | | | 1,964 | |
Direct Line Insurance Group PLC ‡ | | | 292,900 | | | | 919 | |
Experian Group, Ltd. | | | 199,817 | | | | 3,450 | |
ICAP PLC | | | 430,110 | | | | 2,256 | |
Informa PLC | | | 331,077 | | | | 2,138 | |
Mitie Group PLC | | | 784,493 | | | | 3,692 | |
NovaTek OAO GDR | | | 16,420 | | | | 1,872 | |
Petrofac, Ltd. | | | 141,950 | | | | 3,674 | |
Reed Elsevier PLC | | | 161,527 | | | | 1,580 | |
RPS Group PLC | | | 811,043 | | | | 3,061 | |
Synergy Health PLC § | | | 226,147 | | | | 3,390 | |
Tullow Oil PLC | | | 136,572 | | | | 3,093 | |
Vodafone Group PLC | | | 1,492,229 | | | | 4,051 | |
United States—3.0% | | | | | | | | |
Autoliv, Inc. ^ | | | 34,400 | | | | 1,981 | |
Check Point Software Technologies, Ltd. ‡^ | | | 75,000 | | | | 3,340 | |
Willis Group Holdings PLC ^ | | | 115,300 | | | | 3,882 | |
| | | | | | | | |
Total Common Stocks (cost $237,380) | | | | | | | 297,692 | |
| | | | | | | | |
The notes to the financial statements are an integral part of this report.
| | | | |
| Transamerica Funds | | | | Annual Report 2012 |
| | Page 94 | | |
Transamerica International
(formerly, Transamerica Neuberger Berman International)
SCHEDULE OF INVESTMENTS (continued)
At October 31, 2012
| | | | | | | | |
| | | Shares | | | Value
(000’s) | |
SECURITIES LENDING COLLATERAL—10.3% | | | | | | | | |
State Street Navigator Securities Lending Trust—Prime Portfolio, 0.31% p | | | 31,552,255 | | | $ | 31,552 | |
Total Securities Lending Collateral (cost $31,552) | | | | | | | | |
| | | | | | | | |
| | | Principal
(000’s) | | | Value
(000’s) | |
REPURCHASE AGREEMENT—3.0% | | | | | | | | |
State Street Bank & Trust Co. 0.03% p, dated 10/31/2012, to be repurchased at $9,213 on 11/01/2012. Collateralized by a U.S. Government Agency Obligation, 3.00%, due 12/01/2026, and with a value of $9,401. | | $ | 9,213 | | | $ | 9,213 | |
Total Repurchase Agreement (cost $9,213) | | | | | | | | |
| | | | | | | | |
Total Investment Securities (cost $278,145) P | | | | | | | 338,457 | |
Other Assets and Liabilities—Net | | | | | | | (31,314 | ) |
| | | | | | | | |
Net Assets | | | | | | $ | 307,143 | |
| | | | | | | | |
| | | | | | | | |
INVESTMENTS BY INDUSTRY (unaudited): | | Percentage of
Total Investment
Securities | | | Value
(000’s) | |
Chemicals | | | 7.3 | % | | $ | 24,725 | |
Commercial Banks | | | 5.6 | | | | 18,964 | |
Metals & Mining | | | 5.5 | | | | 18,721 | |
Media | | | 5.4 | | | | 18,179 | |
Machinery | | | 4.8 | | | | 16,252 | |
Oil, Gas & Consumable Fuels | | | 4.8 | | | | 16,248 | |
Food & Staples Retailing | | | 4.3 | | | | 14,452 | |
Insurance | | | 3.6 | | | | 12,172 | |
Food Products | | | 3.6 | | | | 12,165 | |
Trading Companies & Distributors | | | 3.1 | | | | 10,550 | |
Pharmaceuticals | | | 3.1 | | | | 10,438 | |
Energy Equipment & Services | | | 2.9 | | | | 9,968 | |
Professional Services | | | 2.5 | | | | 8,477 | |
Wireless Telecommunication Services | | | 2.4 | | | | 8,166 | |
Health Care Equipment & Supplies | | | 2.3 | | | | 7,917 | |
Health Care Providers & Services | | | 2.3 | | | | 7,799 | |
Commercial Services & Supplies | | | 2.0 | | | | 6,753 | |
Auto Components | | | 1.9 | | | | 6,542 | |
Software | | | 1.9 | | | | 6,503 | |
Beverages | | | 1.4 | | | | 4,873 | |
Semiconductors & Semiconductor Equipment | | | 1.4 | | | | 4,639 | |
Capital Markets | | | 1.4 | | | | 4,583 | |
Hotels, Restaurants & Leisure | | | 1.3 | | | | 4,415 | |
Communications Equipment | | | 1.3 | | | | 4,326 | |
Electronic Equipment & Instruments | | | 1.3 | | | | 4,273 | |
Real Estate Investment Trusts | | | 1.2 | | | | 4,164 | |
Distributors | | | 1.2 | | | | 3,988 | |
Diversified Telecommunication Services | | | 1.2 | | | | 3,936 | |
Building Products | | | 1.0 | | | | 3,386 | |
Diversified Financial Services | | | 1.0 | | | | 3,326 | |
Life Sciences Tools & Services | | | 0.9 | | | | 3,100 | |
Automobiles | | | 0.8 | | | | 2,845 | |
Biotechnology | | | 0.7 | | | | 2,403 | |
Thrifts & Mortgage Finance | | | 0.7 | | | | 2,291 | |
Household Products | | | 0.7 | | | | 2,273 | |
Industrial Conglomerates | | | 0.6 | | | | 2,057 | |
Construction & Engineering | | | 0.5 | | | | 1,525 | |
Real Estate Management & Development | | | 0.1 | | | | 298 | |
| | | | | | | | |
Investment Securities, at Value | | | 88.0 | | | | 297,692 | |
Short-Term Investments | | | 12.0 | | | | 40,765 | |
| | | | | | | | |
Total Investments | | | 100.0 | % | | $ | 338,457 | |
| | | | | | | | |
The notes to the financial statements are an integral part of this report.
| | | | |
| Transamerica Funds | | | | Annual Report 2012 |
| | Page 95 | | |
Transamerica International
(formerly, Transamerica Neuberger Berman International)
SCHEDULE OF INVESTMENTS (continued)
At October 31, 2012
NOTES TO SCHEDULE OF INVESTMENTS (all amounts in thousands):
| ^ | All or a portion of this security is on loan. The value of all securities on loan is $30,199. |
| ‡ | Non-income producing security. |
| | Rate shown reflects the yield at 10/31/2012. |
| § | Illiquid. Total aggregate market value of illiquid securities is $5,354, or 1.74%, of the fund’s net assets. |
| P | Aggregate cost for federal income tax purposes is $280,845. Aggregate gross unrealized appreciation/depreciation for all securities in which there is an excess of value over tax cost were $67,431 and $9,819, respectively. Net unrealized appreciation for tax purposes is $57,612. |
DEFINITIONS:
| | |
ADR | | American Depositary Receipt |
GDR | | Global Depositary Receipt |
OAO | | Otkrytoe Aktsionernoe Obschestvo (Russian: Open Joint Stock Corporation) |
REIT | | Real Estate Investment Trust (includes domestic REITs and Foreign Real Estate Investment Companies) |
STRIP VVPR | | Is a coupon which, if presented along with the corresponding coupon of the share, entitles the shareholder to a reduced rate of withholding tax on the dividends paid by the company. |
VALUATION SUMMARY (all amounts in thousands): '
| | | | | | | | | | | | | | | | |
Investment Securities | | Level 1 -
Quoted
Prices | | | Level 2 -
Other
Significant
Observable
Inputs | | | Level 3 -
Significant
Unobservable
Inputs | | | Value at
10/31/2012 | |
Common Stocks | | $ | 46,029 | | | $ | 251,663 | | | $ | — | | | $ | 297,692 | |
Repurchase Agreement | | | — | | | | 9,213 | | | | — | | | | 9,213 | |
Securities Lending Collateral | | | 31,552 | | | | — | | | | — | | | | 31,552 | |
| | | | | | | | | | | | | | | | |
Total | | $ | 77,581 | | | $ | 260,876 | | | $ | — | | | $ | 338,457 | |
| | | | | | | | | | | | | | | | |
| ' | Transfers between levels are considered to have occurred at the end of the reporting period. There were no transfers into or out of Levels 1 and 2 during the period ended 10/31/2012. See the notes to the financial statements for more information regarding pricing inputs and valuation techniques. |
The notes to the financial statements are an integral part of this report.
| | | | |
| Transamerica Funds | | | | Annual Report 2012 |
| | Page 96 | | |
Transamerica International Equity Opportunities
(formerly, Transamerica MFS International Equity)
SCHEDULE OF INVESTMENTS
At October 31, 2012
| | | | | | | | |
| | | Shares | | | Value
(000’s) | |
COMMON STOCKS—99.1% | | | | | | | | |
Australia—1.9% | | | | | | | | |
QBE Insurance Group, Ltd. | | | 187,135 | | | $ | 2,560 | |
Westpac Banking Corp. | | | 35,910 | | | | 951 | |
Brazil—1.8% | | | | | | | | |
BM&FBovespa SA | | | 199,000 | | | | 1,274 | |
Itau Unibanco Holding SA ADR | | | 90,430 | | | | 1,318 | |
Tim Participacoes SA ADR | | | 25,320 | | | | 440 | |
Canada—2.3% | | | | | | | | |
Canadian National Railway Co. | | | 47,283 | | | | 4,084 | |
Czech Republic—0.8% | | | | | | | | |
Komercni Banka AS | | | 6,460 | | | | 1,318 | |
France—11.6% | | | | | | | | |
Air Liquide SA | | | 30,199 | | | | 3,562 | |
Danone SA | | | 56,516 | | | | 3,474 | |
Dassault Systemes SA | | | 9,626 | | | | 1,014 | |
Legrand SA | | | 51,925 | | | | 2,000 | |
LVMH Moet Hennessy Louis Vuitton SA | | | 21,493 | | | | 3,493 | |
Pernod-Ricard SA | | | 31,772 | | | | 3,419 | |
Schneider Electric SA | | | 52,604 | | | | 3,289 | |
Germany—11.6% | | | | | | | | |
Bayer AG | | | 69,777 | | | | 6,077 | |
Beiersdorf AG | | | 48,787 | | | | 3,548 | |
Deutsche Boerse AG | | | 10,505 | | | | 569 | |
Linde AG | | | 27,741 | | | | 4,666 | |
Merck KGaA | | | 19,845 | | | | 2,536 | |
SAP AG | | | 44,311 | | | | 3,228 | |
Hong Kong—4.2% | | | | | | | | |
AIA Group, Ltd. | | | 518,000 | | | | 2,049 | |
China Unicom, Ltd. ^ | | | 1,002,000 | | | | 1,642 | |
CNOOC, Ltd. | | | 313,000 | | | | 649 | |
Li & Fung, Ltd. ^ | | | 1,646,000 | | | | 2,761 | |
India—1.7% | | | | | | | | |
ICICI Bank, Ltd. ADR | | | 74,200 | | | | 2,912 | |
Japan—13.8% | | | | | | | | |
Canon, Inc. | | | 69,400 | | | | 2,241 | |
Denso Corp. | | | 100,300 | | | | 3,140 | |
FANUC Corp. | | | 14,800 | | | | 2,356 | |
Honda Motor Co., Ltd. | | | 111,500 | | | | 3,338 | |
Hoya Corp. | | | 92,100 | | | | 1,864 | |
INPEX Corp. | | | 492 | | | | 2,804 | |
Lawson, Inc. ^ | | | 43,300 | | | | 3,184 | |
NTT DOCOMO, Inc. | | | 748 | | | | 1,099 | |
Shin-Etsu Chemical Co., Ltd. | | | 76,400 | | | | 4,307 | |
Korea, Republic of—0.8% | | | | | | | | |
Samsung Electronics Co., Ltd. | | | 1,223 | | | | 1,469 | |
Mexico—0.4% | | | | | | | | |
Grupo Financiero Santander Mexico SAB de CV
ADR ‡ | | | 51,580 | | | | 705 | |
Netherlands—7.8% | | | | | | | | |
Akzo Nobel NV | | | 49,969 | | | | 2,718 | |
Heineken NV | | | 70,473 | | | | 4,345 | |
ING Groep NV ‡ | | | 378,023 | | | | 3,339 | |
Randstad Holding NV | | | 96,136 | | | | 3,138 | |
Singapore—1.3% | | | | | | | | |
DBS Group Holdings, Ltd. | | | 142,000 | | | | 1,618 | |
Singapore Telecommunications, Ltd. | | | 286,150 | | | | 755 | |
South Africa—0.3% | | | | | | | | |
MTN Group, Ltd. | | | 28,220 | | | | 509 | |
Spain—2.9% | | | | | | | | |
Amadeus IT Holding SA—Class A | | | 105,048 | | | | 2,601 | |
Banco Santander SA | | | 239,254 | | | | 1,795 | |
Red Electrica Corp. SA | | | 16,170 | | | | 758 | |
Sweden—1.0% | | | | | | | | |
Hennes & Mauritz AB—Class B | | | 51,770 | | | | 1,752 | |
Switzerland—10.4% | | | | | | | | |
Givaudan SA ‡ | | | 362 | | | | 362 | |
Julius Baer Group, Ltd. ‡ | | | 78,478 | | | | 2,722 | |
Keuhne & Nagel International AG | | | 8,110 | | | | 947 | |
| | | | | | | | |
| | | Shares | | | Value
(000’s) | |
Switzerland (continued) | | | | | | | | |
Nestle SA | | | 94,101 | | | $ | 5,972 | |
Roche Holding AG | | | 14,374 | | | | 2,764 | |
Sonova Holding AG ‡ | | | 12,695 | | | | 1,277 | |
Swiss Re AG ‡ | | | 22,087 | | | | 1,526 | |
UBS AG ‡ | | | 175,095 | | | | 2,625 | |
Taiwan—2.3% | | | | | | | | |
Hon Hai Precision Industry Co., Ltd. | | | 448,530 | | | | 1,362 | |
Taiwan Semiconductor Manufacturing Co., Ltd. ADR | | | 158,131 | | | | 2,514 | |
United Kingdom—20.4% | | | | | | | | |
Barclays PLC | | | 333,850 | | | | 1,226 | |
BG Group PLC | | | 81,400 | | | | 1,507 | |
Compass Group PLC | | | 359,600 | | | | 3,946 | |
Diageo PLC | | | 116,412 | | | | 3,327 | |
Hays PLC | | | 612,054 | | | | 805 | |
HSBC Holdings PLC | | | 663,787 | | | | 6,522 | |
Reckitt Benckiser Group PLC | | | 51,155 | | | | 3,096 | |
Rio Tinto PLC | | | 59,800 | | | | 2,996 | |
Royal Dutch Shell PLC—Class A | | | 92,971 | | | | 3,189 | |
Smiths Group PLC | | | 106,824 | | | | 1,820 | |
Standard Chartered PLC | | | 167,934 | | | | 3,967 | |
WPP PLC | | | 235,826 | | | | 3,043 | |
United States—1.8% | | | | | | | | |
Check Point Software Technologies, Ltd. ‡ ^ | | | 31,280 | | | | 1,393 | |
Delphi Automotive PLC ‡ ^ | | | 53,760 | | | | 1,690 | |
| | | | | | | | |
Total Common Stocks (cost $179,533) | | | | | | | 173,266 | |
| | | | | | | | |
RIGHT—0.0% ¥ | | | | | | | | |
Spain—0.0% ¥ | | | | | | | | |
Banco Santander SA ‡ ^ | | | 239,254 | | | | 47 | |
Total Right (cost $47) | | | | | | | | |
SECURITIES LENDING COLLATERAL—3.4% | | | | | |
State Street Navigator Securities Lending Trust—Prime Portfolio, 0.31% p | | | 6,010,913 | | | | 6,011 | |
Total Securities Lending Collateral (cost $6,011) | |
| | |
| | | Principal
(000’s) | | | Value
(000’s) | |
REPURCHASE AGREEMENT—0.7% | | | | | | | | |
State Street Bank & Trust Co. 0.03% p, dated 10/31/2012, to be repurchased at $1,173 on 11/01/2012. Collateralized by a U.S. Government Agency Obligation, 4.00%, due 08/01/2026, and with a value of $1,198. | | $ | 1,173 | | | | 1,173 | |
Total Repurchase Agreement (cost $1,173) | | | | | | | | |
| | | | | | | | |
Total Investment Securities (cost $186,764) P | | | | | | | 180,497 | |
Other Assets and Liabilities—Net | | | | | | | (5,598 | ) |
| | | | | | | | |
Net Assets | | | | | | $ | 174,899 | |
| | | | | | | | |
The notes to the financial statements are an integral part of this report.
| | | | |
| Transamerica Funds | | | | Annual Report 2012 |
| | Page 97 | | |
Transamerica International Equity Opportunities
(formerly, Transamerica MFS International Equity)
SCHEDULE OF INVESTMENTS (continued)
At October 31, 2012
| | | | | | | | |
INVESTMENTS BY INDUSTRY (unaudited): | | Percentage of
Total Investment
Securities | | | Value
(000’s) | |
Commercial Banks | | | 13.9 | % | | $ | 25,004 | |
Chemicals | | | 8.7 | | | | 15,615 | |
Pharmaceuticals | | | 6.3 | | | | 11,377 | |
Beverages | | | 6.1 | | | | 11,091 | |
Food Products | | | 5.2 | | | | 9,446 | |
Oil, Gas & Consumable Fuels | | | 4.5 | | | | 8,149 | |
Insurance | | | 3.4 | | | | 6,135 | |
Software | | | 3.1 | | | | 5,635 | |
Electrical Equipment | | | 2.9 | | | | 5,289 | |
Diversified Financial Services | | | 2.9 | | | | 5,182 | |
Auto Components | | | 2.7 | | | | 4,830 | |
Road & Rail | | | 2.3 | | | | 4,084 | |
Semiconductors & Semiconductor Equipment | | | 2.2 | | | | 3,983 | |
Hotels, Restaurants & Leisure | | | 2.2 | | | | 3,946 | |
Professional Services | | | 2.2 | | | | 3,943 | |
Personal Products | | | 2.0 | | | | 3,548 | |
Textiles, Apparel & Luxury Goods | | | 1.9 | | | | 3,493 | |
Automobiles | | | 1.9 | | | | 3,338 | |
Electronic Equipment & Instruments | | | 1.8 | | | | 3,226 | |
Food & Staples Retailing | | | 1.8 | | | | 3,184 | |
Household Products | | | 1.7 | | | | 3,096 | |
Media | | | 1.7 | | | | 3,043 | |
Metals & Mining | | | 1.7 | | | | 2,996 | |
Distributors | | | 1.5 | | | | 2,761 | |
Capital Markets | | | 1.5 | | | | 2,722 | |
IT Services | | | 1.4 | | | | 2,601 | |
Diversified Telecommunication Services | | | 1.3 | | | | 2,397 | |
Machinery | | | 1.3 | | | | 2,356 | |
Office Electronics | | | 1.2 | | | | 2,241 | |
Wireless Telecommunication Services | | | 1.1 | | | | 2,048 | |
Industrial Conglomerates | | | 1.0 | | | | 1,820 | |
Specialty Retail | | | 1.0 | | | | 1,752 | |
Health Care Equipment & Supplies | | | 0.7 | | | | 1,277 | |
Marine | | | 0.5 | | | | 947 | |
Electric Utilities | | | 0.4 | | | | 758 | |
| | | | | | | | |
Investment Securities, at Value | | | 96.0 | | | | 173,313 | |
Short-Term Investments | | | 4.0 | | | | 7,184 | |
| | | | | | | | |
Total Investments | | | 100.0 | % | | $ | 180,497 | |
| | | | | | | | |
NOTES TO SCHEDULE OF INVESTMENTS (all amounts in thousands):
| ^ | All or a portion of this security is on loan. The value of all securities on loan is $5,754. |
| ‡ | Non-income producing security. |
| ¥ | Percentage rounds to less than 0.1%. |
| p | Rate shown reflects the yield at 10/31/2012. |
| P | Aggregate cost for federal income tax purposes is $187,708. Aggregate gross unrealized appreciation/depreciation for all securities in which there is an excess of value over tax cost were $11,015 and $18,226, respectively. Net unrealized depreciation for tax purposes is $7,211. |
DEFINITION:
| | |
ADR | | American Depositary Receipt |
VALUATION SUMMARY (all amounts in thousands): '
| | | | | | | | | | | | | | | | |
Investment Securities | | Level 1 -
Quoted
Prices | | | Level 2 -
Other
Significant
Observable
Inputs | | | Level 3 -
Significant
Unobservable
Inputs | | | Value at
10/31/2012 | |
Common Stocks | | $ | 13,418 | | | $ | 159,848 | | | $ | — | | | $ | 173,266 | |
Repurchase Agreement | | | — | | | | 1,173 | | | | — | | | | 1,173 | |
Right | | | — | | | | 47 | | | | — | | | | 47 | |
Securities Lending Collateral | | | 6,011 | | | | — | | | | — | | | | 6,011 | |
| | | | | | | | | | | | | | | | |
Total | | $ | 19,429 | | | $ | 161,068 | | | $ | — | | | $ | 180,497 | |
| | | | | | | | | | | | | | | | |
| ' | Transfers between levels are considered to have occurred at the end of the reporting period. There were no transfers into or out of Levels 1 and 2 during the period ended 10/31/2012. See the notes to the financial statements for more information regarding pricing inputs and valuation techniques. |
The notes to the financial statements are an integral part of this report.
| | | | |
| Transamerica Funds | | | | Annual Report 2012 |
| | Page 98 | | |
Transamerica International Small Cap
(formerly, Transamerica Schroders International Small Cap)
SCHEDULE OF INVESTMENTS
At October 31, 2012
| | | | | | | | |
| | | Shares | | | Value
(000’s) | |
PREFERRED STOCKS— 0.4% | | | | | | | | |
Germany—0.4% | | | | | | | | |
Draegerwerk AG & Co. KGaA, 0.26% p | | | 6,900 | | | $ | 675 | |
Fuchs Petrolub AG, 1.84% p | | | 3,952 | | | | 279 | |
| | | | | | | | |
Total Preferred Stocks (cost $896) | | | | | | | 954 | |
| | | | | | | | |
COMMON STOCKS—96.0% | | | | | | | | |
Australia—7.0% | | | | | | | | |
Amcor, Ltd. | | | 221,398 | | | | 1,815 | |
Ansell, Ltd. | | | 150,650 | | | | 2,440 | |
Computershare, Ltd. | | | 229,881 | | | | 2,074 | |
Iluka Resources, Ltd. ^ | | | 158,998 | | | | 1,638 | |
Mesoblast, Ltd. ‡ ^ | | | 132,910 | | | | 796 | |
Mineral Deposits, Ltd. ‡ | | | 176,790 | | | | 899 | |
Mirvac Group REIT | | | 1,241,526 | | | | 1,940 | |
Myer Holdings, Ltd. ^ | | | 576,320 | | | | 1,170 | |
Sims Metal Management, Ltd. ^ | | | 139,083 | | | | 1,360 | |
Starpharma Holdings, Ltd. ‡ | | | 676,344 | | | | 1,141 | |
Transfield Services, Ltd. | | | 302,518 | | | | 499 | |
Whitehaven Coal, Ltd. ^ | | | 333,679 | | | | 1,056 | |
Austria—2.0% | | | | | | | | |
Kapsch TrafficCom AG | | | 34,000 | | | | 1,981 | |
Mayr Melnhof Karton AG | | | 13,000 | | | | 1,286 | |
Rosenbauer International AG § | | | 38,000 | | | | 1,989 | |
Belgium—1.1% | | | | | | | | |
D’ieteren SA/NV | | | 16,800 | | | | 812 | |
Kinepolis Group NV | | | 6,100 | | | | 609 | |
Tessenderlo Chemie NV ^ | | | 38,000 | | | | 1,101 | |
Brazil—0.9% | | | | | | | | |
BR Properties SA | | | 86,558 | | | | 1,134 | |
Brazil Pharma SA | | | 140,000 | | | | 851 | |
Canada—0.1% | | | | | | | | |
Niko Resources, Ltd. | | | 20,030 | | | | 255 | |
Denmark—1.3% | | | | | | | | |
Jyske Bank A/S ‡ | | | 50,000 | | | | 1,525 | |
Sydbank A/S ‡ | | | 85,000 | | | | 1,555 | |
France—4.8% | | | | | | | | |
Alten SA | | | 42,000 | | | | 1,321 | |
Bourbon SA | | | 60,000 | | | | 1,619 | |
Club Mediterranee ‡ | | | 75,000 | | | | 1,191 | |
Euler Hermes SA | | | 7,000 | | | | 483 | |
Groupe Eurotunnel SA | | | 300,000 | | | | 2,281 | |
ID Logistics Group ‡ § | | | 15,800 | | | | 544 | |
Inside Secure SA ‡ | | | 102,392 | | | | 299 | |
Lectra § | | | 291,306 | | | | 1,698 | |
Medica SA | | | 120,000 | | | | 2,145 | |
Saft Groupe SA | | | 9,600 | | | | 213 | |
Germany—8.3% | | | | | | | | |
CANCOM AG | | | 50,000 | | | | 776 | |
Carl Zeiss Meditec AG | | | 17,400 | | | | 477 | |
Cewe Color Holding AG | | | 12,000 | | | | 529 | |
Delticom AG | | | 21,635 | | | | 1,215 | |
Freenet AG ^ | | | 40,000 | | | | 661 | |
Lotto24 ‡ | | | 10,265 | | | | 46 | |
LPKF Laser & Electronics AG | | | 24,200 | | | | 495 | |
Prime Office REIT-AG | | | 155,000 | | | | 645 | |
PSI AG Gesellschaft Fuer Produkte und Systeme der Informationstechnologie | | | 28,524 | | | | 545 | |
Rheinmetall AG | | | 49,724 | | | | 2,373 | |
RIB Software AG § | | | 200,000 | | | | 1,242 | |
SAF-Holland SA ‡ | | | 200,000 | | | | 1,296 | |
STRATEC Biomedical AG | | | 27,000 | | | | 1,139 | |
Tipp24 SE ‡ | | | 35,000 | | | | 1,724 | |
Tom Tailor Holding AG | | | 125,000 | | | | 2,661 | |
Wirecard AG | | | 77,000 | | | | 1,760 | |
XING AG | | | 46,000 | | | | 2,614 | |
Hong Kong—5.6% | | | | | | | | |
Comba Telecom Systems Holdings, Ltd. ^ | | | 1,711,500 | | | | 669 | |
| | | | | | | | |
| | | Shares | | | Value
(000’s) | |
Hong Kong (continued) | | | | | | | | |
Convenience Retail Asia, Ltd. | | | 1,192,000 | | | $ | 744 | |
Dah Sing Banking Group, Ltd. | | | 1,175,640 | | | | 1,170 | |
Evergreen International Holdings, Ltd. | | | 3,835,000 | | | | 772 | |
Johnson Electric Holdings, Ltd. | | | 3,416,500 | | | | 2,187 | |
Leoch International Technology, Ltd. | | | 1,890,000 | | | | 298 | |
Parkson Retail PLC ^ | | | 732,500 | | | | 619 | |
Ports Design, Ltd. ^ | | | 1,025,500 | | | | 730 | |
Techtronic Industries Co. | | | 1,519,500 | | | | 2,893 | |
Yue Yuen Industrial Holdings ^ | | | 540,500 | | | | 1,859 | |
Yuexiu Transport Infrastructure, Ltd. ^ | | | 3,708,000 | | | | 1,665 | |
Indonesia—0.6% | | | | | | | | |
Ciputra Property PT | | | 24,937,500 | | | | 1,713 | |
Ireland—3.0% | | | | | | | | |
DCC PLC | | | 75,000 | | | | 2,164 | |
Grafton Group PLC | | | 250,000 | | | | 1,105 | |
IFG Group PLC | | | 720,000 | | | | 1,306 | |
Irish Continental Group PLC | | | 45,000 | | | | 1,091 | |
Smurfit Kappa Group PLC | | | 105,000 | | | | 1,153 | |
Italy—4.4% | | | | | | | | |
Amplifon SpA | | | 400,000 | | | | 1,852 | |
Azimut Holding SpA | | | 150,000 | | | | 1,899 | |
Cairo Communication SpA | | | 428,685 | | | | 1,343 | |
Credito Emiliano SpA | | | 101,940 | | | | 491 | |
Danieli & C Officine Meccaniche SpA | | | 33,800 | | | | 526 | |
Interpump Group SpA | | | 18,261 | | | | 139 | |
Natuzzi SpA ADR ‡ ^ | | | 56,721 | | | | 113 | |
Prysmian SpA | | | 140,000 | | | | 2,693 | |
Safilo Group SpA ‡ | | | 47,343 | | | | 399 | |
Sorin SpA ‡ | | | 550,000 | | | | 1,291 | |
Japan—16.7% | | | | | | | | |
Accordia Golf Co., Ltd. | | | 1,960 | | | | 1,395 | |
AICA Kogyo Co., Ltd. ^ | | | 97,700 | | | | 1,653 | |
Arcs Co., Ltd. ^ | | | 70,000 | | | | 1,477 | |
Asahi Diamond Industrial Co., Ltd. ^ | | | 143,600 | | | | 1,270 | |
Capcom Co., Ltd. ^ | | | 75,500 | | | | 1,439 | |
Daido Steel Co., Ltd. | | | 55,000 | | | | 238 | |
Exedy Corp. | | | 13,000 | | | | 252 | |
Fujikura Kasei Co., Ltd. | | | 51,000 | | | | 215 | |
Glory, Ltd. | | | 78,600 | | | | 1,908 | |
Hitachi Transport System, Ltd. ^ | | | 44,100 | | | | 661 | |
Icom, Inc. ^ | | | 8,900 | | | | 186 | |
JSP Corp. ^ | | | 70,900 | | | | 917 | |
Koito Manufacturing Co., Ltd. | | | 30,000 | | | | 372 | |
Kureha Corp. | | | 309,000 | | | | 1,200 | |
Kuroda Electric Co., Ltd. | | | 94,100 | | | | 1,060 | |
Lintec Corp. ^ | | | 47,800 | | | | 826 | |
Mitsui Sugar Co., Ltd. ^ | | | 198,000 | | | | 637 | |
Modec, Inc. ^ | | | 72,800 | | | | 1,477 | |
Musashi Seimitsu Industry Co., Ltd. ^ | | | 93,800 | | | | 1,963 | |
Nabtesco Corp. ^ | | | 27,700 | | | | 516 | |
NEC Networks & System Integration Corp. | | | 115,600 | | | | 2,112 | |
Nichi-iko Pharmaceutical Co., Ltd. ^ | | | 73,900 | | | | 1,564 | |
Nidec Copal Corp. ^ | | | 25,800 | | | | 195 | |
Nifco, Inc. ^ | | | 13,500 | | | | 306 | |
Nihon Parkerizing Co., Ltd. | | | 87,000 | | | | 1,313 | |
Nippon Soda Co., Ltd. ^ | | | 258,000 | | | | 1,121 | |
Nippon Thompson Co., Ltd. ^ | | | 85,000 | | | | 294 | |
Nitta Corp. ^ | | | 104,400 | | | | 1,606 | |
Plenus Co., Ltd. | | | 53,900 | | | | 877 | |
Shinko Plantech Co., Ltd. ^ | | | 40,100 | | | | 330 | |
Takasago International Corp. | | | 222,000 | | | | 1,129 | |
Tokai Tokyo Financial Holdings, Inc. ^ | | | 490,000 | | | | 1,762 | |
Toyo Tanso Co., Ltd. ^ | | | 25,500 | | | | 483 | |
Trusco Nakayama Corp. ^ | | | 65,400 | | | | 1,179 | |
Tsumura & Co. ^ | | | 43,500 | | | | 1,390 | |
Tsuruha Holdings, Inc. ^ | | | 14,500 | | | | 1,099 | |
Tsutsumi Jewelry Co., Ltd. ^ | | | 57,100 | | | | 1,310 | |
The notes to the financial statements are an integral part of this report.
| | | | |
| Transamerica Funds | | | | Annual Report 2012 |
| | Page 99 | | |
Transamerica International Small Cap
(formerly, Transamerica Schroders International Small Cap)
SCHEDULE OF INVESTMENTS (continued)
At October 31, 2012
| | | | | | | | |
| | | Shares | | | Value
(000’s) | |
Japan (continued) | | | | | | | | |
Unipres Corp. ^ | | | 65,200 | | | $ | 1,505 | |
Yushin Precision Equipment Co., Ltd. ^ | | | 46,400 | | | | 814 | |
Korea, Republic of—2.1% | | | | | | | | |
BS Financial Group, Inc. | | | 134,060 | | | | 1,518 | |
Hankook Tire Co., Ltd. ‡ | | | 40,160 | | | | 1,695 | |
Hankook Tire Worldwide Co., Ltd. | | | 9,179 | | | | 119 | |
Hyundai Home Shopping Network Corp. | | | 4,076 | | | | 484 | |
Mando Corp. | | | 11,558 | | | | 1,527 | |
Malaysia—0.3% | | | | | | | | |
Media Prima Bhd | | | 855,900 | | | | 641 | |
Netherlands—2.2% | | | | | | | | |
Delta Lloyd NV | | | 200,000 | | | | 3,325 | |
Koninklijke Ten Cate NV | | | 74,000 | | | | 1,641 | |
Nutreco NV | | | 7,500 | | | | 561 | |
New Zealand—1.7% | | | | | | | | |
Chorus, Ltd. | | | 519,551 | | | | 1,444 | |
Fletcher Building, Ltd. ^ | | | 446,990 | | | | 2,588 | |
Norway—2.4% | | | | | | | | |
Borregaard ASA ‡ | | | 415,000 | | | | 1,434 | |
Dockwise, Ltd. ‡ ^ | | | 70,552 | | | | 1,126 | |
Schibsted ASA | | | 22,800 | | | | 854 | |
Storebrand ASA ‡ | | | 495,000 | | | | 2,496 | |
Singapore—3.5% | | | | | | | | |
First Resources, Ltd. | | | 808,000 | | | | 1,358 | |
Goodpack, Ltd. ^ | | | 289,000 | | | | 460 | |
Mapletree Commercial Trust REIT | | | 1,414,000 | | | | 1,403 | |
Mapletree Industrial Trust REIT ^ | | | 1,518,800 | | | | 1,743 | |
STX OSV Holdings, Ltd. ^ | | | 1,552,000 | | | | 1,947 | |
UOL Group, Ltd. ^ | | | 317,000 | | | | 1,471 | |
Spain—0.1% | | | | | | | | |
Pescanova SA | | | 15,000 | | | | 278 | |
Sweden—1.4% | | | | | | | | |
Byggmax Group AB | | | 305,873 | | | | 1,411 | |
FinnvedenBulten AB | | | 155,000 | | | | 689 | |
Loomis AB | | | 84,000 | | | | 1,152 | |
Switzerland—4.4% | | | | | | | | |
Clariant AG ‡ | | | 100,000 | | | | 1,071 | |
Forbo Holding AG ‡ | | | 2,000 | | | | 1,263 | |
Gategroup Holding AG ‡ | | | 85,706 | | | | 2,259 | |
Helvetia Holding AG | | | 8,000 | | | | 2,805 | |
Kuoni Reisen Holding AG ‡ | | | 7,267 | | | | 1,940 | |
Orior AG ‡ | | | 35,000 | | | | 1,827 | |
Taiwan—1.3% | | | | | | | | |
CTCI Corp. | | | 463,000 | | | | 921 | |
Lung Yen Life Service Corp. | | | 292,000 | | | | 901 | |
Merida Industry Co., Ltd. | | | 340,400 | | | | 1,305 | |
Thailand—0.8% | | | | | | | | |
Hemaraj Land and Development PCL | | | 8,319,900 | | | | 852 | |
Siam City Cement PCL ^ | | | 78,200 | | | | 1,087 | |
United Kingdom—20.0% | | | | | | | | |
A.G.BARR PLC | | | 152,122 | | | | 1,092 | |
Albemarle & Bond Holdings ^ | | | 200,000 | | | | 826 | |
AMEC PLC | | | 51,497 | | | | 881 | |
Anglo Pacific Group PLC | | | 250,000 | | | | 1,010 | |
Ashtead Group PLC | | | 220,000 | | | | 1,324 | |
Berendsen PLC | | | 100,000 | | | | 909 | |
Berkeley Group Holdings PLC ‡ | | | 62,732 | | | | 1,541 | |
Bodycote PLC | | | 120,000 | | | | 731 | |
Bovis Homes Group PLC | | | 127,095 | | | | 1,051 | |
Computacenter PLC | | | 125,000 | | | | 740 | |
Consort Medical PLC | | | 84,267 | | | | 1,038 | |
CSR PLC ^ | | | 234,077 | | | | 1,333 | |
Daily Mail & General Trust PLC | | | 140,446 | | | | 1,082 | |
De La Rue PLC | | | 46,815 | | | | 800 | |
Debenhams PLC | | | 655,417 | | | | 1,266 | |
Dechra Pharmaceuticals PLC | | | 163,854 | | | | 1,631 | |
Derwent London PLC REIT | | | 30,000 | | | | 998 | |
Devro PLC | | | 261,530 | | | | 1,384 | |
| | | | | | | | |
| | | Shares | | | Value
(000’s) | |
United Kingdom (continued) | | | | | | | | |
Dignity PLC | | | 102,994 | | | $ | 1,554 | |
E2V Technologies PLC | | | 500,000 | | | | 938 | |
Elementis PLC | | | 270,893 | | | | 915 | |
Exillon Energy PLC ‡ | | | 340,000 | | | | 855 | |
Fidessa Group PLC | | | 30,000 | | | | 644 | |
Future PLC ‡ | | | 1,123,572 | | | | 308 | |
Grainger PLC | | | 612,380 | | | | 1,091 | |
Halma PLC | | | 140,446 | | | | 935 | |
IG Group Holdings PLC | | | 80,000 | | | | 562 | |
Inchcape PLC | | | 140,446 | | | | 911 | |
John Wood Group PLC | | | 88,631 | | | | 1,215 | |
Keller Group PLC | | | 144,941 | | | | 1,418 | |
Lamprell PLC | | | 450,000 | | | | 537 | |
Millennium & Copthorne Hotels PLC | | | 117,038 | | | | 949 | |
Morgan Crucible Co. PLC | | | 100,000 | | | | 407 | |
Oxford Instruments PLC | | | 40,000 | | | | 868 | |
Pace PLC | | | 150,000 | | | | 450 | |
Premier Oil PLC ‡ | | | 187,262 | | | | 1,060 | |
QinetiQ Group PLC | | | 250,000 | | | | 795 | |
SDL PLC | | | 93,631 | | | | 802 | |
Senior PLC | | | 406,339 | | | | 1,276 | |
Shanks Group PLC | | | 749,048 | | | | 986 | |
SIG PLC | | | 749,048 | | | | 1,266 | |
Sports Direct International PLC ‡ | | | 150,000 | | | | 966 | |
ST Modwen Properties PLC | | | 200,000 | | | | 650 | |
TalkTalk Telecom Group PLC | | | 125,000 | | | | 383 | |
Travis Perkins PLC ^ | | | 84,267 | | | | 1,468 | |
TT electronics PLC | | | 300,000 | | | | 605 | |
Ultra Electronics Holdings PLC | | | 37,452 | | | | 1,023 | |
William Hill PLC | | | 163,854 | | | | 894 | |
WS Atkins PLC | | | 60,000 | | | | 691 | |
Yule Catto & Co. PLC | | | 275,000 | | | | 652 | |
| | | | | | | | |
Total Common Stocks (cost $215,680) | | | | | | | 232,160 | |
| | | | | | | | |
SECURITIES LENDING COLLATERAL—9.0% | |
State Street Navigator Securities Lending Trust—Prime Portfolio, 0.31% p | | | 21,806,174 | | | | 21,806 | |
Total Securities Lending Collateral (cost $21,806) | |
| | |
| | | Principal
(000’s) | | | Value
(000’s) | |
REPURCHASE AGREEMENT—3.1% | | | | | | | | |
State Street Bank & Trust Co. 0.03% p, dated 10/31/2012, to be repurchased at $7,532 on 11/01/2012. Collateralized by a U.S. Government Agency Obligation, 4.00%, due 08/01/2026, and with a value of $7,685. | | $ | 7,532 | | | | 7,532 | |
Total Repurchase Agreement (cost $7,532) | | | | | | | | |
| | | | | | | | |
Total Investment Securities (cost $245,914) P | | | | | | | 262,452 | |
Other Assets and Liabilities—Net | | | | | | | (20,524 | ) |
| | | | | | | | |
Net Assets | | | | | | $ | 241,928 | |
| | | | | | | | |
The notes to the financial statements are an integral part of this report.
| | | | |
| Transamerica Funds | | | | Annual Report 2012 |
| | Page 100 | | |
Transamerica International Small Cap
(formerly, Transamerica Schroders International Small Cap)
SCHEDULE OF INVESTMENTS (continued)
At October 31, 2012
| | | | | | | | |
INVESTMENTS BY INDUSTRY (unaudited): | | Percentage of
Total Investment
Securities | | | Value
(000’s) | |
Chemicals | | | 5.3 | % | | $ | 13,813 | |
Machinery | | | 4.4 | | | | 11,475 | |
Auto Components | | | 3.7 | | | | 9,604 | |
Insurance | | | 3.5 | | | | 9,109 | |
Hotels, Restaurants & Leisure | | | 3.4 | | | | 9,016 | |
IT Services | | | 3.3 | | | | 8,783 | |
Specialty Retail | | | 3.2 | | | | 8,336 | |
Trading Companies & Distributors | | | 2.8 | | | | 7,402 | |
Energy Equipment & Services | | | 2.7 | | | | 7,185 | |
Commercial Services & Supplies | | | 2.7 | | | | 7,134 | |
Health Care Equipment & Supplies | | | 2.7 | | | | 7,060 | |
Real Estate Management & Development | | | 2.6 | | | | 6,911 | |
Household Durables | | | 2.6 | | | | 6,861 | |
Real Estate Investment Trusts | | | 2.6 | | | | 6,729 | |
Software | | | 2.4 | | | | 6,370 | |
Commercial Banks | | | 2.4 | | | | 6,259 | |
Food & Staples Retailing | | | 2.3 | | | | 5,998 | |
Electrical Equipment | | | 2.2 | | | | 5,874 | |
Electronic Equipment & Instruments | | | 2.2 | | | | 5,822 | |
Pharmaceuticals | | | 2.2 | | | | 5,726 | |
Media | | | 1.8 | | | | 4,837 | |
Industrial Conglomerates | | | 1.7 | | | | 4,537 | |
Containers & Packaging | | | 1.6 | | | | 4,254 | |
Oil, Gas & Consumable Fuels | | | 1.6 | | | | 4,236 | |
Food Products | | | 1.6 | | | | 4,218 | |
Metals & Mining | | | 1.6 | | | | 4,135 | |
Health Care Providers & Services | | | 1.5 | | | | 3,997 | |
Construction Materials | | | 1.4 | | | | 3,675 | |
Capital Markets | | | 1.4 | | | | 3,661 | |
Multiline Retail | | | 1.2 | | | | 3,055 | |
Marine | | | 1.2 | | | | 3,038 | |
Textiles, Apparel & Luxury Goods | | | 1.1 | | | | 2,988 | |
Road & Rail | | | 1.1 | | | | 2,942 | |
Internet Software & Services | | | 1.0 | | | | 2,614 | |
Diversified Consumer Services | | | 0.9 | | | | 2,455 | |
Construction & Engineering | | | 0.9 | | | | 2,340 | |
Diversified Financial Services | | | 0.8 | | | | 1,987 | |
Diversified Telecommunication Services | | | 0.7 | | | | 1,828 | |
Aerospace & Defense | | | 0.7 | | | | 1,818 | |
Distributors | | | 0.7 | | | | 1,723 | |
Transportation Infrastructure | | | 0.6 | | | | 1,665 | |
Building Products | | | 0.6 | | | | 1,653 | |
Semiconductors & Semiconductor Equipment | | | 0.6 | | | | 1,632 | |
Leisure Equipment & Products | | | 0.6 | | | | 1,500 | |
Communications Equipment | | | 0.5 | | | | 1,305 | |
Beverages | | | 0.4 | | | | 1,092 | |
Air Freight & Logistics | | | 0.4 | | | | 1,004 | |
Consumer Finance | | | 0.3 | | | | 826 | |
Biotechnology | | | 0.3 | | | | 796 | |
Professional Services | | | 0.3 | | | | 691 | |
Wireless Telecommunication Services | | | 0.3 | | | | 661 | |
Internet & Catalog Retail | | | 0.2 | | | | 484 | |
| | | | | | | | |
Investment Securities, at Value | | | 88.8 | | | | 233,114 | |
Short-Term Investments | | | 11.2 | | | | 29,338 | |
| | | | | | | | |
Total Investments | | | 100.0 | % | | $ | 262,452 | |
| | | | | | | | |
NOTES TO SCHEDULE OF INVESTMENTS (all amounts in thousands):
| p | Rate shown reflects the yield at 10/31/2012. |
| ^ | All or a portion of this security is on loan. The value of all securities on loan is $20,597. |
| ‡ | Non-income producing security. |
| P | Aggregate cost for federal income tax purposes is $250,093. Aggregate gross unrealized appreciation/depreciation for all securities in which there is an excess of value over tax cost were $34,992 and $22,633, respectively. Net unrealized appreciation for tax purposes is $12,359. |
| § | Illiquid. Total aggregate market value of illiquid securities is $5,473, or 2.26% of the fund’s net assets. |
The notes to the financial statements are an integral part of this report.
| | | | |
| Transamerica Funds | | | | Annual Report 2012 |
| | Page 101 | | |
Transamerica International Small Cap
(formerly, Transamerica Schroders International Small Cap)
SCHEDULE OF INVESTMENTS (continued)
At October 31, 2012
DEFINITIONS:
| | |
ADR | | American Depositary Receipt |
REIT | | Real Estate Investment Trust (includes domestic REITs and Foreign Real Estate Investment Companies) |
VALUATION SUMMARY (all amounts in thousands): '
| | | | | | | | | | | | | | | | |
Investment Securities | | Level 1 -
Quoted
Prices | | | Level 2 -
Other
Significant
Observable
Inputs | | | Level 3 -
Significant
Unobservable
Inputs | | | Value at
10/31/2012 | |
Common Stocks | | $ | 2,353 | | | $ | 229,807 | | | $ | — | | | $ | 232,160 | |
Preferred Stocks | | | — | | | | 954 | | | | — | | | | 954 | |
Repurchase Agreement | | | — | | | | 7,532 | | | | — | | | | 7,532 | |
Securities Lending Collateral | | | 21,806 | | | | — | | | | — | | | | 21,806 | |
| | | | | | | | | | | | | | | | |
Total | | $ | 24,159 | | | $ | 238,293 | | | $ | — | | | $ | 262,452 | |
| | | | | | | | | | | | | | | | |
| ' | Transfers between levels are considered to have occurred at the end of the reporting period. There were no transfers into or out of Levels 1 and 2 during the period ended 10/31/2012. See the notes to the financial statements for more information regarding pricing inputs and valuation techniques. |
The notes to the financial statements are an integral part of this report.
| | | | |
| Transamerica Funds | | | | Annual Report 2012 |
| | Page 102 | | |
Transamerica International Value Opportunities
(formerly, Transamerica Thornburg International Value)
SCHEDULE OF INVESTMENTS
At October 31, 2012
| | | | | | | | |
| | | Shares | | | Value
(000’s) | |
PREFERRED STOCKS—2.0% | | | | | | | | |
Germany—2.0% | | | | | | | | |
Volkswagen AG, 1.86% | | | 20,741 | | | $ | 4,291 | |
United Kingdom—0.0% ¥ | | | | | | | | |
Rolls-Royce Holdings PLC ‡ § | | | 14,403,520 | | | | 23 | |
| | | | | | | | |
Total Preferred Stocks (cost $2,171) | | | | | | | 4,314 | |
| | | | | | | | |
COMMON STOCKS—95.2% | | | | | | | | |
Brazil—4.3% | | | | | | | | |
BM&FBovespa SA | | | 315,700 | | | | 2,021 | |
Embraer SA ADR ‡ | | | 77,027 | | | | 2,150 | |
Itau Unibanco Holding SA ADR | | | 173,800 | | | | 2,534 | |
Natura Cosmeticos SA | | | 98,700 | | | | 2,631 | |
Canada—3.1% | | | | | | | | |
Canadian National Railway Co. | | | 36,889 | | | | 3,185 | |
Cenovus Energy, Inc. | | | 64,397 | | | | 2,272 | |
Teck Resources, Ltd.—Class B | | | 51,400 | | | | 1,631 | |
China—1.2% | | | | | | | | |
Baidu, Inc. ADR ‡ | | | 25,299 | | | | 2,698 | |
Denmark—2.7% | | | | | | | | |
Novo Nordisk A/S—Class B | | | 36,782 | | | | 5,928 | |
France—7.0% | | | | | | | | |
Air Liquide SA | | | 34,840 | | | | 4,109 | |
Cie Generale des Etablissements Michelin—Class B | | | 34,433 | | | | 2,957 | |
LVMH Moet Hennessy Louis Vuitton SA | | | 31,440 | | | | 5,110 | |
Publicis Groupe SA | | | 66,947 | | | | 3,607 | |
Germany—11.2% | | | | | | | | |
Adidas AG | | | 65,896 | | | | 5,615 | |
Allianz SE | | | 27,398 | | | | 3,398 | |
Deutsche Bank AG | | | 54,000 | | | | 2,448 | |
Fresenius Medical Care AG & Co., KGaA | | | 58,635 | | | | 4,118 | |
SAP AG | | | 58,709 | | | | 4,277 | |
Siemens AG | | | 46,400 | | | | 4,663 | |
Hong Kong—11.6% | | | | | | | | |
AIA Group, Ltd. | | | 410,721 | | | | 1,624 | |
China Merchants Bank Co., Ltd.—Class H ^ | | | 1,233,160 | | | | 2,304 | |
CNOOC, Ltd. | | | 2,339,333 | | | | 4,853 | |
Hong Kong Exchanges and Clearing, Ltd. ^ | | | 230,700 | | | | 3,798 | |
HSBC Holdings PLC ^ | | | 467,595 | | | | 4,610 | |
Industrial & Commercial Bank of China, Ltd.—Class H ^ | | | 5,095,149 | | | | 3,373 | |
Sinopharm Group Co., Ltd.—Class H | | | 717,114 | | | | 2,415 | |
Tencent Holdings, Ltd. | | | 66,839 | | | | 2,368 | |
India—0.5% | | | | | | | | |
Coal India, Ltd. | | | 181,580 | | | | 1,173 | |
Israel—1.9% | | | | | | | | |
Teva Pharmaceutical Industries, Ltd. ADR | | | 101,938 | | | | 4,120 | |
Japan—8.5% | | | | | | | | |
Dai-ichi Life Insurance Co., Ltd. | | | 914 | | | | 1,053 | |
FANUC Corp. | | | 15,410 | | | | 2,453 | |
KDDI Corp. | | | 39,708 | | | | 3,084 | |
Komatsu, Ltd. | | | 165,055 | | | | 3,457 | |
Mitsubishi UFJ Financial Group, Inc. ^ | | | 905,561 | | | | 4,095 | |
Toyota Motor Corp. | | | 115,674 | | | | 4,441 | |
Korea, Republic of—2.6% | | | | | | | | |
Hyundai Motor Co. | | | 14,128 | | | | 2,908 | |
Samsung Electronics Co., Ltd. | | | 2,342 | | | | 2,813 | |
Mexico—1.5% | | | | | | | | |
Wal-Mart de Mexico SAB de CV—Series V | | | 1,109,280 | | | | 3,264 | |
Sweden—2.5% | | | | | | | | |
Hennes & Mauritz AB—Class B | | | 107,830 | | | | 3,650 | |
Svenska Handelsbanken AB—Class A | | | 53,900 | | | | 1,846 | |
Switzerland—7.4% | | | | | | | | |
Julius Baer Group, Ltd. ‡ | | | 67,370 | | | | 2,337 | |
Nestle SA | | | 70,896 | | | | 4,499 | |
| | | | | | | | |
| | | Shares | | | Value
(000’s) | |
Switzerland (continued) | | | | | | | | |
Novartis AG | | | 68,641 | | | $ | 4,131 | |
Swatch Group AG—BR | | | 5,370 | | | | 2,222 | |
Syngenta AG | | | 7,760 | | | | 3,031 | |
United Kingdom—19.5% | | | | | | | | |
ARM Holdings PLC | | | 235,622 | | | | 2,529 | |
BG Group PLC | | | 211,866 | | | | 3,923 | |
British American Tobacco PLC | | | 86,281 | | | | 4,274 | |
Burberry Group PLC | | | 59,217 | | | | 1,114 | |
Carnival PLC ^ | | | 99,063 | | | | 3,939 | |
Kingfisher PLC | | | 793,460 | | | | 3,707 | |
Pearson PLC | | | 129,007 | | | | 2,592 | |
Reckitt Benckiser Group PLC | | | 88,962 | | | | 5,384 | |
Rolls-Royce Holdings PLC ‡ | | | 189,520 | | | | 2,613 | |
Royal Bank of Scotland Group PLC ‡ | | | 252,375 | | | | 1,124 | |
SABMiller PLC | | | 63,959 | | | | 2,740 | |
Standard Chartered PLC | | | 178,775 | | | | 4,222 | |
Tesco PLC | | | 230,280 | | | | 1,189 | |
Vodafone Group PLC | | | 1,458,900 | | | | 3,961 | |
United States—9.7% | | | | | | | | |
Accenture PLC—Class A | | | 39,026 | | | | 2,631 | |
Check Point Software Technologies, Ltd. ‡^ | | | 52,887 | | | | 2,355 | |
Covidien PLC | | | 55,222 | | | | 3,034 | |
Potash Corp. of Saskatchewan, Inc. | | | 80,845 | | | | 3,264 | |
Schlumberger, Ltd. | | | 71,174 | | | | 4,949 | |
Yandex NV—Class A ‡^ | | | 55,500 | | | | 1,292 | |
Yum! Brands, Inc. | | | 53,300 | | | | 3,737 | |
| | | | | | | | |
Total Common Stocks (cost $194,134) | | | | | | | 209,847 | |
| | | | | | | | |
SECURITIES LENDING COLLATERAL—4.9% | |
State Street Navigator Securities Lending Trust—Prime Portfolio, 0.31% | | | 10,740,101 | | | | 10,740 | |
Total Securities Lending Collateral (cost $10,740) | |
| | | | | | | | |
| | | Principal
(000’s) | | | Value
(000’s) | |
REPURCHASE AGREEMENT—2.3% | |
State Street Bank & Trust Co. 0.03% , dated 10/31/2012, to be repurchased at $5,028 on 11/01/2012. Collateralized by a U.S. Government Agency Obligation, 3.00%, due 12/01/2026, and with a value of $5,129. | | $ | 5,028 | | | | 5,028 | |
Total Repurchase Agreement (cost $5,028) | |
Total Investment Securities (cost $212,073) P | | | | | | | 229,929 | |
Other Assets and Liabilities—Net | | | | | | | (9,739 | ) |
| | | | | | | | |
Net Assets | | | | | | $ | 220,190 | |
| | | | | | | | |
The notes to the financial statements are an integral part of this report.
| | | | |
| Transamerica Funds | | | | Annual Report 2012 |
| | Page 103 | | |
Transamerica International Value Opportunities
(formerly, Transamerica Thornburg International Value)
SCHEDULE OF INVESTMENTS (continued)
At October 31, 2012
FORWARD FOREIGN CURRENCY CONTRACTS:
| | | | | | | | | | | | | | | | | | | | |
Currency | | Counterparty | | | Contracts
Bought
(Sold)
(000’s) | | | Settlement Date | | | Amount in U.S.
Dollars Bought
(Sold)
(000’s) | | | Net Unrealized
Appreciation
(Depreciation)
(000’s) | |
EUR | | | SSB | | | | 3,924 | | | | 11/08/2012 | | | $ | 4,910 | | | $ | 177 | |
EUR | | | SSB | | | | 7,313 | | | | 11/08/2012 | | | | 9,489 | | | | (9 | ) |
EUR | | | SSB | | | | 4,593 | | | | 11/08/2012 | | | | 6,036 | | | | (82 | ) |
EUR | | | SSB | | | | 2,151 | | | | 11/08/2012 | | | | 2,716 | | | | 72 | |
EUR | | | SSB | | | | (21,468 | ) | | | 11/08/2012 | | | | (28,125 | ) | | | 297 | |
| | | | | | | | | | | | | | | | | | | | |
| | | | | | | | | | | | | | | | | | $ | 455 | |
| | | | | | | | | | | | | | | | | | | | |
Collateral (Received) Pledged for OTC Financial Derivative Instruments:
The following is a summary by counterparty of the market value of OTC financial derivative instruments and collateral (received) pledged as of 10/31/2012:
| | | | | | | | | | | | |
Counterparty | | Total Market Value of OTC
Derivatives
(000’s) | | | Collateral (Received)
Pledged
(000’s) | | | Net Exposures (1)
(000’s) | |
SSB | | $ | 455 | | | $ | — �� | | | $ | 455 | |
| (1) | Net exposure represents the net receivable (payable) that would be due from/to the counterparty in the event of default. |
| | | | | | | | |
INVESTMENTS BY INDUSTRY (unaudited): | | Percentage of
Total Investment
Securities | | | Value
(000’s) | |
Commercial Banks | | | 11.6 | % | | $ | 26,555 | |
Pharmaceuticals | | | 6.2 | | | | 14,179 | |
Textiles, Apparel & Luxury Goods | | | 6.1 | | | | 14,061 | |
Oil, Gas & Consumable Fuels | | | 5.3 | | | | 12,221 | |
Automobiles | | | 5.1 | | | | 11,640 | |
Chemicals | | | 4.5 | | | | 10,404 | |
Hotels, Restaurants & Leisure | | | 3.3 | | | | 7,676 | |
Specialty Retail | | | 3.2 | | | | 7,357 | |
Wireless Telecommunication Services | | | 3.1 | | | | 7,045 | |
Software | | | 2.9 | | | | 6,632 | |
Health Care Providers & Services | | | 2.8 | | | | 6,533 | |
Internet Software & Services | | | 2.8 | | | | 6,358 | |
Media | | | 2.7 | | | | 6,199 | |
Insurance | | | 2.6 | | | | 6,075 | |
Machinery | | | 2.6 | | | | 5,911 | |
Diversified Financial Services | | | 2.5 | | | | 5,819 | |
Household Products | | | 2.3 | | | | 5,384 | |
Semiconductors & Semiconductor Equipment | | | 2.3 | | | | 5,342 | |
Energy Equipment & Services | | | 2.2 | | | | 4,949 | |
Aerospace & Defense | | | 2.1 | | | | 4,786 | |
Industrial Conglomerates | | | 2.0 | | | | 4,663 | |
Food Products | | | 2.0 | | | | 4,499 | |
Food & Staples Retailing | | | 1.9 | | | | 4,453 | |
Tobacco | | | 1.9 | | | | 4,274 | |
Road & Rail | | | 1.4 | | | | 3,185 | |
Health Care Equipment & Supplies | | | 1.3 | | | | 3,034 | |
Auto Components | | | 1.3 | | | | 2,957 | |
Beverages | | | 1.2 | | | | 2,740 | |
Personal Products | | | 1.1 | | | | 2,631 | |
IT Services | | | 1.1 | | | | 2,631 | |
Capital Markets | | | 1.0 | | | | 2,337 | |
Metals & Mining | | | 0.7 | | | | 1,631 | |
| | | | | | | | |
Investment Securities, at Value | | | 93.1 | | | | 214,161 | |
Short-Term Investments | | | 6.9 | | | | 15,768 | |
| | | | | | | | |
Total Investments | | | 100.0 | % | | $ | 229,929 | |
| | | | | | | | |
The notes to the financial statements are an integral part of this report.
| | | | |
| Transamerica Funds | | | | Annual Report 2012 |
| | Page 104 | | |
Transamerica International Value Opportunities
(formerly, Transamerica Thornburg International Value)
SCHEDULE OF INVESTMENTS (continued)
At October 31, 2012
NOTES TO SCHEDULE OF INVESTMENTS (all amounts in thousands):
| | Rate shown reflects the yield at 10/31/2012. |
| ¥ | Percentage rounds to less than 0.1%. |
| ‡ | Non-income producing security. |
| ^ | All or a portion of this security is on loan. The value of all securities on loan is $10,290. |
| § | lliquid. Total aggregate market value of illiquid securities is $23, or 0.01% of the fund’s net assets. |
| P | Aggregate cost for federal income tax purposes is $213,218. Aggregate gross unrealized appreciation/depreciation for all securities in which there is an excess of value over tax cost were $26,485 and $9,774, respectively. Net unrealized appreciation for tax purposes is $16,711. |
DEFINITIONS:
| | |
ADR | | American Depositary Receipt |
OTC | | Over the Counter |
SSB | | State Street Bank & Trust Co. |
CURRENCY ABBREVIATION:
VALUATION SUMMARY (all amounts in thousands): '
| | | | | | | | | | | | | | | | |
Investment Securities | | Level 1 -
Quoted
Prices | | | Level 2 -
Other
Significant
Observable
Inputs | | | Level 3 -
Significant
Unobservable
Inputs | | | Value at
10/31/2012 | |
Common Stocks | | $ | 44,504 | | | $ | 165,343 | | | $ | — | | | $ | 209,847 | |
Preferred Stocks | | | — | | | | 4,314 | | | | — | | | | 4,314 | |
Repurchase Agreement | | | — | | | | 5,028 | | | | — | | | | 5,028 | |
Securities Lending Collateral | | | 10,740 | | | | — | | | | — | | | | 10,740 | |
| | | | | | | | | | | | | | | | |
Total | | $ | 55,244 | | | $ | 174,685 | | | $ | — | | | $ | 229,929 | |
| | | | | | | | | | | | | | | | |
| | | | | | | | | | | | | | | | |
Other Financial Instruments ₣ | | Level 1 -
Quoted
Prices | | | Level 2 -
Other
Significant
Observable
Inputs | | | Level 3 -
Significant
Unobservable
Inputs | | | Value at
10/31/2012 | |
Forward Foreign Currency Contracts—Appreciation | | $ | — | | | $ | 546 | | | $ | — | | | $ | 546 | |
Forward Foreign Currency Contracts—Depreciation | | | — | | | | (91 | ) | | | — | | | | (91 | ) |
| | | | | | | | | | | | | | | | |
Total | | $ | — | | | $ | 455 | | | $ | — | | | $ | 455 | |
| | | | | | | | | | | | | | | | |
| ' | Transfers between levels are considered to have occurred at the end of the reporting period. There were no transfers into or out of Levels 1 and 2 during the period ended 10/31/2012. See the notes to the financial statements for more information regarding pricing inputs and valuation techniques. |
| ₣ | Other financial instruments are derivative instruments that are valued at unrealized appreciation (depreciation) on the instrument. |
The notes to the financial statements are an integral part of this report.
| | | | |
| Transamerica Funds | | | | Annual Report 2012 |
| | Page 105 | | |
Transamerica Large Company
(formerly, Transamerica Large Cap Value)
SCHEDULE OF INVESTMENTS
At October 31, 2012
| | | | | | | | |
| | | Shares | | | Value
(000’s) | |
COMMON STOCKS—97.7% | | | | | | | | |
Aerospace & Defense—1.3% | | | | | | | | |
Raytheon Co. | | | 123,300 | | | $ | 6,974 | |
Airlines—1.3% | | | | | | | | |
Delta Air Lines, Inc. ‡ | | | 451,330 | | | | 4,346 | |
United Continental Holdings, Inc. ‡^ | | | 138,632 | | | | 2,663 | |
Auto Components—0.3% | | | | | | | | |
Autoliv, Inc. ^ | | | 29,375 | | | | 1,692 | |
Beverages—1.1% | | | | | | | | |
Constellation Brands, Inc.—Class A ‡ | | | 162,000 | | | | 5,725 | |
Capital Markets—2.4% | | | | | | | | |
Goldman Sachs Group, Inc. | | | 105,029 | | | | 12,854 | |
Chemicals—0.6% | | | | | | | | |
CF Industries Holdings, Inc. | | | 16,700 | | | | 3,427 | |
Commercial Banks—2.6% | | | | | | | | |
U.S. Bancorp | | | 382,875 | | | | 12,715 | |
Wells Fargo & Co. | | | 36,900 | | | | 1,243 | |
Commercial Services & Supplies—1.3% | | | | | | | | |
ADT Corp. ‡ | | | 63,650 | | | | 2,642 | |
Pitney Bowes, Inc. ^ | | | 66,900 | | | | 961 | |
Tyco International, Ltd. | | | 127,300 | | | | 3,420 | |
Computers & Peripherals—1.5% | | | | | | | | |
Hewlett-Packard Co. | | | 238,200 | | | | 3,299 | |
Western Digital Corp. | | | 130,600 | | | | 4,471 | |
Construction & Engineering—1.0% | | | | | | | | |
KBR, Inc. | | | 194,100 | | | | 5,408 | |
Consumer Finance—1.3% | | | | | | | | |
Discover Financial Services | | | 174,200 | | | | 7,142 | |
Containers & Packaging—1.8% | | | | | | | | |
Rock-Tenn Co.—Class A | | | 132,538 | | | | 9,700 | |
Diversified Financial Services—7.9% | | | | | | | | |
Citigroup, Inc. | | | 468,599 | | | | 17,521 | |
JPMorgan Chase & Co. | | | 543,866 | | | | 22,668 | |
Moody’s Corp. ^ | | | 34,900 | | | | 1,681 | |
Diversified Telecommunication Services—2.8% | | | | | | | | |
AT&T, Inc. | | | 142,700 | | | | 4,936 | |
Verizon Communications, Inc. | | | 220,500 | | | | 9,843 | |
Electronic Equipment & Instruments—0.9% | | | | | | | | |
Arrow Electronics, Inc. ‡ | | | 39,585 | | | | 1,395 | |
Avnet, Inc. ‡ | | | 110,900 | | | | 3,177 | |
Food & Staples Retailing—4.8% | | | | | | | | |
CVS Caremark Corp. | | | 272,000 | | | | 12,621 | |
Wal-Mart Stores, Inc. | | | 174,300 | | | | 13,076 | |
Health Care Providers & Services—3.1% | | | | | | | | |
AmerisourceBergen Corp.—Class A ^ | | | 69,500 | | | | 2,741 | |
Humana, Inc. | | | 54,300 | | | | 4,033 | |
UnitedHealth Group, Inc. | | | 170,900 | | | | 9,570 | |
Household Products—0.4% | | | | | | | | |
Procter & Gamble Co. | | | 27,300 | | | | 1,890 | |
Independent Power Producers & Energy Traders—1.8% | | | | | | | | |
AES Corp. | | | 459,200 | | | | 4,799 | |
NRG Energy, Inc. ^ | | | 217,900 | | | | 4,698 | |
Industrial Conglomerates—2.7% | | | | | | | | |
3M Co. | | | 93,000 | | | | 8,146 | |
General Electric Co. | | | 284,500 | | | | 5,992 | |
Insurance—10.5% | | | | | | | | |
American Financial Group, Inc. | | | 129,800 | | | | 5,036 | |
American International Group, Inc. ‡ | | | 285,900 | | | | 9,986 | |
Arch Capital Group, Ltd. ‡ ^ | | | 62,100 | | | | 2,742 | |
Berkshire Hathaway, Inc.—Class B ‡ | | | 9,700 | | | | 838 | |
Chubb Corp. | | | 89,400 | | | | 6,882 | |
HCC Insurance Holdings, Inc. | | | 130,000 | | | | 4,633 | |
MetLife, Inc. | | | 217,400 | | | | 7,716 | |
Prudential Financial, Inc. | | | 122,300 | | | | 6,977 | |
| | | | | | | | |
| | | Shares | | | Value
(000’s) | |
Insurance (continued) | | | | | | | | |
RenaissanceRe Holdings, Ltd. | | | 38,900 | | | $ | 3,165 | |
Travelers Cos., Inc.^ | | | 109,700 | | | | 7,782 | |
IT Services—1.1% | | | | | | | | |
Amdocs, Ltd. | | | 124,300 | | | | 4,111 | |
DST Systems, Inc. | | | 33,000 | | | | 1,882 | |
Machinery—1.9% | | | | | | | | |
Ingersoll-Rand PLC | | | 187,600 | | | | 8,823 | |
Pentair, Ltd. | | | 30,544 | | | | 1,290 | |
Media—7.0% | | | | | | | | |
Comcast Corp.—Class A | | | 384,000 | | | | 14,404 | |
News Corp.—Class A | | | 506,500 | | | | 12,115 | |
Time Warner Cable, Inc. | | | 108,900 | | | | 10,793 | |
Metals & Mining—0.4% | | | | | | | | |
Alcoa, Inc. ^ | | | 234,900 | | | | 2,013 | |
Multiline Retail—0.9% | | | | | | | | |
Dillard’s, Inc.—Class A | | | 62,110 | | | | 4,782 | |
Multi-Utilities—0.4% | | | | | | | | |
Ameren Corp. | | | 69,000 | | | | 2,269 | |
Office Electronics—0.2% | | | | | | | | |
Xerox Corp. | | | 203,275 | | | | 1,309 | |
Oil, Gas & Consumable Fuels—15.6% | | | | | | | | |
Chevron Corp. | | | 226,700 | | | | 24,986 | |
Exxon Mobil Corp. | | | 445,700 | | | | 40,635 | |
Marathon Oil Corp. | | | 222,300 | | | | 6,682 | |
Suncor Energy, Inc. | | | 327,610 | | | | 11,014 | |
Paper & Forest Products—2.3% | | | | | | | | |
Domtar Corp. | | | 72,800 | | | | 5,806 | |
International Paper Co. | | | 184,400 | | | | 6,607 | |
Pharmaceuticals—11.2% | | | | | | | | |
Abbott Laboratories | | | 87,400 | | | | 5,726 | |
Eli Lilly & Co. | | | 107,700 | | | | 5,237 | |
Forest Laboratories, Inc. ‡ | | | 172,900 | | | | 5,828 | |
Johnson & Johnson ^ | | | 9,700 | | | | 687 | |
Merck & Co., Inc. | | | 411,000 | | | | 18,755 | |
Pfizer, Inc. | | | 945,000 | | | | 23,503 | |
Semiconductors & Semiconductor Equipment—1.3% | | | | | | | | |
KLA-Tencor Corp. | | | 152,200 | | | | 7,080 | |
Software—2.5% | | | | | | | | |
CA, Inc. | | | 104,400 | | | | 2,351 | |
Microsoft Corp. | | | 185,300 | | | | 5,288 | |
Oracle Corp. | | | 176,700 | | | | 5,486 | |
Specialty Retail—0.5% | | | | | | | | |
Gap, Inc. | | | 75,900 | | | | 2,711 | |
Tobacco—1.0% | | | | | | | | |
Philip Morris International, Inc. | | | 59,300 | | | | 5,252 | |
| | | | | | | | |
Total Common Stocks (cost $448,674) | | | | | | | 520,651 | |
| | | | | | | | |
SHORT-TERM INVESTMENT COMPANY—2.4% | | | | | | | | |
Capital Markets—2.4% | | | | | | | | |
BlackRock Provident TempFund 24 à | | | 12,805 | | | | 12,805 | |
| | | | | | | | |
Total Short-Term Investment Company
(cost $12,805) | | | | | |
SECURITIES LENDING COLLATERAL—3.2% | |
State Street Navigator Securities Lending Trust—Prime Portfolio, 0.31% | | | 17,085,915 | | | | 17,086 | |
Total Securities Lending Collateral (cost $17,086) | | | | | |
| | | | | | | | |
Total Investment Securities (cost $478,565) P | | | | | | | 550,542 | |
Other Assets and Liabilities—Net | | | | | | | (17,483 | ) |
| | | | | | | | |
Net Assets | | | | | | $ | 533,059 | |
| | | | | | | | |
The notes to the financial statements are an integral part of this report.
| | | | |
| Transamerica Funds | | | | Annual Report 2012 |
| | Page 106 | | |
Transamerica Large Company
(formerly, Transamerica Large Cap Value)
SCHEDULE OF INVESTMENTS (continued)
At October 31, 2012
NOTES TO SCHEDULE OF INVESTMENTS (all amounts in thousands):
| ‡ | Non-income producing security. |
| ^ | All or a portion of this security is on loan. The value of all securities on loan is $16,705. |
| à | The investment issuer is affiliated with the sub-adviser of the fund. |
| | Rate shown reflects the yield at 10/31/2012. |
| P | Aggregate cost for federal income tax purposes is $487,333. Aggregate gross unrealized appreciation/depreciation for all securities in which there is an excess of value over tax cost were $71,546 and $8,337, respectively. Net unrealized appreciation for tax purposes is $63,209. |
VALUATION SUMMARY (all amounts in thousands): '
| | | | | | | | | | | | | | | | |
Investment Securities | | Level 1 -
Quoted
Prices | | | Level 2 -
Other
Significant
Observable
Inputs | | | Level 3 -
Significant
Unobservable
Inputs | | | Value at
10/31/2012 | |
Common Stocks | | $ | 520,651 | | | $ | — | | | $ | — | | | $ | 520,651 | |
Securities Lending Collateral | | | 17,086 | | | | — | | | | — | | | | 17,086 | |
Short-Term Investment Company | | | 12,805 | | | | — | | | | — | | | | 12,805 | |
| | | | | | | | | | | | | | | | |
Total | | $ | 550,542 | | | $ | — | | | $ | — | | | $ | 550,542 | |
| | | | | | | | | | | | | | | | |
| ' | Transfers between levels are considered to have occurred at the end of the reporting period. There were no transfers into or out of Levels 1 and 2 during the period ended 10/31/2012. See the notes to the financial statements for more information regarding pricing inputs and valuation techniques. |
The notes to the financial statements are an integral part of this report.
| | | | |
| Transamerica Funds | | | | Annual Report 2012 |
| | Page 107 | | |
Transamerica Long/Short Strategy
(formerly, Transamerica JPMorgan Long/Short Strategy)
SCHEDULE OF INVESTMENTS
At October 31, 2012
| | | | | | | | |
| | | Shares | | | Value
(000’s) | |
COMMON STOCKS—100.2% | | | | | | | | |
Aerospace & Defense—1.7% | | | | | | | | |
United Technologies Corp. ⌂ | | | 19,920 | | | $ | 1,557 | |
Auto Components—1.9% | | | | | | | | |
BorgWarner, Inc. ‡ | | | 2,000 | | | | 132 | |
Johnson Controls, Inc. ⌂ | | | 36,470 | | | | 939 | |
Lear Corp. | | | 11,590 | | | | 494 | |
TRW Automotive Holdings Corp. ‡ | | | 2,990 | | | | 139 | |
Automobiles—1.3% | | | | | | | | |
General Motors Co. ⌂ ‡ | | | 45,210 | | | | 1,153 | |
Beverages—3.1% | | | | | | | | |
Beam, Inc. | | | 5,490 | | | | 305 | |
Coca-Cola Co. ⌂ | | | 15,190 | | | | 565 | |
Coca-Cola Enterprises, Inc. ⌂ | | | 33,900 | | | | 1,066 | |
Constellation Brands, Inc.—Class A ‡ | | | 7,380 | | | | 261 | |
Dr. Pepper Snapple Group, Inc. ⌂ | | | 5,540 | | | | 237 | |
PepsiCo, Inc. | | | 5,030 | | | | 348 | |
Biotechnology—3.0% | | | | | | | | |
Biogen Idec, Inc. ⌂ ‡ | | | 7,030 | | | | 972 | |
Celgene Corp. ⌂ ‡ | | | 13,730 | | | | 1,006 | |
Dendreon Corp. ⌂ ‡ | | | 7,890 | | | | 30 | |
Onyx Pharmaceuticals, Inc. ‡ | | | 3,900 | | | | 306 | |
Vertex Pharmaceuticals, Inc. ‡ | | | 9,430 | | | | 455 | |
Building Products—0.6% | | | | | | | | |
Masco Corp. ⌂ | | | 37,980 | | | | 573 | |
Capital Markets—2.4% | | | | | | | | |
Ameriprise Financial, Inc. | | | 4,620 | | | | 270 | |
Goldman Sachs Group, Inc. ⌂ | | | 4,730 | | | | 578 | |
Invesco, Ltd. | | | 20,150 | | | | 490 | |
Morgan Stanley ⌂ | | | 13,860 | | | | 241 | |
State Street Corp. ⌂ | | | 9,880 | | | | 440 | |
TD Ameritrade Holding Corp. ⌂ | | | 12,080 | | | | 190 | |
Chemicals—3.5% | | | | | | | | |
Air Products & Chemicals, Inc. ⌂ | | | 15,420 | | | | 1,196 | |
E.I. du Pont de Nemours & Co. ⌂ | | | 31,680 | | | | 1,409 | |
Georgia Gulf Corp. ⌂ | | | 15,500 | | | | 549 | |
Commercial Banks—1.8% | | | | | | | | |
Comerica, Inc. | | | 2,910 | | | | 87 | |
East-West Bancorp, Inc. | | | 7,000 | | | | 149 | |
Regions Financial Corp. | | | 29,980 | | | | 195 | |
SunTrust Banks, Inc. | | | 7,470 | | | | 203 | |
Wells Fargo & Co. ⌂ | | | 28,000 | | | | 944 | |
Zions Bancorporation ⌂ | | | 4,770 | | | | 102 | |
Commercial Services & Supplies—1.1% | | | | | | | | |
ADT Corp. ‡ | | | 6,065 | | | | 252 | |
Tyco International, Ltd. ⌂ | | | 28,710 | | | | 771 | |
Communications Equipment—1.1% | | | | | | | | |
Cisco Systems, Inc. ⌂ | | | 37,150 | | | | 637 | |
Juniper Networks, Inc. ⌂ ‡ | | | 11,400 | | | | 189 | |
QUALCOMM, Inc. ⌂ | | | 3,418 | | | | 200 | |
Computers & Peripherals—1.3% | | | | | | | | |
Apple, Inc. ⌂ | | | 1,640 | | | | 976 | |
Hewlett-Packard Co. | | | 15,740 | | | | 218 | |
Construction & Engineering—1.0% | | | | | | | | |
Fluor Corp. ⌂ | | | 16,700 | | | | 933 | |
Consumer Finance—0.3% | | | | | | | | |
American Express Co. | | | 5,660 | | | | 317 | |
Containers & Packaging—0.1% | | | | | | | | |
Rock-Tenn Co.—Class A | | | 650 | | | | 48 | |
Diversified Financial Services—1.4% | | | | | | | | |
Bank of America Corp. ⌂ | | | 42,130 | | | | 393 | |
Citigroup, Inc. | | | 11,559 | | | | 432 | |
CME Group, Inc.—Class A | | | 4,170 | | | | 233 | |
IntercontinentalExchange, Inc. ‡ | | | 1,720 | | | | 225 | |
Electric Utilities—3.0% | | | | | | | | |
American Electric Power Co., Inc. | | | 15,950 | | | | 709 | |
NextEra Energy, Inc. ⌂ | | | 11,150 | | | | 781 | |
NV Energy, Inc. ⌂ | | | 65,400 | | | | 1,243 | |
| | | | | | | | |
| | | Shares | | | Value
(000’s) | |
Electrical Equipment—1.5% | | | | | | | | |
Emerson Electric Co. ⌂ | | | 27,920 | | | $ | 1,352 | |
Electronic Equipment & Instruments—0.2% | | | | | | | | |
TE Connectivity, Ltd. ⌂ | | | 5,360 | | | | 172 | |
Energy Equipment & Services—1.6% | | | | | | | | |
Baker Hughes, Inc. | | | 4,910 | | | | 206 | |
Cameron International Corp. ‡ | | | 2,350 | | | | 119 | |
Ensco PLC—Class A | | | 4,050 | | | | 234 | |
Halliburton Co. | | | 8,460 | | | | 273 | |
National Oilwell Varco, Inc. | | | 4,140 | | | | 306 | |
Schlumberger, Ltd. ⌂ | | | 4,300 | | | | 299 | |
Food Products—6.2% | | | | | | | | |
Archer-Daniels-Midland Co. ⌂ | | | 22,880 | | | | 614 | |
Campbell Soup Co. ⌂ | | | 36,940 | | | | 1,303 | |
ConAgra Foods, Inc. ⌂ | | | 48,020 | | | | 1,337 | |
General Mills, Inc. ⌂ | | | 34,310 | | | | 1,375 | |
Kraft Foods Group, Inc. ‡ | | | 8,420 | | | | 383 | |
Mondelez International, Inc.—Class A ⌂ | | | 24,270 | | | | 644 | |
Gas Utilities—0.3% | | | | | | | | |
AGL Resources, Inc. | | | 6,330 | | | | 258 | |
Health Care Equipment & Supplies—1.6% | | | | | | | | |
CareFusion Corp. ‡ | | | 17,910 | | | | 476 | |
Covidien PLC ⌂ | | | 17,610 | | | | 967 | |
Health Care Providers & Services—2.2% | | | | | | | | |
DaVita, Inc. ‡ | | | 6,720 | | | | 756 | |
Humana, Inc. | | | 7,540 | | | | 560 | |
UnitedHealth Group, Inc. | | | 12,750 | | | | 714 | |
Hotels, Restaurants & Leisure—0.6% | | | | | | | | |
Carnival Corp. ⌂ | | | 6,950 | | | | 264 | |
Royal Caribbean Cruises, Ltd. | | | 7,640 | | | | 257 | |
Household Durables—1.0% | | | | | | | | |
Lennar Corp.—Class A | | | 13,680 | | | | 513 | |
PulteGroup, Inc. ‡ | | | 14,560 | | | | 252 | |
Ryland Group, Inc. | | | 5,440 | | | | 184 | |
Household Products—0.9% | | | | | | | | |
Energizer Holdings, Inc. | | | 6,560 | | | | 479 | |
Procter & Gamble Co. ⌂ | | | 5,420 | | | | 375 | |
Insurance—7.2% | | | | | | | | |
ACE, Ltd. ⌂ | | | 25,890 | | | | 2,035 | |
Axis Capital Holdings, Ltd. | | | 21,310 | | | | 772 | |
Everest RE Group, Ltd. ⌂ | | | 6,990 | | | | 776 | |
Hartford Financial Services Group, Inc. | | | 16,000 | | | | 347 | |
MetLife, Inc. ⌂ | | | 42,710 | | | | 1,516 | |
PartnerRe, Ltd. | | | 3,160 | | | | 256 | |
Prudential Financial, Inc. ⌂ | | | 8,950 | | | | 511 | |
XL Group PLC—Class A | | | 9,790 | | | | 242 | |
Internet & Catalog Retail—1.3% | | | | | | | | |
Amazon.com, Inc. ⌂ ‡ | | | 3,640 | | | | 847 | |
Expedia, Inc. | | | 5,850 | | | | 346 | |
Internet Software & Services—1.5% | | | | | | | | |
eBay, Inc. ‡ | | | 6,130 | | | | 296 | |
Facebook, Inc.—Class A ‡ | | | 1,530 | | | | 32 | |
Google, Inc.—Class A ‡ | | | 1,280 | | | | 871 | |
LinkedIn Corp.—Class A ‡ | | | 1,370 | | | | 146 | |
IT Services—1.6% | | | | | | | | |
Cognizant Technology Solutions Corp.—Class A ⌂ ‡ | | | 6,490 | | | | 433 | |
Fidelity National Information Services, Inc. | | | 8,490 | | | | 279 | |
Genpact, Ltd. ⌂ | | | 9,570 | | | | 169 | |
VeriFone Systems, Inc. ‡ | | | 4,150 | | | | 123 | |
Visa, Inc.—Class A | | | 3,520 | | | | 488 | |
Life Sciences Tools & Services—0.1% | | | | | | | | |
Mettler-Toledo International, Inc. ‡ | | | 560 | | | | 95 | |
Machinery—2.6% | | | | | | | | |
PACCAR, Inc. ⌂ | | | 32,060 | | | | 1,389 | |
Pentair, Ltd. | | | 11,124 | | | | 470 | |
SPX Corp. | | | 6,890 | | | | 473 | |
Media—6.6% | | | | | | | | |
CBS Corp.—Class B ⌂ | | | 59,130 | | | | 1,916 | |
The notes to the financial statements are an integral part of this report.
| | | | |
| Transamerica Funds | | | | Annual Report 2012 |
| | Page 108 | | |
Transamerica Long/Short Strategy
(formerly, Transamerica JPMorgan Long/Short Strategy)
SCHEDULE OF INVESTMENTS (continued)
At October 31, 2012
| | | | | | | | |
| | | Shares | | | Value
(000’s) | |
Media (continued) | | | | | | | | |
Discovery Communications, Inc.—Series A ⌂ ‡ | | | 11,280 | | | $ | 666 | |
DISH Network Corp.—Class A | | | 8,730 | | | | 311 | |
Time Warner Cable, Inc. | | | 4,230 | | | | 419 | |
Time Warner, Inc. ⌂ | | | 61,770 | | | | 2,684 | |
Metals & Mining—2.0% | | | | | | | | |
Alcoa, Inc. ⌂ | | | 80,360 | | | | 689 | |
Freeport-McMoRan Copper & Gold, Inc. ⌂ | | | 21,060 | | | | 818 | |
U.S. Steel Corp. | | | 12,800 | | | | 261 | |
Walter Energy, Inc. | | | 2,230 | | | | 78 | |
Multiline Retail—0.8% | | | | | | | | |
Target Corp. | | | 11,080 | | | | 706 | |
Multi-Utilities—3.1% | | | | | | | | |
NiSource, Inc. | | | 11,250 | | | | 287 | |
PG&E Corp. ⌂ | | | 30,900 | | | | 1,314 | |
Sempra Energy | | | 17,480 | | | | 1,219 | |
Oil, Gas & Consumable Fuels—2.8% | | | | | | | | |
Anadarko Petroleum Corp. | | | 3,320 | | | | 228 | |
Chevron Corp. | | | 990 | | | | 109 | |
EOG Resources, Inc. | | | 3,620 | | | | 422 | |
Kinder Morgan, Inc. | | | 10,080 | | | | 350 | |
Occidental Petroleum Corp. ⌂ | | | 10,860 | | | | 858 | |
Peabody Energy Corp. | | | 6,430 | | | | 179 | |
Valero Energy Corp. | | | 14,880 | | | | 433 | |
Pharmaceuticals—4.2% | | | | | | | | |
Abbott Laboratories | | | 4,340 | | | | 284 | |
Allergan, Inc. | | | 5,630 | | | | 506 | |
Merck & Co., Inc. ⌂ | | | 58,050 | | | | 2,650 | |
Mylan, Inc. ‡ | | | 16,120 | | | | 408 | |
Real Estate Investment Trusts—7.0% | | | | | | | | |
American Campus Communities, Inc. | | | 20,810 | | | | 944 | |
Apartment Investment & Management Co.—Class A | | | 17,550 | | | | 468 | |
Associated Estates Realty Corp. | | | 11,430 | | | | 171 | |
AvalonBay Communities, Inc. | | | 3,020 | | | | 409 | |
Boston Properties, Inc. | | | 1,800 | | | | 191 | |
DDR Corp. ⌂ | | | 26,330 | | | | 404 | |
Digital Realty Trust, Inc. | | | 2,040 | | | | 125 | |
Highwoods Properties, Inc. | | | 11,100 | | | | 358 | |
Liberty Property Trust | | | 23,400 | | | | 822 | |
Macerich Co. | | | 5,610 | | | | 320 | |
Post Properties, Inc. | | | 8,620 | | | | 421 | |
Public Storage | | | 5,020 | | | | 696 | |
Simon Property Group, Inc. ⌂ | | | 3,120 | | | | 475 | |
SL Green Realty Corp. | | | 2,340 | | | | 176 | |
Sunstone Hotel Investors, Inc. ‡ | | | 20,800 | | | | 206 | |
Ventas, Inc. | | | 3,710 | | | | 235 | |
Road & Rail—2.7% | | | | | | | | |
CSX Corp. ⌂ | | | 47,250 | | | | 967 | |
Norfolk Southern Corp. ⌂ | | | 9,420 | | | | 578 | |
Union Pacific Corp. ⌂ | | | 7,230 | | | | 890 | |
Semiconductors & Semiconductor Equipment—4.5% | | | | | | | | |
Altera Corp. ⌂ | | | 21,010 | | | | 640 | |
ASML Holding NV | | | 5,150 | | | | 283 | |
Avago Technologies, Ltd. | | | 3,510 | | | | 116 | |
Broadcom Corp.—Class A ⌂ ‡ | | | 20,460 | | | | 645 | |
Freescale Semiconductor, Ltd. ⌂ ‡ | | | 27,390 | | | | 245 | |
LAM Research Corp. ⌂ ‡ | | | 21,500 | | | | 762 | |
LSI Corp. ‡ | | | 30,080 | | | | 206 | |
Marvell Technology Group, Ltd. | | | 23,860 | | | | 188 | |
Maxim Integrated Products, Inc. | | | 10,160 | | | | 280 | |
ON Semiconductor Corp. ‡ | | | 22,920 | | | | 141 | |
Texas Instruments, Inc. | | | 7,060 | | | | 198 | |
Xilinx, Inc. ⌂ | | | 12,600 | | | | 413 | |
Software—2.6% | | | | | | | | |
Adobe Systems, Inc. ⌂ ‡ | | | 11,800 | | | | 401 | |
Citrix Systems, Inc. ⌂ ‡ | | | 5,620 | | | | 347 | |
Microsoft Corp. ⌂ | | | 23,200 | | | | 662 | |
| | | | | | | | |
| | | Shares | | | Value
(000’s) | |
Software (continued) | | | | | | | | |
Oracle Corp. ⌂ | | | 24,720 | | | $ | 768 | |
Zynga, Inc.—Class A ‡ | | | 83,520 | | | | 188 | |
Specialty Retail—1.9% | | | | | | | | |
AutoZone, Inc. ‡ | | | 1,770 | | | | 664 | |
Home Depot, Inc. | | | 8,170 | | | | 501 | |
Lowe’s Cos., Inc. | | | 17,810 | | | | 577 | |
Textiles, Apparel & Luxury Goods—1.7% | | | | | | | | |
Coach, Inc. ⌂ | | | 8,200 | | | | 460 | |
Lululemon Athletica, Inc. ‡ | | | 3,040 | | | | 210 | |
NIKE, Inc.—Class B | | | 1,460 | | | | 133 | |
V.F. Corp. | | | 4,830 | | | | 756 | |
Tobacco—0.3% | | | | | | | | |
Philip Morris International, Inc. | | | 2,790 | | | | 247 | |
Trading Companies & Distributors—0.4% | | | | | | | | |
WW Grainger, Inc. | | | 1,900 | | | | 383 | |
Wireless Telecommunication Services—0.6% | | | | | | | | |
SBA Communications Corp.—Class A ‡ | | | 4,170 | | | | 278 | |
Sprint Nextel Corp. ⌂ ‡ | | | 56,190 | | | | 311 | |
| | | | | | | | |
Total Common Stocks (cost $87,134) | | | | | | | 91,376 | |
| | | | | | | | |
| | | | | | | | |
| | | Principal
(000’s) | | | Value
(000’s) | |
REPURCHASE AGREEMENT—0.2% | | | | | | | | |
State Street Bank & Trust Co. 0.03% , dated 10/31/2012, to be repurchased at $180 on 11/01/2012. Collateralized by a U.S. Government Agency Obligation, 3.00%, due 12/01/2026, and with a value of $185. | | $ | 180 | | | | 180 | |
Total Repurchase Agreement (cost $180) | | | | | | | | |
| | | | | | | | |
Total Investment Securities (cost $87,314) P | | | | | | | 91,556 | |
Other Assets and Liabilities—Net | | | | | | | (366 | ) |
| | | | | | | | |
Net Assets | | | | | | $ | 91,190 | |
| | | | | | | | |
| | | | | | | | |
| | | Shares | | | Value
(000’s) | |
SECURITIES SOLD SHORT— (72.0%) | | | | | | | | |
COMMON STOCKS—(72.0%) | | | | | | | | |
Aerospace & Defense—(3.6%) | | | | | | | | |
Boeing Co. | | | (13,210 | ) | | $ | (931 | ) |
Lockheed Martin Corp. | | | (15,190 | ) | | | (1,423 | ) |
Raytheon Co. | | | (9,220 | ) | | | (521 | ) |
Textron, Inc. | | | (14,720 | ) | | | (371 | ) |
Air Freight & Logistics—(1.3%) | | | | | | | | |
FedEx Corp. | | | (8,950 | ) | | | (823 | ) |
United Parcel Service, Inc.—Class B | | | (5,010 | ) | | | (367 | ) |
Auto Components—(0.6%) | | | | | | | | |
Autoliv, Inc. | | | (3,250 | ) | | | (187 | ) |
Gentex Corp. | | | (21,210 | ) | | | (365 | ) |
Automobiles—(0.6%) | | | | | | | | |
Ford Motor Co. | | | (52,350 | ) | | | (584 | ) |
Beverages—(0.7%) | | | | | | | | |
Brown-Forman Corp.—Class B | | | (9,860 | ) | | | (632 | ) |
Biotechnology—(0.8%) | | | | | | | | |
Amgen, Inc. | | | (5,840 | ) | | | (505 | ) |
Medivation, Inc. ‡ | | | (1,680 | ) | | | (86 | ) |
United Therapeutics Corp. ‡ | | | (2,520 | ) | | | (115 | ) |
Capital Markets—(1.1%) | | | | | | | | |
BlackRock, Inc.—Class A | | | (1,290 | ) | | | (245 | ) |
Federated Investors, Inc.—Class B | | | (7,440 | ) | | | (173 | ) |
The notes to the financial statements are an integral part of this report.
| | | | |
| Transamerica Funds | | | | Annual Report 2012 |
| | Page 109 | | |
Transamerica Long/Short Strategy
(formerly, Transamerica JPMorgan Long/Short Strategy)
SCHEDULE OF INVESTMENTS (continued)
At October 31, 2012
| | | | | | | | |
| | | Shares | | | Value
(000’s) | |
Capital Markets (continued) | | | | | | | | |
Franklin Resources, Inc. | | | (4,760 | ) | | $ | (608 | ) |
Teton Advisors, Inc.—Class B Ә | | | (3 | ) | | | ¿ | |
Chemicals—(3.4%) | | | | | | | | |
Cabot Corp. | | | (5,760 | ) | | | (206 | ) |
Celanese Corp.—Series A | | | (2,430 | ) | | | (92 | ) |
Dow Chemical Co. | | | (22,250 | ) | | | (652 | ) |
OM Group, Inc. ‡ | | | (3,150 | ) | | | (64 | ) |
Praxair, Inc. | | | (13,760 | ) | | | (1,461 | ) |
Sigma-Aldrich Corp. | | | (3,190 | ) | | | (224 | ) |
Valspar Corp. | | | (7,160 | ) | | | (401 | ) |
Commercial Banks—(1.7%) | | | | | | | | |
Bank of Hawaii Corp. | | | (9,210 | ) | | | (407 | ) |
Commerce Bancshares, Inc. | | | (5,362 | ) | | | (204 | ) |
UMB Financial Corp. | | | (11,760 | ) | | | (523 | ) |
Valley National Bancorp | | | (42,797 | ) | | | (417 | ) |
Communications Equipment—(0.3%) | | | | | | | | |
JDS Uniphase Corp. ‡ | | | (6,600 | ) | | | (64 | ) |
Motorola Solutions, Inc. | | | (4,200 | ) | | | (217 | ) |
Construction Materials—(0.4%) | | | | | | | | |
Vulcan Materials Co. | | | (8,070 | ) | | | (371 | ) |
Electric Utilities—(3.7%) | | | | | | | | |
Consolidated Edison, Inc. | | | (18,270 | ) | | | (1,103 | ) |
Duke Energy Corp. | | | (10,580 | ) | | | (695 | ) |
Edison International | | | (4,030 | ) | | | (189 | ) |
Entergy Corp. | | | (8,080 | ) | | | (586 | ) |
Exelon Corp. | | | (10,030 | ) | | | (359 | ) |
Southern Co. | | | (9,470 | ) | | | (444 | ) |
Electrical Equipment—(0.9%) | | | | | | | | |
Rockwell Automation, Inc. | | | (12,160 | ) | | | (864 | ) |
Energy Equipment & Services—(0.5%) | | | | | | | | |
Diamond Offshore Drilling, Inc. | | | (3,720 | ) | | | (258 | ) |
Tenaris SA ADR | | | (5,510 | ) | | | (207 | ) |
Food Products—(3.0%) | | | | | | | | |
Hershey Co. | | | (25,900 | ) | | | (1,783 | ) |
HJ Heinz Co. | | | (10,470 | ) | | | (602 | ) |
Mead Johnson Nutrition Co.—Class A | | | (5,640 | ) | | | (348 | ) |
Gas Utilities—(0.3%) | | | | | | | | |
National Fuel Gas Co. | | | (5,040 | ) | | | (266 | ) |
Health Care Equipment & Supplies—(2.3%) | | | | | | | | |
Edwards Lifesciences Corp. ‡ | | | (3,140 | ) | | | (273 | ) |
Medtronic, Inc. | | | (14,520 | ) | | | (604 | ) |
Varian Medical Systems, Inc. ‡ | | | (8,880 | ) | | | (593 | ) |
Zimmer Holdings, Inc. | | | (10,430 | ) | | | (669 | ) |
Health Care Providers & Services—(0.1%) | | | | | | | | |
Tenet Healthcare Corp. ‡ | | | (4,570 | ) | | | (108 | ) |
Hotels, Restaurants & Leisure—(0.5%) | | | | | | | | |
Choice Hotels International, Inc. | | | (3,060 | ) | | | (96 | ) |
Hyatt Hotels Corp.—Class A ‡ | | | (9,270 | ) | | | (338 | ) |
Household Durables—(0.6%) | | | | | | | | |
Harman International Industries, Inc. | | | (4,210 | ) | | | (177 | ) |
Toll Brothers, Inc. ‡ | | | (10,750 | ) | | | (354 | ) |
Household Products—(0.9%) | | | | | | | | |
Church & Dwight Co., Inc. | | | (13,280 | ) | | | (674 | ) |
Kimberly-Clark Corp. | | | (1,530 | ) | | | (128 | ) |
Industrial Conglomerates—(1.4%) | | | | | | | | |
Danaher Corp. | | | (10,070 | ) | | | (521 | ) |
General Electric Co. | | | (35,190 | ) | | | (741 | ) |
Insurance—(7.1%) | | | | | | | | |
Allstate Corp. | | | (11,290 | ) | | | (451 | ) |
American International Group, Inc. ‡ | | | (8,310 | ) | | | (290 | ) |
Aon PLC | | | (18,920 | ) | | | (1,021 | ) |
| | | | | | | | |
| | | Shares | | | Value
(000’s) | |
Insurance (continued) | | | | | | | | |
Arch Capital Group, Ltd. ‡ | | | (10,020 | ) | | $ | (442 | ) |
Chubb Corp. | | | (12,210 | ) | | | (940 | ) |
Lincoln National Corp. | | | (9,450 | ) | | | (234 | ) |
Principal Financial Group, Inc. | | | (6,450 | ) | | | (178 | ) |
Progressive Corp. | | | (19,490 | ) | | | (435 | ) |
RenaissanceRe Holdings, Ltd. | | | (4,270 | ) | | | (347 | ) |
Torchmark Corp. | | | (11,080 | ) | | | (561 | ) |
Travelers Cos., Inc. | | | (7,540 | ) | | | (535 | ) |
WR Berkley Corp. | | | (28,950 | ) | | | (1,127 | ) |
Internet & Catalog Retail—(0.6%) | | | | | | | | |
NetFlix, Inc. ‡ | | | (4,250 | ) | | | (336 | ) |
priceline.com, Inc. ‡ | | | (320 | ) | | | (184 | ) |
Internet Software & Services—(0.4%) | | | | | | | | |
AOL, Inc. ‡ | | | (9,550 | ) | | | (328 | ) |
IT Services—(1.3%) | | | | | | | | |
Automatic Data Processing, Inc. | | | (5,470 | ) | | | (316 | ) |
Fiserv, Inc. ‡ | | | (1,880 | ) | | | (141 | ) |
Paychex, Inc. | | | (10,400 | ) | | | (337 | ) |
SAIC, Inc. | | | (15,050 | ) | | | (165 | ) |
Total System Services, Inc. | | | (10,350 | ) | | | (233 | ) |
Vantiv, Inc.—Class A ‡ | | | (380 | ) | | | (8 | ) |
Life Sciences Tools & Services—(0.2%) | | | | | | | | |
Agilent Technologies, Inc. | | | (4,780 | ) | | | (172 | ) |
Machinery—(3.5%) | | | | | | | | |
Caterpillar, Inc. | | | (6,340 | ) | | | (538 | ) |
Cummins, Inc. | | | (1,890 | ) | | | (177 | ) |
Dover Corp. | | | (17,630 | ) | | | (1,026 | ) |
Eaton Corp. | | | (6,490 | ) | | | (306 | ) |
Illinois Tool Works, Inc. | | | (16,985 | ) | | | (1,043 | ) |
Parker Hannifin Corp. | | | (1,430 | ) | | | (112 | ) |
Media—(5.1%) | | | | | | | | |
Gannett Co., Inc. | | | (23,520 | ) | | | (397 | ) |
Interpublic Group of Cos., Inc. | | | (16,050 | ) | | | (162 | ) |
New York Times Co.—Class A ‡ | | | (13,690 | ) | | | (112 | ) |
News Corp.—Class B | | | (37,270 | ) | | | (908 | ) |
Omnicom Group, Inc. | | | (24,480 | ) | | | (1,173 | ) |
Scripps Networks Interactive, Inc.—Class A | | | (20,480 | ) | | | (1,245 | ) |
Washington Post Co.—Class B | | | (2,010 | ) | | | (670 | ) |
Metals & Mining—(2.3%) | | | | | | | | |
AK Steel Holding Corp. | | | (8,470 | ) | | | (43 | ) |
Cliffs Natural Resources, Inc. | | | (21,500 | ) | | | (780 | ) |
Nucor Corp. | | | (25,570 | ) | | | (1,026 | ) |
Vale SA—Class B ADR | | | (12,170 | ) | | | (223 | ) |
Multiline Retail—(0.2%) | | | | | | | | |
JC Penney Co., Inc. | | | (8,580 | ) | | | (206 | ) |
Multi-Utilities—(0.6%) | | | | | | | | |
Wisconsin Energy Corp. | | | (13,470 | ) | | | (518 | ) |
Oil, Gas & Consumable Fuels—(2.7%) | | | | | | | | |
CONSOL Energy, Inc. | | | (5,680 | ) | | | (200 | ) |
EnCana Corp. | | | (15,280 | ) | | | (345 | ) |
Exxon Mobil Corp. | | | (10,690 | ) | | | (974 | ) |
Newfield Exploration Co. ‡ | | | (5,030 | ) | | | (136 | ) |
Spectra Energy Corp. | | | (4,970 | ) | | | (143 | ) |
TransCanada Corp. | | | (13,810 | ) | | | (625 | ) |
Personal Products—(0.6%) | | | | | | | | |
Estee Lauder Cos., Inc.—Class A | | | (9,110 | ) | | | (561 | ) |
Pharmaceuticals—(2.3%) | | | | | | | | |
Eli Lilly & Co. | | | (29,850 | ) | | | (1,451 | ) |
Forest Laboratories, Inc. ‡ | | | (9,400 | ) | | | (317 | ) |
Hospira, Inc. ‡ | | | (12,140 | ) | | | (373 | ) |
The notes to the financial statements are an integral part of this report.
| | | | |
| Transamerica Funds | | | | Annual Report 2012 |
| | Page 110 | | |
Transamerica Long/Short Strategy
(formerly, Transamerica JPMorgan Long/Short Strategy)
SCHEDULE OF INVESTMENTS (continued)
At October 31, 2012
| | | | | | | | |
| | | Shares | | | Value
(000’s) | |
Real Estate Investment Trusts—(7.2%) | | | | | | | | |
Brandywine Realty Trust | | | (30,450 | ) | | $ | (353 | ) |
DCT Industrial Trust, Inc. | | | (85,700 | ) | | | (553 | ) |
DiamondRock Hospitality Co. | | | (14,370 | ) | | | (122 | ) |
Douglas Emmett, Inc. | | | (13,820 | ) | | | (324 | ) |
EastGroup Properties, Inc. | | | (13,570 | ) | | | (706 | ) |
Health Care REIT, Inc. | | | (4,940 | ) | | | (294 | ) |
Kimco Realty Corp. | | | (41,360 | ) | | | (807 | ) |
Mid-America Apartment Communities, Inc. | | | (5,230 | ) | | | (338 | ) |
ProLogis, Inc. | | | (22,800 | ) | | | (782 | ) |
Realty Income Corp. | | | (16,800 | ) | | | (660 | ) |
Tanger Factory Outlet Centers | | | (9,010 | ) | | | (284 | ) |
Vornado Realty Trust | | | (6,300 | ) | | | (505 | ) |
Weingarten Realty Investors | | | (30,060 | ) | | | (813 | ) |
Road & Rail—(1.5%) | | | | | | | | |
Heartland Express, Inc. | | | (34,360 | ) | | | (480 | ) |
Knight Transportation, Inc. | | | (27,990 | ) | | | (423 | ) |
Werner Enterprises, Inc. | | | (20,310 | ) | | | (470 | ) |
Semiconductors & Semiconductor Equipment—(4.6%) | |
Cypress Semiconductor Corp. ‡ | | | (25,510 | ) | | | (253 | ) |
Intel Corp. | | | (52,730 | ) | | | (1,140 | ) |
| | | | | | | | |
| | | Shares | | | Value
(000’s) | |
Semiconductors & Semiconductor Equipment (continued) | | | | | |
Linear Technology Corp. | | | (7,650 | ) | | $ | (239 | ) |
Microchip Technology, Inc. | | | (36,100 | ) | | | (1,132 | ) |
NVIDIA Corp. ‡ | | | (27,020 | ) | | | (323 | ) |
Taiwan Semiconductor Manufacturing Co., Ltd. ADR | | | (72,510 | ) | | | (1,153 | ) |
Software—(0.6%) | | | | | | | | |
Electronic Arts, Inc. ‡ | | | (33,260 | ) | | | (411 | ) |
Salesforce.com, Inc. ‡ | | | (640 | ) | | | (93 | ) |
Specialty Retail—(0.7%) | | | | | | | | |
Bed Bath & Beyond, Inc. ‡ | | | (2,890 | ) | | | (167 | ) |
CarMax, Inc. ‡ | | | (7,520 | ) | | | (253 | ) |
O’Reilly Automotive, Inc. ‡ | | | (2,100 | ) | | | (180 | ) |
Tobacco—(1.3%) | | | | | | | | |
Altria Group, Inc. | | | (37,590 | ) | | | (1,195 | ) |
Trading Companies & Distributors—(0.5%) | | | | | | | | |
Fastenal Co. | | | (9,580 | ) | | | (428 | ) |
| | | | | | | | |
Total Common Stocks (proceeds $(63,185)) | | | | | | | (65,671 | ) |
| | | | | | | | |
Total Securities Sold Short (proceeds $(63,185)) | | | | (65,671 | ) |
| | | | | | | | |
NOTES TO SCHEDULE OF INVESTMENTS (all amounts in thousands):
| ⌂ | All or a portion of these securities have been pledged to the broker as collateral for open securities sold short transactions. Total value of securities segregated for open securities sold short transactions is $41,328. |
| ‡ | Non-income producing security. |
| | Rate shown reflects the yield at 10/31/2012. |
| P | Aggregate cost for federal income tax purposes is $89,002. Aggregate gross unrealized appreciation/depreciation for all securities in which there is an excess of value over tax cost were $5,932 and $3,378, respectively. Net unrealized appreciation for tax purposes is $2,554. |
| Ә | Fair valued as determined in good faith in accordance with procedures established by the Board of Trustees. Total aggregate market value of fair valued securities is less than $1, or less than 0.01% of the fund’s net assets. |
DEFINITION:
| | |
ADR | | American Depository Receipt |
VALUATION SUMMARY (all amounts in thousands): '
| | | | | | | | | | | | | | | | |
Investment Securities | | Level 1 -
Quoted
Prices | | | Level 2 -
Other
Significant
Observable
Inputs | | | Level 3 -
Significant
Unobservable
Inputs | | | Value at
10/31/2012 | |
Common Stocks | | $ | 91,376 | | | $ | — | | | $ | — | | | $ | 91,376 | |
Repurchase Agreement | | | — | | | | 180 | | | | — | | | | 180 | |
| | | | | | | | | | | | | | | | |
Total | | $ | 91,376 | | | $ | 180 | | | $ | — | | | $ | 91,556 | |
| | | | | | | | | | | | | | | | |
| | | | |
Securities Sold Short | | Level 1 -
Quoted
Prices | | | Level 2 -
Other
Significant
Observable
Inputs | | | Level 3 -
Significant
Unobservable
Inputs | | | Value at
10/31/2012 | |
Common Stocks | | $ | (65,671 | ) | | $ | — | | | $ | ¿ | | | $ | (65,671 | ) |
The notes to the financial statements are an integral part of this report.
| | | | |
| Transamerica Funds | | | | Annual Report 2012 |
| | Page 111 | | |
Transamerica Long/Short Strategy
(formerly, Transamerica JPMorgan Long/Short Strategy)
SCHEDULE OF INVESTMENTS (continued)
At October 31, 2012
VALUATION SUMMARY (continued) (all amounts in thousands): '
Level 3 Rollforward—Securities Sold Short
| | | | | | | | | | | | | | | | | | | | | | | | | | | | | | | | | | | | | | | | |
Security | | Beginning
Balance at
10/31/2011 | | | Purchases | | | Sales | | | Accrued
Discounts/
(Premiums) | | | Total
Realized
Gain/(Loss) | | | Net Change in
Unrealized
Appreciation/
(Depreciation) | | | Transfers
into Level 3 | | | Transfers
out of
Level 3 | | | Ending
Balance at
10/31/2012 ₪ | | | Net Change in
Unrealized
Appreciation/
(Depreciation) on
Investments Held
at 10/31/2012 | |
Common Stocks | | $ | — | | | $ | ¿ | | | $ | — | | | $ | — | | | $ | — | | | $ | — | | | $ | — | | | $ | — | | | $ | ¿ | | | $ | — | |
| ' | Transfers between levels are considered to have occurred at the end of the reporting period. There were no transfers into or out of Levels 1 and 2 during the period ended 10/31/2012. See the notes to the financial statments for more information regarding pricing inputs and valuation techniques. |
| ₪ | Inputs used in the valuation of the Level 3 securities were not considered significant unobservable inputs. |
The notes to the financial statements are an integral part of this report.
| | | | |
| Transamerica Funds | | | | Annual Report 2012 |
| | Page 112 | | |
Transamerica Mid Cap Value
(formerly, Transamerica JPMorgan Mid Cap Value)
SCHEDULE OF INVESTMENTS
At October 31, 2012
| | | | | | | | |
| | | Shares | | | Value
(000’s) | |
COMMON STOCKS—98.8% | | | | | | | | |
Aerospace & Defense—0.6% | | | | | | | | |
Alliant Techsystems, Inc. | | | 22,850 | | | $ | 1,309 | |
Beverages—2.6% | | | | | |
Beam, Inc. | | | 39,280 | | | | 2,183 | |
Brown—Forman Corp.—Class B | | | 21,045 | | | | 1,348 | |
Dr. Pepper Snapple Group, Inc. ^ | | | 42,015 | | | | 1,800 | |
Building Products—0.8% | | | | | | | | |
Fortune Brands Home & Security, Inc. ‡ | | | 61,530 | | | | 1,750 | |
Capital Markets—5.6% | | | | | |
Ameriprise Financial, Inc. | | | 57,770 | | | | 3,372 | |
Charles Schwab Corp. ^ | | | 164,515 | | | | 2,234 | |
Invesco, Ltd. | | | 89,700 | | | | 2,182 | |
Northern Trust Corp. | | | 33,635 | | | | 1,607 | |
T. Rowe Price Group, Inc. | | | 36,435 | | | | 2,366 | |
Chemicals—3.8% | | | | | | | | |
Airgas, Inc. | | | 22,510 | | | | 2,003 | |
Albemarle Corp. | | | 35,979 | | | | 1,983 | |
Sherwin-Williams Co. | | | 12,660 | | | | 1,805 | |
Sigma-Aldrich Corp. ^ | | | 30,450 | | | | 2,135 | |
Commercial Banks—6.1% | | | | | | | | |
City National Corp. | | | 29,070 | | | | 1,485 | |
Cullen/Frost Bankers, Inc. ^ | | | 22,730 | | | | 1,257 | |
Fifth Third Bancorp | | | 175,150 | | | | 2,545 | |
Huntington Bancshares, Inc. | | | 141,020 | | | | 901 | |
M&T Bank Corp. | | | 31,015 | | | | 3,229 | |
SunTrust Banks, Inc. | | | 78,870 | | | | 2,145 | |
Zions Bancorporation ^ | | | 53,760 | | | | 1,154 | |
Commercial Services & Supplies—1.4% | | | | | |
Republic Services, Inc.—Class A | | | 102,147 | | | | 2,896 | |
Containers & Packaging—3.6% | | | | | | | | |
Ball Corp. | | | 80,110 | | | | 3,432 | |
Rock-Tenn Co.—Class A | | | 24,517 | | | | 1,794 | |
Silgan Holdings, Inc. | | | 52,050 | | | | 2,254 | |
Distributors—1.0% | | | | | | | | |
Genuine Parts Co. | | | 34,446 | | | | 2,156 | |
Electric Utilities—2.7% | | | | | | | | |
Northeast Utilities | | | 25,815 | | | | 1,015 | |
NV Energy, Inc. | | | 121,575 | | | | 2,311 | |
Westar Energy, Inc. ^ | | | 78,570 | | | | 2,333 | |
Electrical Equipment—2.1% | | | | | | | | |
AMETEK, Inc. | | | 58,350 | | | | 2,074 | |
Regal Beloit Corp. ^ | | | 34,070 | | | | 2,221 | |
Electronic Equipment & Instruments—2.3% | | | | | |
Amphenol Corp.—Class A | | | 42,370 | | | | 2,548 | |
Arrow Electronics, Inc. ‡ | | | 62,055 | | | | 2,186 | |
Food Products—2.4% | | | | | | | | |
Hershey Co. | | | 28,190 | | | | 1,940 | |
JM Smucker Co. | | | 14,205 | | | | 1,217 | |
Ralcorp Holdings, Inc. ‡ | | | 26,650 | | | | 1,924 | |
Gas Utilities—1.9% | | | | | | | | |
EQT Corp. | | | 45,034 | | | | 2,731 | |
ONEOK, Inc. | | | 25,845 | | | | 1,222 | |
Health Care Equipment & Supplies—0.5% | | | | | | | | |
Becton Dickinson and Co. | | | 13,710 | | | | 1,038 | |
Health Care Providers & Services—3.7% | | | | | | | | |
AmerisourceBergen Corp.—Class A | | | 53,445 | | | | 2,108 | |
CIGNA Corp. | | | 51,455 | | | | 2,625 | |
Henry Schein, Inc. ‡ | | | 16,215 | | | | 1,196 | |
Humana, Inc. | | | 24,040 | | | | 1,785 | |
Hotels, Restaurants & Leisure—2.6% | | | | | | | | |
Darden Restaurants, Inc. ^ | | | 30,785 | | | | 1,620 | |
Marriott International, Inc.—Class A | | | 60,865 | | | | 2,220 | |
Yum! Brands, Inc. | | | 23,502 | | | | 1,648 | |
Household Durables—1.5% | | | | | | | | |
Jarden Corp. | | | 13,960 | | | | 695 | |
| | | | | | | | |
| | | Shares | | | Value
(000’s) | |
Household Durables (continued) | | | | | | | | |
Mohawk Industries, Inc. ‡ | | | 28,350 | | | $ | 2,367 | |
Household Products—1.0% | | | | | | | | |
Energizer Holdings, Inc. | | | 28,175 | | | | 2,056 | |
Industrial Conglomerates—1.2% | | | | | |
Carlisle Cos., Inc. | | | 45,820 | | | | 2,545 | |
Insurance —11.1% | | | | | |
Alleghany Corp. ‡ | | | 7,786 | | | | 2,706 | |
Arch Capital Group, Ltd. ‡ ^ | | | 19,134 | | | | 845 | |
Chubb Corp. | | | 27,350 | | | | 2,105 | |
Hartford Financial Services Group, Inc. ^ | | | 59,840 | | | | 1,299 | |
Loews Corp. | | | 94,955 | | | | 4,014 | |
Marsh & McLennan Cos., Inc. | | | 95,185 | | | | 3,239 | |
Old Republic International Corp. | | | 129,830 | | | | 1,283 | |
OneBeacon Insurance Group, Ltd.—Class A ^ | | | 59,095 | | | | 798 | |
Unum Group | | | 78,652 | | | | 1,595 | |
WR Berkley Corp. ^ | | | 62,800 | | | | 2,442 | |
XL Group PLC—Class A | | | 102,050 | | | | 2,525 | |
Internet & Catalog Retail—1.1% | | | | | | | | |
Expedia, Inc. | | | 26,736 | | | | 1,581 | |
TripAdvisor, Inc. ‡ ^ | | | 25,119 | | | | 761 | |
IT Services—1.2% | | | | | | | | |
Jack Henry & Associates, Inc. | | | 67,360 | | | | 2,560 | |
Machinery—2.3% | | | | | | | | |
IDEX Corp. | | | 37,610 | | | | 1,600 | |
Rexnord Corp. ‡ ^ | | | 72,500 | | | | 1,314 | |
Snap-on, Inc. | | | 24,923 | | | | 1,927 | |
Media—3.2% | | | | | | | | |
AMC Networks, Inc. ‡ | | | 16,545 | | | | 773 | |
Cablevision Systems Corp.—Class A ^ | | | 46,610 | | | | 812 | |
CBS Corp.—Class B | | | 55,280 | | | | 1,791 | |
Clear Channel Outdoor Holdings, Inc.—Class A ‡ ^ | | | 66,363 | | | | 442 | |
DISH Network Corp.—Class A | | | 54,231 | | | | 1,932 | |
Gannett Co., Inc. ^ | | | 37,205 | | | | 629 | |
Washington Post Co.—Class B ^ | | | 1,155 | | | | 385 | |
Multiline Retail—2.8% | | | | | | | | |
Family Dollar Stores, Inc. | | | 35,550 | | | | 2,345 | |
Kohl’s Corp. ^ | | | 65,665 | | | | 3,499 | |
Multi-Utilities—6.1% | | | | | | | | |
CenterPoint Energy, Inc. | | | 79,107 | | | | 1,714 | |
CMS Energy Corp. | | | 99,600 | | | | 2,423 | |
NiSource, Inc. | | | 78,958 | | | | 2,011 | |
Sempra Energy | | | 30,500 | | | | 2,127 | |
Wisconsin Energy Corp. | | | 53,176 | | | | 2,046 | |
Xcel Energy, Inc. | | | 82,348 | | | | 2,326 | |
Oil, Gas & Consumable Fuels—5.0% | | | | | |
Devon Energy Corp. | | | 37,400 | | | | 2,177 | |
Energen Corp. | | | 71,162 | | | | 3,320 | |
Marathon Petroleum Corp. | | | 36,694 | | | | 2,016 | |
QEP Resources, Inc. | | | 49,560 | | | | 1,437 | |
Williams Cos., Inc. | | | 43,164 | | | | 1,510 | |
Professional Services—0.8% | | | | | | | | |
Equifax, Inc. | | | 31,560 | | | | 1,579 | |
Real Estate Investment Trusts—2.7% | | | | | | | | |
HCP, Inc. | | | 38,965 | | | | 1,726 | |
Regency Centers Corp. | | | 43,185 | | | | 2,074 | |
Vornado Realty Trust | | | 22,516 | | | | 1,806 | |
Real Estate Management & Development—0.7% | |
Brookfield Office Properties, Inc. | | | 97,565 | | | | 1,505 | |
Semiconductors & Semiconductor Equipment—2.1% | | | | | | | | |
Analog Devices, Inc. | | | 66,670 | | | | 2,608 | |
Xilinx, Inc. | | | 55,255 | | | | 1,810 | |
Software—0.9% | | | | | | | | |
Synopsys, Inc. ‡ | | | 61,300 | | | | 1,974 | |
The notes to the financial statements are an integral part of this report.
| | | | |
| Transamerica Funds | | | | Annual Report 2012 |
| | Page 113 | | |
Transamerica Mid Cap Value
(formerly, Transamerica JPMorgan Mid Cap Value)
SCHEDULE OF INVESTMENTS (continued)
At October 31, 2012
| | | | | | | | |
| | | Shares | | | Value
(000’s) | |
Specialty Retail—6.8% | | | | | | | | |
AutoZone, Inc. ‡ | | | 6,799 | | | $ | 2,550 | �� |
Bed Bath & Beyond, Inc. ‡ | | | 37,105 | | | | 2,140 | |
Gap, Inc. | | | 59,645 | | | | 2,131 | |
PetSmart, Inc. | | | 18,006 | | | | 1,195 | |
Tiffany & Co. | | | 30,280 | | | | 1,914 | |
TJX Cos., Inc. | | | 39,420 | | | | 1,641 | |
Williams-Sonoma, Inc. | | | 57,560 | | | | 2,660 | |
Textiles, Apparel & Luxury Goods—1.9% | | | | | | | | |
PVH Corp. | | | 25,209 | | | | 2,773 | |
V.F. Corp. | | | 7,810 | | | | 1,222 | |
Thrifts & Mortgage Finance—1.1% | | | | | | | | |
Capitol Federal Financial, Inc. | | | 57,370 | | | | 683 | |
People’s United Financial, Inc. ^ | | | 136,800 | | | | 1,646 | |
Trading Companies & Distributors—1.1% | | | | | | | | |
MSC Industrial Direct Co., Inc.—Class A | | | 29,342 | | | | 2,189 | |
Wireless Telecommunication Services—0.5% | | | | | | | | |
Telephone & Data Systems, Inc. | | | 39,610 | | | | 985 | |
| | | | | | | | |
Total Common Stocks (cost $158,794) | | | | | | | 206,070 | |
| | | | | | | | |
SECURITIES LENDING COLLATERAL—10.2% | | | | | |
State Street Navigator Securities Lending Trust—Prime Portfolio, 0.31% | | | 21,224,973 | | | | 21,225 | |
Total Securities Lending Collateral (cost $21,225) | | | | | |
| | | | | | | | |
| | | Principal
(000’s) | | | Value
(000’s) | |
REPURCHASE AGREEMENT—1.3% | | | | | | | | |
State Street Bank & Trust Co. 0.03% , dated 10/31/2012, to be repurchased at $2,657 on 11/01/2012. Collateralized by a U.S. Government Agency Obligation, 3.00%, due 12/01/2026, and with a value of $2,711. | | $ | 2,657 | | | $ | 2,657 | |
Total Repurchase Agreement (cost $2,657) | | | | | | | | |
| | | | | | | | |
Total Investment Securities (cost $182,676) P | | | | | | | 229,952 | |
Other Assets and Liabilities—Net | | | | | | | (21,494 | ) |
| | | | | | | | |
Net Assets | | | | | | $ | 208,458 | |
| | | | | | | | |
NOTES TO SCHEDULE OF INVESTMENTS (all amounts in thousands):
| ^ | All or a portion of this security is on loan. The value of all securities on loan is $20,706. |
| ‡ | Non-income producing security. |
| | Rate shown reflects the yield at 10/31/2012. |
| P | Aggregate cost for federal income tax purposes is $184,352. Aggregate gross unrealized appreciation/depreciation for all securities in which there is an excess of value over tax cost were $47,117 and $1,517, respectively. Net unrealized appreciation for tax purposes is $45,600. |
VALUATION SUMMARY (all amounts in thousands): '
| | | | | | | | | | | | | | | | |
Investment Securities | | Level 1 -
Quoted
Prices | | | Level 2 -
Other
Significant
Observable
Inputs | | | Level 3 -
Significant
Unobservable
Inputs | | | Value at
10/31/2012 | |
Common Stocks | | $ | 206,070 | | | $ | — | | | $ | — | | | $ | 206,070 | |
Repurchase Agreement | | | — | | | | 2,657 | | | | — | | | | 2,657 | |
Securities Lending Collateral | | | 21,225 | | | | — | | | | — | | | | 21,225 | |
| | | | | | | | | | | | | | | | |
Total | | $ | 227,295 | | | $ | 2,657 | | | $ | — | | | $ | 229,952 | |
| | | | | | | | | | | | | | | | |
| ' | Transfers between levels are considered to have occurred at the end of the reporting period. There were no transfers into or out of Levels 1 and 2 during the period ended 10/31/2012. See the notes to the financial statements for more information regarding pricing inputs and valuation techniques. |
The notes to the financial statements are an integral part of this report.
| | | | |
| Transamerica Funds | | | | Annual Report 2012 |
| | Page 114 | | |
Transamerica Real Return TIPS
(formerly, Transamerica PIMCO Real Return TIPS)
SCHEDULE OF INVESTMENTS
At October 31, 2012
| | | | | | | | |
| | | Principal
(000’s) | | | Value
(000’s) | |
U.S. GOVERNMENT OBLIGATIONS—98.7% | | | | | |
U.S. Treasury Inflation Indexed Bond | | | | | | | | |
0.75%, 02/15/2042 — | | $ | 5,046 | | | $ | 5,619 | |
1.75%, 01/15/2028 Ð g | | | 42,990 | | | | 56,343 | |
2.00%, 01/15/2026 | | | 39,342 | | | | 52,201 | |
2.13%, 02/15/2040 | | | 1,492 | | | | 2,219 | |
2.38%, 01/15/2025 | | | 31,221 | | | | 42,688 | |
2.38%, 01/15/2027 — | | | 60,867 | | | | 84,900 | |
2.50%, 01/15/2029 Ð g | | | 54,329 | | | | 78,509 | |
3.38%, 04/15/2032 | | | 389 | | | | 651 | |
3.63%, 04/15/2028 Ð | | | 46,426 | | | | 74,550 | |
3.88%, 04/15/2029 Ð — | | | 53,019 | | | | 89,018 | |
U.S. Treasury Inflation Indexed Note | | | | | | | | |
0.13%, 04/15/2016 a Ð | | | 33,863 | | | | 35,698 | |
0.13%, 04/15/2017 | | | 913 | | | | 979 | |
0.13%, 01/15/2012—07/15/2022 Ð — | | | 169,355 | | | | 185,307 | |
0.50%, 04/15/2015 | | | 43,153 | | | | 45,081 | |
0.63%, 07/15/2021 Ð g a — | | | 78,848 | | | | 90,220 | |
1.13%, 01/15/2021 g a | | | 15,847 | | | | 18,740 | |
1.25%, 07/15/2020 Ð | | | 58,196 | | | | 69,403 | |
1.38%, 07/15/2018—01/15/2020 | | | 47,569 | | | | 56,169 | |
1.63%, 01/15/2015—01/15/2018 | | | 36,329 | | | | 40,265 | |
1.88%, 07/15/2013—07/15/2019 | | | 56,223 | | | | 60,713 | |
1.88%, 07/15/2015 a | | | 54,000 | | | | 59,016 | |
2.00%, 01/15/2014 — | | | 9,723 | | | | 10,087 | |
2.00%, 07/15/2014—01/15/2016 | | | 106,833 | | | | 114,977 | |
2.13%, 01/15/2019 | | | 20,405 | | | | 24,942 | |
2.38%, 01/15/2017 | | | 11,650 | | | | 13,585 | |
2.63%, 07/15/2017 | | | 10,225 | | | | 12,282 | |
| | | | | | | | |
Total U.S. Government Obligations (cost $1,247,140) | | | | 1,324,162 | |
| | | | | | | | |
U.S. GOVERNMENT AGENCY OBLIGATIONS—0.2% | | | | | |
Fannie Mae | | | | | | | | |
0.36%, 08/25/2034 * | | | 101 | | | | 100 | |
0.89%, 02/25/2041 * | | | 2,319 | | | | 2,335 | |
1.35%, 10/01/2044 * | | | 35 | | | | 36 | |
Freddie Mac | | | | | | | | |
0.44%, 02/15/2019 * | | | 839 | | | | 841 | |
| | | | | | | | |
Total U.S. Government Agency Obligations (cost $3,306) | | | | 3,312 | |
| | | | | | | | |
FOREIGN GOVERNMENT OBLIGATIONS—8.9% | | | | | |
Australia Government Bond | | | | | | | | |
3.00%, 09/20/2025 | | AUD | 3,100 | | | | 4,515 | |
Canadian Government Bond | | | | | | | | |
1.50%, 12/01/2044 | | CAD | 4,636 | | | | 6,174 | |
2.75%, 09/01/2016 | | | 2,600 | | | | 2,745 | |
3.00%, 12/01/2036 | | | 355 | | | | 584 | |
4.25%, 12/01/2021 | | | 13,047 | | | | 18,632 | |
Denmark I/L Government Bond | | | | | | | | |
0.10%, 11/15/2023 | | DKK | 14,344 | | | | 2,612 | |
Italy Buoni Poliennali del Tesoro | | | | | | | | |
2.10%, 09/15/2016—09/15/2017 | | EUR | 28,400 | | | | 36,509 | |
2.35%, 09/15/2019 | | | 652 | | | | 812 | |
Mexican Udibonos | | | | | | | | |
2.00%, 06/09/2022 | | MXN | 13,471 | | | | 1,077 | |
New South Wales Treasury Corp. | | | | | | | | |
2.50%, 11/20/2035 | | AUD | 1,100 | | | | 1,442 | |
2.75%, 11/20/2025 | | | 14,100 | | | | 19,363 | |
South Africa Government Bond—CPI Linked | | | | | | | | |
2.75%, 01/31/2022 | | ZAR | 22,387 | | | | 2,960 | |
| | | | | | | | |
| | | Principal
(000’s) | | | Value
(000’s) | |
FOREIGN GOVERNMENT OBLIGATIONS (continued) | | | | | |
U.K. Gilt Inflation Linked | | | | | | | | |
0.13%, 03/22/2024 | | GBP | 4,711 | | | $ | 8,071 | |
1.25%, 11/22/2032 | | | 895 | | | | 1,776 | |
1.88%, 11/22/2022 | | | 3,072 | | | | 6,280 | |
2.50%, 07/26/2016—Reg S | | | 1,200 | | | | 6,637 | |
| | | | | | | | |
Total Foreign Government Obligations (cost $115,810) | | | | 120,189 | |
| | | | | | | | |
MORTGAGE-BACKED SECURITIES—1.5% | | | | | |
Arran Residential Mortgages Funding PLC | | | | | | | | |
Series 2010-1A, Class A1B | | | | | | | | |
1.55%, 05/16/2047—144A * | | $ | 69 | | | | 90 | |
Series 2011-1A, Class A1B | | | | | | | | |
1.54%, 11/19/2047—144A * | | | 1,730 | | | | 2,251 | |
Banc of America Merrill Lynch Commercial Mortgage, Inc. | | | | | | | | |
Series 2007-3, Class A2 | | | | | | | | |
5.54%, 06/10/2049 * | | | 29 | | | | 29 | |
Series 2007-3, Class A2FL | | | | | | | | |
0.39%, 06/10/2049—144A * | | | 29 | | | | 29 | |
Series 2007-5, Class A4 | | | | | | | | |
5.49%, 02/10/2051 | | | 530 | | | | 623 | |
Banc of America Mortgage Securities, Inc. | | | | | | | | |
Series 2004-1, Class 5A1 | | | | | | | | |
6.50%, 09/25/2033 | | | 23 | | | | 24 | |
Bear Stearns Adjustable Rate Mortgage Trust | | | | | | | | |
Series 2005-2, Class A1 | | | | | | | | |
2.57%, 03/25/2035 * | | | 525 | | | | 529 | |
Series 2005-2, Class A2 | | | | | | | | |
3.08%, 03/25/2035 * | | | 153 | | | | 154 | |
Series 2005-5, Class A1 | | | | | | | | |
2.24%, 08/25/2035 * | | | 163 | | | | 164 | |
Series 2005-5, Class A2 | | | | | | | | |
2.32%, 08/25/2035 * | | | 303 | | | | 295 | |
Citigroup Mortgage Loan Trust, Inc. | | | | | | | | |
Series 2005-6, Class A1 | | | | | | | | |
2.23%, 09/25/2035 * | | | 214 | | | | 212 | |
Series 2005-6, Class A2 | | | | | | | | |
2.34%, 09/25/2035 * | | | 267 | | | | 258 | |
Series 2005-6, Class A3 | | | | | | | | |
1.99%, 09/25/2035 * | | | 34 | | | | 34 | |
Series 2005-11, Class A1A | | | | | | | | |
2.60%, 05/25/2035 * | | | 28 | | | | 27 | |
Citigroup/Deutsche Bank Commercial Mortgage Trust | | | | | | | | |
Series 2007-CD5, Class A4 | | | | | | | | |
5.89%, 11/15/2044 * | | | 400 | | | | 475 | |
Countrywide Home Loan Mortgage Pass-Through Trust | | | | | | | | |
Series 2005-3, Class 1A2 | | | | | | | | |
0.50%, 04/25/2035 * | | | 928 | | | | 698 | |
Series 2005-R2, Class 1AF1 | | | | | | | | |
0.55%, 06/25/2035—144A * | | | 192 | | | | 164 | |
DBUBS Mortgage Trust | | | | | | | | |
Series 2011-LC2A, Class A2 | | | | | | | | |
3.39%, 07/10/2044—144A | | | 6,700 | | | | 7,246 | |
Greenpoint Mortgage Funding Trust | | | | | | | | |
Series 2005-AR1, Class A2 | | | | | | | | |
0.43%, 06/25/2045 * | | | 367 | | | | 290 | |
GSR Mortgage Loan Trust | | | | | | | | |
Series 2005-AR6, Class 2A1 | | | | | | | | |
2.66%, 09/25/2035 * | | | 562 | | | | 564 | |
LB-UBS Commercial Mortgage Trust | | | | | | | | |
Series 2007-C7, Class A3 | | | | | | | | |
5.87%, 09/15/2045 * § | | | 200 | | | | 240 | |
The notes to the financial statements are an integral part of this report.
| | | | |
| Transamerica Funds | | | | Annual Report 2012 |
| | Page 115 | | |
Transamerica Real Return TIPS
(formerly, Transamerica PIMCO Real Return TIPS)
SCHEDULE OF INVESTMENTS (continued)
At October 31, 2012
| | | | | | | | |
| | | Principal
(000’s) | | | Value
(000’s) | |
MORTGAGE-BACKED SECURITIES (continued) | | | | | |
MASTR Alternative Loans Trust | | | | | | | | |
Series 2006-2, Class 2A1 0.61%, 03/25/2036 * | | $ | 607 | | | $ | 104 | |
Merrill Lynch/Countrywide Commercial Mortgage Trust | | | | | | | | |
Series 2007-9, Class A4 5.70%, 09/12/2049 | | | 300 | | | | 352 | |
Morgan Stanley Capital I Trust | | | | | | | | |
Series 2007-IQ15, Class A4 5.88%, 06/11/2049 * | | | 1,200 | | | | 1,407 | |
Permanent Master Issuer PLC | | | | | | | | |
Series 2011-1A, Class 1A3 1.51%, 07/15/2042—144A * | | | 400 | | | | 525 | |
RALI Trust | | | | | | | | |
Series 2006-QO6, Class A1 0.39%, 06/25/2046 * | | | 973 | | | | 424 | |
Sequoia Mortgage Trust | | | | | | | | |
Series 5, Class A 0.91%, 10/19/2026 * | | | 75 | | | | 74 | |
Structured Asset Mortgage Investments, Inc. | | | | | | | | |
Series 2006-AR5, Class 1A1 0.42%, 05/25/2046 * | | | 864 | | | | 494 | |
Wachovia Bank Commercial Mortgage Trust | | | | | | | | |
Series 2006-C28, Class A4 5.57%, 10/15/2048 | | | 400 | | | | 460 | |
WaMu Mortgage Pass-Through Certificates | | | | | | | | |
Series 2003-AR9, Class 2A 2.54%, 09/25/2033 * | | | 627 | | | | 630 | |
Wells Fargo Mortgage Backed Securities Trust | | | | | | | | |
Series 2006-AR8, Class 2A1 2.72%, 04/25/2036 * | | | 1,659 | | | | 1,472 | |
| | | | | | | | |
Total Mortgage-Backed Securities (cost $19,827) | | | | | | | 20,338 | |
| | | | | | | | |
ASSET-BACKED SECURITIES—0.4% | | | | | | | | |
Ares VIR CLO, Ltd. | | | | | | | | |
Series 2006-6RA, Class A1B 0.63%, 03/12/2018—144A * | | | 721 | | | | 715 | |
Countrywide Asset-Backed Certificates | | | | | | | | |
Series 2005-13, Class 3AV3 0.46%, 04/25/2036 * | | | 184 | | | | 174 | |
CSAB Mortgage Backed Trust | | | | | | | | |
Series 2006-1, Class A6A 6.17%, 06/25/2036 * | | | 1,128 | | | | 775 | |
Duane Street CLO I, Ltd. | | | | | | | | |
Series 2005-1A, Class A2 0.69%, 11/08/2017—144A * | | | 300 | | | | 296 | |
Equity One, Inc. | | | | | | | | |
Series 2004-1, Class AV2 0.51%, 04/25/2034 * | | | 46 | | | | 34 | |
Harvest CLO SA | | | | | | | | |
Series I-X, Class A1 0.94%, 03/29/2017 * Ә | | | 111 | | | | 142 | |
Katonah VI, Ltd. | | | | | | | | |
Series 6A, Class A1A 0.70%, 09/20/2016—144A * | | | 384 | | | | 383 | |
Magi Funding PLC | | | | | | | | |
Series I-A, Class A 0.67%, 04/11/2021—144A * Ә | | | 550 | | | | 676 | |
Magnolia Funding, Ltd. | | | | | | | | |
Series 2010-1A, Class A1 3.00%, 04/20/2017–144A Ә | | | 141 | | | | 182 | |
| | | | | | | | |
| | | Principal
(000’s) | | | Value
(000’s) | |
ASSET-BACKED SECURITIES (continued) | | | | | | | | |
Morgan Stanley Mortgage Loan Trust | | | | | | | | |
Series 2006-12XS, Class A6A | | | | | | | | |
5.73%, 10/25/2036 * | | $ | 412 | | | $ | 240 | |
Saxon Asset Securities Trust | | | | | | | | |
Series 2003-1, Class AF7 | | | | | | | | |
4.03%, 06/25/2033 * | | | 412 | | | | 412 | |
SLM Student Loan Trust | | | | | | | | |
Series 2003-6, Class A4 | | | | | | | | |
0.59%, 12/17/2018 * | | | 388 | | | | 387 | |
Series 2010-B, Class A1 | | | | | | | | |
2.13%, 08/15/2016—144A * | | | 147 | | | | 148 | |
Structured Asset Securities Corp. | | | | | | | | |
Series 2007-BC3, Class 2A2 | | | | | | | | |
0.35%, 05/25/2047 * | | | 900 | | | | 684 | |
Wood Street CLO BV | | | | | | | | |
Series II-A, Class A1 | | | | | | | | |
0.70%, 03/29/2021—144A * Ә | | | 215 | | | | 270 | |
| | | | | | | | |
Total Asset-Backed Securities (cost $5,702) | | | | | | | 5,518 | |
| | | | | | | | |
MUNICIPAL GOVERNMENT OBLIGATIONS—0.1% | | | | | |
Tobacco Settlement Finance Authority—Series A | | | | | | | | |
7.47%, 06/01/2047 | | | 660 | | | | 525 | |
Tobacco Settlement Financing Corp.—Series A | | | | | | | | |
6.00%, 06/01/2023 | | | 230 | | | | 235 | |
| | | | | | | | |
Total Municipal Government Obligations (cost $838) | | | | 760 | |
| | | | | | | | |
CORPORATE DEBT SECURITIES—4.3% | | | | | | | | |
Capital Markets—0.8% | | | | | | | | |
Morgan Stanley | | | | | | | | |
0.61%, 03/01/2013 * | | | 1,000 | | | | 1,295 | |
2.94%, 05/14/2013 * | | | 8,800 | | | | 8,886 | |
Morgan Stanley—Series F | | | | | | | | |
0.78%, 10/18/2016 * ^ | | | 800 | | | | 758 | |
Commercial Banks—1.9% | | | | | | | | |
Banco Bradesco SA | | | | | | | | |
2.54%, 05/16/2014—144A * | | | 4,600 | | | | 4,645 | |
BBVA Bancomer SA | | | | | | | | |
6.50%, 03/10/2021—144A ^ | | | 1,900 | | | | 2,168 | |
CIT Group, Inc. | | | | | | | | |
5.25%, 04/01/2014—144A ^ | | | 1,000 | | | | 1,038 | |
Dexia Credit Local | | | | | | | | |
1.65%, 09/12/2013 | | | 3,500 | | | | 3,500 | |
HBOS PLC | | | | | | | | |
1.11%, 09/06/2017 * | | | 9,400 | | | | 7,817 | |
ICICI Bank, Ltd. | | | | | | | | |
2.18%, 02/24/2014—144A * | | | 600 | | | | 589 | |
Societe Generale SA | | | | | | | | |
1.40%, 04/11/2014—144A * | | | 3,800 | | | | 3,786 | |
Turkiye Garanti Bankasi AS | | | | | | | | |
2.82%, 04/20/2016—144A * | | | 500 | | | | 489 | |
Consumer Finance—0.0% ¥ | | | | | | | | |
Ally Financial, Inc. | | | | | | | | |
3.64%, 02/11/2014 * | | | 100 | | | | 102 | |
3.78%, 06/20/2014 * | | | 200 | | | | 204 | |
SLM Corp. | | | | | | | | |
5.05%, 11/14/2014 | | | 300 | | | | 317 | |
Diversified Financial Services—0.6% | | | | | | | | |
Credit Agricole Home Loan SFH | | | | | | | | |
1.07%, 07/21/2014—144A * § | | | 3,400 | | | | 3,368 | |
The notes to the financial statements are an integral part of this report.
| | | | |
| Transamerica Funds | | | | Annual Report 2012 |
| | Page 116 | | |
Transamerica Real Return TIPS
(formerly, Transamerica PIMCO Real Return TIPS)
SCHEDULE OF INVESTMENTS (continued)
At October 31, 2012
| | | | | | | | |
| | | Principal
(000’s) | | | Value
(000’s) | |
Diversified Financial Services (continued) | | | | | | | | |
Ford Motor Credit Co. LLC | | | | | | | | |
3.98%, 06/15/2016 | | $ | 3,600 | | | $ | 3,816 | |
International Lease Finance Corp. | | | | | | | | |
6.50%, 09/01/2014—144A | | | 600 | | | | 645 | |
6.75%, 09/01/2016—144A | | | 500 | | | | 565 | |
Insurance—0.5% | | | | | | | | |
American International Group, Inc. | | | | | | | | |
6.77%, 11/15/2017 ^ | | | 227 | | | | 428 | |
8.18%, 05/15/2058 * ^ | | | 3,650 | | | | 4,554 | |
8.63%, 05/22/2038—Reg S * ^ | | | 250 | | | | 475 | |
Marsh & McLennan Cos., Inc. | | | | | | | | |
5.75%, 09/15/2015 | | | 1,093 | | | | 1,235 | |
Metals & Mining—0.0% ¥ | | | | | | | | |
Gerdau Holdings, Inc. | | | | | | | | |
7.00%, 01/20/2020—144A | | | 200 | | | | 235 | |
Oil, Gas & Consumable Fuels—0.5% | | | | | | | | |
Gazprom OAO Via GAZ Capital SA | | | | | | | | |
5.09%, 11/29/2015—144A ^ | | | 500 | | | | 536 | |
Gazprom OAO Via GAZ Capital SA—Series 16 | | | | | | | | |
7.34%, 04/11/2013—144A | | | 300 | | | | 307 | |
Petrobras International Finance Co. | | | | | | | | |
3.88%, 01/27/2016 | | | 3,700 | | | | 3,930 | |
Petroleos Mexicanos | | | | | | | | |
5.50%, 01/21/2021 | | | 800 | | | | 934 | |
6.50%, 06/02/2041 | | | 700 | | | | 869 | |
| | | | | | | | |
Total Corporate Debt Securities (cost $53,274) | | | | | | | 57,491 | |
| | | | | | | | |
COMMERCIAL PAPER—0.6% | | | | | | | | |
Commercial Banks—0.6% | | | | | | | | |
Santander Commercial Paper SA Unipersonal | | | | | | | | |
2.20%, 04/02/2013—144A | | | 8,300 | | | | 8,223 | |
Total Commercial Paper (cost $8,223) | | | | | | | | |
LOAN ASSIGNMENTS—0.5% | | | | | | | | |
Consumer Finance—0.4% | | | | | | | | |
Springleaf Financial Funding Co. | | | | | | | | |
5.50%, 05/10/2017 * | | | 4,400 | | | | 4,328 | |
Independent Power Producers & Energy Traders —0.1% | | | | | |
NRG Energy, Inc., Tranche B | | | | | | | | |
4.00%, 07/02/2018 * | | | 1,975 | | | | 1,984 | |
| | | | | | | | |
Total Loan Assignments (cost $6,354) | | | | | | | 6,312 | |
| | | | | | | | |
| | | | | | | | |
| | | Notional
Amount
(000’s) | | | Value
(000’s) | |
PURCHASED STRADDLE SWAPTIONS—0.0% ¥ | | | | | |
Straddle Options—0.0% ¥ | | | | | | | | |
OTC- Call & Put 3-Month vs. 30-Year | | | | | | | | |
Forward Volatility Agreement | | | 2,300 | | | | 171 | |
Exercise Level 1.00% Þ | | | | | | | | |
Expires 03/11/2013 § | | | | | | | | |
Counterparty: RBS | | | | | | | | |
OTC- Call & Put 3-Month vs. 30-Year | | | | | | | | |
Forward Volatility Agreement | | | 3,600 | | | | 268 | |
Exercise Level 1.00% Þ | | | | | | | | |
Expires 03/11/2013 § | | | | | | | | |
Counterparty: DUB | | | | | | | | |
| | | | | | | | |
Total Purchased Straddle Swaptions (cost $499) | | | | | | | 439 | |
| | | | | | | | |
| | | | | | | | |
| | | Notional
Amount
(000’s) | | | Value
(000’s) | |
PURCHASED SWAPTIONS—0.0% ¥ | | | | | | | | |
Put Options—0.0% ¥ | | | | | | | | |
OTC- If exercised the Series receives floating 3 month LIBOR, and pays 3.875%, European Style Expires 04/14/2014 § Counterparty: DUB | | $ | 5,000 | | | $ | 120 | |
Total Purchased Swaptions (cost $254) | | | | | | | | |
| | | | | | | | |
| | | Shares | | | Value
(000’s) | |
SECURITIES LENDING COLLATERAL—0.4% | | | | | | | | |
State Street Navigator Securities Lending | | | | | | | | |
Trust—Prime Portfolio, 0.31% | | | 5,407,915 | | | | 5,408 | |
Total Securities Lending Collateral (cost $5,408) | | | | | | | | |
| | | | | | | | |
| | | Principal
(000’s) | | | Value
(000’s) | |
REPURCHASE AGREEMENT—0.0% ¥ | | | | | | | | |
State Street Bank & Trust Co.
0.03% , dated 10/31/2012, to be repurchased at $612 on 11/01/2012. Collateralized by a U.S. Government Agency Obligation, 4.00%, due 04/01/2025, and with a value of $626. | | $ | 612 | | | | 612 | |
Total Repurchase Agreement (cost $612) | | | | | | | | |
| | | | | | | | |
Total Investment Securities (cost $1,467,247) P | | | | | | | 1,552,884 | |
Other Assets and Liabilities—Net | | | | | | | (209,432 | ) |
| | | | | | | | |
Net Assets | | | | | | $ | 1,343,452 | |
| | | | | | | | |
| | | | | | | | |
| | | Principal
(000’s) | | | Value
(000’s) | |
REVERSE REPURCHASE AGREEMENTS—(10.6%) F | | | | | |
BNP Paribas
0.26% , dated 10/18/2012, to be repurchased at $(62,799) on 11/20/2012. | | $ | (62,784 | ) | | $ | (62,784 | ) |
BNP Paribas
0.27% , dated 10/19/2012, to be repurchased at $(39,306) on 11/21/2012. | | | (39,297 | ) | | | (39,297 | ) |
Deutsche Bank Securities, Inc.
0.29% , dated 10/31/2012, to be repurchased at $(1,791) on 02/06/2013. | | | (1,790 | ) | | | (1,790 | ) |
Deutsche Bank Securities, Inc.
0.29% , dated 10/31/2012, to be repurchased at $(5,604) on 01/29/2013. | | | (5,600 | ) | | | (5,600 | ) |
JPMorgan Chase & Co.
0.28% , dated 10/25/2012, to be repurchased at $(33,620) on 11/09/2012. | | | (33,615 | ) | | | (33,615 | ) |
Total Reverse Repurchase Agreements
(cost $(143,086)) | | | | | | | (143,086 | ) |
| | | | | | | | |
The notes to the financial statements are an integral part of this report.
| | | | |
| Transamerica Funds | | | | Annual Report 2012 |
| | Page 117 | | |
Transamerica Real Return TIPS
(formerly, Transamerica PIMCO Real Return TIPS)
SCHEDULE OF INVESTMENTS (continued)
At October 31, 2012
WRITTEN INFLATION FLOOR OPTIONS:
| | | | | | | | | | | | | | | | | | | | | | | | |
Description | | Counterparty | | Strike Index | | | Exercise Index | | Expiration
Date | | | Notional
Amount
(000’s) | | | Premiums
(Received)
(000’s) | | | Value
(000’s) | |
Floor—OTC CPURNSA Index | | DUB | | | 215.95 | | | Maximum of ((1 + 0.000%)10 -
Inflation Adjustment) or 0 | | | 03/10/2020 | | | $ | 1,800 | | | $ | (13 | ) | | $ | (4 | ) |
Floor—OTC CPURNSA Index | | CITI | | | 216.69 | | | Maximum of ((1 + 0.000%)10 -
Inflation Adjustment) or 0 | | | 04/07/2020 | | | | 14,200 | | | | (127 | ) | | | (23 | ) |
Floor—OTC CPURNSA Index | | CITI | | | 217.97 | | | Maximum of ((1 + 0.000%)10 -
Inflation Adjustment) or 0 | | | 09/29/2020 | | | | 1,700 | | | | (22 | ) | | | (3 | ) |
| | | | | | | | | | | | | | | | | | | | | | | | |
| | | | | | | | | | | | | | | | | | $ | (162 | ) | | $ | (30 | ) |
| | | | | | | | | | | | | | | | | | | | | | | | |
WRITTEN SWAPTIONS: p
| | | | | | | | | | | | | | | | | | | | | | | | | | |
Description | | Counterparty | | Floating Rate Index | | Pay/Receive
Floating Rate | | Exercise
Rate | | | Expiration
Date | | | Notional
Amount
(000’s) | | | Premiums
(Received)
(000’s) | | | Value
(000’s) | |
| | | | 3-Month USD | | | | | | | | | | | | | | | | | | | | | | |
Call- OTC 2-Year Interest Rate Swap | | MSC | | LIBOR BBA | | Receive | | | 0.92 | % | | | 11/14/2012 | | | $ | 13,400 | | | $ | — | | | $ | (140 | ) |
| | | | 3-Month USD | | | | | | | | | | | | | | | | | | | | | | |
Call- OTC 5-Year Interest Rate Swap | | RBS | | LIBOR BBA | | Receive | | | 0.75 | | | | 03/18/2013 | | | | 39,000 | | | | (92 | ) | | | (80 | ) |
| | | | 3-Month USD | | | | | | | | | | | | | | | | | | | | | | |
Call- OTC 5-Year Interest Rate Swap | | BNP | | LIBOR BBA | | Receive | | | 0.75 | | | | 03/18/2013 | | | | 16,100 | | | | (37 | ) | | | (33 | ) |
| | | | 3-Month USD | | | | | | | | | | | | | | | | | | | | | | |
Call- OTC 5-Year Interest Rate Swap | | DUB | | LIBOR BBA | | Receive | | | 1.70 | | | | 03/18/2013 | | | | 22,900 | | | | (271 | ) | | | (858 | ) |
| | | | 3-Month USD | | | | | | | | | | | | | | | | | | | | | | |
Call- OTC 5-Year Interest Rate Swap | | CITI | | LIBOR BBA | | Receive | | | 1.70 | | | | 03/18/2013 | | | | 7,600 | | | | (90 | ) | | | (285 | ) |
| | | | 6-Month EUR | | | | | | | | | | | | | | | | | | | | | | |
Put- OTC 10-Year Interest Rate Swap | | DUB | | EURIBOR | | Pay | | | 2.15 | | | | 01/07/2013 | | | EUR | 5,900 | | | | (31 | ) | | | (22 | ) |
| | | | 3-Month USD | | | | | | | | | | | | | | | | | | | | | | |
Put- OTC 2-Year Interest Rate Swap | | MSC | | LIBOR BBA | | Pay | | | 0.92 | | | | 11/14/2012 | | | $ | 13,400 | | | | — | | | | — | |
| | | | 3-Month USD | | | | | | | | | | | | | | | | | | | | | | |
Put- OTC 5-Year Interest Rate Swap | | BNP | | LIBOR BBA | | Pay | | | 1.40 | | | | 03/18/2013 | | | | 16,100 | | | | (43 | ) | | | (18 | ) |
| | | | 3-Month USD | | | | | | | | | | | | | | | | | | | | | | |
Put- OTC 5-Year Interest Rate Swap | | RBS | | LIBOR BBA | | Pay | | | 1.40 | | | | 03/18/2013 | | | | 39,000 | | | | (92 | ) | | | (44 | ) |
| | | | 3-Month USD | | | | | | | | | | | | | | | | | | | | | | |
Put- OTC 5-Year Interest Rate Swap | | DUB | | LIBOR BBA | | Pay | | | 1.70 | | | | 03/18/2013 | | | | 22,900 | | | | (446 | ) | | | (8 | ) |
| | | | 3-Month USD | | | | | | | | | | | | | | | | | | | | | | |
Put- OTC 5-Year Interest Rate Swap | | CITI | | LIBOR BBA | | Pay | | | 1.70 | | | | 03/18/2013 | | | | 7,600 | | | | (143 | ) | | | (3 | ) |
| | | | 3-Month USD | | | | | | | | | | | | | | | | | | | | | | |
Put- OTC 5-Year Interest Rate Swap | | DUB | | LIBOR BBA | | Pay | | | 2.00 | | | | 03/18/2013 | | | | 3,100 | | | | (29 | ) | | | (¿) | |
| | | | 3-Month USD | | | | | | | | | | | | | | | | | | | | | | |
Put- OTC 5-Year Interest Rate Swap | | DUB | | LIBOR BBA | | Pay | | | 2.85 | | | | 04/14/2014 | | | | 21,200 | | | | (254 | ) | | | (47 | ) |
| | | | | | | | | | | | | | | | | | | | | | | | | | |
| | | | | | | | | | | | | | | | | | | | $ | (1,528 | ) | | $ | (1,538 | ) |
| | | | | | | | | | | | | | | | | | | | | | | | | | |
CENTRALLY CLEARED SWAP AGREEMENTS:
INTEREST RATE SWAP AGREEMENTS—FIXED RATE PAYABLE:
| | | | | | | | | | | | | | | | | | | | | | | | | | |
Floating Rate Index | | Fixed Rate | | | Maturity
Date | | | Currency Code | | Notional
Amount
(000’s) | | | Market
Value
(000’s) | | | Premiums
Paid
(000’s) | | | Unrealized
(Depreciation)
(000’s) | |
3-Month USD-LIBOR | | | 2.50 | % | | | 12/19/2042 | | | USD | | $ | 31,300 | | | $ | 780 | | | $ | 1,198 | | | $ | (418 | ) |
OVER THE COUNTER SWAP AGREEMENTS: p
CREDIT DEFAULT SWAPS ON CORPORATE AND SOVEREIGN ISSUES—BUY PROTECTION:(1)
| | | | | | | | | | | | | | | | | | | | | | | | | | | | | | |
Reference Obligation | | Fixed Deal Pay
Rate | | | Maturity
Date | | | Counterparty | | Implied
Credit
Spread (BP)
at
10/31/2012(2) | | | Notional
Amount
(000’s)(3) | | | Market
Value
(000’s) | | | Premiums
Paid
(000’s) | | | Unrealized
(Depreciation)
(000’s) | |
Black and Decker Corp., | | | | | | | | | | | | | | | | | | | | | | | | | | | | | | |
8.95%, 04/15/2014 | | | 2.20 | % | | | 06/20/2014 | | | CITI | | | 14.59 | | | $ | 3,000 | | | $ | (101 | ) | | $ | — | | | $ | (101 | ) |
Marsh & McLennan Cos., Inc., | | | | | | | | | | | | | | | | | | | | | | | | | | | | | | |
5.75%, 09/15/2015 | | | 0.76 | | | | 09/20/2015 | | | BCLY | | | 28.87 | | | | 6,000 | | | | (79 | ) | | | — | | | | (79 | ) |
The notes to the financial statements are an integral part of this report.
| | | | |
| Transamerica Funds | | | | Annual Report 2012 |
| | Page 118 | | |
Transamerica Real Return TIPS
(formerly, Transamerica PIMCO Real Return TIPS)
SCHEDULE OF INVESTMENTS (continued)
At October 31, 2012
OVER THE COUNTER SWAP AGREEMENTS (continued): p
CREDIT DEFAULT SWAPS ON CORPORATE AND SOVEREIGN ISSUES—BUY PROTECTION(1) (continued):
| | | | | | | | | | | | | | | | | | | | | | | | | | | | | | |
Reference Obligation | | Fixed Deal Pay
Rate | | | Maturity
Date | | | Counterparty | | Implied
Credit
Spread (BP)
at
10/31/2012(2) | | | Notional
Amount
(000’s)(3) | | | Market
Value
(000’s) | | | Premiums
Paid
(000’s) | | | Unrealized
(Depreciation)
(000’s) | |
Societe Generale SA, | | | | | | | | | | | | | | | | | | | | | | | | | | | | | | |
5.25%, 03/28/2013 | | | 1.00 | % | | | 06/20/2014 | | | BCLY | | | 93.99 | | | $ | 3,800 | | | $ | (2 | ) | | $ | 92 | | | $ | (94 | ) |
| | | | | | | | | | | | | | | | | | | | | | | | | | | | | | |
| | | | | | | | | | | | | | | | | | | | $ | (182 | ) | | $ | 92 | | | $ | (274 | ) |
| | | | | | | | | | | | | | | | | | | | | | | | | | | | | | |
CREDIT DEFAULT SWAPS ON CORPORATE AND SOVEREIGN ISSUES—SELL PROTECTION:(4)
| | | | | | | | | | | | | | | | | | | | | | | | | | | | | | |
Reference Obligation | | Fixed Deal
Receive
Rate | | | Maturity
Date | | | Counterparty | | Implied
Credit
Spread (BP)
at
10/31/2012(2) | | | Notional
Amount
(000’s)(3) | | | Market
Value
(000’s)(5) | | | Premiums
Paid
(Received)
(000’s) | | | Unrealized
Appreciation
(Depreciation)
(000’s) | |
20-Year Japan Government Bond, | | | | | | | | | | | | | | | | | | | | | | | | | | | | | | |
2.00%, 03/21/2022 | | | 1.00 | % | | | 12/20/2015 | | | RBS | | | 38.43 | | | $ | 600 | | | $ | 11 | | | $ | 8 | | | $ | 3 | |
20-Year Japan Government Bond, | | | | | | | | | | | | | | | | | | | | | | | | | | | | | | |
2.00%, 03/21/2022 | | | 1.00 | | | | 12/20/2015 | | | BOA | | | 38.43 | | | | 2,900 | | | | 52 | | | | 39 | | | | 13 | |
American International Group, Inc., | | | | | | | | | | | | | | | | | | | | | | | | | | | | | | |
6.25%, 05/01/2036 | | | 5.00 | | | | 12/20/2013 | | | DUB | | | 35.97 | | | | 800 | | | | 42 | | | | (18 | ) | | | 60 | |
Federative Republic of Brazil, | | | | | | | | | | | | | | | | | | | | | | | | | | | | | | |
12.25%, 03/06/2030 | | | 1.00 | | | | 06/20/2015 | | | HSBC | | | 64.84 | | | | 1,000 | | | | 9 | | | | (7 | ) | | | 16 | |
Federative Republic of Brazil, | | | | | | | | | | | | | | | | | | | | | | | | | | | | | | |
12.25%, 03/06/2030 | | | 1.00 | | | | 06/20/2015 | | | BCLY | | | 64.84 | | | | 1,000 | | | | 9 | | | | (10 | ) | | | 19 | |
Federative Republic of Brazil, | | | | | | | | | | | | | | | | | | | | | | | | | | | | | | |
12.25%, 03/06/2030 | | | 1.00 | | | | 06/20/2015 | | | BCLY | | | 64.84 | | | | 1,000 | | | | 9 | | | | (4 | ) | | | 13 | |
Federative Republic of Brazil, | | | | | | | | | | | | | | | | | | | | | | | | | | | | | | |
12.25%, 03/06/2030 | | | 1.00 | | | | 06/20/2020 | | | DUB | | | 138.99 | | | | 2,500 | | | | (68 | ) | | | (62 | ) | | | (6 | ) |
| | | | | | | | | | | | | | | | | | | | | | | | | | | | | | |
| | | | | | | | | | | | | | | | | | | | $ | 64 | | | $ | (54 | ) | | $ | 118 | |
| | | | | | | | | | | | | | | | | | | | | | | | | | | | | | |
INTEREST RATE SWAP AGREEMENTS—FIXED RATE RECEIVABLE:
| | | | | | | | | | | | | | | | | | | | | | | | | | | | |
Floating Rate Index | | Fixed Rate | | | Maturity
Date | | | Counterparty | | Currency
Code | | Notional
Amount
(000’s) | | | Market
Value
(000’s) | | | Premiums
Paid
(Received)
(000’s) | | | Unrealized
Appreciation
(Depreciation)
(000’s) | |
3-Month USD-LIBOR | | | 1.50 | % | | | 11/02/2012 | | | BCLY | | USD | | $ | 1,100 | | | $ | (2 | ) | | $ | (w | ) | | $ | (2 | ) |
BRL-CDI § | | | 8.63 | | | | 01/02/2015 | | | MSC | | BRL | | | 14,800 | | | | 120 | | | | 63 | | | | 57 | |
BRL-CDI § | | | 8.26 | | | | 01/02/2015 | | | UBS | | BRL | | | 67,900 | | | | 307 | | | | 79 | | | | 229 | |
BRL-CDI § | | | 8.12 | | | | 01/02/2015 | | | HSBC | | BRL | | | 8,700 | | | | 27 | | | | (7 | ) | | | 34 | |
BRL-CDI § | | | 8.83 | | | | 01/02/2015 | | | HSBC | | BRL | | | 46,000 | | | | 463 | | | | 238 | | | | 225 | |
BRL-CDI § | | | 8.26 | | | | 01/02/2015 | | | GSC | | BRL | | | 4,500 | | | | 20 | | | | 3 | | | | 17 | |
France CPI Ex Tobacco § | | | 2.00 | | | | 09/01/2012 | | | BNP | | EUR | | | 3,500 | | | | (9 | ) | | | 5 | | | | (14 | ) |
| | | | | | | | | | | | | | | | | | | | | | | | | | | | |
| | | | | | | | | | | | | | | | | | $ | 926 | | | $ | 381 | | | $ | 546 | |
| | | | | | | | | | | | | | | | | | | | | | | | | | | | |
INTEREST RATE SWAP AGREEMENTS—FIXED RATE PAYABLE:
| | | | | | | | | | | | | | | | | | | | | | | | | | | | |
Floating Rate Index | | Fixed Rate | | | Maturity
Date | | | Counterparty | | Currency
Code | | Notional
Amount
(000’s) | | | Market
Value
(000’s) | | | Premiums
Paid
(000’s) | | | Unrealized
Appreciation
(000’s) | |
U.S. CPI Urban Consumers NAS § | | | 2.50 | | | | 07/15/2022 | | | BNP | | USD | | $ | 5,500 | | | $ | 114 | | | $ | 34 | | | $ | 80 | |
U.S. CPI Urban Consumers NAS § | | | 2.50 | | | | 07/15/2022 | | | DUB | | USD | | | 3,900 | | | | 81 | | | | 31 | | | | 50 | |
| | | | | | | | | | | | | | | | | | | | | | | | | | | | |
| | | | | | | | | | | | | | | | | | $ | 195 | | | $ | 65 | | | $ | 130 | |
| | | | | | | | | | | | | | | | | | | | | | | | | | | | |
The notes to the financial statements are an integral part of this report.
| | | | |
| Transamerica Funds | | | | Annual Report 2012 |
| | Page 119 | | |
Transamerica Real Return TIPS
(formerly, Transamerica PIMCO Real Return TIPS)
SCHEDULE OF INVESTMENTS (continued)
At October 31, 2012
FORWARD FOREIGN CURRENCY CONTRACTS: p
| | | | | | | | | | | | | | | | |
Currency | | Counterparty | | Contracts
Bought
(Sold)
(000’s) | | | Settlement Date | | Amount in U.S.
Dollars Bought
(Sold)
(000’s) | | | Net Unrealized
Appreciation
(Depreciation)
(000’s) | |
AUD | | MSC | | | 2,354 | | | 11/21/2012 | | $ | 2,399 | | | $ | 40 | |
AUD | | BCLY | | | (27,898 | ) | | 11/21/2012 | | | (28,431 | ) | | | (479 | ) |
BRL | | UBS | | | (4,893 | ) | | 12/04/2012 | | | (2,364 | ) | | | (34 | ) |
BRL | | HSBC | | | (16,141 | ) | | 12/04/2012 | | | (7,881 | ) | | | (29 | ) |
BRL | | UBS | | | 4,329 | | | 12/04/2012 | | | 2,110 | | | | 11 | |
BRL | | UBS | | | 5,073 | | | 12/04/2012 | | | 2,490 | | | | (4 | ) |
BRL | | HSBC | | | 693 | | | 12/04/2012 | | | 340 | | | | (w | ) |
BRL | | UBS | | | 693 | | | 12/04/2012 | | | 340 | | | | (w | ) |
BRL | | UBS | | | 1,085 | | | 12/04/2012 | | | 530 | | | | 2 | |
BRL | | UBS | | | 1,517 | | | 12/04/2012 | | | 740 | | | | 3 | |
BRL | | UBS | | | 2,110 | | | 12/04/2012 | | | 1,030 | | | | 4 | |
BRL | | UBS | | | 999 | | | 12/04/2012 | | | 490 | | | | (w | ) |
BRL | | MSC | | | 999 | | | 12/04/2012 | | | 490 | | | | (w | ) |
BRL | | GSC | | | 2,450 | | | 12/04/2012 | | | 1,200 | | | | 1 | |
BRL | | HSBC | | | 1,085 | | | 12/04/2012 | | | 530 | | | | 2 | |
BRL | | HSBC | | | 16,141 | | | 02/04/2013 | | | 7,819 | | | | 30 | |
CAD | | DUB | | | (28,523 | ) | | 12/20/2012 | | | (29,238 | ) | | | 710 | |
CNY | | BCLY | | | 16,915 | | | 02/01/2013 | | | 2,683 | | | | 5 | |
CNY | | JPM | | | (16,753 | ) | | 02/01/2013 | | | (2,629 | ) | | | (33 | ) |
DKK | | BCLY | | | (14,631 | ) | | 11/21/2012 | | | (2,454 | ) | | | (89 | ) |
EUR | | CITI | | | 135 | | | 12/17/2012 | | | 175 | | | | w | |
EUR | | CITI | | | (9,879 | ) | | 12/17/2012 | | | (12,745 | ) | | | (67 | ) |
EUR | | HSBC | | | (4,625 | ) | | 12/17/2012 | | | (5,831 | ) | | | (167 | ) |
EUR | | UBS | | | (9,309 | ) | | 12/17/2012 | | | (11,908 | ) | | | (163 | ) |
EUR | | CITI | | | (4,655 | ) | | 12/17/2012 | | | (5,964 | ) | | | (73 | ) |
EUR | | BCLY | | | (3,968 | ) | | 12/17/2012 | | | (5,108 | ) | | | (38 | ) |
EUR | | CITI | | | (1,648 | ) | | 12/17/2012 | | | (2,167 | ) | | | 30 | |
EUR | | BCLY | | | (2,433 | ) | | 12/17/2012 | | | (3,190 | ) | | | 35 | |
EUR | | BCLY | | | (2,596 | ) | | 12/17/2012 | | | (3,387 | ) | | | 21 | |
EUR | | CITI | | | (6,403 | ) | | 12/17/2012 | | | (8,330 | ) | | | 27 | |
EUR | | WBC | | | 1,808 | | | 12/17/2012 | | | 2,328 | | | | 17 | |
EUR | | RBS | | | (94 | ) | | 12/17/2012 | | | (122 | ) | | | w | |
EUR | | GSC | | | (1,623 | ) | | 12/17/2012 | | | (2,094 | ) | | | (11 | ) |
EUR | | BNP | | | 87 | | | 12/17/2012 | | | 114 | | | | (1 | ) |
EUR | | WBC | | | 1,161 | | | 12/17/2012 | | | 1,517 | | | | (12 | ) |
EUR | | JPM | | | 827 | | | 12/17/2012 | | | 1,072 | | | | 1 | |
EUR | | CITI | | | 891 | | | 12/17/2012 | | | 1,159 | | | | (4 | ) |
EUR | | WBC | | | 7,440 | | | 12/17/2012 | | | 9,646 | | | | 2 | |
EUR | | JPM | | | 156 | | | 12/17/2012 | | | 202 | | | | 1 | |
EUR | | BCLY | | | 2,058 | | | 12/17/2012 | | | 2,634 | | | | 34 | |
GBP | | BNP | | | (3,938 | ) | | 12/12/2012 | | | (6,262 | ) | | | (92 | ) |
GBP | | BCLY | | | (8,075 | ) | | 12/12/2012 | | | (13,113 | ) | | | 83 | |
GBP | | BCLY | | | 518 | | | 12/12/2012 | | | 825 | | | | 10 | |
GBP | | RBS | | | (1,057 | ) | | 12/12/2012 | | | (1,695 | ) | | | (10 | ) |
GBP | | CITI | | | 2,783 | | | 12/12/2012 | | | 4,505 | | | | (14 | ) |
GBP | | BNP | | | (5,013 | ) | | 12/12/2012 | | | (8,077 | ) | | | (11 | ) |
MXN | | HSBC | | | 9,045 | | | 12/03/2012 | | | 700 | | | | (11 | ) |
MXN | | JPM | | | (80 | ) | | 12/03/2012 | | | (6 | ) | | | w | |
MXN | | HSBC | | | (9,045 | ) | | 12/03/2012 | | | (694 | ) | | | 5 | |
MXN | | HSBC | | | 80 | | | 12/03/2012 | | | 6 | | | | w | |
MXN | | HSBC | | | 9,045 | | | 04/03/2013 | | | 685 | | | | (5 | ) |
MXN | | JPM | | | 80 | | | 04/03/2013 | | | 6 | | | | (w | ) |
ZAR | | JPM | | | (23,742 | ) | | 01/30/2013 | | | (2,685 | ) | | | (16 | ) |
| | | | | | | | | | | | | | | | |
| | | | | | | | | | | | | | $ | (289 | ) |
| | | | | | | | | | | | | | | | |
FUTURES CONTRACTS:
| | | | | | | | | | | | |
Description | | Type | | Contracts | | | Expiration Date | | Unrealized
Appreciation
(000’s) | |
10-Year U.S. Treasury Note | | Long | | | 24 | | | 12/19/2012 | | $ | 15 | |
90-Day Eurodollar | | Long | | | 112 | | | 09/14/2015 | | | 11 | |
90-Day Eurodollar | | Long | | | 439 | | | 03/14/2016 | | | 47 | |
| | | | | | | | | | | | |
| | | | | | | | | | $ | 73 | |
| | | | | | | | | | | | |
The notes to the financial statements are an integral part of this report.
| | | | |
| Transamerica Funds | | | | Annual Report 2012 |
| | Page 120 | | |
Transamerica Real Return TIPS
(formerly, Transamerica PIMCO Real Return TIPS)
SCHEDULE OF INVESTMENTS (continued)
At October 31, 2012
Collateral (Received) Pledged for OTC Financial Derivative Instruments
The following is a summary by counterparty of the market value of OTC financial derivative instruments and collateral (received) pledged as of 10/31/2012:
| | | | | | | | | | | | |
Counterparty | | Total Market Value of
OTC Derivatives
(000’s) | | | Collateral (Received)
Pledged
(000’s) | | | Net Exposures (1)
(000’s) | |
BCLY | | $ | (483 | ) | | $ | — | | | $ | (483 | ) |
BNP | | | (50 | ) | | | — | | | | (50 | ) |
BOA | | | 52 | | | | (60 | ) | | | (8 | ) |
CITI | | | (516 | ) | | | — | | | | 516 | |
DUB | | | 214 | | | | (260 | ) | | | (46 | ) |
GSC | | | 10 | | | | — | | | | 10 | |
HSBC | | | 324 | | | | (220 | ) | | | 104 | |
JPM | | | (47 | ) | | | — | | | | (47 | ) |
MSC | | | 20 | | | | (270 | ) | | | (250 | ) |
RBS | | | 48 | | | | — | | | | 48 | |
UBS | | | 126 | | | | — | | | | 126 | |
WBC | | | 7 | | | | — | | | | 7 | |
| (1) | Net exposure represents the net receivable (payable) that would be due from/to the counterparty in the event of default. |
NOTES TO SCHEDULE OF INVESTMENTS (all amounts in thousands):
| Ð | Security is subject to dollar roll transactions. |
| g | All or a portion of this security has been segregated as collateral with the broker to cover margin requirements for open futures contracts. Total value of all segregated securities to cover margin requirements for open futures contracts is $379. |
| a | All or a portion of this security has been segregated as collateral with the custodian for centrally cleared swaps. Total value of securities segregated to cover centrally cleared swaps is $3,172. |
| — | All or a portion of this security has been segregated as collateral with the broker to cover the open reverse repurchase agreements. Total value of all segregated securities to cover open reverse repurchase agreements is $145,692. |
| F | Cash, in the amount of $260, has been pledged by the broker as collateral for open reverse repurchase agreements. |
| p | Cash, in the amount of $810, has been pledged by the broker as collateral for open swaps, swaptions, and/or forward foreign currency contracts. |
| § | Illiquid. Total aggregate market value of illiquid securities is $4,167, or 0.31% of the fund’s net assets, and total aggregate market value of illiquid derivatives is $1,123, or 0.08% of the fund’s net assets. |
| Þ | Exercise level and final premium determined on a future date, based upon implied volatility parameters. |
| * | Floating or variable rate note. Rate is listed as of 10/31/2012. |
| Ә | Fair valued as determined in good faith in accordance with procedures established by the Board of Trustees. Total aggregate market value of fair valued securities is $1,270, or 0.09% of the fund’s net assets. |
| ^ | All or a portion of this security is on loan. The value of all securities on loan is $5,297. |
| ¥ | Percentage rounds to less than 0.1%. |
| | Rate shown reflects the yield at 10/31/2012. |
| P | Aggregate cost for federal income tax purposes is $1,487,579. Aggregate gross unrealized appreciation/depreciation for all securities in which there is an excess of value over tax cost were $68,161 and $2,856, respectively. Net unrealized appreciation for tax purposes is $65,305. |
| (1) | If the fund is a buyer of protection and a credit event occurs, as defined under the terms of that particular swap agreement, the fund will either (a) receive from the seller of protection an amount equal to the notional amount of the swap and deliver the referenced obligation or underlying securities comprising the referenced obligation or (b) receive a net settlement amount in the form of cash or securities equal to the notional amount of the swap less the recovery value of the referenced obligation or underlying securities comprising the referenced obligation. |
| (2) | Implied credit spreads, represented in absolute terms, utilized in determining the market value of credit default swap agreements on corporate issues or sovereign issues of an emerging country as of period end serve as an indicator of the current status of the payment/performance risk and represent the likelihood of risk of default for the credit derivative. The implied credit spread of a particular referenced entity reflects the cost of buying/selling protection and may include the referenced entity’s credit soundness and a greater likelihood or risk of default or other credit event occurring as defined under the terms of the agreement. A credit spread identified as “Defaulted” indicates a credit event has occurred for the referenced entity or obligation. |
| (3) | The maximum potential amount the fund could be required to make as a seller of credit protection or receive as a buyer of credit protection if a credit event occurs as defined under the terms of that particular swap agreement. |
| (4) | If the fund is a seller of protection and a credit event occurs, as defined under the terms of that particular swap agreement, the fund will either (a) pay to the buyer of protection an amount equal to the notional amount of the swap and take delivery of the referenced obligation or underlying securities comprising the referenced obligation or (b) pay a net settlement amount in the form of cash or securities equal to the notional amount of the swap less the recovery value of the referenced obligation or underlying securities comprising the referenced obligation. |
| (5) | The quoted market prices and resulting values for credit default swap agreements on asset-backed securities, sovereign issues and credit indices serve as an indicator of the current status of the payment/performance risk and represent the likelihood of an expected liability (or profit) for the credit derivative had the notional amount of the swap agreement been closed/sold as of the period ended. Increasing market values, in absolute terms when compared to the notional amount of the swap, represent a deterioration of the referenced entity’s credit soundness and a greater likelihood or risk of default or other credit event occurring as defined under the terms of the agreement. |
The notes to the financial statements are an integral part of this report.
| | | | |
| Transamerica Funds | | | | Annual Report 2012 |
| | Page 121 | | |
Transamerica Real Return TIPS
(formerly, Transamerica PIMCO Real Return TIPS)
SCHEDULE OF INVESTMENTS (continued)
At October 31, 2012
DEFINITIONS (all amounts in thousands):
| | |
144A | | 144A Securities are registered pursuant to Rule 144A of the Securities Act of 1933. These securities are deemed to be liquid for purposes of compliance limitations on holdings of illiquid securities and may be resold as transactions exempt from registration, normally to qualified institutional buyers. At 10/31/2012, these securities aggregated $39,569, or 2.95% of the fund’s net assets. |
BBA | | British Banker’s Association |
BCLY | | Barclays Bank PLC |
BNP | | BNP Paribas |
BOA | | Bank of America |
BP | | Basis Point |
CDI | | Credit Default Index |
CITI | | Citibank, Inc. |
CLO | | Collateralized Loan Obligation |
CPI | | Consumer Price Index |
CPURNSA | | US CPI Urban Consumers Non-Seasonably Adjusted Index |
DUB | | Deutsche Bank AG |
GSC | | Goldman Sachs & Co. |
HSBC | | HSBC Bank USA |
JPM | | JP Morgan Chase & Co. |
LIBOR | | London Interbank Offered Rate |
MSC | | Morgan Stanley |
OTC | | Over The Counter |
RBS | | Royal Bank of Scotland PLC |
UBS | | UBS Warburg |
WBC | | Westpac Banking Corporation |
CURRENCY ABBREVIATIONS:
| | |
AUD | | Australian Dollar |
BRL | | Brazilian Real |
CAD | | Canadian Dollar |
CNY | | Chinese Yuan |
DKK | | Danish Krone |
EUR | | Euro |
GBP | | Pound Sterling |
MXN | | Mexican Peso |
USD | | United States Dollar |
ZAR | | South African Rand |
VALUATION SUMMARY (all amounts in thousands): '
| | | | | | | | | | | | | | | | |
Investment Securities | | Level 1 -
Quoted
Prices | | | Level 2 -
Other
Significant
Observable
Inputs | | | Level 3 -
Significant
Unobservable
Inputs | | | Value at
10/31/2012 | |
Asset-Backed Securities | | $ | — | | | $ | 5,336 | | | $ | 182 | | | $ | 5,518 | |
Commercial Paper | | | — | | | | 8,223 | | | | — | | | | 8,223 | |
Corporate Debt Securities | | | — | | | | 57,491 | | | | — | | | | 57,491 | |
Foreign Government Obligations | | | — | | | | 120,189 | | | | — | | | | 120,189 | |
Loan Assignments | | | — | | | | 6,312 | | | | — | | | | 6,312 | |
Mortgage-Backed Securities | | | — | | | | 20,338 | | | | — | | | | 20,338 | |
Municipal Government Obligations | | | — | | | | 760 | | | | — | | | | 760 | |
Purchased Straddle Swaptions | | | — | | | | 439 | | | | — | | | | 439 | |
Purchased Swaptions | | | — | | | | 120 | | | | — | | | | 120 | |
Repurchase Agreement | | | — | | | | 612 | | | | — | | | | 612 | |
Securities Lending Collateral | | | 5,408 | | | | — | | | | — | | | | 5,408 | |
U.S. Government Agency Obligations | | | — | | | | 3,312 | | | | — | | | | 3,312 | |
U.S. Government Obligations | | | — | | | | 1,324,162 | | | | — | | | | 1,324,162 | |
| | | | | | | | | | | | | | | | |
Total | | $ | 5,408 | | | $ | 1,547,294 | | | $ | 182 | | | $ | 1,552,884 | |
| | | | | | | | | | | | | | | | |
The notes to the financial statements are an integral part of this report.
| | | | |
| Transamerica Funds | | | | Annual Report 2012 |
| | Page 122 | | |
Transamerica Real Return TIPS
(formerly, Transamerica PIMCO Real Return TIPS)
SCHEDULE OF INVESTMENTS (continued)
At October 31, 2012
VALUATION SUMMARY (all amounts in thousands) (continued): '
| | | | | | | | | | | | | | | | |
Other Financial Instruments | | Level 1 -
Quoted
Prices | | | Level 2 -
Other
Significant
Observable
Inputs | | | Level 3 -
Significant
Unobservable
Inputs | | | Value at
10/31/2012 | |
Inflation Floor Options | | $ | — | | | $ | (30 | ) | | $ | — | | | $ | (30 | ) |
Reverse Repurchase Agreements | | | — | | | | (143,086 | ) | | | — | | | | (143,086 | ) |
Written Swaptions | | | — | | | | (1,538 | ) | | | — | | | | (1,538 | ) |
| | | | | | | | | | | | | | | | |
Total | | $ | — | | | $ | (144,654 | ) | | $ | — | | | $ | (144,654 | ) |
| | | | | | | | | | | | | | | | |
| | | | | | | | | | | | | | | | |
Other Financial Instruments ₣ | | Level 1 -
Quoted
Prices | | | Level 2 -
Other
Significant
Observable
Inputs | | | Level 3 -
Significant
Unobservable
Inputs | | | Value at
10/31/2012 | |
Futures Contracts—Appreciation | | $ | 73 | | | $ | — | | | $ | — | | | $ | 73 | |
Credit Default Swaps—Appreciation | | | — | | | | 124 | | | | — | | | | 124 | |
Credit Default Swaps—Depreciation | | | — | | | | (280 | ) | | | — | | | | (280 | ) |
Forward Foreign Currency Contracts—Appreciation | | | — | | | | 1,074 | | | | — | | | | 1,074 | |
Forward Foreign Currency Contracts—Depreciation | | | — | | | | (1,363 | ) | | | — | | | | (1,363 | ) |
Interest Rate Swaps—Appreciation | | | — | | | | 692 | | | | — | | | | 692 | |
Interest Rate Swaps—Depreciation | | | — | | | | (434 | ) | | | — | | | | (434 | ) |
| | | | | | | | | | | | | | | | |
Total | | $ | 73 | | | $ | (187 | ) | | $ | — | | | $ | (114 | ) |
| | | | | | | | | | | | | | | | |
Level 3 Rollforward—Investment Securities
| | | | | | | | | | | | | | | | | | | | | | | | | | | | | | | | | | | | | | | | |
Securities | | Beginning
Balance at
10/31/2011 | | | Purchases | | | Sales | | | Accrued
Discounts/
(Premiums) | | | Total
Realized
Gain/(Loss) | | | Net Change in
Unrealized
Appreciation/
(Depreciation) ƒ | | | Transfers
into
Level 3 Y | | | Transfers out
of
Level 3 | | | Ending
Balance at
10/31/2012 ₪ | | | Net Change in
Unrealized
(Depreciation)
on Investments
Held at
10/31/2012 ƒ | |
Asset – Backed Securities | | $ | — | | | $ | — | | | $ | — | | | $ | — | | | $ | — | | | $ | — | | | $ | 182 | | | $ | — | | | $ | 182 | | | $ | (19 | ) |
| ' | Transfers between levels are considered to have occurred at the end of the reporting period. There were no transfers into or out of Levels 1 and 2 during the period ended 10/31/2012. See the notes to the financial statements for more information regarding pricing inputs and valuation techniques. |
| ₣ | Other financial instruments are derivative instruments that are valued at unrealized appreciation (depreciation) on the instrument. |
| ƒ | Any difference between Net Change in Unrealized Appreciation/(Depreciation) and Net Change in Unrealized (Depreciation) on Investments Held at 10/31/2012 may be due to an investment no longer held or becomes categorized as Level 3 at period end. |
| Y | Transferred into Level 3 because of unavailability of observable inputs. |
| ₪ | Inputs used in the valuation of the Level 3 securities were not considered significant unobservable inputs. |
The notes to the financial statements are an integral part of this report.
| | | | |
| Transamerica Funds | | | | Annual Report 2012 |
| | Page 123 | | |
Transamerica Select Equity
(formerly, Transamerica ICAP Select Equity)
SCHEDULE OF INVESTMENTS
At October 31, 2012
| | | | | | | | |
| | | Shares | | | Value
(000’s) | |
COMMON STOCKS—98.8% | | | | | | | | |
Aerospace & Defense—4.5% | | | | | | | | |
Honeywell International, Inc. | | | 880,000 | | | $ | 53,891 | |
Auto Components—2.8% | | | | | | | | |
Johnson Controls, Inc. ^ | | | 1,322,600 | | | | 34,057 | |
Chemicals—3.2% | | | | | | | | |
Monsanto Co. | | | 439,450 | | | | 37,823 | |
Commercial Banks—4.7% | | | | | | | | |
BB&T Corp. | | | 881,050 | | | | 25,506 | |
Wells Fargo & Co. | | | 922,250 | | | | 31,071 | |
Communications Equipment—3.6% | | | | | | | | |
Cisco Systems, Inc. | | | 2,512,000 | | | | 43,056 | |
Consumer Finance—3.3% | | | | | | | | |
Capital One Financial Corp. | | | 648,650 | | | | 39,029 | |
Diversified Financial Services—7.2% | | | | | | | | |
Citigroup, Inc. ^ | | | 1,403,950 | | | | 52,494 | |
JPMorgan Chase & Co. | | | 820,850 | | | | 34,213 | |
Energy Equipment & Services—2.0% | | | | | | | | |
Halliburton Co. | | | 757,150 | | | | 24,448 | |
Food Products—1.3% | | | | | | | | |
Archer-Daniels-Midland Co. | | | 567,400 | | | | 15,229 | |
Health Care Equipment & Supplies—5.9% | | | | | | | | |
Baxter International, Inc. ^ | | | 618,000 | | | | 38,705 | |
Covidien PLC | | | 590,550 | | | | 32,451 | |
Health Care Providers & Services—1.9% | | | | | | | | |
McKesson Corp. | | | 244,050 | | | | 22,772 | |
Industrial Conglomerates—3.7% | | | | | | | | |
General Electric Co. | | | 2,134,250 | | | | 44,947 | |
Machinery—1.8% | | | | | | | | |
Cummins, Inc. ^ | | | 235,600 | | | | 22,047 | |
Media—10.5% | | | | | | | | |
Time Warner, Inc. ^ | | | 1,813,850 | | | | 78,811 | |
Viacom, Inc.—Class B | | | 923,300 | | | | 47,338 | |
Metals & Mining—3.1% | | | | | | | | |
Barrick Gold Corp. | | | 931,750 | | | | 37,736 | |
Oil, Gas & Consumable Fuels—11.1% | | | | | | | | |
EnCana Corp. L | | | 920,200 | | | | 20,751 | |
Exxon Mobil Corp. | | | 544,050 | | | | 49,602 | |
| | | | | | | | |
| | | Shares | | | Value
(000’s) | |
Oil, Gas & Consumable Fuels (continued) | | | | | |
Occidental Petroleum Corp. | | | 501,550 | | | $ | 39,602 | |
Southwestern Energy Co. ‡ ^ | | | 664,500 | | | | 23,058 | |
Pharmaceuticals—13.1% | | | | | | | | |
Johnson & Johnson | | | 641,250 | | | | 45,414 | |
Novartis AG ADR | | | 541,950 | | | | 32,766 | |
Pfizer, Inc. | | | 3,161,850 | | | | 78,636 | |
Semiconductors & Semiconductor Equipment—5.0% | | | | | |
Applied Materials, Inc. | | | 515,250 | | | | 5,462 | |
Texas Instruments, Inc. ^ | | | 1,938,900 | | | | 54,463 | |
Software—5.6% | | | | | | | | |
Adobe Systems, Inc. ‡ | | | 455,150 | | | | 15,475 | |
Microsoft Corp. | | | 1,794,850 | | | | 51,216 | |
Wireless Telecommunication Services—4.5% | | | | | |
Vodafone Group PLC ADR | | | 1,970,200 | | | | 53,629 | |
| | | | | | | | |
Total Common Stocks
(cost $1,066,373) | | | | | | | 1,185,698 | |
| | | | | | | | |
SECURITIES LENDING COLLATERAL—11.2% | | | | | |
State Street Navigator Securities Lending Trust—Prime Portfolio, 0.31% | | | 134,286,725 | | | | 134,287 | |
Total Securities Lending Collateral (cost $134,287) | | | | | |
| | |
| | | Principal
(000’s) | | | Value
(000’s) | |
REPURCHASE AGREEMENT—1.2% | | | | | | | | |
State Street Bank & Trust Co. 0.03% , dated 10/31/2012, to be repurchased at $15,002 on 11/01/2012. Collateralized by a U.S. Government Agency Obligation, 3.50%, due 11/25/2038, and with a value of $15,304. | | $ | 15,002 | | | | 15,002 | |
Total Repurchase Agreement (cost $15,002) | | | | | |
| | | | | | | | |
Total Investment Securities (cost $1,215,662) P | | | | | | | 1,334,987 | |
Other Assets and Liabilities—Net | | | | | | | (134,786 | ) |
| | | | | | | | |
Net Assets | | | | | | $ | 1,200,201 | |
| | | | | | | | |
NOTES TO SCHEDULE OF INVESTMENTS (all amounts in thousands):
| ^ | All or a portion of this security is on loan. The value of all securities on loan is $130,955. |
| ‡ | Non-income producing security. |
| | Rate shown reflects the yield at 10/31/2012. |
| P | Aggregate cost for federal income tax purposes is $1,217,475. Aggregate gross unrealized appreciation/depreciation for all securities in which there is an excess of value over tax cost were $132,776 and $15,264, respectively. Net unrealized appreciation for tax purposes is $117,512. |
DEFINITION:
| | |
ADR | | American Depositary Receipt |
The notes to the financial statements are an integral part of this report.
| | | | |
| Transamerica Funds | | | | Annual Report 2012 |
| | Page 124 | | |
Transamerica Select Equity
(formerly, Transamerica ICAP Select Equity)
SCHEDULE OF INVESTMENTS (continued)
At October 31, 2012
VALUATION SUMMARY (all amounts in thousands): '
| | | | | | | | | | | | | | | | |
Investment Securities | | Level 1 -
Quoted
Prices | | | Level 2 -
Other
Significant
Observable
Inputs | | | Level 3 -
Significant
Unobservable
Inputs | | | Value at
10/31/2012 | |
Common Stocks | | $ | 1,185,698 | | | $ | — | | | $ | — | | | $ | 1,185,698 | |
Repurchase Agreement | | | — | | | | 15,002 | | | | — | | | | 15,002 | |
Securities Lending Collateral | | | 134,287 | | | | — | | | | — | | | | 134,287 | |
| | | | | | | | | | | | | | | | |
Total | | $ | 1,319,985 | | | $ | 15,002 | | | $ | — | | | $ | 1,334,987 | |
| | | | | | | | | | | | | | | | |
| ' | Transfers between levels are considered to have occurred at the end of the reporting period. There were no transfers into or out of Levels 1 and 2 during the period ended 10/31/2012. See the notes to the financial statements for more information regarding pricing inputs and valuation techniques. |
The notes to the financial statements are an integral part of this report.
| | | | |
| Transamerica Funds | | | | Annual Report 2012 |
| | Page 125 | | |
Transamerica Total Return
(formerly, Transamerica PIMCO Total Return)
SCHEDULE OF INVESTMENTS
At October 31, 2012
| | | | | | | | |
| | | Principal
(000’s) | | | Value
(000’s) | |
U.S. GOVERNMENT OBLIGATIONS—21.0% | | | | | |
U.S. Treasury Bond | | | | | | | | |
3.00%, 05/15/2042 | | $ | 1,100 | | | $ | 1,136 | |
3.13%, 11/15/2041 | | | 15,700 | | | | 16,662 | |
3.75%, 08/15/2041 | | | 700 | | | | 834 | |
3.88%, 08/15/2040 | | | 7,200 | | | | 8,765 | |
4.38%, 02/15/2038—05/15/2041 | | | 4,500 | | | | 5,935 | |
7.50%, 11/15/2024 | | | 1,400 | | | | 2,246 | |
U.S. Treasury Inflation Indexed Bond | | | | | | | | |
2.13%, 02/15/2041 | | | 2,945 | | | | 4,419 | |
U.S. Treasury Inflation Indexed Note | | | | | | | | |
0.13%, 01/15/2022—07/15/2022 | | | 22,427 | | | | 24,531 | |
1.13%, 01/15/2021 g | | | 12,004 | | | | 14,195 | |
U.S. Treasury Note | | | | | | | | |
1.25%, 01/31/2019 | | | 4,500 | | | | 4,575 | |
1.75%, 05/15/2022 | | | 5,600 | | | | 5,655 | |
2.00%, 11/15/2021 Ð a | | | 33,900 | | | | 35,213 | |
2.13%, 08/15/2021 | | | 3,500 | | | | 3,683 | |
2.38%, 05/31/2018 | | | 15,000 | | | | 16,252 | |
2.63%, 11/15/2020 a | | | 16,300 | | | | 17,904 | |
3.13%, 05/15/2021 | | | 5,900 | | | | 6,707 | |
| | | | | | | | |
Total U.S. Government Obligations (cost $157,178) | | | | 168,712 | |
| | | | | | | | |
U.S. GOVERNMENT AGENCY OBLIGATIONS—32.4% | | | | | |
Fannie Mae | | | | | | | | |
0.31%, 01/25/2021 * | | | 166 | | | | 166 | |
0.56%, 09/25/2042 * | | | 339 | | | | 337 | |
1.35%, 03/01/2044—10/01/2044 * | | | 1,364 | | | | 1,413 | |
2.18%, 09/01/2035 * | | | 658 | | | | 704 | |
2.31%, 01/01/2026 * | | | 3 | | | | 3 | |
2.34%, 01/01/2028 * | | | 41 | | | | 44 | |
2.39%, 11/01/2033 * | | | 173 | | | | 186 | |
2.42%, 07/01/2035 * | | | 332 | | | | 352 | |
2.82%, 03/01/2034 * | | | 254 | | | | 271 | |
3.50%, 10/01/2013—04/01/2027 | | | 5,397 | | | | 5,746 | |
4.00%, 06/01/2024—03/01/2041 | | | 20,854 | | | | 22,322 | |
4.50%, 12/01/2024 | | | 849 | | | | 915 | |
5.00%, 08/01/2020—01/01/2030 | | | 4,043 | | | | 4,450 | |
5.50%, 12/01/2036—03/01/2037 | | | 8,862 | | | | 9,732 | |
6.00%, 07/01/2038—09/01/2038 | | | 1,453 | | | | 1,611 | |
6.30%, 10/17/2038 | | | 391 | | | | 425 | |
Fannie Mae, IO | | | | | | | | |
6.89%, 07/25/2034 * § | | | 1,403 | | | | 305 | |
Fannie Mae, TBA | | | | | | | | |
2.50% | | | 37,000 | | | | 38,722 | |
3.00% | | | 3,000 | | | | 3,139 | |
3.50% | | | 3,000 | | | | 3,183 | |
4.00% | | | 2,000 | | | | 2,136 | |
4.50% | | | 3,000 | | | | 3,236 | |
5.00% | | | 14,000 | | | | 15,268 | |
Freddie Mac | | | | | | | | |
0.12%, 01/03/2013 | | | 13,500 | | | | 13,496 | |
1.35%, 10/25/2044 * | | | 388 | | | | 388 | |
1.55%, 07/25/2044 * | | | 396 | | | | 402 | |
2.25%, 03/01/2034 * | | | 153 | | | | 162 | |
2.35%, 11/01/2033 * | | | 141 | | | | 147 | |
2.36%, 03/01/2034 * | | | 162 | | | | 172 | |
2.42%, 01/01/2036 * | | | 2,769 | | | | 2,951 | |
2.46%, 09/01/2035 * | | | 47 | | | | 50 | |
| | | | | | | | |
| | | Principal
(000’s) | | | Value
(000’s) | |
U.S. GOVERNMENT AGENCY OBLIGATIONS (continued) | |
Freddie Mac (continued) | | | | | | | | |
3.00%, 09/01/2035 * | | $ | 606 | | | $ | 651 | |
4.00%, 01/01/2041 | | | 3,865 | | | | 4,127 | |
4.50%, 05/15/2018—07/01/2041 | | | 8,787 | | | | 9,457 | |
5.00%, 02/15/2020—08/15/2020 | | | 307 | | | | 311 | |
6.50%, 04/15/2029—07/25/2043 | | | 23 | | | | 27 | |
Freddie Mac, TBA | | | | | | | | |
4.50% | | | 8,000 | | | | 8,573 | |
Ginnie Mae | | | | | | | | |
1.75%, 05/20/2024 * | | | 41 | | | | 43 | |
6.50%, 06/20/2032 | | | 22 | | | | 24 | |
Ginnie Mae, IO | | | | | | | | |
6.35%, 04/16/2033—10/16/2033 * § | | | 1,290 | | | | 267 | |
6.39%, 08/16/2033—09/20/2034 * § | | | 3,059 | | | | 642 | |
Ginnie Mae, TBA | | | | | | | | |
3.00% | | | 75,000 | | | | 79,751 | |
3.50% | | | 10,000 | | | | 10,883 | |
Overseas Private Investment Corp.
| | | | | | | | |
Zero Coupon, 12/10/2012 Ә | | | 2,600 | | | | 2,670 | |
0.01%, 05/02/2013 | | | 9,320 | | | | 9,499 | |
U.S. Small Business Administration | | | | | | | | |
4.50%, 02/01/2014 | | | 27 | | | | 28 | |
| | | | | | | | |
Total U.S. Government Agency Obligations (cost $256,588) | | | | 259,387 | |
| | | | | | | | |
FOREIGN GOVERNMENT OBLIGATIONS—5.8% | | | | | |
Australia Government Bond | | | | | | | | |
5.50%, 12/15/2013 | | AUD | 6,300 | | | | 6,744 | |
Bundesschatzanweisungen | | | | | | | | |
0.75%, 09/13/2013 | | EUR | 19,700 | | | | 25,691 | |
Canadian Government Bond | | | | | | | | |
1.75%, 03/01/2013 | | CAD | 5,300 | | | | 5,320 | |
Province of Ontario Canada | | | | | | | | |
3.15%, 06/02/2022 | | | 5,600 | | | | 5,800 | |
Province of Quebec Canada | | | | | | | | |
3.50%, 12/01/2022 | | | 2,300 | | | | 2,423 | |
Republic of Brazil | | | | | | | | |
10.25%, 01/10/2028 | | BRL | 1,000 | | | | 638 | |
U.K. Gilt Inflation Linked | | | | | | | | |
0.13%, 03/22/2024 | | GBP | 200 | | | | 343 | |
| | | | | | | | |
Total Foreign Government Obligations (cost $45,576) | | | | 46,959 | |
| | | | | | | | |
MORTGAGE-BACKED SECURITIES—7.5% | | | | | |
American Home Mortgage Assets LLC | | | | | | | | |
Series 2006-2, Class 2A1 0.40%, 09/25/2046 * | | $ | 858 | | | | 535 | |
Series 2006-4, Class 1A12 0.42%, 10/25/2046 * | | | 1,905 | | | | 1,099 | |
Banc of America Funding Corp. | | | | | | | | |
Series 2005-D, Class A1 2.62%, 05/25/2035 * | | | 735 | | | | 761 | |
Series 2006-J, Class 4A1 5.67%, 01/20/2047 * | | | 89 | | | | 64 | |
Bear Stearns Adjustable Rate Mortgage Trust | | | | | | | | |
Series 2003-5, Class 2A1 2.76%, 08/25/2033 * | | | 647 | | | | 661 | |
Series 2003-8, Class 2A1 2.94%, 01/25/2034 * | | | 14 | | | | 14 | |
The notes to the financial statements are an integral part of this report.
| | | | |
| Transamerica Funds | | | | Annual Report 2012 |
| | Page 126 | | |
Transamerica Total Return
(formerly, Transamerica PIMCO Total Return)
SCHEDULE OF INVESTMENTS (continued)
At October 31, 2012
| | | | | | | | |
| | | Principal
(000’s) | | | Value
(000’s) | |
MORTGAGE-BACKED SECURITIES (continued) | | | | | |
Bear Stearns Adjustable Rate Mortgage Trust (continued) | |
Series 2003-8, Class 4A1 3.08%, 01/25/2034 * | | $ | 127 | | | $ | 127 | |
Series 2005-2, Class A2 3.08%, 03/25/2035 * | | | 450 | | | | 453 | |
Series 2005-5, Class A2 2.32%, 08/25/2035 * | | | 222 | | | | 216 | |
Bear Stearns Alt-A Trust | | | | | | | | |
Series 2006-6, Class 32A1 3.07%, 11/25/2036 * | | | 321 | | | | 203 | |
Bear Stearns Structured Products, Inc. | | | | | | | | |
Series 2007-R6, Class 1A1 2.85%, 01/26/2036 * | | | 282 | | | | 169 | |
Berica Residential MBS Srl | | | | | | | | |
Series 8, Class A 0.65%, 03/31/2048 * | | | 9,540 | | | | 10,966 | |
CC Funding Corp. | | | | | | | | |
Series 2004-3A, Class A1 0.46%, 08/25/2035—144A * | | | 201 | | | | 153 | |
Citigroup Mortgage Loan Trust, Inc. | | | | | | | | |
Series 2005-6, Class A2 2.34%, 09/25/2035 * | | | 267 | | | | 258 | |
Series 2007-10, Class 22AA 3.08%, 09/25/2037 * | | | 1,659 | | | | 1,242 | |
Series 2007-AHL1, Class A2A 0.25%, 12/25/2036 * | | | 23 | | | | 23 | |
Citigroup/Deutsche Bank Commercial Mortgage Trust | | | | | | | | |
Series 2007-CD5, Class A4 5.89%, 11/15/2044 * | | | 200 | | | | 237 | |
Countrywide Alternative Loan Trust | | | | | | | | |
Series 2003-J1, Class 4A1 6.00%, 10/25/2032 | | | 1 | | | | 1 | |
Series 2005-81, Class A1 0.49%, 02/25/2037 * | | | 602 | | | | 375 | |
Series 2006-30T1, Class 1A3 6.25%, 11/25/2036 | | | 361 | | | | 294 | |
Series 2006-J8, Class A2 6.00%, 02/25/2037 | | | 350 | | | | 245 | |
Series 2006-OA17, Class 1A1A 0.41%, 12/20/2046 * | | | 2,278 | | | | 1,401 | |
Series 2007-2CB, Class 1A13 5.75%, 03/25/2037 * | | | 598 | | | | 463 | |
Series 2007-HY4, Class 1A1 3.00%, 06/25/2037 * | | | 1,066 | | | | 783 | |
Series 2007-OA6, Class A1B 0.41%, 06/25/2037 * | | | 1,001 | | | | 751 | |
Countrywide Home Loan Mortgage Pass-Through Trust | | | | | | | | |
Series 2002-30, Class M 2.79%, 10/19/2032 * | | | 16 | | | | 11 | |
Series 2004-12, Class 12A1 2.86%, 08/25/2034 * | | | 367 | | | | 318 | |
Series 2004-R1, Class 2A 6.50%, 11/25/2034—144A | | | 531 | | | | 538 | |
Series 2005-R2, Class 1AF1 0.55%, 06/25/2035—144A * | | | 1,319 | | | | 1,127 | |
Credit Suisse First Boston Mortgage Securities Corp. | | | | | | | | |
Series 2002-P1A, Class A 0.89%, 03/25/2032—144A * | | | 1 | | | | | ¿ |
| | | | | | | | |
| | | Principal
(000’s) | | | Value
(000’s) | |
MORTGAGE-BACKED SECURITIES (continued) | | | | | |
Credit Suisse First Boston Mortgage | | | | | | | | |
Securities Corp. (continued) | | | | | | | | |
Series 2003-AR15, Class 2A1 2.46%, 06/25/2033 * | | $ | 851 | | | $ | 837 | |
Deutsche ALT-A Securities, Inc., Alternate Loan Trust | | | | | | | | |
Series 2005-6, Class 2A3 5.50%, 12/25/2035 | | | 768 | | | | 613 | |
First Horizon Alternative Mortgage Securities | | | | | | | | |
Series 2007-FA4, Class 1A8 6.25%, 08/25/2037 | | | 353 | | | | 276 | |
First Horizon Asset Securities, Inc. | | | | | | | | |
Series 2005-AR3, Class 2A1 2.61%, 08/25/2035 * | | | 69 | | | | 65 | |
GSR Mortgage Loan Trust | | | | | | | | |
Series 2005-AR6, Class 2A1 2.66%, 09/25/2035 * | | | 116 | | | | 116 | |
Harborview Mortgage Loan Trust | | | | | | | | |
Series 2006-1, Class 2A1A 0.45%, 03/19/2036 * | | | 1,413 | | | | 870 | |
Series 2006-6, Class 5A1A 5.32%, 08/19/2036 * | | | 503 | | | | 420 | |
Series 2006-12, Class 2A2A 0.40%, 01/19/2038 * | | | 956 | | | | 694 | |
Series 2007-1, Class 2A1A 0.34%, 04/19/2038 * | | | 992 | | | | 730 | |
IndyMac Index Mortgage Loan Trust | | | | | | | | |
Series 2004-AR11, Class 2A 2.67%, 12/25/2034 * | | | 43 | | | | 37 | |
JPMorgan Chase Commercial Mortgage Securities Corp. | | | | | | | | |
Series 2011-FL1, Class A 2.11%, 11/15/2028—144A * | | | 5,880 | | | | 5,939 | |
JPMorgan Mortgage Trust | | | | | | | | |
Series 2005-A1, Class 6T1 4.99%, 02/25/2035 * | | | 92 | | | | 93 | |
Series 2007-A1, Class 5A5 2.98%, 07/25/2035 * | | | 653 | | | | 670 | |
LB-UBS Commercial Mortgage Trust | | | | | | | | |
Series 2007-C7, Class A3 5.87%, 09/15/2045 * | | | 1,900 | | | | 2,285 | |
Luminent Mortgage Trust | | | | | | | | |
Series 2006-6, Class 2A1 0.41%, 10/25/2046 * | | | 557 | | | | 425 | |
MASTR Alternative Loans Trust | | | | | | | | |
Series 2006-2, Class 2A1 0.61%, 03/25/2036 * | | | 128 | | | | 22 | |
Mellon Residential Funding Corp. | | | | | | | | |
Series 2000-TBC3, Class A1 0.65%, 12/15/2030 * | | | 267 | | | | 265 | |
MLCC Mortgage Investors, Inc. | | | | | | | | |
Series 2005-2, Class 3A 1.22%, 10/25/2035 * | | | 39 | | | | 38 | |
Series 2005-3, Class 4A 0.46%, 11/25/2035 * | | | 33 | | | | 30 | |
Series 2005-A10, Class A 0.42%, 02/25/2036 * | | | 168 | | | | 142 | |
Morgan Stanley Capital I Trust | | | | | | | | |
Series 2007-IQ15, Class A4 5.88%, 06/11/2049 * | | | 100 | | | | 117 | |
The notes to the financial statements are an integral part of this report.
| | | | |
| Transamerica Funds | | | | Annual Report 2012 |
| | Page 127 | | |
Transamerica Total Return
(formerly, Transamerica PIMCO Total Return)
SCHEDULE OF INVESTMENTS (continued)
At October 31, 2012
| | | | | | | | |
| | | Principal
(000’s) | | | Value
(000’s) | |
MORTGAGE-BACKED SECURITIES (continued) | | | | | |
Permanent Master Issuer PLC | | | | | | | | |
Series 2011-1A, Class 1A1 1.74%, 07/15/2042—144A * § | | $ | 2,100 | | | $ | 2,127 | |
Series 2011-1A, Class 1A3 1.51%, 07/15/2042—144A * | | | 4,200 | | | | 5,511 | |
RALI Trust | | | | | | | | |
Series 2006-QO6, Class A1 0.39%, 06/25/2046 * | | | 292 | | | | 127 | |
Residential Asset Securitization Trust | | | | | | | | |
Series 2006-R1, Class A2 0.61%, 01/25/2046 * | | | 278 | | | | 114 | |
RFMSI Trust | | | | | | | | |
Series 2003-S9, Class A1 6.50%, 03/25/2032 | | | 2 | | | | 2 | |
RMAC Securities PLC | | | | | | | | |
Series 2007-NS1X, Class A2B 0.55%, 06/12/2044 * | | | 3,541 | | | | 3,127 | |
Sequoia Mortgage Trust | | | | | | | | |
Series 10, Class 2A1 0.97%, 10/20/2027 * | | | 40 | | | | 39 | |
Series 2007-1, Class 1A1 2.75%, 01/20/2047 * | | | 601 | | | | 496 | |
Structured Adjustable Rate Mortgage Loan Trust | | | | | | | | |
Series 2004-19, Class 2A1 1.56%, 01/25/2035 * | | | 183 | | | | 127 | |
Structured Asset Mortgage Investments, Inc. | | | | | | | | |
Series 2002-AR3, Class A1 0.87%, 09/19/2032 * | | | 18 | | | | 17 | |
Series 2005-AR5, Class A1 0.46%, 07/19/2035 * | | | 37 | | | | 32 | |
Series 2005-AR5, Class A2 0.46%, 07/19/2035 * | | | 63 | | | | 61 | |
Series 2005-AR5, Class A3 0.46%, 07/19/2035 * | | | 115 | | | | 111 | |
Series 2005-AR8, Class A1A 0.49%, 02/25/2036 * | | | 490 | | | | 320 | |
Series 2006-AR3, Class 12A1 0.43%, 05/25/2036 * | | | 581 | | | | 370 | |
Series 2006-AR6, Class 2A1 0.40%, 07/25/2046 * | | | 2,088 | | | | 1,346 | |
Wachovia Bank Commercial Mortgage Trust | | | | | | | | |
Series 2006-WL7A, Class A1 0.30%, 09/15/2021—144A * | | | 536 | | | | 521 | |
WaMu Mortgage Pass-Through Certificates | | | | | | | | |
Series 2002-AR2, Class A 2.32%, 02/27/2034 * | | | 17 | | | | 17 | |
Series 2002-AR9, Class 1A 1.55%, 08/25/2042 * | | | 9 | | | | 9 | |
Series 2003-AR5, Class A7 2.45%, 06/25/2033 * | | | 605 | | | | 622 | |
Series 2003-AR9, Class 2A 2.54%, 09/25/2033 * | | | 1,238 | | | | 1,243 | |
Series 2005-AR11, Class A1A 0.53%, 08/25/2045 * | | | 525 | | | | 477 | |
Series 2006-AR9, Class 2A 2.57%, 08/25/2046 * | | | 521 | | | | 452 | |
Series 2006-AR19, Class 1A 0.89%, 01/25/2047 * | | | 976 | | | | 685 | |
Series 2006-AR19, Class 1A1A 0.88%, 01/25/2047 * | | | 831 | | | | 680 | |
| | | | | | | | |
| | | Principal
(000’s) | | | Value
(000’s) | |
MORTGAGE-BACKED SECURITIES (continued) | | | | | |
WaMu Mortgage Pass-Through Certificates (continued) | | | | | |
Series 2007-HY1, Class 4A1 2.71%, 02/25/2037 * | | $ | 1,927 | | | $ | 1,495 | |
Series 2007-OA1, Class A1A 0.85%, 02/25/2047 * | | | 2,103 | | | | 1,446 | |
Wells Fargo Mortgage Backed Securities Trust | | | | | | | | |
Series 2003-13, Class A5 4.50%, 11/25/2018 | | | 42 | | | | 43 | |
Series 2004-CC, Class A1 2.62%, 01/25/2035 * | | | 193 | | | | 192 | |
Series 2006-AR4, Class 2A6 5.54%, 04/25/2036 * | | | 182 | | | | 78 | |
Series 2006-AR8, Class 2A4 2.72%, 04/25/2036 * | | | 359 | | | | 318 | |
| | | | | | | | |
Total Mortgage-Backed Securities (cost $62,120) | | | | 60,377 | |
| | | | | | | | |
ASSET-BACKED SECURITIES—4.8% | | | | | |
Amortizing Residential Collateral Trust | | | | | | | | |
Series 2002-BC4, Class A 0.79%, 07/25/2032 * | | | 4 | | | | 3 | |
Artus Loan Fund, Ltd. | | | | | | | | |
Series 2007-1A, Class A1L 1.09%, 02/15/2018—144A * | | | 449 | | | | 446 | |
Asset Backed Funding Certificates | | | | | | | | |
Series 2004-OPT5, Class A1 0.91%, 06/25/2034 * | | | 340 | | | | 284 | |
Babson CLO, Inc. | | | | | | | | |
Series 2004-2A, Class A2C 0.76%, 11/15/2016—144A * | | | 3,359 | | | | 3,347 | |
Bear Stearns Asset Backed Securities Trust | | | | | | | | |
Series 2002-2, Class A1 0.87%, 10/25/2032 * | | | 11 | | | | 10 | |
Series 2006-SD4, Class 1A1 3.02%, 10/25/2036 * | | | 693 | | | | 500 | |
Series 2007-AQ1, Class A1 0.32%, 11/25/2036 * | | | 753 | | | | 459 | |
Chester Asset Receivables Dealings | | | | | | | | |
Series 2004-1, Class A 0.89%, 04/15/2016 * | | | 3,700 | | | | 5,955 | |
Countrywide Asset-Backed Certificates | | | | | | | | |
Series 2007-1, Class 2A1 0.26%, 07/25/2037 * | | | 6 | | | | 6 | |
Credit-Based Asset Servicing and Securitization LLC | | | | | | | | |
Series 2007-CB1, Class AF1A 0.28%, 01/25/2037 * | | | 443 | | | | 130 | |
First Franklin Mortgage Loan Asset Backed Certificates | | | | | | | | |
Series 2005-FF1, Class A2C 0.95%, 12/25/2034 * | | | 15 | | | | 15 | |
Harbourmaster CLO, Ltd. | | | | | | | | |
Series 5A, Class A1 0.51%, 06/15/2020—144A * Ә | | | 511 | | | | 645 | |
Home Equity Asset Trust | | | | | | | | |
Series 2002-1, Class A4 0.81%, 11/25/2032 * | | | 1 | | | | 1 | |
JPMorgan Mortgage Acquisition Corp. | | | | | | | | |
Series 2007-CH3, Class A5 0.47%, 03/25/2037 * | | | 3,500 | | | | 1,553 | |
The notes to the financial statements are an integral part of this report.
| | | | |
| Transamerica Funds | | | | Annual Report 2012 |
| | Page 128 | | |
Transamerica Total Return
(formerly, Transamerica PIMCO Total Return)
SCHEDULE OF INVESTMENTS (continued)
At October 31, 2012
| | | | | | | | |
| | | Principal
(000’s) | | | Value
(000’s) | |
ASSET-BACKED SECURITIES (continued) | | | | | |
Mid-State Trust IV | | | | | | | | |
Series 4, Class A 8.33%, 04/01/2030 | | $ | 143 | | | $ | 150 | |
Morgan Stanley Mortgage Loan Trust | | | | | | | | |
Series 2007-3XS, Class 2A1A 0.28%, 01/25/2047 * | | | 112 | | | | 103 | |
Series 2007-8XS, Class A1 5.75%, 04/25/2037 * | | | 330 | | | | 246 | |
Series 2007-10XS, Class A1 6.00%, 07/25/2047 * | | | 314 | | | | 240 | |
New Century Home Equity Loan Trust | | | | | | | | |
Series 2006-1, Class A2B 0.39%, 05/25/2036 * | | | 146 | | | | 84 | |
Park Place Securities, Inc. | | | | | | | | |
Series 2005-WCW1, Class A1B 0.47%, 09/25/2035 * | | | 77 | | | | 75 | |
Penarth Master Issuer PLC | | | | | | | | |
Series 2011-1A, Class A1 0.86%, 05/18/2015—144A * | | | 3,700 | | | | 3,706 | |
Plymouth Rock CLO, Ltd./Inc. | | | | | | | | |
Series 2010-1A, Class A 1.94%, 02/16/2019—144A * | | | 1,270 | | | | 1,270 | |
Securitized Asset Backed Receivables LLC | | | | | | | | |
Series 2007-HE1, Class A2A 0.27%, 12/25/2036 * | | | 81 | | | | 21 | |
Small Business Administration Participation Certificates | | | | | | | | |
Series 2003-20I, Class 1 5.13%, 09/01/2023 | | | 34 | | | | 38 | |
Series 2004-20C, Class 1 4.34%, 03/01/2024 | | | 230 | | | | 253 | |
Structured Asset Securities Corp. | | | | | | | | |
Series 2002-HF1, Class A 0.79%, 01/25/2033 * | | | 3 | | | | 2 | |
Series 2003-22A, Class 2A1 2.71%, 06/25/2033 * | | | 1,030 | | | | 1,019 | |
Series 2006-BC6, Class A2 0.29%, 01/25/2037 * | | | 9 | | | | 9 | |
Venture VIII CDO, Ltd. | | | | | | | | |
Series 2007-8A, Class A2A 0.54%, 07/22/2021—144A * | | | 6,000 | | | | 5,685 | |
Wood Street CLO BV | | | | | | | | |
Series I, Class A 1.22%, 11/22/2021 * Ә | | | 9,893 | | | | 12,402 | |
| | | | | | | | |
Total Asset-Backed Securities (cost $38,393) | | | | 38,657 | |
| | | | | | | | |
MUNICIPAL GOVERNMENT OBLIGATIONS—6.4% | | | | | |
Buckeye Tobacco Settlement Financing Authority | | | | | | | | |
5.88%, 06/01/2047 | | | 600 | | | | 512 | |
Chicago Board of Education—Class A | | | | | | | | |
5.00%, 12/01/2012 | | | 255 | | | | 256 | |
Chicago Transit Authority—Class A | | | | | | | | |
6.90%, 12/01/2040 | | | 4,900 | | | | 5,936 | |
Chicago Transit Authority—Class B | | | | | | | | |
6.90%, 12/01/2040 | | | 2,700 | | | | 3,271 | |
Citizens Property Insurance Corp. | | | | | | | | |
5.00%, 06/01/2020 | | | 4,735 | | | | 5,515 | |
City of Chicago, IL—Series A | | | | | | | | |
4.75%, 01/01/2036 | | | 6,930 | | | | 7,353 | |
| | | | | | | | |
| | | Principal
(000’s) | | | Value
(000’s) | |
MUNICIPAL GOVERNMENT OBLIGATIONS (continued) | | | | | |
Kentucky State Property & Building Commission | | | | | | | | |
5.37%, 11/01/2025 | | $ | 100 | | | $ | 118 | |
New York City Transitional Finance Authority Future Tax Secured Revenue | | | | | | | | |
4.73%, 11/01/2023 | | | 100 | | | | 118 | |
North Carolina Medical Care Commission | | | | | | | | |
5.00%, 06/01/2035—06/01/2042 | | | 13,280 | | | | 15,251 | |
Port Authority of New York & New Jersey | | | | | | | | |
4.46%, 10/01/2062 | | | 4,100 | | | | 4,047 | |
State of California | | | | | | | | |
5.65%, 04/01/2039 * | | | 5,900 | | | | 6,026 | |
State of California—Build America Bonds | | | | | | | | |
7.50%, 04/01/2034 | | | 300 | | | | 404 | |
Tobacco Settlement Finance Authority—Series A | | | | | | | | |
7.47%, 06/01/2047 | | | 1,115 | | | | 888 | |
Tobacco Settlement Financing Corp. | | | | | | | | |
5.50%, 06/01/2026 | | | 180 | | | | 195 | |
5.88%, 05/15/2039 | | | 40 | | | | 41 | |
Tobacco Settlement Financing Corp.—Series 1A | | | | | | | | |
5.00%, 06/01/2041 | | | 1,400 | | | | 1,218 | |
| | | | | | | | |
Total Municipal Government Obligations (cost $47,587) | | | | 51,149 | |
| | | | | | | | |
CORPORATE DEBT SECURITIES—16.3% | | | | | |
Airlines—0.3% | | | | | | | | |
Continental Airlines, Inc. | | | | | | | | |
6.75%, 09/15/2015—144A | | | 2,200 | | | | 2,302 | |
Automobiles—1.2% | | | | | | | | |
Daimler Finance North America LLC | | | | | | | | |
1.30%, 07/31/2015—144A | | | 8,200 | | | | 8,259 | |
Volkswagen International Finance NV | | | | | | | | |
0.97%, 04/01/2014—144A * | | | 1,600 | | | | 1,606 | |
Capital Markets—2.2% | | | | | | | | |
Goldman Sachs Group, Inc. | | | | | | | | |
0.50%, 02/04/2013 * | | | 300 | | | | 389 | |
0.65%, 11/15/2014 * | | | 500 | | | | 638 | |
6.75%, 10/01/2037 | | | 900 | | | | 991 | |
Morgan Stanley | | | | | | | | |
0.61%, 04/13/2016 * | | | 1,900 | | | | 2,311 | |
1.29%, 04/29/2013 * | | | 6,100 | | | | 6,112 | |
3.45%, 11/02/2015 | | | 4,200 | | | | 4,329 | |
7.30%, 05/13/2019 | | | 700 | | | | 842 | |
Morgan Stanley—Series MTN | | | | | | | | |
6.63%, 04/01/2018 | | | 2,000 | | | | 2,326 | |
Commercial Banks—4.3% | | | | | | | | |
Barclays Bank PLC | | | | | | | | |
6.05%, 12/04/2017—144A § | | | 2,600 | | | | 2,840 | |
6.75%, 05/22/2019 | | | 2,500 | | | | 3,064 | |
10.18%, 06/12/2021—144A § | | | 2,240 | | | | 2,971 | |
Cie de Financement Foncier SA | | | | | | | | |
2.50%, 09/16/2015—144A § | | | 6,000 | | | | 6,221 | |
Export-Import Bank of Korea | | | | | | | | |
1.26%, 07/26/2013—144A * | | | 4,400 | | | | 4,400 | |
8.13%, 01/21/2014 § | | | 3,300 | | | | 3,570 | |
HSBC Capital Funding, LP | | | | | | | | |
10.18%, 06/30/2030—144A * Ž § | | | 150 | | | | 206 | |
Lloyds TSB Bank PLC | | | | | | | | |
5.80%, 01/13/2020—144A | | | 700 | | | | 824 | |
The notes to the financial statements are an integral part of this report.
| | | | |
| Transamerica Funds | | | | Annual Report 2012 |
| | Page 129 | | |
Transamerica Total Return
(formerly, Transamerica PIMCO Total Return)
SCHEDULE OF INVESTMENTS (continued)
At October 31, 2012
| | | | | | | | |
| | | Principal
(000’s) | | | Value
(000’s) | |
Commercial Banks (continued) | | | | | |
Lloyds TSB Bank PLC (continued) | | | | | | | | |
12.00%, 12/16/2024—144A * Ž | | $ | 5,300 | | | $ | 5,914 | |
Rabobank Nederland NV | | | | | | | | |
11.00%, 06/30/2019—144A * Ž § | | | 378 | | | | 506 | |
Royal Bank of Scotland Group PLC | | | | | | | | |
7.64%, 09/29/2017 * Ž | | | 3,000 | | | | 2,513 | |
Wells Fargo & Co.—Series K | | | | | | | | |
7.98%, 03/15/2018 * Ž ^ | | | 800 | | | | 946 | |
Consumer Finance—0.4% | | | | | | | | |
Ally Financial, Inc. | | | | | | | | |
3.78%, 06/20/2014 * | | | 3,100 | | | | 3,169 | |
Diversified Financial Services—5.2% | | | | | |
Bank of America Corp. | | | | | | | | |
7.63%, 06/01/2019 | | | 4,000 | | | | 5,072 | |
Bank of America Corp.—Series MTNL | | | | | | | | |
5.65%, 05/01/2018 | | | 3,900 | | | | 4,541 | |
Bear Stearns Cos., LLC | | | | | | | | |
5.70%, 11/15/2014 | | | 1,900 | | | | 2,078 | |
6.40%, 10/02/2017 | | | 900 | | | | 1,084 | |
7.25%, 02/01/2018 | | | 2,100 | | | | 2,613 | |
Citigroup, Inc. | | | | | | | | |
0.54%, 03/07/2014 * | | | 2,000 | | | | 1,986 | |
2.44%, 08/13/2013 * | | | 1,200 | | | | 1,214 | |
5.50%, 04/11/2013 | | | 1,400 | | | | 1,430 | |
6.00%, 08/15/2017 | | | 600 | | | | 706 | |
Ford Motor Credit Co., LLC | | | | | | | | |
7.00%, 10/01/2013 | | | 400 | | | | 421 | |
International Lease Finance Corp. | | | | | | | | |
7.13%, 09/01/2018—144A | | | 6,600 | | | | 7,754 | |
JPMorgan Chase & Co. | | | | | | | | |
4.25%, 10/15/2020 | | | 1,900 | | | | 2,096 | |
4.40%, 07/22/2020 | | | 200 | | | | 222 | |
6.30%, 04/23/2019 | | | 900 | | | | 1,110 | |
Lehman Brothers Holdings (Escrow shares) | | | | | | | | |
1.00%, 01/24/2013 | | | 4,100 | | | | 928 | |
Lehman Brothers Holdings Prod (Escrow shares) | | | | | | | | |
1.00%, 12/30/2016—05/02/2018 | | | 2,300 | | | | 513 | |
Lehman Brothers Holdings, Inc. (Escrow shares) | | | | | | | | |
6.75%, 12/28/2017 Ә | | | 1,700 | | | | ¿ | |
Merrill Lynch & Co., Inc. | | | | | | | | |
0.46%, 01/31/2014 * | | | 1,000 | | | | 1,282 | |
6.88%, 04/25/2018 | | | 3,900 | | | | 4,709 | |
Merrill Lynch & Co., Inc.—Series C | | | | | | | | |
6.40%, 08/28/2017 | | | 400 | | | | 472 | |
SSIF Nevada, LP | | | | | | | | |
1.04%, 04/14/2014—144A * § | | | 500 | | | | 502 | |
Diversified Telecommunication Services—0.0% ¥ | | | | | | | | |
KT Corp. | | | | | | | | |
4.88%, 07/15/2015—144A | | | 200 | | | | 217 | |
Energy Equipment & Services—0.2% | | | | | | | | |
NGPL PipeCo LLC | | | | | | | | |
7.12%, 12/15/2017—144A ^ | | | 1,800 | | | | 1,931 | |
Household Durables—0.0% ¥ | | | | | | | | |
Urbi Desarrollos Urbanos SAB de CV | | | | | | | | |
9.50%, 01/21/2020—144A | | | 400 | | | | 368 | |
Insurance—0.3% | | | | | | | | |
American International Group, Inc. | | | | | | | | |
4.25%, 09/15/2014 | | | 1,000 | | | | 1,059 | |
5.60%, 10/18/2016 | | | 1,000 | | | | 1,146 | |
| | | | | | | | |
| | | Principal
(000’s) | | | Value
(000’s) | |
Metals & Mining—0.0% ¥ | | | | | |
CSN Resources SA | | | | | | | | |
6.50%, 07/21/2020—144A ^ | | $ | 300 | | | $ | 339 | |
Oil, Gas & Consumable Fuels—1.4% | | | | | | | | |
Gazprom OAO Via GAZ Capital SA | | | | | | | | |
6.51%, 03/07/2022—Reg S | | | 3,500 | | | | 4,121 | |
8.15%, 04/11/2018—144A | | | 1,000 | | | | 1,225 | |
Gazprom OAO Via GAZ Capital SA—Series 2 | | | | | | | | |
8.63%, 04/28/2034—Reg S | | | 1,500 | | | | 2,151 | |
TNK-BP Finance SA | | | | | | | | |
7.50%, 03/13/2013—Reg S ^ | | | 4,000 | | | | 4,088 | |
Paper & Forest Products—0.4% | | | | | |
Georgia-Pacific LLC | | | | | | | | |
5.40%, 11/01/2020—144A ^ | | | 2,500 | | | | 2,967 | |
Tobacco—0.4% | | | | | | | | |
Altria Group, Inc. | | | | | | | | |
4.13%, 09/11/2015 | | | 400 | | | | 438 | |
9.70%, 11/10/2018 | | | 642 | | | | 916 | |
Reynolds American, Inc. | | | | | | | | |
7.63%, 06/01/2016 | | | 200 | | | | 242 | |
7.75%, 06/01/2018 | | | 1,000 | | | | 1,260 | |
Transportation Infrastructure—0.0% ¥ | | | | | |
Korea Expressway Corp. | | | | | | | | |
5.13%, 05/20/2015—144A | | | 200 | | | | 218 | |
| | | | | | | | |
Total Corporate Debt Securities (cost $118,883) | | | | 130,668 | |
| | | | | | | | |
CERTIFICATE OF DEPOSIT—1.0% | | | | | |
Commercial Banks—1.0% | | | | | | | | |
Banco Do Brasil SA | | | | | | | | |
1.95%, 06/28/2013 | | | 8,100 | | | | 7,996 | |
Total Certificate of Deposit (cost $7,996) | | | | | |
COMMERCIAL PAPERS—1.5% | | | | | |
Cash Equivalent—0.5% | | | | | |
Ford Motor Credit Co. | | | | | | | | |
1.05%, 11/16/2012 | | | 4,200 | | | | 4,198 | |
Diversified Financial Services—1.0% | | | | | | | | |
Ford Motor Credit Co. | | | | | | | | |
1.40%, 01/18/2013 | | | 8,000 | | | | 7,976 | |
| | | | | | | | |
Total Commercial Papers (cost $12,174) | | | | 12,174 | |
| | | | | | | | |
SHORT-TERM U.S. GOVERNMENT OBLIGATIONS—13.4% | |
Fannie Mae | | | | | | | | |
0.13%, 02/27/2013 | | | 14,900 | | | | 14,891 | |
0.17%, 08/01/2013 | | | 1,600 | | | | 1,598 | |
Freddie Mac | | | | | | | | |
0.13%, 02/11/2013—02/26/2013 | | | 11,800 | | | | 11,795 | |
0.14%, 03/05/2013 | | | 700 | | | | 700 | |
U.S. Treasury Bill | | | | | | | | |
0.10%, 02/14/2013 a | | | 190 | | | | 190 | |
0.12%, 03/07/2013 | | | 9,600 | | | | 9,596 | |
0.13%, 03/14/2013 | | | 6,600 | | | | 6,596 | |
0.13%, 04/04/2013 ☼ ⌂ a | | | 17,990 | | | | 17,979 | |
0.14%, 03/28/2013—04/25/2013 | | | 14,200 | | | | 14,191 | |
0.15%, 05/02/2013—05/30/2013 | | | 814 | | | | 814 | |
0.17%, 07/25/2013—09/19/2013 | | | 13,300 | | | | 13,279 | |
0.17%, 08/22/2013 ☼ a | | | 16,500 | | | | 16,476 | |
| | | | | | | | |
Total Short-Term U.S. Government Obligations (cost $108,105) | | | | | | | 108,105 | |
| | | | | | | | |
The notes to the financial statements are an integral part of this report.
| | | | |
| Transamerica Funds | | | | Annual Report 2012 |
| | Page 130 | | |
Transamerica Total Return
(formerly, Transamerica PIMCO Total Return)
SCHEDULE OF INVESTMENTS (continued)
At October 31, 2012
| | | | | | | | |
| | | Shares | | | Value
(000’s) | |
CONVERTIBLE PREFERRED STOCK—0.2% | | | | | |
Commercial Banks—0.2% | | | | | | | | |
Wells Fargo & Co., 7.50% | | | 1,600 | | | $ | 2,000 | |
Total Convertible Preferred Stock (cost $1,384) | | | | | | | | |
PREFERRED STOCK—0.1% | | | | | | | | |
Thrifts & Mortgage Finance—0.1% | | | | | | | | |
DG Funding Trust, 0.70%—144A * Ә ‡ § | | | 119 | | | | 873 | |
Total Preferred Stock (cost $1,266) | | | | | | | | |
| | |
| | | Notional
Amount
(000’s) | | | Value
(000’s) | |
PURCHASED SWAPTION—0.0% ¥ | | | | | |
Put Options—0.0% ¥ | | | | | | | | |
OTC- Receives floating based on 3 -month LIBOR, and pays a fixed rate of 3.45% § | | $ | 5,000 | | | | 386 | |
Expires 09/21/2015 | | | | | | | | |
Counterparty: RBS | | | | | | | | |
Total Purchased Swaption (cost $399) | | | | | | | | |
| | |
| | | Shares | | | Value
(000’s) | |
SECURITIES LENDING COLLATERAL—0.2% | | | | | |
State Street Navigator Securities Lending Trust—Prime Portfolio, 0.31% | | | 1,657,398 | | | | 1,657 | |
Total Securities Lending Collateral (cost $1,657) | | | | | |
| | |
| | | Principal
(000’s) | | | Value
(000’s) | |
REPURCHASE AGREEMENTS—10.1% | | | | | |
Barclays Capital, Inc.
0.35%, dated 10/31/2012, to be repurchased at $2,200 on 11/01/2012. Collateralized by a U.S. Government Agency Obligation, 3.50%, due 06/20/2042, and with a value of $2,277. | | $ | 2,200 | | | | 2,200 | |
Citigroup Global Markets
0.22%—0.30%, dated 10/12/2012—10/31/2012, to be repurchased at $42,406 on 11/01/2012—11/14/2012. Collateralized by a U.S. Government Obligation and a U.S Government Agency Obligation, 0.25%—3.50%, due 08/15/2015—01/01/2026, and with a total value of $43,489. § | | | 42,400 | | | | 42,400 | |
| | | | | | | | |
| | | Principal
(000’s) | | | Value
(000’s) | |
REPURCHASE AGREEMENTS (continued) | | | | | |
Morgan Stanley & Co.
0.31%, dated 10/31/2012, to be repurchased at $11,100 on 11/01/2012. Collateralized by a U.S. Government Obligation, 1.50%, due 06/30/2016, and with a value of $11,281. | | $ | 11,100 | | | $ | 11,100 | |
Royal Bank of Scotland
0.22%, dated 10/26/2012, to be repurchased at $5,002 on 01/03/2013. Collateralized by a U.S. Government Obligation, 4.25%, due 11/15/2013, and with a value of $5,009. § | | | 5,000 | | | | 5,000 | |
State Street Bank & Trust Co.
0.03% , dated 10/31/2012, to be repurchased at $547 on 11/01/2012. Collateralized by a U.S. Government Agency Obligation, 4.00%, due 04/01/2025, and with a value of $560. | | | 547 | | | | 547 | |
Toronto Dominion Bank
0.32%, dated 10/31/2012, to be repurchased at $20,000 on 11/01/2012. Collateralized by a U.S. Government Obligation, 1.75%, due 07/31/2015, and with a value of $20,220. | | | 20,000 | | | | 20,000 | |
| | | | | | | | |
Total Repurchase Agreements (cost $81,247) | | | | 81,247 | |
| | | | | | | | |
Total Investment Securities (cost $940,553) P | | | | | | | 970,347 | |
Other Assets and Liabilities—Net | | | | | | | (166,567 | ) |
| | | | | | | | |
Net Assets | | | | | | $ | 803,780 | |
| | | | | | | | |
| | | | | | | | |
| | | Principal
(000’s) | | | Value
(000’s) | |
TBA SHORT COMMITMENTS—(4.3%) ¨ | | | | | |
U.S. Government Agency Obligations—(4.3%) | | | | | |
Fannie Mae, TBA | | | | | | | | |
4.00% | | $ | (22,000 | ) | | $ | (23,502 | ) |
4.50% | | | (800 | ) | | | (862 | ) |
5.50% | | | (8,000 | ) | | | (8,771 | ) |
6.00% | | | (1,100 | ) | | | (1,219 | ) |
| | | | | | | | |
Total TBA Short Commitments (proceeds $(34,324)) | | | $ | (34,354 | ) |
| | | | | | | | |
WRITTEN SWAPTIONS: p
| | | | | | | | | | | | | | | | | | | | | | | | | | |
Description | | Counterparty | | Floating Rate
Index | | Pay/
Receive
Floating
Rate | | Exercise
Rate | | | Expiration
Date | | | Notional
Amount
(000’s) | | | Premiums
(Received)
(000’s) | | | Value
(000’s) | |
Call- OTC 5-Year Interest Rate Swap | | DUB | | 3-Month USD
LIBOR BBA | | Receive | | | 1.40 | % | | | 03/18/2013 | | | $ | 29,100 | | | $ | (187 | ) | | $ | (686 | ) |
Put- OTC 5-Year Interest Rate Swap | | DUB | | 3-Month USD
LIBOR BBA | | Pay | | | 1.40 | | | | 03/18/2013 | | | | 29,100 | | | | (715 | ) | | | (33 | ) |
Put- OTC 5-Year Interest Rate Swap | | RBS | | 3-Month USD
LIBOR BBA | | Pay | | | 2.50 | | | | 09/21/2015 | | | | 21,000 | | | | (399 | ) | | | (365 | ) |
| | | | | | | | | | | | | | | | | | | | | | | | | | |
| | | | | | | | | | | | | | | | | | | | $ | (1,301 | ) | | $ | (1,084 | ) |
| | | | | | | | | | | | | | | | | | | | | | | | | | |
The notes to the financial statements are an integral part of this report.
| | | | |
| Transamerica Funds | | | | Annual Report 2012 |
| | Page 131 | | |
Transamerica Total Return
(formerly, Transamerica PIMCO Total Return)
SCHEDULE OF INVESTMENTS (continued)
At October 31, 2012
CENTRALLY CLEARED SWAP AGREEMENTS: ¶
CREDIT DEFAULT SWAPS ON CREDIT INDICES—BUY PROTECTION:(1)
| | | | | | | | | | | | | | | | | | | | | | | | |
Reference Obligation | | Fixed Deal Pay
Rate | | | Maturity
Date | | Currency Code | | Notional
Amount
(000’s)(2) | | | Market
Value
(000’s)(3) | | | Premiums
Paid
(000’s) | | | Unrealized
(Depreciation)
(000’s) | |
North America High Yield Index—Series 14 | | | 5.00 | % | | 06/20/2015 | | USD | | | 14,016 | | | $ | (734 | ) | | $ | 245 | | | $ | (979 | ) |
North America High Yield Index—Series 15 | | | 5.00 | | | 12/20/2015 | | USD | | | 23,424 | | | | (1,124 | ) | | | 897 | | | | (2,021 | ) |
| | | | | | | | | | | | | | | | | | | | | | | | |
| | | | | | | | | | | | | | $ | (1,858 | ) | | $ | 1,142 | | | $ | (3,000 | ) |
| | | | | | | | | | | | | | | | | | | | | | | | |
| | | | | | | | | | | | | | |
INTEREST RATE SWAP AGREEMENTS—FIXED RATE RECEIVABLE: |
| | | | | | | | | | | | | | | | | | | | | | | | |
Floating Rate Index | | Fixed Rate | | | Maturity
Date | | Currency Code | | Notional
Amount
(000’s) | | | Market
Value
(000’s) | | | Premiums
Paid
(Received)
(000’s) | | | Unrealized
Appreciation
(000’s) | |
6-Month AUD BBR-BBSW | | | 3.50 | % | | 03/15/2018 | | AUD | | | 10,600 | | | $ | 80 | | | $ | (29 | ) | | $ | 109 | |
6-Month EURIBOR | | | 2.00 | | | 03/21/2017 | | EUR | | | 9,900 | | | | 645 | | | | 328 | | | | 317 | |
| | | | | | | | | | | | | | | | | | | | | | | | |
| | | | | | | | | | | | | | $ | 725 | | | $ | 299 | | | $ | 426 | |
| | | | | | | | | | | | | | | | | | | | | | | | |
INTEREST RATE SWAP AGREEMENTS—FIXED RATE PAYABLE: | |
Floating Rate Index | | Fixed Rate | | | Maturity
Date | | Currency Code | | Notional
Amount
(000’s) | | | Market
Value
(000’s) | | | Premiums
Paid
(Received)
(000’s) | | | Unrealized
(Depreciation)
(000’s) | |
3-Month USD-LIBOR | | | 1.50 | % | | 06/20/2017 | | USD | | | 31,300 | | | $ | (1,088 | ) | | $ | (977 | ) | | $ | (111 | ) |
3-Month USD-LIBOR | | | 1.75 | | | 12/19/2022 | | USD | | | 11,100 | | | | 19 | | | | 184 | | | | (165 | ) |
6-Month EURIBOR | | | 1.75 | | | 03/20/2023 | | EUR | | | 2,100 | | | | 34 | | | | 40 | | | | (6 | ) |
| | | | | | | | | | | | | | | | | | | | | | | | |
| | | | | | | | | | | | | | $ | (1,035 | ) | | $ | (753 | ) | | $ | (282 | ) |
| | | | | | | | | | | | | | | | | | | | | | | | |
| | | | | | | | | | | | | | | | | | | | | | | | | | | | |
OVER THE COUNTER SWAP AGREEMENTS: p CREDIT DEFAULT SWAPS ON CORPORATE AND SOVEREIGN ISSUES—BUY PROTECTION:(1) | |
Reference Obligation | | Fixed Deal Pay
Rate | | | Maturity
Date | | Counterparty | | Implied
Credit Spread
(BP) at
10/31/2012(4) | | | Notional
Amount
(000’s)(2) | | | Market
Value
(000’s) | | | Premiums
Paid
(000’s) | | | Unrealized
(Depreciation)
(000’s) | |
Time Warner, Inc., 5.88%, 11/15/2016 | | | 1.19 | % | | 03/20/2014 | | DUB | | | 18.16 | | | $ | 20 | | | $ | ( | ¿) | | $ | ¿ | | | $ | ( | ¿) |
CREDIT DEFAULT SWAPS ON CREDIT INDICES—BUY PROTECTION:(1)
| | | | | | | | | | | | | | | | | | | | | | | | | | | | | | |
Reference Obligation | | Fixed Deal Pay
Rate | | | Maturity
Date | | Counterparty | | | Currency
Code | | | Notional
Amount
(000’s)(2) | | | Market
Value
(000’s)(3) | | | Premiums
Paid
(000’s) | | | Unrealized
(Depreciation)
(000’s) | |
Dow Jones North America Investment Grade Index—Series 5 | | | 0.14 | % | | 12/20/2012 | | | MSC | | | | USD | | | | 4,500 | | | $ | ( | ¿) | | $ | ¿ | | | $ | ( | ¿) |
The notes to the financial statements are an integral part of this report.
| | | | |
| Transamerica Funds | | | | Annual Report 2012 |
| | Page 132 | | |
Transamerica Total Return
(formerly, Transamerica PIMCO Total Return)
SCHEDULE OF INVESTMENTS (continued)
At October 31, 2012
OVER THE COUNTER SWAP AGREEMENTS (continued): p
CREDIT DEFAULT SWAPS ON CREDIT INDICES—SELL PROTECTION:(5)
| | | | | | | | | | | | | | | | | | | | | | | | | | | | | | | | |
Reference Obligation | | Fixed Deal
Receive
Rate | | | Maturity
Date | | | Counterparty | | | Currency
Code | | | Notional
Amount
(000’s)(2) | | �� | Market
Value
(000’s)(3) | | | Premiums
Paid
(Received)
(000’s) | | | Unrealized
Appreciation
(Depreciation)
(000’s) | |
Dow Jones North America Investment Grade Index—Series 5 | | | 0.46 | % | | | 12/20/2015 | | | | MSC | | | | USD | | | | 3,200 | | | $ | (90 | ) | | $ | ¿ | | | $ | (90 | ) |
North America Investment Grade Index—Series 16 | | | 1.00 | | | | 06/20/2016 | | | | BCLY | | | | USD | | | | 6,000 | | | | 56 | | | | (42 | ) | | | 98 | |
| | | | | | | | | | | | | | | | | | | | | | | | | | | | | | | | |
| | | | | | | | | | | | | | | | | | | | | | $ | (34 | ) | | $ | (42 | ) | | $ | 8 | |
| | | | | | | | | | | | | | | | | | | | | | | | | | | | | | | | |
INTEREST RATE SWAP AGREEMENTS—FIXED RATE RECEIVABLE:
| | | | | | | | | | | | | | | | | | | | | | | | | | |
Floating Rate Index | | Fixed Rate | | | Maturity
Date | | Counterparty | | Currency
Code | | Notional
Amount
(000’s) | | | Market
Value
(000’s) | | | Premiums
Paid
(Received)
(000’s) | | | Unrealized
Appreciation
(Depreciation)
(000’s) | |
6-Month AUD BBR-BBSW § | | | 5.50 | % | | 12/15/2017 | | DUB | | AUD | | | 2,200 | | | $ | 236 | | | $ | (7 | ) | | $ | 243 | |
6-Month AUD BBR-BBSW | | | 5.50 | | | 12/15/2017 | | BCLY | | AUD | | | 3,600 | | | | 387 | | | | (13 | ) | | | 400 | |
6-Month AUD BBR-BBSW | | | 3.75 | | | 03/15/2018 | | DUB | | AUD | | | 10,000 | | | | 198 | | | | 15 | | | | 183 | |
6-Month AUD BBR-BBSW | | | 3.75 | | | 03/15/2018 | | GSC | | AUD | | | 5,300 | | | | 105 | | | | 11 | | | | 94 | |
BRL-CDI | | | 12.12 | | | 01/02/2014 | | HSBC | | BRL | | | 11,600 | | | | 486 | | | | 9 | | | | 477 | |
BRL-CDI | | | 11.94 | | | 01/02/2014 | | HSBC | | BRL | | | 6,200 | | | | 219 | | | | 6 | | | | 213 | |
BRL-CDI § | | | 7.78 | | | 01/02/2014 | | HSBC | | BRL | | | 26,600 | | | | 64 | | | | 51 | | | | 13 | |
BRL-CDI | | | 12.56 | | | 01/02/2014 | | HSBC | | BRL | | | 3,200 | | | | 113 | | | | 3 | | | | 110 | |
BRL-CDI | | | 12.51 | | | 01/02/2014 | | JPM | | BRL | | | 3,300 | | | | 116 | | | | 2 | | | | 114 | |
BRL-CDI § | | | 7.79 | | | 01/02/2014 | | MSC | | BRL | | | 26,800 | | | | 68 | | | | 57 | | | | 11 | |
BRL-CDI | | | 11.99 | | | 01/02/2014 | | GSC | | BRL | | | 4,000 | | | | 158 | | | | ¿ | | | | 158 | |
BRL-CDI § | | | 7.40 | | | 01/02/2014 | | BCLY | | BRL | | | 2,000 | | | | 1 | | | | (¿ | ) | | | 1 | |
BRL-CDI | | | 11.96 | | | 01/02/2014 | | GSC | | BRL | | | 24,800 | | | | 972 | | | | (9 | ) | | | 981 | |
BRL-CDI | | | 10.53 | | | 01/02/2014 | | HSBC | | BRL | | | 5,200 | | | | 105 | | | | 1 | | | | 104 | |
BRL-CDI | | | 10.58 | | | 01/02/2014 | | MSC | | BRL | | | 9,300 | | | | 191 | | | | 11 | | | | 180 | |
BRL-CDI § | | | 10.14 | | | 01/02/2015 | | HSBC | | BRL | | | 32,100 | | | | 749 | | | | 52 | | | | 697 | |
BRL-CDI § | | | 8.63 | | | 01/02/2015 | | MSC | | BRL | | | 10,900 | | | | 88 | | | | 87 | | | | 1 | |
BRL-CDI § | | | 10.61 | | | 01/02/2015 | | MSC | | BRL | | | 18,400 | | | | 513 | | | | 85 | | | | 428 | |
BRL-CDI § | | | 9.94 | | | 01/02/2015 | | GSC | | BRL | | | 21,600 | | | | 460 | | | | ¿ | | | | 460 | |
BRL-CDI § | | | 9.93 | | | 01/02/2015 | | UBS | | BRL | | | 22,600 | | | | 479 | | | | 15 | | | | 464 | |
BRL-CDI § | | | 8.08 | | | 01/02/2015 | | HSBC | | BRL | | | 8,200 | | | | 20 | | | | 15 | | | | 5 | |
BRL-CDI § | | | 8.43 | | | 01/02/2015 | | DUB | | BRL | | | 2,400 | | | | 15 | | | | 15 | | | | (¿ | ) |
BRL-CDI § | | | 9.93 | | | 01/02/2015 | | MSC | | BRL | | | 26,200 | | | | 555 | | | | 9 | | | | 546 | |
BRL-CDI § | | | 8.49 | | | 01/02/2017 | | BNP | | BRL | | | 2,300 | | | | ¿ | | | | ¿ | | | | ¿ | |
MXN-TIIE-Banxico | | | 6.50 | | | 03/05/2013 | | MSC | | MXN | | | 64,800 | | | | 23 | | | | (1 | ) | | | 24 | |
MXN-TIIE-Banxico | | | 7.50 | | | 06/02/2021 | | UBS | | MXN | | | 80,200 | | | | 707 | | | | 232 | | | | 475 | |
| | | | | | | | | | | | | | | | | | | | | | | | | | |
| | | | | | | | | | | | | | | | $ | 7,028 | | | $ | 646 | | | $ | 6,382 | |
| | | | | | | | | | | | | | | | | | | | | | | | | | |
The notes to the financial statements are an integral part of this report.
| | | | |
| Transamerica Funds | | | | Annual Report 2012 |
| | Page 133 | | |
Transamerica Total Return
(formerly, Transamerica PIMCO Total Return)
SCHEDULE OF INVESTMENTS (continued)
At October 31, 2012
FUTURES CONTRACTS:
| | | | | | | | | | | | | | | | |
Description | | Type | | | Contracts | | | Expiration Date | | | Unrealized
(Depreciation)
(000’s) | |
5-Year U.S. Treasury Note | | | Short | | | | (34 | ) | | | 12/31/2012 | | | $ | (24 | ) |
Euro OAT | | | Short | | | | (25 | ) | | | 12/06/2012 | | | | (32 | ) |
| | | | | | | | | | | | | | | | |
| | | | | | | | | | | | | | $ | (56 | ) |
| | | | | | | | | | | | | | | | |
FORWARD FOREIGN CURRENCY CONTRACTS: p
| | | | | | | | | | | | | | | | |
Currency | | Counterparty | | Contracts
Bought
(Sold)
(000’s) | | | Settlement Date | | Amount in U.S.
Dollars Bought
(Sold)
(000’s) | | | Net Unrealized
Appreciation
(Depreciation)
(000’s) | |
AUD | | BNP | | | 116 | | | 11/01/2012 | | $ | 118 | | | $ | 2 | |
AUD | | CITI | | | 178 | | | 11/01/2012 | | | 186 | | | | (1 | ) |
AUD | | JPM | | | (89 | ) | | 11/01/2012 | | | (92 | ) | | | (¿ | ) |
AUD | | WBC | | | (29,738 | ) | | 11/01/2012 | | | (30,972 | ) | | | 105 | |
AUD | | JPM | | | (113 | ) | | 11/01/2012 | | | (115 | ) | | | (2 | ) |
AUD | | UBS | | | 13,900 | | | 11/01/2012 | | | 14,460 | | | | (32 | ) |
AUD | | WBC | | | (15,746 | ) | | 12/13/2012 | | | (16,231 | ) | | | (56 | ) |
BRL | | UBS | | | (3,856 | ) | | 12/04/2012 | | | (1,863 | ) | | | (27 | ) |
BRL | | HSBC | | | 3,856 | | | 12/04/2012 | | | 1,883 | | | | 7 | |
BRL | | HSBC | | | (3,856 | ) | | 02/04/2013 | | | (1,868 | ) | | | (7 | ) |
CAD | | BNP | | | 20,713 | | | 12/20/2012 | | | 21,349 | | | | (632 | ) |
CAD | | DUB | | | (10,294 | ) | | 12/20/2012 | | | (10,535 | ) | | | 239 | |
CAD | | DUB | | | (5,943 | ) | | 12/20/2012 | | | (6,092 | ) | | | 148 | |
CAD | | CITI | | | (18,033 | ) | | 12/20/2012 | | | (18,618 | ) | | | 582 | |
CNY | | DUB | | | 6,353 | | | 02/01/2013 | | | 1,004 | | | | 6 | |
CNY | | GSC | | | 6,562 | | | 02/01/2013 | | | 1,046 | | | | (3 | ) |
CNY | | HSBC | | | (1,401 | ) | | 02/01/2013 | | | (219 | ) | | | (4 | ) |
CNY | | DUB | | | 8,367 | | | 02/01/2013 | | | 1,330 | | | | ¿ | |
CNY | | JPM | | | 5,633 | | | 02/01/2013 | | | 884 | | | | 11 | |
CNY | | UBS | | | 103,161 | | | 02/01/2013 | | | 16,366 | | | | 30 | |
CNY | | HSBC | | | (85,721 | ) | | 02/01/2013 | | | (13,478 | ) | | | (145 | ) |
CNY | | RBS | | | (51,388 | ) | | 02/01/2013 | | | (8,042 | ) | | | (125 | ) |
CNY | | DUB | | | 2,000 | | | 08/05/2013 | | | 319 | | | | (5 | ) |
CNY | | UBS | | | 7,078 | | | 08/05/2013 | | | 1,121 | | | | (8 | ) |
EUR | | BOA | | | (24,427 | ) | | 01/15/2013 | | | (31,762 | ) | | | 75 | |
EUR | | RBS | | | (8,359 | ) | | 01/15/2013 | | | (10,836 | ) | | | (7 | ) |
EUR | | UBS | | | (34 | ) | | 01/15/2013 | | | (44 | ) | | | (¿ | ) |
EUR | | HSBC | | | (6,000 | ) | | 09/13/2013 | | | (7,532 | ) | | | (269 | ) |
EUR | | JPM | | | (13,700 | ) | | 09/13/2013 | | | (17,010 | ) | | | (801 | ) |
EUR | | JPM | | | (216 | ) | | 10/11/2013 | | | (262 | ) | | | (19 | ) |
EUR | | JPM | | | (864 | ) | | 10/11/2013 | | | (1,066 | ) | | | (58 | ) |
EUR | | JPM | | | 1,080 | | | 10/11/2013 | | | 1,406 | | | | (1 | ) |
GBP | | BNP | | | (5,768 | ) | | 12/12/2012 | | | (9,172 | ) | | | (135 | ) |
GBP | | BNP | | | (190 | ) | | 12/12/2012 | | | (306 | ) | | | (¿ | ) |
JPY | | BCLY | | | (91,087 | ) | | 12/10/2012 | | | (1,163 | ) | | | 21 | |
MXN | | HSBC | | | 68,443 | | | 12/03/2012 | | | 5,055 | | | | 155 | |
MXN | | CITI | | | 290 | | | 12/03/2012 | | | 21 | | | | 1 | |
MXN | | JPM | | | (68,995 | ) | | 12/03/2012 | | | (5,342 | ) | | | 90 | |
MXN | | DUB | | | (474 | ) | | 12/03/2012 | | | (37 | ) | | | 1 | |
MXN | | MSC | | | 262 | | | 12/03/2012 | | | 20 | | | | ¿ | |
MXN | | UBS | | | 474 | | | 12/03/2012 | | | 37 | | | | (¿ | ) |
MXN | | JPM | | | 68,995 | | | 04/03/2013 | | | 5,279 | | | | (92 | ) |
MXN | | DUB | | | 474 | | | 04/03/2013 | | | 36 | | | | (1 | ) |
NOK | | DUB | | | 15,778 | | | 11/21/2012 | | | 2,687 | | | | 78 | |
TWD | | UBS | | | (27,166 | ) | | 11/30/2012 | | | (911 | ) | | | (19 | ) |
TWD | | BCLY | | | 122,831 | | | 11/30/2012 | | | 4,168 | | | | 37 | |
TWD | | UBS | | | (58,150 | ) | | 11/30/2012 | | | (1,952 | ) | | | (39 | ) |
TWD | | CITI | | | (37,727 | ) | | 11/30/2012 | | | (1,266 | ) | | | (26 | ) |
| | | | | | | | | | | | | | | | |
| | | | | | | | | | | | | | $ | (926 | ) |
| | | | | | | | | | | | | | | | |
The notes to the financial statements are an integral part of this report.
| | | | |
| Transamerica Funds | | | | Annual Report 2012 |
| | Page 134 | | |
Transamerica Total Return
(formerly, Transamerica PIMCO Total Return)
SCHEDULE OF INVESTMENTS (continued)
At October 31, 2012
Collateral (Received) Pledged for OTC Financial Derivative Instruments
The following is a summary by counterparty of the market value of OTC financial derivative instruments and collateral (received) pledged as of 10/31/2012:
| | | | | | | | | | | | |
Counterparty | | Total Market Value of
OTC Derivatives
(000’s) | | | Collateral
(Received) Pledged
(000’s) | | | Net Exposures (1)
(000’s) | |
BCLY | | $ | 502 | | | $ | (640 | ) | | $ | (138 | ) |
BNP | | | (765 | ) | | | 649 | | | | (116 | ) |
BOA | | | 75 | | | | — | | | | 75 | |
CITI | | | 556 | | | | (750 | ) | | | (194 | ) |
DUB | | | 196 | | | | — | | | | 196 | |
GSC | | | 1,692 | | | | (1,450 | ) | | | 242 | |
HSBC | | | 1,493 | | | | (1,630 | ) | | | (137 | ) |
JPM | | | (756 | ) | | | 963 | | | | 207 | |
MSC | | | 1,348 | | | | (1,690 | ) | | | (342 | ) |
RBS | | | (111 | ) | | | — | | | | (111 | ) |
UBS | | | 1,091 | | | | (910 | ) | | | 181 | |
WBC | | | 49 | | | | (180 | ) | | | (131 | ) |
| (1) | Net exposure represents the net receivable (payable) that would be due from/to the counterparty in the event of default. |
NOTES TO SCHEDULE OF INVESTMENTS (all amounts in thousands):
| * | Floating or variable rate note. Rate is listed as of 10/31/2012. |
| Ð | Security is subject to dollar roll transactions. |
| | Rate shown reflects the yield at 10/31/2012. |
| Ә | Fair valued as determined in good faith in accordance with procedures established by the Board of Trustees. Total aggregate market value of fair valued securities is $16,590, or 2.06% of the fund’s net assets. |
| Ž | The security has a perpetual maturity. The date shown is the next call date. |
| ^ | All or a portion of this security is on loan. The value of all securities on loan is $1,625. |
| ¥ | Percentage rounds to less than 0.1%. |
| § | Illiquid. Total aggregate market value of illiquid securities is $68,816, or 8.56% of the fund’s net assets, and total aggregate market value of illiquid derivatives is $3,248, or 0.40% of the fund’s net assets. |
| ‡ | Non-income producing security. |
| P | Aggregate cost for federal income tax purposes is $940,618. Aggregate gross unrealized appreciation/depreciation for all securities in which there is an excess of value over tax cost were $37,654 and $7,925, respectively. Net unrealized appreciation for tax purposes is $29,729. |
| g | All or a portion of this security has been segregated as collateral with the custodian to cover margin requirements for open futures contracts. Total value of securities segregated as collateral to cover margin requirements for open futures contracts is $136. |
| ☼ | All or a portion of this security has been segregated with the broker to cover open swaps, swaptions, and/or forward contracts. Total value of securities segregated to cover open swaps, swaptions, and/or forward contracts is $1,613. |
| a | All or a portion of this security has been segregated as collateral with the broker for centrally cleared swaps. Total value of securities segregated as collateral to cover centrally cleared swaps is $2,392. |
| ⌂ | All or a portion of this security has been pledged to the broker as collateral for open TBA short commitment transactions. Total value of securities pledged as collateral for open TBA short commitment transactions is $470. |
| ¨ | Cash, in the amount of $320, has been segregated as collateral by the broker for open TBA short commitment transactions. |
| ¶ | Cash in the amount of $47, has been segregated by the custodian for centrally cleared swaps. |
| p | Cash, in the amount of $7,250, has been pledged by the broker as collateral for open swaps, swaptions, and/or forward foreign currency contracts. |
| (1) | If the fund is a buyer of protection and a credit event occurs, as defined under the terms of that particular swap agreement, the fund will either (a) receive from the seller of protection an amount equal to the notional amount of the swap and deliver the referenced obligation or underlying securities comprising the referenced obligation or (b) receive a net settlement amount in the form of cash or securities equal to the notional amount of the swap less the recovery value of the referenced obligation or underlying securities comprising the referenced obligation. |
| (2) | The maximum potential amount the fund could be required to make as a seller of credit protection or receive as a buyer of credit protection if a credit event occurs as defined under the terms of that particular swap agreement. |
| (3) | The quoted market prices and resulting values for credit default swap agreements on asset-backed securities and credit indices serve as an indicator of the current status of the payment/performance risk and represent the likelihood of an expected liability (or profit) for the credit derivative had the notional amount of the swap agreement been closed/sold as of the period ended. Increasing market values, in absolute terms when compared to the notional amount of the swap, represent a deterioration of the referenced entity’s credit soundness and a greater likelihood or risk of default or other credit event occurring as defined under the terms of the agreement. |
| (4) | Implied credit spreads, represented in absolute terms, utilized in determining the market value of credit default swap agreements on corporate issues or sovereign issues of an emerging country as of period end serve as an indicator of the current status of the payment/performance risk and represent the likelihood of risk of default for the credit derivative. The implied credit spread of a particular referenced entity reflects the cost of buying/selling protection and may include the referenced entity’s credit soundness and a greater likelihood or risk of default or other credit event occurring as defined under the terms of the agreement. A credit spread identified as “Defaulted” indicates a credit event has occurred for the referenced entity or obligation. |
| (5) | If the fund is a seller of protection and a credit event occurs, as defined under the terms of that particular swap agreement, the fund will either (a) pay to the buyer of protection an amount equal to the notional amount of the swap and take delivery of the referenced obligation or underlying securities comprising the referenced obligation or (b) pay a net settlement amount in the form of cash or securities equal to the notional amount of the swap less the recovery value of the referenced obligation or underlying securities comprising the referenced obligation. |
The notes to the financial statements are an integral part of this report.
| | | | |
| Transamerica Funds | | | | Annual Report 2012 |
| | Page 135 | | |
Transamerica Total Return
(formerly, Transamerica PIMCO Total Return)
SCHEDULE OF INVESTMENTS (continued)
At October 31, 2012
DEFINITIONS (all amounts in thousands):
| | |
| 144A | | 144A Securities are registered pursuant to Rule 144A of the Securities Act of 1933. These securities are deemed to be liquid for purposes of compliance limitations on holdings of illiquid securities and may be resold as transactions exempt from registration, normally to qualified institutional buyers. At 10/31/2012, these securities aggregated $83,458, or 10.38% of the fund’s net assets. |
| BBA | | British Banker’s Association |
| BBR-BBSW | | Bank Bill Rate—Bank Bill Swap Reference Rate |
| BCLY | | Barclays Bank PLC |
| BNP | | BNP Paribas |
| BOA | | Bank of America |
| BP | | Basis Point |
| CDI | | Credit Default Index |
| CDO | | Collateralized Debt Obligation |
| CITI | | Citibank, Inc. |
| CLO | | Collateralized Loan Obligation |
| DUB | | Deutsche Bank AG |
| EURIBOR | | Euro InterBank Offered Rate |
| GSC | | Goldman Sachs & Co. |
| HSBC | | HSBC Bank USA |
| IO | | Interest Only |
| JPM | | JPMorgan Chase Bank |
| LIBOR | | London Interbank Offered Rate |
| MSC | | Morgan Stanley |
| OTC | | Over The Counter |
| RBS | | Royal Bank of Scotland Group PLC |
| TBA | | To Be Announced |
| TIIE | | Tasa de Interés Interbancaria de Equilibrio (Mexican Interbank Interest Rate) |
| UBS | | UBS AG |
| WBC | | Wespac Banking Corporation |
CURRENCY ABBREVIATIONS:
| | |
| AUD | | Australian Dollar |
| BRL | | Brazilian Real |
| CAD | | Canadian Dollar |
| CNY | | Chinese Yuan |
| EUR | | Euro |
| GBP | | Pound Sterling |
| JPY | | Japanese Yen |
| MXN | | Mexican Peso |
| NOK | | Norwegian Krone |
| TWD | | Taiwan New Dollar |
| USD | | United States Dollar |
VALUATION SUMMARY (all amounts in thousands): '
| | | | | | | | | | | | | | | | |
Investment Securities | | Level 1 -
Quoted
Prices | | | Level 2 -
Other
Significant
Observable
Inputs | | | Level 3 -
Significant
Unobservable
Inputs | | | Value at
10/31/2012 | |
Asset-Backed Securities | | $ | — | | | $ | 38,657 | | | $ | — | | | $ | 38,657 | |
Certificate of Deposit | | | — | | | | 7,996 | | | | — | | | | 7,996 | |
Commercial Papers | | | — | | | | 12,174 | | | | — | | | | 12,174 | |
Convertible Preferred Stock | | | 2,000 | | | | — | | | | — | | | | 2,000 | |
Corporate Debt Securities | | | — | | | | 130,668 | | | | ¿ | | | | 130,668 | |
Foreign Government Obligations | | | — | | | | 46,959 | | | | — | | | | 46,959 | |
Mortgage-Backed Securities | | | — | | | | 60,377 | | | | — | | | | 60,377 | |
Municipal Government Obligations | | | — | | | | 51,149 | | | | — | | | | 51,149 | |
Preferred Stock | | | — | | | | — | | | | 873 | | | | 873 | |
Purchased Swaption | | | — | | | | 386 | | | | — | | | | 386 | |
Repurchase Agreements | | | — | | | | 81,247 | | | | — | | | | 81,247 | |
Securities Lending Collateral | | | 1,657 | | | | — | | | | — | | | | 1,657 | |
Short-Term U.S. Government Obligations | | | — | | | | 108,105 | | | | — | | | | 108,105 | |
U.S. Government Agency Obligations | | | — | | | | 259,387 | | | | — | | | | 259,387 | |
U.S. Government Obligations | | | — | | | | 168,712 | | | | — | | | | 168,712 | |
| | | | | | | | | | | | | | | | |
Total | | $ | 3,657 | | | $ | 965,817 | | | $ | 873 | | | $ | 970,347 | |
| | | | | | | | | | | | | | | | |
The notes to the financial statements are an integral part of this report.
| | | | |
| Transamerica Funds | | | | Annual Report 2012 |
| | Page 136 | | |
Transamerica Total Return
(formerly, Transamerica PIMCO Total Return)
SCHEDULE OF INVESTMENTS (continued)
At October 31, 2012
VALUATION SUMMARY (all amounts in thousands) (continued): '
| | | | | | | | | | | | | | | | |
TBA Short Commitments | | Level 1 -
Quoted
Prices | | | Level 2 -
Other
Significant
Observable
Inputs | | | Level 3 -
Significant
Unobservable
Inputs | | | Value at
10/31/2012 | |
U.S. Government Agency Obligations | | $ | — | | | $ | (34,354 | ) | | $ | — | | | $ | (34,354 | ) |
| | | | |
Other Financial Instruments | | Level 1 -
Quoted
Prices | | | Level 2 -
Other
Significant
Observable
Inputs | | | Level 3 -
Significant
Unobservable
Inputs | | | Value at
10/31/2012 | |
Written Swaptions | | $ | — | | | $ | (1,084 | ) | | $ | — | | | $ | (1,084 | ) |
| | | | |
Other Financial Instruments ₣ | | Level 1 -
Quoted
Prices | | | Level 2 -
Other
Significant
Observable
Inputs | | | Level 3 -
Significant
Unobservable
Inputs | | | Value at
10/31/2012 | |
Futures Contracts—Depreciation | | $ | (56 | ) | | $ | — | | | $ | — | | | $ | (56 | ) |
Credit Default Swaps—Appreciation | | | — | | | | 98 | | | | — | | | | 98 | |
Credit Default Swaps—Depreciation | | | (3,000 | ) | | | (90 | ) | | | — | | | | (3,090 | ) |
Forward Foreign Currency Contracts—Appreciation | | | — | | | | 1,588 | | | | — | | | | 1,588 | |
Forward Foreign Currency Contracts—Depreciation | | | — | | | | (2,514 | ) | | | — | | | | (2,514 | ) |
Interest Rate Swaps—Appreciation | | | 426 | | | | 6,382 | | | | — | | | | 6,808 | |
Interest Rate Swaps—Depreciation | | | (282 | ) | | | — | | | | — | | | | (282 | ) |
| | | | | | | | | | | | | | | | |
Total | | $ | (2,912 | ) | | $ | 5,464 | | | $ | — | | | $ | 2,552 | |
| | | | | | | | | | | | | | | | |
Level 3 Rollforward—Investment Securities
| | | | | | | | | | | | | | | | | | | | | | | | | | | | | | | | | | | | | | | | |
Securities | | Beginning
Balance at
10/31/2011 | | | Purchases | | | Sales | | | Accrued
Discounts
(Premiums) | | | Total
Realized
Gain (Loss) | | | Net Change in
Unrealized
Appreciation
(Depreciation) ƒ | | | Transfers
into
Level 3 | | | Transfers
out of
Level 3 | | | Ending
Balance at
10/31/2012 ₪ | | | Net Change in
Unrealized
Appreciation
(Depreciation) on
Investments Held at
10/31/2012 ƒ | |
Corporate Debt Securities | | $ | — | | | $ | ¿ | | | $ | — | | | $ | — | | | $ | — | | | $ | (¿) | | | $ | — | | | $ | — | | | $ | ¿ | | | $ | (¿) | |
Preferred Stocks | | | 895 | | | | — | | | | — | | | | — | | | | — | | | | (22 | ) | | | — | | | | — | | | | 873 | | | | (22 | ) |
| | | | | | | | | | | | | | | | | | | | | | | | | | | | | | | | | | | | | | | | |
Total | | $ | 895 | | | $ | ¿ | | | $ | — | | | $ | — | | | $ | — | | | $ | (22 | ) | | $ | — | | | $ | — | | | $ | 873 | | | | (22 | ) |
| | | | | | | | | | | | | | | | | | | | | | | | | | | | | | | | | | | | | | | | |
| ' | Transfers between levels are considered to have occurred at the end of the reporting period. There were no transfers into or out of Levels 1 and 2 during the period ended 10/31/2012. See the notes to the financial statements for more information regarding pricing inputs and valuation techniques. |
| ₣ | Other financial instruments are derivative instruments that are valued at unrealized appreciation (depreciation) on the instrument. |
| ƒ | Any difference between Net Change in Unrealized Appreciation (Depreciation) and Net Change in Unrealized Appreciation (Depreciation) on Investments Held at 10/31/2012 may be due to an investment no longer held or categorized as Level 3 at period end. |
| ₪ | Inputs used in the valuation of the Level 3 securities were not considered significant unobservable inputs. |
The notes to the financial statements are an integral part of this report.
| | | | |
| Transamerica Funds | | | | Annual Report 2012 |
| | Page 137 | | |
Transamerica Value
(formerly, Transamerica Third Avenue Value)
SCHEDULE OF INVESTMENTS
At October 31, 2012
| | | | | | | | |
| | | Shares | | | Value
(000’s) | |
COMMON STOCKS—86.7% | | | | | | | | |
Canada—0.7% | | | | | | | | |
Viterra, Inc. | | | 126,850 | | | $ | 1,999 | |
France—1.7% | | | | | | | | |
Sanofi | | | 51,950 | | | | 4,567 | |
Germany—1.5% | | | | | | | | |
Lanxess AG | | | 48,000 | | | | 3,965 | |
Hong Kong—15.7% | | | | | | | | |
Cheung Kong Holdings, Ltd. | | | 934,153 | | | | 13,802 | |
Henderson Land Development Co., Ltd. ^ | | | 1,824,727 | | | | 12,655 | |
Hutchison Whampoa, Ltd. | | | 1,245,888 | | | | 12,274 | |
Wheelock & Co., Ltd. | | | 862,000 | | | | 3,787 | |
Japan—6.6% | | | | | | | | |
Daiwa Securities Group, Inc. ^ | | | 365,000 | | | | 1,454 | |
Mitsui Fudosan Co., Ltd. | | | 274,462 | | | | 5,546 | |
Toyota Industries Corp. ^ | | | 385,107 | | | | 10,999 | |
Korea, Republic of—3.9% | | | | | | | | |
POSCO ADR | | | 134,261 | | | | 10,523 | |
Sweden—5.0% | | | | | | | | |
Investor AB—Class A | | | 626,796 | | | | 13,390 | |
Switzerland—3.3% | | | | | | | | |
Pargesa Holding SA | | | 133,000 | | | | 8,969 | |
United Kingdom—1.9% | | | | | | | | |
Segro PLC REIT | | | 1,313,400 | | | | 5,036 | |
United States—46.4% | | | | | | | | |
Alamo Group, Inc. ^ | | | 18,983 | | | | 636 | |
Alleghany Corp. ‡ | | | 12,000 | | | | 4,171 | |
Applied Materials, Inc. | | | 629,461 | | | | 6,672 | |
AVX Corp. | | | 679,541 | | | | 6,687 | |
Bank of New York Mellon Corp. | | | 560,052 | | | | 13,839 | |
Bristow Group, Inc. | | | 173,630 | | | | 8,668 | |
Brookfield Asset Management, Inc.—Class A | | | 395,036 | | | | 13,605 | |
Capital Southwest Corp. | | | 19,256 | | | | 2,075 | |
Comerica, Inc. | | | 141,000 | | | | 4,203 | |
Devon Energy Corp. | | | 103,000 | | | | 5,996 | |
Electronics for Imaging, Inc. ‡ | | | 212,436 | | | | 3,688 | |
EnCana Corp. ^ | | | 317,000 | | | | 7,148 | |
Forest City Enterprises, Inc.—Class A ‡^ | | | 539,836 | | | | 8,664 | |
Haemonetics Corp. ‡ | | | 26,000 | | | | 2,124 | |
Intel Corp. | | | 255,961 | | | | 5,535 | |
Investment Technology Group, Inc. ‡ | | | 424,815 | | | | 3,585 | |
KeyCorp | | | 610,000 | | | | 5,136 | |
Leucadia National Corp. | | | 181,000 | | | | 4,109 | |
Lexmark International, Inc.—Class A ^ | | | 21,205 | | | | 451 | |
Lowe’s Cos., Inc. | | | 74,000 | | | | 2,396 | |
Symantec Corp. ‡ | | | 140,000 | | | | 2,547 | |
Tejon Ranch Co. ‡ ^ | | | 86,299 | | | | 2,584 | |
Tellabs, Inc. | | | 941,479 | | | | 2,749 | |
Westwood Holdings Group, Inc. ^ | | | 99,253 | | | | 3,853 | |
White Mountains Insurance Group, Ltd. | | | 10,100 | | | | 5,178 | |
| | | | | | | | |
Total Common Stocks (cost $285,726) | | | | | | | 235,265 | |
| | | | | | | | |
SECURITIES LENDING COLLATERAL—5.7% | |
State Street Navigator Securities Lending Trust—Prime Portfolio, 0.31% | | | 15,569,014 | | | | 15,569 | |
Total Securities Lending Collateral (cost $15,569) | | | | | |
| | | | | | | | |
| | | Principal
(000’s) | | | Value
(000’s) | |
REPURCHASE AGREEMENT—13.4% | | | | | | | | |
State Street Bank & Trust Co.
0.03% , dated 10/31/2012, to be repurchased at $36,347 on 11/01/2012. Collateralized by a U.S. Government Agency Obligation, 3.00%, due 12/01/2026, and with a value of $37,076. | | $ | 36,347 | | | $ | 36,347 | |
Total Repurchase Agreement (cost $36,347) | | | | | | | | |
| | | | | | | | |
Total Investment Securities (cost $337,642) P | | | | | | | 287,181 | |
Other Assets and Liabilities—Net | | | | | | | (15,622 | ) |
| | | | | | | | |
Net Assets | | | | | | $ | 271,559 | |
| | | | | | | | |
The notes to the financial statements are an integral part of this report.
| | | | |
| Transamerica Funds | | | | Annual Report 2012 |
| | Page 138 | | |
Transamerica Value
(formerly, Transamerica Third Avenue Value)
SCHEDULE OF INVESTMENTS (continued)
At October 31, 2012
| | | | | | | | |
INVESTMENTS BY INDUSTRY (unaudited): | | Percentage of
Total Investment
Securities | | | Value
(000’s) | |
Real Estate Management & Development | | | 21.1 | % | | $ | 60,643 | |
Diversified Financial Services | | | 9.2 | | | | 26,468 | |
Capital Markets | | | 8.6 | | | | 24,806 | |
Oil, Gas & Consumable Fuels | | | 4.6 | | | | 13,144 | |
Industrial Conglomerates | | | 4.3 | | | | 12,274 | |
Semiconductors & Semiconductor Equipment | | | 4.2 | | | | 12,207 | |
Auto Components | | | 3.8 | | | | 10,999 | |
Metals & Mining | | | 3.7 | | | | 10,523 | |
Insurance | | | 3.3 | | | | 9,349 | |
Commercial Banks | | | 3.3 | | | | 9,339 | |
Energy Equipment & Services | | | 3.0 | | | | 8,668 | |
Electronic Equipment & Instruments | | | 2.3 | | | | 6,687 | |
Real Estate Investment Trusts | | | 1.8 | | | | 5,036 | |
Pharmaceuticals | | | 1.6 | | | | 4,567 | |
Computers & Peripherals | | | 1.4 | | | | 4,139 | |
Chemicals | | | 1.4 | | | | 3,965 | |
Communications Equipment | | | 1.0 | | | | 2,749 | |
Software | | | 0.9 | | | | 2,547 | |
Specialty Retail | | | 0.8 | | | | 2,396 | |
Health Care Equipment & Supplies | | | 0.7 | | | | 2,124 | |
Food Products | | | 0.7 | | | | 1,999 | |
Machinery | | | 0.2 | | | | 636 | |
| | | | | | | | |
Investment Securities, at Value | | | 81.9 | | | | 235,265 | |
Short-Term Investments | | | 18.1 | | | | 51,916 | |
| | | | | | | | |
Total Investments | | | 100.0 | % | | $ | 287,181 | |
| | | | | | | | |
NOTES TO SCHEDULE OF INVESTMENTS (all amounts in thousands):
| ^ | All or a portion of this security is on loan. The value of all securities on loan is $15,012. |
| ‡ | Non-income producing security. |
| | Rate shown reflects the yield at 10/31/2012. |
| P | Aggregate cost for federal income tax purposes is $337,765. Aggregate gross unrealized appreciation/depreciation for all securities in which there is an excess of value over tax cost were $16,516 and $67,100, respectively. Net unrealized depreciation for tax purposes is $50,584. |
DEFINITIONS:
| | |
ADR | | American Depositary Receipt |
REIT | | Real Estate Investment Trust (includes domestic REITs and Foreign Real Estate Investment Companies) |
VALUATION SUMMARY (all amounts in thousands): '
| | | | | | | | | | | | | | | | |
Investment Securities | | Level 1 -
Quoted
Prices | | | Level 2 -
Other
Significant
Observable
Inputs | | | Level 3 -
Significant
Unobservable
Inputs | | | Value at
10/31/2012 | |
Common Stocks | | $ | 128,298 | | | $ | 106,967 | | | $ | — | | | $ | 235,265 | |
Repurchase Agreement | | | — | | | | 36,347 | | | | — | | | | 36,347 | |
Securities Lending Collateral | | | 15,569 | | | | — | | | | — | | | | 15,569 | |
| | | | | | | | | | | | | | | | |
Total | | $ | 143,867 | | | $ | 143,314 | | | $ | — | | | $ | 287,181 | |
| | | | | | | | | | | | | | | | |
| ' | Transfers between levels are considered to have occurred at the end of the reporting period. There were no transfers into or out of Levels 1 and 2 during the period ended 10/31/2012. See the notes to the financial statements for more information regarding pricing inputs and valuation techniques. |
The notes to the financial statements are an integral part of this report.
| | | | |
| Transamerica Funds | | | | Annual Report 2012 |
| | Page 139 | | |
STATEMENTS OF ASSETS AND LIABILITIES
At October 31, 2012
(all amounts except per share amounts in thousands)
| | | | | | | | | | | | | | | | | | | | |
| | | Transamerica
Arbitrage
Strategy | | | Transamerica
Bond | | | Transamerica
Core Bond | | | Transamerica
Developing
Markets Equity | | | Transamerica
Global Macro | |
Assets: | | | | | | | | | | | | | | | | | | | | |
Investment securities, at value | | $ | 94,532 | | | $ | 815,034 | | | $ | 1,915,590 | | | $ | 362,648 | | | $ | 68,732 | |
Repurchase agreement, at value | | | 14,259 | | | | 6,283 | | | | 27,436 | | | | 13,968 | | | | 44,637 | |
Cash | | | 7 | | | | — | | | | 2,824 | | | | — | | | | — | |
Cash on deposit with broker | | | 21,222 | | | | — | | | | — | | | | — | | | | — | |
Foreign currency, at value | | | 1,319 | | | | 58 | | | | — | | | | 116 | | | | — | |
Receivables: | | | | | | | | | | | | | | | | | | | | |
Investment securities sold | | | 2,255 | | | | 88 | | | | 358 | | | | 631 | | | | 103 | |
Shares of beneficial interest sold | | | — | | | | 825 | | | | 31 | | | | 4 | | | | 144 | |
Interest | | | — | (A) | | | 9,996 | | | | 9,599 | | | | — | (A) | | | 1 | |
Securities lending income (net) | | | — | | | | 35 | | | | 22 | | | | 14 | | | | — | (A) |
Dividends | | | 246 | | | | 152 | | | | — | | | | 230 | | | | — | |
Dividend reclaims | | | 1 | | | | — | | | | — | | | | 4 | | | | 7 | |
Prepaid expenses | | | 1 | | | | 2 | | | | 8 | | | | 2 | | | | — | (A) |
Unrealized appreciation on swap agreements | | | 57 | | | | — | | | | — | | | | — | | | | — | |
Unrealized appreciation on forward foreign currency contracts | | | 637 | | | | — | | | | — | | | | — | | | | 1,817 | |
| | | | | | | | | | | | | | | | | | | | |
| | $ | 134,536 | | | $ | 832,473 | | | $ | 1,955,868 | | | $ | 377,617 | | | $ | 115,441 | |
| | | | | | | | | | | | | | | | | | | | |
Liabilities: | | | | | | | | | | | | | | | | | | | | |
Cash deposit due to broker | | | 1,399 | | | | — | | | | — | | | | — | | | | — | |
Foreign currency due to broker | | | — | | | | — | | | | — | | | | — | | | | 31 | |
Accounts payable and accrued liabilities: | | | | | | | | | | | | | | | | | | | | |
Investment securities purchased | | | 2,286 | | | | — | | | | 2,824 | | | | 128 | | | | 13 | |
Shares of beneficial interest redeemed | | | 105 | | | | 262 | | | | 2,914 | | | | — | (A) | | | 216 | |
Management and advisory fees | | | 79 | | | | 422 | | | | 754 | | | | 350 | | | | 126 | |
Trustees fees | | | — | (A) | | | 2 | | | | 7 | | | | 1 | | | | — | (A) |
Transfer agent fees | | | 1 | | | | 5 | | | | 14 | | | | 2 | | | | 1 | |
Custody fees | | | 35 | | | | 10 | | | | 37 | | | | 48 | | | | 16 | |
Administration fees | | | 3 | | | | 17 | | | | 47 | | | | 8 | | | | 2 | |
Audit and tax fees | | | 21 | | | | 20 | | | | 20 | | | | 33 | | | | 23 | |
Dividends and interest from securities sold short | | | 24 | | | | — | | | | — | | | | — | | | | — | |
Interest payable | | | 1 | | | | — | | | | — | | | | — | | | | — | |
Variation margin | | | — | | | | — | | | | — | | | | — | | | | 333 | |
Foreign capital gains tax | | | — | | | | — | | | | — | | | | 134 | | | | — | |
Other | | | 16 | | | | 31 | | | | 76 | | | | 16 | | | | 6 | |
Collateral for securities on loan | | | — | | | | 94,624 | | | | 69,981 | | | | 35,535 | | | | — | |
Written options and swaptions, at value | | | 161 | | | | — | | | | — | | | | — | | | | 874 | |
Unrealized depreciation on swap agreements | | | 26 | | | | — | | | | — | | | | — | | | | — | |
Securities sold short, at value | | | 13,932 | | | | — | | | | — | | | | — | | | | — | |
Unrealized depreciation on forward foreign currency contracts | | | 144 | | | | — | | | | — | | | | — | | | | 1,539 | |
| | | | | | | | | | | | | | | | | | | | |
| | | 18,233 | | | | 95,393 | | | | 76,674 | | | | 36,255 | | | | 3,180 | |
| | | | | | | | | | | | | | | | | | | | |
Net assets | | $ | 116,303 | | | $ | 737,080 | | | $ | 1,879,194 | | | $ | 341,362 | | | $ | 112,261 | |
| | | | | | | | | | | | | | | | | | | | |
Net assets consist of: | | | | | | | | | | | | | | | | | | | | |
Shares of beneficial interest, unlimited shares authorized, no par value | | $ | 118,775 | | | $ | 667,387 | | | $ | 1,761,126 | | | $ | 288,619 | | | $ | 183,469 | |
Undistributed (accumulated) net investment income (loss) | | | 408 | | | | 5,697 | | | | 8,974 | | | | 1,448 | | | | (1,222 | ) |
Undistributed (accumulated) net realized gain (loss) from investments | | | (99 | ) | | | 6,746 | | | | 5,785 | | | | 30,514 | | | | (70,006 | ) |
Net unrealized appreciation (depreciation) on: | | | | | | | | | | | | | | | | | | | | |
Investment securities | | | (2,299 | ) | | | 57,231 | | | | 103,309 | | | | 20,951 | | | | (359 | ) |
Futures contracts | | | — | | | | — | | | | — | | | | — | | | | (287 | ) |
Written option and swaption contracts | | | (9 | ) | | | — | | | | — | | | | — | | | | 386 | |
Swap agreements | | | 31 | | | | — | | | | — | | | | — | | | | — | |
Translation of assets and liabilities denominated in foreign currencies | | | 497 | | | | 19 | | | | — | | | | (170 | ) | | | 280 | |
Securities sold short | | | (1,001 | ) | | | — | | | | — | | | | — | | | | — | |
| | | | | | | | | | | | | | | | | | | | |
Net assets | | $ | 116,303 | | | $ | 737,080 | | | $ | 1,879,194 | | | $ | 341,362 | | | $ | 112,261 | |
| | | | | | | | | | | | | | | | | | | | |
Shares outstanding | | | 11,765 | | | | 68,893 | | | | 172,965 | | | | 28,465 | | | | 19,472 | |
| | | | | |
Net asset value and offering price per share | | $ | 9.89 | | | $ | 10.70 | | | $ | 10.86 | | | $ | 11.99 | | | $ | 5.77 | |
| | | | | | | | | | | | | | | | | | | | |
Investment securities, at cost | | $ | 96,831 | | | $ | 757,803 | | | $ | 1,812,281 | | | $ | 341,697 | | | $ | 69,091 | |
| | | | | | | | | | | | | | | | | | | | |
Repurchase agreement, at cost | | $ | 14,259 | | | $ | 6,283 | | | $ | 27,436 | | | $ | 13,968 | | | $ | 44,637 | |
| | | | | | | | | | | | | | | | | | | | |
Foreign currency, at cost | | $ | 1,313 | | | $ | 58 | | | $ | — | | | $ | 149 | | | $ | (31 | ) |
| | | | | | | | | | | | | | | | | | | | |
Securities loaned, at value | | $ | — | | | $ | 92,617 | | | $ | 68,551 | | | $ | 33,954 | | | $ | — | |
| | | | | | | | | | | | | | | | | | | | |
Premiums received on written option and swaption contracts | | $ | 152 | | | $ | — | | | $ | — | | | $ | — | | | $ | 1,260 | |
| | | | | | | | | | | | | | | | | | | | |
Proceeds received from securities sold short | | $ | 12,931 | | | $ | — | | | $ | — | | | $ | — | | | $ | — | |
| | | | | | | | | | | | | | | | | | | | |
The notes to the financial statements are an integral part of this report.
| | | | |
| Transamerica Funds | | | | Annual Report 2012 |
| | Page 140 | | |
STATEMENTS OF ASSETS AND LIABILITIES (continued)
At October 31, 2012
(all amounts except per share amounts in thousands)
| | | | | | | | | | | | | | | | | | | | |
| | | Transamerica
Global Real
Estate
Securities | | | Transamerica
Growth | | | Transamerica
International | | | Transamerica
International
Equity
Opportunities | | | Transamerica
International
Small Cap | |
Assets: | | | | | | | | | | | | | | | | | | | | |
Investment securities, at value | | $ | 180,963 | | | $ | 590,741 | | | $ | 329,244 | | | $ | 179,324 | | | $ | 254,920 | |
Repurchase agreement, at value | | | 1,343 | | | | 6,203 | | | | 9,213 | | | | 1,173 | | | | 7,532 | |
Foreign currency, at value | | | — | | | | — | | | | 39 | | | | 67 | | | | 1,185 | |
Receivables: | | | | | | | | | | | | | | | | | | | | |
Investment securities sold | | | — | | | | 1,258 | | | | 61 | | | | — | (A) | | | 133 | |
Shares of beneficial interest sold | | | 17 | | | | 13 | | | | 2 | | | | 1 | | | | 2 | |
Interest | | | — | (A) | | | — | (A) | | | — | (A) | | | — | (A) | | | — | (A) |
Securities lending income (net) | | | 6 | | | | 8 | | | | 12 | | | | 2 | | | | 23 | |
Dividends | | | 245 | | | | 165 | | | | 317 | | | | 464 | | | | 569 | |
Dividend reclaims | | | 74 | | | | 5 | | | | 251 | | | | 173 | | | | 118 | |
Prepaid expenses | | | — | (A) | | | 2 | | | | 1 | | | | 1 | | | | 1 | |
| | | | | | | | | | | | | | | | | | | | |
| | $ | 182,648 | | | $ | 598,395 | | | $ | 339,140 | | | $ | 181,205 | | | $ | 264,483 | |
| | | | | | | | | | | | | | | | | | | | |
Liabilities: | | | | | | | | | | | | | | | | | | | | |
Accounts payable and accrued liabilities: | | | | | | | | | | | | | | | | | | | | |
Investment securities purchased | | | — | | | | 1,465 | | | | — | | | | 46 | | | | 375 | |
Shares of beneficial interest redeemed | | | 103 | | | | 589 | | | | 118 | | | | 49 | | | | 61 | |
Management and advisory fees | | | 115 | | | | 399 | | | | 270 | | | | 143 | | | | 231 | |
Trustees fees | | | 1 | | | | 2 | | | | 1 | | | | 1 | | | | 1 | |
Transfer agent fees | | | 1 | | | | 1 | | | | 2 | | | | 1 | | | | 2 | |
Custody fees | | | 17 | | | | 7 | | | | 14 | | | | 21 | | | | 15 | |
Administration fees | | | 4 | | | | 13 | | | | 7 | | | | 4 | | | | 5 | |
Audit and tax fees | | | 19 | | | | 18 | | | | 19 | | | | 18 | | | | 19 | |
Foreign capital gains tax | | | — | | | | — | | | | — | | | | — | | | | 29 | |
Other | | | 7 | | | | 23 | | | | 14 | | | | 12 | | | | 11 | |
Collateral for securities on loan | | | 22,051 | | | | 45,671 | | | | 31,552 | | | | 6,011 | | | | 21,806 | |
| | | | | | | | | | | | | | | | | | | | |
| | | 22,318 | | | | 48,188 | | | | 31,997 | | | | 6,306 | | | | 22,555 | |
| | | | | | | | | | | | | | | | | | | | |
Net assets | | $ | 160,330 | | | $ | 550,207 | | | $ | 307,143 | | | $ | 174,899 | | | $ | 241,928 | |
| | | | | | | | | | | | | | | | | | | | |
Net assets consist of: | | | | | | | | | | | | | | | | | | | | |
Shares of beneficial interest, unlimited shares authorized, no par value | | $ | 200,780 | | | $ | 345,896 | | | $ | 412,390 | | | $ | 168,879 | | | $ | 224,689 | |
Undistributed (accumulated) net investment income (loss) | | | (2,881 | ) | | | (1 | ) | | | 4,756 | | | | 4,852 | | | | 3,292 | |
Undistributed (accumulated) net realized gain (loss) from investments | | | (76,363 | ) | | | 55,110 | | | | (170,304 | ) | | | 7,444 | | | | (2,565 | ) |
Net unrealized appreciation (depreciation) on: | | | | | | | | | | | | | | | | | | | | |
Investment securities | | | 38,797 | | | | 149,202 | | | | 60,312 | | | | (6,267 | ) | | | 16,538 | |
Translation of assets and liabilities denominated in foreign currencies | | | (3 | ) | | | — | (A) | | | (11 | ) | | | (9 | ) | | | (26 | ) |
| | | | | | | | | | | | | | | | | | | | |
Net assets | | $ | 160,330 | | | $ | 550,207 | | | $ | 307,143 | | | $ | 174,899 | | | $ | 241,928 | |
| | | | | | | | | | | | | | | | | | | | |
Shares outstanding | | | 12,444 | | | | 40,991 | | | | 33,886 | | | | 23,559 | | | | 30,612 | |
| | | | | |
Net asset value and offering price per share | | $ | 12.88 | | | $ | 13.42 | | | $ | 9.06 | | | $ | 7.42 | | | $ | 7.90 | |
| | | | | | | | | | | | | | | | | | | | |
Investment securities, at cost | | $ | 142,166 | | | $ | 441,539 | | | $ | 268,932 | | | $ | 185,591 | | | $ | 238,382 | |
| | | | | | | | | | | | | | | | | | | | |
Repurchase agreement, at cost | | $ | 1,343 | | | $ | 6,203 | | | $ | 9,213 | | | $ | 1,173 | | | $ | 7,532 | |
| | | | | | | | | | | | | | | | | | | | |
Foreign currency, at cost | | $ | — | | | $ | — | | | $ | 39 | | | $ | 67 | | | $ | 1,170 | |
| | | | | | | | | | | | | | | | | | | | |
Securities loaned, at value | | $ | 21,245 | | | $ | 44,407 | | | $ | 30,199 | | | $ | 5,754 | | | $ | 20,597 | |
| | | | | | | | | | | | | | | | | | | | |
The notes to the financial statements are an integral part of this report.
| | | | |
| Transamerica Funds | | | | Annual Report 2012 |
| | Page 141 | | |
STATEMENTS OF ASSETS AND LIABILITIES (continued)
At October 31, 2012
(all amounts except per share amounts in thousands)
| | | | | | | | | | | | | | | | | | | | |
| | | Transamerica
International
Value
Opportunities | | | Transamerica
Large
Company | | | Transamerica
Long/Short
Strategy | | | Transamerica
Mid Cap
Value | | | Transamerica
Real Return
TIPS | |
Assets: | | | | | | | | | | | | | | | | | | | | |
Investment securities, at value | | $ | 224,901 | | | $ | 550,542 | | | $ | 91,376 | | | $ | 227,295 | | | $ | 1,552,272 | |
Repurchase agreement, at value | | | 5,028 | | | | — | | | | 180 | | | | 2,657 | | | | 612 | |
Cash on deposit with broker | | | — | | | | — | | | | 65,460 | | | | — | | | | — | |
Foreign currency, at value | | | 20 | | | | — | | | | — | | | | — | | | | 78 | |
Receivables: | | | | | | | | | | | | | | | | | | | | |
Investment securities sold | | | 300 | | | | 272 | | | | 17 | | | | — | | | | 9,135 | |
Shares of beneficial interest sold | | | 6 | | | | 14 | | | | — | | | | 3 | | | | 16 | |
Interest | | | — | (A) | | | 1 | | | | — | (A) | | | — | (A) | | | 5,234 | |
Securities lending income (net) | | | 5 | | | | 4 | | | | — | | | | 4 | | | | 1 | |
Dividends | | | 421 | | | | 430 | | | | 82 | | | | 143 | | | | — | |
Dividend reclaims | | | 178 | | | | 1 | | | | 1 | | | | — | | | | — | |
Variation margin | | | — | | | | — | | | | — | | | | — | | | | 84 | |
Prepaid expenses | | | 1 | | | | 2 | | | | — | (A) | | | 1 | | | | 3 | |
Unrealized appreciation on swap agreements | | | — | | | | — | | | | — | | | | — | | | | 816 | |
Premium paid on swap agreements | | | — | | | | — | | | | — | | | | — | | | | 1,790 | |
Unrealized appreciation on forward foreign currency contracts | | | 546 | | | | — | | | | — | | | | — | | | | 1,074 | |
| | | | | | | | | | | | | | | | | | | | |
| | $ | 231,406 | | | $ | 551,266 | | | $ | 157,116 | | | $ | 230,103 | | | $ | 1,571,115 | |
| | | | | | | | | | | | | | | | | | | | |
Liabilities: | | | | | | | | | | | | | | | | | | | | |
Due to custodian | | | — | | | | — | | | | 5 | | | | — | | | | 997 | |
Cash deposit due to broker | | | — | | | | — | | | | — | | | | — | | | | 1,070 | |
Foreign currency due to broker | | | — | | | | — | | | | 6 | | | | — | | | | — | |
Accounts payable and accrued liabilities: | | | | | | | | | | | | | | | | | | | | |
Investment securities purchased | | | 48 | | | | 152 | | | | 8 | | | | — | | | | 4,541 | |
Shares of beneficial interest redeemed | | | 77 | | | | 522 | | | | 32 | | | | 229 | | | | 3,682 | |
Management and advisory fees | | | 208 | | | | 384 | | | | 107 | | | | 155 | | | | 850 | |
Trustees fees | | | 1 | | | | 2 | | | | — | (A) | | | 1 | | | | 5 | |
Transfer agent fees | | | 1 | | | | 4 | | | | 1 | | | | 1 | | | | 10 | |
Custody fees | | | 15 | | | | 6 | | | | 8 | | | | 3 | | | | 29 | |
Administration fees | | | 5 | | | | 12 | | | | 2 | | | | 5 | | | | 35 | |
Audit and tax fees | | | 19 | | | | 18 | | | | 19 | | | | 17 | | | | 25 | |
Dividends and interest from securities sold short | | | — | | | | — | | | | 53 | | | | — | | | | 12 | |
Interest payable | | | — | | | | — | | | | — | | | | — | | | | 17 | |
Other | | | 11 | | | | 21 | | | | 14 | | | | 9 | | | | 66 | |
Collateral for securities on loan | | | 10,740 | | | | 17,086 | | | | — | | | | 21,225 | | | | 5,408 | |
Payable for delayed delivery securities | | | — | | | | — | | | | — | | | | — | | | | 63,957 | |
Deferred income for dollar rolls | | | — | | | | — | | | | — | | | | — | | | | 120 | |
Reverse repurchase agreement, at value | | | — | | | | — | | | | — | | | | — | | | | 143,086 | |
Written options and swaptions, at value | | | — | | | | — | | | | — | | | | — | | | | 1,568 | |
Unrealized depreciation on swap agreements | | | — | | | | — | | | | — | | | | — | | | | 714 | |
Premium received on swap agreements | | | — | | | | — | | | | — | | | | — | | | | 108 | |
Securities sold short, at value | | | — | | | | — | | | | 65,671 | | | | — | | | | — | |
Unrealized depreciation on forward foreign currency contracts | | | 91 | | | | — | | | | — | | | | — | | | | 1,363 | |
| | | | | | | | | | | | | | | | | | | | |
| | | 11,216 | | | | 18,207 | | | | 65,926 | | | | 21,645 | | | | 227,663 | |
| | | | | | | | | | | | | | | | | | | | |
Net assets | | $ | 220,190 | | | $ | 533,059 | | | $ | 91,190 | | | $ | 208,458 | | | $ | 1,343,452 | |
| | | | | | | | | | | | | | | | | | | | |
Net assets consist of: | | | | | | | | | | | | | | | | | | | | |
Shares of beneficial interest, unlimited shares authorized, no par value | | $ | 195,121 | | | $ | 547,593 | | | $ | 103,052 | | | $ | 163,381 | | | $ | 1,214,334 | |
Undistributed (accumulated) net investment income (loss) | | | 4,429 | | | | 6,188 | | | | (928 | ) | | | 1,556 | | | | 4,614 | |
Undistributed (accumulated) net realized gain (loss) from investments | | | 2,338 | | | | (92,699 | ) | | | (12,690 | ) | | | (3,755 | ) | | | 38,988 | |
Net unrealized appreciation (depreciation) on: | | | | | | | | | | | | | | | | | | | | |
Investment securities | | | 17,856 | | | | 71,977 | | | | 4,242 | | | | 47,276 | | | | 85,637 | |
Futures contracts | | | — | | | | — | | | | — | | | | — | | | | 73 | |
Written option and swaption contracts | | | — | | | | — | | | | — | | | | — | | | | 122 | |
Swap agreements | | | — | | | | — | | | | — | | | | — | | | | 102 | |
Translation of assets and liabilities denominated in foreign currencies | | | 446 | | | | — | | | | — | (A) | | | — | | | | (418 | ) |
Securities sold short | | | — | | | | — | | | | (2,486 | ) | | | — | | | | — | |
| | | | | | | | | | | | | | | | | | | | |
Net assets | | $ | 220,190 | | | $ | 533,059 | | | $ | 91,190 | | | $ | 208,458 | | | $ | 1,343,452 | |
| | | | | | | | | | | | | | | | | | | | |
Shares outstanding | | | 24,867 | | | | 53,236 | | | | 11,174 | | | | 15,995 | | | | 114,406 | |
| | | | | |
Net asset value and offering price per share | | $ | 8.85 | | | $ | 10.01 | | | $ | 8.16 | | | $ | 13.03 | | | $ | 11.74 | |
| | | | | | | | | | | | | | | | | | | | |
Investment securities, at cost | | $ | 207,045 | | | $ | 478,565 | | | $ | 87,134 | | | $ | 180,019 | | | $ | 1,466,635 | |
| | | | | | | | | | | | | | | | | | | | |
Repurchase agreement, at cost | | $ | 5,028 | | | $ | — | | | $ | 180 | | | $ | 2,657 | | | $ | 612 | |
| | | | | | | | | | | | | | | | | | | | |
Reverse repurchase agreement, at cost | | $ | — | | | $ | — | | | $ | — | | | $ | — | | | $ | (143,086 | ) |
| | | | | | | | | | | | | | | | | | | | |
Foreign currency, at cost | | $ | 19 | | | $ | — | | | $ | (6 | ) | | $ | — | | | $ | 79 | |
| | | | | | | | | | | | | | | | | | | | |
Securities loaned, at value | | $ | 10,290 | | | $ | 16,705 | | | $ | — | | | $ | 20,706 | | | $ | 5,297 | |
| | | | | | | | | | | | | | | | | | | | |
Premiums received on written option and swaption contracts | | $ | — | | | $ | — | | | $ | — | | | $ | — | | | $ | 1,690 | |
| | | | | | | | | | | | | | | | | | | | |
Proceeds received from securities sold short | | $ | — | | | $ | — | | | $ | 63,185 | | | $ | — | | | $ | — | |
| | | | | | | | | | | | | | | | | | | | |
The notes to the financial statements are an integral part of this report.
| | | | |
| Transamerica Funds | | | | Annual Report 2012 |
| | Page 142 | | |
STATEMENTS OF ASSETS AND LIABILITIES (continued)
At October 31, 2012
(all amounts except per share amounts in thousands)
| | | | | | | | | | | | |
| | | Transamerica
Select Equity | | | Transamerica
Total Return | | | Transamerica
Value | |
Assets: | | | | | | | | | | | | |
Investment securities, at value | | $ | 1,319,985 | | | $ | 889,100 | | | $ | 250,834 | |
Repurchase agreement, at value | | | 15,002 | | | | 81,247 | | | | 36,347 | |
Cash on deposit with custodian | | | — | | | | 47 | | | | — | |
Foreign currency, at value | | | — | | | | 140 | | | | — | |
Receivables: | | | | | | | | | | | | |
Investment securities sold | | | — | | | | 43,966 | | | | — | |
Shares of beneficial interest sold | | | 156 | | | | 33 | | | | 2 | |
Interest | | | — | (A) | | | 4,729 | | | | — | (A) |
Securities lending income (net) | | | 17 | | | | 3 | | | | 5 | |
Dividends | | | 747 | | | | — | | | | 285 | |
Dividend reclaims | | | — | | | | — | | | | 72 | |
Variation margin | | | — | | | | 2,263 | | | | — | |
Prepaid expenses | | | 6 | | | | 2 | | | | 1 | |
Unrealized appreciation on swap agreements | | | — | | | | 6,906 | | | | — | |
Premium paid on swap agreements | | | — | | | | 2,370 | | | | — | |
Unrealized appreciation on forward foreign currency contracts | | | — | | | | 1,588 | | | | — | |
| | | | | | | | | | | | |
| | $ | 1,335,913 | | | $ | 1,032,394 | | | $ | 287,546 | |
| | | | | | | | | | | | |
Liabilities: | | | | | | | | | | | | |
Due to custodian | | | — | | | | 11 | | | | — | |
Cash deposit due to broker | | | — | | | | 7,570 | | | | — | |
Accounts payable and accrued liabilities: | | | | | | | | | | | | |
Investment securities purchased | | | — | | | | 174,905 | | | | — | |
Shares of beneficial interest redeemed | | | 524 | | | | 916 | | | | 175 | |
Management and advisory fees | | | 791 | | | | 475 | | | | 197 | |
Trustees fees | | | 4 | | | | 3 | | | | 1 | |
Transfer agent fees | | | 8 | | | | 5 | | | | 2 | |
Custody fees | | | 9 | | | | 22 | | | | 7 | |
Administration fees | | | 28 | | | | 18 | | | | 6 | |
Audit and tax fees | | | 15 | | | | 25 | | | | 18 | |
Interest payable | | | — | | | | 571 | | | | — | |
Other | | | 46 | | | | 34 | | | | 12 | |
Collateral for securities on loan | | | 134,287 | | | | 1,657 | | | | 15,569 | |
Written options and swaptions, at value | | | — | | | | 1,084 | | | | — | |
Unrealized depreciation on swap agreements | | | — | | | | 3,372 | | | | — | |
Premium received on swap agreements | | | — | | | | 1,078 | | | | — | |
TBA short commitments, at value | | | — | | | | 34,354 | | | | — | |
Unrealized depreciation on forward foreign currency contracts | | | — | | | | 2,514 | | | | — | |
| | | | | | | | | | | | |
| | | 135,712 | | | | 228,614 | | | | 15,987 | |
| | | | | | | | | | | | |
Net assets | | $ | 1,200,201 | | | $ | 803,780 | | | $ | 271,559 | |
| | | | | | | | | | | | |
Net assets consist of: | | | | | | | | | | | | |
Shares of beneficial interest, unlimited shares authorized, no par value | | $ | 1,050,335 | | | $ | 764,582 | | | $ | 401,441 | |
Undistributed (accumulated) net investment income (loss) | | | 786 | | | | 391 | | | | 3,716 | |
Undistributed (accumulated) net realized gain (loss) from investments | | | 29,755 | | | | 6,212 | | | | (83,133 | ) |
Net unrealized appreciation (depreciation) on: | | | | | | | | | | | | |
Investment securities | | | 119,325 | | | | 29,794 | | | | (50,461 | ) |
Futures contracts | | | — | | | | (56 | ) | | | — | |
Written option and swaption contracts | | | — | | | | 217 | | | | — | |
Swap agreements | | | — | | | | 3,534 | | | | — | |
Translation of assets and liabilities denominated in foreign currencies | | | — | | | | (864 | ) | | | (4 | ) |
TBA short commitments | | | — | | | | (30 | ) | | | — | |
| | | | | | | | | | | | |
Net assets | | $ | 1,200,201 | | | $ | 803,780 | | | $ | 271,559 | |
| | | | | | | | | | | | |
| | | | | | | | | | | | |
Shares outstanding | | | 104,823 | | | | 73,813 | | | | 11,892 | |
Net asset value and offering price per share | | $ | 11.45 | | | $ | 10.89 | | | $ | 22.84 | |
| | | | | | | | | | | | |
Investment securities, at cost | | $ | 1,200,660 | | | $ | 859,306 | | | $ | 301,295 | |
| | | | | | | | | | | | |
Repurchase agreement, at cost | | $ | 15,002 | | | $ | 81,247 | | | $ | 36,347 | |
| | | | | | | | | | | | |
Foreign currency, at cost | | $ | — | | | $ | 142 | | | $ | — | |
| | | | | | | | | | | | |
Securities loaned, at value | | $ | 130,955 | | | $ | 1,625 | | | $ | 15,012 | |
| | | | | | | | | | | | |
Premiums received on written option and swaption contracts | | $ | — | | | $ | 1,301 | | | $ | — | |
| | | | | | | | | | | | |
Proceeds received from TBA short commitments | | $ | — | | | $ | 34,324 | | | $ | — | |
| | | | | | | | | | | | |
| (A) | Rounds to less than $1. |
The notes to the financial statements are an integral part of this report.
| | | | |
| Transamerica Funds | | | | Annual Report 2012 |
| | Page 143 | | |
STATEMENTS OF OPERATIONS
For the year ended October 31, 2012
(all amounts in thousands)
| | | | | | | | | | | | | | | | | | | | |
| | | Transamerica
Arbitrage
Strategy | | | Transamerica
Bond | | | Transamerica
Core Bond | | | Transamerica
Developing
Markets Equity | | | Transamerica
Global Macro | |
Investment income: | | | | | | | | | | | | | | | | | | | | |
Dividend income | | $ | 1,275 | | | $ | 2,111 | | | $ | — | | | $ | 7,823 | | | $ | — | |
Withholding taxes on foreign income | | | (27 | ) | | | (48 | ) | | | — | | | | (531 | ) | | | — | |
Interest income | | | 5 | | | | 29,529 | | | | 76,351 | | | | 4 | | | | 56 | |
Securities lending income (net) | | | — | | | | 272 | | | | 315 | | | | 238 | | | | 4 | |
| | | | | | | | | | | | | | | | | | | | |
Total investment income | | | 1,253 | | | | 31,864 | | | | 76,666 | | | | 7,534 | | | | 60 | |
| | | | | | | | | | | | | | | | | | | | |
Expenses: | | | | | | | | | | | | | | | | | | | | |
Management and advisory | | | 1,471 | | | | 3,737 | | | | 8,709 | | | | 4,688 | | | | 1,361 | |
Transfer agent | | | 11 | | | | 44 | | | | 162 | | | | 31 | | | | 8 | |
Printing and shareholder reports | | | 6 | | | | 20 | | | | 55 | | | | 10 | | | | 5 | |
Custody | | | 428 | | | | 111 | | | | 453 | | | | 622 | | | | 163 | |
Administration | | | 33 | | | | 138 | | | | 503 | | | | 96 | | | | 25 | |
Legal | | | 5 | | | | 24 | | | | 68 | | | | 12 | | | | 7 | |
Audit and tax | | | 21 | | | | 19 | | | | 20 | | | | 53 | | | | 20 | |
Trustees | | | 3 | | | | 12 | | | | 40 | | | | 7 | | | | 2 | |
Registration | | | — | | | | 3 | | | | — | | | | — | | | | — | |
Interest | | | 12 | | | | — | | | | — | | | | — | | | | — | |
Dividends and interest on securities sold short | | | 967 | | | | — | | | | — | | | | — | | | | — | |
Other | | | 10 | | | | 9 | | | | 30 | | | | 9 | | | | 2 | |
| | | | | | | | | | | | | | | | | | | | |
Total expenses | | | 2,967 | | | | 4,117 | | | | 10,040 | | | | 5,528 | | | | 1,593 | |
| | | | | | | | | | | | | | | | | | | | |
Expenses reimbursed | | | (172 | ) | | | — | | | | — | | | | — | | | | — | |
| | | | | | | | | | | | | | | | | | | | |
Net expenses | | �� | 2,795 | | | | 4,117 | | | | 10,040 | | | | 5,528 | | | | 1,593 | |
| | | | | | | | | | | | | | | | | | | | |
Net investment income (loss) | | | (1,542 | ) | | | 27,747 | | | | 66,626 | | | | 2,006 | | | | (1,533 | ) |
| | | | | | | | | | | | | | | | | | | | |
Net realized gain (loss) on transactions from: | | | | | | | | | | | | | | | | | | | | |
Investment securities | | | 6,444 | | | | 10,585 | | | | 20,751 | | | | 37,183 | (A) | | | (5,762 | ) |
Futures contracts | | | — | | | | — | | | | — | | | | — | | | | 3,228 | |
Written option and swaption contracts | | | 2,118 | | | | — | | | | — | | | | — | | | | 2,718 | |
Swap agreements | | | (1,585 | ) | | | — | | | | — | | | | — | | | | — | |
Foreign currency transactions | | | (1,435 | ) | | | (126 | ) | | | — | | | | (441 | ) | | | 2,889 | |
Securities sold short | | | (3,528 | ) | | | — | | | | — | | | | — | | | | — | |
| | | | | | | | | | | | | | | | | | | | |
Net realized gain | | | 2,014 | | | | 10,459 | | | | 20,751 | | | | 36,742 | | | | 3,073 | |
| | | | | | | | | | | | | | | | | | | | |
Net change in unrealized appreciation (depreciation) on: | | | | | | | | | | | | | | | | | | | | |
Investment securities | | | (4,550 | ) | | | 42,608 | | | | 42,751 | | | | (13,681 | )(B) | | | 4 | |
Futures contracts | | | — | | | | — | | | | — | | | | — | | | | (1,898 | ) |
Written option and swaption contracts | | | 95 | | | | — | | | | — | | | | — | | | | 506 | |
Swap agreements | | | 31 | | | | — | | | | — | | | | — | | | | — | |
Translation of assets and liabilities denominated in foreign currencies | | | 1,271 | | | | 62 | | | | — | | | | (49 | ) | | | (1,015 | ) |
Securities sold short | | | (210 | ) | | | — | | | | — | | | | — | | | | — | |
| | | | | | | | | | | | | | | | | | | | |
Net change in unrealized appreciation (depreciation) | | | (3,363 | ) | | | 42,670 | | | | 42,751 | | | | (13,730 | ) | | | (2,403 | ) |
| | | | | | | | | | | | | | | | | | | | |
Net realized and change in unrealized gain (loss) | | | (1,349 | ) | | | 53,129 | | | | 63,502 | | | | 23,012 | | | | 670 | |
| | | | | | | | | | | | | | | | | | | | |
Net increase (decrease) in net assets resulting from operations | | $ | (2,891 | ) | | $ | 80,876 | | | $ | 130,128 | | | $ | 25,018 | | | $ | (863 | ) |
| | | | | | | | | | | | | | | | | | | | |
The notes to the financial statements are an integral part of this report.
| | | | |
| Transamerica Funds | | | | Annual Report 2012 |
| | Page 144 | | |
STATEMENTS OF OPERATIONS (continued)
For the year ended October 31, 2012
(all amounts in thousands)
| | | | | | | | | | | | | | | | | | | | |
| | | Transamerica
Global Real
Estate Securities | | | Transamerica
Growth | | | Transamerica
International | | | Transamerica
International
Equity
Opportunities | | | Transamerica
International
Small Cap | |
Investment income: | | | | | | | | | | | | | | | | | | | | |
Dividend income | | $ | 5,183 | | | $ | 5,222 | | | $ | 10,130 | | | $ | 8,418 | | | $ | 7,355 | |
Withholding taxes on foreign income | | | (229 | ) | | | (82 | ) | | | (839 | ) | | | (688 | ) | | | (424 | ) |
Interest income | | | 1 | | | | 1 | | | | 3 | | | | — | (C) | | | 2 | |
Securities lending income (net) | | | 151 | | | | 147 | | | | 307 | | | | 289 | | | | 379 | |
| | | | | | | | | | | | | | | | | | | | |
Total investment income | | | 5,106 | | | | 5,288 | | | | 9,601 | | | | 8,019 | | | | 7,312 | |
| | | | | | | | | | | | | | | | | | | | |
Expenses: | | | | | | | | | | | | | | | | | | | | |
Management and advisory | | | 1,230 | | | | 4,592 | | | | 3,217 | | | | 2,411 | | | | 2,813 | |
Transfer agent | | | 12 | | | | 45 | | | | 25 | | | | 20 | | | | 20 | |
Printing and shareholder reports | | | 7 | | | | 14 | | | | 9 | | | | 7 | | | | 8 | |
Custody | | | 154 | | | | 85 | | | | 190 | | | | 261 | | | | 212 | |
Administration | | | 36 | | | | 138 | | | | 78 | | | | 62 | | | | 61 | |
Legal | | | 6 | | | | 18 | | | | 10 | | | | 15 | | | | 8 | |
Audit and tax | | | 31 | | | | 17 | | | | 19 | | | | 18 | | | | 21 | |
Trustees | | | 3 | | | | 12 | | | | 7 | | | | 5 | | | | 5 | |
Registration | | | 1 | | | | 1 | | | | — | | | | — | | | | — | |
Other | | | 4 | | | | 11 | | | | 7 | | | | 7 | | | | 5 | |
| | | | | | | | | | | | | | | | | | | | |
Total expenses | | | 1,484 | | | | 4,933 | | | | 3,562 | | | | 2,806 | | | | 3,153 | |
| | | | | | | | | | | | | | | | | | | | |
Net investment income | | | 3,622 | | | | 355 | | | | 6,039 | | | | 5,213 | | | | 4,159 | |
| | | | | | | | | | | | | | | | | | | | |
Net realized gain (loss) on transactions from: | | | | | | | | | | | | | | | | | | | | |
Investment securities | | | 10,693 | | | | 60,142 | | | | (395 | ) | | | 7,828 | | | | (1,526 | )(D) |
Foreign currency transactions | | | (96 | ) | | | (21 | ) | | | (494 | ) | | | (207 | ) | | | 12 | |
| | | | | | | | | | | | | | | | | | | | |
Net realized gain (loss) | | | 10,597 | | | | 60,121 | | | | (889 | ) | | | 7,621 | | | | (1,514 | ) |
| | | | | | | | | | | | | | | | | | | | |
Net change in unrealized appreciation (depreciation) on: | | | | | | | | | | | | | | | | | | | | |
Investment securities | | | 6,807 | | | | (9,950 | ) | | | 13,217 | | | | (322 | ) | | | 6,014 | |
Translation of assets and liabilities denominated in foreign currencies | | | — | (C) | | | — | (C) | | | (8 | ) | | | — | (C) | | | (4 | )(E) |
| | | | | | | | | | | | | | | | | | | | |
Net change in unrealized appreciation (depreciation) | | | 6,807 | | | | (9,950 | ) | | | 13,209 | | | | (322 | ) | | | 6,010 | |
| | | | | | | | | | | | | | | | | | | | |
Net realized and change in unrealized gain | | | 17,404 | | | | 50,171 | | | | 12,320 | | | | 7,299 | | | | 4,496 | |
| | | | | | | | | | | | | | | | | | | | |
Net increase in net assets resulting from operations | | $ | 21,026 | | | $ | 50,526 | | | $ | 18,359 | | | $ | 12,512 | | | $ | 8,655 | |
| | | | | | | | | | | | | | | | | | | | |
The notes to the financial statements are an integral part of this report.
| | | | |
| Transamerica Funds | | | | Annual Report 2012 |
| | Page 145 | | |
STATEMENTS OF OPERATIONS (continued)
For the year ended October 31, 2012
(all amounts in thousands)
| | | | | | | | | | | | | | | | | | | | |
| | | Transamerica
International
Value
Opportunities | | | Transamerica
Large
Company | | | Transamerica
Long/Short
Strategy | | | Transamerica
Mid Cap Value | | | Transamerica
Real Return TIPS | |
Investment income: | | | | | | | | | | | | | | | | | | | | |
Dividend income | | $ | 9,306 | | | $ | 12,868 | | | $ | 1,965 | | | $ | 3,802 | | | $ | 15 | |
Withholding taxes on foreign income | | | (734 | ) | | | (133 | ) | | | — | (C) | | | (7 | ) | | | — | (C) |
Interest income | | | 2 | | | | 5 | | | | 71 | | | | 1 | | | | 20,684 | |
Securities lending income (net) | | | 245 | | | | 169 | | | | — | | | | 49 | | | | 88 | |
| | | | | | | | | | | | | | | | | | | | |
Total investment income | | | 8,819 | | | | 12,909 | | | | 2,036 | | | | 3,845 | | | | 20,787 | |
| | | | | | | | | | | | | | | | | | | | |
Expenses: | | | | | | | | | | | | | | | | | | | | |
Management and advisory | | | 3,445 | | | | 4,250 | | | | 1,177 | | | | 1,550 | | | | 7,845 | |
Transfer agent | | | 25 | | | | 41 | | | | 7 | | | | 14 | | | | 93 | |
Printing and shareholder reports | | | 9 | | | | 13 | | | | 4 | | | | 6 | | | | 40 | |
Custody | | | 184 | | | | 71 | | | | 61 | | | | 31 | | | | 306 | |
Administration | | | 77 | | | | 126 | | | | 21 | | | | 44 | | | | 295 | |
Legal | | | 8 | | | | 17 | | | | 3 | | | | 7 | | | | 51 | |
Audit and tax | | | 18 | | | | 17 | | | | 17 | | | | 16 | | | | 24 | |
Trustees | | | 6 | | | | 11 | | | | 2 | | | | 4 | | | | 25 | |
Registration | | | — | | | | — | | | | — | | | | — | (C) | | | 6 | |
Interest | | | — | | | | — | | | | — | | | | — | | | | 68 | |
Dividends and interest on securities sold short | | | — | | | | — | | | | 1,836 | | | | — | | | | — | |
Other | | | 9 | | | | 9 | | | | 2 | | | | 3 | | | | 18 | |
| | | | | | | | | | | | | | | | | | | | |
Total expenses | | | 3,781 | | | | 4,555 | | | | 3,130 | | | | 1,675 | | | | 8,771 | |
| | | | | | | | | | | | | | | | | | | | |
Net investment income (loss) | | | 5,038 | | | | 8,354 | | | | (1,094 | ) | | | 2,170 | | | | 12,016 | |
| | | | | | | | | | | | | | | | | | | | |
Net realized gain (loss) on transactions from: | | | | | | | | | | | | | | | | | | | | |
Investment securities | | | 2,436 | | | | 41,315 | | | | 4,729 | | | | 15,341 | | | | 40,184 | |
Futures contracts | | | — | | | | — | | | | — | | | | — | | | | 2,030 | |
Written option and swaption contracts | | | — | | | | — | | | | — | | | | — | | | | 1,603 | |
Swap agreements | | | — | | | | — | | | | — | | | | — | | | | 3,214 | |
Foreign currency transactions | | | 3,002 | | | | — | (C) | | | — | (C) | | | — | | | | (3,588 | ) |
Securities sold short | | | — | | | | — | | | | (3,149 | ) | | | — | | | | — | |
| | | | | | | | | | | | | | | | | | | | |
Net realized gain | | | 5,438 | | | | 41,315 | | | | 1,580 | | | | 15,341 | | | | 43,443 | |
| | | | | | | | | | | | | | | | | | | | |
Net change in unrealized appreciation (depreciation) on: | | | | | | | | | | | | | | | | | | | | |
Investment securities | | | (4,991 | ) | | | 22,644 | | | | 6,352 | | | | 17,602 | | | | 41,907 | |
Futures contracts | | | — | | | | — | | | | — | | | | — | | | | (1,173 | ) |
Written option and swaption contracts | | | — | | | | — | | | | — | | | | — | | | | (1,115 | ) |
Swap agreements | | | — | | | | — | | | | — | | | | — | | | | (702 | ) |
Translation of assets and liabilities denominated in foreign currencies | | | (755 | ) | | | — | | | | — | (C) | | | — | | | | 4,673 | |
Securities sold short | | | — | | | | — | | | | (3,555 | ) | | | — | | | | — | |
| | | | | | | | | | | | | | | | | | | | |
Net change in unrealized appreciation (depreciation) | | | (5,746 | ) | | | 22,644 | | | | 2,797 | | | | 17,602 | | | | 43,590 | |
| | | | | | | | | | | | | | | | | | | | |
Net realized and change in unrealized gain (loss) | | | (308 | ) | | | 63,959 | | | | 4,377 | | | | 32,943 | | | | 87,033 | |
| | | | | | | | | | | | | | | | | | | | |
Net increase in net assets resulting from operations | | $ | 4,730 | | | $ | 72,313 | | | $ | 3,283 | | | $ | 35,113 | | | $ | 99,049 | |
| | | | | | | | | | | | | | | | | | | | |
The notes to the financial statements are an integral part of this report.
| | | | |
| Transamerica Funds | | | | Annual Report 2012 |
| | Page 146 | | |
STATEMENTS OF OPERATIONS (continued)
For the year ended October 31, 2012
(all amounts in thousands)
| | | | | | | | | | | | |
| | | Transamerica
Select Equity | | | Transamerica
Total Return | | | Transamerica
Value | |
Investment income: | | | | | | | | | | | | |
Dividend income | | $ | 31,440 | | | $ | 153 | | | $ | 6,739 | |
Withholding taxes on foreign income | | | (228 | ) | | | — | | | | (435 | ) |
Interest income | | | 9 | | | | 20,720 | | | | 8 | |
Securities lending income (net) | | | 170 | | | | 54 | | | | 164 | |
| | | | | | | | | | | | |
Total investment income | | | 31,391 | | | | 20,927 | | | | 6,476 | |
| | | | | | | | | | | | |
Expenses: | | | | | | | | | | | | |
Management and advisory | | | 8,370 | | | | 4,735 | | | | 2,306 | |
Transfer agent | | | 87 | | | | 54 | | | | 22 | |
Printing and shareholder reports | | | 47 | | | | 22 | | | | 8 | |
Custody | | | 115 | | | | 263 | | | | 78 | |
Administration | | | 273 | | | | 170 | | | | 67 | |
Legal | | | 42 | | | | 27 | | | | 9 | |
Audit and tax | | | 12 | | | | 24 | | | | 18 | |
Trustees | | | 21 | | | | 14 | | | | 6 | |
Registration | | | 2 | | | | 2 | | | | — | |
Other | | | 15 | | | | 11 | | | | 6 | |
| | | | | | | | | | | | |
Total expenses | | | 8,984 | | | | 5,322 | | | | 2,520 | |
| | | | | | | | | | | | |
Net investment income | | | 22,407 | | | | 15,605 | | | | 3,956 | |
| | | | | | | | | | | | |
Net realized gain (loss) on transactions from: | | | | | | | | | | | | |
Investment securities | | | 33,562 | | | | 14,314 | | | | (496 | ) |
Futures contracts | | | — | | | | 720 | | | | — | |
Written option and swaption contracts | | | — | | | | 451 | | | | — | |
Swap agreements | | | — | | | | (1,103 | ) | | | — | |
Foreign currency transactions | | | — | | | | (4,216 | ) | | | (115 | ) |
Securities sold short | | | — | | | | (705 | ) | | | — | |
| | | | | | | | | | | | |
Net realized gain (loss) | | | 33,562 | | | | 9,461 | | | | (611 | ) |
| | | | | | | | | | | | |
Net change in unrealized appreciation (depreciation) on: | | | | | | | | | | | | |
Investment securities | | | 92,257 | | | | 27,160 | | | | 20,991 | |
Futures contracts | | | — | | | | 45 | | | | — | |
Written option and swaption contracts | | | — | | | | (9 | ) | | | — | |
Swap agreements | | | — | | | | 2,754 | | | | — | |
Translation of assets and liabilities denominated in foreign currencies | | | — | | | | 3,020 | | | | 6 | |
Securities sold short | | | — | | | | 106 | | | | — | |
| | | | | | | | | | | | |
Net change in unrealized appreciation (depreciation) | | | 92,257 | | | | 33,076 | | | | 20,997 | |
| | | | | | | | | | | | |
Net realized and change in unrealized gain | | | 125,819 | | | | 42,537 | | | | 20,386 | |
| | | | | | | | | | | | |
Net increase in net assets resulting from operations | | $ | 148,226 | | | $ | 58,142 | | | $ | 24,342 | |
| | | | | | | | | | | | |
| (A) | Net of foreign capital gains tax of $81. |
| (B) | Net of foreign capital gains tax of $134. |
| (C) | Rounds to less than $1. |
| (D) | Net of foreign capital gains tax of $2. |
| (E) | Net of foreign capital gains tax of $24. |
The notes to the financial statements are an integral part of this report.
| | | | |
| Transamerica Funds | | | | Annual Report 2012 |
| | Page 147 | | |
STATEMENTS OF CHANGES IN NET ASSETS
For the years ended:
(all amounts in thousands)
| | | | | | | | | | | | | | | | | | | | | | | | |
| | | Transamerica Arbitrage
Strategy | | | Transamerica Bond | | | Transamerica Core Bond | |
| | | October 31,
2012 | | | October 31,
2011(A) | | | October 31,
2012 | | | October 31,
2011 | | | October 31,
2012 | | | October 31,
2011 | |
From operations: | | | | | | | | | | | | | | | | | | | | | | | | |
Net investment income (loss) | | $ | (1,542 | ) | | $ | (294 | ) | | $ | 27,747 | | | $ | 27,710 | | | $ | 66,626 | | | $ | 41,873 | |
Net realized gain(B) | | | 2,014 | | | | 1,587 | | | | 10,459 | | | | 32,188 | | | | 20,751 | | | | 4,104 | |
Net change in unrealized appreciation (depreciation) | | | (3,363 | ) | | | 582 | | | | 42,670 | | | | (39,892 | ) | | | 42,751 | | | | 21,961 | |
| | | | | | | | | | | | | | | | | | | | | | | | |
Net increase (decrease) in net assets resulting from operations | | | (2,891 | ) | | | 1,875 | | | | 80,876 | | | | 20,006 | | | | 130,128 | | | | 67,938 | |
| | | | | | | | | | | | | | | | | | | | | | | | |
Distributions to shareholders: | | | | | | | | | | | | | | | | | | | | | | | | |
From net investment income | | | — | | | | — | | | | (33,834 | ) | | | (34,541 | ) | | | (75,050 | ) | | | (45,454 | ) |
From net realized gains | | | (1,456 | ) | | | — | | | | (25,612 | ) | | | (10,465 | ) | | | — | | | | (6,906 | ) |
| | | | | | | | | | | | | | | | | | | | | | | | |
Total distributions to shareholders | | | (1,456 | ) | | | — | | | | (59,446 | ) | | | (45,006 | ) | | | (75,050 | ) | | | (52,360 | ) |
| | | | | | | | | | | | | | | | | | | | | | | | |
Capital share transactions: | | | | | | | | | | | | | | | | | | | | | | | | |
Proceeds from shares sold | | | 52,695 | | | | 123,667 | | | | 244,593 | | | | 67,202 | | | | 258,804 | | | | 1,164,942 | |
Dividends and distributions reinvested | | | 1,456 | | | | — | | | | 59,446 | | | | 45,006 | | | | 75,050 | | | | 52,360 | |
Cost of shares redeemed | | | (57,709 | ) | | | (1,334 | ) | | | (50,729 | ) | | | (219,088 | ) | | | (718,521 | ) | | | (87,555 | ) |
| | | | | | | | | | | | | | | | | | | | | | | | |
Net increase (decrease) in net assets resulting from capital shares transactions | | | (3,558 | ) | | | 122,333 | | | | 253,310 | | | | (106,880 | ) | | | (384,667 | ) | | | 1,129,747 | |
| | | | | | | | | | | | | | | | | | | | | | | | |
Net increase (decrease) in net assets | | | (7,905 | ) | | | 124,208 | | | | 274,740 | | | | (131,880 | ) | | | (329,589 | ) | | | 1,145,325 | |
| | | | | | | | | | | | | | | | | | | | | | | | |
Net assets: | | | | | | | | | | | | | | | | | | | | | | | | |
Beginning of year | | | 124,208 | | | | — | | | | 462,340 | | | | 594,220 | | | | 2,208,783 | | | | 1,063,458 | |
| | | | | | | | | | | | | | | | | | | | | | | | |
End of year | | $ | 116,303 | | | $ | 124,208 | | | $ | 737,080 | | | $ | 462,340 | | | $ | 1,879,194 | | | $ | 2,208,783 | |
| | | | | | | | | | | | | | | | | | | | | | | | |
Undistributed (accumulated) net investment income (loss) | | $ | 408 | | | $ | (80 | ) | | $ | 5,697 | | | $ | 8,071 | | | $ | 8,974 | | | $ | 3,706 | |
| | | | | | | | | | | | | | | | | | | | | | | | |
Share activity: | | | | | | | | | | | | | | | | | | | | | | | | |
Shares issued | | | 5,154 | | | | 12,244 | | | | 24,116 | | | | 6,127 | | | | 24,224 | | | | 111,128 | |
Shares issued-reinvested from dividends and distributions | | | 143 | | | | — | | | | 6,153 | | | | 4,246 | | | | 6,998 | | | | 5,058 | |
Shares redeemed | | | (5,644 | ) | | | (132 | ) | | | (4,960 | ) | | | (20,146 | ) | | | (66,715 | ) | | | (8,438 | ) |
| | | | | | | | | | | | | | | | | | | | | | | | |
Net increase (decrease) in shares outstanding | | | (347 | ) | | | 12,112 | | | | 25,309 | | | | (9,773 | ) | | | (35,493 | ) | | | 107,748 | |
| | | | | | | | | | | | | | | | | | | | | | | | |
| | | |
| | | Transamerica Developing
Markets Equity | | | Transamerica Global
Macro | | | Transamerica Global Real
Estate Securities | |
| | | October 31,
2012 | | | October 31,
2011 | | | October 31,
2012 | | | October 31,
2011 | | | October 31,
2012 | | | October 31,
2011 | |
From operations: | | | | | | | | | | | | | | | | | | | | | | | | |
Net investment income (loss) | | $ | 2,006 | | | $ | 3,479 | | | $ | (1,533 | ) | | $ | (2,033 | ) | | $ | 3,622 | | | $ | 5,062 | |
Net realized gain (loss)(B) | | | 36,742 | | | | 69,535 | | | | 3,073 | | | | (7,580 | ) | | | 10,597 | | | | 35,217 | |
Net change in unrealized appreciation (depreciation) | | | (13,730 | ) | | | (119,084 | ) | | | (2,403 | ) | | | 1,957 | | | | 6,807 | | | | (33,053 | ) |
| | | | | | | | | | | | | | | | | | | | | | | | |
Net increase (decrease) in net assets resulting from operations | | | 25,018 | | | | (46,070 | ) | | | (863 | ) | | | (7,656 | ) | | | 21,026 | | | | 7,226 | |
| | | | | | | | | | | | | | | | | | | | | | | | |
Distributions to shareholders: | | | | | | | | | | | | | | | | | | | | | | | | |
From net investment income | | | (2,678 | ) | | | (1,725 | ) | | | — | | | | — | | | | (5,154 | ) | | | (16,534 | ) |
From net realized gains | | | (40,297 | ) | | | — | | | | — | | | | — | | | | — | | | | — | |
| | | | | | | | | | | | | | | | | | | | | | | | |
Total distributions to shareholders | | | (42,975 | ) | | | (1,725 | ) | | | — | | | | — | | | | (5,154 | ) | | | (16,534 | ) |
| | | | | | | | | | | | | | | | | | | | | | | | |
Capital share transactions: | | | | | | | | | | | | | | | | | | | | | | | | |
Proceeds from shares sold | | | 82,358 | | | | 33,700 | | | | 52,588 | | | | 45,323 | | | | 38,557 | | | | 10,642 | |
Dividends and distributions reinvested | | | 42,975 | | | | 1,725 | | | | — | | | | — | | | | 5,154 | | | | 16,534 | |
Cost of shares redeemed | | | (263,670 | ) | | | (100,186 | ) | | | (77,015 | ) | | | (26,258 | ) | | | (46,310 | ) | | | (190,179 | ) |
| | | | | | | | | | | | | | | | | | | | | | | | |
Net increase (decrease) in net assets resulting from capital shares transactions | | | (138,337 | ) | | | (64,761 | ) | | | (24,427 | ) | | | 19,065 | | | | (2,599 | ) | | | (163,003 | ) |
| | | | | | | | | | | | | | | | | | | | | | | | |
Net increase (decrease) in net assets | | | (156,294 | ) | | | (112,556 | ) | | | (25,290 | ) | | | 11,409 | | | | 13,273 | | | | (172,311 | ) |
| | | | | | | | | | | | | | �� | | | | | | | | | | |
Net assets: | | | | | | | | | | | | | | | | | | | | | | | | |
Beginning of year | | | 497,656 | | | | 610,212 | | | | 137,551 | | | | 126,142 | | | | 147,057 | | | | 319,368 | |
| | | | | | | | | | | | | | | | | | | | | | | | |
End of year | | $ | 341,362 | | | $ | 497,656 | | | $ | 112,261 | | | $ | 137,551 | | | $ | 160,330 | | | $ | 147,057 | |
| | | | | | | | | | | | | | | | | | | | | | | | |
Undistributed (accumulated) net investment income (loss) | | $ | 1,448 | | | $ | 2,677 | | | $ | (1,222 | ) | | $ | — | | | $ | (2,881 | ) | | $ | (4,861 | ) |
| | | | | | | | | | | | | | | | | | | | | | | | |
Share activity: | | | | | | | | | | | | | | | | | | | | | | | | |
Shares issued | | | 7,248 | | | | 2,510 | | | | 9,160 | | | | 7,581 | | | | 3,142 | | | | 869 | |
Shares issued-reinvested from dividends and distributions | | | 4,251 | | | | 128 | | | | — | | | | — | | | | 444 | | | | 1,435 | |
Shares redeemed | | | (23,578 | ) | | | (7,853 | ) | | | (13,337 | ) | | | (4,535 | ) | | | (3,776 | ) | | | (15,685 | ) |
| | | | | | | | | | | | | | | | | | | | | | | | |
Net increase (decrease) in shares outstanding | | | (12,079 | ) | | | (5,215 | ) | | | (4,177 | ) | | | 3,046 | | | | (190 | ) | | | (13,381 | ) |
| | | | | | | | | | | | | | | | | | | | | | | | |
The notes to the financial statements are an integral part of this report.
| | | | |
| Transamerica Funds | | | | Annual Report 2012 |
| | Page 148 | | |
STATEMENTS OF CHANGES IN NET ASSETS (continued)
For the years ended:
(all amounts in thousands)
| | | | | | | | | | | | | | | | | | | | | | | | |
| | | Transamerica Growth | | | Transamerica International | | | Transamerica International
Equity Opportunities | |
| | | October 31,
2012 | | | October 31,
2011 | | | October 31,
2012 | | | October 31,
2011 | | | October 31,
2012 | | | October 31,
2011 | |
From operations: | | | | | | | | | | | | | | | | | | | | | | | | |
Net investment income | | $ | 355 | | | $ | 77 | | | $ | 6,039 | | | $ | 8,398 | | | $ | 5,213 | | | $ | 8,730 | |
Net realized gain (loss)(B) | | | 60,121 | | | | 52,646 | | | | (889 | ) | | | 47,149 | | | | 7,621 | | | | 46,909 | |
Net change in unrealized appreciation (depreciation) | | | (9,950 | ) | | | 14,358 | | | | 13,209 | | | | (64,738 | ) | | | (322 | ) | | | (66,947 | ) |
| | | | | | | | | | | | | | | | | | | | | | | | |
Net increase (decrease) in net assets resulting from operations | | | 50,526 | | | | 67,081 | | | | 18,359 | | | | (9,191 | ) | | | 12,512 | | | | (11,308 | ) |
| | | | | | | | | | | | | | | | | | | | | | | | |
Distributions to shareholders: | | | | | | | | | | | | | | | | | | | | | | | | |
From net investment income | | | (427 | ) | | | (800 | ) | | | (6,082 | ) | | | (7,056 | ) | | | (8,205 | ) | | | (5,767 | ) |
From net realized gains | | | (22,717 | ) | | | — | | | | — | | | | — | | | | (47,521 | ) | | | (27,053 | ) |
| | | | | | | | | | | | | | | | | | | | | | | | |
Total distributions to shareholders | | | (23,144 | ) | | | (800 | ) | | | (6,082 | ) | | | (7,056 | ) | | | (55,726 | ) | | | (32,820 | ) |
| | | | | | | | | | | | | | | | | | | | | | | | |
Capital share transactions: | | | | | | | | | | | | | | | | | | | | | | | | |
Proceeds from shares sold | | | 22,465 | | | | 10,349 | | | | 87,922 | | | | 14,663 | | | | 16,465 | | | | 26,144 | |
Dividends and distributions reinvested | | | 23,144 | | | | 800 | | | | 6,082 | | | | 7,056 | | | | 55,726 | | | | 32,820 | |
Cost of shares redeemed | | | (141,551 | ) | | | (185,395 | ) | | | (158,784 | ) | | | (230,675 | ) | | | (207,772 | ) | | | (197,323 | ) |
| | | | | | | | | | | | | | | | | | | | | | | | |
Net decrease in net assets resulting from capital shares transactions | | | (95,942 | ) | | | (174,246 | ) | | | (64,780 | ) | | | (208,956 | ) | | | (135,581 | ) | | | (138,359 | ) |
| | | | | | | | | | | | | | | | | | | | | | | | |
Net decrease in net assets | | | (68,560 | ) | | | (107,965 | ) | | | (52,503 | ) | | | (225,203 | ) | | | (178,795 | ) | | | (182,487 | ) |
| | | | | | | | | | | | | | | | | | | | | | | | |
Net assets: | | | | | | | | | | | | | | | | | | | | | | | | |
Beginning of year | | | 618,767 | | | | 726,732 | | | | 359,646 | | | | 584,849 | | | | 353,694 | | | | 536,181 | |
| | | | | | | | | | | | | | | | | | | | | | | | |
End of year | | $ | 550,207 | | | $ | 618,767 | | | $ | 307,143 | | | $ | 359,646 | | | $ | 174,899 | | | $ | 353,694 | |
| | | | | | | | | | | | | | | | | | | | | | | | |
Undistributed (accumulated) net investment income (loss) | | $ | (1 | ) | | $ | — | | | $ | 4,756 | | | $ | 5,236 | | | $ | 4,852 | | | $ | 8,051 | |
| | | | | | | | | | | | | | | | | | | | | | | | |
Share activity: | | | | | | | | | | | | | | | | | | | | | | | | |
Shares issued | | | 1,732 | | | | 812 | | | | 10,002 | | | | 1,582 | | | | 2,253 | | | | 2,854 | |
Shares issued-reinvested from dividends and distributions | | | 1,986 | | | | 65 | | | | 788 | | | | 778 | | | | 8,859 | | | | 3,785 | |
Shares redeemed | | | (10,554 | ) | | | (14,750 | ) | | | (19,195 | ) | | | (25,494 | ) | | | (29,944 | ) | | | (23,102 | ) |
| | | | | | | | | | | | | | | | | | | | | | | | |
Net decrease in shares outstanding | | | (6,836 | ) | | | (13,873 | ) | | | (8,405 | ) | | | (23,134 | ) | | | (18,832 | ) | | | (16,463 | ) |
| | | | | | | | | | | | | | | | | | | | | | | | |
| | | |
| | | Transamerica International
Small Cap | | | Transamerica International
Value Opportunities | | | Transamerica Large Company | |
| | | October 31,
2012 | | | October 31,
2011 | | | October 31,
2012 | | | October 31,
2011 | | | October 31,
2012 | | | October 31,
2011 | |
From operations: | | | | | | | | | | | | | | | | | | | | | | | | |
Net investment income | | $ | 4,159 | | | $ | 7,763 | | | $ | 5,038 | | | $ | 10,022 | | | $ | 8,354 | | | $ | 6,672 | |
Net realized gain (loss)(B) | | | (1,514 | ) | | | 38,370 | | | | 5,438 | | | | 55,344 | | | | 41,315 | | | | 26,527 | |
Net change in unrealized appreciation (depreciation) | | | 6,010 | | | | (64,866 | ) | | | (5,746 | ) | | | (103,001 | ) | | | 22,644 | | | | 7,725 | |
| | | | | | | | | | | | | | | | | | | | | | | | |
Net increase (decrease) in net assets resulting from operations | | | 8,655 | | | | (18,733 | ) | | | 4,730 | | | | (37,635 | ) | | | 72,313 | | | | 40,924 | |
| | | | | | | | | | | | | | | | | | | | | | | | |
Distributions to shareholders: | | | | | | | | | | | | | | | | | | | | | | | | |
From net investment income | | | (8,007 | ) | | | (6,178 | ) | | | (8,733 | ) | | | (4,250 | ) | | | (6,909 | ) | | | (8,350 | ) |
From net realized gains | | | (38,213 | ) | | | (3,119 | ) | | | (62,673 | ) | | | (4,928 | ) | | | — | | | | — | |
| | | | | | | | | | | | | | | | | | | | | | | | |
Total distributions to shareholders | | | (46,220 | ) | | | (9,297 | ) | | | (71,406 | ) | | | (9,178 | ) | | | (6,909 | ) | | | (8,350 | ) |
| | | | | | | | | | | | | | | | | | | | | | | | |
Capital share transactions: | | | | | | | | | | | | | | | | | | | | | | | | |
Proceeds from shares sold | | | 51,755 | | | | 19,996 | | | | 20,441 | | | | 32,625 | | | | 20,934 | | | | 77,937 | |
Dividends and distributions reinvested | | | 46,220 | | | | 9,297 | | | | 71,406 | | | | 9,178 | | | | 6,909 | | | | 8,350 | |
Cost of shares redeemed | | | (148,840 | ) | | | (219,193 | ) | | | (253,419 | ) | | | (325,036 | ) | | | (104,237 | ) | | | (277,017 | ) |
| | | | | | | | | | | | | | | | | | | | | | | | |
Net decrease in net assets resulting from capital shares transactions | | | (50,865 | ) | | | (189,900 | ) | | | (161,572 | ) | | | (283,233 | ) | | | (76,394 | ) | | | (190,730 | ) |
| | | | | | | | | | | | | | | | | | | | | | | | |
Net decrease in net assets | | | (88,430 | ) | | | (217,930 | ) | | | (228,248 | ) | | | (330,046 | ) | | | (10,990 | ) | | | (158,156 | ) |
| | | | | | | | | | | | | | | | | | | | | | | | |
Net assets: | | | | | | | | | | | | | | | | | | | | | | | | |
Beginning of year | | | 330,358 | | | | 548,288 | | | | 448,438 | | | | 778,484 | | | | 544,049 | | | | 702,205 | |
| | | | | | | | | | | | | | | | | | | | | | | | |
End of year | | $ | 241,928 | | | $ | 330,358 | | | $ | 220,190 | | | $ | 448,438 | | | $ | 533,059 | | | $ | 544,049 | |
| | | | | | | | | | | | | | | | | | | | | | | | |
Undistributed net investment income | | $ | 3,292 | | | $ | 6,757 | | | $ | 4,429 | | | $ | 8,459 | | | $ | 6,188 | | | $ | 4,743 | |
| | | | | | | | | | | | | | | | | | | | | | | | |
Share activity: | | | | | | | | | | | | | | | | | | | | | | | | |
Shares issued | | | 6,761 | | | | 1,991 | | | | 2,321 | | | | 2,856 | | | | 2,298 | | | | 8,266 | |
Shares issued-reinvested from dividends and distributions | | | 6,698 | | | | 944 | | | | 9,155 | | | | 819 | | | | 811 | | | | 976 | |
Shares redeemed | | | (19,535 | ) | | | (22,976 | ) | | | (30,149 | ) | | | (30,161 | ) | | | (11,109 | ) | | | (32,162 | ) |
| | | | | | | | | | | | | | | | | | | | | | | | |
Net decrease in shares outstanding | | | (6,076 | ) | | | (20,041 | ) | | | (18,673 | ) | | | (26,486 | ) | | | (8,000 | ) | | | (22,920 | ) |
| | | | | | | | | | | | | | | | | | | | | | | | |
The notes to the financial statements are an integral part of this report.
| | | | |
| Transamerica Funds | | | | Annual Report 2012 |
| | Page 149 | | |
STATEMENTS OF CHANGES IN NET ASSETS (continued)
For the years ended:
(all amounts in thousands)
| | | | | | | | | | | | | | | | | | | | | | | | |
| | | Transamerica Long/Short
Strategy | | | Transamerica Mid Cap
Value | | | Transamerica Real Return
TIPS | |
| | | October 31,
2012 | | | October 31,
2011 | | | October 31,
2012 | | | October 31,
2011 | | | October 31,
2012 | | | October 31,
2011 | |
From operations: | | | | | | | | | | | | | | | | | | | | | | | | |
Net investment income (loss) | | $ | (1,094 | ) | | $ | (2,131 | ) | | $ | 2,170 | | | $ | 1,799 | | | $ | 12,016 | | | $ | 28,089 | |
Net realized gain (loss)(B) | | | 1,580 | | | | (917 | ) | | | 15,341 | | | | 8,286 | | | | 43,443 | | | | 54,764 | |
Net change in unrealized appreciation (depreciation) | | | 2,797 | | | | (3,559 | ) | | | 17,602 | | | | 2,850 | | | | 43,590 | | | | (30,952 | ) |
| | | | | | | | | | | | | | | | | | | | | | | | |
Net increase (decrease) in net assets resulting from operations | | | 3,283 | | | | (6,607 | ) | | | 35,113 | | | | 12,935 | | | | 99,049 | | | | 51,901 | |
| | | | | | | | | | | | | | | | | | | | | | | | |
Distributions to shareholders: | | | | | | | | | | | | | | | | | | | | | | | | |
From net investment income | | | — | | | | — | | | | (1,745 | ) | | | (2,200 | ) | | | (15,604 | ) | | | (28,799 | ) |
From net realized gains | | | — | | | | — | | | | — | | | | — | | | | (46,537 | ) | | | (30,631 | ) |
| | | | | | | | | | | | | | | | | | | | | | | | |
Total distributions to shareholders | | | — | | | | — | | | | (1,745 | ) | | | (2,200 | ) | | | (62,141 | ) | | | (59,430 | ) |
| | | | | | | | | | | | | | | | | | | | | | | | |
Capital share transactions: | | | | | | | | | | | | | | | | | | | | | | | | |
Proceeds from shares sold | | | 24,174 | | | | 38,093 | | | | 49,746 | | | | — | | | | 854,212 | | | | 213,951 | |
Dividends and distributions reinvested | | | — | | | | — | | | | 1,745 | | | | 2,200 | | | | 62,141 | | | | 59,430 | |
Cost of shares redeemed | | | (49,375 | ) | | | (26,720 | ) | | | (34,745 | ) | | | (18,203 | ) | | | (581,443 | ) | | | (140,183 | ) |
| | | | | | | | | | | | | | | | | | | | | | | | |
Net increase (decrease) in net assets resulting from capital shares transactions | | | (25,201 | ) | | | 11,373 | | | | 16,746 | | | | (16,003 | ) | | | 334,910 | | | | 133,198 | |
| | | | | | | | | | | | | | | | | | | | | | | | |
Net increase (decrease) in net assets | | | (21,918 | ) | | | 4,766 | | | | 50,114 | | | | (5,268 | ) | | | 371,818 | | | | 125,669 | |
| | | | | | | | | | | | | | | | | | | | | | | | |
Net assets: | | | | | | | | | | | | | | | | | | | | | | | | |
Beginning of year | | | 113,108 | | | | 108,342 | | | | 158,344 | | | | 163,612 | | | | 971,634 | | | | 845,965 | |
| | | | | | | | | | | | | | | | | | | | | | | | |
End of year | | $ | 91,190 | | | $ | 113,108 | | | $ | 208,458 | | | $ | 158,344 | | | $ | 1,343,452 | | | $ | 971,634 | |
| | | | | | | | | | | | | | | | | | | | | | | | |
Undistributed (accumulated) net investment income (loss) | | $ | (928 | ) | | $ | — | | | $ | 1,556 | | | $ | 1,131 | | | $ | 4,614 | | | $ | 5,592 | |
| | | | | | | | | | | | | | | | | | | | | | | | |
Share activity: | | | | | | | | | | | | | | | | | | | | | | | | |
Shares issued | | | 2,995 | | | | 4,746 | | | | 4,190 | | | | — | | | | 74,635 | | | | 19,339 | |
Shares issued-reinvested from dividends and distributions | | | — | | | | — | | | | 165 | | | | 207 | | | | 5,652 | | | | 5,557 | |
Shares redeemed | | | (6,218 | ) | | | (3,374 | ) | | | (2,851 | ) | | | (1,800 | ) | | | (50,747 | ) | | | (12,897 | ) |
| | | | | | | | | | | | | | | | | | | | | | | | |
Net increase (decrease) in shares outstanding | | | (3,223 | ) | | | 1,372 | | | | 1,504 | | | | (1,593 | ) | | | 29,540 | | | | 11,999 | |
| | | | | | | | | | | | | | | | | | | | | | | | |
| | | |
| | | Transamerica Select
Equity | | | Transamerica Total
Return | | | Transamerica Value | |
| | | October 31,
2012 | | | October 31,
2011(C) | | | October 31,
2012 | | | October 31,
2011 | | | October 31,
2012 | | | October 31,
2011 | |
From operations: | | | | | | | | | | | | | | | | | | | | | | | | |
Net investment income | | $ | 22,407 | | | $ | 855 | | | $ | 15,605 | | | $ | 17,888 | | | $ | 3,956 | | | $ | 4,177 | |
Net realized gain (loss)(B) | | | 33,562 | | | | (3,807 | ) | | | 9,461 | | | | 5,845 | | | | (611 | ) | | | 15,644 | |
Net change in unrealized appreciation (depreciation) | | | 92,257 | | | | 27,068 | | | | 33,076 | | | | (10,844 | ) | | | 20,997 | | | | (26,148 | ) |
| | | | | | | | | | | | | | | | | | | | | | | | |
Net increase (decrease) in net assets resulting from operations | | | 148,226 | | | | 24,116 | | | | 58,142 | | | | 12,889 | | | | 24,342 | | | | (6,327 | ) |
| | | | | | | | | | | | | | | | | | | | | | | | |
Distributions to shareholders: | | | | | | | | | | | | | | | | | | | | | | | | |
From net investment income | | | (22,422 | ) | | | (54 | ) | | | (21,728 | ) | | | (17,746 | ) | | | (728 | ) | | | (7,774 | ) |
From net realized gains | | | — | | | | — | | | | (2,586 | ) | | | (19,234 | ) | | | — | | | | — | |
| | | | | | | | | | | | | | | | | | | | | | | | |
Total distributions to shareholders | | | (22,422 | ) | | | (54 | ) | | | (24,314 | ) | | | (36,980 | ) | | | (728 | ) | | | (7,774 | ) |
| | | | | | | | | | | | | | | | | | | | | | | | |
Capital share transactions: | | | | | | | | | | | | | | | | | | | | | | | | |
Proceeds from shares sold | | | 276,365 | | | | 914,980 | | | | 223,125 | | | | 55,205 | | | | 26,221 | | | | 5,202 | |
Dividends and distributions reinvested | | | 22,422 | | | | 54 | | | | 24,314 | | | | 36,980 | | | | 728 | | | | 7,774 | |
Cost of shares redeemed | | | (160,669 | ) | | | (2,817 | ) | | | (103,222 | ) | | | (110,080 | ) | | | (86,728 | ) | | | (74,285 | ) |
| | | | | | | | | | | | | | | | | | | | | | | | |
Net increase (decrease) in net assets resulting from capital shares transactions | | | 138,118 | | | | 912,217 | | | | 144,217 | | | | (17,895 | ) | | | (59,779 | ) | | | (61,309 | ) |
| | | | | | | | | | | | | | | | | | | | | | | | |
Net increase (decrease) in net assets | | | 263,922 | | | | 936,279 | | | | 178,045 | | | | (41,986 | ) | | | (36,165 | ) | | | (75,410 | ) |
| | | | | | | | | | | | | | | | | | | | | | | | |
Net assets: | | | | | | | | | | | | | | | | | | | | | | | | |
Beginning of year | | | 936,279 | | | | — | | | | 625,735 | | | | 667,721 | | | | 307,724 | | | | 383,134 | |
| | | | | | | | | | | | | | | | | | | | | | | | |
End of year | | $ | 1,200,201 | | | $ | 936,279 | | | $ | 803,780 | | | $ | 625,735 | | | $ | 271,559 | | | $ | 307,724 | |
| | | | | | | | | | | | | | | | | | | | | | | | |
Undistributed (accumulated) net investment income (loss) | | $ | 786 | | | $ | 801 | | | $ | 391 | | | $ | 3,557 | | | $ | 3,716 | | | $ | 118 | |
| | | | | | | | | | | | | | | | | | | | | | | | |
Share activity: | | | | | | | | | | | | | | | | | | | | | | | | |
Shares issued | | | 25,687 | | | | 91,871 | | | | 21,153 | | | | 5,272 | | | | 1,177 | | | | 227 | |
Shares issued-reinvested from dividends and distributions | | | 2,090 | | | | 5 | | | | 2,312 | | | | 3,654 | | | | 39 | | | | 353 | |
Shares redeemed | | | (14,553 | ) | | | (277 | ) | | | (9,729 | ) | | | (10,679 | ) | | | (4,163 | ) | | | (3,508 | ) |
| | | | | | | | | | | | | | | | | | | | | | | | |
Net increase (decrease) in shares outstanding | | | 13,224 | | | | 91,599 | | | | 13,736 | | | | (1,753 | ) | | | (2,947 | ) | | | (2,928 | ) |
| | | | | | | | | | | | | | | | | | | | | | | | |
The notes to the financial statements are an integral part of this report.
| | | | |
| Transamerica Funds | | | | Annual Report 2012 |
| | Page 150 | | |
STATEMENTS OF CHANGES IN NET ASSETS (continued)
| (A) | Commenced operations on May 1, 2011. |
| (B) | Net realized gain (loss) includes all items listed in the Statements of Operations. |
| (C) | Commenced operations on August 31, 2011. |
The notes to the financial statements are an integral part of this report.
| | | | |
| Transamerica Funds | | | | Annual Report 2012 |
| | Page 151 | | |
FINANCIAL HIGHLIGHTS
For the period or years ended:
| | | | | | | | |
For a share outstanding throughout each period | | Transamerica Arbitrage Strategy | |
| | October 31, 2012 | | | October 31, 2011(A) | |
Net asset value | | | | | | | | |
Beginning of period/year | | $ | 10.25 | | | $ | 10.00 | |
| | | | | | | | |
Investment operations | | | | | | | | |
Net investment loss(B) | | | (0.11 | ) | | | (0.04 | ) |
Net realized and change in unrealized gain (loss) on investments | | | (0.16 | ) | | | 0.29 | |
| | | | | | | | |
Total from investment operations | | | (0.27 | ) | | | 0.25 | |
| | | | | | | | |
Distributions | | | | | | | | |
Net realized gains on investments | | | (0.09 | ) | | | — | |
| | | | | | | | |
Total distributions | | | (0.09 | ) | | | — | |
| | | | | | | | |
Net asset value | | | | | | | | |
End of year | | $ | 9.89 | | | $ | 10.25 | |
| | | | | | | | |
Total return(C) | | | (2.67 | )% | | | 2.50 | %(D) |
| | | | | | | | |
Net assets end of year (000’s) | | $ | 116,303 | | | $ | 124,208 | |
| | | | | | | | |
Ratio and supplemental data | | | | | | | | |
Expenses to average net assets: | | | | | | | | |
After reimbursement/recapture(E) | | | 1.92 | % | | | 1.55 | %(F) |
Before reimbursement/recapture(E) | | | 2.04 | % | | | 1.71 | %(F) |
Net investment loss to average net assets(E) | | | (1.06 | )% | | | (0.78 | )%(F) |
Portfolio turnover rate | | | 566 | % | | | 311 | %(D) |
| | | | | | | | | | | | | | | | | | | | |
| | | Transamerica Bond | |
For a share outstanding throughout each period | | October 31, 2012 | | | October 31, 2011 | | | October 31, 2010 | | | October 31, 2009 | | | October 31, 2008 | |
Net asset value | | | | | | | | | | | | | | | | | | | | |
Beginning of year | | $ | 10.61 | | | $ | 11.14 | | | $ | 9.93 | | | $ | 7.34 | | | $ | 10.19 | |
| | | | | | | | | | | | | | | | | | | | |
Investment operations | | | | | | | | | | | | | | | | | | | | |
Net investment income(B) | | | 0.49 | | | | 0.54 | | | | 0.57 | | | | 0.60 | | | | 0.60 | |
Net realized and change in unrealized gain (loss) on investments | | | 0.84 | | | | (0.20 | ) | | | 1.23 | | | | 2.61 | | | | (2.88 | ) |
| | | | | | | | | | | | | | | | | | | | |
Total from investment operations | | | 1.33 | | | | 0.34 | | | | 1.80 | | | | 3.21 | | | | (2.28 | ) |
| | | | | | | | | | | | | | | | | | | | |
Distributions | | | | | | | | | | | | | | | | | | | | |
Net investment income | | | (0.65 | ) | | | (0.68 | ) | | | (0.59 | ) | | | (0.57 | ) | | | (0.57 | ) |
Net realized gains on investments | | | (0.59 | ) | | | (0.19 | ) | | | — | | | | (0.05 | ) | | | — | |
| | | | | | | | | | | | | | | | | | | | |
Total distributions | | | (1.24 | ) | | | (0.87 | ) | | | (0.59 | ) | | | (0.62 | ) | | | (0.57 | ) |
| | | | | | | | | | | | | | | | | | | | |
Net asset value | | | | | | | | | | | | | | | | | | | | |
End of year | | $ | 10.70 | | | $ | 10.61 | | | $ | 11.14 | | | $ | 9.93 | | | $ | 7.34 | |
| | | | | | | | | | | | | | | | | | | | |
Total return(C) | | | 14.24 | % | | | 3.31 | % | | | 18.69 | % | | | 46.27 | % | | | (23.56 | )% |
| | | | | | | | | | | | | | | | | | | | |
Net assets end of year (000’s) | | $ | 737,080 | | | $ | 462,340 | | | $ | 594,220 | | | $ | 812,252 | | | $ | 577,368 | |
| | | | | | | | | | | | | | | | | | | | |
Ratio and supplemental data | | | | | | | | | | | | | | | | | | | | |
Expenses to average net assets: | | | | | | | | | | | | | | | | | | | | |
After reimbursement/recapture | | | 0.71 | % | | | 0.71 | % | | | 0.70 | % | | | 0.69 | % | | | 0.69 | % |
Before reimbursement/recapture | | | 0.71 | % | | | 0.71 | % | | | 0.70 | % | | | 0.69 | % | | | 0.69 | % |
Net investment income to average net assets | | | 4.77 | % | | | 4.98 | % | | | 5.49 | % | | | 7.22 | % | | | 6.34 | % |
Portfolio turnover rate | | | 26 | % | | | 57 | % | | | 79 | % | | | 42 | % | | | 24 | % |
The notes to the financial statements are an integral part of this report.
| | | | |
| Transamerica Funds | | | | Annual Report 2012 |
| | Page 152 | | |
FINANCIAL HIGHLIGHTS (continued)
For the period or years ended:
| | | | | | | | | | | | | | | | |
| | | Transamerica Core Bond | |
For a share outstanding throughout each period | | October 31, 2012 | | | October 31, 2011 | | | October 31, 2010 | | | October 31, 2009 (G) | |
Net asset value | | | | | | | | | | | | | | | | |
Beginning of period/year | | $ | 10.60 | | | $ | 10.56 | | | $ | 10.08 | | | $ | 10.00 | |
| | | | | | | | | | | | | | | | |
Investment operations | | | | | | | | | | | | | | | | |
Net investment income(B) | | | 0.33 | | | | 0.32 | | | | 0.28 | | | | 0.07 | |
Net realized and change in unrealized gain on investments | | | 0.31 | | | | 0.15 | | | | 0.53 | | | | 0.06 | |
| | | | | | | | | | | | | | | | |
Total from investment operations | | | 0.64 | | | | 0.47 | | | | 0.81 | | | | 0.13 | |
| | | | | | | | | | | | | | | | |
Distributions | | | | | | | | | | | | | | | | |
Net investment income | | | (0.38 | ) | | | (0.36 | ) | | | (0.33 | ) | | | (0.05 | ) |
Net realized gains on investments | | | — | | | | (0.07 | ) | | | — | | | | — | |
| | | | | | | | | | | | | | | | |
Total distributions | | | (0.38 | ) | | | (0.43 | ) | | | (0.33 | ) | | | (0.05 | ) |
| | | | | | | | | | | | | | | | |
Net asset value | | | | | | | | | | | | | | | | |
End of year | | $ | 10.86 | | | $ | 10.60 | | | $ | 10.56 | | | $ | 10.08 | |
| | | | | | | | | | | | | | | | |
Total return(C) | | | 6.12 | % | | | 4.62 | % | | | 8.16 | % | | | 1.34 | %(D) |
| | | | | | | | | | | | | | | | |
Net assets end of year (000’s) | | $ | 1,879,194 | | | $ | 2,208,783 | | | $ | 1,063,458 | | | $ | 215,816 | |
| | | | | | | | | | | | | | | | |
Ratio and supplemental data | | | | | | | | | | | | | | | | |
Expenses to average net assets: | | | | | | | | | | | | | | | | |
After reimbursement/recapture | | | 0.47 | % | | | 0.48 | % | | | 0.50 | % | | | 0.55 | %(F) |
Before reimbursement/recapture | | | 0.47 | % | | | 0.48 | % | | | 0.50 | % | | | 0.55 | %(F) |
Net investment income to average net assets | | | 3.09 | % | | | 3.04 | % | | | 2.73 | % | | | 2.15 | %(F) |
Portfolio turnover rate | | | 23 | % | | | 19 | % | | | 33 | % | | | 3 | %(D) |
| | | | | | | | | | | | | | | | | | | | |
| | | Transamerica Developing Markets Equity | |
For a share outstanding throughout each period | | October 31, 2012 | | | October 31, 2011 | | | October 31, 2010 | | | October 31, 2009 | | | October 31, 2008 | |
Net asset value | | | | | | | | | | | | | | | | | | | | |
Beginning of year | | $ | 12.27 | | | $ | 13.34 | | | $ | 10.12 | | | $ | 8.20 | | | $ | 17.07 | |
| | | | | | | | | | | | | | | | | | | | |
Investment operations | | | | | | | | | | | | | | | | | | | | |
Net investment income(B) | | | 0.05 | | | | 0.08 | | | | 0.05 | | | | 0.06 | | | | 0.19 | |
Net realized and change in unrealized gain (loss) on investments | | | 0.74 | | | | (1.11 | ) | | | 3.22 | | | | 3.51 | | | | (7.65 | ) |
| | | | | | | | | | | | | | | | | | | | |
Total from investment operations | | | 0.79 | | | | (1.03 | ) | | | 3.27 | | | | 3.57 | | | | (7.46 | ) |
| | | | | | | | | | | | | | | | | | | | |
Distributions | | | | | | | | | | | | | | | | | | | | |
Net investment income | | | (0.07 | ) | | | (0.04 | ) | | | (0.05 | ) | | | (0.16 | ) | | | (0.09 | ) |
Net realized gains on investments | | | (1.00 | ) | | | — | | | | — | | | | (1.49 | ) | | | (1.32 | ) |
| | | | | | | | | | | | | | | | | | | | |
Total distributions | | | (1.07 | ) | | | (0.04 | ) | | | (0.05 | ) | | | (1.65 | ) | | | (1.41 | ) |
| | | | | | | | | | | | | | | | | | | | |
Net asset value | | | | | | | | | | | | | | | | | | | | |
End of year | | $ | 11.99 | | | $ | 12.27 | | | $ | 13.34 | | | $ | 10.12 | | | $ | 8.20 | |
| | | | | | | | | | | | | | | | | | | | |
Total return(C) | | | 8.07 | % | | | (7.77 | )% | | | 32.43 | % | | | 56.01 | % | | | (47.48 | )% |
| | | | | | | | | | | | | | | | | | | | |
Net assets end of year (000’s) | | $ | 341,362 | | | $ | 497,656 | | | $ | 610,212 | | | $ | 495,636 | | | $ | 317,973 | |
| | | | | | | | | | | | | | | | | | | | |
Ratio and supplemental data | | | | | | | | | | | | | | | | | | | | |
Expenses to average net assets: | | | | | | | | | | | | | | | | | | | | |
After reimbursement/recapture | | | 1.33 | % | | | 1.31 | % | | | 1.31 | % | | | 1.35 | % | | | 1.32 | % |
Before reimbursement/recapture | | | 1.33 | % | | | 1.31 | % | | | 1.31 | % | | | 1.35 | % | | | 1.32 | % |
Net investment income to average net assets | | | 0.48 | % | | | 0.58 | % | | | 0.48 | % | | | 0.77 | % | | | 1.42 | % |
Portfolio turnover rate | | | 37 | % | | | 40 | % | | | 54 | % | | | 50 | % | | | 67 | % |
The notes to the financial statements are an integral part of this report.
| | | | |
| Transamerica Funds | | | | Annual Report 2012 |
| | Page 153 | | |
FINANCIAL HIGHLIGHTS (continued)
For the period or years ended:
| | | | | | | | | | | | | | | | | | | | |
| | | Transamerica Global Macro | |
For a share outstanding throughout each period | | October 31, 2012 | | | October 31, 2011 | | | October 31, 2010 | | | October 31, 2009 | | | October 31, 2008 | |
Net asset value | | | | | | | | | | | | | | | | | | | | |
Beginning of year | | $ | 5.82 | | | $ | 6.12 | | | $ | 6.08 | | | $ | 8.60 | | | $ | 9.83 | |
| | | | | | | | | | | | | | | | | | | | |
Investment operations | | | | | | | | | | | | | | | | | | | | |
Net investment income (loss)(B) | | | (0.08 | ) | | | (0.09 | ) | | | (0.10 | ) | | | 0.02 | | | | 0.18 | |
Net realized and change in unrealized gain (loss) on investments | | | 0.03 | | | | (0.21 | ) | | | 0.14 | | | | (0.04 | ) | | | (1.30 | ) |
| | | | | | | | | | | | | | | | | | | | |
Total from investment operations | | | (0.05 | ) | | | (0.30 | ) | | | 0.04 | | | | (0.02 | ) | | | (1.12 | ) |
| | | | | | | | | | | | | | | | | | | | |
Distributions | | | | | | | | | | | | | | | | | | | | |
Net investment income | | | — | | | | — | | | | — | | | | (0.03 | ) | | | (0.11 | ) |
Net realized gains on investments | | | — | | | | — | | | | — | | | | (2.40 | ) | | | — | |
Return of capital | | | — | | | | — | | | | — | | | | (0.07 | ) | | | — | |
| | | | | | | | | | | | | | | | | | | | |
Total distributions | | | — | | | | — | | | | — | | | | (2.50 | ) | | | (0.11 | ) |
| | | | | | | | | | | | | | | | | | | | |
Net asset value | | | | | | | | | | | | | | | | | | | | |
End of year | | $ | 5.77 | | | $ | 5.82 | | | $ | 6.12 | | | $ | 6.08 | | | $ | 8.60 | |
| | | | | | | | | | | | | | | | | | | | |
Total return(C) | | | (0.86 | )% | | | (4.90 | )% | | | 0.66 | % | | | 5.34 | % | | | (11.55 | )% |
| | | | | | | | | | | | | | | | | | | | |
Net assets end of year (000’s) | | $ | 112,261 | | | $ | 137,551 | | | $ | 126,142 | | | $ | 107,017 | | | $ | 165,567 | |
| | | | | | | | | | | | | | | | | | | | |
Ratio and supplemental data | | | | | | | | | | | | | | | | | | | | |
Expenses to average net assets: | | | | | | | | | | | | | | | | | | | | |
After reimbursement/recapture | | | 1.46 | % | | | 1.53 | % | | | 1.61 | % | | | 1.58 | % | | | 1.51 | % |
Before reimbursement/recapture | | | 1.46 | % | | | 1.53 | % | | | 1.61 | % | | | 1.58 | % | | | 1.51 | % |
Net investment income (loss) to average net assets | | | (1.41 | )% | | | (1.49 | )% | | | (1.56 | )% | | | 0.32 | % | | | 1.81 | % |
Portfolio turnover rate | | | — | % | | | — | % | | | — | % | | | 358 | % | | | 84 | % |
| | | | | | | | | | | | | | | | | | | | |
| | | Transamerica Global Real Estate Securities | |
For a share outstanding throughout each period | | October 31, 2012 | | | October 31, 2011 | | | October 31, 2010 | | | October 31, 2009 | | | October 31, 2008 | |
Net asset value | | | | | | | | | | | | | | | | | | | | |
Beginning of year | | $ | 11.64 | | | $ | 12.28 | | | $ | 10.77 | | | $ | 9.52 | | | $ | 20.48 | |
| | | | | | | | | | | | | | | | | | | | |
Investment operations | | | | | | | | | | | | | | | | | | | | |
Net investment income(B) | | | 0.29 | | | | 0.24 | | | | 0.26 | | | | 0.29 | | | | 0.32 | |
Net realized and change in unrealized gain (loss) on investments | | | 1.36 | | | | (0.19 | ) | | | 1.98 | | | | 1.15 | | | | (8.33 | ) |
| | | | | | | | | | | | | | | | | | | | |
Total from investment operations | | | 1.65 | | | | 0.05 | | | | 2.24 | | | | 1.44 | | | | (8.01 | ) |
| | | | | | | | | | | | | | | | | | | | |
Distributions | | | | | | | | | | | | | | | | | | | | |
Net investment income | | | (0.41 | ) | | | (0.69 | ) | | | (0.73 | ) | | | (0.19 | ) | | | (0.90 | ) |
Net realized gains on investments | | | — | | | | — | | | | — | | | | — | | | | (2.05 | ) |
| | | | | | | | | | | | | | | | | | | | |
Total distributions | | | (0.41 | ) | | | (0.69 | ) | | | (0.73 | ) | | | (0.19 | ) | | | (2.95 | ) |
| | | | | | | | | | | | | | | | | | | | |
Net asset value | | | | | | | | | | | | | | | | | | | | |
End of year | | $ | 12.88 | | | $ | 11.64 | | | $ | 12.28 | | | $ | 10.77 | | | $ | 9.52 | |
| | | | | | | | | | | | | | | | | | | | |
Total return(C) | | | 14.57 | % | | | 0.51 | % | | | 21.70 | % | | | 15.72 | % | | | (44.82 | )% |
| | | | | | | | | | | | | | | | | | | | |
Net assets end of year (000’s) | | $ | 160,330 | | | $ | 147,057 | | | $ | 319,368 | | | $ | 285,502 | | | $ | 232,115 | |
| | | | | | | | | | | | | | | | | | | | |
Ratio and supplemental data | | | | | | | | | | | | | | | | | | | | |
Expenses to average net assets: | | | | | | | | | | | | | | | | | | | | |
After reimbursement/recapture | | | 0.97 | % | | | 0.91 | % | | | 0.91 | % | | | 0.93 | % | | | 0.89 | % |
Before reimbursement/recapture | | | 0.97 | % | | | 0.91 | % | | | 0.91 | % | | | 0.93 | % | | | 0.89 | % |
Net investment income to average net assets | | | 2.36 | % | | | 2.01 | % | | | 2.31 | % | | | 3.30 | % | | | 2.29 | % |
Portfolio turnover rate | | | 55 | % | | | 39 | % | | | 62 | % | | | 61 | % | | | 41 | % |
The notes to the financial statements are an integral part of this report.
| | | | |
| Transamerica Funds | | | | Annual Report 2012 |
| | Page 154 | | |
FINANCIAL HIGHLIGHTS (continued)
For the period or years ended:
| | | | | | | | | | | | | | | | | | | | |
| | | Transamerica Growth | |
For a share outstanding throughout each period | | October 31, 2012 | | | October 31, 2011 | | | October 31, 2010 | | | October 31, 2009 | | | October 31, 2008 | |
Net asset value | | | | | | | | | | | | | | | | | | | | |
Beginning of year | | $ | 12.94 | | | $ | 11.78 | | | $ | 10.17 | | | $ | 8.37 | | | $ | 13.05 | |
| | | | | | | | | | | | | | | | | | | | |
Investment operations | | | | | | | | | | | | | | | | | | | | |
Net investment income(B) | | | 0.01 | | | | — | (H) | | | 0.01 | | | | 0.01 | | | | 0.02 | |
Net realized and change in unrealized gain (loss) on investments | | | 0.97 | | | | 1.17 | | | | 1.61 | | | | 1.81 | | | | (4.68 | ) |
| | | | | | | | | | | | | | | | | | | | |
Total from investment operations | | | 0.98 | | | | 1.17 | | | | 1.62 | | | | 1.82 | | | | (4.66 | ) |
| | | | | | | | | | | | | | | | | | | | |
Distributions | | | | | | | | | | | | | | | | | | | | |
Net investment income | | | (0.01 | ) | | | (0.01 | ) | | | (0.01 | ) | | | (0.02 | ) | | | (0.02 | ) |
Net realized gains on investments | | | (0.49 | ) | | | — | | | | — | | | | — | | | | — | |
| | | | | | | | | | | | | | | | | | | | |
Total distributions | | | (0.50 | ) | | | (0.01 | ) | | | (0.01 | ) | | | (0.02 | ) | | | (0.02 | ) |
| | | | | | | | | | | | | | | | | | | | |
Net asset value | | | | | | | | | | | | | | | | | | | | |
End of year | | $ | 13.42 | | | $ | 12.94 | | | $ | 11.78 | | | $ | 10.17 | | | $ | 8.37 | |
| | | | | | | | | | | | | | | | | | | | |
Total return(C) | | | 8.19 | % | | | 9.96 | % | | | 15.96 | % | | | 21.79 | % | | | (35.77 | )% |
| | | | | | | | | | | | | | | | | | | | |
Net assets end of year (000’s) | | $ | 550,207 | | | $ | 618,767 | | | $ | 726,732 | | | $ | 654,610 | | | $ | 184,981 | |
| | | | | | | | | | | | | | | | | | | | |
Ratio and supplemental data | | | | | | | | | | | | | | | | | | | | |
Expenses to average net assets: | | | | | | | | | | | | | | | | | | | | |
After reimbursement/recapture | | | 0.83 | % | | | 0.81 | % | | | 0.81 | % | | | 0.85 | % | | | 0.85 | % |
Before reimbursement/recapture | | | 0.83 | % | | �� | 0.81 | % | | | 0.81 | % | | | 0.85 | % | | | 0.85 | % |
Net investment income to average net assets | | | 0.06 | % | | | 0.01 | % | | | 0.09 | % | | | 0.16 | % | | | 0.21 | % |
Portfolio turnover rate | | | 43 | % | | | 55 | % | | | 83 | % | | | 82 | % | | | 70 | % |
| | | | | | | | | | | | | | | | | | | | |
| | | Transamerica International | |
For a share outstanding throughout each period | | October 31, 2012 | | | October 31, 2011 | | | October 31, 2010 | | | October 31, 2009 | | | October 31, 2008 | |
Net asset value | | | | | | | | | | | | | | | | | | | | |
Beginning of year | | $ | 8.50 | | | $ | 8.94 | | | $ | 7.57 | | | $ | 5.95 | | | $ | 13.55 | |
| | | | | | | | | | | | | | | | | | | | |
Investment operations | | | | | | | | | | | | | | | | | | | | |
Net investment income(B) | | | 0.15 | | | | 0.14 | | | | 0.10 | | | | 0.10 | | | | 0.19 | |
Net realized and change in unrealized gain (loss) on investments | | | 0.56 | | | | (0.47 | ) | | | 1.34 | | | | 1.69 | | | | (6.63 | ) |
| | | | | | | | | | | | | | | | | | | | |
Total from investment operations | | | 0.71 | | | | (0.33 | ) | | | 1.44 | | | | 1.79 | | | | (6.44 | ) |
| | | | | | | | | | | | | | | | | | | | |
Distributions | | | | | | | | | | | | | | | | | | | | |
Net investment income | | | (0.15 | ) | | | (0.11 | ) | | | (0.07 | ) | | | (0.17 | ) | | | (0.13 | ) |
Net realized gains on investments | | | — | | | | — | | | | — | | | | — | | | | (1.03 | ) |
| | | | | | | | | | | | | | | | | | | | |
Total distributions | | | (0.15 | ) | | | (0.11 | ) | | | (0.07 | ) | | | (0.17 | ) | | | (1.16 | ) |
| | | | | | | | | | | | | | | | | | | | |
Net asset value | | | | | | | | | | | | | | | | | | | | |
End of year | | $ | 9.06 | | | $ | 8.50 | | | $ | 8.94 | | | $ | 7.57 | | | $ | 5.95 | |
| | | | | | | | | | | | | | | | | | | | |
Total return(C) | | | 8.65 | % | | | (3.80 | )% | | | 19.16 | % | | | 30.83 | % | | | (51.66 | )% |
| | | | | | | | | | | | | | | | | | | | |
Net assets end of year (000’s) | | $ | 307,143 | | | $ | 359,646 | | | $ | 584,849 | | | $ | 485,803 | | | $ | 307,981 | |
| | | | | | | | | | | | | | | | | | | | |
Ratio and supplemental data | | | | | | | | | | | | | | | | | | | | |
Expenses to average net assets: | | | | | | | | | | | | | | | | | | | | |
After reimbursement/recapture | | | 1.07 | % | | | 1.07 | % | | | 1.06 | % | | | 1.09 | % | | | 1.06 | % |
Before reimbursement/recapture | | | 1.07 | % | | | 1.07 | % | | | 1.06 | % | | | 1.09 | % | | | 1.06 | % |
Net investment income to average net assets | | | 1.81 | % | | | 1.52 | % | | | 1.22 | % | | | 1.62 | % | | | 1.87 | % |
Portfolio turnover rate | | | 50 | % | | | 46 | % | | | 51 | % | | | 75 | % | | | 72 | % |
The notes to the financial statements are an integral part of this report.
| | | | |
| Transamerica Funds | | | | Annual Report 2012 |
| | Page 155 | | |
FINANCIAL HIGHLIGHTS (continued)
For the period or years ended:
| | | | | | | | | | | | | | | | | | | | |
| | | Transamerica International Equity Opportunities | |
For a share outstanding throughout each period | | October 31, 2012 | | | October 31, 2011 | | | October 31, 2010 | | | October 31, 2009 | | | October 31, 2008 (I) | |
Net asset value | | | | | | | | | | | | | | | | | | | | |
Beginning of period/year | | $ | 8.34 | | | $ | 9.11 | | | $ | 8.16 | | | $ | 6.58 | | | $ | 10.00 | |
| | | | | | | | | | | | | | | | | | | | |
Investment operations | | | | | | | | | | | | | | | | | | | | |
Net investment income(B) | | | 0.14 | | | | 0.15 | | | | 0.12 | | | | 0.12 | | | | 0.02 | |
Net realized and change in unrealized gain (loss) on investments | | | 0.29 | | | | (0.37 | ) | | | 1.09 | | | | 1.46 | | | | (3.44 | ) |
| | | | | | | | | | | | | | | | | | | | |
Total from investment operations | | | 0.43 | | | | (0.22 | ) | | | 1.21 | | | | 1.58 | | | | (3.42 | ) |
| | | | | | | | | | | | | | | | | | | | |
Distributions | | | | | | | | | | | | | | | | | | | | |
Net investment income | | | (0.20 | ) | | | (0.10 | ) | | | (0.06 | ) | | | — | | | | — | |
Net realized gains on investments | | | (1.15 | ) | | | (0.45 | ) | | | (0.20 | ) | | | — | | | | — | |
| | | | | | | | | | | | | | | | | | | | |
Total distributions | | | (1.35 | ) | | | (0.55 | ) | | | (0.26 | ) | | | — | | | | — | |
| | | | | | | | | | | | | | | | | | | | |
Net asset value | | | | | | | | | | | | | | | | | | | | |
End of year | | $ | 7.42 | | | $ | 8.34 | | | $ | 9.11 | | | $ | 8.16 | | | $ | 6.58 | |
| | | | | | | | | | | | | | | | | | | | |
Total return(C) | | | 8.00 | % | | | (2.69 | )% | | | 15.16 | % | | | 24.01 | % | | | (34.20 | )%(D) |
| | | | | | | | | | | | | | | | | | | | |
Net assets end of year (000’s) | | $ | 174,899 | | | $ | 353,694 | | | $ | 536,181 | | | $ | 396,754 | | | $ | 40,997 | |
| | | | | | | | | | | | | | | | | | | | |
Ratio and supplemental data | | | | | | | | | | | | | | | | | | | | |
Expenses to average net assets: | | | | | | | | | | | | | | | | | | | | |
After reimbursement/recapture | | | 1.04 | % | | | 0.99 | % | | | 0.99 | % | | | 1.09 | % | | | 1.23 | %(F) |
Before reimbursement/recapture | | | 1.04 | % | | | 0.99 | % | | | 0.99 | % | | | 1.78 | % | | | 0.71 | %(F) |
Net investment income to average net assets | | | 1.94 | % | | | 1.69 | % | | | 1.47 | % | | | 1.78 | % | | | 0.71 | %(F) |
Portfolio turnover rate | | | 29 | % | | | 29 | % | | | 35 | % | | | 24 | % | | | 37 | %(D) |
| | | | | | | | | | | | | | | | | | | | |
| | | Transamerica International Small Cap | |
For a share outstanding throughout each period | | October 31, 2012 | | | October 31, 2011 | | | October 31, 2010 | | | October 31, 2009 | | | October 31, 2008 (J) | |
Net asset value | | | | | | | | | | | | | | | | | | | | |
Beginning of period/year | | $ | 9.00 | | | $ | 9.67 | | | $ | 8.22 | | | $ | 5.82 | | | $ | 10.00 | |
| | | | | | | | | | | | | | | | | | | | |
Investment operations | | | | | | | | | | | | | | | | | | | | |
Net investment income(B) | | | 0.11 | | | | 0.15 | | | | 0.08 | | | | 0.08 | | | | 0.12 | |
Net realized and change in unrealized gain (loss) on investments | | | 0.11 | | | | (0.66 | ) | | | 1.42 | | | | 2.41 | | | | (4.30 | ) |
| | | | | | | | | | | | | | | | | | | | |
Total from investment operations | | | 0.22 | | | | (0.51 | ) | | | 1.50 | | | | 2.49 | | | | (4.18 | ) |
| | | | | | | | | | | | | | | | | | | | |
Distributions | | | | | | | | | | | | | | | | | | | | |
Net investment income | | | (0.23 | ) | | | (0.11 | ) | | | (0.05 | ) | | | (0.09 | ) | | | — | |
Net realized gains on investments | | | (1.09 | ) | | | (0.05 | ) | | | — | | | | — | | | | — | |
| | | | | | | | | | | | | | | | | | | | |
Total distributions | | | (1.32 | ) | | | (0.16 | ) | | | (0.05 | ) | | | (0.09 | ) | | | — | |
| | | | | | | | | | | | | | | | | | | | |
Net asset value | | | | | | | | | | | | | | | | | | | | |
End of year | | $ | 7.90 | | | $ | 9.00 | | | $ | 9.67 | | | $ | 8.22 | | | $ | 5.82 | |
| | | | | | | | | | | | | | | | | | | | |
Total return(C) | | | 4.57 | % | | | (5.39 | )% | | | 18.29 | % | | | 43.56 | % | | | (41.80 | )%(D) |
| | | | | | | | | | | | | | | | | | | | |
Net assets end of year (000’s) | | $ | 241,928 | | | $ | 330,358 | | | $ | 548,288 | | | $ | 543,673 | | | $ | 108,655 | |
| | | | | | | | | | | | | | | | | | | | |
Ratio and supplemental data | | | | | | | | | | | | | | | | | | | | |
Expenses to average net assets: | | | | | | | | | | | | | | | | | | | | |
After reimbursement/recapture | | | 1.20 | % | | | 1.15 | % | | | 1.16 | % | | | 1.23 | % | | | 1.27 | %(F) |
Before reimbursement/recapture | | | 1.20 | % | | | 1.15 | % | | | 1.16 | % | | | 1.21 | % | | | 1.30 | %(F) |
Net investment income to average net assets | | | 1.58 | % | | | 1.46 | % | | | 0.97 | % | | | 1.23 | % | | | 1.96 | %(F) |
Portfolio turnover rate | | | 33 | % | | | 38 | % | | | 54 | % | | | 46 | % | | | 14 | %(D) |
The notes to the financial statements are an integral part of this report.
| | | | |
| Transamerica Funds | | | | Annual Report 2012 |
| | Page 156 | | |
FINANCIAL HIGHLIGHTS (continued)
For the period or years ended:
| | | | | | | | | | | | | | | | | | | | |
| | | Transamerica International Value Opportunities | |
For a share outstanding throughout each period | | October 31, 2012 | | | October 31, 2011 | | | October 31, 2010 | | | October 31, 2009 | | | October 31, 2008(K) | |
Net asset value | | | | | | | | | | | | | | | | | | | | |
Beginning of period/year | | $ | 10.30 | | | $ | 11.12 | | | $ | 9.69 | | | $ | 7.98 | | | $ | 10.00 | |
| | | | | | | | | | | | | | | | | | | | |
Investment operations | | | | | | | | | | | | | | | | | | | | |
Net investment income(B) | | | 0.13 | | | | 0.16 | | | | 0.10 | | | | 0.10 | | �� | | — | (H) |
Net realized and change in unrealized gain (loss) on investments | | | 0.10 | | | | (0.85 | ) | | | 1.42 | | | | 1.66 | | | | (2.02 | ) |
| | | | | | | | | | | | | | | | | | | | |
Total from investment operations | | | 0.23 | | | | (0.69 | ) | | | 1.52 | | | | 1.76 | | | | (2.02 | ) |
| | | | | | | | | | | | | | | | | | | | |
Distributions | | | | | | | | | | | | | | | | | | | | |
Net investment income | | | (0.21 | ) | | | (0.06 | ) | | | (0.06 | ) | | | — | | | | — | |
Net realized gains on investments | | | (1.47 | ) | | | (0.07 | ) | | | (0.03 | ) | | | (0.05 | ) | | | — | |
| | | | | | | | | | | | | | | | | | | | |
Total distributions | | | (1.68 | ) | | | (0.13 | ) | | | (0.09 | ) | | | (0.05 | ) | | | — | |
| | | | | | | | | | | | | | | | | | | | |
Net asset value | | | | | | | | | | | | | | | | | | | | |
End of year | | $ | 8.85 | | | $ | 10.30 | | | $ | 11.12 | | | $ | 9.69 | | | $ | 7.98 | |
| | | | | | | | | | | | | | | | | | | | |
Total return(C) | | | 4.44 | % | | | (6.31 | )% | | | 15.75 | % | | | 22.21 | % | | | (20.20 | )%(D) |
| | | | | | | | | | | | | | | | | | | | |
Net assets end of year (000’s) | | $ | 220,190 | | | $ | 448,438 | | | $ | 778,484 | | | $ | 591,539 | | | $ | 79,516 | |
| | | | | | | | | | | | | | | | | | | | |
Ratio and supplemental data | | | | | | | | | | | | | | | | | | | | |
Expenses to average net assets: | | | | | | | | | | | | | | | | | | | | |
After reimbursement/recapture | | | 1.12 | % | | | 1.08 | % | | | 1.08 | % | | | 1.17 | % | | | 1.35 | %(F) |
Before reimbursement/recapture | | | 1.12 | % | | | 1.08 | % | | | 1.08 | % | | | 1.15 | % | | | 1.76 | %(F) |
Net investment income (loss) to average net assets | | | 1.49 | % | | | 1.41 | % | | | 0.97 | % | | | 1.14 | % | | | (0.18 | )%(F) |
Portfolio turnover rate | | | 19 | % | | | 28 | % | | | 36 | % | | | 39 | % | | | 5 | %(D) |
| | | | | | | | | | | | | | | | | | | | |
| |
| | | Transamerica Large Company | |
For a share outstanding throughout each period | | October 31, 2012 | | | October 31, 2011 | | | October 31, 2010 | | | October 31, 2009 | | | October 31, 2008 | |
Net asset value | | | | | | | | | | | | | | | | | | | | |
Beginning of year | | $ | 8.88 | | | $ | 8.34 | | | $ | 7.81 | | | $ | 7.61 | | | $ | 13.08 | |
| | | | | | | | | | | | | | | | | | | | |
Investment operations | | | | | | | | | | | | | | | | | | | | |
Net investment income(B) | | | 0.15 | | | | 0.10 | | | | 0.10 | | | | 0.13 | | | | 0.13 | |
Net realized and change in unrealized gain (loss) on investments | | | 1.10 | | | | 0.56 | | | | 0.54 | | | | 0.20 | | | | (4.78 | ) |
| | | | | | | | | | | | | | | | | | | | |
Total from investment operations | | | 1.25 | | | | 0.66 | | | | 0.64 | | | | 0.33 | | | | (4.65 | ) |
| | | | | | | | | | | | | | | | | | | | |
Distributions | | | | | | | | | | | | | | | | | | | | |
Net investment income | | | (0.12 | ) | | | (0.12 | ) | | | (0.11 | ) | | | (0.13 | ) | | | (0.09 | ) |
Net realized gains on investments | | | — | | | | — | | | | — | | | | — | | | | (0.73 | ) |
| | | | | | | | | | | | | | | | | | | | |
Total distributions | | | (0.12 | ) | | | (0.12 | ) | | | (0.11 | ) | | | (0.13 | ) | | | (0.82 | ) |
| | | | | | | | | | | | | | | | | | | | |
Net asset value | | | | | | | | | | | | | | | | | | | | |
End of year | | $ | 10.01 | | | $ | 8.88 | | | $ | 8.34 | | | $ | 7.81 | | | $ | 7.61 | |
| | | | | | | | | | | | | | | | | | | | |
Total return(C) | | | 14.26 | % | | | 7.92 | % | | | 8.16 | % | | | 4.50 | % | | | (37.76 | )% |
| | | | | | | | | | | | | | | | | | | | |
Net assets end of year (000’s) | | $ | 533,059 | | | $ | 544,049 | | | $ | 702,205 | | | $ | 633,675 | | | $ | 461,816 | |
| | | | | | | | | | | | | | | | | | | | |
Ratio and supplemental data | | | | | | | | | | | | | | | | | | | | |
Expenses to average net assets: | | | | | | | | | | | | | | | | | | | | |
After reimbursement/recapture | | | 0.84 | % | | | 0.84 | % | | | 0.83 | % | | | 0.83 | % | | | 0.83 | % |
Before reimbursement/recapture | | | 0.84 | % | | | 0.84 | % | | | 0.83 | % | | | 0.83 | % | | | 0.83 | % |
Net investment income to average net assets | | | 1.55 | % | | | 1.05 | % | | | 1.21 | % | | | 1.87 | % | | | 1.21 | % |
Portfolio turnover rate | | | 100 | % | | | 100 | % | | | 124 | % | | | 130 | % | | | 71 | % |
The notes to the financial statements are an integral part of this report.
| | | | |
| Transamerica Funds | | | | Annual Report 2012 |
| | Page 157 | | |
FINANCIAL HIGHLIGHTS (continued)
For the period or years ended:
| | | | | | | | | | | | | | | | | | | | |
| | | Transamerica Long/Short Strategy | |
For a share outstanding throughout each period | | October 31, 2012 | | | October 31, 2011 | | | October 31, 2010 | | | October 31, 2009 | | | October 31, 2008 | |
Net asset value | | | | | | | | | | | | | | | | | | | | |
Beginning of year | | $ | 7.86 | | | $ | 8.32 | | | $ | 8.43 | | | $ | 9.51 | | | $ | 9.78 | |
| | | | | | | | | | | | | | | | | | | | |
Investment operations | | | | | | | | | | | | | | | | | | | | |
Net investment income (loss)(B) | | | (0.10 | ) | | | (0.15 | ) | | | (0.13 | ) | | | (0.17 | ) | | | 0.10 | |
Net realized and change in unrealized gain (loss) on investments | | | 0.40 | | | | (0.31 | ) | | | 0.02 | | | | (0.80 | ) | | | 0.20 | |
| | | | | | | | | | | | | | | | | | | | |
Total from investment operations | | | 0.30 | | | | (0.46 | ) | | | (0.11 | ) | | | (0.97 | ) | | | 0.30 | |
| | | | | | | | | | | | | | | | | | | | |
Distributions | | | | | | | | | | | | | | | | | | | | |
Net investment income | | | — | | | | — | | | | — | | | | — | | | | (0.57 | ) |
Return of capital | | | — | | | | — | | | | — | | | | (0.11 | ) | | | — | |
| | | | | | | | | | | | | | | | | | | | |
Total distributions | | | — | | | | — | | | | — | | | | (0.11 | ) | | | (0.57 | ) |
| | | | | | | | | | | | | | | | | | | | |
Net asset value | | | | | | | | | | | | | | | | | | | | |
End of year | | $ | 8.16 | | | $ | 7.86 | | | $ | 8.32 | | | $ | 8.43 | | | $ | 9.51 | |
| | | | | | | | | | | | | | | | | | | | |
Total return(C) | | | 3.82 | % | | | (5.53 | )% | | | (1.30 | )% | | | (10.27 | )% | | | 3.30 | % |
| | | | | | | | | | | | | | | | | | | | |
Net assets end of year (000’s) | | $ | 91,190 | | | $ | 113,108 | | | $ | 108,342 | | | $ | 86,682 | | | $ | 121,348 | |
| | | | | | | | | | | | | | | | | | | | |
Ratio and supplemental data | | | | | | | | | | | | | | | | | | | | |
Expenses to average net assets: | | | | | | | | | | | | | | | | | | | | |
After reimbursement/recapture(L) | | | 3.46 | % | | | 3.59 | % | | | 2.85 | % | | | 3.61 | % | | | 2.79 | % |
Before reimbursement/recapture(L) | | | 3.46 | % | | | 3.59 | % | | | 2.85 | % | | | 3.61 | % | | | 2.79 | % |
Net investment income (loss) to average net assets(L) | | | (1.21 | )% | | | (1.86 | )% | | | (1.61 | )% | | | (1.87 | )% | | | 1.05 | % |
Portfolio turnover rate | | | 153 | % | | | 411 | % | | | 303 | % | | | 463 | % | | | 192 | % |
| | | | | | | | | | | | | | | | | | | | |
| | | Transamerica Mid Cap Value | |
For a share outstanding throughout each period | | October 31, 2012 | | | October 31, 2011 | | | October 31, 2010 | | | October 31, 2009 | | | October 31, 2008 | |
Net asset value | | | | | | | | | | | | | | | | | | | | |
Beginning of year | | $ | 10.93 | | | $ | 10.17 | | | $ | 8.28 | | | $ | 7.54 | | | $ | 12.32 | |
| | | | | | | | | | | | | | | | | | | | |
Investment operations | | | | | | | | | | | | | | | | | | | | |
Net investment income(B) | | | 0.14 | | | | 0.11 | | | | 0.12 | | | | 0.15 | | | | 0.13 | |
Net realized and change in unrealized gain (loss) on investments | | | 2.08 | | | | 0.79 | | | | 1.93 | | | | 0.82 | | | | (4.20 | ) |
| | | | | | | | | | | | | | | | | | | | |
Total from investment operations | | | 2.22 | | | | 0.90 | | | | 2.05 | | | | 0.97 | | | | (4.07 | ) |
| | | | | | | | | | | | | | | | | | | | |
Distributions | | | | | | | | | | | | | | | | | | | | |
Net investment income | | | (0.12 | ) | | | (0.14 | ) | | | (0.16 | ) | | | (0.17 | ) | | | (0.10 | ) |
Net realized gains on investments | | | — | | | | — | | | | — | | | | (0.06 | ) | | | (0.61 | ) |
| | | | | | | | | | | | | | | | | | | | |
Total distributions | | | (0.12 | ) | | | (0.14 | ) | | | (0.16 | ) | | | (0.23 | ) | | | (0.71 | ) |
| | | | | | | | | | | | | | | | | | | | |
Net asset value | | | | | | | | | | | | | | | | | | | | |
End of year | | $ | 13.03 | | | $ | 10.93 | | | $ | 10.17 | | | $ | 8.28 | | | $ | 7.54 | |
| | | | | | | | | | | | | | | | | | | | |
Total return(C) | | | 20.57 | % | | | 8.88 | % | | | 25.08 | % | | | 13.39 | % | | | (34.92 | )% |
| | | | | | | | | | | | | | | | | | | | |
Net assets end of year (000’s) | | $ | 208,458 | | | $ | 158,344 | | | $ | 163,612 | | | $ | 165,838 | | | $ | 147,772 | |
| | | | | | | | | | | | | | | | | | | | |
Ratio and supplemental data | | | | | | | | | | | | | | | | | | | | |
Expenses to average net assets: | | | | | | | | | | | | | | | | | | | | |
After reimbursement/recapture | | | 0.89 | % | | | 0.90 | % | | | 0.89 | % | | | 0.90 | % | | | 0.87 | % |
Before reimbursement/recapture | | | 0.89 | % | | | 0.90 | % | | | 0.89 | % | | | 0.90 | % | | | 0.87 | % |
Net investment income to average net assets | | | 1.16 | % | | | 1.04 | % | | | 1.33 | % | | | 2.05 | % | | | 1.22 | % |
Portfolio turnover rate | | | 38 | % | | | 39 | % | | | 29 | % | | | 43 | % | | | 45 | % |
The notes to the financial statements are an integral part of this report.
| | | | |
| Transamerica Funds | | | | Annual Report 2012 |
| | Page 158 | | |
FINANCIAL HIGHLIGHTS (continued)
For the period or years ended:
| | | | | | | | | | | | | | | | | | | | |
| | | Transamerica Real Return TIPS | |
For a share outstanding throughout each period | | October 31, 2012 | | | October 31, 2011 | | | October 31, 2010 | | | October 31, 2009 | | | October 31, 2008 | |
Net asset value | | | | | | | | | | | | | | | | | | | | |
Beginning of year | | $ | 11.45 | | | $ | 11.61 | | | $ | 10.72 | | | $ | 9.21 | | | $ | 10.21 | |
| | | | | | | | | | | | | | | | | | | | |
Investment operations | | | | | | | | | | | | | | | | | | | | |
Net investment income(B) | | | 0.10 | | | | 0.37 | | | | 0.25 | | | | 0.32 | | | | 0.47 | |
Net realized and change in unrealized gain (loss) on investments | | | 0.88 | | | | 0.27 | | | | 1.04 | | | | 1.58 | | | | (0.96 | ) |
| | | | | | | | | | | | | | | | | | | | |
Total from investment operations | | | 0.98 | | | | 0.64 | | | | 1.29 | | | | 1.90 | | | | (0.49 | ) |
| | | | | | | | | | | | | | | | | | | | |
Distributions | | | | | | | | | | | | | | | | | | | | |
Net investment income | | | (0.15 | ) | | | (0.37 | ) | | | (0.40 | ) | | | (0.33 | ) | | | (0.51 | ) |
Net realized gains on investments | | | (0.54 | ) | | | (0.43 | ) | | | — | | | | (0.06 | ) | | | — | |
| | | | | | | | | | | | | | | | | | | | |
Total distributions | | | (0.69 | ) | | | (0.80 | ) | | | (0.40 | ) | | | (0.39 | ) | | | (0.51 | ) |
| | | | | | | | | | | | | | | | | | | | |
Net asset value | | | | | | | | | | | | | | | | | | | | |
End of year | | $ | 11.74 | | | $ | 11.45 | | | $ | 11.61 | | | $ | 10.72 | | | $ | 9.21 | |
| | | | | | | | | | | | | | | | | | | | |
Total return(C) | | | 9.07 | % | | | 6.23 | % | | | 12.40 | % | | | 21.00 | % | | | (5.29 | )% |
| | | | | | | | | | | | | | | | | | | | |
Net assets end of year (000’s) | | $ | 1,343,452 | | | $ | 971,634 | | | $ | 845,965 | | | $ | 752,723 | | | $ | 621,092 | |
| | | | | | | | | | | | | | | | | | | | |
Ratio and supplemental data | | | | | | | | | | | | | | | | | | | | |
Expenses to average net assets: | | | | | | | | | | | | | | | | | | | | |
After reimbursement/recapture | | | 0.70 | % | | | 0.73 | % | | | 0.72 | % | | | 0.74 | % | | | 0.74 | % |
Before reimbursement/recapture | | | 0.70 | % | | | 0.73 | % | | | 0.72 | % | | | 0.74 | % | | | 0.74 | % |
Net investment income to average net assets | | | 0.96 | % | | | 3.35 | % | | | 2.32 | % | | | 3.23 | % | | | 4.47 | % |
Portfolio turnover rate | | | 151 | % | | | 213 | % | | | 307 | % | | | 583 | % | | | 1,028 | % |
| | | | | | | | |
| | | Transamerica Select Equity | |
For a share outstanding throughout each period | | October 31, 2012 | | | October 31, 2011 (M) | |
Net asset value | | | | | | | | |
Beginning of period/year | | $ | 10.22 | | | $ | 10.00 | |
| | | | | | | | |
Investment operations | | | | | | | | |
Net investment income(B) | | | 0.21 | | | | 0.01 | |
Net realized and change in unrealized gain on investments | | | 1.23 | | | | 0.21 | |
| | | | | | | | |
Total from investment operations | | | 1.44 | | | | 0.22 | |
| | | | | | | | |
Distributions | | | | | | | | |
Net investment income | | | (0.21 | ) | | | — | (H) |
| | | | | | | | |
Total distributions | | | (0.21 | ) | | | — | (H) |
| | | | | | | | |
Net asset value | | | | | | | | |
End of year | | $ | 11.45 | | | $ | 10.22 | |
| | | | | | | | |
Total return(C) | | | 14.29 | % | | | 2.31 | %(D) |
| | | | | | | | |
Net assets end of year (000’s) | | $ | 1,200,201 | | | $ | 936,279 | |
| | | | | | | | |
Ratio and supplemental data | | | | | | | | |
Expenses to average net assets: | | | | | | | | |
After reimbursement/recapture | | | 0.77 | % | | | 0.83 | %(F) |
Before reimbursement/recapture | | | 0.77 | % | | | 0.83 | %(F) |
Net investment income to average net assets | | | 1.92 | % | | | 0.83 | %(F) |
Portfolio turnover rate | | | 66 | % | | | 6 | %(D) |
The notes to the financial statements are an integral part of this report.
| | | | |
| Transamerica Funds | | | | Annual Report 2012 |
| | Page 159 | | |
FINANCIAL HIGHLIGHTS (continued)
For the period or years ended:
| | | | | | | | | | | | | | | | | | | | |
| | | Transamerica Total Return | |
For a share outstanding throughout each period | | October 31, 2012 | | | October 31, 2011 | | | October 31, 2010 | | | October 31, 2009 | | | October 31, 2008 | |
Net asset value | | | | | | | | | | | | | | | | | | | | |
Beginning of year | | $ | 10.42 | | | $ | 10.80 | | | $ | 10.85 | | | $ | 9.58 | | | $ | 10.47 | |
| | | | | | | | | | | | | | | | | | | | |
Investment operations | | | | | | | | | | | | | | | | | | | | |
Net investment income(B) | | | 0.23 | | | | 0.30 | | | | 0.35 | | | | 0.49 | | | | 0.49 | |
Net realized and change in unrealized gain (loss) on investments | | | 0.62 | | | | (0.07 | ) | | | 0.67 | | | | 1.64 | | | | (0.88 | ) |
| | | | | | | | | | | | | | | | | | | | |
Total from investment operations | | | 0.85 | | | | 0.23 | | | | 1.02 | | | | 2.13 | | | | (0.39 | ) |
| | | | | | | | | | | | | | | | | | | | |
Distributions | | | | | | | | | | | | | | | | | | | | |
Net investment income | | | (0.33 | ) | | | (0.30 | ) | | | (0.34 | ) | | | (0.67 | ) | | | (0.44 | ) |
Net realized gains on investments | | | (0.05 | ) | | | (0.31 | ) | | | (0.73 | ) | | | (0.19 | ) | | | (0.06 | ) |
| | | | | | | | | | | | | | | | | | | | |
Total distributions | | | (0.38 | ) | | | (0.61 | ) | | | (1.07 | ) | | | (0.86 | ) | | | (0.50 | ) |
| | | | | | | | | | | | | | | | | | | | |
Net asset value | | | | | | | | | | | | | | | | | | | | |
End of year | | $ | 10.89 | | | $ | 10.42 | | | $ | 10.80 | | | $ | 10.85 | | | $ | 9.58 | |
| | | | | | | | | | | | | | | | | | | | |
Total return(C) | | | 8.30 | % | | | 2.45 | % | | | 10.25 | % | | | 23.74 | % | | | (4.04 | )% |
| | | | | | | | | | | | | | | | | | | | |
Net assets end of year (000’s) | | $ | 803,780 | | | $ | 625,735 | | | $ | 667,721 | | | $ | 505,329 | | | $ | 555,428 | |
| | | | | | | | | | | | | | | | | | | | |
Ratio and supplemental data | | | | | | | | | | | | | | | | | | | | |
Expenses to average net assets: | | | | | | | | | | | | | | | | | | | | |
After reimbursement/recapture | | | 0.74 | % | | | 0.74 | % | | | 0.74 | % | | | 0.74 | % | | | 0.75 | % |
Before reimbursement/recapture | | | 0.74 | % | | | 0.74 | % | | | 0.74 | % | | | 0.74 | % | | | 0.75 | % |
Net investment income to average net assets | | | 2.16 | % | | | 2.92 | % | | | 3.30 | % | | | 4.95 | % | | | 4.66 | % |
Portfolio turnover rate | | | 98 | % | | | 144 | % | | | 222 | % | | | 841 | % | | | 751 | % |
| | | | | | | | | | | | | | | | | | | | |
| | | Transamerica Value | |
For a share outstanding throughout each period | | October 31, 2012 | | | October 31, 2011 | | | October 31, 2010 | | | October 31, 2009 | | | October 31, 2008 | |
Net asset value | | | | | | | | | | | | | | | | | | | | |
Beginning of year | | $ | 20.74 | | | $ | 21.56 | | | $ | 18.44 | | | $ | 16.93 | | | $ | 28.93 | |
| | | | | | | | | | | | | | | | | | | | |
Investment operations | | | | | | | | | | | | | | | | | | | | |
Net investment income(B) | | | 0.29 | | | | 0.24 | | | | 0.19 | | | | 0.15 | | | | 0.24 | |
Net realized and change in unrealized gain (loss) on investments | | | 1.86 | | | | (0.62 | ) | | | 3.20 | | | | 1.36 | | | | (11.45 | ) |
| | | | | | | | | | | | | | | | | | | | |
Total from investment operations | | | 2.15 | | | | (0.38 | ) | | | 3.39 | | | | 1.51 | | | | (11.21 | ) |
| | | | | | | | | | | | | | | | | | | | |
Distributions | | | | | | | | | | | | | | | | | | | | |
Net investment income | | | (0.05 | ) | | | (0.44 | ) | | | (0.27 | ) | | | — | | | | (0.42 | ) |
Net realized gains on investments | | | — | | | | — | | | | — | | | | — | | | | (0.37 | ) |
| | | | | | | | | | | | | | | | | | | | |
Total distributions | | | (0.05 | ) | | | (0.44 | ) | | | (0.27 | ) | | | — | | | | (0.79 | ) |
| | | | | | | | | | | | | | | | | | | | |
Net asset value | | | | | | | | | | | | | | | | | | | | |
End of year | | $ | 22.84 | | | $ | 20.74 | | | $ | 21.56 | | | $ | 18.44 | | | $ | 16.93 | |
| | | | | | | | | | | | | | | | | | | | |
Total return(C) | | | 10.42 | % | | | (1.87 | )% | | | 18.53 | % | | | 8.92 | % | | | (39.75 | )% |
| | | | | | | | | | | | | | | | | | | | |
Net assets end of year (000’s) | | $ | 271,559 | | | $ | 307,724 | | | $ | 383,134 | | | $ | 423,550 | | | $ | 336,845 | |
| | | | | | | | | | | | | | | | | | | | |
Ratio and supplemental data | | | | | | | | | | | | | | | | | | | | |
Expenses to average net assets: | | | | | | | | | | | | | | | | | | | | |
After reimbursement/recapture | | | 0.87 | % | | | 0.87 | % | | | 0.87 | % | | | 0.87 | % | | | 0.86 | % |
Before reimbursement/recapture | | | 0.87 | % | | | 0.87 | % | | | 0.87 | % | | | 0.87 | % | | | 0.86 | % |
Net investment income to average net assets | | | 1.37 | % | | | 1.06 | % | | | 0.98 | % | | | 0.91 | % | | | 1.00 | % |
Portfolio turnover rate | | | 16 | % | | | 4 | % | | | — | %(N) | | | 17 | % | | | 29 | % |
The notes to the financial statements are an integral part of this report.
| | | | |
| Transamerica Funds | | | | Annual Report 2012 |
| | Page 160 | | |
FINANCIAL HIGHLIGHTS (continued)
| (A) | Commenced operations on May 1, 2011. |
| (B) | Calculated based on average number of shares outstanding. |
| (C) | Total return has been calculated for the applicable period without deduction of a sales load, if any, on an initial purchase. |
| (E) | Includes dividends and interest on securities sold short (representing 0.67% and 0.30% of average net assets for 2012 and 2011, respectively). |
| (G) | Commenced operations on July 1, 2009. |
| (H) | Rounds to less than $0.01 or $(0.01). |
| (I) | Commenced operations on June 10, 2008. |
| (J) | Commenced operations on March 1, 2008. |
| (K) | Commenced operations on September 15, 2008. |
| (L) | Includes dividends and interest on securities sold short (representing 2.03%, 2.17%, 1.35%, 2.09%, and 1.30% of average net assets for 2012, 2011, 2010, 2009, and 2008, respectively). |
| (M) | Commenced operations on August 31, 2011. |
| (N) | Rounds to less than 1%. |
Note: Prior to November 1, 2009, all the financial highlights were audited by another independent registered public accounting firm.
The notes to the financial statements are an integral part of this report.
| | | | |
| Transamerica Funds | | | | Annual Report 2012 |
| | Page 161 | | |
Transamerica Commodity Strategy
(formerly, Transamerica Goldman Sachs Commodity Strategy)
(unaudited)
MARKET ENVIRONMENT
The energy sector was the main driver of the index’s negative return. Crude oil was the largest driver in the sector as increasing supplies and continued global economic concerns drove prices lower. In addition, natural gas prices reached a record low level amid milder-than-normal temperatures over the winter period, leaving record gas volume in storage as production continued to tick up. The agriculture sector was the strongest performer over the period, driven by a severe drought in the U.S. Midwest during the summer growing season of 2012.
PERFORMANCE
For the year ended October 31, 2012, Transamerica Commodity Strategy Class I2 returned (6.57%). By comparison, its benchmark, the Dow Jones-UBS Commodity, returned (4.44%).
STRATEGY REVIEW
During the period, the fund underperformed its benchmark. The primary detractor from performance was our deferred positioning in soybeans, corn and wheat. Hot and dry weather during the growing season in the U.S. Midwest caused significant damage to the crop causing grain prices to rally. Nearby corn, soybean and wheat futures outperformed longer-dated futures, leading to our deferred futures position to underperform that of the benchmark. Offsetting some of this negative impact, our deferred position in natural gas added to performance in the first quarter of 2012 as milder-than-normal temperatures over the winter period left record natural gas volumes in storage, causing nearby natural gas prices to decline more than deferred natural gas prices.
As of October 31, 2012, the fund held exposure to commodities through customized swaps on the Dow Jones-UBS (“DJ-UBS”) Commodity. Relative to the benchmark, we have 6-months deferred positions in Western Texas Intermediate crude oil and natural gas with the remaining commodities in the same contract month as the benchmark.
Goldman Sachs Asset Management’s (“GSAM”) strategy seeks to provide full exposure to the DJ-UBS Commodity. GSAM employs a semi-active approach whereby we do not take active views on individual commodities, but rather create exposure to commodities through the purchase of DJ-UBS total return swaps and total return swaps on enhanced roll versions of the index that deviate from the standard index roll.
Roll management is the primary source of our alpha generation. We implement the roll by deviating slightly from the DJ-UBS convention, which calls for rolling 20% of the futures each day on business days five through nine on a bi-monthly basis. Instead, we tactically avoid the buying pressure that coincides with the peak roll period, which can create a modest amount of alpha with small increases in tracking error.
To the extent the firm believes fundamental or technical developments will impact the futures roll timing decision, it will incorporate those views into the fund by electing to roll positions earlier, later, forward, or in different weights versus the index roll. Roll timing strategies employed may include: alternative roll date modifications, which avoid the market impact of plain vanilla index rolls during business days 5 to 9; forward exposure roll modifications, which avoid the market impact of vanilla index rolls and move exposure out the curve to mitigate the returns impact often associated with persistent contango; and seasonal roll modifications, which take advantage of seasonal relationships in commodity markets to increase returns. These strategies enable GSAM to generate potential excess returns over the benchmark.
Stephen Lucas
Michael G. Johnson
John Calvaruso, CFA
Co-Portfolio Managers
Goldman Sachs Asset Management, L.P.
| | | | |
| Transamerica Funds | | | | Annual Report 2012 |
| | Page 162 | | |
Transamerica Commodity Strategy
(formerly, Transamerica Goldman Sachs Commodity Strategy)
(unaudited)
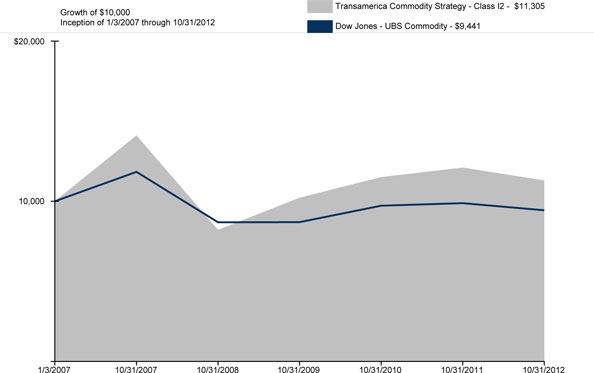
Average Annual Total Return for Periods Ended 10/31/2012
| | | | | | | | | | | | | | |
| | | 1 Year | | | 5 Years | | | 10 Years or
Life of Fund | | | Inception Date |
Class I2 (NAV) | | | (6.57 | )% | | | (4.34 | )% | | | 2.13 | % | | 01/03/2007 |
Dow Jones–UBS Commodity * | | | (4.44 | )% | | | (4.43 | )% | | | (0.98 | )% | | |
NOTES
| * | The Dow Jones–UBS Commodity Index Total Return USD (“Dow Jones–UBS Commodity”) is an unmanaged index used as a general measure of market performance. Calculations assume dividends and capital gains are reinvested and do not include any managerial expenses. The 10 Years or Life of Fund calculation is based on inception date of the class. You cannot invest directly in an index. |
The performance data presented represents past performance; future results may vary. Performance data does not reflect the deduction of taxes that would be paid on fund distributions or the redemption of fund shares. Investment return and principal value will fluctuate so that an investor’s shares, when redeemed, may be worth more or less than their original cost. Current performance may be lower or higher than performance quoted. Please see www.transamericafunds.com for performance data current to the most recent month-end. Net Asset Value (“NAV”) returns include the reinvestment of dividends and capital gains. Fund shares are sold without a sales load.
Performance figures reflect any fee waivers and/or expense reimbursements by the Investment Adviser. Without such waivers and/or reimbursements, the performance would be lower. Future waivers and/or reimbursements are at the discretion of the Investment Adviser.
The fund’s investment exposure to the commodities markets may subject the fund to greater volatility than investments in more traditional securities, such as stocks and bonds. The performance of commodity-linked derivative instruments may depend on the performance of the overall commodities markets and on other factors that affect the value of commodities, including weather, disease, and political, tax, and other regulatory developments. This material must be preceded or accompanied by a current prospectus, which includes specific contents regarding the investment objectives and policies of this fund. This fund is only available in Class I2 shares, which are not available for direct investment by the public.
| | | | |
| Transamerica Funds | | | | Annual Report 2012 |
| | Page 163 | | |
Transamerica Global Allocation
(formerly, Transamerica BlackRock Global Allocation)
(unaudited)
MARKET ENVIRONMENT
For the period of November 1, 2011 through October 31, 2012, global investors generally put aside concerns about Europe’s credit crisis, slowing growth in China, and uncertainty surrounding U.S. elections so as to drive up the returns of global equities versus returns of global bonds. We continue to believe that the best opportunities continue to lie primarily in high-quality equities and certain commodity-oriented investments relative to nearly all forms of fixed income securities, but particularly Western government bonds. Nevertheless, we believe that a diversified approach will remain important, as concerns regarding the U.S. “fiscal cliff” are likely to endure throughout the remainder of 2012, and because some degree of fiscal drag is highly likely to occur in the U.S., even if the full effects of the fiscal cliff are avoided.
PERFORMANCE
For the year ended October 31, 2012, Transamerica Global Allocation Class I2 returned 4.91%. By comparison, its primary and secondary benchmark the Financial Times Stock Exchange World Index (“FTSE World”) and the Transamerica Global Allocation Blended Benchmark, returned 9.48% and 7.75%, respectively.
STRATEGY REVIEW
For the 12-month period ended October 31, 2012, the fund underperformed the broad-based all-equity benchmark, the FTSE World Index and underperformed the Transamerica Global Allocation Blended Benchmark, which is comprised of the Standard & Poor’s 500® Index (36%), Financial Times Stock Exchange All-World ex-U.S. Index (24%), Bank of America Merrill Lynch U.S. Treasury Current 5-Year Index (24%), and Citigroup Non-U.S. Dollar World Government Bond Index (16%).
Within equities, the fund’s underweights in the U.S. and Canada detracted from performance. An overweight to Japan also detracted although this was partially offset by stock selection. From a sector perspective, an overweight and stock selection in materials and energy, as well as stock selection in information technology, had a negative impact. Stock selection in utilities contributed to performance. Within financials, stock selection was also additive, although positive effects were partially offset by an underweight exposure to the sector. The fund’s overall relative underweight in fixed income added to returns. Within fixed income, an overweight to corporate bonds also contributed to performance. The fund’s overweight to cash also weighed on returns.
During the 12-month period, the fund’s overall equity allocation decreased from 63% of net assets to 60%. Within equities, the fund decreased its weightings in Asia and Latin America and increased its weighting in the United States and Europe. The fund decreased its sector weightings in energy, materials, telecom, utilities, and industrials and increased its weightings in health care and financials. The fund’s allocation to fixed income decreased over the period from 27% of net assets to 24%. In the fixed income segment, the fund reduced exposure to U.S. Treasury securities and U.S. dollar-denominated foreign convertible bonds. Conversely, the fund increased exposure to U.S. dollar-denominated foreign corporate bonds, U.S. corporate bonds, and Australian government bonds. Reflecting the changes in the fund’s overall allocations to the equity and fixed income asset classes during the period, the fund’s cash and cash equivalent holdings increased from 10% of net assets to 16%.
Relative to the Transamerica Global Allocation Blended Benchmark, the fund ended the period neutral in equities, significantly underweight in fixed income and overweight in cash and cash equivalents. Within equities, the fund was overweight in Asia (most notably in Japan) and underweight in Europe and the United States. On a sector basis, the fund was overweight in materials, health care, energy, telecom, and IT, and underweight in financials, consumer staples, consumer discretionary, and industrials. Within fixed income, the fund was underweight U.S. treasuries, Japanese government bonds, and sovereign debt in Europe, and overweight sovereign debt in Australia and Brazil. In addition, the fund was overweight convertible bonds and corporate debt. With respect to currency exposure, the fund was overweight the U.S. Dollar, Brazilian Real, Singapore Dollar, and Canadian Dollar, along with smaller overweights in several emerging Asian currencies. The fund was underweight the Euro, Japanese Yen and British Pound.
Throughout the period, cash helped mitigate fund volatility and served as a source of funds for new investments. In addition, the fund’s cash position helped keep overall fund duration (sensitivity to interest rate movements) low.
The fund uses derivatives which may include options, futures, indexed securities, inverse securities, swaps and forward contracts both to seek to increase the return of the fund and to hedge (or protect) the value of the assets against adverse movements in currency exchange rates, interest rates and movements in the securities markets. The use of options, futures, indexed securities, inverse securities, swaps and forward contracts can be effective in protecting or enhancing the value of the fund’s assets and the fund will not engage in certain strategies that are considered highly risky and speculative. In addition, the Global Allocation Team adheres to all BlackRock-wide policies and SEC guidelines to ensure that the fund does not use leverage.
Dennis Stattman, CFA
Dan Chamby, CFA
Aldo Roldan
Co-Portfolio Managers
BlackRock Investment Management, LLC
| | | | |
| Transamerica Funds | | | | Annual Report 2012 |
| | Page 164 | | |
Transamerica Global Allocation
(formerly, Transamerica BlackRock Global Allocation)
(unaudited)
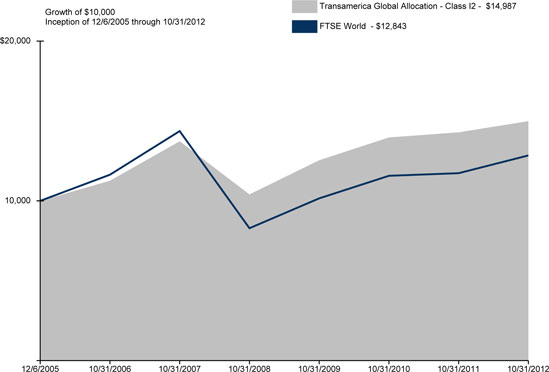
Average Annual Total Return for Periods Ended 10/31/2012
| | | | | | | | | | | | | | |
| | | 1 Year | | | 5 Years | | | 10 Years or
Life of Fund | | | Inception Date |
Class I2 (NAV) | | | 4.91 | % | | | 1.78 | % | | | 6.04 | % | | 12/06/2005 |
FTSE World * | | | 9.48 | % | | | (2.21 | )% | | | 3.69 | % | | |
Transamerica Global Allocation Blended Benchmark * | | | 7.75 | % | | | 2.19 | % | | | 5.34 | % | | |
NOTES
| * | The Financial Times Stock Exchange World Index (“FTSE World”), and the Transamerica Global Allocation Blended Benchmark are unmanaged indices used as a general measure of market performance. The Transamerica Global Allocation Blended Benchmark is composed of the following benchmarks: Standard & Poor’s 500® Index, 36%, The FTSE World, 24%, Merrill Lynch current 5-year Treasury Index, 24%, and Citigroup World Government Bond Index, 16%. Calculations assume dividends and capital gains are reinvested and do not include any managerial expenses. The 10 Years or Life of Fund calculation is based on the inception date of the class. You cannot invest directly in an Index. |
The performance data presented represents past performance; future results may vary. Performance data does not reflect the deduction of taxes that would be paid on fund distributions or the redemption of fund shares. Investment return and principal value will fluctuate so that an investor’s shares, when redeemed, may be worth more or less than their original cost. Current performance may be lower or higher than performance quoted. Please see www.transamericafunds.com for performance data current to the most recent month-end. Net Asset Value (“NAV”) returns include the reinvestment of dividends and capital gains. Fund shares are sold without a sales load.
Performance figures reflect any fee waivers and/or expense reimbursements by the Investment Adviser. Without such waivers and/or reimbursements, the performance would be lower. Future waivers and/or reimbursements are at the discretion of the Investment Adviser.
Global, foreign, and emerging market investing involves special considerations, including risks related to market and currency volatility, adverse social and political developments, and the relatively small size and lesser liquidity of these markets. The risks of investing in foreign securities are magnified in emerging markets. This material must be preceded or accompanied by a current prospectus, which includes specific contents regarding the investment objectives and policies of this fund. This fund is only available in Class I2 shares, which are not available for direct investment by the public.
| | | | |
| Transamerica Funds | | | | Annual Report 2012 |
| | Page 165 | | |
Transamerica Managed Futures Strategy
(formerly, Transamerica AQR Managed Futures Strategy)
unaudited
MARKET ENVIRONMENT
The fund does not express any fundamental views on the market environment. Instead, the fund pursues an active managed futures strategy. We invest in futures and forward contracts both long and short across the global equity, fixed income, commodity, and currency markets. We utilize both short and long-term trend following signals to attempt to profit from different types of trends that occur in all of these markets. Trend following can be simply described as going long markets that are rising in price and going short markets that are falling in price. In addition to trend following signals, we also incorporate signals that seek to identify overextended trends and reduce risk when the chance of a reversal is perceived as higher than normal, since market reversals generally cause losses for trend following strategies.
PERFORMANCE
For the year ended October 31, 2012, Transamerica Managed Futures Strategy, Class I2 returned 0.31%. By comparison, its benchmark, the Citigroup 3-Month Treasury Bill + 7% Wrap Index, returned 7.29%.
STRATEGY REVIEW
Fixed income was the strongest contributing asset class over the period. Most of the gains came from being generally long in global bond markets as well as short term interest rate futures, largely due to aggressive monetary policy actions undertaken by central banks around the world to combat a lackluster global economic growth.
In commodities, the fund performed well yearly in the period as it benefited from continued weakness in natural gas, which dropped primarily because of a very mild winter that tempered seasonal demand. The fund also benefited from drops in softs and precious metals. Conversely, the fund suffered later in the period as short positions detracted from performance when commodities generally rallied.
Equities were a small detractor from the fund’s performance. The fund was generally long equity markets in the period. This contributed to performance when equity markets generally rallied, but detracted from performance during periods of sharp drawdowns.
Currencies detracted from performance as trends reversed from the previous period, and instead generally followed a relatively choppy or trendless pattern throughout the year.
From a signal perspective, long term trend following signals contributed positively while short term trend following signals detracted. Overextended trend signals contributed positively as well, as a number of markets suffered sharp reversals. Overall, we believe this period continued to illustrate the importance of our fund construction, which emphasizes diversification across asset classes as well as diversification across signals.
Clifford S. Asness
John M. Liew
Brian K. Hurst
Yao Hua Ooi
Co-Portfolio Managers
AQR Capital Management, LLC.
| | | | |
| Transamerica Funds | | | | Annual Report 2012 |
| | Page 166 | | |
Transamerica Managed Futures Strategy
(formerly, Transamerica AQR Managed Futures Strategy)
(unaudited)
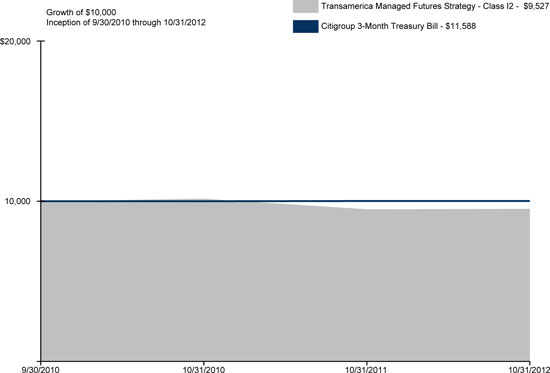
Average Annual Total Return for Periods Ended 10/31/2012
| | | | | | | | | | |
| | | 1 Year | | | 10 Years or
Life of Fund | | | Inception Date |
Class I2 (NAV) | | | 0.31 | % | | | (2.30 | )% | | 09/30/2010 |
Citigroup 3-Month Treasury Bill * | | | 7.29 | % | | | 7.32 | % | | |
NOTES
| * | The Citigroup 3-Month Treasury Bill + 7% Wrap Index (“Citigroup 3-Month Treasury Bill”) is an unmanaged index used as a general measure of market performance. Calculations assume dividends and capital gains are reinvested and do not include any managerial expenses. The 10 Years or Life of Fund calculation is based on the inception date of the class. You cannot invest directly in an index. |
The performance data presented represents past performance; future results may vary. Performance data does not reflect the deduction of taxes that would be paid on fund distributions or the redemption of fund shares. Investment return and principal value will fluctuate so that an investor’s shares, when redeemed, may be worth more or less than their original cost. Current performance may be lower or higher than performance quoted. Please see www.transamericainvestments.com for performance data current to the most recent month-end. Net Asset Value (“NAV”) returns include the reinvestment of dividends and capital gains. Fund shares are sold without a sales load.
Performance figures reflect any fee waivers and/or expense reimbursements by the Investment Adviser. Without such waivers and/or expense reimbursements, the performance would be lower. Future waivers and/or reimbursements are at the discretion of the Investment Adviser.
Securities purchased for an arbitrage strategy are intended to take advantage of a perceived relationship between the value of two securities and may not perform as expected. This material must be preceded or accompanied by a current prospectus, which includes specific contents regarding the investment objectives and policies of this fund. This fund is only available in Class I2 shares, which are not available for direct investment by the public.
| | | | |
| Transamerica Funds | | | | Annual Report 2012 |
| | Page 167 | | |
Understanding Your Funds’ Expenses
(unaudited)
SHAREHOLDER EXPENSES
Fund shareholders may incur two types of costs: (1) transaction costs, including sales charges (loads) on purchases, contingent deferred sales charges on redemptions; and (2) ongoing costs, including management fees, dividend expense on short-sales, and other fund expenses.
The following examples are intended to help you understand your ongoing costs (in dollars and cents) of investing in the funds and to compare these costs with the ongoing costs of investing in other funds.
The examples are based on an investment of $1,000 invested at May 1, 2012 and held for the entire period until October 31, 2012.
ACTUAL EXPENSES
The information in the table under the heading “Actual Expenses” provides information about actual account values and actual expenses. You may use the information in these columns, together with the amount you invested, to estimate the expenses that you paid over the period. Simply divide your account value by $1,000 (for example, an $8,600 account value divided by $1,000 = $8.60), then multiply the result by the number in the appropriate column for your share class titled “Expenses Paid During Period” to estimate the expenses you paid on your account during this period.
HYPOTHETICAL EXAMPLES FOR COMPARISON PURPOSES
The information in the table under the heading “Hypothetical Expenses” provides information about hypothetical account values and hypothetical expenses based on the funds’ actual expense ratios and an assumed rate of return of 5% per year before expenses, which are not the funds’ actual returns. The hypothetical account values and expenses may not be used to estimate the actual ending account balance or expenses you paid for the period. You may use this information to compare the ongoing costs of investing in the funds versus other funds. To do so, compare this 5% hypothetical example with the 5% hypothetical examples that appear in the shareholder reports of the other funds.
Please note that the expenses shown in the table are meant to highlight your ongoing costs only and do not reflect any transactional costs. Therefore, the information under the heading “Hypothetical Expenses” is useful in comparing ongoing costs only, and will not help you determine the relative total costs of owning different funds. In addition, if these transactional costs were included, your costs would have been higher.
Expense ratios may vary period to period because of various factors, such as an increase in expenses that are not a part of the advisory and administrative fees. Examples of such expenses are fees and expenses of trustees and their counsel, extraordinary expenses and interest expense.
| | | | | | | | | | | | | | | | | | | | | | | | |
| | | | | | Actual Expenses | | | Hypothetical Expenses(A) | | | | |
Fund Name(B) | | Beginning
Account Value | | | Ending Account
Value | | | Expenses Paid
During Period(C) | | | Ending Account
Value | | | Expenses Paid
During Period(C) | | | Annualized
Expense Ratio | |
Transamerica Commodity Strategy | | $ | 1,000.00 | | | $ | 997.90 | | | $ | 3.62 | | | $ | 1,021.52 | | | $ | 3.66 | | | | 0.72 | % |
Transamerica Global Allocation | | | 1,000.00 | | | | 1,009.10 | | | | 5.10 | | | | 1,020.06 | | | | 5.13 | | | | 1.01 | |
Transamerica Managed Futures Strategy | | | 1,000.00 | | | | 995.70 | | | | 6.82 | | | | 1,018.30 | | | | 6.90 | | | | 1.36 | |
| (A) | 5% return per year before expenses. |
| (B) | See the Notes to the Financial Statements for information regarding name changes for the funds. |
| (C) | Expenses are calculated using the funds’ annualized expense ratios (as disclosed in the table), multiplied by the average account value for the period, multiplied by the number of days in the period (184 days), and divided by the number of days in the year (366 days). |
| | | | |
| Transamerica Funds | | | | Annual Report 2012 |
| | Page 168 | | |
Consolidated Schedules of Investments Composition
At October 31, 2012
(The following charts summarize the Consolidated Schedules of Investments of the funds by asset type)
(unaudited)
| | | | |
Transamerica Commodity Strategy | | % of Net
Assets | |
Short-Term U.S. Government Obligations | | | 65.7 | % |
Repurchase Agreement | | | 25.7 | |
Securities Lending Collateral | | | 20.5 | |
Other Assets and Liabilities—Net(A) | | | (11.9 | ) |
| | | | |
Total | | | 100.0 | % |
| | | | |
| |
Transamerica Global Allocation | | % of Net
Assets | |
Common Stocks | | | 58.2 | % |
Short-Term U.S. Government Obligations | | | 14.7 | |
Securities Lending Collateral | | | 10.9 | |
Foreign Government Obligations | | | 9.4 | |
U.S. Government Obligations | | | 5.7 | |
Corporate Debt Securities | | | 4.1 | |
Convertible Bonds | | | 3.0 | |
Short-Term Foreign Government Obligations | | | 3.0 | |
Investment Companies | | | 2.7 | |
Preferred Stocks | | | 1.1 | |
Purchased Options | | | 0.7 | |
Convertible Preferred Stocks | | | 0.5 | |
Loan Assignments | | | 0.4 | |
Mortgage-Backed Security | | | 0.1 | |
Preferred Corporate Debt Securities | | | 0.0 | (B) |
Warrants | | | 0.0 | (B) |
Right | | | 0.0 | (B) |
Other Assets and Liabilities—Net(A) | | | (14.5 | ) |
| | | | |
Total | | | 100.0 | % |
| | | | |
| |
Transamerica Managed Futures Strategy | | % of Net
Assets | |
Investment Companies | | | 87.8 | % |
Other Assets and Liabilities—Net(A) | | | 12.2 | |
| | | | |
Total | | | 100.0 | % |
| | | | |
| (A) | The Other Assets and Liabilities—Net category may include, but is not limited to, Forward Foreign Currency contracts, Futures Contracts, Swap Agreements, Written Options and Swaptions, Securities Sold Short, and Cash Collateral. |
| (B) | Amount rounds to less than 0.1%. |
| | | | |
| Transamerica Funds | | | | Annual Report 2012 |
| | Page 169 | | |
Transamerica Commodity Strategy
(formerly, Transamerica Goldman Sachs Commodity Strategy)
CONSOLIDATED SCHEDULE OF INVESTMENTS
At October 31, 2012
| | | | | | | | |
| | | Principal
(000’s) | | | Value
(000’s) | |
SHORT-TERM U.S. GOVERNMENT OBLIGATIONS—65.7% | |
U.S. Treasury Bill | | | | | | | | |
0.08%, 01/10/2013 ^ | | $ | 19,000 | | | $ | 18,995 | |
0.10%, 02/07/2013 ^ | | | 20,000 | | | | 19,992 | |
0.12%, 03/07/2013 | | | 20,000 | | | | 19,988 | |
0.17%, 08/22/2013—09/19/2013 | | | 40,000 | | | | 39,941 | |
| | | | | | | | |
Total Short-Term U.S. Government Obligations
(cost $98,916) | | | | 98,916 | |
| | | | | | | | |
| | |
| | | Shares | | | Value
(000’s) | |
SECURITIES LENDING COLLATERAL—20.5% | |
State Street Navigator Securities Lending Trust—Prime Portfolio, 0.31% | | | 30,835,620 | | | | 30,836 | |
Total Securities Lending Collateral
(cost $30,836) | | | | | | | | |
| | | | | | | | |
| | | Principal
(000’s) | | | Value
(000’s) | |
REPURCHASE AGREEMENT—25.7% | | | | | | | | |
State Street Bank & Trust Co. 0.03% , dated 10/31/2012, to be repurchased at $38,705 on 11/01/2012. Collateralized by U.S. Government Agency Obligations, 3.00%, due 12/01/2026, and with a total value of $39,484. | | $ | 38,705 | | | $ | 38,705 | |
Total Repurchase Agreement (cost $38,705) | | | | | | | | |
| | | | | | | | |
Total Investment Securities (cost $168,457) P | | | | | | | 168,457 | |
Other Assets and Liabilities—Net | | | | | | | (17,964 | ) |
| | | | | | | | |
Net Assets | | | | | | $ | 150,493 | |
| | | | | | | | |
OVER THE COUNTER SWAP AGREEMENTS: b
TOTAL RETURN SWAP AGREEMENTS—RECEIVABLE: (A)
| | | | | | | | | | | | | | | | | | | | | | | | |
Reference Entity | | Fixed Rate | | | Termination
Date | | Counterparty | | Notional Amount
(000’s) | | | Market
Value
(000’s) | | | Premiums
Paid
(Received)
(000’s) | | | Unrealized
Appreciation
(Depreciation)
(000’s) | |
Dow Jones-UBS Commodity Custom Index § | | | 0.27 | % | | 06/13/2013 | | UBS | | $ | 53,873 | | | $ | ¿ | | | $ | — | | | $ | ¿ | |
Dow Jones-UBS Commodity Custom Index § | | | 0.27 | | | 06/13/2013 | | UBS | | | 1,506 | | | | ¿ | | | | — | | | | ¿ | |
Dow Jones-UBS Commodity Custom Index § | | | 0.27 | | | 06/13/2013 | | UBS | | | 30,566 | | | | ¿ | | | | — | | | | ¿ | |
GSAM MLBXGSM7 Index § | | | 0.25 | | | 12/17/2012 | | BOA | | | 38,691 | | | | ¿ | | | | — | | | | ¿ | |
GSAM MLBXGSM7 Index § | | | 0.25 | | | 12/17/2012 | | BOA | | | 26,600 | | | | (¿ | ) | | | — | | | | (¿ | ) |
| | | | | | | | | | | | | | | | | | | | | | | | |
| | | | | | | | | | | | | | $ | ¿ | | | $ | — | | | $ | ¿ | |
| | | | | | | | | | | | | | | | | | | | | | | | |
Collateral (Received) Pledged for OTC Financial Derivative Instruments
The following is a summary by counterparty of the market value of OTC financial derivative instruments and collateral (received) pledged as of 10/31/2012:
| | | | | | | | | | | | |
Counterparty | | Total Market Value of
OTC Derivatives | | | Collateral
(Received)/Pledged | | | Net Exposures | |
BOA | | $ | ¿ | | | $ | 8,690 | | | $ | 8,690 | |
UBS | | | ¿ | | | | 10,425 | | | | 10,425 | |
| (1) | Net exposure represents the net receivable (payable) that would be due from/to the counterparty in the event of default. |
The notes to the financial statements are an integral part of this report.
| | | | |
| Transamerica Funds | | | | Annual Report 2012 |
| | Page 170 | | |
Transamerica Commodity Strategy
(formerly, Transamerica Goldman Sachs Commodity Strategy)
CONSOLIDATED SCHEDULE OF INVESTMENTS (continued)
At October 31, 2012
NOTES TO SCHEDULE OF INVESTMENTS (all amounts in thousands):
| | Rate shown reflects the yield at 10/31/2012. |
| ^ | All or a portion of this security is on loan. The value of all securities on loan is $30,223. |
| P | Aggregate cost for federal income tax purposes is $192,632. Net unrealized depreciation for tax purposes is $11,059. |
| b | Cash, in the amount of $19,115, has been segregated by the custodian for the benefit of the broker for open swap contracts. |
| (A) | At the termination date, a net cash flow is exchanged where the total return is equivalent to the return of the reference index less a financing rate, if any. As a receiver, the fund would receive payments based on any positive total return and would owe payments in the event of a negative total return. As the payer, the fund would owe payments on any net positive total return, and would receive payment in the event of a negative total return. |
| § | Illiquid. Total aggregate market value of illiquid derivatives is less than $1, or less than 0.01% of the fund’s net assets. |
DEFINITIONS:
| | |
BOA | | Bank of America |
OTC | | Over the Counter |
UBS | | UBS Warburg LLC |
VALUATION SUMMARY (all amounts in thousands): '
| | | | | | | | | | | | | | | | |
Investment Securities | | Level 1 -
Quoted
Prices | | | Level 2 -
Other
Significant
Observable
Inputs | | | Level 3 -
Significant
Unobservable
Inputs | | | Value at
10/31/2012 | |
Repurchase Agreement | | $ | — | | | $ | 38,705 | | | $ | — | | | $ | 38,705 | |
Securities Lending Collateral | | | 30,836 | | | | — | | | | — | | | | 30,836 | |
Short-Term U.S. Government Obligations | | | — | | | | 98,916 | | | | — | | | | 98,916 | |
| | | | | | | | | | | | | | | | |
Total | | $ | 30,836 | | | $ | 137,621 | | | $ | — | | | $ | 168,457 | |
| | | | | | | | | | | | | | | | |
| | | | | | | | | | | | | | | | |
Other Financial Instruments ₣ | | Level 1 -
Quoted
Prices | | | Level 2 -
Other
Significant
Observable
Inputs | | | Level 3 -
Significant
Unobservable
Inputs | | | Value at
10/31/2012 | |
Total Return Swaps—Appreciation | | $ | — | | | $ | ¿ | | | $ | — | | | $ | ¿ | |
Total Return Swaps—Depreciation | | | — | | | | (¿ | ) | | | — | | | | (¿ | ) |
| | | | | | | | | | | | | | | | |
Total | | $ | — | | | $ | ¿ | | | $ | — | | | $ | ¿ | |
| | | | | | | | | | | | | | | | |
| ' | Transfers between levels are considered to have occurred at the end of the reporting period. There were no transfers into or out of Levels 1 and 2 during the period ended 10/31/2012. See the notes to the financial statements for more information regarding pricing inputs and valuation techniques. |
| ₣ | Other financial instruments are derivative instruments that are valued at unrealized appreciation (depreciation) on the instrument. |
| | | | |
| The notes to the financial statements are an integral part of this report. |
| Transamerica Funds | | | | Annual Report 2012 |
| | Page 171 | | |
Transamerica Global Allocation
(formerly, Transamerica BlackRock Global Allocation)
CONSOLIDATED SCHEDULE OF INVESTMENTS
At October 31, 2012
| | | | | | | | |
| | | Principal
(000’s) | | | Value
(000’s) | |
U.S. GOVERNMENT OBLIGATIONS—5.7% | |
United States—5.7% | | | | | | | | |
U.S. Treasury Note | | | | | | | | |
0.63%, 09/30/2017 ^ | | $ | 1,544 | | | $ | 1,538 | |
1.00%, 09/30/2019 ^ | | | 1,172 | | | | 1,162 | |
1.25%, 10/31/2019 | | | 392 | | | | 395 | |
1.38%, 09/30/2018 | | | 1,627 | | | | 1,670 | |
1.75%, 05/15/2022 g | | | 562 | | | | 568 | |
2.00%, 11/15/2021 | | | 409 | | | | 424 | |
2.25%, 03/31/2016 | | | 3,035 | | | | 3,220 | |
2.63%, 08/15/2020 | | | 2,721 | | | | 2,990 | |
3.50%, 05/15/2020 ☼ | | | 5,091 | | | | 5,927 | |
| | | | | | | | |
Total U.S. Government Obligations (cost $16,749) | | | | 17,894 | |
| | | | | | | | |
FOREIGN GOVERNMENT OBLIGATIONS—9.4% | |
Australia—2.6% | | | | | | | | |
Australia Government Bond | | | | | | | | |
4.75%, 11/15/2012 | | AUD | 1,453 | | | | 1,509 | |
5.50%, 12/15/2013—04/21/2023 | | | 3,702 | | | | 4,483 | |
5.75%, 05/15/2021— 07/15/2022 | | | 1,710 | | | | 2,150 | |
Brazil—1.5% | | | | | | | | |
Brazil Notas do Tesouro Nacional | | | | | | | | |
6.00%, 05/15/2015—08/15/2022 | | BRL | 1,279 | | | | 1,602 | |
10.00%, 01/01/2017—01/01/2021 | | | 5,936 | | | | 3,073 | |
Canada—0.5% | | | | | | | | |
Canadian Government Bond | | | | | | | | |
1.50%, 03/01/2017 | | CAD | 560 | | | | 565 | |
3.50%, 06/01/2020 | | | 416 | | | | 473 | |
4.00%, 06/01/2016 | | | 363 | | | | 398 | |
Germany—2.0% | | | | | | | | |
Bundesrepublik Deutschland | | | | | | | | |
3.50%, 07/04/2019 | | EUR | 1,801 | | | | 2,733 | |
4.25%, 07/04/2017 | | | 2,299 | | | | 3,506 | |
Hong Kong—0.5% | | | | | | | | |
Hong Kong Government Bond | | | | | | | | |
1.67%, 03/24/2014 | | HKD | 1,550 | | | | 204 | |
1.69%, 12/22/2014 | | | 1,500 | | | | 199 | |
2.03%, 03/18/2013 | | | 2,850 | | | | 370 | |
3.51%, 12/08/2014 | | | 2,750 | | | | 379 | |
4.13%, 02/22/2013 | | | 1,950 | | | | 255 | |
Malaysia—0.5% | | | | | | | | |
Malaysia Government Bond | | | | | | | | |
5.09%, 04/30/2014 | | MYR | 1,956 | | | | 661 | |
Republic of Malaysia | | | | | | | | |
3.21%, 05/31/2013 | | | 1,988 | | | | 653 | |
3.46%, 07/31/2013 | | | 1,092 | | | | 360 | |
Netherlands—0.1% | | | | | | | | |
Netherlands Government Bond | | | | | | | | |
1.00%, 02/24/2017—144A | | $ | 373 | | | | 375 | |
Poland—0.1% | | | | | | | | |
Republic of Poland | | | | | | | | |
3.00%, 08/24/2016 | | PLN | 1,352 | | | | 447 | |
Switzerland—0.2% | | | | | | | | |
Switzerland Government Bond | | | | | | | | |
2.00%, 04/28/2021—05/25/2022 | | CHF | 255 | | | | 312 | |
2.25%, 07/06/2020 | | | 210 | | | | 259 | |
United Kingdom—1.4% | | | | | | | | |
United Kingdom Gilt | | | | | | | | |
4.00%, 09/07/2016 | | GBP | 279 | | | | 509 | |
4.75%, 03/07/2020 | | | 2,007 | | | | 4,018 | |
| | | | | | | | |
Total Foreign Government Obligations (cost $28,241) | | | | 29,493 | |
| | | | | | | | |
| | | | | | | | |
| | | Principal
(000’s) | | | Value
(000’s) | |
MORTGAGE-BACKED SECURITY—0.1% | |
United States—0.1% | | | | | | | | |
Banc of America Large Loan, Inc. | | | | | | | | |
Series 2010-HLTN, Class HLTN | | | | | | | | |
1.96%, 11/15/2015—144A * | | $ | 362 | | | $ | 362 | |
Total Mortgage-Backed Security (cost $328) | | | | | |
|
PREFERRED CORPORATE DEBT SECURITIES—0.0% ¥ | |
United States—0.0% ¥ | | | | | | | | |
Deutsche Bank Capital Funding Trust VII | | | | | |
5.63%, 01/19/2016—144A * Ž | | | 64 | | | | 61 | |
NB Capital Trust II | | | | | | | | |
7.83%, 12/15/2026 | | | 31 | | | | 32 | |
| | | | | | | | |
Total Preferred Corporate Debt Securities (cost $81) | | | | 93 | |
| | | | | | | | |
CORPORATE DEBT SECURITIES—4.1% | |
Argentina—0.0% ¥ | | | | | | | | |
Empresa Distribuidora Y Comercializadora Norte | | | | | | | | |
9.75%, 10/25/2022—144A | | | 73 | | | | 34 | |
Australia—0.4% | | | | | | | | |
Commonwealth Bank of Australia | | | | | | | | |
1.90%, 09/18/2017 | | | 250 | | | | 254 | |
FMG Resources August 2006 Pty, Ltd. | | | | | | | | |
6.00%, 04/01/2017—144A | | | 120 | | | | 115 | |
National Australia Bank, Ltd. | | | | | | | | |
2.00%, 06/20/2017—144A | | | 462 | | | | 478 | |
TFS Corp., Ltd. | | | | | | | | |
11.00%, 07/15/2018—144A § | | | 515 | | | | 491 | |
Austria—0.1% | | | | | | | | |
OGX Austria GmbH | | | | | | | | |
8.50%, 06/01/2018—144A ^ | | | 340 | | | | 297 | |
Brazil—0.2% | | | | | | | | |
Banco Bradesco SA | | | | | | | | |
4.50%, 01/12/2017—144A ^ | | | 200 | | | | 215 | |
Hypermarcas SA | | | | | | | | |
6.50%, 04/20/2021—144A ^ | | | 170 | | | | 183 | |
Canada—0.1% | | | | | | | | |
Bank of Nova Scotia | | | | | | | | |
2.55%, 01/12/2017 ^ | | | 261 | | | | 276 | |
Viterra, Inc. | | | | | | | | |
5.95%, 08/01/2020—144A | | | 106 | | | | 114 | |
Cayman Islands—0.3% | | | | | | | | |
Hutchison Whampoa International 11, Ltd. | | | | | | | | |
3.50%, 01/13/2017—144A | | | 271 | | | | 288 | |
Odebrecht Drilling Norbe VIII/IX, Ltd. | | | | | | | | |
6.35%, 06/30/2021—144A ^ | | | 183 | | | | 211 | |
Petrobras International Finance Co.—Pifco | | | | | | | | |
3.50%, 02/06/2017 | | | 193 | | | | 204 | |
Chile—0.3% | | | | | | | | |
Banco del Estado de Chile | | | | | | | | |
2.03%, 04/02/2015 | | | 250 | | | | 248 | |
Banco Santander Chile | | | | | | | | |
2.44%, 02/14/2014—144A * | | | 270 | | | | 266 | |
Inversiones Alsacia SA | | | | | | | | |
8.00%, 08/18/2018—144A § | | | 190 | | | | 200 | |
Guernsey, Channel Islands—0.0% ¥ | | | | | | | | |
Credit Suisse Group Guernsey I, Ltd. | | | | | | | | |
7.88%, 02/24/2041—Reg S * | | | 200 | | | | 208 | |
Ireland—0.0% ¥ | | | | | | | | |
Nara Cable Funding, Ltd. | | | | | | | | |
8.88%, 12/01/2018—144A | | EUR | 100 | | | | 122 | |
The notes to the financial statements are an integral part of this report.
| | | | |
| Transamerica Funds | | | | Annual Report 2012 |
| | Page 172 | | |
Transamerica Global Allocation
(formerly, Transamerica BlackRock Global Allocation)
CONSOLIDATED SCHEDULE OF INVESTMENTS (continued)
At October 31, 2012
| | | | | | | | |
| | | Principal
(000’s) | | | Value
(000’s) | |
Luxembourg—0.3% | | | | | | | | |
Capsugel FinanceCo S.C.A. | | | | | | | | |
9.88%, 08/01/2019—144A | | EUR | 100 | | | $ | 147 | |
Intelsat Jackson Holdings SA | | | | | | | | |
7.50%, 04/01/2021 | | $ | 234 | | | | 251 | |
Sberbank of Russia Via SB
Capital SA | | | | | | | | |
5.13%, 10/29/2022—144A ^ | | | 200 | | | | 200 | |
TNK-BP Finance SA | | | | | | | | |
6.63%, 03/20/2017—144A | | | 100 | | | | 113 | |
TNK-BP Finance SA—Series 2 | | | | | | | | |
7.50%, 07/18/2016—144A | | | 100 | | | | 114 | |
Netherlands—0.0% ¥ | | | | | | | | |
Cooperatieve Centrale Raiffeisen-Boerenleenbank BA | | | | | | | | |
3.38%, 01/19/2017 | | | 285 | | | | 307 | |
New World Resources NV | | | | | | | | |
7.88%, 05/01/2018—Reg S | | EUR | 91 | | | | 117 | |
Singapore—0.1% | | | | | | | | |
Bumi Investment Pte, Ltd. | | | | | | | | |
10.75%, 10/06/2017—144A | | $ | 144 | | | | 112 | |
Oversea-Chinese Banking Corp., Ltd. | | | | | | | | |
1.63%, 03/13/2015—144A | | | 274 | | | | 277 | |
Sweden—0.1% | | | | | | | | |
Nordea Bank AB | | | | | | | | |
3.13%, 03/20/2017—144A | | | 200 | | | | 211 | |
Switzerland—0.0% ¥ | | | | | | | | |
UBS AG | | | | | | | | |
5.88%, 12/20/2017 | | | 100 | | | | 118 | |
United Kingdom—0.2% | | | | | | | | |
BAT International Finance PLC | | | | | | | | |
2.13%, 06/07/2017—144A ^ | | | 189 | | | | 193 | |
Lloyds TSB Bank PLC | | | | | | | | |
13.00%, 01/22/2029 * Ž | | GBP | 340 | | | | 714 | |
United States—2.0% | | | | | | | | |
Ally Financial, Inc. | | | | | | | | |
4.50%, 02/11/2014 | | $ | 155 | | | | 160 | |
American Express Credit Corp. | | | | | | | | |
1.75%, 06/12/2015 | | | 190 | | | | 195 | |
2.38%, 03/24/2017 | | | 85 | | | | 89 | |
Anheuser-Busch InBev Worldwide, Inc. | | | | | | | | |
1.38%, 07/15/2017 | | | 157 | | | | 159 | |
Bank of America Corp. | | | | | | | | |
1.50%, 10/09/2015 | | | 413 | | | | 414 | |
Building Materials Corp., of America | | | | | | | | |
6.88%, 08/15/2018—144A | | | 61 | | | | 65 | |
Cablevision Systems Corp. | | | | | | | | |
5.88%, 09/15/2022 | | | 118 | | | | 117 | |
Calpine Corp. (Escrow Shares) | | | | | | | | |
8.75%, 07/15/2013 Ә | | | 2,142 | | | | ¿ | |
CCO Holdings LLC / CCO Holdings Capital Corp. | | | | | | | | |
5.25%, 09/30/2022 | | | 387 | | | | 389 | |
Citigroup Funding, Inc. | | | | | | | | |
0.80%, 11/27/2012 | | | 400 | | | | 400 | |
Citigroup, Inc. | | | | | | | | |
5.95%, 01/30/2023 * Ž | | | 142 | | | | 146 | |
CONSOL Energy, Inc. | | | | | | | | |
8.00%, 04/01/2017 | | | 300 | | | | 316 | |
Cricket Communications, Inc. | | | | | | | | |
7.75%, 10/15/2020 ^ | | | 117 | | | | 121 | |
DaVita, Inc. | | | | | | | | |
6.38%, 11/01/2018 | | | 91 | | | | 97 | |
6.63%, 11/01/2020 | | | 73 | | | | 78 | |
| | | | | | | | |
| | | Principal
(000’s) | | | Value
(000’s) | |
United States (continued) | | | | | | | | |
Delta Topco Limited | | | | | | | | |
10.00%, 11/24/2060 Ә § D | | $ | 497 | | | $ | 533 | |
DJO Finance LLC / DJO Finance Corp. | | | | | | | | |
9.75%, 10/15/2017 | | | 50 | | | | 42 | |
Ford Motor Credit Co., LLC | | | | | | | | |
6.63%, 08/15/2017 | | | 112 | | | | 131 | |
General Electric Capital Corp. | | | | | | | | |
5.63%, 05/01/2018 | | | 185 | | | | 220 | |
6.25%, 12/15/2022 * Ž | | | 300 | | | | 327 | |
Hughes Satellite Systems Corp. | | | | | | | | |
6.50%, 06/15/2019 | | | 169 | | | | 181 | |
7.63%, 06/15/2021 | | | 89 | | | | 99 | |
Hyundai Capital America | | | | | | | | |
1.63%, 10/02/2015—144A | | | 74 | | | | 74 | |
2.13%, 10/02/2017—144A | | | 117 | | | | 118 | |
JPMorgan Chase Bank NA | | | | | | | | |
0.73%, 06/13/2016 * | | | 250 | | | | 242 | |
Linn Energy LLC / Linn Energy Finance Corp. | | | | | | | | |
7.75%, 02/01/2021 | | | 158 | | | | 169 | |
Morgan Stanley | | | | | | | | |
4.88%, 11/01/2022 | | | 157 | | | | 159 | |
Phibro Animal Health Corp. | | | | | | | | |
9.25%, 07/01/2018—144A | | | 52 | | | | 50 | |
Reliance Holdings USA, Inc. | | | | | | | | |
4.50%, 10/19/2020—144A | | | 294 | | | | 311 | |
SunGard Data Systems, Inc. | | | | | | | | |
7.38%, 11/15/2018 | | | 171 | | | | 184 | |
Texas Industries, Inc. | | | | | | | | |
9.25%, 08/15/2020 ^ | | | 212 | | | | 226 | |
| | | | | | | | |
Total Corporate Debt Securities (cost $12,470) | | | | 12,890 | |
| | | | | | | | |
CONVERTIBLE BONDS—3.0% | | | | | | | | |
Bermuda—0.0% ¥ | | | | | | | | |
Celestial Nutrifoods, Ltd. | | | | | | | | |
0.00%, 06/12/2011 Џ ‡ § | | SGD | 1,400 | | | | 34 | |
Cayman Islands—0.4% | | | | | | | | |
China Milk Products Group, Ltd. | | | | | | | | |
0.00%, 01/05/2012 Џ ‡ § | | $ | 600 | | | | 120 | |
FU JI Food and Catering Services Holdings, Ltd. | | | | | | | | |
0.00%, 10/18/2010 Џ ‡ § | | CNY | 2,700 | | | | 4 | |
Pyrus, Ltd. | | | | | | | | |
7.50%, 12/20/2015—144A § | | $ | 200 | | | | 224 | |
Zeus Cayman | | | | | | | | |
2.67%, 08/19/2013 | | JPY | 67,000 | | | | 818 | |
China—0.0% ¥ | | | | | | | | |
China Petroleum & Chemical Corp. | | | | | | | | |
1.73%, 04/24/2014 | | HKD | 820 | | | | 125 | |
Guernsey, Channel Islands—0.1% | | | | | | | | |
Credit Suisse Group Capital | | | | | | | | |
4.00%, 03/29/2013 Ә | | CHF | 214 | | | | 308 | |
India—0.3% | | | | | | | | |
REI Agro, Ltd. | | | | | | | | |
5.50%, 11/13/2014—144A § | | $ | 640 | | | | 436 | |
Suzlon Energy, Ltd. | | | | | | | | |
Zero Coupon, 07/25/2014 § | | | 342 | | | | 188 | |
0.01%, 10/11/2012 Џ ‡ | | | 187 | | | | 126 | |
Jersey, Channel Islands—0.3% | | | | | | | | |
Dana Gas Sukuk, Ltd. | | | | | | | | |
7.50%, 10/31/2049 ^ | | | 1,400 | | | | 1,092 | |
The notes to the financial statements are an integral part of this report.
| | | | |
| Transamerica Funds | | | | Annual Report 2012 |
| | Page 173 | | |
Transamerica Global Allocation
(formerly, Transamerica BlackRock Global Allocation)
CONSOLIDATED SCHEDULE OF INVESTMENTS (continued)
At October 31, 2012
| | | | | | | | |
| | | Principal
(000’s) | | | Value
(000’s) | |
Malaysia—0.1% | | | | | | | | |
Paka Capital, Ltd. | | | | | | | | |
3.02%, 03/12/2013 | | $ | 200 | | | $ | 205 | |
Netherlands—0.4% | | | | | | | | |
Bio City Development Co. B.V. | | | | | | | | |
8.00%, 07/06/2018—144A § | | | 1,200 | | | | 1,197 | |
Singapore—0.5% | | | | | | | | |
CapitaLand, Ltd. | | | | | | | | |
2.10%, 11/15/2016 | | SGD | 500 | | | | 411 | |
2.95%, 06/20/2022 | | | 750 | | | | 600 | |
3.13%, 03/05/2018 | | | 250 | | | | 219 | |
Keppel Land, Ltd. | | | | | | | | |
2.50%, 06/23/2013 | | | 200 | | | | 164 | |
Olam International, Ltd. | | | | | | | | |
6.00%, 10/15/2016 | | $ | 400 | | | | 433 | |
Ying Li International Real Estate, Ltd. | | | | | | | | |
4.00%, 03/03/2015 § | | SGD | 500 | | | | 426 | |
United Kingdom—0.1% | | | | | | | | |
Essar Energy PLC | | | | | | | | |
4.25%, 02/01/2016 | | $ | 200 | | | | 140 | |
United States—0.8% | | | | | | | | |
Electronic Arts, Inc. | | | | | | | | |
0.75%, 07/15/2016 | | | 105 | | | | 95 | |
Gilead Sciences, Inc. | | | | | | | | |
1.63%, 05/01/2016 | | | 335 | | | | 527 | |
Hologic, Inc.—Series 2010 | | | | | | | | |
2.00%, 12/15/2037 * | | | 494 | | | | 555 | |
Mylan, Inc. | | | | | | | | |
3.75%, 09/15/2015 | | | 292 | | | | 577 | |
Stillwater Mining Co. | | | | | | | | |
1.75%, 10/15/2032 | | | 118 | | | | 122 | |
Take-Two Interactive Software, Inc. | | | | | | | | |
1.75%, 12/01/2016—144A | | | 306 | | | | 291 | |
4.38%, 06/01/2014 | | | 73 | | | | 91 | |
| | | | | | | | |
Total Convertible Bonds (cost $11,244) | | | | 9,528 | |
| | | | | | | | |
LOAN ASSIGNMENTS—0.4% | | | | | | | | |
Canada—0.0% ¥ | | | | | | | | |
Essar Steel Algoma, Inc. | | | | | | | | |
8.75%, 09/19/2014 * | | | 94 | | | | 94 | |
United States—0.4% | | | | | | | | |
Navistar, Inc., Tranche B | | | | | | | | |
7.00%, 08/17/2017 * | | | 48 | | | | 48 | |
Obsidian Natural Gas Trust | | | | | | | | |
7.00%, 11/02/2015 * § | | | 751 | | | | 751 | |
Vodafone Amers Finance 2, Inc., Tranche B | | | | | | | | |
6.25%, 07/11/2016 * § | | | 386 | | | | 395 | |
| | | | | | | | |
Total Loan Assignments (cost $1,271) | | | | 1,288 | |
| | | | | | | | |
SHORT-TERM FOREIGN GOVERNMENT OBLIGATIONS—3.0% | |
Germany—0.4% | | | | | | | | |
German Treasury Bill | | | | | | | | |
Zero Coupon, 12/05/2012—01/23/2013 | | EUR | 800 | | | | 1,038 | |
Japan—1.0% | | | | | | | | |
Japan Treasury Discount Bill | | | | | | | | |
0.10%, 02/20/2013 | | JPY | 60,000 | | | | 751 | |
0.11%, 12/10/2012—01/16/2013 | | | 110,000 | | | | 1,378 | |
0.73%, 11/09/2012 | | | 80,000 | | | | 1,002 | |
Mexico—0.6% | | | | | | | | |
Mexico Cetes | | | | | | | | |
4.76%, 11/15/2012 | | MXN | 13,040 | | | | 994 | |
6.36%, 12/13/2012 | | | 12,715 | | | | 966 | |
| | | | | | | | |
| | | Principal
(000’s) | | | Value
(000’s) | |
Singapore—1.0% | | | | | | | | |
Singapore Treasury Bill | | | | | | | | |
0.23%, 01/10/2013—01/31/2013 | | SGD | 2,726 | | | $ | 2,233 | |
0.25%, 02/07/2013 | | | 1,129 | | | | 925 | |
| | | | | | | | |
Total Short-Term Foreign Government Obligations
(cost $9,210) | | | | 9,287 | |
| | | | | | | | |
SHORT-TERM U.S. GOVERNMENT OBLIGATIONS—14.7% | |
United States—14.7% | | | | | | | | |
U.S. Treasury Bill | | | | | | | | |
0.05%, 11/01/2012—11/08/2012 | | $ | 11,975 | | | | 11,974 | |
0.07%, 12/06/2012—12/13/2012 ^ | | | 6,270 | | | | 6,270 | |
0.07%, 01/03/2013—01/17/2013 | | | 4,780 | | | | 4,780 | |
0.08%, 12/20/2012 | | | 3,100 | | | | 3,100 | |
0.08%, 01/10/2013 ^ | | | 575 | | | | 575 | |
0.09%, 01/24/2013 | | | 2,945 | | | | 2,944 | |
0.10%, 01/31/2013 | | | 10,875 | | | | 10,871 | |
0.12%, 11/15/2012 ^ | | | 2,200 | | | | 2,200 | |
0.12%, 11/23/2012 | | | 3,500 | | | | 3,500 | |
| | | | | | | | |
Total Short-Term U.S. Government Obligations (cost $46,214) | | | | 46,214 | |
| | | | | | | | |
| | |
| | | Shares | | | Value
(000’s) | |
CONVERTIBLE PREFERRED STOCKS—0.5% | |
United States—0.5% | | | | | | | | |
General Motors Co., 4.75% ^ | | | 7,376 | | | | 300 | |
Health Care REIT, Inc., 6.50% | | | 3,997 | | | | 225 | |
NextEra Energy, Inc., 5.60% | | | 4,971 | | | | 253 | |
Omnicare Capital Trust II, 4.00% | | | 2,661 | | | | 125 | |
PPL Corp., 8.75% | | | 3,988 | | | | 216 | |
PPL Corp., 9.50% ^ | | | 4,300 | | | | 234 | |
United Technologies Corp., 7.50% | | | 2,704 | | | | 147 | |
Wells Fargo & Co., 7.50% | | | 145 | | | | 181 | |
| | | | | | | | |
Total Convertible Preferred Stocks (cost $1,616) | | | | 1,681 | |
| | | | | | | | |
PREFERRED STOCKS—1.1% | |
Brazil—0.2% | | | | | | | | |
Cia Brasileira de Distribuicao Grupo Pao de Acucar, 0.78% | | | 7,208 | | | | 331 | |
Itau Unibanco Holding SA, 3.80% | | | 18,947 | | | | 277 | |
Germany—0.3% | | | | | | | | |
Volkswagen AG, 1.86% | | | 4,188 | | | | 866 | |
United Kingdom—0.2% | | | | | | | | |
HSBC Holdings PLC, 8.00% ^ | | | 8,400 | | | | 237 | |
Royal Bank of Scotland Group PLC, 6.40% ‡ | | | 5,075 | | | | 110 | |
Royal Bank of Scotland Group PLC, 6.75% ^ ‡ | | | 2,725 | | | | 61 | |
Royal Bank of Scotland Group PLC, 7.25% ‡ | | | 8,364 | | | | 199 | |
United States—0.4% | | | | | | | | |
Citigroup Capital XIII, 7.88% * | | | 13,106 | | | | 364 | |
GMAC Capital Trust I, 8.13% * | | | 17,508 | | | | 458 | |
RBS Capital Funding Trust VII, 6.08% ‡ Ž | | | 5,177 | | | | 97 | |
US Bancorp—Series F, 6.50% * | | | 7,244 | | | | 214 | |
US Bancorp—Series G, 6.00% * ^ | | | 4,308 | | | | 124 | |
| | | | | | | | |
Total Preferred Stocks (cost $2,891) | | | | 3,338 | |
| | | | | | | | |
The notes to the financial statements are an integral part of this report.
| | | | |
| Transamerica Funds | | | | Annual Report 2012 |
| | Page 174 | | |
Transamerica Global Allocation
(formerly, Transamerica BlackRock Global Allocation)
CONSOLIDATED SCHEDULE OF INVESTMENTS (continued)
At October 31, 2012
| | | | | | | | |
| | | Shares | | | Value
(000’s) | |
COMMON STOCKS—58.2% | | | | | | | | |
Australia—0.4% | | | | | | | | |
Asciano, Ltd. | | | 50,214 | | | $ | 238 | |
Newcrest Mining, Ltd. | | | 13,720 | | | | 376 | |
Orica, Ltd. | | | 7,190 | | | | 187 | |
Telstra Corp., Ltd. | | | 48,257 | | | | 207 | |
Belgium—0.1% | | | | | | | | |
RHJ International ‡ | | | 36,300 | | | | 181 | |
Brazil—0.8% | | | | | | | | |
Cia Energetica de Minas Gerais ADR | | | 6,882 | | | | 83 | |
Cyrela Brazil Realty SA Empreendimentos e Participacoes | | | 27,741 | | | | 235 | |
Hypermarcas SA ‡ | | | 37,975 | | | | 302 | |
MRV Engenharia e Participacoes SA | | | 47,504 | | | | 241 | |
Petroleo Brasileiro SA—Class A ADR | | | 28,419 | | | | 583 | |
Qualicorp SA ‡ | | | 21,554 | | | | 221 | |
SLC Agricola SA | | | 24,481 | | | | 234 | |
Telefonica Brasil SA ADR | | | 10,926 | | | | 241 | |
Canada—1.6% | | | | | | | | |
Athabasca Oil Corp. ‡ | | | 44,600 | | | | 540 | |
Bank of Nova Scotia ^ | | | 5,098 | | | | 277 | |
Detour Gold Corp. ‡ | | | 6,734 | | | | 190 | |
Eldorado Gold Corp. | | | 27,542 | | | | 407 | |
Kinross Gold Corp. | | | 37,002 | | | | 368 | |
Osisko Mining Corp. ‡ | | | 28,608 | | | | 281 | |
Rogers Communications, Inc.—Class B ^ | | | 4,926 | | | | 216 | |
Shaw Communications, Inc.—Class B | | | 4,616 | | | | 101 | |
Silver Wheaton Corp. | | | 13,563 | | | | 549 | |
Sino-Forest Corp.—Class A ‡ Ә ^ | | | 20,700 | | | | 28 | |
Suncor Energy, Inc. | | | 28,554 | | | | 958 | |
Talisman Energy, Inc. | | | 11,017 | | | | 125 | |
Teck Resources, Ltd.—Class B | | | 1,339 | | | | 43 | |
TELUS Corp. Ә | | | 3,170 | | | | 206 | |
Toronto-Dominion Bank ^ | | | 2,401 | | | | 195 | |
Chile—0.0% ¥ | | | | | | | | |
Sociedad Quimica y Minera de Chile SA ADR | | | 2,651 | | | | 153 | |
Denmark—0.1% | | | | | | | | |
A.P. Moller—Maersk A/S—Class B | | | 24 | | | | 167 | |
France—1.5% | | | | | | | | |
AXA SA | | | 22,769 | | | | 362 | |
BNP Paribas SA | | | 14,497 | | | | 729 | |
Cie Generale D’optique Essilor International SA | | | 1,720 | | | | 155 | |
Eutelsat Communications SA | | | 6,060 | | | | 194 | |
LVMH Moet Hennessy Louis Vuitton SA | | | 2,481 | | | | 403 | |
Safran SA | | | 17,268 | | | | 687 | |
Sanofi ADR | | | 1,000 | | | | 44 | |
Sanofi | | | 6,261 | | | | 550 | |
Technip SA | | | 1,280 | | | | 144 | |
Total SA | | | 11,639 | | | | 586 | |
Total SA ADR | | | 13,996 | | | | 705 | |
Unibail-Rodamco SE REIT | | | 776 | | | | 175 | |
Germany—2.3% | | | | | | | | |
Allianz SE | | | 3,707 | | | | 460 | |
BASF SE | | | 7,693 | | | | 637 | |
Bayer AG | | | 6,914 | | | | 602 | |
Bayerische Motoren Werke AG | | | 3,016 | | | | 240 | |
Daimler AG | | | 3,856 | | | | 180 | |
Deutsche Bank AG | | | 7,173 | | | | 325 | |
Deutsche Boerse AG | | | 1,730 | | | | 94 | |
Deutsche Telekom AG | | | 41,681 | | | | 476 | |
Fresenius Medical Care AG & Co., KGaA | | | 7,877 | | | | 553 | |
Fresenius SE & Co. KGaA | | | 4,762 | | | | 543 | |
Infineon Technologies AG | | | 47,571 | | | | 324 | |
Kabel Deutschland Holding AG | | | 4,306 | | | | 310 | |
Lanxess AG | | | 5,213 | | | | 431 | |
Linde AG | | | 4,281 | | | | 720 | |
| | | | | | | | |
| | | Shares | | | Value
(000’s) | |
Germany (continued) | | | | | | | | |
Muenchener Rueckversicherungs AG | | | 1,118 | | | $ | 180 | |
SAP AG | | | 2,877 | | | | 210 | |
Siemens AG | | | 3,818 | | | | 384 | |
Telefonica Deutschland Holding AG ‡ | | | 27,939 | | | | 213 | |
Hong Kong—0.8% | | | | | | | | |
Beijing Enterprises Holdings, Ltd. ^ | | | 118,790 | | | | 769 | |
Chaoda Modern Agriculture Holdings, Ltd. ‡ Ә ^ § | | | 1,090,190 | | | | 25 | |
China BlueChemical, Ltd. | | | 219,825 | | | | 140 | |
China Resources Gas Group, Ltd. | | | 88,802 | | | | 198 | |
Dongfeng Motor Group Co., Ltd.—Class H | | | 57,273 | | | | 71 | |
Haitian International Holdings, Ltd. | | | 57,386 | | | | 71 | |
Jiangsu Expressway Co., Ltd.—Class H | | | 40,000 | | | | 34 | |
Link Real Estate Investment Trust | | | 140,630 | | | | 698 | |
Sinopharm Group Co., Ltd.—Class H ^ | | | 74,595 | | | | 251 | |
Tianjin Development Holdings, Ltd. ‡ | | | 493,079 | | | | 235 | |
Yuanda China Holdings, Ltd. | | | 778,504 | | | | 91 | |
Zhongsheng Group Holdings, Ltd. ^ | | | 112,578 | | | | 146 | |
Indonesia—0.0% ¥ | | | | | | | | |
Telekomunikasi Indonesia Persero PT | | | 97,683 | | | | 99 | |
Israel—0.1% | | | | | | | | |
Teva Pharmaceutical Industries, Ltd. ADR n | | | 11,101 | | | | 449 | |
Italy—0.6% | | | | | | | | |
ENI SpA | | | 35,285 | | | | 810 | |
Fiat Industrial SpA | | | 57,482 | | | | 621 | |
Intesa Sanpaolo SpA | | | 158,170 | | | | 254 | |
UniCredit SpA ‡ | | | 27,530 | | | | 122 | |
Japan—6.1% | | | | | | | | |
Aisin Seiki Co., Ltd. | | | 4,830 | | | | 140 | |
Asahi Kasei Corp. | | | 39,800 | | | | 219 | |
Astellas Pharma, Inc. | | | 4,200 | | | | 209 | |
Bridgestone Corp. | | | 23,300 | | | | 543 | |
Canon, Inc. | | | 13,664 | | | | 441 | |
Daihatsu Motor Co., Ltd. ^ | | | 8,780 | | | | 154 | |
Daikin Industries, Ltd. | | | 3,200 | | | | 89 | |
Denso Corp. | | | 7,770 | | | | 243 | |
East Japan Railway Co. | | | 9,865 | | | | 677 | |
FANUC Corp. | | | 1,850 | | | | 295 | |
Fuji Heavy Industries, Ltd. | | | 64,420 | | | | 619 | |
Futaba Industrial Co., Ltd. ^ ‡ | | | 11,500 | | | | 43 | |
Hitachi Chemical Co., Ltd. ^ | | | 13,600 | | | | 192 | |
Hitachi, Ltd. | | | 30,300 | | | | 161 | |
Honda Motor Co., Ltd. | | | 17,882 | | | | 535 | |
Hoya Corp. | | | 17,089 | | | | 346 | |
IHI Corp. | | | 20,000 | | | | 42 | |
INPEX Corp. | | | 98 | | | | 559 | |
Japan Airlines Co., Ltd. ‡ | | | 5,000 | | | | 238 | |
JGC Corp. | | | 17,910 | | | | 616 | |
JSR Corp. ^ | | | 11,300 | | | | 194 | |
KAO Corp. | | | 4,300 | | | | 121 | |
KDDI Corp. | | | 5,600 | | | | 435 | |
Kinden Corp. | | | 3,000 | | | | 19 | |
Kirin Holdings Co., Ltd. | | | 24,100 | | | | 302 | |
Kubota Corp. ^ | | | 55,584 | | | | 568 | |
Kuraray Co., Ltd. | | | 14,230 | | | | 165 | |
Kyowa Hakko Kirin Co., Ltd. | | | 19,180 | | | | 204 | |
Mitsubishi Corp. | | | 26,320 | | | | 470 | |
Mitsui & Co., Ltd. | | | 66,832 | | | | 942 | |
Mitsui Fudosan Co., Ltd. | | | 12,500 | | | | 253 | |
MS&AD Insurance Group Holdings | | | 19,517 | | | | 331 | |
Murata Manufacturing Co., Ltd. | | | 5,550 | | | | 270 | |
Nintendo Co., Ltd. ^ | | | 2,700 | | | | 348 | |
Nippon Telegraph & Telephone Corp. | | | 7,530 | | | | 343 | |
Nomura Holdings, Inc. | | | 71,600 | | | | 258 | |
NTT DOCOMO, Inc. | | | 249 | | | | 366 | |
Okumura Corp. ^ | | | 41,300 | | | | 133 | |
Rinnai Corp. | | | 2,780 | | | | 190 | |
The notes to the financial statements are an integral part of this report.
| | | | |
| Transamerica Funds | | | | Annual Report 2012 |
| | Page 175 | | |
Transamerica Global Allocation
(formerly, Transamerica BlackRock Global Allocation)
CONSOLIDATED SCHEDULE OF INVESTMENTS (continued)
At October 31, 2012
| | | | | | | | |
| | | Shares | | | Value
(000’s) | |
Japan (continued) | | | | | | | | |
ROHM Co., Ltd. | | | 3,460 | | | $ | 112 | |
Shin-Etsu Chemical Co., Ltd. | | | 12,276 | | | | 692 | |
Softbank Corp. | | | 1,800 | | | | 57 | |
Sony Financial Holdings, Inc. | | | 10,400 | | | | 186 | |
Sumitomo Corp. | | | 13,300 | | | | 181 | |
Sumitomo Electric Industries, Ltd. | | | 8,900 | | | | 96 | |
Sumitomo Mitsui Financial Group, Inc. | | | 12,080 | | | | 370 | |
Suzuki Motor Corp. | | | 33,662 | | | | 763 | |
Takeda Pharmaceutical Co., Ltd. | | | 3,500 | | | | 163 | |
TDK Corp. ^ | | | 4,120 | | | | 155 | |
Terumo Corp. | | | 3,350 | | | | 144 | |
Toda Corp. ^ | | | 39,900 | | | | 120 | |
Tokio Marine Holdings, Inc. | | | 31,900 | | | | 844 | |
Tokyo Gas Co., Ltd. | | | 96,370 | | | | 511 | |
Toyota Industries Corp. | | | 17,137 | | | | 489 | |
UBE Industries, Ltd. | | | 87,100 | | | | 199 | |
West Japan Railway Co. ^ | | | 4,400 | | | | 192 | |
Yahoo! Japan Corp. | | | 567 | | | | 195 | |
Yamada Denki Co., Ltd. ^ | | | 6,640 | | | | 288 | |
Jersey, Channel Islands—0.1% | | | | | | | | |
Randgold Resources, Ltd. ADR | | | 3,787 | | | | 453 | |
Korea, Republic of—0.9% | | | | | | | | |
Cheil Industries, Inc. | | | 1,764 | | | | 151 | |
Hyundai Motor Co. | | | 1,869 | | | | 385 | |
KT Corp. | | | 1,180 | | | | 40 | |
KT Corp. ADR | | | 6,128 | | | | 104 | |
KT&G Corp. | | | 4,254 | | | | 324 | |
POSCO | | | 427 | | | | 134 | |
POSCO ADR | | | 1,893 | | | | 148 | |
Samsung Electronics Co., Ltd. | | | 1,544 | | | | 1,856 | |
Samsung Fine Chemicals Co., Ltd. | | | 618 | | | | 39 | |
Luxembourg—0.1% | | | | | | | | |
Tenaris SA ADR | | | 4,738 | | | | 178 | |
Malaysia—0.5% | | | | | | | | |
Axiata Group Bhd | | | 267,712 | | | | 574 | |
British American Tobacco Malaysia Bhd | | | 7,200 | | | | 149 | |
IHH Healthcare Bhd ‡ | | | 535,000 | | | | 574 | |
Telekom Malaysia Bhd | | | 115,424 | | | | 227 | |
Mexico—0.4% | | | | | | | | |
America Movil SAB de CV ADR | | | 23,169 | | | | 586 | |
Fomento Economico Mexicano SAB de CV ADR | | | 1,739 | | | | 158 | |
Mexichem SAB de CV ^ | | | 38,300 | | | | 190 | |
Netherlands—0.8% | | | | | | | | |
ASML Holding NV | | | 8,350 | | | | 459 | |
DE Master Blenders 1753 NV ‡ | | | 14,738 | | | | 180 | |
ING Groep NV ‡ | | | 42,255 | | | | 373 | |
Koninklijke KPN NV | | | 22,940 | | | | 145 | |
Royal Dutch Shell PLC—Class A ADR | | | 9,845 | | | | 674 | |
Unilever NV | | | 6,335 | | | | 233 | |
Ziggo NV | | | 16,598 | | | | 538 | |
New Zealand—0.0% ¥ | | | | | | | | |
Guinness Peat Group PLC ‡ ^ | | | 208,533 | | | | 98 | |
Norway—0.1% | | | | | | | | |
Statoil ASA | | | 11,395 | | | | 282 | |
Philippines—0.0% ¥ | | | | | | | | |
Philippine Long Distance Telephone Co. ADR | | | 2,221 | | | | 141 | |
Portugal—0.0% ¥ | | | | | | | | |
Zon Multimedia Servicos de Telecomunicacoes e Multimedia SGPS SA | | | 28,615 | | | | 91 | |
Russian Federation—0.2% | | | | | | | | |
Federal Hydrogenerating Co. JSC ADR | | | 98,167 | | | | 233 | |
Sberbank of Russia | | | 122,978 | | | | 360 | |
Singapore—0.4% | | | | | | | | |
CapitaLand, Ltd. ^ | | | 146,150 | | | | 392 | |
DBS Group Holdings, Ltd. | | | 12,770 | | | | 146 | |
| | | | | | | | |
| | | Shares | | | Value
(000’s) | |
Singapore (continued) | | | | | | | | |
Keppel Corp., Ltd. | | | 50,111 | | | $ | 438 | |
MobileOne, Ltd. | | | 19,000 | | | | 41 | |
Oversea-Chinese Banking Corp. | | | 45,190 | | | | 337 | |
Raffles Medical Group, Ltd. | | | 51,200 | | | | 103 | |
Singapore Press Holdings, Ltd. ^ | | | 31,080 | | | | 103 | |
Singapore Telecommunications, Ltd. | | | 155,450 | | | | 410 | |
United Overseas Bank, Ltd. | | | 6,970 | | | | 104 | |
South Africa—0.1% | | | | | | | | |
Life Healthcare Group Holdings, Ltd. | | | 53,340 | | | | 202 | |
Spain—0.2% | | | | | | | | |
Banco Bilbao Vizcaya Argentaria SA | | | 25,465 | | | | 212 | |
Banco Santander SA | | | 45,649 | | | | 343 | |
Sweden—0.1% | | | | | | | | |
Millicom International Cellular SA | | | 487 | | | | 42 | |
Svenska Handelsbanken AB—Class A | | | 5,248 | | | | 180 | |
Switzerland—1.4% | | | | | | | | |
Nestle SA | | | 15,489 | | | | 982 | |
Novartis AG | | | 5,639 | | | | 339 | |
Roche Holding AG | | | 5,067 | | | | 974 | |
Swisscom AG | | | 679 | | | | 282 | |
Syngenta AG | | | 2,643 | | | | 1,032 | |
UBS AG ‡ | | | 24,005 | | | | 360 | |
Zurich Insurance Group AG ‡ | | | 909 | | | | 224 | |
Taiwan—0.4% | | | | | | | | |
Cheng Shin Rubber Industry Co., Ltd. | | | 61,670 | | | | 154 | |
Chunghwa Telecom Co., Ltd. | | | 56,333 | | | | 177 | |
Chunghwa Telecom Co., Ltd. ADR ^ | | | 10,109 | | | | 314 | |
Far EasTone Telecommunications Co., Ltd. | | | 77,069 | | | | 178 | |
Taiwan Semiconductor Manufacturing Co., Ltd. | | | 103,760 | | | | 315 | |
Yulon Motor Co., Ltd. | | | 84,057 | | | | 147 | |
Thailand—0.4% | | | | | | | | |
Bangkok Dusit Medical Services PCL | | | 48,300 | | | | 168 | |
PTT Global Chemical PCL | | | 159,037 | | | | 317 | |
PTT PCL | | | 20,597 | | | | 214 | |
Siam Commercial Bank PCL | | | 43,875 | | | | 230 | |
United Kingdom—3.2% | | | | | | | | |
Amlin PLC | | | 14,849 | | | | 89 | |
Antofagasta PLC | | | 21,135 | | | | 429 | |
AstraZeneca PLC | | | 18,700 | | | | 868 | |
AstraZeneca PLC ADR | | | 993 | | | | 46 | |
BG Group PLC | | | 63,366 | | | | 1,173 | |
BHP Billiton PLC | | | 10,195 | | | | 327 | |
BP PLC | | | 46,255 | | | | 331 | |
BP PLC ADR | | | 10,204 | | | | 438 | |
British American Tobacco PLC | | | 4,346 | | | | 215 | |
BT Group PLC—Class A | | | 145,445 | | | | 499 | |
Diageo PLC ADR | | | 4,240 | | | | 485 | |
Genel Energy PLC ‡ | | | 18,886 | | | | 247 | |
GlaxoSmithKline PLC ADR | | | 985 | | | | 44 | |
Glencore International PLC | | | 21,396 | | | | 118 | |
HSBC Holdings PLC | | | 99,939 | | | | 982 | |
Invensys PLC | | | 44,396 | | | | 163 | |
KazMunaiGas Exploration Production—Reg S JSC GDR | | | 19,996 | | | | 355 | |
Lloyds TSB Group PLC ‡ | | | 412,852 | | | | 270 | |
National Grid PLC | | | 60,712 | | | | 693 | |
NMC Health PLC ‡ | | | 30,513 | | | | 89 | |
Novorossiysk Commercial Sea Port—Reg S PJSC GDR | | | 18,622 | | | | 124 | |
Polyus Gold International, Ltd. ‡ | | | 85,688 | | | | 285 | |
Rio Tinto PLC | | | 4,544 | | | | 228 | |
Shire PLC | | | 15,721 | | | | 442 | |
SSE PLC | | | 25,425 | | | | 594 | |
Unilever PLC | | | 4,188 | | | | 156 | |
Unilever PLC ADR | | | 2,615 | | | | 98 | |
Vodafone Group PLC | | | 96,716 | | | | 263 | |
The notes to the financial statements are an integral part of this report.
| | | | |
| Transamerica Funds | | | | Annual Report 2012 |
| | Page 176 | | |
Transamerica Global Allocation
(formerly, Transamerica BlackRock Global Allocation)
CONSOLIDATED SCHEDULE OF INVESTMENTS (continued)
At October 31, 2012
| | | | | | | | |
| | | Shares | | | Value
(000’s) | |
United Kingdom (continued) | | | | | | | | |
Vodafone Group PLC ADR | | | 13,830 | | | $ | 376 | |
United States—34.5% | | | | | | | | |
3M Co. | | | 4,809 | | | | 421 | |
Abbott Laboratories | | | 9,192 | | | | 602 | |
Accenture PLC—Class A | | | 732 | | | | 49 | |
ACE, Ltd. | | | 11,035 | | | | 867 | |
Activision Blizzard, Inc. n | | | 66,720 | | | | 727 | |
Adobe Systems, Inc. ‡ | | | 1,776 | | | | 60 | |
AES Corp. | | | 26,404 | | | | 276 | |
Aetna, Inc. | | | 16,849 | | | | 736 | |
Agilent Technologies, Inc. ^ | | | 8,897 | | | | 320 | |
Agrium, Inc. | | | 2,350 | | | | 248 | |
Alcoa, Inc. ^ n | | | 34,190 | | | | 293 | |
Allergan, Inc. | | | 7,157 | | | | 644 | |
Alliance Data Systems Corp. ‡ ^ | | | 448 | | | | 64 | |
Altria Group, Inc. | | | 11,863 | | | | 378 | |
Amdocs, Ltd. ^ | | | 1,597 | | | | 53 | |
American Electric Power Co., Inc. | | | 9,399 | | | | 418 | |
American Express Co. | | | 8,171 | | | | 457 | |
American Tower Corp.—Class A REIT | | | 7,105 | | | | 535 | |
American Water Works Co., Inc. | | | 5,955 | | | | 219 | |
Ameriprise Financial, Inc. | | | 731 | | | | 43 | |
AmerisourceBergen Corp.—Class A ^ | | | 6,992 | | | | 276 | |
Amgen, Inc. | | | 5,261 | | | | 455 | |
Anadarko Petroleum Corp. | | | 4,954 | | | | 341 | |
Apache Corp. | | | 6,285 | | | | 520 | |
Apple, Inc. | | | 8,630 | | | | 5,136 | |
Applied Materials, Inc. n | | | 28,584 | | | | 303 | |
Arch Capital Group, Ltd. ‡ ^ | | | 3,623 | | | | 160 | |
ASML Holding NV ^ | | | 1,095 | | | | 60 | |
AT&T, Inc. | | | 53,431 | | | | 1,847 | |
Autoliv, Inc. ^ | | | 600 | | | | 35 | |
Axis Capital Holdings, Ltd. | | | 1,159 | | | | 42 | |
Bank of America Corp. | | | 96,921 | | | | 903 | |
Bank of New York Mellon Corp. | | | 31,892 | | | | 787 | |
BB&T Corp. | | | 5,380 | | | | 156 | |
Berkshire Hathaway, Inc.—Class B ‡ | | | 2,482 | | | | 214 | |
BioMarin Pharmaceutical, Inc. ‡ ^ n | | | 3,727 | | | | 138 | |
Boeing Co. | | | 8,689 | | | | 612 | |
BorgWarner, Inc. ‡ ^ | | | 2,792 | | | | 184 | |
Bristol-Myers Squibb Co. | | | 14,241 | | | | 474 | |
Brookfield Asset Management, Inc.—Class A ^ | | | 6,862 | | | | 236 | |
CA, Inc. | | | 19,346 | | | | 436 | |
Calpine Corp. ‡ | | | 23,594 | | | | 415 | |
Canadian Natural Resources, Ltd. | | | 11,542 | | | | 349 | |
Canadian Pacific Railway, Ltd. | | | 4,636 | | | | 427 | |
Capital One Financial Corp. | | | 8,261 | | | | 497 | |
Cardinal Health, Inc. | | | 12,464 | | | | 513 | |
Celgene Corp. ‡ | | | 4,107 | | | | 301 | |
CenturyLink, Inc. ^ | | | 3,263 | | | | 125 | |
CF Industries Holdings, Inc. | | | 872 | | | | 179 | |
Charles Schwab Corp. ^ | | | 12,036 | | | | 163 | |
Check Point Software Technologies, Ltd. ‡ | | | 918 | | | | 41 | |
Chevron Corp. | | | 8,803 | | | | 970 | |
Chubb Corp. ^ | | | 5,083 | | | | 391 | |
CIGNA Corp. | | | 6,006 | | | | 306 | |
Cisco Systems, Inc. n | | | 75,136 | | | | 1,288 | |
Citigroup, Inc. | | | 24,898 | | | | 931 | |
CMS Energy Corp. | | | 9,343 | | | | 227 | |
CNA Financial Corp. | | | 1,693 | | | | 50 | |
CNH Global NV ‡ | | | 1,241 | | | | 56 | |
Coach, Inc. ^ | | | 793 | | | | 44 | |
Cobalt International Energy, Inc. ‡ | | | 13,826 | | | | 288 | |
Coca-Cola Co. | | | 7,149 | | | | 266 | |
Colgate-Palmolive Co. | | | 5,897 | | | | 619 | |
Comcast Corp.—Class A | | | 40,971 | | | | 1,536 | |
| | | | | | | | |
| | | Shares | | | Value
(000’s) | |
United States (continued) | | | | | | | | |
Computer Sciences Corp. | | | 1,452 | | | $ | 44 | |
ConocoPhillips | | | 762 | | | | 44 | |
CONSOL Energy, Inc. | | | 21,524 | | | | 757 | |
Constellation Brands, Inc.—Class A ‡ | | | 1,593 | | | | 56 | |
Corning, Inc. ^ n | | | 89,571 | | | | 1,051 | |
Cosan, Ltd.—Class A | | | 35,176 | | | | 577 | |
Coventry Health Care, Inc. | | | 1,045 | | | | 46 | |
Covidien PLC | | | 4,412 | | | | 242 | |
Crown Castle International Corp. ‡ ^ | | | 3,330 | | | | 222 | |
Crown Holdings, Inc. ‡ | | | 3,928 | | | | 150 | |
Cummins, Inc. | | | 2,108 | | | | 197 | |
CVS Caremark Corp. | | | 9,784 | | | | 454 | |
DaVita, Inc. ‡ | | | 2,752 | | | | 310 | |
Dell, Inc. | | | 24,631 | | | | 227 | |
Delphi Automotive PLC ‡ | | | 3,300 | | | | 104 | |
Delta Topco Limited ‡ Ә § D | | | 645,881 | | | | 330 | |
Devon Energy Corp. | | | 16,688 | | | | 971 | |
Diamond Offshore Drilling, Inc. ^ | | | 704 | | | | 49 | |
Discover Financial Services | | | 10,465 | | | | 429 | |
DISH Network Corp.—Class A | | | 1,645 | | | | 59 | |
Dominion Resources, Inc. | | | 5,119 | | | | 270 | |
Dow Chemical Co. | | | 13,649 | | | | 400 | |
Dr. Pepper Snapple Group, Inc. ^ | | | 2,474 | | | | 106 | |
E.I. du Pont de Nemours & Co. ^ | | | 9,415 | | | | 419 | |
Eastman Chemical Co. | | | 877 | | | | 52 | |
Eaton Corp. | | | 1,411 | | | | 67 | |
Electronic Arts, Inc. ‡ n | | | 44,102 | | | | 545 | |
EMC Corp. ‡ n | | | 32,423 | | | | 792 | |
EOG Resources, Inc. | | | 2,917 | | | | 340 | |
Expedia, Inc. ^ | | | 985 | | | | 58 | |
Express Scripts Holding Co. ‡ | | | 4,175 | | | | 257 | |
Fidelity National Financial, Inc.—Class A | | | 8,113 | | | | 174 | |
Fidelity National Information Services, Inc. | | | 1,514 | | | | 50 | |
FMC Corp. | | | 19,706 | | | | 1,054 | |
Ford Motor Co. | | | 36,129 | | | | 403 | |
Freeport-McMoRan Copper & Gold, Inc. | | | 7,418 | | | | 288 | |
Freescale Semiconductor, Ltd. ‡ ^ | | | 49,800 | | | | 445 | |
Fusion-io, Inc. ‡ ^ | | | 11,661 | | | | 275 | |
Garmin, Ltd. ^ | | | 1,157 | | | | 44 | |
General Dynamics Corp. | | | 670 | | | | 46 | |
General Electric Co. | | | 100,066 | | | | 2,107 | |
General Mills, Inc. | | | 11,158 | | | | 447 | |
General Motors Co. ‡ | | | 19,455 | | | | 496 | |
Gilead Sciences, Inc. ‡ ^ | | | 6,738 | | | | 453 | |
Goldcorp, Inc. | | | 30,569 | | | | 1,383 | |
Goldman Sachs Group, Inc. | | | 6,075 | | | | 744 | |
Google, Inc.—Class A ‡ | | | 1,875 | | | | 1,275 | |
Halliburton Co. | | | 11,163 | | | | 360 | |
HCA Holdings, Inc. | | | 23,899 | | | | 679 | |
HealthSouth Corp. ‡ ^ | | | 9,282 | | | | 205 | |
Helmerich & Payne, Inc. ^ | | | 860 | | | | 41 | |
Herbalife, Ltd. ^ | | | 869 | | | | 45 | |
Hillshire Brands Co. ^ | | | 12,290 | | | | 320 | |
HJ Heinz Co. ^ | | | 5,327 | | | | 306 | |
Hologic, Inc. ‡ ^ | | | 11,815 | | | | 244 | |
Humana, Inc. | | | 5,562 | | | | 413 | |
Intel Corp. ^ | | | 69,060 | | | | 1,493 | |
International Game Technology | | | 11,191 | | | | 144 | |
International Paper Co. | | | 1,345 | | | | 49 | |
Intuit, Inc. ^ | | | 815 | | | | 48 | |
Johnson & Johnson ^ | | | 26,944 | | | | 1,909 | |
Johnson Controls, Inc. ^ | | | 5,944 | | | | 153 | |
JPMorgan Chase & Co. | | | 28,842 | | | | 1,202 | |
Juniper Networks, Inc. ‡ | | | 27,257 | | | | 452 | |
KBR, Inc. | | | 8,450 | | | | 235 | |
KLA-Tencor Corp. | | | 825 | | | | 38 | |
Kraft Foods Group, Inc. ‡ n | | | 9,958 | | | | 453 | |
The notes to the financial statements are an integral part of this report.
| | | | |
| Transamerica Funds | | | | Annual Report 2012 |
| | Page 177 | | |
Transamerica Global Allocation
(formerly, Transamerica BlackRock Global Allocation)
CONSOLIDATED SCHEDULE OF INVESTMENTS (continued)
At October 31, 2012
| | | | | | | | |
| | | Shares | | | Value
(000’s) | |
United States (continued) | | | | | | | | |
Kroger Co. ^ | | | 1,886 | | | $ | 48 | |
L-3 Communications Holdings, Inc. | | | 693 | | | | 51 | |
Leap Wireless International, Inc. ‡ ^ | | | 10,529 | | | | 56 | |
Lear Corp. | | | 1,004 | | | | 43 | |
Life Technologies Corp. ‡ | | | 3,302 | | | | 162 | |
Lincoln National Corp. | | | 2,093 | | | | 52 | |
Lorillard, Inc. | | | 1,405 | | | | 163 | |
M&T Bank Corp. ^ | | | 2,180 | | | | 227 | |
Macy’s, Inc. | | | 1,213 | | | | 46 | |
Manchester United PLC—Class A ‡ ^ | | | 11,117 | | | | 140 | |
Marathon Oil Corp. | | | 43,773 | | | | 1,316 | |
Marathon Petroleum Corp. | | | 27,357 | | | | 1,503 | |
Mastercard, Inc.—Class A | | | 2,030 | | | | 936 | |
Mattel, Inc. n | | | 14,629 | | | | 538 | |
McDermott International, Inc. ‡ ^ | | | 15,772 | | | | 169 | |
McDonald’s Corp. | | | 3,989 | | | | 346 | |
McGraw-Hill Cos., Inc. | | | 821 | | | | 45 | |
McKesson Corp. | | | 5,146 | | | | 480 | |
Mead Johnson Nutrition Co.—Class A | | | 8,525 | | | | 526 | |
Medtronic, Inc. | | | 16,562 | | | | 689 | |
Merck & Co., Inc. | | | 28,841 | | | | 1,316 | |
MetLife, Inc. | | | 7,221 | | | | 256 | |
MetroPCS Communications, Inc. ‡ | | | 31,064 | | | | 317 | |
Mettler-Toledo International, Inc. ‡ ^ | | | 1,067 | | | | 181 | |
Microsoft Corp. | | | 39,781 | | | | 1,135 | |
Mondelez International, Inc.—Class A | | | 19,674 | | | | 522 | |
Monsanto Co. | | | 5,630 | | | | 485 | |
Morgan Stanley | | | 12,521 | | | | 218 | |
Motorola Solutions, Inc. ^ | | | 993 | | | | 51 | |
Murphy Oil Corp. | | | 813 | | | | 49 | |
Mylan, Inc. ‡ ^ | | | 15,411 | | | | 391 | |
National Oilwell Varco, Inc. | | | 10,739 | | | | 791 | |
Navistar International Corp. ‡ ^ | | | 7,383 | | | | 138 | |
NetApp, Inc. ‡ | | | 15,440 | | | | 415 | |
Newmont Mining Corp. | | | 14,184 | | | | 774 | |
NextEra Energy, Inc. | | | 11,072 | | | | 775 | |
Northern Trust Corp. | | | 4,139 | | | | 198 | |
Occidental Petroleum Corp. | | | 21,846 | | | | 1,726 | |
Oracle Corp. n | | | 86,576 | | | | 2,687 | |
PACCAR, Inc. ^ | | | 3,615 | | | | 157 | |
Parker Hannifin Corp. | | | 567 | | | | 45 | |
PepsiCo, Inc. | | | 4,641 | | | | 321 | |
PerkinElmer, Inc. | | | 7,043 | | | | 218 | |
Perrigo Co. ^ | | | 2,810 | | | | 323 | |
Pfizer, Inc. | | | 71,752 | | | | 1,784 | |
Philip Morris International, Inc. | | | 8,191 | | | | 726 | |
Phillips 66 n | | | 31,552 | | | | 1,488 | |
Platinum Underwriters Holdings, Ltd. ^ | | | 2,367 | | | | 105 | |
Potash Corp. of Saskatchewan, Inc. | | | 17,940 | | | | 724 | |
PPG Industries, Inc. | | | 518 | | | | 61 | |
PPL Corp. | | | 11,959 | | | | 354 | |
Praxair, Inc. | | | 1,679 | | | | 178 | |
Precision Castparts Corp. | | | 2,341 | | | | 405 | |
Procter & Gamble Co. | | | 21,180 | | | | 1,466 | |
Progressive Corp. ^ | | | 13,507 | | | | 301 | |
Prudential Financial, Inc. ^ | | | 3,170 | | | | 181 | |
PulteGroup, Inc. ‡ ^ n | | | 21,456 | | | | 372 | |
QEP Resources, Inc. ^ | | | 15,410 | | | | 447 | |
QUALCOMM, Inc. | | | 27,835 | | | | 1,630 | |
Reinsurance Group of America, Inc.—Class A | | | 701 | | | | 37 | |
RenaissanceRe Holdings, Ltd. | | | 2,379 | | | | 194 | |
RHJ International—144A ‡ | | | 17,100 | | | | 85 | |
Rockwell Automation, Inc. | | | 8,183 | | | | 581 | |
Ross Stores, Inc. | | | 679 | | | | 41 | |
SanDisk Corp. ‡ ^ n | | | 17,640 | | | | 737 | |
Schlumberger, Ltd. | | | 17,240 | | | | 1,200 | |
| | | | | | | | |
| | | Shares | | | Value
(000’s) | |
United States (continued) | | | | | | | | |
Simon Property Group, Inc. REIT | | | 1,003 | | | $ | 153 | |
SM Energy Co. ^ | | | 11,060 | | | | 596 | |
Southern Co. ^ | | | 6,964 | | | | 326 | |
Spirit Aerosystems Holdings, Inc.—Class A ‡ ^ | | | 14,552 | | | | 227 | |
St. Joe Co. ‡ ^ | | | 56,287 | | | | 1,114 | |
StanCorp Financial Group, Inc. ^ | | | 2,494 | | | | 86 | |
State Street Corp. | | | 11,929 | | | | 532 | |
Stillwater Mining Co. ‡ ^ | | | 10,970 | | | | 114 | |
Suncor Energy, Inc. | | | 1,462 | | | | 49 | |
Symantec Corp. ‡ | | | 18,251 | | | | 332 | |
TE Connectivity, Ltd. | | | 1,432 | | | | 46 | |
Thermo Fisher Scientific, Inc. | | | 5,967 | | | | 364 | |
Tiffany & Co. ^ n | | | 5,518 | | | | 349 | |
Time Warner Cable, Inc. | | | 5,768 | | | | 572 | |
Torchmark Corp. ^ | | | 903 | | | | 46 | |
Travelers Cos., Inc. ^ | | | 8,119 | | | | 576 | |
U.S. Bancorp | | | 19,149 | | | | 636 | |
Unilever NV | | | 2,366 | | | | 87 | |
Union Pacific Corp. | | | 7,398 | | | | 910 | |
United Technologies Corp. | | | 14,281 | | | | 1,117 | |
United Therapeutics Corp. ‡ ^ | | | 1,735 | | | | 79 | |
UnitedHealth Group, Inc. | | | 15,626 | | | | 876 | |
Universal Health Services, Inc.—Class B | | | 11,644 | | | | 482 | |
Unum Group | | | 1,975 | | | | 40 | |
Valeant Pharmaceuticals International, Inc. ‡ n | | | 3,284 | | | | 184 | |
Valero Energy Corp. | | | 1,769 | | | | 51 | |
Verizon Communications, Inc. | | | 24,856 | | | | 1,110 | |
Vertex Pharmaceuticals, Inc. ‡ n | | | 6,343 | | | | 306 | |
Visa, Inc.—Class A | | | 9,617 | | | | 1,334 | |
Wal-Mart Stores, Inc. n | | | 15,300 | | | | 1,147 | |
Waters Corp. ‡ | | | 3,854 | | | | 315 | |
Weatherford International, Ltd. ‡ | | | 9,450 | | | | 107 | |
WellPoint, Inc. | | | 7,398 | | | | 453 | |
Wells Fargo & Co. | | | 47,271 | | | | 1,593 | |
Western Digital Corp. | | | 1,218 | | | | 42 | |
Western Union Co. | | | 1,959 | | | | 25 | |
Whiting Petroleum Corp. ‡ | | | 13,903 | | | | 584 | |
Wyndham Worldwide Corp. | | | 862 | | | | 43 | |
XL Group PLC—Class A | | | 24,232 | | | | 599 | |
| | | | | | | | |
Total Common Stocks (cost $162,405) | | | | | | | 183,356 | |
| | | | | | | | |
INVESTMENT COMPANIES—2.7% | | | | | | | | |
United Kingdom—0.0% ¥ | | | | | | | | |
Vinaland, Ltd. ‡ | | | 40,457 | | | | 18 | |
United States—2.7% | | | | | | | | |
ETFS Physical Palladium Shares ‡ | | | 3,131 | | | | 187 | |
ETFS Platinum Trust ‡ | | | 2,643 | | | | 408 | |
SPDR Gold Shares ‡ | | | 47,349 | | | | 7,901 | |
| | | | | | | | |
Total Investment Companies (cost $6,864) | | | | | | | 8,514 | |
| | | | | | | | |
RIGHT—0.0% ¥ | | | | | | | | |
Spain—0.0% ¥ | | | | | | | | |
Banco Santander SA ‡ ^ | | | 45,649 | | | | 9 | |
Total Right (cost $9) | | | | | | | | |
| | |
WARRANTS—0.0% ¥ | | | | | | | | |
Australia—0.0% ¥ | | | | | | | | |
TFS Corp., Ltd. ‡ Ә | | | | | | | | |
Expiration: 07/15/2018 | | | | | | | | |
Exercise Price: AUD1.28 | | | 190,550 | | | | 7 | |
Canada—0.0% ¥ | | | | | | | | |
Kinross Gold Corp. ‡ | | | | | | | | |
Expiration: 09/03/2013 | | | | | | | | |
Exercise Price: $ 32.00 | | | 9,602 | | | | 2 | |
The notes to the financial statements are an integral part of this report.
| | | | |
| Transamerica Funds | | | | Annual Report 2012 |
| | Page 178 | | |
Transamerica Global Allocation
(formerly, Transamerica BlackRock Global Allocation)
CONSOLIDATED SCHEDULE OF INVESTMENTS (continued)
At October 31, 2012
| | | | | | | | |
| | | | | | | |
| | | Shares | | | Value
(000’s) | |
United States—0.0% ¥ | | | | | | | | |
Ford Motor Co. ‡ | | | | | | | | |
Expiration: 01/01/2013 | | | | | | | | |
Exercise Price: $ 9.20 | | | 43,117 | | | $ | 93 | |
| | | | | | | | |
Total Warrants (cost $235) | | | | | | | 102 | |
| | | | | | | | |
| | |
| | | Notional
Amount
(000’s) | | | Value
(000’s) | |
PURCHASED OPTIONS—0.7% | | | | | | | | |
Call Options—0.5% | | | | | | | | |
OTC- Nikkei 225
Index Value 9,048.47
Expires 12/13/2013
Counterparty: BOA | | $ | ¿ | | | | 51 | |
OTC- Nikkei 225
Index Value 9,054.06
Expires 12/13/2013
Counterparty: JPM | | | ¿ | | | | 51 | |
OTC- Nikkei 225
Index Value 9,068.17
Expires 12/13/2013
Counterparty: CITI | | | ¿ | | | | 51 | |
OTC- Nikkei 225
Index Value 9,097.06
Expires 12/13/2013
Counterparty: GSC | | | ¿ | | | | 49 | |
OTC- Taiwan TAIEX Index
Index Value 8,807.55
Expires 09/18/2013
Counterparty: CSFB | | | 1 | | | | 1 | |
OTC- Taiwan TAIEX Index
Index Value 7,057.00
Expires 12/18/2013
Counterparty: JPM | | | ¿ | | | | 22 | |
OTC- Taiwan TAIEX Index
Index Value 7,249.48
Expires 12/18/2013
Counterparty: CITI | | | ¿ | | | | 26 | |
Taiwan TAIEX Index
Index Value 8,646.11
Expires 12/18/2013 | | | 3 | | | | 7 | |
Anadarko Petroleum Corp.
Strike Price $80.00
Expires 01/19/2013 | | | 24 | | | | 26 | |
Anadarko Petroleum Corp.
Strike Price $75.00
Expires 03/16/2013 | | | 6 | | | | 20 | |
Apple, Inc.
Strike Price $635.00
Expires 02/16/2013 | | | 2 | | | | 37 | |
Murphy Oil Corp.
Strike Price $65.00
Expires 01/19/2013 | | | 15 | | | | 23 | |
Nexen, Inc.
Strike Price $19.00
Expires 12/22/2012 | | | 8 | | | | 46 | |
| | | | | | | | |
| | | Notional
Amount
(000’s) | | | Value
(000’s) | |
Call Options (continued) | | | | | | | | |
OTC- Corning, Inc.
Strike Price $20.00
Expires 01/17/2014
Counterparty: GSC | | $ | 49 | | | $ | 6 | |
OTC- Activision Blizzard, Inc.
Strike Price $20.00
Expires 01/17/2014
Counterparty: GSC | | | 24 | | | | 1 | |
OTC- Aetna, Inc.
Strike Price $60.00
Expires 01/17/2014
Counterparty: GSC | | | 17 | | | | 19 | |
OTC- Agnico-Eagle Mines, Ltd.
Strike Price $85.00
Expires 01/17/2014
Counterparty: DUB | | | 18 | | | | 32 | |
OTC- Alcoa, Inc.
Strike Price $15.00
Expires 01/17/2014
Counterparty: GSC | | | 44 | | | | 5 | |
OTC- AMUNDI ETF EURO STOXX 50 C
Strike Price $50.00
Expires 01/17/2014
Counterparty: GSC | | | 97 | | | | 162 | |
OTC- AngloGold Ashanti, Ltd.
Strike Price $65.00
Expires 01/17/2014
Counterparty: DUB | | | 21 | | | | 6 | |
OTC- AutoZone, Inc.
Strike Price $550.00
Expires 01/17/2014
Counterparty: GSC | | | 2 | | | | 2 | |
OTC- Bank of America Corp
Strike Price $17.00
Expires 01/17/2014
Counterparty: GSC | | | 97 | | | | 11 | |
OTC- Barrick Gold Corp.
Strike Price $80.00
Expires 01/17/2014
Counterparty: DUB | | | 96 | | | | 23 | |
OTC- Best Buy Co., Inc.
Strike Price $30.00
Expires 01/17/2014
Counterparty: GSC | | | 52 | | | | 4 | |
OTC- Boeing Co.
Strike Price $110.00
Expires 01/17/2014
Counterparty: GSC | | | 16 | | | | 2 | |
OTC- Boston Scientific Corp
Strike Price $10.00
Expires 01/17/2014
Counterparty: GSC | | | 44 | | | | 2 | |
OTC- Bristol-Myers Squibb Co.
Strike Price $50.00
Expires 01/17/2014
Counterparty: GSC | | | 44 | | | | 2 | |
The notes to the financial statements are an integral part of this report.
| | | | |
| Transamerica Funds | | | | Annual Report 2012 |
| | Page 179 | | |
Transamerica Global Allocation
(formerly, Transamerica BlackRock Global Allocation)
CONSOLIDATED SCHEDULE OF INVESTMENTS (continued)
At October 31, 2012
| | | | | | | | |
| | | Notional
Amount
(000’s) | | | Value
(000’s) | |
Call Options (continued) | | | | | | | | |
OTC- Broadcom Corp
Strike Price $55.00
Expires 01/17/2014
Counterparty: GSC | | $ | 23 | | | $ | 7 | |
OTC- Caterpillar, Inc.
Strike Price $135.00
Expires 01/17/2014
Counterparty: GSC | | | 25 | | | | 11 | |
OTC- Cisco Systems, Inc.
Strike Price $30.00
Expires 01/17/2014
Counterparty: GSC | | | 97 | | | | 5 | |
OTC- Coeur d’Alene Mines Corp.
Strike Price $40.00
Expires 01/17/2014
Counterparty: DUB | | | 8 | | | | 26 | |
OTC- Eldorado Gold Corp.
Strike Price $25.00
Expires 01/17/2014
Counterparty: DUB | | | 25 | | | | 13 | |
OTC- EMC Corp.
Strike Price $40.00
Expires 01/17/2014
Counterparty: GSC | | | 68 | | | | 14 | |
OTC- Endeavour Silver Corp.
Strike Price $20.00
Expires 01/17/2014
Counterparty: DUB | | | 7 | | | | 2 | |
OTC- First Majestic Silver Corp
Strike Price $35.00
Expires 01/17/2014
Counterparty: DUB | | | 4 | | | | 6 | |
OTC- Freeport-McMoRan Copper &
Gold, Inc.
Strike Price $65.00
Expires 01/17/2014
Counterparty: GSC | | | 52 | | | | 28 | |
OTC- General Electric Co.
Strike Price $35.00
Expires 01/17/2014
Counterparty: GSC | | | 97 | | | | 2 | |
OTC- Gold Fields, Ltd.
Strike Price $22.00
Expires 01/17/2014
Counterparty: DUB | | | 52 | | | | 7 | |
OTC- Goldcorp, Inc.
Strike Price $80.00
Expires 01/17/2014
Counterparty: DUB | | | 60 | | | | 36 | |
OTC- Halliburton Co.
Strike Price $55.00
Expires 01/17/2014
Counterparty: GSC | | | 37 | | | | 9 | |
OTC- Harmony Gold Mining Co., Ltd.
Strike Price $15.00
Expires 01/17/2014
Counterparty: DUB | | | 13 | | | | 3 | |
| | | | | | | | |
| | | Notional
Amount
(000’s) | | | Value
(000’s) | |
Call Options (continued) | | | | | | | | |
OTC- Hewlett-Packard Co.
Strike Price $30.00
Expires 01/17/2014
Counterparty: GSC | | $ | 97 | | | $ | 11 | |
OTC- Humana, Inc.
Strike Price $105.00
Expires 01/17/2014
Counterparty: GSC | | | 8 | | | | 10 | |
OTC- IAMGOLD Corp.
Strike Price $30.00
Expires 01/17/2014
Counterparty: DUB | | | 22 | | | | 11 | |
OTC- Intel Corp
Strike Price $40.00
Expires 01/17/2014
Counterparty: GSC | | | 97 | | | | 3 | |
OTC- International Business Machines Corp
Strike Price $295.00
Expires 01/17/2014
Counterparty: GSC | | | 10 | | | | 1 | |
OTC- JC Penney Co., Inc.
Strike Price $55.00
Expires 01/17/2014
Counterparty: GSC | | | 27 | | | | 17 | |
OTC- JPMorgan Chase & Co.
Strike Price $60.00
Expires 01/17/2014
Counterparty: GSC | | | 97 | | | | 30 | |
OTC- Kinross Gold Corp.
Strike Price $20.00
Expires 01/17/2014
Counterparty: DUB | | | 96 | | | | 16 | |
OTC- Las Vegas Sands Corp
Strike Price $80.00
Expires 01/17/2014
Counterparty: GSC | | | 35 | | | | 21 | |
OTC- Lowe’s Cos, Inc.
Strike Price $45.00
Expires 01/17/2014
Counterparty: GSC | | | 78 | | | | 26 | |
OTC- Marvell Technology Group Ltd
Strike Price $20.00
Expires 01/17/2014
Counterparty: GSC | | | 56 | | | | 2 | |
OTC- Mastercard, Inc.
Strike Price $660.00
Expires 01/17/2014
Counterparty: GSC | | | 3 | | | | 8 | |
OTC- McDonald’s Corp
Strike Price $135.00
Expires 01/17/2014
Counterparty: GSC | | | 17 | | | | 1 | |
The notes to the financial statements are an integral part of this report.
| | | | |
| Transamerica Funds | | | | Annual Report 2012 |
| | Page 180 | | |
Transamerica Global Allocation
(formerly, Transamerica BlackRock Global Allocation)
CONSOLIDATED SCHEDULE OF INVESTMENTS (continued)
At October 31, 2012
| | | | | | | | |
| | | Notional
Amount
(000’s) | | | Value
(000’s) | |
Call Options (continued) | | | | | | | | |
OTC- Microsoft Corp
Strike Price $45.00
Expires 01/17/2014
Counterparty: GSC | | $ | 97 | | | $ | 11 | |
OTC- Monster Beverage Corp
Strike Price $105.00
Expires 01/17/2014
Counterparty: GSC | | | 14 | | | | 50 | |
OTC- NetApp, Inc.
Strike Price $60.00
Expires 01/17/2014
Counterparty: GSC | | | 32 | | | | 5 | |
OTC- New Gold, Inc.
Strike Price $22.00
Expires 01/17/2014
Counterparty: DUB | | | 14 | | | | 5 | |
OTC- Newmont Mining Corp.
Strike Price $90.00
Expires 01/17/2014
Counterparty: DUB | | | 77 | | | | 56 | |
OTC- Novagold Resources, Inc.
Strike Price $12.00
Expires 01/17/2014
Counterparty: DUB | | | 13 | | | | 3 | |
OTC- Pan American Silver Corp.
Strike Price $50.00
Expires 01/17/2014
Counterparty: DUB | | | 24 | | | | 2 | |
OTC- priceline.com, Inc.
Strike Price $1,000.00
Expires 01/17/2014
Counterparty: GSC | | | 4 | | | | 25 | |
OTC- QUALCOMM, Inc.
Strike Price $95.00
Expires 01/17/2014
Counterparty: GSC | | | 39 | | | | 13 | |
OTC- Randgold Resources, Ltd.
Strike Price $165.00
Expires 01/17/2014
Counterparty: DUB | | | 3 | | | | 20 | |
OTC- Royal Gold, Inc.
Strike Price $125.00
Expires 01/17/2014
Counterparty: DUB | | | 3 | | | | 12 | |
OTC- Safeway, Inc.
Strike Price $25.00
Expires 01/17/2014
Counterparty: GSC | | | 23 | | | | 4 | |
OTC- Seabridge Gold, Inc.
Strike Price $30.00
Expires 01/17/2014
Counterparty: DUB | | | 2 | | | | 1 | |
OTC- Silver Standard Resources, Inc.
Strike Price $30.00
Expires 01/17/2014
Counterparty: DUB | | | 6 | | | | 3 | |
| | | | | | | | |
| | | Notional
Amount
(000’s) | | | Value
(000’s) | |
Call Options (continued) | | | | | | | | |
OTC- Silver Wheaton Corp.
Strike Price $55.00
Expires 01/17/2014
Counterparty: DUB | | $ | 24 | | | $ | 77 | |
OTC- Silvercorp Metals, Inc.
Strike Price $15.00
Expires 01/17/2014
Counterparty: DUB | | | 14 | | | | 2 | |
OTC- Staples, Inc.
Strike Price $20.00
Expires 01/17/2014
Counterparty: GSC | | | 86 | | | | 11 | |
OTC- Starwood Hotels & Resorts Worldwide, Inc.
Strike Price $85.00
Expires 01/17/2014
Counterparty: GSC | | | 6 | | | | 2 | |
OTC- Stillwater Mining Co.
Strike Price $25.00
Expires 01/17/2014
Counterparty: DUB | | | 15 | | | | 4 | |
OTC- United Technologies Corp
Strike Price $120.00
Expires 01/17/2014
Counterparty: GSC | | | 15 | | | | 2 | |
OTC- UnitedHealth Group, Inc.
Strike Price $85.00
Expires 01/17/2014
Counterparty: GSC | | | 19 | | | | 5 | |
OTC- Visa, Inc.
Strike Price $190.00
Expires 01/17/2014
Counterparty: GSC | | | 9 | | | | 24 | |
OTC- Western Union Co.
Strike Price $25.00
Expires 01/17/2014
Counterparty: GSC | | | 14 | | | | 1 | |
OTC- Yahoo!, Inc.
Strike Price $25.00
Expires 01/17/2014
Counterparty: GSC | | | 68 | | | | 21 | |
OTC- Yama Gold, Inc.
Strike Price $30.00
Expires 01/17/2014
Counterparty: DUB | | | 58 | | | | 40 | |
OTC- Yum! Brands, Inc.
Strike Price $100.00
Expires 01/17/2014
Counterparty: GSC | | | 14 | | | | 9 | |
SPDR Gold Trust
Strike Price $175.00
Expires 12/22/2012 | | | 6 | | | | 6 | |
United Technologies Corp.
Strike Price $80.00
Expires 11/17/2012 | | | 1 | | | | ¿ | |
The notes to the financial statements are an integral part of this report.
| | | | |
| Transamerica Funds | | | | Annual Report 2012 |
| | Page 181 | | |
Transamerica Global Allocation
(formerly, Transamerica BlackRock Global Allocation)
CONSOLIDATED SCHEDULE OF INVESTMENTS (continued)
At October 31, 2012
| | | | | | | | |
| | | Notional
Amount
(000’s) | | | Value
(000’s) | |
Put Options —0.2% | | | | | | | | |
OTC- EUR vs. USD
Exercise Price $1.20
Expires 06/03/2013 Ә
Counterparty: CSFB | | EUR | 2,952 | | | $ | 27 | |
OTC- Bovespa Index
Index Value 55,389.31
Expires 12/12/2012 Ә
Counterparty: CSFB | | $ | ¿ | | | | 21 | |
OTC- Russell 2000 Index
Index Value 753.98
Expires 11/16/2012
Counterparty: BNP | | | 1 | | | | 2 | |
OTC- Russell 2000 Index
Index Value 759.04
Expires 12/21/2012
Counterparty: JPM | | | 1 | | | | 11 | |
OTC- Russell 2000 Index
Index Value 781.49
Expires 01/18/2013
Counterparty: JPM | | | 1 | | | | 11 | |
OTC- Russell 2000 Index
Index Value 782.61
Expires 02/15/2013
Counterparty: BNP | | | 1 | | | | 15 | |
OTC- S&P 500 E-Mini Index
Index Value 1,373.62
Expires 01/18/2013
Counterparty: JPM | | | 1 | | | | 19 | |
OTC- S&P 500 Index
Index Value 1,375.68
Expires 01/18/2013
Counterparty: GSC | | | 1 | | | | 10 | |
OTC- S&P 500 Index
Index Value 1,372.24
Expires 02/15/2013
Counterparty: DUB | | | 1 | | | | 12 | |
OTC- S&P 500 Index
Index Value 1,372.50
Expires 03/15/2013
Counterparty: CSFB | | | 1 | | | | 27 | |
S&P 100 Index
Index Value 1,435.00
Expires 12/22/2012 | | | 1 | | | | 43 | |
S&P 500 Index
Index Value 1,415.00
Expires 11/17/2012
| | | 1 | | | | 26 | |
S&P 500 Index
Index Value 1,425.00
Expires 11/17/2012
| | | 1 | | | | 32 | |
S&P 500 Index
Index Value 1,435.00
Expires 11/17/2012
| | | 2 | | | | 91 | |
S&P 500 Index
Index Value 1,445.00
Expires 11/17/2012 | | | 2 | | | | 98 | |
| | | | | | | | |
| | | Notional
Amount
(000’s) | | | Value
(000’s) | |
Put Options (continued) | | | | | | | | |
S&P 500 Index
Index Value 1,445.00
Expires 12/22/2012
| | $ | 1 | | | $ | 39 | |
S&P 500 Index
Index Value 1,455.00
Expires 12/22/2012 | | | 1 | | | | 42 | |
CONSOL Energy, Inc.
Strike Price $31.00
Expires 01/19/2013 | | | 32 | | | | 43 | |
HCA Holdings, Inc.
Strike Price $29.50
Expires 11/17/2012 | | | 5 | | | | 9 | |
Hess Corp.
Strike Price $52.50
Expires 01/19/2013 | | | 4 | | | | 12 | |
OTC- Korea Composite Stock Price Index
Index Value 243.53
Expires 12/12/2013
Counterparty: CITI | | | 2,800 | | | | 38 | |
| | | | | | | | |
Total Purchased Options (cost $3,305) | | | | 2,055 | |
| | | | | | | | |
| | |
| | | Shares | | | Value
(000’s) | |
SECURITIES LENDING COLLATERAL—10.9% | |
State Street Navigator Securities Lending Trust—Prime Portfolio, 0.31% | | | 34,185,993 | | | | 34,186 | |
Total Securities Lending Collateral (cost $34,186) | | | | | |
| | | | | | | | |
Total Investment Securities (cost $337,319) P | | | | | | | 360,290 | |
Other Assets and Liabilities—Net | | | | | | | (45,585 | ) |
| | | | | | | | |
Net Assets | | | | | | $ | 314,705 | |
| | | | | | | | |
| | |
| | | Notional
Amount
(000’s) | | | Value
(000’s) | |
WRITTEN OPTIONS—(0.2%) Җ | | | | | | | | |
Call Options—(0.1%) | | | | | | | | |
OTC- EUR vs. USD Ә
Exercise Price $1.40
Expires 06/03/2013
Counterparty: CSFB | | EUR | 2,952 | | | $ | (16 | ) |
OTC- Bovespa Index Ә
Index Value 64,667.72
Expires 12/12/2012
Counterparty: CSFB | | $ | ¿ | | | | (3 | ) |
Activision Blizzard, Inc.
Strike Price $12.50
Expires 01/19/2013
| | | 8 | | | | (1 | ) |
Alcoa, Inc.
Strike Price $10.00
Expires 01/19/2013
| | | 34 | | | | (3 | ) |
Applied Materials, Inc.
Strike Price $12.50
Expires 01/19/2013
| | | 14 | | | | (¿ | ) |
BioMarin Pharmaceutical, Inc.
Strike Price $47.00
Expires 11/17/2012 | | | 4 | | | | (3 | ) |
The notes to the financial statements are an integral part of this report.
| | | | |
| Transamerica Funds | | | | Annual Report 2012 |
| | Page 182 | | |
Transamerica Global Allocation
(formerly, Transamerica BlackRock Global Allocation)
CONSOLIDATED SCHEDULE OF INVESTMENTS (continued)
At October 31, 2012
| | | | | | | | |
| | | Notional
Amount
(000’s) | | | Value
(000’s) | |
Call Options (continued) | | | | | | | | |
Cisco Systems, Inc.
Strike Price $22.00
Expires 12/22/2012
| | $ | 17 | | | $ | (¿ | ) |
Corning, Inc.
Strike Price $15.00
Expires 01/19/2013
| | | 24 | | | | (1 | ) |
EMC Corp.
Strike Price $25.00
Expires 01/19/2013
| | | 4 | | | | (5 | ) |
Kraft Foods Group, Inc.
Strike Price $47.50
Expires 03/16/2013
| | | 3 | | | | (2 | ) |
Mattel, Inc.
Strike Price $35.00
Expires 01/19/2013
| | | 4 | | | | (8 | ) |
Murphy Oil Corp.
Strike Price $70.00
Expires 01/19/2013
| | | 8 | | | | (4 | ) |
Oracle Corp.
Strike Price $33.00
Expires 12/22/2012
| | | 20 | | | | (7 | ) |
Oracle Corp.
Strike Price $34.00
Expires 01/19/2013
| | | 14 | | | | (5 | ) |
OTC- Canon, Inc.
Strike Price $2,758.05
Expires 01/18/2013
Counterparty: DUB
| | JPY | 3 | | | | (3 | ) |
OTC- Mattel, Inc.
Strike Price $33.00
Expires 01/18/2013
Counterparty: MSC
| | $ | 3 | | | | (12 | ) |
OTC- Mead Johnson Nutrition Co.
Strike Price $100.00
Expires 01/18/2013
Counterparty: MSC
| | | 9 | | | | (¿ | ) |
OTC- Mitsui Fudosan Co., Ltd.
Strike Price $1,521.73
Expires 01/18/2013
Counterparty: CITI
| | JPY | 4 | | | | (6 | ) |
OTC- Yahoo Japan Corp.
Strike Price $29,937.18
Expires 01/30/2013
Counterparty: GSC
| | | ¿ | | | | (2 | ) |
OTC- Yamada Denki Co., Ltd.
Strike Price $4,347.00
Expires 01/18/2013
Counterparty: CITI
| | | 1 | | | | (¿ | ) |
Phillips 66
Strike Price $48.00
Expires 01/19/2013
| | $ | 16 | | | | (45 | ) |
PulteGroup, Inc.
Strike Price $19.00
Expires 04/20/2013
| | | 8 | | | | (13 | ) |
SanDisk Corp.
Strike Price $45.00
Expires 01/19/2013 | | | 8 | | | | (12 | ) |
Tiffany & Co.
Strike Price $67.50
Expires 02/16/2013 | | | 6 | | | | (13 | ) |
| | | | | | | | |
| | | Notional
Amount
(000’s) | | | Value
(000’s) | |
Call Options (continued) | | | | | | | | |
Valeant Pharmaceuticals, Inc.
Strike Price $50.00
Expires 01/19/2013 | | $ | 2 | | | $ | (19 | ) |
Vertex Pharmaceuticals, Inc.
Strike Price $40.00
Expires 01/19/2013 | | | 6 | | | | (61 | ) |
Wal-Mart Stores, Inc.
Strike Price $75.00
Expires 01/19/2013 | | | 15 | | | | (30 | ) |
Put Options—(0.1%) | | | | | | | | |
OTC- Bovespa Index Ә
Index Value 46,392.06
Expires 12/12/2012
Counterparty: CSFB | | | ¿ | | | | (2 | ) |
OTC- Nikkei 225
Index Value 8,286.96
Expires 12/13/2013
Counterparty: BOA | | | ¿ | | | | (37 | ) |
OTC- Nikkei 225
Index Value 8,292.09
Expires 12/13/2013
Counterparty: JPM | | | ¿ | | | | (37 | ) |
OTC- Nikkei 225
Index Value 8,305.01
Expires 12/13/2013
Counterparty: CITI | | | ¿ | | | | (37 | ) |
OTC- Nikkei 225
Index Value 8,331.47
Expires 12/13/2013
Counterparty: GSC | | | ¿ | | | | (39 | ) |
OTC- Russell 2000 Index
Index Value 676.65
Expires 11/16/2012
Counterparty: BNP
| | | 1 | | | | (¿ | ) |
OTC- Russell 2000 Index
Index Value 681.19
Expires 12/21/2012
Counterparty: JPM
| | | 1 | | | | (2 | ) |
OTC- Russell 2000 Index
Index Value 701.34
Expires 01/18/2013
Counterparty: JPM
| | | 1 | | | | (3 | ) |
OTC- Russell 2000 Index
Index Value 702.35
Expires 02/15/2013
Counterparty: BNP
| | | 1 | | | | (5 | ) |
OTC- S&P 500 Index
Index Value 1,197.51
Expires 01/18/2013
Counterparty: JPM
| | | 1 | | | | (¿ | ) |
OTC- S&P 500 Index
Index Value 1,199.27
Expires 01/18/2013
Counterparty: GSC
| | | 1 | | | | (3 | ) |
OTC- S&P 500 Index
Index Value 1,196.31
Expires 02/15/2013
Counterparty: DUB | | | 1 | | | | (¿ | ) |
The notes to the financial statements are an integral part of this report.
| | | | |
| Transamerica Funds | | | | Annual Report 2012 |
| | Page 183 | | |
Transamerica Global Allocation
(formerly, Transamerica BlackRock Global Allocation)
CONSOLIDATED SCHEDULE OF INVESTMENTS (continued)
At October 31, 2012
| | | | | | | | |
| | | Notional
Amount
(000’s) | | | Value
(000’s) | |
Put Options (continued) | | | | | | | | |
OTC- S&P 500 Index
Index Value 1,231.73
Expires 03/15/2013
Counterparty: CSFB | | $ | 1 | | | $ | (10 | ) |
OTC- S&P 500 Index
Index Value 1,149.60
Expires 12/20/2013
Counterparty: CITI | | | ¿ | | | | (22 | ) |
OTC- Taiwan TAIEX Index
Index Value 5,758.51
Expires 12/18/2013
Counterparty: JPM | | | ¿ | | | | (11 | ) |
OTC- Taiwan TAIEX Index
Index Value 6,524.53
Expires 12/18/2013
Counterparty: JPM | | | ¿ | | | | (35 | ) |
CONSOL Energy, Inc.
Strike Price $25.00
Expires 01/19/2013 | | | 32 | | | | (13 | ) |
| | | | | | | | |
| | | Notional
Amount
(000’s) | | | Value
(000’s) | |
Put Options (continued) | | | | | | | | |
Mattel, Inc. Ә
Strike Price $25.00
Expires 01/19/2013 | | $ | 18 | | | $ | (2 | ) |
Nexen, Inc.
Strike Price $16.00
Expires 12/22/2012 | | | 4 | | | | (1 | ) |
OTC- Mead Johnson Nutrition Co.
Strike Price $60.00
Expires 01/17/2014
Counterparty: MSC | | | 9 | | | | (65 | ) |
Phillips 66 Ә
Strike Price $34.00
Expires 11/17/2012 | | | 8 | | | | (1 | ) |
United Technologies Corp.
Strike Price $75.00
Expires 11/17/2012 | | | ¿ | | | | (¿ | ) |
| | | | | | | | |
Total Written Options (premiums: $(868)) | | | | | | $ | (599 | ) |
| | | | | | | | |
FORWARD FOREIGN CURRENCY CONTRACTS: b
| | | | | | | | | | | | | | | | | | |
Currency | | Counterparty | | Contracts
Bought
(Sold)
(000’s) | | | Settlement Date | | | Amount in U.S.
Dollars Bought
(Sold)
(000’s) | | | Net Unrealized
Appreciation
(Depreciation)
(000’s) | |
AUD | | UBS | | | 780 | | | | 11/08/2012 | | | $ | 808 | | | $ | 1 | |
AUD | | UBS | | | (1,538 | ) | | | 11/08/2012 | | | | (1,576 | ) | | | (19 | ) |
AUD | | DUB | | | (988 | ) | | | 11/08/2012 | | | | (1,012 | ) | | | (12 | ) |
AUD | | GSC | | | (735 | ) | | | 11/15/2012 | | | | (745 | ) | | | (17 | ) |
AUD | | GSC | | | (753 | ) | | | 11/15/2012 | | | | (760 | ) | | | (20 | ) |
AUD | | JPM | | | 1,453 | | | | 11/15/2012 | | | | 1,418 | | | | 89 | |
AUD | | JPM | | | (1,453 | ) | | | 11/15/2012 | | | | (1,420 | ) | | | (86 | ) |
AUD | | UBS | | | (190 | ) | | | 11/29/2012 | | | | (193 | ) | | | (4 | ) |
AUD | | JPM | | | 238 | | | | 11/29/2012 | | | | 243 | | | | 3 | |
AUD | | JPM | | | (238 | ) | | | 11/29/2012 | | | | (242 | ) | | | (5 | ) |
AUD | | BCLY | | | (415 | ) | | | 11/30/2012 | | | | (423 | ) | | | (6 | ) |
EUR | | JPM | | | (1,316 | ) | | | 11/01/2012 | | | | (1,705 | ) | | | (1 | ) |
EUR | | BCLY | | | 667 | | | | 11/01/2012 | | | | 860 | | | | 4 | |
EUR | | JPM | | | 1,316 | | | | 11/01/2012 | | | | 1,698 | | | | 8 | |
EUR | | BCLY | | | (667 | ) | | | 11/01/2012 | | | | (863 | ) | | | (1 | ) |
EUR | | UBS | | | (674 | ) | | | 11/08/2012 | | | | (872 | ) | | | (1 | ) |
EUR | | CSFB | | | (281 | ) | | | 11/29/2012 | | | | (361 | ) | | | (2 | ) |
EUR | | DUB | | | (531 | ) | | | 11/30/2012 | | | | (687 | ) | | | (1 | ) |
EUR | | HSBC | | | (377 | ) | | | 12/05/2012 | | | | (459 | ) | | | (29 | ) |
EUR | | UBS | | | (689 | ) | | | 12/06/2012 | | | | (894 | ) | | | 1 | |
EUR | | CSFB | | | (539 | ) | | | 12/07/2012 | | | | (700 | ) | | | ¿ | |
EUR | | JPM | | | (1,316 | ) | | | 12/14/2012 | | | | (1,698 | ) | | | (8 | ) |
EUR | | BCLY | | | (667 | ) | | | 12/14/2012 | | | | (861 | ) | | | (4 | ) |
EUR | | CSFB | | | (217 | ) | | | 01/09/2013 | | | | (264 | ) | | | (17 | ) |
EUR | | CSFB | | | (207 | ) | | | 01/23/2013 | | | | (252 | ) | | | (16 | ) |
GBP | | GSC | | | 383 | | | | 11/01/2012 | | | | 614 | | | | 4 | |
GBP | | DUB | | | 254 | | | | 11/01/2012 | | | | 408 | | | | 2 | |
GBP | | GSC | | | (383 | ) | | | 11/01/2012 | | | | (621 | ) | | | 3 | |
GBP | | DUB | | | (254 | ) | | | 11/01/2012 | | | | (412 | ) | | | 2 | |
GBP | | JPM | | | (447 | ) | | | 11/29/2012 | | | | (715 | ) | | | (7 | ) |
GBP | | JPM | | | (679 | ) | | | 12/06/2012 | | | | (1,088 | ) | | | (8 | ) |
GBP | | DUB | | | (841 | ) | | | 12/07/2012 | | | | (1,347 | ) | | | (10 | ) |
GBP | | DUB | | | (254 | ) | | | 12/14/2012 | | | | (408 | ) | | | (2 | ) |
GBP | | GSC | | | (383 | ) | | | 12/14/2012 | | | | (614 | ) | | | (4 | ) |
JPY | | DUB | | | (80,000 | ) | | | 11/09/2012 | | | | (1,008 | ) | | | 5 | |
JPY | | CSFB | | | (31,336 | ) | | | 11/30/2012 | | | | (391 | ) | | | (2 | ) |
JPY | | DUB | | | 31,336 | | | | 11/30/2012 | | | | 401 | | | | (8 | ) |
The notes to the financial statements are an integral part of this report.
| | | | |
| Transamerica Funds | | | | Annual Report 2012 |
| | Page 184 | | |
Transamerica Global Allocation
(formerly, Transamerica BlackRock Global Allocation)
CONSOLIDATED SCHEDULE OF INVESTMENTS (continued)
At October 31, 2012
FORWARD FOREIGN CURRENCY CONTRACTS (continued): b
| | | | | | | | | | | | | | | | | | |
Currency | | Counterparty | | Contracts
Bought
(Sold)
(000’s) | | | Settlement Date | | | Amount in U.S.
Dollars Bought
(Sold)
(000’s) | | | Net Unrealized
Appreciation
(Depreciation)
(000’s) | |
JPY | | CSFB | | | (40,000 | ) | | | 12/10/2012 | | | $ | (510 | ) | | $ | 9 | |
JPY | | UBS | | | (70,000 | ) | | | 01/16/2013 | | | | (893 | ) | | | 16 | |
JPY | | UBS | | | (60,000 | ) | | | 02/20/2013 | | | | (763 | ) | | | 10 | |
MXN | | DUB | | | (13,040 | ) | | | 11/15/2012 | | | | (984 | ) | | | (11 | ) |
MXN | | GSC | | | (1,252 | ) | | | 12/13/2012 | | | | (95 | ) | | | (¿ | ) |
MXN | | JPM | | | (11,463 | ) | | | 12/13/2012 | | | | (862 | ) | | | (9 | ) |
SGD | | UBS | | | (862 | ) | | | 01/24/2013 | | | | (685 | ) | | | (22 | ) |
SGD | | UBS | | | (1,129 | ) | | | 02/07/2013 | | | | (910 | ) | | | (16 | ) |
| | | | | | | | | | | | | | | | | | |
| | | | | | | | | | | | | | | | $ | (191 | ) |
| | | | | | | | | | | | | | | | | | |
FORWARD FOREIGN CROSS CURRENCY CONTRACTS: b
| | | | | | | | | | | | | | | | | | |
Currency | | Counterparty | | Contracts
Bought
(Sold)
(000’s) | | | Settlement Date | | | Amount in U.S.
Dollars Bought
(Sold)
(000’s) | | | Net Unrealized
Appreciation
(Depreciation)
(000’s) | |
CHF | | UBS | | | 1,232 | | | | 12/14/2012 | | | $ | 1,315 | | | $ | 8 | |
EUR | | UBS | | | (1,019 | ) | | | 12/14/2012 | | | | (1,315 | ) | | | (7 | ) |
CHF | | UBS | | | 1,234 | | | | 11/01/2012 | | | | 1,322 | | | | 3 | |
EUR | | UBS | | | (1,019 | ) | | | 11/01/2012 | | | | (1,322 | ) | | | 1 | |
EUR | | UBS | | | 1,019 | | | | 11/01/2012 | | | | 1,315 | | | | 6 | |
CHF | | UBS | | | (1,232 | ) | | | 11/01/2012 | | | | (1,315 | ) | | | (8 | ) |
| | | | | | | | | | | | | | | | | | |
| | | | | | | | | | | | | | | | $ | 3 | |
| | | | | | | | | | | | | | | | | | |
OVER THE COUNTER SWAP AGREEMENTS: b
INTEREST RATE SWAP AGREEMENTS—FIXED RATE RECEIVABLE:
| | | | | | | | | | | | | | | | | | | | | | | | | | | | |
Floating Rate Index | | Fixed Rate | | | Maturity
Date | | | Counterparty | | Currency
Code | | Notional
Amount
(000’s) | | | Market
Value
(000’s) | | | Premiums
Paid
(Received)
(000’s) | | | Unrealized
Appreciation
(Depreciation)
(000’s) | |
3-Month USD-LIBOR | | | 1.28 | % | | | 06/22/2016 | | | UBS | | USD | | | 2,055 | | | $ | 7 | | | $ | — | | | $ | 7 | |
3-Month USD-LIBOR | | | 1.35 | | | | 08/24/2016 | | | DUB | | USD | | | 850 | | | | 3 | | | | — | | | | 3 | |
3-Month USD-LIBOR | | | 1.01 | | | | 09/27/2016 | | | DUB | | USD | | | 7,800 | | | | (2 | ) | | | — | | | | (2 | ) |
3-Month USD-LIBOR | | | 1.00 | | | | 09/28/2016 | | | GSC | | USD | | | 7,823 | | | | (3 | ) | | | — | | | | (3 | ) |
3-Month USD-LIBOR | | | 1.55 | | | | 09/28/2017 | | | GSC | | USD | | | 3,912 | | | | (¿ | ) | | | — | | | | (¿ | ) |
3-Month USD-LIBOR | | | 1.55 | | | | 10/04/2017 | | | JPM | | USD | | | 3,919 | | | | (¿ | ) | | | — | | | | (¿ | ) |
3-Month USD-LIBOR | | | 1.24 | | | | 09/14/2018 | | | DUB | | USD | | | 785 | | | | 5 | | | | — | | | | 5 | |
3-Month USD-LIBOR | | | 1.19 | | | | 09/17/2018 | | | JPM | | USD | | | 792 | | | | 2 | | | | — | | | | 2 | |
| | | | | | | | | | | | | | | | | | | | | | | | | | | | |
| | | | | | | | | | | | | | | | | | $ | 12 | | | $ | — | | | $ | 12 | |
| | | | | | | | | | | | | | | | | | | | | | | | | | | | |
INTEREST RATE SWAP AGREEMENTS—FIXED RATE PAYABLE:
| | | | | | | | | | | | | | | | | | | | | | | | | | | | |
Floating Rate Index | | Fixed Rate | | | Maturity
Date | | | Counterparty | | Currency
Code | | Notional
Amount
(000’s) | | | Market
Value
(000’s) | | | Premiums
Paid
(Received)
(000’s) | | | Unrealized
Appreciation
(Depreciation)
(000’s) | |
3-Month USD-LIBOR | | | 0.54 | % | | | 09/14/2015 | | | DUB | | USD | | | 1,961 | | | $ | (1 | ) | | $ | — | | | $ | (1 | ) |
3-Month USD-LIBOR | | | 0.50 | | | | 09/17/2015 | | | JPM | | USD | | | 1,932 | | | | 1 | | | | — | | | | 1 | |
| | | | | | | | | | | | | | | | | | | | | | | | | | | | |
| | | | | | | | | | | | | | | | | | $ | — | | | $ | — | | | $ | — | |
| | | | | | | | | | | | | | | | | | | | | | | | | | | | |
The notes to the financial statements are an integral part of this report.
| | | | |
| Transamerica Funds | | | | Annual Report 2012 |
| | Page 185 | | |
Transamerica Global Allocation
(formerly, Transamerica BlackRock Global Allocation)
CONSOLIDATED SCHEDULE OF INVESTMENTS (continued)
At October 31, 2012
OVER THE COUNTER SWAP AGREEMENTS (continued): b
TOTAL RETURN SWAP AGREEMENTS—PAYABLE: (A)
| | | | | | | | | | | | | | | | | | | | | | | | | | |
Reference Entity | | Fixed Rate | | | Termination
Date | | | Counterparty | | Notional
Amount
(000’s) | | | Market
Value
(000’s) | | | Premiums
Paid
(Received)
(000’s) | | | Unrealized
Appreciation
(000’s) | |
SGX Nikkei Stock Average Dividend Point Index Futures | | | 1.00 | % | | | 03/31/2014 | | | CITI | | | 259 | | | $ | 54 | | | $ | — | | | $ | 54 | |
FUTURES CONTRACTS:
| | | | | | | | | | | | | | | | |
Description | | Type | | | Contracts | | | Expiration
Date | | | Unrealized
Appreciation
(Depreciation)
(000’s) | |
CAC 40 Index | | | Short | | | | (1 | ) | | | 11/16/2012 | | | $ | 1 | |
DAX Index | | | Short | | | | (5 | ) | | | 12/21/2012 | | | | 19 | |
FTSE 100 Index | | | Short | | | | (2 | ) | | | 12/21/2012 | | | | 2 | |
MSCI Taiwan Index | | | Short | | | | (7 | ) | | | 11/29/2012 | | | | (1 | ) |
Nikkei 225 Index | | | Short | | | | (1 | ) | | | 12/13/2012 | | | | (1 | ) |
S&P 500 E-Mini Index | | | Short | | | | (69 | ) | | | 12/21/2012 | | | | 167 | |
S&P TSE 60 Index | | | Short | | | | (1 | ) | | | 12/20/2012 | | | | (¿ | ) |
| | | | | | | | | | | | | | | | |
| | | | | | | | | | | | | | $ | 187 | |
| | | | | | | | | | | | | | | | |
Collateral (Received) Pledged for OTC Financial Derivative Instruments
The following is a summary by counterparty of the market value of OTC financial derivative instruments and collateral (received) pledged as of 10/31/2012:
| | | | | | | | | | | | |
Counterparty | | Total Market Value of
OTC Derivatives
(000’s) | | | Collateral (Received)
Pledged
(000’s) | | | Net Exposures (1)
(000’s) | |
BCLY | | $ | (7 | ) | | $ | — | | | $ | (7 | ) |
BNP | | | 12 | | | | — | | | | 12 | |
BOA | | | 14 | | | | — | | | | 14 | |
CITI | | | 104 | | | | 91 | | | | 195 | |
CSFB | | | 17 | | | | — | | | | 17 | |
DUB | | | 385 | | | | (100 | ) | | | 285 | |
GSC | | | 583 | | | | (800 | ) | | | (217 | ) |
HSBC | | | (29 | ) | | | — | | | | (29 | ) |
JPM | | | 5 | | | | — | | | | 5 | |
MSC | | | (77 | ) | | | — | | | | (77 | ) |
UBS | | | (24 | ) | | | 633 | | | | 609 | |
| (1) | Net exposure represents the net receivable (payable) that would be due from/to the counterparty in the event of default. |
| | | | | | | | |
INVESTMENTS BY INDUSTRY (unaudited): | | Percentage of
Total Investment
Securities | | | Value
(000’s) | |
Foreign Government Obligations | | | 8.2 | % | | $ | 29,493 | |
Oil, Gas & Consumable Fuels | | | 6.7 | | | | 24,202 | |
U.S. Government Obligations | | | 5.0 | | | | 17,894 | |
Commercial Banks | | | 3.9 | | | | 14,027 | |
Pharmaceuticals | | | 3.7 | | | | 13,335 | |
Capital Markets | | | 3.3 | | | | 11,823 | |
Chemicals | | | 2.6 | | | | 9,266 | |
Health Care Providers & Services | | | 2.5 | | | | 9,036 | |
Metals & Mining | | | 2.3 | | | | 8,340 | |
Diversified Telecommunication Services | | | 2.3 | | | | 8,134 | |
Diversified Financial Services | | | 2.2 | | | | 7,927 | |
Computers & Peripherals | | | 2.1 | | | | 7,624 | |
Insurance | | | 2.0 | | | | 7,047 | |
Software | | | 2.0 | | | | 7,046 | |
Semiconductors & Semiconductor Equipment | | | 1.5 | | | | 5,405 | |
Food Products | | | 1.5 | | | | 5,273 | |
Automobiles | | | 1.5 | | | | 5,252 | |
Media | | | 1.3 | | | | 4,641 | |
Wireless Telecommunication Services | | | 1.2 | | | | 4,386 | |
The notes to the financial statements are an integral part of this report.
| | | | |
| Transamerica Funds | | | | Annual Report 2012 |
| | Page 186 | | |
Transamerica Global Allocation
(formerly, Transamerica BlackRock Global Allocation)
CONSOLIDATED SCHEDULE OF INVESTMENTS (continued)
At October 31, 2012
| | | | | | | | |
INVESTMENTS BY INDUSTRY (unaudited) (continued): | | Percentage of
Total Investment
Securities | | | Value
(000’s) | |
Industrial Conglomerates | | | 1.2 | % | | $ | 4,354 | |
Real Estate Management & Development | | | 1.1 | | | | 4,039 | |
Electric Utilities | | | 1.0 | | | | 3,520 | |
Communications Equipment | | | 0.9 | | | | 3,421 | |
Aerospace & Defense | | | 0.9 | | | | 3,292 | |
Health Care Equipment & Supplies | | | 0.9 | | | | 3,268 | |
Energy Equipment & Services | | | 0.9 | | | | 3,250 | |
IT Services | | | 0.8 | | | | 2,739 | |
Machinery | | | 0.7 | | | | 2,666 | |
Road & Rail | | | 0.7 | | | | 2,444 | |
Food & Staples Retailing | | | 0.7 | | | | 2,413 | |
Biotechnology | | | 0.6 | | | | 2,259 | |
Electronic Equipment & Instruments | | | 0.6 | | | | 2,221 | |
Household Products | | | 0.6 | | | | 2,206 | |
Tobacco | | | 0.6 | | | | 2,148 | |
Auto Components | | | 0.6 | | | | 2,131 | |
Purchased Options | | | 0.6 | | | | 2,055 | |
Beverages | | | 0.5 | | | | 1,853 | |
Consumer Finance | | | 0.5 | | | | 1,827 | |
Real Estate Investment Trusts | | | 0.5 | | | | 1,786 | |
Trading Companies & Distributors | | | 0.4 | | | | 1,593 | |
Life Sciences Tools & Services | | | 0.4 | | | | 1,560 | |
Internet Software & Services | | | 0.4 | | | | 1,470 | |
Multi-Utilities | | | 0.3 | | | | 1,190 | |
Construction & Engineering | | | 0.3 | | | | 1,123 | |
Household Durables | | | 0.3 | | | | 1,082 | |
Electrical Equipment | | | 0.3 | | | | 991 | |
Specialty Retail | | | 0.2 | | | | 824 | |
Independent Power Producers & Energy Traders | | | 0.2 | | | | 691 | |
Paper & Forest Products | | | 0.2 | | | | 574 | |
Textiles, Apparel & Luxury Goods | | | 0.2 | | | | 545 | |
Hotels, Restaurants & Leisure | | | 0.1 | | | | 538 | |
Leisure Equipment & Products | | | 0.1 | | | | 538 | |
Personal Products | | | 0.1 | | | | 529 | |
Gas Utilities | | | 0.1 | | | | 511 | |
Office Electronics | | | 0.1 | | | | 441 | |
Mortgage-Backed Security | | | 0.1 | | | | 362 | |
Transportation Infrastructure | | | 0.1 | | | | 359 | |
Commercial Services & Supplies | | | 0.1 | | | | 288 | |
Building Products | | | 0.1 | | | | 245 | |
Airlines | | | 0.1 | | | | 238 | |
Construction Materials | | | 0.1 | | | | 226 | |
Water Utilities | | | 0.1 | | | | 219 | |
Marine | | | 0.0 | ¥ | | | 167 | |
Containers & Packaging | | | 0.0 | ¥ | | | 150 | |
Internet & Catalog Retail | | | 0.0 | ¥ | | | 58 | |
Multiline Retail | | | 0.0 | ¥ | | | 48 | |
| | | | | | | | |
Investment Securities, at Value | | | 75.1 | | | | 270,603 | |
Short-Term Investments | | | 24.9 | | | | 89,687 | |
| | | | | | | | |
Total Investments | | | 100.0 | % | | $ | 360,290 | |
| | | | | | | | |
NOTES TO SCHEDULE OF INVESTMENTS (all amounts in thousands):
| L | All or a portion of this security is on loan. The value of all securities on loan is $33,349. |
| * | Floating or variable rate note. Rate is listed as of 10/31/2012. |
| ¥ | Percentage rounds to less than 0.1%. |
| Ž | The security has a perpetual maturity. The date shown is the next call date. |
| Ә | Fair valued as determined in good faith in accordance with procedures established by the Board of Trustees. Total aggregate market value of fair valued securities is $1,485, or 0.47% of the fund’s net assets, and total aggregate market value of fair valued derivatives is $(24), or (0.01)% of the fund’s net assets. |
| | Rate shown reflects the yield at 10/31/2012. |
| ‡ | Non-income producing security. |
| P | Aggregate cost for federal income tax purposes is $341,537. Aggregate gross unrealized appreciation/depreciation for all securities in which there is an excess of value over tax cost were $32,654 and $13,901, respectively. Net unrealized appreciation for tax purposes is $18,753. |
| § | Illiquid. Total aggregate market value of illiquid securities is $5,354, or 1.70% of the fund’s net assets. |
The notes to the financial statements are an integral part of this report.
| | | | |
| Transamerica Funds | | | | Annual Report 2012 |
| | Page 187 | | |
Transamerica Global Allocation
(formerly, Transamerica BlackRock Global Allocation)
CONSOLIDATED SCHEDULE OF INVESTMENTS (continued)
At October 31, 2012
NOTES TO SCHEDULE OF INVESTMENTS (all amounts in thousands) (continued):
| ☼ | All or a portion of this security has been segregated with the broker to cover open swaps contracts. Total value of securities segregated to cover open swaps, and/or forward foreign currency contracts is $92. |
| g | All or a portion of this security has been segregated as collateral with the broker to cover margin requirements for open futures contracts. Total value of securities segregated to cover futures contracts is $500. |
| n | All or a portion of this security has been segregated with the broker to cover open written options. Total value of securities segregated to cover written options is $58. |
| Җ | Cash in the amount of $575 has been segregated as collateral with the broker for open written options. |
| β | Cash, in the amount of $900, has been pledged as collateral by the broker for open swaps and/or forward foreign currency contracts. |
| (A) | At the termination date, a net cash flow is exchanged where the total return is equivalent to the return of the reference obligation less a financing rate, if any. As a receiver, the fund would receive payments based on any positive total return and would owe payments in the event of a negative total return. As the payer, the fund would owe payments on any net positive total return, and would receive payment in the event of a negative total return. |
| D | Restricted Security. At 10/31/2012, the fund owned the respective securities which were restricted to public resale as follows: |
| | | | | | | | | | | | | | | | | | | | |
Investment Securities | | Description | | | Acquisition
Date | | | Cost | | | Value | | | Value as %
of Net
Assets | |
Corporate Debt Securities | | | Delta Topco Limited | | | | 05/02/2012 | | | $ | 506 | | | $ | 533 | | | | 0.17 | % |
Common Stocks | | | Delta Topco Limited | | | | 05/02/2012 | | | | 399 | | | | 330 | | | | 0.10 | |
| | | | | | | | | | | | | | | | | | | | |
| | | | | | | | | | $ | 905 | | | $ | 863 | | | | 0.27 | % |
| | | | | | | | | | | | | | | | | | | | |
DEFINITIONS (all amounts in thousands):
| | |
144A | | 144A Securities are registered pursuant to Rule 144A of the Securities Act of 1933. These securities are deemed to be liquid for purposes of compliance limitations on holdings of illiquid securities and may be resold as transactions exempt from registration, normally to qualified institutional buyers. At 10/31/2012, these securities aggregated $8,030, or 2.55% of the fund’s net assets. |
ADR | | American Depositary Receipt |
BCLY | | Barclays Bank PLC |
BNP | | BNP Paribas |
BOA | | Bank of America |
CITI | | Citigroup, Inc. |
CSFB | | Credit Suisse First Boston |
DUB | | Deutsche Bank AG |
GDR | | Global Depositary Receipt |
GSC | | Goldman Sachs & Co. |
HSBC | | HSBC Bank USA |
JPM | | JPMorgan Chase Bank |
JSC | | Joint Stock Company |
MSC | | Morgan Stanley |
OTC | | Over The Counter |
PJSC | | Private Joint Stock Company |
REIT | | Real Estate Investment Trust (includes domestic REITs and Foreign Real Estate Investment Companies) |
SGX | | Singapore Exchange |
UBS | | UBS AG |
CURRENCY ABBREVIATIONS:
| | |
AUD | | Australian Dollar |
BRL | | Brazilian Real |
CAD | | Canadian Dollar |
CHF | | Swiss Franc |
CNY | | Chinese Yuan Renminbi |
EUR | | Euro |
GBP | | Pound Sterling |
HKD | | Hong Kong Dollar |
JPY | | Japanese Yen |
MXN | | Mexican Peso |
MYR | | Malaysian Ringgit |
PLN | | Polish Zloty |
SGD | | Singapore Dollar |
USD | | United States Dollar |
The notes to the financial statements are an integral part of this report.
| | | | |
| Transamerica Funds | | | | Annual Report 2012 |
| | Page 188 | | |
Transamerica Global Allocation
(formerly, Transamerica BlackRock Global Allocation)
CONSOLIDATED SCHEDULE OF INVESTMENTS (continued)
At October 31, 2012
VALUATION SUMMARY (all amounts in thousands): '
| | | | | | | | | | | | | | | | |
Investment Securities | | Level 1 -
Quoted
Prices | | | Level 2 -
Other
Significant
Observable
Inputs | | | Level 3 -
Significant
Unobservable
Inputs | | | Value at
10/31/2012 | |
Common Stocks | | $ | 121,642 | | | $ | 61,356 | | | $ | 358 | | | $ | 183,356 | |
Convertible Bonds | | | — | | | | 9,528 | | | | — | | | | 9,528 | |
Convertible Preferred Stocks | | | 1,681 | | | | — | | | | — | | | | 1,681 | |
Corporate Debt Securities | | | — | | | | 12,357 | | | | 533 | | | | 12,890 | |
Foreign Government Obligations | | | — | | | | 29,493 | | | | — | | | | 29,493 | |
Investment Companies | | | 8,514 | | | | — | | | | — | | | | 8,514 | |
Loan Assignments | | | — | | | | 1,288 | | | | — | | | | 1,288 | |
Mortgage-Backed Security | | | — | | | | 362 | | | | — | | | | 362 | |
Preferred Corporate Debt Securities | | | — | | | | 93 | | | | — | | | | 93 | |
Preferred Stocks | | | 1,926 | | | | 1,412 | | | | — | | | | 3,338 | |
Purchased Options | | | 584 | | | | 1,471 | | | | — | | | | 2,055 | |
Right | | | — | | | | 9 | | | | — | | | | 9 | |
Securities Lending Collateral | | | 34,186 | | | | — | | | | — | | | | 34,186 | |
Short-Term Foreign Government Obligations | | | — | | | | 9,287 | | | | — | | | | 9,287 | |
Short-Term U.S. Government Obligations | | | — | | | | 46,214 | | | | — | | | | 46,214 | |
U.S. Government Obligations | | | — | | | | 17,894 | | | | — | | | | 17,894 | |
Warrants | | | 95 | | | | 7 | | | | — | | | | 102 | |
| | | | | | | | | | | | | | | | |
Total | | $ | 168,628 | | | $ | 190,771 | | | $ | 891 | | | $ | 360,290 | |
| | | | | | | | | | | | | | | | |
| | | | | | | | | | | | | | | | |
Other Financial Instruments | | Level 1 -
Quoted
Prices | | | Level 2 -
Other
Significant
Observable
Inputs | | | Level 3 -
Significant
Unobservable
Inputs | | | Value at
10/31/2012 | |
Written Options | | $ | (249 | ) | | $ | (350 | ) | | $ | — | | | $ | (599 | ) |
| | | | | | | | | | | | | | | | |
Other Financial Instruments ₣ | | Level 1 -
Quoted
Prices | | | Level 2 -
Other
Significant
Observable
Inputs | | | Level 3 -
Significant
Unobservable
Inputs | | | Value at
10/31/2012 | |
Futures Contracts—Appreciation | | $ | 189 | | | $ | — | | | $ | — | | | $ | 189 | |
Futures Contracts—Depreciation | | | (2 | ) | | | — | | | | — | | | | (2 | ) |
Forward Foreign Cross Currency Contract—Appreciation | | | — | | | | 18 | | | | — | | | | 18 | |
Forward Foreign Cross Currency Contract—Depreciation | | | — | | | | (15 | ) | | | — | | | | (15 | ) |
Forward Foreign Currency Contracts—Appreciation | | | — | | | | 157 | | | | — | | | | 157 | |
Forward Foreign Currency Contracts—Depreciation | | | — | | | | (348 | ) | | | — | | | | (348 | ) |
Interest Rate Swaps—Appreciation | | | — | | | | 18 | | | | — | | | | 18 | |
Interest Rate Swaps—Depreciation | | | — | | | | (6 | ) | | | — | | | | (6 | ) |
Total Return Swaps—Appreciation | | | — | | | | 54 | | | | — | | | | 54 | |
| | | | | | | | | | | | | | | | |
Total | | $ | 187 | | | $ | (122 | ) | | $ | — | | | $ | 65 | |
| | | | | | | | | | | | | | | | |
Level 3 Rollforward—Investment Securities
| | | | | | | | | | | | | | | | | | | | | | | | | | | | | | | | | | | | | | | | |
Security | | Beginning
Balance at
10/31/2011 | | | Purchases | | | Sales | | | Accrued
Discounts/
(Premiums) | | | Total
Realized
Gain/
(Loss) | | | Net Change in
Unrealized
Appreciation /
(Depreciation) ƒ | | | Transfers
into
Level 3 | | | Transfers
out of
Level 3 j | | | Ending
Balance at
10/31/2012 ₪ | | | Net Change in
Unrealized
Appreciation/
(Depreciation) on
Investments Held
at 10/31/2012 ƒ | |
Common Stocks | | $ | 463 | | | $ | 404 | | | $ | (89 | ) | | $ | — | | | $ | (52 | ) | | $ | (121 | ) | | $ | — | | | $ | (247 | ) | | $ | 358 | | | $ | (69 | ) |
Corporate Debt Securities | | | ¿ | | | | 644 | | | | (135 | ) | | | (¿) | | | | (3 | ) | | | 27 | | | | — | | | | — | | | | 533 | | | | 27 | |
Loan Assignments | | | 374 | | | | 12 | | | | (386 | ) | | | — | | | | — | | | | — | | | | — | | | | — | | | | — | | | | — | |
| | | | | | | | | | | | | | | | | | | | | | | | | | | | | | | | | | | | | | | | |
Total | | $ | 837 | | | $ | 1,060 | | | $ | (610 | ) | | $ | (¿) | | | $ | (55 | ) | | $ | (94 | ) | | $ | — | | | $ | (247 | ) | | $ | 891 | | | $ | (42 | ) |
| | | | | | | | | | | | | | | | | | | | | | | | | | | | | | | | | | | | | | | | |
| ' | Transfers between levels are considered to have occurred at the end of the reporting period. There were no transfers into or out of Levels 1 and 2 during the period ended 10/31/2012. See the notes to the financial statements for more information regarding pricing inputs and valuation techniques. |
| ₣ | Other financial instruments are derivative instruments that are valued at unrealized appreciation (depreciation) on the instrument. |
| ƒ | Any difference between Net Change in Unrealized Appreciation/(Depreciation) and Net Change in Unrealized Appreciation/(Depreciation) on Investments Held at 10/31/2012 may be due to an investment no longer held or categorized as Level 3 at period end. |
| φ | Transferred out of Level 3 because of availability of observable inputs. |
| ₪ | Inputs used in the valuation of the Level 3 securities were not considered significant unobservable inputs. |
The notes to the financial statements are an integral part of this report.
| | | | |
| Transamerica Funds | | | | Annual Report 2012 |
| | Page 189 | | |
Transamerica Managed Futures Strategy
(formerly, Transamerica AQR Managed Futures Strategy)
CONSOLIDATED SCHEDULE OF INVESTMENTS
At October 31, 2012
| | | | | | | | |
| | | Shares | | | Value
(000’s) | |
INVESTMENT COMPANIES—87.8% | |
Capital Markets—79.0% | | | | | | | | |
Dreyfus Treasury Cash Management | | | 105,978,159 | | | $ | 105,978 | |
UBS Select Treasury Preferred | | | 132,579,996 | | | | 132,580 | |
Money Market—8.8% | | | | | | | | |
BlackRock Liquidity Funds T-Fund Portfolio | | | 26,601,839 | | | | 26,602 | |
| | | | | | | | |
Total Investment Companies (cost $265,160) P | | | | | | | 265,160 | |
Other Assets and Liabilities—Net | | | | | | | 36,963 | |
| | | | | | | | |
Net Assets | | | | | | $ | 302,123 | |
| | | | | | | | |
OVER THE COUNTER SWAP AGREEMENTS: b
TOTAL RETURN SWAP AGREEMENTS—RECEIVABLE: (A)
| | | | | | | | | | | | | | | | | | | | |
Reference Entity | | Termination Date | | Counterparty | | Notional Amount
(000’s) | | | Market
Value
(000’s) | | | Premiums
Paid
(Received)
(000’s) | | | Unrealized
Appreciation
(Depreciation)
(000’s) | |
2-Year Euro-Schatz Futures | | 12/06/2012 | | BOA | | | 23,388 | | | $ | (28 | ) | | $ | — | | | $ | (28 | ) |
5-Year Euro-Bobl Futures | | 12/06/2012 | | BOA | | | 3,914 | | | | 1 | | | | — | | | | 1 | |
5-Year U.S. Treasury Note Futures | | 12/31/2012 | | BOA | | | 5,343 | | | | 4 | | | | — | | | | 4 | |
Corn December Futures | | 11/23/2012 | | BCLY | | | 1,587 | | | | (175 | ) | | | — | | | | (175 | ) |
Soybean January Futures | | 12/21/2012 | | BCLY | | | 1,007 | | | | 29 | | | | — | | | | 29 | |
Swiss Market Index Futures | | 12/21/2012 | | RBS | | | 11,260 | | | | 70 | | | | — | | | | 70 | |
Wheat December Futures | | 11/23/2012 | | BCLY | | | 1,599 | | | | (106 | ) | | | — | | | | (106 | ) |
| | | | | | | | | | | | | | | | | | | | |
| | | | | | | | | | $ | (205 | ) | | $ | — | | | $ | (205 | ) |
| | | | | | | | | | | | | | | | | | | | |
TOTAL RETURN SWAP AGREEMENTS—PAYABLE: (A)
| | | | | | | | | | | | | | | | | | | | |
Reference Entity | | Termination Date | | Counterparty | | Notional Amount
(000’s) | | | Market
Value
(000’s) | | | Premiums
Paid
(Received)
(000’s) | | | Unrealized
Appreciation
(000’s) | |
Cocoa December Futures | | 11/02/2012 | | BCLY | | | 2,221 | | | $ | — | | | $ | — | | | $ | — | |
Coffee December Futures | | 11/09/2012 | | BCLY | | | 531 | | | | 68 | | | | — | | | | 68 | |
Aluminum December Futures | | 12/17/2012 | | BCLY | | | 705 | | | | 40 | | | | — | | | | 40 | |
| | | | | | | | | | | | | | | | | | | | |
| | | | | | | | | | $ | 108 | | | $ | — | | | $ | 108 | |
| | | | | | | | | | | | | | | | | | | | |
FUTURES CONTRACTS: Б
| | | | | | | | | | | | |
Description | | Type | | Contracts | | | Expiration Date | | Unrealized
Appreciation
(Depreciation)
(000’s) | |
10-Year Australian Treasury Bond | | Short | | | (7 | ) | | 12/17/2012 | | $ | (12 | ) |
10-Year Government of Canada Bond | | Short | | | (7 | ) | | 12/18/2012 | | | (7 | ) |
10-Year Japan Government Bond | | Long | | | 28 | | | 12/11/2012 | | | 126 | |
10-Year U.S. Treasury Note | | Long | | | 24 | | | 12/19/2012 | | | (9 | ) |
2-Year U.S. Treasury Note | | Short | | | (285 | ) | | 12/31/2012 | | | (15 | ) |
30-Year U.S. Treasury Bond | | Long | | | 3 | | | 12/19/2012 | | | 1 | |
3-Month Aluminum | | Short | | | (1 | ) | | 11/23/2012 | | | (¿ | ) |
3-Month Aluminum | | Long | | | 1 | | | 11/23/2012 | | | ¿ | |
3-Month Aluminum | | Short | | | (36 | ) | | 12/05/2012 | | | 55 | |
3-Month Aluminum | | Long | | | 36 | | | 12/05/2012 | | | (36 | ) |
3-Month Aluminum | | Long | | | 28 | | | 12/06/2012 | | | (62 | ) |
3-Month Aluminum | | Short | | | (28 | ) | | 12/06/2012 | | | 50 | |
3-Month Aluminum | | Short | | | (20 | ) | | 12/07/2012 | | | 56 | |
The notes to the financial statements are an integral part of this report.
| | | | |
| Transamerica Funds | | | | Annual Report 2012 |
| | Page 190 | | |
Transamerica Managed Futures Strategy
(formerly, Transamerica AQR Managed Futures Strategy)
CONSOLIDATED SCHEDULE OF INVESTMENTS (continued)
At October 31, 2012
FUTURES CONTRACTS (continued): Б
| | | | | | | | | | | | | | |
Description | | Type | | | Contracts | | | Expiration Date | | Unrealized
Appreciation
(Depreciation)
(000’s) | |
3-Month Aluminum | | | Long | | | | 20 | | | 12/07/2012 | | $ | (46 | ) |
3-Month Aluminum | | | Short | | | | (31 | ) | | 12/10/2012 | | | 117 | |
3-Month Aluminum | | | Long | | | | 31 | | | 12/10/2012 | | | (115 | ) |
3-Month Aluminum | | | Long | | | | 32 | | | 12/11/2012 | | | (129 | ) |
3-Month Aluminum | | | Short | | | | (32 | ) | | 12/11/2012 | | | 134 | |
3-Month Aluminum | | | Short | | | | (23 | ) | | 12/12/2012 | | | 103 | |
3-Month Aluminum | | | Long | | | | 23 | | | 12/12/2012 | | | (110 | ) |
3-Month Aluminum | | | Long | | | | 15 | | | 12/13/2012 | | | (67 | ) |
3-Month Aluminum | | | Short | | | | (15 | ) | | 12/13/2012 | | | 74 | |
3-Month Aluminum | | | Short | | | | (1 | ) | | 12/14/2012 | | | 7 | |
3-Month Aluminum | | | Long | | | | 1 | | | 12/14/2012 | | | (6 | ) |
3-Month Aluminum | | | Long | | | | 35 | | | 01/11/2013 | | | (88 | ) |
3-Month Aluminum | | | Short | | | | (35 | ) | | 01/11/2013 | | | 95 | |
3-Month Aluminum | | | Short | | | | (20 | ) | | 01/15/2013 | | | 40 | |
3-Month Aluminum | | | Long | | | | 20 | | | 01/15/2013 | | | (39 | ) |
3-Month Aluminum | | | Long | | | | 8 | | | 01/16/2013 | | | (11 | ) |
3-Month Aluminum | | | Short | | | | (8 | ) | | 01/16/2013 | | | 13 | |
3-Month Aluminum | | | Long | | | | 6 | | | 01/17/2013 | | | (9 | ) |
3-Month Aluminum | | | Short | | | | (6 | ) | | 01/17/2013 | | | 9 | |
3-Month Aluminum | | | Long | | | | 1 | | | 01/18/2013 | | | (3 | ) |
3-Month Aluminum | | | Short | | | | (1 | ) | | 01/18/2013 | | | 2 | |
3-Month Aluminum | | | Long | | | | 20 | | | 01/25/2013 | | | (14 | ) |
3-Month Aluminum | | | Short | | | | (20 | ) | | 01/25/2013 | | | 17 | |
3-Month Canadian Bankers’ Acceptance | | | Short | | | | (57 | ) | | 03/18/2013 | | | (19 | ) |
3-Month Canadian Bankers’ Acceptance | | | Short | | | | (47 | ) | | 06/17/2013 | | | (21 | ) |
3-Month Copper | | | Short | | | | (7 | ) | | 11/02/2012 | | | (65 | ) |
3-Month Copper | | | Long | | | | 7 | | | 11/02/2012 | | | 72 | |
3-Month Copper | | | Short | | | | (2 | ) | | 11/06/2012 | | | (17 | ) |
3-Month Copper | | | Long | | | | 2 | | | 11/06/2012 | | | 17 | |
3-Month Copper | | | Short | | | | (1 | ) | | 11/07/2012 | | | (7 | ) |
3-Month Copper | | | Long | | | | 1 | | | 11/07/2012 | | | 6 | |
3-Month Copper | | | Long | | | | 1 | | | 11/14/2012 | | | 8 | |
3-Month Copper | | | Short | | | | (1 | ) | | 11/14/2012 | | | (8 | ) |
3-Month Copper | | | Long | | | | 1 | | | 11/16/2012 | | | 9 | |
3-Month Copper | | | Short | | | | (1 | ) | | 11/16/2012 | | | (9 | ) |
3-Month Copper | | | Short | | | | (24 | ) | | 11/23/2012 | | | (70 | ) |
3-Month Copper | | | Long | | | | 24 | | | 11/23/2012 | | | 73 | |
3-Month Copper | | | Short | | | | (5 | ) | | 11/28/2012 | | | (22 | ) |
3-Month Copper | | | Long | | | | 5 | | | 11/28/2012 | | | 21 | |
3-Month Copper | | | Long | | | | 2 | | | 11/30/2012 | | | 9 | |
3-Month Copper | | | Short | | | | (2 | ) | | 11/30/2012 | | | (8 | ) |
3-Month Copper | | | Short | | | | (3 | ) | | 12/04/2012 | | | (8 | ) |
3-Month Copper | | | Long | | | | 3 | | | 12/04/2012 | | | 8 | |
3-Month Copper | | | Short | | | | (7 | ) | | 12/05/2012 | | | (16 | ) |
3-Month Copper | | | Long | | | | 7 | | | 12/05/2012 | | | 26 | |
3-Month Copper | | | Long | | | | 3 | | | 12/06/2012 | | | 2 | |
3-Month Copper | | | Short | | | | (3 | ) | | 12/06/2012 | | | (5 | ) |
3-Month Copper | | | Short | | | | (2 | ) | | 12/07/2012 | | | 9 | |
3-Month Copper | | | Long | | | | 2 | | | 12/07/2012 | | | (1 | ) |
3-Month Copper | | | Long | | | | 3 | | | 12/10/2012 | | | (20 | ) |
3-Month Copper | | | Short | | | | (3 | ) | | 12/10/2012 | | | 24 | |
3-Month Copper | | | Short | | | | (5 | ) | | 12/13/2012 | | | 42 | |
3-Month Copper | | | Long | | | | 5 | | | 12/13/2012 | | | (38 | ) |
3-Month Copper | | | Short | | | | (1 | ) | | 12/14/2012 | | | 16 | |
3-Month Copper | | | Long | | | | 1 | | | 12/14/2012 | | | (15 | ) |
3-Month Copper | | | Short | | | | (1 | ) | | 12/17/2012 | | | 15 | |
3-Month Copper | | | Long | | | | 1 | | | 12/17/2012 | | | (14 | ) |
3-Month Copper | | | Long | | | | 1 | | | 12/18/2012 | | | (13 | ) |
3-Month Copper | | | Short | | | | (1 | ) | | 12/18/2012 | | | 12 | |
3-Month Copper | | | Long | | | | 45 | | | 12/19/2012 | | | (296 | ) |
3-Month Copper | | | Short | | | | (22 | ) | | 12/19/2012 | | | (80 | ) |
3-Month Copper | | | Long | | | | 2 | | | 12/20/2012 | | | (24 | ) |
3-Month Copper | | | Short | | | | (2 | ) | | 12/20/2012 | | | 25 | |
3-Month Copper | | | Long | | | | 2 | | | 12/21/2012 | | | (29 | ) |
The notes to the financial statements are an integral part of this report.
| | | | |
| Transamerica Funds | | | | Annual Report 2012 |
| | Page 191 | | |
Transamerica Managed Futures Strategy
(formerly, Transamerica AQR Managed Futures Strategy)
CONSOLIDATED SCHEDULE OF INVESTMENTS (continued)
At October 31, 2012
FUTURES CONTRACTS (continued): Б
| | | | | | | | | | | | | | |
Description | | Type | | | Contracts | | | Expiration Date | | Unrealized
Appreciation
(Depreciation)
(000’s) | |
3-Month Copper | | | Short | | | | (2 | ) | | 12/21/2012 | | $ | 26 | |
3-Month Copper | | | Short | | | | (2 | ) | | 12/24/2012 | | | 24 | |
3-Month Copper | | | Long | | | | 2 | | | 12/24/2012 | | | (24 | ) |
3-Month Copper | | | Long | | | | 1 | | | 12/27/2012 | | | (11 | ) |
3-Month Copper | | | Short | | | | (1 | ) | | 12/27/2012 | | | 10 | |
3-Month Copper | | | Long | | | | 2 | | | 01/02/2013 | | | (21 | ) |
3-Month Copper | | | Short | | | | (2 | ) | | 01/02/2013 | | | 22 | |
3-Month Copper | | | Long | | | | 1 | | | 01/03/2013 | | | (13 | ) |
3-Month Copper | | | Short | | | | (1 | ) | | 01/03/2013 | | | 13 | |
3-Month Copper | | | Long | | | | 4 | | | 01/04/2013 | | | (56 | ) |
3-Month Copper | | | Short | | | | (4 | ) | | 01/04/2013 | | | 57 | |
3-Month Copper | | | Short | | | | (1 | ) | | 01/08/2013 | | | 10 | |
3-Month Copper | | | Long | | | | 1 | | | 01/08/2013 | | | (11 | ) |
3-Month Copper | | | Long | | | | 1 | | | 01/15/2013 | | | (8 | ) |
3-Month Copper | | | Short | | | | (1 | ) | | 01/15/2013 | | | 9 | |
3-Month Copper | | | Short | | | | (2 | ) | | 01/25/2013 | | | 1 | |
3-Month Copper | | | Long | | | | 2 | | | 01/25/2013 | | | ¿ | |
3-Month EURIBOR | | | Long | | | | 203 | | | 03/18/2013 | | | 23 | |
3-Month EURIBOR | | | Long | | | | 149 | | | 06/17/2013 | | | 14 | |
3-Month EURIBOR | | | Long | | | | 122 | | | 09/16/2013 | | | 10 | |
3-Month EURIBOR | | | Long | | | | 109 | | | 12/16/2013 | | | 10 | |
3-Month EURIBOR | | | Long | | | | 102 | | | 03/17/2014 | | | 8 | |
3-Month EURIBOR | | | Long | | | | 95 | | | 06/16/2014 | | | 3 | |
3-Month EURIBOR | | | Long | | | | 87 | | | 09/15/2014 | | | (6 | ) |
3-Month Euroswiss | | | Short | | | | (127 | ) | | 03/18/2013 | | | 5 | |
3-Month Euroswiss | | | Short | | | | (86 | ) | | 06/17/2013 | | | ¿ | |
3-Month Nickel | | | Long | | | | 7 | | | 11/02/2012 | | | 29 | |
3-Month Nickel | | | Short | | | | (7 | ) | | 11/02/2012 | | | (28 | ) |
3-Month Nickel | | | Short | | | | (2 | ) | | 11/06/2012 | | | (6 | ) |
3-Month Nickel | | | Long | | | | 2 | | | 11/06/2012 | | | 6 | |
3-Month Nickel | | | Short | | | | (4 | ) | | 11/07/2012 | | | (11 | ) |
3-Month Nickel | | | Long | | | | 4 | | | 11/07/2012 | | | 9 | |
3-Month Nickel | | | Short | | | | (1 | ) | | 11/08/2012 | | | (3 | ) |
3-Month Nickel | | | Long | | | | 1 | | | 11/08/2012 | | | 3 | |
3-Month Nickel | | | Short | | | | (3 | ) | | 11/09/2012 | | | (13 | ) |
3-Month Nickel | | | Long | | | | 3 | | | 11/09/2012 | | | 13 | |
3-Month Nickel | | | Short | | | | (6 | ) | | 11/13/2012 | | | (31 | ) |
3-Month Nickel | | | Long | | | | 6 | | | 11/13/2012 | | | 29 | |
3-Month Nickel | | | Long | | | | 5 | | | 11/14/2012 | | | 19 | |
3-Month Nickel | | | Short | | | | (5 | ) | | 11/14/2012 | | | (23 | ) |
3-Month Nickel | | | Long | | | | 1 | | | 11/15/2012 | | | 5 | |
3-Month Nickel | | | Short | | | | (1 | ) | | 11/15/2012 | | | (4 | ) |
3-Month Nickel | | | Short | | | | (3 | ) | | 11/16/2012 | | | (13 | ) |
3-Month Nickel | | | Long | | | | 3 | | | 11/16/2012 | | | 13 | |
3-Month Nickel | | | Long | | | | 6 | | | 11/23/2012 | | | (7 | ) |
3-Month Nickel | | | Short | | | | (6 | ) | | 11/23/2012 | | | 11 | |
3-Month Nickel | | | Long | | | | 6 | | | 11/28/2012 | | | (9 | ) |
3-Month Nickel | | | Short | | | | (6 | ) | | 11/28/2012 | | | 6 | |
3-Month Nickel | | | Long | | | | 6 | | | 11/29/2012 | | | (1 | ) |
3-Month Nickel | | | Short | | | | (6 | ) | | 11/29/2012 | | | 2 | |
3-Month Nickel | | | Short | | | | (6 | ) | | 11/30/2012 | | | 10 | |
3-Month Nickel | | | Long | | | | 6 | | | 11/30/2012 | | | (9 | ) |
3-Month Nickel | | | Short | | | | (8 | ) | | 12/10/2012 | | | 26 | |
3-Month Nickel | | | Long | | | | 8 | | | 12/10/2012 | | | (27 | ) |
3-Month Nickel | | | Long | | | | 5 | | | 12/11/2012 | | | (16 | ) |
3-Month Nickel | | | Short | | | | (5 | ) | | 12/11/2012 | | | 16 | |
3-Month Nickel | | | Long | | | | 5 | | | 12/12/2012 | | | (21 | ) |
3-Month Nickel | | | Short | | | | (5 | ) | | 12/12/2012 | | | 12 | |
3-Month Nickel | | | Short | | | | (6 | ) | | 12/13/2012 | | | 23 | |
3-Month Nickel | | | Long | | | | 6 | | | 12/13/2012 | | | (18 | ) |
3-Month Nickel | | | Long | | | | 2 | | | 12/14/2012 | | | (14 | ) |
3-Month Nickel | | | Short | | | | (2 | ) | | 12/14/2012 | | | 17 | |
3-Month Nickel | | | Short | | | | (5 | ) | | 12/17/2012 | | | 55 | |
3-Month Nickel | | | Long | | | | 5 | | | 12/17/2012 | | | (50 | ) |
The notes to the financial statements are an integral part of this report.
| | | | |
| Transamerica Funds | | | | Annual Report 2012 |
| | Page 192 | | |
Transamerica Managed Futures Strategy
(formerly, Transamerica AQR Managed Futures Strategy)
CONSOLIDATED SCHEDULE OF INVESTMENTS (continued)
At October 31, 2012
FUTURES CONTRACTS (continued): Б
| | | | | | | | | | | | | | |
Description | | Type | | | Contracts | | | Expiration Date | | Unrealized
Appreciation
(Depreciation)
(000’s) | |
3-Month Nickel | | | Long | | | | 5 | | | 12/18/2012 | | $ | (53 | ) |
3-Month Nickel | | | Short | | | | (5 | ) | | 12/18/2012 | | | 53 | |
3-Month Nickel | | | Short | | | | (5 | ) | | 12/20/2012 | | | 47 | |
3-Month Nickel | | | Long | | | | 5 | | | 12/20/2012 | | | (43 | ) |
3-Month Nickel | | | Long | | | | 5 | | | 12/21/2012 | | | (60 | ) |
3-Month Nickel | | | Short | | | | (5 | ) | | 12/21/2012 | | | 57 | |
3-Month Nickel | | | Short | | | | (6 | ) | | 12/24/2012 | | | 75 | |
3-Month Nickel | | | Long | | | | 6 | | | 12/24/2012 | | | (74 | ) |
3-Month Nickel | | | Short | | | | (9 | ) | | 12/27/2012 | | | 108 | |
3-Month Nickel | | | Long | | | | 9 | | | 12/27/2012 | | | (113 | ) |
3-Month Nickel | | | Short | | | | (1 | ) | | 12/28/2012 | | | 14 | |
3-Month Nickel | | | Long | | | | 1 | | | 12/28/2012 | | | (15 | ) |
3-Month Nickel | | | Short | | | | (8 | ) | | 01/02/2013 | | | 117 | |
3-Month Nickel | | | Long | | | | 8 | | | 01/02/2013 | | | (110 | ) |
3-Month Nickel | | | Long | | | | 1 | | | 01/03/2013 | | | (14 | ) |
3-Month Nickel | | | Short | | | | (1 | ) | | 01/03/2013 | | | 15 | |
3-Month Nickel | | | Long | | | | 4 | | | 01/04/2013 | | | (60 | ) |
3-Month Nickel | | | Short | | | | (4 | ) | | 01/04/2013 | | | 60 | |
3-Month Nickel | | | Long | | | | 1 | | | 01/08/2013 | | | (12 | ) |
3-Month Nickel | | | Short | | | | (1 | ) | | 01/08/2013 | | | 11 | |
3-Month Nickel | | | Long | | | | 2 | | | 01/09/2013 | | | (24 | ) |
3-Month Nickel | | | Short | | | | (2 | ) | | 01/09/2013 | | | 22 | |
3-Month Nickel | | | Short | | | | (3 | ) | | 01/10/2013 | | | 28 | |
3-Month Nickel | | | Long | | | | 3 | | | 01/10/2013 | | | (30 | ) |
3-Month Nickel | | | Short | | | | (9 | ) | | 01/25/2013 | | | (7 | ) |
3-Month Nickel | | | Long | | | | 9 | | | 01/25/2013 | | | (¿ | ) |
3-Month Sterling | | | Long | | | | 195 | | | 03/20/2013 | | | 8 | |
3-Month Sterling | | | Long | | | | 150 | | | 06/19/2013 | | | (¿ | ) |
3-Month Sterling | | | Long | | | | 146 | | | 09/18/2013 | | | (3 | ) |
3-Month Sterling | | | Long | | | | 157 | | | 12/18/2013 | | | (5 | ) |
3-Month Sterling | | | Long | | | | 162 | | | 03/19/2014 | | | (8 | ) |
3-Month Sterling | | | Long | | | | 146 | | | 06/18/2014 | | | (9 | ) |
3-Month Sterling | | | Long | | | | 129 | | | 09/17/2014 | | | (11 | ) |
3-Month Zinc | | | Long | | | | 29 | | | 11/02/2012 | | | 7 | |
3-Month Zinc | | | Short | | | | (29 | ) | | 11/02/2012 | | | (5 | ) |
3-Month Zinc | | | Long | | | | 3 | | | 11/06/2012 | | | (¿ | ) |
3-Month Zinc | | | Short | | | | (3 | ) | | 11/06/2012 | | | ¿ | |
3-Month Zinc | | | Short | | | | (4 | ) | | 11/07/2012 | | | 1 | |
3-Month Zinc | | | Long | | | | 4 | | | 11/07/2012 | | | (2 | ) |
3-Month Zinc | | | Short | | | | (11 | ) | | 11/14/2012 | | | (1 | ) |
3-Month Zinc | | | Long | | | | 11 | | | 11/14/2012 | | | 2 | |
3-Month Zinc | | | Long | | | | 20 | | | 11/28/2012 | | | (10 | ) |
3-Month Zinc | | | Short | | | | (20 | ) | | 11/28/2012 | | | 16 | |
3-Month Zinc | | | Short | | | | (16 | ) | | 11/29/2012 | | | 6 | |
3-Month Zinc | | | Long | | | | 16 | | | 11/29/2012 | | | (6 | ) |
3-Month Zinc | | | Long | | | | 16 | | | 12/05/2012 | | | (9 | ) |
3-Month Zinc | | | Short | | | | (16 | ) | | 12/05/2012 | | | 15 | |
3-Month Zinc | | | Long | | | | 15 | | | 12/06/2012 | | | (18 | ) |
3-Month Zinc | | | Short | | | | (15 | ) | | 12/06/2012 | | | 20 | |
3-Month Zinc | | | Long | | | | 17 | | | 12/07/2012 | | | (33 | ) |
3-Month Zinc | | | Short | | | | (17 | ) | | 12/07/2012 | | | 51 | |
3-Month Zinc | | | Long | | | | 16 | | | 12/10/2012 | | | (57 | ) |
3-Month Zinc | | | Short | | | | (16 | ) | | 12/10/2012 | | | 62 | |
3-Month Zinc | | | Short | | | | (16 | ) | | 12/11/2012 | | | 62 | |
3-Month Zinc | | | Long | | | | 16 | | | 12/11/2012 | | | (58 | ) |
3-Month Zinc | | | Short | | | | (15 | ) | | 12/12/2012 | | | 60 | |
3-Month Zinc | | | Long | | | | 15 | | | 12/12/2012 | | | (63 | ) |
3-Month Zinc | | | Short | | | | (10 | ) | | 12/13/2012 | | | 46 | |
3-Month Zinc | | | Long | | | | 10 | | | 12/13/2012 | | | (39 | ) |
3-Month Zinc | | | Short | | | | (15 | ) | | 12/14/2012 | | | 93 | |
3-Month Zinc | | | Long | | | | 15 | | | 12/14/2012 | | | (90 | ) |
3-Month Zinc | | | Long | | | | 16 | | | 12/17/2012 | | | (96 | ) |
3-Month Zinc | | | Short | | | | (16 | ) | | 12/17/2012 | | | 94 | |
3-Month Zinc | | | Long | | | | 15 | | | 12/18/2012 | | | (83 | ) |
The notes to the financial statements are an integral part of this report.
| | | | |
| Transamerica Funds | | | | Annual Report 2012 |
| | Page 193 | | |
Transamerica Managed Futures Strategy
(formerly, Transamerica AQR Managed Futures Strategy)
CONSOLIDATED SCHEDULE OF INVESTMENTS (continued)
At October 31, 2012
FUTURES CONTRACTS (continued): Б
| | | | | | | | | | | | | | |
Description | | Type | | | Contracts | | | Expiration Date | | Unrealized
Appreciation
(Depreciation)
(000’s) | |
3-Month Zinc | | | Short | | | | (15 | ) | | 12/18/2012 | | $ | 87 | |
3-Month Zinc | | | Short | | | | (3 | ) | | 12/20/2012 | | | 20 | |
3-Month Zinc | | | Long | | | | 3 | | | 12/20/2012 | | | (18 | ) |
3-Month Zinc | | | Short | | | | (16 | ) | | 12/21/2012 | | | 111 | |
3-Month Zinc | | | Long | | | | 16 | | | 12/21/2012 | | | (112 | ) |
3-Month Zinc | | | Long | | | | 16 | | | 12/24/2012 | | | (107 | ) |
3-Month Zinc | | | Short | | | | (16 | ) | | 12/24/2012 | | | 108 | |
3-Month Zinc | | | Short | | | | (12 | ) | | 12/27/2012 | | | 69 | |
3-Month Zinc | | | Long | | | | 12 | | | 12/27/2012 | | | (72 | ) |
3-Month Zinc | | | Long | | | | 6 | | | 12/28/2012 | | | (40 | ) |
3-Month Zinc | | | Short | | | | (6 | ) | | 12/28/2012 | | | 39 | |
3-Month Zinc | | | Short | | | | (6 | ) | | 01/02/2013 | | | 36 | |
3-Month Zinc | | | Long | | | | 6 | | | 01/02/2013 | | | (34 | ) |
3-Month Zinc | | | Long | | | | 2 | | | 01/03/2013 | | | (12 | ) |
3-Month Zinc | | | Short | | | | (2 | ) | | 01/03/2013 | | | 11 | |
3-Month Zinc | | | Long | | | | 10 | | | 01/04/2013 | | | (56 | ) |
3-Month Zinc | | | Short | | | | (10 | ) | | 01/04/2013 | | | 57 | |
3-Month Zinc | | | Long | | | | 3 | | | 01/08/2013 | | | (14 | ) |
3-Month Zinc | | | Short | | | | (3 | ) | | 01/08/2013 | | | 14 | |
3-Month Zinc | | | Long | | | | 4 | | | 01/09/2013 | | | (19 | ) |
3-Month Zinc | | | Short | | | | (4 | ) | | 01/09/2013 | | | 18 | |
3-Month Zinc | | | Short | | | | (26 | ) | | 01/15/2013 | | | 42 | |
3-Month Zinc | | | Long | | | | 26 | | | 01/15/2013 | | | (37 | ) |
3-Month Zinc | | | Short | | | | (8 | ) | | 01/17/2013 | | | 8 | |
3-Month Zinc | | | Long | | | | 8 | | | 01/17/2013 | | | (8 | ) |
3-Month Zinc | | | Short | | | | (16 | ) | | 01/18/2013 | | | 16 | |
3-Month Zinc | | | Long | | | | 16 | | | 01/18/2013 | | | (16 | ) |
3-Month Zinc | | | Long | | | | 10 | | | 01/22/2013 | | | (4 | ) |
3-Month Zinc | | | Short | | | | (10 | ) | | 01/22/2013 | | | 4 | |
3-Month Zinc | | | Short | | | | (9 | ) | | 01/23/2013 | | | (4 | ) |
3-Month Zinc | | | Long | | | | 9 | | | 01/23/2013 | | | 5 | |
3-Month Zinc | | | Long | | | | 13 | | | 01/24/2013 | | | 5 | |
3-Month Zinc | | | Short | | | | (13 | ) | | 01/24/2013 | | | (3 | ) |
3-Month Zinc | | | Long | | | | 16 | | | 01/25/2013 | | | 15 | |
3-Month Zinc | | | Short | | | | (16 | ) | | 01/25/2013 | | | (15 | ) |
3-Year Australian Treasury Bond | | | Short | | | | (32 | ) | | 12/17/2012 | | | (14 | ) |
5-Year U.S. Treasury Note | | | Long | | | | 116 | | | 12/31/2012 | | | (8 | ) |
90-Day Eurodollar | | | Long | | | | 253 | | | 03/18/2013 | | | 15 | |
90-Day Eurodollar | | | Long | | | | 151 | | | 06/17/2013 | | | 6 | |
90-Day Eurodollar | | | Long | | | | 114 | | | 09/16/2013 | | | 3 | |
90-Day Eurodollar | | | Long | | | | 90 | | | 12/16/2013 | | | 3 | |
90-Day Eurodollar | | | Long | | | | 78 | | | 03/17/2014 | | | 1 | |
90-Day Eurodollar | | | Long | | | | 80 | | | 06/16/2014 | | | 1 | |
90-Day Eurodollar | | | Long | | | | 99 | | | 09/15/2014 | | | (1 | ) |
AEX Index | | | Long | | | | 79 | | | 11/16/2012 | | | (79 | ) |
Aluminum Hg | | | Long | | | | 186 | | | 12/19/2012 | | | (594 | ) |
Aluminum Hg | | | Short | | | | (276 | ) | | 12/19/2012 | | | 719 | |
ASX SPI 200 Index | | | Long | | | | 117 | | | 12/20/2012 | | | 217 | |
Brent Crude Oil Penultimate Financial Futures | | | Long | | | | 40 | | | 11/14/2012 | | | (25 | ) |
CAC 40 Index | | | Long | | | | 125 | | | 11/16/2012 | | | (123 | ) |
Coffee “C” | | | Short | | | | (111 | ) | | 12/18/2012 | | | 419 | |
Corn | | | Long | | | | 17 | | | 12/14/2012 | | | 19 | |
Cotton No. 2 | | | Short | | | | (112 | ) | | 12/06/2012 | | | 69 | |
DAX Index | | | Long | | | | 27 | | | 12/21/2012 | | | (82 | ) |
DJIA Mini Index | | | Long | | | | 105 | | | 12/21/2012 | | | (234 | ) |
European Gasoil (ICE) | | | Long | | | | 66 | | | 11/09/2012 | | | (13 | ) |
FTSE 100 Index | | | Long | | | | 90 | | | 12/21/2012 | | | (96 | ) |
FTSE JSE Top 40 Index | | | Long | | | | 226 | | | 12/20/2012 | | | 185 | |
FTSE MIB Index | | | Long | | | | 43 | | | 12/21/2012 | | | (104 | ) |
German Euro BOBL | | | Long | | | | 7 | | | 12/06/2012 | | | 4 | |
German Euro Bund | | | Short | | | | (2 | ) | | 12/06/2012 | | | (3 | ) |
German Euro BUXL | | | Short | | | | (1 | ) | | 12/06/2012 | | | (3 | ) |
German Euro Schatz | | | Long | | | | 40 | | | 12/06/2012 | | | 4 | |
Gold 100 oz | | | Long | | | | 17 | | | 12/27/2012 | | | (99 | ) |
The notes to the financial statements are an integral part of this report.
| | | | |
| Transamerica Funds | | | | Annual Report 2012 |
| | Page 194 | | |
Transamerica Managed Futures Strategy
(formerly, Transamerica AQR Managed Futures Strategy)
CONSOLIDATED SCHEDULE OF INVESTMENTS (continued)
At October 31, 2012
FUTURES CONTRACTS (continued): Б
| | | | | | | | | | | | | | |
Description | | Type | | | Contracts | | | Expiration Date | | Unrealized
Appreciation
(Depreciation)
(000’s) | |
Hang Seng China ENT Index | | | Long | | | | 18 | | | 11/29/2012 | | $ | (¿ | ) |
Hang Seng Index Futures | | | Long | | | | 65 | | | 11/29/2012 | | | (4 | ) |
Henry Hub Nat Gas Swap | | | Short | | | | (79 | ) | | 11/28/2012 | | | 17 | |
IBEX 35 Index | | | Long | | | | 13 | | | 11/16/2012 | | | (34 | ) |
KOSPI 200 Index | | | Long | | | | 33 | | | 12/13/2012 | | | (175 | ) |
Lean Hogs | | | Short | | | | (193 | ) | | 12/14/2012 | | | (197 | ) |
MSCI Taiwan Index | | | Long | | | | 239 | | | 11/29/2012 | | | (66 | ) |
NASDAQ 100 E-Mini Index | | | Long | | | | 72 | | | 12/21/2012 | | | (291 | ) |
Nickel | | | Long | | | | 86 | | | 12/19/2012 | | | (817 | ) |
Nickel | | | Short | | | | (81 | ) | | 12/19/2012 | | | 44 | |
NYMEX Heating Oil | | | Long | | | | 40 | | | 11/29/2012 | | | (205 | ) |
RBOB Gasoline | | | Long | | | | 68 | | | 11/30/2012 | | | (589 | ) |
Russell 2000 Mini Index | | | Long | | | | 69 | | | 12/21/2012 | | | (288 | ) |
S&P 500 E-Mini Index | | | Long | | | | 99 | | | 12/21/2012 | | | (237 | ) |
S&P Midcap 400 E-Mini Index | | | Long | | | | 74 | | | 12/21/2012 | | | (282 | ) |
S&P TSE 60 Index | | | Long | | | | 56 | | | 12/20/2012 | | | 1 | |
SGX CNX Nifty Index | | | Long | | | | 432 | | | 11/29/2012 | | | (91 | ) |
SGX MSCI Singapore Index | | | Long | | | | 148 | | | 11/29/2012 | | | (44 | ) |
Silver | | | Long | | | | 7 | | | 12/27/2012 | | | (80 | ) |
Soybean | | | Long | | | | 14 | | | 01/14/2013 | | | (11 | ) |
Soybean Meal | | | Short | | | | (4 | ) | | 12/14/2012 | | | (5 | ) |
Soybean Oil | | | Short | | | | (267 | ) | | 12/14/2012 | | | 151 | |
Sugar # 11 | | | Short | | | | (473 | ) | | 02/28/2013 | | | 422 | |
TOPIX Index | | | Long | | | | 41 | | | 12/14/2012 | | | (39 | ) |
U.K. Long Gilt Bond | | | Short | | | | (11 | ) | | 12/27/2012 | | | (7 | ) |
Wheat | | | Long | | | | 15 | | | 12/14/2012 | | | (24 | ) |
WTI-Brent Bullet Swap Future | | | Short | | | | (40 | ) | | 11/15/2012 | | | 4 | |
Zinc | | | Long | | | | 244 | | | 12/19/2012 | | | (1,190 | ) |
Zinc | | | Short | | | | (261 | ) | | 12/19/2012 | | | 419 | |
| | | | | | | | | | | | | | |
| | | | | | | | | | | | $ | (3,603 | ) |
| | | | | | | | | | | | | | |
FORWARD FOREIGN CURRENCY CONTRACTS: b
| | | | | | | | | | | | | | | | |
Currency | | Counterparty | | Contracts
Bought (Sold)
(000’s) | | | Settlement Date | | Amount in U.S.
Dollars Bought
(Sold)
(000’s) | | | Net Unrealized
Appreciation
(Depreciation)
(000’s) | |
AUD | | RBS | | | (3,064 | ) | | 12/19/2012 | | $ | (3,155 | ) | | $ | (12 | ) |
AUD | | RBS | | | 2,648 | | | 12/19/2012 | | | 2,730 | | | | 8 | |
AUD | | RBS | | | 2,405 | | | 12/19/2012 | | | 2,469 | | | | 18 | |
AUD | | RBS | | | (560 | ) | | 12/19/2012 | | | (572 | ) | | | (7 | ) |
AUD | | RBS | | | (5,225 | ) | | 12/19/2012 | | | (5,423 | ) | | | 21 | |
AUD | | RBS | | | (4,683 | ) | | 12/19/2012 | | | (4,758 | ) | | | (83 | ) |
AUD | | RBS | | | (4,250 | ) | | 12/19/2012 | | | (4,330 | ) | | | (64 | ) |
AUD | | RBS | | | (2,554 | ) | | 12/19/2012 | | | (2,593 | ) | | | (48 | ) |
AUD | | RBS | | | 303 | | | 12/19/2012 | | | 310 | | | | 3 | |
AUD | | RBS | | | (1,204 | ) | | 12/19/2012 | | | (1,216 | ) | | | (28 | ) |
AUD | | RBS | | | 1,576 | | | 12/19/2012 | | | 1,621 | | | | 8 | |
AUD | | RBS | | | 3,128 | | | 12/19/2012 | | | 3,232 | | | | 2 | |
AUD | | RBS | | | (696 | ) | | 12/19/2012 | | | (722 | ) | | | 3 | |
AUD | | RBS | | | 224 | | | 12/19/2012 | | | 228 | | | | 4 | |
AUD | | RBS | | | (2,470 | ) | | 12/19/2012 | | | (2,566 | ) | | | 12 | |
AUD | | RBS | | | (344 | ) | | 12/19/2012 | | | (359 | ) | | | 3 | |
AUD | | RBS | | | (630 | ) | | 12/19/2012 | | | (653 | ) | | | 2 | |
AUD | | RBS | | | (416 | ) | | 12/19/2012 | | | (423 | ) | | | (7 | ) |
AUD | | RBS | | | (16 | ) | | 12/19/2012 | | | (17 | ) | | | ¿ | |
AUD | | RBS | | | (2,366 | ) | | 12/19/2012 | | | (2,406 | ) | | | (40 | ) |
AUD | | RBS | | | (1,905 | ) | | 12/19/2012 | | | (1,955 | ) | | | (14 | ) |
AUD | | RBS | | | (4,089 | ) | | 12/19/2012 | | | (4,186 | ) | | | (41 | ) |
AUD | | RBS | | | (2,850 | ) | | 12/19/2012 | | | (2,934 | ) | | | (12 | ) |
AUD | | RBS | | | (3,801 | ) | | 12/19/2012 | | | (3,949 | ) | | | 19 | |
AUD | | RBS | | | (2,683 | ) | | 12/19/2012 | | | (2,777 | ) | | | 4 | |
AUD | | RBS | | | (1,193 | ) | | 12/19/2012 | | | (1,226 | ) | | | (7 | ) |
AUD | | RBS | | | (1,208 | ) | | 12/19/2012 | | | (1,234 | ) | | | (15 | ) |
The notes to the financial statements are an integral part of this report.
| | | | |
| Transamerica Funds | | | | Annual Report 2012 |
| | Page 195 | | |
Transamerica Managed Futures Strategy
(formerly, Transamerica AQR Managed Futures Strategy)
CONSOLIDATED SCHEDULE OF INVESTMENTS (continued)
At October 31, 2012
FORWARD FOREIGN CURRENCY CONTRACTS (continued): β
| | | | | | | | | | | | | | | | | | |
Currency | | Counterparty | | Contracts
Bought (Sold)
(000’s) | | | Settlement Date | | | Amount in U.S.
Dollars Bought
(Sold)
(000’s) | | | Net Unrealized
Appreciation
(Depreciation)
(000’s) | |
AUD | | RBS | | | (4,377 | ) | | | 12/19/2012 | | | $ | (4,442 | ) | | $ | (83 | ) |
AUD | | RBS | | | (2,390 | ) | | | 12/19/2012 | | | | (2,470 | ) | | | (1 | ) |
AUD | | RBS | | | (130 | ) | | | 12/19/2012 | | | | (133 | ) | | | (1 | ) |
AUD | | RBS | | | (2,943 | ) | | | 12/19/2012 | | | | (3,019 | ) | | | (24 | ) |
AUD | | RBS | | | 2,297 | | | | 12/19/2012 | | | | 2,352 | | | | 23 | |
AUD | | RBS | | | 1,591 | | | | 12/19/2012 | | | | 1,613 | | | | 32 | |
AUD | | RBS | | | 41,554 | | | | 12/19/2012 | | | | 42,152 | | | | 807 | |
AUD | | RBS | | | 1,892 | | | | 12/19/2012 | | | | 1,932 | | | | 24 | |
AUD | | RBS | | | (344 | ) | | | 12/19/2012 | | | | (352 | ) | | | (4 | ) |
AUD | | RBS | | | (2,188 | ) | | | 12/19/2012 | | | | (2,295 | ) | | | 33 | |
BRL | | RBS | | | 200 | | | | 12/19/2012 | | | | 98 | | | | (¿ | ) |
BRL | | RBS | | | 100 | | | | 12/19/2012 | | | | 49 | | | | (¿ | ) |
BRL | | RBS | | | 300 | | | | 12/19/2012 | | | | 147 | | | | (¿ | ) |
BRL | | RBS | | | 300 | | | | 12/19/2012 | | | | 146 | | | | ¿ | |
BRL | | RBS | | | 700 | | | | 12/19/2012 | | | | 341 | | | | 2 | |
BRL | | RBS | | | (7,490 | ) | | | 12/19/2012 | | | | (3,622 | ) | | | (41 | ) |
BRL | | RBS | | | 500 | | | | 12/19/2012 | | | | 244 | | | | 1 | |
BRL | | RBS | | | 200 | | | | 12/19/2012 | | | | 97 | | | | ¿ | |
BRL | | RBS | | | 1,000 | | | | 12/19/2012 | | | | 486 | | | | 3 | |
CAD | | RBS | | | (994 | ) | | | 12/19/2012 | | | | (999 | ) | | | 4 | |
CAD | | RBS | | | 41,919 | | | | 12/19/2012 | | | | 42,376 | | | | (448 | ) |
CAD | | RBS | | | (449 | ) | | | 12/19/2012 | | | | (464 | ) | | | 15 | |
CAD | | RBS | | | (1,084 | ) | | | 12/19/2012 | | | | (1,101 | ) | | | 16 | |
CAD | | RBS | | | (1,293 | ) | | | 12/19/2012 | | | | (1,324 | ) | | | 31 | |
CAD | | RBS | | | (1,467 | ) | | | 12/19/2012 | | | | (1,504 | ) | | | 37 | |
CAD | | RBS | | | (1,417 | ) | | | 12/19/2012 | | | | (1,435 | ) | | | 18 | |
CAD | | RBS | | | (1,217 | ) | | | 12/19/2012 | | | | (1,239 | ) | | | 22 | |
CAD | | RBS | | | (185 | ) | | | 12/19/2012 | | | | (189 | ) | | | 4 | |
CAD | | RBS | | | (257 | ) | | | 12/19/2012 | | | | (262 | ) | | | 5 | |
CAD | | RBS | | | (55 | ) | | | 12/19/2012 | | | | (56 | ) | | | 1 | |
CAD | | RBS | | | (310 | ) | | | 12/19/2012 | | | | (312 | ) | | | 2 | |
CAD | | RBS | | | 968 | | | | 12/19/2012 | | | | 977 | | | | (8 | ) |
CAD | | RBS | | | (1,160 | ) | | | 12/19/2012 | | | | (1,182 | ) | | | 22 | |
CAD | | RBS | | | (195 | ) | | | 12/19/2012 | | | | (200 | ) | | | 5 | |
CAD | | RBS | | | (670 | ) | | | 12/19/2012 | | | | (681 | ) | | | 11 | |
CAD | | RBS | | | (398 | ) | | | 12/19/2012 | | | | (402 | ) | | | 4 | |
CAD | | RBS | | | (9 | ) | | | 12/19/2012 | | | | (9 | ) | | | ¿ | |
CAD | | RBS | | | (701 | ) | | | 12/19/2012 | | | | (712 | ) | | | 11 | |
CAD | | RBS | | | (152 | ) | | | 12/19/2012 | | | | (156 | ) | | | 4 | |
CAD | | RBS | | | (1,230 | ) | | | 12/19/2012 | | | | (1,254 | ) | | | 24 | |
CAD | | RBS | | | (707 | ) | | | 12/19/2012 | | | | (716 | ) | | | 9 | |
CAD | | RBS | | | (1,901 | ) | | | 12/19/2012 | | | | (1,953 | ) | | | 52 | |
CAD | | RBS | | | (2,007 | ) | | | 12/19/2012 | | | | (2,048 | ) | | | 40 | |
CLP | | RBS | | | 1,070,000 | | | | 12/19/2012 | | | | 2,194 | | | | 15 | |
COP | | RBS | | | 1,260,000 | | | | 12/19/2012 | | | | 681 | | | | 3 | |
CZK | | RBS | | | 8,000 | | | | 12/19/2012 | | | | 404 | | | | 9 | |
CZK | | RBS | | | 21,900 | | | | 12/19/2012 | | | | 1,117 | | | | 15 | |
CZK | | RBS | | | 5,000 | | | | 12/19/2012 | | | | 252 | | | | 6 | |
CZK | | RBS | | | 1,000 | | | | 12/19/2012 | | | | 52 | | | | (¿ | ) |
CZK | | RBS | | | 8,000 | | | | 12/19/2012 | | | | 409 | | | | 5 | |
CZK | | RBS | | | 4,000 | | | | 12/19/2012 | | | | 203 | | | | 4 | |
CZK | | RBS | | | 5,000 | | | | 12/19/2012 | | | | 267 | | | | (9 | ) |
EUR | | RBS | | | (430 | ) | | | 12/19/2012 | | | | (540 | ) | | | (17 | ) |
EUR | | RBS | | | 3,876 | | | | 12/19/2012 | | | | 5,015 | | | | 11 | |
EUR | | RBS | | | (450 | ) | | | 12/19/2012 | | | | (578 | ) | | | (5 | ) |
EUR | | RBS | | | 1,407 | | | | 12/19/2012 | | | | 1,812 | | | | 13 | |
EUR | | RBS | | | 2,471 | | | | 12/19/2012 | | | | 3,221 | | | | (17 | ) |
EUR | | RBS | | | 4,343 | | | | 12/19/2012 | | | | 5,603 | | | | 29 | |
EUR | | RBS | | | 7,138 | | | | 12/19/2012 | | | | 9,248 | | | | 9 | |
EUR | | RBS | | | 2,078 | | | | 12/19/2012 | | | | 2,688 | | | | 6 | |
EUR | | RBS | | | 3,233 | | | | 12/19/2012 | | | | 4,204 | | | | (12 | ) |
EUR | | RBS | | | 3,296 | | | | 12/19/2012 | | | | 4,318 | | | | (44 | ) |
EUR | | RBS | | | 7,369 | | | | 12/19/2012 | | | | 9,589 | | | | (33 | ) |
The notes to the financial statements are an integral part of this report.
| | | | |
| Transamerica Funds | | | | Annual Report 2012 |
| | Page 196 | | |
Transamerica Managed Futures Strategy
(formerly, Transamerica AQR Managed Futures Strategy)
CONSOLIDATED SCHEDULE OF INVESTMENTS (continued)
At October 31, 2012
FORWARD FOREIGN CURRENCY CONTRACTS (continued): β
| | | | | | | | | | | | | | | | |
Currency | | Counterparty | | Contracts
Bought (Sold)
(000’s) | | | Settlement Date | | Amount in U.S.
Dollars Bought
(Sold)
(000’s) | | | Net Unrealized
Appreciation
(Depreciation)
(000’s) | |
EUR | | RBS | | | 202 | | | 12/19/2012 | | $ | 261 | | | $ | ¿ | |
EUR | | RBS | | | 4,312 | | | 12/19/2012 | | | 5,654 | | | | (63 | ) |
EUR | | RBS | | | (557 | ) | | 12/19/2012 | | | (728 | ) | | | 5 | |
EUR | | RBS | | | 2,245 | | | 12/19/2012 | | | 2,899 | | | | 12 | |
EUR | | RBS | | | 3,194 | | | 12/19/2012 | | | 4,148 | | | | (6 | ) |
EUR | | RBS | | | (2,308 | ) | | 12/19/2012 | | | (2,986 | ) | | | (7 | ) |
EUR | | RBS | | | (103,492 | ) | | 12/19/2012 | | | (131,696 | ) | | | (2,513 | ) |
EUR | | RBS | | | 5,776 | | | 12/19/2012 | | | 7,553 | | | | (62 | ) |
EUR | | RBS | | | 2,339 | | | 12/19/2012 | | | 2,955 | | | | 78 | |
EUR | | RBS | | | (450 | ) | | 12/19/2012 | | | (579 | ) | | | (5 | ) |
EUR | | RBS | | | 5,093 | | | 12/19/2012 | | | 6,603 | | | | 2 | |
EUR | | RBS | | | 600 | | | 12/19/2012 | | | 780 | | | | (2 | ) |
EUR | | RBS | | | 4,975 | | | 12/19/2012 | | | 6,441 | | | | 11 | |
EUR | | RBS | | | 5,626 | | | 12/19/2012 | | | 7,304 | | | | (8 | ) |
EUR | | RBS | | | (3,309 | ) | | 12/19/2012 | | | (4,273 | ) | | | (18 | ) |
EUR | | RBS | | | (1,674 | ) | | 12/19/2012 | | | (2,156 | ) | | | (15 | ) |
EUR | | RBS | | | (446 | ) | | 12/19/2012 | | | (575 | ) | | | (3 | ) |
EUR | | RBS | | | (2,536 | ) | | 12/19/2012 | | | (3,204 | ) | | | (84 | ) |
EUR | | RBS | | | 6,604 | | | 12/19/2012 | | | 8,672 | | | | (108 | ) |
EUR | | RBS | | | 3,948 | | | 12/19/2012 | | | 5,087 | | | | 32 | |
EUR | | RBS | | | 3,107 | | | 12/19/2012 | | | 4,016 | | | | 13 | |
EUR | | RBS | | | 870 | | | 12/19/2012 | | | 1,101 | | | | 27 | |
EUR | | RBS | | | 5,957 | | | 12/19/2012 | | | 7,812 | | | | (87 | ) |
EUR | | RBS | | | 5,546 | | | 12/19/2012 | | | 7,109 | | | | 84 | |
EUR | | RBS | | | 12,068 | | | 12/19/2012 | | | 15,453 | | | | 196 | |
EUR | | RBS | | | 2,415 | | | 12/19/2012 | | | 3,025 | | | | 107 | |
EUR | | RBS | | | 450 | | | 12/19/2012 | | | 588 | | | | (4 | ) |
GBP | | RBS | | | (72 | ) | | 12/19/2012 | | | (115 | ) | | | (1 | ) |
GBP | | RBS | | | 835 | | | 12/19/2012 | | | 1,357 | | | | (10 | ) |
GBP | | RBS | | | (928 | ) | | 12/19/2012 | | | (1,503 | ) | | | 6 | |
GBP | | RBS | | | (829 | ) | | 12/19/2012 | | | (1,335 | ) | | | (2 | ) |
GBP | | RBS | | | (180 | ) | | 12/19/2012 | | | (290 | ) | | | (1 | ) |
GBP | | RBS | | | (2,798 | ) | | 12/19/2012 | | | (4,480 | ) | | | (34 | ) |
GBP | | RBS | | | (2,488 | ) | | 12/19/2012 | | | (3,984 | ) | | | (30 | ) |
GBP | | RBS | | | (120 | ) | | 12/19/2012 | | | (192 | ) | | | (1 | ) |
GBP | | RBS | | | (1,393 | ) | | 12/19/2012 | | | (2,262 | ) | | | 15 | |
GBP | | RBS | | | (740 | ) | | 12/19/2012 | | | (1,203 | ) | | | 9 | |
GBP | | RBS | | | 203 | | | 12/19/2012 | | | 328 | | | | ¿ | |
GBP | | RBS | | | (561 | ) | | 12/19/2012 | | | (907 | ) | | | 2 | |
GBP | | RBS | | | (611 | ) | | 12/19/2012 | | | (983 | ) | | | (3 | ) |
GBP | | RBS | | | 809 | | | 12/19/2012 | | | 1,313 | | | | (8 | ) |
GBP | | RBS | | | 545 | | | 12/19/2012 | | | 878 | | | | 1 | |
GBP | | RBS | | | 671 | | | 12/19/2012 | | | 1,084 | | | | (2 | ) |
GBP | | RBS | | | 1,302 | | | 12/19/2012 | | | 2,075 | | | | 26 | |
GBP | | RBS | | | 31 | | | 12/19/2012 | | | 50 | | | | (¿ | ) |
GBP | | RBS | | | (1,384 | ) | | 12/19/2012 | | | (2,226 | ) | | | (7 | ) |
GBP | | RBS | | | 930 | | | 12/19/2012 | | | 1,511 | | | | (11 | ) |
GBP | | RBS | | | (3,137 | ) | | 12/19/2012 | | | (5,086 | ) | | | 25 | |
GBP | | RBS | | | (1,562 | ) | | 12/19/2012 | | | (2,515 | ) | | | (6 | ) |
GBP | | RBS | | | (2,591 | ) | | 12/19/2012 | | | (4,146 | ) | | | (35 | ) |
GBP | | RBS | | | (1,978 | ) | | 12/19/2012 | | | (3,164 | ) | | | (28 | ) |
GBP | | RBS | | | (390 | ) | | 12/19/2012 | | | (630 | ) | | | 1 | |
GBP | | RBS | | | (889 | ) | | 12/19/2012 | | | (1,422 | ) | | | (12 | ) |
GBP | | RBS | | | (816 | ) | | 12/19/2012 | | | (1,313 | ) | | | (4 | ) |
GBP | | RBS | | | (220 | ) | | 12/19/2012 | | | (353 | ) | | | (2 | ) |
GBP | | RBS | | | (931 | ) | | 12/19/2012 | | | (1,503 | ) | | | ¿ | |
GBP | | RBS | | | 1,268 | | | 12/19/2012 | | | 2,007 | | | | 39 | |
GBP | | RBS | | | 6,035 | | | 12/19/2012 | | | 9,598 | | | | 139 | |
GBP | | RBS | | | 23,768 | | | 12/19/2012 | | | 38,559 | | | | (210 | ) |
GBP | | RBS | | | 1,146 | | | 12/19/2012 | | | 1,821 | | | | 28 | |
GBP | | RBS | | | 2,458 | | | 12/19/2012 | | | 3,880 | | | | 86 | |
GBP | | RBS | | | 47 | | | 12/19/2012 | | | 76 | | | | (¿ | ) |
GBP | | RBS | | | (752 | ) | | 12/19/2012 | | | (1,205 | ) | | | (8 | ) |
The notes to the financial statements are an integral part of this report.
| | | | |
| Transamerica Funds | | | | Annual Report 2012 |
| | Page 197 | | |
Transamerica Managed Futures Strategy
(formerly, Transamerica AQR Managed Futures Strategy)
CONSOLIDATED SCHEDULE OF INVESTMENTS (continued)
At October 31, 2012
FORWARD FOREIGN CURRENCY CONTRACTS (continued): β
| | | | | | | | | | | | | | | | |
Currency | | Counterparty | | Contracts
Bought (Sold)
(000’s) | | | Settlement Date | | Amount in U.S.
Dollars Bought
(Sold)
(000’s) | | | Net Unrealized
Appreciation
(Depreciation)
(000’s) | |
HUF | | RBS | | | (90,000 | ) | | 12/19/2012 | | $ | (399 | ) | | $ | (10 | ) |
HUF | | RBS | | | (50,000 | ) | | 12/19/2012 | | | (227 | ) | | | (¿ | ) |
HUF | | RBS | | | (10,000 | ) | | 12/19/2012 | | | (45 | ) | | | (¿ | ) |
HUF | | RBS | | | (50,000 | ) | | 12/19/2012 | | | (224 | ) | | | (3 | ) |
HUF | | RBS | | | (110,000 | ) | | 12/19/2012 | | | (503 | ) | | | 3 | |
HUF | | RBS | | | (80,000 | ) | | 12/19/2012 | | | (354 | ) | | | (10 | ) |
HUF | | RBS | | | 1,596,000 | | | 12/19/2012 | | | 6,981 | | | | 273 | |
IDR | | RBS | | | 100,000 | | | 12/19/2012 | | | 10 | | | | ¿ | |
IDR | | RBS | | | 400,000 | | | 12/19/2012 | | | 41 | | | | ¿ | |
IDR | | RBS | | | 200,000 | | | 12/19/2012 | | | 21 | | | | ¿ | |
IDR | | RBS | | | 100,000 | | | 12/19/2012 | | | 10 | | | | (¿ | ) |
IDR | | RBS | | | 4,300,000 | | | 12/19/2012 | | | 444 | | | | 1 | |
IDR | | RBS | | | 100,000 | | | 12/19/2012 | | | 10 | | | | (¿ | ) |
IDR | | RBS | | | 100,000 | | | 12/19/2012 | | | 10 | | | | (¿ | ) |
IDR | | RBS | | | 400,000 | | | 12/19/2012 | | | 42 | | | | (¿ | ) |
IDR | | RBS | | | 400,000 | | | 12/19/2012 | | | 41 | | | | ¿ | |
IDR | | RBS | | | (39,000,000 | ) | | 12/19/2012 | | | (4,007 | ) | | | (29 | ) |
IDR | | RBS | | | 200,000 | | | 12/19/2012 | | | 21 | | | | ¿ | |
ILS | | RBS | | | 1,600 | | | 12/19/2012 | | | 402 | | | | 9 | |
ILS | | RBS | | | 4,500 | | | 12/19/2012 | | | 1,150 | | | | 7 | |
ILS | | RBS | | | 100 | | | 12/19/2012 | | | 26 | | | | (¿ | ) |
ILS | | RBS | | | 300 | | | 12/19/2012 | | | 78 | | | | (1 | ) |
ILS | | RBS | | | 200 | | | 12/19/2012 | | | 51 | | | | ¿ | |
ILS | | RBS | | | 100 | | | 12/19/2012 | | | 26 | | | | (¿ | ) |
ILS | | RBS | | | 700 | | | 12/19/2012 | | | 180 | | | | (¿ | ) |
ILS | | RBS | | | 1,500 | | | 12/19/2012 | | | 387 | | | | (1 | ) |
ILS | | RBS | | | 300 | | | 12/19/2012 | | | 78 | | | | (1 | ) |
ILS | | RBS | | | 200 | | | 12/19/2012 | | | 52 | | | | (1 | ) |
ILS | | RBS | | | 400 | | | 12/19/2012 | | | 102 | | | | 1 | |
ILS | | RBS | | | 400 | | | 12/19/2012 | | | 103 | | | | (1 | ) |
ILS | | RBS | | | 700 | | | 12/19/2012 | | | 180 | | | | (¿ | ) |
ILS | | RBS | | | 500 | | | 12/19/2012 | | | 127 | | | | 1 | |
ILS | | RBS | | | 2,300 | | | 12/19/2012 | | | 588 | | | | 3 | |
ILS | | RBS | | | 500 | | | 12/19/2012 | | | 128 | | | | 1 | |
ILS | | RBS | | | 400 | | | 12/19/2012 | | | 103 | | | | (1 | ) |
ILS | | RBS | | | (22,800 | ) | | 12/19/2012 | | | (5,650 | ) | | | (209 | ) |
ILS | | RBS | | | 900 | | | 12/19/2012 | | | 228 | | | | 3 | |
ILS | | RBS | | | 900 | | | 12/19/2012 | | | 229 | | | | 2 | |
ILS | | RBS | | | 900 | | | 12/19/2012 | | | 227 | | | | 4 | |
ILS | | RBS | | | 2,300 | | | 12/19/2012 | | | 599 | | | | (8 | ) |
ILS | | RBS | | | 1,600 | | | 12/19/2012 | | | 403 | | | | 9 | |
INR | | RBS | | | 10,000 | | | 12/19/2012 | | | 189 | | | | (5 | ) |
INR | | RBS | | | 23,000 | | | 12/19/2012 | | | 425 | | | | (2 | ) |
INR | | RBS | | | 30,000 | | | 12/19/2012 | | | 563 | | | | (11 | ) |
INR | | RBS | | | (57,000 | ) | | 12/19/2012 | | | (1,000 | ) | | | (50 | ) |
INR | | RBS | | | 29,000 | | | 12/19/2012 | | | 537 | | | | (3 | ) |
INR | | RBS | | | (64,000 | ) | | 12/19/2012 | | | (1,126 | ) | | | (53 | ) |
INR | | RBS | | | 25,000 | | | 12/19/2012 | | | 467 | | | | (7 | ) |
INR | | RBS | | | 37,000 | | | 12/19/2012 | | | 673 | | | | 8 | |
INR | | RBS | | | 12,000 | | | 12/19/2012 | | | 223 | | | | (2 | ) |
INR | | RBS | | | (30,000 | ) | | 12/19/2012 | | | (531 | ) | | | (22 | ) |
INR | | RBS | | | 39,000 | | | 12/19/2012 | | | 739 | | | | (20 | ) |
INR | | RBS | | | 69,000 | | | 12/19/2012 | | | 1,257 | | | | 14 | |
INR | | RBS | | | (307,000 | ) | | 12/19/2012 | | | (5,420 | ) | | | (233 | ) |
INR | | RBS | | | 12,000 | | | 12/19/2012 | | | 216 | | | | 5 | |
INR | | RBS | | | 46,000 | | | 12/19/2012 | | | 859 | | | | (12 | ) |
INR | | RBS | | | 28,000 | | | 12/19/2012 | | | 525 | | | | (10 | ) |
INR | | RBS | | | 19,000 | | | 12/19/2012 | | | 358 | | | | (8 | ) |
INR | | RBS | | | (3,000 | ) | | 12/19/2012 | | | (55 | ) | | | ¿ | |
INR | | RBS | | | 110,000 | | | 12/19/2012 | | | 2,027 | | | | (1 | ) |
INR | | RBS | | | 32,000 | | | 12/19/2012 | | | 568 | | | | 21 | |
INR | | RBS | | | (42,000 | ) | | 12/19/2012 | | | (739 | ) | | | (34 | ) |
INR | | RBS | | | 30,000 | | | 12/19/2012 | | | 532 | | | | 21 | |
The notes to the financial statements are an integral part of this report.
| | | | |
| Transamerica Funds | | | | Annual Report 2012 |
| | Page 198 | | |
Transamerica Managed Futures Strategy
(formerly, Transamerica AQR Managed Futures Strategy)
CONSOLIDATED SCHEDULE OF INVESTMENTS (continued)
At October 31, 2012
FORWARD FOREIGN CURRENCY CONTRACTS (continued): β
| | | | | | | | | | | | | | | | |
Currency | | Counterparty | | Contracts
Bought (Sold)
(000’s) | | | Settlement Date | | Amount in U.S.
Dollars Bought
(Sold)
(000’s) | | | Net Unrealized
Appreciation
(Depreciation)
(000’s) | |
INR | | RBS | | | 54,000 | | | 12/19/2012 | | $ | 983 | | | $ | 12 | |
INR | | RBS | | | 10,000 | | | 12/19/2012 | | | 187 | | | | (3 | ) |
INR | | RBS | | | 40,000 | | | 12/19/2012 | | | 749 | | | | (12 | ) |
INR | | RBS | | | (17,000 | ) | | 12/19/2012 | | | (301 | ) | | | (12 | ) |
INR | | RBS | | | 44,000 | | | 12/19/2012 | | | 783 | | | | 28 | |
JPY | | RBS | | | (427,517 | ) | | 12/19/2012 | | | (5,359 | ) | | | ¿ | |
JPY | | RBS | | | 628,799 | | | 12/19/2012 | | | 8,109 | | | | (228 | ) |
JPY | | RBS | | | (244,341 | ) | | 12/19/2012 | | | (3,069 | ) | | | 7 | |
JPY | | RBS | | | (388,186 | ) | | 12/19/2012 | | | (4,941 | ) | | | 76 | |
JPY | | RBS | | | (274,854 | ) | | 12/19/2012 | | | (3,487 | ) | | | 42 | |
JPY | | RBS | | | (3,000 | ) | | 12/19/2012 | | | (39 | ) | | | 1 | |
JPY | | RBS | | | 395,090 | | | 12/19/2012 | | | 5,089 | | | | (137 | ) |
JPY | | RBS | | | (767,863 | ) | | 12/19/2012 | | | (9,763 | ) | | | 139 | |
JPY | | RBS | | | (365,118 | ) | | 12/19/2012 | | | (4,569 | ) | | | (7 | ) |
JPY | | RBS | | | (30,529 | ) | | 12/19/2012 | | | (389 | ) | | | 6 | |
JPY | | RBS | | | (390,818 | ) | | 12/19/2012 | | | (4,985 | ) | | | 86 | |
JPY | | RBS | | | 144,008 | | | 12/19/2012 | | | 1,841 | | | | (36 | ) |
JPY | | RBS | | | 346,863 | | | 12/19/2012 | | | 4,477 | | | | (130 | ) |
JPY | | RBS | | | (285,843 | ) | | 12/19/2012 | | | (3,617 | ) | | | 34 | |
JPY | | RBS | | | (452,577 | ) | | 12/19/2012 | | | (5,776 | ) | | | 103 | |
JPY | | RBS | | | (517,465 | ) | | 12/19/2012 | | | (6,458 | ) | | | (28 | ) |
JPY | | RBS | | | (416,277 | ) | | 12/19/2012 | | | (5,316 | ) | | | 98 | |
JPY | | RBS | | | 270,658 | | | 12/19/2012 | | | 3,465 | | | | (72 | ) |
JPY | | RBS | | | 131,212 | | | 12/19/2012 | | | 1,676 | | | | (32 | ) |
JPY | | RBS | | | (187,922 | ) | | 12/19/2012 | | | (2,398 | ) | | | 43 | |
JPY | | RBS | | | (249,901 | ) | | 12/19/2012 | | | (3,152 | ) | | | 20 | |
JPY | | RBS | | | 55,491 | | | 12/19/2012 | | | 710 | | | | (14 | ) |
JPY | | RBS | | | 89,292 | | | 12/19/2012 | | | 1,144 | | | | (24 | ) |
JPY | | RBS | | | 593,739 | | | 12/19/2012 | | | 7,640 | | | | (199 | ) |
JPY | | RBS | | | (427,261 | ) | | 12/19/2012 | | | (5,425 | ) | | | 70 | |
JPY | | RBS | | | (152,166 | ) | | 12/19/2012 | | | (1,925 | ) | | | 18 | |
JPY | | RBS | | | (64,086 | ) | | 12/19/2012 | | | (819 | ) | | | 16 | |
JPY | | RBS | | | (122,000 | ) | | 12/19/2012 | | | (1,547 | ) | | | 18 | |
JPY | | RBS | | | (6,906,723 | ) | | 12/19/2012 | | | (88,075 | ) | | | 1,510 | |
JPY | | RBS | | | (229,994 | ) | | 12/19/2012 | | | (2,946 | ) | | | 63 | |
JPY | | RBS | | | (516,583 | ) | | 12/19/2012 | | | (6,609 | ) | | | 134 | |
JPY | | RBS | | | (234,987 | ) | | 12/19/2012 | | | (3,010 | ) | | | 65 | |
JPY | | RBS | | | 386,898 | | | 12/19/2012 | | | 4,983 | | | | (134 | ) |
JPY | | RBS | | | 26,752 | | | 12/19/2012 | | | 343 | | | | (8 | ) |
JPY | | RBS | | | 356,788 | | | 12/19/2012 | | | 4,587 | | | | (116 | ) |
JPY | | RBS | | | 336,910 | | | 12/19/2012 | | | 4,339 | | | | (117 | ) |
JPY | | RBS | | | 32,367 | | | 12/19/2012 | | | 412 | | | | (6 | ) |
JPY | | RBS | | | 45,191 | | | 12/19/2012 | | | 577 | | | | (11 | ) |
JPY | | RBS | | | (248,376 | ) | | 12/19/2012 | | | (3,112 | ) | | | (¿ | ) |
KRW | | RBS | | | 740,000 | | | 12/20/2012 | | | 664 | | | | 14 | |
KRW | | RBS | | | 15,474,230 | | | 12/20/2012 | | | 13,603 | | | | 579 | |
KRW | | RBS | | | 110,000 | | | 12/20/2012 | | | 98 | | | | 3 | |
KRW | | RBS | | | 500,000 | | | 12/20/2012 | | | 451 | | | | 7 | |
KRW | | RBS | | | 200,000 | | | 12/20/2012 | | | 179 | | | | 4 | |
KRW | | RBS | | | 480,000 | | | 12/20/2012 | | | 433 | | | | 6 | |
KRW | | RBS | | | 1,020,000 | | | 12/20/2012 | | | 923 | | | | 12 | |
KRW | | RBS | | | 30,000 | | | 12/20/2012 | | | 27 | | | | ¿ | |
KRW | | RBS | | | 210,000 | | | 12/20/2012 | | | 188 | | | | 5 | |
KRW | | RBS | | | (220,000 | ) | | 12/20/2012 | | | (193 | ) | | | (8 | ) |
KRW | | RBS | | | (740,000 | ) | | 12/20/2012 | | | (654 | ) | | | (25 | ) |
KRW | | RBS | | | (470,000 | ) | | 12/20/2012 | | | (417 | ) | | | (14 | ) |
KRW | | RBS | | | 510,000 | | | 12/20/2012 | | | 457 | | | | 10 | |
KRW | | RBS | | | (440,000 | ) | | 12/20/2012 | | | (393 | ) | | | (10 | ) |
KRW | | RBS | | | (630,000 | ) | | 12/20/2012 | | | (556 | ) | | | (21 | ) |
KRW | | RBS | | | 40,000 | | | 12/20/2012 | | | 36 | | | | 1 | |
KRW | | RBS | | | (1,060,000 | ) | | 12/20/2012 | | | (934 | ) | | | (37 | ) |
KRW | | RBS | | | 240,000 | | | 12/20/2012 | | | 215 | | | | 5 | |
KRW | | RBS | | | (420,000 | ) | | 12/20/2012 | | | (375 | ) | | | (10 | ) |
The notes to the financial statements are an integral part of this report.
| | | | |
| Transamerica Funds | | | | Annual Report 2012 |
| | Page 199 | | |
Transamerica Managed Futures Strategy
(formerly, Transamerica AQR Managed Futures Strategy)
CONSOLIDATED SCHEDULE OF INVESTMENTS (continued)
At October 31, 2012
FORWARD FOREIGN CURRENCY CONTRACTS (continued): β
| | | | | | | | | | | | | | | | |
Currency | | Counterparty | | Contracts
Bought (Sold)
(000’s) | | | Settlement Date | | Amount in U.S.
Dollars Bought
(Sold)
(000’s) | | | Net Unrealized
Appreciation
(Depreciation)
(000’s) | |
KRW | | RBS | | | (40,000 | ) | | 12/20/2012 | | $ | (36 | ) | | $ | (1 | ) |
KRW | | RBS | | | (940,000 | ) | | 12/20/2012 | | | (828 | ) | | | (34 | ) |
KRW | | RBS | | | 170,000 | | | 12/20/2012 | | | 153 | | | | 3 | |
MXN | | RBS | | | 50,400 | | | 12/19/2012 | | | 3,818 | | | | 12 | |
MXN | | RBS | | | (3,600 | ) | | 12/19/2012 | | | (278 | ) | | | 5 | |
MXN | | RBS | | | 4,200 | | | 12/19/2012 | | | 321 | | | | (1 | ) |
MXN | | RBS | | | (1,300 | ) | | 12/19/2012 | | | (100 | ) | | | 1 | |
MXN | | RBS | | | 500 | | | 12/19/2012 | | | 39 | | | | (1 | ) |
MXN | | RBS | | | 200 | | | 12/19/2012 | | | 15 | | | | (¿ | ) |
MXN | | RBS | | | 3,400 | | | 12/19/2012 | | | 264 | | | | (6 | ) |
MXN | | RBS | | | 1,500 | | | 12/19/2012 | | | 114 | | | | (¿ | ) |
MXN | | RBS | | | 3,300 | | | 12/19/2012 | | | 254 | | | | (3 | ) |
MXN | | RBS | | | 5,700 | | | 12/19/2012 | | | 441 | | | | (7 | ) |
MXN | | RBS | | | 2,200 | | | 12/19/2012 | | | 171 | | | | (4 | ) |
MXN | | RBS | | | 800 | | | 12/19/2012 | | | 62 | | | | (1 | ) |
MXN | | RBS | | | 1,000 | | | 12/19/2012 | | | 77 | | | | (1 | ) |
MXN | | RBS | | | 2,100 | | | 12/19/2012 | | | 160 | | | | (1 | ) |
MXN | | RBS | | | 1,700 | | | 12/19/2012 | | | 131 | | | | (2 | ) |
MXN | | RBS | | | 200 | | | 12/19/2012 | | | 15 | | | | (¿ | ) |
MXN | | RBS | | | (2,200 | ) | | 12/19/2012 | | | (171 | ) | | | 4 | |
MXN | | RBS | | | 6,800 | | | 12/19/2012 | | | 526 | | | | (9 | ) |
MXN | | RBS | | | 100 | | | 12/19/2012 | | | 8 | | | | (¿ | ) |
MXN | | RBS | | | 3,500 | | | 12/19/2012 | | | 266 | | | | (¿ | ) |
MXN | | RBS | | | 900 | | | 12/19/2012 | | | 70 | | | | (1 | ) |
MXN | | RBS | | | (1,600 | ) | | 12/19/2012 | | | (124 | ) | | | 2 | |
MXN | | RBS | | | 4,400 | | | 12/19/2012 | | | 333 | | | | 1 | |
MXN | | RBS | | | 1,300 | | | 12/19/2012 | | | 100 | | | | (1 | ) |
MXN | | RBS | | | 600 | | | 12/19/2012 | | | 46 | | | | (1 | ) |
MYR | | RBS | | | 300 | | | 12/19/2012 | | | 97 | | | | 1 | |
MYR | | RBS | | | 900 | | | 12/19/2012 | | | 291 | | | | 4 | |
MYR | | RBS | | | 600 | | | 12/19/2012 | | | 194 | | | | 2 | |
MYR | | RBS | | | 100 | | | 12/19/2012 | | | 33 | | | | ¿ | |
MYR | | RBS | | | 5,300 | | | 12/19/2012 | | | 1,694 | | | | 40 | |
MYR | | RBS | | | 400 | | | 12/19/2012 | | | 130 | | | | ¿ | |
MYR | | RBS | | | 400 | | | 12/19/2012 | | | 130 | | | | 1 | |
MYR | | RBS | | | 400 | | | 12/19/2012 | | | 130 | | | | 1 | |
MYR | | RBS | | | 500 | | | 12/19/2012 | | | 163 | | | | 1 | |
MYR | | RBS | | | 800 | | | 12/19/2012 | | | 254 | | | | 8 | |
MYR | | RBS | | | 200 | | | 12/19/2012 | | | 65 | | | | 1 | |
MYR | | RBS | | | 200 | | | 12/19/2012 | | | 65 | | | | ¿ | |
MYR | | RBS | | | 300 | | | 12/19/2012 | | | 98 | | | | ¿ | |
MYR | | RBS | | | 300 | | | 12/19/2012 | | | 97 | | | | 1 | |
MYR | | RBS | | | 300 | | | 12/19/2012 | | | 98 | | | | ¿ | |
MYR | | RBS | | | 200 | | | 12/19/2012 | | | 65 | | | | 1 | |
MYR | | RBS | | | 100 | | | 12/19/2012 | | | 33 | | | | ¿ | |
MYR | | RBS | | | 400 | | | 12/19/2012 | | | 130 | | | | 1 | |
MYR | | RBS | | | 500 | | | 12/19/2012 | | | 163 | | | | ¿ | |
MYR | | RBS | | | 400 | | | 12/19/2012 | | | 129 | | | | 1 | |
NOK | | RBS | | | (420 | ) | | 12/19/2012 | | | (73 | ) | | | (1 | ) |
NOK | | RBS | | | 7,254 | | | 12/19/2012 | | | 1,269 | | | | 1 | |
NOK | | RBS | | | 10,343 | | | 12/19/2012 | | | 1,780 | | | | 31 | |
NOK | | RBS | | | (2,462 | ) | | 12/19/2012 | | | (431 | ) | | | ¿ | |
NOK | | RBS | | | (15,883 | ) | | 12/19/2012 | | | (2,756 | ) | | | (25 | ) |
NOK | | RBS | | | (4,128 | ) | | 12/19/2012 | | | (720 | ) | | | (3 | ) |
NOK | | RBS | | | 10,897 | | | 12/19/2012 | | | 1,865 | | | | 43 | |
NOK | | RBS | | | (12,883 | ) | | 12/19/2012 | | | (2,228 | ) | | | (28 | ) |
NOK | | RBS | | | 7,465 | | | 12/19/2012 | | | 1,277 | | | | 30 | |
NOK | | RBS | | | 208,347 | | | 12/19/2012 | | | 35,866 | | | | 613 | |
NOK | | RBS | | | (7,846 | ) | | 12/19/2012 | | | (1,352 | ) | | | (22 | ) |
NOK | | RBS | | | (2,104 | ) | | 12/19/2012 | | | (364 | ) | | | (4 | ) |
NOK | | RBS | | | (13,489 | ) | | 12/19/2012 | | | (2,330 | ) | | | (32 | ) |
NOK | | RBS | | | 3,921 | | | 12/19/2012 | | | 672 | | | | 15 | |
NOK | | RBS | | | 4,648 | | | 12/19/2012 | | | 809 | | | | 5 | |
The notes to the financial statements are an integral part of this report.
| | | | |
| Transamerica Funds | | | | Annual Report 2012 |
| | Page 200 | | |
Transamerica Managed Futures Strategy
(formerly, Transamerica AQR Managed Futures Strategy)
CONSOLIDATED SCHEDULE OF INVESTMENTS (continued)
At October 31, 2012
FORWARD FOREIGN CURRENCY CONTRACTS (continued): β
| | | | | | | | | | | | | | | | |
Currency | | Counterparty | | Contracts
Bought (Sold)
(000’s) | | | Settlement Date | | Amount in U.S.
Dollars Bought
(Sold)
(000’s) | | | Net Unrealized
Appreciation
(Depreciation)
(000’s) | |
NOK | | RBS | | | 8,384 | | | 12/19/2012 | | $ | 1,458 | | | $ | 10 | |
NOK | | RBS | | | (2,780 | ) | | 12/19/2012 | | | (482 | ) | | | (4 | ) |
NOK | | RBS | | | (11,008 | ) | | 12/19/2012 | | | (1,926 | ) | | | (2 | ) |
NOK | | RBS | | | 6,107 | | | 12/19/2012 | | | 1,080 | | | | (11 | ) |
NOK | | RBS | | | (5,290 | ) | | 12/19/2012 | | | (922 | ) | | | (4 | ) |
NZD | | RBS | | | 1,697 | | | 12/19/2012 | | | 1,398 | | | | (8 | ) |
NZD | | RBS | | | 1,603 | | | 12/19/2012 | | | 1,307 | | | | 7 | |
NZD | | RBS | | | 2,847 | | | 12/19/2012 | | | 2,361 | | | | (27 | ) |
NZD | | RBS | | | 124 | | | 12/19/2012 | | | 102 | | | | (¿ | ) |
NZD | | RBS | | | 27,396 | | | 12/19/2012 | | | 21,610 | | | | 844 | |
NZD | | RBS | | | 1,167 | | | 12/19/2012 | | | 953 | | | | 3 | |
NZD | | RBS | | | (1,240 | ) | | 12/19/2012 | | | (1,006 | ) | | | (10 | ) |
NZD | | RBS | | | (4,085 | ) | | 12/19/2012 | | | (3,242 | ) | | | (106 | ) |
NZD | | RBS | | | (3,213 | ) | | 12/19/2012 | | | (2,631 | ) | | | (3 | ) |
NZD | | RBS | | | (1,734 | ) | | 12/19/2012 | | | (1,412 | ) | | | (9 | ) |
NZD | | RBS | | | (3,810 | ) | | 12/19/2012 | | | (3,015 | ) | | | (108 | ) |
NZD | | RBS | | | 1,526 | | | 12/19/2012 | | | 1,255 | | | | (4 | ) |
NZD | | RBS | | | 2,340 | | | 12/19/2012 | | | 1,931 | | | | (13 | ) |
NZD | | RBS | | | 4,924 | | | 12/19/2012 | | | 4,073 | | | | (37 | ) |
NZD | | RBS | | | (106 | ) | | 12/19/2012 | | | (87 | ) | | | (¿ | ) |
NZD | | RBS | | | 3,310 | | | 12/19/2012 | | | 2,747 | | | | (34 | ) |
NZD | | RBS | | | 549 | | | 12/19/2012 | | | 448 | | | | 2 | |
NZD | | RBS | | | 2,951 | | | 12/19/2012 | | | 2,432 | | | | (13 | ) |
NZD | | RBS | | | 1,505 | | | 12/19/2012 | | | 1,234 | | | | (¿ | ) |
NZD | | RBS | | | (493 | ) | | 12/19/2012 | | | (403 | ) | | | (1 | ) |
NZD | | RBS | | | (337 | ) | | 12/19/2012 | | | (276 | ) | | | ¿ | |
NZD | | RBS | | | 5,536 | | | 12/19/2012 | | | 4,523 | | | | 14 | |
NZD | | RBS | | | 6,553 | | | 12/19/2012 | | | 5,411 | | | | (40 | ) |
NZD | | RBS | | | (1,090 | ) | | 12/19/2012 | | | (865 | ) | | | (29 | ) |
NZD | | RBS | | | (2,017 | ) | | 12/19/2012 | | | (1,608 | ) | | | (46 | ) |
NZD | | RBS | | | (1,505 | ) | | 12/19/2012 | | | (1,225 | ) | | | (8 | ) |
PHP | | RBS | | | (1,000 | ) | | 12/19/2012 | | | (24 | ) | | | (¿ | ) |
PHP | | RBS | | | 316,000 | | | 12/19/2012 | | | 7,527 | | | | 141 | |
PHP | | RBS | | | (2,000 | ) | | 12/19/2012 | | | (48 | ) | | | (¿ | ) |
PHP | | RBS | | | (20,000 | ) | | 12/19/2012 | | | (477 | ) | | | (8 | ) |
PHP | | RBS | | | (7,000 | ) | | 12/19/2012 | | | (167 | ) | | | (3 | ) |
PHP | | RBS | | | (2,000 | ) | | 12/19/2012 | | | (48 | ) | | | (1 | ) |
PHP | | RBS | | | (15,000 | ) | | 12/19/2012 | | | (359 | ) | | | (5 | ) |
PHP | | RBS | | | (7,000 | ) | | 12/19/2012 | | | (168 | ) | | | (2 | ) |
PHP | | RBS | | | (20,000 | ) | | 12/19/2012 | | | (481 | ) | | | (4 | ) |
PHP | | RBS | | | (6,000 | ) | | 12/19/2012 | | | (141 | ) | | | (5 | ) |
PHP | | RBS | | | (22,000 | ) | | 12/19/2012 | | | (533 | ) | | | (1 | ) |
PHP | | RBS | | | (12,000 | ) | | 12/19/2012 | | | (288 | ) | | | (3 | ) |
PLN | | RBS | | | (500 | ) | | 12/19/2012 | | | (148 | ) | | | (8 | ) |
PLN | | RBS | | | (2,300 | ) | | 12/19/2012 | | | (683 | ) | | | (34 | ) |
PLN | | RBS | | | (600 | ) | | 12/19/2012 | | | (189 | ) | | | 2 | |
PLN | | RBS | | | (1,500 | ) | | 12/19/2012 | | | (476 | ) | | | 8 | |
PLN | | RBS | | | (800 | ) | | 12/19/2012 | | | (238 | ) | | | (11 | ) |
PLN | | RBS | | | (600 | ) | | 12/19/2012 | | | (179 | ) | | | (8 | ) |
PLN | | RBS | | | (1,500 | ) | | 12/19/2012 | | | (457 | ) | | | (10 | ) |
PLN | | RBS | | | (1,400 | ) | | 12/19/2012 | | | (439 | ) | | | 3 | |
PLN | | RBS | | | (300 | ) | | 12/19/2012 | | | (93 | ) | | | (¿ | ) |
PLN | | RBS | | | 31,900 | | | 12/19/2012 | | | 9,709 | | | | 225 | |
PLN | | RBS | | | (200 | ) | | 12/19/2012 | | | (61 | ) | | | (1 | ) |
RUB | | RBS | | | (11,000 | ) | | 12/19/2012 | | | (350 | ) | | | 2 | |
RUB | | RBS | | | (22,000 | ) | | 12/19/2012 | | | (697 | ) | | | 2 | |
RUB | | RBS | | | (1,000 | ) | | 12/19/2012 | | | (32 | ) | | | ¿ | |
RUB | | RBS | | | 4,000 | | | 12/19/2012 | | | 128 | | | | (1 | ) |
RUB | | RBS | | | (8,000 | ) | | 12/19/2012 | | | (255 | ) | | | 2 | |
RUB | | RBS | | | 6,000 | | | 12/19/2012 | | | 190 | | | | (¿ | ) |
RUB | | RBS | | | 238,000 | | | 12/19/2012 | | | 7,375 | | | | 145 | |
RUB | | RBS | | | 7,000 | | | 12/19/2012 | | | 222 | | | | (1 | ) |
RUB | | RBS | | | (5,000 | ) | | 12/19/2012 | | | (161 | ) | | | 3 | |
The notes to the financial statements are an integral part of this report.
| | | | |
| Transamerica Funds | | | | Annual Report 2012 |
| | Page 201 | | |
Transamerica Managed Futures Strategy
(formerly, Transamerica AQR Managed Futures Strategy)
CONSOLIDATED SCHEDULE OF INVESTMENTS (continued)
At October 31, 2012
FORWARD FOREIGN CURRENCY CONTRACTS (continued): β
| | | | | | | | | | | | | | | | |
Currency | | Counterparty | | Contracts
Bought (Sold)
(000’s) | | | Settlement Date | | Amount in U.S.
Dollars Bought
(Sold)
(000’s) | | | Net Unrealized
Appreciation
(Depreciation)
(000’s) | |
RUB | | RBS | | | (2,000 | ) | | 12/19/2012 | | $ | (64 | ) | | $ | 1 | |
RUB | | RBS | | | (10,000 | ) | | 12/19/2012 | | | (322 | ) | | | 6 | |
RUB | | RBS | | | 4,000 | | | 12/19/2012 | | | 127 | | | | (¿ | ) |
RUB | | RBS | | | (11,000 | ) | | 12/19/2012 | | | (347 | ) | | | (1 | ) |
RUB | | RBS | | | (5,000 | ) | | 12/19/2012 | | | (159 | ) | | | 1 | |
SEK | | RBS | | | 195,994 | | | 12/19/2012 | | | 29,336 | | | | 170 | |
SEK | | RBS | | | (31,801 | ) | | 12/19/2012 | | | (4,731 | ) | | | (56 | ) |
SEK | | RBS | | | (5,380 | ) | | 12/19/2012 | | | (804 | ) | | | (6 | ) |
SEK | | RBS | | | (10,158 | ) | | 12/19/2012 | | | (1,512 | ) | | | (18 | ) |
SEK | | RBS | | | 5,409 | | | 12/19/2012 | | | 818 | | | | (4 | ) |
SEK | | RBS | | | (4,082 | ) | | 12/19/2012 | | | (618 | ) | | | 4 | |
SEK | | RBS | | | (1,274 | ) | | 12/19/2012 | | | (189 | ) | | | (3 | ) |
SEK | | RBS | | | 14,668 | | | 12/19/2012 | | | 2,225 | | | | (17 | ) |
SEK | | RBS | | | (24,149 | ) | | 12/19/2012 | | | (3,574 | ) | | | (62 | ) |
SEK | | RBS | | | 358 | | | 12/19/2012 | | | 54 | | | | ¿ | |
SEK | | RBS | | | (14,365 | ) | | 12/19/2012 | | | (2,143 | ) | | | (19 | ) |
SEK | | RBS | | | (12,007 | ) | | 12/19/2012 | | | (1,785 | ) | | | (23 | ) |
SEK | | RBS | | | (418 | ) | | 12/19/2012 | | | (63 | ) | | | (¿ | ) |
SGD | | RBS | | | 630 | | | 12/19/2012 | | | 506 | | | | 11 | |
SGD | | RBS | | | (180 | ) | | 12/19/2012 | | | (146 | ) | | | (1 | ) |
SGD | | RBS | | | 330 | | | 12/19/2012 | | | 268 | | | | 2 | |
SGD | | RBS | | | (420 | ) | | 12/19/2012 | | | (344 | ) | | | (¿ | ) |
SGD | | RBS | | | 780 | | | 12/19/2012 | | | 637 | | | | 2 | |
SGD | | RBS | | | 200 | | | 12/19/2012 | | | 164 | | | | ¿ | |
SGD | | RBS | | | (510 | ) | | 12/19/2012 | | | (416 | ) | | | (2 | ) |
SGD | | RBS | | | (120 | ) | | 12/19/2012 | | | (98 | ) | | | (¿ | ) |
SGD | | RBS | | | (440 | ) | | 12/19/2012 | | | (358 | ) | | | (3 | ) |
SGD | | RBS | | | 610 | | | 12/19/2012 | | | 499 | | | | 2 | |
SGD | | RBS | | | 380 | | | 12/19/2012 | | | 309 | | | | 3 | |
SGD | | RBS | | | (610 | ) | | 12/19/2012 | | | (496 | ) | | | (4 | ) |
SGD | | RBS | | | 7,880 | | | 12/19/2012 | | | 6,317 | | | | 143 | |
SGD | | RBS | | | 190 | | | 12/19/2012 | | | 155 | | | | 1 | |
SGD | | RBS | | | 1,930 | | | 12/19/2012 | | | 1,548 | | | | 34 | |
SGD | | RBS | | | 900 | | | 12/19/2012 | | | 728 | | | | 9 | |
SGD | | RBS | | | 400 | | | 12/19/2012 | | | 326 | | | | 2 | |
SGD | | RBS | | | 390 | | | 12/19/2012 | | | 316 | | | | 4 | |
SGD | | RBS | | | 510 | | | 12/19/2012 | | | 418 | | | | 1 | |
SGD | | RBS | | | 340 | | | 12/19/2012 | | | 279 | | | | ¿ | |
SGD | | RBS | | | 180 | | | 12/19/2012 | | | 147 | | | | 1 | |
SGD | | RBS | | | 840 | | | 12/19/2012 | | | 685 | | | | 4 | |
SGD | | RBS | | | 740 | | | 12/19/2012 | | | 601 | | | | 5 | |
SGD | | RBS | | | 460 | | | 12/19/2012 | | | 373 | | | | 4 | |
SGD | | RBS | | | 90 | | | 12/19/2012 | | | 73 | | | | ¿ | |
SGD | | RBS | | | 640 | | | 12/19/2012 | | | 522 | | | | 3 | |
SGD | | RBS | | | (400 | ) | | 12/19/2012 | | | (327 | ) | | | (¿ | ) |
SGD | | RBS | | | (130 | ) | | 12/19/2012 | | | (106 | ) | | | (¿ | ) |
SGD | | RBS | | | 1,170 | | | 12/19/2012 | | | 941 | | | | 18 | |
SGD | | RBS | | | (450 | ) | | 12/19/2012 | | | (359 | ) | | | (10 | ) |
SGD | | RBS | | | (250 | ) | | 12/19/2012 | | | (205 | ) | | | ¿ | |
TRY | | RBS | | | (1,100 | ) | | 12/19/2012 | | | (596 | ) | | | (13 | ) |
TRY | | RBS | | | (900 | ) | | 12/19/2012 | | | (495 | ) | | | (4 | ) |
TRY | | RBS | | | 24,220 | | | 12/19/2012 | | | 13,200 | | | | 225 | |
TRY | | RBS | | | (700 | ) | | 12/19/2012 | | | (382 | ) | | | (6 | ) |
TRY | | RBS | | | (1,200 | ) | | 12/19/2012 | | | (655 | ) | | | (10 | ) |
TRY | | RBS | | | (1,300 | ) | | 12/19/2012 | | | (707 | ) | | | (13 | ) |
TRY | | RBS | | | (400 | ) | | 12/19/2012 | | | (216 | ) | | | (6 | ) |
TRY | | RBS | | | (200 | ) | | 12/19/2012 | | | (109 | ) | | | (1 | ) |
TRY | | RBS | | | (1,800 | ) | | 12/19/2012 | | | (989 | ) | | | (8 | ) |
TRY | | RBS | | | (2,300 | ) | | 12/19/2012 | | | (1,247 | ) | | | (28 | ) |
TRY | | RBS | | | (1,500 | ) | | 12/19/2012 | | | (822 | ) | | | (9 | ) |
TRY | | RBS | | | (800 | ) | | 12/19/2012 | | | (438 | ) | | | (6 | ) |
TRY | | RBS | | | (1,000 | ) | | 12/19/2012 | | | (545 | ) | | | (9 | ) |
TRY | | RBS | | | (200 | ) | | 12/19/2012 | | | (110 | ) | | | (1 | ) |
The notes to the financial statements are an integral part of this report.
| | | | |
| Transamerica Funds | | | | Annual Report 2012 |
| | Page 202 | | |
Transamerica Managed Futures Strategy
(formerly, Transamerica AQR Managed Futures Strategy)
CONSOLIDATED SCHEDULE OF INVESTMENTS (continued)
At October 31, 2012
FORWARD FOREIGN CURRENCY CONTRACTS (continued): β
| | | | | | | | | | | | | | | | |
Currency | | Counterparty | | Contracts
Bought (Sold)
(000’s) | | | Settlement Date | | Amount in U.S.
Dollars Bought
(Sold)
(000’s) | | | Net Unrealized
Appreciation
(Depreciation)
(000’s) | |
TRY | | RBS | | | (800 | ) | | 12/19/2012 | | $ | (439 | ) | | $ | (4 | ) |
TRY | | RBS | | | 100 | | | 12/19/2012 | | | 55 | | | | ¿ | |
TRY | | RBS | | | (800 | ) | | 12/19/2012 | | | (438 | ) | | | (6 | ) |
TWD | | RBS | | | 14,000 | | | 12/19/2012 | | | 479 | | | | 1 | |
TWD | | RBS | | | 17,000 | | | 12/19/2012 | | | 584 | | | | (2 | ) |
TWD | | RBS | | | 66,000 | | | 12/19/2012 | | | 2,266 | | | | (6 | ) |
TWD | | RBS | | | 16,000 | | | 12/19/2012 | | | 551 | | | | (3 | ) |
TWD | | RBS | | | 16,000 | | | 12/19/2012 | | | 547 | | | | 1 | |
TWD | | RBS | | | 24,000 | | | 12/19/2012 | | | 823 | | | | (1 | ) |
TWD | | RBS | | | 65,000 | | | 12/19/2012 | | | 2,188 | | | | 38 | |
TWD | | RBS | | | 1,000 | | | 12/19/2012 | | | 34 | | | | ¿ | |
TWD | | RBS | | | 70,000 | | | 12/19/2012 | | | 2,352 | | | | 45 | |
TWD | | RBS | | | 58,000 | | | 12/19/2012 | | | 1,963 | | | | 23 | |
TWD | | RBS | | | (378,000 | ) | | 12/19/2012 | | | (12,706 | ) | | | (237 | ) |
TWD | | RBS | | | 16,000 | | | 12/19/2012 | | | 543 | | | | 5 | |
TWD | | RBS | | | 16,000 | | | 12/19/2012 | | | 546 | | | | 2 | |
TWD | | RBS | | | 29,000 | | | 12/19/2012 | | | 992 | | | | 1 | |
TWD | | RBS | | | 2,000 | | | 12/19/2012 | | | 69 | | | | (¿ | ) |
TWD | | RBS | | | 57,000 | | | 12/19/2012 | | | 1,926 | | | | 26 | |
TWD | | RBS | | | 11,000 | | | 12/19/2012 | | | 377 | | | | (¿ | ) |
TWD | | RBS | | | 74,000 | | | 12/19/2012 | | | 2,525 | | | | 9 | |
TWD | | RBS | | | 5,000 | | | 12/19/2012 | | | 171 | | | | (¿ | ) |
TWD | | RBS | | | 8,000 | | | 12/19/2012 | | | 273 | | | | 1 | |
TWD | | RBS | | | 29,000 | | | 12/19/2012 | | | 990 | | | | 3 | |
TWD | | RBS | | | 21,000 | | | 12/19/2012 | | | 719 | | | | ¿ | |
TWD | | RBS | | | 28,000 | | | 12/19/2012 | | | 956 | | | | 2 | |
TWD | | RBS | | | 15,000 | | | 12/19/2012 | | | 512 | | | | 2 | |
TWD | | RBS | | | 9,000 | | | 12/19/2012 | | | 308 | | | | ¿ | |
TWD | | RBS | | | 28,000 | | | 12/19/2012 | | | 960 | | | | (1 | ) |
TWD | | RBS | | | 14,000 | | | 12/19/2012 | | | 475 | | | | 4 | |
TWD | | RBS | | | 4,000 | | | 12/19/2012 | | | 137 | | | | (¿ | ) |
TWD | | RBS | | | 22,000 | | | 12/19/2012 | | | 752 | | | | 1 | |
TWD | | RBS | | | 67,000 | | | 12/19/2012 | | | 2,290 | | | | 4 | |
ZAR | | RBS | | | (6,800 | ) | | 12/19/2012 | | | (796 | ) | | | 18 | |
ZAR | | RBS | | | (1,200 | ) | | 12/19/2012 | | | (138 | ) | | | ¿ | |
ZAR | | RBS | | | (2,500 | ) | | 12/19/2012 | | | (293 | ) | | | 7 | |
ZAR | | RBS | | | (6,800 | ) | | 12/19/2012 | | | (782 | ) | | | 4 | |
ZAR | | RBS | | | (1,200 | ) | | 12/19/2012 | | | (135 | ) | | | (3 | ) |
ZAR | | RBS | | | (6,000 | ) | | 12/19/2012 | | | (665 | ) | | | (22 | ) |
ZAR | | RBS | | | (1,200 | ) | | 12/19/2012 | | | (137 | ) | | | (1 | ) |
ZAR | | RBS | | | (7,100 | ) | | 12/19/2012 | | | (828 | ) | | | 15 | |
ZAR | | RBS | | | 3,700 | | | 12/19/2012 | | | 446 | | | | (22 | ) |
ZAR | | RBS | | | 3,600 | | | 12/19/2012 | | | 429 | | | | (17 | ) |
ZAR | | RBS | | | (10,700 | ) | | 12/19/2012 | | | (1,277 | ) | | | 52 | |
ZAR | | RBS | | | (1,000 | ) | | 12/19/2012 | | | (113 | ) | | | (1 | ) |
ZAR | | RBS | | | (1,800 | ) | | 12/19/2012 | | | (206 | ) | | | (1 | ) |
ZAR | | RBS | | | 7,600 | | | 12/19/2012 | | | 917 | | | | (47 | ) |
| | | | | | | | | | | | | | | | |
| | | | | | | | | | | | | | $ | 968 | |
| | | | | | | | | | | | | | | | |
Collateral (Received) Pledged for OTC Financial Derivative Instruments
The following is a summary by counterparty of the market value of OTC financial derivative instruments and collateral (received) pledged as of 10/31/2012:
| | | | | | | | | | | | |
Counterparty | | Total Market Value of
OTC Derivatives
(000’s) | | | Collateral
(Received) Pledged
(000’s) | | | Net Exposures (1)
(000’s) | |
BCLY | | $ | (144 | ) | | $ | 17,728 | | | $ | 17,584 | |
BOA | | | (23 | ) | | | 120 | | | | 97 | |
RBS | | | 1,038 | | | | 2,820 | | | | 3,858 | |
| (1) | Net exposure represents the net receivable/(payable) that would be due from/to the counterparty in the event of default. |
The notes to the financial statements are an integral part of this report.
| | | | |
| Transamerica Funds | | | | Annual Report 2012 |
| | Page 203 | | |
Transamerica Managed Futures Strategy
(formerly, Transamerica AQR Managed Futures Strategy)
CONSOLIDATED SCHEDULE OF INVESTMENTS (continued)
At October 31, 2012
NOTES TO SCHEDULE OF INVESTMENTS (all amounts in thousands):
| β | Cash, in the amount of $20,668, has been segregated by the custodian as collateral for the benefit of the broker for open swap contracts and/or forward foreign currency contracts. |
| (A) | At the termination date, a net cash flow is exchanged where the total return is equivalent to the return of the reference index less a financing rate, if any. As a receiver, the fund would receive payments based on any positive total return and would owe payments in the event of a negative total return. As the payer, the fund would owe payments on any net positive total return, and would receive payment in the event of a negative total return. |
| P | Aggregate cost for federal income tax purposes is $296,528. Net unrealized depreciation for tax purposes is $8,001. |
| Б | Cash, in the amount of $21,252, has been segregated as collateral with the broker to cover margin requirements for open futures contracts. |
DEFINITIONS:
| | |
| BCLY | | Barclays Bank PLC |
| BOA | | Bank of America |
| OTC | | Over the Counter |
| RBS | | Royal Bank of Scotland |
CURRENCY ABBREVIATIONS:
| | |
| AUD | | Australian Dollar |
| BRL | | Brazilian Real |
| CAD | | Canadian Dollar |
| CLP | | Chilean Peso |
| COP | | Columbian Peso |
| CZK | | Czech Republic Koruna |
| EUR | | Euro |
| GBP | | Pound Sterling |
| HUF | | Hungarian Forint |
| IDR | | Indonesian Rupiah |
| ILS | | Israel New Shekel |
| INR | �� | Indian Rupee |
| JPY | | Japanese Yen |
| KRW | | South Korean Won |
| MXN | | Mexican Peso |
| MYR | | Malaysian Riggit |
| NOK | | Norwegian Krone |
| NZD | | New Zealand Dollar |
| PHP | | Philippines Peso |
| PLN | | Polish Zloty |
| RUB | | Russian Ruble |
| SEK | | Swedish Krona |
| SGD | | Singapore Dollar |
| TRY | | Turkish New Lira |
| TWD | | Taiwan New Dollar |
| ZAR | | South African Rand |
The notes to the financial statements are an integral part of this report.
| | | | |
| Transamerica Funds | | | | Annual Report 2012 |
| | Page 204 | | |
Transamerica Managed Futures Strategy
(formerly, Transamerica AQR Managed Futures Strategy)
CONSOLIDATED SCHEDULE OF INVESTMENTS (continued)
At October 31, 2012
VALUATION SUMMARY (all amounts in thousands): '
| | | | | | | | | | | | | | | | |
| | | Level 1 -
Quoted
Prices | | | Level 2 -
Other
Significant
Observable
Inputs | | | Level 3 -
Significant
Unobservable
Inputs | | | Value at
10/31/2012 | |
Investment Companies | | $ | 265,160 | | | $ | — | | | $ | — | | | $ | 265,160 | |
| | | | | | | | | | | | | | | | |
Other Financial Instruments ₣ | | Level 1 -
Quoted
Prices | | | Level 2 -
Other
Significant
Observable
Inputs | | | Level 3 -
Significant
Unobservable
Inputs | | | Value at
10/31/2012 | |
Futures Contracts—Appreciation | | $ | 6,380 | | | $ | — | | | $ | — | | | $ | 6,380 | |
Futures Contracts—Depreciation | | | (9,983 | ) | | | — | | | | — | | | | (9,983 | ) |
Forward Foreign Currency Contracts—Appreciation | | | — | | | | 9,221 | | | | — | | | | 9,221 | |
Forward Foreign Currency Contracts—Depreciation | | | — | | | | (8,253 | ) | | | — | | | | (8,253 | ) |
Total Return Swaps—Appreciation | | | — | | | | 212 | | | | — | | | | 212 | |
Total Return Swaps—Depreciation | | | — | | | | (309 | ) | | | — | | | | (309 | ) |
| | | | | | | | | | | | | | | | |
Total | | $ | (3,603 | ) | | $ | 871 | | | $ | — | | | $ | (2,732 | ) |
| | | | | | | | | | | | | | | | |
| ' | Transfers between levels are considered to have occurred at the end of the reporting period. There were no transfers into or out of Levels 1 and 2 during the period ended 10/31/2012. See the notes to the financial statements for more information regarding pricing inputs and valuation techniques. |
| ₣ | Other financial instruments are derivative instruments that are valued at unrealized appreciation (depreciation) on the instrument. |
The notes to the financial statements are an integral part of this report.
| | | | |
| Transamerica Funds | | | | Annual Report 2012 |
| | Page 205 | | |
CONSOLIDATED STATEMENTS OF ASSETS AND LIABILITIES
At October 31, 2012
(all amounts except per share amounts in thousands)
| | | | | | | | | | | | |
| | | Transamerica
Commodity
Strategy | | | Transamerica
Global
Allocation | | | Transamerica
Managed
Futures
Strategy | |
Assets: | | | | | | | | | | | | |
Investment securities, at value | | $ | 129,752 | | | $ | 360,290 | | | $ | 265,160 | |
Repurchase agreement, at value | | | 38,705 | | | | — | | | | — | |
Cash | | | — | | | | 143 | | | | — | |
Cash on deposit with custodian | | | 19,115 | | | | — | | | | 20,668 | |
Cash on deposit with broker | | | — | | | | 575 | | | | 21,252 | �� |
Foreign currency, at value | | | — | | | | 2,229 | | | | 283 | |
Receivables: | | | | | | | | | | | | |
Investment securities sold | | | 302,473 | | | | 553 | | | | 47,385 | |
Shares of beneficial interest sold | | | — | | | | 254 | | | | — | |
Interest | | | — | (A) | | | 763 | | | | 4 | |
Securities lending income (net) | | | 3 | | | | 10 | | | | — | |
Dividends | | | — | | | | 388 | | | | — | |
Dividend reclaims | | | 1 | | | | 73 | | | | — | |
Variation margin | | | — | | | | 5 | | | | — | |
Other | | | — | | | | 19 | | | | — | |
Prepaid expenses | | | 1 | | | | 1 | | | | 1 | |
Unrealized appreciation on swap agreements | | | — | (A) | | | 72 | | | | 212 | |
Premium Paid on Swaps | | | 151,236 | | | | — | | | | — | |
Unrealized appreciation on forward foreign currency contracts | | | — | | | | 175 | | | | 9,221 | |
| | | | | | | | | | | | |
| | $ | 641,286 | | | $ | 365,550 | | | $ | 364,186 | |
| | | | | | | | | | | | |
Liabilities: | | | | | | | | | | | | |
Due to custodian | | | — | | | | 1,295 | | | | — | |
Cash deposit due to broker | | | — | | | | 900 | | | | — | |
Accounts payable and accrued liabilities: | | | | | | | | | | | | |
Investment securities purchased | | | 308,434 | | | | 12,827 | | | | 49,274 | |
Shares of beneficial interest redeemed | | | 124 | | | | 279 | | | | 209 | |
Management and advisory fees | | | 85 | | | | 216 | | | | 316 | |
Trustees fees | | | — | (A) | | | 1 | | | | 1 | |
Transfer agent fees | | | 1 | | | | 2 | | | | 2 | |
Custody fees | | | 6 | | | | 67 | | | | 51 | |
Administration fees | | | 3 | | | | 7 | | | | 7 | |
Audit and tax fees | | | 24 | | | | 33 | | | | 25 | |
Interest payable | | | 37 | | | | — | | | | — | |
Variation margin | | | — | | | | — | | | | 3,603 | |
Foreign capital gains tax | | | — | | | | 32 | | | | — | |
Other | | | 7 | | | | 32 | | | | 13 | |
Collateral for securities on loan | | | 30,836 | | | | 34,186 | | | | — | |
Written options and swaptions, at value | | | — | | | | 599 | | | | — | |
Unrealized depreciation on swap agreements | | | — | (A) | | | 6 | | | | 309 | |
Premium Received on Swaps | | | 151,236 | | | | — | | | | — | |
Unrealized depreciation on forward foreign currency contracts | | | — | | | | 363 | | | | 8,253 | |
| | | | | | | | | | | | |
| | | 490,793 | | | | 50,845 | | | | 62,063 | |
| | | | | | | | | | | | |
Net assets | | $ | 150,493 | | | $ | 314,705 | | | $ | 302,123 | |
| | | | | | | | | | | | |
Net assets consist of: | | | | | | | | | | | | |
Shares of beneficial interest, unlimited shares authorized, no par value | | $ | 151,347 | | | $ | 281,602 | | | $ | 314,578 | |
Undistributed (accumulated) net investment income (loss) | | | (855 | ) | | | 3,976 | | | | (5,636 | ) |
Undistributed (accumulated) net realized gain (loss) from investments | | | 1 | | | | 5,845 | | | | (4,085 | ) |
Net unrealized appreciation (depreciation) on: | | | | | | | | | | | | |
Investment securities | | | — | | | | 22,971 | | | | — | |
Futures contracts | | | — | | | | 187 | | | | (3,603 | ) |
Written option and swaption contracts | | | — | | | | 269 | | | | — | |
Swap agreements | | | — | | | | 66 | | | | (97 | ) |
Translation of assets and liabilities denominated in foreign currencies | | | — | | | | (211 | ) | | | 966 | |
| | | | | | | | | | | | |
Net assets | | $ | 150,493 | | | $ | 314,705 | | | $ | 302,123 | |
| | | | | | | | | | | | |
Shares outstanding | | | 15,555 | | | | 28,509 | | | | 32,264 | |
Net asset value and offering price per share | | $ | 9.67 | | | $ | 11.04 | | | $ | 9.36 | |
| | | | | | | | | | | | |
Investment securities, at cost | | $ | 129,752 | | | $ | 337,319 | | | $ | 265,160 | |
| | | | | | | | | | | | |
Repurchase agreement, at cost | | $ | 38,705 | | | $ | — | | | $ | — | |
| | | | | | | | | | | | |
Foreign currency, at cost | | $ | — | | | $ | 2,221 | | | $ | 284 | |
| | | | | | | | | | | | |
Securities loaned, at value | | $ | 30,223 | | | $ | 33,349 | | | $ | — | |
| | | | | | | | | | | | |
Premium received on written option and swaption contracts | | $ | — | | | $ | 868 | | | $ | — | |
| | | | | | | | | | | | |
| (A) | Rounds to less than $1. |
The notes to the financial statements are an integral part of this report.
| | | | |
| Transamerica Funds | | | | Annual Report 2012 |
| | Page 206 | | |
CONSOLIDATED STATEMENTS OF OPERATIONS
At October 31, 2012
(all amounts except per share amounts in thousands)
| | | | | | | | | | | | |
| | | Transamerica
Commodity
Strategy | | | Transamerica
Global Allocation | | | Transamerica
Managed Futures
Strategy | |
Investment income: | | | | | | | | | | | | |
Dividend income | | $ | — | | | $ | 6,410 | | | $ | — | |
Withholding taxes on foreign income | | | — | | | | (282 | ) | | | — | |
Interest income | | | 98 | | | | 3,557 | | | | 38 | |
Securities lending income (net) | | | 41 | | | | 220 | | | | — | |
| | | | | | | | | | | | |
Total investment income | | | 139 | | | | 9,905 | | | | 38 | |
| | | | | | | | | | | | |
Expenses: | | | | | | | | | | | | |
Management and advisory | | | 977 | | | | 2,879 | | | | 3,043 | |
Transfer agent | | | 12 | | | | 29 | | | | 21 | |
Printing and shareholder reports | | | 5 | | | | 10 | | | | 8 | |
Custody | | | 65 | | | | 660 | | | | 572 | |
Administration | | | 37 | | | | 90 | | | | 65 | |
Legal | | | 9 | | | | 21 | | | | 14 | |
Audit and tax | | | 21 | | | | 41 | | | | 23 | |
Trustees | | | 3 | | | | 7 | | | | 5 | |
Registration | | | — | | | | — | | | | 1 | |
Other | | | 3 | | | | 8 | | | | 34 | |
| | | | | | | | | | | | |
Total expenses | | | 1,132 | | | | 3,745 | | | | 3,786 | |
| | | | | | | | | | | | |
Net investment income (loss) | | | (993 | ) | | | 6,160 | | | | (3,748 | ) |
| | | | | | | | | | | | |
Net realized gain (loss) on transactions from: | | | | | | | | | | | | |
Investment securities | | | — | | | | 9,149 | (A) | | | — | |
Futures contracts | | | — | | | | (2,031 | ) | | | 3,541 | |
Written option and swaption contracts | | | — | | | | 1,384 | | | | — | |
Swap agreements | | | (11,228 | ) | | | 6 | | | | (734 | ) |
Foreign currency transactions | | | — | | | | 323 | | | | (7,902 | ) |
| | | | | | | | | | | | |
Net realized gain (loss) | | | (11,228 | ) | | | 8,831 | | | | (5,095 | ) |
| | | | | | | | | | | | |
Net change in unrealized appreciation (depreciation) on: | | | | | | | | | | | | |
Investment securities | | | — | | | | (1,742 | )(A) | | | — | |
Futures contracts | | | — | | | | 753 | | | | (1,572 | ) |
Written option and swaption contracts | | | — | | | | 624 | | | | — | |
Swap agreements | | | — | | | | 80 | | | | (178 | ) |
Translation of assets and liabilities denominated in foreign currencies | | | — | | | | (426 | ) | | | 7,477 | |
| | | | | | | | | | | | |
Net change in unrealized appreciation (depreciation) | | | — | | | | (711 | ) | | | 5,727 | |
| | | | | | | | | | | | |
Net realized and change in unrealized gain (loss) | | | (11,228 | ) | | | 8,120 | | | | 632 | |
| | | | | | | | | | | | |
Net increase (decrease) in net assets resulting from operations | | $ | (12,221 | ) | | $ | 14,280 | | | $ | (3,116 | ) |
| | | | | | | | | | | | |
| (A) | Net of foreign capital gains tax of $32. |
| | | | |
| Transamerica Funds | | | | Annual Report 2012 |
| | Page 207 | | |
CONSOLIDATED STATEMENTS OF CHANGES IN NET ASSETS
For the years ended:
(all amounts in thousands)
| | | | | | | | | | | | | | | | | | | | | | | | |
| | | Transamerica Commodity Strategy | | | Transamerica Global Allocation | | | Transamerica Managed Futures
Strategy | |
| | | October 31,
2012 | | | October 31,
2011 | | | October 31,
2012 | | | October 31,
2011 | | | October 31,
2012 | | | October 31,
2011 | |
From operations: | | | | | | | | | | | | | | | | | | | | | | | | |
Net investment income (loss) | | $ | (993 | ) | | $ | (1,079 | ) | | $ | 6,160 | | | $ | 9,618 | | | $ | (3,748 | ) | | $ | (3,062 | ) |
Net realized gain (loss)(A) | | | (11,228 | ) | | | 7,381 | | | | 8,831 | | | | 23,095 | | | | (5,095 | ) | | | (4,806 | ) |
Net change in unrealized appreciation (depreciation) | | | — | | | | (2 | ) | | | (711 | ) | | | (20,942 | ) | | | 5,727 | | | | (12,117 | ) |
| | | | | | | | | | | | | | | | | | | | | | | | |
Net increase (decrease) in net assets resulting from operations | | | (12,221 | ) | | | 6,300 | | | | 14,280 | | | | 11,771 | | | | (3,116 | ) | | | (19,985 | ) |
| | | | | | | | | | | | | | | | | | | | | | | | |
Distributions to shareholders: | | | | | | | | | | | | | | | | | | | | | | | | |
From net investment income | | | (6,303 | ) | | | (7,529 | ) | | | (10,437 | ) | | | (7,497 | ) | | | (88 | ) | | | (2,620 | ) |
From net realized gains | | | — | | | | (6,294 | ) | | | (6,764 | ) | | | — | | | | (128 | ) | | | (1,710 | ) |
| | | | | | | | | | | | | | | | | | | | | | | | |
Total distributions to shareholders | | | (6,303 | ) | | | (13,823 | ) | | | (17,201 | ) | | | (7,497 | ) | | | (216 | ) | | | (4,330 | ) |
| | | | | | | | | | | | | | | | | | | | | | | | |
Capital share transactions: | | | | | | | | | | | | | | | | | | | | | | | | |
Proceeds from shares sold | | | 24,648 | | | | 36,071 | | | | 43,521 | | | | 39,339 | | | | 186,221 | | | | 150,756 | |
Dividends and distributions reinvested | | | 6,303 | | | | 13,823 | | | | 17,201 | | | | 7,497 | | | | 216 | | | | 4,330 | |
Cost of shares redeemed | | | (39,777 | ) | | | (11,504 | ) | | | (165,322 | ) | | | (126,189 | ) | | | (143,391 | ) | | | (126,249 | ) |
| | | | | | | | | | | | | | | | | | | | | | | | |
Net increase (decrease) in net assets resulting from capital shares transactions | | | (8,826 | ) | | | 38,390 | | | | (104,600 | ) | | | (79,353 | ) | | | 43,046 | | | | 28,837 | |
| | | | | | | | | | | | | | | | | | | | | | | | |
Net increase (decrease) in net assets | | | (27,350 | ) | | | 30,867 | | | | (107,521 | ) | | | (75,079 | ) | | | 39,714 | | | | 4,522 | |
| | | | | | | | | | | | | | | | | | | | | | | | |
Net assets: | | | | | | | | | | | | | | | | | | | | | | | | |
Beginning of year | | | 177,843 | | | | 146,976 | | | | 422,226 | | | | 497,305 | | | | 262,409 | | | | 257,887 | |
| | | | | | | | | | | | | | | | | | | | | | | | |
End of year | | $ | 150,493 | | | $ | 177,843 | | | $ | 314,705 | | | $ | 422,226 | | | $ | 302,123 | | | $ | 262,409 | |
| | | | | | | | | | | | | | | | | | | | | | | | |
Undistributed (accumulated) net investment income (loss) | | $ | (855 | ) | | $ | 6,303 | | | $ | 3,976 | | | $ | 7,996 | | | $ | (5,636 | ) | | $ | (2,793 | ) |
| | | | | | | | | | | | | | | | | | | | | | | | |
Share activity: | | | | | | | | | | | | | | | | | | | | | | | | |
Shares issued | | | 2,565 | | | | 3,166 | | | | 4,016 | | | | 3,506 | | | | 19,224 | | | | 15,207 | |
Shares issued-reinvested from dividends and distributions | | | 669 | | | | 1,290 | | | | 1,710 | | | | 689 | | | | 22 | | | | 432 | |
Shares redeemed | | | (4,191 | ) | | | (1,026 | ) | | | (15,652 | ) | | | (11,328 | ) | | | (15,088 | ) | | | (12,921 | ) |
| | | | | | | | | | | | | | | | | | | | | | | | |
Net increase (decrease) in shares outstanding | | | (957 | ) | | | 3,430 | | | | (9,926 | ) | | | (7,133 | ) | | | 4,158 | | | | 2,718 | |
| | | | | | | | | | | | | | | | | | | | | | | | |
| (A) | Net realized gain (loss) includes all items listed in the Statement of Operations. |
The notes to the financial statements are an integral part of this report.
| | | | |
| Transamerica Funds | | | | Annual Report 2012 |
| | Page 208 | | |
FINANCIAL HIGHLIGHTS
For the period or years ended:
| | | | | | | | | | | | | | | | | | | | |
For a share outstanding throughout each period | | Transamerica Commodity Strategy | |
| | October 31, 2012 | | | October 31, 2011 | | | October 31, 2010 | | | October 31, 2009 | | | October 31, 2008 | |
Net asset value | | | | | | | | | | | | | | | | | | | | |
Beginning of year | | $ | 10.77 | | | $ | 11.24 | | | $ | 10.03 | | | $ | 8.11 | | | $ | 14.11 | |
| | | | | | | | | | | | | | | | | | | | |
Investment operations | | | | | | | | | | | | | | | | | | | | |
Net investment income (loss)(A) | | | (0.06 | ) | | | (0.07 | ) | | | 0.04 | | | | 0.05 | | | | 0.03 | |
Net realized and change in unrealized gain (loss) on investments | | | (0.66 | ) | | | 0.64 | | | | 1.22 | | | | 1.91 | | | | (5.85 | ) |
| | | | | | | | | | | | | | | | | | | | |
Total from investment operations | | | (0.72 | ) | | | 0.57 | | | | 1.26 | | | | 1.96 | | | | (5.82 | ) |
| | | | | | | | | | | | | | | | | | | | |
Distributions | | | | | | | | | | | | | | | | | | | | |
Net investment income | | | (0.38 | ) | | | (0.57 | ) | | | (0.05 | ) | | | (0.04 | ) | | | (0.03 | ) |
Net realized gains on investments | | | — | | | | (0.47 | ) | | | — | | | | — | (B) | | | (0.15 | ) |
| | | | | | | | | | | | | | | | | | | | |
Total distributions | | | (0.38 | ) | | | (1.04 | ) | | | (0.05 | ) | | | (0.04 | ) | | | (0.18 | ) |
| | | | | | | | | | | | | | | | | | | | |
Net asset value | | | | | | | | | | | | | | | | | | | | |
End of year | | $ | 9.67 | | | $ | 10.77 | | | $ | 11.24 | | | $ | 10.03 | | | $ | 8.11 | |
| | | | | | | | | | | | | | | | | | | | |
Total return(C) | | | (6.57 | )% | | | 5.12 | % | | | 12.61 | % | | | 24.41 | % | | | (41.77 | )% |
| | | | | | | | | | | | | | | | | | | | |
Net assets end of year (000’s) | | $ | 150,493 | | | $ | 177,843 | | | $ | 146,976 | | | $ | 121,342 | | | $ | 87,252 | |
| | | | | | | | | | | | | | | | | | | | |
Ratio and supplemental data | | | | | | | | | | | | | | | | | | | | |
Expenses to average net assets: | | | | | | | | | | | | | | | | | | | | |
After reimbursement/recapture | | | 0.71 | % | | | 0.71 | % | | | 0.86 | % | | | 0.89 | % | | | 0.86 | % |
Before reimbursement/recapture | | | 0.71 | % | | | 0.71 | % | | | 0.86 | % | | | 0.89 | % | | | 0.86 | % |
Net investment income (loss) to average net assets | | | (0.62 | )% | | | (0.60 | )% | | | 0.38 | % | | | 0.63 | % | | | 0.21 | % |
Portfolio turnover rate | | | — | % | | | — | % | | | 112 | %(D) | | | 5 | % | | | 4 | % |
| | | | | | | | | | | | | | | | | | | | |
For a share outstanding throughout each period | | Transamerica Global Allocation | |
| | October 31, 2012 | | | October 31, 2011 | | | October 31, 2010 | | | October 31, 2009 | | | October 31, 2008 | |
Net asset value | | | | | | | | | | | | | | | | | | | | |
Beginning of year | | $ | 10.99 | | | $ | 10.91 | | | $ | 9.99 | | | $ | 9.32 | | | $ | 13.23 | |
| | | | | | | | | | | | | | | | | | | | |
Investment operations | | | | | | | | | | | | | | | | | | | | |
Net investment income(A) | | | 0.17 | | | | 0.22 | | | | 0.20 | | | | 0.19 | | | | 0.27 | |
Net realized and change in unrealized gain (loss) on investments | | | 0.33 | | | | 0.03 | | | | 0.93 | | | | 1.55 | | | | (3.25 | ) |
| | | | | | | | | | | | | | | | | | | | |
Total from investment operations | | | 0.50 | | | | 0.25 | | | | 1.13 | | | | 1.74 | | | | (2.98 | ) |
| | | | | | | | | | | | | | | | | | | | |
Distributions | | | | | | | | | | | | | | | | | | | | |
Net investment income | | | (0.27 | ) | | | (0.17 | ) | | | (0.21 | ) | | | (0.55 | ) | | | (0.35 | ) |
Net realized gains on investments | | | (0.18 | ) | | | — | | | | — | | | | (0.52 | ) | | | (0.58 | ) |
| | | | | | | | | | | | | | | | | | | | |
Total distributions | | | (0.45 | ) | | | (0.17 | ) | | | (0.21 | ) | | | (1.07 | ) | | | (0.93 | ) |
| | | | | | | | | | | | | | | | | | | | |
Net asset value | | | | | | | | | | | | | | | | | | | | |
End of year | | $ | 11.04 | | | $ | 10.99 | | | $ | 10.91 | | | $ | 9.99 | | | $ | 9.32 | |
| | | | | | | | | | | | | | | | | | | | |
Total return(C) | | | 4.91 | % | | | 2.28 | % | | | 11.40 | % | | | 20.57 | % | | | (24.23 | )% |
| | | | | | | | | | | | | | | | | | | | |
Net assets end of year (000’s) | | $ | 314,705 | | | $ | 422,226 | | | $ | 497,305 | | | $ | 448,979 | | | $ | 377,781 | |
| | | | | | | | | | | | | | | | | | | | |
Ratio and supplemental data | | | | | | | | | | | | | | | | | | | | |
Expenses to average net assets: | | | | | | | | | | | | | | | | | | | | |
After reimbursement/recapture | | | 0.96 | % | | | 0.91 | % | | | 0.87 | % | | | 0.90 | % | | | 0.88 | % |
Before reimbursement/recapture | | | 0.96 | % | | | 0.91 | % | | | 0.87 | % | | | 0.90 | % | | | 0.88 | % |
Net investment income to average net assets | | | 1.58 | % | | | 1.98 | % | | | 1.96 | % | | | 2.08 | % | | | 2.25 | % |
Portfolio turnover rate | | | 38 | % | | | 41 | % | | | 51 | % | | | 43 | % | | | 49 | % |
The notes to the financial statements are an integral part of this report.
| | | | |
| Transamerica Funds | | | | Annual Report 2012 |
| | Page 209 | | |
FINANCIAL HIGHLIGHTS (continued)
For the period or years ended:
| | | | | | | | | | | | |
For a share outstanding throughout each period | | Transamerica Managed Futures Strategy | |
| | October 31, 2012 | | | October 31, 2011 | | | October 31, 2010(E) | |
Net asset value | | | | | | | | | | | | |
Beginning of period/year | | $ | 9.34 | | | $ | 10.16 | | | $ | 10.00 | |
| | | | | | | | | | | | |
Investment operations | | | | | | | | | | | | |
Net investment loss(A) | | | (0.13 | ) | | | (0.12 | ) | | | (0.01 | ) |
Net realized and change in unrealized gain (loss) on investments | | | 0.16 | | | | (0.53 | ) | | | 0.17 | |
| | | | | | | | | | | | |
Total from investment operations | | | 0.03 | | | | (0.65 | ) | | | 0.16 | |
| | | | | | | | | | | | |
Distributions | | | | | | | | | | | | |
Net investment income | | | — | (B) | | | (0.10 | ) | | | — | |
Net realized gains on investments | | | (0.01 | ) | | | (0.07 | ) | | | — | |
| | | | | | | | | | | | |
Total distributions | | | (0.01 | ) | | | (0.17 | ) | | | — | |
| | | | | | | | | | | | |
Net asset value | | | | | | | | | | | | |
End of year | | $ | 9.36 | | | $ | 9.34 | | | $ | 10.16 | |
| | | | | | | | | | | | |
Total return(C) | | | 0.31 | % | | | (6.52 | )% | | | 1.60 | %(F) |
| | | | | | | | | | | | |
Net assets end of year (000’s) | | $ | 302,123 | | | $ | 262,409 | | | $ | 257,887 | |
| | | | | | | | | | | | |
Ratio and supplemental data | | | | | | | | | | | | |
Expenses to average net assets: | | | | | | | | | | | | |
After reimbursement/recapture | | | 1.37 | % | | | 1.31 | % | | | 1.38 | %(G) |
Before reimbursement/recapture | | | 1.37 | % | | | 1.31 | % | | | 1.38 | %(G) |
Net investment loss to average net assets | | | (1.35 | )% | | | (1.21 | )% | | | (1.22 | )%(G) |
Portfolio turnover rate | | | — | % | | | — | % | | | — | %(F) |
| (A) | Calculated based on average number of shares outstanding. |
| (B) | Rounds to less than $0.01 or $(0.01). |
| (C) | Total return has been calculated for the applicable period without deduction of a sales load, if any, on an initial purchase. |
| (D) | Increase in portfolio turnover was triggered by a change in the fund’s objectives. |
| (E) | Commenced operations on September 30, 2010. |
Note: Prior to November 1, 2009, all the financial highlights were audited by another independent registered public accounting firm.
The notes to the financial statements are an integral part of this report.
| | | | |
| Transamerica Funds | | | | Annual Report 2012 |
| | Page 210 | | |
NOTES TO FINANCIAL STATEMENTS
At October 31, 2012
(all amounts in thousands)
NOTE 1. ORGANIZATION AND SIGNIFICANT ACCOUNTING POLICIES
Transamerica Funds (the “Trust”) is an open-end management investment company registered under the Investment Company Act of 1940, as amended (the “1940 Act”). Effective March 1, 2012, the following name changes occurred:
| | |
Fund Name | | Formerly Known As |
Transamerica Arbitrage Strategy | | Transamerica Water Island Arbitrage Strategy |
Transamerica Bond | | Transamerica Loomis Sayles Bond |
Transamerica Core Bond | | Transamerica JPMorgan Core Bond |
Transamerica Developing Markets Equity | | Transamerica Oppenheimer Developing Markets |
Transamerica Global Macro | | Transamerica First Quadrant Global Macro |
Transamerica Global Real Estate Securities | | Transamerica Clarion Global Real Estate Securities |
Transamerica Growth | | Transamerica Jennison Growth |
Transamerica International | | Transamerica Neuberger Berman International |
Transamerica International Equity Opportunities | | Transamerica MFS International Equity |
Transamerica International Small Cap | | Transamerica Schroders International Small Cap |
Transamerica International Value Opportunities | | Transamerica Thornburg International Value |
Transamerica Large Cap Value | | Transamerica BlackRock Large Cap Value |
Transamerica Long/Short Strategy | | Transamerica JPMorgan Long/Short Strategy |
Transamerica Mid Cap Value | | Transamerica JPMorgan Mid Cap Value |
Transamerica Real Return TIPS | | Transamerica PIMCO Real Return TIPS |
Transamerica Select Equity | | Transamerica ICAP Select Equity |
Transamerica Total Return | | Transamerica PIMCO Total Return |
Transamerica Value | | Transamerica Third Avenue Value |
Transamerica Commodity Strategy | | Transamerica Goldman Sachs Commodity Strategy |
Transamerica Global Allocation | | Transamerica BlackRock Global Allocation |
Transamerica Managed Futures Strategy | | Transamerica AQR Managed Futures Strategy |
Effective July 31, 2012, Transamerica Large Cap Value changed its name to Transamerica Large Company.
Transamerica Arbitrage Strategy, Transamerica Bond, Transamerica Core Bond, Transamerica Developing Markets Equity, Transamerica Global Macro, Transamerica Global Real Estate Securities, Transamerica Growth, Transamerica International, Transamerica International Equity Opportunities, Transamerica International Small Cap, Transamerica International Value Opportunities, Transamerica Large Company, Transamerica Long/Short Strategy, Transamerica Mid Cap Value, Transamerica Real Return TIPS, Transamerica Select Equity, Transamerica Total Return, Transamerica Value, Transamerica Commodity Strategy, Transamerica Global Allocation, and Transamerica Managed Futures Strategy, (each a “Fund”; collectively, the “Funds”) are part of the Trust.
Transamerica Global Macro, Transamerica Global Real Estate Securities, Transamerica Real Return TIPS, Transamerica Value, Transamerica Commodity Strategy, and Transamerica Managed Futures Strategy are “non-diversified” under the 1940 Act.
This report should be read in conjunction with the Funds’ current prospectus, which contains more complete information about the Funds, including investment objectives and strategies.
In the normal course of business, the Funds enter into contracts that contain a variety of representations that provide general indemnifications. The Funds’ maximum exposure under these arrangements is unknown, as this would involve future claims that may be made against the Funds and/or their affiliates that have not yet occurred. However, based on experience, the Funds expect the risk of loss to be remote.
In preparing the Funds’ financial statements in accordance with accounting principles generally accepted in the United States of America (“GAAP”), estimates or assumptions (which could differ from actual results) may be used that affect reported amounts and disclosures. The following is a summary of significant accounting policies followed by the Funds.
Securities lending: Securities are lent to qualified financial institutions and brokers. The lending of Funds’ securities exposes the Funds to risks such as the following: (i) the borrowers may fail to return the loaned securities; (ii) the borrowers may not be able to provide additional collateral; (iii) the Funds may experience delays in recovery of the loaned securities or delays in access to collateral; or (iv) the Funds may experience losses related to the investment collateral. To minimize certain risks, loan counterparties pledge cash collateral equal to at least the market value of the securities loaned. Cash collateral received is invested in the State Street Navigator Securities Lending Trust-Prime Portfolio, a money market mutual fund registered under the 1940 Act. By lending such securities, the Funds seek to increase their net investment income through the receipt of interest and fees.
Such income is reflected separately in the Statements of Operations or Consolidated Statements of Operations. The value of loaned securities and related collateral outstanding at October 31, 2012 are shown in the Schedules of Investments and Statements of Assets and Liabilities, or in the Consolidated Schedules of Investments and Consolidated Statements of Assets and Liabilities.
Income from loaned securities in the Statements of Operations or Consolidated Statements of Operations is net of fees and rebates earned by the lending agent for its services.
| | | | |
| Transamerica Funds | | | | Annual Report 2012 |
| | Page 211 | | |
NOTES TO FINANCIAL STATEMENTS (continued)
At October 31, 2012
(all amounts in thousands)
NOTE 1. (continued)
Repurchase agreements: Securities purchased subject to a repurchase agreement are held at the Funds’ custodian, or designated sub-custodian related to tri-party repurchase agreements, and, pursuant to the terms of the repurchase agreement, must be collateralized by securities with an aggregate market value greater than or equal to 100% of the resale price. The Funds will bear the risk of value fluctuations until the securities can be sold and may encounter delays and incur costs in liquidating the securities. In the event of bankruptcy or insolvency of the seller, delays and costs may be incurred.
Foreign currency denominated investments: The accounting records of the Funds are maintained in U.S. dollars. Securities and other assets and liabilities denominated in foreign currencies are translated into U.S. dollars at the closing exchange rate each day. The cost of foreign securities is translated at the exchange rates in effect when the investment was acquired. Each Fund combines fluctuations from currency exchange rates and fluctuations in value when computing net realized and unrealized gains or losses from investments.
Net foreign currency gains and losses resulting from changes in exchange rates include: 1) foreign currency fluctuations between trade date and settlement date of investment security transactions; 2) gains and losses on forward foreign currency contracts; and 3) the difference between the receivable amounts of interest and dividends recorded in the accounting records in U.S. dollars and the amounts actually received.
Foreign currency denominated assets may involve risks not typically associated with domestic transactions. These risks include revaluation of currencies, adverse fluctuations in foreign currency values, and possible adverse political, social, and economic developments, including those particular to a specific industry, country, or region.
Foreign taxes: The Funds may be subjected to taxes imposed by the countries in which they invest, with respect to their investments in issuers existing or operating in such countries. The Funds may also be subject to foreign taxes on income, gains on investments or currency repatriation, a portion of which may be recoverable. The Funds accrue such taxes and recoveries as applicable, when the related income or capital gains are earned and based upon the current interpretation of tax rules and regulations that exist in the markets in which the Funds invest. Some countries require governmental approval for the repatriation of investment income, capital, or the proceeds of sales earned by foreign investors. In addition, if there is deterioration in a country’s balance of payments or for other reasons, a country may impose temporary restrictions of foreign capital remittances abroad.
Forward foreign currency contracts: The Funds are subject to foreign currency exchange rate risk exposure in the normal course of pursuing their investment objectives. The Funds enter into forward foreign currency contracts to hedge against exchange rate risk arising from investments in securities denominated in foreign currencies. Forward foreign currency contracts are marked to market daily, with the change in value recorded as an unrealized gain or loss. When the contracts are settled, a realized gain or loss is incurred. Risks may arise from changes in market value of the underlying currencies and from the possible inability of counterparties to meet the terms of their contracts.
Open forward foreign currency contracts at October 31, 2012 are listed in the Schedules of Investments or Consolidated Schedules of Investments.
Option contracts: The Funds are subject to equity price risk, interest rate risk, and foreign currency exchange rate risk in the normal course of pursuing their investment objectives. The Funds enter into option contracts to manage exposure to various market fluctuations. Funds purchase or write put and call options on U.S. securities, indices, futures, swaps (“swaptions”), commodities, and currency transactions. Options are valued at the average of the bid and ask (“Mean Quote”) established each day at the close of the board of trade or exchange on which they are traded. Options are marked-to-market daily to reflect the current value of the option. The primary risks associated with options are an imperfect correlation between the change in value of the securities held and the prices of the option contracts, the possibility of an illiquid market, and an inability of the counterparty to meet the contract terms.
Purchased options: Purchasing call options tends to increase a Fund’s exposure to the underlying instrument. Purchasing put options tends to decrease a Fund’s exposure to the underlying instrument. The Funds pay premiums, which are included in the Statement of Assets and Liabilities as an investment and subsequently marked-to-market to reflect the current value of the option. The risk associated with purchasing put and call options is limited to the premium paid. Premiums paid from options which expire are treated as realized losses. Premiums paid for purchasing options which are exercised or closed are added to the amounts paid or offset against the proceeds on the underlying U.S. security, index, future, swaption, commodity, or currency transaction to determine the realized gain or loss.
Written options: Writing call options tends to decrease a Fund’s exposure to the underlying investment. When a Fund writes a covered call or put option, the premium received is recorded as a liability in the Statement of Assets and Liabilities and is subsequently marked-to-market to reflect the current market value of the option written. Premiums received from written options which expire unexercised are treated as realized gains. Premiums received from writing options/swaptions which are exercised or closed are added to the proceeds or offset against amounts paid on the underlying U.S. security, index, future, swaption, commodity, or currency transaction to determine the realized gain or loss. In writing an option, a Fund bears the market risk of an unfavorable change in the price of the security or currency underlying the written option. Exercise of an option written by a Fund could result in the Fund selling or buying a security or currency at a price different from the current market value.
| | | | |
| Transamerica Funds | | | | Annual Report 2012 |
| | Page 212 | | |
NOTES TO FINANCIAL STATEMENTS (continued)
At October 31, 2012
(all amounts in thousands)
NOTE 1. (continued)
Inflation-capped options: A Fund purchases or writes inflation-capped options to enhance returns or for hedging opportunities. The purpose of purchasing inflation-capped options is to protect a Fund from inflation erosion above a certain rate on a given notional exposure. A floor can be used to give downside protection to the investments in inflation-linked products.
Straddle swaption contracts: The Funds enter into straddle swaption contracts. A straddle swaption is an investment strategy that consists of two swaptions, each with a different underlying swap, wherein the holder buys both a payer and receiver option on the same floating rate. If the floating rate falls, the holder receives the fixed rate, and if the floating rate rises, the holder pays the fixed rate.
The underlying face amounts of open option and swaption contracts at October 31, 2012 are listed in the Schedules of Investments or Consolidated Schedules of Investments.
Transactions in written options were as follows:
| | | | | | | | |
Transamerica Arbitrage Strategy | | Premium | | | Notional
Amount | |
Balance at October 31, 2011 | | $ | 157 | | | $ | 244 | |
Sales | | | 3,345 | | | | 4,164 | |
Closing Buys | | | (1,223 | ) | | | (1,080 | ) |
Expirations | | | (2,051 | ) | | | (2,775 | ) |
Exercised | | | (76 | ) | | | (87 | ) |
| | | | | | | | |
Balance at October 31, 2012 | | $ | 152 | | | $ | 466 | |
| | | | | | | | |
| | |
Transamerica Global Macro | | Premium | | | Notional
Amount | |
Balance at October 31, 2011 | | $ | 1,868 | | | $ | 53 | |
Sales | | | 11,119 | | | | 2,158 | |
Closing Buys | | | (8,415 | ) | | | (881 | ) |
Expirations | | | (3,312 | ) | | | (988 | ) |
Exercised | | | — | | | | — | |
| | | | | | | | |
Balance at October 31, 2012 | | $ | 1,260 | | | $ | 342 | |
| | | | | | | | |
| | |
Transamerica Real Return TIPS | | Premium | | | Notional
Amount | |
Balance at October 31, 2011 | | $ | 227 | | | $ | 25,300 | |
Sales | | | 29 | | | | 54 | |
Closing Buys | | | (94 | ) | | | (7,654 | ) |
Expirations | | | — | | | | — | |
Exercised | | | — | | | | — | |
| | | | | | | | |
Balance at October 31, 2012 | | $ | 162 | | | $ | 17,700 | |
| | | | | | | | |
| | |
Transamerica Global Allocation | | Premium | | | Notional
Amount | |
Balance at October 31, 2011 | | $ | 1,744 | | | $ | 448 | |
Sales | | | 3,477 | | | | 1,034 | |
Closing Buys | | | (3,515 | ) | | | (853 | ) |
Expirations | | | (741 | ) | | | (209 | ) |
Exercised | | | (165 | ) | | | (114 | ) |
| | | | | | | | |
Balance at October 31, 2012 | | $ | 800 | | | $ | 306 | |
| | | | | | | | |
| | |
Transamerica Global Allocation | | Premium | | | Notional
Amount | |
Balance at October 31, 2011 | | $ | 59 | | | EUR | 971 | |
Sales | | | 174 | | | | 10,244 | |
Closing Buys | | | (124 | ) | | | (7,322 | ) |
Expirations | | | (56 | ) | | | (940 | ) |
Exercised | | | (3 | ) | | | (1 | ) |
| | | | | | | | |
Balance at October 31, 2012 | | $ | 50 | | | EUR | 2,952 | |
| | | | | | | | |
| | | | | | | | |
Transamerica Global Allocation | | Premium | | | Notional
Amount | |
Balance at October 31, 2011 | | $ | 5 | | | HKD | 81 | |
Sales | | | 3 | | | | 71 | |
Closing Buys | | | — | | | | — | |
Expirations | | | (8 | ) | | | (152 | ) |
Exercised | | | — | | | | — | |
| | | | | | | | |
Balance at October 31, 2012 | | $ | — | | | HKD | — | |
| | | | | | | | |
| | |
Transamerica Global Allocation | | Premium | | | Notional
Amount | |
Balance at October 31, 2011 | | $ | 61 | | | JPY | 137 | |
Sales | | | 24 | | | | 9 | |
Closing Buys | | | (36 | ) | | | (64 | ) |
Expirations | | | (31 | ) | | | (74 | ) |
Exercised | | | — | | | | — | |
| | | | | | | | |
Balance at October 31, 2012 | | $ | 18 | | | JPY | 8 | |
| | | | | | | | |
Transactions in written swaptions were as follows:
| | | | | | | | |
Transamerica Real Return TIPS | | Premium | | | Notional
Amount | |
Balance at October 31, 2011 | | $ | 2,041 | | | $ | 262,000 | |
Sales | | | 2,130 | | | | 293,700 | |
Closing Buys | | | (2,528 | ) | | | (320,000 | ) |
Expirations | | | (146 | ) | | | (13,400 | ) |
Exercised | | | — | | | | — | |
| | | | | | | | |
Balance at October 31, 2012 | | $ | 1,497 | | | $ | 222,300 | |
| | | | | | | | |
| | |
Transamerica Real Return TIPS | | Premium | | | Notional
Amount | |
Balance at October 31, 2011 | | $ | — | | | EUR | — | |
Sales | | | 31 | | | | 5,900 | |
Closing Buys | | | — | | | | — | |
Expirations | | | — | | | | — | |
Exercised | | | — | | | | — | |
| | | | | | | | |
Balance at October 31, 2012 | | $ | 31 | | | EUR | 5,900 | |
| | | | | | | | |
| | |
Transamerica Total Return | | Premium | | | Notional
Amount | |
Balance at October 31, 2011 | | $ | 691 | | | $ | 70,600 | |
Sales | | | 1,301 | | | | 84,200 | |
Closing Buys | | | (664 | ) | | | (73,100 | ) |
Expirations | | | (27 | ) | | | (2,500 | ) |
Exercised | | | — | | | | — | |
| | | | | | | | |
Balance at October 31, 2012 | | $ | 1,301 | | | $ | 79,200 | |
| | | | | | | | |
| | | | |
| Transamerica Funds | | | | Annual Report 2012 |
| | Page 213 | | |
NOTES TO FINANCIAL STATEMENTS (continued)
At October 31, 2012
(all amounts in thousands)
NOTE 1. (continued)
Futures contracts: The Funds are subject to equity and commodity price risks, interest rate risk, and foreign currency exchange rate risk in the normal course of pursuing their investment objectives. The Funds use futures contracts to gain exposure to, or hedge against, changes in the value of equities and commodities, interest rates, or foreign currencies. A futures contract represents a commitment for the future purchase or sale of an asset at a specified price on a specified date. Upon entering into such contracts, the Funds are required to deposit with the broker, either in cash or in securities, an initial margin in an amount equal to a certain percentage of the contract amount. Subsequent payments (variation margin) are paid or received by the Funds each day, depending on the daily fluctuations in the value of the contract, and are recorded for financial statement purposes as unrealized gains or losses by the Funds. Upon entering into such contracts, the Funds bear the risk of equity and commodity prices, interest rates, or exchange rates moving unexpectedly, in which case, the Funds may not achieve the anticipated benefits of the futures contracts and may realize losses. With futures, there is minimal counterparty credit risk to the Funds since futures are exchange traded and the exchange’s clearinghouse, as counterparty to all exchange traded futures, guarantees the futures against default.
The open futures contracts at October 31, 2012 are listed in the Schedules of Investments or Consolidated Schedules of Investments. The variation margin receivable or payable, as applicable, is included in the Statements of Assets and Liabilities or Consolidated Statements of Assets and Liabilities.
Swap agreements: Swap agreements are bilaterally negotiated agreements between a Fund and a counterparty to exchange or swap investments, cash flows, assets, foreign currencies, or market-linked returns at specified, future intervals. Swap agreements are privately negotiated in the over-the-counter (“OTC”) market and may be executed in a multilateral or other trade facility platform, such as a registered exchange (“centrally cleared swaps”). The Funds enter into credit default, cross-currency, interest rate, total return, variance, and other forms of swap agreements to manage exposure to credit, currency, interest rate, and commodity risks. In connection with these agreements, securities or cash may be identified as collateral or margin in accordance with the terms of the respective swap agreements to provide assets of value and recourse in the event of default or bankruptcy/insolvency. Swaps are marked to market daily based upon values from third party vendors, which may include a registered exchange, or quotations from market makers to the extent available and the change in value, if any, is recorded as an unrealized gain or loss in the Statements of Assets and Liabilities or Consolidated Statements of Assets and Liabilities.
Payments received or made at the beginning of the measurement period are reflected as such in the Statements of Assets and Liabilities or Consolidated Statements of Assets and Liabilities, and represent payments made or received upon entering into the swap agreements to compensate for differences between the stated terms of the swap agreement and prevailing market conditions (credit spreads, currency exchange rates, interest rates, and other relevant factors). These upfront payments are recorded as realized gains or losses in the Statements of Operations or Consolidated Statements of Operations upon termination or maturity of the swap. A liquidation payment received or made at the termination of the swap is recorded as realized gain or loss in the Statements of Operations or Consolidated Statements of Operations. Net periodic payments received or paid by the Funds are included as part of realized gains or losses in the Statement of Operations or Consolidated Statements of Operations.
Specific risks and accounting related to each type of swap agreement are identified and described in the following paragraphs:
Credit default swap agreements: The Funds are subject to credit risk in the normal course of pursuing their investment objectives. The Funds enter into credit default swaps to manage their exposure to the market, or certain sectors of the market, to reduce their risk exposure to defaults of corporate and sovereign issuers, or to create exposure to corporate or sovereign issuers to which they are not otherwise exposed. Credit default swaps involve the exchange of a fixed rate premium for protection against the loss in value of an underlying security in the event of a defined credit event, such as payment default or bankruptcy (buy protection).
Under a credit default swap, one party acts as a guarantor by receiving the fixed periodic payment in exchange for the commitment to purchase the underlying security at par if the defined credit event occurs (sell protection). The Funds’ maximum risk of loss from counterparty risk, either as the protection seller or as the protection buyer, is the notional amount of the contract. This risk is mitigated by having a master netting arrangement between the Funds and the counterparty, and by the posting of collateral.
Certain Funds sell credit default swaps, which exposes them to risk of loss from credit risk related events specified in the contracts. Although contract-specific, credit events are generally defined as bankruptcy, failure to pay, restructuring, obligation acceleration, obligation default, or repudiation/moratorium. The aggregate fair value of the credit default swaps are disclosed in the Schedules of Investments. The aggregate fair value of assets posted as collateral, net of assets received as collateral, for these swaps is included in the footnotes to the Schedules of Investments. If a defined credit event had occurred during the year, the swaps’ credit-risk-related contingent features would have been triggered, and the Funds would have been required to pay the notional amounts for the credit default swaps with a sell protection less the value of the contracts’ related reference obligations.
Interest rate swap agreements: The Funds are subject to interest rate risk exposure in the normal course of pursuing their investment objectives. Because a Fund holds fixed rate bonds, the value of these bonds may decrease if interest rates rise. To help hedge against this risk, the Funds enter into interest rate swap contracts. Interest rate swaps are agreements between two parties to exchange cash flows based on a notional principal amount. Funds with interest rate agreements can elect to pay a fixed rate and receive a floating rate, or receive a fixed rate and pay a floating rate, on a notional principal amount. The risks of interest rate swaps include changes in market conditions which will affect the value of the contract or the cash flows, and the possible inability of the counterparty to fulfill its obligations under the agreement. The Funds’ maximum risk of loss from counterparty credit risk is the discounted net value of the cash flows to be received from/paid to the counterparties over the contracts’ remaining lives, to the extent that that amount is positive. This risk is mitigated by having a master netting arrangement between the Funds and the counterparty, and by the posting of collateral.
| | | | |
| Transamerica Funds | | | | Annual Report 2012 |
| | Page 214 | | |
NOTES TO FINANCIAL STATEMENTS (continued)
At October 31, 2012
(all amounts in thousands)
NOTE 1. (continued)
Total return swap agreements: The Funds are subject to commodity, equity, and other risks related to the underlying investments of the swap agreement in the normal course of pursuing their investment objectives. The value of the commodity-linked investments held by a Fund can be affected by a variety of factors, including, but not limited to, overall market movements and other factors affecting the value of particular industries or commodities, such as weather, disease, embargoes, acts of war or terrorism, or political and regulatory developments. Commodity-linked derivatives are available from a relatively small number of issuers, subjecting a Fund’s investments in commodity-linked derivatives to counterparty risk, which is the risk that the issuer of the commodity-linked derivative will not fulfill its contractual obligations. Total return swap agreements on commodities involve commitments whereby cash flows are exchanged based on the price of a commodity in exchange for either a fixed or floating price or rate. One party would receive payments based on the market value of the commodity involved and pay a fixed amount. Total return swap agreements on indices involve commitments to pay interest in exchange for a market-linked return. One counterparty pays out the total return of a specific reference asset, which may be an equity, index, or bond, and in return receives a regular stream of payments.
Cross-currency swap agreements: The Funds are subject to foreign currency exchange rate risk in the normal course of pursuing their investment objectives. The Funds enter into cross-currency swap agreements to gain or reduce exposure to foreign currencies or to hedge against foreign currency exchange rate and/or interest rate risk. Cross-currency swap agreements are interest rate swaps in which two parties agree to exchange cash flows based on the notional amounts of two different currencies. The Funds with cross-currency swap agreements can elect to pay a fixed rate and receive a floating rate, or, receive a fixed rate and pay a floating rate on the notional amounts of two different currencies. The notional amounts are typically determined based on the spot exchange rates at the inception of the trade. Cross-currency swap agreements can also involve an exchange of notional amounts at the start, during and/or at expiration of the contract, either at the current spot rate or another specified rate.
The open swap agreements at October 31, 2012 are listed in the Schedules of Investments or Consolidated Schedules of Investments.
Cash overdraft: Throughout the year, the Funds may have cash overdraft balances. A fee is incurred on these overdrafts, calculated by multiplying the overdraft by a rate based on the federal funds rate. Payables, if any, are reflected as Due to Custodian in the Statements of Assets and Liabilities or Consolidated Statements of Assets and Liabilities. Expenses from cash overdrafts are included in Other in the Statements of Operations or Consolidated Statements of Operations.
Reverse repurchase agreements: The Funds enter into reverse repurchase agreements in which the Funds sell portfolio securities and agree to repurchase them from the buyer at a specified date and price. Pursuant to the terms of the reverse repurchase agreements, the Funds’ custodian must segregate assets with an aggregate market value greater than or equal to 100% of the resale price. Securities sold under reverse repurchase agreements are shown in the Schedules of Investments or Consolidated Schedules of Investments and reflected as a liability on the Statements of Assets and Liabilities or Consolidated Statements of Assets and Liabilities.
Transamerica Real Return TIPS entered into reverse repurchase agreements during the year ended October 31, 2012. The average reverse repurchase agreement for the year was approximately $24,320 with an average interest rate of 0.25%.
The open reverse repurchase agreements at October 31, 2012 are listed in the Schedules of Investments or Consolidated Schedules of Investments.
Dollar Rolls: For the period November 1, 2011 to April 30, 2012, the Funds accounted for dollar roll transactions as Purchase and Sale transactions. With the adoption of the amended authoritative guidance “Reconsideration of Effective Control for Repurchase Agreements” as issued by the Financial Accounting Standards Board (“FASB”) in April 2011 and adopted by the Funds on May 1, 2012, the Funds account for dollar roll transactions as borrowing transactions and realize gains and losses on these transactions at the end of the roll period. Dollar roll transactions involve sales by the Funds of securities and simultaneously contracts to repurchase substantially similar securities (same type and interest rate) on a specified future date. The Funds forgo principal and interest paid during the roll period on the securities sold in a dollar roll transaction. The Funds are compensated by the difference between the current sales price and the price for the future purchase (often referred to as the “drop”) as well as by any interest earned on the proceeds of the securities sold. Dollar roll transactions may be renewed with a new sale and a repurchase price and a cash settlement made at each renewal without physical delivery of the securities subject to the contract. Dollar roll transactions expose the Funds to risks such as the following: (i) buyer under the agreement may file for bankruptcy, become insolvent, or otherwise default on its obligations to the Funds; (ii) the market value of the securities the Funds are obligated to repurchase under the agreement may decline below the repurchase price.
Dollar roll transactions accounted for as borrowing transactions are excluded from the Funds’ turnover rates. The Funds recognize drop fee income on a straight line basis over the period of the roll. For the six months ended October 31, 2012, Transamerica Real Return TIPS and Transamerica Total Return earned drop fee income of $224 and less than $1, respectively. The drop fee income is included in “Interest income” in the Statements of Operations.
The outstanding payable for securities to be repurchased is included in payable for funds borrowed in the Statements of Assets and Liabilities. The average borrowing for dollar roll transactions during the six months ended October 31, 2012 for Transamerica Real Return TIPS and Transamerica Total Return was approximately $56,058 and $51, respectively, with an average interest rate of 0.24% and 0.19%, respectively. The interest expense is included in Interest in the Statements of Operations.
Open dollar roll transactions at October 31, 2012 are included in the Schedules of Investments.
| | | | |
| Transamerica Funds | | | | Annual Report 2012 |
| | Page 215 | | |
NOTES TO FINANCIAL STATEMENTS (continued)
At October 31, 2012
(all amounts in thousands)
NOTE 1. (continued)
Short sales: A short sale is a transaction in which a Fund sells securities it does not own, but has borrowed, in anticipation of a decline in the market price of the securities. The Funds are obligated to replace the borrowed securities at the market price at the time of replacement. The Funds’ obligation to replace the securities borrowed in connection with a short sale is fully secured by collateral deposited with the custodian. In addition, the Funds consider the short sale to be a borrowing by the Funds that is subject to the asset coverage requirements of the 1940 Act. Short sales represent an aggressive trading practice with a high risk/return potential, and short sales involve special considerations. Risks of short sales include that possible losses from short sales may be unlimited (e.g., if the price of stocks sold short rises), whereas losses from direct purchases of securities are limited to the total amount invested, and the Fund may be unable to replace borrowed securities sold short.
The Funds investing in short sales are liable for any dividends payable on securities while those securities are in a short position and also bears other costs, such as charges for the prime brokerage accounts, in connection with its short positions. These costs are reported as dividends and/or interest from securities sold short in the Statements of Operations or Consolidated Statements of Operations.
Loan participations and assignments: The Funds may invest in direct debt instruments which are interests in amounts owed to lenders or lending syndicates by corporate, governmental, or other borrowers, either in the form of participations at the time the loan is originated (“Participations”) or buying an interest in the loan in the secondary market from a financial institution or institutional investor (“Assignments”). Participations and Assignments in commercial loans may be secured or unsecured. These investments may include standby financing commitments, including revolving credit facilities that obligate the Funds to supply additional cash to the borrowers on demand. Loan Participations and Assignments involve risks of insolvency of the lending banks or other financial intermediaries. As such, the Funds assume the credit risks associated with the corporate borrowers and may assume the credit risks associated with the interposed banks or other financial intermediaries.
The Funds may be contractually obligated to receive approval from the agent banks and/or borrowers prior to the sale of these investments. The Funds that participate in such syndications, or that can buy a portion of the loans, become part lenders. Loans are often administered by agent banks acting as agents for all holders.
The agent banks administer the terms of the loans, as specified in the loan agreements. In addition, the agent banks are normally responsible for the collection of principal and interest payments from the corporate borrowers and the apportionment of these payments to the credit of all institutions that are parties to the loan agreements. Unless the Funds have direct recourse against the corporate borrowers under the terms of the loans or other indebtedness, the Funds may have to rely on the agent banks or other financial intermediaries to apply appropriate credit remedies against corporate borrowers.
The Funds held no unsecured loan participations at October 31, 2012.
Structured notes: Certain Funds invest in structured notes. A structured debt instrument is a hybrid debt security that has an embedded derivative. This type of instrument is used to manage cash flows from the debt security. All structured notes are listed within the Schedules of Investments.
To be announced (“TBA”) purchase commitments: TBA purchase commitments are entered into to purchase securities for a fixed price at a future date, typically not to exceed 45 days. They are considered securities in themselves, and involve a risk of loss if the value of the security to be purchased declines prior to settlement date, in addition to the risk of decline in the value of the Funds’ other assets. Unsettled TBA purchase commitments are valued at the current value of the underlying securities, according to the procedures described under Security Valuations. Open balances are included in the payable or receivable for investments purchased or sold.
Treasury inflation-protected securities (“TIPS”): Certain Funds invest in TIPS, specially structured bonds in which the principal amount is adjusted daily to keep pace with inflation as measured by the U.S. Consumer Price Index. The adjustments to principal due to inflation/deflation are reflected as increases/decreases to interest income in the Statements of Operations or Consolidated Statements of Operations with a corresponding adjustment to cost.
Restricted and illiquid securities: The Funds may invest in unregulated or restricted securities. Restricted and illiquid securities are subject to legal or contractual restrictions on resale or are illiquid. Restricted securities generally may be resold in transactions exempt from registration. A security may be considered illiquid if it lacks a readily available market or if its valuation has not changed for a certain period of time. Disposal of these securities may involve time-consuming negotiations and expense, and prompt sale at the current valuation may be difficult.
The restricted and illiquid securities at October 31, 2012 are listed in the Schedules of Investments or Consolidated Schedules of Investments.
Commission recapture: The sub-adviser, to the extent consistent with the best execution and usual commission rate policies and practices, has elected to place security transactions of the Funds with broker/dealers with which Transamerica Funds has established a Commission Recapture Program. A Commission Recapture Program is any arrangement under which a broker/dealer applies a portion of the commissions received by such broker/dealer on the security transactions to the Funds. In no event will commissions paid by the Funds be used to pay expenses that would otherwise be borne by any other funds within Transamerica Funds, or by any other party.
| | | | |
| Transamerica Funds | | | | Annual Report 2012 |
| | Page 216 | | |
NOTES TO FINANCIAL STATEMENTS (continued)
At October 31, 2012
(all amounts in thousands)
NOTE 1. (continued)
Commissions recaptured for the year ended October 31, 2012, are included in net realized gain (loss) in the Statements of Operations and are summarized as follows:
| | | | |
Fund Name | | Commissions | |
Transamerica Global Real Estate Securities | | $ | 15 | |
Transamerica Growth | | | 47 | |
Transamerica International | | | 1 | |
Transamerica International Equity Opportunities | | | — | (A) |
Transamerica International Value Opportunities | | | 1 | |
Transamerica Mid Cap Value | | | 8 | |
Transamerica Select Equity | | | 226 | |
Transamerica Value | | | 12 | |
| (A) | Rounds to less than $1. |
Security transactions and investment income: Security transactions are recorded on the trade date. Security gains and losses are calculated on the specific identification basis. Dividend income, if any, is recorded on the ex-dividend date or, in the case of foreign securities, as soon as the Funds are informed of the ex-dividend dates, net of foreign taxes. Interest income, including accretion of discounts and amortization of premiums, is recorded on the accrual basis commencing on the settlement date.
Real estate investment trust (“REITs”): Dividend income related to a Real Estate Investment Trust is recorded at management’s estimate of the income included in distributions from the REIT investments. Distributions received in excess of the estimated amount are recorded as a reduction of the cost of investments. The actual amounts of income, return of capital, and capital gains are only determined by each REIT after the fiscal year end and may differ from the estimated amounts.
There are certain additional risks involved in investing in REITs. These include, but are not limited to, economical conditions, changes in zoning laws, real estate values, property taxes, and interest rates.
Dividend distributions: Distributions to shareholders are recorded on the ex-dividend date and are determined in accordance with federal income tax regulations which may differ from GAAP.
NOTE 2. SECURITY VALUATIONS
All investments in securities are recorded at their estimated fair value. The Funds value their investments at the close of the New York Stock Exchange (“NYSE”), normally 4 p.m. Eastern Time, each day the NYSE is open for business. The Funds utilize various methods to measure the fair value of their investments on a recurring basis. GAAP establishes a hierarchy that prioritizes inputs to valuation methods. The inputs or methodology used for valuing securities are not necessarily an indication of the risk associated with investing in those securities. The three Levels of inputs of the fair value hierarchy are defined as follows:
Level 1—Unadjusted quoted prices in active markets for identical securities.
Level 2—Inputs, other than quoted prices included in Level 1, that are observable, either directly or indirectly. These inputs may include quoted prices for the identical instrument on an inactive market, prices for similar instruments, interest rates, prepayment speeds, credit risk, yield curves, default rates and similar data.
Level 3—Unobservable inputs, which may include Transamerica Asset Management, Inc.’s (“TAM”) Valuation Committee’s own assumptions in determining the fair value of investments. Factors considered in making this determination may include, but are not limited to, information obtained by contacting the sub-adviser, issuer, analysts, or the appropriate stock exchange (for exchange-traded securities), analysis of the issuer’s financial statements or other available documents and, if necessary, available information concerning other securities in similar circumstances.
The Funds’ Board of Trustees has delegated the valuation functions on a day-to-day basis to TAM, subject to board oversight. TAM has formed an internal valuation committee (the “Valuation Committee”) to monitor and implement the fair valuation policies and procedures as approved by the Board of Trustees. These policies and procedures are reviewed at least annually by the Board of Trustees. The Valuation Committee, among other tasks, monitors for when market quotations are not readily available or are unreliable and determines in good faith the fair value of portfolio investments. For instances which daily market quotes are not readily available, securities may be valued, pursuant to procedures adopted by the Board of Trustees, with reference to other instruments or indices. Depending on the relative significance of valuation inputs, these instruments may be classified in either Level 2 or Level 3 of the fair value hierarchy. The Valuation Committee may employ a market-based approach which may use related or comparable assets or liabilities, recent transactions, market multiples, book values, and other relevant information for the security to determine the fair value of the security. An income-based valuation approach may also be used in which the anticipated future cash flows of the security are discounted to calculate fair value. Discounts may also be applied due to the nature or duration of any restrictions on the disposition of the securities. When the Funds use fair value methods that rely on significant unobservable inputs to determine a security’s value, the Valuation Committee will choose the method that is believed to accurately reflect fair market value. These securities are categorized as Level 3 of the fair value hierarchy. The Valuation Committee reviews fair value measurements on a regular and ad hoc basis and may, as deemed appropriate, update the security valuations as well as the fair valuation guidelines.
| | | | |
| Transamerica Funds | | | | Annual Report 2012 |
| | Page 217 | | |
NOTES TO FINANCIAL STATEMENTS (continued)
At October 31, 2012
(all amounts in thousands)
NOTE 2. (continued)
The availability of observable inputs can vary from security to security and is affected by a wide variety of factors, including, but not limited to, the type of security, whether the security is new and not yet established in the marketplace, the liquidity of markets, and other characteristics particular to the security. To the extent that valuation is based on models or inputs that are less observable or unobservable in the market, the determination of fair value requires more judgment. Accordingly, the degree of judgment exercised in determining fair value is generally greatest for instruments categorized in Level 3. Due to the inherent uncertainty of valuation, TAM’s Valuation Committee’s determination of values may differ significantly from values that would have been realized had a ready market for investments existed and the differences could be material. The Valuation Committee employs various methods for calibrating these valuation approaches including a regular review of valuation methodologies, key inputs and assumptions, transactional back-testing and reviews of any market related activity.
The inputs used to measure fair value may fall into different Levels of the fair value hierarchy. In such cases, for disclosure purposes, the Level in the fair value hierarchy that is assigned to the fair value measurement of a security is determined based on the lowest Level input that is significant to the fair value measurement in its entirety.
For assets and liabilities for which significant unobservable inputs (Level 3) were used, a reconciliation of the beginning to the ending balances for reported market values that presents changes attributed to total realized and unrealized gains or losses, purchases and sales, and transfers in/out of the Level 3 category during the year. The Level 3 reconciliation, if any, is disclosed in the Valuation Summary of each Fund’s Schedule of Investments.
Fair value measurements: Descriptions of the valuation techniques applied to the Funds’ major categories of assets and liabilities measured at fair value on a recurring basis are as follows:
Investment company securities: Investment company securities are valued at the net asset value of the underlying fund. These securities are actively traded and no valuation adjustments are applied. Exchange Traded Funds are stated at the last reported sale price or closing price on the day of valuation taken from the primary exchange where the security is principally traded. They are categorized in Level 1 of the fair value hierarchy.
Equity securities (common and preferred stocks): Securities are stated at the last reported sales price or closing price on the day of valuation taken from the primary exchange where the security is principally traded. To the extent these securities are actively traded and valuation adjustments are not applied, they are categorized in Level 1 of the fair value hierarchy.
Foreign securities, in which the primary trading market closes at the same time or after the NYSE, are valued based on quotations from the primary market in which they are traded and are categorized in Level 1. Because many foreign securities markets and exchanges close prior to the close of the NYSE, closing prices for foreign securities in those markets or on those exchanges do not reflect the events that occur after that close. Certain foreign securities may be fair valued using a pricing service that considers the correlation of the trading patterns of the foreign security to the intraday trading in the U.S. markets for investments such as American Depositary Receipts, financial futures, Exchange Traded Funds, and the movement of the certain indices of securities based on a statistical analysis of their historical relationship; such valuations generally are categorized in Level 2.
Preferred stock, repurchase agreements, and other equities traded on inactive markets or valued by reference to similar instruments are also generally categorized in Level 2 or Level 3 if inputs are unobservable.
Securities lending collateral: Securities lending collateral is invested in a money market fund which is valued at the net asset value of the underlying securities and no valuation adjustments are applied. It is categorized in Level 1 of the fair value hierarchy.
Corporate bonds: The fair value of corporate bonds is estimated using various techniques, which consider recently executed transactions in securities of the issuer or comparable issuers, market price quotations (where observable), bond spreads, fundamental data relating to the issuer, and credit default swap spreads adjusted for any basis difference between cash and derivative instruments. While most corporate bonds are categorized in Level 2 of the fair value hierarchy, in instances where lower relative weight is placed on transaction prices, quotations, or similar observable inputs, they are categorized in Level 3.
Asset backed securities: The fair value of asset backed securities is estimated based on models that consider the estimated cash flows of each tranche of the entity, establish a benchmark yield, and develop an estimated tranche specific spread to the benchmark yield based on the unique attributes of the tranche. To the extent the inputs are observable and timely, the values would generally be categorized in Level 2 of the fair value hierarchy; otherwise they would be categorized as Level 3.
Short-term notes: Short-term notes are valued using amortized cost, which approximates fair value. To the extent the inputs are observable and timely, the values would be generally categorized in Level 2 of the fair value hierarchy; otherwise they would be categorized in Level 3.
Government securities: Government securities are normally valued using a model that incorporates market observable data such as reported sales of similar securities, broker quotes, yields, bids, offers, and reference data. Certain securities are valued by principally using dealer quotations. Government securities generally are categorized in Level 2 of the fair value hierarchy or Level 3 if inputs are unobservable.
| | | | |
| Transamerica Funds | | | | Annual Report 2012 |
| | Page 218 | | |
NOTES TO FINANCIAL STATEMENTS (continued)
At October 31, 2012
(all amounts in thousands)
NOTE 2. (continued)
U.S. government agency securities: U.S. government agency securities are comprised of two main categories consisting of agency issued debt and mortgage pass-throughs. Generally, agency issued debt securities are valued in a manner similar to U.S. government securities. Mortgage pass-throughs include to be announced (“TBA”) securities and mortgage pass-through certificates. Generally, TBA securities and mortgage pass-throughs are valued using dealer quotations. Depending on market activity levels and whether quotations or other observable data are used, these securities are typically categorized in Level 2 of the fair value hierarchy; otherwise they would be categorized in Level 3.
Restricted securities (equity and debt): The Funds may invest in unregulated or otherwise restricted securities. Restricted securities for which quotations are not readily available are valued at fair value as determined in good faith by TAM’s Valuation Committee under the supervision of the Funds’ Board of Trustees. Restricted securities issued by publicly traded companies are generally valued at a discount to similar publicly traded securities. Restricted securities issued by nonpublic entities may be valued by reference to comparable public entities and/or fundamental data relating to the issuer. Depending on the relative significance of observable valuation inputs, these instruments may be classified in either Level 2 or Level 3 of the fair value hierarchy.
Derivative instruments: Listed derivatives that are actively traded are valued based on quoted prices from the exchange and are categorized in Level 1 of the fair value hierarchy. Over the counter (“OTC”) derivative contracts include forward, swap, swaption, and option contracts related to interest rates, foreign currencies, credit standing of reference entities, equity prices, or commodity prices. Depending on the product and the terms of the transaction, the fair value of the OTC derivative products are modeled taking into account the counterparties’ creditworthiness and using a series of techniques, including simulation models. Many pricing models do not entail material subjectivity because the methodologies employed do not necessitate significant judgments and the pricing inputs are observed from actively quoted markets, as is the case of interest rate swap and option contracts. A substantial majority of OTC derivative products valued by the Funds using pricing models fall into this category and are categorized within Level 2 of the fair value hierarchy or Level 3 if inputs are unobservable.
The hierarchy classification of inputs used to value the Funds’ investments, at October 31, 2012, is disclosed in the Valuation Summary of each Fund’s Schedule of Investments.
NOTE 3. RELATED PARTY TRANSACTIONS
TAM, the Funds’ investment adviser, is directly owned by Western Reserve Life Assurance Co. of Ohio and AUSA Holding Company (“AUSA”), both of which are indirect, wholly owned subsidiaries of AEGON NV. AUSA is wholly owned by AEGON USA, LLC (“AEGON USA”), a financial services holding company whose primary emphasis is on life and health insurance, and annuity and investment products. AEGON USA is owned by AEGON US Holding Corporation, which is owned by Transamerica Corporation (DE). Transamerica Corporation (DE) is owned by The AEGON Trust, which is owned by AEGON International B.V., which is owned by AEGON NV, a Netherlands corporation, and a publicly traded international insurance group.
Transamerica Fund Services, Inc. (“TFS”) is the Funds’ administrator and transfer agent. Transamerica Capital, Inc. (“TCI”) is the Funds’ distributor/principal underwriter. TAM, TFS, and TCI are affiliates of AEGON NV.
Certain officers and trustees of the Funds are also officers and/or trustees of TAM, TFS, and TCI. No interested trustee receives compensation from the Funds.
The following schedule reflects the percentage of each Fund’s assets owned by affiliated investment companies at October 31, 2012:
| | | | | | | | |
Transamerica Arbitrage Strategy | | Market
Value | | | % of Net
Assets | |
Transamerica Asset Allocation-Conservative Portfolio | | $ | 19,669 | | | | 16.91 | % |
Transamerica Asset Allocation-Growth Portfolio | | | 2,681 | | | | 2.31 | |
Transamerica Asset Allocation-Moderate Portfolio | | | 33,893 | | | | 29.14 | |
Transamerica Asset Allocation-Moderate Growth Portfolio | | | 27,087 | | | | 23.29 | |
Transamerica Multi-Manager Alternative Strategies Portfolio | | | 32,940 | | | | 28.32 | |
| | | | | | | | |
Total | | $ | 116,270 | | | | 99.97 | % |
| | | | | | | | |
| | |
Transamerica Bond | | Market
Value | | | % of Net
Assets | |
Transamerica Asset Allocation-Conservative Portfolio | | $ | 72,174 | | | | 9.79 | % |
| | | | | | | | |
Transamerica Bond (continued) | | Market
Value | | | % of Net
Assets | |
Transamerica Asset Allocation- Moderate Portfolio | | $ | 94,162 | | | | 12.78 | % |
Transamerica Asset Allocation- Moderate Growth Portfolio | | | 56,553 | | | | 7.67 | |
Transamerica Multi-Manager Alternative Strategies Portfolio | | | 63,564 | | | | 8.62 | |
Transamerica Asset Allocation- Conservative VP | | | 43,140 | | | | 5.85 | |
Transamerica Asset Allocation-Growth VP | | | 24,980 | | | | 3.39 | |
Transamerica Asset Allocation- Moderate Growth VP | | | 101,490 | | | | 13.77 | |
Transamerica Asset Allocation- Moderate VP | | | 180,324 | | | | 24.47 | |
Transamerica BlackRock Tactical Allocation VP | | | 63,495 | | | | 8.61 | |
| | | | |
| Transamerica Funds | | | | Annual Report 2012 |
| | Page 219 | | |
NOTES TO FINANCIAL STATEMENTS (continued)
At October 31, 2012
(all amounts in thousands)
NOTE 3. (continued)
| | | | | | | | |
Transamerica Bond (continued) | | Market
Value | | | % of Net
Assets | |
Transamerica International Moderate Growth VP | | $ | 21,369 | | | | 2.90 | % |
Transamerica Madison Balanced Allocation VP | | | 5,038 | | | | 0.69 | |
Transamerica Madison Conservative Allocation VP | | | 5,688 | | | | 0.77 | |
| | | | | | | | |
Total | | $ | 731,977 | | | | 99.31 | % |
| | | | | | | | |
| | |
Transamerica Core Bond | | Market
Value | | | % of Net
Assets | |
Transamerica Asset Allocation-Conservative Portfolio | | $ | 216,573 | | | | 11.52 | % |
Transamerica Asset Allocation-Moderate Portfolio | | | 193,681 | | | | 10.31 | |
Transamerica Asset Allocation-Moderate Growth Portfolio | | | 195,512 | | | | 10.40 | |
Transamerica Asset Allocation-Conservative VP | | | 239,887 | | | | 12.77 | |
Transamerica Asset Allocation-Moderate Growth VP | | | 391,375 | | | | 20.83 | |
Transamerica Asset Allocation-Moderate VP | | | 562,461 | | | | 29.93 | |
Transamerica International Moderate Growth VP | | | 47,152 | | | | 2.51 | |
| | | | | | | | |
Total | | $ | 1,846,641 | | | | 98.27 | % |
| | | | | | | | |
| | |
Transamerica Developing Markets Equity | | Market
Value | | | % of Net
Assets | |
Transamerica Asset Allocation-Conservative Portfolio | | $ | 6,486 | | | | 1.90 | % |
Transamerica Asset Allocation-Growth Portfolio | | | 50,446 | | | | 14.78 | |
Transamerica Asset Allocation-Moderate Portfolio | | | 18,348 | | | | 5.38 | |
Transamerica Asset Allocation-Moderate Growth Portfolio | | | 52,192 | | | | 15.29 | |
Transamerica Multi-Manager Alternative Strategies Portfolio | | | 18,088 | | | | 5.30 | |
Transamerica Multi-Manager International Portfolio | | | 26,333 | | | | 7.71 | |
Transamerica Asset Allocation-Conservative VP | | | 12,849 | | | | 3.76 | |
Transamerica Asset Allocation-Growth VP | | | 20,867 | | | | 6.11 | |
Transamerica Asset Allocation-Moderate Growth VP | | | 85,523 | | | | 25.05 | |
Transamerica Asset Allocation-Moderate VP | | | 38,764 | | | | 11.36 | |
Transamerica International Moderate Growth VP | | | 5,585 | | | | 1.64 | |
| | | | | | | | |
Total | | $ | 335,481 | | | | 98.28 | % |
| | | | | | | | |
| | |
Transamerica Global Macro | | Market
Value | | | % of Net
Assets | |
Transamerica Asset Allocation-Conservative Portfolio | | $ | 9,700 | | | | 8.64 | % |
Transamerica Asset Allocation-Moderate Portfolio | | | 13,008 | | | | 11.59 | |
Transamerica Multi-Manager Alternative Strategies Portfolio | | | 75,419 | | | | 67.18 | |
Transamerica Multi-Manager International Portfolio | | | 3,725 | | | | 3.32 | |
| | | | | | | | |
Transamerica Global Macro (continued) | | Market
Value | | | % of Net
Assets | |
Transamerica Asset Allocation-Growth VP | | $ | 10,335 | | | | 9.21 | % |
| | | | | | | | |
Total | | $ | 112,187 | | | | 99.94 | % |
| | | | | | | | |
| | |
Transamerica Global Real Estate Securities | | Market
Value | | | % of Net
Assets | |
Transamerica Asset Allocation- Conservative Portfolio | | $ | 1,017 | | | | 0.63 | % |
Transamerica Asset Allocation-Growth Portfolio | | | 37,288 | | | | 23.26 | |
Transamerica Asset Allocation-Moderate Portfolio | | | 14,894 | | | | 9.29 | |
Transamerica Asset Allocation-Moderate Growth Portfolio | | | 53,435 | | | | 33.33 | |
Transamerica Multi-Manager Alternative Strategies Portfolio | | | 34,634 | | | | 21.60 | |
Transamerica Multi-Manager International Portfolio | | | 8,440 | | | | 5.26 | |
| | | | | | | | |
Total | | $ | 149,708 | | | | 93.37 | % |
| | | | | | | | |
| | |
Transamerica Growth | | Market
Value | | | % of Net
Assets | |
Transamerica Asset Allocation-Conservative Portfolio | | $ | 43,765 | | | | 7.95 | % |
Transamerica Asset Allocation-Growth Portfolio | | | 143,317 | | | | 26.05 | |
Transamerica Asset Allocation-Moderate Portfolio | | | 136,667 | | | | 24.84 | |
Transamerica Asset Allocation-Moderate Growth Portfolio | | | 212,585 | | | | 38.64 | |
| | | | | | | | |
Total | | $ | 536,334 | | | | 97.48 | % |
| | | | | | | | |
| | |
Transamerica International | | Market
Value | | | % of Net
Assets | |
Transamerica Asset Allocation-Conservative Portfolio | | $ | 7,053 | | | | 2.30 | % |
Transamerica Asset Allocation-Growth Portfolio | | | 35,017 | | | | 11.40 | |
Transamerica Asset Allocation-Moderate Portfolio | | | 20,931 | | | | 6.81 | |
Transamerica Asset Allocation-Moderate Growth Portfolio | | | 61,601 | | | | 20.06 | |
Transamerica Multi-Manager International Portfolio | | | 40,472 | | | | 13.18 | |
Transamerica Asset Allocation-Growth VP | | | 20,918 | | | | 6.81 | |
Transamerica Asset Allocation-Moderate Growth VP | | | 42,997 | | | | 14.00 | |
Transamerica Asset Allocation-Moderate VP | | | 23,373 | | | | 7.61 | |
Transamerica International Moderate Growth VP | | | 51,759 | | | | 16.85 | |
| | | | | | | | |
Total | | $ | 304,121 | | | | 99.02 | % |
| | | | | | | | |
| | |
Transamerica International Equity
Opportunities | | Market
Value | | | % of Net
Assets | |
Transamerica Asset Allocation-Conservative Portfolio | | $ | 5,755 | | | | 3.29 | % |
Transamerica Asset Allocation-Growth Portfolio | | | 9,150 | | | | 5.23 | |
Transamerica Asset Allocation-Moderate Portfolio | | | 15,070 | | | | 8.62 | |
| | | | |
| Transamerica Funds | | | | Annual Report 2012 |
| | Page 220 | | |
NOTES TO FINANCIAL STATEMENTS (continued)
At October 31, 2012
(all amounts in thousands)
NOTE 3. (continued)
| | | | | | | | |
Transamerica International Equity
Opportunities (continued) | | Market
Value | | | % of Net
Assets | |
Transamerica Asset Allocation- Moderate Growth Portfolio | | $ | 14,778 | | | | 8.45 | % |
Transamerica Multi-Manager International Portfolio | | | 33,735 | | | | 19.29 | |
Transamerica Asset Allocation- Moderate Growth VP | | | 5,319 | | | | 3.04 | |
Transamerica Asset Allocation- Moderate VP | | | 25,329 | | | | 14.48 | |
Transamerica International Moderate Growth VP | | | 62,572 | | | | 35.78 | |
| | | | | | | | |
Total | | $ | 171,708 | | | | 98.18 | % |
| | | | | | | | |
| | |
Transamerica International Small Cap | | Market
Value | | | % of Net
Assets | |
Transamerica Asset Allocation- Conservative Portfolio | | $ | 4,942 | | | | 2.04 | % |
Transamerica Asset Allocation-Growth Portfolio | | | 17,507 | | | | 7.24 | |
Transamerica Asset Allocation- Moderate Portfolio | | | 13,516 | | | | 5.59 | |
Transamerica Asset Allocation- Moderate Growth Portfolio | | | 25,989 | | | | 10.74 | |
Transamerica Multi-Manager Alternative Strategies Portfolio | | | 27,876 | | | | 11.52 | % |
Transamerica Multi-Manager International Portfolio | | | 11,590 | | | | 4.79 | |
Transamerica Asset Allocation-Growth VP | | | 15,469 | | | | 6.39 | |
Transamerica Asset Allocation- Moderate Growth VP | | | 43,129 | | | | 17.83 | |
Transamerica Asset Allocation- Moderate VP | | | 38,213 | | | | 15.80 | |
Transamerica International Moderate Growth VP | | | 39,999 | | | | 16.53 | |
| | | | | | | | |
Total | | $ | 238,230 | | | | 98.47 | % |
| | | | | | | | |
| | |
Transamerica International Value Opportunities | | Market
Value | | | % of Net
Assets | |
Transamerica Asset Allocation- Conservative Portfolio | | $ | 6,304 | | | | 2.86 | % |
Transamerica Asset Allocation-Growth Portfolio | | | 21,008 | | | | 9.54 | |
Transamerica Asset Allocation- Moderate Portfolio | | | 15,854 | | | | 7.20 | |
Transamerica Asset Allocation- Moderate Growth Portfolio | | | 34,213 | | | | 15.54 | |
Transamerica Multi-Manager International Portfolio | | | 39,257 | | | | 17.83 | |
Transamerica Asset Allocation-Growth VP | | | 8,667 | | | | 3.94 | |
Transamerica Asset Allocation- Moderate Growth VP | | | 41,401 | | | | 18.80 | |
Transamerica Asset Allocation- Moderate VP | | | 22,844 | | | | 10.37 | |
Transamerica International Moderate Growth VP | | | 26,224 | | | | 11.91 | |
Transamerica Madison Balanced Allocation VP | | | 1,054 | | | | 0.48 | |
| | | | | | | | |
Total | | $ | 216,826 | | | | 98.47 | % |
| | | | | | | | |
| | | | | | | | |
Transamerica Large Company | | Market
Value | | | % of Net
Assets | |
Transamerica Asset Allocation- Conservative Portfolio | | $ | 37,985 | | | | 7.12 | % |
Transamerica Asset Allocation-Growth Portfolio | | | 144,188 | | | | 27.05 | |
Transamerica Asset Allocation- Moderate Portfolio | | | 111,566 | | | | 20.93 | |
Transamerica Asset Allocation- Moderate Growth Portfolio | | | 225,362 | | | | 42.28 | |
| | | | | | | | |
Total | | $ | 519,101 | | | | 97.38 | % |
| | | | | | | | |
| | |
Transamerica Long/Short Strategy | | Market
Value | | | % of Net
Assets | |
Transamerica Asset Allocation- Conservative Portfolio | | $ | 9,877 | | | | 10.83 | % |
Transamerica Asset Allocation- Moderate Portfolio | | | 14,129 | | | | 15.50 | |
Transamerica Multi-Manager Alternative Strategies Portfolio | | | 67,074 | | | | 73.55 | |
| | | | | | | | |
Total | | $ | 91,080 | | | | 99.88 | % |
| | | | | | | | |
| | |
Transamerica Mid Cap Value | | Market
Value | | | % of Net
Assets | |
Transamerica Asset Allocation- Conservative Portfolio | | $ | 8,618 | | | | 4.14 | % |
Transamerica Asset Allocation-Growth Portfolio | | | 60,006 | | | | 28.79 | |
Transamerica Asset Allocation- Moderate Portfolio | | | 42,491 | | | | 20.38 | |
Transamerica Asset Allocation- Moderate Growth Portfolio | | | 93,853 | | | | 45.02 | |
| | | | | | | | |
Total | | $ | 204,968 | | | | 98.33 | % |
| | | | | | | | |
| | |
Transamerica Real Return TIPS | | Market
Value | | | % of Net
Assets | |
Transamerica Asset Allocation- Conservative Portfolio | | $ | 71,131 | | | | 5.29 | % |
Transamerica Asset Allocation- Moderate Portfolio | | | 78,409 | | | | 5.84 | |
Transamerica Asset Allocation- Moderate Growth Portfolio | | | 83,447 | | | | 6.21 | |
Transamerica Multi-Manager Alternative Strategies Portfolio | | | 20,514 | | | | 1.53 | |
Transamerica Asset Allocation- Conservative VP | | | 115,328 | | | | 8.58 | |
Transamerica Asset Allocation-Growth VP | | | 4,770 | | | | 0.35 | |
Transamerica Asset Allocation- Moderate Growth VP | | | 522,565 | | | | 38.89 | |
Transamerica Asset Allocation- Moderate VP | | | 425,321 | | | | 31.66 | |
Transamerica International Moderate Growth VP | | | 8,025 | | | | 0.60 | |
| | | | | | | | |
Total | | $ | 1,329,510 | | | | 98.95 | % |
| | | | | | | | |
| | |
Transamerica Select Equity | | Market
Value | | | % of Net
Assets | |
Transamerica Asset Allocation- Conservative Portfolio | | $ | 37,475 | | | | 3.12 | % |
Transamerica Asset Allocation-Growth Portfolio | | | 145,948 | | | | 12.16 | |
Transamerica Asset Allocation- Moderate Portfolio | | | 109,490 | | | | 9.12 | |
| | | | |
| Transamerica Funds | | | | Annual Report 2012 |
| | Page 221 | | |
NOTES TO FINANCIAL STATEMENTS (continued)
At October 31, 2012
(all amounts in thousands)
NOTE 3. (continued)
| | | | | | | | |
Transamerica Select Equity (continued) | | Market
Value | | | % of Net
Assets | |
Transamerica Asset Allocation- Moderate Growth Portfolio | | $ | 220,404 | | | | 18.37 | % |
Transamerica Asset Allocation- Conservative VP | | | 60,373 | | | | 5.03 | |
Transamerica Asset Allocation-Growth VP | | | 93,248 | | | | 7.77 | |
Transamerica Asset Allocation- Moderate Growth VP | | | 312,910 | | | | 26.07 | |
Transamerica Asset Allocation- Moderate VP | | | 176,748 | | | | 14.73 | |
Transamerica BlackRock Tactical Allocation VP | | | 30,311 | | | | 2.52 | |
| | | | | | | | |
Total | | $ | 1,186,907 | | | | 98.89 | % |
| | | | | | | | |
| | |
Transamerica Total Return | | Market
Value | | | % of Net
Assets | |
Transamerica Asset Allocation- Conservative Portfolio | | $ | 219,008 | | | | 27.25 | % |
Transamerica Asset Allocation- Moderate Portfolio | | | 286,308 | | | | 35.62 | |
Transamerica Asset Allocation- Moderate Growth Portfolio | | | 265,962 | | | | 33.09 | |
| | | | | | | | |
Total | | $ | 771,278 | | | | 95.96 | % |
| | | | | | | | |
| | |
Transamerica Value | | Market
Value | | | % of Net
Assets | |
Transamerica Asset Allocation- Conservative Portfolio | | $ | 18,963 | | | | 6.99 | % |
Transamerica Asset Allocation-Growth Portfolio | | | 45,114 | | | | 16.61 | |
Transamerica Asset Allocation- Moderate Portfolio | | | 36,456 | | | | 13.43 | |
Transamerica Asset Allocation- Moderate Growth Portfolio | | | 75,903 | | | | 27.95 | |
Transamerica Asset Allocation-Growth VP | | | 15,868 | | | | 5.84 | |
Transamerica Asset Allocation- Moderate Growth VP | | | 46,795 | | | | 17.23 | |
Transamerica Asset Allocation- Moderate VP | | | 29,987 | | | | 11.04 | |
| | | | | | | | |
Total | | $ | 269,086 | | | | 99.09 | % |
| | | | | | | | |
| | | | | | | | |
Transamerica Commodity Strategy | | Market
Value | | | % of Net
Assets | |
Transamerica Asset Allocation- Conservative Portfolio | | $ | 11,634 | | | | 7.73 | % |
Transamerica Asset Allocation-Growth Portfolio | | | 19,973 | | | | 13.27 | |
Transamerica Asset Allocation- Moderate Portfolio | | | 29,530 | | | | 19.62 | |
Transamerica Asset Allocation- Moderate Growth Portfolio | | | 51,402 | | | | 34.16 | |
Transamerica Multi-Manager Alternative Strategies Portfolio | | | 37,063 | | | | 24.63 | |
| | | | | | | | |
Total | | $ | 149,602 | | | | 99.41 | % |
| | | | | | | | |
| | |
Transamerica Global Allocation | | Market
Value | | | % of Net
Assets | |
Transamerica Asset Allocation- Conservative Portfolio | | $ | 21,268 | | | | 6.76 | % |
Transamerica Asset Allocation-Growth Portfolio | | | 10,941 | | | | 3.47 | |
Transamerica Asset Allocation- Moderate Portfolio | | | 41,284 | | | | 13.12 | |
Transamerica Asset Allocation- Moderate Growth Portfolio | | | 67,214 | | | | 21.36 | |
Transamerica Multi-Manager International Portfolio | | | 10,955 | | | | 3.48 | |
Transamerica Asset Allocation- Moderate Growth VP | | | 69,475 | | | | 22.07 | |
Transamerica BlackRock Tactical Allocation VP | | | 54,569 | | | | 17.34 | |
Transamerica Asset Allocation- Moderate VP | | | 36,219 | | | | 11.51 | |
| | | | | | | | |
Total | | $ | 311,925 | | | | 99.11 | % |
| | | | | | | | |
| | |
Transamerica Managed Futures Strategy | | Market
Value | | | % of Net
Assets | |
Transamerica Asset Allocation- Conservative Portfolio | | $ | 22,035 | | | | 7.29 | % |
Transamerica Asset Allocation-Growth Portfolio | | | 40,394 | | | | 13.37 | |
Transamerica Asset Allocation- Moderate Portfolio | | | 40,270 | | | | 13.33 | |
Transamerica Asset Allocation- Moderate Growth Portfolio | | | 82,705 | | | | 27.38 | |
Transamerica Multi-Manager Alternative Strategies Portfolio | | | 31,875 | | | | 10.55 | |
Transamerica Asset Allocation-Growth VP | | | 83,508 | | | | 27.64 | |
| | | | | | | | |
Total | | $ | 300,787 | | | | 99.56 | % |
| | | | | | | | |
| | | | |
| Transamerica Funds | | | | Annual Report 2012 |
| | Page 222 | | |
NOTES TO FINANCIAL STATEMENTS (continued)
At October 31, 2012
(all amounts in thousands)
NOTE 3. (continued)
Investment advisory fees: The Funds pay management fees to TAM based on average daily net assets (“ANA”) at the following breakpoints and/or rates:
| | | | |
Fund Name/Breakpoint | | Rate | |
Transamerica Arbitrage Strategy | | | | |
First $50 million | | | 1.05 | % |
Over $50 million | | | 1.00 | |
Transamerica Bond | | | | |
First $200 million | | | 0.675 | % |
Over $200 million up to $750 million | | | 0.625 | |
Over $750 million | | | 0.575 | |
Transamerica Core Bond | | | | |
First $750 million | | | 0.45 | % |
Over $750 million up to $1 billion | | | 0.40 | |
Over $1 billion | | | 0.375 | |
Transamerica Developing Markets Equity | | | | |
First $50 million | | | 1.20 | % |
Over $50 million up to $200 million | | | 1.15 | |
Over $200 million up to $500 million | | | 1.10 | |
Over $500 million | | | 1.05 | |
Transamerica Global Macro | | | | |
First $300 million | | | 1.25 | % |
Over $300 million | | | 1.20 | |
Transamerica Global Real Estate Securities | | | | |
First $250 million | | | 0.80 | % |
Over $250 million up to $500 million | | | 0.775 | |
Over $500 million up to $1 billion | | | 0.70 | |
Over $1 billion | | | 0.65 | |
Transamerica Growth | | | | |
First $250 million | | | 0.80 | % |
Over $250 million up to $500 million | | | 0.775 | |
Over $500 million up to $1 billion | | | 0.70 | |
Over $1 billion up to $1.5 billion | | | 0.675 | |
Over $1.5 billion | | | 0.65 | |
Transamerica International | | | | |
First $100 million | | | 1.00 | % |
Over $100 million | | | 0.95 | |
Transamerica International Equity Opportunities | |
First $250 million | | | 0.90 | % |
Over $250 million up to $500 million | | | 0.875 | |
Over $500 million up to $1 billion | | | 0.85 | |
Over $1 billion | | | 0.80 | |
Transamerica International Small Cap | | | | |
First $300 million | | | 1.07 | % |
Over $300 million | | | 1.00 | |
Transamerica International Value Opportunities | |
First $100 million | | | 1.10 | % |
Over $100 million up to $300 million | | | 1.00 | |
Over $300 million | | | 0.95 | |
| | | | |
Fund Name/Breakpoint | | Rate | |
Transamerica Large Company | | | | |
First $250 million | | | 0.80 | % |
Over $250 million up to $750 million | | | 0.775 | |
Over $750 million up to $1 billion | | | 0.75 | |
Over $1 billion up to $2 billion | | | 0.65 | |
Over $2 billion | | | 0.625 | |
Transamerica Long/Short Strategy | | | | |
ANA | | | 1.30 | % |
Transamerica Mid Cap Value | | | | |
First $100 million | | | 0.85 | % |
Over $100 million | | | 0.80 | |
Transamerica Real Return TIPS | | | | |
First $250 million | | | 0.70 | % |
Over $250 million up to $750 million | | | 0.65 | |
Over $750 million up to $1 billion | | | 0.60 | |
Over $1 billion | | | 0.55 | |
Transamerica Select Equity | | | | |
First $200 million | | | 0.80 | % |
Over $200 million up to $500 million | | | 0.74 | |
Over $500 million up to $1 billion | | | 0.69 | |
Over $1 billion up to $1.5 billion | | | 0.67 | |
Over $1.5 billion | | | 0.62 | |
Transamerica Total Return | | | | |
First $250 million | | | 0.675 | % |
Over $250 million up to $750 million | | | 0.65 | |
Over $750 million | | | 0.60 | |
Transamerica Value | | | | |
ANA | | | 0.80 | % |
Transamerica Commodity Strategy | | | | |
First $200 million | | | 0.61 | % |
Over $200 million up to $1 billion | | | 0.59 | |
Over $1 billion | | | 0.56 | |
Transamerica Global Allocation | | | | |
First $100 million | | | 0.80 | % |
Over $100 million | | | 0.72 | |
Transamerica Managed Futures Strategy | | | | |
First $500 million | | | 1.10 | % |
Over $500 million | | | 1.05 | |
| | | | |
| Transamerica Funds | | | | Annual Report 2012 |
| | Page 223 | | |
NOTES TO FINANCIAL STATEMENTS (continued)
At October 31, 2012
(all amounts in thousands)
NOTE 3. (continued)
TAM has contractually agreed to waive fees and/or reimburse Fund expenses to the extent that the operating expenses excluding, as applicable, 12b-1 fees, acquired fund fees and expenses, interest, taxes, brokerage commissions, dividend and interest expenses on securities sold short, extraordinary expenses and other expenses not incurred in the ordinary course of the Fund’s business, exceed the following stated annual limit:
| | | | |
Fund Name | | Expense Limit | | Maximum Operating Expense
Limit Effective Through |
Transamerica Arbitrage Strategy | | 1.25% | | March 1, 2013 |
Transamerica Bond | | 0.88 | | March 1, 2013 |
Transamerica Core Bond | | 0.70 | | March 1, 2013 |
Transamerica Developing Markets Equity | | 1.45 | | March 1, 2013 |
Transamerica Global Macro | | 1.65 | | March 1, 2013 |
Transamerica International | | 1.25 | | March 1, 2013 |
Transamerica International Small Cap | | 1.27 | | March 1, 2013 |
Transamerica International Value Opportunities | | 1.35 | | March 1, 2013 |
Transamerica Large Company | | 1.00 | | March 1, 2013 |
Transamerica Long/Short Strategy | | 1.65 | | March 1, 2013 |
Transamerica Mid Cap Value | | 1.05 | | March 1, 2013 |
Transamerica Select Equity | | 0.90 | | March 1, 2013 |
Transamerica Value | | 1.00 | | March 1, 2013 |
Transamerica Commodity Strategy | | 1.00 | | March 1, 2013 |
Transamerica Global Allocation | | 1.00 | | March 1, 2013 |
Transamerica Managed Futures Strategy | | 1.45 | | March 1, 2013 |
Funds not listed in the above table did not have an expense limit.
TAM is entitled to reimbursement by the Funds of fees waived and/or expenses reduced during any of the previous 36 months if on any day or month the estimated annualized Fund operating expenses are less than the stated annual limit.
There were no amounts recaptured by TAM during the year ended October 31, 2012.
The following amounts were available for recapture by TAM as of October 31, 2012:
| | | | | | | | | | | | |
Fund Name | | Amount
Available | | | Year
Reimbursed | | | Available
Through | |
Transamerica Arbitrage Strategy | | $ | 61 | | | | 2011 | | | | 10/31/2013 | |
| | | 172 | | | | 2012 | | | | 10/31/2014 | |
Administrative services: The Funds have entered into an agreement with TFS for financial and legal fund administration services. Effective March 1, 2012, the Funds pay TFS an annual fee of 0.025% of ANA. Prior to March 1, 2012, the Funds paid TFS an annual fee of 0.02% of ANA. The Legal fees on the Statement of Operations are for fees paid to external legal counsel.
Transfer agent fees: Pursuant to a Transfer Agency Agreement, as amended, the Funds pay TFS a fee for providing transfer agent services. Fees paid for the year ended October 31, 2012 and the amounts due to TFS at year end are disclosed in the Statements of Operations and the Statements of Assets and Liabilities, respectively; or in the Consolidated Statements of Operations and Consolidated Statements of Assets and Liabilities, respectively.
Deferred compensation plan: Under a non-qualified deferred compensation plan effective January 1, 1996, as amended and restated (the “Deferred Compensation Plan”), available to the Trustees, compensation may be deferred that would otherwise be payable by the Trust to an Independent Trustee on a current basis for services rendered as Trustee. Deferred compensation amounts will accumulate based on the value of Class A (or comparable) shares of a series of Transamerica Funds (without imposition of sales charge), or investment options under Transamerica Partners Institutional Funds and Transamerica Institutional Asset Allocation Funds, as elected by the Trustee.
Brokerage commissions: There were no brokerage commissions incurred on security transactions placed with affiliates of the adviser or sub-advisers for the year ended October 31, 2012.
| | | | |
| Transamerica Funds | | | | Annual Report 2012 |
| | Page 224 | | |
NOTES TO FINANCIAL STATEMENTS (continued)
At October 31, 2012
(all amounts in thousands)
NOTE 4. INVESTMENT TRANSACTIONS
The cost of securities purchased and proceeds from securities sold (excluding short-term securities) for the year ended October 31, 2012 were as follows:
| | | | | | | | | | | | | | | | |
| | | Purchases of securities: | | | Proceeds from maturities
and sales of securities: | |
Fund Name | | Long-term | | | U.S.
Government | | | Long-term | | | U.S.
Government | |
Transamerica Arbitrage Strategy | | $ | 761,635 | | | $ | — | | | $ | 776,488 | | | $ | — | |
Transamerica Bond | | | 270,951 | | | | 89,204 | | | | 126,685 | | | | 15,891 | |
Transamerica Core Bond | | | 363,900 | | | | 107,784 | | | | 380,679 | | | | 356,803 | |
Transamerica Developing Markets Equity | | | 150,199 | | | | — | | | | 334,199 | | | | — | |
Transamerica Global Macro | | | — | | | | — | | | | — | | | | — | |
Transamerica Global Real Estate Securities | | | 82,307 | | | | — | | | | 86,205 | | | | — | |
Transamerica Growth | | | 253,070 | | | | — | | | | 368,612 | | | | — | |
Transamerica International | | | 162,689 | | | | — | | | | 222,840 | | | | — | |
Transamerica International Equity Opportunities | | | 78,466 | | | | — | | | | 265,140 | | | | — | |
Transamerica International Small Cap | | | 85,092 | | | | — | | | | 181,520 | | | | — | |
Transamerica International Value Opportunities | | | 64,412 | | | | — | | | | 292,057 | | | | — | |
Transamerica Large Company | | | 539,536 | | | | — | | | | 627,828 | | | | — | |
Transamerica Long/Short Strategy | | | 174,111 | | | | — | | | | 180,912 | | | | — | |
Transamerica Mid Cap Value | | | 87,658 | | | | — | | | | 69,064 | | | | — | |
Transamerica Real Return TIPS | | | 153,181 | | | | 2,078,723 | | | | 214,153 | | | | 1,780,187 | |
Transamerica Select Equity | | | 888,512 | | | | — | | | | 736,808 | | | | — | |
Transamerica Total Return | | | 113,915 | | | | 639,545 | | | | 197,885 | | | | 611,845 | |
Transamerica Value | | | 42,254 | | | | — | | | | 106,061 | | | | — | |
Transamerica Commodity Strategy | | | — | | | | — | | | | — | | | | — | |
Transamerica Global Allocation | | | 109,891 | | | | 20,706 | | | | 224,820 | | | | 37,812 | |
Transamerica Managed Futures Strategy | | | — | | | | — | | | | — | | | | — | |
NOTE 5. DERIVATIVE FINANCIAL INSTRUMENTS
Transamerica Arbitrage Strategy:
The Fund is subject to various risks in the normal course of pursuing its investment objective. The volume of swap contracts increased throughout the year from zero to 11 contracts. The volume of forward foreign currency contracts and purchased options/swaptions contracts held throughout the year averaged 147 and 13 contracts, respectively, with overall increases from 129 and 8 contracts, respectively, to 131 and 11 contracts, respectively The volume of written options/swaptions contracts held during the year averaged 59 contracts, beginning and ending the year with an overall decrease from 48 to 32 contracts. The tables below highlight the types of risks and the derivative instruments used to mitigate the risks:
Fair Values of Derivative Instruments in the Statement of Assets and Liabilities as of October 31, 2012:
Derivatives not accounted for as hedging instruments
| | | | | | | | | | | | |
Location | | Foreign
exchange
contracts | | | Equity
Contracts | | | Total | |
Asset derivatives | | | | | | | | | | | | |
Purchased options, at value * | | $ | — | | | $ | 171 | | | $ | 171 | |
Unrealized appreciation on swap agreements | | | — | | | | 57 | | | | 57 | |
Unrealized appreciation on forward foreign currency contracts | | | 637 | | | | — | | | | 637 | |
Liability derivatives | | | | | | | | | | | | |
Written options, at value | | | — | | | | (161 | ) | | | (161 | ) |
Unrealized depreciation on swap agreements | | | — | | | | (26 | ) | | | (26 | ) |
Unrealized depreciation on forward foreign currency contracts | | | (144 | ) | | | — | | | | (144 | ) |
| | | | | | | | | | | | |
Total | | $ | 493 | | | $ | 41 | | | $ | 534 | |
| | | | | | | | | | | | |
| * | Included within Investment securities, at value. |
| | | | |
| Transamerica Funds | | | | Annual Report 2012 |
| | Page 225 | | |
NOTES TO FINANCIAL STATEMENTS (continued)
At October 31, 2012
(all amounts in thousands)
NOTE 5. (continued)
Transamerica Arbitrage Strategy (continued):
Effect of Derivative Instruments in the Statement of Operations for the year ended October 31, 2012:
Derivatives not accounted for as hedging instruments
| | | | | | | | | | | | |
Location | | Foreign
exchange
contracts | | | Equity
Contracts | | | Total | |
Net Realized Gain (Loss) on derivatives recognized in income | | | | | | | | | | | | |
Net realized gain (loss) on purchased options ^ | | $ | — | | | $ | (788 | ) | | $ | (788 | ) |
Net realized gain (loss) on written options and swaptions | | | — | | | | 2,118 | | | | 2,118 | |
Net realized gain (loss) on swap agreements | | | — | | | | (1,585 | ) | | | (1,585 | ) |
Net realized gain (loss) on forward foreign currency contracts ~ | | | (1,861 | ) | | | — | | | | (1,861 | ) |
Net change in Unrealized Appreciation (Depreciation) on derivatives recognized in income | | | | | | | | | | | | |
Net change in unrealized appreciation (depreciation) on purchased options Y | | | — | | | | (16 | ) | | | (16 | ) |
Net change in unrealized appreciation (depreciation) on written options and swaptions | | | — | | | | 95 | | | | 95 | |
Net change in unrealized appreciation (depreciation) on swap agreements | | | — | | | | 31 | | | | 31 | |
Net change in unrealized appreciation (depreciation) on forward foreign currency transactions ŧ | | | 1,307 | | | | — | | | | 1,307 | |
| | | | | | | | | | | | |
Total | | $ | (554 | ) | | $ | (145 | ) | | $ | (699 | ) |
| | | | | | | | | | | | |
| ^ | Included within net realized gain (loss) on transactions from Investment securities. |
| ~ | Included within net realized gain (loss) on transactions from foreign currency transactions. |
| Y | Included within net change in unrealized appreciation (depreciation) on Investment securities. |
| ŧ | Included within net change in unrealized appreciation (depreciation) on translation of assets and liabilities denominated in foreign currencies. |
For non-exchange traded derivatives (swaps and forward foreign currency contracts), under standard derivatives agreements, the Fund may be required to post collateral on derivatives if the Fund is in a net liability position with the counterparty exceeding certain amounts. Additionally, counterparties may immediately terminate derivatives contracts if the Fund fails to maintain sufficient asset coverage for its contracts or its net assets decline by stated percentages.
Transamerica Global Macro:
The Fund is subject to various risks in the normal course of pursuing its investment objective. The volume of futures contracts held at the end of the year is indicative of the volume held throughout the year. The volume of forward foreign currency contracts and purchased options held averaged 89 and 13 contracts, respectively, beginning at 114 and 14 and ending at 67 and 22, respectively. The volume of written options held throughout the year increased, beginning at 8 contracts, and ending at 25 contracts. The tables below highlight the types of risks and the derivative instruments used to mitigate the risks:
Fair Values of Derivative Instruments in the Statement of Assets and Liabilities as of October 31, 2012:
Derivatives not accounted for as hedging instruments
| | | | | | | | | | | | | | | | |
Location | | Interest rate
contracts | | | Foreign
exchange
contracts | | | Equity
contracts | | | Total | |
Asset derivatives | | | | | | | | | | | | | | | | |
Purchased options, at value * | | $ | — | | | $ | — | | | $ | 741 | | | $ | 741 | |
Unrealized appreciation on futures contracts ** | | | 128 | | | | — | | | | 489 | | | | 617 | |
Unrealized appreciation on forward foreign currency contracts | | | — | | | | 1,817 | | | | — | | | | 1,817 | |
Liability derivatives | | | | | | | | | | | | | | | | |
Unrealized depreciation on futures contracts ** | | | (604 | ) | | | — | | | | (300 | ) | | | (904 | ) |
Written options, at value | | | — | | | | — | | | | (874 | ) | | | (874 | ) |
Unrealized depreciation on forward foreign currency contracts | | | — | | | | (1,539 | ) | | | — | | | | (1,539 | ) |
| | | | | | | | | | | | | | | | |
Total | | $ | (476 | ) | | $ | 278 | | | $ | 56 | | | $ | (142 | ) |
| | | | | | | | | | | | | | | | |
| * | Included within Investment securities, at value. |
| ** | Includes cumulative appreciation/depreciation of futures contracts as reported in the Schedule of Investments. Only current day’s variation margin is reported within the Statement of Assets and Liabilities. |
| | | | |
| Transamerica Funds | | | | Annual Report 2012 |
| | Page 226 | | |
NOTES TO FINANCIAL STATEMENTS (continued)
At October 31, 2012
(all amounts in thousands)
NOTE 5. (continued)
Transamerica Global Macro (continued):
Effect of Derivative Instruments in the Statement of Operations for the year ended October 31, 2012:
Derivatives not accounted for as hedging instruments
| | | | | | | | | | | | | | | | |
Location | | Interest rate
contracts | | | Foreign
exchange
contracts | | | Equity
contracts | | | Total | |
Net Realized Gain (Loss) on derivatives recognized in income | | | | | | | | | | | | | | | | |
Net realized gain (loss) on purchased options ^ | | $ | — | | | $ | — | | | $ | (5,762 | ) | | $ | (5,762 | ) |
Net realized gain (loss) on futures contracts | | | 159 | | | | — | | | | 3,069 | | | | 3,228 | |
Net realized gain (loss) on written options and swaptions | | | — | | | | — | | | | 2,718 | | | | 2,718 | |
Net realized gain (loss) on forward foreign currency contracts ~ | | | — | | | | 2,887 | | | | — | | | | 2,887 | |
Net change in Unrealized Appreciation (Depreciation) on derivatives recognized in income | | | | | | | | | | | | | | | | |
Net change in unrealized appreciation (depreciation) on purchased options Y | | | — | | | | — | | | | 4 | | | | 4 | |
Net change in unrealized appreciation (depreciation) on futures contracts | | | (1,922 | ) | | | — | | | | 24 | | | | (1,898 | ) |
Net change in unrealized appreciation (depreciation) on written options and swaptions | | | — | | | | — | | | | 506 | | | | 506 | |
Net change in unrealized appreciation (depreciation) on forward foreign currency transactions ŧ | | | — | | | | (1,013 | ) | | | — | | | | (1,013 | ) |
| | | | | | | | | | | | | | | | |
Total | | $ | (1,763 | ) | | $ | 1,874 | | | $ | 559 | | | $ | 670 | |
| | | | | | | | | | | | | | | | |
| ^ | Included within net realized gain (loss) on transactions from Investment securities. |
| ~ | Included within net realized gain (loss) on transactions from foreign currency transactions. |
| Y | Included within net change in unrealized appreciation (depreciation) on Investment securities. |
| ŧ | Included within net change in unrealized appreciation (depreciation) on translation of assets and liabilities denominated in foreign currencies. |
For non-exchange traded derivatives (forward foreign currency contracts), under standard derivatives agreements, the Fund may be required to post collateral on derivatives if the Fund is in a net liability position with the counterparty exceeding certain amounts. Additionally, counterparties may immediately terminate derivatives contracts if the Fund fails to maintain sufficient asset coverage for its contracts or its net assets decline by stated percentages.
Transamerica International Value Opportunities:
The Fund is subject to various risks in the normal course of pursuing its investment objective. The volume of forward foreign currency contracts held increased during the year, starting at 3 contracts and ending at 5 contracts. The tables below highlight the types of risks and the derivative instruments used to mitigate the risks:
Fair Values of Derivative Instruments in the Statement of Assets and Liabilities as of October 31, 2012:
Derivatives not accounted for as hedging instruments
| | | | |
Location | | Foreign
exchange
contracts | |
Asset derivatives | | | | |
Unrealized appreciation on forward foreign currency contracts | | $ | 546 | |
Liability derivatives | | | | |
Unrealized depreciation on forward foreign currency contracts | | | (91 | ) |
| | | | |
Total | | $ | 455 | |
| | | | |
| | | | |
| Transamerica Funds | | | | Annual Report 2012 |
| | Page 227 | | |
NOTES TO FINANCIAL STATEMENTS (continued)
At October 31, 2012
(all amounts in thousands)
NOTE 5. (continued)
Transamerica International Value Opportunities (continued):
Effect of Derivative Instruments in the Statement of Operations for the year ended October 31, 2012:
Derivatives not accounted for as hedging instruments
| | | | |
Location | | Foreign
exchange
contracts | |
Net Realized Gain (Loss) on derivatives recognized in income | | | | |
Net realized gain (loss) on forward foreign currency contracts ~ | | $ | 3,337 | |
Net change in Unrealized Appreciation (Depreciation) on derivatives recognized in income | | | | |
Net change in unrealized appreciation (depreciation) on forward foreign currency transactions ŧ | | | (751 | ) |
| | | | |
Total | | $ | 2,586 | |
| | | | |
| ~ | Included within net realized gain (loss) on transactions from foreign currency transactions. |
| ŧ | Included within net change in unrealized appreciation (depreciation) on translation of assets and liabilities denominated in foreign currencies. |
For non-exchange traded derivatives (forward foreign currency contracts), under standard derivatives agreements, the Fund may be required to post collateral on derivatives if the Fund is in a net liability position with the counterparty exceeding certain amounts. Additionally, counterparties may immediately terminate derivatives contracts if the Fund fails to maintain sufficient asset coverage for its contracts or its net assets decline by stated percentages.
Transamerica Real Return TIPS:
The Fund is subject to various risks in the normal course of pursuing its investment objective. The volume of forward foreign currency contracts held throughout the year averaged 61, beginning and ending the year with 61 and 54 contracts, respectively. The volume of written swaptions contracts, futures and swap contracts decreased throughout the year, beginning the year with 22, 8, and 48, respectively and ending the year at 16, 3, and 20, respectively. The volume of purchased options/swaptions held at year end is indicative of the volume held throughout the year. The tables below highlight the types of risks and the derivative instruments used to mitigate the risks:
Fair Values of Derivative Instruments in the Statement of Assets and Liabilities as of October 31, 2012:
Derivatives not accounted for as hedging instruments
| | | | | | | | | | | | | | | | |
Location | | Interest rate
contracts | | | Foreign
exchange
contracts | | | Credit
contracts | | | Total | |
Asset derivatives | | | | | | | | | | | | | | | | |
Purchased swaptions, at value * | | $ | 559 | | | $ | — | | | $ | — | | | $ | 559 | |
Unrealized appreciation on futures contracts ** | | | 73 | | | | — | | | | — | | | | 73 | |
Premium paid on swap agreements | | | 1,651 | | | | — | | | | 139 | | | | 1,790 | |
Unrealized appreciation on swap agreements | | | 692 | | | | — | | | | 124 | | | | 816 | |
Unrealized appreciation on forward foreign currency contracts | | | — | | | | 1,074 | | | | — | | | | 1,074 | |
Liability derivatives | | | | | | | | | | | | | | | | |
Written options and swaptions, at value | | | (1,568 | ) | | | — | | | | — | | | | (1,568 | ) |
Premium received on swap agreements | | | (7 | ) | | | — | | | | (101 | ) | | | (108 | ) |
Unrealized depreciation on swap agreements | | | (434 | ) | | | — | | | | (280 | ) | | | (714 | ) |
Unrealized depreciation on forward foreign currency contracts | | | — | | | | (1,363 | ) | | | — | | | | (1,363 | ) |
| | | | | | | | | | | | | | | | |
Total | | $ | 966 | | | $ | (289 | ) | | $ | (118 | ) | | $ | 559 | |
| | | | | | | | | | | | | | | | |
| * | Included within Investment securities, at value. |
| ** | Includes cumulative appreciation/depreciation of futures contracts as reported in the Schedule of Investments. Only current day’s variation margin is reported within the Statement of Assets and Liabilities. |
| | | | |
| Transamerica Funds | | | | Annual Report 2012 |
| | Page 228 | | |
NOTES TO FINANCIAL STATEMENTS (continued)
At October 31, 2012
(all amounts in thousands)
NOTE 5. (continued)
Transamerica Real Return TIPS (continued):
Effect of Derivative Instruments in the Statement of Operations for the year ended October 31, 2012:
Derivatives not accounted for as hedging instruments
| | | | | | | | | | | | | | | | |
Location | | Interest
rate
contracts | | | Foreign
exchange
contracts | | | Credit
contracts | | | Total | |
Net Realized Gain (Loss) on derivatives recognized in income | | | | | | | | | | | | | | | | |
Net realized gain (loss) on purchased swaptions ^ | | $ | (141 | ) | | $ | — | | | $ | — | | | $ | (141 | ) |
Net realized gain (loss) on futures contracts | | | 2,030 | | | | — | | | | — | | | | 2,030 | |
Net realized gain (loss) on written options and swaptions | | | 1,603 | | | | — | | | | — | | | | 1,603 | |
Net realized gain (loss) on swap agreements | | | 3,237 | | | | — | | | | (23 | ) | | | 3,214 | |
Net realized gain (loss) on forward foreign currency contracts ~ | | | — | | | | (3,885 | ) | | | — | | | | (3,885 | ) |
Net change in Unrealized Appreciation (Depreciation) on derivatives recognized in income | | | | | | | | | | | | | | | | |
Net change in unrealized appreciation (depreciation) on purchased swaptions Y | | | (344 | ) | | | — | | | | — | | | | (344 | ) |
Net change in unrealized appreciation (depreciation) on futures contracts | | | (1,173 | ) | | | — | | | | — | | | | (1,173 | ) |
Net change in unrealized appreciation (depreciation) on written options and swaptions | | | (1,115 | ) | | | — | | | | — | | | | (1,115 | ) |
Net change in unrealized appreciation (depreciation) on swap agreements | | | (792 | ) | | | — | | | | 90 | | | | (702 | ) |
Net change in unrealized appreciation (depreciation) on forward foreign currency transactions ŧ | | | — | | | | 4,554 | | | | — | | | | 4,554 | |
| | | | | | | | | | | | | | | | |
Total | | $ | 3,305 | | | $ | 669 | | | $ | 67 | | | $ | 4,041 | |
| | | | | | | | | | | | | | | | |
| ^ | Included within net realized gain (loss) on transactions from Investment securities. |
| ~ | Included within net realized gain (loss) on transactions from foreign currency transactions. |
| Y | Included within net change in unrealized appreciation (depreciation) on Investment securities. |
| ŧ | Included within net change in unrealized appreciation (depreciation) on translation of assets and liabilities denominated in foreign currencies. |
For non-exchange traded derivatives (swaps and forward foreign currency contracts), under standard derivatives agreements, the Fund may be required to post collateral on derivatives if the Fund is in a net liability position with the counterparty exceeding certain amounts. Additionally, counterparties may immediately terminate derivatives contracts if the Fund fails to maintain sufficient asset coverage for its contracts or its net assets decline by stated percentages.
| | | | |
| Transamerica Funds | | | | Annual Report 2012 |
| | Page 229 | | |
NOTES TO FINANCIAL STATEMENTS (continued)
At October 31, 2012
(all amounts in thousands)
NOTE 5. (continued)
Transamerica Total Return:
The Fund is subject to various risks in the normal course of pursuing its investment objective. The volume of swap contracts held at the end of the year is indicative of the volume held throughout the year. The volume of written option/swaption contracts, forward foreign currency contracts, and futures contracts held throughout the year decreased, starting at 16, 73, 4 contracts, respectively, and ending at 3, 48, and 2 contracts, respectively. The volume of purchase option/swaption held throughout the year increased from zero to 1. The tables below highlight the types of risks and the derivative instruments used to mitigate the risks:
Fair Values of Derivative Instruments in the Statement of Assets and Liabilities as of October 31, 2012:
Derivatives not accounted for as hedging instruments
| | | | | | | | | | | | | | | | |
Location | | Interest rate
contracts | | | Foreign
exchange
contracts | | | Credit
contracts | | | Total | |
Asset derivatives | | | | | | | | | | | | | | | | |
Purchased swaptions, at value * | | $ | 386 | | | $ | — | | | $ | — | | | $ | 386 | |
Premium paid on swap agreements | | | 1,228 | | | | — | | | | 1,142 | | | | 2,370 | |
Unrealized appreciation on swap agreements | | | 6,808 | | | | — | | | | 98 | | | | 6,906 | |
Unrealized appreciation on forward foreign currency contracts | | | — | | | | 1,588 | | | | — | | | | 1,588 | |
Liability derivatives | | | | | | | | | | | | | | | | |
Unrealized depreciation on futures contracts ** | | | (56 | ) | | | — | | | | — | | | | (56 | ) |
Written options and swaptions, at value | | | (1,084 | ) | | | — | | | | — | | | | (1,084 | ) |
Premium received on swap agreements | | | (1,036 | ) | | | — | | | | (42 | ) | | | (1,078 | ) |
Unrealized depreciation on swap agreements | | | (282 | ) | | | — | | | | (3,090 | ) | | | (3,372 | ) |
Unrealized depreciation on forward foreign currency contracts | | | — | | | | (2,514 | ) | | | — | | | | (2,514 | ) |
| | | | | | | | | | | | | | | | |
Total | | $ | 5,964 | | | $ | (926 | ) | | $ | (1,892 | ) | | $ | 3,146 | |
| | | | | | | | | | | | | | | | |
| * | Included within Investment securities, at value. |
| ** | Includes cumulative appreciation/depreciation of futures contracts as reported in the Schedule of Investments. Only current day’s variation margin is reported within the Statement of Assets and Liabilities. |
Effect of Derivative Instruments in the Statement of Operations for the year ended October 31, 2012:
Derivatives not accounted for as hedging instruments
| | | | | | | | | | | | | | | | |
Location | | Interest rate
contracts | | | Foreign
exchange
contracts | | | Credit
contracts | | | Total | |
Net Realized Gain (Loss) on derivatives recognized in income | | | | | | | | | | | | | | | | |
Net realized gain (loss) on futures contracts | | $ | 720 | | | $ | — | | | $ | — | | | $ | 720 | |
Net realized gain (loss) on written options and swaptions | | | 451 | | | | — | | | | — | | | | 451 | |
Net realized gain (loss) on swap agreements | | | (1,341 | ) | | | — | | | | 238 | | | | (1,103 | ) |
Net realized gain (loss) on forward foreign currency contracts ~ | | | — | | | | (6,976 | ) | | | — | | | | (6,976 | ) |
Net change in Unrealized Appreciation (Depreciation) on derivatives recognized in income | | | | | | | | | | | | | | | | |
Net change in unrealized appreciation (depreciation) on purchased swaptions Y | | | (13 | ) | | | — | | | | — | | | �� | (13 | ) |
Net change in unrealized appreciation (depreciation) on futures contracts | | | 45 | | | | — | | | | — | | | | 45 | |
Net change in unrealized appreciation (depreciation) on written options and swaptions | | | (9 | ) | | | — | | | | — | | | | (9 | ) |
Net change in unrealized appreciation (depreciation) on swap agreements | | | 5,569 | | | | — | | | | (2,815 | ) | | | 2,754 | |
Net change in unrealized appreciation (depreciation) on forward foreign currency transactions ŧ | | | — | | | | 2,971 | | | | — | | | | 2,971 | |
| | | | | | | | | | | | | | | | |
Total | | $ | 5,422 | | | $ | (4,005 | ) | | $ | (2,577 | ) | | $ | (1,160 | ) |
| | | | | | | | | | | | | | | | |
| ~ | Included within net realized gain (loss) on transactions from foreign currency transactions. |
| Y | Included within net change in unrealized appreciation (depreciation) on Investment securities. |
| ŧ | Included within net change in unrealized appreciation (depreciation) on translation of assets and liabilities denominated in foreign currencies. |
For non-exchange traded derivatives (swaps and forward foreign currency contracts), under standard derivatives agreements, the Fund may be required to post collateral on derivatives if the Fund is in a net liability position with the counterparty exceeding certain amounts. Additionally, counterparties may immediately terminate derivatives contracts if the Fund fails to maintain sufficient asset coverage for its contracts or its net assets decline by stated percentages.
| | | | |
| Transamerica Funds | | | | Annual Report 2012 |
| | Page 230 | | |
NOTES TO FINANCIAL STATEMENTS (continued)
At October 31, 2012
(all amounts in thousands)
NOTE 5. (continued)
Transamerica Commodity Strategy:
The Fund is subject to various risks in the normal course of pursuing its investment objective. The volume of swap contracts held throughout the year increased from 2 to 5 contracts. The table below highlights the types of risks and the derivative instruments used to mitigate the risks:
Fair Values of Derivative Instruments in the Consolidated Statement of Assets and Liabilities as of October 31, 2012:
Derivatives not accounted for as hedging instruments
| | | | |
Location | | Commodity
contracts | |
Asset derivatives | | | | |
Premium paid on swap agreements | | | 151,236 | |
Liability derivatives | | | | |
Premium received on swap agreements | | | (151,236 | ) |
Effect of Derivative Instruments in the Consolidated Statement of Operations for the year ended October 31, 2012:
Derivatives not accounted for as hedging instruments
| | | | |
Location | | Commodity
contracts | |
Net Realized Gain (Loss) on derivatives recognized in income | | | | |
Net realized gain (loss) on swap agreements | | $ | (11,228 | ) |
For non-exchange traded derivatives (swaps and forward foreign currency contracts), under standard derivatives agreements, the Fund may be required to post collateral on derivatives if the Fund is in a net liability position with the counterparty exceeding certain amounts. Additionally, counterparties may immediately terminate derivatives contracts if the Fund fails to maintain sufficient asset coverage for its contracts or its net assets decline by stated percentages.
Transamerica Global Allocation:
The Fund is subject to various risks in the normal course of pursuing its investment objective. The volume of swap contracts and written options/swaptions held throughout the year averaged 7 and 56 contracts, respectively, with overall increases from 5 and 41 contracts, respectively, to 11 and 49 contracts, respectively. The volume of forward foreign currency contracts and purchased options held throughout the year averaged 52 and 53 contracts, respectively, with increases from 44 and 38 contracts at the beginning of the year to 51 and 103 contracts at the end of the year, respectively. The volume of futures contracts held throughout the year increased from 4 contracts at the beginning of the year to 7 contracts at the end of the year. The tables below highlight the types of risks and the derivative instruments used to mitigate the risks:
Fair Values of Derivative Instruments in the Consolidated Statement of Assets and Liabilities as of October 31, 2012:
Derivatives not accounted for as hedging instruments
| | | | | | | | | | | | | | | | | | | | |
Location | | Interest rate
contracts | | | Foreign
exchange
contracts | | | Equity | | | Commodity
contracts | | | Total | |
Asset derivatives | | | | | | | | | | | | | | | | | | | | |
Purchased Options, at value * | | $ | — | | | $ | 27 | | | $ | 2,022 | | | $ | 6 | | | $ | 2,055 | |
Unrealized appreciation on futures contracts ** | | | — | | | | — | | | | 189 | | | | — | | | | 189 | |
Unrealized appreciation on swap agreements | | | 18 | | | | — | | | | 54 | | | | — | | | | 72 | |
Unrealized appreciation on forward foreign currency contracts | | | — | | | | 175 | | | | — | | | | — | | | | 175 | |
Liability derivatives | | | | | | | | | | | | | | | | | | | | |
Unrealized depreciation on futures contracts ** | | | — | | | | — | | | | (2 | ) | | | — | | | | (2 | ) |
Written options and swaptions, at value | | | — | | | | (16 | ) | | | (583 | ) | | | — | | | | (599 | ) |
Unrealized depreciation on swap agreements | | | (6 | ) | | | — | | | | — | | | | — | | | | (6 | ) |
Unrealized depreciation on forward foreign currency contracts | | | — | | | | (363 | ) | | | — | | | | — | | | | (363 | ) |
| | | | | | | | | | | | | | | | | | | | |
Total | | $ | 12 | | | $ | (177 | ) | | $ | 1,680 | | | $ | 6 | | | $ | 1,521 | |
| | | | | | | | | | | | | | | | | | | | |
| * | Included within Investment securities, at value. |
| ** | Includes cumulative appreciation/depreciation of futures contracts as reported in the Schedule of Investments. Only current day’s variation margin is reported within the Consolidated Statement of Assets and Liabilities. |
| | | | |
| Transamerica Funds | | | | Annual Report 2012 |
| | Page 231 | | |
NOTES TO FINANCIAL STATEMENTS (continued)
At October 31, 2012
(all amounts in thousands)
NOTE 5. (continued)
Transamerica Global Allocation:
Effect of Derivative Instruments in the Consolidated Statement of Operations for the year ended October 31, 2012:
Derivatives not accounted for as hedging instruments
| | | | | | | | | | | | | | | | | | | | | | | | |
Location | | Interest rate
contracts | | | Foreign
exchange
contracts | | | Credit
contracts | | | Equity
contracts | | | Commodity
contracts | | | Total | |
Net Realized Gain (Loss) on derivatives recognized in income | | | | | | | | | | | | | | | | | | | | | | | | |
Net realized gain (loss) on purchased options ^ | | $ | — | | | $ | (178 | ) | | $ | — | | | $ | (4,320 | ) | | $ | (6 | ) | | $ | (4,504 | ) |
Net realized gain (loss) on futures contracts | | | — | | | | — | | | | — | | | | (2,031 | ) | | | — | | | | (2,031 | ) |
Net realized gain (loss) on written options and swaptions | | | — | | | | 53 | | | | — | | | | 1,299 | | | | 32 | | | | 1,384 | |
Net realized gain (loss) on swap agreements | | | 134 | | | | 4 | | | | (173 | ) | | | 41 | | | | — | | | | 6 | |
Net realized gain (loss) on forward foreign currency contracts ~ | | | — | | | | 326 | | | | — | | | | — | | | | — | | | | 326 | |
Net change in Unrealized Appreciation (Depreciation) on derivatives recognized in income | | | | | | | | | | | | | | | | | | | | | | | | |
Net change in unrealized appreciation (depreciation) on purchased options Y | | | — | | | | (27 | ) | | | — | | | | (104 | ) | | | (26 | ) | | | (157 | ) |
Net change in unrealized appreciation (depreciation) on futures contracts | | | — | | | | — | | | | — | | | | 753 | | | | — | | | | 753 | |
Net change in unrealized appreciation (depreciation) on written options and swaptions | | | — | | | | 34 | | | | — | | | | 590 | | | | — | | | | 624 | |
Net change in unrealized appreciation (depreciation) on swap agreements | | | 39 | | | | (13 | ) | | | — | | | | 54 | | | | — | | | | 80 | |
Net change in unrealized appreciation (depreciation) on forward foreign currency transactions ŧ | | | — | | | | (430 | ) | | | — | | | | — | | | | — | | | | (430 | ) |
| | | | | | | | | | | | | | | | | | | | | | | | |
Total | | $ | 173 | | | $ | (231 | ) | | $ | (173 | ) | | $ | (3,718 | ) | | $ | — | | | $ | (3,949 | ) |
| | | | | | | | | | | | | | | | | | | | | | | | |
| ^ | Included within net realized gain (loss) on transactions from Investment securities. |
| ~ | Included within net realized gain (loss) on transactions from foreign currency transactions. |
| Y | Included within net change in unrealized appreciation (depreciation) on Investment securities. |
| ŧ | Included within net change in unrealized appreciation (depreciation) on translation of assets and liabilities denominated in foreign currencies. |
For non-exchange traded derivatives (swaps and forward foreign currency contracts), under standard derivatives agreements, the Fund may be required to post collateral on derivatives if the Fund is in a net liability position with the counterparty exceeding certain amounts. Additionally, counterparties may immediately terminate derivatives contracts if the Fund fails to maintain sufficient asset coverage for its contracts or its net assets decline by stated percentages.
| | | | |
| Transamerica Funds | | | | Annual Report 2012 |
| | Page 232 | | |
NOTES TO FINANCIAL STATEMENTS (continued)
At October 31, 2012
(all amounts in thousands)
NOTE 5. (continued)
Transamerica Managed Futures Strategy:
The Fund is subject to various risks in the normal course of pursuing its investment objective. The volume of swap contracts held throughout the year increased, beginning at 6 contracts and ending at 10 contracts. The volume of forward foreign currency contracts averaged 499 throughout the year, beginning at 455 and ending at 515 contracts. The volume of futures contracts held during the year averaged 203 contracts, with an increase from 210 contracts at the beginning of the year to 298 contracts at the end of the year. The tables below highlight the types of risks and the derivative instruments used to mitigate the risks:
Fair Values of Derivative Instruments in the Consolidated Statement of Assets and Liabilities as of October 31, 2012:
Derivatives not accounted for as hedging instruments
| | | | | | | | | | | | | | | | | | | | |
Location | | Interest
rate
contracts | | | Foreign
exchange
contracts | | | Equity
contracts | | | Commodity
Contracts | | | Total | |
Asset derivatives | | | | | | | | | | | | | | | | | | | | |
Unrealized appreciation on futures contracts ** | | $ | 237 | | | $ | — | | | $ | 403 | | | $ | 5,740 | | | $ | 6,380 | |
Unrealized appreciation on swap agreements | | | 5 | | | | — | | | | 70 | | | | 137 | | | | 212 | |
Unrealized appreciation on forward foreign currency contracts | | | — | | | | 9,221 | | | | — | | | | — | | | | 9,221 | |
Liability derivatives | | | | | | | | | | | | | | | | | | | | |
Unrealized depreciation on futures contracts ** | | | (125 | ) | | | — | | | | (2,269 | ) | | | (7,589 | ) | | | (9,983 | ) |
Unrealized depreciation on swap agreements | | | (28 | ) | | | — | | | | — | | | | (281 | ) | | | (309 | ) |
Unrealized depreciation on forward foreign currency contracts | | | — | | | | (8,253 | ) | | | — | | | | — | | | | (8,253 | ) |
| | | | | | | | | | | | | | | | | | | | |
Total | | $ | 89 | | | $ | 968 | | | $ | (1,796 | ) | | $ | (1,993 | ) | | $ | (2,732 | ) |
| | | | | | | | | | | | | | | | | | | | |
| ** | Includes cumulative appreciation/depreciation of futures contracts as reported in the Schedule of Investments. Only current day’s variation margin is reported within the Consolidated Statement of Assets and Liabilities. |
Effect of Derivative Instruments in the Consolidated Statement of Operations for the year ended October 31, 2012:
Derivatives not accounted for as hedging instruments
| | | | | | | | | | | | | | | | | | | | |
Location | | Interest rate
contracts | | | Foreign
exchange
contracts | | | Equity
contracts | | | Commodity
contracts | | | Total | |
Net Realized Gain (Loss) on derivatives recognized in income | | | | | | | | | | | | | | | | | | | | |
Net realized gain (loss) on futures contracts | | $ | 3,663 | | | $ | — | | | $ | (2,223 | ) | | $ | 2,101 | | | $ | 3,541 | |
Net realized gain (loss) on swap agreements | | | (2,400 | ) | | | — | | | | 1,714 | | | | (48 | ) | | | (734 | ) |
Net realized gain (loss) on forward foreign currency contracts ~ | | | — | | | | (7,904 | ) | | | — | | | | — | | | | (7,904 | ) |
Net change in Unrealized Appreciation (Depreciation) on derivatives recognized in income | | | | | | | | | | | | | | | | | | | | |
Net change in unrealized appreciation (depreciation) on futures contracts | | | 777 | | | | — | | | | (606 | ) | | | (1,743 | ) | | | (1,572 | ) |
Net change in unrealized appreciation (depreciation) on swap agreements | | | (277 | ) | | | — | | | | 243 | | | | (144 | ) | | | (178 | ) |
Net change in unrealized appreciation (depreciation) on forward foreign currency transactions ŧ | | | — | | | | 7,496 | | | | — | | | | — | | | | 7,496 | |
| | | | | | | | | | | | | | | | | | | | |
Total | | $ | 1,763 | | | $ | (408 | ) | | $ | (872 | ) | | $ | 166 | | | $ | 649 | |
| | | | | | | | | | | | | | | | | | | | |
| ~ | Included within net realized gain (loss) on transactions from foreign currency transactions. |
| ŧ | Included within net change in unrealized appreciation (depreciation) on translation of assets and liabilities denominated in foreign currencies. |
For non-exchange traded derivatives (swaps and forward foreign currency contracts), under standard derivatives agreements, the Fund may be required to post collateral on derivatives if the Fund is in a net liability position with the counterparty exceeding certain amounts. Additionally, counterparties may immediately terminate derivatives contracts if the Fund fails to maintain sufficient asset coverage for its contracts or its net assets decline by stated percentages.
| | | | |
| Transamerica Funds | | | | Annual Report 2012 |
| | Page 233 | | |
NOTES TO FINANCIAL STATEMENTS (continued)
At October 31, 2012
(all amounts in thousands)
NOTE 6. FEDERAL INCOME TAX MATTERS
The Funds have not made any provision for federal income or excise taxes due to its policy to distribute all of their taxable income and capital gains to their shareholders and otherwise qualify as a regulated investment company under Subchapter M of the Internal Revenue Code. The Funds recognize the tax benefits of uncertain tax positions only where the position is “more likely than not” to be sustained assuming examination by tax authorities. Management has evaluated the Funds’ tax provisions taken or expected to be taken for all open tax years 2009-2012, and has concluded that no provision for income tax is required in the Funds’ financial statements. If applicable, the Funds recognize interest accrued related to unrecognized tax benefits in interest and penalties expense in Other on the Statement of Operations. The Funds identify their major tax jurisdictions as U.S. Federal, the state of Florida, and foreign jurisdictions where the Funds make significant investments; however, the Funds are not aware of any tax positions for which it is reasonably possible that the total amounts of unrecognized tax benefits will change materially in the next twelve months. Income and capital gain distributions are determined in accordance with income tax regulations, which may differ from GAAP. These differences are primarily due to differing treatment for items including, but not limited to, wash sales, structured notes, foreign bonds, swaps, net operating losses, distribution reclasses for REITs, passive foreign investment companies, foreign currency transactions, capital loss carryforwards, paydown gain/loss, foreign capital gains tax, and return of capital distributions from underlying investments.
Therefore, distributions determined in accordance with tax regulations may differ significantly in amount or character from net investment income and realized gains for financial reporting purposes. Financial reporting records are adjusted for permanent book/tax differences to reflect tax character. These reclassifications have no impact on net assets or results of operations. Financial records are not adjusted for temporary differences. These reclassifications are as follows:
| | | | | | | | | | | | |
Fund Name | | Shares of
beneficial interest,
unlimited shares
authorized | | | Undistributed
(accumulated)
net investment
income (loss) | | | Undistributed
(accumulated)
net realized gain (loss)
from investment
securities | |
Transamerica Arbitrage Strategy | | $ | — | | | $ | 2,030 | | | $ | (2,030 | ) |
Transamerica Bond | | | — | | | | 3,713 | | | | (3,713 | ) |
Transamerica Core Bond | | | — | | | | 13,692 | | | | (13,692 | ) |
Transamerica Developing Markets Equity | | | — | | | | (557 | ) | | | 557 | |
Transamerica Global Macro | | | (881 | ) | | | 311 | | | | 570 | |
Transamerica Global Real Estate Securities | | | — | | | | 3,512 | | | | (3,512 | ) |
Transamerica Growth | | | — | | | | 71 | | | | (71 | ) |
Transamerica International | | | — | | | | (437 | ) | | | 437 | |
Transamerica International Equity Opportunities | | | — | | | | (207 | ) | | | 207 | |
Transamerica International Small Cap | | | — | | | | 383 | | | | (383 | ) |
Transamerica International Value Opportunities | | | — | | | | (335 | ) | | | 335 | |
Transamerica Large Company | | | — | | | | — | (A) | | | (— | ) (A) |
Transamerica Long/Short Strategy | | | (172 | ) | | | 166 | | | | 6 | |
Transamerica Real Return TIPS | | | — | | | | 2,610 | | | | (2,610 | ) |
Transamerica Total Return | | | — | | | | 2,957 | | | | (2,957 | ) |
Transamerica Value | | | — | | | | 370 | | | | (370 | ) |
Transamerica Commodity Strategy | | | (11,366 | ) | | | 138 | | | | 11,228 | |
Transamerica Global Allocation | | | 5 | | | | 257 | | | | (262 | ) |
Transamerica Managed Futures Strategy | | | 278 | | | | 993 | | | | (1,271 | ) |
| (A) | Rounds to less than $1. |
| | | | |
| Transamerica Funds | | | | Annual Report 2012 |
| | Page 234 | | |
NOTES TO FINANCIAL STATEMENTS (continued)
At October 31, 2012
(all amounts in thousands)
NOTE 6. (continued)
At October 31, 2012, the Funds had capital loss carryforwards available to offset future realized gains through the periods listed below:
| | | | | | |
Fund Name | | Capital Loss
Carryforwards | | | Available Through |
Transamerica Global Macro | | $ | 65,043 | | | October 31, 2017 |
Transamerica Global Macro | | | 4,794 | | | October 31, 2019 |
Transamerica Global Real Estate Securities | | | 1,360 | | | October 31, 2016 |
Transamerica Global Real Estate Securities | | | 60,884 | | | October 31, 2017 |
Transamerica Global Real Estate Securities | | | 12,882 | | | October 31, 2018 |
Transamerica International | | | 62,635 | | | October 31, 2016 |
Transamerica International | | | 103,154 | | | October 31, 2017 |
Transamerica International | | | 869 | | | October 31, 2018 |
Transamerica International | | | 1,570 | | | Short-Term Indefinitely |
Transamerica International Small Cap | | | 1,568 | | | Short-Term Indefinitely |
Transamerica Large Company | | | 83,930 | | | October 31, 2017 |
Transamerica Long/Short Strategy | | | 8,292 | | | October 31, 2016 |
Transamerica Long/Short Strategy | | | 2,462 | | | October 31, 2018 |
Transamerica Long/Short Strategy | | | 247 | | | October 31, 2019 |
Transamerica Mid Cap Value | | | 2,079 | | | October 31, 2017 |
Transamerica Value | | | 82,097 | | | October 31, 2017 |
Transamerica Value | | | 999 | | | Long-Term Indefinitely |
Transamerica Managed Futures Strategy | | | 4,334 | | | October 31, 2019 |
Transamerica Managed Futures Strategy | | | 102 | | | Short-Term Indefinitely |
The capital loss carryforwards utilized or expired during the year ended October 31, 2012 were as follows:
| | | | |
Fund Name | | Capital Loss
Carryforwards
Utilized/Expired During
the Year Ended
October 31, 2012 | |
Transamerica Core Bond | | $ | 1,274 | |
Transamerica Global Macro | | | 2,931 | |
Transamerica Global Real Estate Securities | | | 6,188 | |
Transamerica Large Company | | | 41,114 | |
Transamerica Long/Short Strategy | | | 1,799 | |
Transamerica Mid Cap Value | | | 14,569 | |
Transamerica Select Equity | | | 3,466 | |
Funds not listed in the table above do not have capital loss carryforwards utilized or expired.
| | | | |
| Transamerica Funds | | | | Annual Report 2012 |
| | Page 235 | | |
NOTES TO FINANCIAL STATEMENTS (continued)
At October 31, 2012
(all amounts in thousands)
NOTE 6. (continued)
The tax character of distributions paid may differ from the character of distributions shown in the Statements of Changes in Net Assets or Consolidated Statements of Changes in Net Assets due to short-term gains being treated as ordinary income for tax purposes. The tax character of distributions paid during 2012 and 2011 was as follows:
| | | | | | | | | | | | | | | | | | | | | | | | |
| | | 2012 Distributions Paid From | | | 2011 Distributions Paid From | |
| | | Ordinary
income | | | Long-term
Capital Gain | | | Return of
Capital | | | Ordinary
income | | | Long-term
Capital Gain | | | Return of
Capital | |
Transamerica Arbitrage Strategy | | $ | 1,456 | | | $ | — | | | $ | — | | | $ | — | | | $ | — | | | $ | — | |
Transamerica Bond | | | 38,269 | | | | 21,177 | | | | — | | | | 34,806 | | | | 10,200 | | | | — | |
Transamerica Core Bond | | | 75,050 | | | | — | | | | — | | | | 52,360 | | | | — | | | | — | |
Transamerica Developing Markets Equity | | | 2,678 | | | | 40,297 | | | | — | | | | 1,725 | | | | — | | | | — | |
Transamerica Global Real Estate Securities | | | 5,154 | | | | — | | | | — | | | | 16,534 | | | | — | | | | — | |
Transamerica Growth | | | 276 | | | | 22,868 | | | | — | | | | 177 | | | | 623 | | | | — | |
Transamerica International | | | 6,082 | | | | — | | | | — | | | | 7,056 | | | | — | | | | — | |
Transamerica International Equity Opportunities | | | 11,838 | | | | 43,888 | | | | — | | | | 10,751 | | | | 22,069 | | | | — | |
Transamerica International Small Cap | | | 10,379 | | | | 35,841 | | | | — | | | | 6,177 | | | | 3,120 | | | | — | |
Transamerica International Value Opportunities | | | 8,733 | | | | 62,673 | | | | — | | | | 4,184 | | | | 4,994 | | | | — | |
Transamerica Large Company | | | 6,909 | | | | — | | | | — | | | | 8,350 | | | | — | | | | — | |
Transamerica Mid Cap Value | | | 1,745 | | | | — | | | | — | | | | 2,200 | | | | — | | | | — | |
Transamerica Real Return TIPS | | | 35,531 | | | | 26,610 | | | | — | | | | 35,057 | | | | 24,373 | | | | — | |
Transamerica Select Equity | | | 22,422 | | | | — | | | | — | | | | 54 | | | | — | | | | — | |
Transamerica Total Return | | | 21,727 | | | | 2,586 | | | | — | | | | 27,213 | | | | 9,767 | | | | — | |
Transamerica Value | | | 728 | | | | — | | | | — | | | | 7,774 | | | | — | | | | — | |
Transamerica Commodity Strategy | | | 6,303 | | | | — | | | | — | | | | 7,529 | | | | 6,294 | | | | — | |
Transamerica Global Allocation | | | 10,396 | | | | 6,805 | | | | — | | | | 7,497 | | | | — | | | | — | |
Transamerica Managed Futures Strategy | | | 88 | | | | 128 | | | | — | | | | 3,392 | | | | 938 | | | | — | |
The tax basis components of distributable earnings as of October 31, 2012 are as follows:
| | | | | | | | | | | | | | | | | | | | |
Fund Name | | Undistributed
Ordinary
income | | | Undistributed
Long-term
Capital Gain | | | Capital Loss
Carryforward | | | Other
Temporary
Differences | | | Net Unrealized
Appreciation
(Depreciation) | |
Transamerica Arbitrage Strategy | | $ | 2,782 | | | $ | — | | | $ | — | | | $ | (30 | ) | | $ | (5,224 | ) |
Transamerica Bond | | | 6,260 | | | | 6,268 | | | | — | | | | (85 | ) | | | 57,250 | |
Transamerica Core Bond | | | 8,974 | | | | 5,785 | | | | — | | | | — | | | | 103,310 | |
Transamerica Developing Markets Equity | | | 1,448 | | | | 35,429 | | | | — | | | | — | | | | 15,866 | |
Transamerica Global Macro | | | — | | | | — | | | | (69,837 | ) | | | (1,221 | )^ | | | (150 | ) |
Transamerica Global Real Estate Securities | | | 9,016 | | | | — | | | | (75,126 | ) | | | — | | | | 25,660 | |
Transamerica Growth | | | — | | �� | | 58,044 | | | | — | | | | — | | | | 146,267 | |
Transamerica International | | | 5,381 | | | | — | | | | (168,228 | ) | | | — | (A) | | | 57,600 | |
Transamerica International Equity Opportunities | | | 4,852 | | | | 8,389 | | | | — | | | | — | | | | (7,221 | ) |
Transamerica International Small Cap | | | 6,476 | | | | — | | | | (1,568 | ) | | | — | | | | 12,331 | |
Transamerica International Value Opportunities | | | 4,428 | | | | 3,939 | | | | — | | | | — | | | | 16,702 | |
Transamerica Large Company | | | 6,188 | | | | — | | | | (83,930 | ) | | | — | | | | 63,208 | |
Transamerica Long/Short Strategy | | | — | | | | — | | | | (11,001 | ) | | | (928 | )^ | | | 67 | |
Transamerica Mid Cap Value | | | 1,555 | | | | — | | | | (2,079 | ) | | | — | | | | 45,601 | |
Transamerica Real Return TIPS | | | 32,874 | | | | 31,910 | | | | — | | | | (977 | ) | | | 65,311 | |
Transamerica Select Equity | | | 31,614 | | | | 740 | | | | — | | | | — | | | | 117,512 | |
Transamerica Total Return | | | 6,747 | | | | — | | | | — | | | | (929 | ) | | | 33,380 | |
Transamerica Value | | | 3,802 | | | | — | | | | (83,096 | ) | | | — | | | | (50,588 | ) |
Transamerica Commodity Strategy | | | — | | | | — | | | | — | | | | 10,205 | | | | (11,059 | ) |
Transamerica Global Allocation | | | 5,114 | | | | 9,904 | | | | — | | | | (820 | ) | | | 18,905 | |
Transamerica Managed Futures Strategy | | | — | | | | — | | | | (4,436 | ) | | | 448^ | | | | (8,467 | ) |
| (A) | Rounds to less than $1. |
| ^ | Amounts include qualified ordinary late-year loss deferral. |
| | | | |
| Transamerica Funds | | | | Annual Report 2012 |
| | Page 236 | | |
NOTES TO FINANCIAL STATEMENTS (continued)
At October 31, 2012
(all amounts in thousands)
NOTE 7. BASIS FOR CONSOLIDATION
Transamerica Cayman Commodity Strategy, Ltd., Transamerica Cayman Global Allocation, Ltd., and Transamerica Cayman Managed Futures Strategy, Ltd., (each, a “Subsidiary”; collectively, the “Subsidiaries”) are organized under the laws of the Cayman Islands as wholly-owned subsidiaries which act as investment vehicles for Transamerica Commodity Strategy, Transamerica Global Allocation, and Transamerica Managed Futures Strategy, respectively. The principal purpose of investment of the Subsidiaries is to allow the Funds noted above to gain exposure to the commodity markets within the limitations of the federal tax law requirements applicable to regulated investment companies.
The following schedule reflects the net assets of the Subsidiaries as a percentage of the Funds’ net assets at October 31, 2012:
| | | | | | | | | | |
Fund Name | | Subsidiary Name | | Market
Value | | | % of Net
Assets | |
Transamerica Commodity Strategy | | Transamerica Cayman Commodity Strategy, Ltd. | | $ | 25,382 | | | | 16.87 | % |
Transamerica Global Allocation | | Transamerica Cayman Global Allocation, Ltd. | | | 5,148 | | | | 1.64 | |
Transamerica Managed Futures Strategy | | Transamerica Cayman Managed Futures Strategy, Ltd. | | | 70,842 | | | | 23.45 | |
NOTE 8. ACCOUNTING PRONOUNCEMENTS
In December 2011, the Financial Accounting Standards Board issued the authoritative guidance that will enhance disclosures related to financial instruments and derivative instruments that are either offset in the statement of assets and liabilities or subject to an enforceable master netting arrangement or similar agreement. This information will enable users of the Funds’ financial statements to evaluate the effect or potential effect of netting arrangements on the Funds’ financial position. The adoption of this disclosure requirement is effective for financial statements interim and annual periods beginning on or after January 1, 2013. Management is currently evaluating the implication of the additional disclosure requirements and its impact on the Funds’ financial statements.
NOTE 9. SUBSEQUENT EVENTS
The Board of Trustees has approved the liquidation of Transamerica Large Company effective on or about January 4, 2013.
Management has evaluated subsequent events through the date of issuance of the financial statements, and determined that no other material events or transactions would require recognition or disclosure in the Funds’ financial statements.
| | | | |
| Transamerica Funds | | | | Annual Report 2012 |
| | Page 237 | | |
Report of Independent Registered Public Accounting Firm
To the Board of Trustees & Shareholders of Transamerica Funds:
We have audited the accompanying statements of assets and liabilities of Transamerica Arbitrage Strategy (formerly “Transamerica Water Island Arbitrage Strategy”), Transamerica Bond (formerly “Transamerica Loomis Sayles Bond”), Transamerica Core Bond (formerly “Transamerica JPMorgan Core Bond”), Transamerica Developing Markets Equity (formerly “Transamerica Oppenheimer Developing Markets”), Transamerica Global Macro (formerly “Transamerica First Quadrant Global Macro”), Transamerica Global Real Estate Securities (formerly “Transamerica Clarion Global Real Estate Securities”), Transamerica Growth (formerly “Transamerica Jennison Growth”), Transamerica International (formerly “Transamerica Neuberger Berman International”), Transamerica International Equity Opportunities (formerly “Transamerica MFS International Equity”), Transamerica International Small Cap (formerly “Transamerica Schroders International Small Cap”), Transamerica International Value Opportunities (formerly “Transamerica Thornburg International Value”), Transamerica Large Company (formerly “Transamerica BlackRock Large Cap Value”), Transamerica Long/Short Strategy (formerly “Transamerica JPMorgan Long/Short Strategy”), Transamerica Mid Cap Value (formerly “Transamerica JPMorgan Mid Cap Value”), Transamerica Real Return TIPS (formerly “Transamerica PIMCO Real Return TIPS”), Transamerica Select Equity (formerly “Transamerica ICAP Select Equity”), Transamerica Total Return (formerly “Transamerica PIMCO Total Return”), and Transamerica Value (formerly “Transamerica Third Avenue Value”), including the schedules of investments, as of October 31, 2012, and the related statements of operations for the year then ended and the statements of changes in net assets and the financial highlights for each of the periods indicated therein. We have also audited the accompanying consolidated statements of assets and liabilities of Transamerica Commodity Strategy (formerly “Transamerica Goldman Sachs Commodity Strategy”), Transamerica Global Allocation (formerly “Transamerica BlackRock Global Allocation”), and Transamerica Managed Futures Strategy (formerly “Transamerica AQR Managed Futures Strategy”) , including the consolidated schedules of investments, as of October 31, 2012, and the related consolidated statements of operations for the year then ended, the consolidated statements of changes in net assets for each of the two years in the period then ended, and the consolidated financial highlights for each of the periods indicated therein. The aforementioned twenty one funds of the Transamerica Funds are hereafter referred to as the “Funds.” These financial statements and consolidated financial statements and financial highlights and consolidated financial highlights are the responsibility of the Funds’ management. Our responsibility is to express an opinion on these financial statements and consolidated financial statements and financial highlights and consolidated financial highlights based on our audits. The financial highlights and consolidated financial highlights for periods ended prior to November 1, 2009 were audited by another independent registered public accounting firm whose report, dated December 21, 2009, expressed an unqualified opinion on those financial highlights and consolidated financial highlights.
We conducted our audits in accordance with the standards of the Public Company Accounting Oversight Board (United States). Those standards require that we plan and perform the audits to obtain reasonable assurance about whether the financial statements and financial highlights are free of material misstatement. We were not engaged to perform an audit of the Funds’ internal control over financial reporting. Our audits included consideration of internal control over financial reporting as a basis for designing audit procedures that are appropriate in the circumstances, but not for the purpose of expressing an opinion on the effectiveness of the Funds’ internal control over financial reporting. Accordingly, we express no such opinion. An audit also includes examining, on a test basis, evidence supporting the amounts and disclosures in the financial statements and financial highlights, assessing the accounting principles used and significant estimates made by management, and evaluating the overall financial statement presentation. Our procedures included confirmation of securities owned as of October 31, 2012, by correspondence with the custodian and others or by other appropriate auditing procedures where replies from others were not received. We believe that our audits provide a reasonable basis for our opinion.
In our opinion, the financial statements and consolidated financial statements and financial highlights and consolidated financial highlights referred to above present fairly, in all material respects, the financial position of the aforementioned twenty one Funds of the Transamerica Funds at October 31, 2012, the results of their operations and consolidated operations for the year ended, the changes in their net assets and consolidated changes in their net assets, and the financial highlights and consolidated financial highlights for each of the periods indicated therein, in conformity with U.S. generally accepted accounting principles.
Boston, Massachusetts
December 26, 2012
| | | | |
| Transamerica Funds | | | | Annual Report 2012 |
| | Page 238 | | |
TRANSAMERICA FUNDS
INVESTMENT ADVISORY AND SUB-ADVISORY AGREEMENTS—CONTRACT RENEWAL
(unaudited)
At a meeting of the Board of Trustees of Transamerica Funds (the “Board”) held on June 13-14, 2012, the Board reviewed and considered the renewal of the investment advisory agreements (each an “Investment Advisory Agreement” and collectively the “Investment Advisory Agreements”) between each of the following funds (each a “Fund” and collectively the “Funds”) and Transamerica Asset Management, Inc. (“TAM”):
| | |
| Transamerica Arbitrage Strategy | | Transamerica International Equity Opportunities |
| Transamerica Bond | | Transamerica International Small Cap |
| Transamerica Commodity Strategy | | Transamerica International Value |
| Transamerica Core Bond | | Transamerica International Value Opportunities |
| Transamerica Developing Markets Equity | | Transamerica Large Company (then named Transamerica Large Cap Value) |
| Transamerica Developing Markets Debt | | Transamerica Long/Short Strategy |
| Transamerica Emerging Markets | | Transamerica Managed Futures Strategy |
| Transamerica Global Allocation | | Transamerica Mid Cap Value |
| Transamerica Global Macro | | Transamerica Real Return TIPS |
| Transamerica Global Real Estate Securities | | Transamerica Small Company Growth |
| Transamerica Growth | | Transamerica Total Return |
| Transamerica International | | Transamerica Value |
For the Funds listed in the left-hand column below, the Board also reviewed and considered the renewal of the investment sub-advisory agreements (each a “Sub-Advisory Agreement” and collectively the “Sub-Advisory Agreements”) between TAM and the corresponding sub-advisers listed in the right-hand column below (each a “Sub-Adviser” and collectively the “Sub-Advisers”).
| | |
Fund | | Sub-Adviser |
| Transamerica Arbitrage Strategy | | Water Island Capital, LLC |
| Transamerica Bond | | Loomis, Sayles & Company, L.P. |
| Transamerica Commodity Strategy | | Goldman Sachs Asset Management, L.P. |
| Transamerica Core Bond | | J.P. Morgan Investment Management Inc. |
| Transamerica Developing Markets Equity | | OppenheimerFunds, Inc. |
| Transamerica Developing Markets Debt | | Morgan Stanley Investment Management Inc. |
| Transamerica Emerging Markets | | Wellington Management Company, LLP |
| Transamerica Global Allocation | | BlackRock Investment Management, LLC |
| Transamerica Global Macro | | First Quadrant, L.P. |
| Transamerica Global Real Estate Securities | | CBRE Clarion Securities LLC |
| Transamerica Growth | | Jennison Associates LLC |
| Transamerica International | | Neuberger Berman Management LLC |
| Transamerica International Equity Opportunities | | MFS Investment Management |
| Transamerica International Small Cap | | Schroder Investment Management North America Inc. |
| Transamerica International Value | | Hansberger Global Investors, Inc. |
| Transamerica International Value Opportunities | | Thornburg Investment Management, Inc. |
| Transamerica Large Company (then named Transamerica Large Cap Value) | | BlackRock Investment Management, LLC |
| Transamerica Long/Short Strategy | | J.P. Morgan Investment Management Inc. |
| Transamerica Managed Futures Strategy | | AQR Capital Management, LLC |
| Transamerica Mid Cap Value | | J.P. Morgan Investment Management Inc. |
| Transamerica Real Return TIPS | | Pacific Investment Management Company LLC |
| Transamerica Small Company Growth | | Morgan Stanley Investment Management Inc. |
| Transamerica Total Return | | Pacific Investment Management Company LLC |
| Transamerica Value | | Third Avenue Management LLC |
With respect to each of Transamerica Commodity Strategy, Transamerica Global Allocation, and Transamerica Managed Futures Strategy, the Board’s consideration of the applicable Investment Advisory Agreement and Sub-Advisory Agreement also included consideration of (i) the investment advisory agreement between TAM and the Fund’s wholly owned subsidiary organized under the laws of the Cayman Islands; and (ii) the investment sub-advisory agreement between TAM and the Fund’s Sub-Adviser relating to the Fund’s subsidiary.
| | | | |
| Transamerica Funds | | | | Annual Report 2012 |
| | Page 239 | | |
TRANSAMERICA FUNDS
INVESTMENT ADVISORY AND SUB-ADVISORY AGREEMENTS—CONTRACT RENEWAL (continued)
(unaudited)
Following their review and consideration, the Trustees determined that the terms of each Investment Advisory Agreement and Sub-Advisory Agreement are reasonable and that the renewal of each agreement is in the best interests of the applicable Fund and its shareholders. The Board, including the independent members of the Board (the “Independent Trustees”), unanimously approved the renewal of each Investment Advisory Agreement and Sub-Advisory Agreement through June 30, 2013. In reaching their decision, the Trustees requested and received from TAM and each Sub-Adviser such information as they deemed reasonably necessary to evaluate the agreements, including, to the extent applicable, information about fees and performance of comparable funds and/or accounts managed by each Sub-Adviser. The Trustees also considered information they had previously received from TAM and each Sub-Adviser as part of their regular oversight of each Fund, as well as comparative fee, expense, and performance information prepared by Lipper Inc. (“Lipper”), an independent provider of mutual fund performance information, and fee and expense information and profitability data prepared by TAM. In considering the renewal of the Investment Advisory Agreement and Sub-Advisory Agreement for Transamerica Small Company Growth, the Trustees noted that in May 2012 they had approved the liquidation of the Fund and, as a result, considered the information in light of the upcoming liquidation.
In their deliberations, the Independent Trustees had the opportunity to meet privately without representatives of TAM or any Sub-Adviser present and were represented throughout the process by independent legal counsel. In considering the proposed continuation of each Investment Advisory Agreement and Sub-Advisory Agreement, the Trustees evaluated a number of considerations that they believed, in light of the legal advice furnished to them by independent legal counsel and their own business judgment, to be relevant. They based their decisions on the considerations discussed below, among others, although they did not identify any consideration or particular information that was controlling of their decisions, and each Trustee may have attributed different weights to the various factors.
Nature, Extent and Quality of the Services Provided
The Board considered the nature, extent and quality of the services provided by TAM and each Sub-Adviser to the applicable Fund in the past and the services anticipated to be provided in the future. The Board also considered the investment approach for each Fund; the experience, capability and integrity of TAM’s senior management; the financial resources of TAM and each Sub-Adviser; TAM’s management oversight process; and the professional qualifications of the portfolio management team of each Sub-Adviser. The Trustees noted that they receive, on a quarterly basis, an execution analysis from Capital Institutional Services, Inc. (CAPIS), an independent provider of trade analyses, for each applicable Sub-Adviser and a comparison of trading results against a peer universe of managers.
The Board also considered the services provided by TAM for the portion of the management fee it retains after payment of the sub-advisory fee for each Fund. The Board noted that these services include not only the services TAM provides to all Transamerica funds in the form of oversight of the services provided by the funds’ administrator, custodian and transfer agent and supervision of the performance of recordkeeping, shareholder relations, regulatory reporting and compliance functions of the funds, but also the “manager of managers” services TAM provides to sub-advised funds in the form of selection and oversight of the sub-adviser(s).
Based on these considerations, the Board determined that TAM and each Sub-Adviser can provide investment and related services that are appropriate in scope and extent in light of the applicable Fund’s operations, the competitive landscape of the investment company business and investor needs.
Investment Performance
The Board considered the short-and longer-term performance, as applicable, of each Fund in light of its investment objective, policies and strategies, including relative performance against (i) a peer universe of comparable mutual funds, as prepared by Lipper, and (ii) the Fund’s benchmark(s), in each case for various trailing periods ended December 31, 2011.
Transamerica Arbitrage Strategy. The Board noted that the performance of Class I2 of the Fund was above the median for its peer universe for the period since inception. The Board also noted that the performance of Class I2 of the Fund was above its benchmark for the period since inception.
Transamerica Bond. The Board noted that the performance of Class I2 of the Fund was below the median for its peer universe for the past 1-year period and above the median for the past 3-year period. The Board also noted that the performance of Class I2 of the Fund was below its benchmark for the past 1-year period and above its benchmark for the past 3-year period. The Trustees discussed the reasons for the underperformance with TAM and agreed to continue to monitor the performance of the Fund. The Trustees also noted that the performance of the Fund had improved during 2012.
| | | | |
| Transamerica Funds | | | | Annual Report 2012 |
| | Page 240 | | |
TRANSAMERICA FUNDS
INVESTMENT ADVISORY AND SUB-ADVISORY AGREEMENTS—CONTRACT RENEWAL (continued)
(unaudited)
Investment Performance (continued)
Transamerica Commodity Strategy. The Board noted that the performance of Class I2 of the Fund was below the median for its peer universe for the past 1-year period and above the median for the past 3-year period. The Board also noted that the performance of Class I2 of the Fund was above its benchmark for the past 1-year period. The Board noted that the Fund’s performance for the 3-year period included the management of the Fund’s previous sub-adviser in accordance with different investment strategies. The Trustees discussed the reasons for the underperformance with TAM and agreed to continue to monitor the performance of the Fund.
Transamerica Core Bond. The Board noted that the performance of Class I2 of the Fund was above the median for its peer universe for the past 1-year period and in line with the median for the past 2-year period. The Board also noted that the performance of Class I2 of the Fund was below its benchmark for the past 1- and 2-year periods.
Transamerica Developing Markets Equity. The Board noted that the performance of Class I2 of the Fund was above the median for its peer universe for the past 1-, 3- and 5-year periods. The Board also noted that the performance of Class I2 of the Fund was below its benchmark for the past 1-year period and above its benchmark for the past 3- and 5-year periods.
Transamerica Developing Markets Debt. The Board noted that the performance of Class I2 of the Fund was above the median for its peer universe for the past 1-year period, in line with the median for the past 3-year period and below the median for the past 5-year period. The Board also noted that the performance of Class I2 of the Fund was below its benchmark for the past 1-, 3- and 5-year periods. The Trustees discussed the reasons for the underperformance with TAM and agreed to continue to monitor the performance of the Fund.
Transamerica Emerging Markets. The Board noted that the performance of Class I2 of the Fund was below the median for its peer universe for the past 1- and 3-year periods. The Board also noted that the performance of Class I2 of the Fund was below its benchmark for the past 1- and 3-year periods. The Trustees discussed the reasons for the underperformance with TAM and agreed to continue to monitor the performance of the Fund. The Trustees also noted that the performance of the Fund had improved during 2012.
Transamerica Global Allocation. The Board noted that the performance of Class I2 of the Fund was in line with the median for its peer universe for the past 1-year period, below the median for the past 3-year period and above the median for the past 5-year period. The Board also noted that the performance of Class I2 of the Fund was above its primary benchmark for the past 1- and 5-year periods and below its primary benchmark for the past 3-year period.
Transamerica Global Macro. The Board noted that the performance of Class I2 of the Fund was below the median for its peer universe for the past 1-year period and in line with the median for the past 3-year period. The Board also noted that the performance of Class I2 of the Fund was below its benchmark for the past 1-year period and above its benchmark for the past 3-year period. The Board noted that the Fund’s performance for the 3-year period included the management of the Fund’s previous sub-adviser in accordance with different investment strategies. The Trustees discussed the reasons for the underperformance with TAM and agreed to continue to monitor the performance of the Fund.
Transamerica Global Real Estate Securities. The Board noted that the performance of Class I2 of the Fund was above the median for its peer universe for the past 1- and 5-year periods and below the median for the past 3-year period. The Board also noted that the performance of Class I2 of the Fund was below its benchmark for the past 1- and 3-year periods and above its benchmark for the past 5-year period.
Transamerica Growth. The Board noted that the performance of Class I2 of the Fund was above the median for its peer universe for the past 1-, 3- and 5-year periods. The Board also noted that the performance of Class I2 of the Fund was below its benchmark for the past 1-, 3- and 5-year periods.
Transamerica International. The Board noted that the performance of Class I2 of the Fund was above the median for its peer universe for the past 1-year period, in line with the median for the past 3-year period and below the median for the past 5-year period. The Board also noted that the performance of Class I2 of the Fund was below its benchmark for the past 1- and 5-year periods and above its benchmark for the past 3-year period.
Transamerica International Equity Opportunities. The Board noted that the performance of Class I2 of the Fund was above the median for its peer universe for the past 1-year period and in line with the median for the past 3-year period. The Board also noted that the performance of Class I2 of the Fund was above its benchmark for the past 1- and 3-year periods.
Transamerica International Small Cap. The Board noted that the performance of Class I2 of the Fund was in line with the median for its peer universe for the past 1- and 3-year periods. The Board also noted that the performance of Class I2 of the Fund was below its benchmark for the past 1-year period and above its benchmark for the past 3-year period.
| | | | |
| Transamerica Funds | | | | Annual Report 2012 |
| | Page 241 | | |
TRANSAMERICA FUNDS
INVESTMENT ADVISORY AND SUB-ADVISORY AGREEMENTS—CONTRACT RENEWAL (continued)
(unaudited)
Investment Performance (continued)
Transamerica International Value. The Board noted that the performance of Class I2 of the Fund was below the median for its peer universe for the past 1-, 3- and 5-year periods. The Board also noted that the performance of Class I2 of the Fund was below its benchmark for the past 1-, 3- and 5-year periods. The Board noted that the Fund’s performance for longer periods included the management of the Fund’s previous sub-adviser in accordance with different investment strategies. The Trustees discussed the reasons for the underperformance with TAM and agreed to continue to monitor the performance of the Fund. The Trustees also noted that the performance of the Fund had improved during 2012.
Transamerica International Value Opportunities. The Board noted that the performance of Class I2 of the Fund was in line with the median for its peer universe for the past 1-year period and above the median for the past 3-year period. The Board also noted that the performance of Class I2 of the Fund was below its benchmark for the past 1- and 3-year periods.
Transamerica Large Company. The Board noted that the performance of Class I2 of the Fund was above the median for its peer universe for the past 1-year period and below the median for the past 3- and 5-year periods. The Board also noted that the performance of Class I2 of the Fund was above its benchmark for the past 1-year period and below its benchmark for the past 3- and 5-year periods. The Trustees discussed the reasons for the underperformance with TAM and agreed to continue to monitor the performance of the Fund.
Transamerica Long/Short Strategy. The Board noted that the performance of Class I2 of the Fund was below the median for its peer universe for the past 1- and 3-year periods. The Board also noted that the performance of Class I2 of the Fund was below its primary benchmark for the past 1- and 3-year periods. The Board noted that the Fund’s performance included the management of the Fund’s previous sub-adviser in accordance with different investment strategies. The Trustees discussed the reasons for the underperformance with TAM and agreed to continue to monitor the performance of the Fund. The Trustees also noted that the performance of the Fund had improved during 2012.
Transamerica Managed Futures Strategy. The Board noted that the performance of Class I2 of the Fund was below the median for its peer universe for the past
1-year period. The Board also noted that the performance of Class I2 of the Fund was below its benchmark for the past 1-year period. The Trustees discussed the reasons for the underperformance with TAM and agreed to continue to monitor the performance of the Fund.
Transamerica Mid Cap Value. The Board noted that the performance of Class I2 of the Fund was above the median for its peer universe for the past 1- and 5-year periods and in line with the median for the past 3-year period. The Board also noted that the performance of Class I2 of the Fund was above its benchmark for the past 1- and 5-year periods and below its benchmark for the past 3-year period.
Transamerica Real Return TIPS. The Board noted that the performance of Class I2 of the Fund was below the median for its peer universe for the past 1-year period and above the median for the past 3- and 5-year periods. The Board also noted that the performance of Class I2 of the Fund was below its benchmark for the past 1-year period and above its benchmark for the past 3- and 5-year periods.
Transamerica Small Company Growth. The Board noted that the performance of Class I2 of the Fund was below the median for its peer universe for the past 1- and 5-year periods and in line with the median for the past 3-year period. The Board also noted that the performance of Class I2 of the Fund was below its benchmark for the past 1-, 3- and 5-year periods.
Transamerica Total Return. The Board noted that the performance of Class I2 of the Fund was in line with the median for its peer universe for the past 1-year period and above the median for the past
3- and 5-year periods. The Board also noted that the performance of Class I2 of the Fund was below its benchmark for the past 1-year period and above its benchmark for the past 3- and 5-year periods.
Transamerica Value. The Board noted that the performance of Class I2 of the Fund was below the median for its peer universe for the past 1- and 3-year periods. The Board also noted that the performance of Class I2 of the Fund was below its primary benchmark for the past 1- and 3-year periods. The Trustees discussed the reasons for the underperformance with TAM and agreed to continue to monitor the performance of the Fund.
On the basis of this information and the Board’s assessment of the nature, extent and quality of the services to be provided or procured by TAM and the Sub-Advisers, the Board concluded that TAM and each Sub-Adviser are capable of generating a level of investment performance that is appropriate in light of the applicable Fund’s investment objectives, policies and strategies and competitive with other investment companies.
| | | | |
| Transamerica Funds | | | | Annual Report 2012 |
| | Page 242 | | |
TRANSAMERICA FUNDS
INVESTMENT ADVISORY AND SUB-ADVISORY AGREEMENTS—CONTRACT RENEWAL (continued)
(unaudited)
Management and Sub-Advisory Fees and Total Expense Ratios
The Board considered the management fee and total expense ratio of each Fund, including information provided by Lipper comparing the management fee and total expense ratio of each Fund to the management fees and total expense ratios of other investment companies in both a peer group and broader peer universe compiled by Lipper. The Board also considered the fees charged by the Sub-Advisers for sub-advisory services as well as the portion of a Fund’s management fee retained by TAM following payment of the sub-advisory fee.
Transamerica Arbitrage Strategy. The Board noted that the Fund’s contractual management fee was below the medians for its peer group and peer universe and that the actual total expenses (i.e., expenses reflecting any waivers and/or reimbursements) of Class I2 of the Fund were below the medians for its peer group and peer universe. The Board also noted that TAM has entered into an expense limitation arrangement with the Fund, which may result in TAM waiving fees for the benefit of shareholders.
Transamerica Bond. The Board noted that the Fund’s contractual management fee was above the medians for its peer group and peer universe and that the actual total expenses (i.e., expenses reflecting any waivers and/or reimbursements) of Class I2 of the Fund were in line with the median for its peer group and below the median for its peer universe. The Board also noted that TAM has entered into an expense limitation arrangement with the Fund, which may result in TAM waiving fees for the benefit of shareholders.
Transamerica Commodity Strategy. The Board noted that the Fund’s contractual management fee was below the medians for its peer group and peer universe and that the actual total expenses (i.e., expenses reflecting any waivers and/or reimbursements) of Class I2 of the Fund were below the medians for its peer group and peer universe. The Board also noted that TAM has entered into an expense limitation arrangement with the Fund, which may result in TAM waiving fees for the benefit of shareholders.
Transamerica Core Bond. The Board noted that the Fund’s contractual management fee was below the medians for its peer group and peer universe and that the actual total expenses (i.e., expenses reflecting any waivers and/or reimbursements) of Class I2 of the Fund were below the medians for its peer group and peer universe. The Board also noted that TAM has entered into an expense limitation arrangement with the Fund, which may result in TAM waiving fees for the benefit of shareholders. In addition, the Board noted a proposal to amend the current sub-advisory fee structure for the Fund in order to aggregate the Fund’s assets with the assets of Transamerica JPMorgan Core Bond VP, a series of Transamerica Series Trust, for purposes of calculating the sub-advisory fee to be paid by TAM to the Sub-Adviser.
Transamerica Developing Markets Equity. The Board noted that the Fund’s contractual management fee was above the medians for its peer group and peer universe and that the actual total expenses (i.e., expenses reflecting any waivers and/or reimbursements) of Class I2 of the Fund were below the medians for its peer group and peer universe. The Board also noted that TAM has entered into an expense limitation arrangement with the Fund, which may result in TAM waiving fees for the benefit of shareholders.
Transamerica Developing Markets Debt. The Board noted that the Fund’s contractual management fee was above the medians for its peer group and peer universe and that the actual total expenses (i.e., expenses reflecting any waivers and/or reimbursements) of Class I2 of the Fund were above the medians for its peer group and peer universe. The Board also noted that TAM has entered into an expense limitation arrangement with the Fund, which may result in TAM waiving fees for the benefit of shareholders. The Board further noted that TAM and the Sub-Adviser proposed to reduce the initial breakpoint in the Funds’ management and sub-advisory fee schedules from $250 million to $200 million, which would result in a reduced management fee rate payable by the Fund at certain asset levels.
Transamerica Emerging Markets. The Board noted that the Fund’s contractual management fee was above the medians for its peer group and peer universe and that the actual total expenses (i.e., expenses reflecting any waivers and/or reimbursements) of Class I2 of the Fund were below the medians for its peer group and peer universe. The Board also noted that TAM has entered into an expense limitation arrangement with the Fund, which may result in TAM waiving fees for the benefit of shareholders.
Transamerica Global Allocation. The Board noted that the Fund’s contractual management fee was below the medians for its peer group and peer universe and that the actual total expenses (i.e., expenses reflecting any waivers and/or reimbursements) of Class I2 of the Fund were below the medians for its peer group and peer universe. The Board also noted that TAM has entered into an expense limitation arrangement with the Fund, which may result in TAM waiving fees for the benefit of shareholders.
Transamerica Global Macro. The Board noted that the Fund’s contractual management fee was above the medians for its peer group and peer universe and that the actual total expenses (i.e., expenses reflecting any waivers and/or reimbursements) of Class I2 of the Fund were below the medians for its peer group and peer universe. The Board also noted that TAM has entered into an expense limitation arrangement with the Fund, which may result in TAM waiving fees for the benefit of shareholders.
Transamerica Global Real Estate Securities. The Board noted that the Fund’s contractual management fee was below the medians for its peer group and peer universe and that the actual total expenses (i.e., expenses reflecting any waivers and/or reimbursements) of Class I2 of the Fund were below the medians for its peer group and its peer universe.
| | | | |
| Transamerica Funds | | | | Annual Report 2012 |
| | Page 243 | | |
TRANSAMERICA FUNDS
INVESTMENT ADVISORY AND SUB-ADVISORY AGREEMENTS—CONTRACT RENEWAL (continued)
(unaudited)
Management and Sub-Advisory Fees and Total Expense Ratios (continued)
Transamerica Growth. The Board noted that the Fund’s contractual management fee was in line with the median for its peer group and above the median for its peer universe and that the actual total expenses (i.e., expenses reflecting any waivers and/or reimbursements) of Class I2 of the Fund were below the medians for its peer group and peer universe.
Transamerica International. The Board noted that the Fund’s contractual management fee was below the median for its peer group and in line with the median for its peer universe and that the actual total expenses (i.e., expenses reflecting any waivers and/or reimbursements) of Class I2 of the Fund were below the medians for its peer group and peer universe. The Board also noted that TAM has entered into an expense limitation arrangement with the Fund, which may result in TAM waiving fees for the benefit of shareholders.
Transamerica International Equity Opportunities. The Board noted that the Fund’s contractual management fee was above the medians for its peer group and peer universe and that the actual total expenses (i.e., expenses reflecting any waivers and/or reimbursements) of Class I2 of the Fund were below the medians for its peer group and peer universe.
Transamerica International Small Cap. The Board noted that the Fund’s contractual management fee was in line with the medians for its peer group and peer universe and that the actual total expenses (i.e., expenses reflecting any waivers and/or reimbursements) of Class I2 of the Fund were below the medians for its peer group and peer universe. The Board also noted that TAM has entered into an expense limitation arrangement with the Fund, which may result in TAM waiving fees for the benefit of shareholders.
Transamerica International Value. The Board noted that the Fund’s contractual management fee was above the median for its peer group and in line with the median for its peer universe and that the actual total expenses (i.e., expenses reflecting any waivers and/or reimbursements) of Class I2 of the Fund were below the medians for its peer group and peer universe. The Board also noted that TAM has entered into an expense limitation arrangement with the Fund, which may result in TAM waiving fees for the benefit of shareholders.
Transamerica International Value Opportunities. The Board noted that the Fund’s contractual management fee was below the median for its peer group and in line with the median for its peer universe and that the actual total expenses (i.e., expenses reflecting any waivers and/or reimbursements) of Class I2 of the Fund were below the medians for its peer group and peer universe. The Board also noted that TAM has entered into an expense limitation arrangement with the Fund, which may result in TAM waiving fees for the benefit of shareholders.
Transamerica Large Company Value. The Board noted that the Fund’s contractual management fee was above the median for its peer group and in line with the median for its peer universe and that the actual total expenses (i.e., expenses reflecting any waivers and/or reimbursements) of Class I2 of the Fund were below the medians for its peer group and peer universe. The Board also noted that TAM has entered into an expense limitation arrangement with the Fund, which may result in TAM waiving fees for the benefit of shareholders.
Transamerica Long/Short Strategy. The Board noted that the Fund’s contractual management fee was below the median for its peer group and in line with the median for its peer universe and that the actual total expenses (i.e., expenses reflecting any waivers and/or reimbursements) of Class I2 of the Fund were below the medians for its peer group and peer universe. The Board also noted that TAM has entered into an expense limitation arrangement with the Fund, which may result in TAM waiving fees for the benefit of shareholders.
Transamerica Managed Futures Strategy. The Board noted that the Fund’s contractual management fee was below the median for its peer group and in line with the median for its peer universe and that the actual total expenses (i.e., expenses reflecting any waivers and/or reimbursements) of Class I2 of the Fund were below the medians for its peer group and peer universe. The Board also noted that TAM has entered into an expense limitation arrangement with the Fund, which may result in TAM waiving fees for the benefit of shareholders.
Transamerica Mid Cap Value. The Board noted that the Fund’s contractual management fee was above the medians for its peer group and peer universe and that the actual total expenses (i.e., expenses reflecting any waivers and/or reimbursements) of Class I2 of the Fund were below the medians for its peer group and peer universe. The Board also noted that TAM has entered into an expense limitation arrangement with the Fund, which may result in TAM waiving fees for the benefit of shareholders.
Transamerica Real Return TIPS. The Board noted that the Fund’s contractual management fee was above the medians for its peer group and peer universe and that the actual total expenses (i.e., expenses reflecting any waivers and/or reimbursements) of Class I2 of the Fund were above the medians for its peer group and peer universe.
Transamerica Small Company Growth. The Board noted that the Fund’s contractual management fee was in line with the medians for its peer group and peer universe and that the actual total expenses (i.e., expenses reflecting any waivers and/or reimbursements) of Class I2 of the Fund were below the medians for its peer group and peer universe. The Board also noted that TAM has entered into an expense limitation arrangement with the Fund, which may result in TAM waiving fees for the benefit of shareholders.
| | | | |
| Transamerica Funds | | | | Annual Report 2012 |
| | Page 244 | | |
TRANSAMERICA FUNDS
INVESTMENT ADVISORY AND SUB-ADVISORY AGREEMENTS—CONTRACT RENEWAL (continued)
(unaudited)
Management and Sub-Advisory Fees and Total Expense Ratios (continued)
Transamerica Total Return. The Board noted that the Fund’s contractual management fee was above the medians for its peer group and peer universe and that the actual total expenses (i.e., expenses reflecting any waivers and/or reimbursements) of Class I2 of the Fund were above the medians for its peer group and peer universe.
Transamerica Value. The Board noted that the Fund’s contractual management fee was below the medians for its peer group and peer universe and that the actual total expenses (i.e., expenses reflecting any waivers and/or reimbursements) of Class I2 of the Fund were below the medians for its peer group and peer universe. The Board also noted that TAM has entered into an expense limitation arrangement with the Fund, which may result in TAM waiving fees for the benefit of shareholders.
On the basis of these considerations, together with the other information it considered, the Board determined that the management and sub-advisory fees to be received by TAM and the Sub-Advisers under the Investment Advisory Agreements and Sub-Advisory Agreements are reasonable in light of the services provided.
Cost of Services Provided and Level of Profitability
The Board reviewed information provided by TAM about the cost of providing and/or procuring fund management services, as applicable, as well as the costs of the provision of administration, transfer agency and other services, to each Fund and to Transamerica Funds as a whole by TAM and its affiliates. The Board considered the profitability of TAM and its affiliates in providing these services for each Fund and Transamerica Funds as a whole, as well as the allocation methodology used for calculating profitability.
With respect to the Sub-Advisers, the Board noted that the sub-advisory fees are the product of arm’s-length negotiation between TAM and the applicable Sub-Adviser and are paid by TAM and not the applicable Fund. As a result, the Board principally considered the profitability of TAM and its affiliates with respect to each Fund.
Based on this information, the Board determined that the profitability of TAM and its affiliates from their relationships with the Funds was not excessive.
Economies of Scale
The Board considered economies of scale with respect to the management of each Fund, whether the Fund had appropriately benefited from any economies of scale, and whether there was the potential for realization of any further economies of scale. The Board also considered the existence of economies of scale with respect to management of the Transamerica funds overall and the extent to which the Funds benefited from these economies of scale. The Board considered each Fund’s management fee schedule and the existence of breakpoints, if any, and also considered the extent to which TAM shared economies of scale with the Funds through investments in capabilities and services. The Trustees concluded that each Fund’s fee structure reflected economies of scale to date but noted that they will have the opportunity to periodically reexamine whether each Fund has achieved economies of scale, and the appropriateness of management fees payable to TAM and fees paid to the Sub-Advisers, in the future.
Benefits to TAM, its Affiliates, or the Sub-Advisers from their Relationships with the Funds
The Board considered any other benefits derived by TAM, its affiliates, and the Sub-Advisers from their relationships with the Funds. The Board noted that TAM does not realize soft dollar benefits from its relationships with the Funds and that TAM believes that any use of soft dollars by the Sub-Advisers is generally appropriate and in the best interests of the Funds. The Board also noted that certain Sub-Advisers are participating in a brokerage program pursuant to which a portion of brokerage commissions paid by each applicable Fund is recaptured for the benefit of the Fund and its shareholders, thus limiting the amount of soft dollar arrangements the Sub-Adviser may engage in with respect to a Fund’s brokerage transactions.
Other Considerations
The Board noted that TAM has made a substantial commitment to the recruitment and retention of high quality personnel, and maintains the financial, compliance and operational resources reasonably necessary to manage each Fund in a professional manner that is consistent with the best interests of the Fund and its shareholders. In this regard, the Board favorably considered the procedures and policies TAM has in place to enforce compliance with applicable laws and regulations and oversee the portfolio management activities of the Sub-Advisers. The Board also noted that TAM has made a significant entrepreneurial commitment to the management and success of the Funds.
| | | | |
| Transamerica Funds | | | | Annual Report 2012 |
| | Page 245 | | |
TRANSAMERICA FUNDS
INVESTMENT ADVISORY AND SUB-ADVISORY AGREEMENTS—CONTRACT RENEWAL (continued)
(unaudited)
Conclusion
After consideration of the factors described above, as well as other factors, the Trustees, including all of the Independent Trustees, concluded that the renewal of each Investment Advisory Agreement and Sub-Advisory Agreement is in the best interests of the applicable Fund and its shareholders and voted to approve the renewal of each Investment Advisory Agreement and Sub-Advisory Agreement.
| | | | |
| Transamerica Funds | | | | Annual Report 2012 |
| | Page 246 | | |
SUPPLEMENTAL INFORMATION (unaudited)
TAX INFORMATION
For Dividends paid during the year ended October 31, 2012, the Funds designated the following maximum amounts of qualified dividend income:
| | | | |
Fund | | Qualified Dividend
Income (000’s) | |
Transamerica Arbitrage Strategy | | $ | 510 | |
Transamerica Bond | | | 1,956 | |
Transamerica Core Bond | | | — | |
Transamerica Developing Markets Equity | | | 2,678 | |
Transamerica Global Real Estate Securities | | | — | |
Transamerica Growth | | | 276 | |
Transamerica International | | | 5,957 | |
Transamerica International Equity Opportunities | | | 8,458 | |
Transamerica International Small Cap | | | 7,002 | |
Transamerica International Value Opportunities | | | 8,733 | |
Transamerica Large Company | | | 6,909 | |
Transamerica Mid Cap Value | | | 1,745 | |
Transamerica Real Return Tips | | | — | |
Transamerica Select Equity | | | 11,625 | |
Transamerica Total Return | | | — | |
Transamerica Value | | | 678 | |
Transamerica Commodity Strategy | | | — | |
Transamerica Global Allocation | | | 6,050 | |
Transamerica Managed Future Strategy | | | — | |
For corporate shareholders, investment income (dividend income plus short-term gains, if any) qualifies for the maximum dividends received deductions as follows:
| | | | |
Fund | | Dividend Received
Deduction Percentage | |
Transamerica Arbitrage Strategy | | | 6 | % |
Transamerica Bond | | | 5 | |
Transamerica Core Bond | | | — | |
Transamerica Developing Markets Equity | | | — | |
Transamerica Global Real Estate Securities | | | — | |
Transamerica Growth | | | 100 | |
Transamerica International | | | — | |
Transamerica International Equity Opportunities | | | — | |
Transamerica International Small Cap | | | — | |
Transamerica International Value Opportunities | | | — | |
Transamerica Large Company | | | 100 | |
Transamerica Mid Cap Value | | | 100 | |
Transamerica Real Return Tips | | | — | |
Transamerica Select Equity | | | 44 | |
Transamerica Total Return | | | — | |
Transamerica Value | | | 5 | |
Transamerica Commodity Strategy | | | — | |
Transamerica Global Allocation | | | 36 | |
Transamerica Managed Future Strategy | | | — | |
The amounts which represent income derived from sources within, and taxes paid to, foreign countries or possessions of the United States are as follows:
| | | | | | | | |
Fund | | Foreign Source Income
(000’s) | | | Foreign Taxes
(000’s) | |
Transamerica Developing Markets Equity | | $ | 8,065 | | | $ | 531 | |
Transamerica International | | | 10,440 | | | | 838 | |
Transamerica International Equity Opportunities | | | 8,707 | | | | 669 | |
Transamerica International Small Cap | | | 7,736 | | | | 407 | |
The information and distributions reported herein may differ from the information and distributions taxable to the shareholders for the calendar year ending December 31, 2012. Complete information will be computed and reported in conjunction with your 2012 Form 1099-DIV.
| | | | |
| Transamerica Funds | | | | Annual Report 2012 |
| | Page 247 | | |
TRANSAMERICA FUNDS
SUPPLEMENTAL SHAREHOLDER INFORMATION (unaudited)
At a meeting held on August 2, 2012, the Board of Trustees of the funds approved certain initiatives that are intended to move the fund complex to a more modern and efficient operating platform. The Board authorized seeking shareholder approval for these measures where required. A proxy statement asking fund shareholders to elect Trustees, approve a new investment advisory agreement between Transamerica Asset Management, Inc. and their funds, and approve changes to their fund’s fundamental investment policies was mailed in September 2012. If shareholder approval is obtained, these initiatives are expected to be implemented during the fourth quarter of 2012 or the first quarter of 2013. Shareholders of certain funds have already approved these proposals.
| | | | |
| Transamerica Funds | | | | Annual Report 2012 |
| | Page 248 | | |
TRANSAMERICA FUNDS
Management of the Funds
(unaudited)
Interested Board Member means a board member who may be deemed an “interested person” (as that term is defined in the 1940 Act) of the Trust because of his current or former service with TAM or an affiliate of TAM. Interested Board Members may also be referred to herein as “Interested Trustees.” Independent Board Member means a Board Member who is not an “interested person” (as defined under the 1940 Act) of the Trust and may also be referred to herein as an “Independent Trustee.”
The Board governs each fund and is responsible for protecting the interests of the shareholders. The Board Members are experienced executives who meet periodically throughout the year to oversee the business affairs of each fund and the operation of each fund by its officers. The Board also reviews the management of each fund’s assets by the investment adviser and its respective sub-adviser.
The funds are among the funds advised and sponsored by TAM (collectively, “Transamerica Asset Management Group”). Transamerica Asset Management Group (“TAMG”) consists of Transamerica Funds, Transamerica Series Trust (“TST”), Transamerica Income Shares, Inc. (“TIS”), Transamerica Partners Funds Group (“TPFG”), Transamerica Partners Funds Group II (“TPFG II”), Transamerica Partners Portfolios (“TPP”) and Transamerica Asset Allocation Variable Funds (“TAAVF”) and consists of 161 funds as of the mailing of this annual report.
The mailing address of each Board Member is c/o Secretary, 570 Carillon Parkway, St. Petersburg, Florida 33716.
The Board Members, their year of birth, their positions with the Trust, and their principal occupations for the past five years (their titles may have varied during that period), the number of funds in TAMG the Board oversees, and other board memberships they hold are set forth in the table below.
| | | | | | | | | | |
Name and Year of Birth | | Position(s) Held with Trust | | Term of Office and Length of Time Served* | | Principal Occupation(s) During Past Five Years | | Number of
Funds in
Complex Overseen
by Board
Member | | Other Directorships
During the Past Five Years |
| INTERESTED BOARD MEMBER |
| | | | | |
| Thomas A. Swank (1960) | | Board Member | | Since 2012 | | President and Chief Executive Officer, Transamerica Individual Savings & Retirement (2010 – present); | | 101 | | N/A |
| | | | | |
| | | | | | President and Chief Executive Officer, Transamerica Capital Management (2009 – present); | | | | |
| | | | | |
| | | | | | Board Member (November 2012 – present), President and Chief Executive Officer, Transamerica Funds, TST, TIS, (May 2012 – present); | | | | |
| | | | | |
| | | | | | President and Chief Executive Officer, TPP, TPFG, TPFG II and TAAVF (May 2012 – present); | | | | |
| | | | | |
| | | | | | Director, Chairman of the Board, Chief Executive Officer and President, Transamerica Asset Management, Inc. (“TAM”) (May 2012 – present); | | | | |
| | | | | |
| | | | | | Director, Chairman of the Board, Chief Executive Officer and President, Transamerica Fund Services, Inc. (“TFS”) (May 2012 – present); | | | | |
| | | | |
| Transamerica Funds | | | | Annual Report 2012 |
| | Page 249 | | |
| | | | | | | | | | |
Name and Year of Birth | | Position(s) Held with Trust | | Term of Office and Length of Time Served* | | Principal Occupation(s) During Past Five Years | | Number of
Funds in
Complex Overseen
by Board
Member | | Other Directorships
During the Past Five Years |
| INTERESTED BOARD MEMBER—continued |
| | | | | |
Thomas A. Swank (continued) | | | | | | Director and Trust Officer, Massachusetts Fidelity Trust Company (May 2012 – present); Supervisory Board Member, AEGON Sony Life Insurance Co., LTD. (2011 – present); | | | | |
| | | | | |
| | | | | | Division President, Monumental Life Insurance Company (2011 – present); | | | | |
| | | | | |
| | | | | | Division President, Western Reserve Life Assurance Co. of Ohio (2011 – present); | | | | |
| | | | | |
| | | | | | Vice President, Money Services, Inc. (2011 –present); | | | | |
| | | | | |
| | | | | | Director, AEGON Financial Services Group, Inc. (2010 – present); | | | | |
| | | | | |
| | | | | | Director, AFSG Securities Corporation (2010 – present); Director and President, Transamerica Advisors Life Insurance Company (2010 – present); | | | | |
| | | | | |
| | | | | | Director, Chairman of the Board and President, Transamerica Advisors Life Insurance Company of New York (2010 – present); | | | | |
| | | | | |
| | | | | | Director and President, Transamerica Resources, Inc. (2010 – present); | | | | |
| | | | | |
| | | | | | Executive Vice President, Transamerica Life Insurance Company (2010 – present); | | | | |
| | | | | |
| | | | | | Executive Vice President, Transamerica Financial Life Insurance Company (2009 – present); | | | | |
| | | | | |
| | | | | | Director, Transamerica Capital, Inc. (2009 – present); and | | | | |
| | | | | |
| | | | | | President and Chief Operating Officer (2007 – 2009), Senior Vice President, Chief Marketing Officer (2006 – 2007), Senior Vice President, Chief Financial Officer (2003 – 2006), Senior Vice President, Chief Risk Officer (2000 – 2003), Senior Vice President, Chief Investment Officer (1997 – 2000) and High Yield Portfolio Manager (1992 – 1997), Security Benefit Corporation | | | | |
| | | | |
| Transamerica Funds | | | | Annual Report 2012 |
| | Page 250 | | |
| | | | | | | | | | | | |
Name and Year of Birth | | Position(s) Held with Trust | | Term of Office and Length of Time Served* | | Principal Occupation(s) During Past Five Years | | Number of
Funds in
Complex Overseen
by Board
Member | | | Other Directorships
During the Past Five Years |
| INTERESTED BOARD MEMBER—continued |
| | | | | |
Alan F. Warrick (1948) | | Board Member | | Since 2012 | | Board Member, Transamerica Funds, TST, TIS, TPP, TPFG, TPFG II and TAAVF (January 2012 – present); | | | 161 | | | N/A |
| | | | | |
| | | | | | Consultant, AEGON USA (2010 – present); Senior Advisor, Lovell Minnick Equity Partners (2010 – present); | | | | | | |
| | | | | |
| | | | | | Retired (2010 – present); and Managing Director for Strategic Business Development, AEGON USA (1994 – 2010). | | | | | | |
|
| INDEPENDENT BOARD MEMBERS |
| | | | | |
Sandra N. Bane (1952) | | Board Member | | Since 2008 | | Retired (1999 – present); Board Member, Transamerica Funds, TST, TIS, TPP, TPFG, TPFG II and TAAVF
(2008 – present); Board Member, TII (2003 – 2010); and | | | 161 | | | Big 5 Sporting Goods
(2002 – present); AGL Resources, Inc. (energy services holding company) (2008 – present) |
| | | | | |
| | | | | | Partner, KPMG (1975 – 1999). | | | | | | |
| | | | | |
Leo J. Hill (1956) | | Lead Independent Board Member | | Since 2002 | | Principal, Advisor Network Solutions, LLC (business consulting) (2006 – present); | | | 161 | | | N/A |
| | | | | |
| | | | | | Board Member, TST
(2001 – present); | | | | | | |
| | | | | |
| | | | | | Board Member, Transamerica Funds and TIS (2002 – present); | | | | | | |
| | | | | |
| | | | | | Board Member, TPP, TPFG, TPFG II and TAAVF (2007 – present); | | | | | | |
| | | | | |
| | | | | | Board Member, TII (2008 – 2010); | | | | | | |
| | | | | |
| | | | | | President, L. J. Hill & Company (a holding company for privately-held assets) (1999 – present); | | | | | | |
| | | | | |
| | | | | | Market President, Nations Bank of Sun Coast Florida (1998 – 1999); | | | | | | |
| | | | | |
| | | | | | Chairman, President and Chief Executive Officer, Barnett Banks of Treasure Coast Florida
(1994 – 1998); | | | | | | |
| | | | |
| Transamerica Funds | | | | Annual Report 2012 |
| | Page 251 | | |
| | | | | | | | | | | | |
Name and Year of Birth | | Position(s) Held with Trust | | Term of Office and Length of Time Served* | | Principal Occupation(s) During Past Five Years | | Number of
Funds in
Complex Overseen
by Board
Member | | | Other Directorships
During the Past Five Years |
| INDEPENDENT BOARD MEMBERS—continued |
| | | | | |
Leo J. Hill (continued) | | | | | | Executive Vice President and Senior Credit Officer, Barnett Banks of Jacksonville, Florida (1991 – 1994); and | | | | | | |
| | | | | |
| | | | | | Senior Vice President and Senior Loan Administration Officer, Wachovia Bank of Georgia (1976 – 1991). | | | | | | |
| | | | | |
David W. Jennings (1946) | | Board Member | | Since 2009 | | Board Member, Transamerica Funds, TST, TIS, TPP, TPFG, TPFG II and TAAVF (2009 – present); Board Member, TII (2009 – 2010); Managing Director, Hilton Capital
(2010 – present); Principal, Maxam Capital Management, LLC (2006 – 2008); and Principal, Cobble Creek Management LP (2004 – 2006). | | | 161 | | | N/A |
| | | | | |
Russell A. Kimball, Jr. (1944) | | Board Member | | 1986 – 1990 and Since 2002 | | General Manager, Sheraton Sand Key Resort (1975 – present); Board Member, TST (1986 – present); Board Member, Transamerica Funds, (1986 – 1990), (2002 – present); Board Member, TIS (2002 – present); Board Member, TPP, TPFG, TPFG II and TAAVF (2007 – present); and Board Member, TII (2008 – 2010). | | | 161 | | | N/A |
| | | | | |
Eugene M. Mannella (1954) | | Board Member | | Since 2007 | | Chief Executive Officer, HedgeServ Corporation (hedge fund administration) (2008 – present); | | | 161 | | | N/A |
| | | | | |
| | | | | | Self-employed consultant
(2006 – present); Managing Member and Chief Compliance Officer, HedgeServ Investment Services, LLC (limited purpose broker-dealer) (2011 – present); | | | | | | |
| | | | |
| Transamerica Funds | | | | Annual Report 2012 |
| | Page 252 | | |
| | | | | | | | | | | | |
Name and Year of Birth | | Position(s) Held with Trust | | Term of Office and Length of Time Served* | | Principal Occupation(s) During Past Five Years | | Number of
Funds in
Complex Overseen
by Board
Member | | | Other Directorships
During the Past Five Years |
| INDEPENDENT BOARD MEMBERS—continued |
| | | | | |
Eugene M. Mannella (continued) | | | | | | President, ARAPAHO Partners LLC (limited purpose broker-dealer)
(1998 – 2008); | | | | | | |
| | | | | |
| | | | | | Board Member, TPP, TPFG, TPFG II and TAAVF (1993 – present); | | | | | | |
| | | | | |
| | | | | | Board Member, Transamerica Funds, TST and TIS (2007 – present); | | | | | | |
| | | | | |
| | | | | | Board Member, TII (2008 – 2010); and | | | | | | |
| | | | | |
| | | | | | President, International Fund Services (alternative asset administration)
(1993 – 2005). | | | | | | |
| | | | | |
Norman R. Nielsen, Ph.D. (1939) | | Board Member | | Since 2006 | | Retired (2005 – present); Board Member, Transamerica Funds, TST and TIS (2006 – present); | | | 161 | | | Buena Vista University Board of Trustees (2004 – present) |
| | | | | |
| | | | | | Board Member, TPP, TPFG, TPFG II and TAAVF (2007 – present); | | | | | | |
| | | | | |
| | | | | | Board Member, TII (2008 – 2010); | | | | | | |
| | | | | |
| | | | | | Director, Aspire Resources Inc. (formerly, Iowa Student Loan Service Corporation) (2006 – present); | | | | | | |
| | | | | |
| | | | | | Director, League for Innovation in the Community Colleges (1985 – 2005); | | | | | | |
| | | | | |
| | | | | | Director, Iowa Health Systems
(1994 – 2003); | | | | | | |
| | | | | |
| | | | | | Director, U.S. Bank (1985 – 2006); and | | | | | | |
| | | | | |
| | | | | | President, Kirkwood Community College (1985 – 2005). | | | | | | |
| | | | | |
Joyce G. Norden (1939) | | Board Member | | Since 2007 | | Retired (2004 – present); Board Member, TPFG, TPFG II and TAAVF (1993 – present); Board Member, TPP (2002 – present); Board Member, Transamerica Funds, TST and TIS (2007 – present); | | | 161 | | | Board of Governors, Reconstructionist Rabbinical College (2007 – present) |
| | | | |
| Transamerica Funds | | | | Annual Report 2012 |
| | Page 253 | | |
| | | | | | | | | | | | |
Name and Year of Birth | | Position(s) Held with Trust | | Term of Office and Length of Time Served* | | Principal Occupation(s) During Past Five Years | | Number of
Funds in
Complex Overseen
by Board
Member | | | Other Directorships
During the Past Five Years |
| INDEPENDENT BOARD MEMBERS—continued |
| | | | | |
Joyce G. Norden (continued) | | | | | | Board Member, TII (2008 – 2010); and | | | | | | |
| | | | | | Vice President, Institutional Advancement, Reconstructionist Rabbinical College (1996 – 2004). | | | | | | |
| | | | | |
Patricia L. Sawyer (1950) | | Board Member | | Since 2007 | | Retired (2007 – present); President/Founder, Smith & Sawyer LLC (management consulting) (1989 – 2007); | | | 161 | | | Honorary Trustee, Bryant University (1996 – present) |
| | | | | |
| | | | | | Board Member, Transamerica Funds, TST and TIS (2007 – present); | | | | | | |
| | | | | |
| | | | | | Board Member, TII (2008 – 2010); | | | | | | |
| | | | | |
| | | | | | Board Member, TPP, TPFG, TPFG II and TAAVF (1993 – present); | | | | | | |
| | | | | |
| | | | | | Trustee, Chair of Finance Committee and Chair of Nominating Committee
(1987 – 1996), Bryant University; | | | | | | |
| | | | | |
| | | | | | Vice President, American Express
(1987 – 1989); | | | | | | |
| | | | | |
| | | | | | Vice President, The Equitable (1986 – 1987); and | | | | | | |
| | | | | |
| | | | | | Strategy Consultant, Booz, Allen & Hamilton (1982 – 1986). | | | | | | |
| | | | | |
John W. Waechter (1952) | | Board Member | | Since 2005 | | Attorney, Englander and Fischer, LLP
(2008 – present); Retired (2004 – 2008); | | | | | | |
| | | | | |
| | | | | | Board Member, TST and TIS
(2004 – present); | | | | | | |
| | | | | |
| | | | | | Board Member, Transamerica Funds (2005 – present); | | | | | | |
| | | | | |
| | | | | | Board Member, TPP, TPFG, TPFG II and TAAVF (2007 – present); | | | | | | |
| | | | | |
| | | | | | Board Member, TII (2008 – 2010); | | | | | | |
| | | | | |
| | | | | | Employee, RBC Dain Rauscher (securities dealer) (2004); | | | | | | |
| | | | |
| Transamerica Funds | | | | Annual Report 2012 |
| | Page 254 | | |
| | | | | | | | | | |
Name and Year of Birth | | Position(s) Held with Trust | | Term of Office and Length of Time Served* | | Principal Occupation(s) During Past Five Years | | Number of
Funds in
Complex Overseen
by Board
Member | | Other Directorships
During the Past Five Years |
| INDEPENDENT BOARD MEMBERS—continued |
| | | | | |
John W. Waechter (continued) | | Board Member | | Since 2005 | | Executive Vice President, Chief Financial Officer and Chief Compliance Officer, William R. Hough & Co. (securities dealer)
(1979 – 2004); and Treasurer, The Hough Group of Funds (1993 – 2004). | | 161 | | Operation PAR, Inc. (2008 – present); West Central Florida Council – Boy Scouts of America (2008 – present) |
| * | Each Board Member shall hold office until: 1) his or her successor is elected and qualified or 2) he or she resigns, retires or his or her term as a Board Member is terminated in accordance with the Trust’s Declaration of Trust. |
| | | | |
| Transamerica Funds | | | | Annual Report 2012 |
| | Page 255 | | |
OFFICERS
The mailing address of each officer is c/o Secretary, 570 Carillon Parkway, St. Petersburg, Florida 33716. The following table shows information about the officers, including their year of birth, their positions held with the Trust and their principal occupations during the past five years (their titles may have varied during that period). Each officer will hold office until his or her successor has been duly elected or appointed or until his or her earlier death, resignation or removal.
| | | | | | |
Name and Year of Birth | | Position | | Term of Office and Length of Time Served* | | Principal Occupation(s) or Employment During Past Five Years |
Thomas A. Swank (1960) | | Board Member, President and Chief Executive Officer | | Since 2012 | | See table above. |
| | | |
Timothy S. Galbraith (1964) | | Vice President and
Chief Investment Officer, Alternative Investments | | Since 2012 | | Vice President and Chief Investment Officer, Alternative Investments, Transamerica Funds, TST, TIS, TPP, TPFG, TPFG II and TAAVF (April 2012 – present); |
| | | |
| | | | | | Senior Vice President and Chief Investment Officer, Alternative Investments (March 2012 – present), TAM; |
| | | |
| | | | | | Head of Alternative Investment Strategies, Morningstar Associates, LLC (2009 – March 2012); and |
| | | |
| | | | | | Managing Director, Bear Stearns Asset Management (2001 – 2009). |
| | | |
Dennis P. Gallagher (1970) | | Vice President, General Counsel and Secretary | | Since 2006 | | Vice President, General Counsel and Secretary, Transamerica Funds, TST and TIS (2006 – present); |
| | | |
| | | | | | Vice President, General Counsel and Secretary, TPP, TPFG, TPFG II and TAAVF (2007 – present); |
| | | |
| | | | | | Vice President, General Counsel and Secretary, TII, (2006 – 2010); |
| | | |
| | | | | | Director, Senior Vice President, General Counsel, Operations and Secretary, TAM (2006 – present); |
| | | |
| | | | | | Director, Senior Vice President, General Counsel, Chief Administrative Officer and Secretary, TFS (2006 – present); |
| | | |
| | | | | | Assistant Vice President, TCI (2007 – present); |
| | | |
| | | | | | Director, Deutsche Asset Management (1998 – 2006); and |
| | | |
| | | | | | Corporate Associate, Ropes & Gray LLP (1995 – 1998). |
| | | |
Todd R. Porter (1961) | | Vice President and Chief Investment Officer, Asset Allocation | | Since 2012 | | Vice President and Chief Investment Officer, Asset Allocation, Transamerica Funds, TST, TIS, TPP, TPFG, TPFG II and TAAVF (April 2012 – present); Senior Vice President and Chief Investment Officer, Asset Allocation (April 2012 – present), TAM; |
| | | |
| | | | | | Chief Investment Officer, Fund Architects, LLC (2007 – 2012); and |
| | | |
| | | | | | Chief Investment Strategist, Morningstar |
| | | | | | Associates, LLC (1999 – 2006). |
| | | | |
| Transamerica Funds | | | | Annual Report 2012 |
| | Page 256 | | |
| | | | | | |
Name and Year of Birth | | Position | | Term of Office and Length of Time Served* | | Principal Occupation(s) or Employment During Past Five Years |
Christopher A. Staples (1970) | | Vice President and Chief Investment Officer, Advisory Services | | Since 2005 | | Vice President and Chief Investment Officer, Advisory Services (2007 – present), Senior Vice President – Investment Management (2006 – 2007), Vice President – Investment Management (2005 – 2006), Transamerica Funds, TST and TIS; |
| | | |
| | | | | | Vice President and Chief Investment Officer, Advisory Services, TPP, TPFG, TPFG II and TAAVF (2007 – present); |
| | | |
| | | | | | Vice President and Chief Investment Officer (2007 – 2010); Vice President – Investment Administration (2005 – 2007), TII; |
| | | |
| | | | | | Director (2005 – present), Senior Vice President (2006 –present) and Chief Investment Officer, Advisory Services (2007 – present), TAM; |
| | | |
| | | | | | Director, TFS (2005 – present); and Assistant Vice President, Raymond James & Associates (1999 – 2004). |
| | | |
Elizabeth Strouse (1974) | | Vice President, Treasurer and Principal Financial Officer | | Since 2010 | | Vice President, Treasurer and Principal Financial Officer
(2011 – present), Assistant Treasurer (2010 – 2011), Transamerica Funds, TST, TIS, TPP, TPFG, TPFG II and TAAVF; |
| | | |
| | | | | | Vice President, TAM and TFS (2009 – present); |
| | | |
| | | | | | Director, Fund Administration, TIAA-CREF (2007 – 2009); and |
| | | |
| | | | | | Manager (2006 – 2007) and Senior (2003 – 2006) Accounting and Assurance, PricewaterhouseCoopers, LLC. |
| | | |
Robert S. Lamont, Jr. (1973) | | Vice President, Chief Compliance Officer and Conflicts of Interest Officer | | Since 2010 | | Vice President, Chief Compliance Officer and Conflicts of Interest Officer, Transamerica Funds, TST, TIS, TPP, TPFG, TPFG II and TAAVF (2010 – present); |
| | | |
| | | | | | Vice President and Senior Counsel, TAM and TFS (2007 – present); |
| | | |
| | | | | | Senior Counsel, United States Securities and Exchange Commission (2004 – 2007); and |
| | | |
| | | | | | Associate, Dechert, LLP (1999 – 2004). |
| | | |
Bradley O. Ackerman (1966) | | Deputy Chief Compliance Officer and Anti-Money Laundering Officer | | Since 2007 | | Deputy Chief Compliance Officer, Transamerica Funds, TST, TIS, TPP, TPFG, TPFG II and TAAVF (January 2012 – present); |
| | | |
| | | | | | Anti-Money Laundering Officer, TPP, TPFG, TPFG II and TAAVF (2009 – present); |
| | | |
| | | | | | Anti-Money Laundering Officer, Transamerica Funds, TST and TIS (2007 – present); |
| | | |
| | | | | | Senior Compliance Officer, TAM (2007 – present); and |
| | | |
| | | | | | Director, Institutional Services, Rydex Investments (2002 – 2007). |
| | | | |
| Transamerica Funds | | | | Annual Report 2012 |
| | Page 257 | | |
| | | | | | |
Name and Year of Birth | | Position | | Term of Office and Length of Time Served* | | Principal Occupation(s) or Employment During Past Five Years |
Sarah L. Bertrand (1967) | | Assistant Secretary | | Since 2009 | | Assistant Secretary, Transamerica Funds, TST, TIS, TPP, TPFG, TPFG II and TAAVF (2009 – present); |
| | | |
| | | | | | Assistant Secretary, TII (2009 – 2010); |
| | | |
| | | | | | Assistant Vice President and Director, Legal Administration, TAM and TFS (2007 – present); |
| | | |
| | | | | | Assistant Secretary and Chief Compliance Officer, 40|86 Series Trust and 40|86 Strategic Income Fund (2000 – 2007); and |
| | | |
| | | | | | Second Vice President and Assistant Secretary, Legal and Compliance, 40|86 Capital Management, Inc. (1994 – 2007). |
| | | |
Timothy J. Bresnahan (1968) | | Assistant Secretary | | Since 2009 | | Assistant Secretary, Transamerica Funds, TST, TIS, TPP, TPFG, TPFG II and TAAVF (2009 – present); |
| | | |
| | | | | | Assistant Secretary, TII (2009 – 2010); Vice President and Senior Counsel, TAM (2008 – present); |
| | | |
| | | | | | Counsel (contract), Massachusetts Financial Services, Inc. (2007); |
| | | |
| | | | | | Assistant Counsel, BISYS Fund Services Ohio, Inc. (2005 – 2007); and |
| | | |
| | | | | | Associate, Greenberg Traurig, P.A. (2004 – 2005). |
| | | |
Margaret A. Cullem-Fiore (1957) | | Assistant Secretary | | Since 2010 | | Assistant Secretary, Transamerica Funds, TST, TIS, TPP, TPFG, TPFG II and TAAVF (2010 – present); |
| | | |
| | | | | | Assistant Vice President, TCI (2009 – present); |
| | | |
| | | | | | Vice President and Assistant General Counsel, TAM and TFS
(2006 – present); |
| | | |
| | | | | | Vice President and Senior Counsel, Transamerica Financial Advisors, Inc. (2004 – 2007); and |
| | | |
| | | | | | Vice President and Senior Counsel, Western Reserve Life Assurance Co. of Ohio (2006). |
| * | Elected and serves at the pleasure of the Board of the Trust. |
If an officer has held offices for different funds for different periods of time, the earliest applicable date is shown. No officer of the Trust, except for the Chief Compliance Officer, receives any compensation from the Trust.
Additional information about the Funds’ Board Members can be found in the Statement of Additional Information, available, without charge, upon request, by calling toll free 1-800-233-4339 or on the Trust’s website at www.transamericainvestments.com.
| | | | |
| Transamerica Funds | | | | Annual Report 2012 |
| | Page 258 | | |
PROXY VOTING POLICIES AND PROCEDURES AND QUARTERLY PORTFOLIO HOLDINGS
(unaudited)
A description of the Transamerica Funds’ proxy voting policies and procedures is available in the Statement of Additional Information of the Funds, available without charge upon request by calling 1-888-233-4339 (toll free) or on the Securities and Exchange Commission’s (“SEC”) website at http://www.sec.gov.
In addition, the Funds are required to file Form N-PX, with their complete proxy voting records for the 12 months ended June 30th, no later than August 31st of each year. The Form is available without charge: (1) from the Funds, upon request by calling 1-888-233-4339; and (2) on the SEC’s website at http://www.sec.gov.
The Funds file their complete schedule of portfolio holdings with the SEC for the first and third quarter of each fiscal year on Form N-Q, which is available on the SEC’s website at http://www.sec.gov. The Funds’ Form N-Q may be reviewed and copied at the SEC’s Public Reference Room in Washington, D.C. Information on the operation of the Public Reference Room may be obtained by calling 1-800-SEC-0330.
You may also visit the Trust’s website at www.transamericainvestments.com for this and other information about the Portfolios and the Trust.
Important Notice Regarding Delivery of Shareholder Documents
Every year we send shareholders informative materials such as the Transamerica Funds Annual Report, the Transamerica Funds Prospectus, and other required documents that keep you informed regarding your Funds. Transamerica Funds will only send one piece per mailing address, a method that saves your Funds’ money by reducing mailing and printing costs. We will continue to do this unless you tell us not to. To elect to receive individual mailings, simply call a Transamerica Customer Service Representative toll free at 1-888-233-4339, 8 a.m. to 7 p.m. Eastern Time, Monday–Friday. Your request will take effect within 30 days.
| | | | |
| Transamerica Funds | | | | Annual Report 2012 |
| | Page 259 | | |
NOTICE OF PRIVACY POLICY
(unaudited)
Protecting your privacy is very important to us. We want you to understand what information we collect and how we use it. We collect and use “nonpublic personal information” in connection with providing our customers with a broad range of financial products and services as effectively and conveniently as possible. We treat nonpublic personal information in accordance with our Privacy Policy.
What Information We Collect and From Whom We Collect It
We may collect nonpublic personal information about you from the following sources:
| | • | | Information we receive from you on applications or other forms, such as your name, address, and account number; |
| | • | | Information about your transactions with us, our affiliates, or others, such as your account balance and purchase/redemption history; and |
| | • | | Information we receive from non-affiliated third parties, including consumer reporting agencies. |
What Information We Disclose and To Whom We Disclose It
We do not disclose any nonpublic personal information about current or former customers to anyone without their express consent, except as permitted by law. We may disclose the nonpublic personal information we collect, as described above, to persons or companies that perform services on our behalf and to other financial institutions with which we have joint marketing agreements. We will require these companies to protect the confidentiality of your nonpublic personal information and to use it only to perform the services for which we have hired them.
Our Security Procedures
We restrict access to your nonpublic personal information and only allow disclosures to persons and companies as permitted by law to assist in providing products or services to you. We maintain physical, electronic, and procedural safeguards to protect your nonpublic personal information and to safeguard the disposal of certain consumer information.
If you have any questions about our Privacy Policy, please call 1-888-233-4339 on any business day between 8 a.m. and 7 p.m. Eastern Time.
Note: This Privacy Policy applies only to customers that have a direct relationship with us or our affiliates. If you own shares of our funds in the
| | | | |
| Transamerica Funds | | | | Annual Report 2012 |
| | Page 260 | | |
Customer Service 1-888-233-4339
P.O. Box 9012 • Clearwater, FL 33758-9012
Distributor: Transamerica Capital, Inc.
| (a) | Registrant has adopted a code of ethics that applies to its principal executive officer, principal financial officer, and any other officers who serve a similar function. |
| (b) | Registrant’s code of ethics is reasonably designed as described in this Form N-CSR. |
| (c) | During the period covered by the report, the code of ethics was revised to reflect the appointment of a new Chief Executive Officer and a new Principal Financial Officer. |
| (d) | During the period covered by the report, Registrant did not grant any waivers, including implicit waivers, from the provisions of this code of ethics. |
| (f) | Registrant has filed this code of ethics as an exhibit pursuant to Item 12(a)(1) of Form N-CSR. |
Item 3: Audit Committee Financial Experts.
Registrant’s Board of Trustees has determined that Sandra N. Bane, John W. Waechter and Eugene M. Mannella are “audit committee financial experts,” as such term is defined in Item 3 of Form N-CSR. Ms. Bane, Mr. Waechter and Mr. Mannella are “independent” under the standards set forth in Item 3 of Form N-CSR. The designation of Ms. Bane, Mr. Waechter and Mr. Mannella as “audit committee financial experts” pursuant to Item 3 of Form N-CSR does not (i) impose upon them any duties, obligations, or liabilities that are greater than the duties, obligations and liabilities imposed upon them as a member of the Registrant’s audit committee or Board of Trustees in the absence of such designation; or (ii) affect the duties, obligations or liabilities of any other member of the Registrant’s audit committee or Board of Trustees.
Item 4: Principal Accountant Fees and Services.
| | | | | | | | | | |
| (in thousands) | | Fiscal Year Ended 10/31 | |
| | | | | 2012 | | | 2011 | |
| (a) | | Audit Fees | | | 473 | | | | 483 | |
| (b) | | Audit-related Fees (1) | | | — | | | | — | |
| (c) | | Tax Fees (2) | | | 355 | | | | 330 | |
| (d) | | All Other Fees | | | 10 | | | | 3 | |
| (e) (1) | | Pre-approval policy (3) | | | | | | | | |
| (e) (2) | | % of above that were pre-approved | | | 0 | % | | | 0 | % |
| (f) | | If greater than 50%, disclose hours | | | N/A | | | | N/A | |
(g) | | Non-audit fees rendered to Adviser (or affiliate that provided services to Registrant) | | | N/A | | | | N/A | |
(h) | | Disclose whether the Audit Committee has considered whether the provisions of non-audit services rendered to the Adviser that
were NOT pre-approved is compatible with maintaining the auditor’s independence. | | | Yes | | | | Yes | |
| (1) | Audit-Related Fees represent assurance and related services provided that are reasonably related to the performance of the audit of the financial statements of the Registrant, specifically data verification and agreed-upon procedures related to asset securitizations and agreed-upon procedures engagements. |
| (2) | Tax Fees represent tax compliance, tax planning and tax advice services provided in connection with the preparation and review of the Registrant’s tax returns. |
| (3) | The Audit Committee may delegate any portion of its authority, including the authority to grant pre-approvals of audit and permitted non-audit services, to one or more members or a subcommittee. Any decision of the subcommittee to grant pre-approvals shall be presented to the full Audit Committee at its next regularly scheduled meeting. |
Item 5: Audit Committee of Listed Registrants.
The following individuals comprise the standing Audit Committee: Sandra N. Bane, Leo J. Hill, David W. Jennings, Russell A. Kimball, Jr., Eugene M. Mannella, Norman R. Nielsen, Joyce G. Norden, Patricia L. Sawyer and John W. Waechter.
Item 6: Schedule of Investments.
The schedules of investments and consolidated schedules of investments are included in the annual report to shareholders filed under Item 1 of this Form N-CSR.
Item 7: Disclosure of Proxy Voting Policies and Procedures for Closed-End Management Investment Companies. Not applicable.
Item 8: Portfolio Managers of Closed-End Management Investment Companies. Not applicable.
Item 9. Purchases of Equity Securities by Closed-End Management Investment Company and Affiliated Purchasers. Not applicable.
Item 10: Submission of Matters to a Vote of Security Holders
There have been no material changes to the procedures by which shareholders may recommend nominees to the Registrant’s Board of Trustees that have been implemented since the Registrant last provided disclosure in response to the requirements of this Item.
Item 11: Controls and Procedures.
| | (a) | The Registrant’s principal executive officer and principal financial officer evaluated the Registrant’s disclosure controls and procedures within 90 days of this filing and have concluded that the Registrant’s disclosure controls and procedures (as defined in Rule 30a-3(c) under the Investment Company Act of 1940, as amended (the “1940 Act”)) are appropriately designed to ensure that information required to be disclosed by Registrant in the reports that it files on Form N-CSR (a) is accumulated and communicated to Registrant’s management, including its principal executive officer and principal financial officer, to allow timely decisions regarding required disclosure, and (b) is recorded, processed, summarized and reported, within the time periods specified in the rules and forms adopted by the U.S. Securities and Exchange Commission. |
4
| | (b) | The Registrant’s principal executive officer and principal financial officer are aware of no change in the Registrant’s internal control over financial reporting that occurred during the Registrant’s most recent fiscal quarter that has materially affected, or is reasonably likely to materially affect, the Registrant’s internal control over financial reporting. |
Item 12: Exhibits.
| (a) (1) | Registrant’s code of ethics (that is the subject of the disclosure required by Item 2(a)) is attached. |
| (2) Separate | certifications for Registrant’s principal executive officer and principal financial officer, as required by Rule |
| | 30a-2(a) under the 1940 Act, are attached. |
| (b) | A certification for Registrant’s principal executive officer and principal financial officer, as required by Rule 30a-2(b) under the 1940 Act, is attached. The certification furnished pursuant to this paragraph is not deemed to be “filed” for purposes of Section 18 of the Securities Act of 1934, or otherwise subject to liability of that section. Such certification is not deemed to be incorporated by reference into any filing under the Securities Act of 1933 or the Securities Exchange Act of 1934, except to the extent that the Registrant specifically incorporates it by reference |
5
SIGNATURES
Pursuant to the requirements of the Securities Exchange Act of 1934 and the Investment Company Act of 1940, the Registrant has duly caused this report to be signed on its behalf by the undersigned, thereunto duly authorized.
| | |
| Transamerica Funds |
| (Registrant) |
| |
| By: | | /s/ Thomas A. Swank |
| | Thomas A. Swank |
| | Chief Executive Officer |
| | Date: December 28, 2012 |
Pursuant to the requirements of the Securities Exchange Act of 1934 and the Investment Company Act of 1940, this report has been signed below by the following persons on behalf of the Registrant and in the capacities and on the dates indicated.
| | |
| |
| By: | | /s/ Thomas A. Swank |
| | Thomas A. Swank |
| | Chief Executive Officer |
| | Date: December 28, 2012 |
| | |
| |
| By: | | /s/ Elizabeth Strouse |
| | Elizabeth Strouse |
| | Principal Financial Officer |
| | Date: December 28, 2012 |
EXHIBIT INDEX
| | |
Exhibit No. | | Description of Exhibit |
| |
| 12(a)(1) | | Code of Ethics for Principal Executive and Senior Financial Officers |
| |
| 12(a)(2)(i) | | Section 302 N-CSR Certification of Principal Executive Officer |
| |
| 12(a)(2)(ii) | | Section 302 N-CSR Certification of Principal Financial Officer |
| |
| 12(b) | | Section 906 N-CSR Certification of Principal Executive Officer and Principal Financial Officer |