As filed with the Securities and Exchange Commission on January 9, 2015
SECURITIES AND EXCHANGE COMMISSION
WASHINGTON, D.C. 20549
FORM N-CSR
CERTIFIED SHAREHOLDER REPORT OF REGISTERED MANAGEMENT INVESTMENT COMPANIES
Investment Company Act file number: 811-04556
TRANSAMERICA FUNDS
(Exact Name of Registrant as Specified in Charter)
570 Carillon Parkway, St. Petersburg, Florida 33716
(Address of Principal Executive Offices) (Zip Code)
Registrant’s Telephone Number, including Area Code: (727) 299-1800
Tané T. Tyler, Esq., 4600 S. Syracuse St., Suite 1100, Denver, Colorado 80237
(Name and Address of Agent for Service)
Date of fiscal year end: October 31
Date of reporting period: October 31, 2014
Item 1: Report(s) to Shareholders. The Annual Report is attached.

Fund of Funds
Annual Report
October 31, 2014
www.transamerica.com
Customer Service 1-888-233-4339
P.O. Box 9012 • Clearwater, FL 33758-9012
Distributor: Transamerica Capital, Inc.
Dear Fellow Shareholder,
On behalf of Transamerica Funds, I would like to thank you for your continued support and confidence in our products as we look forward to continuing to serve you and your financial adviser in the future. We value the trust you have placed in us.
This annual report is provided to you with the intent of presenting a comprehensive review of the investments of each of your Funds. The Securities and Exchange Commission requires that annual and semi-annual reports be sent to all shareholders, and we believe this report to be an important part of the investment process. In addition to providing a comprehensive review, this report also provides a discussion of accounting policies as well as matters presented to shareholders that may have required their vote.
We believe it is important to understand market conditions over the last year in order to provide a context for reading this report. At the beginning of this year, markets were focused on the possibility that 2014 would be the year that quantitative easing—the extraordinary monetary accommodation enacted by the U.S. Federal Reserve (“Fed”)—would finally be coming to an end. Fed officials had widely publicized their intentions to end the quantitative easing program as long as they saw continued improvement in the economy. In a welcomed development, the economy and the all-important labor market continued to make gains throughout 2014, with the Bureau of Labor Statistics reporting that the unemployment rate falling below six percent in September, the first time this has occurred since July 2008.
For all of the economic improvements witnessed in the U.S., much of the rest of the world seems to have been on a different path. Europe produced anemic economic growth, as it continued to grapple with weak internal demand and structural imbalances. Japan, a very indebted country, has been attempting to boost its economy through aggressive Central Bank stimulus. Finally, China has been working to slowly let the air out of speculative areas of its economy while trying to avoid damaging its broader economy.
Given the notable differences in Central Bank policy and the different degrees of economic health in which major economies find themselves, it is little surprise that the returns from major asset classes have varied. For the year ended October 31, 2014, the S&P 500® returned 17.27% while the Morgan Stanley Capital International Europe, Australasia, Far East Index, representing international developed market equities, lost 0.17%. During the same period, the Barclays U.S. Aggregate Bond Index returned 4.14%. Please keep in mind that it is important to maintain a diversified portfolio as investment returns have historically been difficult to predict.
In addition to your active involvement in the investment process, we firmly believe that a financial adviser is a key resource to help you build a complete picture of your current and future financial needs. Financial advisers are familiar with the market’s history, including long-term returns and volatility of various asset classes. With your financial adviser, you can develop an investment program that incorporates factors such as your goals, your investment timeline, and your risk tolerance.
Please contact your financial adviser if you have any questions about the contents of this report, and thanks again for the confidence you have placed in us.
Sincerely,
Marijn Smit
President & Chief Executive Officer
Transamerica Funds
Tom Wald, CFA
Chief Investment Officer
Transamerica Funds
The views expressed in this report reflect those of the portfolio managers only and may not necessarily represent the views of Transamerica Funds. These views are subject to change based upon market conditions. These views should not be relied upon as investment advice and are not indicative of trading intent on behalf of Transamerica Funds.
Transamerica Asset Allocation – Conservative Portfolio
(unaudited)
MARKET ENVIRONMENT
With a few minor setbacks in January, July, and late September/early October, the U.S. stock market advanced during the year ended October 31, 2014. The underlying impetus for the gains was mainly steady improvement in the U.S. economy, which by the end of the period appeared finally to be on steady footing. Employment continually improved throughout the period, with private payrolls adding an average of more than 200,000 jobs per month, and the official unemployment rate falling to 5.80% by October 2014 from 7.20% a year earlier. The Institute of Supply Management surveys for both manufacturing and services painted an increasingly positive picture of the economy’s strength, and corporate earnings continued to grow. Thus, despite the psychological overhang of the U.S. Federal Reserve’s (“Fed”) stimulative bond-buying program coming to an end and the threat of interest-rate hikes around the bend in 2015, the U.S. large-cap focused S&P 500® recorded a robust 17.27% gain for the year. Smaller-cap stocks didn’t fare as well as the small-cap Russell 2000® Index only gained 8.06% for the year.
While the U.S. economy improved, conditions remained much worse abroad. The Eurozone economies continued to struggle with slow or negative real Gross Domestic Product (“GDP”) growth and high unemployment. Even stalwart Germany, which had been carrying the region to some degree, ultimately felt the Eurozone’s malaise, posting slightly negative real GDP growth in 2014’s second quarter. Meanwhile Eurozone unemployment still hovered at 11.50% as of October 2014. In Japan, the government’s stimulus efforts were significantly hampered by an April sales-tax increase that put a dent in consumer spending and caused GDP growth there to turn sharply negative. Amid this weak environment, the Morgan Stanley Capital International Europe, Australasia, Far East Index of foreign developed markets declined 0.60% for the year, underperforming the S&P 500® by nearly 18 percentage points. Appreciation in the U.S. dollar against the euro and yen—as investors anticipated higher U.S. interest rates while the European Central Bank and Bank of Japan pursued currency-weakening monetary policies to spur growth—was also a major driver of the negative returns when translated into dollars. The rise in the dollar also depressed the Morgan Stanley Capital International Emerging Markets Index. Emerging markets had been lagging developed markets early in the year; while they made an upward dash over the summer, the Morgan Stanley Capital International Emerging Markets Index significantly underperformed U.S. stocks for the year, eking out only a 0.64% gain.
Bonds, on the other hand, were reasonably strong, with the Barclays U.S. Aggregate Bond Index returning 4.14%. The gain was largely a rebound from a 2013 bond sell-off sparked by the Fed’s announcement that it would scale down and then end a bond-buying program that had encouraged low market yields. Investors’ concern seemed to ease after the turn of the year, allowing bond prices to recover. Meanwhile the drumbeat of mostly positive U.S. economic news and healthy corporate earnings allowed credit-sensitive bonds to rise alongside the equity markets; the Barclays U.S. Corporate High Yield Index was up 5.82% and the Barclays U.S. Corporate Investment Grade Index returned 6.29%. Foreign bonds were generally weak, however, owing largely to currency movements, and Treasury Inflation-Protected Securities (“TIPS”) did not keep up with other domestic bonds given subdued U.S. inflation and fear of deflation in Europe.
PERFORMANCE
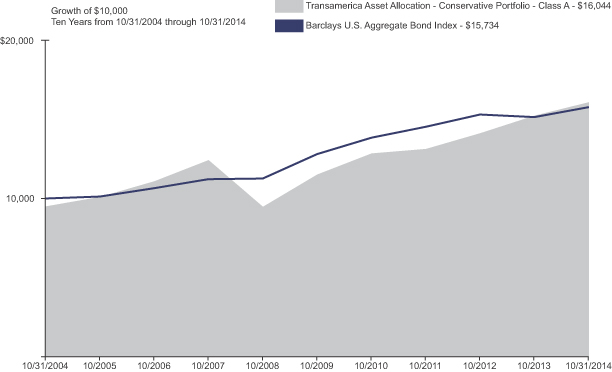
For the year ended October 31, 2014, Transamerica Asset Allocation—Conservative Portfolio Class A returned 5.65%. By comparison, its primary and secondary benchmarks, the Barclays U.S. Aggregate Bond Index and the Wilshire 5000® Total Market Index, returned 4.14% and 15.78%, respectively.
STRATEGY REVIEW
The goal of the Transamerica Asset Allocation Portfolios is to provide investors one-stop participation in the broad financial markets. Transamerica Asset Allocation—Conservative Portfolio is designed to provide a mix of approximately 35% equity and 65% fixed-income securities over time. The equity side covers both domestic and international markets across the entire range of investment styles, including both value and growth stocks and large and small companies. The fixed-income portion includes investment-grade and credit-sensitive holdings, as well as international bonds. The Fund also diversifies into emerging markets, global real estate, commodities, and alternative strategies. Our specific asset-class targets are derived from asset-allocation modeling designed to optimize expected long-term returns for a given level of risk. While this strategic blueprint forms the backbone of our asset allocation, we may actively over- and underweight asset classes relative to their long-term targets in response to market and economic conditions. Meanwhile we endeavor to find and use strong investment managers in each asset class and investment style. We carefully monitor these underlying managers for performance and style issues, and adjust their weightings both to manage our asset-class exposures and to reflect the managers’ relative merit.
| | |
| Transamerica Funds | | Annual Report 2014 |
Page 1
Transamerica Asset Allocation – Conservative Portfolio
(unaudited)
STRATEGY REVIEW (continued)
The Fund’s diversification blueprint is optimized for long-term risk-adjusted performance. Broad diversification was something of a headwind for this particular reporting period, in which the largest gains came in narrow slices of the stock and bond markets. Diversification into equity asset classes beyond U.S. large-cap stocks, and into bond asset classes other than plain-vanilla investment-grade bonds, in some instances diluted returns. Most notably, stocks in foreign developed markets and emerging markets both dramatically lagged the U.S. market. And both U.S. small caps and global real estate underperformed U.S. large caps. Commodities declined as well. On the fixed income side, the Fund was penalized by its diversification into TIPS and developed-market foreign bonds, but it was aided by its exposures to high-yield and emerging-markets bonds.
Our active over- and underweights relative to the long-term targets were mostly helpful. Within bonds, tactical overweights to the lower end of the credit spectrum and emerging-markets bonds were helpful, as both high-yield and emerging-markets bonds outperformed. Meanwhile the Fund was underweight struggling foreign developed-market equities and overweight strong-performing U.S. large-cap stocks. And it was underweight commodities due to soft global demand and certain structural issues facing commodity strategies, and thus sidestepped some of that asset class’ losses. We also maintained an underweight to global real estate given the historically low yields for real estate investment trusts (“REITs”), a position that aided performance.
The underlying funds performed decently on the whole. Although none of the six U.S. large-cap funds could quite match the S&P 500®’s gain, most were competitive within their styles, and on balance the international funds delivered respectable relative returns within their disciplines. Meanwhile the absolute-return funds pulled their weight in terms of the role we expected them to play. On the bond side, the only notable disappointment was Transamerica Total Return, managed by Pacific Investment Management Company LLC; this core bond holding, which has an admirable longer-term record, experienced a lagging year. But Transamerica Core Bond—another large fixed-income holding—turned in a strong performance.
As of this writing we’re holding the bond Fund’s duration below that of the Barclays U.S. Aggregate Bond Index as a cautionary measure against a potential rising-rate environment. We’re also substituting absolute-return strategies for part of the bond Fund; we believe absolute-return strategies could produce bond-like returns without the same vulnerability as bonds to rising interest rates. We remain underweight in foreign developed-market equities, global real estate, commodities, and longer-duration bonds (including TIPS). We’re more sanguine about U.S. large caps given the strength of the U.S. economy, although we’re also cognizant of the run these stocks have had. We’re optimistic toward emerging markets; they still exhibit robust growth rates and, having lagged the broader market over the past three years, sport attractive valuations. We will continue to follow the overall diversification blueprint, while using our flexibility in making make prudent adjustments in response to market conditions.
Dario Castagna, CFA
Dan McNeela, CFA
Michael Stout, CFA
Co-Portfolio Managers
Morningstar Associates, LLC
| | |
| Transamerica Funds | | Annual Report 2014 |
Page 2
Transamerica Asset Allocation – Conservative Portfolio
(unaudited)
| | | | | | | | | | | | | | | | |
| Average Annual Total Return for Periods Ended 10/31/2014 | |
| | | 1 Year | | | 5 Years | | | 10 Years or
Life of Class | | | Inception Date | |
Class A (NAV) | | | 5.65 | % | | | 6.94 | % | | | 5.43 | % | | | 03/01/2002 | |
Class A (POP) | | | (0.17 | )% | | | 5.73 | % | | | 4.84 | % | | | 03/01/2002 | |
Barclays U.S. Aggregate Bond Index (A) | | | 4.14 | % | | | 4.22 | % | | | 4.64 | % | | | | |
Wilshire 5000® Total Market Index (A) | | | 15.78 | % | | | 17.06 | % | | | 8.76 | % | | | | |
Class B (NAV) | | | 4.96 | % | | | 6.20 | % | | | 4.88 | % | | | 03/01/2002 | |
Class B (POP) | | | (0.04 | )% | | | 6.04 | % | | | 4.88 | % | | | 03/01/2002 | |
Class C (NAV) | | | 4.97 | % | | | 6.26 | % | | | 4.78 | % | | | 11/11/2002 | |
Class C (POP) | | | 3.97 | % | | | 6.26 | % | | | 4.78 | % | | | 11/11/2002 | |
Class I (NAV) | | | 5.94 | % | | | N/A | | | | 6.88 | % | | | 11/30/2009 | |
Class R (NAV) | | | 5.40 | % | | | 6.65 | % | | | 4.98 | % | | | 06/15/2006 | |
(A) The Barclays U.S. Aggregate Bond Index and the Wilshire 5000® Total Market Index are unmanaged indices used as a general measure of market performance. Calculations assume dividends and capital gains are reinvested and do not include any managerial expenses. The 10 Years or Life of Class calculation is based on the previous 10 years or since the inception date of the class, whichever is more recent. You cannot invest directly in an index.
The performance data presented represents past performance; future results may vary. Performance data does not reflect the deduction of taxes that would be paid on Fund distributions or the redemption of Fund shares. Investment return and principal value will fluctuate so that an investor’s shares, when redeemed, may be worth more or less than their original cost. Current performance may be lower or higher than performance quoted. Please see www.transamerica.com for performance data current to the most recent month-end. Net Asset Value (“NAV”) returns include the reinvestment of dividends and capital gains but do not reflect any sales charges. Public Offering Price (“POP”) returns include the reinvestment of dividends and capital gains and reflect the maximum sales charge of 5.50% for Class A shares or the maximum applicable contingent deferred sales charge (5% in the 1st year, decreasing to 0% after 6 years) for Class B shares and 1% (during the first 12 months) for Class C shares. Shares purchased prior to March 1, 2004 are subject to a maximum applicable contingent deferred sales charge (5% in the 1st year, decreasing to 0% after 7 years) for Class B shares and (2% in the 1st year, decreasing to 0% after 2 years) for Class C shares. There are no sales charges on Class I and R shares.
Performance figures reflect any fee waivers and/or expense reimbursements by the Investment Adviser. Without such waivers and/or reimbursements, the performance would be lower. Future waivers and/or reimbursements are at the discretion of the Investment Adviser.
Performance results do not include adjustments made for financial reporting purposes in accordance with U.S. generally accepted accounting principles and may differ from amounts reported in the financial highlights.
Asset allocation does not ensure a profit or protect against a loss. An investment in the Fund is subject to all of the risks associated with the underlying funds.
Please refer to page 15 for index descriptions.
| | |
| Transamerica Funds | | Annual Report 2014 |
Page 3
Transamerica Asset Allocation – Growth Portfolio
(unaudited)
MARKET ENVIRONMENT
With a few minor setbacks in January, July, and late September/early October, the U.S. stock market advanced during the year ended October 31, 2014. The underlying impetus for the gains was mainly steady improvement in the U.S. economy, which by the end of the period appeared finally to be on steady footing. Employment continually improved throughout the period, with private payrolls adding an average of more than 200,000 jobs per month, and the official unemployment rate falling to 5.80% by October 2014 from 7.20% a year earlier. The Institute of Supply Management surveys for both manufacturing and services painted an increasingly positive picture of the economy’s strength, and corporate earnings continued to grow. Thus, despite the psychological overhang of the U.S. Federal Reserve’s (“Fed”) stimulative bond-buying program coming to an end and the threat of interest-rate hikes around the bend in 2015, the U.S. large-cap focused S&P 500® recorded a robust 17.27% gain for the year. Smaller-cap stocks didn’t fare as well as the small-cap Russell 2000® Index only gained 8.06% for the year.
While the U.S. economy improved, conditions remained much worse abroad. The Eurozone economies continued to struggle with slow or negative real Gross Domestic Product (“GDP”) growth and high unemployment. Even stalwart Germany, which had been carrying the region to some degree, ultimately felt the Eurozone’s malaise, posting slightly negative real GDP growth in 2014’s second quarter. Meanwhile Eurozone unemployment still hovered at 11.50% as of October 2014. In Japan, the government’s stimulus efforts were significantly hampered by an April sales-tax increase that put a dent in consumer spending and caused GDP growth there to turn sharply negative. Amid this weak environment, the Morgan Stanley Capital International Europe, Australasia, Far East Index of foreign developed markets declined 0.60% for the year, underperforming the S&P 500® by nearly 18 percentage points. Appreciation in the U.S. dollar against the euro and yen—as investors anticipated higher U.S. interest rates while the European Central Bank and Bank of Japan pursued currency-weakening monetary policies to spur growth—was also a major driver of the negative returns when translated into dollars. The rise in the dollar also depressed the Morgan Stanley Capital International Emerging Markets Index. Emerging markets had been lagging developed markets early in the year; while they made an upward dash over the summer, the Morgan Stanley Capital International Emerging Markets Index significantly underperformed U.S. stocks for the year, eking out only a 0.64% gain.
Bonds, on the other hand, were reasonably strong, with the Barclays U.S. Aggregate Bond Index returning 4.14%. The gain was largely a rebound from a 2013 bond sell-off sparked by the Fed’s announcement that it would scale down and then end a bond-buying program that had encouraged low market yields. Investors’ concern seemed to ease after the turn of the year, allowing bond prices to recover. Meanwhile the drumbeat of mostly positive U.S. economic news and healthy corporate earnings allowed credit-sensitive bonds to rise alongside the equity markets; the Barclays U.S. Corporate High Yield Index was up 5.82% and the Barclays U.S. Corporate Investment Grade Index returned 6.29%. Foreign bonds were generally weak, however, owing largely to currency movements, and Treasury Inflation-Protected Securities (“TIPS”) did not keep up with other domestic bonds given subdued U.S. inflation and fear of deflation in Europe.
PERFORMANCE
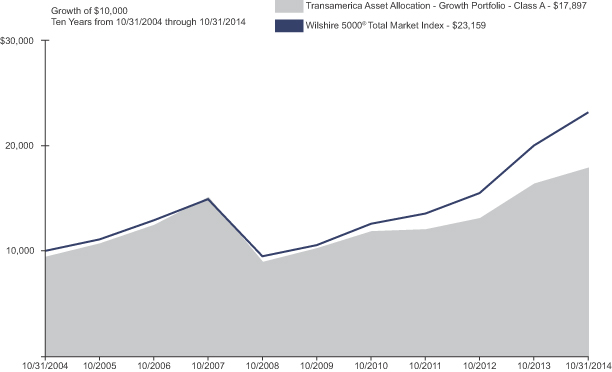
For the year ended October 31, 2014, Transamerica Asset Allocation—Growth Portfolio Class A returned 9.30%. By comparison, its benchmark, the Wilshire 5000® Total Market Index, returned 15.78%.
STRATEGY REVIEW
The goal of the Transamerica Asset Allocation Portfolios is to provide investors one-stop participation in the broad financial markets. Transamerica Asset Allocation—Growth Portfolio targets mainly equities, but also alternative strategies. It is designed to provide diversified, global coverage of equities, while employing absolute-return funds to manage portfolio risk. By design, the Fund invests in both domestic and international stocks across the entire range of investment styles, including both value and growth stocks and large and small companies. The Fund also diversifies into emerging markets, global real estate, commodities, and as mentioned, alternative strategies. Our specific asset-class targets are derived from asset-allocation modeling designed to optimize expected long-term returns for a given level of risk. While this strategic blueprint forms the backbone of our asset allocation, we may actively over- and underweight asset classes relative to their long-term targets in response to market and economic conditions. Meanwhile we endeavor to find and use strong investment managers in each asset class and investment style. We carefully monitor these underlying managers for performance and style issues, and adjust their weightings both to manage our asset-class exposures and to reflect the managers’ relative merit.
The Fund’s diversification blueprint is optimized for long-term risk-adjusted performance. Broad diversification was something of a headwind for this particular reporting period, in which the largest gains came in narrow slices of the equity markets. Diversification into
| | |
| Transamerica Funds | | Annual Report 2014 |
Page 4
Transamerica Asset Allocation – Growth Portfolio
(unaudited)
STRATEGY REVIEW (continued)
equity asset classes beyond U.S. large-cap stocks in some instances diluted returns. Stocks in foreign developed markets and emerging markets both dramatically lagged the U.S. market. And both U.S. small caps and global real estate underperformed U.S. large caps.
Our active over- and underweights relative to the long-term targets were mostly helpful. The Fund was underweight struggling foreign developed-market equities and overweight strong-performing U.S. large-cap stocks. We also maintained an underweight to global real estate given the historically low yields for real estate investment trusts (“REITs”), and we held U.S. small caps somewhat underweight in favor of U.S. large caps based on relative valuations. Both of those positions added to performance.
The underlying funds performed decently on the whole. Although none of the six U.S. large-cap funds could quite match the S&P 500®’s gain, most were competitive within their styles. On balance, the international funds delivered respectable relative returns within their disciplines; Transamerica Developing Markets Equity and Transamerica International Small Cap performed particularly well. Meanwhile the absolute-return funds pulled their weight in terms of the role we expected them to play.
As of this writing we remain underweight in foreign developed-market equities and global real estate. We’re more sanguine about U.S. large caps given the strength of the U.S. economy, although we’re also cognizant of the run these stocks have had. We’re optimistic toward emerging markets; they still exhibit robust growth rates and, having lagged the broader market over the past three years, sport attractive valuations. Alternative strategies—in the form of Transamerica Managed Futures Strategy, Transamerica Arbitrage Strategy, and Transamerica Long/Short Strategy—make up about 10% of the Fund. We will continue to follow the overall diversification blueprint, while using our flexibility in making make prudent adjustments in response to market conditions.
Dario Castagna, CFA
Dan McNeela, CFA
Michael Stout, CFA
Co-Portfolio Managers
Morningstar Associates, LLC
| | |
| Transamerica Funds | | Annual Report 2014 |
Page 5
Transamerica Asset Allocation – Growth Portfolio
(unaudited)
| | | | | | | | | | | | | | | | |
| Average Annual Total Return for Periods Ended 10/31/2014 | |
| | | 1 Year | | | 5 Years | | | 10 Years or
Life of Class | | | Inception Date | |
Class A (NAV) | | | 9.30 | % | | | 11.77 | % | | | 6.60 | % | | | 03/01/2002 | |
Class A (POP) | | | 3.27 | % | | | 10.50 | % | | | 5.99 | % | | | 03/01/2002 | |
Wilshire 5000® Total Market Index (A) | | | 15.78 | % | | | 17.06 | % | | | 8.76 | % | | | | |
Class B (NAV) | | | 8.49 | % | | | 10.95 | % | | | 6.01 | % | | | 03/01/2002 | |
Class B (POP) | | | 3.49 | % | | | 10.82 | % | | | 6.01 | % | | | 03/01/2002 | |
Class C (NAV) | | | 8.51 | % | | | 11.04 | % | | | 5.93 | % | | | 11/11/2002 | |
Class C (POP) | | | 7.51 | % | | | 11.04 | % | | | 5.93 | % | | | 11/11/2002 | |
Class I (NAV) | | | 9.64 | % | | | N/A | | | | 11.51 | % | | | 11/30/2009 | |
Class R (NAV) | | | 9.01 | % | | | 11.55 | % | | | 5.28 | % | | | 06/15/2006 | |
(A) The Wilshire 5000® Total Market Index is an unmanaged index used as a general measure of market performance. Calculations assume dividends and capital gains are reinvested and do not include any managerial expenses. The 10 Years or Life of Class calculation is based on the previous 10 years or since the inception date of the class, whichever is more recent. You cannot invest directly in an index.
The performance data presented represents past performance; future results may vary. Performance data does not reflect the deduction of taxes that would be paid on Fund distributions or the redemption of Fund shares. Investment return and principal value will fluctuate so that an investor’s shares, when redeemed, may be worth more or less than their original cost. Current performance may be lower or higher than performance quoted. Please see www.transamerica.com for performance data current to the most recent month-end. Net Asset Value (“NAV”) returns include the reinvestment of dividends and capital gains but do not reflect any sales charges. Public Offering Price (“POP”) returns include the reinvestment of dividends and capital gains and reflect the maximum sales charge of 5.50% for Class A shares or the maximum applicable contingent deferred sales charge (5% in the 1st year, decreasing to 0% after 6 years) for Class B shares and 1% (during the first 12 months) for Class C shares. Shares purchased prior to March 1, 2004 are subject to a maximum applicable contingent deferred sales charge (5% in the 1st year, decreasing to 0% after 7 years) for Class B shares and (2% in the 1st year, decreasing to 0% after 2 years) for Class C shares. There are no sales charges on Class I and R shares.
Performance figures reflect any fee waivers and/or expense reimbursements by the Investment Adviser. Without such waivers and/or reimbursements, the performance would be lower. Future waivers and/or reimbursements are at the discretion of the Investment Adviser.
Performance results do not include adjustments made for financial reporting purposes in accordance with U.S. generally accepted accounting principles and may differ from amounts reported in the financial highlights.
Asset allocation does not ensure a profit or protect against a loss. An investment in the Fund is subject to all of the risks associated with the underlying funds.
Please refer to page 15 for index descriptions.
| | |
| Transamerica Funds | | Annual Report 2014 |
Page 6
Transamerica Asset Allocation – Moderate Growth Portfolio
(unaudited)
MARKET ENVIRONMENT
With a few minor setbacks in January, July, and late September/early October, the U.S. stock market advanced during the year ended October 31, 2014. The underlying impetus for the gains was mainly steady improvement in the U.S. economy, which by the end of the period appeared finally to be on steady footing. Employment continually improved throughout the period, with private payrolls adding an average of more than 200,000 jobs per month, and the official unemployment rate falling to 5.80% by October 2014 from 7.20% a year earlier. The Institute of Supply Management surveys for both manufacturing and services painted an increasingly positive picture of the economy’s strength, and corporate earnings continued to grow. Thus, despite the psychological overhang of the U.S. Federal Reserve’s (“Fed”) stimulative bond-buying program coming to an end and the threat of interest-rate hikes around the bend in 2015, the U.S. large-cap focused S&P 500® recorded a robust 17.27% gain for the year. Smaller-cap stocks didn’t fare as well as the small-cap Russell 2000® Index only gained 8.06% for the year.
While the U.S. economy improved, conditions remained much worse abroad. The Eurozone economies continued to struggle with slow or negative real Gross Domestic Product (“GDP”) growth and high unemployment. Even stalwart Germany, which had been carrying the region to some degree, ultimately felt the Eurozone’s malaise, posting slightly negative real GDP growth in 2014’s second quarter. Meanwhile Eurozone unemployment still hovered at 11.50% as of October 2014. In Japan, the government’s stimulus efforts were significantly hampered by an April sales-tax increase that put a dent in consumer spending and caused GDP growth there to turn sharply negative. Amid this weak environment, the Morgan Stanley Capital International Europe, Australasia, Far East Index of foreign developed markets declined 0.60% for the year, underperforming the S&P 500® by nearly 18 percentage points. Appreciation in the U.S. dollar against the euro and yen—as investors anticipated higher U.S. interest rates while the European Central Bank and Bank of Japan pursued currency-weakening monetary policies to spur growth—was also a major driver of the negative returns when translated into dollars. The rise in the dollar also depressed the Morgan Stanley Capital International Emerging Markets Index. Emerging markets had been lagging developed markets early in the year; while they made an upward dash over the summer, the Morgan Stanley Capital International Emerging Markets Index significantly underperformed U.S. stocks for the year, eking out only a 0.64% gain.
Bonds, on the other hand, were reasonably strong, with the Barclays U.S. Aggregate Bond Index returning 4.14%. The gain was largely a rebound from a 2013 bond sell-off sparked by the Fed’s announcement that it would scale down and then end a bond-buying program that had encouraged low market yields. Investors’ concern seemed to ease after the turn of the year, allowing bond prices to recover. Meanwhile the drumbeat of mostly positive U.S. economic news and healthy corporate earnings allowed credit-sensitive bonds to rise alongside the equity markets; the Barclays U.S. Corporate High Yield Index was up 5.82% and the Barclays U.S. Corporate Investment Grade Index returned 6.29%. Foreign bonds were generally weak, however, owing largely to currency movements, and Treasury Inflation-Protected Securities (“TIPS”) did not keep up with other domestic bonds given subdued U.S. inflation and fear of deflation in Europe.
PERFORMANCE
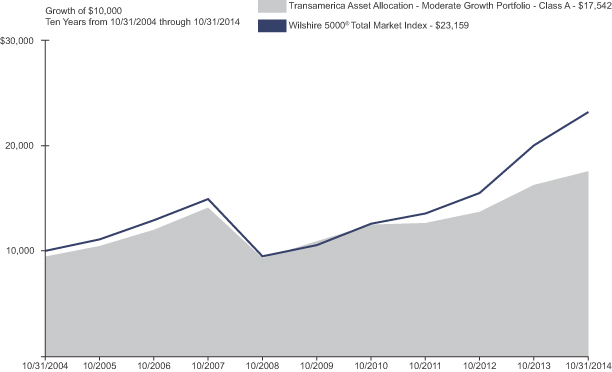
For the year ended October 31, 2014, Transamerica Asset Allocation—Moderate Growth Portfolio Class A returned 8.01%. By comparison, its primary and secondary benchmarks the Wilshire 5000® Total Market Index and the Barclays U.S. Aggregate Bond Index, returned 15.78% and 4.14%, respectively.
STRATEGY REVIEW
The goal of the Transamerica Asset Allocation Portfolios is to provide investors one-stop participation in the broad financial markets. Transamerica Asset Allocation—Moderate Growth Portfolio is designed to provide a mix of approximately 70% equity and 30% fixed-income securities over time. The equity side covers both domestic and international markets across the entire range of investment styles, including both value and growth stocks and large and small companies. The fixed-income portion includes investment-grade and credit-sensitive holdings, as well as international bonds. The Fund also diversifies into emerging markets, global real estate, commodities, and alternative strategies. Our specific asset-class targets are derived from asset-allocation modeling designed to optimize expected long-term returns for a given level of risk. While this strategic blueprint forms the backbone of our asset allocation, we may actively over- and underweight asset classes relative to their long-term targets in response to market and economic conditions. Meanwhile we endeavor to find and use strong investment managers in each asset class and investment style. We carefully monitor these underlying managers for performance and style issues, and adjust their weightings both to manage our asset-class exposures and to reflect the managers’ relative merit.
| | |
| Transamerica Funds | | Annual Report 2014 |
Page 7
Transamerica Asset Allocation – Moderate Growth Portfolio
(unaudited)
STRATEGY REVIEW (continued)
The Fund’s diversification blueprint is optimized for long-term risk-adjusted performance. Broad diversification was something of a headwind for this particular reporting period, in which the largest gains came in narrow slices of the stock and bond markets. Diversification into equity asset classes beyond U.S. large-cap stocks, and into bond asset classes other than plain-vanilla investment-grade bonds, in some instances diluted returns. Most notably, stocks in foreign developed markets and emerging markets both dramatically lagged the U.S. market. And both U.S. small caps and global real estate underperformed U.S. large caps. Commodities declined as well. On the fixed income side, the Fund was penalized by its diversification into TIPS and developed-market foreign bonds, but it was aided by its exposures to high-yield and emerging-markets bonds.
Our active over- and underweights relative to the long-term targets were mostly helpful. The Fund was underweight struggling foreign developed-market equities and overweight strong-performing U.S. large-cap stocks. And it was underweight commodities due to soft global demand and certain structural issues facing commodity strategies, and thus sidestepped some of that asset class’ losses. We also maintained an underweight to global real estate given the historically low yields for real estate investment trusts (“REITs”), and we held U.S. small caps somewhat underweight in favor of U.S. large caps based on relative valuations. Both positions added to performance. Within bonds, a tactical overweight to the lower end of the credit spectrum was helpful.
The underlying funds performed decently on the whole. Although none of the six U.S. large-cap funds could quite match the S&P 500®’s gain, most were competitive within their styles, and on balance the international funds delivered respectable relative returns within their disciplines. Meanwhile the absolute-return funds pulled their weight in terms of the role we expected them to play. On the bond side, the only notable disappointment was Transamerica Total Return, managed by Pacific Investment Management Company LLC; this core bond holding, which has an admirable longer-term record, experienced a lagging year. But Transamerica Core Bond—another large fixed-income holding—turned in a strong performance.
As of this writing we remain underweight in foreign developed-market equities, global real estate, commodities, and longer-duration bonds (including TIPS). We’re more sanguine about U.S. large caps given the strength of the U.S. economy, although we’re also cognizant of the run these stocks have had. We’re optimistic toward emerging markets; they still exhibit robust growth rates and, having lagged the broader market over the past three years, sport attractive valuations. Within the bond Fund we’re holding duration below that of the Barclays U.S. Aggregate Bond Index as a cautionary measure against a potential rising-rate environment. We’re also substituting absolute-return strategies for part of the bond Fund; we believe absolute-return strategies could produce bond-like returns without the same vulnerability as bonds to rising interest rates. We will continue to follow the overall diversification blueprint, while using our flexibility in making prudent adjustments in response to market conditions.
Dario Castagna, CFA
Dan McNeela, CFA
Michael Stout, CFA
Co-Portfolio Managers
Morningstar Associates, LLC
| | |
| Transamerica Funds | | Annual Report 2014 |
Page 8
Transamerica Asset Allocation – Moderate Growth Portfolio
(unaudited)
| | | | | | | | | | | | | | | | |
| Average Annual Total Return for Periods Ended 10/31/2014 | |
| | | 1 Year | | | 5 Years | | | 10 Years or
Life of Class | | | Inception Date | |
Class A (NAV) | | | 8.01 | % | | | 9.96 | % | | | 6.38 | % | | | 03/01/2002 | |
Class A (POP) | | | 2.05 | % | | | 8.73 | % | | | 5.78 | % | | | 03/01/2002 | |
Wilshire 5000® Total Market Index (A) | | | 15.78 | % | | | 17.06 | % | | | 8.76 | % | | | | |
Barclays U.S. Aggregate Bond Index (A) | | | 4.14 | % | | | 4.22 | % | | | 4.64 | % | | | | |
Class B (NAV) | | | 7.16 | % | | | 9.16 | % | | | 5.82 | % | | | 03/01/2002 | |
Class B (POP) | | | 2.16 | % | | | 9.02 | % | | | 5.82 | % | | | 03/01/2002 | |
Class C (NAV) | | | 7.23 | % | | | 9.24 | % | | | 5.70 | % | | | 11/11/2002 | |
Class C (POP) | | | 6.23 | % | | | 9.24 | % | | | 5.70 | % | | | 11/11/2002 | |
Class I (NAV) | | | 8.27 | % | | | N/A | | | | 9.76 | % | | | 11/30/2009 | |
Class R (NAV) | | | 7.77 | % | | | 9.76 | % | | | 5.40 | % | | | 06/15/2006 | |
(A) The Wilshire 5000® Total Market Index and the Barclays U.S. Aggregate Bond Index are unmanaged indices used as a general measure of market performance. Calculations assume dividends and capital gains are reinvested and do not include any managerial expenses. The 10 Years or Life of Class calculation is based on the previous 10 years or since the inception date of the class, whichever is more recent. You cannot invest directly in an index.
The performance data presented represents past performance; future results may vary. Performance data does not reflect the deduction of taxes that would be paid on Fund distributions or the redemption of Fund shares. Investment return and principal value will fluctuate so that an investor’s shares, when redeemed, may be worth more or less than their original cost. Current performance may be lower or higher than performance quoted. Please see www.transamerica.com for performance data current to the most recent month-end. Net Asset Value (“NAV”) returns include the reinvestment of dividends and capital gains but do not reflect any sales charges. Public Offering Price (“POP”) returns include the reinvestment of dividends and capital gains and reflect the maximum sales charge of 5.50% for Class A shares or the maximum applicable contingent deferred sales charge (5% in the 1st year, decreasing to 0% after 6 years) for Class B shares and 1% (during the first 12 months) for Class C shares. Shares purchased prior to March 1, 2004 are subject to a maximum applicable contingent deferred sales charge (5% in the 1st year, decreasing to 0% after 7 years) for Class B shares and (2% in the 1st year, decreasing to 0% after 2 years) for Class C shares. There are no sales charges on Class I and R shares.
Performance figures reflect any fee waivers and/or expense reimbursements by the Investment Adviser. Without such waivers and/or reimbursements, the performance would be lower. Future waivers and/or reimbursements are at the discretion of the Investment Adviser.
Performance results do not include adjustments made for financial reporting purposes in accordance with U.S. generally accepted accounting principles and may differ from amounts reported in the financial highlights.
Asset allocation does not ensure a profit or protect against a loss. An investment in the Fund is subject to all of the risks associated with the underlying funds.
Please refer to page 15 for index descriptions.
| | |
| Transamerica Funds | | Annual Report 2014 |
Page 9
Transamerica Asset Allocation – Moderate Portfolio
(unaudited)
MARKET ENVIRONMENT
With a few minor setbacks in January, July, and late September/early October, the U.S. stock market advanced during the year ended October 31, 2014. The underlying impetus for the gains was mainly steady improvement in the U.S. economy, which by the end of the period appeared finally to be on steady footing. Employment continually improved throughout the period, with private payrolls adding an average of more than 200,000 jobs per month, and the official unemployment rate falling to 5.80% by October 2014 from 7.20% a year earlier. The Institute of Supply Management surveys for both manufacturing and services painted an increasingly positive picture of the economy’s strength, and corporate earnings continued to grow. Thus, despite the psychological overhang of the U.S. Federal Reserve’s (“Fed”) stimulative bond-buying program coming to an end and the threat of interest-rate hikes around the bend in 2015, the U.S. large-cap focused S&P 500® Index recorded a robust 17.27% gain for the year. Smaller-cap stocks didn’t fare as well as the small-cap Russell 2000® Index only gained 8.06% for the year.
While the U.S. economy improved, conditions remained much worse abroad. The Eurozone economies continued to struggle with slow or negative real Gross Domestic Product (“GDP”) growth and high unemployment. Even stalwart Germany, which had been carrying the region to some degree, ultimately felt the Eurozone’s malaise, posting slightly negative real GDP growth in 2014’s second quarter. Meanwhile Eurozone unemployment still hovered at 11.50% as of October 2014. In Japan, the government’s stimulus efforts were significantly hampered by an April sales-tax increase that put a dent in consumer spending and caused GDP growth there to turn sharply negative. Amid this weak environment, the Morgan Stanley Capital International Europe, Australasia, Far East Index of foreign developed markets declined 0.60% for the year, underperforming the S&P 500® by nearly 18 percentage points. Appreciation in the U.S. dollar against the euro and yen—as investors anticipated higher U.S. interest rates while the European Central Bank and Bank of Japan pursued currency-weakening monetary policies to spur growth—was also a major driver of the negative returns when translated into dollars. The rise in the dollar also depressed the Morgan Stanley Capital International Emerging Markets Index. Emerging markets had been lagging developed markets early in the year; while they made an upward dash over the summer, the Morgan Stanley Capital International Emerging Markets Index significantly underperformed U.S. stocks for the year, eking out only a 0.64% gain.
Bonds, on the other hand, were reasonably strong, with the Barclays U.S. Aggregate Bond Index returning 4.14%. The gain was largely a rebound from a 2013 bond sell-off sparked by the Fed’s announcement that it would scale down and then end a bond-buying program that had encouraged low market yields. Investors’ concern seemed to ease after the turn of the year, allowing bond prices to recover. Meanwhile the drumbeat of mostly positive U.S. economic news and healthy corporate earnings allowed credit-sensitive bonds to rise alongside the equity markets; the Barclays U.S. Corporate High Yield Index was up 5.82% and the Barclays U.S. Corporate Investment Grade Index returned 6.29%. Foreign bonds were generally weak, however, owing largely to currency movements, and Treasury Inflation-Protected Securities (“TIPS”) did not keep up with other domestic bonds given subdued U.S. inflation and fear of deflation in Europe.
PERFORMANCE
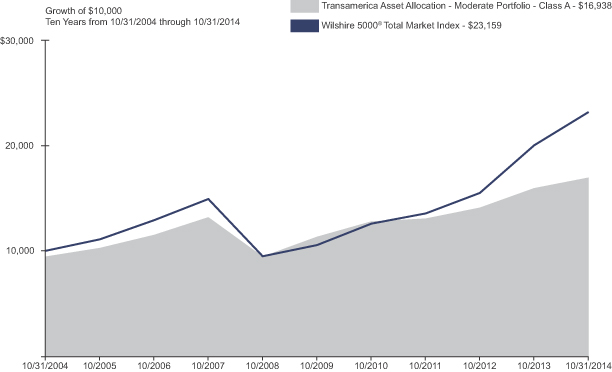
For the year ended October 31, 2014, Transamerica Asset Allocation—Moderate Portfolio Class A returned 6.20%. By comparison, its primary and secondary benchmarks, the Wilshire 5000® Total Market Index and the Barclays U.S. Aggregate Bond Index, returned 15.78% and 4.14%, respectively.
STRATEGY REVIEW
The goal of the Transamerica Asset Allocation Portfolios is to provide investors one-stop participation in the broad financial markets. Transamerica Asset Allocation—Moderate Portfolio is designed to provide a mix of approximately 50% equity and 50% fixed-income securities over time. The equity side covers both domestic and international markets across the entire range of investment styles, including both value and growth stocks and large and small companies. The fixed-income portion includes investment-grade and credit-sensitive holdings, as well as international bonds. The Fund also diversifies into emerging markets, global real estate, commodities, and alternative strategies. Our specific asset-class targets are derived from asset-allocation modeling designed to optimize expected long-term returns for a given level of risk. While this strategic blueprint forms the backbone of our asset allocation, we may actively over- and underweight asset classes relative to their long-term targets in response to market and economic conditions. Meanwhile we endeavor to find and use strong investment managers in each asset class and investment style. We carefully monitor these underlying managers for performance and style issues, and adjust their weightings both to manage our asset-class exposures and to reflect the managers’ relative merit.
| | |
| Transamerica Funds | | Annual Report 2014 |
Page 10
Transamerica Asset Allocation – Moderate Portfolio
(unaudited)
STRATEGY REVIEW (continued)
The Fund’s diversification blueprint is optimized for long-term risk-adjusted performance. Broad diversification was something of a headwind for this particular reporting period, in which the largest gains came in narrow slices of the stock and bond markets. Diversification into equity asset classes beyond U.S. large-cap stocks, and into bond asset classes other than plain-vanilla investment-grade bonds, in some instances diluted returns. Most notably, stocks in foreign developed markets and emerging markets both dramatically lagged the U.S. market. And both U.S. small caps and global real estate underperformed U.S. large caps. Commodities declined as well. On the fixed income side, the Fund was penalized by its diversification into TIPS and developed-market foreign bonds, but it was aided by its exposures to high-yield and emerging-markets bonds.
Our active over- and underweights relative to the long-term targets were mostly helpful. The Fund was underweight struggling foreign developed-market equities and overweight strong-performing U.S. large-cap stocks. And it was underweight commodities due to soft global demand and certain structural issues facing commodity strategies, and thus sidestepped some of that asset class’ losses. We also maintained an underweight to global real estate given the historically low yields for real estate investment trusts (“REITs”), and we held U.S. small caps somewhat underweight in favor of U.S. large caps based on relative valuations. Both positions aided performance. Within bonds, tactical overweights to the lower end of the credit spectrum and emerging-markets bonds were helpful.
The underlying funds performed decently on the whole. Although none of the six U.S. large-cap funds could quite match the S&P 500®’s gain, most were competitive within their styles, and on balance the international funds delivered respectable relative returns within their disciplines. Meanwhile the absolute-return funds pulled their weight in terms of the role we expected them to play. On the bond side, the only notable disappointment was Transamerica Total Return, managed by Pacific Investment Management Company LLC; this core bond holding, which has an admirable longer-term record, experienced a lagging year. But Transamerica Core Bond—another large fixed-income holding—turned in a strong performance.
As of this writing we remain underweight in foreign developed-market equities, global real estate, commodities, and longer-duration bonds (including TIPS). We’re more sanguine about U.S. large caps given the strength of the U.S. economy, although we’re also cognizant of the run these stocks have had. We’re optimistic toward emerging markets; they still exhibit robust growth rates and, having lagged the broader market over the past three years, sport attractive valuations. Within the bond Fund we’re holding duration below that of the Barclays U.S. Aggregate Bond Index as a cautionary measure against a potential rising-rate environment. We’re also substituting absolute-return strategies for part of the bond Fund; we believe absolute-return strategies could produce bond-like returns without the same vulnerability as bonds to rising interest rates. We will continue to follow the overall diversification blueprint, while using our flexibility in making make prudent adjustments in response to market conditions.
Dario Castagna, CFA
Dan McNeela, CFA
Michael Stout, CFA
Co-Portfolio Managers
Morningstar Associates, LLC
| | |
| Transamerica Funds | | Annual Report 2014 |
Page 11
Transamerica Asset Allocation – Moderate Portfolio
(unaudited)
| | | | | | | | | | | | | | | | |
| Average Annual Total Return for Periods Ended 10/31/2014 | |
| | | 1 Year | | | 5 Years | | | 10 Years or
Life of Class | | | Inception Date | |
Class A (NAV) | | | 6.20 | % | | | 8.38 | % | | | 6.01 | % | | | 03/01/2002 | |
Class A (POP) | | | 0.36 | % | | | 7.16 | % | | | 5.41 | % | | | 03/01/2002 | |
Wilshire 5000® Total Market Index (A) | | | 15.78 | % | | | 17.06 | % | | | 8.76 | % | | | | |
Barclays U.S. Aggregate Bond Index (A) | | | 4.14 | % | | | 4.22 | % | | | 4.64 | % | | | | |
Class B (NAV) | | | 5.32 | % | | | 7.59 | % | | | 5.43 | % | | | 03/01/2002 | |
Class B (POP) | | | 0.32 | % | | | 7.44 | % | | | 5.43 | % | | | 03/01/2002 | |
Class C (NAV) | | | 5.39 | % | | | 7.67 | % | | | 5.32 | % | | | 11/11/2002 | |
Class C (POP) | | | 4.39 | % | | | 7.67 | % | | | 5.32 | % | | | 11/11/2002 | |
Class I (NAV) | | | 6.45 | % | | | N/A | | | | 8.26 | % | | | 11/30/2009 | |
Class R (NAV) | | | 5.88 | % | | | 8.15 | % | | | 5.31 | % | | | 06/15/2006 | |
(A) The Wilshire 5000® Total Market Index and the Barclays U.S. Aggregate Bond Index are unmanaged indices used as a general measure of market performance. Calculations assume dividends and capital gains are reinvested and do not include any managerial expenses. The 10 Years or Life of Class calculation is based on the previous 10 years or since the inception date of the class, whichever is more recent. You cannot invest directly in an index.
The performance data presented represents past performance; future results may vary. Performance data does not reflect the deduction of taxes that would be paid on Fund distributions or the redemption of Fund shares. Investment return and principal value will fluctuate so that an investor’s shares, when redeemed, may be worth more or less than their original cost. Current performance may be lower or higher than performance quoted. Please see www.transamerica.com for performance data current to the most recent month-end. Net Asset Value (“NAV”) returns include the reinvestment of dividends and capital gains but do not reflect any sales charges. Public Offering Price (“POP”) returns include the reinvestment of dividends and capital gains and reflect the maximum sales charge of 5.50% for Class A shares or the maximum applicable contingent deferred sales charge (5% in the 1st year, decreasing to 0% after 6 years) for Class B shares and 1% (during the first 12 months) for Class C shares. Shares purchased prior to March 1, 2004 are subject to a maximum applicable contingent deferred sales charge (5% in the 1st year, decreasing to 0% after 7 years) for Class B shares and (2% in the 1st year, decreasing to 0% after 2 years) for Class C shares. There are no sales charges on Class I and R shares.
Performance figures reflect any fee waivers and/or expense reimbursements by the Investment Adviser. Without such waivers and/or reimbursements, the performance would be lower. Future waivers and/or reimbursements are at the discretion of the Investment Adviser.
Performance results do not include adjustments made for financial reporting purposes in accordance with U.S. generally accepted accounting principles and may differ from amounts reported in the financial highlights.
Asset allocation does not ensure a profit or protect against a loss. An investment in the Fund is subject to all of the risks associated with the underlying funds.
Please refer to page 15 for index descriptions.
| | |
| Transamerica Funds | | Annual Report 2014 |
Page 12
Transamerica Multi-Manager Alternative Strategies Portfolio
(unaudited)
MARKET ENVIRONMENT
The year ended October 31, 2014 can be summarized as great expectations that were never met. This narrative applies most directly to the economic recovery and the expected sell-off in fixed income markets, especially long duration assets.
The expectations were building throughout 2013 as the 10-year Treasury rate almost doubled, briefly piercing the three percent threshold. This move was intertwined with the consensus thinking that the annual growth rate of the U.S. economy was finally going to hit terminal velocity close to three percent. All was perceived to be going as planned until Mother Nature chimed in. The cold weather and snow sent inventory accumulation into hibernation. What magnified the weather event was that in the second half of 2013, factories were participating in the consensus view that the economy was accelerating by rapidly ramping up their inventories in anticipation of higher demand in 2014. The literal freeze in economic activity in 1st quarter of 2014 created such a drag that it was quickly made apparent that the full-year growth numbers were not going to be attainable.
The underwhelming economic performance was not just a U.S. event. The consensus in the eurozone had also been calling for a healthy acceleration. However, the necessary balance sheet moves in order for banks to pass the asset quality review test meant that lending to the region would be very limited. Such restriction of private credit, especially to the small and medium sized enterprises, was completely contrary to what was required for an economic expansion. The ensuing slowdown was not limited to the periphery, even the German growth engine lost steam.
The most recent policy answer to the European growth problem created a new global narrative—divergent monetary policy in the developed world. At a time when U.S. and U.K. are winding down quantitative easing (“QE”) and talking about raising interest rates, Japan and Europe are going the other way—either increasing the QE pace or seeking alternative ways to implement QE policy. Even the largest emerging market country (China) is adding stimulus through numerous channels. This divergence of policy has resulted in a huge rate differential in sovereign bonds and has incentivized, in part, investors domiciled in low yielding countries to buy debt instruments in (relatively) higher interest bearing countries.
PERFORMANCE
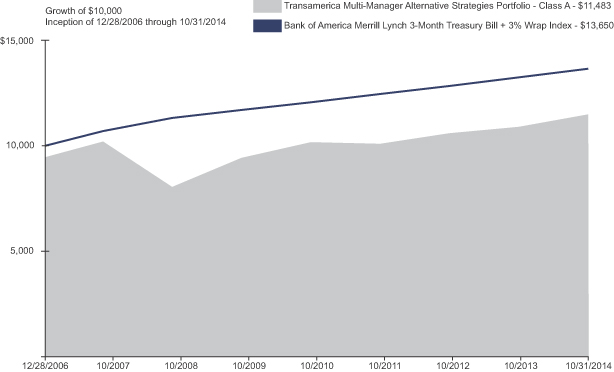
For the year ended October 31, 2014, Transamerica Multi-Manager Alternative Strategies Portfolio Class A, returned 5.46%. By comparison, its primary and secondary benchmarks, the Bank of America Merrill Lynch 3-Month Treasury Bill + 3% Wrap Index and the HFRX Global Hedge Fund Index, returned 3.10% and 0.96%, respectively.
STRATEGY REVIEW
The Fund outperformed its benchmark for the period, largely due to our equity hedge allocation. Our allocation to the category focused primarily on long/short equities, master limited partnerships (“MLPs”) and energy companies. Macro strategies generally positioned for declines in commodity prices, U.S. dollar strength, and tighter European sovereign spreads, also contributed to performance. The relative value and event -driven strategies were reduced in size throughout the year in the face of limited opportunity.
Aside from trading and re-positioning the Fund in response to market conditions, there were three significant changes during the year. One, Transamerica Asset Management terminated the global macro strategy at the end of the year ended on October 31, 2014. Secondly, as a result the Fund’s cash allocation ended the period significantly higher than it entered the fiscal year and current market conditions and opportunities will dictate the pace at which that cash balance finds compelling opportunities. Thirdly, the Fund’s allocation to arbitrage strategies was lowered as the abundance of liquidity and low interest rates continued to weigh on merger arbitrage deal spreads, creating a negative skew to the strategy’s risk/return profile.
Timothy S. Galbraith
Prat Patel, CFA
Co-Portfolio Managers
Aegon USA Investment Management, LLC
| | |
| Transamerica Funds | | Annual Report 2014 |
Page 13
Transamerica Multi-Manager Alternative Strategies Portfolio
(unaudited)
| | | | | | | | | | | | | | | | |
| Average Annual Total Return for Periods Ended 10/31/2014 | |
| | | 1 Year | | | 5 Years | | | 10 Years or
Life of Class | | | Inception Date | |
Class A (NAV) | | | 5.46 | % | | | 4.03 | % | | | 2.51 | % | | | 12/28/2006 | |
Class A (POP) | | | (0.32 | )% | | | 2.87 | % | | | 1.78 | % | | | 12/28/2006 | |
Bank of America Merrill Lynch 3-Month Treasury Bill + 3% Wrap Index (A) | | | 3.10 | % | | | 3.14 | % | | | 4.05 | % | | | | |
HFRX Global Hedge Fund Index (A) | | | 0.96 | % | | | 1.57 | % | | | (0.50 | )% | | | | |
Class C (NAV) | | | 4.64 | % | | | 3.32 | % | | | 1.83 | % | | | 12/28/2006 | |
Class C (POP) | | | 3.64 | % | | | 3.32 | % | | | 1.83 | % | | | 12/28/2006 | |
Class I (NAV) | | | 5.81 | % | | | N/A | | | | 4.22 | % | | | 11/30/2009 | |
(A) The Bank of America Merrill Lynch 3-Month Treasury Bill + 3% Wrap Index is an unmanaged index used as a general measure of market performance. The HFRX Global Hedge Fund Index is a passively-managed index that is compiled by Hedge Fund Research, Inc. It is designed to measure the daily performance of the overall composition of the hedge fund universe. It is comprised of all eligible hedge fund strategies; including but not limited to convertible arbitrage, distressed securities, equity hedge, equity market neutral, event driven, macro, merger arbitrage, and relative value arbitrage. The strategies are asset weighted based on the distribution of assets in the hedge fund industry. Returns of funds within the composition of the HFRX Global Hedge Fund Index presented are net of underlying manager fees, but do not reflect the deduction of management fees, taxes and other expenses. Calculations for the Bank of America Merrill Lynch 3-Month Treasury Bill + 3% Wrap Index assume dividends and capital gains are reinvested and do not include any managerial expenses. The 10 Years or Life of Class calculation is based on the inception date of the class. You cannot invest directly in an index.
The performance data presented represents past performance; future results may vary. Performance data does not reflect the deduction of taxes that would be paid on Fund distributions or the redemption of Fund shares. Investment return and principal value will fluctuate so that an investor’s shares, when redeemed, may be worth more or less than their original cost. Current performance may be lower or higher than performance quoted. Please see www.transamerica.com for performance data current to the most recent month-end. Net Asset Value (“NAV”) returns include the reinvestment of dividends and capital gains but do not reflect any sales charges. Public Offering Price (“POP”) returns include the reinvestment of dividends and capital gains and reflect the maximum sales charge of 5.50% for Class A shares or the maximum applicable contingent deferred sales charge of 1% (during the first 12 months) for Class C shares. There are no sales charges on Class I shares.
Performance figures reflect any fee waivers and/or expense reimbursements by the Investment Adviser. Without such waivers and/or reimbursements, the performance would be lower. Future waivers and/or reimbursements are at the discretion of the Investment Adviser.
Performance results do not include adjustments made for financial reporting purposes in accordance with U.S. generally accepted accounting principles and may differ from amounts reported in the financial highlights.
Alternative strategies are not suitable for all investors. Many alternative strategies use sophisticated and aggressive investment techniques. Certain alternative strategies may be tied to hard assets such as commodities, currencies and real estate and may be subject to greater volatility as they may be affected by overall market movements, changes in interest rates or factors affecting a particular industry, commodity or currency, and international economic, political, and regulatory developments.
Please refer to page 15 for index descriptions.
| | |
| Transamerica Funds | | Annual Report 2014 |
Page 14
Index Descriptions
(unaudited)
| | |
| Index | | Description |
| |
| Bank of America Merrill Lynch 3-Month Treasury Bill + 3% Wrap Index | | The Bank of America Merrill Lynch 3-Month Treasury Bill + 3% Wrap Index assumes a 3% wrap fee and is comprised of a single issue purchased at the beginning of the month, which is subsequently sold at the end of the month and rolled into a newly selected issue. The issue selected at each month-end rebalancing is the outstanding Treasury Bill that matures closest to, but not beyond, three months from the rebalancing date. |
| |
| Barclays U.S. Aggregate Bond Index | | The Barclays U.S. Aggregate Bond Index measures investment grade, U.S. dollar-denominated, fixed-rate taxable bonds, including Treasuries, government-related and corporate securities, as well as both mortgage- and asset-backed securities. |
| |
| HFRX Global Hedge Fund Index | | The HFRX Global Hedge Fund Index is a passively-managed index that is compiled by Hedge Fund Research, Inc. It is designed to measure the daily performance of the overall composition of the hedge fund universe. It is comprised of all eligible hedge fund strategies; including but not limited to convertible arbitrage, distressed securities, equity hedge, equity market neutral, event driven, macro, merger arbitrage, and relative value arbitrage. |
| |
| Wilshire 5000® Total Market Index | | The Wilshire 5000® Total Market Index measures the performance of most U.S. domiciled public securities with readily available price data. Companies in the index are weighted by available float and market-capitalization. |
| | |
| Transamerica Funds | | Annual Report 2014 |
Page 15
Understanding Your Funds’ Expenses
(unaudited)
SHAREHOLDER EXPENSES
Fund shareholders may incur two types of costs: (1) transaction costs, including sales charges (loads) on purchases, contingent deferred sales charges on redemptions; and (2) ongoing costs, including management fees, and other fund expenses.
The following examples are intended to help you understand your ongoing costs (in dollars and cents) of investing in the Funds and to compare these costs with the ongoing costs of investing in other funds.
The examples are based on an investment of $1,000 invested at May 1, 2014, and held for the entire period until October 31, 2014.
ACTUAL EXPENSES
The information in the table under the heading “Actual Expenses” provides information about actual account values and actual expenses. You may use the information in these columns, together with the amount you invested, to estimate the expenses that you paid over the period. Simply divide your account value by $1,000 (for example, an $8,600 account value divided by $1,000 = $8.60), then multiply the result by the number in the appropriate column for your share class titled “Expenses Paid During Period” to estimate the expenses you paid on your account during this period. If your account is an IRA, your expenses could have included a $15 annual fee. The amount of any fee paid during the period can decrease your ending account value.
HYPOTHETICAL EXAMPLE FOR COMPARISON PURPOSES
The information in the table under the heading “Hypothetical Expenses” provides information about hypothetical account values and hypothetical expenses based on the Funds’ actual expense ratios and assumed rates of return of 5% per year before expenses, which are not the Funds’ actual returns. The hypothetical account values and expenses may not be used to estimate the actual ending account balance or expenses you paid for the period. You may use this information to compare the ongoing costs of investing in your Fund versus other funds. To do so, compare this 5% hypothetical example with the 5% hypothetical examples that appear in the shareholder reports of the other funds. As in the case of the actual expense example, if your account is subject to an IRA fee, the amount of the fee paid through your account would increase the hypothetical expenses you would have paid during the period and decrease the hypothetical ending account value.
Please note that the expenses shown in the table are meant to highlight your ongoing costs only and do not reflect any transactional costs, such as sales charges and brokerage commissions paid on purchases and sales of Fund shares. Therefore, the information under the heading “Hypothetical Expenses” is useful in comparing ongoing costs only, and will not help you determine the relative total costs of owning different funds. If any of these transaction costs were included, your costs would be higher. The expenses shown in the table do not reflect any fees that may be charged to you by brokers, financial intermediaries, or other financial institutions.
Expense ratios may vary period to period because of various factors, such as an increase in expenses that are not covered by the advisory and administrative fees, expenses and fees of the trustees and their counsel, extraordinary expenses and interest expense.
| | | | | | | | | | | | | | | | | | | | | | | | |
| | | | | | Actual Expenses | | | Hypothetical Expenses (A) | | | | |
| Fund Name | | Beginning
Account Value | | | Ending Account
Value | | | Expenses Paid
During Period (B) | | | Ending Account
Value | | | Expenses Paid
During Period (B) | | | Annualized
Expense Ratio (C) | |
| | | | | |
Transamerica Asset Allocation - Conservative Portfolio | | | | | | | | | | | | | | | | | | | | | |
Class A | | $ | 1,000.00 | | | $ | 1,027.30 | | | $ | 2.55 | | | $ | 1,022.70 | | | $ | 2.55 | | | | 0.50 | % |
Class B | | | 1,000.00 | | | | 1,024.10 | | | | 6.48 | | | | 1,018.80 | | | | 6.46 | | | | 1.27 | |
Class C | | | 1,000.00 | | | | 1,023.90 | | | | 6.17 | | | | 1,019.10 | | | | 6.16 | | | | 1.21 | |
Class I | | | 1,000.00 | | | | 1,028.60 | | | | 1.28 | | | | 1,023.90 | | | | 1.28 | | | | 0.25 | |
Class R | | | 1,000.00 | | | | 1,026.20 | | | | 4.24 | | | | 1,021.00 | | | | 4.23 | | | | 0.83 | |
| | | | | |
Transamerica Asset Allocation - Growth Portfolio | | | | | | | | | | | | | | | | | | | | | |
Class A | | | 1,000.00 | | | | 1,046.70 | | | | 2.79 | | | | 1,022.50 | | | | 2.75 | | | | 0.54 | |
Class B | | | 1,000.00 | | | | 1,043.10 | | | | 6.80 | | | | 1,018.60 | | | | 6.72 | | | | 1.32 | |
Class C | | | 1,000.00 | | | | 1,043.30 | | | | 6.44 | | | | 1,018.90 | | | | 6.36 | | | | 1.25 | |
Class I | | | 1,000.00 | | | | 1,048.00 | | | | 1.34 | | | | 1,023.90 | | | | 1.33 | | | | 0.26 | |
Class R | | | 1,000.00 | | | | 1,045.70 | | | | 4.43 | | | | 1,020.90 | | | | 4.38 | | | | 0.86 | |
| | | | |
Transamerica Asset Allocation - Moderate Growth Portfolio | | | | | | | | | | | | | | | | | |
Class A | | | 1,000.00 | | | | 1,038.20 | | | | 2.57 | | | | 1,022.70 | | | | 2.55 | | | | 0.50 | |
Class B | | | 1,000.00 | | | | 1,033.90 | | | | 6.61 | | | | 1,018.70 | | | | 6.56 | | | | 1.29 | |
Class C | | | 1,000.00 | | | | 1,034.20 | | | | 6.31 | | | | 1,019.00 | | | | 6.26 | | | | 1.23 | |
Class I | | | 1,000.00 | | | | 1,038.90 | | | | 1.28 | | | | 1,023.90 | | | | 1.28 | | | | 0.25 | |
Class R | | | 1,000.00 | | | | 1,037.00 | | | | 3.80 | | | | 1,021.50 | | | | 3.77 | | | | 0.74 | |
| | |
| Transamerica Funds | | Annual Report 2014 |
Page 16
Understanding Your Funds’ Expenses (continued)
(unaudited)
| | | | | | | | | | | | | | | | | | | | | | | | |
| | | | | | Actual Expenses | | | Hypothetical Expenses (A) | | | | |
| Fund Name | | Beginning
Account Value | | | Ending Account
Value | | | Expenses Paid
During Period (B) | | | Ending Account
Value | | | Expenses Paid
During Period (B) | | | Annualized
Expense Ratio (C) | |
| | | | | |
Transamerica Asset Allocation - Moderate Portfolio | | | | | | | | | | | | | | | | | | | | | |
Class A | | $ | 1,000.00 | | | $ | 1,029.60 | | | $ | 2.56 | | | $ | 1,022.70 | | | $ | 2.55 | | | | 0.50 | % |
Class B | | | 1,000.00 | | | | 1,025.60 | | | | 6.59 | | | | 1,018.70 | | | | 6.56 | | | | 1.29 | |
Class C | | | 1,000.00 | | | | 1,026.00 | | | | 6.23 | | | | 1,019.10 | | | | 6.21 | | | | 1.22 | |
Class I | | | 1,000.00 | | | | 1,030.40 | | | | 1.28 | | | | 1,023.90 | | | | 1.28 | | | | 0.25 | |
Class R | | | 1,000.00 | | | | 1,028.20 | | | | 3.73 | | | | 1,021.50 | | | | 3.72 | | | | 0.73 | |
| | | | |
Transamerica Multi-Manager Alternative Strategies Portfolio | | | | | | | | | | | | | | | | | |
Class A | | | 1,000.00 | | | | 1,026.40 | | | | 3.63 | | | | 1,021.60 | | | | 3.62 | | | | 0.71 | |
Class C | | | 1,000.00 | | | | 1,021.70 | | | | 7.49 | | | | 1,017.80 | | | | 7.48 | | | | 1.47 | |
Class I | | | 1,000.00 | | | | 1,028.30 | | | | 2.20 | | | | 1,023.00 | | | | 2.19 | | | | 0.43 | |
| (A) | 5% return per year before expenses. |
| (B) | Expenses are calculated using the Funds’ annualized expense ratios (as disclosed in the table), multiplied by the average account value for the period, multiplied by the number of days in the period (184 days), and divided by the number of days in the year (365 days). |
| (C) | During the period ended October 31, 2014, expense ratios do not include expenses of the investment companies in which the Funds invest. |
| | |
| Transamerica Funds | | Annual Report 2014 |
Page 17
Schedules of Investments Composition
At October 31, 2014
(unaudited)
| | | | |
| Transamerica Asset Allocation - Conservative Portfolio | |
| |
| Asset Allocation | | % of Net
Assets | |
Fixed Income | | | 55.1 | % |
U.S. Equity | | | 26.6 | |
Global/International Equity | | | 7.8 | |
Tactical and Specialty | | | 5.8 | |
Inflation-Protected Securities | | | 4.9 | |
Net Other Assets (Liabilities) | | | (0.2 | ) |
Total | | | 100.0 | % |
| | | | |
|
| Transamerica Asset Allocation - Growth Portfolio | |
| |
| Asset Allocation | | % of Net
Assets | |
U.S. Equity | | | 68.8 | % |
Global/International Equity | | | 21.2 | |
Tactical and Specialty | | | 10.1 | |
Fixed Income | | | 0.0 | * |
Net Other Assets (Liabilities) | | | (0.1 | ) |
Total | | | 100.0 | % |
| | | | |
|
| Transamerica Asset Allocation - Moderate Growth Portfolio | |
| |
| Asset Allocation | | % of Net
Assets | |
U.S. Equity | | | 53.0 | % |
Fixed Income | | | 23.2 | |
Global/International Equity | | | 15.1 | |
Tactical and Specialty | | | 6.9 | |
Inflation-Protected Securities | | | 1.9 | |
Net Other Assets (Liabilities) | | | (0.1 | ) |
Total | | | 100.0 | % |
| | | | |
| | | | |
| Transamerica Asset Allocation - Moderate Portfolio | |
| |
| Asset Allocation | | % of Net
Assets | |
Fixed Income | | | 43.2 | % |
U.S. Equity | | | 35.9 | |
Global/International Equity | | | 10.3 | |
Tactical and Specialty | | | 7.7 | |
Inflation-Protected Securities | | | 3.0 | |
Net Other Assets (Liabilities) | | | (0.1 | ) |
Total | | | 100.0 | % |
| | | | |
|
| Transamerica Multi-Manager Alternative Strategies Portfolio | |
| |
| Asset Allocation | | % of Net
Assets | |
Tactical and Specialty | | | 47.9 | % |
Repurchase Agreement | | | 22.0 | |
Fixed Income | | | 17.6 | |
Alternative Investments | | | 9.8 | |
Global/International Equity | | | 2.8 | |
Net Other Assets (Liabilities) | | | (0.1 | ) |
Total | | | 100.0 | % |
| | | | |
| * | Percentage rounds to less than 0.1% or (0.1)%. |
| | |
| Transamerica Funds | | Annual Report 2014 |
Page 18
Transamerica Asset Allocation – Conservative Portfolio
SCHEDULE OF INVESTMENTS
At October 31, 2014
| | | | | | | | |
| | | Shares | | | Value | |
INVESTMENT COMPANIES - 100.2% | | | | | |
Fixed Income - 55.1% | | | | | | | | |
Transamerica Bond (A) | | | 5,366,259 | | | | $ 58,009,260 | |
Transamerica Core Bond (A) | | | 17,034,409 | | | | 173,069,596 | |
Transamerica Emerging Markets Debt (A) | | | 1,387,062 | | | | 14,966,400 | |
Transamerica Flexible Income (A) | | | 2,279,307 | | | | 21,607,831 | |
Transamerica High Yield Bond (A) | | | 2,519,452 | | | | 24,615,051 | |
Transamerica Short-Term Bond (A) | | | 7,882,411 | | | | 80,242,941 | |
Transamerica Total Return (A) | | | 16,571,780 | | | | 176,323,736 | |
| | | | | | | | |
| | | | | | | 548,834,815 | |
| | | | | | | | |
Global/International Equity - 7.8% | | | | | | | | |
Transamerica Developing Markets Equity (A) | | | 1,802,703 | | | | 22,083,110 | |
Transamerica Emerging Markets Equity (A) | | | 650,210 | | | | 6,697,165 | |
Transamerica International Equity (A) | | | 697,731 | | | | 12,426,584 | |
Transamerica International Equity Opportunities (A) | | | 2,173,576 | | | | 18,497,135 | |
Transamerica International Small Cap (A) | | | 1,368,162 | | | | 13,626,890 | |
Transamerica International Small Cap Value (A) | | | 361,618 | | | | 4,274,328 | |
| | | | | | | | |
| | | | | | | 77,605,212 | |
| | | | | | | | |
Inflation-Protected Securities - 4.9% | | | | | |
Transamerica Inflation Opportunities (A) | | | 4,913,336 | | | | 48,936,825 | |
| | | | | | | | |
Tactical and Specialty - 5.8% | | | | | | | | |
Transamerica Arbitrage Strategy (A) | | | 1,548,302 | | | | 15,498,502 | |
Transamerica Commodity
Strategy (A) (B) | | | 906,286 | | | | 7,132,473 | |
Transamerica Global Allocation Liquidating Trust (B) (C) (D) (E) (F) | | | 7,891 | | | | 72,178 | |
Transamerica Global Real Estate Securities (A) | | | 1,553 | | | | 22,392 | |
| | | | | | | | |
| | | Shares | | | Value | |
INVESTMENT COMPANIES (continued) | | | | | |
Tactical and Specialty (continued) | | | | | |
Transamerica Long/Short Strategy (A) (B) | | | 933,502 | | | | $ 8,924,278 | |
Transamerica Managed Futures Strategy (A) | | | 2,525,356 | | | | 25,960,658 | |
| | | | | | | | |
| | | | | | | 57,610,481 | |
| | | | | | | | |
U.S. Equity - 26.6% | | | | | | | | |
Transamerica Capital Growth (A) | | | 1,456,515 | | | | 24,585,975 | |
Transamerica Concentrated Growth (A) | | | 1,091,877 | | | | 17,753,918 | |
Transamerica Dividend Focused (A) | | | 4,227,037 | | | | 56,473,208 | |
Transamerica Growth (A) | | | 2,334,007 | | | | 37,764,237 | |
Transamerica Growth Opportunities (A) | | | 1,482,026 | | | | 17,932,515 | |
Transamerica Large Cap Value (A) | | | 4,168,046 | | | | 55,601,729 | |
Transamerica Mid Cap Value (A) | | | 583,102 | | | | 10,361,716 | |
Transamerica Mid Cap Value Opportunities (A) | | | 435,311 | | | | 4,653,475 | |
Transamerica Small Cap Core (A) | | | 545,105 | | | | 5,903,484 | |
Transamerica Small Cap Growth (A) | | | 536,459 | | | | 6,957,874 | |
Transamerica Small Cap Value (A) | | | 69,559 | | | | 907,043 | |
Transamerica Small Company Growth Liquidating
Trust (B) (C) (D) (E) (F) | | | 1,529 | | | | 6,378 | |
Transamerica US Growth (A) | | | 1,338,755 | | | | 26,078,954 | |
| | | | | | | | |
| | | | | | | 264,980,506 | |
| | | | | | | | |
Total Investment Companies
(Cost $895,527,867) | | | | 997,967,839 | |
| | | | | | | | |
Total Investments
(Cost $895,527,867) (G) | | | | 997,967,839 | |
Net Other Assets (Liabilities) - (0.2)% | | | | (1,509,348 | ) |
| | | | | | | | |
| | |
Net Assets - 100.0% | | | | | | | $ 996,458,491 | |
| | | | | | | | |
SECURITY VALUATION:
Valuation Inputs (H)
| | | | | | | | | | | | | | | | |
| | | Level 1
Quoted Prices | | | Level 2
Other Significant
Observable Inputs | | | Level 3
Significant
Unobservable Inputs (I) | | | Value at
October 31, 2014 | |
ASSETS | | | | | | | | | | | | | | | | |
Investments | | | | | | | | | | | | | | | | |
Investment Companies | | | | | | | | | | | | | | | | |
Fixed Income | | $ | 548,834,815 | | | $ | — | | | $ | — | | | $ | 548,834,815 | |
Global/International Equity | | | 77,605,212 | | | | — | | | | — | | | | 77,605,212 | |
Inflation-Protected Securities | | | 48,936,825 | | | | — | | | | — | | | | 48,936,825 | |
Tactical and Specialty | | | 57,538,303 | | | | — | | | | 72,178 | | | | 57,610,481 | |
U.S. Equity | | | 264,974,128 | | | | — | | | | 6,378 | | | | 264,980,506 | |
| | | | | | | | | | | | | | | | |
Total Investments | | $ | 997,889,283 | | | $ | — | | | $ | 78,556 | | | $ | 997,967,839 | |
| | | | | | | | | | | | | | | | |
FOOTNOTES TO SCHEDULE OF INVESTMENTS:
| (A) | Investment in the Class I2 shares of the affiliated series of Transamerica Funds. |
| (B) | Non-income producing security. |
| (C) | Investment in affiliated company of Transamerica Asset Management, Inc. |
| (D) | Fair valued as determined in good faith in accordance with procedures established by the board of trustees. Total aggregate fair value of securities is $78,556, or 0.01% of the Fund’s net assets. |
The Notes to Financial Statements are an integral part of this report.
| | |
| Transamerica Funds | | Annual Report 2014 |
Page 19
Transamerica Asset Allocation – Conservative Portfolio
SCHEDULE OF INVESTMENTS (continued)
At October 31, 2014
FOOTNOTES TO SCHEDULE OF INVESTMENTS (continued):
| (E) | Total aggregate value of illiquid securities is $78,556, or 0.01% of the Fund’s net assets. |
| (F) | At October 31, 2014, the Fund owned the respective securities which were restricted to public resale: |
| | | | | | | | | | | | | | | | | | |
| Investments | | Description | | Acquisition
Date | | | Cost | | | Value | | | Value as % of Net Assets | |
Investment Companies | | Transamerica Global Allocation Liquidating Trust | | | 07/31/2014 | | | $ | 81,188 | | | $ | 72,178 | | | | 0.01 | % |
| | | | | |
Investment Companies | | Transamerica Small Company Growth Liquidating Trust | | | 10/26/2012 | | | | 15,291 | | | | 6,378 | | | | 0.00 | (J) |
| | | | | | | | | | | | | | | | | | |
| | | | | | | | $ | 96,479 | | | $ | 78,556 | | | | 0.01 | % |
| | | | | | | | | | | | | | | | | | |
| (G) | Aggregate cost for federal income tax purposes is $899,833,270. Aggregate gross unrealized appreciation and depreciation for all securities is $103,481,769 and $5,347,200, respectively. Net unrealized appreciation for tax purposes is $98,134,569. |
| (H) | The Fund recognizes transfers between Levels at the end of the reporting period. There were no transfers between Level 1, 2 and 3 during the period ended October 31, 2014. See the Notes to Financial Statements for more information regarding security valuation and pricing inputs. |
| (I) | Level 3 securities were not considered significant to the Fund. |
| (J) | Percentage rounds to less than 0.01% or (0.01)%. |
The Notes to Financial Statements are an integral part of this report.
| | |
| Transamerica Funds | | Annual Report 2014 |
Page 20
Transamerica Asset Allocation – Growth Portfolio
SCHEDULE OF INVESTMENTS
At October 31, 2014
| | | | | | | | |
| | | Shares | | | Value | |
INVESTMENT COMPANIES - 100.1% | |
Fixed Income - 0.0% (A) | |
Transamerica Money Market (B) | | | 60,293 | | | | $ 60,293 | |
| | | | | | | | |
Global/International Equity - 21.2% | |
Transamerica Developing Markets Equity (B) | | | 6,531,224 | | | | 80,007,496 | |
Transamerica Emerging Markets Equity (B) | | | 2,174,276 | | | | 22,395,040 | |
Transamerica International Equity (B) | | | 3,778,409 | | | | 67,293,472 | |
Transamerica International Equity Opportunities (B) | | | 10,775,661 | | | | 91,700,878 | |
Transamerica International Small Cap (B) | | | 5,474,701 | | | | 54,528,024 | |
Transamerica International Small Cap Value (B) | | | 1,449,975 | | | | 17,138,699 | |
| | | | | | | | |
| | | | | | | 333,063,609 | |
| | | | | | | | |
Tactical and Specialty - 10.1% | |
Transamerica Arbitrage Strategy (B) | | | 3,179,059 | | | | 31,822,378 | |
Transamerica Global Allocation Liquidating Trust (C) (D) (E) (F) (G) | | | 5,149 | | | | 47,096 | |
Transamerica Global Real Estate Securities (B) | | | 418,565 | | | | 6,035,708 | |
Transamerica Long/Short Strategy (B) (C) | | | 1,642,105 | | | | 15,698,522 | |
Transamerica Managed Futures Strategy (B) | | | 10,299,721 | | | | 105,881,130 | |
| | | | | | | | |
| | | | | | | 159,484,834 | |
| | | | | | | | |
| | | | | | | | |
| | | Shares | | | Value | |
INVESTMENT COMPANIES (continued) | |
U.S. Equity - 68.8% | |
Transamerica Capital Growth (B) | | | 5,552,494 | | | | $ 93,726,092 | |
Transamerica Concentrated Growth (B) | | | 4,223,110 | | | | 68,667,772 | |
Transamerica Dividend Focused (B) | | | 16,262,147 | | | | 217,262,282 | |
Transamerica Growth (B) | | | 8,966,826 | | | | 145,083,239 | |
Transamerica Growth Opportunities (B) | | | 4,738,521 | | | | 57,336,106 | |
Transamerica Large Cap Value (B) | | | 15,955,009 | | | | 212,839,816 | |
Transamerica Mid Cap Value (B) | | | 4,521,856 | | | | 80,353,389 | |
Transamerica Mid Cap Value Opportunities (B) | | | 2,955,168 | | | | 31,590,747 | |
Transamerica Small Cap Core (B) | | | 445,578 | | | | 4,825,611 | |
Transamerica Small Cap Growth (B) | | | 2,622,046 | | | | 34,007,940 | |
Transamerica Small Cap Value (B) | | | 2,754,040 | | | | 35,912,675 | |
Transamerica Small Company Growth Liquidating Trust (C) (D) (E) (F) (G) | | | 5,111 | | | | 21,317 | |
Transamerica US Growth (B) | | | 5,102,814 | | | | 99,402,820 | |
| | | | | | | | |
| | | | | | | 1,081,029,806 | |
| | | | | | | | |
Total Investment Companies
(Cost $1,234,944,672) | | | | 1,573,638,542 | |
| | | | | | | | |
Total Investments
(Cost $1,234,944,672) (H) | | | | 1,573,638,542 | |
Net Other Assets (Liabilities) - (0.1)% | | | | (2,341,524 | ) |
| | | | | | | | |
| | |
Net Assets - 100.0% | | | | | | | $ 1,571,297,018 | |
| | | | | | | | |
SECURITY VALUATION:
Valuation Inputs (I)
| | | | | | | | | | | | | | | | |
| | | Level 1
Quoted Prices | | | Level 2
Other Significant
Observable Inputs | | | Level 3
Significant
Unobservable Inputs (J) | | | Value at
October 31, 2014 | |
ASSETS | | | | | | | | | | | | | | | | |
Investments | | | | | | | | | | | | | | | | |
Investment Companies | | | | | | | | | | | | | | | | |
Fixed Income | | $ | 60,293 | | | $ | — | | | $ | — | | | $ | 60,293 | |
Global/International Equity | | | 333,063,609 | | | | — | | | | — | | | | 333,063,609 | |
Tactical and Specialty | | | 159,437,738 | | | | — | | | | 47,096 | | | | 159,484,834 | |
U.S. Equity | | | 1,081,008,489 | | | | — | | | | 21,317 | | | | 1,081,029,806 | |
| | | | | | | | | | | | | | | | |
Total Investments | | $ | 1,573,570,129 | | | $ | — | | | $ | 68,413 | | | $ | 1,573,638,542 | |
| | | | | | | | | | | | | | | | |
FOOTNOTES TO SCHEDULE OF INVESTMENTS:
| (A) | Percentage rounds to less than 0.1% or (0.1)%. |
| (B) | Investment in the Class I2 shares of the affiliated series of Transamerica Funds. |
| (C) | Non-income producing security. |
| (D) | Investment in affiliated company of Transamerica Asset Management, Inc. |
| (E) | Fair valued as determined in good faith in accordance with procedures established by the board of trustees. Total aggregate fair value of securities is $68,413, or less than 0.01% of the Fund’s net assets. |
| (F) | Total aggregate value of illiquid securities is $68,413, or less than 0.01% of the Fund’s net assets. |
The Notes to Financial Statements are an integral part of this report.
| | |
| Transamerica Funds | | Annual Report 2014 |
Page 21
Transamerica Asset Allocation – Growth Portfolio
SCHEDULE OF INVESTMENTS (continued)
At October 31, 2014
FOOTNOTES TO SCHEDULE OF INVESTMENTS (continued):
| (G) | At October 31, 2014, the Fund owned the respective securities which were restricted to public resale: |
| | | | | | | | | | | | | | | | | | |
| Investments | | Description | | Acquisition
Date | | | Cost | | | Value | | | Value as % of
Net Assets | |
Investment Companies | | Transamerica Global Allocation Liquidating Trust | | | 07/31/2014 | | | $ | 52,975 | | | $ | 47,096 | | | | 0.00 | %(K) |
| | | | | |
Investment Companies | | Transamerica Small Company Growth Liquidating Trust | | | 10/26/2012 | | | | 51,112 | | | | 21,317 | | | | 0.00 | (K) |
| | | | | | | | | | | | | | | | | | |
| | | | | | | | $ | 104,087 | | | $ | 68,413 | | | | 0.00 | %(K) |
| | | | | | | | | | | | | | | | | | |
| (H) | Aggregate cost for federal income tax purposes is $1,242,610,737. Aggregate gross unrealized appreciation and depreciation for all securities is $332,003,404 and $975,599, respectively. Net unrealized appreciation for tax purposes is $331,027,805. |
| (I) | The Fund recognizes transfers between Levels at the end of the reporting period. There were no transfers between Level 1, 2 and 3 during the period ended October 31, 2014. See the Notes to Financial Statements for more information regarding security valuation and pricing inputs. |
| (J) | Level 3 securities were not considered significant to the Fund. |
| (K) | Percentage rounds to less than 0.01% or (0.01)%. |
The Notes to Financial Statements are an integral part of this report.
| | |
| Transamerica Funds | | Annual Report 2014 |
Page 22
Transamerica Asset Allocation – Moderate Growth Portfolio
SCHEDULE OF INVESTMENTS
At October 31, 2014
| | | | | | | | |
| | | Shares | | | Value | |
INVESTMENT COMPANIES - 100.1% | | | | | |
Fixed Income - 23.2% | | | | | | | | |
Transamerica Bond (A) | | | 4,360,267 | | | | $ 47,134,482 | |
Transamerica Core Bond (A) | | | 15,151,034 | | | | 153,934,507 | |
Transamerica Emerging Markets Debt (A) | | | 1,546,513 | | | | 16,686,878 | |
Transamerica Flexible Income (A) | | | 1,597,816 | | | | 15,147,292 | |
Transamerica High Yield Bond (A) | | | 4,408,351 | | | | 43,069,591 | |
Transamerica Short-Term Bond (A) | | | 6,852 | | | | 69,753 | |
Transamerica Total Return (A) | | | 40,251,843 | | | | 428,279,612 | |
| | | | | | | | |
| | | | | | | 704,322,115 | |
| | | | | | | | |
Global/International Equity - 15.1% | | | | | | | | |
Transamerica Developing Markets Equity (A) | | | 8,648,637 | | | | 105,945,797 | |
Transamerica Emerging Markets Equity (A) | | | 3,231,737 | | | | 33,286,896 | |
Transamerica International Equity (A) | | | 4,377,618 | | | | 77,965,384 | |
Transamerica International Equity Opportunities (A) | | | 14,827,641 | | | | 126,183,228 | |
Transamerica International Small Cap (A) | | | 8,289,797 | | | | 82,566,381 | |
Transamerica International Small Cap Value (A) | | | 2,736,687 | | | | 32,347,640 | |
| | | | | | | | |
| | | | | | | 458,295,326 | |
| | | | | | | | |
Inflation-Protected Securities - 1.9% | | | | | |
Transamerica Inflation Opportunities (A) | | | 5,878,734 | | | | 58,552,194 | |
| | | | | | | | |
Tactical and Specialty - 6.9% | | | | | | | | |
Transamerica Arbitrage Strategy (A) | | | 5,144,224 | | | | 51,493,681 | |
Transamerica Commodity Strategy (A) (B) | | | 3,313,251 | | | | 26,075,288 | |
Transamerica Global Allocation Liquidating Trust (B) (C) (D) (E) (F) | | | 34,418 | | | | 314,812 | |
| | | | | | | | |
| | | Shares | | | Value | |
INVESTMENT COMPANIES (continued) | |
Tactical and Specialty (continued) | | | | | |
Transamerica Global Real Estate Securities (A) | | | 1,100,296 | | | | $ 15,866,264 | |
Transamerica Managed Futures Strategy (A) | | | 11,389,870 | | | | 117,087,863 | |
| | | | | | | | |
| | | | | | | 210,837,908 | |
| | | | | | | | |
U.S. Equity - 53.0% | | | | | | | | |
Transamerica Capital Growth (A) | | | 8,410,309 | | | | 141,966,010 | |
Transamerica Concentrated Growth (A) | | | 6,310,571 | | | | 102,609,879 | |
Transamerica Dividend Focused (A) | | | 24,353,308 | | | | 325,360,195 | |
Transamerica Growth (A) | | | 13,475,687 | | | | 218,036,609 | |
Transamerica Growth Opportunities (A) | | | 8,719,679 | | | | 105,508,117 | |
Transamerica Large Cap Value (A) | | | 24,028,306 | | | | 320,537,606 | |
Transamerica Mid Cap Value (A) | | | 6,762,695 | | | | 120,173,098 | |
Transamerica Mid Cap Value Opportunities (A) | | | 4,692,626 | | | | 50,164,171 | |
Transamerica Small Cap Core (A) | | | 1,881,618 | | | | 20,377,920 | |
Transamerica Small Cap Growth (A) | | | 1,937,793 | | | | 25,133,174 | |
Transamerica Small Cap Value (A) | | | 2,219,507 | | | | 28,942,369 | |
Transamerica Small Company Growth Liquidating Trust (B) (C) (D) (E) (F) | | | 4,660 | | | | 19,435 | |
Transamerica US Growth (A) | | | 7,731,839 | | | | 150,616,218 | |
| | | | | | | | |
| | | | | | | 1,609,444,801 | |
| | | | | | | | |
Total Investment Companies
(Cost $2,549,565,330) | | | | 3,041,452,344 | |
| | | | | | | | |
Total Investments
(Cost $2,549,565,330) (G) | | | | 3,041,452,344 | |
Net Other Assets (Liabilities) - (0.1)% | | | | (2,583,028 | ) |
| | | | | | | | |
| | |
Net Assets - 100.0% | | | | | | | $ 3,038,869,316 | |
| | | | | | | | |
SECURITY VALUATION:
Valuation Inputs (H)
| | | | | | | | | | | | | | | | |
| | | Level 1
Quoted Prices | | | Level 2
Other Significant
Observable Inputs | | | Level 3
Significant
Unobservable Inputs (I) | | | Value at October 31, 2014 | |
ASSETS | | | | | | | | | | | | | | | | |
Investments | | | | | | | | | | | | | | | | |
Investment Companies | | | | | | | | | | | | | | | | |
Fixed Income | | $ | 704,322,115 | | | $ | — | | | $ | — | | | $ | 704,322,115 | |
Global/International Equity | | | 458,295,326 | | | | — | | | | — | | | | 458,295,326 | |
Inflation-Protected Securities | | | 58,552,194 | | | | — | | | | — | | | | 58,552,194 | |
Tactical and Specialty | | | 210,523,096 | | | | — | | | | 314,812 | | | | 210,837,908 | |
U.S. Equity | | | 1,609,425,366 | | | | — | | | | 19,435 | | | | 1,609,444,801 | |
| | | | | | | | | | | | | | | | |
Total Investments | | $ | 3,041,118,097 | | | $ | — | | | $ | 334,247 | | | $ | 3,041,452,344 | |
| | | | | | | | | | | | | | | | |
FOOTNOTES TO SCHEDULE OF INVESTMENTS:
| (A) | Investment in the Class I2 shares of the affiliated series of Transamerica Funds. |
| (B) | Non-income producing security. |
| (C) | Investment in affiliated company of Transamerica Asset Management, Inc. |
| (D) | Fair valued as determined in good faith in accordance with procedures established by the board of trustees. Total aggregate fair value of securities is $334,247, or 0.01% of the Fund’s net assets. |
| (E) | Total aggregate value of illiquid securities is $334,247, or 0.01% of the Fund’s net assets. |
The Notes to Financial Statements are an integral part of this report.
| | |
| Transamerica Funds | | Annual Report 2014 |
Page 23
Transamerica Asset Allocation – Moderate Growth Portfolio
SCHEDULE OF INVESTMENTS (continued)
At October 31, 2014
FOOTNOTES TO SCHEDULE OF INVESTMENTS (continued):
| (F) | At October 31, 2014, the Fund owned the respective securities which were restricted to public resale: |
| | | | | | | | | | | | | | | | | | |
| Investments | | Description | | Acquisition
Date | | | Cost | | | Value | | | Value as % of
Net Assets | |
Investment Companies | | Transamerica Global Allocation Liquidating Trust | | | 07/31/2014 | | | $ | 354,111 | | | $ | 314,812 | | | | 0.01 | % |
| | | | | |
Investment Companies | | Transamerica Small Company Growth Liquidating Trust | | | 10/26/2012 | | | | 46,600 | | | | 19,435 | | | | 0.00 | (J) |
| | | | | | | | | | | | | | | | | | |
| | | | | | | | $ | 400,711 | | | $ | 334,247 | | | | 0.01 | % |
| | | | | | | | | | | | | | | | | | |
| (G) | Aggregate cost for federal income tax purposes is $2,559,808,855. Aggregate gross unrealized appreciation and depreciation for all securities is $494,309,685 and $12,666,196, respectively. Net unrealized appreciation for tax purposes is $481,643,489. |
| (H) | The Fund recognizes transfers between Levels at the end of the reporting period. There were no transfers between Level 1, 2 and 3 during the period ended October 31, 2014. See the Notes to Financial Statements for more information regarding security valuation and pricing inputs. |
| (I) | Level 3 securities were not considered significant to the Fund. |
| (J) | Percentage rounds to less than 0.01% or (0.01)%. |
The Notes to Financial Statements are an integral part of this report.
| | |
| Transamerica Funds | | Annual Report 2014 |
Page 24
Transamerica Asset Allocation – Moderate Portfolio
SCHEDULE OF INVESTMENTS
At October 31, 2014
| | | | | | | | |
| | | Shares | | | Value | |
INVESTMENT COMPANIES - 100.1% | | | | | |
Fixed Income - 43.2% | | | | | | | | |
Transamerica Bond (A) | | | 8,574,651 | | | | $ 92,691,973 | |
Transamerica Core Bond (A) | | | 17,297,917 | | | | 175,746,838 | |
Transamerica Emerging Markets Debt (A) | | | 2,741,882 | | | | 29,584,908 | |
Transamerica Flexible Income (A) | | | 6,865,162 | | | | 65,081,735 | |
Transamerica High Yield Bond (A) | | | 3,731,456 | | | | 36,456,324 | |
Transamerica Short-Term Bond (A) | | | 13,226,583 | | | | 134,646,617 | |
Transamerica Total Return (A) | | | 37,594,768 | | | | 400,008,328 | |
| | | | | | | | |
| | | | | | | 934,216,723 | |
| | | | | | | | |
Global/International Equity - 10.3% | | | | | | | | |
Transamerica Developing Markets Equity (A) | | | 3,459,543 | | | | 42,379,400 | |
Transamerica Emerging Markets Equity (A) | | | 1,225,828 | | | | 12,626,028 | |
Transamerica International Equity (A) | | | 2,594,387 | | | | 46,206,036 | |
Transamerica International Equity Opportunities (A) | | | 8,223,099 | | | | 69,978,572 | |
Transamerica International Small Cap (A) | | | 3,923,620 | | | | 39,079,251 | |
Transamerica International Small Cap Value (A) | | | 1,162,791 | | | | 13,744,190 | |
| | | | | | | | |
| | | | | | | 224,013,477 | |
| | | | | | | | |
Inflation-Protected Securities - 3.0% | | | | | |
Transamerica Inflation Opportunities (A) | | | 6,508,919 | | | | 64,828,831 | |
| | | | | | | | |
Tactical and Specialty - 7.7% | | | | | | | | |
Transamerica Arbitrage Strategy (A) | | | 3,381,579 | | | | 33,849,606 | |
Transamerica Commodity
Strategy (A) (B) | | | 2,435,992 | | | | 19,171,259 | |
Transamerica Global Allocation Liquidating Trust (B) (C) (D) (E) (F) | | | 21,365 | | | | 195,418 | |
Transamerica Global Real Estate Securities (A) | | | 1,639 | | | | 23,639 | |
| | | | | | | | |
| | | Shares | | | Value | |
INVESTMENT COMPANIES (continued) | |
Tactical and Specialty (continued) | | | | | |
Transamerica Long/Short Strategy (A) (B) | | | 2,927,632 | | | | $ 27,988,162 | |
Transamerica Managed Futures Strategy (A) | | | 8,267,732 | | | | 84,992,280 | |
| | | | | | | | |
| | | | | | | 166,220,364 | |
| | | | | | | | |
U.S. Equity - 35.9% | | | | | | | | |
Transamerica Capital Growth (A) | | | 4,042,215 | | | | 68,232,591 | |
Transamerica Concentrated Growth (A) | | | 3,034,796 | | | | 49,345,777 | |
Transamerica Dividend Focused (A) | | | 11,755,434 | | | | 157,052,596 | |
Transamerica Growth (A) | | | 6,402,238 | | | | 103,588,212 | |
Transamerica Growth Opportunities (A) | | | 4,468,387 | | | | 54,067,480 | |
Transamerica Large Cap Value (A) | | | 11,481,555 | | | | 153,163,946 | |
Transamerica Mid Cap Value (A) | | | 3,006,985 | | | | 53,434,128 | |
Transamerica Mid Cap Value Opportunities (A) | | | 2,155,227 | | | | 23,039,378 | |
Transamerica Small Cap Core (A) | | | 1,062,892 | | | | 11,511,122 | |
Transamerica Small Cap Growth (A) | | | 1,189,560 | | | | 15,428,587 | |
Transamerica Small Cap Value (A) | | | 1,198,437 | | | | 15,627,619 | |
Transamerica Small Company Growth Liquidating
Trust (B) (C) (D) (E) (F) | | | 2,887 | | | | 12,040 | |
Transamerica US Growth (A) | | | 3,642,620 | | | | 70,958,245 | |
| | | | | | | | |
| | | | | | | 775,461,721 | |
| | | | | | | | |
Total Investment Companies
(Cost $1,907,191,224) | | | | 2,164,741,116 | |
| | | | | | | | |
Total Investments
(Cost $1,907,191,224) (G) | | | | 2,164,741,116 | |
Net Other Assets (Liabilities) - (0.1)% | | | | (2,430,851 | ) |
| | | | | | | | |
| | |
Net Assets - 100.0% | | | | | | | $ 2,162,310,265 | |
| | | | | | | | |
SECURITY VALUATION:
Valuation Inputs (H)
| | | | | | | | | | | | | | | | |
| | | Level 1
Quoted Prices | | | Level 2
Other Significant
Observable Inputs | | | Level 3
Significant
Unobservable Inputs (I) | | | Value at
October 31, 2014 | |
ASSETS | | | | | | | | | | | | | | | | |
Investments | | | | | | | | | | | | | | | | |
Investment Companies | | | | | | | | | | | | | | | | |
Fixed Income | | $ | 934,216,723 | | | $ | — | | | $ | — | | | $ | 934,216,723 | |
Global/International Equity | | | 224,013,477 | | | | — | | | | — | | | | 224,013,477 | |
Inflation-Protected Securities | | | 64,828,831 | | | | — | | | | — | | | | 64,828,831 | |
Tactical and Specialty | | | 166,024,946 | | | | — | | | | 195,418 | | | | 166,220,364 | |
U.S. Equity | | | 775,449,681 | | | | — | | | | 12,040 | | | | 775,461,721 | |
| | | | | | | | | | | | | | | | |
Total Investments | | $ | 2,164,533,658 | | | $ | — | | | $ | 207,458 | | | $ | 2,164,741,116 | |
| | | | | | | | | | | | | | | | |
FOOTNOTES TO SCHEDULE OF INVESTMENTS:
| (A) | Investment in the Class I2 shares of the affiliated series of Transamerica Funds. |
| (B) | Non-income producing security. |
| (C) | Investment in affiliated company of Transamerica Asset Management, Inc. |
| (D) | Fair valued as determined in good faith in accordance with procedures established by the board of trustees. Total aggregate fair value of securities is $207,458, or 0.01% of the Fund’s net assets. |
The Notes to Financial Statements are an integral part of this report.
| | |
| Transamerica Funds | | Annual Report 2014 |
Page 25
Transamerica Asset Allocation – Moderate Portfolio
SCHEDULE OF INVESTMENTS (continued)
At October 31, 2014
FOOTNOTES TO SCHEDULE OF INVESTMENTS (continued):
| (E) | Total aggregate value of illiquid securities is $207,458, or 0.01% of the Fund’s net assets. |
| (F) | At October 31, 2014, the Fund owned the respective securities which were restricted to public resale: |
| | | | | | | | | | | | | | | | | | |
| Investments | | Description | | Acquisition
Date | | | Cost | | | Value | | | Value as % of
Net Assets | |
Investment Companies | | Transamerica Global Allocation Liquidating Trust | | | 07/31/2014 | | | $ | 219,813 | | | $ | 195,418 | | | | 0.01 | % |
| | | | | |
Investment Companies | | Transamerica Small Company Growth Liquidating Trust | | | 10/26/2012 | | | | 28,869 | | | | 12,040 | | | | 0.00 | (J) |
| | | | | | | | | | | | | | | | | | |
| | | | | | | | $ | 248,682 | | | $ | 207,458 | | | | 0.01 | % |
| | | | | | | | | | | | | | | | | | |
| (G) | Aggregate cost for federal income tax purposes is $1,913,103,923. Aggregate gross unrealized appreciation and depreciation for all securities is $262,555,590 and $10,918,397, respectively. Net unrealized appreciation for tax purposes is $251,637,193. |
| (H) | The Fund recognizes transfers between Levels at the end of the reporting period. There were no transfers between Level 1, 2 and 3 during the period ended October 31, 2014. See the Notes to Financial Statements for more information regarding security valuation and pricing inputs. |
| (I) | Level 3 securities were not considered significant to the Fund. |
| (J) | Percentage rounds to less than 0.01% or (0.01)%. |
The Notes to Financial Statements are an integral part of this report.
| | |
| Transamerica Funds | | Annual Report 2014 |
Page 26
Transamerica Multi-Manager Alternative Strategies Portfolio
SCHEDULE OF INVESTMENTS
At October 31, 2014
| | | | | | | | |
| | | Shares | | | Value | |
INVESTMENT COMPANIES - 78.1% | | | | | | | | |
Alternative Investments - 9.8% | | | | | | | | |
Transamerica MLP & Energy Income (A) | | | 4,173,922 | | | | $ 48,542,717 | |
| | | | | | | | |
Fixed Income - 17.6% | | | | | | | | |
Transamerica Bond (A) | | | 1,112,921 | | | | 12,030,678 | |
Transamerica Emerging Markets Debt (A) | | | 1,164,023 | | | | 12,559,804 | |
Transamerica High Yield Bond (A) | | | 3,114,783 | | | | 30,431,428 | |
Transamerica Short-Term Bond (A) | | | 892,248 | | | | 9,083,086 | |
Transamerica Strategic High Income (A) | | | 2,192,006 | | | | 22,577,659 | |
| | | | | | | | |
| | | | | | | 86,682,655 | |
| | | | | | | | |
Global/International Equity - 2.8% | | | | | | | | |
Transamerica Developing Markets Equity (A) | | | 625,071 | | | | 7,657,118 | |
Transamerica International Small Cap (A) | | | 608,230 | | | | 6,057,973 | |
| | | | | | | | |
| | | | | | | 13,715,091 | |
| | | | | | | | |
Tactical and Specialty - 47.9% | | | | | | | | |
Transamerica Arbitrage Strategy (A) | | | 2,148,281 | | | | 21,504,295 | |
Transamerica Commodity Strategy (A) (B) | | | 1,909,319 | | | | 15,026,338 | |
Transamerica Global Real Estate Securities (A) | | | 1,893,421 | | | | 27,303,129 | |
Transamerica Long/Short Strategy (A) (B) | | | 11,283,521 | | | | 107,870,460 | |
Transamerica Managed Futures Strategy (A) | | | 6,296,789 | | | | 64,730,986 | |
| | | | | | | | |
| | | | | | | 236,435,208 | |
| | | | | | | | |
Total Investment Companies
(Cost $359,361,626) | | | | 385,375,671 | |
| | | | | | | | |
| | | | | | | | |
| | | Principal | | | Value | |
REPURCHASE AGREEMENT - 22.0% | |
State Street Bank & Trust Co.
0.01% (C), dated 10/31/2014, to be repurchased at $108,448,644 on 11/03/2014. Collateralized by U.S. Government Agency Obligations, 2.50%, due 12/15/2027 - 04/01/2028, and with a total value of $110,620,255. | | | $ 108,448,554 | | | | $ 108,448,554 | |
| | | | | | | | |
Total Repurchase Agreement
(Cost $108,448,554) | | | | | | | 108,448,554 | |
| | | | | | | | |
Total Investments
(Cost $467,810,180) (D) | | | | | | | 493,824,225 | |
Net Other Assets (Liabilities) - (0.1)% | | | | (259,864 | ) |
| | | | | | | | |
| | |
Net Assets - 100.0% | | | | | | | $ 493,564,361 | |
| | | | | | | | |
SECURITY VALUATION:
Valuation Inputs (E)
| | | | | | | | | | | | | | | | |
| | | Level 1
Quoted Prices | | | Level 2
Other Significant
Observable Inputs | | | Level 3
Significant
Unobservable Inputs | | | Value at
October 31, 2014 | |
ASSETS | | | | | | | | | | | | | | | | |
Investments | | | | | | | | | | | | | | | | |
Investment Companies | | $ | 385,375,671 | | | $ | — | | | $ | — | | | $ | 385,375,671 | |
Repurchase Agreement | | | — | | | | 108,448,554 | | | | — | | | | 108,448,554 | |
| | | | | | | | | | | | | | | | |
Total Investments | | $ | 385,375,671 | | | $ | 108,448,554 | | | $ | — | | | $ | 493,824,225 | |
| | | | | | | | | | | | | | | | |
FOOTNOTES TO SCHEDULE OF INVESTMENTS:
| (A) | Investment in the Class I2 shares of the affiliated series of Transamerica Funds. |
| (B) | Non-income producing security. |
| (C) | Rate shown reflects the yield at October 31, 2014. |
| (D) | Aggregate cost for federal income tax purposes is $470,832,263. Aggregate gross unrealized appreciation and depreciation for all securities is $25,530,818 and $2,538,856, respectively. Net unrealized appreciation for tax purposes is $22,991,962. |
| (E) | The Fund recognizes transfers between Levels at the end of the reporting period. There were no transfers between Level 1, 2 and 3 during the period ended October 31, 2014. See the Notes to Financial Statements for more information regarding security valuation and pricing inputs. |
The Notes to Financial Statements are an integral part of this report.
| | |
| Transamerica Funds | | Annual Report 2014 |
Page 27
STATEMENTS OF ASSETS AND LIABILITIES
At October 31, 2014
| | | | | | | | | | | | | | | | | | | | |
| | | Transamerica Asset
Allocation -
Conservative
Portfolio | | | Transamerica Asset
Allocation -
Growth
Portfolio | | | Transamerica Asset
Allocation -
Moderate Growth
Portfolio | | | Transamerica Asset
Allocation -
Moderate
Portfolio | | | Transamerica Multi-
Manager Alternative
Strategies Portfolio | |
Assets: | | | | | | | | | | | | | | | | | | | | |
Affiliated investments, at value | | $ | 997,967,839 | | | $ | 1,573,638,542 | | | $ | 3,041,452,344 | | | $ | 2,164,741,116 | | | $ | 385,375,671 | |
Repurchase agreements, at value | | | — | | | | — | | | | — | | | | — | | | | 108,448,554 | |
Cash | | | — | | | | 163 | | | | — | | | | — | | | | — | |
Receivables: | | | | | | | | | | | | | | | | | | | | |
Shares of beneficial interest sold | | | 720,015 | | | | 1,128,559 | | | | 1,685,847 | | | | 1,448,404 | | | | 1,196,057 | |
Affiliated investments sold | | | 372,861 | | | | 137,812 | | | | 513,249 | | | | 775,033 | | | | — | |
Interest | | | — | | | | — | | | | — | | | | — | | | | 30 | |
Dividends | | | 9,751 | | | | — | | | | 8 | | | | 16,360 | | | | 1,103 | |
Prepaid expenses | | | 5,630 | | | | 7,120 | | | | 14,325 | | | | 10,588 | | | | 2,906 | |
Total assets | | | 999,076,096 | | | | 1,574,912,196 | | | | 3,043,665,773 | | | | 2,166,991,501 | | | | 495,024,321 | |
| | | | | | |
Liabilities: | | | | | | | | | | | | | | | | | | | | |
Due to custodian | | | — | | | | — | | | | 10 | | | | 15 | | | | 12 | |
Accounts payable and accrued liabilities: | | | | | | | | | | | | | | | | | | | | |
Shares of beneficial interest redeemed | | | 1,808,197 | | | | 2,356,256 | | | | 2,381,092 | | | | 2,956,741 | | | | 1,112,303 | |
Management and advisory fees | | | 84,059 | | | | 129,258 | | | | 252,146 | | | | 180,948 | | | | 83,251 | |
Distribution and service fees | | | 548,797 | | | | 816,704 | | | | 1,653,321 | | | | 1,203,054 | | | | 133,966 | |
Administration fees | | | 14,710 | | | | 22,620 | | | | 44,125 | | | | 31,666 | | | | 7,285 | |
Transfer agent fees | | | 87,372 | | | | 184,784 | | | | 289,177 | | | | 179,164 | | | | 61,945 | |
Trustees fees | | | 66 | | | | 103 | | | | 199 | | | | 143 | | | | 33 | |
Audit and tax fees | | | 17,488 | | | | 19,244 | | | | 23,963 | | | | 21,175 | | | | 17,025 | |
Custody fees | | | 979 | | | | 549 | | | | 2,327 | | | | 1,377 | | | | 519 | |
Legal fees | | | 12,251 | | | | 18,101 | | | | 35,374 | | | | 25,411 | | | | 6,238 | |
Printing and shareholder reports fees | | | 26,377 | | | | 49,032 | | | | 86,841 | | | | 56,142 | | | | 26,060 | |
Registration fees | | | 14,901 | | | | 15,073 | | | | 21,148 | | | | 20,554 | | | | 10,043 | |
Other | | | 2,408 | | | | 3,454 | | | | 6,734 | | | | 4,846 | | | | 1,280 | |
Total liabilities | | | 2,617,605 | | | | 3,615,178 | | | | 4,796,457 | | | | 4,681,236 | | | | 1,459,960 | |
Net assets | | $ | 996,458,491 | | | $ | 1,571,297,018 | | | $ | 3,038,869,316 | | | $ | 2,162,310,265 | | | $ | 493,564,361 | |
| | | | | | |
Net assets consist of: | | | | | | | | | | | | | | | | | | | | |
Paid-in capital | | $ | 828,930,569 | | | $ | 1,148,742,879 | | | $ | 2,293,733,474 | | | $ | 1,743,935,216 | | | $ | 471,002,778 | |
Undistributed (distributions in excess of) net investment income (loss) | | | 124,367 | | | | (3,895,422 | ) | | | 2,339,344 | | | | 8,453,263 | | | | 20,528 | |
Accumulated net realized gain (loss) | | | 64,963,583 | | | | 87,755,691 | | | | 250,909,484 | | | | 152,371,894 | | | | (3,472,990 | ) |
Net unrealized appreciation (depreciation) on: | | | | | | | | | | | | | | | | | | | | |
Affiliated investments | | | 102,439,972 | | | | 338,693,870 | | | | 491,887,014 | | | | 257,549,892 | | | | 26,014,045 | |
Net assets | | $ | 996,458,491 | | | $ | 1,571,297,018 | | | $ | 3,038,869,316 | | | $ | 2,162,310,265 | | | $ | 493,564,361 | |
Net assets by class: | | | | | | | | | | | | | | | | | | | | |
Class A | | $ | 416,116,044 | | | $ | 728,850,249 | | | $ | 1,319,225,835 | | | $ | 899,852,270 | | | $ | 129,568,337 | |
Class B | | | 37,191,778 | | | | 73,479,202 | | | | 133,060,219 | | | | 71,121,217 | | | | — | |
Class C | | | 508,285,392 | | | | 736,246,084 | | | | 1,526,266,872 | | | | 1,138,082,221 | | | | 125,950,198 | |
Class I | | | 32,813,915 | | | | 30,594,903 | | | | 54,952,612 | | | | 47,590,048 | | | | 238,045,826 | |
Class R | | | 2,051,362 | | | | 2,126,580 | | | | 5,363,778 | | | | 5,664,509 | | | | — | |
Shares outstanding (unlimited shares, no par value): | | | | | | | | | | | | | | | | | | | | |
Class A | | | 33,614,912 | | | | 44,566,414 | | | | 86,623,151 | | | | 66,376,449 | | | | 12,342,052 | |
Class B | | | 3,019,696 | | | | 4,597,997 | | | | 8,735,901 | | | | 5,230,273 | | | | — | |
Class C | | | 41,372,005 | | | | 46,235,793 | | | | 100,967,734 | | | | 84,655,276 | | | | 12,143,756 | |
Class I | | | 2,645,232 | | | | 1,868,464 | | | | 3,607,154 | | | | 3,509,187 | | | | 22,637,365 | |
Class R | | | 164,527 | | | | 130,968 | | | | 354,062 | | | | 420,177 | | | | — | |
Net asset value per share: | | | | | | | | | | | | | | | | | | | | |
Class A | | $ | 12.38 | | | $ | 16.35 | | | $ | 15.23 | | | $ | 13.56 | | | $ | 10.50 | |
Class B | | | 12.32 | | | | 15.98 | | | | 15.23 | | | | 13.60 | | | | — | |
Class C | | | 12.29 | | | | 15.92 | | | | 15.12 | | | | 13.44 | | | | 10.37 | |
Class I | | | 12.40 | | | | 16.37 | | | | 15.23 | | | | 13.56 | | | | 10.52 | |
Class R | | | 12.47 | | | | 16.24 | | | | 15.15 | | | | 13.48 | | | | — | |
Maximum offering price per share: (A) | | | | | | | | | | | | | | | | | | | | |
Class A | | $ | 13.10 | | | $ | 17.30 | | | $ | 16.12 | | | $ | 14.35 | | | $ | 11.11 | |
| | | | | | | | | | | | | | | | | | | | | |
Affiliated investments, at cost | | $ | 895,527,867 | | | $ | 1,234,944,672 | | | $ | 2,549,565,330 | | | $ | 1,907,191,224 | | | $ | 359,361,626 | |
Repurchase agreements, at cost | | $ | — | | | $ | — | | | $ | — | | | $ | — | | | $ | 108,448,554 | |
| (A) | Includes the maximum selling commission (represented as a percentage of offering price) which is reduced on certain levels of sales as set forth in the prospectus. Net asset value per share for Classes B, C, I and R shares represents offering price. The redemption price for Classes B and C shares equals net asset value less any applicable contingent deferred sales charge. |
The Notes to Financial Statements are an integral part of this report.
| | |
| Transamerica Funds | | Annual Report 2014 |
Page 28
STATEMENTS OF OPERATIONS
For the year ended October 31, 2014
| | | | | | | | | | | | | | | | | | | | |
| | | Transamerica Asset
Allocation -
Conservative
Portfolio | | | Transamerica Asset
Allocation -
Growth
Portfolio | | | Transamerica Asset
Allocation -
Moderate Growth
Portfolio | | | Transamerica Asset
Allocation -
Moderate
Portfolio | | | Transamerica Multi-
Manager Alternative
Strategies Portfolio | |
Investment Income: | | | | | | | | | | | | | | | | | | | | |
Dividend income from affiliated investments | | $ | 30,262,615 | | | $ | 40,614,713 | | | $ | 80,422,877 | | | $ | 54,981,579 | | | $ | 6,062,121 | |
Interest income from repurchase agreements | | | — | | | | — | | | | 1 | | | | 1 | | | | 4,060 | |
Total investment income | | | 30,262,615 | | | | 40,614,713 | | | | 80,422,878 | | | | 54,981,580 | | | | 6,066,181 | |
| | | | | | |
Expenses: | | | | | | | | | | | | | | | | | | | | |
Management and advisory fees | | | 1,037,914 | | | | 1,570,681 | | | | 3,059,506 | | | | 2,186,667 | | | | 1,042,755 | |
Distribution and service fees: | | | | | | | | | | | | | | | | | | | | |
Class A | | | 1,157,656 | | | | 1,926,221 | | | | 3,490,068 | | | | 2,411,186 | | | | 469,972 | |
Class B | | | 456,660 | | | | 862,815 | | | | 1,581,440 | | | | 841,157 | | | | — | |
Class C | | | 5,263,747 | | | | 7,311,852 | | | | 15,338,633 | | | | 11,482,507 | | | | 1,323,671 | |
Class R | | | 11,482 | | | | 10,182 | | | | 28,970 | | | | 27,393 | | | | — | |
Administration fees | | | 181,635 | | | | 274,869 | | | | 535,413 | | | | 382,667 | | | | 91,447 | |
Transfer agent fees: | | | | | | | | | | | | | | | | | | | | |
Class A | | | 494,618 | | | | 1,001,126 | | | | 1,415,158 | | | | 946,979 | | | | 250,815 | |
Class B | | | 58,229 | | | | 163,380 | | | | 252,589 | | | | 128,432 | | | | — | |
Class C | | | 366,572 | | | | 802,393 | | | | 1,352,333 | | | | 853,529 | | | | 191,618 | |
Class I | | | 31,723 | | | | 30,625 | | | | 54,190 | | | | 46,653 | | | | 227,945 | |
Class R | | | 3,846 | | | | 4,120 | | | | 5,892 | | | | 4,795 | | | | — | |
Trustees fees | | | 17,780 | | | | 27,283 | | | | 52,909 | | | | 37,677 | | | | 8,940 | |
Audit and tax fees | | | 34,767 | | | | 45,108 | | | | 75,220 | | | | 57,714 | | | | 24,818 | |
Custody fees | | | 45,006 | | | | 48,539 | | | | 91,438 | | | | 69,418 | | | | 17,597 | |
Legal fees | | | 34,794 | | | | 55,225 | | | | 106,283 | | | | 75,765 | | | | 18,465 | |
Printing and shareholder reports fees | | | 79,540 | | | | 160,008 | | | | 276,300 | | | | 177,165 | | | | 330,642 | |
Registration fees | | | 86,855 | | | | 95,380 | | | | 116,097 | | | | 107,773 | | | | 41,909 | |
Other | | | 46,585 | | | | 65,847 | | | | 126,722 | | | | 92,244 | | | | 24,099 | |
Total expenses | | | 9,409,409 | | | | 14,455,654 | | | | 27,959,161 | | | | 19,929,721 | | | | 4,064,693 | |
Net investment income (loss) | | | 20,853,206 | | | | 26,159,059 | | | | 52,463,717 | | | | 35,051,859 | | | | 2,001,488 | |
| | | | | | |
Net realized gain (loss) on transactions from: | | | | | | | | | | | | | | | | | | | | |
Affiliated investments | | | 37,767,482 | | | | 106,464,868 | | | | 200,362,985 | | | | 84,305,136 | | | | 7,790,804 | |
Distributions from affiliated investments | | | 32,636,884 | | | | 89,972,405 | | | | 150,707,606 | | | | 76,990,164 | | | | 3,399,628 | |
Net realized gain (loss) | | | 70,404,366 | | | | 196,437,273 | | | | 351,070,591 | | | | 161,295,300 | | | | 11,190,432 | |
| | | | | | |
Net change in unrealized appreciation (depreciation) on: | | | | | | | | | | | | | | | | | | | | |
Affiliated investments | | | (37,388,370 | ) | | | (88,766,366 | ) | | | (180,315,618 | ) | | | (74,285,780 | ) | | | 14,149,480 | |
Net change in unrealized appreciation (depreciation) | | | (37,388,370 | ) | | | (88,766,366 | ) | | | (180,315,618 | ) | | | (74,285,780 | ) | | | 14,149,480 | |
Net realized and change in unrealized gain (loss) | | | 33,015,996 | | | | 107,670,907 | | | | 170,754,973 | | | | 87,009,520 | | | | 25,339,912 | |
Net increase (decrease) in net assets resulting from operations | | $ | 53,869,202 | | | $ | 133,829,966 | | | $ | 223,218,690 | | | $ | 122,061,379 | | | $ | 27,341,400 | |
The Notes to Financial Statements are an integral part of this report.
| | |
| Transamerica Funds | | Annual Report 2014 |
Page 29
STATEMENTS OF CHANGES IN NET ASSETS
For the years ended:
| | | | | | | | | | | | | | | | | | | | | | | | |
| | | | |
| | | Transamerica Asset Allocation -
Conservative Portfolio | | | Transamerica Asset Allocation -
Growth Portfolio | | | Transamerica Asset Allocation -
Moderate Growth Portfolio | |
| | | October 31, 2014 | | | October 31, 2013 | | | October 31, 2014 | | | October 31, 2013 | | | October 31, 2014 | | | October 31, 2013 | |
From operations: | | | | | | | | | | | | | | | | | | | | | | | | |
Net investment income (loss) | | $ | 20,853,206 | | | $ | 22,117,080 | | | $ | 26,159,059 | | | $ | 11,808,806 | | | $ | 52,463,717 | | | $ | 35,398,822 | |
Net realized gain (loss) | | | 70,404,366 | | | | 28,578,593 | | | | 196,437,273 | | | | 95,368,315 | | | | 351,070,591 | | | | 147,851,516 | |
Net change in unrealized appreciation (depreciation) | | | (37,388,370 | ) | | | 31,879,875 | | | | (88,766,366 | ) | | | 202,707,372 | | | | (180,315,618 | ) | | | 300,575,133 | |
Net increase (decrease) in net assets resulting from operations | | | 53,869,202 | | | | 82,575,548 | | | | 133,829,966 | | | | 309,884,493 | | | | 223,218,690 | | | | 483,825,471 | |
| | | | | | | |
Distributions to shareholders: | | | | | | | | | | | | | | | | | | | | | | | | |
Net investment income: | | | | | | | | | | | | | | | | | | | | | | | | |
Class A | | | (10,580,782 | ) | | | (10,978,030 | ) | | | (14,307,900 | ) | | | (6,676,938 | ) | | | (26,273,816 | ) | | | (20,502,070 | ) |
Class B | | | (812,485 | ) | | | (927,916 | ) | | | (1,194,204 | ) | | | (252,676 | ) | | | (2,094,986 | ) | | | (1,743,921 | ) |
Class C | | | (9,312,213 | ) | | | (9,223,740 | ) | | | (10,343,063 | ) | | | (2,834,256 | ) | | | (21,533,259 | ) | | | (14,453,079 | ) |
Class I | | | (785,216 | ) | | | (676,262 | ) | | | (590,110 | ) | | | (261,663 | ) | | | (1,128,677 | ) | | | (750,571 | ) |
Class R | | | (48,442 | ) | | | (60,282 | ) | | | (30,933 | ) | | | (13,135 | ) | | | (98,754 | ) | | | (78,630 | ) |
Total distributions from net investment income | | | (21,539,138 | ) | | | (21,866,230 | ) | | | (26,466,210 | ) | | | (10,038,668 | ) | | | (51,129,492 | ) | | | (37,528,271 | ) |
Net realized gains: | | | | | | | | | | | | | | | | | | | | | | | | |
Class A | | | (11,721,482 | ) | | | (1,780,439 | ) | | | — | | | | — | | | | — | | | | — | |
Class B | | | (1,346,271 | ) | | | (228,134 | ) | | | — | | | | — | | | | — | | | | — | |
Class C | | | (14,311,268 | ) | | | (2,093,689 | ) | | | — | | | | — | | | | — | | | | — | |
Class I | | | (752,757 | ) | | | (87,623 | ) | | | — | | | | — | | | | — | | | | — | |
Class R | | | (60,054 | ) | | | (11,473 | ) | | | — | | | | — | | | | — | | | | — | |
Total distributions from net realized gains | | | (28,191,832 | ) | | | (4,201,358 | ) | | | — | | | | — | | | | — | | | | — | |
Total distributions to shareholders | | | (49,730,970 | ) | | | (26,067,588 | ) | | | (26,466,210 | ) | | | (10,038,668 | ) | | | (51,129,492 | ) | | | (37,528,271 | ) |
| | | | | | | |
Capital share transactions: | | | | | | | | | | | | | | | | | | | | | | | | |
Proceeds from shares sold: | | | | | | | | | | | | | | | | | | | | | | | | |
Class A | | | 46,765,241 | | | | 74,219,593 | | | | 75,642,243 | | | | 74,878,505 | | | | 130,608,420 | | | | 124,435,077 | |
Class B | | | 634,432 | | | | 1,789,457 | | | | 990,901 | | | | 2,888,851 | | | | 563,872 | | | | 3,821,906 | |
Class C | | | 53,402,116 | | | | 67,764,532 | | | | 76,340,404 | | | | 66,195,177 | | | | 144,779,252 | | | | 143,112,702 | |
Class I | | | 13,993,421 | | | | 12,629,701 | | | | 14,561,078 | | | | 9,169,163 | | | | 22,223,234 | | | | 19,229,192 | |
Class R | | | 612,792 | | | | 1,716,762 | | | | 805,494 | | | | 1,479,438 | | | | 2,310,203 | | | | 1,730,232 | |
| | | | 115,408,002 | | | | 158,120,045 | | | | 168,340,120 | | | | 154,611,134 | | | | 300,484,981 | | | | 292,329,109 | |
Dividends and distributions reinvested: | | | | | | | | | | | | | | | | | | | | | | | | |
Class A | | | 21,166,706 | | | | 12,144,852 | | | | 13,853,420 | | | | 6,440,706 | | | | 25,163,146 | | | | 19,620,835 | |
Class B | | | 1,797,570 | | | | 964,216 | | | | 1,140,415 | | | | 238,114 | | | | 2,005,501 | | | | 1,660,386 | |
Class C | | | 19,400,181 | | | | 9,114,473 | | | | 9,045,528 | | | | 2,457,504 | | | | 18,370,118 | | | | 12,193,074 | |
Class I | | | 1,187,723 | | | | 556,112 | | | | 461,995 | | | | 196,619 | | | | 891,482 | | | | 588,056 | |
Class R | | | 88,448 | | | | 56,335 | | | | 29,451 | | | | 12,453 | | | | 75,702 | | | | 70,646 | |
| | | | 43,640,628 | | | | 22,835,988 | | | | 24,530,809 | | | | 9,345,396 | | | | 46,505,949 | | | | 34,132,997 | |
Cost of shares redeemed: | | | | | | | | | | | | | | | | | | | | | | | | |
Class A | | | (111,239,274 | ) | | | (159,802,543 | ) | | | (124,103,089 | ) | | | (139,613,542 | ) | | | (217,123,310 | ) | | | (278,818,347 | ) |
Class B | | | (12,279,760 | ) | | | (12,492,365 | ) | | | (12,655,179 | ) | | | (17,597,656 | ) | | | (23,615,585 | ) | | | (33,018,933 | ) |
Class C | | | (115,031,694 | ) | | | (140,936,873 | ) | | | (109,595,248 | ) | | | (125,996,363 | ) | | | (229,199,565 | ) | | | (248,560,350 | ) |
Class I | | | (11,102,061 | ) | | | (10,317,985 | ) | | | (9,348,867 | ) | | | (7,645,680 | ) | | | (17,107,825 | ) | | | (14,128,088 | ) |
Class R | | | (1,098,433 | ) | | | (2,053,875 | ) | | | (1,372,304 | ) | | | (991,605 | ) | | | (2,553,264 | ) | | | (2,366,462 | ) |
| | | | (250,751,222 | ) | | | (325,603,641 | ) | | | (257,074,687 | ) | | | (291,844,846 | ) | | | (489,599,549 | ) | | | (576,892,180 | ) |
Automatic conversions: | | | | | | | | | | | | | | | | | | | | | | | | |
Class A | | | 5,746,807 | | | | 6,013,509 | | | | 20,142,083 | | | | 15,383,836 | | | | 37,147,865 | | | | 33,862,775 | |
Class B | | | (5,746,807 | ) | | | (6,013,509 | ) | | | (20,142,083 | ) | | | (15,383,836 | ) | | | (37,147,865 | ) | | | (33,862,775 | ) |
| | | | — | | | | — | | | | — | | | | — | | | | — | | | | — | |
Net increase (decrease) in net assets resulting from capital share transactions | | | (91,702,592 | ) | | | (144,647,608 | ) | | | (64,203,758 | ) | | | (127,888,316 | ) | | | (142,608,619 | ) | | | (250,430,074 | ) |
Net increase (decrease) in net assets | | | (87,564,360 | ) | | | (88,139,648 | ) | | | 43,159,998 | | | | 171,957,509 | | | | 29,480,579 | | | | 195,867,126 | |
| | | | | | | |
Net assets: | | | | | | | | | | | | | | | | | | | | | | | | |
Beginning of year | | | 1,084,022,851 | | | | 1,172,162,499 | | | | 1,528,137,020 | | | | 1,356,179,511 | | | | 3,009,388,737 | | | | 2,813,521,611 | |
End of year | | $ | 996,458,491 | | | $ | 1,084,022,851 | | | $ | 1,571,297,018 | | | $ | 1,528,137,020 | | | $ | 3,038,869,316 | | | $ | 3,009,388,737 | |
Undistributed (distributions in excess of) net investment income (loss) | | $ | 124,367 | | | $ | 811,250 | | | $ | (3,895,422 | ) | | $ | (3,601,983 | ) | | $ | 2,339,344 | | | $ | 1,008,016 | |
The Notes to Financial Statements are an integral part of this report.
| | |
| Transamerica Funds | | Annual Report 2014 |
Page 30
STATEMENTS OF CHANGES IN NET ASSETS (continued)
For the years ended:
| | | | | | | | | | | | | | | | | | | | | | | | |
| | | | |
| | | Transamerica Asset Allocation -
Conservative Portfolio | | | Transamerica Asset Allocation -
Growth Portfolio | | | Transamerica Asset Allocation -
Moderate Growth Portfolio | |
| | | October 31, 2014 | | | October 31, 2013 | | | October 31, 2014 | | | October 31, 2013 | | | October 31, 2014 | | | October 31, 2013 | |
Capital share transactions - shares: | | | | | | | | | | | | | | | | | | | | | | | | |
Shares issued: | | | | | | | | | | | | | | | | | | | | | | | | |
Class A | | | 3,815,298 | | | | 6,227,787 | | | | 4,795,230 | | | | 5,432,088 | | | | 8,845,636 | | | | 9,389,435 | |
Class B | | | 52,439 | | | | 151,555 | | | | 64,253 | | | | 214,690 | | | | 37,984 | | | | 289,487 | |
Class C | | | 4,406,036 | | | | 5,718,360 | | | | 4,962,367 | | | | 4,914,380 | | | | 9,854,757 | | | | 10,804,561 | |
Class I | | | 1,141,969 | | | | 1,056,981 | | | | 921,691 | | | | 671,253 | | | | 1,502,942 | | | | 1,451,434 | |
Class R | | | 50,129 | | | | 143,600 | | | | 51,545 | | | | 103,307 | | | | 157,610 | | | | 130,729 | |
| | | | 9,465,871 | | | | 13,298,283 | | | | 10,795,086 | | | | 11,335,718 | | | | 20,398,929 | | | | 22,065,646 | |
Shares issued-reinvested from dividends and distributions: | | | | | | | | | | | | | | | | | | | | | | | | |
Class A | | | 1,757,400 | | | | 1,032,736 | | | | 885,203 | | | | 515,669 | | | | 1,727,049 | | | | 1,590,019 | |
Class B | | | 150,337 | | | | 82,705 | | | | 74,101 | | | | 19,390 | | | | 136,801 | | | | 133,794 | |
Class C | | | 1,624,430 | | | | 782,346 | | | | 590,054 | | | | 200,613 | | | | 1,262,551 | | | | 988,895 | |
Class I | | | 98,362 | | | | 47,075 | | | | 29,558 | | | | 15,767 | | | | 61,312 | | | | 47,771 | |
Class R | | | 7,296 | | | | 4,767 | | | | 1,890 | | | | 1,002 | | | | 5,214 | | | | 5,744 | |
| | | | 3,637,825 | | | | 1,949,629 | | | | 1,580,806 | | | | 752,441 | | | | 3,192,927 | | | | 2,766,223 | |
Shares redeemed: | | | | | | | | | | | | | | | | | | | | | | | | |
Class A | | | (9,087,273 | ) | | | (13,350,340 | ) | | | (7,838,064 | ) | | | (10,276,346 | ) | | | (14,662,458 | ) | | | (21,121,708 | ) |
Class B | | | (1,007,718 | ) | | | (1,050,250 | ) | | | (818,362 | ) | | | (1,327,181 | ) | | | (1,592,152 | ) | | | (2,498,302 | ) |
Class C | | | (9,477,142 | ) | | | (11,861,297 | ) | | | (7,106,007 | ) | | | (9,509,671 | ) | | | (15,555,629 | ) | | | (18,922,337 | ) |
Class I | | | (906,609 | ) | | | (859,828 | ) | | | (591,183 | ) | | | (568,384 | ) | | | (1,155,934 | ) | | | (1,063,878 | ) |
Class R | | | (89,422 | ) | | | (171,064 | ) | | | (90,081 | ) | | | (72,059 | ) | | | (172,003 | ) | | | (177,496 | ) |
| | | | (20,568,164 | ) | | | (27,292,779 | ) | | | (16,443,697 | ) | | | (21,753,641 | ) | | | (33,138,176 | ) | | | (43,783,721 | ) |
Automatic conversions: | | | | | | | | | | | | | | | | | | | | | | | | |
Class A | | | 469,638 | | | | 503,937 | | | | 1,274,213 | | | | 1,135,533 | | | | 2,511,305 | | | | 2,571,151 | |
Class B | | | (472,173 | ) | | | (506,739 | ) | | | (1,300,058 | ) | | | (1,159,135 | ) | | | (2,503,739 | ) | | | (2,566,372 | ) |
| | | | (2,535 | ) | | | (2,802 | ) | | | (25,845 | ) | | | (23,602 | ) | | | 7,566 | | | | 4,779 | |
| | | | | | | |
Net increase (decrease) in shares outstanding: | | | | | | | | | | | | | | | | | | | | | | | | |
Class A | | | (3,044,937 | ) | | | (5,585,880 | ) | | | (883,418 | ) | | | (3,193,056 | ) | | | (1,578,468 | ) | | | (7,571,103 | ) |
Class B | | | (1,277,115 | ) | | | (1,322,729 | ) | | | (1,980,066 | ) | | | (2,252,236 | ) | | | (3,921,106 | ) | | | (4,641,393 | ) |
Class C | | | (3,446,676 | ) | | | (5,360,591 | ) | | | (1,553,586 | ) | | | (4,394,678 | ) | | | (4,438,321 | ) | | | (7,128,881 | ) |
Class I | | | 333,722 | | | | 244,228 | | | | 360,066 | | | | 118,636 | | | | 408,320 | | | | 435,327 | |
Class R | | | (31,997 | ) | | | (22,697 | ) | | | (36,646 | ) | | | 32,250 | | | | (9,179 | ) | | | (41,023 | ) |
| | | | (7,467,003 | ) | | | (12,047,669 | ) | | | (4,093,650 | ) | | | (9,689,084 | ) | | | (9,538,754 | ) | | | (18,947,073 | ) |
The Notes to Financial Statements are an integral part of this report.
| | |
| Transamerica Funds | | Annual Report 2014 |
Page 31
STATEMENTS OF CHANGES IN NET ASSETS (continued)
For the years ended:
| | | | | | | | | | | | | | | | |
| | | |
| | | Transamerica Asset Allocation -
Moderate Portfolio | | | Transamerica Multi-Manager
Alternative Strategies Portfolio | |
| | | October 31, 2014 | | | October 31, 2013 | | | October 31, 2014 | | | October 31, 2013 | |
From operations: | | | | | | | | | | | | | | | | |
Net investment income (loss) | | $ | 35,051,859 | | | $ | 32,121,606 | | | $ | 2,001,488 | | | $ | 7,493,657 | |
Net realized gain (loss) | | | 161,295,300 | | | | 121,232,197 | | | | 11,190,432 | | | | (3,673,255 | ) |
Net change in unrealized appreciation
(depreciation) | | | (74,285,780 | ) | | | 101,078,496 | | | | 14,149,480 | | | | 10,015,736 | |
Net increase (decrease) in net assets resulting
from operations | | | 122,061,379 | | | | 254,432,299 | | | | 27,341,400 | | | | 13,836,138 | |
| | | | | |
Distributions to shareholders: | | | | | | | | | | | | | | | | |
Net investment income: | | | | | | | | | | | | | | | | |
Class A | | | (17,678,409 | ) | | | (18,056,123 | ) | | | (1,057,689 | ) | | | (3,457,203 | ) |
Class B | | | (1,014,152 | ) | | | (1,323,522 | ) | | | — | | | | — | |
Class C | | | (15,397,807 | ) | | | (15,176,949 | ) | | | — | | | | (1,781,814 | ) |
Class I | | | (941,395 | ) | | | (879,053 | ) | | | (1,874,312 | ) | | | (4,098,091 | ) |
Class R | | | (90,315 | ) | | | (87,075 | ) | | | — | | | | — | |
Total distributions from net investment income | | | (35,122,078 | ) | | | (35,522,722 | ) | | | (2,932,001 | ) | | | (9,337,108 | ) |
Net realized gains: | | | | | | | | | | | | | | | | |
Class A | | | (36,688,043 | ) | | | — | | | | — | | | | — | |
Class B | | | (3,757,218 | ) | | | — | | | | — | | | | — | |
Class C | | | (47,158,106 | ) | | | — | | | | — | | | | — | |
Class I | | | (1,691,669 | ) | | | — | | | | — | | | | — | |
Class R | | | (205,791 | ) | | | — | | | | — | | | | — | |
Total distributions from net realized gains | | | (89,500,827 | ) | | | — | | | | — | | | | — | |
Total distributions to shareholders | | | (124,622,905 | ) | | | (35,522,722 | ) | | | (2,932,001 | ) | | | (9,337,108 | ) |
| | | | | |
Capital share transactions: | | | | | | | | | | | | | | | | |
Proceeds from shares sold: | | | | | | | | | | | | | | | | |
Class A | | | 98,495,834 | | | | 111,076,747 | | | | 34,140,397 | | | | 89,397,953 | |
Class B | | | 1,019,018 | | | | 2,462,555 | | | | — | | | | — | |
Class C | | | 118,467,322 | | | | 138,068,753 | | | | 15,008,060 | | | | 31,300,408 | |
Class I | | | 18,333,301 | | | | 16,760,405 | | | | 103,715,160 | | | | 114,180,612 | |
Class R | | | 1,625,444 | | | | 1,208,432 | | | | — | | | | — | |
| | | | 237,940,919 | | | | 269,576,892 | | | | 152,863,617 | | | | 234,878,973 | |
Dividends and distributions reinvested: | | | | | | | | | | | | | | | | |
Class A | | | 51,998,972 | | | | 17,136,926 | | | | 1,006,688 | | | | 3,216,996 | |
Class B | | | 4,482,498 | | | | 1,235,320 | | | | — | | | | — | |
Class C | | | 52,659,589 | | | | 12,492,438 | | | | — | | | | 1,558,515 | |
Class I | | | 2,043,595 | | | | 685,577 | | | | 1,122,594 | | | | 2,754,700 | |
Class R | | | 256,684 | | | | 73,933 | | | | — | | | | — | |
| | | | 111,441,338 | | | | 31,624,194 | | | | 2,129,282 | | | | 7,530,211 | |
Cost of shares redeemed: | | | | | | | | | | | | | | | | |
Class A | | | (167,175,344 | ) | | | (201,398,631 | ) | | | (115,096,289 | ) | | | (70,110,595 | ) |
Class B | | | (13,470,886 | ) | | | (18,123,064 | ) | | | — | | | | — | |
Class C | | | (173,507,616 | ) | | | (189,869,850 | ) | | | (35,390,304 | ) | | | (36,624,473 | ) |
Class I | | | (14,124,096 | ) | | | (16,645,089 | ) | | | (84,295,903 | ) | | | (86,330,101 | ) |
Class R | | | (1,218,096 | ) | | | (1,747,099 | ) | | | — | | | | — | |
| | | | (369,496,038 | ) | | | (427,783,733 | ) | | | (234,782,496 | ) | | | (193,065,169 | ) |
Automatic conversions: | | | | | | | | | | | | | | | | |
Class A | | | 15,977,700 | | | | 16,655,098 | | | | — | | | | — | |
Class B | | | (15,977,700 | ) | | | (16,655,098 | ) | | | — | | | | — | |
| | | | — | | | | — | | | | — | | | | — | |
| | | | | |
Net increase (decrease) in net assets resulting
from capital share transactions | | | (20,113,781 | ) | | | (126,582,647 | ) | | | (79,789,597 | ) | | | 49,344,015 | |
Net increase (decrease) in net assets | | | (22,675,307 | ) | | | 92,326,930 | | | | (55,380,198 | ) | | | 53,843,045 | |
| | | | | |
Net assets: | | | | | | | | | | | | | | | | |
Beginning of year | | | 2,184,985,572 | | | | 2,092,658,642 | | | | 548,944,559 | | | | 495,101,514 | |
End of year | | $ | 2,162,310,265 | | | $ | 2,184,985,572 | | | $ | 493,564,361 | | | $ | 548,944,559 | |
Undistributed (distributions in excess of) net
investment income (loss) | | $ | 8,453,263 | | | $ | 8,525,280 | | | $ | 20,528 | | | $ | 951,041 | |
The Notes to Financial Statements are an integral part of this report.
| | |
| Transamerica Funds | | Annual Report 2014 |
Page 32
STATEMENTS OF CHANGES IN NET ASSETS (continued)
For the years ended:
| | | | | | | | | | | | | | | | |
| | | |
| | | Transamerica Asset Allocation -
Moderate Portfolio | | | Transamerica Multi-Manager
Alternative Strategies Portfolio | |
| | | October 31, 2014 | | | October 31, 2013 | | | October 31, 2014 | | | October 31, 2013 | |
Capital share transactions - shares: | | | | | | | | | | | | | | | | |
Shares issued: | | | | | | | | | | | | | | | | |
Class A | | | 7,388,033 | | | | 8,674,616 | | | | 3,333,277 | | | | 8,917,564 | |
Class B | | | 76,100 | | | | 192,163 | | | | — | | | | — | |
Class C | | | 8,949,086 | | | | 10,810,760 | | | | 1,475,321 | | | | 3,143,475 | |
Class I | | | 1,377,610 | | | | 1,303,557 | | | | 10,030,886 | | | | 11,408,329 | |
Class R | | | 122,940 | | | | 95,044 | | | | — | | | | — | |
| | | | 17,913,769 | | | | 21,076,140 | | | | 14,839,484 | | | | 23,469,368 | |
Shares issued-reinvested from dividends and distributions: | | | | | | | | | | | | | | | | |
Class A | | | 3,987,651 | | | | 1,408,129 | | | | 98,792 | | | | 325,607 | |
Class B | | | 340,357 | | | | 100,677 | | | | — | | | | — | |
Class C | | | 4,047,624 | | | | 1,028,184 | | | | — | | | | 158,386 | |
Class I | | | 156,958 | | | | 56,426 | | | | 110,274 | | | | 279,098 | |
Class R | | | 19,760 | | | | 6,095 | | | | — | | | | — | |
| | | | 8,552,350 | | | | 2,599,511 | | | | 209,066 | | | | 763,091 | |
Shares redeemed: | | | | | | | | | | | | | | | | |
Class A | | | (12,518,604 | ) | | | (15,738,225 | ) | | | (11,152,254 | ) | | | (7,005,001 | ) |
Class B | | | (1,002,370 | ) | | | (1,411,034 | ) | | | — | | | | — | |
Class C | | | (13,082,379 | ) | | | (14,938,145 | ) | | | (3,485,306 | ) | | | (3,686,165 | ) |
Class I | | | (1,062,340 | ) | | | (1,302,230 | ) | | | (8,205,503 | ) | | | (8,639,197 | ) |
Class R | | | (91,711 | ) | | | (138,135 | ) | | | — | | | | — | |
| | | | (27,757,404 | ) | | | (33,527,769 | ) | | | (22,843,063 | ) | | | (19,330,363 | ) |
Automatic conversions: | | | | | | | | | | | | | | | | |
Class A | | | 1,198,031 | | | | 1,306,127 | | | | — | | | | — | |
Class B | | | (1,190,974 | ) | | | (1,301,041 | ) | | | — | | | | — | |
| | | | 7,057 | | | | 5,086 | | | | — | | | | — | |
| | | | | |
Net increase (decrease) in shares outstanding: | | | | | | | | | | | | | | | | |
Class A | | | 55,111 | | | | (4,349,353 | ) | | | (7,720,185 | ) | | | 2,238,170 | |
Class B | | | (1,776,887 | ) | | | (2,419,235 | ) | | | — | | | | — | |
Class C | | | (85,669 | ) | | | (3,099,201 | ) | | | (2,009,985 | ) | | | (384,304 | ) |
Class I | | | 472,228 | | | | 57,753 | | | | 1,935,657 | | | | 3,048,230 | |
Class R | | | 50,989 | | | | (36,996 | ) | | | — | | | | — | |
| | | | (1,284,228 | ) | | | (9,847,032 | ) | | | (7,794,513 | ) | | | 4,902,096 | |
The Notes to Financial Statements are an integral part of this report.
| | |
| Transamerica Funds | | Annual Report 2014 |
Page 33
FINANCIAL HIGHLIGHTS
| | | | | | | | | | | | | | | | | | | | |
| For a share outstanding during the years indicated: | | Transamerica Asset Allocation - Conservative Portfolio | |
| | | Class A | |
| | | October 31,
2014 | | | October 31,
2013 | | | October 31,
2012 | | | October 31,
2011 | | | October 31,
2010 | |
Net asset value | | | | | | | | | | | | | | | | | | | | |
Beginning of year | | $ | 12.33 | | | $ | 11.73 | | | $ | 11.17 | | | $ | 11.22 | | | $ | 10.42 | |
Investment operations | | | | | | | | | | | | | | | | | | | | |
Net investment income (loss) (A) (B) | | | 0.29 | | | | 0.27 | | | | 0.28 | | | | 0.30 | | | | 0.35 | |
Net realized and unrealized gain (loss) | | | 0.39 | | | | 0.64 | | | | 0.55 | | | | (0.06 | ) | | | 0.83 | |
Total investment operations | | | 0.68 | | | | 0.91 | | | | 0.83 | | | | 0.24 | | | | 1.18 | |
Distributions | | | | | | | | | | | | | | | | | | | | |
Net investment income | | | (0.30 | ) | | | (0.27 | ) | | | (0.27 | ) | | | (0.29 | ) | | | (0.38 | ) |
Net realized gains | | | (0.33 | ) | | | (0.04 | ) | | | — | | | | — | | | | — | |
Total distributions | | | (0.63 | ) | | | (0.31 | ) | | | (0.27 | ) | | | (0.29 | ) | | | (0.38 | ) |
Net asset value | | | | | | | | | | | | | | | | | | | | |
End of year | | $ | 12.38 | | | $ | 12.33 | | | $ | 11.73 | | | $ | 11.17 | | | $ | 11.22 | |
Total return (C) | | | 5.65 | % | | | 7.90 | % | | | 7.55 | % | | | 2.20 | % | | | 11.59 | % |
Ratio and supplemental data | | | | | | | | | | | | | | | | | | | | |
Net assets end of year (000’s) | | $ | 416,116 | | | $ | 451,868 | | | $ | 495,444 | | | $ | 489,240 | | | $ | 485,473 | |
Expenses to average net assets (D) | | | 0.53 | % | | | 0.58 | % | | | 0.59 | % | | | 0.62 | % | | | 0.63 | % |
Net investment income (loss) to average net assets (B) | | | 2.38 | % | | | 2.30 | % | | | 2.40 | % | | | 2.63 | % | | | 3.28 | % |
Portfolio turnover rate (E) | | | 26 | % | | | 6 | % | | | 20 | % | | | 31 | % | | | 16 | % |
| (A) | Calculated based on average number of shares outstanding. |
| (B) | Recognition of net investment income by the Fund is affected by the timing of the declaration of dividends by the investment companies in which the Fund invests. |
| (C) | Total return has been calculated for the applicable period without deduction of a sales load, if any, on an initial purchase. |
| (D) | Does not include expenses of the investment companies in which the Fund invests. |
| (E) | Does not include portfolio activity of the investment companies in which the Fund invests. |
| | | | | | | | | | | | | | | | | | | | |
| For a share outstanding during the years indicated: | | Transamerica Asset Allocation - Conservative Portfolio | |
| | | Class B | |
| | | October 31,
2014 | | | October 31,
2013 | | | October 31,
2012 | | | October 31,
2011 | | | October 31,
2010 | |
Net asset value | | | | | | | | | | | | | | | | | | | | |
Beginning of year | | $ | 12.26 | | | $ | 11.66 | | | $ | 11.11 | | | $ | 11.17 | | | $ | 10.38 | |
Investment operations | | | | | | | | | | | | | | | | | | | | |
Net investment income (loss) (A) (B) | | | 0.21 | | | | 0.19 | | | | 0.20 | | | | 0.24 | | | | 0.30 | |
Net realized and unrealized gain (loss) | | | 0.38 | | | | 0.63 | | | | 0.55 | | | | (0.07 | ) | | | 0.80 | |
Total investment operations | | | 0.59 | | | | 0.82 | | | | 0.75 | | | | 0.17 | | | | 1.10 | |
Distributions | | | | | | | | | | | | | | | | | | | | |
Net investment income | | | (0.20 | ) | | | (0.18 | ) | | | (0.20 | ) | | | (0.23 | ) | | | (0.31 | ) |
Net realized gains | | | (0.33 | ) | | | (0.04 | ) | | | — | | | | — | | | | — | |
Total distributions | | | (0.53 | ) | | | (0.22 | ) | | | (0.20 | ) | | | (0.23 | ) | | | (0.31 | ) |
Net asset value | | | | | | | | | | | | | | | | | | | | |
End of year | | $ | 12.32 | | | $ | 12.26 | | | $ | 11.66 | | | $ | 11.11 | | | $ | 11.17 | |
Total return (C) | | | 4.96 | % | | | 7.13 | % | | | 6.81 | % | | | 1.50 | % | | | 10.82 | % |
Ratio and supplemental data | | | | | | | | | | | | | | | | | | | | |
Net assets end of year (000’s) | | $ | 37,192 | | | $ | 52,694 | | | $ | 65,549 | | | $ | 80,696 | | | $ | 114,303 | |
Expenses to average net assets (D) | | | 1.28 | % | | | 1.29 | % | | | 1.28 | % | | | 1.27 | % | | | 1.26 | % |
Net investment income (loss) to average net assets (B) | | | 1.73 | % | | | 1.62 | % | | | 1.78 | % | | | 2.08 | % | | | 2.81 | % |
Portfolio turnover rate (E) | | | 26 | % | | | 6 | % | | | 20 | % | | | 31 | % | | | 16 | % |
| (A) | Calculated based on average number of shares outstanding. |
| (B) | Recognition of net investment income by the Fund is affected by the timing of the declaration of dividends by the investment companies in which the Fund invests. |
| (C) | Total return has been calculated for the applicable period without deduction of a sales load, if any, on an initial purchase. |
| (D) | Does not include expenses of the investment companies in which the Fund invests. |
| (E) | Does not include portfolio activity of the investment companies in which the Fund invests. |
The Notes to Financial Statements are an integral part of this report.
| | |
| Transamerica Funds | | Annual Report 2014 |
Page 34
FINANCIAL HIGHLIGHTS (continued)
| | | | | | | | | | | | | | | | | | | | |
| For a share outstanding during the years indicated: | | Transamerica Asset Allocation - Conservative Portfolio | |
| | | Class C | |
| | | October 31,
2014 | | | October 31,
2013 | | | October 31,
2012 | | | October 31,
2011 | | | October 31,
2010 | |
Net asset value | | | | | | | | | | | | | | | | | | | | |
Beginning of year | | $ | 12.24 | | | $ | 11.64 | | | $ | 11.09 | | | $ | 11.16 | | | $ | 10.37 | |
Investment operations | | | | | | | | | | | | | | | | | | | | |
Net investment income (loss) (A) (B) | | | 0.21 | | | | 0.19 | | | | 0.20 | | | | 0.23 | | | | 0.29 | |
Net realized and unrealized gain (loss) | | | 0.38 | | | | 0.64 | | | | 0.55 | | | | (0.06 | ) | | | 0.82 | |
Total investment operations | | | 0.59 | | | | 0.83 | | | | 0.75 | | | | 0.17 | | | | 1.11 | |
Distributions | | | | | | | | | | | | | | | | | | | | |
Net investment income | | | (0.21 | ) | | | (0.19 | ) | | | (0.20 | ) | | | (0.24 | ) | | | (0.32 | ) |
Net realized gains | | | (0.33 | ) | | | (0.04 | ) | | | — | | | | — | | | | — | |
Total distributions | | | (0.54 | ) | | | (0.23 | ) | | | (0.20 | ) | | | (0.24 | ) | | | (0.32 | ) |
Net asset value | | | | | | | | | | | | | | | | | | | | |
End of year | | $ | 12.29 | | | $ | 12.24 | | | $ | 11.64 | | | $ | 11.09 | | | $ | 11.16 | |
Total return (C) | | | 4.97 | % | | | 7.24 | % | | | 6.90 | % | | | 1.50 | % | | | 10.92 | % |
Ratio and supplemental data | | | | | | | | | | | | | | | | | | | | |
Net assets end of year (000’s) | | $ | 508,285 | | | $ | 548,471 | | | $ | 584,283 | | | $ | 578,193 | | | $ | 601,625 | |
Expenses to average net assets (D) | | | 1.22 | % | | | 1.23 | % | | | 1.22 | % | | | 1.21 | % | | | 1.22 | % |
Net investment income (loss) to average net assets (B) | | | 1.69 | % | | | 1.63 | % | | | 1.77 | % | | | 2.04 | % | | | 2.75 | % |
Portfolio turnover rate (E) | | | 26 | % | | | 6 | % | | | 20 | % | | | 31 | % | | | 16 | % |
| (A) | Calculated based on average number of shares outstanding. |
| (B) | Recognition of net investment income by the Fund is affected by the timing of the declaration of dividends by the investment companies in which the Fund invests. |
| (C) | Total return has been calculated for the applicable period without deduction of a sales load, if any, on an initial purchase. |
| (D) | Does not include expenses of the investment companies in which the Fund invests. |
| (E) | Does not include portfolio activity of the investment companies in which the Fund invests. |
| | | | | | | | | | | | | | | | | | | | |
| For a share outstanding during the period and years indicated: | | Transamerica Asset Allocation - Conservative Portfolio | |
| | | Class I | |
| | | October 31,
2014 | | | October 31,
2013 | | | October 31,
2012 | | | October 31,
2011 | | | October 31,
2010 (A) | |
Net asset value | | | | | | | | | | | | | | | | | | | | |
Beginning of period/year | | $ | 12.35 | | | $ | 11.75 | | | $ | 11.19 | | | $ | 11.24 | | | $ | 10.69 | |
Investment operations | | | | | | | | | | | | | | | | | | | | |
Net investment income (loss) (B) (C) | | | 0.32 | | | | 0.30 | | | | 0.30 | | | | 0.32 | | | | 0.22 | |
Net realized and unrealized gain (loss) | | | 0.39 | | | | 0.65 | | | | 0.56 | | | | (0.04 | ) | | | 0.75 | |
Total investment operations | | | 0.71 | | | | 0.95 | | | | 0.86 | | | | 0.28 | | | | 0.97 | |
Distributions | | | | | | | | | | | | | | | | | | | | |
Net investment income | | | (0.33 | ) | | | (0.31 | ) | | | (0.30 | ) | | | (0.33 | ) | | | (0.42 | ) |
Net realized gains | | | (0.33 | ) | | | (0.04 | ) | | | — | | | | — | | | | — | |
Total distributions | | | (0.66 | ) | | | (0.35 | ) | | | (0.30 | ) | | | (0.33 | ) | | | (0.42 | ) |
Net asset value | | | | | | | | | | | | | | | | | | | | |
End of period/year | | $ | 12.40 | | | $ | 12.35 | | | $ | 11.75 | | | $ | 11.19 | | | $ | 11.24 | |
Total return (D) | | | 5.94 | % | | | 8.24 | % | | | 7.87 | % | | | 2.52 | % | | | 9.39 | %(E) |
Ratio and supplemental data | | | | | | | | | | | | | | | | | | | | |
Net assets end of period/year (000’s) | | $ | 32,814 | | | $ | 28,551 | | | $ | 24,297 | | | $ | 15,067 | | | $ | 10,813 | |
Expenses to average net assets (F) | | | 0.26 | % | | | 0.26 | % | | | 0.25 | % | | | 0.26 | % | | | 0.28 | %(G) |
Net investment income (loss) to average net assets (C) | | | 2.58 | % | | | 2.47 | % | | | 2.58 | % | | | 2.83 | % | | | 2.24 | %(G) |
Portfolio turnover rate (H) | | | 26 | % | | | 6 | % | | | 20 | % | | | 31 | % | | | 16 | %(E) |
| (A) | Commenced operations on November 30, 2009. |
| (B) | Calculated based on average number of shares outstanding. |
| (C) | Recognition of net investment income by the Fund is affected by the timing of the declaration of dividends by the investment companies in which the Fund invests. |
| (D) | Total return has been calculated for the applicable period without deduction of a sales load, if any, on an initial purchase. |
| (F) | Does not include expenses of the investment companies in which the Fund invests. |
| (H) | Does not include portfolio activity of the investment companies in which the Fund invests. |
The Notes to Financial Statements are an integral part of this report.
| | |
| Transamerica Funds | | Annual Report 2014 |
Page 35
FINANCIAL HIGHLIGHTS (continued)
| | | | | | | | | | | | | | | | | | | | |
| For a share outstanding during the years indicated: | | Transamerica Asset Allocation - Conservative Portfolio | |
| | | Class R | |
| | | October 31,
2014 | | | October 31,
2013 | | | October 31,
2012 | | | October 31,
2011 | | | October 31,
2010 | |
Net asset value | | | | | | | | | | | | | | | | | | | | |
Beginning of year | | $ | 12.41 | | | $ | 11.81 | | | $ | 11.24 | | | $ | 11.29 | | | $ | 10.49 | |
Investment operations | | | | | | | | | | | | | | | | | | | | |
Net investment income (loss) (A) (B) | | | 0.25 | | | | 0.27 | | | | 0.26 | | | | 0.28 | | | | 0.27 | |
Net realized and unrealized gain (loss) | | | 0.40 | | | | 0.61 | | | | 0.55 | | | | (0.07 | ) | | | 0.88 | |
Total investment operations | | | 0.65 | | | | 0.88 | | | | 0.81 | | | | 0.21 | | | | 1.15 | |
Distributions | | | | | | | | | | | | | | | | | | | | |
Net investment income | | | (0.26 | ) | | | (0.24 | ) | | | (0.24 | ) | | | (0.26 | ) | | | (0.35 | ) |
Net realized gains | | | (0.33 | ) | | | (0.04 | ) | | | — | | | | — | | | | — | |
Total distributions | | | (0.59 | ) | | | (0.28 | ) | | | (0.24 | ) | | | (0.26 | ) | | | (0.35 | ) |
Net asset value | | | | | | | | | | | | | | | | | | | | |
End of year | | $ | 12.47 | | | $ | 12.41 | | | $ | 11.81 | | | $ | 11.24 | | | $ | 11.29 | |
Total return (C) | | | 5.40 | % | | | 7.61 | % | | | 7.30 | % | | | 1.90 | % | | | 11.23 | % |
Ratio and supplemental data | | | | | | | | | | | | | | | | | | | | |
Net assets end of year (000’s) | | $ | 2,051 | | | $ | 2,439 | | | $ | 2,589 | | | $ | 2,425 | | | $ | 3,061 | |
Expenses to average net assets (D) | | | 0.82 | % | | | 0.81 | % | | | 0.85 | % | | | 0.90 | % | | | 0.88 | % |
Net investment income (loss) to average net assets (B) | | | 2.06 | % | | | 2.21 | % | | | 2.23 | % | | | 2.50 | % | | | 2.56 | % |
Portfolio turnover rate (E) | | | 26 | % | | | 6 | % | | | 20 | % | | | 31 | % | | | 16 | % |
| (A) | Calculated based on average number of shares outstanding. |
| (B) | Recognition of net investment income by the Fund is affected by the timing of the declaration of dividends by the investment companies in which the Fund invests. |
| (C) | Total return has been calculated for the applicable period without deduction of a sales load, if any, on an initial purchase. |
| (D) | Does not include expenses of the investment companies in which the Fund invests. |
| (E) | Does not include portfolio activity of the investment companies in which the Fund invests. |
| | | | | | | | | | | | | | | | | | | | |
| For a share outstanding during the years indicated: | | Transamerica Asset Allocation - Growth Portfolio | |
| | | Class A | |
| | | October 31,
2014 | | | October 31,
2013 | | | October 31,
2012 | | | October 31,
2011 | | | October 31,
2010 | |
Net asset value | | | | | | | | | | | | | | | | | | | | |
Beginning of year | | $ | 15.26 | | | $ | 12.37 | | | $ | 11.49 | | | $ | 11.36 | | | $ | 9.92 | |
Investment operations | | | | | | | | | | | | | | | | | | | | |
Net investment income (loss) (A) (B) | | | 0.32 | | | | 0.16 | | | | 0.07 | | | | 0.07 | | | | 0.05 | |
Net realized and unrealized gain (loss) | | | 1.08 | | | | 2.87 | | | | 0.94 | | | | 0.11 | | | | 1.48 | |
Total investment operations | | | 1.40 | | | | 3.03 | | | | 1.01 | | | | 0.18 | | | | 1.53 | |
Distributions | | | | | | | | | | | | | | | | | | | | |
Net investment income | | | (0.31 | ) | | | (0.14 | ) | | | (0.13 | ) | | | (0.05 | ) | | | (0.09 | ) |
Net asset value | | | | | | | | | | | | | | | | | | | | |
End of year | | $ | 16.35 | | | $ | 15.26 | | | $ | 12.37 | | | $ | 11.49 | | | $ | 11.36 | |
Total return (C) | | | 9.30 | % | | | 24.75 | % | | | 8.96 | % | | | 1.59 | % | | | 15.55 | % |
Ratio and supplemental data | | | | | | | | | | | | | | | | | | | | |
Net assets end of year (000’s) | | $ | 728,850 | | | $ | 693,517 | | | $ | 601,498 | | | $ | 610,951 | | | $ | 645,459 | |
Expenses to average net assets (D) | | | 0.55 | % | | | 0.62 | % | | | 0.65 | % | | | 0.67 | % | | | 0.68 | % |
Net investment income (loss) to average net assets (B) | | | 2.02 | % | | | 1.18 | % | | | 0.56 | % | | | 0.58 | % | | | 0.45 | % |
Portfolio turnover rate (E) | | | 31 | % | | | 22 | % | | | 21 | % | | | 30 | % | | | 10 | % |
| (A) | Calculated based on average number of shares outstanding. |
| (B) | Recognition of net investment income by the Fund is affected by the timing of the declaration of dividends by the investment companies in which the Fund invests. |
| (C) | Total return has been calculated for the applicable period without deduction of a sales load, if any, on an initial purchase. |
| (D) | Does not include expenses of the investment companies in which the Fund invests. |
| (E) | Does not include portfolio activity of the investment companies in which the Fund invests. |
The Notes to Financial Statements are an integral part of this report.
| | |
| Transamerica Funds | | Annual Report 2014 |
Page 36
FINANCIAL HIGHLIGHTS (continued)
| | | | | | | | | | | | | | | | | | | | |
| For a share outstanding during the years indicated: | | Transamerica Asset Allocation - Growth Portfolio | |
| | | Class B | |
| | | October 31,
2014 | | | October 31,
2013 | | | October 31,
2012 | | | October 31,
2011 | | | October 31,
2010 | |
Net asset value | | | | | | | | | | | | | | | | | | | | |
Beginning of year | | $ | 14.91 | | | $ | 12.07 | | | $ | 11.20 | | | $ | 11.09 | | | $ | 9.70 | |
Investment operations | | | | | | | | | | | | | | | | | | | | |
Net investment income (loss) (A) (B) | | | 0.23 | | | | 0.07 | | | | (0.01 | ) | | | — | (C) | | | (0.02 | ) |
Net realized and unrealized gain (loss) | | | 1.03 | | | | 2.80 | | | | 0.91 | | | | 0.11 | | | | 1.44 | |
Total investment operations | | | 1.26 | | | | 2.87 | | | | 0.90 | | | | 0.11 | | | | 1.42 | |
Distributions | | | | | | | | | | | | | | | | | | | | |
Net investment income | | | (0.19 | ) | | | (0.03 | ) | | | (0.03 | ) | | | — | | | | (0.03 | ) |
Net asset value | | | | | | | | | | | | | | | | | | | | |
End of year | | $ | 15.98 | | | $ | 14.91 | | | $ | 12.07 | | | $ | 11.20 | | | $ | 11.09 | |
Total return (D) | | | 8.49 | % | | | 23.83 | % | | | 8.08 | % | | | 0.99 | % | | | 14.65 | % |
Ratio and supplemental data | | | | | | | | | | | | | | | | | | | | |
Net assets end of year (000’s) | | $ | 73,479 | | | $ | 98,099 | | | $ | 106,594 | | | $ | 140,909 | | | $ | 184,263 | |
Expenses to average net assets (E) | | | 1.34 | % | | | 1.38 | % | | | 1.38 | % | | | 1.36 | % | | | 1.35 | % |
Net investment income (loss) to average net assets (B) | | | 1.51 | % | | | 0.51 | % | | | (0.12 | )% | | | (0.02 | )% | | | (0.18 | )% |
Portfolio turnover rate (F) | | | 31 | % | | | 22 | % | | | 21 | % | | | 30 | % | | | 10 | % |
| (A) | Calculated based on average number of shares outstanding. |
| (B) | Recognition of net investment income by the Fund is affected by the timing of the declaration of dividends by the investment companies in which the Fund invests. |
| (C) | Rounds to less than $0.01 or $(0.01). |
| (D) | Total return has been calculated for the applicable period without deduction of a sales load, if any, on an initial purchase. |
| (E) | Does not include expenses of the investment companies in which the Fund invests. |
| (F) | Does not include portfolio activity of the investment companies in which the Fund invests. |
| | | | | | | | | | | | | | | | | | | | |
| For a share outstanding during the years indicated: | | Transamerica Asset Allocation - Growth Portfolio | |
| | | Class C | |
| | | October 31,
2014 | | | October 31,
2013 | | | October 31,
2012 | | | October 31,
2011 | | | October 31,
2010 | |
Net asset value | | | | | | | | | | | | | | | | | | | | |
Beginning of year | | $ | 14.88 | | | $ | 12.06 | | | $ | 11.20 | | | $ | 11.09 | | | $ | 9.69 | |
Investment operations | | | | | | | | | | | | | | | | | | | | |
Net investment income (loss) (A) (B) | | | 0.20 | | | | 0.07 | | | | (0.01 | ) | | | — | (C) | | | (0.01 | ) |
Net realized and unrealized gain (loss) | | | 1.06 | | | | 2.81 | | | | 0.92 | | | | 0.11 | | | | 1.45 | |
Total investment operations | | | 1.26 | | | | 2.88 | | | | 0.91 | | | | 0.11 | | | | 1.44 | |
Distributions | | | | | | | | | | | | | | | | | | | | |
Net investment income | | | (0.22 | ) | | | (0.06 | ) | | | (0.05 | ) | | | — | | | | (0.04 | ) |
Net asset value | | | | | | | | | | | | | | | | | | | | |
End of year | | $ | 15.92 | | | $ | 14.88 | | | $ | 12.06 | | | $ | 11.20 | | | $ | 11.09 | |
Total return (D) | | | 8.51 | % | | | 23.95 | % | | | 8.22 | % | | | 0.99 | % | | | 14.86 | % |
Ratio and supplemental data | | | | | | | | | | | | | | | | | | | | |
Net assets end of year (000’s) | | $ | 736,246 | | | $ | 710,928 | | | $ | 629,208 | | | $ | 682,872 | | | $ | 774,914 | |
Expenses to average net assets (E) | | | 1.26 | % | | | 1.30 | % | | | 1.29 | % | | | 1.29 | % | | | 1.29 | % |
Net investment income (loss) to average net assets (B) | | | 1.32 | % | | | 0.51 | % | | | (0.08 | )% | | | — | %(F) | | | (0.12 | )% |
Portfolio turnover rate (G) | | | 31 | % | | | 22 | % | | | 21 | % | | | 30 | % | | | 10 | % |
| (A) | Calculated based on average number of shares outstanding. |
| (B) | Recognition of net investment income by the Fund is affected by the timing of the declaration of dividends by the investment companies in which the Fund invests. |
| (C) | Rounds to less than $0.01 or $(0.01). |
| (D) | Total return has been calculated for the applicable period without deduction of a sales load, if any, on an initial purchase. |
| (E) | Does not include expenses of the investment companies in which the Fund invests. |
| (F) | Rounds to less than 0.01% or (0.01)%. |
| (G) | Does not include portfolio activity of the investment companies in which the Fund invests. |
The Notes to Financial Statements are an integral part of this report.
| | |
| Transamerica Funds | | Annual Report 2014 |
Page 37
FINANCIAL HIGHLIGHTS (continued)
| | | | | | | | | | | | | | | | | | | | |
| For a share outstanding during the period and years indicated: | | Transamerica Asset Allocation - Growth Portfolio | |
| | | Class I | |
| | | October 31,
2014 | | | October 31,
2013 | | | October 31,
2012 | | | October 31,
2011 | | | October 31,
2010 (A) | |
Net asset value | | | | | | | | | | | | | | | | | | | | |
Beginning of period/year | | $ | 15.28 | | | $ | 12.39 | | | $ | 11.53 | | | $ | 11.39 | | | $ | 10.35 | |
Investment operations | | | | | | | | | | | | | | | | | | | | |
Net investment income (loss) (B) (C) | | | 0.35 | | | | 0.20 | | | | 0.10 | | | | 0.11 | | | | (0.02 | ) |
Net realized and unrealized gain (loss) | | | 1.11 | | | | 2.88 | | | | 0.94 | | | | 0.13 | | | | 1.20 | |
Total investment operations | | | 1.46 | | | | 3.08 | | | | 1.04 | | | | 0.24 | | | | 1.18 | |
Distributions | | | | | | | | | | | | | | | | | | | | |
Net investment income | | | (0.37 | ) | | | (0.19 | ) | | | (0.18 | ) | | | (0.10 | ) | | | (0.14 | ) |
Net asset value | | | | | | | | | | | | | | | | | | | | |
End of period/year | | $ | 16.37 | | | $ | 15.28 | | | $ | 12.39 | | | $ | 11.53 | | | $ | 11.39 | |
Total return (D) | | | 9.64 | % | | | 25.21 | % | | | 9.28 | % | | | 2.10 | % | | | 11.57 | %(E) |
Ratio and supplemental data | | | | | | | | | | | | | | | | | | | | |
Net assets end of period/year (000’s) | | $ | 30,595 | | | $ | 23,052 | | | $ | 17,219 | | | $ | 14,642 | | | $ | 13,112 | |
Expenses to average net assets (F) | | | 0.26 | % | | | 0.27 | % | | | 0.25 | % | | | 0.27 | % | | | 0.30 | %(G) |
Net investment income (loss) to average net assets (C) | | | 2.19 | % | | | 1.49 | % | | | 0.86 | % | | | 0.93 | % | | | (0.15 | )%(G) |
Portfolio turnover rate (H) | | | 31 | % | | | 22 | % | | | 21 | % | | | 30 | % | | | 10 | %(E) |
| (A) | Commenced operations on November 30, 2009. |
| (B) | Calculated based on average number of shares outstanding. |
| (C) | Recognition of net investment income by the Fund is affected by the timing of the declaration of dividends by the investment companies in which the Fund invests. |
| (D) | Total return has been calculated for the applicable period without deduction of a sales load, if any, on an initial purchase. |
| (F) | Does not include expenses of the investment companies in which the Fund invests. |
| (H) | Does not include portfolio activity of the investment companies in which the Fund invests. |
| | | | | | | | | | | | | | | | | | | | |
| For a share outstanding during the years indicated: | | Transamerica Asset Allocation - Growth Portfolio | |
| | | Class R | |
| | | October 31,
2014 | | | October 31,
2013 | | | October 31,
2012 | | | October 31,
2011 | | | October 31,
2010 | |
Net asset value | | | | | | | | | | | | | | | | | | | | |
Beginning of year | | $ | 15.16 | | | $ | 12.27 | | | $ | 11.39 | | | $ | 11.27 | | | $ | 9.85 | |
Investment operations | | | | | | | | | | | | | | | | | | | | |
Net investment income (loss) (A) (B) | | | 0.23 | | | | 0.13 | | | | 0.06 | | | | 0.05 | | | | 0.01 | |
Net realized and unrealized gain (loss) | | | 1.12 | | | | 2.86 | | | | 0.92 | | | | 0.11 | | | | 1.49 | |
Total investment operations | | | 1.35 | | | | 2.99 | | | | 0.98 | | | | 0.16 | | | | 1.50 | |
Distributions | | | | | | | | | | | | | | | | | | | | |
Net investment income | | | (0.27 | ) | | | (0.10 | ) | | | (0.10 | ) | | | (0.04 | ) | | | (0.08 | ) |
Net asset value | | | | | | | | | | | | | | | | | | | | |
End of year | | $ | 16.24 | | | $ | 15.16 | | | $ | 12.27 | | | $ | 11.39 | | | $ | 11.27 | |
Total return (C) | | | 9.01 | % | | | 24.51 | % | | | 8.76 | % | | | 1.45 | % | | | 15.35 | % |
Ratio and supplemental data | | | | | | | | | | | | | | | | | | | | |
Net assets end of year (000’s) | | $ | 2,127 | | | $ | 2,541 | | | $ | 1,661 | | | $ | 3,722 | | | $ | 3,762 | |
Expenses to average net assets (D) | | | 0.85 | % | | | 0.84 | % | | | 0.82 | % | | | 0.82 | % | | | 0.84 | % |
Net investment income (loss) to average net assets (B) | | | 1.47 | % | | | 0.97 | % | | | 0.52 | % | | | 0.44 | % | | | 0.15 | % |
Portfolio turnover rate (E) | | | 31 | % | | | 22 | % | | | 21 | % | | | 30 | % | | | 10 | % |
| (A) | Calculated based on average number of shares outstanding. |
| (B) | Recognition of net investment income by the Fund is affected by the timing of the declaration of dividends by the investment companies in which the Fund invests. |
| (C) | Total return has been calculated for the applicable period without deduction of a sales load, if any, on an initial purchase. |
| (D) | Does not include expenses of the investment companies in which the Fund invests. |
| (E) | Does not include portfolio activity of the investment companies in which the Fund invests. |
The Notes to Financial Statements are an integral part of this report.
| | |
| Transamerica Funds | | Annual Report 2014 |
Page 38
FINANCIAL HIGHLIGHTS (continued)
| | | | | | | | | | | | | | | | | | | | |
| For a share outstanding during the years indicated: | | Transamerica Asset Allocation - Moderate Growth Portfolio | |
| | | Class A | |
| | | October 31,
2014 | | | October 31,
2013 | | | October 31,
2012 | | | October 31,
2011 | | | October 31,
2010 | |
Net asset value | | | | | | | | | | | | | | | | | | | | |
Beginning of year | | $ | 14.39 | | | $ | 12.34 | | | $ | 11.55 | | | $ | 11.59 | | | $ | 10.39 | |
Investment operations | | | | | | | | | | | | | | | | | | | | |
Net investment income (loss) (A) (B) | | | 0.31 | | | | 0.21 | | | | 0.16 | | | | 0.19 | | | | 0.19 | |
Net realized and unrealized gain (loss) | | | 0.83 | | | | 2.06 | | | | 0.80 | | | | (0.06 | ) | | | 1.27 | |
Total investment operations | | | 1.14 | | | | 2.27 | | | | 0.96 | | | | 0.13 | | | | 1.46 | |
Distributions | | | | | | | | | | | | | | | | | | | | |
Net investment income | | | (0.30 | ) | | | (0.22 | ) | | | (0.17 | ) | | | (0.17 | ) | | | (0.23 | ) |
Return of capital | | | — | | | | — | | | | — | | | | — | | | | (0.03 | ) |
Total distributions | | | (0.30 | ) | | | (0.22 | ) | | | (0.17 | ) | | | (0.17 | ) | | | (0.26 | ) |
Net asset value | | | | | | | | | | | | | | | | | | | | |
End of year | | $ | 15.23 | | | $ | 14.39 | | | $ | 12.34 | | | $ | 11.55 | | | $ | 11.59 | |
Total return (C) | | | 8.01 | % | | | 18.67 | % | | | 8.48 | % | | | 1.09 | % | | | 14.35 | % |
Ratio and supplemental data | | | | | | | | | | | | | | | | | | | | |
Net assets end of year (000’s) | | $ | 1,319,226 | | | $ | 1,269,265 | | | $ | 1,181,926 | | | $ | 1,186,790 | | | $ | 1,202,885 | |
Expenses to average net assets (D) | | | 0.52 | % | | | 0.58 | % | | | 0.60 | % | | | 0.62 | % | | | 0.62 | % |
Net investment income (loss) to average net assets (B) | | | 2.09 | % | | | 1.60 | % | | | 1.30 | % | | | 1.58 | % | | | 1.80 | % |
Portfolio turnover rate (E) | | | 33 | % | | | 19 | % | | | 25 | % | | | 35 | % | | | 17 | % |
| (A) | Calculated based on average number of shares outstanding. |
| (B) | Recognition of net investment income by the Fund is affected by the timing of the declaration of dividends by the investment companies in which the Fund invests. |
| (C) | Total return has been calculated for the applicable period without deduction of a sales load, if any, on an initial purchase. |
| (D) | Does not include expenses of the investment companies in which the Fund invests. |
| (E) | Does not include portfolio activity of the investment companies in which the Fund invests. |
| | | | | | | | | | | | | | | | | | | | |
| For a share outstanding during the years indicated: | | Transamerica Asset Allocation - Moderate Growth Portfolio | |
| | | Class B | |
| | | October 31,
2014 | | | October 31,
2013 | | | October 31,
2012 | | | October 31,
2011 | | | October 31,
2010 | |
Net asset value | | | | | | | | | | | | | | | | | | | | |
Beginning of year | | $ | 14.38 | | | $ | 12.32 | | | $ | 11.50 | | | $ | 11.53 | | | $ | 10.34 | |
Investment operations | | | | | | | | | | | | | | | | | | | | |
Net investment income (loss) (A) (B) | | | 0.23 | | | | 0.12 | | | | 0.08 | | | | 0.12 | | | | 0.13 | |
Net realized and unrealized gain (loss) | | | 0.79 | | | | 2.05 | | | | 0.80 | | | | (0.07 | ) | | | 1.25 | |
Total investment operations | | | 1.02 | | | | 2.17 | | | | 0.88 | | | | 0.05 | | | | 1.38 | |
Distributions | | | | | | | | | | | | | | | | | | | | |
Net investment income | | | (0.17 | ) | | | (0.11 | ) | | | (0.06 | ) | | | (0.08 | ) | | | (0.16 | ) |
Return of capital | | | — | | | | — | | | | — | | | | — | | | | (0.03 | ) |
Total distributions | | | (0.17 | ) | | | (0.11 | ) | | | (0.06 | ) | | | (0.08 | ) | | | (0.19 | ) |
Net asset value | | | | | | | | | | | | | | | | | | | | |
End of year | | $ | 15.23 | | | $ | 14.38 | | | $ | 12.32 | | | $ | 11.50 | | | $ | 11.53 | |
Total return (C) | | | 7.16 | % | | | 17.72 | % | | | 7.73 | % | | | 0.43 | % | | | 13.57 | % |
Ratio and supplemental data | | | | | | | | | | | | | | | | | | | | |
Net assets end of year (000’s) | | $ | 133,060 | | | $ | 182,030 | | | $ | 213,032 | | | $ | 283,905 | | | $ | 383,062 | |
Expenses to average net assets (D) | | | 1.30 | % | | | 1.33 | % | | | 1.33 | % | | | 1.31 | % | | | 1.30 | % |
Net investment income (loss) to average net assets (B) | | | 1.52 | % | | | 0.94 | % | | | 0.65 | % | | | 1.02 | % | | | 1.19 | % |
Portfolio turnover rate (E) | | | 33 | % | | | 19 | % | | | 25 | % | | | 35 | % | | | 17 | % |
| (A) | Calculated based on average number of shares outstanding. |
| (B) | Recognition of net investment income by the Fund is affected by the timing of the declaration of dividends by the investment companies in which the Fund invests. |
| (C) | Total return has been calculated for the applicable period without deduction of a sales load, if any, on an initial purchase. |
| (D) | Does not include expenses of the investment companies in which the Fund invests. |
| (E) | Does not include portfolio activity of the investment companies in which the Fund invests. |
The Notes to Financial Statements are an integral part of this report.
| | |
| Transamerica Funds | | Annual Report 2014 |
Page 39
FINANCIAL HIGHLIGHTS (continued)
| | | | | | | | | | | | | | | | | | | | |
| For a share outstanding during the years indicated: | | Transamerica Asset Allocation - Moderate Growth Portfolio | |
| | | Class C | |
| | | October 31,
2014 | | | October 31,
2013 | | | October 31,
2012 | | | October 31,
2011 | | | October 31,
2010 | |
Net asset value | | | | | | | | | | | | | | | | | �� | | | |
Beginning of year | | $ | 14.30 | | | $ | 12.26 | | | $ | 11.47 | | | $ | 11.50 | | | $ | 10.32 | |
Investment operations | | | | | | | | | | | | | | | | | | | | |
Net investment income (loss) (A) (B) | | | 0.21 | | | | 0.12 | | | | 0.08 | | | | 0.12 | | | | 0.13 | |
Net realized and unrealized gain (loss) | | | 0.82 | | | | 2.05 | | | | 0.80 | | | | (0.05 | ) | | | 1.25 | |
Total investment operations | | | 1.03 | | | | 2.17 | | | | 0.88 | | | | 0.07 | | | | 1.38 | |
Distributions | | | | | | | | | | | | | | | | | | | | |
Net investment income | | | (0.21 | ) | | | (0.13 | ) | | | (0.09 | ) | | | (0.10 | ) | | | (0.17 | ) |
Return of capital | | | — | | | | — | | | | — | | | | — | | | | (0.03 | ) |
Total distributions | | | (0.21 | ) | | | (0.13 | ) | | | (0.09 | ) | | | (0.10 | ) | | | (0.20 | ) |
Net asset value | | | | | | | | | | | | | | | | | | | | |
End of year | | $ | 15.12 | | | $ | 14.30 | | | $ | 12.26 | | | $ | 11.47 | | | $ | 11.50 | |
Total return (C) | | | 7.23 | % | | | 17.88 | % | | | 7.74 | % | | | 0.56 | % | | | 13.58 | % |
Ratio and supplemental data | | | | | | | | | | | | | | | | | | | | |
Net assets end of year (000’s) | | $ | 1,526,267 | | | $ | 1,506,825 | | | $ | 1,379,454 | | | $ | 1,468,164 | | | $ | 1,606,227 | |
Expenses to average net assets (D) | | | 1.23 | % | | | 1.26 | % | | | 1.25 | % | | | 1.25 | % | | | 1.25 | % |
Net investment income (loss) to average net assets (B) | | | 1.39 | % | | | 0.92 | % | | | 0.66 | % | | | 0.99 | % | | | 1.20 | % |
Portfolio turnover rate (E) | | | 33 | % | | | 19 | % | | | 25 | % | | | 35 | % | | | 17 | % |
| (A) | Calculated based on average number of shares outstanding. |
| (B) | Recognition of net investment income by the Fund is affected by the timing of the declaration of dividends by the investment companies in which the Fund invests. |
| (C) | Total return has been calculated for the applicable period without deduction of a sales load, if any, on an initial purchase. |
| (D) | Does not include expenses of the investment companies in which the Fund invests. |
| (E) | Does not include portfolio activity of the investment companies in which the Fund invests. |
| | | | | | | | | | | | | | | | | | | | |
| For a share outstanding during the period and years indicated: | | Transamerica Asset Allocation - Moderate Growth Portfolio | |
| | | Class I | |
| | | October 31,
2014 | | | October 31,
2013 | | | October 31,
2012 | | | October 31,
2011 | | | October 31,
2010 (A) | |
Net asset value | | | | | | | | | | | | | | | | | | | | |
Beginning of period/year | | $ | 14.40 | | | $ | 12.36 | | | $ | 11.58 | | | $ | 11.61 | | | $ | 10.76 | |
Investment operations | | | | | | | | | | | | | | | | | | | | |
Net investment income (loss) (B) (C) | | | 0.34 | | | | 0.24 | | | | 0.18 | | | | 0.21 | | | | 0.09 | |
Net realized and unrealized gain (loss) | | | 0.84 | | | | 2.06 | | | | 0.81 | | | | (0.03 | ) | | | 1.07 | |
Total investment operations | | | 1.18 | | | | 2.30 | | | | 0.99 | | | | 0.18 | | | | 1.16 | |
Distributions | | | | | | | | | | | | | | | | | | | | |
Net investment income | | | (0.35 | ) | | | (0.26 | ) | | | (0.21 | ) | | | (0.21 | ) | | | (0.28 | ) |
Return of capital | | | — | | | | — | | | | — | | | | — | | | | (0.03 | ) |
Total distributions | | | (0.35 | ) | | | (0.26 | ) | | | (0.21 | ) | | | (0.21 | ) | | | (0.31 | ) |
Net asset value | | | | | | | | | | | | | | | | | | | | |
End of period/year | | $ | 15.23 | | | $ | 14.40 | | | $ | 12.36 | | | $ | 11.58 | | | $ | 11.61 | |
Total return(D) | | | 8.27 | % | | | 19.00 | % | | | 8.82 | % | | | 1.54 | % | | | 11.07 | %(E) |
Ratio and supplemental data | | | | | | | | | | | | | | | | | | | | |
Net assets end of period/year (000’s) | | $ | 54,952 | | | $ | 46,067 | | | $ | 34,145 | | | $ | 23,403 | | | $ | 16,293 | |
Expenses to average net assets (F) | | | 0.25 | % | | | 0.26 | % | | | 0.25 | % | | | 0.26 | % | | | 0.29 | %(G) |
Net investment income (loss) to average net assets (C) | | | 2.30 | % | | | 1.84 | % | | | 1.53 | % | | | 1.74 | % | | | 0.89 | %(G) |
Portfolio turnover rate (H) | | | 33 | % | | | 19 | % | | | 25 | % | | | 35 | % | | | 17 | %(E) |
| (A) | Commenced operations on November 30, 2009. |
| (B) | Calculated based on average number of shares outstanding. |
| (C) | Recognition of net investment income by the Fund is affected by the timing of the declaration of dividends by the investment companies in which the Fund invests. |
| (D) | Total return has been calculated for the applicable period without deduction of a sales load, if any, on an initial purchase. |
| (F) | Does not include expenses of the investment companies in which the Fund invests. |
| (H) | Does not include portfolio activity of the investment companies in which the Fund invests. |
The Notes to Financial Statements are an integral part of this report.
| | |
| Transamerica Funds | | Annual Report 2014 |
Page 40
FINANCIAL HIGHLIGHTS (continued)
| | | | | | | | | | | | | | | | | | | | |
| For a share outstanding during the years indicated: | | Transamerica Asset Allocation - Moderate Growth Portfolio | |
| | | Class R | |
| | | October 31,
2014 | | | October 31,
2013 | | | October 31,
2012 | | | October 31,
2011 | | | October 31,
2010 | |
Net asset value | | | | | | | | | | | | | | | | | | | | |
Beginning of year | | $ | 14.32 | | | $ | 12.28 | | | $ | 11.50 | | | $ | 11.53 | | | $ | 10.36 | |
Investment operations | | | | | | | | | | | | | | | | | | | | |
Net investment income (loss) (A) (B) | | | 0.26 | | | | 0.19 | | | | 0.14 | | | | 0.17 | | | | 0.15 | |
Net realized and unrealized gain (loss) | | | 0.84 | | | | 2.04 | | | | 0.79 | | | | (0.04 | ) | | | 1.28 | |
Total investment operations | | | 1.10 | | | | 2.23 | | | | 0.93 | | | | 0.13 | | | | 1.43 | |
Distributions | | | | | | | | | | | | | | | | | | | | |
Net investment income | | | (0.27 | ) | | | (0.19 | ) | | | (0.15 | ) | | | (0.16 | ) | | | (0.23 | ) |
Return of capital | | | — | | | | — | | | | — | | | | — | | | | (0.03 | ) |
Total distributions | | | (0.27 | ) | | | (0.19 | ) | | | (0.15 | ) | | | (0.16 | ) | | | (0.26 | ) |
Net asset value | | | | | | | | | | | | | | | | | | | | |
End of year | | $ | 15.15 | | | $ | 14.32 | | | $ | 12.28 | | | $ | 11.50 | | | $ | 11.53 | |
Total return (C) | | | 7.77 | % | | | 18.46 | % | | | 8.21 | % | | | 1.06 | % | | | 14.08 | % |
Ratio and supplemental data | | | | | | | | | | | | | | | | | | | | |
Net assets end of year (000’s) | | $ | 5,364 | | | $ | 5,202 | | | $ | 4,965 | | | $ | 5,306 | | | $ | 5,413 | |
Expenses to average net assets (D) | | | 0.75 | % | | | 0.77 | % | | | 0.77 | % | | | 0.77 | % | | | 0.79 | % |
Net investment income (loss) to average net assets (B) | | | 1.75 | % | | | 1.42 | % | | | 1.14 | % | | | 1.43 | % | | | 1.43 | % |
Portfolio turnover rate (E) | | | 33 | % | | | 19 | % | | | 25 | % | | | 35 | % | | | 17 | % |
| (A) | Calculated based on average number of shares outstanding. |
| (B) | Recognition of net investment income by the Fund is affected by the timing of the declaration of dividends by the investment companies in which the Fund invests. |
| (C) | Total return has been calculated for the applicable period without deduction of a sales load, if any, on an initial purchase. |
| (D) | Does not include expenses of the investment companies in which the Fund invests. |
| (E) | Does not include portfolio activity of the investment companies in which the Fund invests. |
| | | | | | | | | | | | | | | | | | | | |
| For a share outstanding during the years indicated: | | Transamerica Asset Allocation - Moderate Portfolio | |
| | | Class A | |
| | | October 31,
2014 | | | October 31,
2013 | | | October 31,
2012 | | | October 31,
2011 | | | October 31,
2010 | |
Net asset value | | | | | | | | | | | | | | | | | | | | |
Beginning of year | | $ | 13.58 | | | $ | 12.26 | | | $ | 11.60 | | | $ | 11.59 | | | $ | 10.62 | |
Investment operations | | | | | | | | | | | | | | | | | | | | |
Net investment income (loss) (A) (B) | | | 0.27 | | | | 0.24 | | | | 0.23 | | | | 0.26 | | | | 0.30 | |
Net realized and unrealized gain (loss) | | | 0.54 | | | | 1.34 | | | | 0.67 | | | | (0.02 | ) | | | 1.04 | |
Total investment operations | | | 0.81 | | | | 1.58 | | | | 0.90 | | | | 0.24 | | | | 1.34 | |
Distributions | | | | | | | | | | | | | | | | | | | | |
Net investment income | | | (0.27 | ) | | | (0.26 | ) | | | (0.24 | ) | | | (0.23 | ) | | | (0.37 | ) |
Net realized gains | | | (0.56 | ) | | | — | | | | — | | | | — | | | | — | |
Total distributions | | | (0.83 | ) | | | (0.26 | ) | | | (0.24 | ) | | | (0.23 | ) | | | (0.37 | ) |
Net asset value | | | | | | | | | | | | | | | | | | | | |
End of year | | $ | 13.56 | | | $ | 13.58 | | | $ | 12.26 | | | $ | 11.60 | | | $ | 11.59 | |
Total return (C) | | | 6.20 | % | | | 13.13 | % | | | 7.95 | % | | | 2.10 | % | | | 12.95 | % |
Ratio and supplemental data | | | | | | | | | | | | | | | | | | | | |
Net assets end of year (000’s) | | $ | 899,852 | | | $ | 900,887 | | | $ | 866,505 | | | $ | 877,866 | | | $ | 857,469 | |
Expenses to average net assets (D) | | | 0.52 | % | | | 0.56 | % | | | 0.58 | % | | | 0.61 | % | | | 0.61 | % |
Net investment income (loss) to average net assets (B) | | | 1.99 | % | | | 1.89 | % | | | 1.93 | % | | | 2.23 | % | | | 2.78 | % |
Portfolio turnover rate (E) | | | 27 | % | | | 21 | % | | | 22 | % | | | 30 | % | | | 16 | % |
| (A) | Calculated based on average number of shares outstanding. |
| (B) | Recognition of net investment income by the Fund is affected by the timing of the declaration of dividends by the investment companies in which the Fund invests. |
| (C) | Total return has been calculated for the applicable period without deduction of a sales load, if any, on an initial purchase. |
| (D) | Does not include expenses of the investment companies in which the Fund invests. |
| (E) | Does not include portfolio activity of the investment companies in which the Fund invests. |
The Notes to Financial Statements are an integral part of this report.
| | |
| Transamerica Funds | | Annual Report 2014 |
Page 41
FINANCIAL HIGHLIGHTS (continued)
| | | | | | | | | | | | | | | | | | | | |
| For a share outstanding during the years indicated: | | Transamerica Asset Allocation - Moderate Portfolio | |
| | | Class B | |
| | | October 31,
2014 | | | October 31,
2013 | | | October 31,
2012 | | | October 31,
2011 | | | October 31,
2010 | |
Net asset value | | | | | | | | | | | | | | | | | | | | |
Beginning of year | | $ | 13.61 | | | $ | 12.26 | | | $ | 11.58 | | | $ | 11.55 | | | $ | 10.59 | |
Investment operations | | | | | | | | | | | | | | | | | | | | |
Net investment income (loss) (A) (B) | | | 0.18 | | | | 0.16 | | | | 0.15 | | | | 0.20 | | | | 0.24 | |
Net realized and unrealized gain (loss) | | | 0.52 | | | | 1.34 | | | | 0.65 | | | | (0.03 | ) | | | 1.02 | |
Total investment operations | | | 0.70 | | | | 1.50 | | | | 0.80 | | | | 0.17 | | | | 1.26 | |
Distributions | | | | | | | | | | | | | | | | | | | | |
Net investment income | | | (0.15 | ) | | | (0.15 | ) | | | (0.12 | ) | | | (0.14 | ) | | | (0.30 | ) |
Net realized gains | | | (0.56 | ) | | | — | | | | — | | | | — | | | | — | |
Total distributions | | | (0.71 | ) | | | (0.15 | ) | | | (0.12 | ) | | | (0.14 | ) | | | (0.30 | ) |
Net asset value | | | | | | | | | | | | | | | | | | | | |
End of year | | $ | 13.60 | | | $ | 13.61 | | | $ | 12.26 | | | $ | 11.58 | | | $ | 11.55 | |
Total return (C) | | | 5.32 | % | | | 12.36 | % | | | 7.06 | % | | | 1.49 | % | | | 12.13 | % |
Ratio and supplemental data | | | | | | | | | | | | | | | | | | | | |
Net assets end of year (000’s) | | $ | 71,121 | | | $ | 95,350 | | | $ | 115,595 | | | $ | 152,538 | | | $ | 220,658 | |
Expenses to average net assets (D) | | | 1.30 | % | | | 1.31 | % | | | 1.31 | % | | | 1.28 | % | | | 1.28 | % |
Net investment income (loss) to average net assets (B) | | | 1.32 | % | | | 1.21 | % | | | 1.28 | % | | | 1.69 | % | | | 2.24 | % |
Portfolio turnover rate (E) | | | 27 | % | | | 21 | % | | | 22 | % | | | 30 | % | | | 16 | % |
| (A) | Calculated based on average number of shares outstanding. |
| (B) | Recognition of net investment income by the Fund is affected by the timing of the declaration of dividends by the investment companies in which the Fund invests. |
| (C) | Total return has been calculated for the applicable period without deduction of a sales load, if any, on an initial purchase. |
| (D) | Does not include expenses of the investment companies in which the Fund invests. |
| (E) | Does not include portfolio activity of the investment companies in which the Fund invests. |
| | | | | | | | | | | | | | | | | | | | |
| For a share outstanding during the years indicated: | | Transamerica Asset Allocation - Moderate Portfolio | |
| | | Class C | |
| | | October 31,
2014 | | | October 31,
2013 | | | October 31,
2012 | | | October 31,
2011 | | | October 31,
2010 | |
Net asset value | | | | | | | | | | | | | | | | | | | | |
Beginning of year | | $ | 13.48 | | | $ | 12.17 | | | $ | 11.52 | | | $ | 11.50 | | | $ | 10.55 | |
Investment operations | | | | | | | | | | | | | | | | | | | | |
Net investment income (loss) (A) (B) | | | 0.17 | | | | 0.15 | | | | 0.15 | | | | 0.19 | | | | 0.24 | |
Net realized and unrealized gain (loss) | | | 0.53 | | | | 1.34 | | | | 0.66 | | | | (0.01 | ) | | | 1.02 | |
Total investment operations | | | 0.70 | | | | 1.49 | | | | 0.81 | | | | 0.18 | | | | 1.26 | |
Distributions | | | | | | | | | | | | | | | | | | | | |
Net investment income | | | (0.18 | ) | | | (0.18 | ) | | | (0.16 | ) | | | (0.16 | ) | | | (0.31 | ) |
Net realized gains | | | (0.56 | ) | | | — | | | | — | | | | — | | | | — | |
Total distributions | | | (0.74 | ) | | | (0.18 | ) | | | (0.16 | ) | | | (0.16 | ) | | | (0.31 | ) |
Net asset value | | | | | | | | | | | | | | | | | | | | |
End of year | | $ | 13.44 | | | $ | 13.48 | | | $ | 12.17 | | | $ | 11.52 | | | $ | 11.50 | |
Total return (C) | | | 5.39 | % | | | 12.37 | % | | | 7.17 | % | | | 1.50 | % | | | 12.22 | % |
Ratio and supplemental data | | | | | | | | | | | | | | | | | | | | |
Net assets end of year (000’s) | | $ | 1,138,082 | | | $ | 1,142,473 | | | $ | 1,069,033 | | | $ | 1,088,747 | | | $ | 1,142,029 | |
Expenses to average net assets (D) | | | 1.22 | % | | | 1.24 | % | | | 1.23 | % | | | 1.22 | % | | | 1.22 | % |
Net investment income (loss) to average net assets (B) | | | 1.29 | % | | | 1.21 | % | | | 1.28 | % | | | 1.64 | % | | | 2.21 | % |
Portfolio turnover rate (E) | | | 27 | % | | | 21 | % | | | 22 | % | | | 30 | % | | | 16 | % |
| (A) | Calculated based on average number of shares outstanding. |
| (B) | Recognition of net investment income by the Fund is affected by the timing of the declaration of dividends by the investment companies in which the Fund invests. |
| (C) | Total return has been calculated for the applicable period without deduction of a sales load, if any, on an initial purchase. |
| (D) | Does not include expenses of the investment companies in which the Fund invests. |
| (E) | Does not include portfolio activity of the investment companies in which the Fund invests. |
The Notes to Financial Statements are an integral part of this report.
| | |
| Transamerica Funds | | Annual Report 2014 |
Page 42
FINANCIAL HIGHLIGHTS (continued)
| | | | | | | | | | | | | | | | | | | | |
| For a share outstanding during the period and years indicated: | | Transamerica Asset Allocation - Moderate Portfolio | |
| | | Class I | |
| | | October 31,
2014 | | | October 31,
2013 | | | October 31,
2012 | | | October 31,
2011 | | | October 31,
2010 (A) | |
Net asset value | | | | | | | | | | | | | | | | | | | | |
Beginning of period/year | | $ | 13.59 | | | $ | 12.28 | | | $ | 11.63 | | | $ | 11.61 | | | $ | 10.94 | |
Investment operations | | | | | | | | | | | | | | | | | | | | |
Net investment income (loss) (B) (C) | | | 0.30 | | | | 0.28 | | | | 0.25 | | | | 0.28 | | | | 0.17 | |
Net realized and unrealized gain (loss) | | | 0.54 | | | | 1.33 | | | | 0.68 | | | | 0.01 | | | | 0.91 | |
Total investment operations | | | 0.84 | | | | 1.61 | | | | 0.93 | | | | 0.29 | | | | 1.08 | |
Distributions | | | | | | | | | | | | | | | | | | | | |
Net investment income | | | (0.31 | ) | | | (0.30 | ) | | | (0.28 | ) | | | (0.27 | ) | | | (0.41 | ) |
Net realized gains | | | (0.56 | ) | | | — | | | | — | | | | — | | | | — | |
Total distributions | | | (0.87 | ) | | | (0.30 | ) | | | (0.28 | ) | | | (0.27 | ) | | | (0.41 | ) |
Net asset value | | | | | | | | | | | | | | | | | | | | |
End of period/year | | $ | 13.56 | | | $ | 13.59 | | | $ | 12.28 | | | $ | 11.63 | | | $ | 11.61 | |
Total return (D) | | | 6.45 | % | | | 13.41 | % | | | 8.26 | % | | | 2.53 | % | | | 10.27 | %(E) |
Ratio and supplemental data | | | | | | | | | | | | | | | | | | | | |
Net assets end of period/year (000’s) | | $ | 47,590 | | | $ | 41,286 | | | $ | 36,572 | | | $ | 26,332 | | | $ | 17,853 | |
Expenses to average net assets (F) | | | 0.25 | % | | | 0.26 | % | | | 0.25 | % | | | 0.26 | % | | | 0.28 | %(G) |
Net investment income (loss) to average net assets (C) | | | 2.21 | % | | | 2.17 | % | | | 2.11 | % | | | 2.42 | % | | | 1.73 | %(G) |
Portfolio turnover rate (H) | | | 27 | % | | | 21 | % | | | 22 | % | | | 30 | % | | | 16 | %(E) |
| (A) | Commenced operations on November 30, 2009. |
| (B) | Calculated based on average number of shares outstanding. |
| (C) | Recognition of net investment income by the Fund is affected by the timing of the declaration of dividends by the investment companies in which the Fund invests. |
| (D) | Total return has been calculated for the applicable period without deduction of a sales load, if any, on an initial purchase. |
| (F) | Does not include expenses of the investment companies in which the Fund invests. |
| (H) | Does not include portfolio activity of the investment companies in which the Fund invests. |
| | | | | | | | | | | | | | | | | | | | |
| For a share outstanding during the years indicated: | | Transamerica Asset Allocation - Moderate Portfolio | |
| | | Class R | |
| | | October 31,
2014 | | | October 31,
2013 | | | October 31,
2012 | | | October 31,
2011 | | | October 31,
2010 | |
Net asset value | | | | | | | | | | | | | | | | | | | | |
Beginning of year | | $ | 13.52 | | | $ | 12.20 | | | $ | 11.54 | | | $ | 11.53 | | | $ | 10.58 | |
Investment operations | | | | | | | | | | | | | | | | | | | | |
Net investment income (loss) (A) (B) | | | 0.22 | | | | 0.21 | | | | 0.20 | | | | 0.23 | | | | 0.24 | |
Net realized and unrealized gain (loss) | | | 0.55 | | | | 1.34 | | | | 0.67 | | | | — | (C) | | | 1.06 | |
Total investment operations | | | 0.77 | | | | 1.55 | | | | 0.87 | | | | 0.23 | | | | 1.30 | |
Distributions | | | | | | | | | | | | | | | | | | | | |
Net investment income | | | (0.25 | ) | | | (0.23 | ) | | | (0.21 | ) | | | (0.22 | ) | | | (0.35 | ) |
Net realized gains | | | (0.56 | ) | | | — | | | | — | | | | — | | | | — | |
Total distributions | | | (0.81 | ) | | | (0.23 | ) | | | (0.21 | ) | | | (0.22 | ) | | | (0.35 | ) |
Net asset value | | | | | | | | | | | | | | | | | | | | |
End of year | | $ | 13.48 | | | $ | 13.52 | | | $ | 12.20 | | | $ | 11.54 | | | $ | 11.53 | |
Total return (D) | | | 5.88 | % | | | 12.93 | % | | | 7.72 | % | | | 2.01 | % | | | 12.60 | % |
Ratio and supplemental data | | | | | | | | | | | | | | | | | | | | |
Net assets end of year (000’s) | | $ | 5,665 | | | $ | 4,990 | | | $ | 4,954 | | | $ | 5,314 | | | $ | 4,278 | |
Expenses to average net assets (E) | | | 0.73 | % | | | 0.76 | % | | | 0.79 | % | | | 0.82 | % | | | 0.83 | % |
Net investment income (loss) to average net assets (B) | | | 1.68 | % | | | 1.67 | % | | | 1.71 | % | | | 2.00 | % | | | 2.23 | % |
Portfolio turnover rate (F) | | | 27 | % | | | 21 | % | | | 22 | % | | | 30 | % | | | 16 | % |
| (A) | Calculated based on average number of shares outstanding. |
| (B) | Recognition of net investment income by the Fund is affected by the timing of the declaration of dividends by the investment companies in which the Fund invests. |
| (C) | Rounds to less than $0.01 or $(0.01). |
| (D) | Total return has been calculated for the applicable period without deduction of a sales load, if any, on an initial purchase. |
| (E) | Does not include expenses of the investment companies in which the Fund invests. |
| (F) | Does not include portfolio activity of the investment companies in which the Fund invests. |
The Notes to Financial Statements are an integral part of this report.
| | |
| Transamerica Funds | | Annual Report 2014 |
Page 43
FINANCIAL HIGHLIGHTS (continued)
| | | | | | | | | | | | | | | | | | | | |
| For a share outstanding during the years indicated: | | Transamerica Multi-Manager Alternative Strategies Portfolio | |
| | | Class A | |
| | | October 31,
2014 | | | October 31,
2013 | | | October 31,
2012 | | | October 31,
2011 | | | October 31,
2010 | |
Net asset value | | | | | | | | | | | | | | | | | | | | |
Beginning of year | | $ | 10.01 | | | $ | 9.92 | | | $ | 9.68 | | | $ | 9.82 | | | $ | 9.35 | |
Investment operations | | | | | | | | | | | | | | | | | | | | |
Net investment income (loss) (A) (B) | | | 0.05 | | | | 0.14 | | | | 0.21 | | | | 0.15 | | | | 0.14 | |
Net realized and unrealized gain (loss) | | | 0.49 | | | | 0.14 | | | | 0.25 | | | | (0.23 | ) | | | 0.58 | |
Total investment operations | | | 0.54 | | | | 0.28 | | | | 0.46 | | | | (0.08 | ) | | | 0.72 | |
Distributions | | | | | | | | | | | | | | | | | | | | |
Net investment income | | | (0.05 | ) | | | (0.19 | ) | | | (0.22 | ) | | | (0.06 | ) | | | (0.15 | ) |
Return of capital | | | — | | | | — | | | | — | | | | — | | | | (0.10 | ) |
Total distributions | | | (0.05 | ) | | | (0.19 | ) | | | (0.22 | ) | | | (0.06 | ) | | | (0.25 | ) |
Net asset value | | | | | | | | | | | | | | | | | | | | |
End of year | | $ | 10.50 | | | $ | 10.01 | | | $ | 9.92 | | | $ | 9.68 | | | $ | 9.82 | |
Total return (C) | | | 5.46 | % | | | 2.89 | % | | | 4.95 | % | | | (0.77 | )% | | | 7.83 | % |
Ratio and supplemental data | | | | | | | | | | | | | | | | | | | | |
Net assets end of year (000’s) | | $ | 129,568 | | | $ | 200,903 | | | $ | 176,808 | | | $ | 171,567 | | | $ | 128,041 | |
Expenses to average net assets (D) | | | 0.72 | % | | | 0.72 | % | | | 0.74 | % | | | 0.76 | % | | | 0.80 | % |
Net investment income (loss) to average net assets (B) | | | 0.46 | % | | | 1.42 | % | | | 2.19 | % | | | 1.53 | % | | | 1.51 | % |
Portfolio turnover rate (E) | | | 79 | % | | | 116 | % | | | 62 | % | | | 31 | % | | | 35 | % |
| (A) | Calculated based on average number of shares outstanding. |
| (B) | Recognition of net investment income by the Fund is affected by the timing of the declaration of dividends by the investment companies in which the Fund invests. |
| (C) | Total return has been calculated for the applicable period without deduction of a sales load, if any, on an initial purchase. |
| (D) | Does not include expenses of the investment companies in which the Fund invests. |
| (E) | Does not include portfolio activity of the investment companies in which the Fund invests. |
| | | | | | | | | | | | | | | | | | | | |
| For a share outstanding during the years indicated: | | Transamerica Multi-Manager Alternative Strategies Portfolio | |
| | | Class C | |
| | | October 31,
2014 | | | October 31,
2013 | | | October 31,
2012 | | | October 31,
2011 | | | October 31,
2010 | |
Net asset value | | | | | | | | | | | | | | | | | | | | |
Beginning of year | | $ | 9.91 | | | $ | 9.82 | | | $ | 9.59 | | | $ | 9.73 | | | $ | 9.27 | |
Investment operations | | | | | | | | | | | | | | | | | | | | |
Net investment income (loss) (A) (B) | | | (0.03 | ) | | | 0.08 | | | | 0.14 | | | | 0.09 | | | | 0.08 | |
Net realized and unrealized gain (loss) | | | 0.49 | | | | 0.13 | | | | 0.25 | | | | (0.22 | ) | | | 0.57 | |
Total investment operations | | | 0.46 | | | | 0.21 | | | | 0.39 | | | | (0.13 | ) | | | 0.65 | |
Distributions | | | | | | | | | | | | | | | | | | | | |
Net investment income | | | — | | | | (0.12 | ) | | | (0.16 | ) | | | (0.01 | ) | | | (0.09 | ) |
Return of capital | | | — | | | | — | | | | — | | | | — | | | | (0.10 | ) |
Total distributions | | | — | | | | (0.12 | ) | | | (0.16 | ) | | | (0.01 | ) | | | (0.19 | ) |
Net asset value | | | | | | | | | | | | | | | | | | | | |
End of year | | $ | 10.37 | | | $ | 9.91 | | | $ | 9.82 | | | $ | 9.59 | | | $ | 9.73 | |
Total return (C) | | | 4.64 | % | | | 2.18 | % | | | 4.21 | % | | | (1.35 | )% | | | 7.12 | % |
Ratio and supplemental data | | | | | | | | | | | | | | | | | | | | |
Net assets end of year (000’s) | | $ | 125,950 | | | $ | 140,309 | | | $ | 142,788 | | | $ | 141,413 | | | $ | 114,662 | |
Expenses to average net assets (D) | | | 1.45 | % | | | 1.44 | % | | | 1.41 | % | | | 1.42 | % | | | 1.44 | % |
Net investment income (loss) to average net assets (B) | | | (0.29 | )% | | | 0.80 | % | | | 1.47 | % | | | 0.91 | % | | | 0.82 | % |
Portfolio turnover rate (E) | | | 79 | % | | | 116 | % | | | 62 | % | | | 31 | % | | | 35 | % |
| (A) | Calculated based on average number of shares outstanding. |
| (B) | Recognition of net investment income by the Fund is affected by the timing of the declaration of dividends by the investment companies in which the Fund invests. |
| (C) | Total return has been calculated for the applicable period without deduction of a sales load, if any, on an initial purchase. |
| (D) | Does not include expenses of the investment companies in which the Fund invests. |
| (E) | Does not include portfolio activity of the investment companies in which the Fund invests. |
The Notes to Financial Statements are an integral part of this report.
| | |
| Transamerica Funds | | Annual Report 2014 |
Page 44
FINANCIAL HIGHLIGHTS (continued)
| | | | | | | | | | | | | | | | | | | | |
| For a share outstanding during the period and years indicated: | | Transamerica Multi-Manager Alternative Strategies Portfolio | |
| | | Class I | |
| | | October 31,
2014 | | | October 31,
2013 | | | October 31,
2012 | | | October 31,
2011 | | | October 31,
2010 (A) | |
Net asset value | | | | | | | | | | | | | | | | | | | | |
Beginning of period/year | | $ | 10.03 | | | $ | 9.94 | | | $ | 9.70 | | | $ | 9.84 | | | $ | 9.49 | |
Investment operations | | | | | | | | | | | | | | | | | | | | |
Net investment income (loss) (B) (C) | | | 0.08 | | | | 0.17 | | | | 0.23 | | | | 0.15 | | | | 0.07 | |
Net realized and unrealized gain (loss) | | | 0.50 | | | | 0.15 | | | | 0.27 | | | | (0.19 | ) | | | 0.57 | |
Total investment operations | | | 0.58 | | | | 0.32 | | | | 0.50 | | | | (0.04 | ) | | | 0.64 | |
Distributions | | | | | | | | | | | | | | | | | | | | |
Net investment income | | | (0.09 | ) | | | (0.23 | ) | | | (0.26 | ) | | | (0.10 | ) | | | (0.19 | ) |
Return of capital | | | — | | | | — | | | | — | | | | — | | | | (0.10 | ) |
Total distributions | | | (0.09 | ) | | | (0.23 | ) | | | (0.26 | ) | | | (0.10 | ) | | | (0.29 | ) |
Net asset value | | | | | | | | | | | | | | | | | | | | |
End of period/year | | $ | 10.52 | | | $ | 10.03 | | | $ | 9.94 | | | $ | 9.70 | | | $ | 9.84 | |
Total return (D) | | | 5.81 | % | | | 3.25 | % | | | 5.34 | % | | | (0.47 | )% | | | 6.90 | %(E) |
Ratio and supplemental data | | | | | | | | | | | | | | | | | | | | |
Net assets end of period/year (000’s) | | $ | 238,046 | | | $ | 207,733 | | | $ | 175,506 | | | $ | 120,465 | | | $ | 34,131 | |
Expenses to average net assets (F) | | | 0.41 | % | | | 0.39 | % | | | 0.37 | % | | | 0.40 | % | | | 0.50 | %(G) |
Net investment income (loss) to average net assets (C) | | | 0.74 | % | | | 1.74 | % | | | 2.37 | % | | | 1.56 | % | | | 0.82 | %(G) |
Portfolio turnover rate (H) | | | 79 | % | | | 116 | % | | | 62 | % | | | 31 | % | | | 35 | %(E) |
| (A) | Commenced operations on November 30, 2009. |
| (B) | Calculated based on average number of shares outstanding. |
| (C) | Recognition of net investment income by the Fund is affected by the timing of the declaration of dividends by the investment companies in which the Fund invests. |
| (D) | Total return has been calculated for the applicable period without deduction of a sales load, if any, on an initial purchase. |
| (F) | Does not include expenses of the investment companies in which the Fund invests. |
| (H) | Does not include portfolio activity of the investment companies in which the Fund invests. |
The Notes to Financial Statements are an integral part of this report.
| | |
| Transamerica Funds | | Annual Report 2014 |
Page 45
NOTES TO FINANCIAL STATEMENTS
At October 31, 2014
NOTE 1. ORGANIZATION AND SIGNIFICANT ACCOUNTING POLICIES
Transamerica Funds (the “Trust”) is an open-end management investment company registered under the Investment Company Act of 1940, as amended (the “1940 Act”). The Trust applies investment company accounting and reporting guidance. The Funds (each, a “Fund” and collectively, the “Funds”) listed in the table below are a series of the Trust. Each class has a public offering price that reflects different sales charges, if any, and expense levels. Class B shares will convert to Class A shares eight years after purchase. Effective November 1, 2013, Class B shares are no longer available to existing investors except for exchanges, and dividend and capital gains reinvestment.
| | |
| Fund Name | | Class |
Transamerica Asset Allocation – Conservative Portfolio | | A, B, C, I, R |
Transamerica Asset Allocation – Growth Portfolio | | A, B, C, I, R |
Transamerica Asset Allocation – Moderate Growth Portfolio | | A, B, C, I, R |
| | |
| Fund Name | | Class |
Transamerica Asset Allocation – Moderate Portfolio | | A, B, C, I, R |
Transamerica Multi-Manager Alternative Strategies Portfolio | | A, C, I |
Each Fund, a “fund of fund”, invests the majority of its assets among certain affiliated series of the Trust (hereafter referred to as “Underlying Funds”). The financial statements of the Underlying Funds, including the Schedule of Investments, should be read in conjunction with the Funds’ financial statements. The Underlying Funds’ shareholder reports are available without charge at www.transamerica.com and on the Securities and Exchange Commission’s (“SEC”) website at http://www.sec.gov, or at the SEC’s Public Reference Room in Washington, D.C. The Underlying Funds’ shareholder reports are not covered by this report.
This report must be accompanied by the Funds’ current prospectuses, which contain additional information about the Funds, including investment objectives and strategies.
Transamerica Asset Management, Inc. (“TAM”) provides continuous and regular investment advisory services to the Funds. TAM acts as a manager of managers, providing advisory services that include, without limitation, the design and development of each Fund and its investment strategy and the ongoing review and evaluation of that investment strategy including recommending changes in strategy where it believes appropriate or advisable; the selection of one or more sub-advisers for each Fund employing a combination of quantitative and qualitative screens, research, analysis and due diligence; oversight and monitoring of sub-advisers and recommending changes to sub-advisers where it believes appropriate or advisable; recommending and implementing fund combinations and liquidations where it believes appropriate or advisable; regular supervision of the Funds’ investments; regular review of sub-adviser performance and holdings; ongoing trade oversight and analysis; regular monitoring to ensure adherence to investment process; risk management oversight and analysis; design, development, implementation and regular monitoring of the valuation of portfolio holdings; design, development, implementation and regular monitoring of the compliance process; review of proxies voted by sub-advisers; oversight of preparation, and review, of materials for meetings of the Funds’ Board of Trustees (the “Board”), participation in these meetings and preparation of regular communications with the Board; oversight of preparation and review of prospectuses, shareholder reports and other disclosure materials and filings; and oversight of other service providers to the Funds, such as the custodian, the transfer agent, the Funds’ independent registered public accounting firm and legal counsel; supervision of the performance of recordkeeping and shareholder relations for the Funds; and ongoing cash management services. TAM uses a variety of quantitative and qualitative tools to carry out its investment advisory services. Where TAM employs sub-advisers, the sub-advisers carry out and effectuate the investment strategy designed for the Funds by TAM and are responsible, subject to TAM’s and the Board’s oversight, among other things, for making decisions to buy, hold or sell a particular security.
Transamerica Fund Services, Inc. (“TFS”) provides supervisory and administrative services to each Fund. TFS’s supervisory and administrative services include performing certain administrative services for the Funds and supervising and overseeing the administrative, clerical, recordkeeping and bookkeeping services provided for the Funds by State Street Bank and Trust Company (“State Street”), to whom TFS has outsourced the provision of certain services as described below; to the extent agreed upon by TFS and the Funds from time to time, monitoring and verifying the custodian’s daily calculation of Net Asset Value (“NAV”); shareholder relations functions; compliance services; valuation services; assisting in due diligence and in oversight and monitoring of certain activities of sub-advisers and certain aspects of each Fund’s investments; assisting with fund combinations and liquidations; oversight of the preparation and filing, and review, of all returns and reports, in connection with federal, state and local taxes; oversight and review of regulatory reporting; supervising and coordinating the Funds’ custodian and their dividend disbursing agent and monitoring their services to the Funds; assisting the Funds in preparing reports to shareholders; acting as liaison with the Funds’ independent public accountants and providing, upon request, analyses, fiscal year summaries and other audit related services; assisting in the preparation of agendas and supporting documents for and minutes of meetings of the Board and committees of trustees; assisting in the preparation of regular communications with the trustees; and providing personnel and office space, telephones and other office equipment as necessary in order for TFS to perform supervisory and administrative services to the Funds. State Street performs back office services to support TFS, including furnishing financial and performance information about the Funds for inclusion in regulatory
| | |
| Transamerica Funds | | Annual Report 2014 |
Page 46
NOTES TO FINANCIAL STATEMENTS (continued)
At October 31, 2014
NOTE 1. (continued)
filings and trustees’ and shareholder reports; preparing drafts of regulatory filings, trustees’ materials, tax returns, expenses and budgeting; tax compliance testing; and maintaining books and records. TFS pays all expenses it incurs in connection with providing these services in the Amended and Restated Administrative Services Agreement with the exception of the costs of certain services specifically assumed by the Funds, as numerated within the Statements of Operations.
In the normal course of business, the Funds enter into contracts that contain a variety of representations that provide general indemnifications. The Funds’ maximum exposure under these arrangements is unknown, as this would involve future claims that may be made against the Funds and/or its affiliates that have not yet occurred. However, based on experience, the Funds expect the risk of loss to be remote.
In preparing the Funds’ financial statements in accordance with Generally Accepted Accounting Principles (“GAAP”) in the United States of America, estimates or assumptions (which could differ from actual results) may be used that affect reported amounts and disclosures. The following is a summary of significant accounting policies followed by the Funds.
Repurchase agreements: In a repurchase agreement, the Funds purchase a security and simultaneously commits to resell that security to the seller at an agreed-upon price on an agreed-upon date. Securities purchased subject to a repurchase agreement are held at the Funds’ custodian, or designated sub-custodian related to tri-party repurchase agreements, and, pursuant to the terms of the repurchase agreement, must be collateralized by securities with an aggregate market value greater than or equal to 100% of the resale price. The Funds will bear the risk of value fluctuations until the securities can be sold and may encounter delays and incur costs in liquidating the securities. In the event of bankruptcy or insolvency of the seller, delays and costs may be incurred.
Repurchase agreements are subject to netting agreements, which are agreements between the Fund and its counterparties that provide for the net settlement of all transactions and collateral with the Fund, through a single payment, in the event of default or termination. Amounts presented on the Schedule of Investments, and as part of Repurchase agreements, at value on the Statements of Assets and Liabilities are shown on a gross basis. The value of the related collateral for each repurchase agreement, as reflected in the Schedule of Investments, exceeds the value of each repurchase agreement at October 31, 2014.
Open repurchase agreements at October 31, 2014, if any, are shown on the Schedule of Investments.
Cash overdraft: Throughout the year, the Funds may have cash overdraft balances. A fee is incurred on these overdrafts, calculated by multiplying the overdraft by a rate based on the federal funds rate.
Payables, if any, are reflected as Due to custodian in the Statements of Assets and Liabilities.
Restricted and illiquid securities: The Funds may invest in unregulated restricted securities. Restricted and illiquid securities are subject to legal or contractual restrictions on resale or are illiquid. Restricted securities generally may be resold in transactions exempt from registration under the Securities Act of 1933. A security may be considered illiquid if it lacks a readily available market or if its valuation has not changed for a certain period of time. Disposal of these securities may involve time-consuming negotiations and expense, and prompt sale at the current valuation may be difficult.
The restricted and illiquid securities at October 31, 2014, if any, are identified in the Schedule of Investments.
Security transactions and investment income: Security transactions are recorded on the trade date. Security gains and losses are calculated on the specific identification basis. Interest income is accrued as earned. Dividend income and capital gain distributions from investment companies, if any, are recorded on the ex-dividend date. Dividends and net realized gain (loss) for the Funds are from investments in shares of investment companies.
Multiple class operations, income, and expenses: Income, non-class specific expenses, and realized and unrealized gains and losses are allocated to each class daily based upon net assets. Each class bears its own specific expenses in addition to the non-class specific expenses.
Dividend distributions: Distributions to shareholders are recorded on the ex-dividend date and are determined in accordance with federal income tax regulations, which may differ from GAAP.
NOTE 2. SECURITY VALUATION
All investments in securities are recorded at their estimated fair value. The Funds value their investments at the close of the New York Stock Exchange (“NYSE”), normally 4:00 p.m. Eastern Time, each day the NYSE is open for business. The Funds utilize various methods to measure the fair value of their investments on a recurring basis. GAAP establishes a hierarchy that prioritizes inputs to
| | |
| Transamerica Funds | | Annual Report 2014 |
Page 47
NOTES TO FINANCIAL STATEMENTS (continued)
At October 31, 2014
NOTE 2. (continued)
valuation methods. The inputs or methodology used for valuing securities are not necessarily an indication of the risk associated with investing in those securities. The three Levels of inputs of the fair value hierarchy are defined as follows:
Level 1—Unadjusted quoted prices in active markets for identical securities.
Level 2—Inputs, other than quoted prices included in Level 1, that are observable, either directly or indirectly. These inputs may include quoted prices for the identical instrument on an inactive market, prices for similar instruments, interest rates, prepayment speeds, credit risk, yield curves, default rates, and similar data.
Level 3—Unobservable inputs, which may include TAM’s internal valuation committee’s (the “Valuation Committee”) own assumptions in determining the fair value of investments. Factors considered in making this determination may include, but are not limited to, information obtained by contacting the sub-adviser, issuer, analysts, or the appropriate stock exchange (for exchange-traded securities), analysis of the issuer’s financial statements or other available documents and, if necessary, available information concerning other securities in similar circumstances.
The inputs used to measure fair value may fall into different Levels of the fair value hierarchy. In such cases, for disclosure purposes, the Level in the fair value hierarchy that is assigned to the fair value measurement of a security is determined based on the lowest Level input that is significant to the fair value measurement in its entirety. The hierarchy classification of inputs used to value the Funds’ investments, at October 31, 2014, is disclosed in the Valuation Summary of each Fund’s Schedule of Investments.
The Funds’ Board has delegated the valuation functions on a day-to-day basis to TAM, subject to board oversight. TAM has formed the Valuation Committee to monitor and implement the fair valuation policies and procedures as approved by the Board. These policies and procedures are reviewed at least annually by the Board. The Valuation Committee, among other tasks, monitors for when market quotations are not readily available or are unreliable and determines in good faith the fair value of the portfolio investments. For instances in which daily market quotes are not readily available, securities may be valued, pursuant to procedures adopted by the Board, with reference to other instruments or indices. Depending on the relative significance of valuation inputs, these instruments may be classified in either Level 2 or Level 3 of the fair value hierarchy.
The Valuation Committee may employ a market-based approach which may use related or comparable assets or liabilities, recent transactions, market multiples, book values, and other relevant information for the security to determine the fair value of the security. An income-based valuation approach may also be used in which the anticipated future cash flows of the security are discounted to calculate fair value. Discounts may also be applied due to the nature or duration of any restrictions on the disposition of the securities. When the Funds use fair value methods that rely on significant unobservable inputs to determine a security’s value, the Valuation Committee will choose the method that is believed to accurately reflect fair value. These securities are categorized in Level 3 of the fair value hierarchy. The Valuation Committee reviews fair value measurements on a regular and ad hoc basis and may, as deemed appropriate, update the security valuations as well as the fair valuation guidelines.
The availability of observable inputs can vary from security to security and is affected by a wide variety of factors, including, but not limited to, the type of security, whether the security is new and not yet established in the marketplace, the liquidity of markets, and other characteristics particular to the security. To the extent that valuation is based on models or inputs that are less observable or unobservable in the market, the determination of fair value requires more judgment. Accordingly, the degree of judgment exercised in determining fair value is generally greatest for instruments categorized in Level 3. Due to the inherent uncertainty of valuation, the Valuation Committee’s determination of values may differ significantly from values that would have been realized had a ready market for investments existed, and the differences could be material. The Valuation Committee employs various methods for calibrating these valuation approaches, including a regular review of valuation methodologies, key inputs and assumptions, transactional back-testing, and reviews of any market related activity.
Fair value measurements: Descriptions of the valuation techniques applied to the Funds’ major categories of assets and liabilities measured at fair value on a recurring basis are as follows:
Investment companies: Investment companies are valued at the NAV of the Underlying Funds. These securities are actively traded and no valuation adjustments are applied. Exchange-Traded Funds are stated at the last reported sale price or closing price on the day of valuation taken from the primary exchange where the security is principally traded. They are categorized in Level 1 of the fair value hierarchy. Investments in privately held investment funds with significant restrictions on redemptions where the inputs of NAVs are unobservable will be valued based upon the NAVs of such investments and are categorized in Level 3 of the fair value hierarchy.
Repurchase agreements: Repurchase agreements are traded on inactive markets or valued by reference to similar instruments and are generally categorized in Level 2.
| | |
| Transamerica Funds | | Annual Report 2014 |
Page 48
NOTES TO FINANCIAL STATEMENTS (continued)
At October 31, 2014
NOTE 2. (continued)
Restricted securities (equity and debt): Restricted securities for which quotations are not readily available are valued at fair value as determined in good faith by the Valuation Committee under the supervision of the Funds’ Board. Restricted securities issued by publicly traded companies are generally valued at a discount to similar publicly traded securities. Restricted securities issued by nonpublic entities may be valued by reference to comparable public entities and/or fundamental data relating to the issuer. Depending on the relative significance of observable valuation inputs, these instruments may be classified in either Level 2 or Level 3 of the fair value hierarchy.
NOTE 3. RELATED PARTY TRANSACTIONS
TAM, the Funds’ investment adviser, is directly owned by Transamerica Premier Life Insurance Company (“TPLIC”) and AUSA Holding Company (“AUSA”), both of which are indirect, wholly owned subsidiaries of Aegon NV. TPLIC is owned by Commonwealth General Corporation (“Commonwealth”) and Aegon USA, LLC (“Aegon USA”). Commonwealth and AUSA are wholly owned by Aegon USA. Aegon USA is wholly owned by Aegon US Holding Corporation, which is wholly owned by Transamerica Corporation (DE). Transamerica Corporation (DE) is wholly owned by The Aegon Trust, which is wholly owned by Aegon International B.V., which is wholly owned by Aegon NV, a Netherlands corporation, and a publicly traded international insurance group.
TAM is both an affiliate and sub-adviser of Transamerica Multi-Manager Alternative Strategies Portfolio.
TFS is the Funds’ administrator and transfer agent. Transamerica Capital, Inc. (“TCI”) is the Funds’ distributor/principal underwriter. TAM, TFS, and TCI are affiliates of Aegon NV.
Certain officers and trustees of the Funds are also officers and/or trustees of TAM, TFS, and TCI. No interested trustee, who is deemed an interested person due to current or former service to TAM or an affiliate of TAM, receives compensation from the Funds.
Because the Underlying Funds have varied expense and fee levels and the Funds may own different proportions of Underlying Funds at different times, the amount of fees and expenses incurred indirectly by the Funds will vary. Fund expenses do not include expenses of the investment companies in which the Funds invest. The Funds have material ownership interests in the Underlying Funds.
Interest, dividends, realized and unrealized gains (losses) are broken out between affiliated and unaffiliated investments, on the Statements of Operations.
Investment advisory fees: The Funds pay management fees to TAM based on daily Average Net Assets (“ANA”) at the following rates:
| | |
| Fund Name | | Rate |
Transamerica Asset Allocation – Conservative Portfolio | | 0.10% |
Transamerica Asset Allocation – Growth Portfolio | | 0.10 |
Transamerica Asset Allocation – Moderate Growth
Portfolio | | 0.10 |
| | |
| Fund Name | | Rate |
Transamerica Asset Allocation – Moderate Portfolio | | 0.10% |
Transamerica Multi-Manager Alternative Strategies Portfolio |
First $500 million | | 0.20 |
Over $500 million up to $1 billion | | 0.19 |
Over $1 billion | | 0.18 |
TAM has contractually agreed to waive fees and/or reimburse Fund expenses to the extent that the total operating expenses excluding, as applicable, 12b-1 fees, acquired fund fees and expenses, interest, taxes, brokerage commissions, dividend and interest expenses on securities sold short, extraordinary expenses and other expenses not incurred in the ordinary course of the Funds’ business, exceed the following stated annual limit:
| | | | | | |
| Fund Name | | Expense Limit | | | Maximum Operating Expense
Limit Effective Through |
Transamerica Asset Allocation – Conservative Portfolio | | | 0.45 | % | | March 1, 2015 |
Transamerica Asset Allocation – Growth Portfolio | | | 0.45 | | | March 1, 2015 |
Transamerica Asset Allocation – Moderate Growth Portfolio | | | 0.45 | | | March 1, 2015 |
Transamerica Asset Allocation – Moderate Portfolio | | | 0.45 | | | March 1, 2015 |
Transamerica Multi-Manager Alternative Strategies Portfolio | | | 0.55 | | | March 1, 2015 |
TAM is entitled to reimbursement by the Fund of fees waived and/or expenses reduced during any of the previous 36 months if on any day or month the estimated annualized Fund operating expenses are less than the stated annual limit.
During the year ended October 31, 2014, there were no amounts recaptured by TAM. There are no amounts available for recapture by TAM as of October 31, 2014.
| | |
| Transamerica Funds | | Annual Report 2014 |
Page 49
NOTES TO FINANCIAL STATEMENTS (continued)
At October 31, 2014
NOTE 3. (continued)
Distribution and service fees: The Funds have 12b-1 distribution plans under the 1940 Act pursuant to which an annual fee, based on ANA, is paid to the distributor for various disbursements such as broker-dealer account servicing fees and other promotional expenses of the Funds. Pursuant to the distribution plan, the Trust entered into a distribution agreement with TCI as the Funds’ distributor. The Funds are authorized under the 12b-1 plans to pay fees on each available class up to the following limits: 0.25% for Class A (effective March 1, 2014); 1.00% for Class B; 1.00% for Class C; and 0.50% for Class R. 12b-1 fees are not applicable for Class I. Prior to March 1, 2014, the Funds were authorized under the 12b-1 plans to pay up to 0.30% for Class A. Amounts paid are included in the Statements of Operations.
Underwriter commissions relate to front-end sales charges imposed for Class A shares and contingent deferred sales charges from Class B, Class C, and certain Class A share redemptions. For the year ended October 31, 2014, the underwriter commissions were as follows:
| | | | |
Transamerica Asset Allocation – Conservative Portfolio | | | Amount | |
Received by Underwriter | | $ | 965,704 | |
Retained by Underwriter | | | 160,759 | |
Contingent Deferred Sales Charge | | | 62,160 | |
Transamerica Asset Allocation – Growth Portfolio | | | | |
Received by Underwriter | | $ | 2,168,232 | |
Retained by Underwriter | | | 332,986 | |
Contingent Deferred Sales Charge | | | 82,800 | |
Transamerica Asset Allocation – Moderate Growth Portfolio | | | | |
Received by Underwriter | | $ | 3,630,336 | |
Retained by Underwriter | | | 572,700 | |
Contingent Deferred Sales Charge | | | 146,439 | |
| | | | |
Transamerica Asset Allocation – Moderate Portfolio | | | Amount | |
Received by Underwriter | | $ | 2,427,704 | |
Retained by Underwriter | | | 392,168 | |
Contingent Deferred Sales Charge | | | 87,447 | |
Transamerica Multi-Manager Alternative Strategies Portfolio | | | | |
Received by Underwriter | | $ | 154,564 | |
Retained by Underwriter | | | 25,250 | |
Contingent Deferred Sales Charge | | | 28,685 | |
Administrative services: The Funds have entered into an agreement with TFS for financial and legal fund administration services. The Funds pay TFS at annual fee of 0.0175% on daily ANA. The Legal fees on the Statements of Operations are for fees paid to external legal counsel.
Transfer agent fees: Pursuant to a transfer agency agreement, as amended, the Funds pay TFS a fee for providing services based on the number of classes, accounts and transactions relating to the Fund.
Transfer Agent Fees paid and the amounts due to TFS for the year ended October 31, 2014 are as follows:
| | | | | | | | |
| Fund Name | | Fees Paid to TFS | | | Fees Due to TFS | |
Transamerica Asset Allocation – Conservative Portfolio | | $ | 29,734 | | | $ | 2,706 | |
Transamerica Asset Allocation – Growth Portfolio | | | 27,489 | | | | 2,500 | |
Transamerica Asset Allocation – Moderate Growth Portfolio | | | 50,534 | | | | 4,518 | |
Transamerica Asset Allocation – Moderate Portfolio | | | 43,714 | | | | 3,944 | |
Transamerica Multi-Manager Alternative Strategies Portfolio | | | 215,120 | | | | 19,987 | |
Deferred compensation plan: Under a non-qualified deferred compensation plan effective January 1, 1996, as amended and restated, available to the trustees, compensation may be deferred that would otherwise be payable by the Trust to an independent trustee on a current basis for services rendered as trustee. Deferred compensation amounts will accumulate based on the value of the investment option, as elected by the trustee.
NOTE 4. PURCHASES AND SALES OF SECURITIES
The cost of affiliated investments purchased and proceeds from affiliated investments sold (excluding short-term securities) for the year ended October 31, 2014 were as follows:
| | | | | | | | |
| Fund Name | | Purchases of affiliated
investments | | | Proceeds from maturities and
sales of affiliated
investments | |
Transamerica Asset Allocation – Conservative Portfolio | | $ | 268,559,895 | | | $ | 397,375,939 | |
Transamerica Asset Allocation – Growth Portfolio | | | 488,929,771 | | | | 551,549,174 | |
Transamerica Asset Allocation – Moderate Growth Portfolio | | | 1,007,804,105 | | | | 1,147,896,138 | |
Transamerica Asset Allocation – Moderate Portfolio | | | 582,915,042 | | | | 697,196,484 | |
Transamerica Multi-Manager Alternative Strategies Portfolio | | | 377,144,064 | | | | 562,378,841 | |
| | |
| Transamerica Funds | | Annual Report 2014 |
Page 50
NOTES TO FINANCIAL STATEMENTS (continued)
At October 31, 2014
NOTE 4. (continued)
There were no transactions in U.S. Government securities during the year ended October 31, 2014.
NOTE 5. FEDERAL INCOME TAXES AND DISTRIBUTIONS TO SHAREHOLDERS
The Funds have not made any provision for federal income or excise taxes due to its policy to distribute all of their taxable income and capital gains to their shareholders and otherwise qualify as regulated investment companies under Subchapter M of the Internal Revenue Code. The Funds recognize the tax benefits of uncertain tax positions only where the position is “more likely than not” to be sustained assuming examination by tax authorities. The Funds’ federal and state tax returns remain subject to examination by the Internal Revenue Service and state tax authorities for the prior three years. Management has evaluated the Funds’ tax provisions taken for all open tax years, and has concluded that no provision for income tax is required in the Funds’ financial statements. If applicable, the Funds recognize interest accrued related to unrecognized tax benefits in interest and penalties expense in Other on the Statements of Operations. The Funds identify their major tax jurisdictions as U.S. Federal, the states of Colorado and Florida, and foreign jurisdictions where the Funds make significant investments; however, the Funds are not aware of any tax positions for which it is reasonably possible that the total amounts of unrecognized tax benefits will change materially in the next twelve months. Income and capital gain distributions are determined in accordance with income tax regulations, which may differ from GAAP. These differences are primarily due to different treatment for items including, but not limited to, wash sales, and capital loss carryforwards.
Therefore, distributions determined in accordance with tax regulations may differ significantly in amount or character from net investment income and realized gains for financial reporting purposes. Financial reporting records are adjusted for permanent book/tax differences to reflect tax character. These reclassifications have no impact on net assets or results of operations. Financial records are not adjusted for temporary differences. These reclassifications are as follows:
| | | | | | | | | | | | |
| Fund Name | | Shares of
beneficial interest,
unlimited shares
authorized | | | Undistributed
(accumulated) net
investment income (loss) | | | Undistributed
(accumulated) net realized
gain (loss) from
investments | |
Transamerica Asset Allocation – Conservative Portfolio | | $ | — | | | $ | (951 | ) | | $ | 951 | |
Transamerica Asset Allocation – Growth Portfolio | | | 2 | | | | 13,712 | | | | (13,714 | ) |
Transamerica Asset Allocation – Moderate Growth Portfolio | | | 1 | | | | (2,897 | ) | | | 2,896 | |
Transamerica Asset Allocation – Moderate Portfolio | | | 3 | | | | (1,798 | ) | | | 1,795 | |
Transamerica Multi-Manager Alternative Strategies Portfolio | | | 1 | | | | — | | | | (1 | ) |
At October 31, 2014, the capital loss carryforwards are available to offset future realized capital gains through the periods listed below. Funds not listed in the table below do not have capital loss carryforwards.
| | | | | | |
| Fund Name | | Capital Loss Carryforwards | | | Available Through |
Transamerica Multi-Manager Alternative Strategies Portfolio | | $ | 450,907 | | | October 31, 2018 |
The capital loss carryforwards utilized or expired during the year ended October 31, 2014 were as follows:
| | | | |
| Fund Name | | Capital Loss Carryforwards
Utilized/Expired During the
Year Ended October 31, 2014 | |
Transamerica Asset Allocation – Growth Portfolio | | $ | 100,078,981 | |
Transamerica Asset Allocation – Moderate Growth Portfolio | | | 77,897,053 | |
Transamerica Multi-Manager Alternative Strategies Portfolio | | | 8,151,338 | |
| | |
| Transamerica Funds | | Annual Report 2014 |
Page 51
NOTES TO FINANCIAL STATEMENTS (continued)
At October 31, 2014
NOTE 5. (continued)
The tax character of distributions paid may differ from the character of distributions shown in the Statements of Changes in Net Assets due to short-term gains being treated as ordinary income for tax purposes. The tax character of distributions paid during 2014 and 2013 was as follows:
| | | | | | | | | | | | | | | | | | | | | | | | |
| | | 2014 Distributions Paid From | | | 2013 Distributions Paid From | |
| | | Ordinary
Income | | | Long-Term
Capital Gain | | | Return of
Capital | | | Ordinary
Income | | | Long-Term
Capital Gain | | | Return of
Capital | |
Transamerica Asset Allocation – Conservative Portfolio | | $ | 21,539,138 | | | $ | 28,191,832 | | | $ | — | | | $ | 21,866,230 | | | $ | 4,201,358 | | | $ | — | |
Transamerica Asset Allocation – Growth Portfolio | | | 26,449,323 | | | | 16,887 | | | | — | | | | 10,038,668 | | | | — | | | | — | |
Transamerica Asset Allocation – Moderate Growth Portfolio | | | 51,129,492 | | | | — | | | | — | | | | 37,528,271 | | | | — | | | | — | |
Transamerica Asset Allocation – Moderate Portfolio | | | 35,122,078 | | | | 89,500,827 | | | | — | | | | 35,522,722 | | | | — | | | | — | |
Transamerica Multi-Manager Alternative Strategies Portfolio | | | 2,932,001 | | | | — | | | | — | | | | 9,337,108 | | | | — | | | | — | |
The tax basis components of distributable earnings as of October 31, 2014 are as follows:
| | | | | | | | | | | | | | | | | | | | | | | | |
| | | Undistributed
Ordinary
Income | | | Undistributed
Long-Term
Capital Gain | | | Capital Loss
Carryforwards | | | Late Year
Ordinary
Loss Deferral | | | Other
Temporary
Differences | | | Net Unrealized
Appreciation
(Depreciation) | |
Transamerica Asset Allocation – Conservative Portfolio | | $ | 4,180,626 | | | $ | 65,212,727 | | | $ | — | | | $ | — | | | $ | — | | | $ | 98,134,569 | |
Transamerica Asset Allocation – Growth Portfolio | | | — | | | | 95,421,756 | | | | — | | | | (3,895,422 | ) | | | — | | | | 331,027,805 | |
Transamerica Asset Allocation – Moderate Growth Portfolio | | | 2,339,344 | | | | 261,153,009 | | | | — | | | | — | | | | — | | | | 481,643,489 | |
Transamerica Asset Allocation – Moderate Portfolio | | | 20,680,852 | | | | 146,057,004 | | | | — | | | | — | | | | — | | | | 251,637,193 | |
Transamerica Multi-Manager Alternative Strategies Portfolio | | | 20,528 | | | | — | | | | (450,907 | ) | | | — | | | | — | | | | 22,991,962 | |
NOTE 6. ACCOUNTING PRONOUNCEMENTS
In June 2014, the Financial Accounting Standards Board issued Accounting Standards Update No. 2014-11, “Transfers and Servicing, Repurchase-to-Maturity Transactions, Repurchase Financings, and Disclosures”. The guidance changes the accounting for certain repurchase agreements and expands disclosure requirements related to repurchase agreements, securities lending, repurchase-to-maturity and similar transactions. The guidance is effective for financial statements with fiscal years beginning on or after December 15, 2014 and interim periods within those fiscal years. Management is currently evaluating the implication, if any, of the additional disclosure requirements and its impact on the Funds’ financial statements.
| | |
| Transamerica Funds | | Annual Report 2014 |
Page 52
REPORT OF INDEPENDENT REGISTERED PUBLIC ACCOUNTING FIRM
To the Board of Trustees and Shareholders of Transamerica Funds:
We have audited the accompanying statements of assets and liabilities of Transamerica Asset Allocation—Conservative Portfolio, Transamerica Asset Allocation—Growth Portfolio, Transamerica Asset Allocation—Moderate Growth Portfolio, Transamerica Asset Allocation—Moderate Portfolio, and Transamerica Multi-Manager Alternative Strategies Portfolio (collectively, the “Funds”) (five of the Funds comprising Transamerica Funds), including the schedules of investments, as of October 31, 2014, and the related statements of operations for the year then ended, the statements of changes in net assets for each of the two years in the period then ended, and the financial highlights for each of the years or periods indicated therein. These financial statements and financial highlights are the responsibility of the Funds’ management. Our responsibility is to express an opinion on these financial statements and financial highlights based on our audits.
We conducted our audits in accordance with the standards of the Public Company Accounting Oversight Board (United States). Those standards require that we plan and perform the audits to obtain reasonable assurance about whether the financial statements and financial highlights are free of material misstatement. We were not engaged to perform an audit of the Funds’ internal control over financial reporting. Our audits included consideration of internal control over financial reporting as a basis for designing audit procedures that are appropriate in the circumstances, but not for the purpose of expressing an opinion on the effectiveness of the Funds’ internal control over financial reporting. Accordingly, we express no such opinion. An audit also includes examining, on a test basis, evidence supporting the amounts and disclosures in the financial statements and financial highlights, assessing the accounting principles used and significant estimates made by management, and evaluating the overall financial statement presentation. Our procedures included confirmation of securities owned as of October 31, 2014, by correspondence with the custodian and others or by other appropriate auditing procedures where replies from others were not received. We believe that our audits provide a reasonable basis for our opinion.
In our opinion, the financial statements and financial highlights referred to above present fairly, in all material respects, the financial position of the aforementioned five Funds of the Transamerica Funds at October 31, 2014, the results of their operations for the year then ended, the changes in their net assets for each of the two years in the period then ended and the financial highlights for each of the years and periods indicated therein, in conformity with U.S. generally accepted accounting principles.

Boston, Massachusetts
December 24, 2014
| | |
| Transamerica Funds | | Annual Report 2014 |
Page 53
SUPPLEMENTAL INFORMATION (unaudited)
TAX INFORMATION
For dividends paid during the year ended October 31, 2014, the Funds designated the following maximum amounts of qualified dividend income:
| | | | |
| Fund | | Qualified Dividend
Income | |
Transamerica Asset Allocation – Conservative Portfolio | | $ | 5,083,151 | |
Transamerica Asset Allocation – Growth Portfolio | | | 18,053,013 | |
Transamerica Asset Allocation – Moderate Growth Portfolio | | | 32,202,599 | |
Transamerica Asset Allocation – Moderate Portfolio | | | 15,044,054 | |
Transamerica Multi-Manager Alternative Strategies Portfolio | | | 1,229,574 | |
For corporate shareholders, investment income (dividend income plus short-term gains, if any) qualifies for the maximum dividends received deductions as follows:
| | | | |
| Fund | | Dividend Received
Deduction Percentage | |
Transamerica Asset Allocation – Conservative Portfolio | | | 26 | % |
Transamerica Asset Allocation – Growth Portfolio | | | 67 | |
Transamerica Asset Allocation – Moderate Growth Portfolio | | | 54 | |
Transamerica Asset Allocation – Moderate Portfolio | | | 35 | |
Transamerica Multi-Manager Alternative Strategies Portfolio | | | 19 | |
For tax purposes, the long-term capital gain designations for the year ended October 31, 2014 were as follows:
| | | | |
| Fund | | Long-Term Capital Gain
Designation | |
Transamerica Asset Allocation – Conservative Portfolio | | $ | 28,191,832 | |
Transamerica Asset Allocation – Growth Portfolio | | | 16,887 | |
Transamerica Asset Allocation – Moderate Portfolio | | | 89,500,827 | |
The Funds expect to elect to treat foreign taxes attributed to foreign source income from certain of its investments, as if incurred directly by the Funds’ shareholders.
| | | | | | | | |
| Fund | | Foreign Source Income | | | Foreign Taxes | |
Transamerica Asset Allocation – Conservative Portfolio | | $ | 1,423,095 | | | $ | 100,278 | |
Transamerica Asset Allocation – Growth Portfolio | | | 6,233,007 | | | | 401,108 | |
Transamerica Asset Allocation – Moderate Growth Portfolio | | | 8,611,515 | | | | 557,421 | |
Transamerica Asset Allocation – Moderate Portfolio | | | 4,293,135 | | | | 254,440 | |
Transamerica Multi-Manager Alternative Strategies Portfolio | | | 211,865 | | | | 19,349 | |
The information and distributions reported herein may differ from the information and distributions taxable to the shareholders for the calendar year ending December 31, 2014. Complete information will be computed and reported in conjunction with your 2014 Form 1099-DIV.
| | |
| Transamerica Funds | | Annual Report 2014 |
Page 54
TRANSAMERICA FUNDS
INVESTMENT ADVISORY AND SUB-ADVISORY AGREEMENTS — CONTRACT RENEWAL
(unaudited)
At a meeting of the Board of Trustees of Transamerica Funds (the “Trustees” or the “Board”) held on June 18-19, 2014, the Board considered the renewal of the investment advisory agreements (each an “Investment Advisory Agreement”) between each of the following funds (each a “Portfolio” and collectively the “Portfolios”) and Transamerica Asset Management, Inc. (“TAM”):
| | |
Transamerica Asset Allocation – Conservative Portfolio | | Transamerica Asset Allocation – Moderate Portfolio |
Transamerica Asset Allocation – Growth Portfolio | | Transamerica Multi-Manager Alternative Strategies Portfolio |
Transamerica Asset Allocation – Moderate Growth Portfolio | | |
For each Portfolio except Transamerica Multi-Manager Alternative Strategies Portfolio, the Board also considered the renewal of an investment sub-advisory agreement (each a “Sub-Advisory Agreement” and, together with each Investment Advisory Agreement, the “Agreements”) between TAM and Morningstar Associates, LLC (the “Sub-Adviser”).
Following its review and consideration, the Board determined that the terms of each Investment Advisory Agreement and Sub-Advisory Agreement are reasonable and that the renewal of each of the Agreements is in the best interests of the applicable Portfolio and its shareholders. The Board, including the independent members of the Board (the “Independent Trustees”), unanimously approved the renewal of each of the Agreements through June 30, 2015. In reaching their decision, the Trustees requested and received from TAM and the Sub-Adviser such information as they deemed reasonably necessary to evaluate the Agreements, including, to the extent applicable, information about fees and performance of comparable funds and/or accounts managed by the Sub-Adviser. The Trustees also considered information they had previously received from TAM and the Sub-Adviser as part of their regular oversight of each Portfolio, as well as comparative fee, expense and performance information prepared by Lipper Inc. (“Lipper”), an independent provider of mutual fund performance information, and fee, expense and profitability information prepared by TAM.
In their deliberations, the Independent Trustees had the opportunity to meet privately without representatives of TAM or the Sub-Adviser present and were represented throughout the process by independent legal counsel. In considering the proposed continuation of each of the Agreements, the Trustees evaluated a number of considerations that they believed, in light of the legal advice furnished to them by independent legal counsel and/or their own business judgment, to be relevant. They based their decisions on the considerations discussed below, among others, although they did not identify any particular consideration or information that was controlling of their decisions, and each Trustee may have attributed different weights to the various factors.
Nature, Extent and Quality of the Services Provided
The Board considered the nature, extent and quality of the services provided by TAM and the Sub-Adviser to the applicable Portfolio in the past and the services anticipated to be provided in the future. The Board also considered the investment approach for each Portfolio; the experience, capability and integrity of TAM’s senior management; the financial resources of TAM and the Sub-Adviser; TAM’s management oversight process; and the professional qualifications of the portfolio management team of the Sub-Adviser.
The Board also considered the continuous and regular investment advisory and other services provided by TAM for the portion of the investment advisory fee it retains after payment of the sub-advisory fee for each Portfolio. The Board noted that the investment advisory services include the design, development and ongoing review and evaluation of each Portfolio and its investment strategy; where applicable the selection, oversight and monitoring of one or more investment sub-advisers to perform certain duties with respect to the Portfolios; ongoing portfolio trading oversight and analysis; risk management oversight and analysis; design, development, implementation and ongoing review and evaluation of a process for the valuation of Portfolio investments; design, development, implementation and ongoing review and evaluation of a compliance program for the Portfolios; design, development, implementation and ongoing review and evaluation of a process for the voting of proxies and rights to consent to corporate action for Portfolio investments; participation in Board meetings and oversight of preparation of materials for the Board, including materials for Board meetings and regular communications with the Board; oversight of preparation of the Portfolios’ prospectuses, statements of additional information, shareholder reports and other disclosure materials and regulatory filings for the Portfolios; and ongoing cash management services. The Board also noted that TAM, as part of the investment advisory services it provides to all Transamerica mutual funds, including the Portfolios, oversees the services provided by the funds’ administrator, custodian, transfer agent, independent accountant and legal counsel and supervises the performance of the recordkeeping and shareholder functions of the funds.
Based on these considerations, the Board determined that TAM and the Sub-Adviser can provide investment and related services that are appropriate in scope and extent in light of the applicable Portfolio’s operations, the competitive landscape of the investment company business and investor needs.
| | |
| Transamerica Funds | | Annual Report 2014 |
Page 55
TRANSAMERICA FUNDS
INVESTMENT ADVISORY AND SUB-ADVISORY AGREEMENTS — CONTRACT RENEWAL (continued)
(unaudited)
Investment Performance
The Board considered the short- and longer-term performance, as applicable, of each Portfolio in light of its investment objective, policies and strategies, including relative performance against (i) a peer universe of comparable mutual funds, as prepared by Lipper, and (ii) the Portfolio’s benchmark(s), in each case for various trailing periods ended December 31, 2013.
Transamerica Asset Allocation – Conservative Portfolio. The Board noted that the performance of Class A Shares of the Portfolio was above the median for its peer universe for the past 1-, 5- and 10-year periods and in line with the median for the past 3-year period. The Board also noted that the performance of Class A Shares of the Portfolio was above its primary benchmark for the past 1-, 3-, 5- and 10-year periods. The Trustees and TAM agreed to continue to monitor the performance of the Portfolio.
Transamerica Asset Allocation – Growth Portfolio. The Board noted that the performance of Class A Shares of the Portfolio was below the median for its peer universe for the past 1-, 3-, 5- and 10-year periods. The Board also noted that the performance of Class A Shares of the Portfolio was below its benchmark for the past 1-, 3-, 5- and 10-year periods. The Trustees discussed the reasons for the underperformance with TAM and agreed to continue to monitor the performance of the Portfolio.
Transamerica Asset Allocation – Moderate Growth Portfolio. The Board noted that the performance of Class A Shares of the Portfolio was above the median for its peer universe for the past 1-year period, in line with the median for the past 10-year period and below the median for the past 3- and 5-year periods. The Board also noted that the performance of Class A Shares of the Portfolio was below its primary benchmark for the past 1-, 3-, 5- and 10-year periods. The Trustees discussed the reasons for the underperformance with TAM and agreed to continue to monitor the performance of the Portfolio.
Transamerica Asset Allocation – Moderate Portfolio. The Board noted that the performance of Class A Shares of the Portfolio was above the median for its peer universe for the past 10-year period, in line with the median for the past 1- and 5-year periods and below the median for the past 3-year period. The Board also noted that the performance of Class A Shares of the Portfolio was below its primary benchmark for the past 1-, 3-, 5- and 10-year periods. The Trustees discussed the reasons for the underperformance with TAM and agreed to continue to monitor the performance of the Portfolio.
Transamerica Multi-Manager Alternative Strategies Portfolio. The Board noted that the performance of Class A Shares of the Portfolio was above the median for its peer universe for the past 5-year period and in line with the median for the past 1- and 3-year periods. The Board also noted that the performance of Class A Shares of the Portfolio was above its primary benchmark for the past 1- and 5-year periods and below its primary benchmark for the past 3-year period. The Trustees noted that they had recently approved a sub-advisory agreement with a new sub-adviser, but that the portfolio management team had remained the same. The Board also noted that the Portfolio’s performance included the management of a previous sub-adviser to the Portfolio.
On the basis of this information and the Board’s assessment of the nature, extent and quality of the services to be provided or procured by TAM and provided by the Sub-Adviser, the Board concluded that TAM and the Sub-Adviser are capable of generating a level of investment performance that is appropriate in light of the applicable Portfolio’s investment objectives, policies and strategies and that is competitive with other investment companies.
Investment Advisory and Sub-Advisory Fees and Total Expense Ratios
The Board considered the investment advisory fee and total expense ratio of each Portfolio, including information provided by Lipper comparing the investment advisory fee and total expense ratio of each Portfolio to the investment advisory fees and total expense ratios of other investment companies in both a peer group and broader peer universe compiled by Lipper. The Board also considered the fees charged by the Sub-Adviser for sub-advisory services, the portion of a Portfolio’s investment advisory fee retained by TAM following payment of the sub-advisory fee and how the portion of the contractual investment advisory fee retained by TAM at a specified asset level compared to the portions retained by other investment advisers managing mutual funds with similar investment strategies as calculated by TAM. The Board also gave consideration to the fact that each Portfolio indirectly bears the fees and expenses of the underlying funds in which the Portfolio invests.
Transamerica Asset Allocation – Conservative Portfolio. The Board noted that the Portfolio’s contractual investment advisory fee was in line with the medians for its peer group and peer universe and that the actual total expenses (i.e., expenses reflecting any waivers and/or reimbursements) of Class A Shares of the Portfolio were above the medians for its peer group and peer universe. The Board also noted that TAM has entered into an expense limitation arrangement with the Portfolio, which may result in TAM waiving fees for the benefit of shareholders.
| | |
| Transamerica Funds | | Annual Report 2014 |
Page 56
TRANSAMERICA FUNDS
INVESTMENT ADVISORY AND SUB-ADVISORY AGREEMENTS — CONTRACT RENEWAL (continued)
(unaudited)
Transamerica Asset Allocation – Growth Portfolio. The Board noted that the Portfolio’s contractual investment advisory fee was in line with the medians for its peer group and peer universe and that the actual total expenses (i.e., expenses reflecting any waivers and/or reimbursements) of Class A Shares of the Portfolio were above the medians for its peer group and peer universe. The Board also noted that TAM has entered into an expense limitation arrangement with the Portfolio, which may result in TAM waiving fees for the benefit of shareholders.
Transamerica Asset Allocation – Moderate Growth Portfolio. The Board noted that the Portfolio’s contractual investment advisory fee was above the median for its peer group and in line with the median for its peer universe and that the actual total expenses (i.e., expenses reflecting any waivers and/or reimbursements) of Class A Shares of the Portfolio were above the medians for its peer group and peer universe. The Board also noted that TAM has entered into an expense limitation arrangement with the Portfolio, which may result in TAM waiving fees for the benefit of shareholders.
Transamerica Asset Allocation – Moderate Portfolio. The Board noted that the Portfolio’s contractual investment advisory fee was above the medians for its peer group and peer universe and that the actual total expenses (i.e., expenses reflecting any waivers and/or reimbursements) of Class A Shares of the Portfolio were above the medians for its peer group and peer universe. The Board also noted that TAM has entered into an expense limitation arrangement with the Portfolio, which may result in TAM waiving fees for the benefit of shareholders.
Transamerica Multi-Manager Alternative Strategies Portfolio. The Board noted that the Portfolio’s contractual investment advisory fee was below the medians for its peer group and peer universe and that the actual total expenses (i.e., expenses reflecting any waivers and/or reimbursements) of Class A Shares of the Portfolio were in line with the medians for its peer group and peer universe. The Board also noted that TAM has entered into an expense limitation arrangement with the Portfolio, which may result in TAM waiving fees for the benefit of shareholders.
On the basis of these considerations, together with the other information it considered, the Board determined that the investment advisory and sub-advisory fees to be received by TAM and the Sub-Adviser under each Investment Advisory Agreement and Sub-Advisory Agreement are reasonable in light of the services provided.
Cost of Services Provided and Level of Profitability
The Board reviewed information provided by TAM about the cost of providing and procuring fund management services, as well as the costs of the provision of administration, transfer agency and other services, to each Portfolio and to Transamerica Funds as a whole by TAM and its affiliates. The Board considered the profitability of TAM and its affiliates in providing these services for each Portfolio and Transamerica Funds as a whole, as well as the allocation methodology used for calculating profitability. The Board also considered the assessment prepared by Ernst & Young LLP (“E&Y”), independent registered public accounting firm and auditor to the Portfolios, to assist the Board’s evaluation of TAM’s profitability analysis. E&Y’s engagement included the review and assessment of the revenue and expense allocation methodology used by TAM to estimate its profitability with respect to its relationship with the Portfolios, and completion of procedures in respect of the mathematical accuracy of the profitability calculation and its conformity to established allocation methodologies. After considering E&Y’s assessment and information provided by TAM, the Board concluded that, while other allocation methods may also be reasonable, TAM’s profitability methodologies are reasonable.
With respect to the Sub-Adviser, the Board noted that the sub-advisory fees are the product of arm’s-length negotiation between TAM and the Sub-Adviser and are paid by TAM and not the applicable Portfolio.
Based on this information, the Board determined that the profitability of TAM and its affiliates from their relationships with the Portfolios was not excessive.
Economies of Scale
The Board considered economies of scale with respect to the management of each Portfolio, whether the Portfolio had appropriately benefited from any economies of scale and whether there was the potential for realization of any further economies of scale. The Board also considered the existence of economies of scale with respect to management of the Transamerica mutual funds overall and the extent to which the Portfolios benefited from these economies of scale. The Board considered each Portfolio’s investment advisory fee schedule and the existence of breakpoints, if any, and also considered the extent to which TAM shared economies of scale with the Portfolios through investments in maintaining and developing its capabilities and services. The Trustees concluded that each Portfolio’s fee structure reflected economies of scale to date and noted that they will have the opportunity to periodically reexamine the appropriateness of the investment advisory fees payable to TAM and the fees paid to the Sub-Adviser and whether each Portfolio has achieved economies of scale in the future.
| | |
| Transamerica Funds | | Annual Report 2014 |
Page 57
TRANSAMERICA FUNDS
INVESTMENT ADVISORY AND SUB-ADVISORY AGREEMENTS — CONTRACT RENEWAL (continued)
(unaudited)
Benefits to TAM, its Affiliates and the Sub-Adviser from their Relationships with the Portfolios
The Board considered any other benefits derived by TAM, its affiliates, and the Sub-Adviser from their relationships with the Portfolios. The Board noted that TAM does not realize soft dollar benefits from its relationships with the Portfolios and that TAM believes that any use of soft dollars by the Sub-Adviser is generally appropriate and in the best interests of the Portfolios. The Board also noted that certain Sub-Advisers are participating in a brokerage program pursuant to which a portion of brokerage commissions paid by each applicable Portfolio is recaptured for the benefit of the Portfolio and its shareholders, thus limiting the amount of soft dollar arrangements the Sub-Adviser may engage in with respect to a Portfolio’s brokerage transactions.
Other Considerations
The Board noted that TAM has made a substantial commitment to the recruitment and retention of high quality personnel and maintains the financial, compliance and operational resources reasonably necessary to manage each Portfolio in a professional manner that is consistent with the best interests of the Portfolio and its shareholders. In this regard, the Board favorably considered the procedures and policies TAM has in place to enforce compliance with applicable laws and regulations and oversee the portfolio management activities of the Sub-Adviser. The Board also noted that TAM has made a significant entrepreneurial commitment to the management and success of the Portfolios.
Conclusion
After consideration of the factors described above, as well as other factors, the Trustees, including the Independent Trustees, concluded that the renewal of each Investment Advisory Agreement and Sub-Advisory Agreement is in the best interests of the applicable Portfolio and its shareholders and voted to approve the renewal of the Agreements.
| | |
| Transamerica Funds | | Annual Report 2014 |
Page 58
Management of the Trust
Board Members and Officers
(unaudited)
The Board Members and executive officers of each Trust are listed below.
Interested Board Member means a board member who may be deemed an “interested person” (as that term is defined in the 1940 Act) of each Trust because of his current or former service with TAM or an affiliate of TAM. Interested Board Members may also be referred to herein as “Interested Trustees.” Independent Board Member means a Board Member who is not an “interested person” (as defined under the 1940 Act) of each Trust and may also be referred to herein as an “Independent Trustee.”
The Board governs each Fund and is responsible for protecting the interests of the shareholders. The Board Members are experienced executives who meet periodically throughout the year to oversee the business affairs of each Fund and the operation of each Fund by its officers. The Board also reviews the management of each Fund’s assets by the investment adviser and its respective sub-adviser.
The Funds are among the Funds advised and sponsored by TAM (collectively, “Transamerica Mutual Funds”). The Transamerica Mutual Funds consist of Transamerica Funds, Transamerica Series Trust (“TST”), Transamerica Income Shares, Inc. (“TIS”), Transamerica Partners Funds Group (“TPFG”), Transamerica Partners Funds Group II (“TPFG II”), Transamerica Partners Portfolios (“TPP”) and Transamerica Asset Allocation Variable Funds (“TAAVF”) and consists of 170 funds as of the date of this Annual Report.
The mailing address of each Board Member is c/o Secretary, 4600 South Syracuse St., Suite 1100, Denver, CO 80237.
The Board Members of each Trust and each Portfolio Trust, their year of birth, their positions with the Trusts, and their principal occupations for the past five years (their titles may have varied during that period) the number of Funds in Transamerica Mutual Funds the Board oversees, and other board memberships they hold are set forth in the table below. The length of time served is provided from the date a Trustee became a Trustee of either of the Trusts or Transamerica Partners Portfolios.
| | | | | | | | | | |
Name and Year of Birth | | Position(s) Held with Trust | | Term of Office and Length of Time Served* | | Principal Occupation(s) During Past Five Years | | Number of
Funds in
Complex
Overseen
by Board
Member | | Other
Directorships
During the Past
Five Years |
INTERESTED BOARD MEMBERS | | | | |
Marijn P. Smit (1973) | | Chairman of the Board**, President and Chief Executive Officer | | Since 2014 | | Chairman of the Board, President and Chief Executive Officer, Transamerica Funds, TST, TPP, TPFG, TPFG II, TAAVF and TIS (2014 – present); Director, Chairman of the Board, President and Chief Executive Officer, Transamerica Asset Management, Inc. (“TAM”) and Transamerica Fund Services, Inc. (“TFS”) (2014 – present); President, Investment Solutions, Transamerica Investments & Retirement (2014 – present); Vice President, Transamerica Premier Life Insurance Company (2010 – present); Vice President, Transamerica Life Insurance Company (2010 – present); Senior Vice President, Transamerica Financial Life Insurance Company (2013 – present); Senior Vice President, Transamerica Retirement Advisors, Inc. (2013 – present); | | 170 | | N/A |
| | |
| Transamerica Funds | | Annual Report 2014 |
Page 59
| | | | | | | | | | |
Name and Year of Birth | | Position(s) Held with Trust | | Term of Office and Length of Time Served* | | Principal Occupation(s) During Past Five Years | | Number of
Funds in
Complex
Overseen
by Board
Member | | Other
Directorships
During the Past
Five Years |
INTERESTED BOARD MEMBERS — continued | | | | |
Marijn P. Smit (continued) | | | | | | Senior Vice President, Transamerica Retirement Solutions Corporation (2012 – present); and President and Director, Transamerica Stable Value Solutions, Inc. (2010 – present). | | | | |
Alan F. Warrick (1948) | | Board Member | | Since 2012 | | Board Member, Transamerica Funds, TST, TIS, TPP, TPFG, TPFG II and TAAVF (2012 – present); Consultant, Aegon USA (2010 – 2011); Senior Advisor, Lovell Minnick Equity Partners (2010 – present); Retired (2010 – present); and Managing Director for Strategic Business Development, Aegon USA (1994 – 2010). | | 170 | | First Allied
Holdings Inc.
(2013 – 2014) |
INDEPENDENT BOARD MEMBERS | | | | | | |
Sandra N. Bane (1952) | | Board Member | | Since 2008 | | Retired (1999 – present); Board Member, Transamerica Funds, TST, TIS, TPP, TPFG, TPFG II and TAAVF (2008 – present); Board Member, Transamerica Investors, Inc. (“TII”) (2003 – 2010); and Partner, KPMG (1975 – 1999). | | 170 | | Big 5 Sporting
Goods (2002 –
present); AGL
Resources, Inc.
(energy services
holding
company)
(2008 – present) |
Leo J. Hill (1956) | | Lead Independent Board Member | | Since 2001 | | Principal, Advisor Network Solutions, LLC (business consulting) (2006 – present); Board Member, TST (2001 – present); Board Member, Transamerica Funds and TIS (2002 – present); Board Member, TPP, TPFG, TPFG II and TAAVF (2007 – present); Board Member, TII (2008 – 2010); Market President, Nations Bank of Sun Coast Florida (1998 – 1999); Chairman, President and Chief Executive Officer, Barnett Banks of Treasure Coast Florida (1994 – 1998); | | 170 | | Ameris Bancorp
(2013 – present);
Ameris Bank
(2013 – present) |
| | |
| Transamerica Funds | | Annual Report 2014 |
Page 60
| | | | | | | | | | |
Name and Year of Birth | | Position(s) Held with Trust | | Term of Office and Length of Time Served* | | Principal Occupation(s) During Past Five Years | | Number of
Funds in
Complex
Overseen
by Board
Member | | Other
Directorships
During the Past
Five Years |
INDEPENDENT BOARD MEMBERS — continued | | | | | | |
Leo J. Hill (continued) | | | | | | Executive Vice President and Senior Credit Officer, Barnett Banks of Jacksonville, Florida (1991 – 1994); and Senior Vice President and Senior Loan Administration Officer, Wachovia Bank of Georgia (1976 – 1991). | | | | |
David W. Jennings (1946) | | Board Member | | Since 2009 | | Board Member, Transamerica Funds, TST, TIS, TPP, TPFG, TPFG II and TAAVF (2009 – present); Board Member, TII (2009 – 2010); Managing Director, Hilton Capital (2010 – present); Principal, Maxam Capital Management, LLC (2006 – 2008); and Principal, Cobble Creek Management LP (2004 – 2006). | | 170 | | N/A |
| Russell A. Kimball, Jr. (1944) | | Board Member | | 1986 – 1990 and Since 2002 | | General Manager, Sheraton Sand Key Resort (1975 – present); Board Member, TST (1986 – present); Board Member, Transamerica Funds, (1986 – 1990), (2002 – present); Board Member, TIS (2002 – present); Board Member, TPP, TPFG, TPFG II and TAAVF (2007 – present); and Board Member, TII (2008 – 2010). | | 170 | | N/A |
Eugene M. Mannella (1954) | | Board Member | | Since 2007 | | Chief Executive Officer, HedgeServ Corporation (hedge fund administration) (2008 – present); Self-employed consultant (2006 – present); Managing Member and Chief Compliance Officer, HedgeServ Investment Services, LLC (limited purpose broker-dealer) (2011 – present); President, ARAPAHO Partners LLC (limited purpose broker-dealer) (1998 – 2008); | | 170 | | N/A |
| | |
| Transamerica Funds | | Annual Report 2014 |
Page 61
| | | | | | | | | | |
Name and Year of Birth | | Position(s) Held with Trust | | Term of Office and Length of Time Served* | | Principal Occupation(s) During Past Five Years | | Number of
Funds in
Complex
Overseen
by Board
Member | | Other
Directorships
During the Past
Five Years |
INDEPENDENT BOARD MEMBERS — continued | | | | | | |
Eugene M. Mannella (continued) | | | | | | Board Member, TPP, TPFG, TPFG II and TAAVF (1993 – present); Board Member, Transamerica Funds, TST and TIS (2007 – present); Board Member, TII (2008 – 2010); and President, International Fund Services (alternative asset administration) (1993 – 2005). | | | | |
| Norman R. Nielsen, Ph.D. (1939) | | Board Member | | Since 2006 | | Retired (2005 – present); Board Member, Transamerica Funds, TST and TIS (2006 – present); Board Member, TPP, TPFG, TPFG II and TAAVF (2007 – present); Board Member, TII (2008 – 2010); Interim President, Mt. Mercy University (2013 – 2014); Director, Aspire Inc. (formerly, Iowa Student Loan Service Corporation) (2006 – present); Director, League for Innovation in the Community Colleges (1985 – 2005); Director, Iowa Health Systems (1994 – 2003); Director, U.S. Bank (1985 – 2006); and President, Kirkwood Community College (1985 – 2005). | | 170 | | Buena Vista
University Board
of Trustees
(2004 – present);
Chairman(2012 – present) |
Joyce G. Norden (1939) | | Board Member | | Since 2007 | | Retired (2004 – present); Board Member, TPP, TPFG, TPFG II and TAAVF (1993 – present); Board Member, Transamerica Funds, TST and TIS (2007 – present); Board Member, TII (2008 – 2010); and Vice President, Institutional Advancement, Reconstructionist Rabbinical College (1996 – 2004). | | 170 | | Board of
Governors,
Reconstructionist
Rabbinical
College(2007 – 2012) |
| | |
| Transamerica Funds | | Annual Report 2014 |
Page 62
| | | | | | | | | | |
Name and Year of Birth | | Position(s) Held with Trust | | Term of Office and Length of Time Served* | | Principal Occupation(s) During Past Five Years | | Number of
Funds in
Complex
Overseen
by Board
Member | | Other
Directorships
During the Past
Five Years |
INDEPENDENT BOARD MEMBERS — continued | | | | |
Patricia L. Sawyer (1950) | | Board Member | | Since 2007 | | Retired (2007 – present); President/Founder, Smith & Sawyer LLC (management consulting) (1989 – 2007); Board Member, Transamerica Funds, TST and TIS (2007 – present); Board Member, TII (2008 – 2010); Board Member, TPP, TPFG, TPFG II and TAAVF (1993 – present); Trustee, Chair of Finance Committee and Chair of Nominating Committee (1987 – 1996), Bryant University. | | 170 | | Honorary Trustee,
Bryant University
(1996 – present) |
John W. Waechter (1952) | | Board Member | | Since 2004 | | Attorney, Englander Fischer (2008 – present); Retired (2004 – 2008); Board Member, TST and TIS (2004 – present); Board Member, Transamerica Funds (2005 – present); Board Member, TPP, TPFG, TPFG II and TAAVF (2007 – present); Board Member, TII (2008 – 2010); Employee, RBC Dain Rauscher (securities dealer) (2004); Executive Vice President, Chief Financial Officer and Chief Compliance Officer, William R. Hough & Co. (securities dealer) (1979 – 2004); and Treasurer, The Hough Group of Funds (1993 – 2004). | | 170 | | Operation PAR,
Inc. (2008 – present);West Central Florida
Council – Boy Scouts
of America
(2008 – 2013);
Remember Honor
Support, Inc.
(non-profit
organization)
(2013 – present)
Board Member,
WRH Income
Properties, Inc. (real
estate) (2014 –
present) |
| * | Each Board Member shall hold office until: 1) his or her successor is elected and qualified or 2) he or she resigns, retires or his or her term as a Board Member is terminated in accordance with the Trust’s Declaration of Trust. |
| ** | Mr. Smit was elected as Chairman of the Board on December 11, 2014. |
| | |
| Transamerica Funds | | Annual Report 2014 |
Page 63
Officers
The mailing address of each officer is c/o Secretary, 4600 South Syracuse St., Suite 1100, Denver, CO 80237. The following table shows information about the officers, including their year of birth, their positions held with the Trust and their principal occupations during the past five years (their titles may have varied during that period). Each officer will hold office until his or her successor has been duly elected or appointed or until his or her earlier death, resignation or removal.
| | | | | | |
Name and Year of Birth | | Position | | Term of Office
and Length of
Time Served* | | Principal Occupation(s) or Employment During Past Five Years |
Marijn P. Smit (1973) | | Chairman of the Board**, President and Chief Executive Officer | | Since 2014 | | See Table Above. |
Tané T. Tyler (1965) | | Vice President, Associate General Counsel, Chief Legal Officer and Secretary | | Since 2014 | | Vice President, Associate General Counsel, Chief Legal Officer and Secretary, Transamerica Funds, TST, TPP, TPFG, TPFG II, TAAVF and TIS (2014 – present); Director, Vice President, Associate General Counsel, Chief Legal Officer and Secretary, TAM and TFS (2014 – present); Senior Vice President, Secretary and General Counsel, ALPS, Inc., ALPS Fund Services, Inc. and ALPS Distributors, Inc. (2004 – 2013); and Secretary, Liberty All-Star Funds (2005 – 2013). |
Christopher A. Staples (1970) | | Vice President and Chief Investment Officer, Advisory Services | | Since 2005 | | Vice President and Chief Investment Officer, Advisory Services (2007 – present), Senior Vice President – Investment Management (2006 – 2007), Vice President – Investment Management (2005 – 2006), Transamerica Funds, TST and TIS; Vice President and Chief Investment Officer, Advisory Services, TPP, TPFG, TPFG II and TAAVF (2007 – present); Vice President and Chief Investment Officer (2007 – 2010); Vice President – Investment Administration (2005 – 2007), TII; Director (2005 – present), Senior Vice President (2006 – present) and Chief Investment Officer, Advisory Services (2007 – present), TAM; Director, TFS (2005 – present); and Assistant Vice President, Raymond James & Associates (1999 – 2004). |
Thomas R. Wald (1960) | | Chief Investment Officer | | Since 2014 | | Chief Investment Officer, Transamerica Funds, TST, TPP, TPFG, TPFG II, TAAVF and TIS (2014 – present); Senior Vice President and Chief Investment Officer, TAM (2014 – present); Chief Investment Officer, Transamerica Investments & Retirement (2014 – present); Vice President and Client Portfolio Manager, Curian Capital, LLC (2012 – 2014); Portfolio Manager, Tactical Allocation Group, LLC (2010 – 2011); Mutual Fund Manager, Munder Capital Management (2005 – 2008); and Mutual Fund Manager, Invesco Ltd. (1997 – 2004). |
| | |
| Transamerica Funds | | Annual Report 2014 |
Page 64
| | | | | | |
Name and Year of Birth | | Position | | Term of Office
and Length of
Time Served* | | Principal Occupation(s) or Employment During Past Five Years |
Vincent J. Toner (1970) | | Vice President and Treasurer | | Since 2014 | | Vice President and Treasurer (2014 – present) Transamerica Funds, TST, TIS, TPP, TPFG, TPFG II and TAAVF; Vice President and Treasurer, TAM and TFS (2014 – present); Senior Vice President and Vice President, Fund Administration, Brown Brothers Harriman (2010 – 2014); and Vice President Fund Administration & Fund Accounting, OppenheimerFunds (2007 – 2010). |
Matthew H. Huckman, Sr. (1968) | | Tax Manager | | Since 2014 | | Tax Manager, Transamerica Funds, TST, TIS, TPP, TPFG, TPFG II and TAAVF (2014 – present); Tax Manager, TFS (2012 – present); and Assistant Mutual Fund Tax Manager, Invesco (2007 – 2012). |
Scott M. Lenhart (1961) | | Chief Compliance Officer and Anti-Money Laundering Officer | | Since 2014 | | Chief Compliance Officer and Anti-Money Laundering Officer, Transamerica Funds, TST, TIS, TPP, TPFG, TPFG II and TAAVF (2014 – present); Chief Compliance Officer and Anti-Money Laundering Officer (2014 – present), Senior Compliance Officer (2008 – 2014), TAM; Vice President and Chief Compliance Officer, TFS (2014 – present); Director of Compliance, Transamerica Investments & Retirement (2014 – present); Vice President and Chief Compliance Officer, Transamerica Financial Advisors, Inc. (1999 – 2006); and Assistant Chief Compliance Officer, Raymond James Financial, Inc., Robert Thomas Securities, Inc. (1989 – 1998). |
| * | Elected and serves at the pleasure of the Board of the Trust. |
| ** | Mr. Smit was elected as Chairman of the Board on December 11, 2014. |
| | |
| Transamerica Funds | | Annual Report 2014 |
Page 65
PROXY VOTING POLICIES AND PROCEDURES AND QUARTERLY PORTFOLIO HOLDINGS
(unaudited)
A description of the Transamerica Funds’ proxy voting policies and procedures is available in the Statements of Additional Information of the Funds, available without charge upon request by calling 1-888-233-4339 (toll free) or on the Securities and Exchange Commission’s (“SEC”) website at http://www.sec.gov.
In addition, the Funds are required to file Form N-PX, with their complete proxy voting records for the 12 months ended June 30th, no later than August 31st of each year. The Form is available without charge: (1) from the Funds, upon request by calling 1-888-233-4339; and (2) on the SEC’s website at http://www.sec.gov.
The Funds file their complete schedule of portfolio holdings with the SEC for the first and third quarter of each fiscal year on Form N-Q, which is available on the SEC’s website at http://www.sec.gov. The Funds’ Form N-Q may be reviewed and copied at the SEC’s Public Reference Room in Washington, D.C. Information on the operation of the Public Reference Room may be obtained by calling 1-800-SEC-0330.
You may also visit the Trust’s website at www.transamerica.com for this and other information about the Funds and the Trust.
Important Notice Regarding Delivery of Shareholder Documents
Every year we send shareholders informative materials such as the Transamerica Funds Annual Report, the Transamerica Funds Prospectus, and other required documents that keep you informed regarding your Funds. Transamerica Funds will only send one piece per mailing address, a method that saves your Funds’ money by reducing mailing and printing costs. We will continue to do this unless you tell us not to. To elect to receive individual mailings, simply call a Transamerica Customer Service Representative toll free at 1-888-233-4339, 8 a.m. to 7 p.m. Eastern Time, Monday-Friday. Your request will take effect within 30 days.
| | |
| Transamerica Funds | | Annual Report 2014 |
Page 66
NOTICE OF PRIVACY POLICY
(unaudited)
Your privacy is very important to us. We want you to understand what information we collect and how we use it. We collect and use “nonpublic personal information” in connection with providing our customers with a broad range of financial products and services as effectively and conveniently as possible. We treat nonpublic personal information in accordance with our Privacy Policy.
What Information We Collect and From Whom We Collect It
We may collect nonpublic personal information about you from the following sources:
| • | | Information we receive from you on applications or other forms, such as your name, address, and account number; |
| • | | Information about your transactions with us, our affiliates, or others, such as your account balance and purchase/redemption history; and |
| • | | Information we receive from non-affiliated third parties, including consumer reporting agencies. |
What Information We Disclose and To Whom We Disclose It
We do not disclose any nonpublic personal information about current or former customers to anyone without their express consent, except as permitted by law. We may disclose the nonpublic personal information we collect, as described above, to persons or companies that perform services on our behalf and to other financial institutions with which we have joint marketing agreements. We will require these companies to protect the confidentiality of your nonpublic personal information and to use it only to perform the services for which we have hired them.
Our Security Procedures
We restrict access to your nonpublic personal information and only allow disclosures to persons and companies as permitted by law to assist in providing products or services to you. We maintain physical, electronic, and procedural safeguards to protect your nonpublic personal information and to safeguard the disposal of certain consumer information.
If you have any questions about our Privacy Policy, please call 1-888-233-4339 on any business day between 8 a.m. and 7 p.m. Eastern Time.
Note: This Privacy Policy applies only to customers that have a direct relationship with us or our affiliates. If you own shares of our funds in the name of a third party such as a bank or broker-dealer, its privacy policy may apply to you instead of ours.
| | |
| Transamerica Funds | | Annual Report 2014 |
Page 67
4600 S. Syracuse St., Suite 1100
Denver, Colorado 80237

Customer Service 1-888-233-4339
P.O. Box 9012 • Clearwater, FL 33758-9012
Distributor: Transamerica Capital, Inc.

Open Funds
Annual Report
October 31, 2014
www.transamerica.com
Customer Service 1-888-233-4339
P.O. Box 9012 • Clearwater, FL 33758-9012
Distributor: Transamerica Capital, Inc.
Dear Fellow Shareholder,
On behalf of Transamerica Funds, I would like to thank you for your continued support and confidence in our products as we look forward to continuing to serve you and your financial adviser in the future. We value the trust you have placed in us.
This annual report is provided to you with the intent of presenting a comprehensive review of the investments of each of your Funds. The Securities and Exchange Commission requires that annual and semi-annual reports be sent to all shareholders, and we believe this report to be an important part of the investment process. In addition to providing a comprehensive review, this report also provides a discussion of accounting policies as well as matters presented to shareholders that may have required their vote.
We believe it is important to understand market conditions over the last year in order to provide a context for reading this report. At the beginning of this year, markets were focused on the possibility that 2014 would be the year that quantitative easing—the extraordinary monetary accommodation enacted by the U.S. Federal Reserve (“Fed”)—would finally be coming to an end. Fed officials had widely publicized their intentions to end the quantitative easing program as long as they saw continued improvement in the economy. In a welcomed development, the economy and the all-important labor market continued to make gains throughout 2014, with the Bureau of Labor Statistics reporting that the unemployment rate falling below six percent in September, the first time this has occurred since July 2008.
For all of the economic improvements witnessed in the U.S., much of the rest of the world seems to have been on a different path. Europe produced anemic economic growth, as it continued to grapple with weak internal demand and structural imbalances. Japan, a very indebted country, has been attempting to boost its economy through aggressive Central Bank stimulus. Finally, China has been working to slowly let the air out of speculative areas of its economy while trying to avoid damaging its broader economy.
Given the notable differences in Central Bank policy and the different degrees of economic health in which major economies find themselves, it is little surprise that the returns from major asset classes have varied. For the year ended October 31, 2014, the S&P 500® returned 17.27% while the Morgan Stanley Capital International Europe, Australasia, Far East Index, representing international developed market equities, lost 0.17%. During the same period, the Barclays U.S. Aggregate Bond Index returned 4.14%. Please keep in mind that it is important to maintain a diversified portfolio as investment returns have historically been difficult to predict.
In addition to your active involvement in the investment process, we firmly believe that a financial adviser is a key resource to help you build a complete picture of your current and future financial needs. Financial advisers are familiar with the market’s history, including long-term returns and volatility of various asset classes. With your financial adviser, you can develop an investment program that incorporates factors such as your goals, your investment timeline, and your risk tolerance.
Please contact your financial adviser if you have any questions about the contents of this report, and thanks again for the confidence you have placed in us.
Sincerely,
Marijn Smit
President & Chief Executive Officer
Transamerica Funds
Tom Wald, CFA
Chief Investment Officer
Transamerica Funds
The views expressed in this report reflect those of the portfolio managers only and may not necessarily represent the views of Transamerica Funds. These views are subject to change based upon market conditions. These views should not be relied upon as investment advice and are not indicative of trading intent on behalf of Transamerica Funds.
Transamerica Capital Growth
(unaudited)
MARKET ENVIRONMENT
Although volatility re-emerged toward the end of the period, U.S. stocks appreciated strongly over the 12-month period. After much anticipation, the U.S. Federal Reserve (“Fed”) announced in December 2013 that it would begin reducing its bond purchases beginning the next month. Stocks finished 2013 on a high note but stumbled in the early months of 2014 as an exceptionally cold winter dampened economic activity. As the year progressed, economic growth recovered and stocks resumed their climb. However, August saw a return to volatility as geopolitical risks intensified, the pace of global economic growth slowed, and the timing of the Fed’s first rate hike was debated. A spike in oil prices during the summer also contributed to some softness in U.S. economic data. After recovering their losses in September, stocks tumbled sharply again in October. Uncertainty about U.S. corporate earnings growth and weak economic data in Europe and China contributed to market volatility. In the final weeks of the period, stocks rallied strongly, erasing the losses from the downturn earlier in October.
PERFORMANCE
For the year ended October 31, 2014, Transamerica Capital Growth Class A returned 16.52%. By comparison, its benchmark, the Russell 1000® Growth Index, returned 17.11%.
STRATEGY REVIEW
The investment team looks for high-quality growth companies that we believe have these attributes: sustainable competitive advantages, above-average business visibility, rising return on invested capital, strong free cash flow generation and a favorable risk/reward profile. We find these companies through intense fundamental research. Our emphasis is on secular growth, and as a result, short-term market events are not as meaningful in the stock selection process.
The Fund slightly underperformed its benchmark during the year ended October 31, 2014.
Stock selection in the Health Care sector was the largest positive contributor to relative performance during the period. Illumina, Inc., a leader in genetic testing and analysis, was the Fund’s top-contributing holding for the period. Although Illumina, Inc.’s stock price was pressured by a general sell-off in high-growth and high-valuation stocks in March and April, its shares recovered significantly in May and June. We attributed the strength to continued investor enthusiasm for the company’s progress in lowering the cost of genome mapping. We believe Illumina, Inc. is unique because it controls the core patents and intellectual property used in analyzing genetic variation and biological function, and provides best-in-class genomic tools for academic and industry researchers to generate valuable medical information that can potentially enhance drug discovery and clinical research.
The Consumer Staples and Information Technology (“IT”) sectors also added to relative returns. A holding in specialty coffee producer Keurig Green Mountain, Inc. was the chief contributor in the Consumer Staples sector. In the IT sector, both an overweight position and stock selection bolstered relative results. The Fund’s holding in online social networking service Facebook, Inc., Class A led the IT sector’s performance.
The Consumer Discretionary sector detracted the most from relative performance during the period. Both stock selection and an overweight position were unfavorable to returns, with e-commerce giant Amazon.com, Inc. hurting the most. Its shares were pressured earlier in 2014 during the general sell-off in high growth, high multiple stocks. In addition, the company’s results have fallen short of high expectations due to somewhat slower unit growth and reinvestment in various business initiatives which is weighing on near-term profitability. We believe this could be transitory and remain attracted to Amazon.com, Inc., as we believe the company has substantial scale, strong brand and competitive advantages, which should allow it to continue gaining market share in both its core retail and cloud computing businesses. Stock selection in the Industrial sector also diminished relative returns. All four of the Fund’s holdings in the sector had a negative impact on performance. In the Financial sector, both stock selection and an overweight position dampened performance. Although most of the Fund’s holdings in the sector added to performance, relative gains were hampered by the Fund’s lack of exposure to real estate investment trusts (“REITs”), a group which performed well within the Index during the period.
During the period, the Fund utilized options for foreign exchange management. These positions detracted from performance.
Dennis P. Lynch
Alexander T. Norton
Armistead B. Nash
David S. Cohen
Jason C. Yeung, CFA
Sam G. Chainani, CFA
Co-Portfolio Managers
Morgan Stanley Investment Management Inc.
| | |
| Transamerica Funds | | Annual Report 2014 |
Page 1
Transamerica Capital Growth
(unaudited)
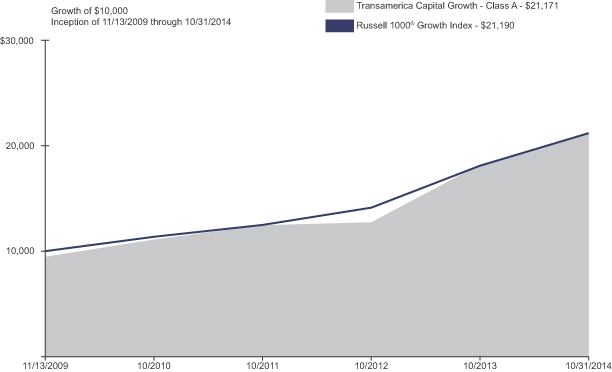
| | | | | | | | | | | | |
| Average Annual Total Return for Periods Ended 10/31/2014 | |
| | | 1 Year | | | 10 Years or
Life of Class | | | Inception Date | |
Class A (NAV) | | | 16.52 | % | | | 17.64 | % | | | 11/13/2009 | |
Class A (POP) | | | 10.09 | % | | | 16.30 | % | | | 11/13/2009 | |
Russell 1000® Growth Index (A) | | | 17.11 | % | | | 16.32 | % | | | | |
Class B (NAV) | | | 15.39 | % | | | 16.79 | % | | | 11/13/2009 | |
Class B (POP) | | | 10.39 | % | | | 16.68 | % | | | 11/13/2009 | |
Class C (NAV) | | | 15.74 | % | | | 16.91 | % | | | 11/13/2009 | |
Class C (POP) | | | 14.74 | % | | | 16.91 | % | | | 11/13/2009 | |
Class I (NAV) | | | 16.88 | % | | | 18.73 | % | | | 11/30/2009 | |
Class I2 (NAV) | | | 17.05 | % | | | 23.11 | % | | | 09/30/2011 | |
(A) The Russell 1000® Growth Index is an unmanaged index used as a general measure of market performance. Calculations assume dividends and capital gains are reinvested and do not include any managerial expenses. The 10 Years or Life of Class calculation is based on the inception date of the class. You cannot invest directly in an index.
The performance data presented represents past performance; future results may vary. Performance data does not reflect the deduction of taxes that would be paid on Fund distributions or the redemption of Fund shares. Investment return and principal value will fluctuate so that an investor’s shares, when redeemed, may be worth more or less than their original cost. Current performance may be lower or higher than performance quoted. Please see www.transamerica.com for performance data current to the most recent month-end. Net Asset Value (“NAV”) returns include the reinvestment of dividends and capital gains but do not reflect any sales charges. Public Offering Price (“POP”) returns include the reinvestment of dividends and capital gains and reflect the maximum sales charge of 5.5% for A shares or the maximum applicable contingent deferred sales charge (5% in the 1st year, decreasing to 0% after 6 years) for Class B shares and 1% (during the first 12 months) for Class C shares. There are no sales charges on Class I and I2 shares.
Performance figures reflect any fee waivers and/or expense reimbursements by the Investment Adviser. Without such waivers and/or reimbursements, the performance would be lower. Future waivers and/or reimbursements are at the discretion of the Investment Adviser.
Performance results do not include adjustments made for financial reporting purposes in accordance with U.S. generally accepted accounting principles and may differ from amounts reported in the financial highlights.
Returns on growth stocks may not move in tandem with returns on other categories of stocks or the market as a whole. Growth stocks may be particularly susceptible to larger price swings or to adverse developments. Growth stocks as a group may be out of favor and underperform the overall equity market for a long period of time, for example, while the market favors “value” stocks.
Russell Investment Group is the source and owner of the trademarks, service marks, and copyrights related to the Russell indexes. Russell® is a trademark of Russell Investment Group.
Please refer to page 72 for index descriptions.
| | |
| Transamerica Funds | | Annual Report 2014 |
Page 2
Transamerica Concentrated Growth
(formerly, The Torray Resolute Fund)
(unaudited)
MARKET ENVIRONMENT
The last 12 months continued to generate the kind of positive returns enjoyed by investors over the past five years. Equity markets are rising along with steady underlying fundamentals: moderate economic growth, muted inflation, low cost of capital and productivity-driven profit margin expansion. With this as a backdrop, profits at U.S. companies are growing; over the past five years (as of 9/30/14), earnings for the Russell 1000® Growth Index (the “Index”) have compounded at a double digit pace as the Index has gained more than 15% on an average annual basis. Despite the occasional bout of volatility, robust returns have been supported by similar earnings growth.
PERFORMANCE
For the year ended October 31, 2014, Transamerica Concentrated Growth Class I returned 11.34%. By comparison, its benchmark, the Russell 1000® Growth Index, returned 17.11%.
STRATEGY REVIEW
The Fund’s strategy is to invest in companies with proven records of increasing earnings on a consistent and sustainable basis. Over the long term, this has been a successful approach for producing attractive returns without assuming excessive risk. Over the last 12 months, the strategy has performed in a manner consistent with expectations, lagging in a particularly strong market while offering lower risk characteristics compared to its benchmark and peers. For the period, underperformance was largely the result of three factors: (1) not assuming enough risk in the strongest areas of the market, which included Health Care and Biotechnology, and (2) poor stock selection in cyclical areas, such as Materials and Industrials, and (3) timing of fund flows resulting in higher-than-desired cash levels. We have addressed the mechanics of the fund flow process to reduce the potential for future impact. Despite recent underperformance, we remain committed to our strategy of investing in high-quality companies with sustainable growth characteristics. We have taken advantage of recent volatility to make a number of new investments we believe contribute to the Fund’s growth profile and decrease associated market risks.
The three best performing holdings over the period contributed 4.2% to performance. These included Apple, Inc., Gilead Sciences, Inc., and Fiserv, Inc. Conversely, the three worst performing holdings detracted just 2.1% from performance, which included FMC Corp., Class A, Core Laboratories NV, and Precision Castparts Corp. Sector performance was largely consistent with the winners and losers identified above; the best performing sectors were Information Technology, Consumer Discretionary and Telecommunication Services. The poorest performing sectors were Industrials, Materials and Health Care. Underperforming sectors were penalized by growing concerns about global growth, a rising dollar, declining commodity prices and moderating demand for industrial goods. As foreign holdings constitute less than 10% of the Fund’s value, country performance had little effect on performance.
In the face of uncertainty, perspective is critical to successful investing. U.S. equities have exhibited a remarkable degree of resilience despite numerous geopolitical and economic risks. Recent events have caused some to question this resilience and cast an element of risk aversion over global capital markets. We don’t believe much has changed in the economy since the market reached a high in September 2014. The basic message remains the same: a gradually improving global economy led by a strong U.S. economy. We believe that short-term challenges should not overshadow long-term opportunities, which include low energy costs, high productivity, declining unemployment and low inflation. Importantly, we continue to see many long-term growth trends fueled by innovation and outstanding companies. Our strategy is to identify and invest in these trends and the businesses that benefit from them over time.
Nicholas C. Haffenreffer
Portfolio Manager
Torray LLC
| | |
| Transamerica Funds | | Annual Report 2014 |
Page 3
Transamerica Concentrated Growth
(formerly, The Torray Resolute Fund)
(unaudited)
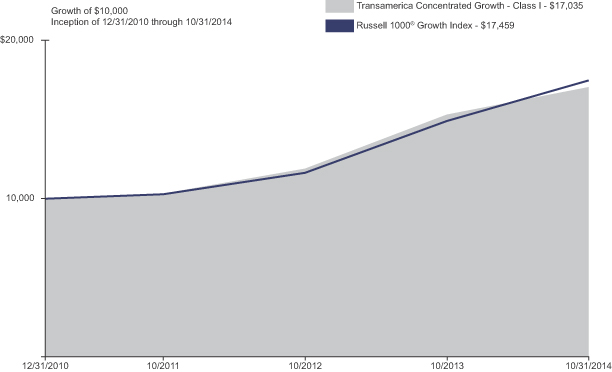
| | | | | | | | | | | | |
| Average Annual Total Return for Periods Ended 10/31/2014 | |
| | | 1 Year | | | 10 Years or
Life of Class | | | Inception Date | |
Class A (NAV) | | | N/A | | | | 4.17 | % (A) | | | 03/01/2014 | |
Class A (POP) | | | N/A | | | | (1.58 | )% (A) | | | 03/01/2014 | |
Class C (NAV) | | | N/A | | | | 3.66 | % (A) | | | 03/01/2014 | |
Class C (POP) | | | N/A | | | | 2.66 | % (A) | | | 03/01/2014 | |
Class I (NAV) | | | 11.34 | % | | | 14.90 | % | | | 12/31/2010 | |
Russell 1000® Growth Index (B) | | | 17.11 | % | | | 15.64 | % | | | | |
Class I2 (NAV) | | | N/A | | | | 4.43 | % (A) | | | 03/01/2014 | |
(A) Not annualized.
(B) The Russell 1000® Growth Index is an unmanaged index used as a general measure of market performance. Calculations assume dividends and capital gains are reinvested and do not include any managerial expenses. The 10 Years or Life of Class calculation is based on the inception date of the class. You cannot invest directly in an index.
The performance data presented represents past performance; future results may vary. Performance data does not reflect the deduction of taxes that would be paid on Fund distributions or the redemption of Fund shares. Investment return and principal value will fluctuate so that an investor’s shares, when redeemed, may be worth more or less than their original cost. Current performance may be lower or higher than performance quoted. Please see www.transamerica.com for performance data current to the most recent month-end. Net Asset Value (“NAV”) returns include the reinvestment of dividends and capital gains but do not reflect any sales charges. Public Offering Price (“POP”) returns include the reinvestment of dividends and capital gains and reflect the maximum sales charge of 5.5% for A shares or the maximum applicable contingent deferred sales charge of 1% (during the first 12 months) for Class C shares. There are no sales charges on Class I and I2 shares.
Performance figures reflect any fee waivers and/or expense reimbursements by the Investment Adviser. Without such waivers and/or reimbursements, the performance would be lower. Future waivers and/or reimbursements are at the discretion of the Investment Adviser.
Performance results do not include adjustments made for financial reporting purposes in accordance with U.S. generally accepted accounting principles and may differ from amounts reported in the financial highlights.
Equities are subject to market risk meaning that stock prices in general may decline over short or extended periods of time. The Fund may be more concentrated than that of a more diversified fund, subjecting it to greater fluctuation and risk.
Russell Investment Group is the source and owner of the trademarks, service marks, and copyrights related to the Russell indexes. Russell® is a trademark of Russell Investment Group.
Please refer to page 72 for index descriptions.
| | |
| Transamerica Funds | | Annual Report 2014 |
Page 4
Transamerica Dividend Focused
(unaudited)
MARKET ENVIRONMENT
Equity markets around the globe remained resilient during the period despite a number of geopolitical risks, including the violence in Middle East, Argentina’s default, the continuing Russia/Ukraine dispute, fears of a slowdown in China, and the Ebola scare. Meanwhile, central banks sent mixed messages, with European and Japanese Central banks signaling further accommodation while the U.S. Federal Reserve (“Fed”) continued to wind down the massive, multi-year stimulus program that has driven interest rates to near-record lows and domestic stock markets to record highs.
Several trends within our primary large cap value universe, the Russell 1000® Value Index (the “Index”), have created significant headwinds for active managers over the last 12 months and even prior years. First, the smaller/mid cap stocks in the Index have outperformed the largest capitalization stocks. Another trend is the meaningful outperformance of low and non-dividend paying stocks in tandem with lower quality companies that have outperformed higher quality companies.
PERFORMANCE
For the year ended October 31, 2014, Transamerica Dividend Focused Class A returned 14.14%. By comparison, its benchmark, the Russell 1000® Value Index, returned 16.46%.
STRATEGY REVIEW
Our approach to the equity market is based on the underlying philosophy that markets are inefficient. These inefficiencies can best be exploited through adherence to a value-oriented investment process dedicated to the selection of securities on a bottom-up basis and constructing concentrated portfolios.
We stay fully invested with a conservative orientation based on our belief that superior returns can be achieved while taking below average risks. We implement this strategy by constructing portfolios of individual stocks that reflect all three value characteristics: price/earnings and price/book ratios below the market and dividend yields above the market (S&P 500®). In addition, the strategy requires that stocks purchased in the Fund not only pay a dividend, but also that each stock has a consecutive 25-year history of paying cash dividends. While we are exacting in our definition of value, we are equally demanding in our pursuit of quality companies. We seek companies with profitability and earnings growth greater than the market. Our history indicates that a strategy of emphasizing discounted valuations and high dividend yields provides a measure of protection in down markets, as well as participation in improving economic cycles.
The Fund modestly trailed the value benchmark for the year ended October 31, 2014. Performance of selections in the Industrials sector was one of the largest contributors to performance, although relative allocation diminished some of the positive effects. Overweighting the Health Care sector also positively contributed to performance. The top five contributing stocks included Southwest Airlines Co., Cardinal Health, Inc., Teva Pharmaceutical Industries, Ltd. (no longer held at year end), General Dynamics Corp., and Raytheon Co.
Not participating in the Information Technology sector was the greatest detractor from performance as none of the Tech stocks that detracted from relative performance met the 25-year divided paying history requirement. Also detracting were stock selection combined with allocation in Financials, Telecommunication Services and Materials. Holdings in Consumer Discretionary also detracted from performance, but underweighting the sector lessened some of the negative total effect. The five largest detractors from performance for the period were BP PLC, Target Corp., Loews Corp., Occidental Petroleum Corp., and CRH PLC.
We believe the market is transitioning from dependence upon an accommodative Fed and low interest rates. Additionally, if central banks continue to diverge in their monetary policies to the benefit of the U.S. dollar, there may be an additional element of volatility and complexity that should benefit our active and fundamental stock selection process.
Ray Nixon, Jr.
Lewis Ropp
Brian Quinn, CFA
Co-Portfolio Managers
Barrow, Hanley, Mewhinney & Strauss, LLC
| | |
| Transamerica Funds | | Annual Report 2014 |
Page 5
Transamerica Dividend Focused
(unaudited)
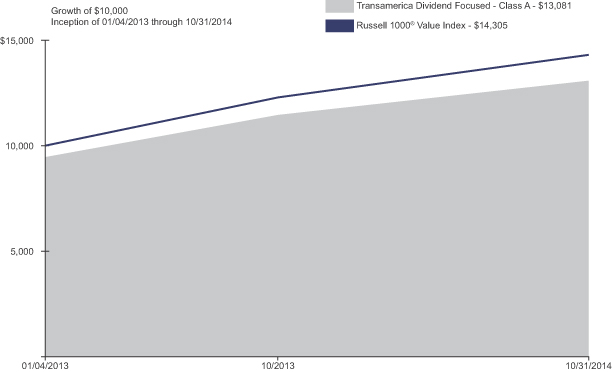
| | | | | | | | | | | | |
| Average Annual Total Return for Periods Ended 10/31/2014 | |
| | | 1 Year | | | 10 Years or
Life of Class | | | Inception Date | |
Class A (NAV) | | | 14.14 | % | | | 19.49 | % | | | 01/04/2013 | |
Class A (POP) | | | 7.84 | % | | | 15.86 | % | | | 01/04/2013 | |
Russell 1000® Value Index (A) | | | 16.46 | % | | | 21.68 | % | | | | |
Class C (NAV) | | | 13.30 | % | | | 18.61 | % | | | 01/04/2013 | |
Class C (POP) | | | 12.30 | % | | | 18.61 | % | | | 01/04/2013 | |
Class I (NAV) | | | 14.37 | % | | | 19.71 | % | | | 01/04/2013 | |
Class I2 (NAV) | | | 14.56 | % | | | 19.86 | % | | | 01/04/2013 | |
(A) The Russell 1000® Value Index is an unmanaged index used as a general measure of market performance. Calculations assume dividends and capital gains are reinvested and do not include any managerial expenses. The 10 Years or Life of Class calculation is based on the inception date of the class. You cannot invest directly in an index.
The performance data presented represents past performance; future results may vary. Performance data does not reflect the deduction of taxes that would be paid on Fund distributions or the redemption of Fund shares. Investment return and principal value will fluctuate so that an investor’s shares, when redeemed, may be worth more or less than their original cost. Current performance may be lower or higher than performance quoted. Please see www.transamerica.com for performance data current to the most recent month-end. Net Asset Value (“NAV”) returns include the reinvestment of dividends and capital gains but do not reflect any sales charges. Public Offering Price (“POP”) returns include the reinvestment of dividends and capital gains and reflect the maximum sales charge of 5.5% for A shares or the maximum applicable contingent deferred sales charge of 1% (during the first 12 months) for Class C shares. There are no sales charges on Class I and I2 shares.
Performance figures reflect any fee waivers and/or expense reimbursements by the Investment Adviser. Without such waivers and/or reimbursements, the performance would be lower. Future waivers and/or reimbursements are at the discretion of the Investment Adviser.
Performance results do not include adjustments made for financial reporting purposes in accordance with U.S. generally accepted accounting principles and may differ from amounts reported in the financial highlights.
Focused funds are less diversified than other mutual funds; therefore, the performance of each holding in a focused fund has a greater impact upon the overall portfolio, which increases the risks associated with investing in the Fund. Value investing carries the risk that the market will not recognize a security’s intrinsic value for a long time or that a stock considered undervalued. ADRs involve the same risks as foreign securities including currency fluctuations, adverse social and political developments, and relatively small size and lesser liquidity of the markets.
Russell Investment Group is the source and owner of the trademarks, service marks, and copyrights related to the Russell indexes. Russell® is a trademark of Russell Investment Group.
Please refer to page 72 for index descriptions.
| | |
| Transamerica Funds | | Annual Report 2014 |
Page 6
Transamerica Emerging Markets Debt
(unaudited)
MARKET ENVIRONMENT
Over the past fiscal year, the emerging market debt universe has witnessed periods of both euphoria and pain. 2014 started in a frenzy as the Turkish Central Bank hiked rates aggressively in late January, causing a dramatic turn in investor sentiment. Following the inauspicious start, the first half of 2014 recovered to report impressive returns despite geopolitical headwinds in Russia and the Middle East. With the call for higher interest rates in the U.S. and a stronger dollar failing to materialize for much of the first half, emerging market assets performed well. Corporate spreads tightened and foreign exchange (“F/X”), away from the hotspot of Russia, appreciated versus developed market currencies across the board. In the second half of the year, the euphoria faded, and despite U.S. interest rates rallying, the dollar appreciated dramatically and market sentiment shifted negatively. Commodity prices dropped, and high beta sovereigns and local currency positions underperformed.
Two themes have been driving factors in overall risk sentiment as it pertains to the asset class: elections and U.S. interest rates. On the election side, India and Indonesia have voted for reform while Brazil and Turkey have opted for the status quo. Meanwhile, U.S. interest rates remain low, with many investors looking at the U.S. as a potential carry trade given low yields in Germany and Japan. We believe that the election follow through will be key in determining the flow of funds into emerging economies, while the direction of interest rates will remain a heated debate for the some time to come.
“Data dependent” has been the phrase of the day, and the market continues to search for clues as to where and when the U.S. Federal Reserve (“Fed”) will move interest rates higher. With asset purchases ending in the U.S. and the European Central Bank trying to stimulate, the world is left wondering whether or not growth will materialize. Emerging market policy makers are adjusting to this in different ways, with some maintaining a focus on controlling inflation and others toeing the line between inflation and growth.
PERFORMANCE
For the year ended October 31, 2014, Transamerica Emerging Markets Debt Class A returned 4.91%. By comparison, its benchmark, the J.P. Morgan Emerging Markets Bond Index Global, returned 7.20%.
STRATEGY REVIEW
The Fund underperformed its benchmark, the J.P. Morgan Emerging Market Bond Index Global (the “Index”) during the fiscal year. The Fund’s diverse allocation underperformed, as high beta sovereign paper and local currency exposure lagged longer duration U.S. dollar (“USD”) sovereign paper. The Fund’s lack of exposure to interest rate sensitive securities, in favor of event dependent sovereign exposure was a large drag on performance.
The local currency exposure in the Fund ranged from 20% to 32% for the year. The focus remained on higher real rate countries like Brazil and reform oriented regimes in Mexico. As the year progressed, the Fund did increase exposure in lower volatility Asian countries, such as Malaysia and Thailand, while reducing some exposure within the higher volatility F/X space. The Fund did increase exposure to the Indian Rupee throughout the year and remains committed to that exposure.
Corporate allocations were more dynamic, with the headlines within Russia and Ukraine driving a significant shift in the asset mix of the Fund. The Fund reduced overall Russia risk by four to five percent, primarily through a reduction of corporate and local currency assets. Corporate exposure in Brazil and Turkey were increased with a focus on the five to seven year maturity bucket, where the Fund can increase its yield advantage without significantly increasing its duration exposure. The winter could provide pockets of opportunity in credits more exposed to the Russia/Ukraine conflict, however, the Fund remains at lower levels of exposure to that region.
Finally, in the USD sovereign space it was “a tale of two cities.” Low beta investment grade sovereigns, (away from Russia), performed very well on an absolute return basis as they have kept pace with U.S. Treasuries, while high beta countries such as Ukraine and Venezuela struggled. The Fund’s exposure in high grade assets like Mexico, Colombia and Turkey helped offset some of the drag in other areas, but this wasn’t enough to compensate for local currency and high beta sovereign exposure.
Looking forward, we are committed to keeping an active balance of diversified assets in the Fund and continue to search for individual opportunities that are exploitable. Brazilian policy makers could set the tone during the fourth quarter, as the market hopes for signals that the Dilma’s second term will not be a repeat of the first. Monetary and fiscal policy responses to lower commodity prices and increased F/X volatility will likely be a key driver of both investor sentiment and asset price moves going forward. Therefore, the Fund may increase exposure in local currency assets if we see policy makers start to act. It is too soon to call for the differentiation of emerging market F/X versus developed markets; however, we believe the massive underperformance of non-dollar assets could present an attractive entry point for the Fund.
| | |
| Transamerica Funds | | Annual Report 2014 |
Page 7
Transamerica Emerging Markets Debt
(unaudited)
STRATEGY REVIEW (continued)
Within the Fund, derivatives were a minor positive contributor to performance. The Fund used futures which were a drag on performance as well as currency forwards which added to returns.
Scott Moses, CFA
Todd Howard, CFA
Co-Portfolio Managers
Logan Circle Partners, LP
| | |
| Transamerica Funds | | Annual Report 2014 |
Page 8
Transamerica Emerging Markets Debt
(unaudited)
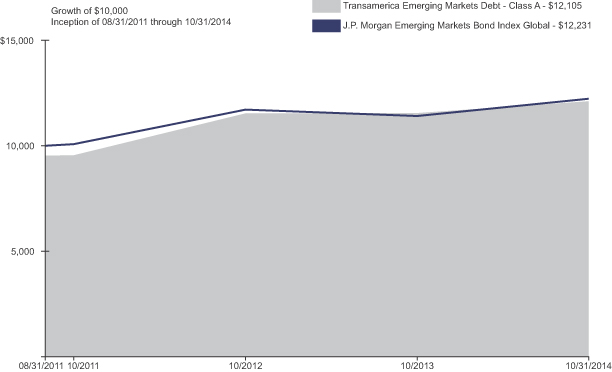
| | | | | | | | | | | | |
| Average Annual Total Return for Periods Ended 10/31/2014 | |
| | | 1 Year | | | 10 Years or
Life of Class | | | Inception Date | |
Class A (NAV) | | | 4.91 | % | | | 7.86 | % | | | 08/31/2011 | |
Class A (POP) | | | (0.07 | )% | | | 6.21 | % | | | 08/31/2011 | |
J.P. Morgan Emerging Markets Bond Index Global (A) | | | 7.20 | % | | | 6.56 | % | | | | |
Class C (NAV) | | | 4.31 | % | | | 7.14 | % | | | 08/31/2011 | |
Class C (POP) | | | 3.32 | % | | | 7.14 | % | | | 08/31/2011 | |
Class I (NAV) | | | 5.39 | % | | | 8.24 | % | | | 08/31/2011 | |
Class I2 (NAV) | | | 5.39 | % | | | 8.31 | % | | | 08/31/2011 | |
(A) The J.P. Morgan Emerging Markets Bond Index Global is an unmanaged index used as a general measure of market performance. Calculations assume dividends and capital gains are reinvested and do not include any managerial expenses. The 10 Years or Life of Class calculation is based on the inception date of the class. You cannot invest directly in an index.
The performance data presented represents past performance; future results may vary. Performance data does not reflect the deduction of taxes that would be paid on Fund distributions or the redemption of Fund shares. Investment return and principal value will fluctuate so that an investor’s shares, when redeemed, may be worth more or less than their original cost. Current performance may be lower or higher than performance quoted. Please see www.transamerica.com for performance data current to the most recent month-end. Net Asset Value (“NAV”) returns include the reinvestment of dividends and capital gains but do not reflect any sales charges. Public Offering Price (“POP”) returns include the reinvestment of dividends and capital gains and reflect the maximum sales charge of 4.75% for A shares or the maximum applicable contingent deferred sales charge of 1% (during the first 12 months) for Class C shares. There are no sales charges on Class I and I2 shares.
Performance figures reflect any fee waivers and/or expense reimbursements by the Investment Adviser. Without such waivers and/or reimbursements, the performance would be lower. Future waiver and/or reimbursements are at the discretion of the Investment Adviser.
Performance results do not include adjustments made for financial reporting purposes in accordance with U.S. generally accepted accounting principles and may differ from amounts reported in the financial highlights.
The risks of investing in foreign securities are magnified in emerging markets. These may include risks related to market and currency volatility, adverse social and political developments, and the relatively small size and lesser liquidity of these markets. Debt investing is subject to credit risk, inflation risk, and interest rate risk.
Please refer to page 72 for index descriptions.
| | |
| Transamerica Funds | | Annual Report 2014 |
Page 9
Transamerica Emerging Markets Equity
(unaudited)
MARKET ENVIRONMENT
The market environment for the year ended October 31, 2014 was volatile for the emerging markets.
While the global economy appears to be making positive gains in 2014, geopolitical risks do have the potential to disrupt this outlook. In addition, market volatility in September and October, and ongoing concerns about an Ebola epidemic have rattled investors. Growth rates may finally be able to sustain a normal, healthy recovery, albeit with the level of Gross Domestic Product (“GDP”) still tracking below previous long term trends. The global growth projection from the International Monetary Fund (“IMF”) for 2014 has been reduced by 0.3% to 3.4%. This reflects both a weak first quarter, particularly in the U.S., and a less optimistic outlook for several emerging markets. With somewhat stronger growth expected in some advanced economies next year, the IMF global growth projection for 2015 remains at 4%.
One key driver of market volatility was concerns over a Chinese slowdown. China’s GDP grew 7.5% in the second quarter of 2014 versus a year earlier, however almost half of the GDP increase was due to amplified fixed asset investment, which was up 17.3%. It appears that government stimulus continues to spur economic growth. The government has shown concerns that the drop in house prices will contribute to slower economic growth, and has taken steps to stimulate housing activity.
As is almost always the case, even in markets that are facing challenges, there will be individual companies that are thriving, and who may very well be a great investment now because of the cynicism around their area of the world. Perhaps now more than ever, a focus on good stock selection and solid macro risk control is critical. It is our opinion that emerging market equities have been, and continue to be, an important, long-term, core investment from a strategic perspective.
PERFORMANCE
For the year ended October 31, 2014, Transamerica Emerging Markets Equity Class A returned (0.40)%. By comparison, its benchmark, the Morgan Stanley Capital International Emerging Markets Index, returned 0.98%.
STRATEGY REVIEW
The Fund continues to be positioned in line with our overall philosophy. ClariVest Asset Management LLC employs a strategy of aggressively identifying and investing in the securities of firms entering or extending a fundamental growth cycle. We manage this aggressive strategy by marrying it with a disciplined approach to portfolio construction. We maintain a balanced profile of growth and value, as demonstrated by a positive exposure to recent earnings growth relative to benchmark, as well as a positive exposure to valuation (via such measures as earnings to price) relative to benchmark.
The Fund underperformed its benchmark this fiscal year. An overweight in Health Care and an underweight in Energy contributed to performance. An underweight to Russia helped performance, whereas an overweight to South Korea detracted from performance.
Top stock-level contributors included Tata Motors, Ltd., Series V, an India-based automotive company, and Largan Precision Co., Ltd., a Taiwanese camera lens manufacturer and Apple, Inc. supplier. Tata Motors, Ltd. outperformed due to strong performance in its Jaguar Land Rover division globally, and the introduction of a new car in India in an effort to gain market share. Largan Precision Co., Ltd. helped performance as it benefited from the smartphone camera upgrade cycle and an increase in smartphone demand from China. Bottom stock-level contributors included Hyundai Motor Co., a South Korean automotive company, and Vale SA, Class B, a Brazil-based metals and mining company. Hyundai Motors Co. detracted from performance following its successful bid for the land sold by Korea Electric Power Corp. at a higher price than expected. The company also suffered from a partial labor strike and an appreciating currency. Vale SA, the world’s largest iron ore producer, hurt performance as stocks in the industry suffered from a large decline in iron ore prices. The stock was also affected by the uncertainty leading up to the presidential elections in Brazil.
David R. Vaughn, CFA
Alex Turner, CFA
Stacey Nutt, PhD
Priyanshu Mutreja, CFA
Co-Portfolio Managers
ClariVest Asset Management LLC
| | |
| Transamerica Funds | | Annual Report 2014 |
Page 10
Transamerica Emerging Markets Equity
(unaudited)
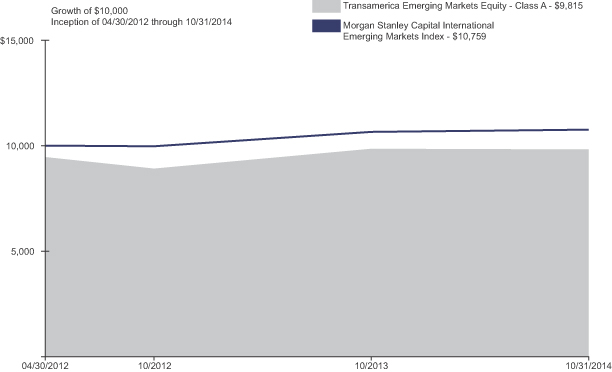
| | | | | | | | | | | | |
| Average Annual Total Return for Periods Ended 10/31/2014 | |
| | | 1 Year | | | 10 Years or
Life of Class | | | Inception Date | |
Class A (NAV) | | | (0.40 | )% | | | 1.51 | % | | | 04/30/2012 | |
Class A (POP) | | | (5.92 | )% | | | (0.74 | )% | | | 04/30/2012 | |
Morgan Stanley Capital International Emerging Markets Index (A) | | | 0.98 | % | | | 2.96 | % | | | | |
Class C (NAV) | | | (1.15 | )% | | | 0.84 | % | | | 04/30/2012 | |
Class C (POP) | | | (2.13 | )% | | | 0.84 | % | | | 04/30/2012 | |
Class I (NAV) | | | (0.04 | )% | | | 1.83 | % | | | 04/30/2012 | |
Class I2 (NAV) | | | (0.02 | )% | | | 1.91 | % | | | 04/30/2012 | |
(A) The Morgan Stanley Capital International Emerging Markets Index is an unmanaged index used as a general measure of market performance. Calculations assume dividends and capital gains are reinvested and do not include any managerial expenses. The 10 Years or Life of Fund calculation is based on the inception date of the class. You cannot invest directly in an index.
The performance data presented represents past performance; future results may vary. Performance data does not reflect the deduction of taxes that would be paid on Fund distributions or the redemption of Fund shares. Investment return and principal value will fluctuate so that an investor’s shares, when redeemed, may be worth more or less than their original cost. Current performance may be lower or higher than performance quoted. Please see www.transamerica.com for performance data current to the most recent month-end. Net Asset Value (“NAV”) returns include the reinvestment of dividends and capital gains but do not reflect any sales charges. Public Offering Price (“POP”) returns include the reinvestment of dividends and capital gains and reflect the maximum sales charge of 5.5% for A shares or the maximum applicable contingent deferred sales charge of 1% (during the first 12 months) for Class C shares. There are no sales charges on Class I and I2 shares.
Performance figures reflect any fee waivers and/or expense reimbursements by the Investment Adviser. Without such waivers and/or reimbursements, the performance would be lower. Future waivers and/or reimbursements are at the discretion of the Investment Adviser.
Performance results do not include adjustments made for financial reporting purposes in accordance with U.S. generally accepted accounting principles and may differ from amounts reported in the financial highlights.
The risks of investing in foreign securities are magnified in emerging markets. These may include risks related to market and currency volatility, adverse social and political developments and the relatively small size and less liquidity of these markets.
Please refer to page 72 for index descriptions.
| | |
| Transamerica Funds | | Annual Report 2014 |
Page 11
Transamerica Enhanced Muni
(unaudited)
MARKET ENVIRONMENT
For the year ended October 31, 2014 we have seen a flattening of the yield curve and positive performance from the municipal bond market. For the remainder of 2014, interest rates and market volatility will be important to monitor.
Puerto Rico, Detroit, and the bond insurers were the big headlines in the first quarter. Puerto Rico successfully placed $3.5 billion in general obligation bonds that were well received. Both Assured Guaranty and National Public Finance were upgraded by S&P to AA and AA- respectively. S&P downgraded Detroit Water and Sewer bonds to CCC. Puerto Rico continued to take up the majority of the headlines after legislation was passed allowing for the restructuring of Puerto Rico Electric Power Authority (“PREPA”), Puerto Rico Aqueduct & Sewer Authority (“PRASA”), and Puerto Rico Highways & Transportation Authority (“PRHTA”). In response, Moody’s downgraded PREPA to Caa2 from Ba3, PRASA downgraded to Caa1 from Ba3, and PRHTA downgraded to Caa1 from Ba3. Puerto Rico’s General Obligation bonds were downgraded to B2 from Ba2. While it is still possible that insured Puerto Rico bonds will see full or near-full repayment, many buyers are concerned that if governments can change the rules once they might change them in the future. Continued headline risk from Puerto Rico may create opportunities across the municipal market and in the name itself. Any panic could offer further opportunities, especially if redemption’s ramp up from funds with large losses in Puerto Rico.
A common theme for 2014 was large inflows to municipal bond funds coupled with a low supply of new issues. The trend reversal from 2013 was due to falling interest rates and anemic tax-exempt supply. Between the first and second quarters of 2014 alone, inflows rose substantially. This trend into bond funds from equities could continue, especially if there is concern of a slowing economy and developing geopolitical risks.
Supply has remained tight as state and local governments have been reluctant to issue new bonds, and the majority of refunding has already occurred. Improving state budgets combined with the supply and demand imbalance have been factors contributing to more positive fundamentals of municipal bond funds. These same dynamics have also contributed to a compression of credit spreads.
PERFORMANCE
For the year ended October 31, 2014, Transamerica Enhanced Muni Class A returned 10.05%. By comparison, its benchmark, the Barclays Managed Money Intermediate (1-17 Year) Index, returned 5.71%.
STRATEGY REVIEW
The Fund’s outperformance was primarily attributable to duration management, credit quality allocation, bond selection and active management. Over the course of the year, the duration of the Fund has moved slightly, but remained range bound. It was extended in the first half of the year and then scaled back slightly to opportunistically capitalize on the supply/demand imbalance of longer dated bonds.
Additionally, there was an increased exposure to lower rated credits, however, the average credit quality remained constant at A. This move helped bolster relative performance.
Looking ahead, we will continue to closely monitor and potentially adjust the Fund’s exposure to interest rates (i.e., duration). However, we don’t currently anticipate an upward move in interest rates in the first half of 2015.
Matthew Dalton
Brian Steeves
Co-Portfolio Managers
Belle Haven Investments, L.P.
| | |
| Transamerica Funds | | Annual Report 2014 |
Page 12
Transamerica Enhanced Muni
(unaudited)
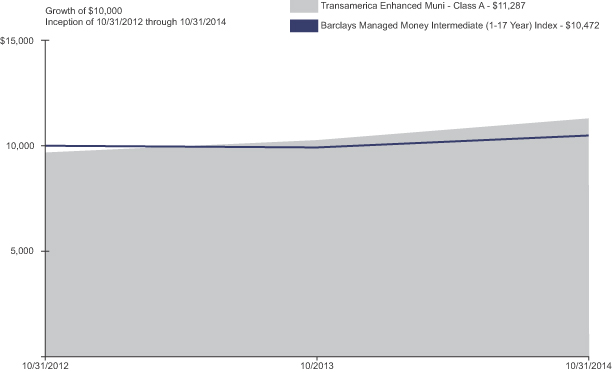
| | | | | | | | | | | | |
| Average Annual Total Return for Periods Ended 10/31/2014 | |
| | | 1 Year | | | 10 Years or
Life of Class | | | Inception Date | |
Class A (NAV) | | | 10.05 | % | | | 8.02 | % | | | 10/31/2012 | |
Class A (POP) | | | 6.45 | % | | | 6.23 | % | | | 10/31/2012 | |
Barclays Managed Money Intermediate (1-17 Year) Index (A) | | | 5.71 | % | | | 2.32 | % | | | | |
Class C (NAV) | | | 9.35 | % | | | 7.35 | % | | | 10/31/2012 | |
Class C (POP) | | | 8.35 | % | | | 7.35 | % | | | 10/31/2012 | |
Class I (NAV) | | | 10.16 | % | | | 8.10 | % | | | 10/31/2012 | |
(A) The Barclays Managed Money Intermediate (1-17 Year) Index is an unmanaged index used as a general measure of market performance. Calculations assume dividends and capital gains are reinvested and do not include any managerial expenses. The 10 Years or Life of Class calculation is based on the previous 10 years or since the inception date of the class, whichever is more recent. You cannot invest directly in an index.
The performance data presented represents past performance; future results may vary. Performance data does not reflect the deduction of taxes that would be paid on Fund distributions or the redemption of Fund shares. Investment return and principal value will fluctuate so that an investor’s shares, when redeemed, may be worth more or less than their original cost. Current performance may be lower or higher than performance quoted. Please see www.transamerica.com for performance data current to the most recent month-end. Net Asset Value (“NAV”) returns include the reinvestment of dividends and capital gains but do not reflect any sales charges. Public Offering Price (“POP”) returns include the reinvestment of dividends and capital gains and reflect the maximum sales charge of 3.25% for A shares or the maximum applicable contingent deferred sales charge of 1% (during the first 12 months) for Class C shares. There are no sales charges on Class I shares.
Performance figures reflect any fee waivers and/or expense reimbursements by the Investment Adviser. Without such waivers and/or reimbursements, the performance would be lower. Future waivers and/or reimbursements are at the discretion of the Investment Adviser.
Performance results do not include adjustments made for financial reporting purposes in accordance with U.S. generally accepted accounting principles and may differ from amounts reported in the financial highlights.
Municipal bond prices can rise or fall depending on interest rates. Interest rate changes generally have a greater effect on long-term bond prices. All municipal bonds carry credit risk that the issuer will default or be unable to make timely payments of interest and principal. Generally, lower rated bonds carry more credit risk.
Please refer to page 72 for index descriptions.
| | |
| Transamerica Funds | | Annual Report 2014 |
Page 13
Transamerica Flexible Income
(unaudited)
MARKET ENVIRONMENT
The year ended October 31, 2014 can be summarized as great expectations that were never met. This narrative applies most directly to the economic recovery and the expected sell-off in fixed income markets, especially long duration assets.
The expectations were building throughout 2013 as the 10-year Treasury rate almost doubled, briefly piercing the 3% threshold. This move was intertwined with the consensus thinking that the growth rate of the U.S. economy was finally going to hit terminal velocity of close to three percent. All was perceived to be going as planned until Mother Nature chimed in. The cold weather and snow in the first quarter of this year sent inventory accumulation into hibernation. What magnified the weather event is that in the second half of 2013, factories had been participating in the consensus view that the economy was accelerating by rapidly ramping up their inventories in anticipation of higher demand in 2014. The literal freeze in economic activity in the first quarter of 2014 created such a drag that it was quickly made apparent that the full-year growth numbers were not going to be attainable.
The underwhelming economic performance was not just a U.S. event. The consensus in the Eurozone had also been calling for a healthy acceleration. However, the necessary balance sheet repairs needed to allow banks to pass the Asset Quality Review test meant that lending to the region would be very hard to come by. Such a restriction of private credit, especially to the Small & Medium Sized Enterprises, is completely contrary to what is required for an economic expansion. The ensuing slowdown was not limited to the periphery, as even the German growth engine lost steam.
The most recent policy answer to the European growth problem created a new global narrative – divergent monetary policy in the developed world. At a time when the U.S. and U.K. have been winding down quantitative easing (“QE”) and talking about raising interest rates, Japan and Europe have been going the other way – either increasing the pace of QE or seeking alternative ways to implement QE policy. (Even the largest Emerging Market country (China) is adding stimulus through numerous channels.) This divergence of policy has resulted in a huge interest rate differential between sovereign bonds and has incentivized, in part, investors domiciled in countries with low yields to buy debt instruments in (relatively) higher interest bearing countries. This so called ‘tractor-beam’ effect has also contributed downward pressure to U.S. interest rates.
As is often the case, what the consensus was expecting to be the worst asset class for the coming year (i.e., 30-year Treasuries) turned out to be one of the best, especially after accounting for volatility. Can history repeat itself in 2015? It will be tough, at least for the long bond, given the challenges to attaining capital appreciation on top of the lower starting yield versus last year. Much of the 2015 narrative could be a continuation of the divergence in global monetary policy – does the U.S. Federal Reserve (“Fed”) and Bank of England start hiking rates in 2015? Does the European Central Bank start sovereign QE? How long does the Bank of Japan keep up its torrid pace of QE? While the answers to these questions may play out in due time, with no recession seen in site, Aegon USA Investment Management, LLC remains of the view that risk assets remain in a long-term bull market.
PERFORMANCE
For the year ended October 31, 2014, Transamerica Flexible Income Class A returned 3.98%. By comparison, its benchmark, the Barclays U.S. Aggregate Bond Index, returned 4.14%.
STRATEGY REVIEW
The Fund achieved a higher gross total return than the benchmark for the fiscal year ended October 31, 2014. The biggest driver of performance was our overweighting of various spread products, primarily, corporate bonds (investment grade and high yield). In addition, investments in non-agency residential mortgage backed securities (“RMBS”) as well as name and sector selection added to Fund performance. Our underweighting of U.S. Treasuries and Agency mortgage backed securities (“MBS”) securities helped performance given their minimal carry and interest rate risk.
Corporate bonds continued to benefit from strong corporate profitability and robust market technicals. However, given the increase in M&A activity this year, diligence to avoid idiosyncratic risks became more paramount. Our overweighting of financials benefited the Fund during the period, as we have seen credit spreads tighten due to the improved environment for asset quality and regulations supporting credit quality.
Within other spread sectors, our allocation to non-agency RMBS was a solid contributor during the fiscal year. Improvement in the housing environment due to price appreciation, lower delinquencies and higher recoveries all helped RMBS performance. We continued to be selective in our emerging markets positioning, investing mostly in Mexico and in solid corporate credits. Though we have remained cautious on many of these markets, we believe there continue to be select opportunities to pursue yield and return.
| | |
| Transamerica Funds | | Annual Report 2014 |
Page 14
Transamerica Flexible Income
(unaudited)
STRATEGY REVIEW (continued)
Finally, our yield curve positioning was a drag on performance during the year. Long Treasury bonds rallied during the year as the Fed began to normalize its policies, and given the low global interest rate environment, we were underweight this component of the yield curve. While the rally in the long end of the curve added to the Index’s total returns, the excess returns from our investments in other spread based assets helped performance for the year. While spreads on risky assets do not offer the return opportunities they once did, we believe there are still excess yield opportunities available.
Brian W. Westhoff, CFA
Doug Weih, CFA
Rick Perry, CFA
James K. Schaeffer, Jr.
Co-Portfolio Managers
Aegon USA Investment Management, LLC
| | |
| Transamerica Funds | | Annual Report 2014 |
Page 15
Transamerica Flexible Income
(unaudited)
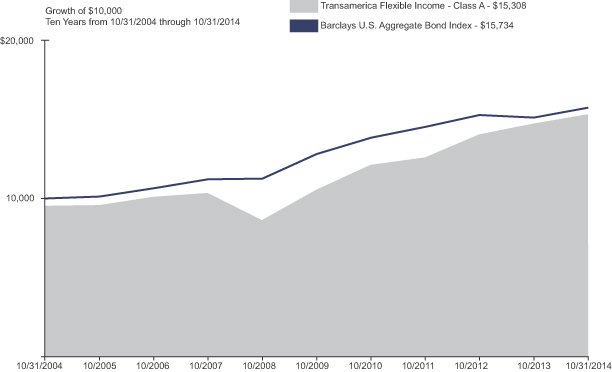
| | | | | | | | | | | | | | | | |
| Average Annual Total Return for Periods Ended 10/31/2014 | |
| | | 1 Year | | | 5 Years | | | 10 Years or
Life of Class | | | Inception Date | |
Class A (NAV) | | | 3.98 | % | | | 7.75 | % | | | 4.86 | % | | | 06/29/1987 | |
Class A (POP) | | | (0.98 | )% | | | 6.70 | % | | | 4.35 | % | | | 06/29/1987 | |
Barclays U.S. Aggregate Bond Index (A) | | | 4.14 | % | | | 4.22 | % | | | 4.64 | % | | | | |
Class B (NAV) | | | 3.09 | % | | | 6.86 | % | | | 4.24 | % | | | 10/01/1995 | |
Class B (POP) | | | (1.91 | )% | | | 6.70 | % | | | 4.24 | % | | | 10/01/1995 | |
Class C (NAV) | | | 3.26 | % | | | 7.00 | % | | | 4.15 | % | | | 11/11/2002 | |
Class C (POP) | | | 2.26 | % | | | 7.00 | % | | | 4.15 | % | | | 11/11/2002 | |
Class I (NAV) | | | 4.25 | % | | | N/A | | | | 7.77 | % | | | 11/30/2009 | |
Class I2 (NAV) | | | 4.35 | % | | | 8.16 | % | | | 5.37 | % | | | 11/08/2004 | |
(A) The Barclays U.S. Aggregate Bond Index is an unmanaged index used as a general measure of market performance. Calculations assume dividends and capital gains are reinvested and do not include any managerial expenses. The 10 Years or Life of Class calculation is based on the previous 10 years or since the inception date of the class, whichever is more recent. You cannot invest directly in an index.
The performance data presented represents past performance; future results may vary. Performance data does not reflect the deduction of taxes that would be paid on Fund distributions or the redemption of Fund shares. Investment return and principal value will fluctuate so that an investor’s shares, when redeemed, may be worth more or less than their original cost. Current performance may be lower or higher than performance quoted. Please see www.transamerica.com for performance data current to the most recent month-end. Net Asset Value (“NAV”) returns include the reinvestment of dividends and capital gains but do not reflect any sales charges. Public Offering Price (“POP”) returns include the reinvestment of dividends and capital gains and reflect the maximum sales charge of 4.75% for A shares or the maximum applicable contingent deferred sales charge (5% in the 1st year, decreasing to 0% after 6 years) for Class B shares and 1% (during the first 12 months) for Class C shares. Shares purchased prior to March 1, 2004 are subject to a maximum applicable contingent deferred sales charge (5% in the 1st year, decreasing to 0% after 7 years) for Class B shares and (2% in the 1st year, decreasing to 0% after 2 years) for Class C shares. There are no sales charges on Class I and I2 shares.
Performance figures reflect any fee waivers and/or expense reimbursements by the Investment Adviser. Without such waivers and/or reimbursements, the performance would be lower. Future waivers and/or reimbursements are at the discretion of the Investment Adviser.
Performance results do not include adjustments made for financial reporting purposes in accordance with U.S. generally accepted accounting principles and may differ from amounts reported in the financial highlights.
Investing in bond funds entails interest rate and credit risk as well as additional risks in that the Fund may invest in high-yield/high-risk bonds and is subject to greater levels of liquidity risk, which are described in more detail in the prospectus.
Please refer to page 72 for index descriptions.
| | |
| Transamerica Funds | | Annual Report 2014 |
Page 16
Transamerica Floating Rate
(unaudited)
MARKET ENVIRONMENT
The year ended October 31, 2014 can be summarized as great expectations that were never met. This narrative applies most directly to the economic recovery and the expected sell-off in fixed income markets, especially long duration assets.
The expectations were building throughout 2013 as the 10-year Treasury rate almost doubled, briefly piercing the 3% threshold. This move was intertwined with the consensus thinking that the growth rate of the U.S. economy was finally going to hit terminal velocity of close to three percent. All was perceived to be going as planned until Mother Nature chimed in. The cold weather and snow in the first quarter of this year sent inventory accumulation into hibernation. What magnified the weather event is that in the second half of 2013, factories had been participating in the consensus view that the economy was accelerating by rapidly ramping up their inventories in anticipation of higher demand in 2014. The literal freeze in economic activity in the first quarter of 2014 created such a drag that it was quickly made apparent that the full-year growth numbers were not going to be attainable.
The underwhelming economic performance was not just a U.S. event. The consensus in the Eurozone had also been calling for a healthy acceleration. However, the necessary balance sheet repairs needed to allow banks to pass the Asset Quality Review test meant that lending to the region would be very hard to come by. Such a restriction of private credit, especially to the Small & Medium Sized Enterprises, is completely contrary to what is required for an economic expansion. The ensuing slowdown was not limited to the periphery, as even the German growth engine lost steam.
The most recent policy answer to the European growth problem created a new global narrative – divergent monetary policy in the developed world. At a time when the U.S. and U.K. have been winding down quantitative easing (“QE”) and talking about raising interest rates, Japan and Europe have been going the other way – either increasing the pace of QE or seeking alternative ways to implement QE policy. (Even the largest Emerging Market country (China) is adding stimulus through numerous channels.) This divergence of policy has resulted in a huge interest rate differential between sovereign bonds and has incentivized, in part, investors domiciled in countries with low yields to buy debt instruments in (relatively) higher interest bearing countries. This so called ‘tractor-beam’ effect has also contributed downward pressure to U.S. interest rates.
As is often the case, what the consensus was expecting to be the worst asset class for the coming year (i.e., 30-year Treasuries) turned out to be one of the best, especially after accounting for volatility. Can history repeat itself in 2015? It will be tough, at least for the long bond, given the challenges to attaining capital appreciation on top of the lower starting yield versus last year. Much of the 2015 narrative could be a continuation of the divergence in global monetary policy – does the U.S. Federal Reserve (“Fed”) and Bank of England start hiking rates in 2015? Does the European Central Bank start sovereign QE? How long does the Bank of Japan keep up its torrid pace of QE? While the answers to these questions may play out in due time, with no recession seen in site, Aegon USA Investment Management, LLC remains of the view that risk assets remain in a long-term bull market.
PERFORMANCE
For the year ended October 31, 2014, Transamerica Floating Rate Class A returned 2.17%. By comparison, its benchmark, the Credit Suisse Leveraged Loan Index, returned 3.77%.
STRATEGY REVIEW
The Fund finished its first full year at the end of October 2014. Preliminary performance for this time period shows the Fund slightly underperforming the benchmark. Due to the large cash installments during the ramp-up, transaction costs had a negative impact on performance. The Fund did benefit from an underweighting of Metals and Mining sectors as well as other Energy related sectors (i.e. offshore drilling) as these sectors underperformed.
In terms of valuation, we believe the leveraged loan asset class remains attractive at current levels. We believe for the next several months, loans can earn a coupon while having some potential for limited capital appreciation. This is due to our belief that Collateralized Loan Obligation issuance may create increasing demand for loans. In addition, longer term, we believe short term interest rates should eventually start to rise, potentially increasing demand for floating-rate loans which could push prices up. Fundamentally, we believe the credit markets can remain reasonably strong as the U.S. economy continues to recover and many corporate balance sheets exhibit abundant liquidity.
John F. Bailey, CFA
Jason P. Felderman, CFA
James K. Schaeffer, Jr.
Co-Portfolio Managers
Aegon USA Investment Management, LLC
| | |
| Transamerica Funds | | Annual Report 2014 |
Page 17
Transamerica Floating Rate
(unaudited)
| | | | | | | | | | | | |
| Average Annual Total Return for Periods Ended 10/31/2014 | |
| | | 1 Year | | | 10 Years or
Life of Class | | | Inception Date | |
Class A (NAV) | | | 2.17 | % | | | 2.17 | % | | | 10/31/2013 | |
Class A (POP) | | | (2.69 | )% | | | (2.69 | )% | | | 10/31/2013 | |
Credit Suisse Leveraged Loan Index (A) | | | 3.77 | % | | | 3.77 | % | | | | |
Class C (NAV) | | | 1.43 | % | | | 1.43 | % | | | 10/31/2013 | |
Class C (POP) | | | 0.44 | % | | | 0.44 | % | | | 10/31/2013 | |
Class I (NAV) | | | 2.45 | % | | | 2.45 | % | | | 10/31/2013 | |
Class I2 (NAV) | | | 2.47 | % | | | 2.47 | % | | | 10/31/2013 | |
(A) The Credit Suisse Leveraged Loan Index is an unmanaged index used as a general measure of market performance. Calculations assume dividends and capital gains are reinvested and do not include any managerial expenses. The 10 Years or Life of Class calculation is based on the inception date of the class. You cannot invest directly in an index.
The performance data presented represents past performance; future results may vary. Performance data does not reflect the deduction of taxes that would be paid on Fund distributions or the redemption of Fund shares. Investment return and principal value will fluctuate so that an investor’s shares, when redeemed, may be worth more or less than their original cost. Current performance may be lower or higher than performance quoted. Please see www.transamerica.com for performance data current to the most recent month-end. Net Asset Value (“NAV”) returns include the reinvestment of dividends and capital gains but do not reflect any sales charges. Public Offering Price (“POP”) returns include the reinvestment of dividends and capital gains and reflect the maximum sales charge of 4.75% for A shares or the maximum applicable contingent deferred sales charge of 1% (during the first 12 months) for Class C shares. There are no sales charges on Class I and I2 shares.
Performance figures reflect any fee waivers and/or expense reimbursements by the Investment Adviser. Without such waivers and/or reimbursements, the performance would be lower. Future waivers and/or reimbursements are at the discretion of the Investment Adviser.
Performance results do not include adjustments made for financial reporting purposes in accordance with U.S. generally accepted accounting principles and may differ from amounts reported in the financial highlights.
Investing in high-yield bond (“junk bonds”) funds may be subject to greater volatility and risks as the income derived from these securities is not guaranteed and may be unpredictable and the value of these securities tends to decline when interest rates increases. Interest rates may go up, causing the value of the Fund’s investments to decline. Changes in interest rates, the market’s perception of the issuers and the creditworthiness of the issuers may significantly affect the value of a bond.
Please refer to page 72 for index descriptions.
| | |
| Transamerica Funds | | Annual Report 2014 |
Page 18
Transamerica Global Bond
(unaudited)
MARKET ENVIRONMENT
Since the inception of the Transamerica Global Bond, there have been significant fluctuations in global currencies and interest rates. In the early part of 2014, the asset class exhibited very little currency volatility with a bullish backdrop for global rates. However, as monetary policies diverged further over the course of the year, with both the European Central Bank and the Bank of Japan committing to additional monetary easing, the U.S. dollar stood out as a compelling asset within an environment of global competitive devaluation. The commensurate commodity price weakness supported by dollar strength and weaker global demand also exacerbated moves for many developing market currencies.
PERFORMANCE
For the period ended October 31, 2014, Transamerica Global Bond Class A returned (0.82)%. By comparison, its benchmark, the Citigroup Non-U.S. Dollar World Government Bond Index (the “Index”), returned (3.64)%.
STRATEGY REVIEW
Although the absolute return was negative, the Fund outperformed the Index from inception thru October 31, 2014.
Opportunities within global fixed income remain, but room for dramatically lower yields is limited within many of the largest sovereign issuers like Germany, Japan, Sweden and other core European countries. We will look to maintain positions in countries where we believe the fundamental outlook is strongest and valuations remain supportive, such as Mexico, New Zealand and United Kingdom. Within developing market exposures, we prefer to own idiosyncratic opportunities such as India, Indonesia and longer-dated Brazil local opportunities.
The Fund is currently positioned in anticipation of a gradual rising rate environment, as we are marginally shorter duration versus the Index. There is continued anticipation that the dollar will benefit from an improving U.S. economy along with a higher probability that the U.S. Federal Reserve (“Fed”) will raise rates in mid-2015. We envisage that the majority of the U.S. dollar’s strength will be reflected in developed market currencies, such as the Japanese Yen and the Euro and to a lesser degree in developing market currencies.
The Fund utilizes derivatives such as forwards primarily to gain or hedge currency exposure. During the period, derivatives slightly detracted from returns.
Scott Moses, CFA
Todd Howard, CFA
Co-Portfolio Managers
Logan Circle Partners, LP
| | |
| Transamerica Funds | | Annual Report 2014 |
Page 19
Transamerica Global Bond
(unaudited)
| | | | | | | | |
| Average Annual Total Return for Periods Ended 10/31/2014 | |
| | | 10 Years or
Life of Class | | | Inception Date | |
Class A (NAV) | | | (0.82 | )% (A) | | | 03/01/2014 | |
Class A (POP) | | | (5.54 | )% (A) | | | 03/01/2014 | |
Citigroup Non-U.S. Dollar World Government Bond Index (B) | | | (3.64 | )% (A) | | | | |
Class C (NAV) | | | (1.34 | )% (A) | | | 03/01/2014 | |
Class C (POP) | | | (2.32 | )% (A) | | | 03/01/2014 | |
Class I (NAV) | | | (0.71 | )% (A) | | | 03/01/2014 | |
Class I2 (NAV) | | | (0.61 | )% (A) | | | 03/01/2014 | |
(A) Not annualized.
(B) The Citigroup Non-U.S. Dollar World Government Bond Index is an unmanaged index used as a general measure of market performance. Calculations assume dividends and capital gains are reinvested and do not include any managerial expenses. The 10 Years or Life of Class calculation is based on the inception date of the class. You cannot invest directly in an index.
The performance data presented represents past performance; future results may vary. Performance data does not reflect the deduction of taxes that would be paid on Fund distributions or the redemption of Fund shares. Investment return and principal value will fluctuate so that an investor’s shares, when redeemed, may be worth more or less than their original cost. Current performance may be lower or higher than performance quoted. Please see www.transamerica.com for performance data current to the most recent month-end. Net Asset Value (“NAV”) returns include the reinvestment of dividends and capital gains but do not reflect any sales charges. Public Offering Price (“POP”) returns include the reinvestment of dividends and capital gains and reflect the maximum sales charge of 4.75% for A shares or the maximum applicable contingent deferred sales charge of 1% (during the first 12 months) for Class C shares. There are no sales charges on Class I and I2 shares.
Performance figures reflect any fee waivers and/or expense reimbursements by the Investment Adviser. Without such waivers and/or reimbursements, the performance would be lower. Future waivers and/or reimbursements are at the discretion of the Investment Adviser.
Performance results do not include adjustments made for financial reporting purposes in accordance with U.S. generally accepted accounting principles and may differ from amounts reported in the financial highlights.
Investments in global/international markets involve risks not associated with U.S. markets, such as currency fluctuations adverse social and political developments, and the relatively small size and lesser liquidity of the markets. Investments in developing markets involve greater risks than investments in developed markets. Fixed income investing is subject to credit risk, inflation risk, and interest rate risk.
Please refer to page 72 for index descriptions.
| | |
| Transamerica Funds | | Annual Report 2014 |
Page 20
Transamerica Global Equity
(formerly, Transamerica Multi-Manager International Portfolio)
(unaudited)
MARKET ENVIRONMENT
Since we began managing the Fund in September 2014, global equity markets experienced elevated volatility and a brief but sharp correction that bottomed in mid-October. There were a number of contributing factors: decelerating growth in most geographies outside of the U.S.; the fear of Ebola spreading beyond West Africa; falling commodity prices, especially in crude oil; and growing concern of deflation in the Eurozone. These issues prompted policymakers to seek more market-friendly measures in an effort to calm market sentiment and stimulate aggregate demand. Specifically, the European Central Bank indicated that it intends to materially expand its balance sheet through low-cost loans to European banks and asset purchases. The Chinese central bank injected 200 billion yuan ($32.7 billion) into 20 banks in an effort to boost liquidity. The Bank of Japan then gave markets a surprise Halloween treat by announcing an unexpected expansion in its quantitative and qualitative easing program on October 31, 2014. These measures helped to calm jittery markets and triggered a V-shaped recovery in equity markets around the globe.
On the currency front, the U.S. dollar rose to multi-year highs. The U.S. economy strengthened while the rest of the world appeared to be softening. Likewise, U.S. monetary policy moved toward tightening while several of its trading partners were still easing. However, in spite of the strengthening economy, U.S. Treasury’s long bond yields drifted lower in 2014. With crude oil prices sliding to multi-year lows, it may take longer to reach the U.S. Federal Reserve’s 2% inflation target.
PERFORMANCE
For the year ended October 31, 2014, Transamerica Global Equity Class A returned 2.54%. By comparison, its primary and secondary benchmarks, the Morgan Stanley Capital International All Country World Index Net and Morgan Stanley Capital International World ex-U.S. Index, returned 7.77% and 0.30%, respectively.
STRATEGY REVIEW
We continue to expect that equities should have a positive bias as long as corporate earnings continue to grow on a year-over-year basis and valuations in general remain reasonable based on historic measures. We made several Fund changes as a result of economic and industry developments. Specifically, we reduced exposure to the energy sector as crude oil prices declined. It was unclear the extent to which Saudi Arabia would reduce production in an effort to support oil prices as it has done in the past. We also increased exposure to stocks that we believe could benefit from lower fuel costs. For example, some companies in the utilities and hospitality industries may benefit from lower fuel costs and potentially more consumer spending. We also continued to view airlines and cruise industries positively.
Additionally, we believe the strengthening U.S. dollar will start to impact many multinational corporations’ sales and earnings. U.S.-headquartered multinational corporations could face some potential headwinds as their products and services become more expensive overseas. On the other hand, select exporters in the Eurozone and Japan would likely benefit from having a much weaker home currency to boost their exports.
Our Fund’s largest sector overweight was in Health Care, which has benefited from aging demographics in the developed world and a rising standard of living in emerging markets. Select companies also benefited from breakthrough innovations in life sciences.
The Fund’s biggest sector underweight was in Materials. With China working on rebalancing its economy from infrastructure driven to a more consumption-driven growth model, we believe base metal prices are likely to continue their downward bias until production is materially curtailed.
David P. Harris, CFA
Jimmy C. Chang, CFA
Co-Portfolio Managers
Rockefeller & Co., Inc.
| | |
| Transamerica Funds | | Annual Report 2014 |
Page 21
Transamerica Global Equity
(formerly, Transamerica Multi-Manager International Portfolio)
(unaudited)
| | | | | | | | | | | | | | | | |
| Average Annual Total Return for Periods Ended 10/31/2014 | |
| | | 1 Year | | | 5 Years | | | 10 Years or
Life of Class | | | Inception Date | |
Class A (NAV) | | | 2.54 | % | | | 6.98 | % | | | 3.21 | % | | | 03/01/2006 | |
Class A (POP) | | | (3.12 | )% | | | 5.77 | % | | | 2.54 | % | | | 03/01/2006 | |
Morgan Stanley Capital International All Country World Index Net (A) | | | 7.77 | % | | | 10.57 | % | | | 5.26 | % | | | | |
Morgan Stanley Capital International World ex-U.S. Index (A) | | | 0.30 | % | | | 7.03 | % | | | 3.81 | % | | | | |
Class B (NAV) | | | 1.64 | % | | | 6.16 | % | | | 2.51 | % | | | 03/01/2006 | |
Class B (POP) | | | (3.36 | )% | | | 6.00 | % | | | 2.51 | % | | | 03/01/2006 | |
Class C (NAV) | | | 1.73 | % | | | 6.26 | % | | | 2.51 | % | | | 03/01/2006 | |
Class C (POP) | | | 0.73 | % | | | 6.26 | % | | | 2.51 | % | | | 03/01/2006 | |
Class I (NAV) | | | 2.75 | % | | | N/A | | | | 6.76 | % | | | 11/30/2009 | |
Class I2 (NAV) | | | N/A | | | | N/A | | | | (2.21 | )% (B) | | | 09/04/2014 | |
(A) The Morgan Stanley Capital International All Country World Index Net and Morgan Stanley Capital International World ex-U.S. Index are unmanaged indices used as a general measure of market performance. Calculations assume dividends and capital gains are reinvested and do not include any managerial expenses. The 10 Years or Life of Class calculation is based on the inception date of the class. You cannot invest directly in an index.
(B) Not annualized.
The performance data presented represents past performance; future results may vary. Performance data does not reflect the deduction of taxes that would be paid on Fund distributions or the redemption of Fund shares. Investment return and principal value will fluctuate so that an investor’s shares, when redeemed, may be worth more or less than their original cost. Current performance may be lower or higher than performance quoted. Please see www.transamerica.com for performance data current to the most recent month-end. Net Asset Value (“NAV”) returns include the reinvestment of dividends and capital gains but do not reflect any sales charges. Public Offering Price (“POP”) returns include the reinvestment of dividends and capital gains and reflect the maximum sales charge of 5.5% for A shares or the maximum applicable contingent deferred sales charge (5% in the 1st year, decreasing to 0% after 6 years) for Class B shares or 1% (during the first 12 months) for Class C shares. There are no sales charges on Class I and I2 shares.
Performance figures reflect any fee waivers and/or expense reimbursements by the Investment Adviser. Without such waivers and/or reimbursements, the performance would be lower. Future waivers and/or reimbursements are at the discretion of the Investment Adviser.
Performance results do not include adjustments made for financial reporting purposes in accordance with U.S. generally accepted accounting principles and may differ from amounts reported in the financial highlights.
Investments in global/international markets involve risks not associated with U.S. markets, such as currency fluctuations, adverse social and political developments, and the relatively small size and lesser liquidity of the markets. Investments in developing markets involve greater risks than investments in developed markets. Investments in small- and medium-size companies involve greater risks than are customarily associated with more established companies.
Please refer to page 72 for index descriptions.
| | |
| Transamerica Funds | | Annual Report 2014 |
Page 22
Transamerica Growth Opportunities
(unaudited)
MARKET ENVIRONMENT
Although volatility re-emerged toward the end of the period, U.S. stocks appreciated strongly over the 12-month period. After much anticipation, the U.S. Federal Reserve (“Fed”) announced in December 2013 that it would begin reducing its bond purchases beginning the next month. Stocks finished 2013 on a high note but stumbled in the early months of 2014 as an exceptionally cold winter dampened economic activity. As the year progressed, economic growth recovered and stocks resumed their climb. However, August saw a return to volatility as geopolitical risks intensified, the pace of global economic growth slowed, and the timing of the Fed’s first rate hike was debated. A spike in oil prices during the summer also contributed to some softness in U.S. economic data. After recovering their losses in September, stocks tumbled sharply again in October. Uncertainty about U.S. corporate earnings growth and weak economic data in Europe and China contributed to market volatility. In the final weeks of the period, stocks rallied strongly, erasing the losses from the downturn earlier in October.
PERFORMANCE
For the year ended October 31, 2014, Transamerica Growth Opportunities Class A returned 9.57%. By comparison, its benchmark, the Russell Midcap® Growth Index, returned 14.59%.
STRATEGY REVIEW
The investment team looks for high-quality growth companies that we believe have these attributes: sustainable competitive advantages, above-average business visibility, rising return on invested capital, strong free cash flow generation and a favorable risk/reward profile. We find these companies through intense fundamental research. Our emphasis is on secular growth, and as a result, short-term market events are not as meaningful in the stock selection process.
The Fund underperformed its benchmark during the year ended October 31, 2014.
Relative underperformance was mainly driven by stock selection in the Information Technology and Consumer Discretionary sectors. A holding in cyber security services provider, FireEye, Inc., was the largest detractor in the Fund overall. The stock declined in March and April amid a general sell-off in high-growth, high-valuation stocks. Its stock price saw another drop in May, when shares were pressured by the expiration of the lock-up period, which restricts certain insiders from selling shares within a certain time period following an initial public offering. We remain attracted to FireEye, Inc., as we believe it is a leading next-generation security vendor with a disruptive technology and a large addressable market.
In contrast, the Health Care sector was a positive contributor to relative performance, due to both stock selection and overweight position in the sector. Illumina, Inc., a leader in genetic testing and analysis, was the Fund’s top-contributing holding for the period. Although Illumina, Inc.’s stock price was similarly pressured by the general sell-off in high-growth and high-valuation stocks in March and April, its shares recovered meaningfully in May and June. We attribute the strength to continued investor enthusiasm for the company’s progress in lowering the cost of genome mapping. We believe Illumina, Inc. is unique because it controls the core patents and intellectual property used in analyzing genetic variation and biological function, and provides best-in-class genomic tools for academic and industry researchers to generate valuable medical information that can potentially enhance drug discovery and clinical research.
The Fund’s underweight in the Energy sector was beneficial to relative performance as well, as the sector was the weakest-performing group in the Index during the period.
During the period, the Fund utilized options for foreign exchange management. These positions detracted from performance.
Dennis P. Lynch
Alexander T. Norton
Armistead B. Nash
David S. Cohen
Jason C. Yeung, CFA
Sam G. Chainani, CFA
Co-Portfolio Managers
Morgan Stanley Investment Management Inc.
| | |
| Transamerica Funds | | Annual Report 2014 |
Page 23
Transamerica Growth Opportunities
(unaudited)
| | | | | | | | | | | | | | | | |
| Average Annual Total Return for Periods Ended 10/31/2014 | |
| | | 1 Year | | | 5 Years | | | 10 Years or
Life of Class | | | Inception Date | |
Class A (NAV) | | | 9.57 | % | | | 15.32 | % | | | 8.80 | % | | | 03/01/2000 | |
Class A (POP) | | | 3.58 | % | | | 14.02 | % | | | 8.19 | % | | | 03/01/2000 | |
Russell Midcap® Growth Index (A) | | | 14.59 | % | | | 18.73 | % | | | 10.17 | % | | | | |
Class B (NAV) | | | 8.63 | % | | | 14.46 | % | | | 8.17 | % | | | 03/01/2000 | |
Class B (POP) | | | 3.63 | % | | | 14.35 | % | | | 8.17 | % | | | 03/01/2000 | |
Class C (NAV) | | | 8.80 | % | | | 14.52 | % | | | 8.03 | % | | | 11/11/2002 | |
Class C (POP) | | | 7.80 | % | | | 14.52 | % | | | 8.03 | % | | | 11/11/2002 | |
Class I (NAV) | | | 9.97 | % | | | N/A | | | | 15.40 | % | | | 11/30/2009 | |
Class I2 (NAV) | | | 10.16 | % | | | 16.16 | % | | | 8.40 | % | | | 11/15/2005 | |
(A) The Russell Midcap® Growth Index is an unmanaged index used as a general measure of market performance. Calculations assume dividends and capital gains are reinvested and do not include any managerial expenses. The 10 Years or Life of Class calculation is based on the previous 10 years or since the inception date of the class, whichever is more recent. You cannot invest directly in an index.
The performance data presented represents past performance; future results may vary. Performance data does not reflect the deduction of taxes that would be paid on Fund distributions or the redemption of Fund shares. Investment return and principal value will fluctuate so that an investor’s shares, when redeemed, may be worth more or less than their original cost. Current performance may be lower or higher than performance quoted. Please see www.transamerica.com for performance data current to the most recent month-end. Net Asset Value (“NAV”) returns include the reinvestment of dividends and capital gains but do not reflect any sales charges. Public Offering Price (“POP”) returns include the reinvestment of dividends and capital gains and reflect the maximum sales charge of 5.5% for A shares or the maximum applicable contingent deferred sales charge (5% in the 1st year, decreasing to 0% after 6 years) for Class B shares and 1% (during the first 12 months) for Class C shares. Shares purchased prior to March 1, 2004 are subject to a maximum applicable contingent deferred sales charge (5% in the 1st year, decreasing to 0% after 7 years) for Class B shares and (2% in the 1st year, decreasing to 0% after 2 years) for Class C shares. There are no sales charges on Class I and I2 shares.
Performance figures reflect any fee waivers and/or expense reimbursements by the Investment Adviser. Without such waivers and/or reimbursements, the performance would be lower. Future waivers and/or reimbursements are at the discretion of the Investment Adviser.
Performance results do not include adjustments made for financial reporting purposes in accordance with U.S. generally accepted accounting principles and may differ from amounts reported in the financial highlights.
Investing in small and medium-size companies involves greater risk than is customarily associated with more established companies. The securities of small and mid capitalization companies are subject to higher volatility than larger, more established companies.
Russell Investment Group is the source and owner of the trademarks, service marks, and copyrights related to the Russell indexes. Russell® is a trademark of Russell Investment Group.
Please refer to page 72 for index descriptions.
| | |
| Transamerica Funds | | Annual Report 2014 |
Page 24
Transamerica High Yield Bond
(unaudited)
MARKET ENVIRONMENT
The year ended October 31, 2014 can be summarized as great expectations that were never met. This narrative applies most directly to the economic recovery and the expected sell-off in fixed income markets, especially long duration assets.
The expectations were building throughout 2013 as the 10-year Treasury rate almost doubled, briefly piercing the 3% threshold. This move was intertwined with the consensus thinking that the growth rate of the U.S. economy was finally going to hit terminal velocity of close to three percent. All was perceived to be going as planned until Mother Nature chimed in. The cold weather and snow in the first quarter of this year sent inventory accumulation into hibernation. What magnified the weather event is that in the second half of 2013, factories had been participating in the consensus view that the economy was accelerating by rapidly ramping up their inventories in anticipation of higher demand in 2014. The literal freeze in economic activity in the first quarter of 2014 created such a drag that it was quickly made apparent that the full-year growth numbers were not going to be attainable.
The underwhelming economic performance was not just a U.S. event. The consensus in the Eurozone had also been calling for a healthy acceleration. However, the necessary balance sheet repairs needed to allow banks to pass the Asset Quality Review test meant that lending to the region would be very hard to come by. Such a restriction of private credit, especially to the Small & Medium Sized Enterprises, is completely contrary to what is required for an economic expansion. The ensuing slowdown was not limited to the periphery, as even the German growth engine lost steam.
The most recent policy answer to the European growth problem created a new global narrative – divergent monetary policy in the developed world. At a time when the U.S. and U.K. have been winding down quantitative easing (“QE”) and talking about raising interest rates, Japan and Europe have been going the other way – either increasing the pace of QE or seeking alternative ways to implement QE policy. (Even the largest Emerging Market country (China) is adding stimulus through numerous channels.) This divergence of policy has resulted in a huge interest rate differential between sovereign bonds and has incentivized, in part, investors domiciled in countries with low yields to buy debt instruments in (relatively) higher interest bearing countries. This so called ‘tractor-beam’ effect has also contributed downward pressure to U.S. interest rates.
As is often the case, what the consensus was expecting to be the worst asset class for the coming year (i.e., 30-year Treasuries) turned out to be one of the best, especially after accounting for volatility. Can history repeat itself in 2015? It will be tough, at least for the long bond, given the challenges to attaining capital appreciation on top of the lower starting yield versus last year. Much of the 2015 narrative could be a continuation of the divergence in global monetary policy – does the U.S. Federal Reserve (“Fed”) and Bank of England start hiking rates in 2015? Does the European Central Bank start sovereign QE? How long does the Bank of Japan keep up its torrid pace of QE? While the answers to these questions may play out in due time, with no recession seen in site, Aegon USA Investment Management, LLC remains of the view that risk assets remain in a long-term bull market.
PERFORMANCE
For the year ended October 31, 2014, Transamerica High Yield Bond Class A returned 5.85%. By comparison, its benchmark, the Barclays U.S. Corporate High Yield 2% Issuer Capped Index, returned 5.82%.
STRATEGY REVIEW
The Fund performed generally in-line with the Index for the year ended October 31, 2014. On the positive side, the Fund benefited from strong security selection across ratings categories. This was partially offset by our allocation decision, as the Fund’s underweight exposure to the BB segment of the High Yield (“HY”) market hurt performance. BB rated securities performed well, as the move lower in interest rates disproportionately benefited this sub-segment of the HY market. Looking at sector contributors and detractors, the Fund benefited from its positioning in Metals and Mining, Independent Energy, Oil Field Services, Brokerage, and Wirelines sectors. Sectors which detracted from performance included Gaming, Food and Beverage, Consumer Products, Media & Entertainment and Paper.
Despite historically low yields in the marketplace, we remain comfortable with the HY asset class largely due to the strong fundamental and technical backdrop. Aegon USA Investment Management, LLC’s forecast calls for stable growth into 2015, and we anticipate earnings will remain solid for most U.S. issuers. Balance sheets are generally conservatively positioned, and therefore, we expect defaults to remain low over the next 12 months, with our base case being a default rate below three percent.
From a valuation perspective, we remain constructive on the HY asset class at current levels, both relative to other fixed income assets and on an absolute return basis. We believe the combination of healthy fundamentals, low defaults, and low global interest rates should create demand for higher-yielding, shorter-duration assets such as high yield bonds.
Kevin Bakker, CFA
Benjamin D. Miller, CFA
Bradley J. Beman, CFA
James K. Schaeffer, Jr.
Co-Portfolio Managers
Aegon USA Investment Management, LLC
| | |
| Transamerica Funds | | Annual Report 2014 |
Page 25
Transamerica High Yield Bond
(unaudited)
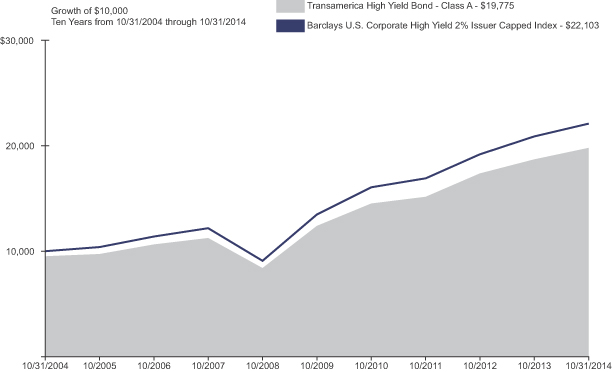
| | | | | | | | | | | | | | | | |
| Average Annual Total Return for Periods Ended 10/31/2014 | |
| | | 1 Year | | | 5 Years | | | 10 Years or
Life of Class | | | Inception Date | |
Class A (NAV) | | | 5.85 | % | | | 9.81 | % | | | 7.58 | % | | | 06/14/1985 | |
Class A (POP) | | | 0.79 | % | | | 8.75 | % | | | 7.06 | % | | | 06/14/1985 | |
Barclays U.S. Corporate High Yield 2% Issuer Capped Index (A) | | | 5.82 | % | | | 10.38 | % | | | 8.25 | % | | | | |
Class B (NAV) | | | 4.99 | % | | | 9.01 | % | | | 6.97 | % | | | 10/01/1995 | |
Class B (POP) | | | 0.03 | % | | | 8.87 | % | | | 6.97 | % | | | 10/01/1995 | |
Class C (NAV) | | | 4.98 | % | | | 9.08 | % | | | 6.85 | % | | | 11/11/2002 | |
Class C (POP) | | | 3.99 | % | | | 9.08 | % | | | 6.85 | % | | | 11/11/2002 | |
Class I (NAV) | | | 5.95 | % | | | N/A | | | | 10.01 | % | | | 11/30/2009 | |
Class I2 (NAV) | | | 6.16 | % | | | 10.29 | % | | | 8.07 | % | | | 11/08/2004 | |
(A) The Barclays U.S. Corporate High Yield 2% Issuer Capped Index is an unmanaged index used as a general measure of market performance. Calculations assume dividends and capital gains are reinvested and do not include any managerial expenses. The 10 Years or Life of Class calculation is based on the previous 10 years or since the inception date of the class, whichever is more recent. You cannot invest directly in an index.
The performance data presented represents past performance; future results may vary. Performance data does not reflect the deduction of taxes that would be paid on Fund distributions or the redemption of Fund shares. Investment return and principal value will fluctuate so that an investor’s shares, when redeemed, may be worth more or less than their original cost. Current performance may be lower or higher than performance quoted. Please see www.transamerica.com for performance data current to the most recent month-end. Net Asset Value (“NAV”) returns include the reinvestment of dividends and capital gains but do not reflect any sales charges. Public Offering Price (“POP”) returns include the reinvestment of dividends and capital gains and reflect the maximum sales charge of 4.75% for A shares or the maximum applicable contingent deferred sales charge (5% in the 1st year, decreasing to 0% after 6 years) for Class B shares and 1% (during the first 12 months) for Class C shares. Shares purchased prior to March 1, 2004 are subject to a maximum applicable contingent deferred sales charge (5% in the 1st year, decreasing to 0% after 7 years) for Class B shares and (2% in the 1st year, decreasing to 0% after 2 years) for Class C shares. There are no sales charges on Class I and I2 shares.
Performance figures reflect any fee waivers and/or expense reimbursements by the Investment Adviser. Without such waivers and/or reimbursements, the performance would be lower. Future waivers and/or reimbursements are at the discretion of the Investment Adviser.
Performance results do not include adjustments made for financial reporting purposes in accordance with U.S. generally accepted accounting principles and may differ from amounts reported in the financial highlights.
Investments in high-yield bonds (“junk bonds”) may be subject to greater volatility and risks as the income derived from these securities is not guaranteed and may be unpredictable and the value of these securities tends to decline when the interest rate increases.
Please refer to page 72 for index descriptions.
| | |
| Transamerica Funds | | Annual Report 2014 |
Page 26
Transamerica High Yield Muni
(unaudited)
MARKET ENVIRONMENT
For the year ended October 31, 2014 we have seen a flattening of the yield curve and positive performance from the municipal bond market. For the remainder of 2014, interest rates and market volatility will be important to monitor.
Puerto Rico, Detroit, and the bond insurers were the big headlines in the first quarter. Puerto Rico successfully placed $3.5 billion in general obligation bonds that were well received. Both Assured Guaranty and National Public Finance were upgraded by S&P to AA and AA- respectively. S&P downgraded Detroit Water and Sewer bonds to CCC. Puerto Rico continued to take up the majority of the headlines after legislation was passed allowing for the restructuring of Puerto Rico Electric Power Authority (“PREPA”), Puerto Rico Aqueduct & Sewer Authority (“PRASA”), and Puerto Rico Highways & Transportation Authority (“PRHTA”). In response, Moody’s downgraded PREPA to Caa2 from Ba3, PRASA downgraded to Caa1 from Ba3, and PRHTA downgraded to Caa1 from Ba3. Puerto Rico’s General Obligation (“GO”) bonds were downgraded to B2 from Ba2. While it is still possible that insured Puerto Rico bonds will see full or near-full repayment, many buyers are concerned that if governments can change the rules once they might change them in the future. Continued headline risk from Puerto Rico may create opportunities across the municipal market and in the name itself. Any panic could offer further opportunities, especially if redemption’s ramp up from funds with large losses in Puerto Rico.
A common theme for 2014 was large inflows to municipal bond funds coupled with a low supply of new issues. The trend reversal from 2013 was due to falling interest rates and anemic tax-exempt supply. Between the first and second quarters of 2014 alone, inflows rose substantially. This trend into bond funds from equities could continue, especially if there is concern of a slowing economy and developing geopolitical risks.
Supply has remained tight as state and local governments have been reluctant to issue new bonds, and the majority of refunding has already occurred. Improving state budgets combined with the supply and demand imbalance have been factors contributing to more positive fundamentals of municipal bond funds. These same dynamics have also contributed to a compression of credit spreads.
PERFORMANCE
For the year ended October 31, 2014, the Transamerica High Yield Muni Class A returned 16.70%. By comparison, its benchmark, the Barclays High Yield Municipal Index, returned 10.84%.
STRATEGY REVIEW
The Fund has been positioned to take on less interest rate risk than its benchmark during much of the past fiscal year, as we believe the potential risks currently outweigh the rewards. In this market environment, we have generally preferred to seek returns through specific credit stories as well as through value added trade execution. We have done this in an effort to position the Fund for a possible rising interest rate environment.
Over the course of the year, the Fund’s average credit quality has remained relatively constant at BBB. There was an increased exposure to higher quality municipal bonds in the period due to our more cautious views of the risk/rewards characteristic of high yield in this market environment. Looking ahead, there may be a reversal of that concentration should the right opportunities present themselves in lower rated credits.
Matthew Dalton
Portfolio Manager
Belle Haven Investments, L.P.
| | |
| Transamerica Funds | | Annual Report 2014 |
Page 27
Transamerica High Yield Muni
(unaudited)
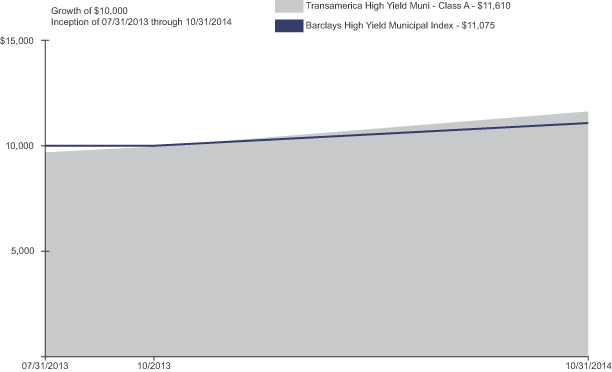
| | | | | | | | | | | | |
| Average Annual Total Return for Periods Ended 10/31/2014 | |
| | | 1 Year | | | 10 Years or
Life of Class | | | Inception Date | |
Class A (NAV) | | | 16.70 | % | | | 15.67 | % | | | 07/31/2013 | |
Class A (POP) | | | 12.94 | % | | | 12.63 | % | | | 07/31/2013 | |
Barclays High Yield Municipal Index (A) | | | 10.84 | % | | | 8.47 | % | | | | |
Class C (NAV) | | | 16.16 | % | | | 15.12 | % | | | 07/31/2013 | |
Class C (POP) | | | 15.16 | % | | | 15.12 | % | | | 07/31/2013 | |
Class I (NAV) | | | 16.98 | % | | | 15.92 | % | | | 07/31/2013 | |
(A) The Barclays High Yield Municipal Index is an unmanaged index used as a general measure of market performance. Calculations assume dividends and capital gains are reinvested and do not include any managerial expenses. The 10 Years or Life of Class calculation is based on the previous 10 years or since the inception date of the class, whichever is more recent. You cannot invest directly in an index.
The performance data presented represents past performance; future results may vary. Performance data does not reflect the deduction of taxes that would be paid on Fund distributions or the redemption of Fund shares. Investment return and principal value will fluctuate so that an investor’s shares, when redeemed, may be worth more or less than their original cost. Current performance may be lower or higher than performance quoted. Please see www.transamerica.com for performance data current to the most recent month-end. Net Asset Value (“NAV”) returns include the reinvestment of dividends and capital gains but do not reflect any sales charges. Public Offering Price (“POP”) returns include the reinvestment of dividends and capital gains and reflect the maximum sales charge of 3.25% for A shares or the maximum applicable contingent deferred sales charge of 1% (during the first 12 months) for Class C shares. There are no sales charges on Class I shares.
Performance figures reflect any fee waivers and/or expense reimbursements by the Investment Adviser. Without such waivers and/or reimbursements, the performance would be lower. Future waivers and/or reimbursements are at the discretion of the Investment Adviser.
Performance results do not include adjustments made for financial reporting purposes in accordance with U.S. generally accepted accounting principles and may differ from amounts reported in the financial highlights.
Municipal bond prices can rise or fall depending on interest rates. Interest rate changes generally have a greater effect on long-term bond prices. All municipal bonds carry credit risk that the issuer will default or be unable to make timely payments of interest and principal. Generally, lower rated bonds carry more credit risk.
Investing in high-yield (junk) bond funds may be subject to greater volatility and risks as the income derived from these securities is not guaranteed and may be unpredictable and the value of these securities tends to decline when interest rates increases. Interest rates may go up, causing the value of the Fund’s investments to decline. Changes in interest rates, the market’s perception of the issuers and the creditworthiness of the issuers may significantly affect the value of a bond.
The Fund is classified as “non-diversified,” which means it may invest a larger percentage of its assets in a smaller number of issuers than a diversified fund. To the extent the Fund invests its assets in fewer issuers, the Fund will be more susceptible to negative events.
Please refer to page 72 for index descriptions.
| | |
| Transamerica Funds | | Annual Report 2014 |
Page 28
Transamerica Income & Growth
(unaudited)
MARKET ENVIRONMENT
Global equity markets rose during the year ended October 31, 2014. The U.S. market was particularly strong, reflecting the country’s continued economic recovery. After a slow start to the year due to the long winter, the U.S. economy continued to gain strength. This was not the case in most other parts of the world. The economies of Western Europe generally slowed since early 2014, and were reflected in the relatively poor performance of their equity markets. Emerging market shares were also relatively poor performers, reflecting economic and political stagnation (or worse) in many of these countries. The Japanese market performed well in local currency terms, but the weak yen limited gains to dollar-based investors.
The decoupling of the U.S., European and developing economies presents an obstacle to global economic growth. It is easy to overlook the fact that the European and U.S. economies are roughly the same size. It will be difficult for the U.S. to continue its recovery if European economies weaken substantially. The situation also presented a dilemma for policy makers of an accommodative central bank in Europe and an increasingly restrictive one in the U.S. One could liken the situation to a nearly full bathtub in which the hot and cold water are turned on simultaneously - a lot of bubbles will be created but the temperature is unlikely to change much. The differing directions of monetary policy have important implications for economic growth, inflation and exchange rates.
PERFORMANCE
For the year ended October 31, 2014, Transamerica Income & Growth Class A returned 3.29%. By comparison, its benchmark, the Morgan Stanley Capital International All Country World Index Gross, returned 8.32%.
STRATEGY REVIEW
The Fund seeks long-term growth of capital while providing current income through investment primarily in global equities. The sub-adviser’s philosophy is built around three investment characteristics: quality - return on invested capital, recurring revenues and strong industry position; financial strength - strong balance sheet, interest coverage and dividend coverage; and valuation - dividend yield, multiple of free sustainable free cash flow and earnings yield.
Identifying companies which meet all these criteria requires substantial research. Companies which meet the quality metrics are rarely available on valuation and yield levels, which are attractive for the strategy. Conversely, companies which sell at tempting yield levels almost never possess the quality or financial strength parameters which are required. This is one reason the sub-adviser typically limits the Fund to 50 well-researched stocks at a given time.
During the prior fiscal year, Belgian telecommunications services provider Belgacom SA was the top contributor to the Fund’s return. It was followed by U.S. midstream energy company Energy Transfer Partners, LP, Class B. The third largest contributor was British pharmaceutical firm AstraZeneca PLC (no longer held at year end). The biggest detractors of the Fund were U.S. pipeline company Boardwalk Pipeline Partners, LP, Australian Coca-Cola bottler Coca-Cola Amatil, Ltd., and offshore oil driller Diamond Offshore Drilling, Inc. None of the laggards remain in the Fund.
From a sector standpoint, Telecommunication Services, Financials and Consumer Discretionary shares were the biggest contributors to the Fund’s performance. Industrials, Energy and Consumer Staples were the biggest detractors. From a sector perspective, the Fund lagged the global benchmark primarily due to low weightings in the growth-oriented Technology and Health Care sectors. While the portfolio managers spent substantial time researching these sectors, they did not identify additional companies with the combination of quality and current income which they seek.
With equity markets at record highs and the prospect of interest rate increases in the not-too-distant future, there are substantial reasons for investors to be concerned about financial markets. In the year ahead, the portfolio managers expect European economies to be a drag on global growth. This may be offset somewhat by lower oil prices which will be a net positive for the global economy.
The sub-adviser believes the income focused, value driven philosophy of the fund may be well suited to an environment, which is likely to a more challenging one than has been seen in the past few years.
William R. Andersen, CFA, Senior Portfolio Manager and Chief Investment Officer
Jeff Middleswart, Assistant Portfolio Manager
Ranger International Management, LP
| | |
| Transamerica Funds | | Annual Report 2014 |
Page 29
Transamerica Income & Growth
(unaudited)
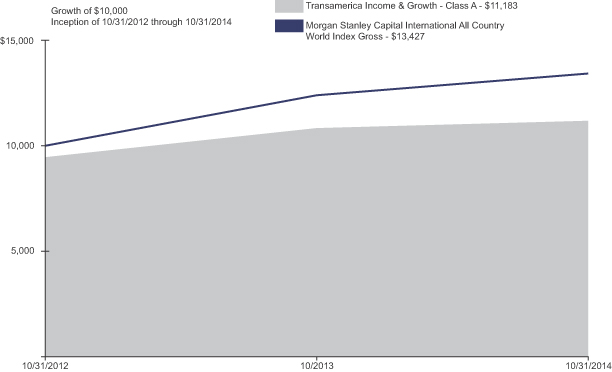
| | | | | | | | | | | | |
| Average Annual Total Return for Periods Ended 10/31/2014 | |
| | | 1 Year | | | 10 Years or
Life of Class | | | Inception Date | |
Class A (NAV) | | | 3.29 | % | | | 8.76 | % | | | 10/31/2012 | |
Class A (POP) | | | (2.37 | )% | | | 5.74 | % | | | 10/31/2012 | |
Morgan Stanley Capital International All Country World Index Gross (A) | | | 8.32 | % | | | 15.85 | % | | | | |
Class C (NAV) | | | 2.55 | % | | | 7.96 | % | | | 10/31/2012 | |
Class C (POP) | | | 1.57 | % | | | 7.96 | % | | | 10/31/2012 | |
Class I (NAV) | | | 3.54 | % | | | 9.04 | % | | | 10/31/2012 | |
Class I2 (NAV) | | | 3.63 | % | | | 9.13 | % | | | 10/31/2012 | |
(A) The Morgan Stanley Capital International All Country World Index Gross is an unmanaged index used as a general measure of market performance. Calculations assume dividends and capital gains are reinvested and do not include any managerial expenses. The 10 Years or Life of Class calculation is based on the previous 10 years or since the inception date of the class, whichever is more recent. You cannot invest directly in an index.
The performance data presented represents past performance; future results may vary. Performance data does not reflect the deduction of taxes that would be paid on Fund distributions or the redemption of Fund shares. Investment return and principal value will fluctuate so that an investor’s shares, when redeemed, may be worth more or less than their original cost. Current performance may be lower or higher than performance quoted. Please see www.transamerica.com for performance data current to the most recent month-end. Net Asset Value (“NAV”) returns include the reinvestment of dividends and capital gains but do not reflect any sales charges. Public Offering Price (“POP”) returns include the reinvestment of dividends and capital gains and reflect the maximum sales charge of 5.5% for A shares or the maximum applicable contingent deferred sales charge of 1% (during the first 12 months) for Class C shares. There are no sales charges on Class I and I2 shares.
Performance figures reflect any fee waivers and/or expense reimbursements by the Investment Adviser. Without such waivers and/or reimbursements, the performance would be lower. Future waivers and/or reimbursements are at the discretion of the Investment Adviser.
Performance results do not include adjustments made for financial reporting purposes in accordance with U.S. generally accepted accounting principles and may differ from amounts reported in the financial highlights.
REITs are subject to a number of highly technical tax-related rules and requirements; and the failure to qualify as a REIT could result in corporate-level taxation, significantly reducing the return on an investment to the Fund.
Investments in MLPs involve risks that differ from investments in corporate issuers, including risks related to limited control, cash flow risks, dilution risks and risks related to the general partner’s right to require unitholders to sell their common units at an undesirable time or price.
Investments in global/international markets involve risks not associated with U.S. markets, such as currency fluctuations, adverse social and political developments, and the relatively small size and lesser liquidity of the markets. Investing in high-yield securities may be subject to greater volatility and risks as the income derived from these securities is not guaranteed and may be unpredictable and the value of these securities tends to decline when interest rates increases.
Please refer to page 72 for index descriptions.
| | |
| Transamerica Funds | | Annual Report 2014 |
Page 30
Transamerica Inflation Opportunities
(unaudited)
MARKET ENVIRONMENT
Global inflation diverged meaningfully over the past year rising in the U.S., U.K., Japan, Latin America and parts of Asia while falling in Europe and China. U.S. Consumer Price Index inflation rose from 1.1% in October 2013 to 1.7% in September 2014. In contrast, European inflation was in free fall declining from 0.9% to 0.4% in the same period. Fear of deflation forced the European Central Bank to cut short-term rates to negative territory and install a new quantitative easing program that led to a precipitous drop in European bond yields. Longer-dated U.S. bond yields dropped as well, despite steady economic progress and a winding down of the asset purchase program by U.S. Federal Reserve (“Fed”). Divergent global monetary policy led to a significant increase in currency market volatility and meaningful appreciation of the U.S. dollar against most G-7 and Emerging Markets (“EM”) currencies between July and October 2014. During this four month period, oil prices also dropped to their lowest level since June 2012 pressured by higher U.S. shale gas production, weaker global demand, and a stronger U.S. dollar.
The 10 year Treasury bond yield ended October 2014 at 2.34%, down 0.22% from a year ago and 0.36% from March 1, 2014 (the launch date of the Fund). Lower interest rates globally had a positive impact on the Fund given the duration sensitivity of inflation-linked securities which more than offset the negative impact of lower oil prices on the breakeven rate of inflation securities. Within the credit sector, high yield experienced significant dislocation during the summer months on valuation concerns. Commodity and energy company bonds also were hit due to the weakness in global commodities. On the other hand, financial sector bonds performed well with a continued improvement in fundamentals. Overall credit recorded positive returns since the launch of the Fund thus benefiting the portfolio. Currency weakness negatively impacted the performance of non-domestic inflation-protected securities.
PERFORMANCE
For the period ended October 31, 2014, Transamerica Inflation Opportunities Class A returned 1.01%. By comparison, its benchmark, the Barclays Global Inflation Linked Bond Index, returned 1.08%.
STRATEGY REVIEW
The Fund underperformed the benchmark from the March 1, 2014 to October 31, 2014. Superior asset and foreign exchange allocation along with security selection helped performance while short duration positioning hurt performance versus the benchmark. With the government sector (“core” allocation), the Fund maintained an overweight position in U.S. Treasury Inflation-Protected Securities (“TIPS”) versus the benchmark and underweight in non-domestic TIPS, particularly in Europe, given weak inflation and prospects of continued currency volatility. Within the credit sector (“opportunistic” allocation), the Fund’s greatest exposure was in the Financial sector, mostly in floating-rate securities. The Fund allocated less than 5% to high-yield given its less attractive valuation. Exposure to commodity bonds was also very low. Within the Emerging Market sector, which is permitted by the guidelines, exposure was limited to Brazil, Mexico and Turkey. We believe inflation remains stubbornly high in Brazil and remains an attractive market for inflation linked securities, both from a yield and total return perspective.
Top securities that had the greatest positive impact on the Fund were Brazilian linker due to local stagflation and Spanish and Italian linkers due to Eurozone disinflation and a weakening currency. Top securities that have the greatest negative impact were U.S. TIPS and U.K. linker due to an improving economy. Among sectors, overweight in financials, industrials, and government-related entities had the greatest positive impact. Across countries, U.K. and Brazil had the largest positive impact, while Eurozone had the largest negative impact.
Treasury futures are utilized to manage duration and currency forwards are used to hedge currency risk. Forward foreign currency transactions were accretive, while futures contracts were drag on performance.
Amit Agrawal
Robert A. Vanden Assem, CFA
Co-Portfolio Managers
PineBridge Investments LLC
| | |
| Transamerica Funds | | Annual Report 2014 |
Page 31
Transamerica Inflation Opportunities
(unaudited)
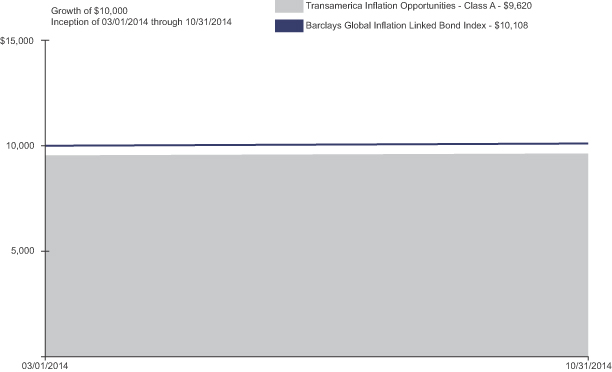
| | | | | | | | |
| Average Annual Total Return for Periods Ended 10/31/2014 | |
| | | 10 Years or
Life of Class | | | Inception Date | |
Class A (NAV) | | | 1.01 | % (A) | | | 03/01/2014 | |
Class A (POP) | | | (3.80 | )% (A) | | | 03/01/2014 | |
Barclays Global Inflation Linked Bond Index (B) | | | 1.08 | % (A) | | | | |
Class C (NAV) | | | 0.52 | % (A) | | | 03/01/2014 | |
Class C (POP) | | | (0.47 | )% (A) | | | 03/01/2014 | |
Class I (NAV) | | | 1.16 | % (A) | | | 03/01/2014 | |
Class I2 (NAV) | | | 1.26 | % (A) | | | 03/01/2014 | |
(A) Not annualized.
(B) The Barclays Global Inflation Linked Bond Index is an unmanaged index used as a general measure of market performance. Calculations assume dividends and capital gains are reinvested and do not include any managerial expenses. The 10 Years or Life of Class calculation is based on the inception date of the class. You cannot invest directly in an index.
The performance data presented represents past performance; future results may vary. Performance data does not reflect the deduction of taxes that would be paid on Fund distributions or the redemption of Fund shares. Investment return and principal value will fluctuate so that an investor’s shares, when redeemed, may be worth more or less than their original cost. Current performance may be lower or higher than performance quoted. Please see www.transamerica.com for performance data current to the most recent month-end. Net Asset Value (“NAV”) returns include the reinvestment of dividends and capital gains but do not reflect any sales charges. Public Offering Price (“POP”) returns include the reinvestment of dividends and capital gains and reflect the maximum sales charge of 4.75% for A shares or the maximum applicable contingent deferred sales charge of 1% (during the first 12 months) for Class C shares. There are no sales charges on Class I and I2 shares.
Performance figures reflect any fee waivers and/or expense reimbursements by the Investment Adviser. Without such waivers and/or reimbursements, the performance would be lower. Future waivers and/or reimbursements are at the discretion of the Investment Adviser.
Performance results do not include adjustments made for financial reporting purposes in accordance with U.S. generally accepted accounting principles and may differ from amounts reported in the financial highlights.
Fixed income investing is subject to credit risk, inflation risk, and interest rate risk. Investing in high-yield (junk bonds) may be subject to greater volatility and risks as the income derived from these securities is not guaranteed and may be unpredictable and the value of these securities tends to decline when interest rates increases. Interest payments on inflation-protected debt securities can be unpredictable and will vary as the principal and/or interest is adjusted for inflation.
Please refer to page 72 for index descriptions.
| | |
| Transamerica Funds | | Annual Report 2014 |
Page 32
Transamerica International Equity
(unaudited)
MARKET ENVIRONMENT
The European Central Bank and the Bank of Japan both announced intentions to increase economic stimulus in the face of softening growth and inflation. As a result, the U.S. dollar appreciated rapidly in September against the euro and yen, meaningfully impacting U.S. dollar-based investors in global equities. For the year ended October 31, 2014, the Morgan Stanley Capital International Europe, Australasia, Far East Index (the “Index”) posted a gain of 6.8% in local currency terms. However, U.S. dollar-based investors experienced a modest decline of (0.6)%.
Low interest rates and a slow-growth global economy formed the fundamental foundation for stocks. The summer of 2014 saw a minor correction in prices, especially in U.S. dollar terms, as investors grappled with geopolitical worries and valuations that have moved closer to long-term averages after three terrific years for stocks. At period end, the Index traded at 8.6x cash flow and 13.9x expected earnings over the next 12 months. With bullish sentiment tempered by news of war, epidemic and economic torpor, the climate for patient value investors improved. We believe our valuation discipline and focus on fundamentals should be rewarded in this market environment.
PERFORMANCE
For the year ended October 31, 2014, Transamerica International Equity Class I returned (0.20)%. By comparison, its benchmark, the Morgan Stanley Capital International Europe, Australasia, Far East Index, returned (0.17)%.
STRATEGY REVIEW
The Fund performed in line with the Index for the fiscal year. In Japan, equities fared better than global peers as the government continued to pull all available levers to ensure the fragile economic recovery continues. Although equities declined (0.70)% in U.S. dollar terms they rose 13.47% in local currency, well ahead of other benchmark regions in local currency terms. Stock selection resulted in regional portfolio holdings posting a positive return and the region was the top contributor to relative return, with FUJIFILM Holdings Corp. up the most. FUJIFILM Holdings Corp. continued to post solid earnings growth, resulting from cost-cutting efforts and improving sales in both its document and medical systems businesses.
Europe was the only regional detractor from relative return for the period. Companies on the continent had difficulty maintaining top-line growth as the euro strengthened through the first half of the year, making it difficult for firms to compete on price for goods sold outside of the region. French chemicals firm Arkema SA declined the most, as investors grew concerned by the company’s worse-than-expected weakness in the fluorinated gas industry and its large currency headwinds.
Strong stock selection in financials was the leading contributor to relative return on a sector basis. In general, global economies and financial markets showed stability for several quarters. Better credit metrics, an improving ability to deal with toxic assets and compelling valuations attracted investors’ attention to the sector. Cheung Kong Holdings, Ltd., a real-estate development company in Hong Kong, led the group on continued strong sales momentum. Utilities were also a top contributor with four of the Fund’s five positions outperforming the benchmark. Hong Kong-based Guangdong Investment, Ltd. was the top contributor for the sector and the Fund overall. After 19 years of no change, water tariffs are expected to rise in Hong Kong, where the rate is currently 50% lower than in Beijing. This is an opportunity for Guangdong Investment, Ltd. to raise supply prices to water distributors in Hong Kong.
The consumer staples sector was the primary detractor from relative return. Two holdings with exposure to Russia had a noticeable impact. For German retailer Metro AG, news of additional sanctions against Russia caused the company’s planned spin-off of its Russian cash-and-carry business to be delayed, despite positive results for the subsidiary. Danish brewer Carlsberg A/S, Class B also declined as investors grew concerned the company’s revenue growth may be adversely impacted by a sales decline in Russian markets.
Brandon H. Harrell, CFA
Portfolio Manager
Thompson, Siegel & Walmsley LLC
| | |
| Transamerica Funds | | Annual Report 2014 |
Page 33
Transamerica International Equity
(unaudited)

| | | | | | | | | | | | | | | | |
| Average Annual Total Return for Periods Ended 10/31/2014 | |
| | | 1 Year | | | 5 Years | | | 10 Years or
Life of Class | | | Inception Date | |
Class A (NAV) | | | (0.51 | )% | | | N/A | | | | 6.82 | % | | | 03/01/2011 | |
Class A (POP) | | | (5.97 | )% | | | N/A | | | | 5.19 | % | | | 03/01/2011 | |
Class C (NAV) | | | (1.19 | )% | | | N/A | | | | 6.14 | % | | | 03/01/2011 | |
Class C (POP) | | | (2.14 | )% | | | N/A | | | | 6.14 | % | | | 03/01/2011 | |
Class I (NAV) | | | (0.20 | )% | | | 9.69 | % | | | 7.61 | % | | | 12/18/1992 | |
Morgan Stanley Capital International Europe, Australasia, Far East Index (A) | | | (0.17 | )% | | | 7.00 | % | | | 6.29 | % | | | | |
Class I2 (NAV) | | | (0.07 | )% | | | N/A | | | | 7.32 | % | | | 03/01/2011 | |
(A) The Morgan Stanley Capital International Europe, Australasia, Far East Index is an unmanaged index used as a general measure of market performance. Calculations assume dividends and capital gains are reinvested and do not include any managerial expenses. The 10 Years or Life of Class calculation is based on the previous 10 years or since the inception date of the class, whichever is more recent. You cannot invest directly in an index.
The performance data presented represents past performance; future results may vary. Performance data does not reflect the deduction of taxes that would be paid on Fund distributions or the redemption of Fund shares. Investment return and principal value will fluctuate so that an investor’s shares, when redeemed, may be worth more or less than their original cost. Current performance may be lower or higher than performance quoted. Please see www.transamerica.com for performance data current to the most recent month-end. Net Asset Value (“NAV”) returns include the reinvestment of dividends and capital gains but do not reflect any sales charges. Public Offering Price (“POP”) returns include the reinvestment of dividends and capital gains and reflect the maximum sales charge of 5.5% for A shares or the maximum applicable contingent deferred sales charge of 1% (during the first 12 months) for Class C shares. There are no sales charges on Class I and I2 shares.
Performance figures reflect any fee waivers and/or expense reimbursements by the Investment Adviser. Without such waivers and/or reimbursements, the performance would be lower. Future waivers and/or reimbursements are at the discretion of the Investment Adviser.
Performance results do not include adjustments made for financial reporting purposes in accordance with U.S. generally accepted accounting principles and may differ from amounts reported in the financial highlights.
The prices of securities the sub-adviser believes are undervalued may not appreciate as anticipated or may go down. Investments in global/international markets involve risks not associated with U.S. markets, such as currency fluctuations, adverse social and political developments, and the relatively small size and lesser liquidity of the markets.
Please refer to page 72 for index descriptions.
| | |
| Transamerica Funds | | Annual Report 2014 |
Page 34
Transamerica International Small Cap Value
(unaudited)
MARKET ENVIRONMENT
The European Central Bank and the Bank of Japan announced intentions to increase economic stimulus in the face of softening growth and inflation. As a result, the U.S. dollar appreciated rapidly in September 2014 against the euro and yen, meaningfully impacting U.S. dollar-based investors in global equities. For the year ended October 31, 2014, the Morgan Stanley Capital International Europe, Australasia, Far East Small Cap Index Gross posted a gain of 5.7% in local currency terms. However, U.S. dollar-based investors experienced a decline of (1.69)%.
Low interest rates and a slow growth global economy formed the fundamental foundation for stocks. The summer of 2014 saw a minor correction in prices, especially in U.S. dollar terms, as investors grappled with geopolitical worries and valuations that have moved closer to long-term averages after three terrific years for stocks. At period end, the Morgan Stanley Capital International Europe, Australasia, Far East Small Cap traded at 9.9x cash flow and 14.4x expected earnings over the next 12 months. With bullish sentiment tempered by news of war, epidemic and economic torpor, the climate for patient value investors improved. We believe our valuation discipline and focus on fundamentals should be rewarded in this market environment.
PERFORMANCE
For the year ended October 31, 2014, Transamerica International Small Cap Value Class I2 returned (1.66)%. By comparison, its benchmark, the Morgan Stanley Capital International Europe, Australasia, Far East Small Cap returned (1.69)%.
STRATEGY REVIEW
The Fund outperformed the Morgan Stanley Capital International Europe, Australasia, Far East Small Cap Index for the year ended October 31, 2014. Japan was the top regional contributor primarily on strong stock selection in Consumer Discretionary and Health Care. In Consumer Discretionary, several Fund positions exceeded investor expectations despite the effects of the consumption tax increase that went into effect on April 1, 2014. In Health Care, Kaken Pharmaceutical Co., Ltd. received Food and Drug Administration approval to market its toe fungus treatment in the U.S. The product, a topical treatment with fewer side effects and an easier delivery method than competing products, also received a higher-than-expected pricing allowance by Japanese regulators.
A small allocation to North America, a non-benchmark region, was the primary detractor to relative return. Exposure to a basket of Canadian energy-related companies weighed on portfolio returns, as stocks traded down with rapidly falling oil prices. Equities in Asia Ex-Japan were also a detractor as Fund holdings, primarily in Australia, underperformed the market. Reject Shop, Ltd. (no longer held at year end), a discount retailer, had worse-than-expected results for the 2013 holiday shopping period. The stock was the largest detractor from relative return in the region and was sold after the resignation of its CEO.
Health Care was the top contributor to relative return on a sector basis. In addition to Kaken Pharmaceutical Co., Ltd., several additional holdings outperformed their benchmark peers with the portfolio sector up an average of 11.8% compared to the benchmark sector up 2.7%. In Denmark, vaccine manufacturer Bavarian Nordic A/S was also a top contributor on an announced licensing agreement with U.S.-based Johnson & Johnson. Stock selection in the Industrials sector also aided the Fund’s relative return. In the Netherlands, AerCap Holdings NV (no longer held at year end) announced the acquisition of International Lease Finance Corp. from AIG, making AerCap Holdings NV the largest global aircraft leasing firm. With investors cheering the news, we sold the stock on strength.
Stock selection in Financials was the primary detractor from a sector perspective. A position in Etalon Group, Ltd., a Russian homebuilder, listed in London, suffered the most as investors grew concerned over increasing sanctions placed on Russia as a result of unrest in Ukraine. Stock selection in Materials also lagged as a few portfolio positions experienced margin pressure from higher input costs. In Japan, Denki Kagaku Kogyo KK, a producer of specialty chemicals, declined the most, as the company has been pressured by high electricity costs.
Brandon H. Harrell, CFA
Stedman D. Oakey, CFA
Co-Portfolio Managers
Thompson, Siegel & Walmsley LLC
| | |
| Transamerica Funds | | Annual Report 2014 |
Page 35
Transamerica International Small Cap Value
(unaudited)
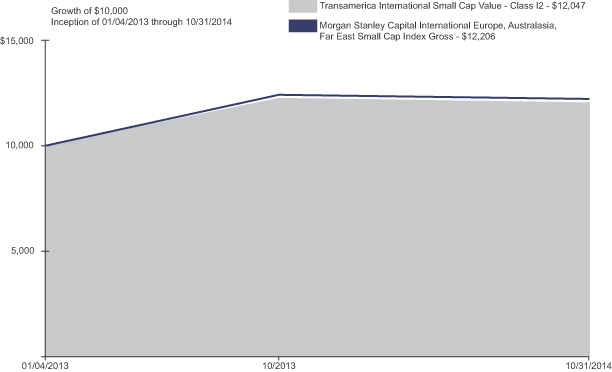
| | | | | | | | | | | | |
| Average Annual Total Return for Periods Ended 10/31/2014 | |
| | | 1 Year | | | 10 Years or
Life of Class | | | Inception Date | |
Class I (NAV) | | | (1.67 | )% | | | 10.69 | % | | | 01/04/2013 | |
Class I2 (NAV) | | | (1.66 | )% | | | 10.75 | % | | | 01/04/2013 | |
Morgan Stanley Capital International Europe, Australasia, Far East Small Cap Index Gross (A) | | | (1.69 | )% | | | 11.54 | % | | | | |
(A) The Morgan Stanley Capital International Europe, Australasia, Far East Small Cap Index Gross is an unmanaged index used as a general measure of market performance. Calculations assume dividends and capital gains are reinvested and do not include any managerial expenses. The 10 Years or Life of Class calculation is based on the previous 10 years or since the inception date of the class, whichever is more recent. You cannot invest directly in an index.
The performance data presented represents past performance; future results may vary. Performance data does not reflect the deduction of taxes that would be paid on Fund distributions or the redemption of Fund shares. Investment return and principal value will fluctuate so that an investor’s shares, when redeemed, may be worth more or less than their original cost. Current performance may be lower or higher than performance quoted. Please see www.transamerica.com for performance data current to the most recent month-end. Net Asset Value (“NAV”) returns include the reinvestment of dividends and capital gains but do not reflect any sales charges. There are no sales charges on Class I and I2 shares.
Performance figures reflect any fee waivers and/or expense reimbursements by the Investment Adviser. Without such waivers and/or reimbursements, the performance would be lower. Future waivers and/or reimbursements are at the discretion of the Investment Adviser.
Performance results do not include adjustments made for financial reporting purposes in accordance with U.S. generally accepted accounting principles and may differ from amounts reported in the financial highlights.
Investing in small- and medium-size companies involves greater risk than is customarily associated with more established companies. The prices of securities the sub-adviser believes are undervalued may not appreciate as anticipated or may go down. Investments in global/international markets involve risks not associated with U.S. markets, such as currency fluctuations, adverse social and political developments, and relatively small size and lesser liquidity of the markets.
Please refer to page 72 for index descriptions.
| | |
| Transamerica Funds | | Annual Report 2014 |
Page 36
Transamerica Large Cap Value
(unaudited)
MARKET ENVIRONMENT
U. S. equity markets turned in their fifth consecutive annual gain, with the Russell 1000® Value Index (the “Index”) up 16.46% for the year ended October 31, 2014. The driving factors behind these persistent gains have remained fairly constant, namely aggressively accommodative policies by the U.S. Federal Reserve (“Fed”) and other central banks around the world, a corresponding very low interest rate environment, low consumer price inflation, and moderate but relatively steady growth in U.S. and overall world economic activity.
As the bull market has matured, it may have become somewhat more momentum driven, and we believe it has temporarily impacted our contra-momentum strategy. However, we have benefited from the market becoming more catalyst driven, with merger and acquisition activity strong and managements seeking to use cash flows in shareholder friendly ways such as share repurchases or business spinoffs.
When interest rates inevitably rise, we expect equities to be perceived to be a better investment opportunity than bonds and therefore have a bias for further advancement.
PERFORMANCE
For the year ended October 31, 2014, Transamerica Large Cap Value Class A returned 12.09%. By comparison, its benchmark, the Russell 1000® Value Index, returned 16.46%.
STRATEGY REVIEW
The Fund trailed the Index returns during the year ended October 31, 2014. Sector weights had limited net impact on relative performance; rather, our underperformance during this period came from stock selection. We believe the timing of catalysts has been delayed for some of our investments, and we remain confident in both our strategy and stock portfolio.
We pursue an intensive fundamental research strategy to identify individual investment ideas using a bottom up stock selection process. Our strategy emphasizes companies with leading competitive positions, strong balance sheets, healthy free cash flows that investor oriented managements will use to enhance shareholder value, and prospects for catalysts that can propel stock prices higher in the near to intermediate term. We furthermore seek companies that are down in price or have significantly underperformed the market averages. The Fund is diversified by industry and sector, and a sector overweight or underweight typically occurs only as a result of identifying more or fewer individual stock ideas in a given sector.
The top contributors to performance for the period were Apple, Inc., branded food company Pinnacle Foods, Inc., and pharmaceutical giant Merck & Co., Inc. (no longer held at year end). Apple, Inc. recovered to new highs as it benefited from a favorable product cycle, better profit margins on the new iPhones than most investors expected, and increasing willingness to use its very high cash generation to boost both its dividend and share repurchase program. Pinnacle Foods, Inc. is a recent IPO that has continued its successful strategy of acquiring and integrating second tier brands found in the grocery store. We owned Merck & Co., Inc. because we thought investors would give the stock a higher valuation once a series of new products were introduced. Once this happened, we sold the stock in August.
Top detractors from performance were iron ore miner Cliffs Natural Resources, Inc., private label soft drink company Cott Corp., and medical diagnostic equipment company Bio-Rad Laboratories, Inc., Class A. Cliffs Natural Resources, Inc. saw activist investors install a new management dedicated to unlocking hidden asset value in the company, but has been hurt by substantial weakness in iron ore prices in the meantime. Cott Corp. was hurt by weak carbonated soft drink (“CSD”) demand. We still like its valuation, strategy to diversify beyond CSD, and opportunity to make acquisitions to transform the company. Bio-Rad Laboratories, Inc. was hurt by constrained research budgets for its customers, especially in Europe. We like its valuation versus peers, opportunity to gain market share through new products, and expectations that research spending will improve somewhat.
Jack Murphy
John Levin
Co-Portfolio Managers
Levin Capital Strategies, L.P.
| | |
| Transamerica Funds | | Annual Report 2014 |
Page 37
Transamerica Large Cap Value
(unaudited)

| | | | | | | | | | | | |
| Average Annual Total Return for Periods Ended 10/31/2014 | |
| | | 1 Year | | | 10 Years or
Life of Class | | | Inception Date | |
Class A (NAV) | | | 12.09 | % | | | 15.33 | % | | | 11/15/2010 | |
Class A (POP) | | | 5.91 | % | | | 13.70 | % | | | 11/15/2010 | |
Russell 1000® Value Index (A) | | | 16.46 | % | | | 16.43 | % | | | | |
Class C (NAV) | | | 11.30 | % | | | 14.58 | % | | | 11/15/2010 | |
Class C (POP) | | | 10.37 | % | | | 14.58 | % | | | 11/15/2010 | |
Class I (NAV) | | | 12.40 | % | | | 15.75 | % | | | 11/15/2010 | |
Class I2 (NAV) | | | 12.53 | % | | | 15.87 | % | | | 11/15/2010 | |
(A) The Russell 1000® Value Index is an unmanaged index used as a general measure of market performance. Calculations assume dividends and capital gains are reinvested and do not include any managerial expenses. The 10 Years or Life of Class calculation is based on the inception date of the class. You cannot invest directly in an index.
The performance data presented represents past performance; future results may vary. Performance data does not reflect the deduction of taxes that would be paid on Fund distributions or the redemption of Fund shares. Investment return and principal value will fluctuate so that an investor’s shares, when redeemed, may be worth more or less than their original cost. Current performance may be lower or higher than performance quoted. Please see www.transamerica.com for performance data current to the most recent month-end. Net Asset Value (“NAV”) returns include the reinvestment of dividends and capital gains but do not reflect any sales charges. Public Offering Price (“POP”) returns include the reinvestment of dividends and capital gains and reflect the maximum sales charge of 5.5% for A shares or the maximum applicable contingent deferred sales charge of 1% (during the first 12 months) for Class C shares. There are no sales charges on Class I and I2 shares.
Performance figures reflect any fee waivers and/or expense reimbursements by the Investment Adviser. Without such waivers and/or reimbursements, the performance would be lower. Future waivers and/or reimbursements are at the discretion of the Investment Adviser.
Performance results do not include adjustments made for financial reporting purposes in accordance with U.S. generally accepted accounting principles and may differ from amounts reported in the financial highlights.
Growth stocks can be volatile and experience sharp price declines and certain types of stocks, especially technology, can be extremely volatile and subject to greater price swings than the broader market. Value approach carries the risk that the market will not recognize a security’s intrinsic value for a long time or that an undervalued stock is actually appropriately priced.
Russell Investment Group is the source and owner of the trademarks, service marks, and copyrights related to the Russell indexes. Russell® is a trademark of Russell Investment Group.
Please refer to page 72 for index descriptions.
| | |
| Transamerica Funds | | Annual Report 2014 |
Page 38
Transamerica Mid Cap Growth
(unaudited)
MARKET ENVIRONMENT
The U.S. stock market appears to be on stable footing as an environment characterized by low interest rates and a steadily-growing economy remains in place. The U.S. Federal Reserve (“Fed”) has refrained from raising interest rates so far and is looking for a pick-up in wage growth to spur such action. Over the past 12 months, improvements in U.S. manufacturing, strong corporate earnings, falling headline unemployment, and steady growth in nonfarm payrolls all show evidence of a healing economy.
However, the Fed will likely wait for real wage growth, the final phase in a labor market recovery, to actually pull back on the extremely accommodative low interest rate policy currently in place. Additionally, advances in U.S. energy production and efficiency have led to material decline in crude oil prices. The lower fuel costs create economic tailwinds for U.S. consumer sentiment and spending heading into the holiday season.
Some risks to the U.S. economy do remain in place including the potential for a global growth slowdown, conflict between Russia and Ukraine, high debt and deflationary pressures in the Eurozone, and the over reliance on central bank support in many of the world’s largest economies as well as others. Mindful of such risks, we remain fully invested in quality growth companies based on our diligent fundamental analysis.
PERFORMANCE
For the year ended October 31, 2014, Transamerica Mid Cap Growth Class A returned 9.50%. By comparison, its benchmark, the Russell Midcap® Growth Index, returned 14.59%.
STRATEGY REVIEW
The Fund was impacted in part by combination of macroeconomic and geopolitical events as well as by individual security selection within the strategy. While the equities within the strategy are typically higher-quality growth stocks, they were challenged in the near term due to detracting market actions.
The Fund underperformed its benchmark during the year ended October 31, 2014.
The Fund, on a total return basis, generated positive performance from the Consumer Discretionary, Energy and Financial sectors. While the Health Care, Consumer Staples, Industrials, Technology and Telecommunications sectors detracted from overall Fund performance for the respective time period. The Fund did not have any allocation the Utilities sector.
During the period, the largest contribution to performance came from Synaptics, Inc., which benefited from strength in its mobile phone business including their touchscreen products and newly acquired finger print identification products. The second biggest contributor during the period was PTC, Inc. PTC, Inc.’s strong product offerings and a global economic recovery allowed the company to accelerate its growth rate in its core computer-aided design and product lifecycle management lines of businesses. Furthermore, through cost containment, the company was able to significantly increase its profit margins. KLA-Tencor Corp. also contributed to the performance during the period. The company benefited from a rebound in global spending on semiconductor manufacturing equipment, in addition to a shareholder-friendly capital allocation policy.
On the other hand, Trimble Navigation, Ltd. detracted from the performance during the quarter. The company experienced significant weakness in its agricultural-related businesses, due in part to the decline in many agricultural commodities during the year. While this weakness was partially offset by relative strength in the company’s engineering and construction business, earnings still declined for the year pressuring the stock. Rock-Tenn Co., Class A (no longer held at year end) also detracted from performance during the period. After a solid year in 2013, containerboard volumes didn’t recover in 2014. In addition, box volumes are running well below trend for an economic recovery, which forced the company to idle plants to maintain industry pricing and the stock price has suffered as a result.
Timothy D. Chatard, CFA
Howard Aschwald, CFA
Co-Portfolio Managers
Quantum Capital Management
| | |
| Transamerica Funds | | Annual Report 2014 |
Page 39
Transamerica Mid Cap Growth
(unaudited)
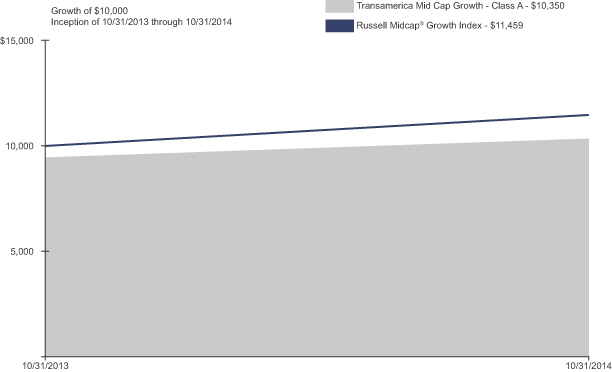
| | | | | | | | | | | | |
| Average Annual Total Return for Periods Ended 10/31/2014 | |
| | | 1 Year | | | 10 Years or
Life of Class | | | Inception Date | |
Class A (NAV) | | | 9.50 | % | | | 9.50 | % | | | 10/31/2013 | |
Class A (POP) | | | 3.50 | % | | | 3.50 | % | | | 10/31/2013 | |
Russell Midcap® Growth Index (A) | | | 14.59 | % | | | 14.59 | % | | | | |
Class C (NAV) | | | 8.80 | % | | | 8.80 | % | | | 10/31/2013 | |
Class C (POP) | | | 7.80 | % | | | 7.80 | % | | | 10/31/2013 | |
Class I (NAV) | | | 9.81 | % | | | 9.81 | % | | | 10/31/2013 | |
Class I2 (NAV) | | | 9.91 | % | | | 9.91 | % | | | 10/31/2013 | |
(A) The Russell Midcap® Growth Index is an unmanaged index used as a general measure of market performance. Calculations assume dividends and capital gains are reinvested and do not include any managerial expenses. The 10 Years or Life of Class calculation is based on the inception date of the class. You cannot invest directly in an index.
Performance results do not include adjustments made for financial reporting purposes in accordance with U.S. generally accepted accounting principles and may differ from amounts reported in the financial highlights.
The performance data presented represents past performance; future results may vary. Performance data does not reflect the deduction of taxes that would be paid on Fund distributions or the redemption of Fund shares. Investment return and principal value will fluctuate so that an investor’s shares, when redeemed, may be worth more or less than their original cost. Current performance may be lower or higher than performance quoted. Please see www.transamerica.com for performance data current to the most recent month-end. Net Asset Value (“NAV”) returns include the reinvestment of dividends and capital gains but do not reflect any sales charges. Public Offering Price (“POP”) returns include the reinvestment of dividends and capital gains and reflect the maximum sales charge of 5.5% for A shares or the maximum applicable contingent deferred sales charge of 1% (during the first 12 months) for Class C shares. There are no sales charges on Class I and I2 shares.
Performance figures reflect any fee waivers and/or expense reimbursements by the Investment Adviser. Without such waivers and/or reimbursements, the performance would be lower. Future waivers and/or reimbursements are at the discretion of the Investment Adviser.
Performance results do not include adjustments made for financial reporting purposes in accordance with U.S. generally accepted accounting principles and may differ from amounts reported in the financial highlights.
Investing in small and medium-size companies involves greater risk than is customarily associated with more established companies. The securities of small and mid capitalization companies are subject to higher volatility than larger, more established companies. The price of equity securities may rise of fall because of changes in the market or changes in a company’s financial condition. Equities are subject to market risk, meaning that stock prices in general may decline over short or extended periods of time.
Russell Investment Group is the source and owner of the trademarks, service marks, and copyrights related to the Russell indexes. Russell® is a trademark of Russell Investment Group.
Please refer to page 72 for index descriptions.
| | |
| Transamerica Funds | | Annual Report 2014 |
Page 40
Transamerica Mid Cap Value Opportunities
(unaudited)
MARKET ENVIRONMENT
Over the last six months the equity markets in the U.S. have been driven by uncertainty over the fragile economic recovery coupled with investor concerns over the timing and length of the U.S. Federal Reserve’s (“Fed”) drawdown of the monumental stimulus program. Global issues further exacerbated the situation, including turmoil in the Middle East and eastern Europe, political tensions in Hong Kong, the human tragedy of Ebola, strained sovereign balance sheets and persistent disinflation across most of the world.
Despite the market’s vacillations, the Russell Midcap® Value Index is up 5.9% for the last six months and an average of 19.2% per year for the last five years, ahead of its large and small cap peers. As a result stock prices have risen faster than earnings, leading to multiple expansions. The benchmark’s valuation multiples on earnings, book value, sales, and growth are well above their long-term average. This may suggest the market expects earnings growth to accelerate. However, with profit margins at near-record levels, companies should drive top-line revenue growth or they may find it difficult to keep pace with investor expectations. In this environment, we expect our valuation discipline and focus on fundamentals to be rewarded.
PERFORMANCE
For the period from inception April 30, 2014 through October 31, 2014, Transamerica Mid Cap Value Opportunities Class A returned 7.62%. By comparison, its benchmark, the Russell Midcap® Value Index, returned 6.55%.
STRATEGY REVIEW
The Fund has outperformed the Russell Midcap® Value Index net of fees since inception on April 30, 2014 primarily from strong stock selection in the Technology, Consumer Discretionary and Utilities sectors. An overweight position and strong stock selection in Technology made the sector the top contributor to relative return. Storage and data management firm NetApp, Inc. was the top contributor. After several quarters of sluggish growth, the company reported results above expectations on renewed growth in U.S. enterprise spending and a strong new product cycle. In the Consumer Discretionary sector, stock selection resulted in three Fund holdings being up more than 25%. While we see compelling valuations and good long-term earnings power in media and select areas of retail, it was gaming that took the lead this period. International Game Technology (no longer held at period end), a manufacturer of electronic casino gaming equipment, was the Fund’s second best contributor on its announced acquisition by an Italian competitor. The Utilities sector continues to present an attractive combination of dividend yield and steady earnings growth. Windstream Holdings, Inc. (no longer held at period end) was the top contributor in the group after announcing plans to spin-off its real estate assets into a tax-advantaged publically traded Real Estate Investment Trust (“REIT”).
Stock selection in the Financials sector was the main detractor from relative performance. This is attributable to the Fund’s underweight in REITs, the largest component of the sector and the top performing industry for the period. Additionally, the Fund’s position in Ocwen Financial Corp., Class B was a significant drag on performance as the company traded lower after missing earnings expectations in July. Despite top-line growth and strong mortgage servicing metrics, uncertainties about the continued escalation of costs to meet new regulatory requirements have weighed on the industry. In the Energy sector, stocks traded in sympathy with rapidly declining oil prices. It was the worst performing sector for both the Fund and the benchmark. Stock selection in Energy XXI Bermuda, Ltd. was the Fund’s primary detractor to return as the company faced headwinds integrating the recent acquisition of EPL Corp. and significantly underperformed its peers. Finally, in Containers & Packaging, both of the Fund’s holdings underperformed the benchmark for the period. Rexam PLC was the primary detractor as investors worried about the aluminum can manufacturer’s exposure to Russia and emerging markets.
Brett P. Hawkins, CFA, CPA
Portfolio Manager
Thompson, Siegel & Walmsley LLC
| | |
| Transamerica Funds | | Annual Report 2014 |
Page 41
Transamerica Mid Cap Value Opportunities
(unaudited)

| | | | | | | | |
| Average Annual Total Return for Periods Ended 10/31/2014 | |
| | | 10 Years or
Life of Class | | | Inception Date | |
Class A (NAV) | | | 7.62 | % (A) | | | 04/30/2014 | |
Class A (POP) | | | 1.72 | % (A) | | | 04/30/2014 | |
Russell Midcap® Value Index (B) | | | 6.55 | % (A) | | | | |
Class C (NAV) | | | 7.29 | % (A) | | | 04/30/2014 | |
Class C (POP) | | | 6.29 | % (A) | | | 04/30/2014 | |
Class I (NAV) | | | 7.83 | % (A) | | | 04/30/2014 | |
Class I2 (NAV) | | | 7.86 | % (A) | | | 04/30/2014 | |
(A) Not annualized.
(B) The Russell Midcap® Value Index is an unmanaged index used as a general measure of market performance. Calculations assume dividends and capital gains are reinvested and do not include any managerial expenses. The 10 Years or Life of Class calculation is based on the inception date of the class. You cannot invest directly in an index.
The performance data presented represents past performance; future results may vary. Performance data does not reflect the deduction of taxes that would be paid on Fund distributions or the redemption of Fund shares. Investment return and principal value will fluctuate so that an investor’s shares, when redeemed, may be worth more or less than their original cost. Current performance may be lower or higher than performance quoted. Please see www.transamerica.com for performance data current to the most recent month-end. Net Asset Value (“NAV”) returns include the reinvestment of dividends and capital gains but do not reflect any sales charges. Public Offering Price (“POP”) returns include the reinvestment of dividends and capital gains and reflect the maximum sales charge of 5.5% for A shares or the maximum applicable contingent deferred sales charge of 1% (during the first 12 months) for Class C shares. There are no sales charges on Class I and I2 shares.
Performance figures reflect any fee waivers and/or expense reimbursements by the Investment Adviser. Without such waivers and/or reimbursements, the performance would be lower. Future waivers and/or reimbursements are at the discretion of the Investment Adviser.
Performance results do not include adjustments made for financial reporting purposes in accordance with U.S. generally accepted accounting principles and may differ from amounts reported in the financial highlights.
Investing in mid-sized companies involves greater risk than is customarily associated with more established companies. The securities of mid-sized companies are subject to higher volatility than larger, more established companies. The prices of securities the sub-adviser believes are undervalued may not appreciate as anticipated or may go down. Value approach carries the risk that the market will not recognize a security’s intrinsic value for a long time or that an undervalued stock is actually appropriately priced.
Russell Investment Group is the source and owner of the trademarks, service marks, and copyrights related to the Russell indexes. Russell® is a trademark of Russell Investment Group.
Please refer to page 72 for index descriptions.
| | |
| Transamerica Funds | | Annual Report 2014 |
Page 42
Transamerica MLP & Energy Income
(unaudited)
MARKET ENVIRONMENT
Recent headlines have focused on the fall of the West Texas Intermediate crude oil spot price from approximately $105/bbl to under $80/bbl over the past four months. While this contributed to great volatility within the energy sector, we find it important to note that most companies in the energy infrastructure sector have limited direct exposure to oil prices (about 70-75% of master limited partnership (“MLPs”) activities are related to natural gas). In addition, most MLPs have migrated their business models to be more fee-based.
Mergers, acquisitions, and restructuring are the prevailing themes, highlighted by the announced restructuring of the Kinder Morgan family of companies that will result in Kinder Morgan, Inc. acquiring all outstanding units of Kinder Morgan Energy Partners, LP, El Paso Pipeline Partners, LP, and Kinder Morgan Management LLC in a cash and stock transaction valued at $71 billion. The combined effect of the transaction eliminates incentive distribution rights, lowers equity and debt capital costs, and affects a step-up in depreciation. This enables Kinder Morgan, Inc. to sustainably increase its dividend growth at nearly twice the rate Kinder Morgan Energy Partners, LP could have managed with the same assets, and positions the company to be highly competitive in the midstream energy consolidation theme we see emerging. Our significant exposure to the Kinder Morgan complex was consequently one of largest contributors to the Fund’s return.
Shifting focus to long-term fundamentals, shale drilling has boosted U.S. oil output to the highest level since 1986 and by next year is expected to reduce petroleum imports to the lowest level since 1968. The fundamental story underpinning growth in the MLP sector remains robust, driven by rising shale production and the corresponding demand for energy infrastructure investments required to support those growing volumes.
PERFORMANCE
For the year ended October 31, 2014, Transamerica MLP & Energy Income Class A returned 16.36%. By comparison, its primary and secondary benchmarks, the S&P 500® and the Transamerica MLP & Energy Income Blended Benchmark (“Blended Benchmark”), returned 17.27% and 8.50%, respectively.
The Blended Benchmark is comprised of the Alerian MLP Index (50%) and the Barclays Investment-Grade Credit Index (50%).
STRATEGY REVIEW
The Fund generated strong absolute returns during the year ended October 31, 2014, reflecting attractive underlying fundamentals, visible distribution growth, and M&A activity in the energy infrastructure sector. The latter half of the year was characterized by an increase in volatility as the price of crude oil declined, hostilities between Russia and Ukraine, geopolitical concerns in the Middle East and worries about global growth, which drove investors to reduce risk in their portfolios. Despite these concerns, the Fund achieved a healthy return in the last six months of the fiscal year.
While company fundamentals remained strong (as indicated by strong continuing operating results and distribution growth), we were more opportunistic when putting capital to work given the increase in volatility during the latter half of the fiscal year. Within sub-sectors in the energy infrastructure space, the strongest were General Partners / C-corps, with both Shipping and Canadian Infrastructure lagging. Our belief that M&A activity would pick up played out with a host of announced mergers and restructuring transactions. This resulted in the strongest portfolio-level contributions to return from our investments in Williams Cos., Inc. and Kinder Morgan Management LLC as both positions were top-5 positions in the Fund to begin the year. Transamerica MLP & Energy Income uses derivatives primarily in a covered call writing strategy. This helps to generate additional income for the Fund and can help reduce portfolio-level volatility. Written options contributed positively to performance.
John C. Frey
Portfolio Manager
Kayne Anderson Capital Advisors, L.P.
| | |
| Transamerica Funds | | Annual Report 2014 |
Page 43
Transamerica MLP & Energy Income
(unaudited)
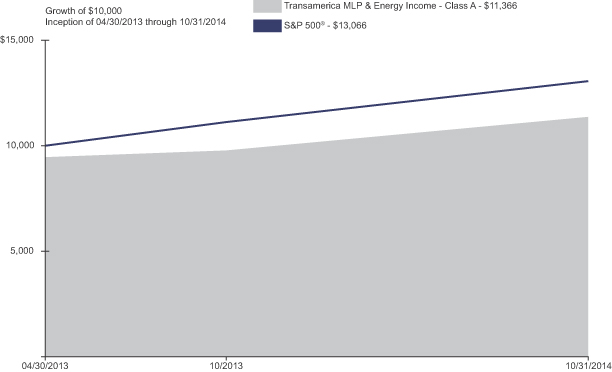
| | | | | | | | | | | | |
| Average Annual Total Return for Periods Ended 10/31/2014 | |
| | | 1 Year | | | 10 Years or
Life of Class | | | Inception Date | |
Class A (NAV) | | | 16.36 | % | | | 13.02 | % | | | 04/30/2013 | |
Class A (POP) | | | 9.94 | % | | | 8.87 | % | | | 04/30/2013 | |
S&P 500® (A) | | | 17.27 | % | | | 19.42 | % | | | | |
Transamerica MLP & Energy Income Blended Benchmark (A) | | | 8.50 | % | | | 4.43 | % | | | | |
Class C (NAV) | | | 15.49 | % | | | 12.14 | % | | | 04/30/2013 | |
Class C (POP) | | | 14.49 | % | | | 12.14 | % | | | 04/30/2013 | |
Class I (NAV) | | | 16.69 | % | | | 13.27 | % | | | 04/30/2013 | |
Class I2 (NAV) | | | 16.79 | % | | | 13.35 | % | | | 04/30/2013 | |
(A) The S&P 500® is an unmanaged index used as a general measure of market performance. The Transamerica MLP & Energy Income Blended Benchmark is composed of the following benchmarks: Alerian MLP Index (50%) and the Barclays Investment Grade Credit Index (50%). All benchmarks are unmanaged indices used as a general measure of market performance. Calculations assume dividends and capital gains are reinvested and do not include any managerial expenses. The 10 Years or Life of Class calculation is based on the inception date of the Class. You cannot invest directly in an index.
The performance data presented represents past performance; future results may vary. Performance data does not reflect the deduction of taxes that would be paid on Fund distributions or the redemption of Fund shares. Investment return and principal value will fluctuate so that an investor’s shares, when redeemed, may be worth more or less than their original cost. Current performance may be lower or higher than performance quoted. Please see www.transamerica.com for performance data current to the most recent month-end. Net Asset Value (“NAV”) returns include the reinvestment of dividends and capital gains but do not reflect any sales charges. Public Offering Price (“POP”) returns include the reinvestment of dividends and capital gains and reflect the maximum sales charge of 5.5% for A shares or the maximum applicable contingent deferred sales charge of 1% (during the first 12 months) for Class C shares. There are no sales charges on Class I and I2 shares.
Performance figures reflect any fee waivers and/or expense reimbursements by the Investment Adviser. Without such waivers and/or reimbursements, the performance would be lower. Future waivers and/or reimbursements are at the discretion of the Investment Adviser.
Performance results do not include adjustments made for financial reporting purposes in accordance with U.S. generally accepted accounting principles and may differ from amounts reported in the financial highlights.
Investments in MLPs involve risks that differ from investments in corporate issuers, including risks related to limited control, cash flow risks, dilution risks and risks related to the general partner’s right to require unit holders to sell their common units at an undesirable time or price. The energy industries can be significantly affected by fluctuations in energy prices and supply and demand of energy fuels, energy conservation, the success of exploration projects, and tax and other government regulations.
The Fund is subject to certain MLP tax risks. Risks associated with accounting for deferred tax liability could materially impact the net asset value. An investment in the Fund does not offer the same tax benefits of a direct investment in a MLP.
The Fund is classified as “non-diversified,” which means it may invest a larger percentage of its assets in a smaller number of issuers than a diversified fund. To the extent the Fund invests its assets in fewer issuers, the Fund will be more susceptible to negative events affecting those issuers.
Please refer to page 72 for index descriptions.
| | |
| Transamerica Funds | | Annual Report 2014 |
Page 44
Transamerica Multi-Managed Balanced
(unaudited)
MARKET ENVIRONMENT
Aegon USA Investment Management, LLC
The year ended October 31, 2014 can be summarized as great expectations that were never met. This narrative applies most directly to the economic recovery and the expected sell-off in fixed income markets, especially long duration assets.
The expectations were building throughout 2013 as the 10-year Treasury rate almost doubled, briefly piercing the 3% threshold. This move was intertwined with the consensus thinking that the growth rate of the U.S. economy was finally going to hit terminal velocity of close to three percent. All was perceived to be going as planned until Mother Nature chimed in. The cold weather and snow in the first quarter of this year sent inventory accumulation into hibernation. What magnified the weather event is that in the second half of 2013, factories had been participating in the consensus view that the economy was accelerating by rapidly ramping up their inventories in anticipation of higher demand in 2014. The literal freeze in economic activity in the first quarter of 2014 created such a drag that it was quickly made apparent that the full-year growth numbers were not going to be attainable.
The underwhelming economic performance was not just a U.S. event. The consensus in the Eurozone had also been calling for a healthy acceleration. However, the necessary balance sheet repairs needed to allow banks to pass the Asset Quality Review test meant that lending to the region would be very hard to come by. Such a restriction of private credit, especially to the Small & Medium Sized Enterprises, is completely contrary to what is required for an economic expansion. The ensuing slowdown was not limited to the periphery, as even the German growth engine lost steam.
The most recent policy answer to the European growth problem created a new global narrative – divergent monetary policy in the developed world. At a time when the U.S. and U.K. have been winding down quantitative easing (“QE”) and talking about raising interest rates, Japan and Europe have been going the other way – either increasing the pace of QE or seeking alternative ways to implement QE policy. (Even the largest Emerging Market country (China) is adding stimulus through numerous channels.) This divergence of policy has resulted in a huge interest rate differential between sovereign bonds and has incentivized, in part, investors domiciled in countries with low yields to buy debt instruments in (relatively) higher interest bearing countries. This so called ‘tractor-beam’ effect has also contributed downward pressure to U.S. interest rates.
As is often the case, what the consensus was expecting to be the worst asset class for the coming year (i.e., 30-year Treasuries) turned out to be one of the best, especially after accounting for volatility. Can history repeat itself in 2015? It will be tough, at least for the long bond, given the challenges to attaining capital appreciation on top of the lower starting yield versus last year. Much of the 2015 narrative could be a continuation of the divergence in global monetary policy – does the U.S. Federal Reserve (“Fed”) and Bank of England start hiking rates in 2015? Does the European Central Bank start sovereign QE? How long does the Bank of Japan keep up its torrid pace of QE? While the answers to these questions may play out in due time, with no recession seen in site, Aegon USA Investment Management, LLC remains of the view that risk assets remain in a long-term bull market.
J.P. Morgan Investment Management Inc.
Early in the fiscal year, U.S. equity markets rallied as S&P 500® company quarterly earnings hit their third-consecutive record, offsetting earlier concerns about a 16-day shutdown of the U.S. government and relentless debate over when the Fed would begin reducing the pace of its bond-buying program. A proposal introduced by the U.S. Senate was passed at the last minute, funding the U.S. government through January 2014 and extending the debt ceiling to that February. The most important Fed development at that time was the decision to begin reducing the pace of asset purchases from $85 billion per month to $75 billion per month.
Choppier markets followed in subsequent months, as investors confronted volatility in emerging markets, a brutally harsh winter in the U.S., Russian occupation of Ukraine and signals from the Fed that interest rates could rise sooner than expected. Markets eventually settled down as Crimean citizens voted to join Russia without resistance, and investors came to realize that when the Fed did decide to raise interest rates, it would be a long time before policy became restrictive. March also saw a vicious rotation in the market as stocks with higher-growth expectations, such as biotechnology and internet companies, sold off significantly in favor of stocks with more attractive valuations, such as banks and mature technology companies.
By the middle of the fiscal year, investors began to question the strength of the global economy, as bond yields across the developed world continued to fall. Adding to investor anxiety were ongoing tensions between Russia and Ukraine and increasing insurgency in Iraq. Equity markets regained their footing in mid-May, as economic releases pointed to a U.S. economy that was much stronger than the initial U.S. Gross Domestic Product number suggested. Global monetary policy was also supportive of markets, particularly in June, as the Fed continued to reinforce continued low interest rate levels while the European Central Bank launched a new facility designed to encourage bank lending.
| | |
| Transamerica Funds | | Annual Report 2014 |
Page 45
Transamerica Multi-Managed Balanced
(unaudited)
MARKET ENVIRONMENT (continued)
Towards the end of the fiscal year, U.S. equity indexes hit new highs. However, stocks later sold off over the fiscal year’s final two weeks, as weaker economic data from Europe and China reignited concerns over global growth. In the U.S., the question over the timing of the Fed’s first interest rate hike was also cause for volatility. Despite this, U.S. corporations posted record operating earnings, helped in part by greater revenue growth. Meanwhile, the Fed was able to calm fears over an early rise in interest rates by reiterating its pledge to not raise interest rates until a “considerable time” has passed after the end of its asset purchases.
October was a wild ride for U.S. equity markets. The S&P 500® fell 7.4% from its September 18 high, reaching a low of 1,862.49 on October 15, as investors feared that signs of a sharp reversal in the German economic outlook could increase the likelihood that the Eurozone could fall back in recession. Markets staged an impressive rebound during the back half of the month on strong corporate earnings and encouraging U.S. economic data. On the final trading day of the month, the index made its 35th new closing high of 2014, finishing at 2,018.05 on the heels of a surprise announcement by the Bank of Japan indicating that the central bank would increase its bond purchasing program.
PERFORMANCE
For the year ended October 31, 2014, Transamerica Multi-Managed Balanced Class A returned 12.11%. By comparison, its primary and secondary benchmarks, the S&P 500® and the Barclays U.S. Aggregate Bond Index, returned 17.27% and 4.14%, respectively.
STRATEGY REVIEW
Aegon USA Investment Management, LLC
The Fund underperformed S&P 500® from its inception date of April 1, 2014 through its year end of October 31, 2014. The biggest driver of performance was our short duration positioning and underweighting of U.S. Treasuries and Agency Mortgage Backed Securities (“MBS”). Our overweighting of various spread products added positively to returns but did not deliver enough positive total return to offset the difference. We continue to position the Fund with a shorter than index duration and an underweight to Treasuries due to our belief that the current low rates offer minimal value.
Corporate bonds appeared to benefit from strong corporate profitability and robust market technicals. However, given the increase in merger and acquisition activity this year, diligence to avoid idiosyncratic risks becomes more paramount. Our overweighting of financials benefited during the period, as we have seen credit spreads tighten due to the improved environment for asset quality and regulations supporting credit quality. We continued to be selective in our emerging markets positioning, investing mostly in highly rated solid corporate credit.
Agency MBS outperformed their duration matched Treasuries, and our underweight was a negative contribution to performance. We continued to invest in agency mortgage dollar rolls which are helped by the Fed’s balance sheet policies and non-agency MBS re-REMICs, which have benefited from the extra yield and positive technicals. Due to the Fed’s taper of MBS purchases, we intend to remain underweight Agency MBS given our expectation of deteriorating technicals and widening spreads with their reduced role in the market. We also prefer other securitized segments, and we intend to focus on niche sectors in Asset Backed Securities (“ABS”) and select Commercial Mortgage Backed Securities (“CMBS”).
While we do not believe that spreads on risky assets offer the return opportunities they once did, our analysis suggests that there are still excess yield opportunities available. We have continued to position the Fund in corporate credit and structured securities to pursue potential opportunities to gain excess yield while remaining cautious around duration (i.e., interest rate) risks.
J.P. Morgan Investment Management Inc.
The Fund outperformed Barclays U.S. Aggregate Bond Index during the year ended October 31, 2014. Stock selection in the Retail, Basic Materials and Consumer Cyclical sectors added value while the Consumer Staples, Pharmaceutical/Medical Technology and Real Estate Investment Trust sectors detracted from returns.
Among contributors, an overweight position in Union Pacific Corp. added value. The stock outperformed throughout the year on strong pricing, share buybacks, improved operating metrics and higher volumes. We remain positive on the name, as we see pricing growth continuing to accelerate due to tight network capacity and legacy re-pricing. Within pharmaceutical/medical technology, an underweight in Pfizer, Inc. helped returns. The stock sold off later in the fiscal year after AstraZeneca thwarted the pharmaceutical company’s takeover attempt. We continue to think that Pfizer, Inc.‘s revenue and operating margin expectations are too high and believe that its
| | |
| Transamerica Funds | | Annual Report 2014 |
Page 46
Transamerica Multi-Managed Balanced
(unaudited)
STRATEGY REVIEW (continued)
pipeline is underwhelming. The company appears to be overvalued, and we see better opportunities elsewhere in the sector. In Basic Materials, shares of Alcoa, Inc. advanced throughout the year. Ongoing smelter closures supported aluminum prices, and we expect this trend to continue. A tight scrap market and sell-side analysts’ forecasts for large aluminum deficits also point to an aluminum supply shortage and potentially higher aluminum prices.
On the negative side, within the industrial cyclical sector, an overweight position in Fluor Corp. hurt performance, as management indicated that earnings would come in at the low end of guidance. The stock also saw choppiness amid concerns over whether order backlogs would be realized as revenue. However, we remain bullish on Fluor Corp.’s exposure to the oil and gas and petrochemical businesses, which we believe will be a driver going forward, especially in the U.S. and in China. In the Pharmaceutical/Medical Technology sector, our overweight position in Bristol-Myers Squibb Co. weighed on returns. Shares suffered particularly after Bristol-Myers Squibb Co. reported disappointing data for its lung cancer treatment. However, we see these concerns as near-term noise that should not significantly change the opportunity. We remain positive on the name. Lastly, within industrial cyclical, an overweight position in Ensco PLC, Class A detracted from results. The stock underperformed as offshore drillers have been challenged with an oversupplied market, leading to lower utilization, though we still like the high-quality name.
The Fund uses derivatives to hedge cash positions. The derivatives had a slight positive impact on performance.
Brian W. Westhoff, CFA
Rick Perry, CFA
Doug Weih, CFA
Co-Portfolio Managers
Aegon USA Investment Management, LLC
Raffaele Zingone, CFA
Timothy Snyder, CFA
Aryeh Glatter
Steven G. Lee
Co-Portfolio Managers
J.P. Morgan Investment Management Inc.
| | |
| Transamerica Funds | | Annual Report 2014 |
Page 47
Transamerica Multi-Managed Balanced
(unaudited)
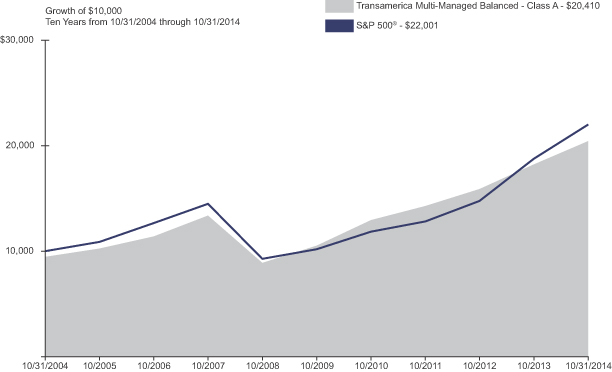
| | | | | | | | | | | | | | | | |
| Average Annual Total Return for Periods Ended 10/31/2014 | |
| | | 1 Year | | | 5 Years | | | 10 Years or
Life of Class | | | Inception Date | |
Class A (NAV) | | | 12.11 | % | | | 14.17 | % | | | 8.01 | % | | | 12/02/1994 | |
Class A (POP) | | | 5.95 | % | | | 12.89 | % | | | 7.40 | % | | | 12/02/1994 | |
S&P 500® (A) | | | 17.27 | % | | | 16.69 | % | | | 8.20 | % | | | | |
Barclays U.S. Aggregate Bond Index (A) | | | 4.14 | % | | | 4.22 | % | | | 4.64 | % | | | | |
Class B (NAV) | | | 11.07 | % | | | 13.20 | % | | | 7.40 | % | | | 10/01/1995 | |
Class B (POP) | | | 6.07 | % | | | 13.07 | % | | | 7.40 | % | | | 10/01/1995 | |
Class C (NAV) | | | 11.38 | % | | | 13.50 | % | | | 7.39 | % | | | 11/11/2002 | |
Class C (POP) | | | 10.38 | % | | | 13.50 | % | | | 7.39 | % | | | 11/11/2002 | |
Class I (NAV) | | | 12.46 | % | | | N/A | | | | 14.10 | % | | | 11/30/2009 | |
(A) The S&P 500® and the Barclays U.S. Aggregate Bond Index are unmanaged indices used as a general measure of market performance. Calculations assume dividends and capital gains are reinvested and do not include any managerial expenses. The 10 Years or Life of Class calculation is based on the previous 10 years or since the inception date of the class, whichever is more recent. You cannot invest directly in an index.
The performance data presented represents past performance; future results may vary. Performance data does not reflect the deduction of taxes that would be paid on Fund distributions or the redemption of Fund shares. Investment return and principal value will fluctuate so that an investor’s shares, when redeemed, may be worth more or less than their original cost. Current performance may be lower or higher than performance quoted. Please see www.transamerica.com for performance data current to the most recent month-end. Net Asset Value (“NAV”) returns include the reinvestment of dividends and capital gains but do not reflect any sales charges. Public Offering Price (“POP”) returns include the reinvestment of dividends and capital gains and reflect the maximum sales charge of 5.5% for A shares or the maximum applicable contingent deferred sales charge (5% in the 1st year, decreasing to 0% after 6 years) for Class B shares and 1% (during the first 12 months) for Class C shares. Shares purchased prior to March 1, 2004 are subject to a maximum applicable contingent deferred sales charge (5% in the 1st year, decreasing to 0% after 7 years) for Class B shares and (2% in the 1st year, decreasing to 0% after 2 years) for Class C shares. There are no sales charges on Class I shares.
Performance figures reflect any fee waivers and/or expense reimbursements by the Investment Adviser. Without such waivers and/or reimbursements, the performance would be lower. Future waivers and/or reimbursements are at the discretion of the Investment Adviser.
Performance results do not include adjustments made for financial reporting purposes in accordance with U.S. generally accepted accounting principles and may differ from amounts reported in the financial highlights.
Equity securities tend to go up and down more dramatically over the short term and price movements may result from many individual factors as well as the market as a whole. Fixed income securities have several risks including fluctuations in market value, changes in interest rates as the value will decrease as interest rates rise, and issuers defaulting on their obligations to pay interest or return principal.
Please refer to page 72 for index descriptions.
| | |
| Transamerica Funds | | Annual Report 2014 |
Page 48
Transamerica Opportunistic Allocation
(unaudited)
MARKET ENVIRONMENT
The year ended October 31, 2014 can be summarized as great expectations that were never met. This narrative applies most directly to the economic recovery and the expected sell-off in fixed income markets, especially long duration assets.
The expectations were building throughout 2013 as the 10-year Treasury rate almost doubled, briefly piercing the three percent threshold. This move was intertwined with the consensus thinking that the growth rate of the U.S. economy was finally going to hit terminal velocity close to three percent. All was perceived to be going as planned until Mother Nature chimed in. The cold weather and snow sent inventory accumulation into hibernation. What magnified the weather event is that in the second half of 2013, factories had been participating in the consensus view that the economy was accelerating by rapidly ramping up their inventories in anticipation of higher demand in 2014. The literal freeze in economic activity in first quarter of 2014 created such a drag that it was quickly made apparent that the full-year growth numbers were not going to be attainable.
The underwhelming economic performance was not just a U.S. event. The consensus in the Eurozone had also been calling for a healthy acceleration. However, the necessary balance sheet moves in order for banks to pass the Asset Quality Review test meant that lending to the region would be very hard to come by. Such restriction of private credit, especially to the Small & Medium Sized Enterprises, is completely contrary to what is required for an economic expansion. The ensuing slowdown was not limited to the periphery, even the German growth engine lost steam.
The most recent policy answer to the European growth problem created a new global narrative – divergent monetary policy in the developed world. At a time when U.S. and U.K. are winding down quantitative easing (“QE”) and talking about raising interest rates, Japan and Europe are going the other way – either increasing the QE pace or seeking alternative ways to implement QE policy. (Even the largest Emerging Market country (China) is adding stimulus through numerous channels.) This divergence of policy has resulted in a huge rate differential in sovereign bonds and has incentivized, in part, investors domiciled in low yielding countries to buy debt instruments in (relatively) higher interest bearing countries. This so called ‘tractor-beam’ effect has also contributed downward pressure to U.S. rates.
As is often the case, what consensus was expecting to be the worst asset class for the coming year (i.e., 30 year Treasuries) turned out to be one of the best, especially when factoring in volatility measures like the Sharpe ratio. Can history repeat itself in 2015? It will be tough, at least for the long bond given the challenges to attaining capital appreciation on top of the lower starting yield versus last year. Much of the 2015 narrative could be a continuation of the divergence in global monetary policy – does the U.S. Federal Reserve (“Fed”) and Bank of England start hiking rates in 2015? Does the European Central Bank start sovereign QE? How long does the Bank of Japan keep up its torrid pace of QE? While the answers to these questions may play out in due time, with no recession seen in site, Aegon USA Investment Management, LLC remains of the view that risk assets remain in a long-term bull market.
PERFORMANCE
For the year ended October 31, 2014, Transamerica Opportunistic Allocation Class A returned 4.38%. By comparison, its primary and secondary benchmarks, the S&P 500® and the Transamerica Opportunistic Allocation Blended Benchmark returned 17.27% and 11.93%, respectively.
The Blended Benchmark is comprised of S&P 500® (60%) and the Barclays Aggregate Bond Index (40%).
STRATEGY REVIEW
In general, over the course of the fiscal year, the Fund was overweight in long-duration municipal bond closed-end funds. These holdings severally performed well, because interest rates declined significantly over the period, and the closed-end funds’ discounts to Net Asset Value (“NAV”) decreased. The Fund’s equity exposure also generally helped performance through the fiscal year. However, in the period from September to mid-October 2014, the Fund lost approximately 8% as a result of declines in the equity market, and expansion of the closed-end funds’ discounts to NAV. At that point we reallocated the Fund, but because many of the closed-end fund’s discounts to NAV were still deteriorating, few potential holdings passed our selection criteria. As a result, we significantly reduced the Fund’s equity exposure. The stock market generally rebounded through the end of October 2014, but the Fund was not able to fully participate in that rebound due to our equity underweight. As a result of the rebound, more potential holdings became acceptable, and consequently, the Fund is now back to being fully invested.
Todd R. Porter, CFA
Maciej J. Kowara, CFA
Co-Portfolio Managers
Aegon USA Investment Management, LLC
| | |
| Transamerica Funds | | Annual Report 2014 |
Page 49
Transamerica Opportunistic Allocation
(unaudited)
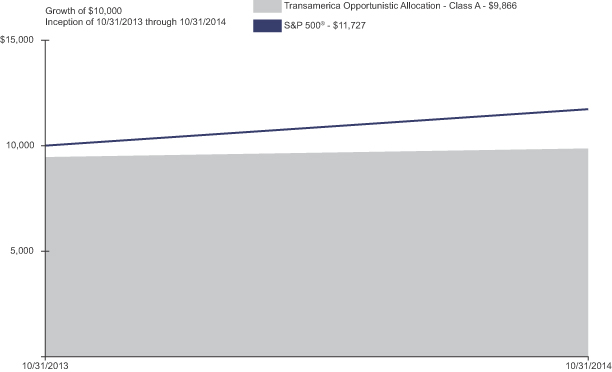
| | | | | | | | | | | | |
| Average Annual Total Return for Periods Ended 10/31/2014 | |
| | | 1 Year | | | 10 Years or
Life of Class | | | Inception Date | |
Class A (NAV) | | | 4.38 | % | | | 4.38 | % | | | 10/31/2013 | |
Class A (POP) | | | (1.34 | )% | | | (1.34 | )% | | | 10/31/2013 | |
S&P 500® (A) | | | 17.27 | % | | | 17.27 | % | | | | |
Transamerica Opportunistic Allocation Blended Benchmark (A) | | | 11.93 | % | | | 11.93 | % | | | | |
Class C (NAV) | | | 3.69 | % | | | 3.69 | % | | | 10/31/2013 | |
Class C (POP) | | | 2.70 | % | | | 2.70 | % | | | 10/31/2013 | |
Class I (NAV) | | | 4.74 | % | | | 4.74 | % | | | 10/31/2013 | |
(A) The S&P 500® and the Transamerica Opportunistic Allocation Blended Benchmark are unmanaged indices used as a general measure of market performance. The Transamerica Opportunistic Allocation Blended Benchmark is composed of the following benchmarks: S&P 500 (60%) and Barclays Aggregate Bond Index (40%). Calculations assume dividends and capital gains are reinvested and do not include any managerial expenses. The 10 Years or Life of Class calculation is based on the inception date of the class. You cannot invest directly in an index.
The performance data presented represents past performance; future results may vary. Performance data does not reflect the deduction of taxes that would be paid on Fund distributions or the redemption of Fund shares. Investment return and principal value will fluctuate so that an investor’s shares, when redeemed, may be worth more or less than their original cost. Current performance may be lower or higher than performance quoted. Please see www.transamerica.com for performance data current to the most recent month-end. Net Asset Value (“NAV”) returns include the reinvestment of dividends and capital gains but do not reflect any sales charges. Public Offering Price (“POP”) returns include the reinvestment of dividends and capital gains and reflect the maximum sales charge of 5.5% for A shares or the maximum applicable contingent deferred sales charge of 1% (during the first 12 months) for Class C shares. There are no sales charges on Class I shares.
Performance figures reflect any fee waivers and/or expense reimbursements by the Investment Adviser. Without such waivers and/or reimbursements, the performance would be lower. Future waivers and/or reimbursements are at the discretion of the Investment Adviser.
Performance results do not include adjustments made for financial reporting purposes in accordance with U.S. generally accepted accounting principles and may differ from amounts reported in the financial highlights.
Because the Fund invests its assets in various underlying closed-end funds and its ability to achieve its investment objective depends largely on the performance of the underlying funds in which it invests. Each of the underlying funds in which the Fund may invest has its own investment risks, and those risks can affect the value of the underlying funds’ shares and therefore the value of the Fund’s investments.
Please refer to page 72 for index descriptions.
| | |
| Transamerica Funds | | Annual Report 2014 |
Page 50
Transamerica Short-Term Bond
(unaudited)
MARKET ENVIRONMENT
The year ended October 31, 2014 can be summarized as great expectations that were never met. This narrative applies most directly to the economic recovery and the expected sell-off in fixed income markets, especially long duration assets.
The expectations were building throughout 2013 as the 10-year Treasury rate almost doubled, briefly piercing the 3% threshold. This move was intertwined with the consensus thinking that the growth rate of the U.S. economy was finally going to hit terminal velocity close to 3%. All was perceived to be going as planned until Mother Nature chimed in. The cold weather and snow sent inventory accumulation into hibernation. What magnified the weather event is that in the second half of 2013, factories had been participating in the consensus view that the economy was accelerating by rapidly ramping up their inventories in anticipation of higher demand in 2014. The literal freeze in economic activity in the first quarter of 2014 created such a drag that it was quickly made apparent that the full-year growth numbers were not going to be attainable.
The underwhelming economic performance was not just a U.S. event. The consensus in the Eurozone had also been calling for a healthy acceleration. However, the necessary balance sheet moves in order for banks to pass the Asset Quality Review test meant that lending to the region would be very hard to come by. Such restriction of private credit, especially to the Small & Medium Sized Enterprises, is completely contrary to what is required for an economic expansion. The ensuing slowdown was not limited to the periphery, even the German growth engine lost steam.
The most recent policy answer to the European growth problem created a new global narrative – divergent monetary policy in the developed world. At a time when U.S. and U.K. are winding down quantitative easing (“QE”) and talking about raising interest rates, Japan and Europe are going the other way – either increasing the QE pace or seeking alternative ways to implement QE policy. (Even the largest Emerging Market country (China) is adding stimulus through numerous channels.) This divergence of policy has resulted in a huge rate differential in sovereign bonds and has incentivized, in part, investors domiciled in low yielding countries to buy debt instruments in (relatively) higher interest bearing countries. This so called ‘tractor-beam’ effect has also contributed downward pressure to U.S. rates.
As is often the case, what consensus was expecting to be the worst asset class for the coming year (i.e., 30 year Treasuries) turned out to be one of the best, especially when factoring in volatility measures like the Sharpe ratio. Can history repeat itself in 2015? It will be tough, at least for the long bond given the challenges to attaining capital appreciation on top of the lower starting yield versus last year. Much of the 2015 narrative could be a continuation of the divergence in global monetary policy – does the U.S. Federal Reserve (“Fed”) and Bank of England start hiking rates in 2015? Does the European Central Bank start sovereign QE? How long does the Bank of Japan keep up its torrid pace of QE? While the answers to these questions may play out in due time, with no recession seen in site, Aegon USA Investment Management, LLC remains of the view that risk assets remain in a long-term bull market.
PERFORMANCE
For the year ended October 31, 2014, Transamerica Short-Term Bond Class I2 returned 2.18%. By comparison, its benchmark, the Bank of America Merrill Lynch U.S. Corporate & Government 1-3 Years Index, returned 0.92%.
STRATEGY REVIEW
The Fund maintained a higher yield and achieved a higher total return than the Bank of America Merrill Lynch U.S. Corporate & Government 1-3 Years Index for the year ended October 31, 2014. The primary driver was our overweighting of spread products and significant underweighting of Treasury and Agency Mortgage-Backed Securities (“MBS”). Overweight positioning in corporate bonds and out-of-index purchases in securitized bonds contributed to our additional yield versus the benchmark, while curve roll-down and sector/security selection added to our performance. Additionally, we maintained an underweight to interest-sensitive areas of the market (Treasuries and Agencies), which also favorably impacted performance.
Corporate bonds benefited from spread compression and strong market technicals. Throughout the year ended October 31, 2014, we maintained our overweight within the Financial sector in select bank and insurance company bonds. We continue to believe their repaired balance sheets and increased regulatory scrutiny has made them better capitalized and more stable companies since the financial crisis of 2008. We maintained an underweight to the metals and mining sector, as we believe the continued slowing in global growth will negatively impact these companies and the bonds could be relative underperformers. We increased our exposure to investment grade floating-rate credit. Although the relatively low yield offered on these bonds was a bit of a drag on performance, we believe the Fund will be in a better position to perform well when rates start to rise.
| | |
| Transamerica Funds | | Annual Report 2014 |
Page 51
Transamerica Short-Term Bond
(unaudited)
STRATEGY REVIEW (continued)
Within securitized sectors, we continued to add investment grade rated Commercial Mortgage-Backed Securities (“CMBS”) and esoteric Asset-Backed Securities (“ABS”). As noted above, we added to our investment grade floating-rate exposure in securitized bonds to better position the Fund to perform well in a rising interest rate environment. We favored select single-borrower CMBS deals where we can leverage our internal commercial real estate valuation group. Additionally, we increased our exposure to the ABS sector with bonds collateralized by timeshares. This sector performed well through the last crisis.
Our duration positioning, which remained lower than the benchmark, had a positive relative impact on the Fund as short Treasury yields increased. With the Fed narrative skewed towards less accommodation and ultimately tightening, we believe rates may continue to have an upward pressure bias to them and, as such, we anticipate keeping our short duration positioning against the benchmark.
Doug Weih, CFA
Matthew Buchannan, CFA
Glen Kneeland
Co-Portfolio Managers
Aegon USA Investment Management, LLC
| | |
| Transamerica Funds | | Annual Report 2014 |
Page 52
Transamerica Short-Term Bond
(unaudited)
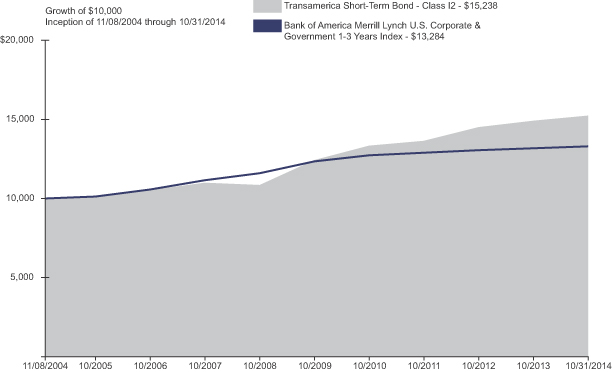
| | | | | | | | | | | | | | | | |
| Average Annual Total Return for Periods Ended 10/31/2014 | |
| | | 1 Year | | | 5 Years | | | 10 Years or
Life of Class | | | Inception Date | |
Class A (NAV) | | | 1.97 | % | | | 3.88 | % | | | 4.45 | % | | | 11/01/2007 | |
Class A (POP) | | | (0.60 | )% | | | 3.36 | % | | | 4.06 | % | | | 11/01/2007 | |
Class C (NAV) | | | 1.20 | % | | | 3.09 | % | | | 3.67 | % | | | 11/01/2007 | |
Class C (POP) | | | 0.21 | % | | | 3.09 | % | | | 3.67 | % | | | 11/01/2007 | |
Class I (NAV) | | | 2.18 | % | | | N/A | | | | 3.95 | % | | | 11/30/2009 | |
Class I2 (NAV) | | | 2.18 | % | | | 4.17 | % | | | 4.31 | % | | | 11/08/2004 | |
Bank of America Merrill Lynch U.S. Corporate & Government 1-3 Years Index (A) | | | 0.92 | % | | | 1.49 | % | | | 2.53 | % | | | | |
(A) The Bank of America Merrill Lynch U.S. Corporate & Government 1-3 Years Index is an unmanaged index used as a general measure of market performance. Calculations assume dividends and capital gains are reinvested and do not include any managerial expenses. The 10 Years or Life of Class calculation is based on the inception date of the class. You cannot invest directly in an index.
The performance data presented represents past performance; future results may vary. Performance data does not reflect the deduction of taxes that would be paid on Fund distributions or the redemption of Fund shares. Investment return and principal value will fluctuate so that an investor’s shares, when redeemed, may be worth more or less than their original cost. Current performance may be lower or higher than performance quoted. Please see www.transamerica.com for performance data current to the most recent month-end. Net Asset Value (“NAV”) returns include the reinvestment of dividends and capital gains but do not reflect any sales charges. Public Offering Price (“POP”) returns include the reinvestment of dividends and capital gains and reflect the maximum sales charge of 2.5% for A shares or the maximum applicable contingent deferred sales charge of 1% (during the first 12 months) for Class C shares. There are no sales charges on Class I and I2 shares.
Performance figures reflect any fee waivers and/or expense reimbursements by the Investment Adviser. Without such waivers and/or reimbursements, the performance would be lower. Future waivers and/or reimbursements are at the discretion of the Investment Adviser.
Performance results do not include adjustments made for financial reporting purposes in accordance with U.S. generally accepted accounting principles and may differ from amounts reported in the financial highlights.
Short-term bond funds are exposed to many of the same risks that longer-term bond funds are subject to, including credit risk, inflation risk, interest rate risk and also foreign securities and mortgage-backed securities risk.
Please refer to page 72 for index descriptions.
| | |
| Transamerica Funds | | Annual Report 2014 |
Page 53
Transamerica Small Cap Core
(unaudited)
MARKET ENVIRONMENT
The year overall saw generally healthy market conditions for domestic small cap equities, with the Russell 2000® Index advancing modestly for the period. The favorable market action mirrored a constructive U.S. economic environment, which saw further expansion after a slow start to the calendar year due to severe winter weather conditions. U.S. Gross Domestic Product actually turned negative in the first quarter of 2014, as a winter freeze was felt deep into the South. However, domestic industrial activities picked up through the remainder of the year and led the economy back. This was seen in railroad, automobile, and housing data, all of which demonstrated strength during the past 12 months, creating a self-reinforcing cycle of solid business sentiment and spending levels. Consumer confidence improved as well, but this did not translate to widespread traffic gains at retailers, which saw mixed results overall.
Meanwhile, the U.S. economy faced headwinds from abroad in the last year, as weaker economic conditions in Europe, China and emerging markets generally became constraints. Aside from the obvious challenges, the slowdown in foreign markets has posed for U.S. multinationals and their trading partners, this dynamic has also had a pronounced effect on global interest rates. The domestic yield curve was by no means immune from this trend, which served to focus investors on stocks with high dividend yields. In fact, the highest-yielding quintile of stocks within the Russell 2000® Index were up almost twice as much as the index overall during the period. Given the cross currents in the economic backdrop over the period, investors also sought comfort in companies with earnings, as they materially outperformed their loss-making counterparts.
PERFORMANCE
For the year ended October 31, 2014, Transamerica Small Cap Core Class A returned 8.18%. By comparison, its benchmark, the Russell 2000® Index, returned 8.06%.
STRATEGY REVIEW
Substantial academic and empirical research has shown the existence of a number of market anomalies that can be profitably exploited by a disciplined approach to security selection and portfolio construction. We believe the ultimate strength of our strategy lies in its ability to produce a portfolio that, in aggregate, maintains objective and economically-meaningful exposures to the factors our research has shown to be indicative of prospective outperformance.
The Fund outperformed its benchmark during the year ended October 31, 2014.
The outperformance of the Fund during this time frame is attributable to our stock selections, as the stocks in our Fund outperformed their counterparts in the benchmark in seven of the 10 economic sectors. Our holdings in the Energy sector added the most value, followed by those in the Information Technology and Materials sectors. The only sector where our holdings meaningfully detracted from results was Consumer Discretionary. From a sector allocation standpoint, our overweight to the Energy sector served to reduce our outperformance during the period.
Our stock selection model was effective at both identifying outperforming issues and avoiding underperformers, as those stocks in the top quintile of our ranking system outperformed those in the bottom quintile by a wide margin. Within our overall framework, our valuation and capital deployment measures proved to be the most helpful stock selection tools, as investors generally favored issues with lower valuation and more conservative capital use metrics. Our Fund also benefited from investors preference for companies with earnings. The relative underperformance of loss-making companies had a bigger negative impact on the benchmark than it did on our portfolio due to the Index’s larger exposure to these companies. Finally, our Fund had a greater proportion of its assets in the top quintile of companies sorted by earnings growth over the trailing 12 months. This served as a tailwind to relative performance as these stocks materially outperformed.
Eoin E. Middaugh, CFA
D. Kevin McCreesh, CFA
Co-Portfolio Managers
Systematic Financial Management, L.P.
| | |
| Transamerica Funds | | Annual Report 2014 |
Page 54
Transamerica Small Cap Core
(unaudited)
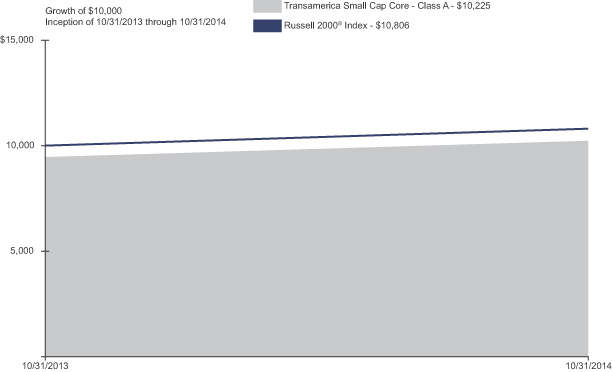
| | | | | | | | | | | | |
| Average Annual Total Return for Periods Ended 10/31/2014 | |
| | | 1 Year | | | 10 Years or
Life of Class | | | Inception Date | |
Class A (NAV) | | | 8.18 | % | | | 8.18 | % | | | 10/31/2013 | |
Class A (POP) | | | 2.25 | % | | | 2.25 | % | | | 10/31/2013 | |
Russell 2000® Index (A) | | | 8.06 | % | | | 8.06 | % | | | | |
Class C (NAV) | | | 7.36 | % | | | 7.36 | % | | | 10/31/2013 | |
Class C (POP) | | | 6.36 | % | | | 6.36 | % | | | 10/31/2013 | |
Class I (NAV) | | | 8.44 | % | | | 8.44 | % | | | 10/31/2013 | |
Class I2 (NAV) | | | 8.55 | % | | | 8.55 | % | | | 10/31/2013 | |
(A) The Russell 2000® Index is an unmanaged index used as a general measure of market performance. Calculations assume dividends and capital gains are reinvested and do not include any managerial expenses. The 10 Years or Life of Class calculation is based on the inception date of the class. You cannot invest directly in an index.
The performance data presented represents past performance; future results may vary. Performance data does not reflect the deduction of taxes that would be paid on Fund distributions or the redemption of Fund shares. Investment return and principal value will fluctuate so that an investor’s shares, when redeemed, may be worth more or less than their original cost. Current performance may be lower or higher than performance quoted. Please see www.transamerica.com for performance data current to the most recent month-end. Net Asset Value (“NAV”) returns include the reinvestment of dividends and capital gains but do not reflect any sales charges. Public Offering Price (“POP”) returns include the reinvestment of dividends and capital gains and reflect the maximum sales charge of 5.5% for A shares or the maximum applicable contingent deferred sales charge of 1% (during the first 12 months) for Class C shares. There are no sales charges on Class I and I2 shares.
Performance figures reflect any fee waivers and/or expense reimbursements by the Investment Adviser. Without such waivers and/or reimbursements, the performance would be lower. Future waivers and/or reimbursements are at the discretion of the Investment Adviser.
Performance results do not include adjustments made for financial reporting purposes in accordance with U.S. generally accepted accounting principles and may differ from amounts reported in the financial highlights.
Investing in small- and medium-size companies involves greater risk than is customarily associated with more established companies. The securities of small- and mid-capitalization companies are subject to higher volatility than larger, more established companies. The price of equity securities may rise of fall because of changes in the market or changes in a company’s financial condition. Equities are subject to market risk, meaning that stock prices in general may decline over short or extended periods of time
Russell Investment Group is the source and owner of the trademarks, service marks, and copyrights related to the Russell indexes. Russell® is a trademark of Russell Investment Group.
Please refer to page 72 for index descriptions.
| | |
| Transamerica Funds | | Annual Report 2014 |
Page 55
Transamerica Small Cap Growth
(unaudited)
MARKET ENVIRONMENT
The stock market has had a great run since the nadir in March 2009. Due to the length of this market cycle, investors have naturally asked whether the bull market is over. Our view is that the bull market is maturing. There has not yet been an economic boom and while valuations are higher, they have not reached levels of extreme exuberance. Core inflation rates are below the U.S. Federal Reserve’s (“Fed”) two percent target, and real Gross Domestic Product growth has not been consistently strong. Rather, the ocean of liquidity pumped by the Fed has fueled outsized performance by the most speculative asset classes. Now that tapering has ended, and there is a heightened volume of discussion by the Fed on higher rates, investors are keenly focused on sustainable growth and valuation. Therefore, we believe that as this market cycle matures there will be a renewed focus on quality stocks. During these periods of transition, our focus on fundamentals and valuation should exhibit differentiation. We continue to believe that a focus on innovative companies that are experiencing growing demand for their products and services should lead to superior returns and portfolio success.
Lower quality, speculative companies led the market in 2013 and early 2014. This trend was particularly evident in December 2013 and January 2014. As this market has begun to mature, quality has begun to exhibit leadership, and large cap stocks have begun to outperform the stocks of smaller companies.
PERFORMANCE
For the year ended October 31, 2014, Transamerica Small Cap Growth Class A returned 4.04%. By comparison, its benchmark, the Russell 2000® Growth Index, returned 8.26%.
STRATEGY REVIEW
The Fund underperformed its benchmark during the year ended October 31, 2014.
Looking at the past fiscal year, most of the relative underperformance occurred in December 2013 and January 2014. During these two months, speculative stocks outperformed and the Fund was out of sync with the market. During the month of January, small cap pharmaceutical and biotechnology stocks in particular demonstrated significant outperformance. As a reminder, as part of our investment process, we avoid companies that are unprofitable and most small cap pharmaceutical and biotechnology companies fit this profile. In our view, these sorts of speculative rallies tend to be temporary in nature. This latest episode was no exception as the Fund outperformed from the beginning of February through the end of October 2014.
From a sector perspective, the two weakest performers on a relative basis over the past fiscal year were Technology and Producer Durables. On the positive side, the Health Care and Financial Services sectors were the two strongest performers for the year.
Akorn, Inc., Class A, an ophthalmic and injectable pharmaceutical company, was the largest contributor to Fund performance. The strength was attributable to better financial results and accretive acquisitions over the year. The second largest contributor to performance was Centene Corp., a managed care provider with a focus on Medicaid-related programs. The company has benefited meaningfully in the past year from the expansion of Medicaid programs in the U.S.
The biggest detractor from performance was Comstock Resources, Inc., an exploration and production company with operations focused onshore in the U.S. The biggest reason for the decline in the stock was the significant decline in oil prices from a peak in mid-June to late October 2014.
W. Conrad Doenges
Portfolio Manager
Ranger Investment Management, L.P.
| | |
| Transamerica Funds | | Annual Report 2014 |
Page 56
Transamerica Small Cap Growth
(unaudited)
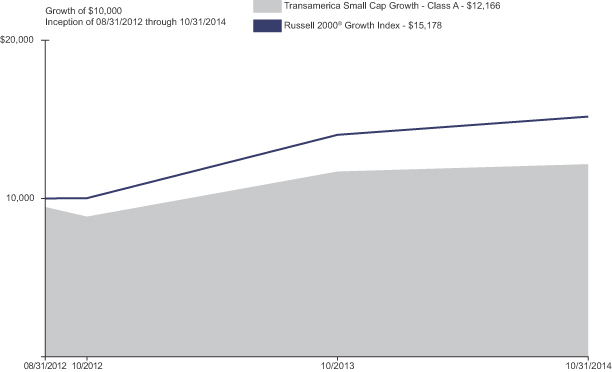
| | | | | | | | | | | | |
| Average Annual Total Return for Periods Ended 10/31/2014 | |
| | | 1 Year | | | 10 Years or
Life of Class | | | Inception Date | |
Class A (NAV) | | | 4.04 | % | | | 12.34 | % | | | 08/31/2012 | |
Class A (POP) | | | (1.68 | )% | | | 9.46 | % | | | 08/31/2012 | |
Russell 2000® Growth Index (A) | | | 8.26 | % | | | 21.20 | % | | | | |
Class C (NAV) | | | 3.42 | % | | | 11.64 | % | | | 08/31/2012 | |
Class C (POP) | | | 2.42 | % | | | 11.64 | % | | | 08/31/2012 | |
Class I (NAV) | | | 4.35 | % | | | 12.66 | % | | | 08/31/2012 | |
Class I2 (NAV) | | | 4.51 | % | | | 12.80 | % | | | 08/31/2012 | |
(A) The Russell 2000® Growth Index is an unmanaged index used as a general measure of market performance. Calculations assume dividends and capital gains are reinvested and do not include any managerial expenses. The 10 Years or Life of Class calculation is based on the inception date of the class. You cannot invest directly in an index.
The performance data presented represents past performance; future results may vary. Performance data does not reflect the deduction of taxes that would be paid on Fund distributions or the redemption of Fund shares. Investment return and principal value will fluctuate so that an investor’s shares, when redeemed, may be worth more or less than their original cost. Current performance may be lower or higher than performance quoted. Please see www.transamerica.com for performance data current to the most recent month-end. Net Asset Value (“NAV”) returns include the reinvestment of dividends and capital gains but do not reflect any sales charges. Public Offering Price (“POP”) returns include the reinvestment of dividends and capital gains and reflect the maximum sales charge of 5.5% for A shares or the maximum applicable contingent deferred sales charge of 1% (during the first 12 months) for Class C shares. There are no sales charges on Class I and I2 shares.
Performance figures reflect any fee waivers and/or expense reimbursements by the Investment Adviser. Without such waivers and/or reimbursements, the performance would be lower. Future waivers and/or reimbursements are at the discretion of the Investment Adviser.
Performance results do not include adjustments made for financial reporting purposes in accordance with U.S. generally accepted accounting principles and may differ from amounts reported in the financial highlights.
Investing in small-sized companies involves greater risk than is customarily associated with more established companies. The securities of small capitalization companies are subject to higher volatility than larger, more established companies.
Russell Investment Group is the source and owner of the trademarks, service marks, and copyrights related to the Russell indexes. Russell® is a trademark of Russell Investment Group.
Please refer to page 72 for index descriptions.
| | |
| Transamerica Funds | | Annual Report 2014 |
Page 57
Transamerica Small Cap Value
(unaudited)
MARKET ENVIRONMENT
The past year has been sporadic. At the end of 2013 markets were resilient to say the least as the upward climb continued despite the best efforts of many macro events. As a result of the markets’ strength, Price to Earnings (“P/E”) multiples for small caps were trading at their highest levels since 2007. In the first quarter of 2014 markets struggled to find direction as stocks posted modest declines in January followed by gains in February and early March. During the second quarter, the Russell 2000® Value Index (the “Index”) corrected from early April through mid-May, but then proceeded to climb upward and finished the second quarter at an all-time high. The Index corrected during the third quarter, but partially recovered in October 2014.
The end of the fiscal year was difficult for equities, small caps in particular. Many of the geopolitical concerns that existed earlier this year remain, while some new concerns replaced others. The markets digested another conflict between Israel and Hamas, ongoing unrest in the Middle East, and the fighting between Russia and Ukraine among others. Here in the U.S., the economic trends have not changed much – it remains uninspiring with a lack of direction. Steel production and auto sales were strong, and job growth ticked up slightly. On the other hand, the housing market sputtered a bit and commentary from many of our companies has been cautious.
PERFORMANCE
For the year ended October 31, 2014, Transamerica Small Cap Value Class A returned 4.99%. By comparison, its benchmark, the Russell 2000® Value Index, returned 7.89%.
STRATEGY REVIEW
The Fund seeks capital appreciation through value-oriented stock selection, and employs a bottom-up strategy of buying stocks below intrinsic value and selling stocks as they become fully price, have a change in thesis, or if a better opportunity exists.
Transamerica Small Cap Value underperformed its benchmark during the year ended October 31, 2014.
During the period, the Fund’s stock selection was negative. Stock selection was positive/neutral in six of 10 sectors, with Industrials, Information Technology, and Health Care performing the best. This was offset by negative stock selection in four sectors, with Financials, Consumer Staples and Consumer Discretionary performing the worst.
The largest contributor to performance came from Janus Capital Group, Inc., an asset management holding company. Select Comfort Corp. also positively contributed to the performance. The company offers innovative and individualized sleep solutions including a complete line of Sleep Number beds through its own retail stores and website.
The largest detractor from performance during the period came from Nu Skin Enterprises, Inc., Class A, a developer and distributor of anti-aging personal care products and nutritional supplements. The second largest detractor was Ascena Retail Group, Inc., Class B, a national specialty retailer of apparel for women and teen girls. GrafTech International, Ltd., which is a manufacturer of graphite electrodes, products essential to the production of electric arc furnace steel and various other ferrous and nonferrous metals, also detracted from the performance during the period.
Alvin W. Marley, CFA
Andrew Absler
Stephen Malcolm, CFA
Co-Portfolio Managers
Lombardia Capital Partners, LLC
| | |
| Transamerica Funds | | Annual Report 2014 |
Page 58
Transamerica Small Cap Value
(unaudited)
| | | | | | | | | | | | |
| Average Annual Total Return for Periods Ended 10/31/2014 | |
| | | 1 Year | | | 10 Years or
Life of Class | | | Inception Date | |
Class A (NAV) | | | 4.99 | % | | | 14.25 | % | | | 04/30/2012 | |
Class A (POP) | | | (0.79 | )% | | | 11.70 | % | | | 04/30/2012 | |
Russell 2000® Value Index (A) | | | 7.89 | % | | | 16.15 | % | | | | |
Class C (NAV) | | | 4.39 | % | | | 13.58 | % | | | 04/30/2012 | |
Class C (POP) | | | 3.41 | % | | | 13.58 | % | | | 04/30/2012 | |
Class I (NAV) | | | 5.37 | % | | | 14.65 | % | | | 04/30/2012 | |
Class I2 (NAV) | | | 5.54 | % | | | 14.79 | % | | | 04/30/2012 | |
(A) The Russell 2000® Value Index is an unmanaged index used as a general measure of market performance. Calculations assume dividends and capital gains are reinvested and do not include any managerial expenses. The 10 Years or Life of Class calculation is based on the inception date of the class. You cannot invest directly in an index.
The performance data presented represents past performance; future results may vary. Performance data does not reflect the deduction of taxes that would be paid on Fund distributions or the redemption of Fund shares. Investment return and principal value will fluctuate so that an investor’s shares, when redeemed, may be worth more or less than their original cost. Current performance may be lower or higher than performance quoted. Please see www.transamerica.com for performance data current to the most recent month-end. Net Asset Value (“NAV”) returns include the reinvestment of dividends and capital gains but do not reflect any sales charges. Public Offering Price (“POP”) returns include the reinvestment of dividends and capital gains and reflect the maximum sales charge of 5.5% for A shares or the maximum applicable contingent deferred sales charge of 1% (during the first 12 months) for Class C shares. There are no sales charges on Class I and I2 shares.
Performance figures reflect any fee waivers and/or expense reimbursements by the Investment Adviser. Without such waivers and/or reimbursements, the performance would be lower. Future waivers and/or reimbursements are at the discretion of the Investment Adviser.
Performance results do not include adjustments made for financial reporting purposes in accordance with U.S. generally accepted accounting principles and may differ from amounts reported in the financial highlights.
Investing in small-sized companies involves greater risk than is customarily associated with more established companies. The securities of small capitalization companies are subject to higher volatility than larger, more established companies.
Russell Investment Group is the source and owner of the trademarks, service marks, and copyrights related to the Russell indexes. Russell® is a trademark of Russell Investment Group.
Please refer to page 72 for index descriptions.
| | |
| Transamerica Funds | | Annual Report 2014 |
Page 59
Transamerica Small/Mid Cap Value
(unaudited)
MARKET ENVIRONMENT
The Fund’s absolute performance was boosted by healthy market conditions for the domestic equity markets. The favorable market action mirrored a constructive U.S. economic environment, which saw further expansion after a slow start to the calendar year due to severe winter weather conditions. U.S. Gross Domestic Product actually turned negative in the first quarter of 2014, as a winter freeze was felt deep into the South. At the time, our bottom-up investment research suggested that the economy was well positioned for the resumption of growth due to a healthy supply chain poised for reacceleration with only a small uptick in demand. Our analysis proved prescient, as domestic industrial activity did, indeed, pick up and lead the economy back In fact, railroad, automobile, and housing data all demonstrated strength during the past 12 months, creating a self-reinforcing cycle of solid business sentiment and spending levels. Consumer confidence improved as well, but this did not translate to widespread traffic gains at retailers, which saw mixed results overall.
Meanwhile, the U.S. economy saw headwinds from abroad in the last year, as weaker economic conditions in Europe, China and emerging markets generally became constraints. Aside from the obvious challenges, the slowdown in foreign markets has posed for U.S. multinationals and their trading partners, this dynamic has also had a pronounced effect on global interest rates. The domestic yield curve was by no means immune from this trend, which had served to focus investors on stocks with high dividend yields and not necessarily those with improving underlying company-level fundamentals.
PERFORMANCE
For the year ended October 31, 2014, Transamerica Small/Mid Cap Value Class A returned 8.13%. By comparison, its benchmark, the Russell 2500® Value Index, returned 10.23%.
STRATEGY REVIEW
The Fund underperformed its benchmark during the year ended October 31, 2014.
Wall Street’s desire for yield over some of the fundamentals we rely upon in our investment discipline hurt the Fund’s performance on a relative basis. Our stock selection process works best when investors differentiate one stock from another on the basis of metrics, such as earnings and estimate revisions, not dividend yield. Instead, we saw valuation spreads between growth- and value-oriented investments actually contract in the past 12 months from already low levels entering the fiscal year, and investor appetite for yield played no small role there. In fact, the top 20% dividend payers in the Index (calculated by their yields) actually outperformed materially during the 12-month period. Given the historically high valuations of Utilities and Real Estate Investment Trusts (“REITs”) as indicated by our multifactor valuation methodology, we have been, and remain, underweight this particular category of equities. Many individual stocks held in the Fund were likewise hurt by the protracted decline in interest rates, such as our regional banks and life insurance companies. Accordingly, our sector allocation and relative stock selection was negative in Financials.
Sector allocation did have a slight positive impact to our relative performance overall during the past 12 months, our underweight to REITs and Utilities notwithstanding. Our overweight to Health Care was materially beneficial. Health Care stocks were up significantly, as the Affordable Care Act’s implementation was a driver of incremental business for many companies in the group.
Strong selection within the Health Care, Consumer Staples and Information Technology sectors was also positive for our results relative to the benchmark, but stock selection was negative overall. Along with Financials, selection in the Consumer Discretionary sector was unfavorable.
Ron Mushock, CFA
Kenneth Burgess, CFA
Co-Portfolio Managers
Systematic Financial Management, L.P.
| | |
| Transamerica Funds | | Annual Report 2014 |
Page 60
Transamerica Small/Mid Cap Value
(unaudited)
| | | | | | | | | | | | | | | | |
| Average Annual Total Return for Periods Ended 10/31/2014 | |
| | | 1 Year | | | 5 Years | | | 10 Years or
Life of Class | | | Inception Date | |
Class A (NAV) | | | 8.13 | % | | | 17.85 | % | | | 11.91 | % | | | 04/02/2001 | |
Class A (POP) | | | 2.18 | % | | | 16.52 | % | | | 11.28 | % | | | 04/02/2001 | |
Russell 2500® Value Index (A) | | | 10.23 | % | | | 17.63 | % | | | 8.93 | % | | | | |
Class B (NAV) | | | 7.38 | % | | | 17.05 | % | | | 11.30 | % | | | 04/02/2001 | |
Class B (POP) | | | 2.45 | % | | | 16.95 | % | | | 11.30 | % | | | 04/02/2001 | |
Class C (NAV) | | | 7.42 | % | | | 17.10 | % | | | 11.18 | % | | | 11/11/2002 | |
Class C (POP) | | | 6.43 | % | | | 17.10 | % | | | 11.18 | % | | | 11/11/2002 | |
Class I (NAV) | | | 8.51 | % | | | N/A | | | | 17.74 | % | | | 11/30/2009 | |
Class I2 (NAV) | | | 8.63 | % | | | 18.46 | % | | | 11.53 | % | | | 11/15/2005 | |
(A) The Russell 2500® Value Index is an unmanaged index used as a general measure of market performance. Calculations assume dividends and capital gains are reinvested and do not include any managerial expenses. The 10 Years or Life of Class calculation is based on the previous 10 years or since the inception date of the class, whichever is more recent. You cannot invest directly in an index.
The performance data presented represents past performance; future results may vary. Performance data does not reflect the deduction of taxes that would be paid on Fund distributions or the redemption of Fund shares. Investment return and principal value will fluctuate so that an investor’s shares, when redeemed, may be worth more or less than their original cost. Current performance may be lower or higher than performance quoted. Please see www.transamerica.com for performance data current to the most recent month-end. Net Asset Value (“NAV”) returns include the reinvestment of dividends and capital gains but do not reflect any sales charges. Public Offering Price (“POP”) returns include the reinvestment of dividends and capital gains and reflect the maximum sales charge of 5.5% for A shares or the maximum applicable contingent deferred sales charge (5% in the 1st year, decreasing to 0% after 6 years) for Class B shares and 1% (during the first 12 months) for Class C shares. Shares purchased prior to March 1, 2004 are subject to a maximum applicable contingent deferred sales charge (5% in the 1st year, decreasing to 0% after 7 years) for Class B shares and (2% in the 1st year, decreasing to 0% after 2 years) for Class C shares. There are no sales charges on Class I and I2 shares.
Performance figures reflect any fee waivers and/or expense reimbursements by the Investment Adviser. Without such waivers and/or reimbursements, the performance would be lower. Future waivers and/or reimbursements are at the discretion of the Investment Adviser.
Performance results do not include adjustments made for financial reporting purposes in accordance with U.S. generally accepted accounting principles and may differ from amounts reported in the financial highlights.
Investing in small- and medium-size companies involves greater risk than is customarily associated with more established companies. The securities of small and mid capitalization companies are subject to higher volatility than larger, more established companies.
Russell Investment Group is the source and owner of the trademarks, service marks, and copyrights related to the Russell indexes. Russell® is a trademark of Russell Investment Group.
Please refer to page 72 for index descriptions.
| | |
| Transamerica Funds | | Annual Report 2014 |
Page 61
Transamerica Strategic High Income
(unaudited)
MARKET ENVIRONMENT
Since the Fund’s inception on March 3, 2014, the broad equity market as represented by the S&P 500® is up, the broad preferred stock market as represented by the iShares U.S. Preferred Stock ETF is up and the broad high yield credit market as represented by the iShares iBoxx High Yield Corporate Bond ETF is up. All three asset classes however saw significant volatility during the period with a minor pullback in early August followed by a more severe selloff in September. The S&P 500® and the iShares U.S. Preferred Stock ETF rebounded in October closing the month very close to the highs for the year. iShares iBoxx High Yield Corporate Bond ETF however rebounded less in October and is modestly lower than the high reached in June 2014.
Global macroeconomic uncertainty, concerns surrounding monetary policy, and domestic Ebola fears hit the market simultaneously in late September sending all ‘risk-on’ markets lower. This volatility, which we view as short-term and emotional in nature, more often than not presents opportunity with regard to portfolio management. We do realize we need to be concerned with the weak Euro region, the strengthening dollar due to opposing central bank actions, and the chance Ebola worsens but we also know that during these periods the baby often gets thrown out with the bathwater.
PERFORMANCE
For the period from inception March 1, 2014 through October 31, 2014, Transamerica Strategic High Income Class A returned 4.99%. By comparison, its primary and secondary benchmarks, the S&P 500® Index and Transamerica Strategic High Income Blended Benchmark, returned 9.94% and 6.94%, respectively.
The Blended Benchmark is comprised of S&P 500® (60%) and the Bank of America Merrill Lynch High Yield BB/B Rated Constrained Index (40%).
STRATEGY REVIEW
As volatility crept into the credit market in early September, we actively raised cash not only protecting the Fund but also giving us the dry powder needed to take advantage of market opportunities. We found compelling opportunities in both Technology and Consumer Discretionary on the equity side. In credit, we took advantage of forced selling by the ETFs to add securities we feel were mispriced offering great yield and strong risk/reward profiles.
In equities, Technology and Consumer Discretionary were the sectors contributing the most to relative return for the period. Fund holdings in Apple, Inc., Intel Corp., and Microsoft Corp. all performed well with the introduction of the iPhone 6 and Windows 10. An underweight to the Consumer Discretionary sector and favorable stock selection, were beneficial. Fund holding, Whirlpool Corp., bucked the trend as many stocks in this sector lagged the benchmark as concern of global events mounted.
The largest detractor from performance for the period was poor stock selection in Financials and Producer Durables. Copa Holding SA, Class A, a Panamanian based airline, posted poor results as economic conditions worsened in Venezuela and the company’s ability to continue ongoing operations in this region became uncertain. High dividend paying financial stocks, Annaly Capital Management, Inc. and New York Community Bancorp, Inc., underperformed as well with expectations of higher interest rates looming.
In credit, the Funds’ allocation to preferred stock was the largest contributor to return as long term interest rates fell during the period. Preferred equity of Corporate Office Properties Trust, Series L, PartnerRe, Ltd., Series E, and Allstate Corp., Series C were the best performers. The largest detractors from performance in credit came from the high yield sector. Energy bonds were hit with the sell-off in oil and three of our more levered names, Linn Energy LLC / Linn Energy Finance Corp., Stone Energy Corp., and Energy XXI Gulf Coast, Inc. bonds were impacted especially hard. Our position in Rent-A-Center, Inc. bonds also detracted from performance due to weaker than expected revenue growth and lower forward guidance to earnings.
William M. Bellamy, CFA
Portfolio Manager
Thompson, Siegel & Walmsley LLC
| | |
| Transamerica Funds | | Annual Report 2014 |
Page 62
Transamerica Strategic High Income
(unaudited)
| | | | | | | | |
| Average Annual Total Return for Periods Ended 10/31/2014 | |
| | | 10 Years or
Life of Class | | | Inception Date | |
Class A (NAV) | | | 4.99 | % (A) | | | 03/01/2014 | |
Class A (POP) | | | (0.76 | )% (A) | | | 03/01/2014 | |
S&P 500® (B) | | | 9.94 | % (A) | | | | |
Transamerica Strategic High Income Blended Benchmark (B) | | | 6.94 | % (A) | | | | |
Class C (NAV) | | | 4.46 | % (A) | | | 03/01/2014 | |
Class C (POP) | | | 3.46 | % (A) | | | 03/01/2014 | |
Class I (NAV) | | | 5.24 | % (A) | | | 03/01/2014 | |
Class I2 (NAV) | | | 5.14 | % (A) | | | 03/01/2014 | |
(A) Not annualized.
(B) The S&P 500® and the Transamerica Strategic High Income Blended Benchmark are unmanaged indices used as a general measure of market performance. The Transamerica Strategic High Income Blended Benchmark is comprised of the following benchmarks: S&P 500 (60%) and Bank of America Merrill Lynch High Yield BB/B Rated Constrained Index (40%). Calculations assume dividends and capital gains are reinvested and do not include any managerial expenses. The 10 Years or Life of Class calculation is based on the inception date of the class. You cannot invest directly in an index.
The performance data presented represents past performance; future results may vary. Performance data does not reflect the deduction of taxes that would be paid on Fund distributions or the redemption of Fund shares. Investment return and principal value will fluctuate so that an investor’s shares, when redeemed, may be worth more or less than their original cost. Current performance may be lower or higher than performance quoted. Please see www.transamerica.com for performance data current to the most recent month-end. Net Asset Value (“NAV”) returns include the reinvestment of dividends and capital gains but do not reflect any sales charges. Public Offering Price (“POP”) returns include the reinvestment of dividends and capital gains and reflect the maximum sales charge of 5.5% for A shares or the maximum applicable contingent deferred sales charge of 1% (during the first 12 months) for Class C shares. There are no sales charges on Class I and I2 shares.
Performance figures reflect any fee waivers and/or expense reimbursements by the Investment Adviser. Without such waivers and/or reimbursements, the performance would be lower. Future waivers and/or reimbursements are at the discretion of the Investment Adviser.
Performance results do not include adjustments made for financial reporting purposes in accordance with U.S. generally accepted accounting principles and may differ from amounts reported in the financial highlights.
Equities are subject to market risk meaning that stock prices in general may decline over short or extended periods of time. Fixed income investing is subject to credit risk, inflation risk, and interest rate risk. Investing in high-yield (junk bonds) may be subject to greater volatility and risks. Investments in international markets involve risks not associated with U.S. markets, such as currency fluctuations, adverse social and political developments, and relatively small size and lesser liquidity of the markets.
Please refer to page 72 for index descriptions.
| | |
| Transamerica Funds | | Annual Report 2014 |
Page 63
Transamerica Tactical Allocation
(unaudited)
MARKET ENVIRONMENT
The year ended October 31, 2014 can be summarized as great expectations that were never met. This narrative applies most directly to the economic recovery and the expected sell-off in fixed income markets, especially long duration assets.
The expectations were building throughout 2013 as the 10-year Treasury rate almost doubled, briefly piercing the three percent threshold. This move was intertwined with the consensus thinking that the growth rate of the U.S. economy was finally going to hit terminal velocity close to three percent. All was perceived to be going as planned until Mother Nature chimed in. The cold weather and snow sent inventory accumulation into hibernation. What magnified the weather event is that in the second half of 2013, factories had been participating in the consensus view that the economy was accelerating by rapidly ramping up their inventories in anticipation of higher demand in 2014. The literal freeze in economic activity in the first quarter of 2014 created such a drag that it was quickly made apparent that the full-year growth numbers were not going to be attainable.
The underwhelming economic performance was not just a U.S. event. The consensus in the Eurozone had also been calling for a healthy acceleration. However, the necessary balance sheet moves in order for banks to pass the Asset Quality Review test meant that lending to the region would be very hard to come by. Such restriction of private credit, especially to the Small & Medium Sized Enterprises, is completely contrary to what is required for an economic expansion. The ensuing slowdown was not limited to the periphery, even the German growth engine lost steam.
The most recent policy answer to the European growth problem created a new global narrative – divergent monetary policy in the developed world. At a time when U.S. and U.K. are winding down quantitative easing (“QE”) and talking about raising interest rates, Japan and Europe are going the other way – either increasing the QE pace or seeking alternative ways to implement QE policy. (Even the largest Emerging Market country (China) is adding stimulus through numerous channels.) This divergence of policy has resulted in a huge rate differential in sovereign bonds and has incentivized, in part, investors domiciled in low yielding countries to buy debt instruments in (relatively) higher interest bearing countries. This so called ‘tractor-beam’ effect has also contributed downward pressure to U.S. rates.
As is often the case, what consensus was expecting to be the worst asset class for the coming year (i.e., 30-year Treasuries) turned out to be one of the best, especially when factoring in volatility measures like the Sharpe ratio. Can history repeat itself in 2015? It will be tough, at least for the long bond given the challenges to attaining capital appreciation on top of the lower starting yield versus last year. Much of the 2015 narrative could be a continuation of the divergence in global monetary policy – does the U.S. Federal Reserve (“Fed”) and Bank of England start hiking rates in 2015? Does the European Central Bank start sovereign QE? How long does the Bank of Japan keep up its torrid pace of QE? While the answers to these questions may play out in due time, with no recession seen in site, Aegon USA Investment Management, LLC remains of the view that risk assets remain in a long-term bull market.
PERFORMANCE
For the year ended October 31, 2014, Transamerica Tactical Allocation Class A returned 3.05%. By comparison, its primary, secondary, and additional benchmarks, the FTSE All-World Index Total Return, the Barclays Global Aggregate Index and the Transamerica Tactical Allocation Blended Benchmark returned 8.36%, 0.22% and 5.10%, respectively.
The Blended Benchmark is comprised of the FTSE All-World Index Total Return (60%) and the Barclays Global Aggregate Index (40%).
STRATEGY REVIEW
The Fund underperformed relative to the Transamerica Tactical Allocation Blended Benchmark, for the year ended October 31, 2014. As explained below, there were multiple factors contributing to, and detracting from performance over the period, but two broad themes carried the most weight over the course of the year. Our allocation to the domestic (U.S.) fixed income markets outperformed the Fund’s secondary benchmark, the Barclays Global Aggregate Index, for the year ended October 31, 2014. Investor confidence in non-U.S. growth deteriorated considerably during the period, especially the third quarter of 2014, leading to the performance differential. On the equity side of the Fund, the U.S./non-U.S. differential detracted from performance as we were overweight in certain non-U.S. markets. In aggregate, the equity portion of the Fund underperformed the primary benchmark, the FTSE All-World Index Total Return, for the year ended October 31, 2014. Additional negative impacts were generated from both commodity and volatility exposures.
Domestic fixed income exposures contributed positively to performance, while non-U.S. equity exposures representing Asia, emerging markets, etc. contributed negative excess returns relative to our Barclays Global Aggregate Index benchmark.
Frank Koster
David Halfpap, CFA
Frank Rybinski, CFA
Co-Portfolio Managers
Aegon USA Investment Management, LLC
| | |
| Transamerica Funds | | Annual Report 2014 |
Page 64
Transamerica Tactical Allocation
(unaudited)
| | | | | | | | | | | | |
| Average Annual Total Return for Periods Ended 10/31/2014 | |
| | | 1 Year | | | 10 Years or
Life of Class | | | Inception Date | |
Class A (NAV) | | | 3.05 | % | | | 4.95 | % | | | 10/31/2012 | |
Class A (POP) | | | (2.63 | )% | | | 2.04 | % | | | 10/31/2012 | |
FTSE All-World Index Total Return (A) | | | 8.36 | % | | | 15.87 | % | | | | |
Barclays Global Aggregate Index (A) | | | 0.22 | % | | | (0.69 | )% | | | | |
Transamerica Tactical Allocation Blended Benchmark (A) | | | 5.10 | % | | | 9.03 | % | | | | |
Class C (NAV) | | | 2.24 | % | | | 4.19 | % | | | 10/31/2012 | |
Class C (POP) | | | 1.24 | % | | | 4.19 | % | | | 10/31/2012 | |
Class I (NAV) | | | 3.25 | % | | | 5.26 | % | | | 10/31/2012 | |
(A) The FTSE All-World Index Total Return, the Barclays Global Aggregate Index, and the Transamerica Tactical Allocation Blended Benchmark are unmanaged indices used as a general measure of market performance. The Transamerica Tactical Allocation Blended Benchmark is composed of the following benchmarks: FTSE All-World Index Total Return (60%) and the Barclays Global Aggregate Index (40%). Calculations assume dividends and capital gains are reinvested and do not include any managerial expenses. The 10 Years or Life of Fund calculation is based on the inception date of the class. You cannot invest directly in an Index.
The performance data presented represents past performance; future results may vary. Performance data does not reflect the deduction of taxes that would be paid on Fund distributions or the redemption of Fund shares. Investment return and principal value will fluctuate so that an investor’s shares, when redeemed, may be worth more or less than their original cost. Current performance may be lower or higher than performance quoted. Please see www.transamerica.com for performance data current to the most recent month-end. Net Asset Value (“NAV”) returns include the reinvestment of dividends and capital gains but do not reflect any sales charges. Public Offering Price (“POP”) returns include the reinvestment of dividends and capital gains and reflect the maximum sales charge of 5.5% for A shares or the maximum applicable contingent deferred sales charge of 1% (during the first 12 months) for Class C shares. There are no sales charges on Class I shares.
Performance figures reflect any fee waivers and/or expense reimbursements by the Investment Adviser. Without such waivers and/or reimbursements, the performance would be lower. Future waivers and/or reimbursements are at the discretion of the Investment Adviser.
Performance results do not include adjustments made for financial reporting purposes in accordance with U.S. generally accepted accounting principles and may differ from amounts reported in the financial highlights.
Tactical asset allocation is a portfolio strategy that attempts to take advantage of market highs and lows. The selection of a tactical asset allocation portfolio strategy will not guarantee a profit or protect against a loss. Exchange Traded Funds (“ETFs”) generally present the same risks as an investment in a conventional fund that has the same investment objectives, strategies, and policies. The market price of an ETFs share may be above or below the shares’ net asset value; and an active trading market for an ETFs share may not develop or be maintained.
The Fund’s investment exposure to the commodities markets may subject the Fund to greater volatility than investments in more traditional securities, such as stocks and bonds.
The risks of investing in foreign securities are magnified in emerging markets. These may include risks related to market and currency volatility, adverse social and political developments and the relatively small size and less liquidity of these markets. Fixed income investing is subject to credit risk, inflation risk and interest rate risk.
Please refer to page 72 for index descriptions.
| | |
| Transamerica Funds | | Annual Report 2014 |
Page 65
Transamerica Tactical Income
(unaudited)
MARKET ENVIRONMENT
The year ended October 31, 2014 can be summarized as great expectations that were never met. This narrative applies most directly to the economic recovery and the expected sell-off in fixed income markets, especially long duration assets.
The expectations were building throughout 2013 as the 10-year Treasury rate almost doubled, briefly piercing the three percent threshold. This move was intertwined with the consensus thinking that the growth rate of the U.S. economy was finally going to hit terminal velocity close to three percent. All was perceived to be going as planned until Mother Nature chimed in. The cold weather and snow sent inventory accumulation into hibernation. What magnified the weather event is that in the second half of 2013, factories had been participating in the consensus view that the economy was accelerating by rapidly ramping up their inventories in anticipation of higher demand in 2014. The literal freeze in economic activity in the first quarter of 2014 created such a drag that it was quickly made apparent that the full-year growth numbers were not going to be attainable.
The underwhelming economic performance was not just a U.S. event. The consensus in the Eurozone had also been calling for a healthy acceleration. However, the necessary balance sheet moves in order for banks to pass the Asset Quality Review test meant that lending to the region would be very hard to come by. Such restriction of private credit, especially to the Small & Medium Sized Enterprises, is completely contrary to what is required for an economic expansion. The ensuing slowdown was not limited to the periphery, even the German growth engine lost steam.
The most recent policy answer to the European growth problem created a new global narrative – divergent monetary policy in the developed world. At a time when U.S. and U.K. are winding down quantitative easing (“QE”) and talking about raising interest rates, Japan and Europe are going the other way – either increasing the QE pace or seeking alternative ways to implement QE policy. (Even the largest emerging market country (China) is adding stimulus through numerous channels.) This divergence of policy has resulted in a huge rate differential in sovereign bonds and has incentivized, in part, investors domiciled in low yielding countries to buy debt instruments in (relatively) higher interest bearing countries. This so called ‘tractor-beam’ effect has also contributed downward pressure to U.S. rates.
As is often the case, what consensus was expecting to be the worst asset class for the coming year (i.e., 30-year Treasuries) turned out to be one of the best, especially when factoring in volatility measures like the Sharpe ratio. Can history repeat itself in 2015? It will be tough, at least for the long bond given the challenges to attaining capital appreciation on top of the lower starting yield versus last year. Much of the 2015 narrative could be a continuation of the divergence in global monetary policy – does the U.S. Federal Reserve (“Fed”) and Bank of England start hiking rates in 2015? Does the European Central Bank start sovereign QE? How long does the Bank of Japan keep up its torrid pace of QE? While the answers to these questions may play out in due time, with no recession seen in site, Aegon USA Investment Management, LLC remains of the view that risk assets remain in a long-term bull market.
PERFORMANCE
For the year ended October 31, 2014, Transamerica Tactical Income Class A returned 6.39%. By comparison, its primary and secondary benchmarks, the iBoxx $ Liquid High Yield Index and the Transamerica Tactical Income Blended Benchmark, returned 4.99% and 8.34%, respectively.
The Blended Benchmark is comprised of S&P 500® (30%), the Barclays U.S. Aggregate Bond Index (30%), and the iBoxx $ Liquid High Yield Index (40%).
STRATEGY REVIEW
The Fund underperformed relative to its blended benchmark (30% S&P 500®, 30% Barclays U.S. Aggregate Bond Index, and 40% iBoxx $ Liquid High Yield Index) for the year ended October 31, 2014. Primary detractors from performance were our short duration posture relative to our benchmark on the fixed income side, and exposures to non-U.S. equities within the overall equity allocation.
As alluded to above, the macro backdrop, both domestic and foreign, changed rather dramatically over the course of the year. We were anticipating a gradual rise in interest rates over the course of the year, and positioned the Fund accordingly. Instead, rates rallied persistently from the beginning of calendar year 2014, as the global growth outlook slowed. Additionally, the deterioration of the growth outlook was primarily focused on non-U.S. markets, particularly the Eurozone and much of Asia, causing equity exposures in those markets to underperform U.S. equity markets.
Frank Koster
David Halfpap, CFA
Frank Rybinski, CFA
Co-Portfolio Managers
Aegon USA Investment Management, LLC
| | |
| Transamerica Funds | | Annual Report 2014 |
Page 66
Transamerica Tactical Income
(unaudited)
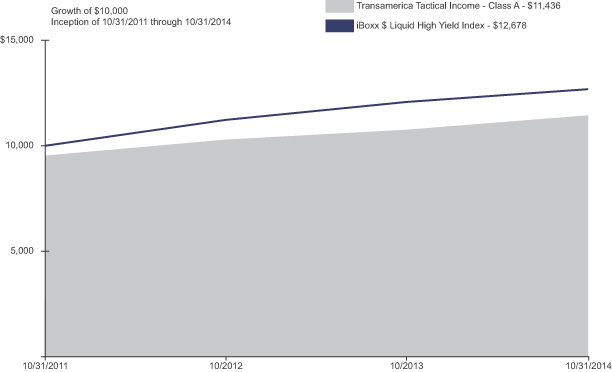
| | | | | | | | | | | | |
| Average Annual Total Return for Periods Ended 10/31/2014 | |
| | | 1 Year | | | 10 Years or
Life of Class | | | Inception Date | |
Class A (NAV) | | | 6.39 | % | | | 6.28 | % | | | 10/31/2011 | |
Class A (POP) | | | 1.30 | % | | | 4.57 | % | | | 10/31/2011 | |
iBoxx $ Liquid High Yield Index (A) | | | 4.99 | % | | | 8.22 | % | | | | |
Transamerica Tactical Income Blended Benchmark (A) | | | 8.34 | % | | | 9.71 | % | | | | |
Class C (NAV) | | | 5.61 | % | | | 5.49 | % | | | 10/31/2011 | |
Class C (POP) | | | 4.61 | % | | | 5.49 | % | | | 10/31/2011 | |
Class I (NAV) | | | 6.64 | % | | | 6.52 | % | | | 10/31/2011 | |
(A) The iBoxx $ Liquid High Yield Index and the Transamerica Tactical Income Blended Benchmark are unmanaged indices used as a general measure of market performance. The Transamerica Tactical Income Blended Benchmark is composed of the following benchmarks: S&P 500® (30%), Barclays U.S. Aggregate Bond Index (30%), and the iBoxx $ Liquid High Yield Index (40%). Calculations assume dividends and capital gains are reinvested and do not include any managerial expenses. The 10 Years or Life of Fund calculation is based on the inception date of the class. You cannot invest directly in an Index.
The performance data presented represents past performance; future results may vary. Performance data does not reflect the deduction of taxes that would be paid on Fund distributions or the redemption of Fund shares. Investment return and principal value will fluctuate so that an investor’s shares, when redeemed, may be worth more or less than their original cost. Current performance may be lower or higher than performance quoted. Please see www.transamerica.com for performance data current to the most recent month-end. Net Asset Value (“NAV”) returns include the reinvestment of dividends and capital gains but do not reflect any sales charges. Public Offering Price (“POP”) returns include the reinvestment of dividends and capital gains and reflect the maximum sales charge of 4.75% for A shares or the maximum applicable contingent deferred sales charge of 1% (during the first 12 months) for Class C shares. There are no sales charges on Class I shares.
Performance figures reflect any fee waivers and/or expense reimbursements by the Investment Adviser. Without such waivers and/or reimbursements, the performance would be lower. Future waivers and/or reimbursements are at the discretion of the Investment Adviser.
Performance results do not include adjustments made for financial reporting purposes in accordance with U.S. generally accepted accounting principles and may differ from amounts reported in the financial highlights.
Tactical asset allocation is a portfolio strategy that attempts to take advantage of market highs and lows. The selection of a tactical asset allocation portfolio strategy will not guarantee a profit or protect against a loss. Exchange Traded Funds (“ETFs”) generally present the same risks as an investment in a conventional fund that has the same investment objectives, strategies, and policies. The market price of an ETF’s share may be above or below the shares’ net asset value; and an active trading market for an ETF’s share may not develop or be maintained. Foreign and emerging market investments involve risks not associated with U.S. markets, such as currency fluctuations, adverse social and political developments and the relatively small size and lesser liquidity of the markets. Investments in the real estate industry are subject to risks associated with direct investment in real estate. Investments in high yield bonds (‘junk bonds’) may be subject to greater volatility and risks as the income derived from these securities is not guaranteed and may be unpredictable. Fixed income investing is subject to credit risk, inflation risk and interest rate risk.
Please refer to page 72 for index descriptions.
| | |
| Transamerica Funds | | Annual Report 2014 |
Page 67
Transamerica Tactical Rotation
(unaudited)
MARKET ENVIRONMENT
The year ended October 31, 2014 can be summarized as great expectations that were never met. This narrative applies most directly to the economic recovery and the expected sell-off in fixed income markets, especially long duration assets.
The expectations were building throughout 2013 as the 10-year Treasury rate almost doubled, briefly piercing the three percent threshold. This move was intertwined with the consensus thinking that the growth rate of the U.S. economy was finally going to hit terminal velocity close to three percent. All was perceived to be going as planned until Mother Nature chimed in. The cold weather and snow sent inventory accumulation into hibernation. What magnified the weather event is that in the second half of 2013, factories had been participating in the consensus view that the economy was accelerating by rapidly ramping up their inventories in anticipation of higher demand in 2014. The literal freeze in economic activity in first quarter of 2014 created such a drag that it was quickly made apparent that the full-year growth numbers were not going to be attainable.
The underwhelming economic performance was not just a U.S. event. The consensus in the Eurozone had also been calling for a healthy acceleration. However, the necessary balance sheet moves in order for banks to pass the Asset Quality Review test meant that lending to the region would be very hard to come by. Such restriction of private credit, especially to the Small & Medium Sized Enterprises, is completely contrary to what is required for an economic expansion. The ensuing slowdown was not limited to the periphery, even the German growth engine lost steam.
The most recent policy answer to the European growth problem created a new global narrative – divergent monetary policy in the developed world. At a time when U.S. and U.K. are winding down quantitative easing (“QE”) and talking about raising interest rates, Japan and Europe are going the other way – either increasing the QE pace or seeking alternative ways to implement QE policy. (Even the largest Emerging Market country (China) is adding stimulus through numerous channels.) This divergence of policy has resulted in a huge rate differential in sovereign bonds and has incentivized, in part, investors domiciled in low yielding countries to buy debt instruments in (relatively) higher interest bearing countries. This so called ‘tractor-beam’ effect has also contributed downward pressure to U.S. rates.
As is often the case, what consensus was expecting to be the worst asset class for the coming year (i.e., 30 year Treasuries) turned out to be one of the best, especially when factoring in volatility measures like the Sharpe ratio. Can history repeat itself in 2015? It will be tough, at least for the long bond given the challenges to attaining capital appreciation on top of the lower starting yield versus last year. Much of the 2015 narrative could be a continuation of the divergence in global monetary policy – does the U.S. Federal Reserve (“Fed”) and Bank of England start hiking rates in 2015? Does the European Central Bank start sovereign QE? How long does the Bank of Japan keep up its torrid pace of QE? While the answers to these questions may play out in due time, with no recession seen in site, Aegon USA Investment Management, LLC remains of the view that risk assets remain in a long-term bull market.
PERFORMANCE
For the year ended October 31, 2014, Transamerica Tactical Rotation Class A returned 6.31%. By comparison, its primary, secondary, and additional benchmarks, the FTSE All-World Index Total Return, the S&P 500®, and the Transamerica Tactical Rotation Blended Benchmark returned 8.36%, 17.27%, and 6.70%, respectively.
The Blended Benchmark is comprised of the FTSE All-World Index Total Return (80%) and the Barclays 1-3 Month U.S. Treasury Bill Index (20%).
STRATEGY REVIEW
The year resulted in very bifurcated performance between the U.S. and non-U.S. markets. The U.S. economy appears to be on a sustainable growth trajectory, while many non-U.S. economies appear to be slowing for various reasons. Regional conflicts (e.g. Ukraine), declining commodity prices (e.g. many emerging economies), and strained fiscal situations (e.g. much of the Eurozone) seem to be contributing to pull-backs in non-U.S. growth assumptions and equity market outcomes. These disparate outcomes have been manifested in the dollar appreciating over virtually all major currencies, detracting from realized performance from foreign markets translated to U.S. dollars. As these scenarios play out, we expect disparate returns to continue from one country to the next, creating both opportunity as well as risk.
The Fund underperformed the blended benchmark (80% FTSE World, 20% Barclays Capital Short Treasury 1-3mo) for the year ended October 31, 2014. Primary contributors to performance over the period came from allocations to the domestic healthcare, technology, and financials sectors. Detractions from performance for the year generally came from exposure to non-U.S. equities markets such as the Eurozone, Asia, and South America.
Frank Koster
David Halfpap, CFA
Frank Rybinski, CFA
Co-Portfolio Managers
Aegon USA Investment Management, LLC
| | |
| Transamerica Funds | | Annual Report 2014 |
Page 68
Transamerica Tactical Rotation
(unaudited)
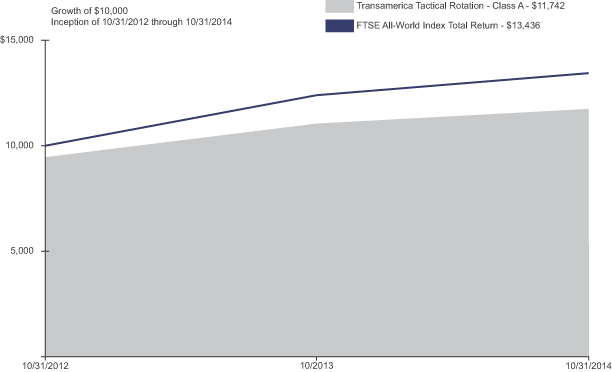
| | | | | | | | | | | | |
| Average Annual Total Return for Periods Ended 10/31/2014 | |
| | | 1 Year | | | 10 Years or
Life of Class | | | Inception Date | |
Class A (NAV) | | | 6.31 | % | | | 11.44 | % | | | 10/31/2012 | |
Class A (POP) | | | 0.44 | % | | | 8.35 | % | | | 10/31/2012 | |
FTSE All-World Index Total Return (A) | | | 8.36 | % | | | 15.87 | % | | | | |
S&P 500® (A) | | | 17.27 | % | | | 22.11 | % | | | | |
Transamerica Tactical Rotation Blended Benchmark (A) | | | 6.70 | % | | | 12.60 | % | | | | |
Class C (NAV) | | | 5.46 | % | | | 10.60 | % | | | 10/31/2012 | |
Class C (POP) | | | 4.46 | % | | | 10.60 | % | | | 10/31/2012 | |
Class I (NAV) | | | 6.57 | % | | | 11.77 | % | | | 10/31/2012 | |
(A) The FTSE All-World Index Total Return, the S&P 500®, and the Transamerica Tactical Rotation Blended Benchmark are unmanaged indices used as a general measure of market performance. The Transamerica Tactical Rotation Blended Benchmark is composed of the following benchmarks: FTSE All-World Index Total Return (80%) and the Barclays 1-3 Month U.S. Treasury Bill Index (20%). Calculations assume dividends and capital gains are reinvested and do not include any managerial expenses. The 10 Years or Life of Fund calculation is based on the inception date of the class. You cannot invest directly in an Index.
The performance data presented represents past performance; future results may vary. Performance data does not reflect the deduction of taxes that would be paid on Fund distributions or the redemption of Fund shares. Investment return and principal value will fluctuate so that an investor’s shares, when redeemed, may be worth more or less than their original cost. Current performance may be lower or higher than performance quoted. Please see www.transamerica.com for performance data current to the most recent month-end. Net Asset Value (“NAV”) returns include the reinvestment of dividends and capital gains but do not reflect any sales charges. Public Offering Price (“POP”) returns include the reinvestment of dividends and capital gains and reflect the maximum sales charge of 5.5% for A shares or the maximum applicable contingent deferred sales charge of 1% (during the first 12 months) for Class C shares. There are no sales charges on Class I shares.
Performance figures reflect any fee waivers and/or expense reimbursements by the Investment Adviser. Without such waivers and/or reimbursements, the performance would be lower. Future waivers and/or reimbursements are at the discretion of the Investment Adviser.
Performance results do not include adjustments made for financial reporting purposes in accordance with U.S. generally accepted accounting principles and may differ from amounts reported in the financial highlights.
Tactical asset allocation is a portfolio strategy that attempts to take advantage of market highs and lows. The selection of a Tactical Asset Allocation portfolio will not guarantee a profit or protect against a loss. Exchange Traded Funds (“ETFs”) generally present the same risks as an investment in a conventional fund that has the same investment objectives, strategies, and policies. The market price of an ETF’s share may be above or below the shares’ net asset value; and an active trading market for an ETF’s share may not develop or be maintained.
The risks of investing in foreign securities are magnified in emerging markets. These may include risks related to market and currency volatility, adverse social and political developments and the relatively small size and less liquidity of these markets. Fixed income investing is subject to credit risk, inflation risk and interest rate risk.
Please refer to page 72 for index descriptions.
| | |
| Transamerica Funds | | Annual Report 2014 |
Page 69
Transamerica US Growth
(formerly, Transamerica Diversified Equity)
(unaudited)
MARKET ENVIRONMENT
U.S. equities and other developed-market stocks rose during the one-year period as the S&P 500® posted a 17.27% return and the Morgan Stanley Capital International World Index posted a 9.3% return. Emerging markets trailed, with the Morgan Stanley Capital International Emerging Markets Index posting a gain of just 0.98%.
The fourth quarter of 2013 began on an unnerving note, with a 16-day government shutdown and near breach of the U.S. debt ceiling. The elimination of two market overhangs – the timing of the U.S. Federal Reserve’s (“Fed”) tapering and the threat of a government shutdown – led the market higher into 2014, only to be met by a pullback in January. However, once again U.S. equities fought back and finished February at a new peak, and by the end of the second quarter the S&P 500® was scaling new highs. The third quarter was also bumpy, with U.S. equities sinking in July, rebounding in August, and falling once again around mid-September before recovering towards the end of October.
All ten sectors in the Russell 1000® Growth Index posted positive returns during the period, led by Health Care, Utilities, and Information Technology. Energy, Telecommunication Services, and Consumer Discretionary posted more modest gains relative to the broader index.
PERFORMANCE
For the year ended October 31, 2014, Transamerica US Growth Class A returned 14.25%. By comparison, its benchmark, the Russell 1000® Growth Index, returned 17.11%.
STRATEGY REVIEW
The Fund underperformed its benchmark, the Russell 1000® Growth Index for the period.
The Fund’s portfolio management team adheres to a disciplined portfolio construction process that allows them to assess risk, weigh individual positions accordingly, and in the process build a portfolio that focuses largely on stock selection for generating benchmark relative outperformance.
During the year, security selection within the Industrials, Information Technology and Energy sectors detracted from relative performance. A frictional cash position in an upward trending market also weighed on relative results. More favorable selection within (as well as an underweight allocation to) Consumer Staples helped to partially offset weaker results elsewhere in the Fund. An overweight allocation to Information Technology also aided benchmark relative performance.
The Fund’s largest contributors to relative performance during the period included Monster Beverage Corp., a U.S. marketer and distributor of energy drinks, Skyworks Solutions, Inc. (no longer held at year end), a semiconductor firm, and Bristol-Myers Squibb Co., a biopharmaceutical company. The Fund’s avoidance of International Business Machines Corp., an information technology products and services provider, also contributed to relative results.
The Fund’s largest relative detractors during the period included Halliburton Co., a global oilfield services company, and Anadarko Petroleum Corp., Class A, an independent energy exploration and production company. The Fund’s underweight position in Apple, Inc. during the early part of the period also weighed on results, as did an underweight to benchmark constituent Amgen, Inc. (no longer held at year end).
Mammen Chally, CFA
Portfolio Manager
Wellington Management Company, LLP
| | |
| Transamerica Funds | | Annual Report 2014 |
Page 70
Transamerica US Growth
(formerly, Transamerica Diversified Equity)
(unaudited)
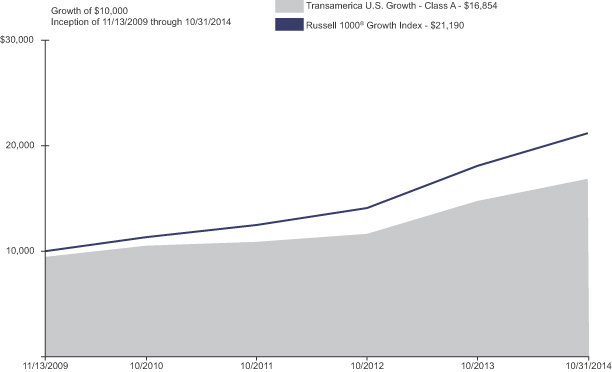
| | | | | | | | | | | | |
| Average Annual Total Return for Periods Ended 10/31/2014 | |
| | | 1 Year | | | 10 Years or
Life of Class | | | Inception Date | |
Class A (NAV) | | | 14.25 | % | | | 12.36 | % | | | 11/13/2009 | |
Class A (POP) | | | 7.94 | % | | | 11.08 | % | | | 11/13/2009 | |
Russell 1000® Growth Index (A) | | | 17.11 | % | | | 16.32 | % | | | | |
Class B (NAV) | | | 13.28 | % | | | 11.53 | % | | | 11/13/2009 | |
Class B (POP) | | | 8.28 | % | | | 11.40 | % | | | 11/13/2009 | |
Class C (NAV) | | | 13.37 | % | | | 11.55 | % | | | 11/13/2009 | |
Class C (POP) | | | 12.37 | % | | | 11.55 | % | | | 11/13/2009 | |
Class I (NAV) | | | 14.67 | % | | | 13.44 | % | | | 11/30/2009 | |
Class I2 (NAV) | | | 14.91 | % | | | 13.08 | % | | | 11/13/2009 | |
Class T (NAV) | | | 14.74 | % | | | 14.85 | % | | | 02/10/2012 | |
Class T (POP) | | | 4.99 | % | | | 11.16 | % | | | 02/10/2012 | |
(A) The Russell 1000® Growth Index is an unmanaged index used as a general measure of market performance. Calculations assume dividends and capital gains are reinvested and do not include any managerial expenses. The 10 Years or Life of Class calculation is based on the inception date of the class. You cannot invest directly in an index.
The performance data presented represents past performance; future results may vary. Performance data does not reflect the deduction of taxes that would be paid on Fund distributions or the redemption of Fund shares. Investment return and principal value will fluctuate so that an investor’s shares, when redeemed, may be worth more or less than their original cost. Current performance may be lower or higher than performance quoted. Please see www.transamerica.com for performance data current to the most recent month-end. Net Asset Value (“NAV”) returns include the reinvestment of dividends and capital gains but do not reflect any sales charges. Public Offering Price (“POP”) returns include the reinvestment of dividends and capital gains and reflect the maximum sales charge of 5.5% for A shares or the maximum applicable contingent deferred sales charge (5% in the 1st year, decreasing to 0% after 6 years) for Class B shares or 1% (during the first 12 months) for Class C shares and the maximum sales charge of 8.5% for Class T shares. There are no sales charges on Class I and I2 shares.
Performance figures reflect any fee waivers and/or expense reimbursements by the Investment Adviser. Without such waivers and/or reimbursements, the performance would be lower. Future waivers and/or reimbursements are at the discretion of the Investment Adviser.
Performance results do not include adjustments made for financial reporting purposes in accordance with U.S. generally accepted accounting principles and may differ from amounts reported in the financial highlights.
Growth stocks can be volatile and experience sharp price declines and certain types of stocks, especially technology, can be extremely volatile and subject to greater price swings than the broader market. Value approach carries the risk that the market will not recognize a security’s intrinsic value for a long time or that an undervalued stock is actually appropriately priced.
Russell Investment Group is the source and owner of the trademarks, service marks, and copyrights related to the Russell indexes. Russell® is a trademark of Russell Investment Group.
Please refer to page 72 for index descriptions.
| | |
| Transamerica Funds | | Annual Report 2014 |
Page 71
Index Descriptions
(unaudited)
| | |
| Index | | Description |
| |
| Alerian MLP Index | | The Alerian MLP Index is a composite of the 50 most prominent energy Master Limited Partnerships (“MLPs”) that provides investors with an unbiased, comprehensive benchmark for this asset class. |
| |
| Bank of America Merrill Lynch U.S. Corporate & Government 1-3 Years Index | | The Bank of America Merrill Lynch U.S. Corporate & Government 1-3 Years Index tracks the performance of U.S. dollar denominated investment grade debt publicly issued in the U.S. domestic market, including U.S. Treasury, U.S. agency, foreign government, supranational and corporate securities that have a remaining maturity of less than 3 years and more than 1 year. |
| |
| Barclays 1-3 Month U.S. Treasury Bill Index | | The Barclays 1-3 Month U.S. Treasury Bill Index includes all publicly issued zero coupon, fixed rate, non-convertible U.S. Treasury Bills denominated in U.S. dollars that have a remaining maturity of less than 3 months and more than 1 month, are rated investment grade, and have $250 million or more of outstanding face value. |
| |
| Barclays Global Aggregate Index | | The Barclays Global Aggregate Index is a multi-currency benchmark that includes fixed-rate treasury, government-related, corporate and securitized bonds from both developed and emerging markets issuers. |
| |
| Barclays High Yield Municipal Index | | The Barclays High Yield Municipal Index is comprised of bonds that are non-investment grade, unrated, or rated below Ba1 by Moody’s Investors Service with a remaining maturity of at least one year. |
| |
| Barclays Investment Grade Credit Index | | The Barclays Investment Grade Credit Index is comprised of the Barclays U.S. Corporate Index, which measures the investment grade, U.S. dollar-denominated, fixed-rate, taxable corporate bond market, as well as a non-corporate component that includes foreign agencies, sovereigns, supranationals and local authorities. |
| |
| Barclays Managed Money Intermediate (1-17 Year) Index | | The Barclays Managed Money Intermediate (1-17 Year) Index is comprised of tax-exempt bonds with maturites ranging from 1 to 17 years that are rated Aa3/AA- or higher by at least two of the following statistical ratings agencies: Moody’s, S&P and Fitch. |
| |
| Barclays U.S. Aggregate Bond Index | | The Barclays U.S. Aggregate Bond Index measures investment grade, U.S. dollar-denominated, fixed-rate taxable bonds, including Treasuries, government-related and corporate securities, as well as both mortgage- and asset-backed securities. |
| | |
| Transamerica Funds | | Annual Report 2014 |
Page 72
Index Descriptions (continued)
(unaudited)
| | |
| Index | | Description |
| |
| Barclays U.S. Corporate High Yield 2% Issuer Capped Index | | The Barclays U.S. Corporate High-Yield 2% Issuer Capped Index is an issuer-constrained measurement of the market of U.S. dollar denominated, non-investment grade, fixed-rate, taxable corporate bonds. The exposure of each issuer is limited to 2% of the total market value of the index. |
| |
| Citigroup Non-U.S. Dollar World Government Bond Index | | The Citigroup Non-U.S. Dollar World Government Bond Index measures the performance of fixed-rate, local currency, investment grade sovereign bonds issued by governments outside the U.S, and is comprised of sovereign debt from 22 countries that is denominated in a variety of currencies. |
| |
| FTSE All-World Index Total Return | | The FTSE All-World Index Total Return is a market-capitalization weighted index comprised of an aggregate of large and mid-cap stocks, providing coverage of developed and emerging markets. |
| |
| iBoxx $ Liquid High Yield Index | | The iBoxx $ Liquid High Yield Index is comprised of U.S. dollar-denominated high yield liquid corporate bonds. |
| |
| J.P. Morgan Emerging Markets Bond Index Global | | The J.P. Morgan Emerging Markets Bond Index Global tracks total returns for U.S. dollar denominated debt instruments issued by emerging market sovereign and quasi-sovereign entities: Brady bonds, loans, Eurobonds, and local market instruments. |
| |
| Morgan Stanley Capital International Emerging Markets Index | | The Morgan Stanley Capital International Emerging Markets Index captures large and mid-cap representation across emerging markets countries. |
| |
| Morgan Stanley Capital International Europe, Australasia, Far East Index | | The Morgan Stanley Capital International Europe, Australasia, Far East Index is a free float-adjusted market capitalization index that is designed to measure the equity market performance of developed markets, excluding the U.S. and Canada. |
| |
| Morgan Stanley Capital International Europe, Australasia, Far East Small Cap Index Gross | | The Morgan Stanley Capital International Europe, Australasia, Far East Small Cap Index Gross is an equity index which captures small cap representation across developed markets countries around the world, excluding the U.S. and Canada. |
| |
| Morgan Stanley Capital International All Country World Index Gross | | The Morgan Stanley Capital International All Country World Index Gross is a free float-adjusted market capitalization weighted index that is designed to measure the equity market performance of developed and emerging markets. |
| | |
| Transamerica Funds | | Annual Report 2014 |
Page 73
Index Descriptions (continued)
(unaudited)
| | |
| Index | | Description |
| |
| Morgan Stanley Capital International World Index ex-U.S. | | The Morgan Stanley Capital International World Index ex-U.S. captures large and mid-cap representation across developed markets countries, excluding the U.S. |
| |
| Russell 1000® Growth Index | | The Russell 1000® Growth Index measures the performance of the large-cap growth segment of the U.S. equity universe, and is comprised of Russell 1000® Index companies with higher price-to-book ratios and higher forecasted growth values. |
| |
| Russell 1000® Value Index | | The Russell 1000® Value Index measures the performance of the large-cap value segment of the U.S. equity universe, and is comprised of Russell 1000® Index companies with lower price-to-book ratios and lower expected growth values. |
| |
| Russell 2000® Index | | The Russell 2000® Index measures the performance of the small-cap segment of the U.S. equity universe, and is comprised of approximately 2,000 of the smallest securities of the Russell 3000® Index based on a combination of market cap and current index membership. |
| |
| Russell 2000® Growth Index | | The Russell 2000® Growth Index measures the performance of the small-cap growth segment of the U.S. equity universe, and is comprised of Russell 2000® Index companies with higher price-to-value ratios and higher forecasted growth values. |
| |
| Russell 2000® Value Index | | The Russell 2000® Value Index measures the performance of small-cap value segment of the U.S. equity universe, and is comprised of Russell 2000® Index companies with lower price-to-book ratios and lower forecasted growth values. |
| |
| Russell 2500® Value Index | | The Russell 2500® Value Index measures the performance of the small to mid-cap value segment of the U.S. equity universe, and is comprised of Russell 2500® Index companies with lower price-to-book ratios and lower forecasted growth values. |
| |
| Russell Midcap® Growth Index | | The Russell Midcap® Growth Index measures the performance of the mid-cap growth segment of the U.S. equity universe, and is comprised of Russell Midcap® Index companies with higher price-to-book ratios and higher forecasted growth values. |
| |
| Russell Midcap® Value Index | | The Russell Midcap® Value Index measures the performance of the mid-cap value segment of the U.S. equity universe, and is comprised of Russell Midcap® Index companies with lower price-to-book ratios and lower forecasted growth values. |
| |
| S&P 500® | | The S&P 500® is market-capitalization weighted index of 500 large U.S. companies with common stock listed on the NYSE or NASDAQ. |
| | |
| Transamerica Funds | | Annual Report 2014 |
Page 74
Understanding Your Funds’ Expenses
(unaudited)
SHAREHOLDER EXPENSES
Fund shareholders may incur two types of costs: (1) transaction costs, including sales charges (loads) on purchases, contingent deferred sales charges on redemptions; and (2) ongoing costs, including management fees, and other fund expenses.
The following examples are intended to help you understand your ongoing costs (in dollars and cents) of investing in the Funds and to compare these costs with the ongoing costs of investing in other funds.
The examples are based on an investment of $1,000 invested at May 1, 2014, and held for the entire period until October 31, 2014.
ACTUAL EXPENSES
The information in the table under the heading “Actual Expenses” provides information about actual account values and actual expenses. You may use the information in these columns, together with the amount you invested, to estimate the expenses that you paid over the period. Simply divide your account value by $1,000 (for example, an $8,600 account value divided by $1,000 = $8.60), then multiply the result by the number in the appropriate column for your share class titled “Expenses Paid During Period” to estimate the expenses you paid on your account during this period. If your account is an IRA, your expenses could have included a $15 annual fee. The amount of any fee paid during the period can decrease your ending account value.
HYPOTHETICAL EXAMPLE FOR COMPARISON PURPOSES
The information in the table under the heading “Hypothetical Expenses” provides information about hypothetical account values and hypothetical expenses based on the Funds’ actual expense ratios and assumed rates of return of 5% per year before expenses, which are not the Funds’ actual returns. The hypothetical account values and expenses may not be used to estimate the actual ending account balance or expenses you paid for the period. You may use this information to compare the ongoing costs of investing in your Fund versus other funds. To do so, compare this 5% hypothetical example with the 5% hypothetical examples that appear in the shareholder reports of the other funds. As in the case of the actual expense example, if your account is subject to an IRA fee, the amount of the fee paid through your account would increase the hypothetical expenses you would have paid during the period and decrease the hypothetical ending account value.
Please note that the expenses shown in the table are meant to highlight your ongoing costs only and do not reflect any transactional costs, such as sales charges and brokerage commissions paid on purchases and sales of Fund shares. Therefore, the information under the heading “Hypothetical Expenses” is useful in comparing ongoing costs only, and will not help you determine the relative total costs of owning different funds. If any of these transaction costs were included, your costs would be higher. The expenses shown in the table do not reflect any fees that may be charged to you by brokers, financial intermediaries, or other financial institutions.
Expense ratios may vary period to period because of various factors, such as an increase in expenses that are not covered by the advisory and administrative fees, expenses and fees of the trustees and their counsel, extraordinary expenses and interest expense.
| | | | | | | | | | | | | | | | | | | | | | | | |
| | | | | | Actual Expenses | | | Hypothetical Expenses (A) | | | | |
| Fund Name | | Beginning
Account Value | | | Ending Account
Value | | | Expenses Paid
During Period | | | Ending Account
Value | | | Expenses Paid
During Period (B) | | | Annualized
Expense Ratio | |
| | | | | | |
Transamerica Capital Growth | | | | | | | | | | | | | | | | | | | | | | | | |
Class A | | $ | 1,000.00 | | | $ | 1,129.60 | | | $ | 6.71(B | ) | | $ | 1,018.90 | | | $ | 6.36 | | | | 1.25 | % |
Class B | | | 1,000.00 | | | | 1,124.50 | | | | 11.78(B | ) | | | 1,014.10 | | | | 11.17 | | | | 2.20 | |
Class C | | | 1,000.00 | | | | 1,125.20 | | | | 10.50(B | ) | | | 1,015.30 | | | | 9.96 | | | | 1.96 | |
Class I | | | 1,000.00 | | | | 1,131.20 | | | | 5.05(B | ) | | | 1,020.50 | | | | 4.79 | | | | 0.94 | |
Class I2 | | | 1,000.00 | | | | 1,132.10 | | | | 4.35(B | ) | | | 1,021.10 | | | | 4.13 | | | | 0.81 | |
| | | | | | |
Transamerica Concentrated Growth | | | | | | | | | | | | | | | | | | | | | | | | |
Class A | | | 1,000.00 | | | | 1,055.30 | | | | 6.06(B | ) | | | 1,019.30 | | | | 5.95 | | | | 1.17 | |
Class C | | | 1,000.00 | | | | 1,051.50 | | | | 9.93(B | ) | | | 1,015.50 | | | | 9.75 | | | | 1.92 | |
Class I | | | 1,000.00 | | | | 1,056.50 | | | | 4.92(B | ) | | | 1,020.40 | | | | 4.84 | | | | 0.95 | |
Class I2 | | | 1,000.00 | | | | 1,057.20 | | | | 3.89(B | ) | | | 1,021.40 | | | | 3.82 | | | | 0.75 | |
| | | | | | |
Transamerica Dividend Focused | | | | | | | | | | | | | | | | | | | | | | | | |
Class A | | | 1,000.00 | | | | 1,045.80 | | | | 4.95(B | ) | | | 1,020.40 | | | | 4.89 | | | | 0.96 | |
Class C | | | 1,000.00 | | | | 1,041.90 | | | | 9.32(B | ) | | | 1,016.10 | | | | 9.20 | | | | 1.81 | |
Class I | | | 1,000.00 | | | | 1,046.70 | | | | 4.13(B | ) | | | 1,021.20 | | | | 4.08 | | | | 0.80 | |
Class I2 | | | 1,000.00 | | | | 1,047.10 | | | | 3.61(B | ) | | | 1,021.70 | | | | 3.57 | | | | 0.70 | |
| | |
| Transamerica Funds | | Annual Report 2014 |
Page 75
Understanding Your Funds’ Expenses (continued)
(unaudited)
| | | | | | | | | | | | | | | | | | | | | | | | |
| | | | | | Actual Expenses | | | Hypothetical Expenses (A) | | | | |
| Fund Name | | Beginning
Account Value | | | Ending Account
Value | | | Expenses Paid
During Period | | | Ending Account
Value | | | Expenses Paid
During Period (B) | | | Annualized
Expense Ratio | |
| | | | | | |
Transamerica Emerging Markets Debt | | | | | | | | | | | | | | | | | | | | | | | | |
Class A | | $ | 1,000.00 | | | $ | 1,017.60 | | | $ | 5.80(B | ) | | $ | 1,019.50 | | | $ | 5.80 | | | | 1.14 | % |
Class C | | | 1,000.00 | | | | 1,014.00 | | | | 9.19(B | ) | | | 1,016.10 | | | | 9.20 | | | | 1.81 | |
Class I | | | 1,000.00 | | | | 1,020.00 | | | | 4.12(B | ) | | | 1,021.10 | | | | 4.13 | | | | 0.81 | |
Class I2 | | | 1,000.00 | | | | 1,020.40 | | | | 3.56(B | ) | | | 1,021.70 | | | | 3.57 | | | | 0.70 | |
| | | | | | |
Transamerica Emerging Markets Equity | | | | | | | | | | | | | | | | | | | | | | | | |
Class A | | | 1,000.00 | | | | 1,038.50 | | | | 8.43(B | ) | | | 1,016.90 | | | | 8.34 | | | | 1.64 | |
Class C | | | 1,000.00 | | | | 1,034.70 | | | | 11.85(B | ) | | | 1,013.60 | | | | 11.72 | | | | 2.31 | |
Class I | | | 1,000.00 | | | | 1,041.50 | | | | 6.74(B | ) | | | 1,018.60 | | | | 6.67 | | | | 1.31 | |
Class I2 | | | 1,000.00 | | | | 1,040.40 | | | | 6.07(B | ) | | | 1,019.30 | | | | 6.01 | | | | 1.18 | |
| | | | | | |
Transamerica Enhanced Muni | | | | | | | | | | | | | | | | | | | | | | | | |
Class A | | | 1,000.00 | | | | 1,051.60 | | | | 4.45(B | ) | | | 1,020.90 | | | | 4.38 | | | | 0.86 | (C) |
Class C | | | 1,000.00 | | | | 1,047.70 | | | | 7.54(B | ) | | | 1,017.80 | | | | 7.43 | | | | 1.46 | (C) |
Class I | | | 1,000.00 | | | | 1,051.20 | | | | 3.67(B | ) | | | 1,021.60 | | | | 3.62 | | | | 0.71 | (C) |
| | | | | | |
Transamerica Flexible Income | | | | | | | | | | | | | | | | | | | | | | | | |
Class A | | | 1,000.00 | | | | 1,016.20 | | | | 4.57(B | ) | | | 1,020.70 | | | | 4.58 | | | | 0.90 | |
Class B | | | 1,000.00 | | | | 1,012.00 | | | | 8.57(B | ) | | | 1,016.70 | | | | 8.59 | | | | 1.69 | |
Class C | | | 1,000.00 | | | | 1,012.70 | | | | 8.07(B | ) | | | 1,017.20 | | | | 8.08 | | | | 1.59 | |
Class I | | | 1,000.00 | | | | 1,017.60 | | | | 3.15(B | ) | | | 1,022.10 | | | | 3.16 | | | | 0.62 | |
Class I2 | | | 1,000.00 | | | | 1,019.20 | | | | 2.60(B | ) | | | 1,022.60 | | | | 2.60 | | | | 0.51 | |
| | | | | | |
Transamerica Floating Rate | | | | | | | | | | | | | | | | | | | | | | | | |
Class A | | | 1,000.00 | | | | 1,005.90 | | | | 5.31(B | ) | | | 1,019.90 | | | | 5.35 | | | | 1.05 | (C) |
Class C | | | 1,000.00 | | | | 1,002.20 | | | | 9.08(B | ) | | | 1,016.10 | | | | 9.15 | | | | 1.80 | (C) |
Class I | | | 1,000.00 | | | | 1,007.30 | | | | 4.05(B | ) | | | 1,021.20 | | | | 4.08 | | | | 0.80 | (C) |
Class I2 | | | 1,000.00 | | | | 1,007.40 | | | | 4.05(B | ) | | | 1,021.20 | | | | 4.08 | | | | 0.80 | (C) |
| | | | | | |
Transamerica Global Bond | | | | | | | | | | | | | | | | | | | | | | | | |
Class A | | | 1,000.00 | | | | 967.50 | | | | 4.96(B | ) | | | 1,020.20 | | | | 5.09 | | | | 1.00 | |
Class C | | | 1,000.00 | | | | 963.70 | | | | 8.66(B | ) | | | 1,016.40 | | | | 8.89 | | | | 1.75 | |
Class I | | | 1,000.00 | | | | 968.20 | | | | 3.72(B | ) | | | 1,021.40 | | | | 3.82 | | | | 0.75 | |
Class I2 | | | 1,000.00 | | | | 969.20 | | | | 3.72(B | ) | | | 1,021.40 | | | | 3.82 | | | | 0.75 | |
| | | | | | |
Transamerica Global Equity | | | | | | | | | | | | | | | | | | | | | | | | |
Class A | | | 1,000.00 | | | | 997.30 | | | | 4.08(B | ) | | | 1,021.10 | | | | 4.13 | | | | 0.81 | (C) |
Class B | | | 1,000.00 | | | | 992.80 | | | | 8.24(B | ) | | | 1,016.90 | | | | 8.34 | | | | 1.64 | (C) |
Class C | | | 1,000.00 | | | | 993.70 | | | | 7.89(B | ) | | | 1,017.30 | | | | 7.98 | | | | 1.57 | (C) |
Class I | | | 1,000.00 | | | | 998.20 | | | | 2.92(B | ) | | | 1,022.30 | | | | 2.96 | | | | 0.58 | (C) |
Class I2 | | | 1,000.00 | | | | 977.90 | | | | 1.67(D | ) | | | 1,019.90 | | | | 5.40 | | | | 1.06 | |
| | | | | | |
Transamerica Growth Opportunities | | | | | | | | | | | | | | | | | | | | | | | | |
Class A | | | 1,000.00 | | | | 1,097.20 | | | | 7.14(B | ) | | | 1,018.40 | | | | 6.87 | | | | 1.35 | |
Class B | | | 1,000.00 | | | | 1,092.70 | | | | 11.82(B | ) | | | 1,013.90 | | | | 11.37 | | | | 2.24 | |
Class C | | | 1,000.00 | | | | 1,093.20 | | | | 11.29(B | ) | | | 1,014.40 | | | | 10.87 | | | | 2.14 | |
Class I | | | 1,000.00 | | | | 1,099.10 | | | | 5.24(B | ) | | | 1,020.20 | | | | 5.04 | | | | 0.99 | |
Class I2 | | | 1,000.00 | | | | 1,101.00 | | | | 4.40(B | ) | | | 1,021.00 | | | | 4.23 | | | | 0.83 | |
| | | | | | |
Transamerica High Yield Bond | | | | | | | | | | | | | | | | | | | | | | | | |
Class A | | | 1,000.00 | | | | 1,013.90 | | | | 4.92(B | ) | | | 1,020.30 | | | | 4.94 | | | | 0.97 | |
Class B | | | 1,000.00 | | | | 1,009.80 | | | | 9.07(B | ) | | | 1,016.20 | | | | 9.10 | | | | 1.79 | |
Class C | | | 1,000.00 | | | | 1,009.20 | | | | 8.81(B | ) | | | 1,016.40 | | | | 8.84 | | | | 1.74 | |
Class I | | | 1,000.00 | | | | 1,014.00 | | | | 3.81(B | ) | | | 1,021.40 | | | | 3.82 | | | | 0.75 | |
Class I2 | | | 1,000.00 | | | | 1,015.50 | | | | 3.30(B | ) | | | 1,021.90 | | | | 3.31 | | | | 0.65 | |
| | |
Transamerica High Yield Muni | | | | | | | | | |
Class A | | | 1,000.00 | | | | 1,079.00 | | | | 4.77(B | ) | | | 1,020.60 | | | | 4.63 | | | | 0.91 | (C) |
Class C | | | 1,000.00 | | | | 1,076.80 | | | | 7.90(B | ) | | | 1,017.60 | | | | 7.68 | | | | 1.51 | (C) |
Class I | | | 1,000.00 | | | | 1,080.80 | | | | 3.99(B | ) | | | 1,021.40 | | | | 3.87 | | | | 0.76 | (C) |
| | |
Transamerica Income & Growth | | | | | | | | | |
Class A | | | 1,000.00 | | | | 998.80 | | | | 5.54(B | ) | | | 1,019.70 | | | | 5.60 | | | | 1.10 | |
Class C | | | 1,000.00 | | | | 994.30 | | | | 9.30(B | ) | | | 1,015.90 | | | | 9.40 | | | | 1.85 | |
Class I | | | 1,000.00 | | | | 999.20 | | | | 4.28(B | ) | | | 1,020.90 | | | | 4.33 | | | | 0.85 | |
Class I2 | | | 1,000.00 | | | | 999.60 | | | | 3.78(B | ) | | | 1,021.40 | | | | 3.82 | | | | 0.75 | |
| | |
Transamerica Inflation Opportunities | | | | | | | | | |
Class A | | | 1,000.00 | | | | 998.60 | | | | 5.04(B | ) | | | 1,020.20 | | | | 5.09 | | | | 1.00 | |
Class C | | | 1,000.00 | | | | 995.00 | | | | 8.80(B | ) | | | 1,016.40 | | | | 8.89 | | | | 1.75 | |
Class I | | | 1,000.00 | | | | 999.60 | | | | 3.78(B | ) | | | 1,021.40 | | | | 3.82 | | | | 0.75 | |
Class I2 | | | 1,000.00 | | | | 1,000.60 | | | | 3.63(B | ) | | | 1,021.60 | | | | 3.67 | | | | 0.72 | |
| | |
| Transamerica Funds | | Annual Report 2014 |
Page 76
Understanding Your Funds’ Expenses (continued)
(unaudited)
| | | | | | | | | | | | | | | | | | | | | | | | |
| | | | | | Actual Expenses | | | Hypothetical Expenses (A) | | | | |
| Fund Name | | Beginning
Account Value | | | Ending Account
Value | | | Expenses Paid
During Period | | | Ending Account
Value | | | Expenses Paid
During Period (B) | | | Annualized
Expense Ratio | |
| | |
Transamerica International Equity | | | | | | | | | |
Class A | | $ | 1,000.00 | | | $ | 960.20 | | | $ | 6.42(B | ) | | $ | 1,018.70 | | | $ | 6.61 | | | | 1.30 | % |
Class C | | | 1,000.00 | | | | 957.50 | | | | 9.87(B | ) | | | 1,015.10 | | | | 10.16 | | | | 2.00 | |
Class I | | | 1,000.00 | | | | 962.20 | | | | 4.70(B | ) | | | 1,020.40 | | | | 4.84 | | | | 0.95 | |
Class I2 | | | 1,000.00 | | | | 962.70 | | | | 4.21(B | ) | | | 1,020.90 | | | | 4.33 | | | | 0.85 | |
| | |
Transamerica International Small Cap Value | | | | | | | | | |
Class I | | | 1,000.00 | | | | 932.90 | | | | 5.60(B | ) | | | 1,019.40 | | | | 5.85 | | | | 1.15 | |
Class I2 | | | 1,000.00 | | | | 932.90 | | | | 5.12(B | ) | | | 1,019.90 | | | | 5.35 | | | | 1.05 | |
| | |
Transamerica Large Cap Value | | | | | | | | | |
Class A | | | 1,000.00 | | | | 1,042.40 | | | | 5.61(B | ) | | | 1,019.70 | | | | 5.55 | | | | 1.09 | |
Class C | | | 1,000.00 | | | | 1,038.60 | | | | 9.30(B | ) | | | 1,016.10 | | | | 9.20 | | | | 1.81 | |
Class I | | | 1,000.00 | | | | 1,043.50 | | | | 4.02(B | ) | | | 1,021.30 | | | | 3.97 | | | | 0.78 | |
Class I2 | | | 1,000.00 | | | | 1,044.20 | | | | 3.56(B | ) | | | 1,021.70 | | | | 3.52 | | | | 0.69 | |
| | |
Transamerica Mid Cap Growth | | | | | | | | | |
Class A | | | 1,000.00 | | | | 1,045.80 | | | | 6.70(B | ) | | | 1,018.70 | | | | 6.61 | | | | 1.30 | |
Class C | | | 1,000.00 | | | | 1,042.10 | | | | 10.55(B | ) | | | 1,014.90 | | | | 10.41 | | | | 2.05 | |
Class I | | | 1,000.00 | | | | 1,046.70 | | | | 5.42(B | ) | | | 1,019.90 | | | | 5.35 | | | | 1.05 | |
Class I2 | | | 1,000.00 | | | | 1,046.70 | | | | 4.80(B | ) | | | 1,020.50 | | | | 4.74 | | | | 0.93 | |
| | |
Transamerica Mid Cap Value Opportunities | | | | | | | | | |
Class A | | | 1,000.00 | | | | 1,076.20 | | | | 6.18(B | ) | | | 1,019.30 | | | | 6.01 | | | | 1.18 | |
Class C | | | 1,000.00 | | | | 1,072.90 | | | | 10.08(B | ) | | | 1,015.50 | | | | 9.80 | | | | 1.93 | |
Class I | | | 1,000.00 | | | | 1,078.30 | | | | 4.98(B | ) | | | 1,020.40 | | | | 4.84 | | | | 0.95 | |
Class I2 | | | 1,000.00 | | | | 1,078.60 | | | | 4.51(B | ) | | | 1,020.90 | | | | 4.38 | | | | 0.86 | |
| | |
Transamerica MLP & Energy Income | | | | | | | | | |
Class A | | | 1,000.00 | | | | 1,057.20 | | | | 7.93(B | ) | | | 1,017.50 | | | | 7.78 | | | | 1.53 | |
Class C | | | 1,000.00 | | | | 1,053.50 | | | | 11.70(B | ) | | | 1,013.80 | | | | 11.47 | | | | 2.26 | |
Class I | | | 1,000.00 | | | | 1,058.30 | | | | 6.54(B | ) | | | 1,018.90 | | | | 6.41 | | | | 1.26 | |
Class I2 | | | 1,000.00 | | | | 1,058.70 | | | | 5.97(B | ) | | | 1,019.40 | | | | 5.85 | | | | 1.15 | |
| | |
Transamerica Money Market | | | | | | | | | |
Class A | | | 1,000.00 | | | | 1,000.00 | | | | 1.16(B | ) | | | 1,024.00 | | | | 1.17 | | | | 0.23 | |
Class B | | | 1,000.00 | | | | 1,000.00 | | | | 1.16(B | ) | | | 1,024.00 | | | | 1.17 | | | | 0.23 | |
Class C | | | 1,000.00 | | | | 1,000.00 | | | | 1.16(B | ) | | | 1,024.00 | | | | 1.17 | | | | 0.23 | |
Class I | | | 1,000.00 | | | | 1,000.00 | | | | 1.16(B | ) | | | 1,024.00 | | | | 1.17 | | | | 0.23 | |
Class I2 | | | 1,000.00 | | | | 1,000.00 | | | | 1.16(B | ) | | | 1,024.00 | | | | 1.17 | | | | 0.23 | |
| | |
Transamerica Multi-Managed Balanced | | | | | | | | | |
Class A | | | 1,000.00 | | | | 1,058.30 | | | | 6.28(B | ) | | | 1,019.10 | | | | 6.16 | | | | 1.21 | (C) |
Class B | | | 1,000.00 | | | | 1,053.50 | | | | 11.02(B | ) | | | 1,014.50 | | | | 10.82 | | | | 2.13 | (C) |
Class C | | | 1,000.00 | | | | 1,054.50 | | | | 9.84(B | ) | | | 1,015.60 | | | | 9.65 | | | | 1.90 | (C) |
Class I | | | 1,000.00 | | | | 1,059.60 | | | | 4.72(B | ) | | | 1,020.60 | | | | 4.63 | | | | 0.91 | (C) |
| | |
Transamerica Opportunistic Allocation | | | | | | | | | |
Class A | | | 1,000.00 | | | | 972.20 | | | | 5.97(B | ) | | | 1,019.20 | | | | 6.11 | | | | 1.20 | (C) |
Class C | | | 1,000.00 | | | | 968.60 | | | | 9.68(B | ) | | | 1,015.40 | | | | 9.91 | | | | 1.95 | (C) |
Class I | | | 1,000.00 | | | | 973.50 | | | | 4.73(B | ) | | | 1,020.40 | | | | 4.84 | | | | 0.95 | (C) |
| | |
Transamerica Short-Term Bond | | | | | | | | | |
Class A | | | 1,000.00 | | | | 1,005.60 | | | | 4.25(B | ) | | | 1,021.00 | | | | 4.28 | | | | 0.84 | |
Class C | | | 1,000.00 | | | | 1,001.80 | | | | 8.02(B | ) | | | 1,017.20 | | | | 8.08 | | | | 1.59 | |
Class I | | | 1,000.00 | | | | 1,006.60 | | | | 3.19(B | ) | | | 1,022.00 | | | | 3.21 | | | | 0.63 | |
Class I2 | | | 1,000.00 | | | | 1,007.10 | | | | 2.68(B | ) | | | 1,022.50 | | | | 2.70 | | | | 0.53 | |
| | |
Transamerica Small Cap Core | | | | | | | | | |
Class A | | | 1,000.00 | | | | 1,026.60 | | | | 6.64(B | ) | | | 1,018.70 | | | | 6.61 | | | | 1.30 | |
Class C | | | 1,000.00 | | | | 1,021.90 | | | | 10.45(B | ) | | | 1,014.90 | | | | 10.41 | | | | 2.05 | |
Class I | | | 1,000.00 | | | | 1,027.50 | | | | 5.37(B | ) | | | 1,019.90 | | | | 5.35 | | | | 1.05 | |
Class I2 | | | 1,000.00 | | | | 1,028.50 | | | | 4.76(B | ) | | | 1,020.50 | | | | 4.74 | | | | 0.93 | |
| | |
Transamerica Small Cap Growth | | | | | | | | | |
Class A | | | 1,000.00 | | | | 1,068.90 | | | | 7.20(B | ) | | | 1,018.20 | | | | 7.02 | | | | 1.38 | |
Class C | | | 1,000.00 | | | | 1,065.40 | | | | 10.52(B | ) | | | 1,015.00 | | | | 10.26 | | | | 2.02 | |
Class I | | | 1,000.00 | | | | 1,071.20 | | | | 5.38(B | ) | | | 1,020.00 | | | | 5.24 | | | | 1.03 | |
Class I2 | | | 1,000.00 | | | | 1,071.90 | | | | 4.65(B | ) | | | 1,020.70 | | | | 4.53 | | | | 0.89 | |
| | |
Transamerica Small Cap Value | | | | | | | | | |
Class A | | | 1,000.00 | | | | 1,009.40 | | | | 6.69(B | ) | | | 1,018.60 | | | | 6.72 | | | | 1.32 | (C) |
Class C | | | 1,000.00 | | | | 1,006.30 | | | | 10.11(B | ) | | | 1,015.10 | | | | 10.16 | | | | 2.00 | (C) |
Class I | | | 1,000.00 | | | | 1,010.90 | | | | 5.32(B | ) | | | 1,019.90 | | | | 5.35 | | | | 1.05 | (C) |
Class I2 | | | 1,000.00 | | | | 1,011.60 | | | | 4.61(B | ) | | | 1,020.60 | | | | 4.63 | | | | 0.91 | (C) |
| | |
| Transamerica Funds | | Annual Report 2014 |
Page 77
Understanding Your Funds’ Expenses (continued)
(unaudited)
| | | | | | | | | | | | | | | | | | | | | | | | |
| | | | | | Actual Expenses | | | Hypothetical Expenses (A) | | | | |
| Fund Name | | Beginning
Account Value | | | Ending Account
Value | | | Expenses Paid
During Period | | | Ending Account
Value | | | Expenses Paid
During Period (B) | | | Annualized
Expense Ratio | |
| | |
Transamerica Small/Mid Cap Value | | | | | | | | | |
Class A | | $ | 1,000.00 | | | $ | 1,021.90 | | | $ | 6.63(B | ) | | $ | 1,018.70 | | | $ | 6.61 | | | | 1.30 | % |
Class B | | | 1,000.00 | | | | 1,018.60 | | | | 10.23(B | ) | | | 1,015.10 | | | | 10.21 | | | | 2.01 | |
Class C | | | 1,000.00 | | | | 1,018.80 | | | | 10.08(B | ) | | | 1,015.20 | | | | 10.06 | | | | 1.98 | |
Class I | | | 1,000.00 | | | | 1,023.80 | | | | 4.90(B | ) | | | 1,020.40 | | | | 4.89 | | | | 0.96 | |
Class I2 | | | 1,000.00 | | | | 1,024.50 | | | | 4.39(B | ) | | | 1,020.90 | | | | 4.38 | | | | 0.86 | |
| | |
Transamerica Strategic High Income | | | | | | | | | |
Class A | | | 1,000.00 | | | | 1,028.80 | | | | 6.14(B | ) | | | 1,019.20 | | | | 6.11 | | | | 1.20 | (C) |
Class C | | | 1,000.00 | | | | 1,025.10 | | | | 9.95(B | ) | | | 1,015.40 | | | | 9.91 | | | | 1.95 | (C) |
Class I | | | 1,000.00 | | | | 1,031.00 | | | | 4.86(B | ) | | | 1,020.40 | | | | 4.84 | | | | 0.95 | (C) |
Class I2 | | | 1,000.00 | | | | 1,031.10 | | | | 4.86(B | ) | | | 1,020.40 | | | | 4.84 | | | | 0.95 | (C) |
| | |
Transamerica Tactical Allocation | | | | | | | | | |
Class A | | | 1,000.00 | | | | 999.80 | | | | 5.54(B | ) | | | 1,019.70 | | | | 5.60 | | | | 1.10 | (C) |
Class C | | | 1,000.00 | | | | 996.00 | | | | 9.31(B | ) | | | 1,015.90 | | | | 9.40 | | | | 1.85 | (C) |
Class I | | | 1,000.00 | | | | 1,001.00 | | | | 4.29(B | ) | | | 1,020.90 | | | | 4.33 | | | | 0.85 | (C) |
| | |
Transamerica Tactical Income | | | | | | | | | |
Class A | | | 1,000.00 | | | | 1,024.40 | | | | 4.34(B | ) | | | 1,020.90 | | | | 4.33 | | | | 0.85 | (C) |
Class C | | | 1,000.00 | | | | 1,020.50 | | | | 8.25(B | ) | | | 1,017.00 | | | | 8.24 | | | | 1.62 | (C) |
Class I | | | 1,000.00 | | | | 1,025.50 | | | | 3.22(B | ) | | | 1,022.00 | | | | 3.21 | | | | 0.63 | (C) |
| | |
Transamerica Tactical Rotation | | | | | | | | | |
Class A | | | 1,000.00 | | | | 1,021.80 | | | | 5.61(B | ) | | | 1,019.70 | | | | 5.60 | | | | 1.10 | (C) |
Class C | | | 1,000.00 | | | | 1,016.70 | | | | 9.40(B | ) | | | 1,015.90 | | | | 9.40 | | | | 1.85 | (C) |
Class I | | | 1,000.00 | | | | 1,022.70 | | | | 4.33(B | ) | | | 1,020.90 | | | | 4.33 | | | | 0.85 | (C) |
| | |
Transamerica US Growth | | | | | | | | | |
Class A | | | 1,000.00 | | | | 1,086.50 | | | | 6.47(B | ) | | | 1,019.00 | | | | 6.26 | | | | 1.23 | |
Class B | | | 1,000.00 | | | | 1,081.50 | | | | 11.38(B | ) | | | 1,014.30 | | | | 11.02 | | | | 2.17 | |
Class C | | | 1,000.00 | | | | 1,082.20 | | | | 10.60(B | ) | | | 1,015.00 | | | | 10.26 | | | | 2.02 | |
Class I | | | 1,000.00 | | | | 1,088.20 | | | | 4.63(B | ) | | | 1,020.80 | | | | 4.48 | | | | 0.88 | |
Class I2 | | | 1,000.00 | | | | 1,089.50 | | | | 3.95(B | ) | | | 1,021.40 | | | | 3.82 | | | | 0.75 | |
Class T | | | 1,000.00 | | | | 1,088.60 | | | | 4.42(B | ) | | | 1,021.00 | | | | 4.28 | | | | 0.84 | |
| (A) | 5% return per year before expenses. |
| (B) | Expenses are calculated using the Funds’ annualized expense ratios (as disclosed in the table), multiplied by the average account value for the period, multiplied by the number of days in the period (184 days), and divided by the number of days in the year (365 days). |
| (C) | During the period ended October 31, 2014, expense ratios do not include expenses of the investment companies in which the Funds invest. |
| (D) | The Fund class commenced operations on September 4, 2014. Actual expenses are calculated using each Fund’s annualized expense ratio (as disclosed in the table), multiplied by the average account value for the period, multiplied by the number of days in the period (58), and divided by the number of days in the year (365 days). For comparability purposes, hypothetical expenses assume that the Funds’ were in operation for the entire six-month period ended October 31, 2014. Thus, the hypothetical expenses are calculated using the Funds’ annualized expense ratios (as disclosed in the table), multiplied by the average account value for the period, multiplied by the number of days in the period (184 days), and divided by the number of days in the year (365 days). |
| | |
| Transamerica Funds | | Annual Report 2014 |
Page 78
Schedules of Investments Composition
At October 31, 2014
(unaudited)
| | | | |
| Transamerica Capital Growth | | | |
| Asset Allocation | | % of Net
Assets | |
Common Stocks | | | 94.9 | % |
Repurchase Agreement | | | 11.2 | |
Securities Lending Collateral | | | 5.8 | |
Purchased Foreign Exchange Options | | | 0.0 | * |
Preferred Stock | | | 0.0 | |
Net Other Assets (Liabilities) | | | (11.9 | ) |
Total | | | 100.0 | % |
| | | | |
|
Transamerica Concentrated Growth
(formerly, The Torray Resolute Fund) | |
| Asset Allocation | | % of Net
Assets | |
Common Stocks | | | 96.9 | % |
Securities Lending Collateral | | | 19.3 | |
Repurchase Agreement | | | 0.8 | |
Net Other Assets (Liabilities) | | | (17.0 | ) |
Total | | | 100.0 | % |
| | | | |
|
| Transamerica Dividend Focused | |
| Asset Allocation | | % of Net
Assets | |
Common Stocks | | | 95.6 | % |
Securities Lending Collateral | | | 4.8 | |
Repurchase Agreement | | | 4.3 | |
Net Other Assets (Liabilities) | | | (4.7 | ) |
Total | | | 100.0 | % |
| | | | |
|
| Transamerica Emerging Markets Debt | |
| Asset Allocation | | % of Net
Assets | |
Foreign Government Obligations | | | 53.7 | % |
Corporate Debt Securities | | | 42.4 | |
Securities Lending Collateral | | | 13.7 | |
Repurchase Agreement | | | 1.6 | |
Asset-Backed Security | | | 0.5 | |
Net Other Assets (Liabilities)^ | | | (11.9 | ) |
Total | | | 100.0 | % |
| | | | |
|
| Transamerica Emerging Markets Equity | |
| Asset Allocation | | % of Net
Assets | |
Common Stocks | | | 97.2 | % |
Securities Lending Collateral | | | 2.4 | |
Repurchase Agreement | | | 2.2 | |
Preferred Stock | | | 0.3 | |
Net Other Assets (Liabilities) | | | (2.1 | ) |
Total | | | 100.0 | % |
| | | | |
|
| Transamerica Enhanced Muni | |
| Credit Quality‡ | | % of Net
Assets | |
AAA | | | 4.6 | % |
AA | | | 49.3 | |
A | | | 7.8 | |
BBB | | | 9.0 | |
BB and Below | | | 2.1 | |
NR (Not Rated) | | | 47.7 | |
Net Other Assets (Liabilities) | | | (20.5 | ) |
Total | | | 100.0 | % |
| | | | |
| | | | |
| Transamerica Flexible Income | | | |
| Asset Allocation | | % of Net
Assets | |
Corporate Debt Securities | | | 57.3 | % |
Mortgage-Backed Securities | | | 12.8 | |
U.S. Government Obligations | | | 12.1 | |
Asset-Backed Securities | | | 6.7 | |
Securities Lending Collateral | | | 4.4 | |
U.S. Government Agency Obligations | | | 3.5 | |
Short-Term U.S. Government Obligation | | | 3.5 | |
Preferred Corporate Debt Securities | | | 1.4 | |
Foreign Government Obligations | | | 1.1 | |
Repurchase Agreement | | | 1.0 | |
Preferred Stocks | | | 0.9 | |
Municipal Government Obligations | | | 0.7 | |
Convertible Bonds | | | 0.6 | |
Loan Assignments | | | 0.5 | |
Warrant | | | 0.4 | |
Common Stock | | | 0.2 | |
Net Other Assets (Liabilities) | | | (7.1 | ) |
Total | | | 100.0 | % |
| | | | |
|
| Transamerica Floating Rate | |
| Asset Allocation | | % of Net
Assets | |
Loan Assignments | | | 94.5 | % |
Repurchase Agreement | | | 12.5 | |
Corporate Debt Securities | | | 3.6 | |
Securities Lending Collateral | | | 0.9 | |
Investment Company | | | 0.9 | |
Net Other Assets (Liabilities) | | | (12.4 | ) |
Total | | | 100.0 | % |
| | | | |
|
| Transamerica Global Bond | |
| Asset Allocation | | % of Net
Assets | |
Foreign Government Obligations | | | 79.7 | % |
Corporate Debt Securities | | | 10.2 | |
Repurchase Agreement | | | 6.2 | |
U.S. Government Obligation | | | 0.1 | |
Net Other Assets (Liabilities)^ | | | 3.8 | |
Total | | | 100.0 | % |
| | | | |
|
Transamerica Global Equity
(formerly, Transamerica Multi-Manager International Portfolio) | |
| Asset Allocation | | % of Net
Assets | |
Common Stocks | | | 97.1 | % |
Preferred Stock | | | 1.8 | |
Repurchase Agreement | | | 0.8 | |
Net Other Assets (Liabilities) | | | 0.3 | |
Total | | | 100.0 | % |
| | | | |
|
| Transamerica Growth Opportunities | |
| Asset Allocation | | % of Net
Assets | |
Common Stocks | | | 93.5 | % |
Securities Lending Collateral | | | 16.5 | |
Repurchase Agreement | | | 10.0 | |
Preferred Stocks | | | 0.3 | |
Convertible Preferred Stocks | | | 0.1 | |
Purchased Foreign Exchange Options | | | 0.0 | * |
Net Other Assets (Liabilities) | | | (20.4 | ) |
Total | | | 100.0 | % |
| | | | |
| | |
| Transamerica Funds | | Annual Report 2014 |
Page 79
Schedules of Investments Composition (continued)
At October 31, 2014
(unaudited)
| | | | |
| Transamerica High Yield Bond | | | |
| Asset Allocation | | % of Net
Assets | |
Corporate Debt Securities | | | 88.0 | % |
Securities Lending Collateral | | | 11.8 | |
Loan Assignments | | | 4.4 | |
Repurchase Agreement | | | 2.9 | |
Preferred Stocks | | | 1.9 | |
Preferred Corporate Debt Securities | | | 1.2 | |
Convertible Bond | | | 0.2 | |
Common Stock | | | 0.1 | |
Net Other Assets (Liabilities) | | | (10.5 | ) |
Total | | | 100.0 | % |
| | | | |
| |
| Transamerica High Yield Muni | | | |
| Credit Quality‡ | | % of Net
Assets | |
AA | | | 47.9 | % |
A | | | 8.1 | |
BBB | | | 2.6 | |
BB and Below | | | 25.9 | |
NR (Not Rated) | | | 19.2 | |
Net Other Assets (Liabilities) | | | (3.7 | ) |
Total | | | 100.0 | % |
| | | | |
| |
| Transamerica Income & Growth | | | |
| Asset Allocation | | % of Net
Assets | |
Common Stocks | | | 82.3 | % |
Securities Lending Collateral | | | 15.8 | |
Master Limited Partnerships | | | 15.0 | |
Repurchase Agreement | | | 2.1 | |
Net Other Assets (Liabilities) | | | (15.2 | ) |
Total | | | 100.0 | % |
| | | | |
| |
| Transamerica Inflation Opportunities | | | |
| Asset Allocation | | % of Net
Assets | |
U.S. Government Obligations | | | 54.3 | % |
Foreign Government Obligations | | | 23.6 | |
Corporate Debt Securities | | | 13.7 | |
Securities Lending Collateral | | | 2.7 | |
Repurchase Agreement | | | 2.5 | |
U.S. Government Agency Obligations | | | 2.4 | |
Mortgage-Backed Securities | | | 1.8 | |
Preferred Corporate Debt Securities | | | 0.9 | |
Preferred Stocks | | | 0.5 | |
Asset-Backed Securities | | | 0.5 | |
Short-Term U.S. Government Obligations | | | 0.1 | |
Net Other Assets (Liabilities)^ | | | (3.0 | ) |
Total | | | 100.0 | % |
| | | | |
| |
| Transamerica International Equity | | | |
| Asset Allocation | | % of Net
Assets | |
Common Stocks | | | 93.2 | % |
Securities Lending Collateral | | | 5.3 | |
Repurchase Agreement | | | 3.8 | |
Convertible Preferred Stock | | | 1.3 | |
Preferred Stocks | | | 1.1 | |
Net Other Assets (Liabilities) | | | (4.7 | ) |
Total | | | 100.0 | % |
| | | | |
| | | | |
| Transamerica International Small Cap Value | | | |
| Asset Allocation | | % of Net
Assets | |
Common Stocks | | | 96.3 | % |
Securities Lending Collateral | | | 2.9 | |
Repurchase Agreement | | | 1.6 | |
Preferred Stock | | | 1.0 | |
Right | | | 0.0 | * |
Net Other Assets (Liabilities) | | | (1.8 | ) |
Total | | | 100.0 | % |
| | | | |
| |
| Transamerica Large Cap Value | | | |
| Asset Allocation | | % of Net
Assets | |
Common Stocks | | | 97.2 | % |
Repurchase Agreement | | | 3.4 | |
Securities Lending Collateral | | | 3.2 | |
Net Other Assets (Liabilities) | | | (3.8 | ) |
Total | | | 100.0 | % |
| | | | |
| |
| Transamerica Mid Cap Growth | | | |
| Asset Allocation | | % of Net
Assets | |
Common Stocks | | | 99.1 | % |
Securities Lending Collateral | | | 24.7 | |
Repurchase Agreement | | | 1.0 | |
Net Other Assets (Liabilities) | | | (24.8 | ) |
Total | | | 100.0 | % |
| | | | |
| |
| Transamerica Mid Cap Value Opportunities | | | |
| Asset Allocation | | % of Net
Assets | |
Common Stocks | | | 97.9 | % |
Securities Lending Collateral | | | 23.0 | |
Repurchase Agreement | | | 2.2 | |
Net Other Assets (Liabilities) | | | (23.1 | ) |
Total | | | 100.0 | % |
| | | | |
| |
| Transamerica MLP & Energy Income | | | |
| Asset Allocation | | % of Net
Assets | |
Common Stocks | | | 53.2 | % |
Master Limited Partnerships | | | 33.5 | |
Securities Lending Collateral | | | 20.4 | |
Repurchase Agreement | | | 7.7 | |
Corporate Debt Securities | | | 5.2 | |
Preferred Stocks | | | 0.6 | |
Convertible Preferred Stock | | | 0.0 | * |
Net Other Assets (Liabilities) ^ | | | (20.6 | ) |
Total | | | 100.0 | % |
| | | | |
| |
| Transamerica Money Market | | | |
| Asset Allocation | | % of Net
Assets | |
Commercial Paper | | | 69.5 | % |
Certificates of Deposit | | | 13.9 | |
Repurchase Agreements | | | 8.2 | |
Short-Term U.S. Government Agency Obligation | | | 3.9 | |
Corporate Debt Security | | | 3.1 | |
Demand Note | | | 2.0 | |
Net Other Assets (Liabilities) | | | (0.6 | ) |
Total | | | 100.0 | % |
| | | | |
| | |
| Transamerica Funds | | Annual Report 2014 |
Page 80
Schedules of Investments Composition (continued)
At October 31, 2014
(unaudited)
| | | | |
| Transamerica Multi-Managed Balanced | | | |
| Asset Allocation | | % of Net
Assets | |
Common Stocks | | | 59.8 | % |
Corporate Debt Securities | | | 13.0 | |
U.S. Government Obligations | | | 8.0 | |
U.S. Government Agency Obligations | | | 6.0 | |
Mortgage-Backed Securities | | | 4.9 | |
Short-Term U.S. Government Obligations | | | 4.9 | |
Asset-Backed Securities | | | 4.6 | |
Securities Lending Collateral | | | 3.4 | |
Repurchase Agreement | | | 2.0 | |
Preferred Corporate Debt Securities | | | 0.6 | |
Foreign Government Obligations | | | 0.5 | |
Municipal Government Obligations | | | 0.2 | |
Preferred Stocks | | | 0.1 | |
Net Other Assets (Liabilities) ^ | | | (8.0 | ) |
Total | | | 100.0 | % |
| | | | |
| |
| Transamerica Opportunistic Allocation | | | |
| Asset Allocation | | % of Net
Assets | |
Capital Markets | | | 90.8 | % |
Repurchase Agreement | | | 17.2 | |
Diversified Financial Services | | | 3.2 | |
Securities Lending Collateral | | | 0.8 | |
Net Other Assets (Liabilities) | | | (12.0 | ) |
Total | | | 100.0 | % |
| | | | |
| |
| Transamerica Short-Term Bond | | | |
| Asset Allocation | | % of Net
Assets | |
Corporate Debt Securities | | | 61.4 | % |
Mortgage-Backed Securities | | | 21.8 | |
Asset-Backed Securities | | | 12.5 | |
Securities Lending Collateral | | | 2.7 | |
Loan Assignments | | | 2.0 | |
Preferred Corporate Debt Security | | | 1.1 | |
Municipal Government Obligation | | | 0.3 | |
Repurchase Agreement | | | 0.2 | |
U.S. Government Agency Obligation | | | 0.0 | * |
Net Other Assets (Liabilities) | | | (2.0 | ) |
Total | | | 100.0 | % |
| | | | |
| |
| Transamerica Small Cap Core | | | |
| Asset Allocation | | % of Net
Assets | |
Common Stocks | | | 96.8 | % |
Securities Lending Collateral | | | 25.4 | |
Repurchase Agreement | | | 1.6 | |
Master Limited Partnerships | | | 1.3 | |
Net Other Assets (Liabilities) | | | (25.1 | ) |
Total | | | 100.0 | % |
| | | | |
| |
| Transamerica Small Cap Growth | | | |
| Asset Allocation | | % of Net
Assets | |
Common Stocks | | | 97.3 | % |
Securities Lending Collateral | | | 25.6 | |
Repurchase Agreement | | | 2.4 | |
Net Other Assets (Liabilities) | | | (25.3 | ) |
Total | | | 100.0 | % |
| | | | |
| | | | |
| Transamerica Small Cap Value | | | |
| Asset Allocation | | % of Net
Assets | |
Common Stocks | | | 97.9 | % |
Securities Lending Collateral | | | 14.9 | |
Repurchase Agreement | | | 0.0 | * |
Net Other Assets (Liabilities) | | | (12.8 | ) |
Total | | | 100.0 | % |
| | | | |
| |
| Transamerica Small/Mid Cap Value | | | |
| Asset Allocation | | % of Net
Assets | |
Common Stocks | | | 98.7 | % |
Securities Lending Collateral | | | 8.9 | |
Repurchase Agreement | | | 1.6 | |
Net Other Assets (Liabilities) | | | (9.2 | ) |
Total | | | 100.0 | % |
| | | | |
| |
| Transamerica Strategic High Income | | | |
| Asset Allocation | | % of Net
Assets | |
Common Stocks | | | 45.6 | % |
Corporate Debt Securities | | | 37.5 | |
Securities Lending Collateral | | | 24.8 | |
Preferred Stocks | | | 14.9 | |
Repurchase Agreement | | | 1.7 | |
Investment Company | | | 0.9 | |
Net Other Assets (Liabilities) | | | (25.4 | ) |
Total | | | 100.0 | % |
| | | | |
| |
| Transamerica Tactical Allocation | | | |
| Asset Allocation | | % of Net
Assets | |
Investment Companies | | | 101.8 | % |
Repurchase Agreement | | | 47.1 | |
Securities Lending Collateral | | | 4.3 | |
Net Other Assets (Liabilities) | | | (53.2 | ) |
Total | | | 100.0 | % |
| | | | |
| |
| Transamerica Tactical Income | | | |
| Asset Allocation | | % of Net
Assets | |
Investment Companies | | | 99.4 | % |
Securities Lending Collateral | | | 22.7 | |
Repurchase Agreement | | | 0.5 | |
Net Other Assets (Liabilities) | | | (22.6 | ) |
Total | | | 100.0 | % |
| | | | |
| |
| Transamerica Tactical Rotation | | | |
| Asset Allocation | | % of Net
Assets | |
Investment Companies | | | 99.9 | % |
Securities Lending Collateral | | | 23.3 | |
Repurchase Agreement | | | 0.4 | |
Net Other Assets (Liabilities) | | | (23.6 | ) |
Total | | | 100.0 | % |
| | | | |
| | |
| Transamerica Funds | | Annual Report 2014 |
Page 81
Schedules of Investments Composition (continued)
At October 31, 2014
(unaudited)
| | | | |
Transamerica US Growth
(formerly, Transamerica Diversified Equity) | | | |
| Asset Allocation | | % of Net
Assets | |
Common Stocks | | | 99.8 | % |
Securities Lending Collateral | | | 3.1 | |
Repurchase Agreement | | | 0.4 | |
Net Other Assets (Liabilities) | | | (3.3 | ) |
Total | | | 100.0 | % |
| | | | |
| * | Percentage rounds to less than 0.1% or (0.1)%. |
| ^ | The Net Other Assets (Liabilities) category may include, but is not limited to, reverse repurchase agreements, forward foreign currency contracts, futures contracts, swap agreements, written options and swaptions, securities sold short, TBA short commitments, and cash collateral. |
| ‡ | Source: S&P. Ratings BBB or higher are considered investment grade. “Not Rated” includes securities that are not ranked by S&P, but may have been ranked by other Nationally Recognized Statistical Rating Organizations. Credit ratings are subject to change. |
| | |
| Transamerica Funds | | Annual Report 2014 |
Page 82
Transamerica Capital Growth
SCHEDULE OF INVESTMENTS
At October 31, 2014
| | | | | | | | |
| | | Shares | | | Value | |
PREFERRED STOCK - 0.0% | | | | | | | | |
Automobiles - 0.0% | | | | | | | | |
Better Place
Series C, 0.00% (A) (B) (C) (D) | | | 1,099,962 | | | | $ 0 | |
| | | | | | | | |
Total Preferred Stock
(Cost $4,993,827) | | | | | | | 0 | |
| | | | | | | | |
| |
COMMON STOCKS - 94.9% | | | | | |
Automobiles - 3.6% | | | | | | | | |
Tesla Motors, Inc. (A) (E) | | | 175,102 | | | | 42,322,153 | |
| | | | | | | | |
Beverages - 1.5% | | | | | | | | |
PepsiCo, Inc. | | | 179,750 | | | | 17,286,557 | |
| | | | | | | | |
Biotechnology - 3.1% | | | | | | | | |
Alexion Pharmaceuticals, Inc. (A) | | | 35,309 | | | | 6,756,730 | |
Gilead Sciences, Inc. (A) | | | 199,432 | | | | 22,336,384 | |
Regeneron Pharmaceuticals, Inc., Class A (A) | | | 17,969 | | | | 7,074,755 | |
| | | | | | | | |
| | | | | | | 36,167,869 | |
| | | | | | | | |
Chemicals - 1.8% | | | | | | | | |
Monsanto Co. | | | 188,011 | | | | 21,628,785 | |
| | | | | | | | |
Diversified Financial Services - 3.6% | | | | | | | | |
McGraw-Hill Financial, Inc. | | | 342,832 | | | | 31,019,440 | |
MSCI, Inc., Class A | | | 242,164 | | | | 11,299,372 | |
| | | | | | | | |
| | | | | | | 42,318,812 | |
| | | | | | | | |
Electrical Equipment - 0.4% | | | | | | | | |
SolarCity Corp. (A) (E) | | | 71,755 | | | | 4,246,461 | |
| | | | | | | | |
Food & Staples Retailing - 1.5% | | | | | | | | |
Costco Wholesale Corp. | | | 131,961 | | | | 17,599,639 | |
| | | | | | | | |
Food Products - 5.9% | | | | | | | | |
Keurig Green Mountain, Inc. | | | 243,749 | | | | 36,988,911 | |
Mead Johnson Nutrition Co., Class A | | | 331,048 | | | | 32,876,377 | |
| | | | | | | | |
| | | | | | | 69,865,288 | |
| | | | | | | | |
Health Care Equipment & Supplies - 4.3% | |
Intuitive Surgical, Inc. (A) | | | 103,426 | | | | 51,278,611 | |
| | | | | | | | |
Health Care Technology - 0.9% | | | | | | | | |
athenahealth, Inc. (A) (E) | | | 85,602 | | | | 10,486,245 | |
| | | | | | | | |
Hotels, Restaurants & Leisure - 2.0% | | | | | | | | |
Starbucks Corp. | | | 304,648 | | | | 23,019,203 | |
| | | | | | | | |
Insurance - 1.9% | | | | | | | | |
Progressive Corp. | | | 868,761 | | | | 22,943,978 | |
| | | | | | | | |
Internet & Catalog Retail - 12.8% | | | | | | | | |
Amazon.com, Inc. (A) | | | 274,504 | | | | 83,849,992 | |
JD.com, Inc. ADR (A) (E) | | | 446,080 | | | | 10,656,851 | |
Netflix, Inc. (A) | | | 31,554 | | | | 12,393,464 | |
Priceline Group, Inc. (A) | | | 36,752 | | | | 44,330,630 | |
| | | | | | | | |
| | | | | | | 151,230,937 | |
| | | | | | | | |
Internet Software & Services - 23.0% | |
Alibaba Group Holding, Ltd. ADR (A) | | | 202,753 | | | | 19,991,446 | |
Facebook, Inc., Class A (A) | | | 1,218,988 | | | | 91,411,910 | |
Google, Inc., Class A (A) | | | 55,546 | | | | 31,542,907 | |
Google, Inc., Class C (A) | | | 82,136 | | | | 45,920,595 | |
LinkedIn Corp., Class A (A) | | | 172,626 | | | | 39,524,449 | |
Twitter, Inc. (A) | | | 1,033,660 | | | | 42,865,880 | |
| | | | | | | | |
| | | | | | | 271,257,187 | |
| | | | | | | | |
| | | | | | | | |
| | | Shares | | | Value | |
COMMON STOCKS (continued) | | | | | |
IT Services - 4.5% | | | | | | | | |
Mastercard, Inc., Class A | | | 309,582 | | | | $ 25,927,493 | |
Visa, Inc., Class A | | | 109,903 | | | | 26,533,881 | |
| | | | | | | | |
| | | | | | | 52,461,374 | |
| | | | | | | | |
Life Sciences Tools & Services - 4.8% | |
Illumina, Inc. (A) | | | 295,137 | | | | 56,837,483 | |
| | | | | | | | |
Media - 1.5% | | | | | | | | |
Naspers, Ltd., Class N | | | 142,677 | | | | 17,795,979 | |
| | | | | | | | |
Pharmaceuticals - 2.9% | | | | | | | | |
Valeant Pharmaceuticals International, Inc. (A) | | | 258,472 | | | | 34,387,115 | |
| | | | | | | | |
Professional Services - 1.0% | |
Verisk Analytics, Inc., Class A (A) | | | 188,780 | | | | 11,770,433 | |
| | | | | | | | |
Semiconductors & Semiconductor Equipment - 0.9% | |
ARM Holdings PLC ADR | | | 251,040 | | | | 10,721,918 | |
| | | | | | | | |
Software - 7.2% | | | | | | | | |
FireEye, Inc. (A) (E) | | | 245,864 | | | | 8,356,917 | |
salesforce.com, Inc. (A) | | | 636,243 | | | | 40,713,190 | |
Splunk, Inc. (A) | | | 211,383 | | | | 13,968,189 | |
Workday, Inc., Class A (A) | | | 224,536 | | | | 21,438,697 | |
| | | | | | | | |
| | | | | | | 84,476,993 | |
| | | | | | | | |
Technology Hardware, Storage & Peripherals - 3.3% | |
Apple, Inc. | | | 363,772 | | | | 39,287,375 | |
| | | | | | | | |
Textiles, Apparel & Luxury Goods - 2.5% | | | | | |
Michael Kors Holdings, Ltd. (A) | | | 380,849 | | | | 29,930,923 | |
| | | | | | | | |
Total Common Stocks
(Cost $776,389,362) | | | | | | | 1,119,321,318 | |
| | | | | | | | |
| | |
| | | Notional
Amount | | | Value | |
PURCHASED FOREIGN EXCHANGE OPTIONS - 0.0% (F) (G) | |
Call Options - 0.0% (G) | | | | | | | | |
OTC - USD vs. CNY (C) Exercise Price CNY 6.50 Expires 01/07/2015
Counterparty: RBS | | | CNY 308,158,136 | | | | 24,344 | |
OTC - USD vs. CNY (C)
Exercise Price CNY 6.62
Expires 06/19/2015 Counterparty: RBS | | | 185,364,979 | | | | 151,629 | |
| | | | | | | | |
Total Purchased Foreign Exchange Options
(Cost $1,290,286) | | | | 175,973 | |
| | | | | | | | |
| | |
| | | Shares | | | Value | |
SECURITIES LENDING COLLATERAL - 5.8% | |
State Street Navigator Securities Lending Trust - Prime Portfolio 0.16% (H) | | | 67,859,738 | | | | 67,859,738 | |
| | | | | | | | |
Total Securities Lending Collateral
(Cost $67,859,738) | | | | 67,859,738 | |
| | | | | | | | |
The Notes to Financial Statements are an integral part of this report.
| | |
| Transamerica Funds | | Annual Report 2014 |
Page 83
Transamerica Capital Growth
SCHEDULE OF INVESTMENTS (continued)
At October 31, 2014
| | | | | | | | |
| | | Principal | | | Value | |
REPURCHASE AGREEMENT - 11.2% | |
State Street Bank & Trust Co.
0.01% (H), dated 10/31/2014, to be repurchased at $132,217,621 on 11/03/2014. Collateralized by U.S. Government Agency Obligations, 2.50%, due 10/20/2027 - 11/01/2027, and with a total value of $134,862,874. | | | $ 132,217,511 | | | | $ 132,217,511 | |
| | | | | | | | |
Total Repurchase Agreement
(Cost $132,217,511) | | | | | | | 132,217,511 | |
| | | | | | | | |
Total Investments
(Cost $982,750,724) (I) | | | | | | | 1,319,574,540 | |
Net Other Assets (Liabilities) - (11.9)% | | | | (140,508,182 | ) |
| | | | | | | | |
| | |
Net Assets - 100.0% | | | | | | | $ 1,179,066,358 | |
| | | | | | | | |
SECURITY VALUATION:
Valuation Inputs (J)
| | | | | | | | | | | | | | | | |
| | | Level 1
Quoted Prices | | | Level 2
Other Significant
Observable Inputs | | | Level 3
Significant
Unobservable Inputs (K) | | | Value at
October 31, 2014 | |
ASSETS | | | | | | | | | | | | | | | | |
Investments | | | | | | | | | | | | | | | | |
Preferred Stock | | | | | | | | | | | | | | | | |
Automobiles | | $ | — | | | $ | — | | | $ | 0 | | | $ | 0 | |
Common Stocks | | | 1,101,525,339 | | | | 17,795,979 | | | | — | | | | 1,119,321,318 | |
Purchased Foreign Exchange Options | | | — | | | | 175,973 | | | | — | | | | 175,973 | |
Securities Lending Collateral | | | 67,859,738 | | | | — | | | | — | | | | 67,859,738 | |
Repurchase Agreement | | | — | | | | 132,217,511 | | | | — | | | | 132,217,511 | |
| | | | | | | | | | | | | | | | |
Total Investments | | $ | 1,169,385,077 | | | $ | 150,189,463 | | | $ | 0 | | | $ | 1,319,574,540 | |
| | | | | | | | | | | | | | | | |
FOOTNOTES TO SCHEDULE OF INVESTMENTS:
| (A) | Non-income producing security. |
| (B) | Fair valued as determined in good faith in accordance with procedures established by the board of trustees. Total aggregate fair value of securities is $0, or less than 0.01% of the Fund’s net assets. |
| (C) | Total aggregate value of illiquid securities is $175,973, or 0.01% of the Fund’s net assets. |
| (D) | At October 31, 2014, the Fund owned the respective securities which were restricted to public resale: |
| | | | | | | | | | | | | | | | | | |
| Investments | | Description | | Acquisition
Date | | | Cost | | | Value | | | Value as % of
Net Assets | |
Preferred Stock | | Better Place, Series C | | | 11/11/2011 | | | $ | 4,993,827 | | | $ | 0 | | | | 0.00 | % |
| (E) | All or a portion of this security is on loan. The value of all securities on loan is $66,414,450. The amount of securities on loan indicated may not correspond with the securities on loan identified because securities with pending sales are in the process of recall from the brokers. |
| (F) | Cash in the amount of $260,000 has been segregated by the broker as collateral for open options contracts. |
| (G) | Percentage rounds to less than 0.1% or (0.1)%. |
| (H) | Rate shown reflects the yield at October 31, 2014. |
| (I) | Aggregate cost for federal income tax purposes is $983,477,517. Aggregate gross unrealized appreciation and depreciation for all securities is $352,848,146 and $16,751,123, respectively. Net unrealized appreciation for tax purposes is $336,097,023. |
| (J) | The Fund recognizes transfers between Levels at the end of the reporting period. There were no transfers between Level 1, 2 and 3 during the period ended October 31, 2014. See the Notes to Financial Statements for more information regarding security valuation and pricing inputs. |
| (K) | Level 3 securities were not considered significant to the Fund. |
The Notes to Financial Statements are an integral part of this report.
| | |
| Transamerica Funds | | Annual Report 2014 |
Page 84
Transamerica Capital Growth
SCHEDULE OF INVESTMENTS (continued)
At October 31, 2014
DEFINITIONS:
| | |
| ADR | | American Depositary Receipt |
| RBS | | Royal Bank of Scotland Group PLC |
CURRENCY ABBREVIATION:
| | |
| CNY | | Chinese Yuan Renminbi |
| USD | | United States Dollar |
The Notes to Financial Statements are an integral part of this report.
| | |
| Transamerica Funds | | Annual Report 2014 |
Page 85
Transamerica Concentrated Growth
(formerly, The Torray Resolute Fund)
SCHEDULE OF INVESTMENTS
At October 31, 2014
| | | | | | | | |
| | | Shares | | | Value | |
COMMON STOCKS - 96.9% | | | | | | | | |
Aerospace & Defense - 7.2% | | | | | | | | |
Precision Castparts Corp. (A) | | | 55,493 | | | | $ 12,247,305 | |
United Technologies Corp. | | | 136,730 | | | | 14,630,110 | |
| | | | | | | | |
| | | | | | | 26,877,415 | |
| | | | | | | | |
Biotechnology - 6.6% | | | | | | | | |
BioMarin Pharmaceutical, Inc. (A) (B) | | | 166,495 | | | | 13,735,838 | |
Gilead Sciences, Inc. (B) | | | 98,635 | | | | 11,047,120 | |
| | | | | | | | |
| | | | | | | 24,782,958 | |
| | | | | | | | |
Capital Markets - 2.5% | | | | | | | | |
BlackRock, Inc., Class A | | | 27,700 | | | | 9,448,747 | |
| | | | | | | | |
Chemicals - 5.9% | | | | | | | | |
FMC Corp., Class A | | | 166,880 | | | | 9,570,568 | |
Praxair, Inc. (A) | | | 99,787 | | | | 12,572,164 | |
| | | | | | | | |
| | | | | | | 22,142,732 | |
| | | | | | | | |
Communications Equipment - 3.6% | | | | | | | | |
QUALCOMM, Inc. | | | 173,440 | | | | 13,616,774 | |
| | | | | | | | |
Electronic Equipment, Instruments & Components - 2.9% | |
Amphenol Corp., Class A | | | 215,704 | | | | 10,910,308 | |
| | | | | | | | |
Energy Equipment & Services - 2.3% | | | | | | | | |
Core Laboratories NV | | | 60,997 | | | | 8,510,911 | |
| | | | | | | | |
Health Care Equipment & Supplies - 5.7% | |
Baxter International, Inc. (A) | | | 169,453 | | | | 11,885,434 | |
Cooper Cos., Inc. | | | 57,160 | | | | 9,368,524 | |
| | | | | | | | |
| | | | | | | 21,253,958 | |
| | | | | | | | |
Health Care Providers & Services - 3.9% | |
Express Scripts Holding Co. (A) (B) | | | 189,865 | | | | 14,585,429 | |
| | | | | | | | |
Household Products - 3.5% | | | | | | | | |
Colgate-Palmolive Co. (A) | | | 193,498 | | | | 12,941,146 | |
| | | | | | | | |
Industrial Conglomerates - 4.3% | | | | | | | | |
Danaher Corp. | | | 198,101 | | | | 15,927,320 | |
| | | | | | | | |
Internet Software & Services - 3.1% | | | | | | | | |
Akamai Technologies, Inc. (B) | | | 190,210 | | | | 11,469,663 | |
| | | | | | | | |
IT Services - 12.3% | | | | | | | | |
Accenture PLC, Class A (A) | | | 159,376 | | | | 12,928,581 | |
Fiserv, Inc. (A) (B) | | | 235,327 | | | | 16,350,520 | |
Visa, Inc., Class A (A) | | | 68,735 | | | | 16,594,691 | |
| | | | | | | | |
| | | | | | | 45,873,792 | |
| | | | | | | | |
Machinery - 3.0% | | | | | | | | |
Cummins, Inc. | | | 76,591 | | | | 11,196,072 | |
| | | | | | | | |
Oil, Gas & Consumable Fuels - 6.7% | | | | | |
Enbridge, Inc. (A) | | | 289,450 | | | | 13,708,352 | |
EOG Resources, Inc. | | | 117,812 | | | | 11,198,031 | |
| | | | | | | | |
| | | | | | | 24,906,383 | |
| | | | | | | | |
Pharmaceuticals - 4.4% | | | | | | | | |
Roche Holding AG, ADR | | | 451,695 | | | | 16,626,893 | |
| | | | | | | | |
Professional Services - 1.9% | | | | | | | | |
Verisk Analytics, Inc., Class A (B) | | | 114,640 | | | | 7,147,804 | |
| | | | | | | | |
Real Estate Investment Trusts - 3.6% | | | | | |
American Tower Corp., Class A | | | 138,487 | | | | 13,502,483 | |
| | | | | | | | |
Software - 1.9% | | | | | | | | |
Adobe Systems, Inc. (A) (B) | | | 101,534 | | | | 7,119,564 | |
| | | | | | | | |
| | | | | | | | |
| | | Shares | | | Value | |
COMMON STOCKS (continued) | | | | | | | | |
Technology Hardware, Storage & Peripherals - 4.3% | | | | | |
Apple, Inc. | | | 149,170 | | | | $ 16,110,360 | |
| | | | | | | | |
Textiles, Apparel & Luxury Goods - 7.3% | | | | | |
NIKE, Inc., Class B (A) | | | 140,925 | | | | 13,101,797 | |
VF Corp. | | | 208,830 | | | | 14,133,615 | |
| | | | | | | | |
| | | | | | | 27,235,412 | |
| | | | | | | | |
Total Common Stocks
(Cost $346,392,610) | | | | 362,186,124 | |
| | | | | | | | |
|
SECURITIES LENDING COLLATERAL - 19.3% | |
State Street Navigator Securities Lending Trust - Prime Portfolio
0.16% (C) | | | 72,458,026 | | | | 72,458,026 | |
| | | | | | | | |
Total Securities Lending Collateral (Cost $72,458,026) | | | | | | | 72,458,026 | |
| | | | | | | | |
| | |
| | | Principal | | | Value | |
REPURCHASE AGREEMENT - 0.8% | | | | | |
State Street Bank & Trust Co.
0.01% (C), dated 10/31/2014, to be repurchased at $2,858,857 on 11/03/2014. Collateralized by a U.S. Government Agency Obligation, 3.00%, due 07/25/2037, and with a value of $2,919,211. | | | $ 2,858,855 | | | | 2,858,855 | |
| | | | | | | | |
Total Repurchase Agreement
(Cost $2,858,855) | | | | | | | 2,858,855 | |
| | | | | | | | |
Total Investments
(Cost $421,709,491) (D) | | | | | | | 437,503,005 | |
Net Other Assets (Liabilities) - (17.0)% | | | | | | | (63,662,467 | ) |
| | | | | | | | |
| | |
Net Assets - 100.0% | | | | | | | $ 373,840,538 | |
| | | | | | | | |
The Notes to Financial Statements are an integral part of this report.
| | |
| Transamerica Funds | | Annual Report 2014 |
Page 86
Transamerica Concentrated Growth
(formerly, The Torray Resolute Fund)
SCHEDULE OF INVESTMENTS (continued)
At October 31, 2014
SECURITY VALUATION:
Valuation Inputs (E)
| | | | | | | | | | | | | | | | |
| | | Level 1 Quoted Prices | | | Level 2 Other Significant
Observable Inputs | | | Level 3 Significant
Unobservable Inputs | | | Value at
October 31, 2014 | |
ASSETS | | | | | | | | | | | | | | | | |
Investments | | | | | | | | | | | | | | | | |
Common Stocks | | $ | 362,186,124 | | | $ | — | | | $ | — | | | $ | 362,186,124 | |
Securities Lending Collateral | | | 72,458,026 | | | | — | | | | — | | | | 72,458,026 | |
Repurchase Agreement | | | — | | | | 2,858,855 | | | | — | | | | 2,858,855 | |
| | | | | | | | | | | | | | | | |
Total Investments | | $ | 434,644,150 | | | $ | 2,858,855 | | | $ | — | | | $ | 437,503,005 | |
| | | | | | | | | | | | | | | | |
FOOTNOTES TO SCHEDULE OF INVESTMENTS:
| (A) | All or a portion of this security is on loan. The value of all securities on loan is $70,942,668. The amount of securities on loan indicated may not correspond with the securities on loan identified because securities with pending sales are in the process of recall from the brokers. |
| (B) | Non-income producing security. |
| (C) | Rate shown reflects the yield at October 31, 2014. |
| (D) | Aggregate cost for federal income tax purposes is $421,978,980. Aggregate gross unrealized appreciation and depreciation for all securities is $24,685,401 and $9,161,376, respectively. Net unrealized appreciation for tax purposes is $15,524,025. |
| (E) | The Fund recognizes transfers between Levels at the end of the reporting period. There were no transfers between Level 1, 2 and 3 during the period ended October 31, 2014. See the Notes to Financial Statements for more information regarding security valuation and pricing inputs. |
DEFINITION:
| | |
| ADR | | American Depositary Receipt |
The Notes to Financial Statements are an integral part of this report.
| | |
| Transamerica Funds | | Annual Report 2014 |
Page 87
Transamerica Dividend Focused
SCHEDULE OF INVESTMENTS
At October 31, 2014
| | | | | | | | |
| | | Shares | | | Value | |
COMMON STOCKS - 95.6% | | | | | | | | |
Aerospace & Defense - 8.6% | | | | | | | | |
General Dynamics Corp. | | | 213,741 | | | | $ 29,872,442 | |
Honeywell International, Inc. | | | 551,600 | | | | 53,019,792 | |
Raytheon Co. | | | 426,500 | | | | 44,304,820 | |
| | | | | | | | |
| | | | | | | 127,197,054 | |
| | | | | | | | |
Airlines - 1.8% | | | | | | | | |
Southwest Airlines Co. | | | 776,800 | | | | 26,784,064 | |
| | | | | | | | |
Banks - 8.7% | | | | | | | | |
PNC Financial Services Group, Inc. | | | 665,100 | | | | 57,457,989 | |
Wells Fargo & Co. | | | 1,337,700 | | | | 71,018,493 | |
| | | | | | | | |
| | | | | | | 128,476,482 | |
| | | | | | | | |
Capital Markets - 5.2% | | | | | | | | |
Ameriprise Financial, Inc. | | | 123,200 | | | | 15,544,144 | |
State Street Corp. | | | 812,200 | | | | 61,288,612 | |
| | | | | | | | |
| | | | | | | 76,832,756 | |
| | | | | | | | |
Chemicals - 0.6% | | | | | | | | |
E.I. du Pont de Nemours & Co. | | | 116,300 | | | | 8,042,145 | |
| | | | | | | | |
Construction Materials - 1.6% | | | | | | | | |
CRH PLC, ADR | | | 1,079,100 | | | | 24,182,631 | |
| | | | | | | | |
Consumer Finance - 3.4% | | | | | | | | |
American Express Co. | | | 560,900 | | | | 50,452,955 | |
| | | | | | | | |
Diversified Financial Services - 8.3% | |
Bank of America Corp. | | | 3,983,300 | | | | 68,353,428 | |
JPMorgan Chase & Co. | | | 898,000 | | | | 54,311,040 | |
| | | | | | | | |
| | | | | | | 122,664,468 | |
| | | | | | | | |
Diversified Telecommunication Services - 5.1% | |
AT&T, Inc. | | | 1,138,500 | | | | 39,665,340 | |
Verizon Communications, Inc. | | | 718,500 | | | | 36,104,625 | |
| | | | | | | | |
| | | | | | | 75,769,965 | |
| | | | | | | | |
Electric Utilities - 1.7% | | | | | | | | |
Entergy Corp., Class B | | | 302,700 | | | | 25,432,854 | |
| | | | | | | | |
Food & Staples Retailing - 2.9% | | | | | | | | |
Wal-Mart Stores, Inc. | | | 554,700 | | | | 42,306,969 | |
| | | | | | | | |
Health Care Equipment & Supplies - 3.9% | |
Medtronic, Inc. (A) | | | 837,800 | | | | 57,104,448 | |
| | | | | | | | |
Health Care Providers & Services - 2.2% | |
Cardinal Health, Inc. | | | 415,100 | | | | 32,577,048 | |
| | | | | | | | |
Household Durables - 1.1% | | | | | | | | |
Lennar Corp., Class A (A) | | | 360,400 | | | | 15,526,032 | |
| | | | | | | | |
Industrial Conglomerates - 0.9% | | | | | | | | |
General Electric Co. | | | 538,300 | | | | 13,893,523 | |
| | | | | | | | |
Insurance - 1.8% | | | | | | | | |
Loews Corp. | | | 603,197 | | | | 26,299,390 | |
| | | | | | | | |
Machinery - 4.3% | | | | | | | | |
Illinois Tool Works, Inc., Class A | | | 432,200 | | | | 39,351,810 | |
Stanley Black & Decker, Inc. | | | 258,728 | | | | 24,227,290 | |
| | | | | | | | |
| | | | | | | 63,579,100 | |
| | | | | | | | |
Metals & Mining - 0.8% | | | | | | | | |
Rio Tinto PLC, ADR (A) | | | 240,300 | | | | 11,527,191 | |
| | | | | | | | |
Multiline Retail - 2.7% | | | | | | | | |
Target Corp. | | | 648,600 | | | | 40,096,452 | |
| | | | | | | | |
Oil, Gas & Consumable Fuels - 11.7% | | | | | |
BP PLC, ADR | | | 989,300 | | | | 42,994,978 | |
ConocoPhillips | | | 635,400 | | | | 45,844,110 | |
| | | | | | | | |
| | | Shares | | | Value | |
COMMON STOCKS (continued) | |
Oil, Gas & Consumable Fuels (continued) | | | | | |
Occidental Petroleum Corp. | | | 407,700 | | | | $ 36,256,761 | |
Phillips 66 | | | 610,300 | | | | 47,908,550 | |
| | | | | | | | |
| | | | | | | 173,004,399 | |
| | | | | | | | |
Pharmaceuticals - 10.7% | | | | | | | | |
Johnson & Johnson | | | 529,100 | | | | 57,026,398 | |
Merck & Co., Inc. | | | 946,000 | | | | 54,811,240 | |
Pfizer, Inc. | | | 1,539,200 | | | | 46,099,040 | |
| | | | | | | | |
| | | | | | | 157,936,678 | |
| | | | | | | | |
Road & Rail - 1.4% | | | | | | | | |
Norfolk Southern Corp. | | | 192,000 | | | | 21,242,880 | |
| | | | | | | | |
Specialty Retail - 1.3% | | | | | | | | |
Gap, Inc., Class A | | | 510,900 | | | | 19,358,001 | |
| | | | | | | | |
Tobacco - 4.9% | | | | | | | | |
Altria Group, Inc. | | | 567,100 | | | | 27,413,614 | |
Philip Morris International, Inc. | | | 500,700 | | | | 44,567,307 | |
| | | | | | | | |
| | | | | | | 71,980,921 | |
| | | | | | | | |
Total Common Stocks
(Cost $1,165,782,929) | | | | | | | 1,412,268,406 | |
| | | | | | | | |
|
SECURITIES LENDING COLLATERAL - 4.8% | |
State Street Navigator Securities Lending Trust - Prime Portfolio 0.16% (B) | | | 70,447,920 | | | | 70,447,920 | |
| | | | | | | | |
Total Securities Lending Collateral
(Cost $70,447,920) | | | | 70,447,920 | |
| | | | | | | | |
| | |
| | | Principal | | | Value | |
REPURCHASE AGREEMENT - 4.3% | |
State Street Bank & Trust Co. 0.01% (B), dated 10/31/2014, to be repurchased at $63,523,780 on 11/03/2014. Collateralized by U.S. Government Agency Obligations, 3.00%, due 07/25/2037, and with a total value of $64,795,068. | | | $ 63,523,727 | | | | 63,523,727 | |
| | | | | | | | |
Total Repurchase Agreement
(Cost $63,523,727) | | | | 63,523,727 | |
| | | | | | | | |
Total Investments
(Cost $1,299,754,576) (C) | | | | | | | 1,546,240,053 | |
Net Other Assets (Liabilities) - (4.7)% | | | | (69,132,446 | ) |
| | | | | | | | |
| | |
Net Assets - 100.0% | | | | | | | $ 1,477,107,607 | |
| | | | | | | | |
The Notes to Financial Statements are an integral part of this report.
| | |
| Transamerica Funds | | Annual Report 2014 |
Page 88
Transamerica Dividend Focused
SCHEDULE OF INVESTMENTS (continued)
At October 31, 2014
SECURITY VALUATION:
Valuation Inputs (D)
| | | | | | | | | | | | | | | | |
| | | Level 1
Quoted Prices | | | Level 2
Other Significant
Observable Inputs | | | Level 3
Significant
Unobservable Inputs | | | Value at
October 31, 2014 | |
ASSETS | | | | | | | | | | | | | | | | |
Investments | | | | | | | | | | | | | | | | |
Common Stocks | | $ | 1,412,268,406 | | | $ | — | | | $ | — | | | $ | 1,412,268,406 | |
Securities Lending Collateral | | | 70,447,920 | | | | — | | | | — | | | | 70,447,920 | |
Repurchase Agreement | | | — | | | | 63,523,727 | | | | — | | | | 63,523,727 | |
| | | | | | | | | | | | | | | | |
Total Investments | | $ | 1,482,716,326 | | | $ | 63,523,727 | | | $ | — | | | $ | 1,546,240,053 | |
| | | | | | | | | | | | | | | | |
FOOTNOTES TO SCHEDULE OF INVESTMENTS:
| (A) | All or a portion of this security is on loan. The value of all securities on loan is $68,883,946. The amount of securities on loan indicated may not correspond with the securities on loan identified because securities with pending sales are in the process of recall from the brokers. |
| (B) | Rate shown reflects the yield at October 31, 2014. |
| (C) | Aggregate cost for federal income tax purposes is $1,299,754,576. Aggregate gross unrealized appreciation and depreciation for all securities is $253,269,347 and $6,783,870, respectively. Net unrealized appreciation for tax purposes is $246,485,477. |
| (D) | The Fund recognizes transfers between Levels at the end of the reporting period. There were no transfers between Level 1, 2 and 3 during the period ended October 31, 2014. See the Notes to Financial Statements for more information regarding security valuation and pricing inputs. |
DEFINITIONS:
| | |
| ADR | | American Depositary Receipt |
The Notes to Financial Statements are an integral part of this report.
| | |
| Transamerica Funds | | Annual Report 2014 |
Page 89
Transamerica Emerging Markets Debt
SCHEDULE OF INVESTMENTS
At October 31, 2014
| | | | | | | | |
| | | Principal | | | Value | |
FOREIGN GOVERNMENT OBLIGATIONS - 53.7% | | | | | |
Argentina - 0.6% | | | | | | | | |
Argentina Boden Bonds | | | | | | | | |
7.00%, 10/03/2015 | | | $ 3,720,000 | | | | $ 3,475,100 | |
| | | | | | | | |
Bahrain - 1.2% | | | | | | | | |
Bahrain Government International Bond | | | | | | | | |
6.00%, 09/19/2044, 144A (A) | | | 6,700,000 | | | | 6,934,500 | |
| | | | | | | | |
Belarus - 1.1% | | | | | | | | |
Republic of Belarus | | | | | | | | |
8.75%, 08/03/2015, Reg S | | | 6,290,000 | | | | 6,417,058 | |
| | | | | | | | |
Brazil - 3.1% | | | | | | | | |
Brazil Notas do Tesouro Nacional
Series F | | | | | | | | |
10.00%, 01/01/2017 - 01/01/2025 | | | BRL 29,940,000 | | | | 11,109,380 | |
Brazilian Government International Bond | | | | | | | | |
5.00%, 01/27/2045 | | | $ 7,215,000 | | | | 7,070,700 | |
| | | | | | | | |
| | | | | | | 18,180,080 | |
| | | | | | | | |
Cayman Islands - 0.4% | | | | | | | | |
Brazil Minas SPE via State of Minas Gerais | | | | | | | | |
5.33%, 02/15/2028, 144A | | | 2,500,000 | | | | 2,512,500 | |
| | | | | | | | |
Colombia - 2.2% | | | | | | | | |
Colombia Government International Bond | | | | | | | | |
4.38%, 03/21/2023 (A) | | | COP 12,693,000,000 | | | | 5,444,263 | |
5.63%, 02/26/2044 (A) | | | $ 3,970,000 | | | | 4,432,926 | |
Empresa de Telecomunicaciones de Bogota | | | | | | | | |
7.00%, 01/17/2023, 144A | | | COP 7,104,000,000 | | | | 3,254,202 | |
| | | | | | | | |
Costa Rica - 0.7% | | | | | | | | |
Costa Rica Government International Bond | | | | | | | | |
10.00%, 08/01/2020, 144A | | | $ 3,485,000 | | | | 4,486,938 | |
| | | | | | | | |
Cote d’Ivoire - 1.1% | | | | | | | | |
Ivory Coast Government International Bond | | | | | | | | |
7.77%, 12/31/2032 (Cash Rate: 7.77%),
Reg S (A) (B) (C) | | | 6,636,000 | | | | 6,405,067 | |
| | | | | | | | |
Croatia - 2.7% | | | | | | | | |
Croatia Government International Bond | | | | | | | | |
3.88%, 05/30/2022, Reg S | | | EUR 3,559,000 | | | | 4,510,136 | |
6.75%, 11/05/2019, 144A | | | $ 10,330,000 | | | | 11,453,387 | |
| | | | | | | | |
| | | | | | | 15,963,523 | |
| | | | | | | | |
Ecuador - 1.1% | | | | | | | | |
Ecuador Government International Bond | | | | | | | | |
7.95%, 06/20/2024, 144A | | | 4,200,000 | | | | 4,410,000 | |
9.38%, 12/15/2015, Reg S | | | 2,210,000 | | | | 2,298,400 | |
| | | | | | | | |
| | | | | | | 6,708,400 | |
| | | | | | | | |
Ghana - 2.0% | | | | | | | | |
Republic of Ghana | | | | | | | | |
8.13%, 01/18/2026, 144A (A) | | | 11,650,000 | | | | 11,708,250 | |
| | | | | | | | |
| | | | | | | | |
| | | Principal | | | Value | |
FOREIGN GOVERNMENT OBLIGATIONS (continued) | |
Guatemala - 0.8% | | | | | | | | |
Guatemala Government Bond | | | | | | | | |
4.88%, 02/13/2028, 144A | | | $ 4,900,000 | | | | $ 5,010,250 | |
| | | | | | | | |
Hungary - 2.9% | | | | | | | | |
Hungary Government Bond | | | | | | | | |
4.00%, 04/25/2018 | | | HUF 2,659,000,000 | | | | 11,236,683 | |
Hungary Government International Bond | | | | | | | | |
4.00%, 03/25/2019 | | | $ 3,130,000 | | | | 3,206,685 | |
5.38%, 03/25/2024 (A) | | | 2,690,000 | | | | 2,878,569 | |
| | | | | | | | |
| | | | | | | 17,321,937 | |
| | | | | | | | |
Indonesia - 6.2% | | | | | | | | |
Indonesia Government International Bond | | | | | | | | |
3.38%, 04/15/2023, 144A (A) | | | 5,525,000 | | | | 5,290,188 | |
6.63%, 02/17/2037, 144A | | | 5,510,000 | | | | 6,432,925 | |
Indonesia Treasury Bond | | | | | | | | |
5.63%, 05/15/2023 | | | IDR 56,508,000,000 | | | | 3,997,877 | |
7.00%, 05/15/2022 | | | 73,587,000,000 | | | | 5,738,994 | |
Perusahaan Penerbit SBSN Indonesia III | | | | | |
3.30%, 11/21/2022, 144A | | | $ 10,825,000 | | | | 10,283,750 | |
4.35%, 09/10/2024, 144A (A) | | | 2,750,000 | | | | 2,756,875 | |
6.13%, 03/15/2019, 144A | | | 2,300,000 | | | | 2,553,000 | |
| | | | | | | | |
| | | | | | | 37,053,609 | |
| | | | | | | | |
Lithuania - 0.9% | | | | | | | | |
Lithuania Government International Bond | | | | | | | | |
6.13%, 03/09/2021, 144A | | | 4,673,000 | | | | 5,444,045 | |
| | | | | | | | |
Malaysia - 1.9% | | | | | | | | |
Malaysia Government Bond | | | | | | | | |
3.65%, 10/31/2019 | | | MYR 18,800,000 | | | | 5,716,606 | |
4.18%, 07/15/2024 | | | 18,200,000 | | | | 5,673,946 | |
| | | | | | | | |
| | | | | | | 11,390,552 | |
| | | | | | | | |
Mexico - 3.1% | | | | | | | | |
Mexican Bonos | | | | | | | | |
7.75%, 05/29/2031 | | | MXN 112,484,600 | | | | 9,311,415 | |
8.00%, 12/07/2023 | | | 68,500,000 | | | | 5,837,154 | |
Mexican Udibonos
Series S | | | | | | | | |
4.50%, 11/22/2035 | | | 34,113,988 | | | | 2,979,084 | |
| | | | | | | | |
| | | | | | | 18,127,653 | |
| | | | | | | | |
Paraguay - 0.8% | | | | | | | | |
Republic of Paraguay | | | | | | | | |
6.10%, 08/11/2044, 144A | | | $ 4,250,000 | | | | 4,552,813 | |
| | | | | | | | |
Peru - 0.9% | | | | | | | | |
Peruvian Government International Bond | | | | | |
5.63%, 11/18/2050 | | | $ 2,200,000 | | | | 2,484,764 | |
5.70%, 08/12/2024, 144A | | | PEN 8,100,000 | | | | 2,764,466 | |
| | | | | | | | |
| | | | | | | 5,249,230 | |
| | | | | | | | |
Romania - 0.7% | | | | | | | | |
Romania Government Bond | | | | | | | | |
5.95%, 06/11/2021 | | | RON 12,910,000 | | | | 4,186,657 | |
| | | | | | | | |
Russian Federation - 1.3% | | | | | | | | |
Russian Foreign Bond - Eurobond | | | | | |
4.88%, 09/16/2023, 144A | | | $ 7,160,000 | | | | 7,170,382 | |
The Notes to Financial Statements are an integral part of this report.
| | |
| Transamerica Funds | | Annual Report 2014 |
Page 90
Transamerica Emerging Markets Debt
SCHEDULE OF INVESTMENTS (continued)
At October 31, 2014
| | | | | | | | |
| | | Principal | | | Value | |
FOREIGN GOVERNMENT OBLIGATIONS (continued) | |
Russian Federation (continued) | |
Russian Foreign Bond - Eurobond (continued) | | | | | |
7.50%, 03/31/2030, Reg S (B) | | | $ 687,750 | | | | $ 780,246 | |
| | | | | | | | |
| | | | | | | 7,950,628 | |
| | | | | | | | |
Slovenia - 2.9% | | | | | | | | |
Slovenia Government International Bond | | | | | |
5.25%, 02/18/2024, 144A | | | 10,370,000 | | | | 11,167,246 | |
5.50%, 10/26/2022, 144A | | | 5,350,000 | | | | 5,878,312 | |
| | | | | | | | |
| | | | | | | 17,045,558 | |
| | | | | | | | |
South Africa - 1.4% | | | | | | | | |
South Africa Government Bond | | | | | |
6.50%, 02/28/2041 | | | ZAR 38,985,000 | | | | 2,750,396 | |
10.50%, 12/21/2026 | | | 50,250,000 | | | | 5,468,854 | |
| | | | | | | | |
| | | | | | | 8,219,250 | |
| | | | | | | | |
Sri Lanka - 1.1% | | | | | | | | |
Sri Lanka Government International Bond | | | | | |
5.88%, 07/25/2022, 144A | | | $ 6,100,000 | | | | 6,344,000 | |
| | | | | | | | |
Supranational - 3.4% | | | | | | | | |
Eastern and Southern African Trade and
Development Bank
Series MTN | | | | | |
6.38%, 12/06/2018, Reg S (A) | | | 3,899,000 | | | | 3,996,475 | |
European Bank for Reconstruction &
Development
Series MTN | | | | | |
5.00%, 05/28/2015 | | | INR 370,000,000 | | | | 5,992,916 | |
Inter-American Development Bank Series MTN | | | | | | | | |
7.25%, 07/17/2017 | | | IDR 61,600,000,000 | | | | 5,074,800 | |
International Finance Corp.
Series MTN | | | | | |
7.75%, 12/03/2016 | | | INR 235,100,000 | | | | 3,905,922 | |
7.80%, 06/03/2019 | | | 70,350,000 | | | | 1,220,593 | |
| | | | | | | | |
| | | | | | | 20,190,706 | |
| | | | | | | | |
Thailand - 1.3% | | | | | | | | |
Thailand Government Bond | | | | | | | | |
3.88%, 06/13/2019 | | | THB 231,000,000 | | | | 7,457,506 | |
| | | | | | | | |
Turkey - 3.0% | | | | | | | | |
Hazine Mustesarligi Varlik Kiralama AS | | | | | |
4.56%, 10/10/2018, 144A | | | $ 2,975,000 | | | | 3,123,750 | |
Turkey Government Bond | | | | | | | | |
10.50%, 01/15/2020 | | | TRY 12,201,000 | | | | 6,002,652 | |
Turkey Government International Bond | | | | | |
5.75%, 03/22/2024 (A) | | | $ 7,910,000 | | | | 8,735,013 | |
| | | | | | | | |
| | | | | | | 17,861,415 | |
| | | | | | | | |
Ukraine - 3.2% | | | | | | | | |
Financing of Infrastrucural Projects State Enterprise | | | | | | | | |
8.38%, 11/03/2017, Reg S | | | 3,920,000 | | | | 3,214,400 | |
Ukraine Government International Bond | | | | | |
6.25%, 06/17/2016, 144A | | | 6,030,000 | | | | 5,366,700 | |
6.88%, 09/23/2015, 144A (A) | | | 8,117,000 | | | | 7,428,678 | |
7.50%, 04/17/2023, 144A | | | 3,250,000 | | | | 2,762,500 | |
| | | | | | | | |
| | | | 18,772,278 | |
| | | | | | | | |
Venezuela - 1.7% | | | | | | | | |
Republic of Venezuela | | | | | |
6.00%, 12/09/2020, Reg S | | | 2,760,000 | | | | 1,642,200 | |
| | | | | | | | |
| | | Principal | | | Value | |
FOREIGN GOVERNMENT OBLIGATIONS (continued) | |
Venezuela (continued) | | | | | | | | |
Venezuela Government International Bond | | | | | |
7.75%, 10/13/2019, Reg S | | | $ 5,695,000 | | | | $ 3,687,512 | |
9.25%, 09/15/2027 (A) | | | 5,550,000 | | | | 3,690,750 | |
9.25%, 05/07/2028, Reg S | | | 1,490,000 | | | | 946,150 | |
| | | | | | | | |
| | | | 9,966,612 | |
| | | | | | | | |
Total Foreign Government Obligations
(Cost $317,709,199) | | | | 318,067,506 | |
| | | | | | | | |
| |
ASSET-BACKED SECURITY - 0.5% | | | | | |
United States - 0.5% | | | | | |
Brazil Loan Trust 1 | | | | | | | | |
5.48%, 07/24/2023, 144A | | | 3,120,345 | | | | 3,245,159 | |
| | | | | | | | |
Total Asset-Backed Security
(Cost $3,164,529) | | | | | |
| |
CORPORATE DEBT SECURITIES - 42.4% | | | | | |
Bermuda - 1.1% | | | | | | | | |
Digicel Group, Ltd. | | | | | | | | |
7.13%, 04/01/2022, 144A (A) | | | 3,255,000 | | | | 3,271,275 | |
8.25%, 09/30/2020, 144A | | | 2,900,000 | | | | 3,030,500 | |
| | | | | | | | |
| | | | | | | 6,301,775 | |
| | | | | | | | |
Brazil - 3.1% | | | | | |
Banco BMG SA | | | | | | | | |
8.00%, 04/15/2018, 144A | | | 3,000,000 | | | | 3,165,000 | |
Banco do Brasil SA | | | | | | | | |
9.00%, 06/18/2024, 144A (D) (E) | | | 3,115,000 | | | | 3,062,045 | |
Banco Santander Brasil SA
Series MTN | | | | | | | | |
8.00%, 03/18/2016, 144A | | | BRL 9,800,000 | | | | 3,786,876 | |
Oi SA | | | | | | | | |
5.75%, 02/10/2022, 144A (A) | | | $ 3,250,000 | | | | 3,071,250 | |
Telemar Norte Leste SA | | | | | | | | |
9.50%, 04/23/2019, 144A | | | 4,590,000 | | | | 5,129,325 | |
| | | | | | | | |
| | | | | | | 18,214,496 | |
| | | | | | | | |
Canada - 1.0% | | | | | |
Pacific Rubiales Energy Corp. | | | | | |
5.63%, 01/19/2025, 144A (A) | | | 2,220,000 | | | | 2,111,109 | |
7.25%, 12/12/2021, 144A (A) | | | 3,830,000 | | | | 4,088,525 | |
| | | | | | | | |
| | | | | | | 6,199,634 | |
| | | | | | | | |
Cayman Islands - 4.6% | | | | | |
Braskem Finance, Ltd. | | | | | | | | |
6.45%, 02/03/2024 | | | 3,620,000 | | | | 3,839,915 | |
Dubai Holding Commercial Operations,
Ltd.
Series MTN | | | | | |
6.00%, 02/01/2017 | | | GBP 1,950,000 | | | | 3,187,419 | |
Fibria Overseas Finance, Ltd. | | | | | | | | |
5.25%, 05/12/2024 | | | $ 2,200,000 | | | | 2,243,340 | |
KWG Property Holding, Ltd. | | | | | | | | |
13.25%, 03/22/2017, Reg S (A) | | | 1,600,000 | | | | 1,764,000 | |
Marfrig Overseas, Ltd. | | | | | | | | |
9.50%, 05/04/2020, 144A | | | 3,990,000 | | | | 4,214,438 | |
Odebrecht Finance, Ltd. | | | | | | | | |
8.25%, 04/25/2018, 144A | | | BRL 9,620,000 | | | | 3,464,970 | |
Saudi Electricity Global Sukuk Co. | | | | | | | | |
2 5.06%, 04/08/2043, 144A | | | $ 4,980,000 | | | | 5,051,613 | |
The Notes to Financial Statements are an integral part of this report.
| | |
| Transamerica Funds | | Annual Report 2014 |
Page 91
Transamerica Emerging Markets Debt
SCHEDULE OF INVESTMENTS (continued)
At October 31, 2014
| | | | | | | | |
| | | Principal | | | Value | |
CORPORATE DEBT SECURITIES (continued) | | | | | |
Cayman Islands (continued) | | | | | |
Telemovil Finance Co., Ltd. | | | | | | | | |
8.00%, 10/01/2017, 144A | | | $ 600,000 | | | | $ 622,500 | |
Vale Overseas, Ltd. | | | | | | | | |
8.25%, 01/17/2034 (A) | | | 2,300,000 | | | | 2,905,314 | |
| | | | | | | | |
| | | | | | | 27,293,509 | |
| | | | | | | | |
Chile - 3.0% | | | | | | | | |
Corp. Nacional del Cobre de Chile | | | | | | | | |
4.88%, 11/04/2044, 144A (F) | | | 3,430,000 | | | | 3,395,069 | |
Corpbanca SA | | | | | | | | |
3.88%, 09/22/2019, 144A (A) | | | 3,790,000 | | | | 3,820,100 | |
E.CL SA | | | | | | | | |
4.50%, 01/29/2025, 144A (A) | | | 3,500,000 | | | | 3,518,011 | |
GNL Quintero SA | | | | | | | | |
4.63%, 07/31/2029, 144A | | | 3,240,000 | | | | 3,339,164 | |
SACI Falabella | | | | | | | | |
4.38%, 01/27/2025, 144A (A) | | | 3,600,000 | | | | 3,613,345 | |
| | | | | | | | |
| | | | | | | 17,685,689 | |
| | | | | | | | |
Colombia - 1.6% | | | | | | | | |
Bancolombia SA | | | | | | | | |
6.13%, 07/26/2020 (A) | | | 1,415,000 | | | | 1,536,690 | |
Ecopetrol SA | | | | | | | | |
5.88%, 05/28/2045 (A) | | | 2,500,000 | | | | 2,568,750 | |
Financiera de Desarrollo Territorial SA Findeter | | | | | | | | |
7.88%, 08/12/2024, 144A | | | COP 10,548,000,000 | | | | 5,218,376 | |
| | | | | | | | |
| | | | | | | 9,323,816 | |
| | | | | | | | |
El Salvador - 0.5% | | | | | | | | |
Telemovil Finance Co., Ltd. | | | | | | | | |
8.00%, 10/01/2017, Reg S (A) | | | $ 3,000,000 | | | | 3,112,500 | |
| | | | | | | | |
Hungary - 0.4% | | | | | | | | |
MFB Magyar Fejlesztesi Bank Zrt | | | | | |
6.25%, 10/21/2020, 144A (A) | | | 2,045,000 | | | | 2,254,613 | |
| | | | | | | | |
India - 0.6% | | | | | | | | |
Indian Oil Corp, Ltd. | | | | | | | | |
5.63%, 08/02/2021, Reg S | | | 3,400,000 | | | | 3,685,831 | |
| | | | | | | | |
Indonesia - 0.6% | | | | | | | | |
Pelabuhan Indonesia III PT | | | | | | | | |
4.88%, 10/01/2024, 144A (A) | | | 1,700,000 | | | | 1,725,500 | |
Pertamina Persero PT | | | | | | | | |
6.45%, 05/30/2044, 144A | | | 1,480,000 | | | | 1,576,200 | |
| | | | | | | | |
| | | | | | | 3,301,700 | |
| | | | | | | | |
Ireland - 0.8% | | | | | | | | |
Federal Grid Co., OJS via Federal Grid Finance, Ltd.
Series MTN | | | | | | | | |
8.45%, 03/13/2019, Reg S (A) | | | RUB 98,200,000 | | | | 2,020,611 | |
Vimpel Communications Via VIP Finance Ireland, Ltd., OJSC | | | | | | | | |
7.75%, 02/02/2021, 144A | | | $ 2,920,000 | | | | 2,971,100 | |
| | | | | | | | |
| | | | | | | 4,991,711 | |
| | | | | | | | |
Israel - 0.6% | | | | | | | | |
Israel Electric Corp, Ltd. | | | | | | | | |
5.63%, 06/21/2018, Reg S (A) | | | 3,200,000 | | | | 3,400,320 | |
| | | | | | | | |
| | | | | | | | |
| | | Principal | | | Value | |
CORPORATE DEBT SECURITIES (continued) | | | | | |
Kazakhstan - 0.9% | | | | | | | | |
KazMunayGas National Co. | | | | | | | | |
6.00%, 11/07/2044, 144A | | | $ 5,295,000 | | | | $ 5,222,511 | |
| | | | | | | | |
Luxembourg - 1.6% | | | | | | | | |
Atento Luxco 1 SA | | | | | | | | |
7.38%, 01/29/2020, Reg S | | | 2,500,000 | | | | 2,536,250 | |
7.38%, 01/29/2020, 144A | | | 800,000 | | | | 811,600 | |
NII International Telecom SCA | | | | | | | | |
7.88%, 08/15/2019, 144A (A) (G) | | | 2,710,000 | | | | 1,734,400 | |
Tupy Overseas SA | | | | | | | | |
6.63%, 07/17/2024, 144A | | | 2,300,000 | | | | 2,328,750 | |
Wind Acquisition Finance SA | | | | | | | | |
7.38%, 04/23/2021, 144A | | | 2,100,000 | | | | 2,052,750 | |
| | | | | | | | |
| | | | | | | 9,463,750 | |
| | | | | | | | |
Mexico - 5.4% | | | | | | | | |
America Movil SAB de CV | | | | | | | | |
6.00%, 06/09/2019 | | | MXN 67,790,000 | | | | 5,072,829 | |
Banco Inbursa SA Institucion de Banca Multiple | | | | | | | | |
4.13%, 06/06/2024, 144A (A) | | | $ 3,740,000 | | | | 3,665,200 | |
Cemex SAB de CV | | | | | | | | |
5.70%, 01/11/2025, 144A (A) | | | 2,610,000 | | | | 2,557,017 | |
Fermaca Enterprises S de RL de CV | | | | | | | | |
6.38%, 03/30/2038, 144A (A) | | | 3,550,000 | | | | 3,740,812 | |
Grupo Televisa SAB
Series MTN | | | | | | | | |
7.25%, 05/14/2043 | | | MXN 73,780,000 | | | | 4,671,049 | |
Petroleos Mexicanos | | | | | | | | |
6.38%, 01/23/2045 | | | $ 5,025,000 | | | | 5,765,685 | |
7.19%, 09/12/2024, 144A | | | MXN 64,575,000 | | | | 4,859,099 | |
8.63%, 02/01/2022 | | | $ 1,450,000 | | | | 1,805,250 | |
| | | | | | | | |
| | | | | | | 32,136,941 | |
| | | | | | | | |
Netherlands - 2.3% | | | | | | | | |
Bharti Airtel International Netherlands BV | | | | | |
5.13%, 03/11/2023, 144A | | | 6,650,000 | | | | 7,024,262 | |
LUKOIL International Finance BV | | | | | | | | |
6.13%, 11/09/2020, 144A | | | 2,350,000 | | | | 2,391,125 | |
Petrobras Global Finance BV | | | | | | | | |
5.63%, 05/20/2043 | | | 1,820,000 | | | | 1,660,331 | |
VimpelCom Holdings BV | | | | | | | | |
5.95%, 02/13/2023, 144A | | | 2,920,000 | | | | 2,682,984 | |
| | | | | | | | |
| | | | | | | 13,758,702 | |
| | | | | | | | |
Panama - 2.1% | | | | | | | | |
ENA Norte Trust | | | | | | | | |
4.95%, 04/25/2028, 144A | | | 4,538,556 | | | | 4,663,366 | |
Global Bank Corp. | | | | | | | | |
4.75%, 10/05/2017, 144A | | | 4,200,000 | | | | 4,317,600 | |
5.13%, 10/30/2019, 144A | | | 3,430,000 | | | | 3,444,989 | |
| | | | | | | | |
| | | | | | | 12,425,955 | |
| | | | | | | | |
Peru - 1.6% | | | | | | | | |
BBVA Banco Continental SA | | | | | | | | |
5.25%, 09/22/2029, 144A (A) (D) | | | 3,650,000 | | | | 3,691,975 | |
Corp. Financiera de Desarrollo SA | | | | | | | | |
5.25%, 07/15/2029, 144A (A) (D) | | | 2,300,000 | | | | 2,358,650 | |
Telefonica del Peru SAA | | | | | | | | |
8.00%, 04/11/2016, Reg S | | | PEN 10,560,004 | | | | 3,757,237 | |
| | | | | | | | |
| | | | | | | 9,807,862 | |
| | | | | | | | |
The Notes to Financial Statements are an integral part of this report.
| | |
| Transamerica Funds | | Annual Report 2014 |
Page 92
Transamerica Emerging Markets Debt
SCHEDULE OF INVESTMENTS (continued)
At October 31, 2014
| | | | | | | | |
| | | Principal | | | Value | |
CORPORATE DEBT SECURITIES (continued) | | | | | |
Sri Lanka - 0.5% | | | | | | | | |
National Savings Bank | | | | | | | | |
5.15%, 09/10/2019, 144A | | | $ 2,950,000 | | | | $ 2,920,500 | |
| | | | | | | | |
Turkey - 3.3% | | | | | | | | |
Finansbank AS | | | | | | | | |
6.25%, 04/30/2019, 144A (A) | | | 5,800,000 | | | | 6,070,860 | |
TC Ziraat Bankasi AS | | | | | | | | |
4.25%, 07/03/2019, 144A | | | 3,520,000 | | | | 3,480,576 | |
Turkiye Garanti Bankasi AS | | | | | | | | |
4.75%, 10/17/2019, 144A (A) | | | 2,975,000 | | | | 3,018,316 | |
Turkiye Halk Bankasi AS | | | | | | | | |
4.75%, 06/04/2019, 144A | | | 3,100,000 | | | | 3,108,996 | |
Turkiye Is Bankasi | | | | | | | | |
5.00%, 04/30/2020, 144A | | | 3,620,000 | | | | 3,646,824 | |
| | | | | | | | |
| | | | | | | 19,325,572 | |
| | | | | | | | |
United Arab Emirates - 0.4% | | | | | | | | |
DP World, Ltd. | | | | | | | | |
6.85%, 07/02/2037, 144A (A) | | | 1,980,000 | | | | 2,272,050 | |
| | | | | | | | |
United States - 1.8% | | | | | | | | |
Braskem America Finance Co. | | | | | | | | |
7.13%, 07/22/2041, 144A | | | 3,745,000 | | | | 3,819,900 | |
Cemex Finance LLC | | | | | | | | |
9.38%, 10/12/2022, 144A | | | 2,375,000 | | | | 2,737,188 | |
NII Capital Corp. | | | | | | | | |
7.63%, 04/01/2021 (G) | | | 2,267,000 | | | | 453,400 | |
10.00%, 08/15/2016 (A) (G) | | | 1,920,000 | | | | 595,200 | |
Rolta Americas LLC | | | | | | | | |
8.88%, 07/24/2019, 144A (A) | | | 3,050,000 | | | | 3,057,625 | |
| | | | | | | | |
| | | | | | | 10,663,313 | |
| | | | | | | | |
Venezuela - 4.0% | | | | | | | | |
Petroleos de Venezuela SA | | | | | | | | |
5.25%, 04/12/2017, Reg S | | | 5,960,000 | | | | 3,951,480 | |
5.38%, 04/12/2027, Reg S | | | 2,250,000 | | | | 1,068,750 | |
6.00%, 05/16/2024, Reg S (A) | | | 11,690,000 | | | | 6,013,336 | |
8.50%, 11/02/2017, Reg S | | | 3,720,000 | | | | 2,817,528 | |
9.00%, 11/17/2021, Reg S | | | 15,625,000 | | | | 9,902,344 | |
| | | | | | | | |
| | | | | | | 23,753,438 | |
| | | | | | | | |
| | | | | | | | |
| | | Principal | | | Value | |
CORPORATE DEBT SECURITIES (continued) | | | | | |
Virgin Islands, British - 0.6% | | | | | | | | |
Arcos Dorados Holdings, Inc. | | | | | | | | |
6.63%, 09/27/2023, 144A (A) | | | $ 1,668,000 | | | | $ 1,655,490 | |
Yingde Gases Investment, Ltd. | | | | | | | | |
7.25%, 02/28/2020, 144A (A) | | | 2,150,000 | | | | 2,133,875 | |
| | | | | | | | |
| | | | | | | 3,789,365 | |
| | | | | | | | |
Total Corporate Debt Securities
(Cost $258,214,067) | | | | | | | 251,305,553 | |
| | | | | | | | |
| | |
| | | Shares | | | Value | |
SECURITIES LENDING COLLATERAL - 13.7% | | | | | |
State Street Navigator Securities Lending Trust - Prime Portfolio
0.16% (H) | | | 81,169,789 | | | | 81,169,789 | |
| | | | | | | | |
Total Securities Lending Collateral
(Cost $81,169,789) | | | | 81,169,789 | |
| | | | | | | | |
| | |
| | | Principal | | | Value | |
REPURCHASE AGREEMENT - 1.6% | |
State Street Bank & Trust Co.
0.01% (H), dated 10/31/2014, to
be repurchased at $9,364,210 on 11/03/2014. Collateralized by a U.S. Government Agency Obligation, 3.50%, due 02/15/2041, and with a value of $9,551,786. | | | $ 9,364,202 | | | | 9,364,202 | |
| | | | | | | | |
Total Repurchase Agreement
(Cost $9,364,202) | | | | 9,364,202 | |
| | | | | | | | |
Total Investments
(Cost $669,621,786) (I) | | | | | | | 663,152,209 | |
Net Other Assets (Liabilities) - (11.9)% | | | | (70,685,959 | ) |
| | | | | | | | |
| | |
Net Assets - 100.0% | | | | | | | $ 592,466,250 | |
| | | | | | | | |
| | | | | | | | | | | | | | | | |
| FUTURES CONTRACTS: (J) | | | | | | | | | | | | |
| Description | | Type | | | Contracts | | | Expiration
Date | | | Net
Unrealized
Appreciation
(Depreciation) | |
Long U.S. Treasury Bond | | | Short | | | | (60 | ) | | | 12/19/2014 | | | $ | (103,211 | ) |
| | | | | | | | | | | | | | | | |
| | | | | | | | | | | | | | | | | | | | | | | | | | |
| FORWARD FOREIGN CURRENCY CONTRACTS: | | | | | | | | | | | | | |
| Counterparty | | Settlement
Date | | Currency Purchased | | | | | | Currency Sold | | | | | | Unrealized
Appreciation | | | Unrealized
Depreciation | |
BCLY | | 11/28/2014 | | | 34,269,253 | | | | ZAR | | | | 3,116,463 | | | | USD | | | $ | — | | | $ | (23,690 | ) |
BOA | | 11/05/2014 | | | 158,550,000 | | | | RUB | | | | 3,775,000 | | | | USD | | | | — | | | | (94,019 | ) |
BOA | | 11/05/2014 | | | 3,748,670 | | | | USD | | | | 158,550,000 | | | | RUB | | | | 67,688 | | | | — | |
BOA | | 11/28/2014 | | | 1,032,580 | | | | USD | | | | 14,038,964 | | | | MXN | | | | — | | | | (8,146 | ) |
HSBC | | 11/12/2014 | | | 3,520,048,500 | | | | CLP | | | | 5,935,000 | | | | USD | | | | 175,304 | | | | — | |
NTC | | 11/03/2014 | | | 2,231,782 | | | | EUR | | | | 2,811,956 | | | | USD | | | | — | | | | (15,145 | ) |
RBS | | 11/28/2014 | | | 18,082,176 | | | | USD | | | | 14,224,829 | | | | EUR | | | | 253,144 | | | | — | |
RBS | | 11/28/2014 | | | 3,354,907 | | | | USD | | | | 2,079,692 | | | | GBP | | | | 28,780 | | | | — | |
RBS | | 11/28/2014 | | | 1,276,000 | | | | USD | | | | 310,802,894 | | | | HUF | | | | 12,836 | | | | — | |
The Notes to Financial Statements are an integral part of this report.
| | |
| Transamerica Funds | | Annual Report 2014 |
Page 93
Transamerica Emerging Markets Debt
SCHEDULE OF INVESTMENTS (continued)
At October 31, 2014
| | | | | | | | | | | | | | | | | | | | | | | | | | |
| FORWARD FOREIGN CURRENCY CONTRACTS (continued): | | | | | | | | | | | | | |
| Counterparty | | Settlement
Date | | Currency Purchased | | | | | | Currency Sold | | | | | | Unrealized
Appreciation | | | Unrealized
Depreciation | |
SCB | | 11/04/2014 | | | 1,381,680 | | | | BRL | | | | 565,289 | | | | USD | | | $ | — | | | $ | (8,376 | ) |
SCB | | 11/04/2014 | | | 570,000 | | | | USD | | | | 1,381,680 | | | | BRL | | | | 13,086 | | | | — | |
SCB | | 11/10/2014 | | | 17,934,393 | | | | BRL | | | | 7,340,479 | | | | USD | | | | — | | | | (125,016 | ) |
SCB | | 11/10/2014 | | | 13,675,000 | | | | USD | | | | 33,144,325 | | | | BRL | | | | 340,195 | | | | — | |
SCB | | 11/24/2014 | | | 16,522,200,000 | | | | COP | | | | 8,040,000 | | | | USD | | | | — | | | | (33,584 | ) |
SCB | | 11/28/2014 | | | 3,240,000 | | | | USD | | | | 35,310,816 | | | | ZAR | | | | 53,227 | | | | — | |
| | | | | | | | | | | | | | | | | | | | | | | | | | |
Total | | | | | | | | | | | | | | | | | | | | $ | 944,260 | | | $ | (307,976 | ) |
| | | | | | | | | | | | | | | | | | | | | | | | | | |
| | | | | | | | | | | | | | | | | | | | | | | | | | |
INVESTMENTS BY INDUSTRY (unaudited):
| | | | | | | | |
| Industry | | Percentage of
Total Investments | | | Value | |
Foreign Government Obligations | | | 48.0 | % | | $ | 318,067,506 | |
Oil, Gas & Consumable Fuels | | | 9.0 | | | | 59,487,854 | |
Banks | | | 8.3 | | | | 54,991,160 | |
Wireless Telecommunication Services | | | 3.5 | | | | 23,546,688 | |
Diversified Telecommunication Services | | | 3.2 | | | | 21,034,824 | |
Electric Utilities | | | 1.8 | | | | 11,969,944 | |
Chemicals | | | 1.5 | | | | 9,793,690 | |
Diversified Financial Services | | | 1.4 | | | | 9,597,637 | |
Metals & Mining | | | 1.3 | | | | 8,629,133 | |
Gas Utilities | | | 1.1 | | | | 7,079,976 | |
Transportation Infrastructure | | | 1.0 | | | | 6,935,416 | |
Commercial Services & Supplies | | | 1.0 | | | | 6,535,269 | |
Construction Materials | | | 0.8 | | | | 5,294,205 | |
Media | | | 0.7 | | | | 4,671,049 | |
Food Products | | | 0.6 | | | | 4,214,438 | |
Multiline Retail | | | 0.5 | | | | 3,613,345 | |
Construction & Engineering | | | 0.5 | | | | 3,464,970 | |
Asset-Backed Security | | | 0.5 | | | | 3,245,159 | |
Software | | | 0.5 | | | | 3,057,625 | |
Paper & Forest Products | | | 0.3 | | | | 2,243,340 | |
Real Estate Management & Development | | | 0.3 | | | | 1,764,000 | |
Marine | | | 0.3 | | | | 1,725,500 | |
Hotels, Restaurants & Leisure | | | 0.2 | | | | 1,655,490 | |
| | | | | | | | |
Investments, at Value | | | 86.3 | | | | 572,618,218 | |
Short-Term Investments | | | 13.7 | | | | 90,533,991 | |
| | | | | | | | |
Total Investments | | | 100.0 | % | | $ | 663,152,209 | |
| | | | | | | | |
| | | | | | | | |
SECURITY VALUATION:
Valuation Inputs (K)
| | | | | | | | | | | | | | | | |
| | | Level 1
Quoted Prices | | | Level 2
Other Significant
Observable Inputs | | | Level 3
Significant
Unobservable Inputs | | | Value at
October 31, 2014 | |
ASSETS | | | | | | | | | | | | | | | | |
Investments | | | | | | | | | | | | | | | | |
Foreign Government Obligations | | $ | — | | | $ | 318,067,506 | | | $ | — | | | $ | 318,067,506 | |
Asset-Backed Security | | | — | | | | 3,245,159 | | | | — | | | | 3,245,159 | |
Corporate Debt Securities | | | — | | | | 251,305,553 | | | | — | | | | 251,305,553 | |
Securities Lending Collateral | | | 81,169,789 | | | | — | | | | — | | | | 81,169,789 | |
Repurchase Agreement | | | — | | | | 9,364,202 | | | | — | | | | 9,364,202 | |
| | | | | | | | | | | | | | | | |
Total Investments | | $ | 81,169,789 | | | $ | 581,982,420 | | | $ | — | | | $ | 663,152,209 | |
| | | | | | | | | | | | | | | | |
The Notes to Financial Statements are an integral part of this report.
| | |
| Transamerica Funds | | Annual Report 2014 |
Page 94
Transamerica Emerging Markets Debt
SCHEDULE OF INVESTMENTS (continued)
At October 31, 2014
SECURITY VALUATION (continued):
Valuation Inputs (continued) (K)
| | | | | | | | | | | | | | | | |
| | | Level 1
Quoted Prices | | | Level 2
Other Significant
Observable Inputs | | | Level 3
Significant
Unobservable Inputs | | | Value at
October 31, 2014 | |
Derivative Financial Instruments | | | | | | | | | | | | | | | | |
Forward Foreign Currency Contracts (L) | | $ | — | | | $ | 944,260 | | | $ | — | | | $ | 944,260 | |
| | | | | | | | | | | | | | | | |
Total Derivative Financial Instruments | | $ | — | | | $ | 944,260 | | | $ | — | | | $ | 944,260 | |
| | | | | | | | | | | | | | | | |
LIABILITIES | | | | | | | | | | | | | | | | |
Derivative Financial Instruments | | | | | | | | | | | | | | | | |
Futures Contracts (L) | | $ | (103,211 | ) | | $ | — | | | $ | — | | | $ | (103,211 | ) |
Forward Foreign Currency Contracts (L) | | | — | | | | (307,976 | ) | | | — | | | | (307,976 | ) |
| | | | | | | | | | | | | | | | |
Total Derivative Financial Instruments | | $ | (103,211 | ) | | $ | (307,976 | ) | | $ | — | | | $ | (411,187 | ) |
| | | | | | | | | | | | | | | | |
FOOTNOTES TO SCHEDULE OF INVESTMENTS:
| (A) | All or a portion of this security is on loan. The value of all securities on loan is $79,080,629. The amount of securities on loan indicated may not correspond with the securities on loan identified because securities with pending sales are in the process of recall from the brokers. |
| (B) | Step bond. Coupon rate changes in increments to maturity. Rate disclosed is as of October 31, 2014. Maturity date disclosed is the ultimate maturity date. |
| (C) | Payment in-kind. Securities pay interest or dividends in the form of additional bonds or preferred stock. If a security makes cash payment in addition to in-kind, the cash rate is disclosed separately. |
| (D) | Floating or variable rate security. Rate is listed as of October 31, 2014. |
| (E) | The security has a perpetual maturity. The date shown is the next call date. |
| (F) | When-issued security. A conditional transaction in a security authorized for issuance, but not yet issued. |
| (H) | Rate shown reflects the yield at October 31, 2014. |
| (I) | Aggregate cost for federal income tax purposes is $675,584,586. Aggregate gross unrealized appreciation and depreciation for all securities is $10,414,353 and $22,846,730, respectively. Net unrealized depreciation for tax purposes is $12,432,377. |
| (J) | Cash in the amount of $228,000 has been segregated by the custodian as collateral to cover margin requirements for open futures contracts. |
| (K) | The Fund recognizes transfers between Levels at the end of the reporting period. There were no transfers between Level 1, 2 and 3 during the period ended October 31, 2014. See the Notes to Financial Statements for more information regarding security valuation and pricing inputs. |
| (L) | Derivative financial instruments valued at unrealized appreciation (depreciation) on the instrument. |
DEFINITIONS:
| | |
| 144A | | 144A securities are registered pursuant to Rule 144A of the Securities Act of 1933. These securities are deemed to be liquid for purposes of compliance limitations on holdings of illiquid securities and may be resold as transactions exempt from registration, normally to qualified institutional buyers. At October 31, 2014, these securities aggregated $313,305,010, or 52.88% of the Fund’s net assets. |
| BCLY | | Barclays Bank PLC |
| BOA | | Bank of America |
| HSBC | | HSBC Bank USA |
| MTN | | Medium Term Note |
| NTC | | Northern Trust Company |
| OJSC | | Open Joint Stock Co. |
| RBS | | Royal Bank of Scotland Group PLC |
| Reg S | | Security exempt from registration under Regulation S of the Securities Act of 1933, which exempts from registration securities offered and sold outside the United States. Security may not be offered or sold in the United States except pursuant to an exemption from, or in a transaction not subject to, the registration requirements of the Securities Act of 1933. |
| SCB | | Standard Chartered Bank |
The Notes to Financial Statements are an integral part of this report.
| | |
| Transamerica Funds | | Annual Report 2014 |
Page 95
Transamerica Emerging Markets Debt
SCHEDULE OF INVESTMENTS (continued)
At October 31, 2014
CURRENCY ABBREVIATIONS:
| | |
| BRL | | Brazilian Real |
| CLP | | Chilean Peso |
| COP | | Columbian Peso |
| EUR | | Euro |
| GBP | | Pound Sterling |
| HUF | | Hungarian Forint |
| IDR | | Indonesian Rupiah |
| INR | | Indian Rupee |
| MXN | | Mexican Peso |
| MYR | | Malaysian Ringgit |
| PEN | | Peruvian Nuevo Sol |
| RON | | New Romanian Leu |
| RUB | | Russian Ruble |
| THB | | Thai Baht |
| TRY | | Turkish New Lira |
| USD | | United States Dollar |
| ZAR | | South African Rand |
The Notes to Financial Statements are an integral part of this report.
| | |
| Transamerica Funds | | Annual Report 2014 |
Page 96
Transamerica Emerging Markets Equity
SCHEDULE OF INVESTMENTS
At October 31, 2014
| | | | | | | | |
| | | Shares | | | Value | |
PREFERRED STOCK - 0.3% | | | | | | | | |
Brazil - 0.3% | | | | | | | | |
Itausa - Investimentos Itau SA
3.81% (A) | | | 222,051 | | | | $ 886,268 | |
| | | | | | | | |
Total Preferred Stock
(Cost $836,783) | | | | | | | 886,268 | |
| | | | | | | | |
| | |
COMMON STOCKS - 97.2% | | | | | | | | |
Brazil - 8.1% | | | | | | | | |
Banco Bradesco SA, ADR | | | 181,700 | | | | 2,721,866 | |
BB Seguridade Participacoes SA | | | 97,000 | | | | 1,294,057 | |
BRF SA, ADR (B) | | | 51,234 | | | | 1,334,646 | |
Even Construtora e Incorporadora SA | | | 303,800 | | | | 657,156 | |
Itau Unibanco Holding SA, ADR | | | 223,913 | | | | 3,304,956 | |
JBS SA | | | 1,126,100 | | | | 5,021,754 | |
Petroleo Brasileiro SA, Class A, ADR (B) | | | 65,853 | | | | 805,382 | |
Vale SA, Class B, ADR | | | 464,843 | | | | 4,072,025 | |
Vale SA, Class B, ADR (C) | | | 78,700 | | | | 794,083 | |
| | | | | | | | |
| | | | | | | 20,005,925 | |
| | | | | | | | |
Chile - 0.9% | | | | | | | | |
Banco de Chile | | | 4,846,687 | | | | 592,128 | |
Enersis S.A., ADR | | | 99,600 | | | | 1,572,684 | |
| | | | | | | | |
| | | | | | | 2,164,812 | |
| | | | | | | | |
China - 17.8% | | | | | | | | |
Baidu, Inc., ADR (B) | | | 2,300 | | | | 549,171 | |
Bank of China, Ltd., Class H | | | 12,416,000 | | | | 5,942,930 | |
Beijing Capital International Airport Co., Ltd., Class H | | | 674,000 | | | | 494,684 | |
China CITIC Bank Corp., Ltd., Class H | | | 4,969,000 | | | | 3,237,050 | |
China Communications Construction Co., Ltd., Class H | | | 1,617,000 | | | | 1,241,344 | |
China Construction Bank Corp., Class H | | | 7,432,000 | | | | 5,545,007 | |
China Merchants Bank Co., Ltd., Class H | | | 909,500 | | | | 1,687,855 | |
China Oilfield Services, Ltd., Class H | | | 558,000 | | | | 1,166,245 | |
China Petroleum & Chemical Corp., ADR | | | 16,723 | | | | 1,454,567 | |
CNOOC, Ltd., ADR (C) | | | 7,900 | | | | 1,235,323 | |
Datang International Power Generation Co., Ltd., Class H | | | 4,204,000 | | | | 2,207,024 | |
Dongfeng Motor Group Co., Ltd., Class H | | | 2,866,000 | | | | 4,432,147 | |
Huadian Power International Corp., Ltd., Class H | | | 1,684,000 | | | | 1,290,670 | |
Industrial & Commercial Bank of China, Ltd., Class H | | | 5,165,000 | | | | 3,422,668 | |
KWG Property Holding, Ltd. (C) | | | 1,941,000 | | | | 1,347,814 | |
PetroChina Co., Ltd., Class H | | | 2,570,000 | | | | 3,220,808 | |
Shanghai Pharmaceuticals Holding Co., Ltd., Class H | | | 453,400 | | | | 1,134,654 | |
Sihuan Pharmaceutical Holdings Group, Ltd. | | | 1,034,000 | | | | 828,317 | |
Sinopharm Group Co., Ltd., Class H | | | 500,800 | | | | 1,966,105 | |
Sinotrans, Ltd., Class H | | | 1,034,000 | | | | 820,483 | |
Tencent Holdings, Ltd. | | | 35,500 | | | | 570,565 | |
| | | | | | | | |
| | | | | | | 43,795,431 | |
| | | | | | | | |
Hong Kong - 3.6% | | | | | | | | |
China Mobile, Ltd. | | | 279,500 | | | | 3,484,889 | |
China Resources Cement Holdings, Ltd. | | | 1,530,000 | | | | 1,036,450 | |
China Unicom Hong Kong, Ltd., ADR | | | 87,600 | | | | 1,312,248 | |
Kingboard Chemical Holdings, Ltd. | | | 579,800 | | | | 1,134,809 | |
Shiamo Property Holdings, Ltd. | | | 540,500 | | | | 1,164,678 | |
Skyworth Digital Holdings, Ltd. | | | 1,434,000 | | | | 784,326 | |
| | | | | | | | |
| | | | | | | 8,917,400 | |
| | | | | | | | |
| | | | | | | | |
| | | Shares | | | Value | |
COMMON STOCKS (continued) | | | | | | | | |
India - 6.4% | | | | | | | | |
Dr. Reddy’s Laboratories, Ltd., ADR (C) | | | 37,069 | | | | $ 1,938,338 | |
HDFC Bank, Ltd., ADR | | | 32,261 | | | | 1,691,444 | |
ICICI Bank, Ltd., ADR | | | 24,300 | | | | 1,369,548 | |
Infosys, Ltd., ADR (C) | | | 30,635 | | | | 2,048,256 | |
State Bank of India, GDR, Reg S | | | 13,506 | | | | 1,185,827 | |
Tata Motors, Ltd., Series V, ADR | | | 140,935 | | | | 6,638,039 | |
Wipro, Ltd., ADR (C) | | | 65,651 | | | | 800,942 | |
| | | | | | | | |
| | | | | | | 15,672,394 | |
| | | | | | | | |
Indonesia - 1.2% | | | | | | | | |
Adaro Energy Tbk PT | | | 6,670,900 | | | | 627,316 | |
Bank Negara Indonesia Persero Tbk PT | | | 3,262,800 | | | | 1,608,120 | |
Gudang Garam Tbk PT | | | 159,500 | | | | 763,281 | |
| | | | | | | | |
| | | | | | | 2,998,717 | |
| | | | | | | | |
Korea, Republic of - 16.5% | | | | | | | | |
Amorepacific Corp. | | | 251 | | | | 538,957 | |
CJ CheilJedang Corp. | | | 3,224 | | | | 1,177,169 | |
Hana Financial Group, Inc. | | | 36,581 | | | | 1,266,794 | |
Hyundai Mobis Co., Ltd. | | | 4,627 | | | | 1,082,554 | |
Hyundai Motor Co. | | | 28,323 | | | | 4,494,338 | |
Industrial Bank of Korea | | | 89,683 | | | | 1,311,463 | |
KIA Motors Corp. | | | 86,912 | | | | 4,221,528 | |
Korea Electric Power Corp. | | | 83,629 | | | | 3,670,960 | |
Korea Gas Corp. (B) | | | 17,141 | | | | 803,593 | |
LG Corp. | | | 20,406 | | | | 1,214,158 | |
LG Electronics, Inc. | | | 39,910 | | | | 2,437,370 | |
LG Innotek Co., Ltd. (B) | | | 13,498 | | | | 1,064,292 | |
LG Uplus Corp. | | | 374,298 | | | | 3,849,268 | |
Samsung Electronics Co., Ltd. | | | 3,168 | | | | 3,694,339 | |
SK Holdings Co., Ltd. | | | 17,193 | | | | 2,694,983 | |
SK Hynixm, Inc. (B) | | | 90,208 | | | | 4,022,762 | |
SK Telecom Co., Ltd. | | | 11,565 | | | | 2,898,177 | |
| | | | | | | | |
| | | | | | | 40,442,705 | |
| | | | | | | | |
Malaysia - 4.4% | | | | | | | | |
AirAsia Bhd | | | 3,190,500 | | | | 2,425,226 | |
Genting Malaysia Bhd, Class B | | | 428,300 | | | | 560,111 | |
IHH Healthcare Bhd, Class A | | | 570,200 | | | | 858,095 | |
Malayan Banking Bhd | | | 673,878 | | | | 1,988,024 | |
Tenaga Nasional Bhd | | | 1,206,900 | | | | 4,903,345 | |
| | | | | | | | |
| | | | | | | 10,734,801 | |
| | | | | | | | |
Mexico - 3.4% | | | | | | | | |
America Movil SAB de CV, Series L, ADR | | | 129,700 | | | | 3,165,977 | |
Gruma SAB de CV, Class B (B) | | | 110,100 | | | | 1,209,475 | |
Grupo Lala SAB de CV | | | 480,553 | | | | 1,096,622 | |
Grupo Mexico SAB de CV, Series B | | | 358,000 | | | | 1,232,214 | |
Grupo Simec SAB de CV, Series B (B) | | | 133,800 | | | | 589,997 | |
OHL Mexico SAB de CV (B) | | | 356,000 | | | | 999,034 | |
| | | | | | | | |
| | | | | | | 8,293,319 | |
| | | | | | | | |
Peru - 0.6% | | | | | | | | |
Credicorp, Ltd. | | | 9,605 | | | | 1,546,405 | |
| | | | | | | | |
Poland - 2.3% | | | | | | | | |
Bank Zachodni WBK SA | | | 8,269 | | | | 937,564 | |
KGHM Polska Miedz SA | | | 106,809 | | | | 4,119,446 | |
Polskie Gornictwo Naftowe I Gazownictwo SA | | | 373,953 | | | | 558,741 | |
| | | | | | | | |
| | | | | | | 5,615,751 | |
| | | | | | | | |
The Notes to Financial Statements are an integral part of this report.
| | |
| Transamerica Funds | | Annual Report 2014 |
Page 97
Transamerica Emerging Markets Equity
SCHEDULE OF INVESTMENTS (continued)
At October 31, 2014
| | | | | | | | |
| | | Shares | | | Value | |
COMMON STOCKS (continued) | | | | | | | | |
Russian Federation - 0.5% | | | | | | | | |
Mobile Telesystems OJSC, ADR | | | 84,000 | | | | $ 1,201,200 | |
| | | | | | | | |
South Africa - 10.5% | | | | | | | | |
African Rainbow Minerals, Ltd. | | | 52,466 | | | | 647,224 | |
AngloGold Ashanti, Ltd., ADR (B) | | | 98,400 | | | | 813,768 | |
Aspen Pharmacare Holdings, Ltd. (B) | | | 87,017 | | | | 3,108,783 | |
AVI, Ltd. | | | 151,680 | | | | 989,147 | |
FirstRand, Ltd. | | | 403,187 | | | | 1,726,981 | |
Mediclinic International, Ltd. | | | 491,841 | | | | 4,397,002 | |
MMI Holdings, Ltd. | | | 809,754 | | | | 2,069,869 | |
Murray & Roberts Holdings, Ltd. | | | 271,358 | | | | 557,430 | |
Netcare, Ltd. | | | 631,013 | | | | 1,909,057 | |
Sanlam, Ltd. | | | 375,763 | | | | 2,374,462 | |
Sappi, Ltd. (B) | | | 325,043 | | | | 1,287,379 | |
Sasol, Ltd. | | | 120,963 | | | | 6,040,312 | |
| | | | | | | | |
| | | | | | | 25,921,414 | |
| | | | | | | | |
Taiwan - 15.3% | | | | | | | | |
Catcher Technology Co., Ltd. | | | 175,000 | | | | 1,477,305 | |
Cathay Financial Holding Co., Ltd. | | | 431,224 | | | | 710,815 | |
Cathay Real Estate Development Co., Ltd. | | | 778,000 | | | | 405,770 | |
Compal Electronics, Inc. | | | 3,970,000 | | | | 2,934,293 | |
Delta Electronics, Inc. | | | 116,000 | | | | 695,906 | |
HannStar Display Corp. | | | 2,519,900 | | | | 634,774 | |
Highwealth Construction Corp. | | | 827,100 | | | | 1,431,501 | |
Inotera Memories, Inc. (B) | | | 809,000 | | | | 1,250,290 | |
Largan Precision Co., Ltd. | | | 70,000 | | | | 4,917,451 | |
MediaTek, Inc. | | | 377,000 | | | | 5,384,675 | |
Nan Ya Plastics Corp. | | | 869,800 | | | | 1,800,112 | |
Pegatron Corp. | | | 1,912,000 | | | | 3,484,608 | |
Taiwan Semiconductor Manufacturing Co., Ltd., ADR | | | 404,500 | | | | 8,907,090 | |
Wistron Corp. | | | 3,442,000 | | | | 3,616,219 | |
| | | | | | | | |
| | | | | | | 37,650,809 | |
| | | | | | | | |
Thailand - 2.0% | | | | | | | | |
Bangkok Expressway PCL | | | 946,529 | | | | 1,104,332 | |
Krung Thai Bank PCL | | | 1,814,800 | | | | 1,298,276 | |
| | | | | | | | |
| | | Shares | | | Value | |
COMMON STOCKS (continued) | | | | | | | | |
Thailand (continued) | | | | | | | | |
PTT Exploration & Production PCL | | | 233,400 | | | | $ 1,049,834 | |
TMB Bank PCL | | | 14,561,300 | | | | 1,376,998 | |
| | | | | | | | |
| | | | | | | 4,829,440 | |
| | | | | | | | |
Turkey - 3.7% | | | | | | | | |
Pegasus Hava Tasimaciligi AS (B) | | | 157,724 | | | | 2,027,989 | |
Turk Hava Yollari (B) | | | 1,294,084 | | | | 4,241,543 | |
Turkiye Is Bankasi, Class C | | | 875,588 | | | | 2,189,323 | |
Ulker Biskuvi Sanayi AS | | | 76,415 | | | | 563,288 | |
| | | | | | | | |
| | | | | | | 9,022,143 | |
| | | | | | | | |
Total Common Stocks
(Cost $227,620,200) | | | | | | | 238,812,666 | |
| | | | | | | | |
| |
SECURITIES LENDING COLLATERAL - 2.4% | | | | | |
State Street Navigator Securities Lending Trust - Prime Portfolio
0.16% (A) | | | 5,924,000 | | | | 5,924,000 | |
| | | | | | | | |
Total Securities Lending Collateral
(Cost $5,924,000) | | | | 5,924,000 | |
| | | | | | | | |
| | |
| | | Principal | | | Value | |
REPURCHASE AGREEMENT - 2.2% | | | | | | | | |
State Street Bank & Trust Co.
0.01% (A), dated 10/31/2014, to be repurchased at $5,287,452 on 11/03/2014. Collateralized by a U.S. Government Agency Obligation, 3.50%, due 01/01/2032, and with a value of $5,394,812. | | | $ 5,287,447 | | | | 5,287,447 | |
| | | | | | | | |
Total Repurchase Agreement
(Cost $5,287,447) | | | | | | | 5,287,447 | |
| | | | | | | | |
Total Investments
(Cost $239,668,430) (D) | | | | | | | 250,910,381 | |
Net Other Assets (Liabilities) - (2.1)% | | | | (5,186,130 | ) |
| | | | | | | | |
| | |
Net Assets - 100.0% | | | | | | | $ 245,724,251 | |
| | | | | | | | |
INVESTMENTS BY INDUSTRY (unaudited):
| | | | | | | | |
| Industry | | Percentage of
Total Investments | | | Value | |
Banks | | | 18.0 | % | | $ | 45,110,514 | |
Semiconductors & Semiconductor Equipment | | | 9.3 | | | | 23,259,156 | |
Automobiles | | | 7.9 | | | | 19,786,052 | |
Oil, Gas & Consumable Fuels | | | 6.0 | | | | 14,992,283 | |
Wireless Telecommunication Services | | | 5.8 | | | | 14,599,511 | |
Metals & Mining | | | 4.9 | | | | 12,268,757 | |
Technology Hardware, Storage & Peripherals | | | 4.6 | | | | 11,512,425 | |
Food Products | | | 4.5 | | | | 11,392,101 | |
Health Care Providers & Services | | | 4.1 | | | | 10,264,913 | |
Electric Utilities | | | 4.0 | | | | 10,146,989 | |
Airlines | | | 3.5 | | | | 8,694,758 | |
Electronic Equipment, Instruments & Components | | | 3.4 | | | | 8,447,232 | |
Insurance | | | 2.6 | | | | 6,449,203 | |
Pharmaceuticals | | | 2.3 | | | | 5,875,438 | |
Real Estate Management & Development | | | 1.7 | | | | 4,349,763 | |
Industrial Conglomerates | | | 1.6 | | | | 3,909,141 | |
The Notes to Financial Statements are an integral part of this report.
| | |
| Transamerica Funds | | Annual Report 2014 |
Page 98
Transamerica Emerging Markets Equity
SCHEDULE OF INVESTMENTS (continued)
At October 31, 2014
INVESTMENTS BY INDUSTRY (unaudited) (continued):
| | | | | | | | |
| Industry | | Percentage of
Total Investments | | | Value | |
Household Durables | | | 1.5 | % | | $ | 3,878,852 | |
Independent Power and Renewable Electricity Producers | | | 1.4 | | | | 3,497,694 | |
Transportation Infrastructure | | | 1.4 | | | | 3,418,533 | |
IT Services | | | 1.1 | | | | 2,849,198 | |
Chemicals | | | 0.7 | | | | 1,800,112 | |
Construction & Engineering | | | 0.7 | | | | 1,798,774 | |
Diversified Financial Services | | | 0.7 | | | | 1,726,981 | |
Diversified Telecommunication Services | | | 0.5 | | | | 1,312,248 | |
Paper & Forest Products | | | 0.5 | | | | 1,287,379 | |
Energy Equipment & Services | | | 0.5 | | | | 1,166,245 | |
Internet Software & Services | | | 0.5 | | | | 1,119,736 | |
Auto Components | | | 0.4 | | | | 1,082,554 | |
Construction Materials | | | 0.4 | | | | 1,036,450 | |
Gas Utilities | | | 0.3 | | | | 803,593 | |
Tobacco | | | 0.3 | | | | 763,281 | |
Hotels, Restaurants & Leisure | | | 0.2 | | | | 560,111 | |
Personal Products | | | 0.2 | | | | 538,957 | |
| | | | | | | | |
Investments, at Value | | | 95.5 | | | | 239,698,934 | |
Short-Term Investments | | | 4.5 | | | | 11,211,447 | |
| | | | | | | | |
Total Investments | | | 100.0 | % | | $ | 250,910,381 | |
| | | | | | | | |
| | | | | | | | |
SECURITY VALUATION:
Valuation Inputs (E)
| | | | | | | | | | | | | | | | |
| | | Level 1
Quoted Prices | | | Level 2
Other Significant
Observable Inputs | | | Level 3
Significant
Unobservable Inputs | | | Value at
October 31, 2014 | |
ASSETS | | | | | | | | | | | | | | | | |
Investments | | | | | | | | | | | | | | | | |
Preferred Stock | | $ | 886,268 | | | $ | — | | | $ | — | | | $ | 886,268 | |
Common Stocks | | | 60,676,338 | | | | 178,136,328 | | | | — | | | | 238,812,666 | |
Securities Lending Collateral | | | 5,924,000 | | | | — | | | | — | | | | 5,924,000 | |
Repurchase Agreement | | | — | | | | 5,287,447 | | | | — | | | | 5,287,447 | |
| | | | | | | | | | | | | | | | |
Total Investments | | $ | 67,486,606 | | | $ | 183,423,775 | | | $ | — | | | $ | 250,910,381 | |
| | | | | | | | | | | | | | | | |
FOOTNOTES TO SCHEDULE OF INVESTMENTS:
| (A) | Rate shown reflects the yield at October 31, 2014. |
| (B) | Non-income producing security. |
| (C) | All or a portion of this security is on loan. The value of all securities on loan is $5,747,061. The amount of securities on loan indicated may not correspond with the securities on loan identified because securities with pending sales are in the process of recall from the brokers. |
| (D) | Aggregate cost for federal income tax purposes is $240,089,132. Aggregate gross unrealized appreciation and depreciation for all securities is $25,352,169 and $14,530,920, respectively. Net unrealized appreciation for tax purposes is $10,821,249. |
| (E) | The Fund recognizes transfers between Levels at the end of the reporting period. There were no transfers between Level 1, 2 and 3 during the period ended October 31, 2014. See the Notes to Financial Statements for more information regarding security valuation and pricing inputs. |
DEFINITIONS:
| | |
| ADR | | American Depositary Receipt |
| GDR | | Global Depositary Receipt |
| OJSC | | Open Joint Stock Co. |
| Reg S | | Security exempt from registration under Regulation S of the Securities Act of 1933, which exempts from registration securities offered and sold outside the United States. Security may not be offered or sold in the United States except pursuant to an exemption from, or in a transaction not subject to, the registration requirements of the Securities Act of 1933. |
The Notes to Financial Statements are an integral part of this report.
| | |
| Transamerica Funds | | Annual Report 2014 |
Page 99
Transamerica Enhanced Muni
SCHEDULE OF INVESTMENTS
At October 31, 2014
| | | | | | | | |
| | | Principal | | | Value | |
MUNICIPAL GOVERNMENT OBLIGATIONS - 92.7% | |
Alabama - 0.1% | |
County of Jefferson, Revenue Bonds | | | | | | | | |
Series A, AGM-CR | | | | | | | | |
5.50%, 01/01/2022 | | | $ 85,000 | | | | $ 85,103 | |
| | | | | | | | |
Alaska - 0.1% | |
City of Valdez, Revenue Bonds | | | | | | | | |
Series C | | | | | | | | |
5.00%, 01/01/2021 | | | 50,000 | | | | 59,042 | |
| | | | | | | | |
Arizona - 2.0% | |
City of Tucson, Certificate of Participation | | | | | | | | |
Series A, NATL-RE | | | | | | | | |
5.00%, 07/01/2019 | | | 75,000 | | | | 80,553 | |
County of Pima Sewer System Revenue, Revenue Bonds | | | | | | | | |
Series A | | | | | | | | |
5.00%, 07/01/2019 | | | 25,000 | | | | 29,286 | |
Maricopa County Elementary School District No. 25-Liberty, General Obligation Unlimited | | | | | | | | |
Series A, BAM | | | | | | | | |
4.00%, 07/01/2024 - 07/01/2025 | | | 395,000 | | | | 443,896 | |
Maricopa County Industrial Development Authority, Revenue Bonds | | | | | | | | |
Series A | | | | | | | | |
5.00%, 01/01/2034 | | | 725,000 | | | | 785,929 | |
Maricopa County Unified School District No. 89-Dysart, General Obligation Limited | | | | | | | | |
5.00%, 07/01/2023 | | | 40,000 | | | | 48,146 | |
| | | | | | | | |
| | | | | | | 1,387,810 | |
| | | | | | | | |
California - 10.2% | |
Banning Unified School District, General Obligation Unlimited | | | | | | | | |
AGM | | | | | | | | |
3.25%, 08/01/2027 | | | 40,000 | | | | 40,163 | |
Calexico Financing Authority, Revenue Bonds | | | | | | | | |
AGM | | | | | | | | |
4.00%, 04/01/2024 | | | 715,000 | | | | 790,254 | |
California City Redevelopment Agency Successor Agency, Tax Allocation | | | | | | | | |
AGM | | | | | | | | |
3.25%, 09/01/2026 | | | 280,000 | | | | 284,528 | |
California Health Facilities Financing Authority, Revenue Bonds | | | | | | | | |
Series D | | | | | | | | |
5.00%, 08/15/2022 | | | 25,000 | | | | 29,704 | |
California Municipal Finance Authority, Revenue Bonds | | | | | | | | |
5.50%, 08/01/2034, 144A | | | 250,000 | | | | 252,042 | |
California School Finance Authority, Revenue Bonds | | | | | | | | |
Series A | | | | | | | | |
3.40%, 11/01/2015, 144A | | | 100,000 | | | | 100,027 | |
6.40%, 08/01/2034 | | | 250,000 | | | | 276,580 | |
California Statewide Communities Development Authority, Revenue Bonds | | | | | | | | |
AGM | | | | | | | | |
5.00%, 10/01/2026 | | | 520,000 | | | | 609,476 | |
| | | | | | | | |
| | | Principal | | | Value | |
MUNICIPAL GOVERNMENT OBLIGATIONS (continued) | |
California (continued) | |
Caruthers Unified School District, General Obligation Unlimited | | | | | | | | |
Series B, BAM | | | | | | | | |
Zero Coupon, 08/01/2019 - 08/01/2030 | | | $ 735,000 | | | | $ 429,874 | |
City of San Buenaventura Wastewater Revenue, Revenue Bonds | | | | | | | | |
Series B | | | | | | | | |
4.00%, 01/01/2023 | | | 40,000 | | | | 44,412 | |
City of Visalia, Certificate of Participation | | | | | | | | |
AGM | | | | | | | | |
5.00%, 12/01/2024 | | | 360,000 | | | | 435,305 | |
Davis Joint Unified School District, Certificate of Participation | | | | | | | | |
BAM | | | | | | | | |
4.00%, 08/01/2024 | | | 95,000 | | | | 107,340 | |
Fontana Unified School District, General Obligation Unlimited | | | | | | | | |
4.00%, 08/01/2024 | | | 150,000 | | | | 167,833 | |
Los Angeles County Redevelopment Authority, Tax Allocation | | | | | | | | |
Series E, AGM | | | | | | | | |
5.00%, 12/01/2022 - 12/01/2023 | | | 680,000 | | | | 809,125 | |
Los Angeles Unified School District, General Obligation Unlimited | | | | | | | | |
Series A-1, NATL-RE | | | | | | | | |
4.50%, 07/01/2025 | | | 50,000 | | | | 54,477 | |
Oakley Public Finance Authority, Special Assessment | | | | | | | | |
BAM | | | | | | | | |
2.50%, 09/02/2019 | | | 160,000 | | | | 166,614 | |
Oxnard Union High School District, General Obligation Unlimited | | | | | | | | |
4.00%, 08/01/2020 | | | 25,000 | | | | 28,477 | |
Sacramento Power Authority, Revenue Bonds | | | | | | | | |
AMBAC | | | | | | | | |
5.05%, 07/01/2022 (A) | | | 30,000 | | | | 30,040 | |
San Carlos Elementary School District, General Obligation Unlimited | | | | | | | | |
Zero Coupon, 10/01/2025 - 10/01/2034 | | | 2,355,000 | | | | 1,182,517 | |
San Diego Unified School District, General Obligation Unlimited | | | | | | | | |
Series C-2, AGM | | | | | | | | |
5.50%, 07/01/2025 | | | 85,000 | | | | 109,851 | |
San Gorgonio Memorial Health Care District, General Obligation Unlimited | | | | | | | | |
5.00%, 08/01/2024 | | | 135,000 | | | | 160,425 | |
San Leandro Unified School District, General Obligation Unlimited | | | | | | | | |
Series B | | | | | �� | | | |
4.00%, 08/01/2025 | | | 185,000 | | | | 206,120 | |
Stockton Public Financing Authority, Revenue Bonds | | | | | | | | |
BAM | | | | | | | | |
5.00%, 09/01/2019 | | | 230,000 | | | | 266,724 | |
Stockton Unified School District, General Obligation Unlimited | | | | | | | | |
AGM | | | | | | | | |
5.00%, 07/01/2021 | | | 75,000 | | | | 89,832 | |
The Notes to Financial Statements are an integral part of this report.
| | |
| Transamerica Funds | | Annual Report 2014 |
Page 100
Transamerica Enhanced Muni
SCHEDULE OF INVESTMENTS (continued)
At October 31, 2014
| | | | | | | | |
| | | Principal | | | Value | |
MUNICIPAL GOVERNMENT OBLIGATIONS (continued) | |
California (continued) | |
Twin Rivers Unified School District, Certificate of Participation
AGM | | | | | | | | |
3.20%, 06/01/2027 (A) | | | $ 145,000 | | | | $ 145,132 | |
Vallejo City Unified School District, Special Tax
AGM | | | | | | | | |
5.00%, 09/01/2019 | | | 100,000 | | | | 100,297 | |
| | | | | | | | |
| | | | | | | 6,917,169 | |
| | | | | | | | |
Colorado - 1.4% | | | | | | | | |
Adams & Arapahoe Joint School District 28J Aurora, Certificate of Participation | | | | | | | | |
3.50%, 12/01/2026 | | | 775,000 | | | | 802,830 | |
City of Colorado Springs Utilities System Revenue, Revenue Bonds
Series A | | | | | | | | |
5.00%, 11/15/2021 | | | 25,000 | | | | 30,276 | |
City of Longmont, Certificate of Participation Series A | | | | | | | | |
5.00%, 12/01/2024 | | | 100,000 | | | | 119,266 | |
| | | | | | | | |
| | | | | | | 952,372 | |
| | | | | | | | |
Connecticut - 3.6% | | | | | | | | |
City of West Haven, General Obligation Unlimited
Series B, BAM | | | | | | | | |
4.00%, 09/01/2034 | | | 230,000 | | | | 233,358 | |
Connecticut Housing Finance Authority, Revenue Bonds | | | | | | | | |
Series A-2 | | | | | | | | |
3.50%, 05/15/2025 | | | 925,000 | | | | 976,707 | |
Series C-1 | | | | | | | | |
3.05%, 05/15/2025 | | | 800,000 | | | | 816,136 | |
Connecticut State Health & Educational Facility Authority, Revenue Bonds
Series B, RADIAN | | | | | | | | |
5.50%, 07/01/2032 | | | 250,000 | | | | 250,217 | |
State of Connecticut, General Obligation Unlimited
Series C | | | | | | | | |
3.00%, 06/01/2020 | | | 25,000 | | | | 27,029 | |
Town of East Haven, General Obligation Unlimited
AGC-ICC | | | | | | | | |
4.25%, 08/01/2019 | | | 50,000 | | | | 56,256 | |
Town of Hamden, General Obligation Unlimited
Series A, BAM | | | | | | | | |
4.00%, 08/15/2022 | | | 75,000 | | | | 83,101 | |
University of Connecticut,
Revenue Bonds
Series A | | | | | | | | |
5.00%, 11/15/2023 | | | 25,000 | | | | 29,057 | |
| | | | | | | | |
| | | | | | | 2,471,861 | |
| | | | | | | | |
District of Columbia - 0.2% | | | | | | | | |
District of Columbia, Revenue Bonds
Series C | | | | | | | | |
4.00%, 12/01/2021 | | | 25,000 | | | | 28,636 | |
| | | | | | | | |
| | | Principal | | | Value | |
MUNICIPAL GOVERNMENT OBLIGATIONS (continued) | |
District of Columbia (continued) | | | | | | | | |
District of Columbia Water & Sewer Authority, Revenue Bonds
Series A | | | | | | | | |
5.00%, 10/01/2023 | | | $ 25,000 | | | | $ 30,040 | |
Metropolitan Washington Airports Authority, Revenue Bonds | | | | | | | | |
Series A | | | | | | | | |
5.00%, 10/01/2020 | | | 25,000 | | | | 29,679 | |
Series C | | | | | | | | |
5.00%, 10/01/2019 | | | 55,000 | | | | 64,417 | |
| | | | | | | | |
| | | | | | | 152,772 | |
| | | | | | | | |
Florida - 3.2% | | | | | | | | |
Citizens Property Insurance Corp.,
Revenue Bonds
Series A-1, AGM | | | | | | | | |
5.00%, 06/01/2016 | | | 25,000 | | | | 26,803 | |
City of Daytona Beach Utility System Revenue, Revenue Bonds
AGM | | | | | | | | |
4.00%, 11/01/2025 | | | 65,000 | | | | 72,411 | |
City of Fernandina Beach,
Revenue Bonds
Series A | | | | | | | | |
5.00%, 09/01/2019 | | | 30,000 | | | | 34,765 | |
City of Riviera Beach, Revenue Bonds
BAM | | | | | | | | |
3.00%, 10/01/2022 | | | 125,000 | | | | 133,259 | |
City of Tampa, Revenue Bonds
Series A | | | | | | | | |
5.00%, 11/15/2025 | | | 25,000 | | | | 28,808 | |
County of Miami-Dade, Revenue Bonds
Series A | | | | | | | | |
5.00%, 10/01/2023 | | | 100,000 | | | | 117,402 | |
Escambia County Housing Finance Authority, Revenue Bonds
AGM | | | | | | | | |
3.50%, 06/01/2017 | | | 50,000 | | | | 53,444 | |
Florida Department of Environmental Protection, Revenue Bonds
Series A | | | | | | | | |
5.00%, 07/01/2022 | | | 55,000 | | | | 66,500 | |
Florida Department of Management Services, Certificate of Participation
Series A | | | | | | | | |
5.00%, 08/01/2019 | | | 35,000 | | | | 39,974 | |
Florida Municipal Power Agency, Revenue Bonds
Series A | | | | | | | | |
5.00%, 10/01/2018 | | | 25,000 | | | | 28,665 | |
Florida’s Turnpike Enterprise, Revenue Bonds
Series A | | | | | | | | |
5.00%, 07/01/2024 | | | 25,000 | | | | 27,900 | |
Greater Orlando Aviation Authority, Revenue Bonds
Series A | | | | | | | | |
3.60%, 10/01/2018 | | | 40,000 | | | | 43,565 | |
The Notes to Financial Statements are an integral part of this report.
| | |
| Transamerica Funds | | Annual Report 2014 |
Page 101
Transamerica Enhanced Muni
SCHEDULE OF INVESTMENTS (continued)
At October 31, 2014
| | | | | | | | |
| | | Principal | | | Value | |
MUNICIPAL GOVERNMENT OBLIGATIONS (continued) | |
Florida (continued) | | | | | | | | |
Miami Beach Health Facilities Authority, Revenue Bonds | | | | | | | | |
4.25%, 11/15/2034 | | | $ 225,000 | | | | $ 226,825 | |
Miami-Dade County Industrial Development Authority, Revenue Bonds | | | | | | | | |
5.00%, 09/15/2034 | | | 130,000 | | | | 134,709 | |
Miami-Dade County School Board Foundation, Inc., Certificate of Participation | | | | | | | | |
Series A, ASSURED GTY | | | | | | | | |
5.00%, 02/01/2020 | | | 45,000 | | | | 50,970 | |
Series B, ASSURED GTY | | | | | | | | |
4.00%, 05/01/2018 | | | 25,000 | | | | 27,306 | |
Sumter County Industrial Development Authority, Revenue Bonds | | | | | | | | |
Series A | | | | | | | | |
5.13%, 07/01/2034 | | | 200,000 | | | | 219,528 | |
Tampa Bay Water, Revenue Bonds
NATL | | | | | | | | |
5.50%, 10/01/2024 | | | 25,000 | | | | 32,288 | |
Tampa Sports Authority, Revenue Bonds | | | | | | | | |
AGM | | | | | | | | |
4.50%, 01/01/2025 | | | 25,000 | | | | 25,171 | |
Tradition Community Development District No. 1, Special Assessment | | | | | | | | |
AGM | | | | | | | | |
4.00%, 05/01/2023 | | | 725,000 | | | | 791,381 | |
| | | | | | | | |
| | | | | | | 2,181,674 | |
| | | | | | | | |
Georgia - 0.2% | | | | | | | | |
City of Atlanta Department of Aviation, Revenue Bonds | | | | | | | | |
Series C | | | | | | | | |
5.00%, 01/01/2020 | | | 40,000 | | | | 46,978 | |
Municipal Electric Authority of Georgia, Revenue Bonds | | | | | | | | |
Series B | | | | | | | | |
5.00%, 01/01/2020 | | | 75,000 | | | | 88,002 | |
| | | | | | | | |
| | | | | | | 134,980 | |
| | | | | | | | |
Idaho - 0.3% | | | | | | | | |
Idaho Health Facilities Authority, Revenue Bonds | | | | | | | | |
Series B | | | | | | | | |
6.13%, 12/01/2028 | | | 145,000 | | | | 168,755 | |
| | | | | | | | |
Illinois - 10.6% | | | | | | | | |
Central Lake County Joint Action Water Agency, Revenue Bonds
XLCA | | | | | | | | |
4.13%, 05/01/2029 | | | 340,000 | | | | 351,441 | |
Chicago Board of Education, General Obligation Unlimited | | | | | | | | |
Series A, AGM-CR, AMBAC | | | | | | | | |
5.50%, 12/01/2021 | | | 480,000 | | | | 552,326 | |
Series A, AMBAC | | | | | | | | |
5.50%, 12/01/2019 | | | 25,000 | | | | 28,117 | |
Series D, AGM | | | | | | | | |
5.00%, 12/01/2017 | | | 70,000 | | | | 77,223 | |
| | | | | | | | |
| | | Principal | | | Value | |
MUNICIPAL GOVERNMENT OBLIGATIONS (continued) | |
Illinois (continued) | | | | | | | | |
Chicago O’Hare International Airport, Revenue Bonds | | | | | | | | |
Series B | | | | | | | | |
5.00%, 01/01/2021 | | | $ 150,000 | | | | $ 177,510 | |
City of Burbank, General Obligation Unlimited BAM | | | | | | | | |
3.70%, 12/01/2018 | | | 500,000 | | | | 538,385 | |
City of Chicago, General Obligation Unlimited | | | | | | | | |
Series A, AGM | | | | | | | | |
5.00%, 01/01/2026 | | | 110,000 | | | | 117,196 | |
City of Chicago Waterworks Revenue, Revenue Bonds | | | | | | | | |
5.00%, 11/01/2028 | | | 485,000 | | | | 561,004 | |
City of Evanston, General Obligation Unlimited | | | | | | | | |
Series C | | | | | | | | |
4.00%, 12/01/2018 | | | 50,000 | | | | 55,114 | |
City of Sterling, General Obligation Unlimited | | | | | | | | |
3.00%, 11/01/2018 | | | 25,000 | | | | 26,427 | |
Cook County Forest Preserve District, General Obligation Unlimited | | | | | | | | |
Series C | | | | | | | | |
5.00%, 12/15/2020 | | | 150,000 | | | | 177,033 | |
Cook County School District No. 163 Park Forest, General Obligation Limited | | | | | | | | |
Series A, AGM | | | | | | | | |
5.00%, 12/15/2028 | | | 70,000 | | | | 78,344 | |
Cook County School District No. 89 Maywood, General Obligation Unlimited | | | | | | | | |
Series A, AGM | | | | | | | | |
5.00%, 12/15/2028 | | | 150,000 | | | | 162,923 | |
County of Cook, General Obligation Unlimited | | | | | | | | |
Series C | | | | | | | | |
5.00%, 11/15/2021 | | | 150,000 | | | | 168,586 | |
Series D | | | | | | | | |
5.00%, 11/15/2019 | | | 25,000 | | | | 28,626 | |
Governors State University, Certificate of Participation | | | | | | | | |
ASSURED GTY | | | | | | | | |
4.50%, 01/01/2019 | | | 235,000 | | | | 257,875 | |
Grundy & Will Counties Community Unit School District No. 1 Coal City, General Obligation Unlimited
XLCA | | | | | | | | |
4.63%, 02/01/2015 | | | 30,000 | | | | 30,326 | |
Illinois Finance Authority, Revenue Bonds AGM | | | | | | | | |
5.25%, 01/01/2022 | | | 25,000 | | | | 27,417 | |
Series A | | | | | | | | |
5.00%, 08/15/2023 - 03/15/2025 | | | 115,000 | | | | 127,643 | |
Series A-2 | | | | | | | | |
5.00%, 11/01/2030 (A) | | | 150,000 | | | | 174,889 | |
Series B | | | | | | | | |
5.50%, 11/01/2020 | | | 80,000 | | | | 94,162 | |
Series B, AGM | | | | | | | | |
4.50%, 05/15/2020 | | | 150,000 | | | | 158,759 | |
Series C | | | | | | | | |
5.00%, 05/15/2020 | | | 100,000 | | | | 115,958 | |
The Notes to Financial Statements are an integral part of this report.
| | |
| Transamerica Funds | | Annual Report 2014 |
Page 102
Transamerica Enhanced Muni
SCHEDULE OF INVESTMENTS (continued)
At October 31, 2014
| | | | | | | | |
| | | Principal | | | Value | |
MUNICIPAL GOVERNMENT OBLIGATIONS (continued) | |
Illinois (continued) | | | | | | | | |
Illinois Finance Authority, Revenue Bonds (continued) | | | | | | | | |
Series D, AGM | | | | | | | | |
6.25%, 11/01/2028 | | | $ 105,000 | | | | $ 122,270 | |
Illinois Municipal Electric Agency, Revenue Bonds | | | | | | | | |
Series A, NATL | | | | | | | | |
5.25%, 02/01/2026 | | | 75,000 | | | | 81,810 | |
Lake County School District No. 33 Emmons, General Obligation Unlimited | | | | | | | | |
Series B, XCLA | | | | | | | | |
Zero Coupon, 12/01/2031 | | | 45,000 | | | | 21,502 | |
Madison-Macoupin Counties Community College District No. 536, General Obligation Limited | | | | | | | | |
AGM | | | | | | | | |
4.25%, 11/01/2017 | | | 50,000 | | | | 55,108 | |
McHenry County Community Unit School District No. 12 Johnsburg, General Obligation Unlimited | | | | | | | | |
Series A, AGM | | | | | | | | |
4.25%, 01/01/2029 | | | 675,000 | | | | 688,561 | |
Metropolitan Pier & Exposition Authority, Revenue Bonds | | | | | | | | |
Series A, AGM-CR, FGIC | | | | | | | | |
5.50%, 12/15/2023 | | | 55,000 | | | | 64,743 | |
Northern Illinois University, Certificate of Participation | | | | | | | | |
AGM | | | | | | | | |
5.00%, 09/01/2024 | | | 355,000 | | | | 409,173 | |
Peoria Metropolitan Airport Authority, Revenue Bonds | | | | | | | | |
5.60%, 12/01/2022 | | | 35,000 | | | | 40,648 | |
Railsplitter Tobacco Settlement Authority, Revenue Bonds | | | | | | | | |
5.00%, 06/01/2018 - 06/01/2019 | | | 205,000 | | | | 234,591 | |
5.38%, 06/01/2021 | | | 85,000 | | | | 101,060 | |
6.00%, 06/01/2028 | | | 75,000 | | | | 88,007 | |
6.25%, 06/01/2024 | | | 25,000 | | | | 27,171 | |
Regional Transportation Authority, Revenue Bonds | | | | | | | | |
Series A, AGM-CR, MBIA | | | | | | | | |
6.00%, 07/01/2027 | | | 45,000 | | | | 58,832 | |
Series A, NATL-RE | | | | | | | | |
5.00%, 07/01/2019 | | | 75,000 | | | | 80,359 | |
St. Clair County Community Unit School District No. 187 Cahokia, General Obligation Unlimited | | | | | | | | |
AGM | | | | | | | | |
Zero Coupon, 01/01/2022 | | | 50,000 | | | | 40,051 | |
State of Illinois, General Obligation Unlimited | | | | | | | | |
4.50%, 04/01/2018 | | | 100,000 | | | | 106,737 | |
5.25%, 02/01/2034 | | | 200,000 | | | | 217,544 | |
AGM | | | | | | | | |
5.00%, 08/01/2020 | | | 35,000 | | | | 39,941 | |
University of Illinois, Revenue Bonds | | | | | | | | |
Series A, AMBAC | | | | | | | | |
5.50%, 04/01/2022 | | | 200,000 | | | | 245,094 | |
| | | | | | | | |
| | | Principal | | | Value | |
MUNICIPAL GOVERNMENT OBLIGATIONS (continued) | |
Illinois (continued) | | | | | | | | |
Village of Bedford Park Water System Revenue, Revenue Bonds | | | | | | | | |
Series A, AGM | | | | | | | | |
4.00%, 12/01/2026 | | | $ 295,000 | | | | $ 308,602 | |
Village of Mount Prospect, General Obligation Unlimited | | | | | | | | |
3.00%, 12/01/2021 | | | 100,000 | | | | 107,784 | |
| | | | | | | | |
| | | | | | | 7,226,872 | |
| | | | | | | | |
Indiana - 6.4% | | | | | | | | |
Aurora School Building Corp., Revenue Bonds | | | | | | | | |
5.00%, 07/15/2020 | | | 115,000 | | | | 136,392 | |
Greater Clark County School Building Corp., Revenue Bonds | | | | | | | | |
Series A | | | | | | | | |
4.00%, 07/15/2024 | | | 335,000 | | | | 376,902 | |
Indiana Finance Authority, Revenue Bonds | | | | | | | | |
3.50%, 10/01/2025 | | | 1,310,000 | | | | 1,299,114 | |
4.25%, 10/01/2034 | | | 500,000 | | | | 495,340 | |
Series A | | | | | | | | |
5.00%, 09/15/2021 - 02/01/2026 | | | 1,720,000 | | | | 1,982,617 | |
Indiana Health Facility Financing Authority, Revenue Bonds | | | | | | | | |
Series A-8 | | | | | | | | |
5.00%, 11/01/2027 (A) | | | 35,000 | | | | 37,778 | |
| | | | | | | | |
| | | | 4,328,143 | |
| | | | | | | | |
Iowa - 0.1% | | | | | | | | |
Iowa State Board of Regents, Revenue Bonds | | | | | | | | |
4.00%, 09/01/2022 | | | 50,000 | | | | 56,699 | |
| | | | | | | | |
Kansas - 1.1% | | | | | | | | |
City of Bel Aire, General Obligation Unlimited | | | | | | | | |
Series A | | | | | | | | |
3.25%, 10/01/2027 | | | 100,000 | | | | 102,245 | |
City of Dodge City, Revenue Bonds | | | | | | | | |
3.00%, 07/15/2021 - 07/15/2022 | | | 485,000 | | | | 508,242 | |
Kansas Development Finance Authority, Revenue Bonds | | | | | | | | |
Series A | | | | | | | | |
5.00%, 01/01/2020 | | | 90,000 | | | | 104,872 | |
| | | | | | | | |
| | | | | | | 715,359 | |
| | | | | | | | |
Kentucky - 4.5% | | | | | | | | |
Bullitt County School District Finance Corp., Revenue Bonds | | | | | | | | |
3.10%, 09/01/2026 | | | 375,000 | | | | 383,085 | |
3.25%, 09/01/2028 | | | 545,000 | | | | 553,905 | |
City of Covington, General Obligation Unlimited | | | | | | | | |
AGM | | | | | | | | |
3.00%, 04/01/2021 - 04/01/2024 | | | 1,840,000 | | | | 1,890,125 | |
Kentucky Asset Liability Commission, Revenue Bonds
NATL-RE | | | | | | | | |
5.25%, 09/01/2019 | | | 150,000 | | | | 177,198 | |
Kentucky Turnpike Authority, Revenue Bonds | | | | | | | | |
Series A | | | | | | | | |
5.00%, 07/01/2021 | | | 25,000 | | | | 30,040 | |
| | | | | | | | |
| | | | | | | 3,034,353 | |
| | | | | | | | |
The Notes to Financial Statements are an integral part of this report.
| | |
| Transamerica Funds | | Annual Report 2014 |
Page 103
Transamerica Enhanced Muni
SCHEDULE OF INVESTMENTS (continued)
At October 31, 2014
| | | | | | | | |
| | | Principal | | | Value | |
MUNICIPAL GOVERNMENT OBLIGATIONS (continued) | |
Louisiana - 0.6% | | | | | | | | |
Fremaux Economic Development District, Revenue Bonds | | | | | | | | |
5.00%, 11/01/2034 | | | $ 300,000 | | | | $ 314,418 | |
St. Tammany Parish Wide School District No. 12, General Obligation Unlimited | | | | | | | | |
Series A | | | | | | | | |
4.00%, 03/01/2022 | | | 75,000 | | | | 84,877 | |
| | | | | | | | |
| | | | | | | 399,295 | |
| | | | | | | | |
Maine - 0.2% | | | | | | | | |
Maine Municipal Bond Bank, Revenue Bonds | | | | | | | | |
4.00%, 11/01/2019 | | | 25,000 | | | | 28,235 | |
Series B | | | | | | | | |
5.00%, 11/01/2022 - 11/01/2025 | | | 75,000 | | | | 90,395 | |
| | | | | | | | |
| | | | | | | 118,630 | |
| | | | | | | | |
Maryland - 0.1% | | | | | | | | |
Maryland Health & Higher Educational Facilities Authority, Revenue Bonds | | | | | | | | |
5.00%, 07/01/2021 | | | 35,000 | | | | 42,018 | |
| | | | | | | | |
Michigan - 4.2% | | | | | | | | |
City of Detroit Sewage Disposal System Revenue, Revenue Bonds | | | | | | | | |
Series A, AGM | | | | | | | | |
5.25%, 07/01/2023 - 07/01/2024 | | | 80,000 | | | | 94,422 | |
5.50%, 07/01/2015 | | | 100,000 | | | | 103,412 | |
Series A, NATL-RE | | | | | | | | |
5.25%, 07/01/2019 | | | 60,000 | | | | 64,988 | |
Series B, NATL-RE | | | | | | | | |
5.00%, 07/01/2015 | | | 50,000 | | | | 51,489 | |
City of Detroit Water Supply System Revenue, Revenue Bonds | | | | | | | | |
Series A, NATL-RE | | | | | | | | |
5.00%, 07/01/2034 | | | 10,000 | | | | 9,999 | |
Series C, AGM | | | | | | | | |
5.00%, 07/01/2026 - 07/01/2033 | | | 165,000 | | | | 169,242 | |
Series C, BHAC, FGIC | | | | | | | | |
4.25%, 07/01/2018 | | | 100,000 | | | | 110,377 | |
Series D, AGM | | | | | | | | |
5.00%, 07/01/2025 | | | 100,000 | | | | 103,787 | |
Detroit City School District, General Obligation Unlimited | | | | | | | | |
Series A, AGM | | | | | | | | |
5.25%, 05/01/2027 | | | 195,000 | | | | 230,180 | |
Forest Hills Public Schools, General Obligation Unlimited | | | | | | | | |
3.00%, 05/01/2023 - 05/01/2024 | | | 1,025,000 | | | | 1,074,336 | |
Grand Valley State University, Revenue Bonds | | | | | | | | |
Series B | | | | | | | | |
5.00%, 12/01/2026 | | | 55,000 | | | | 65,285 | |
Michigan Finance Authority, Revenue Bonds | | | | | | | | |
5.00%, 10/01/2017 - 06/01/2029 | | | 145,000 | | | | 146,692 | |
Michigan Municipal Bond Authority, Revenue Bonds | | | | | | | | |
5.00%, 10/01/2019 | | | 25,000 | | | | 29,496 | |
Michigan State Financing Authority, Revenue Bonds | | | | | | | | |
Series D2, AGM | | | | | | | | |
5.00%, 07/01/2026 | | | 250,000 | | | | 283,815 | |
| | | | | | | | |
| | | Principal | | | Value | |
MUNICIPAL GOVERNMENT OBLIGATIONS (continued) | |
Michigan (continued) | | | | | | | | |
Michigan State Hospital Finance Authority, Revenue Bonds | | | | | | | | |
5.00%, 11/15/2020 | | | $ 25,000 | | | | $ 29,090 | |
Series A | | | | | | | | |
6.00%, 12/01/2017 | | | 120,000 | | | | 138,938 | |
Wayne County Airport Authority, Revenue Bonds | | | | | | | | |
Series B | | | | | | | | |
3.25%, 12/01/2024 | | | 45,000 | | | | 46,123 | |
4.00%, 12/01/2021 | | | 40,000 | | | | 44,436 | |
5.00%, 12/01/2022 | | | 30,000 | | | | 35,510 | |
| | | | | | | | |
| | | | | | | 2,831,617 | |
| | | | | | | | |
Minnesota - 3.4% | | | | | | | | |
City of Duluth, General Obligation Unlimited | | | | | | | | |
Series D | | | | | | | | |
3.13%, 02/01/2026 | | | 210,000 | | | | 214,360 | |
City of Rochester, Revenue Bonds | | | | | | | | |
Series C | | | | | | | | |
4.50%, 11/15/2038 (A) | | | 50,000 | | | | 58,223 | |
Dakota County Community Development Agency, Revenue Bonds | | | | | | | | |
Series A | | | | | | | | |
5.00%, 09/01/2029 | | | 755,000 | | | | 785,291 | |
Minnesota Housing Finance Agency, Revenue Bonds | | | | | | | | |
Series A | | | | | | | | |
2.60%, 07/01/2021 | | | 100,000 | | | | 102,815 | |
Series B | | | | | | | | |
3.20%, 07/01/2025 | | | 700,000 | | | | 719,348 | |
3.35%, 01/01/2026 - 07/01/2026 | | | 300,000 | | | | 309,438 | |
State of Minnesota, General Obligation Unlimited | | | | | | | | |
Series E | | | | | | | | |
3.00%, 08/01/2023 | | | 95,000 | | | | 101,623 | |
| | | | | | | | |
| | | | | | | 2,291,098 | |
| | | | | | | | |
Mississippi - 0.3% | | | | | | | | |
City of Gulfport, General Obligation Unlimited | | | | | | | | |
AGM | | | | | | | | |
3.00%, 11/01/2025 | | | 110,000 | | | | 111,096 | |
Mississippi Development Bank, Revenue Bonds | | | | | | | | |
Series A, CNTY GTD | | | | | | | | |
5.25%, 01/01/2025 | | | 85,000 | | | | 102,642 | |
Mississippi Home Corp., Revenue Bonds | | | | | | | | |
Series B-1, GNMA, FNMA, FHLMC | | | | | | | | |
4.25%, 12/01/2018 | | | 15,000 | | | | 16,347 | |
| | | | | | | | |
| | | | | | | 230,085 | |
| | | | | | | | |
Montana - 0.2% | | | | | | | | |
Montana Board of Housing, Revenue Bonds | | | | | | | | |
Series A-3, FHA | | | | | | | | |
3.38%, 12/01/2025 | | | 150,000 | | | | 158,673 | |
| | | | | | | | |
Nebraska - 0.0% (B) | | | | | | | | |
Nebraska Public Power District, Revenue Bonds | | | | | | | | |
Series B | | | | | | | | |
5.00%, 01/01/2022 | | | 25,000 | | | | 30,039 | |
| | | | | | | | |
The Notes to Financial Statements are an integral part of this report.
| | |
| Transamerica Funds | | Annual Report 2014 |
Page 104
Transamerica Enhanced Muni
SCHEDULE OF INVESTMENTS (continued)
At October 31, 2014
| | | | | | | | |
| | | Principal | | | Value | |
MUNICIPAL GOVERNMENT OBLIGATIONS (continued) | |
Nevada - 0.5% | | | | | | | | |
Clark County School District, General Obligation Limited | | | | | | | | |
Class A, NATL | | | | | | | | |
5.00%, 06/15/2025 | | | $ 100,000 | | | | $ 113,238 | |
County of Clark, Revenue Bonds | | | | | | | | |
5.00%, 07/01/2024 | | | 25,000 | | | | 28,617 | |
Nevada System of Higher Education, Revenue Bonds | | | | | | | | |
Series A | | | | | | | | |
5.00%, 07/01/2021 - 07/01/2024 | | | 145,000 | | | | 173,492 | |
| | | | | | | | |
| | | | | | | 315,347 | |
| | | | | | | | |
New Jersey - 2.5% | | | | | | | | |
Burlington County Bridge Commission, Revenue Bonds | | | | | | | | |
Series A, CNTY GTD | | | | | | | | |
5.00%, 10/15/2019 | | | 50,000 | | | | 58,829 | |
City of Trenton, General Obligation Unlimited | | | | | | | | |
ASSURED GTY | | | | | | | | |
5.00%, 07/15/2020 | | | 705,000 | | | | 821,459 | |
East Brunswick Sewage Authority, Revenue Bonds | | | | | | | | |
AGM | | | | | | | | |
4.00%, 12/15/2018 | | | 355,000 | | | | 383,308 | |
Lacey Municipal Utilities Authority, Revenue Bonds | | | | | | | | |
4.00%, 12/01/2022 | | | 100,000 | | | | 112,433 | |
New Jersey Economic Development Authority, Revenue Bonds | | | | | | | | |
Series A | | | | | | | | |
5.25%, 09/01/2022 | | | 25,000 | | | | 28,567 | |
New Jersey Transportation Trust Fund Authority, Revenue Bonds | | | | | | | | |
Series A | | | | | | | | |
4.38%, 12/15/2020 | | | 50,000 | | | | 55,857 | |
5.00%, 06/15/2020 | | | 25,000 | | | | 28,560 | |
Series A, AGM-CR | | | | | | | | |
5.25%, 12/15/2019 | | | 120,000 | | | | 138,571 | |
Township of Voorhees, General Obligation Unlimited | | | | | | | | |
3.00%, 06/01/2020 | | | 60,000 | | | | 64,839 | |
| | | | | | | | |
| | | | | | | 1,692,423 | |
| | | | | | | | |
New Mexico - 1.6% | | | | | | | | |
Artesia Hospital District, General Obligation Unlimited | | | | | | | | |
3.50%, 08/01/2024 | | | 225,000 | | | | 239,913 | |
County of Dona Ana, Revenue Bonds | | | | | | | | |
BAM | | | | | | | | |
4.00%, 12/01/2022 | | | 610,000 | | | | 675,789 | |
Inc. County of Los Alamos, Revenue Bonds | | | | | | | | |
5.00%, 06/01/2024 | | | 135,000 | | | | 163,038 | |
New Mexico Educational Assistance Foundation, Revenue Bonds | | | | | | | | |
Series A-1 | | | | | | | | |
4.00%, 12/01/2020 | | | 25,000 | | | | 28,384 | |
| | | | | | | | |
| | | | | | | 1,107,124 | |
| | | | | | | | |
| | | | | | | | |
| | | Principal | | | Value | |
MUNICIPAL GOVERNMENT OBLIGATIONS (continued) | |
New York - 6.8% | | | | | | | | |
Albany Capital Resource Corp., Revenue Bonds | | | | | | | | |
Series A | | | | | | | | |
5.00%, 12/01/2027 - 12/01/2033 | | | $ 700,000 | | | | $ 796,215 | |
Central Islip Union Free School District, General Obligation Unlimited | | | | | | | | |
3.00%, 09/01/2025 | | | 425,000 | | | | 441,970 | |
City of Long Beach, General Obligation Limited | | | | | | | | |
Series B, BAM | | | | | | | | |
3.00%, 12/15/2018 | | | 385,000 | | | | 409,698 | |
County of Chautauqua, General Obligation Limited | | | | | | | | |
AGM | | | | | | | | |
4.00%, 06/01/2019 | | | 25,000 | | | | 27,727 | |
Metropolitan Transportation Authority, Revenue Bonds | | | | | | | | |
Series A | | | | | | | | |
5.00%, 11/15/2025 | | | 50,000 | | | | 60,197 | |
New York State Dormitory Authority, Revenue Bonds | | | | | | | | |
Series A | | | | | | | | |
5.00%, 07/01/2018 - 03/15/2028 | | | 925,000 | | | | 1,103,035 | |
Series A, NATL | | | | | | | | |
5.50%, 05/15/2024 | | | 55,000 | | | | 69,362 | |
Niagara Tobacco Asset Securitization Corp., Revenue Bonds | | | | | | | | |
4.00%, 05/15/2029 | | | 250,000 | | | | 250,352 | |
Town of Oyster Bay, General Obligation Limited | | | | | | | | |
AGM | | | | | | | | |
3.25%, 08/01/2022 | | | 1,365,000 | | | | 1,420,719 | |
Series B, AGM | | | | | | | | |
4.00%, 11/01/2023 | | | 50,000 | | | | 54,431 | |
| | | | | | | | |
| | | | | | | 4,633,706 | |
| | | | | | | | |
North Carolina - 0.6% | | | | | | | | |
City of Charlotte, Certificate of Participation | | | | | | | | |
Series A | | | | | | | | |
5.00%, 12/01/2021 | | | 25,000 | | | | 30,310 | |
County of Mecklenburg, Certificate of Participation | | | | | | | | |
Series B | | | | | | | | |
5.00%, 02/01/2018 | | | 30,000 | | | | 34,050 | |
County of Union, Revenue Bonds | | | | | | | | |
4.00%, 12/01/2022 | | | 40,000 | | �� | | 45,280 | |
Johnston Memorial Hospital Authority, Revenue Bonds | | | | | | | | |
AGM, FHA | | | | | | | | |
5.00%, 10/01/2017 | | | 40,000 | | | | 44,526 | |
Winston-Salem State University, Revenue Bonds | | | | | | | | |
5.00%, 06/01/2023 | | | 200,000 | | | | 228,254 | |
| | | | | | | | |
| | | | | | | 382,420 | |
| | | | | | | | |
The Notes to Financial Statements are an integral part of this report.
| | |
| Transamerica Funds | | Annual Report 2014 |
Page 105
Transamerica Enhanced Muni
SCHEDULE OF INVESTMENTS (continued)
At October 31, 2014
| | | | | | | | |
| | | Principal | | | Value | |
MUNICIPAL GOVERNMENT OBLIGATIONS (continued) | |
North Dakota - 2.2% | | | | | | | | |
City of Bismarck Water Revenue, Revenue Bonds | | | | | | | | |
2.50%, 04/01/2025 - 04/01/2026 (C) | | | $ 1,270,000 | | | | $ 1,241,678 | |
North Dakota Housing Finance Agency, Revenue Bonds | | | | | | | | |
Series A | | | | | | | | |
3.15%, 01/01/2025 - 07/01/2025 | | | 270,000 | | | | 275,710 | |
| | | | | | | | |
| | | | | | | 1,517,388 | |
| | | | | | | | |
Ohio - 5.4% | | | | | | | | |
Buckeye Tobacco Settlement Financing Authority, Revenue Bonds | | | | | | | | |
Series A-2 | | | | | | | | |
5.13%, 06/01/2024 | | | 280,000 | | | | 233,663 | |
City of Lorain, General Obligation Limited | | | | | | | | |
BAM | | | | | | | | |
3.00%, 12/01/2024 | | | 145,000 | | | | 148,209 | |
3.25%, 12/01/2026 | | | 185,000 | | | | 188,352 | |
City of Toledo, General Obligation Limited | | | | | | | | |
AGM | | | | | | | | |
5.25%, 12/01/2030 | | | 340,000 | | | | 404,824 | |
Cloverleaf Local School District, Certificate of Participation | | | | | | | | |
BAM | | | | | | | | |
4.00%, 03/01/2024 | | | 95,000 | | | | 101,737 | |
County of Allen, Revenue Bonds | | | | | | | | |
Series B | | | | | | | | |
4.13%, 09/01/2020 | | | 60,000 | | | | 67,231 | |
County of Cuyahoga, Revenue Bonds | | | | | | | | |
7.50%, 01/01/2030 | | | 185,000 | | | | 185,276 | |
County of Lucas, Revenue Bonds | | | | | | | | |
Series D | | | | | | | | |
5.00%, 11/15/2018 | | | 25,000 | | | | 28,844 | |
County of Warren, Revenue Bonds | | | | | | | | |
4.00%, 07/01/2018 | | | 125,000 | | | | 136,246 | |
5.00%, 07/01/2022 - 07/01/2023 | | | 425,000 | | | | 490,792 | |
Series B | | | | | | | | |
4.00%, 04/01/2017 | | | 25,000 | | | | 26,780 | |
Ohio Higher Educational Facility Commission, Revenue Bonds | | | | | | | | |
5.00%, 01/01/2019 | | | 35,000 | | | | 40,559 | |
Ohio Housing Finance Agency, Revenue Bonds | | | | | | | | |
Series B-1, GNMA, FNMA | | | | | | | | |
3.80%, 05/01/2021 | | | 25,000 | | | | 27,332 | |
Ohio State Water Development Authority, Revenue Bonds | | | | | | | | |
Series C | | | | | | | | |
4.00%, 06/01/2033 (A) | | | 1,250,000 | | | | 1,325,213 | |
Toledo-Lucas County Port Authority, Revenue Bonds | | | | | | | | |
Series A | | | | | | | | |
5.00%, 07/01/2020 | | | 215,000 | | | | 239,379 | |
| | | | | | | | |
| | | | | | | 3,644,437 | |
| | | | | | | | |
Oklahoma - 0.9% | | | | | | | | |
Grand River Dam Authority, Revenue Bonds | | | | | | | | |
Series A | | | | | | | | |
4.00%, 06/01/2024 | | | 535,000 | | | | 605,277 | |
| | | | | | | | |
| | | Principal | | | Value | |
MUNICIPAL GOVERNMENT OBLIGATIONS (continued) | |
Oklahoma (continued) | | | | | | | | |
Oklahoma Development Finance Authority, Revenue Bonds | | | | | | | | |
5.00%, 06/01/2020 | | | $ 25,000 | | | | $ 29,535 | |
| | | | | | | | |
| | | | | | | 634,812 | |
| | | | | | | | |
Oregon - 0.3% | | | | | | | | |
Oregon State Facilities Authority, Revenue Bonds | | | | | | | | |
Series A | | | | | | | | |
4.13%, 11/15/2032 | | | 90,000 | | | | 94,118 | |
State of Oregon Housing & Community Services Department, Revenue Bonds | | | | | | | | |
Series A, FHLMC | | | | | | | | |
5.00%, 07/01/2019 | | | 75,000 | | | | 87,231 | |
Series B | | | | | | | | |
5.00%, 07/01/2019 | | | 45,000 | | | | 51,700 | |
| | | | | | | | |
| | | | | | | 233,049 | |
| | | | | | | | |
Pennsylvania - 3.9% | | | | | | | | |
Allegheny Valley Joint School District, General Obligation Limited | | | | | | | | |
BAM | | | | | | | | |
5.00%, 11/01/2023 | | | 140,000 | | | | 168,363 | |
Beaver County Industrial Development Authority, Revenue Bonds | | | | | | | | |
Series B | | | | | | | | |
3.50%, 12/01/2035 (A) | | | 840,000 | | | | 863,344 | |
Central Bradford Progress Authority, Revenue Bonds | | | | | | | | |
5.25%, 12/01/2019 | | | 95,000 | | | | 111,733 | |
County of Westmoreland, General Obligation Unlimited | | | | | | | | |
Series A | | | | | | | | |
5.00%, 12/01/2021 | | | 25,000 | | | | 30,180 | |
Erie Water Authority, Revenue Bonds | | | | | | | | |
AGM | | | | | | | | |
4.00%, 12/01/2026 (C) | | | 200,000 | | | | 216,306 | |
Hempfield Area School District, General Obligation Unlimited | | | | | | | | |
Series B, XCLA | | | | | | | | |
4.00%, 03/15/2021 | | | 25,000 | | | | 26,634 | |
Indiana County Hospital Authority, Revenue Bonds | | | | | | | | |
Series A | | | | | | | | |
5.50%, 06/01/2029 | | | 250,000 | | | | 277,392 | |
Philadelphia Gas Works Co., Revenue Bonds | | | | | | | | |
5.00%, 07/01/2015 | | | 25,000 | | | | 25,741 | |
Pottsville Hospital Authority, Revenue Bonds | | | | | | | | |
6.50%, 07/01/2028 | | | 700,000 | | | | 737,387 | |
School District of Philadelphia, General Obligation Unlimited | | | | | | | | |
Series C | | | | | | | | |
5.00%, 09/01/2017 | | | 150,000 | | | | 167,028 | |
| | | | | | | | |
| | | | | | | 2,624,108 | |
| | | | | | | | |
Puerto Rico - 5.5% | | | | | | | | |
Commonwealth of Puerto Rico, General Obligation Unlimited | | | | | | | | |
AGM | | | | | | | | |
5.50%, 07/01/2018 - 07/01/2019 | | | 285,000 | | | | 299,992 | |
The Notes to Financial Statements are an integral part of this report.
| | |
| Transamerica Funds | | Annual Report 2014 |
Page 106
Transamerica Enhanced Muni
SCHEDULE OF INVESTMENTS (continued)
At October 31, 2014
| | | | | | | | |
| | | Principal | | | Value | |
MUNICIPAL GOVERNMENT OBLIGATIONS (continued) | |
Puerto Rico (continued) | | | | | | | | |
Commonwealth of Puerto Rico, General Obligation Unlimited (continued) | | | | | | | | |
AGM-CR | | | | | | | | |
4.50%, 07/01/2023 | | | $ 15,000 | | | | $ 14,925 | |
5.25%, 07/01/2017 | | | 100,000 | | | | 104,414 | |
Series A, AMBAC | | | | | | | | |
4.60%, 07/01/2019 | | | 20,000 | | | | 20,174 | |
Series A, ASSURED GTY | | | | | | | | |
4.00%, 07/01/2015 - 07/01/2016 | | | 80,000 | | | | 81,521 | |
5.00%, 07/01/2016 | | | 35,000 | | | | 36,128 | |
Series A, NATL-RE | | | | | | | | |
5.50%, 07/01/2019 - 07/01/2020 | | | 50,000 | | | | 51,950 | |
Series A, NATL-RE-IBC | | | | | | | | |
5.50%, 07/01/2016 - 07/01/2018 | | | 170,000 | | | | 176,023 | |
Government Development Bank for Puerto Rico, Revenue Bonds | | | | | | | | |
NATL-RE COMWLTH GTD | | | | | | | | |
4.75%, 12/01/2015 | | | 610,000 | | | | 610,342 | |
Puerto Rico Electric Power Authority, Revenue Bonds | | | | | | | | |
AGM-CR | | | | | | | | |
5.00%, 07/01/2017 | | | 80,000 | | | | 82,614 | |
ASSURED GTY | | | | | | | | |
5.00%, 07/01/2018 | | | 10,000 | | | | 10,276 | |
Series DDD, AGM | | | | | | | | |
5.00%, 07/01/2023 | | | 25,000 | | | | 25,368 | |
Series KK, AGM | | | | | | | | |
5.50%, 07/01/2015 | | | 80,000 | | | | 81,478 | |
Series LL, NATL-RE | | | | | | | | |
5.50%, 07/01/2016 - 07/01/2017 | | | 185,000 | | | | 189,060 | |
Series MM, NATL-RE | | | | | | | | |
5.00%, 07/01/2020 | | | 10,000 | | | | 10,024 | |
Series SS, AGM | | | | | | | | |
5.00%, 07/01/2019 | | | 45,000 | | | | 45,261 | |
Series SS, NATL-RE | | | | | | | | |
3.75%, 07/01/2015 | | | 20,000 | | | | 20,012 | |
Series UU, AGM | | | | | | | | |
4.00%, 07/01/2015 | | | 50,000 | | | | 50,397 | |
5.00%, 07/01/2016 - 07/01/2024 | | | 525,000 | | | | 531,383 | |
Puerto Rico Highways & Transportation Authority, Revenue Bonds | | | | | | | | |
NATL-RE | | | | | | | | |
5.00%, 07/01/2018 | | | 20,000 | | | | 20,029 | |
Series A, AMBAC | | | | | | | | |
Zero Coupon, 07/01/2015 | | | 300,000 | | | | 290,397 | |
Series E, AGM | | | | | | | | |
5.50%, 07/01/2015 - 07/01/2017 | | | 205,000 | | | | 208,982 | |
Series L, AGC | | | | | | | | |
5.25%, 07/01/2017 - 07/01/2019 | | | 270,000 | | | | 277,409 | |
Puerto Rico Infrastructure Financing Authority, Revenue Bonds | | | | | | | | |
Series C, AMBAC | | | | | | | | |
5.50%, 07/01/2016 - 07/01/2017 | | | 165,000 | | | | 169,725 | |
Puerto Rico Municipal Finance Agency, Revenue Bonds | | | | | | | | |
Series A, AGM | | | | | | | | |
5.00%, 08/01/2019 | | | 25,000 | | | | 24,967 | |
| | | | | | | | |
| | | Principal | | | Value | |
MUNICIPAL GOVERNMENT OBLIGATIONS (continued) | |
Puerto Rico (continued) | | | | | | | | |
Puerto Rico Municipal Finance Agency, Revenue Bonds (continued) | | | | | | | | |
Series C, AGM | | | | | | | | |
5.00%, 08/01/2015 - 08/01/2016 | | | $ 250,000 | | | | $ 252,001 | |
5.25%, 08/01/2017 | | | 25,000 | | | | 25,641 | |
University of Puerto Rico, Revenue Bonds | | | | | | | | |
Series P, NATL-RE-IBC | | | | | | | | |
5.00%, 06/01/2017 | | | 55,000 | | | | 55,834 | |
| | | | | | | | |
| | | | | | | 3,766,327 | |
| | | | | | | | |
Rhode Island - 0.0% (B) | | | | | | | | |
Rhode Island Health & Educational Building Corp., Revenue Bonds | | | | | | | | |
Series E, ASSURED GTY | | | | | | | | |
5.00%, 05/15/2017 | | | 25,000 | | | | 26,739 | |
| | | | | | | | |
South Carolina - 0.3% | | | | | | | | |
County of Florence, Revenue Bonds | | | | | | | | |
Series A, AGM | | | | | | | | |
5.00%, 11/01/2031 | | | 75,000 | | | | 75,000 | |
Piedmont Municipal Power Agency, Revenue Bonds | | | | | | | | |
Series A-3 | | | | | | | | |
5.00%, 01/01/2023 | | | 70,000 | | | | 80,459 | |
Series A-4 | | | | | | | | |
5.00%, 01/01/2020 | | | 35,000 | | | | 40,897 | |
| | | | | | | | |
| | | | | | | 196,356 | |
| | | | | | | | |
Tennessee - 0.1% | | | | | | | | |
Tennessee State School Bond Authority, Revenue Bonds | | | | | | | | |
Series C | | | | | | | | |
5.00%, 05/01/2019 | | | 30,000 | | | | 35,100 | |
| | | | | | | | |
Texas - 6.8% | | | | | | | | |
Arlington Higher Education Finance Corp., Revenue Bonds | | | | | | | | |
Series A, PSF-GTD | | | | | | | | |
5.00%, 08/15/2021 | | | 215,000 | | | | 255,179 | |
Cinco Southwest Municipal Utility District No. 1, Revenue Bonds
BAM | | | | | | | | |
2.00%, 12/01/2018 (C) | | | 570,000 | | | | 586,194 | |
City of Corpus Christi Utility System Revenue, Revenue Bonds | | | | | | | | |
5.00%, 07/15/2019 | | | 60,000 | | | | 70,285 | |
City of Laredo International Toll Bridge System Revenue, Revenue Bonds | | | | | | | | |
AGM | | | | | | | | |
5.00%, 10/01/2021 - 10/01/2023 | | | 870,000 | | | | 1,025,810 | |
City of Pearland, General Obligation Limited | | | | | | | | |
5.00%, 03/01/2023 | | | 25,000 | | | | 30,346 | |
City of Westworth Village, General Obligation Limited | | | | | | | | |
BAM | | | | | | | | |
3.00%, 08/15/2019 | | | 35,000 | | | | 37,784 | |
Denton County Fresh Water Supply District No. 10, General Obligation Unlimited | | | | | | | | |
AGM | | | | | | | | |
3.00%, 09/01/2026 (C) | | | 300,000 | | | | 292,767 | |
The Notes to Financial Statements are an integral part of this report.
| | |
| Transamerica Funds | | Annual Report 2014 |
Page 107
Transamerica Enhanced Muni
SCHEDULE OF INVESTMENTS (continued)
At October 31, 2014
| | | | | | | | |
| | | Principal | | | Value | |
MUNICIPAL GOVERNMENT OBLIGATIONS (continued) | |
Texas (continued) | | | | | | | | |
El Paso County Hospital District, General Obligation Limited | | | | | | | | |
5.00%, 08/15/2022 | | | $ 185,000 | | | | $ 221,306 | |
Fort Bend County Levee Improvement District No. 7, General Obligation Unlimited | | | | | | | | |
3.00%, 03/01/2023 | | | 250,000 | | | | 264,002 | |
Fort Bend County Municipal Utility District No. 133, General Obligation Unlimited | | | | | | | | |
AGM | | | | | | | | |
2.00%, 09/01/2019 | | | 150,000 | | | | 151,981 | |
3.00%, 09/01/2024 | | | 125,000 | | | | 125,054 | |
Harris County Cultural Education Facilities Finance Corp., Revenue Bonds | | | | | | | | |
Series A | | | | | | | | |
4.38%, 11/15/2021 | | | 20,000 | | | | 22,374 | |
Harris County Municipal Utility District No. 389, General Obligation Unlimited | | | | | | | | |
BAM | | | | | | | | |
4.00%, 09/01/2025 | | | 120,000 | | | | 129,623 | |
Harris County Municipal Utility District No. 419, General Obligation Unlimited | | | | | | | | |
Series A, BAM | | | | | | | | |
3.00%, 09/01/2026 | | | 140,000 | | | | 139,719 | |
Harris County Municipal Utility District No. 49, General Obligation Unlimited | | | | | | | | |
BAM | | | | | | | | |
6.00%, 04/01/2020 | | | 50,000 | | | | 60,784 | |
Lower Colorado River Authority, Revenue Bonds | | | | | | | | |
5.00%, 05/15/2020 | | | 35,000 | | | | 41,281 | |
Metropolitan Transit Authority of Harris County, Revenue Bonds | | | | | | | | |
Series A | | | | | | | | |
5.00%, 11/01/2020 | | | 40,000 | | | | 47,046 | |
Montgomery County Municipal Utility District No. 112, General Obligation Unlimited | | | | | | | | |
BAM | | | | | | | | |
2.50%, 10/01/2022 | | | 85,000 | | | | 84,651 | |
3.00%, 10/01/2023 | | | 95,000 | | | | 96,474 | |
Montgomery County Municipal Utility District No. 94, General Obligation Unlimited | | | | | | | | |
Series A, BAM | | | | | | | | |
3.25%, 10/01/2026 | | | 260,000 | | | | 260,772 | |
Morton Road Municipal Utility District, General Obligation Unlimited | | | | | | | | |
BAM | | | | | | | | |
4.00%, 09/01/2026 | | | 565,000 | | | | 600,493 | |
University of Houston, Revenue Bonds | | | | | | | | |
Series A | | | 40,000 | | | | 47,216 | |
5.00%, 02/15/2024 | | | | | | | | |
University of North Texas, Revenue Bonds | | | | | | | | |
Series A, AGM | | | | | | | | |
5.50%, 04/15/2017 | | | 50,000 | | | | 50,220 | |
| | | | | | | | |
| | | | | | | 4,641,361 | |
| | | | | | | | |
Utah - 1.3% | | | | | | | | |
City of Riverton, Revenue Bonds | | | | | | | | |
5.00%, 08/15/2018 | | | 75,000 | | | | 85,879 | |
| | | | | | | | |
| | | Principal | | | Value | |
MUNICIPAL GOVERNMENT OBLIGATIONS (continued) | |
Utah (continued) | | | | | | | | |
South Davis Recreational District, General Obligation Unlimited | | | | | | | | |
4.00%, 01/01/2025 | | | $ 50,000 | | | | $ 55,508 | |
Utah State Board of Regents, Revenue Bonds | | | | | | | | |
Series EE-2 | | | | | | | | |
5.00%, 11/01/2019 | | | 40,000 | | | | 47,134 | |
Utah State Charter School Finance Authority, Revenue Bonds | | | | | | | | |
4.00%, 04/15/2020 | | | 380,000 | | | | 423,992 | |
4.25%, 04/15/2034 | | | 170,000 | | | | 176,261 | |
Washington County Water Conservancy District, Revenue Bonds | | | | | | | | |
5.00%, 10/01/2022 | | | 50,000 | | | | 60,033 | |
| | | | | | | | |
| | | | | | | 848,807 | |
| | | | | | | | |
Virginia - 0.1% | |
Virginia College Building Authority, Revenue Bonds | | | | | | | | |
Series B | | | | | | | | |
5.00%, 09/01/2028 | | | 50,000 | | | | 57,415 | |
Virginia Resources Authority, Revenue Bonds | | | | | | | | |
Series C | | | | | | | | |
5.00%, 11/01/2020 | | | 35,000 | | | | 41,685 | |
| | | | | | | | |
| | | | | | | 99,100 | |
| | | | | | | | |
Washington - 0.3% | |
Central Puget Sound Regional Transit Authority, Revenue Bonds | | | | | | | | |
NATL | | | | | | | | |
4.75%, 02/01/2028 | | | 50,000 | | | | 50,553 | |
Energy Northwest, Revenue Bonds | | | | | | | | |
Series A | | | | | | | | |
5.25%, 07/01/2018 | | | 35,000 | | | | 40,506 | |
Port of Seattle, Revenue Bonds | | | | | | | | |
Series A | | | | | | | | |
5.00%, 08/01/2018 | | | 25,000 | | | | 28,598 | |
Snohomish County Public Utility District No. 1, Revenue Bonds | | | | | | | | |
5.00%, 12/01/2021 | | | 25,000 | | | | 30,219 | |
Washington Health Care Facilities Authority, Revenue Bonds | | | | | | | | |
Series A | | | | | | | | |
5.00%, 10/01/2019 | | | 25,000 | | | | 29,177 | |
| | | | | | | | |
| | | | | | | 179,053 | |
| | | | | | | | |
West Virginia - 0.0% (B) | |
West Virginia University, Revenue Bonds | | | | | | | | |
Series A | | | | | | | | |
5.00%, 10/01/2024 | | | 25,000 | | | | 29,960 | |
| | | | | | | | |
Wisconsin - 0.6% | |
Public Finance Authority, Revenue Bonds | | | | | | | | |
Series A | | | | | | | | |
4.50%, 09/01/2026 | | | 170,000 | | | | 177,128 | |
State of Wisconsin, Revenue Bonds | | | | | | | | |
Series A | | | | | | | | |
5.00%, 05/01/2019 | | | 25,000 | | | | 29,214 | |
Wisconsin Health & Educational Facilities Authority, Revenue Bonds | | | | | | | | |
5.00%, 08/15/2022 - 08/15/2023 | | | 140,000 | | | | 158,866 | |
The Notes to Financial Statements are an integral part of this report.
| | |
| Transamerica Funds | | Annual Report 2014 |
Page 108
Transamerica Enhanced Muni
SCHEDULE OF INVESTMENTS (continued)
At October 31, 2014
| | | | | | | | |
| | | Principal | | | Value | |
MUNICIPAL GOVERNMENT OBLIGATIONS (continued) | |
Wisconsin (continued) | |
Wisconsin Health & Educational Facilities Authority, Revenue Bonds (continued) | | | | | | | | |
Series B | | | | | | | | |
5.00%, 08/15/2018 | | | $ 25,000 | | | | $ 28,802 | |
| | | | | | | | |
| | | | | | | 394,010 | |
| | | | | | | | |
Total Municipal Government Obligations
(Cost $61,550,067) | | | | 62,976,046 | |
| | | | | | | | |
| | |
| | | Shares | | | Value | |
INVESTMENT COMPANY - 0.1% | | | | | | | | |
Capital Markets - 0.1% | |
PIMCO Municipal Income Fund III | | | 8,940 | | | | 97,446 | |
| | | | | | | | |
Total Investment Company
(Cost $95,920) | | | | 97,446 | |
| | | | | | | | |
| | | | | | | | |
| | | Principal | | | Value | |
REPURCHASE AGREEMENT - 27.7% | |
State Street Bank & Trust Co.
0.01% (D), dated 10/31/2014, to be repurchased at $18,801,303 on 11/03/2014. Collateralized by a U.S. Government Agency Obligation, 2.00%, due 12/01/2027, and with a value of $19,178,691. | | | $ 18,801,287 | | | | $ 18,801,287 | |
| | | | | | | | |
Total Repurchase Agreement
(Cost $18,801,287) | | | | 18,801,287 | |
| | | | | | | | |
Total Investments
(Cost $80,447,274) (E) | | | | 81,874,779 | |
Net Other Assets (Liabilities) - (20.5)% | | | | (13,933,583 | ) |
| | | | | | | | |
| | |
Net Assets - 100.0% | | | | | | | $ 67,941,196 | |
| | | | | | | | |
SECURITY VALUATION:
Valuation Inputs (F)
| | | | | | | | | | | | | | | | |
| | | Level 1
Quoted Prices | | | Level 2
Other Significant
Observable Inputs | | | Level 3
Significant
Unobservable Inputs | | | Value at
October 31, 2014 | |
ASSETS | | | | | | | | | | | | | | | | |
Investments | | | | | | | | | | | | | | | | |
Municipal Government Obligations | | $ | — | | | $ | 62,976,046 | | | $ | — | | | $ | 62,976,046 | |
Investment Company | | | 97,446 | | | | — | | | | — | | | | 97,446 | |
Repurchase Agreement | | | — | | | | 18,801,287 | | | | — | | | | 18,801,287 | |
| | | | | | | | | | | | | | | | |
Total Investments | | $ | 97,446 | | | $ | 81,777,333 | | | $ | — | | | $ | 81,874,779 | |
| | | | | | | | | | | | | | | | |
FOOTNOTES TO SCHEDULE OF INVESTMENTS:
| (A) | Floating or variable rate security. Rate is listed as of October 31, 2014. |
| (B) | Percentage rounds to less than 0.1% or (0.1)%. |
| (C) | When-issued security. A conditional transaction in a security authorized for issuance, but not yet issued. |
| (D) | Rate shown reflects the yield at October 31, 2014. |
| (E) | Aggregate cost for federal income tax purposes is $80,447,274. Aggregate gross unrealized appreciation and depreciation for all securities is $1,524,576 and $97,071, respectively. Net unrealized appreciation for tax purposes is $1,427,505. |
| (F) | The Fund recognizes transfers between Levels at the end of the reporting period. There were no transfers between Level 1, 2 and 3 during the period ended October 31, 2014. See the Notes to Financial Statements for more information regarding security valuation and pricing inputs. |
DEFINITIONS:
| | |
| 144A | | 144A securities are registered pursuant to Rule 144A of the Securities Act of 1933. These securities are deemed to be liquid for purposes of compliance limitations on holdings of illiquid securities and may be resold as transactions exempt from registration, normally to qualified institutional buyers. At October 31, 2014, these securities aggregated $352,069, or 0.52% of the Fund’s net assets. |
| AGC | | Assured Guaranty Corp. |
| AGM | | Assured Guaranty Municipal Corp. |
| AMBAC | | AMBAC Financial Group, Inc. |
| ASSURED GTY | | Assured Guaranty, Ltd. |
| BAM | | Build America Mutual Assurance Co. |
| BHAC | | Berkshire Hathaway Assurance Corp. |
The Notes to Financial Statements are an integral part of this report.
| | |
| Transamerica Funds | | Annual Report 2014 |
Page 109
Transamerica Enhanced Muni
SCHEDULE OF INVESTMENTS (continued)
At October 31, 2014
DEFINITIONS (continued):
| | |
| CNTY GTD | | County Guaranteed |
| COMWLTH | | Commonwealth |
| CR | | Custodial Receipts |
| FGIC | | Financial Guaranty Insurance Co. |
| FHA | | Federal Housing Administration |
| FHLMC | | Federal Home Loan Mortgage Corp. |
| FNMA | | Federal National Mortgage Association |
| GNMA | | Government National Mortgage Association |
| GTD | | Guaranteed |
| IBC | | Insured Bond Certificate |
| ICC | | Insured Custody Certificate |
| MBIA | | National Public Finance Guarantee Corp. (formerly Municipal Bond Insurance Association) |
| NATL | | National Public Finance Guarantee Corp. |
| NATL-RE | | National Public Finance Guarantee Corp. Reinsured |
| PSF | | Public School Fund |
| RADIAN | | Radian Asset Assurance Inc. |
| XLCA | | Syncora (formerly XL Capital Assurance, Inc.) |
The Notes to Financial Statements are an integral part of this report.
| | |
| Transamerica Funds | | Annual Report 2014 |
Page 110
Transamerica Flexible Income
SCHEDULE OF INVESTMENTS
At October 31, 2014
| | | | | | | | |
| | | Principal | | | Value | |
U.S. GOVERNMENT OBLIGATIONS - 12.1% | | | | | |
U.S. Treasury Inflation Indexed Bond | | | | | | | | |
2.50%, 01/15/2029 | | | $ 4,353,050 | | | | $ 5,416,487 | |
U.S. Treasury Note | | | | | | | | |
0.25%, 05/15/2015 | | | 3,360,000 | | | | 3,362,362 | |
0.38%, 08/31/2015 | | | 27,193,600 | | | | 27,248,830 | |
0.50%, 09/30/2016 | | | 7,286,000 | | | | 7,289,417 | |
1.38%, 07/31/2018 | | | 19,125,000 | | | | 19,192,244 | |
1.75%, 05/15/2022 | | | 22,629,100 | | | | 22,059,843 | |
2.50%, 08/15/2023 | | | 3,763,000 | | | | 3,840,318 | |
| | | | | | | | |
Total U.S. Government Obligations
(Cost $87,473,160) | | | | 88,409,501 | |
| | | | | | | | |
|
U.S. GOVERNMENT AGENCY OBLIGATIONS - 3.5% | |
Federal Home Loan Mortgage Corp., IO | | | | | | | | |
5.00%, 08/01/2035 | | | 1,977,362 | | | | 405,986 | |
Federal National Mortgage Association | | | | | | | | |
3.50%, TBA | | | 20,328,000 | | | | 21,477,796 | |
4.00%, TBA | | | 3,468,000 | | | | 3,682,041 | |
| | | | | | | | |
Total U.S. Government Agency Obligations
(Cost $26,146,556) | | | | 25,565,823 | |
| | | | | | | | |
| |
FOREIGN GOVERNMENT OBLIGATIONS - 1.1% | | | | | |
Canada Housing Trust No. 1 | | | | | | | | |
3.15%, 06/15/2015, 144A | | | CAD 2,500,000 | | | | 2,246,883 | |
Mexican Bonos | | | | | | | | |
7.25%, 12/15/2016 | | | MXN 28,500,000 | | | | 2,263,769 | |
8.50%, 12/13/2018 | | | 15,428,600 | | | | 1,301,809 | |
Philippine Government International Bond | | | | | | | | |
4.95%, 01/15/2021 | | | PHP 90,000,000 | | | | 2,076,769 | |
| | | | | | | | |
Total Foreign Government Obligations
(Cost $8,029,434) | | | | 7,889,230 | |
| | | | | | | | |
| |
MORTGAGE-BACKED SECURITIES - 12.8% | | | | | |
7 WTC Depositor LLC Trust | | | | | | | | |
Series 2012-7WTC, Class A | | | | | | | | |
4.08%, 03/13/2031, 144A | | | $ 469,837 | | | | 484,719 | |
Alternative Loan Trust | | | | | | | | |
Series 2004-3T1, Class A3 | | | | | | | | |
5.00%, 05/25/2034 | | | 453,833 | | | | 466,906 | |
Series 2005-14, Class 4A1 | | | | | | | | |
0.37%, 05/25/2035 (A) | | | 2,109,527 | | | | 1,799,682 | |
Series 2006-OC1, Class 2A3A | | | | | | | | |
0.47%, 03/25/2036 (A) | | | 2,683,427 | | | | 2,347,575 | |
American Home Mortgage Assets Trust | | | | | | | | |
Series 2007-2, Class A1 | | | | | | | | |
0.28%, 03/25/2047 (A) | | | 1,070,358 | | | | 868,996 | |
BB-UBS Trust | | | | | | | | |
Series 2012-TFT, Class C | | | | | | | | |
3.47%, 06/05/2030, 144A (A) | | | 2,325,000 | | | | 2,218,738 | |
BBCMS Trust | | | | | | | | |
Series 2014-BXO, Class C | | | | | | | | |
2.15%, 08/15/2027, 144A (A) | | | 3,735,000 | | | | 3,736,008 | |
BCAP LLC Trust | | | | | | | | |
Series 2009-RR10, Class 2A1 | | | | | | | | |
2.68%, 08/26/2035, 144A (A) | | | 323,589 | | | | 320,014 | |
| | | | | | | | |
| | | Principal | | | Value | |
MORTGAGE-BACKED SECURITIES (continued) | | | | | |
BCAP LLC Trust (continued) | | | | | | | | |
Series 2009-RR14, Class 1A1 | | | | | | | | |
6.00%, 05/26/2037, 144A (A) | | | $ 612,414 | | | | $ 651,547 | |
Series 2009-RR6, Class 2A1 | | | | | | | | |
2.54%, 08/26/2035, 144A (A) | | | 591,022 | | | | 589,232 | |
Series 2010-RR1, Class 12A1 | | | | | | | | |
5.25%, 08/26/2036, 144A (A) | | | 668,919 | | | | 686,155 | |
BHMS Mortgage Trust | | | | | | | | |
Series 2014-ATLS, Class CFX | | | | | | | | |
4.69%, 07/05/2033, 144A (A) | | | 4,500,000 | | | | 4,496,175 | |
Boca Hotel Portfolio Trust | | | | | | | | |
Series 2013-BOCA, Class C | | | | | | | | |
2.30%, 08/15/2026, 144A (A) | | | 4,500,000 | | | | 4,508,559 | |
CD Commercial Mortgage Trust | | | | | | | | |
Series 2007-CD4, Class A1A | | | | | | | | |
5.29%, 12/11/2049 (A) | | | 997,170 | | | | 1,058,960 | |
Citigroup Commercial Mortgage Trust | | | | | | | | |
Series 2014-388G, Class D | | | | | | | | |
1.90%, 06/15/2033, 144A (A) | | | 1,280,000 | | | | 1,275,180 | |
Citigroup Mortgage Loan Trust | | | | | | | | |
Series 2014-A, Class A | | | | | | | | |
4.00%, 01/25/2035, 144A (A) | | | 2,221,834 | | | | 2,311,598 | |
COMM Mortgage Trust | | | | | | | | |
Series 2014-PAT, Class D | | | | | | | | |
2.30%, 08/13/2027, 144A (A) | | | 1,825,000 | | | | 1,806,726 | |
Credit Suisse Commercial Mortgage Trust | | | | | | | | |
Series 2007-C1, Class A1A | | | | | | | | |
5.36%, 02/15/2040 | | | 3,439,573 | | | | 3,655,564 | |
CSMC Trust | | | | | | | | |
Series 2010-18R, Class 1A11 | | | | | | | | |
3.75%, 08/26/2035, 144A (A) | | | 255,884 | | | | 255,013 | |
GS Mortgage Securities Trust | | | | | | | | |
Series 2013-G1, Class A2 | | | | | | | | |
3.56%, 04/10/2031, 144A (A) | | | 5,000,000 | | | | 4,945,430 | |
HarborView Mortgage Loan Trust | | | | | | | | |
Series 2006-9, Class 2A1A | | | | | | | | |
0.37%, 11/19/2036 (A) | | | 6,640,128 | | | | 4,819,651 | |
Series 2007-2, Class 2A1A | | | | | | | | |
0.31%, 05/25/2038 (A) | | | 5,817,072 | | | | 4,360,320 | |
Hilton USA Trust | | | | | | | | |
Series 2013-HLF, Class CFL | | | | | | | | |
2.05%, 11/05/2030, 144A (A) | | | 1,560,000 | | | | 1,560,016 | |
Independent National Mortage Corp. Index Mortgage Loan Trust | | | | | | | | |
Series 2007-AR15, Class 2A1 | | | | | | | | |
4.38%, 08/25/2037 (A) | | | 1,477,417 | | | | 1,217,782 | |
Jefferies Re-REMIC Trust | | | | | | | | |
Series 2009-R2, Class 2A | | | | | | | | |
2.59%, 12/26/2037, 144A (A) | | | 233,118 | | | | 232,632 | |
Series 2009-R7, Class 10A3 | | | | | | | | |
6.00%, 12/26/2036, 144A | | | 143,422 | | | | 153,686 | |
Series 2009-R7, Class 12A1 | | | | | | | | |
2.62%, 08/26/2036, 144A (A) | | | 111,142 | | | | 109,892 | |
Series 2009-R7, Class 1A1 | | | | | | | | |
2.38%, 02/26/2036, 144A (A) | | | 498,348 | | | | 489,337 | |
Series 2009-R7, Class 4A1 | | | | | | | | |
2.39%, 09/26/2034, 144A (A) | | | 278,849 | | | | 274,052 | |
Series 2009-R9, Class 1A1 | | | | | | | | |
2.24%, 08/26/2046, 144A (A) | | | 331,795 | | | | 335,180 | |
The Notes to Financial Statements are an integral part of this report.
| | |
| Transamerica Funds | | Annual Report 2014 |
Page 111
Transamerica Flexible Income
SCHEDULE OF INVESTMENTS (continued)
At October 31, 2014
| | | | | | | | |
| | | Principal | | | Value | |
MORTGAGE-BACKED SECURITIES (continued) | | | | | |
JPMorgan Chase Commercial Mortgage Securities Trust | | | | | | | | |
Series 2007-LD11, Class ASB | | | | | | | | |
5.79%, 06/15/2049 (A) | | | $ 545,622 | | | | $ 573,230 | |
Series 2013-ALC, Class B | | | | | | | | |
3.00%, 07/17/2026, 144A (A) | | | 1,290,000 | | | | 1,301,398 | |
Series 2014-DSTY, Class B | | | | | | | | |
3.77%, 06/10/2027, 144A | | | 3,835,000 | | | | 3,932,532 | |
Series 2014-DSTY, Class C | | | | | | | | |
3.80%, 06/10/2027, 144A (A) | | | 4,475,000 | | | | 4,510,272 | |
Series 2014-FBLU, Class D | | | | | | | | |
2.75%, 12/15/2028, 144A (A) | | | 3,750,000 | | | | 3,743,010 | |
JPMorgan Commercial Mortgage-Backed Securities Trust | | | | | | | | |
Series 2009-RR2, Class MLB | | | | | | | | |
5.74%, 06/15/2050, 144A (A) | | | 3,110,000 | | | | 3,307,466 | |
JPMorgan Re-REMIC Trust | | | | | | | | |
Series 2009-7, Class 8A1 | | | | | | | | |
2.83%, 01/27/2047, 144A (A) | | | 176,716 | | | | 178,127 | |
LB Commercial Mortgage Trust | | | | | | | | |
Series 2007-C3, Class A1A | | | | | | | | |
5.86%, 07/15/2044 (A) | | | 1,291,440 | | | | 1,419,127 | |
Merrill Lynch Mortgage Investors Trust | | | | | | | | |
Series 2006-A1, Class 1A1 | | | | | | | | |
2.83%, 03/25/2036 (A) | | | 2,999,461 | | | | 2,228,399 | |
Morgan Stanley Re-REMIC Trust | | | | | | | | |
Series 2010-GG10, Class A4A | | | | | | | | |
5.80%, 08/15/2045, 144A (A) | | | 2,209,607 | | | | 2,396,438 | |
Series 2010-R4, Class 3A | | | | | | | | |
5.50%, 08/26/2047, 144A | | | 795,842 | | | | 826,085 | |
Series 2014-R4, Class 4A | | | | | | | | |
3.80%, 11/21/2035, 144A (A) | | | 4,415,226 | | | | 4,510,100 | |
RALI Trust | | | | | | | | |
Series 2006-QO1, Class 3A1 | | | | | | | | |
0.42%, 02/25/2046 (A) | | | 1,889,474 | | | | 1,253,696 | |
Residential Asset Securitization Trust | | | | | | | | |
Series 2004-A4, Class A11 | | | | | | | | |
5.50%, 08/25/2034 | | | 1,742,859 | | | | 1,824,901 | |
Structured Asset Mortgage Investments II Trust | | | | | | | | |
Series 2006-AR7, Class A1BG | | | | | | | | |
0.27%, 08/25/2036 (A) | | | 6,701,694 | | | | 5,140,675 | |
Series 2007-AR3, Class 1A3 | | | | | | | | |
0.36%, 09/25/2047 (A) | | | 5,882,476 | | | | 4,098,633 | |
Wells Fargo Mortgage-Backed Securities Trust | | | | | | | | |
Series 2003-G, Class A1 | | | | | | | | |
2.49%, 06/25/2033 (A) | | | 139,946 | | | | 141,287 | |
Series 2003-L, Class 1A2 | | | | | | | | |
2.49%, 11/25/2033 (A) | | | 97,671 | | | | 97,371 | |
| | | | | | | | |
Total Mortgage-Backed Securities
(Cost $92,119,085) | | | | 93,518,072 | |
| | | | | | | | |
| | |
ASSET-BACKED SECURITIES - 6.7% | | | | | | | | |
Bayview Opportunity Master Fund IIlA Trust, LP | | | | | | | | |
Series 2013-4RPL, Class A | | | | | | | | |
4.46%, 07/28/2018, 144A (A) | | | 46,812 | | | | 46,815 | |
| | | | | | | | |
| | | Principal | | | Value | |
ASSET-BACKED SECURITIES (continued) | |
BXG Receivables Note Trust | | | | | | | | |
Series 2013-A, Class A | | | | | | | | |
3.01%, 12/04/2028, 144A | | | $ 1,708,195 | | | | $ 1,727,527 | |
Countrywide Asset-Backed Certificates | | | | | | | | |
Series 2005-AB3, Class 2A3 | | | | | | | | |
0.51%, 02/25/2036 (A) | | | 2,957,686 | | | | 2,755,055 | |
Series 2006-22, Class 2A3 | | | | | | | | |
0.31%, 01/25/2034 (A) | | | 3,390,942 | | | | 2,904,047 | |
Series 2006-6, Class 2A3 | | | | | | | | |
0.43%, 09/25/2036 (A) | | | 3,600,000 | | | | 3,037,194 | |
CWABS Asset-Backed Certificates Trust | | | | | | | | |
Series 2006-17, Class 2A2 | | | | | | | | |
0.30%, 03/25/2047 (A) | | | 4,397,891 | | | | 3,732,085 | |
Diamond Resorts Owner Trust | | | | | | | | |
Series 2013-1, Class A | | | | | | | | |
1.95%, 01/20/2025, 144A | | | 1,466,112 | | | | 1,462,721 | |
Series 2013-2, Class A | | | | | | | | |
2.27%, 05/20/2026, 144A | | | 1,208,613 | | | | 1,218,601 | |
GSAA Trust | | | | | | | | |
Series 2006-1, Class A3 | | | | | | | | |
0.48%, 01/25/2036 (A) | | | 1,879,291 | | | | 1,322,072 | |
GSAMP Trust | | | | | | | | |
Series 2006-HE1, Class A2D | | | | | | | | |
0.46%, 01/25/2036 (A) | | | 2,270,000 | | | | 2,074,108 | |
HLSS Servicer Advance Receivables Trust | | | | | | | | |
Series 2014-T1, Class DT1 | | | | | | | | |
2.29%, 01/17/2045, 144A | | | 1,870,000 | | | | 1,870,561 | |
HSBC Home Equity Loan Trust | | | | | | | | |
Series 2006-3, Class A4 | | | | | | | | |
0.40%, 03/20/2036 (A) | | | 1,353,382 | | | | 1,342,468 | |
JGWPT XXIII LLC | | | | | | | | |
Series 2011-1A, Class A | | | | | | | | |
4.70%, 10/15/2056, 144A | | | 2,698,280 | | | | 2,973,615 | |
Lehman XS Trust | | | | | | | | |
Series 2005-8, Class 1A3 | | | | | | | | |
0.50%, 12/25/2035 (A) | | | 2,223,778 | | | | 1,509,562 | |
Orange Lake Timeshare Trust | | | | | | | | |
Series 2014-AA, Class A | | | | | | | | |
2.29%, 07/09/2029, 144A | | | 1,598,784 | | | | 1,605,486 | |
ORES LLC | | | | | | | | |
Series 2014-LV3, Class A | | | | | | | | |
3.00%, 03/27/2024, 144A | | | 1,080,578 | | | | 1,080,525 | |
Popular ABS Mortgage Pass-Through Trust | | | | | | | | |
Series 2006-A, Class A4 | | | | | | | | |
0.47%, 02/25/2036 (A) | | | 1,042,827 | | | | 1,024,785 | |
SBA Tower Trust | | | | | | | | |
Series 2014-1A, Class C | | | | | | | | |
2.90%, 10/15/2044, 144A (A) | | | 3,245,000 | | | | 3,253,622 | |
Sierra Timeshare Receivables Funding LLC | | | | | | | | |
Series 2011-2A, Class A | | | | | | | | |
3.26%, 05/20/2028, 144A | | | 721,272 | | | | 735,003 | |
Series 2014-1A, Class A | | | | | | | | |
2.07%, 03/20/2030, 144A | | | 1,651,489 | | | | 1,663,534 | |
Soundview Home Loan Trust | | | | | | | | |
Series 2006-3, Class A3 | | | | | | | | |
0.31%, 11/25/2036 (A) | | | 3,978,462 | | | | 3,302,195 | |
The Notes to Financial Statements are an integral part of this report.
| | |
| Transamerica Funds | | Annual Report 2014 |
Page 112
Transamerica Flexible Income
SCHEDULE OF INVESTMENTS (continued)
At October 31, 2014
| | | | | | | | |
| | | Principal | | | Value | |
ASSET-BACKED SECURITIES (continued) | |
Spirit Master Funding LLC | | | | | | | | |
Series 2014-3A, Class A | | | | | | | | |
5.74%, 03/20/2042, 144A | | | $ 6,571,558 | | | | $ 7,236,928 | |
US Residential Opportunity Fund Trust | | | | | | | | |
Series 2014, Class 1A | | | | | | | | |
3.47%, 03/25/2034, 144A (A) | | | 736,543 | | | | 737,318 | |
Westgate Resorts LLC | | | | | | | | |
Series 2013-1A, Class A | | | | | | | | |
2.25%, 08/20/2025, 144A | | | 576,640 | | | | 578,802 | |
| | | | | | | | |
Total Asset-Backed Securities
(Cost $44,788,747) | | | | 49,194,629 | |
| | | | | | | | |
| |
MUNICIPAL GOVERNMENT OBLIGATIONS - 0.7% | | | | | |
Rhode Island Economic Development Corp., Revenue Bonds | | | | | | | | |
AGM | | | | | | | | |
6.00%, 11/01/2015 (B) | | | 1,065,000 | | | | 1,082,530 | |
State of California, General Obligation Unlimited | | | | | | | | |
7.95%, 03/01/2036 | | | 3,150,000 | | | | 3,894,282 | |
| | | | | | | | |
Total Municipal Government Obligations
(Cost $4,435,768) | | | | 4,976,812 | |
| | | | | | | | |
|
PREFERRED CORPORATE DEBT SECURITIES - 1.4% | |
Insurance - 1.4% | | | | | | | | |
Reinsurance Group of America, Inc. | | | | | | | | |
6.75%, 12/15/2065 (A) (C) | | | 2,925,000 | | | | 2,983,500 | |
ZFS Finance USA Trust II | | | | | | | | |
6.45%, 12/15/2065, 144A (A) | | | 7,105,000 | | | | 7,566,825 | |
| | | | | | | | |
Total Preferred Corporate Debt Securities
(Cost $9,705,053) | | | | 10,550,325 | |
| | | | | | | | |
|
CORPORATE DEBT SECURITIES - 57.3% | |
Aerospace & Defense - 0.3% | | | | | | | | |
Bombardier, Inc. | | | | | | | | |
4.75%, 04/15/2019, 144A (C) | | | 1,920,000 | | | | 1,972,800 | |
| | | | | | | | |
Airlines - 1.7% | | | | | | | | |
America West Airlines Pass-Through Trust | | | | | | | | |
8.06%, 01/02/2022 | | | 682,381 | | | | 772,796 | |
American Airlines Pass-Through Trust | | | | | | | | |
4.00%, 01/15/2027 | | | 2,765,529 | | | | 2,800,098 | |
Continental Airlines Pass-Through Trust | | | | | | | | |
6.90%, 10/19/2023 | | | 1,700,673 | | | | 1,802,713 | |
7.46%, 10/01/2016 | | | 73,837 | | | | 75,313 | |
U.S. Airways Pass-Through Trust | | | | | | | | |
3.95%, 05/15/2027 | | | 1,255,000 | | | | 1,264,413 | |
UAL Pass-Through Trust | | | | | | | | |
10.40%, 05/01/2018 | | | 2,016,345 | | | | 2,228,061 | |
United Airlines Pass-Through Trust | | | | | | | | |
3.75%, 03/03/2028 | | | 2,065,000 | | | | 2,090,813 | |
Virgin Australia Trust | | | | | | | | |
5.00%, 04/23/2025, 144A | | | 1,445,448 | | | | 1,488,811 | |
| | | | | | | | |
| | | | | | | 12,523,018 | |
| | | | | | | | |
Automobiles - 0.5% | | | | | | | | |
Chrysler Group LLC / CG Co-Issuer, Inc. | | | | | | | | |
8.25%, 06/15/2021 | | | 3,100,000 | | | | 3,464,250 | |
| | | | | | | | |
| | | Principal | | | Value | |
CORPORATE DEBT SECURITIES (continued) | |
Banks - 8.5% | | | | | | | | |
Barclays Bank PLC | | | | | | | | |
10.18%, 06/12/2021, 144A | | | $ 4,720,000 | | | | $ 6,337,412 | |
BBVA Bancomer SA | | | | | | | | |
6.50%, 03/10/2021, 144A (C) | | | 3,000,000 | | | | 3,330,000 | |
BNP Paribas SA
Series MTN | | | | | | | | |
2.38%, 09/14/2017 | | | 3,225,000 | | | | 3,286,952 | |
CIT Group, Inc. | | | | | | | | |
4.75%, 02/15/2015, 144A | | | 570,000 | | | | 574,275 | |
Cooperatieve Centrale Raiffeisen-Boerenleenbank BA | | | | | | | | |
11.00%, 06/30/2019, 144A (A) (D) | | | 4,110,000 | | | | 5,363,550 | |
Deutsche Bank AG | | | | | | | | |
6.00%, 09/01/2017 | | | 4,140,000 | | | | 4,640,174 | |
HBOS PLC
Series MTN | | | | | | | | |
6.75%, 05/21/2018, 144A | | | 4,465,000 | | | | 5,014,583 | |
HSBC Holdings PLC | | | | | | | | |
6.38%, 09/17/2024 (A) (C) (D) | | | 3,060,000 | | | | 3,121,200 | |
ING Bank NV | | | | | | | | |
5.80%, 09/25/2023, 144A | | | 4,545,000 | | | | 5,058,230 | |
Intesa Sanpaolo SpA | | | | | | | | |
2.38%, 01/13/2017 | | | 1,500,000 | | | | 1,516,688 | |
3.13%, 01/15/2016 | | | 2,750,000 | | | | 2,807,767 | |
5.02%, 06/26/2024, 144A | | | 1,930,000 | | | | 1,886,216 | |
Regions Bank | | | | | | | | |
7.50%, 05/15/2018 | | | 4,955,000 | | | | 5,805,114 | |
Royal Bank of Scotland Group PLC | | | | | | | | |
5.13%, 05/28/2024 | | | 4,135,000 | | | | 4,189,483 | |
Societe Generale SA | | | | | | | | |
5.75%, 04/20/2016, 144A | | | 2,569,000 | | | | 2,716,867 | |
Turkiye Halk Bankasi AS | | | | | | | | |
4.75%, 06/04/2019, 144A | | | 1,070,000 | | | | 1,073,105 | |
Wells Fargo & Co. | | | | | | | | |
7.98%, 03/15/2018 (A) (D) | | | 5,105,000 | | | | 5,626,665 | |
| | | | | | | | |
| | | | | | | 62,348,281 | |
| | | | | | | | |
Beverages - 0.1% | | | | | | | | |
Anheuser-Busch InBev Worldwide, Inc. | | | | | | | | |
9.75%, 11/17/2015 | | | BRL 2,200,000 | | | | 878,970 | |
| | | | | | | | |
Building Products - 1.2% | | | | | | | | |
Associated Materials LLC / AMH New Finance, Inc. | | | | | | | | |
9.13%, 11/01/2017 | | | $ 3,175,000 | | | | 3,103,562 | |
Owens Corning | | | | | | | | |
4.20%, 12/15/2022 | | | 5,653,000 | | | | 5,690,706 | |
| | | | | | | | |
| | | | | | | 8,794,268 | |
| | | | | | | | |
Capital Markets - 1.7% | | | | | | | | |
Bank of New York Mellon Corp. | | | | | | | | |
Series MTN | | | | | | | | |
3.65%, 02/04/2024 (C) | | | 1,000,000 | | | | 1,026,678 | |
Goldman Sachs Group, Inc. | | | | | | | | |
5.70%, 05/10/2019 (A) (C) (D) | | | 1,690,000 | | | | 1,728,025 | |
Morgan Stanley | | | | | | | | |
5.45%, 07/15/2019 (A) (D) | | | 1,210,000 | | | | 1,215,673 | |
5.75%, 01/25/2021 | | | 1,850,000 | | | | 2,124,277 | |
Prospect Capital Corp. | | | | | | | | |
5.88%, 03/15/2023 (C) | | | 2,625,000 | | | | 2,756,436 | |
UBS AG | | | | | | | | |
7.63%, 08/17/2022 | | | 2,805,000 | | | | 3,310,338 | |
| | | | | | | | |
| | | | | | | 12,161,427 | |
| | | | | | | | |
The Notes to Financial Statements are an integral part of this report.
| | |
| Transamerica Funds | | Annual Report 2014 |
Page 113
Transamerica Flexible Income
SCHEDULE OF INVESTMENTS (continued)
At October 31, 2014
| | | | | | | | |
| | | Principal | | | Value | |
CORPORATE DEBT SECURITIES (continued) | |
Chemicals - 0.5% | | | | | | | | |
Huntsman International LLC | | | | | | | | |
8.63%, 03/15/2021 | | | $ 3,200,000 | | | | $ 3,488,000 | |
| | | | | | | | |
Commercial Services & Supplies - 1.1% | |
Hertz Corp. | | | | | | | | |
6.75%, 04/15/2019 | | | 1,685,000 | | | | 1,756,613 | |
Steelcase, Inc. | | | | | | | | |
6.38%, 02/15/2021 | | | 3,035,000 | | | | 3,507,258 | |
Trinity Industries, Inc. | | | | | | | | |
4.55%, 10/01/2024 | | | 2,675,000 | | | | 2,605,153 | |
| | | | | | | | |
| | | | | | | 7,869,024 | |
| | | | | | | | |
Communications Equipment - 0.7% | |
Motorola Solutions, Inc. | | | | | | | | |
3.50%, 09/01/2021 | | | 4,990,000 | | | | 4,967,301 | |
| | | | | | | | |
Construction Materials - 0.7% | | | | | | | | |
Martin Marietta Materials, Inc. | | | | | | | | |
4.25%, 07/02/2024, 144A | | | 4,820,000 | | | | 4,913,696 | |
| | | | | | | | |
Consumer Finance - 1.0% | | | | | | | | |
Ally Financial, Inc. | | | | | | | | |
4.63%, 06/26/2015 | | | 890,000 | | | | 908,245 | |
Springleaf Finance Corp.
Series MTN | | | | | | | | |
6.90%, 12/15/2017 | | | 5,640,000 | | | | 6,147,600 | |
| | | | | | | | |
| | | | | | | 7,055,845 | |
| | | | | | | | |
Containers & Packaging - 0.5% | | | | | | | | |
Ardagh Packaging Finance PLC / Ardagh Holdings USA, Inc. | | | | | | | | |
3.23%, 12/15/2019, 144A (A) | | | 2,400,000 | | | | 2,346,000 | |
Exopack Holding Corp. | | | | | | | | |
10.00%, 06/01/2018, 144A | | | 1,280,000 | | | | 1,376,000 | |
| | | | | | | | |
| | | | | | | 3,722,000 | |
| | | | | | | | |
Distributors - 0.4% | | | | | | | | |
Owens & Minor, Inc. | | | | | | | | |
3.88%, 09/15/2021 | | | 3,060,000 | | | | 3,082,136 | |
| | | | | | | | |
Diversified Financial Services - 4.9% | |
Bank of America Corp. | | | | | | | | |
6.50%, 07/15/2018 | | | 2,420,000 | | | | 2,767,880 | |
Series MTN | | | | | | | | |
6.88%, 04/25/2018 | | | 4,050,000 | | | | 4,684,927 | |
Citigroup, Inc. | | | | | | | | |
5.95%, 01/30/2023 (A) (D) | | | 4,790,000 | | | | 4,760,063 | |
General Electric Capital Corp. | | | | | | | | |
7.13%, 06/15/2022 (A) (D) | | | 3,500,000 | | | | 4,077,500 | |
ILFC E-Capital Trust I | | | | | | | | |
4.84%, 12/21/2065, 144A (A) | | | 2,430,000 | | | | 2,302,425 | |
Jefferies Group LLC | | | | | | | | |
5.13%, 01/20/2023 | | | 1,935,000 | | | | 2,050,492 | |
JPMorgan Chase & Co. | | | | | | | | |
5.15%, 05/01/2023 (A) (C) (D) | | | 4,810,000 | | | | 4,557,475 | |
Oaktree Capital Management, LP | | | | | | | | |
6.75%, 12/02/2019, 144A | | | 2,480,000 | | | | 2,961,003 | |
Vesey Street Investment Trust I | | | | | | | | |
4.40%, 09/01/2016 (E) | | | 3,745,000 | | | | 3,963,008 | |
Voya Financial, Inc. | | | | | | | | |
5.50%, 07/15/2022 | | | 3,030,000 | | | | 3,415,931 | |
| | | | | | | | |
| | | | | | | 35,540,704 | |
| | | | | | | | |
| | | | | | | | |
| | | Principal | | | Value | |
CORPORATE DEBT SECURITIES (continued) | |
Diversified Telecommunication Services - 3.3% | | | | | |
CenturyLink, Inc. | | | | | | | | |
5.80%, 03/15/2022 | | | $ 2,975,000 | | | | $ 3,153,500 | |
Frontier Communications Corp. | | | | | | | | |
7.63%, 04/15/2024 (C) | | | 3,220,000 | | | | 3,461,500 | |
GTP Acquisition Partners I LLC | | | | | | | | |
7.63%, 06/15/2041, 144A | | | 500,000 | | | | 526,676 | |
Hughes Satellite Systems Corp. | | | | | | | | |
6.50%, 06/15/2019 | | | 885,000 | | | | 958,012 | |
Intelsat Jackson Holdings SA | | | | | | | | |
7.50%, 04/01/2021 | | | 3,324,000 | | | | 3,598,230 | |
Level 3 Communications, Inc. | | | | | | | | |
8.88%, 06/01/2019 | | | 180,000 | | | | 193,050 | |
Level 3 Financing, Inc. | | | | | | | | |
8.13%, 07/01/2019 | | | 4,010,000 | | | | 4,290,700 | |
Unison Ground Lease Funding LLC | | | | | | | | |
6.39%, 04/15/2040, 144A | | | 4,615,000 | | | | 5,295,593 | |
Verizon Communications, Inc. | | | | | | | | |
1.76%, 09/15/2016 (A) | | | 2,387,000 | | | | 2,440,891 | |
| | | | | | | | |
| | | | | | | 23,918,152 | |
| | | | | | | | |
Electric Utilities - 0.1% | | | | | | | | |
EDP Finance BV | | | | | | | | |
5.25%, 01/14/2021, 144A | | | 945,000 | | | | 980,617 | |
| | | | | | | | |
Electrical Equipment - 0.2% | | | | | | | | |
Anixter, Inc. | | | | | | | | |
5.95%, 03/01/2015 | | | 1,300,000 | | | | 1,311,375 | |
| | | | | | | | |
Energy Equipment & Services - 2.1% | |
Enterprise Products Operating LLC | | | | | | | | |
8.38%, 08/01/2066 (A) | | | 2,540,000 | | | | 2,774,950 | |
NuStar Logistics, LP | | | | | | | | |
8.15%, 04/15/2018 | | | 2,196,000 | | | | 2,481,480 | |
Regency Energy Partners, LP / Regency Energy Finance Corp. | | | | | | | | |
5.88%, 03/01/2022 | | | 1,000,000 | | | | 1,065,000 | |
Seadrill, Ltd. | | | | | | | | |
6.13%, 09/15/2017, 144A | | | 1,700,000 | | | | 1,654,100 | |
Transocean, Inc. | | | | | | | | |
6.38%, 12/15/2021 | | | 2,221,000 | | | | 2,333,953 | |
Weatherford International, Ltd. | | | | | | | | |
9.63%, 03/01/2019 | | | 3,657,000 | | | | 4,673,262 | |
| | | | | | | | |
| | | | | | | 14,982,745 | |
| | | | | | | | |
Food & Staples Retailing - 0.2% | | | | | | | | |
CVS Health Corp. | | | | | | | | |
2.25%, 08/12/2019 (C) | | | 1,500,000 | | | | 1,493,340 | |
| | | | | | | | |
Food Products - 0.4% | | | | | | | | |
Post Holdings, Inc. | | | | | | | | |
7.38%, 02/15/2022 (C) | | | 2,833,000 | | | | 2,903,825 | |
| | | | | | | | |
Health Care Equipment & Supplies - 0.6% | |
Hologic, Inc. | | | | | | | | |
6.25%, 08/01/2020 | | | 1,465,000 | | | | 1,540,081 | |
Mallinckrodt International Finance SA | | | | | | | | |
3.50%, 04/15/2018 | | | 3,155,000 | | | | 3,107,675 | |
| | | | | | | | |
| | | | | | | 4,647,756 | |
| | | | | | | | |
Health Care Providers & Services - 0.9% | |
CHS / Community Health Systems, Inc. | | | | | | | | |
7.13%, 07/15/2020 | | | 3,400,000 | | | | 3,680,500 | |
The Notes to Financial Statements are an integral part of this report.
| | |
| Transamerica Funds | | Annual Report 2014 |
Page 114
Transamerica Flexible Income
SCHEDULE OF INVESTMENTS (continued)
At October 31, 2014
| | | | | | | | |
| | | Principal | | | Value | |
CORPORATE DEBT SECURITIES (continued) | |
Health Care Providers & Services (continued) | |
Express Scripts Holding Co. | | | | | | | | |
4.75%, 11/15/2021 | | | $ 2,920,000 | | | | $ 3,206,677 | |
| | | | | | | | |
| | | | | | | 6,887,177 | |
| | | | | | | | |
Hotels, Restaurants & Leisure - 0.5% | |
Wyndham Worldwide Corp. | | | | | | | | |
2.50%, 03/01/2018 (C) | | | 3,350,000 | | | | 3,369,577 | |
| | | | | | | | |
Household Durables - 0.2% | | | | | | | | |
Meritage Homes Corp. | | | | | | | | |
4.50%, 03/01/2018 | | | 1,430,000 | | | | 1,458,600 | |
| | | | | | | | |
Household Products - 0.6% | | | | | | | | |
Reynolds Group Issuer, Inc. / Reynolds Group Issuer LLC | | | | | | | | |
5.75%, 10/15/2020 | | | 4,000,000 | | | | 4,160,000 | |
| | | | | | | | |
Independent Power and Renewable Electricity Producers - 0.8% | |
NRG Energy, Inc. | | | | | | | | |
7.88%, 05/15/2021 (C) | | | 5,535,000 | | | | 6,005,475 | |
| | | | | | | | |
Insurance - 4.4% | | | | | | | | |
American Financial Group, Inc. | | | | | | | | |
9.88%, 06/15/2019 | | | 3,275,000 | | | | 4,219,936 | |
American International Group, Inc., | | | | | | | | |
Series MTN | | | | | | | | |
5.85%, 01/16/2018 | | | 3,055,000 | | | | 3,442,875 | |
Chubb Corp. | | | | | | | | |
6.38%, 03/29/2067 (A) | | | 3,713,000 | | | | 4,047,170 | |
Fidelity National Financial, Inc. | | | | | | | | |
6.60%, 05/15/2017 (C) | | | 2,170,000 | | | | 2,413,012 | |
Hanover Insurance Group, Inc. | | | | | | | | |
6.38%, 06/15/2021 | | | 3,365,000 | | | | 3,850,297 | |
Hartford Financial Services Group, Inc. | | | | | | | | |
5.50%, 10/15/2016 | | | 3,124,000 | | | | 3,384,435 | |
Oil Insurance, Ltd. | | | | | | | | |
3.22%, 12/01/2014, 144A (A) (D) | | | 1,245,000 | | | | 1,152,769 | |
Sompo Japan Nipponkoa Insurance, Inc. | | | | | | | | |
5.33%, 03/28/2073, 144A (A) | | | 5,635,000 | | | | 5,930,838 | |
Stone Street Trust | | | | | | | | |
5.90%, 12/15/2015, 144A | | | 3,675,000 | | | | 3,842,293 | |
| | | | | | | | |
| | | | | | | 32,283,625 | |
| | | | | | | | |
IT Services - 0.4% | | | | | | | | |
SunGard Data Systems, Inc. | | | | | | | | |
6.63%, 11/01/2019 | | | 3,000,000 | | | | 3,105,000 | |
| | | | | | | | |
Life Sciences Tools & Services - 0.4% | |
Thermo Fisher Scientific, Inc. | | | | | | | | |
1.30%, 02/01/2017 | | | 2,600,000 | | | | 2,596,932 | |
| | | | | | | | |
Media - 1.7% | | | | | | | | |
CCO Holdings LLC / CCO Holdings Capital Corp. | | | | | | | | |
7.25%, 10/30/2017 | | | 1,360,000 | | | | 1,416,100 | |
Clear Channel Worldwide Holdings, Inc. | | | | | | | | |
7.63%, 03/15/2020 | | | 5,540,000 | | | | 5,891,775 | |
Nara Cable Funding, Ltd. | | | | | | | | |
8.88%, 12/01/2018, 144A (C) | | | 2,415,000 | | | | 2,533,577 | |
Numericable Group SA | | | | | | | | |
4.88%, 05/15/2019, 144A | | | 2,350,000 | | | | 2,344,125 | |
| | | | | | | | |
| | | | | | | 12,185,577 | |
| | | | | | | | |
| | | | | | | | |
| | | Principal | | | Value | |
CORPORATE DEBT SECURITIES (continued) | |
Metals & Mining - 1.2% | | | | | | | | |
Anglo American Capital PLC | | | | | | | | |
9.38%, 04/08/2019, 144A (C) | | | $ 1,956,000 | | | | $ 2,470,101 | |
Glencore Finance Canada, Ltd. | | | | | | | | |
5.80%, 11/15/2016, 144A | | | 1,850,000 | | | | 2,001,115 | |
Glencore Funding LLC | | | | | | | | |
2.50%, 01/15/2019, 144A (C) | | | 955,000 | | | | 947,133 | |
Rio Tinto Finance USA, Ltd. | | | | | | | | |
9.00%, 05/01/2019 | | | 2,614,000 | | | | 3,373,885 | |
| | | | | | | | |
| | | | | | | 8,792,234 | |
| | | | | | | | |
Multi-Utilities - 0.4% | | | | | | | | |
Black Hills Corp. | | | | | | | | |
4.25%, 11/30/2023 | | | 1,650,000 | | | | 1,750,703 | |
5.88%, 07/15/2020 | | | 1,200,000 | | | | 1,379,223 | |
| | | | | | | | |
| | | | | | | 3,129,926 | |
| | | | | | | | |
Oil, Gas & Consumable Fuels - 3.6% | |
California Resources Corp. | | | | | | | | |
5.00%, 01/15/2020, 144A (C) | | | 1,606,000 | | | | 1,630,090 | |
Chesapeake Energy Corp. | | | | | | | | |
3.48%, 04/15/2019 (A) | | | 1,400,500 | | | | 1,401,466 | |
6.50%, 08/15/2017 (C) | | | 2,075,000 | | | | 2,251,375 | |
CITGO Petroleum Corp. | | | | | | | | |
6.25%, 08/15/2022, 144A | | | 1,706,000 | | | | 1,735,855 | |
Energy Transfer Partners, LP | | | | | | | | |
4.90%, 02/01/2024 | | | 2,232,000 | | | | 2,378,060 | |
Gazprom OAO Via GAZ Capital SA | | | | | | | | |
5.09%, 11/29/2015, 144A | | | 725,000 | | | | 736,042 | |
Linn Energy LLC / Linn Energy Finance Corp. | | | | | | | | |
6.25%, 11/01/2019 | | | 3,105,000 | | | | 2,856,600 | |
Lukoil International Finance BV | | | | | | | | |
3.42%, 04/24/2018, 144A (C) | | | 1,550,000 | | | | 1,478,313 | |
6.38%, 11/05/2014, 144A | | | 1,180,000 | | | | 1,180,000 | |
Petrobras Global Finance BV | | | | | | | | |
3.00%, 01/15/2019 (C) | | | 3,980,000 | | | | 3,879,465 | |
Petroleum Co., of Trinidad & Tobago, Ltd. | | | | | | | | |
9.75%, 08/14/2019, 144A (C) | | | 1,351,000 | | | | 1,688,750 | |
Ras Laffan Liquefied Natural Gas Co., Ltd. III | | | | | | | | |
6.75%, 09/30/2019, 144A (C) | | | 2,270,000 | | | | 2,689,950 | |
Rosneft Finance SA | | | | | | | | |
6.25%, 02/02/2015, 144A | | | 1,835,000 | | | | 1,843,808 | |
Rosneft Oil Co. via Rosneft International Finance, Ltd. | | | | | | | | |
3.15%, 03/06/2017, 144A | | | 765,000 | | | | 734,331 | |
| | | | | | | | |
| | | | | | | 26,484,105 | |
| | | | | | | | |
Paper & Forest Products - 0.6% | | | | | | | | |
Ainsworth Lumber Co., Ltd. | | | | | | | | |
7.50%, 12/15/2017, 144A (C) | | | 608,000 | | | | 629,280 | |
Boise Cascade Co. | | | | | | | | |
6.38%, 11/01/2020 | | | 1,390,000 | | | | 1,452,550 | |
Coveris Holdings SA | | | | | | | | |
7.88%, 11/01/2019, 144A | | | 2,100,000 | | | | 2,205,000 | |
| | | | | | | | |
| | | | | | | 4,286,830 | |
| | | | | | | | |
Pharmaceuticals - 1.2% | | | | | | | | |
Actavis Funding SCS | | | | | | | | |
1.30%, 06/15/2017, 144A | | | 2,235,000 | | | | 2,200,860 | |
The Notes to Financial Statements are an integral part of this report.
| | |
| Transamerica Funds | | Annual Report 2014 |
Page 115
Transamerica Flexible Income
SCHEDULE OF INVESTMENTS (continued)
At October 31, 2014
| | | | | | | | |
| | | Principal | | | Value | |
CORPORATE DEBT SECURITIES (continued) | |
Pharmaceuticals (continued) | | | | | | | | |
Actavis, Inc. | | | | | | | | |
3.25%, 10/01/2022 (C) | | | $ 2,015,000 | | | | $ 1,935,893 | |
Perrigo Co. PLC | | | | | | | | |
2.30%, 11/08/2018 | | | 4,498,000 | | | | 4,459,034 | |
| | | | | | | | |
| | | | | | | 8,595,787 | |
| | | | | | | | |
Professional Services - 0.6% | | | | | | | | |
Cardtronics, Inc. | | | | | | | | |
5.13%, 08/01/2022, 144A | | | 4,120,000 | | | | 4,099,400 | |
| | | | | | | | |
Real Estate Investment Trusts - 2.8% | |
ARC Properties Operating Partnership LP / Clark Acquisition LLC | | | | | | | | |
2.00%, 02/06/2017 (C) | | | 3,405,000 | | | | 3,325,241 | |
CBL & Associates, LP | | | | | | | | |
5.25%, 12/01/2023 | | | 1,388,000 | | | | 1,476,653 | |
EPR Properties | | | | | | | | |
5.75%, 08/15/2022 | | | 835,000 | | | | 918,347 | |
7.75%, 07/15/2020 | | | 4,558,000 | | | | 5,505,832 | |
Government Properties Income Trust | | | | | | | | |
3.75%, 08/15/2019 | | | 3,990,000 | | | | 4,055,504 | |
Hospitality Properties Trust | | | | | | | | |
5.00%, 08/15/2022 | | | 1,553,000 | | | | 1,637,096 | |
Kilroy Realty, LP | | | | | | | | |
6.63%, 06/01/2020 (C) | | | 3,252,000 | | | | 3,829,204 | |
| | | | | | | | |
| | | | | | | 20,747,877 | |
| | | | | | | | |
Road & Rail - 1.1% | | | | | | | | |
Aviation Capital Group Corp. | | | | | | | | |
4.63%, 01/31/2018, 144A | | | 1,410,000 | | | | 1,469,450 | |
7.13%, 10/15/2020, 144A | | | 5,925,000 | | | | 6,810,420 | |
| | | | | | | | |
| | | | | | | 8,279,870 | |
| | | | | | | | |
Semiconductors & Semiconductor Equipment - 0.3% | |
KLA-Tencor Corp. | | | | | | | | |
4.13%, 11/01/2021 | | | 1,990,000 | | | | 2,003,667 | |
| | | | | | | | |
Software - 0.5% | | | | | | | | |
First Data Corp. | | | | | | | | |
6.75%, 11/01/2020, 144A (C) | | | 422,000 | | | | 451,540 | |
7.38%, 06/15/2019, 144A | | | 2,730,000 | | | | 2,893,800 | |
| | | | | | | | |
| | | | | | | 3,345,340 | |
| | | | | | | | |
Specialty Retail - 0.3% | | | | | | | | |
Claire’s Stores, Inc. | | | | | | | | |
9.00%, 03/15/2019, 144A | | | 2,315,000 | | | | 2,361,300 | |
| | | | | | | | |
Tobacco - 0.4% | | | | | | | | |
Lorillard Tobacco Co. | | | | | | | | |
8.13%, 06/23/2019 | | | 2,700,000 | | | | 3,307,562 | |
| | | | | | | | |
Trading Companies & Distributors - 0.7% | |
International Lease Finance Corp. | | | | | | | | |
6.75%, 09/01/2016, 144A | | | 4,530,000 | | | | 4,801,800 | |
| | | | | | | | |
Wireless Telecommunication Services - 3.0% | |
Crown Castle Towers LLC | | | | | | | | |
4.88%, 08/15/2040, 144A | | | 2,150,000 | | | | 2,372,725 | |
6.11%, 01/15/2040, 144A | | | 5,000,000 | | | | 5,776,825 | |
SBA Tower Trust | | | | | | | | |
5.10%, 04/15/2042, 144A | | | 3,680,000 | | | | 3,901,911 | |
Sprint Communications, Inc. | | | | | | | | |
9.00%, 11/15/2018, 144A | | | 5,185,000 | | | | 6,098,856 | |
| | | | | | | | |
| | | Principal | | | Value | |
CORPORATE DEBT SECURITIES (continued) | |
Wireless Telecommunication Services (continued) | |
WCP Wireless Site Funding / WCP Wireless Site RE Funding | | | | | | | | |
4.14%, 11/15/2040, 144A | | | $ 1,416,682 | | | | $ 1,441,715 | |
6.83%, 11/15/2040, 144A | | | 2,570,000 | | | | 2,651,857 | |
| | | | | | | | |
| | | | | | | 22,243,889 | |
| | | | | | | | |
Total Corporate Debt Securities
(Cost $407,460,589) | | | | | | | 417,551,080 | |
| | | | | | | | |
| | |
CONVERTIBLE BONDS - 0.6% | | | | | | | | |
Automobiles - 0.3% | | | | | | | | |
Ford Motor Co. | | | | | | | | |
Series 2012-D, Class A3 | | | | | | | | |
4.25%, 11/15/2016 | | | 1,140,000 | | | | 1,877,438 | |
| | | | | | | | |
Diversified Telecommunication Services - 0.3% | |
Level 3 Financing, Inc. | | | | | | | | |
8.63%, 07/15/2020 | | | 2,090,000 | | | | 2,299,000 | |
| | | | | | | | |
Total Convertible Bonds
(Cost $3,773,142) | | | | | | | 4,176,438 | |
| | | | | | | | |
| | |
LOAN ASSIGNMENTS - 0.5% | | | | | | | | |
Food & Staples Retailing - 0.1% | | | | | | | | |
Albertson’s LLC, Term Loan B2 | | | | | | | | |
4.75%, 03/21/2019 (A) | | | 495,012 | | | | 493,259 | |
| | | | | | | | |
Household Products - 0.3% | | | | | | | | |
Dell, Inc., Term Loan B | | | | | | | | |
4.50%, 04/29/2020 (A) | | | 2,648,250 | | | | 2,650,657 | |
| | | | | | | | |
Metals & Mining - 0.1% | | | | | | | | |
Atkore International, Inc., 2nd Lien Term Loan | | | | | | | | |
7.75%, 10/09/2021 (A) | | | 550,000 | | | | 541,061 | |
| | | | | | | | |
Total Loan Assignments
(Cost $3,668,587) | | | | 3,684,977 | |
| | | | | |
|
SHORT-TERM U.S. GOVERNMENT OBLIGATION - 3.5% | |
U.S. Treasury Bill | | | | | | | | |
0.03%, 12/11/2014 (F) | | | 25,520,700 | | | | 25,519,928 | |
| | | | | | | | |
Total Short-Term U.S. Government Obligation
(Cost $25,519,927) | | | | 25,519,928 | |
| | | | | | | | |
| | |
| | | Shares | | | Value | |
PREFERRED STOCKS - 0.9% | | | | | | | | |
Banks - 0.1% | | | | | | | | |
CoBank ACB | | | | | | | | |
Series F, 6.25%, 144A (A) | | | 9,770 | | | | 1,016,386 | |
| | | | | | | | |
Consumer Finance - 0.3% | | | | | | | | |
Ally Financial, Inc. | | | | | | | | |
Series A, 8.50% (A) | | | 69,200 | | | | 1,832,416 | |
| | | | | | | | |
Diversified Telecommunication Services - 0.5% | |
Centaur Funding Corp. | | | | | | | | |
Series B, 9.08%, 144A | | | 2,661 | | | | 3,339,554 | |
| | | | | | | | |
Total Preferred Stocks
(Cost $6,173,197) | | | | | | | 6,188,356 | |
| | | | | | | | |
The Notes to Financial Statements are an integral part of this report.
| | |
| Transamerica Funds | | Annual Report 2014 |
Page 116
Transamerica Flexible Income
SCHEDULE OF INVESTMENTS (continued)
At October 31, 2014
| | | | | | | | |
| | | Shares | | | Value | |
COMMON STOCK - 0.2% | | | | | | | | |
Diversified Telecommunication Services - 0.2% | | | | | |
Verizon Communications, Inc. | | | 26,000 | | | | $ 1,306,500 | |
| | | | | | | | |
Total Common Stock
(Cost $814,250) | | | | | | | 1,306,500 | |
| | | | | | | | |
| | |
WARRANT - 0.4% | | | | | | | | |
Banks - 0.4% | | | | | | | | |
Wells Fargo & Co. (G) | | | | | | | | |
Expiration: 10/28/2018 | | | | | | | | |
Exercise Price: $34.01 | | | 148,210 | | | | 3,183,551 | |
| | | | | | | | |
Total Warrant
(Cost $1,141,217) | | | | | | | 3,183,551 | |
| | | | | | | | |
| |
SECURITIES LENDING COLLATERAL - 4.4% | | | | | |
State Street Navigator Securities Lending Trust - Prime Portfolio
0.16% (F) | | | 31,871,120 | | | | 31,871,120 | |
| | | | | | | | |
Total Securities Lending Collateral
(Cost $31,871,120) | | | | 31,871,120 | |
| | | | | | | | |
| | | | | | | | |
| | | Principal | | | Value | |
REPURCHASE AGREEMENT - 1.0% | |
State Street Bank & Trust Co.
0.01% (F), dated 10/31/2014, to be repurchased at $7,244,494 on 11/03/2014. Collateralized by U.S. Government Agency Obligations, 2.26% - 4.00%, due 12/15/2017 - 10/17/2022, and with a total value of $7,393,218. | | | $ 7,244,488 | | | | $ 7,244,488 | |
| | | | | | | | |
Total Repurchase Agreement
(Cost $7,244,488) | | | | 7,244,488 | |
| | | | | | | | |
Total Investments
(Cost $760,364,320) (H) | | | | 780,830,830 | |
Net Other Assets (Liabilities) - (7.1)% | | | | (51,465,182 | ) |
| | | | | | | | |
| | |
Net Assets - 100.0% | | | | | | | $ 729,365,648 | |
| | | | | | | | |
SECURITY VALUATION:
Valuation Inputs (I)
| | | | | | | | | | | | | | | | |
| | | Level 1
Quoted Prices | | | Level 2
Other Significant
Observable Inputs | | | Level 3
Significant
Unobservable Inputs | | | Value at
October 31, 2014 | |
ASSETS | | | | | | | | | | | | | | | | |
Investments | | | | | | | | | | | | | | | | |
U.S. Government Obligations | | $ | — | | | $ | 88,409,501 | | | $ | — | | | $ | 88,409,501 | |
U.S. Government Agency Obligations | | | — | | | | 25,565,823 | | | | — | | | | 25,565,823 | |
Foreign Government Obligations | | | — | | | | 7,889,230 | | | | — | | | | 7,889,230 | |
Mortgage-Backed Securities | | | — | | | | 93,518,072 | | | | — | | | | 93,518,072 | |
Asset-Backed Securities | | | — | | | | 49,194,629 | | | | — | | | | 49,194,629 | |
Municipal Government Obligations | | | — | | | | 4,976,812 | | | | — | | | | 4,976,812 | |
Preferred Corporate Debt Securities | | | — | | | | 10,550,325 | | | | — | | | | 10,550,325 | |
Corporate Debt Securities | | | — | | | | 417,551,080 | | | | — | | | | 417,551,080 | |
Convertible Bonds | | | — | | | | 4,176,438 | | | | — | | | | 4,176,438 | |
Loan Assignments | | | — | | | | 3,684,977 | | | | — | | | | 3,684,977 | |
Short-Term U.S. Government Obligation | | | — | | | | 25,519,928 | | | | — | | | | 25,519,928 | |
Preferred Stocks | | | 6,188,356 | | | | — | | | | — | | | | 6,188,356 | |
Common Stock | | | 1,306,500 | | | | — | | | | — | | | | 1,306,500 | |
Warrant | | | 3,183,551 | | | | — | | | | — | | | | 3,183,551 | |
Securities Lending Collateral | | | 31,871,120 | | | | — | | | | — | | | | 31,871,120 | |
Repurchase Agreement | | | — | | | | 7,244,488 | | | | — | | | | 7,244,488 | |
| | | | | | | | | | | | | | | | |
Total Investments | | $ | 42,549,527 | | | $ | 738,281,303 | | | $ | — | | | $ | 780,830,830 | |
| | | | | | | | | | | | | | | | |
| | | | | | | | | | | | | | | | |
| Investments | | Transfer from
Level 1 to Level 2 | | | Transfer from
Level 2 to Level 1 (J) | | | Transfer from
Level 2 to Level 3 | | | Transfer from
Level 3 to Level 2 | |
Preferred Stocks | | $ | — | | | $ | 4,355,940 | | | $ | — | | | $ | — | |
| | | | | | | | | | | | | | | | |
FOOTNOTES TO SCHEDULE OF INVESTMENTS:
| (A) | Floating or variable rate security. Rate is listed as of October 31, 2014. |
| (B) | Total aggregate value of illiquid securities is $1,082,530, or 0.15% of the Fund’s net assets. |
| (C) | All or a portion of this security is on loan. The value of all securities on loan is $31,211,453. The amount of securities on loan indicated may not correspond with the securities on loan identified because securities with pending sales are in the process of recall from the brokers. |
The Notes to Financial Statements are an integral part of this report.
| | |
| Transamerica Funds | | Annual Report 2014 |
Page 117
Transamerica Flexible Income
SCHEDULE OF INVESTMENTS (continued)
At October 31, 2014
FOOTNOTES TO SCHEDULE OF INVESTMENTS (continued):
| (D) | The security has a perpetual maturity. The date shown is the next call date. |
| (E) | Step bond. Coupon rate changes in increments to maturity. Rate disclosed is as of October 31, 2014. Maturity date disclosed is the ultimate maturity date. |
| (F) | Rate shown reflects the yield at October 31, 2014. |
| (G) | Non-income producing security. |
| (H) | Aggregate cost for federal income tax purposes is $760,364,320. Aggregate gross unrealized appreciation and depreciation for all securities is $24,114,812 and $3,648,302, respectively. Net unrealized appreciation for tax purposes is $20,466,510. |
| (I) | The Fund recognizes transfers between Levels at the end of the reporting period. See the Notes to Financial Statements for more information regarding security valuation and pricing inputs. |
| (J) | Transferred from Level 2 to 1 due to utilizing quoted market prices in active markets, which were not available on October 31, 2013. |
DEFINITIONS:
| | |
| 144A | | 144A securities are registered pursuant to Rule 144A of the Securities Act of 1933. These securities are deemed to be liquid for purposes of compliance limitations on holdings of illiquid securities and may be resold as transactions exempt from registration, normally to qualified institutional buyers. At October 31, 2014, these securities aggregated $238,783,811, or 32.74% of the Fund’s net assets. |
| AGM | | Assured Guaranty Municipal Corp. |
| IO | | Interest only portion of a STRIPS (Separate Trading of Registered Interest and Principal of Securities) |
| MTN | | Medium Term Note |
| TBA | | To Be Announced |
CURRENCY ABBREVIATIONS:
| | |
| BRL | | Brazilian Real |
| CAD | | Canadian Dollar |
| MXN | | Mexican Peso |
| PHP | | Philippine Peso |
The Notes to Financial Statements are an integral part of this report.
| | |
| Transamerica Funds | | Annual Report 2014 |
Page 118
Transamerica Floating Rate
SCHEDULE OF INVESTMENTS
At October 31, 2014
| | | | | | | | |
| | | Principal | | | Value | |
CORPORATE DEBT SECURITIES - 3.6% | |
Banks - 0.7% | | | | | | | | |
CIT Group, Inc. | | | | | | | | |
5.25%, 03/15/2018 | | | $ 1,500,000 | | | | $ 1,582,500 | |
| | | | | | | | |
Chemicals - 0.4% | | | | | | | | |
Hexion US Finance Corp. | | | | | | | | |
6.63%, 04/15/2020 | | | 750,000 | | | | 750,000 | |
| | | | | | | | |
Commercial Services & Supplies - 0.2% | |
Ceridian LLC / Comdata, Inc. | | | | | | | | |
8.13%, 11/15/2017, 144A | | | 425,000 | | | | 425,000 | |
| | | | | | | | |
Food Products - 0.2% | | | | | | | | |
Post Holdings, Inc. | | | | | | | | |
6.75%, 12/01/2021, 144A | | | 500,000 | | | | 499,375 | |
| | | | | | | | |
Health Care Providers & Services - 0.7% | |
CHS / Community Health Systems, Inc. | | | | | | | | |
5.13%, 08/01/2021 | | | 1,000,000 | | | | 1,045,000 | |
LifePoint Hospitals, Inc. | | | | | | | | |
5.50%, 12/01/2021 | | | 500,000 | | | | 523,750 | |
| | | | | | | | |
| | | | | | | 1,568,750 | |
| | | | | | | | |
Household Durables - 0.5% | | | | | | | | |
Meritage Homes Corp. | | | | | | | | |
4.50%, 03/01/2018 (A) | | | 1,000,000 | | | | 1,020,000 | |
| | | | | | | | |
Household Products - 0.5% | | | | | | | | |
Reynolds Group Issuer, Inc. / Reynolds Group Issuer LLC | | | | | | | | |
5.75%, 10/15/2020 | | | 1,000,000 | | | | 1,040,000 | |
| | | | | | | | |
Media - 0.2% | | | | | | | | |
Clear Channel Worldwide Holdings, Inc. | | | | | | | | |
6.50%, 11/15/2022 | | | 500,000 | | | | 515,000 | �� |
| | | | | | | | |
Oil, Gas & Consumable Fuels - 0.2% | | | | | | | | |
CITGO Petroleum Corp. | | | | | | | | |
6.25%, 08/15/2022, 144A | | | 396,000 | | | | 402,930 | |
| | | | | | | | |
Total Corporate Debt Securities
(Cost $7,740,873) | | | | | | | 7,803,555 | |
| | | | | | | | |
| | |
LOAN ASSIGNMENTS - 94.5% | | | | | | | | |
Aerospace & Defense - 0.9% | | | | | | | | |
Silver II US Holdings LLC, Term Loan | | | | | | | | |
4.00%, 12/13/2019 (B) | | | 949,848 | | | | 926,992 | |
TransDigm, Inc., Term Loan C | | | | | | | | |
3.75%, 02/28/2020 (B) | | | 989,924 | | | | 972,911 | |
| | | | | | | | |
| | | | | | | 1,899,903 | |
| | | | | | | | |
Auto Components - 3.7% | | | | | | | | |
Allison Transmission, Inc., Term Loan B3 | | | | | | | | |
3.75%, 08/23/2019 (B) | | | 1,231,655 | | | | 1,220,658 | |
Crowne Group LLC, 1st Lien Term Loan | | | | | | | | |
6.00%, 09/29/2020 (B) | | | 1,000,000 | | | | 985,000 | |
Goodyear Tire & Rubber Co., 2nd Lien Term Loan | | | | | | | | |
4.75%, 04/30/2019 (B) | | | 3,000,000 | | | | 3,003,000 | |
UCI International, Inc., Term Loan B | | | | | | | | |
5.50%, 07/26/2017 (B) | | | 494,859 | | | | 493,621 | |
Veyance Technologies, Inc., 1st Lien Term Loan | | | | | | | | |
5.25%, 09/08/2017 (B) | | | 2,363,226 | | | | 2,349,195 | |
| | | | | | | | |
| | | | | | | 8,051,474 | |
| | | | | | | | |
| | | | | | | | |
| | | Principal | | | Value | |
LOAN ASSIGNMENTS (continued) | | | | | | | | |
Automobiles - 0.5% | | | | | | | | |
Chrysler Group LLC, Term Loan B | | | | | | | | |
TBD, 05/24/2017 (C) | | | $ 1,000,000 | | | | $ 993,542 | |
| | | | | | | | |
Biotechnology - 1.0% | | | | | | | | |
Sage Products Holdings III LLC, Refi Term Loan B | | | | | | | | |
4.25%, 12/13/2019 (B) | | | 2,272,519 | | | | 2,257,368 | |
| | | | | | | | |
Building Products - 0.9% | | | | | | | | |
Ply Gem Industries, Inc., Term Loan | | | | | | | | |
4.00%, 02/01/2021 (B) | | | 1,990,000 | | | | 1,956,419 | |
| | | | | | | | |
Capital Markets - 0.7% | | | | | | | | |
Guggenheim Partners LLC, Term Loan | | | | | | | | |
4.25%, 07/22/2020 (B) | | | 1,493,715 | | | | 1,482,047 | |
| | | | | | | | |
Chemicals - 2.9% | | | | | | | | |
Axalta Coating Systems US Holdings, Inc., Term Loan | | | | | | | | |
3.75%, 02/01/2020 (B) | | | 1,888,043 | | | | 1,855,594 | |
AZ Chem US, Inc., 1st Lien Term Loan | | | | | | | | |
4.50%, 06/12/2021 (B) | | | 1,478,767 | | | | 1,474,453 | |
Minerals Technologies, Inc., Term Loan B | | | | | | | | |
4.00%, 05/09/2021 (B) | | | 978,269 | | | | 970,688 | |
Road Infrastructure Investment LLC, 2nd Lien Term Loan | | | | | | | | |
7.75%, 09/21/2021 (B) | | | 1,000,000 | | | | 905,000 | |
Tronox Pigments BV, Term Loan | | | | | | | | |
4.00%, 03/19/2020 (B) | | | 496,646 | | | | 490,990 | |
Verdesian Life Sciences LLC, Term Loan | | | | | | | | |
6.00%, 07/01/2020 (B) | | | 493,750 | | | | 492,515 | |
| | | | | | | | |
| | | | | | | 6,189,240 | |
| | | | | | | | |
Commercial Services & Supplies - 6.3% | | | | | | | | |
ADS Waste Holdings, Inc., Term Loan | | | | | | | | |
3.75%, 10/09/2019 (B) | | | 1,465,019 | | | | 1,430,591 | |
Allied Security Holdings LLC, 1st Lien Term Loan | | | | | | | | |
4.25%, 02/12/2021 (B) | | | 1,101,875 | | | | 1,088,102 | |
ARG IH Corp., Term Loan B | | | | | | | | |
4.75%, 11/15/2020 (B) | | | 1,488,750 | | | | 1,483,633 | |
Autoparts Holdings, Ltd., 1st Lien Term Loan | | | | | | | | |
6.50%, 07/28/2017 (B) | | | 796,093 | | | | 796,839 | |
EnergySolutions LLC, Term Loan | | | | | | | | |
6.75%, 05/29/2020 (B) | | | 997,500 | | | | 1,001,657 | |
Multi Packaging Solutions, Inc., Term Loan B | | | | | | | | |
4.25%, 09/30/2020 (B) | | | 995,000 | | | | 977,587 | |
Polymer Group, Inc., 1st Lien Term Loan | | | | | | | | |
5.25%, 12/19/2019 (B) | | | 1,989,054 | | | | 1,981,595 | |
Pre-Paid Legal Services, Inc., 1st Lien Term Loan | | | | | | | | |
6.25%, 07/01/2019 (B) | | | 1,187,719 | | | | 1,184,255 | |
Protection One, Inc., Term Loan | | | | | | | | |
4.25%, 03/21/2019 (B) | | | 818,723 | | | | 813,947 | |
PSC Industrial Outsourcing, LP, Term Loan B | | | | | | | | |
5.50%, 05/15/2020 (B) | | | 748,125 | | | | 736,903 | |
RGIS Services LLC, Term Loan C | | | | | | | | |
5.50%, 10/18/2017 (B) | | | 494,924 | | | | 466,466 | |
The Notes to Financial Statements are an integral part of this report.
| | |
| Transamerica Funds | | Annual Report 2014 |
Page 119
Transamerica Floating Rate
SCHEDULE OF INVESTMENTS (continued)
At October 31, 2014
| | | | | | | | |
| | | Principal | | | Value | |
LOAN ASSIGNMENTS (continued) | | | | | | | | |
Commercial Services & Supplies (continued) | |
W / S Packaging Group, Inc., Term Loan B | | | | | | | | |
5.00%, 08/05/2019 (B) | | | $ 495,000 | | | | $ 488,194 | |
WTG Holdings III Corp., 1st Lien Term Loan | | | | | | | | |
4.75%, 01/15/2021 (B) | | | 1,157,917 | | | | 1,146,337 | |
| | | | | | | | |
| | | | | | | 13,596,106 | |
| | | | | | | | |
Communications Equipment - 1.0% | |
AVSC Holding Corp., 1st Lien Term Loan | | | | | | | | |
4.50%, 01/24/2021 (B) | | | 1,492,500 | | | | 1,480,684 | |
Global Tel*Link Corp., 1st Lien Term Loan | | | | | | | | |
5.00%, 05/22/2020 (B) | | | 733,835 | | | | 727,643 | |
| | | | | | | | |
| | | | | | | 2,208,327 | |
| | | | | | | | |
Construction & Engineering - 0.7% | |
Floatel International, Ltd., Term Loan B | | | | | | | | |
6.00%, 06/27/2020 (B) | | | 497,500 | | | | 481,331 | |
Pike Corp., 1st Lien Term Loan | | | | | | | | |
TBD, 10/01/2021 (C) | | | 1,000,000 | | | | 992,500 | |
| | | | | | | | |
| | | | | | | 1,473,831 | |
| | | | | | | | |
Containers & Packaging - 5.1% | |
Anchor Glass Container Corp., 1st Lien Term Loan | | | | | | | | |
4.25%, 06/30/2021 (B) | | | 2,720,000 | | | | 2,694,500 | |
Berry Plastics Holding Corp., Term Loan E | | | | | | | | |
3.75%, 01/06/2021 (B) | | | 1,990,000 | | | | 1,954,345 | |
BWAY Holding Co., Inc., Term Loan B | | | | | | | | |
5.50%, 08/14/2020 (B) | | | 997,500 | | | | 999,994 | |
Crown Americas LLC, Term Loan B | | | | | | | | |
TBD, 10/22/2021 (C) | | | 1,500,000 | | | | 1,503,750 | |
Multi Packaging Solutions, Inc., Term Loan A | | | | | | | | |
4.25%, 09/30/2020 (B) | | | 498,750 | | | | 491,269 | |
Packaging Coordinators, Inc., 1st Lien Term Loan | | | | | | | | |
5.25%, 08/01/2021 (B) | | | 500,000 | | | | 497,916 | |
Printpack Holdings, Inc., Term Loan | | | | | | | | |
6.00%, 05/28/2020 (B) | | | 498,750 | | | | 495,633 | |
Tekni-Plex, Inc., Term Loan B | | | | | | | | |
4.75%, 08/25/2019 (B) | | | 2,482,453 | | | | 2,463,835 | |
| | | | | | | | |
| | | | | | | 11,101,242 | |
| | | | | | | | |
Diversified Consumer Services - 1.4% | |
ServiceMaster Co., Term Loan B | | | | | | | | |
4.25%, 07/01/2021 (B) | | | 2,000,000 | | | | 1,980,834 | |
William Morris Endeavor Entertainment LLC, 1st Lien Term Loan | | | | | | | | |
5.25%, 05/06/2021 (B) | | | 997,500 | | | | 980,044 | |
| | | | | | | | |
| | | | | | | 2,960,878 | |
| | | | | | | | |
Diversified Financial Services - 0.7% | |
Delos Finance Sarl, Term Loan B | | | | | | | | |
3.50%, 03/06/2021 (B) | | | 500,000 | | | | 496,875 | |
Duff & Phelps Investment Management Co., Term Loan B | | | | | | | | |
4.50%, 04/23/2020 (B) | | | 989,982 | | | | 979,257 | |
| | | | | | | | |
| | | | | | | 1,476,132 | |
| | | | | | | | |
Diversified Telecommunication Services - 0.9% | |
Cincinnati Bell, Inc., Term Loan B | | | | | | | | |
4.00%, 09/10/2020 (B) | | | 891,000 | | | | 882,090 | |
| | | | | | | | |
| | | Principal | | | Value | |
LOAN ASSIGNMENTS (continued) | | | | | | | | |
Diversified Telecommunication Services (continued) | |
Level 3 Financing, Inc., Incremental Term Loan B5 | | | | | | | | |
TBD, 01/31/2022 (C) | | | $ 500,000 | | | | $ 501,407 | |
Securus Technologies Holdings, Inc., Term Loan | | | | | | | | |
4.75%, 04/30/2020 (B) | | | 495,000 | | | | 489,122 | |
| | | | | | | | |
| | | | | | | 1,872,619 | |
| | | | | | | | |
Electric Utilities - 1.2% | |
Star West Generation LLC, Term Loan B | | | | | | | | |
4.25%, 03/13/2020 (B) | | | 1,229,136 | | | | 1,216,845 | |
Viva Alamo LLC, Term Loan B | | | | | | | | |
4.75%, 02/20/2021 (B) | | | 1,494,994 | | | | 1,466,962 | |
| | | | | | | | |
| | | | | | | 2,683,807 | |
| | | | | | | | |
Electrical Equipment - 0.2% | |
Trojan Battery Co. LLC, Term Loan | | | | | | | | |
5.75%, 06/11/2021 (B) | | | 498,750 | | | | 495,633 | |
| | | | | | | | |
Electronic Equipment, Instruments & Components - 1.5% | |
Sensus USA, Inc., 1st Lien Term Loan | | | | | | | | |
4.50%, 05/09/2017 (B) | | | 2,185,148 | | | | 2,119,594 | |
Zebra Technologies Corp., Term Loan B | | | | | | | | |
TBD, 09/30/2021 (C) | | | 1,000,000 | | | | 1,006,500 | |
| | | | | | | | |
| | | | | | | 3,126,094 | |
| | | | | | | | |
Energy Equipment & Services - 0.3% | |
Stallion Oilfield Services, Ltd., Term Loan B | | | | | | | | |
8.00%, 06/19/2018 (B) | | | 773,603 | | | | 742,659 | |
| | | | | | | | |
Food & Staples Retailing - 2.2% | |
Albertson’s LLC, Term Loan B2 | | | | | | | | |
4.75%, 03/21/2019 (B) | | | 796,005 | | | | 793,186 | |
Bellisio Foods, Inc., Term Loan | | | | | | | | |
4.50%, 07/31/2019 (B) | | | 881,571 | | | | 868,348 | |
Rite Aid Corp., 2nd Lien Term Loan | | | | | | | | |
5.75%, 08/21/2020 (B) | | | 1,500,000 | | | | 1,504,999 | |
Roundy’s Supermarkets, Inc., Term Loan B | | | | | | | | |
5.75%, 03/03/2021 (B) | | | 1,038,960 | | | | 925,973 | |
SUPERVALU, Inc., Refi Term Loan B | | | | | | | | |
4.50%, 03/21/2019 (B) | | | 741,530 | | | | 730,407 | |
| | | | | | | | |
| | | | | | | 4,822,913 | |
| | | | | | | | |
Food Products - 5.5% | |
Aramark Services, Inc., Extended Synthetic Line of Credit 2 | | | | | | | | |
0.01%, 07/26/2016 (B) | | | 1,409,295 | | | | 1,398,725 | |
Aramark Services, Inc., Extended Synthetic Line of Credit 3 | | | | | | | | |
0.01%, 07/26/2016 (B) | | | 587,318 | | | | 582,913 | |
Big Heart Pet Brands, Term Loan | | | | | | | | |
3.50%, 03/08/2020 (B) | | | 1,495,000 | | | | 1,436,695 | |
CSM Bakery Solutions LLC, 1st Lien Term Loan | | | | | | | | |
5.00%, 07/03/2020 (B) | | | 1,988,959 | | | | 1,969,899 | |
Del Monte Foods, Inc., 1st Lien Term Loan | | | | | | | | |
4.25%, 02/18/2021 (B) | | | 1,488,750 | | | | 1,394,463 | |
Del Monte Foods, Inc., 2nd Lien Term Loan | | | | | | | | |
8.25%, 08/18/2021 (B) | | | 250,000 | | | | 225,000 | |
Dole Food Co., Inc., Term Loan B | | | | | | | | |
4.50%, 11/01/2018 (B) | | | 1,958,333 | | | | 1,949,358 | |
HB Acquisition LLC, Term Loan | | | | | | | | |
TBD, 04/09/2020 (C) | | | 1,000,000 | | | | 1,018,750 | |
The Notes to Financial Statements are an integral part of this report.
| | |
| Transamerica Funds | | Annual Report 2014 |
Page 120
Transamerica Floating Rate
SCHEDULE OF INVESTMENTS (continued)
At October 31, 2014
| | | | | | | | |
| | | Principal | | | Value | |
LOAN ASSIGNMENTS (continued) | | | | | | | | |
Food Products (continued) | |
Post Holdings, Inc., Series A Incremental Term Loan | | | | | | | | |
3.75%, 06/02/2021 (B) | | | $ 997,500 | | | | $ 991,404 | |
Shearer’s Foods, Inc., 1st Lien Term Loan | | | | | | | | |
4.50%, 06/30/2021 (B) | | | 1,000,000 | | | | 993,125 | |
| | | | | | | | |
| | | | | | | 11,960,332 | |
| | | | | | | | |
Health Care Equipment & Supplies - 4.3% | | | | | | | | |
Alere, Inc., Term Loan B | | | | | | | | |
4.25%, 06/30/2017 (B) | | | 2,484,680 | | | | 2,472,878 | |
Biomet Inc., Term Loan B2 | | | | | | | | |
3.65%, 07/25/2017 (B) | | | 1,934,309 | | | | 1,927,357 | |
CPI Buyer LLC, 1st Lien Term Loan | | | | | | | | |
5.50%, 08/18/2021 (B) | | | 1,000,000 | | | | 985,000 | |
DJO Finance LLC, Term Loan | | | | | | | | |
4.25%, 09/15/2017 (B) | | | 1,496,241 | | | | 1,487,824 | |
Kinetic Concepts, Inc., Term Loan E1 | | | | | | | | |
4.00%, 05/04/2018 (B) | | | 1,989,987 | | | | 1,975,063 | |
Millennium Laboratories, Inc., Term Loan B | | | | | | | | |
5.25%, 04/16/2021 (B) | | | 498,750 | | | | 498,438 | |
| | | | | | | | |
| | | | | | | 9,346,560 | |
| | | | | | | | |
Health Care Providers & Services - 6.4% | | | | | | | | |
Ardent Medical Services, Inc., Term Loan | | | | | | | | |
6.75%, 07/02/2018 (B) | | | 456,767 | | | | 456,767 | |
Community Health Systems, Inc., Term Loan D | | | | | | | | |
4.25%, 01/27/2021 (B) | | | 2,099,610 | | | | 2,100,922 | |
Halyard Health, Inc., Term Loan B | | | | | | | | |
TBD, 10/01/2021 (C) | | | 1,000,000 | | | | 1,001,250 | |
IASIS Healthcare LLC, Term Loan B2 | | | | | | | | |
4.50%, 05/03/2018 (B) | | | 1,991,155 | | | | 1,988,666 | |
INC Research LLC, Term Loan B | | | | | | | | |
TBD, 10/22/2021 (C) | | | 1,000,000 | | | | 997,083 | |
Medpace Holdings, Inc., 1st Lien Term Loan | | | | | | | | |
TBD, 04/01/2021 (C) | | | 500,000 | | | | 496,250 | |
Ortho-Clinical Diagnostics, Inc., Term Loan B | | | | | | | | |
4.75%, 06/30/2021 (B) | | | 1,995,000 | | | | 1,968,816 | |
Planet Fitness Holdings LLC, Term Loan | | | | | | | | |
4.75%, 03/31/2021 (B) | | | 995,000 | | | | 998,731 | |
Radnet Management, Inc., Term Loan B | | | | | | | | |
4.28%, 10/10/2018 (B) | | | 487,500 | | | | 481,162 | |
Regionalcare Hospital Partners, Inc., 1st Lien Term Loan | | | | | | | | |
6.00%, 04/19/2019 (B) | | | 1,248,750 | | | | 1,246,409 | |
Surgery Center Holdings, Inc., 1st Lien Term Loan | | | | | | | | |
TBD, 07/09/2020 (C) | | | 500,000 | | | | 498,750 | |
United Surgical Partners International, Inc., Extended Term Loan | | | | | | | | |
4.25%, 04/19/2017 (B) | | | 496,183 | | | | 492,462 | |
United Surgical Partners International, Inc., Incremental Term Loan | | | | | | | | |
4.75%, 04/03/2019 (B) | | | 498,734 | | | | 498,579 | |
Valitas Health Services, Inc., Term Loan B | | | | | | | | |
6.00%, 06/02/2017 (B) | | | 700,000 | | | | 658,000 | |
| | | | | | | | |
| | | | | | | 13,883,847 | |
| | | | | | | | |
| | | | | | | | |
| | | Principal | | | Value | |
LOAN ASSIGNMENTS (continued) | | | | | | | | |
Health Care Technology - 1.1% | | | | | | | | |
CT Technologies Intermediate Holdings, Inc., 1st Lien Term Loan | | | | | | | | |
5.25%, 10/02/2019 (B) | | | $ 496,250 | | | | $ 493,148 | |
Onex Carestream Finance, LP, 1st Lien Term Loan | | | | | | | | |
5.00%, 06/07/2019 (B) | | | 1,942,788 | | | | 1,943,274 | |
| | | | | | | | |
| | | | | | | 2,436,422 | |
| | | | | | | | |
Hotels, Restaurants & Leisure - 6.4% | | | | | | | | |
1011778 B.C. Unlimited Liability Co., Term Loan B | | | | | | | | |
TBD, 10/27/2021 (C) | | | 1,000,000 | | | | 998,611 | |
Affinity Gaming LLC, Term Loan B | | | | | | | | |
5.25%, 11/09/2017 (B) | | | 515,963 | | | | 514,244 | |
Aristocrat Leisure, Ltd., Term Loan B | | | | | | | | |
TBD, 10/20/2021 (C) | | | 500,000 | | | | 495,417 | |
Caesars Entertainment Resort Properties LLC, Term Loan B | | | | | | | | |
7.00%, 10/11/2020 (B) | | | 496,250 | | | | 473,050 | |
CityCenter Holdings LLC, Term Loan B | | | | | | | | |
4.25%, 10/16/2020 (B) | | | 1,500,000 | | | | 1,489,125 | |
Great Wolf Resorts, Inc., Term Loan B | | | | | | | | |
4.25%, 08/06/2020 (B) | | | 1,987,450 | | | | 1,966,747 | |
Hearthside Group Holdings LLC, Term Loan | | | | | | | | |
4.50%, 06/02/2021 (B) | | | 997,500 | | | | 990,642 | |
Hilton Worldwide Finance LLC, Term Loan B2 | | | | | |
3.50%, 10/26/2020 (B) | | | 1,040,000 | | | | 1,028,950 | |
MGM Resorts International, Term Loan B | | | | | | | | |
3.50%, 12/20/2019 (B) | | | 992,424 | | | | 979,709 | |
NEP/NCP Holdco, Inc., Incremental Term Loan | | | | | | | | |
4.25%, 01/22/2020 (B) | | | 1,487,534 | | | | 1,450,346 | |
Peninsula Gaming LLC, Term Loan | | | | | | | | |
4.25%, 11/20/2017 (B) | | | 492,297 | | | | 488,144 | |
Scientific Games International, Inc., Term Loan B1 | | | | | | | | |
4.25%, 10/18/2020 (B) | | | 1,488,750 | | | | 1,457,114 | |
SGMS Escrow Corp., Incremental Term Loan B2 | | | | | | | | |
TBD, 10/01/2021 (C) | | | 500,000 | | | | 488,594 | |
WMG Acquisition Corp., Term Loan | | | | | | | | |
3.75%, 07/01/2020 (B) | | | 990,000 | | | | 957,206 | |
| | | | | | | | |
| | | | | | | 13,777,899 | |
| | | | | | | | |
Household Durables - 1.1% | | | | | | | | |
API Heat Transfer ThermaSys Corp., Term Loan | | | | | | | | |
5.25%, 05/03/2019 (B) | | | 993,590 | | | | 977,444 | |
Hoffmaster Group, Inc., 1st Lien Term Loan | | | | | | | | |
5.25%, 05/09/2020 (B) | | | 997,500 | | | | 993,343 | |
Libbey Glass, Inc., Term Loan B | | | | | | | | |
TBD, 04/09/2021 (C) | | | 500,000 | | | | 492,813 | |
| | | | | | | | |
| | | | | | | 2,463,600 | |
| | | | | | | | |
Household Products - 3.9% | | | | | | | | |
Armored Autogroup, Inc., Term Loan B | | | | | | | | |
6.00%, 11/04/2016 (B) | | | 959,363 | | | | 956,565 | |
Dell, Inc., Term Loan B | | | | | | | | |
4.50%, 04/29/2020 (B) | | | 2,977,481 | | | | 2,980,188 | |
The Notes to Financial Statements are an integral part of this report.
| | |
| Transamerica Funds | | Annual Report 2014 |
Page 121
Transamerica Floating Rate
SCHEDULE OF INVESTMENTS (continued)
At October 31, 2014
| | | | | | | | |
| | | Principal | | | Value | |
LOAN ASSIGNMENTS (continued) | | | | | | | | |
Household Products (continued) | | | | | | | | |
Herff Jones, Inc., Term Loan B | | | | | | | | |
5.50%, 06/25/2019 (B) | | | $ 1,458,199 | | | | $ 1,452,730 | |
KIK Custom Products, Inc., 1st Lien Term Loan | | | | | | | | |
5.50%, 04/29/2019 (B) | | | 1,984,965 | | | | 1,970,078 | |
Reynolds Group Holdings, Inc., Term Loan | | | | | | | | |
4.00%, 12/01/2018 (B) | | | 997,487 | | | | 991,114 | |
| | | | | | | | |
| | | | | | | 8,350,675 | |
| | | | | | | | |
Independent Power and Renewable Electricity Producers - 0.7% | |
Dynegy Holdings, Inc., Term Loan B2 | | | | | | | | |
4.00%, 04/23/2020 (B) | | | 1,484,962 | | | | 1,475,681 | |
| | | | | | | | |
Industrial Conglomerates - 0.9% | | | | | | | | |
Gates Global, Inc., Term Loan B | | | | | | | | |
4.25%, 07/05/2021 (B) | | | 1,000,000 | | | | 987,321 | |
Osmose Holdings, Inc., 1st Lien Term Loan | | | | | | | | |
4.75%, 07/31/2021 (B) | | | 997,500 | | | | 986,902 | |
| | | | | | | | |
| | | | | | | 1,974,223 | |
| | | | | | | | |
Insurance - 0.8% | | | | | | | | |
Asurion LLC, Term Loan B1 | | | | | | | | |
5.00%, 05/24/2019 (B) | | | 1,707,883 | | | | 1,707,082 | |
| | | | | | | | |
IT Services - 1.5% | | | | | | | | |
MoneyGram International, Inc., Term Loan B | | | | | | | | |
4.25%, 03/27/2020 (B) | | | 248,737 | | | | 229,460 | |
SunGard Data Systems, Inc., Term Loan C | | | | | | | | |
3.90%, 02/28/2017 (B) | | | 1,000,000 | | | | 995,000 | |
SunGard Data Systems, Inc., Term Loan E | | | | | | | | |
4.00%, 03/08/2020 (B) | | | 2,019,928 | | | | 2,009,829 | |
| | | | | | | | |
| | | | | | | 3,234,289 | |
| | | | | | | | |
Life Sciences Tools & Services - 0.2% | | | | | | | | |
Pharmaceutical Product Development LLC, Term Loan B | | | | | | | | |
4.00%, 12/05/2018 (B) | | | 494,962 | | | | 490,755 | |
| | | | | | | | |
Machinery - 5.0% | | | | | | | | |
Apex Tool Group LLC, Term Loan B | | | | | | | | |
4.50%, 01/31/2020 (B) | | | 985,000 | | | | 930,825 | |
Doosan Infracore International, Inc., Term Loan B | | | | | | | | |
4.50%, 05/28/2021 (B) | | | 1,496,250 | | | | 1,495,004 | |
Filtration Group Corp., 1st Lien Term Loan | | | | | | | | |
4.50%, 11/21/2020 (B) | | | 1,488,750 | | | | 1,479,445 | |
Gardner Denver, Inc., Term Loan | | | | | | | | |
4.25%, 07/30/2020 (B) | | | 990,000 | | | | 974,188 | |
Phillips-Medisize Corp., 1st Lien Term Loan | | | | | | | | |
4.75%, 06/16/2021 (B) | | | 498,750 | | | | 495,944 | |
Rexnord LLC, 1st Lien Term Loan B | | | | | | | | |
4.00%, 08/21/2020 (B) | | | 1,990,000 | | | | 1,958,373 | |
Wastequip LLC, Term Loan | | | | | | | | |
5.50%, 08/09/2019 (B) | | | 987,500 | | | | 985,031 | |
| | | | | | | | |
| | | Principal | | | Value | |
LOAN ASSIGNMENTS (continued) | | | | | | | | |
Machinery (continued) | | | | | | | | |
Xerium Technologies, Inc., Term Loan | | | | | | | | |
5.75%, 05/17/2019 (B) | | | $ 2,486,206 | | | | $ 2,476,883 | |
| | | | | | | | |
| | | | | | | 10,795,693 | |
| | | | | | | | |
Marine - 0.2% | | | | | | | | |
Commercial Barge Line Co., 1st Lien Term Loan | | | | | | | | |
7.50%, 09/23/2019 (B) | | | 492,500 | | | | 491,577 | |
| | | | | | | | |
Media - 6.8% | | | | | | | | |
Affinion Group, Inc., Term Loan B | | | | | | | | |
6.75%, 04/30/2018 (B) | | | 991,137 | | | | 959,750 | |
Block Communications, Inc., Term Loan B | | | | | | | | |
TBD, 10/21/2021 (C) | | | 1,000,000 | | | | 998,750 | |
Charter Communications Operating LLC, Term Loan G | | | | | | | | |
TBD, 09/12/2021 (C) | | | 2,000,000 | | | | 2,014,166 | |
Cumulus Media Holdings, Inc., Term Loan | | | | | | | | |
4.25%, 12/23/2020 (B) | | | 1,447,315 | | | | 1,425,605 | |
Granite Acquisition, Inc., Term Loan B | | | | | | | | |
TBD, 10/15/2021 (C) | | | 1,957,854 | | | | 1,960,302 | |
Granite Acquisition, Inc., Term Loan C | | | | | | | | |
TBD, 10/15/2021 (C) | | | 42,146 | | | | 42,198 | |
Learfield Communications, Inc., 1st Lien Term Loan | | | | | | | | |
4.50%, 10/09/2020 (B) | | | 1,492,503 | | | | 1,485,041 | |
Liberty Cablevision of Puerto Rico LLC,
1st Lien Term Loan | | | | | | | | |
4.50%, 01/07/2022 (B) | | | 797,959 | | | | 789,481 | |
Liberty Cablevision of Puerto Rico LLC,
2nd Lien Term Loan | | | | | | | | |
7.75%, 07/07/2023 (B) | | | 1,000,000 | | | | 991,667 | |
Tribune Co., Term Loan | | | | | | | | |
4.00%, 12/27/2020 (B) | | | 2,106,536 | | | | 2,089,421 | |
Univision Communications, Inc., Term Loan C4 | | | | | | | | |
4.00%, 03/01/2020 (B) | | | 1,485,009 | | | | 1,469,231 | |
Visant Corp., Term Loan | | | | | | | | |
7.00%, 09/23/2021 (B) | | | 500,000 | | | | 492,083 | |
| | | | | | | | |
| | | | | | | 14,717,695 | |
| | | | | | | | |
Metals & Mining - 0.5% | | | | | | | | |
American Rock Salt Holdings LLC, 1st Lien Term Loan | | | | | | | | |
4.75%, 05/20/2021 (B) | | | 498,750 | | | | 493,347 | |
WireCo WorldGroup, Inc., Term Loan | | | | | | | | |
6.00%, 02/15/2017 (B) | | | 498,728 | | | | 499,039 | |
| | | | | | | | |
| | | | | | | 992,386 | |
| | | | | | | | |
Multi-Utilities - 0.5% | | | | | | | | |
Solenis International, LP, 1st Lien Term Loan | | | | | | | | |
4.25%, 07/31/2021 (B) | | | 1,000,000 | | | | 978,125 | |
| | | | | | | | |
Oil, Gas & Consumable Fuels - 0.2% | | | | | | | | |
Arch Coal, Inc., Term Loan B | | | | | | | | |
6.25%, 05/16/2018 (B) | | | 494,948 | | | | 435,378 | |
| | | | | | | | |
Paper & Forest Products - 0.7% | | | | | | | | |
Exopack Holdings SA, Term Loan B | | | | | | | | |
5.25%, 05/08/2019 (B) | | | 1,492,500 | | | | 1,498,097 | |
| | | | | | | | |
The Notes to Financial Statements are an integral part of this report.
| | |
| Transamerica Funds | | Annual Report 2014 |
Page 122
Transamerica Floating Rate
SCHEDULE OF INVESTMENTS (continued)
At October 31, 2014
| | | | | | | | |
| | | Principal | | | Value | |
LOAN ASSIGNMENTS (continued) | | | | | | | | |
Personal Products - 2.1% | | | | | | | | |
Prestige Brands, Inc., Term Loan | | | | | | | | |
4.13%, 01/31/2019 (B) | | | $ 984,090 | | | | $ 981,630 | |
Prestige Brands, Inc., Term Loan B2 | | | | | | | | |
4.50%, 09/03/2021 (B) | | | 1,500,000 | | | | 1,501,249 | |
Revlon Consumer Products Corp., Acquisition Term Loan | | | | | | | | |
4.00%, 10/08/2019 (B) | | | 992,500 | | | | 979,267 | |
Vogue International, Inc., Term Loan | | | | | | | | |
5.25%, 02/14/2020 (B) | | | 995,000 | | | | 995,000 | |
| | | | | | | | |
| | | | | | | 4,457,146 | |
| | | | | | | | |
Pharmaceuticals - 3.3% | | | | | | | | |
Akorn, Inc., Term Loan B | | | | | | | | |
4.50%, 04/16/2021 (B) | | | 1,000,000 | | | | 992,083 | |
Amneal Pharmaceuticals LLC, Term Loan | | | | | | | | |
4.75%, 11/01/2019 (B) | | | 1,441,115 | | | | 1,433,009 | |
Catalent Pharma Solutions, Inc., Term
Loan B | | | | | | | | |
4.50%, 05/20/2021 (B) | | | 1,996,250 | | | | 1,990,190 | |
Salix Pharmaceuticals, Ltd., Term Loan | | | | | | | | |
4.25%, 01/02/2020 (B) | | | 1,925,000 | | | | 1,921,562 | |
Valeant Pharmaceuticals International, Inc. | | | | | | | | |
Series E, Term Loan B | | | | | | | | |
3.50%, 08/05/2020 (B) | | | 802,213 | | | | 795,528 | |
| | | | | | | | |
| | | | | | | 7,132,372 | |
| | | | | | | | |
Professional Services - 1.9% | | | | | | | | |
Ceridian LLC, Term Loan B1 | | | | | | | | |
4.12%, 05/09/2017 (B) | | | 813,656 | | | | 812,299 | |
Ceridian LLC, Term Loan B2 | | | | | | | | |
4.50%, 09/15/2020 (B) | | | 1,848,717 | | | | 1,831,001 | |
TransUnion LLC, Term Loan | | | | | | | | |
4.00%, 04/09/2021 (B) | | | 1,492,500 | | | | 1,469,180 | |
| | | | | | | | |
| | | | | | | 4,112,480 | |
| | | | | | | | |
Real Estate Management & Development - 1.4% | | | | | |
DTZ U.S. Borrower LLC, 1st Lien Term Loan | | | | | | | | |
TBD, 11/04/2021 (C) | | | 250,667 | | | | 250,771 | |
Realogy Corp., Extended Letter of Credit | | | | | | | | |
4.25%, 10/10/2016 (B) | | | 1,694,709 | | | | 1,658,697 | |
Realogy Corp., Term Loan B | | | | | | | | |
3.75%, 03/05/2020 (B) | | | 1,193,004 | | | | 1,178,390 | |
| | | | | | | | |
| | | | | | | 3,087,858 | |
| | | | | | | | |
Road & Rail - 1.2% | | | | | | | | |
Fly Funding II S.a.r.l., Term Loan B | | | | | | | | |
4.50%, 08/09/2019 (B) | | | 1,703,125 | | | | 1,699,400 | |
Swift Transportation Co. LLC, Term Loan B | | | | | | | | |
3.75%, 06/09/2021 (B) | | | 1,000,000 | | | | 992,083 | |
| | | | | | | | |
| | | | | | | 2,691,483 | |
| | | | | | | | |
Semiconductors & Semiconductor Equipment - 0.9% | | | | | |
Avago Technologies Cayman, Ltd., Term Loan B | | | | | | | | |
3.75%, 05/06/2021 (B) | | | 997,500 | | | | 993,759 | |
Freescale Semiconductor, Inc., Term Loan B4 | | | | | | | | |
4.25%, 02/28/2020 (B) | | | 992,500 | | | | 978,078 | |
| | | | | | | | |
| | | | | | | 1,971,837 | |
| | | | | | | | |
Software - 2.7% | | | | | | | | |
Aricent Technologies, 1st Lien Term Loan | | | | | | | | |
5.50%, 04/14/2021 (B) | | | 498,750 | | | | 497,919 | |
| | | | | | | | |
| | | Principal | | | Value | |
LOAN ASSIGNMENTS (continued) | | | | | | | | |
Software (continued) | | | | | | | | |
BMC Foreign Holding Co., Term Loan | | | | | | | | |
5.00%, 09/10/2020 (B) | | | $ 496,250 | | | | $ 484,464 | |
BMC Software Finance, Inc., Term Loan | | | | | | | | |
5.00%, 09/10/2020 (B) | | | 478,889 | | | | 472,250 | |
First Data Corp., Term Loan B | | | | | | | | |
3.65%, 03/24/2017 (B) | | | 1,000,000 | | | | 991,750 | |
Infor, Inc., Term Loan B5 | | | | | | | | |
3.75%, 06/03/2020 (B) | | | 1,460,011 | | | | 1,435,981 | |
Magic Newco LLC, 1st Lien Term Loan | | | | | | | | |
5.00%, 12/12/2018 (B) | | | 989,911 | | | | 989,911 | |
Sophia, LP, Term Loan B | | | | | | | | |
4.00%, 07/19/2018 (B) | | | 955,855 | | | | 946,296 | |
| | | | | | | | |
| | | | | | | 5,818,571 | |
| | | | | | | | |
Specialty Retail - 1.1% | | | | | | | | |
PFS Holding Corp., 1st Lien Term Loan | | | | | | | | |
4.50%, 01/31/2021 (B) | | | 1,492,500 | | | | 1,261,163 | |
Pilot Travel Centers LLC, Term Loan B | | | | | | | | |
TBD, 10/01/2021 (C) | | | 1,000,000 | | | | 1,000,625 | |
| | | | | | | | |
| | | | | | | 2,261,788 | |
| | | | | | | | |
Technology Hardware, Storage & Peripherals - 0.7% | | | | | |
Kronos, Inc., Initial Incremental Term Loan | | | | | | | | |
4.50%, 10/30/2019 (B) | | | 1,488,277 | | | | 1,480,092 | |
| | | | | | | | |
Textiles, Apparel & Luxury Goods - 0.2% | |
Otter Products LLC, Term Loan | | | | | | | | |
5.75%, 06/03/2020 (B) | | | 498,750 | | | | 492,516 | |
| | | | | | | | |
Water Utilities - 0.2% | | | | | | | | |
Utility Services Associates, Inc., Term Loan B | | | | | | | | |
6.75%, 09/30/2020 (B) | | | 496,250 | | | | 493,769 | |
| | | | | | | | |
Total Loan Assignments
(Cost $206,480,943) | | | | | | | 204,400,462 | |
| | | | | | | | |
| | |
| | | Shares | | | Value | |
INVESTMENT COMPANY - 0.9% | | | | | | | | |
Capital Markets - 0.9% | | | | | | | | |
PowerShares Senior Loan Portfolio (A) | | | 76,200 | | | | 1,857,756 | |
| | | | | | | | |
Total Investment Company
(Cost $1,897,870) | | | | | | | 1,857,756 | |
| | | | | | | | |
| |
SECURITIES LENDING COLLATERAL - 0.9% | | | | | |
State Street Navigator Securities Lending Trust - Prime Portfolio
0.16% (D) | | | 2,010,000 | | | | 2,010,000 | |
| | | | | | | | |
Total Securities Lending Collateral
(Cost $2,010,000) | | | | | | | 2,010,000 | |
| | | | | | | | |
The Notes to Financial Statements are an integral part of this report.
| | |
| Transamerica Funds | | Annual Report 2014 |
Page 123
Transamerica Floating Rate
SCHEDULE OF INVESTMENTS (continued)
At October 31, 2014
| | | | | | | | |
| | | Principal | | | Value | |
REPURCHASE AGREEMENT - 12.5% | | | | | |
State Street Bank & Trust Co.
0.01% (D), dated 10/31/2014, to be repurchased at $27,027,568 on 11/03/2014. Collateralized by U.S. Government Agency Obligations, 2.00% - 4.00%, due 11/01/2027 - 02/15/2041, and with a total value of $27,571,834. | | | $ 27,027,546 | | | | $ 27,027,546 | |
| | | | | | | | |
Total Repurchase Agreement
(Cost $27,027,546) | | | | | | | 27,027,546 | |
| | | | | | | | |
Total Investments
(Cost $245,157,232) (E) | | | | | | | 243,099,319 | |
Net Other Assets (Liabilities) - (12.4)% | | | | (26,901,657 | ) |
| | | | | | | | |
| | |
Net Assets - 100.0% | | | | | | | $ 216,197,662 | |
| | | | | | | | |
SECURITY VALUATION:
Valuation Inputs (F)
| | | | | | | | | | | | | | | | |
| | | Level 1
Quoted Prices | | | Level 2
Other Significant
Observable Inputs | | | Level 3
Significant
Unobservable Inputs | | | Value at
October 31, 2014 | |
ASSETS | | | | | | | | | | | | | | | | |
Investments | | | | | | | | | | | | | | | | |
Corporate Debt Securities | | $ | — | | | $ | 7,803,555 | | | $ | — | | | $ | 7,803,555 | |
Loan Assignments | | | — | | | | 204,400,462 | | | | — | | | | 204,400,462 | |
Investment Company | | | 1,857,756 | | | | — | | | | — | | | | 1,857,756 | |
Securities Lending Collateral | | | 2,010,000 | | | | — | | | | — | | | | 2,010,000 | |
Repurchase Agreement | | | — | | | | 27,027,546 | | | | — | | | | 27,027,546 | |
| | | | | | | | | | | | | | | | |
Total Investments | | $ | 3,867,756 | | | $ | 239,231,563 | | | $ | — | | | $ | 243,099,319 | |
| | | | | | | | | | | | | | | | |
FOOTNOTES TO SCHEDULE OF INVESTMENTS:
| (A) | All or a portion of this security is on loan. The value of all securities on loan is $1,960,494. The amount of securities on loan indicated may not correspond with the securities on loan identified because securities with pending sales are in the process of recall from the brokers. |
| (B) | Floating or variable rate security. Rate is listed as of October 31, 2014. |
| (C) | All or a portion of this security represents unsettled loan commitments at October 31, 2014 where the rate will be determined at time of settlement. |
| (D) | Rate shown reflects the yield at October 31, 2014. |
| (E) | Aggregate cost for federal income tax purposes is $245,159,791. Aggregate gross unrealized appreciation and depreciation for all securities is $314,552 and $2,375,024, respectively. Net unrealized depreciation for tax purposes is $2,060,472. |
| (F) | The Fund recognizes transfers between Levels at the end of the reporting period. There were no transfers between Level 1, 2 and 3 during the period ended October 31, 2014. See the Notes to Financial Statements for more information regarding security valuation and pricing inputs. |
DEFINITION:
| | |
| 144A | | 144A securities are registered pursuant to Rule 144A of the Securities Act of 1933. These securities are deemed to be liquid for purposes of compliance limitations on holdings of illiquid securities and may be resold as transactions exempt from registration, normally to qualified institutional buyers. At October 31, 2014, these securities aggregated $1,327,305, or 0.61% of the Fund’s net assets. |
| TBD | | To Be Determined. |
The Notes to Financial Statements are an integral part of this report.
| | |
| Transamerica Funds | | Annual Report 2014 |
Page 124
Transamerica Global Bond
SCHEDULE OF INVESTMENTS
At October 31, 2014
| | | | | | | | |
| | | Principal | | | Value | |
U.S. GOVERNMENT OBLIGATION - 0.1% | | | | | |
United States - 0.1% | | | | | | | | |
U.S. Treasury Note | | | | | | | | |
1.75%, 09/30/2019 | | | $ 190,000 | | | | $ 191,262 | |
| | | | | | | | |
Total U.S. Government Obligation
(Cost $189,532) | | | | 191,262 | |
| | | | | | | | |
| |
FOREIGN GOVERNMENT OBLIGATIONS - 79.7% | | | | | |
Austria - 3.0% | | | | | | | | |
Austria Government Bond | | | | | | | | |
1.65%, 10/21/2024, Reg S | | | EUR 5,475,000 | | | | 7,258,248 | |
| | | | | | | | |
Belgium - 4.1% | | | | | | | | |
Belgium Government Bond | | | | | | | | |
3.75%, 06/22/2045, Reg S | | | 1,456,522 | | | | 2,410,230 | |
4.00%, 03/28/2019 | | | 5,000,000 | | | | 7,317,106 | |
| | | | | | | | |
| | | | | | | 9,727,336 | |
| | | | | | | | |
Brazil - 1.0% | | | | | | | | |
Brazil Notas do Tesouro Nacional | | | | | | | | |
Series F | | | | | | | | |
10.00%, 01/01/2025 | | | BRL 6,720,000 | | | | 2,399,700 | |
| | | | | | | | |
Canada - 6.2% | | | | | | | | |
Canadian Government Bond | | | | | | | | |
1.25%, 03/01/2018 | | | CAD 5,200,000 | | | | 4,611,231 | |
Province of Manitoba Canada | | | | | | | | |
1.75%, 05/30/2019 | | | $ 1,800,000 | | | | 1,797,100 | |
Province of Quebec Canada | | | | | | | | |
4.50%, 12/01/2020 | | | CAD 6,400,000 | | | | 6,383,192 | |
Series MTN | | | | | | | | |
6.35%, 01/30/2026 | | | $ 1,715,000 | | | | 2,178,719 | |
| | | | | | | | |
| | | | | | | 14,970,242 | |
| | | | | | | | |
Colombia - 0.8% | | | | | | | | |
Colombia Government International Bond | | | | | | | | |
4.38%, 03/21/2023 | | | COP 4,687,000,000 | | | | 2,010,341 | |
| | | | | | | | |
Croatia - 1.0% | | | | | | | | |
Croatia Government International Bond | | | | | | | | |
3.88%, 05/30/2022, Reg S | | | EUR 1,810,000 | | | | 2,293,719 | |
| | | | | | | | |
Germany - 4.4% | | | | | | | | |
Bundesrepublik Deutschland | | | | | | | | |
2.00%, 08/15/2023 | | | 2,530,000 | | | | 3,524,294 | |
4.75%, 07/04/2028 | | | 3,900,000 | | | | 7,049,127 | |
| | | | | | | | |
| | | | | | | 10,573,421 | |
| | | | | | | | |
Ghana - 0.3% | | | | | | | | |
Republic of Ghana | | | | | | | | |
8.13%, 01/18/2026, 144A | | | $ 750,000 | | | | 753,750 | |
| | | | | | | | |
Hungary - 0.7% | | | | | | | | |
Hungary Government Bond | | | | | | | | |
4.00%, 04/25/2018 | | | HUF 290,000,000 | | | | 1,225,513 | |
Magyar Nemzeti Bank | | | | | | | | |
6.00%, 10/19/2015 | | | JPY 51,000,000 | | | | 467,480 | |
| | | | | | | | |
| | | | | | | 1,692,993 | |
| | | | | | | | |
Indonesia - 1.6% | | | | | |
Indonesia Government International Bond | | | | | | | | |
2.88%, 07/08/2021, 144A | | | EUR 2,580,000 | | | | 3,281,624 | |
| | | | | | | | |
| | | Principal | | | Value | |
FOREIGN GOVERNMENT OBLIGATIONS (continued) | |
Indonesia (continued) | | | | | |
Indonesia Treasury Bond | | | | | | | | |
7.00%, 05/15/2022 | | | IDR 6,500,000,000 | | | | $ 506,930 | |
| | | | | | | | |
| | | | | | | 3,788,554 | |
| | | | | | | | |
Italy - 1.1% | | | | | |
Italy Buoni Poliennali del Tesoro | | | | | | | | |
4.75%, 09/01/2044, Reg S | | | EUR 1,710,000 | | | | 2,538,249 | |
| | | | | | | | |
Korea, Republic of - 3.3% | | | | | |
Republic of Korea | | | | | | | | |
2.13%, 06/10/2024, Reg S | | | 6,085,000 | | | | 7,998,614 | |
| | | | | | | | |
Malaysia - 3.7% | | | | | |
Malaysia Government Bond | | | | | | | | |
3.65%, 10/31/2019 | | | MYR 19,600,000 | | | | 5,959,866 | |
4.18%, 07/15/2024 | | | 9,413,000 | | | | 2,934,552 | |
| | | | | | | | |
| | | | | | | 8,894,418 | |
| | | | | | | | |
Mexico - 3.7% | | | | | |
Mexican Bonos | | | | | | | | |
7.75%, 05/29/2031 | | | MXN 89,591,200 | | | | 7,416,312 | |
8.00%, 12/07/2023 | | | 18,200,000 | | | | 1,550,893 | |
| | | | | | | | |
| | | | | | | 8,967,205 | |
| | | | | | | | |
Netherlands - 4.6% | | | | | |
Netherlands Government Bond | | | | | | | | |
2.00%, 07/15/2024 | | | EUR 8,000,000 | | | | 10,965,685 | |
| | | | | | | | |
New Zealand - 4.2% | | | | | |
New Zealand Government Bond | | | | | | | | |
3.00%, 04/15/2020, Reg S | | | NZD 13,583,000 | | | | 10,138,593 | |
| | | | | | | | |
Peru - 0.5% | | | | | |
Peruvian Government International Bond | | | | | | | | |
5.70%, 08/12/2024, 144A | | | PEN 3,340,000 | | | | 1,139,915 | |
| | | | | | | | |
Poland - 4.6% | | | | | |
Poland Government Bond | | | | | | | | |
3.25%, 07/25/2019 | | | PLN 17,500,000 | | | | 5,485,338 | |
3.75%, 04/25/2018 | | | 15,000,000 | | | | 4,729,321 | |
Poland Government International Bond | | | | | | | | |
0.91%, 11/13/2020 | | | JPY 100,000,000 | | | | 898,455 | |
| | | | | | | | |
| | | | | | | 11,113,114 | |
| | | | | | | | |
Portugal - 2.1% | | | | | |
Portugal Obrigacoes do Tesouro OT | | | | | | | | |
5.65%, 02/15/2024, Reg S | | | EUR 3,425,000 | | | | 5,108,514 | |
| | | | | | | | |
Romania - 2.7% | | | | | | | | |
Romanian Government International Bond | | | | | | | | |
Series MTN | | | | | | | | |
3.63%, 04/24/2024, Reg S | | | 1,785,000 | | | | 2,386,609 | |
4.88%, 11/07/2019, Reg S | | | 2,843,000 | | | | 4,052,222 | |
| | | | | | | | |
| | | | | | | 6,438,831 | |
| | | | | | | | |
Slovenia - 1.9% | | | | | | | | |
Slovenia Government Bond | | | | | | | | |
4.63%, 09/09/2024, Reg S | | | 2,384,000 | | | | 3,447,586 | |
Slovenia Government International Bond | | | | | | | | |
5.50%, 10/26/2022, 144A | | | $ 950,000 | | | | 1,043,813 | |
| | | | | | | | |
| | | | | | | 4,491,399 | |
| | | | | | | | |
South Africa - 1.0% | | | | | | | | |
South Africa Government Bond | | | | | | | | |
10.50%, 12/21/2026 | | | ZAR 20,860,000 | | | | 2,270,255 | |
| | | | | | | | |
The Notes to Financial Statements are an integral part of this report.
| | |
| Transamerica Funds | | Annual Report 2014 |
Page 125
Transamerica Global Bond
SCHEDULE OF INVESTMENTS (continued)
At October 31, 2014
| | | | | | | | |
| | | Principal | | | Value | |
FOREIGN GOVERNMENT OBLIGATIONS (continued) | |
Spain - 1.2% | | | | | | | | |
Spain Government Bond | | | | | | | | |
5.15%, 10/31/2044, Reg S | | | EUR 1,715,000 | | | | $ 2,809,265 | |
| | | | | | | | |
Supranational - 9.7% | | | | | | | | |
European Bank for Reconstruction & Development, | | | | | | | | |
Series MTN | | | | | | | | |
5.00%, 05/28/2015 | | | INR 44,000,000 | | | | 712,671 | |
European Investment Bank | | | | | | | | |
Series MTN | | | | | | | | |
2.25%, 03/07/2020, Reg S | | | GBP 3,400,000 | | | | 5,548,958 | |
Inter-American Development Bank | | | | | | | | |
Series MTN | | | | | | | | |
7.25%, 07/17/2017 | | | IDR 83,000,000,000 | | | | 6,837,799 | |
International Bank for Reconstruction & Development | | | | | | | | |
1.38%, 06/23/2019 | | | SEK 10,000,000 | | | | 1,404,766 | |
Series MTN | | | | | | | | |
2.38%, 09/26/2016 | | | CNY 26,250,000 | | | | 4,285,618 | |
3.75%, 05/19/2017 | | | NOK 3,250,000 | | | | 508,562 | |
International Finance Corp. | | | | | | | | |
Series MTN | | | | | | | | |
3.88%, 02/26/2018 | | | NZD 500,000 | | | | 385,871 | |
7.75%, 12/03/2016 | | | INR 185,000,000 | | | | 3,073,567 | |
7.80%, 06/03/2019 | | | 27,500,000 | | | | 477,133 | |
| | | | | | | | |
| | | | | | | 23,234,945 | |
| | | | | | | | |
Sweden - 4.8% | | | | | | | | |
Kommuninvest I Sverige AB | | | | | | | | |
1.82%, 11/15/2016 (A) | | | NOK 10,500,000 | | | | 1,550,086 | |
Sweden Government Bond | | | | | | | | |
3.50%, 06/01/2022 | | | SEK 49,000,000 | | | | 7,915,489 | |
4.25%, 03/12/2019 | | | 13,000,000 | | | | 2,061,782 | |
| | | | | | | | |
| | | | | | | 11,527,357 | |
| | | | | | | | |
Thailand - 1.1% | | | | | | | | |
Thailand Government Bond | | | | | | | | |
3.88%, 06/13/2019 | | | THB 78,000,000 | | | | 2,518,119 | |
| | | | | | | | |
Turkey - 1.1% | | | | | | | | |
Turkey Government Bond | | | | | | | | |
10.50%, 01/15/2020 | | | TRY 5,450,000 | | | | 2,681,293 | |
| | | | | | | | |
Ukraine - 0.5% | | | | | | | | |
Ukraine Government International Bond | | | | | | | | |
7.50%, 04/17/2023, 144A | | | $ 1,350,000 | | | | 1,147,500 | |
| | | | | | | | |
United Kingdom - 4.8% | | | | | | | | |
U.K. Gilt | | | | | | | | |
4.75%, 12/07/2030, Reg S | | | GBP 1,515,000 | | | | 3,089,004 | |
5.00%, 03/07/2018, Reg S | | | 4,700,000 | | | | 8,469,093 | |
| | | | | | | | |
| | | | | | | 11,558,097 | |
| | | | | | | | |
Total Foreign Government Obligations
(Cost $198,794,152) | | | | 191,009,672 | |
| | | | | | | | |
| | | | | | | | |
| | | Principal | | | Value | |
CORPORATE DEBT SECURITIES - 10.2% | |
Canada - 0.1% | | | | | | | | |
TELUS Corp. | | | | | | | | |
5.05%, 12/04/2019 | | | CAD 125,000 | | | | $ 123,155 | |
| | | | | | | | |
Colombia - 0.9% | | | | | | | | |
Financiera de Desarrollo Territorial SA Findeter | | | | | | | | |
7.88%, 08/12/2024, 144A | | | COP 4,436,000,000 | | | | 2,194,607 | |
| | | | | | | | |
France - 1.1% | | | | | | | | |
Numericable Group SA | | | | | | | | |
5.63%, 05/15/2024, 144A | | | EUR 2,100,000 | | | | 2,723,722 | |
| | | | | | | | |
Germany - 0.5% | | | | | | | | |
KFW
Series MTN | | | | | | | | |
3.75%, 08/16/2017 | | | NZD 500,000 | | | | 387,146 | |
3.75%, 06/14/2018, Reg S | | | 1,000,000 | | | | 769,857 | |
| | | | | | | | |
| | | | | | | 1,157,003 | |
| | | | | | | | |
Ireland - 1.5% | | | | | | | | |
GE Capital UK Funding | | | | | | | | |
Series MTN | | | | | | | | |
5.13%, 05/24/2023 | | | GBP 1,920,000 | | | | 3,533,042 | |
| | | | | | | | |
Kazakhstan - 0.9% | | | | | | | | |
KazMunayGas National Co. | | | | | | | | |
6.00%, 11/07/2044, 144A | | | $ 2,180,000 | | | | 2,150,156 | |
| | | | | | | | |
Korea, Republic of - 0.4% | | | | | | | | |
Korea Development Bank | | | | | | | | |
0.43%, 01/29/2016 | | | JPY 100,000,000 | | | | 891,853 | |
| | | | | | | | |
Mexico - 1.3% | | | | | | | | |
America Movil SAB de CV | | | | | | | | |
4.75%, 06/28/2022 | | | EUR 500,000 | | | | 774,873 | |
6.00%, 06/09/2019 | | | MXN 5,000,000 | | | | 374,157 | |
Petroleos Mexicanos | | | | | | | | |
7.19%, 09/12/2024, 144A | | | 27,115,000 | | | | 2,040,333 | |
| | | | | | | | |
| | | | | | | 3,189,363 | |
| | | | | | | | |
Netherlands - 0.3% | | | | | | | | |
Cooperatieve Centrale Raiffeisen-Boerenleenbank | | | | | | | | |
Series MTN | | | | | | | | |
4.25%, 05/02/2018 | | | NZD 1,000,000 | | | | 775,481 | |
| | | | | | | | |
Peru - 1.7% | | | | | | | | |
Telefonica del Peru SAA | | | | | | | | |
8.00%, 04/11/2016, Reg S | | | PEN 11,660,005 | | | | 4,148,616 | |
| | | | | | | | |
United States - 1.5% | | | | | | | | |
Morgan Stanley | | | | | | | | |
3.13%, 08/05/2021 | | | CAD 3,700,000 | | | | 3,250,833 | |
Series MTN | | | | | | | | |
7.60%, 08/08/2017 | | | NZD 500,000 | | | | 413,735 | |
| | | | | | | | |
| | | | | | | 3,664,568 | |
| | | | | | | | |
Total Corporate Debt Securities
(Cost $25,762,951) | | | | 24,551,566 | |
| | | | | | | | |
The Notes to Financial Statements are an integral part of this report.
| | |
| Transamerica Funds | | Annual Report 2014 |
Page 126
Transamerica Global Bond
SCHEDULE OF INVESTMENTS (continued)
At October 31, 2014
| | | | | | | | |
| | | Principal | | | Value | |
REPURCHASE AGREEMENT - 6.2% | |
State Street Bank & Trust Co.
0.01% (B), dated 10/31/2014, to be repurchased at $14,910,907 on 11/03/2014. Collateralized by a U.S. Government Agency Obligation, 3.00%, due 07/25/2037, and with a value of $15,211,358. | | | $ 14,910,895 | | | | $ 14,910,895 | |
| | | | | | | | |
Total Repurchase Agreement
(Cost $14,910,895) | | | | | | | 14,910,895 | |
| | | | | | | | |
Total Investments
(Cost $239,657,530) (C) | | | | 230,663,395 | |
Net Other Assets (Liabilities) - 3.8% | | | | | | | 9,020,952 | |
| | | | | | | | |
| | |
Net Assets - 100.0% | | | | | | | $ 239,684,347 | |
| | | | | | | | |
| | | | | | | | | | | | | | | | | | | | | | |
| FORWARD FOREIGN CURRENCY CONTRACTS: | | | | | | | | | | | |
| Counterparty | | Settlement
Date | | Currency
Purchased | | | | | Currency
Sold | | | | | Unrealized
Appreciation | | | Unrealized
Depreciation | |
BCLY | | 11/28/2014 | | | 3,717,107 | | | USD | | | 12,372,392 | | | PLN | | $ | 49,634 | | | $ | — | |
BCLY | | 11/28/2014 | | | 4,213,768 | | | USD | | | 30,686,642 | | | SEK | | | 57,787 | | | | — | |
BCLY | | 11/28/2014 | | | 20,160,862 | | | ZAR | | | 1,833,439 | | | USD | | | — | | | | (13,937 | ) |
BOA | | 11/05/2014 | | | 65,730,000 | | | RUB | | | 1,565,000 | | | USD | | | — | | | | (38,977 | ) |
BOA | | 11/05/2014 | | | 1,554,084 | | | USD | | | 65,730,000 | | | RUB | | | 28,062 | | | | — | |
BOA | | 11/28/2014 | | | 2,198,141,878 | | | JPY | | | 20,398,496 | | | USD | | | — | | | | (824,900 | ) |
BOA | | 11/28/2014 | | | 48,891,245 | | | NOK | | | 7,381,582 | | | USD | | | — | | | | (139,996 | ) |
BOA | | 11/28/2014 | | | 4,396,340 | | | NZD | | | 3,458,930 | | | USD | | | — | | | | (41,260 | ) |
BOA | | 11/28/2014 | | | 1,930,126 | | | USD | | | 26,241,997 | | | MXN | | | — | | | | (15,226 | ) |
BOA | | 11/28/2014 | | | 10,241,965 | | | USD | | | 13,167,864 | | | NZD | | | 5,398 | | | | — | |
HSBC | | 11/12/2014 | | | 1,464,957,000 | | | CLP | | | 2,470,000 | | | USD | | | 72,957 | | | | — | |
HSBC | | 11/28/2014 | | | 1,570,731 | | | USD | | | 3,486,080 | | | TRY | | | 12,342 | | | | — | |
RBS | | 11/28/2014 | | | 5,954,019 | | | USD | | | 4,683,889 | | | EUR | | | 83,354 | | | | — | |
RBS | | 11/28/2014 | | | 15,562,609 | | | USD | | | 9,647,192 | | | GBP | | | 133,502 | | | | — | |
RBS | | 11/28/2014 | | | 1,187,339 | | | USD | | | 289,207,350 | | | HUF | | | 11,944 | | | | — | |
SCB | | 11/10/2014 | | | 3,920,849 | | | BRL | | | 1,607,655 | | | USD | | | — | | | | (30,197 | ) |
SCB | | 11/10/2014 | | | 1,385,000 | | | USD | | | 3,351,280 | | | BRL | | | 36,695 | | | | — | |
SCB | | 11/24/2014 | | | 6,966,450,000 | | | COP | | | 3,390,000 | | | USD | | | — | | | | (14,161 | ) |
SCB | | 11/28/2014 | | | 19,919,671 | | | USD | | | 22,426,064 | | | CAD | | | 35,318 | | | | — | |
SCB | | 11/28/2014 | | | 1,340,000 | | | USD | | | 14,603,856 | | | ZAR | | | 22,014 | | | | — | |
| | | | | | | | | | | | | | | | | | | | | | |
Total | | | | | | | | | | | | | | | | $ | 549,007 | | | $ | (1,118,654 | ) |
| | | | | | | | | | | | | | | | | | | | | | |
INVESTMENTS BY INDUSTRY (unaudited):
| | | | | | | | |
| Industry | | Percentage of
Total Investments | | | Value | |
Foreign Government Obligations | | | 82.8 | % | | $ | 191,009,672 | |
Diversified Financial Services | | | 2.5 | | | | 5,727,649 | |
Diversified Telecommunication Services | | | 1.8 | | | | 4,271,771 | |
Oil, Gas & Consumable Fuels | | | 1.8 | | | | 4,190,489 | |
Capital Markets | | | 1.6 | | | | 3,664,568 | |
Banks | | | 1.2 | | | | 2,824,337 | |
Media | | | 1.2 | | | | 2,723,722 | |
Wireless Telecommunication Services | | | 0.5 | | | | 1,149,030 | |
U.S. Government Obligation | | | 0.1 | | | | 191,262 | |
| | | | | | | | |
Investments, at Value | | | 93.5 | | | | 215,752,500 | |
Short-Term Investments | | | 6.5 | | | | 14,910,895 | |
| | | | | | | | |
Total Investments | | | 100.0 | % | | $ | 230,663,395 | |
| | | | | | | | |
| | | | | | | | |
The Notes to Financial Statements are an integral part of this report.
| | |
| Transamerica Funds | | Annual Report 2014 |
Page 127
Transamerica Global Bond
SCHEDULE OF INVESTMENTS (continued)
At October 31, 2014
SECURITY VALUATION:
Valuation Inputs (D)
| | | | | | | | | | | | | | | | |
| | | Level 1
Quoted Prices | | | Level 2
Other Significant
Observable Inputs | | | Level 3
Significant
Unobservable Inputs | | | Value at
October 31, 2014 | |
ASSETS | | | | | | | | | | | | | | | | |
Investments | | | | | | | | | | | | | | | | |
U.S. Government Obligation | | $ | — | | | $ | 191,262 | | | $ | — | | | $ | 191,262 | |
Foreign Government Obligations | | | — | | | | 191,009,672 | | | | — | | | | 191,009,672 | |
Corporate Debt Securities | | | — | | | | 24,551,566 | | | | — | | | | 24,551,566 | |
Repurchase Agreement | | | — | | | | 14,910,895 | | | | — | | | | 14,910,895 | |
| | | | | | | | | | | | | | | | |
Total Investments | | $ | — | | | $ | 230,663,395 | | | $ | — | | | $ | 230,663,395 | |
| | | | | | | | | | | | | | | | |
Derivative Financial Instruments | | | | | | | | | | | | | | | | |
Forward Foreign Currency Contracts (E) | | $ | — | | | $ | 549,007 | | | $ | — | | | $ | 549,007 | |
| | | | | | | | | | | | | | | | |
Total Derivative Financial Instruments | | $ | — | | | $ | 549,007 | | | $ | — | | | $ | 549,007 | |
| | | | | | | | | | | | | | | | |
LIABILITIES | | | | | | | | | | | | | | | | |
Derivative Financial Instruments | | | | | | | | | | | | | | | | |
Forward Foreign Currency Contracts (E) | | $ | — | | | $ | (1,118,654 | ) | | $ | — | | | $ | (1,118,654 | ) |
| | | | | | | | | | | | | | | | |
Total Derivative Financial Instruments | | $ | — | | | $ | (1,118,654 | ) | | $ | — | | | $ | (1,118,654 | ) |
| | | | | | | | | | | | | | | | |
FOOTNOTES TO SCHEDULE OF INVESTMENTS:
| (A) | Floating or variable rate security. Rate is listed as of October 31, 2014. |
| (B) | Rate shown reflects the yield at October 31, 2014. |
| (C) | Aggregate cost for federal income tax purposes is $239,726,812. Aggregate gross unrealized appreciation and depreciation for all securities is $197,897 and $9,261,314, respectively. Net unrealized depreciation for tax purposes is $9,063,417. |
| (D) | The Fund recognizes transfers between Levels at the end of the reporting period. There were no transfers between Level 1, 2 and 3 during the period ended October 31, 2014. See the Notes to Financial Statements for more information regarding security valuation and pricing inputs. |
| (E) | Derivative financial instruments valued at unrealized appreciation (depreciation) on the instrument. |
DEFINITIONS:
| | |
| 144A | | 144A securities are registered pursuant to Rule 144A of the Securities Act of 1933. These securities are deemed to be liquid for purposes of compliance limitations on holdings of illiquid securities and may be resold as transactions exempt from registration, normally to qualified institutional buyers. At October 31, 2014, these securities aggregated $16,475,420, or 6.87% of the Fund’s net assets. |
| BCLY | | Barclays Bank PLC |
| BOA | | Bank of America |
| HSBC | | HSBC Bank USA |
| MTN | | Medium Term Note |
| RBS | | Royal Bank of Scotland Group PLC |
| Reg S | | Security exempt from registration under Regulation S of the Securities Act of 1933, which exempts from registration securities offered and sold outside the United States. Security may not be offered or sold in the United States except pursuant to an exemption from, or in a transaction not subject to, the registration requirements of the Securities Act of 1933. |
| SCB | | Standard Chartered Bank |
CURRENCY ABBREVIATIONS:
| | |
| BRL | | Brazilian Real |
| CAD | | Canadian Dollar |
| CLP | | Chilean Peso |
| CNY | | Chinese Yuan Renminbi |
| COP | | Columbian Peso |
| EUR | | Euro |
The Notes to Financial Statements are an integral part of this report.
| | |
| Transamerica Funds | | Annual Report 2014 |
Page 128
Transamerica Global Bond
SCHEDULE OF INVESTMENTS (continued)
At October 31, 2014
CURRENCY ABBREVIATIONS (continued):
| | |
| GBP | | Pound Sterling |
| HUF | | Hungarian Forint |
| IDR | | Indonesian Rupiah |
| INR | | Indian Rupee |
| JPY | | Japanese Yen |
| MXN | | Mexican Peso |
| MYR | | Malaysian Ringgit |
| NOK | | Norwegian Krone |
| NZD | | New Zealand Dollar |
| PEN | | Peruvian Nuevo Sol |
| PLN | | Polish Zloty |
| RUB | | Russian Ruble |
| SEK | | Swedish Krona |
| THB | | Thai Baht |
| TRY | | Turkish New Lira |
| USD | | United States Dollar |
| ZAR | | South African Rand |
The Notes to Financial Statements are an integral part of this report.
| | |
| Transamerica Funds | | Annual Report 2014 |
Page 129
Transamerica Global Equity
(formerly, Transamerica Multi-Manager International Portfolio)
SCHEDULE OF INVESTMENTS
At October 31, 2014
| | | | | | | | |
| | | Shares | | | Value | |
PREFERRED STOCK - 1.8% | | | | | | | | |
Automobiles - 1.8% | | | | | | | | |
Hyundai Motor Co.
1.61% (A) | | | 46,596 | | | | $ 5,573,682 | |
| | | | | | | | |
Total Preferred Stock
(Cost $5,223,944) | | | | | | | 5,573,682 | |
| | | | | | | | |
| | |
COMMON STOCKS - 97.1% | | | | | | | | |
Aerospace & Defense - 4.1% | | | | | | | | |
Honeywell International, Inc. | | | 68,939 | | | | 6,626,417 | |
Safran SA | | | 90,323 | | | | 5,720,472 | |
| | | | | | | | |
| | | | | | | 12,346,889 | |
| | | | | | | | |
Airlines - 2.3% | | | | | | | | |
United Continental Holdings, Inc. (B) | | | 128,017 | | | | 6,760,578 | |
| | | | | | | | |
Auto Components - 3.9% | | | | | | | | |
Delphi Automotive PLC, Class A | | | 83,045 | | | | 5,728,444 | |
NGK Spark Plug Co., Ltd. | | | 125,295 | | | | 3,267,757 | |
Valeo SA | | | 23,952 | | | | 2,685,753 | |
| | | | | | | | |
| | | | | | | 11,681,954 | |
| | | | | | | | |
Banks - 7.1% | | | | | | | | |
DNB ASA | | | 195,646 | | | | 3,594,458 | |
Swedbank AB, Class A | | | 132,304 | | | | 3,506,145 | |
Toronto-Dominion Bank | | | 155,531 | | | | 7,654,767 | |
Wells Fargo & Co. | | | 122,822 | | | | 6,520,620 | |
| | | | | | | | |
| | | | | | | 21,275,990 | |
| | | | | | | | |
Biotechnology - 2.6% | | | | | | | | |
Alexion Pharmaceuticals, Inc. (B) | | | 13,490 | | | | 2,581,446 | |
Incyte Corp. (B) | | | 42,735 | | | | 2,865,809 | |
Regeneron Pharmaceuticals, Inc., Class A (B) | | | 5,804 | | | | 2,285,151 | |
| | | | | | | | |
| | | | | | | 7,732,406 | |
| | | | | | | | |
Chemicals - 0.9% | | | | | | | | |
Johnson Matthey PLC | | | 56,522 | | | | 2,698,451 | |
| | | | | | | | |
Communications Equipment - 1.5% | | | | | | | | |
QUALCOMM, Inc. | | | 57,481 | | | | 4,512,833 | |
| | | | | | | | |
Construction & Engineering - 0.9% | | | | | | | | |
Boskalis Westminster NV | | | 48,450 | | | | 2,584,824 | |
| | | | | | | | |
Construction Materials - 0.7% | | | | | | | | |
Semen Indonesia Persero Tbk PT | | | 1,471,900 | | | | 1,933,418 | |
| | | | | | | | |
Consumer Finance - 2.1% | | | | | | | | |
Capital One Financial Corp. | | | 76,574 | | | | 6,338,030 | |
| | | | | | | | |
Diversified Financial Services - 5.2% | | | | | | | | |
ING Groep NV, CVA (B) | | | 441,990 | | | | 6,329,457 | |
JPMorgan Chase & Co. | | | 152,927 | | | | 9,249,025 | |
| | | | | | | | |
| | | | | | | 15,578,482 | |
| | | | | | | | |
Electric Utilities - 2.7% | | | | | | | | |
Korea Electric Power Corp., ADR | | | 366,602 | | | | 8,013,920 | |
| | | | | | | | |
Energy Equipment & Services - 2.1% | | | | | | | | |
Baker Hughes, Inc. | | | 62,174 | | | | 3,292,735 | |
Oceaneering International, Inc. | | | 43,350 | | | | 3,046,205 | |
| | | | | | | | |
| | | | | | | 6,338,940 | |
| | | | | | | | |
Food & Staples Retailing - 1.6% | | | | | | | | |
Wal-Mart Stores, Inc. | | | 64,371 | | | | 4,909,576 | |
| | | | | | | | |
| | | | | | | | |
| | | Shares | | | Value | |
COMMON STOCKS (continued) | | | | | | | | |
Food Products - 1.0% | | | | | | | | |
Darling International, Inc. (B) | | | 165,345 | | | | $ 2,910,072 | |
| | | | | | | | |
Health Care Equipment & Supplies - 2.7% | |
CareFusion Corp., Class A (B) | | | 69,481 | | | | 3,986,125 | |
St. Jude Medical, Inc. | | | 61,389 | | | | 3,939,332 | |
| | | | | | | | |
| | | | | | | 7,925,457 | |
| | | | | | | | |
Health Care Providers & Services - 2.0% | |
Express Scripts Holding Co. (B) | | | 76,158 | | | | 5,850,458 | |
| | | | | | | | |
Hotels, Restaurants & Leisure - 5.1% | |
MGM Resorts International (B) | | | 160,875 | | | | 3,740,344 | |
Royal Caribbean Cruises, Ltd., Class A | | | 111,929 | | | | 7,607,814 | |
Yum! Brands, Inc. | | | 55,108 | | | | 3,958,407 | |
| | | | | | | | |
| | | | | | | 15,306,565 | |
| | | | | | | | |
Insurance - 6.0% | | | | | | | | |
Aflac, Inc. | | | 64,467 | | | | 3,850,614 | |
PICC Property & Casualty Co., Ltd., Class H | | | 2,648,044 | | | | 4,857,672 | |
Prudential PLC | | | 185,663 | | | | 4,299,218 | |
Reinsurance Group of America, Inc., Class A | | | 57,967 | | | | 4,883,720 | |
| | | | | | | | |
| | | | | | | 17,891,224 | |
| | | | | | | | |
Internet & Catalog Retail - 1.1% | | | | | | | | |
Ctrip.com International, Ltd., ADR (B) | | | 56,133 | | | | 3,272,554 | |
| | | | | | | | |
Internet Software & Services - 5.3% | | | | | | | | |
eBay, Inc. (B) | | | 97,344 | | | | 5,110,560 | |
Google, Inc., Class C (B) | | | 18,901 | | | | 10,567,171 | |
| | | | | | | | |
| | | | | | | 15,677,731 | |
| | | | | | | | |
IT Services - 2.9% | | | | | | | | |
InterXion Holding NV (B) | | | 47,081 | | | | 1,287,195 | |
Visa, Inc., Class A | | | 31,084 | | | | 7,504,610 | |
| | | | | | | | |
| | | | | | | 8,791,805 | |
| | | | | | | | |
Machinery - 4.8% | | | | | | | | |
Amada Co., Ltd. | | | 490,823 | | | | 4,286,616 | |
Nabtesco Corp. | | | 155,066 | | | | 3,752,672 | |
Pentair PLC | | | 44,274 | | | | 2,968,572 | |
SMC Corp. | | | 11,615 | | | | 3,294,401 | |
| | | | | | | | |
| | | | | | | 14,302,261 | |
| | | | | | | | |
Media - 1.9% | | | | | | | | |
Comcast Corp., Class A | | | 101,018 | | | | 5,591,346 | |
| | | | | | | | |
Multi-Utilities - 1.5% | | | | | | | | |
Centrica PLC | | | 919,908 | | | | 4,461,528 | |
| | | | | | | | |
Oil, Gas & Consumable Fuels - 8.4% | | | | | | | | |
Anadarko Petroleum Corp., Class A | | | 49,823 | | | | 4,572,755 | |
Apache Corp. | | | 49,656 | | | | 3,833,443 | |
Cabot Oil & Gas Corp. | | | 89,205 | | | | 2,774,276 | |
Chevron Corp. | | | 62,840 | | | | 7,537,658 | |
Continental Resources, Inc., Class B (B) | | | 41,720 | | | | 2,351,756 | |
Royal Dutch Shell PLC, Class A, ADR | | | 57,728 | | | | 4,144,293 | |
| | | | | | | | |
| | | | | | | 25,214,181 | |
| | | | | | | | |
Pharmaceuticals - 8.2% | | | | | | | | |
Kalbe Farma PT | | | 11,002,700 | | | | 1,553,500 | |
Mallinckrodt PLC (B) | | | 48,394 | | | | 4,460,959 | |
Merck & Co., Inc. | | | 94,369 | | | | 5,467,740 | |
The Notes to Financial Statements are an integral part of this report.
| | |
| Transamerica Funds | | Annual Report 2014 |
Page 130
Transamerica Global Equity
(formerly, Transamerica Multi-Manager International Portfolio)
SCHEDULE OF INVESTMENTS (continued)
At October 31, 2014
| | | | | | | | |
| | | Shares | | | Value | |
COMMON STOCKS (continued) | | | | | | | | |
Pharmaceuticals (continued) | | | | | | | | |
Novartis AG, ADR | | | 82,806 | | | | $ 7,675,288 | |
Roche Holding AG | | | 17,641 | | | | 5,205,883 | |
| | | | | | | | |
| | | | | | | 24,363,370 | |
| | | | | | | | |
Real Estate Management & Development - 0.7% | |
E-House China Holdings, Ltd., ADR | | | 209,527 | | | | 2,093,175 | |
| | | | | | | | |
Software - 4.6% | | | | | | | | |
Microsoft Corp. | | | 180,804 | | | | 8,488,748 | |
Oracle Corp. | | | 137,632 | | | | 5,374,529 | |
| | | | | | | | |
| | | | | | | 13,863,277 | |
| | | | | | | | |
Technology Hardware, Storage & Peripherals - 1.4% | |
NetApp, Inc. | | | 98,905 | | | | 4,233,134 | |
| | | | | | | | |
Wireless Telecommunication Services - 1.8% | |
China Mobile, Ltd., ADR | | | 86,233 | | | | 5,354,207 | |
| | | | | | | | |
Total Common Stocks
(Cost $295,444,182) | | | | | | | 289,808,636 | |
| | | | | | | | |
| | | | | | | | |
| | | Principal | | | Value | |
REPURCHASE AGREEMENT - 0.8% | |
State Street Bank & Trust Co.
0.01% (A), dated 10/31/2014, to be repurchased at $2,343,924 on 11/03/2014. Collateralized by a U.S. Government Agency Obligation, 3.00%, due 07/25/2037, and with a value of $2,391,810. | | | $ 2,343,922 | | | | $ 2,343,922 | |
| | | | | | | | |
Total Repurchase Agreement
(Cost $2,343,922) | | | | 2,343,922 | |
| | | | | | | | |
Total Investments
(Cost $303,012,048) (C) | | | | 297,726,240 | |
Net Other Assets (Liabilities) - 0.3% | | | | 813,955 | |
| | | | | | | | |
| | |
Net Assets - 100.0% | | | | | | | $ 298,540,195 | |
| | | | | | | | |
SECURITY VALUATION:
Valuation Inputs (D)
| | | | | | | | | | | | | | | | |
| | | Level 1
Quoted Prices | | | Level 2
Other Significant
Observable Inputs | | | Level 3
Significant
Unobservable Inputs | | | Value at
October 31, 2014 | |
ASSETS | | | | | | | | | | | | | | | | |
Investments | | | | | | | | | | | | | | | | |
Preferred Stock | | $ | — | | | $ | 5,573,682 | | | $ | — | | | $ | 5,573,682 | |
Common Stocks | | | 225,776,411 | | | | 64,032,225 | | | | — | | | | 289,808,636 | |
Repurchase Agreement | | | — | | | | 2,343,922 | | | | — | | | | 2,343,922 | |
| | | | | | | | | | | | | | | | |
Total Investments | | $ | 225,776,411 | | | $ | 71,949,829 | | | $ | — | | | $ | 297,726,240 | |
| | | | | | | | | | | | | | | | |
FOOTNOTES TO SCHEDULE OF INVESTMENTS:
| (A) | Rate shown reflects the yield at October 31, 2014. |
| (B) | Non-income producing security. |
| (C) | Aggregate cost for federal income tax purposes is $303,012,048. Aggregate gross unrealized appreciation and depreciation for all securities is $6,403,416 and $11,689,224, respectively. Net unrealized depreciation for tax purposes is $5,285,808. |
| (D) | The Fund recognizes transfers between Levels at the end of the reporting period. There were no transfers between Level 1, 2 and 3 during the period ended October 31, 2014. See the Notes to Financial Statements for more information regarding security valuation and pricing inputs. |
DEFINITIONS:
| | |
| ADR | | American Depositary Receipt |
| CVA | | Dutch Certificate-Depositary Receipt |
The Notes to Financial Statements are an integral part of this report.
| | |
| Transamerica Funds | | Annual Report 2014 |
Page 131
Transamerica Growth Opportunities
SCHEDULE OF INVESTMENTS
At October 31, 2014
| | | | | | | | |
| | | Shares | | | Value | |
CONVERTIBLE PREFERRED STOCKS - 0.1% | | | | | |
Automobiles - 0.0% | | | | | | | | |
Better Place
0.00% (A) (B) (C) (D) | | | 666,891 | | | | $ 0 | |
| | | | | | | | |
Internet Software & Services - 0.1% | | | | | | | | |
Dropbox, Inc.
0.00% (A) (B) (C) (D) | | | 34,602 | | | | 649,825 | |
| | | | | | | | |
Total Convertible Preferred Stocks
(Cost $1,980,343) | | | | | | | 649,825 | |
| | | | | | | | |
| | |
PREFERRED STOCKS - 0.3% | | | | | | | | |
Automobiles - 0.0% | | | | | | | | |
Better Place | | | | | | | | |
Series C, 0.00% (A) (B) (C) (D) | | | 581,653 | | | | 0 | |
| | | | | | | | |
Internet Software & Services - 0.0% (E) | | | | | | | | |
Peixe Urbano, Inc.
0.00% (A) (B) (C) (D) | | | 50,890 | | | | 107,887 | |
| | | | | | | | |
Software - 0.3% | | | | | | | | |
Palantir Technologies, Inc. | | | | | | | | |
Series G, 0.00% (A) (B) (C) (D) | | | 355,382 | | | | 2,132,292 | |
| | | | | | | | |
Total Preferred Stocks
(Cost $5,403,518) | | | | | | | 2,240,179 | |
| | | | | | | | |
| | |
COMMON STOCKS - 93.5% | | | | | | | | |
Aerospace & Defense - 2.4% | | | | | | | | |
TransDigm Group, Inc. | | | 101,635 | | | | 19,008,794 | |
| | | | | | | | |
Automobiles - 3.7% | | | | | | | | |
Tesla Motors, Inc. (A) (F) | | | 119,902 | | | | 28,980,313 | |
| | | | | | | | |
Beverages - 1.0% | | | | | | | | |
Monster Beverage Corp. (A) | | | 77,948 | | | | 7,863,394 | |
| | | | | | | | |
Biotechnology - 1.9% | | | | | | | | |
Alnylam Pharmaceuticals, Inc. (A) | | | 42,709 | | | | 3,960,833 | |
Intercept Pharmaceuticals, Inc. (A) | | | 5,075 | | | | 1,311,329 | |
Ironwood Pharmaceuticals, Inc., Class A (A) (F) | | | 366,922 | | | | 5,144,246 | |
Pharmacyclics, Inc. (A) (F) | | | 19,294 | | | | 2,521,147 | |
Seattle Genetics, Inc. (A) (F) | | | 53,855 | | | | 1,974,863 | |
| | | | | | | | |
| | | | | | | 14,912,418 | |
| | | | | | | | |
Commercial Services & Supplies - 1.0% | | | | | | | | |
Stericycle, Inc. (A) | | | 60,604 | | | | 7,636,104 | |
| | | | | | | | |
Communications Equipment - 0.9% | | | | | | | | |
Palo Alto Networks, Inc. (A) | | | 64,216 | | | | 6,787,631 | |
| | | | | | | | |
Diversified Financial Services - 5.0% | | | | | | | | |
McGraw-Hill Financial, Inc. | | | 230,912 | | | | 20,892,918 | |
MSCI, Inc., Class A | | | 399,940 | | | | 18,661,200 | |
| | | | | | | | |
| | | | | | | 39,554,118 | |
| | | | | | | | |
Electrical Equipment - 0.4% | | | | | | | | |
SolarCity Corp. (A) (F) | | | 52,945 | | | | 3,133,285 | |
| | | | | | | | |
Food Products - 7.6% | | | | | | | | |
Keurig Green Mountain, Inc. | | | 160,186 | | | | 24,308,225 | |
McCormick & Co., Inc. | | | 105,598 | | | | 7,467,891 | |
Mead Johnson Nutrition Co., Class A | | | 278,500 | | | | 27,657,835 | |
| | | | | | | | |
| | | | | | | 59,433,951 | |
| | | | | | | | |
Health Care Equipment & Supplies - 4.5% | |
Intuitive Surgical, Inc. (A) | | | 70,564 | | | | 34,985,631 | |
| | | | | | | | |
Health Care Technology - 2.9% | | | | | | | | |
athenahealth, Inc. (A) (F) | | | 183,949 | | | | 22,533,753 | |
| | | | | | | | |
| | | | | | | | |
| | | Shares | | | Value | |
COMMON STOCKS (continued) | | | | | | | | |
Hotels, Restaurants & Leisure - 4.8% | |
Chipotle Mexican Grill, Inc., Class A (A) | | | 5,544 | | | | $ 3,537,072 | |
Dunkin’ Brands Group, Inc. | | | 394,911 | | | | 17,960,552 | |
Panera Bread Co., Class A (A) (F) | | | 101,134 | | | | 16,347,300 | |
| | | | | | | | |
| | | | | | | 37,844,924 | |
| | | | | | | | |
Insurance - 3.0% | | | | | | | | |
Arch Capital Group, Ltd. (A) | | | 129,677 | | | | 7,303,409 | |
Progressive Corp. | | | 615,358 | | | | 16,251,605 | |
| | | | | | | | |
| | | | | | | 23,555,014 | |
| | | | | | | | |
Internet & Catalog Retail - 3.5% | | | | | | | | |
Ctrip.com International, Ltd., ADR (A) | | | 134,526 | | | | 7,842,866 | |
Groupon, Inc., Class A (A) (F) | | | 626,694 | | | | 4,581,133 | |
TripAdvisor, Inc. (A) | | | 73,795 | | | | 6,542,664 | |
zulily, Inc., Class A (A) (F) | | | 236,344 | | | | 8,598,195 | |
| | | | | | | | |
| | | | | | | 27,564,858 | |
| | | | | | | | |
Internet Software & Services - 12.6% | |
Autohome, Inc., ADR (A) (F) | | | 125,926 | | | | 6,660,226 | |
Dropbox, Inc. (A) (B) (C) (D) | | | 327,298 | | | | 6,146,656 | |
LinkedIn Corp., Class A (A) | | | 164,888 | | | | 37,752,756 | |
MercadoLibre, Inc. (F) | | | 43,484 | | | | 5,920,347 | |
Pandora Media, Inc. (A) (F) | | | 301,960 | | | | 5,821,789 | |
Twitter, Inc. (A) | | | 694,776 | | | | 28,812,361 | |
Youku Tudou, Inc., ADR (A) (F) | | | 365,988 | | | | 7,173,365 | |
| | | | | | | | |
| | | | | | | 98,287,500 | |
| | | | | | | | |
IT Services - 5.2% | | | | | | | | |
FleetCor Technologies, Inc. (A) | | | 138,401 | | | | 20,837,655 | |
Gartner, Inc. (A) | | | 243,400 | | | | 19,644,814 | |
| | | | | | | | |
| | | | | | | 40,482,469 | |
| | | | | | | | |
Life Sciences Tools & Services - 5.6% | |
Illumina, Inc. (A) | | | 225,725 | | | | 43,470,121 | |
| | | | | | | | |
Machinery - 1.8% | | | | | | | | |
Colfax Corp. (A) | | | 254,045 | | | | 13,814,967 | |
| | | | | | | | |
Oil, Gas & Consumable Fuels - 0.5% | | | | | |
Range Resources Corp. | | | 56,927 | | | | 3,893,807 | |
| | | | | | | | |
Pharmaceuticals - 3.4% | | | | | | | | |
ENDO International PLC (A) | | | 289,538 | | | | 19,375,883 | |
Zoetis, Inc., Class A | | | 198,655 | | | | 7,382,020 | |
| | | | | | | | |
| | | | | | | 26,757,903 | |
| | | | | | | | |
Professional Services - 4.7% | | | | | | | | |
IHS, Inc., Class A (A) | | | 141,122 | | | | 18,491,216 | |
Verisk Analytics, Inc., Class A (A) | | | 298,749 | | | | 18,627,000 | |
| | | | | | | | |
| | | | | | | 37,118,216 | |
| | | | | | | | |
Software - 11.7% | | | | | | | | |
FireEye, Inc. (A) (F) | | | 413,959 | | | | 14,070,466 | |
NetSuite, Inc. (A) (F) | | | 70,446 | | | | 7,654,662 | |
ServiceNow, Inc. (A) | | | 155,319 | | | | 10,550,820 | |
Splunk, Inc. (A) | | | 389,385 | | | | 25,730,561 | |
Tableau Software, Inc., Class A (A) (F) | | | 57,123 | | | | 4,717,789 | |
Workday, Inc., Class A (A) | | | 275,202 | | | | 26,276,287 | |
Zynga, Inc., Class A (A) | | | 975,607 | | | | 2,487,798 | |
| | | | | | | | |
| | | | | | | 91,488,383 | |
| | | | | | | | |
Technology Hardware, Storage & Peripherals - 0.9% | |
3D Systems Corp. (A) (F) | | | 69,177 | | | | 2,614,890 | |
Stratasys, Ltd. (A) (F) | | | 37,480 | | | | 4,511,093 | |
| | | | | | | | |
| | | | | | | 7,125,983 | |
| | | | | | | | |
The Notes to Financial Statements are an integral part of this report.
| | |
| Transamerica Funds | | Annual Report 2014 |
Page 132
Transamerica Growth Opportunities
SCHEDULE OF INVESTMENTS (continued)
At October 31, 2014
| | | | | | | | |
| | | Shares | | | Value | |
COMMON STOCKS (continued) | | | | | |
Textiles, Apparel & Luxury Goods - 4.5% | | | | | |
lululemon athletica, Inc. (A) (F) | | | 178,648 | | | | $ 7,440,689 | |
Michael Kors Holdings, Ltd. (A) | | | 255,667 | | | | 20,092,870 | |
Under Armour, Inc., Class A (A) (F) | | | 57,525 | | | | 3,772,489 | |
Zalando SE, 144A (A) (F) | | | 155,274 | | | | 3,599,760 | |
| | | | | | | | |
| | | | | | | 34,905,808 | |
| | | | | | | | |
Total Common Stocks
(Cost $572,547,251) | | | | | | | 731,139,345 | |
| | | | | | | | |
| | |
| | | Notional
Amount | | | Value | |
PURCHASED FOREIGN EXCHANGE OPTIONS - 0.0% (E) (G) | |
Call Options - 0.0% (E) | | | | | | | | |
OTC - USD vs. CNY (C) | | | | | | | | |
Exercise Price CNY 6.50 | | | | | | | | |
Expires 01/07/2015 | | | | | | | | |
Counterparty: RBS | | | CNY 296,949,204 | | | | 23,459 | |
OTC - USD vs. CNY (C) | | | | | | | | |
Exercise Price CNY 6.62 | | | | | | | | |
Expires 06/19/2015 | | | | | | | | |
Counterparty: RBS | | | 135,629,653 | | | | 110,945 | |
| | | | | | | | |
Total Purchased Foreign Exchange Options
(Cost $1,123,558) | | | | 134,404 | |
| | | | | | | | |
| | | | | | | | |
| | | Shares | | | Value | |
SECURITIES LENDING COLLATERAL - 16.5% | |
State Street Navigator Securities Lending Trust - Prime Portfolio 0.16% (H) | | | 128,753,647 | | | | $ 128,753,647 | |
| | | | | | | | |
Total Securities Lending Collateral
(Cost $128,753,647) | | | | 128,753,647 | |
| | | | | | | | |
| | |
| | | Principal | | | Value | |
REPURCHASE AGREEMENT - 10.0% | | | | | |
State Street Bank & Trust Co. 0.01% (H), dated 10/31/2014, to be repurchased at $77,799,364 on 11/03/2014. Collateralized by U.S. Government Agency Obligations, 4.00%, due 12/15/2017, and with a total value of $79,355,820. | | | $ 77,799,299 | | | | 77,799,299 | |
| | | | | | | | |
Total Repurchase Agreement
(Cost $77,799,299) | | | | | | | 77,799,299 | |
| | | | | | | | |
Total Investments
(Cost $787,607,616) (I) | | | | | | | 940,716,699 | |
Net Other Assets (Liabilities) - (20.4)% | | | | (159,155,025 | ) |
| | | | | | | | |
| | |
Net Assets - 100.0% | | | | | | | $ 781,561,674 | |
| | | | | | | | |
SECURITY VALUATION:
Valuation Inputs (J)
| | | | | | | | | | | | | | | | |
| | | Level 1
Quoted Prices | | | Level 2
Other Significant
Observable Inputs | | | Level 3
Significant
Unobservable Inputs | | | Value at
October 31, 2014 | |
ASSETS | | | | | | | | | | | | | | | | |
Investments | | | | | | | | | | | | | | | | |
Convertible Preferred Stocks | | | | | | | | | | | | | | | | |
Automobiles | | $ | — | | | $ | — | | | $ | 0 | | | $ | 0 | |
Internet Software & Services | | | — | | | | — | | | | 649,825 | | | | 649,825 | |
Preferred Stocks | | | | | | | | | | | | | | | | |
Automobiles | | | — | | | | — | | | | 0 | | | | 0 | |
Internet Software & Services | | | — | | | | — | | | | 107,887 | | | | 107,887 | |
Software | | | — | | | | — | | | | 2,132,292 | | | | 2,132,292 | |
Common Stocks | | | | | | | | | | | | | | | | |
Aerospace & Defense | | | 19,008,794 | | | | — | | | | — | | | | 19,008,794 | |
Automobiles | | | 28,980,313 | | | | — | | | | — | | | | 28,980,313 | |
Beverages | | | 7,863,394 | | | | — | | | | — | | | | 7,863,394 | |
Biotechnology | | | 14,912,418 | | | | — | | | | — | | | | 14,912,418 | |
Commercial Services & Supplies | | | 7,636,104 | | | | — | | | | — | | | | 7,636,104 | |
Communications Equipment | | | 6,787,631 | | | | — | | | | — | | | | 6,787,631 | |
Diversified Financial Services | | | 39,554,118 | | | | — | | | | — | | | | 39,554,118 | |
Electrical Equipment | | | 3,133,285 | | | | — | | | | — | | | | 3,133,285 | |
Food Products | | | 59,433,951 | | | | — | | | | — | | | | 59,433,951 | |
Health Care Equipment & Supplies | | | 34,985,631 | | | | — | | | | — | | | | 34,985,631 | |
Health Care Technology | | | 22,533,753 | | | | — | | | | — | | | | 22,533,753 | |
Hotels, Restaurants & Leisure | | | 37,844,924 | | | | — | | | | — | | | | 37,844,924 | |
Insurance | | | 23,555,014 | | | | — | | | | — | | | | 23,555,014 | |
Internet & Catalog Retail | | | 27,564,858 | | | | — | | | | — | | | | 27,564,858 | |
Internet Software & Services | | | 92,140,844 | | | | — | | | | 6,146,656 | | | | 98,287,500 | |
IT Services | | | 40,482,469 | | | | — | | | | — | | | | 40,482,469 | |
The Notes to Financial Statements are an integral part of this report.
| | |
| Transamerica Funds | | Annual Report 2014 |
Page 133
Transamerica Growth Opportunities
SCHEDULE OF INVESTMENTS (continued)
At October 31, 2014
SECURITY VALUATION (continued):
Valuation Inputs (continued) (J)
| | | | | | | | | | | | | | | | |
| | | Level 1
Quoted Prices | | | Level 2
Other Significant
Observable Inputs | | | Level 3
Significant
Unobservable Inputs | | | Value at
October 31, 2014 | |
Life Sciences Tools & Services | | $ | 43,470,121 | | | $ | — | | | $ | — | | | $ | 43,470,121 | |
Machinery | | | 13,814,967 | | | | — | | | | — | | | | 13,814,967 | |
Oil, Gas & Consumable Fuels | | | 3,893,807 | | | | — | | | | — | | | | 3,893,807 | |
Pharmaceuticals | | | 26,757,903 | | | | — | | | | — | | | | 26,757,903 | |
Professional Services | | | 37,118,216 | | | | — | | | | — | | | | 37,118,216 | |
Software | | | 91,488,383 | | | | — | | | | — | | | | 91,488,383 | |
Technology Hardware, Storage & Peripherals | | | 7,125,983 | | | | — | | | | — | | | | 7,125,983 | |
Textiles, Apparel & Luxury Goods | | | 31,306,048 | | | | 3,599,760 | | | | — | | | | 34,905,808 | |
Purchased Foreign Exchange Options | | | — | | | | 134,404 | | | | — | | | | 134,404 | |
Securities Lending Collateral | | | 128,753,647 | | | | — | | | | — | | | | 128,753,647 | |
Repurchase Agreement | | | — | | | | 77,799,299 | | | | — | | | | 77,799,299 | |
| | | | | | | | | | | | | | | | |
Total Investments | | $ | 850,146,576 | | | $ | 81,533,463 | | | $ | 9,036,660 | | | $ | 940,716,699 | |
| | | | | | | | | | | | | | | | |
Level 3 Rollforward - Investments
| | | | | | | | | | | | | | | | | | | | | | | | | | | | | | | | | | | | | | | | |
| Investments | | Beginning
Balance at
October 31, 2013 | | | Purchases | | | Sales | | | Accrued
Discounts
(Premiums) | | | Total
Realized
Gain (Loss) | | | Net Change in
Unrealized
Appreciation
(Depreciation) (K) | | | Transfers
into
Level 3 | | | Transfers
out of
Level 3 | | | Ending
Balance at
October 31, 2014 (L) | | | Net Change
in Unrealized
Appreciation
(Depreciation)
on Investments
Held at
October 31, 2014 (K) | |
| Convertible Preferred Stocks | | $ | 397,923 | | | $ | — | | | $ | — | | | $ | — | | | $ | — | | | $ | 251,902 | | | $ | — | | | $ | — | | | $ | 649,825 | | | $ | 251,902 | |
| Preferred Stocks | | | 1,326,270 | | | | — | | | | — | | | | — | | | | — | | | | 913,909 | | | | — | | | | — | | | | 2,240,179 | | | | 913,909 | |
| Common Stocks | | | 3,763,927 | | | | — | | | | — | | | | — | | | | — | | | | 2,382,729 | | | | — | | | | — | | | | 6,146,656 | | | | 2,382,729 | |
| | | | | | | | | | | | | | | | | | | | | | | | | | | | | | | | | | | | | | | | |
| Total | | $ | 5,488,120 | | | $ | — | | | $ | — | | | $ | — | | | $ | — | | | $ | 3,548,540 | | | $ | — | | | $ | — | | | $ | 9,036,660 | | | $ | 3,548,540 | |
| | | | | | | | | | | | | | | | | | | | | | | | | | | | | | | | | | | | | | | | |
Quantitative Information About Significant Unobservable Inputs (Level 3)
| | | | | | | | | | | | | | | | | | | | | | |
| Investments | | Value at
October 31, 2014 | | | Valuation Techniques | | Unobservable Input | | Range | | | Weighted
Average | | | Impact to
Valuation
from an
Increase
in Input |
| Convertible Preferred Stocks | | | $ 649,825 | | | Market Transaction Method Market Comparable Companies Discounted Cash Flow | | Precedent Transaction of Preferred Stock Enterprise Value / Revenue Discount for Lack of Marketability Weighted Average Cost of Capital Perpetual Growth Rate | |
| $ 19.1012
7.9x
15.0%
16.0%
2.5% |
| |
| $ 19.1012
18.8x
15.0%
18.0%
3.5% |
| |
| $ 19.1012
14.1x 15.0%
17.0%
3.0% |
| | Increase
Increase Decrease Decrease Increase |
| | | | | | | Merger & Acquisition Transaction Market Transaction Method | | Sale / Merger Scenario Precedent Transaction of Preferred Stock | |
| $ 2.12
$ 6.13 |
| |
| $ 2.12
$ 6.13 |
| |
| $ 2.12
$ 6.13 |
| | Increase
Increase |
| Preferred Stocks | | | $ 2,240,179 | | | Market Comparable Companies Discounted Cash Flow | | Enterprise Value / Revenue Discount for Lack of Marketability Weighted Average Cost of Capital Perpetual Growth Rate | |
| 10.2x
15.0%
16.0%
2.5% |
| |
| 13.1x
15.0%
18.0%
3.5% |
| |
| 11.2x
15.0%
17.0%
3.0% |
| | Increase
Decrease Decrease Increase |
| Common Stock | | | $ 6,146,656 | | | Market Transaction Method | | Precedent Transaction of Preferred Stock | | | $ 19.1012 | | | | $ 19.1012 | | | | $ 19.1012 | | | Increase |
| | | | | | | Market Comparable Companies Discounted Cash Flow | | Enterprise Value / Revenue Discount for Lack of Marketability Weighted Average Cost of Capital Perpetual Growth Rate | |
| 7.9x
15.0%
16.0%
2.5% |
| |
| 18.8x
15.0%
18.0%
3.5% |
| |
| 14.1x
15.0%
17.0%
3.0% |
| | Increase
Decrease Decrease Increase |
The Notes to Financial Statements are an integral part of this report.
| | |
| Transamerica Funds | | Annual Report 2014 |
Page 134
Transamerica Growth Opportunities
SCHEDULE OF INVESTMENTS (continued)
At October 31, 2014
FOOTNOTES TO SCHEDULE OF INVESTMENTS:
| (A) | Non-income producing security. |
| (B) | Fair valued as determined in good faith in accordance with procedures established by the board of trustees. Total aggregate fair value of securities is $9,036,660, or 1.16% of the Fund’s net assets. |
| (C) | Total aggregate value of illiquid securities is $9,171,064, or 1.17% of the Fund’s net assets. |
| (D) | At October 31, 2014, the Fund owned the respective securities which were restricted to public resale: |
| | | | | | | | | | | | | | | | | | |
| Investments | | Description | | Acquisition
Date | | | Cost | | | Value | | | Value as % of
Net Assets | |
Convertible Preferred Stocks | | Better Place | | | 01/25/2010 | | | $ | 1,667,226 | | | $ | 0 | | | | 0.00 | % |
Convertible Preferred Stocks | | Dropbox, Inc. | | | 05/25/2012 | | | | 313,117 | | | | 649,825 | | | | 0.08 | |
Preferred Stocks | | Better Place, Series C | | | 11/11/2011 | | | | 2,640,705 | | | | 0 | | | | 0.00 | |
Preferred Stocks | | Peixe Urbano, Inc. | | | 12/02/2011 | | | | 1,675,344 | | | | 107,887 | | | | 0.02 | |
Preferred Stocks | | Palantir Technologies, Inc., Series G | | | 07/19/2012 | | | | 1,087,469 | | | | 2,132,292 | | | | 0.27 | |
Common Stocks | | Dropbox, Inc. | | | 05/01/2012 | | | | 2,961,752 | | | | 6,146,656 | | | | 0.79 | |
| | | | | | | | | | | | | | | | | | |
| | | | | | | | $ | 10,345,613 | | | $ | 9,036,660 | | | | 1.16 | % |
| | | | | | | | | | | | | | | | | | |
| (E) | Percentage rounds to less than 0.1% or (0.1)%. |
| (F) | All or a portion of this security is on loan. The value of all securities on loan is $125,928,840. The amount of securities on loan indicated may not correspond with the securities on loan identified because securities with pending sales are in the process of recall from the brokers. |
| (G) | Cash in the amount of $330,000 has been segregated by the broker as collateral for open options contracts. |
| (H) | Rate shown reflects the yield at October 31, 2014. |
| (I) | Aggregate cost for federal income tax purposes is $788,027,620. Aggregate gross unrealized appreciation and depreciation for all securities is $196,590,540 and $43,901,461, respectively. Net unrealized appreciation for tax purposes is $152,689,079. |
| (J) | The Fund recognizes transfers between Levels at the end of the reporting period. There were no transfers between Level 1, 2 and 3 during the period ended October 31, 2014. See the Notes to Financial Statements for more information regarding security valuation and pricing inputs. |
| (K) | Any difference between Net Change in Unrealized Appreciation (Depreciation) and Net Change in Unrealized Appreciation (Depreciation) on Investments Held at October 31, 2014 may be due to an investment no longer held or categorized as Level 3 at year end. |
| (L) | Total aggregate fair value of Level 3 securities is 1.16% of the Fund’s net assets. |
DEFINITIONS:
| | |
| 144A | | 144A securities are registered pursuant to Rule 144A of the Securities Act of 1933. These securities are deemed to be liquid for purposes of compliance limitations on holdings of illiquid securities and may be resold as transactions exempt from registration, normally to qualified institutional buyers. At October 31, 2014, these securities aggregated $3,599,760, or 0.46% of the Fund’s net assets. |
| ADR | | American Depositary Receipt |
| OTC | | Over the Counter |
| RBS | | Royal Bank of Scotland Group PLC |
|
| CURRENCY ABBREVIATIONS: |
| |
| CNY | | Chinese Yuan Renminbi |
| USD | | United States Dollar |
The Notes to Financial Statements are an integral part of this report.
| | |
| Transamerica Funds | | Annual Report 2014 |
Page 135
Transamerica High Yield Bond
SCHEDULE OF INVESTMENTS
At October 31, 2014
| | | | | | | | |
| | | Principal | | | Value | |
PREFERRED CORPORATE DEBT SECURITIES - 1.2% | |
Banks - 0.8% | | | | | | | | |
Goldman Sachs Capital II | | | | | | | | |
4.00%, 12/01/2014 (A) (B) | | | $ 12,958,000 | | | | $ 9,744,416 | |
| | | | | | | | |
Diversified Financial Services - 0.4% | |
Bank of America Corp. | | | | | | | | |
6.50%, 10/23/2024 (A) (B) (C) | | | 2,450,000 | | | | 2,517,375 | |
Citigroup, Inc. | | | | | | | | |
5.80%, 11/15/2019 (A) (B) (C) | | | 3,113,000 | | | | 3,116,891 | |
| | | | | | | | |
| | | | | | | 5,634,266 | |
| | | | | | | | |
Total Preferred Corporate Debt Securities
(Cost $15,397,695) | | | | 15,378,682 | |
| | | | | | | | |
| |
CORPORATE DEBT SECURITIES - 88.0% | | | | | |
Aerospace & Defense - 1.8% | | | | | | | | |
Bombardier, Inc. | | | | | | | | |
6.00%, 10/15/2022, 144A | | | 4,965,000 | | | | 5,098,434 | |
6.13%, 01/15/2023, 144A (C) | | | 630,000 | | | | 648,900 | |
7.50%, 03/15/2018, 144A (C) | | | 450,000 | | | | 499,500 | |
7.75%, 03/15/2020, 144A (C) | | | 5,941,000 | | | | 6,594,510 | |
Spirit AeroSystems, Inc. | | | | | | | | |
5.25%, 03/15/2022 | | | 627,000 | | | | 637,973 | |
6.75%, 12/15/2020 | | | 3,420,000 | | | | 3,625,200 | |
TransDigm, Inc. | | | | | | | | |
6.00%, 07/15/2022 | | | 2,431,000 | | | | 2,458,349 | |
Triumph Group, Inc. | | | | | | | | |
4.88%, 04/01/2021 (C) | | | 320,000 | | | | 323,200 | |
5.25%, 06/01/2022 | | | 4,114,000 | | | | 4,165,425 | |
| | | | | | | | |
| | | | | | | 24,051,491 | |
| | | | | | | | |
Air Freight & Logistics - 0.2% | | | | | | | | |
PHI, Inc. | | | | | | | | |
5.25%, 03/15/2019 | | | 3,179,000 | | | | 3,140,407 | |
| | | | | | | | |
Airlines - 2.3% | | | | | | | | |
American Airlines Group, Inc. | | | | | | | | |
5.50%, 10/01/2019, 144A (C) | | | 7,006,000 | | | | 7,023,515 | |
American Airlines Pass-Through Trust | | | | | | | | |
5.60%, 01/15/2022, 144A | | | 2,298,803 | | | | 2,344,779 | |
5.63%, 01/15/2021, 144A | | | 1,083,592 | | | | 1,110,682 | |
6.00%, 01/15/2017, 144A | | | 1,119,000 | | | | 1,152,570 | |
6.13%, 07/15/2018, 144A | | | 1,600,000 | | | | 1,636,000 | |
Continental Airlines Pass-Through Certificates | | | | | | | | |
6.13%, 04/29/2018 | | | 2,224,000 | | | | 2,346,320 | |
Continental Airlines Pass-Through Trust | | | | | | | | |
5.50%, 04/29/2022 | | | 978,460 | | | | 1,034,721 | |
6.90%, 10/19/2023 | | | 3,036,851 | | | | 3,219,063 | |
Delta Air Lines Pass-Through Trust | | | | | | | | |
6.38%, 07/02/2017, 144A | | | 1,180,000 | | | | 1,230,150 | |
6.75%, 05/23/2017 | | | 1,325,000 | | | | 1,381,312 | |
U.S. Airways Pass-Through Trust | | | | | | | | |
5.38%, 05/15/2023 | | | 507,000 | | | | 515,873 | |
6.75%, 12/03/2022 | | | 2,103,959 | | | | 2,240,716 | |
9.13%, 10/01/2015 | | | 1,028,933 | | | | 1,064,946 | |
United Airlines Pass-Through Trust | | | | | | | | |
4.63%, 03/03/2024 | | | 1,070,000 | | | | 1,037,900 | |
United Continental Holdings, Inc. | | | | | | | | |
6.38%, 06/01/2018 (C) | | | 438,000 | | | | 457,710 | |
| | | | | | | | |
| | | Principal | | | Value | |
CORPORATE DEBT SECURITIES (continued) | | | | | |
Airlines (continued) | | | | | | | | |
US Airways Group, Inc. | | | | | | | | |
6.13%, 06/01/2018 (C) | | | $ 2,000,000 | | | | $ 2,065,000 | |
| | | | | | | | |
| | | | | | | 29,861,257 | |
| | | | | | | | |
Auto Components - 0.4% | | | | | | | | |
Goodyear Tire & Rubber Co. | | | | | | | | |
6.50%, 03/01/2021 (C) | | | 3,028,000 | | | | 3,239,960 | |
8.25%, 08/15/2020 | | | 1,294,000 | | | | 1,391,050 | |
| | | | | | | | |
| | | | | | | 4,631,010 | |
| | | | | | | | |
Automobiles - 1.8% | | | | | | | | |
Chrysler Group LLC / CG Co-Issuer, Inc. | | | | | | | | |
8.00%, 06/15/2019 (C) | | | 5,944,000 | | | | 6,367,510 | |
8.25%, 06/15/2021 | | | 6,846,000 | | | | 7,650,405 | |
Jaguar Land Rover Automotive PLC | | | | | | | | |
4.25%, 11/15/2019, 144A | | | 748,000 | | | | 751,740 | |
5.63%, 02/01/2023, 144A (C) | | | 2,465,000 | | | | 2,563,600 | |
8.13%, 05/15/2021, 144A | | | 5,615,000 | | | | 6,176,500 | |
| | | | | | | | |
| | | | | | | 23,509,755 | |
| | | | | | | | |
Banks - 1.1% | | | | | | | | |
Barclays PLC | | | | | | | | |
6.63%, 09/15/2019 (A) (B) (C) | | | 4,000,000 | | | | 3,828,000 | |
8.25%, 12/15/2018 (A) (B) | | | 2,574,000 | | | | 2,657,655 | |
CIT Group, Inc. | | | | | | | | |
4.25%, 08/15/2017 | | | 1,500,000 | | | | 1,541,250 | |
5.00%, 05/15/2017 | | | 450,000 | | | | 471,375 | |
5.25%, 03/15/2018 | | | 583,000 | | | | 615,065 | |
5.50%, 02/15/2019, 144A | | | 3,500,000 | | | | 3,734,063 | |
Royal Bank of Scotland Group PLC | | | | | | | | |
6.00%, 12/19/2023 | | | 2,183,000 | | | | 2,349,497 | |
| | | | | | | | |
| | | | | | | 15,196,905 | |
| | | | | | | | |
Beverages - 0.4% | | | | | | | | |
Cott Beverages, Inc. | | | | | | | | |
5.38%, 07/01/2022, 144A | | | 5,380,000 | | | | 5,326,200 | |
| | | | | | | | |
Building Products - 2.1% | | | | | | | | |
Associated Materials LLC / AMH New Finance, Inc. | | | | | | | | |
9.13%, 11/01/2017 | | | 9,930,000 | | | | 9,706,575 | |
Builders FirstSource, Inc. | | | | | | | | |
7.63%, 06/01/2021, 144A (C) | | | 2,500,000 | | | | 2,600,000 | |
Building Materials Holding Corp. | | | | | | | | |
9.00%, 09/15/2018, 144A | | | 1,900,000 | | | | 2,047,250 | |
Griffon Corp.
5.25%, 03/01/2022 (C) | | | 6,090,000 | | | | 5,861,625 | |
Ply Gem Industries, Inc. | | | | | | | | |
6.50%, 02/01/2022 (C) | | | 6,137,000 | | | | 6,037,274 | |
6.50%, 02/01/2022, 144A | | | 2,032,000 | | | | 1,998,980 | |
| | | | | | | | |
| | | | | | | 28,251,704 | |
| | | | | | | | |
Capital Markets - 0.4% | | | | | | | | |
Goldman Sachs Group, Inc. | | | | | | | | |
5.70%, 05/10/2019 (A) (B) (C) | | | 2,600,000 | | | | 2,658,500 | |
Morgan Stanley | | | | | | | | |
5.45%, 07/15/2019 (A) (B) (C) | | | 3,054,000 | | | | 3,068,317 | |
| | | | | | | | |
| | | | | | | 5,726,817 | |
| | | | | | | | |
Chemicals - 1.2% | | | | | | | | |
Hexion US Finance Corp. | | | | | | | | |
6.63%, 04/15/2020 (C) | | | 7,980,000 | | | | 7,980,000 | |
The Notes to Financial Statements are an integral part of this report.
| | |
| Transamerica Funds | | Annual Report 2014 |
Page 136
Transamerica High Yield Bond
SCHEDULE OF INVESTMENTS (continued)
At October 31, 2014
| | | | | | | | |
| | | Principal | | | Value | |
CORPORATE DEBT SECURITIES (continued) | | | | | |
Chemicals (continued) | | | | | | | | |
Huntsman International LLC | | | | | | | | |
8.63%, 03/15/2020 (C) | | | $ 1,600,000 | | | | $ 1,716,416 | |
8.63%, 03/15/2021 | | | 5,390,000 | | | | 5,875,100 | |
| | | | | | | | |
| | | | | | | 15,571,516 | |
| | | | | | | | |
Commercial Services & Supplies - 2.5% | |
Ceridian LLC | | | | | | | | |
8.88%, 07/15/2019, 144A | | | 7,071,000 | | | | 7,813,455 | |
Hertz Corp. | | | | | | | | |
5.88%, 10/15/2020 | | | 3,413,000 | | | | 3,438,597 | |
6.75%, 04/15/2019 | | | 3,460,000 | | | | 3,607,050 | |
Polymer Group, Inc. | | | | | | | | |
6.88%, 06/01/2019, 144A | | | 1,795,000 | | | | 1,772,563 | |
United Rentals North America, Inc. | | | | | | | | |
7.38%, 05/15/2020 | | | 2,634,000 | | | | 2,857,890 | |
7.63%, 04/15/2022 | | | 11,875,000 | | | | 13,240,625 | |
8.25%, 02/01/2021 | | | 589,000 | | | | 642,010 | |
| | | | | | | | |
| | | | | | | 33,372,190 | |
| | | | | | | | |
Construction & Engineering - 2.0% | | | | | | | | |
Abengoa Finance SAU | | | | | | | | |
7.75%, 02/01/2020, 144A (C) | | | 1,350,000 | | | | 1,410,750 | |
Abengoa Greenfield SA | | | | | | | | |
6.50%, 10/01/2019, 144A | | | 2,490,000 | | | | 2,496,225 | |
Ashton Woods USA LLC / Ashton Woods Finance Co. | | | | | | | | |
6.88%, 02/15/2021, 144A | | | 6,724,000 | | | | 6,589,520 | |
K Hovnanian Enterprises, Inc. | | | | | | | | |
7.00%, 01/15/2019, 144A | | | 3,515,000 | | | | 3,427,125 | |
7.25%, 10/15/2020, 144A | | | 5,630,000 | | | | 5,925,575 | |
7.50%, 05/15/2016 | | | 85,000 | | | | 89,038 | |
9.13%, 11/15/2020, 144A | | | 6,427,000 | | | | 6,973,295 | |
| | | | | | | | |
| | | | | | | 26,911,528 | |
| | | | | | | | |
Construction Materials - 0.1% | | | | | | | | |
Vulcan Materials Co. | | | | | | | | |
7.15%, 11/30/2037 | | | 1,463,000 | | | | 1,506,890 | |
| | | | | | | | |
Consumer Finance - 2.5% | | | | | | | | |
Ally Financial, Inc. | | | | | | | | |
4.75%, 09/10/2018 | | | 6,325,000 | | | | 6,641,250 | |
7.50%, 09/15/2020 (C) | | | 3,278,000 | | | | 3,900,820 | |
8.00%, 03/15/2020 (C) | | | 563,000 | | | | 677,007 | |
Navient Corp. | | | | | | | | |
Series MTN | | | | | | | | |
4.88%, 06/17/2019 | | | 3,100,000 | | | | 3,146,500 | |
5.00%, 06/15/2018 | | | 1,700,000 | | | | 1,683,000 | |
Springleaf Finance Corp. | | | | | | | | |
6.00%, 06/01/2020 | | | 8,500,000 | | | | 8,797,500 | |
7.75%, 10/01/2021 (C) | | | 1,000,000 | | | | 1,130,000 | |
Series MTN | | | | | | | | |
6.50%, 09/15/2017 | | | 150,000 | | | | 160,500 | |
6.90%, 12/15/2017 | | | 6,102,000 | | | | 6,651,180 | |
| | | | | | | | |
| | | | | | | 32,787,757 | |
| | | | | | | | |
Containers & Packaging - 1.4% | | | | | | | | |
Ardagh Packaging Finance PLC / Ardagh Holdings USA, Inc. | | | | | | | | |
3.23%, 12/15/2019, 144A (A) | | | 3,010,000 | | | | 2,942,275 | |
Packaging Dynamics Corp. | | | | | | | | |
8.75%, 02/01/2016, 144A (C) | | | 6,520,000 | | | | 6,568,900 | |
| | | | | | | | |
| | | Principal | | | Value | |
CORPORATE DEBT SECURITIES (continued) | | | | | |
Containers & Packaging (continued) | | | | | | | | |
Sealed Air Corp. | | | | | | | | |
8.38%, 09/15/2021, 144A | | | $ 1,425,000 | | | | $ 1,613,813 | |
Tekni-Plex, Inc. | | | | | | | | |
9.75%, 06/01/2019, 144A | | | 6,986,000 | | | | 7,632,205 | |
| | | | | | | | |
| | | | | | | 18,757,193 | |
| | | | | | | | |
Diversified Consumer Services - 0.1% | |
Service Corp., International | | | | | | | | |
6.75%, 04/01/2016 | | | 220,000 | | | | 232,650 | |
7.00%, 06/15/2017 | | | 1,240,000 | | | | 1,354,700 | |
| | | | | | | | |
| | | | | | | 1,587,350 | |
| | | | | | | | |
Diversified Financial Services - 5.2% | |
AerCap Ireland Capital, Ltd. / AerCap Global Aviation Trust | | | | | | | | |
4.50%, 05/15/2021, 144A | | | 844,000 | | | | 852,440 | |
Bank of America Corp. | | | | | | | | |
5.13%, 06/17/2019 (A) (B) (C) | | | 6,663,000 | | | | 6,463,110 | |
8.00%, 01/30/2018 (A) (B) | | | 7,883,000 | | | | 8,484,079 | |
Citigroup, Inc. | | | | | | | | |
6.30%, 05/15/2024 (A) (B) | | | 923,000 | | | | 917,231 | |
Credit Suisse Group AG | | | | | | | | |
6.25%, 12/18/2024, 144A (A) (B) (C) | | | 3,050,000 | | | | 2,966,125 | |
7.50%, 12/11/2023, 144A (A) (B) | | | 3,900,000 | | | | 4,144,920 | |
Denali Borrower LLC / Denali Finance Corp. | | | | | | | | |
5.63%, 10/15/2020, 144A | | | 12,691,000 | | | | 13,460,392 | |
General Motors Financial Co., Inc. | | | | | | | | |
3.25%, 05/15/2018 | | | 938,000 | | | | 959,105 | |
4.75%, 08/15/2017 | | | 1,884,000 | | | | 2,011,170 | |
General Motors Financial Co., Inc. (Escrow Shares) | | | | | | | | |
7.20%, 01/15/2049 | | | 2,825,000 | | | | 847,500 | |
ILFC E-Capital Trust I | | | | | | | | |
4.84%, 12/21/2065, 144A (A) | | | 6,316,000 | | | | 5,984,410 | |
Jefferies Finance LLC / JFIN Co-Issuer Corp. | | | | | | | | |
7.50%, 04/15/2021, 144A | | | 3,843,000 | | | | 3,823,785 | |
JPMorgan Chase & Co. | | | | | | | | |
5.00%, 07/01/2019 (A) (B) (C) | | | 3,000,000 | | | | 2,951,250 | |
7.90%, 04/30/2018 (A) (B) | | | 4,950,000 | | | | 5,364,562 | |
Nuveen Investments, Inc. | | | | | | | | |
9.50%, 10/15/2020, 144A | | | 7,934,000 | | | | 9,679,480 | |
| | | | | | | | |
| | | | | | | 68,909,559 | |
| | | | | | | | |
Diversified Telecommunication Services - 8.3% | | | | | |
CenturyLink, Inc. | | | | | | | | |
7.60%, 09/15/2039 | | | 7,123,000 | | | | 7,194,230 | |
7.65%, 03/15/2042 (C) | | | 10,509,000 | | | | 10,482,727 | |
Cincinnati Bell, Inc. | | | | | | | | |
8.38%, 10/15/2020 | | | 3,119,000 | | | | 3,345,128 | |
Frontier Communications Corp. | | | | | | | | |
6.88%, 01/15/2025 | | | 500,000 | | | | 506,250 | |
7.13%, 01/15/2023 (C) | | | 2,000,000 | | | | 2,130,000 | |
7.63%, 04/15/2024 (C) | | | 6,101,000 | | | | 6,558,575 | |
Hughes Satellite Systems Corp. | | | | | | | | |
6.50%, 06/15/2019 | | | 7,701,000 | | | | 8,336,332 | |
7.63%, 06/15/2021 | | | 4,418,000 | | | | 4,915,025 | |
Intelsat Jackson Holdings SA | | | | | | | | |
7.25%, 04/01/2019 (C) | | | 3,575,000 | | | | 3,753,750 | |
7.25%, 10/15/2020 | | | 2,963,000 | | | | 3,163,003 | |
The Notes to Financial Statements are an integral part of this report.
| | |
| Transamerica Funds | | Annual Report 2014 |
Page 137
Transamerica High Yield Bond
SCHEDULE OF INVESTMENTS (continued)
At October 31, 2014
| | | | | | | | |
| | | Principal | | | Value | |
CORPORATE DEBT SECURITIES (continued) | | | | | |
Diversified Telecommunication Services (continued) | |
Koninklijke KPN NV | | | | | | | | |
7.00%, 03/28/2073, 144A (A) | | | $ 3,100,000 | | | | $ 3,230,200 | |
Level 3 Communications, Inc. | | | | | | | | |
8.88%, 06/01/2019 | | | 300,000 | | | | 321,750 | |
Level 3 Financing, Inc. | | | | | | | | |
7.00%, 06/01/2020 | | | 3,500,000 | | | | 3,736,250 | |
8.13%, 07/01/2019 | | | 6,600,000 | | | | 7,062,000 | |
Sprint Capital Corp. | | | | | | | | |
6.90%, 05/01/2019 | | | 3,593,000 | | | | 3,808,580 | |
8.75%, 03/15/2032 | | | 5,144,000 | | | | 5,748,420 | |
Telecom Italia Capital SA | | | | | | | | |
7.00%, 06/04/2018 | | | 3,240,000 | | | | 3,624,750 | |
Telecom Italia SpA | | | | | | | | |
5.30%, 05/30/2024, 144A | | | 1,400,000 | | | | 1,417,500 | |
Virgin Media Finance PLC | | | | | | | | |
6.00%, 10/15/2024, 144A (C) | | | 1,137,000 | | | | 1,182,480 | |
6.38%, 04/15/2023, 144A (C) | | | 6,600,000 | | | | 6,979,500 | |
Wind Acquisition Finance SA | | | | | | | | |
4.75%, 07/15/2020, 144A | | | 3,600,000 | | | | 3,519,000 | |
7.38%, 04/23/2021, 144A | | | 6,368,000 | | | | 6,224,720 | |
Windstream Corp. | | | | | | | | |
7.75%, 10/15/2020 - 10/01/2021 | | | 11,217,000 | | | | 11,965,605 | |
| | | | | | | | |
| | | | | | | 109,205,775 | |
| | | | | | | | |
Electric Utilities - 2.0% | | | | | | | | |
Calpine Corp. | | | | | | | | |
5.38%, 01/15/2023 (C) | | | 500,000 | | | | 505,000 | |
5.75%, 01/15/2025 (C) | | | 3,240,000 | | | | 3,280,500 | |
Dynegy Finance I, Inc. / Dynegy Finance II, Inc. | | | | | | | | |
6.75%, 11/01/2019, 144A | | | 1,155,000 | | | | 1,195,425 | |
Elwood Energy LLC | | | | | | | | |
8.16%, 07/05/2026 | | | 4,170,531 | | | | 4,650,141 | |
Homer City Generation, LP | | | | | | | | |
8.14%, 10/01/2019
(Cash Rate: 8.14%) (D) | | | 2,840,529 | | | | 2,947,049 | |
8.73%, 10/01/2026
(Cash Rate: 8.73%) (D) | | | 6,594,861 | | | | 6,891,630 | |
LSP Energy, LP (Escrow Shares) | | | | | | | | |
7.16%, 01/15/2014 (E) (F) (G) | | | 7,150,000 | | | | 1 | |
8.16%, 07/15/2025 (E) (F) (G) | | | 750,000 | | | | 4 | |
NRG Energy, Inc. | | | | | | | | |
6.25%, 07/15/2022 | | | 1,500,000 | | | | 1,567,500 | |
Red Oak Power LLC | | | | | | | | |
9.20%, 11/30/2029 | | | 4,740,000 | | | | 5,237,700 | |
| | | | | | | | |
| | | | | | | 26,274,950 | |
| | | | | | | | |
Electronic Equipment, Instruments & Components - 0.9% | |
Belden, Inc. | | | | | | | | |
5.50%, 09/01/2022, 144A | | | 4,500,000 | | | | 4,578,750 | |
Sanmina Corp. | | | | | | | | |
4.38%, 06/01/2019, 144A | | | 3,121,000 | | | | 3,124,901 | |
Zebra Technologies Corp. | | | | | | | | |
7.25%, 10/15/2022, 144A | | | 3,505,000 | | | | 3,689,013 | |
| | | | | | | | |
| | | | | | | 11,392,664 | |
| | | | | | | | |
Energy Equipment & Services - 2.7% | |
Compressco Partners, LP / Compressco Finance, Inc. | | | | | | | | |
7.25%, 08/15/2022, 144A | | | 1,899,000 | | | | 1,880,010 | |
| | | | | | | | |
| | | Principal | | | Value | |
CORPORATE DEBT SECURITIES (continued) | | | | | |
Energy Equipment & Services (continued) | |
Kinder Morgan, Inc. | | | | | | | | |
7.25%, 06/01/2018 (C) | | | $ 13,186,000 | | | | $ 15,032,040 | |
Series MTN | | | | | | | | |
8.05%, 10/15/2030 | | | 486,000 | | | | 592,920 | |
NuStar Logistics, LP | | | | | | | | |
4.80%, 09/01/2020 | | | 1,140,000 | | | | 1,142,850 | |
6.75%, 02/01/2021 | | | 4,330,000 | | | | 4,708,875 | |
8.15%, 04/15/2018 | | | 1,210,000 | | | | 1,367,300 | |
Regency Energy Partners, LP / Regency Energy Finance Corp. | | | | | | | | |
5.75%, 09/01/2020 | | | 9,355,000 | | | | 9,939,687 | |
5.88%, 03/01/2022 | | | 233,000 | | | | 248,145 | |
Tesoro Logistics, LP / Tesoro Logistics Finance Corp. | | | | | | | | |
6.25%, 10/15/2022, 144A | | | 1,090,000 | | | | 1,128,150 | |
| | | | | | | | |
| | | | | | | 36,039,977 | |
| | | | | | | | |
Food & Staples Retailing - 0.3% | | | | | | | | |
Rite Aid Corp. | | | | | | | | |
6.75%, 06/15/2021 (C) | | | 3,722,000 | | | | 3,973,235 | |
| | | | | | | | |
Food Products - 1.0% | | | | | | | | |
Aramark Services, Inc. | | | | | | | | |
5.75%, 03/15/2020 | | | 1,705,000 | | | | 1,781,725 | |
JBS USA LLC / JBS USA Finance, Inc. | | | | | | | | |
7.25%, 06/01/2021, 144A | | | 3,523,000 | | | | 3,751,995 | |
Post Holdings, Inc. | | | | | | | | |
7.38%, 02/15/2022 (C) | | | 7,922,000 | | | | 8,120,050 | |
| | | | | | | | |
| | | | | | | 13,653,770 | |
| | | | | | | | |
Health Care Equipment & Supplies - 2.5% | | | | | |
Biomet, Inc. | | | | | | | | |
6.50%, 08/01/2020 | | | 8,785,000 | | | | 9,399,950 | |
Crimson Merger Sub, Inc. | | | | | | | | |
6.63%, 05/15/2022, 144A (C) | | | 7,822,000 | | | | 7,313,570 | |
Hologic, Inc. | | | | | | | | |
6.25%, 08/01/2020 | | | 4,605,000 | | | | 4,841,006 | |
Mallinckrodt International Finance SA | | | | | | | | |
3.50%, 04/15/2018 | | | 4,420,000 | | | | 4,353,700 | |
4.75%, 04/15/2023 (C) | | | 5,055,000 | | | | 4,852,800 | |
Mallinckrodt International Finance SA / Mallinckrodt CB LLC | | | | | | | | |
5.75%, 08/01/2022, 144A | | | 1,890,000 | | | | 1,979,775 | |
| | | | | | | | |
| | | | | | | 32,740,801 | |
| | | | | | | | |
Health Care Providers & Services - 6.2% | |
CHS / Community Health Systems, Inc. | | | | | | | | |
6.88%, 02/01/2022 (C) | | | 2,120,000 | | | | 2,284,300 | |
7.13%, 07/15/2020 | | | 7,490,000 | | | | 8,107,925 | |
8.00%, 11/15/2019 | | | 12,807,000 | | | | 13,831,560 | |
DaVita HealthCare Partners, Inc. | | | | | | | | |
5.75%, 08/15/2022 | | | 4,280,000 | | | | 4,536,800 | |
HCA Holdings, Inc. | | | | | | | | |
6.25%, 02/15/2021 | | | 7,824,000 | | | | 8,420,580 | |
7.75%, 05/15/2021 | | | 2,888,000 | | | | 3,111,820 | |
HCA, Inc. | | | | | | | | |
6.50%, 02/15/2020 | | | 1,300,000 | | | | 1,451,125 | |
7.50%, 02/15/2022 | | | 8,235,000 | | | | 9,562,894 | |
HealthSouth Corp. | | | | | | | | |
7.75%, 09/15/2022 | | | 6,256,000 | | | | 6,686,100 | |
The Notes to Financial Statements are an integral part of this report.
| | |
| Transamerica Funds | | Annual Report 2014 |
Page 138
Transamerica High Yield Bond
SCHEDULE OF INVESTMENTS (continued)
At October 31, 2014
| | | | | | | | |
| | | Principal | | | Value | |
CORPORATE DEBT SECURITIES (continued) | | | | | |
Health Care Providers & Services (continued) | |
LifePoint Hospitals, Inc. | | | | | | | | |
5.50%, 12/01/2021 | | | $ 2,442,000 | | | | $ 2,557,995 | |
6.63%, 10/01/2020 | | | 5,634,000 | | | | 5,986,125 | |
Tenet Healthcare Corp. | | | | | | | | |
4.38%, 10/01/2021 | | | 2,344,000 | | | | 2,329,350 | |
5.00%, 03/01/2019, 144A (C) | | | 3,042,000 | | | | 3,045,802 | |
5.50%, 03/01/2019, 144A (C) | | | 1,600,000 | | | | 1,636,000 | |
6.00%, 10/01/2020 | | | 1,293,000 | | | | 1,389,975 | |
6.25%, 11/01/2018 | | | 275,000 | | | | 298,719 | |
8.13%, 04/01/2022 | | | 5,549,000 | | | | 6,360,541 | |
| | | | | | | | |
| | | | | | | 81,597,611 | |
| | | | | | | | |
Hotels, Restaurants & Leisure - 4.7% | |
Caesars Entertainment Operating Co., Inc. | | | | | | | | |
9.00%, 02/15/2020 (C) | | | 2,112,000 | | | | 1,589,560 | |
10.00%, 12/15/2018 | | | 6,851,000 | | | | 993,395 | |
12.75%, 04/15/2018 | | | 6,500,000 | | | | 1,137,500 | |
Felcor Lodging, LP | | | | | | | | |
5.63%, 03/01/2023 | | | 3,515,000 | | | | 3,506,212 | |
MGM Resorts International | | | | | | | | |
6.63%, 12/15/2021 (C) | | | 5,537,000 | | | | 6,063,015 | |
6.75%, 10/01/2020 (C) | | | 4,384,000 | | | | 4,811,440 | |
11.38%, 03/01/2018 | | | 9,931,000 | | | | 12,115,820 | |
NCL Corp., Ltd. | | | | | | | | |
5.00%, 02/15/2018 | | | 4,725,000 | | | | 4,725,000 | |
Pinnacle Entertainment, Inc. | | | | | | | | |
6.38%, 08/01/2021 | | | 542,000 | | | | 579,940 | |
7.50%, 04/15/2021 (C) | | | 7,892,000 | | | | 8,424,710 | |
Seneca Gaming Corp. | | | | | | | | |
8.25%, 12/01/2018, 144A | | | 5,173,000 | | | | 5,405,785 | |
Studio City Finance, Ltd. | | | | | | | | |
8.50%, 12/01/2020, 144A (C) | | | 2,735,000 | | | | 2,967,475 | |
Viking Cruises, Ltd. | | | | | | | | |
8.50%, 10/15/2022, 144A | | | 7,536,000 | | | | 8,157,720 | |
Wynn Las Vegas LLC / Wynn Las Vegas Capital Corp. | | | | | | | | |
7.75%, 08/15/2020 | | | 2,147,000 | | | | 2,308,025 | |
| | | | | | | | |
| | | | | | | 62,785,597 | |
| | | | | | | | |
Household Durables - 3.7% | | | | | | | | |
Beazer Homes USA, Inc. | | | | | | | | |
5.75%, 06/15/2019 | | | 3,455,000 | | | | 3,308,162 | |
6.63%, 04/15/2018 | | | 1,917,000 | | | | 1,998,473 | |
7.25%, 02/01/2023 | | | 5,191,000 | | | | 5,165,045 | |
9.13%, 05/15/2019 (C) | | | 5,250,000 | | | | 5,486,250 | |
Jarden Corp. | | | | | | | | |
6.13%, 11/15/2022 | | | 3,000,000 | | | | 3,142,500 | |
7.50%, 05/01/2017 | | | 1,262,000 | | | | 1,381,890 | |
KB Home | | | | | | | | |
4.75%, 05/15/2019 (C) | | | 1,702,000 | | | | 1,689,235 | |
7.25%, 06/15/2018 | | | 2,765,000 | | | | 2,993,113 | |
9.10%, 09/15/2017 | | | 4,891,000 | | | | 5,575,740 | |
Meritage Homes Corp. | | | | | | | | |
4.50%, 03/01/2018 | | | 3,330,000 | | | | 3,396,600 | |
7.00%, 04/01/2022 | | | 1,413,000 | | | | 1,533,105 | |
7.15%, 04/15/2020 | | | 4,953,000 | | | | 5,448,300 | |
Standard Pacific Corp. | | | | | | | | |
6.25%, 12/15/2021 | | | 1,800,000 | | | | 1,890,000 | |
8.38%, 01/15/2021 (C) | | | 2,675,000 | | | | 3,123,062 | |
| | | | | | | | |
| | | Principal | | | Value | |
CORPORATE DEBT SECURITIES (continued) | | | | | |
Household Durables (continued) | | | | | | | | |
Tempur Sealy International, Inc. | | | | | | | | |
6.88%, 12/15/2020 | | | $ 3,135,000 | | | | $ 3,346,612 | |
| | | | | | | | |
| | | | | | | 49,478,087 | |
| | | | | | | | |
Household Products - 1.9% | | | | | | | | |
Reynolds Group Issuer, Inc. / Reynolds Group Issuer LLC | | | | | | | | |
5.75%, 10/15/2020 | | | 745,000 | | | | 774,800 | |
6.88%, 02/15/2021 | | | 300,000 | | | | 318,750 | |
7.13%, 04/15/2019 | | | 10,189,000 | | | | 10,583,824 | |
9.88%, 08/15/2019 | | | 9,850,000 | | | | 10,699,562 | |
Sun Products Corp. | | | | | | | | |
7.75%, 03/15/2021, 144A (C) | | | 4,332,000 | | | | 3,205,680 | |
| | | | | | | | |
| | | | | | | 25,582,616 | |
| | | | | | | | |
Independent Power and Renewable Electricity Producers - 1.8% | |
Dynegy, Inc. | | | | | | | | |
5.88%, 06/01/2023 (C) | | | 1,570,000 | | | | 1,538,600 | |
NRG Energy, Inc. | | | | | | | | |
6.63%, 03/15/2023 (C) | | | 3,775,000 | | | | 3,982,625 | |
7.88%, 05/15/2021 | | | 12,762,000 | | | | 13,846,770 | |
8.25%, 09/01/2020 | | | 3,606,000 | | | | 3,898,988 | |
| | | | | | | | |
| | | | | | | 23,266,983 | |
| | | | | | | | |
Insurance - 0.7% | | | | | | | | |
Lincoln National Corp. | | | | | | | | |
7.00%, 05/17/2066 (A) | | | 9,013,000 | | | | 9,238,325 | |
| | | | | | | | |
IT Services - 1.3% | | | | | | | | |
SunGard Data Systems, Inc. | | | | | | | | |
6.63%, 11/01/2019 | | | 4,942,000 | | | | 5,114,970 | |
7.63%, 11/15/2020 | | | 11,087,000 | | | | 11,821,514 | |
Unisys Corp. | | | | | | | | |
6.25%, 08/15/2017 | | | 615,000 | | | | 644,212 | |
| | | | | | | | |
| | | | | | | 17,580,696 | |
| | | | | | | | |
Media - 7.7% | | | | | | | | |
Cablevision Systems Corp. | | | | | | | | |
5.88%, 09/15/2022 (C) | | | 5,590,000 | | | | 5,687,825 | |
7.75%, 04/15/2018 | | | 12,652,000 | | | | 14,094,328 | |
CCO Holdings LLC / CCO Holdings Capital Corp. | | | | | | | | |
5.13%, 02/15/2023 | | | 1,900,000 | | | | 1,895,250 | |
5.75%, 01/15/2024 (C) | | | 4,035,000 | | | | 4,130,831 | |
6.50%, 04/30/2021 | | | 5,016,000 | | | | 5,291,880 | |
7.00%, 01/15/2019 | | | 2,500,000 | | | | 2,606,250 | |
7.25%, 10/30/2017 | | | 1,500,000 | | | | 1,561,875 | |
CCOH Safari LLC | | | | | | | | |
5.50%, 12/01/2022 (H) | | | 1,579,000 | | | | 1,594,790 | |
Cequel Communications Holdings I LLC / Cequel Capital Corp. | | | | | | | | |
6.38%, 09/15/2020, 144A (C) | | | 4,043,000 | | | | 4,214,828 | |
Clear Channel Worldwide Holdings, Inc. | | | | | | | | |
6.50%, 11/15/2022 | | | 10,926,000 | | | | 11,268,560 | |
7.63%, 03/15/2020 | | | 8,558,000 | | | | 9,099,197 | |
DISH DBS Corp. | | | | | | | | |
4.63%, 07/15/2017 | | | 3,026,000 | | | | 3,154,605 | |
5.00%, 03/15/2023 | | | 3,185,000 | | | | 3,173,056 | |
5.88%, 07/15/2022 (C) | | | 1,030,000 | | | | 1,091,800 | |
7.88%, 09/01/2019 | | | 4,000,000 | | | | 4,645,000 | |
Getty Images, Inc. | | | | | | | | |
7.00%, 10/15/2020, 144A (C) | | | 3,886,000 | | | | 2,992,220 | |
The Notes to Financial Statements are an integral part of this report.
| | |
| Transamerica Funds | | Annual Report 2014 |
Page 139
Transamerica High Yield Bond
SCHEDULE OF INVESTMENTS (continued)
At October 31, 2014
| | | | | | | | |
| | | Principal | | | Value | |
CORPORATE DEBT SECURITIES (continued) | | | | | |
Media (continued) | | | | | | | | |
Numericable Group SA | | | | | | | | |
4.88%, 05/15/2019, 144A | | | $ 5,465,000 | | | | $ 5,451,338 | |
Regal Entertainment Group | | | | | | | | |
5.75%, 06/15/2023 | | | 855,000 | | | | 820,800 | |
Unitymedia KabelBW GMBH | | | | | | | | |
6.13%, 01/15/2025, 144A | | | 2,640,000 | | | | 2,755,500 | |
Univision Communications, Inc. | | | | | | | | |
6.88%, 05/15/2019, 144A | | | 4,050,000 | | | | 4,257,563 | |
7.88%, 11/01/2020, 144A | | | 6,005,000 | | | | 6,492,906 | |
8.50%, 05/15/2021, 144A | | | 5,000,000 | | | | 5,412,500 | |
| | | | | | | | |
| | | | | | | 101,692,902 | |
| | | | | | | | |
Metals & Mining - 0.7% | | | | | | | | |
ArcelorMittal | | | | | | | | |
7.50%, 10/15/2039 | | | 3,880,000 | | | | 4,141,900 | |
Novelis, Inc. | | | | | | | | |
8.38%, 12/15/2017 | | | 4,900,000 | | | | 5,120,500 | |
| | | | | | | | |
| | | | | | | 9,262,400 | |
| | | | | | | | |
Oil, Gas & Consumable Fuels - 4.8% | |
BreitBurn Energy Partners, LP / BreitBurn Finance Corp. | | | | | | | | |
7.88%, 04/15/2022 | | | 5,004,000 | | | | 4,800,713 | |
California Resources Corp. | | | | | | | | |
5.00%, 01/15/2020, 144A (C) | | | 1,956,000 | | | | 1,985,340 | |
5.50%, 09/15/2021, 144A | | | 2,274,000 | | | | 2,319,480 | |
6.00%, 11/15/2024, 144A (C) | | | 3,138,000 | | | | 3,200,760 | |
Carrizo Oil & Gas, Inc. | | | | | | | | |
7.50%, 09/15/2020, 144A | | | 3,175,000 | | | | 3,206,750 | |
Chesapeake Energy Corp. | | | | | | | | |
6.63%, 08/15/2020 (C) | | | 2,756,000 | | | | 3,107,390 | |
CITGO Petroleum Corp. | | | | | | | | |
6.25%, 08/15/2022, 144A | | | 2,901,000 | | | | 2,951,768 | |
Denbury Resources, Inc. | | | | | | | | |
5.50%, 05/01/2022 | | | 5,308,000 | | | | 5,228,380 | |
Energy XXI Gulf Coast, Inc. | | | | | | | | |
6.88%, 03/15/2024, 144A | | | 1,392,000 | | | | 1,099,680 | |
7.50%, 12/15/2021 (C) | | | 3,218,000 | | | | 2,670,940 | |
7.75%, 06/15/2019 | | | 2,375,000 | | | | 2,137,500 | |
Linn Energy LLC / Linn Energy Finance Corp. | | | | | | | | |
6.25%, 11/01/2019 | | | 6,460,000 | | | | 5,943,200 | |
6.50%, 05/15/2019 | | | 1,350,000 | | | | 1,262,250 | |
7.75%, 02/01/2021 | | | 6,300,000 | | | | 6,174,000 | |
8.63%, 04/15/2020 | | | 3,640,000 | | | | 3,649,100 | |
Newfield Exploration Co. | | | | | | | | |
6.88%, 02/01/2020 | | | 2,238,000 | | | | 2,321,925 | |
Peabody Energy Corp. | | | | | | | | |
6.25%, 11/15/2021 (C) | | | 2,605,000 | | | | 2,466,609 | |
6.50%, 09/15/2020 (C) | | | 1,440,000 | | | | 1,371,600 | |
SM Energy Co. | | | | | | | | |
6.50%, 11/15/2021 (C) | | | 5,173,000 | | | | 5,366,987 | |
6.50%, 01/01/2023 | | | 520,000 | | | | 536,900 | |
6.63%, 02/15/2019 | | | 1,328,000 | | | | 1,374,480 | |
| | | | | | | | |
| | | | | | | 63,175,752 | |
| | | | | | | | |
Paper & Forest Products - 0.6% | | | | | | | | |
Ainsworth Lumber Co., Ltd. | | | | | | | | |
7.50%, 12/15/2017, 144A | | | 3,604,000 | | | | 3,730,140 | |
| | | | | | | | |
| | | Principal | | | Value | |
CORPORATE DEBT SECURITIES (continued) | |
Paper & Forest Products (continued) | |
Boise Cascade Co. | | | | | | | | |
6.38%, 11/01/2020 | | | $ 2,698,000 | | | | $ 2,819,410 | |
Coveris Holdings SA | | | | | | | | |
7.88%, 11/01/2019, 144A | | | 1,940,000 | | | | 2,037,000 | |
| | | | | | | | |
| | | | | | | 8,586,550 | |
| | | | | | | | |
Personal Products - 0.5% | | | | | | | | |
First Quality Finance Co., Inc. | | | | | | | | |
4.63%, 05/15/2021, 144A | | | 1,197,000 | | | | 1,107,225 | |
Revlon Consumer Products Corp. | | | | | | | | |
5.75%, 02/15/2021 (C) | | | 5,731,000 | | | | 5,731,000 | |
| | | | | | | | |
| | | | | | | 6,838,225 | |
| | | | | | | | |
Pharmaceuticals - 1.3% | | | | | | | | |
Salix Pharmaceuticals, Ltd. | | | | | | | | |
6.00%, 01/15/2021, 144A | | | 1,279,000 | | | | 1,384,518 | |
Valeant Pharmaceuticals International, Inc. | | | | | | | | |
5.63%, 12/01/2021, 144A (C) | | | 350,000 | | | | 346,500 | |
6.38%, 10/15/2020, 144A | | | 2,561,000 | | | | 2,628,226 | |
6.88%, 12/01/2018, 144A | | | 3,350,000 | | | | 3,467,250 | |
7.00%, 10/01/2020, 144A | | | 3,700,000 | | | | 3,875,750 | |
7.50%, 07/15/2021, 144A | | | 4,527,000 | | | | 4,843,890 | |
| | | | | | | | |
| | | | | | | 16,546,134 | |
| | | | | | | | |
Professional Services - 0.0% (I) | | | | | | | | |
Cardtronics, Inc. | | | | | | | | |
5.13%, 08/01/2022, 144A | | | 592,000 | | | | 589,040 | |
| | | | | | | | |
Real Estate Management & Development - 0.7% | |
Algeco Scotsman Global Finance PLC | | | | | | | | |
8.50%, 10/15/2018, 144A (C) | | | 6,785,000 | | | | 7,056,400 | |
Realogy Group LLC / Realogy Co-Issuer Corp. | | | | | | | | |
4.50%, 04/15/2019, 144A (C) | | | 1,727,000 | | | | 1,731,318 | |
| | | | | | | | |
| | | | | | | 8,787,718 | |
| | | | | | | | |
Road & Rail - 1.2% | | | | | | | | |
Aviation Capital Group Corp. | | | | | | | | |
4.63%, 01/31/2018, 144A | | | 1,024,000 | | | | 1,067,175 | |
6.75%, 04/06/2021, 144A | | | 3,823,000 | | | | 4,358,220 | |
7.13%, 10/15/2020, 144A | | | 4,310,000 | | | | 4,954,078 | |
Avis Budget Car Rental LLC / Avis Budget Finance, Inc. | | | | | | | | |
5.50%, 04/01/2023 (C) | | | 1,320,000 | | | | 1,326,600 | |
9.75%, 03/15/2020 | | | 3,605,000 | | | | 3,974,512 | |
| | | | | | | | |
| | | | | | | 15,680,585 | |
| | | | | | | | |
Semiconductors & Semiconductor Equipment - 0.7% | |
Freescale Semiconductor, Inc. | | | | | | | | |
5.00%, 05/15/2021, 144A (C) | | | 5,266,000 | | | | 5,187,010 | |
6.00%, 01/15/2022, 144A (C) | | | 2,555,000 | | | | 2,618,875 | |
NXP BV / NXP Funding LLC | | | | | | | | |
3.75%, 06/01/2018, 144A | | | 800,000 | | | | 806,000 | |
| | | | | | | | |
| | | | | | | 8,611,885 | |
| | | | | | | | |
Software - 1.5% | | | | | | | | |
First Data Corp. | | | | | | | | |
6.75%, 11/01/2020, 144A (C) | | | 5,913,000 | | | | 6,326,910 | |
7.38%, 06/15/2019, 144A | | | 1,648,000 | | | | 1,746,880 | |
8.25%, 01/15/2021, 144A | | | 750,000 | | | | 813,750 | |
The Notes to Financial Statements are an integral part of this report.
| | |
| Transamerica Funds | | Annual Report 2014 |
Page 140
Transamerica High Yield Bond
SCHEDULE OF INVESTMENTS (continued)
At October 31, 2014
| | | | | | | | |
| | | Principal | | | Value | |
CORPORATE DEBT SECURITIES (continued) | | | | | |
Software (continued) | | | | | | | | |
First Data Corp. (continued) | | | | | | | | |
8.75%, 01/15/2022, 144A
(Cash Rate: 8.75%) (D) | | | $ 2,717,000 | | | | $ 2,968,323 | |
8.88%, 08/15/2020, 144A (C) | | | 4,160,000 | | | | 4,503,200 | |
11.75%, 08/15/2021 (C) | | | 3,117,000 | | | | 3,654,682 | |
| | | | | | | | |
| | | | | | | 20,013,745 | |
| | | | | | | | |
Specialty Retail - 0.7% | | | | | | | | |
Claire’s Stores, Inc. | | | | | | | | |
6.13%, 03/15/2020, 144A | | | 600,000 | | | | 555,000 | |
9.00%, 03/15/2019, 144A (C) | | | 8,987,000 | | | | 9,166,740 | |
| | | | | | | | |
| | | | | | | 9,721,740 | |
| | | | | | | | |
Technology Hardware, Storage & Peripherals - 0.5% | |
Dell, Inc. | | | | | | | | |
6.50%, 04/15/2038 (C) | | | 4,324,000 | | | | 4,107,800 | |
7.10%, 04/15/2028 | | | 2,455,000 | | | | 2,504,100 | |
| | | | | | | | |
| | | | | | | 6,611,900 | |
| | | | | | | | |
Textiles, Apparel & Luxury Goods - 0.8% | |
Levi Strauss & Co. | | | | | | | | |
6.88%, 05/01/2022 (C) | | | 9,344,000 | | | | 10,161,600 | |
| | | | | | | | |
Transportation Infrastructure - 0.2% | |
syncreon Group BV / syncreon Global Finance US, Inc. | | | | | | | | |
8.63%, 11/01/2021, 144A | | | 2,337,000 | | | | 2,284,418 | |
| | | | | | | | |
Wireless Telecommunication Services - 2.6% | |
Sprint Communications, Inc. | | | | | | | | |
9.00%, 11/15/2018, 144A | | | 4,673,000 | | | | 5,496,616 | |
Sprint Corp. | | | | | | | | |
7.13%, 06/15/2024, 144A | | | 1,920,000 | | | | 1,972,800 | |
7.88%, 09/15/2023, 144A (C) | | | 15,733,000 | | | | 17,030,972 | |
T-Mobile USA, Inc. | | | | | | | | |
6.13%, 01/15/2022 | | | 702,000 | | | | 727,448 | |
6.63%, 04/01/2023 | | �� | 5,700,000 | | | | 6,013,500 | |
6.73%, 04/28/2022 | | | 3,030,000 | | | | 3,204,225 | |
| | | | | | | | |
| | | | | | | 34,445,561 | |
| | | | | | | | |
Total Corporate Debt Securities
(Cost $1,156,294,560) | | | | | | | 1,164,920,771 | |
| | | | | | | | |
| | |
CONVERTIBLE BOND - 0.2% | | | | | | | | |
Diversified Telecommunication Services - 0.2% | | | | | |
Level 3 Financing, Inc. | | | | | | | | |
8.63%, 07/15/2020 | | | 1,848,000 | | | | 2,032,800 | |
| | | | | | | | |
Total Convertible Bond
(Cost $2,035,163) | | | | | | | 2,032,800 | |
| | | | | | | | |
| | |
LOAN ASSIGNMENTS - 4.4% | | | | | | | | |
Aerospace & Defense - 0.2% | | | | | | | | |
Silver II US Holdings LLC, Term Loan | | | | | | | | |
4.00%, 12/13/2019 (A) | | | 2,842,384 | | | | 2,773,990 | |
| | | | | | | | |
Commercial Services & Supplies - 0.3% | |
ADS Waste Holdings, Inc., Term Loan | | | | | | | | |
3.75%, 10/09/2019 (A) | | | 3,959,773 | | | | 3,866,719 | |
| | | | | | | | |
Diversified Financial Services - 0.2% | |
Delos Finance Sarl, Term Loan B | | | | | | | | |
TBD, 03/06/2021 (J) | | | 2,800,000 | | | | 2,782,500 | |
| | | | | | | | |
| | | | | | | | |
| | | Principal | | | Value | |
LOAN ASSIGNMENTS (continued) | | | | | | | | |
Diversified Telecommunication Services - 0.4% | | | | | |
Intelsat Jackson Holdings SA, Term Loan B2 | | | | | | | | |
3.75%, 06/30/2019 (A) | | | $ 3,864,684 | | | | $ 3,832,480 | |
Level 3 Financing, Inc., Term Loan B | | | | | | | | |
4.00%, 01/15/2020 (A) | | | 1,000,000 | | | | 991,000 | |
| | | | | | | | |
| | | | | | | 4,823,480 | |
| | | | | | | | |
Energy Equipment & Services - 0.3% | | | | | | | | |
Stallion Oilfield Services, Ltd., Term Loan B | | | | | | | | |
8.00%, 06/19/2018 (A) | | | 3,761,888 | | | | 3,611,413 | |
| | | | | | | | |
Food Products - 0.6% | | | | | | | | |
Big Heart Pet Brands, Term Loan | | | | | | | | |
3.50%, 03/08/2020 (A) | | | 3,980,000 | | | | 3,824,780 | |
Del Monte Foods, Inc., 1st Lien Term Loan | | | | | | | | |
4.25%, 02/18/2021 (A) | | | 3,970,000 | | | | 3,718,568 | |
| | | | | | | | |
| | | | | | | 7,543,348 | |
| | | | | | | | |
Hotels, Restaurants & Leisure - 0.9% | | | | | | | | |
CityCenter Holdings LLC, Term Loan B | | | | | | | | |
4.25%, 10/16/2020 (A) | | | 4,400,000 | | | | 4,368,100 | |
Dunkin’ Brands, Inc., Term Loan C | | | | | | | | |
2.65%, 09/30/2017 (A) | | | 3,934,045 | | | | 3,911,098 | |
Great Wolf Resorts, Inc., Term Loan B | | | | | | | | |
4.25%, 08/06/2020 (A) | | | 3,950,000 | | | | 3,908,853 | |
| | | | | | | | |
| | | | | | | 12,188,051 | |
| | | | | | | | |
Independent Power and Renewable Electricity Producers - 0.3% | |
Dynegy Holdings, Inc., Term Loan B2 | | | | | | | | |
4.00%, 04/23/2020 (A) | | | 3,950,000 | | | | 3,925,312 | |
| | | | | | | | |
Media - 0.0% (I) | | | | | | | | |
Checkout Holding Corp., 2nd Lien Term Loan | | | | | | | | |
7.75%, 04/11/2022 (A) | | | 479,000 | | | | 453,852 | |
| | | | | | | | |
Metals & Mining - 0.1% | | | | | | | | |
Atkore International, Inc., 1st Lien Term Loan | | | | | | | | |
4.50%, 04/09/2021 (A) | | | 668,325 | | | | 661,642 | |
Atkore International, Inc., 2nd Lien Term Loan | | | | | | | | |
7.75%, 10/09/2021 (A) | | | 580,000 | | | | 570,575 | |
| | | | | | | | |
| | | | | | | 1,232,217 | |
| | | | | | | | |
Paper & Forest Products - 0.1% | | | | | | | | |
Exopack Holdings SA, Term Loan B | | | | | | | | |
5.25%, 05/08/2019 (A) | | | 1,881,780 | | | | 1,888,837 | |
| | | | | | | | |
Professional Services - 0.5% | | | | | | | | |
Ceridian LLC, Term Loan B1 | | | | | | | | |
4.12%, 05/09/2017 (A) | | | 1,422,321 | | | | 1,419,950 | |
Ceridian LLC, Term Loan B2 | | | | | | | | |
4.50%, 09/15/2020 (A) | | | 1,483,610 | | | | 1,469,393 | |
Interactive Data Corp., Term Loan | | | | | | | | |
4.75%, 05/02/2021 (A) | | | 3,447,360 | | | | 3,443,051 | |
| | | | | | | | |
| | | | | | | 6,332,394 | |
| | | | | | | | |
Software - 0.3% | | | | | | | | |
BMC Software Finance, Inc., Term Loan | | | | | | | | |
5.00%, 09/10/2020 (A) | | | 3,831,111 | | | | 3,777,997 | |
| | | | | | | | |
The Notes to Financial Statements are an integral part of this report.
| | |
| Transamerica Funds | | Annual Report 2014 |
Page 141
Transamerica High Yield Bond
SCHEDULE OF INVESTMENTS (continued)
At October 31, 2014
| | | | | | | | |
| | | Principal | | | Value | |
LOAN ASSIGNMENTS (continued) | |
Textiles, Apparel & Luxury Goods - 0.2% | |
Philips-Van Heusen Corp., Term Loan B | | | | | | | | |
3.25%, 02/13/2020 (A) | | | $ 2,583,905 | | | | $ 2,587,134 | |
| | | | | | | | |
Total Loan Assignments
(Cost $58,697,696) | | | | | | | 57,787,244 | |
| | | | | | | | |
| | |
| | | Shares | | | Value | |
PREFERRED STOCKS - 1.9% | | | | | | | | |
Banks - 0.8% | | | | | | | | |
GMAC Capital Trust I | | | | | | | | |
Series 2, 8.13% (A) | | | 420,750 | | | | 11,246,648 | |
| | | | | | | | |
Capital Markets - 0.1% | | | | | | | | |
Goldman Sachs Group, Inc. | | | | | | | | |
Series J, 5.50% (B) (C) | | | 52,081 | | | | 1,246,298 | |
| | | | | | | | |
Consumer Finance - 0.8% | | | | | | | | |
Ally Financial, Inc. | | | | | | | | |
Series A, 8.50% (A) | | | 211,700 | | | | 5,605,816 | |
Series G, 7.00%, 144A | | | 4,580 | | | | 4,586,870 | |
| | | | | | | | |
| | | | | | | 10,192,686 | |
| | | | | | | | |
Insurance - 0.2% | | | | | | | | |
Hartford Financial Services Group, Inc., 7.88% (A) | | | 98,086 | | | | 2,970,044 | |
| | | | | | | | |
Total Preferred Stocks
(Cost $24,292,086) | | | | | | | 25,655,676 | |
| | | | | | | | |
| | | | | | | | |
| | | Shares | | | Value | |
COMMON STOCK - 0.1% | | | | | | | | |
IT Services - 0.1% | | | | | | | | |
Unisys Corp. (C) (K) | | | 61,972 | | | | $ 1,588,962 | |
| | | | | | | | |
Total Common Stock
(Cost $1,487,453) | | | | | | | 1,588,962 | |
| | | | | | | | |
|
SECURITIES LENDING COLLATERAL - 11.8% | |
State Street Navigator Securities Lending Trust - Prime Portfolio 0.16% (L) | | | 156,039,680 | | | | 156,039,680 | |
| | | | | | | | |
Total Securities Lending Collateral
(Cost $156,039,680) | | | | 156,039,680 | |
| | | | | | | | |
| | |
| | | Principal | | | Value | |
REPURCHASE AGREEMENT - 2.9% | |
State Street Bank & Trust Co. 0.01% (L), dated 10/31/2014, to be repurchased at $38,791,539 on 11/03/2014. Collateralized by U.S. Government Agency Obligations, 4.00%, due 12/15/2017, and with a total value of $39,567,824. | | | $ 38,791,507 | | | | 38,791,507 | |
| | | | | | | | |
Total Repurchase Agreement
(Cost $38,791,507) | | | | 38,791,507 | |
| | | | | | | | |
Total Investments
(Cost $1,453,035,840) (M) | | | | 1,462,195,322 | |
Net Other Assets (Liabilities) - (10.5)% | | | | (138,889,477 | ) |
| | | | | | | | |
| | |
Net Assets - 100.0% | | | | | | | $ 1,323,305,845 | |
| | | | | | | | |
SECURITY VALUATION:
Valuation Inputs (N)
| | | | | | | | | | | | | | | | |
| | | Level 1
Quoted Prices | | | Level 2
Other Significant
Observable Inputs | | | Level 3
Significant
Unobservable Inputs (O) | | | Value at
October 31, 2014 | |
ASSETS | | | | | | | | | | | | | | | | |
Investments | | | | | | | | | | | | | | | | |
Preferred Corporate Debt Securities | | $ | — | | | $ | 15,378,682 | | | $ | — | | | $ | 15,378,682 | |
Corporate Debt Securities | | | | | | | | | | | | | | | | |
Aerospace & Defense | | | — | | | | 24,051,491 | | | | — | | | | 24,051,491 | |
Air Freight & Logistics | | | — | | | | 3,140,407 | | | | — | | | | 3,140,407 | |
Airlines | | | — | | | | 29,861,257 | | | | — | | | | 29,861,257 | |
Auto Components | | | — | | | | 4,631,010 | | | | — | | | | 4,631,010 | |
Automobiles | | | — | | | | 23,509,755 | | | | — | | | | 23,509,755 | |
Banks | | | — | | | | 15,196,905 | | | | — | | | | 15,196,905 | |
Beverages | | | — | | | | 5,326,200 | | | | — | | | | 5,326,200 | |
Building Products | | | — | | | | 28,251,704 | | | | — | | | | 28,251,704 | |
Capital Markets | | | — | | | | 5,726,817 | | | | — | | | | 5,726,817 | |
Chemicals | | | — | | | | 15,571,516 | | | | — | | | | 15,571,516 | |
Commercial Services & Supplies | | | — | | | | 33,372,190 | | | | — | | | | 33,372,190 | |
Construction & Engineering | | | — | | | | 26,911,528 | | | | — | | | | 26,911,528 | |
Construction Materials | | | — | | | | 1,506,890 | | | | — | | | | 1,506,890 | |
Consumer Finance | | | — | | | | 32,787,757 | | | | — | | | | 32,787,757 | |
Containers & Packaging | | | — | | | | 18,757,193 | | | | — | | | | 18,757,193 | |
Diversified Consumer Services | | | — | | | | 1,587,350 | | | | — | | | | 1,587,350 | |
Diversified Financial Services | | | — | | | | 68,909,559 | | | | — | | | | 68,909,559 | |
Diversified Telecommunication Services | | | — | | | | 109,205,775 | | | | — | | | | 109,205,775 | |
Electric Utilities | | | — | | | | 26,274,945 | | | | 5 | | | | 26,274,950 | |
The Notes to Financial Statements are an integral part of this report.
| | |
| Transamerica Funds | | Annual Report 2014 |
Page 142
Transamerica High Yield Bond
SCHEDULE OF INVESTMENTS (continued)
At October 31, 2014
SECURITY VALUATION (continued):
Valuation Inputs (continued) (N)
| | | | | | | | | | | | | | | | |
| | | Level 1
Quoted Prices | | | Level 2
Other Significant
Observable Inputs | | | Level 3
Significant
Unobservable Inputs (O) | | | Value at
October 31, 2014 | |
Electronic Equipment, Instruments & Components | | $ | — | | | $ | 11,392,664 | | | $ | — | | | $ | 11,392,664 | |
Energy Equipment & Services | | | — | | | | 36,039,977 | | | | — | | | | 36,039,977 | |
Food & Staples Retailing | | | — | | | | 3,973,235 | | | | — | | | | 3,973,235 | |
Food Products | | | — | | | | 13,653,770 | | | | — | | | | 13,653,770 | |
Health Care Equipment & Supplies | | | — | | | | 32,740,801 | | | | — | | | | 32,740,801 | |
Health Care Providers & Services | | | — | | | | 81,597,611 | | | | — | | | | 81,597,611 | |
Hotels, Restaurants & Leisure | | | — | | | | 62,785,597 | | | | — | | | | 62,785,597 | |
Household Durables | | | — | | | | 49,478,087 | | | | — | | | | 49,478,087 | |
Household Products | | | — | | | | 25,582,616 | | | | — | | | | 25,582,616 | |
Independent Power and Renewable Electricity Producers | | | — | | | | 23,266,983 | | | | — | | | | 23,266,983 | |
Insurance | | | — | | | | 9,238,325 | | | | — | | | | 9,238,325 | |
IT Services | | | — | | | | 17,580,696 | | | | — | | | | 17,580,696 | |
Media | | | — | | | | 101,692,902 | | | | — | | | | 101,692,902 | |
Metals & Mining | | | — | | | | 9,262,400 | | | | — | | | | 9,262,400 | |
Oil, Gas & Consumable Fuels | | | — | | | | 63,175,752 | | | | — | | | | 63,175,752 | |
Paper & Forest Products | | | — | | | | 8,586,550 | | | | — | | | | 8,586,550 | |
Personal Products | | | — | | | | 6,838,225 | | | | — | | | | 6,838,225 | |
Pharmaceuticals | | | — | | | | 16,546,134 | | | | — | | | | 16,546,134 | |
Professional Services | | | — | | | | 589,040 | | | | — | | | | 589,040 | |
Real Estate Management & Development | | | — | | | | 8,787,718 | | | | — | | | | 8,787,718 | |
Road & Rail | | | — | | | | 15,680,585 | | | | — | | | | 15,680,585 | |
Semiconductors & Semiconductor Equipment | | | — | | | | 8,611,885 | | | | — | | | | 8,611,885 | |
Software | | | — | | | | 20,013,745 | | | | — | | | | 20,013,745 | |
Specialty Retail | | | — | | | | 9,721,740 | | | | — | | | | 9,721,740 | |
Technology Hardware, Storage & Peripherals | | | — | | | | 6,611,900 | | | | — | | | | 6,611,900 | |
Textiles, Apparel & Luxury Goods | | | — | | | | 10,161,600 | | | | — | | | | 10,161,600 | |
Transportation Infrastructure | | | — | | | | 2,284,418 | | | | — | | | | 2,284,418 | |
Wireless Telecommunication Services | | | — | | | | 34,445,561 | | | | — | | | | 34,445,561 | |
Convertible Bond | | | — | | | | 2,032,800 | | | | — | | | | 2,032,800 | |
Loan Assignments | | | — | | | | 57,787,244 | | | | — | | | | 57,787,244 | |
Preferred Stocks | | | 25,655,676 | | | | — | | | | — | | | | 25,655,676 | |
Common Stock | | | 1,588,962 | | | | — | | | | — | | | | 1,588,962 | |
Securities Lending Collateral | | | 156,039,680 | | | | — | | | | — | | | | 156,039,680 | |
Repurchase Agreement | | | — | | | | 38,791,507 | | | | — | | | | 38,791,507 | |
| | | | | | | | | | | | | | | | |
Total Investments | | $ | 183,284,318 | | | $ | 1,278,910,999 | | | $ | 5 | | | $ | 1,462,195,322 | |
| | | | | | | | | | | | | | | | |
| | | | | | | | | | | | | | | | |
| Investments | | Transfer from
Level 1 to Level 2 | | | Transfer from
Level 2 to Level 1 | | | Transfer from
Level 2 to Level 3 | | | Transfer from
Level 3 to Level 2 (P) | |
Corporate Debt Securities | | $ | — | | | $ | — | | | $ | — | | | $ | 847,500 | |
| | | | | | | | | | | | | | | | |
FOOTNOTES TO SCHEDULE OF INVESTMENTS:
| (A) | Floating or variable rate security. Rate is listed as of October 31, 2014. |
| (B) | The security has a perpetual maturity. The date shown is the next call date. |
| (C) | All or a portion of this security is on loan. The value of all securities on loan is $152,834,116. The amount of securities on loan indicated may not correspond with the securities on loan identified because securities with pending sales are in the process of recall from the brokers. |
| (D) | Payment in-kind. Securities pay interest or dividends in the form of additional bonds or preferred stock. If a security makes cash payment in addition to in-kind, the cash rate is disclosed separately. |
| (E) | Fair valued as determined in good faith in accordance with procedures established by the board of trustees. Total aggregate fair value of securities is $5, or less than 0.01% of the Fund’s net assets. |
| (F) | Total aggregate value of illiquid securities is $5, or less than 0.01% of the Fund’s net assets. |
| (G) | Securities in default. |
| (H) | When-issued security. A conditional transaction in a security authorized for issuance, but not yet issued. |
| (I) | Percentage rounds to less than 0.1% or (0.1)%. |
The Notes to Financial Statements are an integral part of this report.
| | |
| Transamerica Funds | | Annual Report 2014 |
Page 143
Transamerica High Yield Bond
SCHEDULE OF INVESTMENTS (continued)
At October 31, 2014
FOOTNOTES TO SCHEDULE OF INVESTMENTS (continued):
| (J) | All or a portion of this security represents unsettled loan commitments at October 31, 2014 where the rate will be determined at time of settlement. |
| (K) | Non-income producing security. |
| (L) | Rate shown reflects the yield at October 31, 2014. |
| (M) | Aggregate cost for federal income tax purposes is $1,453,144,824. Aggregate gross unrealized appreciation and depreciation for all securities is $30,382,844 and $21,332,346, respectively. Net unrealized appreciation for tax purposes is $9,050,498. |
| (N) | The Fund recognizes transfers between Levels at the end of the reporting period. See the Notes to Financial Statements for more information regarding security valuation and pricing inputs. |
| (O) | Level 3 securities were not considered significant to the Fund. |
| (P) | Transferred from Level 3 to 2 due to utilizing significant observable inputs, as of prior reporting period the security utilized significant unobservable inputs. |
DEFINITIONS:
| | |
| 144A | | 144A securities are registered pursuant to Rule 144A of the Securities Act of 1933. These securities are deemed to be liquid for purposes of compliance limitations on holdings of illiquid securities and may be resold as transactions exempt from registration, normally to qualified institutional buyers. At October 31, 2014, these securities aggregated $379,809,804, or 28.70% of the Fund’s net assets. |
MTN TBD | | Medium Term Note To Be Determined |
The Notes to Financial Statements are an integral part of this report.
| | |
| Transamerica Funds | | Annual Report 2014 |
Page 144
Transamerica High Yield Muni
SCHEDULE OF INVESTMENTS
At October 31, 2014
| | | | | | | | |
| | | Principal | | | Value | |
ASSET-BACKED SECURITY - 0.1% | | | | | | | | |
Tobacco Settlement Financing Corp. | | | | | | | | |
Series 2002-A, Class B | | | | | | | | |
6.13%, 06/01/2032 | | | $ 15,000 | | | | $ 15,075 | |
| | | | | | | | |
Total Asset-Backed Security
(Cost $14,713) | | | | | | | 15,075 | |
| | | | | | | | |
|
MUNICIPAL GOVERNMENT OBLIGATIONS - 100.6% | |
Alabama - 1.7% | | | | | | | | |
Alabama State University, Revenue Bonds | | | | | | | | |
Series A, AGM | | | | | | | | |
3.00%, 03/01/2023 | | | 185,000 | | | | 188,239 | |
| | | | | | | | |
Arizona - 1.1% | | | | | | | | |
Student & Academic Services LLC, Revenue Bonds | | | | | | | | |
BAM | | | | | | | | |
5.00%, 06/01/2026 | | | 100,000 | | | | 117,284 | |
| | | | | | | | |
California - 17.4% | | | | | | | | |
Aromas-San Juan Unified School District, General Obligation Unlimited | | | | | | | | |
Series B, AGM | | | | | | | | |
Zero Coupon, 08/01/2042 | | | 300,000 | | | | 127,323 | |
California School Finance Authority, Revenue Bonds | | | | | | | | |
Series A | | | | | | | | |
5.75%, 11/01/2024, 144A | | | 100,000 | | | | 102,755 | |
6.75%, 08/01/2044 | | | 250,000 | | | | 280,388 | |
6.75%, 11/01/2045, 144A | | | 100,000 | | | | 102,519 | |
Coachella Valley Unified School District, General Obligation Unlimited | | | | | | | | |
Series C, AGM | | | | | | | | |
Zero Coupon, 08/01/2037 - 08/01/2038 | | | 35,000 | | | | 12,674 | |
Cypress School District, General Obligation Unlimited | | | | | | | | |
Zero Coupon, 08/01/2050 | | | 100,000 | | | | 49,256 | |
Folsom Cordova Unified School District School Facilities Improvement District No. 3, General Obligation Unlimited | | | | | | | | |
Series B, ASSURED GTY | | | | | | | | |
Zero Coupon, 10/01/2034 | | | 720,000 | | | | 296,762 | |
Golden State Tobacco Securitization Corp., Revenue Bonds | | | | | | | | |
Series A-1 | | | | | | | | |
5.00%, 06/01/2033 | | | 235,000 | | | | 191,997 | |
Oakley Public Finance Authority, Special Assessment | | | | | | | | |
BAM | | | | | | | | |
2.88%, 09/02/2020 | | | 160,000 | | | | 167,875 | |
Paramount Unified School District, General Obligation Unlimited | | | | | | | | |
Zero Coupon, 08/01/2045 | | | 50,000 | | | | 38,535 | |
San Carlos Elementary School District, General Obligation Unlimited | | | | | | | | |
Zero Coupon, 10/01/2035 - 10/01/2037 | | | 1,350,000 | | | | 478,167 | |
Santee School District, General Obligation Unlimited | | | | | | | | |
Series E, AGM | | | | | | | | |
Zero Coupon, 05/01/2051 | | | 150,000 | | | | 24,819 | |
| | | | | | | | |
| | | Principal | | | Value | |
MUNICIPAL GOVERNMENT OBLIGATIONS (continued) | |
California (continued) | | | | | | | | |
Tobacco Securitization Authority of Southern California, Revenue Bonds | | | | | | | | |
Series A1 | | | | | | | | |
5.13%, 06/01/2046 | | | $ 30,000 | | | | $ 22,429 | |
| | | | | | | | |
| | | | | | | 1,895,499 | |
| | | | | | | | |
Illinois - 17.3% | | | | | | | | |
Chicago Board of Education, General Obligation Unlimited | | | | | | | | |
AGM | | | | | | | | |
5.00%, 12/01/2024 | | | 115,000 | | | | 122,905 | |
Series A | | | | | | | | |
5.00%, 12/01/2041 | | | 150,000 | | | | 150,171 | |
Cook County Township High School District No. 201 J. Sterling Morton, General Obligation Limited | | | | | | | | |
Series C, AGM | | | | | | | | |
Zero Coupon, 12/01/2025 | | | 195,000 | | | | 132,360 | |
County of Kankakee, General Obligation Unlimited | | | | | | | | |
2.00%, 12/01/2016 | | | 120,000 | | | | 118,937 | |
DuPage County School District No. 2 Bensenville, General Obligation Limited | | | | | | | | |
Series A | | | | | | | | |
3.00%, 01/01/2024 | | | 250,000 | | | | 259,985 | |
Illinois Finance Authority, Revenue Bonds | | | | | | | | |
5.00%, 08/15/2021 | | | 30,000 | | | | 35,010 | |
6.50%, 04/01/2044 | | | 75,000 | | | | 82,169 | |
Kendall Kane & Will Counties Community Unit School District No. 308, General Obligation Unlimited | | | | | | | | |
AGM | | | | | | | | |
Zero Coupon, 02/01/2020 | | | 110,000 | | | | 98,710 | |
Lake County School District No. 38 Big Hollow, General Obligation Unlimited | | | | | | | | |
AMBAC | | | | | | | | |
Zero Coupon, 02/01/2020 | | | 60,000 | | | | 53,064 | |
Marion-Clinton Counties High School District No. 200-Centralia, General Obligation Unlimited | | | | | | | | |
BAM | | | | | | | | |
3.25%, 12/01/2023 | | | 200,000 | | | | 205,828 | |
Southwestern Illinois Development Authority, Revenue Bonds | | | | | | | | |
AGM | | | | | | | | |
Zero Coupon, 12/01/2022 - 12/01/2024 | | | 100,000 | | | | 73,568 | |
Springfield Park District, General Obligation Limited | | | | | | | | |
3.00%, 12/30/2023 | | | 100,000 | | | | 102,668 | |
Stephenson County School District No. 145 Freeport, General Obligation Limited | | | | | | | | |
AMBAC | | | | | | | | |
Zero Coupon, 01/01/2021 | | | 30,000 | | | | 25,505 | |
Village of Elk Grove Village, General Obligation Unlimited | | | | | | | | |
4.00%, 01/01/2022 | | | 60,000 | | | | 67,888 | |
Will & Kendall Counties Community Consolidated School District 202 Plainfield, General Obligation Unlimited | | | | | | | | |
Series A, AGM | | | | | | | | |
2.70%, 01/01/2025 | | | 100,000 | | | | 96,617 | |
The Notes to Financial Statements are an integral part of this report.
| | |
| Transamerica Funds | | Annual Report 2014 |
Page 145
Transamerica High Yield Muni
SCHEDULE OF INVESTMENTS (continued)
At October 31, 2014
| | | | | | | | |
| | | Principal | | | Value | |
MUNICIPAL GOVERNMENT OBLIGATIONS (continued) | |
Illinois (continued) | | | | | | | | |
Will County Community High School District No. 210 Lincoln-Way, General Obligation Unlimited | | | | | | | | |
Series A | | | | | | | | |
5.00%, 01/01/2027 | | | $ 55,000 | | | | $ 63,042 | |
Winnebago & Boone Counties School District No. 205 Rockford, General Obligation Unlimited | | | | | | | | |
Zero Coupon, 02/01/2022 | | | 65,000 | | | | 53,754 | |
Zion Park District, General Obligation Limited | | | | | | | | |
Series B | | | | | | | | |
2.00%, 12/30/2015 | | | 150,000 | | | | 152,350 | |
| | | | | | | | |
| | | | | | | 1,894,531 | |
| | | | | | | | |
Indiana - 0.5% | | | | | | | | |
Indiana Finance Authority, Revenue Bonds | | | | | | | | |
Series A | | | | | | | | |
5.00%, 08/15/2021 | | | 45,000 | | | | 52,731 | |
| | | | | | | | |
Iowa - 1.7% | | | | | | | | |
Iowa Tobacco Settlement Authority, Revenue Bonds | | | | | | | | |
Series A | | | | | | | | |
6.50%, 06/01/2023 | | | 95,000 | | | | 94,274 | |
Series C | | | | | | | | |
5.63%, 06/01/2046 | | | 110,000 | | | | 92,530 | |
| | | | | | | | |
| | | | | | | 186,804 | |
| | | | | | | | |
Kansas - 0.2% | | | | | | | | |
Kansas Rural Water Finance Authority, Revenue Bonds | | | | | | | | |
4.25%, 03/01/2038 | | | 25,000 | | | | 25,812 | |
| | | | | | | | |
Kentucky - 3.4% | | | | | | | | |
City of Covington, General Obligation Unlimited | | | | | | | | |
AGM | | | | | | | | |
3.10%, 04/01/2025 | | | 350,000 | | | | 353,119 | |
Kentucky Area Development Districts, Certificate of Participation | | | | | | | | |
Series J | | | | | | | | |
5.25%, 01/01/2016 | | | 20,000 | | | | 20,731 | |
| | | | | | | | |
| | | | | | | 373,850 | |
| | | | | | | | |
Maine - 0.3% | | | | | | | | |
Byron Independent School District No. 531, General Obligation Unlimited | | | | | | | | |
Series A | | | | | | | | |
3.13%, 02/01/2025 | | | 35,000 | | | | 36,067 | |
| | | | | | | | |
Michigan - 7.5% | | | | | | | | |
Bad Axe Public Schools, General Obligation Unlimited | | | | | | | | |
Series B | | | | | | | | |
4.00%, 05/01/2024 | | | 50,000 | | | | 56,669 | |
City of Detroit, General Obligation Unlimited | | | | | | | | |
Series A, AGM | | | | | | | | |
5.00%, 04/01/2019 | | | 15,000 | | | | 15,017 | |
Series A, ASSURED GTY | | | | | | | | |
4.00%, 04/01/2018 | | | 110,000 | | | | 112,717 | |
Series A-1, NATL-RE | | | | | | | | |
5.38%, 04/01/2015 - 04/01/2016 | | | 35,000 | | | | 35,004 | |
| | | | | | | | |
| | | Principal | | | Value | |
MUNICIPAL GOVERNMENT OBLIGATIONS (continued) | |
Michigan (continued) | | | | | | | | |
City of Detroit, General Obligation Unlimited (continued) | | | | | |
Series B, ASSURED GTY | | | | | | | | |
5.00%, 04/01/2018 | | | $ 40,000 | | | | $ 41,033 | |
Series C, AGM | | | | | | | | |
5.00%, 04/01/2016 - 04/01/2018 | | | 15,000 | | | | 15,478 | |
City of Detroit Sewage Disposal System Revenue, Revenue Bonds | | | | | | | | |
BHAC, FGIC | | | | | | | | |
5.75%, 07/01/2031 | | | 150,000 | | | | 167,923 | |
Series A, NATL | | | | | | | | |
Zero Coupon, 07/01/2017 | | | 30,000 | | | | 27,307 | |
Series A, NATL-RE | | | | | | | | |
3.70%, 07/01/2015 | | | 15,000 | | | | 15,317 | |
5.25%, 07/01/2018 | | | 50,000 | | | | 54,841 | |
Series B, NATL | | | | | | | | |
4.25%, 07/01/2025 | | | 25,000 | | | | 25,099 | |
Series C, NATL | | | | | | | | |
5.00%, 07/01/2017 | | | 50,000 | | | | 53,142 | |
City of Detroit Water Supply System Revenue, Revenue Bonds | | | | | | | | |
Series B, NATL-RE | | | | | | | | |
5.00%, 07/01/2018 - 07/01/2034 | | | 65,000 | | | | 67,843 | |
Detroit Local Development Finance Authority, Tax Allocation | | | | | | | | |
Series A, ACA-CBI | | | | | | | | |
5.50%, 05/01/2021 | | | 135,000 | | | | 128,106 | |
| | | | | | | | |
| | | | | | | 815,496 | |
| | | | | | | | |
Missouri - 0.6% | | | | | | | | |
Missouri Joint Municipal Electric Utility Commission, Revenue Bonds | | | | | | | | |
7.73%, 01/01/2039 | | | 55,000 | | | | 67,330 | |
| | | | | | | | |
New Jersey - 0.5% | | | | | | | | |
New Jersey Economic Development Authority, Revenue Bonds | | | | | | | | |
Series A | | | | | | | | |
6.10%, 07/01/2044 | | | 50,000 | | | | 48,594 | |
Tobacco Settlement Financing Corp., Revenue Bonds | | | | | | | | |
Series 1A | | | | | | | | |
4.50%, 06/01/2023 | | | 10,000 | | | | 9,887 | |
| | | | | | | | |
| | | | | | | 58,481 | |
| | | | | | | | |
New York - 1.6% | | | | | | | | |
New York Counties Tobacco Trust IV, Revenue Bonds | | | | | | | | |
Series A | | | | | | | | |
5.00%, 06/01/2042 | | | 225,000 | | | | 170,248 | |
| | | | | | | | |
Ohio - 15.3% | | | | | | | | |
Bethel Local School District, General Obligation Unlimited | | | | | | | | |
Series B | | | | | | | | |
Zero Coupon, 11/01/2021 | | | 50,000 | | | | 41,914 | |
Buckeye Tobacco Settlement Financing Authority, Revenue Bonds | | | | | | | | |
Series A-2 | | | | | | | | |
5.13%, 06/01/2024 | | | 620,000 | | | | 517,396 | |
5.75%, 06/01/2034 | | | 100,000 | | | | 78,745 | |
5.88%, 06/01/2030 - 06/01/2047 | | | 175,000 | | | | 138,818 | |
The Notes to Financial Statements are an integral part of this report.
| | |
| Transamerica Funds | | Annual Report 2014 |
Page 146
Transamerica High Yield Muni
SCHEDULE OF INVESTMENTS (continued)
At October 31, 2014
| | | | | | | | |
| | | Principal | | | Value | |
MUNICIPAL GOVERNMENT OBLIGATIONS (continued) | |
Ohio (continued) | | | | | | | | |
Cleveland-Cuyahoga County Port Authority, Revenue Bonds | | | | | | | | |
Series A | | | | | | | | |
7.05%, 11/15/2040 | | | $ 100,000 | | | | $ 100,708 | |
County of Warren, Revenue Bonds | | | | | | | | |
5.00%, 07/01/2021 - 07/01/2026 | | | 600,000 | | | | 688,526 | |
Toledo-Lucas County Port Authority, Revenue Bonds | | | | | | | | |
Series A | | | | | | | | |
5.00%, 07/01/2046 | | | 100,000 | | | | 103,878 | |
| | | | | | | | |
| | | | | | | 1,669,985 | |
| | | | | | | | |
Pennsylvania - 3.2% | | | | | | | | |
City of Scranton, General Obligation Unlimited | | | | | | | | |
Series B, AMBAC | | | | | | | | |
3.70%, 09/01/2015 | | | 25,000 | | | | 24,709 | |
Philadelphia Gas Works Co., Revenue Bonds | | | | | | | | |
AGM | | | | | | | | |
5.00%, 07/01/2026 | | | 10,000 | | | | 10,037 | |
Pottsville Hospital Authority, Revenue Bonds | | | | | | | | |
6.50%, 07/01/2028 | | | 300,000 | | | | 316,023 | |
| | | | | | | | |
| | | | | | | 350,769 | |
| | | | | | | | |
Puerto Rico - 10.4% | | | | | | | | |
Commonwealth of Puerto Rico, General Obligation Unlimited | | | | | | | | |
AGC-ICC | | | | | | | | |
5.50%, 07/01/2022 | | | 100,000 | | | | 105,700 | |
AGM | | | | | | | | |
5.50%, 07/01/2017 | | | 20,000 | | | | 20,853 | |
AGM-CR | | | | | | | | |
5.25%, 07/01/2016 | | | 25,000 | | | | 25,824 | |
Series A, AGC-ICC | | | | | | | | |
5.50%, 07/01/2029 | | | 50,000 | | | | 52,573 | |
Series A, AGM | | | | | | | | |
4.00%, 07/01/2022 | | | 10,000 | | | | 9,738 | |
5.00%, 07/01/2035 | | | 10,000 | | | | 9,973 | |
Series A, ASSURED GTY | | | | | | | | |
4.00%, 07/01/2015 | | | 10,000 | | | | 10,125 | |
5.00%, 07/01/2016 | | | 175,000 | | | | 180,642 | |
Puerto Rico Electric Power Authority, Revenue Bonds | | | | | | | | |
Series RR, NATL | | | | | | | | |
5.00%, 07/01/2022 | | | 25,000 | | | | 24,748 | |
Series UU, AGM | | | | | | | | |
5.00%, 07/01/2015 - 07/01/2022 | | | 135,000 | | | | 137,151 | |
Puerto Rico Highways & Transportation Authority, Revenue Bonds | | | | | | | | |
Series A, AMBAC | | | | | | | | |
Zero Coupon, 07/01/2015 | | | 70,000 | | | | 67,759 | |
Series CC, AGM | | | | | | | | |
5.25%, 07/01/2033 | | | 50,000 | | | | 50,115 | |
Series CC, AGM | | | | | | | | |
5.25%, 07/01/2036 | | | 15,000 | | | | 14,999 | |
Series E, AGM | | | | | | | | |
5.50%, 07/01/2017 | | | 30,000 | | | | 30,774 | |
Series K, CIFG, FSA-CR | | | | | | | | |
5.00%, 07/01/2018 | | | 10,000 | | | | 10,035 | |
| | | | | | | | |
| | | Principal | | | Value | |
MUNICIPAL GOVERNMENT OBLIGATIONS (continued) | |
Puerto Rico (continued) | | | | | | | | |
Puerto Rico Highways & Transportation Authority, Revenue Bonds (continued) | | | | | | | | |
Series Y, AGM | | | | | | | | |
6.25%, 07/01/2021 | | | $ 110,000 | | | | $ 121,240 | |
Puerto Rico Infrastructure Financing Authority, Revenue Bonds | | | | | | | | |
Series C, AMBAC | | | | | | | | |
5.50%, 07/01/2016 | | | 20,000 | | | | 20,591 | |
Puerto Rico Public Buildings Authority, Revenue Bonds | | | | | | | | |
Series H, AMBAC | | | | | | | | |
5.50%, 07/01/2017 | | | 130,000 | | | | 133,645 | |
Series H, RADIAN, FGIC, COMWLTH GTD | | | | | | | | |
5.25%, 07/01/2015 | | | 100,000 | | | | 99,449 | |
Puerto Rico Sales Tax Financing Corp., Revenue Bonds | | | | | | | | |
Series A, BHAC-CR, FGIC | | | | | | | | |
Zero Coupon, 08/01/2041 | | | 45,000 | | | | 13,438 | |
| | | | | | | | |
| | | | | | | 1,139,372 | |
| | | | | | | | |
Rhode Island - 4.1% | | | | | | | | |
Tobacco Settlement Financing Corp. | | | | | | | | |
Series A, Class C | | | | | | | | |
6.25%, 06/01/2042 | | | 445,000 | | | | 444,947 | |
| | | | | | | | |
South Carolina - 4.3% | | | | | | | | |
Richland County Recreational District, General Obligation Unlimited | | | | | | | | |
3.00%, 03/01/2026 | | | 340,000 | | | | 347,565 | |
South Carolina Jobs-Economic Development Authority, Revenue Bonds | | | | | | | | |
CIFG | | | | | | | | |
5.00%, 11/01/2014 - 11/01/2015 | | | 125,000 | | | | 124,976 | |
| | | | | | | | |
| | | | | | | 472,541 | |
| | | | | | | | |
Texas - 7.3% | | | | | | | | |
City of Houston Airport System Revenue, Revenue Bonds | | | | | | | | |
5.00%, 07/01/2029 | | | 250,000 | | | | 263,910 | |
City of Laredo International Toll Bridge System Revenue, Revenue Bonds | | | | | | | | |
AGM | | | | | | | | |
5.00%, 10/01/2025 | | | 300,000 | | | | 352,185 | |
Fort Bend Grand Parkway Toll Road Authority, Revenue Bonds | | | | | | | | |
5.00%, 03/01/2025 | | | 40,000 | | | | 47,156 | |
Willow Creek Farms Municipal Utility District, General Obligation Unlimited | | | | | | | | |
BAM | | | | | | | | |
3.00%, 09/01/2023 (A) | | | 130,000 | | | | 131,600 | |
| | | | | | | | |
| | | | | | | 794,851 | |
| | | | | | | | |
Wisconsin - 2.2% | | | | | | | | |
Wisconsin Health & Educational Facilities Authority, Revenue Bonds | | | | | | | | |
5.00%, 12/01/2044 (A) | | | 250,000 | | | | 238,770 | |
| | | | | | | | |
Total Municipal Government Obligations
(Cost $10,644,638) | | | | | | | 10,993,607 | |
| | | | | | | | |
The Notes to Financial Statements are an integral part of this report.
| | |
| Transamerica Funds | | Annual Report 2014 |
Page 147
Transamerica High Yield Muni
SCHEDULE OF INVESTMENTS (continued)
At October 31, 2014
| | | | | | | | |
| | | Shares | | | Value | |
INVESTMENT COMPANY - 2.3% | | | | | | | | |
Capital Markets - 2.3% | | | | | | | | |
PIMCO Municipal Income Fund III | | | 22,550 | | | | $ 245,795 | |
| | | | | | | | |
Total Investment Company
(Cost $245,813) | | | | | | | 245,795 | |
| | | | | | | | |
| | |
| | | Principal | | | Value | |
REPURCHASE AGREEMENT - 0.7% | | | | | | | | |
State Street Bank & Trust Co.
0.01% (B), dated 10/31/2014, to be repurchased at $76,879 on 11/03/2014. Collateralized by a U.S. Government Agency Obligation, 3.00%, due 07/25/2037, and with a value of $82,890. | | | $ 76,879 | | | | 76,879 | |
| | | | | | | | |
Total Repurchase Agreement
(Cost $76,879) | | | | | | | 76,879 | |
| | | | | | | | |
Total Investments
(Cost $10,982,043) (C) | | | | | | | 11,331,356 | |
Net Other Assets (Liabilities) - (3.7)% | | | | | | | (399,043 | ) |
| | | | | | | | |
| | |
Net Assets - 100.0% | | | | | | | $ 10,932,313 | |
| | | | | | | | |
SECURITY VALUATION:
Valuation Inputs (D)
| | | | | | | | | | | | | | | | |
| | | Level 1
Quoted Prices | | | Level 2
Other Significant
Observable Inputs | | | Level 3
Significant
Unobservable Inputs | | | Value at
October 31, 2014 | |
ASSETS | | | | | | | | | | | | | | | | |
Investments | | | | | | | | | | | | | | | | |
Asset-Backed Security | | $ | — | | | $ | 15,075 | | | $ | — | | | $ | 15,075 | |
Municipal Government Obligations | | | — | | | | 10,993,607 | | | | — | | | | 10,993,607 | |
Investment Company | | | 245,795 | | | | — | | | | — | | | | 245,795 | |
Repurchase Agreement | | | — | | | | 76,879 | | | | — | | | | 76,879 | |
| | | | | | | | | | | | | | | | |
Total Investments | | $ | 245,795 | | | $ | 11,085,561 | | | $ | — | | | $ | 11,331,356 | |
| | | | | | | | | | | | | | | | |
FOOTNOTES TO SCHEDULE OF INVESTMENTS:
| (A) | When-issued security. A conditional transaction in a security authorized for issuance, but not yet issued. |
| (B) | Rate shown reflects the yield at October 31, 2014. |
| (C) | Aggregate cost for federal income tax purposes is $10,982,043. Aggregate gross unrealized appreciation and depreciation for all securities in which there is an excess of value over tax cost were $369,993 and $20,680, respectively. Net unrealized appreciation for tax purposes is $349,313. |
| (D) | The Fund recognizes transfers between Levels at the end of the reporting period. There were no transfers between Level 1, 2 and 3 during the period ended October 31, 2014. See the Notes to Financial Statements for more information regarding security valuation and pricing inputs. |
DEFINITIONS:
| | |
| 144A | | 144A securities are registered pursuant to Rule 144A of the Securities Act of 1933. These securities are deemed to be liquid for purposes of compliance limitations on holdings of illiquid securities and may be resold as transactions exempt from registration, normally to qualified institutional buyers. At October 31, 2014, these securities aggregated $205,274, or 1.88% of the Fund’s net assets. |
| ACA | | ACA Financial Guaranty Corp. |
| AGC | | Assured Guaranty Corp. |
| AGM | | Assured Guaranty Municipal Corp. |
The Notes to Financial Statements are an integral part of this report.
| | |
| Transamerica Funds | | Annual Report 2014 |
Page 148
Transamerica High Yield Muni
SCHEDULE OF INVESTMENTS (continued)
At October 31, 2014
DEFINITIONS (continued):
| | |
| AMBAC | | AMBAC Financial Group, Inc. |
| ASSURED GTY | | Assured Guaranty, Ltd. |
| BAM | | Build America Mutual Assurance Co. |
| BHAC | | Berkshire Hathaway Assurance Corp. |
| CBI | | Certificates of bond insurance |
| CIFG | | CIFG Assurance North America, Inc. |
| COMWLTH | | Commonwealth |
| CR | | Custodial Receipts |
| FGIC | | Financial Guaranty Insurance Co. |
| FSA | | Assured Guaranty Municipal Corp. (formerly Financial Security Assurance, Inc.) |
| GTD | | Guaranteed |
| ICC | | Insured Custody Certificate |
| NATL | | National Public Finance Guarantee Corp. |
| NATL-RE | | National Public Finance Guarantee Corp. Reinsured |
| RADIAN | | Radian Asset Assurance Inc. |
The Notes to Financial Statements are an integral part of this report.
| | |
| Transamerica Funds | | Annual Report 2014 |
Page 149
Transamerica Income & Growth
SCHEDULE OF INVESTMENTS
At October 31, 2014
| | | | | | | | |
| | | Shares | | | Value | |
COMMON STOCKS - 82.3% | | | | | | | | |
Aerospace & Defense - 3.2% | | | | | | | | |
BAE Systems PLC | | | 3,866,042 | | | | $ 28,470,525 | |
| | | | | | | | |
Airlines - 2.5% | | | | | | | | |
Japan Airlines Co., Ltd. (A) | | | 822,200 | | | | 22,077,773 | |
| | | | | | | | |
Automobiles - 1.9% | | | | | | | | |
Daimler AG | | | 224,059 | | | | 17,469,651 | |
| | | | | | | | |
Banks - 2.6% | | | | | | | | |
Commonwealth Bank of Australia | | | 321,948 | | | | 22,893,536 | |
| | | | | | | | |
Beverages - 2.0% | | | | | | | | |
Thai Beverage PCL (A) (B) | | | 30,250,003 | | | | 18,012,962 | |
| | | | | | | | |
Capital Markets - 4.9% | | | | | | | | |
Ares Capital Corp. | | | 1,224,235 | | | | 19,575,517 | |
Federated Investors, Inc., Class B (A) | | | 787,703 | | | | 24,631,473 | |
| | | | | | | | |
| | | | | | | 44,206,990 | |
| | | | | | | | |
Chemicals - 4.1% | | | | | | | | |
LyondellBasell Industries NV, Class A | | | 200,560 | | | | 18,377,313 | |
Potash Corp. of Saskatchewan, Inc. | | | 255,620 | | | | 8,734,536 | |
Yara International ASA | | | 205,140 | | | | 9,420,304 | |
| | | | | | | | |
| | | | | | | 36,532,153 | |
| | | | | | | | |
Diversified Telecommunication Services - 17.5% | |
AT&T, Inc. | | | 768,900 | | | | 26,788,476 | |
BCE, Inc. (A) | | | 306,062 | | | | 13,591,592 | |
Belgacom SA (A) | | | 802,450 | | | | 30,307,361 | |
HKT Trust and HKT, Ltd. | | | 15,992,540 | | | | 19,585,725 | |
Swisscom AG | | | 33,854 | | | | 19,957,641 | |
Telenor ASA | | | 790,090 | | | | 17,766,468 | |
Telstra Corp., Ltd. | | | 5,791,054 | | | | 28,817,170 | |
| | | | | | | | |
| | | | | | | 156,814,433 | |
| | | | | | | | |
Food Products - 2.5% | | | | | | | | |
Marine Harvest ASA (A) | | | 1,570,870 | | | | 22,247,413 | |
| | | | | | | | |
Media - 2.2% | | | | | | | | |
Regal Entertainment Group, Class A (A) | | | 904,939 | | | | 20,044,399 | |
| | | | | | | | |
Metals & Mining - 1.1% | | | | | | | | |
Antofagasta PLC, Class A | | | 844,320 | | | | 9,508,562 | |
| | | | | | | | |
Multi-Utilities - 0.8% | | | | | | | | |
Centrica PLC | | | 1,522,610 | | | | 7,384,616 | |
| | | | | | | | |
Oil, Gas & Consumable Fuels - 9.3% | |
Canadian Oil Sands, Ltd. | | | 1,291,320 | | | | 20,233,984 | |
Royal Dutch Shell PLC, Class B ADR (A) | | | 296,950 | | | | 22,173,256 | |
Ship Finance International, Ltd. (A) | | | 1,068,520 | | | | 18,367,859 | |
Total SA | | | 382,187 | | | | 22,817,808 | |
| | | | | | | | |
| | | | | | | 83,592,907 | |
| | | | | | | | |
Pharmaceuticals - 2.5% | | | | | | | | |
GlaxoSmithKline PLC | | | 982,170 | | | | 22,210,756 | |
| | | | | | | | |
Real Estate Investment Trusts - 23.0% | |
American Capital Agency Corp. | | | 1,034,070 | | | | 23,514,752 | |
Ascendas Real Estate Investment Trust | | | 13,586,756 | | | | 23,599,731 | |
Blackstone Mortgage Trust, Inc., Class A | | | 982,168 | | | | 27,422,131 | |
Lexington Realty Trust | | | 1,269,070 | | | | 13,909,007 | |
National Retail Properties, Inc. (A) | | | 312,328 | | | | 11,905,943 | |
PennyMac Mortgage Investment Trust | | | 739,910 | | | | 15,974,657 | |
Realty Income Corp. (A) | | | 474,766 | | | | 21,853,479 | |
Select Income REIT | | | 400,251 | | | | 9,810,152 | |
Spirit Realty Capital, Inc. | | | 2,202,940 | | | | 26,214,986 | |
Starwood Property Trust, Inc. | | | 1,375,757 | | | | 31,037,078 | |
| | | | | | | | |
| | | | | | | 205,241,916 | |
| | | | | | | | |
| | | | | | | | |
| | | Shares | | | Value | |
COMMON STOCKS (continued) | |
Thrifts & Mortgage Finance - 1.1% | |
Home Loan Servicing Solutions, Ltd. (A) | | | 495,970 | | | | $ 9,527,584 | |
| | | | | | | | |
Wireless Telecommunication Services - 1.1% | |
Vodafone Group PLC ADR | | | 288,100 | | | | 9,570,682 | |
| | | | | | | | |
Total Common Stocks
(Cost $718,194,062) | | | | | | | 735,806,858 | |
| | | | | | | | |
| |
MASTER LIMITED PARTNERSHIPS - 15.0% | | | | | |
Capital Markets - 4.7% | | | | | | | | |
Apollo Global Management LLC, Class A | | | 475,360 | | | | 10,814,440 | |
KKR & Co, LP | | | 643,055 | | | | 13,864,266 | |
Oaktree Capital Group LLC, Class A | | | 353,709 | | | | 16,794,103 | |
| | | | | | | | |
| | | | | | | 41,472,809 | |
| | | | | | | | |
Electric Utilities - 0.9% | | | | | | | | |
Brookfield Infrastructure Partners, LP | | | 194,848 | | | | 7,908,880 | |
| | | | | | | | |
Oil, Gas & Consumable Fuels - 9.4% | |
Alliance Resource Partners, LP | | | 424,546 | | | | 20,416,417 | |
Cheniere Energy Partners, LP | | | 185,814 | | | | 5,875,439 | |
Energy Transfer Partners, LP, Class B | | | 591,527 | | | | 38,112,085 | |
TC Pipelines, LP | | | 188,778 | | | | 11,770,308 | |
Teekay LNG Partners, LP | | | 207,413 | | | | 8,151,331 | |
| | | | | | | | |
| | | | | | | 84,325,580 | |
| | | | | | | | |
Total Master Limited Partnerships
(Cost $126,306,615) | | | | | | | 133,707,269 | |
| | | | | | | | |
|
SECURITIES LENDING COLLATERAL - 15.8% | |
State Street Navigator Securities Lending Trust - Prime Portfolio 0.16% (C) | | | 141,468,418 | | | | 141,468,418 | |
| | | | | | | | |
Total Securities Lending Collateral
(Cost $141,468,418) | | | | | | | 141,468,418 | |
| | | | | | | | |
| | |
| | | Principal | | | Value | |
REPURCHASE AGREEMENT - 2.1% | |
State Street Bank & Trust Co. 0.01% (C), dated 10/31/2014, to be repurchased at $18,801,303 on 11/03/2014. Collateralized by a U.S. Government Agency Obligation, 2.00%, due 11/01/2027, and with a value of $19,180,578. | | | $ 18,801,287 | | | | 18,801,287 | |
| | | | | | | | |
Total Repurchase Agreement
(Cost $18,801,287) | | | | | | | 18,801,287 | |
| | | | | | | | |
Total Investments
(Cost $1,004,770,382) (D) | | | | | | | 1,029,783,832 | |
Net Other Assets (Liabilities) - (15.2)% | | | | (136,169,819 | ) |
| | | | | | | | |
| | |
Net Assets - 100.0% | | | | | | | $ 893,614,013 | |
| | | | | | | | |
The Notes to Financial Statements are an integral part of this report.
| | |
| Transamerica Funds | | Annual Report 2014 |
Page 150
Transamerica Income & Growth
SCHEDULE OF INVESTMENTS (continued)
At October 31, 2014
SECURITY VALUATION:
Valuation Inputs (E)
| | | | | | | | | | | | | | | | |
| | | Level 1
Quoted Prices | | | Level 2
Other Significant
Observable Inputs | | | Level 3
Significant
Unobservable Inputs | | | Value at
October 31, 2014 | |
ASSETS | | | | | | | | | | | | | | | | |
Investments | | | | | | | | | | | | | | | | |
Common Stocks | | $ | 393,258,856 | | | $ | 342,548,002 | | | $ | — | | | $ | 735,806,858 | |
Master Limited Partnerships | | | 133,707,269 | | | | — | | | | — | | | | 133,707,269 | |
Securities Lending Collateral | | | 141,468,418 | | | | — | | | | — | | | | 141,468,418 | |
Repurchase Agreement | | | — | | | | 18,801,287 | | | | — | | | | 18,801,287 | |
| | | | | | | | | | | | | | | | |
Total Investments | | $ | 668,434,543 | | | $ | 361,349,289 | | | $ | — | | | $ | 1,029,783,832 | |
| | | | | | | | | | | | | | | | |
FOOTNOTES TO SCHEDULE OF INVESTMENTS:
| (A) | All or a portion of this security is on loan. The value of all securities on loan is $136,988,926. The amount of securities on loan indicated may not correspond with the securities on loan identified because securities with pending sales are in the process of recall from the brokers. |
| (B) | Fair valued as determined in good faith in accordance with procedures established by the board of trustees. Total aggregate fair value of securities is $18,012,962, or 2.02% of the Fund’s net assets. |
| (C) | Rate shown reflects the yield at October 31, 2014. |
| (D) | Aggregate cost for federal income tax purposes is $995,730,169. Aggregate gross unrealized appreciation and depreciation for all securities is $73,050,250 and $38,996,587, respectively. Net unrealized appreciation for tax purposes is $34,053,663. |
| (E) | The Fund recognizes transfers between Levels at the end of the reporting period. There were no transfers between Level 1, 2 and 3 during the period ended October 31, 2014. See the Notes to Financial Statements for more information regarding security valuation and pricing inputs. |
DEFINITION:
| | |
| ADR | | American Depositary Receipt |
The Notes to Financial Statements are an integral part of this report.
| | |
| Transamerica Funds | | Annual Report 2014 |
Page 151
Transamerica Inflation Opportunities
SCHEDULE OF INVESTMENTS
At October 31, 2014
| | | | | | | | |
| | | Principal | | | Value | |
U.S. GOVERNMENT OBLIGATIONS - 54.3% | |
U.S. Treasury Floating Rate Note | | | | | | | | |
0.07%, 01/31/2016 (A) | | | $ 720,000 | | | | $ 719,965 | |
0.09%, 04/30/2016 - 07/31/2016 (A) | | | 7,320,000 | | | | 7,322,299 | |
U.S. Treasury Inflation Indexed Bond | | | | | | | | |
1.38%, 02/15/2044 | | | 3,061,860 | | | | 3,376,178 | |
1.75%, 01/15/2028 | | | 817,495 | | | | 928,624 | |
2.38%, 01/15/2025 | | | 6,372,595 | | | | 7,556,999 | |
3.38%, 04/15/2032 | | | 6,767,404 | | | | 9,606,540 | |
3.88%, 04/15/2029 | | | 7,306,997 | | | | 10,496,953 | |
U.S. Treasury Inflation Indexed Note | | | | | | | | |
0.13%, 04/15/2016 - 07/15/2024 | | | 69,188,062 | | | | 69,363,218 | |
0.50%, 04/15/2015 | | | 4,346,536 | | | | 4,338,047 | |
0.63%, 01/15/2024 | | | 1,544,436 | | | | 1,569,534 | |
1.13%, 01/15/2021 | | | 12,048,060 | | | | 12,724,823 | |
1.25%, 07/15/2020 | | | 3,921,067 | | | | 4,186,656 | |
1.38%, 07/15/2018 | | | 1,588,406 | | | | 1,692,769 | |
| | | | | | | | |
Total U.S. Government Obligations
(Cost $134,921,883) | | | | 133,882,605 | |
| | | | | | | | |
|
U.S. GOVERNMENT AGENCY OBLIGATIONS - 2.4% | |
Federal Home Loan Bank | | | | | | | | |
0.78%, 07/23/2019 (A) | | | 800,000 | | | | 800,317 | |
Federal Home Loan Mortgage Corp. | | | | | | | | |
1.80%, 04/25/2024 (A) | | | 3,000,000 | | | | 2,897,868 | |
2.35%, 02/25/2024 (A) | | | 1,500,000 | | | | 1,483,617 | |
Federal National Mortgage Association | | | | | | | | |
2.15%, 10/25/2023 (A) | | | 846,806 | | | | 852,442 | |
| | | | | | | | |
Total U.S. Government Agency Obligations
(Cost $6,197,998) | | | | 6,034,244 | |
| | | | | | | | |
|
FOREIGN GOVERNMENT OBLIGATIONS - 23.6% | |
Australia Government Bond | | | | | | | | |
3.00%, 09/20/2025, Reg S | | | AUD 2,100,000 | | | | 2,530,651 | |
Brazil Notas do Tesouro Nacional, | | | | | | | | |
Series B | | | | | | | | |
6.00%, 05/15/2017 - 08/15/2022 | | | BRL 6,000,000 | | | | 6,116,016 | |
Canadian Government Bond | | | | | | | | |
1.50%, 12/01/2044 | | | CAD 978,633 | | | | 1,049,739 | |
4.25%, 12/01/2021 | | | 6,536,376 | | | | 7,517,659 | |
Italy Buoni Poliennali del Tesoro | | | | | | | | |
2.10%, 09/15/2021, Reg S | | | EUR 6,222,182 | | | | 8,437,177 | |
Japanese Government CPI Linked Bond | | | | | | | | |
0.10%, 03/10/2024 | | | JPY 51,450,000 | | | | 489,857 | |
Kommunalbanken AS | | | | | | | | |
0.61%, 03/27/2017, 144A (A) | | | $ 500,000 | | | | 504,110 | |
Mexican Udibonos | | | | | | | | |
Series S | | | | | | | | |
4.50%, 12/04/2025 | | | MXN 36,402,121 | | | | 3,189,062 | |
New Zealand Government Bond | | | | | | | | |
2.00%, 09/20/2025, Reg S | | | NZD 2,000,000 | | | | 1,553,871 | |
Spain Government Inflation-Linked Bond | | | | | | | | |
0.55%, 11/30/2019, Reg S | | | EUR 1,996,840 | | | | 2,533,795 | |
1.80%, 11/30/2024, Reg S | | | 1,827,109 | | | | 2,481,765 | |
Turkey Government Bond | | | | | | | | |
3.00%, 02/23/2022 | | | TRY 1,513,118 | | | | 734,894 | |
| | | | | | | | |
| | | Principal | | | Value | |
FOREIGN GOVERNMENT OBLIGATIONS (continued) | |
U.K. Gilt Inflation-Linked | | | | | | | | |
0.13%, 03/22/2029 - 03/22/2044, Reg S | | | GBP 11,902,240 | | | | $ 20,957,794 | |
| | | | | | | | |
Total Foreign Government Obligations
(Cost $59,488,762) | | | | 58,096,390 | |
| | | | | | | | |
|
MORTGAGE-BACKED SECURITIES - 1.8% | |
GS Mortgage Securities Trust | | | | | | | | |
Series 2014-GSFL, Class B | | | | | | | | |
1.90%, 07/15/2031, 144A (A) | | | $ 3,000,000 | | | | 2,990,598 | |
JPMorgan Chase Commercial Mortgage Securities Trust | | | | | | | | |
Series 2014-FBLU, Class B | | | | | | | | |
1.65%, 12/15/2028, 144A (A) | | | 1,500,000 | | | | 1,497,204 | |
| | | | | | | | |
Total Mortgage-Backed Securities
(Cost $4,501,250) | | | | 4,487,802 | |
| | | | | | | | |
|
ASSET-BACKED SECURITIES - 0.5% | |
Invitation Homes Trust | | | | | | | | |
Series 2014-SFR1, Class A | | | | | | | | |
1.15%, 06/17/2031, 144A (A) | | | 200,000 | | | | 198,217 | |
SLM Student Loan Trust | | | | | | | | |
Series 2014-1, Class A3 | | | | | | | | |
0.75%, 02/26/2029 (A) | | | 1,000,000 | | | | 1,004,010 | |
| | | | | | | | |
Total Asset-Backed Securities
(Cost $1,203,906) | | | | 1,202,227 | |
| | | | | | | | |
|
PREFERRED CORPORATE DEBT SECURITIES - 0.9% | |
Banks - 0.9% | | | | | | | | |
Goldman Sachs Capital II | | | | | | | | |
4.00%, 12/01/2014 (A) (B) | | | 500,000 | | | | 376,000 | |
UBS Preferred Funding Trust V | | | | | | | | |
6.24%, 05/15/2016 (A) (B) | | | 400,000 | | | | 415,720 | |
BAC Capital Trust XIV | | | | | | | | |
Series G | | | | | | | | |
4.00%, 11/17/2014 (A) (B) | | | 700,000 | | | | 549,500 | |
Societe Generale SA | | | | | | | | |
6.00%, 01/27/2020, 144A (A) (B) (C) | | | 800,000 | | | | 754,000 | |
| | | | | | | | |
Total Preferred Corporate Debt Securities
(Cost $2,264,327) | | | | 2,095,220 | |
| | | | | | | | |
| |
CORPORATE DEBT SECURITIES - 13.7% | | | | | |
Automobiles - 0.5% | | | | | | | | |
Toyota Motor Credit Corp. | | | | | | | | |
Series MTN | | | | | | | | |
0.75%, 03/05/2017 (D) | | | 1,300,000 | | | | 1,295,958 | |
| | | | | | | | |
Banks - 2.5% | | | | | | | | |
Banco do Brasil SA | | | | | | | | |
9.00%, 06/18/2024, 144A (A) (B) | | | 1,250,000 | | | | 1,228,750 | |
Banco Santander Chile | | | | | | | | |
1.13%, 04/11/2017, 144A (A) | | | 200,000 | | | | 199,043 | |
Fifth Third Bancorp | | | | | | | | |
0.65%, 12/20/2016 (A) | | | 400,000 | | | | 398,315 | |
Intesa Sanpaolo SpA | | | | | | | | |
5.02%, 06/26/2024, 144A (C) | | | 1,000,000 | | | | 977,314 | |
RBS Capital Trust IV | | | | | | | | |
2.03%, 12/30/2014 (A) (B) | | | 400,000 | | | | 388,000 | |
Royal Bank of Scotland NV | | | | | | | | |
4.65%, 06/04/2018 | | | 200,000 | | | | 206,389 | |
The Notes to Financial Statements are an integral part of this report.
| | |
| Transamerica Funds | | Annual Report 2014 |
Page 152
Transamerica Inflation Opportunities
SCHEDULE OF INVESTMENTS (continued)
At October 31, 2014
| | | | | | | | |
| | | Principal | | | Value | |
CORPORATE DEBT SECURITIES (continued) | | | | | |
Banks (continued) | | | | | | | | |
UBS AG | | | | | | | | |
Series MTN | | | | | | | | |
4.75%, 05/22/2023, Reg S (A) | | | $ 1,200,000 | | | | $ 1,213,500 | |
Zions Bancorporation | | | | | | | | |
5.65%, 11/15/2023 (A) | | | 1,400,000 | | | | 1,440,190 | |
| | | | | | | | |
| | | | | | | 6,051,501 | |
| | | | | | | | |
Building Products - 0.1% | | | | | | | | |
Masco Corp. | | | | | | | | |
5.95%, 03/15/2022 (C) | | | 315,000 | | | | 346,500 | |
| | | | | | | | |
Capital Markets - 1.1% | |
Morgan Stanley | | | | | | | | |
Series MTN | | | | | | | | |
3.99%, 04/25/2023 - 06/09/2023 (A) | | | 2,643,000 | | | | 2,694,460 | |
| | | | | | | | |
Commercial Services & Supplies - 0.2% | |
Hutchison Whampoa International 14, Ltd. | | | | | | | | |
1.63%, 10/31/2017, 144A | | | 400,000 | | | | 399,321 | |
| | | | | | | | |
Construction Materials - 0.2% | |
Vulcan Materials Co. | | | | | | | | |
7.00%, 06/15/2018 (C) | | | 500,000 | | | | 556,250 | |
| | | | | | | | |
Diversified Financial Services - 2.5% | |
Bank of America Corp. | | | | | | | | |
Series MTN | | | | | | | | |
1.30%, 03/22/2018 (A) | | | 1,500,000 | | | | 1,521,557 | |
4.09%, 02/18/2020 (A) | | | 400,000 | | | | 405,400 | |
Citigroup, Inc. | | | | | | | | |
0.50%, 06/09/2016 (A) | | | 2,070,000 | | | | 2,052,442 | |
Goldman Sachs Capital III | | | | | | | | |
4.00%, 12/01/2014 (A) (B) (C) | | | 2,600,000 | | | | 1,951,300 | |
JPMorgan Chase & Co. | | | | | | | | |
2.20%, 10/22/2019 | | | 240,000 | | | | 237,115 | |
| | | | | | | | |
| | | | | | | 6,167,814 | |
| | | | | | | | |
Energy Equipment & Services - 0.3% | |
Transocean, Inc. | | | | | | | | |
6.38%, 12/15/2021 (C) | | | 400,000 | | | | 420,343 | |
6.50%, 11/15/2020 (C) | | | 400,000 | | | | 411,434 | |
| | | | | | | | |
| | | | | | | 831,777 | |
| | | | | | | | |
Insurance - 2.0% | |
Genworth Holdings, Inc. | | | | | | | | |
6.15%, 11/15/2066 (A) | | | 1,850,000 | | | | 1,581,750 | |
XL Group PLC | | | | | | | | |
6.50%, 04/15/2017 (A) (B) (C) | | | 3,350,000 | | | | 3,214,325 | |
| | | | | | | | |
| | | | | | | 4,796,075 | |
| | | | | | | | |
Machinery - 0.1% | |
Valmont Industries, Inc. | | | | | | | | |
5.00%, 10/01/2044 | | | 128,000 | | | | 126,222 | |
5.25%, 10/01/2054 | | | 180,000 | | | | 172,870 | |
| | | | | | | | |
| | | | | | | 299,092 | |
| | | | | | | | |
Metals & Mining - 1.2% | |
Alcoa, Inc. | | | | | | | | |
5.13%, 10/01/2024 (C) | | | 244,000 | | | | 257,595 | |
Glencore Canada Corp. | | | | | | | | |
6.00%, 10/15/2015 | | | 400,000 | | | | 418,470 | |
Glencore Funding LLC | | | | | | | | |
1.59%, 01/15/2019, 144A (A) | | | 800,000 | | | | 812,458 | |
| | | | | | | | |
| | | Principal | | | Value | |
CORPORATE DEBT SECURITIES (continued) | | | | | |
Metals & Mining (continued) | |
Goldcorp, Inc. | | | | | | | | |
3.63%, 06/09/2021 (C) | | | 400,000 | | | | 400,576 | |
5.45%, 06/09/2044 | | | 178,000 | | | | 173,639 | |
Kinross Gold Corp. | | | | | | | | |
5.13%, 09/01/2021 | | | $ 119,000 | | | | $ 116,085 | |
5.95%, 03/15/2024, 144A | | | 699,000 | | | | 668,519 | |
| | | | | | | | |
| | | | | | | 2,847,342 | |
| | | | | | | | |
Oil, Gas & Consumable Fuels - 2.9% | |
BP Capital Markets PLC | | | | | | | | |
2.52%, 01/15/2020 | | | 133,000 | | | | 133,585 | |
Petrobras Global Finance BV | | | | | | | | |
1.85%, 05/20/2016 (A) | | | 1,355,000 | | | | 1,355,000 | |
2.37%, 01/15/2019 (A) | | | 3,000,000 | | | | 2,993,550 | |
2.59%, 03/17/2017 (A) | | | 2,750,000 | | | | 2,759,625 | |
| | | | | | | | |
| | | | | | | 7,241,760 | |
| | | | | | | | |
Paper & Forest Products - 0.1% | |
Domtar Corp. | | | | | | | | |
6.75%, 02/15/2044 | | | 200,000 | | | | 218,649 | |
| | | | | | | | |
Total Corporate Debt Securities
(Cost $34,789,327) | | | | 33,746,499 | |
| | | | | | | | |
|
SHORT-TERM U.S. GOVERNMENT OBLIGATIONS - 0.1% | |
U.S. Treasury Bill | | | | | | | | |
0.00%, 12/26/2014 (E) (F) | | | 50,000 | | | | 50,000 | |
0.01%, 12/11/2014 (E) | | | 70,000 | | | | 69,999 | |
| | | | | | | | |
Total Short-Term U.S. Government Obligations
(Cost $119,999) | | | | 119,999 | |
| | | | | | | | |
| | |
| | | Shares | | | Value | |
PREFERRED STOCKS - 0.5% | | | | | | | | |
Banks - 0.1% | |
UBS Preferred Funding Trust IV | | | | | | | | |
Series D, 0.85% (A) | | | 14,000 | | | | 263,060 | |
| | | | | | | | |
Consumer Finance - 0.2% | |
Navient Corp. | | | | | | | | |
3.70% (A) | | | 3,200 | | | | 78,944 | |
3.75% (A) | | | 19,249 | | | | 471,793 | |
| | | | | | | | |
| | | | | | | 550,737 | |
| | | | | | | | |
Insurance - 0.2% | |
Principal Financial Group, Inc. | | | | | | | | |
Series A, 5.56% (A) | | | 4,000 | | | | 402,000 | |
Prudential Financial, Inc. | | | | | | | | |
4.39% (A) | | | 4,655 | | | | 123,358 | |
| | | | | | | | |
| | | | | | | 525,358 | |
| | | | | | | | |
Total Preferred Stocks
(Cost $1,356,527) | | | | 1,339,155 | |
| | | | | | | | |
|
SECURITIES LENDING COLLATERAL - 2.7% | |
State Street Navigator Securities Lending Trust - Prime Portfolio
0.16% (G) | | | 6,762,445 | | | | 6,762,445 | |
| | | | | | | | |
Total Securities Lending Collateral
(Cost $6,762,445) | | | | 6,762,445 | |
| | | | | | | | |
The Notes to Financial Statements are an integral part of this report.
| | |
| Transamerica Funds | | Annual Report 2014 |
Page 153
Transamerica Inflation Opportunities
SCHEDULE OF INVESTMENTS (continued)
At October 31, 2014
| | | | | | | | |
| | | Principal | | | Value | |
REPURCHASE AGREEMENT - 2.5% | |
State Street Bank & Trust Co.
0.01% (G), dated 10/31/2014, to be repurchased at $6,183,737 on 11/03/2014. Collateralized by a U.S. Government Agency Obligation, 3.00%, due 07/25/2037, and with a value of $6,310,308 | | | $ 6,183,732 | | | | $ 6,183,732 | |
| | | | | | | | |
Total Repurchase Agreement
(Cost $6,183,732) | | | | 6,183,732 | |
| | | | | | | | |
Total Investments
(Cost $257,790,156) (H) | | | | 253,950,318 | |
Net Other Assets (Liabilities) - (3.0)% | | | | (7,279,771 | ) |
| | | | | | | | |
| | |
Net Assets - 100.0% | | | | | | | $ 246,670,547 | |
| | | | | | | | |
| | | | | | | | | | | | | | | | |
| FUTURES CONTRACTS: | | | | | | | | | | | | |
| Description | | Type | | | Contracts | | | Expiration
Date | | | Net Unrealized Appreciation
(Depreciation) | |
5-Year U.S. Treasury Note | | | Short | | | | (130 | ) | | | 12/31/2014 | | | $ | (200,081 | ) |
| | | | | | | | | | | | | | | | |
| | | | | | | | | | | | | | | | | | | | | | |
| FORWARD FOREIGN CURRENCY CONTRACTS: | | | | | | | | | | | |
| Counterparty | | Settlement
Date | | Currency
Purchased | | | | | Currency
Sold | | | | | Unrealized
Appreciation | | | Unrealized
Depreciation | |
JPM | | 11/28/2014 | | | 727,600 | | | USD | | | 551,929 | | | EUR | | $ | 35,827 | | | $ | — | |
JPM | | 12/05/2014 | | | 1,314,851 | | | USD | | | 1,000,000 | | | EUR | | | 61,418 | | | | — | |
GSC | | 12/16/2014 | | | 1,295,300 | | | USD | | | 1,000,000 | | | EUR | | | 41,771 | | | | — | |
JPM | | 01/14/2015 | | | 5,118,618 | | | USD | | | 4,035,835 | | | EUR | | | 58,547 | | | | — | |
GSC | | 01/30/2015 | | | 1,277,254 | | | USD | | | 1,000,000 | | | EUR | | | 23,314 | | | | — | |
JPM | | 08/14/2015 | | | 1,807,905 | | | USD | | | 1,081,000 | | | GBP | | | 83,685 | | | | — | |
| | | | | | | | | | | | | | | | | | | | | | |
Total | | | | | | | | | | | | | | | | $ | 304,562 | | | $ | — | |
| | | | | | | | | | | | | | | | | | | | | | |
The Notes to Financial Statements are an integral part of this report.
| | |
| Transamerica Funds | | Annual Report 2014 |
Page 154
Transamerica Inflation Opportunities
SCHEDULE OF INVESTMENTS (continued)
At October 31, 2014
SECURITY VALUATION:
Valuation Inputs (I)
| | | | | | | | | | | | | | | | |
| | | Level 1
Quoted Prices | | | Level 2
Other Significant
Observable Inputs | | | Level 3
Significant
Unobservable Inputs | | | Value at
October 31, 2014 | |
ASSETS | | | | | | | | | | | | | | | | |
Investments | | | | | | | | | | | | | | | | |
U.S. Government Obligations | | $ | — | | | $ | 133,882,605 | | | $ | — | | | $ | 133,882,605 | |
U.S. Government Agency Obligations | | | — | | | | 6,034,244 | | | | — | | | | 6,034,244 | |
Foreign Government Obligations | | | — | | | | 58,096,390 | | | | — | | | | 58,096,390 | |
Mortgage-Backed Securities | | | — | | | | 4,487,802 | | | | — | | | | 4,487,802 | |
Asset-Backed Securities | | | — | | | | 1,202,227 | | | | — | | | | 1,202,227 | |
Preferred Corporate Debt Securities | | | — | | | | 2,095,220 | | | | — | | | | 2,095,220 | |
Corporate Debt Securities | | | — | | | | 33,746,499 | | | | — | | | | 33,746,499 | |
Short-Term U.S. Government Obligations | | | — | | | | 119,999 | | | | — | | | | 119,999 | |
Preferred Stocks | | | 1,339,155 | | | | — | | | | — | | | | 1,339,155 | |
Securities Lending Collateral | | | 6,762,445 | | | | — | | | | — | | | | 6,762,445 | |
Repurchase Agreement | | | — | | | | 6,183,732 | | | | — | | | | 6,183,732 | |
| | | | | | | | | | | | | | | | |
Total Investments | | $ | 8,101,600 | | | $ | 245,848,718 | | | $ | — | | | $ | 253,950,318 | |
| | | | | | | | | | | | | | | | |
Derivative Financial Instruments | | | | | | | | | | | | | | | | |
Forward Foreign Currency Contracts (J) | | $ | — | | | $ | 304,562 | | | $ | — | | | $ | 304,562 | |
| | | | | | | | | | | | | | | | |
Total Derivative Financial Instruments | | $ | — | | | $ | 304,562 | | | $ | — | | | $ | 304,562 | |
| | | | | | | | | | | | | | | | |
LIABILITIES | | | | | | | | | | | | | | | | |
Derivative Financial Instruments | | | | | | | | | | | | | | | | |
Futures Contracts (J) | | $ | (200,081 | ) | | $ | — | | | $ | — | | | $ | (200,081 | ) |
| | | | | | | | | | | | | | | | |
Total Derivative Financial Instruments | | $ | (200,081 | ) | | $ | — | | | $ | — | | | $ | (200,081 | ) |
| | | | | | | | | | | | | | | | |
FOOTNOTES TO SCHEDULE OF INVESTMENTS:
| (A) | Floating or variable rate security. Rate is listed as of October 31, 2014. |
| (B) | The security has a perpetual maturity. The date shown is the next call date. |
| (C) | All or a portion of this security is on loan. The value of all securities on loan is $6,624,466. The amount of securities on loan indicated may not correspond with the securities on loan identified because securities with pending sales are in the process of recall from the brokers. |
| (D) | Step bond. Coupon rate changes in increments to maturity. Rate disclosed is as of October 31, 2014. Maturity date disclosed is the ultimate maturity date. |
| (E) | All or a portion of this security has been segregated by the custodian with the broker as collateral to cover margin requirements for open futures contracts. Total value of securities segregated as collateral to cover margin requirements for open futures contracts is $119,999. |
| (F) | Percentage rounds to less than 0.01% or (0.01)%. |
| (G) | Rate shown reflects the yield at October 31, 2014. |
| (H) | Aggregate cost for federal income tax purposes is $258,089,509. Aggregate gross unrealized appreciation and depreciation for all securities is $352,484 and $4,491,675 respectively. Net unrealized depreciation for tax purposes is $4,139,191. |
| (I) | The Fund recognizes transfers between Levels at the end of the reporting period. There were no transfers between Level 1, 2 and 3 during the period ended October 31, 2014. See the Notes to Financial Statements for more information regarding security valuation and pricing inputs. |
| (J) | Derivative financial instruments valued at unrealized appreciation (depreciation) on the instrument. |
DEFINITIONS:
| | |
| 144A | | 144A securities are registered pursuant to Rule 144A of the Securities Act of 1933. These securities are deemed to be liquid for purposes of compliance limitations on holdings of illiquid securities and may be resold as transactions exempt from registration, normally to qualified institutional buyers. At October 31, 2014, these securities aggregated $10,229,534, or 4.15% of the Fund’s net assets. |
| GSC | | Goldman Sachs & Co. |
| JPM | | JPMorgan Chase Bank |
| MTN | | Medium Term Note |
| Reg S | | Security exempt from registration under Regulation S of the Securities Act of 1933, which exempts from registration securities offered and sold outside the United States. Security may not be offered or sold in the United States except pursuant to an exemption from, or in a transaction not subject to, the registration requirements of the Securities Act of 1933. |
The Notes to Financial Statements are an integral part of this report.
| | |
| Transamerica Funds | | Annual Report 2014 |
Page 155
Transamerica Inflation Opportunities
SCHEDULE OF INVESTMENTS (continued)
At October 31, 2014
CURRENCY ABBREVIATIONS:
| | |
| AUD | | Australian Dollar |
| BRL | | Brazilian Real |
| CAD | | Canadian Dollar |
| EUR | | Euro |
| GBP | | Pound Sterling |
| JPY | | Japanese Yen |
| MXN | | Mexican Peso |
| NZD | | New Zealand Dollar |
| TRY | | Turkish New Lira |
| USD | | United States Dollar |
The Notes to Financial Statements are an integral part of this report.
| | |
| Transamerica Funds | | Annual Report 2014 |
Page 156
Transamerica International Equity
SCHEDULE OF INVESTMENTS
At October 31, 2014
| | | | | | | | |
| | | Shares | | | Value | |
CONVERTIBLE PREFERRED STOCK - 1.3% | | | | | |
Germany - 1.3% | | | | | | | | |
Volkswagen AG | | | | | | | | |
2.21% (A) | | | 74,600 | | | | $ 15,953,352 | |
| | | | | | | | |
Total Convertible Preferred Stock
(Cost $18,609,952) | | | | 15,953,352 | |
| | | | | | | | |
| | |
PREFERRED STOCKS - 1.1% | | | | | | | | |
Brazil - 0.7% | | | | | | | | |
Itau Unibanco Holding SA | | | | | | | | |
3.16% (A) | | | 633,760 | | | | 9,399,362 | |
| | | | | | | | |
Korea, Republic of - 0.4% | | | | | | | | |
Hyundai Motor Co. | | | | | | | | |
1.59% (A) | | | 38,530 | | | | 4,453,249 | |
| | | | | | | | |
Total Preferred Stocks
(Cost $12,648,666) | | | | | | | 13,852,611 | |
| | | | | | | | |
| | |
COMMON STOCKS - 93.2% | | | | | | | | |
Australia - 3.9% | | | | | | | | |
APA Group | | | 877,500 | | | | 6,100,670 | |
Asciano, Ltd. | | | 3,097,000 | | | | 17,130,926 | |
BHP Billiton PLC, ADR (B) | | | 260,069 | | | | 13,533,991 | |
Challenger, Ltd. | | | 2,060,784 | | | | 12,675,184 | |
| | | | | | | | |
| | | | | | | 49,440,771 | |
| | | | | | | | |
Belgium - 0.7% | | | | | | | | |
Ageas | | | 250,464 | | | | 8,372,489 | |
| | | | | | | | |
Canada - 0.8% | | | | | | | | |
Fairfax Financial Holdings, Ltd. | | | 22,931 | | | | 10,476,784 | |
| | | | | | | | |
Denmark - 1.2% | | | | | | | | |
Carlsberg A/S, Class B | | | 167,376 | | | | 14,762,330 | |
| | | | | | | | |
France - 9.7% | | | | | | | | |
Arkema SA | | | 157,894 | | | | 9,745,522 | |
Bollore SA (B) | | | 19,200 | | | | 9,102,739 | |
Cie Generale des Etablissements Michelin, | | | | | | | | |
Class B | | | 105,191 | | | | 9,136,567 | |
GDF Suez | | | 561,200 | | | | 13,625,891 | |
Rexel SA | | | 895,700 | | | | 15,055,859 | |
Sanofi | | | 200,800 | | | | 18,220,598 | |
Total SA | | | 229,200 | | | | 13,683,987 | |
Veolia Environnement SA | | | 728,440 | | | | 12,098,517 | |
Vinci SA (B) | | | 174,900 | | | | 9,982,984 | |
Vivendi SA (C) | | | 473,583 | | | | 11,569,293 | |
| | | | | | | | |
| | | | | | | 122,221,957 | |
| | | | | | | | |
Germany - 6.9% | | | | | | | | |
adidas AG | | | 59,200 | | | | 4,313,666 | |
Allianz SE, Class A | | | 94,900 | | | | 15,091,199 | |
Bayer AG | | | 88,865 | | | | 12,709,629 | |
Merck KGaA | | | 183,300 | | | | 16,593,109 | |
Metro AG (C) | | | 450,700 | | | | 14,367,621 | |
Siemens AG, Class A | | | 128,400 | | | | 14,482,676 | |
Talanx AG (C) | | | 279,451 | | | | 9,017,892 | |
| | | | | | | | |
| | | | | | | 86,575,792 | |
| | | | | | | | |
Guernsey, Channel Islands - 0.9% | | | | | | | | |
Friends Life Group, Ltd. | | | 2,306,300 | | | | 11,960,524 | |
| | | | | | | | |
Hong Kong - 4.8% | | | | | | | | |
Cheung Kong Holdings, Ltd. | | | 887,500 | | | | 15,789,494 | |
First Pacific Co., Ltd. | | | 7,858,112 | | | | 8,450,135 | |
Guangdong Investment, Ltd. | | | 9,326,900 | | | | 12,244,766 | |
| | | | | | | | |
| | | Shares | | | Value | |
COMMON STOCKS (continued) | | | | | | | | |
Hong Kong (continued) | | | | | | | | |
Noble Group, Ltd. (B) | | | 13,240,000 | | | | $ 12,324,557 | |
SJM Holdings, Ltd. | | | 5,601,000 | | | | 11,809,317 | |
| | | | | | | | |
| | | | | | | 60,618,269 | |
| | | | | | | | |
Ireland - 2.1% | | | | | | | | |
DCC PLC | | | 58,500 | | | | 3,278,384 | |
Ryanair Holdings PLC, ADR (C) | | | 217,200 | | | | 12,063,288 | |
Smurfit Kappa Group PLC, Class B | | | 563,500 | | | | 11,642,888 | |
| | | | | | | | |
| | | | | | | 26,984,560 | |
| | | | | | | | |
Israel - 0.7% | | | | | | | | |
Israel Corp., Ltd. (C) | | | 18,872 | | | | 9,207,076 | |
| | | | | | | | |
Italy - 2.6% | | | | | | | | |
Davide Campari-Milano SpA | | | 719,344 | | | | 5,173,215 | |
Eni SpA, Class B | | | 814,900 | | | | 17,361,358 | |
Pirelli & C. SpA | | | 298,000 | | | | 3,996,103 | |
Prysmian SpA | | | 390,994 | | | | 6,776,384 | |
| | | | | | | | |
| | | | | | | 33,307,060 | |
| | | | | | | | |
Japan - 21.2% | | | | | | | | |
Aisin Seiki Co., Ltd. | | | 379,600 | | | | 12,644,007 | |
Daiichi Sankyo Co., Ltd. | | | 800,900 | | | | 12,047,002 | |
Denki Kagaku Kogyo KK | | | 2,348,000 | | | | 7,669,732 | |
Electric Power Development Co., Ltd. (B) | | | 202,700 | | | | 7,088,647 | |
FUJIFILM Holdings Corp. | | | 581,500 | | | | 19,520,134 | |
Hitachi, Ltd. | | | 3,383,300 | | | | 26,584,180 | |
Japan Airlines Co., Ltd. | | | 582,300 | | | | 15,635,961 | |
Kintetsu World Express, Inc. | | | 128,800 | | | | 4,457,295 | |
Komatsu, Ltd. | | | 483,800 | | | | 11,422,203 | |
Kuraray Co., Ltd. | | | 1,037,300 | | | | 12,048,302 | |
Mitsubishi Corp. | | | 716,200 | | | | 14,043,500 | |
MS&AD Insurance Group Holdings, Inc. | | | 809,600 | | | | 17,500,928 | |
Nippon Telegraph & Telephone Corp. | | | 329,700 | | | | 20,513,546 | |
Nitori Holdings Co., Ltd. | | | 192,500 | | | | 12,199,795 | |
ORIX Corp. | | | 1,184,300 | | | | 16,438,370 | |
Resona Holdings, Inc. | | | 3,029,800 | | | | 17,329,806 | |
Sony Corp. (B) | | | 636,500 | | | | 12,566,620 | |
Sumitomo Mitsui Financial Group, Inc. | | | 490,400 | | | | 19,999,936 | |
USS Co., Ltd. | | | 454,000 | | | | 7,145,049 | |
| | | | | | | | |
| | | | | | | 266,855,013 | |
| | | | | | | | |
Korea, Republic of - 2.7% | | | | | | | | |
Kangwon Land, Inc. | | | 269,425 | | | | 8,810,293 | |
Samsung Electronics Co., Ltd. | | | 11,000 | | | | 12,827,567 | |
SK Telecom Co., Ltd. | | | 47,050 | | | | 11,790,681 | |
| | | | | | | | |
| | | | | | | 33,428,541 | |
| | | | | | | | |
Macau - 1.3% | | | | | | | | |
MGM China Holdings, Ltd. | | | 4,917,400 | | | | 15,808,437 | |
| | | | | | | | |
Netherlands - 4.7% | | | | | | | | |
Akzo Nobel NV | | | 177,700 | | | | 11,850,192 | |
Boskalis Westminster NV | | | 181,700 | | | | 9,693,758 | |
Delta Lloyd NV | | | 404,379 | | | | 9,217,109 | |
Heineken Holding NV, Class A | | | 180,600 | | | | 11,705,876 | |
Koninklijke Philips NV | | | 514,156 | | | | 14,374,713 | |
Wolters Kluwer NV | | | 81,260 | | | | 2,169,536 | |
| | | | | | | | |
| | | | | | | 59,011,184 | |
| | | | | | | | |
Singapore - 0.3% | | | | | | | | |
SIA Engineering Co., Ltd. (B) | | | 1,145,400 | | | | 4,247,433 | |
| | | | | | | | |
The Notes to Financial Statements are an integral part of this report.
| | |
| Transamerica Funds | | Annual Report 2014 |
Page 157
Transamerica International Equity
SCHEDULE OF INVESTMENTS (continued)
At October 31, 2014
| | | | | | | | |
| | | Shares | | | Value | |
COMMON STOCKS (continued) | | | | | | | | |
Spain - 1.5% | | | | | | | | |
Amadeus IT Holding SA, Class A | | | 517,241 | | | | $ 19,030,416 | |
| | | | | | | | |
Sweden - 4.3% | | | | | | | | |
Investor AB, Class B | | | 493,700 | | | | 17,720,167 | |
Saab AB, Class B (B) | | | 135,427 | | | | 3,657,496 | |
Svenska Cellulosa AB SCA, Class B | | | 759,280 | | | | 17,012,793 | |
Telefonaktiebolaget LM Ericsson, Class B | | | 1,370,700 | | | | 16,196,734 | |
| | | | | | | | |
| | | | | | | 54,587,190 | |
| | | | | | | | |
Switzerland - 4.8% | | | | | | | | |
GAM Holding AG (C) | | | 786,500 | | | | 13,431,743 | |
Nestle SA | | | 219,262 | | | | 16,079,381 | |
Novartis AG | | | 187,800 | | | | 17,428,376 | |
UBS AG, Class A (C) | | | 789,200 | | | | 13,722,715 | |
| | | | | | | | |
| | | | | | | 60,662,215 | |
| | | | | | | | |
United Kingdom - 16.3% | | | | | | | | |
Admiral Group PLC | | | 376,200 | | | | 8,049,610 | |
Barclays PLC | | | 3,734,200 | | | | 14,361,429 | |
BP PLC, ADR (B) | | | 287,100 | | | | 12,477,366 | |
British Sky Broadcasting Group PLC | | | 954,200 | | | | 13,523,165 | |
HSBC Holdings PLC | | | 1,806,800 | | | | 18,488,262 | |
IG Group Holdings PLC | | | 1,043,213 | | | | 10,053,920 | |
Imperial Tobacco Group PLC | | | 338,500 | | | | 14,705,057 | |
Inchcape PLC | | | 1,041,000 | | | | 11,597,062 | |
Johnson Matthey PLC | | | 127,145 | | | | 6,070,107 | |
Kingfisher PLC | | | 3,103,800 | | | | 15,036,248 | |
National Grid PLC, Class B | | | 1,081,200 | | | | 16,044,969 | |
Noble Corp. PLC (B) | | | 475,557 | | | | 9,948,652 | |
Rexam PLC | | | 1,460,536 | | | | 11,132,014 | |
Royal Bank of Scotland Group PLC (C) | | | 2,234,900 | | | | 13,895,602 | |
UBM PLC | | | 767,600 | | | | 6,996,928 | |
Unilever PLC | | | 352,700 | | | | 14,187,527 | |
Vodafone Group PLC | | | 2,656,420 | | | | 8,833,803 | |
| | | | | | | | |
| | | | | | | 205,401,721 | |
| | | | | | | | |
| | | | | | | | |
| | | Shares | | | Value | |
COMMON STOCKS (continued) | | | | | | | | |
United States - 1.8% | | | | | | | | |
Flextronics International, Ltd. (C) | | | 1,164,605 | | | | $ 12,484,566 | |
Mallinckrodt PLC (B) (C) | | | 106,900 | | | | 9,854,042 | |
Paragon Offshore PLC (B) (C) | | | 111,897 | | | | 544,938 | |
| | | | | | | | |
| | | | | | | 22,883,546 | |
| | | | | | | | |
Total Common Stocks
(Cost $1,158,373,410) | | | | | | | 1,175,843,308 | |
| | | | | | | | |
|
SECURITIES LENDING COLLATERAL - 5.3% | |
State Street Navigator Securities Lending Trust - Prime Portfolio 0.16% (A) | | | 67,589,195 | | | | 67,589,195 | |
| | | | | | | | |
Total Securities Lending Collateral
(Cost $67,589,195) | | | | | | | 67,589,195 | |
| | | | | | | | |
| | |
| | | Principal | | | Value | |
REPURCHASE AGREEMENT - 3.8% | |
State Street Bank & Trust Co. 0.01% (A), dated 10/31/2014, to be repurchased at $47,474,112 on 11/03/2014. Collateralized by a U.S. Government Agency Obligation, 2.50%, due 11/01/2027, and with a value of $48,426,188. | | | $ 47,474,073 | | | | 47,474,073 | |
| | | | | | | | |
Total Repurchase Agreement
(Cost $47,474,073) | | | | | | | 47,474,073 | |
| | | | | | | | |
Total Investments
(Cost $1,304,695,296) (D) | | | | | | | 1,320,712,539 | |
Net Other Assets (Liabilities) - (4.7)% | | | | (59,270,511 | ) |
| | | | | | | | |
| | |
Net Assets - 100.0% | | | | | | | $1,261,442,028 | |
| | | | | | | | |
INVESTMENTS BY INDUSTRY (unaudited):
| | | | | | | | |
| Industry | | Percentage of
Total Investments | | | Value | |
Banks | | | 7.1 | % | | $ | 93,474,397 | |
Insurance | | | 6.8 | | | | 89,686,535 | |
Pharmaceuticals | | | 6.6 | | | | 86,852,756 | |
Electronic Equipment, Instruments & Components | | | 4.4 | | | | 58,588,880 | |
Chemicals | | | 4.3 | | | | 56,590,931 | |
Diversified Financial Services | | | 3.7 | | | | 48,899,406 | |
Oil, Gas & Consumable Fuels | | | 3.3 | | | | 43,522,711 | |
Multi-Utilities | | | 3.2 | | | | 41,769,377 | |
Trading Companies & Distributors | | | 3.1 | | | | 41,423,916 | |
Hotels, Restaurants & Leisure | | | 2.8 | | | | 36,428,047 | |
Specialty Retail | | | 2.6 | | | | 34,381,092 | |
Media | | | 2.6 | | | | 34,258,922 | |
Industrial Conglomerates | | | 2.4 | | | | 32,135,773 | |
Beverages | | | 2.4 | | | | 31,641,421 | |
Food Products | | | 2.3 | | | | 30,266,908 | |
Airlines | | | 2.1 | | | | 27,699,249 | |
Capital Markets | | | 2.1 | | | | 27,154,458 | |
Auto Components | | | 2.0 | | | | 25,776,677 | |
Containers & Packaging | | | 1.7 | | | | 22,774,902 | |
The Notes to Financial Statements are an integral part of this report.
| | |
| Transamerica Funds | | Annual Report 2014 |
Page 158
Transamerica International Equity
SCHEDULE OF INVESTMENTS (continued)
At October 31, 2014
INVESTMENTS BY INDUSTRY (unaudited) (continued):
| | | | | | | | |
| Industry | | Percentage of
Total Investments | | | Value | |
Wireless Telecommunication Services | | | 1.6 | % | | $ | 20,624,484 | |
Diversified Telecommunication Services | | | 1.6 | | | | 20,513,546 | |
Automobiles | | | 1.5 | | | | 20,406,601 | |
Construction & Engineering | | | 1.5 | | | | 19,676,742 | |
IT Services | | | 1.4 | | | | 19,030,416 | |
Road & Rail | | | 1.3 | | | | 17,130,926 | |
Household Products | | | 1.3 | | | | 17,012,793 | |
Consumer Finance | | | 1.2 | | | | 16,438,370 | |
Communications Equipment | | | 1.2 | | | | 16,196,734 | |
Real Estate Management & Development | | | 1.2 | | | | 15,789,494 | |
Tobacco | | | 1.1 | | | | 14,705,057 | |
Food & Staples Retailing | | | 1.1 | | | | 14,367,621 | |
Air Freight & Logistics | | | 1.0 | | | | 13,560,034 | |
Metals & Mining | | | 1.0 | | | | 13,533,991 | |
Semiconductors & Semiconductor Equipment | | | 1.0 | | | | 12,827,567 | |
Household Durables | | | 0.9 | | | | 12,566,620 | |
Water Utilities | | | 0.9 | | | | 12,244,766 | |
Distributors | | | 0.9 | | | | 11,597,062 | |
Machinery | | | 0.9 | | | | 11,422,203 | |
Energy Equipment & Services | | | 0.8 | | | | 10,493,590 | |
Independent Power and Renewable Electricity Producers | | | 0.5 | | | | 7,088,647 | |
Electrical Equipment | | | 0.5 | | | | 6,776,384 | |
Gas Utilities | | | 0.5 | | | | 6,100,670 | |
Textiles, Apparel & Luxury Goods | | | 0.3 | | | | 4,313,666 | |
Transportation Infrastructure | | | 0.3 | | | | 4,247,433 | |
Aerospace & Defense | | | 0.3 | | | | 3,657,496 | |
| | | | | | | | |
Investments, at Value | | | 91.3 | | | | 1,205,649,271 | |
Short-Term Investments | | | 8.7 | | | | 115,063,268 | |
| | | | | | | | |
Total Investments | | | 100.0 | % | | $ | 1,320,712,539 | |
| | | | | | | | |
| | | | | | | | |
SECURITY VALUATION:
Valuation Inputs (E)
| | | | | | | | | | | | | | | | |
| | | Level 1
Quoted Prices | | | Level 2 Other Significant
Observable Inputs | | | Level 3
Significant
Unobservable Inputs | | | Value at
October 31, 2014 | |
ASSETS | | | | | | | | | | | | | | | | |
Investments | | | | | | | | | | | | | | | | |
Convertible Preferred Stock | | $ | — | | | $ | 15,953,352 | | | $ | — | | | $ | 15,953,352 | |
Preferred Stocks | | | 9,399,362 | | | | 4,453,249 | | | | — | | | | 13,852,611 | |
Common Stocks | | | 81,383,627 | | | | 1,094,459,681 | | | | — | | | | 1,175,843,308 | |
Securities Lending Collateral | | | 67,589,195 | | | | — | | | | — | | | | 67,589,195 | |
Repurchase Agreement | | | — | | | | 47,474,073 | | | | — | | | | 47,474,073 | |
| | | | | | | | | | | | | | | | |
Total Investments | | $ | 158,372,184 | | | $ | 1,162,340,355 | | | $ | — | | | $ | 1,320,712,539 | |
| | | | | | | | | | | | | | | | |
FOOTNOTES TO SCHEDULE OF INVESTMENTS:
| (A) | Rate shown reflects the yield at October 31, 2014. |
| (B) | All or a portion of this security is on loan. The value of all securities on loan is $65,474,092. The amount of securities on loan indicated may not correspond with the securities on loan identified because securities with pending sales are in the process of recall from the brokers. |
| (C) | Non-income producing security. |
The Notes to Financial Statements are an integral part of this report.
| | |
| Transamerica Funds | | Annual Report 2014 |
Page 159
Transamerica International Equity
SCHEDULE OF INVESTMENTS (continued)
At October 31, 2014
FOOTNOTES TO SCHEDULE OF INVESTMENTS (continued):
| (D) | Aggregate cost for federal income tax purposes is $1,311,526,513. Aggregate gross unrealized appreciation and depreciation for all securities is $70,837,761 and $61,651,735, respectively. Net unrealized appreciation for tax purposes is $9,186,026. |
| (E) | The Fund recognizes transfers between Levels at the end of the reporting period. There were no transfers between Level 1, 2 and 3 during the period ended October 31, 2014. See the Notes to Financial Statements for more information regarding security valuation and pricing inputs. |
DEFINITION:
| | |
| ADR | | American Depositary Receipt |
The Notes to Financial Statements are an integral part of this report.
| | |
| Transamerica Funds | | Annual Report 2014 |
Page 160
Transamerica International Small Cap Value
SCHEDULE OF INVESTMENTS
At October 31, 2014
| | | | | | | | |
| | | Shares | | | Value | |
PREFERRED STOCK - 1.0% | | | | | | | | |
Germany - 1.0% | | | | | | | | |
Sartorius AG
1.16% (A) | | | 66,450 | | | | $ 7,251,923 | |
| | | | | | | | |
Total Preferred Stock
(Cost $7,685,409) | | | | | | | 7,251,923 | |
| | | | | | | | |
| | |
COMMON STOCKS - 96.3% | | | | | | | | |
Australia - 3.9% | | | | | | | | |
APA Group | | | 1,056,400 | | | | 7,344,442 | |
Bentham IMF, Ltd. (B) | | | 2,236,400 | | | | 4,042,884 | |
FlexiGroup, Ltd. | | | 2,145,900 | | | | 6,777,314 | |
Senex Energy, Ltd. (B) (C) | | | 10,996,100 | | | | 5,264,196 | |
STW Communications Group, Ltd. | | | 5,761,200 | | | | 5,758,072 | |
| | | | | | | | |
| | | | | | | 29,186,908 | |
| | | | | | | | |
Austria - 0.9% | | | | | | | | |
Flughafen Wien AG (B) | | | 71,600 | | | | 6,576,033 | |
| | | | | | | | |
Belgium - 1.9% | | | | | | | | |
Barco NV (B) | | | 95,100 | | | | 7,011,978 | |
D’ieteren SA (B) | | | 208,700 | | | | 7,556,925 | |
| | | | | | | | |
| | | | | | | 14,568,903 | |
| | | | | | | | |
Canada - 1.4% | | | | | | | | |
Essential Energy Services Trust (C) | | | 1,404,000 | | | | 2,516,375 | |
Newalta Corp. | | | 407,400 | | | | 7,356,009 | |
TransGlobe Energy Corp. (B) | | | 164,100 | | | | 711,990 | |
| | | | | | | | |
| | | | | | | 10,584,374 | |
| | | | | | | | |
Denmark - 1.5% | | | | | | | | |
Bavarian Nordic A/S (C) | | | 196,984 | | | | 6,099,641 | |
Schouw & Co. | | | 114,200 | | | | 5,059,704 | |
| | | | | | | | |
| | | | | | | 11,159,345 | |
| | | | | | | | |
Finland - 2.2% | | | | | | | | |
Kesko OYJ, Class B | | | 165,300 | | | | 6,269,089 | |
Ramirent OYJ | | | 645,881 | | | | 5,154,884 | |
Tieto OYJ (B) | | | 203,200 | | | | 5,151,948 | |
| | | | | | | | |
| | | | | | | 16,575,921 | |
| | | | | | | | |
France - 2.2% | | | | | | | | |
BioMerieux (B) | | | 47,400 | | | | 4,998,934 | |
Societe BIC SA | | | 65,500 | | | | 8,170,827 | |
Sopra Group SA | | | 40,900 | | | | 3,065,830 | |
| | | | | | | | |
| | | | | | | 16,235,591 | |
| | | | | | | | |
Georgia - 0.2% | | | | | | | | |
Bank of Georgia Holdings PLC | | | 44,600 | | | | 1,829,163 | |
| | | | | | | | |
Germany - 6.4% | | | | | | | | |
Bertrandt AG | | | 37,268 | | | | 4,878,389 | |
Gerresheimer AG | | | 164,200 | | | | 9,136,401 | |
Patrizia Immobilien AG (C) | | | 621,640 | | | | 8,404,332 | |
Rhoen Klinikum AG | | | 209,700 | | | | 6,243,804 | |
SAF-Holland SA | | | 771,500 | | | | 9,667,109 | |
Stroeer Media AG | | | 282,580 | | | | 6,448,278 | |
Tom Tailor Holding AG (C) | | | 238,200 | | | | 3,339,410 | |
| | | | | | | | |
| | | | | | | 48,117,723 | |
| | | | | | | | |
Guernsey, Channel Islands - 0.4% | | | | | | | | |
Etalon Group, Ltd. GDR, Reg S | | | 993,193 | | | | 3,056,055 | |
| | | | | | | | |
Hong Kong - 4.7% | | | | | | | | |
AMVIG Holdings, Ltd. | | | 3,886,000 | | | | 1,814,555 | |
| | | | | | | | |
| | | Shares | | | Value | |
COMMON STOCKS (continued) | | | | | | | | |
Hong Kong (continued) | | | | | | | | |
Far East Consortium International, Ltd. | | | 5,262,000 | | | | $ 1,955,211 | |
First Pacific Co., Ltd. | | | 13,066,750 | | | | 14,051,187 | |
Midland Holdings, Ltd. (C) | | | 7,198,000 | | | | 3,538,160 | |
Newocean Energy Holdings, Ltd. | | | 8,521,120 | | | | 4,014,120 | |
Pacific Textiles Holdings, Ltd. | | | 3,955,000 | | | | 5,323,069 | |
Shun Tak Holdings, Ltd. | | | 8,226,000 | | | | 4,191,003 | |
| | | | | | | | |
| | | | | | | 34,887,305 | |
| | | | | | | | |
Ireland - 1.0% | | | | | | | | |
Smurfit Kappa Group PLC, Class B | | | 371,011 | | | | 7,665,731 | |
| | | | | | | | |
Israel - 0.6% | | | | | | | | |
Plus500, Ltd. (B) | | | 543,500 | | | | 4,450,269 | |
| | | | | | | | |
Italy - 5.2% | | | | | | | | |
ASTM SpA | | | 573,200 | | | | 6,894,909 | |
Danieli & C Officine Meccaniche SpA, | | | | | | | | |
Class B | | | 420,200 | | | | 7,583,995 | |
Davide Campari-Milano SpA (B) | | | 1,058,400 | | | | 7,611,561 | |
Pirelli & C. SpA | | | 588,200 | | | | 7,887,610 | |
Prysmian SpA | | | 495,300 | | | | 8,584,129 | |
| | | | | | | | |
| | | | | | | 38,562,204 | |
| | | | | | | | |
Japan - 27.1% | | | | | | | | |
Air Water, Inc. | | | 555,500 | | | | 8,854,840 | |
Avex Group Holdings, Inc. (B) | | | 686,700 | | | | 10,199,913 | |
Chugoku Marine Paints, Ltd. | | | 831,000 | | | | 6,567,177 | |
Daiichikosho Co., Ltd. | | | 189,600 | | | | 4,784,831 | |
Denki Kagaku Kogyo KK | | | 3,820,700 | | | | 12,480,300 | |
Dynam Japan Holdings Co., Ltd. | | | 3,288,300 | | | | 9,275,160 | |
Electric Power Development Co., Ltd. (B) | | | 172,500 | | | | 6,032,519 | |
Hikari Tsushin, Inc. | | | 114,000 | | | | 7,562,213 | |
HIS Co., Ltd. | | | 264,900 | | | | 6,881,556 | |
Hoshizaki Electric Co., Ltd. | | | 197,900 | | | | 9,585,813 | |
kabu.com Securities Co., Ltd. | | | 915,400 | | | | 4,550,915 | |
Kaken Pharmaceutical Co., Ltd. | | | 483,400 | | | | 12,111,109 | |
Kintetsu World Express, Inc. | | | 267,500 | | | | 9,257,194 | |
Miraca Holdings, Inc. (B) | | | 156,300 | | | | 6,561,386 | |
Nakanishi, Inc. | | | 214,800 | | | | 7,346,119 | |
Nitori Holdings Co., Ltd. | | | 202,000 | | | | 12,801,863 | |
Rohto Pharmaceutical Co., Ltd. (B) | | | 654,300 | | | | 9,491,086 | |
Ryohin Keikaku Co., Ltd. | | | 62,400 | | | | 8,425,935 | |
Sanwa Holdings Corp. | | | 1,430,600 | | | | 9,919,800 | |
SKY Perfect JSAT Holdings, Inc. | | | 2,085,400 | | | | 12,801,842 | |
Sogo Medical Co., Ltd. | | | 112,400 | | | | 5,367,070 | |
Toho Holdings Co., Ltd. | | | 302,800 | | | | 3,961,334 | |
Token Corp. | | | 82,100 | | | | 3,717,354 | |
USS Co., Ltd. | | | 562,300 | | | | 8,849,473 | |
Welcia Holdings Co., Ltd. (B) | | | 142,500 | | | | 4,760,538 | |
| | | | | | | | |
| | | | | | | 202,147,340 | |
| | | | | | | | |
Korea, Republic of - 0.6% | | | | | | | | |
Eugene Technology Co., Ltd. | | | 268,800 | | | | 4,345,992 | |
| | | | | | | | |
Mexico - 0.6% | | | | | | | | |
Credito Real SAB de CV | | | 1,616,435 | | | | 4,147,244 | |
| | | | | | | | |
Netherlands - 8.8% | | | | | | | | |
BE Semiconductor Industries NV | | | 277,423 | | | | 5,284,154 | |
BinckBank NV | | | 870,500 | | | | 8,627,241 | |
Boskalis Westminster NV | | | 226,200 | | | | 12,067,849 | |
Delta Lloyd NV | | | 693,400 | | | | 15,804,835 | |
Koninklijke Ten Cate NV (B) | | | 537,961 | | | | 12,133,283 | |
The Notes to Financial Statements are an integral part of this report.
| | |
| Transamerica Funds | | Annual Report 2014 |
Page 161
Transamerica International Small Cap Value
SCHEDULE OF INVESTMENTS (continued)
At October 31, 2014
| | | | | | | | |
| | | Shares | | | Value | |
COMMON STOCKS (continued) | | | | | | | | |
Netherlands (continued) | | | | | | | | |
Nutreco NV | | | 235,700 | | | | $ 11,805,597 | |
| | | | | | | | |
| | | | | | | 65,722,959 | |
| | | | | | | | |
New Zealand - 0.6% | | | | | | | | |
Kathmandu Holdings, Ltd. | | | 1,878,700 | | | | 4,683,504 | |
| | | | | | | | |
Norway - 1.1% | | | | | | | | |
ABG Sundal Collier Holding ASA | | | 3,340,500 | | | | 2,451,634 | |
Norwegian Property ASA (C) | | | 3,705,445 | | | | 5,658,049 | |
| | | | | | | | |
| | | | | | | 8,109,683 | |
| | | | | | | | |
Philippines - 0.7% | | | | | | | | |
Alliance Global Group, Inc. | | | 8,946,700 | | | | 5,042,249 | |
| | | | | | | | |
Singapore - 1.9% | | | | | | | | |
ARA Asset Management, Ltd. | | | 4,462,300 | | | | 5,948,079 | |
CWT, Ltd. | | | 6,354,200 | | | | 7,992,393 | |
| | | | | | | | |
| | | | | | | 13,940,472 | |
| | | | | | | | |
Sweden - 0.8% | | | | | | | | |
Dios Fastigheter AB (B) | | | 920,954 | | | | 6,239,734 | |
| | | | | | | | |
Switzerland - 3.3% | | | | | | | | |
GAM Holding AG (C) | | | 799,190 | | | | 13,648,462 | |
Gategroup Holding AG, Class A (C) | | | 255,000 | | | | 5,746,021 | |
Swissquote Group Holding SA | | | 159,576 | | | | 4,977,089 | |
| | | | | | | | |
| | | | | | | 24,371,572 | |
| | | | | | | | |
United Arab Emirates - 0.7% | | | | | | | | |
Dragon Oil PLC | | | 629,100 | | | | 5,431,473 | |
| | | | | | | | |
United Kingdom - 17.3% | | | | | | | | |
Berendsen PLC | | | 258,951 | | | | 4,193,212 | |
Cineworld Group PLC | | | 1,699,712 | | | | 9,111,829 | |
Fenner PLC | | | 988,900 | | | | 4,894,307 | |
IG Group Holdings PLC | | | 1,261,500 | | | | 12,157,652 | |
Inchcape PLC | | | 1,043,500 | | | | 11,624,913 | |
Inmarsat PLC | | | 554,600 | | | | 6,089,444 | |
International Personal Finance PLC | | | 1,248,500 | | | | 9,738,093 | |
Ithaca Energy, Inc. (C) | | | 4,193,600 | | | | 5,358,044 | |
Lancashire Holdings, Ltd. | | | 1,202,400 | | | | 12,888,295 | |
Northgate PLC | | | 1,856,806 | | | | 14,565,752 | |
Rexam PLC | | | 2,071,348 | | | | 15,787,543 | |
| | | | | | | | |
| | | Shares | | | Value | |
COMMON STOCKS (continued) | |
United Kingdom (continued) | |
Stock Spirits Group PLC | | | 1,961,700 | | | | $ 9,580,041 | |
UBM PLC | | | 1,446,800 | | | | 13,188,060 | |
| | | | | | | | |
| | | | | | | 129,177,185 | |
| | | | | | | | |
United States - 0.3% | | | | | | | | |
Eros International PLC (C) | | | 128,978 | | | | 2,380,934 | |
| | | | | | | | |
Total Common Stocks
(Cost $734,628,934) | | | | | | | 719,195,866 | |
| | | | | | | | |
| | |
RIGHT - 0.0% (D) | | | | | | | | |
Germany - 0.0% (D) | | | | | | | | |
Rhoen Klinikum AG (C) | | | 209,700 | | | | 176,592 | |
| | | | | | | | |
Total Right (Cost $0) | | | | | | | 176,592 | |
| | | | | | | | |
|
SECURITIES LENDING COLLATERAL - 2.9% | |
State Street Navigator Securities Lending Trust - Prime Portfolio
0.16% (A) | | | 21,996,640 | | | | 21,996,640 | |
| | | | | | | | |
Total Securities Lending Collateral
(Cost $21,996,640) | | | | | | | 21,996,640 | |
| | | | | | | | |
| | |
| | | Principal | | | Value | |
REPURCHASE AGREEMENT - 1.6% | |
State Street Bank & Trust Co.
0.01% (A), dated 10/31/2014, to be repurchased at $11,969,261 on 11/03/2014. Collateralized by a U.S. Government Agency Obligation, 3.50%, due 01/25/2039, and with a value of $12,211,761. | | | $ 11,969,251 | | | | 11,969,251 | |
| | | | | | | | |
Total Repurchase Agreement
(Cost $11,969,251) | | | | 11,969,251 | |
| | | | | | | | |
Total Investments
(Cost $776,280,234) (E) | | | | | | | 760,590,272 | |
Net Other Assets (Liabilities) - (1.8)% | | | | (13,362,619 | ) |
| | | | | | | | |
| | |
Net Assets - 100.0% | | | | | | | $ 747,227,653 | |
| | | | | | | | |
INVESTMENTS BY INDUSTRY (unaudited):
| | | | | | | | |
| Industry | | Percentage of
Total Investments | | | Value | |
Media | | | 8.5 | % | | $ | 64,673,759 | |
Capital Markets | | | 5.3 | | | | 40,203,420 | |
Chemicals | | | 5.3 | | | | 40,035,600 | |
Specialty Retail | | | 4.9 | | | | 37,236,463 | |
Diversified Financial Services | | | 4.6 | | | | 34,701,992 | |
Real Estate Management & Development | | | 3.8 | | | | 28,851,541 | |
Insurance | | | 3.8 | | | | 28,693,130 | |
Commercial Services & Supplies | | | 3.3 | | | | 25,466,069 | |
Containers & Packaging | | | 3.3 | | | | 25,267,829 | |
Machinery | | | 2.9 | | | | 22,064,115 | |
Pharmaceuticals | | | 2.8 | | | | 21,602,195 | |
Oil, Gas & Consumable Fuels | | | 2.7 | | | | 20,779,823 | |
Consumer Finance | | | 2.7 | | | | 20,662,651 | |
Health Care Equipment & Supplies | | | 2.6 | | | | 19,596,976 | |
The Notes to Financial Statements are an integral part of this report.
| | |
| Transamerica Funds | | Annual Report 2014 |
Page 162
Transamerica International Small Cap Value
SCHEDULE OF INVESTMENTS (continued)
At October 31, 2014
INVESTMENTS BY INDUSTRY (unaudited) (continued):
| | | | | | | | |
| Industry | | Percentage of
Total Investments | | | Value | |
Distributors | | | 2.5 | % | | $ | 19,181,838 | |
Auto Components | | | 2.3 | | | | 17,554,719 | |
Air Freight & Logistics | | | 2.3 | | | | 17,249,587 | |
Beverages | | | 2.3 | | | | 17,191,602 | |
Health Care Providers & Services | | | 2.2 | | | | 16,943,116 | |
Food Products | | | 2.2 | | | | 16,865,301 | |
Food & Staples Retailing | | | 2.2 | | | | 16,396,697 | |
Hotels, Restaurants & Leisure | | | 2.1 | | | | 16,156,716 | |
Road & Rail | | | 1.9 | | | | 14,565,752 | |
Transportation Infrastructure | | | 1.8 | | | | 13,470,942 | |
Construction & Engineering | | | 1.6 | | | | 12,067,849 | |
Building Products | | | 1.3 | | | | 9,919,800 | |
Semiconductors & Semiconductor Equipment | | | 1.3 | | | | 9,630,146 | |
Industrial Conglomerates | | | 1.2 | | | | 9,233,252 | |
Life Sciences Tools & Services | | | 1.2 | | | | 9,136,401 | |
Electrical Equipment | | | 1.1 | | | | 8,584,129 | |
Multiline Retail | | | 1.1 | | | | 8,425,935 | |
IT Services | | | 1.1 | | | | 8,217,778 | |
Gas Utilities | | | 1.0 | | | | 7,344,442 | |
Electronic Equipment, Instruments & Components | | | 0.9 | | | | 7,011,978 | |
Biotechnology | | | 0.8 | | | | 6,099,641 | |
Diversified Telecommunication Services | | | 0.8 | | | | 6,089,444 | |
Independent Power and Renewable Electricity Producers | | | 0.8 | | | | 6,032,519 | |
Textiles, Apparel & Luxury Goods | | | 0.7 | | | | 5,323,069 | |
Trading Companies & Distributors | | | 0.7 | | | | 5,154,884 | |
Professional Services | | | 0.6 | | | | 4,878,389 | |
Household Durables | | | 0.5 | | | | 3,717,354 | |
Energy Equipment & Services | | | 0.3 | | | | 2,516,375 | |
Banks | | | 0.2 | | | | 1,829,163 | |
| | | | | | | | |
Investments, at Value | | | 95.5 | | | | 726,624,381 | |
Short-Term Investments | | | 4.5 | | | | 33,965,891 | |
| | | | | | | | |
Total Investments | | | 100.0 | % | | $ | 760,590,272 | |
| | | | | | | | |
| | | | | | | | |
SECURITY VALUATION:
Valuation Inputs (F)
| | | | | | | | | | | | | | | | |
| | | Level 1
Quoted Prices | | | Level 2
Other Significant
Observable Inputs | | | Level 3
Significant
Unobservable Inputs | | | Value at
October 31, 2014 | |
ASSETS | | | | | | | | | | | | | | | | |
Investments | | | | | | | | | | | | | | | | |
Preferred Stock | | $ | — | | | $ | 7,251,923 | | | $ | — | | | $ | 7,251,923 | |
Common Stocks | | | 25,526,651 | | | | 693,669,215 | | | | — | | | | 719,195,866 | |
Right | | | — | | | | 176,592 | | | | — | | | | 176,592 | |
Securities Lending Collateral | | | 21,996,640 | | | | — | | | | — | | | | 21,996,640 | |
Repurchase Agreement | | | — | | | | 11,969,251 | | | | — | | | | 11,969,251 | |
| | | | | | | | | | | | | | | | |
Total Investments | | $ | 47,523,291 | | | $ | 713,066,981 | | | $ | — | | | $ | 760,590,272 | |
| | | | | | | | | | | | | | | | |
FOOTNOTES TO SCHEDULE OF INVESTMENTS:
| (A) | Rate shown reflects the yield at October 31, 2014. |
| (B) | All or a portion of this security is on loan. The value of all securities on loan is $20,924,956. The amount of securities on loan indicated may not correspond with the securities on loan identified because securities with pending sales are in the process of recall from the brokers. |
| (C) | Non-income producing security. |
The Notes to Financial Statements are an integral part of this report.
| | |
| Transamerica Funds | | Annual Report 2014 |
Page 163
Transamerica International Small Cap Value
SCHEDULE OF INVESTMENTS (continued)
At October 31, 2014
FOOTNOTES TO SCHEDULE OF INVESTMENTS (continued):
| (D) | Percentage rounds to less than 0.1% or (0.1)%. |
| (E) | Aggregate cost for federal income tax purposes is $778,061,061. Aggregate gross unrealized appreciation and depreciation for all securities is $39,966,763 and $57,437,552, respectively. Net unrealized depreciation for tax purposes is $17,470,789. |
| (F) | The Fund recognizes transfers between Levels at the end of the reporting period. There were no transfers between Level 1, 2 and 3 during the period ended October 31, 2014. See the Notes to Financial Statements for more information regarding security valuation and pricing inputs. |
DEFINITIONS:
| | |
| GDR | | Global Depositary Receipt |
| Reg S | | Security exempt from registration under Regulation S of the Securities Act of 1933, which exempts from registration securities offered and sold outside the United States. Security may not be offered or sold in the United States except pursuant to an exemption from, or in a transaction not subject to, the registration requirements of the Securities Act of 1933. |
The Notes to Financial Statements are an integral part of this report.
| | |
| Transamerica Funds | | Annual Report 2014 |
Page 164
Transamerica Large Cap Value
SCHEDULE OF INVESTMENTS
At October 31, 2014
| | | | | | | | |
| | | Shares | | | Value | |
COMMON STOCKS - 97.2% | | | | | | | | |
Aerospace & Defense - 2.5% | | | | | | | | |
Exelis, Inc. | | | 2,531,794 | | | | $ 45,192,523 | |
| | | | | | | | |
Automobiles - 2.2% | | | | | | | | |
General Motors Co. | | | 1,244,188 | | | | 39,067,503 | |
| | | | | | | | |
Banks - 1.4% | | | | | | | | |
Great Western Bancorp, Inc. (A) | | | 1,325,901 | | | | 25,748,997 | |
| | | | | | | | |
Beverages - 1.2% | | | | | | | | |
Cott Corp. (B) | | | 3,421,227 | | | | 20,766,848 | |
| | | | | | | | |
Chemicals - 3.2% | | | | | | | | |
E.I. du Pont de Nemours & Co. | | | 819,661 | | | | 56,679,558 | |
| | | | | | | | |
Diversified Financial Services - 9.9% | |
Citigroup, Inc. | | | 1,687,127 | | | | 90,311,908 | |
JPMorgan Chase & Co. | | | 1,455,579 | | | | 88,033,418 | |
| | | | | | | | |
| | | | | | | 178,345,326 | |
| | | | | | | | |
Diversified Telecommunication Services - 2.1% | |
Verizon Communications, Inc. | | | 741,339 | | | | 37,252,285 | |
| | | | | | | | |
Electrical Equipment - 4.2% | | | | | | | | |
Eaton Corp. PLC | | | 1,094,348 | | | | 74,842,460 | |
| | | | | | | | |
Energy Equipment & Services - 2.9% | |
Cameron International Corp. (A) | | | 632,720 | | | | 37,678,476 | |
National Oilwell Varco, Inc. | | | 208,112 | | | | 15,117,256 | |
| | | | | | | | |
| | | | | | | 52,795,732 | |
| | | | | | | | |
Food & Staples Retailing - 2.2% | | | | | | | | |
Wal-Mart Stores, Inc. | | | 509,264 | | | | 38,841,565 | |
| | | | | | | | |
Food Products - 5.3% | | | | | | | | |
Pinnacle Foods, Inc. | | | 2,787,672 | | | | 94,223,314 | |
| | | | | | | | |
Health Care Equipment & Supplies - 4.0% | |
Hologic, Inc. (A) | | | 1,284,964 | | | | 33,653,207 | |
Medtronic, Inc. (C) | | | 571,976 | | | | 38,985,884 | |
| | | | | | | | |
| | | | | | | 72,639,091 | |
| | | | | | | | |
Hotels, Restaurants & Leisure - 1.5% | |
McDonald’s Corp. | | | 285,520 | | | | 26,761,790 | |
| | | | | | | | |
Independent Power and Renewable Electricity Producers - 1.6% | |
AES Corp. | | | 2,085,130 | | | | 29,337,779 | |
| | | | | | | | |
Industrial Conglomerates - 6.7% | | | | | | | | |
General Electric Co. | | | 3,629,366 | | | | 93,673,936 | |
Koninklijke Philips NV | | | 945,008 | | | | 26,403,524 | |
| | | | | | | | |
| | | | | | | 120,077,460 | |
| | | | | | | | |
Insurance - 10.5% | | | | | | | | |
ACE, Ltd. | | | 354,945 | | | | 38,795,488 | |
Allstate Corp. | | | 1,184,074 | | | | 76,787,199 | |
MetLife, Inc. | | | 1,343,129 | | | | 72,851,317 | |
| | | | | | | | |
| | | | | | | 188,434,004 | |
| | | | | | | | |
Life Sciences Tools & Services - 6.6% | | | | | |
Affymetrix, Inc. (A) (B) (C) | | | 1,881,918 | | | | 16,956,081 | |
Bio-Rad Laboratories, Inc., Class A (A) | | | 484,563 | | | | 54,668,398 | |
VWR Corp. (A) (C) | | | 1,218,287 | | | | 27,192,166 | |
Waters Corp. (A) | | | 182,220 | | | | 20,189,976 | |
| | | | | | | | |
| | | | | | | 119,006,621 | |
| | | | | | | | |
Media - 2.0% | | | | | | | | |
Time Warner Cable, Inc. | | | 246,350 | | | | 36,265,183 | |
| | | | | | | | |
Metals & Mining - 1.1% | | | | | | | | |
Cliffs Natural Resources, Inc. (C) | | | 1,773,641 | | | | 19,917,988 | |
| | | | | | | | |
Multi-Utilities - 2.5% | | | | | | | | |
PG&E Corp. | | | 890,213 | | | | 44,795,518 | |
| | | | | | | | |
| | | | | | | | |
| | | Shares | | | Value | |
COMMON STOCKS (continued) | | | | | |
Oil, Gas & Consumable Fuels - 6.3% | |
Occidental Petroleum Corp. | | | 964,979 | | | | $ 85,815,583 | |
Williams Cos., Inc. | | | 489,255 | | | | 27,158,545 | |
| | | | | | | | |
| | | | | | | 112,974,128 | |
| | | | | | | | |
Pharmaceuticals - 8.6% | | | | | | | | |
Actavis PLC (A) | | | 207,145 | | | | 50,282,377 | |
Pfizer, Inc. | | | 3,464,308 | | | | 103,756,025 | |
| | | | | | | | |
| | | | | | | 154,038,402 | |
| | | | | | | | |
Semiconductors & Semiconductor Equipment - 2.5% | |
Applied Materials, Inc., Class A | | | 2,042,755 | | | | 45,124,458 | |
| | | | | | | | |
Technology Hardware, Storage & Peripherals - 6.2% | |
Apple, Inc. | | | 511,117 | | | | 55,200,636 | |
EMC Corp. | | | 1,925,772 | | | | 55,327,430 | |
| | | | | | | | |
| | | | | | | 110,528,066 | |
| | | | | | | | |
Total Common Stocks
(Cost $1,521,272,722) | | | | 1,743,656,599 | |
| | | | | | | | |
|
SECURITIES LENDING COLLATERAL - 3.2% | |
State Street Navigator Securities Lending Trust - Prime Portfolio 0.16% (D) | | | 56,589,281 | | | | 56,589,281 | |
| | | | | | | | |
Total Securities Lending Collateral
(Cost $56,589,281) | | | | 56,589,281 | |
| | | | | | | | |
| | |
| | | Principal | | | Value | |
REPURCHASE AGREEMENT - 3.4% | |
State Street Bank & Trust Co.
0.01% (D), dated 10/31/2014, to be repurchased at $61,410,663 on 11/03/2014. Collateralized by U.S. Government Agency Obligations, 2.50% - 3.50%, due 01/01/2032 - 01/01/2033, and with a total value of $62,641,088. | | | $ 61,410,611 | | | | 61,410,611 | |
| | | | | | | | |
Total Repurchase Agreement
(Cost $61,410,611) | | | | 61,410,611 | |
| | | | | | | | |
Total Investments
(Cost $1,639,272,614) (E) | | | | 1,861,656,491 | |
Net Other Assets (Liabilities) - (3.8)% | | | | (67,757,973 | ) |
| | | | | | | | |
| | |
Net Assets - 100.0% | | | | | | | $ 1,793,898,518 | |
| | | | | | | | |
The Notes to Financial Statements are an integral part of this report.
| | |
| Transamerica Funds | | Annual Report 2014 |
Page 165
Transamerica Large Cap Value
SCHEDULE OF INVESTMENTS (continued)
At October 31, 2014
SECURITY VALUATION:
Valuation Inputs (F)
| | | | | | | | | | | | | | | | |
| | | Level 1
Quoted Prices | | | Level 2
Other Significant
Observable Inputs | | | Level 3
Significant
Unobservable Inputs | | | Value at
October 31, 2014 | |
ASSETS | | | | | | | | | | | | | | | | |
Investments | | | | | | | | | | | | | | | | |
Common Stocks | | $ | 1,743,656,599 | | | $ | — | | | $ | — | | | $ | 1,743,656,599 | |
Securities Lending Collateral | | | 56,589,281 | | | | — | | | | — | | | | 56,589,281 | |
Repurchase Agreement | | | — | | | | 61,410,611 | | | | — | | | | 61,410,611 | |
| | | | | | | | | | | | | | | | |
Total Investments | | $ | 1,800,245,880 | | | $ | 61,410,611 | | | $ | — | | | $ | 1,861,656,491 | |
| | | | | | | | | | | | | | | | |
FOOTNOTES TO SCHEDULE OF INVESTMENTS:
| (A) | Non-income producing security. |
| (B) | Total aggregate value of illiquid securities is $37,722,929, or 2.10% of the Fund’s net assets. |
| (C) | All or a portion of this security is on loan. The value of all securities on loan is $55,070,470. The amount of securities on loan indicated may not correspond with the securities on loan identified because securities with pending sales are in the process of recall from the brokers. |
| (D) | Rate shown reflects the yield at October 31, 2014. |
| (E) | Aggregate cost for federal income tax purposes is $1,642,107,467. Aggregate gross unrealized appreciation and depreciation for all securities is $246,579,060 and $27,030,036, respectively. Net unrealized appreciation for tax purposes is $219,549,024. |
| (F) | The Fund recognizes transfers between Levels at the end of the reporting period. There were no transfers between Level 1, 2 and 3 during the period ended October 31, 2014. See the Notes to Financial Statements for more information regarding security valuation and pricing inputs. |
The Notes to Financial Statements are an integral part of this report.
| | |
| Transamerica Funds | | Annual Report 2014 |
Page 166
Transamerica Mid Cap Growth
SCHEDULE OF INVESTMENTS
At October 31, 2014
| | | | | | | | |
| | | Shares | | | Value | |
COMMON STOCKS - 99.1% | | | | | | | | |
Auto Components - 2.0% | | | | | | | | |
BorgWarner, Inc. (A) | | | 19,997 | | | | $ 1,140,229 | |
| | | | | | | | |
Banks - 4.9% | | | | | | | | |
Comerica, Inc., Class A | | | 28,317 | | | | 1,351,854 | |
First Republic Bank, Class A (A) | | | 27,398 | | | | 1,395,380 | |
| | | | | | | | |
| | | | | | | 2,747,234 | |
| | | | | | | | |
Biotechnology - 4.2% | | | | | | | | |
BioMarin Pharmaceutical, Inc. (A) (B) | | | 15,922 | | | | 1,313,565 | |
Cubist Pharmaceuticals, Inc. (A) (B) | | | 14,783 | | | | 1,068,663 | |
| | | | | | | | |
| | | | | | | 2,382,228 | |
| | | | | | | | |
Building Products - 2.1% | | | | | | | | |
USG Corp. (A) (B) | | | 42,975 | | | | 1,154,309 | |
| | | | | | | | |
Chemicals - 4.0% | | | | | | | | |
Methanex Corp. | | | 16,156 | | | | 958,697 | |
RPM International, Inc. (A) | | | 28,746 | | | | 1,302,194 | |
| | | | | | | | |
| | | | | | | 2,260,891 | |
| | | | | | | | |
Commercial Services & Supplies - 2.3% | |
Stericycle, Inc. (A) (B) | | | 10,381 | | | | 1,308,006 | |
| | | | | | | | |
Construction Materials - 2.0% | | | | | | | | |
Eagle Materials, Inc. | | | 13,005 | | | | 1,137,027 | |
| | | | | | | | |
Electrical Equipment - 2.6% | | | | | | | | |
AMETEK, Inc., Class A | | | 27,968 | | | | 1,458,531 | |
| | | | | | | | |
Electronic Equipment, Instruments & Components - 2.5% | |
Trimble Navigation, Ltd. (A) (B) | | | 51,242 | | | | 1,376,360 | |
| | | | | | | | |
Food & Staples Retailing - 1.9% | | | | | | | | |
Rite Aid Corp. (A) (B) | | | 201,916 | | | | 1,060,059 | |
| | | | | | | | |
Food Products - 2.3% | | | | | | | | |
WhiteWave Foods Co., Class A (B) | | | 34,097 | | | | 1,269,431 | |
| | | | | | | | |
Health Care Equipment & Supplies - 2.4% | |
Align Technology, Inc. (A) (B) | | | 25,816 | | | | 1,358,438 | |
| | | | | | | | |
Health Care Providers & Services - 2.7% | |
Cardinal Health, Inc. | | | 19,518 | | | | 1,531,773 | |
| | | | | | | | |
Household Durables - 6.0% | | | | | | | | |
Mohawk Industries, Inc. (A) (B) | | | 8,451 | | | | 1,200,380 | |
Whirlpool Corp. | | | 12,586 | | | | 2,165,421 | |
| | | | | | | | |
| | | | | | | 3,365,801 | |
| | | | | | | | |
Insurance - 2.9% | | | | | | | | |
Hartford Financial Services Group, Inc. (A) | | | 41,237 | | | | 1,632,160 | |
| | | | | | | | |
Media - 3.3% | | | | | | | | |
Lions Gate Entertainment Corp. (A) | | | 55,783 | | | | 1,848,091 | |
| | | | | | | | |
Oil, Gas & Consumable Fuels - 5.9% | | | | | | | | |
Cimarex Energy Co. (A) | | | 10,027 | | | | 1,139,769 | |
Energen Corp. | | | 11,115 | | | | 752,485 | |
EQT Corp. | | | 15,313 | | | | 1,440,035 | |
| | | | | | | | |
| | | | | | | 3,332,289 | |
| | | | | | | | |
Pharmaceuticals - 3.0% | | | | | | | | |
Mylan, Inc. (A) (B) | | | 31,726 | | | | 1,698,927 | |
| | | | | | | | |
Professional Services - 5.6% | | | | | | | | |
Equifax, Inc. | | | 21,808 | | | | 1,651,738 | |
Towers Watson & Co., Class A (A) | | | 13,370 | | | | 1,474,577 | |
| | | | | | | | |
| | | | | | | 3,126,315 | |
| | | | | | | | |
Road & Rail - 5.2% | | | | | | | | |
Genesee & Wyoming, Inc., Class A (A) (B) | | | 15,547 | | | | 1,495,621 | |
| | | | | | | | |
| | | Shares | | | Value | |
COMMON STOCKS (continued) | | | | | | | | |
Road & Rail (continued) | | | | | | | | |
Ryder System, Inc., Class A (A) | | | 16,335 | | | | $ 1,445,158 | |
| | | | | | | | |
| | | | | | | 2,940,779 | |
| | | | | | | | |
Semiconductors & Semiconductor Equipment - 5.1% | |
KLA-Tencor Corp. (A) | | | 21,414 | | | | 1,694,918 | |
Synaptics, Inc. (A) (B) | | | 17,265 | | | | 1,181,444 | |
| | | | | | | | |
| | | | | | | 2,876,362 | |
| | | | | | | | |
Software - 7.8% | | | | | | | | |
Fortinet, Inc. (B) | | | 57,914 | | | | 1,508,660 | |
PTC, Inc. (B) | | | 42,892 | | | | 1,636,330 | |
Solera Holdings, Inc. | | | 24,253 | | | | 1,259,943 | |
| | | | | | | | |
| | | | | | | 4,404,933 | |
| | | | | | | | |
Specialty Retail - 12.2% | | | | | | | | |
Dick’s Sporting Goods, Inc. (A) | | | 23,550 | | | | 1,068,464 | |
Ross Stores, Inc. | | | 19,375 | | | | 1,563,950 | |
Signet Jewelers, Ltd. (A) | | | 13,140 | | | | 1,576,931 | |
Ulta Salon Cosmetics & Fragrance, Inc. (B) | | | 11,307 | | | | 1,365,999 | |
Williams-Sonoma, Inc., Class A (A) | | | 19,799 | | | | 1,287,529 | |
| | | | | | | | |
| | | | | | | 6,862,873 | |
| | | | | | | | |
Textiles, Apparel & Luxury Goods - 2.8% | |
Under Armour, Inc., Class A (A) (B) | | | 23,944 | | | | 1,570,248 | |
| | | | | | | | |
Trading Companies & Distributors - 3.4% | |
Air Lease Corp., Class A | | | 51,402 | | | | 1,880,799 | |
| | | | | | | | |
Total Common Stocks
(Cost $50,794,073) | | | | | | | 55,724,093 | |
| | | | | | | | |
|
SECURITIES LENDING COLLATERAL - 24.7% | |
State Street Navigator Securities Lending Trust - Prime Portfolio | | | | | | | | |
0.16% (C) | | | 13,919,363 | | | | 13,919,363 | |
| | | | | | | | |
Total Securities Lending Collateral
(Cost $13,919,363) | | | | 13,919,363 | |
| | | | | | | | |
| | |
| | | Principal | | | Value | |
REPURCHASE AGREEMENT - 1.0% | | | | | |
State Street Bank & Trust Co.
0.01% (C), dated 10/31/2014, to be repurchased at $580,371 on 11/03/2014. Collateralized by a U.S. Government Agency Obligation, 2.00%, due 11/01/2027, and with a value of $594,778. | | | $ 580,370 | | | | 580,370 | |
| | | | | | | | |
Total Repurchase Agreement
(Cost $580,370) | | | | 580,370 | |
| | | | | | | | |
Total Investments
(Cost $65,293,806) (D) | | | | 70,223,826 | |
Net Other Assets (Liabilities) - (24.8)% | | | | (13,977,111 | ) |
| | | | | | | | |
| | |
Net Assets - 100.0% | | | | | | | $ 56,246,715 | |
| | | | | | | | |
The Notes to Financial Statements are an integral part of this report.
| | |
| Transamerica Funds | | Annual Report 2014 |
Page 167
Transamerica Mid Cap Growth
SCHEDULE OF INVESTMENTS (continued)
At October 31, 2014
SECURITY VALUATION:
Valuation Inputs (E)
| | | | | | | | | | | | | | | | |
| | | Level 1
Quoted Prices | | | Level 2
Other Significant
Observable Inputs | | | Level 3
Significant
Unobservable Inputs | | | Value at
October 31, 2014 | |
ASSETS | | | | | | | | | | | | | | | | |
Investments | | | | | | | | | | | | | | | | |
Common Stocks | | $ | 55,724,093 | | | $ | — | | | $ | — | | | $ | 55,724,093 | |
Securities Lending Collateral | | | 13,919,363 | | | | — | | | | — | | | | 13,919,363 | |
Repurchase Agreement | | | — | | | | 580,370 | | | | — | | | | 580,370 | |
| | | | | | | | | | | | | | | | |
Total Investments | | $ | 69,643,456 | | | $ | 580,370 | | | $ | — | | | $ | 70,223,826 | |
| | | | | | | | | | | | | | | | |
FOOTNOTES TO SCHEDULE OF INVESTMENTS:
| (A) | All or a portion of this security is on loan. The value of all securities on loan is $13,615,652. The amount of securities on loan indicated may not correspond with the securities on loan identified because securities with pending sales are in the process of recall from the brokers. |
| (B) | Non-income producing security. |
| (C) | Rate shown reflects the yield at October 31, 2014. |
| (D) | Aggregate cost for federal income tax purposes is $65,293,806. Aggregate gross unrealized appreciation and depreciation for all securities is $6,453,159 and $1,523,139, respectively. Net unrealized appreciation for tax purposes is $4,930,020. |
| (E) | The Fund recognizes transfers between Levels at the end of the reporting period. There were no transfers between Level 1, 2 and 3 during the period ended October 31, 2014. See the Notes to Financial Statements for more information regarding security valuation and pricing inputs. |
The Notes to Financial Statements are an integral part of this report.
| | |
| Transamerica Funds | | Annual Report 2014 |
Page 168
Transamerica Mid Cap Value Opportunities
SCHEDULE OF INVESTMENTS
At October 31, 2014
| | | | | | | | |
| | | Shares | | | Value | |
COMMON STOCKS - 97.9% | | | | | | | | |
Aerospace & Defense - 1.7% | | | | | | | | |
Exelis, Inc. | | | 164,600 | | | | $ 2,938,110 | |
| | | | | | | | |
Airlines - 1.5% | | | | | | | | |
Copa Holdings SA, Class A (A) | | | 22,900 | | | | 2,677,468 | |
| | | | | | | | |
Banks - 2.8% | | | | | | | | |
CIT Group, Inc. | | | 42,400 | | | | 2,074,632 | |
First Republic Bank, Class A | | | 53,900 | | | | 2,745,127 | |
| | | | | | | | |
| | | | | | | 4,819,759 | |
| | | | | | | | |
Commercial Services & Supplies - 1.8% | |
ADT Corp. (A) | | | 84,700 | | | | 3,035,648 | |
| | | | | | | | |
Communications Equipment - 2.3% | | | | | | | | |
ARRIS Group, Inc. (B) | | | 33,300 | | | | 999,666 | |
EchoStar Corp., Class A (B) | | | 64,100 | | | | 2,995,393 | |
| | | | | | | | |
| | | | | | | 3,995,059 | |
| | | | | | | | |
Consumer Finance - 1.4% | | | | | | | | |
Navient Corp. | | | 121,000 | | | | 2,393,380 | |
| | | | | | | | |
Containers & Packaging - 3.2% | | | | | | | | |
Bemis Co., Inc. (A) | | | 43,400 | | | | 1,669,598 | |
Rexam PLC, ADR (A) | | | 99,566 | | | | 3,814,573 | |
| | | | | | | | |
| | | | | | | 5,484,171 | |
| | | | | | | | |
Diversified Consumer Services - 1.8% | | | | | | | | |
H&R Block, Inc. | | | 98,100 | | | | 3,169,611 | |
| | | | | | | | |
Electric Utilities - 7.1% | | | | | | | | |
PPL Corp. | | | 166,050 | | | | 5,810,089 | |
Westar Energy, Inc., Class A (A) | | | 122,700 | | | | 4,639,287 | |
Xcel Energy, Inc. (A) | | | 54,000 | | | | 1,807,380 | |
| | | | | | | | |
| | | | | | | 12,256,756 | |
| | | | | | | | |
Electrical Equipment - 1.7% | | | | | | | | |
Babcock & Wilcox Co. (A) | | | 104,900 | | | | 3,000,140 | |
| | | | | | | | |
Electronic Equipment, Instruments & Components - 0.7% | |
CDW Corp. | | | 41,300 | | | | 1,273,692 | |
| | | | | | | | |
Energy Equipment & Services - 1.0% | | | | | | | | |
Nabors Industries, Ltd. | | | 98,300 | | | | 1,754,655 | |
| | | | | | | | |
Food & Staples Retailing - 1.8% | | | | | | | | |
Sysco Corp. (A) | | | 81,600 | | | | 3,144,864 | |
| | | | | | | | |
Food Products - 2.3% | | | | | | | | |
ConAgra Foods, Inc. | | | 24,000 | | | | 824,400 | |
Kellogg Co. | | | 48,300 | | | | 3,089,268 | |
| | | | | | | | |
| | | | | | | 3,913,668 | |
| | | | | | | | |
Health Care Equipment & Supplies - 1.0% | |
ResMed, Inc. (A) | | | 32,000 | | | | 1,671,040 | |
| | | | | | | | |
Health Care Providers & Services - 6.9% | |
Cardinal Health, Inc. | | | 18,100 | | | | 1,420,488 | |
Catamaran Corp. (B) | | | 39,300 | | | | 1,873,431 | |
Cigna Corp. | | | 28,100 | | | | 2,797,917 | |
Community Health Systems, Inc. (A) (B) | | | 30,000 | | | | 1,649,100 | |
Humana, Inc., Class A | | | 10,600 | | | | 1,471,810 | |
Laboratory Corp. of America
Holdings (A) (B) | | | 21,000 | | | | 2,295,090 | |
MEDNAX, Inc. (B) | | | 7,400 | | | | 461,982 | |
| | | | | | | | |
| | | | | | | 11,969,818 | |
| | | | | | | | |
Household Durables - 0.8% | | | | | | | | |
Sony Corp., ADR | | | 68,800 | | | | 1,363,616 | |
| | | | | | | | |
Insurance - 13.1% | | | | | | | | |
Alleghany Corp. (B) | | | 8,000 | | | | 3,554,240 | |
| | | | | | | | |
| | | Shares | | | Value | |
COMMON STOCKS (continued) | | | | | | | | |
Insurance (continued) | | | | | | | | |
Allstate Corp. (A) | | | 50,100 | | | | $ 3,248,985 | |
Assured Guaranty, Ltd. | | | 93,500 | | | | 2,157,980 | |
Fairfax Financial Holdings, Ltd. | | | 5,400 | | | | 2,439,450 | |
HCC Insurance Holdings, Inc. | | | 53,800 | | | | 2,807,822 | |
Loews Corp. | | | 102,300 | | | | 4,460,280 | |
Progressive Corp. | | | 150,200 | | | | 3,966,782 | |
| | | | | | | | |
| | | | | | | 22,635,539 | |
| | | | | | | | |
Internet Software & Services - 1.3% | | | | | | | | |
Equinix, Inc. (A) | | | 10,800 | | | | 2,256,120 | |
| | | | | | | | |
IT Services - 7.0% | | | | | | | | |
Amdocs, Ltd. | | | 54,900 | | | | 2,609,946 | |
Computer Sciences Corp. | | | 40,400 | | | | 2,440,160 | |
DST Systems, Inc. (A) | | | 19,200 | | | | 1,849,920 | |
Total System Services, Inc. | | | 79,400 | | | | 2,682,926 | |
Western Union Co. (A) | | | 146,500 | | | | 2,484,640 | |
| | | | | | | | |
| | | | | | | 12,067,592 | |
| | | | | | | | |
Life Sciences Tools & Services - 2.0% | | | | | | | | |
Bio-Rad Laboratories, Inc., Class A (B) | | | 30,500 | | | | 3,441,010 | |
| | | | | | | | |
Media - 6.6% | | | | | | | | |
AMC Networks, Inc., Class A (A) (B) | | | 49,700 | | | | 3,014,305 | |
Cablevision Systems Corp., Class A (A) | | | 130,000 | | | | 2,420,600 | |
Liberty Media Corp., Class C (A) (B) | | | 45,600 | | | | 2,185,608 | |
Shaw Communications, Inc., Class B | | | 151,400 | | | | 3,887,952 | |
| | | | | | | | |
| | | | | | | 11,508,465 | |
| | | | | | | | |
Multi-Utilities - 6.9% | | | | | | | | |
Alliant Energy Corp. (A) | | | 36,800 | | | | 2,278,288 | |
CMS Energy Corp. | | | 150,000 | | | | 4,900,500 | |
Wisconsin Energy Corp. (A) | | | 97,500 | | | | 4,841,850 | |
| | | | | | | | |
| | | | | | | 12,020,638 | |
| | | | | | | | |
Oil, Gas & Consumable Fuels - 1.6% | | | | | | | | |
Energy XXI Bermuda, Ltd. (A) | | | 112,200 | | | | 862,818 | |
Valero Energy Corp. | | | 38,900 | | | | 1,948,501 | |
| | | | | | | | |
| | | | | | | 2,811,319 | |
| | | | | | | | |
Real Estate Investment Trusts - 3.5% | | | | | | | | |
Annaly Capital Management, Inc. | | | 528,200 | | | | 6,026,762 | |
| | | | | | | | |
Semiconductors & Semiconductor Equipment - 3.7% | |
Broadcom Corp., Class A | | | 34,400 | | | | 1,440,672 | |
LAM Research Corp. (A) | | | 11,800 | | | | 918,748 | |
Micron Technology, Inc. (B) | | | 71,400 | | | | 2,362,626 | |
NVIDIA Corp. (A) | | | 90,500 | | | | 1,768,370 | |
| | | | | | | | |
| | | | | | | 6,490,416 | |
| | | | | | | | |
Software - 1.6% | | | | | | | | |
CA, Inc. | | | 60,200 | | | | 1,749,412 | |
Citrix Systems, Inc. (B) | | | 16,500 | | | | 1,059,795 | |
| | | | | | | | |
| | | | | | | 2,809,207 | |
| | | | | | | | |
Specialty Retail - 4.4% | | | | | | | | |
Abercrombie & Fitch Co., Class A (A) | | | 70,500 | | | | 2,360,340 | |
Bed Bath & Beyond, Inc. (A) (B) | | | 13,000 | | | | 875,420 | |
Best Buy Co., Inc. | | | 53,200 | | | | 1,816,248 | |
Staples, Inc. (A) | | | 200,200 | | | | 2,538,536 | |
| | | | | | | | |
| | | | | | | 7,590,544 | |
| | | | | | | | |
Technology Hardware, Storage & Peripherals - 2.6% | |
NetApp, Inc. | | | 85,700 | | | | 3,667,960 | |
Western Digital Corp. | | | 9,200 | | | | 905,004 | |
| | | | | | | | |
| | | | | | | 4,572,964 | |
| | | | | | | | |
The Notes to Financial Statements are an integral part of this report.
| | |
| Transamerica Funds | | Annual Report 2014 |
Page 169
Transamerica Mid Cap Value Opportunities
SCHEDULE OF INVESTMENTS (continued)
At October 31, 2014
| | | | | | | | |
| | | Shares | | | Value | |
COMMON STOCKS (continued) | | | | | | | | |
Thrifts & Mortgage Finance - 0.8% | | | | | | | | |
Ocwen Financial Corp., Class B (A) (B) | | | 58,000 | | | | $ 1,366,480 | |
| | | | | | | | |
Water Utilities - 3.0% | | | | | | | | |
American Water Works Co., Inc. | | | 95,900 | | | | 5,118,183 | |
| | | | | | | | |
Total Common Stocks
(Cost $162,800,641) | | | | 169,576,694 | |
| | | | | | | | |
|
SECURITIES LENDING COLLATERAL - 23.0% | |
State Street Navigator Securities
Lending Trust - Prime Portfolio
0.16% (C) | | | 39,800,615 | | | | 39,800,615 | |
| | | | | | | | |
Total Securities Lending Collateral
(Cost $39,800,615) | | | | 39,800,615 | |
| | | | | | | | |
| | | | | | | | |
| | | Principal | | | Value | |
REPURCHASE AGREEMENT - 2.2% | |
State Street Bank & Trust Co.
0.01% (C), dated 10/31/2014, to be repurchased at $3,747,587 on 11/03/2014. Collateralized by a U.S. Government Agency Obligation, 3.00%, due 07/25/2037, and with a value of $3,825,971. | | | $ 3,747,584 | | | | $ 3,747,584 | |
| | | | | | | | |
Total Repurchase Agreement
(Cost $3,747,584) | | | | 3,747,584 | |
| | | | | | | | |
Total Investments
(Cost $206,348,840) (D) | | | | 213,124,893 | |
Net Other Assets (Liabilities) - (23.1)% | | | | (39,995,163 | ) |
| | | | | | | | |
| | |
Net Assets - 100.0% | | | | | | | $ 173,129,730 | |
| | | | | | | | |
SECURITY VALUATION:
Valuation Inputs (E)
| | | | | | | | | | | | | | | | |
| | | Level 1
Quoted Prices | | | Level 2
Other Significant
Observable Inputs | | | Level 3
Significant
Unobservable Inputs | | | Value at
October 31, 2014 | |
ASSETS | | | | | | | | | | | | | | | | |
Investments | | | | | | | | | | | | | | | | |
Common Stocks | | $ | 169,576,694 | | | $ | — | | | $ | — | | | $ | 169,576,694 | |
Securities Lending Collateral | | | 39,800,615 | | | | — | | | | — | | | | 39,800,615 | |
Repurchase Agreement | | | — | | | | 3,747,584 | | | | — | | | | 3,747,584 | |
| | | | | | | | | | | | | | | | |
Total Investments | | $ | 209,377,309 | | | $ | 3,747,584 | | | $ | — | | | $ | 213,124,893 | |
| | | | | | | | | | | | | | | | |
FOOTNOTES TO SCHEDULE OF INVESTMENTS:
| (A) | All or a portion of this security is on loan. The value of all securities on loan is $38,852,055. The amount of securities on loan indicated may not correspond with the securities on loan identified because securities with pending sales are in the process of recall from the brokers. |
| (B) | Non-income producing security. |
| (C) | Rate shown reflects the yield at October 31, 2014. |
| (D) | Aggregate cost for federal income tax purposes is $206,767,905. Aggregate gross unrealized appreciation and depreciation for all securities is $10,108,696 and $3,751,708, respectively. Net unrealized appreciation for tax purposes is $6,356,988. |
| (E) | The Fund recognizes transfers between Levels at the end of the reporting period. There were no transfers between Level 1, 2 and 3 during the period ended October 31, 2014. See the Notes to Financial Statements for more information regarding security valuation and pricing inputs. |
DEFINITION:
| | |
| ADR | | American Depositary Receipt |
The Notes to Financial Statements are an integral part of this report.
| | |
| Transamerica Funds | | Annual Report 2014 |
Page 170
Transamerica MLP & Energy Income
SCHEDULE OF INVESTMENTS
At October 31, 2014
| | | | | | | | |
| | | Principal | | | Value | |
CORPORATE DEBT SECURITIES - 5.2% | |
Energy Equipment & Services - 0.1% | | | | | | | | |
Hiland Partners, LP / Hiland Partners Finance Corp. | | | | | | | | |
5.50%, 05/15/2022, 144A | | | $ 800,000 | | | | $ 788,000 | |
| | | | | | | | |
| | | | | | | 788,000 | |
| | | | | | | | |
Oil, Gas & Consumable Fuels - 5.1% | | | | | | | | |
American Eagle Energy Corp. | | | | | | | | |
11.00%, 09/01/2019, 144A | | | 1,900,000 | | | | 1,691,000 | |
American Energy - Woodford LLC/AEW Finance Corp. | | | | | | | | |
9.00%, 09/15/2022, 144A | | | 1,700,000 | | | | 1,496,000 | |
Baytex Energy Corp. | | | | | | | | |
5.63%, 06/01/2024, 144A | | | 375,000 | | | | 361,875 | |
Carrizo Oil & Gas, Inc. | | | | | | | | |
7.50%, 09/15/2020, 144A | | | 450,000 | | | | 454,500 | |
CrownRock, LP / CrownRock Finance, Inc. | | | | | | | | |
7.13%, 04/15/2021, 144A | | | 600,000 | | | | 594,000 | |
Endeavor Energy Resources, LP / EER Finance, Inc. | | | | | | | | |
7.00%, 08/15/2021, 144A | | | 2,800,000 | | | | 2,828,000 | |
Gulfport Energy Corp. | | | | | | | | |
7.75%, 11/01/2020 | | | 200,000 | | | | 204,000 | |
7.75%, 11/01/2020, 144A | | | 2,800,000 | | | | 2,856,000 | |
Jupiter Resources, Inc. | | | | | | | | |
8.50%, 10/01/2022, 144A | | | 3,600,000 | | | | 3,177,000 | |
Lonestar Resources America, Inc. | | | | | | | | |
8.75%, 04/15/2019, 144A | | | 2,050,000 | | | | 1,886,000 | |
MEG Energy Corp. | | | | | | | | |
7.00%, 03/31/2024, 144A | | | 500,000 | | | | 502,500 | |
Memorial Resource Development Corp. | | | | | | | | |
5.88%, 07/01/2022, 144A | | | 1,300,000 | | | | 1,267,500 | |
Midstates Petroleum Co., Inc. / Midstates Petroleum Co. LLC | | | | | | | | |
9.25%, 06/01/2021 (A) | | | 1,550,000 | | | | 1,317,500 | |
10.75%, 10/01/2020 (A) | | | 900,000 | | | | 801,000 | |
Parsley Energy LLC / Parsley Finance Corp. | | | | | | | | |
7.50%, 02/15/2022, 144A | | | 1,575,000 | | | | 1,543,500 | |
Resolute Energy Corp. | | | | | | | | |
8.50%, 05/01/2020 (A) | | | 3,000,000 | | | | 2,670,000 | |
RKI Exploration & Production LLC / RKI Finance Corp. | | | | | | | | |
8.50%, 08/01/2021, 144A | | | 1,200,000 | | | | 1,173,000 | |
RSP Permian, Inc. | | | | | | | | |
6.63%, 10/01/2022, 144A | | | 700,000 | | | | 698,110 | |
Sanchez Energy Corp. | | | | | | | | |
6.13%, 01/15/2023, 144A | | | 1,875,000 | | | | 1,785,937 | |
SemGroup Corp. | | | | | | | | |
7.50%, 06/15/2021 | | | 400,000 | | | | 421,000 | |
Teine Energy, Ltd. | | | | | | | | |
6.88%, 09/30/2022, 144A | | | 1,675,000 | | | | 1,587,063 | |
Triangle USA Petroleum Corp. | | | | | | | | |
6.75%, 07/15/2022, 144A | | | 250,000 | | | | 218,750 | |
Williams Cos., Inc. | | | | | | | | |
8.75%, 03/15/2032 | | | 4,750,000 | | | | 6,049,690 | |
| | | | | | | | |
| | | | | | | 35,583,925 | |
| | | | | | | | |
Total Corporate Debt Securities
(Cost $38,543,698) | | | | | | | 36,371,925 | |
| | | | | | | | |
| | | | | | | | |
| | | Shares | | | Value | |
CONVERTIBLE PREFERRED STOCK - 0.0% (B) | |
Multi-Utilities - 0.0% (B) | | | | | | | | |
Dominion Resources, Inc.
6.38% | | | 5,000 | | | | $ 251,750 | |
| | | | | | | | |
Total Convertible Preferred Stock
(Cost $250,000) | | | | | | | 251,750 | |
| | | | | | | | |
| | |
PREFERRED STOCKS - 0.6% | | | | | | | | |
Marine - 0.6% | | | | | | | | |
Navios Maritime Holdings, Inc.
8.63% | | | 62,800 | | | | 1,483,336 | |
Seaspan Corp. | | | | | | | | |
Series D
7.95% (A) | | | 100,000 | | | | 2,555,000 | |
| | | | | | | | |
Total Preferred Stocks
(Cost $4,069,360) | | | | | | | 4,038,336 | |
| | | | | | | | |
| | |
COMMON STOCKS - 53.2% | | | | | | | | |
Chemicals - 0.2% | | | | | | | | |
Dow Chemical Co. (A) | | | 32,500 | | | | 1,605,500 | |
| | | | | | | | |
Electric Utilities - 1.4% | | | | | | | | |
NRG Yield, Inc., Class A (A) | | | 193,595 | | | | 9,673,942 | |
| | | | | | | | |
Energy Equipment & Services - 0.9% | | | | | | | | |
Exterran Holdings, Inc. (A) | | | 83,700 | | | | 3,291,921 | |
Seadrill, Ltd. (A) | | | 135,600 | | | | 3,118,800 | |
| | | | | | | | |
| | | | | | | 6,410,721 | |
| | | | | | | | |
Gas Utilities - 0.4% | | | | | | | | |
National Fuel Gas Co. (A) | | | 36,800 | | | | 2,547,664 | |
| | | | | | | | |
Independent Power and Renewable Electricity Producers - 1.5% | |
Abengoa Yield PLC (A) (C) | | | 314,700 | | | | 10,227,750 | |
| | | | | | | | |
Marine - 0.1% | | | | | | | | |
Safe Bulkers, Inc. | | | 83,100 | | | | 443,754 | |
Scorpio Bulkers, Inc. (A) (C) | | | 65,800 | | | | 321,762 | |
| | | | | | | | |
| | | | | | | 765,516 | |
| | | | | | | | |
Multi-Utilities - 1.6% | | | | | | | | |
CenterPoint Energy, Inc. | | | 226,800 | | | | 5,567,940 | |
NiSource, Inc., Class B (A) | | | 137,500 | | | | 5,783,250 | |
| | | | | | | | |
| | | | | | | 11,351,190 | |
| | | | | | | | |
Oil, Gas & Consumable Fuels - 47.1% | | | | | | | | |
AltaGas, Ltd. (A) | | | 234,600 | | | | 9,679,162 | |
ARC Resources, Ltd. (A) | | | 170,225 | | | | 4,014,534 | |
Baytex Energy Corp. (A) | | | 164,700 | | | | 5,031,585 | |
Baytex Energy Corp. (A) | | | 15,000 | | | | 458,365 | |
Bonavista Energy Corp. (A) | | | 194,021 | | | | 1,823,062 | |
Bonterra Energy Corp. (A) | | | 61,700 | | | | 2,773,913 | |
Cheniere Energy, Inc. (C) | | | 77,500 | | | | 5,812,500 | |
CONSOL Energy, Inc. (A) | | | 261,700 | | | | 9,630,560 | |
Crescent Point Energy Corp. (A) | | | 85,000 | | | | 2,809,325 | |
Enbridge Energy Management LLC (A) (C) | | | 901,435 | | | | 32,027,986 | |
Enbridge, Inc. (A) | | | 301,521 | | | | 14,280,035 | |
EnLink Midstream LLC | | | 238,400 | | | | 9,035,360 | |
EQT Corp. | | | 80,000 | | | | 7,523,200 | |
GasLog, Ltd. (A) | | | 204,600 | | | | 4,259,772 | |
Gibson Energy, Inc. | | | 50,000 | | | | 1,454,239 | |
Golar LNG, Ltd. (A) | | | 95,000 | | | | 5,330,450 | |
HollyFrontier Corp. | | | 61,500 | | | | 2,790,870 | |
Inter Pipeline, Ltd. (A) | | | 124,200 | | | | 3,913,173 | |
Kinder Morgan Management LLC (C) | | | 401,002 | | | | 38,151,329 | |
The Notes to Financial Statements are an integral part of this report.
| | |
| Transamerica Funds | | Annual Report 2014 |
Page 171
Transamerica MLP & Energy Income
SCHEDULE OF INVESTMENTS (continued)
At October 31, 2014
| | | | | | | | |
| | | Shares | | | Value | |
COMMON STOCKS (continued) | | | | | | | | |
Oil, Gas & Consumable Fuels (continued) | | | | | |
Kinder Morgan, Inc. (A) | | | 386,800 | | | | $ 14,969,160 | |
LinnCo LLC (A) | | | 234,700 | | | | 5,625,759 | |
Marathon Petroleum Corp. (D) | | | 43,000 | | | | 3,908,700 | |
ONEOK, Inc. (A) | | | 238,600 | | | | 14,063,084 | |
Pembina Pipeline Corp. (C) | | | 188,200 | | | | 7,799,008 | |
Pengrowth Energy Corp. (A) | | | 440,000 | | | | 1,773,200 | |
Phillips 66 | | | 225,800 | | | | 17,725,300 | |
SemGroup Corp., Class A | | | 174,000 | | | | 13,354,500 | |
Spectra Energy Corp. (A) | | | 339,500 | | | | 13,284,635 | |
Targa Resources Corp. | | | 146,517 | | | | 18,846,482 | |
Teekay Corp. (A) | | | 120,000 | | | | 7,015,200 | |
Tesoro Corp. (D) | | | 27,500 | | | | 1,963,775 | |
TransCanada Corp. | | | 197,100 | | | | 9,715,059 | |
Valero Energy Corp. | | | 25,000 | | | | 1,252,250 | |
Williams Cos., Inc. | | | 625,300 | | | | 34,710,403 | |
| | | | | | | | |
| | | | | | | 326,805,935 | |
| | | | | | | | |
Total Common Stocks
(Cost $347,661,211) | | | | 369,388,218 | |
| | | | | | | | |
|
MASTER LIMITED PARTNERSHIPS - 33.5% | |
Energy Equipment & Services - 1.7% | | | | | | | | |
Transocean Partners LLC (A) (C) | | | 163,700 | | | | 4,113,781 | |
Seadrill Partners LLC | | | 227,551 | | | | 5,722,908 | |
Shell Midstream Partners, LP (C) | | | 54,100 | | | | 1,822,629 | |
USA Compression Partners, LP | | | 10,023 | | | | 228,524 | |
| | | | | | | | |
| | | | | | | 11,887,842 | |
| | | | | | | | |
Marine - 0.2% | | | | | | | | |
Navios Maritime Partners, LP | | | 80,000 | | | | 1,292,800 | |
| | | | | | | | |
Metals & Mining - 0.4% | | | | | | | | |
SunCoke Energy Partners, LP | | | 99,700 | | | | 2,590,206 | |
| | | | | | | | |
Oil, Gas & Consumable Fuels - 31.0% | |
Hoegh LNG Partners, LP | | | 164,650 | | | | 3,459,297 | |
Golar LNG Partners, LP | | | 287,296 | | | | 10,397,242 | |
Teekay Offshore Partners, LP | | | 113,100 | | | | 3,385,083 | |
Dynagas LNG Partners, LP | | | 429,400 | | | | 9,455,388 | |
Capital Product Partners, LP | | | 237,975 | | | | 2,196,509 | |
GasLog Partners, LP | | | 7,000 | | | | 187,320 | |
VTTI Energy Partners, LP (C) | | | 251,087 | | | | 6,088,860 | |
KNOT Offshore Partners, LP | | | 250,247 | | | | 6,023,445 | |
Plains All American Pipeline, LP | | | 109,300 | | | | 6,159,055 | |
Sunoco Logistics Partners, LP | | | 99,060 | | | | 4,728,134 | |
Phillips 66 Partners, LP | | | 42,300 | | | | 2,947,887 | |
ONEOK Partners, LP | | | 75,950 | | | | 3,881,045 | |
MarkWest Energy Partners, LP | | | 160,387 | | | | 11,235,109 | |
Magellan Midstream Partners, LP | | | 61,400 | | | | 5,026,818 | |
DCP Midstream Partners, LP | | | 166,300 | | | | 8,805,585 | |
Buckeye Partners, LP | | | 89,100 | | | | 6,718,140 | |
Atlas Pipeline Partners, LP | | | 90,100 | | | | 3,306,670 | |
Access Midstream Partners, LP | | | 107,900 | | | | 6,721,091 | |
Plains GP Holdings, LP, Class A | | | 429,100 | | | | 12,306,588 | |
QEP Midstream Partners, LP | | | 115,700 | | | | 1,868,555 | |
Regency Energy Partners, LP | | | 365,040 | | | | 10,951,200 | |
Energy Transfer Equity, LP | | | 228,700 | | | | 13,346,932 | |
MPLX, LP | | | 13,800 | | | | 920,184 | |
Targa Resources Partners, LP | | | 75,506 | | | | 4,611,907 | |
Tesoro Logistics, LP | | | 6,000 | | | | 337,800 | |
Valero Energy Partners, LP | | | 26,700 | | | | 1,140,090 | |
| | | | | | | | |
| | | Shares | | | Value | |
MASTER LIMITED PARTNERSHIPS (continued) | |
Oil, Gas & Consumable Fuels (continued) | |
Western Gas Equity Partners, LP | | | 78,100 | | | | $ 4,820,332 | |
Enable Midstream Partners, LP | | | 122,000 | | | | 2,947,520 | |
EnLink Midstream Partners, LP | | | 59,700 | | | | 1,791,000 | |
Midcoast Energy Partners, LP | | | 111,700 | | | | 1,731,350 | |
Southcross Energy Partners, LP | | | 25,000 | | | | 496,750 | |
Western Gas Partners, LP | | | 204,900 | | | | 14,322,510 | |
Williams Partners, LP | | | 96,900 | | | | 4,995,195 | |
Summit Midstream Partners, LP | | | 73,927 | | | | 3,473,830 | |
Crestwood Midstream Partners, LP | | | 143,960 | | | | 2,863,364 | |
Global Partners, LP | | | 42,024 | | | | 1,717,941 | |
Holly Energy Partners, LP | | | 62,567 | | | | 2,093,492 | |
Enterprise Products Partners, LP | | | 328,748 | | | | 12,130,801 | |
Energy Transfer Partners, LP, Class B | | | 242,449 | | | | 15,620,989 | |
| | | | | | | | |
| | | | | | | 215,211,008 | |
| | | | | | | | |
Road & Rail - 0.2% | | | | | | | | |
USD Partners, LP (A) (C) | | | 71,200 | | | | 1,183,344 | |
| | | | | | | | |
Total Master Limited Partnerships
(Cost $220,122,597) | | | | 232,165,200 | |
| | | | | | | | |
|
SECURITIES LENDING COLLATERAL - 20.4% | |
State Street Navigator Securities Lending Trust - Prime Portfolio 0.16% (E) | | | 141,399,123 | | | | 141,399,123 | |
| | | | | | | | |
Total Securities Lending Collateral
(Cost $141,399,123) | | | | 141,399,123 | |
| | | | | | | | |
| | |
| | | Principal | | | Value | |
REPURCHASE AGREEMENT - 7.7% | |
State Street Bank & Trust Co.
0.01% (E), dated 10/31/2014, to be repurchased at $53,319,926 on 11/03/2014. Collateralized by a U.S. Government Agency Obligation, 2.26%, due 10/17/2022, and with a value of $54,386,343. | | | $ 53,319,882 | | | | 53,319,882 | |
| | | | | | | | |
Total Repurchase Agreement
(Cost $53,319,882) | | | | 53,319,882 | |
| | | | | | | | |
Total Investments
(Cost $805,365,871) (F) | | | | 836,934,434 | |
Net Other Assets (Liabilities) - (20.6)% | | | | (142,950,708 | ) |
| | | | | | | | |
| | |
Net Assets - 100.0% | | | | | | | $ 693,983,726 | |
| | | | | | | | |
| | |
| | | Contracts | | | Value | |
WRITTEN OPTIONS - (0.0)% (B) | | | | | | | | |
Call Options - (0.0)% (B) | | | | | | | | |
Marathon Petroleum Corp.
Strike Price $90.00
Expires 11/22/2014 | | | 200 | | | | $ (59,000 | ) |
Marathon Petroleum Corp.
Strike Price $92.50
Expires 11/22/2014 | | | 200 | | | | (32,000 | ) |
Tesoro Corp.
Strike Price $65.00
Expires 11/22/2014 | | | 100 | | | | (73,000 | ) |
The Notes to Financial Statements are an integral part of this report.
| | |
| Transamerica Funds | | Annual Report 2014 |
Page 172
Transamerica MLP & Energy Income
SCHEDULE OF INVESTMENTS (continued)
At October 31, 2014
| | | | | | | | |
| | | Contracts | | | Value | |
WRITTEN OPTIONS (continued) | | | | | | | | |
Call Options (continued) | | | | | | | | |
Tesoro Corp.
Strike Price $70.00
Expires 11/22/2014 | | | 175 | | | | $ (56,875 | ) |
| | | | | | | | |
Total Written Options
(Premium received $82,292) | | | | | | | $ (220,875 | ) |
| | | | | | | | |
SECURITY VALUATION:
Valuation Inputs (G)
| | | | | | | | | | | | | | | | |
| | | Level 1
Quoted Prices | | | Level 2
Other Significant
Observable Inputs | | | Level 3
Significant
Unobservable Inputs | | | Value at
October 31, 2014 | |
ASSETS | | | | | | | | | | | | | | | | |
Investments | | | | | | | | | | | | | | | | |
Corporate Debt Securities | | $ | — | | | $ | 36,371,925 | | | $ | — | | | $ | 36,371,925 | |
Convertible Preferred Stock | | | 251,750 | | | | — | | | | — | | | | 251,750 | |
Preferred Stocks | | | 4,038,336 | | | | — | | | | — | | | | 4,038,336 | |
Common Stocks | | | 369,388,218 | | | | — | | | | — | | | | 369,388,218 | |
Master Limited Partnerships | | | 232,165,200 | | | | — | | | | — | | | | 232,165,200 | |
Securities Lending Collateral | | | 141,399,123 | | | | — | | | | — | | | | 141,399,123 | |
Repurchase Agreement | | | — | | | | 53,319,882 | | | | — | | | | 53,319,882 | |
| | | | | | | | | | | | | | | | |
Total Investments | | $ | 747,242,627 | | | $ | 89,691,807 | | | $ | — | | | $ | 836,934,434 | |
| | | | | | | | | | | | | | | | |
LIABILITIES | | | | | | | | | | | | | | | | |
Derivative Financial Instruments | | | | | | | | | | | | | | | | |
Written Options | | $ | (220,875 | ) | | $ | — | | | $ | — | | | $ | (220,875 | ) |
| | | | | | | | | | | | | | | | |
Total Derivative Financial Instruments | | $ | (220,875 | ) | | $ | — | | | $ | — | | | $ | (220,875 | ) |
| | | | | | | | | | | | | | | | |
FOOTNOTES TO SCHEDULE OF INVESTMENTS:
| (A) | All or a portion of this security is on loan. The value of all securities on loan is $137,823,377. The amount of securities on loan indicated may not correspond with the securities on loan identified because securities with pending sales are in the process of recall from the brokers. |
| (B) | Percentage rounds to less than 0.1% or (0.1)%. |
| (C) | Non-income producing security. |
| (D) | All or a portion of this security has been segregated as collateral for open options transactions. Total value of securities segregated as collateral for open options transactions is $5,599,775. |
| (E) | Rate shown reflects the yield at October 31, 2014. |
| (F) | Aggregate cost for federal income tax purposes is $797,582,723. Aggregate gross unrealized appreciation and depreciation for all securities is $56,568,828 and $17,217,117, respectively. Net unrealized appreciation for tax purposes is $39,351,711. |
| (G) | The Fund recognizes transfers between Levels at the end of the reporting period. There were no transfers between Level 1, 2 and 3 during the period ended October 31, 2014. See the Notes to Financial Statements for more information regarding security valuation and pricing inputs. |
DEFINITION:
| | |
| 144A | | 144A securities are registered pursuant to Rule 144A of the Securities Act of 1933. These securities are deemed to be liquid for purposes of compliance limitations on holdings of illiquid securities and may be resold as transactions exempt from registration, normally to qualified institutional buyers. At October 31, 2014, these securities aggregated $24,908,735, or 3.59% of the Fund’s net assets. |
The Notes to Financial Statements are an integral part of this report.
| | |
| Transamerica Funds | | Annual Report 2014 |
Page 173
Transamerica Money Market
SCHEDULE OF INVESTMENTS
At October 31, 2014
| | | | | | | | |
| | | Principal | | | Value | |
CORPORATE DEBT SECURITY - 3.1% | |
Banks - 3.1% | | | | | | | | |
Korea Development Bank | | | | | | | | |
0.58%, 01/16/2015, 144A (A) | | | $ 5,500,000 | | | | $ 5,500,000 | |
| | | | | | | | |
Total Corporate Debt Security
(Cost $5,500,000) | | | | 5,500,000 | |
| | | | | | | | |
|
CERTIFICATES OF DEPOSIT - 13.9% | |
Banks - 13.9% | | | | | | | | |
Bank of Nova Scotia | | | | | | | | |
0.20%, 02/05/2015 - 06/12/2015 (B) | | | 6,250,000 | | | | 6,250,000 | |
Bank of Tokyo-Mitsubishi UFJ, Ltd. | | | | | | | | |
0.08%, 11/06/2014 (B) | | | 4,000,000 | | | | 4,000,000 | |
0.32%, 06/24/2015 (B) | | | 4,125,000 | | | | 4,125,266 | |
Cooperatieve Centrale Raiffeisen-Boerenleenbank BA | | | | | | | | |
0.25%, 07/09/2015 (B) | | | 5,500,000 | | | | 5,500,000 | |
DnB NOR Bank ASA | | | | | | | | |
0.09%, 11/04/2014 (B) | | | 5,000,000 | | | | 5,000,000 | |
| | | | | | | | |
Total Certificates of Deposit
(Cost $24,875,266) | | | | 24,875,266 | |
| | | | | | | | |
| | |
COMMERCIAL PAPER - 69.5% | | | | | | | | |
Banks - 36.7% | | | | | | | | |
Barclays Bank PLC | | | | | | | | |
0.49%, 04/02/2015 (C) (B) | | | 4,700,000 | | | | 4,700,000 | |
BNP Paribas Finance, Inc. | | | | | | | | |
0.21%, 01/06/2015 (B) | | | 2,000,000 | | | | 1,999,230 | |
Commonwealth Bank of Australia | | | | | | | | |
0.22%, 11/24/2014, 144A (B) | | | 2,000,000 | | | | 2,000,000 | |
Mizuho Funding LLC | | | | | | | | |
0.19%, 01/06/2015 (B) | | | 4,000,000 | | | | 3,998,643 | |
0.23%, 04/01/2015 (B) | | | 3,500,000 | | | | 3,496,697 | |
National Australia Funding Delaware, Inc. | | | | | | | | |
0.03%, 11/03/2014 (B) | | | 4,100,000 | | | | 4,099,993 | |
Natixis | | | | | | | | |
0.10%, 11/05/2014 (B) | | | 8,000,000 | | | | 7,999,911 | |
PNC Bank NA | | | | | | | | |
0.31%, 05/01/2015 (B) | | | 5,000,000 | | | | 5,000,000 | |
Skandinaviska Enskilda Banken AB | | | | | | | | |
0.26%, 03/17/2015 (B) | | | 2,000,000 | | | | 1,998,036 | |
0.27%, 02/27/2015, 144A (B) | | | 2,000,000 | | | | 1,998,230 | |
Standard Chartered Bank | | | | | | | | |
0.37%, 05/13/2015, 144A (B) | | | 6,000,000 | | | | 5,988,098 | |
Sumitomo Mitsui Banking Corp. | | | | | | | | |
0.20%, 01/05/2015 (B) | | | 4,000,000 | | | | 3,998,556 | |
0.24%, 01/02/2015, 144A (B) | | | 3,000,000 | | | | 2,998,760 | |
Swedbank AB | | | | | | | | |
0.24%, 01/06/2015 (B) | | | 2,000,000 | | | | 1,999,138 | |
US Bank NA | | | | | | | | |
0.10%, 11/03/2014 (B) | | | 7,500,000 | | | | 7,500,000 | |
Westpac Banking Corp. | | | | | | | | |
0.23%, 08/03/2015 (B) | | | 6,000,000 | | | | 5,999,583 | |
| | | | | | | | |
| | | | 65,774,875 | |
| | | | | | | | |
Chemicals - 0.4% | | | | | | | | |
Monsanto Co. | | | | | | | | |
0.34%, 11/18/2014 (B) | | | 800,000 | | | | 799,872 | |
| | | | | | | | |
| | | | | | | | |
| | | Principal | | | Value | |
COMMERCIAL PAPER (continued) | |
Consumer Finance - 2.2% | |
Toyota Motor Credit Corp. | | | | | | | | |
0.21%, 01/26/2015 (B) | | | $ 4,000,000 | | | | $ 4,000,000 | |
| | | | | | | | |
Diversified Financial Services - 27.6% | |
Alpine Securitization Corp. | | | | | | | | |
0.22%, 01/02/2015 (B) | | | 4,000,000 | | | | 3,998,484 | |
0.26%, 01/02/2015 - 01/05/2015 (B) | | | 4,000,000 | | | | 3,998,177 | |
Ciesco LLC | | | | | | | | |
0.25%, 12/15/2014 (B) | | | 1,700,000 | | | | 1,699,481 | |
Collateralized Commercial Paper II Co. LLC | | | | | | | | |
0.37%, 03/05/2015, 144A (B) | | | 7,000,000 | | | | 6,991,079 | |
0.38%, 05/15/2015 (B) | | | 1,500,000 | | | | 1,496,913 | |
Gemini Securitization Corp. LLC | | | | | | | | |
0.18%, 11/07/2014 (B) | | | 1,500,000 | | | | 1,499,955 | |
0.33%, 12/15/2014 (B) | | | 3,500,000 | | | | 3,498,588 | |
0.34%, 01/05/2015 (B) | | | 3,000,000 | | | | 2,998,158 | |
JPMorgan Securities LLC | | | | | | | | |
0.45%, 10/26/2015 (B) | | | 3,000,000 | | | | 2,986,537 | |
Kells Funding LLC | | | | | | | | |
0.24%, 04/05/2015, 144A (B) | | | 4,250,000 | | | | 4,250,000 | |
Mont Blanc Capital Corp. | | | | | | | | |
0.22%, 01/07/2015 (B) | | | 2,000,000 | | | | 1,999,181 | |
Nieuw Amsterdam Receivables Corp. | | | | | | | | |
0.18%, 01/07/2015 (B) | | | 3,500,000 | | | | 3,498,827 | |
Regency Markets No. 1 LLC | | | | | | | | |
0.14%, 11/25/2014 (B) | | | 2,000,000 | | | | 1,999,813 | |
Salisbury Receivables Co. LLC | | | | | | | | |
0.18%, 11/06/2014 - 12/04/2014 (B) | | | 4,000,000 | | | | 3,999,620 | |
0.27%, 03/06/2015 (B) | | | 2,000,000 | | | | 1,998,125 | |
Victory Receivables Corp. | | | | | | | | |
0.17%, 01/05/2015 (B) | | | 2,500,000 | | | | 2,499,233 | |
| | | | | | | | |
| | | | 49,412,171 | |
| | | | | | | | |
Electric Utilities - 0.8% | | | | | | | | |
OGE Energy Corp. | | | | | | | | |
0.28%, 11/14/2014 (B) | | | 700,000 | | | | 699,929 | |
Westar Energy, Inc. | | | | | | | | |
0.26%, 11/26/2014 (B) | | | 700,000 | | | | 699,874 | |
| | | | | | | | |
| | | | 1,399,803 | |
| | | | | | | | |
Media - 0.4% | | | | | | | | |
Viacom, Inc. | | | | | | | | |
0.26%, 11/04/2014 (B) | | | 800,000 | | | | 799,983 | |
| | | | | | | | |
Multi-Utilities - 0.5% | | | | | | | | |
Dominion Resources, Inc. | | | | | | | | |
0.25%, 11/03/2014 (B) | | | 800,000 | | | | 799,989 | |
| | | | | | | | |
Oil, Gas & Consumable Fuels - 0.9% | |
South Carolina Fuel Co. | | | | | | | | |
0.24%, 11/03/2014 (B) | | | 800,000 | | | | 799,990 | |
Spectra Energy Partners LP | | | | | | | | |
0.29%, 11/07/2014 (B) | | | 800,000 | | | | 799,961 | |
| | | | | | | | |
| | | | 1,599,951 | |
| | | | | | | | |
Total Commercial Paper
(Cost $124,586,644) | | | | 124,586,644 | |
| | | | | | | | |
The Notes to Financial Statements are an integral part of this report.
| | |
| Transamerica Funds | | Annual Report 2014 |
Page 174
Transamerica Money Market
SCHEDULE OF INVESTMENTS (continued)
At October 31, 2014
| | | | | | | | |
| | | Principal | | | Value | |
DEMAND NOTE - 2.0% | | | | | | | | |
Capital Markets - 2.0% | | | | | | | | |
Goldman Sachs & Co. | | | | | | | | |
0.39%, 01/09/2015 (B) (C) | | | $ 3,500,000 | | | | $ 3,500,000 | |
| | | | | | | | |
Total Demand Note
(Cost $3,500,000) | | | | 3,500,000 | |
| | | | | | | | |
|
SHORT-TERM U.S. GOVERNMENT AGENCY OBLIGATION - 3.9% | |
Federal Home Loan Bank
Discount Notes | | | | | | | | |
0.07%, 11/21/2014 (B) | | | 7,000,000 | | | | 6,999,747 | |
| | | | | | | | |
Total Short-Term U.S. Government Agency Obligation
(Cost $6,999,747) | | | | 6,999,747 | |
| | | | | | | | |
|
REPURCHASE AGREEMENTS - 8.2% | |
Barclays Capital, Inc.
0.09% (B), dated 10/31/2014, to be repurchased at $6,300,016 on 11/03/2014. Collateralized by a U.S. Government Obligation, 0.09%, due 01/22/2015, and with a value of $6,430,346. | | | 6,300,000 | | | | 6,300,000 | |
| | | | | | | | |
| | | Principal | | | Value | |
REPURCHASE AGREEMENTS (continued) | | | | | |
Goldman Sachs & Co.
0.09% (B), dated 10/31/2014, to be repurchased at $8,000,020 on 11/03/2014. Collateralized by U.S. Government Agency Obligations, 3.00% - 4.50%, due 03/01/2027 - 11/01/2044, and with a total value of $8,160,000. | | | $ 8,000,000 | | | | $ 8,000,000 | |
State Street Bank & Trust Co.
0.01% (B), dated 10/31/2014, to be repurchased at $393,951 on 11/03/2014. Collateralized by a U.S. Government Agency Obligation, 4.00%, due 09/25/2039 and with a value of $401,902. | | | 393,950 | | | | 393,950 | |
| | | | | | | | |
Total Repurchase Agreements
(Cost $14,693,950) | | | | 14,693,950 | |
| | | | | | | | |
Total Investments
(Cost $180,155,607) (D) | | | | | | | 180,155,607 | |
Net Other Assets (Liabilities) - (0.6)% | | | | (998,773 | ) |
| | | | | | | | |
| | |
Net Assets - 100.0% | | | | | | | $ 179,156,834 | |
| | | | | | | | |
SECURITY VALUATION:
Valuation Inputs (E)
| | | | | | | | | | | | | | | | |
| | | Level 1
Quoted Prices | | | Level 2
Other Significant
Observable Inputs | | | Level 3
Significant
Unobservable Inputs | | | Value at
October 31, 2014 | |
ASSETS | | | | | | | | | | | | | | | | |
Investments | | | | | | | | | | | | | | | | |
Corporate Debt Security | | $ | — | | | $ | 5,500,000 | | | $ | — | | | $ | 5,500,000 | |
Certificates of Deposit | | | — | | | | 24,875,266 | | | | — | | | | 24,875,266 | |
Commercial Paper | | | — | | | | 124,586,644 | | | | — | | | | 124,586,644 | |
Demand Note | | | — | | | | 3,500,000 | | | | — | | | | 3,500,000 | |
Short-Term U.S. Government Agency Obligation | | | — | | | | 6,999,747 | | | | — | | | | 6,999,747 | |
Repurchase Agreements | | | — | | | | 14,693,950 | | | | — | | | | 14,693,950 | |
| | | | | | | | | | | | | | | | |
Total Investments | | $ | — | | | $ | 180,155,607 | | | $ | — | | | $ | 180,155,607 | |
| | | | | | | | | | | | | | | | |
FOOTNOTES TO SCHEDULE OF INVESTMENTS:
| (A) | Floating or variable rate security. Rate is listed as of October 31, 2014. |
| (B) | Rate shown reflects the yield at October 31, 2014. |
| (C) | Total aggregate value of illiquid securities is $8,200,000, or 4.58% of the Fund’s net assets. |
| (D) | Aggregate cost for federal income tax purposes is $180,155,607. |
| (E) | The Fund recognizes transfers between Levels at the end of the reporting period. There were no transfers between Level 1, 2 and 3 during the period ended October 31, 2014. See the Notes to Financial Statements for more information regarding security valuation and pricing inputs. |
DEFINITION:
| | |
| 144A | | 144A securities are registered pursuant to Rule 144A of the Securities Act of 1933. These securities are deemed to be liquid for purposes of compliance limitations on holdings of illiquid securities and may be resold as transactions exempt from registration, normally to qualified institutional buyers. At October 31, 2014, these securities aggregated $29,726,167, or 16.59% of the Fund’s net assets. |
The Notes to Financial Statements are an integral part of this report.
| | |
| Transamerica Funds | | Annual Report 2014 |
Page 175
Transamerica Multi-Managed Balanced
SCHEDULE OF INVESTMENTS
At October 31, 2014
| | | | | | | | |
| | | Principal | | | Value | |
U.S. GOVERNMENT OBLIGATIONS - 8.0% | |
U.S. Treasury Bond | | | | | | | | |
2.75%, 08/15/2042 - 11/15/2042 | | | $ 390,000 | | | | $ 367,099 | |
3.63%, 02/15/2044 | | | 6,206,400 | | | | 6,887,652 | |
U.S. Treasury Inflation Indexed Bond | | | | | | | | |
2.50%, 01/15/2029 | | | 1,001,098 | | | | 1,245,664 | |
U.S. Treasury Inflation Indexed Note | | | | | | | | |
0.13%, 01/15/2023 | | | 443,119 | | | | 433,738 | |
0.63%, 01/15/2024 | | | 3,557,811 | | | | 3,615,625 | |
U.S. Treasury Note | | | | | | | | |
0.38%, 03/31/2016 | | | 645,000 | | | | 645,756 | |
0.50%, 09/30/2016 | | | 5,186,400 | | | | 5,188,832 | |
0.88%, 04/30/2017 | | | 2,351,900 | | | | 2,359,616 | |
1.00%, 09/15/2017 (A) | | | 165,000 | | | | 165,503 | |
1.25%, 11/30/2018 | | | 3,955,000 | | | | 3,932,136 | |
1.63%, 03/31/2019 - 11/15/2022 | | | 9,006,700 | | | | 9,029,191 | |
2.50%, 05/15/2024 | | | 5,373,600 | | | | 5,460,083 | |
| | | | | | | | |
Total U.S. Government Obligations
(Cost $38,530,759) | | | | | | | 39,330,895 | |
| | | | | | | | |
|
U.S. GOVERNMENT AGENCY OBLIGATIONS - 6.0% | |
Federal Home Loan Mortgage Corp. | | | | | | | | |
5.00%, 04/01/2018 | | | 16,705 | | | | 17,625 | |
5.50%, 09/01/2018 - 06/01/2041 | | | 393,021 | | | | 437,156 | |
Federal National Mortgage Association | | | | | | | | |
2.05%, 02/01/2043 (B) | | | 350,649 | | | | 360,459 | |
3.33%, 10/25/2023 (B) | | | 190,000 | | | | 197,429 | |
3.36%, 06/01/2041 (B) | | | 122,014 | | | | 128,795 | |
3.50%, 07/01/2028 - 11/01/2028 | | | 812,125 | | | | 864,878 | |
3.50%, TBA | | | 11,109,000 | | | | 11,550,395 | |
3.51%, 09/01/2041 (B) | | | 93,311 | | | | 98,868 | |
4.00%, 04/01/2026 | | | 29,165 | | | | 31,310 | |
4.00%, TBA | | | 5,011,000 | | | | 5,320,273 | |
4.50%, 02/01/2025 - 06/01/2026 | | | 782,772 | | | | 847,668 | |
4.50%, TBA | | | 3,204,000 | | | | 3,472,335 | |
5.00%, 05/01/2018 | | | 9,211 | | | | 9,724 | |
5.00%, TBA | | | 2,595,000 | | | | 2,873,354 | |
5.50%, 07/01/2019 - 11/01/2038 | | | 580,696 | | | | 650,646 | |
6.00%, 08/01/2036 - 06/01/2041 | | | 1,435,221 | | | | 1,628,948 | |
6.50%, 05/01/2040 | | | 425,321 | | | | 482,710 | |
FREMF Mortgage Trust | | | | | | | | |
Series 2012-K23, Class B | | | | | | | | |
3.66%, 10/25/2045, 144A (B) | | | 120,000 | | | | 120,276 | |
Series 2012-K711, Class B | | | | | | | | |
3.56%, 08/25/2045, 144A (B) | | | 160,000 | | | | 163,362 | |
Government National Mortgage Association, IO | | | | | | | | |
0.99%, 02/16/2053 (B) | | | 945,931 | | | | 72,558 | |
| | | | | | | | |
Total U.S. Government Agency Obligations
(Cost $29,112,591) | | | | | | | 29,328,769 | |
| | | | | | | | |
| |
FOREIGN GOVERNMENT OBLIGATIONS - 0.5% | | | | | |
Brazilian Government International Bond | | | | | | | | |
4.25%, 01/07/2025 | | | 330,000 | | | | 335,280 | |
Colombia Government International Bond | | | | | | | | |
4.00%, 02/26/2024 | | | 235,000 | | | | 241,110 | |
Indonesia Government International Bond | | | | | | | | |
5.38%, 10/17/2023, 144A (A) | | | 315,000 | | | | 346,106 | |
Mexico Government International Bond | | | | | | | | |
4.00%, 10/02/2023 (A) | | | 630,000 | | | | 657,720 | |
| | | | | | | | |
| | | Principal | | | Value | |
FOREIGN GOVERNMENT OBLIGATIONS (continued) | |
Peruvian Government International Bond | | | | | | | | |
7.35%, 07/21/2025 | | | $ 125,000 | | | | $ 165,313 | |
Turkey Government International Bond | | | | | | | | |
5.75%, 03/22/2024 | | | 400,000 | | | | 441,720 | |
| | | | | | | | |
Total Foreign Government Obligations
(Cost $2,083,499) | | | | | | | 2,187,249 | |
| | | | | | | | |
|
MORTGAGE-BACKED SECURITIES - 4.9% | |
Banc of America Commercial Mortgage Trust | | | | | | | | |
Series 2007-3, Class A1A | | | | | | | | |
5.56%, 06/10/2049 (B) | | | 299,496 | | | | 324,028 | |
BB-UBS Trust | | | | | | | | |
Series 2012-TFT, Class A | | | | | | | | |
2.89%, 06/05/2030, 144A | | | 460,000 | | | | 448,866 | |
Series 2012-TFT, Class C | | | | | | | | |
3.47%, 06/05/2030, 144A (B) | | | 475,000 | | | | 453,291 | |
BB-UBS Trust, IO | | | | | | | | |
Series 2012-SHOW, Class XA | | | | | | | | |
0.60%, 11/05/2036, 144A (B) | | | 3,045,000 | | | | 165,240 | |
BCAP LLC Trust | | | | | | | | |
Series 2009-RR10, Class 2A1 | | | | | | | | |
2.68%, 08/26/2035, 144A (B) | | | 265,906 | | | | 262,968 | |
Series 2009-RR13, Class 13A3 | | | | | | | | |
5.25%, 03/26/2037, 144A (B) | | | 51,334 | | | | 51,393 | |
Series 2009-RR14, Class 1A1 | | | | | | | | |
6.00%, 05/26/2037, 144A (B) | | | 275,586 | | | | 293,196 | |
Series 2009-RR6, Class 2A1 | | | | | | | | |
2.54%, 08/26/2035, 144A (B) | | | 234,273 | | | | 233,563 | |
Series 2010-RR1, Class 12A1 | | | | | | | | |
5.25%, 08/26/2036, 144A (B) | | | 300,590 | | | | 308,335 | |
Bear Stearns Commercial Mortgage Securities Trust | | | | | | | | |
Series 2006-PW14, Class A1A | | | | | | | | |
5.19%, 12/11/2038 | | | 324,537 | | | | 348,623 | |
Series 2007-PW15, Class A1A | | | | | | | | |
5.32%, 02/11/2044 | | | 246,697 | | | | 265,272 | |
Series 2007-PW17, Class A1A | | | | | | | | |
5.65%, 06/11/2050 (B) | | | 338,149 | | | | 371,691 | |
Citigroup Commercial Mortgage Trust | | | | | | | | |
Series 2014-GC19, Class A3 | | | | | | | | |
3.75%, 03/10/2047 | | | 145,000 | | | | 150,942 | |
Series 2014-GC19, Class A4 | | | | | | | | |
4.02%, 03/10/2047 | | | 220,000 | | | | 233,678 | |
COMM Mortgage Trust | | | | | | | | |
Series 2010-RR1, Class GEB | | | | | | | | |
5.54%, 12/11/2049, 144A (B) | | | 100,000 | | | | 104,908 | |
Series 2013-CR11, Class AM | | | | | | | | |
4.72%, 10/10/2046 (B) | | | 70,000 | | | | 76,885 | |
Series 2013-GAM, Class A2 | | | | | | | | |
3.37%, 02/10/2028, 144A | | | 110,000 | | | | 109,461 | |
Series 2014-CR14, Class B | | | | | | | | |
4.61%, 02/10/2047 (B) | | | 150,000 | | | | 161,969 | |
Series 2014-UBS2, Class A5 | | | | | | | | |
3.96%, 03/10/2047 | | | 155,000 | | | | 163,992 | |
Commercial Mortgage Pass-Through Certificates | | | | | | | | |
Series 2012-LTRT, Class A2 | | | | | | | | |
3.40%, 10/05/2030, 144A | | | 380,000 | | | | 373,732 | |
The Notes to Financial Statements are an integral part of this report.
| | |
| Transamerica Funds | | Annual Report 2014 |
Page 176
Transamerica Multi-Managed Balanced
SCHEDULE OF INVESTMENTS (continued)
At October 31, 2014
| | | | | | | | |
| | | Principal | | | Value | |
MORTGAGE-BACKED SECURITIES (continued) | |
Commercial Mortgage Trust | | | | | | | | |
Series 2007-GG11, Class AM | | | | | | | | |
5.87%, 12/10/2049 (B) | | | $ 70,000 | | | | $ 76,216 | |
Credit Suisse Mortgage Capital Certificates | | | | | | | | |
Series 2007-TF2A, Class A3 | | | | | | | | |
0.42%, 04/15/2022, 144A (B) | | | 128,140 | | | | 127,148 | |
Series 2009-11R, Class 5A1 | | | | | | | | |
4.36%, 08/26/2036, 144A (B) | | | 969,939 | | | | 980,644 | |
CSMC Trust | | | | | | | | |
Series 2010-15R, Class 2A1 | | | | | | | | |
3.50%, 05/26/2036, 144A (B) | | | 132,460 | | | | 136,079 | |
Series 2010-18R, Class 3A1 | | | | | | | | |
4.00%, 03/26/2037, 144A | | | 55,314 | | | | 56,062 | |
Series 2010-1R, Class 28A1 | | | | | | | | |
5.00%, 02/27/2047, 144A | | | 459,661 | | | | 467,000 | |
Series 2010-RR1, Class 2A | | | | | | | | |
5.70%, 09/15/2040, 144A (B) | | | 585,000 | | | | 629,923 | |
Series 2013-8R, Class 3A1 | | | | | | | | |
0.31%, 03/27/2036, 144A (B) | | | 741,633 | | | | 723,242 | |
Series 2014-4R, Class 21A1 | | | | | | | | |
0.55%, 12/27/2035, 144A (B) | | | 1,000,000 | | | | 948,045 | |
DBRR Trust | | | | | | | | |
Series 2011-C32, Class A3A | | | | | | | | |
5.72%, 06/17/2049, 144A (B) | | | 150,000 | | | | 163,272 | |
Series 2013-EZ3, Class A | | | | | | | | |
1.64%, 12/18/2049, 144A (B) | | | 166,422 | | | | 167,280 | |
Extended Stay America Trust | | | | | | | | |
Series 2013-ESH7, Class A27 | | | | | | | | |
2.96%, 12/05/2031, 144A | | | 165,000 | | | | 167,472 | |
GS Mortgage Securities Corp. II | | | | | | | | |
Series 2013-KING, Class E | | | | | | | | |
3.44%, 12/10/2027, 144A (B) | | | 320,000 | | | | 300,473 | |
Hilton USA Trust, IO | | | | | | | | |
Series 2013-HLT, Class X1FX | | | | | | | | |
1.67%, 11/05/2030, 144A (B) | | | 15,000,000 | | | | 34,695 | |
Jefferies Re-REMIC Trust | | | | | | | | |
Series 2009-R2, Class 2A | | | | | | | | |
2.59%, 12/26/2037, 144A (B) | | | 208,503 | | | | 208,069 | |
Series 2009-R7, Class 10A3 | | | | | | | | |
6.00%, 12/26/2036, 144A | | | 126,607 | | | | 135,668 | |
Series 2009-R7, Class 12A1 | | | | | | | | |
2.62%, 08/26/2036, 144A (B) | | | 96,910 | | | | 95,820 | |
Series 2009-R7, Class 1A1 | | | | | | | | |
2.38%, 02/26/2036, 144A (B) | | | 405,918 | | | | 398,579 | |
Series 2009-R7, Class 4A1 | | | | | | | | |
2.39%, 09/26/2034, 144A (B) | | | 225,355 | | | | 221,479 | |
Series 2009-R9, Class 1A1 | | | | | | | | |
2.24%, 08/26/2046, 144A (B) | | | 178,561 | | | | 180,383 | |
Series 2010-R2, Class 1A1 | | | | | | | | |
6.00%, 05/26/2036, 144A | | | 135,904 | | | | 140,677 | |
Series 2010-R3, Class 1A1 | | | | | | | | |
2.80%, 03/21/2036, 144A (B) | | | 93,681 | | | | 94,032 | |
JPMorgan Chase Commercial Mortgage Securities Trust | | | | | | | | |
Series 2006-CB14, Class AM | | | | | | | | |
5.41%, 12/12/2044 (B) | | | 100,000 | | | | 104,543 | |
Series 2007-CB18, Class A1A | | | | | | | | |
5.43%, 06/12/2047 (B) | | | 488,276 | | | | 524,468 | |
| | | | | | | | |
| | | Principal | | | Value | |
MORTGAGE-BACKED SECURITIES (continued) | |
JPMorgan Chase Commercial Mortgage Securities Trust (continued) | | | | | | | | |
Series 2007-CB20, Class AM | | | | | | | | |
5.88%, 02/12/2051 (B) | | | $ 360,000 | | | | $ 398,870 | |
Series 2007-LD12, Class A1A | | | | | | | | |
5.85%, 02/15/2051 (B) | | | 440,738 | | | | 484,403 | |
Series 2007-LDPX, Class A1A | | | | | | | | |
5.44%, 01/15/2049 | | | 327,206 | | | | 354,271 | |
Series 2008-C2, Class ASB | | | | | | | | |
6.13%, 02/12/2051 (B) | | | 117,429 | | | | 124,186 | |
Series 2010-C1, Class B | | | | | | | | |
5.95%, 06/15/2043, 144A | | | 370,000 | | | | 422,889 | |
JPMorgan Re-REMIC Trust | | | | | | | | |
Series 2009-7, Class 8A1 | | | | | | | | |
2.83%, 01/27/2047, 144A (B) | | | 84,342 | | | | 85,015 | |
Series 2010-4, Class 7A1 | | | | | | | | |
1.87%, 08/26/2035, 144A (B) | | | 138,875 | | | | 138,504 | |
Series 2014-2, Class 6A1 | | | | | | | | |
2.87%, 05/26/2037, 144A (B) | | | 1,051,342 | | | | 1,050,585 | |
LB-UBS Commercial Mortgage Trust | | | | | | | | |
Series 2004-C8, Class C | | | | | | | | |
4.93%, 12/15/2039 (B) | | | 605,000 | | | | 605,230 | |
Series 2005-C2, Class AJ | | | | | | | | |
5.21%, 04/15/2030 (B) | | | 125,000 | | | | 126,990 | |
Series 2007-C7, Class AM | | | | | | | | |
6.16%, 09/15/2045 (B) | | | 110,000 | | | | 123,592 | |
Merrill Lynch Mortgage Trust | | | | | | | | |
Series 2005-CKI1, Class AJ | | | | | | | | |
5.29%, 11/12/2037 (B) | | | 300,000 | | | | 310,376 | |
Series 2007-C1, Class A1A | | | | | | | | |
5.84%, 06/12/2050 (B) | | | 138,632 | | | | 148,730 | |
Morgan Stanley Capital I Trust | | | | | | | | |
Series 2007-HQ12, Class A2FX | | | | | | | | |
5.59%, 04/12/2049 (B) | | | 136,579 | | | | 138,123 | |
Series 2007-HQ12, Class AM | | | | | | | | |
5.59%, 04/12/2049 (B) | | | 280,000 | | | | 300,119 | |
Series 2007-IQ13, Class A1A | | | | | | | | |
5.31%, 03/15/2044 | | | 468,667 | | | | 504,724 | |
Series 2007-IQ13, Class AM | | | | | | | | |
5.41%, 03/15/2044 | | | 110,000 | | | | 118,069 | |
Series 2007-IQ14, Class A1A | | | | | | | | |
5.67%, 04/15/2049 (B) | | | 128,110 | | | | 139,297 | |
Series 2007-IQ15, Class AM | | | | | | | | |
5.91%, 06/11/2049 (B) | | | 335,000 | | | | 360,721 | |
Morgan Stanley Re-REMIC Trust | | | | | | | | |
Series 2012-IO, Class AXB2 | | | | | | | | |
1.00%, 03/27/2051, 144A | | | 100,000 | | | | 99,075 | |
Series 2012-XA, Class A | | | | | | | | |
2.00%, 07/27/2049, 144A | | | 126,259 | | | | 126,732 | |
Series 2014-R3, Class 2A | | | | | | | | |
3.00%, 07/26/2048, 144A (B) | | | 1,322,459 | | | | 1,242,129 | |
Motel 6 Trust | | | | | | | | |
Series 2012-MTL6, Class B | | | | | | | | |
2.74%, 10/05/2025, 144A | | | 350,000 | | | | 350,444 | |
Series 2012-MTL6, Class C | | | | | | | | |
3.14%, 10/05/2025, 144A | | | 543,000 | | | | 541,384 | |
Nationstar Mortgage Loan Trust | | | | | | | | |
Series 2013-A, Class A | | | | | | | | |
3.75%, 12/25/2052, 144A (B) | | | 829,558 | | | | 852,654 | |
The Notes to Financial Statements are an integral part of this report.
| | |
| Transamerica Funds | | Annual Report 2014 |
Page 177
Transamerica Multi-Managed Balanced
SCHEDULE OF INVESTMENTS (continued)
At October 31, 2014
| | | | | | | | |
| | | Principal | | | Value | |
MORTGAGE-BACKED SECURITIES (continued) | |
New Residential Mortgage Loan Trust | | | | | | | | |
Series 2014-1A, Class A | | | | | | | | |
3.75%, 01/25/2054, 144A (B) | | | $ 360,756 | | | | $ 372,190 | |
Series 2014-2A, Class A3 | | | | | | | | |
3.75%, 05/25/2054, 144A | | | 977,812 | | | | 1,001,963 | |
Queens Center Mortgage Trust | | | | | | | | |
Series 2013-QCA, Class D | | | | | | | | |
3.47%, 01/11/2037, 144A (B) | | | 410,000 | | | | 383,287 | |
SCG Trust | | | | | | | | |
Series 2013-SRP1, Class A | | | | | | | | |
1.55%, 11/15/2026, 144A (B) | | | 230,000 | | | | 230,239 | |
Series 2013-SRP1, Class AJ | | | | | | | | |
2.10%, 11/15/2026, 144A (B) | | | 145,000 | | | | 145,443 | |
STRIPS, Ltd. | | | | | | | | |
Series 2012-1A, Class A | | | | | | | | |
1.50%, 12/25/2044, 144A (C) | | | 177,093 | | | | 175,323 | |
Wachovia Bank Commercial Mortgage Trust | | | | | | | | |
Series 2005-C20, Class B | | | | | | | | |
5.24%, 07/15/2042 (B) | | | 320,000 | | | | 327,791 | |
Series 2006-WL7A, Class H | | | | | | | | |
0.56%, 09/15/2021, 144A (B) | | | 185,000 | | | | 179,794 | |
Wells Fargo Re-REMIC Trust | | | | | | | | |
Series 2012-IO, Class A | | | | | | | | |
1.75%, 08/20/2021, 144A | | | 98,366 | | | | 98,415 | |
| | | | | | | | |
Total Mortgage-Backed Securities
(Cost $24,088,633) | | | | 24,044,859 | |
| | | | | | | | |
| | |
ASSET-BACKED SECURITIES - 4.6% | | | | | | | | |
321 Henderson Receivables VI LLC | | | | | | | | |
Series 2010-1A, Class A | | | | | | | | |
5.56%, 07/15/2059, 144A | | | 576,235 | | | | 657,385 | |
AmeriCredit Automobile Receivables Trust | | | | | | | | |
Series 2011-5, Class C | | | | | | | | |
3.44%, 10/08/2017 | | | 200,000 | | | | 204,024 | |
Series 2012-2, Class C | | | | | | | | |
2.64%, 10/10/2017 | | | 125,000 | | | | 126,795 | |
Series 2012-3, Class C | | | | | | | | |
2.42%, 05/08/2018 | | | 120,000 | | | | 122,064 | |
Series 2012-4, Class C | | | | | | | | |
1.93%, 08/08/2018 | | | 125,000 | | | | 126,089 | |
Series 2012-5, Class C | | | | | | | | |
1.69%, 11/08/2018 | | | 235,000 | | | | 236,657 | |
Series 2014-1, Class B | | | | | | | | |
1.68%, 07/08/2019 | | | 141,000 | | | | 140,936 | |
Chrysler Capital Auto Receivables Trust | | | | | | | | |
Series 2013-BA, Class B | | | | | | | | |
1.78%, 06/17/2019, 144A | | | 60,000 | | | | 60,267 | |
Series 2013-BA, Class C | | | | | | | | |
2.24%, 09/16/2019, 144A | | | 60,000 | | | | 60,255 | |
Series 2013-BA, Class D | | | | | | | | |
2.89%, 10/15/2020, 144A | | | 60,000 | | | | 60,226 | |
Series 2014-AA, Class B | | | | | | | | |
1.76%, 08/15/2019, 144A | | | 75,000 | | | | 75,055 | |
Series 2014-AA, Class C | | | | | | | | |
2.28%, 11/15/2019, 144A | | | 95,000 | | | | 95,197 | |
Credit Acceptance Auto Loan Trust | | | | | | | | |
Series 2013-1A, Class A | | | | | | | | |
1.21%, 10/15/2020, 144A | | | 250,000 | | | | 250,020 | |
| | | | | | | | |
| | | Principal | | | Value | |
ASSET-BACKED SECURITIES (continued) | |
Credit Acceptance Auto Loan Trust (continued) | | | | | |
Series 2013-2A, Class A | | | | | | | | |
1.50%, 04/15/2021, 144A | | | $ 250,000 | | | | $ 250,789 | |
DT Auto Owner Trust | | | | | | | | |
Series 2012-1A, Class D | | | | | | | | |
4.94%, 07/16/2018, 144A | | | 191,883 | | | | 195,488 | |
Ford Credit Floorplan Master Owner Trust | | | | | | | | |
Series 2012-2, Class D | | | | | | | | |
3.50%, 01/15/2019 | | | 100,000 | | | | 104,403 | |
Series 2012-5, Class C | | | | | | | | |
2.14%, 09/15/2019 | | | 100,000 | | | | 101,074 | |
HLSS Servicer Advance Receivables Backed Notes | | | | | | | | |
Series 2013-T2, Class A2 | | | | | | | | |
1.15%, 05/16/2044, 144A | | | 250,000 | | | | 249,775 | |
HLSS Servicer Advance Receivables Trust | | | | | | | | |
Series 2012-T2, Class A2 | | | | | | | | |
1.99%, 10/15/2045, 144A | | | 395,000 | | | | 397,726 | |
Series 2013-T1, Class A2 | | | | | | | | |
1.50%, 01/16/2046, 144A | | | 460,000 | | | | 458,712 | |
HSBC Home Equity Loan Trust | | | | | | | | |
Series 2006-3, Class M1 | | | | | | | | |
0.42%, 03/20/2036 (B) | | | 775,000 | | | | 746,800 | |
Hyundai Auto Receivables Trust | | | | | | | | |
Series 2012-A, Class D | | | | | | | | |
2.61%, 05/15/2018 | | | 95,000 | | | | 97,660 | |
MVW Owner Trust | | | | | | | | |
Series 2014-1A, Class A | | | | | | | | |
2.25%, 09/20/2031, 144A | | | 627,000 | | | | 630,548 | |
Nelnet Student Loan Trust | | | | | | | | |
Series 2008-3, Class A4 | | | | | | | | |
1.88%, 11/25/2024 (B) | | | 205,000 | | | | 214,762 | |
Series 2014-2A, Class A3 | | | | | | | | |
1.00%, 07/27/2037, 144A (B) | | | 165,000 | | | | 164,437 | |
Prestige Auto Receivables Trust | | | | | | | | |
Series 2013-1A, Class A2 | | | | | | | | |
1.09%, 02/15/2018, 144A | | | 79,625 | | | | 79,756 | |
Series 2013-1A, Class A3 | | | | | | | | |
1.33%, 05/15/2019, 144A | | | 110,000 | | | | 110,293 | |
Series 2014-1A, Class A2 | | | | | | | | |
0.97%, 03/15/2018, 144A | | | 182,681 | | | | 182,763 | |
Santander Drive Auto Receivables Trust | | | | | | | | |
Series 2012-2, Class C | | | | | | | | |
3.20%, 02/15/2018 | | | 310,000 | | | | 314,836 | |
Series 2012-4, Class C | | | | | | | | |
2.94%, 12/15/2017 | | | 230,000 | | | | 234,524 | |
Series 2012-AA, Class C | | | | | | | | |
1.78%, 11/15/2018, 144A | | | 795,000 | | | | 801,870 | |
Series 2013-2, Class B | | | | | | | | |
1.33%, 03/15/2018 | | | 370,000 | | | | 371,510 | |
Series 2013-3, Class B | | | | | | | | |
1.19%, 05/15/2018 | | | 350,000 | | | | 350,826 | |
Series 2013-4, Class C | | | | | | | | |
3.25%, 01/15/2020 | | | 170,000 | | | | 176,251 | |
Series 2013-5, Class B | | | | | | | | |
1.55%, 10/15/2018 | | | 530,000 | | | | 531,670 | |
Series 2013-5, Class C | | | | | | | | |
2.25%, 06/17/2019 | | | 250,000 | | | | 251,681 | |
The Notes to Financial Statements are an integral part of this report.
| | |
| Transamerica Funds | | Annual Report 2014 |
Page 178
Transamerica Multi-Managed Balanced
SCHEDULE OF INVESTMENTS (continued)
At October 31, 2014
| | | | | | | | |
| | | Principal | | | Value | |
ASSET-BACKED SECURITIES (continued) | |
Santander Drive Auto Receivables Trust (continued) | | | | | |
Series 2013-A, Class B | | | | | | | | |
1.89%, 10/15/2019, 144A | | | $ 280,000 | | | | $ 283,817 | |
Series 2013-A, Class C | | | | | | | | |
3.12%, 10/15/2019, 144A | | | 110,000 | | | | 113,021 | |
Series 2014-1, Class B | | | | | | | | |
1.59%, 10/15/2018 | | | 575,000 | | | | 577,264 | |
Series 2014-1, Class C | | | | | | | | |
2.36%, 04/15/2020 | | | 250,000 | | | | 252,442 | |
SBA Tower Trust | | | | | | | | |
Series 2014-1A, Class C | | | | | | | | |
2.90%, 10/15/2044, 144A (B) | | | 1,260,000 | | | | 1,263,348 | |
Sierra Timeshare Receivables Funding LLC | | | | | | | | |
Series 2013-3A, Class B | | | | | | | | |
2.70%, 10/20/2030, 144A | | | 238,322 | | | | 239,082 | |
Series 2014-3A, Class A | | | | | | | | |
2.30%, 10/20/2031, 144A (D) | | | 580,000 | | | | 579,893 | |
SLM Private Credit Student Loan Trust | | | | | | | | |
Series 2002-A, Class A2 | | | | | | | | |
0.78%, 12/16/2030 (B) | | | 199,963 | | | | 197,045 | |
Series 2005-B, Class A2 | | | | | | | | |
0.41%, 03/15/2023 (B) | | | 412,342 | | | | 408,744 | |
SLM Private Education Loan Trust | | | | | | | | |
Series 2011-A, Class A3 | | | | | | | | |
2.65%, 01/15/2043, 144A (B) | | | 250,000 | | | | 267,387 | |
Series 2011-B, Class A2 | | | | | | | | |
3.74%, 02/15/2029, 144A | | | 100,000 | | | | 105,250 | |
Series 2011-B, Class A3 | | | | | | | | |
2.40%, 06/16/2042, 144A (B) | | | 100,000 | | | | 106,039 | |
Series 2011-C, Class A2A | | | | | | | | |
3.40%, 10/17/2044, 144A (B) | | | 150,000 | | | | 162,034 | |
Series 2011-C, Class A2B | | | | | | | | |
4.54%, 10/17/2044, 144A | | | 140,000 | | | | 150,953 | |
Series 2012-A, Class A1 | | | | | | | | |
1.55%, 08/15/2025, 144A (B) | | | 58,707 | | | | 59,345 | |
Series 2012-A, Class A2 | | | | | | | | |
3.83%, 01/17/2045, 144A | | | 120,000 | | | | 126,636 | |
Series 2012-B, Class A2 | | | | | | | | |
3.48%, 10/15/2030, 144A | | | 400,000 | | | | 417,381 | |
Series 2012-C, Class A2 | | | | | | | | |
3.31%, 10/15/2046, 144A | | | 430,000 | | | | 447,509 | |
Series 2012-D, Class A2 | | | | | | | | |
2.95%, 02/15/2046, 144A | | | 620,000 | | | | 639,508 | |
Series 2012-E, Class A1 | | | | | | | | |
0.90%, 10/16/2023, 144A (B) | | | 125,650 | | | | 126,013 | |
Series 2012-E, Class A2B | | | | | | | | |
1.90%, 06/15/2045, 144A (B) | | | 535,000 | | | | 550,565 | |
Series 2013-A, Class A2A | | | | | | | | |
1.77%, 05/17/2027, 144A | | | 715,000 | | | | 705,383 | |
Series 2013-A, Class A2B | | | | | | | | |
1.20%, 05/17/2027, 144A (B) | | | 470,000 | | | | 472,895 | |
Series 2013-B, Class A2A | | | | | | | | |
1.85%, 06/17/2030, 144A | | | 1,055,000 | | | | 1,035,476 | |
Series 2013-C, Class A2A | | | | | | | | |
2.94%, 10/15/2031, 144A | | | 305,000 | | | | 312,336 | |
Series 2013-C, Class A2B | | | | | | | | |
1.55%, 10/15/2031, 144A (B) | | | 155,000 | | | | 157,824 | |
SolarCity LMC Series III LLC | | | | | | | | |
Series 2014-2, Class A | | | | | | | | |
4.02%, 07/20/2044, 144A | | | 505,000 | | | | 508,155 | |
| | | | | | | | |
| | | Principal | | | Value | |
ASSET-BACKED SECURITIES (continued) | |
SpringCastle America Funding LLC | | | | | | | | |
Series 2014-AA, Class A | | | | | | | | |
2.70%, 05/25/2023, 144A | | | $ 395,000 | | | | $ 395,305 | |
Trafigura Securitisation Finance PLC | | | | | | | | |
Series 2014-1A, Class A | | | | | | | | |
1.10%, 10/15/2021, 144A (B) | | | 1,840,000 | | | | 1,840,000 | |
World Financial Network Credit Card Master Trust | | | | | | | | |
Series 2010-A, Class B | | | | | | | | |
6.75%, 04/15/2019 | | | 170,000 | | | | 175,565 | |
Series 2012-C, Class A | | | | | | | | |
2.23%, 08/15/2022 | | | 360,000 | | | | 363,545 | |
Series 2012-D, Class A | | | | | | | | |
2.15%, 04/17/2023 | | | 455,000 | | | | 454,792 | |
| | | | | | | | |
Total Asset-Backed Securities
(Cost $22,600,927) | | | | | | | 22,727,676 | |
| | | | | | | | |
|
MUNICIPAL GOVERNMENT OBLIGATIONS - 0.2% | |
Los Angeles Community College District, General Obligation Unlimited | | | | | | | | |
6.60%, 08/01/2042 | | | 45,000 | | | | 62,124 | |
Metropolitan Transportation Authority, Revenue Bonds | | | | | | | | |
Series E | | | | | | | | |
6.81%, 11/15/2040 | | | 45,000 | | | | 61,740 | |
Municipal Electric Authority of Georgia, Revenue Bonds | | | | | | | | |
6.64%, 04/01/2057 | | | 35,000 | | | | 44,467 | |
New Jersey State Turnpike Authority, Revenue Bonds | | | | | | | | |
Series F | | | | | | | | |
7.41%, 01/01/2040 | | | 54,000 | | | | 79,076 | |
New York City Water & Sewer System, Revenue Bonds | | | | | | | | |
5.88%, 06/15/2044 | | | 45,000 | | | | 58,589 | |
New York State Dormitory Authority, Revenue Bonds | | | | | | | | |
Series H | | | | | | | | |
5.39%, 03/15/2040 | | | 40,000 | | | | 49,558 | |
Port Authority of New York & New Jersey, Revenue Bonds | | | | | | | | |
4.96%, 08/01/2046 | | | 70,000 | | | | 77,572 | |
State of California, General Obligation Unlimited | | | | | | | | |
7.60%, 11/01/2040 | | | 200,000 | | | | 302,710 | |
State of Illinois, General Obligation Unlimited | | | | | | | | |
5.10%, 06/01/2033 | | | 190,000 | | | | 187,070 | |
University of California, Revenue Bonds | | | | | | | | |
Series AD | | | | | | | | |
4.86%, 05/15/2112 | | | 40,000 | | | | 39,444 | |
| | | | | | | | |
Total Municipal Government Obligations
(Cost $900,519) | | | | | | | 962,350 | |
| | | | | | | | |
|
PREFERRED CORPORATE DEBT SECURITIES - 0.6% | |
Insurance - 0.6% | | | | | | | | |
ZFS Finance USA Trust II | | | | | | | | |
6.45%, 12/15/2065, 144A (B) | | | 1,195,000 | | | | 1,272,675 | |
The Notes to Financial Statements are an integral part of this report.
| | |
| Transamerica Funds | | Annual Report 2014 |
Page 179
Transamerica Multi-Managed Balanced
SCHEDULE OF INVESTMENTS (continued)
At October 31, 2014
| | | | | | | | |
| | | Principal | | | Value | |
PREFERRED CORPORATE DEBT SECURITIES (continued) | |
Insurance (continued) | | | | | | | | |
Reinsurance Group of America, Inc. | | | | | | | | |
6.75%, 12/15/2065 (B) | | | $ 1,442,000 | | | | $ 1,470,840 | |
| | | | | | | | |
Total Preferred Corporate Debt Securities
(Cost $2,785,494) | | | | | | | 2,743,515 | |
| | | | | | | | |
|
CORPORATE DEBT SECURITIES - 13.0% | |
Aerospace & Defense - 0.1% | | | | | | | | |
Exelis, Inc.
5.55%, 10/01/2021 | | | 480,000 | | | | 515,736 | |
| | | | | | | | |
Air Freight & Logistics - 0.1% | | | | | | | | |
FedEx Corp. | | | | | | | | |
4.90%, 01/15/2034 | | | 225,000 | | | | 246,367 | |
5.10%, 01/15/2044 | | | 160,000 | | | | 176,046 | |
| | | | | | | | |
| | | | | | | 422,413 | |
| | | | | | | | |
Airlines - 0.3% | | | | | | | | |
American Airlines Pass-Through Trust | | | | | | | | |
3.70%, 04/01/2028 | | | 575,000 | | | | 572,844 | |
United Airlines Pass-Through Trust | | | | | | | | |
3.75%, 03/03/2028 | | | 975,000 | | | | 987,187 | |
United Continental Holdings, Inc. | | | | | | | | |
6.00%, 07/15/2028 | | | 95,000 | | | | 90,488 | |
| | | | | | | | |
| | | | | | | 1,650,519 | |
| | | | | | | | |
Automobiles - 0.0% (E) | | | | | | | | |
General Motors Co. | | | | | | | | |
4.88%, 10/02/2023 | | | 105,000 | | | | 112,481 | |
6.25%, 10/02/2043 | | | 65,000 | | | | 77,350 | |
| | | | | | | | |
| | | | | | | 189,831 | |
| | | | | | | | |
Banks - 2.1% | | | | | | | | |
Barclays Bank PLC | | | | | | | | |
10.18%, 06/12/2021, 144A | | | 1,250,000 | | | | 1,678,340 | |
BPCE SA | | | | | | | | |
4.00%, 04/15/2024 | | | 250,000 | | | | 258,400 | |
5.15%, 07/21/2024, 144A | | | 205,000 | | | | 210,985 | |
Branch Banking & Trust Co. | | | | | | | | |
3.80%, 10/30/2026 | | | 355,000 | | | | 360,090 | |
Cooperatieve Centrale Raiffeisen-Boerenleenbank BA | | | | | | | | |
2.25%, 01/14/2019 (A) | | | 250,000 | | | | 253,016 | |
11.00%, 06/30/2019, 144A (B) (F) | | | 1,285,000 | | | | 1,676,925 | |
Credit Agricole SA | | | | | | | | |
2.50%, 04/15/2019, 144A (A) | | | 419,000 | | | | 422,189 | |
Export-Import Bank of Korea | | | | | | | | |
4.00%, 01/11/2017 | | | 515,000 | | | | 542,713 | |
HSBC Bank Brasil SA - Banco Multiplo | | | | | | | | |
Series MTN | | | | | | | | |
4.00%, 05/11/2016, 144A | | | 610,000 | | | | 626,775 | |
Intesa Sanpaolo SpA | | | | | | | | |
5.02%, 06/26/2024, 144A | | | 590,000 | | | | 576,615 | |
Korea Development Bank | | | | | | | | |
3.50%, 08/22/2017 | | | 515,000 | | | | 539,203 | |
Macquarie Bank, Ltd. | | | | | | | | |
1.65%, 03/24/2017, 144A | | | 285,000 | | | | 285,707 | |
Nordea Bank AB | | | | | | | | |
4.25%, 09/21/2022, 144A | | | 1,500,000 | | | | 1,559,007 | |
Royal Bank of Scotland Group PLC | | | | | | | | |
1.88%, 03/31/2017 | | | 245,000 | | | | 245,754 | |
6.00%, 12/19/2023 | | | 215,000 | | | | 231,398 | |
| | | | | | | | |
| | | Principal | | | Value | |
CORPORATE DEBT SECURITIES (continued) | |
Banks (continued) | | | | | | | | |
Societe Generale SA | | | | | | | | |
5.00%, 01/17/2024, 144A | | | $ 415,000 | | | | $ 423,875 | |
Wells Fargo & Co. | | | | | | | | |
2.15%, 01/15/2019 | | | 111,000 | | | | 111,493 | |
4.13%, 08/15/2023 | | | 105,000 | | | | 109,515 | |
5.38%, 11/02/2043 | | | 220,000 | | | | 245,991 | |
5.90%, 06/15/2024 (B) (F) | | | 139,000 | | | | 142,906 | |
| | | | | | | | |
| | | | | | | 10,500,897 | |
| | | | | | | | |
Beverages - 0.1% | | | | | | | | |
Anheuser-Busch InBev Finance, Inc. | | | | | | | | |
2.15%, 02/01/2019 (A) | | | 155,000 | | | | 155,069 | |
3.70%, 02/01/2024 (A) | | | 215,000 | | | | 221,275 | |
| | | | | | | | |
| | | | | | | 376,344 | |
| | | | | | | | |
Biotechnology - 0.1% | | | | | | | | |
Amgen, Inc. | | | | | | | | |
5.15%, 11/15/2041 | | | 120,000 | | | | 128,699 | |
5.65%, 06/15/2042 | | | 100,000 | | | | 114,800 | |
| | | | | | | | |
| | | | | | | 243,499 | |
| | | | | | | | |
Capital Markets - 1.1% | | | | | | | | |
Ameriprise Financial, Inc. | | | | | | | | |
3.70%, 10/15/2024 (A) | | | 470,000 | | | | 476,628 | |
Bank of New York Mellon Corp. | | | | | | | | |
Series MTN | | | | | | | | |
2.10%, 01/15/2019 | | | 155,000 | | | | 154,945 | |
Goldman Sachs Group, Inc. | | | | | | | | |
2.38%, 01/22/2018 | | | 215,000 | | | | 217,006 | |
2.90%, 07/19/2018 | | | 290,000 | | | | 296,651 | |
3.63%, 02/07/2016 - 01/22/2023 | | | 399,000 | | | | 403,914 | |
5.75%, 01/24/2022 | | | 98,000 | | | | 112,899 | |
6.25%, 02/01/2041 | | | 60,000 | | | | 74,349 | |
6.75%, 10/01/2037 | | | 65,000 | | | | 79,688 | |
Series MTN | | | | | | | | |
1.83%, 11/29/2023 (B) | | | 155,000 | | | | 159,996 | |
Macquarie Group, Ltd. | | | | | | | | |
6.25%, 01/14/2021, 144A (A) | | | 955,000 | | | | 1,091,439 | |
Morgan Stanley | | | | | | | | |
3.45%, 11/02/2015 | | | 443,000 | | | | 454,549 | |
3.80%, 04/29/2016 | | | 115,000 | | | | 119,529 | |
5.00%, 11/24/2025 | | | 215,000 | | | | 228,516 | |
Series MTN | | | | | | | | |
5.45%, 01/09/2017 | | | 425,000 | | | | 461,176 | |
UBS AG | | | | | | | | |
7.63%, 08/17/2022 | | | 730,000 | | | | 861,514 | |
| | | | | | | | |
| | | | | | | 5,192,799 | |
| | | | | | | | |
Chemicals - 0.2% | | | | | | | | |
LyondellBasell Industries NV | | | | | | | | |
5.00%, 04/15/2019 | | | 420,000 | | | | 462,999 | |
Monsanto Co. | | | | | | | | |
4.40%, 07/15/2044 | | | 375,000 | | | | 378,029 | |
| | | | | | | | |
| | | | | | | 841,028 | |
| | | | | | | | |
Commercial Services & Supplies - 0.2% | |
ERAC USA Finance LLC | | | | | | | | |
3.85%, 11/15/2024, 144A | | | 560,000 | | | | 566,396 | |
Hutchison Whampoa International 14, Ltd. | | | | | | | | |
1.63%, 10/31/2017, 144A | | | 340,000 | | | | 339,423 | |
| | | | | | | | |
| | | | | | | 905,819 | |
| | | | | | | | |
The Notes to Financial Statements are an integral part of this report.
| | |
| Transamerica Funds | | Annual Report 2014 |
Page 180
Transamerica Multi-Managed Balanced
SCHEDULE OF INVESTMENTS (continued)
At October 31, 2014
| | | | | | | | |
| | | Principal | | | Value | |
CORPORATE DEBT SECURITIES (continued) | |
Communications Equipment - 0.0% (E) | | | | | | | | |
Cisco Systems, Inc. | | | | | | | | |
2.13%, 03/01/2019 | | | $ 175,000 | | | | $ 175,693 | |
| | | | | | | | |
Construction & Engineering - 0.0% (E) | | | | | | | | |
Odebrecht Offshore Drilling Finance, Ltd. | | | | | | | | |
6.75%, 10/01/2022, 144A | | | 190,740 | | | | 199,800 | |
| | | | | | | | |
Construction Materials - 0.2% | | | | | | | | |
Martin Marietta Materials, Inc. | | | | | | | | |
4.25%, 07/02/2024, 144A | | | 705,000 | | | | 718,705 | |
| | | | | | | | |
Consumer Finance - 0.1% | | | | | | | | |
Discover Financial Services | | | | | | | | |
3.85%, 11/21/2022 | | | 217,000 | | | | 219,547 | |
| | | | | | | | |
Diversified Financial Services - 1.1% | | | | | | | | |
Bank of America Corp. | | | | | | | | |
2.60%, 01/15/2019 | | | 189,000 | | | | 190,809 | |
2.65%, 04/01/2019 | | | 770,000 | | | | 776,989 | |
4.10%, 07/24/2023 | | | 154,000 | | | | 160,769 | |
5.75%, 12/01/2017 | | | 250,000 | | | | 278,283 | |
Citigroup, Inc. | | | | | | | | |
2.50%, 09/26/2018 | | | 183,000 | | | | 185,232 | |
2.55%, 04/08/2019 (A) | | | 335,000 | | | | 338,521 | |
3.38%, 03/01/2023 | | | 163,000 | | | | 162,585 | |
4.45%, 01/10/2017 | | | 89,000 | | | | 94,742 | |
4.95%, 11/07/2043 | | | 60,000 | | | | 65,581 | |
6.68%, 09/13/2043 | | | 60,000 | | | | 76,293 | |
General Electric Capital Corp. | | | | | | | | |
7.13%, 06/15/2022 (B) (F) | | | 400,000 | | | | 466,000 | |
Series MTN | | | | | | | | |
6.88%, 01/10/2039 | | | 65,000 | | | | 89,028 | |
JPMorgan Chase & Co. | | | | | | | | |
3.20%, 01/25/2023 | | | 676,000 | | | | 670,668 | |
3.25%, 09/23/2022 | | | 123,000 | | | | 123,168 | |
4.75%, 03/01/2015 | | | 265,000 | | | | 268,728 | |
4.85%, 02/01/2044 | | | 60,000 | | | | 64,512 | |
6.75%, 02/01/2024 (B) (F) | | | 48,000 | | | | 50,573 | |
Series MTN | | | | | | | | |
1.35%, 02/15/2017 | | | 450,000 | | | | 450,668 | |
MassMutual Global Funding II | | | | | | | | |
2.35%, 04/09/2019, 144A | | | 200,000 | | | | 201,776 | |
Oaktree Capital Management, LP | | | | | | | | |
6.75%, 12/02/2019, 144A | | | 545,000 | | | | 650,704 | |
| | | | | | | | |
| | | | | | | 5,365,629 | |
| | | | | | | | |
Diversified Telecommunication Services - 0.6% | |
AT&T, Inc. | | | | | | | | |
2.30%, 03/11/2019 (A) | | | 310,000 | | | | 311,486 | |
4.35%, 06/15/2045 | | | 120,000 | | | | 112,008 | |
Intelsat Jackson Holdings SA | | | | | | | | |
7.25%, 04/01/2019 | | | 170,000 | | | | 178,500 | |
Level 3 Financing, Inc. | | | | | | | | |
8.13%, 07/01/2019 | | | 400,000 | | | | 428,000 | |
Sprint Capital Corp. | | | | | | | | |
6.88%, 11/15/2028 | | | 135,000 | | | | 131,287 | |
Verizon Communications, Inc. | | | | | | | | |
2.63%, 02/21/2020, 144A | | | 397,000 | | | | 394,880 | |
3.45%, 03/15/2021 | | | 145,000 | | | | 148,140 | |
3.85%, 11/01/2042 | | | 551,000 | | | | 485,492 | |
4.50%, 09/15/2020 | | | 140,000 | | | | 152,001 | |
6.55%, 09/15/2043 | | | 377,000 | | | | 475,248 | |
| | | | | | | | |
| | | | | | | 2,817,042 | |
| | | | | | | | |
| | | | | | | | |
| | | Principal | | | Value | |
CORPORATE DEBT SECURITIES (continued) | |
Electric Utilities - 0.6% | | | | | | | | |
CenterPoint Energy Houston Electric LLC | | | | | | | | |
4.50%, 04/01/2044 | | | $ 210,000 | | | | $ 228,035 | |
Cleveland Electric Illuminating Co. | | | | | | | | |
5.95%, 12/15/2036 | | | 125,000 | | | | 144,066 | |
8.88%, 11/15/2018 | | | 28,000 | | | | 35,061 | |
Commonwealth Edison Co. | | | | | | | | |
4.70%, 01/15/2044 (A) | | | 135,000 | | | | 150,175 | |
Duke Energy Carolinas LLC | | | | | | | | |
4.25%, 12/15/2041 | | | 134,000 | | | | 139,498 | |
Duke Energy Corp. | | | | | | | | |
3.75%, 04/15/2024 | | | 35,000 | | | | 36,327 | |
Entergy Arkansas, Inc. | | | | | | | | |
3.70%, 06/01/2024 | | | 206,000 | | | | 215,211 | |
Georgia Power Co. | | | | | | | | |
3.00%, 04/15/2016 | | | 395,000 | | | | 407,887 | |
Jersey Central Power & Light Co. | | | | | | | | |
7.35%, 02/01/2019 | | | 116,000 | | | | 138,618 | |
Niagara Mohawk Power Corp. | | | | | | | | |
4.88%, 08/15/2019, 144A | | | 410,000 | | | | 456,652 | |
Oncor Electric Delivery Co. LLC | | | | | | | | |
4.10%, 06/01/2022 | | | 42,000 | | | | 45,167 | |
5.30%, 06/01/2042 (A) | | | 75,000 | | | | 89,773 | |
Pacific Gas & Electric Co. | | | | | | | | |
4.75%, 02/15/2044 | | | 62,000 | | | | 66,505 | |
PacifiCorp | | | | | | | | |
3.60%, 04/01/2024 | | | 425,000 | | | | 442,216 | |
5.75%, 04/01/2037 | | | 125,000 | | | | 157,586 | |
Progress Energy, Inc. | | | | | | | | |
4.88%, 12/01/2019 | | | 21,000 | | | | 23,437 | |
| | | | | | | | |
| | | | | | | 2,776,214 | |
| | | | | | | | |
Energy Equipment & Services - 0.3% | | | | | | | | |
Schlumberger Investment SA | | | | | | | | |
3.65%, 12/01/2023 (A) | | | 105,000 | | | | 109,874 | |
TransCanada PipeLines, Ltd. | | | | | | | | |
3.75%, 10/16/2023 (A) | | | 120,000 | | | | 122,564 | |
4.63%, 03/01/2034 | | | 110,000 | | | | 115,535 | |
Transocean, Inc. | | | | | | | | |
6.00%, 03/15/2018 (A) | | | 647,000 | | | | 689,828 | |
6.80%, 03/15/2038 (A) | | | 110,000 | | | | 103,043 | |
Weatherford International, Ltd. | | | | | | | | |
5.95%, 04/15/2042 | | | 120,000 | | | | 127,006 | |
| | | | | | | | |
| | | | | | | 1,267,850 | |
| | | | | | | | |
Food & Staples Retailing - 0.2% | | | | | | | | |
CVS Health Corp. | | | | | | | | |
5.30%, 12/05/2043 | | | 42,000 | | | | 48,222 | |
Sysco Corp. | | | | | | | | |
2.35%, 10/02/2019 | | | 595,000 | | | | 598,558 | |
Wal-Mart Stores, Inc. | | | | | | | | |
4.00%, 04/11/2043 | | | 149,000 | | | | 148,986 | |
4.30%, 04/22/2044 (A) | | | 120,000 | | | | 125,077 | |
| | | | | | | | |
| | | | | | | 920,843 | |
| | | | | | | | |
Food Products - 0.0% (E) | | | | | | | | |
Mondelez International, Inc. | | | | | | | | |
2.25%, 02/01/2019 | | | 200,000 | | | | 199,606 | |
| | | | | | | | |
Health Care Equipment & Supplies - 0.0% (E) | |
Boston Scientific Corp. | | | | | | | | |
2.65%, 10/01/2018 | | | 187,000 | | | | 188,950 | |
| | | | | | | | |
The Notes to Financial Statements are an integral part of this report.
| | |
| Transamerica Funds | | Annual Report 2014 |
Page 181
Transamerica Multi-Managed Balanced
SCHEDULE OF INVESTMENTS (continued)
At October 31, 2014
| | | | | | | | |
| | | Principal | | | Value | |
CORPORATE DEBT SECURITIES (continued) | |
Health Care Providers & Services - 0.3% | |
Aetna, Inc. | | | | | | | | |
4.75%, 03/15/2044 (A) | | | $ 44,000 | | | | $ 46,054 | |
Coventry Health Care, Inc. | | | | | | | | |
5.45%, 06/15/2021 (A) | | | 177,000 | | | | 202,825 | |
HCA, Inc. | | | | | | | | |
7.25%, 09/15/2020 | | | 150,000 | | | | 159,000 | |
Tenet Healthcare Corp. | | | | | | | | |
6.25%, 11/01/2018 | | | 165,000 | | | | 179,231 | |
UnitedHealth Group, Inc. | | | | | | | | |
3.38%, 11/15/2021 | | | 61,000 | | | | 63,536 | |
WellPoint, Inc. | | | | | | | | |
1.88%, 01/15/2018 | | | 239,000 | | | | 239,325 | |
2.30%, 07/15/2018 | | | 564,000 | | | | 568,611 | |
3.30%, 01/15/2023 | | | 75,000 | | | | 74,175 | |
| | | | | | | | |
| | | | | | | 1,532,757 | |
| | | | | | | | |
Hotels, Restaurants & Leisure - 0.0% (E) | |
GLP Capital, LP / GLP Financing II, Inc. | | | | | | | | |
4.38%, 11/01/2018 | | | 11,000 | | | | 11,303 | |
4.88%, 11/01/2020 | | | 20,000 | | | | 20,800 | |
| | | | | | | | |
| | | | | | | 32,103 | |
| | | | | | | | |
Industrial Conglomerates - 0.0% (E) | | | | | | | | |
General Electric Co. | | | | | | | | |
4.50%, 03/11/2044 | | | 117,000 | | | | 124,724 | |
| | | | | | | | |
Insurance - 1.2% | | | | | | | | |
American International Group, Inc. | | | | | | | | |
4.13%, 02/15/2024 | | | 171,000 | | | | 180,091 | |
8.18%, 05/15/2068 (B) | | | 61,000 | | | | 82,808 | |
Genworth Holdings, Inc. | | | | | | | | |
7.63%, 09/24/2021 | | | 145,000 | | | | 176,742 | |
Hanover Insurance Group, Inc. | | | | | | | | |
6.38%, 06/15/2021 | | | 1,195,000 | | | | 1,367,342 | |
Lincoln National Corp. | | | | | | | | |
8.75%, 07/01/2019 (A) | | | 630,000 | | | | 800,135 | |
Metropolitan Life Global Funding I | | | | | | | | |
1.30%, 04/10/2017, 144A | | | 640,000 | | | | 641,340 | |
3.88%, 04/11/2022, 144A | | | 750,000 | | | | 794,966 | |
Pacific Life Insurance Co. | | | | | | | | |
9.25%, 06/15/2039, 144A | | | 705,000 | | | | 1,105,555 | |
Principal Financial Group, Inc. | | | | | | | | |
8.88%, 05/15/2019 | | | 345,000 | | | | 437,774 | |
Prudential Financial, Inc. | | | | | | | | |
Series MTN | | | | | | | | |
5.38%, 06/21/2020 | | | 228,000 | | | | 258,637 | |
7.38%, 06/15/2019 | | | 189,000 | | | | 230,003 | |
| | | | | | | | |
| | | | | | | 6,075,393 | |
| | | | | | | | |
IT Services - 0.1% | | | | | | | | |
International Business Machines Corp. | | | | | | | | |
3.63%, 02/12/2024 | | | 283,000 | | | | 288,922 | |
MasterCard, Inc. | | | | | | | | |
2.00%, 04/01/2019 | | | 173,000 | | | | 172,719 | |
3.38%, 04/01/2024 | | | 111,000 | | | | 113,381 | |
| | | | | | | | |
| | | | | | | 575,022 | |
| | | | | | | | |
Life Sciences Tools & Services - 0.1% | | | | | | | | |
Thermo Fisher Scientific, Inc. | | | | | | | | |
2.40%, 02/01/2019 | | | 443,000 | | | | 445,511 | |
5.30%, 02/01/2044 (A) | | | 23,000 | | | | 25,912 | |
| | | | | | | | |
| | | | | | | 471,423 | |
| | | | | | | | |
| | | | | | | | |
| | | Principal | | | Value | |
CORPORATE DEBT SECURITIES (continued) | |
Media - 0.6% | | | | | | | | |
CBS Corp. | | | | | | | | |
4.63%, 05/15/2018 | | | $ 78,000 | | | | $ 84,667 | |
5.75%, 04/15/2020 (A) | | | 62,000 | | | | 71,045 | |
CCO Holdings LLC / CCO Holdings Capital Corp. | | | | | | | | |
7.25%, 10/30/2017 | | | 530,000 | | | | 551,862 | |
Clear Channel Worldwide Holdings, Inc. | | | | | | | | |
6.50%, 11/15/2022 | | | 400,000 | | | | 414,000 | |
Comcast Corp. | | | | | | | | |
5.88%, 02/15/2018 | | | 313,000 | | | | 355,354 | |
Cox Communications, Inc. | | | | | | | | |
8.38%, 03/01/2039, 144A | | | 217,000 | | | | 310,273 | |
DIRECTV Holdings LLC / DIRECTV Financing Co., Inc. | | | | | | | | |
4.60%, 02/15/2021 | | | 215,000 | | | | 232,879 | |
5.00%, 03/01/2021 | | | 115,000 | | | | 126,620 | |
NBCUniversal Enterprise, Inc. | | | | | | | | |
5.25%, 03/19/2021, 144A (F) | | | 200,000 | | | | 208,339 | |
NBCUniversal Media LLC | | | | | | | | |
4.38%, 04/01/2021 | | | 189,000 | | | | 207,621 | |
4.45%, 01/15/2043 | | | 159,000 | | | | 162,069 | |
5.15%, 04/30/2020 | | | 283,000 | | | | 322,022 | |
| | | | | | | | |
| | | | | | | 3,046,751 | |
| | | | | | | | |
Metals & Mining - 0.1% | | | | | | | | |
BHP Billiton Finance USA, Ltd. | | | | | | | | |
3.85%, 09/30/2023 (A) | | | 140,000 | | | | 146,446 | |
Freeport-McMoRan, Inc. | | | | | | | | |
3.88%, 03/15/2023 (A) | | | 140,000 | | | | 138,370 | |
Novelis, Inc. | | | | | | | | |
8.75%, 12/15/2020 | | | 250,000 | | | | 272,813 | |
Rio Tinto Finance USA PLC | | | | | | | | |
2.88%, 08/21/2022 (A) | | | 119,000 | | | | 116,187 | |
| | | | | | | | |
| | | | | | | 673,816 | |
| | | | | | | | |
Multi-Utilities - 0.1% | | | | | | | | |
CMS Energy Corp. | | | | | | | | |
3.88%, 03/01/2024 (A) | | | 70,000 | | | | 72,352 | |
4.88%, 03/01/2044 | | | 152,000 | | | | 162,243 | |
Dominion Resources, Inc. | | | | | | | | |
1.95%, 08/15/2016 | | | 362,000 | | | | 367,591 | |
PG&E Corp. | | | | | | | | |
2.40%, 03/01/2019 | | | 87,000 | | | | 87,324 | |
| | | | | | | | |
| | | | | | | 689,510 | |
| | | | | | | | |
Oil, Gas & Consumable Fuels - 1.3% | | | | | | | | |
Apache Corp. | | | | | | | | |
4.25%, 01/15/2044 | | | 47,000 | | | | 43,583 | |
4.75%, 04/15/2043 | | | 65,000 | | | | 65,094 | |
BP Capital Markets PLC | | | | | | | | |
2.24%, 05/10/2019 | | | 325,000 | | | | 324,561 | |
2.75%, 05/10/2023 | | | 272,000 | | | | 259,123 | |
3.25%, 05/06/2022 | | | 140,000 | | | | 140,418 | |
3.81%, 02/10/2024 | | | 195,000 | | | | 199,492 | |
Energy Transfer Partners, LP | | | | | | | | |
5.95%, 10/01/2043 | | | 120,000 | | | | 132,598 | |
EOG Resources, Inc. | | | | | | | | |
2.45%, 04/01/2020 | | | 290,000 | | | | 288,852 | |
Exxon Mobil Corp. | | | | | | | | |
1.82%, 03/15/2019 | | | 500,000 | | | | 501,855 | |
The Notes to Financial Statements are an integral part of this report.
| | |
| Transamerica Funds | | Annual Report 2014 |
Page 182
Transamerica Multi-Managed Balanced
SCHEDULE OF INVESTMENTS (continued)
At October 31, 2014
| | | | | | | | |
| | | Principal | | | Value | |
CORPORATE DEBT SECURITIES (continued) | |
Oil, Gas & Consumable Fuels (continued) | |
Husky Energy, Inc. | | | | | | | | |
4.00%, 04/15/2024 | | | $ 140,000 | | | | $ 144,335 | |
Kerr-McGee Corp. | | | | | | | | |
6.95%, 07/01/2024 | | | 150,000 | | | | 187,400 | |
Kinder Morgan Energy Partners, LP | | | | | | | | |
2.65%, 02/01/2019 | | | 217,000 | | | | 217,094 | |
4.15%, 02/01/2024 (A) | | | 465,000 | | | | 460,404 | |
Laredo Petroleum, Inc. | | | | | | | | |
7.38%, 05/01/2022 | | | 180,000 | | | | 187,200 | |
Linn Energy LLC / Linn Energy Finance Corp. | | | | | | | | |
6.25%, 11/01/2019 | | | 240,000 | | | | 220,800 | |
MEG Energy Corp. | | | | | | | | |
6.50%, 03/15/2021, 144A | | | 150,000 | | | | 148,500 | |
Murphy Oil Corp. | | | | | | | | |
2.50%, 12/01/2017 | | | 250,000 | | | | 253,978 | |
Nexen Energy ULC | | | | | | | | |
5.88%, 03/10/2035 | | | 10,000 | | | | 11,614 | |
Noble Energy, Inc. | | | | | | | | |
5.25%, 11/15/2043 (A) | | | 85,000 | | | | 91,509 | |
6.00%, 03/01/2041 | | | 150,000 | | | | 173,988 | |
8.25%, 03/01/2019 | | | 139,000 | | | | 171,296 | |
Peabody Energy Corp. | | | | | | | | |
6.25%, 11/15/2021 (A) | | | 135,000 | | | | 127,828 | |
Petrobras Global Finance BV | | | | | | | | |
6.25%, 03/17/2024 | | | 440,000 | | | | 467,834 | |
Petroleos Mexicanos | | | | | | | | |
3.50%, 01/30/2023 | | | 145,000 | | | | 140,346 | |
Range Resources Corp. | | | | | | | | |
5.75%, 06/01/2021 | | | 40,000 | | | | 42,200 | |
Shell International Finance BV | | | | | | | | |
2.00%, 11/15/2018 | | | 283,000 | | | | 285,314 | |
4.55%, 08/12/2043 | | | 169,000 | | | | 181,457 | |
Statoil ASA | | | | | | | | |
2.90%, 11/08/2020 | | | 325,000 | | | | 333,333 | |
Total Capital International SA | | | | | | | | |
3.70%, 01/15/2024 | | | 141,000 | | | | 146,118 | |
Western Gas Partners, LP | | | | | | | | |
5.38%, 06/01/2021 | | | 225,000 | | | | 251,516 | |
Williams Cos., Inc. | | | | | | | | |
3.70%, 01/15/2023 | | | 64,000 | | | | 60,206 | |
7.88%, 09/01/2021 (A) | | | 100,000 | | | | 120,738 | |
Williams Partners, LP | | | | | | | | |
5.40%, 03/04/2044 | | | 104,000 | | | | 108,706 | |
| | | | | | | | |
| | | | | | | 6,489,290 | |
| | | | | | | | |
Paper & Forest Products - 0.1% | | | | | | | | |
International Paper Co. | | | | | | | | |
4.75%, 02/15/2022 | | | 630,000 | | | | 683,178 | |
| | | | | | | | |
Pharmaceuticals - 0.2% | | | | | | | | |
AbbVie, Inc. | | | | | | | | |
4.40%, 11/06/2042 | | | 95,000 | | | | 93,862 | |
Actavis, Inc. | | | | | | | | |
3.25%, 10/01/2022 | | | 210,000 | | | | 201,756 | |
4.63%, 10/01/2042 | | | 195,000 | | | | 177,629 | |
Bristol-Myers Squibb Co. | | | | | | | | |
4.50%, 03/01/2044 | | | 222,000 | | | | 231,901 | |
Teva Pharmaceutical Finance Co., BV | | | | | | | | |
3.65%, 11/10/2021 | | | 70,000 | | | | 71,479 | |
| | | | | | | | |
| | | | | | | 776,627 | |
| | | | | | | | |
| | | | | | | | |
| | | Principal | | | Value | |
CORPORATE DEBT SECURITIES (continued) | |
Real Estate Investment Trusts - 0.9% | | | | | | | | |
ARC Properties Operating Partnership LP / Clark Acquisition LLC | | | | | | | | |
2.00%, 02/06/2017 (A) | | | $ 875,000 | | | | $ 854,504 | |
3.00%, 02/06/2019 (A) | | | 205,000 | | | | 197,409 | |
Kilroy Realty, LP | | | | | | | | |
4.25%, 08/15/2029 | | | 865,000 | | | | 862,128 | |
Realty Income Corp. | | | | | | | | |
3.88%, 07/15/2024 | | | 750,000 | | | | 753,229 | |
Simon Property Group, LP | | | | | | | | |
3.38%, 10/01/2024 | | | 895,000 | | | | 899,760 | |
Ventas Realty, LP / Ventas Capital Corp. | | | | | | | | |
2.70%, 04/01/2020 | | | 61,000 | | | | 60,518 | |
WEA Finance LLC / Westfield UK & Europe Finance PLC | | | | | | | | |
2.70%, 09/17/2019, 144A | | | 570,000 | | | | 573,732 | |
| | | | | | | | |
| | | | | | | 4,201,280 | |
| | | | | | | | |
Road & Rail - 0.0% (E) | | | | | | | | |
Burlington Northern Santa Fe LLC | | | | | | | | |
3.00%, 03/15/2023 | | | 40,000 | | | | 39,445 | |
3.75%, 04/01/2024 | | | 37,000 | | | | 38,159 | |
| | | | | | | | |
| | | | | | | 77,604 | |
| | | | | | | | |
Semiconductors & Semiconductor Equipment - 0.1% | |
KLA-Tencor Corp. | | | | | | | | |
4.13%, 11/01/2021 | | | 520,000 | | | | 523,571 | |
| | | | | | | | |
Software - 0.1% | | | | | | | | |
First Data Corp. | | | | | | | | |
7.38%, 06/15/2019, 144A | | | 200,000 | | | | 212,000 | |
| | | | | | | | |
Technology Hardware, Storage & Peripherals - 0.1% | |
Hewlett-Packard Co. | | | | | | | | |
3.75%, 12/01/2020 | | | 215,000 | | | | 220,535 | |
| | | | | | | | |
Tobacco - 0.1% | | | | | | | | |
Altria Group, Inc. | | | | | | | | |
4.00%, 01/31/2024 (A) | | | 114,000 | | | | 118,006 | |
Philip Morris International, Inc. | | | | | | | | |
1.88%, 01/15/2019 | | | 243,000 | | | | 242,475 | |
4.88%, 11/15/2043 | | | 81,000 | | | | 87,895 | |
| | | | | | | | |
| | | | | | | 448,376 | |
| | | | | | | | |
Wireless Telecommunication Services - 0.2% | |
America Movil SAB de CV | | | | | | | | |
2.38%, 09/08/2016 | | | 300,000 | | | | 307,137 | |
3.13%, 07/16/2022 | | | 200,000 | | | | 196,578 | |
Sprint Communications, Inc. | | | | | | | | |
9.00%, 11/15/2018, 144A | | | 305,000 | | | | 358,756 | |
Sprint Corp. | | | | | | | | |
7.88%, 09/15/2023, 144A | | | 155,000 | | | | 167,787 | |
T-Mobile USA, Inc. | | | | | | | | |
6.46%, 04/28/2019 | | | 20,000 | | | | 20,850 | |
6.63%, 04/28/2021 | | | 55,000 | | | | 57,956 | |
6.73%, 04/28/2022 | | | 55,000 | | | | 58,163 | |
6.84%, 04/28/2023 | | | 15,000 | | | | 15,863 | |
| | | | | | | | |
| | | | | | | 1,183,090 | |
| | | | | | | | |
Total Corporate Debt Securities
(Cost $62,660,427) | | | | | | | 63,725,814 | |
| | | | | | | | |
The Notes to Financial Statements are an integral part of this report.
| | |
| Transamerica Funds | | Annual Report 2014 |
Page 183
Transamerica Multi-Managed Balanced
SCHEDULE OF INVESTMENTS (continued)
At October 31, 2014
| | | | | | | | |
| | | Principal | | | Value | |
SHORT-TERM U.S. GOVERNMENT OBLIGATIONS - 4.9% | |
U.S. Treasury Bill | | | | | | | | |
0.01%, 12/11/2014 (G) | | | $ 14,970,400 | | | | $ 14,970,146 | |
0.02%, 11/06/2014 (G) | | | 5,783,600 | | | | 5,783,584 | |
0.03%, 11/20/2014 (G) | | | 2,810,000 | | | | 2,809,962 | |
0.08%, 05/28/2015 (G) (H) | | | 300,000 | | | | 299,861 | |
| | | | | | | | |
Total Short-Term U.S. Government Obligations
(Cost $23,863,553) | | | | 23,863,553 | |
| | | | | | | | |
| | |
| | | Shares | | | Value | |
PREFERRED STOCKS - 0.1% | | | | | | | | |
Capital Markets - 0.0% (E) | | | | | | | | |
State Street Corp. | | | | | | | | |
Series D
| | | | | | | | |
5.90% (B) | | | 3,072 | | | | 80,179 | |
| | | | | | | | |
Diversified Financial Services - 0.1% | |
Citigroup Capital XIII
7.88% (B) | | | 12,963 | | | | 345,075 | |
| | | | | | | | |
Electric Utilities - 0.0% (E) | | | | | | | | |
SCE Trust III
5.75% (A) (B) | | | 960 | | | | 25,958 | |
| | | | | | | | |
Total Preferred Stocks
(Cost $456,527) | | | | | | | 451,212 | |
| | | | | | | | |
| | |
COMMON STOCKS - 59.8% | | | | | | | | |
Aerospace & Defense - 1.8% | | | | | | | | |
Honeywell International, Inc. | | | 34,766 | | | | 3,341,708 | |
L-3 Communications Holdings, Inc. | | | 8,208 | | | | 996,944 | |
United Technologies Corp. | | | 41,168 | | | | 4,404,976 | |
| | | | | | | | |
| | | | | | | 8,743,628 | |
| | | | | | | | |
Airlines - 0.4% | | | | | | | | |
Delta Air Lines, Inc. | | | 22,529 | | | | 906,342 | |
United Continental Holdings, Inc. (I) | | | 19,529 | | | | 1,031,326 | |
| | | | | | | | |
| | | | | | | 1,937,668 | |
| | | | | | | | |
Auto Components - 0.0% (E) | | | | | | | | |
Johnson Controls, Inc. | | | 3,685 | | | | 174,116 | |
| | | | | | | | |
Automobiles - 0.3% | | | | | | | | |
General Motors Co. | | | 52,080 | | | | 1,635,312 | |
| | | | | | | | |
Banks - 1.8% | | | | | | | | |
BB&T Corp. | | | 26,834 | | | | 1,016,472 | |
PNC Financial Services Group, Inc. | | | 6,621 | | | | 571,988 | |
SVB Financial Group (I) | | | 2,606 | | | | 291,846 | |
Wells Fargo & Co. | | | 128,319 | | | | 6,812,456 | |
| | | | | | | | |
| | | | | | | 8,692,762 | |
| | | | | | | | |
Beverages - 1.5% | | | | | | | | |
Coca-Cola Co. | | | 81,711 | | | | 3,422,057 | |
Coca-Cola Enterprises, Inc. | | | 9,052 | | | | 392,404 | |
Constellation Brands, Inc., Class A (I) | | | 17,473 | | | | 1,599,478 | |
Dr. Pepper Snapple Group, Inc. | | | 9,023 | | | | 624,843 | |
Molson Coors Brewing Co., Class B | | | 11,813 | | | | 878,651 | |
PepsiCo, Inc. | | | 3,935 | | | | 378,429 | |
| | | | | | | | |
| | | | | | | 7,295,862 | |
| | | | | | | | |
Biotechnology - 2.0% | | | | | | | | |
Alexion Pharmaceuticals, Inc. (I) | | | 4,747 | | | | 908,386 | |
Amgen, Inc. | | | 1,025 | | | | 166,234 | |
Biogen Idec, Inc. (I) | | | 8,896 | | | | 2,856,328 | |
Celgene Corp. (I) | | | 31,151 | | | | 3,335,960 | |
| | | | | | | | |
| | | Shares | | | Value | |
COMMON STOCKS (continued) | |
Biotechnology (continued) | | | | | | | | |
Gilead Sciences, Inc. (I) | | | 14,332 | | | | $ 1,605,184 | |
Vertex Pharmaceuticals, Inc. (I) | | | 7,523 | | | | 847,391 | |
| | | | | | | | |
| | | | | | | 9,719,483 | |
| | | | | | | | |
Building Products - 0.2% | | | | | | | | |
Fortune Brands Home & Security, Inc. (A) | | | 3,640 | | | | 157,430 | |
Masco Corp. | | | 25,780 | | | | 568,965 | |
| | | | | | | | |
| | | | | | | 726,395 | |
| | | | | | | | |
Capital Markets - 1.9% | | | | | | | | |
Charles Schwab Corp. | | | 68,781 | | | | 1,971,951 | |
Goldman Sachs Group, Inc. | | | 6,790 | | | | 1,290,032 | |
Invesco, Ltd. | | | 47,418 | | | | 1,919,007 | |
Morgan Stanley | | | 74,766 | | | | 2,613,072 | |
State Street Corp. | | | 17,974 | | | | 1,356,318 | |
| | | | | | | | |
| | | | | | | 9,150,380 | |
| | | | | | | | |
Chemicals - 0.8% | | | | | | | | |
Axiall Corp. | | | 9,335 | | | | 376,201 | |
Dow Chemical Co. | | | 12,146 | | | | 600,012 | |
E.I. du Pont de Nemours & Co. | | | 12,873 | | | | 890,168 | |
Monsanto Co. | | | 6,871 | | | | 790,440 | |
Mosaic Co. | | | 31,787 | | | | 1,408,482 | |
| | | | | | | | |
| | | | | | | 4,065,303 | |
| | | | | | | | |
Commercial Services & Supplies - 0.1% | |
Tyco International, Ltd. | | | 6,264 | | | | 268,914 | |
| | | | | | | | |
Communications Equipment - 1.3% | | | | | | | | |
Cisco Systems, Inc. | | | 128,631 | | | | 3,147,600 | |
QUALCOMM, Inc. | | | 41,690 | | | | 3,273,082 | |
| | | | | | | | |
| | | | | | | 6,420,682 | |
| | | | | | | | |
Construction & Engineering - 0.5% | | | | | | | | |
Fluor Corp. | | | 34,918 | | | | 2,316,460 | |
| | | | | | | | |
Construction Materials - 0.1% | | | | | | | | |
Martin Marietta Materials, Inc. (A) | | | 4,216 | | | | 492,935 | |
| | | | | | | | |
Consumer Finance - 0.2% | | | | | | | | |
Capital One Financial Corp. | | | 11,776 | | | | 974,699 | |
Navient Corp. | | | 3,997 | | | | 79,061 | |
| | | | | | | | |
| | | | | | | 1,053,760 | |
| | | | | | | | |
Containers & Packaging - 0.2% | | | | | | | | |
Crown Holdings, Inc. (I) | | | 16,784 | | | | 804,457 | |
Sealed Air Corp., Class A | | | 3,198 | | | | 115,928 | |
| | | | | | | | |
| | | | | | | 920,385 | |
| | | | | | | | |
Diversified Financial Services - 2.6% | | | | | | | | |
Bank of America Corp. | | | 282,720 | | | | 4,851,475 | |
Berkshire Hathaway, Inc., Class B (I) | | | 22,377 | | | | 3,136,360 | |
Citigroup, Inc. | | | 72,530 | | | | 3,882,531 | |
Intercontinental Exchange, Inc. | | | 5,222 | | | | 1,087,691 | |
| | | | | | | | |
| | | | | | | 12,958,057 | |
| | | | | | | | |
Diversified Telecommunication Services - 0.9% | |
AT&T, Inc. | | | 1,364 | | | | 47,522 | |
Verizon Communications, Inc. | | | 89,226 | | | | 4,483,606 | |
| | | | | | | | |
| | | | | | | 4,531,128 | |
| | | | | | | | |
Electric Utilities - 1.3% | | | | | | | | |
Edison International | | | 33,826 | | | | 2,116,831 | |
Entergy Corp., Class B | | | 10,475 | | | | 880,109 | |
Exelon Corp. (A) | | | 31,917 | | | | 1,167,843 | |
NextEra Energy, Inc. | | | 20,735 | | | | 2,078,062 | |
The Notes to Financial Statements are an integral part of this report.
| | |
| Transamerica Funds | | Annual Report 2014 |
Page 184
Transamerica Multi-Managed Balanced
SCHEDULE OF INVESTMENTS (continued)
At October 31, 2014
| | | | | | | | |
| | | Shares | | | Value | |
COMMON STOCKS (continued) | |
Electric Utilities (continued) | | | | | | | | |
Xcel Energy, Inc. | | | 10,232 | | | | $ 342,465 | |
| | | | | | | | |
| | | | | | | 6,585,310 | |
| | | | | | | | |
Electrical Equipment - 0.9% | | | | | | | | |
Eaton Corp. PLC | | | 31,437 | | | | 2,149,976 | |
Emerson Electric Co. | | | 31,475 | | | | 2,016,289 | |
| | | | | | | | |
| | | | | | | 4,166,265 | |
| | | | | | | | |
Electronic Equipment, Instruments & Components - 0.2% | |
Corning, Inc. | | | 20,601 | | | | 420,878 | |
TE Connectivity, Ltd. | | | 8,382 | | | | 512,392 | |
| | | | | | | | |
| | | | | | | 933,270 | |
| | | | | | | | |
Energy Equipment & Services - 1.2% | | | | | | | | |
Baker Hughes, Inc. | | | 10,331 | | | | 547,130 | |
Ensco PLC, Class A (A) | | | 16,639 | | | | 675,377 | |
Halliburton Co. | | | 33,545 | | | | 1,849,671 | |
Schlumberger, Ltd. | | | 28,066 | | | | 2,768,992 | |
| | | | | | | | |
| | | | | | | 5,841,170 | |
| | | | | | | | |
Food & Staples Retailing - 1.2% | | | | | | | | |
Costco Wholesale Corp. | | | 12,954 | | | | 1,727,675 | |
CVS Health Corp. | | | 35,952 | | | | 3,085,041 | |
Kroger Co. | | | 8,057 | | | | 448,855 | |
Wal-Mart Stores, Inc. | | | 7,243 | | | | 552,424 | |
| | | | | | | | |
| | | | | | | 5,813,995 | |
| | | | | | | | |
Food Products - 1.0% | | | | | | | | |
Archer-Daniels-Midland Co. | | | 27,098 | | | | 1,273,606 | |
General Mills, Inc. | | | 4,002 | | | | 207,944 | |
Kellogg Co. | | | 5,263 | | | | 336,622 | |
Mondelez International, Inc., Class A | | | 86,409 | | | | 3,046,781 | |
| | | | | | | | |
| | | | | | | 4,864,953 | |
| | | | | | | | |
Gas Utilities - 0.1% | | | | | | | | |
Atmos Energy Corp. | | | 2,300 | | | | 121,900 | |
Questar Corp. | | | 11,400 | | | | 274,854 | |
| | | | | | | | |
| | | | | | | 396,754 | |
| | | | | | | | |
Health Care Equipment & Supplies - 1.5% | |
Abbott Laboratories | | | 69,553 | | | | 3,031,815 | |
Boston Scientific Corp. (I) | | | 152,818 | | | | 2,029,423 | |
CareFusion Corp., Class A (I) | | | 15,153 | | | | 869,327 | |
Covidien PLC | | | 3,436 | | | | 317,624 | |
Stryker Corp. | | | 15,305 | | | | 1,339,647 | |
| | | | | | | | |
| | | | | | | 7,587,836 | |
| | | | | | | | |
Health Care Providers & Services - 1.3% | | | | | | | | |
Aetna, Inc. | | | 14,720 | | | | 1,214,547 | |
Humana, Inc., Class A | | | 14,796 | | | | 2,054,424 | |
McKesson Corp. | | | 5,497 | | | | 1,118,145 | |
UnitedHealth Group, Inc. | | | 18,379 | | | | 1,746,189 | |
| | | | | | | | |
| | | | | | | 6,133,305 | |
| | | | | | | | |
Hotels, Restaurants & Leisure - 0.6% | | | | | | | | |
McDonald’s Corp. | | | 760 | | | | 71,235 | |
Royal Caribbean Cruises, Ltd., Class A | | | 15,555 | | | | 1,057,273 | |
Starbucks Corp. | | | 16,977 | | | | 1,282,782 | |
Yum! Brands, Inc. | | | 4,039 | | | | 290,122 | |
| | | | | | | | |
| | | | | | | 2,701,412 | |
| | | | | | | | |
Household Durables - 0.4% | | | | | | | | |
Harman International Industries, Inc. | | | 11,513 | | | | 1,235,806 | |
NVR, Inc. (A) (I) | | | 129 | | | | 158,358 | |
| | | | | | | | |
| | | Shares | | | Value | |
COMMON STOCKS (continued) | |
Household Durables (continued) | | | | | | | | |
PulteGroup, Inc. (A) | | | 35,965 | | | | $ 690,168 | |
| | | | | | | | |
| | | | | | | 2,084,332 | |
| | | | | | | | |
Household Products - 1.3% | | | | | | | | |
Kimberly-Clark Corp. | | | 15,057 | | | | 1,720,564 | |
Procter & Gamble Co. | | | 53,490 | | | | 4,668,072 | |
| | | | | | | | |
| | | | | | | 6,388,636 | |
| | | | | | | | |
Industrial Conglomerates - 0.4% | | | | | | | | |
General Electric Co. | | | 83,346 | | | | 2,151,160 | |
| | | | | | | | |
Insurance - 1.7% | | | | | | | | |
ACE, Ltd. | | | 25,074 | | | | 2,740,588 | |
American International Group, Inc. | | | 10,822 | | | | 579,735 | |
Axis Capital Holdings, Ltd. | | | 8,899 | | | | 428,398 | |
Hartford Financial Services Group, Inc. | | | 8,478 | | | | 335,559 | |
Marsh & McLennan Cos., Inc. | | | 19,677 | | | | 1,069,838 | |
MetLife, Inc. | | | 47,633 | | | | 2,583,614 | |
Prudential Financial, Inc. | | | 6,370 | | | | 564,000 | |
Willis Group Holdings PLC | | | 3,400 | | | | 137,802 | |
| | | | | | | | |
| | | | | | | 8,439,534 | |
| | | | | | | | |
Internet & Catalog Retail - 0.6% | | | | | | | | |
Amazon.com, Inc. (I) | | | 3,012 | | | | 920,046 | |
Expedia, Inc. | | | 3,284 | | | | 279,041 | |
Priceline Group, Inc. (I) | | | 1,356 | | | | 1,635,621 | |
| | | | | | | | |
| | | | | | | 2,834,708 | |
| | | | | | | | |
Internet Software & Services - 2.0% | | | | | | | | |
eBay, Inc. (I) | | | 9,522 | | | | 499,905 | |
Facebook, Inc., Class A (I) | | | 39,121 | | | | 2,933,684 | |
Google, Inc., Class A (I) | | | 5,435 | | | | 3,086,373 | |
Google, Inc., Class C (I) | | | 5,797 | | | | 3,240,987 | |
| | | | | | | | |
| | | | | | | 9,760,949 | |
| | | | | | | | |
IT Services - 1.9% | | | | | | | | |
Accenture PLC, Class A | | | 25,323 | | | | 2,054,202 | |
Alliance Data Systems Corp. (I) | | | 1,706 | | | | 483,395 | |
Cognizant Technology Solutions Corp., Class A (I) | | | 28,475 | | | | 1,391,004 | |
Fidelity National Information Services, Inc. | | | 11,268 | | | | 657,938 | |
International Business Machines Corp. | | | 6,654 | | | | 1,093,918 | |
Visa, Inc., Class A | | | 13,968 | | | | 3,372,294 | |
Xerox Corp. | | | 9,613 | | | | 127,661 | |
| | | | | | | | |
| | | | | | | 9,180,412 | |
| | | | | | | | |
Machinery - 0.7% | | | | | | | | |
Deere & Co. (A) | | | 5,901 | | | | 504,771 | |
PACCAR, Inc. | | | 41,613 | | | | 2,718,161 | |
Snap-on, Inc. | | | 969 | | | | 128,044 | |
SPX Corp. | | | 3,309 | | | | 313,660 | |
| | | | | | | | |
| | | | | | | 3,664,636 | |
| | | | | | | | |
Media - 2.7% | | | | | | | | |
Charter Communications, Inc., Class A (I) | | | 3,643 | | | | 577,015 | |
Comcast Corp., Class A | | | 70,798 | | | | 3,918,669 | |
DIRECTV (I) | | | 2,864 | | | | 248,567 | |
DISH Network Corp., Class A (I) | | | 11,302 | | | | 719,372 | |
Omnicom Group, Inc. | | | 1,900 | | | | 136,534 | |
Time Warner Cable, Inc. | | | 4,476 | | | | 658,912 | |
Time Warner, Inc. | | | 46,936 | | | | 3,730,004 | |
Time, Inc. (I) | | | 6,304 | | | | 142,407 | |
Twenty-First Century Fox, Inc., Class A | | | 46,467 | | | | 1,602,182 | |
The Notes to Financial Statements are an integral part of this report.
| | |
| Transamerica Funds | | Annual Report 2014 |
Page 185
Transamerica Multi-Managed Balanced
SCHEDULE OF INVESTMENTS (continued)
At October 31, 2014
| | | | | | | | |
| | | Shares | | | Value | |
COMMON STOCKS (continued) | |
Media (continued) | | | | | | | | |
Walt Disney Co. | | | 17,030 | | | | $ 1,556,202 | |
| | | | | | | | |
| | | | | | | 13,289,864 | |
| | | | | | | | |
Metals & Mining - 0.6% | | | | | | | | |
Alcoa, Inc. | | | 98,639 | | | | 1,653,190 | |
Freeport-McMoRan, Inc. | | | 2,883 | | | | 82,165 | |
U.S. Steel Corp. (A) | | | 27,559 | | | | 1,103,462 | |
| | | | | | | | |
| | | | | | | 2,838,817 | |
| | | | | | | | |
Multi-Utilities - 0.8% | | | | | | | | |
CenterPoint Energy, Inc. | | | 27,846 | | | | 683,619 | |
CMS Energy Corp. | | | 22,770 | | | | 743,896 | |
Dominion Resources, Inc. | | | 9,491 | | | | 676,708 | |
NiSource, Inc., Class B | | | 33,906 | | | | 1,426,086 | |
Public Service Enterprise Group, Inc. | | | 7,573 | | | | 312,841 | |
Sempra Energy | | | 1,326 | | | | 145,860 | |
| | | | | | | | |
| | | | | | | 3,989,010 | |
| | | | | | | | |
Multiline Retail - 0.2% | | | | | | | | |
Dollar General Corp. (I) | | | 8,557 | | | | 536,267 | |
Dollar Tree, Inc. (I) | | | 3,132 | | | | 189,705 | |
| | | | | | | | |
| | | | | | | 725,972 | |
| | | | | | | | |
Oil, Gas & Consumable Fuels - 3.9% | | | | | | | | |
Anadarko Petroleum Corp., Class A | | | 2,183 | | | | 200,356 | |
Cheniere Energy, Inc. (I) | | | 4,813 | | | | 360,975 | |
Chevron Corp. | | | 42,674 | | | | 5,118,746 | |
EOG Resources, Inc. | | | 13,401 | | | | 1,273,765 | |
EQT Corp. | | | 5,867 | | | | 551,733 | |
Exxon Mobil Corp. | | | 56,338 | | | | 5,448,448 | |
Hess Corp. | | | 180 | | | | 15,266 | |
Marathon Oil Corp. | | | 51,286 | | | | 1,815,524 | |
Occidental Petroleum Corp. | | | 30,323 | | | | 2,696,624 | |
Phillips 66 | | | 19,676 | | | | 1,544,566 | |
Pioneer Natural Resources Co. | | | 27 | | | | 5,105 | |
QEP Resources, Inc. | | | 9,239 | | | | 231,622 | |
| | | | | | | | |
| | | | | | | 19,262,730 | |
| | | | | | | | |
Personal Products - 0.1% | | | | | | | | |
Estee Lauder Cos., Inc., Class A | | | 9,411 | | | | 707,519 | |
| | | | | | | | |
Pharmaceuticals - 3.6% | | | | | | | | |
Actavis PLC (I) | | | 2,993 | | | | 726,521 | |
Allergan, Inc. | | | 4,868 | | | | 925,212 | |
Bristol-Myers Squibb Co. | | | 57,546 | | | | 3,348,602 | |
Johnson & Johnson | | | 71,761 | | | | 7,734,400 | |
Merck & Co., Inc. | | | 52,500 | | | | 3,041,850 | |
Perrigo Co. PLC | | | 4,095 | | | | 661,138 | |
Pfizer, Inc. | | | 40,624 | | | | 1,216,689 | |
| | | | | | | | |
| | | | | | | 17,654,412 | |
| | | | | | | | |
Real Estate Investment Trusts - 1.4% | | | | | | | | |
AvalonBay Communities, Inc. | | | 7,040 | | | | 1,097,113 | |
Boston Properties, Inc. | | | 4,125 | | | | 522,844 | |
Brixmor Property Group, Inc. | | | 17,700 | | | | 431,172 | |
DiamondRock Hospitality Co. | | | 32,586 | | | | 467,609 | |
Essex Property Trust, Inc. (A) | | | 764 | | | | 154,145 | |
Extra Space Storage, Inc. | | | 2,616 | | | | 152,146 | |
Highwoods Properties, Inc. | | | 8,655 | | | | 371,040 | |
Host Hotels & Resorts, Inc. | | | 17,417 | | | | 405,990 | |
Liberty Property Trust, Series C | | | 15,165 | | | | 527,287 | |
Mid-America Apartment Communities, Inc. | | | 4,039 | | | | 285,396 | |
| | | | | | | | |
| | | Shares | | | Value | |
COMMON STOCKS (continued) | |
Real Estate Investment Trusts (continued) | |
Omega Healthcare Investors, Inc. (A) | | | 3,837 | | | | $ 146,420 | |
Prologis, Inc., Class A | | | 19,369 | | | | 806,719 | |
Public Storage | | | 990 | | | | 182,497 | |
Simon Property Group, Inc. | | | 7,756 | | | | 1,389,953 | |
| | | | | | | | |
| | | | | | | 6,940,331 | |
| | | | | | | | |
Road & Rail - 1.6% | | | | | | | | |
Canadian Pacific Railway, Ltd. | | | 3,314 | | | | 688,252 | |
CSX Corp. | | | 75,415 | | | | 2,687,036 | |
Union Pacific Corp. | | | 37,827 | | | | 4,404,954 | |
| | | | | | | | |
| | | | | | | 7,780,242 | |
| | | | | | | | |
Semiconductors & Semiconductor Equipment - 1.5% | |
Avago Technologies, Ltd., Class A | | | 21,098 | | | | 1,819,702 | |
Broadcom Corp., Class A | | | 42,668 | | | | 1,786,936 | |
Freescale Semiconductor, Ltd. (A) (I) | | | 19,380 | | | | 385,468 | |
KLA-Tencor Corp. | | | 8,531 | | | | 675,229 | |
LAM Research Corp. | | | 29,935 | | | | 2,330,739 | |
Teradyne, Inc. (A) | | | 7,800 | | | | 143,520 | |
| | | | | | | | |
| | | | | | | 7,141,594 | |
| | | | | | | | |
Software - 2.5% | | | | | | | | |
Adobe Systems, Inc. (I) | | | 29,863 | | | | 2,093,993 | |
Citrix Systems, Inc. (I) | | | 16,707 | | | | 1,073,091 | |
Microsoft Corp. | | | 151,884 | | | | 7,130,954 | |
Oracle Corp. | | | 42,080 | | | | 1,643,224 | |
VMware, Inc., Class A (A) (I) | | | 3,970 | | | | 331,773 | |
| | | | | | | | |
| | | | | | | 12,273,035 | |
| | | | | | | | |
Specialty Retail - 2.1% | | | | | | | | |
AutoZone, Inc. (A) (I) | | | 2,976 | | | | 1,647,276 | |
Gap, Inc., Class A | | | 2,127 | | | | 80,592 | |
Home Depot, Inc. | | | 40,104 | | | | 3,910,942 | |
Lowe’s Cos., Inc. | | | 50,582 | | | | 2,893,290 | |
Tiffany & Co. (A) | | | 1,724 | | | | 165,711 | |
TJX Cos., Inc. | | | 28,831 | | | | 1,825,579 | |
| | | | | | | | |
| | | | | | | 10,523,390 | |
| | | | | | | | |
Technology Hardware, Storage & Peripherals - 2.5% | |
Apple, Inc. | | | 100,613 | | | | 10,866,204 | |
EMC Corp. | | | 7,972 | | | | 229,035 | |
Hewlett-Packard Co. | | | 37,495 | | | | 1,345,321 | |
| | | | | | | | |
| | | | | | | 12,440,560 | |
| | | | | | | | |
Textiles, Apparel & Luxury Goods - 0.6% | |
lululemon athletica, Inc. (A) (I) | | | 6,771 | | | | 282,012 | |
Ralph Lauren Corp. | | | 5,708 | | | | 940,907 | |
VF Corp. | | | 26,014 | | | | 1,760,627 | |
| | | | | | | | |
| | | | | | | 2,983,546 | |
| | | | | | | | |
Tobacco - 0.7% | |
Philip Morris International, Inc. | | | 38,935 | | | | 3,465,604 | |
| | | | | | | | |
Trading Companies & Distributors - 0.1% | |
WW Grainger, Inc. (A) | | | 2,888 | | | | 712,758 | |
| | | | | | | | |
Total Common Stocks
(Cost $211,551,828) | | | | 293,361,251 | |
| | | | | | | | |
|
SECURITIES LENDING COLLATERAL - 3.4% | |
State Street Navigator Securities Lending Trust - Prime Portfolio
0.16% (G) | | | 16,891,406 | | | | 16,891,406 | |
| | | | | | | | |
Total Securities Lending Collateral
(Cost $16,891,406) | | | | 16,891,406 | |
| | | | | | | | |
The Notes to Financial Statements are an integral part of this report.
| | |
| Transamerica Funds | | Annual Report 2014 |
Page 186
Transamerica Multi-Managed Balanced
SCHEDULE OF INVESTMENTS (continued)
At October 31, 2014
| | | | | | | | |
| | | Principal | | | Value | |
REPURCHASE AGREEMENT - 2.0% | |
State Street Bank & Trust Co.
0.01% (G), dated 10/31/2014, to be repurchased at $9,946,845 on 11/03/2014. Collateralized by U.S. Government Agency Obligations, 2.50% - 3.50%, due 11/01/2027 - 01/01/2032, and with a total value of $10,149,353. | | | $ 9,946,837 | | | | $ 9,946,837 | |
| | | | | | | | |
Total Repurchase Agreement
(Cost $9,946,837) | | | | 9,946,837 | |
| | | | | | | | |
Total Investments
(Cost $445,473,000) (J) | | | | 529,565,386 | |
Net Other Assets (Liabilities) - (8.0)% | | | | (39,029,560 | ) |
| | | | | | | | |
| | |
Net Assets - 100.0% | | | | | | | $ 490,535,826 | |
| | | | | | | | |
| | | | | | | | | | | | | | | | |
| FUTURES CONTRACTS: | | | | | | | | | | | | |
| Description | | Type | | | Contracts | | | Expiration
Date | | | Net Unrealized
Appreciation
(Depreciation) | |
S&P 500 E-Mini Index | | | Long | | | | 54 | | | | 12/19/2014 | | | $ | 144,592 | |
| | | | | | | | | | | | | | | | |
SECURITY VALUATION:
Valuation Inputs (K)
| | | | | | | | | | | | | | | | |
| | | Level 1
Quoted Prices | | | Level 2
Other Significant
Observable Inputs | | | Level 3
Significant
Unobservable Inputs (L) | | | Value at
October 31, 2014 | |
ASSETS | | | | | | | | | | | | | | | | |
Investments | | | | | | | | | | | | | | | | |
U.S. Government Obligations | | $ | — | | | $ | 39,330,895 | | | $ | — | | | $ | 39,330,895 | |
U.S. Government Agency Obligations | | | — | | | | 29,328,769 | | | | — | | | | 29,328,769 | |
Foreign Government Obligations | | | — | | | | 2,187,249 | | | | — | | | | 2,187,249 | |
Mortgage-Backed Securities | | | — | | | | 23,869,536 | | | | 175,323 | | | | 24,044,859 | |
Asset-Backed Securities | | | — | | | | 22,727,676 | | | | — | | | | 22,727,676 | |
Municipal Government Obligations | | | — | | | | 962,350 | | | | — | | | | 962,350 | |
Preferred Corporate Debt Securities | | | — | | | | 2,743,515 | | | | — | | | | 2,743,515 | |
Corporate Debt Securities | | | — | | | | 63,725,814 | | | | — | | | | 63,725,814 | |
Short-Term U.S. Government Obligations | | | — | | | | 23,863,553 | | | | — | | | | 23,863,553 | |
Preferred Stocks | | | 451,212 | | | | — | | | | — | | | | 451,212 | |
Common Stocks | | | 293,361,251 | | | | — | | | | — | | | | 293,361,251 | |
Securities Lending Collateral | | | 16,891,406 | | | | — | | | | — | | | | 16,891,406 | |
Repurchase Agreement | | | — | | | | 9,946,837 | | | | — | | | | 9,946,837 | |
| | | | | | | | | | | | | | | | |
Total Investments | | $ | 310,703,869 | | | $ | 218,686,194 | | | $ | 175,323 | | | $ | 529,565,386 | |
| | | | | | | | | | | | | | | | |
Derivative Financial Instruments | | | | | | | | | | | | | | | | |
Futures Contracts (M) | | $ | 144,592 | | | $ | — | | | $ | — | | | $ | 144,592 | |
| | | | | | | | | | | | | | | | |
Total Derivative Financial Instruments | | $ | 144,592 | | | $ | — | | | $ | — | | | $ | 144,592 | |
| | | | | | | | | | | | | | | | |
| | | | | | | | | | | | | | | | |
| Investments | | Transfer from
Level 1 to Level 2 | | | Transfer from
Level 2 to Level 1 | | | Transfer from
Level 2 to Level 3 (N) | | | Transfer from
Level 3 to Level 2 | |
Mortgage-Backed Securities | | $ | — | | | $ | — | | | $ | 175,323 | | | $ | — | |
| | | | | | | | | | | | | | | | |
The Notes to Financial Statements are an integral part of this report.
| | |
| Transamerica Funds | | Annual Report 2014 |
Page 187
Transamerica Multi-Managed Balanced
SCHEDULE OF INVESTMENTS (continued)
At October 31, 2014
FOOTNOTES TO SCHEDULE OF INVESTMENTS:
| (A) | All or a portion of this security is on loan. The value of all securities on loan is $16,525,148. The amount of securities on loan indicated may not correspond with the securities on loan identified because securities with pending sales are in the process of recall from the brokers. |
| (B) | Floating or variable rate security. Rate is listed as of October 31, 2014. |
| (C) | Fair valued as determined in good faith in accordance with procedures established by the board of trustees. Total aggregate fair value of securities is $175,323, or 0.04% of the Fund’s net assets. |
| (D) | When-issued security. A conditional transaction in a security authorized for issuance, but not yet issued. |
| (E) | Percentage rounds to less than 0.1% or (0.1)%. |
| (F) | The security has a perpetual maturity. The date shown is the next call date. |
| (G) | Rate shown reflects the yield at October 31, 2014. |
| (H) | All or a portion of this security has been segregated by the custodian with the broker as collateral to cover margin requirements for open futures contracts. Total value of securities segregated as collateral to cover margin requirements for open futures contracts is $299,774. |
| (I) | Non-income producing security. |
| (J) | Aggregate cost for federal income tax purposes is $448,614,830. Aggregate gross unrealized appreciation and depreciation for all securities is $82,408,442 and $1,457,886, respectively. Net unrealized appreciation for tax purposes is $80,950,556. |
| (K) | The Fund recognizes transfers between Levels at the end of the reporting period. See the Notes to Financial Statements for more information regarding security valuation and pricing inputs. |
| (L) | Level 3 securities were not considered significant to the Fund. |
| (M) | Derivative financial instruments valued at unrealized appreciation (depreciation) on the instrument. |
| (N) | Transferred from Level 2 to 3 due to utilizing significant unobservable inputs, as of prior reporting period the security utilized significant observable inputs. |
DEFINITIONS:
| | |
| 144A | | 144A securities are registered pursuant to Rule 144A of the Securities Act of 1933. These securities are deemed to be liquid for purposes of compliance limitations on holdings of illiquid securities and may be resold as transactions exempt from registration, normally to qualified institutional buyers. At October 31, 2014, these securities aggregated $51,026,637, or 10.40% of the Fund’s net assets. |
| IO | | Interest only portion of a STRIPS (Separate Trading of Registered Interest and Principal of Securities) |
| MTN | | Medium Term Note |
| TBA | | To Be Announced |
The Notes to Financial Statements are an integral part of this report.
| | |
| Transamerica Funds | | Annual Report 2014 |
Page 188
Transamerica Opportunistic Allocation
SCHEDULE OF INVESTMENTS
At October 31, 2014
| | | | | | | | |
| | | Shares | | | Value | |
INVESTMENT COMPANIES - 94.0% | | | | | | | | |
Capital Markets - 90.8% | | | | | | | | |
Adams Express Co. | | | 2,384 | | | | $ 34,020 | |
AllianceBernstein Income Fund, Inc. | | | 4,209 | | | | 32,073 | |
BlackRock Build America Bond Trust | | | 1,470 | | | | 31,590 | |
BlackRock Muni Intermediate Duration Fund, Inc. | | | 2,194 | | | | 31,857 | |
BlackRock MuniHoldings California Quality Fund, Inc. | | | 2,230 | | | | 31,844 | |
BlackRock MuniHoldings Investment Quality Fund | | | 2,254 | | | | 31,624 | |
Calamos Global Dynamic Income Fund | | | 20 | | | | 180 | |
Calamos Strategic Total Return Fund | | | 5 | | | | 59 | |
Cohen & Steers Quality Income Realty Fund, Inc. | | | 2,752 | | | | 31,951 | |
Cohen & Steers REIT and Preferred Income Fund, Inc. | | | 1,676 | | | | 31,676 | |
Eaton Vance Municipal Bond Fund | | | 2,491 | | | | 31,461 | |
Franklin Limited Duration Income Trust | | | 4 | | | | 50 | |
Invesco Dynamic Credit Opportunities Fund | | | 2,646 | | | | 31,778 | |
Invesco Municipal Opportunity Trust | | | 2,497 | | | | 31,837 | |
Invesco Municipal Trust | | | 2,499 | | | | 31,462 | |
Invesco Quality Municipal Income Trust | | | 2,552 | | | | 31,543 | |
Invesco Trust for Investment Grade Municipals | | | 2,396 | | | | 31,603 | |
John Hancock Preferred Income Fund (A) | | | 1,592 | | | | 32,716 | |
John Hancock Preferred Income Fund III | | | 1,814 | | | | 32,199 | |
John Hancock Premium Dividend Fund | | | 2,300 | | | | 31,487 | |
John Hancock Tax-Advantaged Dividend Income Fund | | | 1,540 | | | | 33,634 | |
Morgan Stanley China A Share Fund, Inc. | | | 1,314 | | | | 32,193 | |
Morgan Stanley India Investment Fund, Inc. (B) | | | 1,317 | | | | 33,636 | |
Nuveen Build American Bond Term Fund | | | 1,528 | | | | 31,400 | |
Nuveen Dividend Advantage Municipal Fund | | | 2,252 | | | | 31,888 | |
Nuveen Dividend Advantage Municipal Fund 3 | | | 2,310 | | | | 31,878 | |
Nuveen Municipal Advantage Fund, Inc. | | | 2,345 | | | | 32,220 | |
Nuveen Municipal Market Opportunity Fund, Inc. | | | 2,375 | | | | 32,300 | |
Nuveen Performance Plus Municipal Fund, Inc. | | | 2,174 | | | | 31,762 | |
Nuveen Premium Income Municipal Fund 2, Inc. | | | 2,283 | | | | 31,962 | |
Nuveen Premium Income Municipal Fund, Inc. | | | 2,327 | | | | 31,833 | |
| | | | | | | | |
| | | Shares | | | Value | |
INVESTMENT COMPANIES (continued) | |
Capital Markets (continued) | |
Nuveen Quality Income Municipal Fund, Inc. | | | 2,282 | | | | $ 31,857 | |
Putnam Municipal Opportunities Trust | | | 2,653 | | | | 31,412 | |
| | | | | | | | |
| | | | | | | 960,985 | |
| | | | | | | | |
Diversified Financial Services - 3.2% | |
India Fund, Inc. | | | 1,211 | | | | 33,593 | |
| | | | | | | | |
Total Investment Companies
(Cost $971,014) | | | | 994,578 | |
| | | | | |
|
SECURITIES LENDING COLLATERAL - 0.8% | |
State Street Navigator Securities Lending Trust - Prime Portfolio
0.16% (C) | | | 8,400 | | | | 8,400 | |
| | | | | | | | |
Total Securities Lending Collateral
(Cost $8,400) | | | | | | | 8,400 | |
| | | | | | | | |
| | |
| | | Principal | | | Value | |
REPURCHASE AGREEMENT - 17.2% | |
State Street Bank & Trust Co.
0.01% (C), dated 10/31/2014, to be repurchased at $181,556 on 11/03/2014. Collateralized by a U.S. Government Agency Obligation, 3.00%, due 07/25/2037, and with a value of $188,806. | | | $ 181,556 | | | | 181,556 | |
| | | | | | | | |
Total Repurchase Agreement
(Cost $181,556) | | | | | | | 181,556 | |
| | | | | | | | |
Total Investments
(Cost $1,160,970) (D) | | | | 1,184,534 | |
Net Other Assets (Liabilities) - (12.0)% | | | | (126,810 | ) |
| | | | | | | | |
| | |
Net Assets - 100.0% | | | | | | | $ 1,057,724 | |
| | | | | | | | |
SECURITY VALUATION:
Valuation Inputs (E)
| | | | | | | | | | | | | | | | |
| | | Level 1
Quoted Prices | | | Level 2
Other Significant
Observable Inputs | | | Level 3
Significant
Unobservable Inputs | | | Value at
October 31, 2014 | |
ASSETS | | | | | | | | | | | | | | | | |
Investments | | | | | | | | | | | | | | | | |
Investment Companies | | $ | 994,578 | | | $ | — | | | $ | — | | | $ | 994,578 | |
Securities Lending Collateral | | | 8,400 | | | | — | | | | — | | | | 8,400 | |
Repurchase Agreement | | | — | | | | 181,556 | | | | — | | | | 181,556 | |
| | | | | | | | | | | | | | | | |
Total Investments | | $ | 1,002,978 | | | $ | 181,556 | | | $ | — | | | $ | 1,184,534 | |
| | | | | | | | | | | | | | | | |
FOOTNOTES TO SCHEDULE OF INVESTMENTS:
| (A) | All or a portion of this security is on loan. The value of all securities on loan is $8,220. The amount of securities on loan indicated may not correspond with the securities on loan identified because securities with pending sales are in the process of recall from the brokers. |
| (B) | Non-income producing security. |
| (C) | Rate shown reflects the yield at October 31, 2014. |
The Notes to Financial Statements are an integral part of this report.
| | |
| Transamerica Funds | | Annual Report 2014 |
Page 189
Transamerica Opportunistic Allocation
SCHEDULE OF INVESTMENTS (continued)
At October 31, 2014
FOOTNOTES TO SCHEDULE OF INVESTMENTS (continued):
| (D) | Aggregate cost for federal income tax purposes is $1,163,739. Aggregate gross unrealized appreciation and depreciation for all securities is $22,860 and $2,065, respectively. Net unrealized appreciation for tax purposes is $20,795. |
| (E) | The Fund recognizes transfers between Levels at the end of the reporting period. There were no transfers between Level 1, 2 and 3 during the period ended October 31, 2014. See the Notes to Financial Statements for more information regarding security valuation and pricing inputs. |
The Notes to Financial Statements are an integral part of this report.
| | |
| Transamerica Funds | | Annual Report 2014 |
Page 190
Transamerica Short-Term Bond
SCHEDULE OF INVESTMENTS
At October 31, 2014
| | | | | | | | |
| | | Principal | | | Value | |
U.S. GOVERNMENT AGENCY OBLIGATION - 0.0% (A) | |
Federal Home Loan Mortgage Corp. | | | | | | | | |
2.27%, 08/01/2037 (B) | | | $ 500,011 | | | | $ 531,495 | |
| | | | | | | | |
Total U.S. Government Agency Obligation
(Cost $507,023) | | | | 531,495 | |
| | | | | | | | |
| |
MORTGAGE-BACKED SECURITIES - 21.8% | | | | | |
7 WTC Depositor LLC Trust | | | | | | | | |
Series 2012-7WTC, Class A | | | | | | | | |
4.08%, 03/13/2031, 144A | | | 11,293,880 | | | | 11,651,603 | |
BAMLL Commercial Mortgage Securities Trust | | | | | | | | |
Series 2014-ICTS, Class C | | | | | | | | |
1.55%, 06/15/2028, 144A (B) | | | 2,250,000 | | | | 2,244,420 | |
Series 2014-ICTS, Class D | | | | | | | | |
2.05%, 06/15/2028, 144A (B) | | | 3,500,000 | | | | 3,482,587 | |
Series 2014-IP, Class D | | | | | | | | |
2.72%, 06/15/2028, 144A (B) | | | 11,000,000 | | | | 10,991,365 | |
Banc of America Funding Trust | | | | | | | | |
Series 2010-R4, Class 1A1 | | | | | | | | |
5.50%, 07/26/2036, 144A | | | 1,888,823 | | | | 1,942,666 | |
Series 2010-R6, Class 3A1 | | | | | | | | |
6.25%, 09/26/2037, 144A | | | 1,734,093 | | | | 1,799,397 | |
BBCMS Trust | | | | | | | | |
Series 2014-BXO, Class C | | | | | | | | |
2.15%, 08/15/2027, 144A (B) | | | 10,000,000 | | | | 10,002,700 | |
BCAP LLC Trust | | | | | | | | |
Series 2009-RR10, Class 2A1 | | | | | | | | |
2.68%, 08/26/2035, 144A (B) | | | 1,688,293 | | | | 1,669,637 | |
Series 2009-RR13, Class 13A3 | | | | | | | | |
5.25%, 03/26/2037, 144A (B) | | | 1,220,538 | | | | 1,221,939 | |
Series 2009-RR13, Class 14A1 | | | | | | | | |
5.25%, 03/26/2037, 144A (B) | | | 137,279 | | | | 137,121 | |
Series 2009-RR13, Class 2A3 | | | | | | | | |
5.50%, 02/26/2036, 144A (B) | | | 1,876,194 | | | | 1,939,904 | |
Series 2009-RR13, Class 3A3 | | | | | | | | |
4.87%, 05/26/2036, 144A (B) | | | 1,304,643 | | | | 1,307,216 | |
Series 2009-RR14, Class 1A1 | | | | | | | | |
6.00%, 05/26/2037, 144A (B) | | | 6,386,606 | | | | 6,794,710 | |
Series 2009-RR6, Class 2A1 | | | | | | | | |
2.54%, 08/26/2035, 144A (B) | | | 5,536,385 | | | | 5,519,609 | |
Series 2010-RR1, Class 12A1 | | | | | | | | |
5.25%, 08/26/2036, 144A (B) | | | 4,040,328 | | | | 4,144,431 | |
Series 2010-RR6, Class 15A5 | | | | | | | | |
5.50%, 07/26/2036, 144A (B) | | | 452,723 | | | | 453,788 | |
Series 2010-RR6, Class 16A5 | | | | | | | | |
5.50%, 04/26/2036, 144A (B) | | | 531,923 | | | | 538,488 | |
Series 2010-RR6, Class 20A1 | | | | | | | | |
4.50%, 11/26/2035, 144A (B) | | | 399,039 | | | | 400,491 | |
Series 2010-RR7, Class 5A6 | | | | | | | | |
5.50%, 10/26/2036, 144A | | | 5,413,215 | | | | 5,613,169 | |
Series 2012-RR2, Class 7A3 | | | | | | | | |
2.61%, 09/26/2035, 144A (B) | | | 4,484,122 | | | | 4,534,613 | |
Series 2012-RR4, Class 2A5 | | | | | | | | |
1.94%, 04/26/2037, 144A (B) | | | 6,578,858 | | | | 6,585,739 | |
Series 2012-RR5, Class 6A1 | | | | | | | | |
2.70%, 10/26/2035(B) | | | 5,655,820 | | | | 5,738,301 | |
Bear Stearns Commercial Mortgage Securities Trust | | | | | | | | |
Series 2007-PW17, Class AAB | | | | | | | | |
5.70%, 06/11/2050 | | | 5,269,671 | | | | 5,310,026 | |
| | | | | | | | |
| | | Principal | | | Value | |
MORTGAGE-BACKED SECURITIES (continued) | |
BHMS Mortgage Trust | | | | | | | | |
Series 2014-ATLS, Class CFL | | | | | | | | |
2.60%, 07/05/2033, 144A (B) | | | $ 15,000,000 | | | | $ 14,999,985 | |
BLCP Hotel Trust | | | | | | | | |
Series 2014-CLRN, Class C | | | | | | | | |
2.10%, 08/15/2029, 144A (B) | | | 10,000,000 | | | | 10,002,700 | |
BNPP Mortgage Securities LLC | | | | | | | | |
Series 2009-1, Class A1 | | | | | | | | |
6.00%, 08/27/2037, 144A | | | 3,882,895 | | | | 4,048,233 | |
Boca Hotel Portfolio Trust | | | | | | | | |
Series 2013-BOCA, Class B | | | | | | | | |
1.90%, 08/15/2026, 144A (B) | | | 15,000,000 | | | | 15,002,370 | |
Series 2013-BOCA, Class C | | | | | | | | |
2.30%, 08/15/2026, 144A (B) | | | 10,745,000 | | | | 10,765,437 | |
Capmark Military Housing Trust | | | | | | | | |
Series 2008-AMCW, Class A2 | | | | | | | | |
5.91%, 03/10/2015, 144A | | | 2,221,896 | | | | 2,235,869 | |
CD Commercial Mortgage Trust | | | | | | | | |
Series 2007-CD4, Class A1A | | | | | | | | |
5.29%, 12/11/2049 (B) | | | 12,062,545 | | | | 12,810,000 | |
CGBAM Commercial Mortgage Trust | | | | | | | | |
Series 2013-BREH, Class B | | | | | | | | |
1.95%, 05/15/2030, 144A (B) | | | 10,000,000 | | | | 9,983,740 | |
CHL Mortgage Pass-Through Trust | | | | | | | | |
Series 2002-35, Class 1A3 | | | | | | | | |
5.00%, 02/25/2018 | | | 2,617,842 | | | | 2,658,353 | |
Citigroup Commercial Mortgage Trust | | | | | | | | |
Series 2014-388G, Class D | | | | | | | | |
1.90%, 06/15/2033, 144A (B) | | | 18,000,000 | | | | 17,932,212 | |
Series 2014-388G, Class E | | | | | | | | |
2.50%, 06/15/2033, 144A (B) | | | 15,000,000 | | | | 14,915,895 | |
Citigroup Mortgage Loan Trust | | | | | | | | |
Series 2009-10, Class 6A1 | | | | | | | | |
2.67%, 09/25/2034, 144A (B) | | | 1,675,344 | | | | 1,670,097 | |
Series 2010-8, Class 5A6 | | | | | | | | |
4.00%, 11/25/2036, 144A | | | 6,937,954 | | | | 7,068,541 | |
Series 2010-8, Class 6A6 | | | | | | | | |
4.50%, 12/25/2036, 144A | | | 6,042,530 | | | | 6,207,853 | |
Series 2010-8, Class 6A62 | | | | | | | | |
3.50%, 12/25/2036, 144A | | | 3,728,568 | | | | 3,782,886 | |
Series 2014-A, Class A | | | | | | | | |
4.00%, 01/25/2035, 144A (B) | | | 16,100,243 | | | | 16,750,709 | |
Citigroup Mortgage Loan Trust, Inc. | | | | | | | | |
Series 2003-HE3, Class A | | | | | | | | |
0.53%, 12/25/2033 (B) | | | 4,113,312 | | | | 3,936,925 | |
COMM Mortgage Trust | | | | | | | | |
Series 2013-FL3, Class B | | | | | | | | |
2.30%, 10/13/2028, 144A (B) | | | 15,000,000 | | | | 15,232,890 | |
Series 2014-PAT, Class D | | | | | | | | |
2.30%, 08/13/2027, 144A (B) | | | 15,000,000 | | | | 14,849,805 | |
Series 2014-PAT, Class E | | | | | | | | |
3.30%, 08/13/2027, 144A (B) | | | 5,000,000 | | | | 4,951,095 | |
Series 2014-TWC, Class C | | | | | | | | |
2.00%, 02/13/2032, 144A (B) | | | 8,000,000 | | | | 7,999,992 | |
Commercial Mortgage Pass-Through Certificates | | | | | | | | |
Series 2012-MVP, Class A | | | | | | | | |
2.09%, 11/17/2026, 144A (B) | | | 8,886,969 | | | | 8,915,967 | |
Series 2012-MVP, Class B | | | | | | | | |
1.75%, 11/17/2026, 144A (B) | | | 9,900,000 | | | | 9,911,543 | |
The Notes to Financial Statements are an integral part of this report.
| | |
| Transamerica Funds | | Annual Report 2014 |
Page 191
Transamerica Short-Term Bond
SCHEDULE OF INVESTMENTS (continued)
At October 31, 2014
| | | | | | | | |
| | | Principal | | | Value | |
MORTGAGE-BACKED SECURITIES (continued) | |
Credit Suisse Commercial Mortgage Trust | | | | | | | | |
Series 2007-C1, Class A1A | | | | | | | | |
5.36%, 02/15/2040 | | | $ 13,758,292 | | | | $ 14,622,257 | |
Series 2007-C1, Class AAB | | | | | | | | |
5.34%, 02/15/2040 | | | 3,861,902 | | | | 4,017,934 | |
Series 2007-C4, Class AAB | | | | | | | | |
5.90%, 09/15/2039 (B) | | | 5,756,081 | | | | 6,012,681 | |
Series 2007-C5, Class A4 | | | | | | | | |
5.70%, 09/15/2040 (B) | | | 6,730,000 | | | | 7,337,255 | |
Credit Suisse First Boston Mortgage Securities Corp.
Series 2005-C6, Class AJ
5.23%, 12/15/2040 (B) | | | 20,842,000 | | | | 21,493,729 | |
CSMC Trust | | | | | | | | |
Series 2010-15R, Class 2A1 | | | | | | | | |
3.50%, 05/26/2036, 144A (B) | | | 3,677,271 | | | | 3,777,745 | |
Series 2010-15R, Class 4A1 | | | | | | | | |
3.50%, 04/26/2035, 144A (B) | | | 7,120,832 | | | | 7,255,808 | |
Series 2010-15R, Class 6A1 | | | | | | | | |
3.50%, 10/26/2046, 144A (B) | | | 1,393,888 | | | | 1,396,935 | |
Series 2010-18R, Class 1A11 | | | | | | | | |
3.75%, 08/26/2035, 144A (B) | | | 2,856,420 | | | | 2,846,697 | |
Series 2010-18R, Class 3A1 | | | | | | | | |
4.00%, 03/26/2037, 144A | | | 1,529,444 | | | | 1,550,111 | |
Series 2010-1R, Class 28A1 | | | | | | | | |
5.00%, 02/27/2047, 144A | | | 11,214,802 | | | | 11,393,858 | |
Series 2010-RR4, Class 2B | | | | | | | | |
5.47%, 09/18/2039, 144A (B) | | | 8,250,000 | | | | 8,769,898 | |
Series 2014-SURF, Class C | | | | | | | | |
1.96%, 02/15/2029, 144A (B) | | | 4,740,000 | | | | 4,748,897 | |
Series 2014-SURF, Class D | | | | | | | | |
2.41%, 02/15/2029, 144A (B) | | | 6,000,000 | | | | 6,018,246 | |
Del Coronado Trust | | | | | | | | |
Series 2013-HDC, Class C | | | | | | | | |
1.75%, 03/15/2026, 144A (B) | | | 10,000,000 | | | | 9,991,480 | |
Series 2013-HDC, Class D | | | | | | | | |
2.10%, 03/15/2026, 144A (B) | | | 8,500,000 | | | | 8,483,263 | |
Extended Stay America Trust
Series 2013-ESH5, Class A15
1.28%, 12/05/2031, 144A | | | 17,900,000 | | | | 17,801,550 | |
GE Capital Commercial Mortgage Corp.
Series 2005-C3, Class C
5.11%, 07/10/2045 (B) | | | 9,000,000 | | | | 9,208,557 | |
GP Portfolio Trust | | | | | | | | |
Series 2014-GPP, Class C | | | | | | | | |
2.10%, 02/15/2027, 144A (B) | | | 13,000,000 | | | | 13,016,627 | |
Series 2014-GPP, Class D | | | | | | | | |
2.90%, 02/15/2027, 144A (B) | | | 10,000,000 | | | | 10,016,570 | |
Hilton USA Trust | | | | | | | | |
Series 2013-HLF, Class CFL | | | | | | | | |
2.05%, 11/05/2030, 144A (B) | | | 14,920,000 | | | | 14,920,149 | |
Series 2013-HLF, Class DFL | | | | | | | | |
2.90%, 11/05/2030, 144A (B) | | | 4,830,000 | | | | 4,830,048 | |
Impac CMB Trust
Series 2007-A, Class A
0.40%, 05/25/2037 (B) | | | 13,453,395 | | | | 13,149,739 | |
Jefferies Re-REMIC Trust | | | | | | | | |
Series 2009-R2, Class 2A | | | | | | | | |
2.59%, 12/26/2037, 144A (B) | | | 2,474,530 | | | | 2,469,371 | |
| | | | | | | | |
| | | Principal | | | Value | |
MORTGAGE-BACKED SECURITIES (continued) | |
Jefferies Re-REMIC Trust (continued) | | | | | |
Series 2009-R2, Class 3A | | | | | | | | |
2.74%, 01/26/2047, 144A (B) | | | $ 1,069,137 | | | | $ 1,068,620 | |
Series 2009-R7, Class 11A1 | | | | | | | | |
2.35%, 03/26/2037, 144A (B) | | | 2,054,648 | | | | 2,020,121 | |
Series 2009-R7, Class 12A1 | | | | | | | | |
2.62%, 08/26/2036, 144A (B) | | | 672,270 | | | | 664,710 | |
Series 2009-R7, Class 4A1 | | | | | | | | |
2.39%, 09/26/2034, 144A (B) | | | 1,170,717 | | | | 1,150,579 | |
Series 2009-R9, Class 1A1 | | | | | | | | |
2.24%, 08/26/2046, 144A (B) | | | 5,232,730 | | | | 5,286,125 | |
Series 2010-R2, Class 1A1 | | | | | | | | |
6.00%, 05/26/2036, 144A | | | 2,444,603 | | | | 2,530,443 | |
Series 2010-R3, Class 1A1 | | | | | | | | |
2.80%, 03/21/2036, 144A (B) | | | 1,951,034 | | | | 1,958,348 | |
Series 2010-R8, Class 2A1 | | | | | | | | |
5.00%, 10/26/2036, 144A | | | 2,528,456 | | | | 2,548,105 | |
JPMorgan Chase Commercial Mortgage Securities Trust | | | | | | | | |
Series 2011-PLSD, Class C | | | | | | | | |
5.14%, 11/13/2044, 144A | | | 4,450,000 | | | | 4,734,075 | |
Series 2013-ALC, Class B | | | | | | | | |
3.00%, 07/17/2026, 144A (B) | | | 18,000,000 | | | | 18,159,048 | |
Series 2013-JWRZ, Class C | | | | | | | | |
1.65%, 04/15/2030, 144A (B) | | | 10,000,000 | | | | 9,978,860 | |
Series 2014-DSTY, Class C | | | | | | | | |
3.80%, 06/10/2027, 144A (B) | | | 10,000,000 | | | | 10,078,820 | |
Series 2014-FBLU, Class C | | | | | | | | |
2.15%, 12/15/2028, 144A (B) | | | 20,000,000 | | | | 19,962,740 | |
Series 2014-FBLU, Class D | | | | | | | | |
2.75%, 12/15/2028, 144A (B) | | | 6,000,000 | | | | 5,988,816 | |
Series 2014-INN, Class C | | | | | | | | |
1.85%, 06/15/2029, 144A (B) | | | 19,365,000 | | | | 19,283,938 | |
JPMorgan Commercial Mortgage-Backed Securities Trust
Series 2009-RR2, Class MLB
5.74%, 06/15/2050, 144A (B) | | | 10,000,000 | | | | 10,634,940 | |
JPMorgan Re-REMIC Trust | | | | | | | | |
Series 2009-11, Class 1A1 | | | | | | | | |
2.67%, 02/26/2037, 144A (B) | | | 4,490,174 | | | | 4,454,010 | |
Series 2009-7, Class 8A1 | | | | | | | | |
2.83%, 01/27/2047, 144A (B) | | | 998,042 | | | | 1,006,014 | |
Series 2010-4, Class 7A1 | | | | | | | | |
1.87%, 08/26/2035, 144A (B) | | | 3,654,810 | | | | 3,645,063 | |
Series 2010-5, Class 2A2 | | | | | | | | |
4.50%, 07/26/2035, 144A (B) | | | 7,038,514 | | | | 7,317,521 | |
LB Commercial Mortgage Trust Series 2007-C3, Class A1A
5.86%, 07/15/2044 (B) | | | 10,030,601 | | | | 11,022,347 | |
LB-UBS Commercial Mortgage Trust
Series 2004-C8, Class B
4.91%, 12/15/2039 (B) | | | 12,585,000 | | | | 12,591,897 | |
Lehman Brothers Small Balance Commercial
Series 2005-1A, Class A
0.40%, 02/25/2030, 144A (B) | | | 8,241,696 | | | | 7,544,662 | |
MASTR Alternative Loan Trust
Series 2003-4, Class 1A1
5.00%, 05/25/2018 | | | 6,477,297 | | | | 6,645,221 | |
Morgan Stanley Re-REMIC Trust | | | | | | | | |
Series 2009-GG10, Class A4B | | | | | | | | |
5.80%, 08/12/2045, 144A (B) | | | 10,000,000 | | | | 10,852,960 | |
The Notes to Financial Statements are an integral part of this report.
| | |
| Transamerica Funds | | Annual Report 2014 |
Page 192
Transamerica Short-Term Bond
SCHEDULE OF INVESTMENTS (continued)
At October 31, 2014
| | | | | | | | |
| | | Principal | | | Value | |
MORTGAGE-BACKED SECURITIES (continued) | |
Morgan Stanley Re-REMIC Trust (continued) | | | | | |
Series 2010-R4, Class 3A | | | | | | | | |
5.50%, 08/26/2047, 144A | | | $ 14,355,581 | | | | $ 14,901,107 | |
Mortgage Equity Conversion Asset Trust
Series 2010-1A, Class A
4.00%, 07/25/2060, 144A (C) | | | 12,165,880 | | | | 11,557,586 | |
Motel 6 Trust
Series 2012-MTL6, Class A1
1.50%, 10/05/2025, 144A | | | 8,519,313 | | | | 8,506,185 | |
New Residential Mortgage Loan Trust Series 2014-1A, Class A
3.75%, 01/25/2054, 144A (B) | | | 8,325,145 | | | | 8,589,011 | |
NorthStar
Series 2013-1A, Class A
2.00%, 08/25/2029, 144A (B) (C) | | | 11,366,313 | | | | 11,376,968 | |
RBSCF Trust | | | | | | | | |
Series 2009-RR2, Class CWB | | | | | | | | |
5.22%, 08/16/2048, 144A (B) | | | 4,000,000 | | | | 4,202,536 | |
Series 2010-RR3, Class CSCA | | | | | | | | |
5.47%, 09/16/2039, 144A (B) | | | 10,518,839 | | | | 11,021,377 | |
RBSSP Re-REMIC Trust | | | | | | | | |
Series 2009-1, Class 10A1 | | | | | | | | |
6.50%, 07/26/2037, 144A | | | 4,457,542 | | | | 4,657,770 | |
Series 2013-2, Class 2A1 | | | | | | | | |
0.35%, 12/20/2036, 144A (B) | | | 15,538,923 | | | | 15,003,980 | |
RREF LLC
Series 2013-RIA4, Class A1
3.25%, 11/27/2028, 144A (B) | | | 4,464,835 | | | | 4,493,432 | |
SCG Trust
Series 2013-SRP1, Class B
2.65%, 11/15/2026, 144A (B) | | | 20,000,000 | | | | 20,050,020 | |
SilverLeaf Finance XVII LLC
Series 2013-A, Class A
2.68%, 03/16/2026, 144A | | | 10,754,232 | | | | 10,735,509 | |
Springleaf Mortgage Loan Trust | | | | | | | | |
Series 2012-2A, Class M2 | | | | | | | | |
4.61%, 10/25/2057, 144A (B) | | | 19,719,000 | | | | 20,737,427 | |
Series 2013-2A, Class A | | | | | | | | |
1.78%, 12/25/2065, 144A (B) | | | 3,773,879 | | | | 3,767,252 | |
Starwood Property Mortgage Trust
Series 2013-FV1, Class B
2.15%, 08/11/2028, 144A (B) | | | 10,000,000 | | | | 10,011,100 | |
TIAA Seasoned Commercial Mortgage Trust
Series 2007-C4, Class AJ
5.56%, 08/15/2039 (B) | | | 5,114,000 | | | | 5,296,048 | |
Wachovia Bank Commercial Mortgage Trust
Series 2005-C20, Class B
5.24%, 07/15/2042 (B) | | | 6,000,000 | | | | 6,146,082 | |
Wells Fargo Mortgage-Backed Securities Trust
Series 2003-G, Class A1
2.49%, 06/25/2033 (B) | | | 720,869 | | | | 727,779 | |
Wells Fargo Mortgage Loan Trust | | | | | | | | |
Series 2010-RR2, Class 1A1 | | | | | | | | |
1.74%, 09/27/2035, 144A (B) | | | 3,222,924 | | | | 3,221,509 | |
Series 2010-RR4, Class 1A1 | | | | | | | | |
2.67%, 12/27/2046, 144A (B) | | | 4,493,913 | | | | 4,511,089 | |
| | | | | | | | |
| | | Principal | | | Value | |
MORTGAGE-BACKED SECURITIES (continued) | |
Wells Fargo Mortgage Loan Trust (continued) | | | | | |
Series 2011-RR3, Class A1 | | | | | | | | |
2.63%, 03/27/2037, 144A (B) | | | $ 11,160,099 | | | | $ 10,923,677 | |
| | | | | | | | |
Total Mortgage-Backed Securities
(Cost $885,928,665) | | | | | | | 887,351,849 | |
| | | | | | | | |
|
ASSET-BACKED SECURITIES - 12.5% | |
AmeriCredit Automobile Receivables Trust
Series 2013-5, Class C
2.29%, 11/08/2019 | | | 3,000,000 | | | | 3,025,923 | |
Ares IIIR / IVR CLO, Ltd.
Series 2007-3RA, Class A2
0.45%, 04/16/2021, 144A (B) | | | 14,998,525 | | | | 14,938,396 | |
ARES XII CLO, Ltd.
Series 2007-12A, Class A
0.86%, 11/25/2020, 144A (B) | | | 13,292,115 | | | | 13,217,121 | |
Bacchus, Ltd.
Series 2006-1A, Class C
1.08%, 01/20/2019, 144A (B) | | | 5,000,000 | | | | 4,909,005 | |
Battalion CLO, Ltd.
Series 2007-1A, Class C
1.03%, 07/14/2022, 144A (B) | | | 14,000,000 | | | | 13,608,574 | |
Bayview Opportunity Master Fund IIlA Trust
Series 2013-4RPL, Class A
4.46%, 07/28/2018, 144A (B) | | | 482,592 | | | | 482,632 | |
Bayview Opportunity Master Fund Trust Series 2013-14NP, Class A
4.21%, 08/28/2033, 144A (B) | | | 7,200,100 | | | | 7,208,107 | |
Burr Ridge CLO Plus LLC
Series 2006-1A, Class C
0.98%, 03/27/2023, 144A (B) | | | 6,500,000 | | | | 6,196,171 | |
BXG Receivables Note Trust | | | | | | | | |
Series 2012-A, Class A | | | | | | | | |
2.66%, 12/02/2027, 144A | | | 11,975,672 | | | | 11,938,775 | |
Series 2013-A, Class A | | | | | | | | |
3.01%, 12/04/2028, 144A | | | 22,517,113 | | | | 22,771,939 | |
ColumbusNova CLO, Ltd.
Series 2007-1A, Class A1
0.48%, 05/16/2019, 144A (B) | | | 1,851,406 | | | | 1,840,081 | |
Comstock Funding, Ltd.
Series 2006-1A, Class B
0.98%, 05/30/2020, 144A (B) | | | 2,500,000 | | | | 2,426,728 | |
CWABS Asset-Backed Certificates Trust
Series 2006-17, Class 2A2
0.30%, 03/25/2047 (B) | | | 21,989,454 | | | | 18,660,427 | |
Diamond Resorts Owner Trust | | | | | | | | |
Series 2013-1, Class A | | | | | | | | |
1.95%, 01/20/2025, 144A | | | 6,353,152 | | | | 6,338,457 | |
Series 2013-2, Class A | | | | | | | | |
2.27%, 05/20/2026, 144A | | | 12,149,743 | | | | 12,250,149 | |
Foursight Capital Automobile Receivables Trust
Series 2014-1, Class A
2.11%, 03/23/2020, 144A | | | 9,347,489 | | | | 9,314,277 | |
Hilton Grand Vacations Trust | | | | | | | | |
Series 2013-A, Class A | | | | | | | | |
2.28%, 01/25/2026, 144A | | | 5,346,534 | | | | 5,395,642 | |
The Notes to Financial Statements are an integral part of this report.
| | |
| Transamerica Funds | | Annual Report 2014 |
Page 193
Transamerica Short-Term Bond
SCHEDULE OF INVESTMENTS (continued)
At October 31, 2014
| | | | | | | | |
| | | Principal | | | Value | |
ASSET-BACKED SECURITIES (continued) | | | | | |
Hilton Grand Vacations Trust (continued) | | | | | |
Series 2014-AA, Class A | | | | | | | | |
1.77%, 11/25/2026, 144A | | | $ 7,312,144 | | | | $ 7,272,249 | |
Series 2014-AA, Class B | | | | | | | | |
2.07%, 11/25/2026, 144A | | | 14,624,287 | | | | 14,490,051 | |
HLSS Servicer Advance Receivables Trust | | | | | | | | |
Series 2012-T2, Class A2 | | | | | | | | |
1.99%, 10/15/2045, 144A | | | 20,000,000 | | | | 20,138,000 | |
Series 2014-T2, Class AT2 | | | | | | | | |
2.22%, 01/15/2047, 144A | | | 10,000,000 | | | | 9,984,000 | |
HSBC Home Equity Loan Trust | | | | | | | | |
Series 2006-3, Class A4 | | | | | | | | |
0.40%, 03/20/2036 (B) | | | 21,260,645 | | | | 21,089,199 | |
Series 2007-1, Class A4 | | | | | | | | |
0.52%, 03/20/2036 (B) | | | 9,352,000 | | | | 9,185,843 | |
Inwood Park CDO, Ltd.
Series 2006-1A, Class C
0.93%, 01/20/2021, 144A (B) | | | 12,750,000 | | | | 12,420,221 | |
Marriott Vacation Club Owner Trust
Series 2012-1A, Class A
2.51%, 05/20/2030, 144A | | | 10,213,050 | | | | 10,382,372 | |
Mountain View CLO III, Ltd.
Series 2007-3A, Class A1
0.44%, 04/16/2021, 144A (B) | | | 4,545,475 | | | | 4,528,316 | |
Mountain View Funding CLO, Ltd.
Series 2006-1A, Class C1
0.98%, 04/15/2019, 144A (B) | | | 4,000,000 | | | | 3,897,008 | |
MVW Owner Trust
Series 2014-1A, Class B
2.70%, 09/20/2031, 144A | | | 10,000,000 | | | | 10,051,250 | |
Newstar Trust
Series 2012-2A, Class A
2.13%, 01/20/2023, 144A (B) | | | 10,000,000 | | | | 9,981,930 | |
Ocean Trails CLO I
Series 2006-1A, Class A1
0.48%, 10/12/2020, 144A (B) | | | 3,674,631 | | | | 3,654,832 | |
Orange Lake Timeshare Trust | | | | | | | | |
Series 2012-AA, Class A | | | | | | | | |
3.45%, 03/10/2027, 144A | | | 3,145,760 | | | | 3,246,455 | |
Series 2014-AA, Class A | | | | | | | | |
2.29%, 07/09/2029, 144A | | | 14,232,495 | | | | 14,292,157 | |
ORES LLC
Series 2014-LV3, Class A
3.00%, 03/27/2024, 144A | | | 8,004,278 | | | | 8,003,885 | |
Prestige Auto Receivables Trust
Series 2012-1A, Class C
3.25%, 07/15/2019, 144A | | | 5,000,000 | | | | 5,120,655 | |
Sierra Timeshare Receivables Funding LLC | | | | | | | | |
Series 2011-2A, Class A | | | | | | | | |
3.26%, 05/20/2028, 144A | | | 2,028,578 | | | | 2,067,196 | |
Series 2012-1A, Class B | | | | | | | | |
3.58%, 11/20/2028, 144A | | | 4,664,714 | | | | 4,780,679 | |
Series 2012-2A, Class A | | | | | | | | |
2.38%, 03/20/2029, 144A | | | 3,923,231 | | | | 3,984,221 | |
Series 2012-2A, Class B | | | | | | | | |
3.42%, 03/20/2029, 144A | | | 1,756,670 | | | | 1,794,537 | |
Series 2013-2A, Class C | | | | | | | | |
4.75%, 11/20/2025, 144A | | | 3,549,545 | | | | 3,650,221 | |
| | | | | | | | |
| | | Principal | | | Value | |
ASSET-BACKED SECURITIES (continued) | | | | | |
Sierra Timeshare Receivables Funding LLC (continued) | |
Series 2014-1A, Class A | | | | | | | | |
2.07%, 03/20/2030, 144A | | | $ 7,072,759 | | | | $ 7,124,340 | |
Series 2014-1A, Class B | | | | | | | | |
2.42%, 03/20/2030, 144A | | | 7,072,759 | | | | 7,050,692 | |
Series 2014-2A, Class B | | | | | | | | |
2.40%, 06/20/2031, 144A | | | 14,765,424 | | | | 14,751,382 | |
Series 2014-3A, Class B | | | | | | | | |
2.80%, 10/20/2031, 144A (D) | | | 15,000,000 | | | | 14,999,691 | |
Silverleaf Finance LLC
Series 2014-A, Class A
2.81%, 01/15/2027, 144A | | | 15,000,000 | | | | 15,055,663 | |
Silverleaf Finance XV LLC
Series 2012-D, Class A
3.00%, 03/17/2025, 144A | | | 8,937,780 | | | | 9,073,419 | |
SpringCastle America Funding LLC
Series 2014-AA, Class A
2.70%, 05/25/2023, 144A | | | 14,300,000 | | | | 14,311,040 | |
Station Place Securitization Trust
2.40%, 11/25/2014 | | | 30,000,000 | | | | 30,000,000 | |
SVO VOI Mortgage LLC
Series 2012-AA, Class A
2.00%, 09/20/2029, 144A | | | 12,628,538 | | | | 12,654,603 | |
Trafigura Securitisation Finance PLC
Series 2012-1A, Class A
2.55%, 10/15/2015, 144A (B) | | | 25,520,000 | | | | 25,707,412 | |
US Residential Opportunity Fund Trust
Series 2014, Class 1A
3.47%, 03/25/2034, 144A (B) | | | 4,794,749 | | | | 4,799,794 | |
Welk Resorts LLC
Series 2013-AA, Class A
3.10%, 03/15/2029, 144A | | | 13,845,961 | | | | 14,002,462 | |
| | | | | | | | |
Total Asset-Backed Securities
(Cost $500,137,355) | | | | | | | 508,068,179 | |
| | | | | | | | |
|
MUNICIPAL GOVERNMENT OBLIGATION - 0.3% | |
Rhode Island Economic Development Corp., Revenue Bonds
AGM
6.00%, 11/01/2015 (E) | | | 11,675,000 | | | | 11,867,170 | |
| | | | | | | | |
Total Municipal Government Obligation
(Cost $11,675,000) | | | | | | | 11,867,170 | |
| | | | | | | | |
|
PREFERRED CORPORATE DEBT SECURITY - 1.1% | |
Insurance - 1.1% | | | | | | | | |
ZFS Finance USA Trust II
6.45%, 12/15/2065, 144A (B) | | | 42,570,000 | | | | 45,337,050 | |
| | | | | | | | |
Total Preferred Corporate Debt Security
(Cost $45,856,237) | | | | | | | 45,337,050 | |
| | | | | | | | |
| |
CORPORATE DEBT SECURITIES - 61.4% | | | | | |
Aerospace & Defense - 1.6% | | | | | | | | |
Bombardier, Inc. | | | | | | | | |
4.75%, 04/15/2019, 144A (F) | | | 3,820,000 | | | | 3,925,050 | |
7.50%, 03/15/2018, 144A (F) | | | 14,956,000 | | | | 16,601,160 | |
Exelis, Inc.
4.25%, 10/01/2016 | | | 40,675,000 | | | | 42,482,028 | |
| | | | | | | | |
| | | | | | | 63,008,238 | |
| | | | | | | | |
The Notes to Financial Statements are an integral part of this report.
| | |
| Transamerica Funds | | Annual Report 2014 |
Page 194
Transamerica Short-Term Bond
SCHEDULE OF INVESTMENTS (continued)
At October 31, 2014
| | | | | | | | |
| | | Principal | | | Value | |
CORPORATE DEBT SECURITIES (continued) | |
Airlines - 1.7% | | | | | | | | |
America West Airlines Pass-Through Trust | | | | | | | | |
7.93%, 07/02/2020 | | | $ 2,443,137 | | | | $ 2,699,667 | |
8.06%, 01/02/2022 | | | 9,309,125 | | | | 10,542,585 | |
Continental Airlines Pass-Through Trust
7.46%, 10/01/2016 (F) | | | 964,891 | | | | 984,188 | |
Delta Air Lines Pass-Through Trust
6.20%, 01/02/2020 | | | 24,698,734 | | | | 27,415,595 | |
Northwest Airlines Pass-Through Trust
6.26%, 05/20/2023 | | | 1,071,478 | | | | 1,145,089 | |
UAL Pass-Through Trust
10.40%, 05/01/2018 | | | 17,240,937 | | | | 19,051,235 | |
Virgin Australia Trust
5.00%, 04/23/2025, 144A | | | 7,607,618 | | | | 7,835,847 | |
| | | | | | | | |
| | | | | | | 69,674,206 | |
| | | | | | | | |
Automobiles - 0.3% | | | | | | | | |
General Motors Co.
3.50%, 10/02/2018 | | | 11,894,000 | | | | 12,250,820 | |
| | | | | | | | |
Banks - 12.5% | | | | | | | | |
Barclays Bank PLC
6.05%, 12/04/2017, 144A | | | 40,900,000 | | | | 45,314,910 | |
BBVA US Senior SAU
4.66%, 10/09/2015 | | | 36,535,000 | | | | 37,854,096 | |
Branch Banking & Trust Co.
0.55%, 09/13/2016 (B) | | | 9,285,000 | | | | 9,265,223 | |
Cooperatieve Centrale Raiffeisen-Boerenleenbank BA
11.00%, 06/30/2019, 144A (B) (G) | | | 12,067,000 | | | | 15,747,435 | |
Export-Import Bank of Korea
4.00%, 01/11/2017 | | | 13,900,000 | | | | 14,647,973 | |
Fifth Third Bancorp | | | | | | | | |
0.65%, 12/20/2016 (B) | | | 1,714,000 | | | | 1,706,782 | |
5.45%, 01/15/2017 | | | 8,737,000 | | | | 9,480,632 | |
First Horizon National Corp.
5.38%, 12/15/2015 (F) | | | 39,835,000 | | | | 41,644,107 | |
HBOS PLC
Series MTN
6.75%, 05/21/2018, 144A (F) | | | 35,695,000 | | | | 40,088,590 | |
ING Bank NV | | | | | | | | |
0.93%, 10/01/2019, 144A (B) | | | 6,800,000 | | | | 6,809,758 | |
3.75%, 03/07/2017, 144A | | | 15,062,000 | | | | 15,865,091 | |
5.13%, 05/01/2015, 144A | | | 14,773,000 | | | | 15,074,886 | |
Intesa Sanpaolo SpA | | | | | | | | |
1.61%, 04/11/2016 (B) | | | 13,000,000 | | | | 13,088,530 | |
3.63%, 08/12/2015, 144A | | | 3,080,000 | | | | 3,135,049 | |
3.88%, 01/16/2018 | | | 21,320,000 | | | | 22,269,230 | |
Lloyds Bank PLC
Series MTN
9.88%, 12/16/2021, Reg S (B) | | | 17,101,000 | | | | 19,666,150 | |
MUFG Union Bank NA
2.63%, 09/26/2018 | | | 15,328,000 | | | | 15,610,526 | |
National City Bank
5.25%, 12/15/2016 | | | 17,300,000 | | | | 18,728,305 | |
Series MTN 5.80%, 06/07/2017 | | | 4,655,000 | | | | 5,155,887 | |
Regions Bank
7.50%, 05/15/2018 | | | 36,086,000 | | | | 42,277,167 | |
| | | | | | | | |
| | | Principal | | | Value | |
CORPORATE DEBT SECURITIES (continued) | |
Banks (continued) | | | | | | | | |
Regions Financial Corp.
2.00%, 05/15/2018 | | | $ 20,000,000 | | | | $ 19,838,940 | |
Royal Bank of Scotland Group PLC 1.17%, 03/31/2017 (B) (F) | | | 6,375,000 | | | | 6,396,127 | |
Royal Bank of Scotland NV
4.65%, 06/04/2018 (F) | | | 4,000,000 | | | | 4,127,776 | |
Royal Bank of Scotland PLC
4.38%, 03/16/2016 | | | 7,005,000 | | | | 7,312,246 | |
Societe Generale SA
5.75%, 04/20/2016, 144A | | | 21,505,000 | | | | 22,742,785 | |
Standard Chartered Bank
6.40%, 09/26/2017, 144A (F) | | | 8,554,000 | | | | 9,615,671 | |
SunTrust Bank
5.45%, 12/01/2017 | | | 5,500,000 | | | | 6,067,188 | |
UniCredit Luxembourg Finance SA
6.00%, 10/31/2017, 144A (F) | | | 5,065,000 | | | | 5,460,794 | |
Wachovia Corp. | | | | | | | | |
0.60%, 10/15/2016 (B) | | | 22,044,000 | | | | 22,021,493 | |
5.63%, 10/15/2016 | | | 10,233,000 | | | | 11,119,188 | |
| | | | | | | | |
| | | | | | | 508,132,535 | |
| | | | | | | | |
Beverages - 0.4% | | | | | | | | |
Anheuser-Busch InBev Worldwide, Inc.
9.75%, 11/17/2015 (F) | | | BRL 21,570,000 | | | | 8,617,902 | |
Coca-Cola Bottling Co., Consolidated
5.00%, 06/15/2016 | | | $ 7,650,000 | | | | 8,078,255 | |
| | | | | | | | |
| | | | | | | 16,696,157 | |
| | | | | | | | |
Building Products - 0.3% | | | | | | | | |
Owens Corning
6.50%, 12/01/2016 | | | 12,170,000 | | | | 13,374,879 | |
| | | | | | | | |
Capital Markets - 2.1% | | | | | | | | |
Goldman Sachs Group, Inc.
5.95%, 01/18/2018 | | | 16,775,000 | | | | 18,782,129 | |
Morgan Stanley
Series MTN | | | | | | | | |
1.51%, 04/25/2018 (B) | | | 33,000,000 | | | | 33,736,461 | |
3.00%, 08/31/2017 (B) | | | 1,500,000 | | | | 1,552,500 | |
5.95%, 12/28/2017 | | | 12,000,000 | | | | 13,486,008 | |
UBS AG
5.88%, 12/20/2017 | | | 14,632,000 | | | | 16,481,572 | |
| | | | | | | | |
| | | | | | | 84,038,670 | |
| | | | | | | | |
Chemicals - 1.0% | | | | | | | | |
ADOP Co.
6.63%, 10/01/2017, 144A | | | 15,000,000 | | | | 16,939,890 | |
Dow Chemical Co.
8.55%, 05/15/2019 | | | 15,777,000 | | | | 19,870,974 | |
Lubrizol Corp.
8.88%, 02/01/2019 (F) | | | 4,310,000 | | | | 5,450,314 | |
| | | | | | | | |
| | | | | | | 42,261,178 | |
| | | | | | | | |
Commercial Services & Supplies - 0.4% | |
Hutchison Whampoa International 11, Ltd.
3.50%, 01/13/2017, 144A (F) | | | 9,600,000 | | | | 10,020,250 | |
Hutchison Whampoa International 14, Ltd.
1.63%, 10/31/2017, 144A | | | 6,690,000 | | | | 6,678,647 | |
| | | | | | | | |
| | | | | | | 16,698,897 | |
| | | | | | | | |
The Notes to Financial Statements are an integral part of this report.
| | |
| Transamerica Funds | | Annual Report 2014 |
Page 195
Transamerica Short-Term Bond
SCHEDULE OF INVESTMENTS (continued)
At October 31, 2014
| | | | | | | | |
| | | Principal | | | Value | |
CORPORATE DEBT SECURITIES (continued) | |
Construction & Engineering - 0.5% | | | | | |
Toll Brothers Finance Corp.
8.91%, 10/15/2017 (F) | | | $ 18,525,000 | | | | $ 21,627,938 | |
| | | | | | | | |
Construction Materials - 0.3% | | | | | | | | |
CRH America, Inc.
6.00%, 09/30/2016 | | | 12,748,000 | | | | 13,881,578 | |
| | | | | | | | |
Consumer Finance - 1.5% | | | | | | | | |
Ally Financial, Inc.
4.75%, 09/10/2018 | | | 18,750,000 | | | | 19,687,500 | |
Discover Financial Services
6.45%, 06/12/2017 | | | 37,678,000 | | | | 42,058,030 | |
| | | | | | | | |
| | | | | | | 61,745,530 | |
| | | | | | | | |
Diversified Financial Services - 7.4% | |
Bank of America Corp. | | | | | | | | |
5.42%, 03/15/2017 | | | 20,206,000 | | | | 21,877,521 | |
7.80%, 09/15/2016 | | | 3,020,000 | | | | 3,363,362 | |
Series MTN 1.11%, 04/01/2019 (B) | | | 16,000,000 | | | | 16,082,624 | |
Bank of America NA | | | | | | | | |
0.51%, 06/15/2016 (B) | | | 5,000,000 | | | | 4,980,085 | |
0.53%, 06/15/2017 (B) | | | 33,850,000 | | | | 33,598,190 | |
Citigroup, Inc.
0.50%, 06/09/2016 (B) (F) | | | 44,069,000 | | | | 43,695,207 | |
Ford Motor Credit Co. LLC
8.00%, 12/15/2016 | | | 34,068,000 | | | | 38,609,605 | |
General Electric Capital Corp.
Series MTN
5.63%, 09/15/2017 | | | 15,891,000 | | | | 17,765,598 | |
JPMorgan Chase Bank NA | | | | | | | | |
0.56%, 06/13/2016 (B) | | | 9,550,000 | | | | 9,523,069 | |
6.00%, 10/01/2017 | | | 34,783,000 | | | | 38,954,038 | |
Lazard Group LLC
6.85%, 06/15/2017 | | | 1,500,000 | | | | 1,689,729 | |
Murray Street Investment Trust I
4.65%, 03/09/2017 (H) | | | 18,046,000 | | | | 19,266,252 | |
National Rural Utilities Cooperative Finance Corp.
10.38%, 11/01/2018 | | | 35,000,000 | | | | 46,076,065 | |
PTTEP Australia International Finance Pty, Ltd.
4.15%, 07/19/2015, 144A | | | 6,000,000 | | | | 6,116,502 | |
| | | | | | | | |
| | | | | | | 301,597,847 | |
| | | | | | | | |
Diversified Telecommunication Services - 2.1% | |
Qwest Corp.
8.38%, 05/01/2016 | | | 11,007,000 | | | | 12,045,742 | |
Telefonica Emisiones SAU | | | | | | | | |
3.19%, 04/27/2018 | | | 18,370,000 | | | | 19,067,399 | |
3.73%, 04/27/2015 | | | 13,630,000 | | | | 13,819,007 | |
3.99%, 02/16/2016 | | | 4,000,000 | | | | 4,150,536 | |
Verizon Communications, Inc.
1.98%, 09/14/2018 (B) | | | 35,900,000 | | | | 37,564,539 | |
| | | | | | | | |
| | | | | | | 86,647,223 | |
| | | | | | | | |
Electronic Equipment, Instruments & Components - 0.9% | |
Avnet, Inc. | | | | | | | | |
6.00%, 09/01/2015 | | | 18,943,000 | | | | 19,709,187 | |
6.63%, 09/15/2016 | | | 15,199,000 | | | | 16,642,130 | |
| | | | | | | | |
| | | | | | | 36,351,317 | |
| | | | | | | | |
| | | | | | | | |
| | | Principal | | | Value | |
CORPORATE DEBT SECURITIES (continued) | |
Energy Equipment & Services - 3.7% | |
Boardwalk Pipelines, LP | | | | | | | | |
5.88%, 11/15/2016 | | | $ 19,745,000 | | | | $ 21,239,380 | |
DCP Midstream Operating, LP | | | | | | | | |
3.25%, 10/01/2015 | | | 24,545,000 | | | | 25,089,703 | |
Sunoco Logistics Partners Operations, LP | | | | | | | | |
6.13%, 05/15/2016 | | | 17,646,000 | | | | 18,548,646 | |
TransCanada PipeLines, Ltd. | | | | | | | | |
0.91%, 06/30/2016 (B) (F) | | | 14,365,000 | | | | 14,450,903 | |
Transocean, Inc. | | | | | | | | |
5.05%, 12/15/2016 | | | 12,500,000 | | | | 13,118,162 | |
6.00%, 03/15/2018 (F) | | | 10,016,000 | | | | 10,678,999 | |
Weatherford International, Ltd. | | | | | | | | |
9.63%, 03/01/2019 | | | 36,745,000 | | | | 46,956,252 | |
| | | | | | | | |
| | | | | | | 150,082,045 | |
| | | | | | | | |
Food & Staples Retailing - 0.1% | | | | | | | | |
Delhaize Group SA | | | | | | | | |
6.50%, 06/15/2017 | | | 3,688,000 | | | | 4,126,754 | |
| | | | | | | | |
Food Products - 0.6% | | | | | | | | |
ConAgra Foods, Inc. | | | | | | | | |
2.10%, 03/15/2018 | | | 23,340,000 | | | | 23,457,330 | |
| | | | | | | | |
Health Care Equipment & Supplies - 0.6% | | | | | |
Boston Scientific Corp. | | | | | | | | |
2.65%, 10/01/2018 | | | 22,000,000 | | | | 22,229,394 | |
| | | | | | | | |
Hotels, Restaurants & Leisure - 0.8% | |
MGM Resorts International | | | | | | | | |
10.00%, 11/01/2016 (F) | | | 18,460,000 | | | | 20,905,950 | |
Seneca Gaming Corp. | | | | | | | | |
8.25%, 12/01/2018, 144A | | | 11,000,000 | | | | 11,495,000 | |
| | | | | | | | |
| | | | | | | 32,400,950 | |
| | | | | | | | |
Household Durables - 0.8% | | | | | | | | |
Meritage Homes Corp. | | | | | | | | |
4.50%, 03/01/2018 | | | 16,694,000 | | | | 17,027,880 | |
Whirlpool Corp. | | | | | | | | |
7.75%, 07/15/2016 | | | 12,970,000 | | | | 14,389,164 | |
| | | | | | | | |
| | | | | | | 31,417,044 | |
| | | | | | | | |
Independent Power and Renewable Electricity Producers - 0.2% | |
Constellation Energy Group, Inc. | | | | | | | | |
4.55%, 06/15/2015 | | | 8,476,000 | | | | 8,667,219 | |
| | | | | | | | |
Insurance - 4.4% | | | | | | | | |
American International Group, Inc. | | | | | | | | |
2.38%, 08/24/2015 | | | 7,540,000 | | | | 7,629,289 | |
CNA Financial Corp. | | | | | | | | |
6.50%, 08/15/2016 | | | 12,500,000 | | | | 13,666,150 | |
Fidelity National Financial, Inc. | | | | | | | | |
6.60%, 05/15/2017 (F) | | | 26,072,000 | | | | 28,991,725 | |
Genworth Holdings, Inc.
Series MTN | | | | | | | | |
6.52%, 05/22/2018 | | | 24,490,000 | | | | 27,577,968 | |
Hartford Financial Services Group, Inc. | | | | | | | | |
4.00%, 10/15/2017 | | | 9,075,000 | | | | 9,695,285 | |
Liberty Mutual Group, Inc. | | | | | | | | |
6.70%, 08/15/2016, 144A | | | 1,925,000 | | | | 2,109,725 | |
Prudential Covered Trust | | | | | | | | |
3.00%, 09/30/2015, 144A | | | 90,001 | | | | 91,685 | |
The Notes to Financial Statements are an integral part of this report.
| | |
| Transamerica Funds | | Annual Report 2014 |
Page 196
Transamerica Short-Term Bond
SCHEDULE OF INVESTMENTS (continued)
At October 31, 2014
| | | | | | | | |
| | | Principal | | | Value | |
CORPORATE DEBT SECURITIES (continued) | |
Insurance (continued) | | | | | | | | |
Stone Street Trust | | | | | | | | |
5.90%, 12/15/2015, 144A | | | $ 35,555,000 | | | | $ 37,173,535 | |
Transatlantic Holdings, Inc. | | | | | | | | |
5.75%, 12/14/2015 | | | 14,000,000 | | | | 14,739,676 | |
WR Berkley Corp. | | | | | | | | |
5.60%, 05/15/2015 | | | 35,260,000 | | | | 36,158,002 | |
| | | | | | | | |
| | | | | | | 177,833,040 | |
| | | | | | | | |
IT Services - 0.9% | | | | | | | | |
Computer Sciences Corp. | | | | | | | | |
2.50%, 09/15/2015 (F) | | | 25,615,000 | | | | 25,975,659 | |
Xerox Business Services LLC | | | | | | | | |
5.20%, 06/01/2015 | | | 11,300,000 | | | | 11,582,873 | |
| | | | | | | | |
| | | | | | | 37,558,532 | |
| | | | | | | | |
Life Sciences Tools & Services - 0.3% | |
Thermo Fisher Scientific, Inc. | | | | | | | | |
1.30%, 02/01/2017 | | | 12,000,000 | | | | 11,985,840 | |
| | | | | | | | |
Machinery - 0.8% | | | | | | | | |
CNH Industrial Capital LLC | | | | | | | | |
3.25%, 02/01/2017 (F) | | | 20,000,000 | | | | 20,000,000 | |
3.88%, 11/01/2015 | | | 11,371,000 | | | | 11,513,137 | |
| | | | | | | | |
| | | | | | | 31,513,137 | |
| | | | | | | | |
Media - 1.8% | | | | | | | | |
British Sky Broadcasting Group PLC | | | | | | | | |
6.10%, 02/15/2018, 144A | | | 14,355,000 | | | | 16,150,165 | |
9.50%, 11/15/2018, 144A | | | 27,879,000 | | | | 35,375,133 | |
Cablevision Systems Corp. | | | | | | | | |
7.75%, 04/15/2018 (F) | | | 19,852,000 | | | | 22,115,128 | |
| | | | | | | | |
| | | | | | | 73,640,426 | |
| | | | | | | | |
Metals & Mining - 1.9% | | | | | | | | |
Glencore Canada Corp. | | | | | | | | |
5.38%, 06/01/2015 | | | 13,250,000 | | | | 13,593,440 | |
Glencore Finance Canada, Ltd. | | | | | | | | |
5.80%, 11/15/2016, 144A | | | 4,913,000 | | | | 5,314,313 | |
Kinross Gold Corp. | | | | | | | | |
3.63%, 09/01/2016 | | | 28,605,000 | | | | 29,593,875 | |
Novelis, Inc. | | | | | | | | |
8.38%, 12/15/2017 | | | 10,000,000 | | | | 10,450,000 | |
Vale Overseas, Ltd. | | | | | | | | |
6.25%, 01/11/2016 | | | 17,000,000 | | | | 17,998,920 | |
| | | | | | | | |
| | | | | | | 76,950,548 | |
| | | | | | | | |
Oil, Gas & Consumable Fuels - 2.3% | |
Chesapeake Energy Corp. | | | | | | | | |
3.48%, 04/15/2019 (B) | | | 22,192,500 | | | | 22,207,813 | |
Enbridge, Inc. | | | | | | | | |
0.89%, 10/01/2016 (B) (F) | | | 19,895,000 | | | | 19,989,700 | |
Petrobras Global Finance BV | | | | | | | | |
2.00%, 05/20/2016 (F) | | | 15,000,000 | | | | 14,951,400 | |
Petrobras International Finance Co. SA | | | | | | | | |
3.50%, 02/06/2017 (F) | | | 17,000,000 | | | | 17,268,430 | |
Ras Laffan Liquefied Natural Gas Co., Ltd. III
5.83%, 09/30/2016, 144A | | | 13,894,140 | | | | 14,622,749 | |
Tengizchevroil Finance Co. Sarl
6.12%, 11/15/2014, 144A | | | 2,699,747 | | | | 2,699,747 | |
| | | | | | | | |
| | | | | | | 91,739,839 | |
| | | | | | | | |
| | | | | | | | |
| | | Principal | | | Value | |
CORPORATE DEBT SECURITIES (continued) | |
Real Estate Investment Trusts - 3.0% | |
ARC Properties Operating Partnership LP / Clark Acquisition LLC | | | | | | | | |
2.00%, 02/06/2017 (F) | | | $ 2,000,000 | | | | $ 1,953,152 | |
3.00%, 02/06/2019 (F) | | | 27,137,000 | | | | 26,132,117 | |
Digital Realty Trust, LP
4.50%, 07/15/2015 (F) | | | 14,200,000 | | | | 14,427,271 | |
Equity Commonwealth
6.65%, 01/15/2018 | | | 2,990,000 | | | | 3,296,098 | |
Government Properties Income Trust
3.75%, 08/15/2019 | | | 24,795,000 | | | | 25,202,059 | |
Highwoods Realty, LP
5.85%, 03/15/2017 | | | 19,300,000 | | | | 21,153,939 | |
Kilroy Realty, LP
5.00%, 11/03/2015 | | | 14,130,000 | | | | 14,694,310 | |
National Retail Properties, Inc.
6.15%, 12/15/2015 | | | 14,850,000 | | | | 15,700,400 | |
| | | | | | | | |
| | | | | | | 122,559,346 | |
| | | | | | | | |
Real Estate Management & Development - 0.8% | |
First Industrial, LP
5.75%, 01/15/2016 | | | 16,570,000 | | | | 17,386,951 | |
Series MTN 7.50%, 12/01/2017 | | | 11,650,000 | | | | 13,323,732 | |
| | | | | | | | |
| | | | | | | 30,710,683 | |
| | | | | | | | |
Road & Rail - 1.5% | |
Aviation Capital Group Corp. | | | | | | | | |
3.88%, 09/27/2016, 144A | | | 6,000,000 | | | | 6,163,608 | |
4.63%, 01/31/2018, 144A (F) | | | 25,984,000 | | | | 27,079,563 | |
7.13%, 10/15/2020, 144A | | | 6,880,000 | | | | 7,908,134 | |
GATX Financial Corp.
5.80%, 03/01/2016 | | | 19,000,000 | | | | 20,178,418 | |
| | | | | | | | |
| | | | | | | 61,329,723 | |
| | | | | | | | |
Semiconductors & Semiconductor Equipment - 0.5% | |
KLA-Tencor Corp.
2.38%, 11/01/2017 (D) | | | 6,770,000 | | | | 6,791,278 | |
NXP BV / NXP Funding LLC
3.75%, 06/01/2018, 144A | | | 13,300,000 | | | | 13,399,750 | |
| | | | | | | | |
| | | | | | | 20,191,028 | |
| | | | | | | | |
Tobacco - 1.1% | |
Altria Group, Inc.
9.70%, 11/10/2018 | | | 15,465,000 | | | | 19,933,024 | |
Lorillard Tobacco Co.
8.13%, 06/23/2019 | | | 20,000,000 | | | | 24,500,460 | |
| | | | | | | | |
| | | | | | | 44,433,484 | |
| | | | | | | | |
Trading Companies & Distributors - 1.0% | |
International Lease Finance Corp.
6.75%, 09/01/2016, 144A | | | 39,130,000 | | | | 41,477,800 | |
| | | | | | | | |
Wireless Telecommunication Services - 1.3% | |
Crown Castle Towers LLC
3.21%, 08/15/2035, 144A | | | 12,000,000 | | | | 12,236,604 | |
SBA Tower Trust
5.10%, 04/15/2042, 144A | | | 2,765,000 | | | | 2,931,735 | |
Sprint Communications, Inc.
9.00%, 11/15/2018, 144A | | | 12,700,000 | | | | 14,938,375 | |
The Notes to Financial Statements are an integral part of this report.
| | |
| Transamerica Funds | | Annual Report 2014 |
Page 197
Transamerica Short-Term Bond
SCHEDULE OF INVESTMENTS (continued)
At October 31, 2014
| | | | | | | | |
| | | Principal | | | Value | |
CORPORATE DEBT SECURITIES (continued) | |
Wireless Telecommunication Services (continued) | |
WCP Wireless Site Funding / WCP Wireless Site RE Funding
4.14%, 11/15/2040, 144A | | | $ 20,461,140 | | | | $ 20,822,688 | |
| | | | | | | | |
| | | | | | | 50,929,402 | |
| | | | | | | | |
Total Corporate Debt Securities
(Cost $2,473,300,943) | | | | | | | 2,493,220,577 | |
| | | | | | | | |
| | |
LOAN ASSIGNMENTS - 2.0% | | | | | | | | |
Food & Staples Retailing - 0.2% | | | | | | | | |
Albertson’s LLC, Term Loan B2
4.75%, 03/21/2019 (B) | | | 8,353,580 | | | | 8,323,992 | |
| | | | | | | | |
Food Products - 0.2% | | | | | | | | |
Aramark Services, Inc., Extended Synthetic Line of Credit 2
1.83%, 07/26/2016 (B) | | | 2,644,062 | | | | 2,624,232 | |
Aramark Services, Inc., Extended Synthetic Line of Credit 3
1.83%, 07/26/2016 (B) | | | 6,211,851 | | | | 6,165,263 | |
| | | | | | | | |
| | | | | | | 8,789,495 | |
| | | | | | | | |
Health Care Providers & Services - 0.3% | |
HCA, Inc., Term Loan B5
2.90%, 03/31/2017 (B) | | | 13,365,000 | | | | 13,303,748 | |
| | | | | | | | |
Hotels, Restaurants & Leisure - 0.4% | |
Dunkin’ Brands, Inc., Term Loan C 2.65%, 09/30/2017 (B) | | | 15,567,065 | | | | 15,476,262 | |
| | | | | | | | |
Household Products - 0.7% | |
Dell, Inc., Term Loan C
3.75%, 10/29/2018 (B) | | | 27,000,000 | | | | 26,773,389 | |
| | | | | | | | |
Personal Products - 0.2% | |
Revlon Consumer Products Corp., Term Loan B
3.25%, 11/20/2017 (B) | | | 8,479,900 | | | | 8,360,655 | |
| | | | | | | | |
Total Loan Assignments
(Cost $81,295,527) | | | | | | | 81,027,541 | |
| | | | | | | | |
| | |
| | | Shares | | | Value | |
SECURITIES LENDING COLLATERAL - 2.7% | |
State Street Navigator Securities Lending Trust - Prime Portfolio
0.16% (I) | | | 109,909,532 | | | | 109,909,532 | |
| | | | | | | | |
Total Securities Lending Collateral
(Cost $109,909,532) | | | | | | | 109,909,532 | |
| | | | | | | | |
| | | | | | | | |
| | | Principal | | | Value | |
REPURCHASE AGREEMENT - 0.2% | |
State Street Bank & Trust Co.
0.01% (I), dated 10/31/2014, to be repurchased at $7,151,273 on 11/03/2014. Collateralized by U.S. Government Agency Obligations, 3.50% - 4.00%, due 09/25/2039 - 02/15/2041, and with a total value of $7,297,572. | | | $ 7,151,267 | | | | $ 7,151,267 | |
| | | | | | | | |
Total Repurchase Agreement
(Cost $7,151,267) | | | | | | | 7,151,267 | |
| | | | | | | | |
Total Investments
(Cost $4,115,761,549) (J) | | | | | | | 4,144,464,660 | |
Net Other Assets (Liabilities) - (2.0)% | | | | (79,814,849 | ) |
| | | | | | | | |
| | |
Net Assets - 100.0% | | | | | | | $ 4,064,649,811 | |
| | | | | | | | |
The Notes to Financial Statements are an integral part of this report.
| | |
| Transamerica Funds | | Annual Report 2014 |
Page 198
Transamerica Short-Term Bond
SCHEDULE OF INVESTMENTS (continued)
At October 31, 2014
SECURITY VALUATION:
Valuation Inputs (K)
| | | | | | | | | | | | | | | | |
| | | Level 1
Quoted Prices | | | Level 2
Other Significant
Observable Inputs | | | Level 3
Significant
Unobservable Inputs (L) | | | Value at
October 31, 2014 | |
ASSETS | | | | | | | | | | | | | | | | |
Investments | | | | | | | | | | | | | | | | |
U.S. Government Agency Obligation | | $ | — | | | $ | 531,495 | | | $ | — | | | $ | 531,495 | |
Mortgage-Backed Securities | | | — | | | | 875,794,263 | | | | 11,557,586 | | | | 887,351,849 | |
Asset-Backed Securities | | | — | | | | 508,068,179 | | | | — | | | | 508,068,179 | |
Municipal Government Obligation | | | — | | | | 11,867,170 | | | | — | | | | 11,867,170 | |
Preferred Corporate Debt Security | | | — | | | | 45,337,050 | | | | — | | | | 45,337,050 | |
Corporate Debt Securities | | | — | | | | 2,493,220,577 | | | | — | | | | 2,493,220,577 | |
Loan Assignments | | | — | | | | 81,027,541 | | | | — | | | | 81,027,541 | |
Securities Lending Collateral | | | 109,909,532 | | | | — | | | | — | | | | 109,909,532 | |
Repurchase Agreement | | | — | | | | 7,151,267 | | | | — | | | | 7,151,267 | |
| | | | | | | | | | | | | | | | |
Total Investments | | $ | 109,909,532 | | | $ | 4,022,997,542 | | | $ | 11,557,586 | | | $ | 4,144,464,660 | |
| | | | | | | | | | | | | | | | |
| | | | | | | | | | | | | | | | |
| Investments | | Transfer from
Level 1 to Level 2 | | | Transfer from
Level 2 to Level 1 | | | Transfer from
Level 2 to Level 3 (M) | | | Transfer from
Level 3 to Level 2 | |
Mortgage-Backed Securities | | $ | — | | | $ | — | | | $ | 11,557,586 | | | $ | — | |
| | | | | | | | | | | | | | | | |
FOOTNOTES TO SCHEDULE OF INVESTMENTS:
| (A) | Percentage rounds to less than 0.1% or (0.1)%. |
| (B) | Floating or variable rate security. Rate is listed as of October 31, 2014. |
| (C) | Fair valued as determined in good faith in accordance with procedures established by the board of trustees. Total aggregate fair value of securities is $22,934,554, or 0.56% of the Fund’s net assets. |
| (D) | When-issued security. A conditional transaction in a security authorized for issuance, but not yet issued. |
| (E) | Total aggregate value of illiquid securities is $11,867,170, or 0.29% of the Fund’s net assets. |
| (F) | All or a portion of this security is on loan. The value of all securities on loan is $107,677,423. The amount of securities on loan indicated may not correspond with the securities on loan identified because securities with pending sales are in the process of recall from the brokers. |
| (G) | The security has a perpetual maturity. The date shown is the next call date. |
| (H) | Step bond. Coupon rate changes in increments to maturity. Rate disclosed is as of October 31, 2014. Maturity date disclosed is the ultimate maturity date. |
| (I) | Rate shown reflects the yield at October 31, 2014. |
| (J) | Aggregate cost for federal income tax purposes is $4,116,208,990. Aggregate gross unrealized appreciation and depreciation for all securities is $43,777,390 and $15,521,720, respectively. Net unrealized appreciation for tax purposes is $28,255,670. |
| (K) | The Fund recognizes transfers between Levels at the end of the reporting period. See the Notes to Financial Statements for more information regarding security valuation and pricing inputs. |
| (L) | Level 3 securities were not considered significant to the Fund. |
| (M) | Transferred from Level 2 to 3 due to utilizing significant unobservable inputs, as of prior reporting period the security utilized significant observable inputs. |
DEFINITIONS:
| | |
| 144A | | 144A securities are registered pursuant to Rule 144A of the Securities Act of 1933. These securities are deemed to be liquid for purposes of compliance limitations on holdings of illiquid securities and may be resold as transactions exempt from registration, normally to qualified institutional buyers. At October 31, 2014, these securities aggregated $1,730,033,179, or 42.56% of the Fund’s net assets. |
| AGM | | Assured Guaranty Municipal Corp. |
| MTN | | Medium Term Note |
| Reg S | | Security exempt from registration under Regulation S of the Securities Act of 1933, which exempts from registration securities offered and sold outside the United States. Security may not be offered or sold in the United States except pursuant to an exemption from, or in a transaction not subject to, the registration requirements of the Securities Act of 1933. |
CURRENCY ABBREVIATION:
The Notes to Financial Statements are an integral part of this report.
| | |
| Transamerica Funds | | Annual Report 2014 |
Page 199
Transamerica Small Cap Core
SCHEDULE OF INVESTMENTS
At October 31, 2014
| | | | | | | | |
| | | Shares | | | Value | |
COMMON STOCKS - 96.8% | | | | | | | | |
Aerospace & Defense - 1.0% | | | | | | | | |
AAR Corp. | | | 28,020 | | | | $ 742,530 | |
Curtiss-Wright Corp. | | | 10,615 | | | | 734,664 | |
Ducommun, Inc. (A) (B) | | | 25,140 | | | | 663,948 | |
| | | | | | | | |
| | | | | | | 2,141,142 | |
| | | | | | | | |
Airlines - 0.3% | | | | | | | | |
JetBlue Airways Corp. (A) (B) | | | 61,785 | | | | 712,999 | |
| | | | | | | | |
Auto Components - 0.4% | | | | | | | | |
Cooper Tire & Rubber Co. | | | 25,085 | | | | 807,988 | |
| | | | | | | | |
Banks - 4.5% | | | | | | | | |
Banner Corp. | | | 19,630 | | | | 848,409 | |
BBCN Bancorp, Inc. (A) | | | 49,310 | | | | 697,243 | |
Cathay General Bancorp (A) | | | 29,920 | | | | 790,187 | |
Chemical Financial Corp. | | | 27,260 | | | | 811,803 | |
First NBC Bank Holding Co. (B) | | | 21,950 | | | | 806,223 | |
Hanmi Financial Corp., Class B | | | 36,945 | | | | 792,470 | |
Lakeland Financial Corp. (A) | | | 19,600 | | | | 812,224 | |
OFG Bancorp | | | 48,820 | | | | 760,127 | |
PrivateBancorp, Inc., Class A | | | 26,105 | | | | 843,714 | |
Prosperity Bancshares, Inc. (A) | | | 12,720 | | | | 768,161 | |
Trustmark Corp., Class A (A) | | | 32,315 | | | | 786,224 | |
Umpqua Holdings Corp. (A) | | | 43,700 | | | | 769,120 | |
| | | | | | | | |
| | | | | | | 9,485,905 | |
| | | | | | | | |
Biotechnology - 0.4% | | | | | | | | |
Myriad Genetics, Inc. (A) (B) | | | 19,110 | | | | 754,654 | |
| | | | | | | | |
Building Products - 0.8% | | | | | | | | |
Quanex Building Products Corp. (A) | | | 42,700 | | | | 854,854 | |
Universal Forest Products, Inc. | | | 16,375 | | | | 818,259 | |
| | | | | | | | |
| | | | | | | 1,673,113 | |
| | | | | | | | |
Capital Markets - 1.7% | | | | | | | | |
Arlington Asset Investment Corp., Class A (A) | | | 26,695 | | | | 730,909 | |
Janus Capital Group, Inc. (A) | | | 50,260 | | | | 753,397 | |
Manning & Napier, Inc., Class A | | | 43,680 | | | | 691,891 | |
Piper Jaffray Cos. (A) (B) | | | 14,240 | | | | 803,991 | |
Solar Capital, Ltd. | | | 38,920 | | | | 723,523 | |
| | | | | | | | |
| | | | | | | 3,703,711 | |
| | | | | | | | |
Chemicals - 2.4% | | | | | | | | |
A. Schulman, Inc. | | | 22,555 | | | | 798,673 | |
Cabot Corp. | | | 15,270 | | | | 708,986 | |
FutureFuel Corp. | | | 60,545 | | | | 806,459 | |
Olin Corp. (A) | | | 28,110 | | | | 681,386 | |
OM Group, Inc. (A) | | | 28,315 | | | | 737,040 | |
PolyOne Corp. (A) | | | 19,750 | | | | 730,948 | |
Stepan Co. | | | 16,155 | | | | 715,343 | |
| | | | | | | | |
| | | | | | | 5,178,835 | |
| | | | | | | | |
Commercial Services & Supplies - 3.7% | | | | | | | | |
ABM Industries, Inc. | | | 28,140 | | | | 777,790 | |
ACCO Brands Corp. (A) (B) | | | 98,385 | | | | 809,709 | |
Brady Corp., Class A (A) | | | 32,875 | | | | 783,740 | |
Brink’s Co. | | | 27,925 | | | | 586,425 | |
Deluxe Corp. (A) | | | 12,525 | | | | 761,520 | |
Kimball International, Inc., Class B (A) | | | 48,790 | | | | 877,244 | |
R.R. Donnelley & Sons Co. (A) | | | 44,890 | | | | 783,330 | |
Tetra Tech, Inc. | | | 29,210 | | | | 783,120 | |
United Stationers, Inc. (A) | | | 17,795 | | | | 743,297 | |
Viad Corp. | | | 34,710 | | | | 885,452 | |
| | | | | | | | |
| | | | | | | 7,791,627 | |
| | | | | | | | |
| | | | | | | | |
| | | Shares | | | Value | |
COMMON STOCKS (continued) | | | | | | | | |
Communications Equipment - 2.5% | | | | | | | | |
ARRIS Group, Inc. (B) | | | 27,545 | | | | $ 826,901 | |
Black Box Corp. | | | 32,160 | | | | 707,198 | |
Brocade Communications Systems, Inc. | | | 73,865 | | | | 792,572 | |
Comtech Telecommunications Corp. | | | 20,180 | | | | 768,253 | |
Harmonic, Inc. (A) (B) | | | 117,400 | | | | 783,058 | |
NETGEAR, Inc. (A) (B) | | | 21,955 | | | | 747,348 | |
Polycom, Inc. (B) | | | 58,130 | | | | 760,340 | |
| | | | | | | | |
| | | | | | | 5,385,670 | |
| | | | | | | | |
Construction & Engineering - 1.4% | | | | | | | | |
AECOM Technology Corp. (A) (B) | | | 22,540 | | | | 733,677 | |
Aegion Corp., Class A (A) (B) | | | 40,175 | | | | 736,006 | |
EMCOR Group, Inc. | | | 17,855 | | | | 787,941 | |
Tutor Perini Corp. (A) (B) | | | 29,550 | | | | 827,696 | |
| | | | | | | | |
| | | | | | | 3,085,320 | |
| | | | | | | | |
Consumer Finance - 0.4% | | | | | | | | |
Cash America International, Inc. (A) | | | 17,305 | | | | 850,541 | |
| | | | | | | | |
Containers & Packaging - 0.7% | | | | | | | | |
Greif, Inc., Class A | | | 16,995 | | | | 748,800 | |
Sonoco Products Co. | | | 18,745 | | | | 766,108 | |
| | | | | | | | |
| | | | | | | 1,514,908 | |
| | | | | | | | |
Distributors - 0.4% | | | | | | | | |
Core-Mark Holding Co., Inc. | | | 14,090 | | | | 817,643 | |
| | | | | | | | |
Diversified Consumer Services - 2.2% | | | | | | | | |
Apollo Education Group, Inc., Class A (B) | | | 27,305 | | | | 782,561 | |
Capella Education Co. (A) | | | 11,875 | | | | 840,037 | |
DeVry Education Group, Inc. | | | 17,365 | | | | 840,640 | |
K12, Inc. (A) (B) | | | 41,800 | | | | 518,320 | |
Steiner Leisure, Ltd., Class A (B) | | | 19,930 | | | | 840,647 | |
Strayer Education, Inc. (B) | | | 12,140 | | | | 888,527 | |
| | | | | | | | |
| | | | | | | 4,710,732 | |
| | | | | | | | |
Diversified Telecommunication Services - 1.2% | | | | | | | | |
Inteliquent, Inc. | | | 57,185 | | | | 962,424 | |
magicJack VocalTec, Ltd. (B) | | | 79,955 | | | | 743,581 | |
Vonage Holdings Corp. (A) (B) | | | 217,835 | | | | 758,066 | |
| | | | | | | | |
| | | | | | | 2,464,071 | |
| | | | | | | | |
Electric Utilities - 0.4% | | | | | | | | |
UIL Holdings Corp. (A) | | | 19,405 | | | | 798,322 | |
| | | | | | | | |
Electrical Equipment - 0.7% | | | | | | | | |
General Cable Corp. (A) | | | 50,890 | | | | 721,111 | |
Regal Beloit Corp. (A) | | | 10,880 | | | | 772,154 | |
| | | | | | | | |
| | | | | | | 1,493,265 | |
| | | | | | | | |
Electronic Equipment, Instruments & Components - 4.0% | |
Benchmark Electronics, Inc. (B) | | | 30,165 | | | | 715,514 | |
Celestica, Inc. (B) | | | 70,555 | | | | 774,694 | |
DTS, Inc. (B) | | | 27,560 | | | | 820,737 | |
Insight Enterprises, Inc. (B) | | | 29,345 | | | | 667,599 | |
Itron, Inc. (A) (B) | | | 19,055 | | | | 741,811 | |
Nam Tai Property, Inc. (A) | | | 126,000 | | | | 695,520 | |
Orbotech, Ltd. (B) | | | 46,740 | | | | 749,710 | |
Sanmina Corp. (B) | | | 35,545 | | | | 891,113 | |
ScanSource, Inc. (B) | | | 21,905 | | | | 836,333 | |
Tech Data Corp. (B) | | | 12,845 | | | | 767,103 | |
Zebra Technologies Corp., Class A (A) (B) | | | 10,715 | | | | 790,231 | |
| | | | | | | | |
| | | | | | | 8,450,365 | |
| | | | | | | | |
The Notes to Financial Statements are an integral part of this report.
| | |
| Transamerica Funds | | Annual Report 2014 |
Page 200
Transamerica Small Cap Core
SCHEDULE OF INVESTMENTS (continued)
At October 31, 2014
| | | | | | | | |
| | | Shares | | | Value | |
COMMON STOCKS (continued) | | | | | | | | |
Energy Equipment & Services - 3.8% | |
Atwood Oceanics, Inc. (A) (B) | | | 16,095 | | | | $ 654,262 | |
Geospace Technologies Corp. (A) (B) | | | 24,995 | | | | 769,596 | |
Helix Energy Solutions Group, Inc., Class A (A) (B) | | | 33,065 | | | | 880,852 | |
ION Geophysical Corp. (A) (B) | | | 293,495 | | | | 821,786 | |
Key Energy Services, Inc. (A) (B) | | | 162,760 | | | | 494,790 | |
Parker Drilling Co. (A) (B) | | | 162,760 | | | | 722,654 | |
Patterson-UTI Energy, Inc. | | | 22,880 | | | | 526,926 | |
Pioneer Energy Services Corp. (B) | | | 60,850 | | | | 558,603 | |
Precision Drilling Corp. | | | 74,570 | | | | 620,422 | |
SEACOR Holdings, Inc. (A) (B) | | | 9,110 | | | | 751,120 | |
Unit Corp. (B) | | | 13,655 | | | | 661,175 | |
Vantage Drilling Co. (A) (B) | | | 635,480 | | | | 614,827 | |
| | | | | | | | |
| | | | | | | 8,077,013 | |
| | | | | | | | |
Food & Staples Retailing - 1.1% | |
Pantry, Inc. (B) | | | 33,490 | | | | 863,037 | |
SpartanNash Co. | | | 35,985 | | | | 806,424 | |
SUPERVALU, Inc. (B) | | | 81,470 | | | | 703,086 | |
| | | | | | | | |
| | | | | | | 2,372,547 | |
| | | | | | | | |
Food Products - 1.1% | |
Calavo Growers, Inc. (A) | | | 16,245 | | | | 788,532 | |
Lancaster Colony Corp. (A) | | | 8,755 | | | | 800,995 | |
Sanderson Farms, Inc. (A) | | | 7,850 | | | | 659,243 | |
| | | | | | | | |
| | | | | | | 2,248,770 | |
| | | | | | | | |
Gas Utilities - 0.7% | |
Laclede Group, Inc. | | | 15,615 | | | | 792,774 | |
WGL Holdings, Inc. (A) | | | 16,485 | | | | 774,795 | |
| | | | | | | | |
| | | | | | | 1,567,569 | |
| | | | | | | | |
Health Care Equipment & Supplies - 4.3% | |
Alere, Inc. (A) (B) | | | 18,485 | | | | 738,845 | |
Analogic Corp. (A) | | | 10,610 | | | | 773,893 | |
CONMED Corp. (A) | | | 18,230 | | | | 765,478 | |
CryoLife, Inc. (A) | | | 67,480 | | | | 692,345 | |
Greatbatch, Inc. (B) | | | 16,080 | | | | 807,055 | |
Haemonetics Corp. (A) (B) | | | 21,420 | | | | 807,962 | |
Hill-Rom Holdings, Inc. (A) | | | 17,225 | | | | 766,168 | |
ICU Medical, Inc., Class B (B) | | | 10,985 | | | | 778,837 | |
Natus Medical, Inc. (A) (B) | | | 23,675 | | | | 804,950 | |
NuVasive, Inc. (A) (B) | | | 20,295 | | | | 830,065 | |
Symmetry Medical, Inc. (A) (B) | | | 74,115 | | | | 733,739 | |
Thoratec Corp. (A) (B) | | | 27,175 | | | | 738,617 | |
| | | | | | | | |
| | | | | | | 9,237,954 | |
| | | | | | | | |
Health Care Providers & Services - 6.0% | |
Addus HomeCare Corp. (A) (B) | | | 35,345 | | | | 702,305 | |
Alliance HealthCare Services, Inc. (A) (B) | | | 32,890 | | | | 793,636 | |
Almost Family, Inc. (A) (B) | | | 26,865 | | | | 790,906 | |
Amsurg Corp., Class A (A) (B) | | | 14,420 | | | | 778,824 | |
Centene Corp. (A) (B) | | | 8,880 | | | | 822,910 | |
Chemed Corp. (A) | | | 7,300 | | | | 754,528 | |
Health Net, Inc. (B) | | | 15,530 | | | | 737,830 | |
Kindred Healthcare, Inc. | | | 37,360 | | | | 812,580 | |
Landauer, Inc. (A) | | | 21,235 | | | | 760,001 | |
Magellan Health, Inc. (A) (B) | | | 14,075 | | | | 851,819 | |
Molina Healthcare, Inc. (A) (B) | | | 16,280 | | | | 791,859 | |
PharMerica Corp. (B) | | | 28,670 | | | | 822,542 | |
Providence Service Corp. (A) (B) | | | 17,415 | | | | 769,395 | |
Select Medical Holdings Corp. | | | 61,565 | | | | 887,767 | |
| | | | | | | | |
| | | Shares | | | Value | |
COMMON STOCKS (continued) | | | | | | | | |
Health Care Providers & Services (continued) | |
Triple-S Management Corp., Class B (A) (B) | | | 37,515 | | | | $ 830,582 | |
VCA, Inc. (A) (B) | | | 18,715 | | | | 852,842 | |
| | | | | | | | |
| | | | | | | 12,760,326 | |
| | | | | | | | |
Health Care Technology - 1.5% | |
Computer Programs & Systems, Inc. (A) | | | 12,410 | | | | 781,582 | |
MedAssets, Inc. (A) (B) | | | 33,490 | | | | 725,393 | |
Omnicell, Inc. (B) | | | 27,270 | | | | 881,094 | |
Quality Systems, Inc. | | | 49,475 | | | | 747,567 | |
| | | | | | | | |
| | | | | | | 3,135,636 | |
| | | | | | | | |
Hotels, Restaurants & Leisure - 1.2% | |
Cheesecake Factory, Inc. (A) | | | 15,985 | | | | 734,351 | |
Marriott Vacations Worldwide Corp. (A) | | | 11,790 | | | | 818,697 | |
Ruby Tuesday, Inc. (A) (B) | | | 125,335 | | | | 962,573 | |
| | | | | | | | |
| | | | | | | 2,515,621 | |
| | | | | | | | |
Household Durables - 1.2% | |
Ethan Allen Interiors, Inc. (A) | | | 30,365 | | | | 859,329 | |
Helen of Troy, Ltd. (B) | | | 12,780 | | | | 790,443 | |
Universal Electronics, Inc. (A) (B) | | | 15,065 | | | | 857,048 | |
| | | | | | | | |
| | | | | | | 2,506,820 | |
| | | | | | | | |
Insurance - 1.8% | |
Argo Group International Holdings, Ltd. (A) | | | 14,015 | | | | 782,037 | |
Aspen Insurance Holdings, Ltd. (A) | | | 17,080 | | | | 745,200 | |
Maiden Holdings, Ltd. (A) | | | 60,260 | | | | 720,107 | |
Montpelier RE Holdings, Ltd. (A) | | | 22,710 | | | | 752,610 | |
United Fire Group, Inc. (A) | | | 26,260 | | | | 852,925 | |
| | | | | | | | |
| | | | | | | 3,852,879 | |
| | | | | | | | |
Internet & Catalog Retail - 1.1% | |
Blue Nile, Inc. (A) (B) | | | 24,880 | | | | 883,240 | |
Nutrisystem, Inc. (A) | | | 47,415 | | | | 798,469 | |
PetMed Express, Inc. (A) | | | 54,920 | | | | 725,493 | |
| | | | | | | | |
| | | | | | | 2,407,202 | |
| | | | | | | | |
Internet Software & Services - 0.2% | |
Monster Worldwide, Inc. (A) (B) | | | 136,385 | | | | 526,446 | |
| | | | | | | | |
IT Services - 2.9% | |
Convergys Corp. (A) | | | 40,275 | | | | 812,346 | |
CSG Systems International, Inc. (A) | | | 26,425 | | | | 700,527 | |
DST Systems, Inc. | | | 8,365 | | | | 805,968 | |
ExlService Holdings, Inc. (B) | | | 29,815 | | | | 834,522 | |
Forrester Research, Inc. | | | 19,925 | | | | 802,579 | |
Global Cash Access Holdings, Inc. (B) | | | 100,300 | | | | 731,187 | |
Leidos Holdings, Inc. | | | 20,475 | | | | 748,771 | |
Sykes Enterprises, Inc. (A) (B) | | | 36,910 | | | | 795,041 | |
| | | | | | | | |
| | | | | | | 6,230,941 | |
| | | | | | | | |
Leisure Products - 0.4% | | | | | | | | |
Nautilus, Inc., Class A (B) | | | 63,435 | | | | 848,760 | |
| | | | | | | | |
Life Sciences Tools & Services - 1.4% | | | | | | | | |
Affymetrix, Inc. (A) (B) | | | 89,400 | | | | 805,494 | |
Bruker Corp. (B) | | | 37,905 | | | | 785,770 | |
Charles River Laboratories International, Inc. (A) (B) | | | 12,575 | | | | 794,237 | |
PAREXEL International Corp. (A) (B) | | | 11,980 | | | | 650,634 | |
| | | | | | | | |
| | | | | | | 3,036,135 | |
| | | | | | | | |
Machinery - 2.6% | | | | | | | | |
Briggs & Stratton Corp. (A) | | | 37,545 | | | | 758,784 | |
ESCO Technologies, Inc. (A) | | | 20,855 | | | | 792,907 | |
The Notes to Financial Statements are an integral part of this report.
| | |
| Transamerica Funds | | Annual Report 2014 |
Page 201
Transamerica Small Cap Core
SCHEDULE OF INVESTMENTS (continued)
At October 31, 2014
| | | | | | | | |
| | | Shares | | | Value | |
COMMON STOCKS (continued) | | | | | | | | |
Machinery (continued) | | | | | | | | |
Federal Signal Corp. | | | 59,030 | | | | $ 838,226 | |
Hillenbrand, Inc. | | | 22,930 | | | | 763,340 | |
LB Foster Co., Class A (A) | | | 16,155 | | | | 873,824 | |
Meritor, Inc. (A) (B) | | | 69,075 | | | | 793,672 | |
Wabash National Corp. (A) (B) | | | 60,050 | | | | 618,515 | |
| | | | | | | | |
| | | | | | | 5,439,268 | |
| | | | | | | | |
Marine - 0.4% | | | | | | | | |
Matson, Inc. (A) | | | 28,380 | | | | 808,546 | |
| | | | | | | | |
Media - 0.4% | | | | | | | | |
Harte-Hanks, Inc. | | | 120,195 | | | | 782,469 | |
| | | | | | | | |
Metals & Mining - 2.5% | | | | | | | | |
Commercial Metals Co. | | | 44,265 | | | | 765,342 | |
Dominion Diamond Corp. (B) | | | 51,070 | | | | 715,491 | |
Kaiser Aluminum Corp. (A) | | | 9,095 | | | | 632,557 | |
Materion Corp. (A) | | | 23,700 | | | | 934,965 | |
Schnitzer Steel Industries, Inc., Class A (A) | | | 32,495 | | | | 765,257 | |
Steel Dynamics, Inc. (A) | | | 32,740 | | | | 753,347 | |
U.S. Steel Corp. (A) | | | 19,775 | | | | 791,791 | |
| | | | | | | | |
| | | | | | | 5,358,750 | |
| | | | | | | | |
Multi-Utilities - 0.8% | | | | | | | | |
Avista Corp. (A) | | | 22,470 | | | | 796,562 | |
Vectren Corp. (A) | | | 18,140 | | | | 815,393 | |
| | | | | | | | |
| | | | | | | 1,611,955 | |
| | | | | | | | |
Multiline Retail - 0.3% | | | | | | | | |
Big Lots, Inc. (A) | | | 15,900 | | | | 725,835 | |
| | | | | | | | |
Oil, Gas & Consumable Fuels - 4.4% | | | | | | | | |
Clayton Williams Energy, Inc. (A) (B) | | | 8,100 | | | | 673,434 | |
Cloud Peak Energy, Inc. (A) (B) | | | 65,485 | | | | 783,855 | |
Comstock Resources, Inc. (A) | | | 45,990 | | | | 544,522 | |
Gran Tierra Energy, Inc. (B) | | | 149,755 | | | | 682,883 | |
Green Plains, Inc. (A) | | | 22,505 | | | | 769,671 | |
Halcon Resources Corp. (A) (B) | | | 208,205 | | | | 647,517 | |
Hugoton Royalty Trust | | | 78,670 | | | | 704,883 | |
InterOil Corp. (A) (B) | | | 14,620 | | | | 828,077 | |
Pacific Ethanol, Inc. (B) | | | 63,880 | | | | 901,347 | |
REX American Resources Corp., Class A (A) (B) | | | 10,460 | | | | 761,070 | |
Teekay Tankers, Ltd., Class A (A) | | | 191,190 | | | | 810,645 | |
VAALCO Energy, Inc. (A) (B) | | | 91,350 | | | | 677,817 | |
Warren Resources, Inc. (A) (B) | | | 167,615 | | | | 579,948 | |
| | | | | | | | |
| | | | | | | 9,365,669 | |
| | | | | | | | |
Paper & Forest Products - 0.7% | | | | | | | | |
Clearwater Paper Corp. (B) | | | 11,070 | | | | 712,354 | |
Neenah Paper, Inc. (A) | | | 13,855 | | | | 845,294 | |
| | | | | | | | |
| | | | | | | 1,557,648 | |
| | | | | | | | |
Personal Products - 0.9% | | | | | | | | |
Medifast, Inc. (A) (B) | | | 23,425 | | | | 743,510 | |
USANA Health Sciences, Inc. (A) (B) | | | 9,445 | | | | 1,076,541 | |
| | | | | | | | |
| | | | | | | 1,820,051 | |
| | | | | | | | |
Professional Services - 2.6% | | | | | | | | |
CBIZ, Inc. (A) (B) | | | 85,030 | | | | 784,827 | |
CRA International, Inc. (B) | | | 29,300 | | | | 879,000 | |
Heidrick & Struggles International, Inc. | | | 34,660 | | | | 721,621 | |
Insperity, Inc. (A) | | | 26,215 | | | | 827,346 | |
Korn / Ferry International (B) | | | 28,000 | | | | 782,040 | |
Resources Connection, Inc. (A) | | | 49,160 | | | | 760,505 | |
| | | | | | | | |
| | | Shares | | | Value | |
COMMON STOCKS (continued) | | | | | | | | |
Professional Services (continued) | | | | | | | | |
TrueBlue, Inc. (B) | | | 27,170 | | | | $ 671,642 | |
| | | | | | | | |
| | | | | | | 5,426,981 | |
| | | | | | | | |
Real Estate Investment Trusts - 8.2% | | | | | | | | |
AG Mortgage Investment Trust, Inc. | | | 38,725 | | | | 738,486 | |
Agree Realty Corp. | | | 26,100 | | | | 798,921 | |
American Capital Mortgage Investment Corp. | | | 37,575 | | | | 736,094 | |
Anworth Mortgage Asset Corp. | | | 150,160 | | | | 779,330 | |
Apollo Residential Mortgage, Inc. | | | 45,895 | | | | 765,529 | |
Capstead Mortgage Corp. (A) | | | 58,760 | | | | 746,840 | |
Corporate Office Properties Trust | | | 26,290 | | | | 718,769 | |
CYS Investments, Inc. (A) | | | 78,660 | | | | 702,434 | |
DuPont Fabros Technology, Inc. (A) | | | 27,150 | | | | 840,836 | |
Dynex Capital, Inc. (A) | | | 89,400 | | | | 752,748 | |
EPR Properties (A) | | | 12,820 | | | | 719,202 | |
Equity Commonwealth | | | 28,265 | | | | 754,958 | |
Franklin Street Properties Corp. | | | 63,700 | | | | 763,763 | |
Government Properties Income Trust (A) | | | 32,355 | | | | 738,341 | |
Hatteras Financial Corp. (A) | | | 39,255 | | | | 747,415 | |
Home Properties, Inc. (A) | | | 11,595 | | | | 745,674 | |
Inland Real Estate Corp. (A) | | | 74,215 | | | | 787,421 | |
Investors Real Estate Trust | | | 90,235 | | | | 757,974 | |
Mack-Cali Realty Corp. (A) | | | 36,460 | | | | 682,896 | |
MFA Financial, Inc. | | | 92,500 | | | | 775,150 | |
Omega Healthcare Investors, Inc. (A) | | | 20,595 | | | | 785,905 | |
Piedmont Office Realty Trust, Inc., Class A | | | 38,405 | | | | 746,977 | |
Select Income REIT | | | 29,325 | | | | 718,756 | |
| | | | | | | | |
| | | | | | | 17,304,419 | |
| | | | | | | | |
Road & Rail - 1.4% | | | | | | | | |
ArcBest Corp. (A) | | | 20,675 | | | | 800,122 | |
Celadon Group, Inc. (A) | | | 36,070 | | | | 701,922 | |
Con-way, Inc. (A) | | | 16,840 | | | | 730,351 | |
Werner Enterprises, Inc. (A) | | | 30,735 | | | | 846,442 | |
| | | | | | | | |
| | | | | | | 3,078,837 | |
| | | | | | | | |
Semiconductors & Semiconductor Equipment - 4.4% | |
Brooks Automation, Inc., Class A (A) | | | 68,815 | | | | 848,489 | |
Cabot Microelectronics Corp., Class A (B) | | | 17,335 | | | | 836,067 | |
ChipMOS TECHNOLOGIES Bermuda, Ltd. | | | 32,300 | | | | 693,804 | |
Diodes, Inc. (A) (B) | | | 30,265 | | | | 781,745 | |
Fairchild Semiconductor International, Inc., Class A (A) (B) | | | 48,460 | | | | 743,861 | |
Integrated Device Technology, Inc. (A) (B) | | | 50,575 | | | | 829,936 | |
Intersil Corp., Class A (A) | | | 50,105 | | | | 665,895 | |
Lattice Semiconductor Corp. (B) | | | 107,470 | | | | 721,123 | |
Microsemi Corp. (B) | | | 29,840 | | | | 777,929 | |
MKS Instruments, Inc. | | | 21,950 | | | | 798,980 | |
OmniVision Technologies, Inc. (B) | | | 27,860 | | | | 746,091 | |
PMC-Sierra, Inc. (A) (B) | | | 102,510 | | | | 798,553 | |
| | | | | | | | |
| | | | | | | 9,242,473 | |
| | | | | | | | |
Software - 1.4% | |
EnerNOC, Inc. (A) (B) | | | 45,110 | | | | 666,274 | |
Netscout Systems, Inc. (B) | | | 15,745 | | | | 580,361 | |
Rovi Corp. (A) (B) | | | 36,985 | | | | 772,247 | |
Take-Two Interactive Software, Inc. (A) (B) | | | 32,685 | | | | 864,518 | |
| | | | | | | | |
| | | | | | | 2,883,400 | |
| | | | | | | | |
Specialty Retail - 4.4% | |
Abercrombie & Fitch Co., Class A (A) | | | 20,760 | | | | 695,045 | |
The Notes to Financial Statements are an integral part of this report.
| | |
| Transamerica Funds | | Annual Report 2014 |
Page 202
Transamerica Small Cap Core
SCHEDULE OF INVESTMENTS (continued)
At October 31, 2014
| | | | | | | | |
| | | Shares | | | Value | |
COMMON STOCKS (continued) | | | | | | | | |
Specialty Retail (continued) | |
Brown Shoe Co., Inc. | | | 28,500 | | | | $ 757,815 | |
Buckle, Inc. (A) | | | 15,975 | | | | 788,047 | |
Build-A-Bear Workshop, Inc. (A) (B) | | | 55,610 | | | | 942,589 | |
Cato Corp., Class A (A) | | | 21,525 | | | | 767,797 | |
Chico’s FAS, Inc. (A) | | | 50,090 | | | | 755,357 | |
Children’s Place, Inc. (A) | | | 13,810 | | | | 680,143 | |
Citi Trends, Inc. (B) | | | 34,845 | | | | 789,239 | |
Guess?, Inc. (A) | | | 33,035 | | | | 732,386 | |
Haverty Furniture Cos., Inc. (A) | | | 33,390 | | | | 734,914 | |
Outerwall, Inc. (A) (B) | | | 13,085 | | | | 827,888 | |
Zumiez, Inc. (A) (B) | | | 25,595 | | | | 854,361 | |
| | | | | | | | |
| | | | | | | 9,325,581 | |
| | | | | | | | |
Technology Hardware, Storage & Peripherals - 0.4% | |
Lexmark International, Inc., Class A (A) | | | 17,565 | | | | 758,105 | |
| | | | | | | | |
Textiles, Apparel & Luxury Goods - 1.7% | |
Columbia Sportswear Co. | | | 20,210 | | | | 778,893 | |
Iconix Brand Group, Inc. (A) (B) | | | 18,470 | | | | 738,985 | |
Movado Group, Inc. | | | 20,630 | | | | 728,239 | |
Skechers U.S.A., Inc., Class A (A) (B) | | | 13,025 | | | | 713,119 | |
Steven Madden, Ltd., Class B (A) (B) | | | 22,700 | | | | 711,645 | |
| | | | | | | | |
| | | | | | | 3,670,881 | |
| | | | | | | | |
Thrifts & Mortgage Finance - 1.1% | |
Home Loan Servicing Solutions, Ltd. (A) | | | 35,025 | | | | 672,830 | |
Radian Group, Inc. (A) | | | 49,715 | | | | 837,698 | |
WSFS Financial Corp. (A) | | | 10,350 | | | | 814,028 | |
| | | | | | | | |
| | | | | | | 2,324,556 | |
| | | | | | | | |
Wireless Telecommunication Services - 0.4% | |
Spok Holdings, Inc. (A) | | | 51,900 | | | | 842,856 | |
| | | | | | | | |
Total Common Stocks
(Cost $200,267,933) | | | | | | | 205,473,710 | |
| | | | | | | | |
| | | | | | | | |
| | | Shares | | | Value | |
MASTER LIMITED PARTNERSHIPS - 1.3% | |
Capital Markets - 0.6% | | | | | | | | |
AllianceBernstein Holding, LP | | | 26,750 | | | | $ 711,550 | |
Och-Ziff Capital Management Group LLC, Class A | | | 61,815 | | | | 681,201 | |
| | | | | | | | |
| | | | | | | 1,392,751 | |
| | | | | | | | |
Chemicals - 0.3% | |
CVR Partners, LP | | | 50,180 | | | | 611,193 | |
| | | | | | | | |
Oil, Gas & Consumable Fuels - 0.4% | |
Alliance Resource Partners, LP | | | 17,335 | | | | 833,640 | |
| | | | | | | | |
Total Master Limited Partnerships
(Cost $3,106,262) | | | | | | | 2,837,584 | |
| | | | | | | | |
|
SECURITIES LENDING COLLATERAL - 25.4% | |
State Street Navigator Securities Lending Trust - Prime Portfolio 0.16% (C) | | | 53,848,738 | | | | 53,848,738 | |
| | | | | | | | |
Total Securities Lending Collateral
(Cost $53,848,738) | | | | | | | 53,848,738 | |
| | | | | | | | |
| | |
| | | Principal | | | Value | |
REPURCHASE AGREEMENT - 1.6% | | | | | | | | |
State Street Bank & Trust Co.
0.01% (C), dated 10/31/2014, to be repurchased at $3,368,367 on 11/03/2014. Collateralized by a U.S. Government Agency Obligation, 2.00%, due 11/01/2027, and with a value of $3,436,936. | | | $ 3,368,364 | | | | 3,368,364 | |
| | | | | | | | |
Total Repurchase Agreement
(Cost $3,368,364) | | | | | | | 3,368,364 | |
| | | | | | | | |
Total Investments
(Cost $260,591,297) (D) | | | | | | | 265,528,396 | |
Net Other Assets (Liabilities) - (25.1)% | | | | | | | (53,307,757 | ) |
| | | | | | | | |
| | |
Net Assets - 100.0% | | | | | | | $ 212,220,639 | |
| | | | | | | | |
SECURITY VALUATION:
Valuation Inputs (E)
| | | | | | | | | | | | | | | | |
| | | Level 1
Quoted Prices | | | Level 2
Other Significant
Observable Inputs | | | Level 3
Significant
Unobservable Inputs | | | Value at
October 31, 2014 | |
ASSETS | | | | | | | | | | | | | | | | |
Investments | | | | | | | | | | | | | | | | |
Common Stocks | | $ | 205,473,710 | | | $ | — | | | $ | — | | | $ | 205,473,710 | |
Master Limited Partnerships | | | 2,837,584 | | | | — | | | | — | | | | 2,837,584 | |
Securities Lending Collateral | | | 53,848,738 | | | | — | | | | — | | | | 53,848,738 | |
Repurchase Agreement | | | — | | | | 3,368,364 | | | | — | | | | 3,368,364 | |
| | | | | | | | | | | | | | | | |
Total Investments | | $ | 262,160,032 | | | $ | 3,368,364 | | | $ | — | | | $ | 265,528,396 | |
| | | | | | | | | | | | | | | | |
The Notes to Financial Statements are an integral part of this report.
| | |
| Transamerica Funds | | Annual Report 2014 |
Page 203
Transamerica Small Cap Core
SCHEDULE OF INVESTMENTS (continued)
At October 31, 2014
FOOTNOTES TO SCHEDULE OF INVESTMENTS:
| (A) | All or a portion of this security is on loan. The value of all securities on loan is $52,458,514. The amount of securities on loan indicated may not correspond with the securities on loan identified because securities with pending sales are in the process of recall from the brokers. |
| (B) | Non-income producing security. |
| (C) | Rate shown reflects the yield at October 31, 2014. |
| (D) | Aggregate cost for federal income tax purposes is $260,584,444. Aggregate gross unrealized appreciation and depreciation for all securities is $15,137,779 and $10,193,827, respectively. Net unrealized appreciation for tax purposes is $4,943,952. |
| (E) | The Fund recognizes transfers between Levels at the end of the reporting period. There were no transfers between Level 1, 2 and 3 during the period ended October 31, 2014. See the Notes to Financial Statements for more information regarding security valuation and pricing inputs. |
The Notes to Financial Statements are an integral part of this report.
| | |
| Transamerica Funds | | Annual Report 2014 |
Page 204
Transamerica Small Cap Growth
SCHEDULE OF INVESTMENTS
At October 31, 2014
| | | | | | | | |
| | | Shares | | | Value | |
COMMON STOCKS - 97.3% | | | | | | | | |
Aerospace & Defense - 2.4% | | | | | | | | |
Engility Holdings, Inc. (A) | | | 142,546 | | | | $ 6,157,987 | |
KEYW Holding Corp. (A) (B) | | | 658,780 | | | | 6,686,617 | |
| | | | | | | | |
| | | | | | | 12,844,604 | |
| | | | | | | | |
Auto Components - 1.2% | | | | | | | | |
Dorman Products, Inc. (A) (B) | | | 139,730 | | | | 6,477,883 | |
| | | | | | | | |
Banks - 12.2% | | | | | | | | |
BancorpSouth, Inc. | | | 361,740 | | | | 8,330,872 | |
Bank of the Ozarks, Inc. (B) | | | 237,180 | | | | 8,358,223 | |
Home BancShares, Inc. | | | 253,640 | | | | 8,096,189 | |
Iberiabank Corp. | | | 220,890 | | | | 15,210,485 | |
Pinnacle Financial Partners, Inc. | | | 135,850 | | | | 5,325,320 | |
PrivateBancorp, Inc., Class A | | | 605,380 | | | | 19,565,882 | |
| | | | | | | | |
| | | | | | | 64,886,971 | |
| | | | | | | | |
Commercial Services & Supplies - 1.1% | | | | | | | | |
Healthcare Services Group, Inc. (B) | | | 198,460 | | | | 5,910,139 | |
| | | | | | | | |
Communications Equipment - 2.9% | | | | | | | | |
Aruba Networks, Inc. (A) | | | 468,390 | | | | 10,107,856 | |
Ruckus Wireless, Inc. (A) (B) | | | 413,050 | | | | 5,361,389 | |
| | | | | | | | |
| | | | | | | 15,469,245 | |
| | | | | | | | |
Diversified Consumer Services - 1.6% | | | | | | | | |
Capella Education Co. | | | 121,360 | | | | 8,585,006 | |
| | | | | | | | |
Diversified Financial Services - 2.1% | | | | | | | | |
MarketAxess Holdings, Inc. (B) | | | 172,043 | | | | 11,122,580 | |
| | | | | | | | |
Electrical Equipment - 2.7% | | | | | | | | |
EnerSys | | | 225,803 | | | | 14,180,428 | |
| | | | | | | | |
Electronic Equipment, Instruments & Components - 1.0% | |
InvenSense, Inc., Class A (A) (B) | | | 326,250 | | | | 5,288,513 | |
| | | | | | | | |
Food Products - 6.0% | | | | | | | | |
J&J Snack Foods Corp. | | | 109,070 | | | | 11,237,482 | |
TreeHouse Foods, Inc. (A) | | | 244,120 | | | | 20,791,701 | |
| | | | | | | | |
| | | | | | | 32,029,183 | |
| | | | | | | | |
Health Care Equipment & Supplies - 3.8% | | | | | | | | |
Anika Therapeutics, Inc. (A) | | | 42,867 | | | | 1,720,681 | |
Cantel Medical Corp. | | | 292,367 | | | | 12,396,361 | |
Neogen Corp. (A) | | | 118,590 | | | | 5,206,101 | |
Vascular Solutions, Inc. (A) | | | 29,544 | | | | 868,889 | |
| | | | | | | | |
| | | | | | | 20,192,032 | |
| | | | | | | | |
Health Care Providers & Services - 6.0% | | | | | | | | |
Air Methods Corp. (A) (B) | | | 259,770 | | | | 12,268,937 | |
Centene Corp. (A) | | | 212,660 | | | | 19,707,202 | |
| | | | | | | | |
| | | | | | | 31,976,139 | |
| | | | | | | | |
Health Care Technology - 2.3% | | | | | | | | |
Medidata Solutions, Inc. (A) (B) | | | 265,090 | | | | 11,958,210 | |
| | | | | | | | |
Hotels, Restaurants & Leisure - 6.3% | | | | | | | | |
Krispy Kreme Doughnuts, Inc. (A) (B) | | | 454,520 | | | | 8,599,518 | |
Red Robin Gourmet Burgers, Inc. (A) | | | 116,347 | | | | 6,395,595 | |
Sonic Corp. (A) (B) | | | 723,480 | | | | 18,238,931 | |
| | | | | | | | |
| | | | | | | 33,234,044 | |
| | | | | | | | |
Internet Software & Services - 3.3% | | | | | | | | |
Envestnet, Inc. (A) | | | 247,020 | | | | 10,972,628 | |
SPS Commerce, Inc. (A) | | | 111,100 | | | | 6,477,130 | |
| | | | | | | | |
| | | | | | | 17,449,758 | |
| | | | | | | | |
| | | | | | | | |
| | | Shares | | | Value | |
COMMON STOCKS (continued) | | | | | | | | |
IT Services - 2.4% | | | | | | | | |
MAXIMUS, Inc., Class A | | | 263,969 | | | | $ 12,791,938 | |
| | | | | | | | |
Life Sciences Tools & Services - 5.2% | | | | | | | | |
Cambrex Corp. (A) | | | 416,729 | | | | 8,784,647 | |
ICON PLC (A) | | | 201,680 | | | | 10,610,385 | |
PAREXEL International Corp. (A) (B) | | | 148,600 | | | | 8,070,466 | |
| | | | | | | | |
| | | | | | | 27,465,498 | |
| | | | | | | | |
Machinery - 3.1% | | | | | | | | |
Proto Labs, Inc. (A) (B) | | | 137,630 | | | | 8,996,873 | |
Wabash National Corp. (A) (B) | | | 732,644 | | | | 7,546,233 | |
| | | | | | | | |
| | | | | | | 16,543,106 | |
| | | | | | | | |
Multiline Retail - 1.5% | | | | | | | | |
Tuesday Morning Corp. (A) (B) | | | 397,810 | | | | 8,111,346 | |
| | | | | | | | |
Oil, Gas & Consumable Fuels - 4.4% | | | | | | | | |
Comstock Resources, Inc. (B) | | | 470,650 | | | | 5,572,496 | |
Matador Resources Co. (A) (B) | | | 556,970 | | | | 13,517,662 | |
PDC Energy, Inc. (A) | | | 93,100 | | | | 4,070,332 | |
| | | | | | | | |
| | | | | | | 23,160,490 | |
| | | | | | | | |
Pharmaceuticals - 7.0% | | | | | | | | |
Akorn, Inc., Class A (A) (B) | | | 245,556 | | | | 10,939,520 | |
Lannett Co., Inc. (A) (B) | | | 150,050 | | | | 8,510,836 | |
Prestige Brands Holdings, Inc. (A) | | | 355,770 | | | | 12,601,373 | |
Sagent Pharmaceuticals, Inc. (A) (B) | | | 162,361 | | | | 5,137,102 | |
| | | | | | | | |
| | | | | | | 37,188,831 | |
| | | | | | | | |
Professional Services - 2.2% | | | | | | | | |
WageWorks, Inc. (A) (B) | | | 207,980 | | | | 11,856,940 | |
| | | | | | | | |
Road & Rail - 1.9% | | | | | | | | |
Saia, Inc. (A) | | | 208,300 | | | | 10,210,866 | |
| | | | | | | | |
Semiconductors & Semiconductor Equipment - 4.2% | |
CEVA, Inc. (A) | | | 347,100 | | | | 5,657,730 | |
Silicon Laboratories, Inc. (A) | | | 363,360 | | | | 16,565,582 | |
| | | | | | | | |
| | | | | | | 22,223,312 | |
| | | | | | | | |
Software - 2.2% | | | | | | | | |
Ellie Mae, Inc. (A) (B) | | | 297,690 | | | | 11,425,342 | |
| | | | | | | | |
Specialty Retail - 3.0% | |
Asbury Automotive Group, Inc. (A) | | | 77,610 | | | | 5,435,804 | |
Monro Muffler Brake, Inc. (B) | | | 193,290 | | | | 10,329,418 | |
| | | | | | | | |
| | | | | | | 15,765,222 | |
| | | | | | | | |
Textiles, Apparel & Luxury Goods - 4.2% | |
Deckers Outdoor Corp. (A) (B) | | | 28,400 | | | | 2,483,864 | |
G-III Apparel Group, Ltd. (A) | | | 156,670 | | | | 12,431,765 | |
Steven Madden, Ltd., Class B (A) | | | 231,537 | | | | 7,258,685 | |
| | | | | | | | |
| | | | | | | 22,174,314 | |
| | | | | | | | |
Trading Companies & Distributors - 1.1% | |
Aceto Corp. | | | 262,085 | | | | 5,959,813 | |
| | | | | | | | |
Total Common Stocks
(Cost $420,030,696) | | | | | | | 516,481,753 | |
| | | | | | | | |
|
SECURITIES LENDING COLLATERAL - 25.6% | |
State Street Navigator Securities Lending Trust - Prime Portfolio 0.16% (C) | | | 135,929,304 | | | | 135,929,304 | |
| | | | | | | | |
Total Securities Lending Collateral
(Cost $135,929,304) | | | | | | | 135,929,304 | |
| | | | | | | | |
The Notes to Financial Statements are an integral part of this report.
| | |
| Transamerica Funds | | Annual Report 2014 |
Page 205
Transamerica Small Cap Growth
SCHEDULE OF INVESTMENTS (continued)
At October 31, 2014
| | | | | | | | |
| | | Principal | | | Value | |
REPURCHASE AGREEMENT - 2.4% | | | | | | | | |
State Street Bank & Trust Co.
0.01% (C), dated 10/31/2014, to be repurchased at $12,615,233 on 11/03/2014. Collateralized by U.S. Government Agency Obligations, 2.00% - 3.50%, due 12/01/2027 - 02/15/2041, and with a total value of $12,871,987. | | | $ 12,615,223 | | | | $ 12,615,223 | |
| | | | | | | | |
Total Repurchase Agreement
(Cost $12,615,223) | | | | | | | 12,615,223 | |
| | | | | | | | |
Total Investments
(Cost $568,575,223) (D) | | | | | | | 665,026,280 | |
Net Other Assets (Liabilities) - (25.3)% | | | | (134,135,310 | ) |
| | | | | | | | |
| | |
Net Assets - 100.0% | | | | | | | $ 530,890,970 | |
| | | | | | | | |
SECURITY VALUATION:
Valuation Inputs (E)
| | | | | | | | | | | | | | | | |
| | | Level 1
Quoted Prices | | | Level 2
Other Significant
Observable Inputs | | | Level 3
Significant
Unobservable Inputs | | | Value at
October 31, 2014 | |
ASSETS | | | | | | | | | | | | | | | | |
Investments | | | | | | | | | | | | | | | | |
Common Stocks | | $ | 516,481,753 | | | $ | — | | | $ | — | | | $ | 516,481,753 | |
Securities Lending Collateral | | | 135,929,304 | | | | — | | | | — | | | | 135,929,304 | |
Repurchase Agreement | | | — | | | | 12,615,223 | | | | — | | | | 12,615,223 | |
| | | | | | | | | | | | | | | | |
Total Investments | | $ | 652,411,057 | | | $ | 12,615,223 | | | $ | — | | | $ | 665,026,280 | |
| | | | | | | | | | | | | | | | |
FOOTNOTES TO SCHEDULE OF INVESTMENTS:
| (A) | Non-income producing security. |
| (B) | All or a portion of this security is on loan. The value of all securities on loan is $132,543,428. The amount of securities on loan indicated may not correspond with the securities on loan identified because securities with pending sales are in the process of recall from the brokers. |
| (C) | Rate shown reflects the yield at October 31, 2014. |
| (D) | Aggregate cost for federal income tax purposes is $569,855,751. Aggregate gross unrealized appreciation and depreciation for all securities is $112,923,418 and $17,752,889, respectively. Net unrealized appreciation for tax purposes is $95,170,529. |
| (E) | The Fund recognizes transfers between Levels at the end of the reporting period. There were no transfers between Level 1, 2 and 3 during the period ended October 31, 2014. See the Notes to Financial Statements for more information regarding security valuation and pricing inputs. |
The Notes to Financial Statements are an integral part of this report.
| | |
| Transamerica Funds | | Annual Report 2014 |
Page 206
Transamerica Small Cap Value
SCHEDULE OF INVESTMENTS
At October 31, 2014
| | | | | | | | |
| | | Shares | | | Value | |
COMMON STOCKS - 97.9% | | | | | | | | |
Aerospace & Defense - 1.5% | | | | | | | | |
Triumph Group, Inc. | | | 151,334 | | | | $ 10,537,386 | |
| | | | | | | | |
Air Freight & Logistics - 0.8% | | | | | | | | |
Air Transport Services Group, Inc. (A) (B) | | | 654,869 | | | | 5,356,828 | |
| | | | | | | | |
Airlines - 0.4% | | | | | | | | |
SkyWest, Inc. | | | 255,040 | | | | 2,938,061 | |
| | | | | | | | |
Automobiles - 0.7% | | | | | | | | |
Thor Industries, Inc. | | | 89,869 | | | | 4,753,171 | |
| | | | | | | | |
Banks - 10.4% | | | | | | | | |
BankUnited, Inc. | | | 285,625 | | | | 8,540,188 | |
BBCN Bancorp, Inc. | | | 559,951 | | | | 7,917,707 | |
East-West Bancorp, Inc. | | | 352,628 | | | | 12,962,605 | |
First Niagara Financial Group, Inc. | | | 1,163,835 | | | | 8,717,124 | |
FirstMerit Corp. | | | 599,608 | | | | 11,002,807 | |
FNB Corp. | | | 598,339 | | | | 7,652,756 | |
Hancock Holding Co. | | | 201,981 | | | | 7,107,711 | |
Trustmark Corp., Class A | | | 275,254 | | | | 6,696,930 | |
| | | | | | | | |
| | | | | | | 70,597,828 | |
| | | | | | | | |
Capital Markets - 4.3% | | | | | | | | |
Ares Capital Corp. | | | 768,186 | | | | 12,283,294 | |
Fifth Street Finance Corp. | | | 432,968 | | | | 3,853,415 | |
Janus Capital Group, Inc. (A) | | | 205,057 | | | | 3,073,804 | |
New Mountain Finance Corp. (A) | | | 336,567 | | | | 4,940,804 | |
Stifel Financial Corp. (B) | | | 114,388 | | | | 5,434,574 | |
| | | | | | | | |
| | | | | | | 29,585,891 | |
| | | | | | | | |
Chemicals - 0.9% | | | | | | | | |
Koppers Holdings, Inc. | | | 69,423 | | | | 2,740,820 | |
RPM International, Inc. | | | 70,455 | | | | 3,191,612 | |
| | | | | | | | |
| | | | | | | 5,932,432 | |
| | | | | | | | |
Commercial Services & Supplies - 4.6% | | | | | | | | |
ACCO Brands Corp. (A) (B) | | | 647,255 | | | | 5,326,909 | |
Deluxe Corp. | | | 129,948 | | | | 7,900,838 | |
Ennis, Inc. | | | 209,260 | | | | 3,103,326 | |
R.R. Donnelley & Sons Co. (A) | | | 299,093 | | | | 5,219,173 | |
Tetra Tech, Inc. | | | 360,504 | | | | 9,665,112 | |
| | | | | | | | |
| | | | | | | 31,215,358 | |
| | | | | | | | |
Communications Equipment - 3.2% | | | | | | | | |
ADTRAN, Inc. (A) | | | 223,604 | | | | 4,742,641 | |
Black Box Corp. | | | 254,398 | | | | 5,594,212 | |
Oplink Communications, Inc. | | | 385,360 | | | | 8,034,756 | |
Plantronics, Inc. | | | 60,112 | | | | 3,118,009 | |
| | | | | | | | |
| | | | | | | 21,489,618 | |
| | | | | | | | |
Consumer Finance - 3.5% | | | | | | | | |
Encore Capital Group, Inc. (A) (B) | | | 225,308 | | | | 10,253,767 | |
World Acceptance Corp. (A) (B) | | | 188,325 | | | | 13,495,370 | |
| | | | | | | | |
| | | | | | | 23,749,137 | |
| | | | | | | | |
Containers & Packaging - 1.9% | | | | | | | | |
Greif, Inc., Class A | | | 162,336 | | | | 7,152,524 | |
Sonoco Products Co. | | | 143,604 | | | | 5,869,096 | |
| | | | | | | | |
| | | | | | | 13,021,620 | |
| | | | | | | | |
Diversified Financial Services - 0.6% | | | | | | | | |
Gain Capital Holdings, Inc., Class A (A) | | | 484,582 | | | | 4,148,022 | |
| | | | | | | | |
Electric Utilities - 4.5% | | | | | | | | |
Hawaiian Electric Industries, Inc. (A) | | | 478,385 | | | | 13,471,322 | �� |
Portland General Electric Co. (A) | | | 469,811 | | | | 17,105,818 | |
| | | | | | | | |
| | | | | | | 30,577,140 | |
| | | | | | | | |
| | | | | | | | |
| | | Shares | | | Value | |
COMMON STOCKS (continued) | | | | | | | | |
Electrical Equipment - 2.7% | | | | | | | | |
EnerSys | | | 164,337 | | | | $ 10,320,364 | |
Franklin Electric Co., Inc. | | | 97,137 | | | | 3,627,096 | |
GrafTech International, Ltd. (A) (B) | | | 955,284 | | | | 4,098,168 | |
| | | | | | | | |
| | | | | | | 18,045,628 | |
| | | | | | | | |
Electronic Equipment, Instruments & Components - 6.1% | |
Anixter International, Inc. | | | 73,475 | | | | 6,257,866 | |
CTS Corp. | | | 246,421 | | | | 4,534,146 | |
Ingram Micro, Inc., Class A (B) | | | 329,890 | | | | 8,854,248 | |
Park Electrochemical Corp. | | | 236,449 | | | | 6,100,384 | |
Plexus Corp. (B) | | | 74,061 | | | | 3,062,422 | |
ScanSource, Inc. (B) | | | 229,564 | | | | 8,764,753 | |
Vishay Intertechnology, Inc. (A) | | | 308,911 | | | | 4,173,388 | |
| | | | | | | | |
| | | | | | | 41,747,207 | |
| | | | | | | | |
Energy Equipment & Services - 2.8% | | | | | | | | |
Atwood Oceanics, Inc. (B) | | | 187,514 | | | | 7,622,444 | |
Gulfmark Offshore, Inc., Class A (A) | | | 141,216 | | | | 4,259,075 | |
Tidewater, Inc. (A) | | | 201,835 | | | | 7,441,656 | |
| | | | | | | | |
| | | | | | | 19,323,175 | |
| | | | | | | | |
Food & Staples Retailing - 0.9% | | | | | | | | |
SpartanNash Co. | | | 269,350 | | | | 6,036,134 | |
| | | | | | | | |
Health Care Equipment & Supplies - 2.2% | | | | | | | | |
Hill-Rom Holdings, Inc. | | | 235,942 | | | | 10,494,700 | |
Symmetry Medical, Inc. (B) | | | 454,543 | | | | 4,499,976 | |
| | | | | | | | |
| | | | | | | 14,994,676 | |
| | | | | | | | |
Health Care Providers & Services - 2.5% | | | | | | | | |
Amsurg Corp., Class A (B) | | | 100,326 | | | | 5,418,607 | |
Kindred Healthcare, Inc. | | | 159,052 | | | | 3,459,381 | |
WellCare Health Plans, Inc. (B) | | | 116,833 | | | | 7,929,456 | |
| | | | | | | | |
| | | | | | | 16,807,444 | |
| | | | | | | | |
Hotels, Restaurants & Leisure - 0.8% | | | | | | | | |
Ruth’s Hospitality Group, Inc. | | | 419,738 | | | | 5,108,211 | |
| | | | | | | | |
Insurance - 5.6% | | | | | | | | |
American Equity Investment Life Holding Co. | | | 185,621 | | | | 4,790,878 | |
FBL Financial Group, Inc., Class A | | | 50,185 | | | | 2,488,172 | |
Hanover Insurance Group, Inc. | | | 109,035 | | | | 7,298,803 | |
HCC Insurance Holdings, Inc. | | | 164,337 | | | | 8,576,748 | |
Stewart Information Services Corp. | | | 192,719 | | | | 6,806,835 | |
Validus Holdings, Ltd. | | | 202,804 | | | | 8,067,543 | |
| | | | | | | | |
| | | | | | | 38,028,979 | |
| | | | | | | | |
| | |
IT Services - 0.7% | | | | | | | | |
CACI International, Inc., Class A (B) | | | 60,546 | | | | 4,982,330 | |
| | | | | | | | |
Leisure Products - 0.6% | | | | | | | | |
LeapFrog Enterprises, Inc., Class A (B) | | | 807,668 | | | | 4,296,794 | |
| | | | | | | | |
Machinery - 3.6% | | | | | | | | |
TriMas Corp. (B) | | | 501,439 | | | | 15,875,559 | |
Woodward, Inc. | | | 172,866 | | | | 8,852,468 | |
| | | | | | | | |
| | | | | | | 24,728,027 | |
| | | | | | | | |
Metals & Mining - 1.3% | | | | | | | | |
Kaiser Aluminum Corp. (A) | | | 126,940 | | | | 8,828,677 | |
| | | | | | | | |
Oil, Gas & Consumable Fuels - 1.4% | | | | | | | | |
Rosetta Resources, Inc. (B) | | | 159,375 | | | | 6,061,031 | |
Triangle Petroleum Corp. (A) (B) | | | 443,929 | | | | 3,440,450 | |
| | | | | | | | |
| | | | | | | 9,501,481 | |
| | | | | | | | |
The Notes to Financial Statements are an integral part of this report.
| | |
| Transamerica Funds | | Annual Report 2014 |
Page 207
Transamerica Small Cap Value
SCHEDULE OF INVESTMENTS (continued)
At October 31, 2014
| | | | | | | | |
| | | Shares | | | Value | |
COMMON STOCKS (continued) | | | | | | | | |
Paper & Forest Products - 0.3% | | | | | | | | |
P.H. Glatfelter Co. | | | 78,500 | | | | $ 1,980,555 | |
| | | | | | | | |
Personal Products - 1.7% | | | | | | | | |
Nu Skin Enterprises, Inc., Class A (A) | | | 221,738 | | | | 11,714,419 | |
| | | | | | | | |
Professional Services - 3.9% | | | | | | | | |
CBIZ, Inc. (A) (B) | | | 865,910 | | | | 7,992,349 | |
FTI Consulting, Inc. (B) | | | 228,633 | | | | 9,232,201 | |
Korn/Ferry International (B) | | | 345,586 | | | | 9,652,217 | |
| | | | | | | | |
| | | | | | | 26,876,767 | |
| | | | | | | | |
Real Estate Investment Trusts - 8.5% | | | | | | | | |
First Potomac Realty Trust | | | 451,670 | | | | 5,645,875 | |
Hersha Hospitality Trust, Class A | | | 2,126,364 | | | | 15,501,194 | |
iStar Financial, Inc. (A) (B) | | | 570,247 | | | | 8,091,805 | |
LaSalle Hotel Properties | | | 358,014 | | | | 14,037,729 | |
Medical Properties Trust, Inc. | | | 489,980 | | | | 6,609,830 | |
Omega Healthcare Investors, Inc. (A) | | | 85,584 | | | | 3,265,885 | |
Ramco-Gershenson Properties Trust | | | 275,423 | | | | 4,814,394 | |
| | | | | | | | |
| | | | | | | 57,966,712 | |
| | | | | | | | |
Road & Rail - 0.8% | | | | | | | | |
Werner Enterprises, Inc. (A) | | | 196,314 | | | | 5,406,488 | |
| | | | | | | | |
Semiconductors & Semiconductor Equipment - 1.6% | |
Integrated Silicon Solution, Inc. (A) | | | 294,353 | | | | 3,997,314 | |
Teradyne, Inc. | | | 391,242 | | | | 7,198,853 | |
| | | | | | | | |
| | | | | | | 11,196,167 | |
| | | | | | | | |
Software - 0.5% | | | | | | | | |
American Software, Inc., Class A | | | 318,600 | | | | 3,077,676 | |
| | | | | | | | |
Specialty Retail - 9.6% | | | | | | | | |
Ascena Retail Group, Inc., Class B (B) | | | 891,802 | | | | 11,102,935 | |
DSW, Inc., Class A | | | 209,869 | | | | 6,222,616 | |
Finish Line, Inc., Class A | | | 244,899 | | | | 6,482,477 | |
Genesco, Inc. (A) (B) | | | 104,190 | | | | 7,990,331 | |
Outerwall, Inc. (A) (B) | | | 119,370 | | | | 7,552,540 | |
Rent-A-Center, Inc. (A) | | | 208,257 | | | | 6,449,719 | |
| | | | | | | | |
| | | Shares | | | Value | |
COMMON STOCKS (continued) | | | | | | | | |
Specialty Retail (continued) | | | | | | | | |
Select Comfort Corp. (A) (B) | | | 355,231 | | | | $ 9,125,884 | |
Sonic Automotive, Inc., Class A (A) | | | 413,879 | | | | 10,301,448 | |
| | | | | | | | |
| | | | | | | 65,227,950 | |
| | | | | | | | |
Technology Hardware, Storage & Peripherals - 0.5% | |
QLogic Corp. (B) | | | 303,998 | | | | 3,590,216 | |
| | | | | | | | |
Textiles, Apparel & Luxury Goods - 2.0% | |
Crocs, Inc. (B) | | | 421,358 | | | | 4,921,461 | |
Iconix Brand Group, Inc. (A) (B) | | | 214,500 | | | | 8,582,145 | |
| | | | | | | | |
| | | | | | | 13,503,606 | |
| | | | | | | | |
Total Common Stocks
(Cost $575,677,456) | | | | | | | 666,871,811 | |
| | | | | | | | |
|
SECURITIES LENDING COLLATERAL - 14.9% | |
State Street Navigator Securities Lending Trust - Prime Portfolio 0.16% (C) | | | 101,901,660 | | | | 101,901,660 | |
| | | | | | | | |
Total Securities Lending Collateral
(Cost $101,901,660) | | | | | | | 101,901,660 | |
| | | | | | | | |
| | |
| | | Principal | | | Value | |
REPURCHASE AGREEMENT - 0.0% (D) | | | | | | | | |
State Street Bank & Trust Co.
0.01% (C), dated 10/31/2014, to be repurchased at $81,407 on 11/03/2014. Collateralized by a U.S. Government Agency Obligation, at 3.50%, due 01/01/2032 with a value of $85,212. | | | $ 81,407 | | | | 81,407 | |
| | | | | | | | |
Total Repurchase Agreement
(Cost $81,407) | | | | | | | 81,407 | |
| | | | | | | | |
Total Investments
(Cost $677,660,523) (E) | | | | | | | 768,854,878 | |
Net Other Assets (Liabilities) - (12.8)% | | | | | | | (87,481,959 | ) |
| | | | | | | | |
| | |
Net Assets - 100.0% | | | | | | | $ 681,372,919 | |
| | | | | | | | |
SECURITY VALUATION:
Valuation Inputs (F)
| | | | | | | | | | | | | | | | |
| | | Level 1
Quoted Prices | | | Level 2
Other Significant
Observable Inputs | | | Level 3
Significant
Unobservable Inputs | | | Value at
October 31, 2014 | |
ASSETS | | | | | | | | | | | | | | | | |
Investments | | | | | | | | | | | | | | | | |
Common Stocks | | $ | 666,871,811 | | | $ | — | | | $ | — | | | $ | 666,871,811 | |
Securities Lending Collateral | | | 101,901,660 | | | | — | | | | — | | | | 101,901,660 | |
Repurchase Agreement | | | — | | | | 81,407 | | | | — | | | | 81,407 | |
| | | | | | | | | | | | | | | | |
Total Investments | | $ | 768,773,471 | | | $ | 81,407 | | | $ | — | | | $ | 768,854,878 | |
| | | | | | | | | | | | | | | | |
The Notes to Financial Statements are an integral part of this report.
| | |
| Transamerica Funds | | Annual Report 2014 |
Page 208
Transamerica Small Cap Value
SCHEDULE OF INVESTMENTS (continued)
At October 31, 2014
FOOTNOTES TO SCHEDULE OF INVESTMENTS:
| (A) | All or a portion of this security is on loan. The value of all securities on loan is $99,528,732. The amount of securities on loan indicated may not correspond with the securities on loan identified because securities with pending sales are in the process of recall from the brokers. |
| (B) | Non-income producing security. |
| (C) | Rate shown reflects the yield at October 31, 2014. |
| (D) | Percentage rounds to less than 0.1% or (0.1)%. |
| (E) | Aggregate cost for federal income tax purposes is $681,233,757. Aggregate gross unrealized appreciation and depreciation for all securities is $113,276,113 and $25,654,992, respectively. Net unrealized appreciation for tax purposes is $87,621,121. |
| (F) | The Fund recognizes transfers between Levels at the end of the reporting period. There were no transfers between Level 1, 2 and 3 during the period ended October 31, 2014. See the Notes to Financial Statements for more information regarding security valuation and pricing inputs. |
The Notes to Financial Statements are an integral part of this report.
| | |
| Transamerica Funds | | Annual Report 2014 |
Page 209
Transamerica Small/Mid Cap Value
SCHEDULE OF INVESTMENTS
At October 31, 2014
| | | | | | | | |
| | | Shares | | | Value | |
COMMON STOCKS - 98.7% | | | | | | | | |
Aerospace & Defense - 0.6% | | | | | | | | |
Aerovironment, Inc. (A) | | | 64,839 | | | | $ 1,987,315 | |
Curtiss-Wright Corp. | | | 38,000 | | | | 2,629,980 | |
Orbital Sciences Corp. (A) | | | 57,200 | | | | 1,504,360 | |
| | | | | | | | |
| | | | | | | 6,121,655 | |
| | | | | | | | |
Airlines - 1.1% | | | | | | | | |
American Airlines Group, Inc. | | | 150,160 | | | | 6,209,116 | |
Delta Air Lines, Inc. | | | 126,650 | | | | 5,095,129 | |
| | | | | | | | |
| | | | | | | 11,304,245 | |
| | | | | | | | |
Auto Components - 1.2% | | | | | | | | |
Dana Holding Corp. | | | 75,700 | | | | 1,548,822 | |
Gentex Corp. (B) | | | 54,500 | | | | 1,784,330 | |
Magna International, Inc., Class A | | | 64,530 | | | | 6,369,756 | |
Stoneridge, Inc. (A) (B) | | | 201,850 | | | | 2,622,032 | |
| | | | | | | | |
| | | | | | | 12,324,940 | |
| | | | | | | | |
Automobiles - 0.2% | | | | | | | | |
Harley-Davidson, Inc. | | | 31,845 | | | | 2,092,217 | |
| | | | | | | | |
Banks - 7.3% | | | | | | | | |
CIT Group, Inc. | | | 148,365 | | | | 7,259,499 | |
First Citizens BancShares, Inc., Class A | | | 27,763 | | | | 6,974,343 | |
First Community Bancshares, Inc. | | | 234,840 | | | | 3,844,331 | |
First Republic Bank, Class A | | | 45,100 | | | | 2,296,943 | |
KeyCorp | | | 251,650 | | | | 3,321,780 | |
Lakeland Bancorp, Inc., Class A | | | 359,550 | | | | 3,951,455 | |
Regions Financial Corp. | | | 421,975 | | | | 4,190,212 | |
Sandy Spring Bancorp, Inc. (B) | | | 170,600 | | | | 4,401,480 | |
Sterling Bancorp (B) | | | 312,100 | | | | 4,388,126 | |
SunTrust Banks, Inc. | | | 165,780 | | | | 6,488,629 | |
Umpqua Holdings Corp. | | | 155,200 | | | | 2,731,520 | |
Union Bankshares Corp. (B) | | | 66,500 | | | | 1,494,920 | |
United Community Banks, Inc. (B) | | | 94,200 | | | | 1,698,426 | |
Washington Trust Bancorp, Inc. (B) | | | 60,321 | | | | 2,314,517 | |
Webster Financial Corp. | | | 636,425 | | | | 19,945,559 | |
Wilshire Bancorp, Inc. | | | 300,800 | | | | 2,977,920 | |
| | | | | | | | |
| | | | | | | 78,279,660 | |
| | | | | | | | |
Beverages - 0.8% | | | | | | | | |
Molson Coors Brewing Co., Class B | | | 122,020 | | | | 9,075,848 | |
| | | | | | | | |
Building Products - 0.8% | | | | | | | | |
Continental Building Products, Inc. (A) (B) | | | 256,400 | | | | 3,779,336 | |
Norcraft Cos., Inc. (A) (B) | | | 241,500 | | | | 4,105,500 | |
Quanex Building Products Corp. (B) | | | 43,400 | | | | 868,868 | |
| | | | | | | | |
| | | | | | | 8,753,704 | |
| | | | | | | | |
Capital Markets - 3.7% | | | | | | | | |
Invesco, Ltd. | | | 237,025 | | | | 9,592,402 | |
Janus Capital Group, Inc. (B) | | | 146,000 | | | | 2,188,540 | |
LPL Financial Holdings, Inc. | | | 25,600 | | | | 1,059,584 | |
Piper Jaffray Cos. (A) (B) | | | 43,600 | | | | 2,461,656 | |
Raymond James Financial, Inc. | | | 305,680 | | | | 17,157,818 | |
Stifel Financial Corp. (A) | | | 78,000 | | | | 3,705,780 | |
Waddell & Reed Financial, Inc., Class A | | | 62,300 | | | | 2,974,202 | |
| | | | | | | | |
| | | | | | | 39,139,982 | |
| | | | | | | | |
Chemicals - 2.2% | | | | | | | | |
Celanese Corp., Series A | | | 130,760 | | | | 7,679,535 | |
Huntsman Corp. | | | 400,850 | | | | 9,780,740 | |
OM Group, Inc. | | | 90,075 | | | | 2,344,652 | |
| | | | | | | | |
| | | Shares | | | Value | |
COMMON STOCKS (continued) | | | | | | | | |
Chemicals (continued) | | | | | | | | |
Tronox, Ltd., Class A (B) | | | 140,700 | | | | $ 3,402,126 | |
| | | | | | | | |
| | | | | | | 23,207,053 | |
| | | | | | | | |
Commercial Services & Supplies - 1.5% | | | | | | | | |
HNI Corp. (B) | | | 107,700 | | | | 5,024,205 | |
Knoll, Inc. | | | 76,500 | | | | 1,521,585 | |
Pitney Bowes, Inc. | | | 166,025 | | | | 4,107,459 | |
R.R. Donnelley & Sons Co. (B) | | | 285,850 | | | | 4,988,082 | |
| | | | | | | | |
| | | | | | | 15,641,331 | |
| | | | | | | | |
Communications Equipment - 1.6% | | | | | | | | |
ARRIS Group, Inc. (A) | | | 136,275 | | | | 4,090,976 | |
CommScope Holding Co., Inc. (A) | | | 170,550 | | | | 3,673,647 | |
F5 Networks, Inc., Class B (A) | | | 48,745 | | | | 5,994,660 | |
KVH Industries, Inc. (A) (B) | | | 296,100 | | | | 3,825,612 | |
| | | | | | | | |
| | | | | | | 17,584,895 | |
| | | | | | | | |
Construction & Engineering - 0.9% | | | | | | | | |
Comfort Systems USA, Inc., Class A (B) | | | 207,400 | | | | 3,185,664 | |
EMCOR Group, Inc. (B) | | | 76,400 | | | | 3,371,532 | |
Granite Construction, Inc. | | | 25,450 | | | | 939,359 | |
Quanta Services, Inc. (A) | | | 56,775 | | | | 1,934,892 | |
| | | | | | | | |
| | | | | | | 9,431,447 | |
| | | | | | | | |
Construction Materials - 0.8% | | | | | | | | |
Caesarstone Sdot-Yam, Ltd. | | | 152,900 | | | | 8,540,994 | |
| | | | | | | | |
Consumer Finance - 0.6% | | | | | | | | |
Discover Financial Services | | | 107,470 | | | | 6,854,437 | |
| | | | | | | | |
Diversified Financial Services - 0.9% | | | | | | | | |
Voya Financial, Inc. | | | 245,550 | | | | 9,637,837 | |
| | | | | | | | |
Diversified Telecommunication Services - 1.7% | | | | | |
Level 3 Communications, Inc. (A) | | | 387,440 | | | | 18,174,810 | |
| | | | | | | | |
Electric Utilities - 1.0% | | | | | | | | |
Exelon Corp. (B) | | | 163,675 | | | | 5,988,868 | |
Portland General Electric Co. (B) | | | 126,631 | | | | 4,610,635 | |
| | | | | | | | |
| | | | | | | 10,599,503 | |
| | | | | | | | |
Electrical Equipment - 0.4% | | | | | | | | |
Regal Beloit Corp. | | | 60,200 | | | | 4,272,394 | |
| | | | | | | | |
Electronic Equipment, Instruments & Components - 2.1% | |
Control4 Corp. (A) (B) | | | 292,000 | | | | 4,528,920 | |
Daktronics, Inc. | | | 252,625 | | | | 3,362,439 | |
Orbotech, Ltd. (A) | | | 335,300 | | | | 5,378,212 | |
Rofin-Sinar Technologies, Inc. (A) (B) | | | 86,700 | | | | 1,941,213 | |
Universal Display Corp., Class A (A) (B) | | | 126,800 | | | | 3,966,304 | |
Vishay Intertechnology, Inc. (B) | | | 264,100 | | | | 3,567,991 | |
| | | | | | | | |
| | | | | | | 22,745,079 | |
| | | | | | | | |
Energy Equipment & Services - 1.4% | | | | | | | | |
Helix Energy Solutions Group, Inc., Class A (A) | | | 119,700 | | | | 3,188,808 | |
Precision Drilling Corp. | | | 1,371,934 | | | | 11,414,491 | |
| | | | | | | | |
| | | | | | | 14,603,299 | |
| | | | | | | | |
Food Products - 1.6% | | | | | | | | |
J&J Snack Foods Corp. | | | 32,895 | | | | 3,389,172 | |
Pinnacle Foods, Inc. | | | 134,425 | | | | 4,543,565 | |
Tyson Foods, Inc., Class A | | | 237,765 | | | | 9,593,818 | |
| | | | | | | | |
| | | | | | | 17,526,555 | |
| | | | | | | | |
Gas Utilities - 1.3% | | | | | | | | |
Atmos Energy Corp. | | | 256,970 | | | | 13,619,410 | |
| | | | | | | | |
The Notes to Financial Statements are an integral part of this report.
| | |
| Transamerica Funds | | Annual Report 2014 |
Page 210
Transamerica Small/Mid Cap Value
SCHEDULE OF INVESTMENTS (continued)
At October 31, 2014
| | | | | | | | |
| | | Shares | | | Value | |
COMMON STOCKS (continued) | | | | | | | | |
Health Care Equipment & Supplies - 3.0% | | | | | | | | |
AngioDynamics, Inc. (A) (B) | | | 281,200 | | | | $ 4,780,400 | |
Boston Scientific Corp. (A) | | | 343,350 | | | | 4,559,688 | |
Cooper Cos., Inc. | | | 19,800 | | | | 3,245,220 | |
Greatbatch, Inc. (A) | | | 81,457 | | | | 4,088,327 | |
Hologic, Inc. (A) | | | 319,525 | | | | 8,368,360 | |
Zimmer Holdings, Inc., Class A | | | 60,105 | | | | 6,686,080 | |
| | | | | | | | |
| | | | | | | 31,728,075 | |
| | | | | | | | |
Health Care Providers & Services - 4.7% | | | | | | | | |
AMN Healthcare Services, Inc. (A) (B) | | | 174,600 | | | | 2,994,390 | |
HCA Holdings, Inc. (A) | | | 175,370 | | | | 12,284,668 | |
Health Net, Inc. (A) | | | 63,600 | | | | 3,021,636 | |
HealthSouth Corp. | | | 99,800 | | | | 4,024,934 | |
Laboratory Corp. of America Holdings (A) | | | 44,240 | | | | 4,834,990 | |
MEDNAX, Inc. (A) | | | 84,750 | | | | 5,290,943 | |
PharMerica Corp. (A) | | | 114,600 | | | | 3,287,874 | |
Universal Health Services, Inc., Class B | | | 23,300 | | | | 2,416,443 | |
WellCare Health Plans, Inc. (A) (B) | | | 54,300 | | | | 3,685,341 | |
WellPoint, Inc. | | | 67,900 | | | | 8,602,251 | |
| | | | | | | | |
| | | | | | | 50,443,470 | |
| | | | | | | | |
Health Care Technology - 0.4% | | | | | | | | |
Omnicell, Inc. (A) | | | 122,700 | | | | 3,964,437 | |
| | | | | | | | |
Hotels, Restaurants & Leisure - 1.1% | | | | | | | | |
Churchill Downs, Inc. | | | 35,500 | | | | 3,620,290 | |
MGM Resorts International (A) | | | 115,000 | | | | 2,673,750 | |
Royal Caribbean Cruises, Ltd., Class A | | | 82,030 | | | | 5,575,579 | |
| | | | | | | | |
| | | | | | | 11,869,619 | |
| | | | | | | | |
Household Durables - 0.9% | | | | | | | | |
Harman International Industries, Inc. | | | 33,400 | | | | 3,585,156 | |
Helen of Troy, Ltd. (A) | | | 45,900 | | | | 2,838,915 | |
La-Z-Boy, Inc. | | | 132,400 | | | | 3,026,664 | |
| | | | | | | | |
| | | | | | | 9,450,735 | |
| | | | | | | | |
Household Products - 0.4% | | | | | | | | |
Spectrum Brands Holdings, Inc., Class A | | | 51,500 | | | | 4,665,385 | |
| | | | | | | | |
Independent Power and Renewable Electricity Producers - 0.4% | |
NRG Energy, Inc. | | | 126,425 | | | | 3,790,222 | |
| | | | | | | | |
Insurance - 4.8% | | | | | | | | |
Allied World Assurance Co. Holdings AG | | | 142,175 | | | | 5,402,650 | |
Aspen Insurance Holdings, Ltd. | | | 62,800 | | | | 2,739,964 | |
eHealth, Inc. (A) (B) | | | 51,900 | | | | 1,294,905 | |
Hartford Financial Services Group, Inc. | | | 201,275 | | | | 7,966,464 | |
HCC Insurance Holdings, Inc. | | | 50,923 | | | | 2,657,671 | |
Lincoln National Corp. | | | 170,280 | | | | 9,324,533 | |
Selective Insurance Group, Inc. | | | 258,600 | | | | 6,677,052 | |
United Fire Group, Inc. (B) | | | 273,843 | | | | 8,894,421 | |
Validus Holdings, Ltd. | | | 57,100 | | | | 2,271,438 | |
XL Group PLC, Class A | | | 129,150 | | | | 4,375,602 | |
| | | | | | | | |
| | | | | | | 51,604,700 | |
| | | | | | | | |
Internet & Catalog Retail - 0.2% | | | | | | | | |
Nutrisystem, Inc. | | | 147,100 | | | | 2,477,164 | |
| | | | | | | | |
Internet Software & Services - 1.2% | | | | | | | | |
AOL, Inc. (A) | | | 125,000 | | | | 5,441,250 | |
Blucora, Inc. (A) (B) | | | 89,600 | | | | 1,518,720 | |
IAC/InterActiveCorp | | | 56,400 | | | | 3,817,716 | |
TheStreet, Inc. | | | 623,000 | | | | 1,426,670 | |
| | | | | | | | |
| | | Shares | | | Value | |
COMMON STOCKS (continued) | | | | | | | | |
Internet Software & Services (continued) | | | | | | | | |
XO Group, Inc. (A) | | | 18,200 | | | | $ 231,686 | |
| | | | | | | | |
| | | | | | | 12,436,042 | |
| | | | | | | | |
IT Services - 0.6% | | | | | | | | |
Global Payments, Inc. | | | 49,400 | | | | 3,976,700 | |
Sykes Enterprises, Inc. (A) (B) | | | 125,000 | | | | 2,692,500 | |
| | | | | | | | |
| | | | | | | 6,669,200 | |
| | | | | | | | |
Life Sciences Tools & Services - 0.5% | | | | | | | | |
Quintiles Transnational Holdings, Inc. (A) | | | 97,185 | | | | 5,689,210 | |
| | | | | | | | |
Machinery - 5.7% | | | | | | | | |
Allison Transmission Holdings, Inc., Class A | | | 462,050 | | | | 15,007,384 | |
Altra Industrial Motion Corp. (B) | | | 117,700 | | | | 3,709,904 | |
CIRCOR International, Inc. | | | 20,200 | | | | 1,518,030 | |
Columbus McKinnon Corp. | | | 67,600 | | | | 1,923,220 | |
Crane Co. | | | 49,500 | | | | 3,086,325 | |
ITT Corp. | | | 168,250 | | | | 7,581,345 | |
Mueller Industries, Inc. (B) | | | 144,800 | | | | 4,700,208 | |
NN, Inc. | | | 225,800 | | | | 5,645,000 | |
Oshkosh Corp. | | | 43,200 | | | | 1,933,632 | |
Stanley Black & Decker, Inc. | | | 67,680 | | | | 6,337,555 | |
Trinity Industries, Inc. (B) | | | 176,090 | | | | 6,288,174 | |
Watts Water Technologies, Inc., Class A (B) | | | 59,200 | | | | 3,589,296 | |
| | | | | | | | |
| | | | | | | 61,320,073 | |
| | | | | | | | |
Media - 1.5% | | | | | | | | |
AMC Networks, Inc., Class A (A) | | | 25,400 | | | | 1,540,510 | |
Gannett Co., Inc. | | | 199,500 | | | | 6,284,250 | |
Starz, Class A (A) | | | 283,475 | | | | 8,759,377 | |
| | | | | | | | |
| | | | | | | 16,584,137 | |
| | | | | | | | |
Metals & Mining - 2.5% | | | | | | | | |
Alcoa, Inc. | | | 718,500 | | | | 12,042,060 | |
Kaiser Aluminum Corp. (B) | | | 43,000 | | | | 2,990,650 | |
Stillwater Mining Co. (A) (B) | | | 333,875 | | | | 4,383,779 | |
U.S. Steel Corp. | | | 192,950 | | | | 7,725,718 | |
| | | | | | | | |
| | | | | | | 27,142,207 | |
| | | | | | | | |
Multi-Utilities - 3.3% | | | | | | | | |
Ameren Corp. | | | 325,840 | | | | 13,796,066 | |
CMS Energy Corp. | | | 155,875 | | | | 5,092,436 | |
DTE Energy Co. | | | 105,365 | | | | 8,656,788 | |
NorthWestern Corp. (B) | | | 143,700 | | | | 7,593,108 | |
| | | | | | | | |
| | | | | | | 35,138,398 | |
| | | | | | | | |
Multiline Retail - 0.2% | | | | | | | | |
Macy’s, Inc. | | | 39,450 | | | | 2,280,999 | |
| | | | | | | | |
Oil, Gas & Consumable Fuels - 3.4% | | | | | | | | |
Cimarex Energy Co. | | | 20,888 | | | | 2,374,339 | |
EnCana Corp. | | | 365,960 | | | | 6,817,835 | |
Gulfport Energy Corp. (A) | | | 55,200 | | | | 2,769,936 | |
Newfield Exploration Co. (A) | | | 137,050 | | | | 4,469,200 | |
PBF Energy, Inc., Class A | | | 247,950 | | | | 6,464,056 | |
VAALCO Energy, Inc. (A) (B) | | | 303,300 | | | | 2,250,486 | |
Western Refining, Inc. (B) | | | 63,900 | | | | 2,913,201 | |
Whiting Petroleum Corp. (A) | | | 134,415 | | | | 8,231,575 | |
| | | | | | | | |
| | | | | | | 36,290,628 | |
| | | | | | | | |
Paper & Forest Products - 0.6% | | | | | | | | |
Domtar Corp. | | | 87,500 | | | | 3,593,625 | |
P.H. Glatfelter Co. | | | 120,500 | | | | 3,040,215 | |
| | | | | | | | |
| | | | | | | 6,633,840 | |
| | | | | | | | |
The Notes to Financial Statements are an integral part of this report.
| | |
| Transamerica Funds | | Annual Report 2014 |
Page 211
Transamerica Small/Mid Cap Value
SCHEDULE OF INVESTMENTS (continued)
At October 31, 2014
| | | | | | | | |
| | | Shares | | | Value | |
COMMON STOCKS (continued) | | | | | | | | |
Pharmaceuticals - 0.6% | | | | | | | | |
Mallinckrodt PLC (A) (B) | | | 28,768 | | | | $ 2,651,834 | |
Nektar Therapeutics (A) (B) | | | 298,933 | | | | 4,122,286 | |
| | | | | | | | |
| | | | | | | 6,774,120 | |
| | | | | | | | |
Professional Services - 0.5% | | | | | | | | |
Heidrick & Struggles International, Inc. | | | 95,000 | | | | 1,977,900 | |
On Assignment, Inc. (A) | | | 123,100 | | | | 3,582,210 | |
| | | | | | | �� | |
| | | | | | | 5,560,110 | |
| | | | | | | | |
Real Estate Investment Trusts - 8.9% | | | | | | | | |
AvalonBay Communities, Inc. | | | 43,880 | | | | 6,838,259 | |
BioMed Realty Trust, Inc., Class B, (B) | | | 593,325 | | | | 12,887,019 | |
Brandywine Realty Trust | | | 474,913 | | | | 7,327,907 | |
CBL & Associates Properties, Inc. | | | 215,775 | | | | 4,127,776 | |
DiamondRock Hospitality Co. | | | 412,500 | | | | 5,919,375 | |
DuPont Fabros Technology, Inc. (B) | | | 340,400 | | | | 10,542,188 | |
Excel Trust, Inc. | | | 443,792 | | | | 5,769,296 | |
Liberty Property Trust, Series C | | | 502,375 | | | | 17,467,579 | |
National Retail Properties, Inc. (B) | | | 117,100 | | | | 4,463,852 | |
Physicians Realty Trust (B) | | | 218,400 | | | | 3,350,256 | |
Summit Hotel Properties, Inc. (B) | | | 506,000 | | | | 5,889,840 | |
Sunstone Hotel Investors, Inc. | | | 686,900 | | | | 10,516,439 | |
| | | | | | | | |
| | | | | | | 95,099,786 | |
| | | | | | | | |
Real Estate Management & Development - 1.2% | | | | | |
CBRE Group, Inc., Class A (A) | | | 406,775 | | | | 13,016,800 | |
| | | | | | | | |
Road & Rail - 0.9% | | | | | | | | |
AMERCO | | | 16,600 | | | | 4,500,592 | |
Con-way, Inc. | | | 116,660 | | | | 5,059,544 | |
| | | | | | | | |
| | | | | | | 9,560,136 | |
| | | | | | | | |
Semiconductors & Semiconductor Equipment - 5.5% | |
Brooks Automation, Inc., Class A (B) | | | 343,900 | | | | 4,240,287 | |
Cohu, Inc. | | | 156,600 | | | | 1,597,320 | |
Entegris, Inc. (A) | | | 351,700 | | | | 4,776,086 | |
First Solar, Inc. (A) (B) | | | 59,530 | | | | 3,506,317 | |
GSI Technology, Inc. (A) (B) | | | 184,500 | | | | 887,445 | |
Integrated Device Technology, Inc. (A) | | | 175,850 | | | | 2,885,698 | |
LAM Research Corp. | | | 41,950 | | | | 3,266,227 | |
Micron Technology, Inc. (A) | | | 200,775 | | | | 6,643,645 | |
MKS Instruments, Inc. | | | 76,400 | | | | 2,780,960 | |
NXP Semiconductor NV (A) | | | 73,164 | | | | 5,023,440 | |
RF Micro Devices, Inc. (A) (B) | | | 325,300 | | | | 4,232,153 | |
Sigma Designs, Inc. (A) | | | 357,500 | | | | 1,426,425 | |
Silicon Motion Technology Corp. ADR | | | 287,600 | | | | 6,818,996 | |
Skyworks Solutions, Inc. | | | 125,370 | | | | 7,301,549 | |
Xcerra Corp. (A) | | | 426,100 | | | | 3,617,589 | |
| | | | | | | | |
| | | | | | | 59,004,137 | |
| | | | | | | | |
Software - 2.2% | | | | | | | | |
AVG Technologies NV (A) (B) | | | 12,200 | | | | 218,624 | |
Check Point Software Technologies, Ltd., Class A (A) (B) | | | 86,135 | | | | 6,395,524 | |
Electronic Arts, Inc. (A) | | | 205,295 | | | | 8,410,936 | |
TiVo, Inc. (A) | | | 690,400 | | | | 9,009,720 | |
| | | | | | | | |
| | | | | | | 24,034,804 | |
| | | | | | | | |
Specialty Retail - 4.3% | | | | | | | | |
Abercrombie & Fitch Co., Class A (B) | | | 96,100 | | | | 3,217,428 | |
American Eagle Outfitters, Inc. (B) | | | 1,028,800 | | | | 13,240,655 | |
ANN, Inc. (A) | | | 72,101 | | | | 2,767,957 | |
| | | | | | | | |
| | | Shares | | | Value | |
COMMON STOCKS (continued) | | | | | | | | |
Specialty Retail (continued) | | | | | | | | |
Express, Inc. (A) | | | 199,200 | | | | $ 2,982,024 | |
Finish Line, Inc., Class A | | | 141,000 | | | | 3,732,270 | |
Foot Locker, Inc. | | | 213,095 | | | | 11,935,451 | |
Guess?, Inc. | | | 106,800 | | | | 2,367,756 | |
Ross Stores, Inc. | | | 70,795 | | | | 5,714,573 | |
| | | | | | | | |
| | | | | | | 45,958,114 | |
| | | | | | | | |
Technology Hardware, Storage & Peripherals - 1.1% | |
NetApp, Inc. | | | 102,800 | | | | 4,399,840 | |
Western Digital Corp. | | | 76,165 | | | | 7,492,351 | |
| | | | | | | | |
| | | | | | | 11,892,191 | |
| | | | | | | | |
Textiles, Apparel & Luxury Goods - 1.2% | | | | | |
Deckers Outdoor Corp. (A) (B) | | | 78,450 | | | | 6,861,237 | |
Hanesbrands, Inc. | | | 45,075 | | | | 4,760,371 | |
Steven Madden, Ltd., Class B (A) (B) | | | 54,400 | | | | 1,705,440 | |
| | | | | | | | |
| | | | | | | 13,327,048 | |
| | | | | | | | |
Thrifts & Mortgage Finance - 1.9% | | | | | | | | |
Berkshire Hills Bancorp, Inc. | | | 152,331 | | | | 3,927,093 | |
Dime Community Bancshares, Inc. (B) | | | 167,700 | | | | 2,641,275 | |
Oritani Financial Corp. (B) | | | 97,500 | | | | 1,440,075 | |
Provident Financial Services, Inc. | | | 148,200 | | | | 2,701,686 | |
TrustCo Bank Corp. (B) | | | 243,000 | | | | 1,773,900 | |
United Financial Bancorp, Inc. | | | 266,408 | | | | 3,737,705 | |
Washington Federal, Inc. | | | 202,500 | | | | 4,420,575 | |
| | | | | | | | |
| | | | | | | 20,642,309 | |
| | | | | | | | |
Trading Companies & Distributors - 1.3% | |
AerCap Holdings NV (A) | | | 99,325 | | | | 4,304,746 | |
GATX Corp. | | | 153,976 | | | | 9,762,078 | |
| | | | | | | | |
| | | | | | | 14,066,824 | |
| | | | | | | | |
Total Common Stocks
(Cost $899,380,492) | | | | | | | 1,058,646,215 | |
| | | | | | | | |
| |
SECURITIES LENDING COLLATERAL - 8.9% | | | | | |
State Street Navigator Securities Lending Trust - Prime Portfolio 0.16% (C) | | | 95,771,159 | | | | 95,771,159 | |
| | | | | | | | |
Total Securities Lending Collateral
(Cost $95,771,159) | | | | 95,771,159 | |
| | | | | | | | |
| | |
| | | Principal | | | Value | |
REPURCHASE AGREEMENT - 1.6% | | | | | | | | |
State Street Bank & Trust Co.
0.01% (C), dated 10/31/2014, to be repurchased at $17,694,667 on 11/03/2014. Collateralized by a U.S. Government Agency Obligation, 2.50%, due 10/20/2027, and with a value of $18,052,368. | | | $ 17,694,652 | | | | 17,694,652 | |
| | | | | | | | |
Total Repurchase Agreement
(Cost $17,694,652) | | | | 17,694,652 | |
| | | | | | | | |
Total Investments
(Cost $1,012,846,303) (D) | | | | 1,172,112,026 | |
Net Other Assets (Liabilities) - (9.2)% | | | | (98,758,914 | ) |
| | | | | | | | |
| | |
Net Assets - 100.0% | | | | | | | $ 1,073,353,112 | |
| | | | | | | | |
The Notes to Financial Statements are an integral part of this report.
| | |
| Transamerica Funds | | Annual Report 2014 |
Page 212
Transamerica Small/Mid Cap Value
SCHEDULE OF INVESTMENTS (continued)
At October 31, 2014
SECURITY VALUATION:
Valuation Inputs (E)
| | | | | | | | | | | | | | | | |
| | | Level 1
Quoted Prices | | | Level 2
Other Significant
Observable Inputs | | | Level 3
Significant
Unobservable Inputs | | | Value at
October 31, 2014 | |
ASSETS | | | | | | | | | | | | | | | | |
Investments | | | | | | | | | | | | | | | | |
Common Stocks | | $ | 1,058,646,215 | | | $ | — | | | $ | — | | | $ | 1,058,646,215 | |
Securities Lending Collateral | | | 95,771,159 | | | | — | | | | — | | | | 95,771,159 | |
Repurchase Agreement | | | — | | | | 17,694,652 | | | | — | | | | 17,694,652 | |
| | | | | | | | | | | | | | | | |
Total Investments | | $ | 1,154,417,374 | | | $ | 17,694,652 | | | $ | — | | | $ | 1,172,112,026 | |
| | | | | | | | | | | | | | | | |
FOOTNOTES TO SCHEDULE OF INVESTMENTS:
| (A) | Non-income producing security. |
| (B) | All or a portion of this security is on loan. The value of all securities on loan is $93,290,186. The amount of securities on loan indicated may not correspond with the securities on loan identified because securities with pending sales are in the process of recall from the brokers. |
| (C) | Rate shown reflects the yield at October 31, 2014. |
| (D) | Aggregate cost for federal income tax purposes is $1,014,064,079. Aggregate gross unrealized appreciation and depreciation for all securities is $177,187,905 and $19,139,958, respectively. Net unrealized appreciation for tax purposes is $158,047,947. |
| (E) | The Fund recognizes transfers between Levels at the end of the reporting period. There were no transfers between Level 1, 2 and 3 during the period ended October 31, 2014. See the Notes to Financial Statements for more information regarding security valuation and pricing inputs. |
DEFINITION:
| | |
| ADR | | American Depositary Receipt |
The Notes to Financial Statements are an integral part of this report.
| | |
| Transamerica Funds | | Annual Report 2014 |
Page 213
Transamerica Strategic High Income
SCHEDULE OF INVESTMENTS
At October 31, 2014
| | | | | | | | |
| | | Principal | | | Value | |
CORPORATE DEBT SECURITIES - 37.5% | | | | | | | | |
Aerospace & Defense - 2.5% | | | | | | | | |
AAR Corp.
7.25%, 01/15/2022 | | | $ 461,000 | | | | $ 500,185 | |
Huntington Ingalls Industries, Inc.
7.13%, 03/15/2021 | | | 450,000 | | | | 483,750 | |
| | | | | | | | |
| | | | | | | 983,935 | |
| | | | | | | | |
Auto Components - 2.6% | | | | | | | | |
Cooper Tire & Rubber Co.
8.00%, 12/15/2019 | | | 500,000 | | | | 555,000 | |
Goodyear Tire & Rubber Co.
8.25%, 08/15/2020 | | | 310,000 | | | | 333,250 | |
Titan International, Inc.
6.88%, 10/01/2020 | | | 131,000 | | | | 118,227 | |
| | | | | | | | |
| | | | | | | 1,006,477 | |
| | | | | | | | |
Chemicals - 1.1% | | | | | | | | |
Huntsman International LLC
8.63%, 03/15/2021 | | | 400,000 | | | | 436,000 | |
| | | | | | | | |
Commercial Services & Supplies - 1.6% | | | | | | | | |
Stena AB
7.00%, 02/01/2024, 144A | | | 149,000 | | | | 148,627 | |
United Rentals North America, Inc.
8.25%, 02/01/2021 | | | 435,000 | | | | 474,150 | |
| | | | | | | | |
| | | | | | | 622,777 | |
| | | | | | | | |
Diversified Consumer Services - 1.1% | | | | | | | | |
Service Corp., International | | | | | | | | |
7.00%, 06/15/2017 | | | 335,000 | | | | 365,988 | |
7.63%, 10/01/2018 | | | 55,000 | | | | 61,600 | |
| | | | | | | | |
| | | | | | | 427,588 | |
| | | | | | | | |
Diversified Telecommunication Services - 1.2% | |
Frontier Communications Corp.
8.50%, 04/15/2020 (A) | | | 385,000 | | | | 443,713 | |
| | | | | | | | |
Energy Equipment & Services - 1.3% | | | | | | | | |
SEACOR Holdings, Inc.
7.38%, 10/01/2019 | | | 443,000 | | | | 489,515 | |
| | | | | | | | |
Food Products - 1.3% | | | | | | | | |
Post Holdings, Inc.
7.38%, 02/15/2022 (A) | | | 500,000 | | | | 512,500 | |
| | | | | | | | |
Gas Utilities - 1.1% | | | | | | | | |
Suburban Propane Partners, LP/Suburban Energy Finance Corp.
7.38%, 03/15/2020 (A) | | | 425,000 | | | | 443,063 | |
| | | | | | | | |
Health Care Providers & Services - 4.1% | | | | | | | | |
CHS / Community Health Systems, Inc.
8.00%, 11/15/2019 | | | 403,000 | | | | 435,240 | |
HealthSouth Corp.
7.75%, 09/15/2022 | | | 585,000 | | | | 625,219 | |
Omnicare, Inc.
7.75%, 06/01/2020 | | | 513,000 | | | | 546,345 | |
| | | | | | | | |
| | | | | | | 1,606,804 | |
| | | | | | | | |
Hotels, Restaurants & Leisure - 1.1% | | | | | | | | |
Viking Cruises, Ltd.
8.50%, 10/15/2022, 144A | | | 400,000 | | | | 433,000 | |
| | | | | | | | |
Independent Power and Renewable Electricity Producers - 1.3% | |
NRG Energy, Inc.
7.63%, 01/15/2018 | | | 455,000 | | | | 510,737 | |
| | | | | | | | |
| | | | | | | | |
| | | Principal | | | Value | |
CORPORATE DEBT SECURITIES (continued) | |
Machinery - 2.8% | | | | | | | | |
Manitowoc Co., Inc.
8.50%, 11/01/2020 | | | $ 464,000 | | | | $ 502,280 | |
Mueller Water Products, Inc.
8.75%, 09/01/2020 | | | 525,000 | | | | 567,000 | |
| | | | | | | | |
| | | | | | | 1,069,280 | |
| | | | | | | | |
Multiline Retail - 1.3% | | | | | | | | |
Dillard’s, Inc. | | | | | | | | |
7.75%, 05/15/2027 | | | 75,000 | | | | 82,875 | |
7.88%, 01/01/2023 | | | 350,000 | | | | 402,500 | |
| | | | | | | | |
| | | | | | | 485,375 | |
| | | | | | | | |
Oil, Gas & Consumable Fuels - 2.4% | | | | | | | | |
Energy XXI Gulf Coast, Inc.
7.75%, 06/15/2019 (A) | | | 30,000 | | | | 27,000 | |
Linn Energy LLC / Linn Energy Finance Corp.
8.63%, 04/15/2020 | | | 500,000 | | | | 501,250 | |
Stone Energy Corp.
7.50%, 11/15/2022 | | | 250,000 | | | | 233,125 | |
United Refining Co.
10.50%, 02/28/2018 | | | 140,000 | | | | 149,100 | |
| | | | | | | | |
| | | | | | | 910,475 | |
| | | | | | | | |
Paper & Forest Products - 2.2% | | | | | | | | |
Cascades, Inc.
7.88%, 01/15/2020 | | | 290,000 | | | | 303,050 | |
Louisiana-Pacific Corp.
7.50%, 06/01/2020 | | | 518,000 | | | | 554,260 | |
| | | | | | | | |
| | | | | | | 857,310 | |
| | | | | | | | |
Professional Services - 0.2% | | | | | | | | |
FTI Consulting, Inc.
6.75%, 10/01/2020 | | | 63,000 | | | | 66,465 | |
| | | | | | | | |
Real Estate Investment Trusts - 0.6% | | | | | | | | |
Potlatch Corp.
7.50%, 11/01/2019 | | | 200,000 | | | | 227,000 | |
| | | | | | | | |
Real Estate Management & Development - 1.3% | |
Mobile Mini, Inc.
7.88%, 12/01/2020 | | | 480,000 | | | | 517,200 | |
| | | | | | | | |
Specialty Retail - 2.0% | | | | | | | | |
L Brands, Inc.
7.00%, 05/01/2020 | | | 375,000 | | | | 425,625 | |
Rent-A-Center, Inc.
6.63%, 11/15/2020 (A) | | | 375,000 | | | | 361,875 | |
| | | | | | | | |
| | | | | | | 787,500 | |
| | | | | | | | |
Textiles, Apparel & Luxury Goods - 3.0% | | | | | | | | |
Hanesbrands, Inc.
6.38%, 12/15/2020 | | | 500,000 | | | | 530,625 | |
Levi Strauss & Co.
7.63%, 05/15/2020 (A) | | | 600,000 | | | | 636,750 | |
| | | | | | | | |
| | | | | | | 1,167,375 | |
| | | | | | | | |
Wireless Telecommunication Services - 1.4% | |
T-Mobile USA, Inc.
6.63%, 11/15/2020 | | | 500,000 | | | | 526,875 | |
| | | | | | | | |
Total Corporate Debt Securities
(Cost $14,830,409) | | | | | | | 14,530,964 | |
| | | | | | | | |
The Notes to Financial Statements are an integral part of this report.
| | |
| Transamerica Funds | | Annual Report 2014 |
Page 214
Transamerica Strategic High Income
SCHEDULE OF INVESTMENTS (continued)
At October 31, 2014
| | | | | | | | |
| | | Shares | | | Value | |
PREFERRED STOCKS - 14.9% | | | | | | | | |
Banks - 1.8% | | | | | | | | |
Citigroup, Inc.
Series J
7.13% | | | 5,500 | | | | $ 148,830 | |
First Republic Bank
7.00% (A) | | | 16,000 | | | | 431,680 | |
TCF Financial Corp.
Series B
6.45% | | | 5,000 | | | | 124,850 | |
| | | | | | | | |
| | | | | | | 705,360 | |
| | | | | | | | |
Capital Markets - 1.3% | | | | | | | | |
Morgan Stanley
Series G
6.63% | | | 20,000 | | | | 509,600 | |
| | | | | | | | |
Consumer Finance - 1.3% | | | | | | | | |
Capital One Financial Corp.
Series D
6.70% | | | 20,000 | | | | 502,800 | |
| | | | | | | | |
Diversified Financial Services - 0.7% | | | | | | | | |
KKR Financial Holdings LLC
Series A
7.38% (A) | | | 10,000 | | | | 260,000 | |
| | | | | | | | |
Diversified Telecommunication Services - 1.3% | |
Qwest Corp
7.00% (A) | | | 19,000 | | | | 488,870 | |
| | | | | | | | |
Insurance - 5.3% | | | | | | | | |
Allstate Corp.
Series C
6.75% | | | 13,000 | | | | 350,870 | |
Aspen Insurance Holdings, Ltd.
7.25% | | | 3,000 | | | | 79,410 | |
Kemper Corp.
7.38% | | | 19,484 | | | | 508,532 | |
Maiden Holdings North America, Ltd.
7.75% | | | 15,600 | | | | 404,664 | |
Maiden Holdings, Ltd.
Series A
8.25% | | | 1,400 | | | | 35,854 | |
Montpelier RE Holdings, Ltd.
Series A
8.88% | | | 12,000 | | | | 331,200 | |
PartnerRe, Ltd.
Series E
7.25% | | | 12,000 | | | | 328,560 | |
| | | | | | | | |
| | | | | | | 2,039,090 | |
| | | | | | | | |
Real Estate Investment Trusts - 3.2% | | | | | | | | |
Corporate Office Properties Trust
Series L
7.38% | | | 15,250 | | | | 396,653 | |
Digital Realty Trust, Inc.
Series H
7.38% | | | 13,000 | | | | 347,230 | |
DuPont Fabros Technology, Inc.
Series A
7.88% | | | 10,000 | | | | 256,000 | |
| | | | | | | | |
| | | Shares | | | Value | |
PREFERRED STOCKS (continued) | | | | | | | | |
Real Estate Investment Trusts (continued) | | | | | | | | |
DuPont Fabros Technology, Inc. (continued)
Series B
7.63% | | | 10,000 | | | | $ 254,900 | |
| | | | | | | | |
| | | | | | | 1,254,783 | |
| | | | | | | | |
Total Preferred Stocks
(Cost $5,666,346) | | | | | | | 5,760,503 | |
| | | | | | | | |
| | |
COMMON STOCKS - 45.6% | | | | | | | | |
Airlines - 0.7% | | | | | | | | |
Copa Holdings SA, Class A (A) | | | 2,300 | | | | 268,916 | |
| | | | | | | | |
Automobiles - 1.0% | | | | | | | | |
Ford Motor Co. (A) | | | 28,600 | | | | 402,974 | |
| | | | | | | | |
Banks - 1.1% | | | | | | | | |
First Republic Bank, Class A (A) | | | 3,050 | | | | 155,337 | |
SunTrust Banks, Inc. (A) | | | 7,400 | | | | 289,636 | |
| | | | | | | | |
| | | | | | | 444,973 | |
| | | | | | | | |
Chemicals - 0.7% | | | | | | | | |
LyondellBasell Industries NV, Class A (A) | | | 3,075 | | | | 281,762 | |
| | | | | | | | |
Communications Equipment - 1.0% | | | | | | | | |
QUALCOMM, Inc. | | | 4,900 | | | | 384,699 | |
| | | | | | | | |
Consumer Finance - 1.3% | | | | | | | | |
Capital One Financial Corp. | | | 5,900 | | | | 488,343 | |
| | | | | | | | |
Diversified Consumer Services - 0.8% | | | | | | | | |
H&R Block, Inc. | | | 9,025 | | | | 291,598 | |
| | | | | | | | |
Diversified Financial Services - 1.2% | | | | | | | | |
JPMorgan Chase & Co. | | | 7,450 | | | | 450,576 | |
| | | | | | | | |
Diversified Telecommunication Services - 3.2% | | | | | | | | |
AT&T, Inc. (A) | | | 10,675 | | | | 371,917 | |
Verizon Communications, Inc. | | | 9,625 | | | | 483,656 | |
Windstream Holdings, Inc. | | | 37,200 | | | | 389,856 | |
| | | | | | | | |
| | | | | | | 1,245,429 | |
| | | | | | | | |
Electric Utilities - 0.9% | | | | | | | | |
PPL Corp. (A) | | | 10,000 | | | | 349,900 | |
| | | | | | | | |
Electrical Equipment - 0.8% | | | | | | | | |
Eaton Corp. PLC (A) | | | 4,500 | | | | 307,755 | |
| | | | | | | | |
Food & Staples Retailing - 1.0% | | | | | | | | |
Sysco Corp. | | | 10,200 | | | | 393,108 | |
| | | | | | | | |
Food Products - 1.4% | | | | | | | | |
Kellogg Co. | | | 3,675 | | | | 235,053 | |
Kraft Foods Group, Inc. | | | 5,525 | | | | 311,334 | |
| | | | | | | | |
| | | | | | | 546,387 | |
| | | | | | | | |
Health Care Equipment & Supplies - 1.0% | | | | | | | | |
Medtronic, Inc. (A) | | | 5,600 | | | | 381,696 | |
| | | | | | | | |
Household Durables - 1.4% | | | | | | | | |
Whirlpool Corp. (A) | | | 3,075 | | | | 529,054 | |
| | | | | | | | |
Insurance - 3.1% | | | | | | | | |
Assured Guaranty, Ltd. (A) | | | 15,075 | | | | 347,931 | |
MetLife, Inc. | | | 9,025 | | | | 489,516 | |
Prudential Financial, Inc. | | | 4,125 | | | | 365,227 | |
| | | | | | | | |
| | | | | | | 1,202,674 | |
| | | | | | | | |
IT Services - 0.6% | | | | | | | | |
DST Systems, Inc. | | | 2,600 | | | | 250,510 | |
| | | | | | | | |
The Notes to Financial Statements are an integral part of this report.
| | |
| Transamerica Funds | | Annual Report 2014 |
Page 215
Transamerica Strategic High Income
SCHEDULE OF INVESTMENTS (continued)
At October 31, 2014
| | | | | | | | |
| | | Shares | | | Value | |
COMMON STOCKS (continued) | | | | | | | | |
Multi-Utilities - 1.1% | | | | | | | | |
National Grid PLC, ADR (A) | | | 6,000 | | | | $ 446,340 | |
| | | | | | | | |
Multiline Retail - 1.7% | | | | | | | | |
Macy’s, Inc. (A) | | | 6,100 | | | | 352,702 | |
Target Corp. (A) | | | 5,275 | | | | 326,100 | |
| | | | | | | | |
| | | | | | | 678,802 | |
| | | | | | | | |
Oil, Gas & Consumable Fuels - 6.4% | | | | | | | | |
Chevron Corp. (A) | | | 2,575 | | | | 308,871 | |
ConocoPhillips (A) | | | 4,425 | | | | 319,264 | |
Eni SpA, ADR | | | 8,500 | | | | 361,250 | |
Occidental Petroleum Corp. (A) | | | 5,000 | | | | 444,650 | |
PBF Energy, Inc., Class A (A) | | | 11,075 | | | | 288,725 | |
Royal Dutch Shell PLC, Class B, ADR (A) | | | 5,800 | | | | 433,086 | |
Valero Energy Corp. | | | 6,300 | | | | 315,567 | |
| | | | | | | | |
| | | | | | | 2,471,413 | |
| | | | | | | | |
Pharmaceuticals - 4.3% | | | | | | | | |
AstraZeneca PLC, ADR (A) | | | 5,175 | | | | 377,464 | |
Eli Lilly & Co. (A) | | | 4,975 | | | | 329,992 | |
Johnson & Johnson (A) | | | 3,725 | | | | 401,480 | |
Novartis AG, ADR | | | 2,875 | | | | 266,484 | |
Pfizer, Inc. (A) | | | 9,725 | | | | 291,264 | |
| | | | | | | | |
| | | | | | | 1,666,684 | |
| | | | | | | | |
Real Estate Investment Trusts - 1.4% | | | | | | | | |
Annaly Capital Management, Inc. | | | 48,150 | | | | 549,392 | |
| | | | | | | | |
Semiconductors & Semiconductor Equipment - 2.0% | |
Intel Corp. (A) | | | 8,200 | | | | 278,882 | |
Maxim Integrated Products, Inc., Class A (A) | | | 8,250 | | | | 242,055 | |
Xilinx, Inc. (A) | | | 5,525 | | | | 245,752 | |
| | | | | | | | |
| | | | | | | 766,689 | |
| | | | | | | | |
Software - 1.9% | | | | | | | | |
CA, Inc. (A) | | | 10,325 | | | | 300,044 | |
Microsoft Corp. (A) | | | 9,100 | | | | 427,245 | |
| | | | | | | | |
| | | | | | | 727,289 | |
| | | | | | | | |
Specialty Retail - 0.9% | | | | | | | | |
Best Buy Co., Inc. | | | 10,450 | | | | 356,763 | |
| | | | | | | | |
Technology Hardware, Storage & Peripherals - 3.1% | |
Apple, Inc. | | | 4,925 | | | | 531,900 | |
Seagate Technology PLC (A) | | | 5,700 | | | | 358,131 | |
| | | | | | | | |
| | | Shares | | | Value | |
COMMON STOCKS (continued) | | | | | | | | |
Technology Hardware, Storage & Peripherals (continued) | |
Western Digital Corp. | | | 3,150 | | | | $ 309,865 | |
| | | | | | | | |
| | | | | | | 1,199,896 | |
| | | | | | | | |
COMMON STOCKS (continued) | | | | | | | | |
Thrifts & Mortgage Finance - 0.9% | | | | | | | | |
New York Community Bancorp, Inc. (A) | | | 21,500 | | | | 342,925 | |
| | | | | | | | |
Wireless Telecommunication Services - 0.7% | | | | | |
Vodafone Group PLC, ADR | | | 7,675 | | | | 254,964 | |
| | | | | | | | |
Total Common Stocks
(Cost $17,212,638) | | | | | | | 17,681,511 | |
| | | | | | | | |
| | |
INVESTMENT COMPANY - 0.9% | | | | | | | | |
Capital Markets - 0.9% | | | | | | | | |
Cushing Renaissance Fund | | | 13,475 | | | | 345,634 | |
| | | | | | | | |
Total Investment Company
(Cost $356,669) | | | | | | | 345,634 | |
| | | | | | | | |
|
SECURITIES LENDING COLLATERAL - 24.8% | |
State Street Navigator Securities Lending Trust - Prime Portfolio
0.16% (B) | | | 9,633,194 | | | | 9,633,194 | |
| | | | | | | | |
Total Securities Lending Collateral
(Cost $9,633,194) | | | | | | | 9,633,194 | |
| | | | | | | | |
| | |
| | | Principal | | | Value | |
REPURCHASE AGREEMENT - 1.7% | | | | | | | | |
State Street Bank & Trust Co.
0.01% (B), dated 10/31/2014, to be repurchased at $672,918 on 11/03/2014. Collateralized by a U.S. Government Agency Obligation, 3.00%, due 07/25/2037, and with a value of $689,322. | | | $ 672,918 | | | | 672,918 | |
| | | | | | | | |
Total Repurchase Agreement
(Cost $672,918) | | | | | | | 672,918 | |
| | | | | | | | |
Total Investments
(Cost $48,372,174) (C) | | | | | | | 48,624,724 | |
Net Other Assets (Liabilities) - (25.4)% | | | | | | | (9,837,061 | ) |
| | | | | | | | |
| | |
Net Assets - 100.0% | | | | | | | $ 38,787,663 | |
| | | | | | | | |
SECURITY VALUATION:
Valuation Inputs (D)
| | | | | | | | | | | | | | | | |
| | | Level 1
Quoted Prices | | | Level 2
Other Significant
Observable Inputs | | | Level 3
Significant
Unobservable Inputs | | | Value at
October 31, 2014 | |
ASSETS | | | | | | | | | | | | | | | | |
Investments | | | | | | | | | | | | | | | | |
Corporate Debt Securities | | $ | — | | | $ | 14,530,964 | | | $ | — | | | $ | 14,530,964 | |
Preferred Stocks | | | 5,257,703 | | | | 502,800 | | | | — | | | | 5,760,503 | |
Common Stocks | | | 17,681,511 | | | | — | | | | — | | | | 17,681,511 | |
Investment Company | | | 345,634 | | | | — | | | | — | | | | 345,634 | |
Securities Lending Collateral | | | 9,633,194 | | | | — | | | | — | | | | 9,633,194 | |
Repurchase Agreement | | | — | | | | 672,918 | | | | — | | | | 672,918 | |
| | | | | | | | | | | | | | | | |
Total Investments | | $ | 32,918,042 | | | $ | 15,706,682 | | | $ | — | | | $ | 48,624,724 | |
| | | | | | | | | | | | | | | | |
The Notes to Financial Statements are an integral part of this report.
| | |
| Transamerica Funds | | Annual Report 2014 |
Page 216
Transamerica Strategic High Income
SCHEDULE OF INVESTMENTS (continued)
At October 31, 2014
FOOTNOTES TO SCHEDULE OF INVESTMENTS:
| (A) | All or a portion of this security is on loan. The value of all securities on loan is $9,420,557. The amount of securities on loan indicated may not correspond with the securities on loan identified because securities with pending sales are in the process of recall from the brokers. |
| (B) | Rate shown reflects the yield at October 31, 2014. |
| (C) | Aggregate cost for federal income tax purposes is $48,374,499. Aggregate gross unrealized appreciation and depreciation for all securities is $1,003,335 and $753,110, respectively. Net unrealized appreciation for tax purposes is $250,225. |
| (D) | The Fund recognizes transfers between Levels at the end of the reporting period. There were no transfers between Level 1, 2 and 3 during the period ended October 31, 2014. See the Notes to Financial Statements for more information regarding security valuation and pricing inputs. |
DEFINITIONS:
| | |
| 144A | | 144A securities are registered pursuant to Rule 144A of the Securities Act of 1933. These securities are deemed to be liquid for purposes of compliance limitations on holdings of illiquid securities and may be resold as transactions exempt from registration, normally to qualified institutional buyers. At October 31, 2014, these securities aggregated $581,627, or 1.50% of the Fund’s net assets. |
| ADR | | American Depositary Receipt |
The Notes to Financial Statements are an integral part of this report.
| | |
| Transamerica Funds | | Annual Report 2014 |
Page 217
Transamerica Tactical Allocation
SCHEDULE OF INVESTMENTS
At October 31, 2014
| | | | | | | | |
| | | Shares | | | Value | |
INVESTMENT COMPANIES - 101.8% | | | | | | | | |
Capital Markets - 81.3% | | | | | | | | |
iShares Floating Rate Bond ETF | | | 12,612 | | | | $ 639,555 | |
iShares MSCI ACWI ETF (A) | | | 72,462 | | | | 4,319,460 | |
SPDR Barclays Short Term High Yield Bond ETF | | | 64,137 | | | | 1,920,903 | |
Vanguard REIT ETF | | | 10,969 | | | | 866,441 | |
Vanguard Short-Term Bond ETF | | | 7,955 | | | | 638,866 | |
Vanguard Total Bond Market ETF | | | 23,247 | | | | 1,914,623 | |
| | | | | | | | |
| | | | | | | 10,299,848 | |
| | | | | | | | |
Growth - Large Cap - 6.8% | | | | | | | | |
Vanguard Growth ETF | | | 8,449 | | | | 867,374 | |
| | | | | | | | |
Growth - Small Cap - 6.9% | | | | | | | | |
Vanguard Small-Cap ETF | | | 7,512 | | | | 868,612 | |
| | | | | | | | |
Value - Large Cap - 6.8% | | | | | | | | |
Vanguard Value ETF | | | 10,456 | | | | 864,293 | |
| | | | | | | | |
Total Investment Companies
(Cost $12,794,732) | | | | | | | 12,900,127 | |
| | | | | | | | |
| | | | | | | | |
| | | Shares | | | Value | |
SECURITIES LENDING COLLATERAL - 4.3% | | | | | |
State Street Navigator Securities Lending Trust - Prime Portfolio
0.16% (B) | | | 542,978 | | | | $ 542,978 | |
| | | | | | | | |
Total Securities Lending Collateral
(Cost $542,978) | | | | 542,978 | |
| | | | | | | | |
| | |
| | | Principal | | | Value | |
REPURCHASE AGREEMENT - 47.1% | | | | | | | | |
State Street Bank & Trust Co.
0.01% (B), dated 10/31/2014, to be repurchased at $5,964,094 on 11/03/2014. Collateralized by a U.S. Government Agency Obligation, 2.00%, due 11/01/2027, and with a value of $6,083,497. | | | $ 5,964,089 | | | | 5,964,089 | |
| | | | | | | | |
Total Repurchase Agreement
(Cost $5,964,089) | | | | | | | 5,964,089 | |
| | | | | | | | |
Total Investments
(Cost $19,301,799) (C) | | | | | | | 19,407,194 | |
Net Other Assets (Liabilities) - (53.2)% | | | | | | | (6,739,677 | ) |
| | | | | | | | |
| | |
Net Assets - 100.0% | | | | | | | $ 12,667,517 | |
| | | | | | | | |
SECURITY VALUATION:
Valuation Inputs (D)
| | | | | | | | | | | | | | | | |
| | | Level 1
Quoted Prices | | | Level 2
Other Significant
Observable Inputs | | | Level 3
Significant
Unobservable Inputs | | | Value at
October 31, 2014 | |
ASSETS | | | | | | | | | | | | | | | | |
Investments | | | | | | | | | | | | | | | | |
Investment Companies | | $ | 12,900,127 | | | $ | — | | | $ | — | | | $ | 12,900,127 | |
Securities Lending Collateral | | | 542,978 | | | | — | | | | — | | | | 542,978 | |
Repurchase Agreement | | | — | | | | 5,964,089 | | | | — | | | | 5,964,089 | |
| | | | | | | | | | | | | | | | |
Total Investments | | $ | 13,443,105 | | | $ | 5,964,089 | | | $ | — | | | $ | 19,407,194 | |
| | | | | | | | | | | | | | | | |
FOOTNOTES TO SCHEDULE OF INVESTMENTS:
| (A) | All or a portion of this security is on loan. The value of all securities on loan is $531,344. The amount of securities on loan indicated may not correspond with the securities on loan identified because securities with pending sales are in the process of recall from the brokers. |
| (B) | Rate shown reflects the yield at October 31, 2014. |
| (C) | Aggregate cost for federal income tax purposes is $19,491,112. Aggregate gross unrealized appreciation and depreciation for all securities is $125,618 and $209,536, respectively. Net unrealized depreciation for tax purposes is $83,918. |
| (D) | The Fund recognizes transfers between Levels at the end of the reporting period. There were no transfers between Level 1, 2 and 3 during the period ended October 31, 2014. See the Notes to Financial Statements for more information regarding security valuation and pricing inputs. |
The Notes to Financial Statements are an integral part of this report.
| | |
| Transamerica Funds | | Annual Report 2014 |
Page 218
Transamerica Tactical Income
SCHEDULE OF INVESTMENTS
At October 31, 2014
| | | | | | | | |
| | | Shares | | | Value | |
INVESTMENT COMPANIES - 99.4% | | | | | | | | |
Capital Markets - 69.2% | | | | | | | | |
iShares Floating Rate Bond ETF (A) | | | 300,343 | | | | $ 15,230,394 | |
iShares iBoxx $ High Yield Corporate Bond ETF (A) | | | 785,885 | | | | 72,717,939 | |
iShares iBoxx $ Investment Grade Corporate Bond ETF (A) | | | 391,905 | | | | 46,769,943 | |
SPDR Barclays High Yield Bond ETF (A) | | | 4,885,890 | | | | 197,194,520 | |
SPDR Barclays Short Term High Yield Bond ETF (A) | | | 5,837,287 | | | | 174,826,746 | |
Vanguard Total Bond Market ETF (A) | | | 1,427,298 | | | | 117,552,263 | |
| | | | | | | | |
| | | | | | | 624,291,805 | |
| | | | | | | | |
Growth - Large Cap - 21.2% | | | | | | | | |
Vanguard Growth ETF (A) | | | 1,856,005 | | | | 190,537,473 | |
| | | | | | | | |
Value - Large Cap - 9.0% | | | | | | | | |
Vanguard Value ETF (A) | | | 984,317 | | | | 81,363,643 | |
| | | | | | | | |
Total Investment Companies
(Cost $885,779,465) | | | | | | | 896,192,921 | |
| | | | | | | | |
| | | | | | | | |
| | | Shares | | | Value | |
SECURITIES LENDING COLLATERAL - 22.7% | | | | | |
State Street Navigator Securities Lending Trust - Prime Portfolio 0.16% (B) | | | 204,977,679 | | | | $ 204,977,679 | |
| | | | | | | | |
Total Securities Lending Collateral
(Cost $204,977,679) | | | | 204,977,679 | |
| | | | | | | | |
| | |
| | | Principal | | | Value | |
REPURCHASE AGREEMENT - 0.5% | | | | | | | | |
State Street Bank & Trust Co.
0.01% (B), dated 10/31/2014, to be repurchased at $4,659,168 on 11/03/2014. Collateralized by a U.S. Government Agency Obligation, 3.50%, due 01/01/2032, and with a value of $4,754,251. | | | $ 4,659,164 | | | | 4,659,164 | |
| | | | | | | | |
Total Repurchase Agreement
(Cost $4,659,164) | | | | 4,659,164 | |
| | | | | | | | |
Total Investments
(Cost $1,095,416,308) (C) | | | | 1,105,829,764 | |
Net Other Assets (Liabilities) - (22.6)% | | | | | | | (203,636,563 | ) |
| | | | | | | | |
| | |
Net Assets - 100.0% | | | | | | | $ 902,193,201 | |
| | | | | | | | |
SECURITY VALUATION:
Valuation Inputs (D)
| | | | | | | | | | | | | | | | |
| | | Level 1
Quoted Prices | | | Level 2
Other Significant
Observable Inputs | | | Level 3
Significant
Unobservable Inputs | | | Value at
October 31, 2014 | |
ASSETS | | | | | | | | | | | | | | | | |
Investments | | | | | | | | | | | | | | | | |
Investment Companies | | $ | 896,192,921 | | | $ | — | | | $ | — | | | $ | 896,192,921 | |
Securities Lending Collateral | | | 204,977,679 | | | | — | | | | — | | | | 204,977,679 | |
Repurchase Agreement | | | — | | | | 4,659,164 | | | | — | | | | 4,659,164 | |
| | | | | | | | | | | | | | | | |
Total Investments | | $ | 1,101,170,600 | | | $ | 4,659,164 | | | $ | — | | | $ | 1,105,829,764 | |
| | | | | | | | | | | | | | | | |
FOOTNOTES TO SCHEDULE OF INVESTMENTS:
| (A) | All or a portion of this security is on loan. The value of all securities on loan is $200,595,760. The amount of securities on loan indicated may not correspond with the securities on loan identified because securities with pending sales are in the process of recall from the brokers. |
| (B) | Rate shown reflects the yield at October 31, 2014. |
| (C) | Aggregate cost for federal income tax purposes is $1,098,380,305. Aggregate gross unrealized appreciation and depreciation for all securities is $9,980,169 and $2,530,710, respectively. Net unrealized appreciation for tax purposes is $7,449,459. |
| (D) | The Fund recognizes transfers between Levels at the end of the reporting period. There were no transfers between Level 1, 2 and 3 during the period ended October 31, 2014. See the Notes to Financial Statements for more information regarding security valuation and pricing inputs. |
The Notes to Financial Statements are an integral part of this report.
| | |
| Transamerica Funds | | Annual Report 2014 |
Page 219
Transamerica Tactical Rotation
SCHEDULE OF INVESTMENTS
At October 31, 2014
| | | | | | | | |
| | | Shares | | | Value | |
INVESTMENT COMPANIES - 99.9% | | | | | | | | |
Capital Markets - 94.6% | | | | | | | | |
Consumer Discretionary Select Sector SPDR Fund (A) | | | 17,814 | | | | $ 1,213,133 | |
Consumer Staples Select Sector SPDR Fund (A) | | | 25,872 | | | | 1,208,481 | |
Financial Select Sector SPDR Fund (A) | | | 51,037 | | | | 1,216,722 | |
Health Care Select Sector SPDR Fund | | | 18,201 | | | | 1,224,381 | |
Industrial Select Sector SPDR Fund (A) | | | 21,897 | | | | 1,209,152 | |
iShares Floating Rate Bond ETF | | | 44,581 | | | | 2,260,703 | |
iShares MSCI ACWI ETF (A) | | | 107,809 | | | | 6,426,495 | |
iShares MSCI China ETF (A) | | | 20,804 | | | | 1,023,765 | |
iShares MSCI Hong Kong ETF (A) | | | 47,349 | | | | 1,023,212 | |
iShares MSCI Taiwan ETF (A) | | | 38,209 | | | | 600,645 | |
Materials Select Sector SPDR Fund | | | 12,686 | | | | 614,002 | |
Technology Select Sector SPDR Fund (A) | | | 30,044 | | | | 1,217,984 | |
Utilities Select Sector SPDR Fund (A) | | | 26,685 | | | | 1,213,367 | |
Vanguard Telecommunication Services ETF (A) | | | 13,554 | | | | 1,207,933 | |
| | | | | | | | |
| | | | | | | 21,659,975 | |
| | | | | | | | |
Growth - Small Cap - 5.3% | | | | | | | | |
Vanguard Small-Cap ETF | | | 10,543 | | | | 1,219,087 | |
| | | | | | | | |
Total Investment Companies
(Cost $21,903,748) | | | | | | | 22,879,062 | |
| | | | | | | | |
| | | | | | | | |
| | | Shares | | | Value | |
SECURITIES LENDING COLLATERAL - 23.3% | |
State Street Navigator Securities Lending Trust - Prime Portfolio
0.16% (B) | | | 5,333,015 | | | | $ 5,333,015 | |
| | | | | | | | |
Total Securities Lending Collateral
(Cost $5,333,015) | | | | | | | 5,333,015 | |
| | | | | | | | |
| | |
| | | Principal | | | Value | |
REPURCHASE AGREEMENT - 0.4% | | | | | | | | |
State Street Bank & Trust Co.
0.01% (B), dated 10/31/2014, to be repurchased at $86,538 on 11/03/2014. Collateralized by a U.S. Government Agency Obligation, 2.50%, due 11/01/2027, and with a value of $88,982. | | | $ 86,538 | | | | 86,538 | |
| | | | | | | | |
Total Repurchase Agreement
(Cost $86,538) | | | | | | | 86,538 | |
| | | | | | | | |
Total Investments
(Cost $27,323,301) (C) | | | | | | | 28,298,615 | |
Net Other Assets (Liabilities) - (23.6)% | | | | | | | (5,396,743 | ) |
| | | | | | | | |
| | |
Net Assets - 100.0% | | | | | | | $ 22,901,872 | |
| | | | | | | | |
SECURITY VALUATION:
Valuation Inputs (D)
| | | | | | | | | | | | | | | | |
| | | Level 1
Quoted Prices | | | Level 2
Other Significant
Observable Inputs | | | Level 3
Significant
Unobservable Inputs | | | Value at
October 31, 2014 | |
ASSETS | | | | | | | | | | | | | | | | |
Investments | | | | | | | | | | | | | | | | |
Investment Companies | | $ | 22,879,062 | | | $ | — | | | $ | — | | | $ | 22,879,062 | |
Securities Lending Collateral | | | 5,333,015 | | | | — | | | | — | | | | 5,333,015 | |
Repurchase Agreement | | | — | | | | 86,538 | | | | — | | | | 86,538 | |
| | | | | | | | | | | | | | | | |
Total Investments | | $ | 28,212,077 | | | $ | 86,538 | | | $ | — | | | $ | 28,298,615 | |
| | | | | | | | | | | | | | | | |
FOOTNOTES TO SCHEDULE OF INVESTMENTS:
| (A) | All or a portion of this security is on loan. The value of all securities on loan is $5,212,377. The amount of securities on loan indicated may not correspond with the securities on loan identified because securities with pending sales are in the process of recall from the brokers. |
| (B) | Rate shown reflects the yield at October 31, 2014. |
| (C) | Aggregate cost for federal income tax purposes is $27,811,820. Aggregate gross unrealized appreciation and depreciation for all securities is $488,875 and $2,080, respectively. Net unrealized appreciation for tax purposes is $486,795. |
| (D) | The Fund recognizes transfers between Levels at the end of the reporting period. There were no transfers between Level 1, 2 and 3 during the period ended October 31, 2014. See the Notes to Financial Statements for more information regarding security valuation and pricing inputs. |
The Notes to Financial Statements are an integral part of this report.
| | |
| Transamerica Funds | | Annual Report 2014 |
Page 220
Transamerica US Growth
(formerly, Transamerica Diversified Equity)
SCHEDULE OF INVESTMENTS
At October 31, 2014
| | | | | | | | |
| | | Shares | | | Value | |
COMMON STOCKS - 99.8% | | | | | | | | |
Aerospace & Defense - 1.9% | | | | | | | | |
TransDigm Group, Inc. (A) | | | 43,450 | | | | $ 8,126,454 | |
United Technologies Corp. | | | 135,609 | | | | 14,510,163 | |
| | | | | | | | |
| | | | | | | 22,636,617 | |
| | | | | | | | |
Airlines - 0.5% | | | | | | | | |
United Continental Holdings, Inc. (B) | | | 121,560 | | | | 6,419,584 | |
| | | | | | | | |
Beverages - 1.7% | | | | | | | | |
Monster Beverage Corp. (B) | | | 203,436 | | | | 20,522,624 | |
| | | | | | | | |
Biotechnology - 6.1% | | | | | | | | |
Celgene Corp. (B) | | | 126,090 | | | | 13,502,978 | |
Gilead Sciences, Inc. (B) | | | 246,220 | | | | 27,576,640 | |
Incyte Corp. (A) (B) | | | 112,030 | | | | 7,512,732 | |
Regeneron Pharmaceuticals, Inc., Class A (B) | | | 29,910 | | | | 11,776,165 | |
Vertex Pharmaceuticals, Inc. (B) | | | 112,700 | | | | 12,694,528 | |
| | | | | | | | |
| | | | | | | 73,063,043 | |
| | | | | | | | |
Capital Markets - 1.6% | | | | | | | | |
Ameriprise Financial, Inc. | | | 156,830 | | | | 19,787,241 | |
| | | | | | | | |
Chemicals - 2.3% | | | | | | | | |
Dow Chemical Co. | | | 311,950 | | | | 15,410,330 | |
Eastman Chemical Co. | | | 154,990 | | | | 12,520,092 | |
| | | | | | | | |
| | | | | | | 27,930,422 | |
| | | | | | | | |
Communications Equipment - 2.4% | | | | | | | | |
Cisco Systems, Inc. | | | 382,520 | | | | 9,360,265 | |
QUALCOMM, Inc. | | | 256,926 | | | | 20,171,260 | |
| | | | | | | | |
| | | | | | | 29,531,525 | |
| | | | | | | | |
Containers & Packaging - 1.1% | | | | | | | | |
Crown Holdings, Inc. (B) | | | 279,390 | | | | 13,391,163 | |
| | | | | | | | |
Electrical Equipment - 0.8% | | | | | | | | |
Eaton Corp. PLC | | | 134,380 | | | | 9,190,248 | |
| | | | | | | | |
Energy Equipment & Services - 1.8% | | | | | | | | |
Halliburton Co. | | | 386,380 | | | | 21,304,993 | |
| | | | | | | | |
Food & Staples Retailing - 4.8% | | | | | | | | |
Costco Wholesale Corp. | | | 164,199 | | | | 21,899,221 | |
CVS Health Corp. | | | 218,512 | | | | 18,750,515 | |
Walgreen Co. | | | 261,120 | | | | 16,769,126 | |
| | | | | | | | |
| | | | | | | 57,418,862 | |
| | | | | | | | |
Food Products - 1.2% | | | | | | | | |
Mondelez International, Inc., Class A | | | 423,348 | | | | 14,927,251 | |
| | | | | | | | |
Health Care Equipment & Supplies - 0.7% | | | | | | | | |
Zimmer Holdings, Inc., Class A | | | 78,323 | | | | 8,712,651 | |
| | | | | | | | |
Health Care Providers & Services - 3.2% | | | | | | | | |
Aetna, Inc. | | | 105,740 | | | | 8,724,607 | |
Envision Healthcare Holdings, Inc. (B) | | | 178,010 | | | | 6,221,450 | |
McKesson Corp. | | | 71,630 | | | | 14,570,258 | |
UnitedHealth Group, Inc. | | | 96,520 | | | | 9,170,365 | |
| | | | | | | | |
| | | | | | | 38,686,680 | |
| | | | | | | | |
Health Care Technology - 1.1% | | | | | | | | |
Cerner Corp. (B) | | | 209,520 | | | | 13,270,997 | |
| | | | | | | | |
Hotels, Restaurants & Leisure - 1.5% | | | | | | | | |
Starbucks Corp. | | | 240,540 | | | | 18,175,202 | |
| | | | | | | | |
Household Products - 1.3% | | | | | | | | |
Colgate-Palmolive Co. | | | 242,220 | | | | 16,199,674 | |
| | | | | | | | |
| | | | | | | | |
| | | Shares | | | Value | |
COMMON STOCKS (continued) | | | | | | | | |
Insurance - 1.7% | | | | | | | | |
Aon PLC | | | 117,460 | | | | $ 10,101,560 | |
Prudential Financial, Inc. | | | 120,460 | | | | 10,665,528 | |
| | | | | | | | |
| | | | | | | 20,767,088 | |
| | | | | | | | |
Internet & Catalog Retail - 3.1% | | | | | | | | |
Amazon.com, Inc. (B) | | | 51,140 | | | | 15,621,225 | |
Priceline Group, Inc. (B) | | | 18,106 | | | | 21,839,638 | |
| | | | | | | | |
| | | | | | | 37,460,863 | |
| | | | | | | | |
Internet Software & Services - 6.4% | | | | | | | | |
Akamai Technologies, Inc. (B) | | | 192,370 | | | | 11,599,911 | |
Facebook, Inc., Class A (B) | | | 269,153 | | | | 20,183,783 | |
Google, Inc., Class A (B) | | | 39,432 | | | | 22,392,250 | |
Google, Inc., Class C (B) | | | 41,408 | | | | 23,150,385 | |
| | | | | | | | |
| | | | | | | 77,326,329 | |
| | | | | | | | |
IT Services - 6.8% | | | | | | | | |
Accenture PLC, Class A | | | 173,690 | | | | 14,089,733 | |
Automatic Data Processing, Inc. | | | 192,620 | | | | 15,752,464 | |
Cognizant Technology Solutions Corp., Class A (B) | | | 249,710 | | | | 12,198,333 | |
Genpact, Ltd. (B) | | | 554,210 | | | | 9,726,386 | |
Jack Henry & Associates, Inc. | | | 168,620 | | | | 10,086,848 | |
Mastercard, Inc., Class A | | | 239,360 | | | | 20,046,400 | |
| | | | | | | | |
| | | | | | | 81,900,164 | |
| | | | | | | | |
Machinery - 2.2% | | | | | | | | |
Dover Corp. | | | 122,691 | | | | 9,746,573 | |
Illinois Tool Works, Inc., Class A | | | 182,775 | | | | 16,641,664 | |
| | | | | | | | |
| | | | | | | 26,388,237 | |
| | | | | | | | |
Media - 3.5% | | | | | | | | |
DIRECTV (B) | | | 187,789 | | | | 16,298,207 | |
Time Warner, Inc. | | | 116,650 | | | | 9,270,175 | |
Twenty-First Century Fox, Inc., Class A | | | 473,170 | | | | 16,314,902 | |
| | | | | | | | |
| | | | | | | 41,883,284 | |
| | | | | | | | |
Metals & Mining - 0.4% | | | | | | | | |
Reliance Steel & Aluminum Co. | | | 66,980 | | | | 4,519,810 | |
| | | | | | | | |
Multiline Retail - 1.5% | | | | | | | | |
Dollar Tree, Inc. (B) | | | 304,920 | | | | 18,469,004 | |
| | | | | | | | |
Oil, Gas & Consumable Fuels - 2.5% | | | | | | | | |
Anadarko Petroleum Corp., Class A | | | 179,540 | | | | 16,478,181 | |
EOG Resources, Inc. | | | 144,060 | | | | 13,692,903 | |
| | | | | | | | |
| | | | | | | 30,171,084 | |
| | | | | | | | |
Personal Products - 2.1% | | | | | | | | |
Coty, Inc., Class A (A) (B) | | | 577,940 | | | | 9,593,804 | |
Estee Lauder Cos., Inc., Class A | | | 214,490 | | | | 16,125,358 | |
| | | | | | | | |
| | | | | | | 25,719,162 | |
| | | | | | | | |
Pharmaceuticals - 4.9% | | | | | | | | |
Actavis PLC (B) | | | 59,350 | | | | 14,406,619 | |
Bristol-Myers Squibb Co. | | | 454,770 | | | | 26,463,066 | |
Merck & Co., Inc. | | | 169,300 | | | | 9,809,242 | |
Salix Pharmaceuticals, Ltd. (A) (B) | | | 61,946 | | | | 8,910,932 | |
| | | | | | | | |
| | | | | | | 59,589,859 | |
| | | | | | | | |
Professional Services - 2.4% | | | | | | | | |
Equifax, Inc. | | | 134,700 | | | | 10,202,178 | |
Nielsen NV | | | 243,610 | | | | 10,350,989 | |
The Notes to Financial Statements are an integral part of this report.
| | |
| Transamerica Funds | | Annual Report 2014 |
Page 221
Transamerica US Growth
(formerly, Transamerica Diversified Equity)
SCHEDULE OF INVESTMENTS (continued)
At October 31, 2014
| | | | | | | | |
| | | Shares | | | Value | |
COMMON STOCKS (continued) | | | | | | | | |
Professional Services (continued) | | | | | | | | |
Verisk Analytics, Inc., Class A (B) | | | 141,720 | | | | $ 8,836,242 | |
| | | | | | | | |
| | | | | | | 29,389,409 | |
| | | | | | | | |
Road & Rail - 2.4% | | | | | | | | |
Hertz Global Holdings, Inc. (B) | | | 435,170 | | | | 9,538,926 | |
JB Hunt Transport Services, Inc. (A) | | | 137,960 | | | | 11,005,069 | |
Norfolk Southern Corp. | | | 79,820 | | | | 8,831,285 | |
| | | | | | | | |
| | | | | | | 29,375,280 | |
| | | | | | | | |
Semiconductors & Semiconductor Equipment - 1.4% | |
Intel Corp. | | | 284,310 | | | | 9,669,383 | |
SunPower Corp., Class A (A) (B) | | | 213,700 | | | | 6,804,208 | |
| | | | | | | | |
| | | | | | | 16,473,591 | |
| | | | | | | | |
Software - 7.5% | | | | | | | | |
Activision Blizzard, Inc. | | | 505,980 | | | | 10,094,301 | |
Intuit, Inc. | | | 216,437 | | | | 19,048,620 | |
Microsoft Corp. | | | 866,626 | | | | 40,688,091 | |
salesforce.com, Inc. (A) (B) | | | 210,410 | | | | 13,464,136 | |
Solera Holdings, Inc. | | | 145,730 | | | | 7,570,673 | |
| | | | | | | | |
| | | | | | | 90,865,821 | |
| | | | | | | | |
Specialty Retail - 5.9% | | | | | | | | |
Advance Auto Parts, Inc. | | | 99,170 | | | | 14,574,023 | |
Lowe’s Cos., Inc. | | | 381,966 | | | | 21,848,455 | |
Ross Stores, Inc. | | | 197,390 | | | | 15,933,321 | |
TJX Cos., Inc. | | | 291,930 | | | | 18,485,008 | |
| | | | | | | | |
| | | | | | | 70,840,807 | |
| | | | | | | | |
Technology Hardware, Storage & Peripherals - 6.9% | |
Apple, Inc. | | | 744,544 | | | | 80,410,752 | |
Western Digital Corp. | | | 27,427 | | | | 2,697,994 | |
| | | | | | | | |
| | | | | | | 83,108,746 | |
| | | | | | | | |
| | | | | | | | |
| | | Shares | | | Value | |
COMMON STOCKS (continued) | | | | | | | | |
Textiles, Apparel & Luxury Goods - 2.4% | | | | | |
PVH Corp. | | | 133,870 | | | | $ 15,308,035 | |
Ralph Lauren Corp. | | | 86,030 | | | | 14,181,185 | |
| | | | | | | | |
| | | | | | | 29,489,220 | |
| | | | | | | | |
Tobacco - 1.8% | | | | | | | | |
Altria Group, Inc. | | | 441,580 | | | | 21,345,977 | |
| | | | | | | | |
Total Common Stocks
(Cost $1,063,791,256) | | | | 1,206,252,512 | |
| | | | | | | | |
| |
SECURITIES LENDING COLLATERAL - 3.1% | | | | | |
State Street Navigator Securities Lending Trust - Prime Portfolio 0.16% (C) | | | 37,764,538 | | | | 37,764,538 | |
| | | | | | | | |
Total Securities Lending Collateral
(Cost $37,764,538) | | | | 37,764,538 | |
| | | | | | | | |
| | |
| | | Principal | | | Value | |
REPURCHASE AGREEMENT - 0.4% | | | | | | | | |
State Street Bank & Trust Co.
0.01% (C), dated 10/31/2014, to be repurchased at $4,741,576 on 11/03/2014. Collateralized by a U.S. Government Agency Obligation, 2.50%, due 11/01/2027, and with a value of $4,837,361. | | | $ 4,741,573 | | | | 4,741,573 | |
| | | | | | | | |
Total Repurchase Agreement
(Cost $4,741,573) | | | | 4,741,573 | |
| | | | | | | | |
Total Investments
(Cost $1,106,297,367) (D) | | | | 1,248,758,623 | |
Net Other Assets (Liabilities) - (3.3)% | | | | (39,563,835 | ) |
| | | | | | | | |
| | |
Net Assets - 100.0% | | | | | | | $ 1,209,194,788 | |
| | | | | | | | |
SECURITY VALUATION:
Valuation Inputs (E)
| | | | | | | | | | | | | | | | |
| | | Level 1
Quoted Prices | | | Level 2
Other Significant
Observable Inputs | | | Level 3
Significant
Unobservable Inputs | | | Value at
October 31, 2014 | |
ASSETS | | | | | | | | | | | | | | | | |
Investments | | | | | | | | | | | | | | | | |
Common Stocks | | $ | 1,206,252,512 | | | $ | — | | | $ | — | | | $ | 1,206,252,512 | |
Securities Lending Collateral | | | 37,764,538 | | | | — | | | | — | | | | 37,764,538 | |
Repurchase Agreement | | | — | | | | 4,741,573 | | | | — | | | | 4,741,573 | |
| | | | | | | | | | | | | | | | |
Total Investments | | $ | 1,244,017,050 | | | $ | 4,741,573 | | | $ | — | | | $ | 1,248,758,623 | |
| | | | | | | | | | | | | | | | |
FOOTNOTES TO SCHEDULE OF INVESTMENTS:
| (A) | All or a portion of this security is on loan. The value of all securities on loan is $36,962,840. The amount of securities on loan indicated may not correspond with the securities on loan identified because securities with pending sales are in the process of recall from the brokers. |
| (B) | Non-income producing security. |
| (C) | Rate shown reflects the yield at October 31, 2014. |
The Notes to Financial Statements are an integral part of this report.
| | |
| Transamerica Funds | | Annual Report 2014 |
Page 222
Transamerica US Growth
(formerly, Transamerica Diversified Equity)
SCHEDULE OF INVESTMENTS (continued)
At October 31, 2014
FOOTNOTES TO SCHEDULE OF INVESTMENTS (continued):
| (D) | Aggregate cost for federal income tax purposes is $1,106,794,083. Aggregate gross unrealized appreciation and depreciation for all securities is $175,193,331 and $33,228,791, respectively. Net unrealized appreciation for tax purposes is $141,964,540. |
| (E) | The Fund recognizes transfers between Levels at the end of the reporting period. There were no transfers between Level 1, 2 and 3 during the period ended October 31, 2014. See the Notes to Financial Statements for more information regarding security valuation and pricing inputs. |
The Notes to Financial Statements are an integral part of this report.
| | |
| Transamerica Funds | | Annual Report 2014 |
Page 223
STATEMENTS OF ASSETS AND LIABILITIES
At October 31, 2014
| | | | | | | | | | | | | | | | | | | | |
| | | Transamerica
Capital Growth | | | Transamerica
Concentrated
Growth (A) | | | Transamerica
Dividend
Focused | | | Transamerica
Emerging
Markets Debt | | | Transamerica
Emerging
Markets Equity | |
Assets: | | | | | | | | | | | | | | | | | | | | |
Investments, at value | | $ | 1,187,357,029 | | | $ | 434,644,150 | | | $ | 1,482,716,326 | | | $ | 653,788,007 | | | $ | 245,622,934 | |
Repurchase agreements, at value | | | 132,217,511 | | | | 2,858,855 | | | | 63,523,727 | | | | 9,364,202 | | | | 5,287,447 | |
Cash on deposit with broker | | | — | | | | — | | | | — | | | | 228,000 | | | | — | |
Foreign currency, at value | | | — | | | | — | | | | — | | | | 1,228,790 | | | | 148,716 | |
Cash | | | — | | | | — | | | | 247,021 | | | | — | | | | — | |
Unrealized appreciation on forward foreign currency contracts | | | — | | | | — | | | | — | | | | 944,260 | | | | — | |
Receivables: | | | | | | | | | | | | | | | | | | | | |
Shares of beneficial interest sold | | | 779,726 | | | | 97,119 | | | | 174,404 | | | | 1,875,737 | | | | 614,790 | |
Investments sold | | | 3,404,510 | | | | 8,701,974 | | | | — | | | | 18,762,536 | | | | — | |
Interest | | | 37 | | | | 1 | | | | 18 | | | | 9,658,411 | | | | 1 | |
Dividends | | | 31,867 | | | | 258,146 | | | | 1,980,328 | | | | 1,925 | | | | 315,748 | |
Dividend reclaims | | | 160,381 | | | | 27,501 | | | | — | | | | — | | | | 13,113 | |
Net income from securities lending | | | 20,761 | | | | 11,481 | | | | 14,410 | | | | 19,440 | | | | 3,730 | |
Variation margin receivable on derivative financial instruments | | | — | | | | — | | | | — | | | | 27,986 | | | | — | |
Prepaid expenses | | | 3,122 | | | | 7,656 | | | | 5,198 | | | | 3,964 | | | | 1,025 | |
Total assets | | | 1,323,974,944 | | | | 446,606,883 | | | | 1,548,661,432 | | | | 695,903,258 | | | | 252,007,504 | |
| | | | | | |
Liabilities: | | | | | | | | | | | | | | | | | | | | |
Cash deposit due to broker | | | 260,000 | | | | — | | | | — | | | | — | | | | — | |
Accounts payable and accrued liabilities: | | | | | | | | | | | | | | | | | | | | |
Shares of beneficial interest redeemed | | | 572,305 | | | | 47,918 | | | | 204,987 | | | | 682,957 | | | | 49,598 | |
Investments purchased | | | 75,339,716 | | | | — | | | | — | | | | 16,839,036 | | | | — | |
When-issued securities purchased | | | — | | | | — | | | | — | | | | 3,381,568 | | | | — | |
Management and advisory fees | | | 661,730 | | | | 206,348 | | | | 766,471 | | | | 295,999 | | | | 194,985 | |
Distribution and service fees | | | 70,740 | | | | 312 | | | | 15,894 | | | | 39,318 | | | | 1,511 | |
Administration fees | | | 22,522 | | | | 7,583 | | | | 30,344 | | | | 12,466 | | | | 5,131 | |
Transfer agent fees | | | 51,901 | | | | 4,458 | | | | 10,985 | | | | 80,898 | | | | 1,975 | |
Trustees fees | | | 72 | | | | 24 | | | | 97 | | | | 39 | | | | 17 | |
Audit and tax fees | | | 18,829 | | | | 16,794 | | | | 19,093 | | | | 25,839 | | | | 18,077 | |
Custody fees | | | — | | | | 428 | | | | 982 | | | | 8,476 | | | | 33,258 | |
Legal fees | | | 10,107 | | | | 2,516 | | | | 12,316 | | | | 6,565 | | | | 2,328 | |
Printing and shareholder reports fees | | | 16,051 | | | | 960 | | | | 15,226 | | | | 23,480 | | | | 4,720 | |
Foreign capital gains tax | | | — | | | | — | | | | — | | | | 556,034 | | | | 35,828 | |
Registration fees | | | 23,313 | | | | 20,705 | | | | 27,429 | | | | 5,454 | | | | 11,368 | |
Other | | | 1,562 | | | | 273 | | | | 2,081 | | | | 1,114 | | | | 457 | |
Collateral for securities on loan | | | 67,859,738 | | | | 72,458,026 | | | | 70,447,920 | | | | 81,169,789 | | | | 5,924,000 | |
Unrealized depreciation on forward foreign currency contracts | | | — | | | | — | | | | — | | | | 307,976 | | | | — | |
Total liabilities | | | 144,908,586 | | | | 72,766,345 | | | | 71,553,825 | | | | 103,437,008 | | | | 6,283,253 | |
Net assets | | $ | 1,179,066,358 | | | $ | 373,840,538 | | | $ | 1,477,107,607 | | | $ | 592,466,250 | | | $ | 245,724,251 | |
| | | | | | |
Net assets consist of: | | | | | | | | | | | | | | | | | | | | |
Paid-in capital | | $ | 803,663,768 | | | $ | 356,580,394 | | | $ | 1,179,611,627 | | | $ | 624,995,736 | | | $ | 239,013,986 | |
Undistributed (distributions in excess of) net investment income (loss) | | | (2,724,226 | ) | | | 716,412 | | | | 1,836,793 | | | | 1,196,143 | | | | 2,971,376 | |
Accumulated net realized gain (loss) | | | 41,303,000 | | | | 750,218 | | | | 49,173,710 | | | | (27,050,301 | ) | | | (7,459,518 | ) |
Net unrealized appreciation (depreciation) on: | | | | | | | | | | | | | | | | | | | | |
Investments | | | 336,823,816 | | | | 15,793,514 | | | | 246,485,477 | | | | (7,025,611 | ) | | | 11,206,123 | |
Futures contracts | | | — | | | | — | | | | — | | | | (103,211 | ) | | | — | |
Translation of assets and liabilities denominated in foreign currencies | | | — | | | | — | | | | — | | | | 453,494 | | | | (7,716 | ) |
Net assets | | $ | 1,179,066,358 | | | $ | 373,840,538 | | | $ | 1,477,107,607 | | | $ | 592,466,250 | | | $ | 245,724,251 | |
Net assets by class: | | | | | | | | | | | | | | | | | | | | |
Class A | | $ | 124,413,617 | | | $ | 444,137 | | | $ | 63,638,989 | | | $ | 81,683,999 | | | $ | 1,494,878 | |
Class B | | | 4,931,674 | | | | — | | | | — | | | | — | | | | — | |
Class C | | | 50,878,755 | | | | 274,048 | | | | 4,418,900 | | | | 27,202,166 | | | | 1,423,791 | |
Class I | | | 161,858,230 | | | | 19,642,417 | | | | 6,310,925 | | | | 340,067,582 | | | | 1,147,233 | |
Class I2 | | | 836,984,082 | | | | 353,479,936 | | | | 1,402,738,793 | | | | 143,512,503 | | | | 241,658,349 | |
Shares outstanding (unlimited shares, no par value): | | | | | | | | | | | | | | | | | | | | |
Class A | | | 5,098,136 | | | | 27,384 | | | | 4,765,548 | | | | 7,596,840 | | | | 145,888 | |
Class B | | | 226,680 | | | | — | | | | — | | | | — | | | | — | |
Class C | | | 2,329,284 | | | | 16,981 | | | | 331,846 | | | | 2,537,175 | | | | 140,429 | |
Class I | | | 6,493,817 | | | | 1,220,685 | | | | 472,690 | | | | 31,543,248 | | | | 111,430 | |
Class I2 | | | 49,571,292 | | | | 21,732,620 | | | | 105,006,848 | | | | 13,317,204 | | | | 23,457,476 | |
Net asset value per share: | | | | | | | | | | | | | | | | | | | | |
Class A | | $ | 24.40 | | | $ | 16.22 | | | $ | 13.35 | | | $ | 10.75 | | | $ | 10.25 | |
Class B | | | 21.76 | | | | — | | | | — | | | | — | | | | — | |
Class C | | | 21.84 | | | | 16.14 | | | | 13.32 | | | | 10.72 | | | | 10.14 | |
Class I | | | 24.92 | | | | 16.09 | | | | 13.35 | | | | 10.78 | | | | 10.30 | |
Class I2 | | | 16.88 | | | | 16.26 | | | | 13.36 | | | | 10.78 | | | | 10.30 | |
Maximum offering price per share: (B) | | | | | | | | | | | | | | | | | | | | |
Class A | | $ | 25.82 | | | $ | 17.16 | | | $ | 14.13 | | | $ | 11.29 | | | $ | 10.85 | |
| | | | | | | | | | | | | | | | | | | | | |
Investments, at cost | | $ | 850,533,213 | | | $ | 418,850,636 | | | $ | 1,236,230,849 | | | $ | 660,257,584 | | | $ | 234,380,983 | |
Repurchase agreements, at cost | | $ | 132,217,511 | | | $ | 2,858,855 | | | $ | 63,523,727 | | | $ | 9,364,202 | | | $ | 5,287,447 | |
Foreign currency, at cost | | $ | — | | | $ | — | | | $ | — | | | $ | 1,315,472 | | | $ | 151,101 | |
Securities loaned, at value | | $ | 66,414,450 | | | $ | 70,942,668 | | | $ | 68,883,946 | | | $ | 79,080,629 | | | $ | 5,747,061 | |
| (A) | Formerly, The Torray Resolute Fund. |
| (B) | Includes the maximum selling commission (represented as a percentage of offering price) which is reduced on certain levels of sales as set forth in the prospectus. Net asset value per share for Classes B, C, I and I2 shares represents offering price. The redemption price for Classes B and C shares equals net asset value less any applicable contingent deferred sales charge. |
The Notes to Financial Statements are an integral part of this report.
| | |
| Transamerica Funds | | Annual Report 2014 |
Page 224
STATEMENTS OF ASSETS AND LIABILITIES (continued)
At October 31, 2014
| | | | | | | | | | | | | | | | | | | | |
| | |
Transamerica
Enhanced Muni | | | Transamerica
Flexible Income | | | Transamerica
Floating Rate | | | Transamerica
Global Bond | | | Transamerica
Global Equity (A) | |
Assets: | | | | | | | | | | | | | | | | | | | | |
Investments, at value | | $ | 63,073,492 | | | $ | 773,586,342 | | | $ | 216,071,773 | | | $ | 215,752,500 | | | $ | 295,382,318 | |
Repurchase agreements, at value | | | 18,801,287 | | | | 7,244,488 | | | | 27,027,546 | | | | 14,910,895 | | | | 2,343,922 | |
Foreign currency, at value | | | — | | | | 6,375 | | | | — | | | | 10,201,480 | | | | 55,130 | |
Cash | | | — | | | | 2,197,285 | | | | 101,276 | | | | — | | | | — | |
Unrealized appreciation on forward foreign currency contracts | | | — | | | | — | | | | — | | | | 549,007 | | | | — | |
Unrealized appreciation on unfunded commitments | | | — | | | | — | | | | 2,302 | | | | — | | | | — | |
Receivables: | | | | | | | | | | | | | | | | | | | | |
Shares of beneficial interest sold | | | 1,578,727 | | | | 436,764 | | | | 17,129 | | | | — | | | | 466,831 | |
Investments sold | | | 1,045,067 | | | | 2,177,729 | | | | 1,673,242 | | | | — | | | | 4,358,562 | |
When-issued securities sold | | | 49,713 | | | | — | | | | — | | | | — | | | | — | |
Interest | | | 626,989 | | | | 7,239,931 | | | | 609,571 | | | | 2,858,996 | | | | 1 | |
Dividends | | | — | | | | 65,456 | | | | — | | | | 273 | | | | 241,823 | |
Dividend reclaims | | | — | | | | — | | | | — | | | | — | | | | 6,049 | |
Net income from securities lending | | | — | | | | 8,046 | | | | 1,048 | | | | 168 | | | | — | |
12b-1 waiver | | | 4,653 | | | | — | | | | — | | | | — | | | | — | |
Prepaid expenses | | | 67 | | | | 1,337 | | | | — | | | | — | | | | 1,018 | |
Total assets | | | 85,179,995 | | | | 792,963,753 | | | | 245,503,887 | | | | 244,273,319 | | | | 302,855,654 | |
| | | | | | |
Liabilities: | | | | | | | | | | | | | | | | | | | | |
Due to custodian | | | 12,837,198 | | | | — | | | | — | | | | — | | | | — | |
Accounts payable and accrued liabilities: | | | | | | | | | | | | | | | | | | | | |
Shares of beneficial interest redeemed | | | 102,768 | | | | 627,039 | | | | — | | | | — | | | | 3,784,293 | |
Investments purchased | | | 1,845,737 | | | | 30,656,010 | | | | 27,143,628 | | | | 3,292,220 | | | | 214,033 | |
When-issued securities purchased | | | 2,403,296 | | | | — | | | | — | | | | — | | | | — | |
Management and advisory fees | | | 8,437 | | | | 265,803 | | | | 64,679 | | | | 120,432 | | | | 166,861 | |
Distribution and service fees | | | 14,735 | | | | 77,125 | | | | 2,496 | | | | 281 | | | | 79,231 | |
Administration fees | | | 1,285 | | | | 15,485 | | | | 4,253 | | | | 5,143 | | | | 4,328 | |
Transfer agent fees | | | 3,727 | | | | 27,499 | | | | 1,546 | | | | 1,603 | | | | 29,352 | |
Trustees fees | | | 3 | | | | 49 | | | | 13 | | | | 16 | | | | 20 | |
Audit and tax fees | | | 19,317 | | | | 20,756 | | | | 18,903 | | | | 18,327 | | | | 16,432 | |
Custody fees | | | — | | | | — | | | | — | | | | 10,140 | | | | — | |
Legal fees | | | 299 | | | | 5,839 | | | | 2,210 | | | | 2,327 | | | | — | |
Printing and shareholder reports fees | | | 828 | | | | 8,156 | | | | 836 | | | | 1,547 | | | | 11,930 | |
Distribution payable | | | — | | | | — | | | | 50,546 | | | | — | | | | — | |
Foreign capital gains tax | | | — | | | | — | | | | — | | | | 2,130 | | | | — | |
Registration fees | | | 1,125 | | | | 22,237 | | | | 6,820 | | | | 16,061 | | | | 8,508 | |
Other | | | 44 | | | | 987 | | | | 295 | | | | 91 | | | | 471 | |
Collateral for securities on loan | | | — | | | | 31,871,120 | | | | 2,010,000 | | | | — | | | | — | |
Unrealized depreciation on forward foreign currency contracts | | | — | | | | — | | | | — | | | | 1,118,654 | | | | — | |
Total liabilities | | | 17,238,799 | | | | 63,598,105 | | | | 29,306,225 | | | | 4,588,972 | | | | 4,315,459 | |
Net assets | | $ | 67,941,196 | | | $ | 729,365,648 | | | $ | 216,197,662 | | | $ | 239,684,347 | | | $ | 298,540,195 | |
| | | | | | |
Net assets consist of: | | | | | | | | | | | | | | | | | | | | |
Paid-in capital | | $ | 65,490,211 | | | $ | 782,126,480 | | | $ | 217,947,051 | | | $ | 250,199,593 | | | $ | 365,479,541 | |
Undistributed (distributions in excess of) net investment income (loss) | | | 2,746 | | | | 91,229 | | | | (5,037 | ) | | | 80,654 | | | | (1,342,869 | ) |
Accumulated net realized gain (loss) | | | 1,020,734 | | | | (73,311,798 | ) | | | 311,259 | | | | (822,219 | ) | | | (60,306,050 | ) |
Net unrealized appreciation (depreciation) on: | | | | | | | | | | | | | | | | | | | | |
Investments | | | 1,427,505 | | | | 20,466,510 | | | | (2,057,913 | ) | | | (8,996,265 | ) | | | (5,285,808 | ) |
Unfunded commitments | | | — | | | | — | | | | 2,302 | | | | — | | | | — | |
Translation of assets and liabilities denominated in foreign currencies | | | — | | | | (6,773 | ) | | | — | | | | (777,416 | ) | | | (4,619 | ) |
Net assets | | $ | 67,941,196 | | | $ | 729,365,648 | | | $ | 216,197,662 | | | $ | 239,684,347 | | | $ | 298,540,195 | |
Net assets by class: | | | | | | | | | | | | | | | | | | | | |
Class A | | $ | 35,973,817 | | | $ | 73,829,293 | | | $ | 632,605 | | | $ | 299,995 | | | $ | 56,663,180 | |
Class B | | | — | | | | 3,643,768 | | | | — | | | | — | | | | 6,459,496 | |
Class C | | | 9,959,700 | | | | 68,628,516 | | | | 1,672,385 | | | | 253,908 | | | | 74,772,403 | |
Class I | | | 22,007,679 | | | | 42,545,051 | | | | 411,559 | | | | 323,404 | | | | 33,329,203 | |
Class I2 | | | — | | | | 540,719,020 | | | | 213,481,113 | | | | 238,807,040 | | | | 127,315,913 | |
Shares outstanding (unlimited shares, no par value): | | | | | | | | | | | | | | | | | | | | |
Class A | | | 3,224,663 | | | | 7,803,863 | | | | 63,769 | | | | 30,487 | | | | 5,115,894 | |
Class B | | | — | | | | 384,979 | | | | — | | | | — | | | | 587,102 | |
Class C | | | 894,210 | | | | 7,300,581 | | | | 168,560 | | | | 25,853 | | | | 6,805,314 | |
Class I | | | 1,964,757 | | | | 4,491,689 | | | | 41,488 | | | | 32,851 | | | | 3,013,055 | |
Class I2 | | | — | | | | 57,062,391 | | | | 21,523,525 | | | | 24,248,913 | | | | 11,510,053 | |
Net asset value per share: | | | | | | | | | | | | | | | | | | | | |
Class A | | $ | 11.16 | | | $ | 9.46 | | | $ | 9.92 | | | $ | 9.84 | | | $ | 11.08 | |
Class B | | | — | | | | 9.46 | | | | — | | | | — | | | | 11.00 | |
Class C | | | 11.14 | | | | 9.40 | | | | 9.92 | | | | 9.82 | | | | 10.99 | |
Class I | | | 11.20 | | | | 9.47 | | | | 9.92 | | | | 9.84 | | | | 11.06 | |
Class I2 | | | — | | | | 9.48 | | | | 9.92 | | | | 9.85 | | | | 11.06 | |
Maximum offering price per share: (B) | | | | | | | | | | | | | | | | | | | | |
Class A | | $ | 11.53 | | | $ | 9.93 | | | $ | 10.41 | | | $ | 10.33 | | | $ | 11.72 | |
| | | | | | | | | | | | | | | | | | | | | |
Investments, at cost | | $ | 61,645,987 | | | $ | 753,119,832 | | | $ | 218,129,686 | | | $ | 224,746,635 | | | $ | 300,668,126 | |
Repurchase agreements, at cost | | $ | 18,801,287 | | | $ | 7,244,488 | | | $ | 27,027,546 | | | $ | 14,910,895 | | | $ | 2,343,922 | |
Foreign currency, at cost | | $ | — | | | $ | 6,598 | | | $ | — | | | $ | 10,318,237 | | | $ | 55,517 | |
Securities loaned, at value | | $ | — | | | $ | 31,211,453 | | | $ | 1,960,494 | | | $ | — | | | $ | — | |
| (A) | Formerly, Transamerica Multi-Manager International Portfolio. |
| (B) | Includes the maximum selling commission (represented as a percentage of offering price) which is reduced on certain levels of sales as set forth in the prospectus. Net asset value per share for Classes B, C, I and I2 shares represents offering price. The redemption price for Classes B and C shares equals net asset value less any applicable contingent deferred sales charge. |
The Notes to Financial Statements are an integral part of this report.
| | |
| Transamerica Funds | | Annual Report 2014 |
Page 225
STATEMENTS OF ASSETS AND LIABILITIES (continued)
At October 31, 2014
| | | | | | | | | | | | | | | | | | | | |
| | | Transamerica
Growth
Opportunities | | | Transamerica
High Yield
Bond | | | Transamerica
High Yield
Muni | | | Transamerica
Income &
Growth | | | Transamerica
Inflation
Opportunities | |
Assets: | | | | | | | | | | | | | | | | | | | | |
Investments, at value | | $ | 862,917,400 | | | $ | 1,423,403,815 | | | $ | 11,254,477 | | | $ | 1,010,982,545 | | | $ | 247,766,586 | |
Repurchase agreements, at value | | | 77,799,299 | | | | 38,791,507 | | | | 76,879 | | | | 18,801,287 | | | | 6,183,732 | |
Foreign currency, at value | | | — | | | | — | | | | — | | | | 1,546 | | | | 1,526 | |
Cash | | | — | | | | 5,339 | | | | 135,433 | | | | — | | | | — | |
Unrealized appreciation on forward foreign currency contracts | | | — | | | | — | | | | — | | | | — | | | | 304,562 | |
Receivables: | | | | | | | | | | | | | | | | | | | | |
Shares of beneficial interest sold | | | 48,763 | | | | 3,892,910 | | | | 81,756 | | | | 2,124,569 | | | | 67,638 | |
Investments sold | | | 2,469,343 | | | | 909,392 | | | | 397,174 | | | | — | | | | 221,635 | |
Interest | | | 22 | | | | 19,466,160 | | | | 131,632 | | | | 5 | | | | 869,294 | |
Dividends | | | — | | | | 212,305 | | | | 2,624 | | | | 4,043,479 | | | | 683 | |
Dividend reclaims | | | — | | | | — | | | | — | | | | 261,154 | | | | — | |
Net income from securities lending | | | 88,852 | | | | 64,731 | | | | 713 | | | | 35,844 | | | | 1,315 | |
Variation margin receivable on derivative financial instruments | | | — | | | | — | | | | — | | | | — | | | | 21,328 | |
12b-1 waiver | | | — | | | | — | | | | 943 | | | | — | | | | — | |
Prepaid expenses | | | 3,396 | | | | 3,526 | | | | — | | | | 2,049 | | | | — | |
Total assets | | | 943,327,075 | | | | 1,486,749,685 | | | | 12,081,631 | | | | 1,036,252,478 | | | | 255,438,299 | |
| | | | | | |
Liabilities: | | | | | | | | | | | | | | | | | | | | |
Cash deposit due to broker | | | 330,000 | | | | — | | | | — | | | | — | | | | — | |
Accounts payable and accrued liabilities: | | | | | | | | | | | | | | | | | | | | |
Shares of beneficial interest redeemed | | | 470,872 | | | | 852,346 | | | | — | | | | 493,262 | | | | 51,934 | |
Investments purchased | | | 31,600,667 | | | | 4,067,558 | | | | 742,815 | | | | — | | | | 1,772,648 | |
When-issued securities purchased | | | — | | | | 1,579,000 | | | | 372,470 | | | | — | | | | — | |
Management and advisory fees | | | 461,750 | | | | 594,530 | | | | 1,125 | | | | 487,199 | | | | 131,695 | |
Distribution and service fees | | | 35,693 | | | | 89,856 | | | | 2,927 | | | | 89,384 | | | | 389 | |
Administration fees | | | 15,354 | | | | 27,050 | | | | 283 | | | | 18,412 | | | | 5,259 | |
Transfer agent fees | | | 45,016 | | | | 67,096 | | | | 701 | | | | 24,376 | | | | 1,645 | |
Trustees fees | | | 49 | | | | 86 | | | | 1 | | | | 58 | | | | 22 | |
Audit and tax fees | | | 17,735 | | | | 23,516 | | | | 19,201 | | | | 20,892 | | | | 18,524 | |
Custody fees | | | — | | | | 2,127 | | | | — | | | | — | | | | 2,144 | |
Legal fees | | | 8,813 | | | | 13,637 | | | | 501 | | | | 6,394 | | | | 3,243 | |
Printing and shareholder reports fees | | | 14,178 | | | | 79,774 | | | | 508 | | | | 10,789 | | | | 1,567 | |
Registration fees | | | 9,844 | | | | 5,478 | | | | 8,777 | | | | 18,342 | | | | 16,101 | |
Other | | | 1,783 | | | | 2,106 | | | | 9 | | | | 939 | | | | 136 | |
Collateral for securities on loan | | | 128,753,647 | | | | 156,039,680 | | | | — | | | | 141,468,418 | | | | 6,762,445 | |
Total liabilities | | | 161,765,401 | | | | 163,443,840 | | | | 1,149,318 | | | | 142,638,465 | | | | 8,767,752 | |
Net assets | | $ | 781,561,674 | | | $ | 1,323,305,845 | | | $ | 10,932,313 | | | $ | 893,614,013 | | | $ | 246,670,547 | |
| | | | | | |
Net assets consist of: | | | | | | | | | | | | | | | | | | | | |
Paid-in capital | | $ | 548,696,420 | | | $ | 1,297,336,178 | | | $ | 10,175,732 | | | $ | 877,142,135 | | | $ | 250,225,366 | |
Undistributed (distributions in excess of) net investment income (loss) | | | 584,629 | | | | 11,216 | | | | 2,314 | | | | 7,905,348 | | | | (75,872 | ) |
Accumulated net realized gain (loss) | | | 79,171,542 | | | | 16,798,969 | | | | 404,954 | | | | (16,414,660 | ) | | | 264,196 | |
Net unrealized appreciation (depreciation) on: | | | | | | | | | | | | | | | | | | | | |
Investments | | | 153,109,083 | | | | 9,159,482 | | | | 349,313 | | | | 25,013,450 | | | | (3,839,838 | ) |
Futures contracts | | | — | | | | — | | | | — | | | | — | | | | (200,081 | ) |
Translation of assets and liabilities denominated in foreign currencies | | | — | | | | — | | | | — | | | | (32,260 | ) | | | 296,776 | |
Net assets | | $ | 781,561,674 | | | $ | 1,323,305,845 | | | $ | 10,932,313 | | | $ | 893,614,013 | | | $ | 246,670,547 | |
Net assets by class: | | | | | | | | | | | | | | | | | | | | |
Class A | | $ | 104,933,061 | | | $ | 135,250,221 | | | $ | 4,491,624 | | | $ | 70,223,038 | | | $ | 298,876 | |
Class B | | | 4,078,732 | | | | 6,434,593 | | | | — | | | | — | | | | — | |
Class C | | | 13,296,487 | | | | 69,198,164 | | | | 1,398,323 | | | | 93,061,732 | | | | 380,168 | |
Class I | | | 65,746,555 | | | | 305,991,938 | | | | 5,042,366 | | | | 72,555,636 | | | | 276,589 | |
Class I2 | | | 593,506,839 | | | | 806,430,929 | | | | — | | | | 657,773,607 | | | | 245,714,914 | |
Shares outstanding (unlimited shares, no par value): | | | | | | | | | | | | | | | | | | | | |
Class A | | | 9,292,386 | | | | 13,967,058 | | | | 392,058 | | | | 6,475,133 | | | | 30,036 | |
Class B | | | 417,052 | | | | 664,351 | | | | — | | | | — | | | | — | |
Class C | | | 1,349,917 | | | | 7,179,278 | | | | 121,941 | | | | 8,617,114 | | | | 38,250 | |
Class I | | | 5,485,966 | | | | 31,403,551 | | | | 439,478 | | | | 6,677,609 | | | | 27,788 | |
Class I2 | | | 49,040,716 | | | | 82,558,879 | | | | — | | | | 60,511,749 | | | | 24,681,588 | |
Net asset value per share: | | | | | | | | | | | | | | | | | | | | |
Class A | | $ | 11.29 | | | $ | 9.68 | | | $ | 11.46 | | | $ | 10.85 | | | $ | 9.95 | |
Class B | | | 9.78 | | | | 9.69 | | | | — | | | | — | | | | — | |
Class C | | | 9.85 | | | | 9.64 | | | | 11.47 | | | | 10.80 | | | | 9.94 | |
Class I | | | 11.98 | | | | 9.74 | | | | 11.47 | | | | 10.87 | | | | 9.95 | |
Class I2 | | | 12.10 | | | | 9.77 | | | | — | | | | 10.87 | | | | 9.96 | |
Maximum offering price per share: (A) | | | | | | | | | | | | | | | | | | | | |
Class A | | $ | 11.95 | | | $ | 10.16 | | | $ | 11.84 | | | $ | 11.48 | | | $ | 10.45 | |
| | | | | | | | | | | | | | | | | | | | | |
Investments, at cost | | $ | 709,808,317 | | | $ | 1,414,244,333 | | | $ | 10,905,164 | | | $ | 985,969,095 | | | $ | 251,606,424 | |
Repurchase agreements, at cost | | $ | 77,799,299 | | | $ | 38,791,507 | | | $ | 76,879 | | | $ | 18,801,287 | | | $ | 6,183,732 | |
Foreign currency, at cost | | $ | — | | | $ | — | | | $ | — | | | $ | 1,609 | | | $ | 1,542 | |
Securities loaned, at value | | $ | 125,928,840 | | | $ | 152,834,116 | | | $ | — | | | $ | 136,988,926 | | | $ | 6,624,466 | |
| (A) | Includes the maximum selling commission (represented as a percentage of offering price) which is reduced on certain levels of sales as set forth in the prospectus. Net asset value per share for Classes B, C, I and I2 shares represents offering price. The redemption price for Classes B and C shares equals net asset value less any applicable contingent deferred sales charge. |
The Notes to Financial Statements are an integral part of this report.
| | |
| Transamerica Funds | | Annual Report 2014 |
Page 226
STATEMENTS OF ASSETS AND LIABILITIES (continued)
At October 31, 2014
| | | | | | | | | | | | | | | | | | | | |
| | | Transamerica
International
Equity | | | Transamerica
International
Small Cap Value | | | Transamerica
Large Cap Value | | | Transamerica
Mid Cap Growth | | | Transamerica
Mid Cap Value
Opportunities | |
Assets: | | | | | | | | | | | | | | | | | | | | |
Investments, at value | | $ | 1,273,238,466 | | | $ | 748,621,021 | | | $ | 1,800,245,880 | | | $ | 69,643,456 | | | $ | 209,377,309 | |
Repurchase agreements, at value | | | 47,474,073 | | | | 11,969,251 | | | | 61,410,611 | | | | 580,370 | | | | 3,747,584 | |
Foreign currency, at value | | | 102,995 | | | | 69,136 | | | | — | | | | — | | | | — | |
Cash | | | — | | | | — | | | | — | | | | — | | | | 9,454 | |
Receivables: | | | | | | | | | | | | | | | | | | | | |
Shares of beneficial interest sold | | | 10,265,350 | | | | 8,690,236 | | | | 332,091 | | | | — | | | | 208,492 | |
Investments sold | | | 472,939 | | | | — | | | | 19,391,709 | | | | — | | | | 66,243 | |
Interest | | | 13 | | | | 4 | | | | 17 | | | | — | | | | 1 | |
Dividends | | | 2,685,348 | | | | 1,534,024 | | | | 528,864 | | | | 16,054 | | | | 115,870 | |
Dividend reclaims | | | 466,640 | | | | 265,303 | | | | — | | | | — | | | | — | |
Net income from securities lending | | | 47,068 | | | | 19,550 | | | | 112,896 | | | | 2,002 | | | | 13,214 | |
Prepaid expenses | | | 2,063 | | | | 885 | | | | 7,287 | | | | — | | | | — | |
Total assets | | | 1,334,754,955 | | | | 771,169,410 | | | | 1,882,029,355 | | | | 70,241,882 | | | | 213,538,167 | |
| | | | | | |
Liabilities: | | | | | | | | | | | | | | | | | | | | |
Accounts payable and accrued liabilities: | | | | | | | | | | | | | | | | | | | | |
Shares of beneficial interest redeemed | | | 2,097,105 | | | | 122,083 | | | | 232,662 | | | | 381 | | | | 48,387 | |
Investments purchased | | | 2,685,931 | | | | 1,181,347 | | | | 30,244,264 | | | | — | | | | 419,229 | |
Management and advisory fees | | | 727,678 | | | | 550,110 | | | | 917,497 | | | | 52,503 | | | | 97,056 | |
Distribution and service fees | | | 42,637 | | | | — | | | | 13,851 | | | | 367 | | | | 302 | |
Administration fees | | | 25,134 | | | | 15,104 | | | | 36,725 | | | | 1,141 | | | | 3,501 | |
Transfer agent fees | | | 66,209 | | | | 19,545 | | | | 16,120 | | | | 445 | | | | 1,597 | |
Trustees fees | | | 78 | | | | 48 | | | | 117 | | | | 27 | | | | 11 | |
Audit and tax fees | | | 19,674 | | | | 19,488 | | | | 20,160 | | | | 15,649 | | | | 15,394 | |
Custody fees | | | 7,671 | | | | — | | | | — | | | | 941 | | | | 967 | |
Legal fees | | | 8,849 | | | | 4,803 | | | | 17,897 | | | | 958 | | | | 1,187 | |
Printing and shareholder reports fees | | | 12,130 | | | | 3,490 | | | | 23,660 | | | | 1,097 | | | | 218 | |
Registration fees | | | 28,864 | | | | 28,374 | | | | 15,276 | | | | 2,203 | | | | 19,836 | |
Other | | | 1,772 | | | | 725 | | | | 3,327 | | | | 92 | | | | 137 | |
Collateral for securities on loan | | | 67,589,195 | | | | 21,996,640 | | | | 56,589,281 | | | | 13,919,363 | | | | 39,800,615 | |
Total liabilities | | | 73,312,927 | | | | 23,941,757 | | | | 88,130,837 | | | | 13,995,167 | | | | 40,408,437 | |
Net assets | | $ | 1,261,442,028 | | | $ | 747,227,653 | | | $ | 1,793,898,518 | | | $ | 56,246,715 | | | $ | 173,129,730 | |
| | | | | | |
Net assets consist of: | | | | | | | | | | | | | | | | | | | | |
Paid-in capital | | $ | 1,206,710,028 | | | $ | 747,846,477 | | | $ | 1,417,967,512 | | | $ | 51,199,792 | | | $ | 164,732,663 | |
Undistributed (distributions in excess of) net investment income (loss) | | | 18,136,775 | | | | 9,123,393 | | | | 488,186 | | | | — | | | | 87,285 | |
Accumulated net realized gain (loss) | | | 20,663,374 | | | | 6,001,314 | | | | 153,058,943 | | | | 116,903 | | | | 1,533,729 | |
Net unrealized appreciation (depreciation) on: | | | | | | | | | | | | | | | | | | | | |
Investments | | | 16,017,243 | | | | (15,689,962 | ) | | | 222,383,877 | | | | 4,930,020 | | | | 6,776,053 | |
Translation of assets and liabilities denominated in foreign currencies | | | (85,392 | ) | | | (53,569 | ) | | | — | | | | — | | | | — | |
Net assets | | $ | 1,261,442,028 | | | $ | 747,227,653 | | | $ | 1,793,898,518 | | | $ | 56,246,715 | | | $ | 173,129,730 | |
Net assets by class: | | | | | | | | | | | | | | | | | | | | |
Class A | | $ | 61,565,981 | | | $ | — | | | $ | 31,676,950 | | | $ | 491,652 | | | $ | 703,311 | |
Class C | | | 36,866,933 | | | | — | | | | 9,401,409 | | | | 329,950 | | | | 277,760 | |
Class I | | | 567,267,500 | | | | 214,169,810 | | | | 13,348,026 | | | | 339,247 | | | | 5,979,072 | |
Class I2 | | | 595,741,614 | | | | 533,057,843 | | | | 1,739,472,133 | | | | 55,085,866 | | | | 166,169,587 | |
Shares outstanding (unlimited shares, no par value): | | | | | | | | | | | | | | | | | | | | |
Class A | | | 3,495,725 | | | | — | | | | 2,382,330 | | | | 44,878 | | | | 65,844 | |
Class C | | | 2,126,542 | | | | — | | | | 709,118 | | | | 30,335 | | | | 26,015 | |
Class I | | | 31,872,693 | | | | 18,136,975 | | | | 999,817 | | | | 30,885 | | | | 559,324 | |
Class I2 | | | 33,453,312 | | | | 45,083,984 | | | | 130,384,961 | | | | 5,011,326 | | | | 15,546,362 | |
Net asset value per share: | | | | | | | | | | | | | | | | | | | | |
Class A | | $ | 17.61 | | | $ | — | | | $ | 13.30 | | | $ | 10.96 | | | $ | 10.68 | |
Class C | | | 17.34 | | | | — | | | | 13.26 | | | | 10.88 | | | | 10.68 | |
Class I | | | 17.80 | | | | 11.81 | | | | 13.35 | | | | 10.98 | | | | 10.69 | |
Class I2 | | | 17.81 | | | | 11.82 | | | | 13.34 | | | | 10.99 | | | | 10.69 | |
Maximum offering price per share: (A) | | | | | | | | | | | | | | | | | | | | |
Class A | | $ | 18.63 | | | $ | — | | | $ | 14.07 | | | $ | 11.60 | | | $ | 11.30 | |
| | | | | | | | | | | | | | | | | | | | | |
Investments, at cost | | $ | 1,257,221,223 | | | $ | 764,310,983 | | | $ | 1,577,862,003 | | | $ | 64,713,436 | | | $ | 202,601,256 | |
Repurchase agreements, at cost | | $ | 47,474,073 | | | $ | 11,969,251 | | | $ | 61,410,611 | | | $ | 580,370 | | | $ | 3,747,584 | |
Foreign currency, at cost | | $ | 102,975 | | | $ | 69,633 | | | $ | — | | | $ | — | | | $ | — | |
Securities loaned, at value | | $ | 65,474,092 | | | $ | 20,924,956 | | | $ | 55,070,470 | | | $ | 13,615,652 | | | $ | 38,852,055 | |
| (A) | Includes the maximum selling commission (represented as a percentage of offering price) which is reduced on certain levels of sales as set forth in the prospectus. Net asset value per share for Classes B, C, I and I2 shares represents offering price. The redemption price for Classes B and C shares equals net asset value less any applicable contingent deferred sales charge. |
The Notes to Financial Statements are an integral part of this report.
| | |
| Transamerica Funds | | Annual Report 2014 |
Page 227
STATEMENTS OF ASSETS AND LIABILITIES (continued)
At October 31, 2014
| | | | | | | | | | | | | | | | | | | | |
| | | Transamerica
MLP & Energy
Income | | | Transamerica
Money Market | | | Transamerica
Multi-Managed
Balanced | | | Transamerica
Opportunistic
Allocation | | | Transamerica
Short-Term
Bond | |
Assets: | | | | | | | | | | | | | | | | | | | | |
Investments, at value | | $ | 783,614,552 | | | $ | 165,461,657 | | | $ | 519,618,549 | | | $ | 1,002,978 | | | $ | 4,137,313,393 | |
Repurchase agreements, at value | | | 53,319,882 | | | | 14,693,950 | | | | 9,946,837 | | | | 181,556 | | | | 7,151,267 | |
Cash | | | 76,983 | | | | — | | | | — | | | | 14 | | | | 311,337 | |
Receivables: | | | | | | | | | | | | | | | | | | | | |
Shares of beneficial interest sold | | | 2,133,793 | | | | 321,821 | | | | 1,503,727 | | | | — | | | | 17,133,686 | |
Due from adviser | | | — | | | | — | | | | — | | | | 16,701 | | | | — | |
Investments sold | | | 3,711,752 | | | | — | | | | 1,601,416 | | | | — | | | | 19,612,966 | |
Interest | | | 694,906 | | | | 15,129 | | | | 1,178,740 | | | | — | | | | 39,720,008 | |
Dividends | | | 1,958,904 | | | | — | | | | 217,175 | | | | 3,352 | | | | — | |
Dividend reclaims | | | — | | | | — | | | | 226 | | | | — | | | | — | |
Net income from securities lending | | | 34,468 | | | | — | | | | 3,058 | | | | 66 | | | | 16,004 | |
Variation margin receivable on derivative financial instruments | | | — | | | | — | | | | 60,576 | | | | — | | | | — | |
12b-1 waiver | | | — | | | | 46,201 | | | | — | | | | — | | | | — | |
Transfer agent | | | — | | | | — | | | | 4 | | | | — | | | | — | |
Prepaid expenses | | | 822 | | | | 1,705 | | | | 2,025 | | | | — | | | | 18,046 | |
Total assets | | | 845,546,062 | | | | 180,540,463 | | | | 534,132,333 | | | | 1,204,667 | | | | 4,221,276,707 | |
| | | | | | |
Liabilities: | | | | | | | | | | | | | | | | | | | | |
Foreign currency, at value | | | 2,212,237 | | | | — | | | | — | | | | — | | | | — | |
Accounts payable and accrued liabilities: | | | | | | | | | | | | | | | | | | | | |
Shares of beneficial interest redeemed | | | 147,238 | | | | 1,111,754 | | | | 273,831 | | | | — | | | | 12,623,284 | |
Investments purchased | | | 6,871,213 | | | | — | | | | 25,326,927 | | | | 125,511 | | | | 8,833,774 | |
When-issued securities purchased | | | — | | | | — | | | | 579,893 | | | | — | | | | 21,765,629 | |
Management and advisory fees | | | 563,591 | | | | 8,037 | | | | 261,964 | | | | — | | | | 1,602,453 | |
Distribution and service fees | | | 55,569 | | | | 191,845 | | | | 148,844 | | | | 280 | | | | 938,310 | |
Administration fees | | | 13,348 | | | | 3,875 | | | | 10,076 | | | | 23 | | | | 86,666 | |
Transfer agent fees | | | 24,444 | | | | 32,824 | | | | 58,393 | | | | 71 | | | | 257,479 | |
Trustees fees | | | 43 | | | | — | | | | 32 | | | | — | | | | 272 | |
Audit and tax fees | | | 23,687 | | | | 15,500 | | | | 18,221 | | | | 11,304 | | | | 32,171 | |
Custody fees | | | — | | | | 1,310 | | | | 4,761 | | | | 55 | | | | 4,857 | |
Legal fees | | | 3,521 | | | | 2,715 | | | | 5,170 | | | | 14 | | | | 45,273 | |
Printing and shareholder reports fees | | | 5,047 | | | | 5,553 | | | | 14,860 | | | | 1,280 | | | | 102,313 | |
Distribution payable | | | — | | | | 232 | | | | — | | | | — | | | | 403,168 | |
Registration fees | | | 21,898 | | | | 9,566 | | | | 1,198 | | | | 3 | | | | 13,265 | |
Other | | | 502 | | | | 418 | | | | 931 | | | | 2 | | | | 8,450 | |
Collateral for securities on loan | | | 141,399,123 | | | | — | | | | 16,891,406 | | | | 8,400 | | | | 109,909,532 | |
Written options and swaptions, at value | | | 220,875 | | | | — | | | | — | | | | — | | | | — | |
Total liabilities | | | 151,562,336 | | | | 1,383,629 | | | | 43,596,507 | | | | 146,943 | | | | 156,626,896 | |
Net assets | | $ | 693,983,726 | | | $ | 179,156,834 | | | $ | 490,535,826 | | | $ | 1,057,724 | | | $ | 4,064,649,811 | |
| | | | | | |
Net assets consist of: | | | | | | | | | | | | | | | | | | | | |
Paid-in capital | | $ | 652,414,763 | | | $ | 179,141,620 | | | $ | 386,906,685 | | | $ | 1,072,647 | | | $ | 4,027,951,044 | |
Undistributed (distributions in excess of) net investment income (loss) | | | 5,779,226 | | | | 16,063 | | | | 6,914 | | | | — | | | | (413,258 | ) |
Accumulated net realized gain (loss) | | | 4,349,089 | | | | (849 | ) | | | 19,385,249 | | | | (38,487 | ) | | | 8,440,661 | |
Net unrealized appreciation (depreciation) on: | | | | | | | | | | | | | | | | | | | | |
Investments | | | 31,568,563 | | | | — | | | | 84,092,386 | | | | 23,564 | | | | 28,703,111 | |
Futures contracts | | | — | | | | — | | | | 144,592 | | | | — | | | | — | |
Written options and swaptions | | | (138,583 | ) | | | — | | | | — | | | | — | | | | — | |
Translation of assets and liabilities denominated in foreign currencies | | | 10,668 | | | | — | | | | — | | | | — | | | | (31,747 | ) |
Net assets | | $ | 693,983,726 | | | $ | 179,156,834 | | | $ | 490,535,826 | | | $ | 1,057,724 | | | $ | 4,064,649,811 | |
Net assets by class: | | | | | | | | | | | | | | | | | | | | |
Class A | | $ | 64,299,750 | | | $ | 100,310,249 | | | $ | 174,817,142 | | | $ | 268,196 | | | $ | 1,012,764,152 | |
Class B | | | — | | | | 3,820,355 | | | | 6,578,789 | | | | — | | | | — | |
Class C | | | 53,064,278 | | | | 24,179,902 | | | | 132,473,344 | | | | 259,126 | | | | 847,406,833 | |
Class I | | | 112,832,920 | | | | 19,324,444 | | | | 176,666,551 | | | | 530,402 | | | | 804,004,176 | |
Class I2 | | | 463,786,778 | | | | 31,521,884 | | | | — | | | | — | | | | 1,400,474,650 | |
Shares outstanding (unlimited shares, no par value): | | | | | | | | | | | | | | | | | | | | |
Class A | | | 5,535,165 | | | | 100,301,401 | | | | 6,827,038 | | | | 27,303 | | | | 97,675,217 | |
Class B | | | — | | | | 3,819,730 | | | | 258,506 | | | | — | | | | — | |
Class C | | | 4,588,277 | | | | 24,173,914 | | | | 5,254,817 | | | | 26,397 | | | | 81,878,203 | |
Class I | | | 9,703,857 | | | | 19,323,403 | | | | 6,873,674 | | | | 53,980 | | | | 78,907,265 | |
Class I2 | | | 39,879,142 | | | | 31,518,586 | | | | — | | | | — | | | | 137,519,382 | |
Net asset value per share: | | | | | | | | | | | | | | | | | | | | |
Class A | | $ | 11.62 | | | $ | 1.00 | | | $ | 25.61 | | | $ | 9.82 | | | $ | 10.37 | |
Class B | | | — | | | | 1.00 | | | | 25.45 | | | | — | | | | — | |
Class C | | | 11.57 | | | | 1.00 | | | | 25.21 | | | | 9.82 | | | | 10.35 | |
Class I | | | 11.63 | | | | 1.00 | | | | 25.70 | | | | 9.83 | | | | 10.19 | |
Class I2 | | | 11.63 | | | | 1.00 | | | | — | | | | — | | | | 10.18 | |
Maximum offering price per share: (A) | | | | | | | | | | | | | | | | | | | | |
Class A | | $ | 12.30 | | | $ | 1.00 | | | $ | 27.10 | | | $ | 10.39 | | | $ | 10.64 | |
| | | | | | | | | | | | | | | | | | | | | |
Investments, at cost | | $ | 752,045,989 | | | $ | 165,461,657 | | | $ | 435,526,163 | | | $ | 979,414 | | | $ | 4,108,610,282 | |
Repurchase agreements, at cost | | $ | 53,319,882 | | | $ | 14,693,950 | | | $ | 9,946,837 | | | $ | 181,556 | | | $ | 7,151,267 | |
Foreign currency, at cost | | $ | (2,219,052 | ) | | $ | — | | | $ | — | | | $ | — | | | $ | — | |
Securities loaned, at value | | $ | 137,823,377 | | | $ | — | | | $ | 16,525,148 | | | $ | 8,220 | | | $ | 107,677,423 | |
Premium received on written options and swaptions | | $ | (82,292 | ) | | $ | — | | | $ | — | | | $ | — | | | $ | — | |
| (A) | Includes the maximum selling commission (represented as a percentage of offering price) which is reduced on certain levels of sales as set forth in the prospectus. Net asset value per share for Classes B, C, I and I2 shares represents offering price. The redemption price for Classes B and C shares equals net asset value less any applicable contingent deferred sales charge. |
The Notes to Financial Statements are an integral part of this report.
| | |
| Transamerica Funds | | Annual Report 2014 |
Page 228
STATEMENTS OF ASSETS AND LIABILITIES (continued)
At October 31, 2014
| | | | | | | | | | | | | | | | | | | | |
| | | Transamerica
Small Cap
Core | | | Transamerica
Small Cap
Growth | | | Transamerica
Small Cap
Value | | | Transamerica
Small/Mid Cap
Value | | | Transamerica
Strategic
High Income | |
Assets: | | | | | | | | | | | | | | | | | | | | |
Investments, at value | | $ | 262,160,032 | | | $ | 652,411,057 | | | $ | 768,773,471 | | | $ | 1,154,417,374 | | | $ | 47,951,806 | |
Repurchase agreements, at value | | | 3,368,364 | | | | 12,615,223 | | | | 81,407 | | | | 17,694,652 | | | | 672,918 | |
Cash | | | 580,370 | | | | — | | | | — | | | | — | | | | — | |
Receivables: | | | | | | | | | | | | | | | | | | | | |
Shares of beneficial interest sold | | | 1,668 | | | | 23,477 | | | | 24,916 | | | | 1,925,042 | | | | 57,970 | |
Investments sold | | | — | | | | 3,430,975 | | | | 25,259,427 | | | | 13,495,653 | | | | — | |
Interest | | | 1 | | | | 4 | | | | — | | | | 5 | | | | 297,997 | |
Dividends | | | 138,624 | | | | — | | | | 307,197 | | | | 266,342 | | | | 20,678 | |
Dividend reclaims | | | — | | | | — | | | | — | | | | 1,892 | | | | 1,401 | |
Net income from securities lending | | | 19,635 | | | | 86,566 | | | | 69,615 | | | | 38,917 | | | | 2,295 | |
Prepaid expenses | | | — | | | | 2,517 | | | | 3,381 | | | | 4,408 | | | | — | |
Total assets | | | 266,268,694 | | | | 668,569,819 | | | | 794,519,414 | | | | 1,187,844,285 | | | | 49,005,065 | |
| | | | | | |
Liabilities: | | | | | | | | | | | | | | | | | | | | |
Accounts payable and accrued liabilities: | | | | | | | | | | | | | | | | | | | | |
Shares of beneficial interest redeemed | | | 10,122 | | | | 15,304 | | | | 5,014,435 | | | | 2,330,809 | | | | — | |
Investments purchased | | | — | | | | 1,313,929 | | | | 5,677,075 | | | | 15,069,077 | | | | 519,446 | |
Management and advisory fees | | | 155,383 | | | | 367,003 | | | | 481,309 | | | | 673,852 | | | | 35,970 | |
Distribution and service fees | | | 362 | | | | 681 | | | | 916 | | | | 372,133 | | | | 1,127 | |
Administration fees | | | 4,246 | | | | 11,150 | | | | 14,198 | | | | 21,754 | | | | 788 | |
Transfer agent fees | | | 1,561 | | | | 3,606 | | | | 4,521 | | | | 155,138 | | | | 1,418 | |
Trustees fees | | | 13 | | | | 35 | | | | 45 | | | | 68 | | | | 8 | |
Audit and tax fees | | | 15,958 | | | | 16,580 | | | | 17,138 | | | | 18,574 | | | | 17,606 | |
Custody fees | | | 140 | | | | 798 | | | | 1,181 | | | | 1,589 | | | | 344 | |
Legal fees | | | 1,442 | | | | 6,465 | | | | 8,365 | | | | 12,432 | | | | 870 | |
Printing and shareholder reports fees | | | 1,114 | | | | 8,591 | | | | 11,189 | | | | 48,021 | | | | 2,196 | |
Registration fees | | | 8,806 | | | | 4,148 | | | | 12,889 | | | | 14,281 | | | | 4,389 | |
Other | | | 170 | | | | 1,255 | | | | 1,574 | | | | 2,286 | | | | 46 | |
Collateral for securities on loan | | | 53,848,738 | | | | 135,929,304 | | | | 101,901,660 | | | | 95,771,159 | | | | 9,633,194 | |
Total liabilities | | | 54,048,055 | | | | 137,678,849 | | | | 113,146,495 | | | | 114,491,173 | | | | 10,217,402 | |
Net assets | | $ | 212,220,639 | | | $ | 530,890,970 | | | $ | 681,372,919 | | | $ | 1,073,353,112 | | | $ | 38,787,663 | |
| | | | | | |
Net assets consist of: | | | | | | | | | | | | | | | | | | | | |
Paid-in capital | | $ | 201,927,152 | | | $ | 397,020,044 | | | $ | 529,739,306 | | | $ | 812,204,396 | | | $ | 38,023,149 | |
Undistributed (distributions in excess of) net investment income (loss) | | | 886,913 | | | | (1,924,168 | ) | | | 5,438,111 | | | | 144,627 | | | | 84,957 | |
Accumulated net realized gain (loss) | | | 4,469,475 | | | | 39,344,037 | | | | 55,001,147 | | | | 101,738,366 | | | | 427,007 | |
Net unrealized appreciation (depreciation) on: | | | | | | | | | | | | | | | | | | | | |
Investments | | | 4,937,099 | | | | 96,451,057 | | | | 91,194,355 | | | | 159,265,723 | | | | 252,550 | |
Net assets | | $ | 212,220,639 | | | $ | 530,890,970 | | | $ | 681,372,919 | | | $ | 1,073,353,112 | | | $ | 38,787,663 | |
Net assets by class: | | | | | | | | | | | | | | | | | | | | |
Class A | | $ | 332,448 | | | $ | 861,522 | | | $ | 955,340 | | | $ | 473,644,328 | | | $ | 1,200,109 | |
Class B | | | — | | | | — | | | | — | | | | 27,009,674 | | | | — | |
Class C | | | 380,132 | | | | 628,383 | | | | 920,903 | | | | 314,998,904 | | | | 1,072,381 | |
Class I | | | 684,727 | | | | 509,847 | | | | 655,292 | | | | 235,417,928 | | | | 13,897,007 | |
Class I2 | | | 210,823,332 | | | | 528,891,218 | | | | 678,841,384 | | | | 22,282,278 | | | | 22,618,166 | |
Shares outstanding (unlimited shares, no par value): | | | | | | | | | | | | | | | | | | | | |
Class A | | | 30,787 | | | | 66,944 | | | | 73,744 | | | | 16,398,764 | | | | 116,475 | |
Class B | | | — | | | | — | | | | — | | | | 1,006,757 | | | | — | |
Class C | | | 35,430 | | | | 49,495 | | | | 71,546 | | | | 11,867,610 | | | | 104,172 | |
Class I | | | 63,286 | | | | 39,410 | | | | 50,312 | | | | 7,945,160 | | | | 1,348,472 | |
Class I2 | | | 19,473,730 | | | | 40,779,730 | | | | 52,044,252 | | | | 750,850 | | | | 2,196,343 | |
Net asset value per share: | | | | | | | | | | | | | | | | | | | | |
Class A | | $ | 10.80 | | | $ | 12.87 | | | $ | 12.95 | | | $ | 28.88 | | | $ | 10.30 | |
Class B | | | — | | | | — | | | | — | | | | 26.83 | | | | — | |
Class C | | | 10.73 | | | | 12.70 | | | | 12.87 | | | | 26.54 | | | | 10.29 | |
Class I | | | 10.82 | | | | 12.94 | | | | 13.02 | | | | 29.63 | | | | 10.31 | |
Class I2 | | | 10.83 | | | | 12.97 | | | | 13.04 | | | | 29.68 | | | | 10.30 | |
Maximum offering price per share: (A) | | | | | | | | | | | | | | | | | | | | |
Class A | | $ | 11.43 | | | $ | 13.62 | | | $ | 13.70 | | | $ | 30.56 | | | $ | 10.90 | |
| | | | | | | | | | | | | | | | | | | | | |
Investments, at cost | | $ | 257,222,933 | | | $ | 555,960,000 | | | $ | 677,579,116 | | | $ | 995,151,651 | | | $ | 47,699,256 | |
Repurchase agreements, at cost | | $ | 3,368,364 | | | $ | 12,615,223 | | | $ | 81,407 | | | $ | 17,694,652 | | | $ | 672,918 | |
Securities loaned, at value | | $ | 52,458,514 | | | $ | 132,543,428 | | | $ | 99,528,732 | | | $ | 93,290,186 | | | $ | 9,420,557 | |
| (A) | Includes the maximum selling commission (represented as a percentage of offering price) which is reduced on certain levels of sales as set forth in the prospectus. Net asset value per share for Classes B, C, I and I2 shares represents offering price. The redemption price for Classes B and C shares equals net asset value less any applicable contingent deferred sales charge. |
The Notes to Financial Statements are an integral part of this report.
| | |
| Transamerica Funds | | Annual Report 2014 |
Page 229
STATEMENTS OF ASSETS AND LIABILITIES (continued)
At October 31, 2014
| | | | | | | | | | | | | | | | |
| | | Transamerica
Tactical
Allocation | | | Transamerica
Tactical Income | | | Transamerica
Tactical
Rotation | | | Transamerica
US Growth (A) | |
Assets: | | | | | | | | | | | | | | | | |
Investments, at value | | $ | 13,443,105 | | | $ | 1,101,170,600 | | | $ | 28,212,077 | | | $ | 1,244,017,050 | |
Repurchase agreements, at value | | | 5,964,089 | | | | 4,659,164 | | | | 86,538 | | | | 4,741,573 | |
Cash | | | — | | | | — | | | | 396,266 | | | | — | |
Receivables: | | | | | | | | | | | | | | | | |
Shares of beneficial interest sold | | | — | | | | 1,595,664 | | | | 126,023 | | | | 159,906 | |
Investments sold | | | 917,264 | | | | 28,892,136 | | | | 881,472 | | | | — | |
Interest | | | 2 | | | | 1 | | | | — | | | | 1 | |
Dividends | | | — | | | | — | | | | — | | | | 631,718 | |
Dividend reclaims | | | — | | | | — | | | | — | | | | 488,171 | |
Net income from securities lending | | | 2,773 | | | | 191,477 | | | | 2,873 | | | | 7,188 | |
Prepaid expenses | | | 49 | | | | 5,873 | | | | 34 | | | | 6,983 | |
Total assets | | | 20,327,282 | | | | 1,136,514,915 | | | | 29,705,283 | | | | 1,250,052,590 | |
| | | | | |
Liabilities: | | | | | | | | | | | | | | | | |
Due to custodian | | | 5,877,551 | | | | — | | | | — | | | | — | |
Accounts payable and accrued liabilities: | | | | | | | | | | | | | | | | |
Shares of beneficial interest redeemed | | | 288,146 | | | | 1,740,083 | | | | 120,817 | | | | 1,384,254 | |
Investments purchased | | | 921,753 | | | | 26,681,965 | | | | 1,311,793 | | | | 644,403 | |
Management and advisory fees | | | 391 | | | | 357,819 | | | | 5,003 | | | | 657,180 | |
Distribution and service fees | | | 6,695 | | | | 392,800 | | | | 8,321 | | | | 145,975 | |
Administration fees | | | 270 | | | | 19,033 | | | | 468 | | | | 24,612 | |
Transfer agent fees | | | 1,353 | | | | 80,555 | | | | 2,723 | | | | 153,270 | |
Trustees fees | | | 1 | | | | 60 | | | | 1 | | | | 78 | |
Audit and tax fees | | | 18,302 | | | | 21,399 | | | | 18,333 | | | | 20,804 | |
Custody fees | | | 814 | | | | 1,305 | | | | 1,352 | | | | 8,787 | |
Legal fees | | | 137 | | | | — | | | | 196 | | | | 15,550 | |
Printing and shareholder reports fees | | | 1,282 | | | | 44,795 | | | | 1,043 | | | | 35,112 | |
Registration fees | | | 67 | | | | 1,591 | | | | 316 | | | | — | |
Other | | | 25 | | | | 2,630 | | | | 30 | | | | 3,239 | |
Collateral for securities on loan | | | 542,978 | | | | 204,977,679 | | | | 5,333,015 | | | | 37,764,538 | |
Total liabilities | | | 7,659,765 | | | | 234,321,714 | | | | 6,803,411 | | | | 40,857,802 | |
Net assets | | $ | 12,667,517 | | | $ | 902,193,201 | | | $ | 22,901,872 | | | $ | 1,209,194,788 | |
| | | | | |
Net assets consist of: | | | | | | | | | | | | | | | | |
Paid-in capital | | $ | 12,278,882 | | | $ | 878,328,564 | | | $ | 21,126,170 | | | $ | 865,144,887 | |
Undistributed (distributions in excess of) net investment income (loss) | | | — | | | | 3,568,177 | | | | 46,352 | | | | 3,085,419 | |
Accumulated net realized gain (loss) | | | 283,240 | | | | 9,883,004 | | | | 754,036 | | | | 198,393,392 | |
Net unrealized appreciation (depreciation) on: | | | | | | | | | | | | | | | | |
Investments | | | 105,395 | | | | 10,413,456 | | | | 975,314 | | | | 142,461,256 | |
Translation of assets and liabilities denominated in foreign currencies | | | — | | | | — | | | | — | | | | 109,834 | |
Net assets | | $ | 12,667,517 | | | $ | 902,193,201 | | | $ | 22,901,872 | | | $ | 1,209,194,788 | |
Net assets by class: | | | | | | | | | | | | | | | | |
Class A | | $ | 5,431,701 | | | $ | 259,348,249 | | | $ | 12,114,908 | | | $ | 459,677,416 | |
Class B | | | — | | | | — | | | | — | | | | 16,421,347 | |
Class C | | | 6,362,089 | | | | 400,141,975 | | | | 7,266,057 | | | | 49,040,608 | |
Class I | | | 873,727 | | | | 242,702,977 | | | | 3,520,907 | | | | 212,865,564 | |
Class I2 | | | — | | | | — | | | | — | | | | 370,160,598 | |
Class T | | | — | | | | — | | | | — | | | | 101,029,255 | |
Shares outstanding (unlimited shares, no par value): | | | | | | | | | | | | | | | | |
Class A | | | 526,347 | | | | 24,747,095 | | | | 1,033,248 | | | | 23,913,901 | |
Class B | | | — | | | | — | | | | — | | | | 871,300 | |
Class C | | | 621,678 | | | | 38,318,373 | | | | 626,196 | | | | 2,605,419 | |
Class I | | | 85,241 | | | | 23,154,634 | | | | 300,785 | | | | 10,922,115 | |
Class I2 | | | — | | | | — | | | | — | | | | 19,006,239 | |
Class T | | | — | | | | — | | | | — | | | | 2,431,451 | |
Net asset value per share: | | | | | | | | | | | | | | | | |
Class A | | $ | 10.32 | | | $ | 10.48 | | | $ | 11.73 | | | $ | 19.22 | |
Class B | | | — | | | | — | | | | — | | | | 18.85 | |
Class C | | | 10.23 | | | | 10.44 | | | | 11.60 | | | | 18.82 | |
Class I | | | 10.25 | | | | 10.48 | | | | 11.71 | | | | 19.49 | |
Class I2 | | | — | | | | — | | | | — | | | | 19.48 | |
Class T | | | — | | | | — | | | | — | | | | 41.55 | |
Maximum offering price per share: (B) | | | | | | | | | | | | | | | | |
Class A | | $ | 10.92 | | | $ | 11.00 | | | $ | 12.41 | | | $ | 20.34 | |
Class T | | $ | — | | | $ | — | | | $ | — | | | $ | 45.41 | |
| | | | | | | | | | | | | | | | | |
Investments, at cost | | $ | 13,337,710 | | | $ | 1,090,757,144 | | | $ | 27,236,763 | | | $ | 1,101,555,794 | |
Repurchase agreements, at cost | | $ | 5,964,089 | | | $ | 4,659,164 | | | $ | 86,538 | | | $ | 4,741,573 | |
Securities loaned, at value | | $ | 531,344 | | | $ | 200,595,760 | | | $ | 5,212,377 | | | $ | 36,962,840 | |
| (A) | Formerly, Transamerica Diversified Equity. |
| (B) | Includes the maximum selling commission (represented as a percentage of offering price) which is reduced on certain levels of sales as set forth in the prospectus. Net asset value per share for Classes B, C, I and I2 shares represents offering price. The redemption price for Classes B and C shares equals net asset value less any applicable contingent deferred sales charge. |
The Notes to Financial Statements are an integral part of this report.
| | |
| Transamerica Funds | | Annual Report 2014 |
Page 230
STATEMENTS OF OPERATIONS
For the period and year ended October 31, 2014 and year ended December 31, 2013
| | | | | | | | | | | | | | | | | | | | | | | | |
| | |
Transamerica
Capital Growth | | | Transamerica
Concentrated
Growth (A) | | | Transamerica
Concentrated
Growth (B) | | | Transamerica
Dividend Focused | | | Transamerica
Emerging Markets
Debt | | | Transamerica
Emerging Markets
Equity | |
Investment Income: | | | | | | | | | | | | | | | | | | | | | | | | |
Dividend income | | $ | 5,354,515 | | | $ | 2,084,404 | | | $ | 153,200 | | | $ | 29,954,838 | | | $ | — | | | $ | 6,566,716 | |
Interest income | | | 4,795 | | | | 682 | | | | 144 | | | | 4,230 | | | | 38,588,790 | | | | 72 | |
Net income from securities lending | | | 729,140 | | | | 61,729 | | | | — | | | | 77,865 | | | | 323,086 | | | | 45,092 | |
Withholding taxes on foreign income | | | (198,020 | ) | | | (49,384 | ) | | | (5,581 | ) | | | (45,234 | ) | | | (79,892 | ) | | | (804,518 | ) |
Total investment income | | | 5,890,430 | | | | 2,097,431 | | | | 147,763 | | | | 29,991,699 | | | | 38,831,984 | | | | 5,807,362 | |
| | | | | | | |
Expenses: | | | | | | | | | | | | | | | | | | | | | | | | |
Management and advisory fees | | | 7,056,414 | | | | 1,159,015 | | | | 119,870 | | | | 7,420,500 | | | | 3,372,952 | | | | 2,112,489 | |
Distribution and service fees: | | | | | | | | | | | | | | | | | | | | | | | | |
Class A | | | 304,122 | | | | 566 | | | | — | | | | 95,179 | | | | 248,192 | | | | 2,854 | |
Class B | | | 54,671 | | | | — | | | | — | | | | — | | | | — | | | | — | |
Class C | | | 426,983 | | | | 1,705 | | | | — | | | | 22,933 | | | | 268,697 | | | | 11,750 | |
Administration fees | | | 238,201 | | | | 43,739 | | | | — | | | | 290,437 | | | | 141,938 | | | | 55,610 | |
Transfer agent fees: | | | | | | | | | | | | | | | | | | | | | | | | |
Fund level | | | — | | | | — | | | | 18,633 | | | | — | | | | — | | | | — | |
Class A | | | 220,363 | | | | 386 | | | | — | | | | 6,747 | | | | 188,942 | | | | 2,004 | |
Class B | | | 19,250 | | | | — | | | | — | | | | — | | | | — | | | | — | |
Class C | | | 61,180 | | | | 287 | | | | — | | | | 2,571 | | | | 35,025 | | | | 1,465 | |
Class I | | | 207,144 | | | | 14,681 | | | | — | | | | 4,410 | | | | 267,341 | | | | 650 | |
Class I2 | | | 48,025 | | | | 12,279 | | | | — | | | | 83,813 | | | | 14,627 | | | | 16,475 | |
Trustees fees | | | 17,002 | | | | 15,431 | | | | 49,000 | | | | 17,654 | | | | 9,529 | | | | 3,960 | |
Audit and tax fees | | | 31,003 | | | | 3,289 | | | | 12,000 | | | | 36,562 | | | | 35,702 | | | | 20,941 | |
Custody fees | | | 139,427 | | | | 20,116 | | | | 4,564 | | | | 109,364 | | | | 251,037 | | | | 322,571 | |
Legal fees | | | 32,028 | | | | 11,268 | | | | 2,073 | | | | 40,044 | | | | 17,231 | | | | 7,009 | |
Printing and shareholder reports fees | | | 57,337 | | | | 12,313 | | | | 1,091 | | | | 53,724 | | | | 80,854 | | | | 12,108 | |
Registration fees | | | 86,607 | | | | 94,708 | | | | 22,820 | | | | 50,222 | | | | 66,627 | | | | 45,202 | |
Insurance fees | | | — | | | | — | | | | 30,680 | | | | — | | | | — | | | | — | |
Other | | | 34,576 | | | | 10,941 | | | | — | | | | 44,908 | | | | 26,681 | | | | 10,426 | |
Total expenses | | | 9,034,333 | | | | 1,400,724 | | | | 260,731 | | | | 8,279,068 | | | | 5,025,375 | | | | 2,625,514 | |
Fund expenses (waived/reimbursed) recaptured | | | — | | | | — | | | | (110,754 | ) | | | — | | | | — | | | | — | |
Class expenses (waived/reimbursed) recaptured: | | | | | | | | | | | | | | | | | | | | | | | | |
Class B | | | 2,198 | | | | — | | | | — | | | | — | | | | — | | | | — | |
Class I | | | — | | | | (10,473 | ) | | | — | | | | — | | | | — | | | | — | |
Total expenses (waived/reimbursed) recaptured | | | 2,198 | | | | (10,473 | ) | | | (110,754 | ) | | | — | | | | — | | | | — | |
Net expenses | | | 9,036,531 | | | | 1,390,251 | | | | 149,977 | | | | — | | | | — | | | | — | |
Net investment income (loss) | | | (3,146,101 | ) | | | 707,180 | | | | (2,214 | ) | | | 21,712,631 | | | | 33,806,609 | | | | 3,181,848 | |
| | | | | | | |
Net realized gain (loss) on transactions from: | | | | | | | | | | | | | | | | | | | | | | | | |
Investments | | | 42,995,849 | | | | 991,442 | | | | 413,282 | | | | 49,179,546 | | | | (18,554,300 | ) | | | 628,492 | |
Futures contracts | | | — | | | | — | | | | — | | | | — | | | | (227,035 | ) | | | — | |
Foreign currency transactions | | | 23,694 | | | | (73 | ) | | | — | | | | — | | | | (232,214 | ) | | | (182,628 | ) |
Net realized gain (loss) | | | 43,019,543 | | | | 991,369 | | | | 413,282 | | | | 49,179,546 | | | | (19,013,549 | ) | | | 445,864 | |
| | | | | | | |
Net change in unrealized appreciation (depreciation) on: | | | | | | | | | | | | | | | | | | | | | | | | |
Investments | | | 89,236,910 | | | | 12,284,158 | | | | 2,910,000 | | | | 79,639,634 | | | | 10,419,801 | (C) | | | (5,230,646 | ) (D) |
Futures contracts | | | — | | | | — | | | | — | | | | — | | | | (103,211 | ) | | | — | |
Translation of assets and liabilities denominated in foreign currencies | | | — | | | | — | | | | — | | | | — | | | | 793,665 | | | | (39,622 | ) |
Net change in unrealized appreciation (depreciation) | | | 89,236,910 | | | | 12,284,158 | | | | 2,910,000 | | | | 79,639,634 | | | | 11,110,255 | | | | (5,270,268 | ) |
Net realized and change in unrealized gain (loss) | | | 132,256,453 | | | | 13,275,527 | | | | 3,323,282 | | | | 128,819,180 | | | | (7,903,294 | ) | | | (4,824,404 | ) |
Net increase (decrease) in net assets resulting from operations | | $ | 129,110,352 | | | $ | 13,982,707 | | | $ | 3,321,068 | | | $ | 150,531,811 | | | $ | 25,903,315 | | | $ | (1,642,556 | ) |
| (A) | Effective at the close of business on February 28, 2014, the fiscal year end of the Fund changed to October 31. The Statement of Operations represents activity for the ten months of January 1, 2014 - October 31, 2014. Refer to the Notes to Financial Statements for details. Formerly, The Torray Resolute Fund. |
| (B) | For the year ended December 31, 2013. Prior to January 1, 2014, the Statements of Operations was audited by another independent registered public accounting firm. |
| (C) | Net of foreign capital gains tax of $556,034. |
| (D) | Net of foreign capital gains tax of $35,828. |
The Notes to Financial Statements are an integral part of this report.
| | |
| Transamerica Funds | | Annual Report 2014 |
Page 231
STATEMENTS OF OPERATIONS (continued)
For the period and year ended October 31, 2014
| | | | | | | | | | | | | | | | | | | | |
| | |
Transamerica
Enhanced Muni | | | Transamerica
Flexible Income | | | Transamerica
Floating Rate (A) | | | Transamerica
Global Bond (B) | | | Transamerica
Global Equity (C) | |
Investment Income: | | | | | | | | | | | | | | | | | | | | |
Dividend income | | $ | 34 | | | $ | 557,091 | | | $ | 67,271 | | | $ | — | | | $ | 551,386 | |
Interest income | | | 1,055,478 | | | | 20,950,295 | | | | 6,319,029 | | | | 2,795,308 | | | | 625 | |
Dividend income from affiliated investments (D) | | | — | | | | — | | | | — | | | | — | | | | 4,309,563 | |
Net income from securities lending | | | — | | | | 79,977 | | | | 7,095 | | | | 429 | | | | — | |
Withholding taxes on foreign income | | | — | | | | 68 | | | | — | | | | (9,027 | ) | | | (21,508 | ) |
Total investment income | | | 1,055,512 | | | | 21,587,431 | | | | 6,393,395 | | | | 2,786,710 | | | | 4,840,066 | |
| | | | | | |
Expenses: | | | | | | | | | | | | | | | | | | | | |
Management and advisory fees | | | 147,797 | | | | 2,464,039 | | | | 934,510 | | | | 504,864 | | | | 548,350 | |
Distribution and service fees: | | | | | | | | | | | | | | | | | | | | |
Class A | | | 35,572 | | | | 211,869 | | | | 1,656 | | | | 480 | | | | 200,303 | |
Class B | | | — | | | | 42,313 | | | | — | | | | — | | | | 78,723 | |
Class C | | | 58,037 | | | | 693,383 | | | | 13,414 | | | | 1,743 | | | | 823,601 | |
Administration fees | | | 8,398 | | | | 140,958 | | | | 38,300 | | | | 23,373 | | | | 37,660 | |
Transfer agent fees: | | | | | | | | | | | | | | | | | | | | |
Class A | | | 6,605 | | | | 103,338 | | | | 548 | | | | 98 | | | | 128,823 | |
Class B | | | — | | | | 8,717 | | | | — | | | | — | | | | 24,589 | |
Class C | | | 3,004 | | | | 61,962 | | | | 1,273 | | | | 47 | | | | 133,944 | |
Class I | | | 14,786 | | | | 37,802 | | | | 436 | | | | 262 | | | | 33,220 | |
Class I2 | | | — | | | | 28,152 | | | | 11,313 | | | | 6,969 | | | | 1,437 | |
Trustees fees | | | 598 | | | | 10,182 | | | | 2,720 | | | | 1,989 | | | | 3,815 | |
Audit and tax fees | | | 19,680 | | | | 24,325 | | | | 21,200 | | | | 18,479 | | | | 18,246 | |
Custody fees | | | 53,382 | | | | 101,938 | | | | 179,925 | | | | 104,550 | | | | 17,482 | |
Legal fees | | | 1,068 | | | | 19,334 | | | | 6,284 | | | | 4,102 | | | | 11,929 | |
Printing and shareholder reports fees | | | 2,902 | | | | 31,680 | | | | 49,119 | | | | 3,294 | | | | 135,176 | |
Registration fees | | | 38,327 | | | | 70,445 | | | | 80,057 | | | | 71,342 | | | | 60,610 | |
Other | | | 2,364 | | | | 17,809 | | | | 5,570 | | | | 3,363 | | | | 10,790 | |
Total expenses | | | 392,520 | | | | 4,068,246 | | | | 1,346,325 | | | | 744,955 | | | | 2,268,698 | |
Fund expenses (waived/reimbursed) recaptured | | | (36,025 | ) | | | — | | | | (92,099 | ) | | | (34,156 | ) | | | — | |
Class expenses (waived/reimbursed) recaptured: | | | | | | | | | | | | | | | | | | | | |
Class A | | | (21,587 | ) | | | (13,220 | ) | | | (548 | ) | | | (98 | ) | | | (13,487 | ) |
Class B | | | — | | | | — | | | | — | | | | — | | | | (7,309 | ) |
Class C | | | (17,514 | ) | | | — | | | | (1,273 | ) | | | (47 | ) | | | (13,840 | ) |
Class I | | | (14,786 | ) | | | — | | | | (436 | ) | | | (262 | ) | | | (4,067 | ) |
Class I2 | | | — | | | | — | | | | (11,313 | ) | | | (6,969 | ) | | | — | |
Total expenses (waived/reimbursed) recaptured | | | (89,912 | ) | | | (13,220 | ) | | | (105,669 | ) | | | (41,532 | ) | | | (38,703 | ) |
Net expenses | | | 302,608 | | | | 4,055,026 | | | | 1,240,656 | | | | 703,423 | | | | 2,229,995 | |
Net investment income (loss) | | | 752,904 | | | | 17,532,405 | | | | 5,152,739 | | | | 2,083,287 | | | | 2,610,071 | |
| | | | | | |
Net realized gain (loss) on transactions from: | | | | | | | | | | | | | | | | | | | | |
Investments | | | 1,020,734 | | | | 2,616,794 | | | | 401,399 | | | | (1,689,286 | ) | | | (1,882,814 | ) |
Affiliated investments | | | — | | | | — | | | | — | | | | — | | | | 33,556,380 | |
Distributions from affiliated investments (D) | | | — | | | | — | | | | — | | | | — | | | | 6,275,341 | |
Foreign currency transactions | | | — | | | | (2,370 | ) | | | — | | | | (438,135 | ) | | | 33,284 | |
Net realized gain (loss) | | | 1,020,734 | | | | 2,614,424 | | | | 401,399 | | | | (2,127,421 | ) | | | 37,982,191 | |
| | | | | | |
Net change in unrealized appreciation (depreciation) on: | | | | | | | | | | | | | | | | | | | | |
Investments | | | 1,491,584 | | | | 2,724,030 | | | | (2,057,913 | ) | | | (8,996,265 | ) (E) | | | (39,166,629 | ) |
Unfunded commitment | | | — | | | | — | | | | 2,302 | | | | — | | | | — | |
Translation of assets and liabilities denominated in foreign currencies | | | — | | | | (5,831 | ) | | | — | | | | (777,416 | ) | | | (4,619 | ) |
Net change in unrealized appreciation (depreciation) | | | 1,491,584 | | | | 2,718,199 | | | | (2,055,611 | ) | | | (9,773,681 | ) | | | (39,171,248 | ) |
Net realized and change in unrealized gain (loss) | | | 2,512,318 | | | | 5,332,623 | | | | (1,654,212 | ) | | | (11,901,102 | ) | | | (1,189,057 | ) |
Net increase (decrease) in net assets resulting from operations | | $ | 3,265,222 | | | $ | 22,865,028 | | | $ | 3,498,527 | | | $ | (9,817,815 | ) | | $ | 1,421,014 | |
| (A) | Commenced operations on October 31, 2013. |
| (B) | Commenced operations on March 1, 2014. |
| (C) | Formerly, Transamerica Multi-Manager International Portfolio. |
| (D) | Information reflects the operation results from Transamerica Multi-Manager International Portfolio. |
| (E) | Net of foreign capital gains tax of $2,130. |
The Notes to Financial Statements are an integral part of this report.
| | |
| Transamerica Funds | | Annual Report 2014 |
Page 232
STATEMENTS OF OPERATIONS (continued)
For the period and year ended October 31, 2014
| | | | | | | | | | | | | | | | | | | | |
| | | Transamerica
Growth
Opportunities | | | Transamerica
High Yield
Bond | | | Transamerica
High Yield
Muni | | | Transamerica
Income &
Growth | | | Transamerica
Inflation
Opportunities (A) | |
Investment Income: | | | | | | | | | | | | | | | | | | | | |
Dividend income | | $ | 6,359,455 | | | $ | 1,857,194 | | | $ | 10,225 | | | $ | 44,326,622 | | | $ | 25,877 | |
Interest income | | | 2,558 | | | | 72,790,518 | | | | 269,508 | | | | 81 | | | | 2,999,847 | |
Net income from securities lending | | | 1,086,871 | | | | 482,599 | | | | 713 | | | | 921,025 | | | | 4,871 | |
Withholding taxes on foreign income | | | (158,169 | ) | | | — | | | | — | | | | (1,135,149 | ) | | | (6,500 | ) |
Total investment income | | | 7,290,715 | | | | 75,130,311 | | | | 280,446 | | | | 44,112,579 | | | | 3,024,095 | |
| | | | | | |
Expenses: | | | | | | | | | | | | | | | | | | | | |
Management and advisory fees | | | 5,621,383 | | | | 6,919,009 | | | | 32,367 | | | | 4,331,645 | | | | 584,999 | |
Distribution and service fees: | | | | | | | | | | | | | | | | | | | | |
Class A | | | 286,704 | | | | 907,600 | | | | 5,947 | | | | 163,116 | | | | 448 | |
Class B | | | 47,886 | | | | 74,700 | | | | — | | | | — | | | | — | |
Class C | | | 138,160 | | | | 728,747 | | | | 10,321 | | | | 715,537 | | | | 1,949 | |
Administration fees | | | 187,371 | | | | 309,119 | | | | 1,587 | | | | 162,786 | | | | 26,648 | |
Transfer agent fees: | | | | | | | | | | | | | | | | | | | | |
Class A | | | 299,306 | | | | 214,660 | | | | 1,715 | | | | 60,171 | | | | 86 | |
Class B | | | 19,668 | | | | 11,657 | | | | — | | | | — | | | | — | |
Class C | | | 44,051 | | | | 73,442 | | | | 458 | | | | 65,913 | | | | 95 | |
Class I | | | 118,011 | | | | 166,618 | | | | 3,067 | | | | 52,505 | | | | 220 | |
Class I2 | | | 41,571 | | | | 50,116 | | | | — | | | | 35,170 | | | | 7,953 | |
Trustees fees | | | 12,701 | | | | 19,940 | | | | 87 | | | | 10,937 | | | | 1,888 | |
Audit and tax fees | | | 29,023 | | | | 41,636 | | | | 19,259 | | | | 29,181 | | | | 18,791 | |
Custody fees | | | 150,064 | | | | 190,676 | | | | 23,591 | | | | 162,877 | | | | 47,357 | |
Legal fees | | | 27,051 | | | | 45,116 | | | | — | | | | 22,515 | | | | 5,640 | |
Printing and shareholder reports fees | | | 40,846 | | | | 284,555 | | | | 4,510 | | | | 45,830 | | | | 3,737 | |
Registration fees | | | 59,672 | | | | 79,678 | | | | 40,167 | | | | 63,317 | | | | 71,543 | |
Other | | | 32,703 | | | | 47,496 | | | | 1,611 | | | | 22,891 | | | | 3,464 | |
Total expenses | | | 7,156,171 | | | | 10,164,765 | | | | 144,687 | | | | 5,944,391 | | | | 774,818 | |
Fund expenses (waived/reimbursed) recaptured | | | — | | | | — | | | | (74,946 | ) | | | — | | | | — | |
Class expenses (waived/reimbursed) recaptured: | | | | | | | | | | | | | | | | | | | | |
Class A | | | — | | | | — | | | | (4,173 | ) | | | — | | | | (27 | ) |
Class C | | | — | | | | — | | | | (3,038 | ) | | | — | | | | (30 | ) |
Class I | | | — | | | | — | | | | (3,067 | ) | | | — | | | | (159 | ) |
Total expenses (waived/reimbursed) recaptured | | | — | | | | — | | | | (85,224 | ) | | | — | | | | (216 | ) |
Net expenses | | | 7,156,171 | | | | 10,164,765 | | | | 59,463 | | | | 5,944,391 | | | | 774,602 | |
Net investment income (loss) | | | 134,544 | | | | 64,965,546 | | | | 220,983 | | | | 38,168,188 | | | | 2,249,493 | |
| | | | | | |
Net realized gain (loss) on transactions from: | | | | | | | | | | | | | | | | | | | | |
Investments | | | 79,392,708 | | | | 16,963,379 | | | | 404,969 | | | | (19,985,459 | ) | | | 73,566 | |
Futures contracts | | | — | | | | — | | | | — | | | | — | | | | (31,414 | ) |
Foreign currency transactions | | | 3,508 | | | | — | | | | — | | | | (404,816 | ) | | | 67,875 | |
Net realized gain (loss) | | | 79,396,216 | | | | 16,963,379 | | | | 404,969 | | | | (20,390,275 | ) | | | 110,027 | |
| | | | | | |
Net change in unrealized appreciation (depreciation) on: | | | | | | | | | | | | | | | | | | | | |
Investments | | | (8,064,424 | ) | | | (11,634,145 | ) | | | 339,358 | | | | (1,019,619 | ) | | | (3,839,838 | ) |
Futures contracts | | | — | | | | — | | | | — | | | | — | | | | (200,081 | ) |
Translation of assets and liabilities denominated in foreign currencies | | | 14 | | | | — | | | | — | | | | (33,089 | ) | | | 296,776 | |
Net change in unrealized appreciation (depreciation) | | | (8,064,410 | ) | | | (11,634,145 | ) | | | 339,358 | | | | (1,052,708 | ) | | | (3,743,143 | ) |
Net realized and change in unrealized gain (loss) | | | 71,331,806 | | | | 5,329,234 | | | | 744,327 | | | | (21,442,983 | ) | | | (3,633,116 | ) |
Net increase (decrease) in net assets resulting from operations | | $ | 71,466,350 | | | $ | 70,294,780 | | | $ | 965,310 | | | $ | 16,725,205 | | | $ | (1,383,623 | ) |
| (A) | Commenced operations on March 1, 2014. |
The Notes to Financial Statements are an integral part of this report.
| | |
| Transamerica Funds | | Annual Report 2014 |
Page 233
STATEMENTS OF OPERATIONS (continued)
For the period and year ended October 31, 2014
| | | | | | | | | | | | | | | | | | | | |
| | | Transamerica
International
Equity | | | Transamerica
International
Small Cap Value | | | Transamerica
Large Cap Value | | | Transamerica
Mid Cap Growth (A) | | | Transamerica
Mid Cap Value
Opportunities (B) | |
Investment Income: | | | | | | | | | | | | | | | | | | | | |
Dividend income | | $ | 34,439,582 | | | $ | 16,630,976 | | | $ | 35,754,635 | | | $ | 396,517 | | | $ | 1,758,673 | |
Interest income | | | 3,410 | | | | 1,334 | | | | 5,238 | | | | 106 | | | | 498 | |
Net income from securities lending | | | 690,557 | | | | 322,292 | | | | 1,224,041 | | | | 20,121 | | | | 37,697 | |
Withholding taxes on foreign income | | | (2,253,560 | ) | | | (1,267,591 | ) | | | (380,157 | ) | | | (1,582 | ) | | | (7,272 | ) |
Total investment income | | | 32,879,989 | | | | 15,687,011 | | | | 36,603,757 | | | | 415,162 | | | | 1,789,596 | |
| | | | | | |
Expenses: | | | | | | | | | | | | | | | | | | | | |
Management and advisory fees | | | 6,561,734 | | | | 4,777,602 | | | | 10,047,478 | | | | 386,103 | | | | 468,756 | |
Distribution and service fees: | | | | | | | | | | | | | | | | | | | | |
Class A | | | 127,898 | | | | — | | | | 50,139 | | | | 946 | | | | 378 | |
Class C | | | 296,103 | | | | — | | | | 97,996 | | | | 3,325 | | | | 1,346 | |
Administration fees | | | 224,128 | | | | 130,686 | | | | 400,937 | | | | 13,406 | | | | 17,491 | |
Transfer agent fees: | | | | | | | | | | | | | | | | | | | | |
Class A | | | 91,423 | | | | — | | | | 25,608 | | | | 297 | | | | 107 | |
Class C | | | 40,228 | | | | — | | | | 11,093 | | | | 216 | | | | 98 | |
Class I | | | 319,740 | | | | 91,377 | | | | 17,688 | | | | 364 | | | | 1,527 | |
Class I2 | | | 38,594 | | | | 32,689 | | | | 116,858 | | | | 3,947 | | | | 5,113 | |
Trustees fees | | | 15,354 | | | | 8,823 | | | | 27,612 | | | | 964 | | | | 1,345 | |
Audit and tax fees | | | 30,428 | | | | 25,424 | | | | 46,031 | | | | 16,722 | | | | 15,533 | |
Custody fees | | | 509,945 | | | | 417,636 | | | | 151,519 | | | | 10,414 | | | | 11,871 | |
Legal fees | | | 30,638 | | | | 18,090 | | | | 53,474 | | | | 2,303 | | | | 2,264 | |
Printing and shareholder reports fees | | | 61,154 | | | | 19,823 | | | | 65,821 | | | | 18,179 | | | | 6,394 | |
Registration fees | | | 121,925 | | | | 57,081 | | | | 56,674 | | | | 74,836 | | | | 72,923 | |
Other | | | 28,450 | | | | 13,520 | | | | 65,649 | | | | 3,923 | | | | 1,806 | |
Total expenses | | | 8,497,742 | | | | 5,592,751 | | | | 11,234,577 | | | | 535,945 | | | | 606,952 | |
Class expenses (waived/reimbursed) recaptured: | | | | | | | | | | | | | | | | | | | | |
Class A | | | — | | | | — | | | | — | | | | (52 | ) | | | — | |
Class I | | | — | | | | 89 | | | | — | | | | (159 | ) | | | (104 | ) |
Total expenses (waived/reimbursed) recaptured | | | — | | | | 89 | | | | — | | | | (211 | ) | | | (104 | ) |
Net expenses | | | 8,497,742 | | | | 5,592,840 | | | | 11,234,577 | | | | 535,734 | | | | 606,848 | |
Net investment income (loss) | | | 24,382,247 | | | | 10,094,171 | | | | 25,369,180 | | | | (120,572 | ) | | | 1,182,748 | |
| | | | | | |
Net realized gain (loss) on transactions from: | | | | | | | | | | | | | | | | | | | | |
Investments | | | 21,523,004 | | | | 5,999,230 | | | | 153,216,673 | | | | 228,530 | | | | 1,533,729 | |
Foreign currency transactions | | | (75,905 | ) | | | (234,347 | ) | | | (326 | ) | | | — | | | | (67 | ) |
Net realized gain (loss) | | | 21,447,099 | | | | 5,764,883 | | | | 153,216,347 | | | | 228,530 | | | | 1,533,662 | |
| | | | | | |
Net change in unrealized appreciation (depreciation) on: | | | | | | | | | | | | | | | | | | | | |
Investments | | | (66,004,265 | ) | | | (42,033,682 | ) | | | 5,638,963 | | | | 4,930,020 | | | | 6,776,053 | |
Translation of assets and liabilities denominated in foreign currencies | | | (94,016 | ) | | | (64,411 | ) | | | — | | | | — | | | | — | |
Net change in unrealized appreciation (depreciation) | | | (66,098,281 | ) | | | (42,098,093 | ) | | | 5,638,963 | | | | 4,930,020 | | | | 6,776,053 | |
Net realized and change in unrealized gain (loss) | | | (44,651,182 | ) | | | (36,333,210 | ) | | | 158,855,310 | | | | 5,158,550 | | | | 8,309,715 | |
Net increase (decrease) in net assets resulting from operations | | $ | (20,268,935 | ) | | $ | (26,239,039 | ) | | $ | 184,224,490 | | | $ | 5,037,978 | | | $ | 9,492,463 | |
| (A) | Commenced operations on October 31, 2013. |
| (B) | Commenced operations on April 30, 2014 |
The Notes to Financial Statements are an integral part of this report.
| | |
| Transamerica Funds | | Annual Report 2014 |
Page 234
STATEMENTS OF OPERATIONS (continued)
For the year ended October 31, 2014
| | | | | | | | | | | | | | | | | | | | |
| | | Transamerica
MLP & Energy
Income | | | Transamerica
Money Market | | | Transamerica
Multi-Managed
Balanced | | | Transamerica
Opportunistic
Allocation | | | Transamerica
Short-Term
Bond | |
Investment Income: | | | | | | | | | | | | | | | | | | | | |
Dividend income | | $ | 12,993,966 | | | $ | — | | | $ | 5,277,254 | | | $ | 80,578 | | | $ | — | |
Interest income | | | 1,700,198 | | | | 455,663 | | | | 4,895,457 | | | | 4 | | | | 114,510,221 | |
Net income from securities lending | | | 249,870 | | | | — | | | | 45,947 | | | | 869 | | | | 235,750 | |
Withholding taxes on foreign income | | | (208,344 | ) | | | — | | | | (619 | ) | | | — | | | | 1,063 | |
Total investment income | | | 14,735,690 | | | | 455,663 | | | | 10,218,039 | | | | 81,451 | | | | 114,747,034 | |
| | | | | | |
Expenses: | | | | | | | | | | | | | | | | | | | | |
Management and advisory fees | | | 4,124,801 | | | | 782,529 | | | | 3,020,057 | | | | 4,487 | | | | 18,356,826 | |
Distribution and service fees: | | | | | | | | | | | | | | | | | | | | |
Class A | | | 104,765 | | | | 237,818 | | | | 434,563 | | | | 710 | | | | 2,686,684 | |
Class B | | | — | | | | 48,950 | | | | 71,636 | | | | — | | | | — | |
Class C | | | 265,419 | | | | 258,252 | | | | 1,125,386 | | | | 2,650 | | | | 8,607,193 | |
Administration fees | | | 95,553 | | | | 48,908 | | | | 114,466 | | | | 267 | | | | 992,046 | |
Transfer agent fees: | | | | | | | | | | | | | | | | | | | | |
Class A | | | 50,793 | | | | 276,336 | | | | 286,907 | | | | 40 | | | | 698,670 | |
Class B | | | — | | | | 16,652 | | | | 26,049 | | | | — | | | | — | |
Class C | | | 27,603 | | | | 39,311 | | | | 118,217 | | | | 37 | | | | 598,929 | |
Class I | | | 64,413 | | | | 50,519 | | | | 215,640 | | | | 614 | | | | 662,146 | |
Class I2 | | | 19,139 | | | | 4,141 | | | | — | | | | — | | | | 110,070 | |
Trustees fees | | | 6,806 | | | | 3,167 | | | | 7,910 | | | | 19 | | | | 68,176 | |
Audit and tax fees | | | 27,132 | | | | 17,969 | | | | 22,328 | | | | 12,060 | | | | 97,616 | |
Custody fees | | | 64,604 | | | | 79,349 | | | | 189,135 | | | | 5,449 | | | | 430,807 | |
Legal fees | | | 17,201 | | | | 1,811 | | | | 15,914 | | | | 42 | | | | 135,332 | |
Printing and shareholder reports fees | | | 9,286 | | | | 6,231 | | | | 184,390 | | | | 6,126 | | | | 315,041 | |
Registration fees | | | 80,202 | | | | 65,266 | | | | 53,572 | | | | 71,340 | | | | 141,013 | |
Other | | | 12,401 | | | | 11,545 | | | | 19,949 | | | | 215 | | | | 160,194 | |
Total expenses | | | 4,970,118 | | | | 1,948,754 | | | | 5,906,119 | | | | 104,056 | | | | 34,060,743 | |
Fund expenses (waived/reimbursed) recaptured | | | — | | | | (598,485 | ) | | | — | | | | (89,855 | ) | | | — | |
Class expenses (waived/reimbursed) recaptured: | | | | | | | | | | | | | | | | | | | | |
Class A | | | 119 | | | | (509,220 | ) | | | — | | | | (40 | ) | | | (159,874 | ) |
Class B | | | — | | | | (65,119 | ) | | | — | | | | — | | | | — | |
Class C | | | 337 | | | | (295,090 | ) | | | — | | | | (37 | ) | | | — | |
Class I | | | 1,595 | | | | (50,519 | ) | | | — | | | | (614 | ) | | | — | |
Class I2 | | | — | | | | (4,141 | ) | | | — | | | | — | | | | — | |
Total expenses (waived/reimbursed) recaptured | | | 2,051 | | | | (1,522,574 | ) | | | — | | | | (90,546 | ) | | | (159,874 | ) |
Net expenses | | | 4,972,169 | | | | 426,180 | | | | 5,906,119 | | | | 13,510 | | | | 33,900,869 | |
Net investment income (loss) | | | 9,763,521 | | | | 29,483 | | | | 4,311,920 | | | | 67,941 | | | | 80,846,165 | |
| | | | | | |
Net realized gain (loss) on transactions from: | | | | | | | | | | | | | | | | | | | | |
Investments | | | 8,929,624 | | | | — | | | | 22,929,216 | | | | (48,558 | ) | | | 12,852,693 | |
Futures contracts | | | — | | | | — | | | | 1,245,655 | | | | — | | | | — | |
Written options and swaptions | | | 852,354 | | | | — | | | | (24,732 | ) | | | — | | | | — | |
Swap agreements | | | — | | | | — | | | | (8,276 | ) | | | — | | | | — | |
Foreign currency transactions | | | (8,625 | ) | | | — | | | | (14,312 | ) | | | — | | | | 3,018 | |
TBA short commitments | | | — | | | | — | | | | (47 | ) | | | — | | | | — | |
Net realized gain (loss) | | | 9,773,353 | | | | — | | | | 24,127,504 | | | | (48,558 | ) | | | 12,855,711 | |
| | | | | | |
Net change in unrealized appreciation (depreciation) on: | | | | | | | | | | | | | | | | | | | | |
Investments | | | 27,139,478 | | | | — | | | | 23,593,910 | | | | 23,564 | | | | (18,966,114 | ) |
Futures contracts | | | — | | | | — | | | | 71,304 | | | | — | | | | — | |
Written options and swaptions | | | (138,583 | ) | | | — | | | | 3,841 | | | | — | | | | — | |
Translation of assets and liabilities denominated in foreign currencies | | | 10,960 | | | | — | | | | (8,143 | ) | | | — | | | | (28,594 | ) |
TBA short commitments | | | — | | | | — | | | | 22,735 | | | | — | | | | — | |
Net change in unrealized appreciation (depreciation) | | | 27,011,855 | | | | — | | | | 23,683,647 | | | | 23,564 | | | | (18,994,708 | ) |
Net realized and change in unrealized gain (loss) | | | 36,785,208 | | | | — | | | | 47,811,151 | | | | (24,994 | ) | | | (6,138,997 | ) |
Net increase (decrease) in net assets resulting from operations | | $ | 46,548,729 | | | $ | 29,483 | | | $ | 52,123,071 | | | $ | 42,947 | | | $ | 74,707,168 | |
The Notes to Financial Statements are an integral part of this report.
| | |
| Transamerica Funds | | Annual Report 2014 |
Page 235
STATEMENTS OF OPERATIONS (continued)
For the period and year ended October 31, 2014
| | | | | | | | | | | | | | | | | | | | |
| | | Transamerica
Small Cap
Core | | | Transamerica
Small Cap
Growth | | | Transamerica
Small Cap
Value | | | Transamerica
Small/Mid Cap
Value | | | Transamerica
Strategic
High Income (A) | |
Investment Income: | | | | | | | | | | | | | | | | | | | | |
Dividend income | | $ | 2,177,158 | | | $ | 1,880,309 | | | $ | 13,896,390 | | | $ | 16,098,388 | | | $ | 615,919 | |
Interest income | | | 403 | | | | 1,555 | | | | 2,402 | | | | 1,737 | | | | 462,010 | |
Net income from securities lending | | | 197,134 | | | | 777,997 | | | | 451,444 | | | | 679,539 | | | | 12,029 | |
Withholding taxes on foreign income | | | (4,633 | ) | | | — | | | | — | | | | (72,618 | ) | | | (4,706 | ) |
Total investment income | | | 2,370,062 | | | | 2,659,861 | | | | 14,350,236 | | | | 16,707,046 | | | | 1,085,252 | |
| | | | | | |
Expenses: | | | | | | | | | | | | | | | | | | | | |
Management and advisory fees | | | 994,891 | | | | 4,569,542 | | | | 6,116,392 | | | | 8,402,629 | | | | 150,629 | |
Distribution and service fees: | | | | | | | | | | | | | | | | | | | | |
Class A | | | 755 | | | | 1,936 | | | | 2,605 | | | | 1,398,669 | | | | 1,776 | |
Class B | | | — | | | | — | | | | — | | | | 301,572 | | | | — | |
Class C | | | 3,232 | | | | 5,709 | | | | 8,289 | | | | 3,105,666 | | | | 6,413 | |
Administration fees | | | 31,090 | | | | 139,048 | | | | 180,548 | | | | 271,754 | | | | 5,706 | |
Transfer agent fees: | | | | | | | | | | | | | | | | | | | | |
Class A | | | 246 | | | | 1,437 | | | | 1,980 | | | | 978,455 | | | | 194 | |
Class B | | | — | | | | — | | | | — | | | | 49,354 | | | | — | |
Class C | | | 295 | | | | 596 | | | | 652 | | | | 389,533 | | | | 96 | |
Class I | | | 574 | | | | 734 | | | | 905 | | | | 210,766 | | | | 5,712 | |
Class I2 | | | 9,245 | | | | 41,578 | | | | 53,979 | | | | 1,667 | | | | 1,211 | |
Trustees fees | | | 2,148 | | | | 8,536 | | | | 11,354 | | | | 17,817 | | | | 440 | |
Audit and tax fees | | | 17,289 | | | | 25,189 | | | | 29,077 | | | | 36,307 | | | | 17,688 | |
Custody fees | | | 35,782 | | | | 63,309 | | | | 78,659 | | | | 145,864 | | | | 14,909 | |
Legal fees | | | 4,105 | | | | 21,612 | | | | 28,028 | | | | 40,358 | | | | 1,392 | |
Printing and shareholder reports fees | | | 28,851 | | | | 26,913 | | | | 32,804 | | | | 164,862 | | | | 3,516 | |
Registration fees | | | 81,502 | | | | 38,812 | | | | 48,244 | | | | 83,608 | | | | 59,561 | |
Other | | | 4,621 | | | | 24,747 | | | | 31,713 | | | | 45,593 | | | | 2,590 | |
Total expenses | | | 1,214,626 | | | | 4,969,698 | | | | 6,625,229 | | | | 15,644,474 | | | | 271,833 | |
Fund expenses (waived/reimbursed) recaptured | | | — | | | | — | | | | — | | | | — | | | | (39,616 | ) |
Class expenses (waived/reimbursed) recaptured: | | | | | | | | | | | | | | | | | | | | |
Class A | | | (4 | ) | | | — | | | | — | | | | — | | | | (194 | ) |
Class C | | | (21 | ) | | | — | | | | — | | | | — | | | | (96 | ) |
Class I | | | (163 | ) | | | — | | | | — | | | | — | | | | (5,712 | ) |
Class I2 | | | — | | | | — | | | | — | | | | — | | | | (1,211 | ) |
Total expenses (waived/reimbursed) recaptured | | | (188 | ) | | | — | | | | — | | | | — | | | | (46,829 | ) |
Net expenses | | | 1,214,438 | | | | 4,969,698 | | | | 6,625,229 | | | | 15,644,474 | | | | 225,004 | |
Net investment income (loss) | | | 1,155,624 | | | | (2,309,837 | ) | | | 7,725,007 | | | | 1,062,572 | | | | 860,248 | |
| | | | | | |
Net realized gain (loss) on transactions from: | | | | | | | | | | | | | | | | | | | | |
Investments | | | 4,401,407 | | | | 51,767,223 | | | | 57,211,344 | | | | 102,933,991 | | | | 427,759 | |
Foreign currency transactions | | | (35 | ) | | | — | | | | — | | | | (22 | ) | | | (16 | ) |
Net realized gain (loss) | | | 4,401,372 | | | | 51,767,223 | | | | 57,211,344 | | | | 102,933,969 | | | | 427,743 | |
| | | | | | |
Net change in unrealized appreciation (depreciation) on: | | | | | | | | | | | | | | | | | | | | |
Investments | | | 4,937,099 | | | | (27,025,684 | ) | | | (28,631,716 | ) | | | (22,145,371 | ) | | | 252,550 | |
Net change in unrealized appreciation (depreciation) | | | 4,937,099 | | | | (27,025,684 | ) | | | (28,631,716 | ) | | | (22,145,371 | ) | | | 252,550 | |
Net realized and change in unrealized gain (loss) | | | 9,338,471 | | | | 24,741,539 | | | | 28,579,628 | | | | 80,788,598 | | | | 680,293 | |
Net increase (decrease) in net assets resulting from operations | | $ | 10,494,095 | | | $ | 22,431,702 | | | $ | 36,304,635 | | | $ | 81,851,170 | | | $ | 1,540,541 | |
| (A) | Commenced operations on March 1, 2014. |
The Notes to Financial Statements are an integral part of this report.
| | |
| Transamerica Funds | | Annual Report 2014 |
Page 236
STATEMENTS OF OPERATIONS (continued)
For the year ended October 31, 2014
| | | | | | | | | | | | | | | | |
| | | Transamerica
Tactical
Allocation | | | Transamerica
Tactical Income | | | Transamerica
Tactical
Rotation | | | Transamerica
US Growth (A) | |
Investment Income: | | | | | | | | | | | | | | | | |
Dividend income | | $ | 323,565 | | | $ | 41,570,094 | | | $ | 323,209 | | | $ | 18,104,964 | |
Interest income | | | 30 | | | | 989 | | | | 108 | | | | 772 | |
Net income from securities lending | | | 58,270 | | | | 2,412,647 | | | | 22,360 | | | | 114,749 | |
Withholding taxes on foreign income | | | — | | | | — | | | | — | | | | (58,912 | ) |
Total investment income | | | 381,865 | | | | 43,983,730 | | | | 345,677 | | | | 18,161,573 | |
| | | | | |
Expenses: | | | | | | | | | | | | | | | | |
Management and advisory fees | | | 66,899 | | | | 4,604,236 | | | | 104,739 | | | | 8,947,646 | |
Distribution and service fees: | | | | | | | | | | | | | | | | |
Class A | | | 12,482 | | | | 821,883 | | | | 25,678 | | | | 1,220,330 | |
Class B | | | — | | | | — | | | | — | | | | 179,790 | |
Class C | | | 63,407 | | | | 4,314,880 | | | | 58,574 | | | | 481,907 | |
Administration fees | | | 3,041 | | | | 245,046 | | | | 4,761 | | | | 321,259 | |
Transfer agent fees: | | | | | | | | | | | | | | | | |
Class A | | | 6,099 | | | | 272,109 | | | | 13,260 | | | | 1,124,641 | |
Class B | | | — | | | | — | | | | — | | | | 62,921 | |
Class C | | | 7,169 | | | | 397,150 | | | | 9,808 | | | | 140,337 | |
Class I | | | 1,262 | | | | 254,635 | | | | 3,703 | | | | 311,499 | |
Class I2 | | | — | | | | — | | | | — | | | | 32,612 | |
Class T | | | — | | | | — | | | | — | | | | 104,189 | |
Trustees fees | | | 163 | | | | 16,670 | | | | 271 | | | | 22,085 | |
Audit and tax fees | | | 19,366 | | | | 38,202 | | | | 18,591 | | | | 40,609 | |
Custody fees | | | 9,788 | | | | 31,029 | | | | 10,499 | | | | 182,580 | |
Legal fees | | | 479 | | | | 35,486 | | | | 743 | | | | 41,345 | |
Printing and shareholder reports fees | | | — | | | | 161,346 | | | | 1,027 | | | | 101,659 | |
Registration fees | | | 31,989 | | | | 53,895 | | | | 32,412 | | | | 73,404 | |
Other | | | 1,984 | | | | 45,410 | | | | 2,098 | | | | 59,357 | |
Total expenses | | | 224,128 | | | | 11,291,977 | | | | 286,164 | | | | 13,448,170 | |
Fund expenses (waived/reimbursed) recaptured | | | (30,320 | ) | | | — | | | | (13,272 | ) | | | — | |
Class expenses (waived/reimbursed) recaptured: | | | | | | | | | | | | | | | | |
Class A | | | (6,099 | ) | | | (54,697 | ) | | | (13,260 | ) | | | — | |
Class B | | | — | | | | — | | | | — | | | | 10,475 | |
Class C | | | (7,169 | ) | | | — | | | | (9,808 | ) | | | — | |
Class I | | | (1,262 | ) | | | — | | | | (3,703 | ) | | | — | |
Total expenses (waived/reimbursed) recaptured | | | (44,850 | ) | | | (54,697 | ) | | | (40,043 | ) | | | 10,475 | |
Net expenses | | | 179,278 | | | | 11,237,280 | | | | 246,121 | | | | 13,458,645 | |
Net investment income (loss) | | | 202,587 | | | | 32,746,450 | | | | 99,556 | | | | 4,702,928 | |
| | | | | |
Net realized gain (loss) on transactions from: | | | | | | | | | | | | | | | | |
Investments | | | 593,953 | | | | 46,787,395 | | | | 859,488 | | | | 417,554,891 | |
Foreign currency transactions | | | — | | | | — | | | | — | | | | 34 | |
Net realized gain (loss) | | | 593,953 | | | | 46,787,395 | | | | 859,488 | | | | 417,554,925 | |
| | | | | |
Net change in unrealized appreciation (depreciation) on: | | | | | | | | | | | | | | | | |
Investments | | | (497,837 | ) | | | (20,881,142 | ) | | | 106,774 | | | | (243,780,159 | ) |
Translation of assets and liabilities denominated in foreign currencies | | | — | | | | — | | | | — | | | | (29,456 | ) |
Net change in unrealized appreciation (depreciation) | | | (497,837 | ) | | | (20,881,142 | ) | | | 106,774 | | | | (243,809,615 | ) |
Net realized and change in unrealized gain (loss) | | | 96,116 | | | | 25,906,253 | | | | 966,262 | | | | 173,745,310 | |
Net increase (decrease) in net assets resulting from operations | | $ | 298,703 | | | $ | 58,652,703 | | | $ | 1,065,818 | | | $ | 178,448,238 | |
| (A) | Formerly, Transamerica Diversified Equity. |
The Notes to Financial Statements are an integral part of this report.
| | |
| Transamerica Funds | | Annual Report 2014 |
Page 237
STATEMENTS OF CHANGES IN NET ASSETS
For the periods and years ended:
| | | | | | | | | | | | | | | | | | | | |
| | |
Transamerica Capital Growth | | |
Transamerica Concentrated Growth (A) | |
| | | October 31, 2014 | | | October 31, 2013 | | | October 31, 2014 (B) | | | December 31, 2013 (C) | | | December 31, 2012 (C) | |
From operations: | | | | | | | | | | | | | | | | | | | | |
Net investment income (loss) | | $ | (3,146,101 | ) | | $ | 1,252,016 | | | $ | 707,180 | | | $ | (2,214 | ) | | $ | 2,628 | |
Net realized gain (loss) | | | 43,019,543 | | | | 21,150,562 | | | | 991,369 | | | | 413,282 | | | | 61,007 | |
Net change in unrealized appreciation (depreciation) | | | 89,236,910 | | | | 228,456,042 | | | | 12,284,158 | | | | 2,910,000 | | | | 607,782 | |
Net increase (decrease) in net assets resulting from operations | | | 129,110,352 | | | | 250,858,620 | | | | 13,982,707 | | | | 3,321,068 | | | | 671,417 | |
| | | | | | |
Distributions to shareholders: | | | | | | | | | | | | | | | | | | | | |
Net investment income: | | | | | | | | | | | | | | | | | | | | |
Fund Level | | | — | | | | — | | | | — | | | | (3,382 | ) | | | (2,880 | ) |
Class I | | | — | | | | (414,609 | ) | | | — | | | | — | | | | — | |
Class I2 | | | — | | | | (4,858,470 | ) | | | — | | | | — | | | | — | |
Total distributions from net investment income | | | — | | | | (5,273,079 | ) | | | — | | | | (3,382 | ) | | | (2,880 | ) |
Net realized gains: | | | | | | | | | | | | | | | | | | | | |
Fund Level | | | — | | | | — | | | | — | | | | (293,304 | ) | | | (23,593 | ) |
Class A | | | (2,081,467 | ) | | | (1,530,417 | ) | | | — | | | | — | | | | — | |
Class B | | | (145,269 | ) | | | (139,179 | ) | | | — | | | | — | | | | — | |
Class C | | | (760,899 | ) | | | (494,636 | ) | | | — | | | | — | | | | — | |
Class I | | | (2,778,746 | ) | | | (1,819,062 | ) | | | (377,911 | ) | | | — | | | | — | |
Class I2 | | | (15,844,892 | ) | | | (18,146,877 | ) | | | — | | | | — | | | | — | |
Total distributions from net realized gains | | | (21,611,273 | ) | | | (22,130,171 | ) | | | (377,911 | ) | | | (293,304 | ) | | | (23,593 | ) |
Total distributions to shareholders | | | (21,611,273 | ) | | | (27,403,250 | ) | | | (377,911 | ) | | | (296,686 | ) | | | (26,473 | ) |
| | | | | | |
Capital share transactions: | | | | | | | | | | | | | | | | | | | | |
Proceeds from shares sold: | | | | | | | | | | | | | | | | | | | | |
Fund Level | | | — | | | | — | | | | 176,841 | | | | 489,107 | | | | 7,365,038 | |
Class A | | | 56,847,940 | | | | 13,760,514 | | | | 462,262 | | | | — | | | | — | |
Class B | | | 204,170 | | | | 406,133 | | | | — | | | | — | | | | — | |
Class C | | | 26,513,720 | | | | 5,432,545 | | | | 264,344 | | | | — | | | | — | |
Class I | | | 98,954,375 | | | | 17,805,329 | | | | 6,252,828 | | | | — | | | | — | |
Class I2 | | | 390,541,414 | | | | 18,632,003 | | | | 345,890,669 | | | | — | | | | — | |
| | | | 573,061,619 | | | | 56,036,524 | | | | 353,046,944 | | | | 489,107 | | | | 7,365,038 | |
Issued from fund acquisition: | | | | | | | | | | | | | | | | | | | | |
Class I | | | — | | | | — | | | | 9,903,534 | | | | — | | | | — | |
Dividends and distributions reinvested: | | | | | | | | | | | | | | | | | | | | |
Fund Level | | | — | | | | — | | | | 370,421 | | | | 290,954 | | | | 24,168 | |
Class A | | | 1,996,249 | | | | 1,494,049 | | | | — | | | | — | | | | — | |
Class B | | | 139,326 | | | | 134,512 | | | | — | | | | — | | | | — | |
Class C | | | 656,374 | | | | 444,699 | | | | — | | | | — | | | | — | |
Class I | | | 2,365,528 | | | | 1,856,211 | | | | — | | | | — | | | | — | |
Class I2 | | | 15,844,893 | | | | 23,005,347 | | | | — | | | | — | | | | — | |
| | | | 21,002,370 | | | | 26,934,818 | | | | | | | | | | | | | |
Redeemed due to acquisition: | | | | | | | | | | | | | | | | | | | | |
Fund Level | | | — | | | | — | | | | (9,903,534 | ) | | | — | | | | — | |
Cost of shares redeemed: | | | | | | | | | | | | | | | | | | | | |
Fund Level | | | — | | | | — | | | | (749,632 | ) | | | (363,523 | ) | | | (514,433 | ) |
Class A | | | (38,249,668 | ) | | | (17,737,159 | ) | | | (33,549 | ) | | | — | | | | — | |
Class B | | | (626,908 | ) | | | (839,159 | ) | | | — | | | | — | | | | — | |
Class C | | | (8,611,228 | ) | | | (5,273,413 | ) | | | — | | | | — | | | | — | |
Class I | | | (63,277,857 | ) | | | (23,628,247 | ) | | | (571,460 | ) | | | — | | | | — | |
Class I2 | | | (149,575,850 | ) | | | (238,009,204 | ) | | | (5,588,234 | ) | | | — | | | | — | |
| | | | (260,341,511 | ) | | | (285,487,182 | ) | | | (6,942,875 | ) | | | (363,523 | ) | | | (514,433 | ) |
Automatic conversions: | | | | | | | | | | | | | | | | | | | | |
Class A | | | 1,459,868 | | | | 1,097,663 | | | | — | | | | — | | | | — | |
Class B | | | (1,459,868 | ) | | | (1,097,663 | ) | | | — | | | | — | | | | — | |
| | | | — | | | | — | | | | — | | | | — | | | | — | |
| | | | | | |
Net increase (decrease) in net assets resulting from capital share transactions | | | 333,722,478 | | | | (202,515,840 | ) | | | 346,474,490 | | | | 416,538 | | | | 6,874,773 | |
Net increase (decrease) in net assets | | | 441,221,557 | | | | 20,939,530 | | | | 360,079,286 | | | | 3,440,920 | | | | 7,519,717 | |
| | | | | | |
Net assets: | | | | | | | | | | | | | | | | | | | | |
Beginning of period/year | | | 737,844,801 | | | | 716,905,271 | | | | 13,761,252 | | | | 10,320,332 | | | | 2,800,615 | |
End of period/year | | $ | 1,179,066,358 | | | $ | 737,844,801 | | | $ | 373,840,538 | | | $ | 13,761,252 | | | $ | 10,320,332 | |
Undistributed (distributions in excess of) net investment income (loss) | | $ | (2,724,226 | ) | | $ | — | | | $ | 716,412 | | | $ | — | | | $ | — | |
The Notes to Financial Statements are an integral part of this report.
| | |
| Transamerica Funds | | Annual Report 2014 |
Page 238
STATEMENTS OF CHANGES IN NET ASSETS (continued)
For the periods and years ended:
| | | | | | | | | | | | | | | | | | | | |
| | |
Transamerica Capital Growth | | |
Transamerica Concentrated Growth (A) | |
| | | October 31, 2014 | | | October 31, 2013 | | | October 31, 2014 (B) | | | December 31, 2013 (C) | | | December 31, 2012 (C) | |
Capital share transactions - shares: | | | | | | | | | | | | | | | | | | | | |
Shares issued: | | | | | | | | | | | | | | | | | | | | |
Fund Level | | | — | | | | — | | | | 11,501 | | | | 36,709 | | | | 611,391 | |
Class A | | | 2,460,389 | | | | 736,697 | | | | 29,524 | | | | — | | | | — | |
Class B | | | 9,828 | | | | 25,736 | | | | — | | | | — | | | | — | |
Class C | | | 1,287,558 | | | | 312,545 | | | | 16,981 | | | | — | | | | — | |
Class I | | | 4,255,489 | | | | 930,310 | | | | 396,020 | | | | — | | | | — | |
Class I2 | | | 23,744,448 | | | | 1,544,176 | | | | 22,085,210 | | | | — | | | | — | |
| | | | 31,757,712 | | | | 3,549,464 | | | | 22,527,735 | | | | 36,709 | | | | 611,391 | |
Shares issued on fund acquisition: | | | | | | | | | | | | | | | | | | | | |
Class I | | | — | | | | — | | | | 861,025 | | | | — | | | | — | |
Shares issued-reinvested from dividends and distributions: | | | | | | | | | | | | | | | | | | | | |
Fund Level | | | — | | | | — | | | | 23,929 | | | | 20,038 | | | | 1,979 | |
Class A | | | 89,198 | | | | 95,102 | | | | — | | | | — | | | | — | |
Class B | | | 6,925 | | | | 9,433 | | | | — | | | | — | | | | — | |
Class C | | | 32,558 | | | | 31,185 | | | | — | | | | — | | | | — | |
Class I | | | 103,751 | | | | 116,596 | | | | — | | | | — | | | | — | |
Class I2 | | | 1,026,889 | | | | 2,118,356 | | | | — | | | | — | | | | — | |
| | | | 1,259,321 | | | | 2,370,672 | | | | 23,929 | | | | 20,038 | | | | 1,979 | |
Shares redeemed due to acquisition: | | | | | | | | | | | | | | | | | | | | |
Fund Level | | | — | | | | — | | | | (861,025 | ) | | | — | | | | — | |
Shares redeemed: | | | | | | | | | | | | | | | | | | | | |
Fund Level | | | — | | | | — | | | | (47,628 | ) | | | (26,638 | ) | | | (44,281 | ) |
Class A | | | (1,665,952 | ) | | | (1,034,466 | ) | | | (2,140 | ) | | | — | | | | — | |
Class B | | | (30,894 | ) | | | (53,494 | ) | | | — | | | | — | | | | — | |
Class C | | | (414,991 | ) | | | (338,280 | ) | | | — | | | | — | | | | — | |
Class I | | | (2,719,996 | ) | | | (1,324,163 | ) | | | (36,360 | ) | | | — | | | | — | |
Class I2 | | | (9,444,270 | ) | | | (19,954,282 | ) | | | (352,590 | ) | | | — | | | | — | |
| | | | (14,276,103 | ) | | | (22,704,685 | ) | | | (438,718 | ) | | | (26,638 | ) | | | (44,281 | ) |
Automatic conversions: | | | | | | | | | | | | | | | | | | | | |
Class A | | | 63,646 | | | | 63,975 | | | | — | | | | — | | | | — | |
Class B | | | (71,016 | ) | | | (70,611 | ) | | | — | | | | — | | | | — | |
| | | | (7,370 | ) | | | (6,636 | ) | | | — | | | | — | | | | — | |
| | | | | | |
Net increase (decrease) in shares outstanding: | | | | | | | | | | | | | | | | | | | | |
Fund Level | | | — | | | | — | | | | (873,223 | ) | | | 30,109 | | | | 569,089 | |
Class A | | | 947,281 | | | | (138,692 | ) | | | 27,384 | | | | — | | | | — | |
Class B | | | (85,157 | ) | | | (88,936 | ) | | | — | | | | — | | | | — | |
Class C | | | 905,125 | | | | 5,450 | | | | 16,981 | | | | — | | | | — | |
Class I | | | 1,639,244 | | | | (277,257 | ) | | | 1,220,685 | | | | — | | | | — | |
Class I2 | | | 15,327,067 | | | | (16,291,750 | ) | | | 21,732,620 | | | | — | | | | — | |
| | | | 18,733,560 | | | | (16,791,185 | ) | | | 22,124,447 | | | | 30,109 | | | | 569,089 | |
| (A) | Formerly, The Torray Resolute Fund. |
| (B) | Effective at the close of business on February 28, 2014, the fiscal year end of the Fund changed to October 31. The Statement of Changes in Net Assets represents activity for the ten months of January 1, 2014 – October 31, 2014. Refer to the Notes to Financial Statements for details. |
| (C) | Prior to January 1, 2014, the Statements of Changes in Net Assets were audited by another independent registered public accounting firm. |
The Notes to Financial Statements are an integral part of this report.
| | |
| Transamerica Funds | | Annual Report 2014 |
Page 239
STATEMENTS OF CHANGES IN NET ASSETS (continued)
For the periods and years ended:
| | | | | | | | | | | | | | | | |
| | |
Transamerica Dividend Focused | | | Transamerica Emerging Markets Debt | |
| | | October 31, 2014 | | | October 31, 2013 (A) | | | October 31, 2014 | | | October 31, 2013 | |
From operations: | | | | | | | | | | | | | | | | |
Net investment income (loss) | | $ | 21,712,631 | | | $ | 15,514,784 | | | $ | 33,806,609 | | | $ | 40,731,202 | |
Net realized gain (loss) | | | 49,179,546 | | | | 7,966,064 | | | | (19,013,549 | ) | | | (18,903,673 | ) |
Net change in unrealized appreciation (depreciation) | | | 79,639,634 | | | | 166,845,843 | | | | 11,110,255 | | | | (31,684,002 | ) |
Net increase (decrease) in net assets resulting from operations | | | 150,531,811 | | | | 190,326,691 | | | | 25,903,315 | | | | (9,856,473 | ) |
| | | | | |
Distributions to shareholders: | | | | | | | | | | | | | | | | |
Net investment income: | | | | | | | | | | | | | | | | |
Class A | | | (493,242 | ) | | | (7,753 | ) | | | (5,052,223 | ) | | | (5,102,239 | ) |
Class C | | | (20,663 | ) | | | (5,285 | ) | | | (1,295,021 | ) | | | (838,968 | ) |
Class I | | | (71,747 | ) | | | (15,822 | ) | | | (13,439,260 | ) | | | (3,993,888 | ) |
Class I2 | | | (20,888,189 | ) | | | (13,934,773 | ) | | | (12,705,101 | ) | | | (23,246,897 | ) |
Total distributions from net investment income | | | (21,473,841 | ) | | | (13,963,633 | ) | | | (32,491,605 | ) | | | (33,181,992 | ) |
Net realized gains: | | | | | | | | | | | | | | | | |
Class A | | | (11,141 | ) | | | — | | | | — | | | | (2,255,450 | ) |
Class C | | | (11,903 | ) | | | — | | | | — | | | | (280,946 | ) |
Class I | | | (13,662 | ) | | | — | | | | — | | | | (1,051,779 | ) |
Class I2 | | | (7,935,194 | ) | | | — | | | | — | | | | (11,406,660 | ) |
Total distributions from net realized gains | | | (7,971,900 | ) | | | — | | | | — | | | | (14,994,835 | ) |
Total distributions to shareholders | | | (29,445,741 | ) | | | (13,963,633 | ) | | | (32,491,605 | ) | | | (48,176,827 | ) |
| | | | | |
Capital share transactions: | | | | | | | | | | | | | | | | |
Proceeds from shares sold: | | | | | | | | | | | | | | | | |
Class A | | | 66,769,358 | | | | 1,687,850 | | | | 60,824,303 | | | | 199,752,472 | |
Class C | | | 3,252,271 | | | | 1,217,386 | | | | 9,291,107 | | | | 28,974,971 | |
Class I | | | 4,453,396 | | | | 1,889,290 | | | | 286,885,850 | | | | 200,189,453 | |
Class I2 | | | 426,493,950 | | | | 975,076,469 | | | | 21,901,688 | | | | 85,050,900 | |
| | | | 500,968,975 | | | | 979,870,995 | | | | 378,902,948 | | | | 513,967,796 | |
Dividends and distributions reinvested: | | | | | | | | | | | | | | | | |
Class A | | | 503,571 | | | | 7,701 | | | | 4,781,683 | | | | 7,018,704 | |
Class C | | | 32,324 | | | | 5,285 | | | | 1,095,269 | | | | 881,693 | |
Class I | | | 85,409 | | | | 15,822 | | | | 12,019,253 | | | | 3,477,805 | |
Class I2 | | | 28,823,383 | | | | 13,934,773 | | | | 12,705,101 | | | | 34,653,557 | |
| | | | 29,444,687 | | | | 13,963,581 | | | | 30,601,306 | | | | 46,031,759 | |
Cost of shares redeemed: | | | | | | | | | | | | | | | | |
Class A | | | (7,127,885 | ) | | | (542,220 | ) | | | (111,939,621 | ) | | | (127,182,355 | ) |
Class C | | | (424,806 | ) | | | (29,705 | ) | | | (13,334,411 | ) | | | (7,542,455 | ) |
Class I | | | (360,262 | ) | | | (367,253 | ) | | | (94,626,856 | ) | | | (108,612,869 | ) |
Class I2 | | | (194,004,001 | ) | | | (141,733,627 | ) | | | (224,316,463 | ) | | | (247,977,045 | ) |
| | | | (201,916,954 | ) | | | (142,672,805 | ) | | | (444,217,351 | ) | | | (491,314,724 | ) |
| | | | | |
Net increase (decrease) in net assets resulting from capital share transactions | | | 328,496,708 | | | | 851,161,771 | | | | (34,713,097 | ) | | | 68,684,831 | |
Net increase (decrease) in net assets | | | 449,582,778 | | | | 1,027,524,829 | | | | (41,301,387 | ) | | | 10,651,531 | |
| | | | | |
Net assets: | | | | | | | | | | | | | | | | |
Beginning of period/year | | | 1,027,524,829 | | | | — | | | | 633,767,637 | | | | 623,116,106 | |
End of period/year | | $ | 1,477,107,607 | | | $ | 1,027,524,829 | | | $ | 592,466,250 | | | $ | 633,767,637 | |
Undistributed (distributions in excess of) net investment income (loss) | | $ | 1,836,793 | | | $ | 1,598,003 | | | $ | 1,196,143 | | | $ | 6,337,250 | |
| | | | | |
Capital share transactions - shares: | | | | | | | | | | | | | | | | |
Shares issued: | | | | | | | | | | | | | | | | |
Class A | | | 5,170,553 | | | | 149,971 | | | | 5,638,083 | | | | 17,579,315 | |
Class C | | | 254,246 | | | | 110,535 | | | | 861,404 | | | | 2,534,373 | |
Class I | | | 351,499 | | | | 175,331 | | | | 26,961,333 | | | | 17,666,138 | |
Class I2 | | | 32,725,036 | | | | 96,711,870 | | | | 2,075,401 | | | | 7,317,501 | |
| | | | 38,501,334 | | | | 97,147,707 | | | | 35,536,221 | | | | 45,097,327 | |
The Notes to Financial Statements are an integral part of this report.
| | |
| Transamerica Funds | | Annual Report 2014 |
Page 240
STATEMENTS OF CHANGES IN NET ASSETS (continued)
For the periods and years ended:
| | | | | | | | | | | | | | | | |
| | |
Transamerica Dividend Focused | | | Transamerica Emerging Markets Debt | |
| | | October 31, 2014 | | | October 31, 2013 (A) | | | October 31, 2014 | | | October 31, 2013 | |
Shares issued-reinvested from dividends and distributions: | | | | | | | | | | | | | | | | |
Class A | | | 38,326 | | | | 683 | | | | 450,089 | | | | 625,834 | |
Class C | | | 2,564 | | | | 467 | | | | 103,284 | | | | 79,270 | |
Class I | | | 6,656 | | | | 1,409 | | | | 1,117,980 | | | | 314,041 | |
Class I2 | | | 2,275,426 | | | | 1,254,768 | | | | 1,199,994 | | | | 3,076,060 | |
| | | | 2,322,972 | | | | 1,257,327 | | | | 2,871,347 | | | | 4,095,205 | |
Shares redeemed: | | | | | | | | | | | | | | | | |
Class A | | | (547,282 | ) | | | (46,703 | ) | | | (10,479,621 | ) | | | (11,480,882 | ) |
Class C | | | (33,410 | ) | | | (2,556 | ) | | | (1,256,970 | ) | | | (699,828 | ) |
Class I | | | (28,569 | ) | | | (33,636 | ) | | | (8,831,612 | ) | | | (9,679,319 | ) |
Class I2 | | | (15,373,793 | ) | | | (12,586,459 | ) | | | (21,283,435 | ) | | | (22,797,436 | ) |
| | | | (15,983,054 | ) | | | (12,669,354 | ) | | | (41,851,638 | ) | | | (44,657,465 | ) |
| | | | | |
Net increase (decrease) in shares outstanding: | | | | | | | | | | | | | | | | |
Class A | | | 4,661,597 | | | | 103,951 | | | | (4,391,449 | ) | | | 6,724,267 | |
Class C | | | 223,400 | | | | 108,446 | | | | (292,282 | ) | | | 1,913,815 | |
Class I | | | 329,586 | | | | 143,104 | | | | 19,247,701 | | | | 8,300,860 | |
Class I2 | | | 19,626,669 | | | | 85,380,179 | | | | (18,008,040 | ) | | | (12,403,875 | ) |
| | | | 24,841,252 | | | | 85,735,680 | | | | (3,444,070 | ) | | | 4,535,067 | |
| (A) | Commenced operations on January 4, 2013. |
The Notes to Financial Statements are an integral part of this report.
| | |
| Transamerica Funds | | Annual Report 2014 |
Page 241
STATEMENTS OF CHANGES IN NET ASSETS (continued)
For the years ended:
| | | | | | | | | | | | | | | | |
| | |
Transamerica Emerging Markets Equity | | | Transamerica Enhanced Muni | |
| | | October 31, 2014 | | | October 31, 2013 | | | October 31, 2014 | | | October 31, 2013 (A) | |
From operations: | | | | | | | | | | | | | | | | |
Net investment income (loss) | | $ | 3,181,848 | | | $ | 3,242,898 | | | $ | 752,904 | | | $ | 220,501 | |
Net realized gain (loss) | | | 445,864 | | | | (3,180,413 | ) | | | 1,020,734 | | | | 20,181 | |
Net change in unrealized appreciation (depreciation) | | | (5,270,268 | ) | | | 14,498,443 | | | | 1,491,584 | | | | (64,079 | ) |
Net increase (decrease) in net assets resulting from operations | | | (1,642,556 | ) | | | 14,560,928 | | | | 3,265,222 | | | | 176,603 | |
| | | | | |
Distributions to shareholders: | | | | | | | | | | | | | | | | |
Net investment income: | | | | | | | | | | | | | | | | |
Class A | | | (8,906 | ) | | | (835 | ) | | | (319,114 | ) | | | (78,248 | ) |
Class C | | | (6,643 | ) | | | — | | | | (98,787 | ) | | | (19,225 | ) |
Class I | | | (5,913 | ) | | | (1,251 | ) | | | (338,642 | ) | | | (133,926 | ) |
Class I2 | | | (2,879,766 | ) | | | (777,953 | ) | | | — | | | | — | |
Total distributions from net investment income | | | (2,901,228 | ) | | | (780,039 | ) | | | (756,543 | ) | | | (231,399 | ) |
Net realized gains: | | | | | | | | | | | | | | | | |
Class A | | | — | | | | — | | | | — | | | | — | |
Class C | | | — | | | | — | | | | — | | | | — | |
Class I | | | — | | | | — | | | | — | | | | — | |
Class I2 | | | — | | | | — | | | | — | | | | — | |
Total distributions from net realized gains | | | — | | | | — | | | | — | | | | — | |
Total distributions to shareholders | | | (2,901,228 | ) | | | (780,039 | ) | | | (756,543 | ) | | | (231,399 | ) |
| | | | | |
Capital share transactions: | | | | | | | | | | | | | | | | |
Proceeds from shares sold: | | | | | | | | | | | | | | | | |
Class A | | | 778,984 | | | | 546,045 | | | | 31,755,448 | | | | 7,973,706 | |
Class C | | | 657,282 | | | | 602,881 | | | | 8,303,538 | | | | 2,064,192 | |
Class I | | | 839,074 | | | | 469,604 | | | | 15,829,734 | | | | 12,848,497 | |
Class I2 | | | 77,941,637 | | | | 112,493,513 | | | | — | | | | — | |
| | | | 80,216,977 | | | | 114,112,043 | | | | 55,888,720 | | | | 22,886,395 | |
Dividends and distributions reinvested: | | | | | | | | | | | | | | | | |
Class A | | | 8,906 | | | | 835 | | | | 304,764 | | | | 72,796 | |
Class C | | | 6,643 | | | | — | | | | 83,295 | | | | 17,748 | |
Class I | | | 5,913 | | | | 1,251 | | | | 334,660 | | | | 131,713 | |
Class I2 | | | 2,879,766 | | | | 777,953 | | | | — | | | | — | |
| | | | 2,901,228 | | | | 780,039 | | | | 722,719 | | | | 222,257 | |
Cost of shares redeemed: | | | | | | | | | | | | | | | | |
Class A | | | (86,240 | ) | | | (92,166 | ) | | | (3,292,547 | ) | | | (1,812,300 | ) |
Class C | | | (137,805 | ) | | | (11,720 | ) | | | (660,265 | ) | | | (314,617 | ) |
Class I | | | (196,245 | ) | | | (262,066 | ) | | | (1,876,940 | ) | | | (6,276,109 | ) |
Class I2 | | | (54,917,222 | ) | | | (13,859,813 | ) | | | — | | | | — | |
| | | | (55,337,512 | ) | | | (14,225,765 | ) | | | (5,829,752 | ) | | | (8,403,026 | ) |
| | | | | |
Net increase (decrease) in net assets resulting from capital share transactions | | | 27,780,693 | | | | 100,666,317 | | | | 50,781,687 | | | | 14,705,626 | |
Net increase (decrease) in net assets | | | 23,236,909 | | | | 114,447,206 | | | | 53,290,366 | | | | 14,650,830 | |
| | | | | |
Net assets: | | | | | | | | | | | | | | | | |
Beginning of year | | | 222,487,342 | | | | 108,040,136 | | | | 14,650,830 | | | | — | |
End of year | | $ | 245,724,251 | | | $ | 222,487,342 | | | $ | 67,941,196 | | | $ | 14,650,830 | |
Undistributed (distributions in excess of) net investment income (loss) | | $ | 2,971,376 | | | $ | 2,865,168 | | | $ | 2,746 | | | $ | 6,385 | |
| | | | | |
Capital share transactions - shares: | | | | | | | | | | | | | | | | |
Shares issued: | | | | | | | | | | | | | | | | |
Class A | | | 76,170 | | | | 54,862 | | | | 2,901,035 | | | | 770,305 | |
Class C | | | 65,101 | | | | 62,943 | | | | 775,285 | | | | 199,980 | |
Class I | | | 82,256 | | | | 45,972 | | | | 1,470,585 | | | | 1,233,436 | |
Class I2 | | | 7,618,026 | | | | 11,067,191 | | | | — | | | | — | |
| | | | 7,841,553 | | | | 11,230,968 | | | | 5,146,905 | | | | 2,203,721 | |
The Notes to Financial Statements are an integral part of this report.
| | |
| Transamerica Funds | | Annual Report 2014 |
Page 242
STATEMENTS OF CHANGES IN NET ASSETS (continued)
For the years ended:
| | | | | | | | | | | | | | | | |
| | |
Transamerica Emerging Markets Equity | | | Transamerica Enhanced Muni | |
| | | October 31, 2014 | | | October 31, 2013 | | | October 31, 2014 | | | October 31, 2013 (A) | |
Shares issued-reinvested from dividends and distributions: | | | | | | | | | | | | | | | | |
Class A | | | 912 | | | | 84 | | | | 28,072 | | | | 7,055 | |
Class C | | | 683 | | | | — | | | | 7,691 | | | | 1,721 | |
Class I | | | 605 | | | | 126 | | | | 30,850 | | | | 12,672 | |
Class I2 | | | 294,455 | | | | 78,186 | | | | — | | | | — | |
| | | | 296,655 | | | | 78,396 | | | | 66,613 | | | | 21,448 | |
Shares redeemed: | | | | | | | | | | | | | | | | |
Class A | | | (8,637 | ) | | | (9,519 | ) | | | (306,165 | ) | | | (175,639 | ) |
Class C | | | (14,097 | ) | | | (1,178 | ) | | | (60,300 | ) | | | (30,167 | ) |
Class I | | | (19,906 | ) | | | (29,673 | ) | | | (173,520 | ) | | | (609,266 | ) |
Class I2 | | | (5,559,277 | ) | | | (1,399,120 | ) | | | — | | | | — | |
| | | | (5,601,917 | ) | | | (1,439,490 | ) | | | (539,985 | ) | | | (815,072 | ) |
| | | | | |
Net increase (decrease) in shares outstanding: | | | | | | | | | | | | | | | | |
Class A | | | 68,445 | | | | 45,427 | | | | 2,622,942 | | | | 601,721 | |
Class C | | | 51,687 | | | | 61,765 | | | | 722,676 | | | | 171,534 | |
Class I | | | 62,955 | | | | 16,425 | | | | 1,327,915 | | | | 636,842 | |
Class I2 | | | 2,353,204 | | | | 9,746,257 | | | | — | | | | — | |
| | | | 2,536,291 | | | | 9,869,874 | | | | 4,673,533 | | | | 1,410,097 | |
| (A) | Commenced operations on October 31, 2012. |
The Notes to Financial Statements are an integral part of this report.
| | |
| Transamerica Funds | | Annual Report 2014 |
Page 243
STATEMENTS OF CHANGES IN NET ASSETS (continued)
For the period and years ended:
| | | | | | | | | | | | | | | | |
| | |
Transamerica Flexible Income | | | Transamerica
Floating Rate | | | Transamerica
Global Bond | |
| | | October 31, 2014 | | | October 31, 2013 | | | October 31, 2014 (B) | | | October 31, 2014 (C) | |
From operations: | | | | | | | | | | | | | | | | |
Net investment income (loss) | | $ | 17,532,405 | | | $ | 11,370,399 | | | $ | 5,152,739 | | | $ | 2,083,287 | |
Net realized gain (loss) | | | 2,614,424 | | | | 4,476,578 | | | | 401,399 | | | | (2,127,421 | ) |
Net change in unrealized appreciation (depreciation) | | | 2,718,199 | | | | (3,941,600 | ) | | | (2,055,611 | ) | | | (9,773,681 | ) |
Net increase (decrease) in net assets resulting from operations | | | 22,865,028 | | | | 11,905,377 | | | | 3,498,527 | | | | (9,817,815 | ) |
| | | | | |
Distributions to shareholders: | | | | | | | | | | | | | | | | |
Net investment income: | | | | | | | | | | | | | | | | |
Class A | | | (2,421,358 | ) | | | (3,702,894 | ) | | | (19,867 | ) | | | (2,194 | ) |
Class B | | | (92,856 | ) | | | (223,929 | ) | | | — | | | | — | |
Class C | | | (1,634,737 | ) | | | (3,315,312 | ) | | | (33,524 | ) | | | (1,240 | ) |
Class I | | | (1,179,920 | ) | | | (1,972,149 | ) | | | (12,877 | ) | | | (2,934 | ) |
Class I2 | | | (12,828,125 | ) | | | (2,885,897 | ) | | | (5,194,388 | ) | | | (703,399 | ) |
Total distributions from net investment income | | | (18,156,996 | ) | | | (12,100,181 | ) | | | (5,260,656 | ) | | | (709,767 | ) |
Total distributions to shareholders | | | (18,156,996 | ) | | | (12,100,181 | ) | | | (5,260,656 | ) | | | (709,767 | ) |
| | | | | |
Capital share transactions: | | | | | | | | | | | | | | | | |
Proceeds from shares sold: | | | | | | | | | | | | | | | | |
Class A | | | 23,918,469 | | | | 40,284,829 | | | | 2,147,440 | | | | 303,746 | |
Class B | | | 413,004 | | | | 831,725 | | | | — | | | | — | |
Class C | | | 18,506,389 | | | | 43,043,792 | | | | 4,365,683 | | | | 280,962 | |
Class I | | | 25,618,926 | | | | 50,944,316 | | | | 490,725 | | | | 328,198 | |
Class I2 | | | 473,052,249 | | | | 495,080 | | | | 228,824,215 | | | | 250,466,458 | |
| | | | 541,509,037 | | | | 135,599,742 | | | | 235,828,063 | | | | 251,379,364 | |
Dividends and distributions reinvested: | | | | | | | | | | | | | | | | |
Class A | | | 2,179,071 | | | | 3,293,438 | | | | 16,171 | | | | 2,194 | |
Class B | | | 85,077 | | | | 201,200 | | | | — | | | | — | |
Class C | | | 1,081,313 | | | | 1,813,634 | | | | 29,180 | | | | 1,240 | |
Class I | | | 798,837 | | | | 1,183,925 | | | | 10,110 | | | | 2,934 | |
Class I2 | | | 12,828,125 | | | | 2,885,897 | | | | 5,108,435 | | | | 703,399 | |
| | | | 16,972,423 | | | | 9,378,094 | | | | 5,163,896 | | | | 709,767 | |
Cost of shares redeemed: | | | | | | | | | | | | | | | | |
Class A | | | (32,107,888 | ) | | | (42,930,806 | ) | | | (1,516,370 | ) | | | — | |
Class B | | | (1,122,028 | ) | | | (2,195,747 | ) | | | — | | | | — | |
Class C | | | (23,191,557 | ) | | | (54,966,032 | ) | | | (2,683,838 | ) | | | (23,424 | ) |
Class I | | | (17,104,535 | ) | | | (50,313,429 | ) | | | (84,815 | ) | | | (1,269 | ) |
Class I2 | | | (4,777,343 | ) | | | (75,467,479 | ) | | | (18,747,145 | ) | | | (1,852,509 | ) |
| | | | (78,303,351 | ) | | | (225,873,493 | ) | | | (23,032,168 | ) | | | (1,877,202 | ) |
Automatic conversions: | | | | | | | | | | | | | | | | |
Class A | | | 588,405 | | | | 674,074 | | | | — | | | | — | |
Class B | | | (588,405 | ) | | | (674,074 | ) | | | — | | | | — | |
| | | | — | | | | — | | | | — | | | | — | |
| | | | | |
Net increase (decrease) in net assets resulting from capital share transactions | | | 480,178,109 | | | | (80,895,657 | ) | | | 217,959,791 | | | | 250,211,929 | |
Net increase (decrease) in net assets | | | 484,886,141 | | | | (81,090,461 | ) | | | 216,197,662 | | | | 239,684,347 | |
| | | | | |
Net assets: | | | | | | | | | | | | | | | | |
Beginning of period/year | | | 244,479,507 | | | | 325,569,968 | | | | — | | | | — | |
End of period/year | | $ | 729,365,648 | | | $ | 244,479,507 | | | $ | 216,197,662 | | | $ | 239,684,347 | |
Undistributed (distributions in excess of) net investment income (loss) | | $ | 91,229 | | | $ | 334,375 | | | $ | (5,037 | ) | | $ | 80,654 | |
| | | | | |
Capital share transactions - shares: | | | | | | | | | | | | | | | | |
Shares issued: | | | | | | | | | | | | | | | | |
Class A | | | 2,542,481 | | | | 4,264,329 | | | | 214,137 | | | | 30,273 | |
Class B | | | 43,617 | | | | 88,010 | | | | — | | | | — | |
Class C | | | 1,972,695 | | | | 4,590,351 | | | | 435,093 | | | | 28,011 | |
Class I | | | 2,704,896 | | | | 5,372,218 | | | | 48,936 | | | | 32,687 | |
Class I2 | | | 50,209,721 | | | | 52,542 | | | | 22,879,633 | | | | 24,365,726 | |
| | | | 57,473,410 | | | | 14,367,450 | | | | 23,577,799 | | | | 24,456,697 | |
The Notes to Financial Statements are an integral part of this report.
| | |
| Transamerica Funds | | Annual Report 2014 |
Page 244
STATEMENTS OF CHANGES IN NET ASSETS (continued)
For the period and years ended:
| | | | | | | | | | | | | | | | |
| | |
Transamerica Flexible Income | | | Transamerica
Floating Rate | | | Transamerica
Global Bond | |
| | | October 31, 2014 | | | October 31, 2013 | | | October 31, 2014 (B) | | | October 31, 2014 (C) | |
Shares issued-reinvested from dividends and distributions: | | | | | | | | | | | | | | | | |
Class A | | | 231,211 | | | | 351,067 | | | | 1,616 | | | | 214 | |
Class B | | | 9,029 | | | | 21,432 | | | | — | | | | — | |
Class C | | | 115,443 | | | | 194,558 | | | | 2,918 | | | | 121 | |
Class I | | | 84,560 | | | | 125,870 | | | | 1,009 | | | | 287 | |
Class I2 | | | 1,355,549 | | | | 307,132 | | | | 510,146 | | | | 68,747 | |
| | | | 1,795,792 | | | | 1,000,059 | | | | 515,689 | | | | 69,369 | |
Shares redeemed: | | | | | | | | | | | | | | | | |
Class A | | | (3,399,515 | ) | | | (4,570,287 | ) | | | (151,984 | ) | | | — | |
Class B | | | (118,755 | ) | | | (233,263 | ) | | | — | | | | — | |
Class C | | | (2,475,726 | ) | | | (5,890,608 | ) | | | (269,451 | ) | | | (2,279 | ) |
Class I | | | (1,815,002 | ) | | | (5,337,746 | ) | | | (8,457 | ) | | | (123 | ) |
Class I2 | | | (504,831 | ) | | | (8,027,144 | ) | | | (1,866,254 | ) | | | (185,560 | ) |
| | | | (8,313,829 | ) | | | (24,059,048 | ) | | | (2,296,146 | ) | | | (187,962 | ) |
Automatic conversions: | | | | | | | | | | | | | | | | |
Class A | | | 62,396 | | | | 71,662 | | | | — | | | | — | |
Class B | | | (62,396 | ) | | | (71,668 | ) | | | — | | | | — | |
| | | | — | | | | (6 | ) | | | — | | | | — | |
| | | | | |
Net increase (decrease) in shares outstanding: | | | | | | | | | | | | | | | | |
Class A | | | (563,427 | ) | | | 116,771 | | | | 63,769 | | | | 30,487 | |
Class B | | | (128,505 | ) | | | (195,489 | ) | | | — | | | | — | |
Class C | | | (387,588 | ) | | | (1,105,699 | ) | | | 168,560 | | | | 25,853 | |
Class I | | | 974,454 | | | | 160,342 | | | | 41,488 | | | | 32,851 | |
Class I2 | | | 51,060,439 | | | | (7,667,470 | ) | | | 21,523,525 | | | | 24,248,913 | |
| | | | 50,955,373 | | | | (8,691,545 | ) | | | 21,797,342 | | | | 24,338,104 | |
| (B) | Commenced operations on October 31, 2013. |
| (C) | Commenced operations on March 1, 2014. |
The Notes to Financial Statements are an integral part of this report.
| | |
| Transamerica Funds | | Annual Report 2014 |
Page 245
STATEMENTS OF CHANGES IN NET ASSETS (continued)
For the years ended:
| | | | | | | | | | | | | | | | | | | | | | | | |
| | | Transamerica Global Equity (A) | | | Transamerica Growth Opportunities | | | Transamerica High Yield Bond | |
| | | October 31, 2014 | | | October 31, 2013 | | | October 31, 2014 | | | October 31, 2013 | | | October 31, 2014 | | | October 31, 2013 | |
From operations: | | | | | | | | | | | | | | | | | | | | | | | | |
Net investment income (loss) | | $ | 2,610,071 | | | $ | 1,738,475 | | | $ | 134,544 | | | $ | 1,213,387 | | | $ | 64,965,546 | | | $ | 42,329,989 | |
Net realized gain (loss) | | | 37,982,191 | | | | 2,704,138 | | | | 79,396,216 | | | | 30,035,549 | | | | 16,963,379 | | | | 16,338,918 | |
Net change in unrealized appreciation (depreciation) | | | (39,171,248 | ) | | | 33,928,458 | | | | (8,064,410 | ) | | | 157,779,255 | | | | (11,634,145 | ) | | | 180,552 | |
Net increase (decrease) in net assets resulting from operations | | | 1,421,014 | | | | 38,371,071 | | | | 71,466,350 | | | | 189,028,191 | | | | 70,294,780 | | | | 58,849,459 | |
| | | | | | | |
Distributions to shareholders: | | | | | | | | | | | | | | | | | | | | | | | | |
Net investment income: | | | | | | | | | | | | | | | | | | | | | | | | |
Class A | | | (1,148,000 | ) | | | (850,005 | ) | | | — | | | | (257,012 | ) | | | (16,889,594 | ) | | | (18,026,038 | ) |
Class B | | | (56,120 | ) | | | (18,249 | ) | | | — | | | | — | | | | (319,025 | ) | | | (437,388 | ) |
Class C | | | (612,675 | ) | | | (272,364 | ) | | | — | | | | — | | | | (3,188,615 | ) | | | (4,017,457 | ) |
Class I | | | (580,821 | ) | | | (453,501 | ) | | | — | | | | (675,466 | ) | | | (8,267,762 | ) | | | (5,564,208 | ) |
Class I2 | | | — | | | | — | | | | — | | | | (4,186,160 | ) | | | (36,588,053 | ) | | | (15,400,340 | ) |
Total distributions from net investment income | | | (2,397,616 | ) | | | (1,594,119 | ) | | | — | | | | (5,118,638 | ) | | | (65,253,049 | ) | | | (43,445,431 | ) |
Net realized gains: | | | | | | | | | | | | | | | | | | | | | | | | |
Class A | | | — | | | | — | | | | (4,376,857 | ) | | | (901,789 | ) | | | (5,006,583 | ) | | | — | |
Class B | | | — | | | | — | | | | (251,719 | ) | | | (60,751 | ) | | | (101,279 | ) | | | — | |
Class C | | | — | | | | — | | | | (616,095 | ) | | | (118,782 | ) | | | (948,563 | ) | | | — | |
Class I | | | — | | | | — | | | | (2,708,792 | ) | | | (704,338 | ) | | | (1,147,640 | ) | | | — | |
Class I2 | | | — | | | | — | | | | (20,801,283 | ) | | | (3,690,555 | ) | | | (7,045,094 | ) | | | — | |
Total distributions from net realized gains | | | — | | | | — | | | | (28,754,746 | ) | | | (5,476,215 | ) | | | (14,249,159 | ) | | | — | |
Total distributions to shareholders | | | (2,397,616 | ) | | | (1,594,119 | ) | | | (28,754,746 | ) | | | (10,594,853 | ) | | | (79,502,208 | ) | | | (43,445,431 | ) |
| | | | | | | |
Capital share transactions: | | | | | | | | | | | | | | | | | | | | | | | | |
Proceeds from shares sold: | | | | | | | | | | | | | | | | | | | | | | | | |
Class A | | | 7,966,644 | | | | 10,911,543 | | | | 6,599,125 | | | | 6,685,229 | | | | 173,219,462 | | | | 421,598,283 | |
Class B | | | 55,549 | | | | 182,475 | | | | 41,149 | | | | 419,541 | | | | 229,560 | | | | 805,604 | |
Class C | | | 4,052,645 | | | | 4,249,730 | | | | 1,931,246 | | | | 1,202,500 | | | | 19,391,683 | | | | 25,931,314 | |
Class I | | | 14,551,208 | | | | 9,075,640 | | | | 5,817,121 | | | | 5,205,955 | | | | 314,041,552 | | | | 67,630,636 | |
Class I2 | | | 130,168,115 | | | | — | | | | 66,586,657 | | | | 26,972,272 | | | | 228,808,324 | | | | 399,268,205 | |
| | | | 156,794,161 | | | | 24,419,388 | | | | 80,975,298 | | | | 40,485,497 | | | | 735,690,581 | | | | 915,234,042 | |
Dividends and distributions reinvested: | | | | | | | | | | | | | | | | | | | | | | | | |
Class A | | | 1,101,850 | | | | 792,546 | | | | 4,325,183 | | | | 1,148,525 | | | | 20,649,402 | | | | 16,918,455 | |
Class B | | | 50,131 | | | | 16,177 | | | | 247,546 | | | | 59,946 | | | | 397,829 | | | | 403,020 | |
Class C | | | 479,502 | | | | 214,910 | | | | 601,654 | | | | 115,797 | | | | 3,673,005 | | | | 3,434,970 | |
Class I | | | 345,993 | | | | 249,056 | | | | 2,693,411 | | | | 1,372,507 | | | | 8,319,790 | | | | 4,485,867 | |
Class I2 | | | — | | | | — | | | | 20,801,283 | | | | 7,876,715 | | | | 43,633,147 | | | | 15,400,340 | |
| | | | 1,977,476 | | | | 1,272,689 | | | | 28,669,077 | | | | 10,573,490 | | | | 76,673,173 | | | | 40,642,652 | |
Cost of shares redeemed: | | | | | | | | | | | | | | | | | | | | | | | | |
Class A | | | (37,266,990 | ) | | | (30,575,173 | ) | | | (17,789,106 | ) | | | (22,012,553 | ) | | | (460,050,845 | ) | | | (292,022,445 | ) |
Class B | | | (1,462,767 | ) | | | (2,196,751 | ) | | | (679,353 | ) | | | (757,870 | ) | | | (1,863,045 | ) | | | (1,751,619 | ) |
Class C | | | (19,262,089 | ) | | | (23,255,098 | ) | | | (2,794,857 | ) | | | (2,296,185 | ) | | | (28,889,093 | ) | | | (31,923,169 | ) |
Class I | | | (14,623,326 | ) | | | (10,263,048 | ) | | | (15,067,251 | ) | | | (38,753,244 | ) | | | (98,492,364 | ) | | | (94,183,370 | ) |
Class I2 | | | — | | | | — | | | | (56,271,968 | ) | | | (29,803,079 | ) | | | (27,435,858 | ) | | | (110,942,388 | ) |
| | | | (72,615,172 | ) | | | (66,290,070 | ) | | | (92,602,535 | ) | | | (93,622,931 | ) | | | (616,731,205 | ) | | | (530,822,991 | ) |
Automatic conversions: | | | | | | | | | | | | | | | | | | | | | | | | |
Class A | | | 1,480,765 | | | | 292,244 | | | | 1,201,990 | | | | 1,284,879 | | | | 510,808 | | | | 614,457 | |
Class B | | | (1,480,765 | ) | | | (292,244 | ) | | | (1,201,990 | ) | | | (1,284,879 | ) | | | (510,808 | ) | | | (614,457 | ) |
| | | | — | | | | — | | | | — | | | | — | | | | — | | | | — | |
| | | | | | | |
Net increase (decrease) in net assets resulting from capital share transactions | | | 86,156,465 | | | | (40,597,993 | ) | | | 17,041,840 | | | | (42,563,944 | ) | | | 195,632,549 | | | | 425,053,703 | |
Net increase (decrease) in net assets | | | 85,179,863 | | | | (3,821,041 | ) | | | 59,753,444 | | | | 135,869,394 | | | | 186,425,121 | | | | 440,457,731 | |
| | | | | | | |
Net assets: | | | | | | | | | | | | | | | | | | | | | | | | |
Beginning of year | | | 213,360,332 | | | | 217,181,373 | | | | 721,808,230 | | | | 585,938,836 | | | | 1,136,880,724 | | | | 696,422,993 | |
End of year | | $ | 298,540,195 | | | $ | 213,360,332 | | | $ | 781,561,674 | | | $ | 721,808,230 | | | $ | 1,323,305,845 | | | $ | 1,136,880,724 | |
Undistributed (distributions in excess of) net investment income (loss) | | $ | (1,342,869 | ) | | $ | (1,584,953 | ) | | $ | 584,629 | | | $ | 567,375 | | | $ | 11,216 | | | $ | 297,528 | |
The Notes to Financial Statements are an integral part of this report.
| | |
| Transamerica Funds | | Annual Report 2014 |
Page 246
STATEMENTS OF CHANGES IN NET ASSETS (continued)
For the years ended:
| | | | | | | | | | | | | | | | | | | | | | | | |
| | | Transamerica Global Equity (A) | | | Transamerica Growth Opportunities | | | Transamerica High Yield Bond | |
| | | October 31, 2014 | | | October 31, 2013 | | | October 31, 2014 | | | October 31, 2013 | | | October 31, 2014 | | | October 31, 2013 | |
Capital share transactions - shares: | | | | | | | | | | | | | | | | | | | | | | | | |
Shares issued: | | | | | | | | | | | | | | | | | | | | | | | | |
Class A | | | 725,367 | | | | 1,097,905 | | | | 593,671 | | | | 691,999 | | | | 17,772,383 | | | | 42,931,870 | |
Class B | | | 5,060 | | | | 18,359 | | | | 4,356 | | | | 50,052 | | | | 23,470 | | | | 82,580 | |
Class C | | | 370,940 | | | | 428,583 | | | | 196,063 | | | | 140,807 | | | | 1,998,850 | | | | 2,666,912 | |
Class I | | | 1,311,464 | | | | 923,404 | | | | 493,398 | | | | 524,902 | | | | 32,162,394 | | | | 6,884,076 | |
Class I2 | | | 11,510,053 | | | | — | | | | 5,563,306 | | | | 2,783,633 | | | | 23,365,813 | | | | 41,224,229 | |
| | | | 13,922,884 | | | | 2,468,251 | | | | 6,850,794 | | | | 4,191,393 | | | | 75,322,910 | | | | 93,789,667 | |
Shares issued-reinvested from dividends and distributions: | | | | | | | | | | | | | | | | | | | | | | | | |
Class A | | | 100,442 | | | | 83,076 | | | | 397,170 | | | | 136,404 | | | | 2,127,398 | | | | 1,740,871 | |
Class B | | | 4,570 | | | | 1,696 | | | | 26,058 | | | | 8,046 | | | | 41,010 | | | | 41,426 | |
Class C | | | 43,790 | | | | 22,575 | | | | 62,935 | | | | 15,440 | | | | 380,287 | | | | 354,471 | |
Class I | | | 31,684 | | | | 26,216 | | | | 233,802 | | | | 155,085 | | | | 851,764 | | | | 457,709 | |
Class I2 | | | — | | | | — | | | | 1,790,128 | | | | 884,031 | | | | 4,456,417 | | | | 1,572,118 | |
| | | | 180,486 | | | | 133,563 | | | | 2,510,093 | | | | 1,199,006 | | | | 7,856,876 | | | | 4,166,595 | |
Shares redeemed: | | | | | | | | | | | | | | | | | | | | | | | | |
Class A | | | (3,370,560 | ) | | | (3,097,747 | ) | | | (1,618,205 | ) | | | (2,330,375 | ) | | | (47,409,587 | ) | | | (30,002,828 | ) |
Class B | | | (133,502 | ) | | | (222,049 | ) | | | (70,777 | ) | | | (90,977 | ) | | | (191,247 | ) | | | (179,860 | ) |
Class C | | | (1,762,053 | ) | | | (2,358,842 | ) | | | (290,370 | ) | | | (283,555 | ) | | | (2,981,084 | ) | | | (3,294,653 | ) |
Class I | | | (1,337,942 | ) | | | (1,025,543 | ) | | | (1,302,409 | ) | | | (3,950,285 | ) | | | (10,046,652 | ) | | | (9,591,677 | ) |
Class I2 | | | — | | | | — | | | | (4,712,809 | ) | | | (3,122,641 | ) | | | (2,793,377 | ) | | | (11,205,242 | ) |
| | | | (6,604,057 | ) | | | (6,704,181 | ) | | | (7,994,570 | ) | | | (9,777,833 | ) | | | (63,421,947 | ) | | | (54,274,260 | ) |
Automatic conversions: | | | | | | | | | | | | | | | | | | | | | | | | |
Class A | | | 132,416 | | | | 29,466 | | | | 110,393 | | | | 138,454 | | | | 52,379 | | | | 63,070 | |
Class B | | | (132,907 | ) | | | (29,571 | ) | | | (126,758 | ) | | | (156,922 | ) | | | (52,364 | ) | | | (63,045 | ) |
| | | | (491 | ) | | | (105 | ) | | | (16,365 | ) | | | (18,468 | ) | | | 15 | | | | 25 | |
| | | | | | | |
Net increase (decrease) in shares outstanding: | | | | | | | | | | | | | | | | | | | | | | | | |
Class A | | | (2,412,335 | ) | | | (1,887,300 | ) | | | (516,971 | ) | | | (1,363,518 | ) | | | (27,457,427 | ) | | | 14,732,983 | |
Class B | | | (256,779 | ) | | | (231,565 | ) | | | (167,121 | ) | | | (189,801 | ) | | | (179,131 | ) | | | (118,899 | ) |
Class C | | | (1,347,323 | ) | | | (1,907,684 | ) | | | (31,372 | ) | | | (127,308 | ) | | | (601,947 | ) | | | (273,270 | ) |
Class I | | | 5,206 | | | | (75,923 | ) | | | (575,209 | ) | | | (3,270,298 | ) | | | 22,967,506 | | | | (2,249,892 | ) |
Class I2 | | | 11,510,053 | | | | — | | | | 2,640,625 | | | | 545,023 | | | | 25,028,853 | | | | 31,591,105 | |
| | | | 7,498,822 | | | | (4,102,472 | ) | | | 1,349,952 | | | | (4,405,902 | ) | | | 19,757,854 | | | | 43,682,027 | |
| (A) | Formerly, Transamerica Multi-Manager International Portfolio. |
The Notes to Financial Statements are an integral part of this report.
| | |
| Transamerica Funds | | Annual Report 2014 |
Page 247
STATEMENTS OF CHANGES IN NET ASSETS (continued)
For the periods and years ended:
| | | | | | | | | | | | | | | | | | | | |
| | |
Transamerica High Yield Muni | | | Transamerica Income & Growth | | | Transamerica
Inflation Opportunities | |
| | | October 31, 2014 | | | October 31, 2013 (A) | | | October 31, 2014 | | | October 31, 2013 (B) | | | October 31, 2014 (C) | |
From operations: | | | | | | | | | | | | | | | | | | | | |
Net investment income (loss) | | $ | 220,983 | | | $ | 6,499 | | | $ | 38,168,188 | | | $ | 14,818,449 | | | $ | 2,249,493 | |
Net realized gain (loss) | | | 404,969 | | | | 6,292 | | | | (20,390,275 | ) | | | (2,532,935 | ) | | | 110,027 | |
Net change in unrealized appreciation (depreciation) | | | 339,358 | | | | 9,955 | | | | (1,052,708 | ) | | | 26,033,898 | | | | (3,743,143 | ) |
Net increase (decrease) in net assets resulting from operations | | | 965,310 | | | | 22,746 | | | | 16,725,205 | | | | 38,319,412 | | | | (1,383,623 | ) |
| | | | | | |
Distributions to shareholders: | | | | | | | | | | | | | | | | | | | | |
Net investment income: | | | | | | | | | | | | | | | | | | | | |
Class A | | | (69,308 | ) | | | (2,193 | ) | | | (2,555,008 | ) | | | (436,188 | ) | | | (3,891 | ) |
Class C | | | (31,759 | ) | | | (2,177 | ) | | | (2,599,791 | ) | | | (354,818 | ) | | | (3,021 | ) |
Class I | | | (118,686 | ) | | | (2,246 | ) | | | (2,130,508 | ) | | | (570,369 | ) | | | (4,477 | ) |
Class I2 | | | — | | | | — | | | | (21,087,158 | ) | | | (9,039,496 | ) | | | (2,172,857 | ) |
Total distributions from net investment income | | | (219,753 | ) | | | (6,616 | ) | | | (28,372,465 | ) | | | (10,400,871 | ) | | | (2,184,246 | ) |
Net realized gains: | | | | | | | | | | | | | | | | | | | | |
Class A | | | (2,293 | ) | | | — | | | | — | | | | — | | | | — | |
Class C | | | (1,015 | ) | | | — | | | | — | | | | — | | | | — | |
Class I | | | (2,999 | ) | | | — | | | | — | | | | — | | | | — | |
Total distributions from net realized gains | | | (6,307 | ) | | | — | | | | — | | | | — | | | | — | |
Return of capital: | | | | | | | | | | | | | | | | | | | | |
Class A | | | — | | | | — | | | | (618,631 | ) | | | (132,412 | ) | | | — | |
Class C | | | — | | | | — | | | | (629,473 | ) | | | (107,711 | ) | | | — | |
Class I | | | — | | | | — | | | | (515,848 | ) | | | (173,145 | ) | | | — | |
Class I2 | | | — | | | | — | | | | (5,105,721 | ) | | | (2,744,090 | ) | | | — | |
Total distributions from return of capital | | | — | | | | — | | | | (6,869,673 | ) | | | (3,157,358 | ) | | | — | |
Total distributions to shareholders | | | (226,060 | ) | | | (6,616 | ) | | | (35,242,138 | ) | | | (13,558,229 | ) | | | (2,184,246 | ) |
| | | | | | |
Capital share transactions: | | | | | | | | | | | | | | | | | | | | |
Proceeds from shares sold: | | | | | | | | | | | | | | | | | | | | |
Class A | | | 17,289,106 | | | | 255,000 | | | | 50,752,561 | | | | 46,054,546 | | | | 302,911 | |
Class C | | | 1,953,129 | | | | 488,616 | | | | 65,243,983 | | | | 41,365,491 | | | | 383,107 | |
Class I | | | 4,680,828 | | | | 250,000 | | | | 68,572,697 | | | | 44,259,022 | | | | 274,798 | |
Class I2 | | | — | | | | — | | | | 344,403,248 | | | | 348,261,842 | | | | 251,277,397 | |
| | | | 23,923,063 | | | | 993,616 | | | | 528,972,489 | | | | 479,940,901 | | | | 252,238,213 | |
Dividends and distributions reinvested: | | | | | | | | | | | | | | | | | | | | |
Class A | | | 65,812 | | | | 2,193 | | | | 2,583,875 | | | | 479,516 | | | | 3,891 | |
Class C | | | 31,859 | | | | 2,177 | | | | 2,649,604 | | | | 406,290 | | | | 3,021 | |
Class I | | | 121,685 | | | | 2,246 | | | | 2,223,963 | | | | 689,749 | | | | 4,477 | |
Class I2 | | | — | | | | — | | | | 26,192,879 | | | | 11,783,586 | | | | 2,172,857 | |
| | | | 219,356 | | | | 6,616 | | | | 33,650,321 | | | | 13,359,141 | | | | 2,184,246 | |
Cost of shares redeemed: | | | | | | | | | | | | | | | | | | | | |
Class A | | | (13,397,989 | ) | | | — | | | | (25,521,972 | ) | | | (4,492,320 | ) | | | (6,266 | ) |
Class C | | | (1,195,759 | ) | | | — | | | | (14,718,432 | ) | | | (1,975,027 | ) | | | (2,150 | ) |
Class I | | | (371,970 | ) | | | — | | | | (24,292,029 | ) | | | (19,217,455 | ) | | | (1,349 | ) |
Class I2 | | | — | | | | — | | | | (56,807,612 | ) | | | (21,528,242 | ) | | | (4,174,278 | ) |
| | | | (14,965,718 | ) | | | — | | | | (121,340,045 | ) | | | (47,213,044 | ) | | | (4,184,043 | ) |
| | | | | | |
Net increase (decrease) in net assets resulting from capital share transactions | | | 9,176,701 | | | | 1,000,232 | | | | 441,282,765 | | | | 446,086,998 | | | | 250,238,416 | |
Net increase (decrease) in net assets | | | 9,915,951 | | | | 1,016,362 | | | | 422,765,832 | | | | 470,848,181 | | | | 246,670,547 | |
| | | | | | |
Net assets: | | | | | | | | | | | | | | | | | | | | |
Beginning of period/year | | | 1,016,362 | | | | — | | | | 470,848,181 | | | | — | | | | — | |
End of period/year | | $ | 10,932,313 | | | $ | 1,016,362 | | | $ | 893,614,013 | | | $ | 470,848,181 | | | $ | 246,670,547 | |
Undistributed (distributions in excess of) net investment income (loss) | | $ | 2,314 | | | $ | 1,084 | | | $ | 7,905,348 | | | $ | 4,072,245 | | | $ | (75,872 | ) |
The Notes to Financial Statements are an integral part of this report.
| | |
| Transamerica Funds | | Annual Report 2014 |
Page 248
STATEMENTS OF CHANGES IN NET ASSETS (continued)
For the periods and years ended:
| | | | | | | | | | | | | | | | | | | | |
| | |
Transamerica High Yield Muni | | | Transamerica Income & Growth | | | Transamerica
Inflation Opportunities | |
| | | October 31, 2014 | | | October 31, 2013 (A) | | | October 31, 2014 | | | October 31, 2013 (B) | | | October 31, 2014 (C) | |
Capital share transactions - shares: | | | | | | | | | | | | | | | | | | | | |
Shares issued: | | | | | | | | | | | | | | | | | | | | |
Class A | | | 1,553,279 | | | | 25,493 | | | | 4,631,575 | | | | 4,295,590 | | | | 30,278 | |
Class C | | | 174,609 | | | | 48,390 | | | | 5,997,856 | | | | 3,863,905 | | | | 38,166 | |
Class I | | | 436,493 | | | | 25,000 | | | | 6,243,996 | | | | 4,184,839 | | | | 27,477 | |
Class I2 | | | — | | | | — | | | | 30,782,763 | | | | 33,431,832 | | | | 24,882,709 | |
| | | | 2,164,381 | | | | 98,883 | | | | 47,656,190 | | | | 45,776,166 | | | | 24,978,630 | |
Shares issued-reinvested from dividends and distributions: | | | | | | | | | | | | | | | | | | | | |
Class A | | | 5,958 | | | | 216 | | | | 237,549 | | | | 45,566 | | | | 386 | |
Class C | | | 2,907 | | | | 214 | | | | 244,534 | | | | 38,796 | | | | 299 | |
Class I | | | 11,074 | | | | 221 | | | | 204,334 | | | | 66,405 | | | | 444 | |
Class I2 | | | — | | | | — | | | | 2,406,073 | | | | 1,129,363 | | | | 215,125 | |
| | | | 19,939 | | | | 651 | | | | 3,092,490 | | | | 1,280,130 | | | | 216,254 | |
Shares redeemed: | | | | | | | | | | | | | | | | | | | | |
Class A | | | (1,192,888 | ) | | | — | | | | (2,321,202 | ) | | | (413,945 | ) | | | (628 | ) |
Class C | | | (104,179 | ) | | | — | | | | (1,345,017 | ) | | | (182,960 | ) | | | (215 | ) |
Class I | | | (33,310 | ) | | | — | | | | (2,225,072 | ) | | | (1,796,893 | ) | | | (133 | ) |
Class I2 | | | — | | | | — | | | | (5,178,998 | ) | | | (2,059,284 | ) | | | (416,246 | ) |
| | | | (1,330,377 | ) | | | — | | | | (11,070,289 | ) | | | (4,453,082 | ) | | | (417,222 | ) |
| | | | | | |
Net increase (decrease) in shares outstanding: | | | | | | | | | | | | | | | | | | | | |
Class A | | | 366,349 | | | | 25,709 | | | | 2,547,922 | | | | 3,927,211 | | | | 30,036 | |
Class C | | | 73,337 | | | | 48,604 | | | | 4,897,373 | | | | 3,719,741 | | | | 38,250 | |
Class I | | | 414,257 | | | | 25,221 | | | | 4,223,258 | | | | 2,454,351 | | | | 27,788 | |
Class I2 | | | — | | | | — | | | | 28,009,838 | | | | 32,501,911 | | | | 24,681,588 | |
| | | | 853,943 | | | | 99,534 | | | | 39,678,391 | | | | 42,603,214 | | | | 24,777,662 | |
| (A) | Commenced operations on July 31, 2013. |
| (B) | Commenced operations on October 31, 2012. |
| (C) | Commenced operations on March 1, 2014. |
The Notes to Financial Statements are an integral part of this report.
| | |
| Transamerica Funds | | Annual Report 2014 |
Page 249
STATEMENTS OF CHANGES IN NET ASSETS (continued)
For the period and years ended:
| | | | | | | | | | | | | | | | | | | | | | | | |
| | | Transamerica International Equity | | | Transamerica
International Small Cap Value | | | Transamerica Large Cap Value | |
| | | October 31, 2014 | | | October 31, 2013 | | | October 31, 2014 | | | October 31, 2013 (A) | | | October 31, 2014 | | | October 31, 2013 | |
From operations: | | | | | | | | | | | | | | | | | | | | | | | | |
Net investment income (loss) | | $ | 24,382,247 | | | $ | 9,612,436 | | | $ | 10,094,171 | | | $ | 3,467,589 | | | $ | 25,369,180 | | | $ | 28,355,805 | |
Net realized gain (loss) | | | 21,447,099 | | | | 17,197,152 | | | | 5,764,883 | | | | 2,791,725 | | | | 153,216,347 | | | | 237,604,959 | |
Net change in unrealized appreciation (depreciation) | | | (66,098,281 | ) | | | 70,756,176 | | | | (42,098,093 | ) | | | 26,354,562 | | | | 5,638,963 | | | | 138,174,635 | |
Net increase (decrease) in net assets resulting from operations | | | (20,268,935 | ) | | | 97,565,764 | | | | (26,239,039 | ) | | | 32,613,876 | | | | 184,224,490 | | | | 404,135,399 | |
| | | | | | | |
Distributions to shareholders: | | | | | | | | | | | | | | | | | | | | | | | | |
Net investment income: | | | | | | | | | | | | | | | | | | | | | | | | |
Class A | | | (509,161 | ) | | | (61,664 | ) | | | — | | | | — | | | | (238,893 | ) | | | (72,760 | ) |
Class C | | | (320,275 | ) | | | (90,894 | ) | | | — | | | | — | | | | (53,303 | ) | | | (41,488 | ) |
Class I | | | (4,077,344 | ) | | | (1,600,664 | ) | | | (291,215 | ) | | | — | | | | (236,054 | ) | | | (137,535 | ) |
Class I2 | | | (9,899,226 | ) | | | (3,903,807 | ) | | | (4,135,115 | ) | | | — | | | | (24,537,425 | ) | | | (28,604,588 | ) |
Total distributions from net investment income | | | (14,806,006 | ) | | | (5,657,029 | ) | | | (4,426,330 | ) | | | — | | | | (25,065,675 | ) | | | (28,856,371 | ) |
Net realized gains: | | | | | | | | | | | | | | | | | | | | | | | | |
Class A | | | (578,921 | ) | | | — | | | | — | | | | — | | | | (1,670,557 | ) | | | (146,611 | ) |
Class C | | | (472,334 | ) | | | — | | | | — | | | | — | | | | (1,440,024 | ) | | | (126,430 | ) |
Class I | | | (4,322,315 | ) | | | — | | | | (171,973 | ) | | | — | | | | (2,462,234 | ) | | | (190,103 | ) |
Class I2 | | | (10,118,807 | ) | | | — | | | | (2,415,423 | ) | | | — | | | | (231,982,105 | ) | | | (73,116,044 | ) |
Total distributions from net realized gains | | | (15,492,377 | ) | | | — | | | | (2,587,396 | ) | | | — | | | | (237,554,920 | ) | | | (73,579,188 | ) |
Total distributions to shareholders | | | (30,298,383 | ) | | | (5,657,029 | ) | | | (7,013,726 | ) | | | — | | | | (262,620,595 | ) | | | (102,435,559 | ) |
| | | | | | | |
Capital share transactions: | | | | | | | | | | | | | | | | | | | | | | | | |
Proceeds from shares sold: | | | | | | | | | | | | | | | | | | | | | | | | |
Class A | | | 67,709,185 | | | | 20,032,741 | | | | — | | | | — | | | | 32,832,975 | | | | 8,146,880 | |
Class C | | | 24,934,132 | | | | 10,681,845 | | | | — | | | | — | | | | 5,714,167 | | | | 6,485,535 | |
Class I | | | 546,077,678 | | | | 57,367,751 | | | | 264,608,512 | | | | 4,172,260 | | | | 10,399,652 | | | | 13,633,565 | |
Class I2 | | | 426,676,921 | | | | 79,776,173 | | | | 384,457,693 | | | | 175,371,482 | | | | 362,993,691 | | | | 157,282,878 | |
| | | | 1,065,397,916 | | | | 167,858,510 | | | | 649,066,205 | | | | 179,543,742 | | | | 411,940,485 | | | | 185,548,858 | |
Dividends and distributions reinvested: | | | | | | | | | | | | | | | | | | | | | | | | |
Class A | | | 1,017,592 | | | | 59,628 | | | | — | | | | — | | | | 1,776,069 | | | | 215,800 | |
Class C | | | 442,217 | | | | 14,908 | | | | — | | | | — | | | | 1,132,600 | | | | 150,365 | |
Class I | | | 7,337,963 | | | | 1,505,165 | | | | 463,188 | | | | — | | | | 1,924,149 | | | | 306,471 | |
Class I2 | | | 20,018,033 | | | | 3,903,807 | | | | 6,550,538 | | | | — | | | | 256,519,530 | | | | 101,720,632 | |
| | | | 28,815,805 | | | | 5,483,508 | | | | 7,013,726 | | | | — | | | | 261,352,348 | | | | 102,393,268 | |
Cost of shares redeemed: | | | | | | | | | | | | | | | | | | | | | | | | |
Class A | | | (26,206,694 | ) | | | (4,205,545 | ) | | | — | | | | — | | | | (11,641,071 | ) | | | (2,626,419 | ) |
Class C | | | (4,501,629 | ) | | | (546,953 | ) | | | — | | | | — | | | | (4,776,962 | ) | | | (1,299,556 | ) |
Class I | | | (138,522,124 | ) | | | (10,514,139 | ) | | | (48,105,231 | ) | | | (391,230 | ) | | | (15,090,961 | ) | | | (1,972,409 | ) |
Class I2 | | | (100,047,281 | ) | | | (26,892,954 | ) | | | (39,248,795 | ) | | | (11,875 | ) | | | (307,852,586 | ) | | | (372,606,026 | ) |
| | | | (269,277,728 | ) | | | (42,159,591 | ) | | | (87,354,026 | ) | | | (403,105 | ) | | | (339,361,580 | ) | | | (378,504,410 | ) |
| | | | | | | |
Net increase (decrease) in net assets resulting from capital share transactions | | | 824,935,993 | | | | 131,182,427 | | | | 568,725,905 | | | | 179,140,637 | | | | 333,931,253 | | | | (90,562,284 | ) |
Net increase (decrease) in net assets | | | 774,368,675 | | | | 223,091,162 | | | | 535,473,140 | | | | 211,754,513 | | | | 255,535,148 | | | | 211,137,556 | |
| | | | | | | |
Net assets: | | | | | | | | | | | | | | | | | | | | | | | | |
Beginning of period/year | | | 487,073,353 | | | | 263,982,191 | | | | 211,754,513 | | | | — | | | | 1,538,363,370 | | | | 1,327,225,814 | |
End of period/year | | $ | 1,261,442,028 | | | $ | 487,073,353 | | | $ | 747,227,653 | | | $ | 211,754,513 | | | $ | 1,793,898,518 | | | $ | 1,538,363,370 | |
Undistributed (distributions in excess of) net investment income (loss) | | $ | 18,136,775 | | | $ | 8,276,287 | | | $ | 9,123,393 | | | $ | 3,691,109 | | | $ | 488,186 | | | $ | 950,667 | |
| | | | | | | |
Capital share transactions - shares: | | | | | | | | | | | | | | | | | | | | | | | | |
Shares issued: | | | | | | | | | | | | | | | | | | | | | | | | |
Class A | | | 3,737,658 | | | | 1,194,438 | | | | — | | | | — | | | | 2,552,312 | | | | 622,081 | |
Class C | | | 1,391,756 | | | | 657,929 | | | | — | | | | — | | | | 439,719 | | | | 489,379 | |
Class I | | | 30,237,856 | | | | 3,480,994 | | | | 21,850,113 | | | | 378,465 | | | | 799,260 | | | | 996,416 | |
Class I2 | | | 22,757,183 | | | | 5,089,120 | | | | 30,906,352 | | | | 16,951,235 | | | | 27,372,842 | | | | 13,076,957 | |
| | | | 58,124,453 | | | | 10,422,481 | | | | 52,756,465 | | | | 17,329,700 | | | | 31,164,133 | | | | 15,184,833 | |
The Notes to Financial Statements are an integral part of this report.
| | |
| Transamerica Funds | | Annual Report 2014 |
Page 250
STATEMENTS OF CHANGES IN NET ASSETS (continued)
For the period and years ended:
| | | | | | | | | | | | | | | | | | | | | | | | |
| | | Transamerica International Equity | | | Transamerica
International Small Cap Value | | | Transamerica Large Cap Value | |
| | | October 31, 2014 | | | October 31, 2013 | | | October 31, 2014 | | | October 31, 2013 (A) | | | October 31, 2014 | | | October 31, 2013 | |
Shares issued-reinvested from dividends and distributions: | | | | | | | | | | | | | | | | | | | | | | | | |
Class A | | | 57,752 | | | | 3,970 | | | | — | | | | — | | | | 141,442 | | | | 18,289 | |
Class C | | | 25,342 | | | | 1,001 | | | | — | | | | — | | | | 90,673 | | | | 12,949 | |
Class I | | | 413,174 | | | | 99,746 | | | | 38,154 | | | | — | | | | 153,085 | | | | 25,654 | |
Class I2 | | | 1,127,777 | | | | 258,873 | | | | 539,139 | | | | — | | | | 20,412,760 | | | | 8,708,966 | |
| | | | 1,624,045 | | | | 363,590 | | | | 577,293 | | | | — | | | | 20,797,960 | | | | 8,765,858 | |
Shares redeemed: | | | | | | | | | | | | | | | | | | | | | | | | |
Class A | | | (1,443,769 | ) | | | (260,135 | ) | | | — | | | | — | | | | (915,902 | ) | | | (201,370 | ) |
Class C | | | (253,620 | ) | | | (33,955 | ) | | | — | | | | — | | | | (369,278 | ) | | | (100,215 | ) |
Class I | | | (7,854,178 | ) | | | (650,654 | ) | | | (4,093,338 | ) | | | (36,419 | ) | | | (1,129,338 | ) | | | (145,894 | ) |
Class I2 | | | (5,463,528 | ) | | | (1,653,350 | ) | | | (3,311,693 | ) | | | (1,049 | ) | | | (22,857,927 | ) | | | (28,155,491 | ) |
| | | | (15,015,095 | ) | | | (2,598,094 | ) | | | (7,405,031 | ) | | | (37,468 | ) | | | (25,272,445 | ) | | | (28,602,970 | ) |
| | | | | | | |
Net increase (decrease) in shares outstanding: | | | | | | | | | | | | | | | | | | | | | | | | |
Class A | | | 2,351,641 | | | | 938,273 | | | | — | | | | — | | | | 1,777,852 | | | | 439,000 | |
Class C | | | 1,163,478 | | | | 624,975 | | | | — | | | | — | | | | 161,114 | | | | 402,113 | |
Class I | | | 22,796,852 | | | | 2,930,086 | | | | 17,794,929 | | | | 342,046 | | | | (176,993 | ) | | | 876,176 | |
Class I2 | | | 18,421,432 | | | | 3,694,643 | | | | 28,133,798 | | | | 16,950,186 | | | | 24,927,675 | | | | (6,369,568 | ) |
| | | | 44,733,403 | | | | 8,187,977 | | | | 45,928,727 | | | | 17,292,232 | | | | 26,689,648 | | | | (4,652,279 | ) |
| (A) | Commenced operations on January 4, 2013. |
The Notes to Financial Statements are an integral part of this report.
| | |
| Transamerica Funds | | Annual Report 2014 |
Page 251
STATEMENTS OF CHANGES IN NET ASSETS (continued)
For the periods and years ended:
| | | | | | | | | | | | | | | | |
| | | Transamerica
Mid Cap Growth | | | Transamerica
Mid Cap Value Opportunities | | | Transamerica MLP & Energy Income | |
| | | October 31, 2014 (A) | | | October 31, 2014 (B) | | | October 31, 2014 | | | October 31, 2013 (C) | |
From operations: | | | | | | | | | | | | | | | | |
Net investment income (loss) | | $ | (120,572 | ) | | $ | 1,182,748 | | | $ | 9,763,521 | | | $ | 1,970,241 | |
Net realized gain (loss) | | | 228,530 | | | | 1,533,662 | | | | 9,773,353 | | | | 955,807 | |
Net change in unrealized appreciation (depreciation) | | | 4,930,020 | | | | 6,776,053 | | | | 27,011,855 | | | | 4,428,793 | |
Net increase (decrease) in net assets resulting from operations | | | 5,037,978 | | | | 9,492,463 | | | | 46,548,729 | | | | 7,354,841 | |
| | | | | |
Distributions to shareholders: | | | | | | | | | | | | | | | | |
Net investment income: | | | | | | | | | | | | | | | | |
Class A | | | — | | | | (2,161 | ) | | | (1,039,676 | ) | | | (55,002 | ) |
Class C | | | — | | | | (1,287 | ) | | | (515,361 | ) | | | (13,768 | ) |
Class I | | | (20 | ) | | | (18,055 | ) | | | (1,577,053 | ) | | | (44,591 | ) |
Class I2 | | | (4,000 | ) | | | (1,129,378 | ) | | | (6,809,315 | ) | | | (1,176,272 | ) |
Total distributions from net investment income | | | (4,020 | ) | | | (1,150,881 | ) | | | (9,941,405 | ) | | | (1,289,633 | ) |
Net realized gains: | | | | | | | | | | | | | | | | |
Class A | | | — | | | | — | | | | (93,935 | ) | | | — | |
Class C | | | — | | | | — | | | | (34,226 | ) | | | — | |
Class I | | | — | | | | — | | | | (58,215 | ) | | | — | |
Class I2 | | | — | | | | — | | | | (969,227 | ) | | | — | |
Total distributions from net realized gains | | | — | | | | — | | | | (1,155,603 | ) | | | — | |
Total distributions to shareholders | | | (4,020 | ) | | | (1,150,881 | ) | | | (11,097,008 | ) | | | (1,289,633 | ) |
| | | | | |
Capital share transactions: | | | | | | | | | | | | | | | | |
Proceeds from shares sold: | | | | | | | | | | | | | | | | |
Class A | | | 469,950 | | | | 740,044 | | | | 73,681,339 | | | | 17,098,597 | |
Class C | | | 392,688 | | | | 278,569 | | | | 48,548,339 | | | | 4,993,590 | |
Class I | | | 319,750 | | | | 5,896,131 | | | | 115,454,149 | | | | 9,673,920 | |
Class I2 | | | 50,276,548 | | | | 158,849,070 | | | | 239,551,414 | | | | 200,103,453 | |
| | | | 51,458,936 | | | | 165,763,814 | | | | 477,235,241 | | | | 231,869,560 | |
Dividends and distributions reinvested: | | | | | | | | | | | | | | | | |
Class A | | | — | | | | 2,161 | | | | 1,015,112 | | | | 53,165 | |
Class C | | | — | | | | 1,287 | | | | 382,065 | | | | 13,488 | |
Class I | | | 20 | | | | 18,055 | | | | 925,964 | | | | 43,974 | |
Class I2 | | | 4,000 | | | | 1,129,378 | | | | 7,778,542 | | | | 1,176,272 | |
| | | | 4,020 | | | | 1,150,881 | | | | 10,101,683 | | | | 1,286,899 | |
Cost of shares redeemed: | | | | | | | | | | | | | | | | |
Class A | | | (6,718 | ) | | | (67,117 | ) | | | (30,496,397 | ) | | | (1,112,229 | ) |
Class C | | | (84,185 | ) | | | (19,175 | ) | | | (2,489,880 | ) | | | (90,532 | ) |
Class I | | | (7,652 | ) | | | (67,213 | ) | | | (17,488,490 | ) | | | (335,246 | ) |
Class I2 | | | (151,644 | ) | | | (1,973,042 | ) | | | (16,007,052 | ) | | | (6,760 | ) |
| | | | (250,199 | ) | | | (2,126,547 | ) | | | (66,481,819 | ) | | | (1,544,767 | ) |
| | | | | |
Net increase (decrease) in net assets resulting from capital share transactions | | | 51,212,757 | | | | 164,788,148 | | | | 420,855,105 | | | | 231,611,692 | |
Net increase (decrease) in net assets | | | 56,246,715 | | | | 173,129,730 | | | | 456,306,826 | | | | 237,676,900 | |
| | | | | |
Net assets: | | | | | | | | | | | | | | | | |
Beginning of period/year | | | — | | | | — | | | | 237,676,900 | | | | — | |
End of period/year | | $ | 56,246,715 | | | $ | 173,129,730 | | | $ | 693,983,726 | | | $ | 237,676,900 | |
Undistributed (distributions in excess of) net investment income (loss) | | $ | — | | | $ | 87,285 | | | $ | 5,779,226 | | | $ | 919,425 | |
| | | | | |
Capital share transactions - shares: | | | | | | | | | | | | | | | | |
Shares issued: | | | | | | | | | | | | | | | | |
Class A | | | 45,511 | | | | 71,952 | | | | 6,444,024 | | | | 1,702,533 | |
Class C | | | 38,172 | | | | 27,721 | | | | 4,285,354 | | | | 496,304 | |
Class I | | | 31,589 | | | | 563,893 | | | | 10,214,886 | | | | 961,149 | |
Class I2 | | | 5,025,215 | | | | 15,627,496 | | | | 20,474,978 | | | | 19,985,228 | |
| | | | 5,140,487 | | | | 16,291,062 | | | | 41,419,242 | | | | 23,145,214 | |
The Notes to Financial Statements are an integral part of this report.
| | |
| Transamerica Funds | | Annual Report 2014 |
Page 252
STATEMENTS OF CHANGES IN NET ASSETS (continued)
For the periods and years ended:
| | | | | | | | | | | | | | | | |
| | | Transamerica
Mid Cap Growth | | | Transamerica
Mid Cap Value Opportunities | | | Transamerica MLP & Energy Income | |
| | | October 31, 2014 (A) | | | October 31, 2014 (B) | | | October 31, 2014 | | | October 31, 2013 (C) | |
Shares issued-reinvested from dividends and distributions: | | | | | | | | | | | | | | | | |
Class A | | | — | | | | 208 | | | | 89,499 | | | | 5,292 | |
Class C | | | — | | | | 123 | | | | 33,671 | | | | 1,345 | |
Class I | | | 2 | | | | 1,749 | | | | 80,333 | | | | 4,378 | |
Class I2 | | | 387 | | | | 108,717 | | | | 697,300 | | | | 117,308 | |
| | | | 389 | | | | 110,797 | | | | 900,803 | | | | 128,323 | |
Shares redeemed: | | | | | | | | | | | | | | | | |
Class A | | | (633 | ) | | | (6,316 | ) | | | (2,596,064 | ) | | | (110,119 | ) |
Class C | | | (7,837 | ) | | | (1,829 | ) | | | (219,332 | ) | | | (9,065 | ) |
Class I | | | (706 | ) | | | (6,318 | ) | | | (1,523,506 | ) | | | (33,383 | ) |
Class I2 | | | (14,276 | ) | | | (189,851 | ) | | | (1,395,001 | ) | | | (671 | ) |
| | | | (23,452 | ) | | | (204,314 | ) | | | (5,733,903 | ) | | | (153,238 | ) |
| | | | | |
Net increase (decrease) in shares outstanding: | | | | | | | | | | | | | | | | |
Class A | | | 44,878 | | | | 65,844 | | | | 3,937,459 | | | | 1,597,706 | |
Class C | | | 30,335 | | | | 26,015 | | | | 4,099,693 | | | | 488,584 | |
Class I | | | 30,885 | | | | 559,324 | | | | 8,771,713 | | | | 932,144 | |
Class I2 | | | 5,011,326 | | | | 15,546,362 | | | | 19,777,277 | | | | 20,101,865 | |
| | | | 5,117,424 | | | | 16,197,545 | | | | 36,586,142 | | | | 23,120,299 | |
| (A) | Commenced operations on October 31, 2013. |
| (B) | Commenced operations on April 30, 2014 |
| (C) | Commenced operations on April 30, 2013. |
The Notes to Financial Statements are an integral part of this report.
| | |
| Transamerica Funds | | Annual Report 2014 |
Page 253
STATEMENTS OF CHANGES IN NET ASSETS (continued)
For the years ended:
| | | | | | | | | | | | | | | | | | | | |
| | | Transamerica Money Market | | | Transamerica
Multi-Managed Balanced | | | Transamerica
Opportunistic Allocation | |
| | | October 31, 2014 | | | October 31, 2013 | | | October 31, 2014 | | | October 31, 2013 | | | October 31, 2014 (A) | |
From operations: | | | | | | | | | | | | | | | | | | | | |
Net investment income (loss) | | $ | 29,483 | | | $ | 158,622 | | | $ | 4,311,920 | | | $ | 4,044,654 | | | $ | 67,941 | |
Net realized gain (loss) | | | — | | | | — | | | | 24,127,504 | | | | 22,450,647 | | | | (48,558 | ) |
Net change in unrealized appreciation (depreciation) | | | — | | | | — | | | | 23,683,647 | | | | 27,250,644 | | | | 23,564 | |
Net increase (decrease) in net assets resulting from operations | | | 29,483 | | | | 158,622 | | | | 52,123,071 | | | | 53,745,945 | | | | 42,947 | |
| | | | | | |
Distributions to shareholders: | | | | | | | | | | | | | | | | | | | | |
Net investment income: | | | | | | | | | | | | | | | | | | | | |
Class A | | | (3,351 | ) | | | (3,125 | ) | | | (2,060,730 | ) | | | (1,441,042 | ) | | | (16,186 | ) |
Class B | | | (204 | ) | | | (283 | ) | | | (26,864 | ) | | | (14,798 | ) | | | — | |
Class C | | | (1,198 | ) | | | (1,221 | ) | | | (727,673 | ) | | | (365,872 | ) | | | (14,271 | ) |
Class I | | | (2,751 | ) | | | (9,874 | ) | | | (2,762,577 | ) | | | (2,532,217 | ) | | | (33,668 | ) |
Class I2 | | | (6,639 | ) | | | (144,240 | ) | | | — | | | | — | | | | — | |
Total distributions from net investment income | | | (14,143 | ) | | | (158,743 | ) | | | (5,577,844 | ) | | | (4,353,929 | ) | | | (64,125 | ) |
Net realized gains: | | | | | | | | | | | | | | | | | | | | |
Class A | | | — | | | | — | | | | (6,969,184 | ) | | | (4,393,440 | ) | | | — | |
Class B | | | — | | | | — | | | | (362,006 | ) | | | (314,260 | ) | | | — | |
Class C | | | — | | | | — | | | | (4,537,375 | ) | | | (2,364,203 | ) | | | — | |
Class I | | | — | | | | — | | | | (8,000,079 | ) | | | (5,851,179 | ) | | | — | |
Total distributions from net realized gains | | | — | | | | — | | | | (19,868,644 | ) | | | (12,923,082 | ) | | | — | |
Total distributions to shareholders | | | (14,143 | ) | | | (158,743 | ) | | | (25,446,488 | ) | | | (17,277,011 | ) | | | (64,125 | ) |
| | | | | | |
Capital share transactions: | | | | | | | | | | | | | | | | | | | | |
Proceeds from shares sold: | | | | | | | | | | | | | | | | | | | | |
Class A | | | 73,169,752 | | | | 93,358,748 | | | | 32,938,100 | | | | 33,411,254 | | | | 257,678 | |
Class B | | | 1,188,265 | | | | 2,702,767 | | | | 367,903 | | | | 1,275,903 | | | | — | |
Class C | | | 14,219,481 | | | | 26,742,098 | | | | 40,695,782 | | | | 34,252,398 | | | | 250,000 | |
Class I | | | 4,608,232 | | | | 7,781,398 | | | | 16,152,567 | | | | 27,830,697 | | | | 508,346 | |
Class I2 | | | 14,874,587 | | | | 866,139,625 | | | | — | | | | — | | | | — | |
| | | | 108,060,317 | | | | 996,724,636 | | | | 90,154,352 | | | | 96,770,252 | | | | 1,016,024 | |
Dividends and distributions reinvested: | | | | | | | | | | | | | | | | | | | | |
Class A | | | 3,270 | | | | 3,092 | | | | 8,698,595 | | | | 5,624,470 | | | | 16,186 | |
Class B | | | 195 | | | | 266 | | | | 378,038 | | | | 318,115 | | | | — | |
Class C | | | 1,156 | | | | 1,192 | | | | 4,882,590 | | | | 2,493,048 | | | | 14,271 | |
Class I | | | 2,736 | | | | 9,841 | | | | 10,640,277 | | | | 7,994,334 | | | | 33,668 | |
Class I2 | | | 30,915 | | | | 120,139 | | | | — | | | | — | | | | — | |
| | | | 38,272 | | | | 134,530 | | | | 24,599,500 | | | | 16,429,967 | | | | 64,125 | |
Cost of shares redeemed: | | | | | | | | | | | | | | | | | | | | |
Class A | | | (64,258,662 | ) | | | (100,230,456 | ) | | | (30,909,489 | ) | | | (26,509,027 | ) | | | — | |
Class B | | | (2,593,616 | ) | | | (4,311,917 | ) | | | (738,849 | ) | | | (1,381,471 | ) | | | — | |
Class C | | | (20,238,646 | ) | | | (27,938,304 | ) | | | (15,522,013 | ) | | | (11,300,169 | ) | | | — | |
Class I | | | (7,592,493 | ) | | | (10,946,023 | ) | | | (34,795,613 | ) | | | (53,323,730 | ) | | | (1,247 | ) |
Class I2 | | | (113,918,131 | ) | | | (1,388,193,824 | ) | | | — | | | | — | | | | — | |
| | | | (208,601,548 | ) | | | (1,531,620,524 | ) | | | (81,965,964 | ) | | | (92,514,397 | ) | | | (1,247 | ) |
Automatic conversions: | | | | | | | | | | | | | | | | | | | | |
Class A | | | 964,155 | | | | 1,491,119 | | | | 1,980,927 | | | | 1,860,400 | | | | — | |
Class B | | | (964,155 | ) | | | (1,491,119 | ) | | | (1,980,927 | ) | | | (1,860,400 | ) | | | — | |
| | | | — | | | | — | | | | — | | | | — | | | | — | |
Net increase (decrease) in net assets resulting from capital share transactions | | | (100,502,959 | ) | | | (534,761,358 | ) | | | 32,787,888 | | | | 20,685,822 | | | | 1,078,902 | |
Net increase (decrease) in net assets | | | (100,487,619 | ) | | | (534,761,479 | ) | | | 59,464,471 | | | | 57,154,756 | | | | 1,057,724 | |
| | | | | | |
Net assets: | | | | | | | | | | | | | | | | | | | | |
Beginning of year | | | 279,644,453 | | | | 814,405,932 | | | | 431,071,355 | | | | 373,916,599 | | | | — | |
End of year | | $ | 179,156,834 | | | $ | 279,644,453 | | | $ | 490,535,826 | | | $ | 431,071,355 | | | $ | 1,057,724 | |
Undistributed (distributions in excess of) net investment income (loss) | | $ | 16,063 | | | $ | 723 | | | $ | 6,914 | | | $ | 887,915 | | | $ | — | |
The Notes to Financial Statements are an integral part of this report.
| | |
| Transamerica Funds | | Annual Report 2014 |
Page 254
STATEMENTS OF CHANGES IN NET ASSETS (continued)
For the year ended:
| | | | | | | | | | | | | | | | | | | | |
| | | Transamerica Money Market | | | Transamerica
Multi-Managed Balanced | | | Transamerica
Opportunistic Allocation | |
| | | October 31, 2014 | | | October 31, 2013 | | | October 31, 2014 | | | October 31, 2013 | | | October 31, 2014 (A) | |
Capital share transactions - shares: | | | | | | | | | | | | | | | | | | | | |
Shares issued: | | | | | | | | | | | | | | | | | | | | |
Class A | | | 73,169,752 | | | | 93,358,748 | | | | 1,349,190 | | | | 1,451,625 | | | | 25,720 | |
Class B | | | 1,188,264 | | | | 2,702,767 | | | | 15,119 | | | | 55,957 | | | | — | |
Class C | | | 14,219,481 | | | | 26,742,098 | | | | 1,684,944 | | | | 1,514,143 | | | | 25,000 | |
Class I | | | 4,608,233 | | | | 7,781,398 | | | | 655,266 | | | | 1,196,508 | | | | 50,806 | |
Class I2 | | | 14,874,587 | | | | 866,139,625 | | | | — | | | | — | | | | — | |
| | | | 108,060,317 | | | | 996,724,636 | | | | 3,704,519 | | | | 4,218,233 | | | | 101,526 | |
Shares issued-reinvested from dividends and distributions: | | | | | | | | | | | | | | | | | | | | |
Class A | | | 3,270 | | | | 3,092 | | | | 366,264 | | | | 258,922 | | | | 1,583 | |
Class B | | | 195 | | | | 266 | | | | 16,108 | | | | 14,871 | | | | — | |
Class C | | | 1,156 | | | | 1,192 | | | | 209,287 | | | | 116,952 | | | | 1,397 | |
Class I | | | 2,736 | | | | 9,841 | | | | 446,156 | | | | 365,981 | | | | 3,291 | |
Class I2 | | | 30,915 | | | | 120,139 | | | | — | | | | — | | | | — | |
| | | | 38,272 | | | | 134,530 | | | | 1,037,815 | | | | 756,726 | | | | 6,271 | |
Shares redeemed: | | | | | | | | | | | | | | | | | | | | |
Class A | | | (64,258,662 | ) | | | (100,230,456 | ) | | | (1,258,739 | ) | | | (1,159,723 | ) | | | — | |
Class B | | | (2,593,615 | ) | | | (4,311,917 | ) | | | (30,556 | ) | | | (60,970 | ) | | | — | |
Class C | | | (20,238,645 | ) | | | (27,938,304 | ) | | | (642,080 | ) | | | (502,298 | ) | | | — | |
Class I | | | (7,592,493 | ) | | | (10,946,023 | ) | | | (1,421,276 | ) | | | (2,323,952 | ) | | | (117 | ) |
Class I2 | | | (113,918,131 | ) | | | (1,388,193,824 | ) | | | — | | | | — | | | | — | |
| | | | (208,601,546 | ) | | | (1,531,620,524 | ) | | | (3,352,651 | ) | | | (4,046,943 | ) | | | (117 | ) |
Automatic conversions: | | | | | | | | | | | | | | | | | | | | |
Class A | | | 964,155 | | | | 1,491,119 | | | | 81,480 | | | | 81,674 | | | | — | |
Class B | | | (964,155 | ) | | | (1,491,117 | ) | | | (82,000 | ) | | | (82,182 | ) | | | — | |
| | | | — | | | | 2 | | | | (520 | ) | | | (508 | ) | | | — | |
| | | | | | |
Net increase (decrease) in shares outstanding: | | | | | | | | | | | | | | | | | | | | |
Class A | | | 9,878,515 | | | | (5,377,497 | ) | | | 538,195 | | | | 632,498 | | | | 27,303 | |
Class B | | | (2,369,311 | ) | | | (3,100,001 | ) | | | (81,329 | ) | | | (72,324 | ) | | | — | |
Class C | | | (6,018,008 | ) | | | (1,195,014 | ) | | | 1,252,151 | | | | 1,128,797 | | | | 26,397 | |
Class I | | | (2,981,524 | ) | | | (3,154,784 | ) | | | (319,854 | ) | | | (761,463 | ) | | | 53,980 | |
Class I2 | | | (99,012,629 | ) | | | (521,934,060 | ) | | | — | | | | — | | | | — | |
| | | | (100,502,957 | ) | | | (534,761,356 | ) | | | 1,389,163 | | | | 927,508 | | | | 107,680 | |
| (A) | Commenced operations on October 31, 2013. |
The Notes to Financial Statements are an integral part of this report.
| | |
| Transamerica Funds | | Annual Report 2014 |
Page 255
STATEMENTS OF CHANGES IN NET ASSETS (continued)
For the years ended:
| | | | | | | | | | | | | | | | | | | | |
| | |
Transamerica Short-Term Bond | | | Transamerica
Small Cap Core | | | Transamerica Small Cap Growth | |
| | | October 31, 2014 | | | October 31, 2013 | | | October 31, 2014 (A) | | | October 31, 2014 | | | October 31, 2013 | |
From operations: | | | | | | | | | | | | | | | | | | | | |
Net investment income (loss) | | $ | 80,846,165 | | | $ | 88,911,109 | | | $ | 1,155,624 | | | $ | (2,309,837 | ) | | $ | (1,374,546 | ) |
Net realized gain (loss) | | | 12,855,711 | | | | 28,108,700 | | | | 4,401,372 | | | | 51,767,223 | | | | (10,235,390 | ) |
Net change in unrealized appreciation (depreciation) | | | (18,994,708 | ) | | | (24,512,090 | ) | | | 4,937,099 | | | | (27,025,684 | ) | | | 132,355,793 | |
Net increase (decrease) in net assets resulting from operations | | | 74,707,168 | | | | 92,507,719 | | | | 10,494,095 | | | | 22,431,702 | | | | 120,745,857 | |
| | | | | | |
Distributions to shareholders: | | | | | | | | | | | | | | | | | | | | |
Net investment income: | | | | | | | | | | | | | | | | | | | | |
Class A | | | (21,792,309 | ) | | | (21,816,489 | ) | | | (443 | ) | | | — | | | | (36 | ) |
Class C | | | (12,151,962 | ) | | | (15,556,070 | ) | | | (148 | ) | | | — | | | | — | |
Class I | | | (14,819,641 | ) | | | (11,069,787 | ) | | | (570 | ) | | | — | | | | (236 | ) |
Class I2 | | | (36,362,344 | ) | | | (46,347,624 | ) | | | (212,400 | ) | | | (13,380 | ) | | | (310,438 | ) |
Total distributions from net investment income | | | (85,126,256 | ) | | | (94,789,970 | ) | | | (213,561 | ) | | | (13,380 | ) | | | (310,710 | ) |
Net realized gains: | | | | | | | | | | | | | | | | | | | | |
Class A | | | (5,375,671 | ) | | | (3,551,210 | ) | | | — | | | | — | | | | — | |
Class C | | | (4,773,809 | ) | | | (3,839,661 | ) | | | — | | | | — | | | | — | |
Class I | | | (2,858,306 | ) | | | (1,692,537 | ) | | | — | | | | — | | | | — | |
Class I2 | | | (8,468,483 | ) | | | (7,974,540 | ) | | | — | | | | — | | | | — | |
Total distributions from net realized gains | | | (21,476,269 | ) | | | (17,057,948 | ) | | | — | | | | — | | | | — | |
Total distributions to shareholders | | | (106,602,525 | ) | | | (111,847,918 | ) | | | (213,561 | ) | | | (13,380 | ) | | | (310,710 | ) |
| | | | | | |
Capital share transactions: | | | | | | | | | | | | | | | | | | | | |
Proceeds from shares sold: | | | | | | | | | | | | | | | | | | | | |
Class A | | | 487,562,162 | | | | 543,762,634 | | | | 320,881 | | | | 358,402 | | | | 270,167 | |
Class C | | | 195,646,184 | | | | 239,503,037 | | | | 386,364 | | | | 245,586 | | | | 83,830 | |
Class I | | | 624,083,494 | | | | 359,047,248 | | | | 658,168 | | | | 121,382 | | | | 169,538 | |
Class I2 | | | 115,908,574 | | | | 543,506,012 | | | | 236,237,390 | | | | 58,927,253 | | | | 207,109,332 | |
| | | | 1,423,200,414 | | | | 1,685,818,931 | | | | 237,602,803 | | | | 59,652,623 | | | | 207,632,867 | |
Dividends and distributions reinvested: | | | | | | | | | | | | | | | | | | | | |
Class A | | | 24,497,042 | | | | 22,910,343 | | | | 443 | | | | — | | | | 36 | |
Class C | | | 14,459,422 | | | | 16,311,981 | | | | 148 | | | | — | | | | — | |
Class I | | | 13,036,726 | | | | 9,076,614 | | | | 570 | | | | — | | | | 236 | |
Class I2 | | | 44,865,067 | | | | 54,612,869 | | | | 212,400 | | | | 13,380 | | | | 310,438 | |
| | | | 96,858,257 | | | | 102,911,807 | | | | 213,561 | | | | 13,380 | | | | 310,710 | |
Cost of shares redeemed: | | | | | | | | | | | | | | | | | | | | |
Class A | | | (444,326,310 | ) | | | (402,741,543 | ) | | | (12,012 | ) | | | (116,509 | ) | | | (14,096 | ) |
Class C | | | (223,138,513 | ) | | | (241,095,077 | ) | | | (29,345 | ) | | | (34,898 | ) | | | — | |
Class I | | | (313,121,163 | ) | | | (249,180,907 | ) | | | (1,000 | ) | | | (124,762 | ) | | | — | |
Class I2 | | | (310,472,462 | ) | | | (549,855,999 | ) | | | (35,833,902 | ) | | | (115,172,585 | ) | | | (4,208,930 | ) |
| | | | (1,291,058,448 | ) | | | (1,442,873,526 | ) | | | (35,876,259 | ) | | | (115,448,754 | ) | | | (4,223,026 | ) |
| | | | | | |
Net increase (decrease) in net assets resulting from capital share transactions | | | 229,000,223 | | | | 345,857,212 | | | | 201,940,105 | | | | (55,782,751 | ) | | | 203,720,551 | |
Net increase (decrease) in net assets | | | 197,104,866 | | | | 326,517,013 | | | | 212,220,639 | | | | (33,364,429 | ) | | | 324,155,698 | |
| | | | | | |
Net assets: | | | | | | | | | | | | | | | | | | | | |
Beginning of year | | | 3,867,544,945 | | | | 3,541,027,932 | | | | — | | | | 564,255,399 | | | | 240,099,701 | |
End of year | | $ | 4,064,649,811 | | | $ | 3,867,544,945 | | | $ | 212,220,639 | | | $ | 530,890,970 | | | $ | 564,255,399 | |
Undistributed (distributions in excess of) net investment income (loss) | | $ | (413,258 | ) | | $ | (437,572 | ) | | $ | 886,913 | | | $ | (1,924,168 | ) | | $ | (1,867,375 | ) |
| | | | | | |
Capital share transactions - shares: | | | | | | | | | | | | | | | | | | | | |
Shares issued: | | | | | | | | | | | | | | | | | | | | |
Class A | | | 46,830,522 | | | | 52,013,270 | | | | 31,850 | | | | 28,724 | | | | 23,912 | |
Class C | | | 18,823,269 | | | | 22,933,751 | | | | 38,194 | | | | 19,510 | | | | 7,899 | |
Class I | | | 61,010,639 | | | | 34,958,637 | | | | 63,324 | | | | 9,950 | | | | 14,517 | |
Class I2 | | | 11,329,795 | | | | 52,759,014 | | | | 22,743,486 | | | | 4,712,855 | | | | 20,187,902 | |
| | | | 137,994,225 | | | | 162,664,672 | | | | 22,876,854 | | | | 4,771,039 | | | | 20,234,230 | |
The Notes to Financial Statements are an integral part of this report.
| | |
| Transamerica Funds | | Annual Report 2014 |
Page 256
STATEMENTS OF CHANGES IN NET ASSETS (continued)
For the year ended:
| | | | | | | | | | | | | | | | | | | | |
| | |
Transamerica Short-Term Bond | | | Transamerica
Small Cap Core | | | Transamerica Small Cap Growth | |
| | | October 31, 2014 | | | October 31, 2013 | | | October 31, 2014 (A) | | | October 31, 2014 | | | October 31, 2013 | |
Shares issued-reinvested from dividends and distributions: | | | | | | | | | | | | | | | | | | | | |
Class A | | | 2,355,593 | | | | 2,190,396 | | | | 43 | | | | — | | | | 4 | |
Class C | | | 1,393,177 | | | | 1,562,163 | | | | 14 | | | | — | | | | — | |
Class I | | | 1,275,695 | | | | 883,031 | | | | 55 | | | | — | | | | 25 | |
Class I2 | | | 4,390,838 | | | | 5,313,668 | | | | 20,522 | | | | 1,054 | | | | 33,131 | |
| | | | 9,415,303 | | | | 9,949,258 | | | | 20,634 | | | | 1,054 | | | | 33,160 | |
Shares redeemed: | | | | | | | | | | | | | | | | | | | | |
Class A | | | (42,693,290 | ) | | | (38,517,671 | ) | | | (1,106 | ) | | | (9,604 | ) | | | (1,245 | ) |
Class C | | | (21,470,005 | ) | | | (23,098,877 | ) | | | (2,778 | ) | | | (2,914 | ) | | | — | |
Class I | | | (30,622,087 | ) | | | (24,251,555 | ) | | | (93 | ) | | | (10,082 | ) | | | — | |
Class I2 | | | (30,329,868 | ) | | | (53,356,505 | ) | | | (3,290,278 | ) | | | (9,282,608 | ) | | | (372,149 | ) |
| | | | (125,115,250 | ) | | | (139,224,608 | ) | | | (3,294,255 | ) | | | (9,305,208 | ) | | | (373,394 | ) |
| | | | | | |
Net increase (decrease) in shares outstanding: | | | | | | | | | | | | | | | | | | | | |
Class A | | | 6,492,825 | | | | 15,685,995 | | | | 30,787 | | | | 19,120 | | | | 22,671 | |
Class C | | | (1,253,559 | ) | | | 1,397,037 | | | | 35,430 | | | | 16,596 | | | | 7,899 | |
Class I | | | 31,664,247 | | | | 11,590,113 | | | | 63,286 | | | | (132 | ) | | | 14,542 | |
Class I2 | | | (14,609,235 | ) | | | 4,716,177 | | | | 19,473,730 | | | | (4,568,699 | ) | | | 19,848,884 | |
| | | | 22,294,278 | | | | 33,389,322 | | | | 19,603,233 | | | | (4,533,115 | ) | | | 19,893,996 | |
| (A) | Commenced operations on October 31, 2013. |
The Notes to Financial Statements are an integral part of this report.
| | |
| Transamerica Funds | | Annual Report 2014 |
Page 257
STATEMENTS OF CHANGES IN NET ASSETS (continued)
For the period and years ended:
| | | | | | | | | | | | | | | | | | | | |
| | | Transamerica Small Cap Value | | | Transamerica Small/Mid Cap Value | | | Transamerica
Strategic High Income | |
| | | October 31, 2014 | | | October 31, 2013 | | | October 31, 2014 | | | October 31, 2013 | | | October 31, 2014 (A) | |
From operations: | | | | | | | | | | | | | | | | | | | | |
Net investment income (loss) | | $ | 7,725,007 | | | $ | 5,752,003 | | | $ | 1,062,572 | | | $ | 2,604,365 | | | $ | 860,248 | |
Net realized gain (loss) | | | 57,211,344 | | | | 42,658,701 | | | | 102,933,969 | | | | 97,522,134 | | | | 427,743 | |
Net change in unrealized appreciation (depreciation) | | | (28,631,716 | ) | | | 116,989,097 | | | | (22,145,371 | ) | | | 138,372,873 | | | | 252,550 | |
Net increase (decrease) in net assets resulting from operations | | | 36,304,635 | | | | 165,399,801 | | | | 81,851,170 | | | | 238,499,372 | | | | 1,540,541 | |
| | | | | | |
Distributions to shareholders: | | | | | | | | | | | | | | | | | | | | |
Net investment income: | | | | | | | | | | | | | | | | | | | | |
Class A | | | (6,970 | ) | | | (1,818 | ) | | | (1,823,340 | ) | | | (1,447,118 | ) | | | (21,932 | ) |
Class B | | | — | | | | — | | | | — | | | | — | | | | — | |
Class C | | | (1,449 | ) | | | (626 | ) | | | (203 | ) | | | — | | | | (14,963 | ) |
Class I | | | (6,211 | ) | | | (3,120 | ) | | | (1,237,227 | ) | | | (965,696 | ) | | | (220,447 | ) |
Class I2 | | | (6,672,269 | ) | | | (3,059,606 | ) | | | (164,899 | ) | | | (149,218 | ) | | | (530,495 | ) |
Total distributions from net investment income | | | (6,686,899 | ) | | | (3,065,170 | ) | | | (3,225,669 | ) | | | (2,562,032 | ) | | | (787,837 | ) |
Net realized gains: | | | | | | | | | | | | | | | | | | | | |
Class A | | | (67,507 | ) | | | (41 | ) | | | (41,137,010 | ) | | | — | | | | — | |
Class B | | | — | | | | — | | | | (2,688,264 | ) | | | — | | | | — | |
Class C | | | (43,009 | ) | | | (28 | ) | | | (25,079,326 | ) | | | — | | | | — | |
Class I | | | (44,883 | ) | | | (30 | ) | | | (14,269,028 | ) | | | — | | | | — | |
Class I2 | | | (43,683,172 | ) | | | (32,267 | ) | | | (1,690,758 | ) | | | — | | | | — | |
Total distributions from net realized gains | | | (43,838,571 | ) | | | (32,366 | ) | | | (84,864,386 | ) | | | — | | | | — | |
Total distributions to shareholders | | | (50,525,470 | ) | | | (3,097,536 | ) | | | (88,090,055 | ) | | | (2,562,032 | ) | | | (787,837 | ) |
| | | | | | |
Capital share transactions: | | | | | | | | | | | | | | | | | | | | |
Proceeds from shares sold: | | | | | | | | | | | | | | | | | | | | |
Class A | | | 431,439 | | | | 631,592 | | | | 87,652,676 | | | | 168,638,341 | | | | 1,153,243 | |
Class B | | | — | | | | — | | | | 706,194 | | | | 883,904 | | | | — | |
Class C | | | 364,868 | | | | 300,447 | | | | 57,877,052 | | | | 61,189,175 | | | | 1,066,569 | |
Class I | | | 62,650 | | | | 212,736 | | | | 121,395,417 | | | | 74,137,947 | | | | 14,025,078 | |
Class I2 | | | 92,994,125 | | | | 293,402,564 | | | | 1,055,255 | | | | 2,672,078 | | | | 32,956,154 | |
| | | | 93,853,082 | | | | 294,547,339 | | | | 268,686,594 | | | | 307,521,445 | | | | 49,201,044 | |
Dividends and distributions reinvested: | | | | | | | | | | | | | | | | | | | | |
Class A | | | 74,130 | | | | 1,859 | | | | 41,378,601 | | | | 1,399,157 | | | | 21,932 | |
Class B | | | — | | | | — | | | | 2,240,828 | | | | — | | | | — | |
Class C | | | 44,298 | | | | 654 | | | | 21,380,464 | | | | — | | | | 14,963 | |
Class I | | | 51,094 | | | | 3,150 | | | | 10,657,939 | | | | 664,877 | | | | 205,018 | |
Class I2 | | | 50,355,441 | | | | 3,091,873 | | | | 1,855,657 | | | | 149,218 | | | | 530,495 | |
| | | | 50,524,963 | | | | 3,097,536 | | | | 77,513,489 | | | | 2,213,252 | | | | 772,408 | |
Cost of shares redeemed: | | | | | | | | | | | | | | | | | | | | |
Class A | | | (522,416 | ) | | | (28,905 | ) | | | (175,013,075 | ) | | | (100,015,781 | ) | | | (725 | ) |
Class B | | | — | | | | — | | | | (5,904,431 | ) | | | (5,288,500 | ) | | | — | |
Class C | | | (106,250 | ) | | | (29,934 | ) | | | (48,837,255 | ) | | | (37,495,211 | ) | | | (35,357 | ) |
Class I | | | (154,279 | ) | | | (7,749 | ) | | | (76,056,692 | ) | | | (40,738,524 | ) | | | (390,084 | ) |
Class I2 | | | (187,601,274 | ) | | | (9,834,788 | ) | | | (2,284,369 | ) | | | (1,910,960 | ) | | | (11,512,327 | ) |
| | | | (188,384,219 | ) | | | (9,901,376 | ) | | | (308,095,822 | ) | | | (185,448,976 | ) | | | (11,938,493 | ) |
Automatic conversions: | | | | | | | | | | | | | | | | | | | | |
Class A | | | — | | | | — | | | | 1,856,060 | | | | 1,582,310 | | | | — | |
Class B | | | — | | | | — | | | | (1,856,060 | ) | | | (1,582,310 | ) | | | — | |
| | | | — | | | | — | | | | — | | | | — | | | | — | |
| | | | | | |
Net increase (decrease) in net assets resulting from capital share transactions | | | (44,006,174 | ) | | | 287,743,499 | | | | 38,104,261 | | | | 124,285,721 | | | | 38,034,959 | |
Net increase (decrease) in net assets | | | (58,227,009 | ) | | | 450,045,764 | | | | 31,865,376 | | | | 360,223,061 | | | | 38,787,663 | |
| | | | | | |
Net assets: | | | | | | | | | | | | | | | | | | | | |
Beginning of period/year | | | 739,599,928 | | | | 289,554,164 | | | | 1,041,487,736 | | | | 681,264,675 | | | | — | |
End of period/year | | $ | 681,372,919 | | | $ | 739,599,928 | | | $ | 1,073,353,112 | | | $ | 1,041,487,736 | | | $ | 38,787,663 | |
Undistributed (distributions in excess of) net investment income (loss) | | $ | 5,438,111 | | | $ | 4,329,328 | | | $ | 144,627 | | | $ | 2,259,731 | | | $ | 84,957 | |
The Notes to Financial Statements are an integral part of this report.
| | |
| Transamerica Funds | | Annual Report 2014 |
Page 258
STATEMENTS OF CHANGES IN NET ASSETS (continued)
For the period and years ended:
| | | | | | | | | | | | | | | | | | | | |
| | | Transamerica Small Cap Value | | | Transamerica Small/Mid Cap Value | | | Transamerica
Strategic High Income | |
| | | October 31, 2014 | | | October 31, 2013 | | | October 31, 2014 | | | October 31, 2013 | | | October 31, 2014 (A) | |
Capital share transactions - shares: | | | | | | | | | | | | | | | | | | | | |
Shares issued: | | | | | | | | | | | | | | | | | | | | |
Class A | | | 33,285 | | | | 50,363 | | | | 3,086,404 | | | | 6,634,584 | | | | 114,409 | |
Class B | | | — | | | | — | | | | 26,773 | | | | 36,426 | | | | — | |
Class C | | | 28,348 | | | | 24,984 | | | | 2,213,351 | | | | 2,556,135 | | | | 106,121 | |
Class I | | | 4,786 | | | | 16,892 | | | | 4,130,014 | | | | 2,891,549 | | | | 1,365,979 | |
Class I2 | | | 7,192,651 | | | | 26,779,785 | | | | 35,971 | | | | 100,517 | | | | 3,252,437 | |
| | | | 7,259,070 | | | | 26,872,024 | | | | 9,492,513 | | | | 12,219,211 | | | | 4,838,946 | |
Shares issued-reinvested from dividends and distributions: | | | | | | | | | | | | | | | | | | | | |
Class A | | | 5,801 | | | | 183 | | | | 1,497,055 | | | | 62,518 | | | | 2,137 | |
Class B | | | — | | | | — | | | | 86,753 | | | | — | | | | — | |
Class C | | | 3,469 | | | | 64 | | | | 836,809 | | | | — | | | | 1,458 | |
Class I | | | 3,989 | | | | 312 | | | | 377,005 | | | | 29,123 | | | | 19,988 | |
Class I2 | | | 3,930,947 | | | | 305,782 | | | | 65,594 | | | | 6,533 | | | | 51,602 | |
| | | | 3,944,206 | | | | 306,341 | | | | 2,863,216 | | | | 98,174 | | | | 75,185 | |
Shares redeemed: | | | | | | | | | | | | | | | | | | | | |
Class A | | | (40,730 | ) | | | (2,405 | ) | | | (6,130,690 | ) | | | (4,069,459 | ) | | | (71 | ) |
Class B | | | — | | | | — | | | | (222,732 | ) | | | (224,587 | ) | | | — | |
Class C | | | (8,574 | ) | | | (2,396 | ) | | | (1,870,301 | ) | | | (1,625,590 | ) | | | (3,407 | ) |
Class I | | | (12,677 | ) | | | (663 | ) | | | (2,618,525 | ) | | | (1,584,404 | ) | | | (37,495 | ) |
Class I2 | | | (14,626,262 | ) | | | (870,242 | ) | | | (79,242 | ) | | | (72,140 | ) | | | (1,107,696 | ) |
| | | | (14,688,243 | ) | | | (875,706 | ) | | | (10,921,490 | ) | | | (7,576,180 | ) | | | (1,148,669 | ) |
Automatic conversions: | | | | | | | | | | | | | | | | | | | | |
Class A | | | — | | | | — | | | | 65,165 | | | | 63,137 | | | | — | |
Class B | | | — | | | | — | | | | (69,867 | ) | | | (67,145 | ) | | | — | |
| | | | — | | | | — | | | | (4,702 | ) | | | (4,008 | ) | | | — | |
| | | | | | |
Net increase (decrease) in shares outstanding: | | | | | | | | | | | | | | | | | | | | |
Class A | | | (1,644 | ) | | | 48,141 | | | | (1,482,066 | ) | | | 2,690,780 | | | | 116,475 | |
Class B | | | — | | | | — | | | | (179,073 | ) | | | (255,306 | ) | | | — | |
Class C | | | 23,243 | | | | 22,652 | | | | 1,179,859 | | | | 930,545 | | | | 104,172 | |
Class I | | | (3,902 | ) | | | 16,541 | | | | 1,888,494 | | | | 1,336,268 | | | | 1,348,472 | |
Class I2 | | | (3,502,664 | ) | | | 26,215,325 | | | | 22,323 | | | | 34,910 | | | | 2,196,343 | |
| | | | (3,484,967 | ) | | | 26,302,659 | | | | 1,429,537 | | | | 4,737,197 | | | | 3,765,462 | |
| (A) | Commenced operations on March 1, 2014. |
The Notes to Financial Statements are an integral part of this report.
| | |
| Transamerica Funds | | Annual Report 2014 |
Page 259
STATEMENTS OF CHANGES IN NET ASSETS (continued)
For the years ended:
| | | | | | | | | | | | | | | | | | | | | | | | |
| | |
Transamerica Tactical Allocation | | | Transamerica Tactical Income | | | Transamerica Tactical Rotation | |
| | | October 31, 2014 | | | October 31, 2013 (A) | | | October 31, 2014 | | | October 31, 2013 | | | October 31, 2014 | | | October 31, 2013 (A) | |
From operations: | | | | | | | | | | | | | | | | | | | | | | | | |
Net investment income (loss) | | $ | 202,587 | | | $ | 70,157 | | | $ | 32,746,450 | | | $ | 32,449,119 | | | $ | 99,556 | | | $ | 14,580 | |
Net realized gain (loss) | | | 593,953 | | | | (227,762 | ) | | | 46,787,395 | | | | (25,475,573 | ) | | | 859,488 | | | | (31,458 | ) |
Net change in unrealized appreciation (depreciation) | | | (497,837 | ) | | | 603,232 | | | | (20,881,142 | ) | | | 30,157,802 | | | | 106,774 | | | | 868,540 | |
Net increase (decrease) in net assets resulting from operations | | | 298,703 | | | | 445,627 | | | | 58,652,703 | | | | 37,131,348 | | | | 1,065,818 | | | | 851,662 | |
| | | | | | | |
Distributions to shareholders: | | | | | | | | | | | | | | | | | | | | | | | | |
Net investment income: | | | | | | | | | | | | | | | | | | | | | | | | |
Class A | | | (116,188 | ) | | | (47,652 | ) | | | (9,387,251 | ) | | | (15,878,009 | ) | | | (35,784 | ) | | | (20,490 | ) |
Class C | | | (111,628 | ) | | | (29,951 | ) | | | (10,079,093 | ) | | | (16,406,179 | ) | | | (7,089 | ) | | | (17,020 | ) |
Class I | | | (27,765 | ) | | | (24,159 | ) | | | (8,025,504 | ) | | | (14,004,956 | ) | | | (17,768 | ) | | | (14,990 | ) |
Total distributions from net investment income | | | (255,581 | ) | | | (101,762 | ) | | | (27,491,848 | ) | | | (46,289,144 | ) | | | (60,641 | ) | | | (52,500 | ) |
Net realized gains: | | | | | | | | | | | | | | | | | | | | | | | | |
Class A | | | (6,626 | ) | | | — | | | | — | | | | (1,145,016 | ) | | | (21,960 | ) | | | — | |
Class C | | | (10,192 | ) | | | — | | | | — | | | | (1,298,064 | ) | | | (13,300 | ) | | | — | |
Class I | | | (2,523 | ) | | | — | | | | — | | | | (1,027,731 | ) | | | (8,367 | ) | | | — | |
Total distributions from net realized gains | | | (19,341 | ) | | | — | | | | — | | | | (3,470,811 | ) | | | (43,627 | ) | | | — | |
Return of capital: | | | | | | | | | | | | | | | | | | | | | | | | |
Class A | | | — | | | | — | | | | — | | | | (724,530 | ) | | | — | | | | — | |
Class C | | | — | | | | — | | | | — | | | | (748,631 | ) | | | — | | | | — | |
Class I | | | — | | | | — | | | | — | | | | (639,062 | ) | | | — | | | | — | |
Total distributions from return of capital | | | — | | | | — | | | | — | | | | (2,112,223 | ) | | | — | | | | — | |
Total distributions to shareholders | | | (274,922 | ) | | | (101,762 | ) | | | (27,491,848 | ) | | | (51,872,178 | ) | | | (104,268 | ) | | | (52,500 | ) |
| | | | | | | |
Capital share transactions: | | | | | | | | | | | | | | | | | | | | | | | | |
Proceeds from shares sold: | | | | | | | | | | | | | | | | | | | | | | | | |
Class A | | | 2,033,070 | | | | 4,509,182 | | | | 48,021,688 | | | | 255,790,051 | | | | 6,072,181 | | | | 6,636,656 | |
Class C | | | 2,120,963 | | | | 6,345,790 | | | | 52,497,261 | | | | 274,261,506 | | | | 4,349,824 | | | | 3,737,108 | |
Class I | | | 148,863 | | | | 4,551,591 | | | | 82,956,484 | | | | 218,879,286 | | | | 1,770,288 | | | | 2,955,354 | |
| | | | 4,302,896 | | | | 15,406,563 | | | | 183,475,433 | | | | 748,930,843 | | | | 12,192,293 | | | | 13,329,118 | |
Dividends and distributions reinvested: | | | | | | | | | | | | | | | | | | | | | | | | |
Class A | | | 122,191 | | | | 45,081 | | | | 8,694,710 | | | | 16,307,555 | | | | 57,698 | | | | 20,490 | |
Class C | | | 121,209 | | | | 29,924 | | | | 8,941,478 | | | | 16,258,490 | | | | 20,390 | | | | 17,020 | |
Class I | | | 26,003 | | | | 24,159 | | | | 6,550,437 | | | | 12,461,119 | | | | 26,135 | | | | 14,990 | |
| | | | 269,403 | | | | 99,164 | | | | 24,186,625 | | | | 45,027,164 | | | | 104,223 | | | | 52,500 | |
Cost of shares redeemed: | | | | | | | | | | | | | | | | | | | | | | | | |
Class A | | | (777,688 | ) | | | (599,405 | ) | | | (149,952,578 | ) | | | (179,409,998 | ) | | | (976,776 | ) | | | (615,827 | ) |
Class C | | | (1,801,486 | ) | | | (612,568 | ) | | | (139,234,720 | ) | | | (100,809,838 | ) | | | (1,218,130 | ) | | | (132,814 | ) |
Class I | | | (841,328 | ) | | | (3,145,680 | ) | | | (124,650,121 | ) | | | (196,619,979 | ) | | | (1,280,840 | ) | | | (312,587 | ) |
| | | | (3,420,502 | ) | | | (4,357,653 | ) | | | (413,837,419 | ) | | | (476,839,815 | ) | | | (3,475,746 | ) | | | (1,061,228 | ) |
| | | | | | | |
Net increase (decrease) in net assets resulting from capital share transactions | | | 1,151,797 | | | | 11,148,074 | | | | (206,175,361 | ) | | | 317,118,192 | | | | 8,820,770 | | | | 12,320,390 | |
Net increase (decrease) in net assets | | | 1,175,578 | | | | 11,491,939 | | | | (175,014,506 | ) | | | 302,377,362 | | | | 9,782,320 | | | | 13,119,552 | |
| | | | | | | |
Net assets: | | | | | | | | | | | | | | | | | | | | | | | | |
Beginning of year | | | 11,491,939 | | | | — | | | | 1,077,207,707 | | | | 774,830,345 | | | | 13,119,552 | | | | — | |
End of year | | $ | 12,667,517 | | | $ | 11,491,939 | | | $ | 902,193,201 | | | $ | 1,077,207,707 | | | $ | 22,901,872 | | | $ | 13,119,552 | |
Undistributed (distributions in excess of) net investment income (loss) | | $ | — | | | $ | — | | | $ | 3,568,177 | | | $ | (1,624,157 | ) | | $ | 46,352 | | | $ | 9,851 | |
| | | | | | | |
Capital share transactions - shares: | | | | | | | | | | | | | | | | | | | | | | | | |
Shares issued: | | | | | | | | | | | | | | | | | | | | | | | | |
Class A | | | 196,312 | | | | 448,991 | | | | 4,654,071 | | | | 25,116,273 | | | | 532,540 | | | | 636,890 | |
Class C | | | 206,858 | | | | 637,816 | | | | 5,103,509 | | | | 27,009,959 | | | | 383,593 | | | | 358,348 | |
Class I | | | 14,577 | | | | 464,614 | | | | 7,976,112 | | | | 21,509,562 | | | | 155,900 | | | | 283,008 | |
| | | | 417,747 | | | | 1,551,421 | | | | 17,733,692 | | | | 73,635,794 | | | | 1,072,033 | | | | 1,278,246 | |
The Notes to Financial Statements are an integral part of this report.
| | |
| Transamerica Funds | | Annual Report 2014 |
Page 260
STATEMENTS OF CHANGES IN NET ASSETS (continued)
For the year ended:
| | | | | | | | | | | | | | | | | | | | | | | | |
| | |
Transamerica Tactical Allocation | | | Transamerica Tactical Income | | | Transamerica Tactical Rotation | |
| | | October 31, 2014 | | | October 31, 2013 (A) | | | October 31, 2014 | | | October 31, 2013 | | | October 31, 2014 | | | October 31, 2013 (A) | |
Shares issued-reinvested from dividends and distributions: | | | | | | | | | | | | | | | | | | | | | | | | |
Class A | | | 11,839 | | | | 4,550 | | | | 841,151 | | | | 1,615,063 | | | | 5,152 | | | | 2,119 | |
Class C | | | 11,834 | | | | 3,033 | | | | 867,629 | | | | 1,616,041 | | | | 1,827 | | | | 1,762 | |
Class I | | | 2,544 | | | | 2,452 | | | | 633,166 | | | | 1,233,427 | | | | 2,342 | | | | 1,560 | |
| | | | 26,217 | | | | 10,035 | | | | 2,341,946 | | | | 4,464,531 | | | | 9,321 | | | | 5,441 | |
Shares redeemed: | | | | | | | | | | | | | | | | | | | | | | | | |
Class A | | | (75,538 | ) | | | (59,807 | ) | | | (14,461,409 | ) | | | (17,862,420 | ) | | | (85,107 | ) | | | (58,346 | ) |
Class C | | | (176,194 | ) | | | (61,669 | ) | | | (13,535,177 | ) | | | (10,110,632 | ) | | | (106,790 | ) | | | (12,544 | ) |
Class I | | | (81,886 | ) | | | (317,060 | ) | | | (12,085,747 | ) | | | (19,541,746 | ) | | | (112,192 | ) | | | (29,833 | ) |
| | | | (333,618 | ) | | | (438,536 | ) | | | (40,082,333 | ) | | | (47,514,798 | ) | | | (304,089 | ) | | | (100,723 | ) |
| | | | | | | |
Net increase (decrease) in shares outstanding: | | | | | | | | | | | | | | | | | | | | | | | | |
Class A | | | 132,613 | | | | 393,734 | | | | (8,966,187 | ) | | | 8,868,916 | | | | 452,585 | | | | 580,663 | |
Class C | | | 42,498 | | | | 579,180 | | | | (7,564,039 | ) | | | 18,515,368 | | | | 278,630 | | | | 347,566 | |
Class I | | | (64,765 | ) | | | 150,006 | | | | (3,476,469 | ) | | | 3,201,243 | | | | 46,050 | | | | 254,735 | |
| | | | 110,346 | | | | 1,122,920 | | | | (20,006,695 | ) | | | 30,585,527 | | | | 777,265 | | | | 1,182,964 | |
| (A) | Commenced operations on October 31, 2012. |
The Notes to Financial Statements are an integral part of this report.
| | |
| Transamerica Funds | | Annual Report 2014 |
Page 261
STATEMENTS OF CHANGES IN NET ASSETS (continued)
For the years ended:
| | | | | | | | |
| | |
Transamerica US Growth (A) | |
| | | October 31, 2014 | | | October 31, 2013 | |
From operations: | | | | | | | | |
Net investment income (loss) | | $ | 4,702,928 | | | $ | 11,869,628 | |
Net realized gain (loss) | | | 417,554,925 | | | | 185,255,598 | |
Net change in unrealized appreciation (depreciation) | | | (243,809,615 | ) | | | 153,323,695 | |
Net increase (decrease) in net assets resulting from operations | | | 178,448,238 | | | | 350,448,921 | |
| | | |
Distributions to shareholders: | | | | | | | | |
Net investment income: | | | | | | | | |
Class A | | | (3,465,587 | ) | | | (769,591 | ) |
Class C | | | (26,540 | ) | | | — | |
Class I | | | (2,870,434 | ) | | | (1,532,076 | ) |
Class I2 | | | (6,480,546 | ) | | | (4,002,443 | ) |
Class T | | | (482,132 | ) | | | (228,735 | ) |
Total distributions from net investment income | | | (13,325,239 | ) | | | (6,532,845 | ) |
| | | |
Capital share transactions: | | | | | | | | |
Proceeds from shares sold: | | | | | | | | |
Class A | | | 9,117,367 | | | | 11,366,538 | |
Class B | | | 118,596 | | | | 1,223,955 | |
Class C | | | 2,861,175 | | | | 2,754,039 | |
Class I | | | 9,138,705 | | | | 10,465,200 | |
Class I2 | | | 18,392,356 | | | | 12,660,078 | |
Class T | | | 1,012,958 | | | | 785,477 | |
| | | | 40,641,157 | | | | 39,255,287 | |
Dividends and distributions reinvested: | | | | | | | | |
Class A | | | 3,398,566 | | | | 755,349 | |
Class C | | | 25,660 | | | | — | |
Class I | | | 2,833,632 | | | | 1,502,638 | |
Class I2 | | | 6,470,353 | | | | 3,997,098 | |
Class T | | | 474,365 | | | | 225,596 | |
| | | | 13,202,576 | | | | 6,480,681 | |
Cost of shares redeemed: | | | | | | | | |
Class A | | | (61,755,721 | ) | | | (91,495,788 | ) |
Class B | | | (1,902,375 | ) | | | (2,834,318 | ) |
Class C | | | (7,265,117 | ) | | | (8,053,129 | ) |
Class I | | | (78,094,564 | ) | | | (138,001,397 | ) |
Class I2 | | | (266,711,312 | ) | | | (179,355,730 | ) |
Class T | | | (8,367,204 | ) | | | (9,082,315 | ) |
| | | | (424,096,293 | ) | | | (428,822,677 | ) |
Automatic conversions: | | | | | | | | |
Class A | | | 3,709,838 | | | | 3,970,796 | |
Class B | | | (3,709,838 | ) | | | (3,970,796 | ) |
| | | | — | | | | — | |
| | | |
Net increase (decrease) in net assets resulting from capital share transactions | | | (370,252,560 | ) | | | (383,086,709 | ) |
Net increase (decrease) in net assets | | | (205,129,561 | ) | | | (39,170,633 | ) |
| | | |
Net assets: | | | | | | | | |
Beginning of year | | | 1,414,324,349 | | | | 1,453,494,982 | |
End of year | | $ | 1,209,194,788 | | | $ | 1,414,324,349 | |
Undistributed (distributions in excess of) net investment income (loss) | | $ | 3,085,419 | | | $ | 11,882,467 | |
The Notes to Financial Statements are an integral part of this report.
| | |
| Transamerica Funds | | Annual Report 2014 |
Page 262
STATEMENTS OF CHANGES IN NET ASSETS (continued)
For the year ended:
| | | | | | | | |
| | |
Transamerica US Growth (A) | |
| | | October 31, 2014 | | | October 31, 2013 | |
Capital share transactions - shares: | | | | | | | | |
Shares issued: | | | | | | | | |
Class A | | | 505,770 | | | | 771,500 | |
Class B | | | 6,713 | | | | 83,088 | |
Class C | | | 159,743 | | | | 179,174 | |
Class I | | | 494,219 | | | | 680,611 | |
Class I2 | | | 993,024 | | | | 875,085 | |
Class T | | | 26,058 | | | | 24,274 | |
| | | | 2,185,527 | | | | 2,613,732 | |
Shares issued-reinvested from dividends and distributions: | | | | | | | | |
Class A | | | 193,430 | | | | 47,269 | |
Class C | | | 1,481 | | | | — | |
Class I | | | 159,552 | | | | 92,755 | |
Class I2 | | | 365,145 | | | | 247,039 | |
Class T | | | 12,533 | | | | 6,577 | |
| | | | 732,141 | | | | 393,640 | |
Shares redeemed: | | | | | | | | |
Class A | | | (3,402,414 | ) | | | (6,028,455 | ) |
Class B | | | (107,475 | ) | | | (192,092 | ) |
Class C | | | (409,264 | ) | | | (549,732 | ) |
Class I | | | (4,262,368 | ) | | | (9,056,038 | ) |
Class I2 | | | (14,668,763 | ) | | | (11,316,596 | ) |
Class T | | | (213,712 | ) | | | (281,788 | ) |
| | | | (23,063,996 | ) | | | (27,424,701 | ) |
Automatic conversions: | | | | | | | | |
Class A | | | 205,841 | | | | 265,338 | |
Class B | | | (209,143 | ) | | | (269,403 | ) |
| | | | (3,302 | ) | | | (4,065 | ) |
| | | |
Net increase (decrease) in shares outstanding: | | | | | | | | |
Class A | | | (2,497,373 | ) | | | (4,944,348 | ) |
Class B | | | (309,905 | ) | | | (378,407 | ) |
Class C | | | (248,040 | ) | | | (370,558 | ) |
Class I | | | (3,608,597 | ) | | | (8,282,672 | ) |
Class I2 | | | (13,310,594 | ) | | | (10,194,472 | ) |
Class T | | | (175,121 | ) | | | (250,937 | ) |
| | | | (20,149,630 | ) | | | (24,421,394 | ) |
| (A) | Formerly, Transamerica Diversified Equity. |
The Notes to Financial Statements are an integral part of this report.
| | |
| Transamerica Funds | | Annual Report 2014 |
Page 263
FINANCIAL HIGHLIGHTS
| | | | | | | | | | | | | | | | | | | | |
| For a share outstanding during the period and years indicated: | | Transamerica Capital Growth | |
| | | Class A | |
| | | October 31,
2014 | | | October 31,
2013 | | | October 31,
2012 | | | October 31,
2011 | | | October 31,
2010 (A) | |
Net asset value | | | | | | | | | | | | | | | | | | | | |
Beginning of period/year | | $ | 21.40 | | | $ | 15.34 | | | $ | 15.47 | | | $ | 13.78 | | | $ | 11.77 | |
Investment operations | | | | | | | | | | | | | | | | | | | | |
Net investment income (loss) (B) | | | (0.15 | ) | | | (0.07 | ) | | | — | (C) | | | (0.12 | ) | | | (0.09 | ) |
Net realized and unrealized gain (loss) | | | 3.64 | | | | 6.49 | | | | 0.32 | | | | 1.81 | | | | 2.12 | |
Total investment operations | | | 3.49 | | | | 6.42 | | | | 0.32 | | | | 1.69 | | | | 2.03 | |
Distributions | | | | | | | | | | | | | | | | | | | | |
Net investment income | | | — | | | | — | | | | — | | | | — | | | | (0.02 | ) |
Net realized gains | | | (0.49 | ) | | | (0.36 | ) | | | (0.45 | ) | | | — | | | | — | |
Total distributions | | | (0.49 | ) | | | (0.36 | ) | | | (0.45 | ) | | | — | | | | (0.02 | ) |
Net asset value | | | | | | | | | | | | | | | | | | | | |
End of period/year | | $ | 24.40 | | | $ | 21.40 | | | $ | 15.34 | | | $ | 15.47 | | | $ | 13.78 | |
Total return (D) | | | 16.52 | % | | | 42.74 | % | | | 2.38 | % | | | 12.34 | % | | | 17.24 | %(E) |
Ratio and supplemental data | | | | | | | | | | | | | | | | | | | | |
Net assets end of period/year (000’s) | | $ | 124,413 | | | $ | 88,843 | | | $ | 65,782 | | | $ | 66,058 | | | $ | 48,547 | |
Expenses to average net assets | | | | | | | | | | | | | | | | | | | | |
After (waiver/reimbursement) recapture | | | 1.26 | % | | | 1.48 | % | | | 1.52 | % | | | 1.55 | % | | | 1.55 | %(F) |
Before (waiver/reimbursement) recapture | | | 1.26 | % | | | 1.41 | % | | | 1.47 | % | | | 1.63 | % | | | 1.78 | %(F) |
Net investment income (loss) to average net assets | | | (0.63 | )% | | | (0.38 | )% | | | 0.01 | % | | | (0.76 | )% | | | (0.75 | )%(F) |
Portfolio turnover rate | | | 30 | % | | | 29 | % | | | 52 | % | | | 90 | % | | | 57 | %(E) |
| (A) | Commenced operations on November 13, 2009. |
| (B) | Calculated based on average number of shares outstanding. |
| (C) | Rounds to less than $0.01 or $(0.01). |
| (D) | Total return has been calculated for the applicable period without deduction of a sales load, if any, on an initial purchase. |
| | | | | | | | | | | | | | | | | | | | |
| For a share outstanding during the period and years indicated: | | Transamerica Capital Growth | |
| | | Class B | |
| | | October 31,
2014 | | | October 31,
2013 | | | October 31,
2012 | | | October 31,
2011 | | | October 31,
2010 (A) | |
Net asset value | | | | | | | | | | | | | | | | | | | | |
Beginning of period/year | | $ | 19.31 | | | $ | 13.96 | | | $ | 14.22 | | | $ | 12.75 | | | $ | 10.95 | |
Investment operations | | | | | | | | | | | | | | | | | | | | |
Net investment income (loss) (B) | | | (0.32 | ) | | | (0.17 | ) | | | (0.10 | ) | | | (0.20 | ) | | | (0.15 | ) |
Net realized and unrealized gain (loss) | | | 3.26 | | | | 5.88 | | | | 0.29 | | | | 1.67 | | | | 1.96 | |
Total investment operations | | | 2.94 | | | | 5.71 | | | | 0.19 | | | | 1.47 | | | | 1.81 | |
Distributions | | | | | | | | | | | | | | | | | | | | |
Net investment income | | | — | | | | — | | | | — | (C) | | | — | | | | (0.01 | ) |
Net realized gains | | | (0.49 | ) | | | (0.36 | ) | | | (0.45 | ) | | | — | | | | — | |
Total distributions | | | (0.49 | ) | | | (0.36 | ) | | | (0.45 | ) | | | — | | | | (0.01 | ) |
Net asset value | | | | | | | | | | | | | | | | | | | | |
End of period/year | | $ | 21.76 | | | $ | 19.31 | | | $ | 13.96 | | | $ | 14.22 | | | $ | 12.75 | |
Total return (D) | | | 15.44 | % | | | 41.86 | % | | | 1.65 | % | | | 11.61 | % | | | 16.51 | %(E) |
Ratio and supplemental data | | | | | | | | | | | | | | | | | | | | |
Net assets end of period/year (000’s) | | $ | 4,932 | | | $ | 6,020 | | | $ | 5,596 | | | $ | 7,786 | | | $ | 9,916 | |
Expenses to average net assets | | | | | | | | | | | | | | | | | | | | |
After (waiver/reimbursement) recapture | | | 2.20 | % | | | 2.20 | % | | | 2.20 | % | | | 2.20 | % | | | 2.20 | %(F) |
Before (waiver/reimbursement) recapture | | | 2.16 | % | | | 2.28 | % | | | 2.33 | % | | | 2.45 | % | | | 2.51 | %(F) |
Net investment income (loss) to average net assets | | | (1.54 | )% | | | (1.07 | )% | | | (0.73 | )% | | | (1.41 | )% | | | (1.36 | )%(F) |
Portfolio turnover rate | | | 30 | % | | | 29 | % | | | 52 | % | | | 90 | % | | | 57 | %(E) |
| (A) | Commenced operations on November 13, 2009. |
| (B) | Calculated based on average number of shares outstanding. |
| (C) | Rounds to less than $0.01 or $(0.01). |
| (D) | Total return has been calculated for the applicable period without deduction of a sales load, if any, on an initial purchase. |
The Notes to Financial Statements are an integral part of this report.
| | |
| Transamerica Funds | | Annual Report 2014 |
Page 264
FINANCIAL HIGHLIGHTS (continued)
| | | | | | | | | | | | | | | | | | | | |
| For a share outstanding during the period and years indicated: | | Transamerica Capital Growth | |
| | | Class C | |
| | | October 31,
2014 | | | October 31,
2013 | | | October 31,
2012 | | | October 31,
2011 | | | October 31,
2010 (A) | |
Net asset value | | | | | | | | | | | | | | | | | | | | |
Beginning of period/year | | $ | 19.33 | | | $ | 13.96 | | | $ | 14.20 | | | $ | 12.74 | | | $ | 10.94 | |
Investment operations | | | | | | | | | | | | | | | | | | | | |
Net investment income (loss) (B) | | | (0.28 | ) | | | (0.15 | ) | | | (0.08 | ) | | | (0.20 | ) | | | (0.15 | ) |
Net realized and unrealized gain (loss) | | | 3.28 | | | | 5.88 | | | | 0.29 | | | | 1.66 | | | | 1.96 | |
Total investment operations | | | 3.00 | | | | 5.73 | | | | 0.21 | | | | 1.46 | | | | 1.81 | |
Distributions | | | | | | | | | | | | | | | | | | | | |
Net investment income | | | — | | | | — | | | | — | (C) | | | — | | | | (0.01 | ) |
Net realized gains | | | (0.49 | ) | | | (0.36 | ) | | | (0.45 | ) | | | — | | | | — | |
Total distributions | | | (0.49 | ) | | | (0.36 | ) | | | (0.45 | ) | | | — | | | | (0.01 | ) |
Net asset value | | | | | | | | | | | | | | | | | | | | |
End of period/year | | $ | 21.84 | | | $ | 19.33 | | | $ | 13.96 | | | $ | 14.20 | | | $ | 12.74 | |
Total return (D) | | | 15.74 | % | | | 42.01 | % | | | 1.80 | % | | | 11.62 | % | | | 16.53 | %(E) |
Ratio and supplemental data | | | | | | | | | | | | | | | | | | | | |
Net assets end of period/year (000’s) | | $ | 50,879 | | | $ | 27,535 | | | $ | 19,809 | | | $ | 16,252 | | | $ | 12,814 | |
Expenses to average net assets | | | | | | | | | | | | | | | | | | | | |
After (waiver/reimbursement) recapture | | | 1.95 | % | | | 2.04 | % | | | 2.08 | % | | | 2.20 | % | | | 2.20 | %(F) |
Before (waiver/reimbursement) recapture | | | 1.95 | % | | | 2.04 | % | | | 2.06 | % | | | 2.18 | % | | | 2.26 | %(F) |
Net investment income (loss) to average net assets | | | (1.34 | )% | | | (0.95 | )% | | | (0.54 | )% | | | (1.41 | )% | | | (1.39 | )%(F) |
Portfolio turnover rate | | | 30 | % | | | 29 | % | | | 52 | % | | | 90 | % | | | 57 | %(E) |
| (A) | Commenced operations on November 13, 2009. |
| (B) | Calculated based on average number of shares outstanding. |
| (C) | Rounds to less than $0.01 or $(0.01). |
| (D) | Total return has been calculated for the applicable period without deduction of a sales load, if any, on an initial purchase. |
| | | | | | | | | | | | | | | | | | | | |
| For a share outstanding during the period and years indicated: | | Transamerica Capital Growth | |
| | | Class I | |
| | | October 31,
2014 | | | October 31,
2013 | | | October 31,
2012 | | | October 31,
2011 | | | October 31, 2010 (A) | |
Net asset value | | | | | | | | | | | | | | | | | | | | |
Beginning of period/year | | $ | 21.78 | | | $ | 15.61 | | | $ | 15.66 | | | $ | 13.89 | | | $ | 11.64 | |
Investment operations | | | | | | | | | | | | | | | | | | | | |
Net investment income (loss) (B) | | | (0.07 | ) | | | 0.02 | | | | 0.11 | | | | (0.06 | ) | | | (0.06 | ) |
Net realized and unrealized gain (loss) | | | 3.70 | | | | 6.59 | | | | 0.30 | | | | 1.83 | | | | 2.33 | |
Total investment operations | | | 3.63 | | | | 6.61 | | | | 0.41 | | | | 1.77 | | | | 2.27 | |
Distributions | | | | | | | | | | | | | | | | | | | | |
Net investment income | | | — | | | | (0.08 | ) | | | (0.01 | ) | | | — | | | | (0.02 | ) |
Net realized gains | | | (0.49 | ) | | | (0.36 | ) | | | (0.45 | ) | | | — | | | | — | |
Total distributions | | | (0.49 | ) | | | (0.44 | ) | | | (0.46 | ) | | | — | | | | (0.02 | ) |
Net asset value | | | | | | | | | | | | | | | | | | | | |
End of period/year | | $ | 24.92 | | | $ | 21.78 | | | $ | 15.61 | | | $ | 15.66 | | | $ | 13.89 | |
Total return (C) | | | 16.88 | % | | | 43.45 | % | | | 2.96 | % | | | 12.81 | % | | | 19.58 | %(D) |
Ratio and supplemental data | | | | | | | | | | | | | | | | | | | | |
Net assets end of period/year (000’s) | | $ | 161,858 | | | $ | 105,747 | | | $ | 80,083 | | | $ | 11,767 | | | $ | 434 | |
Expenses to average net assets | | | | | | | | | | | | | | | | | | | | |
After (waiver/reimbursement) recapture | | | 0.95 | % | | | 0.99 | % | | | 0.94 | % | | | 1.13 | % | | | 1.20 | %(E) |
Before (waiver/reimbursement) recapture | | | 0.95 | % | | | 0.99 | % | | | 0.94 | % | | | 1.10 | % | | | 1.85 | %(E) |
Net investment income (loss) to average net assets | | | (0.31 | )% | | | 0.11 | % | | | 0.66 | % | | | (0.37 | )% | | | (0.51 | )%(E) |
Portfolio turnover rate | | | 30 | % | | | 29 | % | | | 52 | % | | | 90 | % | | | 57 | %(D) |
| (A) | Commenced operations on November 30, 2009. |
| (B) | Calculated based on average number of shares outstanding. |
| (C) | Total return has been calculated for the applicable period without deduction of a sales load, if any, on an initial purchase. |
The Notes to Financial Statements are an integral part of this report.
| | |
| Transamerica Funds | | Annual Report 2014 |
Page 265
FINANCIAL HIGHLIGHTS (continued)
| | | | | | | | | | | | | | | | |
| For a share outstanding during the period and years indicated: | | Transamerica Capital Growth | |
| | | Class I2 | |
| | | October 31,
2014 | | | October 31,
2013 | | | October 31,
2012 | | | October 31,
2011 (A) | |
Net asset value | | | | | | | | | | | | | | | | |
Beginning of period/year | | $ | 14.88 | | | $ | 10.80 | | | $ | 10.96 | | | $ | 10.00 | |
Investment operations | | | | | | | | | | | | | | | | |
Net investment income (loss) (B) | | | (0.03 | ) | | | 0.04 | | | | 0.07 | | | | — | (C) |
Net realized and unrealized gain (loss) | | | 2.52 | | | | 4.50 | | | | 0.22 | | | | 0.96 | |
Total investment operations | | | 2.49 | | | | 4.54 | | | | 0.29 | | | | 0.96 | |
Distributions | | | | | | | | | | | | | | | | |
Net investment income | | | — | | | | (0.10 | ) | | | — | (C) | | | — | |
Net realized gains | | | (0.49 | ) | | | (0.36 | ) | | | (0.45 | ) | | | — | |
Total distributions | | | (0.49 | ) | | | (0.46 | ) | | | (0.45 | ) | | | — | |
Net asset value | | | | | | | | | | | | | | | | |
End of period/year | | $ | 16.88 | | | $ | 14.88 | | | $ | 10.80 | | | $ | 10.96 | |
Total return (D) | | | 17.05 | % | | | 43.65 | % | | | 3.11 | % | | | 9.70 | %(E) |
Ratio and supplemental data | | | | | | | | | | | | | | | | |
Net assets end of period/year (000’s) | | $ | 836,984 | | | $ | 509,700 | | | $ | 545,635 | | | $ | 407,302 | |
Expenses to average net assets | | | | | | | | | | | | | | | | |
After (waiver/reimbursement) recapture | | | 0.81 | % | | | 0.84 | % | | | 0.84 | % | | | 1.09 | %(F) |
Before (waiver/reimbursement) recapture | | | 0.81 | % | | | 0.84 | % | | | 0.84 | % | | | 1.09 | %(F) |
Net investment income (loss) to average net assets | | | (0.20 | )% | | | 0.32 | % | | | 0.67 | % | | | (0.48 | )%(F) |
Portfolio turnover rate | | | 30 | % | | | 29 | % | | | 52 | % | | | 90 | %(E) |
| (A) | Commenced operations on September 30, 2011. |
| (B) | Calculated based on average number of shares outstanding. |
| (C) | Rounds to less than $0.01 or $(0.01). |
| (D) | Total return has been calculated for the applicable period without deduction of a sales load, if any, on an initial purchase. |
| | | | | | | | | | | | |
| For a share outstanding during the period indicated: | | Transamerica Concentrated Growth | |
| | | Class A | | | Class C | | | Class I2 | |
| | | October 31,
2014 (A) | | | October 31,
2014 (A) | | | October 31,
2014 (A) | |
Net asset value | | | | | | | | | | | | |
Beginning of period | | $ | 15.57 | | | $ | 15.57 | | | $ | 15.57 | |
Investment operations | | | | | | | | | | | | |
Net investment income (loss) (B) | | | — | (C) | | | (0.07 | ) | | | 0.04 | |
Net realized and unrealized gain (loss) | | | 0.65 | | | | 0.64 | | | | 0.65 | |
Total investment operations | | | 0.65 | | | | 0.57 | | | | 0.69 | |
Net asset value | | | | | | | | | | | | |
End of period | | $ | 16.22 | | | $ | 16.14 | | | $ | 16.26 | |
Total return (D) | | | 4.17 | %(E) | | | 3.66 | %(E) | | | 4.43 | %(E) |
Ratio and supplemental data | | | | | | | | | | | | |
Net assets end of period (000’s) | | $ | 444 | | | $ | 274 | | | $ | 353,480 | |
Expenses to average net assets | | | | | | | | | | | | |
After (waiver/reimbursement) recapture | | | 1.18 | %(F) | | | 1.93 | %(F) | | | 0.77 | %(F) |
Before (waiver/reimbursement) recapture | | | 1.18 | %(F) | | | 1.93 | %(F) | | | 0.77 | %(F) |
Net investment income (loss) to average net assets | | | 0.03 | %(F) | | | (0.67 | )%(F) | | | 0.42 | %(F) |
Portfolio turnover rate | | | 18 | %(E) | | | 18 | %(E) | | | 18 | %(E) |
| (A) | Commenced operations on March 1, 2014. |
| (B) | Calculated based on average number of shares outstanding. |
| (C) | Rounds to less than $0.01 or $(0.01). |
| (D) | Total return has been calculated for the applicable period without deduction of a sales load, if any, on an initial purchase. |
The Notes to Financial Statements are an integral part of this report.
| | |
| Transamerica Funds | | Annual Report 2014 |
Page 266
FINANCIAL HIGHLIGHTS (continued)
| | | | | | | | | | | | | | | | | | | | |
| For a share outstanding during the period and years indicated: | | Transamerica Concentrated Growth | |
| | | Class I (A) | |
| | | October 31,
2014 (B) | | | December 31,
2013 | | | December 31,
2012 | | | December 31,
2011 | | | December 31,
2010 (C) | |
Net asset value | | | | | | | | | | | | | | | | | | | | |
Beginning of period/year | | $ | 15.76 | | | $ | 12.240 | | | $ | 10.220 | | | $ | 10.000 | | | $ | 10.000 | |
Investment operations | | | | | | | | | | | | | | | | | | | | |
Net investment income (loss) (D) | | | 0.02 | | | | (0.003 | ) | | | 0.009 | (E) | | | 0.003 | | | | 0.000 | |
Net realized and unrealized gain (loss) | | | 0.76 | | | | 3.869 | | | | 2.064 | | | | 0.221 | (F) | | | 0.000 | |
Total investment operations | | | 0.78 | | | | 3.866 | | | | 2.073 | | | | 0.224 | | | | 0.000 | |
Distributions | | | | | | | | | | | | | | | | | | | | |
Net investment income | | | — | | | | (0.004 | ) | | | (0.006 | ) | | | (0.002 | ) | | | 0.000 | |
Net realized gains | | | (0.45 | ) | | | (0.342 | ) | | | (0.047 | ) | | | (0.002 | ) | | | — | |
Total distributions | | | (0.45 | ) | | | (0.346 | ) | | | (0.053 | ) | | | (0.004 | ) | | | 0.000 | |
Net asset value | | | | | | | | | | | | | | | | | | | | |
End of period/year | | $ | 16.09 | | | $ | 15.76 | | | $ | 12.24 | | | $ | 10.22 | | | $ | 10.00 | |
Total return (G) | | | 6.13 | %(H) | | | 31.84 | % | | | 20.28 | % | | | 2.23 | % | | | 0.00 | % |
Ratio and supplemental data | | | | | | | | | | | | | | | | | | | | |
Net assets end of period/year (000’s) | | $ | 19,643 | | | $ | 13,761 | | | $ | 10,320 | | | $ | 2,801 | | | $ | 100 | |
Expenses to average net assets | | | | | | | | | | | | | | | | | | | | |
After (waiver/reimbursement) recapture | | | 1.00 | %(I) | | | 1.25 | % | | | 1.25 | % | | | 1.25 | % | | | 0.00 | % |
Before (waiver/reimbursement) recapture | | | 1.08 | %(I) | | | 2.18 | % | | | 3.68 | % | | | 5.90 | % | | | 0.00 | % |
Net investment income (loss) to average net assets | | | 0.16 | %(I) | | | (0.02 | )% | | | 0.08 | %(E) | | | 0.03 | % | | | 0.00 | % |
Portfolio turnover rate | | | 18 | %(H) | | | 14.84 | % | | | 21.76 | % | | | 22.35 | % | | | 0.00 | % |
| (A) | Prior to February 28, 2014, information provided in previous periods reflects The Torray Resolute Fund, which is the accounting survivor pursuant to a Plan of Reorganization. Prior to January 1, 2014, the Financial Highlights were audited by another independent registered public accounting firm. |
| (B) | Effective at the close of business on February 28, 2014, the fiscal year end of the Fund changed to October 31. The Financial Highlights represent activity for the ten months of January 1, 2014 - October 31, 2014. Refer to the Notes to Financial Statements for details. |
| (C) | Commenced operations on December 31, 2010. |
| (D) | Calculated based on average number of shares outstanding. |
| (E) | For the year ended December 31, 2012, investment income per share reflects a special dividend which amounted to $0.01 per share. Excluding the special dividend, the ratio of net investment income to average net assets would have been (0.01)%. |
| (F) | The amount of net gains on securities (both realized and unrealized) per share does not accord with the amounts reported in the Statement of Changes due to the timing of purchases and redemptions of Fund shares and fluctuating market values during the period. |
| (G) | Total return has been calculated for the applicable period without deduction of a sales load, if any, on an initial purchase. |
The Notes to Financial Statements are an integral part of this report.
| | |
| Transamerica Funds | | Annual Report 2014 |
Page 267
FINANCIAL HIGHLIGHTS (continued)
| | | | | | | | |
| For a share outstanding during the period and year indicated: | | Transamerica Dividend Focused | |
| | | Class A | |
| | | October 31,
2014 | | | October 31,
2013 (A) | |
Net asset value | | | | | | | | |
Beginning of period/year | | $ | 11.98 | | | $ | 10.00 | |
Investment operations | | | | | | | | |
Net investment income (loss) (B) | | | 0.20 | | | | 0.14 | |
Net realized and unrealized gain (loss) | | | 1.47 | | | | 1.97 | |
Total investment operations | | | 1.67 | | | | 2.11 | |
Distributions | | | | | | | | |
Net investment income | | | (0.20 | ) | | | (0.13 | ) |
Net realized gains | | | (0.10 | ) | | | — | |
Total distributions | | | (0.30 | ) | | | (0.13 | ) |
Net asset value | | | | | | | | |
End of period/year | | $ | 13.35 | | | $ | 11.98 | |
Total return (C) | | | 14.14 | % | | | 21.25 | %(D) |
Ratio and supplemental data | | | | | | | | |
Net assets end of period/year (000’s) | | $ | 63,639 | | | $ | 1,245 | |
Expenses to average net assets | | | | | | | | |
After (waiver/reimbursement) recapture | | | 0.96 | % | | | 1.07 | %(E) |
Before (waiver/reimbursement) recapture | | | 0.96 | % | | | 1.07 | %(E) |
Net investment income (loss) to average net assets | | | 1.55 | % | | | 1.47 | %(E) |
Portfolio turnover rate | | | 21 | % | | | 23 | %(D) |
| (A) | Commenced operations on January 4, 2013. |
| (B) | Calculated based on average number of shares outstanding. |
| (C) | Total return has been calculated for the applicable period without deduction of a sales load, if any, on an initial purchase. |
| | | | | | | | |
| For a share outstanding during the period and year indicated: | | Transamerica Dividend Focused | |
| | | Class C | |
| | | October 31,
2014 | | | October 31,
2013 (A) | |
Net asset value | | | | | | | | |
Beginning of period/year | | $ | 11.96 | | | $ | 10.00 | |
Investment operations | | | | | | | | |
Net investment income (loss) (B) | | | 0.09 | | | | 0.08 | |
Net realized and unrealized gain (loss) | | | 1.49 | | | | 1.96 | |
Total investment operations | | | 1.58 | | | | 2.04 | |
Distributions | | | | | | | | |
Net investment income | | | (0.12 | ) | | | (0.08 | ) |
Net realized gains | | | (0.10 | ) | | | — | |
Total distributions | | | (0.22 | ) | | | (0.08 | ) |
Net asset value | | | | | | | | |
End of period/year | | $ | 13.32 | | | $ | 11.96 | |
Total return (C) | | | 13.30 | % | | | 20.50 | %(D) |
Ratio and supplemental data | | | | | | | | |
Net assets end of period/year (000’s) | | $ | 4,419 | | | $ | 1,297 | |
Expenses to average net assets | | | | | | | | |
After (waiver/reimbursement) recapture | | | 1.81 | % | | | 1.78 | %(E) |
Before (waiver/reimbursement) recapture | | | 1.81 | % | | | 1.78 | %(E) |
Net investment income (loss) to average net assets | | | 0.74 | % | | | 0.83 | %(E) |
Portfolio turnover rate | | | 21 | % | | | 23 | %(D) |
| (A) | Commenced operations on January 4, 2013. |
| (B) | Calculated based on average number of shares outstanding. |
| (C) | Total return has been calculated for the applicable period without deduction of a sales load, if any, on an initial purchase. |
The Notes to Financial Statements are an integral part of this report.
| | |
| Transamerica Funds | | Annual Report 2014 |
Page 268
FINANCIAL HIGHLIGHTS (continued)
| | | | | | | | |
| For a share outstanding during the period and year indicated: | | Transamerica Dividend Focused | |
| | | Class I | |
| | | October 31,
2014 | | | October 31,
2013 (A) | |
Net asset value | | | | | | | | |
Beginning of period/year | | $ | 11.98 | | | $ | 10.00 | |
Investment operations | | | | | | | | |
Net investment income (loss) (B) | | | 0.23 | | | | 0.17 | |
Net realized and unrealized gain (loss) | | | 1.47 | | | | 1.96 | |
Total investment operations | | | 1.70 | | | | 2.13 | |
Distributions | | | | | | | | |
Net investment income | | | (0.23 | ) | | | (0.15 | ) |
Net realized gains | | | (0.10 | ) | | | — | |
Total distributions | | | (0.33 | ) | | | (0.15 | ) |
Net asset value | | | | | | | | |
End of period/year | | $ | 13.35 | | | $ | 11.98 | |
Total return (C) | | | 14.37 | % | | | 21.40 | %(D) |
Ratio and supplemental data | | | | | | | | |
Net assets end of period/year (000’s) | | $ | 6,311 | | | $ | 1,715 | |
Expenses to average net assets | | | | | | | | |
After (waiver/reimbursement) recapture | | | 0.80 | % | | | 0.82 | %(E) |
Before (waiver/reimbursement) recapture | | | 0.80 | % | | | 0.82 | %(E) |
Net investment income (loss) to average net assets | | | 1.80 | % | | | 1.82 | %(E) |
Portfolio turnover rate | | | 21 | % | | | 23 | %(D) |
| (A) | Commenced operations on January 4, 2013. |
| (B) | Calculated based on average number of shares outstanding. |
| (C) | Total return has been calculated for the applicable period without deduction of a sales load, if any, on an initial purchase. |
| | | | | | | | |
| For a share outstanding during the period and year indicated: | | Transamerica Dividend Focused | |
| | | Class I2 | |
| | | October 31,
2014 | | | October 31,
2013 (A) | |
Net asset value | | | | | | | | |
Beginning of period/year | | $ | 11.98 | | | $ | 10.00 | |
Investment operations | | | | | | | | |
Net investment income (loss) (B) | | | 0.24 | | | | 0.17 | |
Net realized and unrealized gain (loss) | | | 1.48 | | | | 1.97 | |
Total investment operations | | | 1.72 | | | | 2.14 | |
Distributions | | | | | | | | |
Net investment income | | | (0.24 | ) | | | (0.16 | ) |
Net realized gains | | | (0.10 | ) | | | — | |
Total distributions | | | (0.34 | ) | | | (0.16 | ) |
Net asset value | | | | | | | | |
End of period/year | | $ | 13.36 | | | $ | 11.98 | |
Total return (C) | | | 14.56 | % | | | 21.49 | %(D) |
Ratio and supplemental data | | | | | | | | |
Net assets end of period/year (000’s) | | $ | 1,402,739 | | | $ | 1,023,268 | |
Expenses to average net assets | | | | | | | | |
After (waiver/reimbursement) recapture | | | 0.70 | % | | | 0.71 | %(E) |
Before (waiver/reimbursement) recapture | | | 0.70 | % | | | 0.71 | %(E) |
Net investment income (loss) to average net assets | | | 1.88 | % | | | 1.91 | %(E) |
Portfolio turnover rate | | | 21 | % | | | 23 | %(D) |
| (A) | Commenced operations on January 4, 2013. |
| (B) | Calculated based on average number of shares outstanding. |
| (C) | Total return has been calculated for the applicable period without deduction of a sales load, if any, on an initial purchase. |
The Notes to Financial Statements are an integral part of this report.
| | |
| Transamerica Funds | | Annual Report 2014 |
Page 269
FINANCIAL HIGHLIGHTS (continued)
| | | | | | | | | | | | | | | | |
| For a share outstanding during the period and years indicated: | | Transamerica Emerging Markets Debt | |
| | | Class A | |
| | | October 31,
2014 | | | October 31,
2013 | | | October 31,
2012 | | | October 31,
2011 (A) | |
Net asset value | | | | | | | | | | | | | | | | |
Beginning of period/year | | $ | 10.83 | | | $ | 11.54 | | | $ | 10.00 | | | $ | 10.00 | |
Investment operations | | | | | | | | | | | | | | | | |
Net investment income (loss) (B) | | | 0.61 | | | | 0.56 | | | | 0.59 | | | | 0.08 | |
Net realized and unrealized gain (loss) | | | (0.11 | ) | | | (0.55 | ) | | | 1.45 | | | | (0.08 | ) |
Total investment operations | | | 0.50 | | | | 0.01 | | | | 2.04 | | | | — | |
Distributions | | | | | | | | | | | | | | | | |
Net investment income | | | (0.58 | ) | | | (0.47 | ) | | | (0.50 | ) | | | — | (C) |
Net realized gains | | | — | | | | (0.25 | ) | | | — | | | | — | |
Total distributions | | | (0.58 | ) | | | (0.72 | ) | | | (0.50 | ) | | | — | (C) |
Net asset value | | | | | | | | | | | | | | | | |
End of period/year | | $ | 10.75 | | | $ | 10.83 | | | $ | 11.54 | | | $ | 10.00 | |
Total return (D) | | | 4.81 | % | | | (0.07 | )% | | | 21.07 | % | | | 0.04 | %(E) |
Ratio and supplemental data | | | | | | | | | | | | | | | | |
Net assets end of period/year (000’s) | | $ | 81,684 | | | $ | 129,805 | | | $ | 60,754 | | | $ | 2,247 | |
Expenses to average net assets | | | | | | | | | | | | | | | | |
After (waiver/reimbursement) recapture | | | 1.18 | % | | | 1.11 | % | | | 1.21 | % | | | 1.35 | %(F) |
Before (waiver/reimbursement) recapture | | | 1.18 | % | | | 1.11 | % | | | 1.19 | % | | | 1.65 | %(F) |
Net investment income (loss) to average net assets | | | 5.68 | % | | | 5.02 | % | | | 5.47 | % | | | 5.24 | %(F) |
Portfolio turnover rate | | | 321 | % | | | 326 | % | | | 305 | % | | | 31 | %(E) |
| (A) | Commenced operations on August 31, 2011. |
| (B) | Calculated based on average number of shares outstanding. |
| (C) | Rounds to less than $0.01 or $(0.01). |
| (D) | Total return has been calculated for the applicable period without deduction of a sales load, if any, on an initial purchase. |
| | | | | | | | | | | | | | | | |
| For a share outstanding during the period and years indicated: | | Transamerica Emerging Markets Debt | |
| | | Class C | |
| | | October 31,
2014 | | | October 31,
2013 | | | October 31,
2012 | | | October 31,
2011 (A) | |
Net asset value | | | | | | | | | | | | | | | | |
Beginning of period/year | | $ | 10.80 | | | $ | 11.51 | | | $ | 9.99 | | | $ | 10.00 | |
Investment operations | | | | | | | | | | | | | | | | |
Net investment income (loss) (B) | | | 0.54 | | | | 0.48 | | | | 0.52 | | | | 0.07 | |
Net realized and unrealized gain (loss) | | | (0.11 | ) | | | (0.54 | ) | | | 1.44 | | | | (0.08 | ) |
Total investment operations | | | 0.43 | | | | (0.06 | ) | | | 1.96 | | | | (0.01 | ) |
Distributions | | | | | | | | | | | | | | | | |
Net investment income | | | (0.51 | ) | | | (0.40 | ) | | | (0.44 | ) | | | — | (C) |
Net realized gains | | | — | | | | (0.25 | ) | | | — | | | | — | |
Total distributions | | | (0.51 | ) | | | (0.65 | ) | | | (0.44 | ) | | | — | (C) |
Net asset value | | | | | | | | | | | | | | | | |
End of period/year | | $ | 10.72 | | | $ | 10.80 | | | $ | 11.51 | | | $ | 9.99 | |
Total return (D) | | | 4.12 | % | | | (0.69 | )% | | | 20.24 | % | | | (0.08 | )%(E) |
Ratio and supplemental data | | | | | | | | | | | | | | | | |
Net assets end of period/year (000’s) | | $ | 27,202 | | | $ | 30,547 | | | $ | 10,543 | | | $ | 1,025 | |
Expenses to average net assets | | | | | | | | | | | | | | | | |
After (waiver/reimbursement) recapture | | | 1.84 | % | | | 1.81 | % | | | 1.87 | % | | | 2.00 | %(F) |
Before (waiver/reimbursement) recapture | | | 1.84 | % | | | 1.81 | % | | | 1.86 | % | | | 2.29 | %(F) |
Net investment income (loss) to average net assets | | | 5.02 | % | | | 4.36 | % | | | 4.87 | % | | | 4.35 | %(F) |
Portfolio turnover rate | | | 321 | % | | | 326 | % | | | 305 | % | | | 31 | %(E) |
| (A) | Commenced operations on August 31, 2011. |
| (B) | Calculated based on average number of shares outstanding. |
| (C) | Rounds to less than $0.01 or $(0.01). |
| (D) | Total return has been calculated for the applicable period without deduction of a sales load, if any, on an initial purchase. |
The Notes to Financial Statements are an integral part of this report.
| | |
| Transamerica Funds | | Annual Report 2014 |
Page 270
FINANCIAL HIGHLIGHTS (continued)
| | | | | | | | | | | | | | | | |
| For a share outstanding during the period and years indicated: | | Transamerica Emerging Markets Debt | |
| | | Class I | |
| | | October 31,
2014 | | | October 31,
2013 | | | October 31,
2012 | | | October 31,
2011 (A) | |
Net asset value | | | | | | | | | | | | | | | | |
Beginning of period/year | | $ | 10.85 | | | $ | 11.56 | | | $ | 10.01 | | | $ | 10.00 | |
Investment operations | | | | | | | | | | | | | | | | |
Net investment income (loss) (B) | | | 0.65 | | | | 0.60 | | | | 0.63 | | | | 0.09 | |
Net realized and unrealized gain (loss) | | | (0.10 | ) | | | (0.56 | ) | | | 1.44 | | | | (0.08 | ) |
Total investment operations | | | 0.55 | | | | 0.04 | | | | 2.07 | | | | 0.01 | |
Distributions | | | | | | | | | | | | | | | | |
Net investment income | | | (0.62 | ) | | | (0.50 | ) | | | (0.52 | ) | | | — | (C) |
Net realized gains | | | — | | | | (0.25 | ) | | | — | | | | — | |
Total distributions | | | (0.62 | ) | | | (0.75 | ) | | | (0.52 | ) | | | — | (C) |
Net asset value | | | | | | | | | | | | | | | | |
End of period/year | | $ | 10.78 | | | $ | 10.85 | | | $ | 11.56 | | | $ | 10.01 | |
Total return (D) | | | 5.30 | % | | | 0.23 | % | | | 21.40 | % | | | 0.14 | %(E) |
Ratio and supplemental data | | | | | | | | | | | | | | | | |
Net assets end of period/year (000’s) | | $ | 340,068 | | | $ | 133,449 | | | $ | 46,190 | | | $ | 2,064 | |
Expenses to average net assets | | | | | | | | | | | | | | | | |
After (waiver/reimbursement) recapture | | | 0.81 | % | | | 0.79 | % | | | 0.86 | % | | | 1.00 | %(F) |
Before (waiver/reimbursement) recapture | | | 0.81 | % | | | 0.79 | % | | | 0.84 | % | | | 1.34 | %(F) |
Net investment income (loss) to average net assets | | | 6.00 | % | | | 5.38 | % | | | 5.68 | % | | | 5.46 | %(F) |
Portfolio turnover rate | | | 321 | % | | | 326 | % | | | 305 | % | | | 31 | %(E) |
| (A) | Commenced operations on August 31, 2011. |
| (B) | Calculated based on average number of shares outstanding. |
| (C) | Rounds to less than $0.01 or $(0.01). |
| (D) | Total return has been calculated for the applicable period without deduction of a sales load, if any, on an initial purchase. |
| | | | | | | | | | | | | | | | |
| For a share outstanding during the period and years indicated: | | Transamerica Emerging Markets Debt | |
| | | Class I2 | |
| | | October 31,
2014 | | | October 31,
2013 | | | October 31,
2012 | | | October 31,
2011 (A) | |
Net asset value | | | | | | | | | | | | | | | | |
Beginning of period/year | | $ | 10.85 | | | $ | 11.56 | | | $ | 10.01 | | | $ | 10.00 | |
Investment operations | | | | | | | | | | | | | | | | |
Net investment income (loss) (B) | | | 0.66 | | | | 0.61 | | | | 0.63 | | | | 0.07 | |
Net realized and unrealized gain (loss) | | | (0.10 | ) | | | (0.56 | ) | | | 1.45 | | | | (0.06 | ) |
Total investment operations | | | 0.56 | | | | 0.05 | | | | 2.08 | | | | 0.01 | |
Distributions | | | | | | | | | | | | | | | | |
Net investment income | | | (0.63 | ) | | | (0.51 | ) | | | (0.53 | ) | | | — | (C) |
Net realized gains | | | — | | | | (0.25 | ) | | | — | | | | — | |
Total distributions | | | (0.63 | ) | | | (0.76 | ) | | | (0.53 | ) | | | — | (C) |
Net asset value | | | | | | | | | | | | | | | | |
End of period/year | | $ | 10.78 | | | $ | 10.85 | | | $ | 11.56 | | | $ | 10.01 | |
Total return (D) | | | 5.39 | % | | | 0.33 | % | | | 21.50 | % | | | 0.14 | %(E) |
Ratio and supplemental data | | | | | | | | | | | | | | | | |
Net assets end of period/year (000’s) | | $ | 143,512 | | | $ | 339,967 | | | $ | 505,629 | | | $ | 95,233 | |
Expenses to average net assets | | | | | | | | | | | | | | | | |
After (waiver/reimbursement) recapture | | | 0.71 | % | | | 0.69 | % | | | 0.76 | % | | | 1.00 | %(F) |
Before (waiver/reimbursement) recapture | | | 0.71 | % | | | 0.69 | % | | | 0.74 | % | | | 1.23 | %(F) |
Net investment income (loss) to average net assets | | | 6.16 | % | | | 5.38 | % | | | 5.82 | % | | | 4.63 | %(F) |
Portfolio turnover rate | | | 321 | % | | | 326 | % | | | 305 | % | | | 31 | %(E) |
| (A) | Commenced operations on August 31, 2011. |
| (B) | Calculated based on average number of shares outstanding. |
| (C) | Rounds to less than $0.01 or $(0.01). |
| (D) | Total return has been calculated for the applicable period without deduction of a sales load, if any, on an initial purchase. |
The Notes to Financial Statements are an integral part of this report.
| | |
| Transamerica Funds | | Annual Report 2014 |
Page 271
FINANCIAL HIGHLIGHTS (continued)
| | | | | | | | | | | | |
| For a share outstanding during the period and years indicated: | | Transamerica Emerging Markets Equity | |
| | | Class A | |
| | | October 31, 2014 | | | October 31, 2013 | | | October 31, 2012 (A) | |
Net asset value | | | | | | | | | | | | |
Beginning of period/year | | $ | 10.40 | | | $ | 9.42 | | | $ | 10.00 | |
Investment operations | | | | | | | | | | | | |
Net investment income (loss) (B) | | | 0.11 | | | | 0.12 | | | | 0.09 | |
Net realized and unrealized gain (loss) | | | (0.16 | ) | | | 0.88 | | | | (0.67 | ) |
Total investment operations | | | (0.05 | ) | | | 1.00 | | | | (0.58 | ) |
Distributions | | | | | | | | | | | | |
Net investment income | | | (0.10 | ) | | | (0.02 | ) | | | — | |
Net asset value | | | | | | | | | | | | |
End of period/year | | $ | 10.25 | | | $ | 10.40 | | | $ | 9.42 | |
Total return (C) | | | (0.40 | )% | | | 10.68 | % | | | (5.80 | )%(D) |
Ratio and supplemental data | | | | | | | | | | | | |
Net assets end of period/year (000’s) | | $ | 1,495 | | | $ | 805 | | | $ | 302 | |
Expenses to average net assets | | | | | | | | | | | | |
After (waiver/reimbursement) recapture | | | 1.62 | % | | | 1.60 | % | | | 1.85 | %(E) |
Before (waiver/reimbursement) recapture | | | 1.62 | % | | | 1.60 | % | | | 1.85 | %(E) |
Net investment income (loss) to average net assets | | | 1.05 | % | | | 1.19 | % | | | 1.97 | %(E) |
Portfolio turnover rate | | | 69 | % | | | 63 | % | | | 76 | %(D) |
| (A) | Commenced operations on April 30, 2012. |
| (B) | Calculated based on average number of shares outstanding. |
| (C) | Total return has been calculated for the applicable period without deduction of a sales load, if any, on an initial purchase. |
| | | | | | | | | | | | |
| For a share outstanding during the period and years indicated: | | Transamerica Emerging Markets Equity | |
| | | Class C | |
| | | October 31, 2014 | | | October 31, 2013 | | | October 31,
2012 (A) | |
Net asset value | | | | | | | | | | | | |
Beginning of period/year | | $ | 10.32 | | | $ | 9.39 | | | $ | 10.00 | |
Investment operations | | | | | | | | | | | | |
Net investment income (loss) (B) | | | 0.04 | | | | 0.06 | | | | 0.07 | |
Net realized and unrealized gain (loss) | | | (0.15 | ) | | | 0.87 | | | | (0.68 | ) |
Total investment operations | | | (0.11 | ) | | | 0.93 | | | | (0.61 | ) |
Distributions | | | | | | | | | | | | |
Net investment income | | | (0.07 | ) | | | — | | | | — | |
Net asset value | | | | | | | | | | | | |
End of period/year | | $ | 10.14 | | | $ | 10.32 | | | $ | 9.39 | |
Total return (C) | | | (1.05 | )% | | | 9.90 | % | | | (6.10 | )%(D) |
Ratio and supplemental data | | | | | | | | | | | | |
Net assets end of period/year (000’s) | | $ | 1,424 | | | $ | 916 | | | $ | 253 | |
Expenses to average net assets | | | | | | | | | | | | |
After (waiver/reimbursement) recapture | | | 2.29 | % | | | 2.23 | % | | | 2.52 | %(E) |
Before (waiver/reimbursement) recapture | | | 2.29 | % | | | 2.23 | % | | | 2.52 | %(E) |
Net investment income (loss) to average net assets | | | 0.36 | % | | | 0.57 | % | | | 1.43 | %(E) |
Portfolio turnover rate | | | 69 | % | | | 63 | % | | | 76 | %(D) |
| (A) | Commenced operations on April 30, 2012. |
| (B) | Calculated based on average number of shares outstanding. |
| (C) | Total return has been calculated for the applicable period without deduction of a sales load, if any, on an initial purchase. |
The Notes to Financial Statements are an integral part of this report.
| | |
| Transamerica Funds | | Annual Report 2014 |
Page 272
FINANCIAL HIGHLIGHTS (continued)
| | | | | | | | | | | | |
| For a share outstanding during the period and years indicated: | | Transamerica Emerging Markets Equity | |
| | | Class I | |
| | | October 31, 2014 | | | October 31, 2013 | | | October 31,
2012 (A) | |
Net asset value | | | | | | | | | | | | |
Beginning of period/year | | $ | 10.43 | | | $ | 9.43 | | | $ | 10.00 | |
Investment operations | | | | | | | | | | | | |
Net investment income (loss) (B) | | | 0.12 | | | | 0.17 | | | | 0.11 | |
Net realized and unrealized gain (loss) | | | (0.13 | ) | | | 0.87 | | | | (0.68 | ) |
Total investment operations | | | (0.01 | ) | | | 1.04 | | | | (0.57 | ) |
Distributions | | | | | | | | | | | | |
Net investment income | | | (0.12 | ) | | | (0.04 | ) | | | — | |
Net asset value | | | | | | | | | | | | |
End of period/year | | $ | 10.30 | | | $ | 10.43 | | | $ | 9.43 | |
Total return (C) | | | (0.04 | )% | | | 11.03 | % | | | (5.70 | )%(D) |
Ratio and supplemental data | | | | | | | | | | | | |
Net assets end of period/year (000’s) | | $ | 1,147 | | | $ | 505 | | | $ | 302 | |
Expenses to average net assets | | | | | | | | | | | | |
After (waiver/reimbursement) recapture | | | 1.29 | % | | | 1.26 | % | | | 1.60 | %(E) |
Before (waiver/reimbursement) recapture | | | 1.29 | % | | | 1.26 | % | | | 1.60 | %(E) |
Net investment income (loss) to average net assets | | | 1.22 | % | | | 1.74 | % | | | 2.26 | %(E) |
Portfolio turnover rate | | | 69 | % | | | 63 | % | | | 76 | %(D) |
| (A) | Commenced operations on April 30, 2012. |
| (B) | Calculated based on average number of shares outstanding. |
| (C) | Total return has been calculated for the applicable period without deduction of a sales load, if any, on an initial purchase. |
| | | | | | | | | | | | |
| For a share outstanding during the period and years indicated: | | Transamerica Emerging Markets Equity | |
| | | Class I2 | |
| | | October 31, 2014 | | | October 31, 2013 | | | October 31,
2012 (A) | |
Net asset value | | | | | | | | | | | | |
Beginning of period/year | | $ | 10.44 | | | $ | 9.44 | | | $ | 10.00 | |
Investment operations | | | | | | | | | | | | |
Net investment income (loss) (B) | | | 0.15 | | | | 0.16 | | | | 0.10 | |
Net realized and unrealized gain (loss) | | | (0.16 | ) | | | 0.88 | | | | (0.66 | ) |
Total investment operations | | | (0.01 | ) | | | 1.04 | | | | (0.56 | ) |
Distributions | | | | | | | | | | | | |
Net investment income | | | (0.13 | ) | | | (0.04 | ) | | | — | |
Net asset value | | | | | | | | | | | | |
End of period/year | | $ | 10.30 | | | $ | 10.44 | | | $ | 9.44 | |
Total return (C) | | | (0.02 | )% | | | 11.09 | % | | | (5.60 | )%(D) |
Ratio and supplemental data | | | | | | | | | | | | |
Net assets end of period/year (000’s) | | $ | 241,658 | | | $ | 220,261 | | | $ | 107,183 | |
Expenses to average net assets | | | | | | | | | | | | |
After (waiver/reimbursement) recapture | | | 1.17 | % | | | 1.15 | % | | | 1.49 | %(E) |
Before (waiver/reimbursement) recapture | | | 1.17 | % | | | 1.15 | % | | | 1.49 | %(E) |
Net investment income (loss) to average net assets | | | 1.44 | % | | | 1.66 | % | | | 2.06 | %(E) |
Portfolio turnover rate | | | 69 | % | | | 63 | % | | | 76 | %(D) |
| (A) | Commenced operations on April 30, 2012. |
| (B) | Calculated based on average number of shares outstanding. |
| (C) | Total return has been calculated for the applicable period without deduction of a sales load, if any, on an initial purchase. |
The Notes to Financial Statements are an integral part of this report.
| | |
| Transamerica Funds | | Annual Report 2014 |
Page 273
FINANCIAL HIGHLIGHTS (continued)
| | | | | | | | |
| For a share outstanding during the years indicated: | | Transamerica Enhanced Muni | |
| | | Class A | |
| | | October 31,
2014 | | | October 31,
2013 (A) | |
Net asset value | | | | | | | | |
Beginning of year | | $ | 10.37 | | | $ | 10.00 | |
Investment operations | | | | | | | | |
Net investment income (loss) (B) (C) | | | 0.25 | | | | 0.22 | |
Net realized and unrealized gain (loss) | | | 0.78 | | | | 0.38 | (D) |
Total investment operations | | | 1.03 | | | | 0.60 | |
Distributions | | | | | | | | |
Net investment income | | | (0.24 | ) | | | (0.23 | ) |
Net asset value | | | | | | | | |
End of year | | $ | 11.16 | | | $ | 10.37 | |
Total return (E) | | | 10.05 | % | | | 6.05 | % |
Ratio and supplemental data | | | | | | | | |
Net assets end of year (000’s) | | $ | 35,974 | | | $ | 6,241 | |
Expenses to average net assets (F) | | | | | | | | |
After (waiver/reimbursement) recapture | | | 0.86 | % | | | 0.86 | % |
Before (waiver/reimbursement) recapture | | | 1.12 | % | | | 2.36 | % |
Net investment income (loss) to average net assets (C) | | | 2.27 | % | | | 2.12 | % |
Portfolio turnover rate (G) | | | 107 | % | | | 111 | % |
| (A) | Commenced operations on October 31, 2012. |
| (B) | Calculated based on average number of shares outstanding. |
| (C) | Recognition of net investment income by the Fund is affected by the timing of the declaration of dividends by the investment companies in which the Fund invests. |
| (D) | The per share amount may differ with the change in aggregate gains (losses) as shown in the Statements of Operations due to the timing of purchases and sales of Fund shares in relation to fluctuating market values during the year. |
| (E) | Total return has been calculated for the applicable period without deduction of a sales load, if any, on an initial purchase. |
| (F) | Does not include expenses of the investment companies in which the Fund invests. |
| (G) | Does not include portfolio activity of the investment companies in which the Fund invests. |
| | | | | | | | |
| For a share outstanding during the years indicated: | | Transamerica Enhanced Muni | |
| | | Class C | |
| | | October 31,
2014 | | | October 31,
2013 (A) | |
Net asset value | | | | | | | | |
Beginning of year | | $ | 10.36 | | | $ | 10.00 | |
Investment operations | | | | | | | | |
Net investment income (loss) (B) (C) | | | 0.18 | | | | 0.15 | |
Net realized and unrealized gain (loss) | | | 0.78 | | | | 0.39 | (D) |
Total investment operations | | | 0.96 | | | | 0.54 | |
Distributions | | | | | | | | |
Net investment income | | | (0.18 | ) | | | (0.18 | ) |
Net asset value | | | | | | | | |
End of year | | $ | 11.14 | | | $ | 10.36 | |
Total return (E) | | | 9.35 | % | | | 5.42 | % |
Ratio and supplemental data | | | | | | | | |
Net assets end of year (000’s) | | $ | 9,960 | | | $ | 1,778 | |
Expenses to average net assets (F) | | | | | | | | |
After (waiver/reimbursement) recapture | | | 1.46 | % | | | 1.46 | % |
Before (waiver/reimbursement) recapture | | | 1.87 | % | | | 3.08 | % |
Net investment income (loss) to average net assets (C) | | | 1.69 | % | | | 1.47 | % |
Portfolio turnover rate (G) | | | 107 | % | | | 111 | % |
| (A) | Commenced operations on October 31, 2012. |
| (B) | Calculated based on average number of shares outstanding. |
| (C) | Recognition of net investment income by the Fund is affected by the timing of the declaration of dividends by the investment companies in which the Fund invests. |
| (D) | The per share amount may differ with the change in aggregate gains (losses) as shown in the Statements of Operations due to the timing of purchases and sales of Fund shares in relation to fluctuating market values during the year. |
| (E) | Total return has been calculated for the applicable period without deduction of a sales load, if any, on an initial purchase. |
| (F) | Does not include expenses of the investment companies in which the Fund invests. |
| (G) | Does not include portfolio activity of the investment companies in which the Fund invests. |
The Notes to Financial Statements are an integral part of this report.
| | |
| Transamerica Funds | | Annual Report 2014 |
Page 274
FINANCIAL HIGHLIGHTS (continued)
| | | | | | | | |
| For a share outstanding during the years indicated: | | Transamerica Enhanced Muni | |
| | | Class I | |
| | | October 31,
2014 | | | October 31,
2013 (A) | |
Net asset value | | | | | | | | |
Beginning of year | | $ | 10.41 | | | $ | 10.00 | |
Investment operations | | | | | | | | |
Net investment income (loss) (B) (C) | | | 0.26 | | | | 0.23 | |
Net realized and unrealized gain (loss) | | | 0.78 | | | | 0.38 | (D) |
Total investment operations | | | 1.04 | | | | 0.61 | |
Distributions | | | | | | | | |
Net investment income | | | (0.25 | ) | | | (0.20 | ) |
Net asset value | | | | | | | | |
End of year | | $ | 11.20 | | | $ | 10.41 | |
Total return (E) | | | 10.16 | % | | | 6.10 | % |
Ratio and supplemental data | | | | | | | | |
Net assets end of year (000’s) | | $ | 22,007 | | | $ | 6,632 | |
Expenses to average net assets (F) | | | | | | | | |
After (waiver/reimbursement) recapture | | | 0.71 | % | | | 0.71 | % |
Before (waiver/reimbursement) recapture | | | 0.92 | % | | | 2.12 | % |
Net investment income (loss) to average net assets (C) | | | 2.44 | % | | | 2.21 | % |
Portfolio turnover rate (G) | | | 107 | % | | | 111 | % |
| (A) | Commenced operations on October 31, 2012. |
| (B) | Calculated based on average number of shares outstanding. |
| (C) | Recognition of net investment income by the Fund is affected by the timing of the declaration of dividends by the investment companies in which the Fund invests. |
| (D) | The per share amount may differ with the change in aggregate gains (losses) as shown in the Statements of Operations due to the timing of purchases and sales of Fund shares in relation to fluctuating market values during the year. |
| (E) | Total return has been calculated for the applicable period without deduction of a sales load, if any, on an initial purchase. |
| (F) | Does not include expenses of the investment companies in which the Fund invests. |
| (G) | Does not include portfolio activity of the investment companies in which the Fund invests. |
| | | | | | | | | | | | | | | | | | | | |
| For a share outstanding during the years indicated: | | Transamerica Flexible Income | |
| | | Class A | |
| | | October 31,
2014 | | | October 31,
2013 | | | October 31,
2012 | | | October 31,
2011 | | | October 31,
2010 | |
Net asset value | | | | | | | | | | | | | | | | | | | | |
Beginning of year | | $ | 9.38 | | | $ | 9.37 | | | $ | 8.83 | | | $ | 8.99 | | | $ | 8.33 | |
Investment operations | | | | | | | | | | | | | | | | | | | | |
Net investment income (loss) (A) | | | 0.29 | | | | 0.41 | | | | 0.45 | | | | 0.51 | | | | 0.50 | |
Net realized and unrealized gain (loss) | | | 0.08 | | | | 0.03 | | | | 0.55 | | | | (0.16 | ) | | | 0.70 | |
Total investment operations | | | 0.37 | | | | 0.44 | | | | 1.00 | | | | 0.35 | | | | 1.20 | |
Distributions | | | | | | | | | | | | | | | | | | | | |
Net investment income | | | (0.29 | ) | | | (0.43 | ) | | | (0.46 | ) | | | (0.51 | ) | | | (0.54 | ) |
Net asset value | | | | | | | | | | | | | | | | | | | | |
End of year | | $ | 9.46 | | | $ | 9.38 | | | $ | 9.37 | | | $ | 8.83 | | | $ | 8.99 | |
Total return (B) | | | 3.98 | % | | | 4.85 | % | | | 11.60 | % | | | 3.93 | % | | | 14.89 | % |
Ratio and supplemental data | | | | | | | | | | | | | | | | | | | | |
Net assets end of year (000’s) | | $ | 73,829 | | | $ | 78,512 | | | $ | 77,291 | | | $ | 65,393 | | | $ | 55,103 | |
Expenses to average net assets | | | | | | | | | | | | | | | | | | | | |
After (waiver/reimbursement) recapture | | | 0.89 | % | | | 0.95 | % | | | 0.95 | % | | | 0.97 | % | | | 1.07 | %(C) |
Before (waiver/reimbursement) recapture | | | 0.91 | % | | | 1.00 | % | | | 1.01 | % | | | 1.07 | % | | | 1.15 | %(C) |
Net investment income (loss) to average net assets | | | 3.04 | % | | | 4.32 | % | | | 4.95 | % | | | 5.70 | % | | | 5.79 | % |
Portfolio turnover rate | | | 26 | % | | | 32 | % | | | 35 | % | | | 42 | % | | | 120 | % |
| (A) | Calculated based on average number of shares outstanding. |
| (B) | Total return has been calculated for the applicable period without deduction of a sales load, if any, on an initial purchase. |
| (C) | Includes extraordinary expenses. The impact of the extraordinary expenses was 0.01%. |
The Notes to Financial Statements are an integral part of this report.
| | |
| Transamerica Funds | | Annual Report 2014 |
Page 275
FINANCIAL HIGHLIGHTS (continued)
| | | | | | | | | | | | | | | | | | | | |
| For a share outstanding during the years indicated: | | Transamerica Flexible Income | |
| | | Class B | |
| | | October 31,
2014 | | | October 31,
2013 | | | October 31,
2012 | | | October 31,
2011 | | | October 31,
2010 | |
Net asset value | | | | | | | | | | | | | | | | | | | | |
Beginning of year | | $ | 9.39 | | | $ | 9.37 | | | $ | 8.83 | | | $ | 9.00 | | | $ | 8.34 | |
Investment operations | | | | | | | | | | | | | | | | | | | | |
Net investment income (loss) (A) | | | 0.21 | | | | 0.32 | | | | 0.37 | | | | 0.44 | | | | 0.43 | |
Net realized and unrealized gain (loss) | | | 0.07 | | | | 0.05 | | | | 0.55 | | | | (0.18 | ) | | | 0.71 | |
Total investment operations | | | 0.28 | | | | 0.37 | | | | 0.92 | | | | 0.26 | | | | 1.14 | |
Distributions | | | | | | | | | | | | | | | | | | | | |
Net investment income | | | (0.21 | ) | | | (0.35 | ) | | | (0.38 | ) | | | (0.43 | ) | | | (0.48 | ) |
Net asset value | | | | | | | | | | | | | | | | | | | | |
End of year | | $ | 9.46 | | | $ | 9.39 | | | $ | 9.37 | | | $ | 8.83 | | | $ | 9.00 | |
Total return (B) | | | 2.98 | % | | | 4.00 | % | | | 10.69 | % | | | 2.96 | % | | | 14.02 | % |
Ratio and supplemental data | | | | | | | | | | | | | | | | | | | | |
Net assets end of year (000’s) | | $ | 3,644 | | | $ | 4,819 | | | $ | 6,641 | | | $ | 7,066 | | | $ | 10,614 | |
Expenses to average net assets | | | | | | | | | | | | | | | | | | | | |
After (waiver/reimbursement) recapture | | | 1.72 | % | | | 1.85 | % | | | 1.79 | % | | | 1.82 | % | | | 1.88 | %(C) |
Before (waiver/reimbursement) recapture | | | 1.72 | % | | | 1.85 | % | | | 1.79 | % | | | 1.82 | % | | | 1.88 | %(C) |
Net investment income (loss) to average net assets | | | 2.24 | % | | | 3.42 | % | | | 4.13 | % | | | 4.87 | % | | | 4.97 | % |
Portfolio turnover rate | | | 26 | % | | | 32 | % | | | 35 | % | | | 42 | % | | | 120 | % |
| (A) | Calculated based on average number of shares outstanding. |
| (B) | Total return has been calculated for the applicable period without deduction of a sales load, if any, on an initial purchase. |
| (C) | Includes extraordinary expenses. The impact of the extraordinary expenses was 0.01%. |
| | | | | | | | | | | | | | | | | | | | |
| For a share outstanding during the years indicated: | | Transamerica Flexible Income | |
| | | Class C | |
| | | October 31,
2014 | | | October 31,
2013 | | | October 31,
2012 | | | October 31,
2011 | | | October 31,
2010 | |
Net asset value | | | | | | | | | | | | | | | | | | | | |
Beginning of year | | $ | 9.32 | | | $ | 9.31 | | | $ | 8.79 | | | $ | 8.96 | | | $ | 8.31 | |
Investment operations | | | | | | | | | | | | | | | | | | | | |
Net investment income (loss) (A) | | | 0.22 | | | | 0.34 | | | | 0.38 | | | | 0.45 | | | | 0.44 | |
Net realized and unrealized gain (loss) | | | 0.08 | | | | 0.04 | | | | 0.54 | | | | (0.17 | ) | | | 0.70 | |
Total investment operations | | | 0.30 | | | | 0.38 | | | | 0.92 | | | | 0.28 | | | | 1.14 | |
Distributions | | | | | | | | | | | | | | | | | | | | |
Net investment income | | | (0.22 | ) | | | (0.37 | ) | | | (0.40 | ) | | | (0.45 | ) | | | (0.49 | ) |
Net asset value | | | | | | | | | | | | | | | | | | | | |
End of year | | $ | 9.40 | | | $ | 9.32 | | | $ | 9.31 | | | $ | 8.79 | | | $ | 8.96 | |
Total return (B) | | | 3.26 | % | | | 4.10 | % | | | 10.71 | % | | | 3.21 | % | | | 14.15 | % |
Ratio and supplemental data | | | | | | | | | | | | | | | | | | | | |
Net assets end of year (000’s) | | $ | 68,629 | | | $ | 71,692 | | | $ | 81,874 | | | $ | 50,314 | | | $ | 36,264 | |
Expenses to average net assets | | | | | | | | | | | | | | | | | | | | |
After (waiver/reimbursement) recapture | | | 1.60 | % | | | 1.67 | % | | | 1.65 | % | | | 1.68 | % | | | 1.74 | %(C) |
Before (waiver/reimbursement) recapture | | | 1.60 | % | | | 1.67 | % | | | 1.65 | % | | | 1.68 | % | | | 1.74 | %(C) |
Net investment income (loss) to average net assets | | | 2.33 | % | | | 3.60 | % | | | 4.22 | % | | | 4.98 | % | | | 5.14 | % |
Portfolio turnover rate | | | 26 | % | | | 32 | % | | | 35 | % | | | 42 | % | | | 120 | % |
| (A) | Calculated based on average number of shares outstanding. |
| (B) | Total return has been calculated for the applicable period without deduction of a sales load, if any, on an initial purchase. |
| (C) | Includes extraordinary expenses. The impact of the extraordinary expenses was 0.01%. |
The Notes to Financial Statements are an integral part of this report.
| | |
| Transamerica Funds | | Annual Report 2014 |
Page 276
FINANCIAL HIGHLIGHTS (continued)
| | | | | | | | | | | | | | | | | | | | |
| For a share outstanding during the period and years indicated: | | Transamerica Flexible Income | |
| | | Class I | |
| | | October 31,
2014 | | | October 31,
2013 | | | October 31,
2012 | | | October 31,
2011 | | | October 31,
2010 (A) | |
Net asset value | | | | | | | | | | | | | | | | | | | | |
Beginning of period/year | | $ | 9.39 | | | $ | 9.38 | | | $ | 8.85 | | | $ | 9.02 | | | $ | 8.48 | |
Investment operations | | | | | | | | | | | | | | | | | | | | |
Net investment income (loss) (B) | | | 0.31 | | | | 0.43 | | | | 0.47 | | | | 0.53 | | | | 0.50 | |
Net realized and unrealized gain (loss) | | | 0.08 | | | | 0.04 | | | | 0.55 | | | | (0.16 | ) | | | 0.57 | |
Total investment operations | | | 0.39 | | | | 0.47 | | | | 1.02 | | | | 0.37 | | | | 1.07 | |
Distributions | | | | | | | | | | | | | | | | | | | | |
Net investment income | | | (0.31 | ) | | | (0.46 | ) | | | (0.49 | ) | | | (0.54 | ) | | | (0.53 | ) |
Net asset value | | | | | | | | | | | | | | | | | | | | |
End of period/year | | $ | 9.47 | | | $ | 9.39 | | | $ | 9.38 | | | $ | 8.85 | | | $ | 9.02 | |
Total return (C) | | | 4.25 | % | | | 5.13 | % | | | 11.87 | % | | | 4.19 | % | | | 13.10 | %(D) |
Ratio and supplemental data | | | | | | | | | | | | | | | | | | | | |
Net assets end of period/year (000’s) | | $ | 42,545 | | | $ | 33,036 | | | $ | 31,480 | | | $ | 19,992 | | | $ | 9,787 | |
Expenses to average net assets | | | | | | | | | | | | | | | | | | | | |
After (waiver/reimbursement) recapture | | | 0.62 | % | | | 0.68 | % | | | 0.67 | % | | | 0.69 | % | | | 0.76 | %(E)(F) |
Before (waiver/reimbursement) recapture | | | 0.62 | % | | | 0.68 | % | | | 0.67 | % | | | 0.69 | % | | | 0.76 | %(E)(F) |
Net investment income (loss) to average net assets | | | 3.29 | % | | | 4.58 | % | | | 5.20 | % | | | 5.93 | % | | | 6.25 | %(F) |
Portfolio turnover rate | | | 26 | % | | | 32 | % | | | 35 | % | | | 42 | % | | | 120 | %(D) |
| (A) | Commenced operations on November 30, 2009. |
| (B) | Calculated based on average number of shares outstanding. |
| (C) | Total return has been calculated for the applicable period without deduction of a sales load, if any, on an initial purchase. |
| (E) | Includes extraordinary expenses. The impact of the extraordinary expenses was 0.01%. |
| | | | | | | | | | | | | | | | | | | | |
| For a share outstanding during the years indicated: | | Transamerica Flexible Income | |
| | | Class I2 | |
| | | October 31,
2014 | | | October 31,
2013 | | | October 31,
2012 | | | October 31,
2011 | | | October 31,
2010 (A) | |
Net asset value | | | | | | | | | | | | | | | | | | | | |
Beginning of year | | $ | 9.40 | | | $ | 9.38 | | | $ | 8.86 | | | $ | 9.03 | | | $ | 8.37 | |
Investment operations | | | | | | | | | | | | | | | | | | | | |
Net investment income (loss) (B) | | | 0.31 | | | | 0.44 | | | | 0.48 | | | | 0.55 | | | | 0.53 | |
Net realized and unrealized gain (loss) | | | 0.09 | | | | 0.05 | | | | 0.54 | | | | (0.17 | ) | | | 0.71 | |
Total investment operations | | | 0.40 | | | | 0.49 | | | | 1.02 | | | | 0.38 | | | | 1.24 | |
Distributions | | | | | | | | | | | | | | | | | | | | |
Net investment income | | | (0.32 | ) | | | (0.47 | ) | | | (0.50 | ) | | | (0.55 | ) | | | (0.58 | ) |
Net asset value | | | | | | | | | | | | | | | | | | | | |
End of year | | $ | 9.48 | | | $ | 9.40 | | | $ | 9.38 | | | $ | 8.86 | | | $ | 9.03 | |
Total return (C) | | | 4.35 | % | | | 5.35 | % | | | 11.85 | % | | | 4.31 | % | | | 15.39 | % |
Ratio and supplemental data | | | | | | | | | | | | | | | | | | | | |
Net assets end of year (000’s) | | $ | 540,719 | | | $ | 56,421 | | | $ | 128,284 | | | $ | 109,052 | | | $ | 146,631 | |
Expenses to average net assets | | | | | | | | | | | | | | | | | | | | |
After (waiver/reimbursement) recapture | | | 0.52 | % | | | 0.58 | % | | | 0.57 | % | | | 0.58 | % | | | 0.64 | %(D) |
Before (waiver/reimbursement) recapture | | | 0.52 | % | | | 0.58 | % | | | 0.57 | % | | | 0.58 | % | | | 0.64 | %(D) |
Net investment income (loss) to average net assets | | | 3.26 | % | | | 4.65 | % | | | 5.32 | % | | | 6.10 | % | | | 6.18 | % |
Portfolio turnover rate | | | 26 | % | | | 32 | % | | | 35 | % | | | 42 | % | | | 120 | % |
| (A) | Effective November 30, 2009, all previously existing Class I shares were re-designated as Class I2 Shares. |
| (B) | Calculated based on average number of shares outstanding. |
| (C) | Total return has been calculated for the applicable period without deduction of a sales load, if any, on an initial purchase. |
| (D) | Includes extraordinary expenses. The impact of the extraordinary expenses was 0.01%. |
The Notes to Financial Statements are an integral part of this report.
| | |
| Transamerica Funds | | Annual Report 2014 |
Page 277
FINANCIAL HIGHLIGHTS (continued)
| | | | | | | | | | | | | | | | |
| For a share outstanding during the years indicated: | | Transamerica Floating Rate | |
| | | Class A | | | Class C | | | Class I | | | Class I2 | |
| | | October 31,
2014 (A) | | | October 31,
2014 (A) | | | October 31,
2014 (A) | | | October 31,
2014 (A) | |
Net asset value | | | | | | | | | | | | | | | | |
Beginning of year | | $ | 10.00 | | | $ | 10.00 | | | $ | 10.00 | | | $ | 10.00 | |
Investment operations | | | | | | | | | | | | | | | | |
Net investment income (loss) (B) (C) | | | 0.31 | | | | 0.24 | | | | 0.33 | | | | 0.34 | |
Net realized and unrealized gain (loss) | | | (0.10 | ) | | | (0.10 | ) | | | (0.09 | ) | | | (0.10 | ) |
Total investment operations | | | 0.21 | | | | 0.14 | | | | 0.24 | | | | 0.24 | |
Distributions | | | | | | | | | | | | | | | | |
Net investment income | | | (0.29 | ) | | | (0.22 | ) | | | (0.32 | ) | | | (0.32 | ) |
Net asset value | | | | | | | | | | | | | | | | |
End of year | | $ | 9.92 | | | $ | 9.92 | | | $ | 9.92 | | | $ | 9.92 | |
Total return (D) | | | 2.17 | % | | | 1.43 | % | | | 2.45 | % | | | 2.47 | % |
Ratio and supplemental data | | | | | | | | | | | | | | | | |
Net assets end of year (000’s) | | $ | 633 | | | $ | 1,672 | | | $ | 412 | | | $ | 213,481 | |
Expenses to average net assets (E) | | | | | | | | | | | | | | | | |
After (waiver/reimbursement) recapture | | | 1.06 | % | | | 1.80 | % | | | 0.80 | % | | | 0.80 | % |
Before (waiver/reimbursement) recapture | | | 1.21 | % | | | 1.97 | % | | | 0.97 | % | | | 0.87 | % |
Net investment income (loss) to average net assets (C) | | | 3.08 | % | | | 2.45 | % | | | 3.27 | % | | | 3.37 | % |
Portfolio turnover rate (F) | | | 73 | % | | | 73 | % | | | 73 | % | | | 73 | % |
| (A) | Commenced operations on October 31, 2013. |
| (B) | Calculated based on average number of shares outstanding. |
| (C) | Recognition of net investment income by the Fund is affected by the timing of the declaration of dividends by the investment companies in which the Fund invests. |
| (D) | Total return has been calculated for the applicable period without deduction of a sales load, if any, on an initial purchase. |
| (E) | Does not include expenses of the investment companies in which the Fund invests. |
| (F) | Does not include portfolio activity of the investment companies in which the Fund invests. |
| | | | | | | | | | | | | | | | |
| For a share outstanding during the period indicated: | | Transamerica Global Bond | |
| | | Class A | | | Class C | | | Class I | | | Class I2 | |
| | | October 31,
2014 (A) | | | October 31,
2014 (A) | | | October 31,
2014 (A) | | | October 31,
2014 (A) | |
Net asset value | | | | | | | | | | | | | | | | |
Beginning of period | | $ | 10.00 | | | $ | 10.00 | | | $ | 10.00 | | | $ | 10.00 | |
Investment operations | | | | | | | | | | | | | | | | |
Net investment income (loss) (B) | | | 0.15 | | | | 0.09 | | | | 0.16 | | | | 0.15 | |
Net realized and unrealized gain (loss) | | | (0.23 | ) | | | (0.22 | ) | | | (0.23 | ) | | | (0.21 | ) |
Total investment operations | | | (0.08 | ) | | | (0.13 | ) | | | (0.07 | ) | | | (0.06 | ) |
Distributions | | | | | | | | | | | | | | | | |
Net investment income | | | (0.08 | ) | | | (0.05 | ) | | | (0.09 | ) | | | (0.09 | ) |
Net asset value | | | | | | | | | | | | | | | | |
End of period | | $ | 9.84 | | | $ | 9.82 | | | $ | 9.84 | | | $ | 9.85 | |
Total return (C) | | | (0.82 | )%(D) | | | (1.34 | )%(D) | | | (0.71 | )%(D) | | | (0.61 | )%(D) |
Ratio and supplemental data | | | | | | | | | | | | | | | | |
Net assets end of period (000’s) | | $ | 300 | | | $ | 254 | | | $ | 323 | | | $ | 238,807 | |
Expenses to average net assets | | | | | | | | | | | | | | | | |
After (waiver/reimbursement) recapture | | | 1.00 | %(E) | | | 1.75 | %(E) | | | 0.75 | %(E) | | | 0.75 | %(E) |
Before (waiver/reimbursement) recapture | | | 1.09 | %(E) | | | 1.81 | %(E) | | | 0.91 | %(E) | | | 0.79 | %(E) |
Net investment income (loss) to average net assets | | | 2.15 | %(E) | | | 1.39 | %(E) | | | 2.42 | %(E) | | | 2.23 | %(E) |
Portfolio turnover rate | | | 138 | %(D) | | | 138 | %(D) | | | 138 | %(D) | | | 138 | %(D) |
| (A) | Commenced operations on March 1, 2014. |
| (B) | Calculated based on average number of shares outstanding. |
| (C) | Total return has been calculated for the applicable period without deduction of a sales load, if any, on an initial purchase. |
The Notes to Financial Statements are an integral part of this report.
| | |
| Transamerica Funds | | Annual Report 2014 |
Page 278
FINANCIAL HIGHLIGHTS (continued)
| | | | | | | | | | | | | | | | | | | | |
| For a share outstanding during the years indicated: | | Transamerica Global Equity (formerly, Transamerica Multi-Manager International Portfolio) | |
| | | Class A | |
| | | October 31,
2014 | | | October 31,
2013 | | | October 31,
2012 | | | October 31,
2011 | | | October 31,
2010 | |
Net asset value | | | | | | | | | | | | | | | | | | | | |
Beginning of year | | $ | 10.96 | | | $ | 9.22 | | | $ | 9.09 | | | $ | 9.84 | | | $ | 8.53 | |
Investment operations | | | | | | | | | | | | | | | | | | | | |
Net investment income (loss) (A) (B) | | | 0.18 | | | | 0.11 | | | | 0.16 | | | | 0.08 | | | | 0.09 | |
Net realized and unrealized gain (loss) | | | 0.10 | | | | 1.73 | | | | 0.22 | | | | (0.75 | ) | | | 1.33 | |
Total investment operations | | | 0.28 | | | | 1.84 | | | | 0.38 | | | | (0.67 | ) | | | 1.42 | |
Distributions | | | | | | | | | | | | | | | | | | | | |
Net investment income | | | (0.16 | ) | | | (0.10 | ) | | | (0.25 | ) | | | (0.08 | ) | | | (0.11 | ) |
Net asset value | | | | | | | | | | | | | | | | | | | | |
End of year | | $ | 11.08 | | | $ | 10.96 | | | $ | 9.22 | | | $ | 9.09 | | | $ | 9.84 | |
Total return (C) | | | 2.54 | % | | | 20.08 | % | | | 4.65 | % | | | (6.90 | )% | | | 16.80 | % |
Ratio and supplemental data | | | | | | | | | | | | | | | | | | | | |
Net assets end of year (000’s) | | $ | 56,663 | | | $ | 82,534 | | | $ | 86,834 | | | $ | 118,070 | | | $ | 135,479 | |
Expenses to average net assets (D) | | | | | | | | | | | | | | | | | | | | |
After (waiver/reimbursement) recapture | | | 0.74 | % | | | 0.69 | % | | | 0.68 | % | | | 0.67 | % | | | 0.70 | % |
Before (waiver/reimbursement) recapture | | | 0.75 | % | | | 0.69 | % | | | 0.68 | % | | | 0.67 | % | | | 0.70 | % |
Net investment income (loss) to average net assets (B) | | | 1.64 | % | | | 1.09 | % | | | 1.79 | % | | | 0.77 | % | | | 1.04 | % |
Portfolio turnover rate (E) | | | 150 | % | | | 18 | % | | | 41 | % | | | 13 | % | | | 11 | % |
| (A) | Calculated based on average number of shares outstanding. |
| (B) | Recognition of net investment income by the Fund is affected by the timing of the declaration of dividends by the investment companies in which the Fund invests. |
| (C) | Total return has been calculated for the applicable period without deduction of a sales load, if any, on an initial purchase. |
| (D) | Does not include expenses of the investment companies in which the Fund invests. |
| (E) | Does not include portfolio activity of the investment companies in which the Fund invests. |
| | | | | | | | | | | | | | | | | | | | |
| For a share outstanding during the years indicated: | | Transamerica Global Equity (formerly, Transamerica Multi-Manager International Portfolio) | |
| | | Class B | |
| | | October 31,
2014 | | | October 31,
2013 | | | October 31,
2012 | | | October 31,
2011 | | | October 31,
2010 | |
Net asset value | | | | | | | | | | | | | | | | | | | | |
Beginning of year | | $ | 10.89 | | | $ | 9.16 | | | $ | 9.00 | | | $ | 9.74 | | | $ | 8.45 | |
Investment operations | | | | | | | | | | | | | | | | | | | | |
Net investment income (loss) (A) (B) | | | 0.10 | | | | 0.04 | | | | 0.09 | | | | 0.01 | | | | 0.02 | |
Net realized and unrealized gain (loss) | | | 0.08 | | | | 1.71 | | | | 0.24 | | | | (0.75 | ) | | | 1.32 | |
Total investment operations | | | 0.18 | | | | 1.75 | | | | 0.33 | | | | (0.74 | ) | | | 1.34 | |
Distributions | | | | | | | | | | | | | | | | | | | | |
Net investment income | | | (0.07 | ) | | | (0.02 | ) | | | (0.17 | ) | | | — | (C) | | | (0.05 | ) |
Net asset value | | | | | | | | | | | | | | | | | | | | |
End of year | | $ | 11.00 | | | $ | 10.89 | | | $ | 9.16 | | | $ | 9.00 | | | $ | 9.74 | |
Total return (D) | | | 1.64 | % | | | 19.11 | % | | | 3.92 | % | | | (7.59 | )% | | | 15.95 | % |
Ratio and supplemental data | | | | | | | | | | | | | | | | | | | | |
Net assets end of year (000’s) | | $ | 6,460 | | | $ | 9,191 | | | $ | 9,847 | | | $ | 13,373 | | | $ | 18,432 | |
Expenses to average net assets (E) | | | | | | | | | | | | | | | | | | | | |
After (waiver/reimbursement) recapture | | | 1.53 | % | | | 1.45 | % | | | 1.45 | % | | | 1.45 | % | | | 1.45 | % |
Before (waiver/reimbursement) recapture | | | 1.63 | % | | | 1.54 | % | | | 1.54 | % | | | 1.48 | % | | | 1.49 | % |
Net investment income (loss) to average net assets (B) | | | 0.95 | % | | | 0.37 | % | | | 1.05 | % | | | 0.11 | % | | | 0.19 | % |
Portfolio turnover rate (F) | | | 150 | % | | | 18 | % | | | 41 | % | | | 13 | % | | | 11 | % |
| (A) | Calculated based on average number of shares outstanding. |
| (B) | Recognition of net investment income by the Fund is affected by the timing of the declaration of dividends by the investment companies in which the Fund invests. |
| (C) | Rounds to less than $0.01 or $(0.01). |
| (D) | Total return has been calculated for the applicable period without deduction of a sales load, if any, on an initial purchase. |
| (E) | Does not include expenses of the investment companies in which the Fund invests. |
| (F) | Does not include portfolio activity of the investment companies in which the Fund invests. |
The Notes to Financial Statements are an integral part of this report.
| | |
| Transamerica Funds | | Annual Report 2014 |
Page 279
FINANCIAL HIGHLIGHTS (continued)
| | | | | | | | | | | | | | | | | | | | |
| For a share outstanding during the years indicated: | | Transamerica Global Equity (formerly, Transamerica Multi-Manager International Portfolio) | |
| | | Class C | |
| | | October 31,
2014 | | | October 31,
2013 | | | October 31,
2012 | | | October 31,
2011 | | | October 31,
2010 | |
Net asset value | | | | | | | | | | | | | | | | | | | | |
Beginning of year | | $ | 10.88 | | | $ | 9.15 | | | $ | 9.01 | | | $ | 9.75 | | | $ | 8.45 | |
Investment operations | | | | | | | | | | | | | | | | | | | | |
Net investment income (loss) (A) (B) | | | 0.09 | | | | 0.04 | | | | 0.09 | | | | 0.02 | | | | 0.02 | |
Net realized and unrealized gain (loss) | | | 0.10 | | | | 1.72 | | | | 0.23 | | | | (0.74 | ) | | | 1.33 | |
Total investment operations | | | 0.19 | | | | 1.76 | | | | 0.32 | | | | (0.72 | ) | | | 1.35 | |
Distributions | | | | | | | | | | | | | | | | | | | | |
Net investment income | | | (0.08 | ) | | | (0.03 | ) | | | (0.18 | ) | | | (0.02 | ) | | | (0.05 | ) |
Net asset value | | | | | | | | | | | | | | | | | | | | |
End of year | | $ | 10.99 | | | $ | 10.88 | | | $ | 9.15 | | | $ | 9.01 | | | $ | 9.75 | |
Total return (C) | | | 1.73 | % | | | 19.26 | % | | | 3.87 | % | | | (7.42 | )% | | | 16.10 | % |
Ratio and supplemental data | | | | | | | | | | | | | | | | | | | | |
Net assets end of year (000’s) | | $ | 74,772 | | | $ | 88,681 | | | $ | 92,050 | | | $ | 117,858 | | | $ | 144,849 | |
Expenses to average net assets (D) | | | | | | | | | | | | | | | | | | | | |
After (waiver/reimbursement) recapture | | | 1.47 | % | | | 1.40 | % | | | 1.38 | % | | | 1.34 | % | | | 1.36 | % |
Before (waiver/reimbursement) recapture | | | 1.49 | % | | | 1.40 | % | | | 1.38 | % | | | 1.34 | % | | | 1.36 | % |
Net investment income (loss) to average net assets (B) | | | 0.87 | % | | | 0.40 | % | | | 1.07 | % | | | 0.16 | % | | | 0.27 | % |
Portfolio turnover rate (E) | | | 150 | % | | | 18 | % | | | 41 | % | | | 13 | % | | | 11 | % |
| (A) | Calculated based on average number of shares outstanding. |
| (B) | Recognition of net investment income by the Fund is affected by the timing of the declaration of dividends by the investment companies in which the Fund invests. |
| (C) | Total return has been calculated for the applicable period without deduction of a sales load, if any, on an initial purchase. |
| (D) | Does not include expenses of the investment companies in which the Fund invests. |
| (E) | Does not include portfolio activity of the investment companies in which the Fund invests. |
| | | | | | | | | | | | | | | | | | | | |
| For a share outstanding during the period and years indicated: | | Transamerica Global Equity (formerly, Transamerica Multi-Manager International Portfolio) | |
| | | Class I | |
| | | October 31,
2014 | | | October 31,
2013 | | | October 31,
2012 | | | October 31,
2011 | | | October 31,
2010 (A) | |
Net asset value | | | | | | | | | | | | | | | | | | | | |
Beginning of period/year | | $ | 10.96 | | | $ | 9.23 | | | $ | 9.11 | | | $ | 9.86 | | | $ | 8.84 | |
Investment operations | | | | | | | | | | | | | | | | | | | | |
Net investment income (loss) (B) (C) | | | 0.21 | | | | 0.14 | | | | 0.16 | | | | 0.11 | | | | (0.02 | ) |
Net realized and unrealized gain (loss) | | | 0.09 | | | | 1.73 | | | | 0.25 | | | | (0.74 | ) | | | 1.19 | |
Total investment operations | | | 0.30 | | | | 1.87 | | | | 0.41 | | | | (0.63 | ) | | | 1.17 | |
Distributions | | | | | | | | | | | | | | | | | | | | |
Net investment income | | | (0.20 | ) | | | (0.14 | ) | | | (0.29 | ) | | | (0.12 | ) | | | (0.15 | ) |
Net asset value | | | | | | | | | | | | | | | | | | | | |
End of period/year | | $ | 11.06 | | | $ | 10.96 | | | $ | 9.23 | | | $ | 9.11 | | | $ | 9.86 | |
Total return (D) | | | 2.75 | % | | | 20.53 | % | | | 5.07 | % | | | (6.49 | )% | | | 13.41 | %(E) |
Ratio and supplemental data | | | | | | | | | | | | | | | | | | | | |
Net assets end of period/year (000’s) | | $ | 33,329 | | | $ | 32,954 | | | $ | 28,450 | | | $ | 28,748 | | | $ | 28,047 | |
Expenses to average net assets (F) | | | | | | | | | | | | | | | | | | | | |
After (waiver/reimbursement) recapture | | | 0.44 | % | | | 0.31 | % | | | 0.28 | % | | | 0.29 | % | | | 0.34 | %(G) |
Before (waiver/reimbursement) recapture | | | 0.46 | % | | | 0.31 | % | | | 0.28 | % | | | 0.29 | % | | | 0.34 | %(G) |
Net investment income (loss) to average net assets (C) | | | 1.88 | % | | | 1.39 | % | | | 1.87 | % | | | 1.12 | % | | | (0.21 | )%(G) |
Portfolio turnover rate (H) | | | 150 | % | | | 18 | % | | | 41 | % | | | 13 | % | | | 11 | %(E) |
| (A) | Commenced operations on November 30, 2009. |
| (B) | Calculated based on average number of shares outstanding. |
| (C) | Recognition of net investment income by the Fund is affected by the timing of the declaration of dividends by the investment companies in which the Fund invests. |
| (D) | Total return has been calculated for the applicable period without deduction of a sales load, if any, on an initial purchase. |
| (F) | Does not include expenses of the investment companies in which the Fund invests. |
| (H) | Does not include portfolio activity of the investment companies in which the Fund invests. |
The Notes to Financial Statements are an integral part of this report.
| | |
| Transamerica Funds | | Annual Report 2014 |
Page 280
FINANCIAL HIGHLIGHTS (continued)
| | | | |
| For a share outstanding during the period indicated: | | Transamerica
Global Equity | |
| | | Class I2 | |
| | | October 31,
2014 (A) | |
Net asset value | | | | |
Beginning of period | | $ | 11.31 | |
Investment operations | | | | |
Net investment income (loss) (B) | | | — | (C) |
Net realized and unrealized gain (loss) | | | (0.25 | ) |
Total investment operations | | | (0.25 | ) |
Net asset value | | | | |
End of period | | $ | 11.06 | |
Total return (D) | | | (2.21 | )%(E) |
Ratio and supplemental data | | | | |
Net assets end of period (000’s) | | $ | 127,316 | |
Expenses to average net assets | | | | |
After (waiver/reimbursement) recapture | | | 1.08 | %(F) |
Before (waiver/reimbursement) recapture | | | 1.08 | %(F) |
Net investment income (loss) to average net assets | | | 0.07 | %(F) |
Portfolio turnover rate | | | 150 | %(E) |
| (A) | Commenced operations on September 4, 2014. |
| (B) | Calculated based on average number of shares outstanding. |
| (C) | Rounds to less than $0.01 or $(0.01). |
| (D) | Total return has been calculated for the applicable period without deduction of a sales load, if any, on an initial purchase. |
| | | | | | | | | | | | | | | | | | | | |
| For a share outstanding during the years indicated: | | Transamerica Growth Opportunities | |
| | | Class A | |
| | | October 31,
2014 | | | October 31,
2013 | | | October 31,
2012 | | | October 31,
2011 | | | October 31,
2010 | |
Net asset value | | | | | | | | | | | | | | | | | | | | |
Beginning of year | | $ | 10.73 | | | $ | 8.15 | | | $ | 10.93 | | | $ | 9.82 | | | $ | 7.54 | |
Investment operations | | | | | | | | | | | | | | | | | | | | |
Net investment income (loss) (A) | | | (0.04 | ) | | | (0.03 | ) | | | 0.01 | | | | (0.10 | ) | | | (0.05 | ) |
Net realized and unrealized gain (loss) | | | 1.05 | | | | 2.71 | | | | (0.55 | ) | | | 1.21 | | | | 2.33 | |
Total investment operations | | | 1.01 | | | | 2.68 | | | | (0.54 | ) | | | 1.11 | | | | 2.28 | |
Distributions | | | | | | | | | | | | | | | | | | | | |
Net investment income | | | — | | | | (0.02 | ) | | | — | (B) | | | — | | | | — | |
Net realized gains | | | (0.45 | ) | | | (0.08 | ) | | | (2.24 | ) | | | — | | | | — | |
Total distributions | | | (0.45 | ) | | | (0.10 | ) | | | (2.24 | ) | | | — | | | | — | |
Net asset value | | | | | | | | | | | | | | | | | | | | |
End of year | | $ | 11.29 | | | $ | 10.73 | | | $ | 8.15 | | | $ | 10.93 | | | $ | 9.82 | |
Total return (C) | | | 9.57 | % | | | 33.31 | % | | | (3.79 | )% | | | 11.30 | % | | | 30.41 | % |
Ratio and supplemental data | | | | | | | | | | | | | | | | | | | | |
Net assets end of year (000’s) | | $ | 104,933 | | | $ | 105,245 | | | $ | 91,110 | | | $ | 103,177 | | | $ | 59,685 | |
Expenses to average net assets | | | | | | | | | | | | | | | | | | | | |
After (waiver/reimbursement) recapture | | | 1.37 | % | | | 1.46 | % | | | 1.67 | % | | | 1.75 | % | | | 1.75 | % |
Before (waiver/reimbursement) recapture | | | 1.37 | % | | | 1.46 | % | | | 1.54 | % | | | 1.64 | % | | | 1.98 | % |
Net investment income (loss) to average net assets | | | (0.39 | )% | | | (0.27 | )% | | | 0.10 | % | | | (0.83 | )% | | | (0.56 | )% |
Portfolio turnover rate | | | 53 | % | | | 45 | % | | | 38 | % | | | 125 | % | | | 63 | % |
| (A) | Calculated based on average number of shares outstanding. |
| (B) | Rounds to less than $0.01 or $(0.01). |
| (C) | Total return has been calculated for the applicable period without deduction of a sales load, if any, on an initial purchase. |
The Notes to Financial Statements are an integral part of this report.
| | |
| Transamerica Funds | | Annual Report 2014 |
Page 281
FINANCIAL HIGHLIGHTS (continued)
| | | | | | | | | | | | | | | | | | | | |
| For a share outstanding during the years indicated: | | Transamerica Growth Opportunities | |
| | | Class B | |
| | | October 31,
2014 | | | October 31,
2013 | | | October 31,
2012 | | | October 31,
2011 | | | October 31,
2010 | |
Net asset value | | | | | | | | | | | | | | | | | | | | |
Beginning of year | | $ | 9.43 | | | $ | 7.21 | | | $ | 10.01 | | | $ | 9.05 | | | $ | 6.99 | |
Investment operations | | | | | | | | | | | | | | | | | | | | |
Net investment income (loss) (A) | | | (0.12 | ) | | | (0.09 | ) | | | (0.04 | ) | | | (0.15 | ) | | | (0.10 | ) |
Net realized and unrealized gain (loss) | | | 0.92 | | | | 2.39 | | | | (0.52 | ) | | | 1.11 | | | | 2.16 | |
Total investment operations | | | 0.80 | | | | 2.30 | | | | (0.56 | ) | | | 0.96 | | | | 2.06 | |
Distributions | | | | | | | | | | | | | | | | | | | | |
Net investment income | | | — | | | | — | | | | — | (B) | | | — | | | | — | |
Net realized gains | | | (0.45 | ) | | | (0.08 | ) | | | (2.24 | ) | | | — | | | | — | |
Total distributions | | | (0.45 | ) | | | (0.08 | ) | | | (2.24 | ) | | | — | | | | — | |
Net asset value | | | | | | | | | | | | | | | | | | | | |
End of year | | $ | 9.78 | | | $ | 9.43 | | | $ | 7.21 | | | $ | 10.01 | | | $ | 9.05 | |
Total return (C) | | | 8.63 | % | | | 32.23 | % | | | (4.47 | )% | | | 10.61 | % | | | 29.47 | % |
Ratio and supplemental data | | | | | | | | | | | | | | | | | | | | |
Net assets end of year (000’s) | | $ | 4,079 | | | $ | 5,507 | | | $ | 5,582 | | | $ | 9,636 | | | $ | 12,406 | |
Expenses to average net assets | | | | | | | | | | | | | | | | | | | | |
After (waiver/reimbursement) recapture | | | 2.23 | % | | | 2.27 | % | | | 2.32 | % | | | 2.40 | % | | | 2.40 | % |
Before (waiver/reimbursement) recapture | | | 2.23 | % | | | 2.27 | % | | | 2.31 | % | | | 2.29 | % | | | 2.41 | % |
Net investment income (loss) to average net assets | | | (1.27 | )% | | | (1.06 | )% | | | (0.56 | )% | | | (1.40 | )% | | | (1.21 | )% |
Portfolio turnover rate | | | 53 | % | | | 45 | % | | | 38 | % | | | 125 | % | | | 63 | % |
| (A) | Calculated based on average number of shares outstanding. |
| (B) | Rounds to less than $0.01 or $(0.01). |
| (C) | Total return has been calculated for the applicable period without deduction of a sales load, if any, on an initial purchase. |
| | | | | | | | | | | | | | | | | | | | |
| For a share outstanding during the years indicated: | | Transamerica Growth Opportunities | |
| | | Class C | |
| | | October 31,
2014 | | | October 31,
2013 | | | October 31,
2012 | | | October 31,
2011 | | | October 31,
2010 | |
Net asset value | | | | | | | | | | | | | | | | | | | | |
Beginning of year | | $ | 9.48 | | | $ | 7.25 | | | $ | 10.05 | | | $ | 9.08 | | | $ | 7.01 | |
Investment operations | | | | | | | | | | | | | | | | | | | | |
Net investment income (loss) (A) | | | (0.11 | ) | | | (0.09 | ) | | | (0.04 | ) | | | (0.15 | ) | | | (0.10 | ) |
Net realized and unrealized gain (loss) | | | 0.93 | | | | 2.40 | | | | (0.52 | ) | | | 1.12 | | | | 2.17 | |
Total investment operations | | | 0.82 | | | | 2.31 | | | | (0.56 | ) | | | 0.97 | | | | 2.07 | |
Distributions | | | | | | | | | | | | | | | | | | | | |
Net realized gains | | | (0.45 | ) | | | (0.08 | ) | | | (2.24 | ) | | | — | | | | — | |
Net asset value | | | | | | | | | | | | | | | | | | | | |
End of year | | $ | 9.85 | | | $ | 9.48 | | | $ | 7.25 | | | $ | 10.05 | | | $ | 9.08 | |
Total return (B) | | | 8.80 | % | | | 32.19 | % | | | (4.46 | )% | | | 10.68 | % | | | 29.53 | % |
Ratio and supplemental data | | | | | | | | | | | | | | | | | | | | |
Net assets end of year (000’s) | | $ | 13,296 | | | $ | 13,099 | | | $ | 10,943 | | | $ | 14,288 | | | $ | 12,781 | |
Expenses to average net assets | | | | | | | | | | | | | | | | | | | | |
After (waiver/reimbursement) recapture | | | 2.14 | % | | | 2.25 | % | | | 2.28 | % | | | 2.40 | % | | | 2.40 | % |
Before (waiver/reimbursement) recapture | | | 2.14 | % | | | 2.25 | % | | | 2.28 | % | | | 2.28 | % | | | 2.41 | % |
Net investment income (loss) to average net assets | | | (1.16 | )% | | | (1.06 | )% | | | (0.51 | )% | | | (1.43 | )% | | | (1.21 | )% |
Portfolio turnover rate | | | 53 | % | | | 45 | % | | | 38 | % | | | 125 | % | | | 63 | % |
| (A) | Calculated based on average number of shares outstanding. |
| (B) | Total return has been calculated for the applicable period without deduction of a sales load, if any, on an initial purchase. |
The Notes to Financial Statements are an integral part of this report.
| | |
| Transamerica Funds | | Annual Report 2014 |
Page 282
FINANCIAL HIGHLIGHTS (continued)
| | | | | | | | | | | | | | | | | | | | |
| For a share outstanding during the period and years indicated: | | Transamerica Growth Opportunities | |
| | | Class I | |
| | | October 31,
2014 | | | October 31,
2013 | | | October 31,
2012 | | | October 31,
2011 | | | October 31,
2010 (A) | |
Net asset value | | | | | | | | | | | | | | | | | | | | |
Beginning of period/year | | $ | 11.32 | | | $ | 8.61 | | | $ | 11.37 | | | $ | 10.19 | | | $ | 8.04 | |
Investment operations | | | | | | | | | | | | | | | | | | | | |
Net investment income (loss) (B) | | | — | (C) | | | 0.02 | | | | 0.08 | | | | (0.02 | ) | | | (0.02 | ) |
Net realized and unrealized gain (loss) | | | 1.11 | | | | 2.85 | | | | (0.58 | ) | | | 1.24 | | | | 2.17 | |
Total investment operations | | | 1.11 | | | | 2.87 | | | | (0.50 | ) | | | 1.22 | | | | 2.15 | |
Distributions | | | | | | | | | | | | | | | | | | | | |
Net investment income | | | — | | | | (0.08 | ) | | | (0.02 | ) | | | (0.04 | ) | | | — | |
Net realized gains | | | (0.45 | ) | | | (0.08 | ) | | | (2.24 | ) | | | — | | | | — | |
Total distributions | | | (0.45 | ) | | | (0.16 | ) | | | (2.26 | ) | | | (0.04 | ) | | | — | |
Net asset value | | | | | | | | | | | | | | | | | | | | |
End of period/year | | $ | 11.98 | | | $ | 11.32 | | | $ | 8.61 | | | $ | 11.37 | | | $ | 10.19 | |
Total return (D) | | | 9.97 | % | | | 33.87 | % | | | (3.16 | )% | | | 12.01 | % | | | 26.74 | %(E) |
Ratio and supplemental data | | | | | | | | | | | | | | | | | | | | |
Net assets end of period/year (000’s) | | $ | 65,747 | | | $ | 68,609 | | | $ | 80,359 | | | $ | 9,954 | | | $ | 815 | |
Expenses to average net assets | | | | | | | | | | | | | | | | | | | | |
After (waiver/reimbursement) recapture | | | 0.99 | % | | | 1.01 | % | | | 0.99 | % | | | 1.08 | % | | | 1.40 | %(F) |
Before (waiver/reimbursement) recapture | | | 0.99 | % | | | 1.01 | % | | | 0.99 | % | | | 1.08 | % | | | 1.48 | %(F) |
Net investment income (loss) to average net assets | | | (0.02 | )% | | | 0.22 | % | | | 0.90 | % | | | (0.20 | )% | | | (0.23 | )%(F) |
Portfolio turnover rate | | | 53 | % | | | 45 | % | | | 38 | % | | | 125 | % | | | 63 | %(E) |
| (A) | Commenced operations on November 30, 2009. |
| (B) | Calculated based on average number of shares outstanding. |
| (C) | Rounds to less than $0.01 or $(0.01). |
| (D) | Total return has been calculated for the applicable period without deduction of a sales load, if any, on an initial purchase. |
| | | | | | | | | | | | | | | | | | | | |
| For a share outstanding during the years indicated: | | Transamerica Growth Opportunities | |
| | | Class I2 (A) | |
| | | October 31,
2014 | | | October 31,
2013 | | | October 31,
2012 | | | October 31,
2011 | | | October 31,
2010 | |
Net asset value | | | | | | | | | | | | | | | | | | | | |
Beginning of year | | $ | 11.41 | | | $ | 8.68 | | | $ | 11.43 | | | $ | 10.23 | | | $ | 7.78 | |
Investment operations | | | | | | | | | | | | | | | | | | | | |
Net investment income (loss) (B) | | | 0.02 | | | | 0.03 | | | | 0.09 | | | | 0.01 | | | | 0.03 | |
Net realized and unrealized gain (loss) | | | 1.12 | | | | 2.87 | | | | (0.58 | ) | | | 1.25 | | | | 2.42 | |
Total investment operations | | | 1.14 | | | | 2.90 | | | | (0.49 | ) | | | 1.26 | | | | 2.45 | |
Distributions | | | | | | | | | | | | | | | | | | | | |
Net investment income | | | — | | | | (0.09 | ) | | | (0.02 | ) | | | (0.06 | ) | | | — | |
Net realized gains | | | (0.45 | ) | | | (0.08 | ) | | | (2.24 | ) | | | — | | | | — | |
Total distributions | | | (0.45 | ) | | | (0.17 | ) | | | (2.26 | ) | | | (0.06 | ) | | | — | |
Net asset value | | | | | | | | | | | | | | | | | | | | |
End of year | | $ | 12.10 | | | $ | 11.41 | | | $ | 8.68 | | | $ | 11.43 | | | $ | 10.23 | |
Total return (C) | | | 10.16 | % | | | 34.04 | % | | | (2.97 | )% | | | 12.28 | % | | | 31.49 | % |
Ratio and supplemental data | | | | | | | | | | | | | | | | | | | | |
Net assets end of year (000’s) | | $ | 593,507 | | | $ | 529,348 | | | $ | 397,945 | | | $ | 113,057 | | | $ | 106,970 | |
Expenses to average net assets | | | | | | | | | | | | | | | | | | | | |
After (waiver/reimbursement) recapture | | | 0.83 | % | | | 0.84 | % | | | 0.85 | % | | | 0.89 | % | | | 0.88 | % |
Before (waiver/reimbursement) recapture | | | 0.83 | % | | | 0.84 | % | | | 0.85 | % | | | 0.89 | % | | | 0.88 | % |
Net investment income (loss) to average net assets | | | 0.14 | % | | | 0.32 | % | | | 0.99 | % | | | 0.09 | % | | | 0.32 | % |
Portfolio turnover rate | | | 53 | % | | | 45 | % | | | 38 | % | | | 125 | % | | | 63 | % |
| (A) | Effective November 30, 2009, all previously existing Class I shares were re-designated as Class I2 Shares. |
| (B) | Calculated based on average number of shares outstanding. |
| (C) | Total return has been calculated for the applicable period without deduction of a sales load, if any, on an initial purchase. |
The Notes to Financial Statements are an integral part of this report.
| | |
| Transamerica Funds | | Annual Report 2014 |
Page 283
FINANCIAL HIGHLIGHTS (continued)
| | | | | | | | | | | | | | | | | | | | |
| For a share outstanding during the years indicated: | | Transamerica High Yield Bond | |
| | | Class A | |
| | | October 31,
2014 | | | October 31,
2013 | | | October 31,
2012 | | | October 31,
2011 | | | October 31,
2010 | |
Net asset value | | | | | | | | | | | | | | | | | | | | |
Beginning of year | | $ | 9.75 | | | $ | 9.59 | | | $ | 8.95 | | | $ | 9.16 | | | $ | 8.45 | |
Investment operations | | | | | | | | | | | | | | | | | | | | |
Net investment income (loss) (A) | | | 0.50 | | | | 0.54 | | | | 0.59 | | | | 0.61 | | | | 0.66 | |
Net realized and unrealized gain (loss) | | | 0.05 | | | | 0.17 | | | | 0.67 | | | | (0.21 | ) | | | 0.73 | |
Total investment operations | | | 0.55 | | | | 0.71 | | | | 1.26 | | | | 0.40 | | | | 1.39 | |
Distributions | | | | | | | | | | | | | | | | | | | | |
Net investment income | | | (0.49 | ) | | | (0.55 | ) | | | (0.62 | ) | | | (0.61 | ) | | | (0.68 | ) |
Net realized gains | | | (0.13 | ) | | | — | | | | — | | | | — | | | | — | |
Total distributions | | | (0.62 | ) | | | (0.55 | ) | | | (0.62 | ) | | | (0.61 | ) | | | (0.68 | ) |
Net asset value | | | | | | | | | | | | | | | | | | | | |
End of year | | $ | 9.68 | | | $ | 9.75 | | | $ | 9.59 | | | $ | 8.95 | | | $ | 9.16 | |
Total return (B) | | | 5.85 | % | | | 7.58 | % | | | 14.57 | % | | | 4.41 | % | | | 17.21 | % |
Ratio and supplemental data | | | | | | | | | | | | | | | | | | | | |
Net assets end of year (000’s) | | $ | 135,250 | | | $ | 404,077 | | | $ | 256,099 | | | $ | 228,920 | | | $ | 193,332 | |
Expenses to average net assets | | | | | | | | | | | | | | | | | | | | |
After (waiver/reimbursement) recapture | | | 0.97 | % | | | 1.04 | % | | | 1.06 | % | | | 1.17 | % | | | 1.15 | % |
Before (waiver/reimbursement) recapture | | | 0.97 | % | | | 1.04 | % | | | 1.06 | % | | | 1.17 | % | | | 1.15 | % |
Net investment income (loss) to average net assets | | | 5.10 | % | | | 5.49 | % | | | 6.44 | % | | | 6.65 | % | | | 7.52 | % |
Portfolio turnover rate | | | 48 | % | | | 64 | % | | | 78 | % | | | 93 | % | | | 91 | % |
| (A) | Calculated based on average number of shares outstanding. |
| (B) | Total return has been calculated for the applicable period without deduction of a sales load, if any, on an initial purchase. |
| | | | | | | | | | | | | | | | | | | | |
| For a share outstanding during the years indicated: | | Transamerica High Yield Bond | |
| | | Class B | |
| | | October 31,
2014 | | | October 31,
2013 | | | October 31,
2012 | | | October 31,
2011 | | | October 31,
2010 | |
Net asset value | | | | | | | | | | | | | | | | | | | | |
Beginning of year | | $ | 9.76 | | | $ | 9.60 | | | $ | 8.95 | | | $ | 9.15 | | | $ | 8.44 | |
Investment operations | | | | | | | | | | | | | | | | | | | | |
Net investment income (loss) (A) | | | 0.42 | | | | 0.46 | | | | 0.52 | | | | 0.55 | | | | 0.61 | |
Net realized and unrealized gain (loss) | | | 0.05 | | | | 0.17 | | | | 0.67 | | | | (0.21 | ) | | | 0.72 | |
Total investment operations | | | 0.47 | | | | 0.63 | | | | 1.19 | | | | 0.34 | | | | 1.33 | |
Distributions | | | | | | | | | | | | | | | | | | | | |
Net investment income | | | (0.41 | ) | | | (0.47 | ) | | | (0.54 | ) | | | (0.54 | ) | | | (0.62 | ) |
Net realized gains | | | (0.13 | ) | | | — | | | | — | | | | — | | | | — | |
Total distributions | | | (0.54 | ) | | | (0.47 | ) | | | (0.54 | ) | | | (0.54 | ) | | | (0.62 | ) |
Net asset value | | | | | | | | | | | | | | | | | | | | |
End of year | | $ | 9.69 | | | $ | 9.76 | | | $ | 9.60 | | | $ | 8.95 | | | $ | 9.15 | |
Total return (B) | | | 4.99 | % | | | 6.69 | % | | | 13.77 | % | | | 3.81 | % | | | 16.38 | % |
Ratio and supplemental data | | | | | | | | | | | | | | | | | | | | |
Net assets end of year (000’s) | | $ | 6,435 | | | $ | 8,234 | | | $ | 9,236 | | | $ | 9,431 | | | $ | 13,887 | |
Expenses to average net assets | | | | | | | | | | | | | | | | | | | | |
After (waiver/reimbursement) recapture | | | 1.80 | % | | | 1.83 | % | | | 1.84 | % | | | 1.83 | % | | | 1.83 | % |
Before (waiver/reimbursement) recapture | | | 1.80 | % | | | 1.83 | % | | | 1.83 | % | | | 1.84 | % | | | 1.83 | % |
Net investment income (loss) to average net assets | | | 4.28 | % | | | 4.72 | % | | | 5.69 | % | | | 5.99 | % | | | 6.93 | % |
Portfolio turnover rate | | | 48 | % | | | 64 | % | | | 78 | % | | | 93 | % | | | 91 | % |
| (A) | Calculated based on average number of shares outstanding. |
| (B) | Total return has been calculated for the applicable period without deduction of a sales load, if any, on an initial purchase. |
The Notes to Financial Statements are an integral part of this report.
| | |
| Transamerica Funds | | Annual Report 2014 |
Page 284
FINANCIAL HIGHLIGHTS (continued)
| | | | | | | | | | | | | | | | | | | | |
| For a share outstanding during the years indicated: | | Transamerica High Yield Bond | |
| | | Class C | |
| | | October 31,
2014 | | | October 31,
2013 | | | October 31,
2012 | | | October 31,
2011 | | | October 31,
2010 | |
Net asset value | | | | | | | | | | | | | | | | | | | | |
Beginning of year | | $ | 9.72 | | | $ | 9.56 | | | $ | 8.92 | | | $ | 9.13 | | | $ | 8.42 | |
Investment operations | | | | | | | | | | | | | | | | | | | | |
Net investment income (loss) (A) | | | 0.42 | | | | 0.47 | | | | 0.53 | | | | 0.55 | | | | 0.61 | |
Net realized and unrealized gain (loss) | | | 0.05 | | | | 0.17 | | | | 0.66 | | | | (0.21 | ) | | | 0.73 | |
Total investment operations | | | 0.47 | | | | 0.64 | | | | 1.19 | | | | 0.34 | | | | 1.34 | |
Distributions | | | | | | | | | | | | | | | | | | | | |
Net investment income | | | (0.42 | ) | | | (0.48 | ) | | | (0.55 | ) | | | (0.55 | ) | | | (0.63 | ) |
Net realized gains | | | (0.13 | ) | | | — | | | | — | | | | — | | | | — | |
Total distributions | | | (0.55 | ) | | | (0.48 | ) | | | (0.55 | ) | | | (0.55 | ) | | | (0.63 | ) |
Net asset value | | | | | | | | | | | | | | | | | | | | |
End of year | | $ | 9.64 | | | $ | 9.72 | | | $ | 9.56 | | | $ | 8.92 | | | $ | 9.13 | |
Total return (B) | | | 4.98 | % | | | 6.80 | % | | | 13.81 | % | | | 3.84 | % | | | 16.54 | % |
Ratio and supplemental data | | | | | | | | | | | | | | | | | | | | |
Net assets end of year (000’s) | | $ | 69,198 | | | $ | 75,630 | | | $ | 76,995 | | | $ | 48,789 | | | $ | 41,810 | |
Expenses to average net assets | | | | | | | | | | | | | | | | | | | | |
After (waiver/reimbursement) recapture | | | 1.74 | % | | | 1.77 | % | | | 1.77 | % | | | 1.76 | % | | | 1.77 | % |
Before (waiver/reimbursement) recapture | | | 1.74 | % | | | 1.77 | % | | | 1.77 | % | | | 1.76 | % | | | 1.77 | % |
Net investment income (loss) to average net assets | | | 4.33 | % | | | 4.78 | % | | | 5.73 | % | | | 6.07 | % | | | 6.96 | % |
Portfolio turnover rate | | | 48 | % | | | 64 | % | | | 78 | % | | | 93 | % | | | 91 | % |
| (A) | Calculated based on average number of shares outstanding. |
| (B) | Total return has been calculated for the applicable period without deduction of a sales load, if any, on an initial purchase. |
| | | | | | | | | | | | | | | | | | | | |
| For a share outstanding during the period and years indicated: | | Transamerica High Yield Bond | |
| | | Class I | |
| | | October 31,
2014 | | | October 31,
2013 | | | October 31,
2012 | | | October 31,
2011 | | | October 31,
2010 (A) | |
Net asset value | | | | | | | | | | | | | | | | | | | | |
Beginning of period/year | | $ | 9.82 | | | $ | 9.66 | | | $ | 9.00 | | | $ | 9.20 | | | $ | 8.55 | |
Investment operations | | | | | | | | | | | | | | | | | | | | |
Net investment income (loss) (B) | | | 0.52 | | | | 0.57 | | | | 0.62 | | | | 0.65 | | | | 0.63 | |
Net realized and unrealized gain (loss) | | | 0.05 | | | | 0.17 | | | | 0.68 | | | | (0.21 | ) | | | 0.68 | |
Total investment operations | | | 0.57 | | | | 0.74 | | | | 1.30 | | | | 0.44 | | | | 1.31 | |
Distributions | | | | | | | | | | | | | | | | | | | | |
Net investment income | | | (0.52 | ) | | | (0.58 | ) | | | (0.64 | ) | | | (0.64 | ) | | | (0.66 | ) |
Net realized gains | | | (0.13 | ) | | | — | | | | — | | | | — | | | | — | |
Total distributions | | | (0.65 | ) | | | (0.58 | ) | | | (0.64 | ) | | | (0.64 | ) | | | (0.66 | ) |
Net asset value | | | | | | | | | | | | | | | | | | | | |
End of period/year | | $ | 9.74 | | | $ | 9.82 | | | $ | 9.66 | | | $ | 9.00 | | | $ | 9.20 | |
Total return (C) | | | 5.95 | % | | | 7.80 | % | | | 15.05 | % | | | 4.95 | % | | | 15.92 | %(D) |
Ratio and supplemental data | | | | | | | | | | | | | | | | | | | | |
Net assets end of period/year (000’s) | | $ | 305,992 | | | $ | 82,840 | | | $ | 103,181 | | | $ | 82,736 | | | $ | 27,057 | |
Expenses to average net assets | | | | | | | | | | | | | | | | | | | | |
After (waiver/reimbursement) recapture | | | 0.75 | % | | | 0.79 | % | | | 0.78 | % | | | 0.77 | % | | | 0.83 | %(E) |
Before (waiver/reimbursement) recapture | | | 0.75 | % | | | 0.79 | % | | | 0.78 | % | | | 0.78 | % | | | 0.83 | %(E) |
Net investment income (loss) to average net assets | | | 5.32 | % | | | 5.78 | % | | | 6.64 | % | | | 7.09 | % | | | 7.71 | %(E) |
Portfolio turnover rate | | | 48 | % | | | 64 | % | | | 78 | % | | | 93 | % | | | 91 | %(D) |
| (A) | Commenced operations on November 30, 2009. |
| (B) | Calculated based on average number of shares outstanding. |
| (C) | Total return has been calculated for the applicable period without deduction of a sales load, if any, on an initial purchase. |
The Notes to Financial Statements are an integral part of this report.
| | |
| Transamerica Funds | | Annual Report 2014 |
Page 285
FINANCIAL HIGHLIGHTS (continued)
| | | | | | | | | | | | | | | | | | | | |
| For a share outstanding during the years indicated: | | Transamerica High Yield Bond | |
| | | Class I2 | |
| | | October 31,
2014 | | | October 31,
2013 | | | October 31,
2012 | | | October 31,
2011 | | | October 31,
2010 (A) | |
Net asset value | | | | | | | | | | | | | | | | | | | | |
Beginning of year | | $ | 9.84 | | | $ | 9.67 | | | $ | 9.02 | | | $ | 9.22 | | | $ | 8.50 | |
Investment operations | | | | | | | | | | | | | | | | | | | | |
Net investment income (loss) (B) | | | 0.53 | | | | 0.57 | | | | 0.64 | | | | 0.66 | | | | 0.71 | |
Net realized and unrealized gain (loss) | | | 0.06 | | | | 0.19 | | | | 0.66 | | | | (0.21 | ) | | | 0.73 | |
Total investment operations | | | 0.59 | | | | 0.76 | | | | 1.30 | | | | 0.45 | | | | 1.44 | |
Distributions | | | | | | | | | | | | | | | | | | | | |
Net investment income | | | (0.53 | ) | | | (0.59 | ) | | | (0.65 | ) | | | (0.65 | ) | | | (0.72 | ) |
Net realized gains | | | (0.13 | ) | | | — | | | | — | | | | — | | | | — | |
Total distributions | | | (0.66 | ) | | | (0.59 | ) | | | (0.65 | ) | | | (0.65 | ) | | | (0.72 | ) |
Net asset value | | | | | | | | | | | | | | | | | | | | |
End of year | | $ | 9.77 | | | $ | 9.84 | | | $ | 9.67 | | | $ | 9.02 | | | $ | 9.22 | |
Total return (C) | | | 6.16 | % | | | 8.03 | % | | | 15.01 | % | | | 5.06 | % | | | 17.74 | % |
Ratio and supplemental data | | | | | | | | | | | | | | | | | | | | |
Net assets end of year (000’s) | | $ | 806,431 | | | $ | 566,100 | | | $ | 250,912 | | | $ | 388,633 | | | $ | 408,505 | |
Expenses to average net assets | | | | | | | | | | | | | | | | | | | | |
After (waiver/reimbursement) recapture | | | 0.65 | % | | | 0.67 | % | | | 0.67 | % | | | 0.66 | % | | | 0.66 | % |
Before (waiver/reimbursement) recapture | | | 0.65 | % | | | 0.67 | % | | | 0.67 | % | | | 0.66 | % | | | 0.66 | % |
Net investment income (loss) to average net assets | | | 5.43 | % | | | 5.83 | % | | | 6.88 | % | | | 7.16 | % | | | 8.11 | % |
Portfolio turnover rate | | | 48 | % | | | 64 | % | | | 78 | % | | | 93 | % | | | 91 | % |
| (A) | Effective November 30, 2009, all previously existing Class I shares were re-designated as Class I2 Shares. |
| (B) | Calculated based on average number of shares outstanding. |
| (C) | Total return has been calculated for the applicable period without deduction of a sales load, if any, on an initial purchase. |
| | | | | | | | |
| For a share outstanding during the period and years indicated: | | Transamerica High Yield Muni | |
| | | Class A | |
| | | October 31,
2014 | | | October 31,
2013 (A) | |
Net asset value | | | | | | | | |
Beginning of period/year | | $ | 10.21 | | | $ | 10.00 | |
Investment operations | | | | | | | | |
Net investment income (loss) (B) (C) | | | 0.34 | | | | 0.09 | |
Net realized and unrealized gain (loss) | | | 1.31 | | | | 0.21 | |
Total investment operations | | | 1.65 | | | | 0.30 | |
Distributions | | | | | | | | |
Net investment income | | | (0.38 | ) | | | (0.09 | ) |
Net realized gains | | | (0.02 | ) | | | — | |
Total distributions | | | (0.40 | ) | | | (0.09 | ) |
Net asset value | | | | | | | | |
End of period/year | | $ | 11.46 | | | $ | 10.21 | |
Total return (D) | | | 16.49 | % | | | 2.96 | %(E) |
Ratio and supplemental data | | | | | | | | |
Net assets end of period/year (000’s) | | $ | 4,492 | | | $ | 262 | |
Expenses to average net assets (F) | | | | | | | | |
After (waiver/reimbursement) recapture | | | 0.91 | % | | | 0.91 | %(G) |
Before (waiver/reimbursement) recapture | | | 2.27 | % | | | 43.10 | %(G) |
Net investment income (loss) to average net assets (C) | | | 3.11 | % | | | 3.50 | %(G) |
Portfolio turnover rate (H) | | | 266 | % | | | 52 | %(E) |
| (A) | Commenced operations on July 31, 2013. |
| (B) | Calculated based on average number of shares outstanding. |
| (C) | Recognition of net investment income by the Fund is affected by the timing of the declaration of dividends by the investment companies in which the Fund invests. |
| (D) | Total return has been calculated for the applicable period without deduction of a sales load, if any, on an initial purchase. |
| (F) | Does not include expenses of the investment companies in which the Fund invests. |
| (H) | Does not include portfolio activity of the investment companies in which the Fund invests. |
The Notes to Financial Statements are an integral part of this report.
| | |
| Transamerica Funds | | Annual Report 2014 |
Page 286
FINANCIAL HIGHLIGHTS (continued)
| | | | | | | | |
| For a share outstanding during the period and years indicated: | | Transamerica High Yield Muni | |
| | | Class C | |
| | | October 31,
2014 | | | October 31,
2013 (A) | |
Net asset value | | | | | | | | |
Beginning of period/year | | $ | 10.21 | | | $ | 10.00 | |
Investment operations | | | | | | | | |
Net investment income (loss) (B) (C) | | | 0.34 | | | | 0.07 | |
Net realized and unrealized gain (loss) | | | 1.26 | | | | 0.21 | |
Total investment operations | | | 1.60 | | | | 0.28 | |
Distributions | | | | | | | | |
Net investment income | | | (0.32 | ) | | | (0.07 | ) |
Net realized gains | | | (0.02 | ) | | | — | |
Total distributions | | | (0.34 | ) | | | (0.07 | ) |
Net asset value | | | | | | | | |
End of period/year | | $ | 11.47 | | | $ | 10.21 | |
Total return (D) | | | 15.94 | % | | | 2.83 | %(E) |
Ratio and supplemental data | | | | | | | | |
Net assets end of period/year (000’s) | | $ | 1,398 | | | $ | 496 | |
Expenses to average net assets (F) | | | | | | | | |
After (waiver/reimbursement) recapture | | | 1.51 | % | | | 1.51 | %(G) |
Before (waiver/reimbursement) recapture | | | 2.98 | % | | | 43.79 | %(G) |
Net investment income (loss) to average net assets (C) | | | 3.08 | % | | | 2.88 | %(G) |
Portfolio turnover rate (H) | | | 266 | % | | | 52 | %(E) |
| (A) | Commenced operations on July 31, 2013. |
| (B) | Calculated based on average number of shares outstanding. |
| (C) | Recognition of net investment income by the Fund is affected by the timing of the declaration of dividends by the investment companies in which the Fund invests. |
| (D) | Total return has been calculated for the applicable period without deduction of a sales load, if any, on an initial purchase. |
| (F) | Does not include expenses of the investment companies in which the Fund invests. |
| (H) | Does not include portfolio activity of the investment companies in which the Fund invests. |
| | | | | | | | |
| For a share outstanding during the period and years indicated: | | Transamerica High Yield Muni | |
| | | Class I | |
| | | October 31,
2014 | | | October 31,
2013 (A) | |
Net asset value | | | | | | | | |
Beginning of period/year | | $ | 10.21 | | | $ | 10.00 | |
Investment operations | | | | | | | | |
Net investment income (loss) (B) (C) | | | 0.43 | | | | 0.09 | |
Net realized and unrealized gain (loss) | | | 1.25 | | | | 0.21 | |
Total investment operations | | | 1.68 | | | | 0.30 | |
Distributions | | | | | | | | |
Net investment income | | | (0.40 | ) | | | (0.09 | ) |
Net realized gains | | | (0.02 | ) | | | — | |
Total distributions | | | (0.42 | ) | | | (0.09 | ) |
Net asset value | | | | | | | | |
End of period/year | | $ | 11.47 | | | $ | 10.21 | |
Total return (D) | | | 16.76 | % | | | 3.00 | %(E) |
Ratio and supplemental data | | | | | | | | |
Net assets end of period/year (000’s) | | $ | 5,042 | | | $ | 258 | |
Expenses to average net assets (F) | | | | | | | | |
After (waiver/reimbursement) recapture | | | 0.76 | % | | | 0.76 | %(G) |
Before (waiver/reimbursement) recapture | | | 2.04 | % | | | 42.89 | %(G) |
Net investment income (loss) to average net assets (C) | | | 3.91 | % | | | 3.64 | %(G) |
Portfolio turnover rate (H) | | | 266 | % | | | 52 | %(E) |
| (A) | Commenced operations on July 31, 2013. |
| (B) | Calculated based on average number of shares outstanding. |
| (C) | Recognition of net investment income by the Fund is affected by the timing of the declaration of dividends by the investment companies in which the Fund invests. |
| (D) | Total return has been calculated for the applicable period without deduction of a sales load, if any, on an initial purchase. |
| (F) | Does not include expenses of the investment companies in which the Fund invests. |
| (H) | Does not include portfolio activity of the investment companies in which the Fund invests. |
The Notes to Financial Statements are an integral part of this report.
| | |
| Transamerica Funds | | Annual Report 2014 |
Page 287
FINANCIAL HIGHLIGHTS (continued)
| | | | | | | | |
| For a share outstanding during the years indicated: | | Transamerica Income & Growth | |
| | | Class A | |
| | | October 31,
2014 | | | October 31,
2013 (A) | |
Net asset value | | | | | | | | |
Beginning of year | | $ | 11.04 | | | $ | 10.00 | |
Investment operations | | | | | | | | |
Net investment income (loss) (B) | | | 0.65 | | | | 0.40 | |
Net realized and unrealized gain (loss) | | | (0.30 | ) | | | 1.03 | |
Total investment operations | | | 0.35 | | | | 1.43 | |
Distributions | | | | | | | | |
Net investment income | | | (0.43 | ) | | | (0.30 | ) |
Return of capital | | | (0.11 | ) | | | (0.09 | ) |
Total distributions | | | (0.54 | ) | | | (0.39 | ) |
Net asset value | | | | | | | | |
End of year | | $ | 10.85 | | | $ | 11.04 | |
Total return (C) | | | 3.29 | % | | | 14.55 | % |
Ratio and supplemental data | | | | | | | | |
Net assets end of year (000’s) | | $ | 70,223 | | | $ | 43,345 | |
Expenses to average net assets | | | | | | | | |
After (waiver/reimbursement) recapture | | | 1.10 | % | | | 1.19 | % |
Before (waiver/reimbursement) recapture | | | 1.10 | % | | | 1.19 | % |
Net investment income (loss) to average net assets | | | 5.29 | % | | | 3.73 | % |
Portfolio turnover rate | | | 23 | % | | | 24 | % |
| (A) | Commenced operations on October 31, 2012. |
| (B) | Calculated based on average number of shares outstanding. |
| (C) | Total return has been calculated for the applicable period without deduction of a sales load, if any, on an initial purchase. |
| | | | | | | | |
| For a share outstanding during the years indicated: | | Transamerica Income & Growth | |
| | | Class C | |
| | | October 31,
2014 | | | October 31,
2013 (A) | |
Net asset value | | | | | | | | |
Beginning of year | | $ | 11.00 | | | $ | 10.00 | |
Investment operations | | | | | | | | |
Net investment income (loss) (B) | | | 0.56 | | | | 0.32 | |
Net realized and unrealized gain (loss) | | | (0.29 | ) | | | 1.02 | |
Total investment operations | | | 0.27 | | | | 1.34 | |
Distributions | | | | | | | | |
Net investment income | | | (0.38 | ) | | | (0.26 | ) |
Return of capital | | | (0.09 | ) | | | (0.08 | ) |
Total distributions | | | (0.47 | ) | | | (0.34 | ) |
Net asset value | | | | | | | | |
End of year | | $ | 10.80 | | | $ | 11.00 | |
Total return (C) | | | 2.55 | % | | | 13.67 | % |
Ratio and supplemental data | | | | | | | | |
Net assets end of year (000’s) | | $ | 93,062 | | | $ | 40,924 | |
Expenses to average net assets | | | | | | | | |
After (waiver/reimbursement) recapture | | | 1.84 | % | | | 1.88 | % |
Before (waiver/reimbursement) recapture | | | 1.84 | % | | | 1.88 | % |
Net investment income (loss) to average net assets | | | 5.16 | % | | | 3.05 | % |
Portfolio turnover rate | | | 23 | % | | | 24 | % |
| (A) | Commenced operations on October 31, 2012. |
| (B) | Calculated based on average number of shares outstanding. |
| (C) | Total return has been calculated for the applicable period without deduction of a sales load, if any, on an initial purchase. |
The Notes to Financial Statements are an integral part of this report.
| | |
| Transamerica Funds | | Annual Report 2014 |
Page 288
FINANCIAL HIGHLIGHTS (continued)
| | | | | | | | |
| For a share outstanding during the years indicated: | | Transamerica Income & Growth | |
| | | Class I | |
| | | October 31,
2014 | | | October 31,
2013 (A) | |
Net asset value | | | | | | | | |
Beginning of year | | $ | 11.06 | | | $ | 10.00 | |
Investment operations | | | | | | | | |
Net investment income (loss) (B) | | | 0.65 | | | | 0.48 | |
Net realized and unrealized gain (loss) | | | (0.27 | ) | | | 0.98 | |
Total investment operations | | | 0.38 | | | | 1.46 | |
Distributions | | | | | | | | |
Net investment income | | | (0.46 | ) | | | (0.31 | ) |
Return of capital | | | (0.11 | ) | | | (0.09 | ) |
Total distributions | | | (0.57 | ) | | | (0.40 | ) |
Net asset value | | | | | | | | |
End of year | | $ | 10.87 | | | $ | 11.06 | |
Total return (C) | | | 3.54 | % | | | 14.86 | % |
Ratio and supplemental data | | | | | | | | |
Net assets end of year (000’s) | | $ | 72,556 | | | $ | 27,139 | |
Expenses to average net assets | | | | | | | | |
After (waiver/reimbursement) recapture | | | 0.85 | % | | | 0.90 | % |
Before (waiver/reimbursement) recapture | | | 0.85 | % | | | 0.90 | % |
Net investment income (loss) to average net assets | | | 5.94 | % | | | 4.55 | % |
Portfolio turnover rate | | | 23 | % | | | 24 | % |
| (A) | Commenced operations on October 31, 2012. |
| (B) | Calculated based on average number of shares outstanding. |
| (C) | Total return has been calculated for the applicable period without deduction of a sales load, if any, on an initial purchase. |
| | | | | | | | |
| For a share outstanding during the years indicated: | | Transamerica Income & Growth | |
| | | Class I2 | |
| | | October 31,
2014 | | | October 31,
2013 (A) | |
Net asset value | | | | | | | | |
Beginning of year | | $ | 11.06 | | | $ | 10.00 | |
Investment operations | | | | | | | | |
Net investment income (loss) (B) | | | 0.65 | | | | 0.51 | |
Net realized and unrealized gain (loss) | | | (0.26 | ) | | | 0.95 | |
Total investment operations | | | 0.39 | | | | 1.46 | |
Distributions | | | | | | | | |
Net investment income | | | (0.47 | ) | | | (0.31 | ) |
Return of capital | | | (0.11 | ) | | | (0.09 | ) |
Total distributions | | | (0.58 | ) | | | (0.40 | ) |
Net asset value | | | | | | | | |
End of year | | $ | 10.87 | | | $ | 11.06 | |
Total return (C) | | | 3.63 | % | | | 14.95 | % |
Ratio and supplemental data | | | | | | | | |
Net assets end of year (000’s) | | $ | 657,773 | | | $ | 359,440 | |
Expenses to average net assets | | | | | | | | |
After (waiver/reimbursement) recapture | | | 0.75 | % | | | 0.79 | % |
Before (waiver/reimbursement) recapture | | | 0.75 | % | | | 0.79 | % |
Net investment income (loss) to average net assets | | | 5.95 | % | | | 4.81 | % |
Portfolio turnover rate | | | 23 | % | | | 24 | % |
| (A) | Commenced operations on October 31, 2012. |
| (B) | Calculated based on average number of shares outstanding. |
| (C) | Total return has been calculated for the applicable period without deduction of a sales load, if any, on an initial purchase. |
The Notes to Financial Statements are an integral part of this report.
| | |
| Transamerica Funds | | Annual Report 2014 |
Page 289
FINANCIAL HIGHLIGHTS (continued)
| | | | | | | | | | | | | | | | |
| For a share outstanding during the period indicated: | | Transamerica Inflation Opportunities | |
| | | Class A | | | Class C | | | Class I | | | Class I2 | |
| | | October 31,
2014 (A) | | | October 31,
2014 (A) | | | October 31,
2014 (A) | | | October 31,
2014 (A) | |
Net asset value | | | | | | | | | | | | | | | | |
Beginning of period | | $ | 10.00 | | | $ | 10.00 | | | $ | 10.00 | | | $ | 10.00 | |
Investment operations | | | | | | | | | | | | | | | | |
Net investment income (loss) (B) | | | 0.16 | | | | 0.09 | | | | 0.18 | | | | 0.14 | |
Net realized and unrealized gain (loss) | | | (0.06 | ) | | | (0.04 | ) | | | (0.06 | ) | | | (0.01 | ) |
Total investment operations | | | 0.10 | | | | 0.05 | | | | 0.12 | | | | 0.13 | |
Distributions | | | | | | | | | | | | | | | | |
Net investment income | | | (0.15 | ) | | | (0.11 | ) | | | (0.17 | ) | | | (0.17 | ) |
Net asset value | | | | | | | | | | | | | | | | |
End of period | | $ | 9.95 | | | $ | 9.94 | | | $ | 9.95 | | | $ | 9.96 | |
Total return (C) | | | 1.01 | %(D) | | | 0.52 | %(D) | | | 1.16 | %(D) | | | 1.26 | %(D) |
Ratio and supplemental data | | | | | | | | | | | | | | | | |
Net assets end of period (000’s) | | $ | 299 | | | $ | 380 | | | $ | 277 | | | $ | 245,715 | |
Expenses to average net assets | | | | | | | | | | | | | | | | |
After (waiver/reimbursement) recapture | | | 1.00 | %(E) | | | 1.75 | %(E) | | | 0.75 | %(E) | | | 0.72 | %(E) |
Before (waiver/reimbursement) recapture | | | 1.01 | %(E) | | | 1.77 | %(E) | | | 0.84 | %(E) | | | 0.72 | %(E) |
Net investment income (loss) to average net assets | | | 2.30 | %(E) | | | 1.39 | %(E) | | | 2.67 | %(E) | | | 2.11 | %(E) |
Portfolio turnover rate | | | 57 | %(D) | | | 57 | %(D) | | | 57 | %(D) | | | 57 | %(D) |
| (A) | Commenced operations on March 1, 2014. |
| (B) | Calculated based on average number of shares outstanding. |
| (C) | Total return has been calculated for the applicable period without deduction of a sales load, if any, on an initial purchase. |
| | | | | | | | | | | | | | | | |
| For a share outstanding during the period and years indicated: | | Transamerica International Equity | |
| | | Class A | |
| | | October 31, 2014 | | | October 31, 2013 | | | October 31, 2012 | | | October 31,
2011 (A) | |
Net asset value | | | | | | | | | | | | | | | | |
Beginning of period/year | | $ | 18.44 | | | $ | 14.57 | | | $ | 13.47 | | | $ | 15.03 | |
Investment operations | | | | | | | | | | | | | | | | |
Net investment income (loss) (B) | | | 0.48 | | | | 0.30 | | | | 0.24 | | | | 0.15 | |
Net realized and unrealized gain (loss) | | | (0.58 | ) | | | 3.81 | | | | 1.19 | | | | (1.71 | ) |
Total investment operations | | | (0.10 | ) | | | 4.11 | | | | 1.43 | | | | (1.56 | ) |
Distributions | | | | | | | | | | | | | | | | |
Net investment income | | | (0.34 | ) | | | (0.24 | ) | | | (0.33 | ) | | | — | |
Net realized gains | | | (0.39 | ) | | | — | | | | — | | | | — | |
Total distributions | | | (0.73 | ) | | | (0.24 | ) | | | (0.33 | ) | | | — | |
Net asset value | | | | | | | | | | | | | | | | |
End of period/year | | $ | 17.61 | | | $ | 18.44 | | | $ | 14.57 | | | $ | 13.47 | |
Total return (C) | | | (0.51 | )% | | | 28.61 | % | | | 11.10 | % | | | (10.38 | )%(D) |
Ratio and supplemental data | | | | | | | | | | | | | | | | |
Net assets end of period/year (000’s) | | $ | 61,566 | | | $ | 21,102 | | | $ | 2,999 | | | $ | 490 | |
Expenses to average net assets | | | | | | | | | | | | | | | | |
After (waiver/reimbursement) recapture | | | 1.29 | % | | | 1.42 | % | | | 1.46 | % | | | 1.50 | %(E) |
Before (waiver/reimbursement) recapture | | | 1.29 | % | | | 1.42 | % | | | 1.51 | % | | | 1.52 | %(E) |
Net investment income (loss) to average net assets | | | 2.62 | % | | | 1.82 | % | | | 1.76 | % | | | 1.56 | %(E) |
Portfolio turnover rate | | | 19 | % | | | 34 | % | | | 33 | % | | | 16 | %(D) |
| (A) | Commenced operations on March 1, 2011. |
| (B) | Calculated based on average number of shares outstanding. |
| (C) | Total return has been calculated for the applicable period without deduction of a sales load, if any, on an initial purchase. |
The Notes to Financial Statements are an integral part of this report.
| | |
| Transamerica Funds | | Annual Report 2014 |
Page 290
FINANCIAL HIGHLIGHTS (continued)
| | | | | | | | | | | | | | | | |
| For a share outstanding during the period and years indicated: | | Transamerica International Equity | |
| | | Class C | |
| | | October 31,
2014 | | | October 31,
2013 | | | October 31,
2012 | | | October 31,
2011 (A) | |
Net asset value | | | | | | | | | | | | | | | | |
Beginning of period/year | | $ | 18.21 | | | $ | 14.45 | | | $ | 13.40 | | | $ | 15.03 | |
Investment operations | | | | | | | | | | | | | | | | |
Net investment income (loss) (B) | | | 0.33 | | | | 0.22 | | | | 0.11 | | | | 0.16 | |
Net realized and unrealized gain (loss) | | | (0.54 | ) | | | 3.76 | | | | 1.24 | | | | (1.79 | ) |
Total investment operations | | | (0.21 | ) | | | 3.98 | | | | 1.35 | | | | (1.63 | ) |
Distributions | | | | | | | | | | | | | | | | |
Net investment income | | | (0.27 | ) | | | (0.22 | ) | | | (0.30 | ) | | | — | |
Net realized gains | | | (0.39 | ) | | | — | | | | — | | | | — | |
Total distributions | | | (0.66 | ) | | | (0.22 | ) | | | (0.30 | ) | | | — | |
Net asset value | | | | | | | | | | | | | | | | |
End of period/year | | $ | 17.34 | | | $ | 18.21 | | | $ | 14.45 | | | $ | 13.40 | |
Total return (C) | | | (1.19 | )% | | | 27.87 | % | | | 10.49 | % | | | (10.84 | )%(D) |
Ratio and supplemental data | | | | | | | | | | | | | | | | |
Net assets end of period/year (000’s) | | $ | 36,867 | | | $ | 17,537 | | | $ | 4,886 | | | $ | 113 | |
Expenses to average net assets | | | | | | | | | | | | | | | | |
After (waiver/reimbursement) recapture | | | 1.98 | % | | | 2.06 | % | | | 2.04 | % | | | 2.14 | %(E) |
Before (waiver/reimbursement) recapture | | | 1.98 | % | | | 2.06 | % | | | 2.04 | % | | | 2.14 | %(E) |
Net investment income (loss) to average net assets | | | 1.82 | % | | | 1.35 | % | | | 0.82 | % | | | 1.64 | %(E) |
Portfolio turnover rate | | | 19 | % | | | 34 | % | | | 33 | % | | | 16 | %(D) |
| (A) | Commenced operations on March 1, 2011. |
| (B) | Calculated based on average number of shares outstanding. |
| (C) | Total return has been calculated for the applicable period without deduction of a sales load, if any, on an initial purchase. |
| | | | | | | | | | | | | | | | | | | | |
| For a share outstanding during the period and years indicated: | | Transamerica International Equity | |
| | | Class I (A) | |
| | | October 31,
2014 | | | October 31,
2013 | | | October 31,
2012 | | | October 31,
2011 | | | October 31,
2010 | |
Net asset value | | | | | | | | | | | | | | | | | | | | |
Beginning of period/year | | $ | 18.60 | | | $ | 14.65 | | | $ | 13.50 | | | $ | 13.97 | | | $ | 12.55 | |
Investment operations | | | | | | | | | | | | | | | | | | | | |
Net investment income (loss) (B) | | | 0.48 | | | | 0.40 | | | | 0.33 | | | | 0.40 | | | | 0.22 | |
Net realized and unrealized gain (loss) | | | (0.52 | ) | | | 3.81 | | | | 1.17 | | | | (0.68 | ) | | | 1.36 | |
Total investment operations | | | (0.04 | ) | | | 4.21 | | | | 1.50 | | | | (0.28 | ) | | | 1.58 | |
Distributions | | | | | | | | | | | | | | | | | | | | |
Net investment income | | | (0.37 | ) | | | (0.26 | ) | | | (0.35 | ) | | | (0.19 | ) | | | (0.16 | ) |
Net realized gains | | | (0.39 | ) | | | — | | | | — | | | | — | | | | — | |
Total distributions | | | (0.76 | ) | | | (0.26 | ) | | | (0.35 | ) | | | (0.19 | ) | | | (0.16 | ) |
Net asset value | | | | | | | | | | | | | | | | | | | | |
End of period/year | | $ | 17.80 | | | $ | 18.60 | | | $ | 14.65 | | | $ | 13.50 | | | $ | 13.97 | |
Total return (C) | | | (0.20 | )% | | | 29.14 | % | | | 11.58 | % | | | (2.05 | )% | | | 12.73 | % |
Ratio and supplemental data | | | | | | | | | | | | | | | | | | | | |
Net assets end of period/year (000’s) | | $ | 567,267 | | | $ | 168,782 | | | $ | 90,012 | | | $ | 78,738 | | | $ | 75,271 | |
Expenses to average net assets | | | | | | | | | | | | | | | | | | | | |
After (waiver/reimbursement) recapture | | | 0.95 | % | | | 1.02 | % | | | 1.05 | % | | | 1.16 | % | | | 1.43 | % |
Before (waiver/reimbursement) recapture | | | 0.95 | % | | | 1.02 | % | | | 1.05 | % | | | 1.16 | % | | | 1.43 | % |
Net investment income (loss) to average net assets | | | 2.63 | % | | | 2.40 | % | | | 2.39 | % | | | 2.79 | % | | | 1.76 | % |
Portfolio turnover rate | | | 19 | % | | | 34 | % | | | 33 | % | | | 16 | % | | | 43 | % |
| (A) | Prior to March 1, 2011, information provided in previous periods reflects TS&W International Equity Portfolio, which is the accounting survivor pursuant to a Plan of Reorganization. Prior to November 1, 2010, the financial highlights were audited by another independent registered public accounting firm. |
| (B) | Calculated based on average number of shares outstanding. |
| (C) | Total return has been calculated for the applicable period without deduction of a sales load, if any, on an initial purchase. |
The Notes to Financial Statements are an integral part of this report.
| | |
| Transamerica Funds | | Annual Report 2014 |
Page 291
FINANCIAL HIGHLIGHTS (continued)
| | | | | | | | | | | | | | | | |
| For a share outstanding during the period and years indicated: | | Transamerica International Equity | |
| | | Class I2 | |
| | | October 31,
2014 | | | October 31,
2013 | | | October 31,
2012 | | | October 31,
2011 (A) | |
Net asset value | | | | | | | | | | | | | | | | |
Beginning of period/year | | $ | 18.60 | | | $ | 14.65 | | | $ | 13.51 | | | $ | 15.03 | |
Investment operations | | | | | | | | | | | | | | | | |
Net investment income (loss) (B) | | | 0.52 | | | | 0.43 | | | | 0.36 | | | | 0.29 | |
Net realized and unrealized gain (loss) | | | (0.54 | ) | | | 3.79 | | | | 1.14 | | | | (1.81 | ) |
Total investment operations | | | (0.02 | ) | | | 4.22 | | | | 1.50 | | | | (1.52 | ) |
Distributions | | | | | | | | | | | | | | | | |
Net investment income | | | (0.38 | ) | | | (0.27 | ) | | | (0.36 | ) | | | — | |
Net realized gains | | | (0.39 | ) | | | — | | | | — | | | | — | |
Total distributions | | | (0.77 | ) | | | (0.27 | ) | | | (0.36 | ) | | | — | |
Net asset value | | | | | | | | | | | | | | | | |
End of period/year | | $ | 17.81 | | | $ | 18.60 | | | $ | 14.65 | | | $ | 13.51 | |
Total return (C) | | | (0.07 | )% | | | 29.26 | % | | | 11.64 | % | | | (10.11 | )%(D) |
Ratio and supplemental data | | | | | | | | | | | | | | | | |
Net assets end of period/year (000’s) | | $ | 595,742 | | | $ | 279,652 | | | $ | 166,085 | | | $ | 46,313 | |
Expenses to average net assets | | | | | | | | | | | | | | | | |
After (waiver/reimbursement) recapture | | | 0.85 | % | | | 0.91 | % | | | 0.95 | % | | | 1.02 | %(E) |
Before (waiver/reimbursement) recapture | | | 0.85 | % | | | 0.91 | % | | | 0.95 | % | | | 1.02 | %(E) |
Net investment income (loss) to average net assets | | | 2.83 | % | | | 2.63 | % | | | 2.62 | % | | | 3.07 | %(E) |
Portfolio turnover rate | | | 19 | % | | | 34 | % | | | 33 | % | | | 16 | %(D) |
| (A) | Commenced operations on March 1, 2011. |
| (B) | Calculated based on average number of shares outstanding. |
| (C) | Total return has been calculated for the applicable period without deduction of a sales load, if any, on an initial purchase. |
| | | | | | | | |
| For a share outstanding during the period and years indicated: | | Transamerica International Small
Cap Value | |
| | | Class I | |
| | | October 31, 2014 | | | October 31, 2013 (A) | |
Net asset value | | | | | | | | |
Beginning of period/year | | $ | 12.24 | | | $ | 10.00 | |
Investment operations | | | | | | | | |
Net investment income (loss) (B) | | | 0.25 | | | | 0.20 | |
Net realized and unrealized gain (loss) | | | (0.44 | ) | | | 2.04 | |
Total investment operations | | | (0.19 | ) | | | 2.24 | |
Distributions | | | | | | | | |
Net investment income | | | (0.15 | ) | | | — | |
Net realized gains | | | (0.09 | ) | | | — | |
Total distributions | | | (0.24 | ) | | | — | |
Net asset value | | | | | | | | |
End of period/year | | $ | 11.81 | | | $ | 12.24 | |
Total return (C) | | | (1.67 | )% | | | 22.40 | %(D) |
Ratio and supplemental data | | | | | | | | |
Net assets end of period/year (000’s) | | $ | 214,170 | | | $ | 4,186 | |
Expenses to average net assets | | | | | | | | |
After (waiver/reimbursement) recapture | | | 1.15 | % | | | 1.22 | %(E) |
Before (waiver/reimbursement) recapture | | | 1.15 | % | | | 1.23 | %(E) |
Net investment income (loss) to average net assets | | | 2.03 | % | | | 2.16 | %(E) |
Portfolio turnover rate | | | 21 | % | | | 23 | %(D) |
| (A) | Commenced operations on January 4, 2013. |
| (B) | Calculated based on average number of shares outstanding. |
| (C) | Total return has been calculated for the applicable period without deduction of a sales load, if any, on an initial purchase. |
The Notes to Financial Statements are an integral part of this report.
| | |
| Transamerica Funds | | Annual Report 2014 |
Page 292
FINANCIAL HIGHLIGHTS (continued)
| | | | | | | | |
| For a share outstanding during the period and years indicated: | | Transamerica International Small
Cap Value | |
| | | Class I2 | |
| | | October 31,
2014 | | | October 31,
2013 (A) | |
Net asset value | | | | | | | | |
Beginning of period/year | | $ | 12.25 | | | $ | 10.00 | |
Investment operations | | | | | | | | |
Net investment income (loss) (B) | | | 0.24 | | | | 0.24 | |
Net realized and unrealized gain (loss) | | | (0.43 | ) | | | 2.01 | |
Total investment operations | | | (0.19 | ) | | | 2.25 | |
Distributions | | | | | | | | |
Net investment income | | | (0.15 | ) | | | — | |
Net realized gains | | | (0.09 | ) | | | — | |
Total distributions | | | (0.24 | ) | | | — | |
Net asset value | | | | | | | | |
End of period/year | | $ | 11.82 | | | $ | 12.25 | |
Total return (C) | | | (1.66 | )% | | | 22.50 | %(D) |
Ratio and supplemental data | | | | | | | | |
Net assets end of period/year (000’s) | | $ | 533,058 | | | $ | 207,569 | |
Expenses to average net assets | | | | | | | | |
After (waiver/reimbursement) recapture | | | 1.05 | % | | | 1.12 | %(E) |
Before (waiver/reimbursement) recapture | | | 1.05 | % | | | 1.12 | %(E) |
Net investment income (loss) to average net assets | | | 1.91 | % | | | 2.63 | %(E) |
Portfolio turnover rate | | | 21 | % | | | 23 | %(D) |
| (A) | Commenced operations on January 4, 2013. |
| (B) | Calculated based on average number of shares outstanding. |
| (C) | Total return has been calculated for the applicable period without deduction of a sales load, if any, on an initial purchase. |
| | | | | | | | | | | | | | | | |
| For a share outstanding during the period and years indicated: | | Transamerica Large Cap Value | |
| | | Class A | |
| | | October 31, 2014 | | | October 31, 2013 | | | October 31, 2012 | | | October 31,
2011 (A) | |
Net asset value | | | | | | | | | | | | | | | | |
Beginning of period/year | | $ | 14.24 | | | $ | 11.77 | | | $ | 10.30 | | | $ | 10.00 | |
Investment operations | | | | | | | | | | | | | | | | |
Net investment income (loss) (B) | | | 0.15 | | | | 0.17 | | | | 0.16 | | | | 0.11 | |
Net realized and unrealized gain (loss) | | | 1.40 | | | | 3.13 | | | | 1.51 | | | | 0.28 | |
Total investment operations | | | 1.55 | | | | 3.30 | | | | 1.67 | | | | 0.39 | |
Distributions | | | | | | | | | | | | | | | | |
Net investment income | | | (0.17 | ) | | | (0.19 | ) | | | (0.20 | ) | | | (0.09 | ) |
Net realized gains | | | (2.32 | ) | | | (0.64 | ) | | | — | | | | — | |
Total distributions | | | (2.49 | ) | | | (0.83 | ) | | | (0.20 | ) | | | (0.09 | ) |
Net asset value | | | | | | | | | | | | | | | | |
End of period/year | | $ | 13.30 | | | $ | 14.24 | | | $ | 11.77 | | | $ | 10.30 | |
Total return (C) | | | 12.09 | % | | | 29.74 | % | | | 16.40 | % | | | 3.94 | %(D) |
Ratio and supplemental data | | | | | | | | | | | | | | | | |
Net assets end of period/year (000’s) | | $ | 31,677 | | | $ | 8,605 | | | $ | 1,949 | | | $ | 1,021 | |
Expenses to average net assets | | | | | | | | | | | | | | | | |
After (waiver/reimbursement) recapture | | | 1.07 | % | | | 1.13 | % | | | 1.26 | % | | | 1.32 | %(E) |
Before (waiver/reimbursement) recapture | | | 1.07 | % | | | 1.13 | % | | | 1.26 | % | | | 1.32 | %(E) |
Net investment income (loss) to average net assets | | | 1.13 | % | | | 1.32 | % | | | 1.45 | % | | | 1.09 | %(E) |
Portfolio turnover rate | | | 87 | % | | | 121 | % | | | 117 | % | | | 35 | %(D) |
| (A) | Commenced operations on November 15, 2010. |
| (B) | Calculated based on average number of shares outstanding. |
| (C) | Total return has been calculated for the applicable period without deduction of a sales load, if any, on an initial purchase. |
The Notes to Financial Statements are an integral part of this report.
| | |
| Transamerica Funds | | Annual Report 2014 |
Page 293
FINANCIAL HIGHLIGHTS (continued)
| | | | | | | | | | | | | | | | |
| For a share outstanding during the period and years indicated: | | Transamerica Large Cap Value | |
| | | Class C | |
| | | October 31, 2014 | | | October 31, 2013 | | | October 31, 2012 | | | October 31,
2011 (A) | |
Net asset value | | | | | | | | | | | | | | | | |
Beginning of period/year | | $ | 14.20 | | | $ | 11.76 | | | $ | 10.29 | | | $ | 10.00 | |
Investment operations | | | | | | | | | | | | | | | | |
Net investment income (loss) (B) | | | 0.06 | | | | 0.09 | | | | 0.10 | | | | 0.06 | |
Net realized and unrealized gain (loss) | | | 1.39 | | | | 3.12 | | | | 1.50 | | | | 0.28 | |
Total investment operations | | | 1.45 | | | | 3.21 | | | | 1.60 | | | | 0.34 | |
Distributions | | | | | | | | | | | | | | | | |
Net investment income | | | (0.07 | ) | | | (0.13 | ) | | | (0.13 | ) | | | (0.05 | ) |
Net realized gains | | | (2.32 | ) | | | (0.64 | ) | | | — | | | | — | |
Total distributions | | | (2.39 | ) | | | (0.77 | ) | | | (0.13 | ) | | | (0.05 | ) |
Net asset value | | | | | | | | | | | | | | | | |
End of period/year | | $ | 13.26 | | | $ | 14.20 | | | $ | 11.76 | | | $ | 10.29 | |
Total return (C) | | | 11.30 | % | | | 28.86 | % | | | 15.64 | % | | | 3.38 | %(D) |
Ratio and supplemental data | | | | | | | | | | | | | | | | |
Net assets end of period/year (000’s) | | $ | 9,402 | | | $ | 7,783 | | | $ | 1,716 | | | $ | 1,752 | |
Expenses to average net assets | | | | | | | | | | | | | | | | |
After (waiver/reimbursement) recapture | | | 1.79 | % | | | 1.79 | % | | | 1.87 | % | | | 1.91 | %(E) |
Before (waiver/reimbursement) recapture | | | 1.79 | % | | | 1.79 | % | | | 1.87 | % | | | 1.91 | %(E) |
Net investment income (loss) to average net assets | | | 0.49 | % | | | 0.68 | % | | | 0.90 | % | | | 0.49 | %(E) |
Portfolio turnover rate | | | 87 | % | | | 121 | % | | | 117 | % | | | 35 | %(D) |
| (A) | Commenced operations on November 15, 2010. |
| (B) | Calculated based on average number of shares outstanding. |
| (C) | Total return has been calculated for the applicable period without deduction of a sales load, if any, on an initial purchase. |
| | | | | | | | | | | | | | | | |
| For a share outstanding during the period and years indicated: | | Transamerica Large Cap Value | |
| | | Class I | |
| | | October 31, 2014 | | | October 31, 2013 | | | October 31, 2012 | | | October 31, 2011 (A) | |
Net asset value | | | | | | | | | | | | | | | | |
Beginning of period/year | | $ | 14.28 | | | $ | 11.81 | | | $ | 10.31 | | | $ | 10.00 | |
Investment operations | | | | | | | | | | | | | | | | |
Net investment income (loss) (B) | | | 0.20 | | | | 0.22 | | | | 0.22 | | | | 0.13 | |
Net realized and unrealized gain (loss) | | | 1.39 | | | | 3.13 | | | | 1.51 | | | | 0.30 | |
Total investment operations | | | 1.59 | | | | 3.35 | | | | 1.73 | | | | 0.43 | |
Distributions | | | | | | | | | | | | | | | | |
Net investment income | | | (0.20 | ) | | | (0.24 | ) | | | (0.23 | ) | | | (0.12 | ) |
Net realized gains | | | (2.32 | ) | | | (0.64 | ) | | | — | | | | — | |
Total distributions | | | (2.52 | ) | | | (0.88 | ) | | | (0.23 | ) | | | (0.12 | ) |
Net asset value | | | | | | | | | | | | | | | | |
End of period/year | | $ | 13.35 | | | $ | 14.28 | | | $ | 11.81 | | | $ | 10.31 | |
Total return (C) | | | 12.40 | % | | | 30.11 | % | | | 17.00 | % | | | 4.31 | %(D) |
Ratio and supplemental data | | | | | | | | | | | | | | | | |
Net assets end of period/year (000’s) | | $ | 13,348 | | | $ | 16,805 | | | $ | 3,550 | | | $ | 7,855 | |
Expenses to average net assets | | | | | | | | | | | | | | | | |
After (waiver/reimbursement) recapture | | | 0.79 | % | | | 0.79 | % | | | 0.83 | % | | | 0.95 | %(E) |
Before (waiver/reimbursement) recapture | | | 0.79 | % | | | 0.79 | % | | | 0.83 | % | | | 0.95 | %(E) |
Net investment income (loss) to average net assets | | | 1.55 | % | | | 1.64 | % | | | 2.01 | % | | | 1.38 | %(E) |
Portfolio turnover rate | | | 87 | % | | | 121 | % | | | 117 | % | | | 35 | %(D) |
| (A) | Commenced operations on November 15, 2010. |
| (B) | Calculated based on average number of shares outstanding. |
| (C) | Total return has been calculated for the applicable period without deduction of a sales load, if any, on an initial purchase. |
The Notes to Financial Statements are an integral part of this report.
| | |
| Transamerica Funds | | Annual Report 2014 |
Page 294
FINANCIAL HIGHLIGHTS (continued)
| | | | | | | | | | | | | | | | |
| For a share outstanding during the period and years indicated: | | Transamerica Large Cap Value | |
| | | Class I2 | |
| | | October 31, 2014 | | | October 31, 2013 | | | October 31, 2012 | | | October 31,
2011 (A) | |
Net asset value | | | | | | | | | | | | | | | | |
Beginning of period/year | | $ | 14.27 | | | $ | 11.80 | | | $ | 10.32 | | | $ | 10.00 | |
Investment operations | | | | | | | | | | | | | | | | |
Net investment income (loss) (B) | | | 0.21 | | | | 0.24 | | | | 0.23 | | | | 0.16 | |
Net realized and unrealized gain (loss) | | | 1.39 | | | | 3.12 | | | | 1.49 | | | | 0.30 | |
Total investment operations | | | 1.60 | | | | 3.36 | | | | 1.72 | | | | 0.46 | |
Distributions | | | | | | | | | | | | | | | | |
Net investment income | | | (0.21 | ) | | | (0.25 | ) | | | (0.24 | ) | | | (0.14 | ) |
Net realized gains | | | (2.32 | ) | | | (0.64 | ) | | | — | | | | — | |
Total distributions | | | (2.53 | ) | | | (0.89 | ) | | | (0.24 | ) | | | (0.14 | ) |
Net asset value | | | | | | | | | | | | | | | | |
End of period/year | | $ | 13.34 | | | $ | 14.27 | | | $ | 11.80 | | | $ | 10.32 | |
Total return (C) | | | 12.53 | % | | | 30.25 | % | | | 16.90 | % | | | 4.60 | %(D) |
Ratio and supplemental data | | | | | | | | | | | | | | | | |
Net assets end of period/year (000’s) | | $ | 1,739,472 | | | $ | 1,505,170 | | | $ | 1,320,011 | | | $ | 1,328,468 | |
Expenses to average net assets | | | | | | | | | | | | | | | | |
After (waiver/reimbursement) recapture | | | 0.69 | % | | | 0.69 | % | | | 0.73 | % | | | 0.76 | %(E) |
Before (waiver/reimbursement) recapture | | | 0.69 | % | | | 0.69 | % | | | 0.73 | % | | | 0.76 | %(E) |
Net investment income (loss) to average net assets | | | 1.59 | % | | | 1.89 | % | | | 2.04 | % | | | 1.61 | %(E) |
Portfolio turnover rate | | | 87 | % | | | 121 | % | | | 117 | % | | | 35 | %(D) |
| (A) | Commenced operations on November 15, 2010. |
| (B) | Calculated based on average number of shares outstanding. |
| (C) | Total return has been calculated for the applicable period without deduction of a sales load, if any, on an initial purchase. |
| | | | | | | | | | | | | | | | |
| For a share outstanding during the year indicated: | | Transamerica Mid Cap Growth | |
| | | Class A | | | Class C | | | Class I | | | Class I2 | |
| | | October 31, 2014 (A) | | | October 31,
2014 (A) | | | October 31,
2014 (A) | | | October 31,
2014 (A) | |
Net asset value | | | | | | | | | | | | | | | | |
Beginning of year | | $ | 10.00 | | | $ | 10.00 | | | $ | 10.00 | | | $ | 10.00 | |
Investment operations | | | | | | | | | | | | | | | | |
Net investment income (loss) (B) | | | (0.06 | ) | | | (0.14 | ) | | | (0.03 | ) | | | (0.02 | ) |
Net realized and unrealized gain (loss) | | | 1.02 | | | | 1.02 | | | | 1.01 | | | | 1.01 | |
Total investment operations | | | 0.96 | | | | 0.88 | | | | 0.98 | | | | 0.99 | |
Distributions | | | | | | | | | | | | | | | | |
Net investment income | | | — | | | | — | | | | — | (C) | | | — | (C) |
Net asset value | | | | | | | | | | | | | | | | |
End of year | | $ | 10.96 | | | $ | 10.88 | | | $ | 10.98 | | | $ | 10.99 | |
Total return (D) | | | 9.60 | % | | | 8.80 | % | | | 9.81 | % | | | 9.91 | % |
Ratio and supplemental data | | | | | | | | | | | | | | | | |
Net assets end of year (000’s) | | $ | 492 | | | $ | 330 | | | $ | 339 | | | $ | 55,086 | |
Expenses to average net assets | | | | | | | | | | | | | | | | |
After (waiver/reimbursement) recapture | | | 1.31 | % | | | 2.05 | % | | | 1.05 | % | | | 0.99 | % |
Before (waiver/reimbursement) recapture | | | 1.33 | % | | | 2.05 | % | | | 1.10 | % | | | 0.99 | % |
Net investment income (loss) to average net assets | | | (0.55 | )% | | | (1.28 | )% | | | (0.29 | )% | | | (0.22 | )% |
Portfolio turnover rate | | | 67 | % | | | 67 | % | | | 67 | % | | | 67 | % |
| (A) | Commenced operations on October 31, 2013. |
| (B) | Calculated based on average number of shares outstanding. |
| (C) | Rounds to less than $0.01 or $(0.01). |
| (D) | Total return has been calculated for the applicable period without deduction of a sales load, if any, on an initial purchase. |
The Notes to Financial Statements are an integral part of this report.
| | |
| Transamerica Funds | | Annual Report 2014 |
Page 295
FINANCIAL HIGHLIGHTS (continued)
| | | | | | | | | | | | | | | | |
| For a share outstanding during the period indicated: | | Transamerica Mid Cap Value Opportunities | |
| | | Class A | | | Class C | | | Class I | | | Class I2 | |
| | | October 31,
2014 (A) | | | October 31,
2014 (A) | | | October 31,
2014 (A) | | | October 31,
2014 (A) | |
Net asset value | | | | | | | | | | | | | | | | |
Beginning of period | | $ | 10.00 | | | $ | 10.00 | | | $ | 10.00 | | | $ | 10.00 | |
Investment operations | | | | | | | | | | | | | | | | |
Net investment income (loss) (B) | | | 0.07 | | | | 0.04 | | | | 0.06 | | | | 0.09 | |
Net realized and unrealized gain (loss) | | | 0.69 | | | | 0.69 | | | | 0.72 | | | | 0.69 | |
Total investment operations | | | 0.76 | | | | 0.73 | | | | 0.78 | | | | 0.78 | |
Distributions | | | | | | | | | | | | | | | | |
Net investment income | | | (0.08 | ) | | | (0.05 | ) | | | (0.09 | ) | | | (0.09 | ) |
Net asset value | | | | | | | | | | | | | | | | |
End of period | | $ | 10.68 | | | $ | 10.68 | | | $ | 10.69 | | | $ | 10.69 | |
Total return (C) | | | 7.62 | %(D) | | | 7.29 | %(D) | | | 7.83 | %(D) | | | 7.86 | %(D) |
Ratio and supplemental data | | | | | | | | | | | | | | | | |
Net assets end of period (000’s) | | $ | 703 | | | $ | 278 | | | $ | 5,979 | | | $ | 166,170 | |
Expenses to average net assets | | | | | | | | | | | | | | | | |
After (waiver/reimbursement) recapture | | | 1.18 | %(E) | | | 1.93 | %(E) | | | 0.95 | %(E) | | | 0.86 | %(E) |
Before (waiver/reimbursement) recapture | | | 1.18 | %(E) | | | 1.93 | %(E) | | | 0.96 | %(E) | | | 0.86 | %(E) |
Net investment income (loss) to average net assets | | | 1.38 | %(E) | | | 0.71 | %(E) | | | 1.13 | %(E) | | | 1.71 | %(E) |
Portfolio turnover rate | | | 23 | %(D) | | | 23 | %(D) | | | 23 | %(D) | | | 23 | %(D) |
| (A) | Commenced operations on April 30, 2014 |
| (B) | Calculated based on average number of shares outstanding. |
| (C) | Total return has been calculated for the applicable period without deduction of a sales load, if any, on an initial purchase. |
| | | | | | | | |
| For a share outstanding during the period and years indicated: | | Transamerica MLP & Energy
Income | |
| | | Class A | |
| | | October 31,
2014 | | | October 31,
2013 (A) | |
Net asset value | | | | | | | | |
Beginning of period/year | | $ | 10.28 | | | $ | 10.00 | |
Investment operations | | | | | | | | |
Net investment income (loss) (B) | | | 0.26 | | | | 0.13 | |
Net realized and unrealized gain (loss) | | | 1.40 | | | | 0.20 | |
Total investment operations | | | 1.66 | | | | 0.33 | |
Distributions | | | | | | | | |
Net investment income | | | (0.27 | ) | | | (0.05 | ) |
Net realized gains | | | (0.05 | ) | | | — | |
Total distributions | | | (0.32 | ) | | | (0.05 | ) |
Net asset value | | | | | | | | |
End of period/year | | $ | 11.62 | | | $ | 10.28 | |
Total return (C) | | | 16.36 | % | | | 3.35 | %(D) |
Ratio and supplemental data | | | | | | | | |
Net assets end of period/year (000’s) | | $ | 64,300 | | | $ | 16,419 | |
Expenses to average net assets | | | | | | | | |
After (waiver/reimbursement) recapture | | | 1.54 | % | | | 1.65 | %(E) |
Before (waiver/reimbursement) recapture | | | 1.54 | % | | | 1.65 | %(E) |
Net investment income (loss) to average net assets | | | 2.24 | % | | | 2.67 | %(E) |
Portfolio turnover rate | | | 46 | % | | | 28 | %(D) |
| (A) | Commenced operations on April 30, 2013. |
| (B) | Calculated based on average number of shares outstanding. |
| (C) | Total return has been calculated for the applicable period without deduction of a sales load, if any, on an initial purchase. |
The Notes to Financial Statements are an integral part of this report.
| | |
| Transamerica Funds | | Annual Report 2014 |
Page 296
FINANCIAL HIGHLIGHTS (continued)
| | | | | | | | |
| For a share outstanding during the period and years indicated: | | Transamerica MLP & Energy
Income | |
| | | Class C | |
| | | October 31,
2014 | | | October 31,
2013 (A) | |
Net asset value | | | | | | | | |
Beginning of period/year | | $ | 10.25 | | | $ | 10.00 | |
Investment operations | | | | | | | | |
Net investment income (loss) (B) | | | 0.17 | | | | 0.09 | |
Net realized and unrealized gain (loss) | | | 1.41 | | | | 0.20 | |
Total investment operations | | | 1.58 | | | | 0.29 | |
Distributions | | | | | | | | |
Net investment income | | | (0.21 | ) | | | (0.04 | ) |
Net realized gains | | | (0.05 | ) | | | — | |
Total distributions | | | (0.26 | ) | | | (0.04 | ) |
Net asset value | | | | | | | | |
End of period/year | | $ | 11.57 | | | $ | 10.25 | |
Total return (C) | | | 15.59 | % | | | 2.90 | %(D) |
Ratio and supplemental data | | | | | | | | |
Net assets end of period/year (000’s) | | $ | 53,064 | | | $ | 5,008 | |
Expenses to average net assets | | | | | | | | |
After (waiver/reimbursement) recapture | | | 2.26 | % | | | 2.35 | %(E) |
Before (waiver/reimbursement) recapture | | | 2.26 | % | | | 2.39 | %(E) |
Net investment income (loss) to average net assets | | | 1.47 | % | | | 1.71 | %(E) |
Portfolio turnover rate | | | 46 | % | | | 28 | %(D) |
| (A) | Commenced operations on April 30, 2013. |
| (B) | Calculated based on average number of shares outstanding. |
| (C) | Total return has been calculated for the applicable period without deduction of a sales load, if any, on an initial purchase. |
| | | | | | | | |
| For a share outstanding during the period and years indicated: | | Transamerica MLP & Energy
Income | |
| | | Class I | |
| | | October 31,
2014 | | | October 31,
2013 (A) | |
Net asset value | | | | | | | | |
Beginning of period/year | | $ | 10.28 | | | $ | 10.00 | |
Investment operations | | | | | | | | |
Net investment income (loss) (B) | | | 0.29 | | | | 0.14 | |
Net realized and unrealized gain (loss) | | | 1.41 | | | | 0.20 | |
Total investment operations | | | 1.70 | | | | 0.34 | |
Distributions | | | | | | | | |
Net investment income | | | (0.30 | ) | | | (0.06 | ) |
Net realized gains | | | (0.05 | ) | | | — | |
Total distributions | | | (0.35 | ) | | | (0.06 | ) |
Net asset value | | | | | | | | |
End of period/year | | $ | 11.63 | | | $ | 10.28 | |
Total return (C) | | | 16.69 | % | | | 3.40 | %(D) |
Ratio and supplemental data | | | | | | | | |
Net assets end of period/year (000’s) | | $ | 112,833 | | | $ | 9,582 | |
Expenses to average net assets | | | | | | | | |
After (waiver/reimbursement) recapture | | | 1.27 | % | | | 1.35 | %(E) |
Before (waiver/reimbursement) recapture | | | 1.27 | % | | | 1.42 | %(E) |
Net investment income (loss) to average net assets | | | 2.52 | % | | | 2.82 | %(E) |
Portfolio turnover rate | | | 46 | % | | | 28 | %(D) |
| (A) | Commenced operations on April 30, 2013. |
| (B) | Calculated based on average number of shares outstanding. |
| (C) | Total return has been calculated for the applicable period without deduction of a sales load, if any, on an initial purchase. |
The Notes to Financial Statements are an integral part of this report.
| | |
| Transamerica Funds | | Annual Report 2014 |
Page 297
FINANCIAL HIGHLIGHTS (continued)
| | | | | | | | |
| For a share outstanding during the period and years indicated: | | Transamerica MLP & Energy
Income | |
| | | Class I2 | |
| | | October 31,
2014 | | | October 31,
2013 (A) | |
Net asset value | | | | | | | | |
Beginning of period/year | | $ | 10.28 | | | $ | 10.00 | |
Investment operations | | | | | | | | |
Net investment income (loss) (B) | | | 0.31 | | | | 0.12 | |
Net realized and unrealized gain (loss) | | | 1.40 | | | | 0.22 | |
Total investment operations | | | 1.71 | | | | 0.34 | |
Distributions | | | | | | | | |
Net investment income | | | (0.31 | ) | | | (0.06 | ) |
Net realized gains | | | (0.05 | ) | | | — | |
Total distributions | | | (0.36 | ) | | | (0.06 | ) |
Net asset value | | | | | | | | |
End of period/year | | $ | 11.63 | | | $ | 10.28 | |
Total return (C) | | | 16.79 | % | | | 3.42 | %(D) |
Ratio and supplemental data | | | | | | | | |
Net assets end of period/year (000’s) | | $ | 463,787 | | | $ | 206,668 | |
Expenses to average net assets | | | | | | | | |
After (waiver/reimbursement) recapture | | | 1.17 | % | | | 1.29 | %(E) |
Before (waiver/reimbursement) recapture | | | 1.17 | % | | | 1.29 | %(E) |
Net investment income (loss) to average net assets | | | 2.73 | % | | | 2.29 | %(E) |
Portfolio turnover rate | | | 46 | % | | | 28 | %(D) |
| (A) | Commenced operations on April 30, 2013. |
| (B) | Calculated based on average number of shares outstanding. |
| (C) | Total return has been calculated for the applicable period without deduction of a sales load, if any, on an initial purchase. |
| | | | | | | | | | | | | | | | | | | | |
| For a share outstanding during the years indicated: | | Transamerica Money Market | |
| | | Class A | |
| | | October 31,
2014 | | | October 31,
2013 | | | October 31,
2012 | | | October 31,
2011 | | | October 31,
2010 | |
Net asset value | | | | | | | | | | | | | | | | | | | | |
Beginning of year | | $ | 1.00 | | | $ | 1.00 | | | $ | 1.00 | | | $ | 1.00 | | | $ | 1.00 | |
Investment operations | | | | | | | | | | | | | | | | | | | | |
Net investment income (loss) (A) | | | — | (B) | | | — | (B) | | | — | (B) | | | — | (B) | | | — | (B) |
Net realized and unrealized gain (loss) | | | — | | | | — | | | | — | | | | — | | | | — | (B) |
Total investment operations | | | — | (B) | | | — | (B) | | | — | (B) | | | — | (B) | | | — | (B) |
Net equalization credits and charges | | | — | | | | — | | | | — | | | | — | | | | — | (B) |
Distributions | | | | | | | | | | | | | | | | | | | | |
Net investment income | | | — | (B) | | | — | (B) | | | — | (B) | | | — | (B) | | | — | (B) |
Net asset value | | | | | | | | | | | | | | | | | | | | |
End of year | | $ | 1.00 | | | $ | 1.00 | | | $ | 1.00 | | | $ | 1.00 | | | $ | 1.00 | |
Total return (C) | | | 0.01 | % | | | 0.01 | % | | | 0.01 | % | | | — | %(D) | | | 0.01 | % |
Ratio and supplemental data | | | | | | | | | | | | | | | | | | | | |
Net assets end of year (000’s) | | $ | 100,310 | | | $ | 90,423 | | | $ | 95,801 | | | $ | 112,490 | | | $ | 119,744 | |
Expenses to average net assets | | | | | | | | | | | | | | | | | | | | |
After (waiver/reimbursement) recapture (E) | | | 0.22 | % | | | 0.24 | % | | | 0.27 | % | | | 0.20 | % | | | 0.22 | % |
Before (waiver/reimbursement) recapture | | | 1.09 | % | | | 1.09 | % | | | 1.17 | % | | | 1.26 | % | | | 1.19 | % |
Net investment income (loss) to average net assets | | | 0.01 | % | | | — | %(D) | | | — | %(D) | | | — | %(D) | | | — | %(D) |
| (A) | Calculated based on average number of shares outstanding. |
| (B) | Rounds to less than $0.01 or $(0.01). |
| (C) | Total return has been calculated for the applicable period without deduction of a sales load, if any, on an initial purchase. |
| (D) | Rounds to less than 0.01% or (0.01)%. |
| (E) | Transamerica Asset Management, Inc. or any of its affiliates waive fees or reimburse expenses in order to avoid a negative yield. Refer to the notes to the financial statements for details. |
The Notes to Financial Statements are an integral part of this report.
| | |
| Transamerica Funds | | Annual Report 2014 |
Page 298
FINANCIAL HIGHLIGHTS (continued)
| | | | | | | | | | | | | | | | | | | | |
| For a share outstanding during the years indicated: | | Transamerica Money Market | |
| | | Class B | |
| | | October 31,
2014 | | | October 31,
2013 | | | October 31,
2012 | | | October 31,
2011 | | | October 31,
2010 | |
Net asset value | | | | | | | | | | | | | | | | | | | | |
Beginning of year | | $ | 1.00 | | | $ | 1.00 | | | $ | 1.00 | | | $ | 1.00 | | | $ | 1.00 | |
Investment operations | | | | | | | | | | | | | | | | | | | | |
Net investment income (loss) (A) | | | — | (B) | | | — | (B) | | | — | (B) | | | — | (B) | | | — | (B) |
Net realized and unrealized gain (loss) | | | — | | | | — | | | | — | | | | — | | | | — | (B) |
Total investment operations | | | — | (B) | | | — | (B) | | | — | (B) | | | — | (B) | | | — | (B) |
Net equalization credits and charges | | | — | | | | — | | | | — | | | | — | | | | — | (B) |
Distributions | | | | | | | | | | | | | | | | | | | | |
Net investment income | | | — | (B) | | | — | (B) | | | — | (B) | | | — | (B) | | | — | (B) |
Net asset value | | | | | | | | | | | | | | | | | | | | |
End of year | | $ | 1.00 | | | $ | 1.00 | | | $ | 1.00 | | | $ | 1.00 | | | $ | 1.00 | |
Total return (C) | | | 0.01 | % | | | 0.01 | % | | | 0.01 | % | | | — | %(D) | | | 0.01 | % |
Ratio and supplemental data | | | | | | | | | | | | | | | | | | | | |
Net assets end of year (000’s) | | $ | 3,820 | | | $ | 6,189 | | | $ | 9,289 | | | $ | 15,318 | | | $ | 19,442 | |
Expenses to average net assets | | | | | | | | | | | | | | | | | | | | |
After (waiver/reimbursement) recapture (E) | | | 0.22 | % | | | 0.24 | % | | | 0.27 | % | | | 0.20 | % | | | 0.21 | % |
Before (waiver/reimbursement) recapture | | | 1.86 | % | | | 1.82 | % | | | 1.84 | % | | | 1.89 | % | | | 1.81 | % |
Net investment income (loss) to average net assets | | | 0.01 | % | | | — | %(D) | | | — | %(D) | | | — | %(D) | | | — | %(D) |
| (A) | Calculated based on average number of shares outstanding. |
| (B) | Rounds to less than $0.01 or $(0.01). |
| (C) | Total return has been calculated for the applicable period without deduction of a sales load, if any, on an initial purchase. |
| (D) | Rounds to less than 0.01% or (0.01)%. |
| (E) | Transamerica Asset Management, Inc. or any of its affiliates waive fees or reimburse expenses in order to avoid a negative yield. Refer to the notes to the financial statements for details. |
| | | | | | | | | | | | | | | | | | | | |
| For a share outstanding during the years indicated: | | Transamerica Money Market | |
| | | Class C | |
| | | October 31,
2014 | | | October 31,
2013 | | | October 31,
2012 | | | October 31,
2011 | | | October 31,
2010 | |
Net asset value | | | | | | | | | | | | | | | | | | | | |
Beginning of year | | $ | 1.00 | | | $ | 1.00 | | | $ | 1.00 | | | $ | 1.00 | | | $ | 1.00 | |
Investment operations | | | | | | | | | | | | | | | | | | | | |
Net investment income (loss) (A) | | | — | (B) | | | — | (B) | | | — | (B) | | | — | (B) | | | — | (B) |
Net realized and unrealized gain (loss) | | | — | | | | — | | | | — | | | | — | | | | — | (B) |
Total investment operations | | | — | (B) | | | — | (B) | | | — | (B) | | | — | (B) | | | — | (B) |
Net equalization credits and charges | | | — | | | | — | | | | — | | | | — | | | | — | (B) |
Distributions | | | | | | | | | | | | | | | | | | | | |
Net investment income | | | — | (B) | | | — | (B) | | | — | (B) | | | — | (B) | | | — | (B) |
Net asset value | | | | | | | | | | | | | | | | | | | | |
End of year | | $ | 1.00 | | | $ | 1.00 | | | $ | 1.00 | | | $ | 1.00 | | | $ | 1.00 | |
Total return (C) | | | 0.01 | % | | | 0.01 | % | | | — | %(D) | | | — | %(D) | | | 0.01 | % |
Ratio and supplemental data | | | | | | | | | | | | | | | | | | | | |
Net assets end of year (000’s) | | $ | 24,180 | | | $ | 30,196 | | | $ | 31,391 | | | $ | 36,078 | | | $ | 33,800 | |
Expenses to average net assets | | | | | | | | | | | | | | | | | | | | |
After (waiver/reimbursement) recapture (E) | | | 0.22 | % | | | 0.24 | % | | | 0.27 | % | | | 0.20 | % | | | 0.22 | % |
Before (waiver/reimbursement) recapture | | | 1.67 | % | | | 1.64 | % | | | 1.67 | % | | | 1.73 | % | | | 1.66 | % |
Net investment income (loss) to average net assets | | | 0.01 | % | | | — | %(D) | | | — | %(D) | | | — | %(D) | | | — | %(D) |
| (A) | Calculated based on average number of shares outstanding. |
| (B) | Rounds to less than $0.01 or $(0.01). |
| (C) | Total return has been calculated for the applicable period without deduction of a sales load, if any, on an initial purchase. |
| (D) | Rounds to less than 0.01% or (0.01)%. |
| (E) | Transamerica Asset Management, Inc. or any of its affiliates waive fees or reimburse expenses in order to avoid a negative yield. Refer to the notes to the financial statements for details. |
The Notes to Financial Statements are an integral part of this report.
| | |
| Transamerica Funds | | Annual Report 2014 |
Page 299
FINANCIAL HIGHLIGHTS (continued)
| | | | | | | | | | | | | | | | | | | | |
| For a share outstanding during the period and years indicated: | | Transamerica Money Market | |
| | | Class I | |
| | | October 31, 2014 | | | October 31, 2013 | | | October 31, 2012 | | | October 31, 2011 | | | October 31, 2010 (A) | |
Net asset value | | | | | | | | | | | | | | | | | | | | |
Beginning of period/year | | $ | 1.00 | | | $ | 1.00 | | | $ | 1.00 | | | $ | 1.00 | | | $ | 1.00 | |
Investment operations | | | | | | | | | | | | | | | | | | | | |
Net investment income (loss) (B) | | | — | (C) | | | — | (C) | | | — | (C) | | | — | (C) | | | — | (C) |
Net realized and unrealized gain (loss) | | | — | | | | — | | | | — | | | | — | | | | — | (C) |
Total investment operations | | | — | (C) | | | — | (C) | | | — | (C) | | | — | (C) | | | — | (C) |
Net equalization credits and charges | | | — | | | | — | | | | — | | | | — | | | | — | (C) |
Distributions | | | | | | | | | | | | | | | | | | | | |
Net investment income | | | — | (C) | | | — | (C) | | | — | (C) | | | — | (C) | | | — | (C) |
Net asset value | | | | | | | | | | | | | | | | | | | | |
End of period/year | | $ | 1.00 | | | $ | 1.00 | | | $ | 1.00 | | | $ | 1.00 | | | $ | 1.00 | |
Total return (D) | | | 0.01 | % | | | 0.04 | % | | | 0.02 | % | | | 0.01 | % | | | 0.01 | %(E) |
Ratio and supplemental data | | | | | | | | | | | | | | | | | | | | |
Net assets end of period/year (000’s) | | $ | 19,325 | | | $ | 22,305 | | | $ | 25,460 | | | $ | 55 | | | $ | 55 | |
Expenses to average net assets | | | | | | | | | | | | | | | | | | | | |
After (waiver/reimbursement) recapture (F) | | | 0.21 | % | | | 0.21 | % | | | 0.26 | % | | | 0.19 | % | | | 0.22 | %(G) |
Before (waiver/reimbursement) recapture | | | 0.77 | % | | | 0.71 | % | | | 0.72 | % | | | 3.60 | % | | | 3.17 | %(G) |
Net investment income (loss) to average net assets | | | 0.02 | % | | | 0.04 | % | | | 0.02 | % | | | 0.02 | % | | | 0.01 | %(G) |
| (A) | Commenced operations on November 30, 2009. |
| (B) | Calculated based on average number of shares outstanding. |
| (C) | Rounds to less than $0.01 or $(0.01). |
| (D) | Total return has been calculated for the applicable period without deduction of a sales load, if any, on an initial purchase. |
| (F) | Transamerica Asset Management, Inc. or any of its affiliates waive fees or reimburse expenses in order to avoid a negative yield. Refer to the notes to the financial statements for details. |
| | | | | | | | | | | | | | | | | | | | |
| For a share outstanding during the years indicated: | | Transamerica Money Market | |
| | | Class I2 | |
| | | October 31, 2014 | | | October 31, 2013 | | | October 31, 2012 | | | October 31, 2011 | | | October 31, 2010 (A) | |
Net asset value | | | | | | | | | | | | | | | | | | | | |
Beginning of year | | $ | 1.00 | | | $ | 1.00 | | | $ | 1.00 | | | $ | 1.00 | | | $ | 1.00 | |
Investment operations | | | | | | | | | | | | | | | | | | | | |
Net investment income (loss) (B) | | | — | (C) | | | — | (C) | | | — | (C) | | | — | (C) | | | — | (C) |
Net realized and unrealized gain (loss) | | | — | | | | — | | | | — | | | | — | | | | — | (C) |
Total investment operations | | | — | (C) | | | — | (C) | | | — | (C) | | | — | (C) | | | — | (C) |
Net equalization credits and charges | | | — | | | | — | | | | — | | | | — | | | | — | (C) |
Distributions | | | | | | | | | | | | | | | | | | | | |
Net investment income | | | — | (C) | | | — | (C) | | | — | (C) | | | — | (C) | | | — | (C) |
Net asset value | | | | | | | | | | | | | | | | | | | | |
End of year | | $ | 1.00 | | | $ | 1.00 | | | $ | 1.00 | | | $ | 1.00 | | | $ | 1.00 | |
Total return (D) | | | 0.01 | % | | | 0.04 | % | | | 0.03 | % | | | 0.01 | % | | | 0.01 | % |
Ratio and supplemental data | | | | | | | | | | | | | | | | | | | | |
Net assets end of year (000’s) | | $ | 31,522 | | | $ | 130,531 | | | $ | 652,465 | | | $ | 17,612 | | | $ | 21,773 | |
Expenses to average net assets | | | | | | | | | | | | | | | | | | | | |
After (waiver/reimbursement) recapture (E) | | | 0.21 | % | | | 0.21 | % | | | 0.25 | % | | | 0.19 | % | | | 0.21 | % |
Before (waiver/reimbursement) recapture | | | 0.53 | % | | | 0.49 | % | | | 0.50 | % | | | 0.55 | % | | | 0.50 | % |
Net investment income (loss) to average net assets | | | 0.02 | % | | | 0.03 | % | | | 0.03 | % | | | 0.02 | % | | | 0.01 | % |
| (A) | Effective November 30, 2009, all previously existing Class I shares were re-designated as Class I2 Shares. |
| (B) | Calculated based on average number of shares outstanding. |
| (C) | Rounds to less than $0.01 or $(0.01). |
| (D) | Total return has been calculated for the applicable period without deduction of a sales load, if any, on an initial purchase. |
| (E) | Transamerica Asset Management, Inc. or any of its affiliates waive fees or reimburse expenses in order to avoid a negative yield. Refer to the notes to the financial statements for details. |
The Notes to Financial Statements are an integral part of this report.
| | |
| Transamerica Funds | | Annual Report 2014 |
Page 300
FINANCIAL HIGHLIGHTS (continued)
| | | | | | | | | | | | | | | | | | | | |
| For a share outstanding during the years indicated: | | Transamerica Multi-Managed Balanced | |
| | | Class A | |
| | | October 31, 2014 | | | October 31, 2013 | | | October 31, 2012 | | | October 31, 2011 | | | October 31, 2010 | |
Net asset value | | | | | | | | | | | | | | | | | | | | |
Beginning of year | | $ | 24.23 | | | $ | 22.15 | | | $ | 23.34 | | | $ | 21.40 | | | $ | 17.85 | |
Investment operations | | | | | | | | | | | | | | | | | | | | |
Net investment income (loss) (A) (B) | | | 0.24 | | | | 0.23 | | | | 0.26 | | | | 0.25 | | | | 0.52 | |
Net realized and unrealized gain (loss) | | | 2.57 | | | | 2.88 | | | | 1.94 | | | | 1.94 | | | | 3.55 | |
Total investment operations | | | 2.81 | | | | 3.11 | | | | 2.20 | | | | 2.19 | | | | 4.07 | |
Distributions | | | | | | | | | | | | | | | | | | | | |
Net investment income | | | (0.31 | ) | | | (0.25 | ) | | | (0.31 | ) | | | (0.25 | ) | | | (0.52 | ) |
Net realized gains | | | (1.12 | ) | | | (0.78 | ) | | | (3.08 | ) | | | — | | | | — | |
Total distributions | | | (1.43 | ) | | | (1.03 | ) | | | (3.39 | ) | | | (0.25 | ) | | | (0.52 | ) |
Net asset value | | | | | | | | | | | | | | | | | | | | |
End of year | | $ | 25.61 | | | $ | 24.23 | | | $ | 22.15 | | | $ | 23.34 | | | $ | 21.40 | |
Total return (C) | | | 12.11 | % | | | 14.61 | % | | | 11.27 | % | | | 10.26 | % | | | 23.08 | % |
Ratio and supplemental data | | | | | | | | | | | | | | | | | | | | |
Net assets end of year (000’s) | | $ | 174,817 | | | $ | 152,382 | | | $ | 125,266 | | | $ | 107,146 | | | $ | 95,258 | |
Expenses to average net assets (D) | | | | | | | | | | | | | | | | | | | | |
After (waiver/reimbursement) recapture | | | 1.23 | % | | | 1.36 | % | | | 1.47 | % | | | 1.46 | % | | | 1.56 | %(E) |
Before (waiver/reimbursement) recapture | | | 1.23 | % | | | 1.36 | % | | | 1.43 | % | | | 1.49 | % | | | 1.56 | %(E) |
Net investment income (loss) to average net assets (B) | | | 1.00 | % | | | 0.99 | % | | | 1.20 | % | | | 1.09 | % | | | 2.67 | % |
Portfolio turnover rate (F) | | | 102 | % | | | 126 | % | | | 153 | % | | | 263 | % | | | 99 | % |
| (A) | Calculated based on average number of shares outstanding. |
| (B) | Recognition of net investment income by the Fund is affected by the timing of the declaration of dividends by the investment companies in which the Fund invests. |
| (C) | Total return has been calculated for the applicable period without deduction of a sales load, if any, on an initial purchase. |
| (D) | Does not include expenses of the investment companies in which the Fund invests. |
| (E) | Includes extraordinary expenses. The impact of the extraordinary expenses was 0.01%. |
| (F) | Does not include portfolio activity of the investment companies in which the Fund invests. |
| | | | | | | | | | | | | | | | | | | | |
| For a share outstanding during the years indicated: | | Transamerica Multi-Managed Balanced | |
| | | Class B | |
| | | October 31, 2014 | | | October 31, 2013 | | | October 31, 2012 | | | October 31, 2011 | | | October 31, 2010 | |
Net asset value | | | | | | | | | | | | | | | | | | | | |
Beginning of year | | $ | 24.09 | | | $ | 22.01 | | | $ | 23.23 | | | $ | 21.34 | | | $ | 17.79 | |
Investment operations | | | | | | | | | | | | | | | | | | | | |
Net investment income (loss) (A) (B) | | | 0.02 | | | | 0.03 | | | | 0.08 | | | | 0.06 | | | | 0.33 | |
Net realized and unrealized gain (loss) | | | 2.55 | | | | 2.87 | | | | 1.92 | | | | 1.92 | | | | 3.58 | |
Total investment operations | | | 2.57 | | | | 2.90 | | | | 2.00 | | | | 1.98 | | | | 3.91 | |
Distributions | | | | | | | | | | | | | | | | | | | | |
Net investment income | | | (0.09 | ) | | | (0.04 | ) | | | (0.14 | ) | | | (0.09 | ) | | | (0.36 | ) |
Net realized gains | | | (1.12 | ) | | | (0.78 | ) | | | (3.08 | ) | | | — | | | | — | |
Total distributions | | | (1.21 | ) | | | (0.82 | ) | | | (3.22 | ) | | | (0.09 | ) | | | (0.36 | ) |
Net asset value | | | | | | | | | | | | | | | | | | | | |
End of year | | $ | 25.45 | | | $ | 24.09 | | | $ | 22.01 | | | $ | 23.23 | | | $ | 21.34 | |
Total return (C) | | | 11.07 | % | | | 13.66 | % | | | 10.30 | % | | | 9.33 | % | | | 22.15 | % |
Ratio and supplemental data | | | | | | | | | | | | | | | | | | | | |
Net assets end of year (000’s) | | $ | 6,579 | | | $ | 8,186 | | | $ | 9,074 | | | $ | 9,996 | | | $ | 14,658 | |
Expenses to average net assets (D) | | | | | | | | | | | | | | | | | | | | |
After (waiver/reimbursement) recapture | | | 2.15 | % | | | 2.24 | % | | | 2.33 | % | | | 2.29 | % | | | 2.34 | %(E) |
Before (waiver/reimbursement) recapture | | | 2.15 | % | | | 2.24 | % | | | 2.29 | % | | | 2.32 | % | | | 2.34 | %(E) |
Net investment income (loss) to average net assets (B) | | | 0.10 | % | | | 0.13 | % | | | 0.36 | % | | | 0.25 | % | | | 1.73 | % |
Portfolio turnover rate (F) | | | 102 | % | | | 126 | % | | | 153 | % | | | 263 | % | | | 99 | % |
| (A) | Calculated based on average number of shares outstanding. |
| (B) | Recognition of net investment income by the Fund is affected by the timing of the declaration of dividends by the investment companies in which the Fund invests. |
| (C) | Total return has been calculated for the applicable period without deduction of a sales load, if any, on an initial purchase. |
| (D) | Does not include expenses of the investment companies in which the Fund invests. |
| (E) | Includes extraordinary expenses. The impact of the extraordinary expenses was 0.01%. |
| (F) | Does not include portfolio activity of the investment companies in which the Fund invests. |
The Notes to Financial Statements are an integral part of this report.
| | |
| Transamerica Funds | | Annual Report 2014 |
Page 301
FINANCIAL HIGHLIGHTS (continued)
| | | | | | | | | | | | | | | | | | | | |
| For a share outstanding during the years indicated: | | Transamerica Multi-Managed Balanced | |
| | | Class C | |
| | | October 31,
2014 | | | October 31,
2013 | | | October 31,
2012 | | | October 31,
2011 | | | October 31,
2010 | |
Net asset value | | | | | | | | | | | | | | | | | | | | |
Beginning of year | | $ | 23.88 | | | $ | 21.85 | | | $ | 23.09 | | | $ | 21.20 | | | $ | 17.69 | |
Investment operations | | | | | | | | | | | | | | | | | | | | |
Net investment income (loss) (A) (B) | | | 0.08 | | | | 0.08 | | | | 0.13 | | | | 0.13 | | | | 0.40 | |
Net realized and unrealized gain (loss) | | | 2.53 | | | | 2.85 | | | | 1.92 | | | | 1.91 | | | | 3.53 | |
Total investment operations | | | 2.61 | | | | 2.93 | | | | 2.05 | | | | 2.04 | | | | 3.93 | |
Distributions | | | | | | | | | | | | | | | | | | | | |
Net investment income | | | (0.16 | ) | | | (0.12 | ) | | | (0.21 | ) | | | (0.15 | ) | | | (0.42 | ) |
Net realized gains | | | (1.12 | ) | | | (0.78 | ) | | | (3.08 | ) | | | — | | | | — | |
Total distributions | | | (1.28 | ) | | | (0.90 | ) | | | (3.29 | ) | | | (0.15 | ) | | | (0.42 | ) |
Net asset value | | | | | | | | | | | | | | | | | | | | |
End of year | | $ | 25.21 | | | $ | 23.88 | | | $ | 21.85 | | | $ | 23.09 | | | $ | 21.20 | |
Total return (C) | | | 11.38 | % | | | 13.90 | % | | | 10.63 | % | | | 9.63 | % | | | 22.43 | % |
Ratio and supplemental data | | | | | | | | | | | | | | | | | | | | |
Net assets end of year (000’s) | | $ | 132,473 | | | $ | 95,601 | | | $ | 62,789 | | | $ | 38,868 | | | $ | 24,194 | |
Expenses to average net assets (D) | | | | | | | | | | | | | | | | | | | | |
After (waiver/reimbursement) recapture | | | 1.90 | % | | | 1.98 | % | | | 2.04 | % | | | 2.03 | % | | | 2.11 | %(E) |
Before (waiver/reimbursement) recapture | | | 1.90 | % | | | 1.98 | % | | | 2.01 | % | | | 2.05 | % | | | 2.11 | %(E) |
Net investment income (loss) to average net assets (B) | | | 0.32 | % | | | 0.36 | % | | | 0.61 | % | | | 0.55 | % | | | 2.09 | % |
Portfolio turnover rate (F) | | | 102 | % | | | 126 | % | | | 153 | % | | | 263 | % | | | 99 | % |
| (A) | Calculated based on average number of shares outstanding. |
| (B) | Recognition of net investment income by the Fund is affected by the timing of the declaration of dividends by the investment companies in which the Fund invests. |
| (C) | Total return has been calculated for the applicable period without deduction of a sales load, if any, on an initial purchase. |
| (D) | Does not include expenses of the investment companies in which the Fund invests. |
| (E) | Includes extraordinary expenses. The impact of the extraordinary expenses was 0.01%. |
| (F) | Does not include portfolio activity of the investment companies in which the Fund invests. |
| | | | | | | | | | | | | | | | | | | | |
| For a share outstanding during the period and years indicated: | | Transamerica Multi-Managed Balanced | |
| | | Class I | |
| | | October 31,
2014 | | | October 31,
2013 | | | October 31,
2012 | | | October 31,
2011 | | | October 31,
2010 (A) | |
Net asset value | | | | | | | | | | | | | | | | | | | | |
Beginning of period/year | | $ | 24.31 | | | $ | 22.22 | | | $ | 23.40 | | | $ | 21.46 | | | $ | 18.49 | |
Investment operations | | | | | | | | | | | | | | | | | | | | |
Net investment income (loss) (B) (C) | | | 0.33 | | | | 0.32 | | | | 0.36 | | | | 0.38 | | | | 0.57 | |
Net realized and unrealized gain (loss) | | | 2.57 | | | | 2.89 | | | | 1.94 | | | | 1.91 | | | | 2.98 | |
Total investment operations | | | 2.90 | | | | 3.21 | | | | 2.30 | | | | 2.29 | | | | 3.55 | |
Distributions | | | | | | | | | | | | | | | | | | | | |
Net investment income | | | (0.39 | ) | | | (0.34 | ) | | | (0.40 | ) | | | (0.35 | ) | | | (0.58 | ) |
Net realized gains | | | (1.12 | ) | | | (0.78 | ) | | | (3.08 | ) | | | — | | | | — | |
Total distributions | | | (1.51 | ) | | | (1.12 | ) | | | (3.48 | ) | | | (0.35 | ) | | | (0.58 | ) |
Net asset value | | | | | | | | | | | | | | | | | | | | |
End of period/year | | $ | 25.70 | | | $ | 24.31 | | | $ | 22.22 | | | $ | 23.40 | | | $ | 21.46 | |
Total return (D) | | | 12.46 | % | | | 15.07 | % | | | 11.76 | % | | | 10.70 | % | | | 19.52 | %(E) |
Ratio and supplemental data | | | | | | | | | | | | | | | | | | | | |
Net assets end of period/year (000’s) | | $ | 176,667 | | | $ | 174,902 | | | $ | 176,788 | | | $ | 12,086 | | | $ | 265 | |
Expenses to average net assets (F) | | | | | | | | | | | | | | | | | | | | |
After (waiver/reimbursement) recapture | | | 0.92 | % | | | 0.98 | % | | | 0.99 | % | | | 1.00 | % | | | 1.46 | %(G)(H) |
Before (waiver/reimbursement) recapture | | | 0.92 | % | | | 0.98 | % | | | 0.96 | % | | | 1.01 | % | | | 2.01 | %(G)(H) |
Net investment income (loss) to average net assets (C) | | | 1.32 | % | | | 1.39 | % | | | 1.63 | % | | | 1.61 | % | | | 3.15 | %(G) |
Portfolio turnover rate (I) | | | 102 | % | | | 126 | % | | | 153 | % | | | 263 | % | | | 99 | %(E) |
| (A) | Commenced operations on November 30, 2009. |
| (B) | Calculated based on average number of shares outstanding. |
| (C) | Recognition of net investment income by the Fund is affected by the timing of the declaration of dividends by the investment companies in which the Fund invests. |
| (D) | Total return has been calculated for the applicable period without deduction of a sales load, if any, on an initial purchase. |
| (F) | Does not include expenses of the investment companies in which the Fund invests. |
| (H) | Includes extraordinary expenses. The impact of the extraordinary expenses was 0.01%. |
| (I) | Does not include portfolio activity of the investment companies in which the Fund invests. |
The Notes to Financial Statements are an integral part of this report.
| | |
| Transamerica Funds | | Annual Report 2014 |
Page 302
FINANCIAL HIGHLIGHTS (continued)
| | | | | | | | | | | | |
| For a share outstanding during the years indicated: | | Transamerica Opportunistic Allocation | |
| | | Class A | | | Class C | | | Class I | |
| | | October 31,
2014 (A) | | | October 31,
2014 (A) | | | October 31,
2014 (A) | |
Net asset value | | | | | | | | | | | | |
Beginning of year | | $ | 10.00 | | | $ | 10.00 | | | $ | 10.00 | |
Investment operations | | | | | | | | | | | | |
Net investment income (loss) (B) | | | 0.66 | | | | 0.58 | | | | 0.69 | |
Net realized and unrealized gain (loss) | | | (0.21 | ) | | | (0.20 | ) | | | (0.21 | ) |
Total investment operations | | | 0.45 | | | | 0.38 | | | | 0.48 | |
Distributions | | | | | | | | | | | | |
Net investment income | | | (0.63 | ) | | | (0.56 | ) | | | (0.65 | ) |
Net asset value | | | | | | | | | | | | |
End of year | | $ | 9.82 | | | $ | 9.82 | | | $ | 9.83 | |
Total return (C) | | | 4.38 | % | | | 3.69 | % | | | 4.74 | % |
Ratio and supplemental data | | | | | | | | | | | | |
Net assets end of year (000’s) | | $ | 268 | | | $ | 259 | | | $ | 531 | |
Expenses to average net assets (D) | | | | | | | | | | | | |
After (waiver/reimbursement) recapture | | | 1.22 | % | | | 1.95 | % | | | 0.95 | % |
Before (waiver/reimbursement) recapture | | | 9.64 | % | | | 10.37 | % | | | 9.47 | % |
Net investment income (loss) to average net assets | | | 6.41 | % | | | 5.68 | % | | | 6.67 | % |
Portfolio turnover rate (E) | | | 118 | % | | | 118 | % | | | 118 | % |
| (A) | Commenced operations on October 31, 2013. |
| (B) | Calculated based on average number of shares outstanding. |
| (C) | Total return has been calculated for the applicable period without deduction of a sales load, if any, on an initial purchase. |
| (D) | Does not include expenses of the investment companies in which the Fund invests. |
| (E) | Does not include portfolio activity of the investment companies in which the Fund invests. |
| | | | | | | | | | | | | | | | | | | | |
| For a share outstanding during the years indicated: | | Transamerica Short-Term Bond | |
| | | Class A | |
| | | October 31, 2014 | | | October 31, 2013 | | | October 31, 2012 | | | October 31, 2011 | | | October 31, 2010 | |
Net asset value | | | | | | | | | | | | | | | | | | | | |
Beginning of year | | $ | 10.45 | | | $ | 10.51 | | | $ | 10.33 | | | $ | 10.53 | | | $ | 10.26 | |
Investment operations | | | | | | | | | | | | | | | | | | | | |
Net investment income (loss) (A) | | | 0.21 | | | | 0.25 | | | | 0.33 | | | | 0.37 | | | | 0.43 | |
Net realized and unrealized gain (loss) | | | — | (B) | | | 0.01 | | | | 0.27 | | | | (0.16 | ) | | | 0.29 | |
Total investment operations | | | 0.21 | | | | 0.26 | | | | 0.60 | | | | 0.21 | | | | 0.72 | |
Distributions | | | | | | | | | | | | | | | | | | | | |
Net investment income | | | (0.23 | ) | | | (0.27 | ) | | | (0.35 | ) | | | (0.39 | ) | | | (0.45 | ) |
Net realized gains | | | (0.06 | ) | | | (0.05 | ) | | | (0.07 | ) | | | (0.02 | ) | | | — | |
Total distributions | | | (0.29 | ) | | | (0.32 | ) | | | (0.42 | ) | | | (0.41 | ) | | | (0.45 | ) |
Net asset value | | | | | | | | | | | | | | | | | | | | |
End of year | | $ | 10.37 | | | $ | 10.45 | | | $ | 10.51 | | | $ | 10.33 | | | $ | 10.53 | |
Total return (C) | | | 1.97 | % | | | 2.46 | % | | | 5.95 | % | | | 2.01 | % | | | 7.15 | % |
Ratio and supplemental data | | | | | | | | | | | | | | | | | | | | |
Net assets end of year (000’s) | | $ | 1,012,764 | | | $ | 953,044 | | | $ | 793,493 | | | $ | 779,041 | | | $ | 856,959 | |
Expenses to average net assets | | | | | | | | | | | | | | | | | | | | |
After (waiver/reimbursement) recapture | | | 0.84 | % | | | 0.83 | % | | | 0.83 | % | | | 0.82 | % | | | 0.83 | % |
Before (waiver/reimbursement) recapture | | | 0.86 | % | | | 0.88 | % | | | 0.89 | % | | | 0.92 | % | | | 0.97 | % |
Net investment income (loss) to average net assets | | | 2.05 | % | | | 2.38 | % | | | 3.22 | % | | | 3.58 | % | | | 4.16 | % |
Portfolio turnover rate | | | 52 | % | | | 73 | % | | | 61 | % | | | 51 | % | | | 54 | % |
| (A) | Calculated based on average number of shares outstanding. |
| (B) | Rounds to less than $0.01 or $(0.01). |
| (C) | Total return has been calculated for the applicable period without deduction of a sales load, if any, on an initial purchase. |
The Notes to Financial Statements are an integral part of this report.
| | |
| Transamerica Funds | | Annual Report 2014 |
Page 303
FINANCIAL HIGHLIGHTS (continued)
| | | | | | | | | | | | | | | | | | | | |
| For a share outstanding during the years indicated: | | Transamerica Short-Term Bond | |
| | | Class C | |
| | | October 31,
2014 | | | October 31,
2013 | | | October 31,
2012 | | | October 31,
2011 | | | October 31,
2010 | |
Net asset value | | | | | | | | | | | | | | | | | | | | |
Beginning of year | | $ | 10.43 | | | $ | 10.49 | | | $ | 10.31 | | | $ | 10.51 | | | $ | 10.24 | |
Investment operations | | | | | | | | | | | | | | | | | | | | |
Net investment income (loss) (A) | | | 0.14 | | | | 0.17 | | | | 0.25 | | | | 0.29 | | | | 0.36 | |
Net realized and unrealized gain (loss) | | | (0.01 | ) | | | 0.01 | | | | 0.27 | | | | (0.17 | ) | | | 0.28 | |
Total investment operations | | | 0.13 | | | | 0.18 | | | | 0.52 | | | | 0.12 | | | | 0.64 | |
Distributions | | | | | | | | | | | | | | | | | | | | |
Net investment income | | | (0.15 | ) | | | (0.19 | ) | | | (0.27 | ) | | | (0.30 | ) | | | (0.37 | ) |
Net realized gains | | | (0.06 | ) | | | (0.05 | ) | | | (0.07 | ) | | | (0.02 | ) | | | — | |
Total distributions | | | (0.21 | ) | | | (0.24 | ) | | | (0.34 | ) | | | (0.32 | ) | | | (0.37 | ) |
Net asset value | | | | | | | | | | | | | | | | | | | | |
End of year | | $ | 10.35 | | | $ | 10.43 | | | $ | 10.49 | | | $ | 10.31 | | | $ | 10.51 | |
Total return (B) | | | 1.20 | % | | | 1.67 | % | | | 5.15 | % | | | 1.23 | % | | | 6.32 | % |
Ratio and supplemental data | | | | | | | | | | | | | | | | | | | | |
Net assets end of year (000’s) | | $ | 847,407 | | | $ | 867,319 | | | $ | 837,435 | | | $ | 846,464 | | | $ | 834,859 | |
Expenses to average net assets | | | | | | | | | | | | | | | | | | | | |
After (waiver/reimbursement) recapture | | | 1.59 | % | | | 1.60 | % | | | 1.59 | % | | | 1.59 | % | | | 1.59 | % |
Before (waiver/reimbursement) recapture | | | 1.59 | % | | | 1.60 | % | | | 1.59 | % | | | 1.59 | % | | | 1.63 | % |
Net investment income (loss) to average net assets | | | 1.30 | % | | | 1.63 | % | | | 2.46 | % | | | 2.81 | % | | | 3.40 | % |
Portfolio turnover rate | | | 52 | % | | | 73 | % | | | 61 | % | | | 51 | % | | | 54 | % |
| (A) | Calculated based on average number of shares outstanding. |
| (B) | Total return has been calculated for the applicable period without deduction of a sales load, if any, on an initial purchase. |
| | | | | | | | | | | | | | | | | | | | |
| For a share outstanding during the period and years indicated: | | Transamerica Short-Term Bond | |
| | | Class I | |
| | | October 31,
2014 | | | October 31,
2013 | | | October 31,
2012 | | | October 31,
2011 | | | October 31,
2010 (A) | |
Net asset value | | | | | | | | | | | | | | | | | | | | |
Beginning of period/year | | $ | 10.27 | | | $ | 10.33 | | | $ | 10.15 | | | $ | 10.35 | | | $ | 10.14 | |
Investment operations | | | | | | | | | | | | | | | | | | | | |
Net investment income (loss) (B) | | | 0.23 | | | | 0.26 | | | | 0.35 | | | | 0.38 | | | | 0.39 | |
Net realized and unrealized gain (loss) | | | (0.01 | ) | | | 0.01 | | | | 0.26 | | | | (0.16 | ) | | | 0.24 | |
Total investment operations | | | 0.22 | | | | 0.27 | | | | 0.61 | | | | 0.22 | | | | 0.63 | |
Distributions | | | | | | | | | | | | | | | | | | | | |
Net investment income | | | (0.24 | ) | | | (0.28 | ) | | | (0.36 | ) | | | (0.40 | ) | | | (0.42 | ) |
Net realized gains | | | (0.06 | ) | | | (0.05 | ) | | | (0.07 | ) | | | (0.02 | ) | | | — | |
Total distributions | | | (0.30 | ) | | | (0.33 | ) | | | (0.43 | ) | | | (0.42 | ) | | | (0.42 | ) |
Net asset value | | | | | | | | | | | | | | | | | | | | |
End of period/year | | $ | 10.19 | | | $ | 10.27 | | | $ | 10.33 | | | $ | 10.15 | | | $ | 10.35 | |
Total return (C) | | | 2.18 | % | | | 2.66 | % | | | 6.21 | % | | | 2.16 | % | | | 6.34 | %(D) |
Ratio and supplemental data | | | | | | | | | | | | | | | | | | | | |
Net assets end of period/year (000’s) | | $ | 804,004 | | | $ | 485,299 | | | $ | 368,296 | | | $ | 270,667 | | | $ | 198,461 | |
Expenses to average net assets | | | | | | | | | | | | | | | | | | | | |
After (waiver/reimbursement) recapture | | | 0.63 | % | | | 0.63 | % | | | 0.63 | % | | | 0.64 | % | | | 0.65 | %(E) |
Before (waiver/reimbursement) recapture | | | 0.63 | % | | | 0.63 | % | | | 0.63 | % | | | 0.64 | % | | | 0.67 | %(E) |
Net investment income (loss) to average net assets | | | 2.25 | % | | | 2.58 | % | | | 3.40 | % | | | 3.75 | % | | | 4.17 | %(E) |
Portfolio turnover rate | | | 52 | % | | | 73 | % | | | 61 | % | | | 51 | % | | | 54 | %(D) |
| (A) | Commenced operations on November 30, 2009. |
| (B) | Calculated based on average number of shares outstanding. |
| (C) | Total return has been calculated for the applicable period without deduction of a sales load, if any, on an initial purchase. |
The Notes to Financial Statements are an integral part of this report.
| | |
| Transamerica Funds | | Annual Report 2014 |
Page 304
FINANCIAL HIGHLIGHTS (continued)
| | | | | | | | | | | | | | | | | | | | |
| For a share outstanding during the years indicated: | | Transamerica Short-Term Bond | |
| | | Class I2 (A) | |
| | | October 31, 2014 | | | October 31, 2013 | | | October 31, 2012 | | | October 31, 2011 | | | October 31, 2010 | |
Net asset value | | | | | | | | | | | | | | | | | | | | |
Beginning of year | | $ | 10.27 | | | $ | 10.32 | | | $ | 10.14 | | | $ | 10.34 | | | $ | 10.08 | |
Investment operations | | | | | | | | | | | | | | | | | | | | |
Net investment income (loss) (B) | | | 0.24 | | | | 0.28 | | | | 0.36 | | | | 0.40 | | | | 0.46 | |
Net realized and unrealized gain (loss) | | | (0.02 | ) | | | 0.01 | | | | 0.26 | | | | (0.17 | ) | | | 0.27 | |
Total investment operations | | | 0.22 | | | | 0.29 | | | | 0.62 | | | | 0.23 | | | | 0.73 | |
Distributions | | | | | | | | | | | | | | | | | | | | |
Net investment income | | | (0.25 | ) | | | (0.29 | ) | | | (0.37 | ) | | | (0.41 | ) | | | (0.47 | ) |
Net realized gains | | | (0.06 | ) | | | (0.05 | ) | | | (0.07 | ) | | | (0.02 | ) | | | — | |
Total distributions | | | (0.31 | ) | | | (0.34 | ) | | | (0.44 | ) | | | (0.43 | ) | | | (0.47 | ) |
Net asset value | | | | | | | | | | | | | | | | | | | | |
End of year | | $ | 10.18 | | | $ | 10.27 | | | $ | 10.32 | | | $ | 10.14 | | | $ | 10.34 | |
Total return (C) | | | 2.18 | % | | | 2.86 | % | | | 6.31 | % | | | 2.28 | % | | | 7.37 | % |
Ratio and supplemental data | | | | | | | | | | | | | | | | | | | | |
Net assets end of year (000’s) | | $ | 1,400,475 | | | $ | 1,561,883 | | | $ | 1,521,804 | | | $ | 924,917 | | | $ | 999,064 | |
Expenses to average net assets | | | | | | | | | | | | | | | | | | | | |
After (waiver/reimbursement) recapture | | | 0.53 | % | | | 0.53 | % | | | 0.53 | % | | | 0.53 | % | | | 0.53 | % |
Before (waiver/reimbursement) recapture | | | 0.53 | % | | | 0.53 | % | | | 0.53 | % | | | 0.53 | % | | | 0.58 | % |
Net investment income (loss) to average net assets | | | 2.37 | % | | | 2.71 | % | | | 3.50 | % | | | 3.87 | % | | | 4.52 | % |
Portfolio turnover rate | | | 52 | % | | | 73 | % | | | 61 | % | | | 51 | % | | | 54 | % |
| (A) | Effective November 30, 2009, all previously existing Class I shares were re-designated as Class I2 Shares. |
| (B) | Calculated based on average number of shares outstanding. |
| (C) | Total return has been calculated for the applicable period without deduction of a sales load, if any, on an initial purchase. |
| | | | | | | | | | | | | | | | |
| For a share outstanding during the year indicated: | | Transamerica Small Cap Core | |
| | | Class A | | | Class C | | | Class I | | | Class I2 | |
| | | October 31, 2014 (A) | | | October 31,
2014 (A) | | | October 31,
2014 (A) | | | October 31,
2014 (A) | |
Net asset value | | | | | | | | | | | | | | | | |
Beginning of year | | $ | 10.00 | | | $ | 10.00 | | | $ | 10.00 | | | $ | 10.00 | |
Investment operations | | | | | | | | | | | | | | | | |
Net investment income (loss) (B) | | | 0.06 | | | | (0.02 | ) | | | 0.08 | | | | 0.10 | |
Net realized and unrealized gain (loss) | | | 0.76 | | | | 0.76 | | | | 0.76 | | | | 0.75 | |
Total investment operations | | | 0.82 | | | | 0.74 | | | | 0.84 | | | | 0.85 | |
Distributions | | | | | | | | | | | | | | | | |
Net investment income | | | (0.02 | ) | | | (0.01 | ) | | | (0.02 | ) | | | (0.02 | ) |
Net asset value | | | | | | | | | | | | | | | | |
End of year | | $ | 10.80 | | | $ | 10.73 | | | $ | 10.82 | | | $ | 10.83 | |
Total return (C) | | | 8.18 | % | | | 7.36 | % | | | 8.44 | % | | | 8.55 | % |
Ratio and supplemental data | | | | | | | | | | | | | | | | |
Net assets end of year (000’s) | | $ | 333 | | | $ | 380 | | | $ | 685 | | | $ | 210,823 | |
Expenses to average net assets | | | | | | | | | | | | | | | | |
After (waiver/reimbursement) recapture | | | 1.32 | % | | | 2.05 | % | | | 1.05 | % | | | 0.97 | % |
Before (waiver/reimbursement) recapture | | | 1.32 | % | | | 2.06 | % | | | 1.08 | % | | | 0.97 | % |
Net investment income (loss) to average net assets | | | 0.55 | % | | | (0.20 | )% | | | 0.79 | % | | | 0.93 | % |
Portfolio turnover rate | | | 140 | % | | | 140 | % | | | 140 | % | | | 140 | % |
| (A) | Commenced operations on October 31, 2013. |
| (B) | Calculated based on average number of shares outstanding. |
| (C) | Total return has been calculated for the applicable period without deduction of a sales load, if any, on an initial purchase. |
The Notes to Financial Statements are an integral part of this report.
| | |
| Transamerica Funds | | Annual Report 2014 |
Page 305
FINANCIAL HIGHLIGHTS (continued)
| | | | | | | | | | | | |
| For a share outstanding during the period and years indicated: | | Transamerica Small Cap Growth | |
| | | Class A | |
| | | October 31, 2014 | | | October 31, 2013 | | | October 31,
2012 (A) | |
Net asset value | | | | | | | | | | | | |
Beginning of period/year | | $ | 12.37 | | | $ | 9.38 | | | $ | 10.00 | |
Investment operations | | | | | | | | | | | | |
Net investment income (loss) (B) | | | (0.11 | ) | | | (0.08 | ) | | | (0.02 | ) |
Net realized and unrealized gain (loss) | | | 0.61 | | | | 3.07 | | | | (0.60 | ) |
Total investment operations | | | 0.50 | | | | 2.99 | | | | (0.62 | ) |
Distributions | | | | | | | | | | | | |
Net investment income | | | — | | | | — | (C) | | | — | |
Net asset value | | | | | | | | | | | | |
End of period/year | | $ | 12.87 | | | $ | 12.37 | | | $ | 9.38 | |
Total return (D) | | | 4.04 | % | | | 31.90 | % | | | (6.20 | )%(E) |
Ratio and supplemental data | | | | | | | | | | | | |
Net assets end of period/year (000’s) | | $ | 862 | | | $ | 591 | | | $ | 236 | |
Expenses to average net assets | | | | | | | | | | | | |
After (waiver/reimbursement) recapture | | | 1.35 | % | | | 1.29 | % | | | 1.45 | %(F) |
Before (waiver/reimbursement) recapture | | | 1.35 | % | | | 1.29 | % | | | 1.52 | %(F) |
Net investment income (loss) to average net assets | | | (0.87 | )% | | | (0.70 | )% | | | (1.17 | )%(F) |
Portfolio turnover rate | | | 73 | % | | | 74 | % | | | 11 | %(E) |
| (A) | Commenced operations on August 31, 2012. |
| (B) | Calculated based on average number of shares outstanding. |
| (C) | Rounds to less than $0.01 or $(0.01). |
| (D) | Total return has been calculated for the applicable period without deduction of a sales load, if any, on an initial purchase. |
| | | | | | | | | | | | |
| For a share outstanding during the period and years indicated: | | Transamerica Small Cap Growth | |
| | | Class C | |
| | | October 31, 2014 | | | October 31, 2013 | | | October 31,
2012 (A) | |
Net asset value | | | | | | | | | | | | |
Beginning of period/year | | $ | 12.28 | | | $ | 9.37 | | | $ | 10.00 | |
Investment operations | | | | | | | | | | | | |
Net investment income (loss) (B) | | | (0.19 | ) | | | (0.14 | ) | | | (0.03 | ) |
Net realized and unrealized gain (loss) | | | 0.61 | | | | 3.05 | | | | (0.60 | ) |
Total investment operations | | | 0.42 | | | | 2.91 | | | | (0.63 | ) |
Net asset value | | | | | | | | | | | | |
End of period/year | | $ | 12.70 | | | $ | 12.28 | | | $ | 9.37 | |
Total return (C) | | | 3.42 | % | | | 31.06 | % | | | (6.30 | )%(D) |
Ratio and supplemental data | | | | | | | | | | | | |
Net assets end of period/year (000’s) | | $ | 628 | | | $ | 404 | | | $ | 234 | |
Expenses to average net assets | | | | | | | | | | | | |
After (waiver/reimbursement) recapture | | | 1.99 | % | | | 1.95 | % | | | 2.15 | %(E) |
Before (waiver/reimbursement) recapture | | | 1.99 | % | | | 1.95 | % | | | 2.21 | %(E) |
Net investment income (loss) to average net assets | | | (1.51 | )% | | | (1.32 | )% | | | (1.89 | )%(E) |
Portfolio turnover rate | | | 73 | % | | | 74 | % | | | 11 | %(D) |
| (A) | Commenced operations on August 31, 2012. |
| (B) | Calculated based on average number of shares outstanding. |
| (C) | Total return has been calculated for the applicable period without deduction of a sales load, if any, on an initial purchase. |
The Notes to Financial Statements are an integral part of this report.
| | |
| Transamerica Funds | | Annual Report 2014 |
Page 306
FINANCIAL HIGHLIGHTS (continued)
| | | | | | | | | | | | |
| For a share outstanding during the period and years indicated: | | Transamerica Small Cap Growth | |
| | | Class I | |
| | | October 31, 2014 | | | October 31, 2013 | | | October 31,
2012 (A) | |
Net asset value | | | | | | | | | | | | |
Beginning of period/year | | $ | 12.39 | | | $ | 9.39 | | | $ | 10.00 | |
Investment operations | | | | | | | | | | | | |
Net investment income (loss) (B) | | | (0.07 | ) | | | (0.04 | ) | | | (0.01 | ) |
Net realized and unrealized gain (loss) | | | 0.62 | | | | 3.05 | | | | (0.60 | ) |
Total investment operations | | | 0.55 | | | | 3.01 | | | | (0.61 | ) |
Distributions | | | | | | | | | | | | |
Net investment income | | | — | | | | (0.01 | ) | | | — | |
Net asset value | | | | | | | | | | | | |
End of period/year | | $ | 12.94 | | | $ | 12.39 | | | $ | 9.39 | |
Total return (C) | | | 4.44 | % | | | 32.08 | % | | | (6.10 | )%(D) |
Ratio and supplemental data | | | | | | | | | | | | |
Net assets end of period/year (000’s) | | $ | 510 | | | $ | 490 | | | $ | 235 | |
Expenses to average net assets | | | | | | | | | | | | |
After (waiver/reimbursement) recapture | | | 1.03 | % | | | 1.04 | % | | | 1.15 | %(E) |
Before (waiver/reimbursement) recapture | | | 1.03 | % | | | 1.02 | % | | | 1.31 | %(E) |
Net investment income (loss) to average net assets | | | (0.54 | )% | | | (0.41 | )% | | | (0.89 | )%(E) |
Portfolio turnover rate | | | 73 | % | | | 74 | % | | | 11 | %(D) |
| (A) | Commenced operations on August 31, 2012. |
| (B) | Calculated based on average number of shares outstanding. |
| (C) | Total return has been calculated for the applicable period without deduction of a sales load, if any, on an initial purchase. |
| | | | | | | | | | | | |
| For a share outstanding during the period and years indicated: | | Transamerica Small Cap Growth | |
| | | Class I2 | |
| | | October 31,
2014 | | | October 31,
2013 | | | October 31,
2012 (A) | |
Net asset value | | | | | | | | | | | | |
Beginning of period/year | | $ | 12.41 | | | $ | 9.39 | | | $ | 10.00 | |
Investment operations | | | | | | | | | | | | |
Net investment income (loss) (B) | | | (0.05 | ) | | | (0.04 | ) | | | (0.01 | ) |
Net realized and unrealized gain (loss) | | | 0.61 | | | | 3.07 | | | | (0.60 | ) |
Total investment operations | | | 0.56 | | | | 3.03 | | | | (0.61 | ) |
Distributions | | | | | | | | | | | | |
Net investment income | | | — | (C) | | | (0.01 | ) | | | — | |
Net asset value | | | | | | | | | | | | |
End of period/year | | $ | 12.97 | | | $ | 12.41 | | | $ | 9.39 | |
Total return (D) | | | 4.51 | % | | | 32.32 | % | | | (6.10 | )%(E) |
Ratio and supplemental data | | | | | | | | | | | | |
Net assets end of period/year (000’s) | | $ | 528,891 | | | $ | 562,770 | | | $ | 239,395 | |
Expenses to average net assets | | | | | | | | | | | | |
After (waiver/reimbursement) recapture | | | 0.89 | % | | | 0.91 | % | | | 1.15 | %(F) |
Before (waiver/reimbursement) recapture | | | 0.89 | % | | | 0.90 | % | | | 1.21 | %(F) |
Net investment income (loss) to average net assets | | | (0.41 | )% | | | (0.33 | )% | | | (0.87 | )%(F) |
Portfolio turnover rate | | | 73 | % | | | 74 | % | | | 11 | %(E) |
| (A) | Commenced operations on August 31, 2012. |
| (B) | Calculated based on average number of shares outstanding. |
| (C) | Rounds to less than $0.01 or $(0.01). |
| (D) | Total return has been calculated for the applicable period without deduction of a sales load, if any, on an initial purchase. |
The Notes to Financial Statements are an integral part of this report.
| | |
| Transamerica Funds | | Annual Report 2014 |
Page 307
FINANCIAL HIGHLIGHTS (continued)
| | | | | | | | | | | | |
| For a share outstanding during the period and years indicated: | | Transamerica Small Cap Value | |
| | | Class A | |
| | | October 31,
2014 | | | October 31,
2013 | | | October 31,
2012 (A) | |
Net asset value | | | | | | | | | | | | |
Beginning of period/year | | $ | 13.21 | | | $ | 9.83 | | | $ | 10.00 | |
Investment operations | | | | | | | | | | | | |
Net investment income (loss) (B) (C) | | | 0.08 | | | | 0.06 | | | | 0.04 | |
Net realized and unrealized gain (loss) | | | 0.56 | | | | 3.39 | | | | (0.21 | ) |
Total investment operations | | | 0.64 | | | | 3.45 | | | | (0.17 | ) |
Distributions | | | | | | | | | | | | |
Net investment income | | | (0.08 | ) | | | (0.07 | ) | | | — | |
Net realized gains | | | (0.82 | ) | | | — | (D) | | | — | |
Total distributions | | | (0.90 | ) | | | (0.07 | ) | | | — | |
Net asset value | | | | | | | | | | | | |
End of period/year | | $ | 12.95 | | | $ | 13.21 | | | $ | 9.83 | |
Total return (E) | | | 4.99 | % | | | 35.30 | % | | | (1.70 | )%(F) |
Ratio and supplemental data | | | | | | | | | | | | |
Net assets end of period/year (000’s) | | $ | 955 | | | $ | 996 | | | $ | 268 | |
Expenses to average net assets (G) | | | | | | | | | | | | |
After (waiver/reimbursement) recapture | | | 1.38 | % | | | 1.37 | % | | | 1.36 | %(H) |
Before (waiver/reimbursement) recapture | | | 1.38 | % | | | 1.37 | % | | | 1.36 | %(H) |
Net investment income (loss) to average net assets (C) | | | 0.61 | % | | | 0.50 | % | | | 0.91 | %(H) |
Portfolio turnover rate (I) | | | 37 | % | | | 49 | % | | | 22 | %(F) |
| (A) | Commenced operations on April 30, 2012. |
| (B) | Calculated based on average number of shares outstanding. |
| (C) | Recognition of net investment income by the Fund is affected by the timing of the declaration of dividends by the investment companies in which the Fund invests. |
| (D) | Rounds to less than $0.01 or $(0.01). |
| (E) | Total return has been calculated for the applicable period without deduction of a sales load, if any, on an initial purchase. |
| (G) | Does not include expenses of the investment companies in which the Fund invests. |
| (I) | Does not include portfolio activity of the investment companies in which the Fund invests. |
| | | | | | | | | | | | |
| For a share outstanding during the period and years indicated: | | Transamerica Small Cap Value | |
| | | Class C | |
| | | October 31, 2014 | | | October 31, 2013 | | | October 31,
2012 (A) | |
Net asset value | | | | | | | | | | | | |
Beginning of period/year | | $ | 13.15 | | | $ | 9.79 | | | $ | 10.00 | |
Investment operations | | | | | | | | | | | | |
Net investment income (loss) (B) (C) | | | (0.01 | ) | | | — | (D) | | | 0.01 | |
Net realized and unrealized gain (loss) | | | 0.58 | | | | 3.38 | | | | (0.22 | ) |
Total investment operations | | | 0.57 | | | | 3.38 | | | | (0.21 | ) |
Distributions | | | | | | | | | | | | |
Net investment income | | | (0.03 | ) | | | (0.02 | ) | | | — | |
Net realized gains | | | (0.82 | ) | | | — | (D) | | | — | |
Total distributions | | | (0.85 | ) | | | (0.02 | ) | | | — | |
Net asset value | | | | | | | | | | | | |
End of period/year | | $ | 12.87 | | | $ | 13.15 | | | $ | 9.79 | |
Total return (E) | | | 4.39 | % | | | 34.65 | % | | | (2.10 | )%(F) |
Ratio and supplemental data | | | | | | | | | | | | |
Net assets end of period/year (000’s) | | $ | 921 | | | $ | 635 | | | $ | 251 | |
Expenses to average net assets (G) | | | | | | | | | | | | |
After (waiver/reimbursement) recapture | | | 1.99 | % | | | 1.98 | % | | | 2.04 | %(H) |
Before (waiver/reimbursement) recapture | | | 1.99 | % | | | 1.98 | % | | | 2.04 | %(H) |
Net investment income (loss) to average net assets (C) | | | (0.05 | )% | | | — | %(I) | | | 0.24 | %(H) |
Portfolio turnover rate (J) | | | 37 | % | | | 49 | % | | | 22 | %(F) |
| (A) | Commenced operations on April 30, 2012. |
| (B) | Calculated based on average number of shares outstanding. |
| (C) | Recognition of net investment income by the Fund is affected by the timing of the declaration of dividends by the investment companies in which the Fund invests. |
| (D) | Rounds to less than $0.01 or $(0.01). |
| (E) | Total return has been calculated for the applicable period without deduction of a sales load, if any, on an initial purchase. |
| (G) | Does not include expenses of the investment companies in which the Fund invests. |
| (I) | Rounds to less than 0.01% or (0.01)%. |
| (J) | Does not include portfolio activity of the investment companies in which the Fund invests. |
The Notes to Financial Statements are an integral part of this report.
| | |
| Transamerica Funds | | Annual Report 2014 |
Page 308
FINANCIAL HIGHLIGHTS (continued)
| | | | | | | | | | | | |
| For a share outstanding during the period and years indicated: | | Transamerica Small Cap Value | |
| | | Class I | |
| | | October 31, 2014 | | | October 31, 2013 | | | October 31,
2012 (A) | |
Net asset value | | | | | | | | | | | | |
Beginning of period/year | | $ | 13.26 | | | $ | 9.84 | | | $ | 10.00 | |
Investment operations | | | | | | | | | | | | |
Net investment income (loss) (B) (C) | | | 0.12 | | | | 0.12 | | | | 0.06 | |
Net realized and unrealized gain (loss) | | | 0.57 | | | | 3.38 | | | | (0.22 | ) |
Total investment operations | | | 0.69 | | | | 3.50 | | | | (0.16 | ) |
Distributions | | | | | | | | | | | | |
Net investment income | | | (0.11 | ) | | | (0.08 | ) | | | — | |
Net realized gains | | | (0.82 | ) | | | — | (D) | | | — | |
Total distributions | | | (0.93 | ) | | | (0.08 | ) | | | — | |
Net asset value | | | | | | | | | | | | |
End of period/year | | $ | 13.02 | | | $ | 13.26 | | | $ | 9.84 | |
Total return (E) | | | 5.37 | % | | | 35.87 | % | | | (1.60 | )%(F) |
Ratio and supplemental data | | | | | | | | | | | | |
Net assets end of period/year (000’s) | | $ | 655 | | | $ | 719 | | | $ | 371 | |
Expenses to average net assets (G) | | | | | | | | | | | | |
After (waiver/reimbursement) recapture | | | 1.04 | % | | | 1.03 | % | | | 1.12 | %(H) |
Before (waiver/reimbursement) recapture | | | 1.04 | % | | | 1.03 | % | | | 1.12 | %(H) |
Net investment income (loss) to average net assets (C) | | | 0.93 | % | | | 1.01 | % | | | 1.17 | %(H) |
Portfolio turnover rate (I) | | | 37 | % | | | 49 | % | | | 22 | %(F) |
| (A) | Commenced operations on April 30, 2012. |
| (B) | Calculated based on average number of shares outstanding. |
| (C) | Recognition of net investment income by the Fund is affected by the timing of the declaration of dividends by the investment companies in which the Fund invests. |
| (D) | Rounds to less than $0.01 or $(0.01). |
| (E) | Total return has been calculated for the applicable period without deduction of a sales load, if any, on an initial purchase. |
| (G) | Does not include expenses of the investment companies in which the Fund invests. |
| (I) | Does not include portfolio activity of the investment companies in which the Fund invests. |
| | | | | | | | | | | | |
| For a share outstanding during the period and years indicated: | | Transamerica Small Cap Value | |
| | | Class I2 | |
| | | October 31,
2014 | | | October 31,
2013 | | | October 31,
2012 (A) | |
Net asset value | | | | | | | | | | | | |
Beginning of period/year | | $ | 13.27 | | | $ | 9.84 | | | $ | 10.00 | |
Investment operations | | | | | | | | | | | | |
Net investment income (loss) (B) (C) | | | 0.14 | | | | 0.12 | | | | 0.06 | |
Net realized and unrealized gain (loss) | | | 0.58 | | | | 3.40 | | | | (0.22 | ) |
Total investment operations | | | 0.72 | | | | 3.52 | | | | (0.16 | ) |
Distributions | | | | | | | | | | | | |
Net investment income | | | (0.13 | ) | | | (0.09 | ) | | | — | |
Net realized gains | | | (0.82 | ) | | | — | (D) | | | — | |
Total distributions | | | (0.95 | ) | | | (0.09 | ) | | | — | |
Net asset value | | | | | | | | | | | | |
End of period/year | | $ | 13.04 | | | $ | 13.27 | | | $ | 9.84 | |
Total return (E) | | | 5.54 | % | | | 36.06 | % | | | (1.60 | )%(F) |
Ratio and supplemental data | | | | | | | | | | | | |
Net assets end of period/year (000’s) | | $ | 678,842 | | | $ | 737,250 | | | $ | 288,664 | |
Expenses to average net assets (G) | | | | | | | | | | | | |
After (waiver/reimbursement) recapture | | | 0.92 | % | | | 0.92 | % | | | 1.01 | %(H) |
Before (waiver/reimbursement) recapture | | | 0.92 | % | | | 0.92 | % | | | 1.01 | %(H) |
Net investment income (loss) to average net assets (C) | | | 1.07 | % | | | 1.06 | % | | | 1.30 | %(H) |
Portfolio turnover rate (I) | | | 37 | % | | | 49 | % | | | 22 | %(F) |
| (A) | Commenced operations on April 30, 2012. |
| (B) | Calculated based on average number of shares outstanding. |
| (C) | Recognition of net investment income by the Fund is affected by the timing of the declaration of dividends by the investment companies in which the Fund invests. |
| (D) | Rounds to less than $0.01 or $(0.01). |
| (E) | Total return has been calculated for the applicable period without deduction of a sales load, if any, on an initial purchase. |
| (G) | Does not include expenses of the investment companies in which the Fund invests. |
| (I) | Does not include portfolio activity of the investment companies in which the Fund invests. |
The Notes to Financial Statements are an integral part of this report.
| | |
| Transamerica Funds | | Annual Report 2014 |
Page 309
FINANCIAL HIGHLIGHTS (continued)
| | | | | | | | | | | | | | | | | | | | |
| For a share outstanding during the years indicated: | | Transamerica Small/Mid Cap Value | |
| | | Class A | |
| | | October 31,
2014 | | | October 31,
2013 | | | October 31,
2012 | | | October 31,
2011 | | | October 31,
2010 | |
Net asset value | | | | | | | | | | | | | | | | | | | | |
Beginning of year | | $ | 29.05 | | | $ | 21.86 | | | $ | 20.65 | | | $ | 18.89 | | | $ | 14.72 | |
Investment operations | | | | | | | | | | | | | | | | | | | | |
Net investment income (loss) (A) | | | 0.07 | | | | 0.11 | | | | 0.11 | | | | (0.06 | ) | | | (0.02 | ) |
Net realized and unrealized gain (loss) | | | 2.18 | | | | 7.18 | | | | 2.24 | | | | 1.82 | | | | 4.19 | |
Total investment operations | | | 2.25 | | | | 7.29 | | | | 2.35 | | | | 1.76 | | | | 4.17 | |
Distributions | | | | | | | | | | | | | | | | | | | | |
Net investment income | | | (0.10 | ) | | | (0.10 | ) | | | — | (B) | | | — | | | | — | |
Net realized gains | | | (2.32 | ) | | | — | | | | (1.14 | ) | | | — | | | | — | |
Total distributions | | | (2.42 | ) | | | (0.10 | ) | | | (1.14 | ) | | | — | | | | — | |
Net asset value | | | | | | | | | | | | | | | | | | | | |
End of year | | $ | 28.88 | | | $ | 29.05 | | | $ | 21.86 | | | $ | 20.65 | | | $ | 18.89 | |
Total return (C) | | | 8.13 | % | | | 33.47 | % | | | 12.28 | % | | | 9.32 | % | | | 28.33 | % |
Ratio and supplemental data | | | | | | | | | | | | | | | | | | | | |
Net assets end of year (000’s) | | $ | 473,644 | | | $ | 519,376 | | | $ | 332,085 | | | $ | 323,147 | | | $ | 283,240 | |
Expenses to average net assets | | | | | | | | | | | | | | | | | | | | |
After (waiver/reimbursement) recapture | | | 1.30 | % | | | 1.38 | % | | | 1.41 | % | | | 1.43 | % | | | 1.47 | % |
Before (waiver/reimbursement) recapture | | | 1.30 | % | | | 1.38 | % | | | 1.41 | % | | | 1.43 | % | | | 1.47 | % |
Net investment income (loss) to average net assets | | | 0.24 | % | | | 0.44 | % | | | 0.50 | % | | | (0.27 | )% | | | (0.12 | )% |
Portfolio turnover rate | | | 96 | % | | | 97 | % | | | 74 | % | | | 174 | % | | | 57 | % |
| (A) | Calculated based on average number of shares outstanding. |
| (B) | Rounds to less than $0.01 or $(0.01). |
| (C) | Total return has been calculated for the applicable period without deduction of a sales load, if any, on an initial purchase. |
| | | | | | | | | | | | | | | | | | | | |
| For a share outstanding during the years indicated: | | Transamerica Small/Mid Cap Value | |
| | | Class B | |
| | | October 31,
2014 | | | October 31,
2013 | | | October 31,
2012 | | | October 31,
2011 | | | October 31,
2010 | |
Net asset value | | | | | | | | | | | | | | | | | | | | |
Beginning of year | | $ | 27.23 | | | $ | 20.55 | | | $ | 19.60 | | | $ | 18.05 | | | $ | 14.16 | |
Investment operations | | | | | | | | | | | | | | | | | | | | |
Net investment income (loss) (A) | | | (0.12 | ) | | | (0.05 | ) | | | (0.03 | ) | | | (0.20 | ) | | | (0.12 | ) |
Net realized and unrealized gain (loss) | | | 2.04 | | | | 6.73 | | | | 2.12 | | | | 1.75 | | | | 4.01 | |
Total investment operations | | | 1.92 | | | | 6.68 | | | | 2.09 | | | | 1.55 | | | | 3.89 | |
Distributions | | | | | | | | | | | | | | | | | | | | |
Net investment income | | | — | | | | — | | | | — | (B) | | | — | | | | — | |
Net realized gains | | | (2.32 | ) | | | — | | | | (1.14 | ) | | | — | | | | — | |
Total distributions | | | (2.32 | ) | | | — | | | | (1.14 | ) | | | — | | | | — | |
Net asset value | | | | | | | | | | | | | | | | | | | | |
End of year | | $ | 26.83 | | | $ | 27.23 | | | $ | 20.55 | | | $ | 19.60 | | | $ | 18.05 | |
Total return (C) | | | 7.38 | % | | | 32.51 | % | | | 11.58 | % | | | 8.59 | % | | | 27.47 | % |
Ratio and supplemental data | | | | | | | | | | | | | | | | | | | | |
Net assets end of year (000’s) | | $ | 27,010 | | | $ | 32,286 | | | $ | 29,615 | | | $ | 33,830 | | | $ | 38,355 | |
Expenses to average net assets | | | | | | | | | | | | | | | | | | | | |
After (waiver/reimbursement) recapture | | | 2.01 | % | | | 2.08 | % | | | 2.08 | % | | | 2.09 | % | | | 2.12 | % |
Before (waiver/reimbursement) recapture | | | 2.01 | % | | | 2.08 | % | | | 2.08 | % | | | 2.09 | % | | | 2.12 | % |
Net investment income (loss) to average net assets | | | (0.47 | )% | | | (0.22 | )% | | | (0.16 | )% | | | (0.95 | )% | | | (0.74 | )% |
Portfolio turnover rate | | | 96 | % | | | 97 | % | | | 74 | % | | | 174 | % | | | 57 | % |
| (A) | Calculated based on average number of shares outstanding. |
| (B) | Rounds to less than $0.01 or $(0.01). |
| (C) | Total return has been calculated for the applicable period without deduction of a sales load, if any, on an initial purchase. |
The Notes to Financial Statements are an integral part of this report.
| | |
| Transamerica Funds | | Annual Report 2014 |
Page 310
FINANCIAL HIGHLIGHTS (continued)
| | | | | | | | | | | | | | | | | | | | |
| For a share outstanding during the years indicated: | | Transamerica Small/Mid Cap Value | |
| | | Class C | |
| | | October 31,
2014 | | | October 31,
2013 | | | October 31,
2012 | | | October 31,
2011 | | | October 31,
2010 | |
Net asset value | | | | | | | | | | | | | | | | | | | | |
Beginning of year | | $ | 26.95 | | | $ | 20.33 | | | $ | 19.40 | | | $ | 17.86 | | | $ | 14.00 | |
Investment operations | | | | | | | | | | | | | | | | | | | | |
Net investment income (loss) (A) | | | (0.12 | ) | | | (0.05 | ) | | | (0.02 | ) | | | (0.18 | ) | | | (0.12 | ) |
Net realized and unrealized gain (loss) | | | 2.03 | | | | 6.67 | | | | 2.09 | | | | 1.72 | | | | 3.98 | |
Total investment operations | | | 1.91 | | | | 6.62 | | | | 2.07 | | | | 1.54 | | | | 3.86 | |
Distributions | | | | | | | | | | | | | | | | | | | | |
Net investment income | | | — | (B) | | | — | | | | — | (B) | | | — | | | | — | |
Net realized gains | | | (2.32 | ) | | | — | | | | (1.14 | ) | | | — | | | | — | |
Total distributions | | | (2.32 | ) | | | — | | | | (1.14 | ) | | | — | | | | — | |
Net asset value | | | | | | | | | | | | | | | | | | | | |
End of year | | $ | 26.54 | | | $ | 26.95 | | | $ | 20.33 | | | $ | 19.40 | | | $ | 17.86 | |
Total return (C) | | | 7.42 | % | | | 32.56 | % | | | 11.60 | % | | | 8.62 | % | | | 27.57 | % |
Ratio and supplemental data | | | | | | | | | | | | | | | | | | | | |
Net assets end of year (000’s) | | $ | 314,999 | | | $ | 288,038 | | | $ | 198,356 | | | $ | 181,765 | | | $ | 169,903 | |
Expenses to average net assets | | | | | | | | | | | | | | | | | | | | |
After (waiver/reimbursement) recapture | | | 1.97 | % | | | 2.03 | % | | | 2.04 | % | | | 2.05 | % | | | 2.07 | % |
Before (waiver/reimbursement) recapture | | | 1.97 | % | | | 2.03 | % | | | 2.04 | % | | | 2.05 | % | | | 2.07 | % |
Net investment income (loss) to average net assets | | | (0.44 | )% | | | (0.20 | )% | | | (0.13 | )% | | | (0.89 | )% | | | (0.73 | )% |
Portfolio turnover rate | | | 96 | % | | | 97 | % | | | 74 | % | | | 174 | % | | | 57 | % |
| (A) | Calculated based on average number of shares outstanding. |
| (B) | Rounds to less than $0.01 or $(0.01). |
| (C) | Total return has been calculated for the applicable period without deduction of a sales load, if any, on an initial purchase. |
| | | | | | | | | | | | | | | | | | | | |
| For a share outstanding during the period and years indicated: | | Transamerica Small/Mid Cap Value | |
| | | Class I | |
| | | October 31,
2014 | | | October 31,
2013 | | | October 31,
2012 | | | October 31,
2011 | | | October 31,
2010 (A) | |
Net asset value | | | | | | | | | | | | | | | | | | | | |
Beginning of period/year | | $ | 29.74 | | | $ | 22.38 | | | $ | 21.03 | | | $ | 19.15 | | | $ | 15.44 | |
Investment operations | | | | | | | | | | | | | | | | | | | | |
Net investment income (loss) (B) | | | 0.17 | | | | 0.22 | | | | 0.20 | | | | 0.05 | | | | (0.02 | ) |
Net realized and unrealized gain (loss) | | | 2.24 | | | | 7.34 | | | | 2.29 | | | | 1.83 | | | | 3.73 | |
Total investment operations | | | 2.41 | | | | 7.56 | | | | 2.49 | | | | 1.88 | | | | 3.71 | |
Distributions | | | | | | | | | | | | | | | | | | | | |
Net investment income | | | (0.20 | ) | | | (0.20 | ) | | | — | (C) | | | — | | | | — | |
Net realized gains | | | (2.32 | ) | | | — | | | | (1.14 | ) | | | — | | | | — | |
Total distributions | | | (2.52 | ) | | | (0.20 | ) | | | (1.14 | ) | | | — | | | | — | |
Net asset value | | | | | | | | | | | | | | | | | | | | |
End of period/year | | $ | 29.63 | | | $ | 29.74 | | | $ | 22.38 | | | $ | 21.03 | | | $ | 19.15 | |
Total return (D) | | | 8.51 | % | | | 34.02 | % | | | 12.75 | % | | | 9.82 | % | | | 24.03 | %(E) |
Ratio and supplemental data | | | | | | | | | | | | | | | | | | | | |
Net assets end of period/year (000’s) | | $ | 235,418 | | | $ | 180,096 | | | $ | 105,664 | | | $ | 68,499 | | | $ | 40,346 | |
Expenses to average net assets | | | | | | | | | | | | | | | | | | | | |
After (waiver/reimbursement) recapture | | | 0.96 | % | | | 0.98 | % | | | 0.97 | % | | | 1.00 | % | | | 1.04 | %(F) |
Before (waiver/reimbursement) recapture | | | 0.96 | % | | | 0.98 | % | | | 0.97 | % | | | 1.00 | % | | | 1.04 | %(F) |
Net investment income (loss) to average net assets | | | 0.57 | % | | | 0.84 | % | | | 0.93 | % | | | 0.24 | % | | | (0.11 | )%(F) |
Portfolio turnover rate | | | 96 | % | | | 97 | % | | | 74 | % | | | 174 | % | | | 57 | %(E) |
| (A) | Commenced operations on November 30, 2009. |
| (B) | Calculated based on average number of shares outstanding. |
| (C) | Rounds to less than $0.01 or $(0.01). |
| (D) | Total return has been calculated for the applicable period without deduction of a sales load, if any, on an initial purchase. |
The Notes to Financial Statements are an integral part of this report.
| | |
| Transamerica Funds | | Annual Report 2014 |
Page 311
FINANCIAL HIGHLIGHTS (continued)
| | | | | | | | | | | | | | | | | | | | |
| For a share outstanding during the years indicated: | | Transamerica Small/Mid Cap Value | |
| | | Class I2 | |
| | | October 31,
2014 | | | October 31,
2013 | | | October 31,
2012 | | | October 31,
2011 | | | October 31,
2010 (A) | |
Net asset value | | | | | | | | | | | | | | | | | | | | |
Beginning of year | | $ | 29.78 | | | $ | 22.41 | | | $ | 21.03 | | | $ | 19.13 | | | $ | 14.82 | |
Investment operations | | | | | | | | | | | | | | | | | | | | |
Net investment income (loss) (B) | | | 0.20 | | | | 0.25 | | | | 0.22 | | | | 0.06 | | | | 0.08 | |
Net realized and unrealized gain (loss) | | | 2.25 | | | | 7.34 | | | | 2.30 | | | | 1.84 | | | | 4.23 | |
Total investment operations | | | 2.45 | | | | 7.59 | | | | 2.52 | | | | 1.90 | | | | 4.31 | |
Distributions | | | | | | | | | | | | | | | | | | | | |
Net investment income | | | (0.23 | ) | | | (0.22 | ) | | | — | (C) | | | — | | | | — | |
Net realized gains | | | (2.32 | ) | | | — | | | | (1.14 | ) | | | — | | | | — | |
Total distributions | | | (2.55 | ) | | | (0.22 | ) | | | (1.14 | ) | | | — | | | | — | |
Net asset value | | | | | | | | | | | | | | | | | | | | |
End of year | | $ | 29.68 | | | $ | 29.78 | | | $ | 22.41 | | | $ | 21.03 | | | $ | 19.13 | |
Total return (D) | | | 8.63 | % | | | 34.14 | % | | | 12.90 | % | | | 9.93 | % | | | 29.00 | % |
Ratio and supplemental data | | | | | | | | | | | | | | | | | | | | |
Net assets end of year (000’s) | | $ | 22,282 | | | $ | 21,692 | | | $ | 15,545 | | | $ | 12,935 | | | $ | 15,893 | |
Expenses to average net assets | | | | | | | | | | | | | | | | | | | | |
After (waiver/reimbursement) recapture | | | 0.85 | % | | | 0.87 | % | | | 0.87 | % | | | 0.88 | % | | | 0.88 | % |
Before (waiver/reimbursement) recapture | | | 0.85 | % | | | 0.87 | % | | | 0.87 | % | | | 0.88 | % | | | 0.88 | % |
Net investment income (loss) to average net assets | | | 0.68 | % | | | 0.96 | % | | | 1.03 | % | | | 0.26 | % | | | 0.47 | % |
Portfolio turnover rate | | | 96 | % | | | 97 | % | | | 74 | % | | | 174 | % | | | 57 | % |
| (A) | Effective November 30, 2009, all previously existing Class I shares were re-designated as Class I2 Shares. |
| (B) | Calculated based on average number of shares outstanding. |
| (C) | Rounds to less than $0.01 or $(0.01). |
| (D) | Total return has been calculated for the applicable period without deduction of a sales load, if any, on an initial purchase. |
| | | | | | | | | | | | | | | | |
| For a share outstanding during the period indicated: | | Transamerica Strategic High Income | |
| | | Class A | | | Class C | | | Class I | | | Class I2 | |
| | | October 31,
2014 (A) | | | October 31,
2014 (A) | | | October 31,
2014 (A) | | | October 31,
2014 (A) | |
Net asset value | | | | | | | | | | | | | | | | |
Beginning of period | | $ | 10.00 | | | $ | 10.00 | | | $ | 10.00 | | | $ | 10.00 | |
Investment operations | | | | | | | | | | | | | | | | |
Net investment income (loss) (B) | | | 0.24 | | | | 0.18 | | | | 0.26 | | | | 0.26 | |
Net realized and unrealized gain (loss) | | | 0.26 | | | | 0.26 | | | | 0.26 | | | | 0.25 | |
Total investment operations | | | 0.50 | | | | 0.44 | | | | 0.52 | | | | 0.51 | |
Distributions | | | | | | | | | | | | | | | | |
Net investment income | | | (0.20 | ) | | | (0.15 | ) | | | (0.21 | ) | | | (0.21 | ) |
Net asset value | | | | | | | | | | | | | | | | |
End of period | | $ | 10.30 | | | $ | 10.29 | | | $ | 10.31 | | | $ | 10.30 | |
Total return (C) | | | 4.99 | %(D) | | | 4.46 | %(D) | | | 5.24 | %(D) | | | 5.14 | %(D) |
Ratio and supplemental data | | | | | | | | | | | | | | | | |
Net assets end of period (000’s) | | $ | 1,200 | | | $ | 1,073 | | | $ | 13,897 | | | $ | 22,618 | |
Expenses to average net assets (E) | | | | | | | | | | | | | | | | |
After (waiver/reimbursement) recapture | | | 1.20 | %(F) | | | 1.95 | %(F) | | | 0.95 | %(F) | | | 0.95 | %(F) |
Before (waiver/reimbursement) recapture | | | 1.40 | %(F) | | | 2.14 | %(F) | | | 1.23 | %(F) | | | 1.13 | %(F) |
Net investment income (loss) to average net assets | | | 3.43 | %(F) | | | 2.66 | %(F) | | | 3.80 | %(F) | | | 3.82 | %(F) |
Portfolio turnover rate (G) | | | 61 | %(D) | | | 61 | %(D) | | | 61 | %(D) | | | 61 | %(D) |
| (A) | Commenced operations on March 1, 2014. |
| (B) | Calculated based on average number of shares outstanding. |
| (C) | Total return has been calculated for the applicable period without deduction of a sales load, if any, on an initial purchase. |
| (E) | Does not include expenses of the investment companies in which the Fund invests. |
| (G) | Does not include portfolio activity of the investment companies in which the Fund invests. |
The Notes to Financial Statements are an integral part of this report.
| | |
| Transamerica Funds | | Annual Report 2014 |
Page 312
FINANCIAL HIGHLIGHTS (continued)
| | | | | | | | |
| For a share outstanding during the years indicated: | | Transamerica Tactical Allocation | |
| | | Class A | |
| | | October 31,
2014 | | | October 31,
2013 (A) | |
Net asset value | | | | | | | | |
Beginning of year | | $ | 10.28 | | | $ | 10.00 | |
Investment operations | | | | | | | | |
Net investment income (loss) (B) (C) | | | 0.21 | | | | 0.13 | |
Net realized and unrealized gain (loss) | | | 0.10 | | | | 0.54 | |
Total investment operations | | | 0.31 | | | | 0.67 | |
Distributions | | | | | | | | |
Net investment income | | | (0.25 | ) | | | (0.39 | ) |
Net realized gains | | | (0.02 | ) | | | — | |
Total distributions | | | (0.27 | ) | | | (0.39 | ) |
Net asset value | | | | | | | | |
End of year | | $ | 10.32 | | | $ | 10.28 | |
Total return (D) | | | 3.05 | % | | | 6.91 | % |
Ratio and supplemental data | | | | | | | | |
Net assets end of year (000’s) | | $ | 5,432 | | | $ | 4,050 | |
Expenses to average net assets (E) | | | | | | | | |
After (waiver/reimbursement) recapture | | | 1.11 | % | | | 1.15 | % |
Before (waiver/reimbursement) recapture | | | 1.49 | % | | | 3.06 | % |
Net investment income (loss) to average net assets (C) | | | 1.99 | % | | | 1.33 | % |
Portfolio turnover rate (F) | | | 228 | % | | | 425 | % |
| (A) | Commenced operations on October 31, 2012. |
| (B) | Calculated based on average number of shares outstanding. |
| (C) | Recognition of net investment income by the Fund is affected by the timing of the declaration of dividends by the investment companies in which the Fund invests. |
| (D) | Total return has been calculated for the applicable period without deduction of a sales load, if any, on an initial purchase. |
| (E) | Does not include expenses of the investment companies in which the Fund invests. |
| (F) | Does not include portfolio activity of the investment companies in which the Fund invests. |
| | | | | | | | |
| For a share outstanding during the years indicated: | | Transamerica Tactical Allocation | |
| | | Class C | |
| | | October 31,
2014 | | | October 31,
2013 (A) | |
Net asset value | | | | | | | | |
Beginning of year | | $ | 10.20 | | | $ | 10.00 | |
Investment operations | | | | | | | | |
Net investment income (loss) (B) (C) | | | 0.13 | | | | 0.04 | |
Net realized and unrealized gain (loss) | | | 0.10 | | | | 0.56 | |
Total investment operations | | | 0.23 | | | | 0.60 | |
Distributions | | | | | | | | |
Net investment income | | | (0.18 | ) | | | (0.40 | ) |
Net realized gains | | | (0.02 | ) | | | — | |
Total distributions | | | (0.20 | ) | | | (0.40 | ) |
Net asset value | | | | | | | | |
End of year | | $ | 10.23 | | | $ | 10.20 | |
Total return (D) | | | 2.24 | % | | | 6.18 | % |
Ratio and supplemental data | | | | | | | | |
Net assets end of year (000’s) | | $ | 6,362 | | | $ | 5,909 | |
Expenses to average net assets (E) | | | | | | | | |
After (waiver/reimbursement) recapture | | | 1.85 | % | | | 1.85 | % |
Before (waiver/reimbursement) recapture | | | 2.21 | % | | | 3.72 | % |
Net investment income (loss) to average net assets (C) | | | 1.30 | % | | | 0.43 | % |
Portfolio turnover rate (F) | | | 228 | % | | | 425 | % |
| (A) | Commenced operations on October 31, 2012. |
| (B) | Calculated based on average number of shares outstanding. |
| (C) | Recognition of net investment income by the Fund is affected by the timing of the declaration of dividends by the investment companies in which the Fund invests. |
| (D) | Total return has been calculated for the applicable period without deduction of a sales load, if any, on an initial purchase. |
| (E) | Does not include expenses of the investment companies in which the Fund invests. |
| (F) | Does not include portfolio activity of the investment companies in which the Fund invests. |
The Notes to Financial Statements are an integral part of this report.
| | |
| Transamerica Funds | | Annual Report 2014 |
Page 313
FINANCIAL HIGHLIGHTS (continued)
| | | | | | | | |
| For a share outstanding during the years indicated: | | Transamerica Tactical Allocation | |
| | | Class I | |
| | | October 31,
2014 | | | October 31,
2013 (A) | |
Net asset value | | | | | | | | |
Beginning of year | | $ | 10.22 | | | $ | 10.00 | |
Investment operations | | | | | | | | |
Net investment income (loss) (B) (C) | | | 0.24 | | | | 0.14 | |
Net realized and unrealized gain (loss) | | | 0.09 | | | | 0.56 | |
Total investment operations | | | 0.33 | | | | 0.70 | |
Distributions | | | | | | | | |
Net investment income | | | (0.28 | ) | | | (0.48 | ) |
Net realized gains | | | (0.02 | ) | | | — | |
Total distributions | | | (0.30 | ) | | | (0.48 | ) |
Net asset value | | | | | | | | |
End of year | | $ | 10.25 | | | $ | 10.22 | |
Total return (D) | | | 3.25 | % | | | 7.32 | % |
Ratio and supplemental data | | | | | | | | |
Net assets end of year (000’s) | | $ | 874 | | | $ | 1,533 | |
Expenses to average net assets (E) | | | | | | | | |
After (waiver/reimbursement) recapture | | | 0.85 | % | | | 0.85 | % |
Before (waiver/reimbursement) recapture | | | 1.21 | % | | | 2.73 | % |
Net investment income (loss) to average net assets (C) | | | 2.37 | % | | | 1.36 | % |
Portfolio turnover rate (F) | | | 228 | % | | | 425 | % |
| (A) | Commenced operations on October 31, 2012. |
| (B) | Calculated based on average number of shares outstanding. |
| (C) | Recognition of net investment income by the Fund is affected by the timing of the declaration of dividends by the investment companies in which the Fund invests. |
| (D) | Total return has been calculated for the applicable period without deduction of a sales load, if any, on an initial purchase. |
| (E) | Does not include expenses of the investment companies in which the Fund invests. |
| (F) | Does not include portfolio activity of the investment companies in which the Fund invests. |
| | | | | | | | | | | | |
| For a share outstanding during the years indicated: | | Transamerica Tactical Income | |
| | | Class A | |
| | | October 31, 2014 | | | October 31, 2013 | | | October 31, 2012 (A) | |
Net asset value | | | | | | | | | | | | |
Beginning of year | | $ | 10.16 | | | $ | 10.25 | | | $ | 10.00 | |
Investment operations | | | | | | | | | | | | |
Net investment income (loss) (B) (C) | | | 0.38 | | | | 0.34 | | | | 0.33 | |
Net realized and unrealized gain (loss) | | | 0.26 | | | | 0.10 | | | | 0.45 | |
Total investment operations | | | 0.64 | | | | 0.44 | | | | 0.78 | |
Distributions | | | | | | | | | | | | |
Net investment income | | | (0.32 | ) | | | (0.47 | ) | | | (0.53 | ) |
Net realized gains | | | — | | | | (0.04 | ) | | | — | |
Return of capital | | | — | | | | (0.02 | ) | | | — | |
Total distributions | | | (0.32 | ) | | | (0.53 | ) | | | (0.53 | ) |
Net asset value | | | | | | | | | | | | |
End of year | | $ | 10.48 | | | $ | 10.16 | | | $ | 10.25 | |
Total return (D) | | | 6.39 | % | | | 4.49 | % | | | 8.02 | % |
Ratio and supplemental data | | | | | | | | | | | | |
Net assets end of year (000’s) | | $ | 259,348 | | | $ | 342,367 | | | $ | 254,763 | |
Expenses to average net assets (E) | | | | | | | | | | | | |
After (waiver/reimbursement) recapture | | | 0.87 | % | | | 0.88 | % | | | 0.92 | % |
Before (waiver/reimbursement) recapture | | | 0.89 | % | | | 0.93 | % | | | 0.98 | % |
Net investment income (loss) to average net assets (C) | | | 3.63 | % | | | 3.32 | % | | | 3.27 | % |
Portfolio turnover rate (F) | | | 102 | % | | | 237 | % | | | 142 | % |
| (A) | Commenced operations on October 31, 2011. |
| (B) | Calculated based on average number of shares outstanding. |
| (C) | Recognition of net investment income by the Fund is affected by the timing of the declaration of dividends by the investment companies in which the Fund invests. |
| (D) | Total return has been calculated for the applicable period without deduction of a sales load, if any, on an initial purchase. |
| (E) | Does not include expenses of the investment companies in which the Fund invests. |
| (F) | Does not include portfolio activity of the investment companies in which the Fund invests. |
The Notes to Financial Statements are an integral part of this report.
| | |
| Transamerica Funds | | Annual Report 2014 |
Page 314
FINANCIAL HIGHLIGHTS (continued)
| | | | | | | | | | | | |
| For a share outstanding during the years indicated: | | Transamerica Tactical Income | |
| | | Class C | |
| | | October 31, 2014 | | | October 31, 2013 | | | October 31,
2012 (A) | |
Net asset value | | | | | | | | | | | | |
Beginning of year | | $ | 10.12 | | | $ | 10.22 | | | $ | 10.00 | |
Investment operations | | | | | | | | | | | | |
Net investment income (loss) (B) (C) | | | 0.29 | | | | 0.25 | | | | 0.25 | |
Net realized and unrealized gain (loss) | | | 0.27 | | | | 0.11 | | | | 0.46 | |
Total investment operations | | | 0.56 | | | | 0.36 | | | | 0.71 | |
Distributions | | | | | | | | | | | | |
Net investment income | | | (0.24 | ) | | | (0.40 | ) | | | (0.49 | ) |
Net realized gains | | | — | | | | (0.04 | ) | | | — | |
Return of capital | | | — | | | | (0.02 | ) | | | — | |
Total distributions | | | (0.24 | ) | | | (0.46 | ) | | | (0.49 | ) |
Net asset value | | | | | | | | | | | | |
End of year | | $ | 10.44 | | | $ | 10.12 | | | $ | 10.22 | |
Total return (D) | | | 5.61 | % | | | 3.63 | % | | | 7.26 | % |
Ratio and supplemental data | | | | | | | | | | | | |
Net assets end of year (000’s) | | $ | 400,142 | | | $ | 464,339 | | | $ | 279,728 | |
Expenses to average net assets (E) | | | | | | | | | | | | |
After (waiver/reimbursement) recapture | | | 1.63 | % | | | 1.63 | % | | | 1.67 | % |
Before (waiver/reimbursement) recapture | | | 1.63 | % | | | 1.63 | % | | | 1.68 | % |
Net investment income (loss) to average net assets (C) | | | 2.86 | % | | | 2.54 | % | | | 2.48 | % |
Portfolio turnover rate (F) | | | 102 | % | | | 237 | % | | | 142 | % |
| (A) | Commenced operations on October 31, 2011. |
| (B) | Calculated based on average number of shares outstanding. |
| (C) | Recognition of net investment income by the Fund is affected by the timing of the declaration of dividends by the investment companies in which the Fund invests. |
| (D) | Total return has been calculated for the applicable period without deduction of a sales load, if any, on an initial purchase. |
| (E) | Does not include expenses of the investment companies in which the Fund invests. |
| (F) | Does not include portfolio activity of the investment companies in which the Fund invests. |
| | | | | | | | | | | | |
| For a share outstanding during the years indicated: | | Transamerica Tactical Income | |
| | | Class I | |
| | | October 31,
2014 | | | October 31,
2013 | | | October 31,
2012 (A) | |
Net asset value | | | | | | | | | | | | |
Beginning of year | | $ | 10.16 | | | $ | 10.26 | | | $ | 10.00 | |
Investment operations | | | | | | | | | | | | |
Net investment income (loss) (B) (C) | | | 0.40 | | | | 0.36 | | | | 0.37 | |
Net realized and unrealized gain (loss) | | | 0.26 | | | | 0.10 | | | | 0.44 | |
Total investment operations | | | 0.66 | | | | 0.46 | | | | 0.81 | |
Distributions | | | | | | | | | | | | |
Net investment income | | | (0.34 | ) | | | (0.50 | ) | | | (0.55 | ) |
Net realized gains | | | — | | | | (0.04 | ) | | | — | |
Return of capital | | | — | | | | (0.02 | ) | | | — | |
Total distributions | | | (0.34 | ) | | | (0.56 | ) | | | (0.55 | ) |
Net asset value | | | | | | | | | | | | |
End of year | | $ | 10.48 | | | $ | 10.16 | | | $ | 10.26 | |
Total return (D) | | | 6.64 | % | | | 4.62 | % | | | 8.35 | % |
Ratio and supplemental data | | | | | | | | | | | | |
Net assets end of year (000’s) | | $ | 242,703 | | | $ | 270,502 | | | $ | 240,339 | |
Expenses to average net assets (E) | | | | | | | | | | | | |
After (waiver/reimbursement) recapture | | | 0.64 | % | | | 0.67 | % | | | 0.67 | % |
Before (waiver/reimbursement) recapture | | | 0.64 | % | | | 0.65 | % | | | 0.72 | % |
Net investment income (loss) to average net assets (C) | | | 3.83 | % | | | 3.57 | % | | | 3.61 | % |
Portfolio turnover rate (F) | | | 102 | % | | | 237 | % | | | 142 | % |
| (A) | Commenced operations on October 31, 2011. |
| (B) | Calculated based on average number of shares outstanding. |
| (C) | Recognition of net investment income by the Fund is affected by the timing of the declaration of dividends by the investment companies in which the Fund invests. |
| (D) | Total return has been calculated for the applicable period without deduction of a sales load, if any, on an initial purchase. |
| (E) | Does not include expenses of the investment companies in which the Fund invests. |
| (F) | Does not include portfolio activity of the investment companies in which the Fund invests. |
The Notes to Financial Statements are an integral part of this report.
| | |
| Transamerica Funds | | Annual Report 2014 |
Page 315
FINANCIAL HIGHLIGHTS (continued)
| | | | | | | | |
| For a share outstanding during the years indicated: | | Transamerica Tactical Rotation | |
| | | Class A | |
| | | October 31,
2014 | | | October 31,
2013 (A) | |
Net asset value | | | | | | | | |
Beginning of year | | $ | 11.12 | | | $ | 10.00 | |
Investment operations | | | | | | | | |
Net investment income (loss) (B) (C) | | | 0.08 | | | | 0.05 | |
Net realized and unrealized gain (loss) | | | 0.61 | | | | 1.56 | |
Total investment operations | | | 0.69 | | | | 1.61 | |
Distributions | | | | | | | | |
Net investment income | | | (0.05 | ) | | | (0.49 | ) |
Net realized gains | | | (0.03 | ) | | | — | |
Total distributions | | | (0.08 | ) | | | (0.49 | ) |
Net asset value | | | | | | | | |
End of year | | $ | 11.73 | | | $ | 11.12 | |
Total return (D) | | | 6.31 | % | | | 16.86 | % |
Ratio and supplemental data | | | | | | | | |
Net assets end of year (000’s) | | $ | 12,115 | | | $ | 6,456 | |
Expenses to average net assets (E) | | | | | | | | |
After (waiver/reimbursement) recapture | | | 1.11 | % | | | 1.15 | % |
Before (waiver/reimbursement) recapture | | | 1.32 | % | | | 3.94 | % |
Net investment income (loss) to average net assets (C) | | | 0.70 | % | | | 0.45 | % |
Portfolio turnover rate (F) | | | 194 | % | | | 301 | % |
| (A) | Commenced operations on October 31, 2012. |
| (B) | Calculated based on average number of shares outstanding. |
| (C) | Recognition of net investment income by the Fund is affected by the timing of the declaration of dividends by the investment companies in which the Fund invests. |
| (D) | Total return has been calculated for the applicable period without deduction of a sales load, if any, on an initial purchase. |
| (E) | Does not include expenses of the investment companies in which the Fund invests. |
| (F) | Does not include portfolio activity of the investment companies in which the Fund invests. |
| | | | | | | | |
| For a share outstanding during the years indicated: | | Transamerica Tactical Rotation | |
| | | Class C | |
| | | October 31,
2014 | | | October 31,
2013 (A) | |
Net asset value | | | | | | | | |
Beginning of year | | $ | 11.05 | | | $ | 10.00 | |
Investment operations | | | | | | | | |
Net investment income (loss) (B) (C) | | | — | (D) | | | (0.03 | ) |
Net realized and unrealized gain (loss) | | | 0.60 | | | | 1.56 | |
Total investment operations | | | 0.60 | | | | 1.53 | |
Distributions | | | | | | | | |
Net investment income | | | (0.02 | ) | | | (0.48 | ) |
Net realized gains | | | (0.03 | ) | | | — | |
Total distributions | | | (0.05 | ) | | | (0.48 | ) |
Net asset value | | | | | | | | |
End of year | | $ | 11.60 | | | $ | 11.05 | |
Total return (E) | | | 5.46 | % | | | 16.03 | % |
Ratio and supplemental data | | | | | | | | |
Net assets end of year (000’s) | | $ | 7,266 | | | $ | 3,840 | |
Expenses to average net assets (F) | | | | | | | | |
After (waiver/reimbursement) recapture | | | 1.85 | % | | | 1.85 | % |
Before (waiver/reimbursement) recapture | | | 2.09 | % | | | 4.69 | % |
Net investment income (loss) to average net assets (C) | | | (0.03 | )% | | | (0.28 | )% |
Portfolio turnover rate (G) | | | 194 | % | | | 301 | % |
| (A) | Commenced operations on October 31, 2012. |
| (B) | Calculated based on average number of shares outstanding. |
| (C) | Recognition of net investment income by the Fund is affected by the timing of the declaration of dividends by the investment companies in which the Fund invests. |
| (D) | Rounds to less than $0.01 or $(0.01). |
| (E) | Total return has been calculated for the applicable period without deduction of a sales load, if any, on an initial purchase. |
| (F) | Does not include expenses of the investment companies in which the Fund invests. |
| (G) | Does not include portfolio activity of the investment companies in which the Fund invests. |
The Notes to Financial Statements are an integral part of this report.
| | |
| Transamerica Funds | | Annual Report 2014 |
Page 316
FINANCIAL HIGHLIGHTS (continued)
| | | | | | | | |
| For a share outstanding during the years indicated: | | Transamerica Tactical Rotation | |
| | | Class I | |
| | | October 31,
2014 | | | October 31,
2013 (A) | |
Net asset value | | | | | | | | |
Beginning of year | | $ | 11.09 | | | $ | 10.00 | |
Investment operations | | | | | | | | |
Net investment income (loss) (B) (C) | | | 0.11 | | | | 0.07 | |
Net realized and unrealized gain (loss) | | | 0.61 | | | | 1.57 | |
Total investment operations | | | 0.72 | | | | 1.64 | |
Distributions | | | | | | | | |
Net investment income | | | (0.07 | ) | | | (0.55 | ) |
Net realized gains | | | (0.03 | ) | | | — | |
Total distributions | | | (0.10 | ) | | | (0.55 | ) |
Net asset value | | | | | | | | |
End of year | | $ | 11.71 | | | $ | 11.09 | |
Total return (D) | | | 6.57 | % | | | 17.26 | % |
Ratio and supplemental data | | | | | | | | |
Net assets end of year (000’s) | | $ | 3,521 | | | $ | 2,824 | |
Expenses to average net assets (E) | | | | | | | | |
After (waiver/reimbursement) recapture | | | 0.85 | % | | | 0.85 | % |
Before (waiver/reimbursement) recapture | | | 1.03 | % | | | 3.63 | % |
Net investment income (loss) to average net assets (C) | | | 0.98 | % | | | 0.67 | % |
Portfolio turnover rate (F) | | | 194 | % | | | 301 | % |
| (A) | Commenced operations on October 31, 2012. |
| (B) | Calculated based on average number of shares outstanding. |
| (C) | Recognition of net investment income by the Fund is affected by the timing of the declaration of dividends by the investment companies in which the Fund invests. |
| (D) | Total return has been calculated for the applicable period without deduction of a sales load, if any, on an initial purchase. |
| (E) | Does not include expenses of the investment companies in which the Fund invests. |
| (F) | Does not include portfolio activity of the investment companies in which the Fund invests. |
| | | | | | | | | | | | | | | | | | | | |
| For a share outstanding during the period and years indicated: | | Transamerica US Growth
(formerly, Transamerica Diversified Equity) | |
| | | Class A | |
| | | October 31,
2014 | | | October 31,
2013 | | | October 31,
2012 | | | October 31,
2011 | | | October 31,
2010 (A) | |
Net asset value | | | | | | | | | | | | | | | | | | | | |
Beginning of period/year | | $ | 16.95 | | | $ | 13.41 | | | $ | 14.63 | | | $ | 14.29 | | | $ | 12.85 | |
Investment operations | | | | | | | | | | | | | | | | | | | | |
Net investment income (loss) (B) | | | 0.02 | | | | 0.07 | | | | 0.01 | | | | (0.06 | ) | | | 0.15 | |
Net realized and unrealized gain (loss) | | | 2.38 | | | | 3.50 | | | | 0.76 | (C) | | | 0.56 | | | | 1.31 | |
Total investment operations | | | 2.40 | | | | 3.57 | | | | 0.77 | | | | 0.50 | | | | 1.46 | |
Distributions | | | | | | | | | | | | | | | | | | | | |
Net investment income | | | (0.13 | ) | | | (0.03 | ) | | | — | | | | (0.16 | ) | | | (0.02 | ) |
Net realized gains | | | — | | | | — | | | | (1.99 | ) | | | — | | | | — | |
Total distributions | | | (0.13 | ) | | | (0.03 | ) | | | (1.99 | ) | | | (0.16 | ) | | | (0.02 | ) |
Net asset value | | | | | | | | | | | | | | | | | | | | |
End of period/year | | $ | 19.22 | | | $ | 16.95 | | | $ | 13.41 | | | $ | 14.63 | | | $ | 14.29 | |
Total return (D) | | | 14.25 | % | | | 26.62 | % | | | 7.04 | %(C) | | | 3.44 | % | | | 11.32 | %(E) |
Ratio and supplemental data | | | | | | | | | | | | | | | | | | | | |
Net assets end of period/year (000’s) | | $ | 459,677 | | | $ | 447,645 | | | $ | 420,504 | | | $ | 77,197 | | | $ | 83,766 | |
Expenses to average net assets | | | | | | | | | | | | | | | | | | | | |
After (waiver/reimbursement) recapture | | | 1.27 | % | | | 1.36 | % | | | 1.47 | % | | | 1.52 | % | | | 1.52 | %(F) |
Before (waiver/reimbursement) recapture | | | 1.27 | % | | | 1.36 | % | | | 1.39 | % | | | 1.66 | % | | | 1.72 | %(F) |
Net investment income (loss) to average net assets | | | 0.13 | % | | | 0.49 | % | | | 0.08 | % | | | (0.42 | )% | | | 1.14 | %(F) |
Portfolio turnover rate | | | 111 | % | | | 55 | % | | | 80 | % | | | 141 | % | | | 79 | %(E) |
| (A) | Commenced operations on November 13, 2009. |
| (B) | Calculated based on average number of shares outstanding. |
| (C) | Includes fair fund settlement. The impacts were $0.01 to Net realized and change in unrealized gain on investments and 0.08% to Total return. |
| (D) | Total return has been calculated for the applicable period without deduction of a sales load, if any, on an initial purchase. |
The Notes to Financial Statements are an integral part of this report.
| | |
| Transamerica Funds | | Annual Report 2014 |
Page 317
FINANCIAL HIGHLIGHTS (continued)
| | | | | | | | | | | | | | | | | | | | |
| For a share outstanding during the period and years indicated: | | Transamerica US Growth
(formerly, Transamerica Diversified Equity) | |
| | | Class B | |
| | | October 31,
2014 | | | October 31,
2013 | | | October 31,
2012 | | | October 31,
2011 | | | October 31,
2010 (A) | |
Net asset value | | | | | | | | | | | | | | | | | | | | |
Beginning of period/year | | $ | 16.64 | | | $ | 13.25 | | | $ | 14.57 | | | $ | 14.22 | | | $ | 12.85 | |
Investment operations | | | | | | | | | | | | | | | | | | | | |
Net investment income (loss) (B) | | | (0.13 | ) | | | (0.05 | ) | | | (0.09 | ) | | | (0.16 | ) | | | 0.06 | |
Net realized and unrealized gain (loss) | | | 2.34 | | | | 3.44 | | | | 0.76 | (C) | | | 0.55 | | | | 1.32 | |
Total investment operations | | | 2.21 | | | | 3.39 | | | | 0.67 | | | | 0.39 | | | | 1.38 | |
Distributions | | | | | | | | | | | | | | | | | | | | |
Net investment income | | | — | | | | — | | | | — | (D) | | | (0.04 | ) | | | (0.01 | ) |
Net realized gains | | | — | | | | — | | | | (1.99 | ) | | | — | | | | — | |
Total distributions | | | — | | | | — | | | | (1.99 | ) | | | (0.04 | ) | | | (0.01 | ) |
Net asset value | | | | | | | | | | | | | | | | | | | | |
End of period/year | | $ | 18.85 | | | $ | 16.64 | | | $ | 13.25 | | | $ | 14.57 | | | $ | 14.22 | |
Total return (E) | | | 13.28 | % | | | 25.59 | % | | | 6.29 | %(C) | | | 2.71 | % | | | 10.68 | %(F) |
Ratio and supplemental data | | | | | | | | | | | | | | | | | | | | |
Net assets end of period/year (000’s) | | $ | 16,421 | | | $ | 19,658 | | | $ | 20,668 | | | $ | 5,420 | | | $ | 7,375 | |
Expenses to average net assets | | | | | | | | | | | | | | | | | | | | |
After (waiver/reimbursement) recapture | | | 2.17 | % | | | 2.17 | % | | | 2.17 | % | | | 2.17 | % | | | 2.17 | %(G) |
Before (waiver/reimbursement) recapture | | | 2.11 | % | | | 2.17 | % | | | 2.19 | % | | | 2.30 | % | | | 2.44 | %(G) |
Net investment income (loss) to average net assets | | | (0.76 | )% | | | (0.31 | )% | | | (0.63 | )% | | | (1.07 | )% | | | 0.40 | %(G) |
Portfolio turnover rate | | | 111 | % | | | 55 | % | | | 80 | % | | | 141 | % | | | 79 | %(F) |
| (A) | Commenced operations on November 13, 2009. |
| (B) | Calculated based on average number of shares outstanding. |
| (C) | Includes fair fund settlement. The impacts were $0.01 to Net realized and change in unrealized gain on investments and 0.08% to Total return. |
| (D) | Rounds to less than $0.01 or $(0.01). |
| (E) | Total return has been calculated for the applicable period without deduction of a sales load, if any, on an initial purchase. |
| | | | | | | | | | | | | | | | | | | | |
| For a share outstanding during the period and years indicated: | | Transamerica US Growth
(formerly, Transamerica Diversified Equity) | |
| | | Class C | |
| | | October 31,
2014 | | | October 31,
2013 | | | October 31,
2012 | | | October 31,
2011 | | | October 31,
2010 (A) | |
Net asset value | | | | | | | | | | | | | | | | | | | | |
Beginning of period/year | | $ | 16.61 | | | $ | 13.22 | | | $ | 14.55 | | | $ | 14.22 | | | $ | 12.85 | |
Investment operations | | | | | | | | | | | | | | | | | | | | |
Net investment income (loss) (B) | | | (0.12 | ) | | | (0.05 | ) | | | (0.08 | ) | | | (0.16 | ) | | | 0.06 | |
Net realized and unrealized gain (loss) | | | 2.34 | | | | 3.44 | | | | 0.74 | (C) | | | 0.55 | | | | 1.32 | |
Total investment operations | | | 2.22 | | | | 3.39 | | | | 0.66 | | | | 0.39 | | | | 1.38 | |
Distributions | | | | | | | | | | | | | | | | | | | | |
Net investment income | | | (0.01 | ) | | | — | | | | — | (D) | | | (0.06 | ) | | | (0.01 | ) |
Net realized gains | | | — | | | | — | | | | (1.99 | ) | | | — | | | | — | |
Total distributions | | | (0.01 | ) | | | — | | | | (1.99 | ) | | | (0.06 | ) | | | (0.01 | ) |
Net asset value | | | | | | | | | | | | | | | | | | | | |
End of period/year | | $ | 18.82 | | | $ | 16.61 | | | $ | 13.22 | | | $ | 14.55 | | | $ | 14.22 | |
Total return (E) | | | 13.37 | % | | | 25.64 | % | | | 6.22 | %(C) | | | 2.72 | % | | | 10.68 | %(F) |
Ratio and supplemental data | | | | | | | | | | | | | | | | | | | | |
Net assets end of period/year (000’s) | | $ | 49,041 | | | $ | 47,397 | | | $ | 42,637 | | | $ | 13,393 | | | $ | 15,013 | |
Expenses to average net assets | | | | | | | | | | | | | | | | | | | | |
After (waiver/reimbursement) recapture | | | 2.05 | % | | | 2.16 | % | | | 2.17 | % | | | 2.17 | % | | | 2.17 | %(G) |
Before (waiver/reimbursement) recapture | | | 2.05 | % | | | 2.14 | % | | | 2.16 | % | | | 2.25 | % | | | 2.31 | %(G) |
Net investment income (loss) to average net assets | | | (0.65 | )% | | | (0.32 | )% | | | (0.63 | )% | | | (1.07 | )% | | | 0.48 | %(G) |
Portfolio turnover rate | | | 111 | % | | | 55 | % | | | 80 | % | | | 141 | % | | | 79 | %(F) |
| (A) | Commenced operations on November 13, 2009. |
| (B) | Calculated based on average number of shares outstanding. |
| (C) | Includes fair fund settlement. The impacts were $0.01 to Net realized and change in unrealized gain on investments and 0.08% to Total return. |
| (D) | Rounds to less than $0.01 or $(0.01). |
| (E) | Total return has been calculated for the applicable period without deduction of a sales load, if any, on an initial purchase. |
The Notes to Financial Statements are an integral part of this report.
| | |
| Transamerica Funds | | Annual Report 2014 |
Page 318
FINANCIAL HIGHLIGHTS (continued)
| | | | | | | | | | | | | | | | | | | | |
| For a share outstanding during the period and years indicated: | | Transamerica US Growth
(formerly, Transamerica Diversified Equity) | |
| | | Class I | |
| | | October 31,
2014 | | | October 31,
2013 | | | October 31,
2012 | | | October 31,
2011 | | | October 31,
2010 (A) | |
Net asset value | | | | | | | | | | | | | | | | | | | | |
Beginning of period/year | | $ | 17.19 | | | $ | 13.60 | | | $ | 14.74 | | | $ | 14.41 | | | $ | 12.65 | |
Investment operations | | | | | | | | | | | | | | | | | | | | |
Net investment income (loss) (B) | | | 0.09 | | | | 0.15 | | | | 0.09 | | | | — | (C) | | | 0.26 | |
Net realized and unrealized gain (loss) | | | 2.41 | | | | 3.54 | | | | 0.76 | (D) | | | 0.56 | | | | 1.53 | |
Total investment operations | | | 2.50 | | | | 3.69 | | | | 0.85 | | | | 0.56 | | | | 1.79 | |
Distributions | | | | | | | | | | | | | | | | | | | | |
Net investment income | | | (0.20 | ) | | | (0.10 | ) | | | — | | | | (0.23 | ) | | | (0.03 | ) |
Net realized gains | | | — | | | | — | | | | (1.99 | ) | | | — | | | | — | |
Total distributions | | | (0.20 | ) | | | (0.10 | ) | | | (1.99 | ) | | | (0.23 | ) | | | (0.03 | ) |
Net asset value | | | | | | | | | | | | | | | | | | | | |
End of period/year | | $ | 19.49 | | | $ | 17.19 | | | $ | 13.60 | | | $ | 14.74 | | | $ | 14.41 | |
Total return (E) | | | 14.67 | % | | | 27.16 | % | | | 7.62 | %(D) | | | 3.82 | % | | | 14.16 | %(F) |
Ratio and supplemental data | | | | | | | | | | | | | | | | | | | | |
Net assets end of period/year (000’s) | | $ | 212,866 | | | $ | 249,718 | | | $ | 310,170 | | | $ | 1,127 | | | $ | 421 | |
Expenses to average net assets | | | | | | | | | | | | | | | | | | | | |
After (waiver/reimbursement) recapture | | | 0.90 | % | | | 0.91 | % | | | 0.90 | % | | | 1.17 | % | | | 1.17 | %(G) |
Before (waiver/reimbursement) recapture | | | 0.90 | % | | | 0.91 | % | | | 0.90 | % | | | 1.15 | % | | | 1.81 | %(G) |
Net investment income (loss) to average net assets | | | 0.51 | % | | | 0.97 | % | | | 0.67 | % | | | 0.01 | % | | | 2.14 | %(G) |
Portfolio turnover rate | | | 111 | % | | | 55 | % | | | 80 | % | | | 141 | % | | | 79 | %(F) |
| (A) | Commenced operations on November 30, 2009. |
| (B) | Calculated based on average number of shares outstanding. |
| (C) | Rounds to less than $0.01 or $(0.01). |
| (D) | Includes fair fund settlement. The impacts were $0.01 to Net realized and change in unrealized gain on investments and 0.08% to Total return. |
| (E) | Total return has been calculated for the applicable period without deduction of a sales load, if any, on an initial purchase. |
| | | | | | | | | | | | | | | | | | | | |
| For a share outstanding during the period and years indicated: | | Transamerica US Growth
(formerly, Transamerica Diversified Equity) | |
| | | Class I2 | |
| | | October 31,
2014 | | | October 31,
2013 | | | October 31,
2012 | | | October 31,
2011 | | | October 31,
2010 (A)(B) | |
Net asset value | | | | | | | | | | | | | | | | | | | | |
Beginning of period/year | | $ | 17.17 | | | $ | 13.59 | | | $ | 14.73 | | | $ | 14.38 | | | $ | 12.85 | |
Investment operations | | | | | | | | | | | | | | | | | | | | |
Net investment income (loss) (C) | | | 0.12 | | | | 0.16 | | | | 0.10 | | | | 0.04 | | | | 0.26 | |
Net realized and unrealized gain (loss) | | | 2.42 | | | | 3.54 | | | | 0.77 | (D) | | | 0.57 | | | | 1.30 | |
Total investment operations | | | 2.54 | | | | 3.70 | | | | 0.87 | | | | 0.61 | | | | 1.56 | |
Distributions | | | | | | | | | | | | | | | | | | | | |
Net investment income | | | (0.23 | ) | | | (0.12 | ) | | | (0.02 | ) | | | (0.26 | ) | | | (0.03 | ) |
Net realized gains | | | — | | | | — | | | | (1.99 | ) | | | — | | | | — | |
Total distributions | | | (0.23 | ) | | | (0.12 | ) | | | (2.01 | ) | | | (0.26 | ) | | | (0.03 | ) |
Net asset value | | | | | | | | | | | | | | | | | | | | |
End of period/year | | $ | 19.48 | | | $ | 17.17 | | | $ | 13.59 | | | $ | 14.73 | | | $ | 14.38 | |
Total return (E) | | | 14.91 | % | | | 27.26 | % | | | 7.79 | %(D) | | | 4.19 | % | | | 12.12 | %(F) |
Ratio and supplemental data | | | | | | | | | | | | | | | | | | | | |
Net assets end of period/year (000’s) | | $ | 370,161 | | | $ | 555,040 | | | $ | 577,540 | | | $ | 291,409 | | | $ | 358,714 | |
Expenses to average net assets | | | | | | | | | | | | | | | | | | | | |
After (waiver/reimbursement) recapture | | | 0.77 | % | | | 0.79 | % | | | 0.78 | % | | | 0.80 | % | | | 0.81 | %(G) |
Before (waiver/reimbursement) recapture | | | 0.77 | % | | | 0.79 | % | | | 0.78 | % | | | 0.80 | % | | | 0.81 | %(G) |
Net investment income (loss) to average net assets | | | 0.66 | % | | | 1.08 | % | | | 0.75 | % | | | 0.30 | % | | | 2.02 | %(G) |
Portfolio turnover rate | | | 111 | % | | | 55 | % | | | 80 | % | | | 141 | % | | | 79 | %(F) |
| (A) | Effective November 30, 2009, all previously existing Class I shares were re-designated as Class I2 Shares. |
| (B) | Commenced operations on November 13, 2009. |
| (C) | Calculated based on average number of shares outstanding. |
| (D) | Includes fair fund settlement. The impacts were $0.01 to Net realized and change in unrealized gain on investments and 0.08% to Total return. |
| (E) | Total return has been calculated for the applicable period without deduction of a sales load, if any, on an initial purchase. |
The Notes to Financial Statements are an integral part of this report.
| | |
| Transamerica Funds | | Annual Report 2014 |
Page 319
FINANCIAL HIGHLIGHTS (continued)
| | | | | | | | | | | | |
| For a share outstanding during the period and years indicated: | | Transamerica US Growth
(formerly, Transamerica Diversified Equity) | |
| | | Class T | |
| | | October 31,
2014 | | | October 31,
2013 | | | October 31,
2012 (A) | |
Net asset value | | | | | | | | | | | | |
Beginning of period/year | | $ | 36.39 | | | $ | 28.69 | | | $ | 28.70 | |
Income (loss) from investment operations: | | | | | | | | | | | | |
Net investment income (loss) (B) | | | 0.21 | | | | 0.30 | | | | 0.14 | |
Net realized and unrealized gain (loss) | | | 5.14 | | | | 7.49 | | | | (0.15 | )(C) |
Total investment operations | | | 5.35 | | | | 7.79 | | | | (0.01 | ) |
Distributions | | | | | | | | | | | | |
Net investment income | | | (0.19 | ) | | | (0.09 | ) | | | — | |
Net asset value | | | | | | | | | | | | |
End of period/year | | $ | 41.55 | | | $ | 36.39 | | | $ | 28.69 | |
Total return (D) | | | 14.74 | % | | | 27.16 | % | | | (0.04 | )%(C)(E) |
Ratios and supplemental data | | | | | | | | | | | | |
Net assets end of period/year (000’s) | | $ | 101,029 | | | $ | 94,866 | | | $ | 81,976 | |
Expenses to average net assets | | | | | | | | | | | | |
After (waiver/reimbursement) recapture | | | 0.87 | % | | | 0.91 | % | | | 0.90 | %(F) |
Before (waiver/reimbursement) recapture | | | 0.87 | % | | | 0.91 | % | | | 0.90 | %(F) |
Net investment income (loss) to average net assets | | | 0.53 | % | | | 0.93 | % | | | 0.65 | %(F) |
Portfolio turnover rate | | | 111 | % | | | 55 | % | | | 80 | %(E) |
| (A) | Commenced operations on February 10, 2012. |
| (B) | Calculated based on average number of shares outstanding. |
| (C) | Includes fair fund settlement. The impacts were $0.01 to Net realized and change in unrealized gain on investments and 0.08% to Total return. |
| (D) | Total return has been calculated for the applicable period without deduction of a sales load, if any, on an initial purchase. |
The Notes to Financial Statements are an integral part of this report.
| | |
| Transamerica Funds | | Annual Report 2014 |
Page 320
NOTES TO FINANCIAL STATEMENTS
At October 31, 2014
NOTE 1. ORGANIZATION AND SIGNIFICANT ACCOUNTING POLICIES
Transamerica Funds (the “Trust”) is an open-end management investment company registered under the Investment Company Act of 1940, as amended (the “1940 Act”). The Trust applies investment company accounting and reporting guidance. The Funds (each, a “Fund” and collectively, the “Funds”) listed in the table below are a series of the Trust. Each class has a public offering price that reflects different sales charges, if any, and expense levels. Class B shares will convert to Class A shares eight years after purchase. Effective November 1, 2013, Class B shares are no longer available to existing investors except for exchanges, and dividend and capital gains reinvestment.
| | | | | | |
| Fund Name | | Class | | Fund Name | | Class |
Transamerica Capital Growth | | A,B,C,I,I2 | | Transamerica Large Cap Value | | A,C,I,I2 |
Transamerica Concentrated Growth (A) (B) | | A,C,I,I2 | | Transamerica Mid Cap Growth (C) | | A,C,I,I2 |
Transamerica Dividend Focused | | A,C,I,I2 | | Transamerica Mid Cap Value Opportunities (D) | | A,C,I,I2 |
Transamerica Emerging Markets Debt | | A,C,I,I2 | | Transamerica MLP & Energy Income | | A,C,I,I2 |
Transamerica Emerging Markets Equity | | A,C,I,I2 | | Transamerica Money Market | | A,B,C,I,I2 |
Transamerica Enhanced Muni | | A,C,I | | Transamerica Multi-Managed Balanced | | A,B,C,I |
Transamerica Flexible Income | | A,B,C,I,I2 | | Transamerica Opportunistic Allocation (C) | | A,C,I |
Transamerica Floating Rate (C) | | A,C,I,I2 | | Transamerica Short-Term Bond | | A,C,I,I2 |
Transamerica Global Bond (E) | | A,C,I,I2 | | Transamerica Small Cap Core (C) | | A,C,I,I2 |
Transamerica Global Equity (F) (G) | | A,B,C,I,I2 | | Transamerica Small Cap Growth | | A,C,I,I2 |
Transamerica Growth Opportunities | | A,B,C,I,I2 | | Transamerica Small Cap Value | | A,C,I,I2 |
Transamerica High Yield Bond | | A,B,C,I,I2 | | Transamerica Small/Mid Cap Value | | A,B,C,I,I2 |
Transamerica High Yield Muni | | A,C,I | | Transamerica Strategic High Income (E) | | A,C,I,I2 |
Transamerica Income & Growth | | A,C,I,I2 | | Transamerica Tactical Allocation | | A,C,I |
Transamerica Inflation Opportunities (E) | | A,C,I,I2 | | Transamerica Tactical Income | | A,C,I |
Transamerica International Equity | | A,C,I,I2 | | Transamerica Tactical Rotation | | A,C,I |
Transamerica International Small Cap Value | | I,I2 | | Transamerica US Growth (H) | | A,B,C,I,I2,T |
| | (A) | Formerly, The Torray Resolute Fund. See Reorganization Note 8. |
| | (B) | Classes A, C, I2 commenced operations on March 1, 2014. |
| | (C) | Fund commenced operations on October 31, 2013. |
| | (D) | Fund commenced operations on April 30, 2014. |
| | (E) | Fund commenced operations on March 1, 2014. |
| | (F) | Effective September 4, 2014 the Fund restructured from operating as a fund of fund. The Fund’s name changed from Transamerica Multi-Manager International Portfolio. |
| | (G) | Class I2 commenced operations on September 4, 2014. |
| | (H) | Formerly, Transamerica Diversified Equity. |
Transamerica Emerging Markets Debt, Transamerica High Yield Muni and Transamerica MLP & Energy Income are “non-diversified” Funds, as defined under the 1940 Act.
This report must be accompanied by the Funds’ current prospectuses, which contain additional information about the Funds, including investment objectives and strategies.
Transamerica Asset Management, Inc. (“TAM”) provides continuous and regular investment advisory services to the Funds. TAM acts as a manager of managers, providing advisory services that include, without limitation, the design and development of each Fund and its investment strategy and the ongoing review and evaluation of that investment strategy including recommending changes in strategy where it believes appropriate or advisable; the selection of one or more sub-advisers for each Fund employing a combination of quantitative and qualitative screens, research, analysis and due diligence; oversight and monitoring of sub-advisers and recommending changes to sub-advisers where it believes appropriate or advisable; recommending and implementing fund combinations and liquidations where it believes appropriate or advisable; regular supervision of the Funds’ investments; regular review of sub-adviser performance and holdings; ongoing trade oversight and analysis; regular monitoring to ensure adherence to investment process; risk management oversight and analysis; design, development, implementation and regular monitoring of the valuation of portfolio holdings; design, development, implementation and regular monitoring of the compliance process; review of proxies voted by sub-advisers; oversight of preparation, and review, of materials for meetings of the Funds’ Board of Trustees (the “Board”), participation in these meetings and preparation of regular communications with the Board; oversight of preparation and review of prospectuses, shareholder reports and other disclosure materials and filings; and oversight of other service providers to the Funds, such as the custodian, the
| | |
| Transamerica Funds | | Annual Report 2014 |
Page 321
NOTES TO FINANCIAL STATEMENTS (continued)
At October 31, 2014
NOTE 1. (continued)
transfer agent, the Funds’ independent registered public accounting firm and legal counsel; supervision of the performance of recordkeeping and shareholder relations for the Funds; and ongoing cash management services. TAM uses a variety of quantitative and qualitative tools to carry out its investment advisory services. Where TAM employs sub-advisers, the sub-advisers carry out and effectuate the investment strategy designed for the Funds by TAM and are responsible, subject to TAM’s and the Board’s oversight, among other things, for making decisions to buy, hold or sell a particular security.
Transamerica Fund Services, Inc. (“TFS”) provides supervisory and administrative services to each Fund. TFS’s supervisory and administrative services include performing certain administrative services for the Funds and supervising and overseeing the administrative, clerical, recordkeeping and bookkeeping services provided for the Funds by State Street Bank and Trust Company (“State Street”), to whom TFS has outsourced the provision of certain services as described below; to the extent agreed upon by TFS and the Funds from time to time, monitoring and verifying the custodian’s daily calculation of Net Asset Value (“NAV”); shareholder relations functions; compliance services; valuation services; assisting in due diligence and in oversight and monitoring of certain activities of sub-advisers and certain aspects of each Fund’s investments; assisting with fund combinations and liquidations; oversight of the preparation and filing, and review, of all returns and reports, in connection with federal, state and local taxes; oversight and review of regulatory reporting; supervising and coordinating the Funds’ custodian and their dividend disbursing agent and monitoring their services to the Funds; assisting the Funds in preparing reports to shareholders; acting as liaison with the Funds’ independent public accountants and providing, upon request, analyses, fiscal year summaries and other audit related services; assisting in the preparation of agendas and supporting documents for and minutes of meetings of the Board and committees of trustees; assisting in the preparation of regular communications with the trustees; and providing personnel and office space, telephones and other office equipment as necessary in order for TFS to perform supervisory and administrative services to the Funds. State Street performs back office services to support TFS, including furnishing financial and performance information about the Funds for inclusion in regulatory filings and trustees’ and shareholder reports; preparing drafts of regulatory filings, trustees’ materials, tax returns, expenses and budgeting; tax compliance testing; and maintaining books and records. TFS pays all expenses it incurs in connection with providing these services in the Amended and Restated Administrative Services Agreement with the exception of the costs of certain services specifically assumed by the Funds, as numerated within the Statements of Operations.
In the normal course of business, the Funds enter into contracts that contain a variety of representations that provide general indemnifications. The Funds’ maximum exposure under these arrangements is unknown, as this would involve future claims that may be made against the Funds and/or its affiliates that have not yet occurred. However, based on experience, the Funds expect the risk of loss to be remote.
In preparing the Funds’ financial statements in accordance with Generally Accepted Accounting Principles (“GAAP”) in the United States of America, estimates or assumptions (which could differ from actual results) may be used that affect reported amounts and disclosures. The following is a summary of significant accounting policies followed by the Funds.
Securities lending: Securities are lent to qualified financial institutions and brokers. State Street serves as securities lending agent to the Funds pursuant to a Securities Lending Agreement. The lending of securities exposes the Funds to risks such as the following: (i) the borrowers may fail to return the loaned securities; (ii) the borrowers may not be able to provide additional collateral; (iii) the Funds may experience delays in recovery of the loaned securities or delays in access to collateral; or (iv) the Funds may experience losses related to the investment collateral. To minimize certain risks, loan counterparties pledge cash collateral with a value of at least 102% of the current value of the loaned securities for securities traded on U.S. exchanges and a value of at least 105% for all other securities loaned. The lending agent has agreed to indemnify the Funds in the case of default of any securities borrower.
Cash collateral received is invested in the State Street Navigator Securities Lending Trust-Prime Portfolio, a money market mutual fund registered under the 1940 Act. By lending securities, the Funds seek to increase their net investment income through the receipt of interest and fees. Such income is reflected separately in the Statements of Operations. Income from loaned securities in the Statements of Operations is net of fees and rebates earned by the lending agent for its services.
The value of loaned securities and related collateral outstanding at October 31, 2014, if any, are shown on a gross basis in the Schedule of Investments and Statements of Assets and Liabilities.
Repurchase agreements: In a repurchase agreement, the Funds purchase a security and simultaneously commit to resell that security to the seller at an agreed-upon price on an agreed-upon date. Securities purchased subject to a repurchase agreement are held at the Funds’ custodian, or designated sub-custodian related to tri-party repurchase agreements, and, pursuant to the terms of the repurchase agreement, must be collateralized by securities with an aggregate market value greater than or equal to 100% of the resale price. The Funds will bear the risk of value fluctuations until the securities can be sold and may encounter delays and incur costs in liquidating the securities. In the event of bankruptcy or insolvency of the seller, delays and costs may be incurred.
| | |
| Transamerica Funds | | Annual Report 2014 |
Page 322
NOTES TO FINANCIAL STATEMENTS (continued)
At October 31, 2014
NOTE 1. (continued)
Repurchase agreements are subject to netting agreements, which are agreements between the Fund and its counterparties that provide for the net settlement of all transactions and collateral with the Fund, through a single payment, in the event of default or termination. Amounts presented on the Schedule of Investments, and as part of Repurchase agreements, at value on the Statements of Assets and Liabilities are shown on a gross basis. The value of the related collateral for each repurchase agreement, as reflected in the Schedule of Investments, exceeds the value of each repurchase agreement at October 31, 2014.
Open repurchase agreements at October 31, 2014, if any, are shown on the Schedule of Investments.
Foreign currency denominated investments: The accounting records of the Funds are maintained in U.S. dollars. Securities and other assets and liabilities denominated in foreign currencies are translated into U.S. dollars based on the closing exchange rate each day. The cost of foreign securities purchased and any realized gains or losses are translated at the prevailing exchange rates in effect on the date of the respective transaction. Each Fund combines fluctuations from currency exchange rates and fluctuations in value when computing net realized and unrealized gains or losses from investments.
Net foreign currency gains and losses resulting from changes in exchange rates include: 1) foreign currency fluctuations between trade date and settlement date of investment security transactions; 2) gains and losses on forward foreign currency contracts; and 3) the difference between the receivable amounts of interest and dividends recorded in the accounting records in U.S. dollars and the amounts actually received.
Foreign currency denominated assets may involve risks not typically associated with domestic transactions. These risks include revaluation of currencies, adverse fluctuations in foreign currency values, and possible adverse political, social, and economic developments, including those particular to a specific industry, country or region.
Foreign taxes: The Funds may be subjected to taxes imposed by the countries in which they invest, with respect to their investments in issuers existing or operating in such countries. The Funds may also be subject to foreign taxes on income, gains on investments, or currency repatriation, a portion of which may be recoverable. The Funds accrue such taxes and recoveries as applicable when the related income or capital gains are earned or unrealized, and based upon the current interpretation of tax rules and regulations that exist in the markets in which the Funds invest. Some countries require governmental approval for the repatriation of investment income, capital, or the proceeds of sales earned by foreign investors. In addition, if there is deterioration in a country’s balance of payments or for other reasons, a country may impose temporary restrictions of foreign capital remittances abroad.
Cash overdraft: Throughout the year, the Funds may have cash overdraft balances. A fee is incurred on these overdrafts, calculated by multiplying the overdraft by a rate based on the federal funds rate.
Payables, if any, are reflected as Due to custodian in the Statements of Assets and Liabilities.
Forward foreign currency contracts: The Funds are subject to foreign currency exchange rate risk exposure in the normal course of pursuing their investment objectives. The Funds, with the exception of Transamerica Money Market (“Money Market”), enter into forward foreign currency contracts to hedge against exchange rate risk arising from investments in securities denominated in foreign currencies. Forward foreign currency contracts are marked-to-market daily, with the change in value recorded as an unrealized gain or loss. When the contracts are settled, a realized gain or loss is incurred. Risks may arise from changes in market value of the underlying currencies and from the possible inability of counterparties to meet the terms of their contracts.
Open forward foreign currency contracts at October 31, 2014, if any, are listed in the Schedule of Investments.
Option contracts: The Funds are subject to equity price risk, interest rate risk, and foreign currency exchange rate risk in the normal course of pursuing their investment objectives. The Funds, with the exception of Money Market, enter into option contracts to manage exposure to various market fluctuations. The Funds purchase or write put and call options on U.S. securities, indices, futures, swaps (“swaptions”), commodities, and currency transactions. Options are valued at the average of the bid and ask price (“Mean Quote”) established each day at the close of the board of trade or exchange on which they are traded. Options are marked-to-market daily to reflect the current value of the option. The primary risks associated with options are an imperfect correlation between the change in value of the securities held and the prices of the option contracts, the possibility of an illiquid market, and an inability of the counterparty to meet the contract terms.
Purchased options: Purchasing call options tends to increase exposure to the underlying instrument. Purchasing put options tends to decrease exposure to the underlying instrument. The Funds pay premiums, which are included in the Statements of Assets and Liabilities as an investment and subsequently marked-to-market to reflect the current value of the option. The risk associated with purchasing put and call options is limited to the premium paid. Premiums paid from options which expire are treated as realized losses.
| | |
| Transamerica Funds | | Annual Report 2014 |
Page 323
NOTES TO FINANCIAL STATEMENTS (continued)
At October 31, 2014
NOTE 1. (continued)
Premiums paid for purchasing options which are exercised or closed are added to the amounts paid or offset against the proceeds on the underlying U.S. security, index, future, swaption, commodity, or currency transaction to determine the realized gain or loss.
Written options: Writing call options tends to decrease exposure to the underlying investment. Writing put options tends to increase exposure to the underlying investment. When the Funds write a covered call or put option, the premium received is recorded as a liability in the Statements of Assets and Liabilities and is subsequently marked-to-market to reflect the current market value of the option written. Premiums received from written options which expire unexercised are treated as realized gains. Premiums received from writing options/swaptions which are exercised or closed are added to the proceeds or offset against amounts paid on the underlying U.S. security, index, future, swaption, commodity, or currency transaction to determine the realized gain or loss. In writing an option, the Funds bear the market risk of an unfavorable change in the price of the security or currency underlying the written option. Exercise of an option written by the Funds could result in the Funds selling or buying a security or currency at a price different from the current market value.
Inflation-capped options: The Funds purchase or write inflation-capped options to enhance returns or for hedging opportunities. The purpose of purchasing inflation-capped options is to protect the Funds from inflation erosion above a certain rate on a given notional exposure. A floor can be used to give downside protection to the investments in inflation-linked products.
Foreign currency options: The Funds may write or purchase foreign currency options. Purchasing foreign currency options gives the Funds the right, but not the obligation to buy or sell the currency and will specify the amount of currency and a rate of exchange that may be exercised by a specified date. These options may be used as a short or long hedge against possible variations in foreign exchange rates or to gain exposure to foreign currencies.
Straddle swaption contracts: The Funds enter into straddle swaption contracts. A straddle swaption is an investment strategy that consists of two swaptions, each with a different underlying swap, wherein the holder buys both a payer and receiver option on the same floating rate. If the floating rate falls, the holder receives the fixed rate, and if the floating rate rises, the holder pays the fixed rate.
The underlying face amounts of open options and swaptions at October 31, 2014, if any, are listed in the Schedule of Investments.
Transactions in written options were as follows:
| | | | | | | | |
| Transamerica MLP & Energy Income | | Premiums | | | Contracts | |
Balance at October 31, 2013 | | $ | — | | | | — | |
Sales | | | 993,080 | | | | 8,305 | |
Closing Buys | | | (232,578 | ) | | | (1,970 | ) |
Expirations | | | (233,068 | ) | | | (1,977 | ) |
Exercised | | | (445,142 | ) | | | (3,683 | ) |
| | | | | | | | | |
Balance at October 31, 2014 | | $ | 82,292 | | | | 675 | |
| | | | | | | | |
| Transamerica Multi-Managed Balanced | | Premiums | | | Contracts | |
Balance at October 31, 2013 | | $ | 20,084 | | | | 66 | |
Sales | | | 84,137 | | | | 357 | |
Closing Buys | | | (104,221 | ) | | | (423 | ) |
Expirations | | | — | | | | — | |
Exercised | | | — | | | | — | |
| | | | | | | | | |
Balance at October 31, 2014 | | $ | — | | | | — | |
There were no transactions in written swaptions during the year ended October 31, 2014.
Futures contracts: The Funds are subject to equity and commodity price risk, interest rate risk, and foreign currency exchange rate risk in the normal course of pursuing their investment objectives. The Funds, with the exception of Money Market, use futures contracts to gain exposure to, or hedge against, changes in the value of equities and commodities, interest rates, or foreign currencies. A futures contract represents a commitment for the future purchase or sale of an asset at a specified price on a specified date. Upon entering into such contracts, the Funds are required to deposit with the broker, either in cash or in securities, an initial margin in an amount equal to a certain percentage of the contract amount. Subsequent payments (“variation margin”) are paid or received by the Funds, depending on the daily fluctuations in the value of the contract, and are recorded for financial statement purposes as unrealized gains or losses by the Funds. Upon entering into such contracts, the Funds bear the risk of equity and commodity prices, interest rates, or exchange rates moving unexpectedly, in which case, the Funds may not achieve the anticipated benefits of the futures contracts and may realize
| | |
| Transamerica Funds | | Annual Report 2014 |
Page 324
NOTES TO FINANCIAL STATEMENTS (continued)
At October 31, 2014
NOTE 1. (continued)
losses. With futures, there is minimal counterparty credit risk to the Funds since futures are exchange-traded and the exchange’s clearinghouse, as counterparty to all exchange-traded futures, guarantees the futures against default.
Open futures contracts at October 31, 2014, if any, are listed in the Schedule of Investments. The variation margin receivable or payable, as applicable, is shown on the Statements of Assets and Liabilities.
Swap agreements: Swap agreements are bilaterally negotiated agreements between the Funds and a counterparty to exchange or swap investments, cash flows, assets, foreign currencies, or market-linked returns at specified, future intervals. Swap agreements are privately negotiated in the over-the-counter (“OTC”) market and may be executed in multilateral or other trade facility platforms, such as a registered exchange (“centrally cleared swaps”). Centrally cleared swaps listed or traded on a multilateral platform, are valued at the daily settlement price determined by the corresponding exchange. For centrally cleared credit default swaps the clearing exchange requires all members to provide applicable levels across complete term levels. Centrally cleared interest rate swaps are valued using a pricing model that references the underlying rates including but not limited to the overnight index swap rate and London Interbank Offered Rate (“LIBOR”) forward rate to calculate the daily settlement price. The Funds, with the exception of Money Market, enter into credit default, cross-currency, interest rate, total return, variance, and other forms of swap agreements to manage exposure to credit, currency, interest rate, and commodity risks. In connection with these agreements, securities or cash may be identified as collateral or margin in accordance with the terms of the respective swap agreements to provide assets of value and recourse in the event of default or bankruptcy/insolvency. Swaps are marked-to-market daily based upon values from third party vendors, which may include a registered exchange, or quotations from market makers to the extent available and the change in value, if any, is recorded as an unrealized gain or loss in the Statements of Assets and Liabilities.
For OTC swap agreements, payments received or made at the beginning of the measurement period are reflected as such in the Statements of Assets and Liabilities and represent payments made or received upon entering into the swap agreements to compensate for differences between the stated terms of the swap agreement and prevailing market conditions (credit spreads, currency exchange rates, interest rates, and other relevant factors). These upfront payments are recorded as realized gains or losses in the Statements of Operations upon termination or maturity of the swap. A liquidation payment received or made at the termination of the swap is recorded as realized gain or loss in the Statements of Operations. Net periodic payments received or paid by the Funds are included as part of realized gains or losses in the Statements of Operations.
Specific risks and accounting related to each type of swap agreement are identified and described in the following paragraphs:
Credit default swap agreements: The Funds are subject to credit risk in the normal course of pursuing their investment objectives. The Funds enter into credit default swaps to manage their exposure to the market or certain sectors of the market to reduce their risk exposure to defaults of corporate and sovereign issuers, or to create exposure to corporate or sovereign issuers to which they are not otherwise exposed. Credit default swaps involve the exchange of a fixed rate premium for protection against the loss in value of an underlying security in the event of a defined credit event, such as payment default or bankruptcy (buy protection).
Under a credit default swap, one party acts as a guarantor by receiving the fixed periodic payment in exchange for the commitment to purchase the underlying security at par if the defined credit event occurs (sell protection). The Funds’ maximum risk of loss from counterparty risk, either as the protection seller or as the protection buyer, is the notional amount of the contract. This risk is mitigated by having a master netting arrangement between the Funds and the counterparty, and by the posting of collateral.
Certain Funds sell credit default swaps, which exposes them to risk of loss from credit risk related events specified in the contracts. Although contract-specific, credit events are generally defined as bankruptcy, failure to pay, restructuring, obligation acceleration, obligation default, or repudiation/moratorium. The aggregate fair value of the credit default swaps is disclosed in the Schedule of Investments. The aggregate fair value of assets posted as collateral, net of assets received as collateral, for these swaps is included in the footnotes to the Schedule of Investments. If a defined credit event had occurred during the period, the swaps’ credit-risk-related contingent features would have been triggered, and the Funds would have been required to pay the notional amounts for the credit default swaps with a sell protection less the value of the contracts’ related reference obligations.
Interest rate swap agreements: The Funds are subject to interest rate risk exposure in the normal course of pursuing their investment objectives. Because the Funds hold fixed rate bonds, the value of these bonds may decrease if interest rates rise. To help hedge against this risk, the Funds enter into interest rate swap agreements. Interest rate swaps are agreements between two parties to exchange cash flows based on a notional principal amount. Funds with interest rate agreements can elect to pay a fixed rate and receive a floating rate, or receive a fixed rate and pay a floating rate, on a notional principal amount. The risks of interest rate swaps include changes in market conditions which will affect the value of the contract or the cash flows, and the possible inability of the counterparty to fulfill its obligations under the agreement. The Funds’ maximum risk of loss from counterparty credit risk is the
| | |
| Transamerica Funds | | Annual Report 2014 |
Page 325
NOTES TO FINANCIAL STATEMENTS (continued)
At October 31, 2014
NOTE 1. (continued)
discounted net value of the cash flows to be received from/paid to the counterparties over the contracts’ remaining lives, to the extent that that amount is positive. This risk is mitigated by having a master netting arrangement between the Funds and the counterparty, and by the posting of collateral.
Total return swap agreements: The Funds are subject to commodity, equity, and other risks related to the underlying investments of the swap agreement in the normal course of pursuing their investment objectives. The value of the commodity-linked investments held by the Funds can be affected by a variety of factors, including, but not limited to, overall market movements and other factors affecting the value of particular industries or commodities, such as weather, disease, embargoes, acts of war or terrorism, or political and regulatory developments. Commodity-linked derivatives are available from a relatively small number of issuers, subjecting a Fund’s investments in commodity-linked derivatives to counterparty risk, which is the risk that the issuer of the commodity-linked derivative will not fulfill its contractual obligations. Total return swap agreements on commodities involve commitments whereby cash flows are exchanged based on the price of a commodity in exchange for either a fixed or floating price or rate. One party would receive payments based on the market value of the commodity involved and pay a fixed amount. Total return swap agreements on indices involve commitments to pay interest in exchange for a market-linked return. One counterparty pays out the total return of a specific reference asset, which may be an equity, index, or bond, and in return receives a regular stream of payments.
Cross-currency swap agreements: The Funds are subject to foreign currency exchange rate risk in the normal course of pursuing their investment objectives. The Funds enter into cross-currency swap agreements to gain or reduce exposure to foreign currencies or to hedge against foreign currency exchange rate and/or interest rate risk. Cross-currency swap agreements are interest rate swaps in which two parties agree to exchange cash flows based on the notional amounts of two different currencies. The Funds with cross currency swap agreements can elect to pay a fixed rate and receive a floating rate, or, receive a fixed rate and pay a floating rate on the notional amounts of two different currencies. The notional amounts are typically determined based on the spot exchange rates at the inception of the trade. Cross-currency swap agreements can also involve an exchange of notional amounts at the start, during and/or at expiration of the contract, either at the current spot rate or another specified rate.
Open centrally cleared swap agreements at October 31, 2014, if any, are listed in the Schedule of Investments. The centrally cleared swap agreements are marked-to-market daily and an appropriate payable or receivable for the variation margin is recorded by the Fund, if applicable, and is shown on the Statements of Assets and Liabilities.
Open OTC swap agreements at October 31, 2014, if any, are listed in the Schedule of Investments. The value, as applicable, is shown on the Statements of Assets and Liabilities.
Loan participations and assignments: The Funds may invest in direct debt instruments which are interests in amounts owed to lenders or lending syndicates by corporate, governmental, or other borrowers, either in the form of participations at the time the loan is originated (“Participations”) or buying an interest in the loan in the secondary market from a financial institution or institutional investor (“Assignments”). Participations and Assignments in commercial loans may be secured or unsecured. These investments may include standby financing commitments, including revolving credit facilities that obligate the Funds to supply additional cash to the borrowers on demand. Loan Participations and Assignments involve risks of insolvency of the lending banks or other financial intermediaries. As such, the Funds assume the credit risks associated with the corporate borrowers and may assume the credit risks associated with the interposed banks or other financial intermediaries.
The Funds, with the exception of Money Market, may be contractually obligated to receive approval from the agent banks and/or borrowers prior to the sale of these investments. The Funds that participate in such syndications, or that can buy a portion of the loans, become part lenders. Loans are often administered by agent banks acting as agents for all holders.
The agent banks administer the terms of the loans, as specified in the loan agreements. In addition, the agent banks are normally responsible for the collection of principal and interest payments from the corporate borrowers and the apportionment of these payments to the credit of all institutions that are parties to the loan agreements. Unless the Funds have direct recourse against the corporate borrowers under the terms of the loans or other indebtedness, the Funds may have to rely on the agent banks or other financial intermediaries to apply appropriate credit remedies against corporate borrowers.
Open loan participations and assignments at October 31, 2014, if any, are identified in the Schedule of Investments.
Unfunded commitments represent the remaining obligation of the Funds to the borrower. At any point in time, up to the maturity date of the issue, the borrower may demand the unfunded portion. These unfunded amounts are marked-to-market and any unrealized gains and losses are recorded in the Statements of Assets and Liabilities.
| | |
| Transamerica Funds | | Annual Report 2014 |
Page 326
NOTES TO FINANCIAL STATEMENTS (continued)
At October 31, 2014
NOTE 1. (continued)
At October 31, 2014, the following Fund had an unfunded loan commitment which could be extended at the option of the borrower:
Transamerica Floating Rate:
| | | | | | | | |
| Security | | Commitment | | | Unrealized
Appreciation
(Depreciation) | |
DTZ U.S. Borrower LLC, Delayed Draw Term Loan | | $ | 149,333 | | | $ | 2,302 | |
To be announced (“TBA”) commitments: TBA commitments are entered into to purchase or sell securities for a fixed price at a future date, typically not to exceed 45 days. They are considered securities in themselves, and involve a risk of loss if the value of the security to be purchased declines, or the value of the security sold increases, prior to settlement date, in addition to the risk of decline in the value of the Funds’ other assets. Unsettled TBA commitments are valued at the current value of the underlying securities, according to the procedures described under Security Valuations.
Open balances at October 31, 2014, if any, are included in the payable or receivable for investments purchased or sold in the Statements of Assets and Liabilities. Open TBA commitments at October 31, 2014, if any, are identified in the Schedule of Investments.
When-Issued, forward delivery securities and delayed delivery settlements: The Funds may purchase or sell securities on a when-issued, forward (delayed) delivery basis or delayed settlement. When-issued and forward delivery transactions are made conditionally because a security, although authorized, has not yet been issued in the market. Settlement of such transactions normally occurs within a month or more after the purchase or sale commitment is made. The Funds engage in when-issued transactions to obtain an advantageous price and yield at the time of the transaction. The Funds engage in when-issued and forward delivery transactions for the purpose of acquiring securities, but may enter into a separate agreement to sell the securities before the settlement date. Since the value of securities purchased may fluctuate prior to settlement, the Funds may be required to pay more at settlement than the security is worth. In addition, the Funds are not entitled to any of the interest earned prior to settlement.
Delayed delivery transactions involve a commitment by the Funds to purchase or sell securities for a predetermined price or yield, with payment and delivery taking place beyond the customary settlement period. When delayed delivery transactions are outstanding, the Funds will segregate with its custodian either cash, U.S. Government securities, or other liquid assets at least equal to the value or purchase commitments until payment is made. When purchasing a security on a delayed delivery basis, the Funds assume the rights and risks of ownership of the security, including the risk of price and yield fluctuations. These transactions also involve a risk to the Funds if the other party to the transaction defaults on its obligation to make payment or delivery, and the Funds are delayed or prevented from completing the transaction. The Funds may dispose of or renegotiate a delayed delivery transaction after it is entered into, which may result in a realized gain or loss. When the Funds sell a security on a delayed delivery basis, the Funds do not participate in future gains and losses on the security.
Open when-issued securities at October 31, 2014, if any, are identified in the Schedule of Investments.
Treasury inflation-protected securities (“TIPS”): Certain Funds may invest in TIPS. TIPS are fixed income securities whose principal value is periodically adjusted according to the rate of inflation/deflation. If the index measuring inflation/deflation rises or falls, the principal value of TIPS will be adjusted upward or downward, and consequently the interest payable on these securities (calculated with respect to a larger or smaller principal amount) will be increased or reduced, respectively. Any upward or downward adjustment in the principal amount of a TIPS will be included as interest income in the Statements of Operations, even though investors do not receive their principal until maturity. Repayment of the original bond principal upon maturity (as adjusted for inflation) is guaranteed in the case of U.S. Treasury inflation-indexed bonds. For bonds that do not provide a similar guarantee, the adjusted principal value of the bond repaid at maturity may be less than the original principal.
The adjustments, if any, to principal due to inflation/deflation are reflected as increases/decreases to Interest income in the Statements of Operations with a corresponding adjustment to cost.
Payment in-kind securities (“PIKs”): PIKs give the issuer the option of making interest payments in either cash or additional debt securities at each interest payment date. Those additional debt securities usually have the same terms, including maturity dates and interest rates, and associated risks as the original bonds. The daily market quotations of the original bonds may include the accrued interest (referred to as a “dirty price”) and require a pro-rata adjustment from unrealized appreciation or depreciation on investments to interest receivable in the Statements of Assets and Liabilities.
Open PIKs at October 31, 2014, if any, are identified in the Schedule of Investments.
| | |
| Transamerica Funds | | Annual Report 2014 |
Page 327
NOTES TO FINANCIAL STATEMENTS (continued)
At October 31, 2014
NOTE 1. (continued)
Restricted and illiquid securities: The Funds may invest in unregulated restricted securities. Restricted and illiquid securities are subject to legal or contractual restrictions on resale or are illiquid. Restricted securities generally may be resold in transactions exempt from registration under the Securities Act of 1933. A security may be considered illiquid if it lacks a readily available market or if its valuation has not changed for a certain period of time. Disposal of these securities may involve time-consuming negotiations and expense, and prompt sale at the current valuation may be difficult.
The restricted and illiquid securities at October 31, 2014, if any, are identified in the Schedule of Investments.
Commission recapture: The sub-adviser, to the extent consistent with the best execution and usual commission rate policies and practices, has elected to place security transactions of the Funds with broker/dealers with which Transamerica Funds has established a Commission Recapture Program. A Commission Recapture Program is any arrangement under which a broker/dealer applies a portion of the commissions received by such broker/dealer on the security transactions to the Funds. In no event will commissions paid by the Funds be used to pay expenses that would otherwise be borne by any other funds within Transamerica Funds, or by any other party.
Commissions recaptured for the year ended October 31, 2014, are included in Net realized gain (loss) in the Statements of Operations and are summarized as follows:
| | | | |
| Fund Name | | Commissions | |
Transamerica Capital Growth | | $ | 24,051 | |
Transamerica Concentrated Growth | | | 20,877 | |
Transamerica Dividend Focused | | | 139,464 | |
Transamerica Growth Opportunities | | | 33,427 | |
Transamerica Income & Growth | | | 4,981 | |
Transamerica International Equity | | | 4,924 | |
Transamerica International Small Cap Value | | | 1,161 | |
Transamerica Large Cap Value | | | 11,052 | |
Transamerica Mid Cap Value Opportunities | | | 12,806 | |
Transamerica MLP & Energy Income | | | 2,448 | |
Transamerica Multi-Managed Balanced | | | 4,129 | |
Transamerica Small Cap Growth | | | 24,795 | |
Transamerica Small Cap Value | | | 110,153 | |
Transamerica Small/Mid Cap Value | | | 259,096 | |
Transamerica Strategic High Income | | | 1,264 | |
Transamerica US Growth | | | 1,990 | |
Security transactions and investment income: Security transactions are recorded on the trade date. Security gains and losses are calculated on the specific identification basis. Dividend income, if any, is recorded on the ex-dividend date or, in the case of foreign securities, as soon as the Funds are informed of the ex-dividend dates, net of foreign taxes. Interest income, including accretion of discounts and amortization of premiums, is recorded on the accrual basis commencing on the settlement date.
Real estate investment trusts (“REITs”): Dividend income related to a REIT is recorded at management’s estimate of the income included in distributions from the REIT investments. Distributions received in excess of the estimated amount are recorded as a reduction of the cost of investments. The actual amounts of income, return of capital, and capital gains are only determined by each REIT after the fiscal year end and may differ from the estimated amounts. There are certain additional risks involved in investing in REITs. These include, but are not limited to, economic conditions, changes in zoning laws, real estate values, property taxes, and interest rates.
Open REITs at October 31, 2014, if any, are identified in the Schedule of Investments.
Multiple class operations, income, and expenses: Income, non-class specific expenses, and realized and unrealized gains and losses are allocated to each class daily based upon net assets. Each class bears its own specific expenses in addition to the non-class specific expenses.
Dividend distributions: Distributions to shareholders are recorded on the ex-dividend date and are determined in accordance with federal income tax regulations, which may differ from GAAP.
| | |
| Transamerica Funds | | Annual Report 2014 |
Page 328
NOTES TO FINANCIAL STATEMENTS (continued)
At October 31, 2014
NOTE 2. SECURITY VALUATION
All investments in securities are recorded at their estimated fair value. The Funds value their investments at the close of the New York Stock Exchange (“NYSE”), normally 4:00 p.m. Eastern Time, each day the NYSE is open for business. The Funds utilize various methods to measure the fair value of their investments on a recurring basis.
GAAP establishes a hierarchy that prioritizes inputs to valuation methods. The inputs or methodology used for valuing securities are not necessarily an indication of the risk associated with investing in those securities. The three Levels of inputs of the fair value hierarchy are defined as follows:
Level 1—Unadjusted quoted prices in active markets for identical securities.
Level 2—Inputs, other than quoted prices included in Level 1, that are observable, either directly or indirectly. These inputs may include quoted prices for the identical instrument on an inactive market, prices for similar instruments, interest rates, prepayment speeds, credit risk, yield curves, default rates, and similar data.
Level 3—Unobservable inputs, which may include TAM’s internal valuation committee’s (the “Valuation Committee”) own assumptions in determining the fair value of investments. Factors considered in making this determination may include, but are not limited to, information obtained by contacting the sub-adviser, issuer, analysts, or the appropriate stock exchange (for exchange-traded securities), analysis of the issuer’s financial statements or other available documents and, if necessary, available information concerning other securities in similar circumstances.
The inputs used to measure fair value may fall into different Levels of the fair value hierarchy. In such cases, for disclosure purposes, the Level in the fair value hierarchy that is assigned to the fair value measurement of a security is determined based on the lowest Level input that is significant to the fair value measurement in its entirety. The hierarchy classification of inputs used to value the Funds’ investments, at October 31, 2014, is disclosed in the Valuation Summary of each Fund’s Schedule of Investments.
The Funds’ Board has delegated the valuation functions on a day-to-day basis to TAM, subject to Board oversight. TAM has formed the Valuation Committee to monitor and implement the fair valuation policies and procedures as approved by the Board. These policies and procedures are reviewed at least annually by the Board. The Valuation Committee, among other tasks, monitors for when market quotations are not readily available or are unreliable and determines in good faith the fair value of the portfolio investments. For instances in which daily market quotes are not readily available, securities may be valued, pursuant to procedures adopted by the Board, with reference to other instruments or indices. Depending on the relative significance of valuation inputs, these instruments may be classified in either Level 2 or Level 3 of the fair value hierarchy.
The Valuation Committee may employ a market-based approach which may use related or comparable assets or liabilities, recent transactions, market multiples, book values, and other relevant information for the security to determine the fair value of the security. An income-based valuation approach may also be used in which the anticipated future cash flows of the security are discounted to calculate fair value. Discounts may also be applied due to the nature or duration of any restrictions on the disposition of the securities. When the Funds use fair value methods that rely on significant unobservable inputs to determine a security’s value, the Valuation Committee will choose the method that is believed to accurately reflect fair value. These securities are categorized in Level 3 of the fair value hierarchy. The Valuation Committee reviews fair value measurements on a regular and ad hoc basis and may, as deemed appropriate, update the security valuations as well as the fair valuation guidelines.
The availability of observable inputs can vary from security to security and is affected by a wide variety of factors, including, but not limited to, the type of security, whether the security is new and not yet established in the marketplace, the liquidity of markets, and other characteristics particular to the security. To the extent that valuation is based on models or inputs that are less observable or unobservable in the market, the determination of fair value requires more judgment. Accordingly, the degree of judgment exercised in determining fair value is generally greatest for instruments categorized in Level 3. Due to the inherent uncertainty of valuation, the Valuation Committee’s determination of values may differ significantly from values that would have been realized had a ready market for investments existed, and the differences could be material. The Valuation Committee employs various methods for calibrating these valuation approaches, including a regular review of valuation methodologies, key inputs and assumptions, transactional back-testing, and reviews of any market related activity.
Fair value measurements: Descriptions of the valuation techniques applied to the Funds’ major categories of assets and liabilities measured at fair value on a recurring basis are as follows:
Investment companies: Investment companies are valued at the NAV of the underlying funds. These securities are actively traded and no valuation adjustments are applied. Exchange-Traded Funds (“ETF”) are stated at the last reported sale price or closing price on the day of valuation taken from the primary exchange where the security is principally traded. They are categorized in Level 1 of the fair
| | |
| Transamerica Funds | | Annual Report 2014 |
Page 329
NOTES TO FINANCIAL STATEMENTS (continued)
At October 31, 2014
NOTE 2. (continued)
value hierarchy. Investments in privately held investment funds with significant restrictions on redemptions where the inputs of NAVs are unobservable will be valued based upon the NAVs of such investments and are categorized in Level 3 of the fair value hierarchy.
Equity securities (common and preferred stocks): Securities are stated at the last reported sales price or closing price on the day of valuation taken from the primary exchange where the security is principally traded. To the extent these securities are actively traded and valuation adjustments are not applied, they are categorized in Level 1 of the fair value hierarchy.
Foreign securities, in which the primary trading market closes at the same time or after the NYSE, are valued based on quotations from the primary market in which they are traded and are categorized in Level 1. Because many foreign securities markets and exchanges close prior to the close of the NYSE, closing prices for foreign securities in those markets or on those exchanges do not reflect the events that occur after that close. Certain foreign securities may be fair valued using a pricing service that considers the correlation of the trading patterns of the foreign security to the intraday trading in the U.S. markets for investments such as American Depositary Receipts, financial futures, ETF, and the movement of the certain indices of securities based on a statistical analysis of their historical relationship; such valuations generally are categorized in Level 2.
Preferred stock and other equities traded on inactive markets or valued by reference to similar instruments are also generally categorized in Level 2 or Level 3 if inputs are unobservable.
Securities lending collateral: Securities lending collateral is invested in a money market fund which is valued at the NAV of the underlying securities and no valuation adjustments are applied. It is categorized in Level 1 of the fair value hierarchy.
Repurchase agreements: Repurchase agreements are traded on inactive markets or valued by reference to similar instruments and are generally categorized in Level 2.
Corporate bonds: The fair value of corporate bonds is estimated using various techniques, which consider recently executed transactions in securities of the issuer or comparable issuers, market price quotations (where observable), bond spreads, fundamental data relating to the issuer, and credit default swap spreads adjusted for any basis difference between cash and derivative instruments. While most corporate bonds are categorized in Level 2 of the fair value hierarchy, in instances where lower relative weight is placed on transaction prices, quotations, or similar observable inputs, they are categorized in Level 3.
Asset-backed securities: The fair value of asset-backed securities is estimated based on models that consider the estimated cash flows of each tranche of the entity, establish a benchmark yield, and develop an estimated tranche specific spread to the benchmark yield based on the unique attributes of the tranche. To the extent the inputs are observable and timely, the values would generally be categorized in Level 2 of the fair value hierarchy; otherwise they would be categorized in Level 3.
Municipal Bonds & Notes and Variable Rate Notes: The fair value of municipal bonds & notes and variable rate notes is estimated based on models that consider, among other factors, information received from market makers and broker-dealers, current trades, bid-want lists, offerings, market movements, the liquidity of the bond, state of issuance, benchmark yield curves, and bond or note insurance. To the extent the inputs are observable and timely, the values would generally be categorized in Level 2 of the fair value hierarchy; otherwise they are categorized in Level 3.
Mortgage-Backed Securities: The fair value of mortgage-backed securities is estimated based on models based that consider issuer type, coupon, cash flows, mortgage prepayment projection tables and adjustable rate mortgage evaluations that incorporate index data, periodic life caps and the next coupon reset date. To the extent the inputs are observable and timely, the values would generally be categorized in Level 2 of the fair value hierarchy; otherwise they are categorized in Level 3.
Short-term notes: Short-term notes are valued using amortized cost, which approximates fair value. To the extent the inputs are observable and timely, the values would be generally categorized in Level 2 of the fair value hierarchy; otherwise they would be categorized in Level 3.
Government securities: Government securities are normally valued using a model that incorporates market observable data such as reported sales of similar securities, broker quotes, yields, bids, offers, and reference data. Certain securities are valued by principally using dealer quotations. Government securities generally are categorized in Level 2 of the fair value hierarchy, or Level 3 if inputs are unobservable.
U.S. Government agency securities: U.S. Government Agency securities are comprised of two main categories consisting of agency issued debt and mortgage pass-throughs. Generally, agency issued debt securities are valued in a manner similar to U.S. Government securities. Mortgage pass-throughs include TBA securities and mortgage pass-through certificates. Generally, TBA securities and
| | |
| Transamerica Funds | | Annual Report 2014 |
Page 330
NOTES TO FINANCIAL STATEMENTS (continued)
At October 31, 2014
NOTE 2. (continued)
mortgage pass-throughs are valued using dealer quotations. Depending on market activity levels and whether quotations or other observable data are used, these securities are typically categorized in Level 2 of the fair value hierarchy; otherwise they would be categorized in Level 3.
Restricted securities (equity and debt): Restricted securities for which quotations are not readily available are valued at fair value as determined in good faith by the Valuation Committee under the supervision of the Funds’ Board. Restricted securities issued by publicly traded companies are generally valued at a discount to similar publicly traded securities. Restricted securities issued by nonpublic entities may be valued by reference to comparable public entities and/or fundamental data relating to the issuer. Depending on the relative significance of observable valuation inputs, these instruments may be classified in either Level 2 or Level 3 of the fair value hierarchy.
Derivative instruments: Listed derivatives that are actively traded are valued based on quoted prices from the exchange and are categorized in Level 1 of the fair value hierarchy. OTC derivative contracts include forward, swap, swaption, and option contracts related to interest rates, foreign currencies, credit standing of reference entities, equity prices, or commodity prices. Depending on the product and the terms of the transaction, the fair value of the OTC derivative products are modeled taking into account the counterparties’ creditworthiness and using a series of techniques, including simulation models. Many pricing models do not entail material subjectivity because the methodologies employed do not necessitate significant judgments and the pricing inputs are observed from actively quoted markets, as is the case of interest rate swap and option contracts. A substantial majority of OTC derivative products valued by the Funds using pricing models fall into this category and are categorized within Level 2 of the fair value hierarchy or Level 3 if inputs are unobservable.
NOTE 3. RELATED PARTY TRANSACTIONS
TAM, the Funds’ investment adviser, is directly owned by Transamerica Premier Life Insurance Company (“TPLIC”) and AUSA Holding Company (“AUSA”), both of which are indirect, wholly owned subsidiaries of Aegon NV. TPLIC is owned by Commonwealth General Corporation (“Commonwealth”) and Aegon USA, LLC (“Aegon USA”). Commonwealth and AUSA are wholly owned by Aegon USA. Aegon USA is wholly owned by Aegon US Holding Corporation, which is wholly owned by Transamerica Corporation (DE). Transamerica Corporation (DE) is wholly owned by The Aegon Trust, which is wholly owned by Aegon International B.V., which is wholly owned by Aegon NV, a Netherlands corporation, and a publicly traded international insurance group.
Aegon USA Investment Management LLC (“AUIM”) is both an affiliate and a sub-adviser of Transamerica Flexible Income, Transamerica Floating Rate, Transamerica High Yield Bond, Transamerica Money Market, Transamerica Multi-Managed Balanced, Transamerica Opportunistic Allocation, Transamerica Short-Term Bond, Transamerica Tactical Allocation, Transamerica Tactical Income, and Transamerica Tactical Rotation. Since its inception, Transamerica Tactical Income has been managed using a tactical and strategic asset allocation process. The tactical and strategic process has involved the combination of a number of methods, inputs and analyses applied in the portfolio manager’s discretion. Reliance on any particular input has not been required, and inputs may change over time. For example, the portfolio managers may take into account the output from a proprietary quantitative framework when making changes to the Funds’ asset mix. The portfolio managers also may rely on other investment tools and resources when making investment decisions for the Funds. More information appears in the Funds’ prospectus.
Torray LLC was the investment advisor for The Torray Resolute Fund prior to the reorganization with Transamerica Concentrated Growth.
TFS is the Funds’ administrator and transfer agent. Transamerica Capital, Inc. (“TCI”) is the Funds’ distributor/principal underwriter. TAM, TFS, and TCI are affiliates of Aegon NV.
BNY Mellon Investment Servicing was the administrator and transfer agent for The Torray Resolute Fund prior to the reorganization with Transamerica Concentrated Growth.
Certain officers and trustees of the Funds are also officers and/or trustees of TAM, AUIM, TFS, and TCI. No interested trustee who is deemed an interested person due to current or former service with TAM or an affiliate of TAM, receives compensation from the Funds.
| | |
| Transamerica Funds | | Annual Report 2014 |
Page 331
NOTES TO FINANCIAL STATEMENTS (continued)
At October 31, 2014
NOTE 3. (continued)
At the commencement of operations TAM invested in the Funds. As of October 31, 2014, TAM’s investment in the Funds were as follows:
| | | | | | | | |
| Fund Name | | Market Value | | | % of Fund’s Net Assets | |
Transamerica Opportunistic Allocation | | | | | | | | |
Class A | | $ | 260,953 | | | | 24.67 | % |
Class C | | | 259,213 | | | | 24.51 | |
Class I | | | 523,681 | | | | 49.51 | |
The following schedule reflects the percentage of each Fund’s assets owned by affiliated investment companies at October 31, 2014:
| | | | | | | | |
| Transamerica Capital Growth | | Market Value | | | % of Net
Assets | |
Transamerica Asset Allocation –Conservative Portfolio | | $ | 24,585,975 | | | | 2.09 | % |
Transamerica Asset Allocation – Growth Portfolio | | | 93,726,092 | | | | 7.95 | |
Transamerica Asset Allocation – Growth VP | | | 113,478,415 | | | | 9.62 | |
Transamerica Asset Allocation – Moderate Growth Portfolio | | | 141,966,010 | | | | 12.04 | |
Transamerica Asset Allocation – Moderate Growth VP | | | 266,586,771 | | | | 22.60 | |
Transamerica Asset Allocation – Moderate Portfolio | | | 68,232,591 | | | | 5.79 | |
Transamerica Asset Allocation – Moderate VP | | | 111,750,149 | | | | 9.48 | |
Transamerica Voya Balanced Allocation VP | | | 174,590 | | | | 0.01 | |
Transamerica Voya Moderate Growth Allocation VP | | | 303,646 | | | | 0.03 | |
Total | | $ | 820,804,239 | | | | 69.61 | % |
Transamerica Concentrated
Growth | | Market Value | | | % of Net
Assets | |
Transamerica Asset Allocation – Conservative Portfolio | | $ | 17,753,918 | | | | 4.75 | % |
Transamerica Asset Allocation – Conservative VP | | | 66,882,670 | | | | 17.89 | |
Transamerica Asset Allocation – Growth Portfolio | | | 68,667,772 | | | | 18.37 | |
Transamerica Asset Allocation – Moderate Growth Portfolio | | | 102,609,879 | | | | 27.45 | |
Transamerica Asset Allocation – Moderate Portfolio | | | 49,345,777 | | | | 13.20 | |
Transamerica Asset Allocation – Moderate VP | | | 36,558,573 | | | | 9.78 | |
Transamerica Voya Balanced Allocation VP | | | 120,347 | | | | 0.03 | |
Transamerica Voya Conservative Allocation VP | | | 69,646 | | | | 0.02 | |
Total | | $ | 342,008,582 | | | | 91.49 | % |
| | | | | | | | |
| Transamerica Dividend Focused | | Market Value | | | % of Net
Assets | |
Transamerica Asset Allocation – Conservative Portfolio | | $ | 56,473,208 | | | | 3.82 | % |
Transamerica Asset Allocation – Conservative VP | | | 55,339,230 | | | | 3.75 | |
Transamerica Asset Allocation – Growth Portfolio | | | 217,262,282 | | | | 14.71 | |
Transamerica Asset Allocation – Growth VP | | | 48,163,048 | | | | 3.26 | |
Transamerica Asset Allocation – Moderate Growth Portfolio | | | 325,360,195 | | | | 22.03 | |
Transamerica Asset Allocation – Moderate Growth VP | | | 213,200,658 | | | | 14.43 | |
Transamerica Asset Allocation – Moderate Portfolio | | | 157,052,596 | | | | 10.63 | |
Transamerica Asset Allocation – Moderate VP | | | 292,483,246 | | | | 19.80 | |
Transamerica Voya Balanced Allocation VP | | | 467,472 | | | | 0.03 | |
Transamerica Voya Conservative Allocation VP | | | 52,021 | | | | 0.00 | (A) |
Transamerica Voya Moderate Growth Allocation VP | | | 244,940 | | | | 0.02 | |
Total | | $ | 1,366,098,896 | | | | 92.48 | % |
Transamerica Emerging Markets
Debt | | Market Value | | | % of Net
Assets | |
Transamerica Asset Allocation – Conservative Portfolio | | $ | 14,966,400 | | | | 2.53 | % |
Transamerica Asset Allocation – Moderate Growth Portfolio | | | 16,686,878 | | | | 2.82 | |
Transamerica Asset Allocation – Moderate Growth VP | | | 60,038,439 | | | | 10.13 | |
Transamerica Asset Allocation – Moderate Portfolio | | | 29,584,908 | | | | 4.99 | |
Transamerica International Moderate Growth VP | | | 3,726,031 | | | | 0.63 | |
Transamerica Multi-Manager Alternative Strategies Portfolio | | | 12,559,804 | | | | 2.12 | |
Transamerica Multi-Manager Alternative Strategies VP | | | 24,849 | | | | 0.00 | (A) |
Total | | $ | 137,587,309 | | | | 23.22 | % |
| | |
| Transamerica Funds | | Annual Report 2014 |
Page 332
NOTES TO FINANCIAL STATEMENTS (continued)
At October 31, 2014
NOTE 3. (continued)
| | | | | | | | |
Transamerica Emerging Markets
Equity | | Market Value | | | % of Net
Assets | |
Transamerica Asset Allocation – Conservative Portfolio | | $ | 6,697,165 | | | | 2.73 | % |
Transamerica Asset Allocation – Growth Portfolio | | | 22,395,040 | | | | 9.11 | |
Transamerica Asset Allocation – Growth VP | | | 27,691,405 | | | | 11.27 | |
Transamerica Asset Allocation – Moderate Growth Portfolio | | | 33,286,896 | | | | 13.55 | |
Transamerica Asset Allocation – Moderate Growth VP | | | 99,234,337 | | | | 40.38 | |
Transamerica Asset Allocation – Moderate Portfolio | | | 12,626,028 | | | | 5.14 | |
Transamerica Asset Allocation – Moderate VP | | | 35,323,473 | | | | 14.37 | |
Total | | $ | 237,254,344 | | | | 96.55 | % |
| Transamerica Flexible Income | | Market Value | | | % of Net
Assets | |
Transamerica Asset Allocation – Conservative Portfolio | | $ | 21,607,831 | | | | 2.96 | % |
Transamerica Asset Allocation – Conservative VP | | | 60,058,476 | | | | 8.23 | |
Transamerica Asset Allocation – Moderate Growth Portfolio | | | 15,147,292 | | | | 2.08 | |
Transamerica Asset Allocation – Moderate Growth VP | | | 131,163,274 | | | | 17.98 | |
Transamerica Asset Allocation – Moderate Portfolio | | | 65,081,735 | | | | 8.92 | |
Transamerica Asset Allocation – Moderate VP | | | 241,671,849 | | | | 33.14 | |
Transamerica Voya Balanced Allocation VP | | | 441,210 | | | | 0.06 | |
Transamerica Voya Conservative Allocation VP | | | 65,292 | | | | 0.01 | |
Transamerica Voya Moderate Growth Allocation VP | | | 144,528 | | | | 0.02 | |
Total | | $ | 535,381,487 | | | | 73.40 | % |
| Transamerica Floating Rate | | Market Value | | | % of Net
Assets | |
Transamerica Asset Allocation – Conservative VP | | $ | 26,513,164 | | | | 12.26 | % |
Transamerica Asset Allocation – Moderate Growth VP | | | 45,923,507 | | | | 21.24 | |
Transamerica Asset Allocation – Moderate VP | | | 131,645,775 | | | | 60.89 | |
Transamerica International Moderate Growth VP | | | 9,117,804 | | | | 4.22 | |
Transamerica Voya Balanced Allocation VP | | | 222,033 | | | | 0.10 | |
Transamerica Voya Conservative Allocation VP | | | 32,892 | | | | 0.02 | |
Transamerica Voya Moderate Growth Allocation VP | | | 58,198 | | | | 0.03 | |
Total | | $ | 213,513,373 | | | | 98.76 | % |
| | | | | | | | |
| Transamerica Global Bond | | Market Value | | | % of Net
Assets | |
Transamerica Asset Allocation – Conservative VP | | $ | 38,076,647 | | | | 15.89 | % |
Transamerica Asset Allocation – Moderate Growth VP | | | 74,744,855 | | | | 31.18 | |
Transamerica Asset Allocation – Moderate VP | | | 125,921,689 | | | | 52.53 | |
Transamerica Voya Balanced Allocation VP | | | 108,593 | | | | 0.05 | |
Total | | $ | 238,851,784 | | | | 99.65 | % |
| Transamerica Global Equity | | Market Value | | | % of Net
Assets | |
Transamerica Asset Allocation – Moderate Growth VP | | $ | 53,784,262 | | | | 18.02 | % |
Transamerica Asset Allocation – Moderate VP | | | 59,651,636 | | | | 19.97 | |
Transamerica International Moderate Growth VP | | | 13,690,539 | | | | 4.59 | |
Transamerica Voya Balanced Allocation VP | | | 114,643 | | | | 0.04 | |
Transamerica Voya Moderate Growth Allocation VP | | | 60,093 | | | | 0.02 | |
Total | | $ | 127,301,173 | | | | 42.64 | % |
Transamerica Growth
Opportunities | | Market Value | | | % of Net
Assets | |
Transamerica Asset Allocation – Conservative Portfolio | | $ | 17,932,515 | | | | 2.29 | % |
Transamerica Asset Allocation – Conservative VP | | | 26,256,246 | | | | 3.36 | |
Transamerica Asset Allocation – Growth Portfolio | | | 57,336,106 | | | | 7.34 | |
Transamerica Asset Allocation – Growth VP | | | 56,804,129 | | | | 7.27 | |
Transamerica Asset Allocation – Moderate Growth Portfolio | | | 105,508,117 | | | | 13.50 | |
Transamerica Asset Allocation – Moderate Growth VP | | | 137,630,152 | | | | 17.61 | |
Transamerica Asset Allocation – Moderate Portfolio | | | 54,067,480 | | | | 6.92 | |
Transamerica Asset Allocation – Moderate VP | | | 129,879,852 | | | | 16.62 | |
Transamerica Voya Balanced Allocation VP | | | 232,586 | | | | 0.03 | |
Transamerica Voya Conservative Allocation VP | | | 25,814 | | | | 0.00 | (A) |
Transamerica Voya Moderate Growth Allocation VP | | | 272,414 | | | | 0.03 | |
Total | | $ | 585,945,411 | | | | 74.97 | % |
| | |
| Transamerica Funds | | Annual Report 2014 |
Page 333
NOTES TO FINANCIAL STATEMENTS (continued)
At October 31, 2014
NOTE 3. (continued)
| | | | | | | | |
| Transamerica High Yield Bond | | Market Value | | | % of Net
Assets | |
Transamerica Asset Allocation – Conservative Portfolio | | $ | 24,615,051 | | | | 1.86 | % |
Transamerica Asset Allocation – Conservative VP | | | 67,850,011 | | | | 5.13 | |
Transamerica Asset Allocation – Moderate Growth Portfolio | | | 43,069,591 | | | | 3.25 | |
Transamerica Asset Allocation – Moderate Growth VP | | | 297,852,357 | | | | 22.51 | |
Transamerica Asset Allocation – Moderate Portfolio | | | 36,456,324 | | | | 2.75 | |
Transamerica Asset Allocation – Moderate VP | | | 222,292,256 | | | | 16.80 | |
Transamerica International Moderate Growth VP | | | 30,218,195 | | | | 2.28 | |
Transamerica Multi-Manager Alternative Strategies Portfolio | | | 30,431,428 | | | | 2.30 | |
Transamerica Multi-Manager Alternative Strategies VP | | | 60,231 | | | | 0.01 | |
Transamerica Voya Balanced Allocation VP | | | 444,758 | | | | 0.03 | |
Transamerica Voya Conservative Allocation VP | | | 65,894 | | | | 0.01 | |
Transamerica Voya Moderate Growth Allocation VP | | | 291,373 | | | | 0.02 | |
Total | | $ | 753,647,469 | | | | 56.95 | % |
| Transamerica Income & Growth | | Market Value | | | % of Net
Assets | |
Transamerica Asset Allocation – Conservative VP | | $ | 77,823,792 | | | | 8.71 | % |
Transamerica Asset Allocation – Growth VP | | | 11,832,900 | | | | 1.32 | |
Transamerica Asset Allocation – Moderate Growth VP | | | 211,172,956 | | | | 23.63 | |
Transamerica Asset Allocation – Moderate VP | | | 299,218,048 | | | | 33.49 | |
Transamerica International Moderate Growth VP | | | 56,820,838 | | | | 6.36 | |
Transamerica Voya Balanced Allocation VP | | | 572,653 | | | | 0.06 | |
Transamerica Voya Conservative Allocation VP | | | 81,319 | | | | 0.01 | |
Transamerica Voya Moderate Growth Allocation VP | | | 240,211 | | | | 0.03 | |
Total | | $ | 657,762,717 | | | | 73.61 | % |
| | | | | | | | |
Transamerica Inflation
Opportunities | | Market Value | | | % of Net
Assets | |
Transamerica Asset Allocation – Conservative Portfolio | | $ | 48,936,825 | | | | 19.84 | % |
Transamerica Asset Allocation – Moderate Growth Portfolio | | | 58,552,194 | | | | 23.74 | |
Transamerica Asset Allocation – Moderate Portfolio | | | 64,828,831 | | | | 26.28 | |
Transamerica Asset Allocation – Moderate VP | | | 50,629,291 | | | | 20.53 | |
Transamerica Voya Balanced Allocation VP | | | 109,617 | | | | 0.04 | |
Total | | $ | 223,056,758 | | | | 90.43 | % |
| Transamerica International Equity | | Market Value | | | % of Net
Assets | |
Transamerica Asset Allocation – Conservative Portfolio | | $ | 12,426,584 | | | | 0.99 | % |
Transamerica Asset Allocation – Conservative VP | | | 14,940,060 | | | | 1.18 | |
Transamerica Asset Allocation – Growth Portfolio | | | 67,293,472 | | | | 5.33 | |
Transamerica Asset Allocation – Growth VP | | | 38,092,791 | | | | 3.02 | |
Transamerica Asset Allocation – Moderate Growth Portfolio | | | 77,965,384 | | | | 6.18 | |
Transamerica Asset Allocation – Moderate Growth VP | | | 143,665,331 | | | | 11.40 | |
Transamerica Asset Allocation – Moderate Portfolio | | | 46,206,036 | | | | 3.66 | |
Transamerica Asset Allocation – Moderate VP | | | 110,341,453 | | | | 8.75 | |
Transamerica International Moderate Growth VP | | | 73,414,636 | | | | 5.82 | |
Transamerica Voya Balanced Allocation VP | | | 229,957 | | | | 0.02 | |
Transamerica Voya Conservative Allocation VP | | | 17,045 | | | | 0.00 | (A) |
Transamerica Voya Moderate Growth Allocation VP | | | 150,840 | | | | 0.01 | |
Total | | $ | 584,743,589 | | | | 46.36 | % |
| | |
| Transamerica Funds | | Annual Report 2014 |
Page 334
NOTES TO FINANCIAL STATEMENTS (continued)
At October 31, 2014
NOTE 3. (continued)
| | | | | | | | |
Transamerica International
Small Cap Value | | Market Value | | | % of Net
Assets | |
Transamerica Asset Allocation – Conservative Portfolio | | $ | 4,274,328 | | | | 0.57 | % |
Transamerica Asset Allocation – Conservative VP | | | 26,194,167 | | | | 3.51 | |
Transamerica Asset Allocation – Growth Portfolio | | | 17,138,699 | | | | 2.29 | |
Transamerica Asset Allocation – Growth VP | | | 41,547,558 | | | | 5.56 | |
Transamerica Asset Allocation – Moderate Growth Portfolio | | | 32,347,640 | | | | 4.33 | |
Transamerica Asset Allocation – Moderate Growth VP | | | 170,542,023 | | | | 22.82 | |
Transamerica Asset Allocation – Moderate Portfolio | | | 13,744,190 | | | | 1.84 | |
Transamerica Asset Allocation – Moderate VP | | | 138,516,747 | | | | 18.54 | |
Transamerica International Moderate Growth VP | | | 83,580,412 | | | | 11.19 | |
Transamerica Voya Balanced Allocation VP | | | 229,521 | | | | 0.03 | |
Transamerica Voya Conservative Allocation VP | | | 17,280 | | | | 0.00 | (A) |
Transamerica Voya Moderate Growth Allocation VP | | | 150,667 | | | | 0.02 | |
Total | | $ | 528,283,232 | | | | 70.70 | % |
| Transamerica Large Cap Value | | Market Value | | | % of Net
Assets | |
Transamerica Asset Allocation – Conservative Portfolio | | $ | 55,601,729 | | | | 3.10 | % |
Transamerica Asset Allocation – Conservative VP | | | 88,973,810 | | | | 4.96 | |
Transamerica Asset Allocation – Growth Portfolio | | | 212,839,816 | | | | 11.86 | |
Transamerica Asset Allocation – Growth VP | | | 106,667,346 | | | | 5.95 | |
Transamerica Asset Allocation – Moderate Growth Portfolio | | | 320,537,606 | | | | 17.87 | |
Transamerica Asset Allocation – Moderate Growth VP | | | 383,977,096 | | | | 21.40 | |
Transamerica Asset Allocation – Moderate Portfolio | | | 153,163,946 | | | | 8.54 | |
Transamerica Asset Allocation – Moderate VP | | | 379,775,052 | | | | 21.17 | |
Transamerica Voya Balanced Allocation VP | | | 702,002 | | | | 0.04 | |
Transamerica Voya Conservative Allocation VP | | | 95,289 | | | | 0.01 | |
Transamerica Voya Moderate Growth Allocation VP | | | 428,435 | | | | 0.02 | |
Total | | $ | 1,702,762,127 | | | | 94.92 | % |
| | | | | | | | |
| Transamerica Mid Cap Growth | | Market Value | | | % of Net
Assets | |
Transamerica Asset Allocation – Moderate VP | | $ | 54,954,251 | | | | 97.71 | % |
Transamerica Voya Balanced Allocation VP | | | 120,220 | | | | 0.21 | |
Total | | $ | 55,074,471 | | | | 97.92 | % |
Transamerica Mid Cap Value
Opportunities | | Market Value | | | % of Net
Assets | |
Transamerica Asset Allocation – Conservative Portfolio | | $ | 4,653,475 | | | | 2.69 | % |
Transamerica Asset Allocation – Growth Portfolio | | | 31,590,747 | | | | 18.25 | |
Transamerica Asset Allocation – Moderate Growth Portfolio | | | 50,164,171 | | | | 28.97 | |
Transamerica Asset Allocation – Moderate Portfolio | | | 23,039,378 | | | | 13.31 | |
Transamerica Asset Allocation – Moderate VP | | | 53,928,563 | | | | 31.15 | |
Total | | $ | 163,376,334 | | | | 94.37 | % |
Transamerica MLP & Energy
Income | | Market Value | | | % of Net
Assets | |
Transamerica Asset Allocation – Conservative VP | | $ | 66,336,348 | | | | 9.56 | % |
Transamerica Asset Allocation – Growth VP | | | 20,208,924 | | | | 2.91 | |
Transamerica Asset Allocation – Moderate Growth VP | | | 85,004,896 | | | | 12.25 | |
Transamerica Asset Allocation – Moderate VP | | | 243,027,742 | | | | 35.02 | |
Transamerica Multi-Manager Alternative Strategies Portfolio | | | 48,542,717 | | | | 6.99 | |
Transamerica Multi-Manager Alternative Strategies VP | | | 95,997 | | | | 0.01 | |
Transamerica Voya Balanced Allocation VP | | | 392,955 | | | | 0.06 | |
Transamerica Voya Conservative Allocation VP | | | 66,278 | | | | 0.01 | |
Transamerica Voya Moderate Growth Allocation VP | | | 118,570 | | | | 0.02 | |
Total | | $ | 463,794,427 | | | | 66.83 | % |
| | |
| Transamerica Funds | | Annual Report 2014 |
Page 335
NOTES TO FINANCIAL STATEMENTS (continued)
At October 31, 2014
NOTE 3. (continued)
| | | | | | | | |
| Transamerica Money Market | | Market Value | | | % of Net
Assets | |
Transamerica Asset Allocation – Conservative VP | | $ | 473,101 | | | | 0.26 | % |
Transamerica Asset Allocation – Growth Portfolio | | | 60,293 | | | | 0.03 | |
Transamerica Asset Allocation – Growth VP | | | 3,912 | | | | 0.00 | (A) |
Transamerica Asset Allocation – Moderate Growth VP | | | 32,211 | | | | 0.02 | |
Transamerica Asset Allocation – Moderate VP | | | 23,553,746 | | | | 13.16 | |
Transamerica International Moderate Growth VP | | | 21,070 | | | | 0.01 | |
Transamerica Voya Balanced Allocation VP | | | 110,290 | | | | 0.06 | |
Transamerica Voya Conservative Allocation VP | | | 16,317 | | | | 0.01 | |
Transamerica Voya Moderate Growth Allocation VP | | | 57,811 | | | | 0.03 | |
Total | | $ | 24,328,751 | | | | 13.58 | % |
| Transamerica Short-Term Bond | | Market Value | | | % of Net
Assets | |
Transamerica Asset Allocation – Conservative Portfolio | | $ | 80,242,941 | | | | 1.97 | % |
Transamerica Asset Allocation – Conservative VP | | | 306,547,490 | | | | 7.55 | |
Transamerica Asset Allocation – Moderate Growth Portfolio | | | 69,753 | | | | 0.00 | (A) |
Transamerica Asset Allocation – Moderate Growth VP | | | 98,563,304 | | | | 2.42 | |
Transamerica Asset Allocation – Moderate Portfolio | | | 134,646,617 | | | | 3.31 | |
Transamerica Asset Allocation – Moderate VP | | | 683,451,601 | | | | 16.82 | |
Transamerica BlackRock Tactical Allocation VP | | | 23,315,109 | | | | 0.57 | |
Transamerica International Moderate Growth VP | | | 36,015,383 | | | | 0.89 | |
Transamerica Multi-Manager Alternative Strategies Portfolio | | | 9,083,086 | | | | 0.22 | |
Transamerica Multi-Manager Alternative Strategies VP | | | 17,974 | | | | 0.00 | (A) |
Transamerica Voya Balanced Allocation VP | | | 1,102,518 | | | | 0.03 | |
Transamerica Voya Conservative Allocation VP | | | 326,307 | | | | 0.01 | |
Transamerica Voya Moderate Growth Allocation VP | | | 115,575 | | | | 0.00 | (A) |
Total | | $ | 1,373,497,658 | | | | 33.79 | % |
| | | | | | | | |
| Transamerica Small Cap Core | | Market Value | | | % of Net
Assets | |
Transamerica Asset Allocation – Conservative Portfolio | | $ | 5,903,484 | | | | 2.78 | % |
Transamerica Asset Allocation – Conservative VP | | | 1,303,709 | | | | 0.61 | |
Transamerica Asset Allocation – Growth Portfolio | | | 4,825,611 | | | | 2.27 | |
Transamerica Asset Allocation – Growth VP | | | 18,194,534 | | | | 8.57 | |
Transamerica Asset Allocation – Moderate Growth Portfolio | | | 20,377,920 | | | | 9.60 | |
Transamerica Asset Allocation – Moderate Growth VP | | | 87,338,710 | | | | 41.16 | |
Transamerica Asset Allocation – Moderate Portfolio | | | 11,511,122 | | | | 5.42 | |
Transamerica Asset Allocation – Moderate VP | | | 61,265,320 | | | | 28.88 | |
Transamerica Voya Balanced Allocation VP | | | 117,920 | | | | 0.06 | |
Transamerica Voya Moderate Growth Allocation VP | | | 62,171 | | | | 0.03 | |
Total | | $ | 210,900,501 | | | | 99.38 | % |
| Transamerica Small Cap Growth | | Market Value | | | % of Net
Assets | |
Transamerica Asset Allocation – Conservative Portfolio | | $ | 6,957,874 | | | | 1.31 | % |
Transamerica Asset Allocation – Conservative VP | | | 34,171,837 | | | | 6.44 | |
Transamerica Asset Allocation – Growth Portfolio | | | 34,007,940 | | | | 6.41 | |
Transamerica Asset Allocation – Growth VP | | | 43,752,021 | | | | 8.24 | |
Transamerica Asset Allocation – Moderate Growth Portfolio | | | 25,133,174 | | | | 4.73 | |
Transamerica Asset Allocation – Moderate Growth VP | | | 176,059,230 | | | | 33.16 | |
Transamerica Asset Allocation – Moderate Portfolio | | | 15,428,587 | | | | 2.91 | |
Transamerica Asset Allocation – Moderate VP | | | 184,144,591 | | | | 34.69 | |
Transamerica Voya Balanced Allocation VP | | | 119,641 | | | | 0.02 | |
Transamerica Voya Moderate Growth Allocation VP | | | 124,973 | | | | 0.02 | |
Total | | $ | 519,899,868 | | | | 97.93 | % |
| | |
| Transamerica Funds | | Annual Report 2014 |
Page 336
NOTES TO FINANCIAL STATEMENTS (continued)
At October 31, 2014
NOTE 3. (continued)
| | | | | | | | |
| Transamerica Small Cap Value | | Market Value | | | % of Net
Assets | |
Transamerica Asset Allocation – Conservative Portfolio | | $ | 907,043 | | | | 0.13 | % |
Transamerica Asset Allocation – Conservative VP | | | 37,240,247 | | | | 5.47 | |
Transamerica Asset Allocation – Growth Portfolio | | | 35,912,675 | | | | 5.27 | |
Transamerica Asset Allocation – Growth VP | | | 52,905,596 | | | | 7.76 | |
Transamerica Asset Allocation – Moderate Growth Portfolio | | | 28,942,369 | | | | 4.25 | |
Transamerica Asset Allocation – Moderate Growth VP | | | 254,136,095 | | | | 37.30 | |
Transamerica Asset Allocation – Moderate Portfolio | | | 15,627,619 | | | | 2.29 | |
Transamerica Asset Allocation – Moderate VP | | | 242,837,205 | | | | 35.64 | |
Transamerica Voya Balanced Allocation VP | | | 237,404 | | | | 0.03 | |
Transamerica Voya Moderate Growth Allocation VP | | | 186,613 | | | | 0.03 | |
Total | | $ | 668,932,866 | | | | 98.17 | % |
| | | | | | | | |
Transamerica Strategic High
Income | | Market
Value | | | % of Net
Assets | |
Transamerica Multi-Manager Alternative Strategies Portfolio | | $ | 22,577,659 | | | | 58.20 | % |
Transamerica Multi-Manager Alternative Strategies VP | | | 44,666 | | | | 0.12 | |
Total | | $ | 22,622,325 | | | | 58.32 | % |
| Transamerica US Growth | | Market
Value | | | % of Net
Assets | |
Transamerica Asset Allocation – Conservative Portfolio | | $ | 26,078,954 | | | | 2.16 | % |
Transamerica Asset Allocation – Growth Portfolio | | | 99,402,820 | | | | 8.22 | |
Transamerica Asset Allocation – Moderate Growth Portfolio | | | 150,616,218 | | | | 12.45 | |
Transamerica Asset Allocation – Moderate Portfolio | | | 70,958,245 | | | | 5.87 | |
Total | | $ | 347,056,237 | | | | 28.70 | % |
| (A) | Percentage rounds to less than 0.01%. |
Investment advisory fees: The Funds pay management fees to TAM based on daily Average Net Assets (“ANA”) at the following rates:
| | |
| Fund Name | | Rate |
Transamerica Capital Growth | | |
First $500 million | | 0.8000% |
Over $500 million | | 0.6750 |
Transamerica Concentrated Growth Effective March 1, 2014 |
First $650 million | | 0.6500 |
Over $650 million up to $1.15 billion | | 0.6300 |
Over $1.15 billion | | 0.5750 |
Prior to March 1, 2014 | | 1.0000 |
Transamerica Dividend Focused | | |
First $200 million | | 0.7500 |
Over $200 million up to $500 million | | 0.6500 |
Over $500 million | | 0.6000 |
Transamerica Emerging Markets Debt | | |
First $400 million | | 0.6000 |
Over $400 million | | 0.5800 |
Transamerica Emerging Markets Equity | | |
First $250 million | | 0.9500 |
Over $250 million up to $500 million | | 0.9300 |
Over $500 million | | 0.9000 |
Transamerica Enhanced Muni | | |
First $150 million | | 0.4400 |
Over $150 million up to $350 million | | 0.4200 |
Over $350 million up to $650 million | | 0.4100 |
Over $650 million up to $1 billion | | 0.3900 |
Over $1 billion | | 0.3600 |
| | |
| Fund Name | | Rate |
Transamerica Flexible Income | | |
First $250 million | | 0.4750% |
Over $250 million up to $350 million | | 0.4250 |
Over $350 million | | 0.4000 |
Transamerica Floating Rate | | |
First $1 billion | | 0.6100 |
Over $1 billion up to $1.5 billion | | 0.5900 |
Over $1.5 billion up to $2 billion | | 0.5700 |
Over $2 billion | | 0.5600 |
Transamerica Global Bond | | |
First $750 million | | 0.5400 |
Over $750 million up to $1.5 billion | | 0.5200 |
Over $1.5 billion | | 0.5100 |
Transamerica Global Equity Effective September 4, 2014 | | |
First $250 million | | 0.8100 |
Over $250 million up to $500 million | | 0.8000 |
Over $500 million up to $1 billion | | 0.7900 |
Over $1 billion up to $2 billion | | 0.7800 |
Over $2 billion up to $2.5 billion | | 0.7650 |
Over $2.5 billion | | 0.7600 |
Prior to September 4, 2014 | | 0.1000 |
Transamerica Growth Opportunities | | |
First $250 million | | 0.8000 |
Over $250 million up to $500 million | | 0.7500 |
Over $500 million | | 0.7000 |
| | |
| Transamerica Funds | | Annual Report 2014 |
Page 337
NOTES TO FINANCIAL STATEMENTS (continued)
At October 31, 2014
NOTE 3. (continued)
| | |
| Fund Name | | Rate |
Transamerica High Yield Bond Effective May 1, 2014 |
First $1.25 billion | | 0.5500% |
Over $1.25 billion up to $2 billion | | 0.5250 |
Over $2 billion | | 0.5000 |
Prior to May 1, 2014 | | |
First $400 million | | 0.5900 |
Over $400 million up to $750 million | | 0.5750 |
Over $750 million | | 0.5500 |
Transamerica High Yield Muni | | |
First $500 million | | 0.5100 |
Over $500 million up to $1 billion | | 0.5000 |
Over $1 billion | | 0.4700 |
Transamerica Income & Growth | | |
First $500 million | | 0.6700 |
Over $500 million up to $1 billion | | 0.6500 |
Over $1 billion up to $1.5 billion | | 0.6300 |
Over $1.5 billion | | 0.6000 |
Transamerica Inflation Opportunities | | |
First $200 million | | 0.5500 |
Over $200 million up to $500 million | | 0.5400 |
Over $500 million | | 0.5100 |
Transamerica International Equity Effective December 15, 2013 | | |
First $500 million | | 0.7400 |
Over $500 million up to $1 billion | | 0.7200 |
Over $1 billion up to $2 billion | | 0.6900 |
Over $2 billion | | 0.6600 |
Prior to December 15, 2013 | | |
First $250 million | | 0.8000 |
Over $250 million up to $500 million | | 0.7500 |
Over $500 million up to $1 billion | | 0.7250 |
Over $1 billion | | 0.7000 |
Transamerica International Small Cap Value | | |
First $300 million | | 0.9250 |
Over $300 million up to $750 million | | 0.9000 |
Over $750 million | | 0.8500 |
Transamerica Large Cap Value | | |
First $750 million | | 0.6500 |
Over $750 million up to $1 billion | | 0.6200 |
Over $1 billion | | 0.6000 |
Transamerica Mid Cap Growth | | |
First $1 billion | | 0.7200 |
Over $1 billion | | 0.7000 |
Transamerica Mid Cap Value Opportunities | | |
First $750 million | | 0.6700 |
Over $750 million up to $1.5 billion | | 0.6650 |
Over $1.5 billion up to $2 billion | | 0.6550 |
Over $2 billion | | 0.6475 |
Transamerica MLP & Energy Income | | |
First $250 million | | 1.1000 |
Over $250 million up to $500 million | | 1.0500 |
Over $500 million up to $1 billion | | 0.9800 |
Over $1 billion up to $2 billion | | 0.8800 |
Over $2 billion | | 0.8200 |
Transamerica Money Market | | 0.4000 |
| | |
| Fund Name | | Rate |
Transamerica Multi-Managed Balanced Effective May 1, 2014 |
First $1 billion | | 0.6500% |
Over $1 billion | | 0.6000 |
Prior to May 1, 2014 | | |
First $500 million | | 0.6700 |
Over $500 million up to $1 billion | | 0.6500 |
Over $1 billion | | 0.6000 |
Transamerica Opportunistic Allocation | | |
First $250 million | | 0.4200 |
Over $250 million up to $1 billion | | 0.4000 |
Over $1 billion | | 0.3800 |
Transamerica Short-Term Bond | | |
First $250 million | | 0.5500 |
Over $250 million up to $500 million | | 0.5000 |
Over $500 million up to $1 billion | | 0.4750 |
Over $1 billion | | 0.4500 |
Transamerica Small Cap Core | | |
First $300 million | | 0.8000 |
Over $300 million | | 0.7700 |
Transamerica Small Cap Growth | | |
First $300 million | | 0.8400 |
Over $300 million | | 0.8000 |
Transamerica Small Cap Value | | |
First $250 million | | 0.8600 |
Over $250 million | | 0.8400 |
Transamerica Small/Mid Cap Value | | |
First $500 million | | 0.8000 |
Over $500 million | | 0.7500 |
Transamerica Strategic High Income | | |
First $600 million | | 0.6600 |
Over $600 million up to $1 billion | | 0.6300 |
Over $1 billion up to $2 billion | | 0.6000 |
Over $2 billion | | 0.5850 |
Transamerica Tactical Allocation | | |
First $250 million | | 0.5500 |
Over $250 million up to $500 million | | 0.5400 |
Over $500 million up to $1.5 billion | | 0.5300 |
Over $1.5 billion up to $2.5 billion | | 0.5200 |
Over $2.5 billion | | 0.5100 |
Transamerica Tactical Income | | |
First $1 billion | | 0.4700 |
Over $1 billion up to $2 billion | | 0.4500 |
Over $2 billion | | 0.4300 |
Transamerica Tactical Rotation | | |
First $250 million | | 0.5500 |
Over $250 million up to $500 million | | 0.5400 |
Over $500 million up to $1.5 billion | | 0.5300 |
Over $1.5 billion up to $2.5 billion | | 0.5200 |
Over $2.5 billion | | 0.5100 |
| | |
| Transamerica Funds | | Annual Report 2014 |
Page 338
NOTES TO FINANCIAL STATEMENTS (continued)
At October 31, 2014
NOTE 3. (continued)
| | | | |
| Fund Name | | Rate | |
Transamerica US Growth Effective July 1, 2014 | | | | |
First $150 million | | | 0.7000 | % |
Over $150 million up to $650 million | | | 0.6700 | |
Over $650 million up to $1.15 billion | | | 0.6500 | |
Over $1.15 billion up to $2 billion | | | 0.6250 | |
Over $2 billion up to $3 billion | | | 0.6100 | |
Over $3 billion up to $4 billion | | | 0.6000 | |
Over $4 billion | | | 0.5800 | |
Prior to July 1, 2014 | | | | |
First $500 million | | | 0.7300 | |
Over $500 million up to $2.5 billion | | | 0.7000 | |
Over $2.5 billion | | | 0.6500 | |
TAM has contractually agreed to waive fees and/or reimburse Fund expenses to the extent that the total operating expenses excluding, as applicable, 12b-1 fees, acquired fund fees and expenses, interest, taxes, brokerage commissions, dividend and interest expenses on securities sold short, extraordinary expenses and other expenses not incurred in the ordinary course of the Funds’ business, exceed the following stated annual limit:
| | | | | | |
| Fund Name | | Expense Limit | | | Maximum Operating Expense Limit Effective Through |
Transamerica Capital Growth | | | 1.20 | % | | March 1, 2015 |
Transamerica Concentrated Growth
Effective March 1, 2014 | | | 0.95 | | | March 1, 2015 |
Prior to March 1, 2014 | | | 1.25 | | | |
Transamerica Dividend Focused | | | 0.90 | | | March 1, 2015 |
Transamerica Emerging Markets Debt | | | 1.00 | | | March 1, 2015 |
Transamerica Emerging Markets Equity | | | 1.60 | | | March 1, 2015 |
Transamerica Enhanced Muni | | | 0.71 | | | March 1, 2015 |
Transamerica Flexible Income | | | 1.00 | | | March 1, 2015 |
Transamerica Floating Rate | | | 0.80 | | | March 1, 2015 |
Transamerica Global Bond | | | 0.75 | | | March 1, 2015 |
Transamerica Global Equity
Effective September 4, 2014 | | | 1.10 | | | September 4, 2015 |
Prior to September 4, 2014 | | | 0.45 | | | |
Transamerica Growth Opportunities | | | 1.40 | | | March 1, 2015 |
Transamerica High Yield Bond | | | 0.95 | | | March 1, 2015 |
Transamerica High Yield Muni | | | 0.76 | | | March 1, 2015 |
Transamerica Income & Growth | | | 0.93 | | | March 1, 2015 |
Transamerica Inflation Opportunities | | | 0.75 | | | March 1, 2015 |
Transamerica International Equity | | | 1.15 | | | March 1, 2015 |
Transamerica International Small Cap Value | | | 1.22 | | | March 1, 2015 |
Transamerica Large Cap Value | | | 1.00 | | | March 1, 2015 |
Transamerica Mid Cap Growth | | | 1.05 | | | March 1, 2015 |
Transamerica Mid Cap Value Opportunities | | | 0.95 | | | April 30, 2015 |
Transamerica MLP & Energy Income | | | 1.35 | | | March 1, 2015 |
Transamerica Money Market | | | 0.48 | | | March 1, 2015 |
Transamerica Multi-Managed Balanced Effective March 1, 2014 | | | 1.20 | | | March 1, 2015 |
Prior to March 1, 2014 | | | 1.45 | | | |
Transamerica Opportunistic Allocation | | | 0.95 | | | March 1, 2015 |
Transamerica Short-Term Bond Effective March 1, 2014 | | | 0.80 | | | March 1, 2015 |
Prior to March 1, 2014 | | | 0.85 | | | |
| | |
| Transamerica Funds | | Annual Report 2014 |
Page 339
NOTES TO FINANCIAL STATEMENTS (continued)
At October 31, 2014
NOTE 3. (continued)
| | | | | | |
| Fund Name | | Expense Limit | | | Maximum Operating Expense Limit Effective Through |
Transamerica Small Cap Core | | | 1.05 | % | | March 1, 2015 |
Transamerica Small Cap Growth | | | 1.15 | | | March 1, 2015 |
Transamerica Small Cap Value | | | 1.15 | | | March 1, 2015 |
Transamerica Small/Mid Cap Value | | | 1.25 | | | March 1, 2015 |
Transamerica Strategic High Income | | | 0.95 | | | March 1, 2015 |
Transamerica Tactical Allocation | | | 0.85 | | | March 1, 2015 |
Transamerica Tactical Income | | | 0.67 | | | March 1, 2015 |
Transamerica Tactical Rotation | | | 0.85 | | | March 1, 2015 |
Transamerica US Growth | | | 1.17 | | | March 1, 2015 |
TAM is entitled to reimbursement by the Fund of fees waived and/or expenses reduced during any of the previous 36 months if on any day or month the estimated annualized Fund operating expenses are less than the stated annual limit.
During the year ended October 31, 2014, amounts recaptured by TAM were as follows:
| | | | |
| Fund Name | | Amount Recaptured | |
Transamerica Capital Growth | | | | |
Class B | | $ | 2,377 | |
Transamerica Concentrated Growth | | | | |
Class A | | | 4,808 | |
Class C | | | 1,074 | |
Class I | | | 14,937 | |
Class I2 | | | 518 | |
Transamerica Enhanced Muni | | | | |
Class A | | | 4,670 | |
Class C | | | 1,714 | |
Class I | | | 3,680 | |
Transamerica Floating Rate | | | | |
Class A | | | 206 | |
Class C | | | 319 | |
Class I | | | 126 | |
Class I2 | | | 8,690 | |
Transamerica Global Bond | | | | |
Class A | | | 10,167 | |
Class C | | | 2,825 | |
Class I | | | 2,945 | |
Class I2 | | | 102,494 | |
Transamerica Global Equity | | | | |
Class B | | | 56 | |
Class I2 | | | 2,007 | |
Transamerica High Yield Muni | | | | |
Class A | | | 5,216 | |
Class C | | | 4,444 | |
Class I | | | 10,969 | |
Transamerica Inflation Opportunities | | | | |
Class A | | | 11,260 | |
Class C | | | 2,596 | |
Class I | | | 3,018 | |
Class I2 | | | 54,695 | |
Transamerica International Small Cap Value | | | | |
Class I | | | 325 | |
| | |
| Transamerica Funds | | Annual Report 2014 |
Page 340
NOTES TO FINANCIAL STATEMENTS (continued)
At October 31, 2014
NOTE 3. (continued)
| | | | |
| Fund Name | | Amount Recaptured | |
Transamerica Mid Cap Growth | | | | |
Class A | | $ | 14,422 | |
Class C | | | 4,813 | |
Class I | | | 1,829 | |
Class I2 | | | 19,899 | |
Transamerica Mid Cap Value Opportunities | | | | |
Class A | | | 1,843 | |
Class C | | | 1,323 | |
Class I | | | 1,266 | |
Class I2 | | | 9,647 | |
Transamerica MLP & Energy Income | | | | |
Class A | | | 4,999 | |
Class C | | | 337 | |
Class I | | | 1,844 | |
Transamerica Small Cap Core | | | | |
Class A | | | 14,192 | |
Class C | | | 4,594 | |
Class I | | | 1,693 | |
Transamerica Small Cap Value | | | | |
Class A | | | 13 | |
Transamerica Strategic High Income | | | | |
Class A | | | 12,976 | |
Class C | | | 4,749 | |
Class I | | | 4,159 | |
Class I2 | | | 2,406 | |
Transamerica Tactical Allocation | | | | |
Class A | | | 1,145 | |
Class C | | | 4,049 | |
Class I | | | 1,179 | |
Transamerica Tactical Rotation | | | | |
Class A | | | 1,030 | |
Class C | | | 1,765 | |
Class I | | | 1,333 | |
Transamerica US Growth | | | | |
Class B | | | 10,596 | |
The following amounts are available for recapture by TAM as of October 31, 2014:
| | | | | | | | |
| Fund Name/Class | | Amount
Available | | | Year
Reimbursed | |
Transamerica Capital Growth | | | | | | | | |
Class B | | $ | 9,179 | | | | 2012 | |
| | | | 6,046 | | | | 2013 | |
| | | | 179 | | | | 2014 | |
Transamerica Concentrated Growth | | | | | | | | |
Class I | | | 10,473 | | | | 2014 | |
Transamerica Enhanced Muni | | | | | | | | |
Fund Level | | | 136,857 | | | | 2013 | |
| | | | 36,025 | | | | 2014 | |
Class A | | | 7,784 | | | | 2014 | |
Class C | | | 3,611 | | | | 2014 | |
Class I | | | 2,928 | | | | 2013 | |
| | | | 18,466 | | | | 2014 | |
| | |
| Transamerica Funds | | Annual Report 2014 |
Page 341
NOTES TO FINANCIAL STATEMENTS (continued)
At October 31, 2014
NOTE 3. (continued)
| | | | | | | | |
| Fund Name/Class | | Amount
Available | | | Year
Reimbursed | |
Transamerica Floating Rate | | | | | | | | |
Fund Level | | $ | 92,099 | | | | 2014 | |
Class A | | | 548 | | | | 2014 | |
Class C | | | 1,273 | | | | 2014 | |
Class I | | | 436 | | | | 2014 | |
Class I2 | | | 11,313 | | | | 2014 | |
Transamerica Global Bond | | | | | | | | |
Fund Level | | | 34,156 | | | | 2014 | |
Class A | | | 98 | | | | 2014 | |
Class C | | | 47 | | | | 2014 | |
Class I | | | 262 | | | | 2014 | |
Class I2 | | | 6,969 | | | | 2014 | |
Transamerica Global Equity | | | | | | | | |
Class A | | | 13,487 | | | | 2014 | |
Class B | | | 12,688 | | | | 2012 | |
| | | | 10,329 | | | | 2013 | |
| | | | 7,365 | | | | 2014 | |
Class C | | | 13,840 | | | | 2014 | |
Transamerica High Yield Muni | | | | | | | | |
Fund Level | | | 81,791 | | | | 2013 | |
| | | | 74,946 | | | | 2014 | |
Class A | | | 1,729 | | | | 2014 | |
Class C | | | 466 | | | | 2014 | |
Class I | | | 3,136 | | | | 2014 | |
Transamerica Inflation Opportunities | | | | | | | | |
Class A | | | 27 | | | | 2014 | |
Class C | | | 30 | | | | 2014 | |
Class I | | | 159 | | | | 2014 | |
Transamerica Mid Cap Growth | | | | | | | | |
Class A | | | 52 | | | | 2014 | |
Class I | | | 159 | | | | 2014 | |
Transamerica Mid Cap Value Opportunities | | | | | | | | |
Class I | | | 104 | | | | 2014 | |
Transamerica Opportunistic Allocation | | | | | | | | |
Fund Level | | | 89,855 | | | | 2014 | |
Class A | | | 40 | | | | 2014 | |
Class C | | | 37 | | | | 2014 | |
Class I | | | 614 | | | | 2014 | |
Transamerica Small Cap Core | | | | | | | | |
Class A | | | 4 | | | | 2014 | |
Class C | | | 21 | | | | 2014 | |
Class I | | | 163 | | | | 2014 | |
Transamerica Strategic High Income | | | | | | | | |
Fund Level | | | 39,616 | | | | 2014 | |
Class A | | | 194 | | | | 2014 | |
Class C | | | 96 | | | | 2014 | |
Class I | | | 5,712 | | | | 2014 | |
Class I2 | | | 1,211 | | | | 2014 | |
| | |
| Transamerica Funds | | Annual Report 2014 |
Page 342
NOTES TO FINANCIAL STATEMENTS (continued)
At October 31, 2014
NOTE 3. (continued)
| | | | | | | | |
| Fund Name/Class | | Amount
Available | | | Year
Reimbursed | |
Transamerica Tactical Allocation | | | | | | | | |
Fund Level | | $ | 125,543 | | | | 2013 | |
| | | | 30,320 | | | | 2014 | |
Class A | | | 1,894 | | | | 2013 | |
| | | | 7,244 | | | | 2014 | |
Class C | | | 9,986 | | | | 2014 | |
Class I | | | 1,149 | | | | 2013 | |
| | | | 2,441 | | | | 2014 | |
Transamerica Tactical Rotation | | | | | | | | |
Fund Level | | | 134,422 | | | | 2013 | |
| | | | 13,272 | | | | 2014 | |
Class A | | | 2,179 | | | | 2013 | |
| | | | 14,290 | | | | 2014 | |
Class C | | | 716 | | | | 2013 | |
| | | | 11,573 | | | | 2014 | |
Class I | | | 4,919 | | | | 2014 | |
Transamerica US Growth | | | | | | | | |
Class B | | | 3,105 | | | | 2013 | |
| | | | 121 | | | | 2014 | |
In addition to the advisory fee waiver for Transamerica Money Market, TAM or any of its affiliates waive fees or reimburse expenses of one or more classes of Transamerica Money Market in order to avoid a negative yield. At any point in which Transamerica Money Market, or any classes thereof, achieves a positive yield, the expenses previously waived or reimbursed within the succeeding 36 months pursuant to this paragraph may be reimbursed to TAM, to the extent that such reimbursement does not cause classes of Transamerica Money Market to experience a negative yield. Waived expenses related to the maintenance of the yield are included in the Statements of Operations, within the Class expenses (waived/reimbursed) recaptured. For the year ended October 31, 2014 and year ended October 31, 2013, the amounts waived were as follows:
| | | | | | | | | | | | | | | | |
| Fund/Class | | 2014 Amount Waived | | | 2014 Amount Waived | | | 2013 Amount Waived | | | 2013 Amount Waived | |
Fund Level | | $ | 520,745 | | | | 0.27 | % | | $ | 1,596,778 | | | | 0.27 | % |
Class A | | | 232,884 | | | | 0.26 | | | | 250,546 | | | | 0.26 | |
Class B | | | 48,467 | | | | 0.99 | | | | 73,975 | | | | 0.96 | |
Class C | | | 255,779 | | | | 0.99 | | | | 279,510 | | | | 0.96 | |
Distribution and service fees: The Funds have 12b-1 distribution plans under the 1940 Act pursuant to which an annual fee, based on ANA, is paid to the distributor for various disbursements such as broker-dealer account servicing fees and other promotional expenses of the Funds. Pursuant to the distribution plan, the Trust entered into a distribution agreement with TCI as the Funds’ distributor. The Funds are authorized under the 12b-1 plans to pay fees on each class up to the following limits: 0.25% for Class A (effective March 1, 2014), 1.00% for Class B, and 1.00% for Class C. Prior to March 1, 2014, the Funds were authorized under the 12b-1 plans to pay up to 0.30% for Class A. 12b-1 fees are not applicable for Class I, Class I2, and Class T. Effective March 1, 2014, TAM has contractually agreed to waive 0.10% and 0.25% of 12b-1 fees on Class A shares and Class C shares, respectively, of Transamerica Enhanced Muni and Transamerica High Yield Muni through March 1, 2015. Prior to March 1, 2014, TAM had contractually agreed to waive 0.05% of 12b-1 fees on Class A shares of Transamerica Flexible Income, Transamerica Short-Term Bond, and Transamerica Tactical Income and to waive 0.15% and 0.25% of 12b-1 fees on Class A shares and Class C shares, respectively, of Transamerica Enhanced Muni and Transamerica High Yield Muni.
Underwriter commissions relate to front-end sales charges imposed for Class A shares and contingent deferred sales charges from Class B, Class C, and certain Class A share redemptions. For the year ended October 31, 2014, the underwriter commissions were as follows:
| | | | |
Transamerica Capital Growth | | | Amount | |
Received by Underwriter | | $ | 586,474 | |
Retained by Underwriter | | | 91,324 | |
Contingent Deferred Sales Charge | | | 8,227 | |
| | | | |
Transamerica Concentrated Growth | | | Amount | |
Received by Underwriter | | | $ 4,740 | |
Retained by Underwriter | | | 667 | |
Contingent Deferred Sales Charge | | | — | |
| | |
| Transamerica Funds | | Annual Report 2014 |
Page 343
NOTES TO FINANCIAL STATEMENTS (continued)
At October 31, 2014
NOTE 3. (continued)
| | | | |
Transamerica Dividend Focused | | | Amount | |
Received by Underwriter | | $ | 49,122 | |
Retained by Underwriter | | | 7,298 | |
Contingent Deferred Sales Charge | | | 107 | |
Transamerica Emerging Markets Debt | | | | |
Received by Underwriter | | $ | 116,543 | |
Retained by Underwriter | | | 19,849 | |
Contingent Deferred Sales Charge | | | 28,772 | |
Transamerica Emerging Markets Equity | | | | |
Received by Underwriter | | $ | 15,737 | |
Retained by Underwriter | | | 2,447 | |
Contingent Deferred Sales Charge | | | 250 | |
Transamerica Enhanced Muni | | | | |
Received by Underwriter | | $ | 136,372 | |
Retained by Underwriter | | | 32,324 | |
Contingent Deferred Sales Charge | | | 774 | |
Transamerica Flexible Income | | | | |
Received by Underwriter | | $ | 150,674 | |
Retained by Underwriter | | | 28,352 | |
Contingent Deferred Sales Charge | | | 11,388 | |
Transamerica Floating Rate | | | | |
Received by Underwriter | | $ | 19,665 | |
Retained by Underwriter | | | 4,145 | |
Contingent Deferred Sales Charge | | | 259 | |
Transamerica Global Bond | | | | |
Received by Underwriter | | $ | 475 | |
Retained by Underwriter | | | 92 | |
Contingent Deferred Sales Charge | | | — | |
Transamerica Global Equity | | | | |
Received by Underwriter | | $ | 63,747 | |
Retained by Underwriter | | | 10,370 | |
Contingent Deferred Sales Charge | | | 7,876 | |
Transamerica Growth Opportunities | | | | |
Received by Underwriter | | $ | 71,255 | |
Retained by Underwriter | | | 11,274 | |
Contingent Deferred Sales Charge | | | 4,554 | |
Transamerica High Yield Bond | | | | |
Received by Underwriter | | $ | 208,536 | |
Retained by Underwriter | | | 39,833 | |
Contingent Deferred Sales Charge | | | 49,596 | |
Transamerica High Yield Muni | | | | |
Received by Underwriter | | $ | 11,600 | |
Retained by Underwriter | | | 2,653 | |
Contingent Deferred Sales Charge | | | — | |
Transamerica Income & Growth | | | | |
Received by Underwriter | | $ | 1,048,436 | |
Retained by Underwriter | | | 163,311 | |
Contingent Deferred Sales Charge | | | 19,490 | |
Transamerica Inflation Opportunities | | | | |
Received by Underwriter | | $ | 94 | |
Retained by Underwriter | | | 15 | |
Contingent Deferred Sales Charge | | | 20 | |
| | | | |
Transamerica International Equity | | | Amount | |
Received by Underwriter | | $ | 303,583 | |
Retained by Underwriter | | | 46,404 | |
Contingent Deferred Sales Charge | | | 6,684 | |
Transamerica Large Cap Value | | | | |
Received by Underwriter | | $ | 90,896 | |
Retained by Underwriter | | | 15,397 | |
Contingent Deferred Sales Charge | | | 5,943 | |
Transamerica Mid Cap Growth | | | | |
Received by Underwriter | | $ | 3,855 | |
Retained by Underwriter | | | 676 | |
Contingent Deferred Sales Charge | | | — | |
Transamerica Mid Cap Value Opportunities | | | | |
Received by Underwriter | | $ | 2,312 | |
Retained by Underwriter | | | 320 | |
Contingent Deferred Sales Charge | | | 15 | |
Transamerica MLP & Energy Income | | | | |
Received by Underwriter | | $ | 1,360,171 | |
Retained by Underwriter | | | 215,008 | |
Contingent Deferred Sales Charge | | | 6,396 | |
Transamerica Money Market | | | | |
Received by Underwriter | | $ | — | |
Retained by Underwriter | | | — | |
Contingent Deferred Sales Charge | | | 17,377 | |
Transamerica Multi-Managed Balanced | | | | |
Received by Underwriter | | $ | 574,617 | |
Retained by Underwriter | | | 93,949 | |
Contingent Deferred Sales Charge | | | 18,658 | |
Transamerica Short-Term Bond | | | | |
Received by Underwriter | | $ | 551,812 | |
Retained by Underwriter | | | 114,541 | |
Contingent Deferred Sales Charge | | | 217,166 | |
Transamerica Small Cap Core | | | | |
Received by Underwriter | | $ | 2,186 | |
Retained by Underwriter | | | 354 | |
Contingent Deferred Sales Charge | | | — | |
Transamerica Small Cap Growth | | | | |
Received by Underwriter | | $ | 6,498 | |
Retained by Underwriter | | | 974 | |
Contingent Deferred Sales Charge | | | 85 | |
Transamerica Small Cap Value | | | | |
Received by Underwriter | | $ | 10,977 | |
Retained by Underwriter | | | 1,662 | |
Contingent Deferred Sales Charge | | | 300 | |
Transamerica Small/Mid Cap Value | | | | |
Received by Underwriter | | $ | 763,532 | |
Retained by Underwriter | | | 116,703 | |
Contingent Deferred Sales Charge | | | 39,064 | |
Transamerica Strategic High Income | | | | |
Received by Underwriter | | $ | 2,974 | |
Retained by Underwriter | | | 580 | |
Contingent Deferred Sales Charge | | | — | |
| | |
| Transamerica Funds | | Annual Report 2014 |
Page 344
NOTES TO FINANCIAL STATEMENTS (continued)
At October 31, 2014
NOTE 3. (continued)
| | | | |
Transamerica Tactical Allocation | | | Amount | |
Received by Underwriter | | $ | 50,905 | |
Retained by Underwriter | | | 7,982 | |
Contingent Deferred Sales Charge | | | 4,761 | |
Transamerica Tactical Income | | | | |
Received by Underwriter | | $ | 616,109 | |
Retained by Underwriter | | | 114,943 | |
Contingent Deferred Sales Charge | | | 126,010 | |
| | | | |
Transamerica Tactical Rotation | | | Amount | |
Received by Underwriter | | $ | 165,298 | |
Retained by Underwriter | | | 26,898 | |
Contingent Deferred Sales Charge | | | 801 | |
Transamerica US Growth | | | | |
Received by Underwriter | | $ | 224,464 | |
Retained by Underwriter | | | 34,317 | |
Contingent Deferred Sales Charge | | | 20,555 | |
Administrative services: The Funds have entered into an agreement with TFS for financial and legal fund administration services. The Funds pay TFS an annual fee of 0.025% on daily ANA. The Legal fees on the Statements of Operations are for fees paid to external legal counsel.
Transfer agent fees: Pursuant to a transfer agency agreement, as amended, the Funds pay TFS a fee for providing services based on the number of classes, accounts and transactions relating to the Fund.
Transfer Agent Fees paid and the amounts due to TFS for the year ended October 31, 2014 are as follows:
| | | | | | | | |
| Fund Name | | Fees Paid to TFS | | | Fees Due to TFS | |
Transamerica Capital Growth | | $ | 197,263 | | | $ | 17,914 | |
Transamerica Concentrated Growth | | | 23,111 | | | | 3,736 | |
Transamerica Dividend Focused | | | 87,791 | | | | 9,166 | |
Transamerica Emerging Markets Debt | | | 268,057 | | | | 29,554 | |
Transamerica Emerging Markets Equity | | | 16,992 | | | | 1,567 | |
Transamerica Enhanced Muni | | | 14,060 | | | | 1,728 | |
Transamerica Flexible Income | | | 63,598 | | | | 7,100 | |
Transamerica Floating Rate | | | 11,699 | | | | 1,283 | |
Transamerica Global Bond | | | 7,181 | | | | 1,565 | |
Transamerica Global Equity | | | 32,371 | | | | 3,523 | |
Transamerica Growth Opportunities | | | 110,775 | | | | 8,907 | |
Transamerica High Yield Bond | | | 200,541 | | | | 30,033 | |
Transamerica High Yield Muni | | | 2,988 | | | | 418 | |
Transamerica Income & Growth | | | 83,827 | | | | 9,895 | |
Transamerica Inflation Opportunities | | | 8,136 | | | | 1,595 | |
Transamerica International Equity | | | 341,740 | | | | 46,102 | |
Transamerica International Small Cap Value | | | 119,587 | | | | 18,135 | |
Transamerica Large Cap Value | | | 133,414 | | | | 11,780 | |
Transamerica Mid Cap Growth | | | 4,251 | | | | 363 | |
Transamerica Mid Cap Value Opportunities | | | 6,615 | | | | 1,483 | |
Transamerica MLP & Energy Income | | | 79,114 | | | | 11,776 | |
Transamerica Money Market | | | 24,531 | | | | 1,848 | |
Transamerica Multi-Managed Balanced | | | 174,570 | | | | 14,663 | |
Transamerica Opportunistic Allocation | | | 536 | | | | 45 | |
Transamerica Short-Term Bond | | | 739,215 | | | | 77,131 | |
Transamerica Small Cap Core | | | 9,729 | | | | 1,320 | |
Transamerica Small Cap Growth | | | 42,097 | | | | 3,375 | |
Transamerica Small Cap Value | | | 54,643 | | | | 4,297 | |
Transamerica Small/Mid Cap Value | | | 200,950 | | | | 19,167 | |
Transamerica Strategic High Income | | | 6,542 | | | | 1,224 | |
Transamerica Tactical Allocation | | | 1,102 | | | | 72 | |
Transamerica Tactical Income | | | 241,821 | | | | 20,552 | |
Transamerica Tactical Rotation | | | 3,429 | | | | 300 | |
Transamerica US Growth | | | 260,182 | | | | 19,722 | |
| | |
| Transamerica Funds | | Annual Report 2014 |
Page 345
NOTES TO FINANCIAL STATEMENTS (continued)
At October 31, 2014
NOTE 3. (continued)
Deferred compensation plan: Under a non-qualified deferred compensation plan effective January 1, 1996, as amended and restated, available to the trustees, compensation may be deferred that would otherwise be payable by the Trust to an independent trustee on a current basis for services rendered as trustee. Deferred compensation amounts will accumulate based on the value of the investment option, as elected by the trustee.
Brokerage commissions: The Funds incurred brokerage commissions on security transactions placed with affiliates of the adviser or sub-adviser for the year ended October 31, 2014 as follows:
| | | | |
| Fund Name | | Commissions | |
Transamerica Capital Growth | | $ | 1,333 | |
Transamerica Growth Opportunities | | | 2,513 | |
NOTE 4. PURCHASES AND SALES OF SECURITIES
The cost of securities purchased and proceeds from securities sold (excluding short-term securities, securities sold short and written options) for the year ended October 31, 2014 were as follows:
| | | | | | | | | | | | | | | | |
| | | Purchases of securities | | | Proceeds from maturities and
sales of securities | |
| Fund Name | | Long-term | | | U.S. Government | | | Long-term | | | U.S. Government | |
Transamerica Capital Growth | | $ | 555,826,499 | | | $ | — | | | $ | 268,462,438 | | | $ | — | |
Transamerica Concentrated Growth | | | 372,157,132 | | | | — | | | | 36,807,625 | | | | — | |
Transamerica Dividend Focused | | | 496,596,168 | | | | — | | | | 236,985,966 | | | | — | |
Transamerica Emerging Markets Debt | | | 1,692,674,209 | | | | 674,528 | | | | 1,732,509,791 | | | | 674,266 | |
Transamerica Emerging Markets Equity | | | 174,442,371 | | | | — | | | | 148,714,667 | | | | — | |
Transamerica Enhanced Muni | | | 80,716,950 | | | | — | | | | 34,614,904 | | | | — | |
Transamerica Flexible Income | | | 454,264,933 | | | | 132,214,556 | | | | 85,126,846 | | | | 50,462,622 | |
Transamerica Floating Rate | | | 318,710,352 | | | | — | | | | 103,049,429 | | | | — | |
Transamerica Global Bond | | | 388,348,753 | | | | 777,067 | | | | 162,262,425 | | | | 586,298 | |
Transamerica Global Equity | | | 401,140,514 | | | | — | | | | 322,446,582 | | | | — | |
Transamerica Growth Opportunities | | | 382,703,674 | | | | — | | | | 393,784,813 | | | | — | |
Transamerica High Yield Bond | | | 745,224,991 | | | | — | | | | 571,508,533 | | | | — | |
Transamerica High Yield Muni | | | 24,415,376 | | | | — | | | | 14,653,102 | | | | — | |
Transamerica Income & Growth | | | 577,421,495 | | | | — | | | | 148,667,800 | | | | — | |
Transamerica Inflation Opportunities | | | 163,029,142 | | | | 164,603,784 | | | | 53,395,737 | | | | 31,765,770 | |
Transamerica International Equity | | | 938,626,975 | | | | — | | | | 161,928,166 | | | | — | |
Transamerica International Small Cap Value | | | 662,125,347 | | | | — | | | | 107,054,896 | | | | — | |
Transamerica Large Cap Value | | | 1,450,433,117 | | | | — | | | | 1,355,938,948 | | | | — | |
Transamerica Mid Cap Growth | | | 84,055,047 | | | | — | | | | 33,488,065 | | | | — | |
Transamerica Mid Cap Value Opportunities | | | 190,523,489 | | | | — | | | | 28,541,645 | | | | — | |
Transamerica MLP & Energy Income | | | 556,238,226 | | | | — | | | | 166,682,709 | | | | — | |
Transamerica Multi-Managed Balanced | | | 233,139,878 | | | | 219,564,957 | | | | 220,528,529 | | | | 223,337,396 | |
Transamerica Opportunistic Allocation | | | 2,254,558 | | | | — | | | | 1,234,059 | | | | — | |
Transamerica Short-Term Bond | | | 2,362,128,594 | | | | — | | | | 2,034,031,822 | | | | 15,207 | |
Transamerica Small Cap Core | | | 369,081,383 | | | | — | | | | 169,778,397 | | | | — | |
Transamerica Small Cap Growth | | | 397,989,809 | | | | — | | | | 452,461,458 | | | | — | |
Transamerica Small Cap Value | | | 262,067,311 | | | | — | | | | 331,321,606 | | | | — | |
Transamerica Small/Mid Cap Value | | | 1,034,740,914 | | | | — | | | | 1,068,328,978 | | | | — | |
Transamerica Strategic High Income | | | 57,376,503 | | | | — | | | | 19,634,466 | | | | — | |
Transamerica Tactical Allocation | | | 28,903,615 | | | | — | | | | 27,291,374 | | | | — | |
Transamerica Tactical Income | | | 994,010,853 | | | | — | | | | 1,197,249,482 | | | | — | |
Transamerica Tactical Rotation | | | 43,997,026 | | | | — | | | | 35,002,131 | | | | — | |
Transamerica US Growth | | | 1,430,106,847 | | | | — | | | | 1,810,819,121 | | | | — | |
| | |
| Transamerica Funds | | Annual Report 2014 |
Page 346
NOTES TO FINANCIAL STATEMENTS (continued)
At October 31, 2014
NOTE 5. DERIVATIVE FINANCIAL INSTRUMENTS
Transamerica Capital Growth:
The Fund is subject to various risks in the normal course of pursuing its investment objective. The following table details the volume of derivative positions held during the year:
| | | | | | | | | | | | |
| | | Beginning number
of positions at
October 31, 2013 | | | Ending number
of positions at
October 31, 2014 | | | Average number
of positions (A) | |
Purchased options and swaptions | | | — | | | | 2 | | | | 2 | (B) |
| | (A) | Calculated based on positions held at each month end during the current year. |
| | (B) | There were no open positions at the beginning and/or the end of the year, however the Fund periodically invested in this type of derivative instrument during the year. |
Fair Value of Derivative Instruments in the Statements of Assets and Liabilities as of October 31, 2014:
The table below highlights the types of risk associated with each derivative instrument:
| | | | | | | | |
| Derivatives not accounted for as hedging instruments | | Foreign
Exchange
contracts | | | Total | |
Asset derivatives | | | | | | | | |
Purchased options and swaptions, at value (A) | | $ | 175,973 | | | $ | 175,973 | |
Total gross amount of assets (B) | | $ | 175,973 | | | $ | 175,973 | |
| | (A) | Included within Investments, at value. |
| | (B) | The Fund does not offset assets and liabilities that are subject to a master netting agreement or similar arrangement on the Statements of Assets and Liabilities. |
Gross Amounts Not Offset in the Statements of Assets and Liabilities as of October 31, 2014:
The following table presents the Fund’s derivative assets and liabilities by counterparty net of amounts available for offset under a master netting agreement and net of the related collateral received/pledged by the Fund as of October 31, 2014. See Repurchase agreement note for offsetting and collateral information pertaining to repurchase agreements that are subject to master netting agreements.
| | | | | | | | | | | | | | | | |
| Counterparty | | Gross Amounts of
Assets Presented in
Statements of Assets
and Liabilities (A) | | | Value
Available for
Offset | | | Collateral
Received (B) | | | Net Amount
(not less than $0) | |
Royal Bank of Scotland PLC | | | $ 175,973 | | | $ | — | | | $ | (175,973 | ) | | | $ — | |
Total | | | $ 175,973 | | | $ | — | | | $ | (175,973 | ) | | | $ — | |
| | (A) | Absent an event of default or early termination, OTC derivative assets and liabilities are presented gross and not offset in the Statements of Assets and Liabilities. |
| | (B) | In some instances, the actual collateral received and/or pledged may be more than the amount shown due to overcollateralization. |
For non-exchange-traded derivatives, under standard derivatives agreements, the Fund may be required to post collateral on derivatives if the Fund is in a net liability position with the counterparty exceeding certain amounts. Additionally, counterparties may immediately terminate derivatives contracts if the Fund fails to maintain sufficient asset coverage for its contracts or its net assets decline by stated percentages.
Effect of Derivative Instruments in the Statements of Operations for the year ended October 31, 2014:
| | | | | | | | |
| Derivatives not accounted for as hedging instruments | | Foreign
Exchange
contracts | | | Total | |
Net change in unrealized appreciation (depreciation) on derivatives recognized in income | | | | | | | | |
Net change in unrealized appreciation (depreciation) on purchased options and swaptions (A) | | $ | (1,114,313 | ) | | $ | (1,114,313 | ) |
Total Net change in unrealized appreciation (depreciation) | | $ | (1,114,313 | ) | | $ | (1,114,313 | ) |
| | (A) | Included within Net change in unrealized appreciation (depreciation) on Investments. |
| | |
| Transamerica Funds | | Annual Report 2014 |
Page 347
NOTES TO FINANCIAL STATEMENTS (continued)
At October 31, 2014
NOTE 5. (continued)
Transamerica Emerging Markets Debt:
The Fund is subject to various risks in the normal course of pursuing its investment objective. The following table details the volume of derivative positions held during the year:
| | | | | | | | | | | | |
| | | Beginning number
of positions at
October 31, 2013 | | | Ending number
of positions at
October 31, 2014 | | | Average number
of positions (A) | |
Futures contracts | | | — | | | | 1 | | | | 1 | (B) |
Forward foreign currency contracts | | | 10 | | | | 15 | | | | 13 | |
| | (A) | Calculated based on positions held at each month end during the current year. |
| | (B) | There were no open positions at the beginning and/or the end of the year, however the Fund periodically invested in this type of derivative instrument during the year. |
Fair Value of Derivative Instruments in the Statements of Assets and Liabilities as of October 31, 2014:
The table below highlights the types of risk associated with each derivative instrument:
| | | | | | | | | | | | |
| Derivatives not accounted for as hedging instruments | | Interest rate
contracts | | | Foreign
Exchange
contracts | | | Total | |
Asset derivatives | | | | | | | | | | | | |
Unrealized appreciation on forward foreign currency contracts | | $ | — | | | $ | 944,260 | | | $ | 944,260 | |
Total gross amount of assets (A) | | $ | — | | | $ | 944,260 | | | $ | 944,260 | |
Liability derivatives | | | | | | | | | | | | |
Unrealized depreciation on futures contracts (B) (C) | | $ | (103,211 | ) | | $ | — | | | $ | (103,211 | ) |
Unrealized depreciation on forward foreign currency contracts | | | — | | | | (307,976 | ) | | | (307,976 | ) |
Total gross amount of liabilities (A) | | $ | (103,211 | ) | | $ | (307,976 | ) | | $ | (411,187 | ) |
| | (A) | The Fund does not offset assets and liabilities that are subject to a master netting agreement or similar arrangement on the Statements of Assets and Liabilities. |
| | (B) | Includes cumulative appreciation (depreciation) on futures contracts as reported in the Schedule of Investments. Only current day’s variation margin is reported within the Statements of Assets and Liabilities. |
| | (C) | May include exchange-traded derivatives which are not subject to a master netting arrangement, or another similar arrangement. |
Gross Amounts Not Offset in the Statements of Assets and Liabilities as of October 31, 2014:
The following table presents the Fund’s derivative assets and liabilities by counterparty net of amounts available for offset under a master netting agreement and net of the related collateral received/pledged by the Fund as of October 31, 2014. See Repurchase agreement note for offsetting and collateral information pertaining to repurchase agreements that are subject to master netting agreements.
| | | | | | | | | | | | | | | | |
| Counterparty | | Gross Amounts of
Assets Presented in
Statements of Assets
and Liabilities (A) | | | Value
Available for
Offset | | | Collateral
Received (B) | | | Net Amount
(not less than $0) | |
HSBC Securities (USA), Inc. | | $ | 175,304 | | | $ | — | | | $ | — | | | $ | 175,304 | |
Other Derivatives (C) | | | 768,956 | | | | — | | | | — | | | | 768,956 | |
Total | | $ | 944,260 | | | $ | — | | | $ | — | | | $ | 944,260 | |
| | | | | | | | | | | | | | | | |
| Counterparty | | Gross Amounts of
Liabilities Presented in
Statements of Assets
and Liabilities (A) | | | Value
Available for
Offset | | | Collateral
Pledged (B) | | | Net Amount
(not less than $0) | |
Other Derivatives (C) | | $ | 411,187 | | | $ | — | | | $ | — | | | $ | 411,187 | |
Total | | $ | 411,187 | | | $ | — | | | $ | — | | | $ | 411,187 | |
| | (A) | Absent an event of default or early termination, OTC derivative assets and liabilities are presented gross and not offset in the Statements of Assets and Liabilities. |
| | (B) | In some instances, the actual collateral received and/or pledged may be more than the amount shown due to overcollateralization. |
| | (C) | Other Derivatives are not subject to a master netting arrangement or another similar arrangement. |
| | |
| Transamerica Funds | | Annual Report 2014 |
Page 348
NOTES TO FINANCIAL STATEMENTS (continued)
At October 31, 2014
NOTE 5. (continued)
Transamerica Emerging Markets Debt (continued):
For non-exchange-traded derivatives, under standard derivatives agreements, the Fund may be required to post collateral on derivatives if the Fund is in a net liability position with the counterparty exceeding certain amounts. Additionally, counterparties may immediately terminate derivatives contracts if the Fund fails to maintain sufficient asset coverage for its contracts or its net assets decline by stated percentages.
Effect of Derivative Instruments in the Statements of Operations for the year ended October 31, 2014:
| | | | | | | | | | | | |
| Derivatives not accounted for as hedging instruments | | Interest rate
contracts | | | Foreign
Exchange
contracts | | | Total | |
Net realized gain (loss) on derivatives recognized in income | | | | | | | | | | | | |
Net realized gain (loss) on futures contracts | | $ | (227,035 | ) | | $ | — | | | $ | (227,035 | ) |
Net realized gain (loss) on forward foreign currency contracts (A) | | | — | | | | 390,777 | | | | 390,777 | |
Total Net realized gain (loss) | | | (227,035 | ) | | | 390,777 | | | | 163,742 | |
Net change in unrealized appreciation (depreciation) on derivatives recognized in income | | | | | | | | | | | | |
Net change in unrealized appreciation (depreciation) on futures contracts | | | (103,211 | ) | | | — | | | | (103,211 | ) |
Net change in unrealized appreciation (depreciation) on forward foreign currency transactions (B) | | | — | | | | 954,778 | | | | 954,778 | |
Total Net change in unrealized appreciation (depreciation) | | | (103,211 | ) | | | 954,778 | | | | 851,567 | |
Total | | $ | (330,246 | ) | | $ | 1,345,555 | | | $ | 1,015,309 | |
| | (A) | Included within Net realized gain (loss) on transactions from Foreign currency transactions. |
| | (B) | Included within Net change in unrealized appreciation (depreciation) on Translation of assets and liabilities denominated in foreign currencies. |
Transamerica Global Bond:
The Fund is subject to various risks in the normal course of pursuing its investment objective. The following table details the volume of derivative positions held during the year:
| | | | | | | | | | | | |
| | | Beginning number
of positions at
October 31, 2013 | | | Ending number
of positions at
October 31, 2014 | | | Average number
of positions (A) | |
Forward foreign currency contracts | | | — | | | | 22 | | | | 16 | (B) |
| | (A) | Calculated based on positions held at each month end during the current period. |
| | (B) | There were no open positions at the beginning and/or the end of the period, however the Fund periodically invested in this type of derivative instrument during the period. |
Fair Value of Derivative Instruments in the Statements of Assets and Liabilities as of October 31, 2014:
The table below highlights the types of risk associated with each derivative instrument:
| | | | | | | | |
| Derivatives not accounted for as hedging instruments | | Foreign
Exchange
contracts | | | Total | |
Asset derivatives | | | | | | | | |
Unrealized appreciation on forward foreign currency contracts | | $ | 549,007 | | | $ | 549,007 | |
Total gross amount of assets (A) | | $ | 549,007 | | | $ | 549,007 | |
Liability derivatives | | | | | | | | |
Unrealized depreciation on forward foreign currency contracts | | $ | (1,118,654 | ) | | $ | (1,118,654 | ) |
Total gross amount of liabilities (A) | | $ | (1,118,654 | ) | | $ | (1,118,654 | ) |
| | (A) | The Fund does not offset assets and liabilities that are subject to a master netting agreement or similar arrangement on the Statements of Assets and Liabilities. |
| | |
| Transamerica Funds | | Annual Report 2014 |
Page 349
NOTES TO FINANCIAL STATEMENTS (continued)
At October 31, 2014
NOTE 5. (continued)
Transamerica Global Bond (continued):
Gross Amounts Not Offset in the Statements of Assets and Liabilities as of October 31, 2014:
The following table presents the Fund’s derivative assets and liabilities by counterparty net of amounts available for offset under a master netting agreement and net of the related collateral received/pledged by the Fund as of October 31, 2014. See Repurchase agreement note for offsetting and collateral information pertaining to repurchase agreements that are subject to master netting agreements.
| | | | | | | | | | | | | | | | |
| Counterparty | | Gross Amounts of
Assets Presented in
Statements of Assets
and Liabilities (A) | | | Value
Available for
Offset | | | Collateral
Received (B) | | | Net Amount
(not less than $0) | |
HSBC Securities (USA), Inc. | | $ | 85,299 | | | $ | — | | | $ | — | | | $ | 85,299 | |
Other Derivatives (C) | | | 463,708 | | | | — | | | | — | | | | 463,708 | |
Total | | $ | 549,007 | | | $ | — | | | $ | — | | | $ | 549,007 | |
| | | | | | | | | | | | | | | | |
| Counterparty | | Gross Amounts of
Liabilities Presented in
Statements of Assets
and Liabilities (A) | | | Value
Available for
Offset | | | Collateral
Pledged (B) | | | Net Amount
(not less than $0) | |
Other Derivatives (C) | | $ | 1,118,654 | | | $ | — | | | $ | — | | | $ | 1,118,654 | |
Total | | $ | 1,118,654 | | | $ | — | | | $ | — | | | $ | 1,118,654 | |
| | (A) | Absent an event of default or early termination, OTC derivative assets and liabilities are presented gross and not offset in the Statements of Assets and Liabilities. |
| | (B) | In some instances, the actual collateral received and/or pledged may be more than the amount shown due to overcollateralization. |
| | (C) | Other Derivatives are not subject to a master netting arrangement or another similar arrangement. |
For non-exchange-traded derivatives, under standard derivatives agreements, the Fund may be required to post collateral on derivatives if the Fund is in a net liability position with the counterparty exceeding certain amounts. Additionally, counterparties may immediately terminate derivatives contracts if the Fund fails to maintain sufficient asset coverage for its contracts or its net assets decline by stated percentages.
Effect of Derivative Instruments in the Statements of Operations for the period ended October 31, 2014:
| | | | | | | | |
| Derivatives not accounted for as hedging instruments | | Foreign
exchange
contracts | | | Total | |
Net realized gain (loss) on derivatives recognized in income | | | | | | | | |
Net realized gain (loss) on forward foreign currency contracts (A) | | $ | 410,446 | | | $ | 410,446 | |
Net change in unrealized appreciation (depreciation) on derivatives recognized in income | | | | | | | | |
Net change in unrealized appreciation (depreciation) on forward foreign currency transactions (B) | | | (569,647 | ) | | | (569,647 | ) |
Total | | $ | (159,201 | ) | | $ | (159,201 | ) |
| | (A) | Included within Net realized gain (loss) on transactions from Foreign currency transactions. |
| | (B) | Included within Net change in unrealized appreciation (depreciation) on Translation of assets and liabilities denominated in foreign currencies. |
Transamerica Growth Opportunities:
The Fund is subject to various risks in the normal course of pursuing its investment objective. The following table details the volume of derivative positions held during the year:
| | | | | | | | | | | | |
| | | Beginning number
of positions at
October 31, 2013 | | | Ending number
of positions at
October 31, 2014 | | | Average number
of positions (A) | |
Purchased options and swaptions | | | — | | | | 2 | | | | 2 | (B) |
| | (A) | Calculated based on positions held at each month end during the current year. |
| | (B) | There were no open positions at the beginning and/or the end of the year, however the Fund periodically invested in this type of derivative instrument during the year. |
| | |
| Transamerica Funds | | Annual Report 2014 |
Page 350
NOTES TO FINANCIAL STATEMENTS (continued)
At October 31, 2014
NOTE 5. (continued)
Transamerica Growth Opportunities (continued):
Fair Value of Derivative Instruments in the Statements of Assets and Liabilities as of October 31, 2014:
The table below highlights the types of risk associated with each derivative instrument:
| | | | | | | | |
| Derivatives not accounted for as hedging instruments | | Foreign
Exchange
contracts | | | Total | |
Asset derivatives | | | | | | | | |
Purchased options and swaptions, at value (A) | | $ | 134,404 | | | $ | 134,404 | |
Total gross amount of assets (B) | | $ | 134,404 | | | $ | 134,404 | |
| | (A) | Included within Investments, at value. |
| | (B) | The Fund does not offset assets and liabilities that are subject to a master netting agreement or similar arrangement on the Statements of Assets and Liabilities. |
Gross Amounts Not Offset in the Statements of Assets and Liabilities as of October 31, 2014:
The following table presents the Fund’s derivative assets and liabilities by counterparty net of amounts available for offset under a master netting agreement and net of the related collateral received/pledged by the Fund as of October 31, 2014. See Repurchase agreement note for offsetting and collateral information pertaining to repurchase agreements that are subject to master netting agreements.
| | | | | | | | | | | | | | | | |
| Counterparty | | Gross Amounts of
Assets Presented in
Statements of Assets
and Liabilities (A) | | | Value
Available for
Offset | | | Collateral
Received (B) | | | Net Amount
(not less than $0) | |
Royal Bank of Scotland PLC | | | $ 134,404 | | | $ | — | | | $ | (134,404 | ) | | | $ — | |
Total | | | $ 134,404 | | | $ | — | | | $ | (134,404 | ) | | | $ — | |
| | (A) | Absent an event of default or early termination, OTC derivative assets and liabilities are presented gross and not offset in the Statements of Assets and Liabilities. |
| | (B) | In some instances, the actual collateral received and/or pledged may be more than the amount shown due to overcollateralization. |
For non-exchange-traded derivatives, under standard derivatives agreements, the Fund may be required to post collateral on derivatives if the Fund is in a net liability position with the counterparty exceeding certain amounts. Additionally, counterparties may immediately terminate derivatives contracts if the Fund fails to maintain sufficient asset coverage for its contracts or its net assets decline by stated percentages.
Effect of Derivative Instruments in the Statements of Operations for the year ended October 31, 2014:
| | | | | | | | |
| Derivatives not accounted for as hedging instruments | | Foreign
Exchange
contracts | | | Total | |
Net change in unrealized appreciation (depreciation) on derivatives recognized in income | | | | | | | | |
Net change in unrealized appreciation (depreciation) on purchased options and swaptions (A) | | $ | (989,154 | ) | | $ | (989,154 | ) |
Total Net change in unrealized appreciation (depreciation) | | $ | (989,154 | ) | | $ | (989,154 | ) |
| | (A) | Included within Net change in unrealized appreciation (depreciation) on Investments. |
Transamerica Inflation Opportunities:
The Fund is subject to various risks in the normal course of pursuing its investment objective. The following table details the volume of derivative positions held during the year:
| | | | | | | | | | | | |
| | | Beginning number
of positions at
October 31, 2013 | | | Ending number
of positions at
October 31, 2014 | | | Average number
of positions (A) | |
Futures contracts | | | — | | | | 1 | | | | 2 | (B) |
Forward foreign currency contracts | | | — | | | | 6 | | | | 3 | (B) |
| | (A) | Calculated based on positions held at each month end during the current period. |
| | (B) | There were no open positions at the beginning and/or the end of the period, however the Fund periodically invested in this type of derivative instrument during the period. |
| | |
| Transamerica Funds | | Annual Report 2014 |
Page 351
NOTES TO FINANCIAL STATEMENTS (continued)
At October 31, 2014
NOTE 5. (continued)
Transamerica Inflation Opportunities (continued):
Fair Value of Derivative Instruments in the Statements of Assets and Liabilities as of October 31, 2014:
The table below highlights the types of risk associated with each derivative instrument:
| | | | | | | | | | | | |
| Derivatives not accounted for as hedging instruments | | Interest rate
contracts | | | Foreign
Exchange
contracts | | | Total | |
Asset derivatives | | | | | | | | | | | | |
Unrealized appreciation on forward foreign currency contracts | | $ | — | | | $ | 304,562 | | | $ | 304,562 | |
Total gross amount of assets (A) | | $ | — | | | $ | 304,562 | | | $ | 304,562 | |
Liability derivatives | | | | | | | | | | | | |
Unrealized depreciation on futures contracts (B) (C) | | $ | (200,081 | ) | | $ | — | | | $ | (200,081 | ) |
Total gross amount of liabilities (A) | | $ | (200,081 | ) | | $ | — | | | $ | (200,081 | ) |
| | (A) | The Fund does not offset assets and liabilities that are subject to a master netting agreement or similar arrangement on the Statements of Assets and Liabilities. |
| | (B) | Includes cumulative appreciation (depreciation) on futures contracts as reported in the Schedule of Investments. Only current day’s variation margin is reported within the Statements of Assets and Liabilities. |
| | (C) | May include exchange-traded derivatives which are not subject to a master netting arrangement, or another similar arrangement. |
Gross Amounts Not Offset in the Statements of Assets and Liabilities as of October 31, 2014:
The following table presents the Fund’s derivative assets and liabilities by counterparty net of amounts available for offset under a master netting agreement and net of the related collateral received/pledged by the Fund as of October 31, 2014. See Repurchase agreement note for offsetting and collateral information pertaining to repurchase agreements that are subject to master netting agreements.
| | | | | | | | | | | | | | | | |
| Counterparty | | Gross Amounts of
Assets Presented in
Statements of Assets
and Liabilities (A) | | | Value
Available for
Offset | | | Collateral
Received (B) | | | Net Amount
(not less than $0) | |
Goldman Sachs & Co, | | $ | 65,085 | | | $ | — | | | $ | — | | | $ | 65,085 | |
J.P. Morgan Securities LLC | | | 239,477 | | | | — | | | | — | | | | 239,477 | |
Total | | $ | 304,562 | | | $ | — | | | $ | — | | | $ | 304,562 | |
| | | | | | | | | | | | | | | | |
| Counterparty | | Gross Amounts of
Liabilities Presented in
Statements of Assets
and Liabilities (A) | | | Value
Available for
Offset | | | Collateral
Pledged (B) | | | Net Amount
(not less than $0) | |
Other Derivatives (C) | | $ | 200,081 | | | $ | — | | | $ | — | | | $ | 200,081 | |
Total | | $ | 200,081 | | | $ | — | | | $ | — | | | $ | 200,081 | |
| | (A) | Absent an event of default or early termination, OTC derivative assets and liabilities are presented gross and not offset in the Statements of Assets and Liabilities. |
| | (B) | In some instances, the actual collateral received and/or pledged may be more than the amount shown due to overcollateralization. |
| | (C) | Other Derivatives are not subject to a master netting arrangement or another similar arrangement. |
For non-exchange-traded derivatives, under standard derivatives agreements, the Fund may be required to post collateral on derivatives if the Fund is in a net liability position with the counterparty exceeding certain amounts. Additionally, counterparties may immediately terminate derivatives contracts if the Fund fails to maintain sufficient asset coverage for its contracts or its net assets decline by stated percentages.
| | |
| Transamerica Funds | | Annual Report 2014 |
Page 352
NOTES TO FINANCIAL STATEMENTS (continued)
At October 31, 2014
NOTE 5. (continued)
Transamerica Inflation Opportunities (continued):
Effect of Derivative Instruments in the Statements of Operations for the period ended October 31, 2014:
| | | | | | | | | | | | |
| Derivatives not accounted for as hedging instruments | | Interest rate
contracts | | | Foreign
Exchange
contracts | | | Total | |
Net realized gain (loss) on derivatives recognized in income | | | | | | | | | | | | |
Net realized gain (loss) on futures contracts | | $ | (31,414 | ) | | $ | — | | | $ | (31,414 | ) |
Net realized gain (loss) on forward foreign currency contracts (A) | | | — | | | | 104,238 | | | | 104,238 | |
Total Net realized gain (loss) | | | (31,414 | ) | | | 104,238 | | | | 72,824 | |
Net change in unrealized appreciation (depreciation) on derivatives recognized in income | | | | | | | | | | | | |
Net change in unrealized appreciation (depreciation) on futures contracts | | | (200,081 | ) | | | — | | | | (200,081 | ) |
Net change in unrealized appreciation (depreciation) on forward foreign currency transactions (B) | | | — | | | | 304,562 | | | | 304,562 | |
Total Net change in unrealized appreciation (depreciation) | | | (200,081 | ) | | | 304,562 | | | | 104,481 | |
Total | | $ | (231,495 | ) | | $ | 408,800 | | | $ | 177,305 | |
| | (A) | Included within Net realized gain (loss) on transactions from Foreign currency transactions. |
| | (B) | Included within Net change in unrealized appreciation (depreciation) on Translation of assets and liabilities denominated in foreign currencies. |
Transamerica MLP & Energy Income:
The Fund is subject to various risks in the normal course of pursuing its investment objective. The following table details the volume of derivative positions held during the year:
| | | | | | | | | | | | |
| | | Beginning number
of positions at
October 31, 2013 | | | Ending number
of positions at
October 31, 2014 | | | Average number
of positions (A) | |
Written options and swaptions | | | — | | | | 4 | | | | 7 | (B) |
| | (A) | Calculated based on positions held at each month end during the current year. |
| | (B) | There were no open positions at the beginning and/or the end of the year, however the Fund periodically invested in this type of derivative instrument during the year. |
Fair Value of Derivative Instruments in the Statements of Assets and Liabilities as of October 31, 2014:
The table below highlights the types of risk associated with each derivative instrument:
| | | | | | | | |
| Derivatives not accounted for as hedging instruments | | Equity
contracts | | | Total | |
Liability derivatives | | | | | | | | |
Written options and swaptions, at value | | $ | (220,875 | ) | | $ | (220,875 | ) |
Total gross amount of liabilities (A) | | $ | (220,875 | ) | | $ | (220,875 | ) |
| | (A) | The Fund does not offset assets and liabilities that are subject to a master netting agreement or similar arrangement on the Statements of Assets and Liabilities. |
The Fund’s derivatives are not subject to a master netting arrangement, or another similar arrangement.
Effect of Derivative Instruments in the Statements of Operations for the year ended October 31, 2014:
| | | | | | | | |
| Derivatives not accounted for as hedging instruments | | Equity
contracts | | | Total | |
Net realized gain (loss) on derivatives recognized in income | | | | | | | | |
Net realized gain (loss) on written options and swaptions | | $ | 852,354 | | | $ | 852,354 | |
Net change in unrealized appreciation (depreciation) on derivatives recognized in income | | | | | | | | |
Net change in unrealized appreciation (depreciation) on written options and swaptions | | | (138,583 | ) | | | (138,583 | ) |
Total | | $ | 713,771 | | | $ | 713,771 | |
| | |
| Transamerica Funds | | Annual Report 2014 |
Page 353
NOTES TO FINANCIAL STATEMENTS (continued)
At October 31, 2014
NOTE 5. (continued)
Transamerica Multi-Managed Balanced:
The Fund is subject to various risks in the normal course of pursuing its investment objective. The following table details the volume of derivative positions held during the year:
| | | | | | | | | | | | |
| | | Beginning number
of positions at
October 31, 2013 | | | Ending number
of positions at
October 31, 2014 | | | Average number
of positions (A) | |
Futures contracts | | | 10 | | | | 1 | | | | 4 | |
Purchased options and swaptions | | | 2 | | | | — | | | | 1 | (B) |
Written options and swaptions | | | 2 | | | | — | | | | 1 | (B) |
Swap agreements | | | — | | | | — | | | | 3 | (B) |
Forward foreign currency contracts | | | 2 | | | | — | | | | 2 | (B) |
| | (A) | Calculated based on positions held at each month end during the current year. |
| | (B) | There were no open positions at the beginning and/or the end of the year, however the Fund periodically invested in this type of derivative instrument during the year. |
Fair Value of Derivative Instruments in the Statements of Assets and Liabilities as of October 31, 2014:
The table below highlights the types of risk associated with each derivative instrument:
| | | | | | | | |
| Derivatives not accounted for as hedging instruments | | Equity
contracts | | | Total | |
Asset derivatives | | | | | | | | |
Unrealized appreciation on futures contracts (A) (B) | | $ | 144,592 | | | $ | 144,592 | |
Total gross amount of assets (C) | | $ | 144,592 | | | $ | 144,592 | |
| | (A) | Includes cumulative appreciation (depreciation) on futures contracts as reported in the Schedule of Investments. Only current day’s variation margin is reported within the Statements of Assets and Liabilities. |
| | (B) | May include exchange-traded derivatives which are not subject to a master netting arrangement, or another similar arrangement. |
| | (C) | The Fund does not offset assets and liabilities that are subject to a master netting agreement or similar arrangement on the Statements of Assets and Liabilities. |
The Fund’s derivatives are not subject to a master netting arrangement, or another similar arrangement.
Effect of Derivative Instruments in the Statements of Operations for the year ended October 31, 2014:
| | | | | | | | | | | | | | | | |
| Derivatives not accounted for as hedging instruments | | Interest rate
contracts | | | Foreign
Exchange
contracts | | | Equity
contracts | | | Total | |
Net realized gain (loss) on derivatives recognized in income | | | | | | | | | | | | | | | | |
Net realized gain (loss) on purchased options and swaptions (A) | | $ | 38,777 | | | $ | — | | | $ | — | | | $ | 38,777 | |
Net realized gain (loss) on futures contracts | | | 573,048 | | | | — | | | | 672,607 | | | | 1,245,655 | |
Net realized gain (loss) on written options and swaptions | | | (24,732 | ) | | | — | | | | — | | | | (24,732 | ) |
Net realized gain (loss) on swap agreements | | | (8,276 | ) | | | — | | | | — | | | | (8,276 | ) |
Net realized gain (loss) on forward foreign currency contracts (B) | | | — | | | | (18,268 | ) | | | — | | | | (18,268 | ) |
Total Net realized gain (loss) | | | 578,817 | | | | (18,268 | ) | | | 672,607 | | | | 1,233,156 | |
Net change in unrealized appreciation (depreciation) on derivatives recognized in income | | | | | | | | | | | | | | | | |
Net change in unrealized appreciation (depreciation) on purchased options and swaptions (C) | | | (4,202 | ) | | | — | | | | — | | | | (4,202 | ) |
Net change in unrealized appreciation (depreciation) on futures contracts | | | 46,661 | | | | — | | | | 24,643 | | | | 71,304 | |
Net change in unrealized appreciation (depreciation) on written options and swaptions | | | 3,841 | | | | — | | | | — | | | | 3,841 | |
Net change in unrealized appreciation (depreciation) on forward foreign currency transactions (D) | | | — | | | | (7,577 | ) | | | — | | | | (7,577 | ) |
Total Net change in unrealized appreciation (depreciation) | | | 46,300 | | | | (7,577 | ) | | | 24,643 | | | | 63,366 | |
Total | | $ | 625,117 | | | $ | (25,845 | ) | | $ | 697,250 | | | $ | 1,296,522 | |
| | (A) | Included within Net realized gain (loss) on transactions from Investments. |
| | (B) | Included within Net realized gain (loss) on transactions from Foreign currency transactions. |
| | (C) | Included within Net change in unrealized appreciation (depreciation) on Investments. |
| | (D) | Included within Net change in unrealized appreciation (depreciation) on Translation of assets and liabilities denominated in foreign currencies. |
| | |
| Transamerica Funds | | Annual Report 2014 |
Page 354
NOTES TO FINANCIAL STATEMENTS (continued)
At October 31, 2014
NOTE 6. FEDERAL INCOME TAXES AND DISTRIBUTIONS TO SHAREHOLDERS
The Funds have not made any provision for federal income or excise taxes due to its policy to distribute all of their taxable income and capital gains to their shareholders and otherwise qualify as regulated investment companies under Subchapter M of the Internal Revenue Code. The Funds recognize the tax benefits of uncertain tax positions only where the position is “more likely than not” to be sustained assuming examination by tax authorities. The Funds’ federal and state tax returns remain subject to examination by the Internal Revenue Service and state tax authorities for the prior three years. Management has evaluated the Funds’ tax provisions taken for all open tax years, and has concluded that no provision for income tax is required in the Funds’ financial statements. If applicable, the Funds recognize interest accrued related to unrecognized tax benefits in interest and penalties expense in Other on the Statements of Operations. The Funds identify their major tax jurisdictions as U.S. Federal, the states of Colorado and Florida, and foreign jurisdictions where the Funds make significant investments; however, the Funds are not aware of any tax positions for which it is reasonably possible that the total amounts of unrecognized tax benefits will change materially in the next twelve months. Income and capital gain distributions are determined in accordance with income tax regulations, which may differ from GAAP. These differences are primarily due to different treatment for items including, but not limited to, wash sales, structured notes, foreign bonds, swaps, net operating losses, distribution reclasses for REITs, passive foreign investment companies, foreign currency transactions, capital loss carryforwards, Late Year Ordinary Loss Deferrals, paydown gain/loss, foreign capital gains tax, and return of capital distributions from underlying investments.
Therefore, distributions determined in accordance with tax regulations may differ significantly in amount or character from net investment income and realized gains for financial reporting purposes. Financial reporting records are adjusted for permanent book/tax differences to reflect tax character. The differences are primarily due to non-REIT return of capital dividends, expiration of capital loss, paydown gain/loss, partnership basis adjustments, distribution reclasses for REITs, distribution re-designations, passive foreign investment companies, foreign capital gains taxes, TIPS, capital gain distributions from underlying funds, net operating losses, grantor trust basis adjustments, organizational expenses, distribution in excess of current earnings, preferred securities. These reclassifications have no impact on net assets or results of operations. Financial records are not adjusted for temporary differences. These reclassifications are as follows:
| | | | | | | | | | | | |
| Fund Name | | Shares of
beneficial interest,
unlimited shares
authorized | | | Undistributed
(accumulated) net
investment income (loss) | | | Undistributed
(accumulated) net realized
gain (loss) from
investments | |
Transamerica Capital Growth | | $ | (397,388 | ) | | $ | 421,875 | | | $ | (24,487 | ) |
Transamerica Concentrated Growth (A) | | | — | | | | 9,232 | | | | (9,232 | ) |
Transamerica Dividend Focused | | | — | | | | — | | | | — | |
Transamerica Emerging Markets Debt | | | — | | | | (6,456,111 | ) | | | 6,456,111 | |
Transamerica Emerging Markets Equity | | | — | | | | (174,412 | ) | | | 174,412 | |
Transamerica Enhanced Muni | | | 20,181 | | | | — | | | | (20,181 | ) |
Transamerica Flexible Income | | | — | | | | 381,445 | | | | (381,445 | ) |
Transamerica Floating Rate | | | (12,740 | ) | | | 102,880 | | | | (90,140 | ) |
Transamerica Global Bond | | | (12,336 | ) | | | (1,292,866 | ) | | | 1,305,202 | |
Transamerica Global Equity | | | (1 | ) | | | 29,629 | | | | (29,628 | ) |
Transamerica Growth Opportunities | | | (750 | ) | | | (117,290 | ) | | | 118,040 | |
Transamerica High Yield Bond | | | — | | | | 1,191 | | | | (1,191 | ) |
Transamerica High Yield Muni | | | — | | | | — | | | | — | |
Transamerica Income & Growth | | | (192,369 | ) | | | (5,962,620 | ) | | | 6,154,989 | |
Transamerica Inflation Opportunities | | | (13,050 | ) | | | (141,119 | ) | | | 154,169 | |
Transamerica International Equity | | | — | | | | 284,247 | | | | (284,247 | ) |
Transamerica International Small Cap Value | | | — | | | | (235,557 | ) | | | 235,557 | |
Transamerica Large Cap Value | | | — | | | | (765,986 | ) | | | 765,986 | |
Transamerica Mid Cap Growth | | | (12,965 | ) | | | 124,592 | | | | (111,627 | ) |
Transamerica Mid Cap Value Opportunities | | | (55,485 | ) | | | 55,418 | | | | 67 | |
Transamerica MLP & Energy Income | | | (3,227 | ) | | | 5,037,685 | | | | (5,034,458 | ) |
Transamerica Money Market | | | (1,259 | ) | | | — | | | | 1,259 | |
Transamerica Multi-Managed Balanced | | | (13 | ) | | | 384,923 | | | | (384,910 | ) |
Transamerica Opportunistic Allocation | | | (6,255 | ) | | | (3,816 | ) | | | 10,071 | |
Transamerica Short-Term Bond | | | 1 | | | | 4,304,405 | | | | (4,304,406 | ) |
| | |
| Transamerica Funds | | Annual Report 2014 |
Page 355
NOTES TO FINANCIAL STATEMENTS (continued)
At October 31, 2014
NOTE 6. (continued)
| | | | | | | | | | | | |
| Fund Name | | Shares of
beneficial interest,
unlimited shares
authorized | | | Undistributed
(accumulated) net
investment income (loss) | | | Undistributed
(accumulated) net realized
gain (loss) from
investments | |
Transamerica Small Cap Core | | $ | (12,953 | ) | | $ | (55,150 | ) | | $ | 68,103 | |
Transamerica Small Cap Growth | | | (2,314,147 | ) | | | 2,266,424 | | | | 47,723 | |
Transamerica Small Cap Value | | | (3 | ) | | | 70,675 | | | | (70,672 | ) |
Transamerica Small/Mid Cap Value | | | — | | | | 47,993 | | | | (47,993 | ) |
Transamerica Strategic High Income | | | (11,810 | ) | | | 12,546 | | | | (736 | ) |
Transamerica Tactical Allocation | | | (876 | ) | | | 52,994 | | | | (52,118 | ) |
Transamerica Tactical Income (B) | | | (69 | ) | | | (62,268 | ) | | | 62,337 | |
Transamerica Tactical Rotation | | | — | | | | (2,414 | ) | | | 2,414 | |
Transamerica US Growth | | | — | | | | (174,737 | ) | | | 174,737 | |
| | (A) | The reclassifications arising from book/tax differences for Transamerica Concentrated Growth are adjusted for the tax period ended February 28, 2014. |
| | (B) | The reclassifications arising from book/tax differences for Transamerica Tactical Income are for the tax period ended May 31, 2014. |
At October 31, 2014, the capital loss carryforwards are available to offset future realized capital gains through the periods listed below. Funds not listed in the table below do not have capital loss carryforwards.
| | | | | | |
| Fund Name | | Capital Loss Carryforwards | | | Available Through |
Transamerica Emerging Markets Debt | | $ | 11,912,757 | | | Short-Term Indefinitely |
Transamerica Emerging Markets Debt | | | 9,249,174 | | | Long-Term Indefinitely |
Transamerica Emerging Markets Equity | | | 7,038,816 | | | Short-Term Indefinitely |
Transamerica Flexible Income | | | 1,261,782 | | | October 31, 2015 |
Transamerica Flexible Income | | | 51,527,330 | | | October 31, 2016 |
Transamerica Flexible Income | | | 20,522,686 | | | October 31, 2017 |
Transamerica Global Bond | | | 549,871 | | | Short-Term Indefinitely |
Transamerica Global Bond | | | 1,097,248 | | | Long-Term Indefinitely |
Transamerica Global Equity | | | 3,631,025 | | | October 31, 2016 |
Transamerica Global Equity | | | 51,740,251 | | | October 31, 2017 |
Transamerica Global Equity | | | 4,934,774 | | | October 31, 2018 |
Transamerica Income & Growth | | | 9,257,497 | | | Short-Term Indefinitely |
Transamerica Income & Growth | | | 7,227,264 | | | Long-Term Indefinitely |
Transamerica Money Market | | | 258 | | | October 31, 2015 |
Transamerica Money Market | | | 591 | | | October 31, 2017 |
Transamerica Opportunistic Allocation | | | 35,718 | | | Short-Term Indefinitely |
Transamerica Tactical Income | | | 1,288,555 | | | Long-Term Indefinitely |
Transamerica US Growth | | | 11,573,666 | | | October 31, 2016 |
Transamerica US Growth | | | 4,933,190 | | | October 31, 2017 |
The capital loss carryforwards utilized or expired during the year ended October 31, 2014 were as follows:
| | | | |
| Fund Name | | Capital Loss Carryforwards
Utilized/Expired During the
Year Ended October 31, 2014 | |
Transamerica Emerging Markets Equity | | $ | 665,093 | |
Transamerica Flexible Income | | | 2,232,979 | |
Transamerica Global Equity | | | 34,498,914 | |
Transamerica Money Market | | | 1,259 | |
Transamerica Multi-Managed Balanced | | | 803,509 | |
Transamerica Small Cap Growth | | | 8,728,500 | |
Transamerica US Growth | | | 198,047,439 | |
| | |
| Transamerica Funds | | Annual Report 2014 |
Page 356
NOTES TO FINANCIAL STATEMENTS (continued)
At October 31, 2014
NOTE 6. (continued)
The tax character of distributions paid may differ from the character of distributions shown in the Statements of Changes in Net Assets due to short-term gains being treated as ordinary income for tax purposes. The tax character of distributions paid during 2014 and 2013 was as follows:
| | | | | | | | | | | | | | | | | | | | | | | | | | | | | | | | |
| | | 2014 Distributions Paid From | | | 2013 Distributions Paid From | |
| | | Ordinary
Income | | | Tax
Exempt
Income | | | Long-Term
Capital
Gain | | | Return of
Capital | | | Ordinary
Income | | | Tax
Exempt
Income | | | Long-Term
Capital
Gain | | | Return of
Capital | |
Transamerica Capital Growth | | $ | 2,746,835 | | | $ | — | | | $ | 18,864,438 | | | $ | — | | | $ | 5,273,079 | | | $ | — | | | $ | 22,130,171 | | | $ | — | |
Transamerica Concentrated Growth (A) | | | 11,239 | | | | — | | | | 366,672 | | | | — | | | | 79,532 | | | | — | | | | 217,154 | | | | — | |
Transamerica Dividend Focused | | | 29,445,741 | | | | — | | | | — | | | | — | | | | 13,963,633 | | | | — | | | | — | | | | — | |
Transamerica Emerging Markets Debt | | | 32,491,605 | | | | — | | | | — | | | | — | | | | 47,640,995 | | | | — | | | | 535,832 | | | | — | |
Transamerica Emerging Markets Equity | | | 2,901,228 | | | | — | | | | — | | | | — | | | | 780,039 | | | | — | | | | — | | | | — | |
Transamerica Enhanced Muni | | | 6,831 | | | | 749,712 | | | | — | | | | — | | | | 1,296 | | | | 230,103 | | | | — | | | | — | |
Transamerica Flexible Income | | | 18,156,996 | | | | — | | | | — | | | | — | | | | 12,100,181 | | | | — | | | | — | | | | — | |
Transamerica Floating Rate | | | 5,260,656 | | | | — | | | | — | | | | — | | | | — | | | | — | | | | — | | | | — | |
Transamerica Global Bond | | | 709,767 | | | | — | | | | — | | | | — | | | | — | | | | — | | | | — | | | | — | |
Transamerica Global Equity | | | 2,397,616 | | | | — | | | | — | | | | — | | | | 1,594,119 | | | | — | | | | — | | | | — | |
Transamerica Growth Opportunities | | | 4,381,103 | | | | — | | | | 24,373,643 | | | | — | | | | 5,118,638 | | | | — | | | | 5,476,215 | | | | — | |
Transamerica High Yield Bond | | | 69,710,187 | | | | — | | | | 9,792,021 | | | | — | | | | 43,445,431 | | | | — | | | | — | | | | — | |
Transamerica High Yield Muni | | | 33,000 | | | | 193,060 | | | | — | | | | — | | | | 214 | | | | 6,402 | | | | — | | | | — | |
Transamerica Income & Growth | | | 28,372,465 | | | | — | | | | — | | | | 6,689,673 | | | | 10,400,871 | | | | — | | | | — | | | | 3,157,358 | |
Transamerica Inflation Opportunities | | | 2,184,246 | | | | — | | | | — | | | | — | | | | — | | | | — | | | | — | | | | — | |
Transamerica International Equity | | | 18,832,363 | | | | — | | | | 11,466,020 | | | | — | | | | 5,657,029 | | | | — | | | | — | | | | — | |
Transamerica International Small Cap Value | | | 7,013,726 | | | | — | | | | — | | | | — | | | | — | | | | — | | | | — | | | | — | |
Transamerica Large Cap Value | | | 193,536,269 | | | | — | | | | 69,084,326 | | | | — | | | | 44,035,375 | | | | — | | | | 58,400,184 | | | | — | |
Transamerica Mid Cap Growth | | | 4,020 | | | | — | | | | — | | | | — | | | | — | | | | — | | | | — | | | | — | |
Transamerica Mid Cap Value Opportunities | | | 1,150,881 | | | | — | | | | — | | | | — | | | | — | | | | — | | | | — | | | | — | |
Transamerica MLP & Energy Income | | | 11,097,008 | | | | — | | | | — | | | | — | | | | 1,289,633 | | | | — | | | | — | | | | — | |
Transamerica Money Market | | | 14,143 | | | | — | | | | — | | | | — | | | | 158,743 | | | | — | | | | — | | | | — | |
Transamerica Multi-Managed Balanced | | | 7,913,430 | | | | — | | | | 17,533,058 | | | | — | | | | 10,716,009 | | | | — | | | | 6,561,002 | | | | — | |
| | |
| Transamerica Funds | | Annual Report 2014 |
Page 357
NOTES TO FINANCIAL STATEMENTS (continued)
At October 31, 2014
NOTE 6. (continued)
| | | | | | | | | | | | | | | | | | | | | | | | | | | | | | | | |
| | | 2014 Distributions Paid From | | | 2013 Distributions Paid From | |
| | | Ordinary
Income | | | Tax
Exempt
Income | | | Long-Term
Capital
Gain | | | Return of
Capital | | | Ordinary
Income | | | Tax
Exempt
Income | | | Long-Term
Capital
Gain | | | Return of
Capital | |
Transamerica Opportunistic Allocation | | $ | 64,125 | | | $ | — | | | $ | — | | | $ | — | | | $ | — | | | $ | — | | | $ | — | | | $ | — | |
Transamerica Short-Term Bond | | | 95,546,915 | | | | — | | | | 11,055,610 | | | | — | | | | 99,802,724 | | | | — | | | | 12,045,194 | | | | — | |
Transamerica Small Cap Core | | | 213,561 | | | | — | | | | — | | | | — | | | | — | | | | — | | | | — | | | | — | |
Transamerica Small Cap Growth | | | — | | | | — | | | | 13,380 | | | | — | | | | 310,710 | | | | — | | | | — | | | | — | |
Transamerica Small Cap Value | | | 20,025,596 | | | | — | | | | 30,499,874 | | | | — | | | | 3,065,170 | | | | — | | | | 32,366 | | | | — | |
Transamerica Small/Mid Cap Value | | | 25,856,904 | | | | — | | | | 62,233,151 | | | | — | | | | 2,562,032 | | | | — | | | | — | | | | — | |
Transamerica Strategic High Income | | | 787,837 | | | | — | | | | — | | | | — | | | | — | | | | — | | | | — | | | | — | |
Transamerica Tactical Allocation | | | 212,798 | | | | — | | | | 62,124 | | | | — | | | | 101,762 | | | | — | | | | — | | | | — | |
Transamerica Tactical Income (B) | | | 33,213,678 | | | | — | | | | — | | | | — | | | | 32,626,783 | | | | — | | | | 599,585 | | | | 2,112,223 | |
Transamerica Tactical Rotation | | | 104,268 | | | | — | | | | — | | | | — | | | | 52,500 | | | | — | | | | — | | | | — | |
Transamerica US Growth | | | 13,325,239 | | | | — | | | | — | | | | — | | | | 6,532,845 | | | | — | | | | — | | | | — | |
| | (A) | The tax character of distributions paid for Transamerica Concentrated Growth is for the taxable year ended February 28, 2014. |
| | (B) | The tax character of distributions paid for Transamerica Tactical Income is for the taxable year ended May 31, 2014. |
The tax basis components of distributable earnings as of October 31, 2014 are as follows:
| | | | | | | | | | | | | | | | | | | | | | | | | | | | |
| | | Undistributed
Ordinary
Income | | | Undistributed
Tax Exempt
Income | | | Undistributed
Long-Term
Capital Gain | | | Capital Loss
Carryforwards | | | Late Year
Ordinary
Loss Deferral | | | Other
Temporary
Differences | | | Net Unrealized
Appreciation
(Depreciation) | |
Transamerica Capital Growth | | $ | — | | | $ | — | | | $ | 42,029,793 | | | $ | — | | | $ | (2,724,226 | ) | | $ | — | | | $ | 336,097,023 | |
Transamerica Concentrated Growth (A) | | | 716,412 | | | | — | | | | 1,019,707 | | | | — | | | | — | | | | — | | | | 15,524,025 | |
Transamerica Dividend Focused | | | 27,711,230 | | | | — | | | | 23,299,273 | | | | — | | | | — | | | | — | | | | 246,485,477 | |
Transamerica Emerging Markets Debt | | | 2,086,351 | | | | — | | | | — | | | | (21,161,931 | ) | | | — | | | | (424,424 | ) | | | (13,029,482 | ) |
Transamerica Emerging Markets Equity | | | 2,971,376 | | | | — | | | | — | | | | (7,038,816 | ) | | | — | | | | — | | | | 10,777,705 | |
Transamerica Enhanced Muni | | | 992,366 | | | | 2,746 | | | | 28,368 | | | | — | | | | — | | | | — | | | | 1,427,505 | |
| | |
| Transamerica Funds | | Annual Report 2014 |
Page 358
NOTES TO FINANCIAL STATEMENTS (continued)
At October 31, 2014
NOTE 6. (continued)
| | | | | | | | | | | | | | | | | | | | | | | | | | | | |
| | | Undistributed
Ordinary
Income | | | Undistributed
Tax Exempt
Income | | | Undistributed
Long-Term
Capital Gain | | | Capital Loss
Carryforwards | | | Late Year
Ordinary
Loss Deferral | | | Other
Temporary
Differences | | | Net Unrealized
Appreciation
(Depreciation) | |
Transamerica Flexible Income | | $ | 110,136 | | | $ | — | | | $ | — | | | $ | (73,311,798 | ) | | $ | — | | | $ | — | | | $ | 20,440,830 | |
Transamerica Floating Rate | | | 359,327 | | | | — | | | | — | | | | — | | | | — | | | | (50,546 | ) | | | (2,058,170 | ) |
Transamerica Global Bond | | | 346,392 | | | | — | | | | — | | | | (1,647,119 | ) | | | — | | | | — | | | | (9,214,519 | ) |
Transamerica Global Equity | | | — | | | | — | | | | — | | | | (60,306,050 | ) | | | (1,342,869 | ) | | | — | | | | (5,290,427 | ) |
Transamerica Growth Opportunities | | | 5,863,377 | | | | — | | | | 74,312,798 | | | | — | | | | — | | | | — | | | | 152,689,079 | |
Transamerica High Yield Bond | | | 7,302,376 | | | | — | | | | 9,616,793 | | | | — | | | | — | | | | — | | | | 9,050,498 | |
Transamerica High Yield Muni | | | 404,954 | | | | 2,314 | | | | — | | | | — | | | | — | | | | — | | | | 349,313 | |
Transamerica Income & Growth | | | — | | | | — | | | | — | | | | (16,484,761 | ) | | | — | | | | (1,064,764 | ) | | | 34,021,403 | |
Transamerica Inflation Opportunities | | | 593,999 | | | | — | | | | — | | | | — | | | | — | | | | — | | | | (4,148,818 | ) |
Transamerica International Equity | | | 30,872,824 | | | | — | | | | 14,758,542 | | | | — | | | | — | | | | — | | | | 9,100,634 | |
Transamerica International Small Cap Value | | | 10,654,815 | | | | — | | | | 6,250,719 | | | | — | | | | — | | | | — | | | | (17,524,358 | ) |
Transamerica Large Cap Value | | | 35,746,852 | | | | — | | | | 120,635,130 | | | | — | | | | — | | | | — | | | | 219,549,024 | |
Transamerica Mid Cap Growth | | | 115,463 | | | | — | | | | 1,440 | | | | — | | | | — | | | | — | | | | 4,930,020 | |
Transamerica Mid Cap Value Opportunities | | | 2,000,952 | | | | — | | | | 39,127 | | | | — | | | | — | | | | — | | | | 6,356,988 | |
Transamerica MLP & Energy Income | | | 3,599,193 | | | | — | | | | 1,195,784 | | | | — | | | | — | | | | (2,449,810 | ) | | | 39,223,796 | |
Transamerica Money Market | | | 16,295 | | | | — | | | | — | | | | (849 | ) | | | — | | | | (232 | ) | | | — | |
Transamerica Multi-Managed Balanced | | | 5,483,538 | | | | — | | | | 17,368,450 | | | | — | | | | — | | | | (173,403 | ) | | | 80,950,556 | |
| | |
| Transamerica Funds | | Annual Report 2014 |
Page 359
NOTES TO FINANCIAL STATEMENTS (continued)
At October 31, 2014
NOTE 6. (continued)
| | | | | | | | | | | | | | | | | | | | | | | | | | | | |
| | | Undistributed
Ordinary
Income | | | Undistributed
Tax Exempt
Income | | | Undistributed
Long-Term
Capital Gain | | | Capital Loss
Carryforwards | | | Late Year
Ordinary
Loss Deferral | | | Other
Temporary
Differences | | | Net Unrealized
Appreciation
(Depreciation) | |
Transamerica Opportunistic Allocation | | $ | — | | | $ | — | | | $ | — | | | $ | (35,718 | ) | | $ | — | | | $ | — | | | $ | 20,795 | |
Transamerica Short-Term Bond | | | 3,488,811 | | | | — | | | | 5,399,291 | | | | — | | | | — | | | | (403,168 | ) | | | 28,213,833 | |
Transamerica Small Cap Core | | | 5,326,695 | | | | — | | | | 22,840 | | | | — | | | | — | | | | — | | | | 4,943,952 | |
Transamerica Small Cap Growth | | | — | | | | — | | | | 40,624,565 | | | | — | | | | (1,924,168 | ) | | | — | | | | 95,170,529 | |
Transamerica Small Cap Value | | | 8,973,859 | | | | — | | | | 55,071,609 | | | | — | | | | — | | | | (32,976 | ) | | | 87,621,121 | |
Transamerica Small/Mid Cap Value | | | 19,427,233 | | | | — | | | | 83,673,536 | | | | — | | | | — | | | | — | | | | 158,047,947 | |
Transamerica Strategic High Income | | | 523,743 | | | | — | | | | 7,186 | | | | — | | | | — | | | | — | | | | 233,585 | |
Transamerica Tactical Allocation | | | — | | | | — | | | | 472,553 | | | | — | | | | — | | | | — | | | | (83,918 | ) |
Transamerica Tactical Income (B) | | | 1,741,520 | | | | — | | | | — | | | | (1,288,555 | ) | | | (736,379 | ) | | | (27,637 | ) | | | 7,449,459 | |
Transamerica Tactical Rotation | | | 183,149 | | | | — | | | | 1,105,758 | | | | — | | | | — | | | | — | | | | 486,795 | |
Transamerica US Growth | | | 3,085,419 | | | | — | | | | 215,396,963 | | | | (16,506,856 | ) | | | — | | | | — | | | | 142,074,375 | |
| | (A) | The components of distributable earnings for Transamerica Concentrated Growth are adjusted for the tax period ended February 28, 2014. |
| | (B) | The components of distributable earnings for Transamerica Tactical Income are adjusted for the tax period ended May 31, 2014. |
NOTE 7. ACCOUNTING PRONOUNCEMENTS
In June 2014, the Financial Accounting Standards Board issued Accounting Standards Update No. 2014-11, “Transfers and Servicing, Repurchase-to-Maturity Transactions, Repurchase Financings, and Disclosures”. The guidance changes the accounting for certain repurchase agreements and expands disclosure requirements related to repurchase agreements, securities lending, repurchase-to-maturity and similar transactions. The guidance is effective for financial statements with fiscal years beginning on or after December 15, 2014 and interim periods within those fiscal years. Management is currently evaluating the implication, if any, of the additional disclosure requirements and its impact on the Funds’ financial statements.
In July 2014, the Securities and Exchange Commission voted to amend Rule 2a-7, which governs money market funds. A significant change resulting from these amendments is a requirement that institutional prime and institutional municipal money market funds transact fund shares based on a market-based NAV. Government, treasury, retail prime and retail municipal money market funds may continue to transact fund shares at an NAV calculated using the amortized cost valuation method. Among additional disclosure and other requirements, the amendments also will permit a money market fund, or, in certain circumstances, require a money market fund (other than a government money market fund which satisfies the requirements of the amended rules) to impose liquidity fees on redemptions, and permit a money market fund to limit (or gate) redemptions for up to 10 business days in any 90-day period. The degree to which a money market fund will be impacted by the rule amendments will depend upon the type of fund and type of investors
| | |
| Transamerica Funds | | Annual Report 2014 |
Page 360
NOTES TO FINANCIAL STATEMENTS (continued)
At October 31, 2014
NOTE 7. (continued)
(retail or institutional). The amendments have staggered compliance dates; however, the majority of these amendments will be effective on October 14, 2016, two years after the effective date for the rule amendments. Management is currently evaluating the implication, if any, of the additional disclosure requirements and its impact to the Funds’ financial statements.
NOTE 8. REORGANIZATION
Transamerica Concentrated Growth
Following the close of business on February 28, 2014, Class I of Transamerica Concentrated Growth assumed all of the assets and liabilities of The Torray Resolute Fund. The shareholders of The Torray Resolute Fund received an aggregate net asset value equal to the aggregate net asset value of their shares in Class I of Transamerica Concentrated Growth immediately prior to the reorganization. The reorganization was treated as a tax-free reorganization for federal income tax purposes and, accordingly, the basis of the assets of Transamerica Concentrated Growth reflects the historical basis of the assets of The Torray Resolute Fund as of the date of the reorganization. For financial reporting purposes, the Torray Resolute Fund’s operating history prior to the reorganization is reflected in Class I of Transamerica Concentrated Growth’s financial statements and financial highlights.
The purpose of the transaction was to provide an additional large cap growth fund with unique distribution opportunities. The acquisition was accomplished by a tax-free exchange of 861,025 shares of Transamerica Concentrated Growth for 861,025 shares of The Torray Resolute Fund outstanding on February 28, 2014. Transamerica Concentrated Growth’s net assets at that date were $500,010, which were combined with those of The Torray Resolute Fund. The aggregate net assets of Transamerica Concentrated Growth were $500,010; the combined net assets of Transamerica Concentrated Growth immediately after the acquisition were $13,903,438.
Assuming the reorganization had been completed on January 1, 2014, the beginning of the semi-annual reporting period of the Fund, the Fund’s pro forma results of operations for the period ended October 31, 2014, are as follows:
| | | | |
Net investment income (loss) | | $ | 713,725 | |
Net realized and change in unrealized gain (loss) | | | 991,369 | |
Net increase (decrease) in net assets resulting from operations | | | 12,284,158 | |
Because the combined investment portfolios have been managed as a single integrated portfolio since the acquisition was completed, it is not practicable to separate the amounts of revenue and earnings of The Torray Resolute Fund that have been included in the Transamerica Concentrated Growth’s Statement of Operations since March 1, 2014.
NOTE 9. SUBSEQUENT EVENTS
Transamerica International Small Cap Value closed to new investors on November 28, 2014. Transamerica’s asset allocators and existing Class I shareholders will be able to continue to purchase additional shares in the Fund at this time (provided they are already invested in the Fund).
Transamerica Unconstrained Bond commenced operations on December 8, 2014.
Management has evaluated subsequent events through the date of issuance of the financial statements, and determined that no other material events or transactions would require recognition or disclosure in the Funds’ financial statements.
| | |
| Transamerica Funds | | Annual Report 2014 |
Page 361
REPORT OF INDEPENDENT REGISTERED PUBLIC ACCOUNTING FIRM
To the Board of Trustees and Shareholders of Transamerica Funds:
We have audited the accompanying statements of assets and liabilities of Transamerica Capital Growth, Transamerica Concentrated Growth (formerly, the Torray Resolute Fund), Transamerica Dividend Focused, Transamerica Emerging Markets Debt, Transamerica Emerging Markets Equity, Transamerica Enhanced Muni, Transamerica Flexible Income, Transamerica Floating Rate, Transamerica Global Bond, Transamerica Global Equity (formerly, Transamerica Multi-Manager International Portfolio), Transamerica Growth Opportunities, Transamerica High Yield Bond, Transamerica High Yield Muni, Transamerica Income & Growth, Transamerica Inflation Opportunities, Transamerica International Equity, Transamerica International Small Cap Value, Transamerica Large Cap Value, Transamerica Mid Cap Growth, Transamerica Mid Cap Value Opportunities, Transamerica MLP Energy & Income, Transamerica Money Market, Transamerica Multi-Managed Balanced, Transamerica Opportunistic Allocation, Transamerica Short-Term Bond, Transamerica Small Cap Core, Transamerica Small Cap Growth, Transamerica Small Cap Value, Transamerica Small/Mid Cap Value, Transamerica Strategic High Income, Transamerica Tactical Allocation, Transamerica Tactical Income, Transamerica Tactical Rotation, and Transamerica U.S. Growth (thirty-four of the funds of the Transamerica Funds collectively known as “the Funds”), including the schedules of investments, as of October 31, 2014, and the related statements of operations and changes in net assets and the financial highlights for each of the years or periods indicated therein. These financial statements and financial highlights are the responsibility of the Funds’ management. Our responsibility is to express an opinion on these financial statements and financial highlights based on our audits. The statements of changes in net assets for the years ended December 31, 2013 and 2012, and financial highlights for the periods ended prior to October 31, 2014 of Transamerica Concentrated Growth were audited by another independent registered public accounting firm whose report dated February 24, 2014 expressed an unqualified opinion on those financial highlights. The financial highlights of Transamerica International Equity for the periods ended prior to November 1, 2010 were audited by another independent registered public accounting firm whose report dated December 17, 2010, expressed an unqualified opinion on those financial highlights.
We conducted our audits in accordance with the standards of the Public Company Accounting Oversight Board (United States). Those standards require that we plan and perform the audits to obtain reasonable assurance about whether the financial statements and financial highlights are free of material misstatement. We were not engaged to perform an audit of the Funds’ internal control over financial reporting. Our audits included consideration of internal control over financial reporting as a basis for designing audit procedures that are appropriate in the circumstances, but not for the purpose of expressing an opinion on the effectiveness of the Funds’ internal control over financial reporting. Accordingly, we express no such opinion. An audit also includes examining, on a test basis, evidence supporting the amounts and disclosures in the financial statements and financial highlights, assessing the accounting principles used and significant estimates made by management, and evaluating the overall financial statement presentation. Our procedures included confirmation of securities owned as of October 31, 2014, by correspondence with the custodian and others or by other appropriate auditing procedures where replies from others were not received. We believe that our audits provide a reasonable basis for our opinion.
In our opinion, the financial statements and financial highlights referred to above present fairly, in all material respects, the financial position of the aforementioned thirty-four Funds of the Transamerica Funds at October 31, 2014, the results of their operations, the changes in their net assets and the financial highlights for each of the years or periods indicated therein, in conformity with U.S. generally accepted accounting principles.

Boston, Massachusetts
December 24, 2014
| | |
| Transamerica Funds | | Annual Report 2014 |
Page 362
SUPPLEMENTAL INFORMATION (unaudited)
TAX INFORMATION
For dividends paid during the year ended October 31, 2014, the Funds designated the following maximum amounts of qualified dividend income:
| | | | |
| Fund | | Qualified Dividend
Income | |
Transamerica Capital Growth | | $ | 2,746,835 | |
Transamerica Dividend Focused | | | 29,351,561 | |
Transamerica Emerging Markets Equity | | | 3,626,699 | |
Transamerica Flexible Income | | | 234,610 | |
Transamerica Global Equity | | | 2,397,616 | |
Transamerica Growth Opportunities | | | 5,909,254 | |
Transamerica High Yield Bond | | | 1,677,785 | |
Transamerica Income & Growth | | | 15,952,758 | |
Transamerica Inflation Opportunities | | | 22,375 | |
Transamerica International Equity | | | 21,251,246 | |
Transamerica International Small Cap Value | | | 12,195,482 | |
Transamerica Large Cap Value | | | 34,470,591 | |
Transamerica Mid Cap Growth | | | 376,150 | |
Transamerica Mid Cap Value Opportunities | | | 947,473 | |
Transamerica MLP & Energy Income | | | 2,624,057 | |
Transamerica Multi-Managed Balanced | | | 4,903,911 | |
Transamerica Small Cap Core | | | 918,660 | |
Transamerica Small Cap Value | | | 9,135,285 | |
Transamerica Small/Mid Cap Value | | | 10,752,266 | |
Transamerica Strategic High Income | | | 354,464 | |
Transamerica Tactical Allocation | | | 305,246 | |
Transamerica Tactical Rotation | | | 104,268 | |
Transamerica US Growth | | | 16,947,012 | |
For corporate shareholders, investment income (dividend income plus short-term gains, if any) qualifies for the maximum dividends received deductions as follows:
| | | | |
| Fund | | Dividend Received
Deduction Percentage | |
Transamerica Capital Growth | | | 100 | % |
Transamerica Dividend Focused | | | 61 | |
Transamerica Emerging Markets Equity | | | 20 | |
Transamerica Flexible Income | | | 1 | |
Transamerica Global Equity | | | 17 | |
Transamerica Growth Opportunities | | | 64 | |
Transamerica High Yield Bond | | | 2 | |
Transamerica Income & Growth | | | 8 | |
Transamerica Inflation Opportunities | | | 1 | |
Transamerica Large Cap Value | | | 39 | |
Transamerica Mid Cap Growth | | | 100 | |
Transamerica Mid Cap Value Opportunities | | | 28 | |
Transamerica MLP & Energy Income | | | 15 | |
Transamerica Multi-Managed Balanced | | | 41 | |
Transamerica Small Cap Core | | | 15 | |
Transamerica Small Cap Value | | | 38 | |
Transamerica Small/Mid Cap Value | | | 5 | |
| | |
| Transamerica Funds | | Annual Report 2014 |
Page 363
| | | | |
| Fund | | Dividend Received
Deduction Percentage | |
Transamerica Strategic High Income | | | 18 | % |
Transamerica Tactical Allocation | | | 93 | |
Transamerica Tactical Rotation | | | 100 | |
Transamerica US Growth | | | 100 | |
For tax purposes, the long-term capital gain designations for the year ended October 31, 2014 were as follows:
| | | | |
| Fund | | Long-Term Capital Gain
Designation | |
Transamerica Capital Growth | | $ | 18,864,438 | |
Transamerica Growth Opportunities | | | 24,373,643 | |
Transamerica High Yield Bond | | | 9,792,021 | |
Transamerica International Equity | | | 11,466,020 | |
Transamerica Large Cap Value | | | 69,084,326 | |
Transamerica Multi-Managed Balanced | | | 17,533,058 | |
Transamerica Short-Term Bond | | | 11,055,610 | |
Transamerica Small Cap Growth | | | 13,380 | |
Transamerica Small Cap Value | | | 30,499,874 | |
Transamerica Small/Mid Cap Value | | | 62,233,151 | |
Transamerica Tactical Allocation | | | 62,124 | |
The amounts which represent income derived from sources within, and taxes paid to, foreign countries or possessions of the United States are as follows:
| | | | | | | | |
| Fund | | Foreign Source Income | | | Foreign Taxes | |
Transamerica Emerging Markets Equity | | $ | 5,740,910 | | | $ | 700,864 | |
Transamerica International Equity | | | 25,220,704 | | | | 939,070 | |
Transamerica International Small Cap Value | | | 14,065,749 | | | | 832,535 | |
The information and distributions reported herein may differ from the information and distributions taxable to the shareholders for the calendar year ending December 31, 2014. Complete information will be computed and reported in conjunction with your 2014 Form 1099-DIV.
| | |
| Transamerica Funds | | Annual Report 2014 |
Page 364
TRANSAMERICA FUNDS
Transamerica Global Equity (formerly Transamerica Multi-Manager International Portfolio) (“the Fund”)
RESULTS OF SHAREHOLDER PROXY
Rule 30e-1 under the Investment Company Act of 1940, as amended, titled “Reports to Stockholders of Management Companies,” requires registered management companies to report on all subject matters put to the vote of shareholders and to provide final results. Accordingly, the Board of Trustees of the Funds solicited a vote by the shareholders for the following items:
At the special meetings of shareholders held on August 29, 2014, the results were as follows:
Transamerica Global Equity (formerly Transamerica Multi-Manager International Portfolio):
Proposal I — To approve an amended and restated investment advisory agreement with TAM
| | | | | | | | | | | | |
| | | Shares Voted | | | % of Voted | | | % of Total | |
For | | | 7,850,113.775 | | | | 88.680 | | | | 44.735 | |
Against | | | 412,275.466 | | | | 4.657 | | | | 2.349 | |
Abstain | | | 589,778.968 | | | | 6.663 | | | | 3.361 | |
Total | | | 8,852,168.210 | | | | 100.000 | | | | 50.445 | |
Proposal II: To approve the Fund’s use of the Manager of Managers exemptive order available to TAM and the Trust
| | | | | | | | | | | | |
| | | Shares Voted | | | % of Voted | | | % of Total | |
For | | | 6,174,815.222 | | | | 69.755 | | | | 35.188 | |
Against | | | 2,078,866.222 | | | | 23.484 | | | | 11.847 | |
Abstain | | | 598,480.765 | | | | 6.761 | | | | 3.411 | |
Total | | | 8,852,162.210 | | | | 100.000 | | | | 50.445 | |
Proposal III — To approve a new sub-advisory agreement with Rockefeller & Co.
| | | | | | | | | | | | |
| | | Shares Voted | | | % of Voted | | | % of Total | |
For | | | 7,876,713.286 | | | | 88.981 | | | | 44.886 | |
Against | | | 368,287.304 | | | | 4.160 | | | | 2.099 | |
Abstain | | | 607,164.619 | | | | 6.859 | | | | 3.460 | |
Total | | | 8,852,165.210 | | | | 100.000 | | | | 50.445 | |
| | |
| Transamerica Funds | | Annual Report 2014 |
Page 365
INVESTMENT ADVISORY AND SUB-ADVISORY AGREEMENTS — CONTRACT RENEWAL
At a meeting of the Board of Trustees of Transamerica Funds (the “Trustees” or the “Board”) held on June 18-19, 2014, the Board considered the renewal of the investment advisory agreements (each an “Investment Advisory Agreement”) between each of the following funds (each a “Fund” and collectively the “Funds”) and Transamerica Asset Management, Inc. (“TAM”):
| | |
Transamerica Capital Growth | | Transamerica Large Cap Value |
Transamerica Dividend Focused | | Transamerica MLP & Energy Income |
Transamerica Emerging Markets Debt | | Transamerica Money Market |
Transamerica Emerging Markets Equity | | Transamerica Multi-Managed Balanced |
Transamerica Enhanced Muni | | Transamerica Short-Term Bond |
Transamerica Flexible Income | | Transamerica Small Cap Growth |
Transamerica Growth Opportunities | | Transamerica Small Cap Value |
Transamerica High Yield Bond | | Transamerica Small/Mid Cap Value |
Transamerica High Yield Muni | | Transamerica Tactical Allocation |
Transamerica Income & Growth | | Transamerica Tactical Income |
Transamerica International Equity | | Transamerica Tactical Rotation |
Transamerica International Small Cap Value | | Transamerica US Growth |
For the Funds listed in the left-hand column below, the Board also considered the renewal of the investment sub-advisory agreements (each a “Sub-Advisory Agreement” and, together with each Investment Advisory Agreement, the “Agreements”) between TAM and the corresponding sub-advisers listed in the right-hand column below (each a “Sub-Adviser” and collectively the “Sub-Advisers”).
| | |
| Fund | | Sub-Adviser(s) |
Transamerica Capital Growth | | Morgan Stanley Investment Management Inc. |
Transamerica Dividend Focused | | Barrow, Hanley, Mewhinney and Strauss, LLC |
Transamerica Emerging Markets Debt | | Logan Circle Partners, LP |
Transamerica Emerging Markets Equity | | ClariVest Asset Management LLC |
Transamerica Enhanced Muni | | Belle Haven Investments, L.P. |
Transamerica Flexible Income | | Aegon USA Investment Management, LLC |
Transamerica Growth Opportunities | | Morgan Stanley Investment Management Inc. |
Transamerica High Yield Bond | | Aegon USA Investment Management, LLC |
Transamerica High Yield Muni | | Belle Haven Investments, L.P. |
Transamerica Income & Growth | | Ranger International Management, LP |
Transamerica International Equity | | Thompson, Siegel & Walmsley LLC |
Transamerica International Small Cap Value | | Thompson, Siegel & Walmsley LLC |
Transamerica Large Cap Value | | Levin Capital Strategies, L.P. |
Transamerica MLP & Energy Income | | Kayne Anderson Capital Advisers, L.P. |
Transamerica Money Market | | Aegon USA Investment Management, LLC |
Transamerica Multi-Managed Balanced | | J.P. Morgan Investment Management Inc. |
Transamerica Short-Term Bond | | Aegon USA Investment Management, LLC |
Transamerica Small Cap Growth | | Ranger Investment Management, L.P. |
Transamerica Small Cap Value | | Lombardia Capital Partners, LLC |
Transamerica Small/Mid Cap Value | | Systematic Financial Management L.P. |
Transamerica Tactical Allocation | | Aegon USA Investment Management, LLC |
Transamerica Tactical Income | | Aegon USA Investment Management, LLC |
Transamerica Tactical Rotation | | Aegon USA Investment Management, LLC |
Transamerica US Growth | | Wellington Management Company, LLP |
Following its review and consideration, the Board determined that the terms of each Investment Advisory Agreement and Sub-Advisory Agreement are reasonable and that the renewal of each of the Agreements is in the best interests of the applicable Fund and its shareholders. The Board, including the independent members of the Board (the “Independent Trustees”), unanimously approved the renewal of each of the Agreements through June 30, 2015. In reaching their decision, the Trustees requested and received from TAM and each Sub-Adviser such information as they deemed reasonably necessary to evaluate the Agreements, including, to the extent applicable, information about fees and performance of comparable funds and/or accounts managed by each Sub-Adviser. The Trustees also considered information they had previously received from TAM and each Sub-Adviser as part of their regular oversight of each
| | |
| Transamerica Funds | | Annual Report 2014 |
Page 366
INVESTMENT ADVISORY AND SUB-ADVISORY AGREEMENTS — CONTRACT RENEWAL (continued)
Fund, as well as comparative fee, expense and performance information prepared by Lipper Inc. (“Lipper”), an independent provider of mutual fund performance information, and fee, expense and profitability information prepared by TAM.
In their deliberations, the Independent Trustees had the opportunity to meet privately without representatives of TAM or any Sub-Adviser present and were represented throughout the process by independent legal counsel. In considering the proposed continuation of each of the Agreements, the Trustees evaluated a number of considerations that they believed, in light of the legal advice furnished to them by independent legal counsel and/or their own business judgment, to be relevant. They based their decisions on the considerations discussed below, among others, although they did not identify any particular consideration or information that was controlling of their decisions, and each Trustee may have attributed different weights to the various factors.
Nature, Extent and Quality of the Services Provided
The Board considered the nature, extent and quality of the services provided by TAM and each Sub-Adviser to the applicable Fund in the past and the services anticipated to be provided in the future. The Board also considered the investment approach for each Fund; the experience, capability and integrity of TAM’s senior management; the financial resources of TAM and each Sub-Adviser; TAM’s management oversight process; and the professional qualifications of the portfolio management team of each Sub-Adviser. The Trustees noted that they receive, on a quarterly basis, an execution analysis from Capital Institutional Services, Inc. (CAPIS), an independent provider of trade analyses, for each applicable Sub-Adviser and a comparison of trading results against a peer universe of managers.
The Board also considered the continuous and regular investment advisory and other services provided by TAM for the portion of the investment advisory fee it retains after payment of the sub-advisory fee(s) for each Fund. The Board noted that the investment advisory services include the design, development and ongoing review and evaluation of each Fund and its investment strategy; where applicable the selection, oversight and monitoring of one or more investment sub-advisers to perform certain duties with respect to the Funds; ongoing portfolio trading oversight and analysis; risk management oversight and analysis; design, development, implementation and ongoing review and evaluation of a process for the valuation of Fund investments; design, development, implementation and ongoing review and evaluation of a compliance program for the Funds; design, development, implementation and ongoing review and evaluation of a process for the voting of proxies and rights to consent to corporate action for Fund investments; participation in Board meetings and oversight of preparation of materials for the Board, including materials for Board meetings and regular communications with the Board; oversight of preparation of the Funds’ prospectuses, statements of additional information, shareholder reports and other disclosure materials and regulatory filings for the Funds; and ongoing cash management services. The Board also noted that TAM, as part of the investment advisory services it provides to all Transamerica mutual funds, including the Funds, oversees the services provided by the funds’ administrator, custodian, transfer agent, independent accountant and legal counsel and supervises the performance of the recordkeeping and shareholder functions of the funds.
Based on these considerations, the Board determined that TAM and each Sub-Adviser can provide investment and related services that are appropriate in scope and extent in light of the applicable Fund’s operations, the competitive landscape of the investment company business and investor needs.
Investment Performance
The Board considered the short- and longer-term performance, as applicable, of each Fund in light of its investment objective, policies and strategies, including relative performance against (i) a peer universe of comparable mutual funds, as prepared by Lipper, and (ii) the Fund’s benchmark(s), in each case for various trailing periods ended December 31, 2013.
Transamerica Capital Growth. The Board noted that the performance of Class A Shares of the Fund was above the median for its peer universe for the past 1- and 3-year periods. The Board also noted that the performance of Class A Shares of the Fund was above its benchmark for the past 1- and 3-year periods. The Board also noted that the Fund’s performance included the management of a previous sub-adviser to the Fund.
Transamerica Dividend Focused. The Board noted that the performance of Class A Shares of the Fund was above the median for its peer universe since inception. The Board also noted that the performance of Class A Shares of the Fund was below its benchmark since inception.
Transamerica Emerging Markets Debt. The Board noted that the performance of Class A Shares of the Fund was above the median for its peer universe for the past 1-year period. The Board also noted that the performance of Class A Shares of the Fund was above its benchmark for the past 1-year period.
Transamerica Emerging Markets Equity. The Board noted that the performance of Class A Shares of the Fund was in line with the median for its peer universe for the past 1-year period. The Board also noted that the performance of Class A Shares of the Fund was above its benchmark for the past 1-year period. The Trustees and TAM agreed to continue to monitor and report to the Board on the performance of the Fund.
| | |
| Transamerica Funds | | Annual Report 2014 |
Page 367
INVESTMENT ADVISORY AND SUB-ADVISORY AGREEMENTS — CONTRACT RENEWAL (continued)
Transamerica Enhanced Muni. The Board noted that the performance of Class A Shares of the Fund was above the median for its peer universe for the past 1-year period. The Board also noted that the performance of Class A Shares of the Fund was above its benchmark for the past 1-year period.
Transamerica Flexible Income. The Board noted that the performance of Class A Shares of the Fund was above the median for its peer universe for the past 1-, 3- and 5-year periods and below the median for the past 10-year period. The Board also noted that the performance of Class A Shares of the Fund was above its benchmark for the past 1-, 3-, 5- and 10-year periods. The Trustees also noted recent changes in the Fund’s portfolio management team. The Trustees noted that TAM intends to monitor and report to the Board on the portfolio manager transition and performance going forward.
Transamerica Growth Opportunities. The Board noted that the performance of Class A Shares of the Fund was above the median for its peer universe for the past 1- and 10-year periods, in line with the median for the past 5-year period and below the median for the past 3-year period. The Board also noted that the performance of Class A Shares of the Fund was above its benchmark for the past 1-year period and below its benchmark for the past 3-, 5- and 10-year periods. The Trustees discussed the reasons for the underperformance with TAM and TAM agreed to continue to monitor and report to the Board on the performance of the Fund. The Board also noted that the Fund’s performance included the management of a previous sub-adviser to the Fund.
Transamerica High Yield Bond. The Board noted that the performance of Class A Shares of the Fund was above the median for its peer universe for the past 3-, 5- and 10-year periods and in line with the median for the past 1-year period. The Board also noted that the performance of Class A Shares of the Fund was below its benchmark for the past 1-, 3-, 5- and 10-year periods.
Transamerica High Yield Muni. The Board noted that the performance of Class A Shares of the Fund was above the median for its peer universe since inception. The Board also noted that the performance of Class A of the Fund was above its benchmark since inception.
Transamerica Income & Growth. The Board noted that the performance of Class A Shares of the Fund was below the median for its peer universe for the past 1-year period. The Board also noted that the performance of Class A Shares of the Fund was below its benchmark for the past 1-year period. The Trustees discussed the reasons for the underperformance with TAM and TAM agreed to continue to monitor and report to the Board on the performance of the Fund.
Transamerica International Equity. The Board noted that the performance of Class I Shares of the Fund was above the median for its peer universe for the past 1-, 3-, 5- and 10-year periods. The Board also noted that the performance of Class I Shares of the Fund was above its benchmark for the past 1-, 3-, 5- and 10-year periods.
Transamerica International Small Cap Value. The Board noted that the performance of Class I2 Shares of the Fund was above the median for its peer universe for the period since inception. The Board also noted that the performance of Class I2 Shares of the Fund was below its benchmark for the period since inception.
Transamerica Large Cap Value. The Board noted that the performance of Class A Shares of the Fund was above the median for its peer universe for the past 1- and 3-year periods. The Board also noted that the performance of Class A Shares of the Fund was above its benchmark for the past 1-year period and below its benchmark for the past 3-year period.
Transamerica MLP & Energy Income. The Board noted that the performance of Class A Shares of the Fund was in line with the median for its peer universe for the period since inception. The Board also noted that the performance of Class A Shares of the Fund was above its composite benchmark for the period since inception.
Transamerica Money Market. The Board noted that the performance of Class A Shares of the Fund was above the median for its peer universe for the past 1- and 3-year periods and below the median for the past 5- and 10-year periods. The Board noted TAM’s observations that the yields of money market funds have been below average due to a low interest rate environment and that relative performance in the tightly-constrained money market universe is largely a function of expenses. The Trustees also noted recent changes in the Fund’s portfolio management team. The Trustees noted that TAM intends to monitor and report to the Board on the portfolio manager transition and performance going forward. The Board also noted that the Fund’s performance included the management of a previous sub-adviser to the Fund.
Transamerica Multi-Managed Balanced. The Board noted that the performance of Class A Shares of the Fund was above the median for its peer universe for the past 3-, 5- and 10-year periods and below the median for the past 1-year period. The Board also noted that the performance of Class A Shares of the Fund was above its primary benchmark for the past 10-year period and below its primary benchmark for the past 1-, 3- and 5- year periods. The Trustees discussed the reasons for the underperformance with TAM and TAM agreed to continue to monitor and report to the Board on the performance of the Fund. The Board noted that it had approved the replacement of one sub-adviser to the Fund during the past year and that the Fund’s performance included the management of previous sub-advisers to the Fund. The Trustees also noted anticipated changes in the portfolio management team of one of the sub-advisers to the Fund. The Trustees noted that TAM intends to monitor and report to the Board on the portfolio manager transition going forward.
| | |
| Transamerica Funds | | Annual Report 2014 |
Page 368
INVESTMENT ADVISORY AND SUB-ADVISORY AGREEMENTS — CONTRACT RENEWAL (continued)
Transamerica Short-Term Bond. The Board noted that the performance of Class A Shares of the Fund was above the median for its peer universe for the past 1-, 3- and 5-year periods. The Board also noted that the performance of Class A Shares of the Fund was above its benchmark for the past 1-, 3- and 5-year periods. The Trustees also noted recent changes in the Fund’s portfolio management team. The Trustees noted that TAM intends to monitor and report to the Board on the portfolio manager transition and performance going forward. The Board also noted that the Fund’s performance included the management of a previous sub-adviser.
Transamerica Small Cap Growth. The Board noted that the performance of Class A Shares of the Fund was below the median for its peer universe for the past 1-year period. The Board also noted that the performance of Class A Shares of the Fund was below its benchmark for the past 1-year period. The Trustees discussed the reasons for the underperformance with TAM and agreed to continue to monitor the performance of the Fund.
Transamerica Small Cap Value. The Board noted that the performance of Class A Shares of the Fund was in line with the median for its peer universe for the past 1-year period. The Board also noted that the performance of Class A Shares of the Fund was above its benchmark for the past 1-year period.
Transamerica Small/Mid Cap Value. The Board noted that the performance of Class A Shares of the Fund was above the median for its peer universe for the past 5- and 10-year periods and in line with the median for the past 1- and 3-year periods. The Board also noted that the performance of Class A Shares of the Fund was above its benchmark for the past 1-, 5- and 10-year periods and below its benchmark for the past 3-year period. The Board also noted that the Fund’s performance included the performance of previous sub-advisers to the Fund.
Transamerica Tactical Allocation. The Board noted that the performance of Class A Shares of the Fund was in line with the median for its peer universe for the past 1-year period. The Board also noted that the performance of Class A Shares of the Fund was below its primary benchmark for the past 1-year period. The Trustees discussed the reasons for the underperformance with TAM and agreed to continue to monitor the performance of the Fund. The Trustees also noted recent changes in the Fund’s portfolio management team. The Trustees noted that TAM intends to monitor and report to the Board on the portfolio manager transition and performance going forward.
Transamerica Tactical Income. The Board noted that the performance of Class A Shares of the Fund was below the median for its peer universe for the past 1-year period. The Board also noted that the performance of Class A Shares of the Fund was below its composite benchmark for the past 1-year period. The Trustees discussed the reasons for the underperformance with TAM and agreed to continue to monitor the performance of the Fund. The Trustees also noted recent changes in the Fund’s portfolio management team. The Trustees noted that TAM intends to monitor and report to the Board on the portfolio manager transition and performance going forward.
Transamerica Tactical Rotation. The Board noted that the performance of Class A Shares of the Fund was above the median for its peer universe for the past 1-year period. The Board also noted that the performance of Class A Shares of the Fund was below its primary benchmark for the past 1-year period. The Trustees discussed the reasons for the underperformance with TAM and agreed to continue to monitor the performance of the Fund. The Trustees also noted recent changes in the Fund’s portfolio management team. The Trustees noted that TAM intends to monitor and report to the Board on the portfolio manager transition and performance going forward.
Transamerica US Growth. The Board noted that the performance of Class A Shares of the Fund was below the median for its peer universe for the past 1- and 3-year periods. The Board also noted that the performance of Class A Shares of the Fund was below its benchmark for the past 1- and 3-year periods. The Trustees discussed the reasons for the underperformance with TAM and TAM agreed to continue to monitor and report to the Board on the performance of the Fund. The Board also noted upcoming changes to the Fund’s name, portfolio management team and process that would take place on or about July 1, 2014. The Trustees noted that TAM intends to monitor and report to the Board on the portfolio manager transition and performance going forward. The Board also noted that the Fund’s performance included the management of a previous sub-adviser to the Fund.
On the basis of this information and the Board’s assessment of the nature, extent and quality of the services to be provided or procured by TAM and provided by the Sub-Advisers, the Board concluded that TAM and each Sub-Adviser are capable of generating a level of investment performance that is appropriate in light of the applicable Fund’s investment objectives, policies and strategies and that is competitive with other investment companies.
Investment Advisory and Sub-Advisory Fees and Total Expense Ratios
The Board considered the investment advisory fee and total expense ratio of each Fund, including information provided by Lipper comparing the investment advisory fee and total expense ratio of each Fund to the investment advisory fees and total expense ratios of other investment companies in both a peer group and broader peer universe compiled by Lipper. The Board also considered the fees charged by the Sub-Advisers for sub-advisory services, the portion of a Fund’s investment advisory fee retained by TAM following payment of the sub-advisory fee(s) and how the portion of the contractual investment advisory fee retained by TAM at a specified asset
| | |
| Transamerica Funds | | Annual Report 2014 |
Page 369
INVESTMENT ADVISORY AND SUB-ADVISORY AGREEMENTS — CONTRACT RENEWAL (continued)
level compared to the portions retained by other investment advisers managing mutual funds with similar investment strategies as calculated by Strategic Insight, an independent provider of information (except for Transamerica Flexible Income, Transamerica High Yield Bond, Transamerica Multi-Managed Balanced, Transamerica Money Market and Transamerica Short-Term Bond which was calculated by TAM).
Transamerica Capital Growth. The Board noted that the Fund’s contractual investment advisory fee was in line with the median for its peer group and above the median for its peer universe and that the actual total expenses (i.e., expenses reflecting any waivers and/or reimbursements) of Class A Shares of the Fund were above the medians for its peer group and peer universe. The Board also noted that TAM has entered into an expense limitation arrangement with the Fund, which may result in TAM waiving fees for the benefit of shareholders.
Transamerica Dividend Focused. The Board noted that the Fund’s contractual investment advisory fee was below the medians for its peer group and peer universe and that the actual total expenses (i.e., expenses reflecting any waivers and/or reimbursements) of Class A Shares of the Fund were below the medians for its peer group and peer universe. The Board also noted that TAM has entered into an expense limitation arrangement with the Fund, which may result in TAM waiving fees for the benefit of shareholders.
Transamerica Emerging Markets Debt. The Board noted that the Fund’s contractual investment advisory fee was below the medians for its peer group and peer universe and that the actual total expenses (i.e., expenses reflecting any waivers and/or reimbursements) of Class A Shares of the Fund were below the medians for its peer group and peer universe. The Board also noted that TAM has entered into an expense limitation arrangement with the Fund, which may result in TAM waiving fees for the benefit of shareholders.
Transamerica Emerging Markets Equity. The Board noted that the Fund’s contractual investment advisory fee was below the medians for its peer group and peer universe and that the actual total expenses (i.e., expenses reflecting any waivers and/or reimbursements) of Class A Shares of the Fund were below the medians for its peer group and peer universe. The Board also noted that TAM has entered into an expense limitation arrangement with the Fund, which may result in TAM waiving fees for the benefit of shareholders.
Transamerica Enhanced Muni. The Board noted that the Fund’s contractual investment advisory fee was below the medians for its peer group and peer universe and that the actual total expenses (i.e., expenses reflecting any waivers and/or reimbursements) of Class A Shares of the Fund were in line with the median for its peer group and above the median for its peer universe. The Board also noted that TAM has entered into an expense limitation arrangement with the Fund, which may result in TAM waiving fees for the benefit of shareholders.
Transamerica Flexible Income. The Board noted that the Fund’s contractual investment advisory fee was below the medians for its peer group and peer universe and that the actual total expenses (i.e., expenses reflecting any waivers and/or reimbursements) of Class A Shares of the Fund were below the medians for its peer group and peer universe. The Board also noted that TAM has entered into an expense limitation arrangement with the Fund, which may result in TAM waiving fees for the benefit of shareholders.
Transamerica Growth Opportunities. The Board noted that the Fund’s contractual investment advisory fee was below the median for its peer group and in line with the median for its peer universe and that the actual total expenses (i.e., expenses reflecting any waivers and/or reimbursements) of Class A Shares of the Fund were above the medians for its peer group and peer universe. The Board also noted that TAM has entered into an expense limitation arrangement with the Fund, which may result in TAM waiving fees for the benefit of shareholders.
Transamerica High Yield Bond. The Board noted that the Fund’s contractual investment advisory fee was in line with the medians for its peer group and peer universe and that the actual total expenses (i.e., expenses reflecting any waivers and/or reimbursements) of Class A Shares of the Fund were in line with the medians for its peer group and peer universe. The Board also noted that TAM has entered into an expense limitation arrangement with the Fund, which may result in TAM waiving fees for the benefit of shareholders.
Transamerica High Yield Muni. The Board noted that the Fund’s contractual investment advisory fee was below the medians for its peer group and peer universe and that the actual total expenses (i.e., expenses reflecting any waivers and/or reimbursements) of Class A Shares of the Fund were above the medians for its peer group and peer universe. The Board also noted that TAM has entered into an expense limitation arrangement with the Fund, which may result in TAM waiving fees for the benefit of shareholders.
Transamerica Income & Growth. The Board noted that the Fund’s contractual investment advisory fee was below the medians for its peer group and peer universe and that the actual total expenses (i.e., expenses reflecting any waivers and/or reimbursements) of Class A Shares of the Fund were below the medians for its peer group and peer universe. The Board also noted that TAM has entered into an expense limitation arrangement with the Fund, which may result in TAM waiving fees for the benefit of shareholders.
Transamerica International Equity. The Board noted that the Fund’s contractual investment advisory fee was below the medians for its peer group and peer universe and that the actual total expenses (i.e., expenses reflecting any waivers and/or reimbursements) of Class I Shares of the Fund were below the median for its peer group and in line with the median for its peer universe. The Board also noted that TAM has entered into an expense limitation arrangement with the Fund, which may result in TAM waiving fees for the benefit of shareholders.
| | |
| Transamerica Funds | | Annual Report 2014 |
Page 370
INVESTMENT ADVISORY AND SUB-ADVISORY AGREEMENTS — CONTRACT RENEWAL (continued)
Transamerica International Small Cap Value. The Board noted that the Fund’s contractual investment advisory fee was below the medians for its peer group and peer universe and that the actual total expenses (i.e., expenses reflecting any waivers and/or reimbursements) of Class I2 Shares of the Fund were below the medians for its peer group and peer universe. The Board also noted that TAM has entered into an expense limitation arrangement with the Fund, which may result in TAM waiving fees for the benefit of shareholders.
Transamerica Large Cap Value. The Board noted that the Fund’s contractual investment advisory fee was below the medians for its peer group and peer universe and that the actual total expenses (i.e., expenses reflecting any waivers and/or reimbursements) of Class A Shares of the Fund were in line with the medians for its peer group and peer universe. The Board also noted that TAM has entered into an expense limitation arrangement with the Fund, which may result in TAM waiving fees for the benefit of shareholders.
Transamerica MLP & Energy Income. The Board noted that the Fund’s contractual investment advisory fee was in line with the median for its peer group and above the median for its peer universe and that the actual total expenses (i.e., expenses reflecting any waivers and/or reimbursements) of Class A Shares of the Fund were in line with the median for its peer group and above the median for its peer universe. The Board also noted that TAM has entered into an expense limitation arrangement with the Fund, which may result in TAM waiving fees for the benefit of shareholders.
Transamerica Money Market. The Board noted that the Fund’s contractual investment advisory fee was below the median for its peer group and in line with the median for its peer universe and that the actual total expenses (i.e., expenses reflecting any waivers and/or reimbursements) of Class A Shares of the Fund were above the median for its peer group and in line with the median for its peer universe. The Board also noted that TAM has entered into an expense limitation arrangement with the Fund, which may result in TAM waiving fees for the benefit of shareholders.
Transamerica Multi-Managed Balanced. The Board noted that the Fund’s contractual investment advisory fee was above the medians for its peer group and peer universe and that the actual total expenses (i.e., expenses reflecting any waivers and/or reimbursements) of Class A Shares of the Fund were above the medians for its peer group and peer universe. The Board also noted that TAM has entered into an expense limitation arrangement with the Fund, which may result in TAM waiving fees for the benefit of shareholders.
Transamerica Short-Term Bond. The Board noted that the Fund’s contractual investment advisory fee was above the medians for its peer group and peer universe and that the actual total expenses (i.e., expenses reflecting any waivers and/or reimbursements) of Class A Shares of the Fund were in line with the medians for its peer group and peer universe. The Board also noted that TAM has entered into an expense limitation arrangement with the Fund, which may result in TAM waiving fees for the benefit of shareholders.
Transamerica Small Cap Growth. The Board noted that the Fund’s contractual investment advisory fee was in line with the median for its peer group and below the median for its peer universe and that the actual total expenses (i.e., expenses reflecting any waivers and/or reimbursements) of Class A Shares of the Fund were below the medians for its peer group and peer universe. The Board also noted that TAM has entered into an expense limitation arrangement with the Fund, which may result in TAM waiving fees for the benefit of shareholders.
Transamerica Small Cap Value. The Board noted that the Fund’s contractual investment advisory fee was in line with the medians for its peer group and peer universe and that the actual total expenses (i.e., expenses reflecting any waivers and/or reimbursements) of Class A Shares of the Fund were above the median for its peer group and in line with the median for its peer universe. The Board also noted that TAM has entered into an expense limitation arrangement with the Fund, which may result in TAM waiving fees for the benefit of shareholders.
Transamerica Small/Mid Cap Value. The Board noted that the Fund’s contractual investment advisory fee was above the medians for its peer group and peer universe and that the actual total expenses (i.e., expenses reflecting any waivers and/or reimbursements) of Class A Shares of the Fund were above the medians for its peer group and peer universe. The Board also noted that TAM has entered into an expense limitation arrangement with the Fund, which may result in TAM waiving fees for the benefit of shareholders.
Transamerica Tactical Allocation. The Board noted that the Fund’s contractual investment advisory fee was above the medians for its peer group and peer universe and that the actual total expenses (i.e., expenses reflecting any waivers and/or reimbursements) of Class A Shares of the Fund were in line with the median for its peer group and below the median for its peer universe. The Board also noted that TAM has entered into an expense limitation arrangement with the Fund, which may result in TAM waiving fees for the benefit of shareholders.
Transamerica Tactical Income. The Board noted that the Fund’s contractual investment advisory fee was below the medians for its peer group and peer universe and that the actual total expenses (i.e., expenses reflecting any waivers and/or reimbursements) of Class A Shares of the Fund were below the medians for its peer group and peer universe. The Board also noted that TAM has entered into an expense limitation arrangement with the Fund, which may result in TAM waiving fees for the benefit of shareholders.
| | |
| Transamerica Funds | | Annual Report 2014 |
Page 371
INVESTMENT ADVISORY AND SUB-ADVISORY AGREEMENTS — CONTRACT RENEWAL (continued)
Transamerica Tactical Rotation. The Board noted that the Fund’s contractual investment advisory fee was above the medians for its peer group and peer universe and that the actual total expenses (i.e., expenses reflecting any waivers and/or reimbursements) of Class A Shares of the Fund were above the medians for its peer group and peer universe. The Board also noted that TAM has entered into an expense limitation arrangement with the Fund, which may result in TAM waiving fees for the benefit of shareholders.
Transamerica US Growth. The Board noted that the Fund’s contractual investment advisory fee was above the medians for its peer group and peer universe and that the actual total expenses (i.e., expenses reflecting any waivers and/or reimbursements) of Class A Shares of the Fund were above the medians for its peer group and peer universe. The Board also noted that TAM has entered into an expense limitation arrangement with the Fund, which may result in TAM waiving fees for the benefit of shareholders.
On the basis of these considerations, together with the other information it considered, the Board determined that the investment advisory and sub-advisory fees to be received by TAM and the Sub-Advisers under each Investment Advisory Agreement and Sub-Advisory Agreement are reasonable in light of the services provided.
Cost of Services Provided and Level of Profitability
The Board reviewed information provided by TAM about the cost of providing and procuring fund management services, as well as the costs of the provision of administration, transfer agency and other services, to each Fund and to Transamerica Funds as a whole by TAM and its affiliates. The Board considered the profitability of TAM and its affiliates in providing these services for each Fund and Transamerica Funds as a whole, as well as the allocation methodology used for calculating profitability. The Board also considered the assessment prepared by Ernst & Young LLP (“E&Y”), independent registered public accounting firm and auditor to the Funds, to assist the Board’s evaluation of TAM’s profitability analysis. E&Y’s engagement included the review and assessment of the revenue and expense allocation methodology used by TAM to estimate its profitability with respect to its relationship with the Funds, and completion of procedures in respect of the mathematical accuracy of the profitability calculation and its conformity to established allocation methodologies. After considering E&Y’s assessment and information provided by TAM, the Board concluded that, while other allocation methods may also be reasonable, TAM’s profitability methodologies are reasonable.
With respect to the Sub-Advisers, the Board noted that the sub-advisory fees are the product of arm’s-length negotiation between TAM and the applicable Sub-Adviser (with the exception of those fees paid to Aegon USA Investment Management, LLC (“AUIM”)) and are paid by TAM and not the applicable Fund. As a result, for those Funds not sub-advised by AUIM, the Board principally considered the profitability of TAM and its affiliates with respect to the applicable Fund. For each Fund sub-advised by AUIM, the Board noted that information about AUIM’s revenues and expenses was incorporated into TAM’s profitability analysis for the Fund.
Based on this information, the Board determined that the profitability of TAM and its affiliates from their relationships with the Funds was not excessive.
Economies of Scale
The Board considered economies of scale with respect to the management of each Fund, whether the Fund had appropriately benefited from any economies of scale and whether there was the potential for realization of any further economies of scale. The Board also considered the existence of economies of scale with respect to management of the Transamerica mutual funds overall and the extent to which the Funds benefited from these economies of scale. The Board considered each Fund’s investment advisory fee schedule and the existence of breakpoints, if any, and also considered the extent to which TAM shared economies of scale with the Funds through investments in maintaining and developing its capabilities and services. The Trustees concluded that each Fund’s fee structure reflected economies of scale to date and noted that they will have the opportunity to periodically reexamine the appropriateness of the investment advisory fees payable to TAM and the fees paid to the Sub-Advisers and whether each Fund has achieved economies of scale in the future.
Benefits to TAM, its Affiliates and the Sub-Advisers from their Relationships with the Funds
The Board considered any other benefits derived by TAM, its affiliates, and the Sub-Advisers from their relationships with the Funds. The Board noted that TAM does not realize soft dollar benefits from its relationships with the Funds and that TAM believes that any use of soft dollars by the Sub-Advisers is generally appropriate and in the best interests of the Funds. The Board also noted that certain Sub-Advisers are participating in a brokerage program pursuant to which a portion of brokerage commissions paid by each applicable Fund is recaptured for the benefit of the Fund and its shareholders, thus limiting the amount of soft dollar arrangements the Sub-Adviser may engage in with respect to a Fund’s brokerage transactions.
Other Considerations
The Board noted that TAM has made a substantial commitment to the recruitment and retention of high quality personnel and maintains the financial, compliance and operational resources reasonably necessary to manage each Fund in a professional manner that is
| | |
| Transamerica Funds | | Annual Report 2014 |
Page 372
INVESTMENT ADVISORY AND SUB-ADVISORY AGREEMENTS — CONTRACT RENEWAL (continued)
consistent with the best interests of the Fund and its shareholders. In this regard, the Board favorably considered the procedures and policies TAM has in place to enforce compliance with applicable laws and regulations and oversee the portfolio management activities of the Sub-Advisers. The Board also noted that TAM has made a significant entrepreneurial commitment to the management and success of the Funds.
Conclusion
After consideration of the factors described above, as well as other factors, the Trustees, including the Independent Trustees, concluded that the renewal of each Investment Advisory Agreement and Sub-Advisory Agreement is in the best interests of the applicable Fund and its shareholders and voted to approve the renewal of the Agreements.
| | |
| Transamerica Funds | | Annual Report 2014 |
Page 373
TRANSAMERICA MULTI-MANAGED BALANCED
APPROVAL OF NEW INVESTMENT SUB-ADVISORY AGREEMENT
At a meeting of the Board of Trustees of Transamerica Funds (the “Board” or “Board Members”) held on October 16 & 17, 2013, the Board considered the termination of BlackRock Financial Investment Management, LLC (“BlackRock”) as the sub-adviser to Transamerica Multi-Managed Balanced ( the “Fund”) and the approval of a new investment sub-advisory agreement between Transamerica Asset Management, Inc. (“TAM”) and AEGON USA Investment Management, LLC (“AUIM”) (the “New-Sub-Advisory Agreement”) for the Fund.
Following their review and consideration, the Board Members determined that the terms of the New Sub-Advisory Agreement are reasonable and that the termination of BlackRock as sub-adviser to the Fund and approval of the New Sub-Advisory Agreement is in the best interests of the Fund and its shareholders. The Board, including the independent members of the Board (the “Independent Board Members”), unanimously approved the New Sub-Advisory Agreement for an initial two-year period and authorized TAM to terminate the sub-advisory agreement with BlackRock.
To assist the Board Members in their consideration of the New Sub-Advisory Agreement, the Board Members received in advance of their meeting certain materials and information. In addition, the Independent Board Members consulted with their independent legal counsel, discussing, among other things, the legal standards and certain other considerations relevant to the Board Members’ deliberations.
Among other matters, the Board considered:
(a) that TAM advised the Board Members that the appointment of AUIM is not expected to result in any diminution in the nature, extent and quality of services provided to the Fund and its shareholders, including compliance services;
(b) that AUIM is an experienced and respected asset management firm, and that TAM believes that AUIM has the capabilities, resources and personnel necessary to provide sub-advisory services to the Fund based on an assessment of the services that AUIM provides to other funds within the Transamerica mutual fund complex;
(c) that AUIM and TAM are affiliated entities;
(d) that in June 2013 the Board performed a full annual review of a number of sub-advisory agreements with AUIM with respect to Transamerica mutual funds not discussed herein, and determined that AUIM has the capabilities, resources and personnel necessary to provide the sub-advisory services to the Transamerica mutual fund complex;
(e) the proposed responsibilities of AUIM for the Fund and the services expected to be provided by it;
(f) the fact that the sub-advisory fees payable by TAM to AUIM would not increase from those paid by TAM to the Fund’s current sub-adviser;
(g) that advisory fees paid by the Fund to TAM would not increase;
(h) that the proposed sub-advisory fees to be paid by TAM to AUIM are reasonable in light of the services to be provided;
(i) that TAM recommended to the Board that AUIM be appointed as Sub-Adviser to the Fund based on its desire to engage a sub-adviser with strong research and management capabilities across the fixed income spectrum and with the ability to implement the current investment strategies of the Fund; and
(j) that the Fund and other funds for which AUIM was being appointed as sub-adviser would bear the costs of obtaining shareholder approval of the New Sub-Advisory Agreements, such costs to be allocated on the basis of their respective net assets except where direct costs can reasonably be attributed to a particular Fund.
Further, the Board Members, including a majority of the independent Board Members, found that the change in sub-adviser to AUIM is in the best interests of the Fund and its shareholders and does not involve a conflict of interest from which TAM and AUIM derives an inappropriate advantage.
A discussion followed that included consideration of these and other matters.
In their deliberations, the Board Members evaluated a number of considerations that they believed, in light of the legal advice furnished to them by independent legal counsel and their own business judgment, to be relevant. They based their decisions on the considerations discussed here, among others, although they did not identify any consideration or particular information that was controlling of their decisions, and each Board Member may have attributed different weights to the various factors.
| | |
| Transamerica Funds | | Annual Report 2014 |
Page 374
TRANSAMERICA MULTI-MANAGED BALANCED
APPROVAL OF NEW INVESTMENT SUB-ADVISORY AGREEMENT (continued)
Nature, Extent and Quality of the Services to be Provided. In evaluating the nature, extent and quality of the services to be provided by AUIM under the New Sub-Advisory Agreement, the Board considered, among other things, information provided by TAM and AUIM regarding AUIM’s operations (including research and trading), facilities, organization and personnel of AUIM, AUIM’s ability to use its resources effectively in performing its duties under the New Sub-Advisory Agreement, and AUIM’s capabilities in implementing the investment strategies of the Fund. The Board also considered that AUIM and TAM are affiliated entities. The Board considered that TAM has advised the Board that the appointment of AUIM is not expected to result in any diminution in the nature, extent and quality of services provided to the Fund and its Shareholders, including compliance services. The Board considered that AUIM is an experienced and respected asset management firm and that TAM believes that AUIM has the capabilities, resources and personnel necessary to provide sub-advisory services to the Fund based on the assessment of the services that AUIM provides to other Transamerica mutual funds. The Board Members also considered that they recently had performed a full annual review of a number of sub-advisory agreements with AUIM and had determined that AUIM has the capabilities, resources and personnel necessary to provide the sub-advisory services to the funds subject to those agreements.
Based on their review of the materials provided and the assurances they had received from TAM, the Board determined that AUIM can provide sub-advisory services that are appropriate in scope and extent in light of the investment program for the Fund and that AUIM’s appointment is not expected to adversely affect the nature, extent and quality of services provided to the Fund.
Investment Performance. The Board considered AUIM’s performance, investment management experience, capabilities and resources, including with respect to other Transamerica mutual funds that it sub-advises within the Transamerica mutual fund complex. The Board reviewed the performance of the Fund as compared to the performance of the AUIM Core Aggregate Fixed Income strategy, and noted that TAM believes that the replacement of the sub-adviser should enhance the investment performance of the Fund. In addition, the Board Members noted that they had recently considered the performance of other funds sub-advised by AUIM as part of the full annual review of the sub-advisory agreements for those funds and, in that connection, determined that AUIM was capable of providing investment and related services that are appropriate in scope and extent in light of those funds’ operations, the competitive landscape of the investment company business and investor needs.
On the basis of this information and the Board’s assessment of the nature, extent and quality of the services to be provided by AUIM, the Board concluded that AUIM is capable of generating a level of investment performance that is appropriate in light of the Fund’s investment objectives, policies and strategies.
Sub-Advisory Fee, Cost of Services Provided and Profitability. The Board considered that the proposed sub-advisory fee schedule in the New Sub-Advisory Agreement was the same as the sub-advisory fee schedule in the sub-advisory agreement with BlackRock, but noted that the assets of the Fund would be aggregated with the assets of certain other Transamerica mutual funds sub-advised by AUIM for purposes of calculating the sub-advisory fees payable by TAM to AUIM. The Board noted that the advisory fee rate payable by the Fund would be reduced in connection with the sub-adviser change. The Board Members noted that the Fund does not pay the sub-advisory fee. On the basis of these considerations, together with the other information it considered, the Board determined that the sub-advisory fee to be received by AUIM under the New Sub-Advisory Agreement is reasonable in light of the services to be provided.
With respect to AUIM’s costs and profitability in providing services to the Fund, the Board noted that TAM and AUIM are affiliates, and that information about AUIM’s revenues and expenses was incorporated into an analysis of the anticipated impact of the sub-adviser change on TAM’s profitability. As a result, the Board principally considered profitability information for TAM and AUIM in the aggregate.
Economies of Scale. The Board considered that the sub-advisory fee schedule for the Fund would remain unchanged but that the Fund’s assets would be aggregated with the assets of certain other Transamerica mutual funds sub-advised by AUIM for purposes of determining the applicable sub-advisory fee rate. The Board noted that TAM believes that the appointment of AUIM as sub-adviser has the potential to attract additional assets because of AUIM’s asset management capabilities across the fixed income spectrum. The Board Members concluded that they would have the opportunity to periodically reexamine whether the Fund has achieved economies of scale, and the appropriateness of management fees payable to TAM and fees payable by TAM to AUIM, in the future.
Fall-Out Benefits. The Board took into consideration the character of any incidental benefits received by AUIM, including the potential for increased visibility in the marketplace as a result of AUIM’s relationship with the Fund.
Conclusion. After consideration of the factors described above, as well as other factors, the Board Members, including all of the Independent Board Members, found that the change in sub-adviser to AUIM is in the best interests of the Fund and its Shareholders and does not involve a conflict of interest from which TAM or AUIM derives an inappropriate advantage. The Board, including all of the Independent Board Members, concluded that the approval of the New Sub-Advisory Agreement is in the best interests of the Fund and its Shareholders and voted to approve the New Sub-Advisory Agreement.
| | |
| Transamerica Funds | | Annual Report 2014 |
Page 375
Management of the Trust
Board Members and Officers
(unaudited)
The Board Members and executive officers of each Trust are listed below.
Interested Board Member means a board member who may be deemed an “interested person” (as that term is defined in the 1940 Act) of each Trust because of his current or former service with TAM or an affiliate of TAM. Interested Board Members may also be referred to herein as “Interested Trustees.” Independent Board Member means a Board Member who is not an “interested person” (as defined under the 1940 Act) of each Trust and may also be referred to herein as an “Independent Trustee.”
The Board governs each Fund and is responsible for protecting the interests of the shareholders. The Board Members are experienced executives who meet periodically throughout the year to oversee the business affairs of each Fund and the operation of each Fund by its officers. The Board also reviews the management of each Fund’s assets by the investment adviser and its respective sub-adviser.
The Funds are among the Funds advised and sponsored by TAM (collectively, “Transamerica Mutual Funds”). The Transamerica Mutual Funds consist of Transamerica Funds, Transamerica Series Trust (“TST”), Transamerica Income Shares, Inc. (“TIS”), Transamerica Partners Funds Group (“TPFG”), Transamerica Partners Funds Group II (“TPFG II”), Transamerica Partners Portfolios (“TPP”) and Transamerica Asset Allocation Variable Funds (“TAAVF”) and consists of 170 funds as of the date of this Annual Report.
The mailing address of each Board Member is c/o Secretary, 4600 South Syracuse St., Suite 1100, Denver, CO 80237.
The Board Members of each Trust and each Portfolio Trust, their year of birth, their positions with the Trusts, and their principal occupations for the past five years (their titles may have varied during that period) the number of Funds in Transamerica Mutual Funds the Board oversees, and other board memberships they hold are set forth in the table below. The length of time served is provided from the date a Trustee became a Trustee of either of the Trusts or Transamerica Partners Portfolios.
| | | | | | | | | | |
Name and Year of Birth | | Position(s) Held with Trust | | Term of Office and Length of Time Served* | | Principal Occupation(s) During Past Five Years | | Number of
Funds in
Complex
Overseen
by Board
Member | | Other
Directorships
During the Past
Five Years |
INTERESTED BOARD MEMBERS | | | | |
Marijn P. Smit (1973) | | Chairman of the Board**, President and Chief Executive Officer | | Since 2014 | | Chairman of the Board, President and Chief Executive Officer, Transamerica Funds, TST, TPP, TPFG, TPFG II, TAAVF and TIS (2014 – present); Director, Chairman of the Board, President and Chief Executive Officer, Transamerica Asset Management, Inc. (“TAM”) and Transamerica Fund Services, Inc. (“TFS”) (2014 – present); President, Investment Solutions, Transamerica Investments & Retirement (2014 – present); Vice President, Transamerica Premier Life Insurance Company (2010 – present); Vice President, Transamerica Life Insurance Company (2010 – present); Senior Vice President, Transamerica Financial Life Insurance Company (2013 – present); Senior Vice President, Transamerica Retirement Advisors, Inc. (2013 – present); | | 170 | | N/A |
| | |
| Transamerica Funds | | Annual Report 2014 |
Page 376
| | | | | | | | | | |
Name and Year of Birth | | Position(s) Held with Trust | | Term of Office and Length of Time Served* | | Principal Occupation(s) During Past Five Years | | Number of
Funds in
Complex
Overseen
by Board
Member | | Other
Directorships
During the Past
Five Years |
INTERESTED BOARD MEMBERS — continued | | | | |
Marijn P. Smit (continued) | | | | | | Senior Vice President, Transamerica Retirement Solutions Corporation (2012 – present); and President and Director, Transamerica Stable Value Solutions, Inc. (2010 – present). | | | | |
Alan F. Warrick (1948) | | Board Member | | Since 2012 | | Board Member, Transamerica Funds, TST, TIS, TPP, TPFG, TPFG II and TAAVF (2012 – present); Consultant, Aegon USA (2010 – 2011); Senior Advisor, Lovell Minnick Equity Partners (2010 – present); Retired (2010 – present); and Managing Director for Strategic Business Development, Aegon USA (1994 – 2010). | | 170 | | First Allied
Holdings Inc.
(2013 – 2014) |
INDEPENDENT BOARD MEMBERS | | | | | | |
Sandra N. Bane (1952) | | Board Member | | Since 2008 | | Retired (1999 – present); Board Member, Transamerica Funds, TST, TIS, TPP, TPFG, TPFG II and TAAVF (2008 – present); Board Member, Transamerica Investors, Inc. (“TII”) (2003 – 2010); and Partner, KPMG (1975 – 1999). | | 170 | | Big 5 Sporting
Goods (2002 –
present); AGL
Resources, Inc.
(energy services
holding
company)
(2008 – present) |
Leo J. Hill (1956) | | Lead Independent Board Member | | Since 2001 | | Principal, Advisor Network Solutions, LLC (business consulting) (2006 – present); Board Member, TST (2001 – present); Board Member, Transamerica Funds and TIS (2002 – present); Board Member, TPP, TPFG, TPFG II and TAAVF (2007 – present); Board Member, TII (2008 – 2010); Market President, Nations Bank of Sun Coast Florida (1998 – 1999); Chairman, President and Chief Executive Officer, Barnett Banks of Treasure Coast Florida (1994 – 1998); | | 170 | | Ameris Bancorp
(2013 – present);
Ameris Bank
(2013 – present) |
| | |
| Transamerica Funds | | Annual Report 2014 |
Page 377
| | | | | | | | | | |
Name and Year of Birth | | Position(s) Held with Trust | | Term of Office and Length of Time Served* | | Principal Occupation(s) During Past Five Years | | Number of
Funds in
Complex
Overseen
by Board
Member | | Other
Directorships
During the Past
Five Years |
INDEPENDENT BOARD MEMBERS — continued | | | | | | |
Leo J. Hill (continued) | | | | | | Executive Vice President and Senior Credit Officer, Barnett Banks of Jacksonville, Florida (1991 – 1994); and Senior Vice President and Senior Loan Administration Officer, Wachovia Bank of Georgia (1976 – 1991). | | | | |
| David W. Jennings (1946) | | Board Member | | Since 2009 | | Board Member, Transamerica Funds, TST, TIS, TPP, TPFG, TPFG II and TAAVF (2009 – present); Board Member, TII (2009 – 2010); Managing Director, Hilton Capital (2010 – present); Principal, Maxam Capital Management, LLC (2006 – 2008); and Principal, Cobble Creek Management LP (2004 – 2006). | | 170 | | N/A |
| Russell A. Kimball, Jr. (1944) | | Board Member | | 1986 – 1990 and Since 2002 | | General Manager, Sheraton Sand Key Resort (1975 – present); Board Member, TST (1986 – present); Board Member, Transamerica Funds, (1986 – 1990), (2002 – present); Board Member, TIS (2002 – present); Board Member, TPP, TPFG, TPFG II and TAAVF (2007 – present); and Board Member, TII (2008 – 2010). | | 170 | | N/A |
| Eugene M. Mannella (1954) | | Board Member | | Since 2007 | | Chief Executive Officer, HedgeServ Corporation (hedge fund administration) (2008 – present); Self-employed consultant (2006 – present); Managing Member and Chief Compliance Officer, HedgeServ Investment Services, LLC (limited purpose broker-dealer) (2011 – present); President, ARAPAHO Partners LLC (limited purpose broker-dealer) (1998 – 2008); | | 170 | | N/A |
| | |
| Transamerica Funds | | Annual Report 2014 |
Page 378
| | | | | | | | | | |
Name and Year of Birth | | Position(s) Held with Trust | | Term of Office and Length of Time Served* | | Principal Occupation(s) During Past Five Years | | Number of
Funds in
Complex
Overseen
by Board
Member | | Other
Directorships
During the Past
Five Years |
INDEPENDENT BOARD MEMBERS — continued | | | | | | |
Eugene M. Mannella (continued) | | | | | | Board Member, TPP, TPFG, TPFG II and TAAVF (1993 – present); Board Member, Transamerica Funds, TST and TIS (2007 – present); Board Member, TII (2008 – 2010); and President, International Fund Services (alternative asset administration) (1993 – 2005). | | | | |
| Norman R. Nielsen, Ph.D. (1939) | | Board Member | | Since 2006 | | Retired (2005 – present); Board Member, Transamerica Funds, TST and TIS (2006 – present); Board Member, TPP, TPFG, TPFG II and TAAVF (2007 – present); Board Member, TII (2008 – 2010); Interim President, Mt. Mercy University (2013 – 2014); Director, Aspire Inc. (formerly, Iowa Student Loan Service Corporation) (2006 – present); Director, League for Innovation in the Community Colleges (1985 – 2005); Director, Iowa Health Systems (1994 – 2003); Director, U.S. Bank (1985 – 2006); and President, Kirkwood Community College (1985 – 2005). | | 170 | | Buena Vista
University Board
of Trustees
(2004 – present);
Chairman(2012 – present) |
Joyce G. Norden (1939) | | Board Member | | Since 2007 | | Retired (2004 – present); Board Member, TPP, TPFG, TPFG II and TAAVF (1993 – present); Board Member, Transamerica Funds, TST and TIS (2007 – present); Board Member, TII (2008 – 2010); and Vice President, Institutional Advancement, Reconstructionist Rabbinical College (1996 – 2004). | | 170 | | Board of
Governors,
Reconstructionist
Rabbinical
College(2007 – 2012) |
| | |
| Transamerica Funds | | Annual Report 2014 |
Page 379
| | | | | | | | | | |
Name and Year of Birth | | Position(s) Held with Trust | | Term of Office and Length of Time Served* | | Principal Occupation(s) During Past Five Years | | Number of
Funds in
Complex
Overseen
by Board
Member | | Other
Directorships
During the Past
Five Years |
INDEPENDENT BOARD MEMBERS — continued | | | | |
| Patricia L. Sawyer (1950) | | Board Member | | Since 2007 | | Retired (2007 – present); President/Founder, Smith & Sawyer LLC (management consulting) (1989 – 2007); Board Member, Transamerica Funds, TST and TIS (2007 – present); Board Member, TII (2008 – 2010); Board Member, TPP, TPFG, TPFG II and TAAVF (1993 – present); Trustee, Chair of Finance Committee and Chair of Nominating Committee (1987 – 1996), Bryant University. | | 170 | | Honorary Trustee,
Bryant University
(1996 – present) |
| John W. Waechter (1952) | | Board Member | | Since 2004 | | Attorney, Englander Fischer (2008 – present); Retired (2004 – 2008); Board Member, TST and TIS (2004 – present); Board Member, Transamerica Funds (2005 – present); Board Member, TPP, TPFG, TPFG II and TAAVF (2007 – present); Board Member, TII (2008 – 2010); Employee, RBC Dain Rauscher (securities dealer) (2004); Executive Vice President, Chief Financial Officer and Chief Compliance Officer, William R. Hough & Co. (securities dealer) (1979 – 2004); and Treasurer, The Hough Group of Funds (1993 – 2004). | | 170 | | Operation PAR,
Inc. (2008 – present);West Central Florida
Council – Boy Scouts
of America
(2008 – 2013);
Remember Honor
Support, Inc.
(non-profit
organization)
(2013 – present)
Board Member,
WRH Income
Properties, Inc. (real
estate) (2014 –
present) |
| * | Each Board Member shall hold office until: 1) his or her successor is elected and qualified or 2) he or she resigns, retires or his or her term as a Board Member is terminated in accordance with the Trust’s Declaration of Trust. |
| ** | Mr. Smit was elected as Chairman of the Board on December 11, 2014. |
| | |
| Transamerica Funds | | Annual Report 2014 |
Page 380
Officers
The mailing address of each officer is c/o Secretary, 4600 South Syracuse St., Suite 1100, Denver, CO 80237. The following table shows information about the officers, including their year of birth, their positions held with the Trust and their principal occupations during the past five years (their titles may have varied during that period). Each officer will hold office until his or her successor has been duly elected or appointed or until his or her earlier death, resignation or removal.
| | | | | | |
Name and Year of Birth | | Position | | Term of Office
and Length of
Time Served* | | Principal Occupation(s) or Employment During Past Five Years |
Marijn P. Smit (1973) | | Chairman of the Board**, President and Chief Executive Officer | | Since 2014 | | See Table Above. |
Tané T. Tyler (1965) | | Vice President, Associate General Counsel, Chief Legal Officer and Secretary | | Since 2014 | | Vice President, Associate General Counsel, Chief Legal Officer and Secretary, Transamerica Funds, TST, TPP, TPFG, TPFG II, TAAVF and TIS (2014 – present); Director, Vice President, Associate General Counsel, Chief Legal Officer and Secretary, TAM and TFS (2014 – present); Senior Vice President, Secretary and General Counsel, ALPS, Inc., ALPS Fund Services, Inc. and ALPS Distributors, Inc. (2004 – 2013); and Secretary, Liberty All-Star Funds (2005 – 2013). |
Christopher A. Staples (1970) | | Vice President and Chief Investment Officer, Advisory Services | | Since 2005 | | Vice President and Chief Investment Officer, Advisory Services (2007 – present), Senior Vice President – Investment Management (2006 – 2007), Vice President – Investment Management (2005 – 2006), Transamerica Funds, TST and TIS; Vice President and Chief Investment Officer, Advisory Services, TPP, TPFG, TPFG II and TAAVF (2007 – present); Vice President and Chief Investment Officer (2007 – 2010); Vice President – Investment Administration (2005 – 2007), TII; Director (2005 – present), Senior Vice President (2006 – present) and Chief Investment Officer, Advisory Services (2007 – present), TAM; Director, TFS (2005 – present); and Assistant Vice President, Raymond James & Associates (1999 – 2004). |
Thomas R. Wald (1960) | | Chief Investment Officer | | Since 2014 | | Chief Investment Officer, Transamerica Funds, TST, TPP, TPFG, TPFG II, TAAVF and TIS (2014 – present); Senior Vice President and Chief Investment Officer, TAM (2014 – present); Chief Investment Officer, Transamerica Investments & Retirement (2014 – present); Vice President and Client Portfolio Manager, Curian Capital, LLC (2012 – 2014); Portfolio Manager, Tactical Allocation Group, LLC (2010 – 2011); Mutual Fund Manager, Munder Capital Management (2005 – 2008); and Mutual Fund Manager, Invesco Ltd. (1997 – 2004). |
| | |
| Transamerica Funds | | Annual Report 2014 |
Page 381
| | | | | | |
Name and Year of Birth | | Position | | Term of Office
and Length of
Time Served* | | Principal Occupation(s) or Employment During Past Five Years |
Vincent J. Toner (1970) | | Vice President and Treasurer | | Since 2014 | | Vice President and Treasurer (2014 – present) Transamerica Funds, TST, TIS, TPP, TPFG, TPFG II and TAAVF; Vice President and Treasurer, TAM and TFS (2014 – present); Senior Vice President and Vice President, Fund Administration, Brown Brothers Harriman (2010 – 2014); and Vice President Fund Administration & Fund Accounting, OppenheimerFunds (2007 – 2010). |
Matthew H. Huckman, Sr. (1968) | | Tax Manager | | Since 2014 | | Tax Manager, Transamerica Funds, TST, TIS, TPP, TPFG, TPFG II and TAAVF (2014 – present); Tax Manager, TFS (2012 – present); and Assistant Mutual Fund Tax Manager, Invesco (2007 – 2012). |
Scott M. Lenhart (1961) | | Chief Compliance Officer and Anti-Money Laundering Officer | | Since 2014 | | Chief Compliance Officer and Anti-Money Laundering Officer, Transamerica Funds, TST, TIS, TPP, TPFG, TPFG II and TAAVF (2014 – present); Chief Compliance Officer and Anti-Money Laundering Officer (2014 – present), Senior Compliance Officer (2008 – 2014), TAM; Vice President and Chief Compliance Officer, TFS (2014 – present); Director of Compliance, Transamerica Investments & Retirement (2014 – present); Vice President and Chief Compliance Officer, Transamerica Financial Advisors, Inc. (1999 – 2006); and Assistant Chief Compliance Officer, Raymond James Financial, Inc., Robert Thomas Securities, Inc. (1989 – 1998). |
| * | Elected and serves at the pleasure of the Board of the Trust. |
| ** | Mr. Smit was elected as Chairman of the Board on December 11, 2014. |
| | |
| Transamerica Funds | | Annual Report 2014 |
Page 382
PROXY VOTING POLICIES AND PROCEDURES AND QUARTERLY PORTFOLIO HOLDINGS
(unaudited)
A description of the Transamerica Funds’ proxy voting policies and procedures is available in the Statements of Additional Information of the Funds, available without charge upon request by calling 1-888-233-4339 (toll free) or on the Securities and Exchange Commission’s (“SEC”) website at http://www.sec.gov.
In addition, the Funds are required to file Form N-PX, with their complete proxy voting records for the 12 months ended June 30th, no later than August 31st of each year. The Form is available without charge: (1) from the Funds, upon request by calling 1-888-233-4339; and (2) on the SEC’s website at http://www.sec.gov.
The Funds file their complete schedule of portfolio holdings with the SEC for the first and third quarter of each fiscal year on Form N-Q, which is available on the SEC’s website at http://www.sec.gov. The Funds’ Form N-Q may be reviewed and copied at the SEC’s Public Reference Room in Washington, D.C. Information on the operation of the Public Reference Room may be obtained by calling 1-800-SEC-0330.
You may also visit the Trust’s website at www.transamerica.com for this and other information about the Funds and the Trust.
Important Notice Regarding Delivery of Shareholder Documents
Every year we send shareholders informative materials such as the Transamerica Funds Annual Report, the Transamerica Funds Prospectus, and other required documents that keep you informed regarding your Funds. Transamerica Funds will only send one piece per mailing address, a method that saves your Funds’ money by reducing mailing and printing costs. We will continue to do this unless you tell us not to. To elect to receive individual mailings, simply call a Transamerica Customer Service Representative toll free at 1-888-233-4339, 8 a.m. to 7 p.m. Eastern Time, Monday-Friday. Your request will take effect within 30 days.
| | |
| Transamerica Funds | | Annual Report 2014 |
Page 383
NOTICE OF PRIVACY POLICY
(unaudited)
Your privacy is very important to us. We want you to understand what information we collect and how we use it. We collect and use “nonpublic personal information” in connection with providing our customers with a broad range of financial products and services as effectively and conveniently as possible. We treat nonpublic personal information in accordance with our Privacy Policy.
What Information We Collect and From Whom We Collect It
We may collect nonpublic personal information about you from the following sources:
| • | | Information we receive from you on applications or other forms, such as your name, address, and account number; |
| • | | Information about your transactions with us, our affiliates, or others, such as your account balance and purchase/redemption history; and |
| • | | Information we receive from non-affiliated third parties, including consumer reporting agencies. |
What Information We Disclose and To Whom We Disclose It
We do not disclose any nonpublic personal information about current or former customers to anyone without their express consent, except as permitted by law. We may disclose the nonpublic personal information we collect, as described above, to persons or companies that perform services on our behalf and to other financial institutions with which we have joint marketing agreements. We will require these companies to protect the confidentiality of your nonpublic personal information and to use it only to perform the services for which we have hired them.
Our Security Procedures
We restrict access to your nonpublic personal information and only allow disclosures to persons and companies as permitted by law to assist in providing products or services to you. We maintain physical, electronic, and procedural safeguards to protect your nonpublic personal information and to safeguard the disposal of certain consumer information.
If you have any questions about our Privacy Policy, please call 1-888-233-4339 on any business day between 8 a.m. and 7 p.m. Eastern Time.
Note: This Privacy Policy applies only to customers that have a direct relationship with us or our affiliates. If you own shares of our funds in the name of a third party such as a bank or broker-dealer, its privacy policy may apply to you instead of ours.
| | |
| Transamerica Funds | | Annual Report 2014 |
Page 384
4600 S. Syracuse St., Suite 1100
Denver, Colorado 80237

Customer Service 1-888-233-4339
P.O. Box 9012 • Clearwater, FL 33758-9012
Distributor: Transamerica Capital, Inc.

I2 Funds
Annual Report
October 31, 2014
www.transamerica.com
Customer Service 1-888-233-4339
P.O. Box 9012 • Clearwater, FL 33758-9012
Distributor: Transamerica Capital, Inc.
Dear Fellow Shareholder,
On behalf of Transamerica Funds, I would like to thank you for your continued support and confidence in our products as we look forward to continuing to serve you and your financial adviser in the future. We value the trust you have placed in us.
This annual report is provided to you with the intent of presenting a comprehensive review of the investments of each of your Funds. The Securities and Exchange Commission requires that annual and semi-annual reports be sent to all shareholders, and we believe this report to be an important part of the investment process. In addition to providing a comprehensive review, this report also provides a discussion of accounting policies as well as matters presented to shareholders that may have required their vote.
We believe it is important to understand market conditions over the last year in order to provide a context for reading this report. At the beginning of this year, markets were focused on the possibility that 2014 would be the year that quantitative easing—the extraordinary monetary accommodation enacted by the U.S. Federal Reserve (“Fed”)—would finally be coming to an end. Fed officials had widely publicized their intentions to end the quantitative easing program as long as they saw continued improvement in the economy. In a welcomed development, the economy and the all-important labor market continued to make gains throughout 2014, with the Bureau of Labor Statistics reporting that the unemployment rate falling below six percent in September, the first time this has occurred since July 2008.
For all of the economic improvements witnessed in the U.S., much of the rest of the world seems to have been on a different path. Europe produced anemic economic growth, as it continued to grapple with weak internal demand and structural imbalances. Japan, a very indebted country, has been attempting to boost its economy through aggressive Central Bank stimulus. Finally, China has been working to slowly let the air out of speculative areas of its economy while trying to avoid damaging its broader economy.
Given the notable differences in Central Bank policy and the different degrees of economic health in which major economies find themselves, it is little surprise that the returns from major asset classes have varied. For the year ended October 31, 2014, the S&P 500® returned 17.27% while the Morgan Stanley Capital International Europe, Australasia, Far East Index, representing international developed market equities, lost 0.17%. During the same period, the Barclays U.S. Aggregate Bond Index returned 4.14%. Please keep in mind that it is important to maintain a diversified portfolio as investment returns have historically been difficult to predict.
In addition to your active involvement in the investment process, we firmly believe that a financial adviser is a key resource to help you build a complete picture of your current and future financial needs. Financial advisers are familiar with the market’s history, including long-term returns and volatility of various asset classes. With your financial adviser, you can develop an investment program that incorporates factors such as your goals, your investment timeline, and your risk tolerance.
Please contact your financial adviser if you have any questions about the contents of this report, and thanks again for the confidence you have placed in us.
Sincerely,
Marijn Smit
President & Chief Executive Officer
Transamerica Funds
Tom Wald, CFA
Chief Investment Officer
Transamerica Funds
The views expressed in this report reflect those of the portfolio managers only and may not necessarily represent the views of Transamerica Funds. These views are subject to change based upon market conditions. These views should not be relied upon as investment advice and are not indicative of trading intent on behalf of Transamerica Funds.
Transamerica Arbitrage Strategy
(unaudited)
MARKET ENVIRONMENT
Merger arbitrage seeks to profit from investing in securities that are involved in mergers and acquisitions (“M&A”). Typically a low volatility strategy pursued by absolute-return-minded investors, our goal is to capture a return stream having a low correlation to market returns.
The past 12 months have been a continuation of the low short-term interest rate environment that has existed since 2009. The low-interest rate environment has been a significant headwind for “merger arbs” such as ourselves who depend on “the time value of money” to earn positive returns.
As the following statistics show, the M&A environment (a distinct concept from our merger arbitrage strategy) has been acceptable, but the limiting factor of low short-term interest rates has held back our returns. From November 1, 2013 through October 31, 2014, the total dollar value of global M&A volume was $1,153 billion for 1,230 deals, according to Dealogic. This represented an increase in value from $870 billion through the prior 12 months, yet a decrease from the prior period’s deal count of 1,395. Transactions in the Americas accounted for 64% of the dollar volume followed by Europe, Middle East, and Africa at 20% and Asia Pacific at 16%.
An economic environment that includes persistently low interest rates, cash-laden corporate balance sheets, and rising stock prices should be sufficient for a significant uptick in deal flow. Moreover, after years of cost cutting, divestitures, reorganizations, buybacks and dividend payouts, increasingly corporations in mature industries are turning to mergers and acquisitions to fuel growth. While we welcome several transformative transactions such as Comcast Corp.’s (no longer held at year end) $50 billion offer for Time Warner Cable, Inc., we have only started to see these types of strategically-driven deals trickle across industries, geographies and market capitalization levels. Transactions during the past year have been characterized by huge market capitalization deals resulting in a 33% rise in the total dollar amount over the past 12 months on 165, or 13%, fewer deals, the majority of them occurring in the U.S.
Much of the year was predicated on announcements and news about the legality and propriety of mergers based on tax inversions. Tax inversions typically involve a U.S.-domiciled company purchasing a U.K.- or Ireland-based firm, to take advantage of the generally lower corporate tax regimes of those countries. The pro-forma headquarters is moved overseas to benefit from lower taxes. Inversion predicated deal-making has been especially popular in the pharmaceutical industry. Indeed the largest proposed deal of the year, and in some time, was Pfizer, Inc.’s (no longer held at year end) $110 billion bid for U.K.-based AstraZenaca (no longer held at year end), which was ultimately rejected when political objections on both sides of the Atlantic over the motivations for the deal overwhelmed the proposed transaction. The demise of this deal ranks as one of the largest bid withdrawals ever seen. In fact, year to date, the value of terminated deals at $580 billion through October, has reached a six-year high.
We surmised that regulatory oversight and rhetoric on the legality and propriety of inversions would increase during an election year. The first jolt occurred on August 6 when reports about increased regulatory scrutiny of deals employing tax-inversions, along with Walgreens Co.’s (no longer held at year end) abandonment of its widely-expected plan to re-domicile to lower corporate taxes, emerged. The next major announcement occurred on September 22 when the U.S. Treasury announced new rules to rein in inversions, including a provision that would restrict the use of cash held offshore to fund deals. On both occasions, the news spurred a price dislocation so great it caused a risk-off mentality among merger arbitrageurs and Wall Street’s risk officers alike, leading to widening deal spreads among inversion deals as well as in long-dated transactions. Despite the present turmoil, we believe that the announced deals based on tax inversions will successfully come to fruition and we have been opportunistically adding to our positions to potentially take advantage of wider deal spreads.
The demise of AbbVie, Inc.’s $56 billion offer to acquire Shire PLC in October sparked volatility across the M&A deal book, due to the prominence of leveraged players in this deal. The termination of this transaction, despite the $1.6 billion break-up fee, caused an unwinding of holdings by leveraged players and, subsequently, a re-pricing of risk in merger arbitrage positions. Existing and new deal spreads widened in October 2014 to levels not seen since the Great Recession. As investors in Shire PLC, we were not exempt from the losses, however we were able to keep the damage to well-within our stated risk guidelines.
PERFORMANCE
For the year ended October 31, 2014, Transamerica Arbitrage Strategy Class I2 returned 0.26%. By comparison, its benchmark, Bank of America Merrill Lynch U.S. Dollar 3-Month LIBOR Constant Maturity Index, returned 0.24%.
| | |
| Transamerica Funds | | Annual Report 2014 |
Page 1
Transamerica Arbitrage Strategy
(unaudited)
STRATEGY REVIEW
Our strategy is focused on building a diversified global portfolio of sound and strategic deals across all sectors, market capitalizations, and jurisdictions. For the year ended October 31, 2014, Transamerica Arbitrage Strategy Class I2 returned 1.88%, gross, and 0.26%, net. By comparison, its benchmark, Bank of America Merrill Lynch U.S. 3-Month LIBOR Constant Maturity Index, returned 0.24%. For the period, the Fund’s performance fell below the typical annualized spread range we have witnessed in the recent low volatility deal environment.
The Fund experienced a handful of terminated or delayed deals during the period which weighed on performance. The most significant detractors include AbbVie, Inc.’s withdrawn bid for Shire PLC and Liberty Media’s (no longer held at year end) abandoned tender offer for Sirius XM (no longer held at year end). Our position in Medtronic, Inc.’s $43 billion acquisition of Covidien PLC, which is another deal with tax inversion benefits, also weighed on results. The deal’s time frame has been extended as it is being reviewed by U.S. regulators a second time. We still believe that the deal makes strategic sense for both companies and should eventually come to fruition.
Among the positions that added to performance was the battle for Hillshire Brands. In late May, the maker of well-known processed meats and foods announced its intent to buy a rival, Pinnacle Foods (no longer held at year end). This spurred a protracted bidding war for Hillshire Brands (no longer held at year end) between Pilgrim’s Pride (no longer held at year end) and Tyson Foods, Inc., which culminated in Tyson Foods, Inc.’s winning bid of $63 a share for Hillshire Brands (no longer held at year end) in a late-June blind-auction. Another positive result came from our position in Actavis PLC’s $21 billion offer for Forest Labs (no longer held at year end) in mid-February 2014. Given the many overlaps between the two companies’ drug product portfolios, regulators extended their antitrust review of the transaction. We believed it would receive clearance and positioned the Fund opportunistically. The deal was approved June 30, and closed the next day.
The Fund utilizes derivatives in the form of equity options, total return swaps, and currency forward contracts, primarily as hedging mechanisms as part of our risk management process or to gain exposure in certain jurisdictions. The cost of these hedges caused a slight drag on performance for the fiscal year. Contribution from written options and swaptions, swap agreements, and forward foreign currency contracts was accretive, but was offset by the drag from purchased options and swaptions.
Roger P. Foltynowicz
Todd W. Munn
John S. Orrico, CFA
Co-Portfolio Managers
Water Island Capital, LLC
| | |
| Transamerica Funds | | Annual Report 2014 |
Page 2
Transamerica Arbitrage Strategy
(unaudited)
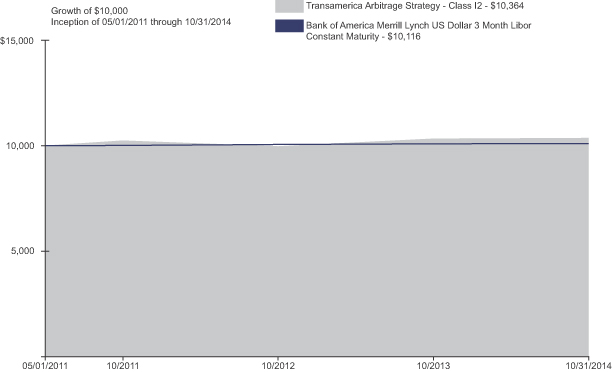
| | | | | | | | | | | | |
| Average Annual Total Return for Periods Ended 10/31/2014 | |
| | | 1 Year | | | 10 Years or
Life of Class | | | Inception Date | |
Class I2 (NAV) | | | 0.26 | % | | | 1.02 | % | | | 05/01/2011 | |
Bank of America Merrill Lynch U.S. Dollar 3-Month LIBOR Constant Maturity Index (A) | | | 0.24 | % | | | 0.33 | % | | | | |
(A) Bank of America Merrill Lynch U.S. Dollar 3-Month LIBOR Constant Maturity Index is an unmanaged index used as a general measure of market performance. Calculations assume dividends and capital gains are reinvested and do not include any managerial expenses. The 10 Years or Life of Fund calculation is based on the inception date of the class. You cannot invest directly in an index.
The performance data presented represents past performance; future results may vary. Performance data does not reflect the deduction of taxes that would be paid on Fund distributions or the redemption of Fund shares. Investment return and principal value will fluctuate so that an investor’s shares, when redeemed, may be worth more or less than their original cost. Current performance may be lower or higher than performance quoted. Please see www.transamerica.com for performance data current to the most recent month-end. Net Asset Value (“NAV”) returns include the reinvestment of dividends and capital gains. Fund shares are sold without a sales load.
Performance figures reflect any fee waivers and/or expense reimbursements by the Investment Adviser. Without such waivers and/or reimbursements, the performance would be lower. Future waivers and/or reimbursements are at the discretion of the Investment Adviser.
Performance results do not include adjustments made for financial reporting purposes in accordance with U.S. generally accepted accounting principles and may differ from amounts reported in the financial highlights.
Securities purchased for an arbitrage strategy are intended to take advantage of a perceived relationship between the value of two securities and may not perform as expected. This Fund is only available in Class I2 shares, which are not available for direct investment by the public.
Please refer to page 29 for index descriptions.
| | |
| Transamerica Funds | | Annual Report 2014 |
Page 3
Transamerica Bond
(unaudited)
MARKET ENVIRONMENT
U.S. macroeconomic indicators, specifically those pertaining to the housing market, were largely positive during the fourth quarter of 2013, bolstering sections of the credit markets in the bookend months as it appeared that the domestic recovery continued to progress. In January 2014, the U.S. Federal Reserve (“Fed”) began tapering its quantitative easing (“QE”) program. The Fed reduced its monthly bond purchases by $10 billion per policy meeting and concluded the program in October 2014. Despite reduced Fed bond buying, the fixed-income market remained resilient through the first half of the year. By the third quarter of 2014, global unrest in the Middle East and Eastern Europe began to weigh on the markets. Additionally, more hawkish announcements from the Fed triggered uncertainty surrounding future interest rate policy. In general, the U.S. economy diverged from many of the world’s economies in the third quarter as it continued to lead global growth. A look at the U.S. dollar (“USD”) can provide some insight into how this divergence impacted the fixed income markets. Against the backdrop of a rallying U.S. dollar, foreign currencies generally struggled during the first ten months of 2014.
PERFORMANCE
For the year ended October 31, 2014, Transamerica Bond Class I2 returned 7.77%. By comparison, its benchmark, the Barclays U.S. Government/Credit Bond Index, returned 4.21%.
STRATEGY REVIEW
In the Fund, out-of-benchmark sectors were significant contributors to alpha, as high yield, convertibles and non-U.S. dollar sectors all benefited from strong security selection. High yield corporates, which represented over 25% of the Fund, had the greatest impact on relative performance, as the high yield market experienced positive returns for the first eight months of the year. Strong security selection within the investment grade corporate space, particularly Financials and Industrials, also provided a significant contribution to excess return. Individual convertible names, specifically within the Technology and Health Care industries, contributed positively to absolute and relative returns. In our view, this sector offers additional diversification to the Fund due to its lower interest rate sensitivity. The Fund maintained a significant underweight to U.S. Treasuries. This proved beneficial as the high quality asset class lagged higher beta assets due to the rally in risk assets during the early stages of the period. Foreign exposure through non-U.S. dollar denominated securities, such as the euro, Indian rupee, Mexican peso and New Zealand dollar, also assisted outperformance during the period.
In relative performance terms, high yield Industrial bonds, investment grade Financials and convertible bonds had the largest positive impact on performance. These out-of-benchmark positions, which were just under 20% of the market value on average for the year, achieved strong returns as spreads tightened over the period. Asset backed securities and a small allocation to cash was a small detractor from performance in the period. Security selection was also strong relative to the benchmark. At the industry level, Treasuries, Consumer Non-Cyclical, Banking, Communications and Technology had the largest positive impact on relative performance. Finally, in relative performance terms, foreign exposure in the Luxembourg, Netherlands, Spain and Mexico had the greatest positive impact in the period and outweighed the minor negative contributions from countries like Canada and Austria.
The Fund utilized Treasury futures which were primarily for duration management purposes. During the period, this derivative exposure was a slight detractor from returns.
Daniel J. Fuss, CFA
Matthew J. Eagan, CFA
Elaine M. Stokes
Co-Portfolio Managers
Loomis, Sayles & Company, L.P.
| | |
| Transamerica Funds | | Annual Report 2014 |
Page 4
Transamerica Bond
(unaudited)
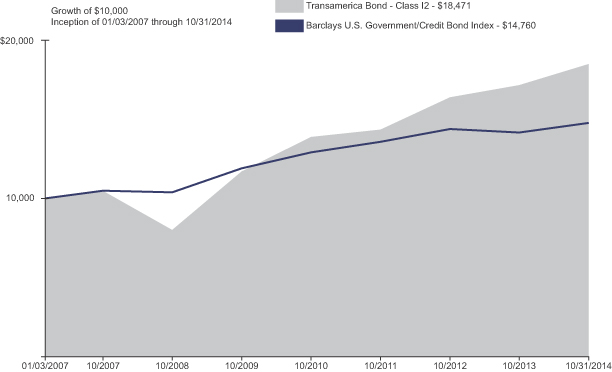
| | | | | | | | | | | | | | | | |
| Average Annual Total Return for Periods Ended 10/31/2014 | |
| | | 1 Year | | | 5 Years | | | 10 Years or
Life of Class | | | Inception Date | |
Class I2 (NAV) | | | 7.77 | % | | | 9.57 | % | | | 8.15 | % | | | 01/03/2007 | |
Barclays U.S. Government/Credit Bond Index (A) | | | 4.21 | % | | | 4.43 | % | | | 5.10 | % | | | | |
(A) The Barclays U.S. Government/Credit Bond Index is an unmanaged index used as a general measure of market performance. Calculations assume dividends and capital gains are reinvested and do not include any managerial expenses. The 10 Years or Life of Fund calculation is based on the inception date of the class. You cannot invest directly in an index.
The performance data presented represents past performance; future results may vary. Performance data does not reflect the deduction of taxes that would be paid on Fund distributions or the redemption of Fund shares. Investment return and principal value will fluctuate so that an investor’s shares, when redeemed, may be worth more or less than their original cost. Current performance may be lower or higher than performance quoted. Please see www.transamerica.com for performance data current to the most recent month-end. Net Asset Value (“NAV”) returns include the reinvestment of dividends and capital gains. Fund shares are sold without a sales load.
Performance figures reflect any fee waivers and/or expense reimbursements by the Investment Adviser. Without such waivers and/or reimbursements, the performance would be lower. Future waivers and/or reimbursements are at the discretion of the Investment Adviser.
Performance results do not include adjustments made for financial reporting purposes in accordance with U.S. generally accepted accounting principles and may differ from amounts reported in the financial highlights.
Fixed income investing is subject to credit risk, inflation risk, and interest rate risk. Credit risk is the risk that the issuer of a bond won’t meet their payments. Inflation risk is the risk that inflation could outpace a bond’s interest income. Interest rate risk is the risk that fluctuations in interest rates will affect the price of a bond. This Fund is only available in Class I2 shares, which are not available for direct investment by the public.
Please refer to page 29 for index descriptions.
| | |
| Transamerica Funds | | Annual Report 2014 |
Page 5
Transamerica Core Bond
(unaudited)
MARKET ENVIRONMENT
Improving economic data led risk assets to improve over the end of calendar year 2013 despite the prospect of the U.S. Federal Reserve (“Fed”) beginning to taper its asset purchases. Even with political wrangling over the debt ceiling in October of last year, interest rates stayed within a narrow range until the announcement of a strong October employment report. This led some market participants to predict that the Fed might begin to reduce its asset purchases as early as that December.
Investors entered the first quarter of 2014 with the expectation that equity markets would continue to rally and bonds would sell off, yet events turned out a bit differently. While developed market equities posted positive returns, these were small compared to the fourth quarter of 2013.
Fixed income, equities and commodities all performed well in the second quarter of 2014. This was primarily driven by the accommodative stance of central banks, which generally maintained or eased their policies in an environment of low growth, low inflation and low volatility. The Federal Open Market Committee (“FOMC”) met twice in the second quarter and largely confirmed market expectations, reducing monthly asset purchases by $10 billion at each meeting to $35 billion beginning in July. The FOMC also revised its economic and rate expectations, downgrading 2014 Gross Domestic Product projections after a poor first quarter, shifting the unemployment rate forecast lower and marginally raising inflation projections. Fed Chairwoman Janet Yellen confirmed the Fed’s commitment to maintaining low rates for as long as needed to support economic growth.
Finally, the bullish sentiment in financial markets during the second quarter softened in July, as improving U.S. economic data led market participants to anticipate that the Fed might push up the timing of its first rate hike in years. Large-cap equity markets hit new record highs in September. However, disappointing global growth, particularly in Europe and China, as well as softer inflation in the U.S. and a Fed signaling its patience in normalizing monetary policy, left markets marginally more risk-averse. The surprise announcement at the end of the period by the head of one of the largest bond managers that he was leaving his firm for a competitor left fixed income markets watchful for the impact on fund flows, given the already strong technical factors in the markets.
PERFORMANCE
For the year ended October 31, 2014, Transamerica Core Bond Class I2 returned 4.26%. By comparison, its benchmark, the Barclays U.S. Aggregate Bond Index, returned 4.14%.
STRATEGY REVIEW
Interest rates were mixed across the yield curve, as investors continued to digest messaging from the Fed over the course of the year. The two- to 10-year part of the curve flattened during the period, with the spread decreasing as well. Within Treasuries, the 30-year finished as the best-performing bellwether, returning 15.44%. The Fund’s underweight in Treasury debt was positive for performance as spread sectors outpaced their risk-free counterparts.
Mortgage-backed securities (“MBS”) outperformed comparable-duration Treasury debt, posting 88 basis points of excess returns over Treasuries with similar maturities. The Fund’s overweight in mortgage-backed securities was generally positive for returns over the period.
Corporate bonds finished as the best-performing investment-grade domestic broad market sector during the period. Overall, the Barclays Corporate Index outpaced comparable-duration Treasuries in the quarter. Utility names were the best-performing sub-sector. The Fund’s underweight in Credit was a slight detractor from performance, as the sector outperformed MBS on a comparable-duration basis.
The Fund’s sector allocations did not change dramatically throughout the year. We remained underweight in Treasury debt, overweight in mortgage securities, slightly overweight in agency debentures and modestly underweight in corporate bonds.
The Fund’s duration ended the year at 4.83 years compared to 5.36 years for the benchmark.
Douglas S. Swanson
Portfolio Manager
J.P. Morgan Investment Management Inc.
| | |
| Transamerica Funds | | Annual Report 2014 |
Page 6
Transamerica Core Bond
(unaudited)
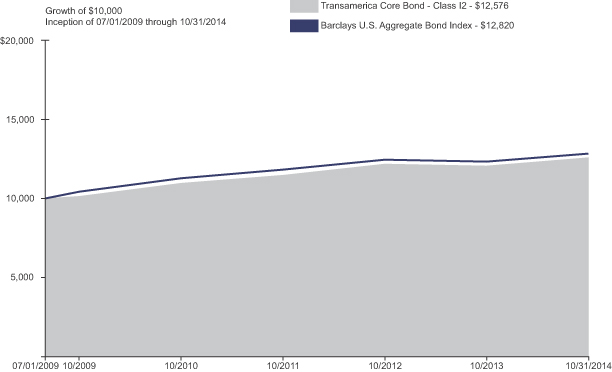
| | | | | | | | | | | | | | | | |
| Average Annual Total Return for Periods Ended 10/31/2014 | |
| | | 1 Year | | | 5 Years | | | 10 Years or
Life of Class | | | Inception Date | |
Class I2 (NAV) | | | 4.26 | % | | | 4.41 | % | | | 4.39 | % | | | 07/01/2009 | |
Barclays U.S. Aggregate Bond Index (A) | | | 4.14 | % | | | 4.22 | % | | | 4.76 | % | | | | |
(A) The Barclays U.S. Aggregate Bond Index is an unmanaged index used as a general measure of market performance. Calculations assume dividends and capital gains are reinvested and do not include any managerial expenses. The 10 Years or Life of Fund calculation is based on the inception date of the class. You cannot invest directly in an index.
The performance data presented represents past performance; future results may vary. Performance data does not reflect the deduction of taxes that would be paid on Fund distributions or the redemption of Fund shares. Investment return and principal value will fluctuate so that an investor’s shares, when redeemed, may be worth more or less than their original cost. Current performance may be lower or higher than performance quoted. Please see www.transamerica.com for performance data current to the most recent month-end. Net Asset Value (“NAV”) returns include the reinvestment of dividends and capital gains. Fund shares are sold without a sales load.
Performance figures reflect any fee waivers and/or expense reimbursements by the Investment Adviser. Without such waivers and/or reimbursements, the performance would be lower. Future waivers and/or reimbursements are at the discretion of the Investment Adviser.
Performance results do not include adjustments made for financial reporting purposes in accordance with U.S. generally accepted accounting principles and may differ from amounts reported in the financial highlights.
Investing in bond funds entails interest rate and credit risk as well as additional risks in that the fund may invest in high-yield/high-risk bonds and is subject to greater levels of liquidity risk, which are described in more detail in the prospectus. This Fund is only available in Class I2 shares, which are not available for direct investment by the public.
Please refer to page 29 for index descriptions.
| | |
| Transamerica Funds | | Annual Report 2014 |
Page 7
Transamerica Developing Markets Equity
(unaudited)
MARKET ENVIRONMENT
As 2014 opened, the emerging markets were dominated by renewed concerns over tighter liquidity, slower growth and political disruptions. At the end of 2013, investors began taking profits on stocks that had performed particularly well for the year and continued to do so early in 2014. As a result, the Morgan Stanley Capital International Emerging Market Index (the “Index”) declined over the first quarter of 2014 before investor sentiment began to turn more positive. However, investors reassessed various concerns in the region. The impact of the U.S. Federal Reserve’s (“Fed”) anticipated end of the Quantitative Easing program proved to be overly exaggerated and the view that emerging market economies were homogeneous and therefore all vulnerable to potential shifts in global liquidity was unfounded. Additionally, the election of Narendra Modi as the new Prime Minister of India was greeted with great optimism and boosted Indian equities. Even the downing of the civilian airplane over Ukraine, which pushed down shares of companies based in Russia, did not halt the upward momentum for long.
PERFORMANCE
For the year ended October 31, 2014, Transamerica Developing Markets Equity Class I2 returned 2.87%. By comparison, its benchmark the Morgan Stanley Capital International Emerging Markets Index, returned 0.98%.
STRATEGY REVIEW
The Fund outperformed the Index in a number of sectors, led by stronger relative stock selection in the Information Technology, Financials and Materials sectors. An underweight to Materials also helped relative performance. Relative to the Index, the most significant underperforming sector for the Fund was Energy, where weaker relative stock selection detracted from performance. Geographically, holdings in India, Brazil, China and South Korea were among the top performers. Conversely, overweight positions in Italy, the United Kingdom, and underweight positions in Taiwan and South Africa detracted from relative performance versus the Index.
The top two performing stocks for the Fund this period were in the Information Technology sector: Baidu, Inc. and Tencent Holdings, Ltd. Also benefiting performance was ICICI Bank, Ltd. Baidu, Inc., the Fund’s largest holding at the end of the period, is the leading internet search provider in China. The company continued to perform well over the first half of the reporting period as concerns about monetizing mobile faded. Tencent Holdings, Ltd., a Chinese internet social networking company, has an online community nearly the size of Facebook, Inc. Users can access Tencent Holdings, Ltd. offerings through desktop and mobile devices. Shares of Tencent Holdings, Ltd. gained significantly overall as mobile adoption of its services, particularly its message service, continued to run ahead of expectations. Indian stocks in general experienced a significant rebound this period on generally more favorable economic and market conditions. This benefited investor optimism regarding Indian financial stocks, of which ICICI Bank, Ltd. is a major one.
The Fund’s top performance detractors included Tullow Oil PLC, Prada SpA, and NOVATEK OAO. Tullow Oil PLC had a few recent exploration bumps during the reporting period but has a well above average record of success. The decline in the oil price over the second half of the period has weighed on the stock as well. Prada SpA’s investors have been disappointed by the company’s recent results, which have been impacted by weak cyclical demand and one-off operational issues. NOVATEK OAO’s stock price declined during the reporting period due to negative investor sentiment on Russian shares caused by political tension over Ukraine.
Justin Leverenz, CFA
Portfolio Manager
OppenheimerFunds, Inc.
| | |
| Transamerica Funds | | Annual Report 2014 |
Page 8
Transamerica Developing Markets Equity
(unaudited)
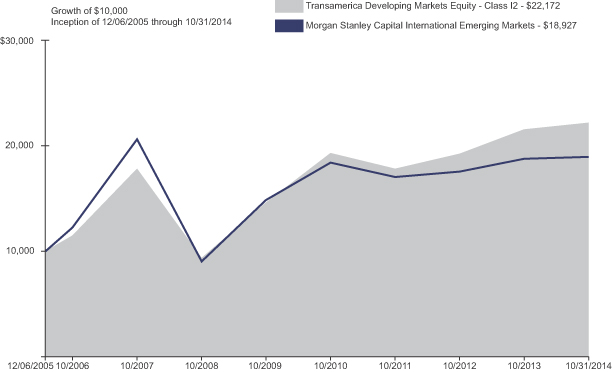
| | | | | | | | | | | | | | | | |
| Average Annual Total Return for Periods Ended 10/31/2014 | |
| | | 1 Year | | | 5 Years | | | 10 Years or
Life of Class | | | Inception Date | |
Class I2 (NAV) | | | 2.87 | % | | | 8.74 | % | | | 9.35 | % | | | 12/06/2005 | |
Morgan Stanley Capital International Emerging Markets Index (A) | | | 0.98 | % | | | 4.98 | % | | | 7.43 | % | | | | |
(A) The Morgan Stanley Capital International Emerging Markets Index is an unmanaged index used as a general measure of market performance. Calculations assume dividends and capital gains are reinvested and do not include any managerial expenses. The 10 Years or Life of Fund calculation is based on the inception date of the class. You cannot invest directly in an index.
The performance data presented represents past performance; future results may vary. Performance data does not reflect the deduction of taxes that would be paid on Fund distributions or the redemption of Fund shares. Investment return and principal value will fluctuate so that an investor’s shares, when redeemed, may be worth more or less than their original cost. Current performance may be lower or higher than performance quoted. Please see www.transamerica.com for performance data current to the most recent month-end. Net Asset Value (“NAV”) returns include the reinvestment of dividends and capital gains. Fund shares are sold without a sales load.
Performance figures reflect any fee waivers and/or expense reimbursements by the Investment Adviser. Without such waivers and/or reimbursements, the performance would be lower. Future waivers and/or reimbursements are at the discretion of the Investment Adviser.
Performance results do not include adjustments made for financial reporting purposes in accordance with U.S. generally accepted accounting principles and may differ from amounts reported in the financial highlights.
Investing in emerging and developing markets involves special considerations. These may include risks related to market and currency volatility, adverse social and political developments, and the relatively small size and lesser liquidity of these markets. This Fund is only available in Class I2 shares, which are not available for direct investment by the public.
Please refer to page 29 for index descriptions.
| | |
| Transamerica Funds | | Annual Report 2014 |
Page 9
Transamerica Global Real Estate Securities
(unaudited)
MARKET ENVIRONMENT
Global real estate shares generated a low double-digit total return over the past 12 months as performance was positive in all regions. Real estate stocks delivered solid returns as the result of lower bond yields, accommodative capital markets and improving demand for real estate space with limited new supply. Strong total return was generated in geographies and property types that offer attractive current yield and/or prospects for continued growth, most notably in the U.S. and the U.K., both of which generated mid-teens total return. This was somewhat tempered by modestly negative returns in Japan.
Real estate stocks continue to benefit from a favorable environment of continued low interest rates, limited new supply, and improving demand for real estate space, leading to higher occupancies, rents and values. Economic growth is expanding in most developed markets around the globe, although the rate of improvement varies dramatically, from relatively robust in the U.S. and the U.K. to tepid in the Eurozone and Japan. Growth expectations have recently been dampened by concern surrounding geopolitical events, including trade sanctions with Russia and intensified regional conflict in the Middle East. Inflationary pressures globally remain low. This bodes well for continued low intermediate and long-term interest rates. Despite the U.S. Federal Reserve (“Fed”) completing its tapering of quantitative easing and potentially increasing short-term policy rates sometime next year, the outlook for long-term interest rates remains relatively benign. Many market observers are calling for a “new normal” of long-term rates well below those observed in the late 20th century. This combination of slow and steady economic growth and low long-term interest rates bodes well for real estate and real estate securities, which generate a material component of total return from current yield. Low levels of new construction globally also suggest that owners of existing properties are expected to enjoy improved pricing power.
Vacancy rates continued to come down across property sectors, including U.S. apartments, global industrial, prime central business district office markets such as those in London, Tokyo, Hong Kong, New York, San Francisco and Los Angeles, and lodging in global gateway cities. Landlords are beginning to exercise pricing power by raising rental rates and limiting tenant concessions such as free rent and tenant improvements, thereby increasing net effective rents. Additionally, property companies are growing cash flow per share via “external” growth of acquisitions and development. Active balance sheet management is also adding value as the cost of debt for many companies remains low with conservative levels of financial leverage.
PERFORMANCE
For the year ended October 31, 2014, Transamerica Global Real Estate Securities Class I2 returned 10.61%. By comparison, its benchmark, the S&P Developed Property Index, returned 10.49%.
STRATEGY REVIEW
The Fund offers a global strategy for real estate securities investors in the U.S. The Fund generally owns between 80 and 110 real estate stocks with the goal of outperforming the S&P Developed Property Index. The Fund seeks to invest in attractively-priced stocks that own property in markets with favorable underlying real estate fundamentals. The global universe of public real estate companies is approximately three times the size of the U.S. public company universe and thus offers additional choices and diversification opportunities to the manager.
The Fund underperformed its benchmark during the year ended October 31, 2014.
Stock selection was positive across all regions during the period, with the strongest relative performance delivered in the U.S., Japan and the U.K. Favorable stock selection in the U.S. was the result of positioning across a number of property types, including the office, hotel and residential sectors. In Japan, the Fund’s positioning in the more economically-sensitive property types such as office and retail added value. In the U.K., an overweight to London office as well as the industrial and storage sectors benefited relative performance. Stock selection in Australia and Hong Kong modestly detracted from performance during the year. Asset allocation decisions negatively impacted relative performance as an overweight to the underperforming Japanese market accounted for most of the shortfall and overshadowed the value added as the result of positive positioning in the Americas and Europe during the course of the year. Japanese property companies have underperformed despite clear evidence of improving property fundamentals.
T. Ritson Ferguson, CFA
Steven D. Burton, CFA
Joseph P. Smith, CFA
Co-Portfolio Managers
CBRE Clarion Securities LLC
| | |
| Transamerica Funds | | Annual Report 2014 |
Page 10
Transamerica Global Real Estate Securities
(unaudited)
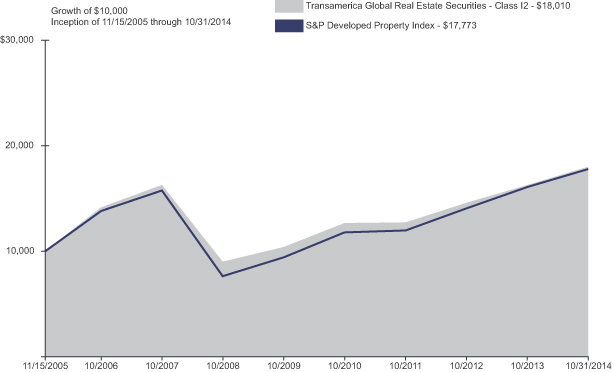
| | | | | | | | | | | | | | | | |
| Average Annual Total Return for Periods Ended 10/31/2014 | |
| | | 1 Year | | | 5 Years | | | 10 Years or
Life of Class | | | Inception Date | |
Class I2 (NAV) | | | 10.61 | % | | | 11.62 | % | | | 6.79 | % | | | 11/15/2005 | |
S&P Developed Property Index (A) | | | 10.49 | % | | | 13.52 | % | | | 6.63 | % | | | | |
(A) The S&P Developed Property Index is an unmanaged index used as a general measure of market performance. Calculations assume dividends and capital gains are reinvested and do not include any managerial expenses. The 10 Years or Life of Fund calculation is based on the inception date of the class. You cannot invest directly in an index.
The performance data presented represents past performance; future results may vary. Performance data does not reflect the deduction of taxes that would be paid on Fund distributions or the redemption of Fund shares. Investment return and principal value will fluctuate so that an investor’s shares, when redeemed, may be worth more or less than their original cost. Current performance may be lower or higher than performance quoted. Please see www.transamerica.com for performance data current to the most recent month-end. Net Asset Value (“NAV”) returns include the reinvestment of dividends and capital gains. Fund shares are sold without a sales load.
Performance figures reflect any fee waivers and/or expense reimbursements by the Investment Adviser. Without such waivers and/or reimbursements, the performance would be lower. Future waivers and/or reimbursements are at the discretion of the Investment Adviser.
Performance results do not include adjustments made for financial reporting purposes in accordance with U.S. generally accepted accounting principles and may differ from amounts reported in the financial highlights.
Investments in real estate securities and real estate investment trusts (“REITs”) involve special risks, such as the possible decline in value of real estate, extended vacancies, and uninsured damages from natural disasters. This Fund is only available in Class I2 shares, which are not available for direct investment by the public.
Please refer to page 29 for index descriptions.
| | |
| Transamerica Funds | | Annual Report 2014 |
Page 11
Transamerica Growth
(unaudited)
MARKET ENVIRONMENT
The U.S. equity market’s advance in the year ended October 31, 2014 reflected sustained improvement in the U.S. economic outlook. Corporate profits remained strong, housing and employment indicators improved, and consumer confidence rose to post-recession highs. The U.S. Federal Reserve (“Fed”) tapered its quantitative-easing program, signaling confidence in the health of U.S. economic activity and labor market conditions. U.S. Gross Domestic Product contracted in early 2014, largely because of severe winter weather, before quickly rebounding. Economic activity in Europe, already anemic, faced new challenges stemming from Ukraine-Russia tensions. China’s expansion moderated as the country sought a better balance between internal and external growth.
PERFORMANCE
For the year ended October 31, 2014, Transamerica Growth Class I2 returned 17.17%. By comparison, its benchmark, the Russell 1000® Growth Index, returned 17.11%.
STRATEGY REVIEW
The Fund is built from the bottom up, based on the fundamentals of individual companies. Health Care positions were the most significant contributors to the Fund’s return. Meaningful scientific advances over the past decade coupled with increased research and development and clinical trial activity have led to numerous drug introductions and material improvement in the treatment of serious diseases. Biotechnology companies held in the Fund benefited from their innovative drugs for Hepatitis C (Gilead Sciences, Inc.’s Sovaldi), blood disorders and autoimmune diseases (Alexion Pharmaceuticals, Inc.’s Soliris), multiple sclerosis (Biogen Idec, Inc.’s Tecfidera), cystic fibrosis (Vertex Pharmaceuticals, Inc.’s Kalydeco), and cancer (Celgene Corp.’s Revlimid and Abraxane).
The Fund’s strength in Health Care extended beyond Biotechnology. Illumina, Inc.’s gain reflected increasing demand for its next-generation gene-sequencing technology. In Pharmaceuticals, Allergan, Inc. advanced on a takeover bid and the strength of its business, which has been enhanced by efforts to manage spending more efficiently and redeploy cash in ways that benefit shareholders.
Information Technology positions were likewise strong contributors to return although portfolio positions lagged the benchmark sector largely on weakness in select cloud-based companies. Apple, Inc.’s strong revenue and earnings reflected expanding global acceptance of its platform. We expect that product updates, especially iPhone 6, will sustain attractive revenue growth in the medium term.
Internet-based social platform Facebook, Inc. reported strong revenue and earnings as well as healthy user and engagement metrics. The company has successfully implemented its mobile interface, and monetization of both mobile and desktop has improved.
Next-generation security software vendor FireEye, Inc. declined with a broad sell-off of high-multiple software growth stocks despite its strong billings, new customer, and revenue growth.
Faced with a challenging consumer environment, the Fund’s consumer holdings in the aggregate underperformed the benchmark’s consumer names. Media company Discovery Communications, Inc. (no longer held at year end) declined on tepid domestic advertising. Whole Foods Market, Inc. (no longer held at year end) was hurt by intensifying competition in the organic and natural foods market. Amazon.com, Inc.’s earnings were constrained by increased business investment that is designed to drive unit growth in its core retail business and through digital commerce via the mobile market. More than offsetting these declines were strong gains in other consumer holdings, including global athletic apparel company Under Armour, Inc., electric car innovator Tesla Motor, Inc., media conglomerate Walt Disney Co., and hotel operator Marriott International, Inc.
Michael Del Balso
Blair A. Boyer
Spiros “Sig” Segalas
Co-Portfolio Managers
Jennison Associates LLC
| | |
| Transamerica Funds | | Annual Report 2014 |
Page 12
Transamerica Growth
(unaudited)
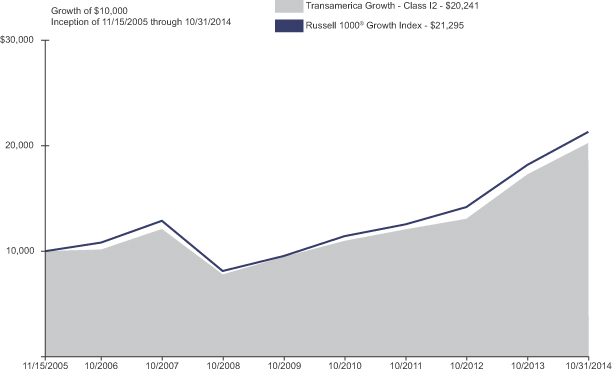
| | | | | | | | | | | | | | | | |
| Average Annual Total Return for Periods Ended 10/31/2014 | |
| | | 1 Year | | | 5 Years | | | 10 Years or
Life of Class | | | Inception Date | |
Class I2 (NAV) | | | 17.17 | % | | | 16.43 | % | | | 8.19 | % | | | 11/15/2005 | |
Russell 1000® Growth Index (A) | | | 17.11 | % | | | 17.43 | % | | | 8.80 | % | | | | |
(A) The Russell 1000® Growth Index is an unmanaged index used as a general measure of market performance. Calculations assume dividends and capital gains are reinvested and do not include any managerial expenses. The 10 Years or Life of Fund calculation is based on the inception date of the class. You cannot invest directly in an index.
The performance data presented represents past performance; future results may vary. Performance data does not reflect the deduction of taxes that would be paid on Fund distributions or the redemption of Fund shares. Investment return and principal value will fluctuate so that an investor’s shares, when redeemed, may be worth more or less than their original cost. Current performance may be lower or higher than performance quoted. Please see www.transamerica.com for performance data current to the most recent month-end. Net Asset Value (“NAV”) returns include the reinvestment of dividends and capital gains. Fund shares are sold without a sales load.
Performance figures reflect any fee waivers and/or expense reimbursements by the Investment Adviser. Without such waivers and/or reimbursements, the performance would be lower. Future waivers and/or reimbursements are at the discretion of the Investment Adviser.
Performance results do not include adjustments made for financial reporting purposes in accordance with U.S. generally accepted accounting principles and may differ from amounts reported in the financial highlights.
Growth stocks can be volatile and experience sharp price declines and certain types of stocks, especially technology, can be extremely volatile and subject to greater price swings than the broader market. This Fund is only available in Class I2 shares, which are not available for direct investment by the public.
Russell Investment Group is the source and owner of the trademarks, service marks, and copyrights related to the Russell indexes. Russell® is a trademark of Russell Investment Group.
Please refer to page 29 for index descriptions.
| | |
| Transamerica Funds | | Annual Report 2014 |
Page 13
Transamerica Intermediate Bond
(unaudited)
MARKET ENVIRONMENT
The year ended October 31, 2014 can be summarized as great expectations that were never met. This narrative applies most directly to the economic recovery and the expected sell-off in fixed income markets, especially long duration assets.
The expectations were building throughout 2013 as the 10-year Treasury rate almost doubled, briefly piercing the 3% threshold. This move was intertwined with the consensus thinking that the growth rate of the U.S. economy was finally going to hit terminal velocity of close to three percent. All was perceived to be going as planned until Mother Nature chimed in. The cold weather and snow in the first quarter of this year sent inventory accumulation into hibernation. What magnified the weather event is that in the second half of 2013, factories had been participating in the consensus view that the economy was accelerating by rapidly ramping up their inventories in anticipation of higher demand in 2014. The literal freeze in economic activity in the first quarter of 2014 created such a drag that it was quickly made apparent that the full-year growth numbers were not going to be attainable.
The underwhelming economic performance was not just a U.S. event. The consensus in the Eurozone had also been calling for a healthy acceleration. However, the necessary balance sheet repairs needed to allow banks to pass the Asset Quality Review test meant that lending to the region would be very hard to come by. Such a restriction of private credit, especially to the Small & Medium Sized Enterprises, is completely contrary to what is required for an economic expansion. The ensuing slowdown was not limited to the periphery, as even the German growth engine lost steam.
The most recent policy answer to the European growth problem created a new global narrative—divergent monetary policy in the developed world. At a time when the U.S. and U.K. have been winding down quantitative easing (“QE”) and talking about raising interest rates, Japan and Europe have been going the other way—either increasing the pace of QE or seeking alternative ways to implement QE policy. (Even the largest Emerging Market country (China) is adding stimulus through numerous channels.) This divergence of policy has resulted in a huge interest rate differential between sovereign bonds and has incentivized, in part, investors domiciled in countries with low yields to buy debt instruments in (relatively) higher interest bearing countries. This so called ‘tractor-beam’ effect has also contributed downward pressure to U.S. interest rates.
As is often the case, what the consensus was expecting to be the worst asset class for the coming year (i.e., 30-year Treasuries) turned out to be one of the best, especially after accounting for volatility. Can history repeat itself in 2015? It will be tough, at least for the long bond, given the challenges to attaining capital appreciation on top of the lower starting yield versus last year. Much of the 2015 narrative could be a continuation of the divergence in global monetary policy—does the U.S. Federal Reserve (“Fed”) and Bank of England start hiking rates in 2015? Does the European Central Bank start sovereign QE? How long does the Bank of Japan keep up its torrid pace of QE? While the answers to these questions may play out in due time, with no recession seen in site, Aegon USA Investment Management, LLC remains of the view that risk assets remain in a long-term bull market.
PERFORMANCE
For the period ended October 31, 2014, Transamerica Intermediate Bond Class I2 returned 2.48%. By comparison, its benchmark, the Barclays U.S. Aggregate Bond Index, returned 3.04%.
STRATEGY REVIEW
The Fund underperformed the benchmark from its inception date of March 1, 2014 through its fiscal year end of October 31, 2014. The biggest driver of performance was our short duration positioning and underweighting of U.S. Treasuries and Agency Mortgage-Backed Securities (“MBS”). Our overweighting of various spread products added positively to returns but did not deliver enough positive total return to offset the difference. We continue to position the Fund with a shorter than index duration and an underweight to Treasuries due to our belief that the current low rates offer minimal value.
Corporate bonds appeared to benefit from strong corporate profitability and robust market technicals. However, given the increase in merger and acquisition activity this year, diligence to avoid idiosyncratic risks becomes more paramount. Our overweighting of Financials benefited during the period, as we have seen credit spreads tighten due to the improved environment for asset quality and regulations supporting credit quality. We continued to be selective in our emerging markets positioning, investing mostly in highly rated solid corporate credit.
Agency MBS outperformed their duration matched Treasuries, and our underweight was a negative contribution to performance. We continued to invest in agency mortgage dollar rolls which are helped by the Fed’s balance sheet policies and non-agency MBS re-REMICs, which have benefited from the extra yield and positive technicals. Due to the Fed’s taper of MBS purchases, we intend to
| | |
| Transamerica Funds | | Annual Report 2014 |
Page 14
Transamerica Intermediate Bond
(unaudited)
STRATEGY REVIEW (continued)
remain underweight Agency MBS given our expectation of deteriorating technicals and widening spreads with their reduced role in the market. We also prefer other securitized segments, and we intend to focus on niche sectors in Asset-Backed Securities (“ABS”) and select Commercial Mortgage-Backed Securities (“CMBS”).
While we do not believe that spreads on risky assets offer the return opportunities they once did, our analysis suggests that there are still excess yield opportunities available. We have continued to position the Fund in corporate credit and structured securities to pursue potential opportunities to gain excess yield while remaining cautious around duration (i.e., interest rate) risks.
Brian W. Westhoff, CFA
Rick Perry, CFA
Doug Weih, CFA
Co-Portfolio Managers
Aegon USA Investment Management, LLC
| | |
| Transamerica Funds | | Annual Report 2014 |
Page 15
Transamerica Intermediate Bond
(unaudited)
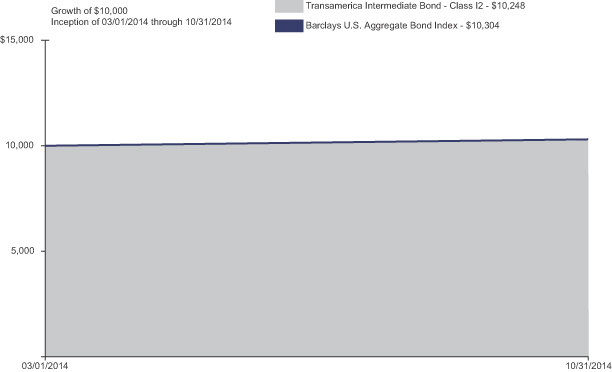
| | | | | | | | |
| Average Annual Total Return for Periods Ended 10/31/2014 | |
| | | 10 Years or
Life of Class | | | Inception Date | |
Class I2 (NAV) | | | 2.48 | % (A) | | | 03/01/2014 | |
Barclays U.S. Aggregate Bond Index (B) | | | 3.04 | % (A) | | | | |
(A) Not annualized.
(B) The Barclays U.S. Aggregate Bond Index is an unmanaged index used as a general measure of market performance. Calculations assume dividends and capital gains are reinvested and do not include any managerial expenses. The 10 Years or Life of Class calculation is based on the inception date of the class. You cannot invest directly in an index.
The performance data presented represents past performance; future results may vary. Performance data does not reflect the deduction of taxes that would be paid on Fund distributions or the redemption of Fund shares. Investment return and principal value will fluctuate so that an investor’s shares, when redeemed, may be worth more or less than their original cost. Current performance may be lower or higher than performance quoted. Please see www.transamerica.com for performance data current to the most recent month-end. Net Asset Value (“NAV”) returns include the reinvestment of dividends and capital gains. Fund shares are sold without a sales load.
Performance figures reflect any fee waivers and/or expense reimbursements by the Investment Adviser. Without such waivers and/or reimbursements, the performance would be lower. Future waivers and/or reimbursements are at the discretion of the Investment Adviser.
Performance results do not include adjustments made for financial reporting purposes in accordance with U.S. generally accepted accounting principles and may differ from amounts reported in the financial highlights.
Fixed income investing is subject to credit risk, inflation risk, and interest rate risk. Investing in high-yield (junk bonds) may be subject to greater volatility and risks as the income derived from these securities is not guaranteed and may be unpredictable and the value of these securities tends to decline when interest rates increases.
Please refer to page 29 for index descriptions.
| | |
| Transamerica Funds | | Annual Report 2014 |
Page 16
Transamerica International Equity Opportunities
(unaudited)
MARKET ENVIRONMENT
Early in the period, the decision by the U.S. Federal Reserve (“Fed”) to postpone tapering (bond purchases) surprised markets. Favorable market reactions were tempered, however, by tense negotiations over U.S. fiscal policy that resulted in a 16-day partial shutdown of the federal government and a short-term extension in the debt ceiling. The volatility was short-lived, however, as an extension of budget and debt ceiling deadlines allowed the government to re-open, and subsequent economic data reflected moderate but resilient U.S. growth. Also well-received was the decision by the European Central Bank (“ECB”) to cut its policy rate as inflation pressures waned in the region. In addition, equity investors appeared to have concluded that there would be no major change in U.S. monetary policy as a result of the nomination of Janet Yellen as the new Fed chair for a term beginning in early 2014 and that tapering would have no major impact on the trajectory.
As the period progressed, financial markets were forced to contend with a series of positive and negative return episodes. Geopolitical tensions flared in the Middle East and Russia/Ukraine. Market setbacks were short-lived, however, as improving economic growth in the U.S. coupled with prospects for easier monetary policy in regions with slowing growth such as Japan, Europe and China supported risk assets. For example, the ECB cut policy interest rates into negative territory and, by the end of the period, expectations were for additional rate cuts and the announcement for non-conventional easing measures. Similarly, the Bank of Japan surprised markets late in the period with fresh stimulus measures given lackluster growth trends and the related decline in developed market government bond yields and credit spreads were also supportive for equity markets. At period end, the U.S. equity market was trading at all-time highs.
PERFORMANCE
For the year ended October 31, 2014, Transamerica International Equity Opportunities Class I2 returned 0.05%. By comparison, its benchmark, the Morgan Stanley Capital International Europe, Australasia, Far East Index, returned (0.17)%.
STRATEGY REVIEW
Stock selection and an overweight position in the technology sector were positive factors for performance relative to the Morgan Stanley Capital International Europe, Australasia, Far East Index. The Fund’s overweight position in Japanese electronic imaging company Hoya Corp. and holdings of semiconductor manufacturer Taiwan Semiconductor Manufacturing Co., Ltd. and electronics equipment and products company Hon Hai Precision Industry Co., Ltd. (based in Taiwan) supported positive performance.
Within the Transportation and Basic Materials sectors, strong security selection aided relative performance. Within Transportation, the Fund’s holdings of railroad company Canadian National Railway Co. boosted relative performance. Within Basic Materials, an avoidance of poor-performing mining giant BHP Billiton PLC (Australia) (no longer held at year end) also helped performance.
Stocks in other sectors that benefited relative performance included overweight positions in German pharmaceutical company Bayer AG and catering company Compass Group PLC (U.K.), and holdings of Canadian pharmaceutical company Valeant Pharmaceuticals International, Inc., food retailer Loblaw Cos., Ltd. (Canada), and financial services firm ING Groep NV (Netherlands).
During the reporting period, the Fund’s relative currency exposure, resulting primarily from differences between the Fund’s and the benchmark’s exposures to holdings of securities denominated in foreign currencies, aided relative performance. MFS Investment Management’s investment decisions are driven by the fundamentals of each individual opportunity and, as such, it is common for its portfolios to have different currency exposure than the benchmark.
Among primary relative detractors, an underweight allocation to the Utilities and Communications sector and stock selection in the Consumer Staples sector were among primary detractors from relative performance. Within the Utilities and Communications sector, there were no individual securities that were among the top relative detractors for the reporting period. Within Consumer Staples, the Fund’s overweight position in poor-performing skin and beauty care products manufacturer Beiersdorf AG (Germany) hindered relative performance.
Elsewhere, overweight allocations to U.K.-based banking group Standard Chartered PLC, human resources and employment services provider Randstad Holdings NV (Netherlands), automobile company Honda Motor Co., Ltd. (Japan), Italian oil and gas turnkey contractor Saipem SpA, oil and gas company BG Group PLC (U.K.) and specialist engineer Smiths Group PLC (U.K.) weighed on relative performance. Not holding shares of strong-performing pharmaceutical companies, Novartis AG (Switzerland) (no longer
| | |
| Transamerica Funds | | Annual Report 2014 |
Page 17
Transamerica International Equity Opportunities
(unaudited)
STRATEGY REVIEW (continued)
held at year end) and AstraZeneca PLC (U.K.) (no longer held at year end), and U.K.-based energy and petrochemicals company Royal Dutch Shell PLC (no longer held at year end), also detracted from performance as all three stocks outperformed the benchmark during the reporting period.
Marcus L. Smith
Daniel Ling
Co-Portfolio Managers
MFS® Investment Management
| | |
| Transamerica Funds | | Annual Report 2014 |
Page 18
Transamerica International Equity Opportunities
(unaudited)
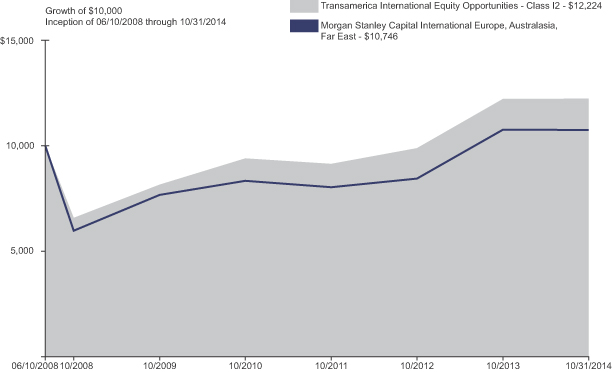
| | | | | | | | | | | | | | | | |
| Average Annual Total Return for Periods Ended 10/31/2014 | |
| | | 1 Year | | | 5 Years | | | 10 Years or
Life of Class | | | Inception Date | |
Class I2 (NAV) | | | 0.05 | % | | | 8.42 | % | | | 3.19 | % | | | 06/10/2008 | |
Morgan Stanley Capital International Europe, Australasia, Far East Index (A) | | | (0.17 | )% | | | 7.00 | % | | | 1.13 | % | | | | |
(A) The Morgan Stanley Capital International Europe, Australasia, Far East Index is an unmanaged index used as a general measure of market performance. Calculations assume dividends and capital gains are reinvested and do not include any managerial expenses. The 10 Years or Life of Fund calculation is based on the inception date of the class. You cannot invest directly in an index.
The performance data presented represents past performance; future results may vary. Performance data does not reflect the deduction of taxes that would be paid on Fund distributions or the redemption of Fund shares. Investment return and principal value will fluctuate so that an investor’s shares, when redeemed, may be worth more or less than their original cost. Current performance may be lower or higher than performance quoted. Please see www.transamerica.com for performance data current to the most recent month-end. Net Asset Value (“NAV”) returns include the reinvestment of dividends and capital gains. Fund shares are sold without a sales load.
Performance figures reflect any fee waivers and/or expense reimbursements by the Investment Adviser. Without such waivers and/or reimbursements, the performance would be lower. Future waivers and/or reimbursements are at the discretion of the Investment Adviser.
Performance results do not include adjustments made for financial reporting purposes in accordance with U.S. generally accepted accounting principles and may differ from amounts reported in the financial highlights.
Investments in global/international markets involve risks not associated with U.S. markets, such as currency fluctuations, adverse social and political developments, and the relatively small size and lesser liquidity of the markets. Investments in developing markets involve greater risks than investments in developed markets. This Fund is only available in Class I2 shares, which are not available for direct investment by the public.
Please refer to page 29 for index descriptions.
| | |
| Transamerica Funds | | Annual Report 2014 |
Page 19
Transamerica International Small Cap
(unaudited)
MARKET ENVIRONMENT
International small company equities ended flat over the period, with the S&P EuroPacific Smallcap Index down 0.3%, almost the same as larger cap equities (the S&P EuroPacific Large/Midcap Index fell 0.2%).
Although international small cap equities made some upward progress in the first half of the year, this was cancelled out in the final three months of the review period as the dollar strengthened, a development which coincided with underlying weakness in global equities as investors fretted about dwindling growth (particularly in Europe and China), continued “tapering” by the U.S. Federal Reserve (“Fed”), the implications of weak commodity prices for vulnerable emerging markets, and broad deflationary concerns. There was remarkably little variation between regional returns, while in sectorial terms defensive areas such as Utilities, Telecommunications and Health Care outperformed. Energy was a notable area of weakness, mirroring the trend in oil prices.
PERFORMANCE
For the year ended October 31, 2014, Transamerica International Small Cap Class I2 returned 1.08%. By comparison, its benchmark, the S&P EuroPacific SmallCap Index, returned (0.31)%.
STRATEGY REVIEW
The biggest positive factors driving relative performance came from stock selection in the U.K. and Japan. In the U.K., the main successes were among Information Technology (CSR PLC following a takeover approach) and Industrials (Ashtead Group PLC and DCC PLC), with lesser impacts from Energy and Materials. In Japan, positive stock selection has been spread across Industrials (Trusco Nakayama Corp. and Asahi Diamond Industrial Co., Ltd.), Materials (Kureha Corp. and Nihon Parkerizing Co., Ltd.), Consumer Cyclicals (auto parts related such as Koito Manufacturing Co., Ltd. and Eagle Industry Co., Ltd.) and Consumer Staples (Tsuruha Holdings, Inc.).
The Fund’s emerging market holdings also contributed positively thanks to some strong contributors in Thailand, including Bumrungrad Hospital PCL, LPN Development PCL (Thai residential developer), and Hemaraj Land and Development PCL (industrial real estate).
In developed Asian markets and continental Europe, the Fund’s performance was slightly behind that of the benchmark. In developed Asia, weakness was primarily due to three stocks: Iluka Resources, Ltd. on weak zircon and titanium oxide pricing, Korean stock Sung Kwang Bend Co., Ltd. on weak volumes and pricing, and Chorus, Ltd. (no longer held at year end) amid adverse regulatory developments in New Zealand. In continental Europe, relative weakness in Financials (Storebrand ASA, Class A and FBD Holdings PLC) and Energy (OW Bunker A/S) sectors was only partially offset by strong stock selection in Materials (Borregaard ASA and Auriga Industries (no longer held at year end)) and Industrials (Groupe Eurotunnel SA and Loomis AB).
In terms of Fund activity, we made a number of adjustments to the geographic positioning. We added to emerging markets, Japan and continental Europe. Sources of funding have been developed Pacific ex-Japan and the U.K.
In line with fading investor confidence, small caps have corrected versus their larger peers in the last half of the review period (particularly in Europe). Consequently, valuations now look more attractive. However, since earnings expanded much faster for smaller caps than larger caps over the last two years, a more subdued global growth outlook (should it transpire) will present challenges to smaller companies. We take some comfort from the fact that our Fund, biased toward companies with higher returns, stronger balance sheets and more visible growth, still exhibits reasonably attractive valuation metrics.
Matthew F. Dobbs
Portfolio Manager
Schroder Investment Management North America Inc.
| | |
| Transamerica Funds | | Annual Report 2014 |
Page 20
Transamerica International Small Cap
(unaudited)
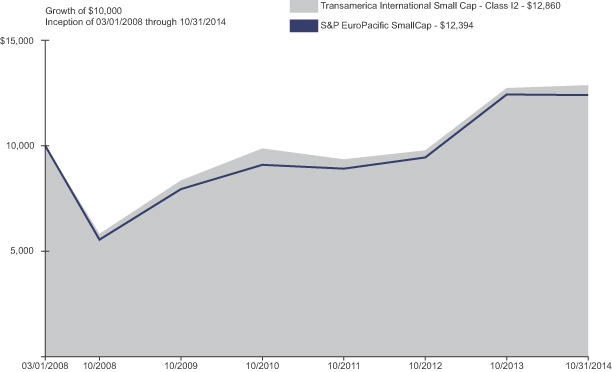
| | | | | | | | | | | | | | | | |
| Average Annual Total Return for Periods Ended 10/31/2014 | |
| | | 1 Year | | | 5 Years | | | 10 Years or
Life of Class | | | Inception Date | |
Class I2 (NAV) | | | 1.08 | % | | | 9.01 | % | | | 3.84 | % | | | 03/01/2008 | |
S&P EuroPacific SmallCap Index (A) | | | (0.31 | )% | | | 9.30 | % | | | 3.27 | % | | | | |
(A) The S&P EuroPacific SmallCap Index is an unmanaged index used as a general measure of market performance. Calculations assume dividends and capital gains are reinvested and do not include any managerial expenses. The 10 Years or Life of Fund calculation is based on the inception date of the class. You cannot invest directly in an index.
The performance data presented represents past performance; future results may vary. Performance data does not reflect the deduction of taxes that would be paid on Fund distributions or the redemption of Fund shares. Investment return and principal value will fluctuate so that an investor’s shares, when redeemed, may be worth more or less than their original cost. Current performance may be lower or higher than performance quoted. Please see www.transamerica.com for performance data current to the most recent month-end. Net Asset Value (“NAV”) returns include the reinvestment of dividends and capital gains. Fund shares are sold without a sales load.
Performance figures reflect any fee waivers and/or expense reimbursements by the Investment Adviser. Without such waivers and/or reimbursements, the performance would be lower. Future waivers and/or reimbursements are at the discretion of the Investment Adviser.
Performance results do not include adjustments made for financial reporting purposes in accordance with U.S. generally accepted accounting principles and may differ from amounts reported in the financial highlights.
Investments in global/international markets involve risks not associated with U.S. markets, such as currency fluctuations, adverse social and political developments, and the relatively small size and lesser liquidity of the markets. Investing in small size companies involves greater risk than is customarily associated with more established companies. This Fund is only available in Class I2 shares, which are not available for direct investment by the public.
Please refer to page 29 for index descriptions.
| | |
| Transamerica Funds | | Annual Report 2014 |
Page 21
Transamerica Long/Short Strategy
(unaudited)
MARKET ENVIRONMENT
Early in the year, U.S. equity markets rallied as S&P 500® company quarterly earnings hit their third consecutive record, offsetting earlier concerns about a 16-day shutdown of the U.S. government and relentless debate over when the U.S. Federal Reserve (“Fed”) would begin reducing the pace of its bond-buying program. A proposal introduced by the U.S. Senate was passed at the last minute, funding the U.S. government through January 2014 and extending the debt ceiling to February.
Choppier markets followed in subsequent months, as investors confronted volatility in emerging markets, a brutally harsh winter in the U.S., Russian occupation of Ukraine and signals from the Fed that interest rates could rise sooner than expected. Markets eventually settled down as Crimean citizens voted to join Russia without resistance and investors came to realize that when the Fed did decide to raise interest rates, it would be a long time before policy became restrictive. March also saw a vicious rotation in the market as stocks with higher-growth expectations, such as biotechnology and internet companies, sold off significantly in favor of stocks with more attractive valuations, such as banks and mature technology companies.
By the middle of the year, investors began to question the strength of the global economy as bond yields across the developed world continued to fall. Adding to investor anxiety were ongoing tensions between Russia and Ukraine and increasing insurgency in Iraq. Equity markets regained their footing in mid-May as economic releases pointed to a U.S. economy that was much stronger than the initial U.S. Gross Domestic Product number suggested. Global monetary policy was also supportive of markets, particularly in June, as the Fed continued to reinforce continued low interest rate levels while the European Central Bank launched a new facility designed to encourage bank lending.
Toward the end of the year, U.S. equity indexes hit new highs. However, stocks later sold off over the final two weeks as weaker economic data from Europe and China reignited concerns over global growth. In the U.S., the question over the timing of the Fed’s first interest rate hike also was cause for volatility. Despite this, U.S. corporations posted record operating earnings, helped in part by greater revenue growth. Meanwhile, the Fed was able to calm fears over an early rise in interest rates, reiterating its pledge to not raise interest rates until a “considerable time” passed after its asset purchases end.
PERFORMANCE
For the year ended October 31, 2014, Transamerica Long/Short Strategy Class I2 returned 8.64%. By comparison its primary and secondary benchmarks, the Bank of America Merrill Lynch 3-Month Treasury Bill Index and the S&P 500®, returned 0.05% and 17.27%, respectively.
STRATEGY REVIEW
The Fund outperformed its benchmark during the year ended October 31, 2014. Stock selection in all sectors except the industrial cyclical sector contributed to the Fund’s return.
Within semiconductors, a long position in Avago Technologies, Ltd. (no longer held at year end), contributed to performance. The company continued to beat estimates throughout the year as it benefited from increased demand for radio frequency (“RF”) content in smartphones and quicker-than-expected cost savings from its recent acquisition of LSI Corp. (no longer held at year end). We remain constructive on Avago Technologies, Ltd. for its ability to grow revenues on the back of wireless growth in LTE and for potential deals that can improve profitability in the future. In basic materials, a long position in Alcoa, Inc. added value as shares of the aluminum producer advanced throughout the year. Ongoing smelter closures supported aluminum prices, and we expect this trend to continue. A tight scrap market and sell-side analysts’ forecasts for large aluminum deficits also point to an aluminum supply shortage and potentially higher aluminum prices. Within the media sector, a long position in Time Warner, Inc. helped returns. The stock rose during the summer due to a takeover bid from 21st Century Fox, which Time Warner, Inc. rejected and was later withdrawn. In addition, the stock benefited from solid earnings throughout the year along with an expanded share buyback program. With the stock still at low multiples, Time Warner, Inc. remains an important holding and we see long-term potential as growth in affiliate fees should drive revenue.
On the negative side, within industrials, a short position in Lockheed Martin Corp. weighed on returns over the year as the stock outperformed amid rising concerns about national security, geopolitical risks in Eastern Europe and Middle East. In addition, some believe that the U.S. Department of Defense budget reductions are nearing a bottom, which could help the stock. Share buybacks and a solid dividend yield have also contributed to Lockheed Martin Corp.’s strength. However, we believe that revenue streams from the government will continue to be reduced, which will further challenge the company. We believe that margin pressure will follow, as it has for the defense prime suppliers. Within semiconductors, a short position in Intel detracted from performance during the year. Intel Corp. reported higher revenues than expected due to higher enterprise spending for personal computer units. Additionally, a Microsoft
| | |
| Transamerica Funds | | Annual Report 2014 |
Page 22
Transamerica Long/Short Strategy
(unaudited)
STRATEGY REVIEW (continued)
Windows refresh helped sales, while a $20 billion increase to its share repurchase program boosted shares. We remain negative on Intel Corp. as we believe that the personal computer market is in secular decline, posing a long-term challenge for the company. Lastly, a short position in medium-haul trucker Heartland Express, Inc. hurt results. The share price reached an all-time high after a number of sell-side research analysts raised their price targets on the stock. The company also announced that it would institute a quarterly dividend, further boosting shares.
Steven G. Lee
Raffael Zingone, CFA
Co-Portfolio Managers
J.P. Morgan Investment Management, Inc.
| | |
| Transamerica Funds | | Annual Report 2014 |
Page 23
Transamerica Long/Short Strategy
(unaudited)
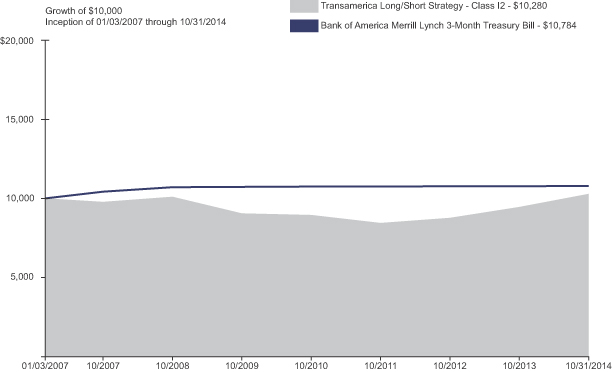
| | | | | | | | | | | | | | | | |
| Average Annual Total Return for Periods Ended 10/31/2014 | |
| | | 1 Year | | | 5 Years | | | 10 Years or
Life of Class | | | Inception Date | |
Class I2 (NAV) | | | 8.64 | % | | | 2.55 | % | | | 0.35 | % | | | 01/03/2007 | |
Bank of America Merrill Lynch 3-Month Treasury Bill Index (A) | | | 0.05 | % | | | 0.09 | % | | | 0.97 | % | | | | |
S&P 500® (A) | | | 17.27 | % | | | 16.69 | % | | | 6.88 | % | | | | |
(A) The Bank of America Merrill Lynch 3-Month Treasury Bill Index and the S&P 500® are unmanaged indices used as a general measure of market performance. Calculations assume dividends and capital gains are reinvested and do not include any managerial expenses. The 10 Years or Life of Fund calculation is based on the inception date of the class. You cannot invest directly in an index.
The performance data presented represents past performance; future results may vary. Performance data does not reflect the deduction of taxes that would be paid on Fund distributions or the redemption of Fund shares. Investment return and principal value will fluctuate so that an investor’s shares, when redeemed, may be worth more or less than their original cost. Current performance may be lower or higher than performance quoted. Please see www.transamerica.com for performance data current to the most recent month-end. Net Asset Value (“NAV”) returns include the reinvestment of dividends and capital gains. Fund shares are sold without a sales load.
Performance figures reflect any fee waivers and/or expense reimbursements by the Investment Adviser. Without such waivers and/or reimbursements, the performance would be lower. Future waivers and/or reimbursements are at the discretion of the Investment Adviser.
Performance results do not include adjustments made for financial reporting purposes in accordance with U.S. generally accepted accounting principles and may differ from amounts reported in the financial highlights.
Securities purchased for an arbitrage strategy are intended to take advantage of a perceived relationship between the value of two securities and may not perform as expected. The Fund is only available in Class I2 shares, which are not available for direct investment by the public.
Please refer to page 29 for index descriptions.
| | |
| Transamerica Funds | | Annual Report 2014 |
Page 24
Transamerica Mid Cap Value
(unaudited)
MARKET ENVIRONMENT
U.S. equity markets have been quite choppy over the past year following a U.S. government shutdown, tapering of asset purchases by the U.S. Federal Reserve (“Fed”), an unusually cold winter, escalating geopolitical tensions, and falling crude oil and natural gas prices, all on the backdrop of a seemingly strengthening U.S. economy. The year got off to a rough start due to concerns with central banks’ ability to sustainably fight inflation and fund deteriorating current account deficits in select emerging markets. Equity markets rebounded in February as investors shrugged off softer economic data blamed on the extremely cold weather.
The second quarter for U.S. equity markets got off to a volatile start. Investors began to question the strength of the global economy as bond yields across the developed world continued to fall. Adding to investor anxiety was the ongoing tension between Russia and Ukraine as well as increasing insurgency in Iraq. Equity markets regained their footing as economic releases pointed to a stronger U.S. economy. Global monetary policy was also supportive of markets as the Fed continued to reinforce low interest rate levels while the European Central Bank launched a new facility designed to encourage bank lending.
The S&P 500® continued to reach new highs in September. However, stocks sold off over the quarter’s final two weeks as weaker economic data from Europe and China reignited concerns over global growth. Closer to home, the question over the timing of the Fed’s first interest rate hike sparked volatility.
October was certainly a wild ride for U.S. equity markets. The S&P® 500 almost reached correction territory as investors feared signs of a sharp reversal in the outlook for the German economy might increase the likelihood that the Eurozone economy would fall back in recession. Markets staged an impressive rebound during the back half of the month on the strength of strong corporate earnings and encouraging U.S. economic data.
We continue to believe that the U.S. economy is reasonably healthy and appears to be decoupling further from the weakness in Europe and China. The consensus view remains that interest rates are expected to rise over time, particularly as the Fed has just completed its bond purchasing program. Consumer Discretionary income also benefits from low interest rates, benign inflation and a strong dollar. While the employment situation is improving, a missing ingredient has been broad-based salary and wage growth. Broad-based wage growth outpacing the rate of inflation can greatly improve the health of U.S. consumers, thereby increasing discretionary spending on retail goods, durable goods and, most importantly, housing.
PERFORMANCE
For the year ended October 31, 2014, Transamerica Mid Cap Value Class I2 returned 15.36%. By comparison its benchmark, the Russell Midcap® Value Index, returned 16.18%.
STRATEGY REVIEW
The Fund outperformed the Russell Midcap® Value Index over the trailing one-year period, primarily due to a combination of stock selection in the Consumer Discretionary and Consumer Staples sectors. In addition, an underweight in the Energy sector contributed to results as it was the worst-performing sector. Stock selection in Information Technology and Financials coupled with an overweight in Consumer Discretionary detracted most from performance.
Shares of Sigma-Aldrich Corp. spiked following Merck’s acquisition, representing a solid premium over the closing share price. This transaction will create the third-largest vendor of research supply and bio-production products in the world, giving massive scale to Sigma-Aldrich Corp.’s existing business. The two businesses are complementary and should realize synergies as well. Southwestern Energy Co. shares dipped during the quarter as natural gas prices fell amidst much cooler-than-normal summer weather in the Midwest and Eastern U.S., significantly reducing natural gas demand from power generators. Given that the majority of its commodity production comes from natural gas, Southwestern Energy Co.’s stock performance can at times be influenced by weather-related fluctuations in natural gas commodity prices. In addition to lower-than-expected natural gas prices, investors are also worried about restricted production growth due to infrastructure limitations in the Marcellus and Fayetteville shale regions. We believe that the recent share price decline has been overstated, and continue to think that its long-term prospects are quite favorable.
Jonathan K.L. Simon
Gloria Fu, CFA
Lawrence Playford, CFA
Co-Portfolio Managers
J.P. Morgan Investment Management Inc.
| | |
| Transamerica Funds | | Annual Report 2014 |
Page 25
Transamerica Mid Cap Value
(unaudited)
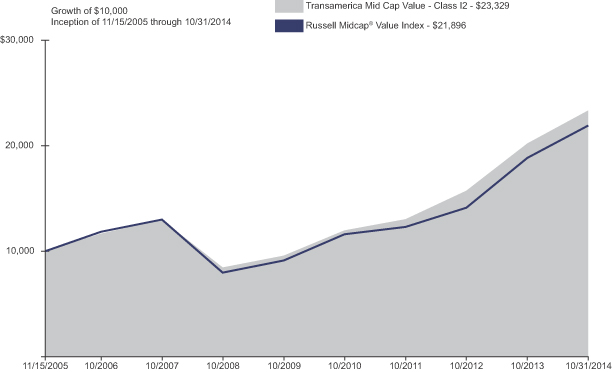
| | | | | | | | | | | | | | | | |
| Average Annual Total Return for Periods Ended 10/31/2014 | |
| | | 1 Year | | | 5 Years | | | 10 Years or
Life of Class | | | Inception Date | |
Class I2 (NAV) | | | 15.36 | % | | | 19.51 | % | | | 9.91 | % | | | 11/15/2005 | |
Russell Midcap® Value Index (A) | | | 16.18 | % | | | 19.19 | % | | | 9.14 | % | | | | |
(A) The Russell Midcap® Value Index is an unmanaged index used as a general measure of market performance. Calculations assume dividends and capital gains are reinvested and do not include any managerial expenses. The 10 Years or Life of Fund calculation is based on inception date of the class. You cannot invest directly in an index.
The performance data presented represents past performance; future results may vary. Performance data does not reflect the deduction of taxes that would be paid on Fund distributions or the redemption of Fund shares. Investment return and principal value will fluctuate so that an investor’s shares, when redeemed, may be worth more or less than their original cost. Current performance may be lower or higher than performance quoted. Please see www.transamerica.com for performance data current to the most recent month-end. Net Asset Value (“NAV”) returns include the reinvestment of dividends and capital gains. Fund shares are sold without a sales load.
Performance figures reflect any fee waivers and/or expense reimbursements by the Investment Adviser. Without such waivers and/or reimbursements, the performance would be lower. Future waivers and/or reimbursements are at the discretion of the Investment Adviser.
Performance results do not include adjustments made for financial reporting purposes in accordance with U.S. generally accepted accounting principles and may differ from amounts reported in the financial highlights.
Growth stocks can be volatile and experience sharp price declines and certain types of stocks, especially technology, can be extremely volatile and subject to greater price swings than the broader market. Value approach carries the risk that the market will not recognize a security’s intrinsic value for a long time or that an undervalued stock is actually appropriately priced. This Fund is only available in Class I2 shares, which are not available for direct investment by the public.
Russell Investment Group is the source and owner of the trademarks, service marks, and copyrights related to the Russell indexes. Russell® is a trademark of Russell Investment Group.
Please refer to page 29 for index descriptions.
| | |
| Transamerica Funds | | Annual Report 2014 |
Page 26
Transamerica Total Return
(unaudited)
MARKET ENVIRONMENT
The U.S. Federal Reserve (“Fed”) ended 2013 by keeping a wary eye on the uncertain policy landscape. The economy was unlikely to escape both a government shutdown and another debt ceiling debate unscathed. Meanwhile, the Fed clearly indicated that it would not begin raising rates until a “considerable time” after the third quantitative easing (“QE3”) had been wound down; the longer the withdrawal from QE3 is delayed, the further the Fed pushes out the eventual first rate hike.
Both uncertainty and volatility increased at the start of 2014. Equity markets swung wildly during the quarter—initially suffering from geopolitical tensions and weather-weakened data, before rebounding strongly toward quarter-end. Bond markets rallied early in the quarter due to the somewhat uncertain pace of economic expansion and mostly held on to gains as the crisis in Ukraine led a general flight to quality.
Unlike one year earlier when the Fed’s “taper talk” caused market turmoil, the second quarter of 2014 saw the return of risk appetite and an easing of global political risks. Bond markets rallied as central banks remained accommodative—emerging markets (“EM”) led gains, and developed market yields fell to 12-month lows during the quarter. Global equity markets posted sizeable gains overall as the S&P® 500 rose to an all-time high.
Far from the typical summer lull, the rest of the year was marked by geopolitical tension and diverging markets. Most developed market government yields were led lower by easy central bank policies, while credit markets backed up. Equity markets somersaulted their way to modest gains in the U.S., but were flat or slightly negative in many other regions as economic data varied. U.S. growth became more sure-footed, but the Eurozone recovery sputtered and growth decelerated in parts of Asia. Shortly after the end of the third quarter, the Fed finally moved to end QE3, marking the beginning of a return to normalcy.
PERFORMANCE
For the year ended October 31, 2014, Transamerica Total Return Class I2 returned 2.59%. By comparison, its benchmark, the Barclays U.S. Aggregate Bond Index, returned 4.14%.
STRATEGY REVIEW
An underweight at the long end of the U.S. yield curve, partially obtained via the use of interest rate swaps, was negative for overall returns during the year as longer maturities outperformed; however, a focus on intermediate maturities marginally offset this negative impact as those maturities also posted positive returns. Allocations to non-U.S. developed market duration, focused on Italy and Spain, contributed to performance, as rates rallied in those regions over the period. In EM, tactical positioning in both Mexico and Brazil detracted from performance, as rates rose in those regions. An allocation to Treasury Inflation-Protected Securities detracted from returns, as inflation expectations declined for the year.
Additionally, an allocation to non-Agency mortgages contributed to returns on the heels of an ongoing recovery in the housing market; however, this was partially offset by the Fund’s underweight to Agency mortgages, which also outperformed like-duration Treasuries for the year. Within the overall corporate sector, an underweight to investment-grade credit was negative for returns as spreads narrowed; however, this was more-than-offset by tactical high-yield positioning, particularly among financials, as the sector also outperformed. An overweight to external EM debt, partially obtained via the use of credit default swaps, detracted from year returns as spreads widened. Within municipal bonds, holdings of non-taxable revenue bonds provided a positive contribution to returns as they outperformed like-duration Treasuries. Finally, the Fund’s defensive currency posture against the euro and the yen contributed to overall returns, as these currencies depreciated versus the U.S. dollar.
Derivatives were used in the Fund and are instrumental in attaining specific exposures targeted to gain from anticipated market developments. The Fund’s duration positioning, which was negative for returns overall, was partly facilitated through the use of interest rate swaps and futures. The Fund’s overall corporate exposure, which was net positive for performance, was partially offset due to some defensive positions that were established via the use of credit default swaps. Additionally, the Fund’s exposure to select currencies, which aided performance, was obtained via forward contracts. In aggregate, derivatives were a net contribution to returns in 2014.
Scott A. Mather
Mark R. Kiesel
Mihir P. Worah
Co-Portfolio Managers
Pacific Investment Management Company LLC
| | |
| Transamerica Funds | | Annual Report 2014 |
Page 27
Transamerica Total Return
(unaudited)
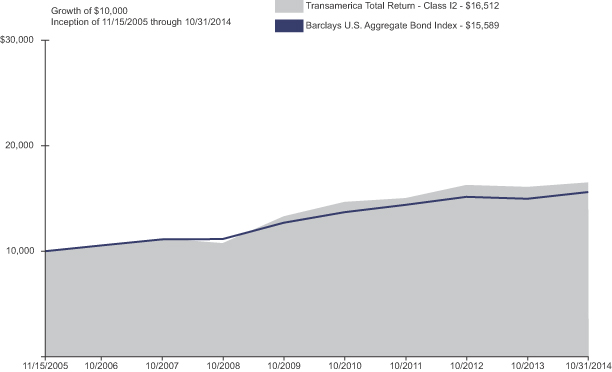
| | | | | | | | | | | | | | | | |
| Average Annual Total Return for Periods Ended 10/31/2014 | |
| | | 1 Year | | | 5 Years | | | 10 Years or
Life of Class | | | Inception Date | |
Class I2 (NAV) | | | 2.59 | % | | | 4.42 | % | | | 5.76 | % | | | 11/15/2005 | |
Barclays U.S. Aggregate Bond Index (A) | | | 4.14 | % | | | 4.22 | % | | | 5.08 | % | | | | |
(A) The Barclays U.S Aggregate Bond Index is an unmanaged index used as a general measure of market performance. Calculations assume dividends and capital gains are reinvested and do not include any managerial expenses. The 10 Years or Life of Fund calculation is based on the inception date of the class. You cannot invest directly in an index.
The performance data presented represents past performance; future results may vary. Performance data does not reflect the deduction of taxes that would be paid on Fund distributions or the redemption of Fund shares. Investment return and principal value will fluctuate so that an investor’s shares, when redeemed, may be worth more or less than their original cost. Current performance may be lower or higher than performance quoted. Please see www.transamerica.com for performance data current to the most recent month-end. Net Asset Value (“NAV”) returns include the reinvestment of dividends and capital gains. Fund shares are sold without a sales load.
Performance figures reflect any fee waivers and/or expenses reimbursements by the Investment Adviser. Without such waivers and/or reimbursements, the performance would be lower. Future waivers and/or reimbursements are at the discretion of the Investment Adviser.
Performance results do not include adjustments made for financial reporting purposes in accordance with U.S. generally accepted accounting principles and may differ from amounts reported in the financial highlights.
This Fund will normally invest its assets in a diversified portfolio of fixed-income securities. The Fund may invest in non-U.S. securities and may invest a portion of its assets in high-yield securities. Investing in non-U.S. securities may entail risk due to foreign economic and political developments; this risk may be enhanced when investing in emerging markets. This Fund is only available in Class I2 shares, which are not available for direct investment by the public.
Please refer to page 29 for index descriptions.
| | |
| Transamerica Funds | | Annual Report 2014 |
Page 28
Index Descriptions
(unaudited)
| | |
| Index | | Description |
| |
| Bank of America Merrill Lynch 3-Month Treasury Bill Index | | The Bank of America Merrill Lynch 3-Month Treasury Bill Index is comprised of a single issue purchased at the beginning of the month, which is subsequently sold at the end of the month and rolled into a newly selected issue. The issue selected at each month-end rebalancing is the outstanding Treasury Bill that matures closest to, but not beyond, three months from the rebalancing date. |
| |
| Bank of America Merrill Lynch U.S. Dollar 3-Month LIBOR Constant Maturity Index | | The Bank of America Merrill Lynch U.S. Dollar 3-Month LIBOR Constant Maturity Index represents the London interbank offered rate (LIBOR) with a constant 3-month average maturity. |
| |
| Barclays U.S. Aggregate Bond Index | | The Barclays U.S. Aggregate Bond Index measures investment grade, U.S. dollar-denominated, fixed-rate taxable bonds, including Treasuries, government-related and corporate securities, as well as both mortgage- and asset-backed securities. |
| |
| Barclays U.S. Government/Credit Bond Index | | The Barclays U.S. Government/Credit Index is comprised of U.S. Treasuries, government-related issues, and corporates. |
| |
| Bloomberg Commodity Index Total Return | | The Bloomberg Commodity Total Return index is composed of futures contracts and reflects the returns on a fully collateralized investment in the Bloomberg Commodity Index (“BCOM”). This combines the returns of the BCOM with the returns on cash collateral invested in 13 week (3 Month) U.S. Treasury Bills. |
| |
| Morgan Stanley Capital International Emerging Markets Index | | The Morgan Stanley Capital International Emerging Markets Index captures large and mid-cap representation across emerging markets countries. |
| |
| Morgan Stanley Capital International Europe, Australasia, Far East Index | | The Morgan Stanley Capital International Europe, Australasia, Far East Index is a free float-adjusted market capitalization index that is designed to measure the equity market performance of developed markets, excluding the U.S. and Canada. |
| |
| Russell 1000® Growth Index | | The Russell 1000® Growth Index measures the performance of the large-cap growth segment of the U.S. equity universe, and is comprised of Russell 1000® Index companies with higher price-to-book ratios and higher forecasted growth values. |
| |
| Russell Midcap® Value Index | | The Russell Midcap® Value Index measures the performance of the mid-cap value segment of the U.S. equity universe, and is comprised of Russell Midcap® Index companies with lower price-to-book ratios and lower forecasted growth values. |
| | |
| Transamerica Funds | | Annual Report 2014 |
Page 29
Index Descriptions (continued)
(unaudited)
| | |
| Index | | Description |
| |
| S&P 500® | | The S&P 500® is market-capitalization weighted index of 500 large U.S. companies with common stock listed on the NYSE or NASDAQ. |
| |
| S&P Developed Property Index | | The S&P Developed Property Index defines and measures the investable universe of publicly traded property companies domiciled in developed markets. |
| |
| S&P EuroPacific SmallCap Index | | The S&P EuroPacific SmallCap Index measures the performance of the smallest companies from select European and Pacific countries. |
| | |
| Transamerica Funds | | Annual Report 2014 |
Page 30
Understanding Your Funds’ Expenses
(unaudited)
SHAREHOLDER EXPENSES
Fund shareholders may incur two types of costs: (1) transaction costs, including sales charges (loads) on purchases, contingent deferred sales charges on redemptions; and (2) ongoing costs, including management fees, and other fund expenses.
The following examples are intended to help you understand your ongoing costs (in dollars and cents) of investing in the Funds and to compare these costs with the ongoing costs of investing in other funds.
The examples are based on an investment of $1,000 invested at May 1, 2014, and held for the entire period until October 31, 2014.
ACTUAL EXPENSES
The information in the table under the heading “Actual Expenses” provides information about actual account values and actual expenses. You may use the information in these columns, together with the amount you invested, to estimate the expenses that you paid over the period. Simply divide your account value by $1,000 (for example, an $8,600 account value divided by $1,000 = $8.60), then multiply the result by the number in the appropriate column for your share class titled “Expenses Paid During Period” to estimate the expenses you paid on your account during this period.
HYPOTHETICAL EXAMPLE FOR COMPARISON PURPOSES
The information in the table under the heading “Hypothetical Expenses” provides information about hypothetical account values and hypothetical expenses based on the Funds’ actual expense ratios and assumed rates of return of 5% per year before expenses, which are not the Funds’ actual returns. The hypothetical account values and expenses may not be used to estimate the actual ending account balance or expenses you paid for the period. You may use this information to compare the ongoing costs of investing in your Fund versus other funds. To do so, compare this 5% hypothetical example with the 5% hypothetical examples that appear in the shareholder reports of the other funds.
Please note that the expenses shown in the table are meant to highlight your ongoing costs only and do not reflect any transactional costs, such as sales charges and brokerage commissions paid on purchases and sales of Fund shares. Therefore, the information under the heading “Hypothetical Expenses” is useful in comparing ongoing costs only, and will not help you determine the relative total costs of owning different funds. If any of these transaction costs were included, your costs would be higher. The expenses shown in the table do not reflect any fees that may be charged to you by brokers, financial intermediaries, or other financial institutions.
Expense ratios may vary period to period because of various factors, such as an increase in expenses that are not covered by the advisory and administrative fees, expenses and fees of the trustees and their counsel, extraordinary expenses and interest expense.
| | | | | | | | | | | | | | | | | | | | | | | | |
| | | | | | Actual Expenses | | | Hypothetical Expenses (A) | | | | |
| Fund Name | | Beginning
Account Value | | | Ending Account
Value | | | Expenses Paid
During Period (B) | | | Ending Account
Value | | | Expenses Paid
During Period (B) | | | Annualized
Expense Ratio | |
| | | | | | |
Transamerica Arbitrage Strategy | | $ | 1,000.00 | | | $ | 996.00 | | | $ | 9.36 | | | $ | 1,015.80 | | | $ | 9.45 | | | | 1.86 | %(C)(D) |
Transamerica Bond | | | 1,000.00 | | | | 1,026.20 | | | | 3.57 | | | | 1,021.70 | | | | 3.57 | | | | 0.70 | |
Transamerica Core Bond | | | 1,000.00 | | | | 1,023.50 | | | | 2.65 | | | | 1,022.60 | | | | 2.65 | | | | 0.52 | |
Transamerica Developing Markets Equity | | | 1,000.00 | | | | 1,047.90 | | | | 6.76 | | | | 1,018.60 | | | | 6.67 | | | | 1.31 | |
Transamerica Global Real Estate Securities | | | 1,000.00 | | | | 1,069.90 | | | | 5.48 | | | | 1,019.90 | | | | 5.35 | | | | 1.05 | |
Transamerica Growth | | | 1,000.00 | | | | 1,122.80 | | | | 4.44 | | | | 1,021.00 | | | | 4.23 | | | | 0.83 | |
Transamerica Intermediate Bond | | | 1,000.00 | | | | 1,019.10 | | | | 2.24 | | | | 1,023.00 | | | | 2.24 | | | | 0.44 | |
Transamerica International Equity Opportunities | | | 1,000.00 | | | | 969.20 | | | | 4.96 | | | | 1,020.20 | | | | 5.09 | | | | 1.00 | |
Transamerica International Small Cap | | | 1,000.00 | | | | 934.30 | | | | 5.61 | | | | 1,019.40 | | | | 5.85 | | | | 1.15 | |
Transamerica Long/Short Strategy | | | 1,000.00 | | | | 1,041.40 | | | | 16.47 | | | | 1,009.10 | | | | 16.20 | | | | 3.20 | (E) |
Transamerica Mid Cap Value | | | 1,000.00 | | | | 1,068.60 | | | | 4.64 | | | | 1,020.70 | | | | 4.53 | | | | 0.89 | |
Transamerica Total Return | | | 1,000.00 | | | | 1,015.90 | | | | 3.76 | | | | 1,021.50 | | | | 3.77 | | | | 0.74 | |
| (A) | 5% return per year before expenses. |
| (B) | Expenses are calculated using the Funds’ annualized expense ratios (as disclosed in the table), multiplied by the average account value for the period, multiplied by the number of days in the period (184 days), and divided by the number of days in the year (365 days). |
| (C) | Includes dividends and interest on securities sold short (representing 0.61% of average net assets). |
| (D) | Expense ratios do not include expenses of the investment companies in which the Funds invest. |
| (E) | Includes dividends and interest on securities sold short (representing 1.78% of average net assets). |
| | |
| Transamerica Funds | | Annual Report 2014 |
Page 31
Schedules of Investments Composition
At October 31, 2014
(unaudited)
| | | | |
| Transamerica Arbitrage Strategy | |
| |
| Asset Allocation | | % of Net
Assets | |
Common Stocks | | | 84.9 | % |
Corporate Debt Securities | | | 11.4 | |
Repurchase Agreement | | | 2.5 | |
Master Limited Partnership | | | 0.5 | |
Purchased Options | | | 0.5 | |
Investment Company | | | 0.0 | * |
Right | | | 0.0 | * |
Net Other Assets (Liabilities) ^ | | | 0.2 | |
Total | | | 100.0 | % |
| | | | |
|
| Transamerica Bond | |
| |
| Asset Allocation | | % of Net
Assets | |
Corporate Debt Securities | | | 59.7 | % |
Asset-Backed Securities | | | 10.2 | |
Securities Lending Collateral | | | 9.6 | |
Mortgage-Backed Securities | | | 8.4 | |
Convertible Bonds | | | 7.8 | |
U.S. Government Obligations | | | 5.1 | |
Foreign Government Obligations | | | 4.6 | |
Preferred Stocks | | | 1.3 | |
Convertible Preferred Stocks | | | 1.2 | |
Repurchase Agreement | | | 0.8 | |
Short-Term U.S. Government Obligation | | | 0.2 | |
Preferred Corporate Debt Securities | | | 0.2 | |
Loan Assignment | | | 0.2 | |
U.S. Government Agency Obligations | | | 0.1 | |
Common Stock | | | 0.1 | |
Net Other Assets (Liabilities) ^ | | | (9.5 | ) |
Total | | | 100.0 | % |
| | | | |
| |
| Transamerica Core Bond | | | |
| |
| Asset Allocation | | % of Net
Assets | |
U.S. Government Agency Obligations | | | 38.8 | % |
Corporate Debt Securities | | | 19.3 | |
U.S. Government Obligations | | | 16.4 | |
Mortgage-Backed Securities | | | 13.0 | |
Asset-Backed Securities | | | 6.3 | |
Repurchase Agreement | | | 3.6 | |
Securities Lending Collateral | | | 2.0 | |
Foreign Government Obligations | | | 1.6 | |
Municipal Government Obligations | | | 0.6 | |
Net Other Assets (Liabilities) | | | (1.6 | ) |
Total | | | 100.0 | % |
| | | | |
| |
| Transamerica Developing Markets Equity | | | |
| |
| Asset Allocation | | % of Net
Assets | |
Common Stocks | | | 93.4 | % |
Securities Lending Collateral | | | 9.2 | |
Repurchase Agreement | | | 4.9 | |
Preferred Stocks | | | 2.0 | |
Warrant | | | 0.1 | |
Net Other Assets (Liabilities) | | | (9.6 | ) |
Total | | | 100.0 | % |
| | | | |
| | | | |
| Transamerica Global Real Estate Securities | |
| |
| Asset Allocation | | % of Net
Assets | |
Common Stocks | | | 97.9 | % |
Securities Lending Collateral | | | 9.1 | |
Repurchase Agreement | | | 2.0 | |
Warrant | | | 0.0 | * |
Net Other Assets (Liabilities) | | | (9.0 | ) |
Total | | | 100.0 | % |
| | | | |
| |
| Transamerica Growth | | | |
| |
| Asset Allocation | | % of Net
Assets | |
Common Stocks | | | 99.1 | % |
Securities Lending Collateral | | | 4.6 | |
Repurchase Agreement | | | 1.0 | |
Net Other Assets (Liabilities) | | | (4.7 | ) |
Total | | | 100.0 | % |
| | | | |
| |
| Transamerica Intermediate Bond | | | |
| |
| Asset Allocation | | % of Net
Assets | |
Corporate Debt Securities | | | 38.0 | % |
U.S. Government Obligations | | | 20.8 | |
U.S. Government Agency Obligations | | | 17.1 | |
Short-Term U.S. Government Obligations | | | 15.1 | |
Mortgage-Backed Securities | | | 14.1 | |
Securities Lending Collateral | | | 6.6 | |
Asset-Backed Securities | | | 5.5 | |
Repurchase Agreement | | | 1.7 | |
Preferred Corporate Debt Securities | | | 1.3 | |
Preferred Stock | | | 0.2 | |
Net Other Assets (Liabilities) | | | (20.4 | ) |
Total | | | 100.0 | % |
| | | | |
|
| Transamerica International Equity Opportunities | |
| |
| Asset Allocation | | % of Net
Assets | |
Common Stocks | | | 99.2 | % |
Securities Lending Collateral | | | 1.8 | |
Repurchase Agreement | | | 0.5 | |
Preferred Stock | | | 0.0 | * |
Net Other Assets (Liabilities) | | | (1.5 | ) |
Total | | | 100.0 | % |
| | | | |
|
| Transamerica International Small Cap | |
| |
| Asset Allocation | | % of Net
Assets | |
Common Stocks | | | 97.5 | % |
Securities Lending Collateral | | | 10.8 | |
Repurchase Agreement | | | 1.1 | |
Preferred Stock | | | 1.0 | |
Net Other Assets (Liabilities) ^ | | | (10.4 | ) |
Total | | | 100.0 | % |
| | | | |
|
| Transamerica Long/Short Strategy | |
| |
| Asset Allocation | | % of Net
Assets | |
Common Stocks | | | 103.5 | % |
Repurchase Agreement | | | 11.5 | |
Net Other Assets (Liabilities) ^ | | | (15.0 | ) |
Total | | | 100.0 | % |
| | | | |
| | |
| Transamerica Funds | | Annual Report 2014 |
Page 32
Schedules of Investments Composition (continued)
At October 31, 2014
(unaudited)
| | | | |
| Transamerica Mid Cap Value | |
| |
| Asset Allocation | | % of Net
Assets | |
Common Stocks | | | 99.0 | % |
Securities Lending Collateral | | | 9.5 | |
Repurchase Agreement | | | 1.0 | |
Net Other Assets (Liabilities) | | | (9.5 | ) |
Total | | | 100.0 | % |
| | | | |
|
| Transamerica Total Return | |
| |
| Asset Allocation | | % of Net
Assets | |
Corporate Debt Securities | | | 34.3 | % |
U.S. Government Obligations | | | 19.7 | |
Foreign Government Obligations | | | 10.7 | |
Asset-Backed Securities | | | 8.7 | |
U.S. Government Agency Obligations | | | 6.3 | |
Mortgage-Backed Securities | | | 4.8 | |
Municipal Government Obligations | | | 4.5 | |
Repurchase Agreements | | | 4.3 | |
Short-Term Foreign Government Obligations | | | 4.3 | |
Commercial Paper | | | 2.3 | |
Certificates of Deposit | | | 2.2 | |
Securities Lending Collateral | | | 1.9 | |
Short-Term U.S. Government Obligation | | | 1.3 | |
Loan Assignments | | | 0.5 | |
Preferred Corporate Debt Securities | | | 0.3 | |
Convertible Preferred Stock | | | 0.2 | |
Net Other Assets (Liabilities) ^ | | | (6.3 | ) |
Total | | | 100.0 | % |
| | | | |
| * | Percentage rounds to less than 0.1% or (0.1)%. |
| ^ | The Net Other Assets (Liabilities) category may include, but is not limited to, reverse repurchase agreements, forward foreign currency contracts, futures contracts, swap agreements, written options and swaptions, securities sold short, TBA short commitments, and cash collateral. |
| | |
| Transamerica Funds | | Annual Report 2014 |
Page 33
Transamerica Arbitrage Strategy
SCHEDULE OF INVESTMENTS
At October 31, 2014
| | | | | | | | |
| | | Principal | | | Value | |
CORPORATE DEBT SECURITIES - 11.4% | | | | | |
Aerospace & Defense - 1.4% | | | | | | | | |
Alliant Techsystems, Inc. | | | | | | | | |
6.88%, 09/15/2020 | | | $ 2,054,000 | | | | $ 2,197,780 | |
| | | | | | | | |
Commercial Services & Supplies - 0.8% | | | | | |
Ceridian LLC / Comdata, Inc. | | | | | | | | |
8.13%, 11/15/2017, 144A | | | 1,164,000 | | | | 1,164,000 | |
| | | | | | | | |
Diversified Financial Services - 1.1% | | | | | |
Nuveen Investments, Inc. | | | | | | | | |
9.50%, 10/15/2020, 144A | | | 1,413,000 | | | | 1,723,860 | |
| | | | | | | | |
Diversified Telecommunication Services - 0.8% | | | | | |
tw telecom holdings, Inc. | | | | | | | | |
6.38%, 09/01/2023 | | | 1,057,000 | | | | 1,204,980 | |
| | | | | | | | |
Electronic Equipment, Instruments & Components - 0.7% | |
Viasystems, Inc. | | | | | | | | |
7.88%, 05/01/2019, 144A | | | 1,050,000 | | | | 1,113,000 | |
| | | | | | | | |
Food & Staples Retailing - 1.4% | | | | | | | | |
US Foods, Inc. | | | | | | | | |
8.50%, 06/30/2019 | | | 1,995,000 | | | | 2,102,231 | |
| | | | | | | | |
Health Care Equipment & Supplies - 1.1% | | | | | |
Biomet, Inc. | | | | | | | | |
6.50%, 10/01/2020 | | | 1,577,000 | | | | 1,667,678 | |
| | | | | | | | |
Hotels, Restaurants & Leisure - 0.7% | | | | | |
Burger King Corp. | | | | | | | | |
9.88%, 10/15/2018 | | | 1,033,000 | | | | 1,089,815 | |
| | | | | | | | |
Media - 0.9% | | | | | | | | |
LIN Television Corp. | | | | | | | | |
8.38%, 04/15/2018 | | | 1,408,000 | | | | 1,466,080 | |
| | | | | | | | |
Oil, Gas & Consumable Fuels - 2.5% | | | | | | | | |
Forest Oil Corp. | | | | | | | | |
7.25%, 06/15/2019 | | | 619,000 | | | | 597,335 | |
QR Energy, LP / QRE Finance Corp. LLC | | | | | | | | |
9.25%, 08/01/2020 | | | 1,956,000 | | | | 2,205,390 | |
Sabine Oil & Gas LLC / Sabine Oil & Gas Finance Corp. | | | | | | | | |
9.75%, 02/15/2017 | | | 1,051,000 | | | | 998,450 | |
| | | | | | | | |
| | | | | | | 3,801,175 | |
| | | | | | | | |
Total Corporate Debt Securities
(Cost $17,699,237) | | | | | | | 17,530,599 | |
| | | | | | | | |
| | |
| | | Shares | | | Value | |
COMMON STOCKS - 84.9% | | | | | | | | |
Aerospace & Defense - 0.7% | | | | | | | | |
B/E Aerospace, Inc. (A) | | | 13,749 | | | | 1,023,613 | |
| | | | | | | | |
Auto Components - 1.9% | | | | | | | | |
TRW Automotive Holdings
Corp. (A) (B) | | | 28,275 | | | | 2,865,671 | |
| | | | | | | | |
Automobiles - 0.3% | | | | | | | | |
General Motors Co. | | | 16,070 | | | | 504,598 | |
| | | | | | | | |
Banks - 1.2% | | | | | | | | |
1st United Bancorp, Inc. | | | 68,161 | | | | 603,225 | |
Bank of Kentucky Financial Corp. | | | 11,313 | | | | 530,693 | |
OmniAmerican Bancorp, Inc. | | | 28,581 | | | | 772,830 | |
| | | | | | | | |
| | | | | | | 1,906,748 | |
| | | | | | | | |
Beverages - 0.1% | | | | | | | | |
Molson Coors Brewing Co., Class B | | | 2,012 | | | | 149,653 | |
| | | | | | | | |
| | | | | | | | |
| | | Shares | | | Value | |
COMMON STOCKS (continued) | | | | | | | | |
Biotechnology - 0.1% | | | | | | | | |
Durata Therapeutics, Inc. (A) | | | 3,131 | | | | $ 75,238 | |
Trius Therapeutics, Inc. (C) (D) | | | 71,641 | | | | 11,520 | |
| | | | | | | | |
| | | | | | | 86,758 | |
| | | | | | | | |
Building Products - 0.2% | | | | | | | | |
Sanitec Corp. (A) | | | 22,682 | | | | 291,283 | |
| | | | | | | | |
Chemicals - 4.2% | | | | | | | | |
CF Industries Holdings, Inc., Class B | | | 788 | | | | 204,880 | |
Methanex Corp. | | | 1,138 | | | | 67,529 | |
Penford Corp. (A) | | | 18,477 | | | | 348,291 | |
Rockwood Holdings, Inc. (B) | | | 31,359 | | | | 2,411,821 | |
Sigma-Aldrich Corp. | | | 13,570 | | | | 1,844,299 | |
Taminco Corp. (A) | | | 61,151 | | | | 1,583,199 | |
| | | | | | | | |
| | | | | | | 6,460,019 | |
| | | | | | | | |
Commercial Services & Supplies - 0.0% (E) | | | | | |
Civeo Corp. | | | 1,578 | | | | 19,236 | |
| | | | | | | | |
Communications Equipment - 0.3% | | | | | | | | |
Juniper Networks, Inc. | | | 19,302 | | | | 406,693 | |
Riverbed Technology, Inc. (A) | | | 5,472 | | | | 103,913 | |
| | | | | | | | |
| | | | | | | 510,606 | |
| | | | | | | | |
Construction & Engineering - 4.1% | | | | | | | | |
Foster Wheeler AG | | | 201,293 | | | | 6,246,122 | |
Pike Corp. (A) | | | 12,103 | | | | 144,510 | |
| | | | | | | | |
| | | | | | | 6,390,632 | |
| | | | | | | | |
Consumer Finance - 0.1% | | | | | | | | |
Carfinco Financial Group, Inc. | | | 18,973 | | | | 186,691 | |
| | | | | | | | |
Containers & Packaging - 0.1% | | | | | | | | |
Berry Plastics Group, Inc. (A) | | | 3,929 | | | | 102,232 | |
Packaging Corp. of America | | | 786 | | | | 56,655 | |
Rock-Tenn Co., Class A | | | 931 | | | | 47,621 | |
| | | | | | | | |
| | | | | | | 206,508 | |
| | | | | | | | |
Diversified Telecommunication Services - 8.6% | |
Globalstar, Inc. (A) | | | 62,665 | | | | 148,516 | |
HC2 Holdings, Inc. (A) | | | 10,697 | | | | 56,694 | |
Jazztel PLC (A) | | | 58,248 | | | | 931,245 | |
tw telecom, Inc., Class A (A) (B) | | | 242,095 | | | | 10,356,824 | |
Ziggo NV | | | 36,876 | | | | 1,802,061 | |
| | | | | | | | |
| | | | | | | 13,295,340 | |
| | | | | | | | |
Electric Utilities - 2.3% | | | | | | | | |
Pepco Holdings, Inc. (B) | | | 128,497 | | | | 3,513,108 | |
| | | | | | | | |
Electrical Equipment - 0.6% | | | | | | | | |
Vacon Oyj | | | 21,894 | | | | 927,078 | |
| | | | | | | | |
Energy Equipment & Services - 2.6% | | | | | | | | |
Bolt Technology Corp. | | | 28,974 | | | | 635,400 | |
Dresser-Rand Group, Inc. (A) | | | 23,778 | | | | 1,942,663 | |
Veresen, Inc. (A) | | | 62,625 | | | | 982,952 | |
Weatherford International PLC (A) | | | 24,476 | | | | 401,896 | |
| | | | | | | | |
| | | | | | | 3,962,911 | |
| | | | | | | | |
Food & Staples Retailing - 3.4% | | | | | | | | |
Safeway, Inc. (B) | | | 150,847 | | | | 5,258,526 | |
| | | | | | | | |
Food Products - 0.7% | | | | | | | | |
Chiquita Brands International, Inc. (A) | | | 16,900 | | | | 243,867 | |
Nutreco NV | | | 11,567 | | | | 579,361 | |
Tyson Foods, Inc., Class A | | | 7,857 | | | | 317,030 | |
| | | | | | | | |
| | | | | | | 1,140,258 | |
| | | | | | | | |
The Notes to Financial Statements are an integral part of this report.
| | |
| Transamerica Funds | | Annual Report 2014 |
Page 34
Transamerica Arbitrage Strategy
SCHEDULE OF INVESTMENTS (continued)
At October 31, 2014
| | | | | | | | |
| | | Shares | | | Value | |
COMMON STOCKS (continued) | | | | | | | | |
Health Care Equipment & Supplies - 5.6% | | | | | |
Becton Dickinson and Co. | | | 946 | | | | $ 121,750 | |
CareFusion Corp., Class A (A) | | | 23,054 | | | | 1,322,608 | |
Covidien PLC (B) | | | 59,397 | | | | 5,490,659 | |
Nobel Biocare Holding AG (A) | | | 98,919 | | | | 1,751,950 | |
| | | | | | | | |
| | | | | | | 8,686,967 | |
| | | | | | | | |
Health Care Providers & Services - 0.8% | | | | | | | | |
Celesio AG | | | 1,606 | | | | 52,985 | |
Gentiva Health Services, Inc. (A) | | | 47,995 | | | | 945,502 | |
Kindred Healthcare, Inc. | | | 8,627 | | | | 187,637 | |
Synergy Health PLC | | | 2,149 | | | | 64,279 | |
| | | | | | | | |
| | | | | | | 1,250,403 | |
| | | | | | | | |
Hotels, Restaurants & Leisure - 2.4% | | | | | | | | |
Einstein Noah Restaurant Group, Inc. | | | 43,001 | | | | 870,770 | |
Hurtigruten ASA (A) | | | 131,219 | | | | 133,461 | |
Tim Hortons, Inc. | | | 29,223 | | | | 2,367,814 | |
Yum! Brands, Inc. | | | 3,935 | | | | 282,651 | |
| | | | | | | | |
| | | | | | | 3,654,696 | |
| | | | | | | | |
Household Products - 0.1% | | | | | | | | |
Energizer Holdings, Inc. | | | 1,667 | | | | 204,458 | |
| | | | | | | | |
Insurance - 5.7% | | | | | | | | |
Assured Guaranty, Ltd. | | | 21,634 | | | | 499,313 | |
Genworth Financial, Inc., Class A (A) | | | 64,838 | | | | 907,083 | |
Manulife Financial Corp. (A) | | | 110,871 | | | | 2,074,681 | |
Protective Life Corp. | | | 75,373 | | | | 5,251,991 | |
| | | | | | | | |
| | | | | | | 8,733,068 | |
| | | | | | | | |
Internet & Catalog Retail - 0.3% | | | | | | | | |
Liberty TripAdvisor Holdings, Inc.,
Class A (A) | | | 3,954 | | | | 124,867 | |
Shutterfly, Inc. (A) | | | 8,336 | | | | 348,695 | |
| | | | | | | | |
| | | | | | | 473,562 | |
| | | | | | | | |
Internet Software & Services - 3.5% | | | | | | | | |
Conversant, Inc. (A) | | | 98,535 | | | | 3,473,359 | |
eBay, Inc. (A) | | | 1,002 | | | | 52,605 | |
Move, Inc. (A) | | | 87,076 | | | | 1,824,242 | |
| | | | | | | | |
| | | | | | | 5,350,206 | |
| | | | | | | | |
Leisure Products - 0.4% | | | | | | | | |
Multimedia Games Holding Co., Inc. (A) | | | 16,174 | | | | 564,473 | |
| | | | | | | | |
Life Sciences Tools & Services - 0.2% | | | | | | | | |
Agilent Technologies, Inc. | | | 6,601 | | | | 364,903 | |
| | | | | | | | |
Machinery - 0.5% | | | | | | | | |
MAN SE | | | 626 | | | | 71,340 | |
Manitowoc Co., Inc. | | | 35,278 | | | | 735,194 | |
| | | | | | | | |
| | | | | | | 806,534 | |
| | | | | | | | |
Media - 5.5% | | | | | | | | |
DIRECTV (A) | | | 66,062 | | | | 5,733,521 | |
DISH Network Corp., Class A (A) | | | 7,171 | | | | 456,434 | |
Media General, Inc., Class A (A) | | | 2,362 | | | | 35,288 | |
Sky Deutschland AG (A) | | | 142,131 | | | | 1,199,939 | |
Time Warner Cable, Inc. | | | 4,500 | | | | 662,445 | |
Viacom, Inc., Class B | | | 4,564 | | | | 331,711 | |
| | | | | | | | |
| | | | | | | 8,419,338 | |
| | | | | | | | |
Metals & Mining - 0.1% | | | | | | | | |
Cayden Resources, Inc. (A) | | | 89,694 | | | | 187,020 | |
Lundin Mining Corp. (A) | | | 4,609 | | | | 20,365 | |
| | | | | | | | |
| | | | | | | 207,385 | |
| | | | | | | | |
| | | | | | | | |
| | | Shares | | | Value | |
COMMON STOCKS (continued) | | | | | | | | |
Multiline Retail - 2.9% | | | | | | | | |
Family Dollar Stores, Inc. | | | 57,967 | | | | $ 4,538,236 | |
| | | | | | | | |
Oil, Gas & Consumable Fuels - 4.3% | | | | | | | | |
Athlon Energy, Inc. (A) (B) | | | 91,668 | | | | 5,344,244 | |
CONSOL Energy, Inc. | | | 17,464 | | | | 642,675 | |
Ithaca Energy, Inc. (A) | | | 25,569 | | | | 32,669 | |
Peabody Energy Corp. | | | 44,321 | | | | 462,268 | |
Talisman Energy, Inc. | | | 19,926 | | | | 127,128 | |
Yancoal Australia, Ltd. (A) | | | 288,970 | | | | 54,673 | |
| | | | | | | | |
| | | | | | | 6,663,657 | |
| | | | | | | | |
Paper & Forest Products - 0.0% (E) | | | | | | | | |
International Paper Co. | | | 786 | | | | 39,787 | |
| | | | | | | | |
Pharmaceuticals - 3.2% | | | | | | | | |
Actavis PLC (A) | | | 1,606 | | | | 389,840 | |
Allergan, Inc. | | | 14,552 | | | | 2,765,753 | |
Chelsea Therapeutics International,
Ltd. (C) (D) | | | 124,250 | | | | 9,580 | |
Mylan, Inc. (A) | | | 10,343 | | | | 553,868 | |
Shire PLC, Class B, ADR | | | 6,446 | | | | 1,287,911 | |
| | | | | | | | |
| | | | | | | 5,006,952 | |
| | | | | | | | |
Real Estate Investment Trusts - 5.0% | | | | | | | | |
American Realty Capital Healthcare Trust, Inc. (B) | | | 524,364 | | | | 5,925,313 | |
Corio NV | | | 10,320 | | | | 502,322 | |
Glimcher Realty Trust | | | 87,145 | | | | 1,196,501 | |
Iron Mountain, Inc. | | | 1,045 | | | | 37,693 | |
| | | | | | | | |
| | | | | | | 7,661,829 | |
| | | | | | | | |
Semiconductors & Semiconductor Equipment - 5.5% | |
International Rectifier Corp. (A) | | | 56,149 | | | | 2,233,046 | |
Tokyo Electron, Ltd., ADR | | | 213,975 | | | | 3,444,997 | |
TriQuint Semiconductor, Inc. (A) (B) | | | 127,009 | | | | 2,747,205 | |
| | | | | | | | |
| | | | | | | 8,425,248 | |
| | | | | | | | |
Software - 6.2% | | | | | |
Compuware Corp. | | | 183,186 | | | | 1,859,338 | |
Concur Technologies, Inc. (A) (B) | | | 32,017 | | | | 4,108,421 | |
Covisint Corp. (A) | | | 25,692 | | | | 74,250 | |
Exact Holding NV | | | 10,006 | | | | 394,097 | |
TIBCO Software, Inc. (A) | | | 123,604 | | | | 2,888,626 | |
XRS Corp. (A) | | | 46,917 | | | | 262,735 | |
| | | | | | | | |
| | | | | | | 9,587,467 | |
| | | | | | | | |
Specialty Retail - 0.4% | | | | | |
Express, Inc. (A) | | | 6,667 | | | | 99,805 | |
Outerwall, Inc. (A) | | | 6,210 | | | | 392,907 | |
PetSmart, Inc., Class A | | | 1,300 | | | | 94,055 | |
| | | | | | | | |
| | | | | | | 586,767 | |
| | | | | | | | |
Technology Hardware, Storage & Peripherals - 0.2% | |
EMC Corp. | | | 11,105 | | | | 319,047 | |
| | | | | | | | |
Trading Companies & Distributors - 0.2% | | | | | |
NOW, Inc. (A) | | | 7,415 | | | | 222,895 | |
| | | | | | | | |
Wireless Telecommunication Services - 0.4% | | | | | |
Leap Wireless (D) | | | 119,712 | | | | 301,674 | |
T-Mobile US, Inc. (A) | | | 12,515 | | | | 365,313 | |
| | | | | | | | |
| | | | | | | 666,987 | |
| | | | | | | | |
| | |
Total Common Stocks
(Cost $128,860,413) | | | | | | | 131,134,102 | |
| | | | | | | | |
The Notes to Financial Statements are an integral part of this report.
| | |
| Transamerica Funds | | Annual Report 2014 |
Page 35
Transamerica Arbitrage Strategy
SCHEDULE OF INVESTMENTS (continued)
At October 31, 2014
| | | | | | | | |
| | | Shares | | | Value | |
RIGHT - 0.0% (E) | | | | | | | | |
Biotechnology - 0.0% (E) | | | | | |
Cubist Pharmaceuticals, Inc., CVR (A) | | | 179,738 | | | | $ 13,534 | |
| | | | | | | | |
Total Right
(Cost $399,468) | | | | | | | 13,534 | |
| | | | | | | | |
| | |
INVESTMENT COMPANY - 0.0% (E) | | | | | | | | |
Capital Markets - 0.0% (E) | | | | | |
iPATH S&P 500 VIX Short-Term Futures ETN (A) | | | 809 | | | | 24,521 | |
| | | | | | | | |
Total Investment Company
(Cost $25,053) | | | | | | | 24,521 | |
| | | | | | | | |
|
MASTER LIMITED PARTNERSHIP - 0.5% | |
Media - 0.5% | | | | | |
LIN Media LLC, Class A (A) | | | 33,685 | | | | 806,082 | |
| | | | | | | | |
Total Master Limited Partnership
(Cost $830,439) | | | | | | | 806,082 | |
| | | | | | | | |
| | |
| | | Contracts | | | Value | |
PURCHASED OPTIONS - 0.5% | | | | | | | | |
Call Options - 0.1% | | | | | | | | |
AbbVie, Inc.
Strike Price $57.50
Expires 11/22/2014 | | | 79 | | | | 48,190 | |
Allergan, Inc.
Strike Price $175.00
Expires 01/17/2015 | | | 7 | | | | 15,435 | |
Allergan, Inc.
Strike Price $180.00
Expires 01/17/2015 | | | 24 | | | | 48,000 | |
Bally Technologies, Inc.
Strike Price $80.00
Expires 01/17/2015 | | | 27 | | | | 7,830 | |
Cliffs Natural Resources, Inc.
Strike Price $12.00
Expires 11/22/2014 | | | 63 | | | | 4,095 | |
Express, Inc.
Strike Price $17.50
Expires 11/22/2014 | | | 21 | | | | 420 | |
Gentiva Health Services, Inc.
Strike Price $17.50
Expires 11/22/2014 | | | 31 | | | | 7,052 | |
Health Net, Inc.
Strike Price $52.50
Expires 11/22/2014 | | | 69 | | | | 4,623 | |
Medtronic, Inc.
Strike Price $70.00
Expires 11/22/2014 | | | 82 | | | | 4,182 | |
T-Mobile US, Inc.
Strike Price $29.00
Expires 11/22/2014 | | | 4 | | | | 392 | |
T-Mobile US, Inc.
Strike Price $31.00
Expires 11/22/2014 | | | 60 | | | | 2,550 | |
T-Mobile US, Inc.
Strike Price $32.00
Expires 11/22/2014 | | | 80 | | | | 1,200 | |
| | | | | | | | |
| | | Contracts | | | Value | |
PURCHASED OPTIONS (continued) | | | | | | | | |
Call Options (continued) | | | | | | | | |
TRW Automotive Holdings Corp.
Strike Price $100.00
Expires 04/17/2015 | | | 41 | | | | $ 17,835 | |
Valeant Pharmaceuticals International, Inc.
Strike Price $130.00
Expires 01/17/2015 | | | 7 | | | | 9,520 | |
| | | | | | | | |
| | | | | | | 171,324 | |
| | | | | | | | |
Put Options - 0.4% | | | | | | | | |
AbbVie, Inc.
Strike Price $52.50
Expires 11/22/2014 | | | 38 | | | | 190 | |
AbbVie, Inc.
Strike Price $52.50
Expires 01/17/2015 | | | 5 | | | | 200 | |
Actavis PLC
Strike Price $210.00
Expires 11/22/2014 | | | 20 | | | | 1,140 | |
Actavis PLC
Strike Price $220.00
Expires 12/20/2014 | | | 10 | | | | 3,200 | |
Agilent Technologies, Inc.
Strike Price $47.50
Expires 11/22/2014 | | | 48 | | | | 1,272 | |
Agilent Technologies, Inc.
Strike Price $50.00
Expires 11/22/2014 | | | 38 | | | | 1,406 | |
Albemarle Corp.
Strike Price $60.00
Expires 11/22/2014 | | | 12 | | | | 3,432 | |
Alliance Data Systems Corp. (C)
Strike Price $220.00
Expires 11/22/2014 | | | 2 | | | | 45 | |
Alliance Data Systems Corp.
Strike Price $230.00
Expires 11/22/2014 | | | 2 | | | | 45 | |
Alliance Data Systems Corp.
Strike Price $230.00
Expires 12/20/2014 | | | 77 | | | | 4,620 | |
AT&T, Inc.
Strike Price $35.00
Expires 01/17/2015 | | | 835 | | | | 97,695 | |
B/E Aerospace, Inc.
Strike Price $70.00
Expires 11/22/2014 | | | 139 | | | | 13,900 | |
B/E Aerospace, Inc.
Strike Price $70.00
Expires 12/20/2014 | | | 11 | | | | 2,475 | |
Bally Technologies, Inc.
Strike Price $75.00
Expires 01/17/2015 | | | 38 | | | | 6,688 | |
Bally Technologies, Inc.
Strike Price $75.00
Expires 04/17/2015 | | | 27 | | | | 5,265 | |
Becton Dickinson and Co.
Strike Price $110.00
Expires 12/20/2014 | | | 28 | | | | 700 | |
Berry Plastics Group, Inc. (C)
Strike Price $22.50
Expires 11/22/2014 | | | 42 | | | | 1,260 | |
The Notes to Financial Statements are an integral part of this report.
| | |
| Transamerica Funds | | Annual Report 2014 |
Page 36
Transamerica Arbitrage Strategy
SCHEDULE OF INVESTMENTS (continued)
At October 31, 2014
| | | | | | | | |
| | | Contracts | | | Value | |
PURCHASED OPTIONS (continued) | | | | | | | | |
Put Options (continued) | | | | | | | | |
Berry Plastics Group, Inc.
Strike Price $22.50
Expires 12/20/2014 | | | 10 | | | | $ 225 | |
Burger King Worldwide, Inc.
Strike Price $26.00
Expires 11/22/2014 | | | 40 | | | | 600 | |
Burger King Worldwide, Inc.
Strike Price $30.00
Expires 01/17/2015 | | | 8 | | | | 1,520 | |
Burger King Worldwide, Inc.
Strike Price $32.00
Expires 01/17/2015 | | | 8 | | | | 2,160 | |
Burger King Worldwide, Inc.
Strike Price $33.00
Expires 01/17/2015 | | | 176 | | | | 63,360 | |
Burger King Worldwide, Inc.
Strike Price $34.00
Expires 01/17/2015 | | | 6 | | | | 2,610 | |
Burger King Worldwide, Inc.
Strike Price $35.00
Expires 01/17/2015 | | | 30 | | | | 15,300 | |
CF Industries Holdings, Inc.
Strike Price $250.00
Expires 11/22/2014 | | | 8 | | | | 3,440 | |
Charter Communications, Inc.
Strike Price $135.00
Expires 11/22/2014 | | | 8 | | | | 720 | |
Civeo Corp. (C)
Strike Price $10.00
Expires 11/22/2014 | | | 209 | | | | 3,135 | |
Concur Technologies, Inc (C)
Strike Price $105.00
Expires 11/22/2014 | | | 2 | | | | 485 | |
Concur Technologies, Inc.
Strike Price $105.00
Expires 02/20/2015 | | | 44 | | | | 1,540 | |
Covidien PLC
Strike Price $75.00
Expires 01/17/2015 | | | 316 | | | | 64,780 | |
Covidien PLC
Strike Price $77.50
Expires 01/17/2015 | | | 71 | | | | 19,170 | |
Covidien PLC
Strike Price $80.00
Expires 11/22/2014 | | | 26 | | | | 2,600 | |
Covidien PLC
Strike Price $80.00
Expires 01/17/2015 | | | 15 | | | | 5,100 | |
DIRECTV
Strike Price $80.00
Expires 01/17/2015 | | | 8 | | | | 1,224 | |
DISH Network Corp.
Strike Price $55.00
Expires 11/22/2014 | | | 78 | | | | 3,900 | |
DISH Network Corp.
Strike Price $57.50
Expires 12/20/2014 | | | 36 | | | | 6,840 | |
| | | | | | | | |
| | | Contracts | | | Value | |
PURCHASED OPTIONS (continued) | | | | | | | | |
Put Options (continued) | | | | | | | | |
eBay, Inc.
Strike Price $47.00
Expires 11/14/2014 | | | 20 | | | | $ 80 | |
EMC Corp.
Strike Price $25.00
Expires 12/20/2014 | | | 120 | | | | 1,800 | |
EMC Corp.
Strike Price $27.00
Expires 12/20/2014 | | | 88 | | | | 2,904 | |
Energizer Holdings, Inc.
Strike Price $110.00
Expires 11/22/2014 | | | 25 | | | | 1,625 | |
Express, Inc.
Strike Price $12.50
Expires 11/22/2014 | | | 107 | | | | 1,284 | |
General Motors Co.
Strike Price $28.00
Expires 12/20/2014 | | | 180 | | | | 3,960 | |
General Motors Co.
Strike Price $29.00
Expires 11/22/2014 | | | 70 | | | | 840 | |
Gentiva Health Services, Inc. (C)
Strike Price $15.00
Expires 11/22/2014 | | | 84 | | | | 3,360 | |
Genworth Financial, Inc.
Strike Price $12.50
Expires 11/07/2014 | | | 25 | | | | 225 | |
Glimcher Realty Trust (C)
Strike Price $12.50
Expires 12/20/2014 | | | 19 | | | | 255 | |
Imperial Tobacco Group PLC
Strike Price GBP 24.00
Expires 12/19/2014 | | | 14 | | | | 2,016 | |
International Paper Co.
Strike Price $45.00
Expires 12/20/2014 | | | 12 | | | | 534 | |
International Rectifier Corp.
Strike Price $35.00
Expires 11/22/2014 | | | 7 | | | | 35 | |
International Rectifier Corp.
Strike Price $35.00
Expires 12/20/2014 | | | 20 | | | | 300 | |
International Rectifier Corp.
Strike Price $35.00
Expires 03/20/2015 | | | 60 | | | | 1,200 | |
Iron Mountain, Inc.
Strike Price $30.00
Expires 11/22/2014 | | | 21 | | | | 210 | |
iShares 7-10 Year Treasury Bond ETF (C)
Strike Price $101.00
Expires 12/20/2014 | | | 6 | | | | 60 | |
iShares Russell 2000 Growth ETF
Strike Price $130.00
Expires 12/20/2014 | | | 39 | | | | 7,020 | |
ITV PLC
Strike Price GBP 1.90
Expires 12/19/2014 | | | 22 | | | | 2,727 | |
The Notes to Financial Statements are an integral part of this report.
| | |
| Transamerica Funds | | Annual Report 2014 |
Page 37
Transamerica Arbitrage Strategy
SCHEDULE OF INVESTMENTS (continued)
At October 31, 2014
| | | | | | | | |
| | | Contracts | | | Value | |
PURCHASED OPTIONS (continued) | | | | | | | | |
Put Options (continued) | | | | | | | | |
Jupiter Networks, Inc.
Strike Price $17.00
Expires 12/20/2014 | | | 241 | | | | $ 1,446 | |
Kindred Healthcare, Inc. (C)
Strike Price $17.50
Expires 11/22/2014 | | | 71 | | | | 1,242 | |
Kindred Healthcare, Inc.
Strike Price $17.50
Expires 12/20/2014 | | | 40 | | | | 1,200 | |
Medtronic, Inc.
Strike Price $57.00
Expires 11/22/2014 | | | 4 | | | | 22 | |
Methanex Corp.
Strike Price $50.00
Expires 12/20/2014 | | | 2 | | | | 120 | |
Methanex Corp.
Strike Price $50.00
Expires 11/22/2014 | | | 19 | | | | 523 | |
Molson Coors Brewing Co.
Strike Price $60.00
Expires 11/22/2014 | | | 21 | | | | 210 | |
Molson Coors Brewing Co.
Strike Price $65.00
Expires 11/22/2014 | | | 29 | | | | 943 | |
Mylan, Inc.
Strike Price $40.00
Expires 01/17/2015 | | | 21 | | | | 420 | |
Mylan, Inc.
Strike Price $44.00
Expires 11/22/2014 | | | 105 | | | | 525 | |
Mylan, Inc.
Strike Price $49.00
Expires 12/20/2014 | | | 39 | | | | 2,535 | |
NOW, Inc.
Strike Price $25.00
Expires 11/22/2014 | | | 144 | | | | 2,880 | |
NOW, Inc.
Strike Price $25.00
Expires 12/20/2014 | | | 22 | | | | 1,100 | |
Outerwall, Inc.
Strike Price $55.00
Expires 12/20/2014 | | | 20 | | | | 1,600 | |
Outerwall, Inc.
Strike Price $55.00
Expires 11/22/2014 | | | 84 | | | | 2,100 | |
Packaging Corp. of America
Strike Price $60.00
Expires 12/20/2014 | | | 12 | | | | 360 | |
PetSmart, Inc. (C)
Strike Price $62.50
Expires 11/22/2014 | | | 28 | | | | 910 | |
Pike Corp. (C)
Strike Price $10.00
Expires 11/22/2014 | | | 38 | | | | 190 | |
Protective Life Corp.
Strike Price $55.00
Expires 04/17/2015 | | | 9 | | | | 180 | |
| | | | | | | | |
| | | Contracts | | | Value | |
PURCHASED OPTIONS (continued) | | | | | | | | |
Put Options (continued) | | | | | | | | |
Riverbed Technology, Inc. (C)
Strike Price $15.00
Expires 12/20/2014 | | | 33 | | | | $ 825 | |
Rock-Tenn Co.
Strike Price $45.00
Expires 12/20/2014 | | | 12 | | | | 810 | |
Safeway, Inc.
Strike Price $33.00
Expires 12/20/2014 | | | 26 | | | | 390 | |
Shire PLC
Strike Price $210.00
Expires 11/22/2014 | | | 16 | | | | 22,160 | |
Shutterfly, Inc.
Strike Price $35.00
Expires 12/20/2014 | | | 62 | | | | 3,875 | |
Shutterfly, Inc.
Strike Price $37.50
Expires 12/20/2014 | | | 21 | | | | 2,415 | |
Shutterfly, Inc.
Strike Price $40.00
Expires 11/22/2014 | | | 41 | | | | 4,510 | |
Sigma-Aldrich Corp.
Strike Price $130.00
Expires 11/22/2014 | | | 1 | | | | 50 | |
SPDR S&P 500 ETF Trust
Strike Price $160.00
Expires 12/20/2014 | | | 42 | | | | 504 | |
SPDR S&P 500 ETF Trust
Strike Price $170.00
Expires 11/22/2014 | | | 42 | | | | 252 | |
SPDR S&P 500 ETF Trust
Strike Price $184.00
Expires 12/20/2014 | | | 40 | | | | 3,000 | |
SPDR S&P 500 ETF Trust
Strike Price $187.00
Expires 11/22/2014 | | | 27 | | | | 594 | |
SPDR S&P 500 ETF Trust
Strike Price $188.00
Expires 11/22/2014 | | | 66 | | | | 1,716 | |
SPDR S&P 500 ETF Trust
Strike Price $189.00
Expires 11/22/2014 | | | 14 | | | | 406 | |
SPDR S&P 500 ETF Trust
Strike Price $196.00
Expires 11/07/2014 | | | 13 | | | | 247 | |
SPDR S&P 500 ETF Trust
Strike Price $197.00
Expires 11/07/2014 | | | 13 | | | | 364 | |
T-Mobile US, Inc.
Strike Price $24.00
Expires 11/22/2014 | | | 125 | | | | 1,375 | |
TIBCO Software, Inc.
Strike Price $20.00
Expires 01/17/2015 | | | 182 | | | | 6,370 | |
Time Warner Cable, Inc.
Strike Price $140.00
Expires 01/17/2015 | | | 88 | | | | 50,160 | |
The Notes to Financial Statements are an integral part of this report.
| | |
| Transamerica Funds | | Annual Report 2014 |
Page 38
Transamerica Arbitrage Strategy
SCHEDULE OF INVESTMENTS (continued)
At October 31, 2014
| | | | | | | | |
| | | Contracts | | | Value | |
PURCHASED OPTIONS (continued) | | | | | |
Put Options (continued) | | | | | | | | |
tw telecom, Inc.
Strike Price $40.00
Expires 01/17/2015 | | | 20 | | | | $ 2,150 | |
Tyson Foods, Inc.
Strike Price $36.00
Expires 12/20/2014 | | | 39 | | | | 2,340 | |
Tyson Foods, Inc.
Strike Price $35.00
Expires 11/22/2014 | | | 84 | | | | 1,680 | |
Tyson Foods, Inc.
Strike Price $38.00
Expires 11/22/2014 | | | 42 | | | | 2,520 | |
Viacom, Inc.
Strike Price $67.50
Expires 12/20/2014 | | | 48 | | | | 4,560 | |
Weatherford International PLC
Strike Price $15.00
Expires 12/20/2014 | | | 269 | | | | 15,871 | |
Yum! Brands, Inc.
Strike Price $65.00
Expires 12/20/2014 | | | 59 | | | | 2,006 | |
Yum! Brands, Inc.
Strike Price $70.00
Expires 12/20/2014 | | | 10 | | | | 1,310 | |
| | | | | | | | |
| | | | | | | 523,643 | |
| | | | | | | | |
Total Purchased Options
(Cost $1,149,227) | | | | | | | 694,967 | |
| | | | | | | | |
| | |
| | | Principal | | | Value | |
REPURCHASE AGREEMENT - 2.5% | | | | | |
State Street Bank & Trust Co.
0.01% (F), dated 10/31/2014, to be repurchased at $3,898,359 on 11/03/2014. Collateralized by a U.S. Government Agency Obligation, 3.50%, due 02/15/2041, and with a value of $3,979,237. | | | $ 3,898,356 | | | | 3,898,356 | |
| | | | | | | | |
Total Repurchase Agreement
(Cost $3,898,356) | | | | | | | 3,898,356 | |
| | | | | | | | |
Total Investments
(Cost $152,862,193) (G) | | | | | | | 154,102,161 | |
Net Other Assets (Liabilities) - 0.2% | | | | 299,607 | |
| | | | | | | | |
| | |
Net Assets - 100.0% | | | | | | | $ 154,401,768 | |
| | | | | | | | |
| | |
| | | Shares | | | Value | |
SECURITIES SOLD SHORT - (28.8)% | | | | | |
COMMON STOCKS - (24.8)% | | | | | | | | |
Aerospace & Defense - (0.4)% | | | | | | | | |
Boeing Co. | | | (1,305 | ) | | | $ (163,007 | ) |
General Dynamics Corp. | | | (1,489 | ) | | | (208,103 | ) |
Precision Castparts Corp. | | | (634 | ) | | | (139,924 | ) |
Teledyne Technologies, Inc. (A) | | | (356 | ) | | | (36,892 | ) |
| | | | | | | | |
| | | | | | | (547,926 | ) |
| | | | | | | | |
| | | | | | | | |
| | | Shares | | | Value | |
SECURITIES SOLD SHORT (continued) | | | | | | | | |
COMMON STOCKS (continued) | | | | | | | | |
Automobiles - (0.0)% (E) | | | | | |
Ford Motor Co. | | | (3,906 | ) | | | $ (55,036 | ) |
| | | | | | | | |
| | | | | | | (55,036 | ) |
| | | | | | | | |
Banks - (1.0)% | | | | | |
BB&T Corp. | | | (11,451 | ) | | | (433,764 | ) |
Southside Bancshares, Inc. | | | (12,601 | ) | | | (423,141 | ) |
Valley National Bancorp | | | (61,063 | ) | | | (609,409 | ) |
| | | | | | | | |
| | | | | | | (1,466,314 | ) |
| | | | | | | | |
Beverages - (0.0)% (E) | | | | | |
Anheuser-Busch InBev NV, ADR | | | (172 | ) | | | (19,089 | ) |
Boston Beer Co., Inc., Class A (A) | | | (48 | ) | | | (11,952 | ) |
| | | | | | | | |
| | | | | | | (31,041 | ) |
| | | | | | | | |
Chemicals - (0.6)% | | | | | |
Albemarle Corp. | | | (13,847 | ) | | | (808,388 | ) |
Celanese Corp., Series A | | | (366 | ) | | | (21,495 | ) |
Olin Corp. | | | (773 | ) | | | (18,737 | ) |
Westlake Chemical Corp. | | | (265 | ) | | | (18,696 | ) |
| | | | | | | | |
| | | | | | | (867,316 | ) |
| | | | | | | | |
Communications Equipment - (0.0)% (E) | | | | | |
ADTRAN, Inc. | | | (287 | ) | | | (6,087 | ) |
Calix, Inc. (A) | | | (900 | ) | | | (9,729 | ) |
Ciena Corp. (A) | | | (610 | ) | | | (10,224 | ) |
Sonus Networks, Inc. (A) | | | (4,548 | ) | | | (15,781 | ) |
| | | | | | | | |
| | | | | | | (41,821 | ) |
| | | | | | | | |
Containers & Packaging - (0.0)% (E) | | | | | |
AptarGroup, Inc. | | | (395 | ) | | | (24,585 | ) |
Ball Corp. | | | (173 | ) | | | (11,146 | ) |
Bemis Co., Inc. | | | (95 | ) | | | (3,655 | ) |
Crown Holdings, Inc. (A) | | | (246 | ) | | | (11,791 | ) |
Silgan Holdings, Inc. | | | (503 | ) | | | (24,727 | ) |
| | | | | | | | |
| | | | | | | (75,904 | ) |
| | | | | | | | |
Diversified Telecommunication Services - (5.0)% | | | | | |
AT&T, Inc. | | | (2,904 | ) | | | (101,175 | ) |
Level 3 Communications, Inc. (A) | | | (163,799 | ) | | | (7,683,811 | ) |
| | | | | | | | |
| | | | | | | (7,784,986 | ) |
| | | | | | | | |
Electrical Equipment - (0.0)% (E) | | | | | |
AMETEK, Inc. | | | (668 | ) | | | (34,836 | ) |
| | | | | | | | |
Electronic Equipment, Instruments & Components - (0.0)% (E) | |
National Instruments Corp. | | | (1,084 | ) | | | (34,341 | ) |
| | | | | | | | |
Energy Equipment & Services - (2.0)% | | | | | | | | |
AMEC PLC | | | (164,792 | ) | | | (2,747,764 | ) |
Baker Hughes, Inc. | | | (2,110 | ) | | | (111,746 | ) |
Frank’s International NV | | | (4,846 | ) | | | (83,497 | ) |
Halliburton Co. | | | (1,885 | ) | | | (103,939 | ) |
Superior Energy Services, Inc. | | | (3,696 | ) | | | (92,954 | ) |
| | | | | | | | |
| | | | | | | (3,139,900 | ) |
| | | | | | | | |
Health Care Equipment & Supplies - (1.7)% | | | | | |
Becton Dickinson and Co. | | | (1,792 | ) | | | (230,630 | ) |
Medtronic, Inc. | | | (33,425 | ) | | | (2,278,248 | ) |
STERIS Corp. | | | (926 | ) | | | (57,227 | ) |
| | | | | | | | |
| | | | | | | (2,566,105 | ) |
| | | | | | | | |
Health Care Providers & Services - (0.2)% | | | | | |
Chemed Corp. | | | (107 | ) | | | (11,060 | ) |
HealthSouth Corp. | | | (549 | ) | | | (22,141 | ) |
Kindred Healthcare, Inc. | | | (13,131 | ) | | | (285,599 | ) |
The Notes to Financial Statements are an integral part of this report.
| | |
| Transamerica Funds | | Annual Report 2014 |
Page 39
Transamerica Arbitrage Strategy
SCHEDULE OF INVESTMENTS (continued)
At October 31, 2014
| | | | | | | | |
| | | Shares | | | Value | |
SECURITIES SOLD SHORT (continued) | | | | | | | | |
COMMON STOCKS (continued) | | | | | | | | |
Health Care Providers & Services (continued) | |
Select Medical Holdings Corp. | | | (1,472 | ) | | | $ (21,226 | ) |
| | | | | | | | |
| | | | | | | (340,026 | ) |
| | | | | | | | |
Hotels, Restaurants & Leisure - (0.1)% | | | | | | | | |
Domino’s Pizza, Inc. | | | (516 | ) | | | (45,816 | ) |
Dunkin’ Brands Group, Inc. | | | (996 | ) | | | (45,298 | ) |
Jack in the Box, Inc. | | | (216 | ) | | | (15,345 | ) |
Sonic Corp. (A) | | | (606 | ) | | | (15,277 | ) |
Wendy’s Co. | | | (1,910 | ) | | | (15,318 | ) |
| | | | | | | | |
| | | | | | | (137,054 | ) |
| | | | | | | | |
Insurance - (1.4)% | | | | | | | | |
Manulife Financial Corp. | | | (110,871 | ) | | | (2,104,193 | ) |
| | | | | | | | |
Internet & Catalog Retail - (0.1)% | | | | | | | | |
TripAdvisor, Inc. (A) | | | (1,653 | ) | | | (146,555 | ) |
| | | | | | | | |
IT Services - (0.3)% | | | | | | | | |
Alliance Data Systems Corp. (A) | | | (1,713 | ) | | | (485,379 | ) |
| | | | | | | | |
Life Sciences Tools & Services - (0.1)% | | | | | | | | |
Bruker Corp. (A) | | | (1,140 | ) | | | (23,632 | ) |
PerkinElmer, Inc. | | | (1,449 | ) | | | (62,915 | ) |
Thermo Fisher Scientific, Inc. | | | (514 | ) | | | (60,431 | ) |
Waters Corp. (A) | | | (637 | ) | | | (70,580 | ) |
| | | | | | | | |
| | | | | | | (217,558 | ) |
| | | | | | | | |
Media - (1.1)% | | | | | | | | |
Gannett Co., Inc. | | | (209 | ) | | | (6,584 | ) |
Liberty Global PLC, Series C (A) | | | (20,761 | ) | | | (923,242 | ) |
Liberty Global PLC, Class A (A) | | | (8,415 | ) | | | (382,630 | ) |
Media General, Inc., Class A (A) | | | (24,829 | ) | | | (370,945 | ) |
Nexstar Broadcasting Group, Inc., Class A | | | (153 | ) | | | (6,903 | ) |
Sinclair Broadcast Group, Inc., Class A | | | (179 | ) | | | (5,200 | ) |
| | | | | | | | |
| | | | | | | (1,695,504 | ) |
| | | | | | | | |
Metals & Mining - (0.2)% | | | | | | | | |
Agnico Eagle Mines, Ltd. | | | (8,065 | ) | | | (190,059 | ) |
Cliffs Natural Resources, Inc. | | | (5,250 | ) | | | (58,958 | ) |
Lundin Mining Corp. (A) | | | (4,609 | ) | | | (20,570 | ) |
| | | | | | | | |
| | | | | | | (269,587 | ) |
| | | | | | | | |
Oil, Gas & Consumable Fuels - (0.6)% | | | | | | | | |
Veresen, Inc. | | | (62,625 | ) | | | (982,952 | ) |
| | | | | | | | |
Pharmaceuticals - (1.3)% | | | | | | | | |
AbbVie, Inc., Class G | | | (7,900 | ) | | | (501,334 | ) |
Valeant Pharmaceuticals International, Inc. (A) | | | (11,276 | ) | | | (1,500,159 | ) |
| | | | | | | | |
| | | | | | | (2,001,493 | ) |
| | | | | | | | |
Real Estate Investment Trusts - (4.1)% | | | | | | | | |
Klepierre | | | (11,760 | ) | | | (508,995 | ) |
Ventas, Inc. | | | (79,660 | ) | | | (5,457,507 | ) |
Washington Prime Group, Inc. | | | (16,984 | ) | | | (299,428 | ) |
| | | | | | | | |
| | | | | | | (6,265,930 | ) |
| | | | | | | | |
Semiconductors & Semiconductor Equipment - (4.3)% | |
Applied Materials, Inc., Class A | | | (173,575 | ) | | | (3,834,272 | ) |
RF Micro Devices, Inc. (A) | | | (212,702 | ) | | | (2,767,253 | ) |
Teradyne, Inc. | | | (1,740 | ) | | | (32,016 | ) |
| | | | | | | | |
| | | | | | | (6,633,541 | ) |
| | | | | | | | |
Software - (0.0)% (E) | | | | | | | | |
Covisint Corp. (A) | | | (4,442 | ) | | | (12,837 | ) |
| | | | | | | | |
| | | | | | | | |
| | | Shares | | | Value | |
SECURITIES SOLD SHORT (continued) | | | | | |
COMMON STOCKS (continued) | | | | | | | | |
Specialty Retail - (0.0)% (E) | | | | | | | | |
Abercrombie & Fitch Co., Class A | | | (52 | ) | | | $ (1,741 | ) |
American Eagle Outfitters, Inc. | | | (246 | ) | | | (3,166 | ) |
Guess?, Inc. | | | (147 | ) | | | (3,259 | ) |
| | | | | | | | |
| | | | | | | (8,166 | ) |
| | | | | | | | |
Trading Companies & Distributors - (0.3)% | |
Fastenal Co. | | | (3,213 | ) | | | (141,501 | ) |
HD Supply Holdings, Inc. (A) | | | (2,558 | ) | | | (73,773 | ) |
WESCO International, Inc. (A) | | | (1,428 | ) | | | (117,681 | ) |
WW Grainger, Inc. | | | (283 | ) | | | (69,844 | ) |
| | | | | | | | |
| | | | | | | (402,799 | ) |
| | | | | | | | |
Total Common Stocks
(Proceeds $36,848,960) | | | | | | | (38,349,100 | ) |
| | | | | | | | |
| | |
INVESTMENT COMPANIES - (4.0)% | | | | | | | | |
Capital Markets - (4.0)% | | | | | | | | |
Consumer Staples Select Sector SPDR Fund | | | (6,384 | ) | | | (298,197 | ) |
Health Care Select Sector SPDR Fund | | | (4,823 | ) | | | (324,443 | ) |
iShares 7-10 Year Treasury Bond ETF | | | (257 | ) | | | (26,990 | ) |
iShares MSCI China ETF | | | (2,837 | ) | | | (139,609 | ) |
iShares Nasdaq Biotechnology ETF | | | (331 | ) | | | (98,181 | ) |
iShares Russell 1000 Value ETF | | | (1,547 | ) | | | (158,103 | ) |
iShares Russell 2000 Growth ETF | | | (4,270 | ) | | | (587,680 | ) |
Market Vectors Coal ETF | | | (8,843 | ) | | | (147,678 | ) |
PowerShares QQQ Trust Series 1 | | | (996 | ) | | | (100,995 | ) |
SPDR Barclays High Yield Bond ETF | | | (2,169 | ) | | | (87,541 | ) |
SPDR S&P 500 ETF Trust | | | (19,262 | ) | | | (3,884,375 | ) |
SPDR S&P Insurance ETF | | | (4,446 | ) | | | (291,569 | ) |
Technology Select Sector SPDR Fund | | | (1,239 | ) | | | (50,229 | ) |
| | | | | | | | |
Total Investment Companies
(Proceeds $6,052,921) | | | | | | | (6,195,590 | ) |
| | | | | | | | |
Total Securities Sold Short
(Proceeds $42,901,881) | | | | | | | $ (44,544,690 | ) |
| | | | | | | | |
| | |
| | | Contracts | | | Value | |
WRITTEN OPTIONS - (0.3)% | | | | | | | | |
Call Options - (0.3)% | | | | | | | | |
AbbVie, Inc. (C)
Strike Price $47.50
Expires 12/20/2014 | | | 30 | | | | $ (300 | ) |
AbbVie, Inc. (C)
Strike Price $50.00
Expires 12/20/2014 | | | 1 | | | | (10 | ) |
Allergan, Inc.
Strike Price $190.00
Expires 01/17/2015 | | | 31 | | | | (40,610 | ) |
Alliance Data Systems Corp.
Strike Price $270.00
Expires 12/20/2014 | | | 3 | | | | (5,250 | ) |
Alliance Data Systems Corp.
Strike Price $280.00
Expires 12/20/2014 | | | 45 | | | | (50,535 | ) |
Athlon Energy, Inc.
Strike Price $60.00
Expires 12/20/2014 | | | 3 | | | | (30 | ) |
The Notes to Financial Statements are an integral part of this report.
| | |
| Transamerica Funds | | Annual Report 2014 |
Page 40
Transamerica Arbitrage Strategy
SCHEDULE OF INVESTMENTS (continued)
At October 31, 2014
| | | | | | | | |
| | | Contracts | | | Value | |
WRITTEN OPTIONS (continued) | | | | | | | | |
Call Options (continued) | | | | | | | | |
Bally Technologies, Inc.
Strike Price $85.00
Expires 01/17/2015 | | | 26 | | | | $ (405 | ) |
Chiquita Brands International
Strike Price $14.00
Expires 11/22/2014 | | | 169 | | | | (8,450 | ) |
Concur Technologies, Inc.
Strike Price $130.00
Expires 11/22/2014 | | | 4 | | | | (30 | ) |
Concur Technologies, Inc.
Strike Price $130.00
Expires 02/20/2015 | | | 40 | | | | (300 | ) |
Conversant, Inc.
Strike Price $35.00
Expires 11/22/2014 | | | 6 | | | | (360 | ) |
DIRECTV
Strike Price $85.00
Expires 12/20/2014 | | | 37 | | | | (9,583 | ) |
DIRECTV
Strike Price $85.00
Expires 01/17/2015 | | | 8 | | | | (3,120 | ) |
DIRECTV
Strike Price $87.50
Expires 11/22/2014 | | | 74 | | | | (6,290 | ) |
DIRECTV
Strike Price $87.50
Expires 12/20/2014 | | | 96 | | | | (7,776 | ) |
General Motors Co.
Strike Price $31.00
Expires 11/07/2014 | | | 10 | | | | (620 | ) |
General Motors Co.
Strike Price $31.50
Expires 11/07/2014 | | | 10 | | | | (360 | ) |
General Motors Co.
Strike Price $32.00
Expires 11/07/2014 | | | 10 | | | | (210 | ) |
Genworth Financial, Inc.
Strike Price $13.50
Expires 11/07/2014 | | | 25 | | | | (1,625 | ) |
International Rectifier Corp.
Strike Price $40.00
Expires 03/20/2015 | | | 60 | | | | (600 | ) |
Jupiter Networks, Inc.
Strike Price $20.00
Expires 11/07/2014 | | | 20 | | | | (2,080 | ) |
Kindred Healthcare, Inc.
Strike Price $22.50
Expires 11/22/2014 | | | 20 | | | | (1,200 | ) |
Level 3 Communications, Inc.
Strike Price $45.00
Expires 11/22/2014 | | | 42 | | | | (12,600 | ) |
Manitowoc Co., Inc.
Strike Price $19.00
Expires 11/22/2014 | | | 60 | | | | (12,000 | ) |
Manitowoc Co., Inc.
Strike Price $20.00
Expires 11/22/2014 | | | 60 | | | | (7,200 | ) |
| | | | | | | | |
| | | Contracts | | | Value | |
WRITTEN OPTIONS (continued) | | | | | | | | |
Call Options (continued) | | | | | | | | |
Manitowoc Co., Inc.
Strike Price $21.00
Expires 11/22/2014 | | | 58 | | | | $ (3,480 | ) |
Medtronic, Inc.
Strike Price $60.00
Expires 11/22/2014 | | | 57 | | | | (46,056 | ) |
Medtronic, Inc.
Strike Price $62.50
Expires 11/22/2014 | | | 84 | | | | (47,880 | ) |
Medtronic, Inc.
Strike Price $65.00
Expires 11/22/2014 | | | 33 | | | | (11,055 | ) |
Medtronic, Inc.
Strike Price $65.50
Expires 11/22/2014 | | | 15 | | | | (5,100 | ) |
Medtronic, Inc.
Strike Price $66.00
Expires 11/22/2014 | | | 68 | | | | (17,748 | ) |
Medtronic, Inc.
Strike Price $67.50
Expires 11/22/2014 | | | 5 | | | | (775 | ) |
Shire PLC
Strike Price $185.00
Expires 11/22/2014 | | | 13 | | | | (21,450 | ) |
Shire PLC
Strike Price $190.00
Expires 11/22/2014 | | | 7 | | | | (8,715 | ) |
Shire PLC
Strike Price $195.00
Expires 11/22/2014 | | | 6 | | | | (5,520 | ) |
Shire PLC
Strike Price $220.00
Expires 11/22/2014 | | | 8 | | | | (1,600 | ) |
Sigma-Aldrich Corp. (C)
Strike Price $145.00
Expires 11/22/2014 | | | 1 | | | | (5 | ) |
TIBCO Software, Inc.
Strike Price $24.00
Expires 01/17/2015 | | | 223 | | | | (1,115 | ) |
TIBCO Software, Inc.
Strike Price $25.00
Expires 01/17/2015 | | | 7 | | | | (35 | ) |
Time Warner Cable, Inc.
Strike Price $150.00
Expires 11/22/2014 | | | 45 | | | | (7,650 | ) |
TRW Automotive Holdings Corp.
Strike Price $105.00
Expires 01/17/2015 | | | 41 | | | | (410 | ) |
TRW Automotive Holdings Corp.
Strike Price $105.00
Expires 04/17/2015 | | | 41 | | | | (2,050 | ) |
tw telecom, Inc.
Strike Price $45.00
Expires 01/17/2015 | | | 20 | | | | (2,100 | ) |
Valeant Pharmaceuticals International, Inc.
Strike Price $150.00
Expires 01/17/2015 | | | 7 | | | | (3,500 | ) |
| | | | | | | | |
| | | | | | | (357,788 | ) |
| | | | | | | | |
The Notes to Financial Statements are an integral part of this report.
| | |
| Transamerica Funds | | Annual Report 2014 |
Page 41
Transamerica Arbitrage Strategy
SCHEDULE OF INVESTMENTS (continued)
At October 31, 2014
| | | | | | | | |
| | | Contracts | | | Value | |
WRITTEN OPTIONS (continued) | | | | | | | | |
Put Options - (0.0)% (E) | | | | | | | | |
Allergan, Inc.
Strike Price $165.00
Expires 01/17/2015 | | | 19 | | | | $ (8,930 | ) |
Allergan, Inc.
Strike Price $170.00
Expires 01/17/2015 | | | 12 | | | | (6,780 | ) |
Alliance Data Systems Corp.
Strike Price $200.00
Expires 12/20/2014 | | | 1 | | | | (23 | ) |
Cliffs Natural Resources, Inc.
Strike Price $7.00
Expires 11/22/2014 | | | 21 | | | | (252 | ) |
CONSOL Energy, Inc.
Strike Price $35.00
Expires 11/22/2014 | | | 12 | | | | (432 | ) |
Covidien PLC
Strike Price $57.50
Expires 01/17/2015 | | | 160 | | | | (3,200 | ) |
Covidien PLC
Strike Price $62.50
Expires 01/17/2015 | | | 53 | | | | (2,385 | ) |
Covidien PLC
Strike Price $85.00
Expires 11/22/2014 | | | 16 | | | | (2,640 | ) |
| | | | | | | | |
| | | Contracts | | | Value | |
WRITTEN OPTIONS (continued) | | | | | | | | |
Put Options (continued) | | | | | | | | |
DIRECTV
Strike Price $85.00
Expires 11/22/2014 | | | 25 | | | | $ (1,625 | ) |
DIRECTV
Strike Price $85.00
Expires 12/20/2014 | | | 17 | | | | (2,482 | ) |
Dresser-Rand Group, Inc.
Strike Price $80.00
Expires 11/22/2014 | | | 11 | | | | (484 | ) |
SPDR S&P 500 ETF Trust
Strike Price $190.00
Expires 11/07/2014 | | | 26 | | | | (130 | ) |
Time Warner Cable, Inc.
Strike Price $140.00
Expires 11/22/2014 | | | 20 | | | | (3,200 | ) |
Time Warner Cable, Inc.
Strike Price $140.00
Expires 01/17/2015 | | | 23 | | | | (13,110 | ) |
Valeant Pharmaceuticals International, Inc.
Strike Price $125.00
Expires 11/22/2014 | | | 5 | | | | (1,150 | ) |
| | | | | | | | |
| | | | | | | (46,823 | ) |
| | | | | | | | |
Total Written Options
(Premiums received $263,975) | | | | | | | (404,611 | ) |
| | | | | | | | |
OVER THE COUNTER SWAP AGREEMENTS: (H)
| | | | | | | | | | | | | | | | | | | | | | | | |
| |
| Total Return Swap Agreements - Payable (I) | |
| | | | | | | |
| Reference Entity | | Floating Rate | | Termination
Date | | | Counterparty | | Number of
Shares or Units | | | Fair
Value | | | Premiums Paid
(Received) | | | Net Unrealized
Appreciation
(Depreciation) | |
ITV PLC | | GBP-1M-LIBOR-BBA | | | 11/01/2017 | | | MSC | | | 22,186 | | | $ | 75 | | | $ | 0 | | | $ | 75 | |
| | | | | | | | | | | | | | | | | | | | | | | | |
|
| Total Return Swap Agreements - Receivable (I) | |
| Reference Entity | | Fixed Rate | | Termination
Date | | | Counterparty | | Number of
Shares or Units | | | Fair
Value | | | Premiums
Paid
(Received) | | | Net Unrealized
Appreciation
(Depreciation) | |
Premier Oil PLC | | GBP-1M-LIBOR-BBA | | | 11/01/2017 | | | MSC | | | 2,552 | | | $ | (42 | ) | | $ | 0 | | | $ | (42 | ) |
ProSiebenSat.1 Media AG | | EUR-1M-LIBOR-BBA | | | 11/01/2017 | | | MSC | | | 80 | | | | (3 | ) | | | 0 | | | | (3 | ) |
RTL Group S.A. | | EUR-1M-LIBOR-BBA | | | 11/01/2017 | | | MSC | | | 67 | | | | 86 | | | | 0 | | | | 86 | |
Societe Television Francaise 1 | | EUR-1M-LIBOR-BBA | | | 11/01/2017 | | | MSC | | | 463 | | | | (61 | ) | | | 0 | | | | (61 | ) |
STOXX 600 Oil & Gas (Price) Index | | EUR-1M-LIBOR-BBA | | | 11/01/2017 | | | MSC | | | 60 | | | | (41 | ) | | | 0 | | | | (41 | ) |
STOXX Europe 600 Media Price | | EUR-1M-LIBOR-BBA | | | 11/07/2017 | | | MSC | | | 47 | | | | (25 | ) | | | 0 | | | | (25 | ) |
Tullow Oil PLC | | GBP-1M-LIBOR-BBA | | | 11/01/2017 | | | MSC | | | 1,296 | | | | 53 | | | | 0 | | | | 53 | |
| | | | | | | | | | | | | | | | | | | | | | | | |
Total | | | | | | | | | | | | | | $ | (33 | ) | | $ | 0 | | | $ | (33 | ) |
| | | | | | | | | | | | | | | | | | | | | | | | |
| | | | | | | | | | | | | | | | | | | | | | |
| FORWARD FOREIGN CURRENCY CONTRACTS: (H) | | | | | | | | | | | |
| Counterparty | | Settlement
Date | | Currency
Purchased | | | | | Currency
Sold | | | | | Unrealized
Appreciation | | | Unrealized
Depreciation | |
| GSC | | 12/15/2014 | | | 60,800 | | | AUD | | | 53,984 | | | USD | | | 53 | | | | (703 | ) |
| GSC | | 12/15/2014 | | | 1,259,800 | | | CAD | | | 1,126,076 | | | USD | | | 21 | | | | (9,595 | ) |
| GSC | | 12/15/2014 | | | 1,155,100 | | | CHF | | | 1,219,710 | | | USD | | | — | | | | (18,658 | ) |
The Notes to Financial Statements are an integral part of this report.
| | |
| Transamerica Funds | | Annual Report 2014 |
Page 42
Transamerica Arbitrage Strategy
SCHEDULE OF INVESTMENTS (continued)
At October 31, 2014
| | | | | | | | | | | | | | | | | | | | | | |
| FORWARD FOREIGN CURRENCY CONTRACTS (continued): (H) | | | | | | | | | | | |
| Counterparty | | Settlement
Date | | Currency
Purchased | | | | | Currency
Sold | | | | | Unrealized
Appreciation | | | Unrealized
Depreciation | |
| GSC | | 12/15/2014 | | | 542,700 | | | EUR | | | 688,171 | | | USD | | | — | | | | (7,886 | ) |
| GSC | | 12/15/2014 | | | 3,012,810 | | | GBP | | | 4,868,924 | | | USD | | | 317 | | | | (51,410 | ) |
| GSC | | 12/15/2014 | | | 2,015,700 | | | NOK | | | 303,349 | | | USD | | | 26 | | | | (4,998 | ) |
| GSC | | 12/15/2014 | | | 110,761 | | | USD | | | 122,900 | | | AUD | | | 3,035 | | | | (80 | ) |
| GSC | | 12/15/2014 | | | 3,100,628 | | | USD | | | 3,436,900 | | | CAD | | | 54,676 | | | | (14 | ) |
| GSC | | 12/15/2014 | | | 3,015,823 | | | USD | | | 2,845,700 | | | CHF | | | 57,347 | | | | (433 | ) |
| GSC | | 12/15/2014 | | | 5,479,722 | | | USD | | | 4,283,900 | | | EUR | | | 109,967 | | | | (199 | ) |
| GSC | | 12/15/2014 | | | 4,906,613 | | | USD | | | 3,026,000 | | | GBP | | | 67,690 | | | | — | |
| GSC | | 12/15/2014 | | | 449,668 | | | USD | | | 2,934,200 | | | NOK | | | 15,329 | | | | — | |
| GSC | | 12/15/2014 | | | 303,914 | | | USD | | | 2,200,200 | | | SEK | | | 5,922 | | | | — | |
| | | | | | | | | | | | | | | | | | | | | | |
Total | | | | | | | | | | | | | | | | $ | 314,383 | | | $ | (93,976 | ) |
| | | | | | | | | | | | | | | | | | | | | | |
SECURITY VALUATION:
Valuation Inputs (J)
| | | | | | | | | | | | | | | | |
| | | Level 1
Quoted Prices | | | Level 2
Other Significant
Observable Inputs | | | Level 3
Significant
Unobservable Inputs (K) | | | Value at
October 31, 2014 | |
ASSETS | | | | | | | | | | | | | | | | |
Investments | | | | | | | | | | | | | | | | |
Corporate Debt Securities | | $ | — | | | $ | 17,530,599 | | | $ | — | | | $ | 17,530,599 | |
Common Stocks | | | | | | | | | | | | | | | | |
Aerospace & Defense | | | 1,023,613 | | | | — | | | | — | | | | 1,023,613 | |
Auto Components | | | 2,865,671 | | | | — | | | | — | | | | 2,865,671 | |
Automobiles | | | 504,598 | | | | — | | | | — | | | | 504,598 | |
Banks | | | 1,906,748 | | | | — | | | | — | | | | 1,906,748 | |
Beverages | | | 149,653 | | | | — | | | | — | | | | 149,653 | |
Biotechnology | | | 75,238 | | | | — | | | | 11,520 | | | | 86,758 | |
Building Products | | | — | | | | 291,283 | | | | — | | | | 291,283 | |
Chemicals | | | 6,460,019 | | | | — | | | | — | | | | 6,460,019 | |
Commercial Services & Supplies | | | 19,236 | | | | — | | | | — | | | | 19,236 | |
Communications Equipment | | | 510,606 | | | | — | | | | — | | | | 510,606 | |
Construction & Engineering | | | 6,390,632 | | | | — | | | | — | | | | 6,390,632 | |
Consumer Finance | | | 186,691 | | | | — | | | | — | | | | 186,691 | |
Containers & Packaging | | | 206,508 | | | | — | | | | — | | | | 206,508 | |
Diversified Telecommunication Services | | | 10,562,034 | | | | 2,733,306 | | | | — | | | | 13,295,340 | |
Electric Utilities | | | 3,513,108 | | | | — | | | | — | | | | 3,513,108 | |
Electrical Equipment | | | — | | | | 927,078 | | | | — | | | | 927,078 | |
Energy Equipment & Services | | | 3,962,911 | | | | — | | | | — | | | | 3,962,911 | |
Food & Staples Retailing | | | 5,258,526 | | | | — | | | | — | | | | 5,258,526 | |
Food Products | | | 560,897 | | | | 579,361 | | | | — | | | | 1,140,258 | |
Health Care Equipment & Supplies | | | 6,935,017 | | | | 1,751,950 | | | | — | | | | 8,686,967 | |
Health Care Providers & Services | | | 1,133,139 | | | | 117,264 | | | | — | | | | 1,250,403 | |
Hotels, Restaurants & Leisure | | | 3,521,235 | | | | 133,461 | | | | — | | | | 3,654,696 | |
Household Products | | | 204,458 | | | | — | | | | — | | | | 204,458 | |
Insurance | | | 8,733,068 | | | | — | | | | — | | | | 8,733,068 | |
Internet & Catalog Retail | | | 473,562 | | | | — | | | | — | | | | 473,562 | |
Internet Software & Services | | | 5,350,206 | | | | — | | | | — | | | | 5,350,206 | |
Leisure Products | | | 564,473 | | | | — | | | | — | | | | 564,473 | |
Life Sciences Tools & Services | | | 364,903 | | | | — | | | | — | | | | 364,903 | |
Machinery | | | 735,194 | | | | 71,340 | | | | — | | | | 806,534 | |
Media | | | 7,219,399 | | | | 1,199,939 | | | | — | | | | 8,419,338 | |
Metals & Mining | | | 207,385 | | | | — | | | | — | | | | 207,385 | |
Multiline Retail | | | 4,538,236 | | | | — | | | | — | | | | 4,538,236 | |
Oil, Gas & Consumable Fuels | | | 6,608,984 | | | | 54,673 | | | | — | | | | 6,663,657 | |
The Notes to Financial Statements are an integral part of this report.
| | |
| Transamerica Funds | | Annual Report 2014 |
Page 43
Transamerica Arbitrage Strategy
SCHEDULE OF INVESTMENTS (continued)
At October 31, 2014
SECURITY VALUATION (continued):
Valuation Inputs (continued) (J)
| | | | | | | | | | | | | | | | |
| | | Level 1
Quoted Prices | | | Level 2
Other Significant
Observable Inputs | | | Level 3
Significant
Unobservable Inputs (K) | | | Value at
October 31, 2014 | |
ASSETS (continued) | | | | | | | | | | | | | | | | |
Investments (continued) | | | | | | | | | | | | | | | | |
Paper & Forest Products | | $ | 39,787 | | | $ | — | | | $ | — | | | $ | 39,787 | |
Pharmaceuticals | | | 4,997,372 | | | | — | | | | 9,580 | | | | 5,006,952 | |
Real Estate Investment Trusts | | | 7,159,507 | | | | 502,322 | | | | — | | | | 7,661,829 | |
Semiconductors & Semiconductor Equipment | | | 8,425,248 | | | | — | | | | — | | | | 8,425,248 | |
Software | | | 9,193,370 | | | | 394,097 | | | | — | | | | 9,587,467 | |
Specialty Retail | | | 586,767 | | | | — | | | | — | | | | 586,767 | |
Technology Hardware, Storage & Peripherals | | | 319,047 | | | | — | | | | — | | | | 319,047 | |
Trading Companies & Distributors | | | 222,895 | | | | — | | | | — | | | | 222,895 | |
Wireless Telecommunication Services | | | 666,987 | | | | — | | | | — | | | | 666,987 | |
Right | | | 13,534 | | | | — | | | | — | | | | 13,534 | |
Investment Company | | | 24,521 | | | | — | | | | — | | | | 24,521 | |
Master Limited Partnership | | | 806,082 | | | | — | | | | — | | | | 806,082 | |
Purchased Options | | | 681,184 | | | | 13,783 | | | | — | | | | 694,967 | |
Repurchase Agreement | | | — | | | | 3,898,356 | | | | — | | | | 3,898,356 | |
| | | | | | | | | | | | | | | | |
Total Investments | | $ | 123,882,249 | | | $ | 30,198,812 | | | $ | 21,100 | | | $ | 154,102,161 | |
| | | | | | | | | | | | | | | | |
Derivative Financial Instruments | | | | | | | | | | | | | | | | |
Total Return Swap Agreements | | $ | — | | | $ | 214 | | | $ | — | | | $ | 214 | |
Forward Foreign Currency Contracts (L) | | | — | | | | 314,383 | | | | — | | | | 314,383 | |
| | | | | | | | | | | | | | | | |
Total Derivative Financial Instruments | | $ | — | | | $ | 314,597 | | | $ | — | | | $ | 314,597 | |
| | | | | | | | | | | | | | | | |
Other Assets | | | | | | | | | | | | | | | | |
Litigation Receivable | | $ | — | | | $ | — | | | $ | 1,172 | | | $ | 1,172 | |
| | | | | | | | | | | | | | | | |
Total Other Assets | | $ | — | | | $ | — | | | $ | 1,172 | | | $ | 1,172 | |
| | | | | | | | | | | | | | | | |
LIABILITIES | | | | | | | | | | | | | | | | |
Securities Sold Short | | | | | | | | | | | | | | | | |
Common Stocks | | $ | (35,092,341 | ) | | $ | (3,256,759 | ) | | $ | — | | | $ | (38,349,100 | ) |
Investment Companies | | | (6,195,590 | ) | | | — | | | | — | | | | (6,195,590 | ) |
| | | | | | | | | | | | | | | | |
Total Securities Sold Short | | $ | (41,287,931 | ) | | $ | (3,256,759 | ) | | $ | — | | | $ | (44,544,690 | ) |
| | | | | | | | | | | | | | | | |
Derivative Financial Instruments | | | | | | | | | | | | | | | | |
Written Options | | $ | (404,296 | ) | | $ | (315 | ) | | $ | — | | | $ | (404,611 | ) |
Total Return Swap Agreements | | | — | | | | (172 | ) | | | — | | | | (172 | ) |
Forward Foreign Currency Contracts (L) | | | — | | | | (93,976 | ) | | | — | | | | (93,976 | ) |
| | | | | | | | | | | | | | | | |
Total Derivative Financial Instruments | | $ | (404,296 | ) | | $ | (94,463 | ) | | $ | — | | | $ | (498,759 | ) |
| | | | | | | | | | | | | | | | |
FOOTNOTES TO SCHEDULE OF INVESTMENTS:
| (A) | Non-income producing security. |
| (B) | All or a portion of this security has been segregated as collateral for open options and securities sold short transactions. Total value of securities segregated as collateral for open options and securities sold short transactions is $32,046,300. |
| (C) | Fair valued as determined in good faith in accordance with procedures established by the board of trustees. Total aggregate fair value of securities is $32,867, or 0.02% of the Fund’s net assets, and total aggregate fair value of derivatives is $(315), or less than (0.01)% of the Fund’s net assets. |
| (D) | Total aggregate value of illiquid securities is $322,774, or 0.21% of the Fund’s net assets. |
| (E) | Percentage rounds to less than 0.1% or (0.1)%. |
| (F) | Rate shown reflects the yield at October 31, 2014. |
| (G) | Aggregate cost for federal income tax purposes is $156,281,090. Aggregate gross unrealized appreciation and depreciation for all securities is $846,990 and $3,025,919, respectively. Net unrealized depreciation for tax purposes is $2,178,929. |
The Notes to Financial Statements are an integral part of this report.
| | |
| Transamerica Funds | | Annual Report 2014 |
Page 44
Transamerica Arbitrage Strategy
SCHEDULE OF INVESTMENTS (continued)
At October 31, 2014
FOOTNOTES TO SCHEDULE OF INVESTMENTS (continued):
| (H) | Cash in the amount of $177,146 has been segregated by the custodian as collateral for open swap and/or forward foreign currency contracts. |
| (I) | At the termination date, a net cash flow is exchanged where the total return is equivalent to the return of the reference index less a financing rate, if any. As a receiver, the Fund would receive payments based on any positive total return and would owe payments in the event of a negative total return. As the payer, the Fund would owe payments on any net positive total return and would receive payment in the event of a negative total return. |
| (J) | The Fund recognizes transfers between Levels at the end of the reporting period. There were no transfers between Level 1, 2 and 3 during the period ended October 31, 2014. See the Notes to Financial Statements for more information regarding security valuation and pricing inputs. |
| (K) | Level 3 securities were not considered significant to the Fund. |
| (L) | Derivative financial instruments valued at unrealized appreciation (depreciation) on the instrument. |
DEFINITIONS:
| | |
| 144A | | 144A securities are registered pursuant to Rule 144A of the Securities Act of 1933. These securities are deemed to be liquid for purposes of compliance limitations on holdings of illiquid securities and may be resold as transactions exempt from registration, normally to qualified institutional buyers. At October 31, 2014, these securities aggregated $4,000,860, or 2.59% of the Fund’s net assets. |
| ADR | | American Depositary Receipt |
| BBA | | British Bankers’ Association |
| CVR | | Contingent Value Right |
| GSC | | Goldman Sachs & Co. |
| LIBOR | | London Interbank Offered Rate |
| MSC | | Morgan Stanley |
| STOXX | | Deutsche Börse Group & SIX Group Index |
CURRENCY ABBREVIATIONS:
| | |
| AUD | | Australian Dollar |
| CAD | | Canadian Dollar |
| CHF | | Swiss Franc |
| EUR | | Euro |
| GBP | | Pound Sterling |
| NOK | | Norwegian Krone |
| SEK | | Swedish Krona |
| USD | | United States Dollar |
The Notes to Financial Statements are an integral part of this report.
| | |
| Transamerica Funds | | Annual Report 2014 |
Page 45
Transamerica Bond
SCHEDULE OF INVESTMENTS
At October 31, 2014
| | | | | | | | |
| | | Principal | | | Value | |
U.S. GOVERNMENT OBLIGATIONS - 5.1% | |
United States - 5.1% | |
U.S. Treasury Note | | | | | | | | |
0.25%, 02/29/2016 (A) | | | $ 15,165,000 | | | | $ 15,168,549 | |
0.88%, 01/31/2017 - 06/15/2017 | | | 24,565,000 | | | | 24,662,511 | |
| | | | | | | | |
Total U.S. Government Obligations
(Cost $39,722,029) | | | | 39,831,060 | |
| | | | | | | | |
|
U.S. GOVERNMENT AGENCY OBLIGATIONS - 0.1% | |
United States - 0.1% | |
Federal Home Loan Mortgage Corp. | | | | | |
1.80%, 04/25/2024 (B) | | | 565,000 | | | | 545,765 | |
2.35%, 02/25/2024 (B) | | | 280,000 | | | | 276,942 | |
| | | | | | | | |
Total U.S. Government Agency Obligations
(Cost $822,788) | | | | 822,707 | |
| | | | | | | | |
|
FOREIGN GOVERNMENT OBLIGATIONS - 4.6% | |
Brazil - 1.1% | |
Brazilian Government International Bond | | | | | | | | |
8.50%, 01/05/2024 (A) | | | BRL 9,100,000 | | | | 3,516,385 | |
Series 2007-2N, Class 3A1 | | | | | | | | |
10.25%, 01/10/2028 | | | 12,000,000 | | | | 5,000,202 | |
| | | | | | | | |
| | | | | | | 8,516,587 | |
| | | | | | | | |
Mexico - 2.0% | |
Mexican Bonos | | | | | | | | |
6.50%, 06/10/2021 | | | MXN 61,000,000 | | | | 4,761,943 | |
7.75%, 11/13/2042 | | | 43,500,000 | | | | 3,612,207 | |
8.50%, 11/18/2038 | | | 84,500,000 | | | | 7,554,427 | |
| | | | | | | | |
| | | | | | | 15,928,577 | |
| | | | | | | | |
Supranational - 1.5% | |
European Bank for Reconstruction & Development | | | | | | | | |
Series MTN | | | | | | | | |
6.25%, 02/05/2016 | | | BRL 10,470,000 | | | | 4,024,225 | |
International Finance Corp. Series MTN | | | | | | | | |
7.80%, 06/03/2019 | | | INR 433,760,000 | | | | 7,525,863 | |
| | | | | | | | |
| | | | | | | 11,550,088 | |
| | | | | | | | |
Total Foreign Government Obligations
(Cost $38,870,503) | | | | 35,995,252 | |
| | | | | | | | |
|
MORTGAGE-BACKED SECURITIES - 8.4% | |
United States - 8.4% | |
Alternative Loan Trust | | | | | | | | |
Series 2003-20CB, Class 2A1 | | | | | | | | |
5.75%, 10/25/2033 | | | $ 886,564 | | | | 914,958 | |
Series 2003-4CB, Class 1A1 | | | | | | | | |
5.75%, 04/25/2033 | | | 1,431,135 | | | | 1,458,753 | |
Series 2003-9T1, Class A7 | | | | | | | | |
5.50%, 07/25/2033 | | | 812,906 | | | | 828,820 | |
Series 2004-27CB, Class A1 | | | | | | | | |
6.00%, 12/25/2034 | | | 2,649,423 | | | | 2,650,851 | |
Series 2004-J3, Class 1A1 | | | | | | | | |
5.50%, 04/25/2034 | | | 683,748 | | | | 722,824 | |
Banc of America Alternative Loan Trust | | | | | |
Series 2003-10, Class 1A1 | | | | | | | | |
5.50%, 12/25/2033 | | | 884,781 | | | | 910,198 | |
Series 2003-10, Class 3A1 | | | | | | | | |
5.50%, 12/25/2033 | | | 1,440,268 | | | | 1,477,533 | |
| | | | | | | | |
| | | Principal | | | Value | |
MORTGAGE-BACKED SECURITIES (continued) | |
United States (continued) | |
Banc of America Commercial Mortgage Trust
Series 2007-2, Class A4
5.61%, 04/10/2049 (B) | | | $ 500,000 | | | | $ 541,903 | |
Banc of America Funding Trust | | | | | | | | |
Series 2005-4, Class 1A3 | | | | | | | | |
5.50%, 08/25/2035 | | | 404,192 | | | | 413,706 | |
Series 2005-7, Class 3A1 | | | | | | | | |
5.75%, 11/25/2035 | | | 1,106,523 | | | | 1,134,793 | |
Series 2006-I, Class 1A1 | | | | | | | | |
2.30%, 12/20/2036 (B) | | | 128,281 | | | | 128,747 | |
Banc of America Mortgage Trust | | | | | | | | |
Series 2004-8, Class 1A19 | | | | | | | | |
5.50%, 10/25/2034 | | | 613,552 | | | | 617,342 | |
Series 2004-A, Class 2A2 | | | | | | | | |
2.68%, 02/25/2034 (B) | | | 860,637 | | | | 856,065 | |
Bear Stearns ARM Trust | | | | | | | | |
Series 2004-10, Class 11A1 | | | | | | | | |
2.64%, 01/25/2035 (B) | | | 57,402 | | | | 56,272 | |
Series 2004-3, Class 2A | | | | | | | | |
2.44%, 07/25/2034 (B) | | | 162,725 | | | | 158,810 | |
Series 2004-9, Class 12A3 | | | | | | | | |
2.80%, 11/25/2034 (B) | | | 513,877 | | | | 506,772 | |
Chase Mortgage Finance Trust
Series 2007-A1, Class 3A1
2.55%, 02/25/2037 (B) | | | 997,830 | | | | 982,483 | |
CHL Mortgage Pass-Through Trust | | | | | | | | |
Series 2003-57, Class A11 | | | | | | | | |
5.50%, 01/25/2034 | | | 900,109 | | | | 939,146 | |
Series 2004-HYB4, Class 2A1 | | | | | | | | |
2.40%, 09/20/2034 (B) | | | 422,501 | | | | 415,606 | |
Series 2005-11, Class 4A1 | | | | | | | | |
0.42%, 04/25/2035 (B) | | | 707,875 | | | | 609,315 | |
Citigroup Mortgage Loan Trust, Inc.
Series 2005-2, Class 1A4 2.56%, 05/25/2035 (B) | | | 462,844 | | | | 455,799 | |
Commercial Mortgage Trust
Series 2007-GG11, Class A4
5.74%, 12/10/2049 | | | 3,100,000 | | | | 3,392,860 | |
Credit Suisse Commercial Mortgage Trust | | | | | | | | |
Series 2007-C3, Class A4 | | | | | | | | |
5.70%, 06/15/2039 (B) | | | 1,904,317 | | | | 2,051,011 | |
Series 2007-C4, Class A4 | | | | | | | | |
5.90%, 09/15/2039 (B) | | | 998,846 | | | | 1,085,800 | |
Series 2008-C1, Class A3 | | | | | | | | |
5.97%, 02/15/2041 (B) | | | 1,540,000 | | | | 1,706,115 | |
Credit Suisse First Boston Mortgage Securities Corp.
Series 2005-1, Class 3A4
5.25%, 05/25/2028 | | | 158,140 | | | | 159,882 | |
Extended Stay America Trust
Series 2013-ESH7, Class D7
5.05%, 12/05/2031, 144A (B) | | | 5,130,000 | | | | 5,305,015 | |
FDIC Trust
Series 2013-N1, Class A
4.50%, 10/25/2018, 144A | | | 296,049 | | | | 298,530 | |
GMACM Mortgage Loan Trust | | | | | | | | |
Series 2003-J7, Class A7 | | | | | | | | |
5.00%, 11/25/2033 | | | 230,759 | | | | 238,132 | |
The Notes to Financial Statements are an integral part of this report.
| | |
| Transamerica Funds | | Annual Report 2014 |
Page 46
Transamerica Bond
SCHEDULE OF INVESTMENTS (continued)
At October 31, 2014
| | | | | | | | |
| | | Principal | | | Value | |
MORTGAGE-BACKED SECURITIES (continued) | |
United States (continued) | |
GMACM Mortgage Loan Trust (continued) | | | | | | | | |
Series 2005-AR4, Class 3A1 | | | | | | | | |
2.95%, 07/19/2035 (B) | | | $ 1,235,819 | | | | $ 1,151,512 | |
GS Mortgage Securities Trust
Series 2007-GG10, Class AM
5.80%, 08/10/2045 (B) | | | 3,110,000 | | | | 3,199,431 | |
GSR Mortgage Loan Trust | | | | | | | | |
Series 2004-14, Class 3A1 | | | | | | | | |
2.82%, 12/25/2034 (B) | | | 995,963 | | | | 955,621 | |
Series 2004-14, Class 5A1 | | | | | | | | |
2.73%, 12/25/2034 (B) | | | 1,233,703 | | | | 1,225,176 | |
Series 2005-AR6, Class 4A5 | | | | | | | | |
2.69%, 09/25/2035 (B) | | | 2,534,711 | | | | 2,547,040 | |
HarborView Mortgage Loan Trust
Series 2004-3, Class 1A
2.59%, 05/19/2034 (B) | | | 1,731,460 | | | | 1,721,579 | |
Hilton USA Trust
4.41%, 11/05/2030, 144A | | | 1,375,000 | | | | 1,410,987 | |
Independent National Mortgage Corp.
Index Mortgage Loan Trust
Series 2005-16IP, Class A1
0.79%, 07/25/2045 (B) | | | 260,230 | | | | 242,902 | |
JPMorgan Chase Commercial Mortgage Securities Trust
Series 2007-LDPX, Class AM
5.46%, 01/15/2049 (B) | | | 400,000 | | | | 420,004 | |
JPMorgan Mortgage Trust | | | | | | | | |
Series 2005-A3, Class 4A1 | | | | | | | | |
2.63%, 06/25/2035 (B) | | | 574,058 | | | | 580,650 | |
Series 2007-A1, Class 5A1 | | | | | | | | |
2.59%, 07/25/2035 (B) | | | 566,772 | | | | 564,161 | |
MASTR Alternative Loan Trust | | | | | | | | |
Series 2003-9, Class 4A1 | | | | | | | | |
5.25%, 11/25/2033 | | | 672,028 | | | | 696,505 | |
Series 2004-5, Class 2A1 | | | | | | | | |
6.00%, 06/25/2034 | | | 717,765 | | | | 756,905 | |
Morgan Stanley Capital I Trust
Series 2007-HQ12, Class AM
5.59%, 04/12/2049 (B) | | | 875,000 | | | | 937,871 | |
Morgan Stanley Mortgage Loan Trust
Series 2005-7, Class 7A5
5.50%, 11/25/2035 | | | 1,443,413 | | | | 1,466,782 | |
Morgan Stanley Re-REMIC Trust
Series 2009-GG10, Class A4B
5.80%, 08/12/2045, 144A (B) | | | 2,900,000 | | | | 3,147,358 | |
Motel 6 Trust
Series 2012-MTL6, Class D
3.78%, 10/05/2025, 144A | | | 1,400,000 | | | | 1,401,158 | |
RALI Trust
Series 2003-QS17, Class CB5
5.50%, 09/25/2033 | | | 964,337 | | | | 1,005,707 | |
Structured Adjustable Rate Mortgage Loan Trust
Series 2004-12, Class 6A
2.63%, 09/25/2034 (B) | | | 526,478 | | | | 521,669 | |
Structured Asset Securities Corp.
Mortgage Pass-Through Certificates | | | | | | | | |
Series 2004-20, Class 8A7 | | | | | | | | |
5.75%, 11/25/2034 | | | 1,530,774 | | | | 1,609,266 | |
| | | | | | | | |
| | | Principal | | | Value | |
MORTGAGE-BACKED SECURITIES (continued) | |
United States (continued) | |
Structured Asset Securities Corp.
Mortgage Pass-Through Certificates (continued) | |
Series 2004-21XS, Class 1A5 | | | | | | | | |
5.00%, 12/25/2034 (B) | | | $ 310,333 | | | | $ 315,330 | |
WaMu Mortgage Pass-Through Certificates Trust | | | | | | | | |
Series 2004-AR1, Class A | | | | | | | | |
2.41%, 03/25/2034 (B) | | | 495,219 | | | | 494,413 | |
Series 2004-AR14, Class A1 | | | | | | | | |
2.40%, 01/25/2035 (B) | | | 1,452,842 | | | | 1,458,630 | |
Series 2004-CB2, Class 2A | | | | | | | | |
5.50%, 07/25/2034 | | | 1,058,652 | | | | 1,115,924 | |
Series 2007-OA3, Class 2A1A | | | | | | | | |
0.87%, 04/25/2047 (B) | | | 454,996 | | | | 410,537 | |
Wells Fargo Mortgage-Backed Securities
Trust | | | | | | | | |
Series 2003-M, Class A1 | | | | | | | | |
2.62%, 12/25/2033 (B) | | | 939,144 | | | | 941,703 | |
Series 2003-N, Class 1A2 | | | | | | | | |
2.48%, 12/25/2033 (B) | | | 521,936 | | | | 516,711 | |
Series 2004-A, Class A1 | | | | | | | | |
2.64%, 02/25/2034 (B) | | | 1,104,440 | | | | 1,110,957 | |
Series 2005-12, Class 1A2 | | | | | | | | |
5.50%, 11/25/2035 | | | 660,707 | | | | 673,975 | |
Series 2005-AR10, Class 2A4 | | | | | | | | |
2.61%, 06/25/2035 (B) | | | 654,050 | | | | 656,249 | |
Series 2005-AR4, Class 2A2 | | | | | | | | |
2.61%, 04/25/2035 (B) | | | 1,524,062 | | | | 1,540,616 | |
| | | | | | | | |
Total Mortgage-Backed Securities
(Cost $60,676,430) | | | | | | | 65,815,370 | |
| | | | | | | | |
| | |
ASSET-BACKED SECURITIES - 10.2% | | | | | | | | |
United States - 10.2% | | | | | | | | |
American Express Credit Account Master Trust
Series 2012-1, Class A
0.42%, 01/15/2020 (B) | | | 2,985,000 | | | | 2,987,716 | |
American Express Credit Account Secured Note Trust
Series 2012-4, Class A
0.39%, 05/15/2020 (B) | | | 5,075,000 | | | | 5,068,946 | |
American Homes 4 Rent
Series 2014-SFR2, Class D
5.15%, 10/17/2036, 144A | | | 395,000 | | | | 394,041 | |
Capital One Multi-Asset Execution Trust Series 2013-A3, Class A3
0.96%, 09/16/2019 | | | 3,865,000 | | | | 3,866,368 | |
Carnow Auto Receivables Trust
Series 2014-1A, Class C
2.81%, 11/15/2018, 144A | | | 1,575,000 | | | | 1,578,235 | |
Chase Issuance Trust | | | | | | | | |
Series 2012-A5, Class A5 | | | | | | | | |
0.59%, 08/15/2017 | | | 875,000 | | | | 875,794 | |
Series 2012-A8, Class A8 | | | | | | | | |
0.54%, 10/16/2017 (A) | | | 1,350,000 | | | | 1,350,612 | |
Series 2013-A8, Class A8 | | | | | | | | |
1.01%, 10/15/2018 | | | 2,940,000 | | | | 2,949,590 | |
The Notes to Financial Statements are an integral part of this report.
| | |
| Transamerica Funds | | Annual Report 2014 |
Page 47
Transamerica Bond
SCHEDULE OF INVESTMENTS (continued)
At October 31, 2014
| | | | | | | | |
| | | Principal | | | Value | |
ASSET-BACKED SECURITIES (continued) | | | | | |
United States (continued) | | | | | | | | |
Chase Issuance Trust (continued) | | | | | | | | |
Series 2013-A9, Class A | | | | | | | | |
0.57%, 11/16/2020 (B) | | | $ 9,850,000 | | | | $ 9,869,976 | |
Citibank Credit Card Issuance Trust | | | | | | | | |
Series 2013-A10, Class A10 | | | | | | | | |
0.73%, 02/07/2018 | | | 7,875,000 | | | | 7,885,505 | |
Series 2013-A2, Class A2 | | | | | | | | |
0.43%, 05/26/2020 (B) | | | 3,967,000 | | | | 3,962,593 | |
Series 2013-A3, Class A3 | | | | | | | | |
1.11%, 07/23/2018 | | | 7,507,075 | | | | 7,544,866 | |
Colony American Homes
Series 2014-1A, Class D
2.40%, 05/17/2031, 144A (B) | | | 365,000 | | | | 352,137 | |
CPS Auto Receivables Trust
Series 2014-C, Class C
3.77%, 08/17/2020, 144A | | | 665,000 | | | | 668,889 | |
CVS Pass-Through Trust
6.94%, 01/10/2030 (A) | | | 1,105,147 | | | | 1,339,723 | |
CWABS Asset-Backed Certificates Trust
Series 2004-13, Class AF5B
5.10%, 05/25/2035 (B) | | | 625,000 | | | | 613,011 | |
First Investors Auto Owner Trust | | | | | | | | |
Series 2014-1A, Class D | | | | | | | | |
3.28%, 04/15/2021, 144A | | | 615,000 | | | | 615,945 | |
Series 2014-2A, Class D | | | | | | | | |
3.47%, 02/15/2021, 144A | | | 895,000 | | | | 897,957 | |
Flagship Credit Auto Trust | | | | | | | | |
Series 2013-2, Class C | | | | | | | | |
4.42%, 12/16/2019, 144A | | | 1,335,000 | | | | 1,367,639 | |
Series 2014-2, Class C | | | | | | | | |
3.95%, 12/15/2020, 144A | | | 625,000 | | | | 625,213 | |
Ford Credit Auto Owner Trust | | | | | | | | |
Series 2011-B, Class A4 | | | | | | | | |
1.35%, 12/15/2016 | | | 1,105,190 | | | | 1,108,662 | |
Series 2013-B, Class A3 | | | | | | | | |
0.57%, 10/15/2017 | | | 2,145,000 | | | | 2,146,727 | |
Series 2013-D, Class A3 | | | | | | | | |
0.67%, 04/15/2018 | | | 2,975,000 | | | | 2,976,252 | |
Honda Auto Receivables Owner Trust | | | | | | | | |
Series 2012-4, Class A3 | | | | | | | | |
0.52%, 08/18/2016 | | | 3,307,340 | | | | 3,310,055 | |
Series 2013-2, Class A3 | | | | | | | | |
0.53%, 02/16/2017 | | | 1,635,000 | | | | 1,636,104 | |
Nissan Auto Receivables Owner Trust
Series 2011-A, Class A4
1.94%, 09/15/2017 | | | 455,930 | | | | 458,541 | |
OneMain Financial Issuance Trust | | | | | | | | |
Series 2014-1A, Class A | | | | | | | | |
2.43%, 06/18/2024, 144A | | | 2,010,000 | | | | 2,020,854 | |
Series 2014-2A, Class B | | | | | | | | |
3.02%, 09/18/2024, 144A | | | 920,000 | | | | 919,999 | |
Santander Drive Auto Receivables Trust
Series 2014-4, Class D
3.10%, 11/16/2020 | | | 1,400,000 | | | | 1,409,451 | |
SNAAC Auto Receivables Trust
Series 2014-1A, Class D
2.88%, 01/15/2020, 144A | | | 465,000 | | | | 468,187 | |
| | | | | | | | |
| | | Principal | | | Value | |
ASSET-BACKED SECURITIES (continued) | | | | | |
United States (continued) | | | | | | | | |
SoFi Professional Loan Program LLC
Series 2014-A, Class A2
3.02%, 10/25/2027, 144A | | | $ 216,303 | | | | $ 219,066 | |
Springleaf Funding Trust | | | | | | | | |
Series 2013-BA, Class A | | | | | | | | |
3.92%, 01/16/2023, 144A | | | 3,750,000 | | | | 3,830,400 | |
Series 2014-AA, Class A | | | | | | | | |
2.41%, 12/15/2022, 144A | | | 2,330,000 | | | | 2,335,117 | |
Series 2014-AA, Class B | | | | | | | | |
3.45%, 12/15/2022, 144A | | | 800,000 | | | | 803,939 | |
World Omni Auto Receivables Trust
Series 2013-A, Class A3
0.64%, 04/16/2018 | | | 1,299,000 | | | | 1,299,603 | |
| | | | | | | | |
Total Asset-Backed Securities
(Cost $79,190,348) | | | | | | | 79,757,713 | |
| | | | | | | | |
|
PREFERRED CORPORATE DEBT SECURITIES - 0.2% | |
United States - 0.2% | | | | | | | | |
Hercules, Inc.
6.50%, 06/30/2029 | | | 1,260,000 | | | | 1,146,600 | |
NGC Corp. Capital Trust I
8.32%, 06/01/2027 | | | 200,000 | | | | 26,250 | |
| | | | | | | | |
Total Preferred Corporate Debt Securities
(Cost $1,083,537) | | | | | | | 1,172,850 | |
| | | | | | | | |
|
CORPORATE DEBT SECURITIES - 59.7% | |
Australia - 0.2% | | | | | | | | |
Newcrest Finance Pty, Ltd.
4.20%, 10/01/2022, 144A | | | 830,000 | | | | 753,585 | |
Virgin Australia Trust
5.00%, 04/23/2025, 144A | | | 500,313 | | | | 515,322 | |
| | | | | | | | |
| | | | | | | 1,268,907 | |
| | | | | | | | |
Austria - 0.0% (D) | | | | | | | | |
OGX Austria GmbH | | | | | | | | |
8.38%, 04/01/2022, 144A (E) | | | 6,100,000 | | | | 122,000 | |
8.50%, 06/01/2018, 144A (E) | | | 600,000 | | | | 12,000 | |
| | | | | | | | |
| | | | | | | 134,000 | |
| | | | | | | | |
Belgium - 0.1% | | | | | | | | |
Delhaize Group SA
5.70%, 10/01/2040 | | | 500,000 | | | | 533,446 | |
| | | | | | | | |
Brazil - 1.1% | | | | | | | | |
BRF SA
3.95%, 05/22/2023, 144A (A) | | | 4,600,000 | | | | 4,347,000 | |
Cielo SA / Cielo USA, Inc.
3.75%, 11/16/2022, 144A | | | 4,460,000 | | | | 4,203,550 | |
| | | | | | | | |
| | | | | | | 8,550,550 | |
| | | | | | | | |
Canada - 1.4% | | | | | | | | |
Methanex Corp. | | | | | | | | |
3.25%, 12/15/2019 | | | 1,050,000 | | | | 1,062,899 | |
5.25%, 03/01/2022 | | | 350,000 | | | | 384,974 | |
Talisman Energy, Inc.
3.75%, 02/01/2021 | | | 2,110,000 | | | | 2,108,753 | |
Valeant Pharmaceuticals International, Inc. | | | | | | | | |
6.38%, 10/15/2020, 144A | | | 3,900,000 | | | | 4,002,375 | |
6.75%, 08/15/2021, 144A | | | 1,670,000 | | | | 1,724,275 | |
7.25%, 07/15/2022, 144A | | | 1,395,000 | | | | 1,471,725 | |
| | | | | | | | |
| | | | | | | 10,755,001 | |
| | | | | | | | |
The Notes to Financial Statements are an integral part of this report.
| | |
| Transamerica Funds | | Annual Report 2014 |
Page 48
Transamerica Bond
SCHEDULE OF INVESTMENTS (continued)
At October 31, 2014
| | | | | | | | |
| | | Principal | | | Value | |
CORPORATE DEBT SECURITIES (continued) | |
Cayman Islands - 0.9% | | | | | | | | |
Odebrecht Drilling Norbe VIII/IX, Ltd.
6.35%, 06/30/2021, 144A | | | $ 962,500 | | | | $ 1,015,630 | |
Odebrecht Finance, Ltd.
4.38%, 04/25/2025, 144A (A) | | | 4,568,000 | | | | 4,293,920 | |
Schahin II Finance Co. SPV, Ltd.
5.88%, 09/25/2023, 144A (A) | | | 1,259,067 | | | | 1,189,818 | |
Transocean, Inc.
3.80%, 10/15/2022 (A) | | | 580,000 | | | | 522,247 | |
| | | | | | | | |
| | | | | | | 7,021,615 | |
| | | | | | | | |
Colombia - 0.4% | | | | | | | | |
Ecopetrol SA | | | | | | | | |
5.88%, 09/18/2023 | | | 1,829,000 | | | | 2,039,335 | |
5.88%, 05/28/2045 (A) | | | 1,025,000 | | | | 1,053,188 | |
| | | | | | | | |
| | | | | | | 3,092,523 | |
| | | | | | | | |
France - 0.0% (D) | | | | | | | | |
Societe Generale SA
Series MTN
5.20%, 04/15/2021, 144A | | | 200,000 | | | | 224,358 | |
| | | | | | | | |
Italy - 1.1% | | | | | | | | |
Enel SpA
8.75%, 09/24/2073, 144A (A) (B) | | | 4,563,000 | | | | 5,327,302 | |
Intesa Sanpaolo SpA
5.02%, 06/26/2024, 144A | | | 2,710,000 | | | | 2,648,521 | |
Telecom Italia SpA
5.30%, 05/30/2024, 144A | | | 650,000 | | | | 658,125 | |
| | | | | | | | |
| | | | | | | 8,633,948 | |
| | | | | | | | |
Luxembourg - 2.5% | | | | | | | | |
Altice SA
7.75%, 05/15/2022, 144A (A) | | | 580,000 | | | | 609,000 | |
ArcelorMittal | | | | | | | | |
6.75%, 02/25/2022 (A) | | | 175,000 | | | | 194,268 | |
7.50%, 10/15/2039 (A) | | | 6,975,000 | | | | 7,445,812 | |
Telecom Italia Capital SA | | | | | | | | |
6.00%, 09/30/2034 | | | 6,085,000 | | | | 5,993,725 | |
6.38%, 11/15/2033 | | | 4,815,000 | | | | 4,863,150 | |
| | | | | | | | |
| | | | | | | 19,105,955 | |
| | | | | | | | |
Mexico - 1.0% | | | | | | | | |
America Movil SAB de CV
8.46%, 12/18/2036 | | | MXN 59,500,000 | | | | 4,348,372 | |
Mexichem SAB de CV | | | | | | | | |
4.88%, 09/19/2022, 144A (A) | | | $ 800,000 | | | | 853,000 | |
5.88%, 09/17/2044, 144A (A) | | | 750,000 | | | | 750,000 | |
Petroleos Mexicanos
4.88%, 01/18/2024 (A) | | | 1,980,000 | | | | 2,093,850 | |
| | | | | | | | |
| | | | | | | 8,045,222 | |
| | | | | | | | |
Netherlands - 2.9% | | | | | | | | |
Bharti Airtel International Netherlands BV
5.35%, 05/20/2024, 144A | | | 615,000 | | | | 660,928 | |
Cooperatieve Centrale Raiffeisen-
Boerenleenbank BA
4.63%, 12/01/2023 | | | 3,550,000 | | | | 3,731,146 | |
Enel Finance International NV | | | | | | | | |
6.00%, 10/07/2039, 144A | | | 8,360,000 | | | | 9,582,884 | |
6.80%, 09/15/2037, 144A (A) | | | 100,000 | | | | 123,871 | |
| | | | | | | | |
| | | Principal | | | Value | |
CORPORATE DEBT SECURITIES (continued) | |
Netherlands (continued) | | | | | | | | |
ING Bank NV
5.80%, 09/25/2023, 144A | | | $ 4,200,000 | | | | $ 4,674,272 | |
Petrobras Global Finance BV
6.25%, 03/17/2024 | | | 3,700,000 | | | | 3,934,062 | |
| | | | | | | | |
| | | | | | | 22,707,163 | |
| | | | | | | | |
Spain - 0.8% | | | | | | | | |
Telefonica Emisiones SAU
7.05%, 06/20/2036 | | | 5,010,000 | | | | 6,432,514 | |
| | | | | | | | |
United Kingdom - 2.2% | | | | | | | | |
Barclays PLC
4.38%, 09/11/2024 | | | 5,815,000 | | | | 5,640,841 | |
British Airways Pass-Through Trust | | | | | | | | |
4.63%, 06/20/2024, 144A (A) | | | 2,088,055 | | | | 2,197,677 | |
5.63%, 12/20/2021, 144A | | | 2,207,996 | | | | 2,334,956 | |
HBOS PLC
6.00%, 11/01/2033, 144A | | | 200,000 | | | | 225,162 | |
Lloyds Banking Group PLC
4.50%, 11/04/2024 (F) | | | 2,000,000 | | | | 2,001,606 | |
Royal Bank of Scotland Group PLC
6.13%, 12/15/2022 | | | 4,200,000 | | | | 4,546,572 | |
| | | | | | | | |
| | | | | | | 16,946,814 | |
| | | | | | | | |
United States - 45.1% | | | | | | | | |
Advance Auto Parts, Inc.
4.50%, 12/01/2023 | | | 2,100,000 | | | | 2,215,800 | |
Air Lease Corp. | | | | | | | | |
4.25%, 09/15/2024 | | | 1,865,000 | | | | 1,869,662 | |
4.75%, 03/01/2020 | | | 930,000 | | | | 992,775 | |
Alcatel-Lucent USA, Inc. | | | | | | | | |
6.45%, 03/15/2029 (A) | | | 3,050,000 | | | | 2,935,625 | |
6.50%, 01/15/2028 (A) | | | 1,275,000 | | | | 1,227,188 | |
Alcoa, Inc. | | | | | | | | |
5.90%, 02/01/2027 (A) | | | 3,590,000 | | | | 3,819,523 | |
6.75%, 01/15/2028 | | | 570,000 | | | | 639,417 | |
Allegheny Technologies, Inc.
5.95%, 01/15/2021 | | | 3,585,000 | | | | 3,766,164 | |
American Airlines Pass-Through Trust | | | | | | | | |
4.38%, 04/01/2024 | | | 845,000 | | | | 854,549 | |
5.60%, 01/15/2022, 144A | | | 3,959,571 | | | | 4,038,762 | |
American International Group, Inc. | | | | | | | | |
6.25%, 03/15/2087 | | | 343,000 | | | | 378,963 | |
8.18%, 05/15/2068 (B) | | | 365,000 | | | | 495,488 | |
Arrow Electronics, Inc.
3.00%, 03/01/2018 | | | 1,640,000 | | | | 1,692,508 | |
Aviation Capital Group Corp.
6.75%, 04/06/2021, 144A | | | 1,055,000 | | | | 1,202,700 | |
Avon Products, Inc.
5.00%, 03/15/2023 (A) | | | 2,295,000 | | | | 2,113,392 | |
Bank of America Corp. | | | | | | | | |
6.05%, 05/16/2016 | | | 100,000 | | | | 107,056 | |
6.11%, 01/29/2037 | | | 1,725,000 | | | | 2,018,454 | |
8.00%, 01/30/2018 (B) (G) | | | 215,000 | | | | 231,394 | |
Series MTN | | | | | | | | |
4.20%, 08/26/2024 | | | 2,930,000 | | | | 2,950,982 | |
4.25%, 10/22/2026 | | | 2,414,000 | | | | 2,396,095 | |
6.05%, 06/01/2034 | | | 820,000 | | | | 951,349 | |
The Notes to Financial Statements are an integral part of this report.
| | |
| Transamerica Funds | | Annual Report 2014 |
Page 49
Transamerica Bond
SCHEDULE OF INVESTMENTS (continued)
At October 31, 2014
| | | | | | | | |
| | | Principal | | | Value | |
CORPORATE DEBT SECURITIES (continued) | |
United States (continued) | | | | | | | | |
Barrick North America Finance LLC
4.40%, 05/30/2021 | | | $ 1,110,000 | | | | $ 1,138,631 | |
Beazer Homes USA, Inc.
7.25%, 02/01/2023 | | | 85,000 | | | | 84,575 | |
Best Buy Co., Inc.
5.00%, 08/01/2018 | | | 2,190,000 | | | | 2,255,700 | |
BMC Software Finance, Inc.
8.13%, 07/15/2021, 144A (A) | | | 140,000 | | | | 134,050 | |
Braskem America Finance Co.
7.13%, 07/22/2041, 144A | | | 2,765,000 | | | | 2,820,300 | |
Broadridge Financial Solutions, Inc.
3.95%, 09/01/2020 | | | 1,980,000 | | | | 2,068,035 | |
Bruce Mansfield Pass-Through Trust
6.85%, 06/01/2034 | | | 2,284,161 | | | | 2,543,688 | |
California Resources Corp. | | | | | | | | |
5.00%, 01/15/2020, 144A (A) | | | 155,000 | | | | 157,325 | |
5.50%, 09/15/2021, 144A | | | 1,600,000 | | | | 1,632,000 | |
6.00%, 11/15/2024, 144A | | | 250,000 | | | | 255,000 | |
CCO Holdings LLC / CCO Holdings Capital Corp.
5.13%, 02/15/2023 | | | 335,000 | | | | 334,163 | |
CenturyLink, Inc. | | | | | | | | |
7.20%, 12/01/2025 | | | 595,000 | | | | 633,675 | |
7.60%, 09/15/2039 | | | 3,675,000 | | | | 3,711,750 | |
Chesapeake Energy Corp.
6.63%, 08/15/2020 | | | 85,000 | | | | 95,838 | |
CHS / Community Health Systems, Inc. (A) 6.88%, 02/01/2022 | | | 520,000 | | | | 560,300 | |
Cimarex Energy Co.
4.38%, 06/01/2024 | | | 800,000 | | | | 813,000 | |
CIT Group, Inc. | | | | | | | | |
5.00%, 08/15/2022 | | | 310,000 | | | | 324,338 | |
5.00%, 08/01/2023 (A) | | | 1,415,000 | | | | 1,476,906 | |
Citigroup, Inc.
6.00%, 10/31/2033 | | | 11,785,000 | | | | 13,469,465 | |
ConAgra Foods, Inc.
6.63%, 08/15/2039 | | | 3,060,000 | | | | 3,791,707 | |
Continental Airlines Pass-Through Trust | | | | | | | | |
5.50%, 04/29/2022 | | | 761,024 | | | | 804,783 | |
6.25%, 10/11/2021 | | | 254,391 | | | | 269,655 | |
Continental Resources, Inc. | | | | | | | | |
3.80%, 06/01/2024 (A) | | | 1,650,000 | | | | 1,630,398 | |
4.50%, 04/15/2023 | | | 1,100,000 | | | | 1,152,231 | |
CVS Pass-Through Trust | | | | | | | | |
4.16%, 08/10/2036, 144A | | | 3,588,240 | | | | 3,624,490 | |
4.70%, 01/10/2036, 144A | | | 5,381,242 | | | | 5,648,515 | |
DDR Corp.
7.88%, 09/01/2020 | | | 1,585,000 | | | | 1,967,773 | |
Delta Air Lines Pass-Through Trust | | | | | | | | |
6.82%, 02/10/2024 | | | 1,890,268 | | | | 2,183,260 | |
8.02%, 02/10/2024 | | | 1,485,651 | | | | 1,723,355 | |
Dillard’s, Inc.
7.13%, 08/01/2018 | | | 990,000 | | | | 1,111,275 | |
Dynegy Holdings LLC
7.63%, 10/15/2026 (C) | | | 450,000 | | | | 0 | |
Energy Transfer Partners, LP
5.20%, 02/01/2022 | | | 1,095,000 | | | | 1,198,153 | |
| | | | | | | | |
| | | Principal | | | Value | |
CORPORATE DEBT SECURITIES (continued) | |
United States (continued) | | | | | | | | |
EnLink Midstream Partners, LP
4.40%, 04/01/2024 (A) | | | $ 835,000 | | | | $ 878,726 | |
Ford Motor Co.
7.50%, 08/01/2026 | | | 115,000 | | | | 146,975 | |
Ford Motor Credit Co. LLC
Series MTN
1.01%, 01/17/2017 (B) | | | 3,060,000 | | | | 3,078,017 | |
Forethought Financial Group, Inc.
8.63%, 04/15/2021, 144A | | | 1,430,000 | | | | 1,629,757 | |
Fresenius Medical Care US Finance II, Inc. | | | | | | | | |
4.13%, 10/15/2020, 144A | | | 635,000 | | | | 636,984 | |
4.75%, 10/15/2024, 144A | | | 615,000 | | | | 616,922 | |
General Electric Capital Corp.
7.13%, 06/15/2022 (B) (G) | | | 6,600,000 | | | | 7,689,000 | |
General Motors Co.
4.88%, 10/02/2023 (A) | | | 10,860,000 | | | | 11,633,775 | |
Glencore Funding LLC
4.63%, 04/29/2024, 144A | | | 6,205,000 | | | | 6,267,050 | |
GLP Capital, LP / GLP Financing II, Inc. | | | | | | | | |
4.38%, 11/01/2018 | | | 505,000 | | | | 518,888 | |
4.88%, 11/01/2020 | | | 1,390,000 | | | | 1,445,600 | |
Goldman Sachs Group, Inc.
6.45%, 05/01/2036 | | | 4,950,000 | | | | 5,837,545 | |
HCA, Inc. | | | | | | | | |
5.00%, 03/15/2024 | | | 8,345,000 | | | | 8,605,865 | |
7.05%, 12/01/2027 | | | 180,000 | | | | 186,300 | |
7.50%, 12/15/2023 - 11/06/2033 | | | 3,700,000 | | | | 3,934,075 | |
7.69%, 06/15/2025 | | | 2,060,000 | | | | 2,327,800 | |
8.36%, 04/15/2024 | | | 190,000 | | | | 222,300 | |
Series MTN | | | | | | | | |
7.58%, 09/15/2025 | | | 1,020,000 | | | | 1,142,400 | |
7.75%, 07/15/2036 | | | 125,000 | | | | 136,250 | |
HCP, Inc.
3.88%, 08/15/2024 (A) | | | 3,535,000 | | | | 3,533,430 | |
HD Supply, Inc.
7.50%, 07/15/2020 | | | 70,000 | | | | 74,550 | |
Icahn Enterprises, LP / Icahn Enterprises
Finance Corp. | | | | | | | | |
4.88%, 03/15/2019 | | | 1,680,000 | | | | 1,709,400 | |
5.88%, 02/01/2022 | | | 840,000 | | | | 863,100 | |
IFM US Colonial Pipeline 2 LLC
6.45%, 05/01/2021, 144A | | | 2,300,000 | | | | 2,488,158 | |
International Lease Finance Corp. | | | | | | | | |
4.63%, 04/15/2021 (A) | | | 5,000,000 | | | | 5,062,500 | |
8.25%, 12/15/2020 (A) | | | 710,000 | | | | 852,000 | |
INVISTA Finance LLC
4.25%, 10/15/2019, 144A | | | 3,230,000 | | | | 3,254,225 | |
iStar Financial, Inc. | | | | | | | | |
4.00%, 11/01/2017 | | | 2,425,000 | | | | 2,401,962 | |
5.00%, 07/01/2019 (A) | | | 2,040,000 | | | | 2,029,800 | |
Jabil Circuit, Inc.
4.70%, 09/15/2022 (A) | | | 6,020,000 | | | | 6,020,000 | |
Jefferies Group LLC | | | | | | | | |
5.13%, 01/20/2023 | | | 965,000 | | | | 1,022,597 | |
6.25%, 01/15/2036 | | | 3,350,000 | | | | 3,594,617 | |
6.45%, 06/08/2027 | | | 275,000 | | | | 311,363 | |
6.50%, 01/20/2043 | | | 1,805,000 | | | | 2,022,587 | |
6.88%, 04/15/2021 | | | 1,385,000 | | | | 1,622,084 | |
The Notes to Financial Statements are an integral part of this report.
| | |
| Transamerica Funds | | Annual Report 2014 |
Page 50
Transamerica Bond
SCHEDULE OF INVESTMENTS (continued)
At October 31, 2014
| | | | | | | | |
| | | Principal | | | Value | |
CORPORATE DEBT SECURITIES (continued) | |
United States (continued) | | | | | | | | |
JPMorgan Chase & Co.
3.88%, 09/10/2024 | | | $ 5,875,000 | | | | $ 5,836,771 | |
KB Home | | | | | | | | |
7.50%, 09/15/2022 | | | 2,210,000 | | | | 2,381,275 | |
8.00%, 03/15/2020 | | | 1,280,000 | | | | 1,427,200 | |
Keysight Technologies, Inc.
4.55%, 10/30/2024, 144A | | | 3,860,000 | | | | 3,858,305 | |
KLA-Tencor Corp.
4.13%, 11/01/2021 | | | 2,960,000 | | | | 2,980,329 | |
Ladder Capital Finance Holdings LLLP / Ladder Capital Finance Corp. | | | | | | | | |
5.88%, 08/01/2021, 144A | | | 2,365,000 | | | | 2,344,306 | |
7.38%, 10/01/2017 | | | 1,020,000 | | | | 1,078,650 | |
Lennar Corp.
4.75%, 11/15/2022 | | | 855,000 | | | | 842,175 | |
Level 3 Financing, Inc. | | | | | | | | |
6.13%, 01/15/2021, 144A | | | 655,000 | | | | 686,931 | |
9.38%, 04/01/2019 | | | 100,000 | | | | 106,875 | |
Mackinaw Power LLC
6.30%, 10/31/2023, 144A (H) (I) | | | 933,960 | | | | 1,032,773 | |
Macy’s Retail Holdings, Inc.
6.79%, 07/15/2027 | | | 1,065,000 | | | | 1,295,372 | |
Masco Corp. | | | | | | | | |
5.95%, 03/15/2022 | | | 275,000 | | | | 302,500 | |
6.50%, 08/15/2032 | | | 895,000 | | | | 928,563 | |
7.13%, 03/15/2020 | | | 1,505,000 | | | | 1,719,462 | |
7.75%, 08/01/2029 | | | 415,000 | | | | 483,475 | |
Meccanica Holdings USA, Inc. | | | | | | | | |
6.25%, 07/15/2019 - 01/15/2040, 144A | | | 2,700,000 | | | | 2,667,750 | |
7.38%, 07/15/2039, 144A | | | 5,400,000 | | | | 5,616,000 | |
Morgan Stanley
Series MTN | | | | | | | | |
4.10%, 05/22/2023 | | | 14,285,000 | | | | 14,418,322 | |
8.00%, 05/09/2017 | | | AUD 2,470,000 | | | | 2,388,999 | |
Navient Corp.
5.50%, 01/25/2023 (A) | | | $ 3,220,000 | | | | 3,220,000 | |
New Albertsons, Inc.
7.45%, 08/01/2029 | | | 1,305,000 | | | | 1,200,600 | |
Series MTN 6.63%, 06/01/2028 | | | 4,210,000 | | | | 3,515,350 | |
Newfield Exploration Co.
5.63%, 07/01/2024 | | | 3,610,000 | | | | 3,880,750 | |
NLV Financial Corp.
7.50%, 08/15/2033, 144A | | | 190,000 | | | | 209,304 | |
Northwest Airlines Pass-Through Trust
7.03%, 05/01/2021 | | | 5,398,926 | | | | 6,154,776 | |
Old Republic International Corp.
4.88%, 10/01/2024 | | | 2,550,000 | | | | 2,602,831 | |
Owens Corning
7.00%, 12/01/2036 | | | 4,585,000 | | | | 5,483,825 | |
PulteGroup, Inc. | | | | | | | | |
6.00%, 02/15/2035 | | | 995,000 | | | | 950,225 | |
6.38%, 05/15/2033 | | | 2,060,000 | | | | 2,065,150 | |
7.88%, 06/15/2032 | | | 3,500,000 | | | | 4,020,625 | |
QEP Resources, Inc.
5.38%, 10/01/2022 | | | 100,000 | | | | 98,500 | |
| | | | | | | | |
| | | Principal | | | Value | |
CORPORATE DEBT SECURITIES (continued) | |
United States (continued) | | | | | | | | |
Qwest Capital Funding, Inc. | | | | | | | | |
6.88%, 07/15/2028 (A) | | | $ 1,510,000 | | | | $ 1,525,100 | |
7.63%, 08/03/2021 | | | 1,000,000 | | | | 1,095,000 | |
Regency Energy Partners, LP / Regency Energy Finance Corp. | | | | | | | | |
4.50%, 11/01/2023 | | | 565,000 | | | | 560,763 | |
5.75%, 09/01/2020 | | | 1,315,000 | | | | 1,397,187 | |
5.88%, 03/01/2022 | | | 150,000 | | | | 159,750 | |
Reliance Holding USA, Inc.
5.40%, 02/14/2022, 144A | | | 500,000 | | | | 544,437 | |
Rialto Holdings LLC / Rialto Corp.
7.00%, 12/01/2018, 144A (A) | | | 1,960,000 | | | | 2,004,100 | |
Rio Oil Finance Trust
6.25%, 07/06/2024, 144A (A) | | | 1,895,000 | | | | 1,976,059 | |
Rowan Cos, Inc.
4.75%, 01/15/2024 (A) | | | 1,485,000 | | | | 1,478,897 | |
Southwestern Energy Co.
4.10%, 03/15/2022 (A) | | | 1,570,000 | | | | 1,595,907 | |
Springleaf Finance Corp. | | | | | | | | |
7.75%, 10/01/2021 | | | 4,305,000 | | | | 4,864,650 | |
8.25%, 10/01/2023 | | | 1,725,000 | | | | 1,979,437 | |
Sprint Capital Corp.
6.88%, 11/15/2028 | | | 5,495,000 | | | | 5,343,887 | |
Sunoco Logistics Partners Operations, LP
4.25%, 04/01/2024 (A) | | | 1,710,000 | | | | 1,755,729 | |
Targa Resources Partners, LP / Targa Resources Partners Finance Corp. | | | | | | | | |
4.13%, 11/15/2019, 144A | | | 1,706,000 | | | | 1,731,590 | |
4.25%, 11/15/2023 | | | 110,000 | | | | 108,900 | |
5.25%, 05/01/2023 (A) | | | 415,000 | | | | 435,750 | |
6.38%, 08/01/2022 | | | 1,080,000 | | | | 1,161,000 | |
Tenet Healthcare Corp.
5.50%, 03/01/2019, 144A (A) | | | 4,230,000 | | | | 4,325,175 | |
Time Warner Cable, Inc. | | | | | | | | |
4.50%, 09/15/2042 (A) | | | 765,000 | | | | 754,145 | |
5.50%, 09/01/2041 | | | 1,600,000 | | | | 1,807,003 | |
5.88%, 11/15/2040 | | | 770,000 | | | | 906,269 | |
Toys “R” Us, Inc.
7.38%, 10/15/2018 (A) | | | 550,000 | | | | 332,750 | |
Tyson Foods, Inc.
3.95%, 08/15/2024 (A) | | | 3,500,000 | | | | 3,569,671 | |
U.S. Airways Pass-Through Trust | | | | | | | | |
3.95%, 05/15/2027 | | | 905,000 | | | | 911,788 | |
4.63%, 12/03/2026 | | | 1,672,841 | | | | 1,743,937 | |
5.90%, 04/01/2026 (A) | | | 1,641,066 | | | | 1,817,481 | |
8.00%, 04/01/2021 | | | 1,468,558 | | | | 1,626,428 | |
UAL Pass-Through Trust
6.64%, 01/02/2024 | | | 5,114,757 | | | | 5,472,789 | |
United Airlines Pass-Through Trust | | | | | | | | |
3.75%, 03/03/2028 (A) | | | 3,740,000 | | | | 3,786,750 | |
4.00%, 10/11/2027 (A) | | | 3,190,000 | | | | 3,229,875 | |
Universal Health Services, Inc. | | | | | | | | |
3.75%, 08/01/2019, 144A | | | 795,000 | | | | 800,963 | |
4.75%, 08/01/2022, 144A | | | 1,535,000 | | | | 1,562,822 | |
Verizon Communications, Inc.
5.15%, 09/15/2023 | | | 3,205,000 | | | | 3,589,241 | |
The Notes to Financial Statements are an integral part of this report.
| | |
| Transamerica Funds | | Annual Report 2014 |
Page 51
Transamerica Bond
SCHEDULE OF INVESTMENTS (continued)
At October 31, 2014
| | | | | | | | |
| | | Principal | | | Value | |
CORPORATE DEBT SECURITIES (continued) | |
United States (continued) | | | | | | | | |
Weyerhaeuser Co. | | | | | | | | |
6.88%, 12/15/2033 | | | $ 4,740,000 | | | | $ 6,129,166 | |
6.95%, 10/01/2027 | | | 130,000 | | | | 162,521 | |
7.38%, 03/15/2032 | | | 1,530,000 | | | | 1,996,740 | |
Whiting Petroleum Corp.
5.75%, 03/15/2021 (A) | | | 1,580,000 | | | | 1,666,900 | |
| | | | | | | | |
| | | | | | | 352,017,308 | |
| | | | | | | | |
Total Corporate Debt Securities
(Cost $434,320,153) | | | | | | | 465,469,324 | |
| | | | | | | | |
| | |
CONVERTIBLE BONDS - 7.8% | | | | | | | | |
United States - 7.8% | | | | | | | | |
BioMarin Pharmaceutical, Inc. | | | | | | | | |
0.75%, 10/15/2018 (A) | | | 1,397,000 | | | | 1,607,423 | |
1.50%, 10/15/2020 (A) | | | 198,000 | | | | 232,774 | |
Ciena Corp.
3.75%, 10/15/2018, 144A | | | 4,125,000 | | | | 4,779,844 | |
Emergent Biosolutions, Inc.
2.88%, 01/15/2021, 144A (A) | | | 1,220,000 | | | | 1,249,738 | |
Ford Motor Co.
Series 2012-D, Class A3
4.25%, 11/15/2016 | | | 985,000 | | | | 1,622,172 | |
Gilead Sciences, Inc.
Series D
1.63%, 05/01/2016 | | | 1,230,000 | | | | 6,050,062 | |
Hornbeck Offshore Services, Inc.
1.50%, 09/01/2019 (A) | | | 980,000 | | | | 934,675 | |
Intel Corp.
3.25%, 08/01/2039 | | | 1,255,000 | | | | 2,081,731 | |
Lennar Corp. | | | | | | | | |
2.75%, 12/15/2020, 144A | | | 2,120,000 | | | | 4,139,300 | |
3.25%, 11/15/2021, 144A | | | 1,465,000 | | | | 2,747,791 | |
Level 3 Communications, Inc.
7.00%, 03/15/2015, 144A (H) (I) | | | 2,110,000 | | | | 3,602,825 | |
Level 3 Financing, Inc.
8.63%, 07/15/2020 | | | 985,000 | | | | 1,083,500 | |
Macquarie Infrastructure Co. LLC
2.88%, 07/15/2019 (A) | | | 465,000 | | | | 524,288 | |
Micron Technology, Inc.
Series G
3.00%, 11/15/2043 | | | 1,782,000 | | | | 2,292,097 | |
Mylan, Inc.
3.75%, 09/15/2015 | | | 925,000 | | | | 3,718,500 | |
Novellus Systems, Inc.
2.63%, 05/15/2041 | | | 975,000 | | | | 2,199,234 | |
Old Republic International Corp.
3.75%, 03/15/2018 (A) | | | 1,790,000 | | | | 2,071,925 | |
Palo Alto Networks, Inc.
Zero Coupon, 07/01/2019, 144A | | | 505,000 | | | | 591,481 | |
Peabody Energy Corp.
4.75%, 12/15/2066 (A) | | | 1,667,000 | | | | 1,104,388 | |
Priceline Group, Inc. | | | | | | | | |
0.35%, 06/15/2020 (A) | | | 3,515,000 | | | | 3,985,131 | |
1.00%, 03/15/2018 | | | 565,000 | | | | 781,819 | |
Ryland Group, Inc.
1.63%, 05/15/2018 | | | 2,585,000 | | | | 3,350,806 | |
Standard Pacific Corp.
1.25%, 08/01/2032 | | | 3,100,000 | | | | 3,504,937 | |
| | | | | | | | |
| | | Principal | | | Value | |
CONVERTIBLE BONDS (continued) | | | | | |
United States (continued) | | | | | | | | |
Trinity Industries, Inc.
3.88%, 06/01/2036 | | | $ 3,050,000 | | | | $ 4,796,125 | |
Xilinx, Inc.
2.63%, 06/15/2017 (A) | | | 1,180,000 | | | | 1,848,175 | |
| | | | | | | | |
Total Convertible Bonds
(Cost $45,681,528) | | | | | | | 60,900,741 | |
| | | | | | | | |
| | |
LOAN ASSIGNMENT - 0.2% | | | | | | | | |
United States - 0.2% | | | | | | | | |
Albertson’s, Inc., Term Loan
4.75%, 06/27/2021 | | | 1,156,000 | | | | 1,140,828 | |
| | | | | | | | |
Total Loan Assignment
(Cost $1,150,220) | | | | | | | 1,140,828 | |
| | | | | | | | |
|
SHORT-TERM U.S. GOVERNMENT OBLIGATION - 0.2% | |
United States - 0.2% | | | | | | | | |
U.S. Treasury Bill
0.04%, 02/05/2015 (J) | | | 1,910,000 | | | | 1,909,791 | |
| | | | | | | | |
Total Short-Term U.S. Government Obligation
(Cost $1,909,791) | | | | 1,909,791 | |
| | | | | | | | |
| | |
| | | Shares | | | Value | |
CONVERTIBLE PREFERRED STOCKS - 1.2% | | | | | |
United States - 1.2% | | | | | | | | |
Crown Castle International Corp.
Series A, 4.50% | | | 12,925 | | | | 1,313,309 | |
Dominion Resources, Inc.
Series A, 6.13% | | | 12,326 | | | | 701,103 | |
Series B, 6.00% | | | 11,532 | | | | 657,901 | |
NextEra Energy, Inc.
5.89% | | | 32,793 | | | | 2,075,469 | |
Stanley Black & Decker, Inc.
6.25% (A) | | | 933 | | | | 108,256 | |
Tyson Foods, Inc.
4.75% | | | 39,293 | | | | 1,970,937 | |
Wells Fargo & Co.
Series L, 7.50% | | | 1,340 | | | | 1,613,360 | |
Weyerhaeuser Co.
Series A, 6.38% | | | 11,292 | | | | 632,352 | |
| | | | | | | | |
Total Convertible Preferred Stocks
(Cost $8,538,063) | | | | | | | 9,072,687 | |
| | | | | | | | |
| | |
PREFERRED STOCKS - 1.3% | | | | | | | | |
United States - 1.3% | | | | | | | | |
Ally Financial, Inc. | | | | | | | | |
Series A , 8.50% (B) | | | 93,825 | | | | 2,484,486 | |
Series G , 7.00% , 144A | | | 5,495 | | | | 5,503,242 | |
Countrywide Capital IV
6.75% | | | 88,375 | | | | 2,260,633 | |
| | | | | | | | |
Total Preferred Stocks
(Cost $7,751,122) | | | | | | | 10,248,361 | |
| | | | | | | | |
| | |
COMMON STOCK - 0.1% | | | | | | | | |
United States - 0.1% | | | | | | | | |
United Rentals, Inc. (A) (K) | | | 3,951 | | | | 434,847 | |
| | | | | | | | |
Total Common Stock
(Cost $146,558) | | | | | | | 434,847 | |
| | | | | | | | |
The Notes to Financial Statements are an integral part of this report.
| | |
| Transamerica Funds | | Annual Report 2014 |
Page 52
Transamerica Bond
SCHEDULE OF INVESTMENTS (continued)
At October 31, 2014
| | | | | | | | |
| | | Shares | | | Value | |
SECURITIES LENDING COLLATERAL - 9.6% | | | | | |
State Street Navigator Securities Lending Trust - Prime Portfolio 0.16% (L) | | | 75,146,144 | | | | $ 75,146,144 | |
| | | | | | | | |
Total Securities Lending Collateral
(Cost $75,146,144) | | | | | | | 75,146,144 | |
| | | | | | | | |
| | |
| | | Principal | | | Value | |
REPURCHASE AGREEMENT - 0.8% | | | | | | | | |
State Street Bank & Trust Co. 0.01% (L), dated 10/31/2014, to be repurchased at $6,618,322 on 11/03/2014. Collateralized by U.S. Government Agency Obligations, 2.00%, due 11/01/2027 - 12/01/2027, and with a total value of $6,754,193. | | | $ 6,618,316 | | | | 6,618,316 | |
| | | | | | | | |
Total Repurchase Agreement
(Cost $6,618,316) | | | | 6,618,316 | |
| | | | | | | | |
Total Investments
(Cost $801,627,530) (M) | | | | 854,335,991 | |
Net Other Assets (Liabilities) - (9.5)% | | | | (74,027,755 | ) |
| | | | | | | | |
| | |
Net Assets - 100.0% | | | | | | | $ 780,308,236 | |
| | | | | | | | |
| | | | | | | | | | | | | | |
| FUTURES CONTRACTS: | | | | | | | | | | | |
| Description | | Type | | | Contracts | | Expiration
Date | | | Net Unrealized
Appreciation
(Depreciation) | |
Long U.S. Treasury Bond | | | Short | | | (241) | | | 12/19/2014 | | | $ | (482,114 | ) |
| | | | | | | | | | | | | | |
INVESTMENTS BY INDUSTRY (unaudited):
| | | | | | | | |
| Industry | | Percentage of
Total Investments | | | Value | |
Asset-Backed Securities | | | 9.3 | % | | $ | 79,757,713 | |
Mortgage-Backed Securities | | | 7.7 | | | | 65,815,370 | |
Diversified Financial Services | | | 7.1 | | | | 60,593,459 | |
Diversified Telecommunication Services | | | 4.7 | | | | 39,987,226 | |
U.S. Government Obligations | | | 4.7 | | | | 39,831,060 | |
Airlines | | | 4.6 | | | | 39,666,143 | |
Foreign Government Obligations | | | 4.2 | | | | 35,995,252 | |
Oil, Gas & Consumable Fuels | | | 3.6 | | | | 30,554,899 | |
Banks | | | 3.2 | | | | 27,107,082 | |
Household Durables | | | 3.0 | | | | 25,514,059 | |
Health Care Providers & Services | | | 2.9 | | | | 25,058,156 | |
Metals & Mining | | | 2.8 | | | | 24,024,450 | |
Capital Markets | | | 2.7 | | | | 22,644,866 | |
Real Estate Investment Trusts | | | 2.4 | | | | 20,167,053 | |
Electric Utilities | | | 2.1 | | | | 18,142,299 | |
Consumer Finance | | | 2.1 | | | | 18,051,815 | |
Food & Staples Retailing | | | 1.8 | | | | 15,663,229 | |
Food Products | | | 1.6 | | | | 13,679,315 | |
Automobiles | | | 1.6 | | | | 13,402,922 | |
Electronic Equipment, Instruments & Components | | | 1.4 | | | | 12,162,294 | |
Semiconductors & Semiconductor Equipment | | | 1.3 | | | | 11,401,566 | |
Energy Equipment & Services | | | 1.3 | | | | 11,262,118 | |
The Notes to Financial Statements are an integral part of this report.
| | |
| Transamerica Funds | | Annual Report 2014 |
Page 53
Transamerica Bond
SCHEDULE OF INVESTMENTS (continued)
At October 31, 2014
INVESTMENTS BY INDUSTRY (unaudited) (continued):
| | | | | | | | |
| Industry | | Percentage of
Total Investments | | | Value | |
Pharmaceuticals | | | 1.3 | % | | $ | 10,916,875 | |
Chemicals | | | 1.2 | | | | 10,271,998 | |
Biotechnology | | | 1.1 | | | | 9,139,997 | |
Communications Equipment | | | 1.0 | | | | 8,942,657 | |
Building Products | | | 1.0 | | | | 8,917,825 | |
Aerospace & Defense | | | 1.0 | | | | 8,283,750 | |
Insurance | | | 0.9 | | | | 7,388,268 | |
Trading Companies & Distributors | | | 0.9 | | | | 7,342,122 | |
Machinery | | | 0.6 | | | | 4,904,381 | |
Specialty Retail | | | 0.6 | | | | 4,804,250 | |
Internet & Catalog Retail | | | 0.6 | | | | 4,766,950 | |
Media | | | 0.5 | | | | 4,410,580 | |
Wireless Telecommunication Services | | | 0.5 | | | | 4,348,372 | |
Construction & Engineering | | | 0.5 | | | | 4,293,920 | |
Professional Services | | | 0.5 | | | | 4,203,550 | |
Independent Power and Renewable Electricity Producers | | | 0.3 | | | | 2,569,938 | |
Multiline Retail | | | 0.3 | | | | 2,406,647 | |
Personal Products | | | 0.2 | | | | 2,113,392 | |
IT Services | | | 0.2 | | | | 2,068,035 | |
Real Estate Management & Development | | | 0.2 | | | | 2,004,100 | |
Hotels, Restaurants & Leisure | | | 0.2 | | | | 1,964,488 | |
Multi-Utilities | | | 0.2 | | | | 1,359,004 | |
Road & Rail | | | 0.1 | | | | 1,202,700 | |
U.S. Government Agency Obligations | | | 0.1 | | | | 822,707 | |
Commercial Services & Supplies | | | 0.1 | | | | 524,288 | |
Software | | | 0.0 | (D) | | | 134,050 | |
Distributors | | | 0.0 | (D) | | | 74,550 | |
| | | | | | | | |
Investments, at Value | | | 90.2 | | | | 770,661,740 | |
Short-Term Investments | | | 9.8 | | | | 83,674,251 | |
| | | | | | | | |
Total Investments | | | 100.0 | % | | $ | 854,335,991 | |
| | | | | | | | |
SECURITY VALUATION:
Valuation Inputs (N)
| | | | | | | | | | | | | | | | |
| | | Level 1
Quoted Prices | | | Level 2
Other Significant
Observable Inputs | | | Level 3
Significant
Unobservable Inputs (O) | | | Value at
October 31, 2014 | |
ASSETS | | | | | | | | | | | | | | | | |
Investments | | | | | | | | | | | | | | | | |
U.S. Government Obligations | | $ | — | | | $ | 39,831,060 | | | $ | — | | | $ | 39,831,060 | |
U.S. Government Agency Obligations | | | — | | | | 822,707 | | | | — | | | | 822,707 | |
Foreign Government Obligations | | | — | | | | 35,995,252 | | | | — | | | | 35,995,252 | |
Mortgage-Backed Securities | | | — | | | | 65,815,370 | | | | — | | | | 65,815,370 | |
Asset-Backed Securities | | | — | | | | 79,757,713 | | | | — | | | | 79,757,713 | |
Preferred Corporate Debt Securities | | | — | | | | 1,172,850 | | | | — | | | | 1,172,850 | |
Corporate Debt Securities | | | | | | | | | | | | | | | | |
Australia | | | — | | | | 1,268,907 | | | | — | | | | 1,268,907 | |
Austria | | | — | | | | 134,000 | | | | — | | | | 134,000 | |
Belgium | | | — | | | | 533,446 | | | | — | | | | 533,446 | |
Brazil | | | — | | | | 8,550,550 | | | | — | | | | 8,550,550 | |
Canada | | | — | | | | 10,755,001 | | | | — | | | | 10,755,001 | |
Cayman Islands | | | — | | | | 7,021,615 | | | | — | | | | 7,021,615 | |
Colombia | | | — | | | | 3,092,523 | | | | — | | | | 3,092,523 | |
France | | | — | | | | 224,358 | | | | — | | | | 224,358 | |
The Notes to Financial Statements are an integral part of this report.
| | |
| Transamerica Funds | | Annual Report 2014 |
Page 54
Transamerica Bond
SCHEDULE OF INVESTMENTS (continued)
At October 31, 2014
SECURITY VALUATION (continued):
Valuation Inputs (continued) (N)
| | | | | | | | | | | | | | | | |
| | | Level 1
Quoted Prices | | | Level 2
Other Significant
Observable Inputs | | | Level 3
Significant
Unobservable Inputs (O) | | | Value at
October 31, 2014 | |
ASSETS (continued) | | | | | | | | | | | | | | | | |
Investments (continued) | | | | | | | | | | | | | | | | |
Italy | | $ | — | | | $ | 8,633,948 | | | $ | — | | | $ | 8,633,948 | |
Luxembourg | | | — | | | | 19,105,955 | | | | — | | | | 19,105,955 | |
Mexico | | | — | | | | 8,045,222 | | | | — | | | | 8,045,222 | |
Netherlands | | | — | | | | 22,707,163 | | | | — | | | | 22,707,163 | |
Spain | | | — | | | | 6,432,514 | | | | — | | | | 6,432,514 | |
United Kingdom | | | — | | | | 16,946,814 | | | | — | | | | 16,946,814 | |
United States | | | — | | | | 352,017,308 | | | | 0 | | | | 352,017,308 | |
Convertible Bonds | | | — | | | | 60,900,741 | | | | — | | | | 60,900,741 | |
Loan Assignment | | | — | | | | 1,140,828 | | | | — | | | | 1,140,828 | |
Short-Term U.S. Government Obligation | | | — | | | | 1,909,791 | | | | — | | | | 1,909,791 | |
Convertible Preferred Stocks | | | 9,072,687 | | | | — | | | | — | | | | 9,072,687 | |
Preferred Stocks | | | 10,248,361 | | | | — | | | | — | | | | 10,248,361 | |
Common Stock | | | 434,847 | | | | — | | | | — | | | | 434,847 | |
Securities Lending Collateral | | | 75,146,144 | | | | — | | | | — | | | | 75,146,144 | |
Repurchase Agreement | | | — | | | | 6,618,316 | | | | — | | | | 6,618,316 | |
| | | | | | | | | | | | | | | | |
Total Investments | | $ | 94,902,039 | | | $ | 759,433,952 | | | $ | 0 | | | $ | 854,335,991 | |
| | | | | | | | | | | | | | | | |
LIABILITIES | | | | | | | | | | | | | | | | |
Derivative Financial Instruments | | | | | | | | | | | | | | | | |
Futures Contracts (P) | | $ | (482,114 | ) | | $ | — | | | $ | — | | | $ | (482,114 | ) |
| | | | | | | | | | | | | | | | |
Total Derivative Financial Instruments | | $ | (482,114 | ) | | $ | — | | | $ | — | | | $ | (482,114 | ) |
| | | | | | | | | | | | | | | | |
FOOTNOTES TO SCHEDULE OF INVESTMENTS:
| (A) | All or a portion of this security is on loan. The value of all securities on loan is $73,571,277. The amount of securities on loan indicated may not correspond with the securities on loan identified because securities with pending sales are in the process of recall from the brokers. |
| (B) | Floating or variable rate security. Rate is listed as of October 31, 2014. |
| (C) | Fair valued as determined in good faith in accordance with procedures established by the board of trustees. Total aggregate fair value of securities is $0, or less than 0.01% of the Fund’s net assets. |
| (D) | Percentage rounds to less than 0.1% or (0.1)%. |
| (F) | When-issued security. A conditional transaction in a security authorized for issuance, but not yet issued. |
| (G) | The security has a perpetual maturity. The date shown is the next call date. |
| (H) | Total aggregate value of illiquid securities is $4,635,598, or 0.59% of the Fund’s net assets. |
| (I) | At October 31, 2014, the Fund owned the respective securities which were restricted to public resale: |
| | | | | | | | | | | | | | | | | | |
| Investments | | Description | | Acquisition
Date | | | Cost | | | Value | | | Value as % of
Net Assets | |
Corporate Debt Securities | | Mackinaw Power LLC | | | 06/15/2007 | | | $ | 933,960 | | | $ | 1,032,773 | | | | 0.13 | % |
| | | | | |
Convertible Bonds | | Level 3 Communications, Inc. | | | 06/22/2009 | | | | 2,106,721 | | | | 3,602,825 | | | | 0.46 | |
| | | | | | | | | | | | | | | | | | |
| | | | | | | | $ | 3,040,681 | | | $ | 4,635,598 | | | | 0.59 | % |
| | | | | | | | | | | | | | | | | | |
| (J) | All or a portion of this security has been segregated by the custodian as collateral to cover margin requirements for open futures contracts. Total value of securities segregated as collateral to cover margin requirements for open futures contracts is $564,868. |
| (K) | Non-income producing security. |
| (L) | Rate shown reflects the yield at October 31, 2014. |
| (M) | Aggregate cost for federal income tax purposes is $801,755,128. Aggregate gross unrealized appreciation and depreciation for all securities is $64,805,807 and $12,224,944, respectively. Net unrealized appreciation for tax purposes is $52,580,863. |
The Notes to Financial Statements are an integral part of this report.
| | |
| Transamerica Funds | | Annual Report 2014 |
Page 55
Transamerica Bond
SCHEDULE OF INVESTMENTS (continued)
At October 31, 2014
FOOTNOTES TO SCHEDULE OF INVESTMENTS (continued):
| (N) | The Fund recognizes transfers between Levels at the end of the reporting period. There were no transfers between Level 1, 2 and 3 during the period ended October 31, 2014. See the Notes to Financial Statements for more information regarding security valuation and pricing inputs. |
| (O) | Level 3 securities were not considered significant to the Fund. |
| (P) | Derivative financial instruments valued at unrealized appreciation (depreciation) on the instrument. |
DEFINITIONS:
| | |
| 144A | | 144A securities are registered pursuant to Rule 144A of the Securities Act of 1933. These securities are deemed to be liquid for purposes of compliance limitations on holdings of illiquid securities and may be resold as transactions exempt from registration, normally to qualified institutional buyers. At October 31, 2014, these securities aggregated $169,562,896, or 21.73% of the Fund’s net assets. |
| MTN | | Medium Term Note |
CURRENCY ABBREVIATIONS:
| | |
| AUD | | Australian Dollar |
| BRL | | Brazilian Real |
| INR | | Indian Rupee |
| MXN | | Mexican Peso |
The Notes to Financial Statements are an integral part of this report.
| | |
| Transamerica Funds | | Annual Report 2014 |
Page 56
Transamerica Core Bond
SCHEDULE OF INVESTMENTS
At October 31, 2014
| | | | | | | | |
| | | Principal | | | Value | |
U.S. GOVERNMENT OBLIGATIONS - 16.4% | |
U.S. Treasury Bond | | | | | | | | |
4.38%, 02/15/2038 | | | $ 600,000 | | | | $ 746,156 | |
5.00%, 05/15/2037 | | | 1,240,000 | | | | 1,679,232 | |
5.25%, 02/15/2029 | | | 200,000 | | | | 261,906 | |
5.50%, 08/15/2028 | | | 300,000 | | | | 399,844 | |
6.13%, 11/15/2027 - 08/15/2029 | | | 506,000 | | | | 709,768 | |
6.38%, 08/15/2027 (A) | | | 50,000 | | | | 70,891 | |
6.63%, 02/15/2027 (A) | | | 150,000 | | | | 215,215 | |
U.S. Treasury Inflation Indexed Bond
2.50%, 01/15/2029 | | | 2,769,750 | | | | 3,446,392 | |
U.S. Treasury Inflation Indexed Note
1.13%, 01/15/2021 | | | 2,174,740 | | | | 2,296,899 | |
U.S. Treasury Note
0.75%, 12/31/2017 | | | 600,000 | | | | 594,375 | |
U.S. Treasury STRIPS | | | | | | | | |
Zero Coupon, 11/15/2017 - 05/15/2036 | | | 151,262,000 | | | | 119,311,884 | |
Zero Coupon, 02/15/2023 - 08/15/2034 (A) | | | 6,640,000 | | | | 5,022,856 | |
| | | | | | | | |
Total U.S. Government Obligations
(Cost $126,118,899) | | | | 134,755,418 | |
| | | | | | | | |
|
U.S. GOVERNMENT AGENCY OBLIGATIONS - 38.8% | |
Federal Home Loan Mortgage Corp. | | | | | | | | |
1.93%, 04/01/2037 (B) | | | 45,193 | | | | 47,577 | |
1.94%, 05/01/2037 (B) | | | 173,147 | | | | 181,973 | |
2.10%, 10/01/2036 (B) | | | 206,542 | | | | 219,219 | |
2.17%, 12/01/2036 (B) | | | 449,876 | | | | 477,379 | |
2.23%, 12/01/2036 (B) | | | 439,345 | | | | 468,199 | |
2.27%, 11/01/2036 - 06/01/2037 (B) | | | 238,098 | | | | 254,829 | |
2.30%, 09/01/2037 (B) | | | 68,997 | | | | 73,717 | |
2.32%, 02/01/2037 (B) | | | 52,552 | | | | 56,106 | |
2.37%, 11/01/2036 (B) | | | 453,910 | | | | 486,398 | |
2.39%, 05/01/2037 (B) | | | 144,525 | | | | 154,547 | |
2.48%, 10/01/2037 (B) | | | 90,122 | | | | 96,503 | |
2.49%, 05/01/2038 (B) | | | 106,872 | | | | 115,018 | |
2.54%, 04/01/2037 (B) | | | 8,281 | | | | 8,515 | |
2.55%, 12/01/2031 (B) | | | 672,389 | | | | 721,324 | |
2.63%, 05/01/2037 (B) | | | 187,193 | | | | 201,603 | |
2.67%, 04/01/2037 (B) | | | 99,581 | | | | 107,678 | |
2.68%, 11/01/2036 - 05/01/2037 (B) | | | 643,860 | | | | 698,486 | |
2.79%, 03/01/2037 (B) | | | 267,955 | | | | 288,556 | |
2.83%, 05/01/2036 (B) | | | 101,930 | | | | 110,694 | |
3.04%, 03/01/2036 (B) | | | 725,711 | | | | 786,374 | |
3.09%, 10/25/2037 (B) | | | 715,005 | | | | 678,102 | |
3.33%, 02/01/2036 (B) | | | 999,006 | | | | 1,071,382 | |
3.44%, 07/01/2036 (B) | | | 539,026 | | | | 560,923 | |
3.50%, 06/01/2042 - 07/15/2042 | | | 4,383,245 | | | | 4,498,172 | |
4.50%, 05/01/2041 | | | 19,294,967 | | | | 20,947,619 | |
5.00%, 10/01/2018 - 08/01/2040 | | | 1,058,038 | | | | 1,165,573 | |
5.04%, 01/01/2035 (B) | | | 700,400 | | | | 737,130 | |
5.23%, 05/25/2043 | | | 1,335,844 | | | | 1,481,934 | |
5.50%, 02/01/2018 - 12/01/2035 | | | 3,687,774 | | | | 4,030,069 | |
6.00%, 05/01/2017 - 06/01/2037 | | | 920,104 | | | | 1,009,490 | |
6.49%, 10/01/2037 (B) | | | 201,720 | | | | 214,187 | |
6.50%, 05/01/2035 - 02/25/2043 | | | 2,862,111 | | | | 3,292,911 | |
6.50%, 09/25/2043 (B) | | | 190,664 | | | | 218,489 | |
7.00%, 02/25/2043 - 07/25/2043 | | | 498,045 | | | | 590,503 | |
7.50%, 02/01/2038 - 09/25/2043 | | | 778,597 | | | | 913,926 | |
8.50%, 09/01/2015 | | | 8,173 | | | | 8,232 | |
10.00%, 03/17/2026 - 10/01/2030 | | | 550,437 | | | | 616,161 | |
| | | | | | | | |
| | | Principal | | | Value | |
U.S. GOVERNMENT AGENCY OBLIGATIONS (continued) | |
Federal Home Loan Mortgage Corp. (continued) | | | | | |
11.00%, 02/17/2021 | | | $ 94,858 | | | | $ 105,708 | |
Federal Home Loan Mortgage Corp., IO
| | | | | | | | |
7.55%, 08/15/2036 (B) | | | 1,241,089 | | | | 226,445 | |
Federal Home Loan Mortgage Corp.
REMIC | | | | | | | | |
0.40%, 08/15/2023 (B) | | | 527,471 | | | | 530,191 | |
0.45%, 06/15/2024 - 03/15/2036 (B) | | | 344,983 | | | | 345,620 | |
0.55%, 02/15/2033 - 07/15/2037 (B) | | | 2,785,068 | | | | 2,780,865 | |
1.35%, 07/15/2039 (B) | | | 194,199 | | | | 198,088 | |
4.00%, 11/15/2041 - 12/15/2041 | | | 2,527,870 | | | | 2,642,063 | |
4.50%, 06/15/2025 | | | 2,000,000 | | | | 2,228,244 | |
5.00%, 07/15/2033 - 07/15/2041 | | | 6,582,550 | | | | 7,444,719 | |
5.30%, 01/15/2033 | | | 960,877 | | | | 1,048,121 | |
5.50%, 02/15/2022 - 01/15/2039 | | | 5,507,367 | | | | 6,064,400 | |
5.50%, 05/15/2041 (B) | | | 2,869,124 | | | | 2,950,835 | |
5.70%, 10/15/2038 (B) | | | 529,021 | | | | 579,589 | |
5.75%, 10/15/2035 | | | 42,686 | | | | 42,990 | |
6.00%, 05/15/2034 - 06/15/2038 | | | 4,384,282 | | | | 4,788,355 | |
6.25%, 10/15/2023 | | | 482,545 | | | | 527,091 | |
6.50%, 08/15/2021 - 06/15/2032 | | | 2,950,971 | | | | 3,260,961 | |
6.71%, 11/15/2021 (B) | | | 490,918 | | | | 523,700 | |
7.00%, 12/15/2036 | | | 1,421,453 | | | | 1,690,290 | |
7.20%, 11/15/2046 (B) | | | 1,631,229 | | | | 1,919,913 | |
7.50%, 11/15/2036 - 12/15/2036 | | | 1,723,776 | | | | 2,028,963 | |
8.00%, 06/15/2035 (B) | | | 67,602 | | | | 71,817 | |
8.85%, 11/15/2033 (B) | | | 164,315 | | | | 185,768 | |
14.57%, 06/15/2033 (B) | | | 75,207 | | | | 93,974 | |
16.99%, 02/15/2040 (B) | | | 500,000 | | | | 666,454 | |
17.07%, 02/15/2038 (B) | | | 36,534 | | | | 46,919 | |
19.76%, 07/15/2035 (B) | | | 73,047 | | | | 99,231 | |
20.53%, 08/15/2031 (B) | | | 89,829 | | | | 137,477 | |
21.39%, 05/15/2035 (B) | | | 92,961 | | | | 124,798 | |
24.06%, 06/15/2035 (B) | | | 106,059 | | | | 154,926 | |
Federal Home Loan Mortgage Corp. REMIC, IO | | | | | | | | |
1.84%, 01/15/2040 (B) | | | 1,858,139 | | | | 153,871 | |
3.50%, 09/15/2024 | | | 659,699 | | | | 32,136 | |
4.00%, 11/15/2029 - 10/15/2037 | | | 7,063,738 | | | | 613,779 | |
4.50%, 12/15/2024 - 07/15/2037 | | | 3,245,318 | | | | 297,003 | |
5.00%, 04/15/2032 - 08/15/2040 | | | 4,761,981 | | | | 584,697 | |
5.50%, 07/15/2037 | | | 54,245 | | | | 1,046 | |
5.85%, 11/15/2037 - 10/15/2040 (B) | | | 3,048,332 | | | | 456,081 | |
5.90%, 05/15/2038 (B) | | | 613,971 | | | | 93,006 | |
5.95%, 05/15/2039 (B) | | | 616,634 | | | | 84,033 | |
6.10%, 12/15/2039 (B) | | | 827,013 | | | | 112,933 | |
6.19%, 12/15/2039 (B) | | | 1,134,032 | | | | 243,775 | |
6.25%, 01/15/2037 (B) | | | 328,082 | | | | 46,554 | |
6.30%, 11/15/2037 (B) | | | 60,265 | | | | 8,147 | |
6.65%, 09/15/2039 (B) | | | 645,385 | | | | 105,214 | |
Federal Home Loan Mortgage Corp. REMIC, PO | | | | | | | | |
03/15/2019 - 01/15/2040 | | | 7,078,899 | | | | 6,563,503 | |
Federal National Mortgage Association | | | | | | | | |
0.37%, 03/25/2045 - 02/25/2046 (B) | | | 350,903 | | | | 350,762 | |
0.55%, 05/25/2042 (B) | | | 439,444 | | | | 442,027 | |
0.70%, 08/25/2042 (B) | | | 1,769,261 | | | | 1,786,772 | |
1.71%, 07/01/2037 (B) | | | 176,799 | | | | 184,262 | |
1.78%, 09/01/2036 (B) | | | 103,195 | | | | 110,588 | |
The Notes to Financial Statements are an integral part of this report.
| | |
| Transamerica Funds | | Annual Report 2014 |
Page 57
Transamerica Core Bond
SCHEDULE OF INVESTMENTS (continued)
At October 31, 2014
| | | | | | | | |
| | | Principal | | | Value | |
U.S. GOVERNMENT AGENCY OBLIGATIONS (continued) | |
Federal National Mortgage Association (continued) | | | | | |
1.80%, 02/01/2037 (B) | | | $ 154,218 | | | | $ 161,374 | |
1.91%, 02/01/2037 (B) | | | 81,344 | | | | 85,792 | |
1.94%, 09/01/2037 (B) | | | 72,122 | | | | 77,375 | |
2.01%, 11/01/2037 (B) | | | 131,173 | | | | 138,659 | |
2.03%, 08/01/2019 | | | 2,233,000 | | | | 2,244,047 | |
2.14%, 09/01/2036 (B) | | | 243,869 | | | | 264,413 | |
2.24%, 07/01/2037 (B) | | | 129,239 | | | | 138,635 | |
2.26%, 10/01/2036 - 11/01/2037 (B) | | | 328,635 | | | | 352,797 | |
2.33%, 07/01/2037 (B) | | | 127,084 | | | | 136,304 | |
2.34%, 04/01/2036 (B) | | | 128,516 | | | | 137,572 | |
2.35%, 06/01/2036 - 04/01/2037 (B) | | | 242,808 | | | | 262,670 | |
2.36%, 05/01/2036 (B) | | | 207,679 | | | | 224,305 | |
2.45%, 09/01/2036 - 12/01/2036 (B) | | | 170,210 | | | | 182,834 | |
2.50%, 09/01/2037 (B) | | | 3,553 | | | | 3,599 | |
2.51%, 11/01/2036 (B) | | | 320,219 | | | | 346,758 | |
2.56%, 12/01/2036 (B) | | | 435,779 | | | | 469,161 | |
2.77%, 11/01/2036 (B) | | | 72,098 | | | | 76,906 | |
2.87%, 08/01/2037 (B) | | | 175,305 | | | | 187,749 | |
2.88%, 03/01/2036 (B) | | | 939,823 | | | | 998,815 | |
2.94%, 03/01/2036 (B) | | | 263,416 | | | | 282,162 | |
3.12%, 01/01/2022 | | | 2,000,000 | | | | 2,083,110 | |
3.32%, 05/01/2024 | | | 1,000,000 | | | | 1,032,408 | |
3.59%, 10/01/2021 | | | 2,000,000 | | | | 2,141,906 | |
3.89%, 07/01/2021 | | | 6,000,000 | | | | 6,530,401 | |
3.95%, 07/01/2021 | | | 7,000,000 | | | | 7,643,072 | |
4.00%, 04/01/2020 | | | 112,634 | | | | 117,436 | |
4.05%, 01/01/2021 | | | 6,065,000 | | | | 6,619,845 | |
4.25%, 04/01/2021 | | | 2,500,000 | | | | 2,773,516 | |
4.26%, 07/01/2021 | | | 2,500,000 | | | | 2,770,659 | |
4.34%, 06/01/2021 | | | 7,000,000 | | | | 7,756,334 | |
4.45%, 07/01/2026 | | | 1,438,725 | | | | 1,613,388 | |
4.48%, 06/01/2021 | | | 2,180,000 | | | | 2,445,536 | |
4.50%, 08/01/2021 | | | 3,000,000 | | | | 3,354,832 | |
4.55%, 06/25/2043 | | | 189,648 | | | | 206,049 | |
5.00%, 04/01/2022 - 08/01/2040 | | | 2,624,925 | | | | 2,906,513 | |
5.24%, 05/01/2017 | | | 5,816,584 | | | | 6,245,187 | |
5.50%, 01/01/2018 - 07/01/2037 | | | 4,551,234 | | | | 5,062,516 | |
6.00%, 03/01/2019 - 11/01/2037 | | | 11,470,705 | | | | 12,766,266 | |
6.25%, 08/01/2036 (B) | | | 42,417 | | | | 45,506 | |
6.50%, 06/01/2023 - 07/25/2042 | | | 4,513,723 | | | | 5,089,098 | |
7.00%, 12/25/2033 - 02/25/2044 | | | 2,163,898 | | | | 2,498,120 | |
7.50%, 10/01/2037 - 12/25/2045 | | | 1,791,412 | | | | 2,083,202 | |
8.00%, 10/01/2031 | | | 162,209 | | | | 189,756 | |
Federal National Mortgage Association, PO
11/15/2021 - 08/25/2032 | | | 2,039,515 | | | | 1,837,995 | |
Federal National Mortgage Association REMIC | | | | | | | | |
0.35%, 10/27/2037 (B) | | | 1,600,000 | | | | 1,596,866 | |
0.39%, 10/25/2046 (B) | | | 349,737 | | | | 349,817 | |
0.40%, 06/27/2036 (B) | | | 1,183,024 | | | | 1,181,973 | |
0.44%, 07/25/2036 (B) | | | 291,618 | | | | 292,912 | |
0.50%, 08/25/2036 (B) | | | 27,987 | | | | 28,010 | |
0.55%, 06/25/2037 (B) | | | 100,968 | | | | 101,606 | |
0.70%, 08/25/2041 (B) | | | 989,829 | | | | 1,003,833 | |
0.75%, 04/25/2040 (B) | | | 1,268,676 | | | | 1,278,403 | |
2.32%, 12/25/2039 (B) | | | 626,637 | | | | 636,332 | |
4.50%, 02/25/2039 - 10/25/2039 | | | 1,033,312 | | | | 1,110,657 | |
5.00%, 01/25/2018 - 09/25/2040 | | | 2,915,154 | | | | 3,102,262 | |
| | | | | | | | |
| | | Principal | | | Value | |
U.S. GOVERNMENT AGENCY OBLIGATIONS (continued) | |
Federal National Mortgage Association REMIC (continued) | |
5.50%, 08/25/2025 - 10/25/2040 | | | $ 16,100,602 | | | | $ 17,807,293 | |
5.61%, 01/25/2032 (C) | | | 173,540 | | | | 191,245 | |
5.75%, 08/25/2034 | | | 1,000,000 | | | | 1,127,602 | |
5.83%, 05/25/2051 (B) | | | 670,478 | | | | 733,684 | |
5.97%, 06/25/2040 (B) | | | 400,429 | | | | 445,692 | |
6.00%, 03/25/2029 - 12/25/2049 | | | 7,883,084 | | | | 8,730,900 | |
6.19%, 02/25/2040 (B) | | | 473,015 | | | | 513,712 | |
6.25%, 09/25/2038 | | | 146,934 | | | | 165,260 | |
6.44%, 03/25/2040 (B) | | | 488,070 | | | | 547,339 | |
6.50%, 04/18/2028 - 11/25/2041 | | | 1,909,971 | | | | 2,124,106 | |
6.58%, 12/25/2042 (B) | | | 189,360 | | | | 222,935 | |
6.75%, 04/25/2037 | | | 243,650 | | | | 270,253 | |
7.00%, 03/25/2038 - 11/25/2041 | | | 5,469,051 | | | | 6,385,404 | |
7.50%, 05/17/2024 | | | 252,829 | | | | 291,642 | |
8.00%, 02/25/2023 | | | 1,179,854 | | | | 1,333,867 | |
8.27%, 11/25/2037 (B) | | | 638,631 | | | | 749,958 | |
12.36%, 03/25/2040 (B) | | | 708,294 | | | | 823,116 | |
15.90%, 01/25/2034 (B) | | | 55,954 | | | | 72,231 | |
16.50%, 08/25/2035 -
10/25/2035 (B) | | | 210,006 | | | | 269,895 | |
17.16%, 04/25/2040 (B) | | | 398,462 | | | | 524,299 | |
17.46%, 09/25/2024 (B) | | | 292,412 | | | | 384,734 | |
19.11%, 05/25/2034 (B) | | | 265,889 | | | | 360,501 | |
19.71%, 05/25/2035 (B) | | | 440,031 | | | | 604,802 | |
22.16%, 04/25/2037 (B) | | | 221,866 | | | | 304,709 | |
24.01%, 11/25/2035 (B) | | | 211,451 | | | | 312,725 | |
Federal National Mortgage Association
REMIC, IO | | | | | | | | |
0.64%, 10/25/2016 (B) | | | 213,404 | | | | 1,850 | |
1.47%, 01/25/2038 (B) | | | 202,158 | | | | 13,487 | |
1.91%, 04/25/2041 (B) | | | 1,405,199 | | | | 102,551 | |
3.00%, 01/25/2021 | | | 1,684,423 | | | | 104,873 | |
4.29%, 11/25/2040 (B) | | | 2,876,805 | | | | 249,920 | |
4.85%, 07/25/2040 (B) | | | 3,462,049 | | | | 381,019 | |
5.00%, 07/25/2039 | | | 219,682 | | | | 32,912 | |
5.50%, 10/25/2039 | | | 361,879 | | | | 59,197 | |
5.75%, 10/25/2039 (B) | | | 224,552 | | | | 30,071 | |
5.85%, 02/25/2038 - 06/25/2039 (B) | | | 2,647,109 | | | | 369,959 | |
6.03%, 12/25/2039 (B) | | | 67,709 | | | | 9,763 | |
6.10%, 01/25/2040 (B) | | | 856,177 | | | | 114,603 | |
6.20%, 12/25/2037 (B) | | | 1,501,497 | | | | 203,121 | |
6.25%, 07/25/2037 - 05/25/2040 (B) | | | 2,083,265 | | | | 291,039 | |
6.27%, 04/25/2040 (B) | | | 452,996 | | | | 58,833 | |
6.30%, 10/25/2037 - 12/25/2037 (B) | | | 765,290 | | | | 125,649 | |
6.47%, 07/25/2037 (B) | | | 662,380 | | | | 87,681 | |
6.50%, 10/25/2026 - 03/25/2039 (B) | | | 1,846,763 | | | | 273,842 | |
6.55%, 03/25/2036 (B) | | | 2,494,788 | | | | 443,079 | |
6.84%, 03/25/2038 (B) | | | 405,068 | | | | 62,022 | |
6.95%, 02/25/2040 (B) | | | 418,651 | | | | 60,848 | |
Federal National Mortgage Association REMIC, PO | | | | | | | | |
10/25/2023 - 12/25/2043 | | | 8,226,386 | | | | 7,582,142 | |
Financing Corp., PO | | | | | | | | |
Series D-P
09/26/2019 | | | 500,000 | | | | 453,287 | |
Government National Mortgage Association | | | | | | | | |
0.35%, 04/16/2037 (B) | | | 126,231 | | | | 126,037 | |
0.61%, 03/20/2060 (B) | | | 781,305 | | | | 783,608 | |
The Notes to Financial Statements are an integral part of this report.
| | |
| Transamerica Funds | | Annual Report 2014 |
Page 58
Transamerica Core Bond
SCHEDULE OF INVESTMENTS (continued)
At October 31, 2014
| | | | | | | | |
| | | Principal | | | Value | |
U.S. GOVERNMENT AGENCY OBLIGATIONS (continued) | |
Government National Mortgage Association (continued) | |
0.81%, 05/20/2061 - 02/20/2064 (B) | | | $ 4,442,440 | | | | $ 4,474,686 | |
0.86%, 05/20/2061 (B) | | | 1,637,363 | | | | 1,651,632 | |
5.50%, 01/16/2033 - 09/20/2039 | | | 6,864,812 | | | | 7,667,333 | |
5.75%, 02/20/2036 - 10/20/2037 | | | 1,703,751 | | | | 1,875,857 | |
5.82%, 10/20/2033 (B) | | | 495,287 | | | | 548,640 | |
6.00%, 11/20/2033 - 08/20/2038 | | | 1,271,540 | | | | 1,445,632 | |
6.13%, 06/16/2031 | | | 1,584,000 | | | | 1,861,777 | |
6.50%, 04/20/2028 - 12/15/2035 | | | 2,375,916 | | | | 2,739,598 | |
7.00%, 09/20/2034 (B) | | | 31,152 | | | | 33,729 | |
7.00%, 08/16/2039 - 10/16/2040 | | | 1,627,545 | | | | 1,881,987 | |
7.50%, 03/17/2033 (B) | | | 97,543 | | | | 104,214 | |
7.50%, 09/16/2035 - 10/15/2037 | | | 476,476 | | | | 536,921 | |
8.84%, 04/20/2034 (B) | | | 125,138 | | | | 134,819 | |
14.43%, 11/17/2032 (B) | | | 52,363 | | | | 66,437 | |
17.05%, 02/20/2034 (B) | | | 73,387 | | | | 100,062 | |
22.73%, 04/20/2037 (B) | | | 323,911 | | | | 458,937 | |
Government National Mortgage Association, IO | | | | | | | | |
4.00%, 09/16/2037 | | | 3,013,787 | | | | 258,907 | |
5.67%, 02/20/2038 (B) | | | 169,445 | | | | 23,292 | |
5.74%, 09/20/2038 (B) | | | 1,198,331 | | | | 164,320 | |
5.79%, 02/20/2039 - 06/20/2039 (B) | | | 521,405 | | | | 70,797 | |
5.84%, 02/20/2038 (B) | | | 1,725,436 | | | | 246,678 | |
5.88%, 02/20/2039 (B) | | | 169,344 | | | | 23,477 | |
5.90%, 08/16/2039 (B) | | | 899,325 | | | | 139,971 | |
5.93%, 09/20/2039 (B) | | | 1,164,238 | | | | 166,824 | |
5.94%, 11/20/2034 - 08/20/2039 (B) | | | 2,061,263 | | | | 282,110 | |
5.95%, 07/16/2039 (B) | | | 912,101 | | | | 111,834 | |
5.99%, 07/20/2038 (B) | | | 1,238,164 | | | | 168,169 | |
6.04%, 03/20/2037 - 06/20/2038 (B) | | | 2,481,239 | | | | 364,066 | |
6.14%, 03/20/2039 (B) | | | 132,917 | | | | 11,862 | |
6.24%, 12/20/2038 (B) | | | 346,344 | | | | 39,673 | |
6.25%, 06/16/2039 - 11/16/2039 (B) | | | 1,586,034 | | | | 200,032 | |
6.37%, 12/20/2037 (B) | | | 81,096 | | | | 12,416 | |
6.39%, 11/20/2037 (B) | | | 114,478 | | | | 17,564 | |
6.40%, 11/16/2033 (B) | | | 170,601 | | | | 34,909 | |
6.44%, 05/20/2041 (B) | | | 720,953 | | | | 131,267 | |
6.49%, 09/20/2033 (B) | | | 255,908 | | | | 4,780 | |
6.50%, 03/20/2039 | | | 108,974 | | | | 22,371 | |
6.52%, 07/20/2037 (B) | | | 747,179 | | | | 122,564 | |
6.54%, 06/20/2037 (B) | | | 1,297,258 | | | | 216,025 | |
7.14%, 12/20/2038 (B) | | | 822,741 | | | | 146,375 | |
7.44%, 09/20/2038 (B) | | | 93,926 | | | | 17,579 | |
7.55%, 04/16/2038 (B) | | | 59,596 | | | | 13,201 | |
Government National Mortgage
Association, PO | | | | | | | | |
12/20/2032 - 12/20/2040 | | | 2,861,410 | | | | 2,556,538 | |
7.00%, 09/15/2031 | | | 190,520 | | | | 226,359 | |
Government Trust Certificate
Series 2001-Z | | | | | | | | |
Zero Coupon, 04/01/2016 - 04/01/2020 | | | 15,890,000 | | | | 14,320,625 | |
National Credit Union Administration Guaranteed Notes Trust
Series 2010-R3, Class 3A | | | | | | | | |
2.40%, 12/08/2020 | | | 237,576 | | | | 240,259 | |
Residual Funding Corp., PO | | | | | | | | |
10/15/2019 - 10/15/2020 | | | 4,900,000 | | | | 4,392,872 | |
| | | | | | | | |
| | | Principal | | | Value | |
U.S. GOVERNMENT AGENCY OBLIGATIONS (continued) | |
Tennessee Valley Authority | | | | | | | | |
4.63%, 09/15/2060 | | | $ 236,000 | | | | $ 259,033 | |
5.25%, 09/15/2039 | | | 40,000 | | | | 49,398 | |
5.88%, 04/01/2036 (A) | | | 2,325,000 | | | | 3,090,934 | |
Tennessee Valley Authority, IO
Zero Coupon, 05/01/2019 | | | 500,000 | | | | 457,778 | |
Tennessee Valley Authority, PO
11/01/2025 | | | 2,000,000 | | | | 1,391,590 | |
| | | | | | | | |
Total U.S. Government Agency Obligations
(Cost $313,088,741) | | | | 319,533,458 | |
| | | | | | | | |
| |
FOREIGN GOVERNMENT OBLIGATIONS - 1.6% | | | | | |
African Development Bank
8.80%, 09/01/2019 | | | 500,000 | | | | 632,899 | |
Corp. Andina de Fomento
3.75%, 01/15/2016 (A) | | | 795,000 | | | | 822,405 | |
Israel Government AID Bond | | | | | | | | |
Series 2008-Z | | | | | | | | |
Zero Coupon, 02/15/2020 | | | 6,500,000 | | | | 5,823,214 | |
Series 2010-Z | | | | | | | | |
Zero Coupon, 02/15/2025 | | | 2,250,000 | | | | 1,651,329 | |
Series 2011-Z | | | | | | | | |
Zero Coupon, 11/15/2026 | | | 1,400,000 | | | | 948,669 | |
Mexico Government International Bond | | | | | | | | |
5.55%, 01/21/2045 | | | 190,000 | | | | 215,650 | |
Series 2012-1, Class A2 | | | | | | | | |
5.75%, 10/12/2110 | | | 550,000 | | | | 582,359 | |
Series MTN | | | | | | | | |
3.50%, 01/21/2021 | | | 731,000 | | | | 751,468 | |
4.75%, 03/08/2044 | | | 688,000 | | | | 698,664 | |
Poland Government International Bond
4.00%, 01/22/2024 | | | 333,000 | | | | 349,921 | |
Province of Quebec Canada
Series MTN
6.35%, 01/30/2026 | | | 285,000 | | | | 362,061 | |
Turkey Government International Bond | | | | | | | | |
5.75%, 03/22/2024 (A) | | | 365,000 | | | | 403,070 | |
6.63%, 02/17/2045 | | | 208,000 | | | | 249,142 | |
| | | | | | | | |
Total Foreign Government Obligations
(Cost $13,123,509) | | | | 13,490,851 | |
| | | | | | | | |
| |
MORTGAGE-BACKED SECURITIES - 13.0% | | | | | |
A10 Securitization LLC
Series 2012-1, Class A
3.49%, 04/15/2024, 144A | | | 341,629 | | | | 341,687 | |
A10 Term Asset Financing LLC | | | | | | | | |
Series 2013-2, Class A | | | | | | | | |
2.62%, 11/15/2027, 144A | | | 1,568,251 | | | | 1,579,458 | |
Series 2013-2, Class B | | | | | | | | |
4.38%, 11/15/2027, 144A | | | 250,000 | | | | 254,751 | |
Series 2014-1, Class A1 | | | | | | | | |
1.72%, 04/15/2033, 144A | | | 515,000 | | | | 515,154 | |
Series 2014-1, Class A2 | | | | | | | | |
3.02%, 04/15/2033, 144A | | | 603,000 | | | | 605,658 | |
American General Mortgage Loan Trust | | | | | | | | |
Series 2006-1, Class A5 | | | | | | | | |
5.75%, 12/25/2035, 144A (B) | | | 130,607 | | | | 134,905 | |
Series 2010-1A, Class A3 | | | | | | | | |
5.65%, 03/25/2058, 144A (B) | | | 1,139,925 | | | | 1,175,083 | |
The Notes to Financial Statements are an integral part of this report.
| | |
| Transamerica Funds | | Annual Report 2014 |
Page 59
Transamerica Core Bond
SCHEDULE OF INVESTMENTS (continued)
At October 31, 2014
| | | | | | | | |
| | | Principal | | | Value | |
MORTGAGE-BACKED SECURITIES (continued) | | | | | |
ASG Re-REMIC Trust | | | | | | | | |
Series 2009-1, Class A60 | | | | | | | | |
2.05%, 06/26/2037, 144A (B) | | | $ 68,124 | | | | $ 67,259 | |
Series 2009-2, Class A55 | | | | | | | | |
4.72%, 05/24/2036, 144A (B) | | | 14,138 | | | | 14,146 | |
Series 2009-2, Class G60 | | | | | | | | |
4.72%, 05/24/2036, 144A (B) | | | 400,000 | | | | 404,360 | |
Series 2009-3, Class A65 | | | | | | | | |
2.07%, 03/26/2037, 144A (B) | | | 657,953 | | | | 656,053 | |
Series 2009-4, Class A60 | | | | | | | | |
6.00%, 06/28/2037, 144A | | | 53,600 | | | | 54,388 | |
Series 2011-1, Class 3A50 | | | | | | | | |
2.59%, 11/28/2035, 144A (B) | | | 397,173 | | | | 389,545 | |
Banc of America Alternative Loan Trust | | | | | | | | |
Series 2003-11, Class 1A1 | | | | | | | | |
6.00%, 01/25/2034 | | | 97,430 | | | | 102,620 | |
Series 2003-11, Class 2A1 | | | | | | | | |
6.00%, 01/25/2034 | | | 131,013 | | | | 136,447 | |
Series 2003-7, Class 2A4 | | | | | | | | |
5.00%, 09/25/2018 | | | 167,998 | | | | 170,028 | |
Series 2003-9, Class 1CB2 | | | | | | | | |
5.50%, 11/25/2033 | | | 31,129 | | | | 31,485 | |
Series 2004-1, Class 1A1 | | | | | | | | |
6.00%, 02/25/2034 | | | 403,142 | | | | 428,898 | |
Series 2004-1, Class 5A1 | | | | | | | | |
5.50%, 02/25/2019 | | | 33,144 | | | | 33,984 | |
Series 2004-8, Class 3A1 | | | | | | | | |
5.50%, 09/25/2019 | | | 53,047 | | | | 55,296 | |
Banc of America Commercial Mortgage Trust | | | | | | | | |
Series 2006-3, Class A4 | | | | | | | | |
5.89%, 07/10/2044 (B) | | | 580,721 | | | | 616,032 | |
Series 2006-4, Class A4 | | | | | | | | |
5.63%, 07/10/2046 | | | 465,581 | | | | 491,795 | |
Series 2006-5, Class A4 | | | | | | | | |
5.41%, 09/10/2047 | | | 225,000 | | | | 238,047 | |
Banc of America Funding Corp.
Series 2012-R6, Class 1A1
3.00%, 10/26/2039, 144A (D) | | | 343,058 | | | | 340,586 | |
Banc of America Funding Trust | | | | | | | | |
Series 2004-3, Class 1A1 | | | | | | | | |
5.50%, 10/25/2034 | | | 421,328 | | | | 442,118 | |
Series 2004-C, Class 1A1 | | | | | | | | |
5.03%, 12/20/2034 (B) | | | 63,542 | | | | 62,461 | |
Series 2005-E, Class 4A1 | | | | | | | | |
2.69%, 03/20/2035 (B) | | | 1,521,800 | | | | 1,513,278 | |
Series 2010-R11A, Class 1A6 | | | | | | | | |
5.20%, 08/26/2035, 144A (B) | | | 329,525 | | | | 335,694 | |
Series 2010-R5, Class 1A1 | | | | | | | | |
5.50%, 10/26/2037, 144A | | | 208,333 | | | | 209,990 | |
Banc of America Merrill Lynch Commercial Mortgage, Inc.
Series 2005-3, Class AM | | | | | | | | |
4.73%, 07/10/2043 | | | 800,000 | | | | 812,456 | |
Banc of America Mortgage Trust | | | | | | | | |
Series 2003-3, Class 2A1 | | | | | | | | |
0.70%, 05/25/2018 (B) | | | 41,056 | | | | 39,737 | |
Series 2003-4, Class 2A1 | | | | | | | | |
0.70%, 06/25/2018 (B) | | | 102,083 | | | | 99,482 | |
| | | | | | | | |
| | | Principal | | | Value | |
MORTGAGE-BACKED SECURITIES (continued) | | | | | |
Banc of America Mortgage Trust (continued) | | | | | |
Series 2003-6, Class 2A1 | | | | | | | | |
0.60%, 08/25/2018 (B) | | | $ 46,075 | | | | $ 45,480 | |
Series 2003-C, Class 3A1 | | | | | | | | |
2.62%, 04/25/2033 (B) | | | 114,539 | | | | 116,501 | |
Series 2003-E, Class 2A2 | | | | | | | | |
2.73%, 06/25/2033 (B) | | | 263,377 | | | | 265,190 | |
Series 2004-3, Class 1A26 | | | | | | | | |
5.50%, 04/25/2034 | | | 321,300 | | | | 329,249 | |
Series 2004-3, Class 3A1 | | | | | | | | |
5.00%, 04/25/2019 | | | 46,378 | | | | 47,311 | |
Series 2004-5, Class 4A1 | | | | | | | | |
4.75%, 06/25/2019 | | | 27,354 | | | | 27,670 | |
Series 2004-C, Class 2A2 | | | | | | | | |
2.71%, 04/25/2034 (B) | | | 486,805 | | | | 491,889 | |
BCAP LLC Trust | | | | | | | | |
Series 2009-RR10, Class 17A1 | | | | | | | | |
5.75%, 06/26/2037, 144A | | | 26,838 | | | | 27,289 | |
Series 2009-RR13, Class 17A2 | | | | | | | | |
5.50%, 04/26/2037, 144A (B) | | | 207,828 | | | | 214,827 | |
Series 2009-RR14, Class 3A2 | | | | | | | | |
2.38%, 08/26/2035, 144A (B) | | | 499,968 | | | | 500,048 | |
Series 2009-RR5, Class 8A1 | | | | | | | | |
5.50%, 11/26/2034, 144A | | | 214,869 | | | | 221,081 | |
Series 2010-RR12, Class 2A5 | | | | | | | | |
4.50%, 01/26/2036, 144A (B) | | | 431,263 | | | | 434,488 | |
Series 2010-RR4, Class 12A1 | | | | | | | | |
4.00%, 07/26/2036, 144A (B) | | | 112,084 | | | | 113,373 | |
Series 2010-RR5, Class 2A5 | | | | | | | | |
5.42%, 04/26/2037, 144A (B) | | | 423,766 | | | | 431,964 | |
Series 2010-RR6, Class 22A3 | | | | | | | | |
4.31%, 06/26/2036, 144A (B) | | | 273,117 | | | | 277,040 | |
Series 2010-RR7, Class 16A1 | | | | | | | | |
0.82%, 02/26/2047, 144A (B) | | | 196,677 | | | | 195,053 | |
Series 2010-RR7, Class 1A5 | | | | | | | | |
4.85%, 04/26/2035, 144A (B) | | | 200,335 | | | | 198,372 | |
Series 2010-RR7, Class 2A1 | | | | | | | | |
2.14%, 07/26/2045, 144A (B) | | | 812,103 | | | | 815,642 | |
Series 2010-RR8, Class 3A3 | | | | | | | | |
5.06%, 05/26/2035, 144A (B) | | | 131,370 | | | | 132,271 | |
Series 2010-RR8, Class 3A4 | | | | | | | | |
5.06%, 05/26/2035, 144A (B) | | | 773,000 | | | | 729,772 | |
Series 2011-RR10, Class 2A1 | | | | | | | | |
1.04%, 09/26/2037, 144A (B) | | | 1,543,126 | | | | 1,417,705 | |
Series 2011-RR4, Class 6A3 | | | | | | | | |
5.00%, 08/26/2037, 144A (B) | | | 682,627 | | | | 691,586 | |
Series 2011-RR5, Class 11A3 | | | | | | | | |
0.30%, 05/28/2036, 144A (B) | | | 488,768 | | | | 479,854 | |
Series 2011-RR5, Class 14A3 | | | | | | | | |
2.59%, 07/26/2036, 144A (B) | | | 132,311 | | | | 131,874 | |
Series 2012-RR10, Class 3A1 | | | | | | | | |
0.35%, 05/26/2036, 144A (B) | | | 560,011 | | | | 529,494 | |
Series 2012-RR2, Class 1A1 | | | | | | | | |
0.32%, 08/26/2036, 144A (B) | | | 596,184 | | | | 582,613 | |
Series 2012-RR3, Class 2A5 | | | | | | | | |
1.99%, 05/26/2037, 144A (B) | | | 841,750 | | | | 843,328 | |
Bear Stearns Alt-A Trust
Series 2005-2, Class 1A1
0.65%, 03/25/2035 (B) | | | 295,516 | | | | 289,725 | |
The Notes to Financial Statements are an integral part of this report.
| | |
| Transamerica Funds | | Annual Report 2014 |
Page 60
Transamerica Core Bond
SCHEDULE OF INVESTMENTS (continued)
At October 31, 2014
| | | | | | | | |
| | | Principal | | | Value | |
MORTGAGE-BACKED SECURITIES (continued) | | | | | |
Bear Stearns ARM Trust | | | | | | | | |
Series 2003-4, Class 3A1 | | | | | | | | |
2.32%, 07/25/2033 (B) | | | $ 117,534 | | | | $ 117,943 | |
Series 2004-2, Class 14A | | | | | | | | |
3.06%, 05/25/2034 (B) | | | 76,815 | | | | 76,578 | |
Bear Stearns Commercial Mortgage Securities Trust
Series 2006-PW11, Class A4
5.43%, 03/11/2039 (B) | | | 197,811 | | | | 206,003 | |
Bear Stearns Commercial Mortgage Securities Trust, IO
Series 2005-PWR8, Class X1
0.76%, 06/11/2041, 144A (B) | | | 11,314,978 | | | | 26,681 | |
CAM Mortgage Trust | | | | | | | | |
Series 2014-1, Class A | | | | | | | | |
3.35%, 12/15/2053, 144A (B) | | | 12,106 | | | | 12,108 | |
Series 2014-2, Class A | | | | | | | | |
2.60%, 05/15/2048, 144A (B) | | | 332,942 | | | | 332,903 | |
CD Commercial Mortgage Trust, IO
Series 2007-CD4, Class XC
0.37%, 12/11/2049, 144A (B) | | | 34,078,711 | | | | 244,174 | |
Chase Mortgage Finance Trust | | | | | | | | |
Series 2004-S3, Class 2A5 | | | | | | | | |
5.50%, 03/25/2034 | | | 390,662 | | | | 406,965 | |
Series 2007-A1, Class 1A3 | | | | | | | | |
2.55%, 02/25/2037 (B) | | | 1,635,255 | | | | 1,613,850 | |
Series 2007-A1, Class 2A1 | | | | | | | | |
2.46%, 02/25/2037 (B) | | | 348,872 | | | | 348,322 | |
Series 2007-A1, Class 7A1 | | | | | | | | |
2.43%, 02/25/2037 (B) | | | 244,499 | | | | 245,052 | |
Series 2007-A1, Class 9A1 | | | | | | | | |
2.51%, 02/25/2037 (B) | | | 124,116 | | | | 122,851 | |
Series 2007-A2, Class 1A1 | | | | | | | | |
2.59%, 07/25/2037 (B) | | | 69,390 | | | | 68,930 | |
Series 2007-A2, Class 2A1 | | | | | | | | |
2.52%, 07/25/2037 (B) | | | 450,372 | | | | 454,756 | |
CHL Mortgage Pass-Through Trust | | | | | | | | |
Series 2003-39, Class A6 | | | | | | | | |
5.00%, 10/25/2033 | | | 340,684 | | | | 355,624 | |
Series 2003-50, Class A1 | | | | | | | | |
5.00%, 11/25/2018 | | | 176,895 | | | | 179,312 | |
Series 2003-J13, Class 1A7 | | | | | | | | |
5.25%, 01/25/2034 | | | 603,991 | | | | 632,911 | |
Series 2004-3, Class A26 | | | | | | | | |
5.50%, 04/25/2034 | | | 311,028 | | | | 326,619 | |
Series 2004-3, Class A4 | | | | | | | | |
5.75%, 04/25/2034 | | | 466,542 | | | | 485,776 | |
Series 2004-5, Class 1A4 | | | | | | | | |
5.50%, 06/25/2034 | | | 433,400 | | | | 449,427 | |
Series 2004-8, Class 2A1 | | | | | | | | |
4.50%, 06/25/2019 | | | 31,923 | | | | 32,929 | |
Series 2004-J4, Class 2A1 | | | | | | | | |
5.00%, 05/25/2019 | | | 66,154 | | | | 67,095 | |
Citigroup Commercial Mortgage Trust | | | | | | | | |
Series 2005-C3, Class AM | | | | | | | | |
4.83%, 05/15/2043 (B) | | | 440,000 | | | | 445,785 | |
Series 2006-C5, Class A4 | | | | | | | | |
5.43%, 10/15/2049 | | | 500,000 | | | | 532,615 | |
| | | | | | | | |
| | | Principal | | | Value | |
MORTGAGE-BACKED SECURITIES (continued) | | | | | |
Citigroup Mortgage Loan Trust, Inc. | | | | | | | | |
Series 2003-1, Class 3A4 | | | | | | | | |
5.25%, 09/25/2033 | | | $ 250,044 | | | | $ 259,667 | |
Series 2005-2, Class 2A11 | | | | | | | | |
5.50%, 05/25/2035 | | | 243,243 | | | | 253,243 | |
Series 2008-AR4, Class 1A1A | | | | | | | | |
2.73%, 11/25/2038, 144A (B) | | | 861,580 | | | | 862,891 | |
Series 2009-10, Class 1A1 | | | | | | | | |
2.41%, 09/25/2033, 144A (B) | | | 538,713 | | | | 545,123 | |
Series 2009-11, Class 3A1 | | | | | | | | |
5.75%, 05/25/2037, 144A (B) | | | 449,106 | | | | 466,333 | |
Series 2010-7, Class 10A1 | | | | | | | | |
2.61%, 02/25/2035, 144A (B) | | | 149,397 | | | | 149,663 | |
Series 2010-8, Class 5A6 | | | | | | | | |
4.00%, 11/25/2036, 144A | | | 3,002,577 | | | | 3,059,091 | |
Series 2010-8, Class 6A6 | | | | | | | | |
4.50%, 12/25/2036, 144A | | | 2,571,289 | | | | 2,641,640 | |
COBALT CMBS Commercial Mortgage Trust
Series 2006-C1, Class A4
5.22%, 08/15/2048 | | | 542,010 | | | | 574,932 | |
COBALT CMBS Commercial Mortgage Trust, IO
Series 2006-C1
0.78%, 08/15/2048 (B) | | | 18,061,242 | | | | 269,040 | |
COBALT Commercial Mortgage Trust
Series 2006-C1, Class AM
5.25%, 08/15/2048 | | | 1,000,000 | | | | 1,019,416 | |
COMM Mortgage Trust, IO
Series 2012-CR2, Class XA
1.91%, 08/15/2045 (B) | | | 2,183,918 | | | | 222,275 | |
Commercial Mortgage Asset Trust
Series 1999-C1, Class D
6.90%, 01/17/2032 (B) | | | 46,009 | | | | 45,949 | |
Commercial Mortgage Trust
Series 2005-GG3, Class AJ
4.86%, 08/10/2042 (B) | | | 220,000 | | | | 220,587 | |
COOF Securitization Trust, Ltd., IO
Series 2014-1, Class A
3.01%, 06/25/2040, 144A (B) | | | 1,077,600 | | | | 146,098 | |
Credit Suisse Commercial Mortgage Trust
Series 2006-C2, Class A3
5.67%, 03/15/2039 (B) | | | 1,591,809 | | | | 1,663,693 | |
Credit Suisse First Boston Mortgage Securities Corp. | | | | | | | | |
Series 2003-21, Class 1A4 | | | | | | | | |
5.25%, 09/25/2033 | | | 148,770 | | | | 153,775 | |
Series 2003-27, Class 5A4 | | | | | | | | |
5.25%, 11/25/2033 | | | 244,907 | | | | 250,047 | |
Series 2003-29, Class 5A1 | | | | | | | | |
7.00%, 12/25/2033 | | | 189,430 | | | | 199,739 | |
Series 2003-29, Class 8A1 | | | | | | | | |
6.00%, 11/25/2018 | | | 72,494 | | | | 74,638 | |
Series 2003-AR15, Class 3A1 | | | | | | | | |
2.78%, 06/25/2033 (B) | | | 222,757 | | | | 221,552 | |
Series 2004-4, Class 2A4 | | | | | | | | |
5.50%, 09/25/2034 | | | 405,419 | | | | 442,815 | |
Series 2004-5, Class 3A1 | | | | | | | | |
5.25%, 08/25/2019 | | | 185,561 | | | | 190,354 | |
The Notes to Financial Statements are an integral part of this report.
| | |
| Transamerica Funds | | Annual Report 2014 |
Page 61
Transamerica Core Bond
SCHEDULE OF INVESTMENTS (continued)
At October 31, 2014
| | | | | | | | |
| | | Principal | | | Value | |
MORTGAGE-BACKED SECURITIES (continued) | | | | | |
Credit Suisse First Boston Mortgage Securities Corp. (continued) | |
Series 2004-8, Class 1A4 | | | | | | | | |
5.50%, 12/25/2034 | | | $ 428,315 | | | | $ 463,360 | |
Series 2005-C3, Class AM | | | | | | | | |
4.73%, 07/15/2037 | | | 400,000 | | | | 406,718 | |
Credit Suisse Mortgage Capital Certificates
Series 2009-3R, Class 19A3 | | | | | | | | |
6.00%, 01/27/2038, 144A | | | 165,802 | | | | 171,771 | |
CSMC Trust | | | | | | | | |
Series 2010-11R, Class A6 | | | | | | | | |
1.16%, 06/28/2047, 144A (B) | | | 1,394,816 | | | | 1,337,925 | |
Series 2010-16, Class A3 | | | | | | | | |
3.76%, 06/25/2050, 144A (B) | | | 400,000 | | | | 406,500 | |
Series 2010-16, Class A4 | | | | | | | | |
3.76%, 06/25/2050, 144A (B) | | | 1,000,000 | | | | 1,026,260 | |
Series 2010-17R, Class 1A1 | | | | | | | | |
2.30%, 06/26/2036, 144A (B) | | | 212,184 | | | | 215,911 | |
Series 2010-1R, Class 5A1 | | | | | | | | |
4.93%, 01/27/2036, 144A (B) | | | 130,194 | | | | 132,323 | |
Series 2011-16R, Class 7A3 | | | | | | | | |
3.50%, 12/27/2036, 144A (B) | | | 308,615 | | | | 311,546 | |
Series 2011-1R, Class A1 | | | | | | | | |
1.15%, 02/27/2047, 144A (B) | | | 51,655 | | | | 51,650 | |
Series 2011-6R, Class 3A1 | | | | | | | | |
2.64%, 07/28/2036, 144A (B) | | | 390,460 | | | | 392,354 | |
Series 2011-9R, Class A1 | | | | | | | | |
2.16%, 03/27/2046, 144A (B) | | | 904,756 | | | | 907,779 | |
Series 2012-3R, Class 1A1 | | | | | | | | |
2.35%, 07/27/2037, 144A (B) | | | 698,844 | | | | 696,235 | |
Series 2014-ICE, Class A | | | | | | | | |
1.05%, 04/15/2027, 144A (B) | | | 841,000 | | | | 840,625 | |
DBRR Trust, IO
Series 2011-C32, Class A3X1
2.02%, 06/17/2049, 144A (B) (E) | | | 6,000,000 | | | | 221,026 | |
Deutsche ALT-A Securities, Inc., Alternate Loan Trust
Series 2005-1, Class 2A1
5.74%, 02/25/2020 (B) | | | 153,167 | | | | 158,139 | |
Deutsche Mortgage Securities, Inc., Re-REMIC Trust
Series 2009-RS2, Class 4A1
0.28%, 04/26/2037, 144A (B) | | | 2,366 | | | | 2,359 | |
FDIC Trust
Series 2013-N1, Class A 4.50%, 10/25/2018, 144A | | | 113,908 | | | | 114,863 | |
First Horizon Mortgage Pass-Through Trust
Series 2004-AR2, Class 2A1
2.63%, 05/25/2034 (B) | | | 425,333 | | | | 423,007 | |
GE Capital Commercial Mortgage Corp.
Series 2005-C1, Class AJ
4.83%, 06/10/2048 (B) | | | 1,000,000 | | | | 1,004,973 | |
GMACM Mortgage Loan Trust | | | | | | | | |
Series 2003-AR1, Class A4 | | | | | | | | |
2.83%, 10/19/2033 (B) | | | 111,947 | | | | 110,461 | |
Series 2003-AR2, Class 2A4 | | | | | | | | |
2.79%, 12/19/2033 (B) | | | 829,850 | | | | 833,402 | |
Series 2004-J5, Class A7 | | | | | | | | |
6.50%, 01/25/2035 | | | 960,590 | | | | 1,001,213 | |
| | | | | | | | |
| | | Principal | | | Value | |
MORTGAGE-BACKED SECURITIES (continued) | | | | | |
GMACM Mortgage Loan Trust (continued) | |
Series 2004-J6, Class 1A1 | | | | | | | | |
5.00%, 01/25/2020 | | | $ 80,425 | | | | $ 82,960 | |
GS Mortgage Securities Trust, IO
Series 2006-GG8, Class X
0.56%, 11/10/2039, 144A (B) | | | 8,989,991 | | | | 80,964 | |
GSMPS Mortgage Loan Trust
Series 2005-RP3, Class 1AF
0.50%, 09/25/2035, 144A (B) | | | 1,192,117 | | | | 1,016,177 | |
GSMPS Mortgage Loan Trust, IO
Series 2005-RP3, Class 1AS
4.80%, 09/25/2035, 144A (B) | | | 894,087 | | | | 121,855 | |
GSR Mortgage Loan Trust | | | | | | | | |
Series 2003-7F, Class 1A4 | | | | | | | | |
5.25%, 06/25/2033 | | | 755,668 | | | | 776,823 | |
Series 2004-8F, Class 2A3 | | | | | | | | |
6.00%, 09/25/2034 | | | 796,159 | | | | 828,663 | |
Series 2005-5F, Class 8A3 | | | | | | | | |
0.65%, 06/25/2035 (B) | | | 45,586 | | | | 44,062 | |
Impac CMB Trust
Series 2005-4, Class 2A1
0.45%, 05/25/2035 (B) | | | 259,518 | | | | 257,316 | |
Impac Secured Assets CMN Owner Trust
Series 2003-2, Class A1
5.50%, 08/25/2033 | | | 89,657 | | | | 93,709 | |
Impac Secured Assets Trust | | | | | | | | |
Series 2006-1, Class 2A1 | | | | | | | | |
0.50%, 05/25/2036 (B) | | | 596,269 | | | | 588,564 | |
Series 2006-2, Class 2A1 | | | | | | | | |
0.50%, 08/25/2036 (B) | | | 446,455 | | | | 438,318 | |
JPMorgan Chase Commercial Mortgage Securities Trust | | | | | | | | |
Series 2005-CB11, Class AJ | | | | | | | | |
5.38%, 08/12/2037 (B) | | | 700,000 | | | | 709,790 | |
Series 2006-CB15, Class A4 | | | | | | | | |
5.81%, 06/12/2043 (B) | | | 1,289,483 | | | | 1,363,516 | |
Series 2006-CB16, Class A4 | | | | | | | | |
5.55%, 05/12/2045 | | | 96,995 | | | | 102,222 | |
Series 2006-LDP9, Class A3SF | | | | | | | | |
0.31%, 05/15/2047 (B) | | | 386,720 | | | | 386,379 | |
JPMorgan Chase Commercial Mortgage
Securities Trust, IO
Series 2006-CB15, Class X1
0.21%, 06/12/2043 (B) | | | 40,970,346 | | | | 163,062 | |
JPMorgan Mortgage Trust | | | | | | | | |
Series 2004-A3, Class 4A1 | | | | | | | | |
2.51%, 07/25/2034 (B) | | | 93,514 | | | | 95,892 | |
Series 2004-A4, Class 1A1 | | | | | | | | |
2.55%, 09/25/2034 (B) | | | 100,589 | | | | 103,383 | |
Series 2004-S1, Class 1A7 | | | | | | | | |
5.00%, 09/25/2034 | | | 28,372 | | | | 29,511 | |
Series 2005-A1, Class 3A4 | | | | | | | | |
2.58%, 02/25/2035 (B) | | | 281,848 | | | | 286,974 | |
Series 2006-A2, Class 5A3 | | | | | | | | |
2.47%, 11/25/2033 (B) | | | 659,001 | | | | 660,296 | |
Series 2006-A3, Class 6A1 | | | | | | | | |
2.54%, 08/25/2034 (B) | | | 64,744 | | | | 65,064 | |
JPMorgan Re-REMIC Trust | | | | | | | | |
Series 2009-6, Class 4A1 | | | | | | | | |
2.51%, 09/26/2036, 144A (B) | | | 172,265 | | | | 174,316 | |
The Notes to Financial Statements are an integral part of this report.
| | |
| Transamerica Funds | | Annual Report 2014 |
Page 62
Transamerica Core Bond
SCHEDULE OF INVESTMENTS (continued)
At October 31, 2014
| | | | | | | | |
| | | Principal | | | Value | |
MORTGAGE-BACKED SECURITIES (continued) | | | | | |
JPMorgan Re-REMIC Trust (continued) | | | | | | | | |
Series 2010-4, Class 7A1 | | | | | | | | |
1.87%, 08/26/2035, 144A (B) | | | $ 166,317 | | | | $ 165,873 | |
KGS-Alpha SBA COOF Trust, IO
Series 2014-2, Class A | | | | | | | | |
3.12%, 04/25/2040, 144A (B) | | | 961,873 | | | | 145,820 | |
LB-UBS Commercial Mortgage Trust
Series 2006-C4, Class A4
5.83%, 06/15/2038 (B) | | | 385,650 | | | | 408,795 | |
LB-UBS Commercial Mortgage Trust, IO Series 2006-C1, Class XCL
0.37%, 02/15/2041, 144A (B) | | | 20,981,673 | | | | 72,597 | |
LVII Re-REMIC Trust
Series 2009-3, Class M3
5.18%, 11/27/2037, 144A (B) | | | 600,000 | | | | 604,387 | |
MASTR Adjustable Rate Mortgages Trust | | | | | | | | |
Series 2004-13, Class 2A1 | | | | | | | | |
2.64%, 04/21/2034 (B) | | | 709,271 | | | | 712,886 | |
Series 2004-13, Class 3A7 | | | | | | | | |
2.64%, 11/21/2034 (B) | | | 462,068 | | | | 470,168 | |
MASTR Alternative Loan Trust | | | | | | | | |
Series 2003-9, Class 2A1 | | | | | | | | |
6.00%, 12/25/2033 | | | 94,962 | | | | 95,069 | |
Series 2004-5, Class 5A1 | | | | | | | | |
4.75%, 06/25/2019 | | | 79,302 | | | | 81,416 | |
MASTR Asset Securitization Trust | | | | | | | | |
Series 2003-11, Class 9A6 | | | | | | | | |
5.25%, 12/25/2033 | | | 610,115 | | | | 641,966 | |
Series 2003-2, Class 1A1 | | | | | | | | |
5.00%, 03/25/2018 | | | 30,659 | | | | 30,833 | |
Series 2003-3, Class 3A18 | | | | | | | | |
5.50%, 04/25/2033 | | | 160,968 | | | | 162,314 | |
Series 2004-P7, Class A6 | | | | | | | | |
5.50%, 12/27/2033, 144A | | | 246,878 | | | | 266,060 | |
MASTR Re-REMIC Trust, PO
Series 2005, Class 3
05/28/2035, 144A | | | 90,275 | | | | 72,220 | |
Merrill Lynch Mortgage Investors Trust | | | | | | | | |
Series 2003-A4, Class 2A | | | | | | | | |
2.58%, 07/25/2033 (B) | | | 108,891 | | | | 99,308 | |
Series 2003-A5, Class 2A6 | | | | | | | | |
2.30%, 08/25/2033 (B) | | | 101,169 | | | | 102,334 | |
Series 2004-1, Class 2A1 | | | | | | | | |
2.15%, 12/25/2034 (B) | | | 385,296 | | | | 375,570 | |
Series 2004-A4, Class A2 | | | | | | | | |
2.46%, 08/25/2034 (B) | | | 172,622 | | | | 176,803 | |
Series 2004-D, Class A2 | | | | | | | | |
1.05%, 09/25/2029 (B) | | | 269,382 | | | | 264,304 | |
Merrill Lynch Mortgage Trust | | | | | | | | |
Series 2005-CIP1, Class A4 | | | | | | | | |
5.05%, 07/12/2038 (B) | | | 700,000 | | | | 712,459 | |
Series 2005-LC1, Class AJ | | | | | | | | |
5.36%, 01/12/2044 (B) | | | 500,000 | | | | 518,532 | |
Series 2006-C1, Class A4 | | | | | | | | |
5.67%, 05/12/2039 (B) | | | 730,000 | | | | 766,877 | |
ML-CFC Commercial Mortgage Trust, IO Series 2006-4, Class XC
0.21%, 12/12/2049, 144A (B) | | | 14,409,099 | | | | 156,324 | |
Morgan Stanley Capital I Trust | | | | | | | | |
Series 2007-T27, Class A4 | | | | | | | | |
5.65%, 06/11/2042 (B) | | | 200,000 | | | | 219,385 | |
| | | | | | | | |
| | | Principal | | | Value | |
MORTGAGE-BACKED SECURITIES (continued) | | | | | |
Morgan Stanley Capital I Trust | | | | | | | | |
Series 2011-C3, Class A3 | | | | | | | | |
4.05%, 07/15/2049 | | | $ 637,000 | | | | $ 681,085 | |
Morgan Stanley Capital I Trust, IO | | | | | | | | |
Series 2006-IQ12, Class X1 | | | | | | | | |
0.46%, 12/15/2043, 144A (B) | | | 32,388,576 | | | | 282,720 | |
Series 2006-T21, Class X | | | | | | | | |
0.21%, 10/12/2052, 144A (B) | | | 83,421,484 | | | | 274,540 | |
Series 2007-HQ11, Class X | | | | | | | | |
0.22%, 02/12/2044, 144A (B) | | | 53,138,246 | | | | 201,872 | |
Morgan Stanley Mortgage Loan Trust
Series 2004-3, Class 4A
5.69%, 04/25/2034 (B) | | | 383,639 | | | | 404,689 | |
Morgan Stanley Re-REMIC Trust | | | | | | | | |
Series 2012-XA, Class A | | | | | | | | |
2.00%, 07/27/2049, 144A | | | 1,215,826 | | | | 1,220,385 | |
Series 2012-XA, Class B | | | | | | | | |
0.25%, 07/27/2049, 144A | | | 500,000 | | | | 437,500 | |
OnDeck Asset Securitization Trust LLC Series 2014-1A, Class A
3.15%, 05/17/2018, 144A | | | 651,000 | | | | 649,437 | |
Prime Mortgage Trust
Series 2004-CL1, Class 1A1
6.00%, 02/25/2034 | | | 151,665 | | | | 159,465 | |
Prime Mortgage Trust, PO
Series 2004-CL1, Class 1
02/25/2034 | | | 12,694 | | | | 10,194 | |
Provident Funding Mortgage Loan Trust
Series 2005-1, Class 2A1
2.49%, 05/25/2035 (B) | | | 281,535 | | | | 284,424 | |
RAIT Trust
Series 2014-FL3, Class A
1.40%, 12/15/2031, 144A (B) | | | 534,000 | | | | 538,920 | |
RALI Trust | | | | | | | | |
Series 2003-QS1, Class A6 | | | | | | | | |
4.25%, 01/25/2033 | | | 38,132 | | | | 38,230 | |
Series 2003-QS13, Class A5 | | | | | | | | |
0.80%, 07/25/2033 (B) | | | 292,739 | | | | 272,529 | |
Series 2003-QS15, Class A7 | | | | | | | | |
5.50%, 08/25/2033 | | | 1,476,410 | | | | 1,506,734 | |
Series 2003-QS18, Class A1 | | | | | | | | |
5.00%, 09/25/2018 | | | 66,367 | | | | 67,817 | |
Series 2004-QS7, Class A4 | | | | | | | | |
5.50%, 05/25/2034 | | | 386,984 | | | | 396,281 | |
RAMP Trust | | | | | | | | |
Series 2004-RZ1, Class M1 | | | | | | | | |
4.82%, 03/25/2034 (B) | | | 570,509 | | | | 574,543 | |
Series 2004-SL2, Class A3 | | | | | | | | |
7.00%, 10/25/2031 | | | 246,814 | | | | 259,871 | |
Series 2005-EFC5, Class A3 | | | | | | | | |
0.49%, 10/25/2035 (B) | | | 73,021 | | | | 72,761 | |
Series 2006-RZ1, Class A3 | | | | | | | | |
0.45%, 03/25/2036 (B) | | | 678,551 | | | | 660,965 | |
RBSSP Re-REMIC Trust | | | | | | | | |
Series 2009-1, Class 1A1 | | | | | | | | |
6.50%, 02/26/2036, 144A | | | 450,982 | | | | 485,606 | |
Series 2010-9, Class 7A5 | | | | | | | | |
4.00%, 05/26/2037, 144A (B) | | | 403,314 | | | | 409,535 | |
The Notes to Financial Statements are an integral part of this report.
| | |
| Transamerica Funds | | Annual Report 2014 |
Page 63
Transamerica Core Bond
SCHEDULE OF INVESTMENTS (continued)
At October 31, 2014
| | | | | | | | |
| | | Principal | | | Value | |
MORTGAGE-BACKED SECURITIES (continued) | | | | | |
RCMC LLC
Series 2012-CRE1, Class A
5.62%, 11/15/2044, 144A | | | $ 244,728 | | | | $ 252,416 | |
Residential Asset Securitization Trust
Series 2002-A13, Class A4
5.25%, 12/25/2017 | | | 18,146 | | | | 18,441 | |
RFMSI Trust | | | | | | | | |
Series 2003-S20, Class 2A1 | | | | | | | | |
4.75%, 12/25/2018 | | | 42,740 | | | | 44,613 | |
Series 2003-S4, Class A4 | | | | | | | | |
5.75%, 03/25/2033 | | | 298,756 | | | | 306,526 | |
Salomon Brothers Mortgage Securities VII, Inc. | | | | | | | | |
Series 2003-HYB1, Class A | | | | | | | | |
2.49%, 09/25/2033 (B) | | | 285,175 | | | | 289,290 | |
Series 2003-UP1, Class A | | | | | | | | |
3.95%, 04/25/2032, 144A (B) | | | 19,774 | | | | 19,411 | |
Sequoia Mortgage Trust | | | | | | | | |
Series 2004-11, Class A1 | | | | | | | | |
0.46%, 12/20/2034 (B) | | | 606,971 | | | | 578,009 | |
Series 2004-11, Class A3 | | | | | | | | |
0.46%, 12/20/2034 (B) | | | 422,710 | | | | 407,224 | |
Series 2004-12, Class A3 | | | | | | | | |
0.64%, 01/20/2035 (B) | | | 268,102 | | | | 245,533 | |
Springleaf Mortgage Loan Trust | | | | | | | | |
Series 2012-1A, Class M3 | | | | | | | | |
6.00%, 09/25/2057, 144A (B) | | | 1,000,000 | | | | 1,065,606 | |
Series 2012-2A, Class M4 | | | | | | | | |
6.00%, 10/25/2057, 144A (B) | | | 1,200,000 | | | | 1,248,012 | |
Series 2012-3A, Class M1 | | | | | | | | |
2.66%, 12/25/2059, 144A (B) | | | 534,000 | | | | 533,950 | |
Series 2012-3A, Class M2 | | | | | | | | |
3.56%, 12/25/2059, 144A (B) | | | 471,000 | | | | 478,089 | |
Series 2012-3A, Class M3 | | | | | | | | |
4.44%, 12/25/2059, 144A (B) | | | 253,000 | | | | 258,996 | |
Series 2012-3A, Class M4 | | | | | | | | |
5.30%, 12/25/2059, 144A (B) | | | 146,000 | | | | 150,673 | |
Series 2013-3A, Class A | | | | | | | | |
1.87%, 09/25/2057, 144A (B) | | | 719,323 | | | | 717,438 | |
Structured Asset Mortgage Investments II Trust
Series 2004-AR5, Class 1A1
0.49%, 10/19/2034 (B) | | | 498,485 | | | | 470,080 | |
Thornburg Mortgage Securities Trust | | | | | | | | |
Series 2003-4, Class A1 | | | | | | | | |
0.79%, 09/25/2043 (B) | | | 287,502 | | | | 276,213 | |
Series 2004-1, Class II2A | | | | | | | | |
1.63%, 03/25/2044 (B) | | | 159,360 | | | | 156,381 | |
TIAA Seasoned Commercial Mortgage Trust
Series 2007-C4, Class A3
5.56%, 08/15/2039 (B) | | | 109,417 | | | | 109,547 | |
UBS-BAMLL Trust
Series 2012-WRM, Class A
3.66%, 06/10/2030, 144A | | | 1,386,000 | | | | 1,415,387 | |
UBS-Barclays Commercial Mortgage Trust
Series 2012-C2, Class A4
3.53%, 05/10/2063 | | | 650,000 | | | | 673,281 | |
UBS-Barclays Commercial Mortgage Trust, IO
Series 2012-C2, Class XA
| | | | | | | | |
1.76%, 05/10/2063, 144A (B) | | | 6,035,706 | | | | 492,242 | |
| | | | | | | | |
| | | Principal | | | Value | |
MORTGAGE-BACKED SECURITIES (continued) | | | | | |
Vendee Mortgage Trust | | | | | | | | |
Series 1993-1, Class ZB | | | | | | | | |
7.25%, 02/15/2023 | | | $ 269,098 | | | | $ 308,522 | |
Series 1998-2, Class 1G | | | | | | | | |
6.75%, 06/15/2028 | | | 536,970 | | | | 613,965 | |
VNDO Mortgage Trust
Series 2012-6AVE, Class A
3.00%, 11/15/2030, 144A | | | 1,000,000 | | | | 993,131 | |
VOLT NPL X LLC
Series 2013-NPL4, Class A1
3.96%, 11/25/2053, 144A (B) | | | 102,728 | | | | 103,171 | |
Wachovia Bank Commercial Mortgage Trust
Series 2004-C11, Class A5
5.22%, 01/15/2041 (B) | | | 168,711 | | | | 168,755 | |
Wachovia Bank Commercial Mortgage Trust, IO
Series 2006-C24, Class XC
0.10%, 03/15/2045, 144A (B) | | | 125,743,699 | | | | 208,357 | |
WaMu Mortgage Pass-Through Certificates Trust | | | | | | | | |
Series 2003-AR6, Class A1 | | | | | | | | |
2.44%, 06/25/2033 (B) | | | 597,975 | | | | 599,060 | |
Series 2003-AR7, Class A7 | | | | | | | | |
2.30%, 08/25/2033 (B) | | | 211,671 | | | | 212,642 | |
Series 2003-AR8, Class A | | | | | | | | |
2.39%, 08/25/2033 (B) | | | 81,189 | | | | 83,431 | |
Series 2003-AR9, Class 1A6 | | | | | | | | |
2.41%, 09/25/2033 (B) | | | 372,919 | | | | 383,570 | |
Series 2003-S3, Class 1A4 | | | | | | | | |
5.50%, 06/25/2033 | | | 385,365 | | | | 399,538 | |
Series 2003-S4, Class 2A10 | | | | | | | | |
17.04%, 06/25/2033 (B) | | | 19,669 | | | | 22,368 | |
Series 2003-S9, Class A8 | | | | | | | | |
5.25%, 10/25/2033 | | | 246,487 | | | | 253,293 | |
Series 2004-AR3, Class A1 | | | | | | | | |
2.37%, 06/25/2034 (B) | | | 53,490 | | | | 54,331 | |
Series 2004-AR3, Class A2 | | | | | | | | |
2.37%, 06/25/2034 (B) | | | 550,181 | | | | 558,834 | |
Series 2004-CB2, Class 7A | | | | | | | | |
5.50%, 08/25/2019 | | | 232,198 | | | | 239,318 | |
Series 2004-CB3, Class 4A | | | | | | | | |
6.00%, 10/25/2019 | | | 269,332 | | | | 283,198 | |
Series 2004-S2, Class 2A4 | | | | | | | | |
5.50%, 06/25/2034 | | | 444,971 | | | | 466,234 | |
Washington Mutual MSC Mortgage Pass-Through Certificates Trust | | | | | | | | |
Series 2003-MS2, Class 1A1 | | | | | | | | |
5.75%, 02/25/2033 | | | 220,394 | | | | 234,501 | |
Series 2004-RA2, Class 2A | | | | | | | | |
7.00%, 07/25/2033 | | | 98,827 | | | | 108,309 | |
Wells Fargo Mortgage-Backed Securities Trust | | | | | | | | |
Series 2003-K, Class 1A1 | | | | | | | | |
2.49%, 11/25/2033 (B) | | | 28,215 | | | | 28,585 | |
Series 2004-4, Class A9 | | | | | | | | |
5.50%, 05/25/2034 | | | 313,848 | | | | 323,097 | |
Series 2004-EE, Class 2A1 | | | | | | | | |
2.61%, 12/25/2034 (B) | | | 257,727 | | | | 259,284 | |
The Notes to Financial Statements are an integral part of this report.
| | |
| Transamerica Funds | | Annual Report 2014 |
Page 64
Transamerica Core Bond
SCHEDULE OF INVESTMENTS (continued)
At October 31, 2014
| | | | | | | | |
| | | Principal | | | Value | |
MORTGAGE-BACKED SECURITIES (continued) | |
Wells Fargo Mortgage-Backed Securities Trust (continued) | |
Series 2004-EE, Class 2A2 | | | | | | | | |
2.61%, 12/25/2034 (B) | | | $ 64,432 | | | | $ 65,557 | |
Series 2004-EE, Class 3A1 | | | | | | | | |
2.50%, 12/25/2034 (B) | | | 62,366 | | | | 63,158 | |
Series 2004-EE, Class 3A2 | | | | | | | | |
2.50%, 12/25/2034 (B) | | | 93,549 | | | | 95,715 | |
Series 2004-I, Class 1A1 | | | | | | | | |
2.61%, 07/25/2034 (B) | | | 892,413 | | | | 898,991 | |
Series 2004-P, Class 2A1 | | | | | | | | |
2.61%, 09/25/2034 (B) | | | 1,514,543 | | | | 1,532,042 | |
Series 2004-R, Class 2A1 | | | | | | | | |
2.62%, 09/25/2034 (B) | | | 779,056 | | | | 788,659 | |
Series 2004-U, Class A1 | | | | | | | | |
2.58%, 10/25/2034 (B) | | | 993,919 | | | | 993,558 | |
Series 2004-V, Class 1A1 | | | | | | | | |
2.61%, 10/25/2034 (B) | | | 156,860 | | | | 158,109 | |
Series 2004-V, Class 1A2 | | | | | | | | |
2.61%, 10/25/2034 (B) | | | 70,027 | | | | 70,947 | |
Series 2004-W, Class A9 | | | | | | | | |
2.62%, 11/25/2034 (B) | | | 234,403 | | | | 240,217 | |
Series 2005-AR3, Class 1A1 | | | | | | | | |
2.62%, 03/25/2035 (B) | | | 1,125,689 | | | | 1,132,639 | |
Series 2005-AR8, Class 2A1 | | | | | | | | |
2.60%, 06/25/2035 (B) | | | 344,779 | | | | 344,830 | |
Series 2005-AR9, Class 2A1 | | | | | | | | |
2.59%, 10/25/2033 (B) | | | 134,505 | | | | 135,516 | |
Wells Fargo Mortgage Loan Trust
Series 2012-RR1, Class A1
2.85%, 08/27/2037, 144A (B) | | | 334,720 | | | | 329,699 | |
Wells Fargo Re-REMIC Trust
Series 2012-IO, Class A
1.75%, 08/20/2021, 144A | | | 980,850 | | | | 981,341 | |
WFRBS Commercial Mortgage Trust
Series 2011-C3, Class A4
4.38%, 03/15/2044, 144A | | | 550,000 | | | | 598,217 | |
| | | | | | | | |
Total Mortgage-Backed Securities
(Cost $104,008,004) | | | | | | | 107,106,006 | |
| | | | | | | | |
|
ASSET-BACKED SECURITIES - 6.3% | |
ABFC Trust
Series 2005-AQ1, Class A4
5.01%, 06/25/2035 (B) | | | 539,644 | | | | 545,340 | |
Academic Loan Funding Trust | | | | | | | | |
Series 2012-1A, Class A1 | | | | | | | | |
0.95%, 12/27/2022, 144A (B) | | | 678,122 | | | | 682,225 | |
Series 2013-1A, Class A | | | | | | | | |
0.95%, 12/26/2044, 144A (B) | | | 1,101,999 | | | | 1,106,076 | |
American Credit Acceptance Receivables Trust | | | | | | | | |
Series 2012-2, Class A | | | | | | | | |
1.89%, 07/15/2016, 144A | | | 20,016 | | | | 20,024 | |
Series 2012-3, Class A | | | | | | | | |
1.64%, 11/15/2016, 144A | | | 38,492 | | | | 38,538 | |
Series 2014-2, Class A | | | | | | | | |
0.99%, 10/10/2017, 144A | | | 1,146,161 | | | | 1,146,340 | |
Series 2014-2, Class B | | | | | | | | |
2.26%, 03/10/2020, 144A | | | 295,000 | | | | 295,518 | |
| | | | | | | | |
| | | Principal | | | Value | |
ASSET-BACKED SECURITIES (continued) | | | | | |
Ascentium Equipment Receivables LLC
Series 2012-1A, Class A
1.83%, 09/15/2019, 144A | | | $ 50,462 | | | | $ 50,448 | |
AXIS Equipment Finance Receivables II LLC
Series 2013-1A, Class A
1.75%, 03/20/2017, 144A | | | 462,373 | | | | 462,422 | |
BXG Receivables Note Trust
Series 2012-A, Class A
2.66%, 12/02/2027, 144A | | | 612,435 | | | | 610,548 | |
CarFinance Capital Auto Trust
Series 2014-1A, Class A
1.46%, 12/17/2018, 144A | | | 317,649 | | | | 318,347 | |
Carlyle Global Market Strategies Commodities Funding, Ltd.
Series 2014-1A, Class A
2.13%, 10/15/2021, 144A (B) (D) | | | 866,667 | | | | 866,667 | |
CarMax Auto Owner Trust
Series 2013-4, Class A3
0.80%, 07/16/2018 | | | 185,000 | | | | 184,958 | |
Chase Funding Trust | | | | | | | | |
Series 2003-2, Class 2A2 | | | | | | | | |
0.71%, 02/25/2033 (B) | | | 436,482 | | | | 409,645 | |
Series 2003-6, Class 1A4 | | | | | | | | |
4.50%, 11/25/2034 | | | 21,856 | | | | 21,832 | |
Series 2003-6, Class 1A5 | | | | | | | | |
5.29%, 11/25/2034 (B) | | | 500,000 | | | | 514,077 | |
CPS Auto Receivables Trust | | | | | | | | |
Series 2011-C, Class A | | | | | | | | |
4.21%, 03/15/2019, 144A | | | 340,977 | | | | 349,579 | |
Series 2012-A, Class A | | | | | | | | |
2.78%, 06/17/2019, 144A | | | 95,658 | | | | 97,215 | |
Series 2012-B, Class A | | | | | | | | |
2.52%, 09/16/2019, 144A | | | 765,813 | | | | 775,901 | |
Series 2013-D, Class A | | | | | | | | |
1.54%, 07/16/2018, 144A | | | 1,089,064 | | | | 1,093,450 | |
Series 2014-A, Class A | | | | | | | | |
1.21%, 08/15/2018, 144A | | | 321,559 | | | | 321,699 | |
CPS Auto Trust
Series 2012-C, Class A
1.82%, 12/16/2019, 144A | | | 489,997 | | | | 494,633 | |
CVS Pass-Through Trust
5.93%, 01/10/2034, 144A | | | 622,881 | | | | 717,948 | |
Exeter Automobile Receivables Trust | | | | | | | | |
Series 2012-2A, Class A | | | | | | | | |
1.30%, 06/15/2017, 144A | | | 186,258 | | | | 186,511 | |
Series 2014-1A, Class A | | | | | | | | |
1.29%, 05/15/2018, 144A | | | 456,567 | | | | 457,137 | |
Series 2014-2A, Class A | | | | | | | | |
1.06%, 08/15/2018, 144A | | | 389,305 | | | | 388,846 | |
Series 2014-2A, Class C | | | | | | | | |
3.26%, 12/16/2019, 144A | | | 120,000 | | | | 117,543 | |
First Investors Auto Owner Trust
Series 2012-2A, Class A2
1.47%, 05/15/2018, 144A | | | 209,197 | | | | 209,850 | |
Flagship Credit Auto Trust | | | | | | | | |
Series 2014-1, Class A | | | | | | | | |
1.21%, 04/15/2019, 144A | | | 492,289 | | | | 491,427 | |
Series 2014-1, Class B | | | | | | | | |
2.55%, 02/18/2020, 144A | | | 95,000 | | | | 94,942 | |
The Notes to Financial Statements are an integral part of this report.
| | |
| Transamerica Funds | | Annual Report 2014 |
Page 65
Transamerica Core Bond
SCHEDULE OF INVESTMENTS (continued)
At October 31, 2014
| | | | | | | | |
| | | Principal | | | Value | |
ASSET-BACKED SECURITIES (continued) | | | | | |
GLC Trust
Series 2014-A, Class A
3.00%, 07/15/2021, 144A (E) | | | $ 894,816 | | | | $ 889,223 | |
GMAT Trust | | | | | | | | |
Series 2013-1A, Class A | | | | | | | | |
3.97%, 11/25/2043, 144A (B) | | | 296,662 | | | | 297,843 | |
Series 2014-1A, Class A | | | | | | | | |
3.72%, 02/25/2044, 144A (B) | | | 230,108 | | | | 230,935 | |
HLSS Servicer Advance Receivables Backed Notes | | | | | | | | |
Series 2013-T2, Class A2 | | | | | | | | |
1.15%, 05/16/2044, 144A | | | 1,300,000 | | | | 1,298,830 | |
Series 2013-T7, Class AT7 | | | | | | | | |
1.98%, 11/15/2046, 144A | | | 714,000 | | | | 710,644 | |
HLSS Servicer Advance Receivables Trust | | | | | | | | |
Series 2012-T2, Class A2 | | | | | | | | |
1.99%, 10/15/2045, 144A | | | 487,000 | | | | 490,360 | |
Series 2014-T1, Class AT1 | | | | | | | | |
1.24%, 01/17/2045, 144A | | | 2,000,000 | | | | 2,000,600 | |
HSBC Home Equity Loan Trust | | | | | | | | |
Series 2006-1, Class A1 | | | | | | | | |
0.32%, 01/20/2036 (B) | | | 79,937 | | | | 79,471 | |
Series 2007-1, Class AS | | | | | | | | |
0.36%, 03/20/2036 (B) | | | 81,420 | | | | 80,649 | |
Series 2007-3, Class APT | | | | | | | | |
1.36%, 11/20/2036 (B) | | | 62,022 | | | | 62,009 | |
KGS Alpha SBA Coof Trust, IO
0.86%, 08/25/2038 | | | 7,559,250 | | | | 289,378 | |
Lake Country Mortgage Loan Trust
Series 2006-HE1, Class A3
0.50%, 07/25/2034, 144A (B) | | | 102,941 | | | | 102,420 | |
Madison Avenue Manufactured Housing
Contract Trust
Series 2002-A, Class M2
2.40%, 03/25/2032 (B) | | | 448,099 | | | | 447,857 | |
New Residential Advance Receivables
Trust Advance Receivables Backed
Series 2014-T1, Class A1
1.27%, 03/15/2045, 144A | | | 806,000 | | | | 806,242 | |
Normandy Mortgage Loan Co. LLC
Series 2013-NPL3, Class A
4.95%, 09/16/2043, 144A (B) | | | 931,339 | | | | 929,942 | |
NYMT Residential LLC
Series 2013-RP3A
4.85%, 09/25/2018, 144A (B) (D) | | | 646,452 | | | | 646,452 | |
OneMain Financial Issuance Trust | | | | | | | | |
Series 2014-1A, Class A | | | | | | | | |
2.43%, 06/18/2024, 144A | | | 1,130,000 | | | | 1,136,102 | |
Series 2014-1A, Class B | | | | | | | | |
3.24%, 06/18/2024, 144A | | | 161,000 | | | | 160,672 | |
PFS Tax Lien Trust
Series 2014-1
1.44%, 05/15/2029, 144A | | | 183,339 | | | | 183,816 | |
Progreso Receivables Funding II LLC
Series 2014-A, Class A
3.50%, 07/08/2019, 144A | | | 1,000,000 | | | | 1,000,625 | |
RBSHD Trust
Series 2013-1A, Class A
4.69%, 10/25/2047, 144A (B) (D) | | | 684,735 | | | | 687,047 | |
| | | | | | | | |
| | | Principal | | | Value | |
ASSET-BACKED SECURITIES (continued) | | | | | |
RMAT
Series 2012-1A, Class A1
2.73%, 08/26/2052, 144A (B) (D) | | | $ 139,788 | | | | $ 140,367 | |
Saxon Asset Securities Trust
Series 2003-1, Class AF6
4.80%, 06/25/2033 (B) | | | 169,537 | | | | 171,413 | |
Selene Non-Performing Loans LLC
Series 2014-1A, Class A
2.98%, 05/25/2054, 144A (B) | | | 403,735 | | | | 400,112 | |
SNAAC Auto Receivables Trust
Series 2014-1A, Class A
1.03%, 09/17/2018, 144A | | | 341,996 | | | | 342,007 | |
SpringCastle America Funding LLC | | | | | | | | |
Series 2014-AA, Class A | | | | | | | | |
2.70%, 05/25/2023, 144A | | | 1,750,000 | | | | 1,751,351 | |
Series 2014-AA, Class B | | | | | | | | |
4.61%, 10/25/2027, 144A | | | 400,000 | | | | 399,264 | |
Springleaf Funding Trust | | | | | | | | |
Series 2013-AA, Class A | | | | | | | | |
2.58%, 09/15/2021, 144A | | | 3,000,000 | | | | 3,020,595 | |
Series 2014-AA, Class A | | | | | | | | |
2.41%, 12/15/2022, 144A | | | 1,867,000 | | | | 1,871,100 | |
Series 2014-AA, Class B | | | | | | | | |
3.45%, 12/15/2022, 144A | | | 292,000 | | | | 293,438 | |
Stanwich Mortgage Loan Co. LLC
Series 2012-NPL4, Class A
2.98%, 09/15/2042, 144A | | | 236,582 | | | | 236,920 | |
Structured Asset Securities Corp. | | | | | | | | |
Series 2003-37A, Class 2A | | | | | | | | |
3.60%, 12/25/2033 (B) | | | 144,364 | | | | 144,581 | |
Series 2004-4XS, Class 1A5 | | | | | | | | |
5.49%, 02/25/2034 (B) | | | 467,626 | | | | 498,715 | |
Series 2005-NC1, Class A11 | | | | | | | | |
4.42%, 02/25/2035 (B) | | | 393,592 | | | | 394,502 | |
Structured Asset Securities Corp.
Mortgage Pass-Through Certificates | | | | | | | | |
Series 2002-AL1, Class A2 | | | | | | | | |
3.45%, 02/25/2032 | | | 197,472 | | | | 196,481 | |
Series 2003-16, Class A3 | | | | | | | | |
0.65%, 06/25/2033 (B) | | | 28,882 | | | | 28,048 | |
Series 2003-32, Class 1A1 | | | | | | | | |
5.46%, 11/25/2033 (B) | | | 97,105 | | | | 100,411 | |
Series 2003-33H, Class 1A1 | | | | | | | | |
5.50%, 10/25/2033 | | | 107,035 | | | | 109,399 | |
Series 2003-35, Class 3A1 | | | | | | | | |
0.65%, 12/25/2033 (B) | | | 175,833 | | | | 173,721 | |
Series 2004-5H, Class A4 | | | | | | | | |
5.54%, 12/25/2033 | | | 495,568 | | | | 509,495 | |
Series 2004-6XS, Class A5A | | | | | | | | |
5.53%, 03/25/2034 (B) | | | 406,639 | | | | 420,629 | |
Series 2004-6XS, Class A5B | | | | | | | | |
5.55%, 03/25/2034 (B) | | | 406,639 | | | | 421,489 | |
Trafigura Securitisation Finance PLC | | | | | | | | |
Series 2012-1A, Class A | | | | | | | | |
2.55%, 10/15/2015, 144A (B) | | | 2,219,000 | | | | 2,235,296 | |
Series 2014-1A, Class A | | | | | | | | |
1.10%, 10/15/2021, 144A (B) | | | 1,063,000 | | | | 1,063,000 | |
US Residential Opportunity Fund Trust
Series 2014, Class 1A
3.47%, 03/25/2034, 144A (B) | | | 434,994 | | | | 435,451 | |
The Notes to Financial Statements are an integral part of this report.
| | |
| Transamerica Funds | | Annual Report 2014 |
Page 66
Transamerica Core Bond
SCHEDULE OF INVESTMENTS (continued)
At October 31, 2014
| | | | | | | | |
| | | Principal | | | Value | |
ASSET-BACKED SECURITIES (continued) | | | | | |
Vericrest Opportunity Loan Transferee LLC
Series 2014-NPL4, Class A1
3.13%, 04/27/2054, 144A (B) | | | $ 1,969,156 | | | | $ 1,969,237 | |
VOLT NPL IX LLC
Series 2013-NPL3, Class A1
4.25%, 04/25/2053, 144A (B) | | | 529,637 | | | | 532,689 | |
VOLT XIX LLC
Series 2013-NPL5, Class A1
3.63%, 04/25/2055, 144A (B) | | | 447,318 | | | | 447,685 | |
VOLT XV LLC
Series 2014-3A, Class A1
3.25%, 05/26/2054, 144A (B) | | | 546,405 | | | | 544,886 | |
VOLT XX LLC
Series 2013-NPL6, Class A1
3.63%, 03/25/2054, 144A (B) | | | 756,797 | | | | 759,563 | |
VOLT XXI LLC
Series 2013-NPL7, Class A1
3.63%, 11/25/2053, 144A (B) | | | 640,150 | | | | 641,160 | |
VOLT XXII LLC
Series 2014-NPL1, Class A1
3.63%, 10/27/2053, 144A (B) | | | 1,116,418 | | | | 1,117,725 | |
VOLT XXIII LLC | | | | | | | | |
1.00%, 08/27/2057 | | | 1,846,000 | | | | 1,843,663 | |
Series 2014-NPL2, Class A1 | | | | | | | | |
3.63%, 11/25/2053, 144A (B) | | | 1,155,016 | | | | 1,161,809 | |
VOLT XXIV LLC
Series 2014-NPL3, Class A1
3.25%, 11/25/2053, 144A (B) | | | 501,458 | | | | 502,175 | |
VOLT XXVI LLC
Series 2014-NPL6, Series A2
4.25%, 09/25/2043, 144A (B) | | | 328,000 | | | | 321,299 | |
Westgate Resorts LLC | | | | | | | | |
Series 2012-1, Class A | | | | | | | | |
4.50%, 09/20/2025, 144A | | | 340,421 | | | | 342,337 | |
Series 2012-2A, Class A | | | | | | | | |
3.00%, 01/20/2025, 144A | | | 618,375 | | | | 623,206 | |
| | | | | | | | |
Total Asset-Backed Securities
(Cost $51,274,913) | | | | | | | 51,766,022 | |
| | | | | | | | |
|
MUNICIPAL GOVERNMENT OBLIGATIONS - 0.6% | |
American Municipal Power, Inc.,
Revenue Bonds
Series B
7.50%, 02/15/2050 | | | 640,000 | | | | 918,957 | |
New York State Dormitory Authority,
Revenue Bonds
5.60%, 03/15/2040 | | | 280,000 | | | | 348,947 | |
Ohio State University, Revenue Bonds
Series A
4.80%, 06/01/2111 | | | 1,370,000 | | | | 1,424,499 | |
Port Authority of New York & New Jersey,
Revenue Bonds | | | | | | | | |
4.46%, 10/01/2062 | | | 970,000 | | | | 971,455 | |
5.65%, 11/01/2040 | | | 485,000 | | | | 586,675 | |
State of California, General Obligation
Unlimited
7.30%, 10/01/2039 | | | 520,000 | | | | 745,748 | |
| | | | | | | | |
| | | Principal | | | Value | |
MUNICIPAL GOVERNMENT OBLIGATIONS (continued) | |
State of Illinois, General Obligation Unlimited
5.10%, 06/01/2033 | | | $ 85,000 | | | | $ 83,689 | |
| | | | | | | | |
Total Municipal Government Obligations
(Cost $4,485,209) | | | | | | | 5,079,970 | |
| | | | | | | | |
| |
CORPORATE DEBT SECURITIES - 19.3% | | | | | |
Aerospace & Defense - 0.2% | | | | | | | | |
BAE Systems Holdings, Inc.
5.20%, 08/15/2015, 144A | | | 380,000 | | | | 393,311 | |
BAE Systems PLC
5.80%, 10/11/2041, 144A | | | 239,000 | | | | 284,251 | |
Lockheed Martin Corp. | | | | | | | | |
4.07%, 12/15/2042 | | | 120,000 | | | | 117,233 | |
4.25%, 11/15/2019 | | | 150,000 | | | | 164,271 | |
4.85%, 09/15/2041 | | | 190,000 | | | | 207,809 | |
United Technologies Corp. | | | | | | | | |
4.50%, 06/01/2042 | | | 257,000 | | | | 274,299 | |
8.88%, 11/15/2019 | | | 250,000 | | | | 325,979 | |
| | | | | | | | |
| | | | | | | 1,767,153 | |
| | | | | | | | |
Air Freight & Logistics - 0.1% | | | | | | | | |
United Parcel Service of America, Inc. | | | | | | | | |
8.38%, 04/01/2020 | | | 60,000 | | | | 77,704 | |
8.38%, 04/01/2030 (C) | | | 200,000 | | | | 293,995 | |
United Parcel Service, Inc.
2.45%, 10/01/2022 | | | 186,000 | | | | 181,152 | |
| | | | | | | | |
| | | | | | | 552,851 | |
| | | | | | | | |
Airlines - 0.1% | | | | | | | | |
Air Canada Pass-Through Trust
4.13%, 11/15/2026, 144A | | | 121,043 | | | | 121,648 | |
American Airlines Pass-Through Trust
5.25%, 07/31/2022 | | | 83,608 | | | | 89,774 | |
Continental Airlines Pass-Through Trust | | | | | | | | |
4.00%, 04/29/2026 | | | 241,421 | | | | 242,628 | |
5.98%, 10/19/2023 | | | 247,679 | | | | 273,686 | |
Delta Air Lines Pass-Through Trust | | | | | | | | |
4.75%, 11/07/2021 | | | 128,241 | | | | 136,577 | |
4.95%, 11/23/2020 | | | 203,028 | | | | 216,225 | |
5.30%, 10/15/2020 | | | 62,632 | | | | 67,956 | |
| | | | | | | | |
| | | | | | | 1,148,494 | |
| | | | | | | | |
Auto Components - 0.1% | | | | | | | | |
Johnson Controls, Inc. | | | | | | | | |
4.25%, 03/01/2021 | | | 150,000 | | | | 161,616 | |
5.25%, 12/01/2041 | | | 300,000 | | | | 327,750 | |
| | | | | | | | |
| | | | | | | 489,366 | |
| | | | | | | | |
Automobiles - 0.2% | | | | | | | | |
American Honda Finance Corp. | | | | | | | | |
1.50%, 09/11/2017, 144A | | | 200,000 | | | | 200,983 | |
7.63%, 10/01/2018, 144A | | | 300,000 | | | | 363,608 | |
Daimler Finance North America LLC | | | | | | | | |
2.63%, 09/15/2016, 144A | | | 200,000 | | | | 205,751 | |
2.88%, 03/10/2021, 144A | | | 550,000 | | | | 555,095 | |
| | | | | | | | |
| | | | | | | 1,325,437 | |
| | | | | | | | |
Banks - 1.7% | | | | | | | | |
ANZ New Zealand International, Ltd.
3.13%, 08/10/2015, 144A | | | 105,000 | | | | 107,020 | |
The Notes to Financial Statements are an integral part of this report.
| | |
| Transamerica Funds | | Annual Report 2014 |
Page 67
Transamerica Core Bond
SCHEDULE OF INVESTMENTS (continued)
At October 31, 2014
| | | | | | | | |
| | | Principal | | | Value | |
CORPORATE DEBT SECURITIES (continued) | | | | | |
Banks (continued) | | | | | | | | |
Australia & New Zealand Banking Group, Ltd.
Series MTN
4.88%, 01/12/2021, 144A | | | $ 137,000 | | | | $ 154,602 | |
Bank of Nova Scotia
2.55%, 01/12/2017 | | | 455,000 | | | | 468,974 | |
Bank of Tokyo-Mitsubishi UFJ, Ltd.
2.35%, 02/23/2017, 144A | | | 435,000 | | | | 445,578 | |
Barclays Bank PLC | | | | | | | | |
2.25%, 05/10/2017, 144A (A) | | | 276,000 | | | | 283,781 | |
5.00%, 09/22/2016 | | | 100,000 | | | | 107,344 | |
BB&T Corp.
5.25%, 11/01/2019 | | | 90,000 | | | | 101,502 | |
Series MTN 6.85%, 04/30/2019 | | | 250,000 | | | | 298,591 | |
BNZ International Funding, Ltd.
2.35%, 03/04/2019, 144A | | | 250,000 | | | | 250,318 | |
Comerica, Inc.
3.00%, 09/16/2015 | | | 150,000 | | | | 153,052 | |
Commonwealth Bank of Australia
2.25%, 03/16/2017, 144A | | | 530,000 | | | | 543,858 | |
Cooperatieve Centrale Raiffeisen-Boerenleenbank BA | | | | | | | | |
2.13%, 10/13/2015 | | | 105,000 | | | | 106,691 | |
3.38%, 01/19/2017 | | | 205,000 | | | | 215,255 | |
4.50%, 01/11/2021 | | | 300,000 | | | | 331,093 | |
5.80%, 09/30/2110, 144A | | | 300,000 | | | | 333,682 | |
Deutsche Bank AG | | | | | | | | |
1.35%, 05/30/2017 | | | 120,000 | | | | 119,297 | |
3.25%, 01/11/2016 | | | 280,000 | | | | 288,144 | |
6.00%, 09/01/2017 | | | 190,000 | | | | 212,955 | |
Discover Bank
4.20%, 08/08/2023 | | | 250,000 | | | | 261,939 | |
Fifth Third Bank
1.45%, 02/28/2018 | | | 270,000 | | | | 267,728 | |
HSBC Holdings PLC | | | | | | | | |
4.88%, 01/14/2022 | | | 1,520,000 | | | | 1,699,947 | |
5.10%, 04/05/2021 | | | 911,000 | | | | 1,028,129 | |
ING Bank NV
3.75%, 03/07/2017, 144A | | | 400,000 | | | | 421,328 | |
KeyBank NA
5.70%, 11/01/2017 | | | 245,000 | | | | 272,672 | |
Manufacturers & Traders Trust Co.
6.63%, 12/04/2017 | | | 250,000 | | | | 285,958 | |
National Australia Bank, Ltd.
2.00%, 06/20/2017, 144A | | | 280,000 | | | | 285,745 | |
Nordea Bank AB | | | | | | | | |
1.63%, 05/15/2018, 144A | | | 500,000 | | | | 496,875 | |
4.88%, 05/13/2021, 144A | | | 384,000 | | | | 415,715 | |
PNC Bank NA
6.88%, 04/01/2018 | | | 600,000 | | | | 695,418 | |
PNC Funding Corp. | | | | | | | | |
5.13%, 02/08/2020 | | | 250,000 | | | | 282,025 | |
5.63%, 02/01/2017 | | | 130,000 | | | | 141,539 | |
6.70%, 06/10/2019 | | | 150,000 | | | | 178,859 | |
Royal Bank of Canada
1.20%, 09/19/2018 | | | 400,000 | | | | 398,387 | |
Stadshypotek AB
1.88%, 10/02/2019, 144A | | | 530,000 | | | | 523,562 | |
| | | | | | | | |
| | | Principal | | | Value | |
CORPORATE DEBT SECURITIES (continued) | | | | | |
Banks (continued) | | | | | | | | |
U.S. Bancorp
Series MTN | | | | | | | | |
3.00%, 03/15/2022 | | | $ 233,000 | | | | $ 234,137 | |
4.13%, 05/24/2021 | | | 133,000 | | | | 144,312 | |
U.S. Bank NA
2.13%, 10/28/2019 | | | 400,000 | | | | 398,243 | |
Wells Fargo & Co. | | | | | | | | |
3.68%, 06/15/2016 (C) | | | 390,000 | | | | 407,630 | |
5.63%, 12/11/2017 | | | 150,000 | | | | 168,315 | |
Series MTN 4.65%, 11/04/2044 (F) | | | 184,000 | | | | 183,396 | |
| | | | | | | | |
| | | | | | | 13,713,596 | |
| | | | | | | | |
Beverages - 0.2% | | | | | | | | |
Anheuser-Busch InBev Worldwide, Inc. | | | | | | | | |
7.75%, 01/15/2019 | | | 118,000 | | | | 143,101 | |
8.20%, 01/15/2039 | | | 240,000 | | | | 365,278 | |
Diageo Capital PLC | | | | | | | | |
4.83%, 07/15/2020 | | | 90,000 | | | | 100,857 | |
5.75%, 10/23/2017 | | | 230,000 | | | | 258,377 | |
Heineken NV
1.40%, 10/01/2017, 144A | | | 400,000 | | | | 399,053 | |
PepsiCo, Inc.
7.90%, 11/01/2018 | | | 21,000 | | | | 25,819 | |
SABMiller Holdings, Inc.
3.75%, 01/15/2022, 144A | | | 200,000 | | | | 206,558 | |
| | | | | | | | |
| | | | | | | 1,499,043 | |
| | | | | | | | |
Biotechnology - 0.2% | | | | | | | | |
Amgen, Inc. | | | | | | | | |
3.45%, 10/01/2020 | | | 400,000 | | | | 415,191 | |
4.50%, 03/15/2020 | | | 56,000 | | | | 61,346 | |
5.15%, 11/15/2041 | | | 575,000 | | | | 616,683 | |
5.75%, 03/15/2040 | | | 165,000 | | | | 189,954 | |
Celgene Corp.
1.90%, 08/15/2017 | | | 509,000 | | | | 513,634 | �� |
| | | | | | | | |
| | | | | | | 1,796,808 | |
| | | | | | | | |
Capital Markets - 1.5% | | | | | | | | |
Bank of New York Mellon Corp. | | | | | | | | |
3.55%, 09/23/2021 | | | 509,000 | | | | 528,965 | |
5.45%, 05/15/2019 (A) | | | 200,000 | | | | 228,228 | |
Series MTN | | | | | | | | |
2.40%, 01/17/2017 | | | 200,000 | | | | 205,672 | |
4.60%, 01/15/2020 | | | 40,000 | | | | 44,358 | |
BlackRock, Inc.
3.38%, 06/01/2022 | | | 174,000 | | | | 179,581 | |
Charles Schwab Corp.
3.23%, 09/01/2022 (A) | | | 100,000 | | | | 101,207 | |
Goldman Sachs Group, Inc. | | | | | | | | |
5.95%, 01/18/2018 | | | 320,000 | | | | 358,288 | |
6.15%, 04/01/2018 | | | 330,000 | | | | 372,900 | |
6.75%, 10/01/2037 | | | 200,000 | | | | 245,195 | |
Series MTN | | | | | | | | |
5.38%, 03/15/2020 | | | 390,000 | | | | 437,313 | |
7.50%, 02/15/2019 | | | 2,475,000 | | | | 2,955,237 | |
Macquarie Group, Ltd. | | | | | | | | |
6.00%, 01/14/2020, 144A | | | 450,000 | | | | 507,439 | |
6.25%, 01/14/2021, 144A | | | 725,000 | | | | 828,579 | |
The Notes to Financial Statements are an integral part of this report.
| | |
| Transamerica Funds | | Annual Report 2014 |
Page 68
Transamerica Core Bond
SCHEDULE OF INVESTMENTS (continued)
At October 31, 2014
| | | | | | | | |
| | | Principal | | | Value | |
CORPORATE DEBT SECURITIES (continued) | | | | | |
Capital Markets (continued) | | | | | | | | |
Morgan Stanley
5.00%, 11/24/2025 | | | $ 373,000 | | | | $ 396,448 | |
Series MTN | | | | | | | | |
5.55%, 04/27/2017 | | | 170,000 | | | | 186,146 | |
5.63%, 09/23/2019 | | | 1,000,000 | | | | 1,132,774 | |
7.30%, 05/13/2019 (A) | | | 1,800,000 | | | | 2,148,673 | |
Nomura Holdings, Inc.
6.70%, 03/04/2020 | | | 257,000 | | | | 305,607 | |
State Street Corp.
3.70%, 11/20/2023 | | | 615,000 | | | | 637,505 | |
UBS AG
5.88%, 12/20/2017 | | | 110,000 | | | | 123,905 | |
Series MTN 4.88%, 08/04/2020 | | | 257,000 | | | | 288,036 | |
| | | | | | | | |
| | | | | | | 12,212,056 | |
| | | | | | | | |
Chemicals - 0.4% | | | | | | | | |
Dow Chemical Co.
4.25%, 11/15/2020 | | | 174,000 | | | | 187,117 | |
E.I. du Pont de Nemours & Co. | | | | | | | | |
1.95%, 01/15/2016 | | | 173,000 | | | | 175,806 | |
4.90%, 01/15/2041 | | | 125,000 | | | | 134,442 | |
Ecolab, Inc.
5.50%, 12/08/2041 | | | 420,000 | | | | 497,878 | |
Mosaic Co. | | | | | | | | |
3.75%, 11/15/2021 | | | 209,000 | | | | 218,730 | |
4.88%, 11/15/2041 | | | 253,000 | | | | 255,835 | |
5.45%, 11/15/2033 | | | 472,000 | | | | 526,947 | |
Potash Corp. of Saskatchewan, Inc.
6.50%, 05/15/2019 | | | 260,000 | | | | 306,226 | |
PPG Industries, Inc.
9.00%, 05/01/2021 | | | 310,000 | | | | 405,478 | |
Praxair, Inc.
5.20%, 03/15/2017 | | | 150,000 | | | | 164,449 | |
Union Carbide Corp. | | | | | | | | |
7.50%, 06/01/2025 | | | 400,000 | | | | 512,535 | |
7.75%, 10/01/2096 | | | 210,000 | | | | 264,214 | |
| | | | | | | | |
| | | | | | | 3,649,657 | |
| | | | | | | | |
Commercial Services & Supplies - 0.3% | | | | | |
ADT Corp. | | | | | | | | |
3.50%, 07/15/2022 (A) | | | 124,000 | | | | 110,980 | |
4.88%, 07/15/2042 | | | 147,000 | | | | 123,480 | |
Eaton Corp.
7.63%, 04/01/2024 | | | 500,000 | | | | 640,895 | |
ERAC USA Finance LLC | | | | | | | | |
2.75%, 03/15/2017, 144A (A) | | | 65,000 | | | | 67,054 | |
4.50%, 08/16/2021, 144A | | | 175,000 | | | | 190,431 | |
5.63%, 03/15/2042, 144A | | | 141,000 | | | | 160,472 | |
6.70%, 06/01/2034, 144A | | | 331,000 | | | | 420,025 | |
Ingersoll-Rand Luxembourg Finance SA | | | | | | | | |
2.63%, 05/01/2020 (A) | | | 200,000 | | | | 199,354 | |
Pitney Bowes, Inc.
Series MTN | | | | | | | | |
5.60%, 03/15/2018 | | | 100,000 | | | | 110,150 | |
Waste Management, Inc. | | | | | | | | |
4.75%, 06/30/2020 | | | 319,000 | | | | 353,615 | |
| | | | | | | | |
| | | | | | | 2,376,456 | |
| | | | | | | | |
| | | | | | | | |
| | | Principal | | | Value | |
CORPORATE DEBT SECURITIES (continued) | | | | | |
Communications Equipment - 0.1% | | | | | | | | |
Cisco Systems, Inc. | | | | | | | | |
2.90%, 03/04/2021 (A) | | | $ 55,000 | | | | $ 56,364 | |
3.63%, 03/04/2024 (A) | | | 200,000 | | | | 206,478 | |
4.45%, 01/15/2020 | | | 150,000 | | | | 165,712 | |
5.90%, 02/15/2039 | | | 100,000 | | | | 122,481 | |
| | | | | | | | |
| | | | | | | 551,035 | |
| | | | | | | | |
Construction & Engineering - 0.1% | | | | | | | | |
ABB Finance USA, Inc. | | | | | | | | |
1.63%, 05/08/2017 | | | 210,000 | | | | 211,817 | |
2.88%, 05/08/2022 | | | 152,000 | | | | 151,644 | |
4.38%, 05/08/2042 (A) | | | 128,000 | | | | 132,688 | |
Fluor Corp. | | | | | | | | |
3.38%, 09/15/2021 | | | 547,000 | | | | 568,845 | |
| | | | | | | | |
| | | | | | | 1,064,994 | |
| | | | | | | | |
Construction Materials - 0.0% (G) | | | | | | | | |
CRH America, Inc. | | | | | | | | |
6.00%, 09/30/2016 | | | 221,000 | | | | 240,652 | |
| | | | | | | | |
| | | | | | | 240,652 | |
| | | | | | | | |
Consumer Finance - 0.3% | | | | | | | | |
American Express Co. | | | | | | | | |
7.00%, 03/19/2018 | | | 700,000 | | | | 815,843 | |
Capital One Financial Corp. | | | | | | | | |
3.50%, 06/15/2023 | | | 220,000 | | | | 219,794 | |
4.75%, 07/15/2021 | | | 625,000 | | | | 688,080 | |
Caterpillar Financial Services Corp.
Series MTN | | | | | | | | |
5.85%, 09/01/2017 | | | 150,000 | | | | 168,704 | |
7.05%, 10/01/2018 | | | 150,000 | | | | 177,707 | |
7.15%, 02/15/2019 | | | 100,000 | | | | 120,287 | |
John Deere Capital Corp.
Series MTN | | | | | | | | |
2.75%, 03/15/2022 | | | 153,000 | | | | 151,687 | |
5.75%, 09/10/2018 | | | 100,000 | | | | 114,261 | |
PACCAR Financial Corp.
Series MTN | | | | | | | | |
1.60%, 03/15/2017 | | | 197,000 | | | | 199,227 | |
| | | | | | | | |
| | | | | | | 2,655,590 | |
| | | | | | | | |
Diversified Financial Services - 2.3% | | | | | | | | |
Associates Corp. of North America | | | | | | | | |
6.95%, 11/01/2018 | | | 1,934,000 | | | | 2,270,158 | |
Bank of America Corp. | | | | | | | | |
5.70%, 01/24/2022 | | | 600,000 | | | | 690,763 | |
5.75%, 12/01/2017 | | | 220,000 | | | | 244,889 | |
Series MTN | | | | | | | | |
5.00%, 05/13/2021 | | | 75,000 | | | | 83,030 | |
5.63%, 07/01/2020 | | | 2,340,000 | | | | 2,657,421 | |
5.88%, 02/07/2042 | | | 400,000 | | | | 488,704 | |
6.40%, 08/28/2017 | | | 1,325,000 | | | | 1,492,701 | |
6.88%, 04/25/2018 | | | 600,000 | | | | 694,063 | |
Blackstone Holdings Finance Co. LLC | | | | | | | | |
5.88%, 03/15/2021, 144A | | | 500,000 | | | | 580,780 | |
Citigroup, Inc. | | | | | | | | |
5.38%, 08/09/2020 | | | 87,000 | | | | 98,796 | |
6.88%, 03/05/2038 | | | 110,000 | | | | 147,678 | |
8.13%, 07/15/2039 | | | 100,000 | | | | 150,498 | |
8.50%, 05/22/2019 | | | 550,000 | | | | 690,096 | |
The Notes to Financial Statements are an integral part of this report.
| | |
| Transamerica Funds | | Annual Report 2014 |
Page 69
Transamerica Core Bond
SCHEDULE OF INVESTMENTS (continued)
At October 31, 2014
| | | | | | | | |
| | | Principal | | | Value | |
CORPORATE DEBT SECURITIES (continued) | | | | | |
Diversified Financial Services (continued) | | | | | |
CME Group, Inc. | | | | | | | | |
3.00%, 09/15/2022 | | | $ 200,000 | | | | $ 200,973 | |
Credit Suisse | | | | | | | | |
3.00%, 10/29/2021 | | | 250,000 | | | | 247,293 | |
Ford Motor Credit Co. LLC | | | | | | | | |
1.50%, 01/17/2017 | | | 363,000 | | | | 362,580 | |
2.38%, 03/12/2019 (A) | | | 600,000 | | | | 599,163 | |
3.98%, 06/15/2016 | | | 555,000 | | | | 579,710 | |
4.25%, 09/20/2022 | | | 332,000 | | | | 348,650 | |
General Electric Capital Corp.
Series MTN | | | | | | | | |
3.10%, 01/09/2023 | | | 800,000 | | | | 801,419 | |
4.65%, 10/17/2021 | | | 900,000 | | | | 1,005,623 | |
5.50%, 01/08/2020 | | | 1,780,000 | | | | 2,054,597 | |
6.00%, 08/07/2019 | | | 420,000 | | | | 492,531 | |
6.75%, 03/15/2032 | | | 485,000 | | | | 644,903 | |
Invesco Finance PLC | | | | | | | | |
4.00%, 01/30/2024 | | | 160,000 | | | | 166,775 | |
Jefferies Group LLC | | | | | | | | |
6.25%, 01/15/2036 | | | 260,000 | | | | 278,985 | |
6.45%, 06/08/2027 | | | 180,000 | | | | 203,801 | |
MassMutual Global Funding II | | | | | | | | |
2.00%, 04/05/2017, 144A (A) | | | 170,000 | | | | 173,256 | |
National Rural Utilities Cooperative Finance Corp. | | | | | | | | |
10.38%, 11/01/2018 | | | 250,000 | | | | 329,115 | |
| | | | | | | | |
| | | | | | | 18,778,951 | |
| | | | | | | | |
Diversified Telecommunication Services - 1.3% | | | | | |
AT&T, Inc. | | | | | | | | |
3.88%, 08/15/2021 | | | 1,300,000 | | | | 1,363,086 | |
5.35%, 09/01/2040 | | | 898,000 | | | | 958,770 | |
6.30%, 01/15/2038 | | | 500,000 | | | | 604,169 | |
BellSouth Telecommunications LLC | | | | | | | | |
6.30%, 12/15/2015 | | | 50,000 | | | | 50,201 | |
British Telecommunications PLC | | | | | | | | |
5.95%, 01/15/2018 | | | 200,000 | | | | 225,258 | |
9.63%, 12/15/2030 | | | 180,000 | | | | 283,348 | |
Centel Capital Corp. | | | | | | | | |
9.00%, 10/15/2019 | | | 450,000 | | | | 542,873 | |
Deutsche Telekom International Finance BV | | | | | | | | |
8.75%, 06/15/2030 | | | 330,000 | | | | 478,950 | |
GTP Acquisition Partners I LLC | | | | | | | | |
4.35%, 06/15/2041, 144A | | | 758,000 | | | | 774,650 | |
Nippon Telegraph & Telephone Corp. | | | | | | | | |
1.40%, 07/18/2017 | | | 400,000 | | | | 400,490 | |
Orange SA | | | | | | | | |
9.00%, 03/01/2031 | | | 430,000 | | | | 637,116 | |
Telefonica Emisiones SAU | | | | | | | | |
5.13%, 04/27/2020 | | | 402,000 | | | | 444,851 | |
5.46%, 02/16/2021 | | | 91,000 | | | | 102,128 | |
5.88%, 07/15/2019 | | | 261,000 | | | | 299,321 | |
Verizon Communications, Inc. | | | | | | | | |
2.63%, 02/21/2020, 144A | | | 82,000 | | | | 81,562 | |
3.00%, 11/01/2021 | | | 1,028,000 | | | | 1,020,120 | |
3.45%, 03/15/2021 | | | 286,000 | | | | 292,194 | |
4.40%, 11/01/2034 | | | 337,000 | | | | 329,090 | |
4.50%, 09/15/2020 | | | 476,000 | | | | 516,802 | |
4.86%, 08/21/2046, 144A | | | 214,000 | | | | 218,236 | |
5.05%, 03/15/2034 | | | 539,000 | | | | 570,519 | |
| | | | | | | | |
| | | Principal | | | Value | |
CORPORATE DEBT SECURITIES (continued) | | | | | |
Diversified Telecommunication Services (continued) | |
Verizon Communications, Inc. (continued) | | | | | | | | |
5.85%, 09/15/2035 | | | $ 175,000 | | | | $ 203,342 | |
6.40%, 09/15/2033 | | | 208,000 | | | | 253,357 | |
Verizon Pennsylvania LLC | | | | | | | | |
8.35%, 12/15/2030 (A) | | | 240,000 | | | | 318,828 | |
| | | | | | | | |
| | | | | | | 10,969,261 | |
| | | | | | | | |
Electric Utilities - 1.6% | | | | | | | | |
AEP Texas Central Co. | | | | | | | | |
6.65%, 02/15/2033 | | | 100,000 | | | | 130,425 | |
Alabama Power Co. | | | | | | | | |
6.00%, 03/01/2039 | | | 248,000 | | | | 319,158 | |
6.13%, 05/15/2038 | | | 77,000 | | | | 100,203 | |
American Electric Power Co., Inc. | | | | | | | | |
1.65%, 12/15/2017 | | | 83,000 | | | | 83,192 | |
Appalachian Power Co. | | | | | | | | |
5.95%, 05/15/2033 | | | 50,000 | | | | 59,935 | |
6.38%, 04/01/2036 | | | 200,000 | | | | 253,090 | |
6.70%, 08/15/2037 | | | 200,000 | | | | 262,947 | |
Arizona Public Service Co. | | | | | | | | |
4.50%, 04/01/2042 | | | 121,000 | | | | 128,188 | |
5.05%, 09/01/2041 | | | 303,000 | | | | 347,370 | |
Cleveland Electric Illuminating Co. | | | | | | | | |
7.88%, 11/01/2017 | | | 180,000 | | | | 212,447 | |
8.88%, 11/15/2018 | | | 337,000 | | | | 421,978 | |
Comision Federal de Electricidad | | | | | | | | |
4.88%, 05/26/2021, 144A | | | 261,000 | | | | 277,965 | |
DTE Electric Co. | | | | | | | | |
2.65%, 06/15/2022 | | | 68,000 | | | | 67,675 | |
3.95%, 06/15/2042 | | | 101,000 | | | | 98,826 | |
Duke Energy Carolinas LLC | | | | | | | | |
4.30%, 06/15/2020 | | | 156,000 | | | | 171,827 | |
6.00%, 01/15/2038 | | | 133,000 | | | | 171,277 | |
6.45%, 10/15/2032 | | | 100,000 | | | | 130,693 | |
Duke Energy Indiana, Inc. | | | | | | | | |
3.75%, 07/15/2020 | | | 200,000 | | | | 214,209 | |
Duke Energy Progress, Inc. | | | | | | | | |
3.00%, 09/15/2021 | | | 610,000 | | | | 621,718 | |
5.30%, 01/15/2019 | | | 80,000 | | | | 90,436 | |
Enel Finance International NV | | | | | | | | |
5.13%, 10/07/2019, 144A | | | 450,000 | | | | 499,681 | |
Florida Power & Light Co. | | | | | | | | |
5.13%, 06/01/2041 | | | 112,000 | | | | 131,675 | |
5.95%, 10/01/2033 (A) | | | 425,000 | | | | 540,054 | |
Great Plains Energy, Inc. | | | | | | | | |
4.85%, 06/01/2021 | | | 26,000 | | | | 28,899 | |
Hydro-Quebec | | | | | | | | |
8.40%, 01/15/2022 | | | 420,000 | | | | 554,030 | |
9.40%, 02/01/2021 | | | 100,000 | | | | 136,453 | |
John Sevier Combined Cycle Generation LLC | | | | | | | | |
4.63%, 01/15/2042 | | | 486,387 | | | | 536,031 | |
Kansas City Power & Light Co. | | | | | | | | |
5.30%, 10/01/2041 | | | 500,000 | | | | 565,370 | |
Massachusetts Electric Co. | | | | | | | | |
5.90%, 11/15/2039, 144A | | | 55,000 | | | | 68,993 | |
Nevada Power Co. | | | | | | | | |
5.38%, 09/15/2040 | | | 52,000 | | | | 62,222 | |
5.45%, 05/15/2041 | | | 400,000 | | | | 486,054 | |
7.13%, 03/15/2019 | | | 100,000 | | | | 120,099 | |
The Notes to Financial Statements are an integral part of this report.
| | |
| Transamerica Funds | | Annual Report 2014 |
Page 70
Transamerica Core Bond
SCHEDULE OF INVESTMENTS (continued)
At October 31, 2014
| | | | | | | | |
| | | Principal | | | Value | |
CORPORATE DEBT SECURITIES (continued) | | | | | |
Electric Utilities (continued) | | | | | | | | |
NextEra Energy Capital Holdings, Inc. | | | | | | | | |
1.20%, 06/01/2015 | | | $ 78,000 | | | | $ 78,330 | |
Niagara Mohawk Power Corp. | | | | | | | | |
4.88%, 08/15/2019, 144A | | | 50,000 | | | | 55,689 | |
NiSource Finance Corp. | | | | | | | | |
5.80%, 02/01/2042 | | | 600,000 | | | | 701,815 | |
6.80%, 01/15/2019 | | | 200,000 | | | | 236,409 | |
Northern States Power Co. | | | | | | | | |
5.35%, 11/01/2039 | | | 19,000 | | | | 22,892 | |
6.25%, 06/01/2036 | | | 100,000 | | | | 132,128 | |
Pacific Gas & Electric Co. | | | | | | | | |
2.45%, 08/15/2022 | | | 181,000 | | | | 173,406 | |
3.25%, 09/15/2021 (A) | | | 159,000 | | | | 162,534 | |
4.50%, 12/15/2041 | | | 200,000 | | | | 206,019 | |
5.40%, 01/15/2040 | | | 42,000 | | | | 49,131 | |
6.05%, 03/01/2034 | | | 60,000 | | | | 74,856 | |
PacifiCorp | | | | | | | | |
5.50%, 01/15/2019 | | | 125,000 | | | | 141,928 | |
5.65%, 07/15/2018 | | | 100,000 | | | | 114,092 | |
6.25%, 10/15/2037 | | | 360,000 | | | | 474,347 | |
Pennsylvania Electric Co. | | | | | | | | |
6.05%, 09/01/2017 | | | 150,000 | | | | 167,537 | |
PPL Capital Funding, Inc. | | | | | | | | |
4.20%, 06/15/2022 | | | 165,000 | | | | 174,577 | |
PPL Electric Utilities Corp. | | | | | | | | |
2.50%, 09/01/2022 | | | 100,000 | | | | 98,111 | |
Progress Energy, Inc. | | | | | | | | |
4.88%, 12/01/2019 | | | 200,000 | | | | 223,214 | |
6.00%, 12/01/2039 | | | 50,000 | | | | 62,824 | |
7.75%, 03/01/2031 | | | 150,000 | | | | 213,766 | |
Public Service Co. of Colorado | | | | | | | | |
2.25%, 09/15/2022 | | | 137,000 | | | | 131,715 | |
3.20%, 11/15/2020 | | | 56,000 | | | | 58,669 | |
Public Service Co. of New Hampshire | | | | | | | | |
3.50%, 11/01/2023 | | | 60,000 | | | | 61,966 | |
Public Service Co. of Oklahoma | | | | | | | | |
5.15%, 12/01/2019 | | | 133,000 | | | | 149,279 | |
Public Service Electric & Gas Co.
Series MTN | | | | | | | | |
3.65%, 09/01/2042 | | | 138,000 | | | | 130,922 | |
5.38%, 11/01/2039 | | | 28,000 | | | | 34,045 | |
South Carolina Electric & Gas Co. | | | | | | | | |
4.50%, 06/01/2064 | | | 58,000 | | | | 59,277 | |
Southern California Edison Co. | | | | | | | | |
3.90%, 12/01/2041 | | | 100,000 | | | | 98,184 | |
5.50%, 03/15/2040 | | | 130,000 | | | | 159,453 | |
6.65%, 04/01/2029 | | | 300,000 | | | | 390,266 | |
Virginia Electric and Power Co. | | | | | | | | |
2.95%, 01/15/2022 | | | 157,000 | | | | 160,167 | |
Wisconsin Electric Power Co. | | | | | | | | |
2.95%, 09/15/2021 | | | 26,000 | | | | 26,599 | |
3.65%, 12/15/2042 | | | 144,000 | | | | 137,794 | |
Xcel Energy, Inc. | | | | | | | | |
4.70%, 05/15/2020 | | | 50,000 | | | | 55,814 | |
4.80%, 09/15/2041 | | | 116,000 | | | | 125,755 | |
| | | | | | | | |
| | | | | | | 13,236,630 | |
| | | | | | | | |
| | | | | | | | |
| | | Principal | | | Value | |
CORPORATE DEBT SECURITIES (continued) | | | | | |
Electronic Equipment, Instruments & Components - 0.1% | |
Arrow Electronics, Inc. | | | | | | | | |
3.38%, 11/01/2015 | | | $ 75,000 | | | | $ 76,821 | |
6.00%, 04/01/2020 | | | 385,000 | | | | 438,752 | |
6.88%, 06/01/2018 | | | 92,000 | | | | 105,337 | |
| | | | | | | | |
| | | | | | | 620,910 | |
| | | | | | | | |
Energy Equipment & Services - 0.6% | | | | | | | | |
ANR Pipeline Co. | | | | | | | | |
9.63%, 11/01/2021 | | | 200,000 | | | | 283,291 | |
Cameron International Corp. | | | | | | | | |
4.00%, 12/15/2023 | | | 85,000 | | | | 88,346 | |
Enterprise Products Operating LLC | | | | | | | | |
3.75%, 02/15/2025 | | | 74,000 | | | | 74,435 | |
3.90%, 02/15/2024 | | | 112,000 | | | | 115,267 | |
4.95%, 10/15/2054 | | | 33,000 | | | | 33,633 | |
5.10%, 02/15/2045 | | | 32,000 | | | | 33,876 | |
Halliburton Co. | | | | | | | | |
6.15%, 09/15/2019 | | | 70,000 | | | | 82,641 | |
7.60%, 08/15/2096, 144A | | | 160,000 | | | | 239,385 | |
Nabors Industries, Inc. | | | | | | | | |
4.63%, 09/15/2021 | | | 450,000 | | | | 474,724 | |
6.15%, 02/15/2018 | | | 205,000 | | | | 230,890 | |
Noble Holding International, Ltd. | | | | | | | | |
3.95%, 03/15/2022 (A) | | | 87,000 | | | | 83,920 | |
5.25%, 03/15/2042 (A) | | | 253,000 | | | | 221,194 | |
Schlumberger Investment SA | | | | | | | | |
3.30%, 09/14/2021, 144A | | | 344,000 | | | | 357,275 | |
3.65%, 12/01/2023 (A) | | | 164,000 | | | | 171,613 | |
Texas Eastern Transmission, LP | | | | | | | | |
2.80%, 10/15/2022, 144A | | | 462,000 | | | | 434,973 | |
TransCanada PipeLines, Ltd. | | | | | | | | |
2.50%, 08/01/2022 | | | 115,000 | | | | 109,518 | |
3.75%, 10/16/2023 (A) | | | 135,000 | | | | 137,885 | |
6.50%, 08/15/2018 | | | 175,000 | | | | 203,242 | |
Transocean, Inc. | | | | | | | | |
6.38%, 12/15/2021 | | | 161,000 | | | | 169,188 | |
6.50%, 11/15/2020 (A) | | | 150,000 | | | | 154,288 | |
7.50%, 04/15/2031 | | | 200,000 | | | | 211,467 | |
Weatherford International, Ltd. | | | | | | | | |
9.88%, 03/01/2039 | | | 655,000 | | | | 968,421 | |
| | | | | | | | |
| | | | | | | 4,879,472 | |
| | | | | | | | |
Food & Staples Retailing - 0.2% | | | | | | | | |
CVS Health Corp. | | | | | | | | |
4.13%, 05/15/2021 | | | 100,000 | | | | 108,601 | |
Kroger Co. | | | | | | | | |
2.20%, 01/15/2017 (A) | | | 123,000 | | | | 125,565 | |
5.40%, 07/15/2040 | | | 51,000 | | | | 57,271 | |
6.15%, 01/15/2020 | | | 300,000 | | | | 350,179 | |
7.50%, 04/01/2031 | | | 100,000 | | | | 132,445 | |
8.00%, 09/15/2029 | | | 175,000 | | | | 238,762 | |
Sysco Corp. | | | | | | | | |
3.00%, 10/02/2021 | | | 19,000 | | | | 19,269 | |
Walgreen Co. | | | | | | | | |
3.10%, 09/15/2022 | | | 516,000 | | | | 505,564 | |
| | | | | | | | |
| | | | | | | 1,537,656 | |
| | | | | | | | |
Food Products - 0.3% | | | | | | | | |
Bunge, Ltd. Finance Corp. | | | | | | | | |
8.50%, 06/15/2019 | | | 310,000 | | | | 383,523 | |
The Notes to Financial Statements are an integral part of this report.
| | |
| Transamerica Funds | | Annual Report 2014 |
Page 71
Transamerica Core Bond
SCHEDULE OF INVESTMENTS (continued)
At October 31, 2014
| | | | | | | | |
| | | Principal | | | Value | |
CORPORATE DEBT SECURITIES (continued) | | | | | |
Food Products (continued) | | | | | | | | |
Cargill, Inc. | | | | | | | | |
3.30%, 03/01/2022, 144A | | | $ 250,000 | | | | $ 256,837 | |
7.35%, 03/06/2019, 144A | | | 250,000 | | | | 302,039 | |
ConAgra Foods, Inc. | | | | | | | | |
2.10%, 03/15/2018 | | | 159,000 | | | | 159,799 | |
Kraft Foods Group, Inc. | | | | | | | | |
5.38%, 02/10/2020 | | | 318,000 | | | | 361,162 | |
6.88%, 01/26/2039 | | | 196,000 | | | | 250,843 | |
Mondelez International, Inc. | | | | | | | | |
4.00%, 02/01/2024 | | | 500,000 | | | | 516,016 | |
| | | | | | | | |
| | | | | | | 2,230,219 | |
| | | | | | | | |
Gas Utilities - 0.2% | | | | | | | | |
AGL Capital Corp. | | | | | | | | |
3.50%, 09/15/2021 | | | 601,000 | | | | 623,249 | |
5.25%, 08/15/2019 | | | 100,000 | | | | 112,267 | |
5.88%, 03/15/2041 | | | 109,000 | | | | 135,702 | |
6.38%, 07/15/2016 | | | 300,000 | | | | 325,636 | |
Atmos Energy Corp. | | | | | | | | |
8.50%, 03/15/2019 | | | 44,000 | | | | 55,301 | |
Boston Gas Co. | | | | | | | | |
4.49%, 02/15/2042, 144A (A) | | | 330,000 | | | | 344,701 | |
CenterPoint Energy Resources Corp. | | | | | | | | |
4.50%, 01/15/2021 (A) | | | 352,000 | | | | 387,275 | |
| | | | | | | | |
| | | | | | | 1,984,131 | |
| | | | | | | | |
Health Care Providers & Services - 0.2% | | | | | |
Aetna, Inc. | | | | | | | | |
4.50%, 05/15/2042 | | | 153,000 | | | | 153,464 | |
6.75%, 12/15/2037 | | | 305,000 | | | | 403,460 | |
Medco Health Solutions, Inc. | | | | | | | | |
2.75%, 09/15/2015 | | | 140,000 | | | | 142,399 | |
7.13%, 03/15/2018 | | | 250,000 | | | | 290,965 | |
UnitedHealth Group, Inc. | | | | | | | | |
3.38%, 11/15/2021 | | | 412,000 | | | | 429,129 | |
WellPoint, Inc. | | | | | | | | |
3.13%, 05/15/2022 | | | 492,000 | | | | 486,949 | |
3.30%, 01/15/2023 | | | 105,000 | | | | 103,844 | |
4.65%, 01/15/2043 | | | 38,000 | | | | 38,474 | |
| | | | | | | | |
| | | | | | | 2,048,684 | |
| | | | | | | | |
Household Products - 0.0% (G) | | | | | | | | |
Kimberly-Clark Corp. | | | | | | | | |
2.40%, 03/01/2022 | | | 68,000 | | | | 66,652 | |
| | | | | | | | |
Independent Power and Renewable Electricity Producers - 0.1% | |
Exelon Generation Co. LLC | | | | | | | | |
4.00%, 10/01/2020 | | | 600,000 | | | | 634,283 | |
5.75%, 10/01/2041 | | | 86,000 | | | | 94,391 | |
PSEG Power LLC | | | | | | | | |
4.15%, 09/15/2021 | | | 91,000 | | | | 96,918 | |
5.13%, 04/15/2020 | | | 151,000 | | | | 168,386 | |
| | | | | | | | |
| | | | | | | 993,978 | |
| | | | | | | | |
Industrial Conglomerates - 0.1% | | | | | | | | |
Danaher Corp. | | | | | | | | |
3.90%, 06/23/2021 | | | 261,000 | | | | 281,877 | |
Koninklijke Philips NV | | | | | | | | |
3.75%, 03/15/2022 | | | 200,000 | | | | 208,560 | |
7.20%, 06/01/2026 | | | 500,000 | | | | 629,519 | |
| | | | | | | | |
| | | | | | | 1,119,956 | |
| | | | | | | | |
| | | | | | | | |
| | | Principal | | | Value | |
CORPORATE DEBT SECURITIES (continued) | | | | | |
Insurance - 0.8% | | | | | | | | |
AIG SunAmerica Global Financing X | | | | | | | | |
6.90%, 03/15/2032, 144A | | | $ 800,000 | | | | $ 1,063,067 | |
Aon Corp. | | | | | | | | |
3.13%, 05/27/2016 | | | 235,000 | | | | 242,270 | |
3.50%, 09/30/2015 | | | 46,000 | | | | 47,180 | |
6.25%, 09/30/2040 | | | 83,000 | | | | 103,156 | |
Berkshire Hathaway Finance Corp. | | | | | | | | |
4.40%, 05/15/2042 | | | 268,000 | | | | 272,278 | |
5.75%, 01/15/2040 | | | 100,000 | | | | 121,285 | |
CNA Financial Corp. | | | | | | | | |
5.85%, 12/15/2014 | | | 200,000 | | | | 201,134 | |
5.88%, 08/15/2020 | | | 282,000 | | | | 323,997 | |
Liberty Mutual Group, Inc. | | | | | | | | |
5.00%, 06/01/2021, 144A | | | 200,000 | | | | 219,566 | |
Lincoln National Corp. | | | | | | | | |
4.20%, 03/15/2022 (A) | | | 53,000 | | | | 56,325 | |
4.85%, 06/24/2021 | | | 58,000 | | | | 64,007 | |
Massachusetts Mutual Life Insurance Co. | | | | | | | | |
5.38%, 12/01/2041, 144A | | | 147,000 | | | | 164,275 | |
Metropolitan Life Global Funding I | | | | | | | | |
3.88%, 04/11/2022, 144A | | | 720,000 | | | | 763,168 | |
Nationwide Mutual Insurance Co. | | | | | | | | |
9.38%, 08/15/2039, 144A | | | 200,000 | | | | 308,233 | |
Pacific Life Global Funding | | | | | | | | |
5.00%, 05/15/2017, 144A | | | 100,000 | | | | 107,229 | |
Pacific Life Insurance Co. | | | | | | | | |
9.25%, 06/15/2039, 144A | | | 300,000 | | | | 470,449 | |
Principal Life Global Funding II | | | | | | | | |
1.00%, 12/11/2015, 144A | | | 145,000 | | | | 145,722 | |
2.25%, 10/15/2018, 144A | | | 200,000 | | | | 201,669 | |
Prudential Insurance Co. of America | | | | | | | | |
8.30%, 07/01/2025, 144A | | | 900,000 | | | | 1,220,810 | |
Travelers Property Casualty Corp. | | | | | | | | |
7.75%, 04/15/2026 | | | 450,000 | | | | 606,213 | |
| | | | | | | | |
| | | | | | | 6,702,033 | |
| | | | | | | | |
Internet Software & Services - 0.1% | |
eBay, Inc. | | | | | | | | |
2.60%, 07/15/2022 (A) | | | 117,000 | | | | 109,345 | |
3.25%, 10/15/2020 | | | 420,000 | | | | 423,849 | |
4.00%, 07/15/2042 | | | 133,000 | | | | 114,049 | |
| | | | | | | | |
| | | | | | | 647,243 | |
| | | | | | | | |
IT Services - 0.3% | |
HP Enterprise Services LLC | | | | | | | | |
7.45%, 10/15/2029 | | | 500,000 | | | | 626,042 | |
International Business Machines Corp. | | | | | | | | |
1.25%, 02/06/2017 | | | 315,000 | | | | 316,795 | |
1.63%, 05/15/2020 | | | 277,000 | | | | 266,665 | |
4.00%, 06/20/2042 (A) | | | 169,000 | | | | 160,962 | |
7.00%, 10/30/2025 | | | 508,000 | | | | 672,842 | |
Xerox Corp. | | | | | | | | |
4.50%, 05/15/2021 | | | 80,000 | | | | 85,475 | |
5.63%, 12/15/2019 (A) | | | 300,000 | | | | 340,529 | |
| | | | | | | | |
| | | | | | | 2,469,310 | |
| | | | | | | | |
Life Sciences Tools & Services - 0.1% | |
Thermo Fisher Scientific, Inc. | | | | | | | | |
1.30%, 02/01/2017 | | | 176,000 | | | | 175,792 | |
4.15%, 02/01/2024 (A) | | | 435,000 | | | | 455,389 | |
| | | | | | | | |
| | | | | | | 631,181 | |
| | | | | | | | |
The Notes to Financial Statements are an integral part of this report.
| | |
| Transamerica Funds | | Annual Report 2014 |
Page 72
Transamerica Core Bond
SCHEDULE OF INVESTMENTS (continued)
At October 31, 2014
| | | | | | | | |
| | | Principal | | | Value | |
CORPORATE DEBT SECURITIES (continued) | | | | | |
Machinery - 0.2% | |
Caterpillar, Inc. | | | | | | | | |
1.50%, 06/26/2017 | | | $ 115,000 | | | | $ 115,704 | |
2.60%, 06/26/2022 | | | 123,000 | | | | 120,402 | |
7.90%, 12/15/2018 | | | 250,000 | | | | 307,498 | |
Deere & Co. | | | | | | | | |
2.60%, 06/08/2022 | | | 119,000 | | | | 116,502 | |
3.90%, 06/09/2042 | | | 107,000 | | | | 104,337 | |
Illinois Tool Works, Inc. | | | | | | | | |
3.90%, 09/01/2042 | | | 624,000 | | | | 603,329 | |
| | | | | | | | |
| | | | | | | 1,367,772 | |
| | | | | | | | |
Media - 1.1% | |
21st Century Fox America, Inc. | | | | | | | | |
6.20%, 12/15/2034 | | | 250,000 | | | | 311,930 | |
7.25%, 05/18/2018 | | | 155,000 | | | | 183,062 | |
7.30%, 04/30/2028 | | | 130,000 | | | | 165,133 | |
7.70%, 10/30/2025 | | | 300,000 | | | | 390,719 | |
8.88%, 04/26/2023 | | | 200,000 | | | | 268,130 | |
CBS Corp. | | | | | | | | |
5.50%, 05/15/2033 | | | 150,000 | | | | 164,529 | |
5.75%, 04/15/2020 | | | 63,000 | | | | 72,191 | |
Comcast Cable Holdings LLC | | | | | | | | |
10.13%, 04/15/2022 | | | 414,000 | | | | 578,140 | |
Comcast Corp. | | | | | | | | |
6.50%, 11/15/2035 | | | 100,000 | | | | 131,234 | |
7.05%, 03/15/2033 | | | 1,300,000 | | | | 1,774,792 | |
Cox Communications, Inc. | | | | | | | | |
5.45%, 12/15/2014 | | | 16,000 | | | | 16,087 | |
Cox Enterprises, Inc. | | | | | | | | |
7.38%, 07/15/2027, 144A | | | 200,000 | | | | 251,685 | |
DIRECTV Holdings LLC / DIRECTV Financing Co., Inc. | | | | | | | | |
4.60%, 02/15/2021 | | | 400,000 | | | | 433,262 | |
6.00%, 08/15/2040 | | | 200,000 | | | | 224,540 | |
6.38%, 03/01/2041 | | | 240,000 | | | | 280,534 | |
Discovery Communications LLC | | | | | | | | |
4.38%, 06/15/2021 | | | 344,000 | | | | 367,587 | |
Historic TW, Inc. | | | | | | | | |
9.15%, 02/01/2023 | | | 200,000 | | | | 272,007 | |
NBCUniversal Media LLC | | | | | | | | |
5.95%, 04/01/2041 | | | 210,000 | | | | 258,805 | |
TCI Communications, Inc. | | | | | | | | |
7.13%, 02/15/2028 | | | 100,000 | | | | 133,293 | |
Thomson Reuters Corp. | | | | | | | | |
3.95%, 09/30/2021 | | | 400,000 | | | | 419,200 | |
4.70%, 10/15/2019 | | | 75,000 | | | | 82,158 | |
Time Warner Cable, Inc. | | | | | | | | |
6.75%, 07/01/2018 (A) | | | 40,000 | | | | 46,528 | |
7.30%, 07/01/2038 | | | 90,000 | | | | 123,824 | |
Time Warner Entertainment Co., LP | | | | | | | | |
8.38%, 07/15/2033 | | | 250,000 | | | | 371,541 | |
Time Warner, Inc. | | | | | | | | |
4.75%, 03/29/2021 | | | 140,000 | | | | 153,996 | |
6.25%, 03/29/2041 | | | 37,000 | | | | 44,536 | |
6.50%, 11/15/2036 | | | 50,000 | | | | 61,553 | |
7.63%, 04/15/2031 | | | 300,000 | | | | 409,790 | |
7.70%, 05/01/2032 | | | 100,000 | | | | 139,352 | |
| | | | | | | | |
| | | Principal | | | Value | |
CORPORATE DEBT SECURITIES (continued) | | | | | |
Media (continued) | |
Viacom, Inc. | | | | | | | | |
3.88%, 12/15/2021 | | | $ 606,000 | | | | $ 625,970 | |
| | | | | | | | |
| | | | | | | 8,756,108 | |
| | | | | | | | |
Metals & Mining - 0.3% | |
BHP Billiton Finance USA, Ltd. | | | | | | | | |
2.05%, 09/30/2018 | | | 82,000 | | | | 82,804 | |
3.25%, 11/21/2021 | | | 670,000 | | | | 689,585 | |
4.13%, 02/24/2042 (A) | | | 300,000 | | | | 297,775 | |
6.50%, 04/01/2019 | | | 270,000 | | | | 320,252 | |
Freeport-McMoRan, Inc. | | | | | | | | |
3.88%, 03/15/2023 (A) | | | 250,000 | | | | 247,090 | |
Nucor Corp. | | | | | | | | |
4.00%, 08/01/2023 | | | 63,000 | | | | 65,578 | |
Placer Dome, Inc. | | | | | | | | |
6.45%, 10/15/2035 | | | 399,000 | | | | 434,766 | |
Rio Tinto Finance USA, Ltd. | | | | | | | | |
3.50%, 11/02/2020 | | | 80,000 | | | | 83,075 | |
3.75%, 09/20/2021 | | | 300,000 | | | | 312,551 | |
| | | | | | | | |
| | | | | | | 2,533,476 | |
| | | | | | | | |
Multi-Utilities - 0.5% | |
Berkshire Hathaway Energy Co. | | | | | | | | |
3.75%, 11/15/2023 | | | 780,000 | | | | 807,826 | |
6.13%, 04/01/2036 | | | 310,000 | | | | 389,112 | |
CenterPoint Energy, Inc. | | | | | | | | |
6.50%, 05/01/2018 | | | 180,000 | | | | 207,108 | |
Consolidated Edison Co. of New York, Inc. | | | | | | | | |
5.70%, 06/15/2040 | | | 154,000 | | | | 189,455 | |
Consumers Energy Co. | | | | | | | | |
2.85%, 05/15/2022 | | | 121,000 | | | | 122,064 | |
6.70%, 09/15/2019 | | | 100,000 | | | | 120,580 | |
Delmarva Power & Light Co. | | | | | | | | |
4.00%, 06/01/2042 | | | 294,000 | | | | 288,666 | |
Dominion Resources, Inc. | | | | | | | | |
4.90%, 08/01/2041 | | | 103,000 | | | | 110,359 | |
5.25%, 08/01/2033 | | | 500,000 | | | | 567,570 | |
6.40%, 06/15/2018 | | | 170,000 | | | | 195,426 | |
DTE Energy Co. | | | | | | | | |
3.85%, 12/01/2023 | | | 152,000 | | | | 159,114 | |
San Diego Gas & Electric Co. | | | | | | | | |
6.00%, 06/01/2026 | | | 320,000 | | | | 401,665 | |
Sempra Energy | | | | | | | | |
6.00%, 10/15/2039 | | | 150,000 | | | | 186,901 | |
9.80%, 02/15/2019 | | | 400,000 | | | | 521,938 | |
| | | | | | | | |
| | | | | | | 4,267,784 | |
| | | | | | | | |
Multiline Retail - 0.1% | |
Macy’s Retail Holdings, Inc. | | | | | | | | |
5.13%, 01/15/2042 | | | 100,000 | | | | 106,097 | |
6.90%, 04/01/2029 | | | 200,000 | | | | 253,662 | |
7.45%, 07/15/2017 | | | 240,000 | | | | 275,750 | |
Nordstrom, Inc. | | | | | | | | |
4.00%, 10/15/2021 | | | 301,000 | | | | 320,764 | |
| | | | | | | | |
| | | | | | | 956,273 | |
| | | | | | | | |
Oil, Gas & Consumable Fuels - 1.7% | |
Anadarko Holding Co. | | | | | | | | |
7.15%, 05/15/2028 | | | 552,000 | | | | 699,987 | |
Anadarko Petroleum Corp. | | | | | | | | |
8.70%, 03/15/2019 | | | 150,000 | | | | 188,131 | |
The Notes to Financial Statements are an integral part of this report.
| | |
| Transamerica Funds | | Annual Report 2014 |
Page 73
Transamerica Core Bond
SCHEDULE OF INVESTMENTS (continued)
At October 31, 2014
| | | | | | | | |
| | | Principal | | | Value | |
CORPORATE DEBT SECURITIES (continued) | | | | | |
Oil, Gas & Consumable Fuels (continued) | |
Apache Corp. | | | | | | | | |
3.25%, 04/15/2022 (A) | | | $ 111,000 | | | | $ 111,997 | |
4.75%, 04/15/2043 | | | 268,000 | | | | 268,387 | |
6.90%, 09/15/2018 | | | 180,000 | | | | 211,448 | |
BG Energy Capital PLC | | | | | | | | |
5.13%, 10/15/2041, 144A | | | 200,000 | | | | 222,394 | |
BP Capital Markets PLC | | | | | | | | |
1.85%, 05/05/2017 (A) | | | 429,000 | | | | 435,025 | |
3.25%, 05/06/2022 | | | 462,000 | | | | 463,379 | |
4.74%, 03/11/2021 | | | 100,000 | | | | 110,427 | |
Burlington Resources Finance Co. | | | | | | | | |
7.40%, 12/01/2031 | | | 290,000 | | | | 409,759 | |
Canadian Natural Resources, Ltd. | | | | | | | | |
6.45%, 06/30/2033 | | | 150,000 | | | | 182,984 | |
Cenovus Energy, Inc. | | | | | | | | |
3.00%, 08/15/2022 | | | 91,000 | | | | 88,711 | |
4.45%, 09/15/2042 | | | 223,000 | | | | 215,709 | |
Chevron Corp. | | | | | | | | |
2.36%, 12/05/2022 | | | 80,000 | | | | 77,384 | |
3.19%, 06/24/2023 | | | 47,000 | | | | 47,942 | |
CNOOC Finance, Ltd. | | | | | | | | |
1.13%, 05/09/2016 | | | 200,000 | | | | 200,089 | |
3.00%, 05/09/2023 | | | 254,000 | | | | 240,942 | |
ConocoPhillips | | | | | | | | |
6.00%, 01/15/2020 | | | 105,000 | | | | 123,193 | |
6.65%, 07/15/2018 | | | 350,000 | | | | 409,652 | |
Devon Energy Corp. | | | | | | | | |
4.75%, 05/15/2042 | | | 224,000 | | | | 227,928 | |
Encana Corp. | | | | | | | | |
6.50%, 05/15/2019 | | | 150,000 | | | | 176,175 | |
Eni SpA | | | | | | | | |
5.70%, 10/01/2040, 144A | | | 900,000 | | | | 1,013,478 | |
EOG Resources, Inc. | | | | | | | | |
2.63%, 03/15/2023 | | | 236,000 | | | | 227,289 | |
4.10%, 02/01/2021 | | | 300,000 | | | | 326,114 | |
Kerr-McGee Corp. | | | | | | | | |
7.88%, 09/15/2031 | | | 300,000 | | | | 412,384 | |
Occidental Petroleum Corp. | | | | | | | | |
2.70%, 02/15/2023 (A) | | | 400,000 | | | | 387,250 | |
Petro-Canada | | | | | | | | |
5.35%, 07/15/2033 | | | 100,000 | | | | 112,692 | |
6.05%, 05/15/2018 | | | 312,000 | | | | 356,337 | |
7.88%, 06/15/2026 (A) | | | 100,000 | | | | 135,929 | |
Petrobras Global Finance BV | | | | | | | | |
4.38%, 05/20/2023 (A) | | | 280,000 | | | | 266,923 | |
6.25%, 03/17/2024 | | | 412,000 | | | | 438,063 | |
Petrobras International Finance Co. SA | | | | | | | | |
5.38%, 01/27/2021 (A) | | | 400,000 | | | | 409,544 | |
Petroleos Mexicanos | | | | | | | | |
4.88%, 01/18/2024 | | | 81,000 | | | | 85,657 | |
6.38%, 01/23/2045 | | | 228,000 | | | | 261,607 | |
Phillips 66 | | | | | | | | |
2.95%, 05/01/2017 | | | 161,000 | | | | 167,190 | |
4.30%, 04/01/2022 | | | 130,000 | | | | 139,360 | |
Shell International Finance BV | | | | | | | | |
4.30%, 09/22/2019 | | | 300,000 | | | | 330,919 | |
4.38%, 03/25/2020 | | | 410,000 | | | | 453,781 | |
6.38%, 12/15/2038 | | | 100,000 | | | | 132,395 | |
| | | | | | | | |
| | | Principal | | | Value | |
CORPORATE DEBT SECURITIES (continued) | | | | | |
Oil, Gas & Consumable Fuels (continued) | |
Spectra Energy Capital LLC | | | | | | | | |
7.50%, 09/15/2038 | | | $ 125,000 | | | | $ 160,759 | |
Statoil ASA | | | | | | | | |
3.15%, 01/23/2022 | | | 313,000 | | | | 320,789 | |
4.25%, 11/23/2041 | | | 236,000 | | | | 236,356 | |
Suncor Energy, Inc. | | | | | | | | |
5.95%, 12/01/2034 | | | 400,000 | | | | 486,274 | |
6.10%, 06/01/2018 | | | 250,000 | | | | 286,760 | |
Talisman Energy, Inc. | | | | | | | | |
7.75%, 06/01/2019 | | | 385,000 | | | | 456,093 | |
Tosco Corp. | | | | | | | | |
7.80%, 01/01/2027 | | | 160,000 | | | | 222,307 | |
8.13%, 02/15/2030 | | | 230,000 | | | | 338,649 | |
Total Capital International SA | | | | | | | | |
2.88%, 02/17/2022 | | | 688,000 | | | | 688,211 | |
Total Capital SA | | | | | | | | |
4.13%, 01/28/2021 | | | 82,000 | | | | 89,345 | |
| | | | | | | | |
| | | | | | | 14,054,098 | |
| | | | | | | | |
Pharmaceuticals - 0.2% | |
Actavis, Inc. | | | | | | | | |
3.25%, 10/01/2022 | | | 162,000 | | | | 155,640 | |
Bayer US Finance LLC | | | | | | | | |
3.38%, 10/08/2024, 144A | | | 200,000 | | | | 200,585 | |
Novartis Capital Corp. | | | | | | | | |
2.40%, 09/21/2022 | | | 160,000 | | | | 156,278 | |
3.40%, 05/06/2024 | | | 395,000 | | | | 405,676 | |
Teva Pharmaceutical Finance Co., BV | | | | | | | | |
3.65%, 11/10/2021 | | | 400,000 | | | | 408,451 | |
| | | | | | | | |
| | | | | | | 1,326,630 | |
| | | | | | | | |
Real Estate Investment Trusts - 0.3% | |
Duke Realty, LP | | | | | | | | |
3.88%, 02/15/2021 | | | 168,000 | | | | 173,144 | |
Equity Commonwealth | | | | | | | | |
5.88%, 09/15/2020 | | | 400,000 | | | | 439,946 | |
6.65%, 01/15/2018 | | | 215,000 | | | | 237,010 | |
ERP Operating, LP | | | | | | | | |
4.63%, 12/15/2021 | | | 479,000 | | | | 525,703 | |
HCP, Inc. | | | | | | | | |
2.63%, 02/01/2020 | | | 232,000 | | | | 230,268 | |
4.20%, 03/01/2024 (A) | | | 54,000 | | | | 55,186 | |
5.38%, 02/01/2021 | | | 105,000 | | | | 117,387 | |
Simon Property Group, LP | | | | | | | | |
4.38%, 03/01/2021 | | | 210,000 | | | | 230,381 | |
5.65%, 02/01/2020 | | | 247,000 | | | | 285,681 | |
| | | | | | | | |
| | | | | | | 2,294,706 | |
| | | | | | | | |
Road & Rail - 0.4% | |
Burlington Northern Santa Fe LLC | | | | | | | | |
3.45%, 09/15/2021 | | | 251,000 | | | | 260,863 | |
3.60%, 09/01/2020 | | | 125,000 | | | | 131,720 | |
5.75%, 05/01/2040 | | | 300,000 | | | | 357,272 | |
7.29%, 06/01/2036 | | | 90,000 | | | | 123,954 | |
Canadian National Railway Co. | | | | | | | | |
5.85%, 11/15/2017 | | | 180,000 | | | | 202,787 | |
CSX Corp. | | | | | | | | |
4.25%, 06/01/2021 | | | 65,000 | | | | 70,825 | |
7.38%, 02/01/2019 | | | 350,000 | | | | 422,771 | |
The Notes to Financial Statements are an integral part of this report.
| | |
| Transamerica Funds | | Annual Report 2014 |
Page 74
Transamerica Core Bond
SCHEDULE OF INVESTMENTS (continued)
At October 31, 2014
| | | | | | | | |
| | | Principal | | | Value | |
CORPORATE DEBT SECURITIES (continued) | | | | | |
Road & Rail (continued) | |
Norfolk Southern Corp. | | | | | | | | |
3.25%, 12/01/2021 | | | $ 166,000 | | | | $ 170,041 | |
6.00%, 03/15/2105 | | | 160,000 | | | | 195,437 | |
Ryder System, Inc.
Series MTN | | | | | | | | |
2.50%, 03/01/2017 | | | 440,000 | | | | 450,890 | |
3.60%, 03/01/2016 | | | 132,000 | | | | 136,828 | |
Union Pacific Corp. | | | | | | | | |
2.95%, 01/15/2023 | | | 43,000 | | | | 43,182 | |
4.16%, 07/15/2022 | | | 306,000 | | | | 334,497 | |
4.30%, 06/15/2042 | | | 148,000 | | | | 152,187 | |
| | | | | | | | |
| | | | | | | 3,053,254 | |
| | | | | | | | |
Semiconductors & Semiconductor Equipment - 0.1% | |
Intel Corp. | | | | | | | | |
3.30%, 10/01/2021 | | | 250,000 | | | | 260,874 | |
4.80%, 10/01/2041 | | | 150,000 | | | | 160,625 | |
National Semiconductor Corp. | | | | | | | | |
6.60%, 06/15/2017 | | | 200,000 | | | | 227,381 | |
| | | | | | | | |
| | | | | | | 648,880 | |
| | | | | | | | |
Software - 0.2% | |
Intuit, Inc. | |
5.75%, 03/15/2017 | | | 70,000 | | | | 76,989 | |
Microsoft Corp. | | | | | | | | |
3.63%, 12/15/2023 | | | 311,000 | | | | 328,511 | |
4.50%, 10/01/2040 | | | 70,000 | | | | 74,551 | |
Oracle Corp. | | | | | | | | |
2.38%, 01/15/2019 | | | 182,000 | | | | 184,888 | |
5.00%, 07/08/2019 | | | 100,000 | | | | 112,520 | |
5.38%, 07/15/2040 | | | 123,000 | | | | 142,372 | |
6.13%, 07/08/2039 | | | 731,000 | | | | 918,272 | |
6.50%, 04/15/2038 | | | 200,000 | | | | 262,432 | |
| | | | | | | | |
| | | | | | | 2,100,535 | |
| | | | | | | | |
Specialty Retail - 0.0% (G) | |
Lowe’s Cos., Inc. | |
5.50%, 10/15/2035 | | | 140,000 | | | | 165,321 | |
Series MTN | | | | | | | | |
7.11%, 05/15/2037 (A) | | | 120,000 | | | | 162,788 | |
| | | | | | | | |
| | | | | | | 328,109 | |
| | | | | | | | |
Technology Hardware, Storage & Peripherals - 0.1% | |
Apple, Inc. | | | | | | | | |
0.48%, 05/03/2018 (B) | | | 297,000 | | | | 297,412 | |
2.40%, 05/03/2023 | | | 494,000 | | | | 476,610 | |
2.85%, 05/06/2021 | | | 302,000 | | | | 306,542 | |
| | | | | | | | |
| | | | | | | 1,080,564 | |
| | | | | | | | |
Transportation Infrastructure - 0.1% | |
Penske Truck Leasing Co., LP / PTL Finance Corp. | | | | | | | | |
4.88%, 07/11/2022, 144A | | | 500,000 | | | | 541,042 | |
| | | | | | | | |
Water Utilities - 0.0% (G) | |
American Water Capital Corp. | | | | | | | | |
3.85%, 03/01/2024 (A) | | | 300,000 | | | | 316,460 | |
| | | | | | | | |
Wireless Telecommunication Services - 0.2% | |
America Movil SAB de CV | | | | | | | | |
2.38%, 09/08/2016 | | | 421,000 | | | | 431,016 | |
3.13%, 07/16/2022 | | | 236,000 | | | | 231,962 | |
| | | | | | | | |
| | | Principal | | | Value | |
CORPORATE DEBT SECURITIES (continued) | |
Wireless Telecommunication Services (continued) | |
Crown Castle Towers LLC | | | | | | | | |
3.21%, 08/15/2035, 144A | | | $ 290,000 | | | | $ 295,718 | |
Rogers Communications, Inc. | | | | | | | | |
4.10%, 10/01/2023 (A) | | | 213,000 | | | | 222,868 | |
5.45%, 10/01/2043 | | | 95,000 | | | | 105,224 | |
Vodafone Group PLC | | | | | | | | |
1.63%, 03/20/2017 | | | 470,000 | | | | 472,312 | |
5.45%, 06/10/2019 | | | 75,000 | | | | 84,729 | |
| | | | | | | | |
| | | | | | | 1,843,829 | |
| | | | | | | | |
Total Corporate Debt Securities
(Cost $148,922,070) | | | | | | | 159,428,975 | |
| | | | | | | | |
| | |
| | | Shares | | | Value | |
| |
SECURITIES LENDING COLLATERAL - 2.0% | | | | | |
State Street Navigator Securities Lending Trust - Prime Portfolio 0.16% (H) | | | 16,062,375 | | | | 16,062,375 | |
| | | | | | | | |
Total Securities Lending Collateral
(Cost $16,062,375) | | | | 16,062,375 | |
| | | | | | | | |
| | |
| | | Principal | | | Value | |
REPURCHASE AGREEMENT - 3.6% | | | | | |
State Street Bank & Trust Co.
0.01% (H), dated 10/31/2014, to be repurchased at $29,989,449 on 11/03/2014. Collateralized by U.S. Government Agency Obligations, 2.00% - 2.50%, due 12/01/2027 - 12/15/2027, and with a total value of $30,589,312. | | | $ 29,989,424 | | | | 29,989,424 | |
| | | | | | | | |
Total Repurchase Agreement
(Cost $29,989,424) | | | | 29,989,424 | |
| | | | | | | | |
Total Investments
(Cost $807,073,144) (I) | | | | 837,212,499 | |
Net Other Assets (Liabilities) - (1.6)% | | | | (12,884,687 | ) |
| | | | | | | | |
| | |
Net Assets - 100.0% | | | | | | | $ 824,327,812 | |
| | | | | | | | |
The Notes to Financial Statements are an integral part of this report.
| | |
| Transamerica Funds | | Annual Report 2014 |
Page 75
Transamerica Core Bond
SCHEDULE OF INVESTMENTS (continued)
At October 31, 2014
SECURITY VALUATION:
Valuation Inputs (J)
| | | | | | | | | | | | | | | | |
| | | Level 1
Quoted Prices | | | Level 2
Other Significant
Observable Inputs | | | Level 3
Significant
Unobservable Inputs | | | Value at
October 31, 2014 | |
ASSETS | | | | | | | | | | | | | | | | |
Investments | | | | | | | | | | | | | | | | |
U.S. Government Obligations | | $ | — | | | $ | 134,755,418 | | | $ | — | | | $ | 134,755,418 | |
U.S. Government Agency Obligations | | | — | | | | 319,533,458 | | | | — | | | | 319,533,458 | |
Foreign Government Obligations | | | — | | | | 13,490,851 | | | | — | | | | 13,490,851 | |
Mortgage-Backed Securities | | | — | | | | 107,106,006 | | | | — | | | | 107,106,006 | |
Asset-Backed Securities | | | — | | | | 51,766,022 | | | | — | | | | 51,766,022 | |
Municipal Government Obligations | | | — | | | | 5,079,970 | | | | — | | | | 5,079,970 | |
Corporate Debt Securities | | | — | | | | 159,428,975 | | | | — | | | | 159,428,975 | |
Securities Lending Collateral | | | 16,062,375 | | | | — | | | | — | | | | 16,062,375 | |
Repurchase Agreement | | | — | | | | 29,989,424 | | | | — | | | | 29,989,424 | |
| | | | | | | | | | | | | | | | |
Total Investments | | $ | 16,062,375 | | | $ | 821,150,124 | | | $ | — | | | $ | 837,212,499 | |
| | | | | | | | | | | | | | | | |
FOOTNOTES TO SCHEDULE OF INVESTMENTS:
| (A) | All or a portion of this security is on loan. The value of all securities on loan is $15,732,626. The amount of securities on loan indicated may not correspond with the securities on loan identified because securities with pending sales are in the process of recall from the brokers. |
| (B) | Floating or variable rate security. Rate is listed as of October 31, 2014. |
| (C) | Step bond. Coupon rate changes in increments to maturity. Rate disclosed is as of October 31, 2014. Maturity date disclosed is the ultimate maturity date. |
| (D) | Total aggregate value of illiquid securities is $2,681,119, or 0.33% of the Fund’s net assets. |
| (E) | Fair valued as determined in good faith in accordance with procedures established by the board of trustees. Total aggregate fair value of securities is $1,110,249, or 0.13% of the Fund’s net assets. |
| (F) | When-issued security. A conditional transaction in a security authorized for issuance, but not yet issued. |
| (G) | Percentage rounds to less than 0.1% or (0.1)%. |
| (H) | Rate shown reflects the yield at October 31, 2014. |
| (I) | Aggregate cost for federal income tax purposes is $807,073,144. Aggregate gross unrealized appreciation and depreciation for all securities is $34,370,071 and $4,230,716, respectively. Net unrealized appreciation for tax purposes is $30,139,355. |
| (J) | The Fund recognizes transfers between Levels at the end of the reporting period. There were no transfers between Level 1, 2 and 3 during the period ended October 31, 2014. See the Notes to Financial Statements for more information regarding security valuation and pricing inputs. |
DEFINITIONS:
| | |
| 144A | | 144A securities are registered pursuant to Rule 144A of the Securities Act of 1933. These securities are deemed to be liquid for purposes of compliance limitations on holdings of illiquid securities and may be resold as transactions exempt from registration, normally to qualified institutional buyers. At October 31, 2014, these securities aggregated $113,725,160, or 13.80% of the Fund’s net assets. |
| IO | | Interest only portion of a STRIPS (Separate Trading of Registered Interest and Principal of Securities) |
| MTN | | Medium Term Note |
| PO | | Principal only portion of a STRIPS (Separate Trading of Registered Interest and Principal of Securities) |
| STRIPS | | Separate Trading of Registered Interest and Principal of Securities |
The Notes to Financial Statements are an integral part of this report.
| | |
| Transamerica Funds | | Annual Report 2014 |
Page 76
Transamerica Developing Markets Equity
SCHEDULE OF INVESTMENTS
At October 31, 2014
| | | | | | | | |
| | | Shares | | | Value | |
PREFERRED STOCKS - 2.0% | | | | | | | | |
Brazil - 1.4% | | | | | | | | |
Lojas Americanas SA | | | | | | | | |
0.70% (A) | | | 2,321,192 | | | | $ 13,695,399 | |
Telefonica Brasil SA | | | | | | | | |
5.73% (A) | | | 600 | | | | 12,264 | |
| | | | | | | | |
| | | | | | | 13,707,663 | |
| | | | | | | | |
Colombia - 0.6% | | | | | | | | |
Banco Davivienda SA | | | | | | | | |
1.97% (A) | | | 301,831 | | | | 4,503,627 | |
Bancolombia SA | | | | | | | | |
2.60% (A) | | | 56,277 | | | | 791,023 | |
| | | | | | | | |
| | | | | | | 5,294,650 | |
| | | | | | | | |
Total Preferred Stocks
(Cost $19,120,543) | | | | | | | 19,002,313 | |
| | | | | | | | |
| | |
COMMON STOCKS - 93.4% | | | | | | | | |
Argentina - 1.6% | | | | | | | | |
MercadoLibre, Inc. (B) | | | 110,550 | | | | 15,051,383 | |
| | | | | | | | |
Brazil - 10.5% | | | | | | | | |
AMBEV SA, ADR (B) | | | 881,690 | | | | 5,889,689 | |
B2W Cia Digital (C) | | | 306,456 | | | | 3,992,251 | |
Banco Bradesco SA, ADR | | | 362,569 | | | | 5,431,284 | |
BM&FBovespa SA | | | 2,558,646 | | | | 11,255,192 | |
Cyrela Brazil Realty SA Empreendimentos e Participacoes, Class A | | | 807,500 | | | | 4,014,851 | |
Diagnosticos da America SA | | | 491,400 | | | | 2,096,169 | |
Embraer SA, ADR | | | 224,240 | | | | 8,664,634 | |
Estacio Participacoes SA | | | 805,500 | | | | 9,329,614 | |
Kroton Educacional SA | | | 1,432,770 | | | | 10,211,356 | |
Natura Cosmeticos SA | | | 418,300 | | | | 6,077,243 | |
Petroleo Brasileiro SA, Class A, ADR (C) | | | 1,651,000 | | | | 20,191,730 | |
Sul America SA | | | 646,566 | | | | 3,432,021 | |
Telefonica Brasil SA, ADR | | | 516,740 | | | | 10,562,166 | |
| | | | | | | | |
| | | | | | | 101,148,200 | |
| | | | | | | | |
Chile - 0.9% | | | | | | | | |
Cencosud SA | | | 2,950,050 | | | | 8,444,314 | |
| | | | | | | | |
China - 15.9% | | | | | | | | |
58.com, Inc., ADR (B) (C) | | | 46,400 | | | | 1,836,048 | |
Alibaba Group Holding, Ltd., ADR (B) (C) | | | 39,900 | | | | 3,934,140 | |
Baidu, Inc., ADR (C) | | | 212,540 | | | | 50,748,176 | |
China Life Insurance Co., Ltd., Class H | | | 882,000 | | | | 2,631,862 | |
China Oilfield Services, Ltd., Class H | | | 2,026,000 | | | | 4,234,430 | |
China Pacific Insurance Group Co., Ltd., Class H | | | 806,800 | | | | 3,024,379 | |
CNOOC, Ltd. | | | 5,290,000 | | | | 8,269,950 | |
Ctrip.com International, Ltd., ADR (C) | | | 35,340 | | | | 2,060,322 | |
Home Inns & Hotels Management, Inc., ADR (C) | | | 150,800 | | | | 4,555,668 | |
JD.com, Inc., ADR (B) (C) | | | 53,463 | | | | 1,277,231 | |
Mindray Medical International, Ltd., ADR (B) | | | 16,750 | | | | 488,095 | |
New Oriental Education & Technology Group, Inc., ADR (B) (C) | | | 404,080 | | | | 8,728,128 | |
Qunar Cayman Islands, Ltd., ADR (C) | | | 114,100 | | | | 3,069,290 | |
Shandong Weigao Group Medical Polymer Co., Ltd., Class H (B) | | | 3,725,000 | | | | 3,766,850 | |
Sinopharm Group Co., Ltd., Class H (B) (D) | | | 1,945,400 | | | | 7,637,501 | |
SOHO China, Ltd. | | | 6,688,000 | | | | 4,899,087 | |
Tencent Holdings, Ltd. | | | 1,088,925 | | | | 17,501,489 | |
| | | | | | | | |
| | | Shares | | | Value | |
COMMON STOCKS (continued) | | | | | | | | |
China (continued) | | | | | | | | |
Tingyi Cayman Islands Holding Corp. | | | 5,189,000 | | | | $ 12,841,944 | |
Tsingtao Brewery Co., Ltd., Class H | | | 536,000 | | | | 3,951,839 | |
Want Want China Holdings, Ltd. (B) | | | 5,296,000 | | | | 7,191,037 | |
| | | | | | | | |
| | | | | | | 152,647,466 | |
| | | | | | | | |
Cocos (Keeling) Islands - 0.3% | | | | | | | | |
Eurasia Drilling Co., Ltd., GDR, Reg S | | | 110,204 | | | | 2,755,100 | |
| | | | | | | | |
Colombia - 2.6% | | | | | | | | |
Almacenes Exito SA, GDR, 144A | | | 276,200 | | | | 3,914,265 | |
Almacenes Exito SA | | | 301,488 | | | | 4,252,336 | |
Bancolombia SA, ADR (B) | | | 94,010 | | | | 5,318,146 | |
Grupo Aval Acciones y Valores, ADR | | | 395,260 | | | | 5,328,105 | |
Grupo de Inversiones Suramericana SA | | | 292,184 | | | | 6,075,155 | |
| | | | | | | | |
| | | | | | | 24,888,007 | |
| | | | | | | | |
Denmark - 1.1% | | | | | | | | |
Carlsberg A/S, Class B | | | 124,051 | | | | 10,941,125 | |
| | | | | | | | |
Egypt - 0.6% | | | | | | | | |
Commercial International Bank Egypt SAE | | | 874,645 | | | | 6,042,679 | |
| | | | | | | | |
France - 2.7% | | | | | | | | |
LVMH Moet Hennessy Louis Vuitton SA | | | 74,730 | | | | 12,684,966 | |
Pernod Ricard SA | | | 116,160 | | | | 13,231,999 | |
| | | | | | | | |
| | | | | | | 25,916,965 | |
| | | | | | | | |
Hong Kong - 4.9% | | | | | | | | |
AIA Group, Ltd. | | | 1,823,200 | | | | 10,174,230 | |
Hang Lung Group, Ltd. | | | 919,750 | | | | 4,627,321 | |
Hang Lung Properties, Ltd. | | | 4,729,549 | | | | 14,769,099 | |
Hong Kong Exchanges and Clearing, Ltd. (B) | | | 393,650 | | | | 8,740,290 | |
Jardine Strategic Holdings, Ltd. | | | 245,312 | | | | 8,744,557 | |
| | | | | | | | |
| | | | | | | 47,055,497 | |
| | | | | | | | |
India - 13.5% | | | | | | | | |
Apollo Hospitals Enterprise, Ltd. | | | 273,024 | | | | 4,952,898 | |
Cipla, Ltd. | | | 605,465 | | | | 6,618,354 | |
Divi’s Laboratories, Ltd. | | | 28,453 | | | | 868,102 | |
Dr. Reddy’s Laboratories, Ltd. | | | 129,000 | | | | 6,674,540 | |
Glenmark Pharmaceuticals, Ltd. | | | 133,540 | | | | 1,565,320 | |
Hindustan Unilever, Ltd. | | | 183,557 | | | | 2,200,892 | |
Housing Development Finance Corp. | | | 1,450,565 | | | | 26,024,106 | |
ICICI Bank, Ltd., ADR | | | 347,930 | | | | 19,609,335 | |
Infosys, Ltd. | | | 392,475 | | | | 26,035,060 | |
Larsen & Toubro, Ltd. | | | 82,103 | | | | 2,209,986 | |
Lupin, Ltd. | | | 59,429 | | | | 1,320,523 | |
Marico, Ltd. | | | 589,220 | | | | 2,987,807 | |
Shriram Transport Finance Co., Ltd. | | | 64,416 | | | | 995,002 | |
Sun Pharmaceuticals Industries, Ltd. | | | 226,817 | | | | 3,112,627 | |
Tata Consultancy Services, Ltd. | | | 231,834 | | | | 9,872,013 | |
Ultratech Cement, Ltd. | | | 92,589 | | | | 3,840,648 | |
Zee Entertainment Enterprises, Ltd. | | | 1,910,765 | | | | 10,701,998 | |
| | | | | | | | |
| | | | | | | 129,589,211 | |
| | | | | | | | |
Indonesia - 2.6% | | | | | | | | |
Astra International Tbk PT | | | 24,254,500 | | | | 13,599,765 | |
Indocement Tunggal Prakarsa Tbk PT | | | 2,401,000 | | | | 4,758,746 | |
Semen Indonesia Persero Tbk PT | | | 3,737,000 | | | | 4,908,747 | |
Unilever Indonesia Tbk PT | | | 754,500 | | | | 1,899,654 | |
| | | | | | | | |
| | | | | | | 25,166,912 | |
| | | | | | | | |
The Notes to Financial Statements are an integral part of this report.
| | |
| Transamerica Funds | | Annual Report 2014 |
Page 77
Transamerica Developing Markets Equity
SCHEDULE OF INVESTMENTS (continued)
At October 31, 2014
| | | | | | | | |
| | | Shares | | | Value | |
COMMON STOCKS (continued) | | | | | | | | |
Italy - 1.7% | | | | | | | | |
Prada SpA (B) | | | 2,687,300 | | | | $ 16,543,389 | |
| | | | | | | | |
Korea, Republic of - 0.7% | | | | | | | | |
NAVER Corp. | | | 9,131 | | | | 6,461,295 | |
Shinsegae Co., Ltd. | | | 1,231 | | | | 228,359 | |
| | | | | | | | |
| | | | | | | 6,689,654 | |
| | | | | | | | |
Luxembourg - 1.1% | | | | | | | | |
Tenaris SA, ADR (B) | | | 276,730 | | | | 10,969,577 | |
| | | | | | | | |
Malaysia - 1.2% | | | | | | | | |
Genting Bhd | | | 3,840,600 | | | | 11,386,089 | |
| | | | | | | | |
Mexico - 6.6% | | | | | | | | |
America Movil SAB de CV, Series L, ADR | | | 663,210 | | | | 16,188,956 | |
Fomento Economico Mexicano SAB de CV | | | 1,034,248 | | | | 9,963,649 | |
Grupo Aeroportuario del Sureste SAB de CV, Class B (B) | | | 154,176 | | | | 2,078,578 | |
Grupo Financiero Banorte SAB de CV, Class O | | | 2,095,191 | | | | 13,427,271 | |
Grupo Financiero Inbursa SAB de CV, Class O | | | 2,294,009 | | | | 6,921,421 | |
Grupo Mexico SAB de CV, Series B | | | 593,722 | | | | 2,043,554 | |
Grupo Televisa SAB, ADR | | | 365,490 | | | | 13,208,809 | |
| | | | | | | | |
| | | | | | | 63,832,238 | |
| | | | | | | | |
Netherlands - 2.1% | | | | | | | | |
Yandex NV, Class A (B) (C) | | | 716,530 | | | | 20,507,089 | |
| | | | | | | | |
Philippines - 2.1% | | | | | | | | |
Jollibee Foods Corp. | | | 1,203,130 | | | | 5,254,203 | |
SM Investments Corp. | | | 498,272 | | | | 8,700,113 | |
SM Prime Holdings, Inc. | | | 17,121,163 | | | | 6,668,806 | |
| | | | | | | | |
| | | | | | | 20,623,122 | |
| | | | | | | | |
Russian Federation - 5.6% | | | | | | | | |
Alrosa AO (E) | | | 4,797,467 | | | | 4,292,534 | |
Magnit OJSC (C) (E) | | | 97,889 | | | | 27,078,686 | |
NOVATEK OAO, GDR, Reg S | | | 202,200 | | | | 21,775,478 | |
Sberbank of Russia, ADR | | | 62,500 | | | | 475,934 | |
| | | | | | | | |
| | | | | | | 53,622,632 | |
| | | | | | | | |
South Africa - 1.5% | | | | | | | | |
MTN Group, Ltd. | | | 337,512 | | | | 7,473,544 | |
Naspers, Ltd., Class N | | | 59,171 | | | | 7,380,348 | |
| | | | | | | | |
| | | | | | | 14,853,892 | |
| | | | | | | | |
Switzerland - 3.1% | | | | | | | | |
CIE Financiere Richemont SA | | | 142,994 | | | | 12,056,365 | |
Glencore PLC (C) | | | 3,469,260 | | | | 17,799,506 | |
| | | | | | | | |
| | | | | | | 29,855,871 | |
| | | | | | | | |
Taiwan - 1.9% | | | | | | | | |
Taiwan Semiconductor Manufacturing Co., Ltd. | | | 4,264,459 | | | | 18,485,877 | |
| | | | | | | | |
Thailand - 1.1% | | | | | | | | |
Airports of Thailand PCL | | | 239,500 | | | | 1,779,521 | |
CP ALL PCL (B) | | | 6,337,900 | | | | 8,853,990 | |
| | | | | | | | |
| | | | | | | 10,633,511 | |
| | | | | | | | |
| | | | | | | | |
| | | Shares | | | Value | |
COMMON STOCKS (continued) | | | | | |
Turkey - 3.0% | | | | | | | | |
Anadolu Efes Biracilik Ve Malt Sanayii AS, Class B (C) | | | 477,303 | | | | $ 5,577,544 | |
BIM Birlesik Magazalar AS | | | 202,454 | | | | 4,624,913 | |
Haci Omer Sabanci Holding AS | | | 2,062,267 | | | | 9,407,778 | |
Turkiye Garanti Bankasi AS | | | 1,955,157 | | | | 7,630,768 | |
Ulker Biskuvi Sanayi AS | | | 240,710 | | | | 1,774,378 | |
| | | | | | | | |
| | | | | | | 29,015,381 | |
| | | | | | | | |
United Kingdom - 4.5% | | | | | | | | |
Genel Energy PLC (B) (C) | | | 344,530 | | | | 3,875,219 | |
HSBC Holdings PLC | | | 849,710 | | | | 8,694,742 | |
Old Mutual PLC (B) | | | 2,752,689 | | | | 8,544,128 | |
SABMiller PLC | | | 208,690 | | | | 11,804,123 | |
Tullow Oil PLC | | | 1,333,313 | | | | 10,405,153 | |
| | | | | | | | |
| | | | | | | 43,323,365 | |
| | | | | | | | |
Total Common Stocks
(Cost $877,987,905) | | | | | | | 899,988,546 | |
| | | | | | | | |
| | |
WARRANT - 0.1% | | | | | | | | |
Malaysia - 0.1% | | | | | | | | |
Genting Bhd (C)
Expiration: 12/18/2018
Exercise Price: $7.96 | | | 572,950 | | | | 470,309 | |
| | | | | | | | |
Total Warrant
(Cost $269,962) | | | | | | | 470,309 | |
| | | | | | | | |
| |
SECURITIES LENDING COLLATERAL - 9.2% | | | | | |
State Street Navigator Securities Lending Trust - Prime Portfolio 0.16% (A) | | | 88,767,885 | | | | 88,767,885 | |
| | | | | | | | |
Total Securities Lending Collateral
(Cost $88,767,885) | | | | 88,767,885 | |
| | | | | | | | |
| | |
| | | Principal | | | Value | |
REPURCHASE AGREEMENT - 4.9% | | | | | |
State Street Bank & Trust Co.
0.01% (A), dated 10/31/2014, to be repurchased at $47,373,221 on 11/03/2014. Collateralized by U.S. Government Agency Obligations, 2.50% - 5.50%, due 12/15/2017 - 10/20/2027, and with a total value of $48,321,188. | | | $ 47,373,182 | | | | 47,373,182 | |
| | | | | | | | |
Total Repurchase Agreement
(Cost $47,373,182) | | | | 47,373,182 | |
| | | | | | | | |
Total Investments
(Cost $1,033,519,477) (F) | | | | 1,055,602,235 | |
Net Other Assets (Liabilities) - (9.6)% | | | | (92,429,012 | ) |
| | | | | | | | |
| | |
Net Assets - 100.0% | | | | | | | $ 963,173,223 | |
| | | | | | | | |
The Notes to Financial Statements are an integral part of this report.
| | |
| Transamerica Funds | | Annual Report 2014 |
Page 78
Transamerica Developing Markets Equity
SCHEDULE OF INVESTMENTS (continued)
At October 31, 2014
INVESTMENTS BY INDUSTRY (unaudited):
| | | | | | | | |
| Industry | | Percentage of
Total Investments | | | Value | |
Internet Software & Services | | | 11.0 | % | | $ | 116,039,620 | |
Banks | | | 7.5 | | | | 78,846,230 | |
Oil, Gas & Consumable Fuels | | | 6.1 | | | | 64,517,530 | |
Beverages | | | 5.8 | | | | 61,359,968 | |
Food & Staples Retailing | | | 5.4 | | | | 57,168,504 | |
Textiles, Apparel & Luxury Goods | | | 3.9 | | | | 41,284,720 | |
IT Services | | | 3.4 | | | | 35,907,073 | |
Diversified Financial Services | | | 3.4 | | | | 35,478,415 | |
Media | | | 3.0 | | | | 31,291,155 | |
Real Estate Management & Development | | | 2.9 | | | | 30,964,313 | |
Diversified Consumer Services | | | 2.7 | | | | 28,269,098 | |
Insurance | | | 2.6 | | | | 27,806,620 | |
Thrifts & Mortgage Finance | | | 2.5 | | | | 26,024,106 | |
Metals & Mining | | | 2.3 | | | | 24,135,594 | |
Wireless Telecommunication Services | | | 2.2 | | | | 23,662,500 | |
Food Products | | | 2.1 | | | | 21,807,359 | |
Hotels, Restaurants & Leisure | | | 2.0 | | | | 21,666,269 | |
Pharmaceuticals | | | 1.8 | | | | 19,291,364 | |
Semiconductors & Semiconductor Equipment | | | 1.7 | | | | 18,485,877 | |
Energy Equipment & Services | | | 1.7 | | | | 17,959,107 | |
Industrial Conglomerates | | | 1.6 | | | | 17,444,670 | |
Health Care Providers & Services | | | 1.4 | | | | 14,686,568 | |
Multiline Retail | | | 1.3 | | | | 13,923,758 | |
Automobiles | | | 1.3 | | | | 13,599,765 | |
Construction Materials | | | 1.3 | | | | 13,508,141 | |
Diversified Telecommunication Services | | | 1.0 | | | | 10,574,430 | |
Internet & Catalog Retail | | | 1.0 | | | | 10,399,094 | |
Personal Products | | | 0.9 | | | | 9,065,050 | |
Aerospace & Defense | | | 0.8 | | | | 8,664,634 | |
Capital Markets | | | 0.5 | | | | 5,328,105 | |
Health Care Equipment & Supplies | | | 0.4 | | | | 4,254,945 | |
Household Products | | | 0.4 | | | | 4,100,546 | |
Household Durables | | | 0.4 | | | | 4,014,851 | |
Transportation Infrastructure | | | 0.4 | | | | 3,858,099 | |
Construction & Engineering | | | 0.2 | | | | 2,209,986 | |
Consumer Finance | | | 0.1 | | | | 995,002 | |
Life Sciences Tools & Services | | | 0.1 | | | | 868,102 | |
| | | | | | | | |
Investments, at Value | | | 87.1 | | | | 919,461,168 | |
Short-Term Investments | | | 12.9 | | | | 136,141,067 | |
| | | | | | | | |
Total Investments | | | 100.0 | % | | $ | 1,055,602,235 | |
| | | | | | | | |
SECURITY VALUATION:
Valuation Inputs (G)
| | | | | | | | | | | | | | | | |
| | | Level 1
Quoted Prices | | | Level 2
Other Significant
Observable Inputs | | | Level 3
Significant
Unobservable Inputs | | | Value at
October 31, 2014 | |
ASSETS | | | | | | | | | | | | | | | | |
Investments | | | | | | | | | | | | | | | | |
Preferred Stocks | | $ | 18,990,049 | | | $ | 12,264 | | | $ | — | | | $ | 19,002,313 | |
Common Stocks | | | 338,191,154 | | | | 561,797,392 | | | | — | | | | 899,988,546 | |
Warrant | | | — | | | | 470,309 | | | | — | | | | 470,309 | |
Securities Lending Collateral | | | 88,767,885 | | | | — | | | | — | | | | 88,767,885 | |
Repurchase Agreement | | | — | | | | 47,373,182 | | | | — | | | | 47,373,182 | |
| | | | | | | | | | | | | | | | |
Total Investments | | $ | 445,949,088 | | | $ | 609,653,147 | | | $ | — | | | $ | 1,055,602,235 | |
| | | | | | | | | | | | | | | | |
The Notes to Financial Statements are an integral part of this report.
| | |
| Transamerica Funds | | Annual Report 2014 |
Page 79
Transamerica Developing Markets Equity
SCHEDULE OF INVESTMENTS (continued)
At October 31, 2014
SECURITY VALUATION (continued):
Valuation Input (continued) (G)
| | | | | | | | | | | | | | | | |
| Investments | | Transfer from
Level 1 to Level 2 (H) (I) | | | Transfer from
Level 2 to Level 1 (J) | | | Transfer from
Level 2 to Level 3 | | | Transfer from
Level 3 to Level 2 | |
Common Stock | | $ | 7,724,555 | | | $ | 3,914,265 | | | $ | — | | | $ | — | |
| | | | | | | | | | | | | | | | |
FOOTNOTES TO SCHEDULE OF INVESTMENTS:
| (A) | Rate shown reflects the yield at October 31, 2014. |
| (B) | All or a portion of this security is on loan. The value of all securities on loan is $85,531,736. The amount of securities on loan indicated may not correspond with the securities on loan identified because securities with pending sales are in the process of recall from the brokers. |
| (C) | Non-income producing security. |
| (D) | Total aggregate value of illiquid securities is $7,637,501, or 0.79% of the Fund’s net assets. |
| (E) | Fair valued as determined in good faith in accordance with procedures established by the board of trustees. Total aggregate fair value of securities is $31,371,220, or 3.26% of the Fund’s net assets. |
| (F) | Aggregate cost for federal income tax purposes is $1,043,990,200. Aggregate gross unrealized appreciation and depreciation for all securities is $66,846,088 and $55,234,053, respectively. Net unrealized appreciation for tax purposes is $11,612,035. |
| (G) | The Fund recognizes transfers between Levels at the end of the reporting period. See the Notes to Financial Statements for more information regarding security valuation and pricing inputs. |
| (H) | Transferred from Level 1 to 2 due to developments which occurred between the time of the close of the foreign markets on which the securities trade and the close of business on the New York Stock Exchange. |
| (I) | Transferred from Level 1 to 2 due to utilizing other observable quoted prices using similar instruments. |
| (J) | Transferred from Level 2 to 1 due to utilizing quoted market prices in active markets, which were not available on October 31, 2013. |
DEFINITIONS:
| | |
| 144A | | 144A securities are registered pursuant to Rule 144A of the Securities Act of 1933. These securities are deemed to be liquid for purposes of compliance limitations on holdings of illiquid securities and may be resold as transactions exempt from registration, normally to qualified institutional buyers. At October 31, 2014, these securities aggregated $3,914,265, or 0.41% of the Fund’s net assets. |
| ADR | | American Depositary Receipt |
| GDR | | Global Depositary Receipt |
| Reg S | | Security exempt from registration under Regulation S of the Securities Act of 1933, which exempts from registration securities offered and sold outside the United States. Security may not be offered or sold in the United States except pursuant to an exemption from, or in a transaction not subject to, the registration requirements of the Securities Act of 1933. |
The Notes to Financial Statements are an integral part of this report.
| | |
| Transamerica Funds | | Annual Report 2014 |
Page 80
Transamerica Global Real Estate Securities
SCHEDULE OF INVESTMENTS
At October 31, 2014
| | | | | | | | |
| | | Shares | | | Value | |
COMMON STOCKS - 97.9% | | | | | | | | |
Australia - 6.6% | | | | | | | | |
Federation Centres, REIT | | | 183,655 | | | | $ 441,028 | |
Goodman Group, REIT | | | 122,755 | | | | 599,314 | |
Investa Office Fund, REIT | | | 88,198 | | | | 278,274 | |
Lend Lease Corp., Ltd. | | | 12,160 | | | | 169,596 | |
Mirvac Group, REIT | | | 497,011 | | | | 788,513 | |
Scentre Group, REIT (A) | | | 177,460 | | | | 566,087 | |
Stockland, REIT | | | 165,559 | | | | 618,988 | |
Westfield Corp., REIT | | | 35,282 | | | | 247,926 | |
| | | | | | | | |
| | | | | | | 3,709,726 | |
| | | | | | | | |
Canada - 0.4% | | | | | | | | |
Boardwalk Real Estate Investment Trust | | | 3,400 | | | | 215,394 | |
| | | | | | | | |
France - 3.1% | | | | | | | | |
ICADE, REIT | | | 2,544 | | | | 202,407 | |
Klepierre, REIT | | | 14,664 | | | | 634,686 | |
Mercialys SA, REIT (B) | | | 9,590 | | | | 211,812 | |
Unibail-Rodamco SE, REIT | | | 2,808 | | | | 719,992 | |
| | | | | | | | |
| | | | | | | 1,768,897 | |
| | | | | | | | |
Germany - 1.4% | | | | | | | | |
LEG Immobilien AG (A) | | | 11,380 | | | | 786,523 | |
| | | | | | | | |
Hong Kong - 7.4% | | | | | | | | |
Cheung Kong Holdings, Ltd. | | | 64,990 | | | | 1,156,236 | |
Hang Lung Properties, Ltd. | | | 69,600 | | | | 217,342 | |
Hongkong Land Holdings, Ltd. | | | 87,397 | | | | 609,499 | |
Link REIT | | | 35,900 | | | | 211,345 | |
Sun Hung Kai Properties, Ltd. | | | 94,245 | | | | 1,409,888 | |
Swire Properties, Ltd. | | | 173,000 | | | | 554,346 | |
| | | | | | | | |
| | | | | | | 4,158,656 | |
| | | | | | | | |
Japan - 15.8% | | | | | | | | |
Daito Trust Construction Co., Ltd. | | | 3,500 | | | | 436,103 | |
Daiwa House Industry Co., Ltd. (B) | | | 14,323 | | | | 270,985 | |
GLP J-REIT (B) | | | 210 | | | | 238,293 | |
Japan Hotel REIT Investment Corp. | | | 182 | | | | 112,892 | |
Japan Real Estate Investment Corp. | | | 109 | | | | 593,968 | |
Japan Retail Fund Investment Corp., Class A, REIT | | | 380 | | | | 765,109 | |
Kenedix Office Investment Corp., Class A, REIT (B) | | | 54 | | | | 288,760 | |
Mitsubishi Estate Co., Ltd. | | | 82,436 | | | | 2,100,037 | |
Mitsui Fudosan Co., Ltd. | | | 68,446 | | | | 2,201,663 | |
Nippon Building Fund, Inc., REIT (B) | | | 28 | | | | 156,930 | |
Nippon Prologis REIT, Inc. (B) | | | 137 | | | | 317,906 | |
NTT Urban Development Corp. | | | 20,800 | | | | 235,415 | |
ORIX JREIT, Inc., Class A, | | | 141 | | | | 187,990 | |
Sumitomo Realty & Development Co., Ltd. | | | 15,000 | | | | 562,334 | |
Tokyo Tatemono Co., Ltd. | | | 12,900 | | | | 112,609 | |
United Urban Investment Corp., Class A, REIT (B) | | | 216 | | | | 340,892 | |
| | | | | | | | |
| | | | | | | 8,921,886 | |
| | | | | | | | |
Jersey, Channel Islands - 0.1% (A) | | | | | | | | |
Atrium European Real Estate, Ltd. | | | 10,000 | | | | 52,369 | |
| | | | | | | | |
Luxembourg - 0.8% | | | | | | | | |
GAGFAH SA (A) | | | 25,591 | | | | 478,578 | |
| | | | | | | | |
Netherlands - 1.2% | | | | | | | | |
Corio NV, REIT | | | 3,302 | | | | 160,724 | |
Eurocommercial Properties NV, CVA | | | 4,738 | | | | 216,295 | |
| | | | | | | | |
| | | Shares | | | Value | |
COMMON STOCKS (continued) | | | | | | | | |
Netherlands (continued) | | | | | | | | |
Nieuwe Steen Investments NV, REIT | | | 60,840 | | | | $ 302,223 | |
| | | | | | | | |
| | | | | | | 679,242 | |
| | | | | | | | |
Singapore - 3.7% | | | | | | | | |
CapitaCommercial Trust, REIT | | | 420,900 | | | | 547,285 | |
CapitaLand, Ltd. | | | 204,200 | | | | 504,153 | |
Global Logistic Properties, Ltd., Class L | | | 302,100 | | | | 647,389 | |
Suntec Real Estate Investment Trust | | | 263,800 | | | | 366,503 | |
| | | | | | | | |
| | | | | | | 2,065,330 | |
| | | | | | | | |
Sweden - 1.0% | | | | | | | | |
Castellum AB | | | 21,198 | | | | 325,074 | |
Fabege AB | | | 800 | | | | 10,269 | |
Hufvudstaden AB, Class A | | | 17,380 | | | | 225,523 | |
| | | | | | | | |
| | | | | | | 560,866 | |
| | | | | | | | |
Switzerland - 0.5% | | | | | | | | |
PSP Swiss Property AG (A) | | | 3,150 | | | | 270,354 | |
| | | | | | | | |
United Kingdom - 6.9% | | | | | | | | |
British Land Co. PLC, REIT | | | 65,976 | | | | 770,382 | |
Derwent London PLC, REIT | | | 10,739 | | | | 510,936 | |
Great Portland Estates PLC, REIT | | | 51,760 | | | | 569,673 | |
Hammerson PLC, REIT | | | 63,612 | | | | 624,924 | |
Land Securities Group PLC, REIT | | | 65,825 | | | | 1,168,002 | |
Safestore Holdings PLC, REIT | | | 46,497 | | | | 154,713 | |
UNITE Group PLC | | | 15,097 | | | | 103,223 | |
| | | | | | | | |
| | | | | | | 3,901,853 | |
| | | | | | | | |
United States - 49.0% | | | | | | | | |
American Realty Capital Properties, Inc.,
REIT | | | 57,000 | | | | 505,590 | |
AvalonBay Communities, Inc., REIT (B) | | | 7,125 | | | | 1,110,360 | |
BioMed Realty Trust, Inc., Class B, REIT (B) | | | 23,500 | | | | 510,420 | |
Boston Properties, Inc., REIT | | | 6,120 | | | | 775,710 | |
Brandywine Realty Trust, REIT | | | 22,300 | | | | 344,089 | |
Brixmor Property Group, Inc., REIT | | | 11,700 | | | | 285,012 | |
Cousins Properties, Inc., REIT (B) | | | 25,430 | | | | 330,844 | |
DCT Industrial Trust, Inc., REIT | | | 41,900 | | | | 359,083 | |
DDR Corp., REIT (B) | | | 45,500 | | | | 825,370 | |
Douglas Emmett, Inc., REIT | | | 22,700 | | | | 638,551 | |
Duke Realty Corp., REIT | | | 36,200 | | | | 686,352 | |
Equity Residential, REIT | | | 22,200 | | | | 1,544,232 | |
Essex Property Trust, Inc., REIT | | | 4,992 | | | | 1,007,186 | |
General Growth Properties, Inc., REIT | | | 37,890 | | | | 981,730 | |
Health Care REIT, Inc. | | | 24,700 | | | | 1,756,417 | |
Healthcare Realty Trust, Inc., REIT | | | 15,300 | | | | 404,991 | |
Healthcare Trust of America, Inc., Class A, REIT | | | 26,500 | | | | 340,260 | |
Highwoods Properties, Inc., REIT | | | 6,700 | | | | 287,229 | |
Hilton Worldwide Holdings, Inc. (A) | | | 11,400 | | | | 287,736 | |
Host Hotels & Resorts, Inc., REIT | | | 68,977 | | | | 1,607,854 | |
Kilroy Realty Corp., REIT | | | 13,100 | | | | 887,394 | |
Kimco Realty Corp., REIT (B) | | | 23,620 | | | | 589,319 | |
Lexington Realty Trust, REIT | | | 31,900 | | | | 349,624 | |
Liberty Property Trust, Series C, REIT | | | 7,200 | | | | 250,344 | |
Macerich Co., Class A, REIT | | | 9,707 | | | | 684,343 | |
Pebblebrook Hotel Trust, REIT | | | 6,800 | | | | 289,680 | |
Post Properties, Inc., REIT | | | 7,300 | | | | 408,362 | |
Prologis, Inc., Class A, REIT | | | 34,103 | | | | 1,420,390 | |
Public Storage, REIT | | | 3,500 | | | | 645,190 | |
Ramco-Gershenson Properties Trust, REIT | | | 13,000 | | | | 227,240 | |
The Notes to Financial Statements are an integral part of this report.
| | |
| Transamerica Funds | | Annual Report 2014 |
Page 81
Transamerica Global Real Estate Securities
SCHEDULE OF INVESTMENTS (continued)
At October 31, 2014
| | | | | | | | |
| | | Shares | | | Value | |
COMMON STOCKS (continued) | | | | | | | | |
United States (continued) | | | | | | | | |
Simon Property Group, Inc., REIT | | | 11,353 | | | | $ 2,034,571 | |
SL Green Realty Corp., REIT | | | 9,700 | | | | 1,122,290 | |
Spirit Realty Capital, Inc., REIT | | | 47,100 | | | | 560,490 | |
Strategic Hotels & Resorts, Inc., REIT (A) (B) | | | 18,500 | | | | 237,725 | |
Sun Communities, Inc., REIT | | | 6,200 | | | | 359,414 | |
Sunstone Hotel Investors, Inc., REIT | | | 19,400 | | | | 297,014 | |
Tanger Factory Outlet Centers, Inc., REIT | | | 4,910 | | | | 175,631 | |
Taubman Centers, Inc., REIT | | | 5,060 | | | | 384,813 | |
UDR, Inc., REIT | | | 32,183 | | | | 972,892 | |
Vornado Realty Trust, Class A, REIT | | | 11,037 | | | | 1,208,331 | |
| | | | | | | | |
| | | | | | | 27,694,073 | |
| | | | | | | | |
Total Common Stocks
(Cost $39,749,059) | | | | 55,263,747 | |
| | | | | | | | |
| | |
WARRANT - 0.0% (C) | | | | | | | | |
Hong Kong - 0.0% (C) | | | | | | | | |
Sun Hung Kai Properties, Ltd. (A) | | | | | | | | |
Expiration: 04/22/2016 | | | | | | | | |
Exercise Price: HKD 98.60 | | | 4,653 | | | | 10,104 | |
| | | | | | | | |
Total Warrant
(Cost $0) | | | | 10,104 | |
| | | | | | | | |
| | | | | | | | |
| | | Shares | | | Value | |
SECURITIES LENDING COLLATERAL - 9.1% | | | | | |
State Street Navigator Securities Lending Trust - Prime Portfolio 0.16% (D) | | | 5,126,698 | | | | $ 5,126,698 | |
| | | | | | | | |
Total Securities Lending Collateral
(Cost $5,126,698) | | | | 5,126,698 | |
| | | | | | | | |
| | |
| | | Principal | | | Value | |
REPURCHASE AGREEMENT - 2.0% | | | | | |
State Street Bank & Trust Co.
0.16% (D), dated 10/31/2014, to be repurchased at $1,138,090 on 11/03/2014. Collateralized by a U.S. Government Agency Obligation, 2.50%, due 11/01/2027, and with a value of $1,164,849. | | | $ 1,138,089 | | | | 1,138,089 | |
| | | | | | | | |
Total Repurchase Agreement
(Cost $1,138,089) | | | | 1,138,089 | |
| | | | | | | | |
Total Investments
(Cost $46,013,846) (E) | | | | | | | 61,538,638 | |
Net Other Assets (Liabilities) - (9.0)% | | | | (5,060,873 | ) |
| | | | | | | | |
| | |
Net Assets - 100.0% | | | | | | | $ 56,477,765 | |
| | | | | | | | |
INVESTMENTS BY INDUSTRY (unaudited):
| | | | | | | | |
| Industry | | Percentage of
Total Investments | | | Value | |
Real Estate Investment Trusts | | | 67.5 | % | | $ | 41,536,503 | |
Real Estate Management & Development | | | 21.8 | | | | 13,449,612 | |
Hotels, Restaurants & Leisure | | | 0.5 | | | | 287,736 | |
| | | | | | | | |
Investments, at Value | | | 89.8 | | | | 55,273,851 | |
Short-Term Investments | | | 10.2 | | | | 6,264,787 | |
| | | | | | | | |
Total Investments | | | 100.0 | % | | $ | 61,538,638 | |
| | | | | | | | |
SECURITY VALUATION:
Valuation Inputs (F)
| | | | | | | | | | | | | | | | |
| | | Level 1
Quoted Prices | | | Level 2
Other Significant
Observable Inputs | | | Level 3
Significant
Unobservable Inputs | | | Value at
October 31, 2014 | |
ASSETS | | | | | | | | | | | | | | | | |
Investments | | | | | | | | | | | | | | | | |
Common Stocks | | $ | 27,909,467 | | | $ | 27,354,280 | | | $ | — | | | $ | 55,263,747 | |
Warrant | | | — | | | | 10,104 | | | | — | | | | 10,104 | |
Securities Lending Collateral | | | 5,126,698 | | | | — | | | | — | | | | 5,126,698 | |
Repurchase Agreement | | | — | | | | 1,138,089 | | | | — | | | | 1,138,089 | |
| | | | | | | | | | | | | | | | |
Total Investments | | $ | 33,036,165 | | | $ | 28,502,473 | | | $ | — | | | $ | 61,538,638 | |
| | | | | | | | | | | | | | | | |
The Notes to Financial Statements are an integral part of this report.
| | |
| Transamerica Funds | | Annual Report 2014 |
Page 82
Transamerica Global Real Estate Securities
SCHEDULE OF INVESTMENTS (continued)
At October 31, 2014
FOOTNOTES TO SCHEDULE OF INVESTMENTS:
| (A) | Non-income producing security. |
| (B) | All or a portion of this security is on loan. The value of all securities on loan is $4,961,344. The amount of securities on loan indicated may not correspond with the securities on loan identified because securities with pending sales are in the process of recall from the brokers. |
| (C) | Percentage rounds to less than 0.1% or (0.1)%. |
| (D) | Rate shown reflects the yield at October 31, 2014. |
| (E) | Aggregate cost for federal income tax purposes is $49,462,531. Aggregate gross unrealized appreciation and depreciation for all securities is $12,411,477 and $335,370, respectively. Net unrealized appreciation for tax purposes is $12,076,107. |
| (F) | The Fund recognizes transfers between Levels at the end of the reporting period. There were no transfers between Level 1, 2 and 3 during the period ended October 31, 2014. See the Notes to Financial Statements for more information regarding security valuation and pricing inputs. |
DEFINITIONS:
| | |
| CVA | | Dutch Certificate-Depositary Receipt |
| REIT | | Real Estate Investment Trust (includes domestic REITs and Foreign Real Estate Investment Companies) |
CURRENCY ABBREVIATION:
The Notes to Financial Statements are an integral part of this report.
| | |
| Transamerica Funds | | Annual Report 2014 |
Page 83
Transamerica Growth
SCHEDULE OF INVESTMENTS
At October 31, 2014
| | | | | | | | |
| | | Shares | | | Value | |
COMMON STOCKS - 99.1% | | | | | | | | |
Aerospace & Defense - 3.2% | | | | | | | | |
Boeing Co. | | | 73,714 | | | | $ 9,207,616 | |
Precision Castparts Corp. | | | 35,865 | | | | 7,915,405 | |
| | | | | | | | |
| | | | | | | 17,123,021 | |
| | | | | | | | |
Automobiles - 1.0% | | | | | | | | |
Tesla Motors, Inc. (A) (B) | | | 21,460 | | | | 5,186,882 | |
| | | | | | | | |
Biotechnology - 10.7% | | | | | | | | |
Alexion Pharmaceuticals, Inc. (B) | | | 52,733 | | | | 10,090,987 | |
Biogen Idec, Inc. (B) | | | 40,797 | | | | 13,099,101 | |
Celgene Corp. (B) | | | 115,814 | | | | 12,402,521 | |
Gilead Sciences, Inc. (B) | | | 94,941 | | | | 10,633,392 | |
Incyte Corp. (B) | | | 38,089 | | | | 2,554,248 | |
Vertex Pharmaceuticals, Inc. (B) | | | 67,922 | | | | 7,650,734 | |
| | | | | | | | |
| | | | | | | 56,430,983 | |
| | | | | | | | |
Capital Markets - 1.0% | | | | | | | | |
Morgan Stanley | | | 152,955 | | | | 5,345,777 | |
| | | | | | | | |
Chemicals - 1.8% | | | | | | | | |
Monsanto Co. | | | 82,914 | | | | 9,538,427 | |
| | | | | | | | |
Diversified Financial Services - 0.3% | | | | | | | | |
McGraw-Hill Financial, Inc. | | | 20,460 | | | | 1,851,221 | |
| | | | | | | | |
Energy Equipment & Services - 2.2% | | | | | | | | |
Schlumberger, Ltd. | | | 115,667 | | | | 11,411,706 | |
| | | | | | | | |
Food & Staples Retailing - 1.7% | | | | | | | | |
Costco Wholesale Corp. | | | 65,992 | | | | 8,801,353 | |
| | | | | | | | |
Food Products - 2.1% | | | | | | | | |
Mead Johnson Nutrition Co., Class A | | | 43,143 | | | | 4,284,531 | |
Mondelez International, Inc., Class A | | | 194,311 | | | | 6,851,406 | |
| | | | | | | | |
| | | | | | | 11,135,937 | |
| | | | | | | | |
Health Care Equipment & Supplies - 1.7% | | | | | |
Abbott Laboratories | | | 206,841 | | | | 9,016,199 | |
| | | | | | | | |
Hotels, Restaurants & Leisure - 4.8% | | | | | | | | |
Chipotle Mexican Grill, Inc., Class A (B) | | | 9,669 | | | | 6,168,822 | |
Dunkin’ Brands Group, Inc. (A) | | | 76,582 | | | | 3,482,949 | |
Marriott International, Inc., Class A (A) | | | 109,697 | | | | 8,309,548 | |
Starbucks Corp. | | | 99,030 | | | | 7,482,707 | |
| | | | | | | | |
| | | | | | | 25,444,026 | |
| | | | | | | | |
Internet & Catalog Retail - 6.7% | | | | | | | | |
Amazon.com, Inc. (B) | | | 41,530 | | | | 12,685,754 | |
Netflix, Inc. (B) | | | 17,173 | | | | 6,745,039 | |
Priceline Group, Inc. (B) | | | 8,938 | | | | 10,781,105 | |
TripAdvisor, Inc. (B) | | | 58,419 | | | | 5,179,429 | |
| | | | | | | | |
| | | | | | | 35,391,327 | |
| | | | | | | | |
Internet Software & Services - 12.2% | | | | | | | | |
Alibaba Group Holding, Ltd., ADR (B) | | | 75,328 | | | | 7,427,341 | |
Facebook, Inc., Class A (B) | | | 248,865 | | | | 18,662,386 | |
Google, Inc., Class A (B) | | | 19,319 | | | | 10,970,681 | |
Google, Inc., Class C (B) | | | 19,704 | | | | 11,016,112 | |
LinkedIn Corp., Class A (B) | | | 43,711 | | | | 10,008,071 | |
Pandora Media, Inc. (B) | | | 38,455 | | | | 741,412 | |
Twitter, Inc. (B) | | | 143,855 | | | | 5,965,667 | |
| | | | | | | | |
| | | | | | | 64,791,670 | |
| | | | | | | | |
IT Services - 7.1% | | | | | | | | |
FleetCor Technologies, Inc. (B) | | | 41,586 | | | | 6,261,188 | |
Mastercard, Inc., Class A | | | 215,219 | | | | 18,024,591 | |
Visa, Inc., Class A | | | 55,387 | | | | 13,372,084 | |
| | | | | | | | |
| | | | | | | 37,657,863 | |
| | | | | | | | |
| | | | | | | | |
| | | Shares | | | Value | |
COMMON STOCKS (continued) | | | | | | | | |
Life Sciences Tools & Services - 1.9% | | | | | |
Illumina, Inc. (B) | | | 52,304 | | | | $ 10,072,704 | |
| | | | | | | | |
Media - 3.5% | | | | | | | | |
Twenty-First Century Fox, Inc., Class A | | | 218,565 | | | | 7,536,121 | |
Walt Disney Co. | | | 118,890 | | | | 10,864,169 | |
| | | | | | | | |
| | | | | | | 18,400,290 | |
| | | | | | | | |
Oil, Gas & Consumable Fuels - 2.3% | | | | | |
Concho Resources, Inc. (B) | | | 54,298 | | | | 5,920,111 | |
EOG Resources, Inc. | | | 65,931 | | | | 6,266,742 | |
| | | | | | | | |
| | | | | | | 12,186,853 | |
| | | | | | | | |
Pharmaceuticals - 6.3% | | | | | | | | |
Actavis PLC (B) | | | 24,465 | | | | 5,938,634 | |
Allergan, Inc. | | | 30,196 | | | | 5,739,052 | |
Bristol-Myers Squibb Co. | | | 197,575 | | | | 11,496,889 | |
Novo Nordisk A/S, ADR | | | 224,766 | | | | 10,154,928 | |
| | | | | | | | |
| | | | | | | 33,329,503 | |
| | | | | | | | |
Real Estate Investment Trusts - 1.2% | | | | | |
American Tower Corp., Class A | | | 63,824 | | | | 6,222,840 | |
| | | | | | | | |
Road & Rail - 3.3% | | | | | | | | |
Canadian Pacific Railway, Ltd. | | | 41,593 | | | | 8,638,034 | |
Union Pacific Corp. | | | 76,424 | | | | 8,899,575 | |
| | | | | | | | |
| | | | | | | 17,537,609 | |
| | | | | | | | |
Semiconductors & Semiconductor Equipment - 0.6% | |
ARM Holdings PLC, ADR (A) | | | 79,268 | | | | 3,385,536 | |
| | | | | | | | |
Software - 8.2% | | | | | | | | |
Adobe Systems, Inc. (B) | | | 98,191 | | | | 6,885,153 | |
FireEye, Inc. (A) (B) | | | 76,982 | | | | 2,616,618 | |
Red Hat, Inc. (B) | | | 139,030 | | | | 8,191,648 | |
salesforce.com, Inc. (B) | | | 157,696 | | | | 10,090,967 | |
Splunk, Inc. (B) | | | 85,155 | | | | 5,627,042 | |
VMware, Inc., Class A (A) (B) | | | 55,938 | | | | 4,674,739 | |
Workday, Inc., Class A (B) | | | 57,024 | | | | 5,444,651 | |
| | | | | | | | |
| | | | | | | 43,530,818 | |
| | | | | | | | |
Specialty Retail - 5.5% | | | | | | | | |
Inditex SA | | | 270,856 | | | | 7,620,018 | |
O’Reilly Automotive, Inc. (B) | | | 39,141 | | | | 6,884,119 | |
Tiffany & Co. | | | 64,784 | | | | 6,227,038 | |
TJX Cos., Inc. | | | 131,847 | | | | 8,348,552 | |
| | | | | | | | |
| | | | | | | 29,079,727 | |
| | | | | | | | |
Technology Hardware, Storage & Peripherals - 5.2% | |
Apple, Inc. | | | 256,722 | | | | 27,725,976 | |
| | | | | | | | |
Textiles, Apparel & Luxury Goods - 4.6% | |
Michael Kors Holdings, Ltd. (B) | | | 72,336 | | | | 5,684,886 | |
NIKE, Inc., Class B | | | 133,297 | | | | 12,392,622 | |
Under Armour, Inc., Class A (A) (B) | | | 92,565 | | | | 6,070,413 | |
| | | | | | | | |
| | | | | | | 24,147,921 | |
| | | | | | | | |
Total Common Stocks
(Cost $295,850,671) | | | | | | | 524,746,169 | |
| | | | | | | | |
| |
SECURITIES LENDING COLLATERAL - 4.6% | | | | | |
State Street Navigator Securities Lending Trust - Prime Portfolio
0.16% (C) | | | 24,009,837 | | | | 24,009,837 | |
| | | | | | | | |
Total Securities Lending Collateral
(Cost $24,009,837) | | | | | | | 24,009,837 | |
| | | | | | | | |
The Notes to Financial Statements are an integral part of this report.
| | |
| Transamerica Funds | | Annual Report 2014 |
Page 84
Transamerica Growth
SCHEDULE OF INVESTMENTS (continued)
At October 31, 2014
| | | | | | | | |
| | | Principal | | | Value | |
REPURCHASE AGREEMENT - 1.0% | | | | | |
State Street Bank & Trust Co.
0.01% (C), dated 10/31/2014, to be repurchased at $5,379,585 on 11/03/2014. Collateralized by a U.S. Government Agency Obligation, 4.00%, due 12/15/2017, and with a value of $5,487,602. | | | $ 5,379,580 | | | | $ 5,379,580 | |
| | | | | | | | |
Total Repurchase Agreement
(Cost $5,379,580) | | | | 5,379,580 | |
| | | | | | | | |
Total Investments
(Cost $325,240,088) (D) | | | | 554,135,586 | |
Net Other Assets (Liabilities) - (4.7)% | | | | (24,709,175 | ) |
| | | | | | | | |
| | |
Net Assets - 100.0% | | | | | | | $ 529,426,411 | |
| | | | | | | | |
SECURITY VALUATION:
Valuation Inputs (E)
| | | | | | | | | | | | | | | | |
| | | Level 1
Quoted Prices | | | Level 2
Other Significant
Observable Inputs | | | Level 3
Significant
Unobservable Inputs | | | Value at
October 31, 2014 | |
ASSETS | | | | | | | | | | | | | | | | |
Investments | | | | | | | | | | | | | | | | |
Common Stocks | | $ | 517,126,151 | | | $ | 7,620,018 | | | $ | — | | | $ | 524,746,169 | |
Securities Lending Collateral | | | 24,009,837 | | | | — | | | | — | | | | 24,009,837 | |
Repurchase Agreement | | | — | | | | 5,379,580 | | | | — | | | | 5,379,580 | |
| | | | | | | | | | | | | | | | |
Total Investments | | $ | 541,135,988 | | | $ | 12,999,598 | | | $ | — | | | $ | 554,135,586 | |
| | | | | | | | | | | | | | | | |
FOOTNOTES TO SCHEDULE OF INVESTMENTS:
| (A) | All or a portion of this security is on loan. The value of all securities on loan is $23,498,318. The amount of securities on loan indicated may not correspond with the securities on loan identified because securities with pending sales are in the process of recall from the brokers. |
| (B) | Non-income producing security. |
| (C) | Rate shown reflects the yield at October 31, 2014. |
| (D) | Aggregate cost for federal income tax purposes is $327,204,126. Aggregate gross unrealized appreciation and depreciation for all securities is $228,146,626 and $1,215,166, respectively. Net unrealized appreciation for tax purposes is $226,931,460. |
| (E) | The Fund recognizes transfers between Levels at the end of the reporting period. There were no transfers between Level 1, 2 and 3 during the period ended October 31, 2014. See the Notes to Financial Statements for more information regarding security valuation and pricing inputs. |
DEFINITION:
| | |
| ADR | | American Depositary Receipt |
The Notes to Financial Statements are an integral part of this report.
| | |
| Transamerica Funds | | Annual Report 2014 |
Page 85
Transamerica Intermediate Bond
SCHEDULE OF INVESTMENTS
At October 31, 2014
| | | | | | | | |
| | | Principal | | | Value | |
U.S. GOVERNMENT OBLIGATIONS - 20.8% | |
U.S. Treasury Bond | | | | | | | | |
3.13%, 02/15/2042 | | | $ 10,568,200 | | | | $ 10,741,582 | |
3.50%, 02/15/2039 | | | 1,480,000 | | | | 1,614,356 | |
U.S. Treasury Inflation Indexed Bond | | | | | | | | |
1.75%, 01/15/2028 | | | 3,509,098 | | | | 3,986,118 | |
2.50%, 01/15/2029 | | | 4,321,918 | | | | 5,377,749 | |
U.S. Treasury Note | | | | | | | | |
0.25%, 08/15/2015 | | | 5,275,700 | | | | 5,280,649 | |
0.38%, 05/31/2016 | | | 6,801,100 | | | | 6,805,881 | |
0.50%, 09/30/2016 - 07/31/2017 | | | 15,186,100 | | | | 15,130,539 | |
0.63%, 09/30/2017 | | | 2,640,000 | | | | 2,616,694 | |
1.63%, 06/30/2019 (A) | | | 3,176,600 | | | | 3,186,775 | |
1.63%, 11/15/2022 | | | 1,085,000 | | | | 1,041,346 | |
1.75%, 05/15/2023 | | | 3,175,400 | | | | 3,056,322 | |
2.50%, 08/15/2023 | | | 4,503,800 | | | | 4,596,340 | |
| | | | | | | | |
Total U.S. Government Obligations
(Cost $62,346,173) | | | | | | | 63,434,351 | |
| | | | | | | | |
|
U.S. GOVERNMENT AGENCY OBLIGATIONS - 17.1% | |
Federal Home Loan Mortgage Corp. | | | | | | | | |
5.50%, 11/01/2038 | | | 521,394 | | | | 586,745 | |
Federal National Mortgage Association | | | | | | | | |
Zero Coupon, 10/09/2019 | | | 1,545,000 | | | | 1,384,944 | |
3.50%, TBA | | | 18,699,000 | | | | 19,511,989 | |
4.00%, TBA | | | 8,529,000 | | | | 9,055,400 | |
4.50%, TBA | | | 5,293,000 | | | | 5,736,289 | |
5.00%, 04/01/2039 | | | 1,239,502 | | | | 1,392,828 | |
5.00%, TBA | | | 7,240,000 | | | | 8,016,603 | |
5.50%, 06/01/2038 | | | 782,111 | | | | 880,022 | |
6.00%, 12/01/2037 - 01/01/2040 | | | 4,698,908 | | | | 5,368,120 | |
| | | | | | | | |
Total U.S. Government Agency Obligations
(Cost $51,696,169) | | | | 51,932,940 | |
| | | | | | | | |
|
MORTGAGE-BACKED SECURITIES - 14.1% | |
Aventura Mall Trust
Series 2013-AVM, Class A | | | | | | | | |
3.87%, 12/05/2032, 144A | | | 1,500,000 | | | | 1,584,999 | |
BB-UBS Trust | | | | | | | | |
Series 2012-TFT, Class A | | | | | | | | |
2.89%, 06/05/2030, 144A | | | 1,234,000 | | | | 1,204,131 | |
Series 2012-TFT, Class C | | | | | | | | |
3.47%, 06/05/2030, 144A (B) | | | 1,560,000 | | | | 1,488,702 | |
BCAP LLC Trust | | | | | | | | |
Series 2009-RR15, Class 1A1 | | | | | | | | |
2.47%, 10/26/2035, 144A (B) | | | 458,920 | | | | 459,165 | |
Series 2009-RR4, Class 9A1 | | | | | | | | |
2.39%, 10/26/2035, 144A (B) | | | 509,342 | | | | 514,338 | |
Series 2011-R11, Class 23A1 | | | | | | | | |
2.60%, 06/26/2035, 144A (B) | | | 1,173,283 | | | | 1,191,656 | |
Series 2012-RR12, Class 4A1 | | | | | | | | |
2.78%, 04/26/2036, 144A (B) | | | 3,002,323 | | | | 3,057,409 | |
Citigroup Mortgage Loan Trust | | | | | | | | |
Series 2014-A, Class A | | | | | | | | |
4.00%, 01/25/2035, 144A (B) | | | 402,506 | | | | 418,768 | |
COMM Mortgage Trust | | | | | | | | |
Series 2013-GAM, Class A1 | | | | | | | | |
1.71%, 02/10/2028, 144A | | | 361,485 | | | | 354,070 | |
Series 2013-GAM, Class A2 | | | | | | | | |
3.37%, 02/10/2028, 144A | | | 900,000 | | | | 895,593 | |
| | | | | | | | |
| | | Principal | | | Value | |
MORTGAGE-BACKED SECURITIES (continued) | |
Commercial Mortgage Pass-Through Certificates | | | | | | | | |
Series 2012-LTRT, Class A2 | | | | | | | | |
3.40%, 10/05/2030, 144A | | | $ 250,000 | | | | $ 245,876 | |
Credit Suisse Mortgage Capital Certificates | | | | | | | | |
Series 2009-12R, Class 1A1 | | | | | | | | |
2.52%, 09/27/2036, 144A (B) | | | 1,347,789 | | | | 1,353,318 | |
CSMC Trust | | | | | | | | |
Series 2009-14R, Class 2A1 | | | | | | | | |
5.00%, 06/26/2037, 144A | | | 836,899 | | | | 863,560 | |
GS Mortgage Securities Trust | | | | | | | | |
Series 2013-G1, Class A2 | | | | | | | | |
3.56%, 04/10/2031, 144A (B) | | | 2,248,000 | | | | 2,223,465 | |
Hilton USA Trust | | | | | | | | |
Series 2013-HLT, Class AFX | | | | | | | | |
2.66%, 11/05/2030, 144A | | | 2,885,000 | | | | 2,901,453 | |
Jefferies Re-REMIC Trust | | | | | | | | |
Series 2009-R2, Class 4A | | | | | | | | |
2.55%, 05/26/2037, 144A (B) | | | 1,901,480 | | | | 1,911,550 | |
JPMorgan Chase Commercial Mortgage Securities Trust | | | | | | | | |
Series 2007-LDPX, Class A1A | | | | | | | | |
5.44%, 01/15/2049 | | | 1,137,040 | | | | 1,231,092 | |
Series 2012-WLDN, Class A | | | | | | | | |
3.91%, 05/05/2030, 144A | | | 2,295,000 | | | | 2,396,375 | |
Series 2014-DSTY, Class B | | | | | | | | |
3.77%, 06/10/2027, 144A | | | 2,800,000 | | | | 2,871,210 | |
LB Commercial Mortgage Trust | | | | | | | | |
Series 2007-C3, Class A1A | | | | | | | | |
5.86%, 07/15/2044 (B) | | | 843,197 | | | | 926,566 | |
Morgan Stanley Re-REMIC Trust | | | | | | | | |
Series 2009-R3, Class 1A | | | | | | | | |
5.50%, 10/26/2035, 144A | | | 403,417 | | | | 433,377 | |
Series 2010-GG10, Class A4A | | | | | | | | |
5.80%, 08/15/2045, 144A (B) | | | 1,643,152 | | | | 1,782,087 | |
Series 2012-R3, Class 1A | | | | | | | | |
2.02%, 11/26/2036, 144A (B) | | | 690,820 | | | | 682,714 | |
Series 2013-R8, Class 9A | | | | | | | | |
0.88%, 09/26/2036, 144A (B) | | | 795,678 | | | | 779,273 | |
Series 2014-R3, Class 2A | | | | | | | | |
3.00%, 07/26/2048, 144A (B) | | | 2,027,127 | | | | 1,903,993 | |
Series 2014-R4, Class 4A | | | | | | | | |
3.80%, 11/21/2035, 144A (B) | | | 2,664,109 | | | | 2,721,355 | |
Motel 6 Trust | | | | | | | | |
Series 2012-MTL6, Class C | | | | | | | | |
3.14%, 10/05/2025, 144A | | | 509,000 | | | | 507,485 | |
Nationstar Mortgage Loan Trust | | | | | | | | |
Series 2013-A, Class A | | | | | | | | |
3.75%, 12/25/2052, 144A (B) | | | 1,372,112 | | | | 1,410,315 | |
New Residential Mortgage Loan Trust | | | | | | | | |
Series 2014-2A, Class A3 | | | | | | | | |
3.75%, 05/25/2054, 144A | | | 2,346,748 | | | | 2,404,711 | |
RBSCF Trust | | | | | | | | |
Series 2009-RR2, Class WBB | | | | | | | | |
5.94%, 02/16/2051, 144A (B) | | | 1,115,000 | | | | 1,217,440 | |
UBS-BAMLL Trust | | | | | | | | |
Series 2012-WRM, Class A | | | | | | | | |
3.66%, 06/10/2030, 144A | | | 1,100,000 | | | | 1,123,323 | |
| | | | | | | | |
Total Mortgage-Backed Securities
(Cost $43,297,477) | | | | | | | 43,059,369 | |
| | | | | | | | |
The Notes to Financial Statements are an integral part of this report.
| | |
| Transamerica Funds | | Annual Report 2014 |
Page 86
Transamerica Intermediate Bond
SCHEDULE OF INVESTMENTS (continued)
At October 31, 2014
| | | | | | | | |
| | | Principal | | | Value | |
ASSET-BACKED SECURITIES - 5.5% | | | | | |
321 Henderson Receivables VI LLC | | | | | | | | |
Series 2010-1A, Class A | | | | | | | | |
5.56%, 07/15/2059, 144A | | | $ 1,525,327 | | | | $ 1,740,138 | |
HLSS Servicer Advance Receivables Backed Notes
Series 2013-T5, Class AT5 | | | | | | | | |
1.98%, 08/15/2046, 144A | | | 3,845,000 | | | | 3,835,387 | |
HLSS Servicer Advance Receivables Trust
Series 2012-T2, Class A2
| | | | | | | | |
1.99%, 10/15/2045, 144A | | | 1,000,000 | | | | 1,006,900 | |
JG Wentworth XXI LLC
Series 2010-2A, Class A | | | | | | | | |
4.07%, 01/15/2048, 144A | | | 374,269 | | | | 399,239 | |
Orange Lake Timeshare Trust
Series 2014-AA, Class A | | | | | | | | |
2.29%, 07/09/2029, 144A | | | 2,585,570 | | | | 2,596,409 | |
SBA Tower Trust
Series 2014-1A, Class C | | | | | | | | |
2.90%, 10/15/2044, 144A (B) | | | 2,015,000 | | | | 2,020,354 | |
Sierra Timeshare Receivables Funding LLC | | | | | | | | |
Series 2014-1A, Class A | | | | | | | | |
2.07%, 03/20/2030, 144A | | | 530,457 | | | | 534,325 | |
Series 2014-2A, Class A | | | | | | | | |
2.05%, 06/20/2031, 144A | | | 1,129,121 | | | | 1,127,911 | |
Series 2014-3A, Class A | | | | | | | | |
2.30%, 10/20/2031, 144A (C) | | | 990,000 | | | | 989,818 | |
SolarCity LMC Series III LLC
Series 2014-2, Class A | | | | | | | | |
4.02%, 07/20/2044, 144A | | | 830,000 | | | | 835,185 | |
SpringCastle America Funding LLC
Series 2014-AA, Class A | | | | | | | | |
2.70%, 05/25/2023, 144A | | | 645,000 | | | | 645,498 | |
Trafigura Securitisation Finance PLC
Series 2012-1A, Class A
2.55%, 10/15/2015, 144A (B) | | | 1,000,000 | | | | 1,007,344 | |
| | | | | | | | |
Total Asset-Backed Securities
(Cost $16,760,812) | | | | | | | 16,738,508 | |
| | | | | | | | |
|
PREFERRED CORPORATE DEBT SECURITIES - 1.3% | |
Insurance - 1.3% | | | | | | | | |
Reinsurance Group of America, Inc.
6.75%, 12/15/2065 (A) (B) | | | 1,516,000 | | | | 1,546,320 | |
ZFS Finance USA Trust II
6.45%, 12/15/2065, 144A (B) | | | 2,120,000 | | | | 2,257,800 | |
| | | | | | | | |
Total Preferred Corporate Debt Securities
(Cost $3,860,873) | | | | 3,804,120 | |
| | | | | | | | |
| |
CORPORATE DEBT SECURITIES - 38.0% | | | | | |
Aerospace & Defense - 0.3% | | | | | | | | |
Exelis, Inc.
5.55%, 10/01/2021 | | | 768,000 | | | | 825,178 | |
| | | | | | | | |
Airlines - 2.3% | | | | | | | | |
American Airlines Pass-Through Trust
3.70%, 04/01/2028 (A) | | | 955,000 | | | | 951,419 | |
Continental Airlines Pass-Through Trust | | | | | | | | |
4.00%, 04/29/2026 (A) | | | 568,049 | | | | 570,889 | |
9.00%, 01/08/2018 | | | 1,119,540 | | | | 1,242,690 | |
| | | | | | | | |
| | | Principal | | | Value | |
CORPORATE DEBT SECURITIES (continued) | | | | | |
Airlines (continued) | | | | | | | | |
Delta Air Lines Pass-Through Trust | | | | | | | | |
4.75%, 11/07/2021 | | | $ 2,466,178 | | | | $ 2,626,480 | |
7.75%, 06/17/2021 | | | 245,295 | | | | 284,542 | |
Southwest Airlines Co. Pass-Through Trust
6.15%, 02/01/2024 | | | 407,390 | | | | 467,887 | |
UAL Pass-Through Trust
10.40%, 05/01/2018 | | | 905,073 | | | | 1,000,105 | |
| | | | | | | | |
| | | | | | | 7,144,012 | |
| | | | | | | | |
Banks - 4.7% | | | | | | | | |
Barclays Bank PLC
10.18%, 06/12/2021, 144A | | | 2,300,000 | | | | 3,088,146 | |
Branch Banking & Trust Co.
3.80%, 10/30/2026 | | | 575,000 | | | | 583,244 | |
Cooperatieve Centrale Raiffeisen-Boerenleenbank BA
11.00%, 06/30/2019, 144A (B) (D) | | | 2,020,000 | | | | 2,636,100 | |
Export-Import Bank of Korea
4.00%, 01/11/2017 | | | 1,700,000 | | | | 1,791,479 | |
Intesa Sanpaolo SpA
5.02%, 06/26/2024, 144A | | | 925,000 | | | | 904,015 | |
Korea Development Bank
3.50%, 08/22/2017 | | | 900,000 | | | | 942,296 | |
Nordea Bank AB
4.25%, 09/21/2022, 144A (A) | | | 2,335,000 | | | | 2,426,854 | |
Oversea-Chinese Banking Corp., Ltd.
3.15%, 03/11/2023, 144A (B) | | | 1,480,000 | | | | 1,497,434 | |
Wells Fargo & Co.
5.38%, 11/02/2043 | | | 403,000 | | | | 450,611 | |
| | | | | | | | |
| | | | | | | 14,320,179 | |
| | | | | | | | |
Building Products - 0.8% | | | | | | | | |
Owens Corning
4.20%, 12/15/2022 | | | 2,604,000 | | | | 2,621,369 | |
| | | | | | | | |
Capital Markets - 2.1% | | | | | | | | |
Ameriprise Financial, Inc.
3.70%, 10/15/2024 | | | 775,000 | | | | 785,928 | |
Macquarie Group, Ltd.
6.25%, 01/14/2021, 144A (A) | | | 1,420,000 | | | | 1,622,873 | |
Morgan Stanley
Series MTN
4.00%, 07/24/2015 | | | 2,470,000 | | | | 2,531,352 | |
UBS AG
7.63%, 08/17/2022 (A) | | | 1,265,000 | | | | 1,492,898 | |
| | | | | | | | |
| | | | | | | 6,433,051 | |
| | | | | | | | |
Chemicals - 0.2% | | | | | | | | |
Monsanto Co.
4.40%, 07/15/2044 | | | 590,000 | | | | 594,766 | |
| | | | | | | | |
Commercial Services & Supplies - 1.0% | | | | | |
Hertz Corp.
6.75%, 04/15/2019 | | | 1,375,000 | | | | 1,433,438 | |
Hutchison Whampoa International 11, Ltd.
3.50%, 01/13/2017, 144A (A) | | | 235,000 | | | | 245,287 | |
Hutchison Whampoa International 12 II, Ltd.
2.00%, 11/08/2017, 144A | | | 1,250,000 | | | | 1,258,385 | |
| | | | | | | | |
| | | | | | | 2,937,110 | |
| | | | | | | | |
The Notes to Financial Statements are an integral part of this report.
| | |
| Transamerica Funds | | Annual Report 2014 |
Page 87
Transamerica Intermediate Bond
SCHEDULE OF INVESTMENTS (continued)
At October 31, 2014
| | | | | | | | |
| | | Principal | | | Value | |
CORPORATE DEBT SECURITIES (continued) | | | | | |
Construction Materials - 0.4% | | | | | | | | |
Martin Marietta Materials, Inc.
4.25%, 07/02/2024, 144A | | | $ 1,140,000 | | | | $ 1,162,160 | |
| | | | | | | | |
Diversified Financial Services - 5.0% | | | | | |
Associates Corp. of North America
6.95%, 11/01/2018 | | | 1,785,000 | | | | 2,095,260 | |
Bank of America Corp.
5.42%, 03/15/2017 | | | 2,000,000 | | | | 2,165,448 | |
Credit Suisse
Series MTN
2.30%, 05/28/2019 | | | 2,105,000 | | | | 2,100,582 | |
Ford Motor Credit Co. LLC
3.66%, 09/08/2024 (A) | | | 1,800,000 | | | | 1,789,500 | |
General Electric Capital Corp.
7.13%, 06/15/2022 (A) (B) (D) | | | 2,000,000 | | | | 2,330,000 | |
JPMorgan Chase & Co.
6.40%, 05/15/2038 (A) | | | 1,220,000 | | | | 1,566,789 | |
Murray Street Investment Trust I
4.65%, 03/09/2017 (E) | | | 1,965,000 | | | | 2,097,871 | |
Oaktree Capital Management, LP
6.75%, 12/02/2019, 144A | | | 900,000 | | | | 1,074,558 | |
| | | | | | | | |
| | | | | | | 15,220,008 | |
| | | | | | | | |
Diversified Telecommunication Services - 1.5% | | | | | |
Intelsat Jackson Holdings SA
7.25%, 04/01/2019 (A) | | | 1,000,000 | | | | 1,050,000 | |
Level 3 Financing, Inc.
8.13%, 07/01/2019 | | | 1,000,000 | | | | 1,070,000 | |
Verizon Communications, Inc. | | | | | | | | |
5.15%, 09/15/2023 | | | 1,400,000 | | | | 1,567,843 | |
6.55%, 09/15/2043 | | | 625,000 | | | | 787,879 | |
| | | | | | | | |
| | | | | | | 4,475,722 | |
| | | | | | | | |
Electric Utilities - 0.4% | | | | | | | | |
Niagara Mohawk Power Corp.
4.88%, 08/15/2019, 144A | | | 1,085,000 | | | | 1,208,458 | |
| | | | | | | | |
Food & Staples Retailing - 0.5% | | | | | | | | |
Wal-Mart Stores, Inc.
4.30%, 04/22/2044 (A) | | | 1,465,000 | | | | 1,526,986 | |
| | | | | | | | |
Household Products - 0.3% | | | | | | | | |
Reynolds Group Issuer, Inc. / Reynolds Group Issuer LLC
6.88%, 02/15/2021 | | | 835,000 | | | | 887,187 | |
| | | | | | | | |
Insurance - 2.4% | | | | | | | | |
Hanover Insurance Group, Inc.
6.38%, 06/15/2021 | | | 1,445,000 | | | | 1,653,397 | |
Nippon Life Insurance Co.
5.00%, 10/18/2042, 144A (B) | | | 1,780,000 | | | | 1,873,450 | |
Pacific Life Insurance Co.
9.25%, 06/15/2039, 144A | | | 1,265,000 | | | | 1,983,726 | |
Swiss Re Solutions Holding Corp.
7.75%, 06/15/2030 | | | 1,235,000 | | | | 1,696,780 | |
| | | | | | | | |
| | | | | | | 7,207,353 | |
| | | | | | | | |
Life Sciences Tools & Services - 0.4% | | | | | |
Thermo Fisher Scientific, Inc.
1.30%, 02/01/2017 (A) | | | 1,125,000 | | | | 1,123,672 | |
| | | | | | | | |
| | | | | | | | |
| | | Principal | | | Value | |
CORPORATE DEBT SECURITIES (continued) | | | | | |
Media - 0.4% | | | | | | | | |
CCO Holdings LLC / CCO Holdings Capital Corp.
7.25%, 10/30/2017 | | | $ 1,132,000 | | | | $ 1,178,695 | |
| | | | | | | | |
Metals & Mining - 0.5% | | | | | | | | |
Novelis, Inc.
8.75%, 12/15/2020 (A) | | | 1,350,000 | | | | 1,473,187 | |
| | | | | | | | |
Multi-Utilities - 0.5% | | | | | | | | |
DTE Electric Co.
4.30%, 07/01/2044 | | | 1,347,000 | | | | 1,419,058 | |
| | | | | | | | |
Oil, Gas & Consumable Fuels - 3.2% | | | | | | | | |
CNOOC Nexen Finance ULC
1.63%, 04/30/2017 | | | 850,000 | | | | 850,238 | |
Continental Resources, Inc.
3.80%, 06/01/2024 (A) | | | 1,055,000 | | | | 1,042,466 | |
Energy Transfer Partners, LP
7.60%, 02/01/2024 (A) | | | 1,275,000 | | | | 1,588,626 | |
EnLink Midstream Partners, LP
2.70%, 04/01/2019 | | | 1,965,000 | | | | 1,983,530 | |
Linn Energy LLC / Linn Energy Finance Corp.
6.25%, 11/01/2019 (A) | | | 950,000 | | | | 874,000 | |
Petrobras International Finance Co. SA
5.38%, 01/27/2021 | | | 2,040,000 | | | | 2,088,674 | |
Ras Laffan Liquefied Natural Gas Co., Ltd. III
5.83%, 09/30/2016, 144A | | | 1,174,900 | | | | 1,236,512 | |
| | | | | | | | |
| | | | | | | 9,664,046 | |
| | | | | | | | |
Pharmaceuticals - 0.7% | | | | | | | | |
AbbVie, Inc.
4.40%, 11/06/2042 | | | 1,630,000 | | | | 1,610,476 | |
Perrigo Co. PLC
2.30%, 11/08/2018 | | | 500,000 | | | | 495,668 | |
| | | | | | | | |
| | | | | | | 2,106,144 | |
| | | | | | | | |
Real Estate Investment Trusts - 4.0% | | | | | | | | |
ARC Properties Operating Partnership LP / Clark Acquisition LLC
2.00%, 02/06/2017 (A) | | | 1,425,000 | | | | 1,391,621 | |
CBL & Associates, LP
5.25%, 12/01/2023 | | | 1,000,000 | | | | 1,063,871 | |
CubeSmart, LP
4.80%, 07/15/2022 (A) | | | 1,400,000 | | | | 1,506,957 | |
EPR Properties
5.75%, 08/15/2022 | | | 1,465,000 | | | | 1,611,232 | |
Highwoods Realty, LP
5.85%, 03/15/2017 | | | 845,000 | | | | 926,170 | |
Hospitality Properties Trust
5.00%, 08/15/2022 | | | 2,310,000 | | | | 2,435,089 | |
Kilroy Realty, LP
4.25%, 08/15/2029 | | | 1,395,000 | | | | 1,390,369 | |
National Retail Properties, Inc.
3.90%, 06/15/2024 | | | 1,935,000 | | | | 1,955,435 | |
| | | | | | | | |
| | | | | | | 12,280,744 | |
| | | | | | | | |
Road & Rail - 1.1% | | | | | | | | |
Aviation Capital Group Corp.
7.13%, 10/15/2020, 144A | | | 2,940,000 | | | | 3,379,348 | |
| | | | | | | | |
The Notes to Financial Statements are an integral part of this report.
| | |
| Transamerica Funds | | Annual Report 2014 |
Page 88
Transamerica Intermediate Bond
SCHEDULE OF INVESTMENTS (continued)
At October 31, 2014
| | | | | | | | |
| | | Principal | | | Value | |
CORPORATE DEBT SECURITIES (continued) | | | | | |
Semiconductors & Semiconductor Equipment - 1.4% | |
Altera Corp
4.10%, 11/15/2023 (A) | | | $ 1,000,000 | | | | $ 1,046,888 | |
Intel Corp.
1.35%, 12/15/2017 (A) | | | 2,530,000 | | | | 2,523,589 | |
KLA-Tencor Corp.
4.13%, 11/01/2021 (C) | | | 830,000 | | | | 835,700 | |
| | | | | | | | |
| | | | | | | 4,406,177 | |
| | | | | | | | |
Technology Hardware, Storage & Peripherals - 0.5% | |
Apple, Inc. | | | | | | | | |
2.40%, 05/03/2023 | | | 1,700,000 | | | | 1,640,157 | |
| | | | | | | | |
Tobacco - 0.7% | |
Lorillard Tobacco Co. | | | | | | | | |
8.13%, 06/23/2019 (A) | | | 1,825,000 | | | | 2,235,667 | |
| | | | | | | | |
Trading Companies & Distributors - 0.6% | |
International Lease Finance Corp. | | | | | | | | |
6.75%, 09/01/2016, 144A | | | 1,685,000 | | | | 1,786,100 | |
| | | | | | | | |
Wireless Telecommunication Services - 2.1% | |
America Movil SAB de CV | | | | | | | | |
4.38%, 07/16/2042 | | | 1,400,000 | | | | 1,330,462 | |
Crown Castle Towers LLC | | | | | | | | |
4.88%, 08/15/2040, 144A | | | 3,200,000 | | | | 3,531,498 | |
Sprint Communications, Inc. | | | | | | | | |
9.00%, 11/15/2018, 144A | | | 1,250,000 | | | | 1,470,312 | |
| | | | | | | | |
| | | | | | | 6,332,272 | |
| | | | | | | | |
Total Corporate Debt Securities
(Cost $115,528,018) | | | | | | | 115,588,806 | |
| | | | | | | | |
|
SHORT-TERM U.S. GOVERNMENT OBLIGATION - 15.1% | |
U.S. Treasury Bill | | | | | | | | |
0.02%, 11/06/2014 - 12/11/2014 (F) | | | 45,998,500 | | | | 45,997,958 | |
| | | | | | | | |
Total Short-Term U.S. Government Obligation
(Cost $45,997,958) | | | | 45,997,958 | |
| | | | | | | | |
| | | | | | | | |
| | | Shares | | | Value | |
PREFERRED STOCK - 0.2% | | | | | | | | |
Banks - 0.2% | | | | | | | | |
CoBank ACB | | | | | | | | |
Series F, 6.25%, 144A (B) | | | 6,000 | | | | $ 624,188 | |
| | | | | | | | |
Total Preferred Stock
(Cost $612,000) | | | | | | | 624,188 | |
| | | | | | | | |
|
SECURITIES LENDING COLLATERAL - 6.6% | |
State Street Navigator Securities Lending Trust - Prime Portfolio 0.16% (F) | | | 20,098,585 | | | | 20,098,585 | |
| | | | | | | | |
Total Securities Lending Collateral
(Cost $20,098,585) | | | | | | | 20,098,585 | |
| | | | | | | | |
| | |
| | | Principal | | | Value | |
REPURCHASE AGREEMENT - 1.7% | | | | | |
State Street Bank & Trust Co.
0.01% (F), dated 10/31/2014, to be repurchased at $5,200,662 on 11/03/2014. Collateralized by a U.S. Government Agency Obligation, 3.00%, due 07/25/2037, and with a value of $5,306,395. | | | $ 5,200,657 | | | | 5,200,657 | |
| | | | | | | | |
Total Repurchase Agreement
(Cost $5,200,657) | | | | | | | 5,200,657 | |
| | | | | | | | |
Total Investments
(Cost $365,398,722) (G) | | | | | | | 366,479,482 | |
Net Other Assets (Liabilities) - (20.4)% | | | | (62,087,308 | ) |
| | | | | | | | |
| | |
Net Assets - 100.0% | | | | | | | $ 304,392,174 | |
| | | | | | | | |
SECURITY VALUATION:
Valuation Inputs (H)
| | | | | | | | | | | | | | | | |
| | | Level 1
Quoted Prices | | | Level 2
Other Significant
Observable Inputs | | | Level 3
Significant
Unobservable Inputs | | | Value at
October 31, 2014 | |
ASSETS | | | | | | | | | | | | | | | | |
Investments | | | | | | | | | | | | | | | | |
U.S. Government Obligations | | $ | — | | | $ | 63,434,351 | | | $ | — | | | $ | 63,434,351 | |
U.S. Government Agency Obligations | | | — | | | | 51,932,940 | | | | — | | | | 51,932,940 | |
Mortgage-Backed Securities | | | — | | | | 43,059,369 | | | | — | | | | 43,059,369 | |
Asset-Backed Securities | | | — | | | | 16,738,508 | | | | — | | | | 16,738,508 | |
Preferred Corporate Debt Securities | | | — | | | | 3,804,120 | | | | — | | | | 3,804,120 | |
Corporate Debt Securities | | | — | | | | 115,588,806 | | | | — | | | | 115,588,806 | |
Short-Term U.S. Government Obligations | | | — | | | | 45,997,958 | | | | — | | | | 45,997,958 | |
Preferred Stock | | | 624,188 | | | | — | | | | — | | | | 624,188 | |
Securities Lending Collateral | | | 20,098,585 | | | | — | | | | — | | | | 20,098,585 | |
Repurchase Agreement | | | — | | | | 5,200,657 | | | | — | | | | 5,200,657 | |
| | | | | | | | | | | | | | | | |
Total Investments | | $ | 20,722,773 | | | $ | 345,756,709 | | | $ | — | | | $ | 366,479,482 | |
| | | | | | | | | | | | | | | | |
The Notes to Financial Statements are an integral part of this report.
| | |
| Transamerica Funds | | Annual Report 2014 |
Page 89
Transamerica Intermediate Bond
SCHEDULE OF INVESTMENTS (continued)
At October 31, 2014
FOOTNOTES TO SCHEDULE OF INVESTMENTS:
| (A) | All or a portion of this security is on loan. The value of all securities on loan is $19,691,189. The amount of securities on loan indicated may not correspond with the securities on loan identified because securities with pending sales are in the process of recall from the brokers. |
| (B) | Floating or variable rate security. Rate is listed as of October 31, 2014. |
| (C) | When-issued security. A conditional transaction in a security authorized for issuance, but not yet issued. |
| (D) | The security has a perpetual maturity. The date shown is the next call date. |
| (E) | Step bond. Coupon rate changes in increments to maturity. Rate disclosed is as of October 31, 2014. Maturity date disclosed is the ultimate maturity date. |
| (F) | Rate shown reflects the yield at October 31, 2014. |
| (G) | Aggregate cost for federal income tax purposes is $365,411,424. Aggregate gross unrealized appreciation and depreciation for all securities is $2,095,755 and $1,027,697, respectively. Net unrealized appreciation for tax purposes is $1,068,058. |
| (H) | The Fund recognizes transfers between Levels at the end of the reporting period. There were no transfers between Level 1, 2 and 3 during the period ended October 31, 2014. See the Notes to Financial Statements for more information regarding security valuation and pricing inputs. |
DEFINITIONS:
| | |
| 144A | | 144A securities are registered pursuant to Rule 144A of the Securities Act of 1933. These securities are deemed to be liquid for purposes of compliance limitations on holdings of illiquid securities and may be resold as transactions exempt from registration, normally to qualified institutional buyers. At October 31, 2014, these securities aggregated $92,907,423, or 30.52% of the Fund’s net assets. |
| MTN | | Medium Term Note |
| TBA | | To Be Announced |
The Notes to Financial Statements are an integral part of this report.
| | |
| Transamerica Funds | | Annual Report 2014 |
Page 90
Transamerica International Equity Opportunities
SCHEDULE OF INVESTMENTS
At October 31, 2014
| | | | | | | | |
| | | Shares | | | Value | |
PREFERRED STOCK - 0.0% (A) | | | | | | | | |
United Kingdom - 0.0% (A) | | | | | | | | |
Rolls-Royce Holdings PLC | | | | | | | | |
0.00% (B) (C) | | | 32,468,220 | | | | $ 51,939 | |
| | | | | | | | |
Total Preferred Stock
(Cost $52,118) | | | | | | | 51,939 | |
| | | | | | | | |
| | |
COMMON STOCKS - 99.2% | | | | | | | | |
Australia - 0.5% | | | | | | | | |
Orica, Ltd. | | | 146,563 | | | | 2,675,396 | |
| | | | | | | | |
Brazil - 1.0% | | | | | | | | |
BM&FBovespa SA | | | 24,506 | | | | 107,799 | |
Itau Unibanco Holding SA, ADR | | | 371,271 | | | | 5,479,960 | |
| | | | | | | | |
| | | | | | | 5,587,759 | |
| | | | | | | | |
Canada - 4.8% | | | | | | | | |
Canadian National Railway Co. | | | 193,413 | | | | 13,651,090 | |
Loblaw Cos., Ltd. | | | 117,317 | | | | 6,112,288 | |
Valeant Pharmaceuticals International, Inc. (B) | | | 56,899 | | | | 7,569,843 | |
| | | | | | | | |
| | | | | | | 27,333,221 | |
| | | | | | | | |
Denmark - 0.5% | | | | | | | | |
Carlsberg A/S, Class B | | | 29,448 | | | | 2,597,273 | |
| | | | | | | | |
France - 13.3% | | | | | | | | |
Air Liquide SA, Class A | | | 96,727 | | | | 11,676,478 | |
Bureau Veritas SA | | | 109,672 | | | | 2,712,619 | |
Danone SA | | | 178,492 | | | | 12,196,813 | |
Dassault Systemes | | | 46,976 | | | | 2,978,791 | |
GDF Suez | | | 298,950 | | | | 7,258,482 | |
Legrand SA | | | 32,641 | | | | 1,756,779 | |
LVMH Moet Hennessy Louis Vuitton SA | | | 68,739 | | | | 11,668,030 | |
Pernod Ricard SA | | | 105,280 | | | | 11,992,638 | |
Schneider Electric SE | | | 165,081 | | | | 13,006,088 | |
| | | | | | | | |
| | | | | | | 75,246,718 | |
| | | | | | | | |
Germany - 12.8% | | | | | | | | |
Bayer AG | | | 190,878 | | | | 27,299,707 | |
Beiersdorf AG | | | 106,795 | | | | 8,658,816 | |
Linde AG | | | 58,401 | | | | 10,778,208 | |
Merck KGaA | | | 101,337 | | | | 9,173,464 | |
MTU Aero Engines AG | | | 24,700 | | | | 2,166,317 | |
ProSiebenSat.1 Media AG | | | 119,331 | | | | 4,820,512 | |
SAP SE | | | 138,254 | | | | 9,419,994 | |
| | | | | | | | |
| | | | | | | 72,317,018 | |
| | | | | | | | |
Hong Kong - 3.8% | | | | | | | | |
AIA Group, Ltd. | | | 1,904,800 | | | | 10,629,593 | |
Global Brands Group Holding, Ltd. (B) | | | 14,170,000 | | | | 3,124,466 | |
Li & Fung, Ltd. | | | 6,462,000 | | | | 7,883,816 | |
| | | | | | | | |
| | | | | | | 21,637,875 | |
| | | | | | | | |
Israel - 0.5% | | | | | | | | |
Check Point Software Technologies, Ltd., Class A (B) (D) | | | 35,516 | | | | 2,637,063 | |
| | | | | | | | |
Italy - 0.5% | | | | | | | | |
Saipem SpA (B) (D) | | | 185,673 | | | | 2,906,701 | |
| | | | | | | | |
Japan - 12.6% | | | | | | | | |
Denso Corp. | | | 250,800 | | | | 11,495,069 | |
FANUC Corp. | | | 37,400 | | | | 6,591,217 | |
Honda Motor Co., Ltd. | | | 373,800 | | | | 11,950,098 | |
Hoya Corp. | | | 344,900 | | | | 12,204,919 | |
| | | | | | | | |
| | | Shares | | | Value | |
COMMON STOCKS (continued) | | | | | | | | |
Japan (continued) | | | | | | | | |
INPEX Corp. | | | 507,400 | | | | $ 6,489,869 | |
Japan Tobacco, Inc. | | | 188,500 | | | | 6,431,439 | |
Kyocera Corp. | | | 122,500 | | | | 5,646,200 | |
Shin-Etsu Chemical Co., Ltd. | | | 78,200 | | | | 5,019,549 | |
Terumo Corp. | | | 211,600 | | | | 5,289,705 | |
| | | | | | | | |
| | | | | | | 71,118,065 | |
| | | | | | | | |
Korea, Republic of - 0.8% | | | | | | | | |
Samsung Electronics Co., Ltd., GDR | | | 7,278 | | | | 4,199,907 | |
| | | | | | | | |
Netherlands - 6.7% | | | | | | | | |
Akzo Nobel NV | | | 137,134 | | | | 9,144,986 | |
Heineken NV | | | 68,966 | | | | 5,152,044 | |
ING Groep NV, CVA (B) | | | 953,010 | | | | 13,647,448 | |
Randstad Holding NV (D) | | | 219,272 | | | | 9,678,950 | |
| | | | | | | | |
| | | | | | | 37,623,428 | |
| | | | | | | | |
Russian Federation - 0.4% | | | | | | | | |
Sberbank of Russia, ADR (D) | | | 295,890 | | | | 2,253,185 | |
| | | | | | | | |
Singapore - 2.3% | | | | | | | | |
DBS Group Holdings, Ltd. | | | 707,000 | | | | 10,170,488 | |
Singapore Telecommunications, Ltd. | | | 893,150 | | | | 2,628,788 | |
| | | | | | | | |
| | | | | | | 12,799,276 | |
| | | | | | | | |
Spain - 1.1% | | | | | | | | |
Amadeus IT Holding SA, Class A | | | 171,851 | | | | 6,322,770 | |
| | | | | | | | |
Sweden - 1.2% | | | | | | | | |
Hennes & Mauritz AB, Class B | | | 162,447 | | | | 6,481,549 | |
| | | | | | | | |
Switzerland - 9.4% | | | | | | | | |
Julius Baer Group, Ltd. (B) | | | 69,598 | | | | 3,051,018 | |
Keuhne & Nagel International AG | | | 24,811 | | | | 3,233,619 | |
Nestle SA | | | 285,800 | | | | 20,958,884 | |
Roche Holding AG | | | 30,261 | | | | 8,930,063 | |
Sonova Holding AG | | | 33,413 | | | | 5,210,118 | |
UBS AG, Class A (B) | | | 673,332 | | | | 11,707,987 | |
| | | | | | | | |
| | | | | | | 53,091,689 | |
| | | | | | | | |
Taiwan - 2.8% | | | | | | | | |
Hon Hai Precision Industry Co., Ltd. | | | 1,135,044 | | | | 3,592,411 | |
Taiwan Semiconductor Manufacturing Co., Ltd., ADR | | | 552,414 | | | | 12,164,156 | |
| | | | | | | | |
| | | | | | | 15,756,567 | |
| | | | | | | | |
Thailand - 0.3% | | | | | | | | |
Kasikornbank PCL | | | 244,000 | | | | 1,769,171 | |
| | | | | | | | |
United Kingdom - 21.8% | | | | | | | | |
Barclays PLC | | | 1,617,133 | | | | 6,219,361 | |
BG Group PLC | | | 490,425 | | | | 8,173,439 | |
British Sky Broadcasting Group PLC | | | 405,386 | | | | 5,745,233 | |
Compass Group PLC | | | 1,031,720 | | | | 16,652,901 | |
Delphi Automotive PLC, Class A | | | 68,168 | | | | 4,702,229 | |
Diageo PLC | | | 272,677 | | | | 8,041,893 | |
Hays PLC | | | 1,047,343 | | | | 2,068,504 | |
HSBC Holdings PLC | | | 1,454,884 | | | | 14,833,071 | |
Prudential PLC | | | 176,166 | | | | 4,079,305 | |
Reckitt Benckiser Group PLC, Class A | | | 134,613 | | | | 11,337,573 | |
Rio Tinto PLC | | | 153,804 | | | | 7,318,217 | |
Rolls-Royce Holdings PLC (B) | | | 356,296 | | | | 4,825,842 | |
Smiths Group PLC | | | 333,296 | | | | 6,224,873 | |
Standard Chartered PLC | | | 565,897 | | | | 8,518,253 | |
The Notes to Financial Statements are an integral part of this report.
| | |
| Transamerica Funds | | Annual Report 2014 |
Page 91
Transamerica International Equity Opportunities
SCHEDULE OF INVESTMENTS (continued)
At October 31, 2014
| | | | | | | | |
| | | Shares | | | Value | |
COMMON STOCKS (continued) | | | | | | | | |
United Kingdom (continued) | | | | | | | | |
WPP PLC, Class A | | | 740,066 | | | | $ 14,455,453 | |
| | | | | | | | |
| | | | | | | 123,196,147 | |
| | | | | | | | |
United States - 2.1% | | | | | | | | |
NCR Corp. (B) (D) | | | 87,998 | | | | 2,434,905 | |
Yum! Brands, Inc. | | | 130,959 | | | | 9,406,785 | |
| | | | | | | | |
| | | | | | | 11,841,690 | |
| | | | | | | | |
Total Common Stocks
(Cost $568,098,997) | | | | | | | 559,392,468 | |
| | | | | | | | |
| |
SECURITIES LENDING COLLATERAL - 1.8% | | | | | |
State Street Navigator Securities Lending Trust - Prime Portfolio
0.16% (C) | | | 10,287,810 | | | | 10,287,810 | |
| | | | | | | | |
Total Securities Lending Collateral
(Cost $10,287,810) | | | | 10,287,810 | |
| | | | | | | | |
| | | | | | | | |
| | | Principal | | | Value | |
REPURCHASE AGREEMENT - 0.5% | | | | | |
State Street Bank & Trust Co.
0.01% (C), dated 10/31/2014, to be repurchased at $2,775,105 on 11/03/2014. Collateralized by a U.S. Government Agency Obligation, 4.00%, due 12/15/2017, and with a value of $2,830,942. | | | $ 2,775,103 | | | | $ 2,775,103 | |
| | | | | | | | |
Total Repurchase Agreement
(Cost $2,775,103) | | | | 2,775,103 | |
| | | | | | | | |
Total Investments
(Cost $581,214,028) (E) | | | | 572,507,320 | |
Net Other Assets (Liabilities) - (1.5)% | | | | (8,372,350 | ) |
| | | | | | | | |
| | |
Net Assets - 100.0% | | | | | | | $ 564,134,970 | |
| | | | | | | | |
INVESTMENTS BY INDUSTRY (unaudited):
| | | | | | | | |
| Industry | | Percentage of
Total Investments | | | Value | |
Pharmaceuticals | | | 9.2 | % | | $ | 52,973,077 | |
Food Products | | | 8.7 | | | | 49,808,598 | |
Banks | | | 8.6 | | | | 49,243,489 | |
Chemicals | | | 6.9 | | | | 39,294,617 | |
Beverages | | | 4.8 | | | | 27,783,848 | |
Media | | | 4.4 | | | | 25,021,198 | |
Textiles, Apparel & Luxury Goods | | | 4.0 | | | | 22,676,312 | |
Electronic Equipment, Instruments & Components | | | 3.7 | | | | 21,443,530 | |
Semiconductors & Semiconductor Equipment | | | 2.9 | | | | 16,364,063 | |
Auto Components | | | 2.8 | | | | 16,197,298 | |
Software | | | 2.6 | | | | 15,035,848 | |
Electrical Equipment | | | 2.6 | | | | 14,762,867 | |
Capital Markets | | | 2.6 | | | | 14,759,005 | |
Insurance | | | 2.6 | | | | 14,708,898 | |
Oil, Gas & Consumable Fuels | | | 2.6 | | | | 14,663,308 | |
Professional Services | | | 2.5 | | | | 14,460,073 | |
Diversified Financial Services | | | 2.4 | | | | 13,755,247 | |
Road & Rail | | | 2.4 | | | | 13,651,090 | |
Automobiles | | | 2.1 | | | | 11,950,098 | |
Household Products | | | 2.0 | | | | 11,337,573 | |
Health Care Equipment & Supplies | | | 1.8 | | | | 10,499,823 | |
Hotels, Restaurants & Leisure | | | 1.6 | | | | 9,406,785 | |
Personal Products | | | 1.5 | | | | 8,658,816 | |
Metals & Mining | | | 1.3 | | | | 7,318,217 | |
Multi-Utilities | | | 1.3 | | | | 7,258,482 | |
Aerospace & Defense | | | 1.2 | | | | 7,044,098 | |
Machinery | | | 1.1 | | | | 6,591,217 | |
Specialty Retail | | | 1.1 | | | | 6,481,549 | |
Tobacco | | | 1.1 | | | | 6,431,439 | |
IT Services | | | 1.1 | | | | 6,322,770 | |
Industrial Conglomerates | | | 1.1 | | | | 6,224,873 | |
Food & Staples Retailing | | | 1.1 | | | | 6,112,288 | |
Marine | | | 0.6 | | | | 3,233,619 | |
Energy Equipment & Services | | | 0.5 | | | | 2,906,701 | |
The Notes to Financial Statements are an integral part of this report.
| | |
| Transamerica Funds | | Annual Report 2014 |
Page 92
Transamerica International Equity Opportunities
SCHEDULE OF INVESTMENTS (continued)
At October 31, 2014
INVESTMENTS BY INDUSTRY (unaudited) (continued):
| | | | | | | | |
| Industry | | Percentage of
Total Investments | | | Value | |
Diversified Telecommunication Services | | | 0.5 | % | | $ | 2,628,788 | |
Technology Hardware, Storage & Peripherals | | | 0.4 | | | | 2,434,905 | |
| | | | | | | | |
Investments, at Value | | | 97.7 | | | | 559,444,407 | |
Short-Term Investments | | | 2.3 | | | | 13,062,913 | |
| | | | | | | | |
Total Investments | | | 100.0 | % | | $ | 572,507,320 | |
| | | | | | | | |
SECURITY VALUATION:
Valuation Inputs (F)
| | | | | | | | | | | | | | | | |
| | | Level 1
Quoted Prices | | | Level 2
Other Significant
Observable Inputs | | | Level 3
Significant
Unobservable Inputs | | | Value at
October 31, 2014 | |
ASSETS | | | | | | | | | | | | | | | | |
Investments | | | | | | | | | | | | | | | | |
Preferred Stock | | $ | — | | | $ | 51,939 | | | $ | — | | | $ | 51,939 | |
Common Stocks | | | 66,519,303 | | | | 492,873,165 | | | | — | | | | 559,392,468 | |
Securities Lending Collateral | | | 10,287,810 | | | | — | | | | — | | | | 10,287,810 | |
Repurchase Agreement | | | — | | | | 2,775,103 | | | | — | | | | 2,775,103 | |
| | | | | | | | | | | | | | | | |
Total Investments | | $ | 76,807,113 | | | $ | 495,700,207 | | | $ | — | | | $ | 572,507,320 | |
| | | | | | | | | | | | | | | | |
FOOTNOTES TO SCHEDULE OF INVESTMENTS:
| (A) | Percentage rounds to less than 0.1% or (0.1)%. |
| (B) | Non-income producing security. |
| (C) | Rate shown reflects the yield at October 31, 2014. |
| (D) | All or a portion of this security is on loan. The value of all securities on loan is $9,929,045. The amount of securities on loan indicated may not correspond with the securities on loan identified because securities with pending sales are in the process of recall from the brokers. |
| (E) | Aggregate cost for federal income tax purposes is $581,662,963. Aggregate gross unrealized appreciation and depreciation for all securities is $25,589,202 and $34,744,845, respectively. Net unrealized depreciation for tax purposes is $9,155,643. |
| (F) | The Fund recognizes transfers between Levels at the end of the reporting period. There were no transfers between Level 1, 2 and 3 during the period ended October 31, 2014. See the Notes to Financial Statements for more information regarding security valuation and pricing inputs. |
DEFINITIONS:
| | |
| ADR | | American Depositary Receipt |
| CVA | | Dutch Certificate-Depositary Receipt |
| GDR | | Global Depositary Receipt |
The Notes to Financial Statements are an integral part of this report.
| | |
| Transamerica Funds | | Annual Report 2014 |
Page 93
Transamerica International Small Cap
SCHEDULE OF INVESTMENTS
At October 31, 2014
| | | | | | | | |
| | | Shares | | | Value | |
PREFERRED STOCK - 1.0% | | | | | | | | |
Germany - 1.0% | | | | | | | | |
Sartorius AG 1.16% (A) (B) | | | 75,000 | | | | $ 8,185,014 | |
| | | | | | | | |
Total Preferred Stock
(Cost $8,472,535) | | | | | | | 8,185,014 | |
| | | | | | | | |
| | |
COMMON STOCKS - 97.5% | | | | | | | | |
Australia - 4.2% | | | | | | | | |
Amcor, Ltd. | | | 424,241 | | | | 4,406,521 | |
Ansell, Ltd. | | | 241,117 | | | | 4,229,345 | |
Asaleo Care, Ltd. (C) | | | 3,579,732 | | | | 6,394,100 | |
Computershare, Ltd. | | | 646,881 | | | | 7,020,382 | |
Iluka Resources, Ltd. (D) | | | 996,534 | | | | 6,397,458 | |
Mirvac Group, REIT | | | 3,941,571 | | | | 6,253,346 | |
Recall Holdings, Ltd. | | | 380,002 | | | | 1,949,156 | |
| | | | | | | | |
| | | | | | | 36,650,308 | |
| | | | | | | | |
Austria - 1.1% | | | | | | | | |
Andritz AG | | | 140,000 | | | | 6,765,395 | |
Kapsch TrafficCom AG (A) (C) (D) | | | 120,000 | | | | 2,527,333 | |
| | | | | | | | |
| | | | | | | 9,292,728 | |
| | | | | | | | |
Brazil - 0.4% | | | | | | | | |
BR Properties SA | | | 631,686 | | | | 3,191,516 | |
| | | | | | | | |
China - 1.3% | | | | | | | | |
Baoxin Auto Group, Ltd. (D) | | | 3,451,500 | | | | 2,639,201 | |
Best Pacific International Holdings, Ltd. | | | 2,246,000 | | | | 1,117,910 | |
E-House China Holdings, Ltd., ADR (D) | | | 196,600 | | | | 1,964,034 | |
Haitian International Holdings, Ltd.,
Series B | | | 724,000 | | | | 1,543,702 | |
Luye Pharma Group, Ltd. (C) | | | 535,500 | | | | 768,762 | |
Shenzhou International Group Holdings, Ltd. (D) | | | 224,000 | | | | 770,457 | |
Tianhe Chemicals Group, Ltd.,
144A (C) (D) | | | 11,960,000 | | | | 2,134,304 | |
| | | | | | | | |
| | | | | | | 10,938,370 | |
| | | | | | | | |
Denmark - 2.5% | | | | | | | | |
GN Store Nord | | | 100,000 | | | | 2,326,744 | |
Jyske Bank A/S (C) | | | 45,000 | | | | 2,426,342 | |
Matas A/S (D) | | | 360,000 | | | | 7,914,835 | |
OW Bunker A/S (C) (D) | | | 450,000 | | | | 5,918,122 | |
SimCorp A/S | | | 100,000 | | | | 3,017,832 | |
| | | | | | | | |
| | | | | | | 21,603,875 | |
| | | | | | | | |
Finland - 0.2% | | | | | | | | |
Vaisala OYJ, Class A (A) | | | 48,038 | | | | 1,354,473 | |
| | | | | | | | |
France - 6.3% | | | | | | | | |
Euler Hermes Group | | | 55,000 | | | | 5,387,758 | |
Groupe Eurotunnel SA | | | 950,000 | | | | 12,007,281 | |
Inside Secure SA (C) (D) | | | 61,690 | | | | 238,105 | |
Lectra (A) | | | 690,915 | | | | 6,822,663 | |
Montupet (D) | | | 195,000 | | | | 15,134,571 | |
Naturex (D) | | | 57,000 | | | | 3,964,340 | |
Rubis SCA (D) | | | 190,000 | | | | 11,179,551 | |
| | | | | | | | |
| | | | | | | 54,734,269 | |
| | | | | | | | |
Germany - 5.7% | | | | | | | | |
CTS Eventim AG & Co. KGaA | | | 175,000 | | | | 4,624,130 | |
Freenet AG | | | 290,000 | | | | 7,608,919 | |
MTU Aero Engines AG | | | 135,000 | | | | 11,840,193 | |
RIB Software AG (D) | | | 440,000 | | | | 5,914,552 | |
Suss Microtec AG (C) (D) | | | 135,416 | | | | 801,155 | |
| | | | | | | | |
| | | Shares | | | Value | |
COMMON STOCKS (continued) | | | | | | | | |
Germany (continued) | | | | | | | | |
Tom Tailor Holding AG (A) (C) (D) | | | 550,000 | | | | $ 7,710,644 | |
XING AG (A) | | | 98,080 | | | | 10,416,960 | |
| | | | | | | | |
| | | | | | | 48,916,553 | |
| | | | | | | | |
Hong Kong - 2.8% | | | | | | | | |
Convenience Retail Asia, Ltd. (D) | | | 648,000 | | | | 431,992 | |
Dah Chong Hong Holdings, Ltd. (D) | | | 5,147,000 | | | | 3,035,396 | |
Dah Sing Banking Group, Ltd. | | | 1,837,244 | | | | 3,338,143 | |
Johnson Electric Holdings, Ltd. | | | 1,063,000 | | | | 3,598,576 | |
Sitoy Group Holdings, Ltd. | | | 1,760,000 | | | | 1,451,764 | |
Techtronic Industries Co., Ltd. | | | 2,822,000 | | | | 8,852,769 | |
Yue Yuen Industrial Holdings, Ltd. | | | 1,145,500 | | | | 3,860,214 | |
| | | | | | | | |
| | | | | | | 24,568,854 | |
| | | | | | | | |
Indonesia - 0.7% | | | | | | | | |
Ciputra Property Tbk PT | | | 20,208,000 | | | | 1,262,603 | |
Holcim Indonesia Tbk PT | | | 7,076,900 | | | | 1,375,940 | |
Matahari Department Store Tbk PT | | | 2,100,500 | | | | 2,543,227 | |
Surya Citra Media Tbk PT | | | 2,233,800 | | | | 625,283 | |
| | | | | | | | |
| | | | | | | 5,807,053 | |
| | | | | | | | |
Ireland - 6.1% | | | | | | | | |
Dalata Hotel Group PLC (C) | | | 931,950 | | | | 3,386,832 | |
DCC PLC | | | 88,000 | | | | 4,931,587 | |
FBD Holdings PLC (A) | | | 390,000 | | | | 6,597,835 | |
Glanbia PLC | | | 525,000 | | | | 7,416,294 | |
Grafton Group PLC | | | 450,000 | | | | 4,568,110 | |
IFG Group PLC | | | 700,000 | | | | 1,342,124 | |
Irish Continental Group PLC | | | 700,000 | | | | 2,447,402 | |
Irish Residential Properties REIT PLC (C) | | | 1,000,000 | | | | 1,347,136 | |
Origin Enterprises PLC | | | 270,000 | | | | 2,672,969 | |
Paddy Power PLC | | | 80,000 | | | | 5,838,932 | |
Smurfit Kappa Group PLC, Class B | | | 575,000 | | | | 11,880,498 | |
| | | | | | | | |
| | | | | | | 52,429,719 | |
| | | | | | | | |
Italy - 5.2% | | | | | | | | |
Amplifon SpA (D) | | | 482,643 | | | | 2,828,158 | |
Banca Popolare dell’Emilia Romagna SC (C) | | | 750,000 | | | | 5,723,010 | |
Cerved Information Solutions SpA (C) | | | 1,250,000 | | | | 6,906,441 | |
Credito Emiliano SpA | | | 400,000 | | | | 3,082,251 | |
FinecoBank SpA (C) | | | 1,000,000 | | | | 5,204,912 | |
Maire Tecnimont SpA (C) (D) | | | 4,700,000 | | | | 10,026,958 | |
Sorin SpA (C) | | | 3,300,000 | | | | 7,383,806 | |
Yoox SpA (C) (D) | | | 210,000 | | | | 3,882,823 | |
| | | | | | | | |
| | | | | | | 45,038,359 | |
| | | | | | | | |
Japan - 20.1% | | | | | | | | |
Ai Holdings Corp. | | | 235,800 | | | | 4,665,702 | |
AICA Kogyo Co., Ltd. | | | 246,200 | | | | 5,096,109 | |
Arcs Co., Ltd. | | | 217,900 | | | | 4,802,153 | |
Asahi Diamond Industrial Co., Ltd. | | | 162,900 | | | | 1,976,712 | |
Daibiru Corp. | | | 531,100 | | | | 5,982,574 | |
Digital Garage, Inc. | | | 212,000 | | | | 2,837,562 | |
Eagle Industry Co., Ltd. | | | 358,900 | | | | 6,883,934 | |
Glory, Ltd. | | | 93,800 | | | | 2,417,176 | |
Hitachi High-Technologies Corp. | | | 153,000 | | | | 4,674,072 | |
Hitachi Transport System, Ltd. | | | 156,900 | | | | 2,076,349 | |
JSP Corp. (A) | | | 416,400 | | | | 6,602,375 | |
Kakaku.com, Inc. (D) | | | 230,800 | | | | 3,142,453 | |
Kissei Pharmaceutical Co., Ltd. | | | 247,300 | | | | 6,464,470 | |
The Notes to Financial Statements are an integral part of this report.
| | |
| Transamerica Funds | | Annual Report 2014 |
Page 94
Transamerica International Small Cap
SCHEDULE OF INVESTMENTS (continued)
At October 31, 2014
| | | | | | | | |
| | | Shares | | | Value | |
COMMON STOCKS (continued) | | | | | | | | |
Japan (continued) | | | | | | | | |
Koito Manufacturing Co., Ltd. | | | 206,400 | | | | $ 6,219,302 | |
Kumiai Chemical Industry Co., Ltd. (D) | | | 393,000 | | | | 2,417,029 | |
Kureha Corp. (D) | | | 1,083,000 | | | | 5,371,284 | |
Kuroda Electric Co., Ltd. (D) | | | 386,600 | | | | 5,435,873 | |
Lintec Corp. | | | 159,600 | | | | 3,332,208 | |
Mitsui Sugar Co., Ltd. | | | 912,000 | | | | 3,163,464 | |
Modec, Inc. (D) | | | 184,800 | | | | 4,417,313 | |
Musashi Seimitsu Industry Co., Ltd. | | | 132,500 | | | | 2,601,215 | |
Nabtesco Corp. | | | 220,300 | | | | 5,331,367 | |
NEC Networks & System Integration Corp. | | | 320,800 | | | | 6,970,225 | |
Nichi-iko Pharmaceutical Co., Ltd. | | | 68,300 | | | | 1,129,006 | |
Nihon Parkerizing Co., Ltd. | | | 236,000 | | | | 5,633,254 | |
Nippon Densetsu Kogyo Co., Ltd. | | | 363,700 | | | | 5,137,045 | |
Nippon Soda Co., Ltd. | | | 636,000 | | | | 3,621,689 | |
Nitta Corp. (A) | | | 455,600 | | | | 10,243,954 | |
Obara Group, Inc. (D) | | | 100,100 | | | | 3,646,397 | |
OBIC Business Consultants, Ltd. (D) | | | 123,900 | | | | 3,747,618 | |
Plenus Co., Ltd. | | | 214,300 | | | | 3,854,656 | |
Sumitomo Real Estate Sales Co., Ltd. | | | 67,600 | | | | 1,556,687 | |
Takasago International Corp. | | | 758,000 | | | | 3,627,535 | |
Tokai Tokyo Financial Holdings, Inc. (D) | | | 852,000 | | | | 5,779,719 | |
TPR Co., Ltd. | | | 120,500 | | | | 2,856,546 | |
Trusco Nakayama Corp. (A) | | | 322,700 | | | | 8,654,708 | |
Tsuruha Holdings, Inc., Class B (D) | | | 87,100 | | | | 5,142,448 | |
Tsutsumi Jewelry Co., Ltd. (A) (D) | | | 74,300 | | | | 1,827,518 | |
Unipres Corp. | | | 139,700 | | | | 2,780,007 | |
Yushin Precision Equipment Co., Ltd. (D) | | | 66,300 | | | | 1,354,344 | |
| | | | | | | | |
| | | | | | | 173,474,052 | |
| | | | | | | | |
Korea, Republic of - 1.3% | | | | | | | | |
Halla Visteon Climate Control Corp. (D) | | | 117,019 | | | | 5,214,920 | |
Hankook Tire Co., Ltd. | | | 56,357 | | | | 2,903,726 | |
Sung Kwang Bend Co., Ltd. (D) | | | 206,016 | | | | 2,980,491 | |
| | | | | | | | |
| | | | | | | 11,099,137 | |
| | | | | | | | |
Luxembourg - 2.0% | | | | | | | | |
BRAAS Monier Building Group SA (C) | | | 100,000 | | | | 2,010,007 | |
Eurofins Scientific SE (D) | | | 27,500 | | | | 6,955,872 | |
Stabilus SA (A) (C) | | | 280,000 | | | | 8,070,287 | |
| | | | | | | | |
| | | | | | | 17,036,166 | |
| | | | | | | | |
Malaysia - 0.6% | | | | | | | | |
Bursa Malaysia Bhd | | | 1,983,000 | | | | 4,880,203 | |
| | | | | | | | |
Netherlands - 1.7% | | | | | | | | |
Delta Lloyd NV (D) | | | 501,732 | | | | 11,436,100 | |
Sligro Food Group NV | | | 80,000 | | | | 2,952,923 | |
| | | | | | | | |
| | | | | | | 14,389,023 | |
| | | | | | | | |
New Zealand - 0.6% | | | | | | | | |
Fletcher Building, Ltd. | | | 731,965 | | | | 4,937,044 | |
| | | | | | | | |
Norway - 1.9% | | | | | | | | |
Borregaard ASA | | | 647,837 | | | | 4,501,955 | |
Storebrand ASA, Class A (C) | | | 1,800,000 | | | | 9,229,326 | |
Vard Holdings, Ltd. (C) (D) | | | 5,797,000 | | | | 3,100,016 | |
| | | | | | | | |
| | | | | | | 16,831,297 | |
| | | | | | | | |
Singapore - 1.9% | | | | | | | | |
First Resources, Ltd. (D) | | | 2,307,000 | | | | 3,737,534 | |
Mapletree Commercial Trust, REIT (D) | | | 1,087,257 | | | | 1,209,794 | |
Mapletree Industrial Trust, REIT | | | 1,171,800 | | | | 1,345,850 | |
| | | | | | | | |
| | | Shares | | | Value | |
COMMON STOCKS (continued) | | | | | | | | |
Singapore (continued | | | | | | | | |
SATS, Ltd. | | | 683,000 | | | | $ 1,648,323 | |
Silverlake Axis, Ltd. | | | 2,943,000 | | | | 3,115,498 | |
UOL Group, Ltd. | | | 989,000 | | | | 4,967,500 | |
| | | | | | | | |
| | | | | | | 16,024,499 | |
| | | | | | | | |
South Africa - 0.5% | | | | | | | | |
Investec PLC | | | 510,000 | | | | 4,676,432 | |
| | | | | | | | |
Spain - 1.1% | | | | | | | | |
Applus Services SA (C) (D) | | | 800,000 | | | | 9,675,102 | |
| | | | | | | | |
Sweden - 2.3% | | | | | | | | |
Bufab Holding AB (C) (D) | | | 500,000 | | | | 3,605,696 | |
Intrum Justitia AB | | | 260,000 | | | | 7,743,241 | |
Loomis AB, Class B | | | 150,000 | | | | 4,132,357 | |
Modern Times Group MTG AB, Class B (D) | | | 59,000 | | | | 1,824,042 | |
Opus Group AB (D) | | | 1,250,000 | | | | 1,897,583 | |
Seamless Distribution AB (C) (D) | | | 89,451 | | | | 248,756 | |
| | | | | | | | |
| | | | | | | 19,451,675 | |
| | | | | | | | |
Switzerland - 3.9% | | | | | | | | |
Ascom Holding AG | | | 200,000 | | | | 2,935,678 | |
Comet Holding AG (C) | | | 5,500 | | | | 3,664,190 | |
EFG International AG (C) | | | 700,000 | | | | 7,278,084 | |
Helvetia Holding AG | | | 24,000 | | | | 11,412,375 | |
Interroll Holding AG (A) (C) | | | 8,000 | | | | 4,548,147 | |
Komax Holding AG (C) | | | 13,000 | | | | 1,915,501 | |
Orior AG (C) | | | 27,000 | | | | 1,459,232 | |
| | | | | | | | |
| | | | | | | 33,213,207 | |
| | | | | | | | |
Taiwan - 3.6% | | | | | | | | |
Aerospace Industrial Development Corp. (C) | | | 2,668,000 | | | | 2,925,314 | |
Chroma ATE, Inc. | | | 1,234,000 | | | | 3,078,130 | |
CTCI Corp. | | | 1,724,000 | | | | 2,818,503 | |
Giant Manufacturing Co., Ltd. | | | 553,000 | | | | 4,477,628 | |
Gourmet Master Co., Ltd. | | | 303,000 | | | | 1,917,918 | |
Merida Industry Co., Ltd. | | | 773,220 | | | | 5,341,121 | |
ScinoPharm Taiwan, Ltd. | | | 1,158,560 | | | | 2,346,742 | |
St. Shine Optical Co., Ltd. | | | 147,000 | | | | 2,582,486 | |
Toung Loong Textile Manufacturing | | | 955,000 | | | | 2,666,431 | |
Yungtay Engineering Co., Ltd. | | | 1,275,000 | | | | 2,831,298 | |
| | | | | | | | |
| | | | | | | 30,985,571 | |
| | | | | | | | |
Thailand - 1.8% | | | | | | | | |
BEC World PCL | | | 2,034,300 | | | | 3,013,662 | |
Bumrungrad Hospital PCL | | | 1,139,000 | | | | 4,651,121 | |
Hemaraj Land and Development PCL | | | 32,463,400 | | | | 4,764,355 | |
LPN Development PCL (D) | | | 4,503,000 | | | | 3,442,576 | |
| | | | | | | | |
| | | | | | | 15,871,714 | |
| | | | | | | | |
United Arab Emirates - 0.2% | | | | | | | | |
Lamprell PLC, Class A (C) | | | 918,750 | | | | 2,156,821 | |
| | | | | | | | |
United Kingdom - 17.2% | | | | | | | | |
A.G.BARR PLC | | | 205,000 | | | | 1,936,478 | |
Alent PLC | | | 693,857 | | | | 3,751,676 | |
Anglo Pacific Group PLC | | | 400,000 | | | | 843,042 | |
Ashtead Group PLC | | | 300,000 | | | | 5,026,270 | |
Berendsen PLC | | | 150,000 | | | | 2,428,961 | |
Bodycote PLC | | | 230,000 | | | | 2,301,999 | |
Computacenter PLC | | | 300,000 | | | | 2,966,922 | |
CSR PLC | | | 513,000 | | | | 6,894,326 | |
Daily Mail & General Trust PLC, Class A (D) | | | 5,749 | | | | 72,745 | |
The Notes to Financial Statements are an integral part of this report.
| | |
| Transamerica Funds | | Annual Report 2014 |
Page 95
Transamerica International Small Cap
SCHEDULE OF INVESTMENTS (continued)
At October 31, 2014
| | | | | | | | |
| | | Shares | | | Value | |
COMMON STOCKS (continued) | | | | | | | | |
United Kingdom (continued) | | | | | | | | |
Dechra Pharmaceuticals PLC | | | 362,000 | | | | $ 4,389,514 | |
Dignity PLC (C) | | | 85,000 | | | | 2,134,800 | |
Diploma PLC | | | 225,000 | | | | 2,503,331 | |
Domino Printing Sciences PLC | | | 264,000 | | | | 2,546,595 | |
Elementis PLC | | | 815,000 | | | | 3,451,646 | |
EnQuest PLC (C) (D) | | | 1,100,000 | | | | 1,223,353 | |
Fenner PLC | | | 627,000 | | | | 3,089,278 | |
Grainger PLC | | | 900,000 | | | | 2,727,341 | |
Halma PLC | | | 225,000 | | | | 2,245,033 | |
HomeServe PLC | | | 695,000 | | | | 3,839,997 | |
IG Group Holdings PLC | | | 396,000 | | | | 3,816,433 | |
Inchcape PLC | | | 175,000 | | | | 1,949,554 | |
John Wood Group PLC | | | 275,000 | | | | 2,917,779 | |
Just Retirement Group PLC (C) | | | 1,320,000 | | | | 2,808,434 | |
Kennedy Wilson Europe Real Estate PLC | | | 342,074 | | | | 5,691,046 | |
Kier Group PLC | | | 69,204 | | | | 1,650,415 | |
London Stock Exchange Group PLC | | | 127,272 | | | | 4,110,046 | |
Londonmetric Property PLC, REIT | | | 1,433,000 | | | | 3,378,955 | |
Micro Focus International PLC | | | 215,000 | | | | 3,425,216 | |
Millennium & Copthorne Hotels PLC | | | 117,038 | | | | 1,063,442 | |
N Brown Group PLC (D) | | | 414,000 | | | | 2,228,587 | |
Pets at Home Group PLC (C) | | | 1,212,000 | | | | 3,745,833 | |
Photo-Me International PLC | | | 1,100,000 | | | | 2,322,765 | |
Premier Oil PLC | | | 790,000 | | | | 3,262,136 | |
QinetiQ Group PLC, Class A | | | 650,000 | | | | 2,106,714 | |
Redrow PLC | | | 960,000 | | | | 4,444,347 | |
Ricardo PLC | | | 192,475 | | | | 2,033,294 | |
Rightmove PLC | | | 80,000 | | | | 2,705,884 | |
SDL PLC (C) | | | 627,000 | | | | 3,946,853 | |
Senior PLC | | | 847,000 | | | | 3,635,909 | |
SIG PLC | | | 650,000 | | | | 1,523,965 | |
Soco International PLC (C) | | | 620,000 | | | | 3,265,349 | |
SSP Group PLC (C) | | | 1,050,000 | | | | 4,022,847 | |
ST Modwen Properties PLC | | | 300,000 | | | | 1,738,899 | |
SuperGroup PLC (C) (D) | | | 240,000 | | | | 3,186,604 | |
Taylor Wimpey PLC | | | 1,950,000 | | | | 3,704,144 | |
| | | | | | | | |
| | | Shares | | | Value | |
COMMON STOCKS (continued) | | | | | | | | |
United Kingdom (continued) | | | | | | | | |
Telecom Plus PLC (D) | | | 100,000 | | | | $ 2,258,777 | |
Tipp24 SE (D) | | | 160,000 | | | | 7,688,327 | |
Victrex PLC | | | 110,000 | | | | 2,988,024 | |
WS Atkins PLC | | | 120,000 | | | | 2,608,927 | |
| | | | | | | | |
| | | | | | | 148,602,812 | |
| | | | | | | | |
United States - 0.3% | | | | | | | | |
Samsonite International SA | | | 747,900 | | | | 2,485,066 | |
| | | | | | | | |
Total Common Stocks
(Cost $801,868,231) | | | | | | | 840,315,898 | |
| | | | | | | | |
| |
SECURITIES LENDING COLLATERAL - 10.8% | | | | | |
State Street Navigator Securities Lending Trust - Prime Portfolio 0.16% (B) | | | 93,311,007 | | | | 93,311,007 | |
| | | | | | | | |
Total Securities Lending Collateral
(Cost $93,311,007) | | | | | | | 93,311,007 | |
| | | | | | | | |
| | |
| | | Principal | | | Value | |
REPURCHASE AGREEMENT - 1.1% | | | | | |
State Street Bank & Trust Co.
0.01% (B), dated 10/31/2014, to be repurchased at $9,239,088 on 11/03/2014. Collateralized by a U.S. Government Obligation, 2.26%, due 10/17/2022, and with a value of $9,428,184. | | | $ 9,239,080 | | | | 9,239,080 | |
| | | | | | | | |
Total Repurchase Agreement
(Cost $9,239,080) | | | | 9,239,080 | |
| | | | | | | | |
Total Investments
(Cost $912,890,853) (E) | | | | 951,050,999 | |
Net Other Assets (Liabilities) - (10.4)% | | | | (89,212,519 | ) |
| | | | | | | | |
| | |
Net Assets - 100.0% | | | | | | | $ 861,838,480 | |
| | | | | | | | |
INVESTMENTS BY INDUSTRY (unaudited):
| | | | | | | | |
| Industry | | Percentage of
Total Investments | | | Value | |
Machinery | | | 6.2 | % | | $ | 59,135,573 | |
Chemicals | | | 5.0 | | | | 47,432,979 | |
Insurance | | | 4.9 | | | | 46,871,828 | |
Auto Components | | | 4.7 | | | | 44,594,221 | |
Real Estate Management & Development | | | 3.3 | | | | 31,598,085 | |
Trading Companies & Distributors | | | 3.3 | | | | 31,317,953 | |
Software | | | 3.2 | | | | 30,238,988 | |
Hotels, Restaurants & Leisure | | | 2.9 | | | | 27,772,954 | |
Specialty Retail | | | 2.8 | | | | 27,024,635 | |
Electronic Equipment, Instruments & Components | | | 2.8 | | | | 26,653,111 | |
Health Care Equipment & Supplies | | | 2.6 | | | | 24,707,395 | |
Capital Markets | | | 2.5 | | | | 23,425,281 | |
Food Products | | | 2.4 | | | | 22,413,833 | |
Diversified Financial Services | | | 2.2 | | | | 21,055,247 | |
Aerospace & Defense | | | 2.2 | | | | 20,508,130 | |
Commercial Services & Supplies | | | 2.1 | | | | 20,093,712 | |
IT Services | | | 2.1 | | | | 19,795,091 | |
The Notes to Financial Statements are an integral part of this report.
| | |
| Transamerica Funds | | Annual Report 2014 |
Page 96
Transamerica International Small Cap
SCHEDULE OF INVESTMENTS (continued)
At October 31, 2014
INVESTMENTS BY INDUSTRY (unaudited) (continued):
| | | | | | | | |
| Industry | | Percentage of
Total Investments | | | Value | |
Banks | | | 2.1 | % | | $ | 19,774,658 | |
Construction & Engineering | | | 2.1 | | | | 19,632,921 | |
Household Durables | | | 1.8 | | | | 17,001,260 | |
Containers & Packaging | | | 1.7 | | | | 16,287,019 | |
Pharmaceuticals | | | 1.6 | | | | 15,098,494 | |
Oil, Gas & Consumable Fuels | | | 1.5 | | | | 14,512,002 | |
Professional Services | | | 1.5 | | | | 14,317,323 | |
Transportation Infrastructure | | | 1.4 | | | | 13,655,604 | |
Internet Software & Services | | | 1.4 | | | | 13,559,413 | |
Real Estate Investment Trusts | | | 1.4 | | | | 13,535,081 | |
Food & Staples Retailing | | | 1.4 | | | | 13,329,516 | |
Media | | | 1.4 | | | | 12,865,746 | |
Textiles, Apparel & Luxury Goods | | | 1.3 | | | | 12,351,842 | |
Leisure Products | | | 1.3 | | | | 12,141,514 | |
Gas Utilities | | | 1.2 | | | | 11,179,551 | |
Energy Equipment & Services | | | 1.0 | | | | 9,491,913 | |
Construction Materials | | | 0.9 | | | | 8,322,991 | |
Building Products | | | 0.8 | | | | 8,076,600 | |
Semiconductors & Semiconductor Equipment | | | 0.8 | | | | 7,933,586 | |
Wireless Telecommunication Services | | | 0.8 | | | | 7,608,919 | |
Health Care Providers & Services | | | 0.8 | | | | 7,479,279 | |
Life Sciences Tools & Services | | | 0.7 | | | | 6,955,872 | |
Metals & Mining | | | 0.7 | | | | 6,397,458 | |
Personal Products | | | 0.7 | | | | 6,394,100 | |
Internet & Catalog Retail | | | 0.6 | | | | 6,111,410 | |
Distributors | | | 0.5 | | | | 4,984,950 | |
Industrial Conglomerates | | | 0.5 | | | | 4,931,587 | |
Electrical Equipment | | | 0.4 | | | | 3,598,576 | |
Communications Equipment | | | 0.3 | | | | 2,935,678 | |
Multiline Retail | | | 0.3 | | | | 2,543,227 | |
Marine | | | 0.3 | | | | 2,447,402 | |
Multi-Utilities | | | 0.2 | | | | 2,258,777 | |
Diversified Consumer Services | | | 0.2 | | | | 2,134,800 | |
Road & Rail | | | 0.2 | | | | 2,076,349 | |
Beverages | | | 0.2 | | | | 1,936,478 | |
| | | | | | | | |
Investments, at Value | | | 89.2 | | | | 848,500,912 | |
Short-Term Investments | | | 10.8 | | | | 102,550,087 | |
| | | | | | | | |
Total Investments | | | 100.0 | % | | $ | 951,050,999 | |
| | | | | | | | |
SECURITY VALUATION:
Valuation Inputs (F)
| | | | | | | | | | | | | | | | |
| | | Level 1
Quoted Prices | | | Level 2
Other Significant
Observable Inputs | | | Level 3
Significant
Unobservable Inputs | | | Value at
October 31, 2014 | |
ASSETS | | | | | | | | | | | | | | | | |
Investments | | | | | | | | | | | | | | | | |
Preferred Stock | | $ | — | | | $ | 8,185,014 | | | $ | — | | | $ | 8,185,014 | |
Common Stocks | | | 1,964,034 | | | | 838,351,864 | | | | — | | | | 840,315,898 | |
Securities Lending Collateral | | | 93,311,007 | | | | — | | | | — | | | | 93,311,007 | |
Repurchase Agreement | | | — | | | | 9,239,080 | | | | — | | | | 9,239,080 | |
| | | | | | | | | | | | | | | | |
Total Investments | | $ | 95,275,041 | | | $ | 855,775,958 | | | $ | — | | | $ | 951,050,999 | |
| | | | | | | | | | | | | | | | |
The Notes to Financial Statements are an integral part of this report.
| | |
| Transamerica Funds | | Annual Report 2014 |
Page 97
Transamerica International Small Cap
SCHEDULE OF INVESTMENTS (continued)
At October 31, 2014
| | | | | | | | | | | | | | | | |
| Investments | | Transfer from
Level 1 to Level 2 (H) | | | Transfer from
Level 2 to Level 1 | | | Transfer from
Level 2 to Level 3 | | | Transfer from
Level 3 to Level 2 | |
Common Stock | | $ | 3,191,516 | | | $ | — | | | $ | — | | | $ | — | |
| | | | | | | | | | | | | | | | |
FOOTNOTES TO SCHEDULE OF INVESTMENTS:
| (A) | Total aggregate value of illiquid securities is $83,561,911, or 9.70% of the Fund’s net assets. |
| (B) | Rate shown reflects the yield at October 31, 2014. |
| (C) | Non-income producing security. |
| (D) | All or a portion of this security is on loan. The value of all securities on loan is $88,218,137. The amount of securities on loan indicated may not correspond with the securities on loan identified because securities with pending sales are in the process of recall from the brokers. |
| (E) | Aggregate cost for federal income tax purposes is $919,855,488. Aggregate gross unrealized appreciation and depreciation for all securities is $88,321,347 and $57,125,836, respectively. Net unrealized appreciation for tax purposes is $31,195,511. |
| (F) | The Fund recognizes transfers between Levels at the end of the reporting period. See the Notes to Financial Statements for more information regarding security valuation and pricing inputs. |
| (G) | Derivative financial instruments valued at unrealized appreciation (depreciation) on the instrument. |
| (H) | Transferred from Level 1 to 2 due to developments which occurred between the time of the close of the foreign markets on which the securities trade and the close of business on the New York Stock Exchange. |
DEFINITIONS:
| | |
| 144A | | 144A securities are registered pursuant to Rule 144A of the Securities Act of 1933. These securities are deemed to be liquid for purposes of compliance limitations on holdings of illiquid securities and may be resold as transactions exempt from registration, normally to qualified institutional buyers. At October 31, 2014, these securities aggregated $2,134,304, or 0.25% of the Fund’s net assets. |
| ADR | | American Depositary Receipt |
| REIT | | Real Estate Investment Trust (includes domestic REITs and Foreign Real Estate Investment Companies) |
| SSC | | State Street Corp. |
CURRENCY ABBREVIATIONS:
| | |
| AUD | | Australian Dollar |
| USD | | United States Dollar |
The Notes to Financial Statements are an integral part of this report.
| | |
| Transamerica Funds | | Annual Report 2014 |
Page 98
Transamerica Long/Short Strategy
SCHEDULE OF INVESTMENTS
At October 31, 2014
| | | | | | | | |
| | | Shares | | | Value | |
COMMON STOCKS - 103.5% | | | | | | | | |
Aerospace & Defense - 3.3% | | | | | | | | |
Honeywell International, Inc. (A) | | | 26,730 | | | | $ 2,569,288 | |
L-3 Communications Holdings, Inc. | | | 4,470 | | | | 542,926 | |
Precision Castparts Corp. | | | 1,070 | | | | 236,149 | |
United Technologies Corp. (A) | | | 18,430 | | | | 1,972,010 | |
| | | | | | | | |
| | | | | | | 5,320,373 | |
| | | | | | | | |
Airlines - 1.5% | | | | | | | | |
Delta Air Lines, Inc. | | | 26,700 | | | | 1,074,141 | |
United Continental Holdings, Inc. (A) (B) | | | 26,930 | | | | 1,422,173 | |
| | | | | | | | |
| | | | | | | 2,496,314 | |
| | | | | | | | |
Automobiles - 0.5% | | | | | | | | |
General Motors Co. (A) | | | 26,940 | | | | 845,916 | |
| | | | | | | | |
Banks - 2.3% | | | | | | | | |
East-West Bancorp, Inc. | | | 5,940 | | | | 218,354 | |
Fifth Third Bancorp | | | 21,840 | | | | 436,582 | |
PNC Financial Services Group, Inc. | | | 7,070 | | | | 610,777 | |
Regions Financial Corp. | | | 42,770 | | | | 424,706 | |
SVB Financial Group (B) | | | 2,240 | | | | 250,858 | |
Wells Fargo & Co. (A) | | | 31,250 | | | | 1,659,062 | |
Zions Bancorporation | | | 5,510 | | | | 159,625 | |
| | | | | | | | |
| | | | | | | 3,759,964 | |
| | | | | | | | |
Beverages - 2.5% | | | | | | | | |
Coca-Cola Enterprises, Inc. | | | 27,440 | | | | 1,189,524 | |
Constellation Brands, Inc., Class A (A) (B) | | | 17,677 | | | | 1,618,152 | |
Molson Coors Brewing Co., Class B | | | 16,720 | | | | 1,243,634 | |
| | | | | | | | |
| | | | | | | 4,051,310 | |
| | | | | | | | |
Biotechnology - 2.4% | | | | | | | | |
Alexion Pharmaceuticals, Inc. (A) (B) | | | 3,740 | | | | 715,686 | |
Biogen Idec, Inc. (A) (B) | | | 4,100 | | | | 1,316,428 | |
Celgene Corp. (A) (B) | | | 9,720 | | | | 1,040,915 | |
Vertex Pharmaceuticals, Inc. (B) | | | 6,370 | | | | 717,517 | |
| | | | | | | | |
| | | | | | | 3,790,546 | |
| | | | | | | | |
Capital Markets - 4.6% | | | | | | | | |
Bank of New York Mellon Corp. | | | 16,440 | | | | 636,557 | |
Charles Schwab Corp. (A) | | | 23,460 | | | | 672,598 | |
Goldman Sachs Group, Inc. | | | 5,660 | | | | 1,075,343 | |
Invesco, Ltd. (A) | | | 39,430 | | | | 1,595,732 | |
Morgan Stanley (A) | | | 65,690 | | | | 2,295,866 | |
State Street Corp. (A) | | | 14,910 | | | | 1,125,109 | |
| | | | | | | | |
| | | | | | | 7,401,205 | |
| | | | | | | | |
Chemicals - 2.5% | | | | | | | | |
Albemarle Corp. | | | 4,020 | | | | 234,687 | |
Ashland, Inc. | | | 3,110 | | | | 336,098 | |
Axiall Corp. (A) | | | 15,836 | | | | 638,191 | |
Dow Chemical Co. (A) | | | 14,940 | | | | 738,036 | |
E.I. du Pont de Nemours & Co. | | | 15,880 | | | | 1,098,102 | |
Mosaic Co. | | | 20,470 | | | | 907,026 | |
| | | | | | | | |
| | | | | | | 3,952,140 | |
| | | | | | | | |
Communications Equipment - 1.5% | | | | | | | | |
QUALCOMM, Inc. (A) | | | 31,318 | | | | 2,458,776 | |
| | | | | | | | |
Construction & Engineering - 1.6% | | | | | | | | |
Fluor Corp. (A) | | | 38,560 | | | | 2,558,070 | |
| | | | | | | | |
Consumer Finance - 0.7% | | | | | | | | |
Ally Financial, Inc. (B) | | | 24,920 | | | | 565,684 | |
Capital One Financial Corp. | | | 4,040 | | | | 334,391 | |
| | | | | | | | |
| | | Shares | | | Value | |
COMMON STOCKS (continued) | | | | | | | | |
Consumer Finance (continued) | | | | | | | | |
Santander Consumer USA Holdings, Inc. | | | 12,970 | | | | $ 239,945 | |
| | | | | | | | |
| | | | | | | 1,140,020 | |
| | | | | | | | |
Containers & Packaging - 0.5% | | | | | | | | |
Crown Holdings, Inc. (B) | | | 16,910 | | | | 810,496 | |
| | | | | | | | |
Diversified Financial Services - 2.0% | | | | | | | | |
Bank of America Corp. (A) | | | 81,010 | | | | 1,390,131 | |
Citigroup, Inc. (A) | | | 29,849 | | | | 1,597,817 | |
Intercontinental Exchange, Inc. (A) | | | 910 | | | | 189,544 | |
| | | | | | | | |
| | | | | | | 3,177,492 | |
| | | | | | | | |
Diversified Telecommunication Services - 0.7% | |
Verizon Communications, Inc. | | | 22,860 | | | | 1,148,715 | |
| | | | | | | | |
Electric Utilities - 3.2% | | | | | | | | |
Edison International (A) | | | 34,330 | | | | 2,148,372 | |
Entergy Corp., Class B | | | 9,250 | | | | 777,185 | |
Exelon Corp. | | | 29,070 | | | | 1,063,671 | |
NextEra Energy, Inc. | | | 12,070 | | | | 1,209,655 | |
| | | | | | | | |
| | | | | | | 5,198,883 | |
| | | | | | | | |
Electrical Equipment - 1.9% | | | | | | | | |
Eaton Corp. PLC (A) | | | 25,440 | | | | 1,739,841 | |
Emerson Electric Co. (A) | | | 21,630 | | | | 1,385,618 | |
| | | | | | | | |
| | | | | | | 3,125,459 | |
| | | | | | | | |
Energy Equipment & Services - 1.2% | | | | | | | | |
Baker Hughes, Inc. | | | 5,410 | | | | 286,514 | |
Halliburton Co. | | | 14,990 | | | | 826,548 | |
Schlumberger, Ltd. (A) | | | 7,660 | | | | 755,736 | |
| | | | | | | | |
| | | | | | | 1,868,798 | |
| | | | | | | | |
Food & Staples Retailing - 1.0% | | | | | | | | |
Costco Wholesale Corp. | | | 7,290 | | | | 972,268 | |
CVS Health Corp. (A) | | | 7,330 | | | | 628,987 | |
| | | | | | | | |
| | | | | | | 1,601,255 | |
| | | | | | | | |
Food Products - 3.3% | | | | | | | | |
General Mills, Inc. | | | 23,420 | | | | 1,216,903 | |
J.M. Smucker, Co. | | | 6,460 | | | | 671,840 | |
Kellogg Co. | | | 20,880 | | | | 1,335,485 | |
Mondelez International, Inc., Class A (A) | | | 56,940 | | | | 2,007,704 | |
| | | | | | | | |
| | | | | | | 5,231,932 | |
| | | | | | | | |
Health Care Equipment & Supplies - 2.1% | | | | | |
Abbott Laboratories | | | 19,030 | | | | 829,518 | |
Boston Scientific Corp. (A) (B) | | | 86,580 | | | | 1,149,782 | |
Stryker Corp. | | | 15,230 | | | | 1,333,082 | |
| | | | | | | | |
| | | | | | | 3,312,382 | |
| | | | | | | | |
Health Care Providers & Services - 3.0% | | | | | | | | |
Aetna, Inc. | | | 7,310 | | | | 603,148 | |
Humana, Inc., Class A (A) | | | 13,320 | | | | 1,849,482 | |
McKesson Corp. (A) | | | 6,450 | | | | 1,311,994 | |
UnitedHealth Group, Inc. | | | 11,780 | | | | 1,119,218 | |
| | | | | | | | |
| | | | | | | 4,883,842 | |
| | | | | | | | |
Hotels, Restaurants & Leisure - 2.1% | | | | | | | | |
Carnival Corp. | | | 6,260 | | | | 251,339 | |
Dunkin’ Brands Group, Inc. | | | 4,550 | | | | 206,934 | |
Royal Caribbean Cruises, Ltd., Class A (A) | | | 25,720 | | | | 1,748,188 | |
Starbucks Corp. | | | 8,520 | | | | 643,771 | |
Yum! Brands, Inc. | | | 6,820 | | | | 489,881 | |
| | | | | | | | |
| | | | | | | 3,340,113 | |
| | | | | | | | |
The Notes to Financial Statements are an integral part of this report.
| | |
| Transamerica Funds | | Annual Report 2014 |
Page 99
Transamerica Long/Short Strategy
SCHEDULE OF INVESTMENTS (continued)
At October 31, 2014
| | | | | | | | |
| | | Shares | | | Value | |
COMMON STOCKS (continued) | | | | | | | | |
Household Durables - 1.2% | | | | | | | | |
Harman International Industries, Inc. | | | 11,860 | | | | $ 1,273,052 | |
PulteGroup, Inc. (A) | | | 32,450 | | | | 622,716 | |
| | | | | | | | |
| | | | | | | 1,895,768 | |
| | | | | | | | |
Household Products - 0.8% | | | | | | | | |
Energizer Holdings, Inc. | | | 2,410 | | | | 295,587 | |
Kimberly-Clark Corp. | | | 8,930 | | | | 1,020,431 | |
| | | | | | | | |
| | | | | | | 1,316,018 | |
| | | | | | | | |
Insurance - 6.5% | | | | | | | | |
ACE, Ltd. (A) | | | 30,970 | | | | 3,385,021 | |
Aflac, Inc. | | | 9,980 | | | | 596,105 | |
American International Group, Inc. | | | 13,460 | | | | 721,052 | |
Axis Capital Holdings, Ltd. | | | 2,815 | | | | 135,514 | |
Hartford Financial Services Group, Inc. | | | 21,430 | | | | 848,200 | |
MetLife, Inc. (A) | | | 49,930 | | | | 2,708,203 | |
Prudential Financial, Inc. | | | 5,650 | | | | 500,251 | |
Willis Group Holdings PLC | | | 22,570 | | | | 914,762 | |
XL Group PLC, Class A | | | 18,600 | | | | 630,168 | |
| | | | | | | | |
| | | | | | | 10,439,276 | |
| | | | | | | | |
Internet & Catalog Retail - 0.3% | | | | | | | | |
Priceline Group, Inc. (B) | | | 370 | | | | 446,298 | |
| | | | | | | | |
Internet Software & Services - 3.6% | | | | | | | | |
Facebook, Inc., Class A (B) | | | 11,600 | | | | 869,884 | |
Google, Inc., Class A (A) (B) | | | 4,240 | | | | 2,407,769 | |
Google, Inc., Class C (A) (B) | | | 4,510 | | | | 2,521,451 | |
| | | | | | | | |
| | | | | | | 5,799,104 | |
| | | | | | | | |
IT Services - 2.9% | | | | | | | | |
Accenture PLC, Class A | | | 15,680 | | | | 1,271,962 | |
Alliance Data Systems Corp. (A) (B) | | | 4,250 | | | | 1,204,237 | |
Cognizant Technology Solutions Corp., Class A (B) | | | 14,490 | | | | 707,836 | |
Fidelity National Information Services, Inc. | | | 8,650 | | | | 505,074 | |
Visa, Inc., Class A (A) | | | 4,340 | | | | 1,047,806 | |
| | | | | | | | |
| | | | | | | 4,736,915 | |
| | | | | | | | |
Machinery - 1.3% | | | | | | | | |
Ingersoll-Rand PLC | | | 5,650 | | | | 353,803 | |
PACCAR, Inc. | | | 15,600 | | | | 1,018,992 | |
SPX Corp. (A) | | | 7,920 | | | | 750,737 | |
| | | | | | | | |
| | | | | | | 2,123,532 | |
| | | | | | | | |
Media - 7.1% | | | | | | | | |
Charter Communications, Inc., Class A (B) | | | 6,970 | | | | 1,103,978 | |
Comcast Corp., Class A (A) | | | 28,230 | | | | 1,562,531 | |
DISH Network Corp., Class A (A) (B) | | | 17,880 | | | | 1,138,062 | |
Time Warner Cable, Inc. | | | 3,010 | | | | 443,102 | |
Time Warner, Inc. (A) | | | 66,560 | | | | 5,289,523 | |
Twenty-First Century Fox, Inc., Class B | | | 32,820 | | | | 1,088,640 | |
Walt Disney Co. | | | 8,850 | | | | 808,713 | |
| | | | | | | | |
| | | | | | | 11,434,549 | |
| | | | | | | | |
Metals & Mining - 2.4% | | | | | | | | |
Alcoa, Inc. (A) | | | 146,660 | | | | 2,458,022 | |
Alumina, Ltd., ADR (A) (B) | | | 82,260 | | | | 468,059 | |
U.S. Steel Corp. | | | 21,750 | | | | 870,870 | |
| | | | | | | | |
| | | | | | | 3,796,951 | |
| | | | | | | | |
Multi-Utilities - 2.3% | | | | | | | | |
CenterPoint Energy, Inc. | | | 13,510 | | | | 331,671 | |
CMS Energy Corp. (A) | | | 23,590 | | | | 770,685 | |
| | | | | | | | |
| | | Shares | | | Value | |
COMMON STOCKS (continued) | | | | | | | | |
Multi-Utilities (continued) | | | | | | | | |
Dominion Resources, Inc. (A) | | | 18,880 | | | | $ 1,346,144 | |
NiSource, Inc., Class B (A) | | | 15,200 | | | | 639,312 | |
Sempra Energy (A) | | | 5,320 | | | | 585,200 | |
| | | | | | | | |
| | | | | | | 3,673,012 | |
| | | | | | | | |
Multiline Retail - 0.8% | | | | | | | | |
Dollar General Corp. (A) (B) | | | 10,800 | | | | 676,836 | |
Dollar Tree, Inc. (A) (B) | | | 10,830 | | | | 655,973 | |
| | | | | | | | |
| | | | | | | 1,332,809 | |
| | | | | | | | |
Oil, Gas & Consumable Fuels - 1.4% | | | | | | | | |
Cheniere Energy, Inc. (A) (B) | | | 5,080 | | | | 381,000 | |
Chevron Corp. | | | 3,750 | | | | 449,813 | |
EQT Corp. | | | 3,670 | | | | 345,127 | |
Occidental Petroleum Corp. | | | 9,040 | | | | 803,927 | |
TransCanada Corp. | | | 6,580 | | | | 324,328 | |
| | | | | | | | |
| | | | | | | 2,304,195 | |
| | | | | | | | |
Pharmaceuticals - 3.7% | | | | | | | | |
Bristol-Myers Squibb Co. (A) | | | 36,720 | | | | 2,136,737 | |
Johnson & Johnson (A) | | | 35,140 | | | | 3,787,389 | |
| | | | | | | | |
| | | | | | | 5,924,126 | |
| | | | | | | | |
Real Estate Investment Trusts - 7.1% | | | | | | | | |
AvalonBay Communities, Inc. (A) | | | 10,330 | | | | 1,609,827 | |
Brixmor Property Group, Inc. | | | 19,610 | | | | 477,700 | |
Corporate Office Properties Trust | | | 16,970 | | | | 463,960 | |
DDR Corp. | | | 35,100 | | | | 636,714 | |
DiamondRock Hospitality Co. (A) | | | 66,510 | | | | 954,418 | |
Extra Space Storage, Inc. (A) | | | 15,420 | | | | 896,827 | |
Healthcare Realty Trust, Inc. | | | 12,590 | | | | 333,257 | |
Highwoods Properties, Inc. (A) | | | 12,850 | | | | 550,880 | |
Host Hotels & Resorts, Inc. (A) | | | 46,270 | | | | 1,078,554 | |
Liberty Property Trust, Series C (A) | | | 22,920 | | | | 796,928 | |
Macerich Co., Class A | | | 9,280 | | | | 654,240 | |
Mid-America Apartment Communities, Inc. | | | 13,960 | | | | 986,414 | |
Omega Healthcare Investors, Inc. | | | 4,310 | | | | 164,470 | |
Prologis, Inc., Class A | | | 25,610 | | | | 1,066,656 | |
Simon Property Group, Inc. | | | 1,400 | | | | 250,894 | |
Sunstone Hotel Investors, Inc. (A) | | | 33,290 | | | | 509,670 | |
| | | | | | | | |
| | | | | | | 11,431,409 | |
| | | | | | | | |
Road & Rail - 4.4% | | | | | | | | |
Canadian Pacific Railway, Ltd. (A) | | | 15,260 | | | | 3,169,197 | |
CSX Corp. | | | 22,130 | | | | 788,492 | |
Norfolk Southern Corp. (A) | | | 2,020 | | | | 223,493 | |
Union Pacific Corp. (A) | | | 24,830 | | | | 2,891,453 | |
| | | | | | | | |
| | | | | | | 7,072,635 | |
| | | | | | | | |
Semiconductors & Semiconductor Equipment - 6.6% | |
Applied Materials, Inc., Class A (A) | | | 31,750 | | | | 701,357 | |
Avago Technologies, Ltd., Class A (A) | | | 37,680 | | | | 3,249,900 | |
Broadcom Corp., Class A (A) | | | 40,150 | | | | 1,681,482 | |
Freescale Semiconductor, Ltd. (A) (B) | | | 15,830 | | | | 314,859 | |
KLA-Tencor Corp. (A) | | | 21,290 | | | | 1,685,103 | |
LAM Research Corp. (A) | | | 30,510 | | | | 2,375,509 | |
Teradyne, Inc. (A) | | | 30,280 | | | | 557,152 | |
| | | | | | | | |
| | | | | | | 10,565,362 | |
| | | | | | | | |
Software - 2.2% | | | | | | | | |
Adobe Systems, Inc. (A) (B) | | | 21,530 | | | | 1,509,684 | |
Citrix Systems, Inc. (A) (B) | | | 14,520 | | | | 932,620 | |
The Notes to Financial Statements are an integral part of this report.
| | |
| Transamerica Funds | | Annual Report 2014 |
Page 100
Transamerica Long/Short Strategy
SCHEDULE OF INVESTMENTS (continued)
At October 31, 2014
| | | | | | | | |
| | | Shares | | | Value | |
COMMON STOCKS (continued) | | | | | | | | |
Software (continued) | | | | | | | | |
Microsoft Corp. (A) | | | 18,510 | | | | $ 869,044 | |
VMware, Inc., Class A (A) (B) | | | 3,090 | | | | 258,231 | |
| | | | | | | | |
| | | | | | | 3,569,579 | |
| | | | | | | | |
Specialty Retail - 2.8% | | | | | | | | |
AutoZone, Inc. (B) | | | 400 | | | | 221,408 | |
Home Depot, Inc. (A) | | | 12,880 | | | | 1,256,058 | |
Lowe’s Cos., Inc. (A) | | | 31,260 | | | | 1,788,072 | |
Tiffany & Co. | | | 1,760 | | | | 169,171 | |
TJX Cos., Inc. (A) | | | 17,170 | | | | 1,087,204 | |
| | | | | | | | |
| | | | | | | 4,521,913 | |
| | | | | | | | |
Textiles, Apparel & Luxury Goods - 0.9% | | | | | |
Ralph Lauren Corp. | | | 6,170 | | | | 1,017,063 | |
VF Corp. (A) | | | 5,555 | | | | 375,962 | |
| | | | | | | | |
| | | | | | | 1,393,025 | |
| | | | | | | | |
Tobacco - 0.8% | | | | | | | | |
Philip Morris International, Inc. (A) | | | 14,680 | | | | 1,306,667 | |
| | | | | | | | |
Total Common Stocks
(Cost $138,723,109) | | | | 166,557,144 | |
| | | | | | | | |
| | |
| | | Principal | | | Value | |
REPURCHASE AGREEMENT - 11.5% | | | | | |
State Street Bank & Trust Co.
0.01% (C), dated 10/31/2014, to be repurchased at $18,436,365 on 11/03/2014. Collateralized by a U.S. Government Agency Obligation, 2.00%, due 11/01/2027, and with a value of $18,805,349. | | | $ 18,436,350 | | | | 18,436,350 | |
| | | | | | | | |
Total Repurchase Agreement
(Cost $18,436,350) | | | | 18,436,350 | |
| | | | | | | | |
Total Investments
(Cost $157,159,459) (D) | | | | 184,993,494 | |
Net Other Assets (Liabilities) - (15.0)% | | | | (24,083,467 | ) |
| | | | | | | | |
| | |
Net Assets - 100.0% | | | | | | | $160,910,027 | |
| | | | | | | | |
| | |
| | | Shares | | | Value | |
SECURITIES SOLD SHORT - (75.9)% | | | | | |
COMMON STOCKS - (75.9)% | | | | | | | | |
Aerospace & Defense - (4.5)% | | | | | | | | |
Boeing Co. | | | (18,215 | ) | | | $ (2,275,236 | ) |
Lockheed Martin Corp. | | | (18,800 | ) | | | (3,582,716 | ) |
Raytheon Co. | | | (13,740 | ) | | | (1,427,311 | ) |
| | | | | | | | |
| | | | | | | (7,285,263 | ) |
| | | | | | | | |
Air Freight & Logistics - (0.5)% | | | | | | | | |
United Parcel Service, Inc., Class B | | | (6,930 | ) | | | (727,026 | ) |
| | | | | | | | |
Auto Components - (0.8)% | | | | | | | | |
Autoliv, Inc. | | | (2,400 | ) | | | (220,176 | ) |
BorgWarner, Inc. | | | (17,820 | ) | | | (1,016,096 | ) |
| | | | | | | | |
| | | | | | | (1,236,272 | ) |
| | | | | | | | |
Banks - (3.1)% | | | | | | | | |
Associated Banc-Corp. | | | (17,760 | ) | | | (333,888 | ) |
BancorpSouth, Inc. | | | (25,830 | ) | | | (594,865 | ) |
Bank of Hawaii Corp. | | | (18,800 | ) | | | (1,100,740 | ) |
| | | | | | | | |
| | | Shares | | | Value | |
SECURITIES SOLD SHORT (continued) | | | | | | | | |
COMMON STOCKS (continued) | | | | | | | | |
Banks (continued) | | | | | | | | |
Comerica, Inc. | | | (4,050 | ) | | | $ (193,347 | ) |
M&T Bank Corp. | | | (1,950 | ) | | | (238,251 | ) |
Signature Bank (B) | | | (7,980 | ) | | | (966,617 | ) |
Synovus Financial Corp. | | | (10,440 | ) | | | (264,758 | ) |
UMB Financial Corp. | | | (11,610 | ) | | | (691,724 | ) |
Valley National Bancorp | | | (57,277 | ) | | | (571,625 | ) |
| | | | | | | | |
| | | | | | | (4,955,815 | ) |
| | | | | | | | |
Beverages - (0.5)% | | | | | | | | |
Boston Beer Co., Inc., Class A (B) | | | (690 | ) | | | (171,810 | ) |
Brown-Forman Corp., Class B | | | (5,920 | ) | | | (548,606 | ) |
| | | | | | | | |
| | | | | | | (720,416 | ) |
| | | | | | | | |
Biotechnology - (0.9)% | | | | | | | | |
Amgen, Inc. | | | (9,170 | ) | | | (1,487,191 | ) |
| | | | | | | | |
Capital Markets - (1.6)% | | | | | | | | |
Ameriprise Financial, Inc. | | | (2,280 | ) | | | (287,668 | ) |
Federated Investors, Inc., Class B | | | (26,300 | ) | | | (822,401 | ) |
Franklin Resources, Inc. | | | (16,750 | ) | | | (931,468 | ) |
T. Rowe Price Group, Inc. | | | (6,860 | ) | | | (563,137 | ) |
Teton Advisors, Inc., Class B (B) (E) | | | (3 | ) | | | 0 | |
| | | | | | | | |
| | | | | | | (2,604,674 | ) |
| | | | | | | | |
Chemicals - (2.5)% | | | | | | | | |
Air Products & Chemicals, Inc. | | | (3,260 | ) | | | (438,992 | ) |
Eastman Chemical Co. | | | (1,910 | ) | | | (154,290 | ) |
Ecolab, Inc. | | | (2,850 | ) | | | (317,005 | ) |
LyondellBasell Industries NV, Class A | | | (5,550 | ) | | | (508,547 | ) |
OM Group, Inc. | | | (13,650 | ) | | | (355,310 | ) |
Praxair, Inc. | | | (15,365 | ) | | | (1,935,836 | ) |
Sherwin-Williams Co. | | | (1,440 | ) | | | (330,566 | ) |
| | | | | | | | |
| | | | | | | (4,040,546 | ) |
| | | | | | | | |
Commercial Services & Supplies - (0.2)% | | | | | |
ADT Corp. | | | (9,350 | ) | | | (335,104 | ) |
| | | | | | | | |
Containers & Packaging - (0.4)% | | | | | | | | |
Bemis Co., Inc. | | | (12,210 | ) | | | (469,719 | ) |
MeadWestvaco Corp. | | | (3,420 | ) | | | (151,061 | ) |
| | | | | | | | |
| | | | | | | (620,780 | ) |
| | | | | | | | |
Diversified Consumer Services - (0.2)% | | | | | | | | |
Graham Holdings Co., Class B | | | (370 | ) | | | (289,932 | ) |
| | | | | | | | |
Diversified Financial Services - (0.2)% | | | | | | | | |
NASDAQ OMX Group, Inc. | | | (9,140 | ) | | | (395,396 | ) |
| | | | | | | | |
Diversified Telecommunication Services - (1.6)% | |
AT&T, Inc. | | | (73,890 | ) | | | (2,574,328 | ) |
| | | | | | | | |
Electric Utilities - (2.8)% | | | | | | | | |
Northeast Utilities | | | (27,120 | ) | | | (1,338,372 | ) |
PPL Corp. | | | (5,790 | ) | | | (202,592 | ) |
Southern Co. | | | (63,330 | ) | | | (2,935,979 | ) |
| | | | | | | | |
| | | | | | | (4,476,943 | ) |
| | | | | | | | |
Electrical Equipment - (0.8)% | | | | | | | | |
Rockwell Automation, Inc., Class B | | | (11,290 | ) | | | (1,268,431 | ) |
| | | | | | | | |
Energy Equipment & Services - (0.2)% | | | | | | | | |
FMC Technologies, Inc. (B) | | | (2,910 | ) | | | (163,076 | ) |
Tenaris SA, ADR | | | (5,370 | ) | | | (212,867 | ) |
| | | | | | | | |
| | | | | | | (375,943 | ) |
| | | | | | | | |
The Notes to Financial Statements are an integral part of this report.
| | |
| Transamerica Funds | | Annual Report 2014 |
Page 101
Transamerica Long/Short Strategy
SCHEDULE OF INVESTMENTS (continued)
At October 31, 2014
| | | | | | | | |
| | | Shares | | | Value | |
SECURITIES SOLD SHORT (continued) | | | | | | | | |
COMMON STOCKS (continued) | | | | | | | | |
Food & Staples Retailing - (1.2)% | | | | | | | | |
Sysco Corp. | | | (29,940 | ) | | | $ (1,153,888 | ) |
Whole Foods Market, Inc. | | | (19,140 | ) | | | (752,776 | ) |
| | | | | | | | |
| | | | | | | (1,906,664 | ) |
| | | | | | | | |
Food Products - (2.9)% | | | | | | | | |
ConAgra Foods, Inc. | | | (30,050 | ) | | | (1,032,218 | ) |
Hershey Co. | | | (12,700 | ) | | | (1,218,057 | ) |
Kraft Foods Group, Inc. | | | (15,030 | ) | | | (846,940 | ) |
Mead Johnson Nutrition Co., Class A | | | (16,100 | ) | | | (1,598,891 | ) |
| | | | | | | | |
| | | | | | | (4,696,106 | ) |
| | | | | | | | |
Gas Utilities - (0.4)% | | | | | | | | |
National Fuel Gas Co. | | | (8,910 | ) | | | (616,839 | ) |
| | | | | | | | |
Health Care Equipment & Supplies - (2.1)% | | | | | |
Baxter International, Inc. | | | (12,290 | ) | | | (862,021 | ) |
Becton Dickinson and Co. | | | (5,310 | ) | | | (683,397 | ) |
Medtronic, Inc. | | | (12,650 | ) | | | (862,224 | ) |
Zimmer Holdings, Inc., Class A | | | (9,350 | ) | | | (1,040,094 | ) |
| | | | | | | | |
| | | | | | | (3,447,736 | ) |
| | | | | | | | |
Health Care Providers & Services - (2.2)% | | | | | |
AmerisourceBergen Corp., Class A | | | (14,300 | ) | | | (1,221,363 | ) |
Cardinal Health, Inc. | | | (13,820 | ) | | | (1,084,594 | ) |
Premier, Inc., Class A (B) | | | (12,240 | ) | | | (408,571 | ) |
WellPoint, Inc. | | | (6,740 | ) | | | (853,890 | ) |
| | | | | | | | |
| | | | | | | (3,568,418 | ) |
| | | | | | | | |
Health Care Technology - (0.2)% | | | | | | | | |
Quality Systems, Inc. | | | (23,790 | ) | | | (359,467 | ) |
| | | | | | | | |
Hotels, Restaurants & Leisure - (2.0)% | | | | | | | | |
Chipotle Mexican Grill, Inc., Class A (B) | | | (240 | ) | | | (153,120 | ) |
Choice Hotels International, Inc. | | | (3,510 | ) | | | (187,785 | ) |
Darden Restaurants, Inc. | | | (10,460 | ) | | | (541,619 | ) |
Hilton Worldwide Holdings, Inc. (B) | | | (37,330 | ) | | | (942,209 | ) |
Marriott International, Inc., Class A | | | (10,220 | ) | | | (774,165 | ) |
McDonald’s Corp. | | | (6,470 | ) | | | (606,433 | ) |
| | | | | | | | |
| | | | | | | (3,205,331 | ) |
| | | | | | | | |
Household Products - (1.7)% | | | | | | | | |
Church & Dwight Co., Inc. | | | (20,750 | ) | | | (1,502,508 | ) |
Clorox Co. | | | (12,750 | ) | | | (1,268,625 | ) |
| | | | | | | | |
| | | | | | | (2,771,133 | ) |
| | | | | | | | |
Industrial Conglomerates - (2.3)% | | | | | | | | |
3M Co. | | | (9,320 | ) | | | (1,433,136 | ) |
Danaher Corp. | | | (7,050 | ) | | | (566,820 | ) |
General Electric Co. | | | (68,000 | ) | | | (1,755,080 | ) |
| | | | | | | | |
| | | | | | | (3,755,036 | ) |
| | | | | | | | |
Insurance - (4.5)% | | | | | | | | |
Allstate Corp. | | | (18,970 | ) | | | (1,230,205 | ) |
Aon PLC | | | (5,350 | ) | | | (460,100 | ) |
Arch Capital Group, Ltd. (B) | | | (15,080 | ) | | | (849,306 | ) |
Chubb Corp., Class A | | | (11,920 | ) | | | (1,184,371 | ) |
Principal Financial Group, Inc. | | | (8,270 | ) | | | (433,100 | ) |
Progressive Corp. | | | (39,920 | ) | | | (1,054,287 | ) |
Torchmark Corp. | | | (18,075 | ) | | | (957,252 | ) |
WR Berkley Corp. | | | (19,230 | ) | | | (991,114 | ) |
| | | | | | | | |
| | | | | | | (7,159,735 | ) |
| | | | | | | | |
Internet & Catalog Retail - (1.4)% | | | | | | | | |
Groupon, Inc., Class A (B) | | | (100,540 | ) | | | (734,947 | ) |
Netflix, Inc. (B) | | | (3,870 | ) | | | (1,520,020 | ) |
| | | | | | | | |
| | | | | | | (2,254,967 | ) |
| | | | | | | | |
| | | | | | | | |
| | | Shares | | | Value | |
SECURITIES SOLD SHORT (continued) | | | | | | | | |
COMMON STOCKS (continued) | | | | | | | | |
Internet Software & Services - (0.5)% | | | | | | | | |
AOL, Inc. (B) | | | (17,500 | ) | | | $ (761,775 | ) |
| | | | | | | | |
IT Services - (1.6)% | | | | | | | | |
Automatic Data Processing, Inc. | | | (10,520 | ) | | | (860,326 | ) |
Paychex, Inc. | | | (14,450 | ) | | | (678,283 | ) |
Total System Services, Inc. | | | (17,470 | ) | | | (590,311 | ) |
Vantiv, Inc., Class A (B) | | | (15,080 | ) | | | (466,274 | ) |
| | | | | | | | |
| | | | | | | (2,595,194 | ) |
| | | | | | | | |
Leisure Products - (1.1)% | | | | | | | | |
Hasbro, Inc. | | | (16,880 | ) | | | (971,107 | ) |
Mattel, Inc. | | | (25,630 | ) | | | (796,324 | ) |
| | | | | | | | |
| | | | | | | (1,767,431 | ) |
| | | | | | | | |
Machinery - (2.0)% | | | | | | | | |
Caterpillar, Inc. | | | (9,000 | ) | | | (912,690 | ) |
Deere & Co. | | | (4,640 | ) | | | (396,906 | ) |
Dover Corp. | | | (12,080 | ) | | | (959,635 | ) |
Illinois Tool Works, Inc., Class A | | | (11,225 | ) | | | (1,022,036 | ) |
| | | | | | | | |
| | | | | | | (3,291,267 | ) |
| | | | | | | | |
Media - (3.0)% | | | | | | | | |
AMC Networks, Inc., Class A (B) | | | (20,360 | ) | | | (1,234,834 | ) |
Discovery Communications, Inc., Class C (B) | | | (8,360 | ) | | | (292,516 | ) |
Discovery Communications, Inc., Series A (B) | | | (14,720 | ) | | | (520,352 | ) |
Interpublic Group of Cos., Inc. | | | (31,600 | ) | | | (612,724 | ) |
News Corp., Class B (B) | | | (34,710 | ) | | | (522,385 | ) |
Scripps Networks Interactive, Inc., Class A | | | (16,940 | ) | | | (1,308,446 | ) |
Viacom, Inc., Class B | | | (4,820 | ) | | | (350,318 | ) |
| | | | | | | | |
| | | | | | | (4,841,575 | ) |
| | | | | | | | |
Metals & Mining - (0.9)% | | | | | | | | |
Cliffs Natural Resources, Inc. | | | (51,135 | ) | | | (574,246 | ) |
Nucor Corp. | | | (16,330 | ) | | | (882,800 | ) |
| | | | | | | | |
| | | | | | | (1,457,046 | ) |
| | | | | | | | |
Multi-Utilities - (1.9)% | | | | | | | | |
Ameren Corp. | | | (28,310 | ) | | | (1,198,645 | ) |
Consolidated Edison, Inc. | | | (10,130 | ) | | | (641,837 | ) |
PG&E Corp. | | | (14,760 | ) | | | (742,723 | ) |
SCANA Corp. | | | (9,810 | ) | | | (538,471 | ) |
| | | | | | | | |
| | | | | | | (3,121,676 | ) |
| | | | | | | | |
Multiline Retail - (0.4)% | | | | | | | | |
Target Corp. | | | (11,600 | ) | | | (717,112 | ) |
| | | | | | | | |
Oil, Gas & Consumable Fuels - (1.6)% | | | | | | | | |
ConocoPhillips | | | (3,940 | ) | | | (284,271 | ) |
Enbridge, Inc. | | | (11,370 | ) | | | (538,483 | ) |
Exxon Mobil Corp. | | | (4,940 | ) | | | (477,748 | ) |
ONEOK, Inc. | | | (10,510 | ) | | | (619,459 | ) |
Spectra Energy Corp. | | | (16,570 | ) | | | (648,384 | ) |
| | | | | | | | |
| | | | | | | (2,568,345 | ) |
| | | | | | | | |
Pharmaceuticals - (2.7)% | | | | | | | | |
AbbVie, Inc., Class G | | | (11,300 | ) | | | (717,098 | ) |
Eli Lilly & Co. | | | (27,400 | ) | | | (1,817,442 | ) |
Pfizer, Inc. | | | (60,770 | ) | | | (1,820,062 | ) |
| | | | | | | | |
| | | | | | | (4,354,602 | ) |
| | | | | | | | |
Real Estate Investment Trusts - (7.0)% | | | | | | | | |
Brandywine Realty Trust | | | (37,060 | ) | | | (571,836 | ) |
Equity Residential | | | (15,320 | ) | | | (1,065,659 | ) |
The Notes to Financial Statements are an integral part of this report.
| | |
| Transamerica Funds | | Annual Report 2014 |
Page 102
Transamerica Long/Short Strategy
SCHEDULE OF INVESTMENTS (continued)
At October 31, 2014
| | | | | | | | |
| | | Shares | | | Value | |
SECURITIES SOLD SHORT (continued) | | | | | |
COMMON STOCKS (continued) | | | | | | | | |
Real Estate Investment Trusts (continued) | | | | | |
Federal Realty Investment Trust | | | (8,310 | ) | | | $ (1,095,258 | ) |
First Potomac Realty Trust | | | (37,910 | ) | | | (473,875 | ) |
Health Care REIT, Inc. | | | (4,850 | ) | | | (344,884 | ) |
Home Properties, Inc. | | | (13,210 | ) | | | (849,535 | ) |
Hudson Pacific Properties, Inc. | | | (25,840 | ) | | | (705,690 | ) |
Kimco Realty Corp. | | | (24,760 | ) | | | (617,762 | ) |
Medical Properties Trust, Inc. | | | (33,660 | ) | | | (454,073 | ) |
Pennsylvania Real Estate Investment Trust | | | (11,380 | ) | | | (243,873 | ) |
Realty Income Corp. | | | (20,040 | ) | | | (922,441 | ) |
SL Green Realty Corp. | | | (4,770 | ) | | | (551,889 | ) |
Tanger Factory Outlet Centers, Inc. | | | (8,680 | ) | | | (310,484 | ) |
UDR, Inc. | | | (32,050 | ) | | | (968,872 | ) |
Ventas, Inc. | | | (14,350 | ) | | | (983,119 | ) |
Washington Real Estate Investment Trust | | | (36,020 | ) | | | (1,017,925 | ) |
| | | | | | | | |
| | | | | | | (11,177,175 | ) |
| | | | | | | | |
Road & Rail - (1.6)% | | | | | | | | |
Heartland Express, Inc. | | | (53,130 | ) | | | (1,335,688 | ) |
Knight Transportation, Inc. | | | (14,630 | ) | | | (428,074 | ) |
Werner Enterprises, Inc. | | | (30,710 | ) | | | (845,753 | ) |
| | | | | | | | |
| | | | | | | (2,609,515 | ) |
| | | | | | | | |
Semiconductors & Semiconductor Equipment - (6.6)% | |
Advanced Micro Devices, Inc. (B) | | | (167,140 | ) | | | (467,992 | ) |
Altera Corp. | | | (52,740 | ) | | | (1,812,674 | ) |
Analog Devices, Inc., Class A | | | (6,810 | ) | | | (337,912 | ) |
Intel Corp. | | | (74,980 | ) | | | (2,550,070 | ) |
Linear Technology Corp. | | | (37,390 | ) | | | (1,601,788 | ) |
Maxim Integrated Products, Inc., Class A | | | (26,010 | ) | | | (763,133 | ) |
| | | | | | | | |
| | | Shares | | | Value | |
SECURITIES SOLD SHORT (continued) | | | | | |
COMMON STOCKS (continued) | | | | | | | | |
Semiconductors & Semiconductor Equipment (continued) | |
NVIDIA Corp. | | | (116,930 | ) | | | $ (2,284,812 | ) |
Taiwan Semiconductor Manufacturing Co., Ltd., ADR | | | (34,000 | ) | | | (748,680 | ) |
| | | | | | | | |
| | | | | | | (10,567,061 | ) |
| | | | | | | | |
Software - (0.1)% | | | | | | | | |
Oracle Corp. | | | (3,650 | ) | | | (142,532 | ) |
| | | | | | | | |
Specialty Retail - (0.5)% | | | | | | | | |
Bed Bath & Beyond, Inc. (B) | | | (7,320 | ) | | | (492,929 | ) |
O’Reilly Automotive, Inc. (B) | | | (1,420 | ) | | | (249,749 | ) |
| | | | | | | | |
| | | | | | | (742,678 | ) |
| | | | | | | | |
Textiles, Apparel & Luxury Goods - (1.3)% | | | | | | | | |
Michael Kors Holdings, Ltd. (B) | | | (2,800 | ) | | | (220,052 | ) |
NIKE, Inc., Class B | | | (11,100 | ) | | | (1,031,967 | ) |
Under Armour, Inc., Class A (B) | | | (12,270 | ) | | | (804,667 | ) |
| | | | | | | | |
| | | | | | | (2,056,686 | ) |
| | | | | | | | |
Thrifts & Mortgage Finance - (0.3)% | | | | | | | | |
People’s United Financial, Inc. | | | (36,140 | ) | | | (528,367 | ) |
| | | | | | | | |
Tobacco - (0.6)% | | | | | | | | |
Altria Group, Inc. | | | (20,320 | ) | | | (982,269 | ) |
| | | | | | | | |
Trading Companies & Distributors - (0.4)% | |
Fastenal Co. | | | (13,320 | ) | | | (586,613 | ) |
| | | | | | | | |
Wireless Telecommunication Services - (0.1)% | |
Sprint Corp. (B) | | | (31,010 | ) | | | (183,889 | ) |
| | | | | | | | |
Total Common Stocks
(Proceeds $108,843,858) | | | | | | | (122,188,300 | ) |
| | | | | | | | |
Total Securities Sold Short
(Proceeds $108,843,858) | | | | | | | $ (122,188,300 | ) |
| | | | | | | | |
SECURITY VALUATION:
Valuation Inputs (F)
| | | | | | | | | | | | | | | | |
| | | Level 1
Quoted Prices | | | Level 2
Other Significant
Observable Inputs | | | Level 3
Significant
Unobservable Inputs (G) | | | Value at
October 31, 2014 | |
ASSETS | | | | | | | | | | | | | | | | |
Investments | | | | | | | | | | | | | | | | |
Common Stocks | | $ | 166,557,144 | | | $ | — | | | $ | — | | | $ | 166,557,144 | |
Repurchase Agreement | | | — | | | | 18,436,350 | | | | — | | | | 18,436,350 | |
| | | | | | | | | | | | | | | | |
Total Investments | | $ | 166,557,144 | | | $ | 18,436,350 | | | $ | — | | | $ | 184,993,494 | |
| | | | | | | | | | | | | | | | |
LIABILITIES | | | | | | | | | | | | | | | | |
Securities Sold Short | | | | | | | | | | | | | | | | |
Common Stocks | | | | | | | | | | | | | | | | |
Aerospace & Defense | | | (7,285,263 | ) | | | — | | | | — | | | | (7,285,263 | ) |
Air Freight & Logistics | | | (727,026 | ) | | | — | | | | — | | | | (727,026 | ) |
Auto Components | | | (1,236,272 | ) | | | — | | | | — | | | | (1,236,272 | ) |
Banks | | | (4,955,815 | ) | | | — | | | | — | | | | (4,955,815 | ) |
Beverages | | | (720,416 | ) | | | — | | | | — | | | | (720,416 | ) |
Biotechnology | | | (1,487,191 | ) | | | — | | | | — | | | | (1,487,191 | ) |
Capital Markets | | | (2,604,674 | ) | | | — | | | | 0 | | | | (2,604,674 | ) |
Chemicals | | | (4,040,546 | ) | | | — | | | | — | | | | (4,040,546 | ) |
Commercial Services & Supplies | | | (335,104 | ) | | | — | | | | — | | | | (335,104 | ) |
Containers & Packaging | | | (620,780 | ) | | | — | | | | — | | | | (620,780 | ) |
The Notes to Financial Statements are an integral part of this report.
| | |
| Transamerica Funds | | Annual Report 2014 |
Page 103
Transamerica Long/Short Strategy
SCHEDULE OF INVESTMENTS (continued)
At October 31, 2014
SECURITY VALUATION (continued):
Valuation Inputs (continued) (F)
| | | | | | | | | | | | | | | | |
| | | Level 1
Quoted Prices | | | Level 2
Other Significant
Observable Inputs | | | Level 3
Significant
Unobservable Inputs (G) | | | Value at
October 31, 2014 | |
LIABILITIES (continued) | | | | | | | | | | | | | | | | |
Securities Sold Short (continued) | | | | | | | | | | | | | | | | |
Diversified Consumer Services | | $ | (289,932 | ) | | $ | — | | | $ | — | | | $ | (289,932 | ) |
Diversified Financial Services | | | (395,396 | ) | | | — | | | | — | | | | (395,396 | ) |
Diversified Telecommunication Services | | | (2,574,328 | ) | | | — | | | | — | | | | (2,574,328 | ) |
Electric Utilities | | | (4,476,943 | ) | | | — | | | | — | | | | (4,476,943 | ) |
Electrical Equipment | | | (1,268,431 | ) | | | — | | | | — | | | | (1,268,431 | ) |
Energy Equipment & Services | | | (375,943 | ) | | | — | | | | — | | | | (375,943 | ) |
Food & Staples Retailing | | | (1,906,664 | ) | | | — | | | | — | | | | (1,906,664 | ) |
Food Products | | | (4,696,106 | ) | | | — | | | | — | | | | (4,696,106 | ) |
Gas Utilities | | | (616,839 | ) | | | — | | | | — | | | | (616,839 | ) |
Health Care Equipment & Supplies | | | (3,447,736 | ) | | | — | | | | — | | | | (3,447,736 | ) |
Health Care Providers & Services | | | (3,568,418 | ) | | | — | | | | — | | | | (3,568,418 | ) |
Health Care Technology | | | (359,467 | ) | | | — | | | | — | | | | (359,467 | ) |
Hotels, Restaurants & Leisure | | | (3,205,331 | ) | | | — | | | | — | | | | (3,205,331 | ) |
Household Products | | | (2,771,133 | ) | | | — | | | | — | | | | (2,771,133 | ) |
Industrial Conglomerates | | | (3,755,036 | ) | | | — | | | | — | | | | (3,755,036 | ) |
Insurance | | | (7,159,735 | ) | | | — | | | | — | | | | (7,159,735 | ) |
Internet & Catalog Retail | | | (2,254,967 | ) | | | — | | | | — | | | | (2,254,967 | ) |
Internet Software & Services | | | (761,775 | ) | | | — | | | | — | | | | (761,775 | ) |
IT Services | | | (2,595,194 | ) | | | — | | | | — | | | | (2,595,194 | ) |
Leisure Products | | | (1,767,431 | ) | | | — | | | | — | | | | (1,767,431 | ) |
Machinery | | | (3,291,267 | ) | | | — | | | | — | | | | (3,291,267 | ) |
Media | | | (4,841,575 | ) | | | — | | | | — | | | | (4,841,575 | ) |
Metals & Mining | | | (1,457,046 | ) | | | — | | | | — | | | | (1,457,046 | ) |
Multi-Utilities | | | (3,121,676 | ) | | | — | | | | — | | | | (3,121,676 | ) |
Multiline Retail | | | (717,112 | ) | | | — | | | | — | | | | (717,112 | ) |
Oil, Gas & Consumable Fuels | | | (2,568,345 | ) | | | — | | | | — | | | | (2,568,345 | ) |
Pharmaceuticals | | | (4,354,602 | ) | | | — | | | | — | | | | (4,354,602 | ) |
Real Estate Investment Trusts | | | (11,177,175 | ) | | | — | | | | — | | | | (11,177,175 | ) |
Road & Rail | | | (2,609,515 | ) | | | — | | | | — | | | | (2,609,515 | ) |
Semiconductors & Semiconductor Equipment | | | (10,567,061 | ) | | | — | | | | — | | | | (10,567,061 | ) |
Software | | | (142,532 | ) | | | — | | | | — | | | | (142,532 | ) |
Specialty Retail | | | (742,678 | ) | | | — | | | | — | | | | (742,678 | ) |
Textiles, Apparel & Luxury Goods | | | (2,056,686 | ) | | | — | | | | — | | | | (2,056,686 | ) |
Thrifts & Mortgage Finance | | | (528,367 | ) | | | — | | | | — | | | | (528,367 | ) |
Tobacco | | | (982,269 | ) | | | — | | | | — | | | | (982,269 | ) |
Trading Companies & Distributors | | | (586,613 | ) | | | — | | | | — | | | | (586,613 | ) |
Wireless Telecommunication Services | | | (183,889 | ) | | | — | | | | — | | | | (183,889 | ) |
| | | | | | | | | | | | | | | | |
Total Securities Sold Short | | $ | (122,188,300 | ) | | $ | — | | | $ | 0 | | | $ | (122,188,300 | ) |
| | | | | | | | | | | | | | | | |
FOOTNOTES TO SCHEDULE OF INVESTMENTS:
| (A) | All or a portion of this security has been segregated as collateral for open securities sold short transactions. Total value of securities segregated as collateral for open securities sold short transactions is $71,775,926. |
| (B) | Non-income producing security. |
| (C) | Rate shown reflects the yield at October 31, 2014. |
| (D) | Aggregate cost for federal income tax purposes is $161,567,637. Aggregate gross unrealized appreciation and depreciation for all securities is $23,954,434 and $528,577, respectively. Net unrealized appreciation for tax purposes is $23,425,857. |
| (E) | Fair valued as determined in good faith in accordance with procedures established by the board of trustees. Total aggregate fair value of securities is $0, or less than 0.01% of the Fund’s net assets. |
The Notes to Financial Statements are an integral part of this report.
| | |
| Transamerica Funds | | Annual Report 2014 |
Page 104
Transamerica Long/Short Strategy
SCHEDULE OF INVESTMENTS (continued)
At October 31, 2014
FOOTNOTES TO SCHEDULE OF INVESTMENTS (continued):
| (F) | The Fund recognizes transfers between Levels at the end of the reporting period. There were no transfers between Level 1, 2 and 3 during the period ended October 31, 2014. See the Notes to Financial Statements for more information regarding security valuation and pricing inputs. |
| (G) | Level 3 securities were not considered significant to the Fund. |
DEFINITION:
| | |
| ADR | | American Depositary Receipt |
The Notes to Financial Statements are an integral part of this report.
| | |
| Transamerica Funds | | Annual Report 2014 |
Page 105
Transamerica Mid Cap Value
SCHEDULE OF INVESTMENTS
At October 31, 2014
| | | | | | | | |
| | | Shares | | | Value | |
COMMON STOCKS - 99.0% | | | | | | | | |
Banks - 5.9% | | | | | | | | |
Citizens Financial Group, Inc. (A) | | | 58,500 | | | | $ 1,381,770 | |
City National Corp. | | | 21,548 | | | | 1,696,043 | |
Fifth Third Bancorp | | | 183,549 | | | | 3,669,145 | |
First Republic Bank, Class A | | | 30,717 | | | | 1,564,417 | |
Huntington Bancshares, Inc., Class A | | | 67,305 | | | | 666,993 | |
M&T Bank Corp. (B) | | | 23,497 | | | | 2,870,863 | |
SunTrust Banks, Inc. | | | 83,382 | | | | 3,263,571 | |
Zions Bancorporation | | | 28,215 | | | | 817,389 | |
| | | | | | | | |
| | | | | | | 15,930,191 | |
| | | | | | | | |
Beverages - 1.5% | | | | | | | | |
Constellation Brands, Inc., Class A (A) | | | 22,572 | | | | 2,066,241 | |
Dr. Pepper Snapple Group, Inc. | | | 28,431 | | | | 1,968,847 | |
| | | | | | | | |
| | | | | | | 4,035,088 | |
| | | | | | | | |
Building Products - 0.8% | | | | | | | | |
Fortune Brands Home & Security, Inc. | | | 53,412 | | | | 2,310,069 | |
| | | | | | | | |
Capital Markets - 4.8% | | | | | | | | |
Ameriprise Financial, Inc. | | | 27,937 | | | | 3,524,811 | |
Invesco, Ltd. | | | 70,779 | | | | 2,864,426 | |
Legg Mason, Inc. | | | 30,503 | | | | 1,586,156 | |
Northern Trust Corp. | | | 25,287 | | | | 1,676,528 | |
T. Rowe Price Group, Inc. | | | 40,554 | | | | 3,329,078 | |
| | | | | | | | |
| | | | | | | 12,980,999 | |
| | | | | | | | |
Chemicals - 3.7% | | | | | | | | |
Airgas, Inc. | | | 33,407 | | | | 3,726,217 | |
Albemarle Corp. (B) | | | 29,775 | | | | 1,738,264 | |
Sherwin-Williams Co. | | | 9,188 | | | | 2,109,197 | |
Sigma-Aldrich Corp. | | | 19,014 | | | | 2,584,193 | |
| | | | | | | | |
| | | | | | | 10,157,871 | |
| | | | | | | | |
Communications Equipment - 0.6% | | | | | | | | |
CommScope Holding Co., Inc. (A) | | | 81,565 | | | | 1,756,910 | |
| | | | | | | | |
Consumer Finance - 0.8% | | | | | | | | |
Ally Financial, Inc. (A) | | | 94,772 | | | | 2,151,324 | |
| | | | | | | | |
Containers & Packaging - 3.1% | | | | | | | | |
Ball Corp. | | | 53,222 | | | | 3,429,093 | |
Rock-Tenn Co., Class A | | | 48,678 | | | | 2,489,880 | |
Silgan Holdings, Inc. | | | 51,619 | | | | 2,537,590 | |
| | | | | | | | |
| | | | | | | 8,456,563 | |
| | | | | | | | |
Electric Utilities - 3.0% | | | | | | | | |
Edison International | | | 41,812 | | | | 2,616,595 | |
Westar Energy, Inc., Class A (B) | | | 77,026 | | | | 2,912,353 | |
Xcel Energy, Inc. | | | 79,030 | | | | 2,645,134 | |
| | | | | | | | |
| | | | | | | 8,174,082 | |
| | | | | | | | |
Electrical Equipment - 2.9% | | | | | | | | |
AMETEK, Inc., Class A | | | 50,752 | | | | 2,646,717 | |
Hubbell, Inc., Class B | | | 20,787 | | | | 2,357,454 | |
Regal Beloit Corp. | | | 38,856 | | | | 2,757,610 | |
| | | | | | | | |
| | | | | | | 7,761,781 | |
| | | | | | | | |
Electronic Equipment, Instruments & Components - 2.9% | |
Amphenol Corp., Class A | | | 71,824 | | | | 3,632,858 | |
Arrow Electronics, Inc. (A) | | | 72,506 | | | | 4,122,691 | |
| | | | | | | | |
| | | | | | | 7,755,549 | |
| | | | | | | | |
Food & Staples Retailing - 2.0% | | | | | | | | |
Kroger Co. | | | 64,808 | | | | 3,610,454 | |
Rite Aid Corp. (A) | | | 334,818 | | | | 1,757,794 | |
| | | | | | | | |
| | | | | | | 5,368,248 | |
| | | | | | | | |
| | | | | | | | |
| | | Shares | | | Value | |
COMMON STOCKS (continued) | | | | | | | | |
Food Products - 0.9% | | | | | | | | |
Hershey Co. | | | 26,142 | | | | $ 2,507,279 | |
| | | | | | | | |
Gas Utilities - 2.0% | | | | | | | | |
National Fuel Gas Co. (B) | | | 26,484 | | | | 1,833,487 | |
Questar Corp. | | | 154,050 | | | | 3,714,146 | |
| | | | | | | | |
| | | | | | | 5,547,633 | |
| | | | | �� | | | |
Health Care Equipment & Supplies - 1.2% | | | | | |
CareFusion Corp., Class A (A) | | | 56,467 | | | | 3,239,512 | |
| | | | | | | | |
Health Care Providers & Services - 5.5% | | | | | | | | |
AmerisourceBergen Corp., Class A | | | 38,740 | | | | 3,308,783 | |
Brookdale Senior Living, Inc., Class A (A) | | | 64,142 | | | | 2,162,227 | |
Cigna Corp. | | | 43,604 | | | | 4,341,650 | |
Henry Schein, Inc. (A) | | | 14,355 | | | | 1,723,031 | |
Humana, Inc., Class A | | | 25,153 | | | | 3,492,494 | |
| | | | | | | | |
| | | | | | | 15,028,185 | |
| | | | | | | | |
Hotels, Restaurants & Leisure - 1.3% | | | | | | | | |
Marriott International, Inc., Class A (B) | | | 15,189 | | | | 1,150,567 | |
Starwood Hotels & Resorts Worldwide, Inc. | | | 29,359 | | | | 2,250,661 | |
| | | | | | | | |
| | | | | | | 3,401,228 | |
| | | | | | | | |
Household Durables - 2.5% | | | | | | | | |
Jarden Corp. (A) | | | 45,144 | | | | 2,938,423 | |
Mohawk Industries, Inc. (A) | | | 26,602 | | | | 3,778,548 | |
| | | | | | | | |
| | | | | | | 6,716,971 | |
| | | | | | | | |
Household Products - 0.9% | | | | | | | | |
Energizer Holdings, Inc. | | | 19,575 | | | | 2,400,874 | |
| | | | | | | | |
Industrial Conglomerates - 1.3% | | | | | | | | |
Carlisle Cos., Inc. | | | 40,990 | | | | 3,643,191 | |
| | | | | | | | |
Insurance - 9.4% | | | | | | | | |
Alleghany Corp. (A) | | | 3,984 | | | | 1,770,011 | |
Chubb Corp., Class A | | | 26,260 | | | | 2,609,194 | |
Hartford Financial Services Group, Inc. | | | 76,969 | | | | 3,046,433 | |
Loews Corp. | | | 110,409 | | | | 4,813,832 | |
Marsh & McLennan Cos., Inc. | | | 70,202 | | | | 3,816,883 | |
Old Republic International Corp. | | | 82,680 | | | | 1,221,184 | |
Progressive Corp. | | | 45,259 | | | | 1,195,290 | |
Unum Group | | | 67,627 | | | | 2,262,799 | |
WR Berkley Corp. | | | 38,961 | | | | 2,008,050 | |
XL Group PLC, Class A | | | 80,045 | | | | 2,711,925 | |
| | | | | | | | |
| | | | | | | 25,455,601 | |
| | | | | | | | |
Internet & Catalog Retail - 1.7% | | | | | | | | |
Expedia, Inc. | | | 52,901 | | | | 4,494,998 | |
| | | | | | | | |
IT Services - 1.7% | | | | | | | | |
Jack Henry & Associates, Inc. | | | 66,123 | | | | 3,955,478 | |
Sabre Corp. (B) | | | 32,717 | | | | 562,732 | |
| | | | | | | | |
| | | | | | | 4,518,210 | |
| | | | | | | | |
Machinery - 2.8% | | | | | | | | |
IDEX Corp. | | | 41,140 | | | | 3,081,797 | |
Rexnord Corp. (A) (B) | | | 53,679 | | | | 1,586,214 | |
Snap-on, Inc. | | | 21,461 | | | | 2,835,857 | |
| | | | | | | | |
| | | | | | | 7,503,868 | |
| | | | | | | | |
Media - 2.8% | | | | | | | | |
CBS Corp., Class B | | | 21,977 | | | | 1,191,593 | |
Clear Channel Outdoor Holdings, Inc., Class A | | | 64,593 | | | | 468,945 | |
DISH Network Corp., Class A (A) | | | 41,834 | | | | 2,662,734 | |
Gannett Co., Inc. | | | 68,842 | | | | 2,168,523 | |
Time, Inc. (A) | | | 51,595 | | | | 1,165,531 | |
| | | | | | | | |
| | | | | | | 7,657,326 | |
| | | | | | | | |
The Notes to Financial Statements are an integral part of this report.
| | |
| Transamerica Funds | | Annual Report 2014 |
Page 106
Transamerica Mid Cap Value
SCHEDULE OF INVESTMENTS (continued)
At October 31, 2014
| | | | | | | | |
| | | Shares | | | Value | |
COMMON STOCKS (continued) | | | | | | | | |
Multi-Utilities - 4.6% | | | | | | | | |
CenterPoint Energy, Inc. | | | 106,669 | | | | $ 2,618,724 | |
CMS Energy Corp. | | | 87,214 | | | | 2,849,281 | |
NiSource, Inc., Class B | | | 27,525 | | | | 1,157,702 | |
Sempra Energy | | | 33,702 | | | | 3,707,220 | |
Wisconsin Energy Corp. (B) | | | 46,457 | | | | 2,307,055 | |
| | | | | | | | |
| | | | | | | 12,639,982 | |
| | | | | | | | |
Multiline Retail - 2.2% | | | | | | | | |
Kohl’s Corp. (B) | | | 74,765 | | | | 4,053,758 | |
Nordstrom, Inc. | | | 27,382 | | | | 1,988,207 | |
| | | | | | | | |
| | | | | | | 6,041,965 | |
| | | | | | | | |
Oil, Gas & Consumable Fuels - 4.2% | | | | | | | | |
Energen Corp. | | | 47,490 | | | | 3,215,073 | |
EQT Corp. | | | 23,500 | | | | 2,209,940 | |
PBF Energy, Inc., Class A | | | 43,912 | | | | 1,144,786 | |
QEP Resources, Inc. | | | 67,481 | | | | 1,691,749 | |
Southwestern Energy Co. (A) | | | 97,708 | | | | 3,176,487 | |
| | | | | | | | |
| | | | | | | 11,438,035 | |
| | | | | | | | |
Professional Services - 1.2% | | | | | | | | |
Equifax, Inc. | | | 44,045 | | | | 3,335,968 | |
| | | | | | | | |
Real Estate Investment Trusts - 8.8% | | | | | | | | |
American Campus Communities, Inc. | | | 48,581 | | | | 1,907,776 | |
AvalonBay Communities, Inc. | | | 18,932 | | | | 2,950,363 | |
Boston Properties, Inc. | | | 9,100 | | | | 1,153,425 | |
Brixmor Property Group, Inc. | | | 70,384 | | | | 1,714,554 | |
CBS Outdoor Americas, Inc. | | | 40,388 | | | | 1,229,007 | |
General Growth Properties, Inc. | | | 90,056 | | | | 2,333,351 | |
Kimco Realty Corp. | | | 120,353 | | | | 3,002,807 | |
Rayonier, Inc. (B) | | | 56,135 | | | | 1,878,839 | |
Regency Centers Corp. | | | 32,089 | | | | 1,947,802 | |
Vornado Realty Trust, Class A | | | 29,304 | | | | 3,208,202 | |
Weyerhaeuser Co. | | | 78,023 | | | | 2,641,859 | |
| | | | | | | | |
| | | | | | | 23,967,985 | |
| | | | | | | | |
Semiconductors & Semiconductor Equipment - 3.3% | |
Analog Devices, Inc., Class A | | | 66,741 | | | | 3,311,688 | |
KLA-Tencor Corp. | | | 29,204 | | | | 2,311,497 | |
Xilinx, Inc. | | | 75,141 | | | | 3,342,272 | |
| | | | | | | | |
| | | | | | | 8,965,457 | |
| | | | | | | | |
Software - 1.1% | | | | | | | | |
Synopsys, Inc. (A) | | | 76,243 | | | | 3,124,438 | |
| | | | | | | | |
| | | | | | | | |
| | | Shares | | | Value | |
COMMON STOCKS (continued) | | | | | | | | |
Specialty Retail - 5.0% | | | | | | | | |
AutoZone, Inc. (A) (B) | | | 5,026 | | | | $ 2,781,992 | |
Bed Bath & Beyond, Inc. (A) (B) | | | 29,188 | | | | 1,965,520 | |
Best Buy Co., Inc. | | | 68,278 | | | | 2,331,011 | |
Gap, Inc., Class A (B) | | | 109,551 | | | | 4,150,887 | |
Tiffany & Co. (B) | | | 25,192 | | | | 2,421,455 | |
| | | | | | | | |
| | | | | | | 13,650,865 | |
| | | | | | | | |
Textiles, Apparel & Luxury Goods - 1.3% | |
PVH Corp. | | | 19,104 | | | | 2,184,543 | |
VF Corp. | | | 19,831 | | | | 1,342,162 | |
| | | | | | | | |
| | | | | | | 3,526,705 | |
| | | | | | | | |
Thrifts & Mortgage Finance - 0.4% | | | | | | | | |
Hudson City Bancorp, Inc. | | | 120,685 | | | | 1,164,610 | |
| | | | | | | | |
Trading Companies & Distributors - 0.9% | |
MSC Industrial Direct Co., Inc., Class A (B) | | | 29,356 | | | | 2,376,955 | |
| | | | | | | | |
Total Common Stocks
(Cost $187,653,301) | | | | | | | 269,186,516 | |
| | | | | | | | |
|
SECURITIES LENDING COLLATERAL - 9.5% | |
State Street Navigator Securities Lending Trust - Prime Portfolio 0.16% (C) | | | 25,889,418 | | | | 25,889,418 | |
| | | | | | | | |
Total Securities Lending Collateral
(Cost $25,889,418) | | | | | | | 25,889,418 | |
| | | | | | | | |
| | |
| | | Principal | | | Value | |
REPURCHASE AGREEMENT - 1.0% | | | | | |
State Street Bank & Trust Co.
0.01% (C), dated 10/31/2014, to be repurchased at $2,726,821 on 11/03/2014. Collateralized by a U.S. Government Agency Obligation, 2.50%, due 11/01/2027, and with a value of $2,782,696. | | | $ 2,726,819 | | | | 2,726,819 | |
| | | | | | | | |
Total Repurchase Agreement
(Cost $2,726,819) | | | | | | | 2,726,819 | |
| | | | | | | | |
Total Investments
(Cost $216,269,538) (D) | | | | | | | 297,802,753 | |
Net Other Assets (Liabilities) - (9.5)% | | | | (25,890,686 | ) |
| | | | | | | | |
| | |
Net Assets - 100.0% | | | | | | | $ 271,912,067 | |
| | | | | | | | |
SECURITY VALUATION:
Valuation Inputs (E)
| | | | | | | | | | | | | | | | |
| | | Level 1
Quoted Prices | | | Level 2 Other Significant
Observable Inputs | | | Level 3
Significant
Unobservable Inputs | | | Value at
October 31, 2014 | |
ASSETS | | | | | | | | | | | | | | | | |
Investments | | | | | | | | | | | | | | | | |
Common Stocks | | $ | 269,186,516 | | | $ | — | | | $ | — | | | $ | 269,186,516 | |
Securities Lending Collateral | | | 25,889,418 | | | | — | | | | — | | | | 25,889,418 | |
Repurchase Agreement | | | — | | | | 2,726,819 | | | | — | | | | 2,726,819 | |
| | | | | | | | | | | | | | | | |
Total Investments | | $ | 295,075,934 | | | $ | 2,726,819 | | | $ | — | | | $ | 297,802,753 | |
| | | | | | | | | | | | | | | | |
The Notes to Financial Statements are an integral part of this report.
| | |
| Transamerica Funds | | Annual Report 2014 |
Page 107
Transamerica Mid Cap Value
SCHEDULE OF INVESTMENTS (continued)
At October 31, 2014
FOOTNOTES TO SCHEDULE OF INVESTMENTS:
| (A) | Non-income producing security. |
| (B) | All or a portion of this security is on loan. The value of all securities on loan is $25,318,223. The amount of securities on loan indicated may not correspond with the securities on loan identified because securities with pending sales are in the process of recall from the brokers. |
| (C) | Rate shown reflects the yield at October 31, 2014. |
| (D) | Aggregate cost for federal income tax purposes is $216,966,479. Aggregate gross unrealized appreciation and depreciation for all securities is $82,467,453 and $1,631,179, respectively. Net unrealized appreciation for tax purposes is $80,836,274. |
| (E) | The Fund recognizes transfers between Levels at the end of the reporting period. There were no transfers between Level 1, 2 and 3 during the period ended October 31, 2014. See the Notes to Financial Statements for more information regarding security valuation and pricing inputs. |
The Notes to Financial Statements are an integral part of this report.
| | |
| Transamerica Funds | | Annual Report 2014 |
Page 108
Transamerica Total Return
SCHEDULE OF INVESTMENTS
At October 31, 2014
| | | | | | | | |
| | | Principal | | | Value | |
U.S. GOVERNMENT OBLIGATIONS - 19.7% | |
U.S. Treasury Bond | | | | | | | | |
3.13%, 08/15/2044 | | | $ 35,000,000 | | | | $ 35,432,040 | |
3.38%, 05/15/2044 (A) | | | 8,500,000 | | | | 9,017,301 | |
U.S. Treasury Inflation Indexed Bond | | | | | | | | |
1.75%, 01/15/2028 | | | 5,109,345 | | | | 5,803,899 | |
2.00%, 01/15/2026 | | | 8,868,530 | | | | 10,248,695 | |
2.38%, 01/15/2025 - 01/15/2027 | | | 36,660,588 | | | | 43,557,630 | |
2.50%, 01/15/2029 | | | 23,598,270 | | | | 29,363,257 | |
U.S. Treasury Inflation Indexed Note | | | | | | | | |
0.13%, 01/15/2022 - 01/15/2023 (B) (C) | | | 20,704,419 | | | | 20,377,111 | |
0.13%, 07/15/2022 (A) | | | 19,549,404 | | | | 19,276,025 | |
0.38%, 07/15/2023 | | | 8,790,232 | | | | 8,792,289 | |
0.63%, 07/15/2021 | | | 16,041,776 | | | | 16,485,427 | |
1.13%, 01/15/2021 (B) (C) | | | 12,396,018 | | | | 13,092,327 | |
| | | | | | | | |
Total U.S. Government Obligations
(Cost $210,958,544) | | | | 211,446,001 | |
| | | | | | | | |
|
U.S. GOVERNMENT AGENCY OBLIGATIONS - 6.3% | |
Federal Home Loan Mortgage Corp. | | | | | | | | |
1.32%, 10/25/2044 (D) | | | 301,714 | | | | 315,652 | |
1.52%, 07/25/2044 (D) | | | 301,036 | | | | 303,288 | |
1.85%, 09/01/2035 (D) | | | 40,359 | | | | 42,172 | |
2.25%, 03/01/2034 (D) | | | 91,118 | | | | 92,317 | |
2.35%, 11/01/2033 (D) | | | 94,555 | | | | 101,030 | |
2.36%, 03/01/2034 (D) | | | 112,398 | | | | 120,371 | |
2.37%, 09/01/2035 (D) | | | 335,417 | | | | 360,605 | |
2.38%, 01/01/2036 (D) | | | 2,179,821 | | | | 2,331,895 | |
4.00%, TBA | | | 1,000,000 | | | | 1,060,859 | |
4.50%, 08/01/2025 - 05/01/2037 | | | 87,825 | | | | 95,140 | |
4.50%, TBA | | | 11,000,000 | | | | 11,914,375 | |
6.50%, 07/25/2043 | | | 14,573 | | | | 16,907 | |
Federal Home Loan Mortgage Corp. REMIC | | | | | | | | |
6.50%, 04/15/2029 | | | 2,844 | | | | 3,178 | |
Federal National Mortgage Association | | | | | | | | |
0.50%, 09/25/2042 (D) | | | 254,881 | | | | 253,708 | |
1.32%, 03/01/2044 (D) | | | 693,273 | | | | 721,500 | |
1.32%, 10/01/2044 | | | 316,361 | | | | 322,217 | |
1.85%, 07/01/2035 (D) | | | 218,367 | | | | 231,592 | |
2.17%, 09/01/2035 (D) | | | 578,338 | | | | 615,500 | |
2.31%, 01/01/2026 - 03/01/2034 (D) | | | 153,384 | | | | 163,167 | |
2.34%, 01/01/2028 (D) | | | 28,598 | | | | 30,569 | |
2.40%, 11/01/2033 (D) | | | 109,039 | | | | 116,862 | |
3.50%, 02/01/2027 | | | 322,230 | | | | 341,510 | |
3.50%, TBA | | | 2,000,000 | | | | 2,113,124 | |
4.00%, TBA | | | 1,000,000 | | | | 1,061,719 | |
4.50%, 11/01/2018 - 12/01/2024 | | | 569,881 | | | | 612,510 | |
4.50%, TBA | | | 19,000,000 | | | | 20,554,063 | |
5.00%, 08/01/2020 - 01/01/2030 | | | 2,028,779 | | | | 2,248,451 | |
5.00%, TBA | | | 13,000,000 | | | | 14,343,065 | |
5.50%, 01/01/2037 - 02/01/2037 | | | 177,927 | | | | 198,796 | |
6.00%, 07/01/2035 - 05/01/2041 | | | 5,380,442 | | | | 6,088,677 | |
Federal National Mortgage Association REMIC | | | | | | | | |
0.25%, 01/25/2021 (D) | | | 39,187 | | | | 39,171 | |
6.30%, 10/17/2038 | | | 307,634 | | | | 312,787 | |
Federal National Mortgage Association REMIC, IO | | | | | | | | |
6.95%, 07/25/2034 (D) | | | 888,625 | | | | 218,938 | |
| | | | | | | | |
| | | Principal | | | Value | |
U.S. GOVERNMENT AGENCY OBLIGATIONS (continued) | |
Government National Mortgage Association | | | | | | | | |
1.63%, 05/20/2024 (D) | | | $ 30,542 | | | | $ 31,656 | |
6.50%, 06/20/2032 | | | 14,226 | | | | 16,340 | |
Government National Mortgage Association, IO | | | | | | | | |
6.41%, 04/16/2033 - 10/16/2033 (D) | | | 806,133 | | | | 156,006 | |
6.44%, 09/20/2034 (D) | | | 737,378 | | | | 137,090 | |
6.45%, 08/16/2033 (D) | | | 1,331,864 | | | | 257,293 | |
| | | | | | | | |
Total U.S. Government Agency Obligations
(Cost $66,511,651) | | | | 67,944,100 | |
| | | | | | | | |
|
FOREIGN GOVERNMENT OBLIGATIONS - 10.7% | |
Banco Nacional de Desenvolvimento Economico e Social | | | | | | | | |
3.38%, 09/26/2016, 144A | | | 300,000 | | | | 306,375 | |
Brazil Letras do Tesouro Nacional Zero Coupon, 04/01/2015 - 07/01/2018 | | | BRL 107,300,000 | | | | 36,611,292 | |
Bundesrepublik Deutschland Bundesobligation Inflation-Linked Bond
0.75%, 04/15/2018 | | | EUR 11,020,360 | | | | 14,415,603 | |
Italy Buoni Poliennali del Tesoro | | | | | | | | |
3.75%, 04/15/2016 - 08/01/2016 | | | 9,400,000 | | | | 12,383,148 | |
4.75%, 09/01/2021 | | | 1,800,000 | | | | 2,690,868 | |
Italy Certificati di Credito del Tesoro Zero Coupon, 12/31/2015 - 04/29/2016 | | | 6,200,000 | | | | 7,708,176 | |
Mexican Bonos
9.50%, 12/18/2014 | | | MXN 271,510,000 | | | | 20,310,349 | |
Spain Government Bond | | | | | | | | |
2.10%, 04/30/2017 | | | EUR 6,100,000 | | | | 7,912,788 | |
3.80%, 01/31/2017 | | | 1,500,000 | | | | 2,013,750 | |
5.50%, 07/30/2017 | | | 2,500,000 | | | | 3,538,457 | |
2.75%, 10/31/2024, Reg S | | | 5,300,000 | | | | 7,022,398 | |
| | | | | | | | |
Total Foreign Government Obligations
(Cost $123,588,908) | | | | 114,913,204 | |
| | | | | | | | |
|
MORTGAGE-BACKED SECURITIES - 4.8% | |
Alternative Loan Trust | | | | | | | | |
Series 2003-J1, Class 4A1 | | | | | | | | |
6.00%, 10/25/2032 | | | $296 | | | | 289 | |
Series 2005-81, Class A1 | | | | | | | | |
0.43%, 02/25/2037 (D) | | | 522,673 | | | | 409,616 | |
Series 2006-30T1, Class 1A3 | | | | | | | | |
6.25%, 11/25/2036 | | | 245,676 | | | | 231,180 | |
Series 2006-J8, Class A2 | | | | | | | | |
6.00%, 02/25/2037 | | | 262,847 | | | | 207,860 | |
Series 2006-OA17, Class 1A1A | | | | | | | | |
0.35%, 12/20/2046 (D) | | | 1,985,867 | | | | 1,509,039 | |
Series 2007-2CB, Class 1A13 | | | | | | | | |
5.75%, 03/25/2037 (D) | | | 429,086 | | | | 364,372 | |
Series 2007-HY4, Class 1A1 | | | | | | | | |
2.56%, 06/25/2037 (D) | | | 978,506 | | | | 806,429 | |
Series 2007-OA6, Class A1B | | | | | | | | |
0.35%, 06/25/2037 (D) | | | 816,631 | | | | 686,357 | |
American Home Mortgage Assets LLC | | | | | | | | |
Series 2006-2, Class 2A1 | | | | | | | | |
0.34%, 09/25/2046 (D) | | | 730,842 | | | | 538,480 | |
Series 2006-4, Class 1A12 | | | | | | | | |
0.36%, 10/25/2046 (D) | | | 1,568,773 | | | | 1,086,150 | |
The Notes to Financial Statements are an integral part of this report.
| | |
| Transamerica Funds | | Annual Report 2014 |
Page 109
Transamerica Total Return
SCHEDULE OF INVESTMENTS (continued)
At October 31, 2014
| | | | | | | | |
| | | Principal | | | Value | |
MORTGAGE-BACKED SECURITIES (continued) | |
Banc of America Funding Trust | | | | | | | | |
Series 2005-D, Class A1 | | | | | | | | |
2.63%, 05/25/2035 (D) | | | $ 431,046 | | | | $ 439,531 | |
Series 2006-J, Class 4A1 | | | | | | | | |
2.83%, 01/20/2047 (D) | | | 62,468 | | | | 47,864 | |
Banc of America Funding, Ltd.
Series 2012-R5, Class A
0.42%, 10/03/2039, 144A (D) | | | 2,800,877 | | | | 2,790,854 | |
Bear Stearns Alt-A Trust
Series 2006-6, Class 32A1
2.56%, 11/25/2036 (D) | | | 302,476 | | | | 206,736 | |
Bear Stearns ARM Trust | | | | | | | | |
Series 2003-5, Class 2A1 | | | | | | | | |
2.44%, 08/25/2033 (D) | | | 433,209 | | | | 440,015 | |
Series 2003-8, Class 2A1 | | | | | | | | |
2.74%, 01/25/2034 (D) | | | 10,414 | | | | 10,672 | |
Series 2003-8, Class 4A1 | | | | | | | | |
2.77%, 01/25/2034 (D) | | | 94,386 | | | | 95,110 | |
Series 2005-2, Class A2 | | | | | | | | |
2.53%, 03/25/2035 (D) | | | 245,637 | | | | 247,872 | |
Series 2005-5, Class A2 | | | | | | | | |
2.27%, 08/25/2035 (D) | | | 134,038 | | | | 134,584 | |
Bear Stearns Structured Products, Inc. Trust
Series 2007-R6, Class 1A1
2.51%, 01/26/2036 (D) | | | 242,593 | | | | 193,008 | |
Berica 8 Residential MBS Srl
Series 2008, Class A
0.38%, 03/31/2048, Reg S (D) | | | EUR 5,315,640 | | | | 6,506,986 | |
Berica ABS Srl
Series 2011-1, Class A1
0.38%, 12/31/2055, Reg S (D) | | | 2,987,039 | | | | 3,719,106 | |
CD Commercial Mortgage Trust
Series 2007-CD5, Class A4
5.89%, 11/15/2044 (D) | | | $ 185,293 | | | | 203,561 | |
Chevy Chase Funding LLC Mortgage-Backed Certificates
Series 2004-3A, Class A1
0.40%, 08/25/2035, 144A (D) | | | 147,971 | | | | 135,174 | |
CHL Mortgage Pass-Through Trust | | | | | | | | |
Series 2002-30, Class M | | | | | | | | |
2.48%, 10/19/2032 (D) | | | 10,923 | | | | 8,868 | |
Series 2004-12, Class 12A1 | | | | | | | | |
2.49%, 08/25/2034 (D) | | | 235,343 | | | | 204,119 | |
Citigroup Mortgage Loan Trust
Series 2007-10, Class 22AA
3.67%, 09/25/2037 (D) | | | 1,282,825 | | | | 1,115,822 | |
Citigroup Mortgage Loan Trust, Inc.
Series 2005-6, Class A2
2.28%, 09/25/2035 (D) | | | 160,867 | | | | 160,795 | |
Credit Suisse First Boston Mortgage Securities Corp. | | | | | | | | |
Series 2002-P1A, Class A | | | | | | | | |
0.80%, 03/25/2032, 144A (D) | | | 354 | | | | 327 | |
Series 2003-AR15, Class 2A1 | | | | | | | | |
2.19%, 06/25/2033 (D) | | | 578,972 | | | | 570,513 | |
Series 2003-AR28, Class 2A1 | | | | | | | | |
2.50%, 12/25/2033 (D) | | | 4,537,029 | | | | 4,518,627 | |
| | | | | | | | |
| | | Principal | | | Value | |
MORTGAGE-BACKED SECURITIES (continued) | |
Deutsche ALT-A Securities, Inc., Alternate Loan Trust
Series 2005-6, Class 2A3
5.50%, 12/25/2035 | | | $ 557,746 | | | | $ 474,804 | |
First Horizon Alternative Mortgage Securities
Series 2007-FA4, Class 1A8
6.25%, 08/25/2037 | | | 278,240 | | | | 218,910 | |
First Horizon Mortgage Pass-Through Trust
Series 2005-AR3, Class 2A1
2.61%, 08/25/2035 (D) | | | 53,669 | | | | 49,917 | |
GSR Mortgage Loan Trust
Series 2005-AR6, Class 2A1
2.66%, 09/25/2035 (D) | | | 75,436 | | | | 75,671 | |
HarborView Mortgage Loan Trust | | | | | | | | |
Series 2006-12, Class 2A2A | | | | | | | | |
0.35%, 01/19/2038 (D) | | | 752,538 | | | | 635,293 | |
Series 2006-6, Class 5A1A | | | | | | | | |
5.06%, 08/19/2036 (D) | | | 259,803 | | | | 236,287 | |
Series 2007-1, Class 2A1A | | | | | | | | |
0.29%, 03/19/2037 (D) | | | 772,848 | | | | 635,717 | |
Independent National Mortage Corp. Index Mortgage Loan Trust
Series 2004-AR11, Class 2A
2.54%, 12/25/2034 (D) | | | 34,012 | | | | 31,277 | |
JPMorgan Mortgage Trust | | | | | | | | |
Series 2005-A1, Class 6T1 | | | | | | | | |
2.64%, 02/25/2035 (D) | | | 48,482 | | | | 47,518 | |
Series 2007-A1, Class 5A5 | | | | | | | | |
2.59%, 07/25/2035 (D) | | | 419,831 | | | | 426,583 | |
LB-UBS Commercial Mortgage Trust
Series 2007-C7, Class A3
5.87%, 09/15/2045 (D) | | | 1,429,237 | | | | 1,585,392 | |
Luminent Mortgage Trust
Series 2006-6, Class A1
0.35%, 10/25/2046 (D) | | | 440,571 | | | | 375,445 | |
MASTR Alternative Loan Trust
Series 2006-2, Class 2A1
0.55%, 03/25/2036 (D) | | | 114,469 | | | | 32,766 | |
Merrill Lynch Mortgage Investors Trust | | | | | | | | |
Series 2005-2, Class 3A | | | | | | | | |
1.15%, 10/25/2035 (D) | | | 32,332 | | | | 30,640 | |
Series 2005-3, Class 4A | | | | | | | | |
0.40%, 11/25/2035 (D) | | | 22,712 | | | | 21,395 | |
Series 2005-A10, Class A | | | | | | | | |
0.36%, 02/25/2036 (D) | | | 134,622 | | | | 123,239 | |
Morgan Stanley Mortgage Loan Trust | | | | | | | | |
Series 2007-10XS, Class A1 | | | | | | | | |
6.00%, 07/25/2047 (D) | | | 244,455 | | | | 196,573 | |
Series 2007-3XS, Class 2A1A | | | | | | | | |
0.22%, 01/25/2047 (D) | | | 51,588 | | | | 51,404 | |
Series 2007-8XS, Class A1 | | | | | | | | |
5.75%, 04/25/2037 (D) | | | 280,366 | | | | 208,118 | |
MRFC Mortgage Pass-Through Trust
Series 2000-TBC3, Class A1
0.59%, 12/15/2030 (D) | | | 169,035 | | | | 160,942 | |
RALI Series Trust
Series 2008-QR1, Class 1A1
1.55%, 08/25/2036 (D) | | | 1,643,049 | | | | 1,307,538 | |
The Notes to Financial Statements are an integral part of this report.
| | |
| Transamerica Funds | | Annual Report 2014 |
Page 110
Transamerica Total Return
SCHEDULE OF INVESTMENTS (continued)
At October 31, 2014
| | | | | | | | |
| | | Principal | | | Value | |
MORTGAGE-BACKED SECURITIES (continued) | |
Reperforming Loan REMIC Trust | | | | | | | | |
Series 2004-R1, Class 2A | | | | | | | | |
6.50%, 11/25/2034, 144A | | | $ 301,553 | | | | $ 315,664 | |
Series 2005-R2, Class 1AF1 | | | | | | | | |
0.49%, 06/25/2035, 144A (D) | | | 793,046 | | | | 703,948 | |
Residential Asset Securitization Trust
Series 2006-R1, Class A2
0.55%, 01/25/2046 (D) | | | 222,551 | | | | 118,352 | |
RFMSI Trust
Series 2003-S9, Class A1
6.50%, 03/25/2032 | | | 1,374 | | | | 1,425 | |
RMAC Securities No. 1 PLC
Series 2007-NS1X, Class A2B
0.38%, 06/12/2044, Reg S (D) | | | 2,908,068 | | | | 2,768,442 | |
Selkirk No. 1, Ltd.
Series 2001, Class A
1.33%, 02/20/2041, 144A | | | 2,141,550 | | | | 2,127,561 | |
Selkirk No. 2, Ltd.
Series 2002, Class A
1.18%, 02/20/2041, 144A | | | 289,512 | | | | 289,564 | |
Sequoia Mortgage Trust | | | | | | | | |
Series 2004-11, Class A2 | | | | | | | | |
0.65%, 12/20/2034 (D) | | | 1,817,647 | | | | 1,725,376 | |
Series 2007-1, Class 1A1 | | | | | | | | |
2.34%, 01/20/2047 (D) | | | 420,880 | | | | 362,839 | |
Series 2010, Class 2A1 | | | | | | | | |
0.92%, 10/20/2027 (D) | | | 16,471 | | | | 15,439 | |
Structured Adjustable Rate Mortgage Loan Trust | | | | | | | | |
Series 2004-12, Class 3A1 | | | | | | | | |
2.41%, 09/25/2034 (D) | | | 581,465 | | | | 583,683 | |
Series 2004-19, Class 2A1 | | | | | | | | |
1.52%, 01/25/2035 (D) | | | 154,123 | | | | 123,028 | |
Structured Asset Mortgage Investments II Trust | | | | | | | | |
Series 2005-AR5, Class A1 | | | | | | | | |
0.41%, 07/19/2035 (D) | | | 32,958 | | | | 30,189 | |
Series 2005-AR5, Class A2 | | | | | | | | |
0.41%, 07/19/2035 (D) | | | 42,517 | | | | 40,982 | |
Series 2005-AR5, Class A3 | | | | | | | | |
0.41%, 07/19/2035 (D) | | | 85,642 | | | | 81,227 | |
Series 2005-AR8, Class A1A | | | | | | | | |
0.43%, 02/25/2036 (D) | | | 425,368 | | | | 341,321 | |
Series 2006-AR3, Class 12A1 | | | | | | | | |
0.37%, 05/25/2036 (D) | | | 509,510 | | | | 387,228 | |
Series 2006-AR6, Class 2A1 | | | | | | | | |
0.34%, 07/25/2046 (D) | | | 1,841,146 | | | | 1,484,317 | |
Structured Asset Mortgage Investments Trust
Series 2002-AR3, Class A1
0.82%, 09/19/2032 (D) | | | 10,872 | | | | 10,564 | |
WaMu Mortgage Pass-Through Certificates Trust | | | | | | | | |
Series 2002-AR2, Class A | | | | | | | | |
1.92%, 02/27/2034 (D) | | | 10,991 | | | | 10,766 | |
Series 2002-AR9, Class 1A | | | | | | | | |
1.51%, 08/25/2042 (D) | | | 6,778 | | | | 6,495 | |
Series 2003-AR5, Class A7 | | | | | | | | |
2.44%, 06/25/2033 (D) | | | 411,820 | | | | 415,781 | |
Series 2003-AR9, Class 2A | | | | | | | | |
2.44%, 09/25/2033 (D) | | | 723,272 | | | | 729,532 | |
Series 2006-AR19, Class 1A | | | | | | | | |
0.85%, 01/25/2047 (D) | | | 798,070 | | | | 649,754 | |
| | | | | | | | |
| | | Principal | | | Value | |
MORTGAGE-BACKED SECURITIES (continued) | |
WaMu Mortgage Pass-Through Certificates Trust (continued) | |
Series 2006-AR19, Class 1A1A | | | | | | | | |
0.84%, 01/25/2047 (D) | | | $ 679,570 | | | | $ 614,217 | |
Series 2006-AR9, Class 2A | | | | | | | | |
2.17%, 08/25/2046 (D) | | | 416,823 | | | | 376,367 | |
Series 2007-OA1, Class A1A | | | | | | | | |
0.81%, 02/25/2047 (D) | | | 574,857 | | | | 466,981 | |
Wells Fargo Mortgage-Backed Securities Trust | | | | | | | | |
Series 2004-CC, Class A1 | | | | | | | | |
2.62%, 01/25/2035 (D) | | | 125,042 | | | | 125,490 | |
Series 2005-AR2, Class 1A1 | | | | | | | | |
2.62%, 03/25/2035 (D) | | | 1,787,887 | | | | 1,812,931 | |
Series 2006-AR4, Class 2A6 | | | | | | | | |
5.60%, 04/25/2036 (D) | | | 106,254 | | | | 35,387 | |
Series 2006-AR8, Class 2A4 | | | | | | | | |
2.60%, 04/25/2036 (D) | | | 246,412 | | | | 239,014 | |
| | | | | | | | |
Total Mortgage-Backed Securities
(Cost $49,587,178) | | | | 51,509,209 | |
| | | | | | | | |
| | |
ASSET-BACKED SECURITIES - 8.7% | | | | | | | | |
ABFC Trust | | | | | | | | |
Series 2004-OPT4, Class A1 | | | | | | | | |
0.77%, 04/25/2034 (D) | | | 427,671 | | | | 422,925 | |
Series 2004-OPT5, Class A1 | | | | | | | | |
0.85%, 06/25/2034 (D) | | | 262,537 | | | | 243,962 | |
ACE Securities Corp. Home Equity Loan Trust
Series 2006-HE1, Class A1A
0.35%, 02/25/2036 (D) | | | 4,351,388 | | | | 4,311,359 | |
Ally Auto Receivables Trust
Series 2014-1, Class A2
0.48%, 02/15/2017 | | | 8,600,000 | | | | 8,604,816 | |
ALM V, Ltd.
Series 2012-5A, Class A1R
1.46%, 02/13/2023, 144A (D) | | | 10,000,000 | | | | 9,996,280 | |
Amortizing Residential Collateral Trust
Series 2002-BC4, Class A
0.73%, 07/25/2032 (D) | | | 3,806 | | | | 3,491 | |
Bear Stearns Asset-Backed Securities I Trust | | | | | | | | |
Series 2006-HE1, Class 1M2 | | | | | | | | |
0.58%, 12/25/2035 (D) | | | 4,500,000 | | | | 4,031,672 | |
Series 2007-AQ1, Class A1 | | | | | | | | |
0.26%, 11/25/2036 (D) | | | 494,756 | | | | 471,221 | |
Bear Stearns Asset-Backed Securities Trust | | | | | | | | |
Series 2002-2, Class A1 | | | | | | | | |
0.81%, 10/25/2032 (D) | | | 9,942 | | | | 9,426 | |
Series 2006-SD4, Class 1A1 | | | | | | | | |
2.96%, 10/25/2036 (D) | | | 535,518 | | | | 522,937 | |
C-BASS Trust
Series 2007-CB1, Class AF1A
0.22%, 01/25/2037 (D) | | | 407,938 | | | | 181,796 | |
CIFC Funding, Ltd.
Series 2012-1AR, Class A1R
1.38%, 08/14/2024, 144A (D) | | | 4,400,000 | | | | 4,399,248 | |
Citibank Omni Master Trust
Series 2009-A17, Class A17
4.90%, 11/15/2018, 144A | | | 8,800,000 | | | | 8,815,189 | |
COA Summit CLO, Ltd.
Series 2014-1A, Class A1
1.58%, 04/20/2023, 144A (D) | | | 4,200,000 | | | | 4,200,953 | |
The Notes to Financial Statements are an integral part of this report.
| | |
| Transamerica Funds | | Annual Report 2014 |
Page 111
Transamerica Total Return
SCHEDULE OF INVESTMENTS (continued)
At October 31, 2014
| | | | | | | | |
| | | Principal | | | Value | |
ASSET-BACKED SECURITIES (continued) | | | | | |
Countrywide Asset-Backed Certificates
Series 2006-26, Class 2A3
0.32%, 06/25/2037 (D) | | | $ 6,021,798 | | | | $ 5,450,973 | |
Denver Arena Trust Revenue Backed Note
6.94%, 11/15/2019, 144A (E) | | | 48,757 | | | | 48,692 | |
Gazprom OAO Via GAZ Capital SA
8.15%, 04/11/2018, 144A | | | 1,000,000 | | | | 1,104,640 | |
Home Equity Asset Trust
Series 2002-1, Class A4
0.75%, 11/25/2032 (D) | | | 1,026 | | | | 902 | |
JPMorgan Mortgage Acquisition Trust
Series 2007-CH3, Class A5
0.41%, 03/25/2037 (D) | | | 3,500,000 | | | | 2,656,563 | |
Mid-State Trust IV
Series 4, Class A
8.33%, 04/01/2030 | | | 83,420 | | | | 84,543 | |
National Collegiate Student Loan Trust
Series 2005-1, Class A4
0.39%, 11/27/2028 (D) | | | 1,268,954 | | | | 1,244,533 | |
Nautique Funding, Ltd.
Series 2006-1A, Class A1A
0.48%, 04/15/2020, 144A (D) | | | 2,592,172 | | | | 2,582,939 | |
New Century Home Equity Loan Trust
Series 2006-1, Class A2B
0.33%, 05/25/2036 (D) | | | 119,576 | | | | 84,254 | |
Park Place Securities, Inc.
Series 2005-WCW1, Class A1B
0.41%, 09/25/2035 (D) | | | 43,071 | | | | 42,783 | |
Park Place Securities, Inc. Asset-Backed Pass-Through Certificates | | | | | | | | |
Series 2005-WCW2, Class M2 | | | | | | | | |
0.68%, 07/25/2035 (D) | | | 500,000 | | | | 428,694 | |
Popular ABS Mortgage Pass-Through Trust | | | | | | | | |
Series 2006-A, Class M1 | | | | | | | | |
0.54%, 02/25/2036 (D) | | | 500,000 | | | | 410,977 | |
Porsche Financial Auto Securitization Trust | | | | | | | | |
Series 2014-1, Class A1 | | | | | | | | |
0.18%, 05/26/2015, 144A | | | 1,123,582 | | | | 1,123,582 | |
Race Point V CLO, Ltd. | | | | | | | | |
Series 2011-5AR, Class AR | | | | | | | | |
1.53%, 12/15/2022, 144A (D) | | | 4,600,000 | | | | 4,599,112 | |
RASC Series Trust | | | | | | | | |
Series 2005-KS11, Class M2 | | | | | | | | |
0.57%, 12/25/2035 (D) | | | 6,500,000 | | | | 5,290,851 | |
Securitized Asset-Backed Receivables LLC | | | | | | | | |
Series 2007-HE1, Class A2A | | | | | | | | |
0.21%, 12/25/2036 (D) | | | 74,599 | | | | 26,937 | |
Small Business Administration Participation Certificates | | | | | | | | |
Series 2003-20I, Class 1 | | | | | | | | |
5.13%, 09/01/2023 | | | 15,901 | | | | 17,231 | |
Series 2004-20C, Class 1 | | | | | | | | |
4.34%, 03/01/2024 | | | 129,341 | | | | 136,064 | |
Specialty Underwriting & Residential Finance Trust | | | | | | | | |
Series 2004-BC2, Class M1 | | | | | | | | |
0.98%, 05/25/2035 (D) | | | 4,841,353 | | | | 4,586,974 | |
| | | | | | | | |
| | | Principal | | | Value | |
ASSET-BACKED SECURITIES (continued) | | | | | |
Structured Asset Securities Corp. Mortgage Pass-Through Certificates | | | | | | | | |
Series 2002-HF1, Class A | | | | | | | | |
0.73%, 01/25/2033 (D) | | | $ 2,134 | | | | $ 1,978 | |
Series 2003-22A, Class 2A1 | | | | | | | | |
2.35%, 06/25/2033 (D) | | | 629,098 | | | | 603,974 | |
Venture VIII CDO, Ltd. | | | | | | | | |
Series 2007-8A, Class A2A | | | | | | | | |
0.45%, 07/22/2021, 144A (D) | | | 5,955,324 | | | | 5,832,215 | |
Wells Fargo Home Equity Asset-Backed Securities Trust | | | | | | | | |
Series 2005-4, Class M2 | | | | | | | | |
0.63%, 12/25/2035 (D) | | | 6,500,000 | | | | 5,316,987 | |
Wood Street CLO BV | | | | | | | | |
Series I, Class A | | | | | | | | |
0.66%, 11/22/2021, Reg S (D) | | | EUR 4,412,634 | | | | 5,500,397 | |
| | | | | | | | |
Total Asset-Backed Securities
(Cost $91,451,714) | | | | | | | 93,392,070 | |
| | | | | | | | |
|
MUNICIPAL GOVERNMENT OBLIGATIONS - 4.5% | |
Bay Area Toll Authority, Revenue Bonds | | | | | | | | |
Series S3 | | | | | | | | |
6.91%, 10/01/2050 | | | $ 3,600,000 | | | | 5,168,628 | |
Buckeye Tobacco Settlement Financing Authority, Revenue Bonds | | | | | | | | |
Series A-2 | | | | | | | | |
5.88%, 06/01/2047 | | | 600,000 | | | | 473,976 | |
Chicago Transit Authority, Revenue Bonds | | | | | | | | |
Series B | | | | | | | | |
6.90%, 12/01/2040 | | | 3,400,000 | | | | 4,220,420 | |
Citizens Property Insurance Corp., Revenue Bonds
Series A-1 | | | | | | | | |
5.00%, 06/01/2020 | | | 4,735,000 | | | | 5,539,334 | |
Golden State Tobacco Securitization Corp., Revenue Bonds | | | | | | | | |
Series A-1 | | | | | | | | |
5.00%, 06/01/2033 | | | 300,000 | | | | 245,103 | |
Kentucky State Property & Building Commission, Revenue Bonds | | | | | |
Series C | | | | | | | | |
5.37%, 11/01/2025 | | | 100,000 | | | | 112,228 | |
New Jersey State Turnpike Authority, Revenue Bonds | | | | | | | | |
Series F | | | | | | | | |
7.41%, 01/01/2040 | | | 600,000 | | | | 878,628 | |
New York City Transitional Finance Authority Future Tax Secured Revenue, Revenue Bonds | | | | | | | | |
4.73%, 11/01/2023 | | | 100,000 | | | | 112,370 | |
New York City Water & Sewer System, Revenue Bonds | | | | | | | | |
6.28%, 06/15/2042 | | | 1,400,000 | | | | 1,625,442 | |
North Carolina Medical Care Commission, Revenue Bonds | | | | | | | | |
Series A | | | | | | | | |
5.00%, 06/01/2035 | | | 10,280,000 | | | | 11,860,858 | |
Port Authority of New York & New Jersey, Revenue Bonds | | | | | | | | |
4.46%, 10/01/2062 | | | 7,600,000 | | | | 7,611,400 | |
The Notes to Financial Statements are an integral part of this report.
| | |
| Transamerica Funds | | Annual Report 2014 |
Page 112
Transamerica Total Return
SCHEDULE OF INVESTMENTS (continued)
At October 31, 2014
| | | | | | | | |
| | | Principal | | | Value | |
MUNICIPAL GOVERNMENT OBLIGATIONS (continued) | |
State of California, General Obligation Unlimited | | | | | | | | |
7.50%, 04/01/2034 | | | $ 300,000 | | | | $ 437,700 | |
7.55%, 04/01/2039 | | | 1,800,000 | | | | 2,696,994 | |
7.60%, 11/01/2040 | | | 1,800,000 | | | | 2,724,390 | |
7.95%, 03/01/2036 | | | 2,200,000 | | | | 2,719,816 | |
Tobacco Settlement Finance Authority, Revenue Bonds | | | | | | | | |
Series A | | | | | | | | |
7.47%, 06/01/2047 | | | 1,040,000 | | | | 875,982 | |
Tobacco Settlement Financing Corp., Revenue Bonds | | | | | | | | |
5.50%, 06/01/2026 | | | 95,000 | | | | 97,936 | |
Series 1A | | | | | | | | |
5.00%, 06/01/2041 | | | 1,400,000 | | | | 1,043,980 | |
| | | | | | | | |
Total Municipal Government Obligations
(Cost $46,487,160) | | | | 48,445,185 | |
| | | | | | | | |
|
PREFERRED CORPORATE DEBT SECURITIES - 0.3% | |
Banks - 0.3% | | | | | | | | |
HSBC USA Capital Trust I | | | | | | | | |
7.81%, 12/15/2026, 144A (E) | | | 1,000,000 | | | | 1,012,341 | |
Lloyds Banking Group PLC | | | | | | | | |
7.63%, 06/27/2023, Reg S (D) (F) (G) | | | GBP 500,000 | | | | 805,849 | |
Royal Bank of Scotland Group PLC | | | | | | | | |
6.99%, 10/05/2017, 144A (D) (G) | | | $ 1,300,000 | | | | 1,475,500 | |
| | | | | | | | |
| | | | | | | 3,293,690 | |
| | | | | | | | |
Total Preferred Corporate Debt Securities
(Cost $3,339,849) | | | | 3,293,690 | |
| | | | | | | | |
|
CORPORATE DEBT SECURITIES - 34.3% | |
Automobiles - 2.5% | | | | | | | | |
BMW US Capital LLC | | | | | | | | |
Series MTN | | | | | | | | |
0.57%, 06/02/2017, Reg S (D) (E) | | | 9,200,000 | | | | 9,202,944 | |
Daimler Finance North America LLC | | | | | | | | |
1.30%, 07/31/2015, 144A | | | 8,200,000 | | | | 8,245,387 | |
Volkswagen International Finance NV | | | | | | | | |
1.63%, 03/22/2015, 144A | | | 9,300,000 | | | | 9,342,110 | |
| | | | | | | | |
| | | | | | | 26,790,441 | |
| | | | | | | | |
Banks - 8.3% | | | | | | | | |
Banco Santander Chile | | | | | | | | |
1.13%, 04/11/2017, 144A (D) | | | 3,500,000 | | | | 3,483,249 | |
Bank of Nova Scotia | | | | | | | | |
0.54%, 04/11/2017 (D) | | | 8,500,000 | | | | 8,495,861 | |
Barclays Bank PLC | | | | | | | | |
7.63%, 11/21/2022 | | | 3,900,000 | | | | 4,248,563 | |
10.18%, 06/12/2021, 144A | | | 2,240,000 | | | | 3,007,585 | |
Barclays PLC | | | | | | | | |
6.50%, 09/15/2019 (D) (G) | | | EUR 800,000 | | | | 981,567 | |
Cie de Financement Foncier SA | | | | | | | | |
2.50%, 09/16/2015, 144A | | | $ 6,000,000 | | | | 6,103,938 | |
CIT Group, Inc. | | | | | | | | |
4.75%, 02/15/2015, 144A | | | 1,900,000 | | | | 1,914,250 | |
Cooperatieve Centrale Raiffeisen-Boerenleenbank BA | | | | | | | | |
11.00%, 06/30/2019, 144A (D) (G) | | | 2,978,000 | | | | 3,886,290 | |
| | | | | | | | |
| | | Principal | | | Value | |
CORPORATE DEBT SECURITIES (continued) | |
Banks (continued) | | | | | | | | |
Cooperatieve Centrale Raiffeisen-Boerenleenbank BA (continued)
Series MTN | | | | | | | | |
6.88%, 03/19/2020, Reg S (F) | | | EUR 3,300,000 | | | | $ 4,910,782 | |
Credit Agricole SA | | | | | | | | |
1.63%, 04/15/2016, 144A (E) | | | $ 4,000,000 | | | | 4,040,348 | |
7.88%, 01/23/2024, 144A (D) (F) (G) | | | 700,000 | | | | 722,540 | |
HSBC Capital Funding, LP | | | | | | | | |
10.18%, 06/30/2030, 144A (D) (G) | | | 150,000 | | | | 223,875 | |
KBC Bank NV | | | | | | | | |
8.00%, 01/25/2023, Reg S (D) (F) | | | 2,000,000 | | | | 2,222,500 | |
Lloyds Bank PLC | | | | | | | | |
12.00%, 12/16/2024, 144A (D) (G) | | | 5,300,000 | | | | 7,671,750 | |
Series MTN | | | | | | | | |
5.80%, 01/13/2020, 144A (F) | | | 700,000 | | | | 812,154 | |
Novo Banco SA
Series MTN | | | | | | | | |
5.88%, 11/09/2015, Reg S (H) | | | EUR 2,400,000 | | | | 2,919,589 | |
Sberbank of Russia Via SB Capital SA | | | | | | | | |
5.50%, 07/07/2015, Reg S (F) | | | $ 2,500,000 | | | | 2,537,025 | |
Toronto-Dominion Bank
Series MTN | | | | | | | | |
0.69%, 09/09/2016 (D) | | | 5,300,000 | | | | 5,326,421 | |
VTB Bank OJSC Via VTB Capital SA | | | | | | | | |
6.47%, 03/04/2015, Reg S (F) | | | 2,500,000 | | | | 2,515,250 | |
Wells Fargo & Co. | | | | | | | | |
7.98%, 03/15/2018 (D) (G) | | | 6,300,000 | | | | 6,943,778 | |
Series MTN | | | | | | | | |
0.53%, 06/02/2017 (D) | | | 16,500,000 | | | | 16,470,481 | |
| | | | | | | | |
| | | | | | | 89,437,796 | |
| | | | | | | | |
Biotechnology - 0.6% | | | | | | | | |
Amgen, Inc. | | | | | | | | |
0.61%, 05/22/2017 (D) | | | 5,800,000 | | | | 5,810,260 | |
| | | | | | | | |
Capital Markets - 3.0% | | | | | | | | |
Goldman Sachs Group, Inc. | | | | | | | | |
0.50%, 11/17/2014 (D) | | | EUR 500,000 | | | | 626,644 | |
5.35%, 01/15/2016 | | | $ 11,048,000 | | | | 11,648,293 | |
Series MTN | | | | | | | | |
1.33%, 11/15/2018 (D) | | | 1,300,000 | | | | 1,313,309 | |
Morgan Stanley | | | | | | | | |
3.45%, 11/02/2015 | | | 4,200,000 | | | | 4,309,494 | |
Series MTN | | | | | | | | |
4.10%, 01/26/2015 | | | 900,000 | | | | 907,259 | |
5.95%, 12/28/2017 | | | 4,900,000 | | | | 5,506,787 | |
6.00%, 04/28/2015 | | | 4,800,000 | | | | 4,923,826 | |
6.63%, 04/01/2018 | | | 2,000,000 | | | | 2,290,312 | |
UBS AG | | | | | | | | |
7.63%, 08/17/2022 | | | 600,000 | | | | 708,094 | |
| | | | | | | | |
| | | | | | | 32,234,018 | |
| | | | | | | | |
Consumer Finance - 1.4% | | | | | | | | |
Ally Financial, Inc. | | | | | | | | |
4.63%, 06/26/2015 | | | 200,000 | | | | 204,100 | |
6.75%, 12/01/2014 | | | 500,000 | | | | 501,500 | |
8.30%, 02/12/2015 | | | 1,800,000 | | | | 1,829,250 | |
The Notes to Financial Statements are an integral part of this report.
| | |
| Transamerica Funds | | Annual Report 2014 |
Page 113
Transamerica Total Return
SCHEDULE OF INVESTMENTS (continued)
At October 31, 2014
| | | | | | | | |
| | | Principal | | | Value | |
CORPORATE DEBT SECURITIES (continued) | |
Consumer Finance (continued) | | | | | | | | |
Navient Corp.
Series MTN | | | | | | | | |
3.88%, 09/10/2015 | | | $ 100,000 | | | | $ 101,000 | |
4.88%, 06/17/2019 | | | 4,000,000 | | | | 4,060,000 | |
6.25%, 01/25/2016 | | | 1,900,000 | | | | 1,976,000 | |
Springleaf Finance Corp.
Series MTN | | | | | | | | |
6.90%, 12/15/2017 | | | 5,700,000 | | | | 6,213,000 | |
| | | | | | | | |
| | | | | | | 14,884,850 | |
| | | | | | | | |
Diversified Consumer Services - 0.5% | | | | | |
President and Fellows of Harvard College | | | | | | | | |
6.50%, 01/15/2039, 144A | | | 3,800,000 | | | | 5,322,698 | |
| | | | | | | | |
Diversified Financial Services - 8.7% | | | | | | | | |
Bank of America Corp. | | | | | | | | |
1.50%, 10/09/2015 | | | 5,600,000 | | | | 5,640,555 | |
4.50%, 04/01/2015 | | | 1,100,000 | | | | 1,117,775 | |
7.63%, 06/01/2019 (F) | | | 4,000,000 | | | | 4,851,760 | |
Series MTN | | | | | | | | |
5.00%, 01/15/2015 | | | 5,348,000 | | | | 5,393,977 | |
5.65%, 05/01/2018 | | | 3,900,000 | | | | 4,353,851 | |
6.40%, 08/28/2017 | | | 400,000 | | | | 450,627 | |
6.88%, 04/25/2018 | | | 3,900,000 | | | | 4,511,411 | |
Bear Stearns Cos. LLC | | | | | | | | |
6.40%, 10/02/2017 | | | 900,000 | | | | 1,017,779 | |
7.25%, 02/01/2018 | | | 2,100,000 | | | | 2,441,237 | |
Citigroup, Inc. | | | | | | | | |
1.30%, 04/01/2016 | | | 17,563,000 | | | | 17,642,385 | |
6.00%, 08/15/2017 | | | 600,000 | | | | 669,460 | |
Ford Motor Credit Co. LLC | | | | | | | | |
3.88%, 01/15/2015 | | | 600,000 | | | | 603,766 | |
4.21%, 04/15/2016 | | | 3,100,000 | | | | 3,235,110 | |
7.00%, 04/15/2015 | | | 6,910,000 | | | | 7,100,108 | |
12.00%, 05/15/2015 | | | 450,000 | | | | 476,400 | |
Series MTN | | | | | | | | |
1.01%, 01/17/2017 (D) | | | 5,400,000 | | | | 5,431,795 | |
GMAC International Finance BV | | | | | | | | |
7.50%, 04/21/2015, Reg S | | | EUR 100,000 | | | | 128,590 | |
JPMorgan Chase & Co. | | | | | | | | |
0.75%, 02/15/2017 (D) | | | $ 10,400,000 | | | | 10,430,587 | |
6.30%, 04/23/2019 (F) | | | 900,000 | | | | 1,044,451 | |
Series MTN | | | | | | | | |
0.85%, 02/26/2016 (D) | | | 6,800,000 | | | | 6,822,365 | |
JPMorgan Chase Bank NA | | | | | | | | |
0.48%, 07/30/2015 (D) | | | 3,800,000 | | | | 3,804,188 | |
Lehman Brothers Holdings, Inc. (Escrow shares) | | | | | | | | |
6.75%, 12/28/2017 | | | 1,700,000 | | | | 1,054 | |
Tayarra, Ltd. | | | | | | | | |
3.63%, 02/15/2022 | | | 5,909,236 | | | | 6,267,353 | |
| | | | | | | | |
| | | | | | | 93,436,584 | |
| | | | | | | | |
Diversified Telecommunication Services - 1.9% | | | | | |
BellSouth Corp. | | | | | | | | |
4.18%, 04/26/2021, 144A (E) | | | 9,200,000 | | | | 9,344,532 | |
| | | | | | | | |
| | | Principal | | | Value | |
CORPORATE DEBT SECURITIES (continued) | |
Diversified Telecommunication Services (continued) | | | | | |
KT Corp. | | | | | | | | |
4.88%, 07/15/2015, 144A | | | $ 200,000 | | | | $ 205,311 | |
Verizon Communications, Inc. | | | | | | | | |
0.63%, 06/09/2017 (D) | | | 4,800,000 | | | | 4,801,224 | |
1.98%, 09/14/2018 (D) | | | 4,500,000 | | | | 4,708,647 | |
2.50%, 09/15/2016 | | | 500,000 | | | | 514,774 | |
3.65%, 09/14/2018 | | | 1,200,000 | �� | | | 1,269,088 | |
| | | | | | | | |
| | | | | | | 20,843,576 | |
| | | | | | | | |
Electric Utilities - 0.4% | | | | | | | | |
Korea Hydro & Nuclear Power Co., Ltd. | | | | | | | | |
1.01%, 05/22/2017, 144A (D) (E) | | | 4,300,000 | | | | 4,296,754 | |
| | | | | | | | |
Food Products - 0.5% | | | | | | | | |
ConAgra Foods, Inc. | | | | | | | | |
0.60%, 07/21/2016 (D) | | | 1,700,000 | | | | 1,699,125 | |
Kraft Foods Group, Inc. | | | | | | | | |
1.63%, 06/04/2015 | | | 4,000,000 | | | | 4,024,528 | |
| | | | | | | | |
| | | | | | | 5,723,653 | |
| | | | | | | | |
Health Care Providers & Services - 0.7% | | | | | |
HCA, Inc. | | | | | | | | |
6.38%, 01/15/2015 (F) | | | 6,100,000 | | | | 6,161,000 | |
Series MTN | | | | | | | | |
9.00%, 12/15/2014 | | | 1,600,000 | | | | 1,608,000 | |
| | | | | | | | |
| | | | | | | 7,769,000 | |
| | | | | | | | |
Hotels, Restaurants & Leisure - 0.9% | | | | | | | | |
MGM Resorts International | | | | | | | | |
6.88%, 04/01/2016 | | | 200,000 | | | | 210,500 | |
7.63%, 01/15/2017 | | | 8,200,000 | | | | 8,948,250 | |
| | | | | | | | |
| | | | | | | 9,158,750 | |
| | | | | | | | |
Household Durables - 0.0% (I) | | | | | | | | |
Urbi Desarrollos Urbanos SAB de CV | | | | | | | | |
9.50%, 01/21/2020, 144A (E) (J) | | | 400,000 | | | | 40,200 | |
| | | | | | | | |
Independent Power and Renewable Electricity Producers - 0.4% | |
Dynegy Finance I, Inc. / Dynegy Finance II, Inc. | | | | | | | | |
6.75%, 11/01/2019, 144A | | | 2,300,000 | | | | 2,380,500 | |
7.38%, 11/01/2022, 144A | | | 900,000 | | | | 951,750 | |
7.63%, 11/01/2024, 144A | | | 500,000 | | | | 530,000 | |
| | | | | | | | |
| | | | | | | 3,862,250 | |
| | | | | | | | |
Insurance - 0.1% | | | | | | | | |
American International Group, Inc.
Series MTN | | | | | | | | |
5.60%, 10/18/2016 | | | 1,000,000 | | | | 1,085,776 | |
| | | | | | | | |
Media - 1.4% | | | | | | | | |
DISH DBS Corp. | | | | | | | | |
7.13%, 02/01/2016 | | | 100,000 | | | | 106,375 | |
7.75%, 05/31/2015 (F) | | | 14,100,000 | | | | 14,593,500 | |
| | | | | | | | |
| | | | | | | 14,699,875 | |
| | | | | | | | |
Oil, Gas & Consumable Fuels - 1.3% | | | | | | | | |
Canadian Natural Resources, Ltd. | | | | | | | | |
0.61%, 03/30/2016 (D) | | | 4,700,000 | | | | 4,702,975 | |
CNPC General Capital, Ltd. | | | | | | | | |
1.13%, 05/14/2017, 144A (D) | | | 3,100,000 | | | | 3,105,388 | |
Gazprom OAO Via GAZ Capital SA | | | | | | | | |
4.95%, 05/23/2016, Reg S | | | 2,800,000 | | | | 2,847,320 | |
The Notes to Financial Statements are an integral part of this report.
| | |
| Transamerica Funds | | Annual Report 2014 |
Page 114
Transamerica Total Return
SCHEDULE OF INVESTMENTS (continued)
At October 31, 2014
| | | | | | | | |
| | | Principal | | | Value | |
CORPORATE DEBT SECURITIES (continued) | |
Oil, Gas & Consumable Fuels (continued) | |
Rosneft Finance SA
Series MTN | | | | | | | | |
7.50%, 07/18/2016, Reg S | | | $ 3,200,000 | | | | $ 3,328,000 | |
| | | | | | | | |
| | | | | | | 13,983,683 | |
| | | | | | | | |
Technology Hardware, Storage & Peripherals - 0.0% (I) | |
Apple, Inc. | | | | | | | | |
2.85%, 05/06/2021 | | | 400,000 | | | | 406,016 | |
| | | | | | | | |
Tobacco - 0.2% | | | | | | | | |
Altria Group, Inc. | | | | | | | | |
4.13%, 09/11/2015 (F) | | | 400,000 | | | | 411,846 | |
9.70%, 11/10/2018 | | | 420,000 | | | | 541,343 | |
Reynolds American, Inc. | | | | | | | | |
7.75%, 06/01/2018 | | | 1,000,000 | | | | 1,185,149 | |
| | | | | | | | |
| | | | | | | 2,138,338 | |
| | | | | | | | |
Trading Companies & Distributors - 0.8% | | | | | |
International Lease Finance Corp. | | | | | | | | |
4.88%, 04/01/2015 | | | 550,000 | | | | 556,449 | |
5.75%, 05/15/2016 | | | 500,000 | | | | 521,250 | |
6.75%, 09/01/2016, 144A | | | 200,000 | | | | 212,000 | |
7.13%, 09/01/2018, 144A | | | 6,600,000 | | | | 7,474,500 | |
| | | | | | | | |
| | | | | | | 8,764,199 | |
| | | | | | | | |
Transportation Infrastructure - 0.0% (I) | | | | | |
Korea Expressway Corp. | | | | | | | | |
5.13%, 05/20/2015, 144A | | | 200,000 | | | | 204,648 | |
| | | | | | | | |
Wireless Telecommunication Services - 0.7% | | | | | |
Sprint Communications, Inc. | | | | | | | | |
6.00%, 12/01/2016 (F) | | | 1,000,000 | | | | 1,058,750 | |
9.13%, 03/01/2017 | | | 6,000,000 | | | | 6,780,000 | |
| | | | | | | | |
| | | | | | | 7,838,750 | |
| | | | | | | | |
Total Corporate Debt Securities
(Cost $362,256,957) | | | | 368,732,115 | |
| | | | | | | | |
| |
CERTIFICATES OF DEPOSIT - 2.2% | | | | | |
Banks - 0.7% | | | | | | | | |
Bank of Nova Scotia | | | | | | | | |
1.27%, 02/10/2015 (K) | | | CAD 8,300,000 | | | | 7,338,727 | |
| | | | | | | | |
Diversified Financial Services - 0.5% | | | | | |
Credit Suisse | | | | | | | | |
0.00% (I), 01/12/2015 -
03/17/2015 (K) | | | $ 5,700,000 | | | | 5,700,000 | |
| | | | | | | | |
Oil, Gas & Consumable Fuels - 1.0% | | | | | |
ENI Finance USA, Inc. | | | | | | | | |
0.00% (I), 04/10/2015 (K) | | | 10,000,000 | | | | 10,002,612 | |
| | | | | | | | |
Total Certificates of Deposit
(Cost $23,295,855) | | | | 23,041,339 | |
| | | | | | | | |
| | |
COMMERCIAL PAPER - 2.3% | | | | | | | | |
Banks - 0.8% | | | | | | | | |
Royal Bank of Canada | | | | | | | | |
0.00% (I), 05/07/2015 (K) | | | CAD 9,500,000 | | | | 8,429,085 | |
| | | | | | | | |
Oil, Gas & Consumable Fuels - 0.5% | |
ENI Finance USA, Inc. | | | | | | | | |
0.59%, 05/22/2015, 144A (K) | | | $ 5,200,000 | | | | 5,183,077 | |
| | | | | | | | |
| | | | | | | | |
| | | Principal | | | Value | |
COMMERCIAL PAPER (continued) | | | | | |
Wireless Telecommunication Services - 1.0% | |
Vodafone Group PLC | | | | | | | | |
0.52%, 04/10/2015, 144A (K) | | | $ 600,000 | | | | $ 598,640 | |
0.56%, 04/01/2015, 144A (K) | | | 10,500,000 | | | | 10,475,777 | |
0.61%, 06/29/2015, 144A (K) | | | 300,000 | | | | 298,800 | |
| | | | | | | | |
| | | | | | | 11,373,217 | |
| | | | | | | | |
Total Commercial Paper
(Cost $25,269,892) | | | | | | | 24,985,379 | |
| | | | | | | | |
| | |
LOAN ASSIGNMENTS - 0.5% | | | | | | | | |
Automobiles - 0.1% | | | | | | | | |
Chrysler Group LLC, Term Loan B | | | | | | | | |
3.50%, 05/24/2017 | | | 1,695,619 | | | | 1,684,668 | |
| | | | | | | | |
Health Care Providers & Services - 0.4% | |
Community Health Systems, Inc., Term Loan E | | | | | | | | |
3.48%, 01/25/2017 | | | 1,695,729 | | | | 1,689,635 | |
HCA, Inc., Term Loan B5 | | | | | | | | |
2.90%, 03/31/2017 | | | 2,393,955 | | | | 2,382,983 | |
| | | | | | | | |
| | | | | | | 4,072,618 | |
| | | | | | | | |
Total Loan Assignments
(Cost $5,786,193) | | | | | | | 5,757,286 | |
| | | | | | | | |
|
SHORT-TERM U.S. GOVERNMENT OBLIGATION - 1.3% | |
U.S. Treasury Bill | | | | | | | | |
0.02%, 11/06/2014 (B) (C) (K) | | | 14,200,000 | | | | 14,199,959 | |
| | | | | | | | |
Total Short-Term U.S. Government Obligation
(Cost $14,199,959) | | | | 14,199,959 | |
| | | | | | | | |
|
SHORT-TERM FOREIGN GOVERNMENT OBLIGATIONS - 4.3% | |
Japan Treasury Discount Bill | | | | | | | | |
0.00% (I), 02/20/2015 - 03/10/2015 (K) | | | JPY 750,000,000 | | | | 6,677,496 | |
Mexico Cetes | | | | | | | | |
2.93%, 12/11/2014 (K) | | | MXN 20,900,000 | | | | 1,547,090 | |
2.95%, 11/06/2014 (K) | | | 50,500,000 | | | | 3,748,611 | |
2.97%, 01/22/2015 (K) | | | 110,500,000 | | | | 8,151,225 | |
3.01%, 02/05/2015 (K) | | | 168,200,000 | | | | 12,393,083 | |
3.04%, 01/08/2015 (K) | | | 184,600,000 | | | | 13,631,825 | |
| | | | | | | | |
Total Short-Term Foreign Government Obligations
(Cost $47,662,360) | | | | 46,149,330 | |
| | | | | | | | |
| | |
| | | Shares | | | Value | |
CONVERTIBLE PREFERRED STOCK - 0.2% | |
Banks - 0.2% | | | | | | | | |
Wells Fargo & Co.
Series L, 7.50% | | | 1,600 | | | | 1,926,400 | |
| | | | | | | | |
Total Convertible Preferred Stock
(Cost $1,384,035) | | | | 1,926,400 | |
| | | | | | | | |
|
SECURITIES LENDING COLLATERAL - 1.9% | |
State Street Navigator Securities Lending Trust - Prime Portfolio
0.16% (K) | | | 19,911,652 | | | | 19,911,652 | |
| | | | | | | | |
Total Securities Lending Collateral
(Cost $19,911,652) | | | | 19,911,652 | |
| | | | | | | | |
The Notes to Financial Statements are an integral part of this report.
| | |
| Transamerica Funds | | Annual Report 2014 |
Page 115
Transamerica Total Return
SCHEDULE OF INVESTMENTS (continued)
At October 31, 2014
| | | | | | | | |
| | | Principal | | | Value | |
REPURCHASE AGREEMENTS - 4.3% | |
BNP Paribas 0.17% (K), dated 10/31/2014, to be repurchased at $32,900,146 on 11/03/2014. Collateralized by a U.S. Government Obligation, 3.00%, due 08/31/2016, and with a value of $33,570,226. | | | $ 32,900,000 | | | | $ 32,900,000 | |
JPMorgan Securities, Inc. 0.17% (K), dated 10/31/2014, to be repurchased at $2,000,009 on 11/03/2014. Collateralized by a U.S. Government Agency Obligation, 0.63%, due 12/29/2014, and with a value of $2,054,180. | | | 2,000,000 | | | | 2,000,000 | |
Morgan Stanley 0.17% (K), dated 10/31/2014, to be repurchased at $10,600,050 on 11/03/2014. Collateralized by a U.S. Government Obligation, 3.75%, due 11/15/2043, and with a value of $10,859,992. | | | 10,600,000 | | | | 10,600,000 | |
State Street Bank & Trust Co. 0.01% (K), dated 10/31/2014, to be repurchased at $1,204,210 on 11/03/2014. Collateralized by a U.S. Government Agency Obligation, 3.50%, due 01/01/2032, and with a value of $1,231,169. | | | 1,204,209 | | | | 1,204,209 | |
| | | | | | | | |
Total Repurchase Agreements
(Cost $46,704,209) | | | | | | | 46,704,209 | |
| | | | | | | | |
Total Investments
(Cost $1,138,396,116) (L) | | | | | | | 1,142,351,128 | |
Net Other Assets (Liabilities) - (6.3)% | | | | (67,309,617 | ) |
| | | | | | | | |
| | |
Net Assets - 100.0% | | | | | | | $ 1,075,041,511 | |
| | | | | | | | |
| | |
| | | Principal | | | Value | |
REVERSE REPURCHASE AGREEMENT - (0.2%) | |
Morgan Stanley & Co. LLC
2.10% (K), dated 10/16/2014, to be repurchased at $(1,781,955) on 11/12/2014. | | | EUR (1,421,000 | ) | | | $ (1,780,726 | ) |
| | | | | | | | |
Total Reverse Repurchase Agreement
(Cost $(1,816,109)) | | | | $ (1,780,726 | ) |
| | | | | | | | |
| | |
| | | Contracts | | | Value | |
WRITTEN OPTIONS - (0.0)% (I) (M) | |
Put Options - (0.0)% (I) | | | | | | | | |
10-Year U.S. Treasury Note Future Exercise Price $125.50
Expires 11/21/2014 | | | 135 | | | | $ (33,750 | ) |
10-Year U.S. Treasury Note Future Exercise Price $126.00
Expires 11/21/2014 | | | 175 | | | | (73,828 | ) |
| | | | | | | | |
Total Written Options
(Premiums received $78,096) | | | | | | | $ (107,578 | ) |
| | | | | | | | |
| | | | | | | | |
| | | Notional
Amount | | | Value | |
WRITTEN FOREIGN EXCHANGE OPTIONS - (0.0)% (I) (M) | |
Call Options - (0.0)% (I) | | | | | | | | |
OTC - AUD vs. USD (E)
Exercise Price AUD 0.89
Expires 12/15/2014
Counterparty: BNP | | | AUD 1,000,000 | | | | $ (4,869 | ) |
OTC - AUD vs. USD (E)
Exercise Price AUD 0.89
Expires 12/15/2014
Counterparty: CITI | | | 1,200,000 | | | | (5,299 | ) |
OTC - AUD vs. USD (E)
Exercise Price AUD 0.90
Expires 01/14/2015
Counterparty: BOA | | | 1,200,000 | | | | (5,625 | ) |
OTC - USD vs. BRL
Exercise Price $2.80
Expires 01/21/2015
Counterparty: JPM | | | $ 1,100,000 | | | | (4,660 | ) |
OTC - USD vs. BRL
Exercise Price $2.80
Expires 01/23/2015
Counterparty: JPM | | | 1,100,000 | | | | (4,759 | ) |
OTC - USD vs. INR
Exercise Price $63.40
Expires 01/22/2015
Counterparty: JPM | | | 900,000 | | | | (5,785 | ) |
OTC - USD vs. INR
Exercise Price $62.80
Expires 12/24/2014
Counterparty: CITI | | | 1,400,000 | | | | (7,897 | ) |
OTC - USD vs. INR
Exercise Price $63.00
Expires 12/18/2014
Counterparty: JPM | | | 1,400,000 | | | | (5,645 | ) |
OTC - USD vs. INR
Exercise Price $63.00
Expires 01/06/2015
Counterparty: HSBC | | | 1,300,000 | | | | (8,707 | ) |
OTC - USD vs. INR
Exercise Price $63.15
Expires 01/28/2015
Counterparty: DUB | | | 100,000 | | | | (819 | ) |
OTC - USD vs. INR
Exercise Price $63.27
Expires 01/27/2015
Counterparty: BCLY | | | 2,300,000 | | | | (17,439 | ) |
OTC - USD vs. INR
Exercise Price $63.85
Expires 02/25/2015
Counterparty: HSBC | | | 700,000 | | | | (6,145 | ) |
OTC - USD vs. INR
Exercise Price $63.90
Expires 01/16/2015
Counterparty: BCLY | | | 1,200,000 | | | | (5,595 | ) |
OTC - USD vs. INR
Exercise Price $64.25
Expires 02/25/2015
Counterparty: BCLY | | | 1,200,000 | | | | (8,947 | ) |
The Notes to Financial Statements are an integral part of this report.
| | |
| Transamerica Funds | | Annual Report 2014 |
Page 116
Transamerica Total Return
SCHEDULE OF INVESTMENTS (continued)
At October 31, 2014
| | | | | | | | |
| | | Notional
Amount | | | Value | |
WRITTEN FOREIGN EXCHANGE OPTIONS (continued) | |
Call Options (continued) | | | | | | | | |
OTC - USD vs. INR
Exercise Price $64.25
Expires 02/25/2015
Counterparty: UBS | | | $ 2,400,000 | | | | $ (17,892 | ) |
OTC - USD vs. JPY (E)
Exercise Price $107.60
Expires 11/07/2014
Counterparty: DUB | | | 1,200,000 | | | | (48,526 | ) |
OTC - USD vs. JPY (E)
Exercise Price $107.70
Expires 11/05/2014
Counterparty: BOA | | | 1,700,000 | | | | (67,162 | ) |
OTC - USD vs. JPY (E)
Exercise Price $107.85
Expires 11/19/2014
Counterparty: DUB | | | 1,200,000 | | | | (46,390 | ) |
OTC - USD vs. JPY (E)
Exercise Price $108.25
Expires 11/06/2014
Counterparty: BCLY | | | 1,200,000 | | | | (41,600 | ) |
OTC - USD vs. MXN (E)
Exercise Price $13.80
Expires 01/14/2015
Counterparty: HSBC | | | 1,700,000 | | | | (13,807 | ) |
| | | | | | | | |
| | | | | | | (327,568 | ) |
| | | | | | | | |
Put Options - (0.0)% (I) | | | | | | | | |
OTC - AUD vs. USD (E)
Exercise Price AUD 0.84
Expires 01/14/2015
Counterparty: BOA | | | AUD 1,200,000 | | | | (4,508 | ) |
OTC - AUD vs. USD (E)
Exercise Price AUD 0.85
Expires 12/15/2014
Counterparty: CITI | | | 1,200,000 | | | | (2,720 | ) |
OTC - AUD vs. USD (E)
Exercise Price AUD 0.85
Expires 11/20/2014
Counterparty: CITI | | | 1,200,000 | | | | (906 | ) |
OTC - AUD vs. USD (E)
Exercise Price AUD 0.85
Expires 11/20/2014
Counterparty: CITI | | | 1,100,000 | | | | (1,112 | ) |
OTC - AUD vs. USD (E)
Exercise Price AUD 0.86
Expires 11/07/2014
Counterparty: BOA | | | 1,300,000 | | | | (875 | ) |
OTC - AUD vs. USD (E)
Exercise Price AUD 0.86
Expires 11/07/2014
Counterparty: CITI | | | 1,400,000 | | | | (1,295 | ) |
OTC - AUD vs. USD (E)
Exercise Price AUD 0.86
Expires 11/13/2014
Counterparty: CITI | | | 1,100,000 | | | | (1,806 | ) |
OTC - AUD vs. USD (E)
Exercise Price AUD 0.86
Expires 11/13/2014
Counterparty: BNP | | | 2,000,000 | | | | (3,284 | ) |
| | | | | | | | |
| | | Notional
Amount | | | Value | |
WRITTEN FOREIGN EXCHANGE OPTIONS (continued) | |
Put Options (continued) | | | | | | | | |
OTC - AUD vs. USD (E)
Exercise Price AUD 0.86
Expires 11/25/2014
Counterparty: BCLY | | | AUD 1,200,000 | | | | $ (3,768 | ) |
OTC - AUD vs. USD (E)
Exercise Price AUD 0.86
Expires 11/06/2014
Counterparty: UBS | | | 1,100,000 | | | | (932 | ) |
OTC - AUD vs. USD (E)
Exercise Price AUD 0.87
Expires 11/13/2014
Counterparty: UBS | | | 2,700,000 | | | | (7,028 | ) |
OTC - AUD vs. USD (E)
Exercise Price AUD 0.87
Expires 11/05/2014
Counterparty: CITI | | | 1,200,000 | | | | (1,326 | ) |
OTC - AUD vs. USD (E)
Exercise Price AUD 0.87
Expires 11/25/2014
Counterparty: BOA | | | 1,300,000 | | | | (6,675 | ) |
OTC - AUD vs. USD (E)
Exercise Price AUD 0.88
Expires 12/03/2014
Counterparty: DUB | | | 1,700,000 | | | | (17,798 | ) |
OTC - EUR vs. USD (E)
Exercise Price EUR 1.26
Expires 11/20/2014
Counterparty: DUB | | | EUR 1,200,000 | | | | (12,433 | ) |
OTC - EUR vs. USD (E)
Exercise Price EUR 1.26
Expires 11/06/2014
Counterparty: DUB | | | 1,800,000 | | | | (14,148 | ) |
OTC - EUR vs. USD (E)
Exercise Price EUR 1.26
Expires 11/18/2014
Counterparty: BNP | | | 1,700,000 | | | | (17,948 | ) |
OTC - EUR vs. USD (E)
Exercise Price EUR 1.26
Expires 11/05/2014
Counterparty: BNP | | | 1,300,000 | | | | (12,596 | ) |
OTC - USD vs. BRL
Exercise Price $2.30
Expires 01/21/2015
Counterparty: JPM | | | $ 1,100,000 | | | | (2,858 | ) |
OTC - USD vs. BRL
Exercise Price $2.30
Expires 01/23/2015
Counterparty: JPM | | | 1,100,000 | | | | (2,731 | ) |
OTC - USD vs. INR
Exercise Price $60.00
Expires 01/06/2015
Counterparty: HSBC | | | 1,300,000 | | | | (1,186 | ) |
OTC - USD vs. INR
Exercise Price $60.90
Expires 01/16/2015
Counterparty: BCLY | | | 1,200,000 | | | | (4,194 | ) |
The Notes to Financial Statements are an integral part of this report.
| | |
| Transamerica Funds | | Annual Report 2014 |
Page 117
Transamerica Total Return
SCHEDULE OF INVESTMENTS (continued)
At October 31, 2014
| | | | | | | | |
| | | Notional
Amount | | | Value | |
WRITTEN FOREIGN EXCHANGE OPTIONS (continued) | |
Put Options (continued) | | | | | | | | |
OTC - USD vs. INR
Exercise Price $60.92
Expires 01/28/2015
Counterparty: DUB | | | $ 100,000 | | | | $ (424 | ) |
OTC - USD vs. JPY (E)
Exercise Price $97.00
Expires 11/10/2014
Counterparty: BOA | | | 1,700,000 | | | | 0 | |
OTC - USD vs. JPY (E)
Exercise Price $97.00
Expires 11/10/2014
Counterparty: BCLY | | | 1,000,000 | | | | 0 | |
OTC - USD vs. JPY (E)
Exercise Price $98.00
Expires 11/10/2014
Counterparty: UBS | | | 1,000,000 | | | | 0 | |
OTC - USD vs. JPY (E)
Exercise Price $99.00
Expires 09/30/2015
Counterparty: CITI | | | 6,400,000 | | | | (36,397 | ) |
OTC - USD vs. JPY (E)
Exercise Price $100.00
Expires 07/03/2015
Counterparty: UBS | | | 2,500,000 | | | | (9,730 | ) |
| | | | | | | | |
| | | Notional
Amount | | | Value | |
WRITTEN FOREIGN EXCHANGE OPTIONS (continued) | |
Put Options (continued) | | | | | | | | |
OTC - USD vs. JPY (E)
Exercise Price $110.00
Expires 12/03/2014
Counterparty: UBS | | | $ 2,100,000 | | | | $ (3,843 | ) |
OTC - USD vs. JPY (E)
Exercise Price $110.50
Expires 12/03/2014
Counterparty: UBS | | | 2,100,000 | | | | (5,076 | ) |
OTC - USD vs. JPY (E)
Exercise Price $110.50
Expires 01/05/2015
Counterparty: BNP | | | 1,300,000 | | | | (7,622 | ) |
OTC - USD vs. JPY (E)
Exercise Price $110.50
Expires 01/07/2015
Counterparty: UBS | | | 1,700,000 | | | | (10,306 | ) |
OTC - USD vs. MXN (E)
Exercise Price $13.20
Expires 01/14/2015
Counterparty: HSBC | | | 1,700,000 | | | | (5,906 | ) |
| | | | | | | | |
| | | | | | | (201,431 | ) |
| | | | | | | | |
Total Written Foreign Exchange Options (Premiums received $466,832) | | | | | | | $(528,999 | ) |
| | | | | | | | |
| | | | | | | | | | | | | | | | | | | | | | | | | | | | |
| WRITTEN SWAPTIONS ON CREDIT DEFAULT SWAP AGREEMENTS: (M) | |
| Description | | Counterparty | | Fixed Deal
Rate | | | Pay/Receive
Floating Rate | | Strike
Price | | | Expiration
Date | | | Notional
Amount | | | Premiums
Paid
(Received) | | | Value | |
Call - OTC iTraxx Europe Series 22 | | JPM | | | 0.60 | % | | Receive | | | $ 0.60 | | | | 01/21/2015 | | | | EUR 1,500,000 | | | | $ (2,107 | ) | | | $ (3,234 | ) |
Call - OTC iTraxx Europe Series 22 | | CITI | | | 0.60 | | | Receive | | | 0.60 | | | | 01/21/2015 | | | | 3,100,000 | | | | (5,416 | ) | | | (6,683 | ) |
Call - OTC iTraxx Europe Series 22 | | GSC | | | 0.60 | | | Receive | | | 0.60 | | | | 01/21/2015 | | | | 1,500,000 | | | | (1,821 | ) | | | (3,234 | ) |
Put - OTC North American Investment Grade Index - Series 22 | | CITI | | | 0.85 | | | Pay | | | 0.85 | | | | 12/17/2014 | | | | $ 2,900,000 | | | | (3,407 | ) | | | (208 | ) |
Put - OTC North American Investment Grade Index - Series 22 | | CITI | | | 0.90 | | | Pay | | | 0.90 | | | | 12/17/2014 | | | | 2,500,000 | | | | (2,845 | ) | | | (507 | ) |
Put - OTC North American Investment Grade Index - Series 22 | | CITI | | | 0.95 | | | Pay | | | 0.95 | | | | 12/17/2014 | | | | 2,000,000 | | | | (2,500 | ) | | | (204 | ) |
Put - OTC iTraxx Europe Series 22 | | CITI | | | 0.90 | | | Pay | | | 0.90 | | | | 01/21/2015 | | | | EUR 2,000,000 | | | | (3,913 | ) | | | (3,249 | ) |
Put - OTC iTraxx Europe Series 22 | | CITI | | | 1.00 | | | Pay | | | 1.00 | | | | 01/21/2015 | | | | 1,100,000 | | | | (2,612 | ) | | | (1,109 | ) |
Put - OTC iTraxx Europe Series 22 | | JPM | | | 1.00 | | | Pay | | | 1.00 | | | | 01/21/2015 | | | | 1,500,000 | | | | (4,213 | ) | | | (1,512 | ) |
Put - OTC iTraxx Europe Series 22 | | GSC | | | 1.00 | | | Pay | | | 1.00 | | | | 01/21/2015 | | | | 1,500,000 | | | | (4,122 | ) | | | (1,512 | ) |
Put - OTC iTraxx Europe Series 22 | | GSC | | | 1.10 | | | Pay | | | 1.10 | | | | 01/21/2015 | | | | 800,000 | | | | (2,011 | ) | | | (478 | ) |
Put - OTC iTraxx Europe Series 22 | | GSC | | | 1.20 | | | Pay | | | 1.20 | | | | 01/21/2015 | | | | 1,900,000 | | | | (4,685 | ) | | | (712 | ) |
| | | | | | | | | | | | | | | | | | | | | | | | | | | | |
Total | | | | | | | | | | | | | | | | | | | | | | | $ (39,652 | ) | | | $ (22,642 | ) |
| | | | | | | | | | | | | | | | | | | | | | | | | | | | |
| | | | | | | | | | | | | | | | | | | | | | | | | | |
| WRITTEN SWAPTIONS ON INTEREST RATE SWAP AGREEMENTS: (M) | |
| Description | | Counterparty | | Floating Rate
Index | | Pay/Receive
Floating Rate | | Exercise
Rate | | | Expiration
Date | | | Notional
Amount | | | Premiums
Paid
(Received) | | | Value | |
Call - OTC 10-Year | | DUB | | 6-Month EUR EURIBOR Reuters | | Receive | | | 0.95 | % | | | 03/23/2015 | | | | EUR 2,300,000 | | | | $ (5,954 | ) | | | $ (12,044 | ) |
Call - OTC 10-Year | | GSC | | 6-Month EUR EURIBOR Reuters | | Receive | | | 1.20 | | | | 01/20/2015 | | | | 9,800,000 | | | | (52,957 | ) | | | (167,251 | ) |
Call - OTC 3-Year | | MSC | | 3-Month USD LIBOR BBA | | Receive | | | 1.03 | | | | 11/14/2014 | | | | $ 8,800,000 | | | | (9,504 | ) | | | (1,280 | ) |
The Notes to Financial Statements are an integral part of this report.
| | |
| Transamerica Funds | | Annual Report 2014 |
Page 118
Transamerica Total Return
SCHEDULE OF INVESTMENTS (continued)
At October 31, 2014
| | | | | | | | | | | | | | | | | | | | | | | | | | |
| WRITTEN SWAPTIONS ON INTEREST RATE SWAP AGREEMENTS (continued): (M) | |
| Description | | Counterparty | | Floating Rate
Index | | Pay/Receive
Floating Rate | | Exercise
Rate | | | Expiration
Date | | | Notional
Amount | | | Premiums
Paid
(Received) | | | Value | |
Call - OTC 5-Year | | BNP | | 6-Month EUR EURIBOR Reuters | | Receive | | | 0.45 | % | | | 12/05/2014 | | | | EUR 4,600,000 | | | | $ (4,600 | ) | | | $ (10,155 | ) |
Call - OTC 5-Year | | MSC | | 3-Month USD LIBOR BBA | | Receive | | | 1.58 | | | | 11/14/2014 | | | | $ 18,800,000 | | | | (24,440 | ) | | | (3,013 | ) |
Call - OTC 5-Year | | MSC | | 3-Month USD LIBOR BBA | | Receive | | | 1.58 | | | | 11/28/2014 | | | | 1,100,000 | | | | (2,035 | ) | | | (531 | ) |
Call - OTC 5-Year | | DUB | | 3-Month USD LIBOR BBA | | Receive | | | 1.65 | | | | 11/17/2014 | | | | 22,200,000 | | | | (35,520 | ) | | | (15,329 | ) |
Call - OTC 5-Year | | MSC | | 3-Month USD LIBOR BBA | | Receive | | | 1.68 | | | | 11/14/2014 | | | | 19,300,000 | | | | (58,383 | ) | | | (16,040 | ) |
Call - OTC 5-Year | | JPM | | 3-Month USD LIBOR BBA | | Receive | | | 1.70 | | | | 11/17/2014 | | | | 6,000,000 | | | | (11,400 | ) | | | (7,707 | ) |
Call - OTC 5-Year | | DUB | | 3-Month USD LIBOR BBA | | Receive | | | 1.70 | | | | 12/02/2014 | | | | 4,000,000 | | | | (8,400 | ) | | | (7,529 | ) |
Call - OTC 5-Year | | MSC | | 3-Month USD LIBOR BBA | | Receive | | | 1.78 | | | | 11/28/2014 | | | | 31,200,000 | | | | (181,740 | ) | | | (100,637 | ) |
Call - OTC 5-Year | | MSC | | 3-Month USD LIBOR BBA | | Receive | | | 1.80 | | | | 12/01/2014 | | | | 17,000,000 | | | | (30,175 | ) | | | (65,695 | ) |
Call - OTC 5-Year | | GSC | | 3-Month USD LIBOR BBA | | Receive | | | 1.80 | | | | 12/01/2014 | | | | 6,900,000 | | | | (12,296 | ) | | | (27,085 | ) |
Call - OTC 5-Year | | MSC | | 3-Month USD LIBOR BBA | | Receive | | | 1.85 | | | | 12/02/2014 | | | | 11,400,000 | | | | (22,800 | ) | | | (59,747 | ) |
Put -OTC 10-Year | | DUB | | 6-Month EUR EURIBOR Reuters | | Pay | | | 1.55 | | | | 03/23/2015 | | | | EUR 2,300,000 | | | | (19,051 | ) | | | (7,139 | ) |
Put -OTC 10-Year | | GSC | | 6-Month EUR EURIBOR Reuters | | Pay | | | 1.60 | | | | 01/20/2015 | | | | 9,800,000 | | | | (103,267 | ) | | | (6,401 | ) |
Put - OTC 10-Year | | MSC | | 3-Month USD LIBOR BBA | | Pay | | | 2.80 | | | | 02/02/2015 | | | | $ 6,700,000 | | | | (106,865 | ) | | | (180,275 | ) |
Put -OTC 10-Year | | MSC | | 3-Month USD LIBOR BBA | | Pay | | | 2.82 | | | | 01/30/2015 | | | | 1,600,000 | | | | (7,480 | ) | | | (8,108 | ) |
Put -OTC 30-Year | | DUB | | 3-Month USD LIBOR BBA | | Pay | | | 3.00 | | | | 01/21/2015 | | | | 3,800,000 | | | | (119,410 | ) | | | (69,575 | ) |
Put -OTC 30-Year | | MSC | | 3-Month USD LIBOR BBA | | Pay | | | 3.30 | | | | 01/30/2015 | | | | 2,300,000 | | | | (26,450 | ) | | | (27,894 | ) |
Put -OTC 30-Year | | MSC | | 3-Month USD LIBOR BBA | | Pay | | | 3.32 | | | | 01/16/2015 | | | | 4,400,000 | | | | (44,880 | ) | | | (37,899 | ) |
Put - OTC 5-Year | | BNP | | 6-Month EUR EURIBOR Reuters | | Pay | | | 0.63 | | | | 12/05/2014 | | | | EUR 4,600,000 | | | | (2,779 | ) | | | (10,155 | ) |
Put - OTC 5-Year | | MSC | | 3-Month USD LIBOR BBA | | Pay | | | 2.03 | | | | 11/28/2014 | | | | $ 2,000,000 | | | | (1,000 | ) | | | (1,387 | ) |
Put - OTC 5-Year | | DUB | | 3-Month USD LIBOR BBA | | Pay | | | 2.05 | | | | 12/02/2014 | | | | 4,000,000 | | | | (18,040 | ) | | | (2,988 | ) |
Put - OTC 5-Year | | GSC | | 3-Month USD LIBOR BBA | | Pay | | | 2.08 | | | | 11/28/2014 | | | | 1,300,000 | | | | (617 | ) | | | (576 | ) |
Put - OTC 5-Year | | GSC | | 3-Month USD LIBOR BBA | | Pay | | | 2.10 | | | | 12/01/2014 | | | | 6,900,000 | | | | (34,500 | ) | | | (3,116 | ) |
Put - OTC 5-Year | | MSC | | 3-Month USD LIBOR BBA | | Pay | | | 2.13 | | | | 11/28/2014 | | | | 3,800,000 | | | | (798 | ) | | | (1,047 | ) |
Put - OTC 5-Year | | MSC | | 3-Month USD LIBOR BBA | | Pay | | | 2.15 | | | | 12/01/2014 | | | | 17,000,000 | | | | (64,600 | ) | | | (4,975 | ) |
Put - OTC 5-Year | | MSC | | 3-Month USD LIBOR BBA | | Pay | | | 2.15 | | | | 12/02/2014 | | | | 9,900,000 | | | | (31,680 | ) | | | (3,165 | ) |
Put - OTC 5-Year | | RBS | | 3-Month USD LIBOR BBA | | Pay | | | 2.50 | | | | 09/21/2015 | | | | 21,000,000 | | | | (399,000 | ) | | | (217,973 | ) |
Put - OTC 5-Year | | MSC | | 3-Month USD LIBOR BBA | | Pay | | | 2.52 | | | | 09/18/2015 | | | | 12,500,000 | | | | (109,375 | ) | | | (122,023 | ) |
The Notes to Financial Statements are an integral part of this report.
| | |
| Transamerica Funds | | Annual Report 2014 |
Page 119
Transamerica Total Return
SCHEDULE OF INVESTMENTS (continued)
At October 31, 2014
| | | | | | | | | | | | | | | | | | | | | | | | | | |
| WRITTEN SWAPTIONS ON INTEREST RATE SWAP AGREEMENTS (continued): (M) | |
| Description | | Counterparty | | Floating Rate
Index | | Pay/Receive
Floating Rate | | Exercise
Rate | | | Expiration
Date | | | Notional
Amount | | | Premiums
Paid
(Received) | | | Value | |
Put - OTC 5-Year | | MSC | | 3-Month USD LIBOR
BBA | | Pay | | | 2.60 | % | | | 09/14/2015 | | | | $ 10,200,000 | | | | $ (133,875 | ) | | | $ (88,259 | ) |
Put - OTC 5-Year | | MSC | | 3-Month USD LIBOR
BBA | | Pay | | | 2.77 | | | | 01/23/2015 | | | | 13,300,000 | | | | (1,862 | ) | | | (2,046 | ) |
| | | | | | | | | | | | | | | | | | | | | | | | | | |
Total | | | | | | | | | | | | | | | | | | | | | $ (1,685,733 | ) | | | $ (1,289,044 | ) |
| | | | | | | | | | | | | | | | | | | | | | | | | | |
| | | | | | | | | | | | | | | | | | | | | | | | |
CENTRALLY CLEARED SWAP AGREEMENTS: (N) | |
|
| Credit Default Swap Agreements on Credit Indices - Sell Protection (O) | |
| Reference Obligation | | Fixed Deal
Pay Rate | | | Expiration
Date | | | Notional
Amount (P) | | | Fair
Value (Q) | | | Premiums
Paid
(Received) | | | Net Unrealized
Appreciation
(Depreciation) | |
iTraxx Europe Senior Financial
Index - Series 22 | | | 1.00 | % | | | 12/20/2019 | | | | EUR 12,600,000 | | | $ | 276,731 | | | $ | 134,573 | | | $ | 142,158 | |
North American Investment
Grade Index - Series 23 | | | 1.00 | | | | 12/20/2019 | | | $ | 9,300,000 | | | | 175,660 | | | | 130,004 | | | | 45,656 | |
| | | | | | | | | | | | | | | | | | | | | | | | |
Total | | | | | | | | | | | | | | $ | 452,391 | | | $ | 264,577 | | | $ | 187,814 | |
| | | | | | | | | | | | | | | | | | | | | | | | |
|
| Interest Rate Swap Agreements - Fixed Rate Receivable | |
| Floating Rate Index | | Fixed
Rate | | | Expiration
Date | | | Notional
Amount | | | Fair
Value | | | Premiums
Paid
(Received) | | | Net Unrealized
Appreciation
(Depreciation) | |
1-Year OIS Federal Funds Rate H.15 | | | 0.09 | % | | | 12/30/2014 | | | $ | 42,400,000 | | | $ | (444 | ) | | $ | 0 | | | $ | (444 | ) |
1-Year OIS Federal Funds Rate H.15 | | | 0.09 | | | | 02/27/2015 | | | | 59,000,000 | | | | (843 | ) | | | (305 | ) | | | (538 | ) |
3-Month USD-LIBOR | | | 1.65 | | | | 10/16/2019 | | | | 62,500,000 | | | | (254,513 | ) | | | (22,378 | ) | | | (232,135 | ) |
MXN TIIE Banxico | | | 7.02 | | | | 06/08/2034 | | | | 404,900,000 | | | | 144,097 | | | | 792,210 | | | | (648,113 | ) |
| | | | | | | | | | | | | | | | | | | | | | | | |
Total | | | | | | | | | | | | | | $ | (111,703 | ) | | $ | 769,527 | | | $ | (881,230 | ) |
| | | | | | | | | | | | | | | | | | | | | | | | |
|
| Interest Rate Swap Agreements - Fixed Rate Payable | |
| Floating Rate Index | | Fixed
Rate | | | Expiration
Date | | | Notional
Amount | | | Fair Value | | | Premiums
Paid
(Received) | | | Net Unrealized
Appreciation
(Depreciation) | |
3-Month USD-LIBOR | | | 2.80 | % | | | 12/18/2043 | | | $ | 27,100,000 | | | $ | 1,064,937 | | | $ | 1,263,824 | | | $ | (198,887 | ) |
3-Month USD-LIBOR | | | 3.00 | | | | 06/19/2043 | | | | 44,700,000 | | | | (123,768 | ) | | | 2,435,078 | | | | (2,558,846 | ) |
3-Month USD-LIBOR | | | 3.50 | | | | 12/18/2043 | | | | 35,700,000 | | | | (3,775,346 | ) | | | 1,940,140 | | | | (5,715,486 | ) |
6-Month GBP-LIBOR | | | 1.50 | | | | 09/18/2016 | | | | GBP 23,600,000 | | | | (194,899 | ) | | | (75,675 | ) | | | (119,224 | ) |
6-Month GBP-LIBOR | | | 1.51 | | | | 10/07/2016 | | | | 3,800,000 | | | | (8,959 | ) | | | 38 | | | | (8,997 | ) |
6-Month GBP-LIBOR | | | 1.59 | | | | 10/05/2016 | | | | 16,100,000 | | | | (59,308 | ) | | | 321 | | | | (59,629 | ) |
6-Month GBP-LIBOR | | | 1.88 | | | | 10/05/2017 | | | | 7,900,000 | | | | (65,517 | ) | | | 0 | | | | (65,517 | ) |
| | | | | | | | | | | | | | | | | | | | | | | | |
Total | | | | | | | | | | | | | | $ | (3,162,860 | ) | | $ | 5,563,726 | | | $ | (8,726,586 | ) |
| | | | | | | | | | | | | | | | | | | | | | | | |
OVER THE COUNTER SWAP AGREEMENTS: (M)
| | | | | | | | | | | | | | | | | | | | | | | | | | | | |
|
| Credit Default Swap Agreements on Corporate and Sovereign Issues - Sell Protection (O) | |
| Reference Obligation | | Fixed Deal
Receive Rate | | | Expiration
Date | | | Counterparty | | Implied Credit
Spread
(Basis Points)
October 31, 2014 (R) | | Notional
Amount (P) | | | Fair
Value | | | Premiums
Paid
(Received) | | | Net Unrealized
Appreciation
(Depreciation) | |
Brazilian Government International Bond,
12.25%, 03/06/2030 | | | 1.00 | % | | | 12/20/2019 | | | GSC | | 152.04 | | $ | 25,300,000 | | | $ | (582,072 | ) | | $ | (896,319 | ) | | $ | 314,247 | |
Brazilian Government International Bond,
12.25%, 03/06/2030 | | | 1.00 | | | | 12/20/2019 | | | HSBC | | 175.04 | | | 5,000,000 | | | | (115,056 | ) | | | (181,004 | ) | | | 65,948 | |
The Notes to Financial Statements are an integral part of this report.
| | |
| Transamerica Funds | | Annual Report 2014 |
Page 120
Transamerica Total Return
SCHEDULE OF INVESTMENTS (continued)
At October 31, 2014
OVER THE COUNTER SWAP AGREEMENTS (continued): (M)
| | | | | | | | | | | | | | | | | | | | | | | | | | | | |
| |
| Credit Default Swap Agreements on Corporate and Sovereign Issues - Sell Protection (continued) (O) | |
| Reference Obligation | | Fixed Deal
Receive Rate | | | Expiration
Date | | | Counterparty | | Implied Credit
Spread
(Basis Points)
October 31, 2014 (R) | | Notional
Amount (P) | | | Fair
Value | | | Premiums
Paid
(Received) | | | Net Unrealized
Appreciation
(Depreciation) | |
Brazilian Government International Bond,
12.25%, 03/06/2030 | | | 1.00 | % | | | 09/20/2016 | | | MSC | | 90.19 | | $ | 3,600,000 | | | $ | 25,319 | | | $ | (29,889 | ) | | $ | 55,208 | |
China Government International Bond,
4.25%, 10/28/2014 | | | 1.00 | | | | 12/20/2019 | | | JPM | | 80.05 | | | 3,000,000 | | | | (25,310 | ) | | | 19,574 | | | | (44,884 | ) |
China Government International Bond,
4.25%, 10/28/2014 | | | 1.00 | | | | 12/20/2019 | | | MSC | | 80.05 | | | 600,000 | | | | (5,062 | ) | | | 3,769 | | | | (8,831 | ) |
Goldman Sachs Group, Inc.,
5.95%, 01/18/2018 | | | 1.00 | | | | 12/20/2018 | | | BCLY | | 77.71 | | | 2,000,000 | | | | 27,291 | | | | 21,166 | | | | 6,125 | |
Hellenic Republic Government Bond,
2.00%, 02/24/2023 | | | 1.00 | % | | | 12/20/2015 | | | GSC | | 763.80 | | | 900,000 | | | | (50,731 | ) | | | (39,826 | ) | | | (10,905 | ) |
Italy Government International Bond,
6.88%, 09/27/2023 (E) | | | 1.00 | | | | 09/20/2016 | | | BCLY | | 59.78 | | | 4,400,000 | | | | 40,728 | | | | 21,593 | | | | 19,135 | |
Italy Government International Bond,
6.88%, 09/27/2023 | | | 1.00 | | | | 12/20/2019 | | | MSC | | 112.57 | | | 1,900,000 | | | | (8,974 | ) | | | 5,511 | | | | (14,485 | ) |
Italy Government International Bond,
6.88%, 09/27/2023 | | | 1.00 | | | | 12/20/2019 | | | CITI | | 112.57 | | | 400,000 | | | | (1,889 | ) | | | 870 | | | | (2,759 | ) |
Italy Government International Bond,
6.88%, 09/27/2023 | | | 1.00 | | | | 09/20/2016 | | | DUB | | 51.93 | | | 3,100,000 | | | | 28,694 | | | | 20,453 | | | | 8,241 | |
Italy Government International Bond,
6.88%, 09/27/2023 | | | 1.00 | | | | 09/20/2016 | | | HSBC | | 51.93 | | | 6,200,000 | | | | 57,389 | | | | 42,083 | | | | 15,306 | |
Italy Government International Bond,
6.88%, 09/27/2023 | | | 1.00 | | | | 09/20/2016 | | | BNP | | 51.93 | | | 1,000,000 | | | | 9,257 | | | | 9,674 | | | | (417 | ) |
Italy Government International Bond,
6.88%, 09/27/2023 | | | 1.00 | | | | 09/20/2016 | | | DUB | | 51.93 | | | 900,000 | | | | 8,331 | | | | 8,169 | | | | 162 | |
Italy Government International Bond,
6.88%, 09/27/2023 (E) | | | 1.00 | | | | 06/20/2017 | | | CITI | | 65.24 | | | 1,400,000 | | | | 11,289 | | | | 7,102 | | | | 4,187 | |
Italy Government International Bond,
6.88%, 09/27/2023 (E) | | | 1.00 | | | | 06/20/2017 | | | MSC | | 80.74 | | | 1,400,000 | | | | 11,288 | | | | 4,847 | | | | 6,441 | |
Italy Government International Bond,
6.88%, 09/27/2023 (E) | | | 1.00 | | | | 06/20/2017 | | | BCLY | | 80.74 | | | 1,400,000 | | | | 11,289 | | | | 5,285 | | | | 6,004 | |
Japan,
2.00%, 03/21/2022 | | | 1.00 | | | | 09/20/2016 | | | DUB | | 15.89 | | | 1,900,000 | | | | 30,871 | | | | 23,292 | | | | 7,579 | |
Mexico Government International Bond,
5.95%, 03/19/2019 | | | 1.00 | | | | 12/20/2019 | | | CITI | | 78.33 | | | 3,600,000 | | | | 40,198 | | | | 21,006 | | | | 19,192 | |
Mexico Government International Bond,
5.95%, 03/19/2019 | | | 1.00 | | | | 12/20/2019 | | | BCLY | | 78.33 | | | 100,000 | | | | 1,117 | | | | 584 | | | | 533 | |
The Notes to Financial Statements are an integral part of this report.
| | |
| Transamerica Funds | | Annual Report 2014 |
Page 121
Transamerica Total Return
SCHEDULE OF INVESTMENTS (continued)
At October 31, 2014
OVER THE COUNTER SWAP AGREEMENTS (continued): (M)
| | | | | | | | | | | | | | | | | | | | | | | | | | | | |
|
| Credit Default Swap Agreements on Corporate and Sovereign Issues - Sell Protection (continued) (O) | |
| Reference Obligation | | Fixed Deal
Receive Rate | | | Expiration
Date | | | Counterparty | | Implied Credit
Spread
(Basis Points)
October 31, 2014 (R) | | Notional
Amount (P) | | | Fair
Value | | | Premiums
Paid
(Received) | | | Net Unrealized
Appreciation
(Depreciation) | |
Mexico Government International Bond,
5.95%, 03/19/2019 | | | 1.00 | % | | | 12/20/2019 | | | MSC | | 87.00 | | $ | 500,000 | | | $ | 5,583 | | | $ | 3,162 | | | $ | 2,421 | |
Mexico Government International Bond,
5.95%, 03/19/2019 | | | 1.00 | | | | 12/20/2019 | | | JPM | | 87.50 | | | 17,400,000 | | | | 194,293 | | | | 105,863 | | | | 88,430 | |
Mexico Government International Bond,
5.95%, 03/19/2019 | | | 1.00 | | | | 12/20/2019 | | | GSC | | 89.00 | | | 1,300,000 | | | | 14,516 | | | | 8,545 | | | | 5,971 | |
Mexico Government International Bond,
7.50%, 04/08/2033 | | | 1.00 | | | | 09/20/2016 | | | DUB | | 40.87 | | | 2,600,000 | | | | 32,971 | | | | 6,312 | | | | 26,659 | |
Russian Foreign Bond - Eurobond,
7.50%, 03/31/2030 | | | 1.00 | | | | 09/20/2015 | | | BCLY | | 208.95 | | | 200,000 | | | | (1,593 | ) | | | (2,049 | ) | | | 456 | |
Russian Foreign Bond - Eurobond,
7.50%, 03/31/2030 | | | 1.00 | | | | 09/20/2015 | | | CITI | | 208.95 | | | 1,100,000 | | | | (8,762 | ) | | | (10,298 | ) | | | 1,536 | |
Russian Foreign Bond - Eurobond,
7.50%, 03/31/2030 | | | 1.00 | | | | 09/20/2015 | | | DUB | | 208.95 | | | 100,000 | | | | (796 | ) | | | (980 | ) | | | 184 | |
Russian Foreign Bond - Eurobond,
7.50%, 03/31/2030 | | | 1.00 | | | | 03/20/2019 | | | CITI | | 239.78 | | | 8,100,000 | | | | (423,760 | ) | | | (259,969 | ) | | | (163,791 | ) |
Sberbank of Russia
Via SB Capital SA,
5.50%, 07/07/2015 | | | 1.00 | | | | 09/20/2015 | | | JPM | | 282.09 | | | 100,000 | | | | (1,645 | ) | | | (1,283 | ) | | | (362 | ) |
Sberbank of Russia
Via SB Capital SA,
5.50%, 07/07/2015 | | | 1.00 | | | | 09/20/2015 | | | CITI | | 282.09 | | | 200,000 | | | | (3,291 | ) | | | (2,829 | ) | | | (462 | ) |
| | | | | | | | | | | | | | | | | | | | | | | | | | | | |
Total | | | | | | | | | | | | | | | | | | $ | (678,517 | ) | | $ | (1,085,586 | ) | | $ | 407,069 | |
| | | | | | | | | | | | | | | | | | | | | | | | | | | | |
| | | | | | | | | | | | | | | | | | | | | | | | | | |
|
| Credit Default Swap Agreements on Credit Indices - Sell Protection (O) | |
| Reference Obligation | | Fixed Deal
Pay Rate | | | Expiration
Date | | | Counterparty | | Notional
Amount (P) | | | Fair
Value (Q) | | | Premiums
Paid
(Received) | | | Net Unrealized
Appreciation
(Depreciation) | |
Dow Jones North American Investment Grade Index - Series 5 | | | 0.46 | % | | | 12/20/2015 | | | MSC | | $ | 3,200,000 | | | $ | 11,702 | | | $ | 0 | | | $ | 11,702 | |
iTraxx Europe Subordinated Financial
Index - Series 22 | | | 1.00 | | | | 12/20/2019 | | | CITI | | | EUR 1,300,000 | | | | (49,034 | ) | | | (42,566 | ) | | | (6,468 | ) |
iTraxx Europe Subordinated Financial
Index - Series 22 | | | 1.00 | | | | 12/20/2019 | | | BCLY | | | EUR 3,100,000 | | | | (116,927 | ) | | | (100,553 | ) | | | (16,374 | ) |
| | | | | | | | | | | | | | | | | | | | | | | | | | |
Total | | | | | | | | | | | | | | | | $ | (154,259 | ) | | $ | (143,119 | ) | | $ | (11,140 | ) |
| | | | | | | | | | | | | | | | | | | | | | | | | | |
| | | | | | | | | | | | | | | | | | | | | | | | | | |
|
| Interest Rate Swap Agreements - Fixed Rate Receivable | |
| Floating Rate Index | | Fixed Rate | | | Expiration
Date | | | Counterparty | | Notional
Amount | | | Fair
Value | | | Premiums
Paid
(Received) | | | Net Unrealized
Appreciation
(Depreciation) | |
BRL-CDI | | | 7.80 | % | | | 01/02/2015 | | | MSC | | BRL | 24,200,000 | | | $ | (278,276 | ) | | $ | (1,052 | ) | | $ | (277,224 | ) |
BRL-CDI | | | 8.08 | | | | 01/02/2015 | | | HSBC | | | 5,300,000 | | | | (47,077 | ) | | | (1,675 | ) | | | (45,402 | ) |
BRL-CDI | | | 8.43 | | | | 01/02/2015 | | | DUB | | | 2,400,000 | | | | (12,568 | ) | | | 2,238 | | | | (14,806 | ) |
The Notes to Financial Statements are an integral part of this report.
| | |
| Transamerica Funds | | Annual Report 2014 |
Page 122
Transamerica Total Return
SCHEDULE OF INVESTMENTS (continued)
At October 31, 2014
OVER THE COUNTER SWAP AGREEMENTS (continued): (M)
| | | | | | | | | | | | | | | | | | | | | | | | | | |
|
| Interest Rate Swap Agreements - Fixed Rate Receivable (continued) | |
| Floating Rate Index | | Fixed Rate | | | Expiration
Date | | | Counterparty | | Notional
Amount | | | Fair
Value | | | Premiums
Paid
(Received) | | | Net Unrealized
Appreciation
(Depreciation) | |
BRL-CDI | | | 9.93 | % | | | 01/02/2015 | | | UBS | | BRL | 12,000,000 | | | $ | 112,571 | | | $ | (11,058 | ) | | $ | 123,629 | |
BRL-CDI | | | 9.93 | | | | 01/02/2015 | | | MSC | | | 26,200,000 | | | | 245,781 | | | | 2,278 | | | | 243,503 | |
BRL-CDI | | | 9.94 | | | | 01/02/2015 | | | GSC | | | 16,000,000 | | | | 151,749 | | | | 0 | | | | 151,749 | |
BRL-CDI | | | 10.91 | | | | 01/02/2017 | | | GSC | | | 200,000 | | | | (526 | ) | | | (647 | ) | | | 121 | |
BRL-CDI | | | 11.25 | | | | 01/04/2021 | | | DUB | | | 3,900,000 | | | | (32,080 | ) | | | (322 | ) | | | (31,758 | ) |
BRL-CDI | | | 11.25 | | | | 01/04/2021 | | | UBS | | | 6,400,000 | | | | (52,644 | ) | | | (11,945 | ) | | | (40,699 | ) |
BRL-CDI | | | 11.25 | | | | 01/04/2021 | | | GSC | | | 900,000 | | | | (7,403 | ) | | | (4,702 | ) | | | (2,701 | ) |
BRL-CDI | | | 11.47 | | | | 01/02/2017 | | | GSC | | | 49,300,000 | | | | (22,949 | ) | | | 32,927 | | | | (55,876 | ) |
BRL-CDI | | | 11.47 | | | | 01/02/2017 | | | HSBC | | | 32,900,000 | | | | (201,170 | ) | | | 30,432 | | | | (231,602 | ) |
BRL-CDI | | | 11.47 | | | | 01/02/2017 | | | JPM | | | 8,400,000 | | | | (3,910 | ) | | | 3,910 | | | | (7,820 | ) |
BRL-CDI | | | 11.47 | | | | 01/02/2017 | | | DUB | | | 4,200,000 | | | | (1,955 | ) | | | 4,587 | | | | (6,542 | ) |
BRL-CDI | | | 11.47 | | | | 01/02/2017 | | | BNP | | | 35,000,000 | | | | (214,010 | ) | | | 26,212 | | | | (240,222 | ) |
BRL-CDI | | | 11.50 | | | | 01/04/2021 | | | DUB | | | 6,200,000 | | | | (31,690 | ) | | | (251 | ) | | | (31,439 | ) |
BRL-CDI | | | 11.50 | | | | 01/04/2021 | | | CITI | | | 29,900,000 | | | | (152,828 | ) | | | 62,718 | | | | (215,546 | ) |
BRL-CDI | | | 11.68 | | | | 01/04/2021 | | | DUB | | | 6,200,000 | | | | (16,964 | ) | | | 2,956 | | | | (19,920 | ) |
BRL-CDI | | | 12.00 | | | | 01/04/2021 | | | DUB | | | 1,200,000 | | | | 303 | | | | 368 | | | | (65 | ) |
BRL-CDI | | | 12.06 | | | | 01/04/2021 | | | MSC | | | 1,600,000 | | | | 2,919 | | | | 1,473 | | | | 1,446 | |
BRL-CDI | | | 12.56 | | | | 01/04/2021 | | | MSC | | | 800,000 | | | | 6,722 | | | | 6,637 | | | | 85 | |
MXN TIIE Banxico | | | 6.81 | | | | 06/19/2034 | | | DUB | | MXN | 10,000,000 | | | | (28,579 | ) | | | 1,089 | | | | (29,668 | ) |
MXN TIIE Banxico | | | 7.02 | | | | 06/08/2034 | | | DUB | | | 46,600,000 | | | | 16,719 | | | | 74,546 | | | | (57,827 | ) |
| | | | | | | | | | | | | | | | | | | | | | | | | | |
Total | | | | | | | | | | | | | | | | $ | (567,865 | ) | | $ | 220,719 | | | $ | (788,584 | ) |
| | | | | | | | | | | | | | | | | | | | | | | | | | |
|
| Interest Rate Swap Agreements - Fixed Rate Payable | |
| Floating Rate Index | | Fixed Rate | | | Expiration
Date | | | Counterparty | | Notional
Amount | | | Fair
Value | | | Premiums
Paid
(Received) | | | Net Unrealized
Appreciation
(Depreciation) | |
BRL-CDI | | | 1.00 | % | | | 01/02/2017 | | | BNP | | BRL | 1,000,000 | | | $ | (4,454 | ) | | $ | (4,284 | ) | | $ | (170 | ) |
BRL-CDI | | | 1.00 | | | | 01/04/2021 | | | BNP | | | 4,900,000 | | | | 8,942 | | | | 2,050 | | | | 6,892 | |
BRL-CDI | | | 1.00 | | | | 01/04/2021 | | | UBS | | | 1,300,000 | | | | (3,557 | ) | | | (5,420 | ) | | | 1,863 | |
BRL-CDI | | | 1.00 | | | | 01/04/2021 | | | HSBC | | | 1,100,000 | | | | (3,010 | ) | | | (97 | ) | | | (2,913 | ) |
BRL-CDI | | | 1.00 | | | | 01/04/2021 | | | UBS | | | 16,700,000 | | | | (85,359 | ) | | | (17,941 | ) | | | (67,418 | ) |
BRL-CDI | | | 1.00 | | | | 01/04/2021 | | | MSC | | | 800,000 | | | | (4,090 | ) | | | (1,511 | ) | | | (2,579 | ) |
| | | | | | | | | | | | | | | | | | | | | | | | | | |
Total | | | | | | | | | | | | | | | | $ | (91,528 | ) | | $ | (27,203 | ) | | $ | (64,325 | ) |
| | | | | | | | | | | | | | | | | | | | | | | | | | |
| | | | | | | | | | | | |
| | | | |
| FUTURES CONTRACTS: (S) | | | | | | | | | | |
| Description | | Type | | Contracts | | Expiration
Date | | | Net Unrealized
Appreciation
(Depreciation) | |
3-Month Sterling | | Short | | (26) | | | 03/18/2015 | | | $ | (5,750 | ) |
3-Month Sterling | | Short | | (38) | | | 06/17/2015 | | | | (12,203 | ) |
3-Month Sterling | | Short | | (36) | | | 09/16/2015 | | | | (14,841 | ) |
10-Year U.S. Treasury Note | | Long | | 1,442 | | | 12/19/2014 | | | | 1,743,271 | |
90-Day Eurodollar | | Long | | 1,652 | | | 03/16/2015 | | | | (5,901 | ) |
90-Day Eurodollar | | Long | | 1,249 | | | 12/14/2015 | | | | (34,315 | ) |
90-Day Eurodollar | | Long | | 49 | | | 06/13/2016 | | | | 20,879 | |
Euro-BTP Italian Government Bond | | Long | | 319 | | | 12/08/2014 | | | | 128,411 | |
German Euro Bund | | Short | | (181) | | | 12/08/2014 | | | | (146,235 | ) |
Long U.S. Treasury Bond | | Long | | 668 | | | 12/19/2014 | | | | 182,013 | |
OTC Call Options Strike @ EUR 151.00 on German Euro Bund Futures (Counterparty: MSC) | | Short | | (23) | | | 11/21/2014 | | | | (9,812 | ) |
OTC Call Options Strike @ EUR 151.50 on German Euro Bund Futures (Counterparty: MSC) | | Short | | (72) | | | 11/21/2014 | | | | 2,818 | |
The Notes to Financial Statements are an integral part of this report.
| | |
| Transamerica Funds | | Annual Report 2014 |
Page 123
Transamerica Total Return
SCHEDULE OF INVESTMENTS (continued)
At October 31, 2014
| | | | | | | | | | | | |
| | | | |
| FUTURES CONTRACTS (continued): (S) | | | | | | | | | | |
| Description | | Type | | Contracts | | Expiration
Date | | | Net Unrealized
Appreciation
(Depreciation) | |
OTC Call Options Strike @ EUR 152.00 on German Euro Bund Futures (Counterparty: MSC) | | Short | | (48) | | | 11/21/2014 | | | $ | (390 | ) |
OTC Put Options Strike @ EUR 146.00 on German Euro Bund Futures (Counterparty: MSC) | | Short | | (22) | | | 11/21/2014 | | | | 7,972 | |
| | | | | | | | | | | | |
Total | | | | | | | | | | $ | 1,855,917 | |
| | | | | | | | | | | | |
| | | | | | | | | | | | | | | | | | | | | | |
|
| FORWARD FOREIGN CURRENCY CONTRACTS: (M) | |
| Counterparty | | Settlement
Date | | Currency
Purchased | | | | | Currency
Sold | | | | | Unrealized
Appreciation | | | Unrealized
Depreciation | |
| BCLY | | 11/04/2014 | | | 4,510,400,000 | | | JPY | | | 41,871,519 | | | USD | | $ | — | | | $ | (1,715,405 | ) |
| BCLY | | 11/04/2014 | | | 13,494,412 | | | USD | | | 10,630,000 | | | EUR | | | 173,086 | | | | — | |
| BCLY | | 11/04/2014 | | | 14,422,324 | | | USD | | | 1,580,600,000 | | | JPY | | | 350,234 | | | | — | |
| BCLY | | 11/17/2014 | | | 2,146,423 | | | USD | | | 2,405,275 | | | CAD | | | 13,180 | | | | — | |
| BCLY | | 12/02/2014 | | | 41,879,567 | | | USD | | | 4,510,400,000 | | | JPY | | | 1,714,070 | | | | — | |
| BCLY | | 12/05/2014 | | | 12,784,320 | | | INR | | | 207,000 | | | USD | | | — | | | | — | |
| BCLY | | 12/18/2014 | | | 1,777,000 | | | MXN | | | 131,408 | | | USD | | | 165 | | | | — | |
| BCLY | | 12/18/2014 | | | 1,745,882 | | | USD | | | 23,564,000 | | | MXN | | | 1,151 | | | | — | |
| BCLY | | 02/05/2015 | | | 6,505,000 | | | MXN | | | 478,672 | | | USD | | | 2,219 | | | | (587 | ) |
| BCLY | | 06/15/2015 | | | 588,000 | | | EUR | | | 778,444 | | | USD | | | — | | | | (40,335 | ) |
| BCLY | | 06/15/2015 | | | 4,403,255 | | | USD | | | 3,241,000 | | | EUR | | | 334,869 | | | | — | |
| BCLY | | 06/27/2016 | | | 4,792,049 | | | USD | | | 3,485,000 | | | EUR | | | 376,306 | | | | — | |
| BNP | | 11/04/2014 | | | 1,496,104 | | | BRL | | | 600,358 | | | USD | | | 3,164 | | | | (488 | ) |
| BNP | | 11/04/2014 | | | 28,068,000 | | | EUR | | | 35,793,219 | | | USD | | | — | | | | (618,903 | ) |
| BNP | | 11/04/2014 | | | 604,335 | | | USD | | | 1,496,104 | | | BRL | | | 2,799 | | | | (1,498 | ) |
| BNP | | 11/04/2014 | | | 15,583,751 | | | USD | | | 12,370,000 | | | EUR | | | 81,888 | | | | — | |
| BNP | | 11/06/2014 | | | 3,780,177 | | | USD | | | 50,155,391 | | | MXN | | | 57,034 | | | | — | |
| BNP | | 11/17/2014 | | | 1,811,000 | | | CAD | | | 1,616,034 | | | USD | | | — | | | | (9,854 | ) |
| BNP | | 12/02/2014 | | | 7,191,000 | | | EUR | | | 9,147,794 | | | USD | | | — | | | | (134,541 | ) |
| BNP | | 12/18/2014 | | | 44,894,385 | | | MXN | | | 3,357,873 | | | USD | | | 598 | | | | (34,389 | ) |
| BNP | | 12/18/2014 | | | 2,011,236 | | | USD | | | 26,921,000 | | | MXN | | | 17,944 | | | | — | |
| BNP | | 01/08/2015 | | | 13,825,140 | | | USD | | | 181,842,062 | | | MXN | | | 377,120 | | | | — | |
| BNP | | 01/22/2015 | | | 7,693,616 | | | USD | | | 101,862,528 | | | MXN | | | 166,617 | | | | — | |
| BNP | | 02/05/2015 | | | 71,160,500 | | | MXN | | | 5,384,418 | | | USD | | | — | | | | (130,197 | ) |
| BNP | | 02/05/2015 | | | 4,194,958 | | | USD | | | 55,421,689 | | | MXN | | | 102,831 | | | | — | |
| BNP | | 06/15/2015 | | | 623,000 | | | EUR | | | 835,138 | | | USD | | | — | | | | (53,094 | ) |
| BNP | | 06/15/2015 | | | 3,385,050 | | | USD | | | 2,496,000 | | | EUR | | | 251,853 | | | | — | |
| BNP | | 07/02/2015 | | | 57,649 | | | USD | | �� | 139,447 | | | BRL | | | 5,068 | | | | — | |
| BNP | | 07/05/2017 | | | 3,261,243 | | | USD | | | 9,500,000 | | | BRL | | | 257,998 | | | | — | |
| BOA | | 11/04/2014 | | | 398,960 | | | BRL | | | 163,844 | | | USD | | | — | | | | (3,035 | ) |
| BOA | | 11/04/2014 | | | 160,000 | | | USD | | | 398,960 | | | BRL | | | — | | | | (809 | ) |
| BOA | | 11/04/2014 | | | 206,000 | | | USD | | | 230,784 | | | CAD | | | 1,252 | | | | — | |
| BOA | | 11/13/2014 | | | 144,505,580 | | | MXN | | | 10,683,146 | | | USD | | | 39,172 | | | | — | |
| BOA | | 11/24/2014 | | | 20,130,120 | | | INR | | | 327,000 | | | USD | | | — | | | | (805 | ) |
| BOA | | 12/11/2014 | | | 550,618 | | | USD | | | 346,000 | | | GBP | | | — | | | | (2,694 | ) |
| BOA | | 12/18/2014 | | | 2,388,000 | | | USD | | | 32,181,695 | | | MXN | | | 5,195 | | | | — | |
| BOA | | 02/20/2015 | | | 373,646 | | | USD | | | 40,000,300 | | | JPY | | | 17,069 | | | | — | |
| BOA | | 03/10/2015 | | | 6,633,925 | | | USD | | | 710,068,800 | | | JPY | | | 302,829 | | | | — | |
| BOA | | 05/05/2015 | | | 8,538,532 | | | USD | | | 9,372,320 | | | CAD | | | 262,505 | | | | — | |
| BOA | | 06/15/2015 | | | 312,000 | | | EUR | | | 407,781 | | | USD | | | — | | | | (16,131 | ) |
| BOA | | 06/15/2015 | | | 7,714,541 | | | USD | | | 5,674,000 | | | EUR | | | 592,040 | | | | — | |
| BOA | | 08/07/2015 | | | 4,680,785 | | | USD | | | 3,500,000 | | | EUR | | | 284,860 | | | | — | |
| BOA | | 08/07/2015 | | | 1,000,000 | | | USD | | | 101,481,200 | | | JPY | | | 93,351 | | | | — | |
| BOA | | 06/13/2016 | | | 541,000 | | | EUR | | | 730,648 | | | USD | | | — | | | | (45,462 | ) |
| BOA | | 06/13/2016 | | | 18,687,019 | | | USD | | | 13,663,000 | | | EUR | | | 1,382,612 | | | | — | |
The Notes to Financial Statements are an integral part of this report.
| | |
| Transamerica Funds | | Annual Report 2014 |
Page 124
Transamerica Total Return
SCHEDULE OF INVESTMENTS (continued)
At October 31, 2014
| | | | | | | | | | | | | | | | | | | | | | |
|
| FORWARD FOREIGN CURRENCY CONTRACTS (continued): (M) | |
| Counterparty | | Settlement
Date | | Currency
Purchased | | | | | Currency
Sold | | | | | Unrealized
Appreciation | | | Unrealized
Depreciation | |
| BOA | | 06/27/2016 | | | 4,335,619 | | | USD | | | 3,149,000 | | | EUR | | $ | 345,612 | | | $ | — | |
| CITI | | 11/04/2014 | | | 5,846,000 | | | EUR | | | 7,400,686 | | | USD | | | — | | | | (74,584 | ) |
| CITI | | 11/04/2014 | | | 1,743,420 | | | USD | | | 1,374,000 | | | EUR | | | 21,548 | | | | — | |
| CITI | | 12/02/2014 | | | 707,200,000 | | | JPY | | | 6,548,961 | | | USD | | | — | | | | (251,284 | ) |
| CITI | | 12/18/2014 | | | 14,693,000 | | | MXN | | | 1,117,398 | | | USD | | | — | | | | (29,495 | ) |
| CITI | | 12/18/2014 | | | 1,450,000 | | | USD | | | 19,533,965 | | | MXN | | | 3,661 | | | | — | |
| CITI | | 02/05/2015 | | | 3,621,000 | | | MXN | | | 268,184 | | | USD | | | — | | | | (824 | ) |
| CITI | | 02/05/2015 | | | 756,753 | | | USD | | | 10,310,000 | | | MXN | | | — | | | | (4,498 | ) |
| CITI | | 02/10/2015 | | | 7,504,449 | | | USD | | | 8,220,486 | | | CAD | | | 229,396 | | | | — | |
| CITI | | 06/15/2015 | | | 1,968,000 | | | EUR | | | 2,603,605 | | | USD | | | — | | | | (133,199 | ) |
| CITI | | 06/15/2015 | | | 5,206,903 | | | USD | | | 3,809,000 | | | EUR | | | 425,513 | | | | — | |
| DUB | | 11/04/2014 | | | 27,430,000 | | | EUR | | | 34,636,167 | | | USD | | | — | | | | (261,383 | ) |
| DUB | | 11/04/2014 | | | 222,300,000 | | | JPY | | | 2,079,785 | | | USD | | | — | | | | (100,647 | ) |
| DUB | | 11/04/2014 | | | 2,839,672 | | | USD | | | 3,228,000 | | | AUD | | | — | | | | (178 | ) |
| DUB | | 11/04/2014 | | | 3,805,168 | | | USD | | | 3,012,000 | | | EUR | | | 30,584 | | | | — | |
| DUB | | 11/04/2014 | | | 10,945,374 | | | USD | | | 1,190,400,000 | | | JPY | | | 347,237 | | | | — | |
| DUB | | 12/02/2014 | | | 3,907,000 | | | EUR | | | 4,919,765 | | | USD | | | — | | | | (22,702 | ) |
| DUB | | 12/02/2014 | | | 351,000,000 | | | JPY | | | 3,222,759 | | | USD | | | — | | | | (97,074 | ) |
| DUB | | 12/18/2014 | | | 19,978,073 | | | USD | | | 263,008,115 | | | MXN | | | 507,269 | | | | (2,912 | ) |
| DUB | | 02/05/2015 | | | 8,358,898 | | | USD | | | 110,441,940 | | | MXN | | | 204,285 | | | | — | |
| DUB | | 06/15/2015 | | | 1,477,000 | | | EUR | | | 1,920,514 | | | USD | | | — | | | | (66,454 | ) |
| DUB | | 07/02/2015 | | | 602,292 | | | USD | | | 1,457,545 | | | BRL | | | 52,696 | | | | — | |
| DUB | | 08/07/2015 | | | 267,586 | | | USD | | | 200,000 | | | EUR | | | 16,390 | | | | — | |
| DUB | | 02/01/2016 | | | 5,450,085 | | | USD | | | 4,050,000 | | | EUR | | | 341,959 | | | | — | |
| DUB | | 06/13/2016 | | | 1,978,000 | | | EUR | | | 2,673,465 | | | USD | | | — | | | | (168,296 | ) |
| DUB | | 06/13/2016 | | | 6,741,941 | | | USD | | | 4,924,000 | | | EUR | | | 505,616 | | | | — | |
| GSC | | 11/04/2014 | | | 18,730,000 | | | AUD | | | 16,534,320 | | | USD | | | — | | | | (56,503 | ) |
| GSC | | 11/04/2014 | | | 261,700,000 | | | JPY | | | 2,451,152 | | | USD | | | — | | | | (121,236 | ) |
| GSC | | 11/04/2014 | | | 12,417,692 | | | USD | | | 14,252,000 | | | AUD | | | — | | | | (120,581 | ) |
| GSC | | 11/13/2014 | | | 10,863,970 | | | USD | | | 143,850,052 | | | MXN | | | 190,292 | | | | — | |
| GSC | | 12/02/2014 | | | 3,526,000 | | | EUR | | | 4,435,901 | | | USD | | | — | | | | (16,386 | ) |
| GSC | | 12/02/2014 | | | 16,501,130 | | | USD | | | 18,730,000 | | | AUD | | | 55,489 | | | | — | |
| GSC | | 12/11/2014 | | | 322,988 | | | USD | | | 203,000 | | | GBP | | | — | | | | (1,643 | ) |
| GSC | | 12/11/2014 | | | 1,572,591 | | | USD | | | 20,708,817 | | | MXN | | | 38,620 | | | | — | |
| GSC | | 12/18/2014 | | | 1,832,000 | | | MXN | | | 135,921 | | | USD | | | — | | | | (276 | ) |
| GSC | | 12/18/2014 | | | 4,890,997 | | | USD | | | 65,000,528 | | | MXN | | | 78,211 | | | | — | |
| GSC | | 01/22/2015 | | | 545,763 | | | USD | | | 7,207,897 | | | MXN | | | 13,145 | | | | — | |
| GSC | | 06/15/2015 | | | 2,632,000 | | | EUR | | | 3,501,240 | | | USD | | | — | | | | (197,324 | ) |
| GSC | | 07/02/2015 | | | 2,642,595 | | | USD | | | 6,403,008 | | | BRL | | | 228,220 | | | | — | |
| HSBC | | 11/04/2014 | | | 1,085,232 | | | USD | | | 1,250,000 | | | AUD | | | — | | | | (14,463 | ) |
| HSBC | | 11/04/2014 | | | 9,950,743 | | | USD | | | 1,090,900,000 | | | JPY | | | 238,455 | | | | — | |
| HSBC | | 11/24/2014 | | | 42,592,600 | | | INR | | | 692,000 | | | USD | | | — | | | | (1,817 | ) |
| HSBC | | 12/18/2014 | | | 730,000 | | | USD | | | 9,835,071 | | | MXN | | | 1,789 | | | | — | |
| HSBC | | 01/08/2015 | | | 348,000 | | | USD | | | 21,767,400 | | | INR | | | — | | | | (1,353 | ) |
| HSBC | | 08/07/2015 | | | 4,228,000 | | | USD | | | 431,122,818 | | | JPY | | | 376,280 | | | | — | |
| JPM | | 11/04/2014 | | | 675,184 | | | BRL | | | 276,239 | | | USD | | | — | | | | (4,093 | ) |
| JPM | | 11/04/2014 | | | 449,000,000 | | | JPY | | | 4,159,294 | | | USD | | | — | | | | (161,845 | ) |
| JPM | | 11/04/2014 | | | 272,000 | | | USD | | | 675,184 | | | BRL | | | 488 | | | | (634 | ) |
| JPM | | 11/04/2014 | | | 14,532,640 | | | USD | | | 1,581,500,000 | | | JPY | | | 452,538 | | | | — | |
| JPM | | 11/24/2014 | | | 327,000 | | | USD | | | 20,136,660 | | | INR | | | 699 | | | | — | |
| JPM | | 12/02/2014 | | | 2,893,000 | | | AUD | | | 2,545,086 | | | USD | | | — | | | | (4,924 | ) |
| JPM | | 12/05/2014 | | | 207,000 | | | USD | | | 12,784,320 | | | INR | | | — | | | | — | |
| JPM | | 12/11/2014 | | | 452,402 | | | USD | | | 282,000 | | | GBP | | | 1,732 | | | | (295 | ) |
| JPM | | 12/18/2014 | | | 32,315,560 | | | MXN | | | 2,446,587 | | | USD | | | 2,052 | | | | (55,922 | ) |
| JPM | | 12/18/2014 | | | 848,000 | | | USD | | | 11,371,256 | | | MXN | | | 6,046 | | | | — | |
| JPM | | 01/05/2015 | | | 11,616,900 | | | USD | | | 27,000,000 | | | BRL | | | 923,725 | | | | — | |
| JPM | | 01/08/2015 | | | 32,651,100 | | | INR | | | 522,000 | | | USD | | | 2,030 | | | | — | |
The Notes to Financial Statements are an integral part of this report.
| | |
| Transamerica Funds | | Annual Report 2014 |
Page 125
Transamerica Total Return
SCHEDULE OF INVESTMENTS (continued)
At October 31, 2014
| | | | | | | | | | | | | | | | | | | | | | |
|
| FORWARD FOREIGN CURRENCY CONTRACTS (continued): (M) | |
| Counterparty | | Settlement
Date | | Currency
Purchased | | | | | Currency
Sold | | | | | Unrealized
Appreciation | | | Unrealized
Depreciation | |
| JPM | | 04/02/2015 | | | 4,029,272 | | | USD | | | 9,912,442 | | | BRL | | $ | 213,707 | | | $ | (18,257 | ) |
| JPM | | 06/15/2015 | | | 415,000 | | | EUR | | | 555,472 | | | USD | | | — | | | | (34,528 | ) |
| UBS | | 11/04/2014 | | | 2,243,871 | | | BRL | | | 934,210 | | | USD | | | 109 | | | | (29,882 | ) |
| UBS | | 11/04/2014 | | | 57,974,000 | | | EUR | | | 73,673,359 | | | USD | | | — | | | | (1,021,380 | ) |
| UBS | | 11/04/2014 | | | 910,681 | | | USD | | | 2,243,871 | | | BRL | | | 6,244 | | | | — | |
| UBS | | 11/04/2014 | | | 117,605,390 | | | USD | | | 91,932,000 | | | EUR | | | 2,397,853 | | | | — | |
| UBS | | 12/02/2014 | | | 1,721,739 | | | BRL | | | 691,712 | | | USD | | | — | | | | (3,621 | ) |
| UBS | | 12/02/2014 | | | 73,684,838 | | | USD | | | 57,974,000 | | | EUR | | | 1,019,795 | | | | — | |
| UBS | | 12/18/2014 | | | 477,000 | | | USD | | | 6,453,273 | | | MXN | | | 686 | | | | (1,501 | ) |
| UBS | | 01/05/2015 | | | 27,000,000 | | | BRL | | | 11,271,133 | | | USD | | | — | | | | (577,958 | ) |
| UBS | | 01/05/2015 | | | 11,128,545 | | | USD | | | 26,446,987 | | | BRL | | | 654,387 | | | | — | |
| UBS | | 06/15/2015 | | | 869,000 | | | EUR | | | 1,145,269 | | | USD | | | — | | | | (54,424 | ) |
| UBS | | 10/02/2015 | | | 16,184,065 | | | USD | | | 41,300,000 | | | BRL | | | 987,112 | | | | — | |
| UBS | | 01/05/2016 | | | 4,246,285 | | | USD | | | 11,000,000 | | | BRL | | | 296,749 | | | | — | |
| | | | | | | | | | | | | | | | | | | | | | |
Total | | | | | | | | | | | | | | | | $ | 18,489,298 | | | $ | (6,522,603 | ) |
| | | | | | | | | | | | | | | | | | | | | | |
SECURITY VALUATION:
Valuation Inputs (T)
| | | | | | | | | | | | | | | | |
| | | Level 1
Quoted Prices | | | Level 2
Other Significant
Observable Inputs | | | Level 3
Significant
Unobservable Inputs | | | Value at
October 31, 2014 | |
ASSETS | | | | | | | | | | | | | | | | |
Investments | | | | | | | | | | | | | | | | |
U.S. Government Obligations | | $ | — | | | $ | 211,446,001 | | | $ | — | | | $ | 211,446,001 | |
U.S. Government Agency Obligations | | | — | | | | 67,944,100 | | | | — | | | | 67,944,100 | |
Foreign Government Obligations | | | — | | | | 114,913,204 | | | | — | | | | 114,913,204 | |
Mortgage-Backed Securities | | | — | | | | 51,509,209 | | | | — | | | | 51,509,209 | |
Asset-Backed Securities | | | — | | | | 93,392,070 | | | | — | | | | 93,392,070 | |
Municipal Government Obligations | | | — | | | | 48,445,185 | | | | — | | | | 48,445,185 | |
Preferred Corporate Debt Securities | | | — | | | | 3,293,690 | | | | — | | | | 3,293,690 | |
Corporate Debt Securities | | | — | | | | 368,732,115 | | | | — | | | | 368,732,115 | |
Certificates of Deposit | | | — | | | | 23,041,339 | | | | — | | | | 23,041,339 | |
Commercial Paper | | | — | | | | 24,985,379 | | | | — | | | | 24,985,379 | |
Loan Assignments | | | — | | | | 5,757,286 | | | | — | | | | 5,757,286 | |
Short-Term U.S. Government Obligation | | | — | | | | 14,199,959 | | | | — | | | | 14,199,959 | |
Short-Term Foreign Government Obligations | | | — | | | | 46,149,330 | | | | — | | | | 46,149,330 | |
Convertible Preferred Stock | | | 1,926,400 | | | | — | | | | — | | | | 1,926,400 | |
Securities Lending Collateral | | | 19,911,652 | | | | — | | | | — | | | | 19,911,652 | |
Repurchase Agreements | | | — | | | | 46,704,209 | | | | — | | | | 46,704,209 | |
| | | | | | | | | | | | | | | | |
Total Investments | | $ | 21,838,052 | | | $ | 1,120,513,076 | | | $ | — | | | $ | 1,142,351,128 | |
| | | | | | | | | | | | | | | | |
Derivative Financial Instruments | | | | | | | | | | | | | | | | |
Credit Default Swap Agreements | | $ | — | | | $ | 1,014,517 | | | $ | — | | | $ | 1,014,517 | |
Interest Rate Swap Agreements | | | — | | | | 1,754,740 | | | | — | | | | 1,754,740 | |
Futures Contracts (U) | | | 2,085,364 | | | | — | | | | — | | | | 2,085,364 | |
Forward Foreign Currency Contracts (U) | | | — | | | | 18,489,298 | | | | — | | | | 18,489,298 | |
| | | | | | | | | | | | | | | | |
Total Derivative Financial Instruments | | $ | 2,085,364 | | | $ | 21,258,555 | | | $ | — | | | $ | 23,343,919 | |
| | | | | | | | | | | | | | | | |
LIABILITIES | | | | | | | | | | | | | | | | |
Derivative Financial Instruments | | | | | | | | | | | | | | | | |
Reverse Repurchase Agreement | | $ | — | | | $ | (1,780,726 | ) | | $ | — | | | $ | (1,780,726 | ) |
Written Options | | | (107,578 | ) | | | — | | | | — | | | | (107,578 | ) |
Written Foreign Exchange Options | | | — | | | | (528,999 | ) | | | — | | | | (528,999 | ) |
Written Swaptions on Credit Default Swap Agreements | | | — | | | | (22,642 | ) | | | — | | | | (22,642 | ) |
The Notes to Financial Statements are an integral part of this report.
| | |
| Transamerica Funds | | Annual Report 2014 |
Page 126
Transamerica Total Return
SCHEDULE OF INVESTMENTS (continued)
At October 31, 2014
SECURITY VALUATION (continued):
Valuation Inputs (continued) (T)
| | | | | | | | | | | | | | | | |
| | | Level 1
Quoted Prices | | | Level 2
Other Significant
Observable Inputs | | | Level 3
Significant
Unobservable Inputs | | | Value at
October 31, 2014 | |
LIABILITIES (continued) | | | | | | | | | | | | | | | | |
Derivative Financial Instruments (continued) | | | | | | | | | | | | | | | | |
Written Swaptions on Interest Rate Swap Agreements | | $ | — | | | $ | (1,289,044 | ) | | $ | — | | | $ | (1,289,044 | ) |
Credit Default Swap Agreements | | | — | | | | (1,394,902 | ) | | | — | | | | (1,394,902 | ) |
Interest Rate Swap Agreements | | | — | | | | (5,688,696 | ) | | | — | | | | (5,688,696 | ) |
Futures Contracts (U) | | | (229,447 | ) | | | — | | | | — | | | | (229,447 | ) |
Forward Foreign Currency Contracts (U) | | | — | | | | (6,522,603 | ) | | | — | | | | (6,522,603 | ) |
| | | | | | | | | | | | | | | | |
Total Derivative Financial Instruments | | $ | (337,025 | ) | | $ | (17,227,612 | ) | | $ | — | | | $ | (17,564,637 | ) |
| | | | | | | | | | | | | | | | |
| | | | | | | | | | | | | | | | |
| Investments | | Transfer from
Level 1 to Level 2 | | | Transfer from
Level 2 to Level 1 | | | Transfer from
Level 2 to Level 3 | | | Transfer from
Level 3 to Level 2 (V) | |
Corporate Debt Securities | | $ | — | | | $ | — | | | $ | — | | | $ | 1,054 | |
| | | | | | | | | | | | | | | | |
FOOTNOTES TO SCHEDULE OF INVESTMENTS:
| (A) | All or a portion of this security has been segregated by the custodian as collateral for open options, swap, swaptions and/or forward foreign currency contracts. Total value of securities segregated for open options, swap, swaptions and/or forward foreign currency contracts is $1,180,780. |
| (B) | All or a portion of this security has been segregated by the custodian as collateral to cover margin requirements for open futures contracts. Total value of securities segregated as collateral to cover margin requirements for open futures contracts is $6,087,379. |
| (C) | All or a portion of this security has been segregated by the custodian as collateral for centrally cleared swap agreements. Total value of securities segregated as collateral to cover centrally cleared swap agreements is $9,329,926. |
| (D) | Floating or variable rate security. Rate is listed as of October 31, 2014. |
| (E) | Total aggregate value of illiquid securities is $27,985,811, or 2.60% of the Fund’s net assets, and total aggregate value of illiquid derivatives is $(348,722), or (0.03)% of the Fund’s net assets. |
| (F) | All or a portion of this security is on loan. The value of all securities on loan is $19,516,402. The amount of securities on loan indicated may not correspond with the securities on loan identified because securities with pending sales are in the process of recall from the brokers. |
| (G) | The security has a perpetual maturity. The date shown is the next call date. |
| (H) | All or a portion of this security has been segregated with the broker as collateral for open reverse repurchase agreements. Total value of securities segregated as collateral for open reverse repurchase agreements is $ 1,804,471. |
| (I) | Percentage rounds to less than 0.1% or (0.1)%. |
| (K) | Rate shown reflects the yield at October 31, 2014. |
| (L) | Aggregate cost for federal income tax purposes is $1,138,579,267. Aggregate gross unrealized appreciation and depreciation for all securities is $20,534,781 and $16,762,920, respectively. Net unrealized appreciation for tax purposes is $3,771,861. |
| (M) | Cash in the amount of $8,250,000 has been segregated by the broker as collateral for open options, swap, swaptions and/or forward foreign currency contracts. |
| (N) | Cash in the amount of $271,000 has been segregated by the custodian as collateral for centrally cleared swap agreements. |
| (O) | If the Fund is a seller of protection and a credit event occurs, as defined under the terms of that particular swap agreement, the Fund will either (a) pay to the buyer of protection an amount equal to the notional amount of the swap and take delivery of the referenced obligation or underlying securities comprising the referenced obligation or (b) pay a net settlement amount in the form of cash or securities equal to the notional amount of the swap agreement less the recovery value of the referenced obligation or underlying securities comprising the referenced obligation. |
| (P) | The maximum potential amount the Fund could be required to make as a seller of credit protection or receive as a buyer of credit protection if a credit event occurs as defined under the terms of that particular swap agreement. |
| (Q) | The quoted market prices and resulting fair values for credit default swap agreements on asset-backed securities and credit indices serve as an indicator of the current status of the payment/performance risk and represent the likelihood of an expected liability (or profit) for the credit derivative had the notional amount of the swap agreement been closed/sold as of the period ended. Increasing fair values, in absolute terms when compared to the notional amount of the swap agreement, represent a deterioration of the referenced entity’s credit soundness and a greater likelihood or risk of default or other credit event occurring as defined under the terms of the agreement. |
| (R) | Implied credit spreads, represented in absolute terms, utilized in determining the market value of credit default swap agreements on corporate issues or sovereign issues of an emerging country as of period end serve as an indicator of the current status of the payment/performance risk and represent the likelihood of risk of default for the credit derivative. The implied credit spread of a particular referenced entity reflects the cost of buying/selling protection and may include the referenced entity’s credit soundness and a greater likelihood or risk of default or other credit event occurring as defined under the terms of the agreement. A credit spread identified as “Defaulted” indicates a credit event has occurred for the referenced entity or obligation. |
The Notes to Financial Statements are an integral part of this report.
| | |
| Transamerica Funds | | Annual Report 2014 |
Page 127
Transamerica Total Return
SCHEDULE OF INVESTMENTS (continued)
At October 31, 2014
FOOTNOTES TO SCHEDULE OF INVESTMENTS (continued):
| (S) | Cash in the amount of $656,000 has been segregated by the custodian as collateral to cover margin requirements for open futures contracts. |
| (T) | The Fund recognizes transfers between Levels at the end of the reporting period. See the Notes to Financial Statements for more information regarding security valuation and pricing inputs. |
| (U) | Derivative financial instruments valued at unrealized appreciation (depreciation) on the instrument. |
| (V) | Transferred from Level 3 to 2 due to utilizing significant observable inputs, as of prior reporting period the security utilized significant unobservable inputs. |
DEFINITIONS:
| | |
| 144A | | 144A securities are registered pursuant to Rule 144A of the Securities Act of 1933. These securities are deemed to be liquid for purposes of compliance limitations on holdings of illiquid securities and may be resold as transactions exempt from registration, normally to qualified institutional buyers. At October 31, 2014, these securities aggregated $151,938,209, or 14.13% of the Fund’s net assets. |
| BBA | | British Bankers’ Association |
| BCLY | | Barclays Bank PLC |
| BNP | | BNP Paribas |
| BOA | | Bank of America |
| BRL-CDI | | Brazil Interbank Deposit Rate |
| BTP | | Buoni del Tesoro Poliennani (Treasury Bonds) |
| CITI | | Citigroup, Inc. |
| DUB | | Deutsche Bank AG |
| EURIBOR | | Euro Interbank Offered Rate |
| GSC | | Goldman Sachs & Co. |
| HSBC | | HSBC Bank USA |
| IO | | Interest only portion of a STRIPS (Separate Trading of Registered Interest and Principal of Securities) |
| JPM | | JPMorgan Chase Bank |
| LIBOR | | London Interbank Offered Rate |
| MSC | | Morgan Stanley |
| MTN | | Medium Term Note |
| MXN TIIE Banxico | | Tasa de Interés Interbancaria de Equilibrio (Interbank Equilibrium Interest Rate) (“TIIE”) for MXNde Equilibrio by the Banco de México |
| OTC | | Over the Counter |
| RBS | | Royal Bank of Scotland Group PLC |
| Reg S | | Security exempt from registration under Regulation S of the Securities Act of 1933, which exempts from registration securities offered and sold outside the United States. Security may not be offered or sold in the United States except pursuant to an exemption from, or in a transaction not subject to, the registration requirements of the Securities Act of 1933. |
| TBA | | To Be Announced |
| UBS | | UBS AG |
CURRENCY ABBREVIATIONS:
| | |
| AUD | | Australian Dollar |
| BRL | | Brazilian Real |
| CAD | | Canadian Dollar |
| EUR | | Euro |
| GBP | | Pound Sterling |
| INR | | Indian Rupee |
| JPY | | Japanese Yen |
| MXN | | Mexican Peso |
| USD | | United States Dollar |
The Notes to Financial Statements are an integral part of this report.
| | |
| Transamerica Funds | | Annual Report 2014 |
Page 128
STATEMENTS OF ASSETS AND LIABILITIES
At October 31, 2014
| | | | | | | | | | | | | | | | | | | | |
| | | Transamerica
Arbitrage
Strategy | | | Transamerica
Bond | | | Transamerica
Core Bond | | | Transamerica
Developing
Markets Equity | | | Transamerica
Global Real
Estate
Securities | |
Assets: | | | | | | | | | | | | | | | | | | | | |
Investments, at value | | $ | 150,203,805 | | | $ | 847,717,675 | | | $ | 807,223,075 | | | $ | 1,008,229,053 | | | $ | 60,400,549 | |
Repurchase agreements, at value | | | 3,898,356 | | | | 6,618,316 | | | | 29,989,424 | | | | 47,373,182 | | | | 1,138,089 | |
Cash on deposit with broker | | | 41,661,504 | | | | — | | | | — | | | | — | | | | — | |
Foreign currency, at value | | | 186,909 | | | | — | | | | — | | | | 1,121,963 | | | | — | |
Cash | | | 68,347 | | | | 137,879 | | | | 2,407 | | | | — | | | | — | |
Unrealized appreciation on forward foreign currency contracts | | | 314,383 | | | | — | | | | — | | | | — | | | | — | |
OTC swap agreements, at value | | | 214 | | | | — | | | | — | | | | — | | | | — | |
Receivables: | | | | | | | | | | | | | | | | | | | | |
Shares of beneficial interest sold | | | 5 | | | | 46,719 | | | | 177,352 | | | | 26,710 | | | | 10,536 | |
Investments sold | | | 9,037,846 | | | | 957,650 | | | | 115,050 | | | | 253,328 | | | | 49,131 | |
Interest | | | 250,070 | | | | 7,533,603 | | | | 3,717,798 | | | | 15 | | | | — | |
Dividends | | | 33,043 | | | | 162,691 | | | | — | | | | 635,900 | | | | 69,508 | |
Dividend reclaims | | | 485 | | | | — | | | | — | | | | 74,576 | | | | 25,089 | |
Net income from securities lending | | | — | | | | 29,535 | | | | 2,644 | | | | 97,222 | | | | 1,397 | |
Variation margin receivable on derivative financial instruments | | | — | | | | 112,969 | | | | — | | | | — | | | | — | |
Prepaid expenses | | | 733 | | | | 3,946 | | | | 5,630 | | | | 2,605 | | | | 813 | |
Total assets | | | 205,655,700 | | | | 863,320,983 | | | | 841,233,380 | | | | 1,057,814,554 | | | | 61,695,112 | |
| | | | | | |
Liabilities: | | | | | | | | | | | | | | | | | | | | |
Due to custodian | | | — | | | | — | | | | — | | | | 9,269 | | | | — | |
Accounts payable and accrued liabilities: | | | | | | | | | | | | | | | | | | | | |
Shares of beneficial interest redeemed | | | 29,663 | | | | 63,489 | | | | 155,574 | | | | 48,381 | | | | 3,203 | |
Investments purchased | | | 6,021,915 | | | | 5,335,182 | | | | 120,401 | | | | 3,085,897 | | | | 27,376 | |
When-issued securities purchased | | | — | | | | 1,988,700 | | | | 182,734 | | | | — | | | | — | |
Management and advisory fees | | | 79,966 | | | | 420,007 | | | | 313,848 | | | | 882,562 | | | | 36,454 | |
Administration fees | | | 3,327 | | | | 16,507 | | | | 17,625 | | | | 20,255 | | | | 1,139 | |
Transfer agent fees | | | 998 | | | | 4,952 | | | | 5,288 | | | | 6,077 | | | | 342 | |
Trustees fees | | | 10 | | | | 52 | | | | 63 | | | | 66 | | | | 4 | |
Audit and tax fees | | | 19,336 | | | | 21,894 | | | | 22,416 | | | | 56,799 | | | | 17,753 | |
Custody fees | | | — | | | | 398 | | | | 6,151 | | | | 35,962 | | | | 2,799 | |
Legal fees | | | 2,138 | | | | 9,453 | | | | 12,744 | | | | 7,193 | | | | 1,135 | |
Printing and shareholder reports fees | | | 343 | | | | 1,404 | | | | 777 | | | | 894 | | | | 287 | |
Dividends and interest from securities sold short | | | 50,348 | | | | — | | | | — | | | | — | | | | — | |
Foreign capital gains tax | | | — | | | | — | | | | — | | | | 1,698,398 | | | | — | |
Registration fees | | | 1,960 | | | | 2,836 | | | | 3,184 | | | | 20,328 | | | | 52 | |
Other | | | 479 | | | | 1,729 | | | | 2,388 | | | | 1,365 | | | | 105 | |
Collateral for securities on loan | | | — | | | | 75,146,144 | | | | 16,062,375 | | | | 88,767,885 | | | | 5,126,698 | |
Written options and swaptions, at value | | | 404,611 | | | | — | | | | — | | | | — | | | | — | |
Securities sold short, at value | | | 44,544,690 | | | | — | | | | — | | | | — | | | | — | |
Unrealized depreciation on forward foreign currency contracts | | | 93,976 | | | | — | | | | — | | | | — | | | | — | |
OTC swap agreements, at value | | | 172 | | | | — | | | | — | | | | — | | | | — | |
Total liabilities | | | 51,253,932 | | | | 83,012,747 | | | | 16,905,568 | | | | 94,641,331 | | | | 5,217,347 | |
Net assets | | $ | 154,401,768 | | | $ | 780,308,236 | | | $ | 824,327,812 | | | $ | 963,173,223 | | | $ | 56,477,765 | |
| | | | | | |
Net assets consist of: | | | | | | | | | | | | | | | | | | | | |
Paid-in capital | | $ | 154,466,974 | | | $ | 697,902,249 | | | $ | 787,317,830 | | | $ | 904,742,016 | | | $ | 90,137,232 | |
Undistributed (distributions in excess of) net investment income (loss) | | | 64,767 | | | | 2,988,481 | | | | 173,362 | | | | 142,297 | | | | (2,290,770 | ) |
Accumulated net realized gain (loss) | | | 190,651 | | | | 27,242,399 | | | | 6,697,265 | | | | 37,973,557 | | | | (46,890,301 | ) |
Net unrealized appreciation (depreciation) on: | | | | | | | | | | | | | | | | | | | | |
Investments | | | 1,239,968 | | | | 52,708,461 | | | | 30,139,355 | | | | 20,384,421 | | | | 15,524,792 | |
Futures contracts | | | — | | | | (482,114 | ) | | | — | | | | — | | | | — | |
Written options and swaptions | | | (140,636 | ) | | | — | | | | — | | | | — | | | | — | |
Swap agreements | | | 42 | | | | — | | | | — | | | | — | | | | — | |
Translation of assets and liabilities denominated in foreign currencies | | | 222,811 | | | | (51,240 | ) | | | — | | | | (69,068 | ) | | | (3,188 | ) |
Securities sold short | | | (1,642,809 | ) | | | — | | | | — | | | | — | | | | — | |
Net assets | | $ | 154,401,768 | | | $ | 780,308,236 | | | $ | 824,327,812 | | | $ | 963,173,223 | | | $ | 56,477,765 | |
Shares outstanding (unlimited shares, no par value) | | | 15,417,044 | | | | 72,178,299 | | | | 81,097,987 | | | | 78,668,833 | | | | 3,917,868 | |
Net asset value and offering price per share | | $ | 10.02 | | | $ | 10.81 | | | $ | 10.16 | | | $ | 12.24 | | | $ | 14.42 | |
| | | | | | | | | | | | | | | | | | | | | |
Investments, at cost | | $ | 148,963,837 | | | $ | 795,009,214 | | | $ | 777,083,720 | | | $ | 986,146,295 | | | $ | 44,875,757 | |
Repurchase agreements, at cost | | $ | 3,898,356 | | | $ | 6,618,316 | | | $ | 29,989,424 | | | $ | 47,373,182 | | | $ | 1,138,089 | |
Foreign currency, at cost | | $ | 186,330 | | | $ | — | | | $ | — | | | $ | 1,181,429 | | | $ | — | |
Securities loaned, at value | | $ | — | | | $ | 73,571,277 | | | $ | 15,732,626 | | | $ | 85,531,736 | | | $ | 4,961,344 | |
Premium received on written options and swaptions | | $ | 263,975 | | | $ | — | | | $ | — | | | $ | — | | | $ | — | |
Proceeds received from securities sold short | | $ | 42,901,881 | | | $ | — | | | $ | — | | | $ | — | | | $ | — | |
The Notes to Financial Statements are an integral part of this report.
| | |
| Transamerica Funds | | Annual Report 2014 |
Page 129
STATEMENTS OF ASSETS AND LIABILITIES (continued)
At October 31, 2014
| | | | | | | | | | | | | | | | | | | | |
| | | Transamerica
Growth | | | Transamerica
Intermediate
Bond | | | Transamerica
International
Equity
Opportunities | | | Transamerica
International
Small Cap | | | Transamerica
Long/Short
Strategy | |
Assets: | | | | | | | | | | | | | | | | | | | | |
Investments, at value | | $ | 548,756,006 | | | $ | 361,278,825 | | | $ | 569,732,217 | | | $ | 941,811,919 | | | $ | 166,557,144 | |
Repurchase agreements, at value | | | 5,379,580 | | | | 5,200,657 | | | | 2,775,103 | | | | 9,239,080 | | | | 18,436,350 | |
Cash on deposit with broker | | | — | | | | — | | | | — | | | | — | | | | 102,681,731 | |
Foreign currency, at value | | | — | | | | — | | | | 79,066 | | | | 1,648,454 | | | | — | |
Cash | | | — | | | | 42,642 | | | | — | | | | — | | | | — | |
Receivables: | | | | | | | | | | | | | | | | | | | | |
Shares of beneficial interest sold | | | 60,231 | | | | — | | | | 24,413 | | | | 27,116 | | | | 6,633 | |
Investments sold | | | 1,119,082 | | | | 4,294 | | | | 948,073 | | | | 1,756,405 | | | | 21,679,510 | |
Interest | | | 2 | | | | 2,156,585 | | | | 1 | | | | 2 | | | | 5 | |
Dividends | | | 148,963 | | | | — | | | | 1,115,940 | | | | 1,431,734 | | | | 81,989 | |
Dividend reclaims | | | 14,385 | | | | — | | | | 320,171 | | | | 231,221 | | | | — | |
Net income from securities lending | | | 5,118 | | | | 4,174 | | | | 21,872 | | | | 125,830 | | | | — | |
Prepaid expenses | | | 2,678 | | | | — | | | | 1,131 | | | | 1,853 | | | | 628 | |
Total assets | | | 555,486,045 | | | | 368,687,177 | | | | 575,017,987 | | | | 956,273,614 | | | | 309,443,990 | |
| | | | | | |
Liabilities: | | | | | | | | | | | | | | | | | | | | |
Due to custodian | | | — | | | | — | | | | — | | | | — | | | | 12,486 | |
Accounts payable and accrued liabilities: | | | | | | | | | | | | | | | | | | | | |
Shares of beneficial interest redeemed | | | 101,118 | | | | — | | | | 61,407 | | | | 37,858 | | | | 9,091 | |
Investments purchased | | | 1,575,701 | | | | 42,241,145 | | | | 51,939 | | | | 262,592 | | | | 25,958,124 | |
When-issued securities purchased | | | — | | | | 1,819,677 | | | | — | | | | — | | | | — | |
Management and advisory fees | | | 332,589 | | | | 90,484 | | | | 420,064 | | | | 750,303 | | | | 137,769 | |
Administration fees | | | 10,745 | | | | 6,463 | | | | 11,886 | | | | 18,312 | | | | 2,870 | |
Transfer agent fees | | | 3,224 | | | | 1,939 | | | | 3,566 | | | | 5,494 | | | | 861 | |
Trustees fees | | | 34 | | | | 20 | | | | 38 | | | | 59 | | | | 9 | |
Audit and tax fees | | | 16,444 | | | | 19,264 | | | | 19,265 | | | | 20,324 | | | | 17,771 | |
Custody fees | | | 897 | | | | — | | | | — | | | | 7,369 | | | | 21,458 | |
Legal fees | | | 6,190 | | | | 1,579 | | | | 4,876 | | | | 7,200 | | | | 1,501 | |
Printing and shareholder reports fees | | | 517 | | | | 801 | | | | 398 | | | | 509 | | | | 417 | |
Dividends and interest from securities sold short | | | — | | | | — | | | | — | | | | — | | | | 157,576 | |
Registration fees | | | 1,145 | | | | 14,828 | | | | 20,735 | | | | 12,820 | | | | 2,326 | |
Other | | | 1,193 | | | | 218 | | | | 1,033 | | | | 1,287 | | | | 23,404 | |
Collateral for securities on loan | | | 24,009,837 | | | | 20,098,585 | | | | 10,287,810 | | | | 93,311,007 | | | | — | |
Securities sold short, at value | | | — | | | | — | | | | — | | | | — | | | | 122,188,300 | |
Total liabilities | | | 26,059,634 | | | | 64,295,003 | | | | 10,883,017 | | | | 94,435,134 | | | | 148,533,963 | |
Net assets | | $ | 529,426,411 | | | $ | 304,392,174 | | | $ | 564,134,970 | | | $ | 861,838,480 | | | $ | 160,910,027 | |
| | | | | | |
Net assets consist of: | | | | | | | | | | | | | | | | | | | | |
Paid-in capital | | $ | 212,155,954 | | | $ | 302,916,021 | | | $ | 534,394,041 | | | $ | 778,240,663 | | | $ | 151,030,065 | |
Undistributed (distributions in excess of) net investment income (loss) | | | (316,526 | ) | | | 15,243 | | | | 7,258,431 | | | | 3,547,315 | | | | (1,570,400 | ) |
Accumulated net realized gain (loss) | | | 88,692,501 | | | | 380,150 | | | | 31,227,733 | | | | 41,964,262 | | | | (3,039,231 | ) |
Net unrealized appreciation (depreciation) on: | | | | | | | | | | | | | | | | | | | | |
Investments | | | 228,895,498 | | | | 1,080,760 | | | | (8,706,708 | ) | | | 38,160,146 | | | | 27,834,035 | |
Translation of assets and liabilities denominated in foreign currencies | | | (1,016 | ) | | | — | | | | (38,527 | ) | | | (73,906 | ) | | | — | |
Securities sold short | | | — | | | | — | | | | — | | | | — | | | | (13,344,442 | ) |
Net assets | | $ | 529,426,411 | | | $ | 304,392,174 | | | $ | 564,134,970 | | | $ | 861,838,480 | | | $ | 160,910,027 | |
Shares outstanding (unlimited shares, no par value) | | | 32,727,664 | | | | 30,072,921 | | | | 66,300,422 | | | | 86,490,253 | | | | 16,824,293 | |
Net asset value and offering price per share | | $ | 16.18 | | | $ | 10.12 | | | $ | 8.51 | | | $ | 9.96 | | | $ | 9.56 | |
| | | | | | | | | | | | | | | | | | | | | |
Investments, at cost | | $ | 319,860,508 | | | $ | 360,198,065 | | | $ | 578,438,925 | | | $ | 903,651,773 | | | $ | 138,723,109 | |
Repurchase agreements, at cost | | $ | 5,379,580 | | | $ | 5,200,657 | | | $ | 2,775,103 | | | $ | 9,239,080 | | | $ | 18,436,350 | |
Foreign currency, at cost | | $ | — | | | $ | — | | | $ | 78,895 | | | $ | 1,665,238 | | | $ | — | |
Securities loaned, at value | | $ | 23,498,318 | | | $ | 19,691,189 | | | $ | 9,929,045 | | | $ | 88,218,137 | | | $ | — | |
Proceeds received from securities sold short | | $ | — | | | $ | — | | | $ | — | | | $ | — | | | $ | 108,843,858 | |
The Notes to Financial Statements are an integral part of this report.
| | |
| Transamerica Funds | | Annual Report 2014 |
Page 130
STATEMENTS OF ASSETS AND LIABILITIES (continued)
At October 31, 2014
| | | | | | | | |
| | | Transamerica
Mid Cap Value | | | Transamerica
Total Return | |
Assets: | | | | | | | | |
Investments, at value | | $ | 295,075,934 | | | $ | 1,095,646,919 | |
Repurchase agreements, at value | | | 2,726,819 | | | | 46,704,209 | |
Cash on deposit with broker | | | — | | | | 1,336,527 | |
Foreign currency, at value | | | — | | | | 1,846,584 | |
Unrealized appreciation on forward foreign currency contracts | | | — | | | | 18,489,298 | |
OTC swap agreements, at value | | | — | | | | 1,107,832 | |
Receivables: | | | | | | | | |
Shares of beneficial interest sold | | | 17,077 | | | | 205,854 | |
Investments sold | | | 249,272 | | | | 27,721,647 | |
Interest | | | 1 | | | | 7,314,297 | |
Dividends | | | 66,440 | | | | — | |
Net income from securities lending | | | 3,083 | | | | 4,954 | |
Prepaid expenses | | | 1,192 | | | | 4,627 | |
Total assets | | | 298,139,818 | | | | 1,200,382,748 | |
| | | |
Liabilities: | | | | | | | | |
Due to custodian | | | — | | | | 5,438 | |
Cash deposit due to broker | | | — | | | | 8,250,000 | |
Accounts payable and accrued liabilities: | | | | | | | | |
Shares of beneficial interest redeemed | | | 50,252 | | | | 284,635 | |
Investments purchased | | | 75,603 | | | | 83,196,157 | |
Management and advisory fees | | | 181,078 | | | | 586,259 | |
Administration fees | | | 5,526 | | | | 22,879 | |
Transfer agent fees | | | 1,658 | | | | 6,864 | |
Trustees fees | | | 17 | | | | 72 | |
Audit and tax fees | | | 15,613 | | | | 27,402 | |
Custody fees | | | 2,011 | | | | — | |
Legal fees | | | 2,941 | | | | 11,618 | |
Printing and shareholder reports fees | | | 583 | | | | 708 | |
Variation margin payable on derivative financial instruments | | | — | | | | 174,987 | |
Registration fees | | | 2,467 | | | | 8,716 | |
Other | | | 584 | | | | 2,257 | |
Collateral for securities on loan | | | 25,889,418 | | | | 19,911,652 | |
Written options and swaptions, at value | | | — | | | | 1,948,263 | |
Reverse repurchase agreement, at value | | | — | | | | 1,780,726 | |
Unrealized depreciation on forward foreign currency contracts | | | — | | | | 6,522,603 | |
OTC swap agreements, at value | | | — | | | | 2,600,001 | |
Total liabilities | | | 26,227,751 | | | | 125,341,237 | |
Net assets | | $ | 271,912,067 | | | $ | 1,075,041,511 | |
| | | |
Net assets consist of: | | | | | | | | |
Paid-in capital | | $ | 153,571,658 | | | $ | 1,051,754,759 | |
Undistributed (distributions in excess of) net investment income (loss) | | | 1,222,085 | | | | 3,096,145 | |
Accumulated net realized gain (loss) | | | 35,585,109 | | | | 12,236,659 | |
Net unrealized appreciation (depreciation) on: | | | | | | | | |
Investments | | | 81,533,215 | | | | 3,955,012 | |
Futures contracts | | | — | | | | 1,855,917 | |
Written options and swaptions | | | — | | | | 322,050 | |
Swap agreements | | | — | | | | (9,876,982 | ) |
Translation of assets and liabilities denominated in foreign currencies | | | — | | | | 11,697,951 | |
Net assets | | $ | 271,912,067 | | | $ | 1,075,041,511 | |
Shares outstanding (unlimited shares, no par value) | | | 15,300,901 | | | | 100,987,088 | |
Net asset value and offering price per share | | $ | 17.77 | | | $ | 10.65 | |
| | | | | | | | | |
Investments, at cost | | $ | 213,542,719 | | | $ | 1,091,691,907 | |
Repurchase agreements, at cost | | $ | 2,726,819 | | | $ | 46,704,209 | |
Foreign currency, at cost | | $ | — | | | $ | 1,853,924 | |
Securities loaned, at value | | $ | 25,318,223 | | | $ | 19,516,402 | |
Premium received on written options and swaptions | | $ | — | | | $ | 2,270,313 | |
Reverse repurchase agreement, at cost | | $ | — | | | $ | 1,816,109 | |
The Notes to Financial Statements are an integral part of this report.
| | |
| Transamerica Funds | | Annual Report 2014 |
Page 131
STATEMENTS OF OPERATIONS
For the year ended October 31, 2014
| | | | | | | | | | | | | | | | | | | | |
| | | Transamerica
Arbitrage
Strategy | | | Transamerica
Bond | | | Transamerica
Core Bond | | | Transamerica
Developing
Markets Equity | | | Transamerica
Global Real
Estate
Securities | |
Investment Income: | | | | | | | | | | | | | | | | | | | | |
Dividend income | | $ | 2,003,167 | | | $ | 1,259,673 | | | $ | — | | | $ | 12,724,615 | | | $ | 1,871,485 | |
Interest income | | | 1,167,490 | | | | 35,610,977 | | | | 35,854,475 | | | | 2,684 | | | | 83 | |
Net income from securities lending | | | — | | | | 316,255 | | | | 61,304 | | | | 438,925 | | | | 28,839 | |
Withholding taxes on foreign income | | | (35,547 | ) | | | 53,429 | | | | (102 | ) | | | (956,999 | ) | | | (105,693 | ) |
Total investment income | | | 3,135,110 | | | | 37,240,334 | | | | 35,915,677 | | | | 12,209,225 | | | | 1,794,714 | |
| | | | | | |
Expenses: | | | | | | | | | | | | | | | | | | | | |
Management and advisory fees | | | 1,793,249 | | | | 5,077,517 | | | | 4,460,284 | | | | 7,965,798 | | | | 505,531 | |
Administration fees | | | 44,206 | | | | 200,109 | | | | 256,468 | | | | 180,733 | | | | 15,798 | |
Transfer agent fees | | | 13,262 | | | | 60,033 | | | | 76,940 | | | | 54,220 | | | | 4,739 | |
Trustees fees | | | 2,174 | | | | 13,635 | | | | 17,357 | | | | 12,285 | | | | 1,117 | |
Audit and tax fees | | | 20,356 | | | | 35,490 | | | | 40,970 | | | | 77,930 | | | | 12,223 | |
Custody fees | | | 409,250 | | | | 141,644 | | | | 299,419 | | | | 1,139,372 | | | | 148,470 | |
Legal fees | | | 7,216 | | | | 28,191 | | | | 34,101 | | | | 22,880 | | | | 1,345 | |
Printing and shareholder reports fees | | | 2,351 | | | | 8,658 | | | | 8,066 | | | | 7,362 | | | | 1,124 | |
Registration fees | | | 4,473 | | | | 7,773 | | | | 9,062 | | | | 26,293 | | | | 6,561 | |
Dividends and interest on securities sold short | | | 1,236,093 | | | | — | | | | — | | | | — | | | | — | |
Other | | | 7,834 | | | | 33,943 | | | | 44,232 | | | | 26,170 | | | | 3,575 | |
Total expenses | | | 3,540,464 | | | | 5,606,993 | | | | 5,246,899 | | | | 9,513,043 | | | | 700,483 | |
Expenses (waived/reimbursed) recaptured | | | (94,059 | ) | | | — | | | | — | | | | — | | | | — | |
Net expenses | | | 3,446,405 | | | | 5,606,993 | | | | 5,246,899 | | | | 9,513,043 | | | | 700,483 | |
Net investment income (loss) | | | (311,295 | ) | | | 31,633,341 | | | | 30,668,778 | | | | 2,696,182 | | | | 1,094,231 | |
| | | | | | |
Net realized gain (loss) on transactions from: | | | | | | | | | | | | | | | | | | | | |
Investments | | | 13,983,079 | | | | 30,374,860 | | | | 10,799,533 | | | | 44,210,963 | | | | 11,422,206 | |
Futures contracts | | | — | | | | (2,226,746 | ) | | | — | | | | — | | | | — | |
Written options and swaptions | | | 1,211,037 | | | | — | | | | — | | | | — | | | | — | |
Securities sold short | | | (13,256,827 | ) | | | — | | | | — | | | | — | | | | — | |
Swap agreements | | | 55,892 | | | | — | | | | — | | | | — | | | | — | |
Foreign currency transactions | | | (374,889 | ) | | | (36,429 | ) | | | — | | | | (1,233,025 | ) | | | (6,910 | ) |
Net realized gain (loss) | | | 1,618,292 | | | | 28,111,685 | | | | 10,799,533 | | | | 42,977,938 | | | | 11,415,296 | |
| | | | | | |
Net change in unrealized appreciation (depreciation) on: | | | | | | | | | | | | | | | | | | | | |
Investments | | | (3,224,338 | ) | | | 892,319 | | | | 2,016,355 | | | | (40,105,676 | )(A) | | | (6,088,075 | ) |
Futures contracts | | | — | | | | (372,642 | ) | | | — | | | | — | | | | — | |
Written options and swaptions | | | (184,633 | ) | | | — | | | | — | | | | — | | | | — | |
Swap agreements | | | 8,469 | | | | — | | | | — | | | | — | | | | — | |
Translation of assets and liabilities denominated in foreign currencies | | | 657,876 | | | | (52,505 | ) | | | — | | | | (24,066 | ) | | | (3,996 | ) |
Securities sold short | | | 2,340,781 | | | | — | | | | — | | | | — | | | | — | |
Net change in unrealized appreciation (depreciation) | | | (401,845 | ) | | | 467,172 | | | | 2,016,355 | | | | (40,129,742 | ) | | | (6,092,071 | ) |
Net realized and change in unrealized gain (loss) | | | 1,216,447 | | | | 28,578,857 | | | | 12,815,888 | | | | 2,848,196 | | | | 5,323,225 | |
Net increase (decrease) in net assets resulting from operations | | $ | 905,152 | | | $ | 60,212,198 | | | $ | 43,484,666 | | | $ | 5,544,378 | | | $ | 6,417,456 | |
| (A) | Net of foreign capital gains tax of $1,698,337. |
The Notes to Financial Statements are an integral part of this report.
| | |
| Transamerica Funds | | Annual Report 2014 |
Page 132
STATEMENTS OF OPERATIONS (continued)
For the year ended October 31, 2014
| | | | | | | | | | | | | | | | | | | | |
| | | Transamerica
Growth | | | Transamerica
Intermediate
Bond (A) | | | Transamerica
International
Equity
Opportunities | | | Transamerica
International
Small Cap | | | Transamerica
Long/Short
Strategy | |
Investment Income: | | | | | | | | | | | | | | | | | | | | |
Dividend income | | $ | 4,002,693 | | | $ | 28,125 | | | $ | 12,494,844 | | | $ | 17,449,394 | | | $ | 2,337,738 | |
Interest income | | | 317 | | | | 2,974,100 | | | | 1,046 | | | | 2,793 | | | | 55,387 | |
Net income from securities lending | | | 136,765 | | | | 27,453 | | | | 274,522 | | | | 671,625 | | | | — | |
Withholding taxes on foreign income | | | (77,330 | ) | | | — | | | | (936,314 | ) | | | (1,097,619 | ) | | | (1,651 | ) |
Total investment income | | | 4,062,445 | | | | 3,029,678 | | | | 11,834,098 | | | | 17,026,193 | | | | 2,391,474 | |
| | | | | | |
Expenses: | | | | | | | | | | | | | | | | | | | | |
Management and advisory fees | | | 4,035,180 | | | | 471,499 | | | | 4,146,413 | | | | 7,182,081 | | | | 1,588,974 | |
Administration fees | | | 130,758 | | | | 33,678 | | | | 116,893 | | | | 174,302 | | | | 33,104 | |
Transfer agent fees | | | 39,227 | | | | 10,103 | | | | 35,068 | | | | 52,291 | | | | 9,931 | |
Trustees fees | | | 9,000 | | | | 2,755 | | | | 8,252 | | | | 12,157 | | | | 2,306 | |
Audit and tax fees | | | 24,119 | | | | 19,661 | | | | 26,016 | | | | 26,864 | | | | 19,003 | |
Custody fees | | | 79,258 | | | | 31,028 | | | | 278,770 | | | | 482,193 | | | | 145,856 | |
Legal fees | | | 17,701 | | | | 4,214 | | | | 15,843 | | | | 24,006 | | | | 4,736 | |
Printing and shareholder reports fees | | | 5,234 | | | | 2,520 | | | | 4,813 | | | | 7,264 | | | | 1,824 | |
Registration fees | | | 8,072 | | | | 17,229 | | | | 24,436 | | | | 17,663 | | | | 4,704 | |
Dividends and interest on securities sold short | | | — | | | | — | | | | — | | | | — | | | | 2,414,562 | |
Other | | | 23,111 | | | | 1,650 | | | | 14,324 | | | | 21,909 | | | | 5,209 | |
Total expenses | | | 4,371,660 | | | | 594,337 | | | | 4,670,828 | | | | 8,000,730 | | | | 4,230,209 | |
Net investment income (loss) | | | (309,215 | ) | | | 2,435,341 | | | | 7,163,270 | | | | 9,025,463 | | | | (1,838,735 | ) |
| | | | | | |
Net realized gain (loss) on transactions from: | | | | | | | | | | | | | | | | | | | | |
Investments | | | 91,102,127 | | | | 502,529 | | | | 31,791,380 | | | | 43,169,307 | | | | 20,646,749 | |
Securities sold short | | | — | | | | — | | | | — | | | | — | | | | (15,407,235 | ) |
Foreign currency transactions | | | (7,311 | ) | | | — | | | | (83,801 | ) | | | (269,988 | ) | | | (152 | ) |
Net realized gain (loss) | | | 91,094,816 | | | | 502,529 | | | | 31,707,579 | | | | 42,899,319 | | | | 5,239,362 | |
| | | | | | |
Net change in unrealized appreciation (depreciation) on: | | | | | | | | | | | | | | | | | | | | |
Investments | | | (6,481,718 | ) | | | 1,080,760 | | | | (40,819,874 | ) | | | (61,464,750 | ) | | | 3,155,705 | |
Translation of assets and liabilities denominated in foreign currencies | | | (1,016 | ) | | | — | | | | (39,250 | ) | | | (86,643 | ) | | | — | |
Securities sold short | | | — | | | | — | | | | — | | | | — | | | | 3,994,650 | |
Net change in unrealized appreciation (depreciation) | | | (6,482,734 | ) | | | 1,080,760 | | | | (40,859,124 | ) | | | (61,551,393 | ) | | | 7,150,355 | |
Net realized and change in unrealized gain (loss) | | | 84,612,082 | | | | 1,583,289 | | | | (9,151,545 | ) | | | (18,652,074 | ) | | | 12,389,717 | |
Net increase (decrease) in net assets resulting from operations | | $ | 84,302,867 | | | $ | 4,018,630 | | | $ | (1,988,275 | ) | | $ | (9,626,611 | ) | | $ | 10,550,982 | |
| (A) | Commenced operations on March 1, 2014. |
The Notes to Financial Statements are an integral part of this report.
| | |
| Transamerica Funds | | Annual Report 2014 |
Page 133
STATEMENTS OF OPERATIONS (continued)
For the year ended October 31, 2014
| | | | | | | | |
| | | Transamerica
Mid Cap Value | | | Transamerica
Total Return | |
Investment Income: | | | | | | | | |
Dividend income | | $ | 4,001,155 | | | $ | 135,024 | |
Interest income | | | 584 | | | | 20,700,162 | |
Net income from securities lending | | | 49,175 | | | | 58,742 | |
Withholding taxes on foreign income | | | (4,197 | ) | | | — | |
Total investment income | | | 4,046,717 | | | | 20,893,928 | |
| | | |
Expenses: | | | | | | | | |
Management and advisory fees | | | 2,053,548 | | | | 6,608,113 | |
Administration fees | | | 62,611 | | | | 257,109 | |
Transfer agent fees | | | 18,783 | | | | 77,132 | |
Trustees fees | | | 4,225 | | | | 17,015 | |
Audit and tax fees | | | 19,190 | | | | 41,467 | |
Custody fees | | | 41,588 | | | | 403,407 | |
Legal fees | | | 9,047 | | | | 36,205 | |
Printing and shareholder reports fees | | | 3,065 | | | | 10,003 | |
Registration fees | | | 5,270 | | | | 14,458 | |
Other | | | 10,681 | | | | 63,361 | |
Total expenses | | | 2,228,008 | | | | 7,528,270 | |
Net investment income (loss) | | | 1,818,709 | | | | 13,365,658 | |
| | | |
Net realized gain (loss) on transactions from: | | | | | | | | |
Investments | | | 36,835,091 | | | | 739,581 | |
Futures contracts | | | — | | | | 10,533,477 | |
Written options and swaptions | | | — | | | | 3,196,515 | |
Swap agreements | | | — | | | | 427,425 | |
Foreign currency transactions | | | — | | | | 8,993,118 | |
Net realized gain (loss) | | | 36,835,091 | | | | 23,890,116 | |
| | | |
Net change in unrealized appreciation (depreciation) on: | | | | | | | | |
Investments | | | (2,837,663 | ) | | | (12,963,722 | ) |
Futures contracts | | | — | | | | (736,768 | ) |
Written options and swaptions | | | — | | | | (12,871 | ) |
Swap agreements | | | — | | | | (9,502,411 | ) |
Translation of assets and liabilities denominated in foreign currencies | | | — | | | | 12,593,803 | |
Net change in unrealized appreciation (depreciation) | | | (2,837,663 | ) | | | (10,621,969 | ) |
Net realized and change in unrealized gain (loss) | | | 33,997,428 | | | | 13,268,147 | |
Net increase (decrease) in net assets resulting from operations | | $ | 35,816,137 | | | $ | 26,633,805 | |
The Notes to Financial Statements are an integral part of this report.
| | |
| Transamerica Funds | | Annual Report 2014 |
Page 134
STATEMENTS OF CHANGES IN NET ASSETS
For the years ended:
| | | | | | | | | | | | | | | | | | | | | | | | |
| | | Transamerica Arbitrage Strategy | | | Transamerica Bond | | | Transamerica Core Bond | |
| | | October 31, 2014 | | | October 31, 2013 | | | October 31, 2014 | | | October 31, 2013 | | | October 31, 2014 | | | October 31, 2013 | |
From operations: | | | | | | | | | | | | | | | | | | | | | | | | |
Net investment income (loss) | | $ | (311,295 | ) | | $ | 177,077 | | | $ | 31,633,341 | | | $ | 34,097,871 | | | $ | 30,668,778 | | | $ | 38,481,768 | |
Net realized gain (loss) | | | 1,618,292 | | | | 1,769,498 | | | | 28,111,685 | | | | 10,520,313 | | | | 10,799,533 | | | | 28,460,956 | |
Net change in unrealized appreciation (depreciation) | | | (401,845 | ) | | | 2,863,425 | | | | 467,172 | | | | (5,541,861 | ) | | | 2,016,355 | | | | (75,185,779 | ) |
Net increase (decrease) in net assets resulting from operations | | | 905,152 | | | | 4,810,000 | | | | 60,212,198 | | | | 39,076,323 | | | | 43,484,666 | | | | (8,243,055 | ) |
| | | | | | | |
Distributions to shareholders: | | | | | | | | | | | | | | | | | | | | | | | | |
Net investment income | | | (525,564 | ) | | | (528,051 | ) | | | (33,169,067 | ) | | | (35,958,799 | ) | | | (39,453,958 | ) | | | (50,332,101 | ) |
Net realized gains | | | — | | | | (2,253,105 | ) | | | (10,700,391 | ) | | | (6,746,182 | ) | | | (20,727,325 | ) | | | (5,785,007 | ) |
Total distributions to shareholders | | | (525,564 | ) | | | (2,781,156 | ) | | | (43,869,458 | ) | | | (42,704,981 | ) | | | (60,181,283 | ) | | | (56,117,108 | ) |
| | | | | | | |
Capital share transactions: | | | | | | | | | | | | | | | | | | | | | | | | |
Proceeds from shares sold | | | 547,617 | | | | 115,276,349 | | | | 54,263,138 | | | | 240,277,198 | | | | 86,157,400 | | | | 41,316,532 | |
Dividends and distributions reinvested | | | 525,564 | | | | 2,781,156 | | | | 43,869,458 | | | | 42,704,981 | | | | 60,181,283 | | | | 56,117,108 | |
Cost of shares redeemed | | | (51,825,587 | ) | | | (31,614,634 | ) | | | (191,973,964 | ) | | | (158,626,453 | ) | | | (439,107,044 | ) | | | (778,474,621 | ) |
| | | | | | | |
Net increase (decrease) in net assets resulting from capital share transactions | | | (50,752,406 | ) | | | 86,442,871 | | | | (93,841,368 | ) | | | 124,355,726 | | | | (292,768,361 | ) | | | (681,040,981 | ) |
Net increase (decrease) in net assets | | | (50,372,818 | ) | | | 88,471,715 | | | | (77,498,628 | ) | | | 120,727,068 | | | | (309,464,978 | ) | | | (745,401,144 | ) |
| | | | | | | |
Net assets: | | | | | | | | | | | | | | | | | | | | | | | | |
Beginning of year | | | 204,774,586 | | | | 116,302,871 | | | | 857,806,864 | | | | 737,079,796 | | | | 1,133,792,790 | | | | 1,879,193,934 | |
End of year | | $ | 154,401,768 | | | $ | 204,774,586 | | | $ | 780,308,236 | | | $ | 857,806,864 | | | $ | 824,327,812 | | | $ | 1,133,792,790 | |
Undistributed (distributions in excess of) net investment income (loss) | | $ | 64,767 | | | $ | 522,779 | | | $ | 2,988,481 | | | $ | 3,601,261 | | | $ | 173,362 | | | $ | 4,862,893 | |
| | | | | | | |
Capital share transactions - shares: | | | | | | | | | | | | | | | | | | | | | | | | |
Shares issued | | | 54,238 | | | | 11,593,563 | | | | 5,073,374 | | | | 22,831,728 | | | | 8,524,729 | | | | 3,982,392 | |
Shares issued-reinvested from dividends and distributions | | | 52,295 | | | | 280,925 | | | | 4,152,483 | | | | 4,041,537 | | | | 5,972,068 | | | | 5,303,963 | |
Shares redeemed | | | (5,152,998 | ) | | | (3,176,459 | ) | | | (17,962,237 | ) | | | (14,852,075 | ) | | | (43,271,093 | ) | | | (72,378,663 | ) |
Net increase (decrease) in shares outstanding | | | (5,046,465 | ) | | | 8,698,029 | | | | (8,736,380 | ) | | | 12,021,190 | | | | (28,774,296 | ) | | | (63,092,308 | ) |
The Notes to Financial Statements are an integral part of this report.
| | |
| Transamerica Funds | | Annual Report 2014 |
Page 135
STATEMENTS OF CHANGES IN NET ASSETS (continued)
For the years ended:
| | | | | | | | | | | | | | | | | | | | | | | | |
| | | Transamerica Developing Markets
Equity | | | Transamerica Global Real Estate
Securities | | | Transamerica Growth | |
| | | October 31, 2014 | | | October 31, 2013 | | | October 31, 2014 | | | October 31, 2013 | | | October 31, 2014 | | | October 31, 2013 | |
From operations: | | | | | | | | | | | | | | | | | | | | | | | | |
Net investment income (loss) | | $ | 2,696,182 | | | $ | 1,557,560 | | | $ | 1,094,231 | | | $ | 2,760,538 | | | $ | (309,215 | ) | | $ | 1,123,608 | |
Net realized gain (loss) | | | 42,977,938 | | | | 10,632,529 | | | | 11,415,296 | | | | 28,321,392 | | | | 91,094,816 | | | | 71,215,050 | |
Net change in unrealized appreciation (depreciation) | | | (40,129,742 | ) | | | 39,663,564 | | | | (6,092,071 | ) | | | (17,180,636 | ) | | | (6,482,734 | ) | | | 86,175,457 | |
Net increase (decrease) in net assets resulting from operations | | | 5,544,378 | | | | 51,853,653 | | | | 6,417,456 | | | | 13,901,294 | | | | 84,302,867 | | | | 158,514,115 | |
| | | | | | | |
Distributions to shareholders: | | | | | | | | | | | | | | | | | | | | | | | | |
Net investment income | | | (1,260,825 | ) | | | (1,448,290 | ) | | | (1,451,496 | ) | | | (12,076,984 | ) | | | (47,957 | ) | | | (1,443,061 | ) |
Net realized gains | | | (13,572,723 | ) | | | (35,428,722 | ) | | | — | | | | — | | | | (70,323,484 | ) | | | (58,043,075 | ) |
Total distributions to shareholders | | | (14,833,548 | ) | | | (36,877,012 | ) | | | (1,451,496 | ) | | | (12,076,984 | ) | | | (70,371,441 | ) | | | (59,486,136 | ) |
| | | | | | | |
Capital share transactions: | | | | | | | | | | | | | | | | | | | | | | | | |
Proceeds from shares sold | | | 503,730,047 | | | | 270,799,797 | | | | 22,687,353 | | | | 34,714,253 | | | | 32,934,883 | | | | 15,832,023 | |
Dividends and distributions reinvested | | | 14,833,548 | | | | 36,877,012 | | | | 1,451,496 | | | | 12,076,984 | | | | 70,371,441 | | | | 59,486,136 | |
Cost of shares redeemed | | | (156,996,938 | ) | | | (53,119,969 | ) | | | (41,900,953 | ) | | | (139,672,100 | ) | | | (161,356,294 | ) | | | (151,008,131 | ) |
| | | | | | | |
Net increase (decrease) in net assets resulting from capital share transactions | | | 361,566,657 | | | | 254,556,840 | | | | (17,762,104 | ) | | | (92,880,863 | ) | | | (58,049,970 | ) | | | (75,689,972 | ) |
Net increase (decrease) in net assets | | | 352,277,487 | | | | 269,533,481 | | | | (12,796,144 | ) | | | (91,056,553 | ) | | | (44,118,544 | ) | | | 23,338,007 | |
| | | | | | | |
Net assets: | | | | | | | | | | | | | | | | | | | | | | | | |
Beginning of year | | | 610,895,736 | | | | 341,362,255 | | | | 69,273,909 | | | | 160,330,462 | | | | 573,544,955 | | | | 550,206,948 | |
End of year | | $ | 963,173,223 | | | $ | 610,895,736 | | | $ | 56,477,765 | | | $ | 69,273,909 | | | $ | 529,426,411 | | | $ | 573,544,955 | |
Undistributed (distributions in excess of) net investment income (loss) | | $ | 142,297 | | | $ | 1,034,965 | | | $ | (2,290,770 | ) | | $ | (4,546,544 | ) | | $ | (316,526 | ) | | $ | — | |
| | | | | | | |
Capital share transactions - shares: | | | | | | | | | | | | | | | | | | | | | | | | |
Shares issued | | | 40,482,237 | | | | 23,005,893 | | | | 1,726,780 | | | | 2,647,812 | | | | 2,154,380 | | | | 1,157,377 | |
Shares issued-reinvested from dividends and distributions | | | 1,276,553 | | | | 3,313,299 | | | | 107,934 | | | | 953,270 | | | | 4,816,663 | | | | 4,808,903 | |
Shares redeemed | | | (13,219,751 | ) | | | (4,654,342 | ) | | | (3,108,871 | ) | | | (10,853,307 | ) | | | (10,330,839 | ) | | | (10,869,967 | ) |
Net increase (decrease) in shares outstanding | | | 28,539,039 | | | | 21,664,850 | | | | (1,274,157 | ) | | | (7,252,225 | ) | | | (3,359,796 | ) | | | (4,903,687 | ) |
The Notes to Financial Statements are an integral part of this report.
| | |
| Transamerica Funds | | Annual Report 2014 |
Page 136
STATEMENTS OF CHANGES IN NET ASSETS (continued)
For the period and years ended:
| | | | | | | | | | | | | | | | | | | | |
| | | Transamerica
Intermediate Bond | | | Transamerica International Equity
Opportunities | | | Transamerica International Small Cap | |
| | | October 31, 2014 (A) | | | October 31, 2014 | | | October 31, 2013 | | | October 31, 2014 | | | October 31, 2013 | |
From operations: | | | | | | | | | | | | | | | | | | | | |
Net investment income (loss) | | $ | 2,435,341 | | | $ | 7,163,270 | | | $ | 3,254,256 | | | $ | 9,025,463 | | | $ | 5,464,860 | |
Net realized gain (loss) | | | 502,529 | | | | 31,707,579 | | | | 4,687,331 | | | | 42,899,319 | | | | 6,659,799 | |
Net change in unrealized appreciation (depreciation) | | | 1,080,760 | | | | (40,859,124 | ) | | | 38,389,798 | | | | (61,551,393 | ) | | | 83,126,093 | |
Net increase (decrease) in net assets resulting from operations | | | 4,018,630 | | | | (1,988,275 | ) | | | 46,331,385 | | | | (9,626,611 | ) | | | 95,250,752 | |
| | | | | | |
Distributions to shareholders: | | | | | | | | | | | | | | | | | | | | |
Net investment income | | | (2,543,477 | ) | | | (3,260,927 | ) | | | (4,852,052 | ) | | | (8,685,809 | ) | | | (6,513,025 | ) |
Net realized gains | | | — | | | | (4,120,952 | ) | | | (8,389,008 | ) | | | (4,067,444 | ) | | | — | |
Total distributions to shareholders | | | (2,543,477 | ) | | | (7,381,879 | ) | | | (13,241,060 | ) | | | (12,753,253 | ) | | | (6,513,025 | ) |
| | | | | | |
Capital share transactions: | | | | | | | | | | | | | | | | | | | | |
Proceeds from shares sold | | | 302,426,202 | | | | 428,475,061 | | | | 47,033,388 | | | | 549,241,025 | | | | 141,230,773 | |
Dividends and distributions reinvested | | | 2,543,477 | | | | 7,381,879 | | | | 13,241,060 | | | | 12,753,253 | | | | 6,513,025 | |
Cost of shares redeemed | | | (2,052,658 | ) | | | (110,366,534 | ) | | | (20,249,400 | ) | | | (114,075,027 | ) | | | (42,110,512 | ) |
| | | | | | |
Net increase (decrease) in net assets resulting from capital share transactions | | | 302,917,021 | | | | 325,490,406 | | | | 40,025,048 | | | | 447,919,251 | | | | 105,633,286 | |
Net increase (decrease) in net assets | | | 304,392,174 | | | | 316,120,252 | | | | 73,115,373 | | | | 425,539,387 | | | | 194,371,013 | |
| | | | | | |
Net assets: | | | | | | | | | | | | | | | | | | | | |
Beginning of period/year | | | — | | | | 248,014,718 | | | | 174,899,345 | | | | 436,299,093 | | | | 241,928,080 | |
End of period/year | | $ | 304,392,174 | | | $ | 564,134,970 | | | $ | 248,014,718 | | | $ | 861,838,480 | | | $ | 436,299,093 | |
Undistributed (distributions in excess of) net investment income (loss) | | $ | 15,243 | | | $ | 7,258,431 | | | $ | 3,257,696 | | | $ | 3,547,315 | | | $ | 2,728,451 | |
| | | | | | |
Capital share transactions - shares: | | | | | | | | | | | | | | | | | | | | |
Shares issued | | | 30,024,336 | | | | 49,522,789 | | | | 5,929,100 | | | | 52,917,724 | | | | 16,838,060 | |
Shares issued-reinvested from dividends and distributions | | | 251,818 | | | | 869,479 | | | | 1,779,712 | | | | 1,284,316 | | | | 815,147 | |
Shares redeemed | | | (203,233 | ) | | | (12,758,767 | ) | | | (2,600,831 | ) | | | (11,044,596 | ) | | | (4,932,732 | ) |
Net increase (decrease) in shares outstanding | | | 30,072,921 | | | | 37,633,501 | | | | 5,107,981 | | | | 43,157,444 | | | | 12,720,475 | |
| (A) | Commenced operations on March 1, 2014. |
The Notes to Financial Statements are an integral part of this report.
| | |
| Transamerica Funds | | Annual Report 2014 |
Page 137
STATEMENTS OF CHANGES IN NET ASSETS (continued)
For the years ended:
| | | | | | | | | | | | | | | | | | | | | | | | |
| | | Transamerica Long/Short Strategy | | | Transamerica Mid Cap Value | | | Transamerica Total Return | |
| | | October 31, 2014 | | | October 31, 2013 | | | October 31, 2014 | | | October 31, 2013 | | | October 31, 2014 | | | October 31, 2013 | |
From operations: | | | | | | | | | | | | | | | | | | | | | | | | |
Net investment income (loss) | | $ | (1,838,735 | ) | | $ | (1,682,565 | ) | | $ | 1,818,709 | | | $ | 2,476,273 | | | $ | 13,365,658 | | | $ | 12,103,939 | |
Net realized gain (loss) | | | 5,239,362 | | | | 4,440,103 | | | | 36,835,091 | | | | 18,494,451 | | | | 23,890,116 | | | | (7,671,011 | ) |
Net change in unrealized appreciation (depreciation) | | | 7,150,355 | | | | 5,582,684 | | | | (2,837,663 | ) | | | 37,094,247 | | | | (10,621,969 | ) | | | (14,018,451 | ) |
Net increase (decrease) in net assets resulting from operations | | | 10,550,982 | | | | 8,340,222 | | | | 35,816,137 | | | | 58,064,971 | | | | 26,633,805 | | | | (9,585,523 | ) |
| | | | | | | |
Distributions to shareholders: | | | | | | | | | | | | | | | | | | | | | | | | |
Net investment income | | | — | | | | — | | | | (2,197,317 | ) | | | (2,380,127 | ) | | | (13,715,169 | ) | | | (12,496,046 | ) |
Net realized gains | | | — | | | | — | | | | (16,041,021 | ) | | | — | | | | — | | | | (6,747,456 | ) |
Return of capital | | | — | | | | — | | | | — | | | | — | | | | — | | | | (498,041 | ) |
Total distributions to shareholders | | | — | | | | — | | | | (18,238,338 | ) | | | (2,380,127 | ) | | | (13,715,169 | ) | | | (19,741,543 | ) |
| | | | | | | |
Capital share transactions: | | | | | | | | | | | | | | | | | | | | | | | | |
Proceeds from shares sold | | | 58,597,921 | | | | 43,109,355 | | | | 58,913,648 | | | | 3,983,070 | | | | 154,614,055 | | | | 332,376,044 | |
Dividends and distributions reinvested | | | — | | | | — | | | | 18,238,338 | | | | 2,380,127 | | | | 13,715,169 | | | | 19,741,543 | |
Cost of shares redeemed | | | (30,626,807 | ) | | | (20,251,554 | ) | | | (74,227,097 | ) | | | (19,096,386 | ) | | | (52,326,459 | ) | | | (180,449,956 | ) |
| | | | | | | |
Net increase (decrease) in net assets resulting from capital share transactions | | | 27,971,114 | | | | 22,857,801 | | | | 2,924,889 | | | | (12,733,189 | ) | | | 116,002,765 | | | | 171,667,631 | |
Net increase (decrease) in net assets | | | 38,522,096 | | | | 31,198,023 | | | | 20,502,688 | | | | 42,951,655 | | | | 128,921,401 | | | | 142,340,565 | |
| | | | | | | |
Net assets: | | | | | | | | | | | | | | | | | | | | | | | | |
Beginning of year | | | 122,387,931 | | | | 91,189,908 | | | | 251,409,379 | | | | 208,457,724 | | | | 946,120,110 | | | | 803,779,545 | |
End of year | | $ | 160,910,027 | | | $ | 122,387,931 | | | $ | 271,912,067 | | | $ | 251,409,379 | | | $ | 1,075,041,511 | | | $ | 946,120,110 | |
Undistributed (distributions in excess of) net investment income (loss) | | $ | (1,570,400 | ) | | $ | (1,345,214 | ) | | $ | 1,222,085 | | | $ | 1,614,450 | | | $ | 3,096,145 | | | $ | 189,695 | |
| | | | | | | |
Capital share transactions - shares: | | | | | | | | | | | | | | | | | | | | | | | | |
Shares issued | | | 6,249,496 | | | | 5,092,359 | | | | 3,427,503 | | | | 288,464 | | | | 14,638,750 | | | | 31,064,297 | |
Shares issued-reinvested from dividends and distributions | | | — | | | | — | | | | 1,147,065 | | | | 181,136 | | | | 1,299,541 | | | | 1,846,023 | |
Shares redeemed | | | (3,331,544 | ) | | | (2,359,873 | ) | | | (4,436,085 | ) | | | (1,301,950 | ) | | | (4,946,730 | ) | | | (16,727,511 | ) |
Net increase (decrease) in shares outstanding | | | 2,917,952 | | | | 2,732,486 | | | | 138,483 | | | | (832,350 | ) | | | 10,991,561 | | | | 16,182,809 | |
The Notes to Financial Statements are an integral part of this report.
| | |
| Transamerica Funds | | Annual Report 2014 |
Page 138
FINANCIAL HIGHLIGHTS
| | | | | | | | | | | | | | | | |
| For a share outstanding during the period and years indicated: | | Transamerica Arbitrage Strategy | |
| | | October 31,
2014 | | | October 31,
2013 | | | October 31,
2012 | | | October 31,
2011 (A) | |
Net asset value | | | | | | | | | | | | | | | | |
Beginning of period/year | | $ | 10.01 | | | $ | 9.89 | | | $ | 10.25 | | | $ | 10.00 | |
Investment operations | | | | | | | | | | | | | | | | |
Net investment income (loss) (B) (C) | | | (0.02 | ) | | | 0.01 | | | | (0.11 | ) | | | (0.04 | ) |
Net realized and unrealized gain (loss) | | | 0.06 | | | | 0.34 | | | | (0.16 | ) | | | 0.29 | |
Total investment operations | | | 0.04 | | | | 0.35 | | | | (0.27 | ) | | | 0.25 | |
Distributions | | | | | | | | | | | | | | | | |
Net investment income | | | (0.03 | ) | | | (0.04 | ) | | | — | | | | — | |
Net realized gains | | | — | | | | (0.19 | ) | | | (0.09 | ) | | | — | |
Total distributions | | | (0.03 | ) | | | (0.23 | ) | | | (0.09 | ) | | | — | |
Net asset value | | | | | | | | | | | | | | | | |
End of period/year | | $ | 10.02 | | | $ | 10.01 | | | $ | 9.89 | | | $ | 10.25 | |
Total return (D) | | | 0.36 | % | | | 3.60 | % | | | (2.67 | )% | | | 2.50 | %(E) |
Ratio and supplemental data | | | | | | | | | | | | | | | | |
Net assets end of period/year (000’s) | | $ | 154,402 | | | $ | 204,775 | | | $ | 116,303 | | | $ | 124,208 | |
Expenses to average net assets (F) | | | | | | | | | | | | | | | | |
After (waiver/reimbursement) recapture (G) | | | 1.95 | % | | | 1.60 | % | | | 1.92 | % | | | 1.55 | %(H) |
Before (waiver/reimbursement) recapture (G) | | | 2.00 | % | | | 1.65 | % | | | 2.04 | % | | | 1.71 | %(H) |
Net investment income (loss) to average net assets (C) (G) | | | (0.18 | )% | | | 0.13 | % | | | (1.06 | )% | | | (0.78 | )%(H) |
Portfolio turnover rate (I) | | | 683 | % | | | 387 | % | | | 566 | % | | | 311 | %(E) |
| (A) | Commenced operations on May 1, 2011. |
| (B) | Calculated based on average number of shares outstanding. |
| (C) | Recognition of net investment income by the Fund is affected by the timing of the declaration of dividends by the investment companies in which the Fund invests. |
| (D) | Total return has been calculated for the applicable period without deduction of a sales load, if any, on an initial purchase. |
| (F) | Does not include expenses of the investment companies in which the Fund invests. |
| (G) | Includes dividends and interest on securities sold short (representing 0.70%, 0.35%, 0.67% and 0.30% of average net assets for 2014, 2013, 2012 and 2011, respectively). |
| (I) | Does not include portfolio activity of the investment companies in which the Fund invests. |
| | | | | | | | | | | | | | | | | | | | |
| For a share outstanding during the years indicated: | | Transamerica Bond | |
| | | October 31,
2014 | | | October 31,
2013 | | | October 31,
2012 | | | October 31,
2011 | | | October 31,
2010 | |
Net asset value | | | | | | | | | | | | | | | | | | | | |
Beginning of year | | $ | 10.60 | | | $ | 10.70 | | | $ | 10.61 | | | $ | 11.14 | | | $ | 9.93 | |
Investment operations | | | | | | | | | | | | | | | | | | | | |
Net investment income (loss) (A) | | | 0.42 | | | | 0.46 | | | | 0.49 | | | | 0.54 | | | | 0.57 | |
Net realized and unrealized gain (loss) | | | 0.38 | | | | 0.02 | | | | 0.84 | | | | (0.20 | ) | | | 1.23 | |
Total investment operations | | | 0.80 | | | | 0.48 | | | | 1.33 | | | | 0.34 | | | | 1.80 | |
Distributions | | | | | | | | | | | | | | | | | | | | |
Net investment income | | | (0.45 | ) | | | (0.49 | ) | | | (0.65 | ) | | | (0.68 | ) | | | (0.59 | ) |
Net realized gains | | | (0.14 | ) | | | (0.09 | ) | | | (0.59 | ) | | | (0.19 | ) | | | — | |
Total distributions | | | (0.59 | ) | | | (0.58 | ) | | | (1.24 | ) | | | (0.87 | ) | | | (0.59 | ) |
Net asset value | | | | | | | | | | | | | | | | | | | | |
End of year | | $ | 10.81 | | | $ | 10.60 | | | $ | 10.70 | | | $ | 10.61 | | | $ | 11.14 | |
Total return (B) | | | 7.77 | % | | | 4.62 | % | | | 14.24 | % | | | 3.31 | % | | | 18.69 | % |
Ratio and supplemental data | | | | | | | | | | | | | | | | | | | | |
Net assets end of year (000’s) | | $ | 780,308 | | | $ | 857,807 | | | $ | 737,080 | | | $ | 462,340 | | | $ | 594,220 | |
Expenses to average net assets | | | 0.70 | % | | | 0.70 | % | | | 0.71 | % | | | 0.71 | % | | | 0.70 | % |
Net investment income (loss) to average net assets | | | 3.95 | % | | | 4.28 | % | | | 4.77 | % | | | 4.98 | % | | | 5.49 | % |
Portfolio turnover rate | | | 36 | % | | | 54 | % | | | 26 | % | | | 57 | % | | | 79 | % |
| (A) | Calculated based on average number of shares outstanding. |
| (B) | Total return has been calculated for the applicable period without deduction of a sales load, if any, on an initial purchase. |
The Notes to Financial Statements are an integral part of this report.
| | |
| Transamerica Funds | | Annual Report 2014 |
Page 139
FINANCIAL HIGHLIGHTS (continued)
| | | | | | | | | | | | | | | | | | | | |
| For a share outstanding during the years indicated: | | Transamerica Core Bond | |
| | | October 31,
2014 | | | October 31,
2013 | | | October 31,
2012 | | | October 31,
2011 | | | October 31,
2010 | |
Net asset value | | | | | | | | | | | | | | | | | | | | |
Beginning of year | | $ | 10.32 | | | $ | 10.86 | | | $ | 10.60 | | | $ | 10.56 | | | $ | 10.08 | |
Investment operations | | | | | | | | | | | | | | | | | | | | |
Net investment income (loss) (A) | | | 0.30 | | | | 0.32 | | | | 0.33 | | | | 0.32 | | | | 0.28 | |
Net realized and unrealized gain (loss) | | | 0.12 | | | | (0.41 | ) | | | 0.31 | | | | 0.15 | | | | 0.53 | |
Total investment operations | | | 0.42 | | | | (0.09 | ) | | | 0.64 | | | | 0.47 | | | | 0.81 | |
Distributions | | | | | | | | | | | | | | | | | | | | |
Net investment income | | | (0.39 | ) | | | (0.41 | ) | | | (0.38 | ) | | | (0.36 | ) | | | (0.33 | ) |
Net realized gains | | | (0.19 | ) | | | (0.04 | ) | | | — | | | | (0.07 | ) | | | — | |
Total distributions | | | (0.58 | ) | | | (0.45 | ) | | | (0.38 | ) | | | (0.43 | ) | | | (0.33 | ) |
Net asset value | | | | | | | | | | | | | | | | | | | | |
End of year | | $ | 10.16 | | | $ | 10.32 | | | $ | 10.86 | | | $ | 10.60 | | | $ | 10.56 | |
Total return (B) | | | 4.26 | % | | | (0.89 | )% | | | 6.12 | % | | | 4.62 | % | | | 8.16 | % |
Ratio and supplemental data | | | | | | | | | | | | | | | | | | | | |
Net assets end of year (000’s) | | $ | 824,328 | | | $ | 1,133,793 | | | $ | 1,879,194 | | | $ | 2,208,783 | | | $ | 1,063,458 | |
Expenses to average net assets | | | 0.51 | % | | | 0.50 | % | | | 0.47 | % | | | 0.48 | % | | | 0.50 | % |
Net investment income (loss) to average net assets | | | 2.99 | % | | | 2.99 | % | | | 3.09 | % | | | 3.04 | % | | | 2.73 | % |
Portfolio turnover rate | | | 14 | % | | | 3 | % | | | 23 | % | | | 19 | % | | | 33 | % |
| (A) | Calculated based on average number of shares outstanding. |
| (B) | Total return has been calculated for the applicable period without deduction of a sales load, if any, on an initial purchase. |
| | | | | | | | | | | | | | | | | | | | |
| For a share outstanding during the years indicated: | | Transamerica Developing Markets Equity | |
| | | October 31,
2014 | | | October 31,
2013 | | | October 31,
2012 | | | October 31,
2011 | | | October 31,
2010 | |
Net asset value | | | | | | | | | | | | | | | | | | | | |
Beginning of year | | $ | 12.19 | | | $ | 11.99 | | | $ | 12.27 | | | $ | 13.34 | | | $ | 10.12 | |
Investment operations | | | | | | | | | | | | | | | | | | | | |
Net investment income (loss) (A) | | | 0.04 | | | | 0.04 | | | | 0.05 | | | | 0.08 | | | | 0.05 | |
Net realized and unrealized gain (loss) | | | 0.28 | | | | 1.28 | | | | 0.74 | | | | (1.11 | ) | | | 3.22 | |
Total investment operations | | | 0.32 | | | | 1.32 | | | | 0.79 | | | | (1.03 | ) | | | 3.27 | |
Distributions | | | | | | | | | | | | | | | | | | | | |
Net investment income | | | (0.02 | ) | | | (0.04 | ) | | | (0.07 | ) | | | (0.04 | ) | | | (0.05 | ) |
Net realized gains | | | (0.25 | ) | | | (1.08 | ) | | | (1.00 | ) | | | — | | | | — | |
Total distributions | | | (0.27 | ) | | | (1.12 | ) | | | (1.07 | ) | | | (0.04 | ) | | | (0.05 | ) |
Net asset value | | | | | | | | | | | | | | | | | | | | |
End of year | | $ | 12.24 | | | $ | 12.19 | | | $ | 11.99 | | | $ | 12.27 | | | $ | 13.34 | |
Total return (B) | | | 2.79 | % | | | 11.95 | % | | | 8.07 | % | | | (7.77 | )% | | | 32.43 | % |
Ratio and supplemental data | | | | | | | | | | | | | | | | | | | | |
Net assets end of year (000’s) | | $ | 963,173 | | | $ | 610,896 | | | $ | 341,362 | | | $ | 497,656 | | | $ | 610,212 | |
Expenses to average net assets | | | 1.32 | % | | | 1.36 | % | | | 1.33 | % | | | 1.31 | % | | | 1.31 | % |
Net investment income (loss) to average net assets | | | 0.37 | % | | | 0.32 | % | | | 0.48 | % | | | 0.58 | % | | | 0.48 | % |
Portfolio turnover rate | | | 57 | % | | | 42 | % | | | 37 | % | | | 40 | % | | | 54 | % |
| (A) | Calculated based on average number of shares outstanding. |
| (B) | Total return has been calculated for the applicable period without deduction of a sales load, if any, on an initial purchase. |
The Notes to Financial Statements are an integral part of this report.
| | |
| Transamerica Funds | | Annual Report 2014 |
Page 140
FINANCIAL HIGHLIGHTS (continued)
| | | | | | | | | | | | | | | | | | | | |
| For a share outstanding during the years indicated: | | Transamerica Global Real Estate Securities | |
| | | October 31,
2014 | | | October 31,
2013 | | | October 31,
2012 | | | October 31,
2011 | | | October 31,
2010 | |
Net asset value | | | | | | | | | | | | | | | | | | | | |
Beginning of year | | $ | 13.34 | | | $ | 12.88 | | | $ | 11.64 | | | $ | 12.28 | | | $ | 10.77 | |
Investment operations | | | | | | | | | | | | | | | | | | | | |
Net investment income (loss) (A) | | | 0.24 | | | | 0.24 | | | | 0.29 | | | | 0.24 | | | | 0.26 | |
Net realized and unrealized gain (loss) | | | 1.15 | | | | 1.21 | | | | 1.36 | | | | (0.19 | ) | | | 1.98 | |
Total investment operations | | | 1.39 | | | | 1.45 | | | | 1.65 | | | | 0.05 | | | | 2.24 | |
Distributions | | | | | | | | | | | | | | | | | | | | |
Net investment income | | | (0.31 | ) | | | (0.99 | ) | | | (0.41 | ) | | | (0.69 | ) | | | (0.73 | ) |
Net asset value | | | | | | | | | | | | | | | | | | | | |
End of year | | $ | 14.42 | | | $ | 13.34 | | | $ | 12.88 | | | $ | 11.64 | | | $ | 12.28 | |
Total return (B) | | | 10.61 | % | | | 11.76 | % | | | 14.57 | % | | | 0.51 | % | | | 21.70 | % |
Ratio and supplemental data | | | | | | | | | | | | | | | | | | | | |
Net assets end of year (000’s) | | $ | 56,478 | | | $ | 69,274 | | | $ | 160,330 | | | $ | 147,057 | | | $ | 319,368 | |
Expenses to average net assets | | | 1.11 | % | | | 0.99 | % | | | 0.97 | % | | | 0.91 | % | | | 0.91 | % |
Net investment income (loss) to average net assets | | | 1.73 | % | | | 1.82 | % | | | 2.36 | % | | | 2.01 | % | | | 2.31 | % |
Portfolio turnover rate | | | 60 | % | | | 50 | % | | | 55 | % | | | 39 | % | | | 62 | % |
| (A) | Calculated based on average number of shares outstanding. |
| (B) | Total return has been calculated for the applicable period without deduction of a sales load, if any, on an initial purchase. |
| | | | | | | | | | | | | | | | | | | | |
| For a share outstanding during the years indicated: | | Transamerica Growth | |
| | | October 31,
2014 | | | October 31,
2013 | | | October 31,
2012 | | | October 31,
2011 | | | October 31,
2010 | |
Net asset value | | | | | | | | | | | | | | | | | | | | |
Beginning of year | | $ | 15.89 | | | $ | 13.42 | | | $ | 12.94 | | | $ | 11.78 | | | $ | 10.17 | |
Investment operations | | | | | | | | | | | | | | | | | | | | |
Net investment income (loss) (A) | | | (0.01 | ) | | | 0.03 | | | | 0.01 | | | | — | (B) | | | 0.01 | |
Net realized and unrealized gain (loss) | | | 2.50 | | | | 3.90 | | | | 0.97 | | | | 1.17 | | | | 1.61 | |
Total investment operations | | | 2.49 | | | | 3.93 | | | | 0.98 | | | | 1.17 | | | | 1.62 | |
Distributions | | | | | | | | | | | | | | | | | | | | |
Net investment income | | | (0.00 | )(B) | | | (0.04 | ) | | | (0.01 | ) | | | (0.01 | ) | | | (0.01 | ) |
Net realized gains | | | (2.20 | ) | | | (1.42 | ) | | | (0.49 | ) | | | — | | | | — | |
Total distributions | | | (2.20 | ) | | | (1.46 | ) | | | (0.50 | ) | | | (0.01 | ) | | | (0.01 | ) |
Net asset value | | | | | | | | | | | | | | | | | | | | |
End of year | | $ | 16.18 | | | $ | 15.89 | | | $ | 13.42 | | | $ | 12.94 | | | $ | 11.78 | |
Total return (C) | | | 17.17 | % | | | 32.38 | % | | | 8.19 | % | | | 9.96 | % | | | 15.96 | % |
Ratio and supplemental data | | | | | | | | | | | | | | | | | | | | |
Net assets end of year (000’s) | | $ | 529,426 | | | $ | 573,545 | | | $ | 550,207 | | | $ | 618,767 | | | $ | 726,732 | |
Expenses to average net assets | | | 0.84 | % | | | 0.84 | % | | | 0.83 | % | | | 0.81 | % | | | 0.81 | % |
Net investment income (loss) to average net assets | | | (0.06 | )% | | | 0.20 | % | | | 0.06 | % | | | 0.01 | % | | | 0.09 | % |
Portfolio turnover rate | | | 31 | % | | | 41 | % | | | 43 | % | | | 55 | % | | | 83 | % |
| (A) | Calculated based on average number of shares outstanding. |
| (B) | Rounds to less than $0.01 or $(0.01). |
| (C) | Total return has been calculated for the applicable period without deduction of a sales load, if any, on an initial purchase. |
The Notes to Financial Statements are an integral part of this report.
| | |
| Transamerica Funds | | Annual Report 2014 |
Page 141
FINANCIAL HIGHLIGHTS (continued)
| | | | |
| For a share outstanding during the period indicated: | | Transamerica
Intermediate
Bond | |
| | | October 31,
2014 (A) | |
Net asset value | | | | |
Beginning of period | | $ | 10.00 | |
Investment operations | | | | |
Net investment income (loss) (B) | | | 0.12 | |
Net realized and unrealized gain (loss) | | | 0.13 | |
Total investment operations | | | 0.25 | |
Distributions | | | | |
Net investment income | | | (0.13 | ) |
Net asset value | | | | |
End of period | | $ | 10.12 | |
Total return (C) | | | 2.48 | %(D) |
Ratio and supplemental data | | | | |
Net assets end of period (000’s) | | $ | 304,392 | |
Expenses to average net assets | | | 0.44 | %(E) |
Net investment income (loss) to average net assets | | | 1.81 | %(E) |
Portfolio turnover rate | | | 83 | %(D) |
| (A) | Commenced operations on March 1, 2014. |
| (B) | Calculated based on average number of shares outstanding. |
| (C) | Total return has been calculated for the applicable period without deduction of a sales load, if any, on an initial purchase. |
| | | | | | | | | | | | | | | | | | | | |
| For a share outstanding during the years indicated: | | Transamerica International Equity Opportunities | |
| | | October 31,
2014 | | | October 31,
2013 | | | October 31,
2012 | | | October 31,
2011 | | | October 31,
2010 | |
Net asset value | | | | | | | | | | | | | | | | | | | | |
Beginning of year | | $ | 8.65 | | | $ | 7.42 | | | $ | 8.34 | | | $ | 9.11 | | | $ | 8.16 | |
Investment operations | | | | | | | | | | | | | | | | | | | | |
Net investment income (loss) (A) | | | 0.13 | | | | 0.11 | | | | 0.14 | | | | 0.15 | | | | 0.12 | |
Net realized and unrealized gain (loss) | | | (0.13 | ) | | | 1.58 | | | | 0.29 | | | | (0.37 | ) | | | 1.09 | |
Total investment operations | | | — | | | | 1.69 | | | | 0.43 | | | | (0.22 | ) | | | 1.21 | |
Distributions | | | | | | | | | | | | | | | | | | | | |
Net investment income | | | (0.06 | ) | | | (0.17 | ) | | | (0.20 | ) | | | (0.10 | ) | | | (0.06 | ) |
Net realized gains | | | (0.08 | ) | | | (0.29 | ) | | | (1.15 | ) | | | (0.45 | ) | | | (0.20 | ) |
Total distributions | | | (0.14 | ) | | | (0.46 | ) | | | (1.35 | ) | | | (0.55 | ) | | | (0.26 | ) |
Net asset value | | | | | | | | | | | | | | | | | | | | |
End of year | | $ | 8.51 | | | $ | 8.65 | | | $ | 7.42 | | | $ | 8.34 | | | $ | 9.11 | |
Total return (B) | | | 0.05 | % | | | 23.72 | % | | | 8.00 | % | | | (2.69 | )% | | | 15.16 | % |
Ratio and supplemental data | | | | | | | | | | | | | | | | | | | | |
Net assets end of year (000’s) | | $ | 564,135 | | | $ | 248,015 | | | $ | 174,899 | | | $ | 353,694 | | | $ | 536,181 | |
Expenses to average net assets | | | 1.00 | % | | | 1.02 | % | | | 1.04 | % | | | 0.99 | % | | | 0.99 | % |
Net investment income (loss) to average net assets | | | 1.53 | % | | | 1.44 | % | | | 1.94 | % | | | 1.69 | % | | | 1.47 | % |
Portfolio turnover rate | | | 39 | % | | | 19 | % | | | 29 | % | | | 29 | % | | | 35 | % |
| (A) | Calculated based on average number of shares outstanding. |
| (B) | Total return has been calculated for the applicable period without deduction of a sales load, if any, on an initial purchase. |
The Notes to Financial Statements are an integral part of this report.
| | |
| Transamerica Funds | | Annual Report 2014 |
Page 142
FINANCIAL HIGHLIGHTS (continued)
| | | | | | | | | | | | | | | | | | | | |
| For a share outstanding during the years indicated: | | Transamerica International Small Cap | |
| | | October 31,
2014 | | | October 31,
2013 | | | October 31,
2012 | | | October 31,
2011 | | | October 31,
2010 | |
Net asset value | | | | | | | | | | | | | | | | | | | | |
Beginning of year | | $ | 10.07 | | | $ | 7.90 | | | $ | 9.00 | | | $ | 9.67 | | | $ | 8.22 | |
Investment operations | | | | | | | | | | | | | | | | | | | | |
Net investment income (loss) (A) | | | 0.13 | | | | 0.13 | | | | 0.11 | | | | 0.15 | | | | 0.08 | |
Net realized and unrealized gain (loss) | | | (0.02 | ) | | | 2.21 | | | | 0.11 | | | | (0.66 | ) | | | 1.42 | |
Total investment operations | | | 0.11 | | | | 2.34 | | | | 0.22 | | | | (0.51 | ) | | | 1.50 | |
Distributions | | | | | | | | | | | | | | | | | | | | |
Net investment income | | | (0.15 | ) | | | (0.17 | ) | | | (0.23 | ) | | | (0.11 | ) | | | (0.05 | ) |
Net realized gains | | | (0.07 | ) | | | — | | | | (1.09 | ) | | | (0.05 | ) | | | — | |
Total distributions | | | (0.22 | ) | | | (0.17 | ) | | | (1.32 | ) | | | (0.16 | ) | | | (0.05 | ) |
Net asset value | | | | | | | | | | | | | | | | | | | | |
End of year | | $ | 9.96 | | | $ | 10.07 | | | $ | 7.90 | | | $ | 9.00 | | | $ | 9.67 | |
Total return (B) | | | 1.08 | % | | | 30.12 | % | | | 4.57 | % | | | (5.39 | )% | | | 18.29 | % |
Ratio and supplemental data | | | | | | | | | | | | | | | | | | | | |
Net assets end of year (000’s) | | $ | 861,838 | | | $ | 436,299 | | | $ | 241,928 | | | $ | 330,358 | | | $ | 548,288 | |
Expenses to average net assets | | | 1.15 | % | | | 1.20 | % | | | 1.20 | % | | | 1.15 | % | | | 1.16 | % |
Net investment income (loss) to average net assets | | | 1.29 | % | | | 1.52 | % | | | 1.58 | % | | | 1.46 | % | | | 0.97 | % |
Portfolio turnover rate | | | 34 | % | | | 34 | % | | | 33 | % | | | 38 | % | | | 54 | % |
| (A) | Calculated based on average number of shares outstanding. |
| (B) | Total return has been calculated for the applicable period without deduction of a sales load, if any, on an initial purchase. |
| | | | | | | | | | | | | | | | | | | | |
| For a share outstanding during the years indicated: | | Transamerica Long/Short Strategy | |
| | | October 31,
2014 | | | October 31,
2013 | | | October 31,
2012 | | | October 31,
2011 | | | October 31,
2010 | |
Net asset value | | | | | | | | | | | | | | | | | | | | |
Beginning of year | | $ | 8.80 | | | $ | 8.16 | | | $ | 7.86 | | | $ | 8.32 | | | $ | 8.43 | |
Investment operations | | | | | | | | | | | | | | | | | | | | |
Net investment income (loss) (A) | | | (0.13 | ) | | | (0.12 | ) | | | (0.10 | ) | | | (0.15 | ) | | | (0.13 | ) |
Net realized and unrealized gain (loss) | | | 0.89 | | | | 0.76 | | | | 0.40 | | | | (0.31 | ) | | | 0.02 | |
Total investment operations | | | 0.76 | | | | 0.64 | | | | 0.30 | | | | (0.46 | ) | | | (0.11 | ) |
Net asset value | | | | | | | | | | | | | | | | | | | | |
End of year | | $ | 9.56 | | | $ | 8.80 | | | $ | 8.16 | | | $ | 7.86 | | | $ | 8.32 | |
Total return (B) | | | 8.64 | % | | | 7.84 | % | | | 3.82 | % | | | (5.53 | )% | | | (1.30 | )% |
Ratio and supplemental data | | | | | | | | | | | | | | | | | | | | |
Net assets end of year (000’s) | | $ | 160,910 | | | $ | 122,388 | | | $ | 91,190 | | | $ | 113,108 | | | $ | 108,342 | |
Expenses to average net assets | | | 3.19 | % | | | 3.46 | % | | | 3.46 | % | | | 3.59 | % | | | 2.85 | % |
Net investment income (loss) to average net assets | | | (1.39 | )% | | | (1.45 | )% | | | (1.21 | )% | | | (1.86 | )% | | | (1.61 | )% |
Portfolio turnover rate | | | 339 | % | | | 280 | % | | | 153 | % | | | 411 | % | | | 303 | % |
| (A) | Calculated based on average number of shares outstanding. |
| (B) | Total return has been calculated for the applicable period without deduction of a sales load, if any, on an initial purchase. |
| (C) | Includes dividends and interest on securities sold short (representing 1.82%, 2.04%, 2.03%, 2.17%, and 1.35% of average net assets for 2014, 2013, 2012, 2011, and 2010, respectively). |
The Notes to Financial Statements are an integral part of this report.
| | |
| Transamerica Funds | | Annual Report 2014 |
Page 143
FINANCIAL HIGHLIGHTS (continued)
| | | | | | | | | | | | | | | | | | | | |
| For a share outstanding during the years indicated: | | Transamerica Mid Cap Value | |
| | | October 31,
2014 | | | October 31,
2013 | | | October 31,
2012 | | | October 31,
2011 | | | October 31,
2010 | |
Net asset value | | | | | | | | | | | | | | | | | | | | |
Beginning of year | | $ | 16.58 | | | $ | 13.03 | | | $ | 10.93 | | | $ | 10.17 | | | $ | 8.28 | |
Investment operations | | | | | | | | | | | | | | | | | | | | |
Net investment income (loss) (A) | | | 0.12 | | | | 0.16 | | | | 0.14 | | | | 0.11 | | | | 0.12 | |
Net realized and unrealized gain (loss) | | | 2.29 | | | | 3.54 | | | | 2.08 | | | | 0.79 | | | | 1.93 | |
Total investment operations | | | 2.41 | | | | 3.70 | | | | 2.22 | | | | 0.90 | | | | 2.05 | |
Distributions | | | | | | | | | | | | | | | | | | | | |
Net investment income | | | (0.15 | ) | | | (0.15 | ) | | | (0.12 | ) | | | (0.14 | ) | | | (0.16 | ) |
Net realized gains | | | (1.07 | ) | | | — | | | | — | | | | — | | | | — | |
Total distributions | | | (1.22 | ) | | | (0.15 | ) | | | (0.12 | ) | | | (0.14 | ) | | | (0.16 | ) |
Net asset value | | | | | | | | | | | | | | | | | | | | |
End of year | | $ | 17.77 | | | $ | 16.58 | | | $ | 13.03 | | | $ | 10.93 | | | $ | 10.17 | |
Total return (B) | | | 15.36 | % | | | 28.70 | % | | | 20.57 | % | | | 8.88 | % | | | 25.08 | % |
Ratio and supplemental data | | | | | | | | | | | | | | | | | | | | |
Net assets end of year (000’s) | | $ | 271,912 | | | $ | 251,409 | | | $ | 208,458 | | | $ | 158,344 | | | $ | 163,612 | |
Expenses to average net assets | | | 0.89 | % | | | 0.89 | % | | | 0.89 | % | | | 0.90 | % | | | 0.89 | % |
Net investment income (loss) to average net assets | | | 0.73 | % | | | 1.07 | % | | | 1.16 | % | | | 1.04 | % | | | 1.33 | % |
Portfolio turnover rate | | | 44 | % | | | 23 | % | | | 38 | % | | | 39 | % | | | 29 | % |
| (A) | Calculated based on average number of shares outstanding. |
| (B) | Total return has been calculated for the applicable period without deduction of a sales load, if any, on an initial purchase. |
| | | | | | | | | | | | | | | | | | | | |
| For a share outstanding during the years indicated: | | Transamerica Total Return | |
| | | October 31,
2014 | | | October 31,
2013 | | | October 31,
2012 | | | October 31,
2011 | | | October 31,
2010 | |
Net asset value | | | | | | | | | | | | | | | | | | | | |
Beginning of year | | $ | 10.51 | | | $ | 10.89 | | | $ | 10.42 | | | $ | 10.80 | | | $ | 10.85 | |
Investment operations | | | | | | | | | | | | | | | | | | | | |
Net investment income (loss) (A) | | | 0.14 | | | | 0.16 | | | | 0.23 | | | | 0.30 | | | | 0.35 | |
Net realized and unrealized gain (loss) | | | 0.14 | | | | (0.27 | ) | | | 0.62 | | | | (0.07 | ) | | | 0.67 | |
Total investment operations | | | 0.28 | | | | (0.11 | ) | | | 0.85 | | | | 0.23 | | | | 1.02 | |
Distributions | | | | | | | | | | | | | | | | | | | | |
Net investment income | | | (0.14 | ) | | | (0.16 | ) | | | (0.33 | ) | | | (0.30 | ) | | | (0.34 | ) |
Net realized gains | | | — | | | | (0.10 | ) | | | (0.05 | ) | | | (0.31 | ) | | | (0.73 | ) |
Return of capital | | | — | | | | (0.01 | ) | | | — | | | | — | | | | — | |
Total distributions | | | (0.14 | ) | | | (0.27 | ) | | | (0.38 | ) | | | (0.61 | ) | | | (1.07 | ) |
Net asset value | | | | | | | | | | | | | | | | | | | | |
End of year | | $ | 10.65 | | | $ | 10.51 | | | $ | 10.89 | | | $ | 10.42 | | | $ | 10.80 | |
Total return (B) | | | 2.69 | % | | | (1.07 | )% | | | 8.30 | % | | | 2.45 | % | | | 10.25 | % |
Ratio and supplemental data | | | | | | | | | | | | | | | | | | | | |
Net assets end of year (000’s) | | $ | 1,075,042 | | | $ | 946,120 | | | $ | 803,780 | | | $ | 625,735 | | | $ | 667,721 | |
Expenses to average net assets | | | 0.73 | % | | | 0.74 | % | | | 0.74 | % | | | 0.74 | % | | | 0.74 | % |
Net investment income (loss) to average net assets | | | 1.30 | % | | | 1.50 | % | | | 2.16 | % | | | 2.92 | % | | | 3.30 | % |
Portfolio turnover rate | | | 178 | %(C) | | | 221 | % | | | 98 | % | | | 144 | % | | | 222 | % |
| (A) | Calculated based on average number of shares outstanding. |
| (B) | Total return has been calculated for the applicable period without deduction of a sales load, if any, on an initial purchase. |
| (C) | Excludes sale-buyback transactions. |
The Notes to Financial Statements are an integral part of this report.
| | |
| Transamerica Funds | | Annual Report 2014 |
Page 144
Transamerica Commodity Strategy
(unaudited)
MARKET ENVIRONMENT
The Bloomberg Commodity Index Total Return (the “Index”) lost approximately six percent for the year ended October 31, 2014. Precious metals saw the largest decline, driven by bearish forces such as the withdrawal of monetary accommodation by the U.S. Federal Reserve (“Fed”) as the U.S. economy improved and U.S. dollar strengthened. Agriculture was down as well, with expectations of record crop yields in the U.S. driving down grain prices. Energy declined substantially in the latter half of 2014 as increased production out of Libya and a surprise in U.S. shale production raised concerns of a global oversupply against softer demand. Livestock saw positive returns due to the impact of the porcine epidemic diarrhea spreading through the U.S., increasing piglet mortality and leading to lower domestic pork production.
PERFORMANCE
For the year ended October 31, 2014, Transamerica Commodity Strategy Class I2 returned (7.52)%. By comparison, its benchmark, Bloomberg Commodity Index Total Return, returned (5.94)%.
STRATEGY REVIEW
Transamerica Commodity Strategy seeks to provide full exposure to the Bloomberg Commodity Index (“BCOM”). Goldman Sachs Asset Management, L.P. (“GSAM”) employs a semi-active approach, whereby we do not take active views on individual commodities, but rather create exposure to commodities through the purchase of BCOM total return swaps and total return swaps on enhanced roll versions of the Index that deviate from the standard index roll.
The Fund underperformed its benchmark during the year ended October 31, 2014.
GSAM deferred six-month position on the natural gas curve detracted from returns earlier in the period. The front contract in natural gas outperformed GSAM deferred position as record low temperatures across much of the Eastern and Midwestern U.S. boosted demand and pressured prices upward. Additionally, six-month deferred West Texas Intermediate positions underperformed the front month both earlier and later in the period. Over the summer, our deferred six-month position on the Brent curve outperformed the front month contract held by the benchmark as global supply concerns, stemming from increased production out of Libya as well as a positive surprise in U.S. shale production drove prices lower.
During the period, the Fund utilized swap agreements. These positions detracted from performance.
Stephen Lucas
Michael Johnson
John Calvaruso, CFA
Co-Portfolio Managers
Goldman Sachs Asset Management, L.P.
| | |
| Transamerica Funds | | Annual Report 2014 |
Page 145
Transamerica Commodity Strategy
(unaudited)
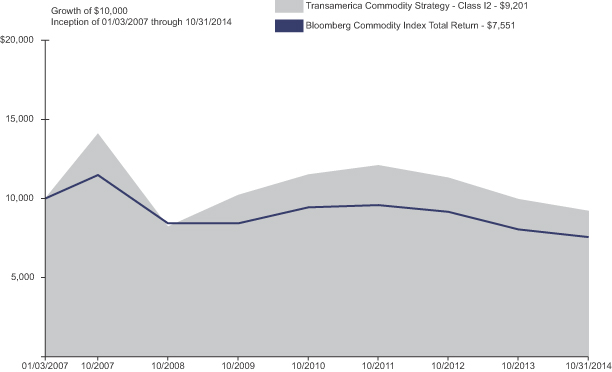
| | | | | | | | | | | | | | | | |
| Average Annual Total Return for Periods Ended 10/31/2014 | |
| | | 1 Year | | | 5 Years | | | 10 Years or
Life of Class | | | Inception Date | |
Class I2 (NAV) | | | (7.52)% | | | | (2.08)% | | | | (1.06)% | | | | 01/03/2007 | |
Bloomberg Commodity Index Total Return (A) | | | (5.94)% | | | | (2.17)% | | | | (3.53)% | | | | | |
(A) The Bloomberg Commodity Index Total Return (formerly, Dow Jones – UBS Commodity Index Total Return) are unmanaged index used as a general measure of market performance. Calculations assume dividends and capital gains are reinvested and do not include any managerial expenses. The 10 Years or Life of Fund calculation is based on inception date of the class. You cannot invest directly in an index.
The performance data presented represents past performance; future results may vary. Performance data does not reflect the deduction of taxes that would be paid on fund distributions or the redemption of fund shares. Investment return and principal value will fluctuate so that an investor’s shares, when redeemed, may be worth more or less than their original cost. Current performance may be lower or higher than performance quoted. Please see www.transamerica.com for performance data current to the most recent month-end. Net Asset Value (“NAV”) returns include the reinvestment of dividends and capital gains. Fund shares are sold without a sales load.
Performance figures reflect any fee waivers and/or expense reimbursements by the Investment Adviser. Without such waivers and/or reimbursements, the performance would be lower. Future waivers and/or reimbursements are at the discretion of the Investment Adviser.
Performance results do not include adjustments made for financial reporting purposes in accordance with U.S. generally accepted accounting principles and may differ from amounts reported in the financial highlights.
The Fund’s investment exposure to the commodities markets may subject the Fund to greater volatility than investments in more traditional securities, such as stocks and bonds. The performance of commodity-linked derivative instruments may depend on the performance of the overall commodities markets and on other factors that affect the value of commodities, including weather, disease, political, tax, and other regulatory developments. This Fund is only available in Class I2 shares, which are not available for direct investment by the public.
Please refer to page 29 for index descriptions.
| | |
| Transamerica Funds | | Annual Report 2014 |
Page 146
Transamerica Managed Futures Strategy
(unaudited)
MARKET ENVIRONMENT
The year ended October 31, 2014 began with global economic growth expanding moderately, as monetary policy remained accommodative. With that said, divergent paths were set in motion. In the U.S., the U.S. Federal Reserve (“Fed”) announced it would begin to taper and end its bond purchases in 2014 as a result of an improving underlying economy and a resolution to political standoffs over fiscal spending. Elsewhere, such as in Japan and Europe, monetary policy was focused on increasing accommodation to fight economic risks. Emerging markets digested the impact of a changing growth mix in China, as well as rising geopolitical risks centered around Russia-Ukraine and the Middle East. Global equities continued their bullish path, but with significant bouts of short-term volatility. Fixed income markets began with bearish performance but reversed course on the back of safe-haven demand early in 2014 that persisted throughout the remainder of the year. In currencies, bear trends in the Japanese yen continued, particularly in the latter half, but with interim reversals. Commodities responded to various macro themes such as rising geopolitical risks and a cold winter in the first half of the year, ultimately succumbing to significant oversupply concerns and a stronger dollar in the second half.
PERFORMANCE
For the year ended October 31, 2014, Transamerica Managed Futures Strategy, Class I2 returned 4.97%. By comparison, its benchmark, the Citigroup 3-Month Treasury Bill Index + 7% Wrap, returned 7.27%.
STRATEY REVIEW
The Fund pursues a Managed Futures strategy which is an active trend-following strategy that goes long assets that have been rising in price and goes short assets that have been falling in price based on short-term and long-term trend following signals. As an alternative strategy, an objective of the Fund is to offer a diversified source of returns that is uncorrelated to traditional asset classes over a full economic cycle.
For the recent year, the strategy’s beta to equity markets was generally positive, but exhibited significant variability as stock markets experienced several major reversals throughout the period. The strategy ran with an average volatility less than its long-run target as there was less agreement among the strategy’s various trend signals.
The Fund returned 6.47% gross of fees, over the year. By asset class, on a gross basis, currencies led gains contributing approximately 3.48% followed by commodities contributing approximately 3.12% and fixed income contributing about 0.90%. Equities detracted (0.96)% over the period. By trend horizon, short term signals contributed 2.45%, long-term signals contributed 7.44% and over-extended signals detracted (3.35)%.
The strategy performed positively over the year, having a strong start with currency crosses short the yen being large contributors, and long positions in developed equity markets also contributing. Moving into 2014, bullish trends in European fixed income and bearish trends in commodity markets drove returns, while several significant market reversals in equity markets caused our allocation to equity trends to ultimately detract from performance. Market reversals also had a negative impact on our short yen currency crosses, but the broader currency strategy still ended with positive attribution as the strategy benefited from a bullish trend in the U.S. dollar versus most currencies in the last few months. These reversals, especially in equities, generally caused short-term trends to underperform long-term trends over the year. Overextended signals, which reduced long fixed income exposure, were long yen versus the U.S. dollar and were broadly short equity markets detracted from the strategy’s performance.
The recent year demonstrated major differences we perceive between our strategy and our competitors in the space. Our strategy emphasizes diversification across asset classes and types of trend signals, as our research suggests this leads to better long-run risk adjusted performance. Over shorter periods of time however, it can lead to meaningful tracking error relative to our competitors. For example, we use overextended signals to help us take more risk in our short-term and long-term trend following signals. As overextended signals limited our longs in fixed income and were generally short equity markets, they created a drag on our performance during the year. As another example, our portfolio construction equally risk weights asset classes, while we believe our competitors concentrate more risk in fixed income trend following. Over a good portion of the year, competitors may have had outsized positions in European fixed income, which experienced a strong and sustained bull trend.
While concentration can be beneficial over short-term periods, we believe remaining diversified will ultimately lead to a better investment experience in the long-run. In that context, the Fund remains positioned to take advantage of trends as they develop across global markets.
| | |
| Transamerica Funds | | Annual Report 2014 |
Page 147
Transamerica Managed Futures Strategy
(unaudited)
STRATEY REVIEW (continued)
The Fund utilizes derivatives to provide long and short exposure to different asset classes. Derivatives contributed positively to performance.
Clifford S. Asness
John M. Liew
Brian K. Hurst
Yao Hua Ooi
Co-Portfolio Managers
AQR Capital Management, LLC
| | |
| Transamerica Funds | | Annual Report 2014 |
Page 148
Transamerica Managed Futures Strategy
(unaudited)
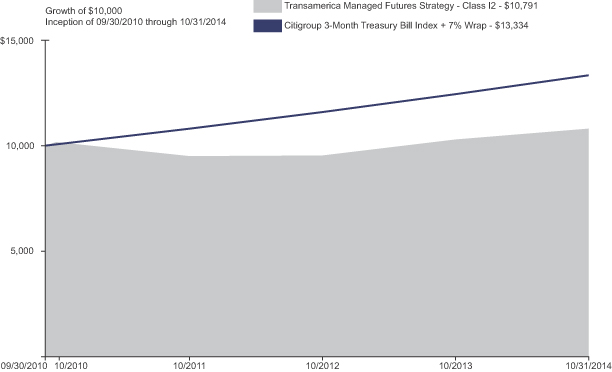
| | | | | | | | | | | | |
| Average Annual Total Return for Periods Ended 10/31/2014 | |
| | | 1 Year | | | 10 Years or
Life of Class | | | Inception Date | |
Class I2 (NAV) | | | 4.97 | % | | | 1.88 | % | | | 09/30/2010 | |
Citigroup 3-Month Treasury Bill Index + 7% Wrap (A) | | | 7.27 | % | | | 7.30 | % | | | | |
(A) The Citigroup 3-Month Treasury Bill Index + 7% Wrap is an unmanaged index used as a general measure of market performance. Calculations assume dividends and capital gains are reinvested and do not include any managerial expenses. The 10 Years or Life of Fund calculation is based on the inception date of the class. You cannot invest directly in an index.
The performance data presented represents past performance; future results may vary. Performance data does not reflect the deduction of taxes that would be paid on fund distributions or the redemption of fund shares. Investment return and principal value will fluctuate so that an investor’s shares, when redeemed, may be worth more or less than their original cost. Current performance may be lower or higher than performance quoted. Please see www.transamerica.com for performance data current to the most recent month-end. Net Asset Value (“NAV”) returns include the reinvestment of dividends and capital gains. Fund shares are sold without a sales load.
Performance figures reflect any fee waivers and/or expense reimbursements by the Investment Adviser. Without such waivers and/or expense reimbursements, the performance would be lower. Future waivers and/or reimbursements are at the discretion of the Investment Adviser.
Performance results do not include adjustments made for financial reporting purposes in accordance with U.S. generally accepted accounting principles and may differ from amounts reported in the financial highlights.
Securities purchased for an arbitrage strategy are intended to take advantage of a perceived relationship between the value of two securities and may not perform as expected. This Fund is only available in Class I2 shares, which are not available for direct investment by the public.
Please refer to page 29 for index descriptions.
| | |
| Transamerica Funds | | Annual Report 2014 |
Page 149
Understanding Your Funds’ Expenses
(unaudited)
SHAREHOLDER EXPENSES
Fund shareholders may incur two types of costs: (1) transaction costs, including sales charges (loads) on purchases, contingent deferred sales charges on redemptions; and (2) ongoing costs, including management fees, and other fund expenses.
The following examples are intended to help you understand your ongoing costs (in dollars and cents) of investing in the Funds and to compare these costs with the ongoing costs of investing in other funds.
The examples are based on an investment of $1,000 invested at May 1, 2014, and held for the entire period until October 31, 2014.
ACTUAL EXPENSES
The information in the table under the heading “Actual Expenses” provides information about actual account values and actual expenses. You may use the information in these columns, together with the amount you invested, to estimate the expenses that you paid over the period. Simply divide your account value by $1,000 (for example, an $8,600 account value divided by $1,000 = $8.60), then multiply the result by the number in the appropriate column for your share class titled “Expenses Paid During Period” to estimate the expenses you paid on your account during this period.
HYPOTHETICAL EXAMPLE FOR COMPARISON PURPOSES
The information in the table under the heading “Hypothetical Expenses” provides information about hypothetical account values and hypothetical expenses based on the Funds’ actual expense ratios and assumed rates of return of 5% per year before expenses, which are not the Funds’ actual returns. The hypothetical account values and expenses may not be used to estimate the actual ending account balance or expenses you paid for the period. You may use this information to compare the ongoing costs of investing in your Fund versus other funds. To do so, compare this 5% hypothetical example with the 5% hypothetical examples that appear in the shareholder reports of the other funds.
Please note that the expenses shown in the table are meant to highlight your ongoing costs only and do not reflect any transactional costs, such as sales charges and brokerage commissions paid on purchases and sales of Fund shares. Therefore, the information under the heading “Hypothetical Expenses” is useful in comparing ongoing costs only, and will not help you determine the relative total costs of owning different funds. If any of these transaction costs were included, your costs would be higher. The expenses shown in the table do not reflect any fees that may be charged to you by brokers, financial intermediaries, or other financial institutions.
Expense ratios may vary period to period because of various factors, such as an increase in expenses that are not covered by the advisory and administrative fees, expenses and fees of the trustees and their counsel, extraordinary expenses and interest expense.
| | | | | | | | | | | | | | | | | | | | | | | | |
| | | | | | Actual Expenses | | | Hypothetical Expenses (A) | | | | |
| Fund Name | | Beginning
Account Value | | | Ending Account
Value | | | Expenses Paid
During Period (B) | | | Ending Account
Value | | | Expenses Paid
During Period (B) | | | Annualized
Expense Ratio | |
| | | | | | |
Transamerica Commodity Strategy | | $ | 1,000.00 | | | $ | 859.20 | | | $ | 3.47 | | | $ | 1,021.50 | | | $ | 3.77 | | | | 0.74 | % |
Transamerica Managed Futures Strategy | | | 1,000.00 | | | | 1,055.40 | | | | 7.77 | | | | 1,017.60 | | | | 7.63 | | | | 1.50 | (C) |
| (A) | 5% return per year before expenses. |
| (B) | Expenses are calculated using the Funds’ annualized expense ratios (as disclosed in the table), multiplied by the average account value for the period, multiplied by the number of days in the period (184 days), and divided by the number of days in the year (365 days). |
| (C) | Expense ratios do not include expenses of the investment companies in which the Fund invests. |
| | |
| Transamerica Funds | | Annual Report 2014 |
Page 150
Schedules of Investments Composition
At October 31, 2014
(unaudited)
| | | | |
| Transamerica Commodity Strategy | | | |
| |
| Asset Allocation | | % of Net
Assets | |
U.S. Government Obligation | | | 58.7 | % |
Repurchase Agreement | | | 34.5 | |
Securities Lending Collateral | | | 25.3 | |
Net Other Assets (Liabilities) ^ | | | (18.5 | ) |
Total | | | 100.0 | % |
| | | | |
| | | | |
| Transamerica Managed Futures Strategy | | | |
| |
| Asset Allocation | | % of Net
Assets | |
Short-Term U.S. Government Obligations | | | 78.0 | % |
Short-Term Investment Companies | | | 11.2 | |
Net Other Assets (Liabilities) ^ | | | 10.8 | |
Total | | | 100.0 | % |
| | | | |
| ^ | The Net Other Assets (Liabilities) category may include, but is not limited to, reverse repurchase agreements, forward foreign currency contracts, futures contracts, swap agreements, written options and swaptions, securities sold short, TBA short commitments, and cash collateral. |
| | |
| Transamerica Funds | | Annual Report 2014 |
Page 151
Transamerica Commodity Strategy
CONSOLIDATED SCHEDULE OF INVESTMENTS
At October 31, 2014
| | | | | | | | |
| | | Principal | | | Value | |
U.S. GOVERNMENT OBLIGATION - 58.7% | |
U.S. Treasury Note 0.25%, 01/31/2015 (A) | | | $ 40,000,000 | | | | $ 40,015,640 | |
| | | | | | | | |
Total U.S. Government Obligation
(Cost $40,030,589) | | | | 40,015,640 | |
| | | | | | | | |
| | |
| | | Shares | | | Value | |
SECURITIES LENDING COLLATERAL - 25.3% | |
State Street Navigator Securities Lending Trust - Prime Portfolio 0.16% (B) | | | 17,262,189 | | | | 17,262,189 | |
| | | | | | | | |
Total Securities Lending Collateral
(Cost $17,262,189) | | | | 17,262,189 | |
| | | | | | | | |
| | | | | | | | |
| | | Principal | | | Value | |
REPURCHASE AGREEMENT - 34.5% | |
State Street Bank & Trust Co.
0.01% (B), dated 10/31/2014, to be repurchased at $23,516,527 on 11/03/2014. Collateralized by U.S. Government Agency Obligations, 2.00% - 2.50%, due 11/01/2027 - 12/01/2027, and with a total value of $23,994,734. | | | $ 23,516,507 | | | | $ 23,516,507 | |
| | | | | | | | |
Total Repurchase Agreement
(Cost $23,516,507) | | | | 23,516,507 | |
| | | | | | | | |
Total Investments
(Cost $80,809,285) (C) | | | | | | | 80,794,336 | |
Net Other Assets (Liabilities) - (18.5)% | | | | (12,595,740 | ) |
| | | | | | | | |
| | |
Net Assets - 100.0% | | | | | | | $ 68,198,596 | |
| | | | | | | | |
OVER THE COUNTER SWAP AGREEMENTS: (D)
| | | | | | | | | | | | | | | | | | | | | | | | | | |
|
| Total Return Swap Agreements - Receivable (E) | |
| Reference Entity | | Fixed Rate | | | Termination
Date | | | Counterparty | | Number of
Shares or Units | | | Fair
Value | | | Premiums
Paid
(Received) | | | Net Unrealized
Appreciation
(Depreciation) | |
Bloomberg Commodity Index 3 Month Forward (F) | | | 0.19 | % | | | 09/02/2015 | | | MBL | | | 20,484 | | | $ | (872 | ) | | $ | 0 | | | $ | (872 | ) |
Bloomberg Commodity Index 3 Month Forward (F) | | | 0.20 | | | | 04/13/2015 | | | BOA | | | 115,405 | | | | (5,174 | ) | | | 0 | | | | (5,174 | ) |
Bloomberg Commodity Index 3 Month Forward (F) | | | 0.20 | | | | 08/27/2015 | | | UBS | | | 127,041 | | | | (5,695 | ) | | | 0 | | | | (5,695 | ) |
| | | | | | | | | | | | | | | | | | | | | | | | | | |
Total | | | | | | | | | | | | | | | | $ | (11,741 | ) | | $ | 0 | | | $ | (11,741 | ) |
| | | | | | | | | | | | | | | | | | | | | | | | | | |
SECURITY VALUATION:
Valuation Inputs (G)
| | | | | | | | | | | | | | | | |
| | | Level 1
Quoted Prices | | | Level 2
Other Significant
Observable Inputs | | | Level 3
Significant
Unobservable Inputs | | | Value at
October 31, 2014 | |
ASSETS | | | | | | | | | | | | | | | | |
Investments | | | | | | | | | | | | | | | | |
U.S. Government Obligation | | $ | — | | | $ | 40,015,640 | | | $ | — | | | $ | 40,015,640 | |
Securities Lending Collateral | | | 17,262,189 | | | | — | | | | — | | | | 17,262,189 | |
Repurchase Agreement | | | — | | | | 23,516,507 | | | | — | | | | 23,516,507 | |
| | | | | | | | | | | | | | | | |
Total Investments | | $ | 17,262,189 | | | $ | 63,532,147 | | | $ | — | | | $ | 80,794,336 | |
| | | | | | | | | | | | | | | | |
LIABILITIES | | | | | | | | | | | | | | | | |
Derivative Financial Instruments | | | | | | | | | | | | | | | | |
Total Return Swap Agreements | | $ | — | | | $ | (11,741 | ) | | $ | — | | | $ | (11,741 | ) |
| | | | | | | | | | | | | | | | |
Total Derivative Financial Instruments | | $ | — | | | $ | (11,741 | ) | | $ | — | | | $ | (11,741 | ) |
| | | | | | | | | | | | | | | | |
FOOTNOTES TO SCHEDULE OF INVESTMENTS:
| (A) | All or a portion of this security is on loan. The value of all securities on loan is $16,920,736. The amount of securities on loan indicated may not correspond with the securities on loan identified because securities with pending sales are in the process of recall from the brokers. |
| (B) | Rate shown reflects the yield at October 31, 2014. |
| (C) | Aggregate cost for federal income tax purposes is $116,723,828. Net unrealized depreciation for tax purposes is $31,218,914. |
| (D) | Cash in the amount of $5,185,575 has been segregated by the custodian as collateral for open swap contracts. |
The Notes to Financial Statements are an integral part of this report.
| | |
| Transamerica Funds | | Annual Report 2014 |
Page 152
Transamerica Commodity Strategy
CONSOLIDATED SCHEDULE OF INVESTMENTS (continued)
At October 31, 2014
FOOTNOTES TO SCHEDULE OF INVESTMENTS (continued):
| (E) | At the termination date, a net cash flow is exchanged where the total return is equivalent to the return of the reference index less a financing rate, if any. As a receiver, the Fund would receive payments based on any positive total return and would owe payments in the event of a negative total return. As the payer, the Fund would owe payments on any net positive total return and would receive payment in the event of a negative total return. |
| (F) | Total aggregate value of illiquid derivatives is $(11,741), or (0.02)% of the Fund’s net assets. |
| (G) | The Fund recognizes transfers between Levels at the end of the reporting period. There were no transfers between Level 1, 2 and 3 during the period ended October 31, 2014. See the Notes to Financial Statements for more information regarding security valuation and pricing inputs. |
DEFINITIONS:
| | |
| BOA | | Bank of America |
| MBL | | Macquarie Bank Ltd. |
| UBS | | UBS AG |
The Notes to Financial Statements are an integral part of this report.
| | |
| Transamerica Funds | | Annual Report 2014 |
Page 153
Transamerica Managed Futures Strategy
CONSOLIDATED SCHEDULE OF INVESTMENTS
At October 31, 2014
| | | | | | | | |
| | | Principal | | | Value | |
SHORT-TERM U.S. GOVERNMENT OBLIGATIONS - 78.0% | |
U.S. Treasury Bill | | | | | | | | |
0.04%, 04/09/2015 (A) | | | $ 4,923,000 | | | | $ 4,922,189 | |
0.05%, 11/20/2014 - 02/05/2015 (A) | | | 264,789,300 | | | | 264,779,906 | |
0.06%, 01/29/2015 (A) | | | 53,047,000 | | | | 53,039,787 | |
| | | | | | | | |
Total Short-Term U.S. Government Obligations
(Cost $322,741,882) | | | | 322,741,882 | |
| | | | | | | | |
| | | | | | | | |
| | | Shares | | | Value | |
SHORT-TERM INVESTMENT COMPANIES - 11.2% | |
BlackRock Liquidity Funds T-Fund Portfolio | | | 4,738,014 | | | | $ 4,738,014 | |
Dreyfus Treasury Cash Management | | | 18,522,951 | | | | 18,522,951 | |
UBS Select Treasury Preferred | | | 23,288,877 | | | | 23,288,877 | |
| | | | | | | | |
Total Short-Term Investment Companies
(Cost $46,549,842) | | | | 46,549,842 | |
| | | | | | | | |
Total Investments
(Cost $369,291,724) (B) | | | | 369,291,724 | |
Net Other Assets (Liabilities) - 10.8% | | | | 44,594,890 | |
| | | | | | | | |
| | |
Net Assets - 100.0% | | | | | | | $ 413,886,614 | |
| | | | | | | | |
OVER THE COUNTER SWAP AGREEMENTS: (C) (D)
| | | | | | | | | | | | | | | | | | | | | | |
|
| Total Return Swap Agreements - Payable (E) | |
| Reference Entity | | Termination
Date | | | Counterparty | | Number of
Shares or Units | | | Fair
Value | | | Premiums
Paid
(Received) | | | Net Unrealized
Appreciation
(Depreciation) | |
Corn December Futures | | | 12/12/2014 | | | CITI | | | $ 1,820,000 | | | | $ (153,758 | ) | | | $ 0 | | | | $ (153,758 | ) |
Cotton No. 2 March Futures | | | 03/09/2015 | | | CITI | | | 3,600,000 | | | | (13,740 | ) | | | 0 | | | | (13,740 | ) |
Gold December Futures | | | 12/29/2014 | | | BOA | | | 13,500 | | | | 812,700 | | | | 0 | | | | 812,700 | |
Heating Oil ULSD December Futures | | | 11/28/2014 | | | DUB | | | 336,000 | | | | 24,898 | | | | 0 | | | | 24,898 | |
HG Copper December Futures | | | 12/29/2014 | | | CITI | | | 1,625,000 | | | | (8,467 | ) | | | 0 | | | | (8,467 | ) |
Kansas Wheat December Futures | | | 12/12/2014 | | | CITI | | | 195,000 | | | | 51,048 | | | | 0 | | | | 51,048 | |
LME Aluminum December Futures | | | 12/17/2014 | | | CITI | | | 200 | | | | (26,100 | ) | | | 0 | | | | (26,100 | ) |
Platinum January Futures | | | 01/28/2015 | | | CITI | | | 5,650 | | | | 538,965 | | | | 0 | | | | 538,965 | |
Silver December Futures | | | 12/29/2014 | | | BCLY | | | 20,000 | | | | 67,360 | | | | 0 | | | | 67,360 | |
Silver December Futures | | | 12/29/2014 | | | BOA | | | 495,000 | | | | 1,462,350 | | | | 0 | | | | 1,462,350 | |
Soybean January Futures | | | 01/14/2015 | | | BOA | | | 65,000 | | | | (69,062 | ) | | | 0 | | | | (69,062 | ) |
Soybean January Futures | | | 01/14/2015 | | | CITI | | | 920,000 | | | | (978,782 | ) | | | 0 | | | | (978,782 | ) |
Soybean Oil December Futures | | | 12/12/2014 | | | CITI | | | 16,800,000 | | | | 663,892 | | | | 0 | | | | 663,892 | |
Unleaded Gas RBOB December Futures | | | 11/28/2014 | | | BCLY | | | 1,428,000 | | | | 198,064 | | | | 0 | | | | 198,064 | |
Unleaded Gas RBOB December Futures | | | 11/28/2014 | | | DUB | | | 1,302,000 | | | | 175,900 | | | | 0 | | | | 175,900 | |
Wheat December Futures | | | 12/12/2014 | | | CITI | | | 2,075,000 | | | | 632,612 | | | | 0 | | | | 632,612 | |
WTI Crude December Futures | | | 11/20/2014 | | | DUB | | | 28,000 | | | | 176,400 | | | | 0 | | | | 176,400 | |
WTI Crude December Futures | | | 11/20/2014 | | | CITI | | | 74,000 | | | | 447,700 | | | | 0 | | | | 447,700 | |
| | | | | | | | | | | | | | | | | | | | | | |
Total | | | | | | | | | | | | | $ 4,001,980 | | | | $ 0 | | | | $ 4,001,980 | |
| | | | | | | | | | | | | | | | | | | | | | |
|
| Total Return Swap Agreements - Receivable (E) | |
| Reference Entity | | Termination
Date | | | Counterparty | | Number of
Shares or Units | | | Fair
Value | | | Premiums
Paid
(Received) | | | Net Unrealized
Appreciation
(Depreciation) | |
2-Year Euro-Schatz Futures | | | 12/08/2014 | | | BOA | | | $ 1,019,000 | | | | $ 46,573 | | | | $ 0 | | | | $ 46,573 | |
2-Year U.S. Treasury Note Futures | | | 12/31/2014 | | | BOA | | | 1,462,000 | | | | 138,977 | | | | 0 | | | | 138,977 | |
5-Year Euro-BOBL Futures | | | 12/08/2014 | | | BOA | | | 409,000 | | | | 312,546 | | | | 0 | | | | 312,546 | |
Cocoa March Futures | | | 03/16/2015 | | | CITI | | | 450 | | | | (13,358 | ) | | | 0 | | | | (13,358 | ) |
London Cocoa March Futures | | | 03/16/2015 | | | CITI | | | 760 | | | | (4,118 | ) | | | 0 | | | | (4,118 | ) |
MSCI Taiwan Index Futures | | | 11/27/2014 | | | BOA | | | 3,400 | | | | 15,452 | | | | 0 | | | | 15,452 | |
OSE Japan 10-Year Bond Futures | | | 12/11/2014 | | | BOA | | | 4,000,000 | | | | 30,843 | | | | 0 | | | | 30,843 | |
SGX CNX Nifty Index Futures | | | 11/27/2014 | | | BOA | | | 420 | | | | 129,608 | | | | 0 | | | | 129,608 | |
Swiss Market Index Futures | | | 12/19/2014 | | | BOA | | | 720 | | | | 169,069 | | | | 0 | | | | 169,069 | |
Taiwan SE Weighted Index Futures | | | 11/19/2014 | | | BOA | | | 2,000 | | | | 17,178 | | | | 0 | | | | 17,178 | |
| | | | | | | | | | | | | | | | | | | | | | |
Total | | | | | | | | | | | | | $ 842,770 | | | | $ 0 | | | | $ 842,770 | |
| | | | | | | | | | | | | | | | | | | | | | |
The Notes to Financial Statements are an integral part of this report.
| | |
| Transamerica Funds | | Annual Report 2014 |
Page 154
Transamerica Managed Futures Strategy
CONSOLIDATED SCHEDULE OF INVESTMENTS (continued)
At October 31, 2014
| | | | | | | | | | | | |
|
| FUTURES CONTRACTS: (F) | |
| Description | | Type | | Contracts | | Expiration
Date | | | Net
Unrealized
Appreciation
(Depreciation) | |
2-Year U.S. Treasury Note | | Long | | 15 | | | 12/31/2014 | | | $ | (4,782 | ) |
3-Month Aluminum | | Long | | 6 | | | 11/18/2014 | | | | 8,625 | |
3-Month Aluminum | | Short | | (6) | | | 11/18/2014 | | | | (10,819 | ) |
3-Month Aluminum | | Long | | 2 | | | 11/20/2014 | | | | 728 | |
3-Month Aluminum | | Short | | (2) | | | 11/20/2014 | | | | (1,345 | ) |
3-Month Aluminum | | Long | | 2 | | | 12/04/2014 | | | | (1,373 | ) |
3-Month Aluminum | | Short | | (2) | | | 12/04/2014 | | | | 1,435 | |
3-Month Aluminum | | Long | | 2 | | | 12/12/2014 | | | | 887 | |
3-Month Aluminum | | Short | | (2) | | | 12/12/2014 | | | | (586 | ) |
3-Month Aluminum | | Long | | 3 | | | 01/15/2015 | | | | 7,903 | |
3-Month Aluminum | | Short | | (3) | | | 01/15/2015 | | | | (7,893 | ) |
3-Month Aluminum | | Long | | 5 | | | 01/16/2015 | | | | 14,450 | |
3-Month Aluminum | | Short | | (5) | | | 01/16/2015 | | | | (16,061 | ) |
3-Month Aluminum | | Long | | 4 | | | 01/22/2015 | | | | 4,220 | |
3-Month Aluminum | | Short | | (4) | | | 01/22/2015 | | | | (3,550 | ) |
3-Month Aluminum | | Long | | 4 | | | 01/23/2015 | | | | 4,020 | |
3-Month Aluminum | | Short | | (4) | | | 01/23/2015 | | | | (3,800 | ) |
3-Month Canadian Bankers’ Acceptance | | Short | | (59) | | | 03/16/2015 | | | | (3,456 | ) |
3-Month Copper | | Long | | 1 | | | 11/06/2014 | | | | (6,153 | ) |
3-Month Copper | | Short | | (1) | | | 11/06/2014 | | | | 6,265 | |
3-Month Copper | | Long | | 12 | | | 11/07/2014 | | | | (72,020 | ) |
3-Month Copper | | Short | | (12) | | | 11/07/2014 | | | | 61,641 | |
3-Month Copper | | Long | | 8 | | | 11/12/2014 | | | | (53,200 | ) |
3-Month Copper | | Short | | (8) | | | 11/12/2014 | | | | 48,214 | |
3-Month Copper | | Long | | 2 | | | 11/13/2014 | | | | (8,330 | ) |
3-Month Copper | | Short | | (2) | | | 11/13/2014 | | | | 8,307 | |
3-Month Copper | | Long | | 17 | | | 11/14/2014 | | | | (40,010 | ) |
3-Month Copper | | Short | | (17) | | | 11/14/2014 | | | | 42,406 | |
3-Month Copper | | Long | | 3 | | | 12/23/2014 | | | | (1,481 | ) |
3-Month Copper | | Short | | (3) | | | 12/23/2014 | | | | 1,957 | |
3-Month Copper | | Long | | 13 | | | 12/24/2014 | | | | 3,237 | |
3-Month Copper | | Short | | (13) | | | 12/24/2014 | | | | (710 | ) |
3-Month Copper | | Long | | 9 | | | 12/29/2014 | | | | 2,323 | |
3-Month Copper | | Short | | (9) | | | 12/29/2014 | | | | (3,617 | ) |
3-Month Copper | | Long | | 9 | | | 01/02/2015 | | | | 7,956 | |
3-Month Copper | | Short | | (9) | | | 01/02/2015 | | | | (12,453 | ) |
3-Month Copper | | Long | | 5 | | | 01/06/2015 | | | | 6,370 | |
3-Month Copper | | Short | | (5) | | | 01/06/2015 | | | | (8,153 | ) |
3-Month Copper | | Long | | 1 | | | 01/09/2015 | | | | 105 | |
3-Month Copper | | Short | | (1) | | | 01/09/2015 | | | | (55 | ) |
3-Month EURIBOR | | Long | | 28 | | | 03/16/2015 | | | | (1,989 | ) |
3-Month EURIBOR | | Long | | 108 | | | 06/15/2015 | | | | 1,144 | |
3-Month EURIBOR | | Long | | 148 | | | 09/14/2015 | | | | 21,022 | |
3-Month EURIBOR | | Long | | 196 | | | 12/14/2015 | | | | 75,989 | |
3-Month EURIBOR | | Long | | 240 | | | 03/14/2016 | | | | 142,314 | |
3-Month EURIBOR | | Long | | 262 | | | 06/13/2016 | | | | 123,123 | |
3-Month EURIBOR | | Long | | 275 | | | 09/19/2016 | | | | 2,179 | |
3-Month Euroswiss | | Short | | (87) | | | 03/16/2015 | | | | 6,401 | |
3-Month Euroswiss | | Long | | 15 | | | 06/15/2015 | | | | (818 | ) |
3-Month Nickel | | Long | | 2 | | | 11/04/2014 | | | | (32,160 | ) |
3-Month Nickel | | Short | | (2) | | | 11/04/2014 | | | | 31,956 | |
3-Month Nickel | | Long | | 2 | | | 11/05/2014 | | | | (33,879 | ) |
3-Month Nickel | | Short | | (2) | | | 11/05/2014 | | | | 33,585 | |
3-Month Nickel | | Long | | 3 | | | 11/18/2014 | | | | (53,239 | ) |
3-Month Nickel | | Short | | (3) | | | 11/18/2014 | | | | 50,892 | |
3-Month Nickel | | Long | | 1 | | | 11/20/2014 | | | | (18,162 | ) |
3-Month Nickel | | Short | | (1) | | | 11/20/2014 | | | | 17,786 | |
The Notes to Financial Statements are an integral part of this report.
| | |
| Transamerica Funds | | Annual Report 2014 |
Page 155
Transamerica Managed Futures Strategy
CONSOLIDATED SCHEDULE OF INVESTMENTS (continued)
At October 31, 2014
| | | | | | | | | | | | |
|
| FUTURES CONTRACTS (continued): (F) | |
| Description | | Type | | Contracts | | Expiration
Date | | | Net
Unrealized
Appreciation
(Depreciation) | |
3-Month Nickel | | Long | | 1 | | | 12/08/2014 | | | $ | (23,951 | ) |
3-Month Nickel | | Short | | (1) | | | 12/08/2014 | | | | 24,490 | |
3-Month Nickel | | Long | | 6 | | | 12/24/2014 | | | | (53,645 | ) |
3-Month Nickel | | Short | | (6) | | | 12/24/2014 | | | | 53,669 | |
3-Month Nickel | | Long | | 1 | | | 12/29/2014 | | | | (9,484 | ) |
3-Month Nickel | | Short | | (1) | | | 12/29/2014 | | | | 8,813 | |
3-Month Sterling | | Long | | 420 | | | 03/18/2015 | | | | 121,596 | |
3-Month Sterling | | Long | | 372 | | | 06/17/2015 | | | | 141,263 | |
3-Month Sterling | | Long | | 291 | | | 09/16/2015 | | | | 134,753 | |
3-Month Sterling | | Long | | 263 | | | 12/16/2015 | | | | 119,793 | |
3-Month Sterling | | Long | | 229 | | | 03/16/2016 | | | | 107,979 | |
3-Month Sterling | | Long | | 218 | | | 06/15/2016 | | | | 103,693 | |
3-Month Sterling | | Long | | 220 | | | 09/21/2016 | | | | 102,883 | |
3-Month Zinc | | Long | | 2 | | | 11/20/2014 | | | | (892 | ) |
3-Month Zinc | | Short | | (2) | | | 11/20/2014 | | | | 620 | |
3-Month Zinc | | Long | | 5 | | | 11/21/2014 | | | | (5,071 | ) |
3-Month Zinc | | Short | | (5) | | | 11/21/2014 | | | | 5,362 | |
3-Month Zinc | | Long | | 2 | | | 12/15/2014 | | | | 2,059 | |
3-Month Zinc | | Short | | (2) | | | 12/15/2014 | | | | (1,894 | ) |
3-Month Zinc | | Short | | (4) | | | 12/16/2014 | | | | 0 | |
3-Month Zinc | | Long | | 4 | | | 12/16/2014 | | | | 673 | |
3-Month Zinc | | Long | | 7 | | | 12/23/2014 | | | | 10,050 | |
3-Month Zinc | | Short | | (7) | | | 12/23/2014 | | | | (12,378 | ) |
3-Month Zinc | | Long | | 15 | | | 12/24/2014 | | | | 18,237 | |
3-Month Zinc | | Short | | (15) | | | 12/24/2014 | | | | (17,731 | ) |
3-Month Zinc | | Long | | 4 | | | 12/29/2014 | | | | 3,032 | |
3-Month Zinc | | Short | | (4) | | | 12/29/2014 | | | | (4,437 | ) |
3-Month Zinc | | Long | | 2 | | | 01/06/2015 | | | | 1,272 | |
3-Month Zinc | | Short | | (2) | | | 01/06/2015 | | | | (1,915 | ) |
3-Month Zinc | | Long | | 3 | | | 01/07/2015 | | | | 3 | |
3-Month Zinc | | Short | | (3) | | | 01/07/2015 | | | | 17 | |
3-Month Zinc | | Long | | 5 | | | 01/09/2015 | | | | (30 | ) |
3-Month Zinc | | Short | | (5) | | | 01/09/2015 | | | | 438 | |
3-Month Zinc | | Long | | 1 | | | 01/13/2015 | | | | (306 | ) |
3-Month Zinc | | Short | | (1) | | | 01/13/2015 | | | | 89 | |
3-Month Zinc | | Long | | 6 | | | 01/15/2015 | | | | (3,524 | ) |
3-Month Zinc | | Short | | (6) | | | 01/15/2015 | | | | 3,016 | |
3-Month Zinc | | Long | | 4 | | | 01/21/2015 | | | | 14,350 | |
3-Month Zinc | | Short | | (4) | | | 01/21/2015 | | | | (12,167 | ) |
3-Month Zinc | | Long | | 3 | | | 01/22/2015 | | | | 5,959 | |
3-Month Zinc | | Short | | (3) | | | 01/22/2015 | | | | (5,859 | ) |
3-Year Australian Treasury Bond | | Long | | 612 | | | 12/15/2014 | | | | 148,922 | |
5-Year U.S. Treasury Note | | Long | | 446 | | | 12/31/2014 | | | | 126,125 | |
10-Year Australian Treasury Bond | | Long | | 208 | | | 12/15/2014 | | | | 415,451 | |
10-Year Government of Canada Bond | | Long | | 227 | | | 12/18/2014 | | | | 149,021 | |
10-Year Japan Government Bond | | Long | | 58 | | | 12/11/2014 | | | | 361,732 | |
10-Year U.S. Treasury Note | | Long | | 270 | | | 12/19/2014 | | | | 187,487 | |
100 Ounce Gold | | Short | | (9) | | | 12/29/2014 | | | | 49,304 | |
90-Day Eurodollar | | Long | | 297 | | | 03/16/2015 | | | | 21,506 | |
90-Day Eurodollar | | Long | | 394 | | | 06/15/2015 | | | | 15,983 | |
90-Day Eurodollar | | Long | | 338 | | | 09/14/2015 | | | | (20,547 | ) |
90-Day Eurodollar | | Long | | 255 | | | 12/14/2015 | | | | (38,172 | ) |
90-Day Eurodollar | | Long | | 212 | | | 03/14/2016 | | | | (46,859 | ) |
90-Day Eurodollar | | Long | | 194 | | | 06/13/2016 | | | | (45,534 | ) |
90-Day Eurodollar | | Long | | 191 | | | 09/19/2016 | | | | (37,560 | ) |
Aluminum | | Long | | 10 | | | 12/17/2014 | | | | 6,837 | |
Aluminum | | Short | | (10) | | | 12/17/2014 | | | | (26,988 | ) |
The Notes to Financial Statements are an integral part of this report.
| | |
| Transamerica Funds | | Annual Report 2014 |
Page 156
Transamerica Managed Futures Strategy
CONSOLIDATED SCHEDULE OF INVESTMENTS (continued)
At October 31, 2014
| | | | | | | | | | | | |
|
| FUTURES CONTRACTS (continued): (F) | |
| Description | | Type | | Contracts | | Expiration
Date | | | Net
Unrealized
Appreciation
(Depreciation) | |
Amsterdam Exchanges Index | | Short | | (45) | | | 11/21/2014 | | | $ | (330,772 | ) |
Brent Crude Oil | | Short | | (174) | | | 12/16/2014 | | | | 109,453 | |
CAC 40 Index | | Short | | (266) | | | 11/21/2014 | | | | (474,097 | ) |
Coffee “C” | | Long | | 21 | | | 03/19/2015 | | | | (13,529 | ) |
Copper | | Short | | (40) | | | 12/17/2014 | | | | (25,844 | ) |
Copper | | Short | | (32) | | | 12/29/2014 | | | | 7,744 | |
Corn | | Short | | (61) | | | 12/12/2014 | | | | (54,458 | ) |
Cotton No. 2 | | Short | | (89) | | | 12/08/2014 | | | | 507,063 | |
Cotton No. 2 | | Long | | 23 | | | 03/09/2015 | | | | (354 | ) |
DAX Index | | Short | | (56) | | | 12/19/2014 | | | | (516,379 | ) |
DJIA Mini Index | | Long | | 141 | | | 12/19/2014 | | | | 328,669 | |
EURO STOXX 50 Index | | Short | | (235) | | | 12/19/2014 | | | | (311,468 | ) |
FTSE 100 Index | | Short | | (211) | | | 12/19/2014 | | | | (436,395 | ) |
FTSE JSE Top 40 Index | | Short | | (64) | | | 12/18/2014 | | | | (100,830 | ) |
FTSE MIB Index | | Short | | (32) | | | 12/19/2014 | | | | (96,597 | ) |
Gas Oil | | Short | | (272) | | | 12/11/2014 | | | | 240,948 | |
German Euro BOBL | | Long | | 26 | | | 12/08/2014 | | | | (3,877 | ) |
German Euro Bund | | Long | | 123 | | | 12/08/2014 | | | | 300,170 | |
German Euro BUXL | | Long | | 67 | | | 12/08/2014 | | | | 264,202 | |
H-Shares Index | | Short | | (16) | | | 11/27/2014 | | | | (22,024 | ) |
Hang Seng Index | | Short | | (8) | | | 11/27/2014 | | | | (26,819 | ) |
IBEX 35 Index | | Long | | 9 | | | 11/21/2014 | | | | 9,767 | |
KC HRW Wheat | | Short | | (39) | | | 12/12/2014 | | | | 102,075 | |
KOSPI 200 Index | | Short | | (34) | | | 12/11/2014 | | | | 4,602 | |
Lean Hogs | | Short | | (41) | | | 12/12/2014 | | | | 81,408 | |
Long U.S. Treasury Bond | | Long | | 145 | | | 12/19/2014 | | | | 300,085 | |
MSCI Singapore Index Futures | | Short | | (73) | | | 11/27/2014 | | | | (80,969 | ) |
MSCI Taiwan Index | | Long | | 4 | | | 11/27/2014 | | | | 2,126 | |
NASDAQ 100 E-Mini Index | | Long | | 259 | | | 12/19/2014 | | | | 593,931 | |
Natural Gas | | Short | | (40) | | | 11/25/2014 | | | | (68,301 | ) |
New York Harbor ULSD | | Short | | (158) | | | 11/28/2014 | | | | (60,694 | ) |
Nickel | | Long | | 7 | | | 12/15/2014 | | | | (148,464 | ) |
Nickel | | Short | | (7) | | | 12/15/2014 | | | | 63,288 | |
RBOB Gasoline | | Short | | (70) | | | 11/28/2014 | | | | 33,997 | |
S&P 500 E-Mini Index | | Long | | 152 | | | 12/19/2014 | | | | 382,967 | |
S&P Midcap 400 E-Mini Index | | Long | | 32 | | | 12/19/2014 | | | | 69,794 | |
S&P TSX 60 Index | | Long | | 8 | | | 12/18/2014 | | | | (60,907 | ) |
SGX CNX Nifty Index | | Long | | 245 | | | 11/27/2014 | | | | 136,196 | |
Soybean Meal | | Long | | 44 | | | 12/12/2014 | | | | 124,184 | |
SPI 200 Index | | Long | | 36 | | | 12/18/2014 | | | | 66,058 | |
Sugar #11 | | Short | | (666) | | | 02/27/2015 | | | | 485,377 | |
TOPIX Index | | Short | | (46) | | | 12/11/2014 | | | | (518,837 | ) |
U.K. Long Gilt Bond | | Long | | 137 | | | 12/29/2014 | | | | 313,748 | |
WTI-Brent Crude Oil | | Short | | (48) | | | 11/20/2014 | | | | 90,211 | |
Zinc | | Long | | 59 | | | 12/15/2014 | | | | (109,088 | ) |
Zinc | | Short | | (45) | | | 12/15/2014 | | | | (63,321 | ) |
| | | | | | | | | | | | |
Total | | | | | | | | | | $ | 3,528,918 | |
| | | | | | | | | | | | |
| | | | | | | | | | | | | | | | | | | | | | |
|
| FORWARD FOREIGN CURRENCY CONTRACTS: (C) (D) | |
| Counterparty | | Settlement
Date | | Currency
Purchased | | | | | Currency
Sold | | | | | Unrealized
Appreciation | | | Unrealized
Depreciation | |
| CSFB | | 12/17/2014 | | | 57,671,000 | | | AUD | | | 52,893,429 | | | USD | | $ | 15,520 | | | $ | (2,328,792 | ) |
| CSFB | | 12/17/2014 | | | 9,705,000 | | | BRL | | | 4,188,489 | | | USD | | | — | | | | (325,533 | ) |
| CSFB | | 12/17/2014 | | | 32,271,000 | | | CAD | | | 29,400,981 | | | USD | | | — | | | | (802,258 | ) |
| CSFB | | 12/17/2014 | | | 550,000 | | | CHF | | | 574,885 | | | USD | | | — | | | | (2,990 | ) |
The Notes to Financial Statements are an integral part of this report.
| | |
| Transamerica Funds | | Annual Report 2014 |
Page 157
Transamerica Managed Futures Strategy
CONSOLIDATED SCHEDULE OF INVESTMENTS (continued)
At October 31, 2014
| | | | | | | | | | | | | | | | | | | | | | |
|
| FORWARD FOREIGN CURRENCY CONTRACTS (continued): (C) (D) | |
| Counterparty | | Settlement
Date | | Currency
Purchased | | | | | Currency
Sold | | | | | Unrealized
Appreciation | | | Unrealized
Depreciation | |
| CSFB | | 12/17/2014 | | | 3,430,000,000 | | | COP | | | 1,756,408 | | | USD | | $ | — | | | $ | (97,947 | ) |
| CSFB | | 12/17/2014 | | | 156,000,000 | | | CZK | | | 7,329,462 | | | USD | | | — | | | | (298,699 | ) |
| CSFB | | 12/17/2014 | | | 71,768,500 | | | EUR | | | 92,065,361 | | | USD | | | — | | | | (2,100,860 | ) |
| CSFB | | 12/17/2014 | | | 35,328,000 | | | GBP | | | 57,564,877 | | | USD | | | — | | | | (1,072,242 | ) |
| CSFB | | 12/17/2014 | | | 7,103,500 | | | HKD | | | 915,872 | | | USD | | | 141 | | | | — | |
| CSFB | | 12/17/2014 | | | 1,765,000,000 | | | HUF | | | 7,259,246 | | | USD | | | 25 | | | | (89,242 | ) |
| CSFB | | 12/17/2014 | | | 24,600,000,000 | | | IDR | | | 2,057,733 | | | USD | | | 324 | | | | (38,761 | ) |
| CSFB | | 12/17/2014 | | | 850,000 | | | ILS | | | 226,970 | | | USD | | | — | | | | (3,243 | ) |
| CSFB | | 12/17/2014 | | | 208,000,000 | | | INR | | | 3,377,529 | | | USD | | | 1,548 | | | | (25,407 | ) |
| CSFB | | 12/17/2014 | | | 14,389,824,500 | | | JPY | | | 133,678,184 | | | USD | | | — | | | | (5,498,643 | ) |
| CSFB | | 12/17/2014 | | | 17,595,000,001 | | | KRW | | | 17,029,201 | | | USD | | | — | | | | (596,615 | ) |
| CSFB | | 12/17/2014 | | | 59,500,000 | | | MXN | | | 4,514,646 | | | USD | | | — | | | | (108,867 | ) |
| CSFB | | 12/17/2014 | | | 9,750,000 | | | MYR | | | 3,048,820 | | | USD | | | — | | | | (95,195 | ) |
| CSFB | | 12/17/2014 | | | 201,538,500 | | | NOK | | | 31,773,842 | | | USD | | | — | | | | (1,942,851 | ) |
| CSFB | | 12/17/2014 | | | 46,258,000 | | | NZD | | | 37,761,434 | | | USD | | | — | | | | (1,871,399 | ) |
| CSFB | | 12/17/2014 | | | 34,000,000 | | | PHP | | | 777,599 | | | USD | | | — | | | | (21,145 | ) |
| CSFB | | 12/17/2014 | | | 9,650,000 | | | PLN | | | 2,950,801 | | | USD | | | — | | | | (92,702 | ) |
| CSFB | | 12/17/2014 | | | 240,000,000 | | | RUB | | | 6,047,234 | | | USD | | | — | | | | (550,221 | ) |
| CSFB | | 12/17/2014 | | | 182,479,500 | | | SEK | | | 25,347,048 | | | USD | | | — | | | | (632,176 | ) |
| CSFB | | 12/17/2014 | | | 20,800,000 | | | SGD | | | 16,581,650 | | | USD | | | — | | | | (394,032 | ) |
| CSFB | | 12/17/2014 | | | 14,000,000 | | | TRY | | | 6,274,567 | | | USD | | | 17,570 | | | | (61,603 | ) |
| CSFB | | 12/17/2014 | | | 114,000,000 | | | TWD | | | 3,825,181 | | | USD | | | — | | | | (75,181 | ) |
| CSFB | | 12/17/2014 | | | 55,832,855 | | | USD | | | 63,069,500 | | | AUD | | | 606,947 | | | | (88,987 | ) |
| CSFB | | 12/17/2014 | | | 4,883,770 | | | USD | | | 11,950,000 | | | BRL | | | 128,031 | | | | (811 | ) |
| CSFB | | 12/17/2014 | | | 48,674,772 | | | USD | | | 53,869,501 | | | CAD | | | 957,940 | | | | (22,593 | ) |
| CSFB | | 12/17/2014 | | | 260,773 | | | USD | | | 241,500 | | | CHF | | | 9,660 | | | | — | |
| CSFB | | 12/17/2014 | | | 2,050,664 | | | USD | | | 1,220,000,000 | | | CLP | | | — | | | | (60,422 | ) |
| CSFB | | 12/17/2014 | | | 2,554,030 | | | USD | | | 5,150,000,000 | | | COP | | | 65,035 | | | | (1,118 | ) |
| CSFB | | 12/17/2014 | | | 12,907,831 | | | USD | | | 275,550,000 | | | CZK | | | 489,070 | | | | — | |
| CSFB | | 12/17/2014 | | | 101,200,986 | | | USD | | | 78,591,816 | | | EUR | | | 2,683,202 | | | | — | |
| CSFB | | 12/17/2014 | | | 62,676,477 | | | USD | | | 39,003,500 | | | GBP | | | 354,216 | | | | (47,828 | ) |
| CSFB | | 12/17/2014 | | | 915,723 | | | USD | | | 7,103,500 | | | HKD | | | 41 | | | | (332 | ) |
| CSFB | | 12/17/2014 | | | 6,404,565 | | | USD | | | 1,542,000,000 | | | HUF | | | 140,438 | | | | — | |
| CSFB | | 12/17/2014 | | | 2,942,747 | | | USD | | | 36,000,000,000 | | | IDR | | | 19,090 | | | | (31,410 | ) |
| CSFB | | 12/17/2014 | | | 4,342,911 | | | USD | | | 15,700,000 | | | ILS | | | 210,537 | | | | — | |
| CSFB | | 12/17/2014 | | | 173,242,088 | | | USD | | | 18,392,784,999 | | | JPY | | | 9,405,568 | | | | — | |
| CSFB | | 12/17/2014 | | | 9,940,572 | | | USD | | | 10,620,000,000 | | | KRW | | | 34,094 | | | | (11,913 | ) |
| CSFB | | 12/17/2014 | | | 12,338,609 | | | USD | | | 164,700,000 | | | MXN | | | 153,612 | | | | (10,491 | ) |
| CSFB | | 12/17/2014 | | | 5,063,742 | | | USD | | | 16,600,000 | | | MYR | | | 35,206 | | | | (198 | ) |
| CSFB | | 12/17/2014 | | | 55,305,224 | | | USD | | | 355,964,000 | | | NOK | | | 2,616,739 | | | | — | |
| CSFB | | 12/17/2014 | | | 41,341,101 | | | USD | | | 52,577,000 | | | NZD | | | 644,689 | | | | (96,327 | ) |
| CSFB | | 12/17/2014 | | | 5,077,874 | | | USD | | | 226,000,000 | | | PHP | | | 51,124 | | | | (1,450 | ) |
| CSFB | | 12/17/2014 | | | 6,355,608 | | | USD | | | 20,850,000 | | | PLN | | | 180,339 | | | | — | |
| CSFB | | 12/17/2014 | | | 10,159,044 | | | USD | | | 389,500,000 | | | RUB | | | 1,237,853 | | | | — | |
| CSFB | | 12/17/2014 | | | 62,493,598 | | | USD | | | 445,596,500 | | | SEK | | | 2,142,378 | | | | — | |
| CSFB | | 12/17/2014 | | | 17,968,575 | | | USD | | | 22,750,000 | | | SGD | | | 263,368 | | | | — | |
| CSFB | | 12/17/2014 | | | 4,990,296 | | | USD | | | 11,390,000 | | | TRY | | | 11,291 | | | | (89,976 | ) |
| CSFB | | 12/17/2014 | | | 9,007,549 | | | USD | | | 272,000,000 | | | TWD | | | 60,340 | | | | (157 | ) |
| CSFB | | 12/17/2014 | | | 2,541,682 | | | USD | | | 28,750,000 | | | ZAR | | | — | | | | (43,690 | ) |
| CSFB | | 12/17/2014 | | | 78,700,000 | | | ZAR | | | 7,137,527 | | | USD | | | 13,287 | | | | (73,642 | ) |
| RBS | | 12/17/2014 | | | 58,658,000 | | | AUD | | | 53,809,818 | | | USD | | | 15,447 | | | | (2,379,464 | ) |
| RBS | | 12/17/2014 | | | 9,705,000 | | | BRL | | | 4,188,472 | | | USD | | | — | | | | (325,516 | ) |
| RBS | | 12/17/2014 | | | 49,449,000 | | | CAD | | | 45,198,662 | | | USD | | | — | | | | (1,376,709 | ) |
| RBS | | 12/17/2014 | | | 761,000 | | | CHF | | | 800,192 | | | USD | | | — | | | | (8,897 | ) |
| RBS | | 12/17/2014 | | | 3,430,000,000 | | | COP | | | 1,756,398 | | | USD | | | — | | | | (97,936 | ) |
| RBS | | 12/17/2014 | | | 156,000,000 | | | CZK | | | 7,328,544 | | | USD | | | — | | | | (297,782 | ) |
| RBS | | 12/17/2014 | | | 72,549,500 | | | EUR | | | 93,077,961 | | | USD | | | — | | | | (2,134,445 | ) |
| RBS | | 12/17/2014 | | | 35,327,999 | | | GBP | | | 57,564,957 | | | USD | | | — | | | | (1,072,321 | ) |
The Notes to Financial Statements are an integral part of this report.
| | |
| Transamerica Funds | | Annual Report 2014 |
Page 158
Transamerica Managed Futures Strategy
CONSOLIDATED SCHEDULE OF INVESTMENTS (continued)
At October 31, 2014
| | | | | | | | | | | | | | | | | | | | | | |
|
| FORWARD FOREIGN CURRENCY CONTRACTS (continued): (C) (D) | |
| Counterparty | | Settlement
Date | | Currency
Purchased | | | | | Currency
Sold | | | | | Unrealized
Appreciation | | | Unrealized
Depreciation | |
| RBS | | 12/17/2014 | | | 18,276,000 | | | HKD | | | 2,356,654 | | | USD | | $ | 386 | | | $ | (306 | ) |
| RBS | | 12/17/2014 | | | 1,765,000,000 | | | HUF | | | 7,259,188 | | | USD | | | 28 | | | | (89,188 | ) |
| RBS | | 12/17/2014 | | | 24,600,000,000 | | | IDR | | | 2,057,762 | | | USD | | | 323 | | | | (38,789 | ) |
| RBS | | 12/17/2014 | | | 850,000 | | | ILS | | | 226,970 | | | USD | | | — | | | | (3,243 | ) |
| RBS | | 12/17/2014 | | | 208,000,000 | | | INR | | | 3,377,513 | | | USD | | | 1,548 | | | | (25,392 | ) |
| RBS | | 12/17/2014 | | | 14,292,446,500 | | | JPY | | | 133,019,317 | | | USD | | | — | | | | (5,707,186 | ) |
| RBS | | 12/17/2014 | | | 17,645,000,000 | | | KRW | | | 17,078,127 | | | USD | | | — | | | | (598,843 | ) |
| RBS | | 12/17/2014 | | | 59,500,000 | | | MXN | | | 4,514,434 | | | USD | | | — | | | | (108,656 | ) |
| RBS | | 12/17/2014 | | | 9,850,000 | | | MYR | | | 3,080,108 | | | USD | | | — | | | | (96,191 | ) |
| RBS | | 12/17/2014 | | | 243,989,500 | | | NOK | | | 38,620,396 | | | USD | | | — | | | | (2,505,965 | ) |
| RBS | | 12/17/2014 | | | 46,258,000 | | | NZD | | | 37,761,432 | | | USD | | | — | | | | (1,871,395 | ) |
| RBS | | 12/17/2014 | | | 34,000,000 | | | PHP | | | 777,607 | | | USD | | | — | | | | (21,152 | ) |
| RBS | | 12/17/2014 | | | 9,650,000 | | | PLN | | | 2,950,826 | | | USD | | | — | | | | (92,728 | ) |
| RBS | | 12/17/2014 | | | 240,000,000 | | | RUB | | | 6,047,400 | | | USD | | | — | | | | (550,387 | ) |
| RBS | | 12/17/2014 | | | 182,479,500 | | | SEK | | | 25,347,178 | | | USD | | | — | | | | (632,305 | ) |
| RBS | | 12/17/2014 | | | 20,800,000 | | | SGD | | | 16,581,720 | | | USD | | | — | | | | (394,101 | ) |
| RBS | | 12/17/2014 | | | 14,000,000 | | | TRY | | | 6,274,565 | | | USD | | | 17,501 | | | | (61,534 | ) |
| RBS | | 12/17/2014 | | | 114,000,000 | | | TWD | | | 3,825,235 | | | USD | | | — | | | | (75,235 | ) |
| RBS | | 12/17/2014 | | | 55,832,724 | | | USD | | | 63,069,500 | | | AUD | | | 606,933 | | | | (89,101 | ) |
| RBS | | 12/17/2014 | | | 4,883,711 | | | USD | | | 11,950,000 | | | BRL | | | 127,976 | | | | (814 | ) |
| RBS | | 12/17/2014 | | | 48,674,603 | | | USD | | | 53,869,501 | | | CAD | | | 957,767 | | | | (22,588 | ) |
| RBS | | 12/17/2014 | | | 1,673,780 | | | USD | | | 1,583,500 | | | CHF | | | 27,240 | | | | — | |
| RBS | | 12/17/2014 | | | 2,050,671 | | | USD | | | 1,220,000,000 | | | CLP | | | — | | | | (60,416 | ) |
| RBS | | 12/17/2014 | | | 2,554,009 | | | USD | | | 5,150,000,000 | | | COP | | | 65,016 | | | | (1,116 | ) |
| RBS | | 12/17/2014 | | | 12,908,092 | | | USD | | | 275,550,000 | | | CZK | | | 489,331 | | | | — | |
| RBS | | 12/17/2014 | | | 112,077,264 | | | USD | | | 86,843,815 | | | EUR | | | 3,215,292 | | | | — | |
| RBS | | 12/17/2014 | | | 62,675,942 | | | USD | | | 39,003,500 | | | GBP | | | 353,905 | | | | (48,051 | ) |
| RBS | | 12/17/2014 | | | 2,355,226 | | | USD | | | 18,276,000 | | | HKD | | | 110 | | | | (1,619 | ) |
| RBS | | 12/17/2014 | | | 6,404,718 | | | USD | | | 1,542,000,000 | | | HUF | | | 140,592 | | | | — | |
| RBS | | 12/17/2014 | | | 2,942,757 | | | USD | | | 36,000,000,000 | | | IDR | | | 19,097 | | | | (31,407 | ) |
| RBS | | 12/17/2014 | | | 4,342,940 | | | USD | | | 15,699,999 | | | ILS | | | 210,567 | | | | — | |
| RBS | | 12/17/2014 | | | 173,241,949 | | | USD | | | 18,392,784,998 | | | JPY | | | 9,405,430 | | | | — | |
| RBS | | 12/17/2014 | | | 9,948,022 | | | USD | | | 10,630,000,000 | | | KRW | | | 34,417 | | | | (14,122 | ) |
| RBS | | 12/17/2014 | | | 13,459,515 | | | USD | | | 179,700,000 | | | MXN | | | 163,814 | | | | (10,490 | ) |
| RBS | | 12/17/2014 | | | 5,094,785 | | | USD | | | 16,700,000 | | | MYR | | | 35,959 | | | | (203 | ) |
| RBS | | 12/17/2014 | | | 55,305,118 | | | USD | | | 355,964,000 | | | NOK | | | 2,616,633 | | | | — | |
| RBS | | 12/17/2014 | | | 41,340,871 | | | USD | | | 52,577,000 | | | NZD | | | 644,550 | | | | (96,418 | ) |
| RBS | | 12/17/2014 | | | 5,077,813 | | | USD | | | 226,000,000 | | | PHP | | | 51,067 | | | | (1,455 | ) |
| RBS | | 12/17/2014 | | | 6,355,412 | | | USD | | | 20,850,000 | | | PLN | | | 180,143 | | | | — | |
| RBS | | 12/17/2014 | | | 10,159,034 | | | USD | | | 389,500,000 | | | RUB | | | 1,237,841 | | | | — | |
| RBS | | 12/17/2014 | | | 62,742,057 | | | USD | | | 447,328,500 | | | SEK | | | 2,156,255 | | | | — | |
| RBS | | 12/17/2014 | | | 17,968,398 | | | USD | | | 22,750,000 | | | SGD | | | 263,189 | | | | — | |
| RBS | | 12/17/2014 | | | 4,989,631 | | | USD | | | 11,390,000 | | | TRY | | | 11,283 | | | | (90,636 | ) |
| RBS | | 12/17/2014 | | | 9,007,451 | | | USD | | | 272,000,000 | | | TWD | | | 60,236 | | | | (153 | ) |
| RBS | | 12/17/2014 | | | 2,541,681 | | | USD | | | 28,750,000 | | | ZAR | | | — | | | | (43,690 | ) |
| RBS | | 12/17/2014 | | | 78,700,000 | | | ZAR | | | 7,137,326 | | | USD | | | 13,347 | | | | (73,503 | ) |
| | | | | | | | | | | | | | | | | | | | | | |
| Total | | | | | | | | | | | | | | | | $ | 45,672,446 | | | $ | (40,859,397 | ) |
| | | | | | | | | | | | | | | | | | | | | | |
The Notes to Financial Statements are an integral part of this report.
| | |
| Transamerica Funds | | Annual Report 2014 |
Page 159
Transamerica Managed Futures Strategy
CONSOLIDATED SCHEDULE OF INVESTMENTS (continued)
At October 31, 2014
SECURITY VALUATION:
Valuation Inputs (G)
| | | | | | | | | | | | | | | | |
| | | Level 1
Quoted Prices | | | Level 2
Other Significant
Observable Inputs | | | Level 3
Significant
Unobservable Inputs | | | Value at
October 31, 2014 | |
ASSETS | | | | | | | | | | | | | | | | |
Investments | | | | | | | | | | | | | | | | |
Short-Term U.S. Government Obligations | | $ | — | | | $ | 322,741,882 | | | $ | — | | | $ | 322,741,882 | |
Short-Term Investment Companies | | | 46,549,842 | | | | — | | | | — | | | | 46,549,842 | |
| | | | | | | | | | | | | | | | |
Total Investments | | $ | 46,549,842 | | | $ | 322,741,882 | | | $ | — | | | $ | 369,291,724 | |
| | | | | | | | | | | | | | | | |
Derivative Financial Instruments | | | | | | | | | | | | | | | | |
Total Return Swap Agreements | | $ | — | | | $ | 6,112,135 | | | $ | — | | | $ | 6,112,135 | |
Futures Contracts (H) | | | 7,821,980 | | | | — | | | | — | | | | 7,821,980 | |
Forward Foreign Currency Contracts (H) | | | — | | | | 45,672,446 | | | | — | | | | 45,672,446 | |
| | | | | | | | | | | | | | | | |
Total Derivative Financial Instruments | | $ | 7,821,980 | | | $ | 51,784,581 | | | $ | — | | | $ | 59,606,561 | |
| | | | | | | | | | | | | | | | |
LIABILITIES | | | | | | | | | | | | | | | | |
Derivative Financial Instruments | | | | | | | | | | | | | | | | |
Total Return Swap Agreements | | $ | — | | | $ | (1,267,385 | ) | | $ | — | | | $ | (1,267,385 | ) |
Futures Contracts (H) | | | (4,293,062 | ) | | | — | | | | — | | | | (4,293,062 | ) |
Forward Foreign Currency Contracts (H) | �� | | — | | | | (40,859,397 | ) | | | — | | | | (40,859,397 | ) |
| | | | | | | | | | | | | | | | |
Total Derivative Financial Instruments | | $ | (4,293,062 | ) | | $ | (42,126,782 | ) | | $ | — | | | $ | (46,419,844 | ) |
| | | | | | | | | | | | | | | | |
FOOTNOTES TO SCHEDULE OF INVESTMENTS:
| (A) | Rate shown reflects the yield at October 31, 2014. |
| (B) | Aggregate cost for federal income tax purposes is $394,675,058. Net unrealized depreciation for tax purpose is $9,215,478. |
| (C) | Cash in the amount of $8,194,013 has been segregated by the custodian as collateral for open swap and/or forward foreign currency contracts. |
| (D) | Cash in the amount of $1,830,337 has been segregated by the broker as collateral for open swap and/or forward foreign currency contracts. |
| (E) | At the termination date, a net cash flow is exchanged where the total return is equivalent to the return of the reference index less a financing rate, if any. As a receiver, the Fund would receive payments based on any positive total return and would owe payments in the event of a negative total return. As the payer, the Fund would owe payments on any net positive total return and would receive payment in the event of a negative total return. |
| (F) | Cash in the amount of $18,980,657 has been segregated by the custodian as collateral to cover margin requirements for open futures contracts. |
| (G) | The Fund recognizes transfers between Levels at the end of the reporting period. There were no transfers between Level 1, 2 and 3 during the period ended October 31, 2014. See the Notes to Financial Statements for more information regarding security valuation and pricing inputs. |
| (H) | Derivative financial instruments valued at unrealized appreciation (depreciation) on the instrument. |
DEFINITIONS:
| | |
| BCLY | | Barclays Bank PLC |
| BOA | | Bank of America |
| BOBL | | Bundesobligationen (German Debt Agency 5 year notes) |
| BUXL | | Bundesanleihen (German Debt Agency 10 and 30 year bonds) |
| CAC | | Cotation Assistée en Continu (French stock market Index) |
| CITI | | Citigroup, Inc. |
| CNX Nifty | | CRISIL NSE Index on the National Stock Exchange of India’s benchmark index |
| CSFB | | Credit Suisse First Boston |
| DAX | | Deutscher Aktienindex (Frankfurt Stock Index) |
| DJIA | | Dow Jones Industrial Average |
| DUB | | Deutsche Bank AG |
| EURIBOR | | Euro InterBank Offered Rate |
The Notes to Financial Statements are an integral part of this report.
| | |
| Transamerica Funds | | Annual Report 2014 |
Page 160
Transamerica Managed Futures Strategy
CONSOLIDATED SCHEDULE OF INVESTMENTS (continued)
At October 31, 2014
DEFINITIONS (continued):
| | |
| FTSE | | Financial Times & London Stock Exchange Index |
| HG | | High Grade |
| IBEX | | Índice Bursatil Español (Bolsa de Madrid Stock Market Index) |
| JSE | | Africa Index Series |
| KC HRW | | Kansas City Hard Red Winter |
| KOSPI | | Korea Composite Stock Price Index |
| LME | | London Metal Exchange |
| MIB | | Milano Borsa Italiana (Italian stock exchange) |
| MSCI | | Morgan Stanley Capital International |
| NASDAQ | | National Association of Securities Dealers Automated Quotations |
| OSE | | Osaka Securities Exchange |
| RBOB | | Reformulated Blendstock for Oxygenate Blending |
| RBS | | Royal Bank of Scotland Group PLC |
| SE | | Stock Exchange |
| SGX | | Singapore Exchange |
| SPI | | Australian Securities Exchange Index |
| TOPIX | | Toronto Stock Exchange |
| TSX | | Tokyo Stock Price Index |
| ULSD | | Ultra-Low Sulfur Diesel |
| WTI | | West Texas Intermediate |
CURRENCY ABBREVIATIONS:
| | |
| AUD | | Australian Dollar |
| BRL | | Brazilian Real |
| CAD | | Canadian Dollar |
| CHF | | Swiss Franc |
| CLP | | Chilean Peso |
| COP | | Columbian Peso |
| CZK | | Czech Republic Koruna |
| EUR | | Euro |
| GBP | | Pound Sterling |
| HKD | | Hong Kong Dollar |
| HUF | | Hungarian Forint |
| IDR | | Indonesian Rupiah |
| ILS | | Israel New Shekel |
| INR | | Indian Rupee |
| JPY | | Japanese Yen |
| KRW | | South Korean Won |
| MXN | | Mexican Peso |
| MYR | | Malaysian Ringgit |
| NOK | | Norwegian Krone |
| NZD | | New Zealand Dollar |
| PHP | | Philippine Peso |
| PLN | | Polish Zloty |
| RUB | | Russian Ruble |
| SEK | | Swedish Krona |
| SGD | | Singapore Dollar |
| TRY | | Turkish New Lira |
| TWD | | Taiwan New Dollar |
| USD | | United States Dollar |
| ZAR | | South African Rand |
The Notes to Financial Statements are an integral part of this report.
| | |
| Transamerica Funds | | Annual Report 2014 |
Page 161
CONSOLIDATED STATEMENTS OF ASSETS AND LIABILITIES
At October 31, 2014
| | | | | | | | |
| | | Transamerica
Commodity
Strategy | | | Transamerica
Managed Futures
Strategy | |
Assets: | | | | | | | | |
Investments, at value | | $ | 57,277,829 | | | $ | 369,291,724 | |
Repurchase agreements, at value | | | 23,516,507 | | | | — | |
Cash on deposit with broker | | | — | | | | 27,174,670 | |
Cash on deposit with custodian | | | 5,185,575 | | | | — | |
Foreign currency, at value | | | 4,009 | | | | 292,694 | |
Cash | | | 4 | | | | 10,483,887 | |
Unrealized appreciation on forward foreign currency contracts | | | — | | | | 45,672,446 | |
OTC swap agreements, at value | | | — | | | | 6,112,135 | |
Receivables: | | | | | | | | |
Shares of beneficial interest sold | | | 28 | | | | 2,993 | |
Interest | | | 25,284 | | | | 445 | |
Dividend reclaims | | | 1,136 | | | | — | |
Net income from securities lending | | | 1,175 | | | | — | |
Prepaid expenses | | | 572 | | | | 1,827 | |
Total assets | | | 86,012,119 | | | | 459,032,821 | |
| | | |
Liabilities: | | | | | | | | |
Cash deposit due to broker | | | — | | | | 1,830,337 | |
Accounts payable and accrued liabilities: | | | | | | | | |
Shares of beneficial interest redeemed | | | 14,131 | | | | 66,807 | |
Investments purchased | | | 462,782 | | | | 496,342 | |
Management and advisory fees | | | 35,505 | | | | 381,093 | |
Administration fees | | | 1,455 | | | | 8,661 | |
Transfer agent fees | | | 437 | | | | 2,598 | |
Trustees fees | | | 5 | | | | 26 | |
Audit and tax fees | | | 18,548 | | | | 19,863 | |
Custody fees | | | 343 | | | | — | |
Legal fees | | | 3,505 | | | | 7,820 | |
Printing and shareholder reports fees | | | 932 | | | | 709 | |
Variation margin payable on derivative financial instruments | | | — | | | | 200,881 | |
Registration fees | | | 1,795 | | | | 3,065 | |
Other | | | 155 | | | | 1,223 | |
Collateral for securities on loan | | | 17,262,189 | | | | — | |
Unrealized depreciation on forward foreign currency contracts | | | — | | | | 40,859,397 | |
OTC swap agreements, at value | | | 11,741 | | | | 1,267,385 | |
Total liabilities | | | 17,813,523 | | | | 45,146,207 | |
Net assets | | $ | 68,198,596 | | | $ | 413,886,614 | |
| | | |
Net assets consist of: | | | | | | | | |
Paid-in capital | | $ | 68,657,317 | | | $ | 403,372,148 | |
Undistributed (distributions in excess of) net investment income (loss) | | | (431,801 | ) | | | (12,039,974 | ) |
Accumulated net realized gain (loss) | | | — | | | | 9,353,640 | |
Net unrealized appreciation (depreciation) on: | | | | | | | | |
Investments | | | (14,949 | ) | | | — | |
Futures contracts | | | — | | | | 3,528,918 | |
Swap agreements | | | (11,741 | ) | | | 4,844,750 | |
Translation of assets and liabilities denominated in foreign currencies | | | (230 | ) | | | 4,827,132 | |
Net assets | | $ | 68,198,596 | | | $ | 413,886,614 | |
Shares outstanding (unlimited shares, no par value) | | | 8,661,996 | | | | 40,268,000 | |
Net asset value and offering price per share | | $ | 7.87 | | | $ | 10.28 | |
| | | | | | | | | |
Investments, at cost | | $ | 57,292,778 | | | $ | 369,291,724 | |
Repurchase agreements, at cost | | $ | 23,516,507 | | | $ | — | |
Foreign currency, at cost | | $ | 4,238 | | | $ | 308,930 | |
Securities loaned, at value | | $ | 16,920,736 | | | $ | — | |
The Notes to Financial Statements are an integral part of this report.
| | |
| Transamerica Funds | | Annual Report 2014 |
Page 162
CONSOLIDATED STATEMENTS OF OPERATIONS
For the year ended October 31, 2014
| | | | | | | | |
| | | Transamerica
Commodity
Strategy | | | Transamerica
Managed Futures
Strategy | |
Investment Income: | | | | | | | | |
Dividend income | | $ | 4,238 | | | $ | — | |
Interest income | | | 41,446 | | | | 141,879 | |
Net income from securities lending | | | 7,039 | | | | — | |
Withholding taxes on foreign income | | | — | | | | (33 | ) |
Total investment income | | | 52,723 | | | | 141,846 | |
| | | |
Expenses: | | | | | | | | |
Management and advisory fees | | | 551,507 | | | | 5,893,926 | |
Administration fees | | | 19,118 | | | | 108,893 | |
Transfer agent fees | | | 5,736 | | | | 32,668 | |
Trustees fees | | | 1,306 | | | | 6,812 | |
Audit and tax fees | | | 17,764 | | | | 25,389 | |
Custody fees | | | 48,335 | | | | 1,160,112 | |
Legal fees | | | 2,555 | | | | 16,616 | |
Printing and shareholder reports fees | | | 1,859 | | | | 5,159 | |
Registration fees | | | 3,993 | | | | 6,655 | |
Dividends and interest on securities sold short | | | — | | | | 92 | |
Other | | | 3,272 | | | | 49,863 | |
Total expenses | | | 655,445 | | | | 7,306,185 | |
Expenses (waived/reimbursed) recaptured | | | (85,024 | ) | | | (1,102,650 | ) |
Net expenses | | | 570,421 | | | | 6,203,535 | |
Net investment income (loss) | | | (517,698 | ) | | | (6,061,689 | ) |
| | | |
Net realized gain (loss) on transactions from: | | | | | | | | |
Futures contracts | | | — | | | | 10,798,235 | |
Swap agreements | | | (5,081,229 | ) | | | 751,104 | |
Foreign currency transactions | | | — | | | | 5,525,518 | |
Net realized gain (loss) | | | (5,081,229 | ) | | | 17,074,857 | |
| | | |
Net change in unrealized appreciation (depreciation) on: | | | | | | | | |
Investments | | | (14,949 | ) | | | — | |
Futures contracts | | | — | | | | (5,152,332 | ) |
Swap agreements | | | 6,122 | | | | 3,970,406 | |
Translation of assets and liabilities denominated in foreign currencies | | | (230 | ) | | | 9,656,482 | |
Net change in unrealized appreciation (depreciation) | | | (9,057 | ) | | | 8,474,556 | |
Net realized and change in unrealized gain (loss) | | | (5,090,286 | ) | | | 25,549,413 | |
Net increase (decrease) in net assets resulting from operations | | $ | (5,607,984 | ) | | $ | 19,487,724 | |
The Notes to Financial Statements are an integral part of this report.
| | |
| Transamerica Funds | | Annual Report 2014 |
Page 163
CONSOLIDATED STATEMENTS OF CHANGES IN NET ASSETS
For the years ended:
| | | | | | | | | | | | | | | | |
| | | Transamerica Commodity Strategy | | | Transamerica Managed Futures
Strategy | |
| | | October 31, 2014 | | | October 31, 2013 | | | October 31, 2014 | | | October 31, 2013 | |
From operations: | | | | | | | | | | | | | | | | |
Net investment income (loss) | | $ | (517,698 | ) | | $ | (730,336 | ) | | $ | (6,061,689 | ) | | $ | (4,777,566 | ) |
Net realized gain (loss) | | | (5,081,229 | ) | | | (15,055,690 | ) | | | 17,074,857 | | | | 20,043,472 | |
Net change in unrealized appreciation (depreciation) | | | (9,057 | ) | | | (17,863 | ) | | | 8,474,556 | | | | 7,459,594 | |
Net increase (decrease) in net assets resulting from operations | | | (5,607,984 | ) | | | (15,803,889 | ) | | | 19,487,724 | | | | 22,725,500 | |
| | | | | |
Distributions to shareholders: | | | | | | | | | | | | | | | | |
Net investment income | | | — | | | | — | | | | (2,055,103 | ) | | | — | |
Net realized gains | | | — | | | | — | | | | (12,761,076 | ) | | | — | |
Total distributions to shareholders | | | — | | | | — | | | | (14,816,179 | ) | | | — | |
| | | | | |
Capital share transactions: | | | | | | | | | | | | | | | | |
Proceeds from shares sold | | | 4,660,196 | | | | 3,786,659 | | | | 102,647,377 | | | | 229,069,841 | |
Dividends and distributions reinvested | | | — | | | | — | | | | 14,816,179 | | | | — | |
Cost of shares redeemed | | | (8,601,791 | ) | | | (60,727,482 | ) | | | (150,023,762 | ) | | | (112,143,398 | ) |
| | | | | |
Net increase (decrease) in net assets resulting from capital share transactions | | | (3,941,595 | ) | | | (56,940,823 | ) | | | (32,560,206 | ) | | | 116,926,443 | |
Net increase (decrease) in net assets | | | (9,549,579 | ) | | | (72,744,712 | ) | | | (27,888,661 | ) | | | 139,651,943 | |
| | | | | |
Net assets: | | | | | | | | | | | | | | | | |
Beginning of year | | | 77,748,175 | | | | 150,492,887 | | | | 441,775,275 | | | | 302,123,332 | |
End of year | | $ | 68,198,596 | | | $ | 77,748,175 | | | $ | 413,886,614 | | | $ | 441,775,275 | |
Undistributed (distributions in excess of) net investment income (loss) | | $ | (431,801 | ) | | $ | (587,982 | ) | | $ | (12,039,974 | ) | | $ | (3,529,370 | ) |
| | | | | |
Capital share transaction - shares: | | | | | | | | | | | | | | | | |
Shares issued | | | 539,912 | | | | 427,946 | | | | 10,292,020 | | | | 22,532,641 | |
Shares issued-reinvested from dividends and distributions | | | — | | | | — | | | | 1,449,724 | | | | — | |
Shares redeemed | | | (1,009,328 | ) | | | (6,851,534 | ) | | | (15,213,528 | ) | | | (11,057,242 | ) |
Net increase (decrease) in shares outstanding | | | (469,416 | ) | | | (6,423,588 | ) | | | (3,471,784 | ) | | | 11,475,399 | |
The Notes to Financial Statements are an integral part of this report.
| | |
| Transamerica Funds | | Annual Report 2014 |
Page 164
FINANCIAL HIGHLIGHTS
| | | | | | | | | | | | | | | | | | | | |
| For a share outstanding during the years indicated: | | Transamerica Commodity Strategy | |
| | | October 31,
2014 | | | October 31,
2013 | | | October 31,
2012 | | | October 31,
2011 | | | October 31,
2010 | |
Net asset value | | | | | | | | | | | | | | | | | | | | |
Beginning of year | | $ | 8.51 | | | $ | 9.67 | | | $ | 10.77 | | | $ | 11.24 | | | $ | 10.03 | |
Investment operations | | | | | | | | | | | | | | | | | | | | |
Net investment income (loss) (A) | | | (0.06 | ) | | | (0.06 | ) | | | (0.06 | ) | | | (0.07 | ) | | | 0.04 | |
Net realized and unrealized gain (loss) | | | (0.58 | ) | | | (1.10 | ) | | | (0.66 | ) | | | 0.64 | | | | 1.22 | |
Total investment operations | | | (0.64 | ) | | | (1.16 | ) | | | (0.72 | ) | | | 0.57 | | | | 1.26 | |
Distributions | | | | | | | | | | | | | | | | | | | | |
Net investment income | | | — | | | | — | | | | (0.38 | ) | | | (0.57 | ) | | | (0.05 | ) |
Net realized gains | | | — | | | | — | | | | — | | | | (0.47 | ) | | | — | |
Total distributions | | | — | | | | — | | | | (0.38 | ) | | | (1.04 | ) | | | (0.05 | ) |
Net asset value | | | | | | | | | | | | | | | | | | | | |
End of year | | $ | 7.87 | | | $ | 8.51 | | | $ | 9.67 | | | $ | 10.77 | | | $ | 11.24 | |
Total return (B) | | | (7.52 | )% | | | (12.00 | )% | | | (6.57 | )% | | | 5.12 | % | | | 12.61 | % |
Ratio and supplemental data | | | | | | | | | | | | | | | | | | | | |
Net assets end of year (000’s) | | $ | 68,199 | | | $ | 77,748 | | | $ | 150,493 | | | $ | 177,843 | | | $ | 146,976 | |
Expenses to average net assets | | | | | | | | | | | | | | | | | | | | |
After (waiver/reimbursement) recapture | | | 0.75 | % | | | 0.72 | % | | | 0.71 | % | | | 0.71 | % | | | 0.86 | % |
Before (waiver/reimbursement) recapture | | | 0.86 | % | | | 0.83 | % | | | 0.71 | % | | | 0.71 | % | | | 0.86 | % |
Net investment income (loss) to average net assets | | | (0.68 | )% | | | (0.62 | )% | | | (0.62 | )% | | | (0.60 | )% | | | 0.38 | % |
Portfolio turnover rate | | | 0 | % | | | — | % | | | — | % | | | — | % | | | 112 | %(C) |
| (A) | Calculated based on average number of shares outstanding. |
| (B) | Total return has been calculated for the applicable period without deduction of a sales load, if any, on an initial purchase. |
| (C) | Increase in portfolio turnover rate was triggered by a change in the fund’s objectives. |
| | | | | | | | | | | | | | | | | | | | |
| For a share outstanding during the period and years indicated: | | Transamerica Managed Futures Strategy | |
| | | October 31,
2014 | | | October 31,
2013 | | | October 31,
2012 | | | October 31,
2011 | | | October 31,
2010 (A) | |
Net asset value | | | | | | | | | | | | | | | | | | | | |
Beginning of period/year | | $ | 10.10 | | | $ | 9.36 | | | $ | 9.34 | | | $ | 10.16 | | | $ | 10.00 | |
Investment operations | | | | | | | | | | | | | | | | | | | | |
Net investment income (loss) (B) | | | (0.14 | ) | | | (0.13 | ) | | | (0.13 | ) | | | (0.12 | ) | | | (0.01 | ) |
Net realized and unrealized gain (loss) | | | 0.64 | | | | 0.87 | | | | 0.16 | | | | (0.53 | ) | | | 0.17 | |
Total investment operations | | | 0.50 | | | | 0.74 | | | | 0.03 | | | | (0.65 | ) | | | 0.16 | |
Distributions | | | | | | | | | | | | | | | | | | | | |
Net investment income | | | (0.04 | ) | | | — | | | | — | (C) | | | (0.10 | ) | | | — | |
Net realized gains | | | (0.28 | ) | | | — | | | | (0.01 | ) | | | (0.07 | ) | | | — | |
Total distributions | | | (0.32 | ) | | | — | | | | (0.01 | ) | | | (0.17 | ) | | | — | |
Net asset value | | | | | | | | | | | | | | | | | | | | |
End of period/year | | $ | 10.28 | | | $ | 10.10 | | | $ | 9.36 | | | $ | 9.34 | | | $ | 10.16 | |
Total return (D) | | | 4.97 | % | | | 7.91 | % | | | 0.31 | % | | | (6.52 | )% | | | 1.60 | %(E) |
Ratio and supplemental data | | | | | | | | | | | | | | | | | | | | |
Net assets end of period/year (000’s) | | $ | 413,887 | | | $ | 441,775 | | | $ | 302,123 | | | $ | 262,409 | | | $ | 257,887 | |
Expenses to average net assets (F) | | | | | | | | | | | | | | | | | | | | |
After (waiver/reimbursement) recapture | | | 1.42 | % | | | 1.32 | % | | | 1.37 | % | | | 1.31 | % | | | 1.38 | %(G) |
Before (waiver/reimbursement) recapture | | | 1.68 | % | | | 1.57 | % | | | 1.37 | % | | | 1.31 | % | | | 1.38 | %(G) |
Net investment income (loss) to average net assets | | | (1.39 | )% | | | (1.30 | )% | | | (1.35 | )% | | | (1.21 | )% | | | (1.22 | )%(G) |
Portfolio turnover rate (H) | | | 0 | % | | | — | % | | | — | % | | | — | % | | | — | %(E) |
| (A) | Commenced operations on September 30, 2010. |
| (B) | Calculated based on average number of shares outstanding. |
| (C) | Rounds to less than $0.01 or $(0.01). |
| (D) | Total return has been calculated for the applicable period without deduction of a sales load, if any, on an initial purchase. |
| (F) | Does not include expenses of the investment companies in which the Fund invests. |
| (H) | Does not include portfolio activity of the investment companies in which the Fund invests. |
The Notes to Financial Statements are an integral part of this report.
| | |
| Transamerica Funds | | Annual Report 2014 |
Page 165
NOTES TO FINANCIAL STATEMENTS
At October 31, 2014
NOTE 1. ORGANIZATION AND SIGNIFICANT ACCOUNTING POLICIES
Transamerica Funds (the “Trust”) is an open-end management investment company registered under the Investment Company Act of 1940, as amended (the “1940 Act”). The Trust applies investment company accounting and reporting guidance.
Transamerica Arbitrage Strategy, Transamerica Bond, Transamerica Core Bond, Transamerica Developing Markets Equity, Transamerica Global Real Estate Securities, Transamerica Growth, Transamerica Intermediate Bond, Transamerica International Equity Opportunities, Transamerica International Small Cap, Transamerica Long/Short Strategy, Transamerica Mid Cap Value, Transamerica Total Return, Transamerica Commodity Strategy, and Transamerica Managed Futures Strategy, (each, a “Fund” and collectively, the “Funds”) are series of the Trust. Transamerica Intermediate Bond commenced operations on March 1, 2014.
Transamerica Global Real Estate Securities, Transamerica Commodity Strategy, and Transamerica Managed Futures Strategy are “non-diversified” funds, as defined under the 1940 Act.
This report must be accompanied by the Funds’ current prospectuses, which contain additional information about the Funds, including investment objectives and strategies.
Transamerica Asset Management, Inc. (“TAM”) provides continuous and regular investment advisory services to the Funds. TAM acts as a manager of managers, providing advisory services that include, without limitation, the design and development of each Fund and its investment strategy and the ongoing review and evaluation of that investment strategy including recommending changes in strategy where it believes appropriate or advisable; the selection of one or more sub-advisers for each Fund employing a combination of quantitative and qualitative screens, research, analysis and due diligence; oversight and monitoring of sub-advisers and recommending changes to sub-advisers where it believes appropriate or advisable; recommending and implementing fund combinations and liquidations where it believes appropriate or advisable; regular supervision of the Funds’ investments; regular review of sub-adviser performance and holdings; ongoing trade oversight and analysis; regular monitoring to ensure adherence to investment process; risk management oversight and analysis; design, development, implementation and regular monitoring of the valuation of portfolio holdings; design, development, implementation and regular monitoring of the compliance process; review of proxies voted by sub-advisers; oversight of preparation, and review, of materials for meetings of the Funds’ Board of Trustees (the “Board”), participation in these meetings and preparation of regular communications with the Board; oversight of preparation and review of prospectuses, shareholder reports and other disclosure materials and filings; and oversight of other service providers to the Funds, such as the custodian, the transfer agent, the Funds’ independent registered public accounting firm and legal counsel; supervision of the performance of recordkeeping and shareholder relations for the Funds; and ongoing cash management services. TAM uses a variety of quantitative and qualitative tools to carry out its investment advisory services. Where TAM employs sub-advisers, the sub-advisers carry out and effectuate the investment strategy designed for the Funds by TAM and are responsible, subject to TAM’s and the Board’s oversight, among other things, for making decisions to buy, hold or sell a particular security.
Transamerica Fund Services, Inc. (“TFS”) provides supervisory and administrative services to each Fund. TFS’s supervisory and administrative services include performing certain administrative services for the Funds and supervising and overseeing the administrative, clerical, recordkeeping and bookkeeping services provided for the Funds by State Street Bank and Trust Company (“State Street”), to whom TFS has outsourced the provision of certain services as described below; to the extent agreed upon by TFS and the Funds from time to time, monitoring and verifying the custodian’s daily calculation of Net Asset Value (“NAV”); shareholder relations functions; compliance services; valuation services; assisting in due diligence and in oversight and monitoring of certain activities of sub-advisers and certain aspects of each Fund’s investments; assisting with fund combinations and liquidations; oversight of the preparation and filing, and review, of all returns and reports, in connection with federal, state and local taxes; oversight and review of regulatory reporting; supervising and coordinating the Funds’ custodian and their dividend disbursing agent and monitoring their services to the Funds; assisting the Funds in preparing reports to shareholders; acting as liaison with the Funds’ independent public accountants and providing, upon request, analyses, fiscal year summaries and other audit related services; assisting in the preparation of agendas and supporting documents for and minutes of meetings of the Board and committees of trustees; assisting in the preparation of regular communications with the trustees; and providing personnel and office space, telephones and other office equipment as necessary in order for TFS to perform supervisory and administrative services to the Funds. State Street performs back office services to support TFS, including furnishing financial and performance information about the Funds for inclusion in regulatory filings and trustees’ and shareholder reports; preparing drafts of regulatory filings, trustees’ materials, tax returns, expenses and budgeting; tax compliance testing; and maintaining books and records. TFS pays all expenses it incurs in connection with providing these services in the Amended and Restated Administrative Services Agreement with the exception of the costs of certain services specifically assumed by the Funds, as numerated within the Statements of Operations or Consolidated Statements of Operations.
In the normal course of business, the Funds enter into contracts that contain a variety of representations that provide general indemnifications. The Funds’ maximum exposure under these arrangements is unknown, as this would involve future claims that may be made against the Funds and/or its affiliates that have not yet occurred. However, based on experience, the Funds expect the risk of loss to be remote.
| | |
| Transamerica Funds | | Annual Report 2014 |
Page 166
NOTES TO FINANCIAL STATEMENTS (continued)
At October 31, 2014
NOTE 1. (continued)
In preparing the Funds’ financial statements in accordance with Generally Accepted Accounting Principles (“GAAP”) in the United States of America, estimates or assumptions (which could differ from actual results) may be used that affect reported amounts and disclosures. The following is a summary of significant accounting policies followed by the Funds.
Securities lending: Securities are lent to qualified financial institutions and brokers. State Street serves as securities lending agent to the Funds pursuant to a Securities Lending Agreement. The lending of securities exposes the Funds to risks such as the following: (i) the borrowers may fail to return the loaned securities; (ii) the borrowers may not be able to provide additional collateral; (iii) the Funds may experience delays in recovery of the loaned securities or delays in access to collateral; or (iv) the Funds may experience losses related to the investment collateral. To minimize certain risks, loan counterparties pledge cash collateral with a value of at least 102% of the current value of the loaned securities for securities traded on U.S. exchanges and a value of at least 105% for all other securities loaned. The lending agent has agreed to indemnify the Funds in the case of default of any securities borrower.
Cash collateral received is invested in the State Street Navigator Securities Lending Trust-Prime Portfolio, a money market mutual fund registered under the 1940 Act. By lending securities, the Funds seek to increase their net investment income through the receipt of interest and fees. Such income is reflected separately in the Statements of Operations or Consolidated Statements of Operations. Income from loaned securities in the Statements of Operations or Consolidated Statements of Operations is net of fees and rebates earned by the lending agent for its services.
The value of loaned securities and related collateral outstanding at October 31, 2014, if any, are shown on a gross basis in the Schedule of Investments or Consolidated Schedule of Investments and Statements of Assets and Liabilities or Consolidated Statements of Assets and Liabilities.
Repurchase agreements: In a repurchase agreement, the Funds purchase a security and simultaneously commits to resell that security to the seller at an agreed-upon price on an agreed-upon date. Securities purchased subject to a repurchase agreement are held at the Funds’ custodian, or designated sub-custodian related to tri-party repurchase agreements, and, pursuant to the terms of the repurchase agreement, must be collateralized by securities with an aggregate market value greater than or equal to 100% of the resale price. The Funds will bear the risk of value fluctuations until the securities can be sold and may encounter delays and incur costs in liquidating the securities. In the event of bankruptcy or insolvency of the seller, delays and costs may be incurred.
Repurchase agreements are subject to netting agreements, which are agreements between the Funds and its counterparties that provide for the net settlement of all transactions and collateral with the Fund, through a single payment, in the event of default or termination. Amounts presented on the Schedule of Investments or Consolidated Schedule of Investments, and as part of Repurchase agreements, at value on the Statements of Assets and Liabilities or Consolidated Statements of Assets and Liabilities are shown on a gross basis. The value of the related collateral for each repurchase agreement, as reflected in the Schedule of Investments or Consolidated Schedule of Investments, exceeds the value of each repurchase agreement at October 31, 2014.
Open repurchase agreements at October 31, 2014, if any, are shown on the Schedule of Investments or Consolidated Schedule of Investments.
Foreign currency denominated investments: The accounting records of the Funds are maintained in U.S. dollars. Securities and other assets and liabilities denominated in foreign currencies are translated into U.S. dollars based on the closing exchange rate each day. The cost of foreign securities purchased and any realized gains or losses are translated at the prevailing exchange rates in effect on the date of the respective transaction. Each Fund combines fluctuations from currency exchange rates and fluctuations in value when computing net realized and unrealized gains or losses from investments.
Net foreign currency gains and losses resulting from changes in exchange rates include: 1) foreign currency fluctuations between trade date and settlement date of investment security transactions; 2) gains and losses on forward foreign currency contracts; and 3) the difference between the receivable amounts of interest and dividends recorded in the accounting records in U.S. dollars and the amounts actually received.
Foreign currency denominated assets may involve risks not typically associated with domestic transactions. These risks include revaluation of currencies, adverse fluctuations in foreign currency values, and possible adverse political, social, and economic developments, including those particular to a specific industry, country or region.
Foreign taxes: The Funds may be subjected to taxes imposed by the countries in which they invest, with respect to their investments in issuers existing or operating in such countries. The Funds may also be subject to foreign taxes on income, gains on investments, or currency repatriation, a portion of which may be recoverable. The Funds accrue such taxes and recoveries as applicable when the related income or capital gains are earned or unrealized, and based upon the current interpretation of tax rules and regulations that
| | |
| Transamerica Funds | | Annual Report 2014 |
Page 167
NOTES TO FINANCIAL STATEMENTS (continued)
At October 31, 2014
NOTE 1. (continued)
exist in the markets in which the Funds invest. Some countries require governmental approval for the repatriation of investment income, capital, or the proceeds of sales earned by foreign investors. In addition, if there is deterioration in a country’s balance of payments or for other reasons, a country may impose temporary restrictions of foreign capital remittances abroad.
Cash overdraft: Throughout the year, the Funds may have cash overdraft balances. A fee is incurred on these overdrafts, calculated by multiplying the overdraft by a rate based on the federal funds rate.
Payables, if any, are reflected as Due to custodian in the Statements of Assets and Liabilities or Consolidated Statements of Assets and Liabilities.
Forward foreign currency contracts: The Funds are subject to foreign currency exchange rate risk exposure in the normal course of pursuing their investment objectives. The Funds enter into forward foreign currency contracts to hedge against exchange rate risk arising from investments in securities denominated in foreign currencies. Additionally, Transamerica Bond and Transamerica Managed Futures Strategy utilize forward foreign currency contracts for speculative purposes as well. Forward foreign currency contracts are marked to market daily, with the change in value recorded as an unrealized gain or loss. When the contracts are settled, a realized gain or loss is incurred. Risks may arise from changes in market value of the underlying currencies and from the possible inability of counterparties to meet the terms of their contracts.
Open forward foreign currency contracts at October 31, 2014, if any, are listed in the Schedule of Investments or Consolidated Schedule of Investments.
Option contracts: The Funds are subject to equity price risk, interest rate risk, and foreign currency exchange rate risk in the normal course of pursuing their investment objectives. The Funds enter into option contracts to manage exposure to various market fluctuations. The Funds purchase or write put and call options on U.S. securities, indices, futures, swaps (“swaptions”), commodities, and currency transactions. Options are valued at the average of the bid and ask price (“Mean Quote”) established each day at the close of the board of trade or exchange on which they are traded. Options are marked-to-market daily to reflect the current value of the option. The primary risks associated with options are an imperfect correlation between the change in value of the securities held and the prices of the option contracts, the possibility of an illiquid market, and an inability of the counterparty to meet the contract terms.
Purchased options: Purchasing call options tends to increase exposure to the underlying instrument. Purchasing put options tends to decrease exposure to the underlying instrument. The Funds pay premiums, which are included in the Statements of Assets and Liabilities or Consolidated Statements of Assets and Liabilities as an investment and subsequently marked-to-market to reflect the current value of the option. The risk associated with purchasing put and call options is limited to the premium paid. Premiums paid from options which expire are treated as realized losses. Premiums paid for purchasing options which are exercised or closed are added to the amounts paid or offset against the proceeds on the underlying U.S. security, index, future, swaption, commodity, or currency transaction to determine the realized gain or loss.
Written options: Writing call options tends to decrease exposure to the underlying investment. Writing put options tends to increase exposure to the underlying investment. When the Funds write a covered call or put option, the premium received is recorded as a liability in the Statements of Assets and Liabilities or Consolidated Statements of Assets and Liabilities and is subsequently marked-to-market to reflect the current market value of the option written. Premiums received from written options which expire unexercised are treated as realized gains. Premiums received from writing options/swaptions which are exercised or closed are added to the proceeds or offset against amounts paid on the underlying U.S. security, index, future, swaption, commodity, or currency transaction to determine the realized gain or loss. In writing an option, the Funds bear the market risk of an unfavorable change in the price of the security or currency underlying the written option. Exercise of an option written by the Funds could result in the Funds selling or buying a security or currency at a price different from the current market value.
Inflation-capped options: The Funds purchase or write inflation-capped options to enhance returns or for hedging opportunities. The purpose of purchasing inflation-capped options is to protect the Funds from inflation erosion above a certain rate on a given notional exposure. A floor can be used to give downside protection to the investments in inflation-linked products.
Foreign currency options: The Funds may purchase or write foreign currency options. Purchasing foreign currency options gives the Funds the right, but not the obligation to buy or sell the currency and will specify the amount of currency and a rate of exchange that may be exercised by a specified date. These options may be used as a short or long hedge against possible variations in foreign exchange rates or to gain exposure to foreign currencies.
The underlying face amounts of open options and swaptions at October 31, 2014, if any, are listed in the Schedule of Investments or Consolidated Schedule of Investments.
| | |
| Transamerica Funds | | Annual Report 2014 |
Page 168
NOTES TO FINANCIAL STATEMENTS (continued)
At October 31, 2014
NOTE 1. (continued)
Transactions in written options were as follows:
| | | | | | | | |
| Transamerica Arbitrage Strategy | | Premiums | | | Contracts | |
Balance at October 31, 2013 | | $ | 197,335 | | | | 3,072 | |
Sales | | | 2,772,052 | | | | 40,909 | |
Closing Buys | | | (1,568,671 | ) | | | (17,679 | ) |
Expirations | | | (1,060,726 | ) | | | (23,180 | ) |
Exercised | | | (76,015 | ) | | | (1,071 | ) |
Balance at October 31, 2014 | | $ | 263,975 | | | | 2,051 | |
| | | | | | | | |
| Transamerica Total Return | | Premiums | | | Contracts | |
Balance at October 31, 2013 | | $ | — | | | | — | |
Sales | | | 317,381 | | | | 26,000,690 | |
Closing Buys | | | — | | | | — | |
Expirations | | | (239,285 | ) | | | (26,000,380 | ) |
Exercised | | | — | | | | — | |
Balance at October 31, 2014 | | $ | 78,096 | | | | 310 | |
Transactions in written swaptions, inflation cap and foreign exchange options were as follows:
| | | | | | | | | | | | |
| Transamerica Arbitrage Strategy | | Premiums | | | Notional
Amount | | | Notional
Amount | |
Balance at October 31, 2013 | | $ | — | | | EUR | — | | | GBP | — | |
Sales | | | 8,702 | | | | 31,800 | | | | 14,000 | |
Closing Buys | | | (8,636 | ) | | | (30,900 | ) | | | (14,000 | ) |
Expirations | | | (66 | ) | | | (900 | ) | | | — | |
Exercised | | | — | | | | — | | | | — | |
Balance at October 31, 2014 | | $ | — | | | EUR | — | | | GBP | — | |
| | | | | | | | | | | | | | | | | | | | |
| Transamerica Total Return | | Premiums | | | Notional
Amount | | | Notional
Amount | | | Notional
Amount | | | Notional
Amount | |
Balance at October 31, 2013 | | $ | 1,176,758 | | | $ | 131,600,000 | | | AUD | — | | | EUR | — | | | GBP | — | |
Sales | | | 4,311,296 | | | | 645,700,000 | | | | 25,800,000 | | | | 58,900,000 | | | | 60,400,000 | |
Closing Buys | | | (710,266 | ) | | | (125,600,000 | ) | | | (2,700,000 | ) | | | — | | | | — | |
Expirations | | | (2,508,476 | ) | | | (306,300,000 | ) | | | — | | | | (4,600,000 | ) | | | (60,400,000 | ) |
Exercised | | | (77,095 | ) | | | (22,200,000 | ) | | | — | | | | — | | | | — | |
Balance at October 31, 2014 | | $ | 2,192,217 | | | $ | 323,200,000 | | | AUD | 23,100,000 | | | EUR | 54,300,000 | | | GBP | — | |
Futures contracts: The Funds are subject to equity and commodity risk, interest rate risk, and foreign currency exchange rate risk in the normal course of pursuing their investment objectives. The Funds use futures contracts to gain exposure to, or hedge against, changes in the value of equities and commodities, interest rates, or foreign currencies. A futures contract represents a commitment for the future purchase or sale of an asset at a specified price on a specified date. Upon entering into such contracts, the Funds are required to deposit with the broker, either in cash or in securities, an initial margin in an amount equal to a certain percentage of the contract amount. Subsequent payments (“variation margin”) are paid or received by the Funds, depending on the daily fluctuations in the value of the contract, and are recorded for financial statement purposes as unrealized gains or losses by the Funds. Upon entering into such contracts, the Funds bear the risk of equity and commodity prices, interest rates, or exchange rates moving unexpectedly, in which case, the Funds may not achieve the anticipated benefits of the futures contracts and may realize losses. With futures, there is minimal counterparty credit risk to the Funds since futures are exchange-traded and the exchange’s clearinghouse, as counterparty to all exchange-traded futures, guarantees the futures against default.
Open futures contracts at October 31, 2014, if any, are listed in the Schedule of Investments or Consolidated Schedule of Investments. The variation margin receivable or payable, as applicable, is shown on the Statements of Assets and Liabilities or Consolidated Statements of Assets and Liabilities.
Swap agreements: Swap agreements are bilaterally negotiated agreements between a Fund and a counterparty to exchange or swap investments, cash flows, assets, foreign currencies, or market-linked returns at specified, future intervals. Swap agreements are
| | |
| Transamerica Funds | | Annual Report 2014 |
Page 169
NOTES TO FINANCIAL STATEMENTS (continued)
At October 31, 2014
NOTE 1. (continued)
privately negotiated in the over-the-counter (“OTC”) market and may be executed in multilateral or other trade facility platforms, such as a registered exchange (“centrally cleared swaps”). Centrally cleared swaps listed or traded on a multilateral platform, are valued at the daily settlement price determined by the corresponding exchange. For centrally cleared credit default swaps the clearing exchange requires all members to provide applicable levels across complete term levels. Centrally cleared interest rate swaps are valued using a pricing model that references the underlying rates including but not limited to the overnight index swap rate and London Interbank Offered Rate (“LIBOR”) forward rate to calculate the daily settlement price. The Funds enter into credit default, cross-currency, interest rate, total return, variance, and other forms of swap agreements to manage exposure to credit, currency, interest rate, and commodity risks. In connection with these agreements, securities or cash may be identified as collateral or margin in accordance with the terms of the respective swap agreements to provide assets of value and recourse in the event of default or bankruptcy/insolvency. Swaps are marked-to-market daily based upon values from third party vendors, which may include a registered exchange, or quotations from market makers to the extent available and the change in value, if any, is recorded as an unrealized gain or loss in the Statements of Assets and Liabilities or Consolidated Statements of Assets and Liabilities.
For OTC swap agreements, payments received or made at the beginning of the measurement period are reflected as such in the Statements of Assets and Liabilities or Consolidated Statements of Assets and Liabilities and represent payments made or received upon entering into the swap agreements to compensate for differences between the stated terms of the swap agreement and prevailing market conditions (credit spreads, currency exchange rates, interest rates, and other relevant factors). These upfront payments are recorded as realized gains or losses in the Statements of Operations or Consolidated Statements of Operations upon termination or maturity of the swap. A liquidation payment received or made at the termination of the swap is recorded as realized gain or loss in the Statements of Operations or Consolidated Statements of Operations. Net periodic payments received or paid by the Funds are included as part of realized gains or losses in the Statements of Operations or Consolidated Statements of Operations.
Specific risks and accounting related to each type of swap agreement are identified and described in the following paragraphs:
Credit default swap agreements: The Funds are subject to credit risk in the normal course of pursuing their investment objectives. The Funds enter into credit default swaps to manage their exposure to the market or certain sectors of the market to reduce their risk exposure to defaults of corporate and sovereign issuers, or to create exposure to corporate or sovereign issuers to which they are not otherwise exposed. Credit default swaps involve the exchange of a fixed rate premium for protection against the loss in value of an underlying security in the event of a defined credit event, such as payment default or bankruptcy (buy protection).
Under a credit default swap, one party acts as a guarantor by receiving the fixed periodic payment in exchange for the commitment to purchase the underlying security at par if the defined credit event occurs (sell protection). The Funds’ maximum risk of loss from counterparty risk, either as the protection seller or as the protection buyer, is the notional amount of the contract. This risk is mitigated by having a master netting arrangement between the Funds and the counterparty, and by the posting of collateral.
Certain Funds sell credit default swaps, which exposes them to risk of loss from credit risk related events specified in the contracts. Although contract-specific, credit events are generally defined as bankruptcy, failure to pay, restructuring, obligation acceleration, obligation default, or repudiation/moratorium. The aggregate fair value of the credit default swaps is disclosed in the Schedule of Investments or Consolidated Schedule of Investments. The aggregate fair value of assets posted as collateral, net of assets received as collateral, for these swaps is included in the footnotes to the Schedule of Investments or Consolidated Schedule of Investments. If a defined credit event had occurred during the period, the swaps’ credit-risk-related contingent features would have been triggered, and the Funds would have been required to pay the notional amounts for the credit default swaps with a sell protection less the value of the contracts’ related reference obligations.
Interest rate swap agreements: The Funds are subject to interest rate risk exposure in the normal course of pursuing their investment objectives. Because the Funds hold fixed rate bonds, the value of these bonds may decrease if interest rates rise. To help hedge against this risk, the Funds enter into interest rate swap agreements. Interest rate swaps are agreements between two parties to exchange cash flows based on a notional principal amount. Funds with interest rate agreements can elect to pay a fixed rate and receive a floating rate, or receive a fixed rate and pay a floating rate, on a notional principal amount. The risks of interest rate swaps include changes in market conditions which will affect the value of the contract or the cash flows, and the possible inability of the counterparty to fulfill its obligations under the agreement. The Funds’ maximum risk of loss from counterparty credit risk is the discounted net value of the cash flows to be received from/paid to the counterparties over the contracts’ remaining lives, to the extent that that amount is positive. This risk is mitigated by having a master netting arrangement between the Funds and the counterparty, and by the posting of collateral.
Total return swap agreements: The Funds are subject to commodity, equity, and other risks related to the underlying investments of the swap agreement in the normal course of pursuing their investment objectives. The value of the commodity-linked investments held by
| | |
| Transamerica Funds | | Annual Report 2014 |
Page 170
NOTES TO FINANCIAL STATEMENTS (continued)
At October 31, 2014
NOTE 1. (continued)
the Funds can be affected by a variety of factors, including, but not limited to, overall market movements and other factors affecting the value of particular industries or commodities, such as weather, disease, embargoes, acts of war or terrorism, or political and regulatory developments. Commodity-linked derivatives are available from a relatively small number of issuers, subjecting a Fund’s investments in commodity-linked derivatives to counterparty risk, which is the risk that the issuer of the commodity-linked derivative will not fulfill its contractual obligations. Total return swap agreements on commodities involve commitments whereby cash flows are exchanged based on the price of a commodity in exchange for either a fixed or floating price or rate. One party would receive payments based on the market value of the commodity involved and pay a fixed amount. Total return swap agreements on indices involve commitments to pay interest in exchange for a market-linked return. One counterparty pays out the total return of a specific reference asset, which may be an equity, index, or bond, and in return receives a regular stream of payments.
Cross-currency swap agreements: The Funds are subject to foreign currency exchange rate risk in the normal course of pursuing their investment objectives. The Funds enter into cross-currency swap agreements to gain or reduce exposure to foreign currencies or to hedge against foreign currency exchange rate and/or interest rate risk. Cross-currency swap agreements are interest rate swaps in which two parties agree to exchange cash flows based on the notional amounts of two different currencies. The Funds with cross currency swap agreements can elect to pay a fixed rate and receive a floating rate, or, receive a fixed rate and pay a floating rate on the notional amounts of two different currencies. The notional amounts are typically determined based on the spot exchange rates at the inception of the trade. Cross-currency swap agreements can also involve an exchange of notional amounts at the start, during and/or at expiration of the contract, either at the current spot rate or another specified rate.
Open centrally cleared swap agreements at October 31, 2014, if any, are listed in the Schedule of Investments or Consolidated Schedule of Investments. The centrally cleared swap agreements are marked-to-market daily and an appropriate payable or receivable for the variation margin is recorded by the Funds, if applicable, and is shown on the Statements of Assets and Liabilities or Consolidated Statements of Assets and Liabilities.
Open OTC swap agreements at October 31, 2014, if any, are listed in the Schedule of Investments or Consolidated Schedule of Investments. The value, as applicable, is shown on the Statements of Assets and Liabilities or Consolidated Statements of Assets and Liabilities.
Reverse repurchase agreements: The Funds may enter into reverse repurchase agreements in which the Funds sell portfolio securities and agree to repurchase them from the buyer at a specified date and price. The Funds may utilize reverse repurchase agreements when it is anticipated that the interest income to be earned from the investment of the proceeds of the transaction is greater than the interest expense of the transaction. Pursuant to the terms of the reverse repurchase agreements, the Funds’ custodian must segregate assets with an aggregate market value greater than or equal to 100% of the repurchase price. In periods of increased demand for the security, the Funds may receive a fee for use of the security by the counterparty, which may result in interest income to the Funds. Reverse repurchase agreements involve leverage risk and also the risk that the market value of the securities that the Funds are obligated to repurchase under the agreement may decline below the repurchase price.
The following Fund’s average borrowings for the year ended October 31, 2014 were as follows:
| | | | | | |
| | | Average Daily Borrowing | | Number of Days Outstanding | | Weighted Average Interest Rate |
Transamerica Total Return | | $ 6,184,829 | | 60 | | (0.87)% |
Open reverse repurchase agreements at October 31, 2014, if any, are included in the Schedule of Investments or Consolidated Schedule of Investments.
Sale-buyback: The Funds may enter into sale-buyback financing transactions. The Funds account for sale-buyback financing transactions as borrowing transactions and realize gains and losses on these transactions at the end of the roll period. Sale-buyback financing transactions involve sales by the Funds of securities and simultaneously contracts to repurchase the same or substantially similar securities at an agreed upon price and date.
The Funds forgo principal and interest paid during the roll period on the securities sold in a sale-buyback financing transaction. The Funds are compensated by the difference between the current sales price and the price for the future purchase (often referred to as the “price drop”), as well as by any interest earned on the proceeds of the securities sold. Sale-buyback financing transactions may be renewed with a new sale and a repurchase price and a cash settlement made at each renewal without physical delivery of the securities subject to the contract. Sale-buyback financing transactions expose the Funds to risks such as the following: (i) the buyer under the
| | |
| Transamerica Funds | | Annual Report 2014 |
Page 171
NOTES TO FINANCIAL STATEMENTS (continued)
At October 31, 2014
NOTE 1. (continued)
agreement may file for bankruptcy, become insolvent, or otherwise default on its obligations to the Funds; (ii) the market value of the securities the Funds are obligated to repurchase under the agreement may decline below the repurchase price.
Sale-buyback financing transactions accounted for as borrowing transactions are excluded from the Funds’ turnover rates. The Funds recognize price drop fee income on a straight line basis over the period of the roll. For the year ended October 31, 2014, Transamerica Total Return earned price drop fee income of $4,356. The price drop fee income is included in Interest income in the Statements of Operations or Consolidated Statements of Operations.
The outstanding payable for securities to be repurchased is included in payable for funds borrowed in the Statements of Assets and Liabilities or Consolidated Statements of Assets and Liabilities. The interest expense is included in Interest on the Statements of Operations or Consolidated Statements of Operations. In periods of increased demand of the security, the Funds may receive a fee for use of the security by the counterparty, which may result in interest income to the Funds, and is reflected in Interest income on the Statements of Operations or Consolidated Statements of Operations.
The following Fund’s average borrowings for the year ended October 31, 2014 were as follows:
| | | | | | |
| | | Average
Daily
Borrowing | | Number
of Days
Outstanding | | Weighted
Average
Interest Rate |
Transamerica Total Return | | $ 155,715 | | 365 | | (0.99)% |
Open sale-buyback financing transactions at October 31, 2014, if any, are included in the Schedule of Investments or Consolidated Schedule of Investments.
Short sales: A short sale is a transaction in which the Funds sell securities it does not own, but has borrowed, in anticipation of a decline in the fair market value of the securities. The Funds are obligated to replace the borrowed securities at the market price at the time of replacement. The Funds’ obligation to replace the securities borrowed in connection with a short sale is fully secured by collateral deposited with the custodian. In addition, the Funds consider the short sale to be a borrowing by the Funds that is subject to the asset coverage requirements of the 1940 Act. Short sales represent an aggressive trading practice with a high risk/return potential, and short sales involve special considerations. Risks of short sales include that possible losses from short sales may be unlimited (e.g., if the price of stocks sold short rises), whereas losses from direct purchases of securities are limited to the total amount invested, and the Fund may be unable to replace borrowed securities sold short.
The Funds investing in short sales are liable for any dividends and/or interest payable on securities in a short position and these payables, if any, are reflected as dividends and/or interest from securities sold short in the Statements of Operations or Consolidated Statements of Operations. The Funds also bear other costs, such as charges for the prime brokerage accounts, in connection with short positions. These costs are reported as dividends and/or interest from securities sold short in the Statements of Operations or Consolidated Statements of Operations.
Open short sale transactions at October 31, 2014, if any, are included in the Schedule of Investments or Consolidated Schedule of Investments.
Loan participations and assignments: The Funds may invest in direct debt instruments which are interests in amounts owed to lenders or lending syndicates by corporate, governmental, or other borrowers, either in the form of participations at the time the loan is originated (“Participations”) or buying an interest in the loan in the secondary market from a financial institution or institutional investor (“Assignments”). Participations and Assignments in commercial loans may be secured or unsecured. These investments may include standby financing commitments, including revolving credit facilities that obligate the Funds to supply additional cash to the borrowers on demand. Loan Participations and Assignments involve risks of insolvency of the lending banks or other financial intermediaries. As such, the Funds assume the credit risks associated with the corporate borrowers and may assume the credit risks associated with the interposed banks or other financial intermediaries.
The Funds may be contractually obligated to receive approval from the agent banks and/or borrowers prior to the sale of these investments. The Funds that participate in such syndications, or that can buy a portion of the loans, become part lenders. Loans are often administered by agent banks acting as agents for all holders.
The agent banks administer the terms of the loans, as specified in the loan agreements. In addition, the agent banks are normally responsible for the collection of principal and interest payments from the corporate borrowers and the apportionment of these payments
| | |
| Transamerica Funds | | Annual Report 2014 |
Page 172
NOTES TO FINANCIAL STATEMENTS (continued)
At October 31, 2014
NOTE 1. (continued)
to the credit of all institutions that are parties to the loan agreements. Unless the Funds have direct recourse against the corporate borrowers under the terms of the loans or other indebtedness, the Funds may have to rely on the agent banks or other financial intermediaries to apply appropriate credit remedies against corporate borrowers.
Open loan participations and assignments at October 31, 2014, if any, are identified in the Schedule of Investments or Consolidated Schedule of Investments.
Structured notes: Certain Funds invest in structured notes. A structured debt instrument is a hybrid debt security that has an embedded derivative. This type of instrument is used to manage cash flows from the debt security. Investing in structured notes involves the credit risk of the issuer and the normal risks of price changes in response to changes in interest rates. Structured notes may be less liquid than other types of securities and more volatile than their underlying reference instruments.
Open structured notes at October 31, 2014, if any, are included in the Schedule of Investments or Consolidated Schedule of Investments.
To be announced (“TBA”) commitments: TBA commitments are entered into to purchase or sell securities for a fixed price at a future date, typically not to exceed 45 days. They are considered securities in themselves, and involve a risk of loss if the value of the security to be purchased declines, or the value of the security sold increases, prior to settlement date, in addition to the risk of decline in the value of the Funds’ other assets. Unsettled TBA commitments are valued at the current value of the underlying securities, according to the procedures described under Security Valuations.
Open balances at October 31, 2014, if any, are included in the payable or receivable for investments purchased or sold in the Statements of Assets and Liabilities or Consolidated Statements of Assets and Liabilities. Open TBA commitments at October 31, 2014, if any, are identified in the Schedule of Investments or Consolidated Schedule of Investments.
When-Issued, forward delivery securities and delayed delivery settlements: The Funds may purchase or sell securities on a when-issued, forward (delayed) delivery basis or delayed settlement. When-issued and forward delivery transactions are made conditionally because a security, although authorized, has not yet been issued in the market. Settlement of such transactions normally occurs within a month or more after the purchase or sale commitment is made. The Funds engage in when-issued transactions to obtain an advantageous price and yield at the time of the transaction. The Funds engage in when-issued and forward delivery transactions for the purpose of acquiring securities, but may enter into a separate agreement to sell the securities before the settlement date. Since the value of securities purchased may fluctuate prior to settlement, the Funds may be required to pay more at settlement than the security is worth. In addition, the Funds are not entitled to any of the interest earned prior to settlement.
Delayed delivery transactions involve a commitment by the Funds to purchase or sell securities for a predetermined price or yield, with payment and delivery taking place beyond the customary settlement period. When delayed delivery transactions are outstanding, the Funds will segregate with its custodian either cash, U.S. Government securities, or other liquid assets at least equal to the value or purchase commitments until payment is made. When purchasing a security on a delayed delivery basis, the Funds assume the rights and risks of ownership of the security, including the risk of price and yield fluctuations. These transactions also involve a risk to the Funds if the other party to the transaction defaults on its obligation to make payment or delivery, and the Funds are delayed or prevented from completing the transaction. The Funds may dispose of or renegotiate a delayed delivery transaction after it is entered into, which may result in a realized gain or loss. When the Funds sell a security on a delayed delivery basis, the Funds do not participate in future gains and losses on the security.
Open when-issued securities at October 31, 2014, if any, are identified in the Schedule of Investments or Consolidated Schedule of Investments.
Treasury inflation-protected securities (“TIPS”): Certain Funds may invest in TIPS. TIPS are fixed income securities whose principal value is periodically adjusted according to the rate of inflation/deflation. If the index measuring inflation/deflation rises or falls, the principal value of TIPS will be adjusted upward or downward, and consequently the interest payable on these securities (calculated with respect to a larger or smaller principal amount) will be increased or reduced, respectively. Any upward or downward adjustment in the principal amount of a TIPS will be included as interest income in the Statements of Operations or Consolidated Statements of Operations, even though investors do not receive their principal until maturity. Repayment of the original bond principal upon maturity (as adjusted for inflation) is guaranteed in the case of U.S. Treasury inflation-indexed bonds. For bonds that do not provide a similar guarantee, the adjusted principal value of the bond repaid at maturity may be less than the original principal.
The adjustments, if any, to principal due to inflation/deflation are reflected as increases/decreases to Interest income in the Statements of Operations or Consolidated Statements of Operations with a corresponding adjustment to cost.
| | |
| Transamerica Funds | | Annual Report 2014 |
Page 173
NOTES TO FINANCIAL STATEMENTS (continued)
At October 31, 2014
NOTE 1. (continued)
Restricted and illiquid securities: The Funds may invest in unregulated restricted securities. Restricted and illiquid securities are subject to legal or contractual restrictions on resale or are illiquid. Restricted securities generally may be resold in transactions exempt from registration under the Securities Act of 1933. A security may be considered illiquid if it lacks a readily available market or if its valuation has not changed for a certain period of time. Disposal of these securities may involve time-consuming negotiations and expense, and prompt sale at the current valuation may be difficult.
The restricted and illiquid securities at October 31, 2014, if any, are identified in the Schedule of Investments or Consolidated Schedule of Investments.
Commission recapture: The sub-adviser, to the extent consistent with the best execution and usual commission rate policies and practices, has elected to place security transactions of the Funds with broker/dealers with which Transamerica Funds has established a Commission Recapture Program. A Commission Recapture Program is any arrangement under which a broker/dealer applies a portion of the commissions received by such broker/dealer on the security transactions to the Funds. In no event will commissions paid by the Funds be used to pay expenses that would otherwise be borne by any other Funds within Transamerica Funds, or by any other party.
Commissions recaptured for the year ended October 31, 2014, are included in Net realized gain (loss) in the Statements of Operations or Consolidated Statements of Operations and are summarized as follows:
| | | | |
| Fund Name | | Commissions | |
Transamerica Global Real Estate Securities | | $ | 4,536 | |
Transamerica Growth | | | 28,333 | |
Transamerica International Equity Opportunities | | | 140 | |
Transamerica Mid Cap Value | | | 6,233 | |
Security transactions and investment income: Security transactions are recorded on the trade date. Security gains and losses are calculated on the specific identification basis. Dividend income, if any, is recorded on the ex-dividend date or, in the case of foreign securities, as soon as the Funds are informed of the ex-dividend dates, net of foreign taxes. Interest income, including accretion of discounts and amortization of premiums, is recorded on the accrual basis commencing on the settlement date.
Real estate investment trusts (“REITs”): Dividend income related to a REIT is recorded at management’s estimate of the income included in distributions from the REIT investments. Distributions received in excess of the estimated amount are recorded as a reduction of the cost of investments. The actual amounts of income, return of capital, and capital gains are only determined by each REIT after the fiscal year end and may differ from the estimated amounts.
There are certain additional risks involved in investing in REITs. These include, but are not limited to, economic conditions, changes in zoning laws, real estate values, property taxes, and interest rates.
Open REIT at October 31, 2014, if any, are identified in the Schedule of Investments or Consolidated Schedule of Investments.
Dividend distributions: Distributions to shareholders are recorded on the ex-dividend date and are determined in accordance with federal income tax regulations, which may differ from GAAP.
NOTE 2. SECURITY VALUATION
All investments in securities are recorded at their estimated fair value. The Funds value their investments at the close of the New York Stock Exchange (“NYSE”), normally 4:00 p.m. Eastern Time, each day the NYSE is open for business. The Funds utilize various methods to measure the fair value of their investments on a recurring basis.
GAAP establishes a hierarchy that prioritizes inputs to valuation methods. The inputs or methodology used for valuing securities are not necessarily an indication of the risk associated with investing in those securities. The three Levels of inputs of the fair value hierarchy are defined as follows:
Level 1—Unadjusted quoted prices in active markets for identical securities.
Level 2—Inputs, other than quoted prices included in Level 1, that are observable, either directly or indirectly. These inputs may include quoted prices for the identical instrument on an inactive market, prices for similar instruments, interest rates, prepayment speeds, credit risk, yield curves, default rates, and similar data.
| | |
| Transamerica Funds | | Annual Report 2014 |
Page 174
NOTES TO FINANCIAL STATEMENTS (continued)
At October 31, 2014
NOTE 2. (continued)
Level 3—Unobservable inputs, which may include TAM’s internal valuation committee’s (the “Valuation Committee”) own assumptions in determining the fair value of investments. Factors considered in making this determination may include, but are not limited to, information obtained by contacting the sub-adviser, issuer, analysts, or the appropriate stock exchange (for exchange-traded securities), analysis of the issuer’s financial statements or other available documents and, if necessary, available information concerning other securities in similar circumstances.
The inputs used to measure fair value may fall into different Levels of the fair value hierarchy. In such cases, for disclosure purposes, the Level in the fair value hierarchy that is assigned to the fair value measurement of a security is determined based on the lowest Level input that is significant to the fair value measurement in its entirety. The hierarchy classification of inputs used to value the Funds’ investments, at October 31, 2014, is disclosed in the Valuation Summary of each Fund’s Schedule of Investments or Consolidated Schedule of Investments.
The Funds’ Board has delegated the valuation functions on a day-to-day basis to TAM, subject to Board oversight. TAM has formed the Valuation Committee to monitor and implement the fair valuation policies and procedures as approved by the Board. These policies and procedures are reviewed at least annually by the Board. The Valuation Committee, among other tasks, monitors for when market quotations are not readily available or are unreliable and determines in good faith the fair value of the portfolio investments. For instances in which daily market quotes are not readily available, securities may be valued, pursuant to procedures adopted by the Board, with reference to other instruments or indices. Depending on the relative significance of valuation inputs, these instruments may be classified in either Level 2 or Level 3 of the fair value hierarchy.
The Valuation Committee may employ a market-based approach which may use related or comparable assets or liabilities, recent transactions, market multiples, book values, and other relevant information for the security to determine the fair value of the security. An income-based valuation approach may also be used in which the anticipated future cash flows of the security are discounted to calculate fair value. Discounts may also be applied due to the nature or duration of any restrictions on the disposition of the securities. When the Funds use fair value methods that rely on significant unobservable inputs to determine a security’s value, the Valuation Committee will choose the method that is believed to accurately reflect fair value. These securities are categorized in Level 3 of the fair value hierarchy. The Valuation Committee reviews fair value measurements on a regular and ad hoc basis and may, as deemed appropriate, update the security valuations as well as the fair valuation guidelines.
The availability of observable inputs can vary from security to security and is affected by a wide variety of factors, including, but not limited to, the type of security, whether the security is new and not yet established in the marketplace, the liquidity of markets, and other characteristics particular to the security. To the extent that valuation is based on models or inputs that are less observable or unobservable in the market, the determination of fair value requires more judgment. Accordingly, the degree of judgment exercised in determining fair value is generally greatest for instruments categorized in Level 3. Due to the inherent uncertainty of valuation, the Valuation Committee’s determination of values may differ significantly from values that would have been realized had a ready market for investments existed, and the differences could be material. The Valuation Committee employs various methods for calibrating these valuation approaches, including a regular review of valuation methodologies, key inputs and assumptions, transactional back-testing, and reviews of any market related activity.
Fair value measurements: Descriptions of the valuation techniques applied to the Funds’ major categories of assets and liabilities measured at fair value on a recurring basis are as follows:
Investment companies: Investment companies are valued at the NAV of the underlying funds. These securities are actively traded and no valuation adjustments are applied. Exchange-Traded Funds (“ETF”) are stated at the last reported sale price or closing price on the day of valuation taken from the primary exchange where the security is principally traded. They are categorized in Level 1 of the fair value hierarchy. Investments in privately held investment funds with significant restrictions on redemptions where the inputs of NAVs are unobservable will be valued based upon the NAVs of such investments and are categorized in Level 3 of the fair value hierarchy.
Equity securities (common and preferred stocks): Securities are stated at the last reported sales price or closing price on the day of valuation taken from the primary exchange where the security is principally traded. To the extent these securities are actively traded and valuation adjustments are not applied, they are categorized in Level 1 of the fair value hierarchy.
Foreign securities, in which the primary trading market closes at the same time or after the NYSE, are valued based on quotations from the primary market in which they are traded and are categorized in Level 1. Because many foreign securities markets and exchanges close prior to the close of the NYSE, closing prices for foreign securities in those markets or on those exchanges do not reflect the events that occur after that close. Certain foreign securities may be fair valued using a pricing service that considers the correlation of the trading patterns of the foreign security to the intraday trading in the U.S. markets for investments such as American Depositary Receipts, financial futures, ETF, and the movement of the certain indices of securities based on a statistical analysis of their historical relationship; such valuations generally are categorized in Level 2.
| | |
| Transamerica Funds | | Annual Report 2014 |
Page 175
NOTES TO FINANCIAL STATEMENTS (continued)
At October 31, 2014
NOTE 2. (continued)
Preferred stock and other equities traded on inactive markets or valued by reference to similar instruments are also generally categorized in Level 2 or Level 3 if inputs are unobservable.
Securities lending collateral: Securities lending collateral is invested in a money market fund which is valued at the NAV of the underlying securities and no valuation adjustments are applied. It is categorized in Level 1 of the fair value hierarchy.
Repurchase agreements: Repurchase agreements are traded on inactive markets or valued by reference to similar instruments and are generally categorized in Level 2.
Corporate bonds: The fair value of corporate bonds is estimated using various techniques, which consider recently executed transactions in securities of the issuer or comparable issuers, market price quotations (where observable), bond spreads, fundamental data relating to the issuer, and credit default swap spreads adjusted for any basis difference between cash and derivative instruments. While most corporate bonds are categorized in Level 2 of the fair value hierarchy, in instances where lower relative weight is placed on transaction prices, quotations, or similar observable inputs, they are categorized in Level 3.
Asset-backed securities: The fair value of asset-backed securities is estimated based on models that consider the estimated cash flows of each tranche of the entity, establish a benchmark yield, and develop an estimated tranche specific spread to the benchmark yield based on the unique attributes of the tranche. To the extent the inputs are observable and timely, the values would generally be categorized in Level 2 of the fair value hierarchy; otherwise they would be categorized in Level 3.
Municipal Bonds & Notes and Variable Rate Notes: The fair value of municipal bonds & notes and variable rate notes is estimated based on models that consider, among other factors, information received from market makers and broker-dealers, current trades, bid-want lists, offerings, market movements, the liquidity of the bond, state of issuance, benchmark yield curves, and bond or note insurance. To the extent the inputs are observable and timely, the values would generally be categorized in Level 2 of the fair value hierarchy; otherwise they are categorized in Level 3.
Mortgage-Backed Securities: The fair value of mortgage-backed securities is estimated based on models based that consider issuer type, coupon, cash flows, mortgage prepayment projection tables and adjustable rate mortgage evaluations that incorporate index data, periodic life caps and the next coupon reset date. To the extent the inputs are observable and timely, the values would generally be categorized in Level 2 of the fair value hierarchy; otherwise they are categorized in Level 3.
Short-term notes: Short-term notes are valued using amortized cost, which approximates fair value. To the extent the inputs are observable and timely, the values would be generally categorized in Level 2 of the fair value hierarchy; otherwise they would be categorized in Level 3.
Government securities: Government securities are normally valued using a model that incorporates market observable data such as reported sales of similar securities, broker quotes, yields, bids, offers, and reference data. Certain securities are valued by principally using dealer quotations. Government securities generally are categorized in Level 2 of the fair value hierarchy, or Level 3 if inputs are unobservable.
U.S. Government agency securities: U.S. Government Agency securities are comprised of two main categories consisting of agency issued debt and mortgage pass-throughs. Generally, agency issued debt securities are valued in a manner similar to U.S. Government securities. Mortgage pass-throughs include TBA securities and mortgage pass-through certificates. Generally, TBA securities and mortgage pass-throughs are valued using dealer quotations. Depending on market activity levels and whether quotations or other observable data are used, these securities are typically categorized in Level 2 of the fair value hierarchy; otherwise they would be categorized in Level 3.
Restricted securities (equity and debt): Restricted securities for which quotations are not readily available are valued at fair value as determined in good faith by the Valuation Committee under the supervision of the Funds’ Board. Restricted securities issued by publicly traded companies are generally valued at a discount to similar publicly traded securities. Restricted securities issued by nonpublic entities may be valued by reference to comparable public entities and/or fundamental data relating to the issuer. Depending on the relative significance of observable valuation inputs, these instruments may be classified in either Level 2 or Level 3 of the fair value hierarchy.
Derivative instruments: Listed derivatives that are actively traded are valued based on quoted prices from the exchange and are categorized in Level 1 of the fair value hierarchy. OTC derivative contracts include forward, swap, swaption, and option contracts related to interest rates, foreign currencies, credit standing of reference entities, equity prices, or commodity prices. Depending on the product and the terms of the transaction, the fair value of the OTC derivative products are modeled taking into account the
| | |
| Transamerica Funds | | Annual Report 2014 |
Page 176
NOTES TO FINANCIAL STATEMENTS (continued)
At October 31, 2014
NOTE 2. (continued)
counterparties’ creditworthiness and using a series of techniques, including simulation models. Many pricing models do not entail material subjectivity because the methodologies employed do not necessitate significant judgments and the pricing inputs are observed from actively quoted markets, as is the case of interest rate swap and option contracts. A substantial majority of OTC derivative products valued by the Funds using pricing models fall into this category and are categorized within Level 2 of the fair value hierarchy or Level 3 if inputs are unobservable.
NOTE 3. RELATED PARTY TRANSACTIONS
TAM, the Funds’ investment adviser, is directly owned by Transamerica Premier Life Insurance Company (“TPLIC”) and AUSA Holding Company (“AUSA”), both of which are indirect, wholly owned subsidiaries of Aegon NV. TPLIC is owned by Commonwealth General Corporation (“Commonwealth”) and Aegon USA, LLC (“Aegon USA”). Commonwealth and AUSA are wholly owned by Aegon USA. Aegon USA is wholly owned by Aegon US Holding Corporation, which is wholly owned by Transamerica Corporation (DE). Transamerica Corporation (DE) is wholly owned by The Aegon Trust, which is wholly owned by Aegon International B.V., which is wholly owned by Aegon NV, a Netherlands corporation, and a publicly traded international insurance group.
Aegon USA Investment Management, LLC is both an affiliate and sub-adviser of Transamerica Intermediate Bond.
TFS is the Funds’ administrator and transfer agent. Transamerica Capital, Inc. (“TCI”) is the Funds’ distributor/principal underwriter. TAM, TFS, and TCI are affiliates of Aegon NV.
Certain officers and trustees of the Funds are also officers and/or trustees of TAM, TFS, and TCI. No interested trustee, who is deemed an interested person due to current or former service with TAM or an affiliate of TAM, receives compensation from the Funds.
The following schedule reflects the percentage of each Fund’s assets owned by affiliated investment companies at October 31, 2014:
| | | | | | | | |
| Transamerica Arbitrage Strategy | | Market
Value | | | % of Net
Assets | |
Transamerica Asset Allocation –
Conservative Portfolio | | $ | 15,498,502 | | | | 10.04 | % |
Transamerica Asset Allocation –
Growth Portfolio | | | 31,822,378 | | | | 20.61 | |
Transamerica Asset Allocation –
Moderate Growth Portfolio | | | 51,493,681 | | | | 33.35 | |
Transamerica Asset Allocation –
Moderate Portfolio | | | 33,849,606 | | | | 21.92 | |
Transamerica Multi-Manager Alternative Strategies Portfolio | | | 21,504,295 | | | | 13.93 | |
Transamerica Multi-Manager Alternative Strategies VP | | | 42,559 | | | | 0.03 | |
Total | | $ | 154,211,021 | | | | 99.88 | % |
| | | | | | | | |
| Transamerica Bond | | Market Value | | | % of Net
Assets | |
Transamerica Asset Allocation –
Conservative Portfolio | | $ | 58,009,260 | | | | 7.43 | % |
Transamerica Asset Allocation –
Conservative VP | | | 59,905,968 | | | | 7.68 | |
Transamerica Asset Allocation –
Moderate Growth Portfolio | | | 47,134,482 | | | | 6.04 | |
Transamerica Asset Allocation –
Moderate Growth VP | | | 233,677,863 | | | | 29.95 | |
Transamerica Asset Allocation –
Moderate Portfolio | | | 92,691,973 | | | | 11.88 | |
Transamerica Asset Allocation – Moderate VP | | | 229,090,117 | | | | 29.36 | |
Transamerica International Moderate Growth VP | | | 24,093,985 | | | | 3.09 | |
Transamerica Madison Balanced Allocation VP | | | 6,927,674 | | | | 0.89 | |
Transamerica Madison Conservative Allocation VP | | | 5,499,609 | | | | 0.70 | |
Transamerica Multi-Manager Alternative Strategies Portfolio | | | 12,030,678 | | | | 1.54 | |
Transamerica Multi-Manager Alternative Strategies VP | | | 23,812 | | | | 0.00 | (A) |
Transamerica Voya Balanced Allocation VP | | | 443,193 | | | | 0.06 | |
Transamerica Voya Conservative Allocation VP | | | 49,221 | | | | 0.01 | |
Transamerica Voya Moderate Growth Allocation VP | | | 174,341 | | | | 0.02 | |
Total | | $ | 769,752,176 | | | | 98.65 | % |
| | |
| Transamerica Funds | | Annual Report 2014 |
Page 177
NOTES TO FINANCIAL STATEMENTS (continued)
At October 31, 2014
NOTE 3. (continued)
| | | | | | | | |
| Transamerica Core Bond | | Market Value | | | % of Net
Assets | |
Transamerica Asset Allocation – Conservative Portfolio | | $ | 173,069,596 | | | | 21.00 | % |
Transamerica Asset Allocation – Conservative VP | | | 53,795,610 | | | | 6.53 | |
Transamerica Asset Allocation – Moderate Growth Portfolio | | | 153,934,507 | | | | 18.67 | |
Transamerica Asset Allocation – Moderate Growth VP | | | 22,263,112 | | | | 2.70 | |
Transamerica Asset Allocation – Moderate Portfolio | | | 175,746,838 | | | | 21.32 | |
Transamerica Asset Allocation – Moderate VP | | | 178,057,179 | | | | 21.60 | |
Transamerica International Moderate Growth VP | | | 6,250,850 | | | | 0.76 | |
Transamerica Voya Balanced Allocation VP | | | 219,011 | | | | 0.03 | |
Transamerica Voya Conservative Allocation VP | | | 40,494 | | | | 0.00 | (A) |
Total | | $ | 763,377,197 | | | | 92.61 | % |
Transamerica Developing
Markets Equity | | Market Value | | | % of Net
Assets | |
Transamerica Asset Allocation – Conservative Portfolio | | $ | 22,083,110 | | | | 2.29 | % |
Transamerica Asset Allocation – Conservative VP | | | 35,712,865 | | | | 3.71 | |
Transamerica Asset Allocation – Growth Portfolio | | | 80,007,496 | | | | 8.31 | |
Transamerica Asset Allocation – Growth VP | | | 67,263,342 | | | | 6.98 | |
Transamerica Asset Allocation – Moderate Growth Portfolio | | | 105,945,797 | | | | 11.00 | |
Transamerica Asset Allocation – Moderate Growth VP | | | 278,076,982 | | | | 28.87 | |
Transamerica Asset Allocation – Moderate Portfolio | | | 42,379,400 | | | | 4.40 | |
Transamerica Asset Allocation – Moderate VP | | | 282,357,589 | | | | 29.32 | |
Transamerica International Moderate Growth VP | | | 27,770,216 | | | | 2.88 | |
Transamerica Multi-Manager Alternative Strategies Portfolio | | | 7,657,118 | | | | 0.80 | |
Transamerica Multi-Manager Alternative Strategies VP | | | 15,144 | | | | 0.00 | (A) |
Transamerica Voya Balanced Allocation VP | | | 287,315 | | | | 0.03 | |
Transamerica Voya Conservative Allocation VP | | | 16,870 | | | | 0.00 | (A) |
Transamerica Voya Moderate Growth Allocation VP | | | 240,768 | | | | 0.02 | |
Total | | $ | 949,814,012 | | | | 98.61 | % |
| | | | | | | | |
Transamerica Global Real Estate
Securities | | Market Value | | | % of Net
Assets | |
Transamerica Asset Allocation – Conservative Portfolio | | $ | 22,392 | | | | 0.04 | % |
Transamerica Asset Allocation – Growth Portfolio | | | 6,035,708 | | | | 10.69 | |
Transamerica Asset Allocation – Moderate Growth Portfolio | | | 15,866,264 | | | | 28.09 | |
Transamerica Asset Allocation – Moderate Portfolio | | | 23,639 | | | | 0.04 | |
Transamerica Multi-Manager Alternative Strategies Portfolio | | | 27,303,129 | | | | 48.34 | |
Transamerica Multi-Manager Alternative Strategies VP | | | 54,017 | | | | 0.10 | |
Total | | $ | 49,305,149 | | | | 87.30 | % |
| Transamerica Growth | | Market Value | | | % of Net
Assets | |
Transamerica Asset Allocation – Conservative Portfolio | | $ | 37,764,237 | | | | 7.13 | % |
Transamerica Asset Allocation – Growth Portfolio | | | 145,083,239 | | | | 27.40 | |
Transamerica Asset Allocation – Moderate Growth Portfolio | | | 218,036,609 | | | | 41.19 | |
Transamerica Asset Allocation – Moderate Portfolio | | | 103,588,212 | | | | 19.57 | |
Total | | $ | 504,472,297 | | | | 95.29 | % |
| Transamerica Intermediate Bond | | Market Value | | | % of Net
Assets | |
Transamerica Asset Allocation – Conservative VP | | $ | 60,438,550 | | | | 19.86 | % |
Transamerica Asset Allocation – Moderate Growth VP | | | 55,402,004 | | | | 18.20 | |
Transamerica Asset Allocation – Moderate VP | | | 183,063,667 | | | | 60.14 | |
Transamerica International Moderate Growth VP | | | 5,036,546 | | | | 1.65 | |
Transamerica Voya Balanced Allocation VP | | | 274,605 | | | | 0.09 | |
Transamerica Voya Conservative Allocation VP | | | 65,003 | | | | 0.02 | |
Transamerica Voya Moderate Growth Allocation VP | | | 57,576 | | | | 0.02 | |
Total | | $ | 304,337,951 | | | | 99.98 | % |
| | |
| Transamerica Funds | | Annual Report 2014 |
Page 178
NOTES TO FINANCIAL STATEMENTS (continued)
At October 31, 2014
NOTE 3. (continued)
| | | | | | | | |
Transamerica International
Equity Opportunities | | Market Value | | | % of Net
Assets | |
Transamerica Asset Allocation – Conservative Portfolio | | $ | 18,497,135 | | | | 3.28 | % |
Transamerica Asset Allocation – Growth Portfolio | | | 91,700,878 | | | | 16.26 | |
Transamerica Asset Allocation – Growth VP | | | 27,211,287 | | | | 4.82 | |
Transamerica Asset Allocation – Moderate Growth Portfolio | | | 126,183,228 | | | | 22.37 | |
Transamerica Asset Allocation – Moderate Growth VP | | | 95,006,542 | | | | 16.84 | |
Transamerica Asset Allocation – Moderate Portfolio | | | 69,978,572 | | | | 12.40 | |
Transamerica Asset Allocation – Moderate VP | | | 51,067,205 | | | | 9.05 | |
Transamerica International Moderate Growth VP | | | 69,876,274 | | | | 12.39 | |
Transamerica Voya Balanced Allocation VP | | | 115,045 | | | | 0.02 | |
Transamerica Voya Moderate Growth Allocation VP | | | 90,769 | | | | 0.02 | |
Total | | $ | 549,726,935 | | | | 97.45 | % |
Transamerica International
Small Cap | | Market Value | | | % of Net
Assets | |
Transamerica Asset Allocation – Conservative Portfolio | | $ | 13,626,890 | | | | 1.58 | % |
Transamerica Asset Allocation – Conservative VP | | | 30,144,560 | | | | 3.50 | |
Transamerica Asset Allocation – Growth Portfolio | | | 54,528,024 | | | | 6.33 | |
Transamerica Asset Allocation – Growth VP | | | 67,874,831 | | | | 7.88 | |
Transamerica Asset Allocation – Moderate Growth Portfolio | | | 82,566,381 | | | | 9.58 | |
Transamerica Asset Allocation – Moderate Growth VP | | | 236,633,733 | | | | 27.45 | |
Transamerica Asset Allocation – Moderate Portfolio | | | 39,079,251 | | | | 4.53 | |
Transamerica Asset Allocation – Moderate VP | | | 225,030,563 | | | | 26.11 | |
Transamerica International Moderate Growth VP | | | 92,311,460 | | | | 10.71 | |
Transamerica Multi-Manager Alternative Strategies Portfolio | | | 6,057,973 | | | | 0.70 | |
Transamerica Multi-Manager Alternative Strategies VP | | | 11,982 | | | | 0.00 | (A) |
Transamerica Voya Balanced Allocation VP | | | 400,410 | | | | 0.05 | |
Transamerica Voya Conservative Allocation VP | | | 17,325 | | | | 0.00 | (A) |
Transamerica Voya Moderate Growth Allocation VP | | | 239,603 | | | | 0.03 | |
Total | | $ | 848,522,986 | | | | 98.45 | % |
| | | | | | | | |
Transamerica Long/Short
Strategy | | Market Value | | | % of Net
Assets | |
Transamerica Asset Allocation – Conservative Portfolio | | $ | 8,924,278 | | | | 5.55 | % |
Transamerica Asset Allocation – Growth Portfolio | | | 15,698,522 | | | | 9.76 | |
Transamerica Asset Allocation – Moderate Portfolio | | | 27,988,162 | | | | 17.39 | |
Transamerica Multi-Manager Alternative Strategies Portfolio | | | 107,870,460 | | | | 67.04 | |
Transamerica Multi-Manager Alternative Strategies VP | | | 213,479 | | | | 0.13 | |
Total | | $ | 160,694,901 | | | | 99.87 | % |
| Transamerica Mid Cap Value | | Market Value | | | % of Net
Assets | |
Transamerica Asset Allocation – Conservative Portfolio | | $ | 10,361,716 | | | | 3.81 | % |
Transamerica Asset Allocation – Growth Portfolio | | | 80,353,389 | | | | 29.55 | |
Transamerica Asset Allocation – Moderate Growth Portfolio | | | 120,173,098 | | | | 44.20 | |
Transamerica Asset Allocation – Moderate Portfolio | | | 53,434,128 | | | | 19.65 | |
Total | | $ | 264,322,331 | | | | 97.21 | % |
| Transamerica Total Return | | Market Value | | | % of Net
Assets | |
Transamerica Asset Allocation – Conservative Portfolio | | $ | 176,323,736 | | | | 16.40 | % |
Transamerica Asset Allocation – Moderate Growth Portfolio | | | 428,279,612 | | | | 39.84 | |
Transamerica Asset Allocation – Moderate Portfolio | | | 400,008,328 | | | | 37.21 | |
Total | | $ | 1,004,611,676 | | | | 93.45 | % |
Transamerica Commodity
Strategy | | Market Value | | | % of Net
Assets | |
Transamerica Asset Allocation – Conservative Portfolio | | $ | 7,132,473 | | | | 10.46 | % |
Transamerica Asset Allocation – Moderate Growth Portfolio | | | 26,075,288 | | | | 38.24 | |
Transamerica Asset Allocation – Moderate Portfolio | | | 19,171,259 | | | | 28.11 | |
Transamerica Multi-Manager Alternative Strategies Portfolio | | | 15,026,338 | | | | 22.03 | |
Transamerica Multi-Manager Alternative Strategies VP | | | 29,724 | | | | 0.04 | |
Total | | $ | 67,435,082 | | | | 98.88 | % |
| | |
| Transamerica Funds | | Annual Report 2014 |
Page 179
NOTES TO FINANCIAL STATEMENTS (continued)
At October 31, 2014
NOTE 3. (continued)
| | | | | | | | |
Transamerica Managed Futures
Strategy | | Market Value | | | % of Net
Assets | |
Transamerica Asset Allocation – Conservative Portfolio | | $ | 25,960,658 | | | | 6.27 | % |
Transamerica Asset Allocation – Growth Portfolio | | | 105,881,130 | | | | 25.58 | |
Transamerica Asset Allocation – Growth VP | | | 13,705,222 | | | | 3.31 | |
Transamerica Asset Allocation – Moderate Growth Portfolio | | | 117,087,863 | | | | 28.29 | |
Transamerica Asset Allocation – Moderate Portfolio | | | 84,992,280 | | | | 20.54 | |
Transamerica Multi-Manager Alternative Strategies Portfolio | | | 64,730,986 | | | | 15.64 | |
Transamerica Multi-Manager Alternative Strategies VP | | | 128,168 | | | | 0.03 | |
Total | | $ | 412,486,307 | | | | 99.66 | % |
| (A) | Percentage rounds to less than 0.01%. |
Investment advisory fees: The Funds pay management fees to TAM based on daily Average Net Assets (“ANA”) at the following rates:
| | |
| Fund Name | | Rate |
Transamerica Arbitrage Strategy | | |
First $50 million | | 1.050% |
Over $50 million | | 1.000 |
Transamerica Bond | | |
First $200 million | | 0.675 |
Over $200 million up to $750 million | | 0.625 |
Over $750 million | | 0.575 |
Transamerica Core Bond | | |
First $750 million | | 0.450 |
Over $750 million up to $1 billion | | 0.400 |
Over $1 billion | | 0.375 |
Transamerica Developing Markets Equity | | |
First $50 million | | 1.200 |
Over $50 million up to $200 million | | 1.150 |
Over $200 million up to $500 million | | 1.100 |
Over $500 million | | 1.050 |
Transamerica Global Real Estate Securities | | |
First $250 million | | 0.800 |
Over $250 million up to $500 million | | 0.775 |
Over $500 million up to $1 billion | | 0.700 |
Over $1 billion | | 0.650 |
Transamerica Growth | | |
First $250 million | | 0.800 |
Over $250 million up to $500 million | | 0.750 |
Over $500 million up to $1 billion | | 0.700 |
Over $1 billion | | 0.600 |
Transamerica Intermediate Bond | | |
First $2 billion | | 0.350 |
Over $2 billion | | 0.335 |
| | |
| Fund Name | | Rate |
Transamerica International Equity Opportunities | | |
Over $250 million | | 0.900% |
Over $250 million up to $500 million | | 0.875 |
Over $500 million up to $1 billion | | 0.850 |
Over $1 billion | | 0.800 |
Transamerica International Small Cap | | |
First $300 million | | 1.070 |
Over $300 million | | 1.000 |
Transamerica Long/Short Strategy | | |
First 300 million | | 1.200 |
Over $300 million up to $1 billion | | 1.150 |
Over $1 billion | | 1.125 |
Transamerica Mid Cap Value | | |
First $100 million | | 0.850 |
Over $100 million | | 0.800 |
Transamerica Total Return | | |
First $250 million | | 0.675 |
Over $250 million up to $750 million | | 0.650 |
Over $750 million | | 0.600 |
Transamerica Commodity Strategy | | |
First $200 million | | 0.610 |
Over $200 million up to $1 billion | | 0.590 |
Over $1 billion | | 0.560 |
Transamerica Managed Futures Strategy | | |
First $500 million | | 1.100 |
Over $500 million | | 1.050 |
Transamerica Cayman Commodity Strategy, Ltd. and Transamerica Cayman Managed Futures Strategy, Ltd., (each, a “Subsidiary”; collectively, the “Subsidiaries”) entered into separate contracts with TAM for the management of the Subsidiaries pursuant to which the
| | |
| Transamerica Funds | | Annual Report 2014 |
Page 180
NOTES TO FINANCIAL STATEMENTS (continued)
At October 31, 2014
NOTE 3. (continued)
Subsidiaries pay TAM a fee that is the same, as a percentage of net assets, as the management fee of the Fund. TAM has contractually agreed to waive a portion of the Funds’ management fee in an amount equal to the management fee paid to TAM by the Subsidiaries. This management fee waiver, which is reflected in the “Expenses (waived/reimbursed)” line item on the Consolidated Statements of Operations, may not be discontinued by TAM as long as its contract with the Subsidiaries is in place. For the year ended October 31, 2014, the amounts waived were $85,024 and $1,102,650, respectively for Transamerica Cayman Commodity Strategy, Ltd. and Transamerica Cayman Managed Futures Strategy, Ltd.
TAM has contractually agreed to waive fees and/or reimburse Fund expenses to the extent that the total operating expenses excluding, as applicable, 12b-1 fees, acquired fund fees and expenses, interest, taxes, brokerage commissions, dividend and interest expenses on securities sold short, extraordinary expenses and other expenses not incurred in the ordinary course of the Funds’ business, exceed the following stated annual limit:
| | | | | | |
| Fund Name | | Expense Limit | | | Maximum Operating Expense Limit Effective Through |
Transamerica Arbitrage Strategy | | | 1.25 | % | | March 1, 2015 |
Transamerica Bond
Effective March 1, 2014 | | | 0.71 | | | March 1, 2015 |
Prior to March 1, 2014 | | | 0.88 | | | |
Transamerica Core Bond | | | 0.70 | | | March 1, 2015 |
Transamerica Developing Markets Equity | | | 1.45 | | | March 1, 2015 |
Transamerica Intermediate Bond | | | 0.55 | | | March 1, 2015 |
Transamerica International Small Cap | | | 1.27 | | | March 1, 2015 |
Transamerica Long/Short Strategy Effective March 1, 2014 | | | 1.59 | | | March 1, 2015 |
Prior to March 1, 2014 | | | 1.65 | | | |
Transamerica Mid Cap Value | | | 1.05 | | | March 1, 2015 |
Transamerica Commodity Strategy Effective March 1, 2014 | | | 0.94 | | | March 1, 2015 |
Prior to March 1, 2014 | | | 1.00 | | | |
Transamerica Managed Futures Strategy | | | 1.45 | | | March 1, 2015 |
Funds not listed in the above table did not have an expense limit.
TAM is entitled to reimbursement by the Fund of fees waived and/or expenses reduced during any of the previous 36 months if on any day or month the estimated annualized Fund operating expenses are less than the stated annual limit.
During the year ended October 31, 2014, amounts recaptured by TAM were as follows:.
| | | | |
| Fund Name | | Amount Recaptured | |
Transamerica Arbitrage Strategy | | $ | 20,881 | |
Transamerica Intermediate Bond | | | 799 | |
The following amounts are available for recapture by TAM as of October 31, 2014:
| | | | | | | | |
| Fund Name | | Amount
Available | | | Year
Reimbursed | |
Transamerica Arbitrage Strategy | | $ | 171,937 | | | | 2012 | |
| | | | 87,653 | | | | 2013 | |
| | | | 114,940 | | | | 2014 | |
Administrative services: The Funds have entered into an agreement with TFS for financial and legal fund administration services. The Funds pay TFS at an annual fee of 0.025% on daily ANA. The Legal fees on the Statements of Operations or Consolidated Statements of Operations are for fees paid to external legal counsel.
Transfer agent fees: Pursuant to a transfer agency agreement, as amended, the Funds pay TFS at an annual fee of 0.0075% on daily ANA for providing transfer agent services. Transfer agent fees paid and the amounts due to TFS for the year ended October 31, 2014 are disclosed in the Statements of Operations and the Statements of Assets and Liabilities, respectively; or in the Consolidated Statements of Operations and the Consolidated Statements of Assets and Liabilities, respectively.
| | |
| Transamerica Funds | | Annual Report 2014 |
Page 181
NOTES TO FINANCIAL STATEMENTS (continued)
At October 31, 2014
NOTE 3. (continued)
Deferred compensation plan: Under a non-qualified deferred compensation plan effective January 1, 1996, as amended and restated available to the trustees, compensation may be deferred that would otherwise be payable by the Trust to an independent trustee on a current basis for services rendered as Trustee. Deferred compensation amounts will accumulate based on the value of the investment option, as elected by the Trustee.
Brokerage commissions: There were no brokerage commissions incurred on security transactions placed with affiliates of the adviser or sub-advisers for the year ended October 31, 2014.
NOTE 4. PURCHASES AND SALES OF SECURITIES
The cost of securities purchased and proceeds from securities sold (excluding short-term securities, securities sold short and written options) for the year ended October 31, 2014 were as follows:
| | | | | | | | | | | | | | | | |
| | | Purchases of securities | | | Proceeds from maturities and
sales of securities | |
| Fund Name | | Long-term | | | U.S. Government | | | Long-term | | | U.S. Government | |
Transamerica Arbitrage Strategy | | $ | 1,255,316,158 | | | $ | — | | | $ | 1,078,391,639 | | | $ | — | |
Transamerica Bond | | | 237,697,143 | | | | 44,158,847 | | | | 298,408,600 | | | | 67,501,321 | |
Transamerica Core Bond | | | 83,397,410 | | | | 51,905,206 | | | | 235,769,744 | | | | 153,089,219 | |
Transamerica Developing Markets Equity | | | 727,864,774 | | | | — | | | | 386,057,083 | | | | — | |
Transamerica Global Real Estate Securities | | | 37,233,332 | | | | — | | | | 55,068,369 | | | | — | |
Transamerica Growth | | | 163,374,594 | | | | — | | | | 295,075,098 | | | | — | |
Transamerica Intermediate Bond | | | 194,876,154 | | | | 193,610,883 | | | | 13,791,324 | | | | 121,779,319 | |
Transamerica International Equity Opportunities | | | 497,388,546 | | | | — | | | | 172,912,922 | | | | — | |
Transamerica International Small Cap | | | 668,409,755 | | | | — | | | | 226,754,719 | | | | — | |
Transamerica Long/Short Strategy | | | 464,119,533 | | | | — | | | | 449,183,830 | | | | — | |
Transamerica Mid Cap Value | | | 110,038,649 | | | | — | | | | 118,919,257 | | | | — | |
Transamerica Total Return | | | 633,921,012 | | | | 892,870,843 | | | | 259,224,237 | | | | 1,084,581,630 | |
NOTE 5. DERIVATIVE FINANCIAL INSTRUMENTS
Transamerica Arbitrage Strategy:
The Fund is subject to various risks in the normal course of pursuing its investment objective. The following table details the volume of derivative positions held during the year:
| | | | | | | | | | | | |
| | | Beginning number
of positions at
October 31, 2013 | | | Ending number
of positions at
October 31, 2014 | | | Average number
of positions (A) | |
Purchased options and swaptions | | | 12 | | | | 115 | | | | 40 | |
Written options and swaptions | | | 19 | | | | 58 | | | | 49 | |
Swap agreements | | | 6 | | | | 8 | | | | 6 | |
Forward foreign currency contracts | | | 86 | | | | 141 | | | | 98 | |
| | (A) | Calculated based on positions held at each month end during the current year. |
| | |
| Transamerica Funds | | Annual Report 2014 |
Page 182
NOTES TO FINANCIAL STATEMENTS (continued)
At October 31, 2014
NOTE 5. (continued)
Transamerica Arbitrage Strategy (continued):
Fair Value of Derivative Instruments in the Statements of Assets and Liabilities as of October 31, 2014:
The table below highlights the types of risk associated with each derivative instrument:
| | | | | | | | | | | | |
| Derivatives not accounted for as hedging instruments | | Foreign
Exchange
contracts | | | Equity
contracts | | | Total | |
Asset derivatives | | | | | | | | | | | | |
Purchased options and swaptions, at value (A) (B) | | $ | — | | | $ | 694,967 | | | $ | 694,967 | |
Swap agreements, at value | | | — | | | | 214 | | | | 214 | |
Unrealized appreciation on forward foreign currency contracts | | | 314,383 | | | | — | | | | 314,383 | |
Total gross amount of assets (C) | | $ | 314,383 | | | $ | 695,181 | | | $ | 1,009,564 | |
Liability derivatives | | | | | | | | | | | | |
Written options and swaptions, at value (B) | | $ | — | | | $ | (404,611 | ) | | $ | (404,611 | ) |
Swap agreements, at value | | | — | | | | (172 | ) | | | (172 | ) |
Unrealized depreciation on forward foreign currency contracts | | | (93,976 | ) | | | — | | | | (93,976 | ) |
Total gross amount of liabilities (C) | | $ | (93,976 | ) | | $ | (404,783 | ) | | $ | (498,759 | ) |
| | (A) | Included within Investments, at value. |
| | (B) | May include exchange-traded derivatives which are not subject to a master netting arrangement, or another similar arrangement. |
| | (C) | The Fund does not offset assets and liabilities that are subject to a master netting agreement or similar arrangement on the Statements of Assets and Liabilities. |
Gross Amounts Not Offset in the Statements of Assets and Liabilities as of October 31, 2014:
The following table presents the Fund’s derivative assets and liabilities by counterparty net of amounts available for offset under a master netting agreement and net of the related collateral received/pledged by the Fund as of October 31, 2014. See Repurchase agreement note for offsetting and collateral information pertaining to repurchase agreements that are subject to master netting agreements.
| | | | | | | | | | | | | | | | |
| Counterparty | | Gross Amounts of
Assets Presented in
Statements of Assets
and Liabilities (A) | | | Value
Available for
Offset | | | Collateral
Received (B) | | | Net Amount | |
Goldman Sachs & Co. | | $ | 314,383 | | | $ | (93,976 | ) | | $ | — | | | $ | 220,407 | |
Morgan Stanley | | | 214 | | | | (172 | ) | | | — | | | | 42 | |
Other Derivatives (C) | | | 694,967 | | | | — | | | | — | | | | 694,967 | |
Total | | $ | 1,009,564 | | | $ | (94,148 | ) | | $ | — | | | $ | 915,416 | |
| | | | | | | | | | | | | | | | |
| Counterparty | | Gross Amounts of
Liabilities Presented in
Statements of Assets
and Liabilities (A) | | | Value
Available for
Offset | | | Collateral
Pledged (B) | | | Net Amount | |
Goldman Sachs & Co. | | $ | 93,976 | | | $ | (93,976 | ) | | $ | — | | | $ | — | |
Morgan Stanley | | | 172 | | | | (172 | ) | | | — | | | | — | |
Other Derivatives (C) | | | 404,611 | | | | — | | | | — | | | | 404,611 | |
Total | | $ | 498,759 | | | $ | (94,148 | ) | | $ | — | | | $ | 404,611 | |
| | (A) | Absent an event of default or early termination, OTC derivative assets and liabilities are presented gross and not offset in the Statements of Assets and Liabilities. |
| | (B) | In some instances, the actual collateral received and/or pledged may be more than the amount shown due to overcollateralization. |
| | (C) | Other Derivatives are not subject to a master netting arrangement or another similar arrangement. |
For non-exchange-traded derivatives, under standard derivatives agreements, the Fund may be required to post collateral on derivatives if the Fund is in a net liability position with the counterparty exceeding certain amounts. Additionally, counterparties may immediately terminate derivatives contracts if the Fund fails to maintain sufficient asset coverage for its contracts or its net assets decline by stated percentages.
| | |
| Transamerica Funds | | Annual Report 2014 |
Page 183
NOTES TO FINANCIAL STATEMENTS (continued)
At October 31, 2014
NOTE 5. (continued)
Transamerica Arbitrage Strategy (continued):
Effect of Derivative Instruments in the Statements of Operations for the year ended October 31, 2014:
| | | | | | | | | | | | |
| Derivatives not accounted for as hedging instruments | | Foreign
Exchange
contracts | | | Equity
contracts | | | Total | |
Net realized gain (loss) on derivatives recognized in income | | | | | | | | | | | | |
Net realized gain (loss) on purchased options and swaptions (A) | | $ | — | | | $ | (1,101,734 | ) | | $ | (1,101,734 | ) |
Net realized gain (loss) on written options and swaptions | | | — | | | | 1,211,037 | | | | 1,211,037 | |
Net realized gain (loss) on swap agreements | | | — | | | | 55,892 | | | | 55,892 | |
Net realized gain (loss) on forward foreign currency contracts (B) | | | (505,289 | ) | | | — | | | | (505,289 | ) |
Total Net realized gain (loss) | | | (505,289 | ) | | | 165,195 | | | | (340,094 | ) |
Net change in unrealized appreciation (depreciation) on derivatives recognized in income | | | | | | | | | | | | |
Net change in unrealized appreciation (depreciation) on purchased options and swaptions (C) | | | — | | | | (426,438 | ) | | | (426,438 | ) |
Net change in unrealized appreciation (depreciation) on written options and swaptions | | | — | | | | (184,633 | ) | | | (184,633 | ) |
Net change in unrealized appreciation (depreciation) on swap agreements | | | — | | | | 8,469 | | | | 8,469 | |
Net change in unrealized appreciation (depreciation) on forward foreign currency transactions (D) | | | 652,624 | | | | — | | | | 652,624 | |
Total Net change in unrealized appreciation (depreciation) | | | 652,624 | | |
| (602,602
| )
| | | 50,022 | |
Total | | $ | 147,335 | | | $ | (437,407 | ) | | $ | (290,072 | ) |
| | (A) | Included within Net realized gain (loss) on transactions from Investments. |
| | (B) | Included within Net realized gain (loss) on transactions from Foreign currency transactions. |
| | (C) | Included within Net change in unrealized appreciation (depreciation) on Investments. |
| | (D) | Included within Net change in unrealized appreciation (depreciation) on Translation of assets and liabilities denominated in foreign currencies. |
Transamerica Bond:
The Fund is subject to various risks in the normal course of pursuing its investment objective. The following table details the volume of derivative positions held during the year:
| | | | | | | | | | | | |
| | | Beginning number
of positions at
October 31, 2013 | | | Ending number
of positions at
October 31, 2014 | | | Average number
of positions (A) | |
Futures contracts | | | 1 | | | | 1 | | | | 1 | |
| | (A) | Calculated based on positions held at each month end during the current year. |
Fair Value of Derivative Instruments in the Statements of Assets and Liabilities as of October 31, 2014:
The table below highlights the types of risk associated with each derivative instrument:
| | | | | | | | |
| Derivatives not accounted for as hedging instruments | | Interest rate
contracts | | | Total | |
Liability derivatives | | | | | | | | |
Unrealized depreciation on futures contracts (A) (B) | | $ | (482,114 | ) | | $ | (482,114 | ) |
Total gross amount of liabilities (C) | | $ | (482,114 | ) | | $ | (482,114 | ) |
| | (A) | May include exchange-traded derivatives which are not subject to a master netting arrangement, or another similar arrangement. |
| | (B) | Includes cumulative appreciation (depreciation) on futures contracts as reported in the Schedule of Investments. Only current day’s variation margin is reported within the Statements of Assets and Liabilities. |
| | (C) | The Fund does not offset assets and liabilities that are subject to a master netting agreement or similar arrangement on the Statements of Assets and Liabilities. |
| | |
| Transamerica Funds | | Annual Report 2014 |
Page 184
NOTES TO FINANCIAL STATEMENTS (continued)
At October 31, 2014
NOTE 5. (continued)
Transamerica Bond (continued):
The Fund’s derivatives are not subject to a master netting arrangement, or another similar arrangement.
Effect of Derivative Instruments in the Statements of Operations for the year ended October 31, 2014:
| | | | | | | | |
| Derivatives not accounted for as hedging instruments | | Interest rate
contracts | | | Total | |
Net realized gain (loss) on derivatives recognized in income | | | | | | | | |
Net realized gain (loss) on futures contracts | | $ | (2,226,746 | ) | | $ | (2,226,746 | ) |
Net change in unrealized appreciation (depreciation) on derivatives recognized in income | | | | | | | | |
Net change in unrealized appreciation (depreciation) on futures contracts | | | (372,642 | ) | | | (372,642 | ) |
Total | | $ | (2,599,388 | ) | | $ | (2,599,388 | ) |
Transamerica Total Return:
The Fund is subject to various risks in the normal course of pursuing its investment objective. The following table details the volume of derivative positions held during the year:
| | | | | | | | | | | | |
| | | Beginning number
of positions at
October 31, 2013 | | | Ending number
of positions at
October 31, 2014 | | | Average number
of positions (A) | |
Futures contracts | | | 7 | | | | 14 | | | | 9 | |
Written options and swaptions | | | 6 | | | | 100 | | | | 22 | |
Swap agreements | | | 15 | | | | 75 | | | | 26 | |
Forward foreign currency contracts | | | 24 | | | | 163 | | | | 55 | |
| | (A) | Calculated based on positions held at each month end during the current year. |
Fair Value of Derivative Instruments in the Statements of Assets and Liabilities as of October 31, 2014:
The table below highlights the types of risk associated with each derivative instrument:
| | | | | | | | | | | | | | | | |
| Derivatives not accounted for as hedging instruments | | Interest rate
contracts | | | Foreign Exchange
contracts | | | Credit
contracts | | | Total | |
Asset derivatives | | | | | | | | | | | | | | | | |
Unrealized appreciation on futures contracts (A) (B) | | $ | 2,085,364 | | | $ | — | | | $ | — | | | $ | 2,085,364 | |
Swap agreements, at value (B) (C) | | | 1,754,740 | | | | — | | | | 1,014,517 | | | | 2,769,257 | |
Unrealized appreciation on forward foreign currency contracts | | | — | | | | 18,489,298 | | | | — | | | | 18,489,298 | |
Total gross amount of assets (D) | | $ | 3,840,104 | | | $ | 18,489,298 | | | $ | 1,014,517 | | | $ | 23,343,919 | |
Liability derivatives | | | | | | | | | | | | | | | | |
Written options and swaptions, at value (B) | | $ | (1,419,264 | ) | | $ | (528,999 | ) | | $ | — | | | $ | (1,948,263 | ) |
Unrealized depreciation on futures contracts (A) (B) | | | (229,447 | ) | | | — | | | | — | | | | (229,447 | ) |
Swap agreements, at value (B) (C) | | | (5,688,696 | ) | | | — | | | | (1,394,902 | ) | | | (7,083,598 | ) |
Unrealized depreciation on forward foreign currency contracts | | | — | | | | (6,522,603 | ) | | | — | | | | (6,522,603 | ) |
Total gross amount of liabilities (D) | | $ | (7,337,407 | ) | | $ | (7,051,602 | ) | | $ | (1,394,902 | ) | | $ | (15,783,911 | ) |
| | (A) | Includes cumulative appreciation (depreciation) on futures contracts as reported in the Schedule of Investments. Only current day’s variation margin is reported within the Statements of Assets and Liabilities. |
| | (B) | May include exchange-traded derivatives which are not subject to a master netting arrangement, or another similar arrangement. |
| | (C) | Includes value on OTC swap agreements as reported on the Statements of Assets and Liabilities, as well as the value on centrally cleared swap agreements included in the variation margin receivable/payable on derivative financial instruments. |
| | (D) | The Fund does not offset assets and liabilities that are subject to a master netting agreement or similar arrangement on the Statements of Assets and Liabilities. |
| | |
| Transamerica Funds | | Annual Report 2014 |
Page 185
NOTES TO FINANCIAL STATEMENTS (continued)
At October 31, 2014
NOTE 5. (continued)
Transamerica Total Return (continued):
Gross Amounts Not Offset in the Statements of Assets and Liabilities as of October 31, 2014:
The following table presents the Fund’s derivative assets and liabilities by counterparty net of amounts available for offset under a master netting agreement and net of the related collateral received/pledged by the Fund as of October 31, 2014. See Repurchase agreement note for offsetting and collateral information pertaining to repurchase agreements that are subject to master netting agreements.
| | | | | | | | | | | | | | | | |
| Counterparty | | Gross Amounts of
Assets Presented in
Statements of Assets
and Liabilities (A) | | | Value
Available for
Offset | | | Collateral
Received (B) | | | Net Amount | |
BNP Paribas | | $ | 1,343,113 | | | $ | (1,268,057 | ) | | $ | (75,056 | ) | | $ | — | |
Bank of America, N.A. | | | 3,326,497 | | | | (153,781 | ) | | | (2,610,000 | ) | | | 562,716 | |
Barclays Bank plc | | | 3,045,705 | | | | (1,956,390 | ) | | | (530,000 | ) | | | 559,315 | |
Citibank N.A. | | | 731,605 | | | | (731,605 | ) | | | — | | | | — | |
Deutsche Bank AG | | | 2,123,925 | | | | (1,099,420 | ) | | | (1,020,000 | ) | | | 4,505 | |
Goldman Sachs Bank | | | 755,726 | | | | (749,734 | ) | | | — | | | | 5,992 | |
Goldman Sachs International | | | 14,516 | | | | (14,516 | ) | | | — | | | | — | |
HSBC Bank USA | | | 673,913 | | | | (419,697 | ) | | | — | | | | 254,216 | |
JPMorgan Chase Bank, N.A. | | | 1,797,310 | | | | (350,254 | ) | | | (800,000 | ) | | | 647,056 | |
Morgan Stanley & Co, | | | 10,790 | | | | (10,202 | ) | | | — | | | | 588 | |
Morgan Stanley Capital Services, Inc. | | | 309,314 | | | | (309,314 | ) | | | — | | | | — | |
UBS AG | | | 5,475,506 | | | | (1,885,133 | ) | | | (2,260,000 | ) | | | 1,330,373 | |
Other Derivatives (C) | | | 3,735,999 | | | | — | | | | — | | | | 3,735,999 | |
Total | | $ | 23,343,919 | | | $ | (8,948,103 | ) | | $ | (7,295,056 | ) | | $ | 7,100,760 | |
| | | | | | | | | | | | | | | | |
| Counterparty | | Gross Amounts of
Liabilities Presented in
Statements of Assets
and Liabilities (A) | | | Value
Available for
Offset | | | Collateral
Pledged (B) | | | Net Amount | |
BNP Paribas | | $ | 1,268,057 | | | $ | (1,268,057 | ) | | $ | — | | | $ | — | |
Bank of America, N.A. | | | 153,781 | | | | (153,781 | ) | | | — | | | | — | |
Barclays Bank plc | | | 1,956,390 | | | | (1,956,390 | ) | | | — | | | | — | |
Citibank N.A. | | | 1,204,166 | | | | (731,605 | ) | | | (286,432 | ) | | | 186,129 | |
Deutsche Bank AG | | | 1,099,420 | | | | (1,099,420 | ) | | | — | | | | — | |
Goldman Sachs Bank | | | 749,734 | | | | (749,734 | ) | | | — | | | | — | |
Goldman Sachs International | | | 638,261 | | | | (14,516 | ) | | | (623,745 | ) | | | — | |
HSBC Bank USA | | | 419,697 | | | | (419,697 | ) | | | — | | | | — | |
JPMorgan Chase Bank, N.A. | | | 350,254 | | | | (350,254 | ) | | | — | | | | — | |
Morgan Stanley & Co, | | | 10,202 | | | | (10,202 | ) | | | — | | | | — | |
Morgan Stanley Capital Services, Inc. | | | 1,020,423 | | | | (309,314 | ) | | | — | | | | 711,109 | |
Royal Bank of Scotland plc | | | 217,973 | | | | — | | | | (217,973 | ) | | | — | |
UBS AG | | | 1,885,133 | | | | (1,885,133 | ) | | | — | | | | — | |
Other Derivatives (C) | | | 4,810,420 | | | | — | | | | — | | | | 4,810,420 | |
Total | | $ | 15,783,911 | | | $ | (8,948,103 | ) | | $ | (1,128,150 | ) | | $ | 5,707,658 | |
| | (A) | Absent an event of default or early termination, OTC derivative assets and liabilities are presented gross and not offset in the Statements of Assets and Liabilities. |
| | (B) | In some instances, the actual collateral received and/or pledged may be more than the amount shown due to overcollateralization. |
| | (C) | Other Derivatives are not subject to a master netting arrangement or another similar arrangement. |
For non-exchange-traded derivatives, under standard derivatives agreements, the Fund may be required to post collateral on derivatives if the Fund is in a net liability position with the counterparty exceeding certain amounts. Additionally, counterparties may immediately terminate derivatives contracts if the Fund fails to maintain sufficient asset coverage for its contracts or its net assets decline by stated percentages.
| | |
| Transamerica Funds | | Annual Report 2014 |
Page 186
NOTES TO FINANCIAL STATEMENTS (continued)
At October 31, 2014
NOTE 5. (continued)
Transamerica Total Return (continued):
Effect of Derivative Instruments in the Statements of Operations for the year ended October 31, 2014:
| | | | | | | | | | | | | | | | |
| Derivatives not accounted for as hedging instruments | | Interest rate
contracts | | | Foreign Exchange
contracts | | | Credit
contracts | | | Total | |
Net realized gain (loss) on derivatives recognized in income | | | | | | | | | | | | | | | | |
Net realized gain (loss) on futures contracts | | $ | 10,533,477 | | | $ | — | | | $ | — | | | $ | 10,533,477 | |
Net realized gain (loss) on written options and swaptions | | | 3,144,386 | | | | 52,129 | | | | — | | | | 3,196,515 | |
Net realized gain (loss) on swap agreements | | | (565,201 | ) | | | — | | | | 992,626 | | | | 427,425 | |
Net realized gain (loss) on forward foreign currency contracts (A) | | | — | | | | 8,709,647 | | | | — | | | | 8,709,647 | |
Total Net realized gain (loss) | | | 13,112,662 | | | | 8,761,776 | | | | 992,626 | | | | 22,867,064 | |
Net change in unrealized appreciation (depreciation) on derivatives recognized in income | | | | | | | | | | | | | | | | |
Net change in unrealized appreciation (depreciation) on futures contracts | | | (736,768 | ) | | | — | | | | — | | | | (736,768 | ) |
Net change in unrealized appreciation (depreciation) on written options and swaptions | | | 49,297 | | | | (62,168 | ) | | | — | | | | (12,871 | ) |
Net change in unrealized appreciation (depreciation) on swap agreements | | | (9,783,817 | ) | | | — | | | | 281,406 | | | | (9,502,411 | ) |
Net change in unrealized appreciation (depreciation) on forward foreign currency transactions (B) | | | — | | | | 12,859,568 | | | | — | | | | 12,859,568 | |
Total Net changes in unrealized appreciation (depreciation) | | | (10,471,288 | ) | | | 12,797,400 | | | | 281,406 | | | | 2,607,518 | |
Total | | $ | 2,641,374 | | | $ | 21,559,176 | | | $ | 1,274,032 | | | $ | 25,474,582 | |
| | (A) | Included within Net realized gain (loss) on transactions from Foreign currency transactions. |
| | (B) | Included within Net change in unrealized appreciation (depreciation) on Translation of assets and liabilities denominated in foreign currencies. |
Transamerica Commodity Strategy:
The Fund is subject to various risks in the normal course of pursuing its investment objective. The following table details the volume of derivative positions held during the year:
| | | | | | | | | | | | |
| | | Beginning number
of positions at
October 31, 2013 | | | Ending number
of positions at
October 31, 2014 | | | Average number
of positions (A) | |
Swap agreements | | | 5 | | | | 3 | | | | 4 | |
| | (A) | Calculated based on positions held at each month end during the current year. |
Fair Value of Derivative Instruments in the Consolidated Statements of Assets and Liabilities as of October 31, 2014:
The table below highlights the types of risk associated with each derivative instrument:
| | | | | | | | |
| Derivatives not accounted for as hedging instruments | | Equity
contracts | | | Total | |
Liability derivatives | | | | | | | | |
Swap agreements, at value | | $ | (11,741 | ) | | $ | (11,741 | ) |
Total gross amount of liabilities (A) | | $ | (11,741 | ) | | $ | (11,741 | ) |
| | (A) | The Fund does not offset assets and liabilities that are subject to a master netting agreement or similar arrangement on the Consolidated Statements of Assets and Liabilities. |
| | |
| Transamerica Funds | | Annual Report 2014 |
Page 187
NOTES TO FINANCIAL STATEMENTS (continued)
At October 31, 2014
NOTE 5. (continued)
Transamerica Commodity Strategy (continued):
Gross Amounts Not Offset in the Consolidated Statements of Assets and Liabilities as of October 31, 2014:
The following table presents the Fund’s derivative assets and liabilities by counterparty net of amounts available for offset under a master netting agreement and net of the related collateral received/pledged by the Fund as of October 31, 2014. See Repurchase agreement note for offsetting and collateral information pertaining to repurchase agreements that are subject to master netting agreements.
| | | | | | | | | | | | | | | | |
| Counterparty | | Gross Amounts of
Liabilities Presented in
Consolidated
Statements of Assets
and Liabilities (A) | | | Value
Available for
Offset | | | Collateral
Pledged (B) | | | Net Amount | |
Macquarie Bank Limited | | $ | 872 | | | $ | — | | | $ | (872 | ) | | $ | — | |
Merrill Lynch International | | | 5,174 | | | | — | | | | (5,174 | ) | | | — | |
UBS AG | | | 5,695 | | | | — | | | | (5,695 | ) | | | — | |
Total | | $ | 11,741 | | | $ | — | | | $ | (11,741 | ) | | $ | — | |
| | (A) | Absent an event of default or early termination, OTC derivative assets and liabilities are presented gross and not offset in the Consolidated Statements of Assets and Liabilities. |
| | (B) | In some instances, the actual collateral received and/or pledged may be more than the amount shown due to overcollateralization. |
For non-exchange-traded derivatives, under standard derivatives agreements, the Fund may be required to post collateral on derivatives if the Fund is in a net liability position with the counterparty exceeding certain amounts. Additionally, counterparties may immediately terminate derivatives contracts if the Fund fails to maintain sufficient asset coverage for its contracts or its net assets decline by stated percentages.
Effect of Derivative Instruments in the Consolidated Statements of Operations for the year ended October 31, 2014:
| | | | | | | | |
| Derivatives not accounted for as hedging instruments | | Equity
contracts | | | Total | |
Net realized gain (loss) on derivatives recognized in income | | | | | | | | |
Net realized gain (loss) on swap agreements | | $ | (5,081,229 | ) | | $ | (5,081,229 | ) |
Net change in unrealized appreciation (depreciation) on derivatives recognized in income | | | | | | | | |
Net change in unrealized appreciation (depreciation) on swap agreements | | | 6,122 | | | | 6,122 | |
Total | | $ | (5,075,107 | ) | | $ | (5,075,107 | ) |
Transamerica Managed Futures Strategy:
The Fund is subject to various risks in the normal course of pursuing its investment objective. The following table details the volume of derivative positions held during the year:
| | | | | | | | | | | | |
| | | Beginning number
of positions at
October 31, 2013 | | | Ending number
of positions at
October 31, 2014 | | | Average number
of positions (A) | |
Futures contracts | | | 203 | | | | 160 | | | | 180 | |
Swap agreements | | | 17 | | | | 28 | | | | 26 | |
Forward foreign currency contracts | | | 1,095 | | | | 1,636 | | | | 1,369 | |
| | (A) | Calculated based on positions held at each month end during the current year. |
| | |
| Transamerica Funds | | Annual Report 2014 |
Page 188
NOTES TO FINANCIAL STATEMENTS (continued)
At October 31, 2014
NOTE 5. (continued)
Transamerica Managed Futures Strategy (continued):
Fair Value of Derivative Instruments in the Consolidated Statements of Assets and Liabilities as of October 31, 2014:
The table below highlights the types of risk associated with each derivative instrument:
| | | | | | | | | | | | | | | | | | | | |
Derivatives not accounted for as hedging
instruments | | Interest rate
contracts | | | Foreign
Exchange
contracts | | | Equity
contracts | | | Commodity
contracts | | | Total | |
Asset derivatives | | | | | | | | | | | | | | | | | | | | |
Unrealized appreciation on futures contracts (A) (B) | | $ | 3,808,564 | | | $ | — | | | $ | 1,594,110 | | | $ | 2,419,306 | | | $ | 7,821,980 | |
Swap agreements, at value | | | 5,251,889 | | | | — | | | | 860,246 | | | | — | | | | 6,112,135 | |
Unrealized appreciation on forward foreign currency contracts | | | — | | | | 45,672,446 | | | | — | | | | — | | | | 45,672,446 | |
Total gross amount of assets (C) | | $ | 9,060,453 | | | $ | 45,672,446 | | | $ | 2,454,356 | | | $ | 2,419,306 | | | $ | 59,606,561 | |
Liability derivatives | | | | | | | | | | | | | | | | | | | | |
Unrealized depreciation on futures contracts (A) (B) | | $ | (203,594 | ) | | $ | — | | | $ | (2,976,094 | ) | | $ | (1,113,374 | ) | | $ | (4,293,062 | ) |
Swap agreements, at value | | | (1,249,909 | ) | | | — | | | | (17,476 | ) | | | — | | | | (1,267,385 | ) |
Unrealized depreciation on forward foreign currency contracts | | | — | | | | (40,859,397 | ) | | | — | | | | — | | | | (40,859,397 | ) |
Total gross amount of liabilities (C) | | $ | (1,453,503 | ) | | $ | (40,859,397 | ) | | $ | (2,993,570 | ) | | $ | (1,113,374 | ) | | $ | (46,419,844 | ) |
| | (A) | May include exchange-traded derivatives which are not subject to a master netting arrangement, or another similar arrangement. |
| | (B) | Includes cumulative appreciation (depreciation) on futures contracts as reported in the Consolidated Schedule of Investments. Only current day’s variation margin is reported within the Consolidated Statements of Assets and Liabilities. |
| | (C) | The Fund does not offset assets and liabilities that are subject to a master netting agreement or similar arrangement on the Consolidated Statements of Assets and Liabilities. |
Gross Amounts Not Offset in the Consolidated Statements of Assets and Liabilities as of October 31, 2014:
The following table presents the Fund’s derivative assets and liabilities by counterparty net of amounts available for offset under a master netting agreement and net of the related collateral received/pledged by the Fund as of October 31, 2014. See Repurchase agreement note for offsetting and collateral information pertaining to repurchase agreements that are subject to master netting agreements.
| | | | | | | | | | | | | | | | |
| Counterparty | | Gross Amounts of
Assets Presented in
Consolidated
Statements of Assets
and Liabilities (A) | | | Value
Available for
Offset | | | Collateral
Received (B) | | | Net Amount | |
Bank of America | | $ | 860,246 | | | $ | — | | | $ | (590,000 | ) | | $ | 270,246 | |
Barclays Bank PLC | | | 265,424 | | | | — | | | | — | | | | 265,424 | |
Citibank, N.A. | | | 2,334,217 | | | | (1,198,323 | ) | | | — | | | | 1,135,894 | |
Credit Suisse International | | | 22,549,223 | | | | (19,707,949 | ) | | | (1,200,129 | ) | | | 1,641,145 | |
Deutsche Bank AG | | | 377,198 | | | | — | | | | — | | | | 377,198 | |
Merrill Lynch International | | | 2,275,050 | | | | (69,062 | ) | | | — | | | | 2,205,988 | |
Royal Bank of Scotland plc | | | 23,123,223 | | | | (21,151,448 | ) | | | — | | | | 1,971,775 | |
Other Derivatives (C) | | | 7,821,980 | | | | — | | | | — | | | | 7,821,980 | |
Total | | $ | 59,606,561 | | | $ | (42,126,782 | ) | | $ | (1,790,129 | ) | | $ | 15,689,650 | |
| | |
| Transamerica Funds | | Annual Report 2014 |
Page 189
NOTES TO FINANCIAL STATEMENTS (continued)
At October 31, 2014
NOTE 5. (continued)
Transamerica Managed Futures Strategy (continued):
| | | | | | | | | | | | | | | | |
| Counterparty | | Gross Amounts of
Liabilities Presented in
Consolidated
Statements of Assets
and Liabilities (A) | | | Value
Available for
Offset | | | Collateral
Pledged (B) | | | Net Amount | |
Citibank, N.A. | | $ | 1,198,323 | | | $ | (1,198,323 | ) | | $ | — | | | $ | — | |
Credit Suisse International | | | 19,707,949 | | | | (19,707,949 | ) | | | — | | | | — | |
Merrill Lynch International | | | 69,062 | | | | (69,062 | ) | | | — | | | | — | |
Royal Bank of Scotland plc | | | 21,151,448 | | | | (21,151,448 | ) | | | — | | | | — | |
Other Derivatives (C) | | | 4,293,062 | | | | — | | | | — | | | | 4,293,062 | |
Total | | $ | 46,419,844 | | | $ | (42,126,782 | ) | | $ | — | | | $ | 4,293,062 | |
| | (A) | Absent an event of default or early termination, OTC derivative assets and liabilities are presented gross and not offset in the Consolidated Statements of Assets and Liabilities. |
| | (B) | In some instances, the actual collateral received and/or pledged may be more than the amount shown due to overcollateralization. |
| | (C) | Other Derivatives are not subject to a master netting arrangement or another similar arrangement. |
For non-exchange-traded derivatives, under standard derivatives agreements, the Fund may be required to post collateral on derivatives if the Fund is in a net liability position with the counterparty exceeding certain amounts. Additionally, counterparties may immediately terminate derivatives contracts if the Fund fails to maintain sufficient asset coverage for its contracts or its net assets decline by stated percentages.
Effect of Derivative Instruments in the Consolidated Statements of Operations for the year ended October 31, 2014:
| | | | | | | | | | | | | | | | | | | | |
Derivatives not accounted for as hedging
instruments | | Interest rate
contracts | | | Foreign
Exchange
contracts | | | Equity
contracts | | | Commodity
contracts | | | Total | |
Net realized gain (loss) on derivatives recognized in income | | | | | | | | | | | | | | | | | | | | |
Net realized gain (loss) on futures contracts | | $ | (3,070,379 | ) | | $ | — | | | $ | 5,023,413 | | | $ | 8,845,201 | | | $ | 10,798,235 | |
Net realized gain (loss) on swap agreements | | | (1,667,052 | ) | | | — | | | | 2,418,156 | | | | — | | | | 751,104 | |
Net realized gain (loss) on forward foreign currency contracts (A) | | | — | | | | 5,276,623 | | | | — | | | | — | | | | 5,276,623 | |
Total Net realized gain (loss) | | | (4,737,431 | ) | | | 5,276,623 | | | | 7,441,569 | | | | 8,845,201 | | | | 16,825,962 | |
Net change in unrealized appreciation (depreciation) on derivatives recognized in income | | | | | | | | | | | | | | | | | | | | |
Net change in unrealized appreciation (depreciation) on futures contracts | | $ | 4,293,076 | | | $ | — | | | $ | (8,502,441 | ) | | $ | (942,967 | ) | | $ | (5,152,332 | ) |
Net change in unrealized appreciation (depreciation) on swap agreements | | | 3,753,170 | | | | — | | | | 217,236 | | | | — | | | | 3,970,406 | |
Net change in unrealized appreciation (depreciation) on forward foreign currency transactions (B) | | | — | | | | 9,660,553 | | | | — | | | | — | | | | 9,660,553 | |
Total Net change in unrealized appreciation (depreciation) | | | 8,046,246 | | | | 9,660,553 | | | | (8,285,205 | ) | | | (942,967 | ) | | | 8,478,627 | |
Total | | $ | 3,308,815 | | | $ | 14,937,176 | | | $ | (843,636 | ) | | $ | 7,902,234 | | | $ | 25,304,589 | |
| | (A) | Included within Net realized gain (loss) on transactions from Foreign currency transactions. |
| | (B) | Included within Net change in unrealized appreciation (depreciation) on Translation of assets and liabilities denominated in foreign currencies. |
| | |
| Transamerica Funds | | Annual Report 2014 |
Page 190
NOTES TO FINANCIAL STATEMENTS (continued)
At October 31, 2014
NOTE 6. FEDERAL INCOME TAXES AND DISTRIBUTIONS TO SHAREHOLDERS
The Funds have not made any provision for federal income or excise taxes due to its policy to distribute all of their taxable income and capital gains to their shareholders and otherwise qualify as regulated investment companies under Subchapter M of the Internal Revenue Code. The Funds recognize the tax benefits of uncertain tax positions only where the position is “more likely than not” to be sustained assuming examination by tax authorities. The Funds’ federal and state tax returns remain subject to examination by the Internal Revenue Service and state tax authorities for the prior three years. Management has evaluated the Funds’ tax provisions taken for all open tax years, and has concluded that no provision for income tax is required in the Funds’ financial statements. If applicable, the Funds recognize interest accrued related to unrecognized tax benefits in interest and penalties expense in Other on the Statements of Operations or Consolidated Statements of Operations. The Funds identify their major tax jurisdictions as U.S. Federal, the states of Colorado and Florida, and foreign jurisdictions where the Funds make significant investments; however, the Funds are not aware of any tax positions for which it is reasonably possible that the total amounts of unrecognized tax benefits will change materially in the next twelve months. Income and capital gain distributions are determined in accordance with income tax regulations, which may differ from GAAP.
These differences are primarily due to different treatment for items including, but not limited to, wash sales, swaps, net operating losses, distribution reclasses for REITs, passive foreign investment companies, foreign currency transactions, Late Year Ordinary Loss Deferrals, paydown gain/loss, short sales, TIPS, defaulted bond income, partnership basis adjustments, futures contracts, options contracts, sale-buyback, non-REIT return of capital dividends, distribution redesignation and straddle deferral.
Therefore, distributions determined in accordance with tax regulations may differ significantly in amount or character from net investment income and realized gains for financial reporting purposes. Financial reporting records are adjusted for permanent book/tax differences to reflect tax character. These reclassifications have no impact on net assets or results of operations. Financial records are not adjusted for temporary differences. These reclassifications are as follows:
| | | | | | | | | | | | |
| Fund Name | | Shares of
beneficial interest,
unlimited shares
authorized | | | Undistributed
(accumulated) net
investment income (loss) | | | Undistributed
(accumulated) net realized
gain (loss) from
investments | |
Transamerica Arbitrage Strategy | | $ | 569 | | | $ | 378,847 | | | $ | (379,416 | ) |
Transamerica Bond | | | — | | | | 922,946 | | | | (922,946 | ) |
Transamerica Core Bond | | | (1 | ) | | | 4,095,649 | | | | (4,095,648 | ) |
Transamerica Developing Markets Equity | | | — | | | | (2,328,025 | ) | | | 2,328,025 | |
Transamerica Global Real Estate Securities | | | (936 | ) | | | 2,613,039 | | | | (2,612,103 | ) |
Transamerica Growth | | | — | | | | 40,646 | | | | (40,646 | ) |
Transamerica Intermediate Bond | | | (1,000 | ) | | | 123,379 | | | | (122,379 | ) |
Transamerica International Equity Opportunities | | | (2 | ) | | | 98,392 | | | | (98,390 | ) |
Transamerica International Small Cap | | | — | | | | 479,210 | | | | (479,210 | ) |
Transamerica Long/Short Strategy | | | (1,599,515 | ) | | | 1,613,549 | | | | (14,034 | ) |
Transamerica Mid Cap Value | | | 4,457 | | | | (13,757 | ) | | | 9,300 | |
Transamerica Total Return | | | — | | | | 3,255,961 | | | | (3,255,961 | ) |
Transamerica Commodity Strategy | | | (5,755,108 | ) | | | 673,879 | | | | 5,081,229 | |
Transamerica Managed Futures Strategy | | | 9,940,318 | | | | (393,812 | ) | | | (9,546,506 | ) |
At October 31, 2014, the capital loss carryforwards are available to offset future realized capital gains through the periods listed below. Funds not listed in the table below do not have capital loss carryforwards.
| | | | | | |
| Fund Name | | Capital Loss Carryforwards | | | Available Through |
Transamerica Global Real Estate Securities | | $ | 33,179,290 | | | October 31, 2017 |
Transamerica Global Real Estate Securities | | | 12,882,785 | | | October 31, 2018 |
The capital loss carryforwards utilized or expired during the year ended October 31, 2014 were as follows:
| | | | |
| Fund Name | | Capital Loss Carryforwards
Utilized/Expired During the
Year Ended October 31, 2014 | |
Transamerica Arbitrage Strategy | | $ | 663,966 | |
Transamerica Global Real Estate Securities | | | 8,645,494 | |
Transamerica Long/Short Strategy | | | 5,551,617 | |
Transamerica Total Return | | | 5,535,858 | |
| | |
| Transamerica Funds | | Annual Report 2014 |
Page 191
NOTES TO FINANCIAL STATEMENTS (continued)
At October 31, 2014
NOTE 6. (continued)
Funds not listed in the table above do not have capital loss carryforwards utilized or expired.
The tax character of distributions paid may differ from the character of distributions shown in the Statements of Changes in Net Assets due to short-term gains being treated as ordinary income for tax purposes. The tax character of distributions paid during 2014 and 2013 was as follows:
| | | | | | | | | | | | | | | | | | | | | | | | |
| | | 2014 Distributions Paid From | | | 2013 Distributions Paid From | |
| | | Ordinary
Income | | | Long-Term
Capital Gain | | | Return of
Capital | | | Ordinary
Income | | | Long-Term
Capital Gain | | | Return of
Capital | |
Transamerica Arbitrage Strategy | | $ | 525,564 | | | $ | — | | | $ | — | | | $ | 2,781,156 | | | $ | — | | | $ | — | |
Transamerica Bond | | | 33,169,067 | | | | 10,700,391 | | | | — | | | | 36,436,642 | | | | 6,268,339 | | | | — | |
Transamerica Core Bond | | | 40,952,319 | | | | 19,228,964 | | | | — | | | | 50,332,101 | | | | 5,785,007 | | | | — | |
Transamerica Developing Markets Equity | | | 1,260,825 | | | | 13,572,723 | | | | — | | | | 1,448,290 | | | | 35,428,722 | | | | — | |
Transamerica Global Real Estate Securities | | | 1,451,496 | | | | — | | | | — | | | | 12,076,984 | | | | — | | | | — | |
Transamerica Growth | | | — | | | | 70,371,441 | | | | — | | | | 1,116,787 | | | | 58,369,349 | | | | — | |
Transamerica Intermediate Bond | | | 2,543,477 | | | | — | | | | — | | | | — | | | | — | | | | — | |
Transamerica International Equity Opportunities | | | 4,177,263 | | | | 3,204,616 | | | | — | | | | 4,852,052 | �� | | | 8,389,008 | | | | — | |
Transamerica International Small Cap | | | 9,576,661 | | | | 3,176,592 | | | | — | | | | 6,513,025 | | | | — | | | | — | |
Transamerica Long/Short Strategy | | | — | | | | — | | | | — | | | | — | | | | — | | | | — | |
Transamerica Mid Cap Value | | | 2,197,317 | | | | 16,041,021 | | | | — | | | | 2,380,127 | | | | — | | | | — | |
Transamerica Total Return | | | 13,715,169 | | | | — | | | | — | | | | 19,243,502 | | | | — | | | | 498,041 | |
Transamerica Commodity Strategy | | | — | | | | — | | | | — | | | | — | | | | — | | | | — | |
Transamerica Managed Futures Strategy | | | 3,411,286 | | | | 11,404,893 | | | | — | | | | — | | | | — | | | | — | |
The tax basis components of distributable earnings as of October 31, 2014 are as follows:
| | | | | | | | | | | | | | | | | | | | | | | | | | | | |
| | | Undistributed
Ordinary
Income | | | Undistributed
Tax Exempt
Income | | | Undistributed
Long-Term
Capital Gain | | | Capital Loss
Carryforwards | | | Late Year
Ordinary Loss
Deferral | | | Other
Temporary
Differences | | | Net Unrealized
Appreciation
(Depreciation) | |
Transamerica Arbitrage Strategy | | $ | 4,512,876 | | | $ | — | | | $ | — | | | $ | — | | | $ | — | | | $ | (468,089 | ) | | $ | (4,109,993 | ) |
Transamerica Bond | | | 4,727,896 | | | | — | | | | 26,048,735 | | | | — | | | | — | | | | — | | | | 51,629,356 | |
Transamerica Core Bond | | | 219,785 | | | | — | | | | 6,651,666 | | | | — | | | | — | | | | — | | | | 30,138,531 | |
Transamerica Developing Markets Equity | | | 2,390,443 | | | | — | | | | 46,196,134 | | | | — | | | | — | | | | — | | | | 9,844,630 | |
Transamerica Global Real Estate Securities | | | 329,689 | | | | — | | | | — | | | | (46,062,075 | ) | | | — | | | | — | | | | 12,072,919 | |
Transamerica Growth | | | — | | | | — | | | | 90,656,539 | | | | — | | | | (316,526 | ) | | | — | | | | 226,930,444 | |
Transamerica Intermediate Bond | | | 408,095 | | | | — | | | | — | | | | — | | | | — | | | | — | | | | 1,068,058 | |
Transamerica International Equity Opportunities | | | 12,471,815 | | | | — | | | | 26,494,992 | | | | — | | | | — | | | | — | | | | (9,225,878 | ) |
| | |
| Transamerica Funds | | Annual Report 2014 |
Page 192
NOTES TO FINANCIAL STATEMENTS (continued)
At October 31, 2014
NOTE 6. (continued)
| | | | | | | | | | | | | | | | | | | | | | | | | | | | |
| | | Undistributed
Ordinary
Income | | | Undistributed
Tax Exempt
Income | | | Undistributed
Long-Term
Capital Gain | | | Capital Loss
Carryforwards | | | Late Year
Ordinary Loss
Deferral | | | Other
Temporary
Differences | | | Net Unrealized
Appreciation
(Depreciation) | |
Transamerica International Small Cap | | $ | 19,707,708 | | | $ | — | | | $ | 32,771,369 | | | $ | — | | | $ | — | | | $ | — | | | $ | 31,118,740 | |
Transamerica Long/Short Strategy | | | — | | | | — | | | | 1,934,571 | | | | — | | | | (1,570,400 | ) | | | (565,624 | ) | | | 10,081,415 | |
Transamerica Mid Cap Value | | | 2,047,834 | | | | — | | | | 35,456,301 | | | | — | | | | — | | | | — | | | | 80,836,274 | |
Transamerica Total Return | | | 21,625,168 | | | | — | | | | 6,450,040 | | | | — | | | | — | | | | (70,400 | ) | | | (4,718,056 | ) |
Transamerica Commodity Strategy | | | — | | | | — | | | | — | | | | — | | | | (425,680 | ) | | | 31,203,965 | | | | (31,237,006 | ) |
Transamerica Managed Futures Strategy | | | 9,280,990 | | | | — | | | | 12,122,929 | | | | — | | | | — | | | | (5,296,302 | ) | | | (5,593,151 | ) |
NOTE 7. BASIS FOR CONSOLIDATION
The Subsidiaries are organized under the laws of the Cayman Islands as wholly-owned subsidiaries which act as investment vehicles for Transamerica Commodity Strategy, and Transamerica Managed Futures Strategy, respectively. The principal purpose of investment of the Subsidiaries is to allow the Funds noted above to gain exposure to the commodity markets within the limitations of the federal tax law requirements applicable to regulated investment companies.
The following table reflects the net assets of the Subsidiaries as a percentage of the Funds’ net assets at October 31, 2014:
| | | | | | | | | | |
| Fund Name | | Subsidiary Name | | Market Value | | | % of Net
Assets | |
Transamerica Commodity Strategy | | Transamerica Cayman Commodity Strategy, Ltd. | | $ | 11,961,580 | | | | 17.54 | % |
Transamerica Managed Futures Strategy | | Transamerica Cayman Managed Futures, Ltd. | | | 101,265,378 | | | | 22.67 | |
NOTE 8. ACCOUNTING PRONOUNCEMENTS
In June 2014, the Financial Accounting Standards Board issued an Accounting Standards Update No. 2014-11, “Transfers and Servicing, Repurchase-to-Maturity Transactions, Repurchase Financings, and Disclosures”. The guidance changes the accounting for certain repurchase agreements and expands disclosure requirements related to repurchase agreements, securities lending, repurchase-to-maturity and similar transactions. The guidance is effective for financial statements with fiscal years beginning on or after December 15, 2014 and interim periods within those fiscal years. Management is currently evaluating the implication, if any, of the additional disclosure requirements and its impact on the Funds’ financial statements.
| | |
| Transamerica Funds | | Annual Report 2014 |
Page 193
REPORT OF INDEPENDENT REGISTERED PUBLIC ACCOUNTING FIRM
To the Board of Trustees and Shareholders of Transamerica Funds:
We have audited the accompanying statements of assets and liabilities of Transamerica Arbitrage Strategy, Transamerica Bond, Transamerica Core Bond, Transamerica Developing Markets Equity, Transamerica Global Real Estate Securities, Transamerica Growth, Transamerica International Equity Opportunities, Transamerica International Small Cap, Transamerica Long/Short Strategy, Transamerica Mid Cap Value and Transamerica Total Return, including the schedules of investments, as of October 31, 2014, and the related statements of operations for the year then ended, the statements of changes in net assets for each of the two years in the period then ended, and the financial highlights for each of the years or periods indicated therein. We have also audited the accompanying statement of assets and liabilities of Transamerica Intermediate Bond, including the schedule of investments, as of October 31, 2014, and the related statements of operations and changes in net assets, and the financial highlights for the period from March 1, 2014 (commencement of operations) to October 31, 2014. We have also audited the accompanying consolidated statements of assets and liabilities of Transamerica Commodity Strategy and Transamerica Managed Futures Strategy, including the consolidated schedules of investments, as of October 31, 2014, and the related consolidated statements of operations for the year then ended, the consolidated statements of changes in net assets for each of the two years in the period then ended, and the financial highlights for each of the years or periods indicated therein. The aforementioned fourteen funds of the Transamerica Funds are hereafter referred to as the “Funds.” These financial statements and consolidated financial statements and financial highlights are the responsibility of the Funds’ management. Our responsibility is to express an opinion on these financial statements and consolidated financial statements and financial highlights based on our audits.
We conducted our audits in accordance with the standards of the Public Company Accounting Oversight Board (United States). Those standards require that we plan and perform the audit to obtain reasonable assurance about whether the financial statements and financial highlights are free of material misstatement. We were not engaged to perform an audit of the Funds’ internal control over financial reporting. Our audits included consideration of internal control over financial reporting as a basis for designing audit procedures that are appropriate in the circumstances, but not for the purpose of expressing an opinion on the effectiveness of the Funds’ internal control over financial reporting. Accordingly, we express no such opinion. An audit also includes examining, on a test basis, evidence supporting the amounts and disclosures in the financial statements and financial highlights, assessing the accounting principles used and significant estimates made by management, and evaluating the overall financial statement presentation. Our procedures included confirmation of securities owned as of October 31, 2014, by correspondence with the custodian and others or by other appropriate auditing procedures where replies from others were not received. We believe that our audits provide a reasonable basis for our opinion.
In our opinion, the financial statements and consolidated financial statements and financial highlights and referred to above present fairly, in all material respects, the financial position of the aforementioned fourteen Funds of the Transamerica Funds at October 31, 2014, the results of their operations and consolidated operations, the changes in their net assets and consolidated changes in their net assets, and the financial highlights for each of the years or periods indicated therein, in conformity with U.S. generally accepted accounting principles.

Boston, Massachusetts
December 24, 2014
| | |
| Transamerica Funds | | Annual Report 2014 |
Page 194
SUPPLEMENTAL INFORMATION (unaudited)
TAX INFORMATION
For dividends paid during the year ended October 31, 2014, the Funds designated the following maximum amounts of qualified dividend income:
| | | | |
| Fund | | Qualified Dividend
Income | |
Transamerica Arbitrage Strategy | | $ | 525,564 | |
Transamerica Bond | | | 1,089,096 | |
Transamerica Developing Markets Equity | | | 1,260,825 | |
Transamerica Global Real Estate Securities | | | 118,340 | |
Transamerica Growth | | | 3,580,725 | |
Transamerica Intermediate Bond | | | 28,125 | |
Transamerica International Equity Opportunities | | | 7,653,441 | |
Transamerica International Small Cap | | | 11,754,359 | |
Transamerica Mid Cap Value | | | 2,197,317 | |
Transamerica Total Return | | | 135,024 | |
For corporate shareholders, investment income (dividend income plus short-term gains, if any) qualifies for the maximum dividends received deductions as follows:
| | | | |
| Fund | | Dividend Received
Deduction Percentage | |
Transamerica Arbitrage Strategy | | | 7 | % |
Transamerica Bond | | | 3 | |
Transamerica Core Bond | | | — | |
Transamerica Developing Markets Equity | | | 0 | (A) |
Transamerica Global Real Estate Securities | | | 1 | |
Transamerica Intermediate Bond | | | 1 | |
Transamerica International Equity Opportunities | | | 0 | (A) |
Transamerica International Small Cap | | | 67 | |
Transamerica Mid Cap Value | | | 100 | |
Transamerica Total Return | | | 0 | (A) |
| | (A) | Rounds to less than 1%. |
For tax purposes, the long-term capital gain designations for the year ended October 31, 2014 were as follows:
| | | | |
| Fund | | Long-Term Capital Gain
Designation | |
Transamerica Arbitrage Strategy | | $ | — | |
Transamerica Bond | | | 10,700,391 | |
Transamerica Core Bond | | | 19,228,964 | |
Transamerica Developing Markets Equity | | | 13,572,723 | |
Transamerica Global Real Estate Securities | | | — | |
Transamerica Growth | | | 70,371,441 | |
Transamerica Intermediate Bond | | | — | |
Transamerica International Equity Opportunities | | | 3,204,616 | |
Transamerica International Small Cap | | | 3,176,592 | |
Transamerica Long/Short Strategy | | | — | |
Transamerica Mid Cap Value | | | 16,041,021 | |
Transamerica Total Return | | | — | |
Transamerica Commodity Strategy | | | — | |
Transamerica Managed Futures Strategy | | | 11,404,893 | |
| | |
| Transamerica Funds | | Annual Report 2014 |
Page 195
The amounts which represent income derived from sources within, and taxes paid to, foreign countries or possessions of the United States are as follows:
| | | | | | | | |
| Fund | | Foreign Source Income | | | Foreign Taxes | |
Transamerica Developing Markets Equity | | $ | 11,220,589 | | | $ | 1,727,657 | |
Transamerica International Equity Opportunities | | | 12,353,253 | | | | 455,821 | |
Transamerica International Small Cap | | | 17,449,394 | | | | 799,370 | |
The information and distributions reported herein may differ from the information and distributions taxable to the shareholders for the calendar year ending December 31, 2014. Complete information will be computed and reported in conjunction with your 2014 Form 1099-DIV.
| | |
| Transamerica Funds | | Annual Report 2014 |
Page 196
INVESTMENT ADVISORY AND SUB-ADVISORY AGREEMENTS — CONTRACT RENEWAL
At a meeting of the Board of Trustees of Transamerica Funds (the “Trustees” or the “Board”) held on June 18-19, 2014, the Board considered the renewal of the investment advisory agreements (each an “Investment Advisory Agreement”) between each of the following funds (each a “Fund” and collectively the “Funds”) and Transamerica Asset Management, Inc. (“TAM”):
| | |
Transamerica Arbitrage Strategy | | Transamerica International Equity Opportunities |
Transamerica Bond | | Transamerica International Small Cap |
Transamerica Commodity Strategy | | Transamerica Long/Short Strategy |
Transamerica Core Bond | | Transamerica Managed Futures Strategy |
Transamerica Developing Markets Equity | | Transamerica Mid Cap Value |
Transamerica Global Real Estate Securities | | Transamerica Total Return |
Transamerica Growth | | |
For the Funds listed in the left-hand column below, the Board also considered the renewal of the investment sub-advisory agreements (each a “Sub-Advisory Agreement” and, together with each Investment Advisory Agreement, the “Agreements”) between TAM and the corresponding sub-advisers listed in the right-hand column below (each a “Sub-Adviser” and collectively the “Sub-Advisers”).
| | |
| Fund | | Sub-Adviser |
Transamerica Arbitrage Strategy | | Water Island Capital, LLC |
Transamerica Bond | | Loomis, Sayles & Company, L.P. |
Transamerica Commodity Strategy | | Goldman Sachs Asset Management, L.P. |
Transamerica Core Bond | | J.P. Morgan Investment Management Inc. |
Transamerica Developing Markets Equity | | OppenheimerFunds, Inc. |
Transamerica Global Real Estate Securities | | CBRE Clarion Securities LLC |
Transamerica Growth | | Jennison Associates LLC |
Transamerica International Equity Opportunities | | MFS Investment Management |
Transamerica International Small Cap | | Schroder Investment Management North America Inc./Schroeder Investment Management North America Limited |
Transamerica Long/Short Strategy | | J.P. Morgan Investment Management Inc. |
Transamerica Managed Futures Strategy | | AQR Capital Management, LLC |
Transamerica Mid Cap Value | | J.P. Morgan Investment Management Inc. |
Transamerica Total Return | | Pacific Investment Management Company LLC |
With respect to each of Transamerica Commodity Strategy and Transamerica Managed Futures Strategy, the Board’s consideration of the applicable Investment Advisory Agreement and Sub-Advisory Agreement also included consideration of (i) the investment advisory agreement between TAM and the Fund’s wholly owned subsidiary organized under the laws of the Cayman Islands; and (ii) the investment sub-advisory agreement between TAM and the Fund’s Sub-Adviser relating to the Fund’s subsidiary.
Following its review and consideration, the Board determined that the terms of each Investment Advisory Agreement and Sub-Advisory Agreement are reasonable and that the renewal of each of the Agreements is in the best interests of the applicable Fund and its shareholders. The Board, including the independent members of the Board (the “Independent Trustees”), unanimously approved the renewal of each of the Agreements through June 30, 2015. In reaching their decision, the Trustees requested and received from TAM and each Sub-Adviser such information as they deemed reasonably necessary to evaluate the Agreements, including, to the extent applicable, information about fees and performance of comparable funds and/or accounts managed by each Sub-Adviser. The Trustees also considered information they had previously received from TAM and each Sub-Adviser as part of their regular oversight of each Fund, as well as comparative fee, expense and performance information prepared by Lipper Inc. (“Lipper”), an independent provider of mutual fund performance information, and fee, expense and profitability information prepared by TAM.
In their deliberations, the Independent Trustees had the opportunity to meet privately without representatives of TAM or any Sub-Adviser present and were represented throughout the process by independent legal counsel. In considering the proposed continuation of each of the Agreements, the Trustees evaluated a number of considerations that they believed, in light of the legal advice furnished to them by independent legal counsel and/or their own business judgment, to be relevant. They based their decisions on the considerations discussed below, among others, although they did not identify any particular consideration or information that was controlling of their decisions, and each Trustee may have attributed different weights to the various factors.
Nature, Extent and Quality of the Services Provided
The Board considered the nature, extent and quality of the services provided by TAM and each Sub-Adviser to the applicable Fund in the past and the services anticipated to be provided in the future. The Board also considered the investment approach for each Fund; the
| | |
| Transamerica Funds | | Annual Report 2014 |
Page 197
INVESTMENT ADVISORY AND SUB-ADVISORY AGREEMENTS — CONTRACT RENEWAL (continued)
experience, capability and integrity of TAM’s senior management; the financial resources of TAM and each Sub-Adviser; TAM’s management oversight process; and the professional qualifications of the portfolio management team of each Sub-Adviser. The Trustees noted that they receive, on a quarterly basis, an execution analysis from Capital Institutional Services, Inc. (CAPIS), an independent provider of trade analyses, for each applicable Sub-Adviser and a comparison of trading results against a peer universe of managers.
The Board also considered the continuous and regular investment advisory and other services provided by TAM for the portion of the investment advisory fee it retains after payment of the sub-advisory fee(s) for each Fund. The Board noted that the investment advisory services include the design, development and ongoing review and evaluation of each Fund and its investment strategy; where applicable the selection, oversight and monitoring of one or more investment sub-advisers to perform certain duties with respect to the Funds; ongoing portfolio trading oversight and analysis; risk management oversight and analysis; design, development, implementation and ongoing review and evaluation of a process for the valuation of Fund investments; design, development, implementation and ongoing review and evaluation of a compliance program for the Funds; design, development, implementation and ongoing review and evaluation of a process for the voting of proxies and rights to consent to corporate action for Fund investments; participation in Board meetings and oversight of preparation of materials for the Board, including materials for Board meetings and regular communications with the Board; oversight of preparation of the Funds’ prospectuses, statements of additional information, shareholder reports and other disclosure materials and regulatory filings for the Funds; and ongoing cash management services. The Board also noted that TAM, as part of the investment advisory services it provides to all Transamerica mutual funds, including the Funds, oversees the services provided by the funds’ administrator, custodian, transfer agent, independent accountant and legal counsel and supervises the performance of the recordkeeping and shareholder functions of the funds.
Based on these considerations, the Board determined that TAM and each Sub-Adviser can provide investment and related services that are appropriate in scope and extent in light of the applicable Fund’s operations, the competitive landscape of the investment company business and investor needs.
Investment Performance
The Board considered the short- and longer-term performance, as applicable, of each Fund in light of its investment objective, policies and strategies, including relative performance against (i) a peer universe of comparable mutual funds, as prepared by Lipper, and (ii) the Fund’s benchmark(s), in each case for various trailing periods ended December 31, 2013.
Transamerica Arbitrage Strategy. The Board noted that the performance of Class I2 Shares of the Fund was below the median for its peer universe for the past 1-year period. The Board also noted that the performance of Class I2 Shares of the Fund was above its benchmark for the past 1-year period. The Trustees discussed the reasons for the underperformance with TAM and agreed to continue to monitor the performance of the Fund.
Transamerica Bond. The Board noted that the performance of Class I2 Shares of the Fund was above the median for its peer universe for the past 1-, 3- and 5-year periods. The Board also noted that the performance of Class I2 Shares of the Fund was above its benchmark for the past 1-, 3- and 5-year periods.
Transamerica Commodity Strategy. The Board noted that the performance of Class I2 Shares of the Fund was above the median for its peer universe for the past 5-year period and below the median for the past 1- and 3-year periods. The Board also noted that the performance of Class I2 Shares of the Fund was above its benchmark for the past 3- and 5-year periods and below its benchmark for the past 1-year period. The Trustees discussed the reasons for the underperformance with TAM and agreed to continue to monitor the performance of the Fund. The Trustees also noted recent changes in the Fund’s portfolio management team. The Trustees noted that TAM intends to monitor and report to the Board on the portfolio manager transition and performance going forward. The Board also noted that the Fund’s performance included the management of a previous sub-adviser to the Fund.
Transamerica Core Bond. The Board noted that the performance of Class I2 Shares of the Fund was in line with the median for its peer universe for the past 1- and 3-year periods. The Board also noted that the performance of Class I2 Shares of the Fund was above its benchmark for the past 1- and 3-year periods.
Transamerica Developing Markets Equity. The Board noted that the performance of Class I2 Shares of the Fund was above the median for its peer universe for the past 1-, 3- and 5-year periods. The Board also noted that the performance of Class I2 Shares of the Fund was above its benchmark for the past 1-, 3- and 5-year periods.
Transamerica Global Real Estate Securities. The Board noted that the performance of Class I2 Shares of the Fund was above the median for its peer universe for the past 1-year period, in line with the median for the past 3-year period and below the median for the past 5-year period. The Board also noted that the performance of Class I2 Shares of the Fund was below its benchmark for the past 1-, 3- and 5-year periods. The Trustees discussed the reasons for the underperformance with TAM and TAM agreed to continue to monitor and report to the Board on the performance of the Fund.
| | |
| Transamerica Funds | | Annual Report 2014 |
Page 198
INVESTMENT ADVISORY AND SUB-ADVISORY AGREEMENTS — CONTRACT RENEWAL (continued)
Transamerica Growth. The Board noted that the performance of Class I2 Shares of the Fund was above the median for its peer universe for the past 1-, 3- and 5-year periods. The Board also noted that the performance of Class I2 Shares of the Fund was above its benchmark for the past 1-, 3- and 5-year periods.
Transamerica International Equity Opportunities. The Board noted that the performance of Class I2 Shares of the Fund was above the median for its peer universe for the past 3- and 5-year periods and in line with the median for the past 1-year period. The Board also noted that the performance of Class I2 Shares of the Fund was above its benchmark for the past 3- and 5-year periods and below its benchmark for the past 1-year period.
Transamerica International Small Cap. The Board noted that the performance of Class I2 Shares of the Fund was above the median for its peer universe for the past 1-year period and below the median for the past 3- and 5-year periods. The Board also noted that the performance of Class I2 Shares of the Fund was above its benchmark for the past 1-year period and below its benchmark for the past 3- and 5-year periods. The Trustees discussed the reasons for the underperformance with TAM and TAM agreed to continue to monitor and report to the Board on the performance of the Fund.
Transamerica Long/Short Strategy. The Board noted that the performance of Class I2 Shares of the Fund was below the median for its peer universe for the past 1-, 3- and 5-year periods. The Board also noted that the performance of Class I2 Shares of the Fund was above its primary benchmark for the past 1- and 3-year periods and below its primary benchmark for the past 5-year period. The Trustees discussed the reasons for the underperformance with TAM and agreed to continue to monitor the performance of the Fund. The Trustees also noted recent and anticipated changes in the Fund’s portfolio management team. The Trustees noted that TAM intends to monitor and report to the Board on the portfolio manager transition and performance going forward.
Transamerica Managed Futures Strategy. The Board noted that the performance of Class I2 Shares of the Fund was above the median for its peer universe for the past 1- and 3-year periods. The Board also noted that the performance of Class I2 Shares of the Fund was above its benchmark for the past 1-year period and below its benchmark for the past 3-year period.
Transamerica Mid Cap Value. The Board noted that the performance of Class I2 Shares of the Fund was above the median for its peer universe for the past 3- and 5-year periods and in line with the median for the past 1-year period. The Board also noted that the performance of Class I2 Shares of the Fund was above its benchmark for the past 3-year period and below its benchmark for the past 1- and 5-year periods.
Transamerica Total Return. The Board noted that the performance of Class I2 Shares of the Fund was in line with the median for its peer universe for the past 5-year period, and below the median for the past 1- and 3-year periods. The Board also noted that the performance of Class I2 Shares of the Fund was above its benchmark for the past 3- and 5-year periods and below its benchmark for the past 1-year period. The Trustees discussed the reasons for the underperformance with TAM and agreed to continue to monitor the performance of the Fund. The Trustees also noted recent changes in the Fund’s portfolio management team. The Trustees noted that TAM intends to monitor and report to the Board on the portfolio manager transition and performance going forward.
On the basis of this information and the Board’s assessment of the nature, extent and quality of the services to be provided or procured by TAM and provided by the Sub-Advisers, the Board concluded that TAM and each Sub-Adviser are capable of generating a level of investment performance that is appropriate in light of the applicable Fund’s investment objectives, policies and strategies and that is competitive with other investment companies.
Investment Advisory and Sub-Advisory Fees and Total Expense Ratios
The Board considered the investment advisory fee and total expense ratio of each Fund, including information provided by Lipper comparing the investment advisory fee and total expense ratio of each Fund to the investment advisory fees and total expense ratios of other investment companies in both a peer group and broader peer universe compiled by Lipper. The Board also considered the fees charged by the Sub-Advisers for sub-advisory services, the portion of a Fund’s investment advisory fee retained by TAM following payment of the sub-advisory fee(s) and how the portion of the contractual investment advisory fee retained by TAM at a specified asset level compared to the portions retained by other investment advisers managing mutual funds with similar investment strategies as calculated by Strategic Insight, an independent provider of information (except for Transamerica International Equity Opportunities and Transamerica Total Return, which were calculated by TAM).
Transamerica Arbitrage Strategy. The Board noted that the Fund’s contractual investment advisory fee was below the medians for its peer group and peer universe and that the actual total expenses (i.e., expenses reflecting any waivers and/or reimbursements) of Class I2 Shares of the Fund were below the medians for its peer group and peer universe. The Board also noted that TAM has entered into an expense limitation arrangement with the Fund, which may result in TAM waiving fees for the benefit of shareholders.
Transamerica Bond. The Board noted that the Fund’s contractual investment advisory fee was above the medians for its peer group and peer universe and that the actual total expenses (i.e., expenses reflecting any waivers and/or reimbursements) of Class I2 Shares
| | |
| Transamerica Funds | | Annual Report 2014 |
Page 199
INVESTMENT ADVISORY AND SUB-ADVISORY AGREEMENTS — CONTRACT RENEWAL (continued)
of the Fund were in line with the median for its peer group and below the median for its peer universe. The Board also noted that TAM has entered into an expense limitation arrangement with the Fund, which may result in TAM waiving fees for the benefit of shareholders.
Transamerica Commodity Strategy. The Board noted that the Fund’s contractual investment advisory fee was below the medians for its peer group and peer universe and that the actual total expenses (i.e., expenses reflecting any waivers and/or reimbursements) of Class I2 Shares of the Fund were below the medians for its peer group and peer universe. The Board also noted that TAM has entered into an expense limitation arrangement with the Fund, which may result in TAM waiving fees for the benefit of shareholders.
Transamerica Core Bond. The Board noted that the Fund’s contractual investment advisory fee was in line with the medians for its peer group and peer universe and that the actual total expenses (i.e., expenses reflecting any waivers and/or reimbursements) of Class I2 Shares of the Fund were below the medians for its peer group and peer universe. The Board also noted that TAM has entered into an expense limitation arrangement with the Fund, which may result in TAM waiving fees for the benefit of shareholders.
Transamerica Developing Markets Equity. The Board noted that the Fund’s contractual investment advisory fee was in line with the median for its peer group and above the median for its peer universe and that the actual total expenses (i.e., expenses reflecting any waivers and/or reimbursements) of Class I2 Shares of the Fund were below the medians for its peer group and peer universe. The Board also noted that TAM has entered into an expense limitation arrangement with the Fund, which may result in TAM waiving fees for the benefit of shareholders.
Transamerica Global Real Estate Securities. The Board noted that the Fund’s contractual investment advisory fee was in line with the medians for its peer group and peer universe and that the actual total expenses (i.e., expenses reflecting any waivers and/or reimbursements) of Class I2 Shares of the Fund were below the medians for its peer group and peer universe. The Board also noted that TAM has entered into an expense limitation arrangement with the Fund, which may result in TAM waiving fees for the benefit of shareholders.
Transamerica Growth. The Board noted that the Fund’s contractual investment advisory fee was in line with the median for its peer group and above the median for its peer universe and that the actual total expenses (i.e., expenses reflecting any waivers and/or reimbursements) of Class I2 Shares of the Fund were below the medians for its peer group and peer universe. The Board also noted that TAM has entered into an expense limitation arrangement with the Fund, which may result in TAM waiving fees for the benefit of shareholders.
Transamerica International Equity Opportunities. The Board noted that the Fund’s contractual investment advisory fee was above the medians for its peer group and peer universe and that the actual total expenses (i.e., expenses reflecting any waivers and/or reimbursements) of Class I2 Shares of the Fund were below the medians for its peer group and peer universe. The Board also noted that TAM has entered into an expense limitation arrangement with the Fund, which may result in TAM waiving fees for the benefit of shareholders.
Transamerica International Small Cap. The Board noted that the Fund’s contractual investment advisory fee was in line with the median for its peer group and above the median for its peer universe and that the actual total expenses (i.e., expenses reflecting any waivers and/or reimbursements) of Class I2 Shares of the Fund were below the medians for its peer group and peer universe. The Board also noted that TAM has entered into an expense limitation arrangement with the Fund, which may result in TAM waiving fees for the benefit of shareholders.
Transamerica Long/Short Strategy. The Board noted that the Fund’s contractual investment advisory fee was in line with the medians for its peer group and peer universe and that the actual total expenses (i.e., expenses reflecting any waivers and/or reimbursements) of Class I2 Shares of the Fund were below the median for its peer group and in line with the median for its peer universe. The Board also noted that TAM has entered into an expense limitation arrangement with the Fund, which may result in TAM waiving fees for the benefit of shareholders.
Transamerica Managed Futures Strategy. The Board noted that the Fund’s contractual investment advisory fee was below the medians for its peer group and peer universe and that the actual total expenses (i.e., expenses reflecting any waivers and/or reimbursements) of Class I2 Shares of the Fund were below the medians for its peer group and peer universe. The Board also noted that TAM has entered into an expense limitation arrangement with the Fund, which may result in TAM waiving fees for the benefit of shareholders.
Transamerica Mid Cap Value. The Board noted that the Fund’s contractual investment advisory fee was above the median for its peer group and in line with the median for its peer universe and that the actual total expenses (i.e., expenses reflecting any waivers and/or reimbursements) of Class I2 Shares of the Fund were below the medians for its peer group and peer universe. The Board also noted that TAM has entered into an expense limitation arrangement with the Fund, which may result in TAM waiving fees for the benefit of shareholders.
| | |
| Transamerica Funds | | Annual Report 2014 |
Page 200
INVESTMENT ADVISORY AND SUB-ADVISORY AGREEMENTS — CONTRACT RENEWAL (continued)
Transamerica Total Return. The Board noted that the Fund’s contractual investment advisory fee was above the medians for its peer group and peer universe and that the actual total expenses (i.e., expenses reflecting any waivers and/or reimbursements) of Class I2 Shares of the Fund were above the medians for its peer group and peer universe.
On the basis of these considerations, together with the other information it considered, the Board determined that the investment advisory and sub-advisory fees to be received by TAM and the Sub-Advisers under each Investment Advisory Agreement and Sub-Advisory Agreement are reasonable in light of the services provided.
Cost of Services Provided and Level of Profitability
The Board reviewed information provided by TAM about the cost of providing and procuring fund management services, as well as the costs of the provision of administration, transfer agency and other services, to each Fund and to Transamerica Funds as a whole by TAM and its affiliates. The Board considered the profitability of TAM and its affiliates in providing these services for each Fund and Transamerica Funds as a whole, as well as the allocation methodology used for calculating profitability. The Board also considered the assessment prepared by Ernst & Young LLP (“E&Y”), independent registered public accounting firm and auditor to the Funds, to assist the Board’s evaluation of TAM’s profitability analysis. E&Y’s engagement included the review and assessment of the revenue and expense allocation methodology used by TAM to estimate its profitability with respect to its relationship with the Funds, and completion of procedures in respect of the mathematical accuracy of the profitability calculation and its conformity to established allocation methodologies. After considering E&Y’s assessment and information provided by TAM, the Board concluded that, while other allocation methods may also be reasonable, TAM’s profitability methodologies are reasonable.
With respect to the Sub-Advisers, the Board noted that the sub-advisory fees are the product of arm’s-length negotiation between TAM and the applicable Sub-Adviser and are paid by TAM and not the applicable Fund. As a result, the Board principally considered the profitability of TAM and its affiliates with respect to the applicable Fund.
Based on this information, the Board determined that the profitability of TAM and its affiliates from their relationships with the Funds was not excessive.
Economies of Scale
The Board considered economies of scale with respect to the management of each Fund, whether the Fund had appropriately benefited from any economies of scale and whether there was the potential for realization of any further economies of scale. The Board also considered the existence of economies of scale with respect to management of the Transamerica mutual funds overall and the extent to which the Funds benefited from these economies of scale. The Board considered each Fund’s investment advisory fee schedule and the existence of breakpoints, if any, and also considered the extent to which TAM shared economies of scale with the Funds through investments in maintaining and developing its capabilities and services. The Trustees concluded that each Fund’s fee structure reflected economies of scale to date and noted that they will have the opportunity to periodically reexamine the appropriateness of the investment advisory fees payable to TAM and the fees paid to the Sub-Advisers and whether each Fund has achieved economies of scale in the future.
Benefits to TAM, its Affiliates and the Sub-Advisers from their Relationships with the Funds
The Board considered any other benefits derived by TAM, its affiliates, and the Sub-Advisers from their relationships with the Funds. The Board noted that TAM does not realize soft dollar benefits from its relationships with the Funds and that TAM believes that any use of soft dollars by the Sub-Advisers is generally appropriate and in the best interests of the Funds. The Board also noted that certain Sub-Advisers are participating in a brokerage program pursuant to which a portion of brokerage commissions paid by each applicable Fund is recaptured for the benefit of the Fund and its shareholders, thus limiting the amount of soft dollar arrangements the Sub-Adviser may engage in with respect to a Fund’s brokerage transactions.
Other Considerations
The Board noted that TAM has made a substantial commitment to the recruitment and retention of high quality personnel and maintains the financial, compliance and operational resources reasonably necessary to manage each Fund in a professional manner that is consistent with the best interests of the Fund and its shareholders. In this regard, the Board favorably considered the procedures and policies TAM has in place to enforce compliance with applicable laws and regulations and oversee the portfolio management activities of the Sub-Advisers. The Board also noted that TAM has made a significant entrepreneurial commitment to the management and success of the Funds.
Conclusion
After consideration of the factors described above, as well as other factors, the Trustees, including the Independent Trustees, concluded that the renewal of each Investment Advisory Agreement and Sub-Advisory Agreement is in the best interests of the applicable Fund and its shareholders and voted to approve the renewal of the Agreements.
| | |
| Transamerica Funds | | Annual Report 2014 |
Page 201
TRANSAMERICA FUNDS
INVESTMENT ADVISORY AND SUB-ADVISORY AGREEMENTS — CONTRACT RENEWAL
At a meeting of the Board of Trustees of Transamerica Funds (the “Trustees” or the “Board”) held on June 18-19, 2014, the Board considered the renewal of the investment advisory agreements (each an “Investment Advisory Agreement”) between each of the following funds (each a “Fund” and collectively the “Funds”) and Transamerica Asset Management, Inc. (“TAM”):
| | |
Transamerica Arbitrage Strategy | | Transamerica International Equity Opportunities |
Transamerica Bond | | Transamerica International Small Cap |
Transamerica Commodity Strategy | | Transamerica Long/Short Strategy |
Transamerica Core Bond | | Transamerica Managed Futures Strategy |
Transamerica Developing Markets Equity | | Transamerica Mid Cap Value |
Transamerica Global Real Estate Securities | | Transamerica Total Return |
Transamerica Growth | | |
For the Funds listed in the left-hand column below, the Board also considered the renewal of the investment sub-advisory agreements (each a “Sub-Advisory Agreement” and, together with each Investment Advisory Agreement, the “Agreements”) between TAM and the corresponding sub-advisers listed in the right-hand column below (each a “Sub-Adviser” and collectively the “Sub-Advisers”).
| | |
| Fund | | Sub-Adviser |
Transamerica Arbitrage Strategy | | Water Island Capital, LLC |
Transamerica Bond | | Loomis, Sayles & Company, L.P. |
Transamerica Commodity Strategy | | Goldman Sachs Asset Management, L.P. |
Transamerica Core Bond | | J.P. Morgan Investment Management Inc. |
Transamerica Developing Markets Equity | | OppenheimerFunds, Inc. |
Transamerica Global Real Estate Securities | | CBRE Clarion Securities LLC |
Transamerica Growth | | Jennison Associates LLC |
Transamerica International Equity Opportunities | | MFS Investment Management |
Transamerica International Small Cap | | Schroder Investment Management North America Inc./Schroeder Investment Management North America Limited |
Transamerica Long/Short Strategy | | J.P. Morgan Investment Management Inc. |
Transamerica Managed Futures Strategy | | AQR Capital Management, LLC |
Transamerica Mid Cap Value | | J.P. Morgan Investment Management Inc. |
Transamerica Total Return | | Pacific Investment Management Company LLC |
With respect to each of Transamerica Commodity Strategy and Transamerica Managed Futures Strategy, the Board’s consideration of the applicable Investment Advisory Agreement and Sub-Advisory Agreement also included consideration of (i) the investment advisory agreement between TAM and the Fund’s wholly owned subsidiary organized under the laws of the Cayman Islands; and (ii) the investment sub-advisory agreement between TAM and the Fund’s Sub-Adviser relating to the Fund’s subsidiary.
Following its review and consideration, the Board determined that the terms of each Investment Advisory Agreement and Sub-Advisory Agreement are reasonable and that the renewal of each of the Agreements is in the best interests of the applicable Fund and its shareholders. The Board, including the independent members of the Board (the “Independent Trustees”), unanimously approved the renewal of each of the Agreements through June 30, 2015. In reaching their decision, the Trustees requested and received from TAM and each Sub-Adviser such information as they deemed reasonably necessary to evaluate the Agreements, including, to the extent applicable, information about fees and performance of comparable funds and/or accounts managed by each Sub-Adviser. The Trustees also considered information they had previously received from TAM and each Sub-Adviser as part of their regular oversight of each Fund, as well as comparative fee, expense and performance information prepared by Lipper Inc. (“Lipper”), an independent provider of mutual fund performance information, and fee, expense and profitability information prepared by TAM.
In their deliberations, the Independent Trustees had the opportunity to meet privately without representatives of TAM or any Sub-Adviser present and were represented throughout the process by independent legal counsel. In considering the proposed continuation of each of the Agreements, the Trustees evaluated a number of considerations that they believed, in light of the legal advice furnished to them by independent legal counsel and/or their own business judgment, to be relevant. They based their decisions on the considerations discussed below, among others, although they did not identify any particular consideration or information that was controlling of their decisions, and each Trustee may have attributed different weights to the various factors.
| | |
| Transamerica Funds | | Annual Report 2014 |
Page 202
TRANSAMERICA FUNDS
INVESTMENT ADVISORY AND SUB-ADVISORY AGREEMENTS — CONTRACT RENEWAL (continued)
Nature, Extent and Quality of the Services Provided
The Board considered the nature, extent and quality of the services provided by TAM and each Sub-Adviser to the applicable Fund in the past and the services anticipated to be provided in the future. The Board also considered the investment approach for each Fund; the experience, capability and integrity of TAM’s senior management; the financial resources of TAM and each Sub-Adviser; TAM’s management oversight process; and the professional qualifications of the portfolio management team of each Sub-Adviser. The Trustees noted that they receive, on a quarterly basis, an execution analysis from Capital Institutional Services, Inc. (CAPIS), an independent provider of trade analyses, for each applicable Sub-Adviser and a comparison of trading results against a peer universe of managers.
The Board also considered the continuous and regular investment advisory and other services provided by TAM for the portion of the investment advisory fee it retains after payment of the sub-advisory fee(s) for each Fund. The Board noted that the investment advisory services include the design, development and ongoing review and evaluation of each Fund and its investment strategy; where applicable the selection, oversight and monitoring of one or more investment sub-advisers to perform certain duties with respect to the Funds; ongoing portfolio trading oversight and analysis; risk management oversight and analysis; design, development, implementation and ongoing review and evaluation of a process for the valuation of Fund investments; design, development, implementation and ongoing review and evaluation of a compliance program for the Funds; design, development, implementation and ongoing review and evaluation of a process for the voting of proxies and rights to consent to corporate action for Fund investments; participation in Board meetings and oversight of preparation of materials for the Board, including materials for Board meetings and regular communications with the Board; oversight of preparation of the Funds’ prospectuses, statements of additional information, shareholder reports and other disclosure materials and regulatory filings for the Funds; and ongoing cash management services. The Board also noted that TAM, as part of the investment advisory services it provides to all Transamerica mutual funds, including the Funds, oversees the services provided by the funds’ administrator, custodian, transfer agent, independent accountant and legal counsel and supervises the performance of the recordkeeping and shareholder functions of the funds.
Based on these considerations, the Board determined that TAM and each Sub-Adviser can provide investment and related services that are appropriate in scope and extent in light of the applicable Fund’s operations, the competitive landscape of the investment company business and investor needs.
Investment Performance
The Board considered the short- and longer-term performance, as applicable, of each Fund in light of its investment objective, policies and strategies, including relative performance against (i) a peer universe of comparable mutual funds, as prepared by Lipper, and (ii) the Fund’s benchmark(s), in each case for various trailing periods ended December 31, 2013.
Transamerica Arbitrage Strategy. The Board noted that the performance of Class I2 Shares of the Fund was below the median for its peer universe for the past 1-year period. The Board also noted that the performance of Class I2 Shares of the Fund was above its benchmark for the past 1-year period. The Trustees discussed the reasons for the underperformance with TAM and agreed to continue to monitor the performance of the Fund.
Transamerica Bond. The Board noted that the performance of Class I2 Shares of the Fund was above the median for its peer universe for the past 1-, 3- and 5-year periods. The Board also noted that the performance of Class I2 Shares of the Fund was above its benchmark for the past 1-, 3- and 5-year periods.
Transamerica Commodity Strategy. The Board noted that the performance of Class I2 Shares of the Fund was above the median for its peer universe for the past 5-year period and below the median for the past 1- and 3-year periods. The Board also noted that the performance of Class I2 Shares of the Fund was above its benchmark for the past 3- and 5-year periods and below its benchmark for the past 1-year period. The Trustees discussed the reasons for the underperformance with TAM and agreed to continue to monitor the performance of the Fund. The Trustees also noted recent changes in the Fund’s portfolio management team. The Trustees noted that TAM intends to monitor and report to the Board on the portfolio manager transition and performance going forward. The Board also noted that the Fund’s performance included the management of a previous sub-adviser to the Fund.
Transamerica Core Bond. The Board noted that the performance of Class I2 Shares of the Fund was in line with the median for its peer universe for the past 1- and 3-year periods. The Board also noted that the performance of Class I2 Shares of the Fund was above its benchmark for the past 1- and 3- year periods.
Transamerica Developing Markets Equity. The Board noted that the performance of Class I2 Shares of the Fund was above the median for its peer universe for the past 1-, 3- and 5-year periods. The Board also noted that the performance of Class I2 Shares of the Fund was above its benchmark for the past 1-, 3- and 5-year periods.
| | |
| Transamerica Funds | | Annual Report 2014 |
Page 203
TRANSAMERICA FUNDS
INVESTMENT ADVISORY AND SUB-ADVISORY AGREEMENTS — CONTRACT RENEWAL (continued)
Transamerica Global Real Estate Securities. The Board noted that the performance of Class I2 Shares of the Fund was above the median for its peer universe for the past 1-year period, in line with the median for the past 3-year period and below the median for the past 5-year period. The Board also noted that the performance of Class I2 Shares of the Fund was below its benchmark for the past 1-, 3- and 5-year periods. The Trustees discussed the reasons for the underperformance with TAM and TAM agreed to continue to monitor and report to the Board on the performance of the Fund.
Transamerica Growth. The Board noted that the performance of Class I2 Shares of the Fund was above the median for its peer universe for the past 1-, 3- and 5-year periods. The Board also noted that the performance of Class I2 Shares of the Fund was above its benchmark for the past 1-, 3- and 5-year periods.
Transamerica International Equity Opportunities. The Board noted that the performance of Class I2 Shares of the Fund was above the median for its peer universe for the past 3- and 5-year periods and in line with the median for the past 1-year period. The Board also noted that the performance of Class I2 Shares of the Fund was above its benchmark for the past 3- and 5-year periods and below its benchmark for the past 1-year period.
Transamerica International Small Cap. The Board noted that the performance of Class I2 Shares of the Fund was above the median for its peer universe for the past 1-year period and below the median for the past 3- and 5-year periods. The Board also noted that the performance of Class I2 Shares of the Fund was above its benchmark for the past 1-year period and below its benchmark for the past 3- and 5-year periods. The Trustees discussed the reasons for the underperformance with TAM and TAM agreed to continue to monitor and report to the Board on the performance of the Fund.
Transamerica Long/Short Strategy. The Board noted that the performance of Class I2 Shares of the Fund was below the median for its peer universe for the past 1-, 3- and 5-year periods. The Board also noted that the performance of Class I2 Shares of the Fund was above its primary benchmark for the past 1- and 3-year periods and below its primary benchmark for the past 5-year period. The Trustees discussed the reasons for the underperformance with TAM and agreed to continue to monitor the performance of the Fund. The Trustees also noted recent and anticipated changes in the Fund’s portfolio management team. The Trustees noted that TAM intends to monitor and report to the Board on the portfolio manager transition and performance going forward.
Transamerica Managed Futures Strategy. The Board noted that the performance of Class I2 Shares of the Fund was above the median for its peer universe for the past 1- and 3-year periods. The Board also noted that the performance of Class I2 Shares of the Fund was above its benchmark for the past 1-year period and below its benchmark for the past 3-year period.
Transamerica Mid Cap Value. The Board noted that the performance of Class I2 Shares of the Fund was above the median for its peer universe for the past 3- and 5-year periods and in line with the median for the past 1-year period. The Board also noted that the performance of Class I2 Shares of the Fund was above its benchmark for the past 3-year period and below its benchmark for the past 1- and 5-year periods.
Transamerica Total Return. The Board noted that the performance of Class I2 Shares of the Fund was in line with the median for its peer universe for the past 5-year period, and below the median for the past 1- and 3-year periods. The Board also noted that the performance of Class I2 Shares of the Fund was above its benchmark for the past 3- and 5-year periods and below its benchmark for the past 1-year period. The Trustees discussed the reasons for the underperformance with TAM and agreed to continue to monitor the performance of the Fund. The Trustees also noted recent changes in the Fund’s portfolio management team. The Trustees noted that TAM intends to monitor and report to the Board on the portfolio manager transition and performance going forward.
On the basis of this information and the Board’s assessment of the nature, extent and quality of the services to be provided or procured by TAM and provided by the Sub-Advisers, the Board concluded that TAM and each Sub-Adviser are capable of generating a level of investment performance that is appropriate in light of the applicable Fund’s investment objectives, policies and strategies and that is competitive with other investment companies.
Investment Advisory and Sub-Advisory Fees and Total Expense Ratios
The Board considered the investment advisory fee and total expense ratio of each Fund, including information provided by Lipper comparing the investment advisory fee and total expense ratio of each Fund to the investment advisory fees and total expense ratios of other investment companies in both a peer group and broader peer universe compiled by Lipper. The Board also considered the fees charged by the Sub-Advisers for sub-advisory services, the portion of a Fund’s investment advisory fee retained by TAM following payment of the sub-advisory fee(s) and how the portion of the contractual investment advisory fee retained by TAM at a specified asset level compared to the portions retained by other investment advisers managing mutual funds with similar investment strategies as calculated by Strategic Insight, an independent provider of information (except for Transamerica International Equity Opportunities and Transamerica Total Return, which were calculated by TAM).
| | |
| Transamerica Funds | | Annual Report 2014 |
Page 204
TRANSAMERICA FUNDS
INVESTMENT ADVISORY AND SUB-ADVISORY AGREEMENTS — CONTRACT RENEWAL (continued)
Transamerica Arbitrage Strategy. The Board noted that the Fund’s contractual investment advisory fee was below the medians for its peer group and peer universe and that the actual total expenses (i.e., expenses reflecting any waivers and/or reimbursements) of Class I2 Shares of the Fund were below the medians for its peer group and peer universe. The Board also noted that TAM has entered into an expense limitation arrangement with the Fund, which may result in TAM waiving fees for the benefit of shareholders.
Transamerica Bond. The Board noted that the Fund’s contractual investment advisory fee was above the medians for its peer group and peer universe and that the actual total expenses (i.e., expenses reflecting any waivers and/or reimbursements) of Class I2 Shares of the Fund were in line with the median for its peer group and below the median for its peer universe. The Board also noted that TAM has entered into an expense limitation arrangement with the Fund, which may result in TAM waiving fees for the benefit of shareholders.
Transamerica Commodity Strategy. The Board noted that the Fund’s contractual investment advisory fee was below the medians for its peer group and peer universe and that the actual total expenses (i.e., expenses reflecting any waivers and/or reimbursements) of Class I2 Shares of the Fund were below the medians for its peer group and peer universe. The Board also noted that TAM has entered into an expense limitation arrangement with the Fund, which may result in TAM waiving fees for the benefit of shareholders.
Transamerica Core Bond. The Board noted that the Fund’s contractual investment advisory fee was in line with the medians for its peer group and peer universe and that the actual total expenses (i.e., expenses reflecting any waivers and/or reimbursements) of Class I2 Shares of the Fund were below the medians for its peer group and peer universe. The Board also noted that TAM has entered into an expense limitation arrangement with the Fund, which may result in TAM waiving fees for the benefit of shareholders.
Transamerica Developing Markets Equity. The Board noted that the Fund’s contractual investment advisory fee was in line with the median for its peer group and above the median for its peer universe and that the actual total expenses (i.e., expenses reflecting any waivers and/or reimbursements) of Class I2 Shares of the Fund were below the medians for its peer group and peer universe. The Board also noted that TAM has entered into an expense limitation arrangement with the Fund, which may result in TAM waiving fees for the benefit of shareholders.
Transamerica Global Real Estate Securities. The Board noted that the Fund’s contractual investment advisory fee was in line with the medians for its peer group and peer universe and that the actual total expenses (i.e., expenses reflecting any waivers and/or reimbursements) of Class I2 Shares of the Fund were below the medians for its peer group and peer universe. The Board also noted that TAM has entered into an expense limitation arrangement with the Fund, which may result in TAM waiving fees for the benefit of shareholders.
Transamerica Growth. The Board noted that the Fund’s contractual investment advisory fee was in line with the median for its peer group and above the median for its peer universe and that the actual total expenses (i.e., expenses reflecting any waivers and/or reimbursements) of Class I2 Shares of the Fund were below the medians for its peer group and peer universe. The Board also noted that TAM has entered into an expense limitation arrangement with the Fund, which may result in TAM waiving fees for the benefit of shareholders.
Transamerica International Equity Opportunities. The Board noted that the Fund’s contractual investment advisory fee was above the medians for its peer group and peer universe and that the actual total expenses (i.e., expenses reflecting any waivers and/or reimbursements) of Class I2 Shares of the Fund were below the medians for its peer group and peer universe. The Board also noted that TAM has entered into an expense limitation arrangement with the Fund, which may result in TAM waiving fees for the benefit of shareholders.
Transamerica International Small Cap. The Board noted that the Fund’s contractual investment advisory fee was in line with the median for its peer group and above the median for its peer universe and that the actual total expenses (i.e., expenses reflecting any waivers and/or reimbursements) of Class I2 Shares of the Fund were below the medians for its peer group and peer universe. The Board also noted that TAM has entered into an expense limitation arrangement with the Fund, which may result in TAM waiving fees for the benefit of shareholders.
Transamerica Long/Short Strategy. The Board noted that the Fund’s contractual investment advisory fee was in line with the medians for its peer group and peer universe and that the actual total expenses (i.e., expenses reflecting any waivers and/or reimbursements) of Class I2 Shares of the Fund were below the median for its peer group and in line with the median for its peer universe. The Board also noted that TAM has entered into an expense limitation arrangement with the Fund, which may result in TAM waiving fees for the benefit of shareholders.
| | |
| Transamerica Funds | | Annual Report 2014 |
Page 205
TRANSAMERICA FUNDS
INVESTMENT ADVISORY AND SUB-ADVISORY AGREEMENTS — CONTRACT RENEWAL (continued)
Transamerica Managed Futures Strategy. The Board noted that the Fund’s contractual investment advisory fee was below the medians for its peer group and peer universe and that the actual total expenses (i.e., expenses reflecting any waivers and/or reimbursements) of Class I2 Shares of the Fund were below the medians for its peer group and peer universe. The Board also noted that TAM has entered into an expense limitation arrangement with the Fund, which may result in TAM waiving fees for the benefit of shareholders.
Transamerica Mid Cap Value. The Board noted that the Fund’s contractual investment advisory fee was above the median for its peer group and in line with the median for its peer universe and that the actual total expenses (i.e., expenses reflecting any waivers and/or reimbursements) of Class I2 Shares of the Fund were below the medians for its peer group and peer universe. The Board also noted that TAM has entered into an expense limitation arrangement with the Fund, which may result in TAM waiving fees for the benefit of shareholders.
Transamerica Total Return. The Board noted that the Fund’s contractual investment advisory fee was above the medians for its peer group and peer universe and that the actual total expenses (i.e., expenses reflecting any waivers and/or reimbursements) of Class I2 Shares of the Fund were above the medians for its peer group and peer universe.
On the basis of these considerations, together with the other information it considered, the Board determined that the investment advisory and sub-advisory fees to be received by TAM and the Sub-Advisers under each Investment Advisory Agreement and Sub-Advisory Agreement are reasonable in light of the services provided.
Cost of Services Provided and Level of Profitability
The Board reviewed information provided by TAM about the cost of providing and procuring fund management services, as well as the costs of the provision of administration, transfer agency and other services, to each Fund and to Transamerica Funds as a whole by TAM and its affiliates. The Board considered the profitability of TAM and its affiliates in providing these services for each Fund and Transamerica Funds as a whole, as well as the allocation methodology used for calculating profitability. The Board also considered the assessment prepared by Ernst & Young LLP (“E&Y”), independent registered public accounting firm and auditor to the Funds, to assist the Board’s evaluation of TAM’s profitability analysis. E&Y’s engagement included the review and assessment of the revenue and expense allocation methodology used by TAM to estimate its profitability with respect to its relationship with the Funds, and completion of procedures in respect of the mathematical accuracy of the profitability calculation and its conformity to established allocation methodologies. After considering E&Y’s assessment and information provided by TAM, the Board concluded that, while other allocation methods may also be reasonable, TAM’s profitability methodologies are reasonable.
With respect to the Sub-Advisers, the Board noted that the sub-advisory fees are the product of arm’s-length negotiation between TAM and the applicable Sub-Adviser and are paid by TAM and not the applicable Fund. As a result, the Board principally considered the profitability of TAM and its affiliates with respect to the applicable Fund.
Based on this information, the Board determined that the profitability of TAM and its affiliates from their relationships with the Funds was not excessive.
Economies of Scale
The Board considered economies of scale with respect to the management of each Fund, whether the Fund had appropriately benefited from any economies of scale and whether there was the potential for realization of any further economies of scale. The Board also considered the existence of economies of scale with respect to management of the Transamerica mutual funds overall and the extent to which the Funds benefited from these economies of scale. The Board considered each Fund’s investment advisory fee schedule and the existence of breakpoints, if any, and also considered the extent to which TAM shared economies of scale with the Funds through investments in maintaining and developing its capabilities and services. The Trustees concluded that each Fund’s fee structure reflected economies of scale to date and noted that they will have the opportunity to periodically reexamine the appropriateness of the investment advisory fees payable to TAM and the fees paid to the Sub-Advisers and whether each Fund has achieved economies of scale in the future.
Benefits to TAM, its Affiliates and the Sub-Advisers from their Relationships with the Funds
The Board considered any other benefits derived by TAM, its affiliates, and the Sub-Advisers from their relationships with the Funds. The Board noted that TAM does not realize soft dollar benefits from its relationships with the Funds and that TAM believes that any use of soft dollars by the Sub-Advisers is generally appropriate and in the best interests of the Funds. The Board also noted that certain Sub-Advisers are participating in a brokerage program pursuant to which a portion of brokerage commissions paid by each applicable Fund is recaptured for the benefit of the Fund and its shareholders, thus limiting the amount of soft dollar arrangements the Sub-Adviser may engage in with respect to a Fund’s brokerage transactions.
| | |
| Transamerica Funds | | Annual Report 2014 |
Page 206
TRANSAMERICA FUNDS
INVESTMENT ADVISORY AND SUB-ADVISORY AGREEMENTS — CONTRACT RENEWAL (continued)
Other Considerations
The Board noted that TAM has made a substantial commitment to the recruitment and retention of high quality personnel and maintains the financial, compliance and operational resources reasonably necessary to manage each Fund in a professional manner that is consistent with the best interests of the Fund and its shareholders. In this regard, the Board favorably considered the procedures and policies TAM has in place to enforce compliance with applicable laws and regulations and oversee the portfolio management activities of the Sub-Advisers. The Board also noted that TAM has made a significant entrepreneurial commitment to the management and success of the Funds.
Conclusion
After consideration of the factors described above, as well as other factors, the Trustees, including the Independent Trustees, concluded that the renewal of each Investment Advisory Agreement and Sub-Advisory Agreement is in the best interests of the applicable Fund and its shareholders and voted to approve the renewal of the Agreements.
| | |
| Transamerica Funds | | Annual Report 2014 |
Page 207
Management of the Trust
Board Members and Officers
(unaudited)
The Board Members and executive officers of each Trust are listed below.
Interested Board Member means a board member who may be deemed an “interested person” (as that term is defined in the 1940 Act) of each Trust because of his current or former service with TAM or an affiliate of TAM. Interested Board Members may also be referred to herein as “Interested Trustees.” Independent Board Member means a Board Member who is not an “interested person” (as defined under the 1940 Act) of each Trust and may also be referred to herein as an “Independent Trustee.”
The Board governs each Fund and is responsible for protecting the interests of the shareholders. The Board Members are experienced executives who meet periodically throughout the year to oversee the business affairs of each Fund and the operation of each Fund by its officers. The Board also reviews the management of each Fund’s assets by the investment adviser and its respective sub-adviser.
The Funds are among the Funds advised and sponsored by TAM (collectively, “Transamerica Mutual Funds”). The Transamerica Mutual Funds consist of Transamerica Funds, Transamerica Series Trust (“TST”), Transamerica Income Shares, Inc. (“TIS”), Transamerica Partners Funds Group (“TPFG”), Transamerica Partners Funds Group II (“TPFG II”), Transamerica Partners Portfolios (“TPP”) and Transamerica Asset Allocation Variable Funds (“TAAVF”) and consists of 170 funds as of the date of this Annual Report.
The mailing address of each Board Member is c/o Secretary, 4600 South Syracuse St., Suite 1100, Denver, CO 80237.
The Board Members of each Trust and each Portfolio Trust, their year of birth, their positions with the Trusts, and their principal occupations for the past five years (their titles may have varied during that period) the number of Funds in Transamerica Mutual Funds the Board oversees, and other board memberships they hold are set forth in the table below. The length of time served is provided from the date a Trustee became a Trustee of either of the Trusts or Transamerica Partners Portfolios.
| | | | | | | | | | |
Name and Year of Birth | | Position(s) Held with Trust | | Term of Office and Length of Time Served* | | Principal Occupation(s) During Past Five Years | | Number of
Funds in
Complex
Overseen
by Board
Member | | Other
Directorships
During the Past
Five Years |
INTERESTED BOARD MEMBERS | | | | |
Marijn P. Smit (1973) | | Chairman of the Board**, President and Chief Executive Officer | | Since 2014 | | Chairman of the Board, President and Chief Executive Officer, Transamerica Funds, TST, TPP, TPFG, TPFG II, TAAVF and TIS (2014 – present); Director, Chairman of the Board, President and Chief Executive Officer, Transamerica Asset Management, Inc. (“TAM”) and Transamerica Fund Services, Inc. (“TFS”) (2014 – present); President, Investment Solutions, Transamerica Investments & Retirement (2014 – present); Vice President, Transamerica Premier Life Insurance Company (2010 – present); Vice President, Transamerica Life Insurance Company (2010 – present); Senior Vice President, Transamerica Financial Life Insurance Company (2013 – present); Senior Vice President, Transamerica Retirement Advisors, Inc. (2013 – present); | | 170 | | N/A |
| | |
| Transamerica Funds | | Annual Report 2014 |
Page 208
| | | | | | | | | | |
Name and Year of Birth | | Position(s) Held with Trust | | Term of Office and Length of Time Served* | | Principal Occupation(s) During Past Five Years | | Number of
Funds in
Complex
Overseen
by Board
Member | | Other
Directorships
During the Past
Five Years |
INTERESTED BOARD MEMBERS — continued | | | | |
Marijn P. Smit (continued) | | | | | | Senior Vice President, Transamerica Retirement Solutions Corporation (2012 – present); and President and Director, Transamerica Stable Value Solutions, Inc. (2010 – present). | | | | |
Alan F. Warrick (1948) | | Board Member | | Since 2012 | | Board Member, Transamerica Funds, TST, TIS, TPP, TPFG, TPFG II and TAAVF (2012 – present); Consultant, Aegon USA (2010 – 2011); Senior Advisor, Lovell Minnick Equity Partners (2010 – present); Retired (2010 – present); and Managing Director for Strategic Business Development, Aegon USA (1994 – 2010). | | 170 | | First Allied
Holdings Inc.
(2013 – 2014) |
INDEPENDENT BOARD MEMBERS | | | | | | |
Sandra N. Bane (1952) | | Board Member | | Since 2008 | | Retired (1999 – present); Board Member, Transamerica Funds, TST, TIS, TPP, TPFG, TPFG II and TAAVF (2008 – present); Board Member, Transamerica Investors, Inc. (“TII”) (2003 – 2010); and Partner, KPMG (1975 – 1999). | | 170 | | Big 5 Sporting
Goods (2002 –
present); AGL
Resources, Inc.
(energy services
holding
company)
(2008 – present) |
Leo J. Hill (1956) | | Lead Independent Board Member | | Since 2001 | | Principal, Advisor Network Solutions, LLC (business consulting) (2006 – present); Board Member, TST (2001 – present); Board Member, Transamerica Funds and TIS (2002 – present); Board Member, TPP, TPFG, TPFG II and TAAVF (2007 – present); Board Member, TII (2008 – 2010); Market President, Nations Bank of Sun Coast Florida (1998 – 1999); Chairman, President and Chief Executive Officer, Barnett Banks of Treasure Coast Florida (1994 – 1998); | | 170 | | Ameris Bancorp
(2013 – present);
Ameris Bank
(2013 – present) |
| | |
| Transamerica Funds | | Annual Report 2014 |
Page 209
| | | | | | | | | | |
Name and Year of Birth | | Position(s) Held with Trust | | Term of Office and Length of Time Served* | | Principal Occupation(s) During Past Five Years | | Number of
Funds in
Complex
Overseen
by Board
Member | | Other
Directorships
During the Past
Five Years |
INDEPENDENT BOARD MEMBERS — continued | | | | | | |
Leo J. Hill (continued) | | | | | | Executive Vice President and Senior Credit Officer, Barnett Banks of Jacksonville, Florida (1991 – 1994); and Senior Vice President and Senior Loan Administration Officer, Wachovia Bank of Georgia (1976 – 1991). | | | | |
David W. Jennings (1946) | | Board Member | | Since 2009 | | Board Member, Transamerica Funds, TST, TIS, TPP, TPFG, TPFG II and TAAVF (2009 – present); Board Member, TII (2009 – 2010); Managing Director, Hilton Capital (2010 – present); Principal, Maxam Capital Management, LLC (2006 – 2008); and Principal, Cobble Creek Management LP (2004 – 2006). | | 170 | | N/A |
Russell A. Kimball, Jr. (1944) | | Board Member | | 1986 – 1990 and Since 2002 | | General Manager, Sheraton Sand Key Resort (1975 – present); Board Member, TST (1986 – present); Board Member, Transamerica Funds, (1986 – 1990), (2002 – present); Board Member, TIS (2002 – present); Board Member, TPP, TPFG, TPFG II and TAAVF (2007 – present); and Board Member, TII (2008 – 2010). | | 170 | | N/A |
Eugene M. Mannella (1954) | | Board Member | | Since 2007 | | Chief Executive Officer, HedgeServ Corporation (hedge fund administration) (2008 – present); Self-employed consultant (2006 – present); Managing Member and Chief Compliance Officer, HedgeServ Investment Services, LLC (limited purpose broker-dealer) (2011 – present); President, ARAPAHO Partners LLC (limited purpose broker-dealer) (1998 – 2008); | | 170 | | N/A |
| | |
| Transamerica Funds | | Annual Report 2014 |
Page 210
| | | | | | | | | | |
Name and Year of Birth | | Position(s) Held with Trust | | Term of Office and Length of Time Served* | | Principal Occupation(s) During Past Five Years | | Number of
Funds in
Complex
Overseen
by Board
Member | | Other
Directorships
During the Past
Five Years |
INDEPENDENT BOARD MEMBERS — continued | | | | | | |
Eugene M. Mannella (continued) | | | | | | Board Member, TPP, TPFG, TPFG II and TAAVF (1993 – present); Board Member, Transamerica Funds, TST and TIS (2007 – present); Board Member, TII (2008 – 2010); and President, International Fund Services (alternative asset administration) (1993 – 2005). | | | | |
| Norman R. Nielsen, Ph.D. (1939) | | Board Member | | Since 2006 | | Retired (2005 – present); Board Member, Transamerica Funds, TST and TIS (2006 – present); Board Member, TPP, TPFG, TPFG II and TAAVF (2007 – present); Board Member, TII (2008 – 2010); Interim President, Mt. Mercy University (2013 – 2014); Director, Aspire Inc. (formerly, Iowa Student Loan Service Corporation) (2006 – present); Director, League for Innovation in the Community Colleges (1985 – 2005); Director, Iowa Health Systems (1994 – 2003); Director, U.S. Bank (1985 – 2006); and President, Kirkwood Community College (1985 – 2005). | | 170 | | Buena Vista
University Board
of Trustees
(2004 – present);
Chairman(2012 – present) |
Joyce G. Norden (1939) | | Board Member | | Since 2007 | | Retired (2004 – present); Board Member, TPP, TPFG, TPFG II and TAAVF (1993 – present); Board Member, Transamerica Funds, TST and TIS (2007 – present); Board Member, TII (2008 – 2010); and Vice President, Institutional Advancement, Reconstructionist Rabbinical College (1996 – 2004). | | 170 | | Board of
Governors,
Reconstructionist
Rabbinical
College(2007 – 2012) |
| | |
| Transamerica Funds | | Annual Report 2014 |
Page 211
| | | | | | | | | | |
Name and Year of Birth | | Position(s) Held with Trust | | Term of Office and Length of Time Served* | | Principal Occupation(s) During Past Five Years | | Number of
Funds in
Complex
Overseen
by Board
Member | | Other
Directorships
During the Past
Five Years |
INDEPENDENT BOARD MEMBERS — continued | | | | |
Patricia L. Sawyer (1950) | | Board Member | | Since 2007 | | Retired (2007 – present); President/Founder, Smith & Sawyer LLC (management consulting) (1989 – 2007); Board Member, Transamerica Funds, TST and TIS (2007 – present); Board Member, TII (2008 – 2010); Board Member, TPP, TPFG, TPFG II and TAAVF (1993 – present); Trustee, Chair of Finance Committee and Chair of Nominating Committee (1987 – 1996), Bryant University. | | 170 | | Honorary Trustee,
Bryant University
(1996 – present) |
John W. Waechter (1952) | | Board Member | | Since 2004 | | Attorney, Englander Fischer (2008 – present); Retired (2004 – 2008); Board Member, TST and TIS (2004 – present); Board Member, Transamerica Funds (2005 – present); Board Member, TPP, TPFG, TPFG II and TAAVF (2007 – present); Board Member, TII (2008 – 2010); Employee, RBC Dain Rauscher (securities dealer) (2004); Executive Vice President, Chief Financial Officer and Chief Compliance Officer, William R. Hough & Co. (securities dealer) (1979 – 2004); and Treasurer, The Hough Group of Funds (1993 – 2004). | | 170 | | Operation PAR,
Inc. (2008 – present);West Central Florida
Council – Boy Scouts
of America
(2008 – 2013);
Remember Honor
Support, Inc.
(non-profit
organization)
(2013 – present)
Board Member,
WRH Income
Properties, Inc. (real
estate) (2014 –
present) |
| * | Each Board Member shall hold office until: 1) his or her successor is elected and qualified or 2) he or she resigns, retires or his or her term as a Board Member is terminated in accordance with the Trust’s Declaration of Trust. |
| ** | Mr. Smit was elected as Chairman of the Board on December 11, 2014. |
| | |
| Transamerica Funds | | Annual Report 2014 |
Page 212
Officers
The mailing address of each officer is c/o Secretary, 4600 South Syracuse St., Suite 1100, Denver, CO 80237. The following table shows information about the officers, including their year of birth, their positions held with the Trust and their principal occupations during the past five years (their titles may have varied during that period). Each officer will hold office until his or her successor has been duly elected or appointed or until his or her earlier death, resignation or removal.
| | | | | | |
Name and Year of Birth | | Position | | Term of Office
and Length of
Time Served* | | Principal Occupation(s) or Employment During Past Five Years |
Marijn P. Smit (1973) | | Chairman of the Board**, President and Chief Executive Officer | | Since 2014 | | See Table Above. |
Tané T. Tyler (1965) | | Vice President, Associate General Counsel, Chief Legal Officer and Secretary | | Since 2014 | | Vice President, Associate General Counsel, Chief Legal Officer and Secretary, Transamerica Funds, TST, TPP, TPFG, TPFG II, TAAVF and TIS (2014 – present); Director, Vice President, Associate General Counsel, Chief Legal Officer and Secretary, TAM and TFS (2014 – present); Senior Vice President, Secretary and General Counsel, ALPS, Inc., ALPS Fund Services, Inc. and ALPS Distributors, Inc. (2004 – 2013); and Secretary, Liberty All-Star Funds (2005 – 2013). |
Christopher A. Staples (1970) | | Vice President and Chief Investment Officer, Advisory Services | | Since 2005 | | Vice President and Chief Investment Officer, Advisory Services (2007 – present), Senior Vice President – Investment Management (2006 – 2007), Vice President – Investment Management (2005 – 2006), Transamerica Funds, TST and TIS; Vice President and Chief Investment Officer, Advisory Services, TPP, TPFG, TPFG II and TAAVF (2007 – present); Vice President and Chief Investment Officer (2007 – 2010); Vice President – Investment Administration (2005 – 2007), TII; Director (2005 – present), Senior Vice President (2006 – present) and Chief Investment Officer, Advisory Services (2007 – present), TAM; Director, TFS (2005 – present); and Assistant Vice President, Raymond James & Associates (1999 – 2004). |
Thomas R. Wald (1960) | | Chief Investment Officer | | Since 2014 | | Chief Investment Officer, Transamerica Funds, TST, TPP, TPFG, TPFG II, TAAVF and TIS (2014 – present); Senior Vice President and Chief Investment Officer, TAM (2014 – present); Chief Investment Officer, Transamerica Investments & Retirement (2014 – present); Vice President and Client Portfolio Manager, Curian Capital, LLC (2012 – 2014); Portfolio Manager, Tactical Allocation Group, LLC (2010 – 2011); Mutual Fund Manager, Munder Capital Management (2005 – 2008); and Mutual Fund Manager, Invesco Ltd. (1997 – 2004). |
| | |
| Transamerica Funds | | Annual Report 2014 |
Page 213
| | | | | | |
Name and Year of Birth | | Position | | Term of Office
and Length of
Time Served* | | Principal Occupation(s) or Employment During Past Five Years |
Vincent J. Toner (1970) | | Vice President and Treasurer | | Since 2014 | | Vice President and Treasurer (2014 – present) Transamerica Funds, TST, TIS, TPP, TPFG, TPFG II and TAAVF; Vice President and Treasurer, TAM and TFS (2014 – present); Senior Vice President and Vice President, Fund Administration, Brown Brothers Harriman (2010 – 2014); and Vice President Fund Administration & Fund Accounting, OppenheimerFunds (2007 – 2010). |
Matthew H. Huckman, Sr. (1968) | | Tax Manager | | Since 2014 | | Tax Manager, Transamerica Funds, TST, TIS, TPP, TPFG, TPFG II and TAAVF (2014 – present); Tax Manager, TFS (2012 – present); and Assistant Mutual Fund Tax Manager, Invesco (2007 – 2012). |
Scott M. Lenhart (1961) | | Chief Compliance Officer and Anti-Money Laundering Officer | | Since 2014 | | Chief Compliance Officer and Anti-Money Laundering Officer, Transamerica Funds, TST, TIS, TPP, TPFG, TPFG II and TAAVF (2014 – present); Chief Compliance Officer and Anti-Money Laundering Officer (2014 – present), Senior Compliance Officer (2008 – 2014), TAM; Vice President and Chief Compliance Officer, TFS (2014 – present); Director of Compliance, Transamerica Investments & Retirement (2014 – present); Vice President and Chief Compliance Officer, Transamerica Financial Advisors, Inc. (1999 – 2006); and Assistant Chief Compliance Officer, Raymond James Financial, Inc., Robert Thomas Securities, Inc. (1989 – 1998). |
| * | Elected and serves at the pleasure of the Board of the Trust. |
| ** | Mr. Smit was elected as Chairman of the Board on December 11, 2014. |
| | |
| Transamerica Funds | | Annual Report 2014 |
Page 214
PROXY VOTING POLICIES AND PROCEDURES AND QUARTERLY PORTFOLIO HOLDINGS
(unaudited)
A description of the Transamerica Funds’ proxy voting policies and procedures is available in the Statements of Additional Information of the Funds, available without charge upon request by calling 1-888-233-4339 (toll free) or on the Securities and Exchange Commission’s (“SEC”) website at http://www.sec.gov.
In addition, the Funds are required to file Form N-PX, with their complete proxy voting records for the 12 months ended June 30th, no later than August 31st of each year. The Form is available without charge: (1) from the Funds, upon request by calling 1-888-233-4339; and (2) on the SEC’s website at http://www.sec.gov.
The Funds file their complete schedule of portfolio holdings with the SEC for the first and third quarter of each fiscal year on Form N-Q, which is available on the SEC’s website at http://www.sec.gov. The Funds’ Form N-Q may be reviewed and copied at the SEC’s Public Reference Room in Washington, D.C. Information on the operation of the Public Reference Room may be obtained by calling 1-800-SEC-0330.
You may also visit the Trust’s website at www.transamerica.com for this and other information about the Funds and the Trust.
Important Notice Regarding Delivery of Shareholder Documents
Every year we send shareholders informative materials such as the Transamerica Funds Annual Report, the Transamerica Funds Prospectus, and other required documents that keep you informed regarding your Funds. Transamerica Funds will only send one piece per mailing address, a method that saves your Funds’ money by reducing mailing and printing costs. We will continue to do this unless you tell us not to. To elect to receive individual mailings, simply call a Transamerica Customer Service Representative toll free at 1-888-233-4339, 8 a.m. to 7 p.m. Eastern Time, Monday-Friday. Your request will take effect within 30 days.
| | |
| Transamerica Funds | | Annual Report 2014 |
Page 215
NOTICE OF PRIVACY POLICY
(unaudited)
Your privacy is very important to us. We want you to understand what information we collect and how we use it. We collect and use “nonpublic personal information” in connection with providing our customers with a broad range of financial products and services as effectively and conveniently as possible. We treat nonpublic personal information in accordance with our Privacy Policy.
What Information We Collect and From Whom We Collect It
We may collect nonpublic personal information about you from the following sources:
| • | | Information we receive from you on applications or other forms, such as your name, address, and account number; |
| • | | Information about your transactions with us, our affiliates, or others, such as your account balance and purchase/redemption history; and |
| • | | Information we receive from non-affiliated third parties, including consumer reporting agencies. |
What Information We Disclose and To Whom We Disclose It
We do not disclose any nonpublic personal information about current or former customers to anyone without their express consent, except as permitted by law. We may disclose the nonpublic personal information we collect, as described above, to persons or companies that perform services on our behalf and to other financial institutions with which we have joint marketing agreements. We will require these companies to protect the confidentiality of your nonpublic personal information and to use it only to perform the services for which we have hired them.
Our Security Procedures
We restrict access to your nonpublic personal information and only allow disclosures to persons and companies as permitted by law to assist in providing products or services to you. We maintain physical, electronic, and procedural safeguards to protect your nonpublic personal information and to safeguard the disposal of certain consumer information.
If you have any questions about our Privacy Policy, please call 1-888-233-4339 on any business day between 8 a.m. and 7 p.m. Eastern Time.
Note: This Privacy Policy applies only to customers that have a direct relationship with us or our affiliates. If you own shares of our funds in the name of a third party such as a bank or broker-dealer, its privacy policy may apply to you instead of ours.
| | |
| Transamerica Funds | | Annual Report 2014 |
Page 216
4600 S. Syracuse St., Suite 1100
Denver, Colorado 80237

Customer Service 1-888-233-4339
P.O. Box 9012 • Clearwater, FL 33758-9012
Distributor: Transamerica Capital, Inc.
Item 2: Code of Ethics.
| (a) | Registrant has adopted a code of ethics that applies to its principal executive officer, principal financial officer, and any other officers who serve a similar function. |
| (b) | Registrant’s code of ethics is reasonably designed as described in this Form N-CSR. |
| (c) | During the period covered by the report no amendments were made to the provisions of this code of ethics. |
| (d) | During the period covered by the report, Registrant did not grant any waivers, including implicit waivers, from the provisions of this code of ethics. |
| (f) | Registrant has filed this code of ethics as an exhibit pursuant to Item 12(a)(1) of Form N-CSR. |
Item 3: Audit Committee Financial Experts.
Registrant’s Board of Trustees has determined that Sandra N. Bane, John W. Waechter and Eugene M. Mannella are “audit committee financial experts,” as such term is defined in Item 3 of Form N-CSR. Ms. Bane, Mr. Waechter and Mr. Mannella are “independent” under the standards set forth in Item 3 of Form N-CSR. The designation of Ms. Bane, Mr. Waechter and Mr. Mannella as “audit committee financial experts” pursuant to Item 3 of Form N-CSR does not (i) impose upon them any duties, obligations, or liabilities that are greater than the duties, obligations and liabilities imposed upon them as a member of the Registrant’s audit committee or Board of Trustees in the absence of such designation; or (ii) affect the duties, obligations or liabilities of any other member of the Registrant’s audit committee or Board of Trustees.
Item 4: Principal Accountant Fees and Services.
| | | | | | |
| | (in thousands) | | Fiscal Year Ended 10/31 |
| | | | 2014 | | 2013 |
| | | |
(a) | | Audit Fees | | 651 | | 614 |
(b) | | Audit-related Fees (1) | | - | | - |
(c) | | Tax Fees (2) | | 217 | | 366 |
(d) | | All Other Fees (3) | | 78 | | 64 |
(e) (1) | | Pre-approval policy (4) | | | | |
(e) (2) | | % of above that were pre-approved | | 0% | | 0% |
(f) | | If greater than 50%, disclose hours | | N/A | | N/A |
(g) | | Non-audit fees rendered to Adviser | | N/A | | N/A |
| | (or affiliate that provided services to | | | | |
| | Registrant) | | | | |
(h) | | Disclose whether the Audit Committee | | | | |
| | has considered whether the provisions | | | | |
| | of non-audit services rendered to the | | | | |
| | Adviser that were NOT pre-approved is | | | | |
| | compatible with maintaining the auditor’s | | | | |
| | independence. | | Yes | | Yes |
| | (1) | Audit-Related Fees represent assurance and related services provided that are reasonably related to the performance of the audit of the financial statements of the Registrant, specifically data verification and agreed-upon procedures related to asset securitizations and agreed-upon procedures engagements. |
| | (2) | Tax Fees represent tax compliance, tax planning and tax advice services provided in connection with the preparation and review of the Registrant’s tax returns. |
| | (3) | All Other Fees represent permissible non-audit services for the Registrant that it believes are routine and recurring services, and would not impair the independence of the accountant. |
| | (4) | Audit Committee Preapproval Policy (“Procedures”). Generally, the Registrant’s Audit Committee must preapprove (i) all audit and non-audit services performed for the Registrant by the independent accountant and (ii) all non-audit services performed by the Registrant’s independent accountant for the Registrant’s investment adviser, and certain of the adviser’s affiliates that provide ongoing services to the Registrant, if the services to be provided by the accountant relate directly to the operations and financial reporting of the Registrant. |
The Audit Committee may delegate preapproval authority to one or more of its members. The member or members to whom such authority is delegated shall report any preapproval decisions to the Audit Committee at its next scheduled meeting.
In accordance with the Procedures, the annual audit services engagement terms and fees for the Registrant will be subject to the preapproval of the Audit Committee. In addition to the annual audit services engagement approved by the Audit Committee, the Audit Committee may grant preapproval for other audit services, which are those services that only the independent accountant reasonably can provide.
Requests or applications to provide services that require separate approval by the Audit Committee will be submitted to the Audit Committee by both the independent accountant and the Registrant’s treasurer, and must include a joint statement as to whether, in their view, the request or application is consistent with the Securities and Exchange Commissions’ rules on auditor independence.
Management will promptly report to the Chair of the Audit Committee any violation of this Procedure of which it becomes aware.
Item 5: Audit Committee of Listed Registrants.
The following individuals comprise the standing Audit Committee: Sandra N. Bane, Leo J. Hill, David W. Jennings, Russell A. Kimball, Jr., Eugene M. Mannella, Norman R. Nielsen, Joyce G. Norden, Patricia L. Sawyer and John W. Waechter.
Item 6: Schedule of Investments.
| | (a) | The schedules of investments and consolidated schedules of investments are included in the annual report to shareholders filed under Item 1 of this Form N-CSR. |
Item 7: Disclosure of Proxy Voting Policies and Procedures for Closed-End Management Investment Companies. Not applicable.
Item 8: Portfolio Managers of Closed-End Management Investment Companies. Not applicable.
Item 9: Purchases of Equity Securities by Closed-End Management Investment Company and Affiliated Purchasers. Not applicable.
Item 10: Submission of Matters to a Vote of Security Holders
There have been no material changes to the procedures by which shareholders may recommend nominees to the Registrant’s Board of Trustees that have been implemented since the Registrant last provided disclosure in response to the requirements of this Item.
Item 11: Controls and Procedures.
| | (a) | The Registrant’s principal executive officer and principal financial officer evaluated the Registrant’s disclosure controls and procedures within 90 days of this filing and have concluded that the Registrant’s disclosure controls and procedures (as defined in Rule 30a-3(c) under the Investment Company Act of 1940, as amended (the “1940 Act”)) are appropriately designed to ensure that information required to be disclosed by the Registrant in the reports that it files on Form N-CSR (a) is accumulated and communicated to the Registrant’s management, including its principal executive officer and principal financial officer, to allow timely decisions regarding required disclosure, and (b) is recorded, processed, summarized and reported, within the time periods specified in the rules and forms adopted by the U.S. Securities and Exchange Commission. |
| | (b) | The Registrant’s principal executive officer and principal financial officer are aware of no change in the Registrant’s internal control over financial reporting that occurred during the Registrant’s most recent fiscal quarter that has materially affected, or is reasonably likely to materially affect, the Registrant’s internal control over financial reporting. |
Item 12: Exhibits.
| | | | |
(a) | | (1) | | Registrant’s code of ethics (that is the subject of the disclosure required by Item 2(a)) is attached. |
| | (2) | | Separate certifications for Registrant’s principal executive officer and principal financial officer, as required by Rule 30a-2(a) under the 1940 Act, are attached. |
| | (3) | | Not applicable. |
| |
(b) | | A certification for the Registrant’s principal executive officer and principal financial officer, as required by Rule 30a-2(b) under the 1940 Act, is attached. The certification furnished pursuant to this paragraph is not deemed to be “filed” for purposes of Section 18 of the Securities Exchange Act of 1934, or otherwise subject to liability of that section. Such certification is not deemed to be incorporated by reference into any filing under the Securities Act of 1933 or the Securities Exchange Act of 1934, except to the extent that the Registrant specifically incorporates it by reference. |
SIGNATURES
Pursuant to the requirements of the Securities Exchange Act of 1934 and the Investment Company Act of 1940, the Registrant has duly caused this report to be signed on its behalf by the undersigned, thereunto duly authorized.
| | |
Transamerica Funds |
(Registrant) |
| |
By: | | /s/ Marijn P. Smit |
| | Marijn P. Smit |
| | Chief Executive Officer |
| | (Principal Executive Officer) |
| |
Date: | | January 9, 2015 |
Pursuant to the requirements of the Securities Exchange Act of 1934 and the Investment Company Act of 1940, this report has been signed below by the following persons on behalf of the Registrant and in the capacities and on the dates indicated.
| | | | |
| | By: | | /s/ Marijn P. Smit |
| | | | Marijn P. Smit |
| | | | Chief Executive Officer |
| | | | (Principal Executive Officer) |
| | |
| | Date: | | January 9, 2015 |
| | |
| | By: | | /s/ Vincent J. Toner |
| | | | Vincent J. Toner |
| | | | Treasurer |
| | | | (Principal Financial Officer) |
| | |
| | Date: | | January 9, 2015 |
EXHIBIT INDEX
| | |
Exhibit No. Description of Exhibit |
| |
| 12(a)(1) | | Code of Ethics for Principal Executive and Principal Financial Officers |
| 12(a)(2)(i) | | Section 302 N-CSR Certification of Principal Executive Officer |
| 12(a)(2)(ii) | | Section 302 N-CSR Certification of Principal Financial Officer |
| 12(b) | | Section 906 N-CSR Certification of Principal Executive Officer and Principal Financial Officer |