Table of Contents
As filed with the Securities and Exchange Commission on March 2, 2018
SECURITIES AND EXCHANGE COMMISSION
WASHINGTON, D.C. 20549
FORM N-CSR
CERTIFIED SHAREHOLDER REPORT OF REGISTERED
MANAGEMENT INVESTMENT COMPANIES
Investment Company Act file number: 811-04556
TRANSAMERICA FUNDS
(Exact Name of Registrant as Specified in Charter)
1801 California St., Suite 5200, Denver, CO 80202
(Address of Principal Executive Offices) (Zip Code)
Registrant’s Telephone Number, including Area Code: 1-888-233-4339
Tané T. Tyler, Esq., 1801 California St., Suite 5200, Denver, CO 80202
(Name and Address of Agent for Service)
Date of fiscal year end: December 31
Date of reporting period: December 31, 2017
Table of Contents
| Item 1: | Report(s) to Shareholders. |
The Annual Report is attached.
Table of Contents
TRANSAMERICA FUNDS
ANNUAL REPORT
DECEMBER 31, 2017

Customer Service: 1-888-233-4339
1801 California St., Suite 5200 Denver, CO 80202
Distributor: Transamerica Capital, Inc.
www.transamerica.com

Table of Contents
| 1 | ||||
| 2 | ||||
| 4 | ||||
| 5 | ||||
| 5 | ||||
| 6 | ||||
| 7 | ||||
| 8 | ||||
| 14 | ||||
| 15 | ||||
| 16 | ||||
Master Investment Portfolio – S&P 500 Index Master Portfolio Annual Report | Appendix A | |||
Proxy Voting Policies and Procedures and Quarterly Portfolio Holdings | Appendix B | |||
| Appendix C |
Authorized for distribution only when accompanied or preceded by a prospectus. Investors should carefully consider a fund’s investment goals, risks, charges and expenses before investing. A prospectus contains this and other information; please read it carefully before investing.
| Transamerica Funds | Annual Report 2017 |
Table of Contents
On behalf of Transamerica Funds, we would like to thank you for your continued support and confidence in our product as we look forward to continuing to serve you and your financial adviser in the future. We value the trust you have placed in us.
This annual report is provided to you to show the investments of your Fund(s). The Securities and Exchange Commission requires that annual and semi-annual reports be sent to all shareholders, and we believe it to be an important part of the investment process. This report provides detailed information about your Fund(s) for the 12-month period ending December 31, 2017.
We believe it is important to understand market conditions over the last year to provide a context for reading this report. Economic measures improved in 2017 with gross domestic product growth rising to annualized rates of over 3% in both the second and third quarters. This growth occurred amidst declining unemployment which fell to just over 4%, its lowest level in more than fifteen years, as more than 2 million jobs were added to the economy. Retail sales and consumer spending also improved and in aggregate, the year finished with a continued upward trend in the broader economy.
The U.S. Federal Reserve, (“Fed”) raised short term rates three times throughout the year, taking the Fed Funds Rate to a target range of 1.25%—1.50%. However, the 10-year Treasury yield actually declined slightly, finishing 2017 at 2.41%. As a result, the 2-year to 10-year Treasury yield spread finished the year at just 0.52%, its narrowest margin in more than ten years.
Equity markets entered 2017 with positive momentum as optimism regarding new economic legislation and deregulation fueled a rise in stocks and higher yields for bonds through the first three months of the year. When it appeared evident that the new administration’s economic agenda was having difficulty in Congress, Treasury yields fell and stocks wavered during April 2017 and May 2017, though they remained above beginning of the year levels.
Following some volatility in the summer months, stocks performed well throughout the second half of the year as corporate earnings displayed their strongest improvement in more than five years, with S&P 500® companies achieving double-digit growth rates in 2017. This strong earnings growth was also accompanied by declining credit spreads, as seen in high yield bonds, which experienced their tightest comparisons to Treasury yields in more than three years. In the month of December 2017, Congress passed the Tax Cuts and Jobs Act (i.e., tax reform) which includes lower personal and corporate tax rates as well as a reduced rate on repatriated corporate cash currently held overseas. This legislation, most of the provisions of which became effective on January 1, 2018, was well received by the market as stocks moved higher and credit spreads tightened to close out the year. By year end, markets had risen toward all-time highs in the Dow, S&P 500® and NASDAQ.
For the 12-month period ending December 31, 2017, the S&P 500® returned 21.83% while the MSCI EAFE Index, representing international developed market equities, gained 25.62%. During the same period, the Bloomberg Barclays U.S. Aggregate Bond Index returned 3.54%. Please keep in mind that it is important to maintain a diversified portfolio as investment returns have historically been difficult to predict.
In addition to your active involvement in the investment process, we firmly believe that a financial adviser is a key resource to help you build a complete picture of your current and future financial needs. Financial advisers are familiar with the market’s history, including long-term returns and volatility of various asset classes. With your adviser, you can develop an investment program that incorporates factors such as your goals, your investment timeline and your risk tolerance.
Please contact your financial adviser if you have any questions about the contents of this report, and thanks again for the confidence you have placed in us.
Sincerely,

Marijn Smit
President & Chief Executive Officer
Transamerica Funds

Tom Wald, CFA
Chief Investment Officer
Transamerica Funds
Bloomberg Barclays U.S. Aggregate Bond Index: measures investment grade, U.S. dollar denominated, fixed-rate taxable bonds, including Treasuries, government-related and corporate securities, as well as both mortgage- and asset-backed securities.
MSCI EAFE Index: a free float-adjusted market capitalization index that is designed to measure the equity market performance of developed markets, excluding the U.S. and Canada.
The views expressed in this report reflect those of the portfolio managers only and may not necessarily represent the views of Transamerica Funds. These views are subject to change based upon market conditions. These views should not be relied upon as investment advice and are not indicative of trading intent on behalf of Transamerica Funds. The performance data presented represents past performance, future results may vary. You cannot invest directly in an index.
Table of Contents
(unaudited)
MARKET ENVIRONMENT
Steady economic growth and a strengthening labor market helped support the U.S. Federal Reserve’s (“Fed”) decision to increase the Fed funds rate by 25 basis points (0.25%) in March. It marked the second rate hike in the past six months and drove higher performance among more growth-oriented and cyclical assets.
Political risk created a headwind for U.S. equities in the second quarter of 2017. In May, President Trump’s firing of FBI Director James Comey and the subsequent investigation of pre-election correspondence between administration members and Russian officials became an enduring source of negative market sentiment. One of the largest single-day dips of the quarter occurred in the wake of the House Oversight Committee’s request for all documents from meetings between President Trump and Comey on May 17, 2017.
The third quarter witnessed investors focused on sustained corporate earnings expansion, a subdued interest rate environment and a healthy economic backdrop, despite threats from an increasingly hostile North Korea and a damaging hurricane season. As a result, volatility dropped, with the Chicago Board Options Exchange Volatility index averaging a record low of 10.94 in the quarter.
The U.S. economy continued to demonstrate strength throughout the fourth quarter. Unemployment dipped to 4.10%, the lowest level since 2000. Third quarter gross domestic product (“GDP”) surged to 4.12% year over year, and real GDP rose 2.29% year over year, which boosted investor confidence.
PERFORMANCE
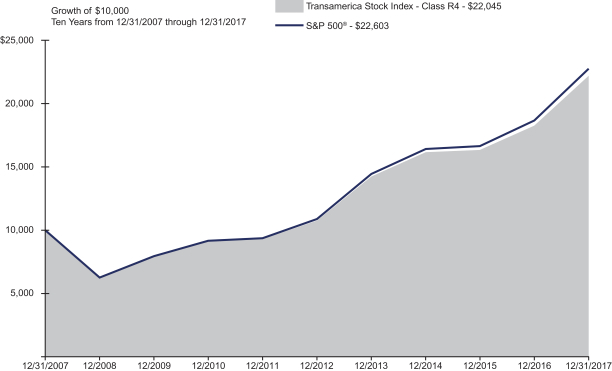
For the year ended December 31, 2017, Transamerica Stock Index, Class R4 returned 21.48%. By comparison, its benchmark, the S&P 500®, returned 21.83%.
STRATEGY REVIEW
The Fund seeks investment results, before fees and expenses that correspond to the performance of the S&P 500® Index (“the Index”). The Fund invests in securities through an underlying master portfolio.
The underlying master portfolio takes positions in securities that, in combination, should have similar return characteristics as the return of the Index. The Index is designed to provide a comprehensive measure of large-cap stock performance. It is an unmanaged, market capitalization-weighted index composed of large-capitalization U.S. equities.
From a sector perspective, the strongest returns in the S&P 500® Index came from the information technology (+38.83%) sector. Increases were seen across most sectors, including strong returns in the materials (+23.84%) and consumer discretionary (+22.98%) sectors. By comparison, the telecommunication services (-1.25%) and energy (-1.01%) sectors experienced negative returns for the reporting period.
Alan Mason
Greg Savage, CFA
Rachel Aguirre
Creighton Jue, CFA
Jennifer Hsui, CFA
Co-Portfolio Managers
BlackRock Fund Advisors
| Transamerica Funds | Annual Report 2017 |
Page 2
Table of Contents
Transamerica Stock Index
(unaudited)
| Average Annual Total Return for Periods Ended 12/31/2017 | ||||||||||||||||
| 1 Year | 5 Years | 10 Years or Since Inception of Class | Inception Date | |||||||||||||
Class R (NAV) | N/A | N/A | 14.93 | %(A) | 04/21/2017 | |||||||||||
Class R4 (NAV) | 21.48 | % | 15.46 | % | 8.23 | % | 09/11/2000 | |||||||||
S&P 500® (B) | 21.83 | % | 15.79 | % | 8.50 | % | ||||||||||
(A) Not annualized.
(B) The S&P 500® is a market-capitalization weighted index of 500 large U.S. companies with common stock listed on the NYSE or NASDAQ.
The Fund’s benchmark is an unmanaged index used as a general measure of market performance. Calculations assume dividends and capital gains are reinvested and do not include any managerial expenses. The 10 Years or the Since Inception of Fund calculation is based on the previous 10 years or since the inception date of the Fund, whichever is more recent. You cannot invest directly in an index.
The performance data presented represents past performance; future results may vary. Performance data does not reflect the deduction of taxes that would be paid on Fund distributions or the redemption of Fund shares. Investment return and principal value will fluctuate so that an investor’s shares, when redeemed, may be worth more or less than their original cost. Current performance may be lower or higher than performance quoted. Please see www.transamerica.com for performance data current to the most recent month-end. Returns include the reinvestment of dividends and capital gains. Fund shares are sold without a sales load.
Performance figures may reflect fee waivers and/or expense reimbursements by the Investment Adviser. Without such waivers and/or reimbursements, the performance would be lower. Future waivers and/or reimbursements are at the discretion of the Investment Adviser.
Performance results do not include adjustments made for financial reporting purposes in accordance with U.S. generally accepted accounting principles and may differ from amounts reported in the Financial Highlights.
Equity funds invest in equity securities, which include common stock, preferred stock and convertible securities. Because such securities represent ownership in a corporation, they tend to be more volatile than fixed income or debt securities, which do not represent ownership.
| Transamerica Funds | Annual Report 2017 |
Page 3
Table of Contents
Transamerica Stock Index
UNDERSTANDING YOUR FUND’S EXPENSES
(unaudited)
SHAREHOLDER EXPENSES
As a shareholder in the Fund, you will bear the ongoing costs (such as the investment advisory fees and other expenses) of managing the corresponding S&P 500 Index Master Portfolio (“Master Portfolio”), in which the Fund invests. You will also bear the cost of operating the Fund (such as management fees, distribution fees, and other expenses).
The following example is intended to help you understand your ongoing costs (in dollars and cents) of investing in the Fund and to compare these costs with the ongoing costs of investing in other funds.
The example is based on an investment of $1,000 invested at July 1, 2017, and held for the entire period until December 31, 2017.
ACTUAL EXPENSES
The information in the table below provides information about actual account values and actual expenses. You may use the information in these columns, together with the amount you invested, to estimate the expenses that you paid over the period. Simply divide your account value by $1,000 (for example, an $8,600 account value divided by $1,000 = $8.60), then multiply the result by the number in the appropriate column for your share class titled “Expenses Paid During Period” to estimate the expenses you paid on your account during this period. If your account is an IRA, your expenses could have included a $15 annual fee. The amount of any fee paid during the period can decrease your ending account value.
HYPOTHETICAL EXAMPLE FOR COMPARISON PURPOSES
The information in the table below provides information about hypothetical account values and hypothetical expenses based on the Fund’s actual expense ratios and assumed rates of return of 5% per year before expenses, which are not the Fund’s actual returns. The hypothetical account values and expenses may not be used to estimate the actual ending account balance or expenses you paid for the period. You may use this information to compare the ongoing costs of investing in your Fund versus other funds. To do so, compare this 5% hypothetical example with the 5% hypothetical examples that appear in the shareholder reports of the other funds. As in the case of the actual expense example, if your account is subject to an IRA fee, the amount of the fee paid through your account would increase the hypothetical expenses you would have paid during the period and decrease the hypothetical ending account value.
Please note that the expenses shown in the table are meant to highlight your ongoing costs only and do not reflect any transactional costs, such as sales charges and brokerage commissions paid on purchases and sales of Fund shares. Therefore, the information under the heading “Hypothetical Expenses” is useful in comparing ongoing costs only, and will not help you determine the relative total costs of owning different funds . If any of these transaction costs were included, your costs would be higher. The expenses shown in the table do not reflect any fees that may be charged to you by brokers, financial intermediaries, or other financial institutions.
Expense ratios may vary period to period because of various factors, such as an increase in expenses that are not covered by the management fees, expenses and fees of the trustees and their counsel, extraordinary expenses and interest expense.
| Actual Expenses | Hypothetical Expenses (A) |
| |||||||||||||||||||||
| Class | Beginning Account Value | Ending Account Value December 31, 2017 | Expenses Paid During Period (B) July 1, 2017 - December 31, 2017 | Ending Account Value December 31, 2017 | Expenses Paid During Period (B) July 1, 2017 - December 31, 2017 | Annualized Expense Ratio (C) (D) | ||||||||||||||||||
Class R | $ | 1,000.00 | $ | 1,110.40 | $ | 3.14 | $ | 1,022.20 | $ | 3.01 | 0.59 | % | ||||||||||||
Class R4 | 1,000.00 | 1,112.80 | 1.60 | 1,023.70 | 1.53 | 0.30 | ||||||||||||||||||
| (A) | 5% return per year before expenses. | |
| (B) | Expenses are calculated using the Fund’s annualized expense ratios (as disclosed in the table), multiplied by the average account value for the period, multiplied by the number of days in the period (184 days), and divided by the number of days in the year (365 days). | |
| (C) | Expense ratios are based on the most recent six-months; the percentage may differ from the expense ratio displayed in the Financial Highlights which covers a twelve-month period. | |
| (D) | Ratio reflects the expenses of both the Fund and the Master Portfolio. | |
| Transamerica Funds | Annual Report 2017 |
Page 4
Table of Contents
Transamerica Stock Index
STATEMENT OF ASSETS AND LIABILITIES
At December 31, 2017
Assets: | ||||
Investment in Master Portfolio, at value | $ | 774,992,195 | ||
Receivables and other assets: | ||||
Shares of beneficial interest sold | 10,455 | |||
Due from Master Portfolio | 15,566,575 | |||
|
| |||
Total assets | 790,569,225 | |||
|
| |||
Liabilities: | ||||
Payables and other liabilities: | ||||
Shares of beneficial interest redeemed | 15,577,030 | |||
Investment management fees | 23,191 | |||
Distribution and service fees | 229,042 | |||
Transfer agent fees | 7,153 | |||
Trustees, CCO and deferred compensation fees | 798 | |||
Audit and tax fees | 9,315 | |||
Custody fees | 2,039 | |||
Legal fees | 6,894 | |||
Printing and shareholder reports fees | 13,417 | |||
Registration fees | 8,646 | |||
Other | 6,959 | |||
|
| |||
Total liabilities | 15,884,484 | |||
|
| |||
Net assets | $ | 774,684,741 | ||
|
| |||
Net assets consist of: | ||||
Paid-in capital | $ | 217,256,653 | ||
Net unrealized appreciation (depreciation) allocated from Master Portfolio | 557,428,088 | |||
|
| |||
Net assets | $ | 774,684,741 | ||
|
| |||
Net assets by class: | ||||
Class R | $ | 262,046,597 | ||
Class R4 | 512,638,144 | |||
Shares outstanding: | ||||
Class R | 23,290,102 | |||
Class R4 | 45,533,028 | |||
Net asset value per share: | ||||
Class R | $ | 11.25 | ||
Class R4 | 11.26 | |||
For the year ended December 31, 2017 (A)
Net investment income (loss) allocated from Master Portfolio: | ||||
Dividend income | $ | 14,340,609 | ||
Interest income | 98,329 | |||
Net income (loss) from securities lending | 24,355 | |||
Withholding taxes on foreign income | (58,234 | ) | ||
Expenses (net of waiver and/or reimbursement) | (283,318 | ) | ||
|
| |||
Total investment income (loss) | 14,121,741 | |||
|
| |||
Expenses: | ||||
Investment advisory fees | 171,971 | |||
Investment management fees | 167,612 | |||
Distribution and service fees: | ||||
Class R | 983,613 | |||
Class R4 | 1,334,891 | |||
Transfer agent fees | ||||
Class R | 6,127 | |||
Class R4 | 27,149 | |||
Trustees, CCO and deferred compensation fees | 14,748 | |||
Audit and tax fees | 29,689 | |||
Custody fees | 12,981 | |||
Legal fees | 43,976 | |||
Printing and shareholder reports fees | 20,718 | |||
Registration fees | 99,678 | |||
Other | 25,050 | |||
|
| |||
Total expenses before waiver and/or reimbursement and recapture | 2,938,203 | |||
|
| |||
Expenses waived and/or reimbursed: | ||||
Class R | (49,774 | ) | ||
Class R4 | (607,466 | ) | ||
Recapture of previously waived and/or reimbursed fees: | ||||
Class R | 49,774 | |||
Class R4 | 183,376 | |||
|
| |||
Net expenses | 2,514,113 | |||
|
| |||
Net investment income (loss) | 11,607,628 | |||
|
| |||
Net realized and change in unrealized gain (loss) on investments allocated from Master Portfolio: | ||||
Net realized gain (loss) | 14,001,967 | |||
Net change in unrealized appreciation (depreciation) | 117,877,019 | |||
|
| |||
Net realized and change in unrealized gain (loss) | 131,878,986 | |||
|
| |||
Net increase (decrease) in net assets resulting from operations | $ | 143,486,614 | ||
|
| |||
| (A) | Transamerica Partners Institutional Stock Index reorganized into the Fund on April 21, 2017. Prior to April 21, 2017, information provided reflects Transamerica Partners Institutional Stock Index, which was the accounting and performance survivor of the reorganization. Please reference the Reorganization section of the Notes to the Financial Statements for additional information. |
The Notes to Financial Statements are an integral part of this report.
| Transamerica Funds | Annual Report 2017 |
Page 5
Table of Contents
Transamerica Stock Index
STATEMENT OF CHANGES IN NET ASSETS
For the years ended: (A) (B)
| December 31, 2017 | December 31, 2016 | |||||||
From operations allocated from Master Portfolio: | ||||||||
Net investment income (loss) | $ | 11,607,628 | $ | 11,698,030 | ||||
Net realized gain (loss) | 14,001,967 | 17,326,076 | ||||||
Net change in unrealized appreciation (depreciation) | 117,877,019 | 36,351,091 | ||||||
|
|
|
| |||||
Net increase (decrease) in net assets resulting from operations | 143,486,614 | 65,375,197 | ||||||
|
|
|
| |||||
Dividends and/or distributions to shareholders: | ||||||||
Net investment income: | ||||||||
Class R | (3,648,044 | ) | — | |||||
Class R4 | (11,146,564 | ) | (12,705,081 | ) | ||||
|
|
|
| |||||
Total dividends and/or distributions from net investment income | (14,794,608 | ) | (12,705,081 | ) | ||||
|
|
|
| |||||
Net realized gains: | ||||||||
Class R | (2,298,712 | ) | — | |||||
Class R4 | (7,107,648 | ) | — | |||||
|
|
|
| |||||
Total dividends and/or distributions from net realized gains | (9,406,360 | ) | — | |||||
|
|
|
| |||||
Total dividends and/or distributions to shareholders | (24,200,968 | ) | (12,705,081 | ) | ||||
|
|
|
| |||||
Capital share transactions: | ||||||||
Proceeds from shares sold: | ||||||||
Class R | 9,192,735 | — | ||||||
Class R4 | 44,536,011 | 70,852,319 | ||||||
|
|
|
| |||||
| 53,728,746 | 70,852,319 | |||||||
|
|
|
| |||||
Issued from fund acquisition: | ||||||||
Class R | 283,331,550 | — | ||||||
|
|
|
| |||||
| 283,331,550 | — | |||||||
|
|
|
| |||||
Dividends and/or distributions reinvested: | ||||||||
Class R | 5,946,756 | — | ||||||
Class R4 | 17,941,034 | 12,705,081 | ||||||
|
|
|
| |||||
| 23,887,790 | 12,705,081 | |||||||
|
|
|
| |||||
Cost of shares redeemed: | ||||||||
Class R | (69,867,254 | ) | — | |||||
Class R4 | (196,770,720 | ) | (282,419,446 | ) | ||||
|
|
|
| |||||
| (266,637,974 | ) | (282,419,446 | ) | |||||
|
|
|
| |||||
Net increase (decrease) in net assets resulting from capital share transactions | 94,310,112 | (198,862,046 | ) | |||||
|
|
|
| |||||
Net increase (decrease) in net assets | 213,595,758 | (146,191,930 | ) | |||||
|
|
|
| |||||
Net assets: | ||||||||
Beginning of year | 561,088,983 | 707,280,913 | ||||||
|
|
|
| |||||
End of year | $ | 774,684,741 | $ | 561,088,983 | ||||
|
|
|
| |||||
Capital share transactions - shares: | ||||||||
Shares issued: | ||||||||
Class R | 847,775 | — | ||||||
Class R4 | 4,279,576 | 8,131,165 | ||||||
|
|
|
| |||||
| 5,127,351 | 8,131,165 | |||||||
|
|
|
| |||||
Shares issued on fund acquisition: | ||||||||
Class R | 28,333,155 | — | ||||||
|
|
|
| |||||
| 28,333,155 | — | |||||||
|
|
|
| |||||
Shares reinvested: | ||||||||
Class R | 537,040 | — | ||||||
Class R4 | 1,680,712 | 1,400,079 | ||||||
|
|
|
| |||||
| 2,217,752 | 1,400,079 | |||||||
|
|
|
| |||||
Shares redeemed: | ||||||||
Class R | (6,427,868 | ) | — | |||||
Class R4 | (18,929,834 | ) | (31,712,614 | ) | ||||
|
|
|
| |||||
| (25,357,702 | ) | (31,712,614 | ) | |||||
|
|
|
| |||||
Net increase (decrease) in shares outstanding: | ||||||||
Class R | 23,290,102 | — | ||||||
Class R4 | (12,969,546 | ) | (22,181,370 | ) | ||||
|
|
|
| |||||
| 10,320,556 | (22,181,370 | ) | ||||||
|
|
|
| |||||
| (A) | Transamerica Partners Institutional Stock Index reorganized into the Fund on April 21, 2017. Prior to April 21, 2017, information provided reflects Transamerica Partners Institutional Stock Index, which was the accounting and performance survivor of the reorganization. Please reference the Reorganization section of the Notes to the Financial Statements for additional information. |
| (B) | Effective April 21, 2017, the Fund underwent a 1.56-for-1 share split. The Capital share transactions - shares have been retroactively adjusted to reflect the share split. See the Stock Split section of the Notes to Financial Statements for more information. |
The Notes to Financial Statements are an integral part of this report.
| Transamerica Funds | Annual Report 2017 |
Page 6
Table of Contents
Transamerica Stock Index
For a share outstanding during the period indicated:
| Class R | ||||
| December 31, 2017 (A) | ||||
Net asset value, beginning of period | $ | 10.00 | ||
|
| |||
Investment operations: (B) | ||||
Net investment income (loss) (C) | 0.10 | |||
Net realized and unrealized gain (loss) | 1.38 | |||
|
| |||
Total investment operations | 1.48 | |||
|
| |||
Dividends and/or distributions to shareholders | ||||
Net investment income | (0.14 | ) | ||
Net realized gains | (0.09 | ) | ||
|
| |||
Total dividends and/or distributions to shareholders | (0.23 | ) | ||
|
| |||
Net asset value, end of period | $ | 11.25 | ||
|
| |||
Total return (D) | 14.93 | %(E) | ||
|
| |||
Ratio and supplemental data: | ||||
Net assets end of period (000’s) | $ | 262,047 | ||
Expenses to average net assets (B) | ||||
Excluding waiver and/or reimbursement and recapture | 0.61 | %(F) | ||
Including waiver and/or reimbursement and recapture (G) | 0.60 | %(F) | ||
Net investment income (loss) to average net assets (B) | 1.37 | %(F) | ||
Portfolio turnover rate of Master Portfolio | 11 | % | ||
| (A) | Commenced operations on April 21, 2017. | |
| (B) | The per share amounts and percentages include the Fund’s proportionate share of income and expenses of the Master Portfolio. | |
| (C) | Calculated based on average number of shares outstanding. | |
| (D) | Total return reflects Fund expenses and includes reinvestment of dividends and capital gains. | |
| (E) | Not annualized. | |
| (F) | Annualized. | |
| (G) | Includes reimbursement or waiver of fees at the underlying Master Portfolio level. |
For a share outstanding during the years indicated:
| Class R4 (A) (B) | ||||||||||||||||||||
| December 31, 2017 | December 31, 2016 | December 31, 2015 | December 31, 2014 | December 31, 2013 | ||||||||||||||||
Net asset value, beginning of year | $ | 9.58 | $ | 8.75 | $ | 8.81 | $ | 7.91 | $ | 6.10 | ||||||||||
|
|
|
|
|
|
|
|
|
| |||||||||||
Investment operations: (C) | ||||||||||||||||||||
Net investment income (loss) (D) | 0.20 | 0.17(E | ) | 0.15 | 0.14 | 0.13 | ||||||||||||||
Net realized and unrealized gain (loss) | 1.85 | 0.85 | (0.06 | ) | 0.91 | 1.81 | ||||||||||||||
|
|
|
|
|
|
|
|
|
| |||||||||||
Total investment operations | 2.05 | 1.02 | 0.09 | 1.05 | 1.94 | |||||||||||||||
|
|
|
|
|
|
|
|
|
| |||||||||||
Dividends and/or distributions to shareholders: | ||||||||||||||||||||
Net investment income | (0.23 | ) | (0.19 | ) | (0.15 | ) | (0.15 | ) | (0.13 | ) | ||||||||||
Net realized gains | (0.14 | ) | — | — | — | — | ||||||||||||||
|
|
|
|
|
|
|
|
|
| |||||||||||
Total dividends and/or distributions to shareholders | (0.37 | ) | (0.19 | ) | (0.15 | ) | (0.15 | ) | (0.13 | ) | ||||||||||
|
|
|
|
|
|
|
|
|
| |||||||||||
Net asset value, end of year | $ | 11.26 | $ | 9.58 | $ | 8.75 | $ | 8.81 | $ | 7.91 | ||||||||||
|
|
|
|
|
|
|
|
|
| |||||||||||
Total return (F) | 21.48 | % | 11.66 | % | 1.08 | % | 13.33 | % | 32.06 | % | ||||||||||
|
|
|
|
|
|
|
|
|
| |||||||||||
Ratio and supplemental data: | ||||||||||||||||||||
Net assets end of year (000’s) | $ | 512,638 | $ | 561,089 | $ | 707,281 | $ | 888,044 | $ | 1,011,521 | ||||||||||
Expenses to average net assets (C) | ||||||||||||||||||||
Excluding waiver and/or reimbursement and recapture | 0.38 | % | 0.42 | % | 0.42 | % | 0.38 | % | 0.38 | % | ||||||||||
Including waiver and/or reimbursement and recapture (G) | 0.30 | % | 0.29 | %(E)(H) | 0.30 | % | 0.30 | % | 0.30 | % | ||||||||||
Net investment income (loss) to average net assets (C) | 1.67 | % | 1.86 | %(E) | 1.73 | % | 1.72 | % | 1.80 | % | ||||||||||
Portfolio turnover rate of Master Portfolio | 11 | % | 4 | % | 2 | % | 3 | % | 2 | % | ||||||||||
| (A) | Transamerica Partners Institutional Stock Index reorganized into the Fund on April 21, 2017. Prior to April 21, 2017, information provided reflects Transamerica Partners Institutional Stock Index, which was the accounting and performance survivor of the reorganization. Please reference the Reorganization section of the Notes to the Financial Statements for additional information. | |
| (B) | Effective April 21, 2017, the Fund underwent a 1.56-for-1 share split. The per share data has been retroactively adjusted to reflect the share split. See the Stock Split section of the Notes to Financial Statements for more information. | |
| (C) | The per share amounts and percentages include the Fund’s proportionate share of income and expenses of the Master Portfolio. | |
| (D) | Calculated based on average number of shares outstanding. | |
| (E) | Please reference the Custody Out-of-Pocket Expense section of the Notes to Financial Statements for more information regarding the reimbursement of custody fees. The amount of the reimbursement on a per share basis was immaterial to the class. The Expenses to average net assets including waiver and/or reimbursement and recapture ratio, and Net investment income (loss) to average net assets ratio would have been 0.00% higher and 0.00% lower, respectively, had the custodian not reimbursed the Fund. | |
| (F) | Total return reflects Fund expenses and includes reinvestment of dividends and capital gains. | |
| (G) | Includes allocated portion of reimbursement and/or waivers of fees at the underlying Master Portfolio level. | |
| (H) | Includes reorganization expenses incurred outside the Fund’s operating expense limit. Please reference the Reorganization section of the Notes to Financial Statements for more information regarding the reorganization. |
The Notes to Financial Statements are an integral part of this report.
| Transamerica Funds | Annual Report 2017 |
Page 7
Table of Contents
Transamerica Stock Index
At December 31, 2017
1. ORGANIZATION
Transamerica Funds (the “Trust”) is an open-end management investment company registered under the Investment Company Act of 1940, as amended (the “1940 Act”). The Trust applies investment company accounting and reporting guidance. Transamerica Stock Index (the “Fund”) is a series of the Trust and invests all of its investable assets in the S&P 500 Index Master Portfolio (the “Master Portfolio”).
The Fund’s Board of Trustees (the “Board”) approved the reorganization of certain series of Transamerica Partners Funds Group and Transamerica Partners Institutional Funds Group into a new Fund within the Trust. Target fund investors approved the reorganization and received newly-issued Class R or Class R4 shares of the new Fund, as applicable. In the reorganization, the Transamerica Partners Institutional Stock Index Fund, a target fund, was the accounting and performance survivor of the reorganization. Additionally, effective March 9, 2017, the fiscal year end of the Fund changed from October 31 to December 31. Please reference the Reorganization section of the Notes to Financial Statements for more information.
The financial statements of the Master Portfolio are included within this report and should be read in conjunction with the Fund’s financial statements.
This report must be accompanied or preceded by the Fund’s current prospectus, which contains additional information about the Fund, including risks, and investment objectives and strategies.
Transamerica Asset Management, Inc. (“TAM”) serves as investment manager for the Fund. TAM provides continuous and regular investment management services to the Fund. TAM supervises the Fund’s investments, conducts its investment program and provides supervisory, compliance and administrative services to the Fund.
TAM is responsible for all aspects of the day-to-day management of the Fund.
TAM’s investment management services also include the provision of supervisory and administrative services to the Fund. These services include performing certain administrative services for the Fund and supervising and overseeing the administrative, clerical, recordkeeping and bookkeeping services provided to the Fund by State Street Bank and Trust Company (“State Street”), to whom TAM has outsourced the provision of certain services as described below; to the extent agreed upon by TAM and the Fund from time to time, monitoring and verifying the custodian’s daily calculation of Net Asset Values (“NAV”); shareholder relations functions; compliance services; valuation services; assisting in due diligence and in oversight and monitoring of certain activities of sub-advisers and certain aspects of fund investments; assisting with fund combinations and liquidations; oversight of the preparation and filing, and review, of all returns and reports, in connection with federal, state and local taxes; oversight and review of regulatory reporting; supervising and coordinating the Fund’s custodian and dividend disbursing agent and monitoring their services to the Fund; assisting the Fund in preparing reports to shareholders; acting as liaison with the Fund’s independent public accountants and providing, upon request, analyses, fiscal year summaries and other audit related services; assisting in the preparation of agendas and supporting documents for and minutes of meetings of trustees and committees of trustees; assisting in the preparation of regular communications with the trustees; and providing personnel and office space, telephones and other office equipment as necessary in order for TAM to perform supervisory and administrative services to the Fund.
2. SIGNIFICANT ACCOUNTING POLICIES
In preparing the Fund’s financial statements in accordance with Generally Accepted Accounting Principles (“GAAP”) in the United States of America, estimates or assumptions (which could differ from actual results) may be used that affect reported amounts and disclosures. The following is a summary of significant accounting policies followed by the Fund.
Investment valuation: The value of the Fund’s investment in the Master Portfolio, included within the Statement of Assets and Liabilities, reflects the Fund’s proportional interest in the net assets of the Master Portfolio.
The valuation policy for the underlying securities held by the Master Portfolio is discussed in the Master Portfolio’s Notes to Financial Statements, which accompany this report.
Security transactions and investment income: The Fund is allocated its proportional share of income and expenses on a daily basis from its investment in the Master Portfolio. All of the net investment income, as well as the realized and unrealized gains and losses from the security transactions of the Master Portfolio are allocated pro rata among the investors and recorded by the Fund on a daily basis.
Operating expenses: The Trust accounts separately for the assets, liabilities, and operations of the Fund. Expenses attributable to the Fund are charged to the Fund.
| Transamerica Funds | Annual Report 2017 |
Page 8
Table of Contents
Transamerica Stock Index
NOTES TO FINANCIAL STATEMENTS (continued)
At December 31, 2017
2. SIGNIFICANT ACCOUNTING POLICIES (continued)
Multiple class operations, income, and expenses: Income, non-class specific expenses, and realized and unrealized gains and losses are allocated to each class daily based upon net assets. Each class bears its own specific expenses in addition to the allocated non-class specific expenses.
Distributions to shareholders: Distributions are recorded on the ex-dividend date and are determined in accordance with federal income tax regulations, which may differ from GAAP.
Indemnification: In the normal course of business, the Fund enters into contracts that contain a variety of representations that provide general indemnifications. The Fund’s maximum exposure under these arrangements is unknown, as this would involve future claims that may be made against the Fund and/or its affiliates that have not yet occurred. However, based on experience, the Fund expects the risk of loss to be remote.
3. BORROWINGS AND OTHER FINANCING TRANSACTIONS
Interfund lending: The Fund, along with other funds and portfolios advised by TAM, may participate in an interfund lending program pursuant to exemptive relief granted by the Securities and Exchange Commission on January 18, 2017. This program allows the Fund to lend to and borrow from other funds and portfolios advised by TAM. Interfund lending transactions are subject to the conditions of the exemptive relief which place limits on the amount of lending or borrowing a Fund may participate in under the program. Interest earned or paid on an interfund lending transaction will be based on the average of certain current market rates. As of December 31, 2017, the Fund has not utilized the program.
4. FEES AND OTHER AFFILIATED TRANSACTIONS
TAM, the Fund’s investment manager, is directly owned by Transamerica Premier Life Insurance Company (“TPLIC”) and AUSA Holding Company (“AUSA”), both of which are indirect, wholly owned subsidiaries of Aegon NV. TPLIC is owned by Commonwealth General Corporation (“Commonwealth”) and Aegon USA, LLC (“Aegon USA”). Commonwealth and AUSA are wholly owned by Aegon USA. Aegon USA is wholly owned by Aegon US Holding Corporation, which is wholly owned by Transamerica Corporation (DE). Transamerica Corporation (DE) is wholly owned by The Aegon Trust, which is wholly owned by Aegon International B.V., which is wholly owned by Aegon NV, a Netherlands corporation, and a publicly traded international insurance group.
Transamerica Fund Services, Inc. (“TFS”) is the Fund’s transfer agent. Transamerica Capital, Inc. (“TCI”) is the Fund’s distributor/principal underwriter. TAM, TFS, and TCI are affiliates of Aegon NV.
Certain officers and trustees of the Fund are also officers and/or trustees of TAM, TFS, and TCI. No interested trustee, who is deemed an interested person due to current or former service with TAM or an affiliate of TAM, receives compensation from the Fund.
As of December 31, 2017, the percentage of the Fund’s interest in the Master Portfolio, including any open receivable or payable, is 5.71%.
Investment management fees: The Fund is allocated investment advisory fees based on the interest owned in the corresponding Master Portfolio. The advisory fees are accrued daily on Average Net Assets (“ANA”) and payable monthly at an annual rate set forth in the Master Portfolio’s Notes to Financial Statements, which accompany this report. The investment advisory fees allocated from the Master Portfolio is included within the Statements of Operations within Net investment income (loss) allocated from Master Portfolio, in Expenses (net of waiver and/or reimbursement). Additionally, TAM serves as the Fund’s investment manager, performing administration as well as investment advisory services. TAM renders investment advisory, supervisory, and administration services under an investment management agreement and the Fund pays a single management fee, which is reflected in Investment management fees within the Statement of Operations.
The Fund pays a management fee to TAM based on daily ANA at the following rates:
| Class | Rate | |||
Class R | 0.03 | % | ||
Class R4 | 0.03 | % | ||
Prior to the closing of the Transamerica Partners reorganizations, TAM provided both advisory and administrative services to Transamerica Partners Stock Index and Transamerica Partners Institutional Stock Index (“Target Funds”) pursuant to investment advisory agreements. For TAM’s services, the Target Funds paid TAM an annual rate of 0.40% and 0.10%, respectively, of the Fund’s
| Transamerica Funds | Annual Report 2017 |
Page 9
Table of Contents
Transamerica Stock Index
NOTES TO FINANCIAL STATEMENTS (continued)
At December 31, 2017
4. FEES AND OTHER AFFILIATED TRANSACTIONS (continued)
daily ANA, which was reduced by the advisory fee charged by the Master Portfolio of 0.05%. The investment advisory fees for Transamerica Partners Institutional Stock Index are included within the Statement of Operations in Investment advisory fees. Please reference the Reorganization section of the Notes to Financial Statements for more information.
TAM has contractually agreed to waive fees and/or reimburse Fund expenses to the extent that the total operating expenses based on daily ANA including the investment management fee but excluding, as applicable, acquired fund fees and expenses, interest, taxes, brokerage commissions, dividend and interest expenses on securities sold short, extraordinary expenses and other expenses not incurred in the ordinary course of the portfolio’s business exceed the following stated annual operating expense limits to the Fund’s daily ANA. The expenses waived and/or reimbursed, if any, are included in Expenses waived and/or reimbursed within the Statement of Operations.
| Class | Operating Expense Limit | Operating Expense Limit Effective Through | ||||||
Effective reorganization date April 21, 2017 | ||||||||
Class R (A) | 0.65 | % | May 1, 2018 | |||||
Class R4 | 0.30 | % | May 1, 2018 | |||||
Prior to reorganization date April 21, 2017 | ||||||||
Target Fund (accounting and performance survivor) | 0.30 | % | ||||||
| (A) | Class commenced operations on April 21, 2017. |
Effective April 21, 2017, TAM is entitled to recapture expenses paid by the Fund for fees waived and/or reimbursed during any of the previous 36 months if on any day or month the estimated annualized Fund operating expenses are less than the stated annual operating expense limit. Amounts recaptured, if any, by TAM for the period ended December 31, 2017, are disclosed in Recapture of previously waived and/or reimbursed fees within the Statement of Operations. Prior to April 21, 2017, fee waivers and/or reimbursements were not subject to recapture by TAM.
As of December 31, 2017, the balances available for recapture by TAM for the Fund are as follows:
| Amounts Available from Fiscal Years | ||||||||
| Class | 2017 | Total | ||||||
Class R4 | $ | 216,119 | $ | 216,119 | ||||
Distribution and service fees: The Trust has a distribution plan (“Distribution Plan”) pursuant to Rule 12b-1 under the 1940 Act. Pursuant to the Distribution Plan, the Trust entered into a distribution agreement with TCI as the Fund’s distributor.
The Distribution Plan requires the Fund to pay distribution fees to TCI as compensation for various distribution activities, not as reimbursement for specific expenses. Under the Distribution Plan and distribution agreement, TCI, on behalf of the Fund, is authorized to pay various service providers, as direct payment for expenses incurred in connection with distribution of the Fund’s shares. The distribution and service fees are included in Distribution fees within the Statement of Operations.
The Fund is authorized under the Distribution Plan to pay fees to TCI based on daily ANA of each class up to the following annual rates:
| Class | Rate | |||
Class R (A) | 0.50 | % | ||
Class R4 (A) | 0.25 | % | ||
| (A) | Prior to the Transamerica Partners reorganization date, the Target Funds had a 0.25% distribution fee. Please reference the Reorganization section of the Notes to Financial Statements for more information. |
Administrative service and transfer agent fees: The Fund pays a management fee to TAM for investment management and administration services and is reflected in Investment management fees within the Statement of Operations.
Pursuant to a transfer agency agreement, as amended, the Fund pays TFS a fee for providing services based on the number of classes, accounts and transactions relating to the Fund. The Transfer agent fees included within the Statement of Assets and Liabilities and Statement of Operations represent fees paid to TFS, and other unaffiliated parties providing transfer agent related services.
| Transamerica Funds | Annual Report 2017 |
Page 10
Table of Contents
Transamerica Stock Index
NOTES TO FINANCIAL STATEMENTS (continued)
At December 31, 2017
4. FEES AND OTHER AFFILIATED TRANSACTIONS (continued)
For the year ended December 31, 2017, transfer agent fees paid and the amounts due to TFS are as follows:
| Fees Paid to TFS | Fees Due to TFS | |||
| $ 27,180 | $ 3,347 |
Prior to the closing of the Transamerica Partners reorganizations, TFS provided transfer agency services to the Target Funds and the Target Funds did not pay a separate transfer agency fee. Please reference the Reorganization section of the Notes to Financial Statements for more information.
Deferred compensation plan: Under a non-qualified deferred compensation plan effective January 1, 1996, as amended and restated January 1, 2010, available to the trustees, compensation may be deferred that would otherwise be payable by the Trust to an independent trustee on a current basis for services rendered as trustee. Deferred compensation amounts will accumulate based on the value of the investment option, as elected by the trustee. Balances pursuant to deferred compensation plan are recorded in Trustees, Chief Compliance Officer (“CCO”) and deferred compensation fees within the Statement of Assets and Liabilities. For the year ended December 31, 2017, amounts included in Trustees, CCO and deferred compensation fees within the Statement of Operations reflect total compensation paid to the independent Board members.
5. PRINCIPAL OWNERSHIP
As of December 31, 2017, the Fund had certain individual shareholder(s) and/or omnibus accounts owning more than 10% of total shares outstanding. The Fund has no knowledge if any portion of the unaffiliated shares are owned beneficially. Subscription and redemption activity by concentrated accounts may have a significant effect on operations, and thus may impact Fund performance. Shareholder accounts with over 10% of total shares outstanding are as follows:
| Class | Number of Individual Shareholders and/or Omnibus Accounts | Total Percentage Interest Held | Total Percentage Held by the Investment Manager and/or Affiliates | |||||||||
Class R | 1 | 99.61 | % | 99.61 | % | |||||||
Class R4 | 1 | 97.30 | % | 97.30 | % | |||||||
As of December 31, 2017, the investment manager and/or other affiliated investment accounts held balances, in aggregate, totaling $760,032,705, representing 98.11% of the Fund’s total net assets.
6. FEDERAL INCOME TAXES AND DISTRIBUTIONS TO SHAREHOLDERS
The Fund has not made any provision for federal income or excise taxes due to its policy to distribute all of its taxable income and capital gains to its shareholders and otherwise qualify as a regulated investment company under Subchapter M of the Internal Revenue Code. The Fund recognizes the tax benefits of uncertain tax positions only where the position is “more likely than not” to be sustained assuming examination by tax authorities. The Fund’s tax returns remain subject to examination by the Internal Revenue Service and state tax authorities three years from the date of filing for federal purposes and four years from the date of filing for state purposes. Management has evaluated the Fund’s tax provisions taken for all open tax years, and has concluded that no provision for income tax is required in the Fund’s financial statements. If applicable, the Fund recognizes interest accrued related to unrecognized tax benefits in relation to interest and penalties expense in Other within the Statement of Operations. The Fund identifies its major tax jurisdictions as U.S. Federal, the state of Colorado, and foreign jurisdictions where the Fund makes significant investments; however, the Fund is not aware of any tax positions for which it is reasonably possible that the total amounts of unrecognized tax benefits will change materially in the next twelve months.
Income and capital gain distributions are determined in accordance with income tax regulations, which may differ from GAAP. Therefore, distributions determined in accordance with tax regulations may differ significantly in amount or character from net investment income and realized gains for financial reporting purposes. Financial reporting records are adjusted for permanent book/tax differences to reflect tax character. The primary permanent differences are due to distribution re-designations, distributions in excess of current earnings, partnership basis adjustments and merger capital loss carryforward. These reclassifications have no impact on net assets or results of operations. Financial records are not adjusted for temporary differences. These permanent reclassifications are as follows:
| Paid-in Capital | Undistributed (Distributions in Excess of) Net Investment Income (Loss) | Accumulated Net Realized Gain (Loss) | ||
| $ 1,244,947 | $ 3,186,980 | $ (4,431,927) |
| Transamerica Funds | Annual Report 2017 |
Page 11
Table of Contents
Transamerica Stock Index
NOTES TO FINANCIAL STATEMENTS (continued)
At December 31, 2017
6. FEDERAL INCOME TAXES AND DISTRIBUTIONS TO SHAREHOLDERS (continued)
As of December 31, 2017, the approximate cost for U.S. federal income tax purposes, the aggregate investment-level gross/net unrealized appreciation (depreciation) in the value of investment securities (including securities sold short, if any), and the net unrealized appreciation (depreciation) of derivatives were as follows:
| Cost | Gross Appreciation | Gross (Depreciation) | Net Appreciation/ (Depreciation) | |||
| $ 384,817,753 | $ 390,174,442 | $ — | $ 390,174,442 |
As of December 31, 2017, the Fund had no capital loss carryforwards available to offset future realized gains. During the year ended December 31, 2017, the capital loss carryforwards utilized or expired are $4,300,709.
The tax character of distributions paid may differ from the character of distributions shown within the Statement of Changes in Net Assets due to short-term gains being treated as ordinary income for tax purposes. The tax character of distributions paid during 2017 and 2016 are as follows:
| 2017 Distributions Paid From | 2016 Distributions Paid From | |||||||||
| Ordinary Income | Long-Term Capital Gain | Return of Capital | Ordinary Income | Long-Term Capital Gain | Return of Capital | |||||
| $ 13,302,764 | $ 10,898,204 | $ — | $ 12,705,081 | $ — | $ — | |||||
As of December 31, 2017, the tax basis components of distributable earnings are as follows:
| Undistributed Ordinary Income | Undistributed Long-Term Capital Gain | Capital Loss Carryforwards | Late Year Ordinary Loss Deferral | Other Temporary Differences | Net Unrealized Appreciation (Depreciation) | |||||
| $ — | $ — | $ — | $ — | $ 167,253,646 | $ 390,174,442 |
7. STOCK SPLIT
Effective as of the close of business on the date listed in the subsequent table, the Fund’s Class R4 underwent a stock split. There was no impact to the aggregate market value of shares outstanding. The historical capital share activity presented within the Statement of Changes in Net Assets and the per share data presented within the Financial Highlights have been retroactively adjusted to reflect the stock split. The stock split ratios, net effect on the NAV per share, and the number of shares outstanding as of the date indicated were as follows:
| Reorganization Date | Share Split Ratio | Shares Prior to Stock Split | Shares After Stock Split | Increase (Decrease) Net Asset Value per Share | Increase (Decrease) Net Shares Outstanding | |||||
| April 21, 2017 | 1.56-for-1 | 35,752,851 | 55,759,431 | Decrease | Increase |
8. REORGANIZATION
Following the close of business on April 21, 2017 (the “Reorganization Date”), the Target Funds reorganized into Transamerica Stock Index, a newly organized series within the Trust (“Destination Fund”). The reorganizations were as follows:
| Target Fund | Destination Fund/Share Class | |
| Transamerica Stock Index | ||
Transamerica Partners Stock Index | Class R | |
Transamerica Partners Institutional Stock Index (A) | Class R4 |
| (A) | Accounting and performance survivor of the reorganizations. For financial reporting purposes, the accounting and performance survivor’s financial and performance history prior to the reorganization became the financial and performance history of the Destination Fund and is reflected in the Destination Fund’s financial statements and financial highlights. |
Pursuant to Agreements and Plans of Reorganization, each Target Fund transferred all of its property and assets to the Destination Fund. The purpose of the transactions was to achieve a more cohesive, focused, and streamlined fund complex. In exchange, the Destination Fund assumed all of the liabilities of each Target Fund and issued shares to each Target Fund. The reorganizations were
| Transamerica Funds | Annual Report 2017 |
Page 12
Table of Contents
Transamerica Stock Index
NOTES TO FINANCIAL STATEMENTS (continued)
At December 31, 2017
8. REORGANIZATION (continued)
tax-free for Federal income tax purposes. For financial statement purposes, assets received and shares issued of the Destination Fund was recorded at fair value; however, the cost basis of the investments received from the Target Funds was carried forward to align ongoing reporting of the Destination Fund’s realized and unrealized gains and losses with amounts distributable to shareholders for tax purposes. Shares issued to Target Fund shareholders from the Destination Fund, along with the exchange ratio of the reorganization for the Destination Fund, were as follows (shares of those Destination Funds that were not the accounting and performance survivor of the applicable reorganization are also shown):
| Fund | Fund Shares | Destination Fund - Class | Destination Fund Shares | Dollar Amount | Exchange Ratio (A) | |||||||||||||
Transamerica Partners Stock Index | 15,527,225 | Transamerica Stock Index – Class R | 28,333,155 | $ | 283,331,550 | 0.82 | ||||||||||||
Transamerica Partners Institutional Stock Index (B) | 55,759,431 | Transamerica Stock Index – Class R4 | 55,759,431 | 557,592,549 | 1.00 | |||||||||||||
| (A) | Calculated by dividing the Destination Fund shares issuable by the Fund shares outstanding on Reorganization Date. |
| (B) | Accounting and performance survivor. |
The net assets of the Target Funds, including unrealized appreciation (depreciation), were combined with those of the Destination Fund. These amounts were as follows:
| Target Fund | Target Fund Unrealized Appreciation (Depreciation) | Target Fund Net Assets | Destination Fund | Destination Fund Net Assets Prior to Reorganization | Net Assets After Reorganization | |||||||||||||||
Transamerica Partners Stock Index | $ | 241,632,573 | $ | 283,331,550 | | Transamerica Stock Index | | $ | — | $ | 840,924,099 | |||||||||
Transamerica Partners Institutional Stock Index (A) | 560,650,512 | 557,592,549 | ||||||||||||||||||
| (A) | Accounting and performance survivor. |
Assuming the reorganizations had been completed as of the beginning of the annual reporting period of the relevant accounting and performance survivor, the pro forma results of operations for the period ended December 31, 2017 would have been as follows:
| Destination Fund | Reporting Period Beginning Date | Net Investment Income (Loss) | Net Realized and Change in Unrealized Gain (Loss) | Net Increase (Decrease) in Net Assets Resulting from Operations | ||||||||||||
Transamerica Stock Index | January 1, 2017 | $ | 13,065,764 | $ | (20,181,288 | ) | $ | (7,115,524 | ) | |||||||
Because the combined investment funds have been managed as a single integrated fund since the reorganizations were completed, it is not practical to separate the amounts of revenue and earnings of the Target Funds that have been included in the Destination Fund’s Statement of Operations.
9. CUSTODY OUT-OF-POCKET EXPENSE
In December 2015, State Street, the Fund’s custodian, identified inconsistencies in the way in which clients were invoiced for categories of expenses, particularly those deemed out-of-pocket costs, during an 18-year period going back to 1998. The issue was the result of inaccurate billing rates that were not subsequently reviewed or adjusted. The amount of the difference in what was charged and what should have been charged, plus interest, was paid back to the Fund in September 2016 as a reimbursement. The amounts applicable to the Fund, if any, were recognized as a change in accounting estimate and are reflected in the prior year Net investment income (loss) within the Statement of Changes in Net Assets. This resulted in a decrease in Net expenses and an overall increase in Net assets.
| Transamerica Funds | Annual Report 2017 |
Page 13
Table of Contents
REPORT OF INDEPENDENT REGISTERED PUBLIC ACCOUNTING FIRM
To the Shareholders and the Board of Trustees of Transamerica Stock Index
Opinion on the Financial Statements
We have audited the accompanying statement of assets and liabilities of Transamerica Stock Index (the “Fund”) (one of the portfolios constituting Transamerica Funds) (the “Trust”), as of December 31, 2017, and the related statement of operations for the year then ended, the statements of changes in net assets for each of the two years in the period then ended, the financial highlights for each of the five years in the period then ended and the related notes (collectively referred to as the “financial statements”). In our opinion, the financial statements present fairly, in all material respects, the financial position of Transamerica Stock Index, one of the portfolios constituting Transamerica Funds, at December 31, 2017, the results of its operations for the year then ended, the changes in its net assets for each of the two years in the period then ended and its financial highlights for each of the five years in the period then ended, in conformity with U.S. generally accepted accounting principles.
Basis for Opinion
These financial statements are the responsibility of the Trust’s management. Our responsibility is to express an opinion on the Portfolio’s financial statements based on our audits. We are a public accounting firm registered with the Public Company Accounting Oversight Board (United States) (“PCAOB”) and are required to be independent with respect to the Trust in accordance with the U.S. federal securities laws and the applicable rules and regulations of the Securities and Exchange Commission and the PCAOB.
We conducted our audits in accordance with the standards of the PCAOB. Those standards require that we plan and perform the audit to obtain reasonable assurance about whether the financial statements are free of material misstatement, whether due to error or fraud. The Trust is not required to have, nor were we engaged to perform, an audit of the Trust’s internal control over financial reporting. As part of our audits, we are required to obtain an understanding of internal control over financial reporting, but not for the purpose of expressing an opinion on the effectiveness of the Trust’s internal control over financial reporting. Accordingly, we express no such opinion.
Our audits included performing procedures to assess the risks of material misstatement of the financial statements, whether due to error or fraud, and performing procedures that respond to those risks. Such procedures included examining, on a test basis, evidence regarding the amounts and disclosures in the financial statements. Our procedures included confirmation of securities owned as of December 31, 2017, by correspondence with the custodian and others, or by other appropriate auditing procedures where replies from others were not received. Our audits also included evaluating the accounting principles used and significant estimates made by management, as well as evaluating the overall presentation of the financial statements. We believe that our audits provide a reasonable basis for our opinion.

We have served as the auditor of one or more Transamerica investment companies since 1995.
Boston, Massachusetts
February 26, 2018
| Transamerica Funds | Annual Report 2017 |
Page 14
Table of Contents
Transamerica Stock Index
SUPPLEMENTAL TAX INFORMATION (unaudited)
For tax purposes, the Fund has made a long-term capital gain designation of $10,898,204 for the year ended December 31, 2017.
For dividends paid during the year ended December 31, 2017, the Fund designated $13,302,764 of qualified dividend income.
For corporate shareholders, investment income (dividend income plus short-term gains, if any) which qualifies for the maximum dividends received deduction is 100%.
| Transamerica Funds | Annual Report 2017 |
Page 15
Table of Contents
Board Members and Officers
(unaudited)
Each of the funds is supervised by the Board. The S&P 500 Index Master Portfolio is supervised by the Board of Trustees of the Master Investment Portfolio.
The members of the Board (“Board Members”) and executive officers of each Trust are listed below.
Interested Board Member means a board member who may be deemed an “interested person” (as that term is defined in the 1940 Act) of each Trust because of his current or former service with TAM or an affiliate of TAM. Interested Board Members may also be referred to herein as “Interested Trustees.” Independent Board Member means a Board Member who is not an “interested person” (as defined under the 1940 Act) of each Trust and may also be referred to herein as an “Independent Trustee.”
The Board governs each fund and is responsible for protecting the interests of the shareholders. The Board Members are experienced executives who meet periodically throughout the year to oversee the business affairs of each fund and the operation of each fund by its officers. The Board also reviews the management of each fund’s assets by the investment manager and its respective sub-adviser.
The funds are among the funds managed and sponsored by TAM (collectively, “Transamerica Fund Family”). The Transamerica Fund Family consists of (i) Transamerica Funds (“TF”); (ii) Transamerica Series Trust (“TST”); (iii) Transamerica ETF Trust (“TET”) and (iv) Transamerica Asset Allocation Variable Funds (“TAAVF”). The Transamerica Fund Family consists of 136 funds as of the date of this annual report.
The mailing address of each Board Member is c/o Secretary, 1801 California Street, Suite 5200, Denver, CO 80202.
The Board Members, their age, their positions with the Trust, and their principal occupations for the past five years (their titles may have varied during that period) the number of funds in Transamerica Mutual Funds the Board oversees, and other board memberships they hold are set forth in the table below. The length of time served is provided from the date a Board Member became a member of the Board.
| Name and Age | Position(s) Held with Trust | Term of Office and Length of Time Served* | Principal Occupation(s) During Past Five Years | Number of Funds in Complex Overseen by Board Member | Other Directorships Held By Board Member | |||||
INTERESTED BOARD MEMBERS | ||||||||||
Marijn P. Smit (44) | Chairman of the Board, President and Chief Executive Officer | Since 2014 | Chairman of the Board, President and Chief Executive Officer, TF, TST and TAAVF (2014 – present); TPP, TPFG and TPFG II (2014 – 2018);
Chairman of the Board, President and Chief Executive Officer, TET (2017 – present);
Chairman of the Board, President and Chief Executive Officer, Transamerica Income Shares, Inc. (“TIS”) (2014 – 2015);
Director, Chairman of the Board, President and Chief Executive Officer, Transamerica Asset Management, Inc. (“TAM”) and Transamerica Fund Services, Inc. (“TFS”) (2014 – present);
President, Investment Solutions, Transamerica Investments & Retirement (2014 – 2016); | 136 | Director, Massachusetts Fidelity Trust Company (2014 – present); Director, Aegon Global Funds (since 2016); Director – Akaan-Aegon, S.A.P.I. de C.V. (financial services joint venture in Mexico) (2017 – present) | |||||
| Transamerica Funds | Annual Report 2017 |
Page 16
Table of Contents
| Name and Age | Position(s) Held with Trust | Term of Office and Length of Time Served* | Principal Occupation(s) During Past Five Years | Number of Funds in Complex Overseen by Board Member | Other Directorships Held By Board Member | |||||||
INTERESTED BOARD MEMBERS — continued | ||||||||||||
Marijn P. Smit (continued) |
Vice President, Transamerica Premier Life Insurance Company (2010 – 2016);
Vice President, Transamerica Life Insurance Company (2010 – present);
Senior Vice President, Transamerica Financial Life Insurance Company (2013 – 2016);
Senior Vice President, Transamerica Retirement Advisors, Inc. (2013 – 2016);
Senior Vice President, Transamerica Retirement Solutions Corporation (2012 – present); and
President and Director, Transamerica Stable Value Solutions, Inc. (2010 – 2016). | |||||||||||
Alan F. Warrick (69) | Board Member | Since 2012 | Board Member, TF, TST and TAAVF (2012 – present); TPP, TPFG and TPFG II (2012- 2018);
Board Member, TIS (2012 – 2015);
Consultant, Aegon USA (2010 – 2011);
Senior Advisor, Lovell Minnick Equity Partners (2010 – present);
Retired (2010 – present); and
Managing Director for Strategic Business Development, Aegon USA (1994 – 2010). | 132 | N/A | |||||||
INDEPENDENT BOARD MEMBERS | ||||||||||||
Sandra N. Bane (65) | Board Member | Since 2008 | Retired (1999 – present);
Board Member, TF, TST and TAAVF (2008 – present); TPP, TPFG and TPFG II (2008 – 2018);
Board Member, TIS (2008 – 2015);
Board Member, Transamerica Investors, Inc. (“TII”) (2003 – 2010); and
Partner, KPMG (1975 – 1999). | 132 | Big 5 Sporting Goods (2002 – present); Southern Company Gas (energy services holding company) (2008 – present) | |||||||
Leo J. Hill (61) | Lead Independent Board Member | Since 2002 | Principal, Advisor Network Solutions, LLC (business consulting) (2006 – present);
Board Member, TST (2001 – present); | | 132 | | Ameris Bancorp (2013 – present); Ameris Bank (2013 – present) | |||||
| Transamerica Funds | Annual Report 2017 |
Page 17
Table of Contents
| Name and Age | Position(s) Held with Trust | Term of Office and Length of Time Served* | Principal Occupation(s) During Past Five Years | Number of Funds in Complex Overseen by Board Member | Other Directorships Held By Board Member | |||||||||
INDEPENDENT BOARD MEMBERS — continued |
| |||||||||||||
Leo J. Hill (continued) |
Board Member, TF (2002 – present);
Board Member, TIS (2002 – 2015);
Board Member TPP, TPFG, TPFG II (2007- 2018);
Board Member, TAAVF (2007 – present);
Board Member, TII (2008 – 2010);
Market President, Nations Bank of Sun Coast Florida (1998 – 1999);
Chairman, President and Chief Executive Officer, Barnett Banks of Treasure Coast Florida (1994 – 1998);
Executive Vice President and Senior Credit Officer, Barnett Banks of Jacksonville, Florida (1991 – 1994); and
Senior Vice President and Senior Loan Administration Officer, Wachovia Bank of Georgia (1976 – 1991). | |||||||||||||
David W. Jennings (71) | Board Member | Since 2009 | Board Member, TF, TST and TAAVF (2009 – present); TPP, TPFG and TPFG II (2009-2018);
Board Member, TIS (2009 – 2015);
Board Member, TII (2009 – 2010);
Managing Director, Hilton Capital Management, LLC (2010 – present);
Principal, Maxam Capital Management, LLC (2006 – 2008); and
Principal, Cobble Creek Management LP (2004 – 2006). | 132 | N/A | |||||||||
Russell A. Kimball, Jr. (73) | Board Member | Since 1986 – 1990 and Since 2002 | General Manager, Sheraton Sand Key Resort (1975 – present);
Board Member, TST (1986 – present);
Board Member, TF, (1986 – 1990), (2002 – present);
Board Member, TIS (2002 – 2015);
Board Member, TPP, TPFG and TPFG II (2007 – 2018); | 132 | N/A | |||||||||
| Transamerica Funds | Annual Report 2017 |
Page 18
Table of Contents
| Name and Age | Position(s) Held with Trust | Term of Office and Length of Time Served* | Principal Occupation(s) During Past Five Years | Number of Funds in Complex Overseen by Board Member | Other Directorships Held By Board Member | |||||
INDEPENDENT BOARD MEMBERS — continued | ||||||||||
Russell A. Kimball, Jr. (continued) |
Board Member, TAAVF (2007 – present); and
Board Member, TII (2008 – 2010). | |||||||||
Fredric A. Nelson III (61) | Board Member | Since 2017 | Board Member, TF, TST and TAAVF (2017 – present); TPP, TPFG and TPFG II (2017 – 2018);
Chief Investment Officer (“CIO”), Commonfund (2011 – 2015);
Vice Chairman, CIO, ING Investment Management Americas (2003 – 2009);
Managing Director, JP Morgan Investment Management (1994 – 2003); and
Head of U.S. Equity, Bankers Trust Company (2000 – 2003);
Managing Director, (1981 – 1994);
Head of Global Quantitative Investments Group (1989 – 1994). | 132 | N/A | |||||
John E. Pelletier (53) | Board Member | Since 2017 | Board Member, TF, TST and TAAVF (2017 – present); TPP, TPFG and TPFG II (2017-2018);
Director, Center for Financial Literacy, Champlain College (2010 – present);
Co-Chair, Vermont Financial Literacy Commission with Vermont State Treasurer (2015 – present);
Chairman, Vermont Universal Children’s Higher Education Savings Account Program Advisory Committee (2015 – present);
Founder and Principal, Sterling Valley Consulting LLC (a financial services consulting firm) (2009 – 2017);
Independent Director, The Sentinel Funds and Sentinel Variable Products Trust (2013 – 2017);
Chief Legal Officer, Eaton Vance Corp. (2007 – 2008); and
Executive Vice President and Chief Operating Officer, Natixis Global Associates (2004 – 2007);
General Counsel (1997 – 2004). | 132 | N/A | |||||
| Transamerica Funds | Annual Report 2017 |
Page 19
Table of Contents
| Name and Age | Position(s) Held with Trust | Term of Office and Length of Time Served* | Principal Occupation(s) During Past Five Years | Number of Funds in Complex Overseen by Board Member | Other Directorships Held By Board Member | |||||
INDEPENDENT BOARD MEMBERS — continued | ||||||||||
Patricia L. Sawyer (67) | Board Member | Since 2007 | Retired (2007 – present);
President/Founder, Smith & Sawyer LLC (management consulting) (1989 – 2007);
Board Member, TF and TST
Board Member, TIS (2007 – 2015);
Board Member, TII (2008 – 2010);
Board Member, TPP, TPFG and TPFG II (1993- 2018);
Board Member, TAAVF (1993 – present); and
Trustee, Chair of Finance Committee and Chair of Nominating Committee (1987 – 1996), Bryant University. | 132 | Honorary Trustee, Bryant University (1996 – present) | |||||
John W. Waechter (65) | Board Member | Since 2005 | Partner, Englander Fischer (2016 – present); Attorney, Englander Fischer (2008 – 2015);
Retired (2004 – 2008);
Board Member, TST (2004 – present);
Board Member, TIS (2004 – 2015);
Board Member, TF (2005 – present);
Board Member, TPP, TPFG and TPFG II (2007 – 2018);
Board Member, TAAVF (2007 – present);
Board Member, TII (2008 – 2010);
Employee, RBC Dain Rauscher (securities dealer) (2004);
Executive Vice President, Chief Financial Officer and Chief Compliance Officer, William R. Hough & Co. (securities dealer) (1979 – 2004); and
Treasurer, The Hough Group of Funds (1993 – 2004). | 132 | Operation PAR, Inc. (non-profit organization) (2008 – present); Remember | |||||
| * | Each Board Member shall hold office until: 1) his or her successor is elected and qualified or 2) he or she resigns, retires or his or her term as a Board Member is terminated in accordance with the Trust’s Declaration of Trust. |
| Transamerica Funds | Annual Report 2017 |
Page 20
Table of Contents
Officers
The mailing address of each officer is c/o Secretary, 1801 California Street, Suite 5200, Denver, CO 80202. The following table shows information about the officers, including their year of birth, their positions held with each Trust and their principal occupations during the past five years (their titles may have varied during that period). Each officer will hold office until his or her successor has been duly elected or appointed or until his or her earlier death, resignation or removal.
| Name and Age | Position | Term of Office and Length of Time Served* | Principal Occupation(s) or Employment During Past Five Years | |||
| Marijn P. Smit (44) | Chairman of the Board, President and Chief Executive Officer | Since 2014 | See Table Above. | |||
| Tané T. Tyler (52) | Vice President, Associate General Counsel, Chief Legal Officer and Secretary | Since 2014 | Vice President, Associate General Counsel, Chief Legal Officer and Secretary, Transamerica Funds, TST and TAAVF (2014 – present); TPP, TPFG and TPFG II (2014 – 2018);
Assistant General Counsel, Chief Legal Officer and Secretary, TIS (2014 – 2015);
Director (2014 – present), Assistant Secretary (2016 – present), Vice President, Secretary, Associate General Counsel and Chief Legal Officer (2014 – 2016), TAM;
Director, Associate General Counsel, Chief Legal Officer, Secretary and Vice President, TFS (2014 – present);
Senior Vice President, Secretary and General Counsel, ALPS, Inc., ALPS Fund Services, Inc. and ALPS Distributors, Inc. (2004 – 2013); and
Secretary, Liberty All-Star Funds (2005 – 2013). | |||
Christopher A. Staples (47) | Vice President and Chief Investment Officer, Advisory Services | Since 2005 | Vice President and Chief Investment Officer, Advisory Services (2007 – present), Senior Vice President – Investment Management (2006 – 2007), Vice President – Investment Management (2005 – 2006), Transamerica Funds and TST;
Vice President and Chief Investment Officer, Advisory Services (2007 – 2015), Senior Vice President – Investment Management (2006 – 2007), Vice President – Investment Management (2005 – 2006), TIS;
Vice President and Chief Investment Officer, Advisory Services, TAAVF (2007 – present); TPP, TPFG and TPFG II (2007 – 2018);
Vice President and Chief Investment Officer (2007 – 2010), Vice President – Investment Administration (2005 – 2007), TII;
Director (2005 – present), Senior Vice President (2006 – present), Senior Director, Investments (2016 – present), Chief Investment Officer, Advisory Services (2012 – 2016), TAM;
Director, TFS (2005 – present); and
Assistant Vice President, Raymond James & Associates (1999 – 2004). |
| Transamerica Funds | Annual Report 2017 |
Page 21
Table of Contents
| Name and Age | Position | Term of Office and Length of Time Served* | Principal Occupation(s) or Employment During Past Five Years | |||
Thomas R. Wald (57) | Chief Investment Officer | Since 2014 | Chief Investment Officer, Transamerica Funds, TST and TAAVF (2014 – present); TPP, TPFG and TPFG II (2014 – 2018);
Chief Investment Officer, TIS (2014 – 2015);
Senior Vice President and Chief Investment Officer, TAM (2014 – present);
Chief Investment Officer, Transamerica Investments & Retirement (2014 – present);
Vice President and Client Portfolio Manager, Curian Capital, LLC (2012 – 2014);
Portfolio Manager, Tactical Allocation Group, LLC (2010 – 2011);
Mutual Fund Manager, Munder Capital Management (2005 – 2008); and
Mutual Fund Manager, Invesco Ltd. (1997 – 2004). | |||
Vincent J. Toner (47) | Vice President and Treasurer | Since 2014 | Vice President and Treasurer, Transamerica Funds, TST and TAAVF (2014 – present); TPP, TPFG and TPFG II (2014 – 2018);
Vice President and Treasurer, TIS (2014 – 2015);
Vice President and Treasurer (2016 – present), Vice President, Administration and Treasurer (2014 – 2016), TAM;
Vice President, Administration and Treasurer, TFS (2014 – present);
Senior Vice President and Vice President, Fund Administration, Brown Brothers Harriman (2010 – 2014); and
Vice President, Fund Administration & Fund Accounting, OppenheimerFunds (2007 – 2010). | |||
Scott M. Lenhart (56) | Chief Compliance Officer and Anti-Money Laundering Officer | Since 2014 | Chief Compliance Officer and Anti-Money Laundering Officer, Transamerica Funds, TST and TAAVF (2014 – present), TIS (2014 – 2015); TPP, TPFG and TPFG II (2014 – 2018);
Chief Compliance Officer (2014 – present), Anti-Money Laundering Officer (2014 – Present), TAM;
Vice President and Chief Compliance Officer, TFS (2014 – present);
Director of Compliance, Transamerica Investments & Retirement (2014);
Vice President and Chief Compliance Officer, Transamerica Financial Advisors, Inc. (1999 – 2006); and
Assistant Chief Compliance Officer, Raymond James Financial, Inc., Robert Thomas Securities, Inc. (1989 – 1998). |
| Transamerica Funds | Annual Report 2017 |
Page 22
Table of Contents
| Name and Age | Position | Term of Office and Length of Time Served* | Principal Occupation(s) or Employment During Past Five Years | |||
Rhonda A. Mills (51) | Assistant General Counsel, Assistant Secretary | Since 2016 | Assistant Secretary, Transamerica Funds, TST and TAAVF (2016 – present); TPP, TPFG, TPFG II (2016 – 2018);
Assistant Secretary, Vice President and High Level Specialist Attorney (2014 – 2016), Assistant General Counsel (2016 – present), TAM;
Assistant Secretary, High Level Specialist Attorney and Vice President (2014 – present), TFS;
Vice President and Associate Counsel, ALPS Fund Services, Inc. (2011 – 2014);
Managing Member, Mills Law, LLC (2010 – 2011);
Counsel, Old Mutual Capital (2006 – 2009);
Senior Counsel, Great-West Life and Annuity Insurance Company (2004 – 2006); and
Securities Counsel, J.D. Edwards (2000 – 2003). |
| * | Elected and serves at the pleasure of the Board of the Trust. |
| Transamerica Funds | Annual Report 2017 |
Page 23
Table of Contents
Appendix A
S&P 500 Index Master Portfolio
Table of Contents
(This page intentionally left blank)
Table of Contents
| Master Portfolio Information as of December 31, 2017 | S&P 500 Index Master Portfolio |
TEN LARGEST HOLDINGS
Security | Percent of Net Assets | |||
| Apple, Inc. | 4 | % | ||
| Microsoft Corp. | 3 | |||
| Amazon.com, Inc. | 2 | |||
| Facebook, Inc. | 2 | |||
| Berkshire Hathaway, Inc. | 2 | |||
| Johnson & Johnson | 2 | |||
| JPMorgan Chase & Co. | 2 | |||
| Exxon Mobil Corp. | 2 | |||
| Alphabet, Inc., Class C | 1 | |||
| Alphabet, Inc., Class A | 1 | |||
SECTOR ALLOCATION
Sector | Percent of Net Assets | |||
| Information Technology | 24 | % | ||
| Financials | 14 | |||
| Health Care | 14 | |||
| Consumer Discretionary | 12 | |||
| Industrials | 10 | |||
| Consumer Staples | 8 | |||
| Energy | 6 | |||
| Materials | 3 | |||
| Utilities | 3 | |||
| Real Estate | 3 | |||
| Telecommunication Services | 2 | |||
| Short-Term Securities | 2 | |||
| Liabilities in Excess of Other Assets | (1 | ) | ||
For Master Portfolio compliance purposes, the Master Portfolio’s sector classifications refer to one or more of the sector sub-classifications used by one or more widely recognized market indexes or ratings group indexes, and/or as defined by the investment adviser. These definitions may not apply for purposes of this report, which may combine such sector sub-classifications for reporting ease.
| MASTER PORTFOLIO INFORMATION | 1 |
Table of Contents
| Schedule of Investments | S&P 500 Index Master Portfolio | |||
| December 31, 2017 | (Percentages shown are based on Net Assets) |
Security | Shares | Value | ||||||
Common Stocks — 99.1% | ||||||||
Aerospace & Defense — 2.5% | ||||||||
Arconic, Inc. | 260,512 | $ | 7,098,952 | |||||
Boeing Co. | 335,324 | 98,890,401 | ||||||
General Dynamics Corp. | 165,842 | 33,740,555 | ||||||
L3 Technologies, Inc. | 45,950 | 9,091,208 | ||||||
Lockheed Martin Corp. | 149,235 | 47,911,897 | ||||||
Northrop Grumman Corp. | 103,698 | 31,825,953 | ||||||
Raytheon Co. | 173,310 | 32,556,283 | ||||||
Rockwell Collins, Inc. | 98,121 | 13,307,170 | ||||||
Textron, Inc. | 154,558 | 8,746,437 | ||||||
TransDigm Group, Inc. | 28,666 | 7,872,257 | ||||||
United Technologies Corp. | 444,550 | 56,711,243 | ||||||
|
| |||||||
| 347,752,356 | ||||||||
Air Freight & Logistics — 0.7% | ||||||||
C.H. Robinson Worldwide, Inc. | 82,640 | 7,362,398 | ||||||
Expeditors International of Washington, Inc. | 109,898 | 7,109,302 | ||||||
FedEx Corp. | 147,215 | 36,736,031 | ||||||
United Parcel Service, Inc., Class B | 411,156 | 48,989,237 | ||||||
|
| |||||||
| 100,196,968 | ||||||||
Airlines — 0.5% | ||||||||
Alaska Air Group, Inc. | 71,558 | 5,260,228 | ||||||
American Airlines Group, Inc. | 261,647 | 13,613,493 | ||||||
Delta Air Lines, Inc. | 390,764 | 21,882,784 | ||||||
Southwest Airlines Co. | 323,477 | 21,171,570 | ||||||
United Continental Holdings, Inc.(a) | 151,097 | 10,183,938 | ||||||
|
| |||||||
| 72,112,013 | ||||||||
Auto Components — 0.3% | ||||||||
Aptiv PLC | 160,226 | 13,591,972 | ||||||
BorgWarner, Inc. | 117,358 | 5,995,820 | ||||||
Goodyear Tire & Rubber Co. | 146,534 | 4,734,514 | ||||||
Johnson Controls International PLC | 558,604 | 21,288,398 | ||||||
|
| |||||||
| 45,610,704 | ||||||||
Automobiles — 0.5% | ||||||||
Ford Motor Co. | 2,347,191 | 29,316,416 | ||||||
General Motors Co. | 768,589 | 31,504,463 | ||||||
Harley-Davidson, Inc. | 100,929 | 5,135,267 | ||||||
|
| |||||||
| 65,956,146 | ||||||||
Banks — 6.5% | ||||||||
Bank of America Corp. | 5,801,130 | 171,249,328 | ||||||
BB&T Corp. | 473,424 | 23,538,641 | ||||||
Citigroup, Inc. | 1,583,223 | 117,807,623 | ||||||
Citizens Financial Group, Inc. | 296,166 | 12,433,049 | ||||||
Comerica, Inc. | 107,698 | 9,349,263 | ||||||
Fifth Third Bancorp | 431,681 | 13,097,202 | ||||||
Huntington Bancshares, Inc. | 665,283 | 9,686,521 | ||||||
JPMorgan Chase & Co. | 2,071,274 | 221,502,042 | ||||||
KeyCorp. | 641,312 | 12,935,263 | ||||||
M&T Bank Corp. | 91,371 | 15,623,527 | ||||||
PNC Financial Services Group, | 285,955 | 41,260,447 | ||||||
Regions Financial Corp. | 702,941 | 12,146,821 | ||||||
SunTrust Banks, Inc. | 281,555 | 18,185,637 | ||||||
U.S. Bancorp | 936,412 | 50,172,955 | ||||||
Wells Fargo & Co. | 2,650,601 | 160,811,963 | ||||||
Zions Bancorporation | 118,421 | 6,019,339 | ||||||
|
| |||||||
| 895,819,621 | ||||||||
Beverages — 2.0% | ||||||||
Brown-Forman Corp., Class B | 113,356 | 7,784,156 | ||||||
Coca-Cola Co. | 2,297,865 | 105,426,046 | ||||||
Constellation Brands, Inc., Class A | 102,679 | 23,469,339 | ||||||
Dr. Pepper Snapple Group, Inc. | 106,715 | 10,357,758 | ||||||
Security | Shares | Value | ||||||
Beverages (continued) | ||||||||
Molson Coors Brewing Co., Class B | 108,560 | $ | 8,909,519 | |||||
Monster Beverage Corp.(a) | 249,172 | 15,770,096 | ||||||
PepsiCo, Inc. | 850,628 | 102,007,310 | ||||||
|
| |||||||
| 273,724,224 | ||||||||
Biotechnology — 2.8% | ||||||||
AbbVie, Inc. | 957,189 | 92,569,748 | ||||||
Alexion Pharmaceuticals, Inc.(a) | 133,393 | 15,952,469 | ||||||
Amgen, Inc. | 435,208 | 75,682,671 | ||||||
Biogen, Inc.(a) | 126,097 | 40,170,721 | ||||||
Celgene Corp.(a) | 472,924 | 49,354,349 | ||||||
Gilead Sciences, Inc. | 779,054 | 55,811,429 | ||||||
Incyte Corp.(a) | 102,748 | 9,731,263 | ||||||
Regeneron Pharmaceuticals, Inc.(a) | 45,981 | 17,287,017 | ||||||
Vertex Pharmaceuticals, Inc.(a) | 150,555 | 22,562,172 | ||||||
|
| |||||||
| 379,121,839 | ||||||||
Building Products — 0.2% | ||||||||
Allegion PLC | 55,592 | 4,422,900 | ||||||
AO Smith Corp. | 86,280 | 5,287,238 | ||||||
Fortune Brands Home & Security, Inc. | 95,901 | 6,563,464 | ||||||
Masco Corp. | 185,105 | 8,133,514 | ||||||
|
| |||||||
| 24,407,116 | ||||||||
Capital Markets — 2.5% | ||||||||
Affiliated Managers Group, Inc. | 32,950 | 6,762,987 | ||||||
Ameriprise Financial, Inc. | 90,303 | 15,303,649 | ||||||
Bank of New York Mellon Corp. | 617,273 | 33,246,324 | ||||||
BlackRock, Inc.(e) | 73,422 | 37,717,616 | ||||||
Charles Schwab Corp. | 712,918 | 36,622,598 | ||||||
CME Group, Inc. | 202,433 | 29,565,340 | ||||||
E*Trade Financial Corp.(a) | 169,204 | 8,387,442 | ||||||
Franklin Resources, Inc. | 192,659 | 8,347,914 | ||||||
Goldman Sachs Group, Inc. | 210,329 | 53,583,416 | ||||||
Invesco Ltd. | 247,235 | 9,033,967 | ||||||
Morgan Stanley | 836,517 | 43,892,047 | ||||||
Northern Trust Corp. | 130,571 | 13,042,737 | ||||||
Raymond James Financial, Inc. | 74,775 | 6,677,408 | ||||||
State Street Corp. | 223,583 | 21,823,937 | ||||||
T. Rowe Price Group, Inc. | 144,329 | 15,144,442 | ||||||
|
| |||||||
| 339,151,824 | ||||||||
Chemicals — 2.2% | ||||||||
Air Products & Chemicals, Inc. | 130,691 | 21,443,779 | ||||||
Albemarle Corp. | 65,091 | 8,324,488 | ||||||
CF Industries Holdings, Inc. | 138,621 | 5,896,937 | ||||||
DowDuPont, Inc. | 1,404,844 | 100,052,990 | ||||||
Eastman Chemical Co. | 85,259 | 7,898,394 | ||||||
Ecolab, Inc. | 155,633 | 20,882,836 | ||||||
FMC Corp. | 79,496 | 7,525,091 | ||||||
International Flavors & Fragrances, Inc. | 47,931 | 7,314,750 | ||||||
LyondellBasell Industries NV, Class A | 193,623 | 21,360,489 | ||||||
Monsanto Co. | 262,015 | 30,598,112 | ||||||
Mosaic Co. | 207,653 | 5,328,376 | ||||||
PPG Industries, Inc. | 154,310 | 18,026,494 | ||||||
Praxair, Inc. | 171,093 | 26,464,665 | ||||||
Sherwin-Williams Co. | 49,185 | 20,167,818 | ||||||
|
| |||||||
| 301,285,219 | ||||||||
Commercial Services & Supplies — 0.3% |
| |||||||
Cintas Corp. | 50,781 | 7,913,203 | ||||||
Iron Mountain, Inc. | 154,662 | 5,835,397 | ||||||
Republic Services, Inc. | 136,001 | 9,195,028 | ||||||
Stericycle, Inc.(a)(b) | 49,455 | 3,362,445 | ||||||
Waste Management, Inc. | 237,269 | 20,476,315 | ||||||
|
| |||||||
| 46,782,388 | ||||||||
| 2 | 2017 BLACKROCK ANNUAL REPORTTO SHAREHOLDERS |
Table of Contents
Schedule of Investments (continued) December 31, 2017 | S&P 500 Index Master Portfolio (Percentages shown are based on Net Assets) |
Security | Shares | Value | ||||||
Communications Equipment — 1.0% |
| |||||||
Cisco Systems, Inc. | 2,959,312 | $ | 113,341,650 | |||||
F5 Networks, Inc.(a) | 37,904 | 4,973,763 | ||||||
Harris Corp. | 70,710 | 10,016,071 | ||||||
Juniper Networks, Inc. | 223,770 | 6,377,445 | ||||||
Motorola Solutions, Inc. | 99,241 | 8,965,432 | ||||||
|
| |||||||
| 143,674,361 | ||||||||
Construction & Engineering — 0.1% |
| |||||||
Fluor Corp. | 82,221 | 4,246,715 | ||||||
Jacobs Engineering Group, Inc. | 70,035 | 4,619,508 | ||||||
Quanta Services, Inc.(a) | 88,806 | 3,473,203 | ||||||
|
| |||||||
| 12,339,426 | ||||||||
Construction Materials — 0.1% |
| |||||||
Martin Marietta Materials, Inc. | 37,045 | 8,188,427 | ||||||
Vulcan Materials Co. | 81,053 | 10,404,773 | ||||||
|
| |||||||
| 18,593,200 | ||||||||
Consumer Finance — 0.8% |
| |||||||
American Express Co. | 429,604 | 42,663,973 | ||||||
Capital One Financial Corp. | 289,609 | 28,839,264 | ||||||
Discover Financial Services | 217,445 | 16,725,870 | ||||||
Navient Corp. | 168,799 | 2,248,403 | ||||||
Synchrony Financial | 449,671 | 17,361,797 | ||||||
|
| |||||||
| 107,839,307 | ||||||||
Containers & Packaging — 0.3% |
| |||||||
Avery Dennison Corp. | 54,591 | 6,270,322 | ||||||
Ball Corp. | 205,558 | 7,780,370 | ||||||
Packaging Corp. of America | 55,189 | 6,653,034 | ||||||
Sealed Air Corp. | 112,730 | 5,557,589 | ||||||
WestRock Co. | 148,512 | 9,387,444 | ||||||
|
| |||||||
| 35,648,759 | ||||||||
Distributors — 0.1% | ||||||||
Genuine Parts Co. | 85,536 | 8,126,776 | ||||||
LKQ Corp.(a) | 180,654 | 7,347,198 | ||||||
|
| |||||||
| 15,473,974 | ||||||||
Diversified Consumer Services — 0.0% |
| |||||||
H&R Block, Inc. | 122,375 | 3,208,672 | ||||||
|
| |||||||
Diversified Financial Services — 2.3% |
| |||||||
Berkshire Hathaway, Inc., Class B(a) | 1,151,061 | 228,163,312 | ||||||
Cboe Global Markets, Inc. | 68,698 | 8,559,084 | ||||||
Intercontinental Exchange, Inc. | 351,995 | 24,836,767 | ||||||
Leucadia National Corp. | 188,762 | 5,000,305 | ||||||
Moody’s Corp. | 100,168 | 14,785,799 | ||||||
Nasdaq, Inc. | 72,363 | 5,559,649 | ||||||
S&P Global, Inc. | 153,345 | 25,976,643 | ||||||
|
| |||||||
| 312,881,559 | ||||||||
Diversified Telecommunication Services — 2.1% |
| |||||||
AT&T, Inc. | 3,679,146 | 143,045,158 | ||||||
CenturyLink, Inc. | 568,527 | 9,483,030 | ||||||
SBA Communications Corp.(a) | 70,903 | 11,582,714 | ||||||
Verizon Communications, Inc. | 2,443,653 | 129,342,553 | ||||||
|
| |||||||
| 293,453,455 | ||||||||
Electric Utilities — 1.6% |
| |||||||
American Electric Power Co., Inc. | 293,238 | 21,573,520 | ||||||
Duke Energy Corp. | 416,768 | 35,054,356 | ||||||
Edison International | 195,588 | 12,368,985 | ||||||
Entergy Corp. | 105,205 | 8,562,635 | ||||||
Eversource Energy | 192,421 | 12,157,159 | ||||||
Exelon Corp. | 573,983 | 22,620,670 | ||||||
FirstEnergy Corp. | 262,946 | 8,051,407 | ||||||
NextEra Energy, Inc. | 282,340 | 44,098,685 | ||||||
Pinnacle West Capital Corp. | 66,548 | 5,668,559 | ||||||
Security | Shares | Value | ||||||
Electric Utilities (continued) |
| |||||||
PPL Corp. | 409,277 | $ | 12,667,123 | |||||
Southern Co. | 596,804 | 28,700,304 | ||||||
Xcel Energy, Inc. | 305,285 | 14,687,261 | ||||||
|
| |||||||
| 226,210,664 | ||||||||
Electrical Equipment — 0.6% |
| |||||||
Acuity Brands, Inc. | 24,532 | 4,317,632 | ||||||
AMETEK, Inc. | 135,148 | 9,794,176 | ||||||
Eaton Corp. PLC | 266,828 | 21,082,080 | ||||||
Emerson Electric Co. | 384,767 | 26,814,412 | ||||||
Rockwell Automation, Inc. | 77,486 | 15,214,376 | ||||||
|
| |||||||
| 77,222,676 | ||||||||
Electronic Equipment, Instruments & Components — 0.4% |
| |||||||
Amphenol Corp., Class A | 182,393 | 16,014,105 | ||||||
Corning, Inc. | 527,323 | 16,869,063 | ||||||
FLIR Systems, Inc. | 81,968 | 3,821,348 | ||||||
TE Connectivity Ltd. | 212,321 | 20,178,988 | ||||||
|
| |||||||
| 56,883,504 | ||||||||
Energy Equipment & Services — 0.8% |
| |||||||
Baker Hughes a GE Co. | 250,848 | 7,936,831 | ||||||
Halliburton Co. | 519,281 | 25,377,262 | ||||||
Helmerich & Payne, Inc. | 63,592 | 4,110,587 | ||||||
National Oilwell Varco, Inc.(b) | 231,780 | 8,348,716 | ||||||
Schlumberger Ltd. | 830,317 | 55,955,063 | ||||||
TechnipFMC PLC | 257,556 | 8,064,078 | ||||||
|
| |||||||
| 109,792,537 | ||||||||
Food & Staples Retailing — 1.8% |
| |||||||
Costco Wholesale Corp. | 262,422 | 48,841,983 | ||||||
CVS Health Corp. | 607,396 | 44,036,210 | ||||||
Kroger Co. | 541,698 | �� | 14,869,610 | |||||
Sysco Corp. | 290,781 | 17,659,130 | ||||||
Wal-Mart Stores, Inc. | 873,810 | 86,288,738 | ||||||
Walgreens Boots Alliance, Inc. | 518,207 | 37,632,192 | ||||||
|
| |||||||
| 249,327,863 | ||||||||
Food Products — 1.2% |
| |||||||
Archer-Daniels-Midland Co. | 337,888 | 13,542,551 | ||||||
Campbell Soup Co. | 112,425 | 5,408,767 | ||||||
Conagra Brands, Inc. | 253,496 | 9,549,194 | ||||||
General Mills, Inc. | 346,360 | 20,535,684 | ||||||
Hershey Co. | 85,736 | 9,731,893 | ||||||
Hormel Foods Corp. | 154,840 | 5,634,628 | ||||||
J.M. Smucker Co. | 67,617 | 8,400,736 | ||||||
Kellogg Co. | 150,460 | 10,228,271 | ||||||
Kraft Heinz Co. | 356,343 | 27,709,232 | ||||||
McCormick & Co., Inc. | 72,889 | 7,428,118 | ||||||
Mondelez International, Inc., Class A | 900,709 | 38,550,345 | ||||||
Tyson Foods, Inc., Class A | 174,479 | 14,145,013 | ||||||
|
| |||||||
| 170,864,432 | ||||||||
Health Care Equipment & Supplies — 2.7% |
| |||||||
Abbott Laboratories | 1,052,155 | 60,046,486 | ||||||
Align Technology, Inc.(a) | 44,042 | 9,785,692 | ||||||
Baxter International, Inc. | 298,514 | 19,295,945 | ||||||
Becton Dickinson & Co. | 157,855 | 33,790,339 | ||||||
Boston Scientific Corp.(a) | 820,488 | 20,339,897 | ||||||
Cooper Cos., Inc. | 29,002 | 6,318,956 | ||||||
Danaher Corp. | 365,209 | 33,898,699 | ||||||
Dentsply Sirona, Inc. | 139,448 | 9,179,862 | ||||||
Edwards Lifesciences Corp.(a) | 126,584 | 14,267,283 | ||||||
Hologic, Inc.(a) | 163,915 | 7,007,366 | ||||||
IDEXX Laboratories, Inc.(a) | 51,887 | 8,114,089 | ||||||
Intuitive Surgical, Inc.(a) | 66,627 | 24,314,857 | ||||||
Medtronic PLC | 809,310 | 65,351,782 | ||||||
| SCHEDULEOF INVESTMENTS | 3 |
Table of Contents
Schedule of Investments (continued) December 31, 2017 | S&P 500 Index Master Portfolio (Percentages shown are based on Net Assets) |
Security | Shares | Value | ||||||
Health Care Equipment & Supplies (continued) |
| |||||||
ResMed, Inc. | 83,059 | $ | 7,034,267 | |||||
Stryker Corp. | 191,733 | 29,687,938 | ||||||
Varian Medical Systems, Inc.(a)(b) | 54,702 | 6,080,127 | ||||||
Zimmer Biomet Holdings, Inc. | 121,489 | 14,660,078 | ||||||
|
| |||||||
| 369,173,663 | ||||||||
Health Care Providers & Services — 2.8% |
| |||||||
Aetna, Inc. | 194,042 | 35,003,236 | ||||||
AmerisourceBergen Corp. | 94,642 | 8,690,028 | ||||||
Anthem, Inc. | 153,330 | 34,500,783 | ||||||
Cardinal Health, Inc. | 190,937 | 11,698,710 | ||||||
Centene Corp.(a) | 104,692 | 10,561,329 | ||||||
Cigna Corp. | 147,841 | 30,025,029 | ||||||
DaVita, Inc.(a) | 90,527 | 6,540,576 | ||||||
Envision Healthcare Corp.(a) | 69,123 | 2,388,891 | ||||||
Express Scripts Holding Co.(a)(b) | 339,740 | 25,358,194 | ||||||
HCA Healthcare, Inc.(a) | 170,084 | 14,940,179 | ||||||
Henry Schein, Inc.(a)(b) | 96,243 | 6,725,461 | ||||||
Humana, Inc. | 86,348 | 21,420,348 | ||||||
Laboratory Corp. of America Holdings(a) | 59,775 | 9,534,710 | ||||||
McKesson Corp. | 125,780 | 19,615,391 | ||||||
Patterson Cos., Inc. | 47,484 | 1,715,597 | ||||||
Quest Diagnostics, Inc. | 83,197 | 8,194,072 | ||||||
UnitedHealth Group, Inc. | 580,186 | 127,907,806 | ||||||
Universal Health Services, Inc., Class B | 52,271 | 5,924,918 | ||||||
|
| |||||||
| 380,745,258 | ||||||||
Health Care Technology — 0.1% |
| |||||||
Cerner Corp.(a) | 189,247 | 12,753,355 | ||||||
|
| |||||||
Hotels, Restaurants & Leisure — 1.8% |
| |||||||
Carnival Corp. | 244,594 | 16,233,704 | ||||||
Chipotle Mexican Grill, Inc.(a)(b) | 14,640 | 4,231,399 | ||||||
Darden Restaurants, Inc. | 74,092 | 7,114,314 | ||||||
Hilton Worldwide Holdings, Inc. | 118,875 | 9,493,357 | ||||||
Marriott International, Inc., Class A | 183,063 | 24,847,141 | ||||||
McDonald’s Corp. | 476,565 | 82,026,368 | ||||||
MGM Resorts International | 313,732 | 10,475,511 | ||||||
Norwegian Cruise Line Holdings Ltd.(a) | 106,192 | 5,654,724 | ||||||
Royal Caribbean Cruises Ltd. | 103,840 | 12,386,035 | ||||||
Starbucks Corp. | 855,400 | 49,125,622 | ||||||
Wyndham Worldwide Corp. | 60,914 | 7,058,105 | ||||||
Wynn Resorts Ltd. | 48,976 | 8,256,864 | ||||||
Yum! Brands, Inc. | 200,837 | 16,390,308 | ||||||
|
| |||||||
| 253,293,452 | ||||||||
Household Durables — 0.4% | ||||||||
D.R. Horton, Inc. | 199,014 | 10,163,645 | ||||||
Garmin Ltd. | 67,037 | 3,993,394 | ||||||
Leggett & Platt, Inc. | 77,738 | 3,710,435 | ||||||
Lennar Corp., Class A | 128,661 | 8,136,522 | ||||||
Mohawk Industries, Inc.(a) | 38,505 | 10,623,529 | ||||||
Newell Brands, Inc. | 287,952 | 8,897,717 | ||||||
PulteGroup, Inc. | 164,364 | 5,465,103 | ||||||
Whirlpool Corp. | 43,002 | 7,251,857 | ||||||
|
| |||||||
| 58,242,202 | ||||||||
Household Products — 1.6% | ||||||||
Church & Dwight Co., Inc. | 147,531 | 7,401,630 | ||||||
Clorox Co. | 78,371 | 11,656,903 | ||||||
Colgate-Palmolive Co. | 525,800 | 39,671,610 | ||||||
Kimberly-Clark Corp. | 211,402 | 25,507,765 | ||||||
Procter & Gamble Co. | 1,525,557 | 140,168,177 | ||||||
|
| |||||||
| 224,406,085 | ||||||||
Security | Shares | Value | ||||||
Independent Power and Renewable Electricity Producers — 0.1% |
| |||||||
AES Corp. | 388,222 | $ | 4,204,444 | |||||
NRG Energy, Inc. | 174,951 | 4,982,605 | ||||||
|
| |||||||
| 9,187,049 | ||||||||
Industrial Conglomerates — 1.9% | ||||||||
3M Co. | 355,843 | 83,754,767 | ||||||
General Electric Co. | 5,212,505 | 90,958,195 | ||||||
Honeywell International, Inc. | 454,381 | 69,683,870 | ||||||
Roper Technologies, Inc. | 61,255 | 15,865,045 | ||||||
|
| |||||||
| 260,261,877 | ||||||||
Insurance — 2.6% | ||||||||
Aflac, Inc. | 237,912 | 20,883,915 | ||||||
Allstate Corp. | 215,113 | 22,524,482 | ||||||
American International Group, Inc. | 541,905 | 32,286,700 | ||||||
Aon PLC | 151,050 | 20,240,700 | ||||||
Arthur J Gallagher & Co. | 105,008 | 6,644,906 | ||||||
Assurant, Inc. | 31,301 | 3,156,393 | ||||||
Brighthouse Financial, Inc.(a) | 57,410 | 3,366,522 | ||||||
Chubb Ltd. | 276,976 | 40,474,503 | ||||||
Cincinnati Financial Corp. | 87,398 | 6,552,228 | ||||||
Everest Re Group Ltd. | 23,935 | 5,295,858 | ||||||
Hartford Financial Services Group, Inc. | 211,554 | 11,906,259 | ||||||
Lincoln National Corp. | 130,619 | 10,040,683 | ||||||
Loews Corp. | 163,488 | 8,179,305 | ||||||
Marsh & McLennan Cos., Inc. | 306,410 | 24,938,710 | ||||||
MetLife, Inc. | 629,624 | 31,833,789 | ||||||
Principal Financial Group, Inc. | 161,991 | 11,430,085 | ||||||
Progressive Corp. | 348,400 | 19,621,888 | ||||||
Prudential Financial, Inc. | 255,866 | 29,419,473 | ||||||
Torchmark Corp. | 64,505 | 5,851,249 | ||||||
Travelers Cos., Inc. | 164,993 | 22,379,651 | ||||||
Unum Group | 134,379 | 7,376,063 | ||||||
Willis Towers Watson PLC | 80,432 | 12,120,298 | ||||||
XL Group Ltd. | 153,302 | 5,390,098 | ||||||
|
| |||||||
| 361,913,758 | ||||||||
Internet & Direct Marketing Retail — 2.8% |
| |||||||
Amazon.com, Inc.(a) | 239,590 | 280,193,317 | ||||||
Expedia, Inc. | 71,880 | 8,609,068 | ||||||
Netflix, Inc.(a) | 259,983 | 49,906,337 | ||||||
Priceline Group, Inc.(a) | 29,283 | 50,886,240 | ||||||
TripAdvisor, Inc.(a)(b) | 62,850 | 2,165,811 | ||||||
|
| |||||||
| 391,760,773 | ||||||||
Internet Software & Services — 4.8% |
| |||||||
Akamai Technologies, Inc.(a) | 102,106 | 6,640,974 | ||||||
Alphabet, Inc., Class A(a) | 178,384 | 187,909,706 | ||||||
Alphabet, Inc., Class C(a) | 180,568 | 188,946,355 | ||||||
eBay, Inc.(a) | 583,179 | 22,009,176 | ||||||
Facebook, Inc., Class A(a) | 1,428,473 | 252,068,346 | ||||||
VeriSign, Inc.(a)(b) | 51,526 | 5,896,635 | ||||||
|
| |||||||
| 663,471,192 | ||||||||
IT Services — 4.0% | ||||||||
Accenture PLC, Class A | 368,410 | 56,399,887 | ||||||
Alliance Data Systems Corp. | 28,163 | 7,138,757 | ||||||
Automatic Data Processing, Inc. | 265,520 | 31,116,289 | ||||||
Cognizant Technology Solutions Corp., Class A | 353,188 | 25,083,412 | ||||||
CSRA, Inc. | 93,680 | 2,802,906 | ||||||
DXC Technology Co. | 171,590 | 16,283,891 | ||||||
Fidelity National Information Services, Inc. | 198,490 | 18,675,924 | ||||||
Fiserv, Inc.(a) | 126,989 | 16,652,068 | ||||||
Gartner, Inc.(a) | 52,808 | 6,503,305 | ||||||
Global Payments, Inc. | 92,693 | 9,291,546 | ||||||
International Business Machines Corp. | 517,508 | 79,396,077 | ||||||
| 4 | 2017 BLACKROCK ANNUAL REPORTTO SHAREHOLDERS |
Table of Contents
Schedule of Investments (continued) December 31, 2017 | S&P 500 Index Master Portfolio (Percentages shown are based on Net Assets) |
Security | Shares | Value | ||||||
IT Services (continued) | ||||||||
Mastercard, Inc., Class A | 556,301 | $ | 84,201,719 | |||||
Paychex, Inc. | 193,665 | 13,184,713 | ||||||
PayPal Holdings, Inc.(a) | 674,190 | 49,633,868 | ||||||
Total System Services, Inc. | 99,065 | 7,835,051 | ||||||
Visa, Inc., Class A | 1,086,599 | 123,894,018 | ||||||
Western Union Co. | 278,703 | 5,298,144 | ||||||
|
| |||||||
| 553,391,575 | ||||||||
Leisure Products — 0.1% | ||||||||
Hasbro, Inc. | 66,185 | 6,015,555 | ||||||
Mattel, Inc. | 198,376 | 3,051,023 | ||||||
|
| |||||||
| 9,066,578 | ||||||||
Life Sciences Tools & Services — 0.8% |
| |||||||
Agilent Technologies, Inc. | 194,103 | 12,999,078 | ||||||
Illumina, Inc.(a) | 87,593 | 19,138,194 | ||||||
IQVIA Holdings, Inc.(a) | 88,064 | 8,621,466 | ||||||
Mettler-Toledo International, Inc.(a) | 15,258 | 9,452,636 | ||||||
PerkinElmer, Inc. | 65,522 | 4,790,969 | ||||||
Thermo Fisher Scientific, Inc. | 238,707 | 45,325,685 | ||||||
Waters Corp.(a) | 46,791 | 9,039,553 | ||||||
|
| |||||||
| 109,367,581 | ||||||||
Machinery — 1.7% | ||||||||
Caterpillar, Inc. | 358,211 | 56,446,890 | ||||||
Cummins, Inc. | 94,628 | 16,715,090 | ||||||
Deere & Co. | 191,087 | 29,907,026 | ||||||
Dover Corp. | 92,089 | 9,300,068 | ||||||
Flowserve Corp. | 76,248 | 3,212,328 | ||||||
Fortive Corp. | 183,255 | 13,258,499 | ||||||
Illinois Tool Works, Inc. | 185,270 | 30,912,300 | ||||||
Ingersoll-Rand PLC | 149,367 | 13,322,043 | ||||||
PACCAR, Inc. | 211,616 | 15,041,665 | ||||||
Parker-Hannifin Corp. | 80,171 | 16,000,528 | ||||||
Pentair PLC | 97,664 | 6,897,032 | ||||||
Snap-on, Inc. | 34,277 | 5,974,481 | ||||||
Stanley Black & Decker, Inc. | 92,286 | 15,660,011 | ||||||
Xylem, Inc. | 109,951 | 7,498,658 | ||||||
|
| |||||||
| 240,146,619 | ||||||||
Media — 2.8% | ||||||||
CBS Corp., Class B | 218,725 | 12,904,775 | ||||||
Charter Communications, Inc., Class A(a) | 116,981 | 39,300,937 | ||||||
Comcast Corp., Class A | 2,795,174 | 111,946,679 | ||||||
Discovery Communications, Inc., Class A(a)(b) | 87,189 | 1,951,290 | ||||||
Discovery Communications, Inc., Class C(a)(b) | 122,201 | 2,586,995 | ||||||
DISH Network Corp., Class A(a) | 132,510 | 6,327,352 | ||||||
IHS Markit Ltd.(a) | 219,526 | 9,911,599 | ||||||
Interpublic Group of Cos., Inc. | 227,431 | 4,585,009 | ||||||
News Corp., Class A | 236,359 | 3,831,379 | ||||||
News Corp., Class B | 53,983 | 896,118 | ||||||
Omnicom Group, Inc. | 136,243 | 9,922,578 | ||||||
Scripps Networks Interactive, Inc., Class A | 56,495 | 4,823,543 | ||||||
Time Warner, Inc. | 468,479 | 42,851,774 | ||||||
Twenty-First Century Fox, Inc., Class A | 618,607 | 21,360,500 | ||||||
Twenty-First Century Fox, Inc., Class B | 272,149 | 9,285,724 | ||||||
Viacom, Inc., Class B | 205,754 | 6,339,281 | ||||||
Walt Disney Co. | 907,458 | 97,560,809 | ||||||
|
| |||||||
| 386,386,342 | ||||||||
Metals & Mining — 0.3% | ||||||||
Freeport-McMoRan, Inc.(a) | 810,698 | 15,370,834 | ||||||
Newmont Mining Corp. | 321,516 | 12,063,280 | ||||||
Nucor Corp. | 193,946 | 12,331,087 | ||||||
|
| |||||||
| 39,765,201 | ||||||||
Security | Shares | Value | ||||||
Multi-Utilities — 1.1% | ||||||||
Alliant Energy Corp. | 140,846 | $ | 6,001,448 | |||||
Ameren Corp. | 143,037 | 8,437,753 | ||||||
CenterPoint Energy, Inc. | 251,857 | 7,142,665 | ||||||
CMS Energy Corp. | 166,727 | 7,886,187 | ||||||
Consolidated Edison, Inc. | 186,554 | 15,847,762 | ||||||
Dominion Energy, Inc. | 382,318 | 30,990,697 | ||||||
DTE Energy Co. | 108,746 | 11,903,337 | ||||||
NiSource, Inc. | 225,931 | 5,799,649 | ||||||
PG&E Corp. | 305,050 | 13,675,391 | ||||||
Public Service Enterprise Group, Inc. | 304,849 | 15,699,723 | ||||||
SCANA Corp. | 83,884 | 3,336,906 | ||||||
Sempra Energy | 150,185 | 16,057,780 | ||||||
WEC Energy Group, Inc. | 190,867 | 12,679,295 | ||||||
|
| |||||||
| 155,458,593 | ||||||||
Multiline Retail — 0.5% | ||||||||
Dollar General Corp. | 156,751 | 14,579,411 | ||||||
Dollar Tree, Inc.(a) | 143,247 | 15,371,836 | ||||||
Kohl’s Corp. | 98,392 | 5,335,798 | ||||||
Macy’s, Inc. | 176,133 | 4,436,790 | ||||||
Nordstrom, Inc. | 68,407 | 3,241,124 | ||||||
Target Corp. | 328,434 | 21,430,318 | ||||||
|
| |||||||
| 64,395,277 | ||||||||
Oil, Gas & Consumable Fuels — 5.2% |
| |||||||
Anadarko Petroleum Corp. | 326,799 | 17,529,498 | ||||||
Andeavor | 87,756 | 10,034,021 | ||||||
Apache Corp. | 230,928 | 9,749,780 | ||||||
Cabot Oil & Gas Corp. | 275,949 | 7,892,141 | ||||||
Chesapeake Energy Corp.(a) | 529,785 | 2,097,949 | ||||||
Chevron Corp. | 1,140,851 | 142,823,137 | ||||||
Cimarex Energy Co. | 58,370 | 7,121,724 | ||||||
Concho Resources, Inc.(a) | 89,503 | 13,445,141 | ||||||
ConocoPhillips | 717,499 | 39,383,520 | ||||||
Devon Energy Corp. | 317,074 | 13,126,864 | ||||||
EOG Resources, Inc. | 344,343 | 37,158,053 | ||||||
EQT Corp. | 143,078 | 8,144,000 | ||||||
Exxon Mobil Corp. | 2,543,439 | 212,733,154 | ||||||
Hess Corp. | 157,721 | 7,487,016 | ||||||
Kinder Morgan, Inc. | 1,146,971 | 20,725,766 | ||||||
Marathon Oil Corp. | 503,091 | 8,517,331 | ||||||
Marathon Petroleum Corp. | 295,497 | 19,496,892 | ||||||
Newfield Exploration Co.(a) | 116,858 | 3,684,533 | ||||||
Noble Energy, Inc. | 283,916 | 8,273,312 | ||||||
Occidental Petroleum Corp. | 457,003 | 33,662,841 | ||||||
ONEOK, Inc. | 229,064 | 12,243,471 | ||||||
Phillips 66 | 255,342 | 25,827,843 | ||||||
Pioneer Natural Resources Co. | 102,059 | 17,640,898 | ||||||
Range Resources Corp. | 131,419 | 2,242,008 | ||||||
Valero Energy Corp. | 259,994 | 23,896,048 | ||||||
Williams Cos., Inc. | 499,125 | 15,218,321 | ||||||
|
| |||||||
| 720,155,262 | ||||||||
Paper & Forest Products — 0.1% |
| |||||||
International Paper Co. | 248,986 | 14,426,249 | ||||||
|
| |||||||
Personal Products — 0.2% | ||||||||
Coty, Inc., Class A | 274,000 | 5,449,860 | ||||||
Estee Lauder Cos., Inc., Class A | 134,496 | 17,113,271 | ||||||
|
| |||||||
| 22,563,131 | ||||||||
Pharmaceuticals — 4.6% | ||||||||
Allergan PLC | 199,691 | 32,665,454 | ||||||
Bristol-Myers Squibb Co. | 978,909 | 59,987,543 | ||||||
Eli Lilly & Co. | 577,503 | 48,775,903 | ||||||
Johnson & Johnson | 1,609,067 | 224,818,841 | ||||||
| SCHEDULEOF INVESTMENTS | 5 |
Table of Contents
Schedule of Investments (continued) December 31, 2017 | S&P 500 Index Master Portfolio (Percentages shown are based on Net Assets) |
Security | Shares | Value | ||||||
Pharmaceuticals (continued) | ||||||||
Merck & Co., Inc. | 1,644,280 | $ | 92,523,636 | |||||
Mylan NV(a) | 325,073 | 13,753,839 | ||||||
Perrigo Co. PLC | 77,467 | 6,752,024 | ||||||
Pfizer, Inc. | 3,560,256 | 128,952,436 | ||||||
Zoetis, Inc. | 293,032 | 21,110,025 | ||||||
|
| |||||||
| 629,339,701 | ||||||||
Professional Services — 0.2% | ||||||||
Equifax, Inc. | 73,274 | 8,640,470 | ||||||
Nielsen Holdings PLC | 196,435 | 7,150,234 | ||||||
Robert Half International, Inc. | 74,783 | 4,153,448 | ||||||
Verisk Analytics, Inc.(a) | 94,221 | 9,045,216 | ||||||
|
| |||||||
| 28,989,368 | ||||||||
Real Estate Investment Trusts (REITs) — 2.7% |
| |||||||
Alexandria Real Estate Equities, Inc. | 55,441 | 7,240,040 | ||||||
American Tower Corp. | 255,858 | 36,503,261 | ||||||
Apartment Investment & Management Co., Class A(b) | 91,141 | 3,983,773 | ||||||
AvalonBay Communities, Inc. | 82,843 | 14,780,020 | ||||||
Boston Properties, Inc. | 94,106 | 12,236,603 | ||||||
Crown Castle International Corp. | 242,560 | 26,926,586 | ||||||
Digital Realty Trust, Inc. | 122,417 | 13,943,296 | ||||||
Duke Realty Corp.(b) | 208,164 | 5,664,142 | ||||||
Equinix, Inc. | 46,469 | 21,060,680 | ||||||
Equity Residential | 220,571 | 14,065,813 | ||||||
Essex Property Trust, Inc. | 39,611 | 9,560,907 | ||||||
Extra Space Storage, Inc.(b) | 77,234 | 6,754,113 | ||||||
Federal Realty Investment Trust | 42,469 | 5,640,308 | ||||||
GGP, Inc. | 366,286 | 8,567,430 | ||||||
HCP, Inc. | 275,244 | 7,178,363 | ||||||
Host Hotels & Resorts, Inc. | 434,468 | 8,624,190 | ||||||
Kimco Realty Corp. | 249,356 | 4,525,811 | ||||||
Macerich Co.(b) | 64,673 | 4,247,723 | ||||||
Mid-America Apartment Communities, Inc. | 66,350 | 6,672,156 | ||||||
Prologis, Inc. | 318,438 | 20,542,435 | ||||||
Public Storage | 89,625 | 18,731,625 | ||||||
Realty Income Corp.(b) | 180,701 | 10,303,571 | ||||||
Regency Centers Corp. | 86,603 | 5,991,196 | ||||||
Simon Property Group, Inc.(b) | 187,157 | 32,142,343 | ||||||
SL Green Realty Corp. | 58,685 | 5,923,077 | ||||||
UDR, Inc. | 164,285 | 6,328,258 | ||||||
Ventas, Inc. | 214,309 | 12,860,683 | ||||||
Vornado Realty Trust | 101,338 | 7,922,605 | ||||||
Welltower, Inc. | 222,184 | 14,168,674 | ||||||
Weyerhaeuser Co. | 456,560 | 16,098,306 | ||||||
|
| |||||||
| 369,187,988 | ||||||||
Real Estate Management & Development — 0.1% |
| |||||||
CBRE Group, Inc., Class A(a) | 187,324 | 8,113,002 | ||||||
|
| |||||||
Road & Rail — 0.9% | ||||||||
CSX Corp. | 536,320 | 29,502,963 | ||||||
JB Hunt Transport Services, Inc. | 50,885 | 5,850,757 | ||||||
Kansas City Southern | 62,228 | 6,547,630 | ||||||
Norfolk Southern Corp. | 172,550 | 25,002,495 | ||||||
Union Pacific Corp. | 470,886 | 63,145,813 | ||||||
|
| |||||||
| 130,049,658 | ||||||||
Semiconductors & Semiconductor Equipment — 3.9% |
| |||||||
Advanced Micro Devices, Inc.(a)(b) | 473,862 | 4,871,301 | ||||||
Analog Devices, Inc. | 220,529 | 19,633,697 | ||||||
Applied Materials, Inc. | 637,974 | 32,613,231 | ||||||
Broadcom Ltd. | 242,729 | 62,357,080 | ||||||
Intel Corp. | 2,807,904 | 129,612,803 | ||||||
KLA-Tencor Corp. | 91,720 | 9,637,020 | ||||||
Lam Research Corp. | 97,106 | 17,874,302 | ||||||
Microchip Technology, Inc. | 143,598 | 12,619,392 | ||||||
Security | Shares | Value | ||||||
Semiconductors & Semiconductor Equipment (continued) |
| |||||||
Micron Technology, Inc.(a) | 692,968 | $ | 28,494,844 | |||||
NVIDIA Corp. | 362,984 | 70,237,404 | ||||||
Qorvo, Inc.(a)(b) | 73,781 | 4,913,815 | ||||||
QUALCOMM, Inc. | 885,265 | 56,674,665 | ||||||
Skyworks Solutions, Inc. | 107,948 | 10,249,663 | ||||||
Texas Instruments, Inc. | 591,789 | 61,806,443 | ||||||
Xilinx, Inc. | 153,198 | 10,328,609 | ||||||
|
| |||||||
| 531,924,269 | ||||||||
Software — 5.2% | ||||||||
Activision Blizzard, Inc. | 450,766 | 28,542,503 | ||||||
Adobe Systems, Inc.(a) | 293,954 | 51,512,499 | ||||||
ANSYS, Inc.(a) | 49,472 | 7,301,572 | ||||||
Autodesk, Inc.(a) | 131,436 | 13,778,436 | ||||||
CA, Inc. | 183,640 | 6,111,539 | ||||||
Cadence Design Systems, Inc.(a) | 171,359 | 7,166,233 | ||||||
Citrix Systems, Inc.(a) | 83,916 | 7,384,608 | ||||||
Electronic Arts, Inc.(a) | 184,561 | 19,389,979 | ||||||
Intuit, Inc. | 145,381 | 22,938,214 | ||||||
Microsoft Corp. | 4,620,172 | 395,209,427 | ||||||
Oracle Corp. | 1,826,490 | 86,356,447 | ||||||
Red Hat, Inc.(a) | 105,055 | 12,617,106 | ||||||
salesforce.com, Inc.(a) | 416,534 | 42,582,271 | ||||||
Symantec Corp. | 368,502 | 10,340,166 | ||||||
Synopsys, Inc.(a) | 87,886 | 7,491,403 | ||||||
|
| |||||||
| 718,722,403 | ||||||||
Specialty Retail — 2.3% | ||||||||
Advance Auto Parts, Inc. | 42,609 | 4,247,691 | ||||||
AutoZone, Inc.(a) | 16,498 | 11,736,182 | ||||||
Best Buy Co., Inc. | 153,631 | 10,519,114 | ||||||
CarMax, Inc.(a) | 111,776 | 7,168,195 | ||||||
Foot Locker, Inc. | 76,660 | 3,593,821 | ||||||
Gap, Inc. | 129,253 | 4,402,357 | ||||||
Home Depot, Inc. | 700,496 | 132,765,007 | ||||||
L Brands, Inc. | 144,385 | 8,694,865 | ||||||
Lowe’s Cos., Inc. | 499,053 | 46,381,986 | ||||||
O’Reilly Automotive, Inc.(a)(b) | 51,367 | 12,355,818 | ||||||
Ross Stores, Inc. | 228,340 | 18,324,285 | ||||||
Signet Jewelers Ltd. | 35,334 | 1,998,138 | ||||||
Tiffany & Co. | 59,106 | 6,144,069 | ||||||
TJX Cos., Inc. | 381,033 | 29,133,783 | ||||||
Tractor Supply Co. | 76,121 | 5,690,045 | ||||||
Ulta Salon Cosmetics & Fragrance, Inc.(a) | 35,557 | 7,952,678 | ||||||
|
| |||||||
| 311,108,034 | ||||||||
Technology Hardware, Storage & Peripherals — 4.3% |
| |||||||
Apple, Inc. | 3,075,188 | 520,414,066 | ||||||
Hewlett Packard Enterprise Co. | 953,223 | 13,688,283 | ||||||
HP, Inc. | 997,927 | 20,966,446 | ||||||
NetApp, Inc. | 165,118 | 9,134,328 | ||||||
Seagate Technology PLC | 168,099 | 7,033,262 | ||||||
Western Digital Corp. | 177,736 | 14,135,344 | ||||||
Xerox Corp. | 127,600 | 3,719,540 | ||||||
|
| |||||||
| 589,091,269 | ||||||||
Textiles, Apparel & Luxury Goods — 0.7% |
| |||||||
Hanesbrands, Inc. | 211,689 | 4,426,417 | ||||||
Michael Kors Holdings Ltd.(a)(b) | 90,090 | 5,671,166 | ||||||
NIKE, Inc., Class B | 787,252 | 49,242,613 | ||||||
PVH Corp. | 44,958 | 6,168,687 | ||||||
Ralph Lauren Corp. | 31,377 | 3,253,481 | ||||||
Tapestry, Inc. | 176,389 | 7,801,685 | ||||||
Under Armour, Inc., Class A(a)(b) | 103,468 | 1,493,043 | ||||||
Under Armour, Inc., Class C(a)(b) | 105,511 | 1,405,407 | ||||||
VF Corp. | 199,537 | 14,765,738 | ||||||
|
| |||||||
| 94,228,237 | ||||||||
| 6 | 2017 BLACKROCK ANNUAL REPORTTO SHAREHOLDERS |
Table of Contents
Schedule of Investments (continued) December 31, 2017 | S&P 500 Index Master Portfolio (Percentages shown are based on Net Assets) |
Security | Shares | Value | ||||||
Thrifts & Mortgage Finance — 0.0% |
| |||||||
People’s United Financial, Inc. | 220,243 | $ | 4,118,544 | |||||
|
| |||||||
Tobacco — 1.3% | ||||||||
Altria Group, Inc. | 1,144,648 | 81,739,314 | ||||||
Philip Morris International, Inc. | 930,651 | 98,323,278 | ||||||
|
| |||||||
| 180,062,592 | ||||||||
Trading Companies & Distributors — 0.2% |
| |||||||
Fastenal Co. | 168,859 | 9,234,898 | ||||||
United Rentals, Inc.(a) | 51,357 | 8,828,782 | ||||||
W.W. Grainger, Inc. | 31,463 | 7,433,134 | ||||||
|
| |||||||
| 25,496,814 | ||||||||
Water Utilities — 0.1% |
| |||||||
American Water Works Co., Inc. | 104,989 | 9,605,444 | ||||||
|
| |||||||
Total Long-Term Investments — 99.1% |
| 13,655,703,202 | ||||||
|
| |||||||
Security | Shares | Value | ||||||
Short-Term Securities — 1.7% |
| |||||||
BlackRock Cash Funds: Institutional, SL Agency Shares, 1.53%(e)(d)(c) | 70,033,981 | $ | 70,040,984 | |||||
BlackRock Cash Funds: Treasury, SL Agency Shares, 1.21%(e)(d) | 164,203,034 | 164,203,034 | ||||||
|
| |||||||
Total Short-Term Securities — 1.7% |
| 234,244,018 | ||||||
|
| |||||||
Total Investments — 100.8% (Cost — $8,533,607,964) | $ | 13,889,947,220 | ||||||
Liabilities in Excess of Other Assets — (0.8)% | (114,872,840 | ) | ||||||
|
| |||||||
Net Assets — 100.0% | $ | 13,775,074,380 | ||||||
|
| |||||||
| (a) | Non-income producing security. |
| (b) | Security, or a portion of the security, is on loan. |
| (c) | All or a portion of security was purchased with the cash collateral from loaned securities. |
| (d) | Annualized 7-day yield as of period end. |
| (e) | During the year ended December 31, 2017, investments in issuers considered to be affiliates of the Master Portfolio for purposes of Section 2(a)(3) of the Investment Company Act of 1940, as amended, and/or related parties of the Fund were as follows: |
Affiliate Persons and/or Related Parties | Shares Held at 12/31/2016 | Shares Purchased | Shares Sold | Shares Held at 12/31/2017 | Value at 12/31/2017 | Income | Net Realized Gain (Loss)(a) | Change in Unrealized Appreciation (Depreciation) | ||||||||||||||||||||||||
BlackRock, Inc. | 60,705 | 12,717 | — | 73,422 | $ | 37,717,616 | $ | 693,695 | $ | — | $ | 9,509,534 | ||||||||||||||||||||
BlackRock Cash Funds: Institutional, SL Agency Shares | 67,939,998 | 2,093,983 | (b) | — | 70,033,981 | 70,040,984 | 404,069 | (c) | (15,327 | ) | (4,472 | ) | ||||||||||||||||||||
BlackRock Cash Funds: Treasury, SL Agency Shares | 485,190,196 | — | (320,987,162 | )(d) | 164,203,034 | 164,203,034 | 1,578,563 | — | — | |||||||||||||||||||||||
PNC Financial Services Group, Inc. | 242,967 | 46,203 | 3,215 | 285,955 | 41,260,447 | 709,937 | 1,354 | 7,554,206 | ||||||||||||||||||||||||
|
|
|
|
|
|
|
| |||||||||||||||||||||||||
| $ | 313,222,081 | $ | 3,386,264 | $ | (13,973 | ) | $ | 17,059,268 | ||||||||||||||||||||||||
|
|
|
|
|
|
|
| |||||||||||||||||||||||||
| (a) | Includes net capital gain distributions, if applicable. |
| (b) | Represents net shares value purchased. |
| (c) | Represents all or portion of securities lending income earned from the reinvestment of cash collateral from loaned securities, net of fees, and collateral investment expenses, and other payments to and from borrowers of securities. |
| (d) | Represents net shares value sold. |
Derivative Financial Instruments Outstanding as of Period End
Futures Contracts
Description | Number of Contracts | Expiration Date | Notional Amount (000) | Value/ Unrealized Appreciation (Depreciation) | ||||||||||||
Long Contracts | ||||||||||||||||
S&P 500 E-Mini Index | 1,326 | 03/16/18 | $ | 177,419 | $ | 1,047,092 | ||||||||||
|
|
|
| |||||||||||||
| SCHEDULEOF INVESTMENTS | 7 |
Table of Contents
Schedule of Investments (continued) December 31, 2017 | S&P 500 Index Master Portfolio |
Derivative Financial Instruments Categorized by Risk Exposure
As of period end, the fair values of derivative financial instruments located in the Statement of Assets and Liabilities were as follows:
| Commodity Contracts | Credit Contracts | Equity Contracts | Foreign Currency Exchange Contracts | Interest Rate Contracts | Other Contracts | Total | ||||||||||||||||||||||
Assets — Derivative Financial Instruments | ||||||||||||||||||||||||||||
Futures contracts | ||||||||||||||||||||||||||||
Net unrealized appreciation(a) | $ | — | $ | — | $ | 1,047,092 | $ | — | $ | — | $ | — | $ | 1,047,092 | ||||||||||||||
|
|
|
|
|
|
|
|
|
|
|
|
|
| |||||||||||||||
| (a) | Includes cumulative appreciation (depreciation) on futures contracts, if any, as reported in the Schedule of Investments. Only current day’s variation margin is reported within the Statement of Assets and Liabilities. |
For the year ended December 31, 2017, the effect of derivative financial instruments in the Statement of Operations was as follows:
| Commodity Contracts | Credit Contracts | Equity Contracts | Foreign Currency Exchange Contracts | Interest Rate Contracts | Other Contracts | Total | ||||||||||||||||||||||
Net Realized Gain (Loss) from: | ||||||||||||||||||||||||||||
Futures contracts | $ | — | $ | — | $ | 30,005,634 | $ | — | $ | — | $ | — | $ | 30,005,634 | ||||||||||||||
|
|
|
|
|
|
|
|
|
|
|
|
|
| |||||||||||||||
Net Change in Unrealized Appreciation (Depreciation) on: | ||||||||||||||||||||||||||||
Futures contracts | $ | — | $ | — | $ | 2,640,598 | $ | — | $ | — | $ | — | $ | 2,640,598 | ||||||||||||||
|
|
|
|
|
|
|
|
|
|
|
|
|
| |||||||||||||||
Average Quarterly Balances of Outstanding Derivative Financial Instruments
Futures contracts: | ||||
Average notional value of contracts — long | $ | 139,033,648 |
For more information about the Master Portfolio’s investment risks regarding derivative financial instruments, refer to the Notes to Financial Statements.
Fair Value Hierarchy as of Period End
Various inputs are used in determining the fair value of investments and derivative financial instruments. For information about the Master Portfolio’s policy regarding valuation of investments and derivative financial instruments, refer to the Notes to Financial Statements.
The following tables summarize the Master Portfolio’s investments and derivative financial instruments categorized in the disclosure hierarchy:
| Level 1 | Level 2 | Level 3 | Total | |||||||||||||
Assets: | ||||||||||||||||
Investments: | ||||||||||||||||
Long-Term Investments Common Stocks(a) | $ | 13,655,703,202 | $ | — | $ | — | $ | 13,655,703,202 | ||||||||
Short-Term Securities | 234,244,018 | — | — | 234,244,018 | ||||||||||||
|
|
|
|
|
|
|
| |||||||||
| $ | 13,889,947,220 | $ | — | $ | — | $ | 13,889,947,220 | |||||||||
|
|
|
|
|
|
|
| |||||||||
Derivative Financial Instruments(b) | ||||||||||||||||
Assets: | ||||||||||||||||
Equity contracts | $ | 1,047,092 | $ | — | $ | — | $ | 1,047,092 | ||||||||
|
|
|
|
|
|
|
| |||||||||
| (a) | See above Schedule of Investments for values in each industry. |
| (b) | Derivative financial instruments are futures contracts. Futures contracts are valued at the unrealized appreciation (depreciation) on the instrument. |
During the year ended December 31, 2017, there were no transfers between levels.
See notes to financial statements.
| 8 | 2017 BLACKROCK ANNUAL REPORTTO SHAREHOLDERS |
Table of Contents
Statement of Assets and Liabilities
December 31, 2017
| S&P 500 Index Master Portfolio | ||||
ASSETS | ||||
Investments at value — unaffiliated (including securities loaned at value of $68,226,228) | $ | 13,576,725,139 | ||
Investments at value — affiliated (cost — $275,715,479 ) | 313,222,081 | |||
Cash pledged for futures contracts | 5,554,800 | |||
Receivables: | ||||
Investments sold | 14,500,601 | |||
Dividends — unaffiliated | 13,693,451 | |||
Dividends — affiliated | 149,716 | |||
Securities lending income — affiliated | 23,406 | |||
Contributions from investor | 10,291 | |||
|
| |||
Total assets | 13,923,879,485 | |||
|
| |||
LIABILITIES | ||||
Cash collateral on securities loaned at value | 70,052,519 | |||
Payables: | ||||
Withdrawals to investor | 72,800,827 | |||
Investments purchased | 4,786,650 | |||
Variation margin on futures contracts | 644,949 | |||
Investment advisory fees | 416,136 | |||
Trustees’ fees | 65,014 | |||
Professional fees | �� | 39,010 | ||
|
| |||
Total liabilities | 148,805,105 | |||
|
| |||
Net Assets | $ | 13,775,074,380 | ||
|
| |||
NET ASSETS CONSIST OF | ||||
Investors’ capital | $ | 8,417,688,032 | ||
Net unrealized appreciation (depreciation) | 5,357,386,348 | |||
|
| |||
Net Assets | $ | 13,775,074,380 | ||
|
| |||
See notes to financial statements.
FINANCIAL STATEMENTS | 9 |
Table of Contents
Statement of Operations
Year Ended December 31, 2017
| S&P 500 Index Master Portfolio | ||||
INVESTMENT INCOME | ||||
Dividends — unaffiliated | $ | 237,449,687 | ||
Dividends — affiliated | 2,982,195 | |||
Securities lending income — affiliated — net | 404,069 | |||
Foreign taxes withheld | (995,770 | ) | ||
|
| |||
Total investment income | 239,840,181 | |||
|
| |||
EXPENSES | ||||
Investment advisory | 4,869,070 | |||
Trustees and Officer | 260,622 | |||
Professional | 61,744 | |||
|
| |||
Total expenses | 5,191,436 | |||
Less fees waived and/or reimbursed by the Manager | (467,453 | ) | ||
|
| |||
Total expenses after fees waived and/or reimbursed | 4,723,983 | |||
|
| |||
Net investment income | 235,116,198 | |||
|
| |||
REALIZED AND UNREALIZED GAIN (LOSS) | ||||
Net realized gain (loss) from: | ||||
Investments — unaffiliated | 24,276,067 | |||
Investments — affiliated | (13,973 | ) | ||
Futures contracts | 30,005,634 | |||
|
| |||
| 54,267,728 | ||||
|
| |||
Net change in unrealized appreciation (depreciation) on: | ||||
Investments — unaffiliated | 2,079,221,608 | |||
Investments — affiliated | 17,059,268 | |||
Futures contracts | 2,640,598 | |||
|
| |||
| 2,098,921,474 | ||||
|
| |||
Net realized and unrealized gain | 2,153,189,202 | |||
|
| |||
NET INCREASE IN NET ASSETS RESULTING FROM OPERATIONS | $ | 2,388,305,400 | ||
|
| |||
See notes to financial statements.
| 10 | 2017 BLACKROCK ANNUAL REPORTTO SHAREHOLDERS |
Table of Contents
| Statement of Changes in Net Assets |
| S&P 500 Index Master Portfolio | ||||||||
| Year Ended December 31, | ||||||||
| 2017 | 2016 | |||||||
INCREASE (DECREASE) IN NET ASSETS: | ||||||||
OPERATIONS | ||||||||
Net investment income | $ | 235,116,198 | $ | 173,503,239 | ||||
Net realized gain | 54,267,728 | 66,081,560 | ||||||
Net change in unrealized appreciation (depreciation) | 2,098,921,474 | 738,386,897 | ||||||
|
|
|
| |||||
Net increase in net assets resulting from operations | 2,388,305,400 | 977,971,696 | ||||||
|
|
|
| |||||
CAPITAL TRANSACTIONS | ||||||||
Proceeds from contributions | 7,322,029,278 | 4,303,951,279 | ||||||
Value of withdrawals | (5,727,019,300 | ) | (2,700,021,283 | ) | ||||
|
|
|
| |||||
Net increase in net assets derived from capital transactions | 1,595,009,978 | 1,603,929,996 | ||||||
|
|
|
| |||||
NET ASSETS | ||||||||
Total increase in net assets | 3,983,315,378 | 2,581,901,692 | ||||||
Beginning of year | 9,791,759,002 | 7,209,857,310 | ||||||
|
|
|
| |||||
End of year | $ | 13,775,074,380 | $ | 9,791,759,002 | ||||
|
|
|
| |||||
See notes to financial statements.
| FINANCIAL STATEMENTS | 11 |
Table of Contents
Financial Highlights
(For a share outstanding throughout each period)
| S&P 500 Index Master Portfolio | ||||||||||||||||||||
| Year Ended December 31, | ||||||||||||||||||||
| 2017 | 2016 | 2015 | 2014 | 2013 | ||||||||||||||||
Total Return | ||||||||||||||||||||
Total return | 21.77 | % | 11.92 | % | 1.35 | % | 13.63 | % | 32.33 | % | ||||||||||
|
|
|
|
|
|
|
|
|
| |||||||||||
Ratios to Average Net Assets | ||||||||||||||||||||
Total expenses | 0.04 | % | 0.04 | % | 0.05 | % | 0.05 | % | 0.05 | % | ||||||||||
|
|
|
|
|
|
|
|
|
| |||||||||||
Total expenses after fees waived and/or reimbursed | 0.04 | % | 0.04 | % | 0.04 | % | 0.05 | % | 0.05 | % | ||||||||||
|
|
|
|
|
|
|
|
|
| |||||||||||
Net investment income | 1.93 | % | 2.11 | % | 2.00 | % | 1.98 | % | 2.08 | % | ||||||||||
|
|
|
|
|
|
|
|
|
| |||||||||||
Supplemental Data | ||||||||||||||||||||
Net assets, end of year (000) | $ | 13,775,074 | $ | 9,791,759 | $ | 7,209,857 | $ | 5,748,578 | $ | 5,271,130 | ||||||||||
|
|
|
|
|
|
|
|
|
| |||||||||||
Portfolio turnover rate | 11 | % | 4 | % | 2 | % | 3 | % | 2 | % | ||||||||||
|
|
|
|
|
|
|
|
|
| |||||||||||
See notes to financial statements.
| 12 | 2017 BLACKROCK ANNUAL REPORTTO SHAREHOLDERS |
Table of Contents
| Notes to Financial Statements | S&P 500 Index Master Portfolio |
| 1. | ORGANIZATION |
Master Investment Portfolio (“MIP”) is registered under the Investment Company Act of 1940, as amended (the “1940 Act”), as an open-end management investment company. S&P 500 Index Master Portfolio (the “Master Portfolio”) is a series of MIP. The Master Portfolio is classified as diversified. MIP is organized as a Delaware statutory trust.
The Master Portfolio, together with certain other registered investment companies advised by BlackRock Fund Advisors (the “Manager”) or its affiliates, is included in a complex of open-end funds referred to as the Equity-Liquidity Complex.
| 2. | SIGNIFICANT ACCOUNTING POLICIES |
The financial statements are prepared in conformity with accounting principles generally accepted in the United States of America (“U.S. GAAP”), which may require management to make estimates and assumptions that affect the reported amounts of assets and liabilities in the financial statements, disclosure of contingent assets and liabilities at the date of the financial statements and the reported amounts of increases and decreases in net assets from operations during the reporting period. Actual results could differ from those estimates. The Master Portfolio is considered an investment company under U.S. GAAP and follows the accounting and reporting guidance applicable to investment companies. Below is a summary of significant accounting policies:
Investment Transactions and Income Recognition: For financial reporting purposes, investment transactions are recorded on the dates the transactions are entered into (the “trade dates”). Realized gains and losses on investment transactions are determined on the identified cost basis. Dividend income is recorded on the ex-dividend date. Under the applicable foreign tax laws, a withholding tax at various rates may be imposed on capital gains, dividends and interest. Upon notification from issuers, some of the dividend income received from a real estate investment trust may be redesignated as a reduction of cost of the related investment and/or realized gain. Interest income, including amortization and accretion of premiums and discounts on debt securities is recognized on an accrual basis.
Segregation and Collateralization: In cases where the Master Portfolio enters into certain investments (e.g., futures contracts) that would be treated as “senior securities” for 1940 Act purposes, the Master Portfolio may segregate or designate on its books and records cash or liquid assets having a market value at least equal to the amount of its future obligations under such investments. Doing so allows the investment to be excluded from treatment as a “senior security.” Furthermore, if required by an exchange or counterparty agreement, the Master Portfolio may be required to deliver/deposit cash and/or securities to/with an exchange, or broker-dealer or custodian as collateral for certain investments or obligations.
Indemnifications: In the normal course of business, the Master Portfolio enters into contracts that contain a variety of representations that provide general indemnification. The Master Portfolio’s maximum exposure under these arrangements is unknown because it involves future potential claims against the Master Portfolio, which cannot be predicted with any certainty.
Other: Expenses directly related to the Master Portfolio are charged to the Master Portfolio. Other operating expenses shared by several funds, including other funds managed by the Manager, are prorated among those funds on the basis of relative net assets or other appropriate methods.
| 3. | INVESTMENT VALUATION AND FAIR VALUE MEASUREMENTS |
Investment Valuation Policies: The Master Portfolio’s investments are valued at fair value (also referred to as “market value” within the financial statements) as of the close of trading on the New York Stock Exchange (“NYSE”) (generally 4:00 p.m., Eastern time) (or if the reporting date falls on a day the NYSE is closed, investments are valued at fair value as of the period end). U.S. GAAP defines fair value as the price the Master Portfolio would receive to sell an asset or pay to transfer a liability in an orderly transaction between market participants at the measurement date. The Master Portfolio determines the fair values of its financial instruments using various independent dealers or pricing services under policies approved by the Board of Trustees of MIP (the “Board”). The BlackRock Global Valuation Methodologies Committee (the “Global Valuation Committee”) is the committee formed by management to develop global pricing policies and procedures and to oversee the pricing function for all financial instruments.
Fair Value Inputs and Methodologies: The following methods and inputs are used to establish the fair value of the Master Portfolio’s assets and liabilities:
| • | Equity investments traded on a recognized securities exchange are valued at the official closing price each day, if available. For equity investments traded on more than one exchange, the official closing price on the exchange where the stock is primarily traded is used. Equity investments traded on a recognized exchange for which there were no sales on that day may be valued at the last available bid (long positions) or ask (short positions) price. |
| • | Investments in open-end U.S. mutual funds are valued at net asset value (“NAV”) each business day. |
| • | Futures contracts traded on exchanges are valued at their last sale price. |
If events (e.g., a company announcement, market volatility or a natural disaster) occur that are expected to materially affect the value of such investments, or in the event that the application of these methods of valuation results in a price for an investment that is deemed not to be representative of the market value of such investment, or if a price is not available, the investment will be valued by the Global Valuation Committee, or its delegate, in accordance with a policy approved by the Board as reflecting fair value (“Fair Valued Investments”). The fair valuation approaches that may be used by the Global Valuation Committee will include market approach, income approach and cost approach. Valuation techniques such as discounted cash flow, use of market comparables and matrix pricing are types of valuation approaches and are typically used in determining fair value. When determining the price for Fair Valued Investments, the Global Valuation Committee, or its delegate, seeks to determine the price that the Master Portfolio might reasonably expect to receive or pay from the current sale or purchase of that asset or liability in an arm’s-length transaction. Fair value determinations shall be based upon all available factors that the Global Valuation Committee, or its delegate, deems relevant and consistent with the principles of fair value measurement. The pricing of all Fair Valued Investments is subsequently reported to the Board or a committee thereof on a quarterly basis.
| NOTESTO FINANCIAL STATEMENTS | 13 |
Table of Contents
| Notes to Financial Statements (continued) | S&P 500 Index Master Portfolio |
Fair Value Hierarchy: Various inputs are used in determining the fair value of investments and derivative financial instruments. These inputs to valuation techniques are categorized into a fair value hierarchy consisting of three broad levels for financial statement purposes as follows:
| • | Level 1 — Unadjusted price quotations in active markets/exchanges for identical assets or liabilities that the Master Portfolio has the ability to access |
| • | Level 2 — Other observable inputs (including, but not limited to, quoted prices for similar assets or liabilities in markets that are active, quoted prices for identical or similar assets or liabilities in markets that are not active, inputs other than quoted prices that are observable for the assets or liabilities (such as interest rates, yield curves, volatilities, prepayment speeds, loss severities, credit risks and default rates) or other market–corroborated inputs) |
| • | Level 3 — Unobservable inputs based on the best information available in the circumstances, to the extent observable inputs are not available (including the Master Portfolio’s own assumptions used in determining the fair value of investments and derivative financial instruments) |
The hierarchy gives the highest priority to unadjusted quoted prices in active markets for identical assets or liabilities (Level 1 measurements) and the lowest priority to unobservable inputs (Level 3 measurements). Accordingly, the degree of judgment exercised in determining fair value is greatest for instruments categorized in Level 3. The inputs used to measure fair value may fall into different levels of the fair value hierarchy. In such cases, for disclosure purposes, the fair value hierarchy classification is determined based on the lowest level input that is significant to the fair value measurement in its entirety. Investments classified within Level 3 have significant unobservable inputs used by the Global Valuation Committee in determining the price for Fair Valued Investments. Level 3 investments include equity or debt issued by privately held companies or funds. There may not be a secondary market, and/or there are a limited number of investors. Level 3 investments may also be adjusted to reflect illiquidity and/or non-transferability, with the amount of such discount estimated by the Global Valuation Committee in the absence of market information.
Changes in valuation techniques may result in transfers into or out of an assigned level within the hierarchy. In accordance with the Master Portfolio’s policy, transfers between different levels of the fair value hierarchy are deemed to have occurred as of the beginning of the reporting period. The categorization of a value determined for investments and derivative financial instruments is based on the pricing transparency of the investments and derivative financial instruments and is not necessarily an indication of the risks associated with investing in those securities.
| 4. | SECURITIES AND OTHER INVESTMENTS |
Securities Lending: The Master Portfolio may lend its securities to approved borrowers, such as brokers, dealers and other financial institutions. The borrower pledges and maintains with the Master Portfolio collateral consisting of cash, an irrevocable letter of credit issued by a bank, or securities issued or guaranteed by the U.S. Government. The initial collateral received by the Master Portfolio is required to have a value of at least 102% of the current value of the loaned securities for securities traded on U.S. exchanges and a value of at least 105% for all other securities. The collateral is maintained thereafter at a value equal to at least 100% of the current market value of the securities on loan. The market value of the loaned securities is determined at the close of each business day of the Master Portfolio and any additional required collateral is delivered to the Master Portfolio, or excess collateral returned by the Master Portfolio, on the next business day. During the term of the loan, the Master Portfolio is entitled to all distributions made on or in respect of the loaned securities, but does not receive interest income on securities received as collateral. Loans of securities are terminable at any time and the borrower, after notice, is required to return borrowed securities within the standard time period for settlement of securities transactions.
The market value of any securities on loan, all of which were classified as common stocks in the Master Portfolio’s Schedule of Investments, and the value of any related collateral are shown separately in the Statement of Assets and Liabilities as a component of investments at value-unaffiliated, and collateral on securities loaned at value, respectively. As of period end, any securities on loan were collateralized by cash and/or U.S. Government obligations. Cash collateral invested by the securities lending agent, BlackRock Institutional Trust Company, N.A. (“BTC”), if any, is disclosed in the Schedule of Investments.
Securities lending transactions are entered into by the Master Portfolio under Master Securities Lending Agreements (each, an “MSLA”), which provide the right, in the event of default (including bankruptcy or insolvency), for the non-defaulting party to liquidate the collateral and calculate a net exposure to the defaulting party or request additional collateral. In the event that a borrower defaults, the Master Portfolio, as lender, would offset the market value of the collateral received against the market value of the securities loaned. When the value of the collateral is greater than that of the market value of the securities loaned, the lender is left with a net amount payable to the defaulting party. However, bankruptcy or insolvency laws of a particular jurisdiction may impose restrictions on or prohibitions against such a right of offset in the event of an MSLA counterparty’s bankruptcy or insolvency. Under the MSLA, absent an event of default, the borrower can resell or re-pledge the loaned securities, and the Master Portfolio can reinvest cash collateral received in connection with loaned securities. Upon an event of default, the parties’ obligations to return the securities or collateral to the other party are extinguished, and the parties can resell or re-pledge the loaned securities or the collateral received in connection with the loaned securities in order to satisfy the defaulting party’s net payment obligation for all transactions under the MSLA. The defaulting party remains liable for any deficiency.
As of period end, the following table is a summary of the Master Portfolio’s securities lending agreements by counterparty which are subject to offset under an MSLA:
Counterparty | Securities Loaned at Value | Cash Collateral Received 1 | Net Amount 2 | |||||||||
Barclays Capital, Inc. | $ | 51,904 | $ | (51,904 | ) | $ | — | |||||
BNP Paribas S.A. | 4,814,605 | (4,814,605 | ) | — | ||||||||
Citigroup Global Markets, Inc. | 14,572,336 | (14,572,336 | ) | — | ||||||||
Deutsche Bank Securities, Inc. | 864,293 | (864,293 | ) | — | ||||||||
Goldman Sachs & Co. | 15,290,172 | (15,290,172 | ) | — | ||||||||
HSBC Bank PLC | 1,431,822 | (1,428,056 | ) | 3,766 | ||||||||
Jefferies LLC | 861,630 | (861,630 | ) | — | ||||||||
JP Morgan Securities LLC | 23,427,272 | (23,427,272 | ) | — | ||||||||
Merrill Lynch, Pierce, Fenner & Smith, Inc. | 2,465,462 | (2,465,462 | ) | — | ||||||||
| 14 | 2017 BLACKROCK ANNUAL REPORTTO SHAREHOLDERS |
Table of Contents
| Notes to Financial Statements (continued) | S&P 500 Index Master Portfolio |
Counterparty | Securities Loaned at Value | Cash Collateral Received1 | Net Amount2 | |||||||||
Mizuho Securities USA, Inc. | $ | 20,657 | $ | (20,657 | ) | $ | — | |||||
State Street Bank & Trust Co. | 3,937,323 | (3,937,323 | ) | — | ||||||||
UBS AG | 207,903 | (207,903 | ) | — | ||||||||
Wells Fargo Securities LLC | 280,849 | (280,849 | ) | — | ||||||||
|
|
|
|
|
| |||||||
| $ | 68,226,228 | $ | (68,222,462 | ) | $ | 3,766 | ||||||
|
|
|
|
|
| |||||||
| 1 | Cash collateral with a value of $70,052,519 has been received in connection with securities lending agreements. Collateral received in excess of the value of securities loaned from the individual counterparty is not shown for financial reporting purposes in the table above. |
| 2 | The market value of the loaned securities is determined as of December 31, 2017. Additional collateral is delivered to the Fund on the next business day in accordance with the MSLA. The net amount would be subject to the borrower default indemnity in the event of default by the counterparty. |
The risks of securities lending include the risk that the borrower may not provide additional collateral when required or may not return the securities when due. To mitigate these risks, the Master Portfolio benefits from a borrower default indemnity provided by BlackRock, Inc. (“BlackRock”). BlackRock’s indemnity allows for full replacement of the securities loaned if the collateral received does not cover the value on the securities loaned in the event of borrower default. The Master Portfolio could incur a loss if the value of an investment purchased with cash collateral falls below the market value of loaned securities or if the value of an investment purchased with cash collateral falls below the value of the original cash collateral received.
| 5. | DERIVATIVE FINANCIAL INSTRUMENTS |
The Master Portfolio engages in various portfolio investment strategies using derivative contracts both to increase the returns of the Master Portfolio and/or to manage its exposure to certain risks such as credit risk, equity risk, interest rate risk, foreign currency exchange rate risk, commodity price risk or other risks (e.g., inflation risk). Derivative financial instruments categorized by risk exposure are included in the Schedule of Investments. These contracts may be transacted on an exchange or over-the-counter (“OTC”).
Futures Contracts: Futures contracts are purchased or sold to gain exposure to, or manage exposure to, changes in interest rates (interest rate risk), changes in the value of equity securities (equity risk) or foreign currencies (foreign currency exchange rate risk).
Futures contracts are agreements between the Master Portfolio and a counterparty to buy or sell a specific quantity of an underlying instrument at a specified price and on a specified date. Depending on the terms of a contract, it is settled either through physical delivery of the underlying instrument on the settlement date or by payment of a cash amount on the settlement date. Upon entering into a futures contract, the Master Portfolio is required to deposit initial margin with the broker in the form of cash or securities in an amount that varies depending on a contract’s size and risk profile. The initial margin deposit must then be maintained at an established level over the life of the contract.
Securities deposited as initial margin are designated in the Schedule of Investments and cash deposited, if any, is shown as cash pledged for futures contracts in the Statement of Assets and Liabilities. Pursuant to the contract, the Master Portfolio agrees to receive from or pay to the broker an amount of cash equal to the daily fluctuation in market value of the contract (“variation margin”). Variation margin is recorded as unrealized appreciation (depreciation) and, if any, shown as variation margin receivable (or payable) on futures contracts in the Statement of Assets and Liabilities. When the contract is closed, a realized gain or loss is recorded in the Statement of Operations equal to the difference between the notional amount of the contract at the time it was opened and the notional amount at the time it was closed. The use of futures contracts involves the risk of an imperfect correlation in the movements in the price of futures contracts and interest, foreign currency exchange rates or underlying assets.
| 6. | INVESTMENT ADVISORY AGREEMENT AND OTHER TRANSACTIONS WITH AFFILIATES |
The PNC Financial Services Group, Inc. is the largest stockholder and an affiliate of BlackRock for 1940 Act purposes.
Investment Advisory: MIP, on behalf of the Master Portfolio, entered into an Investment Advisory Agreement with the Manager, the Master Portfolio’s investment adviser, an indirect, wholly-owned subsidiary of BlackRock, to provide investment advisory services. The Manager is responsible for the management of the Master Portfolio’s portfolio and provides the personnel, facilities, equipment and certain other services necessary to the operations of the Master Portfolio.
For such services, the Master Portfolio pays the Manager a monthly fee at an annual rate equal to 0.04% of the average daily value of the Master Portfolio’s net assets.
Administration: MIP, on behalf of the Master Portfolio, entered into an Administration Agreement with BlackRock Advisors, LLC (“BAL”), which has agreed to provide general administration services (other than investment advice and related portfolio activities). BAL, in consideration thereof, has agreed to bear all of the Master Portfolio’s ordinary operating expenses, excluding, generally, investment advisory fees, distribution fees, brokerage and other expenses related to the execution of portfolio transactions, extraordinary expenses and certain other expenses which are borne by the Master Portfolio.
BAL is not entitled to compensation for providing administrative services to the Master Portfolio, for so long as BAL is entitled to compensation for providing administrative services to corresponding feeder funds that invest substantially all of their assets in the Master Portfolio, or BAL (or an affiliate) receives investment advisory fees from the Master Portfolio.
Expense Waivers and Reimbursements: The fees and expenses of the MIP’s trustees who are not “interested persons” of MIP, as defined in the 1940 Act (“Independent Trustees”), counsel to the Independent Trustees and the Trust’s independent registered public accounting firm (together, the “independent expenses”) are paid directly by the Master Portfolio. BAL has contractually agreed to reimburse the Master Portfolio or provide an offsetting credit against the administration fees paid by the Master Portfolio in an amount equal to these independent expenses through April 30, 2018. For the year ended December 31, 2017, the amount waived and/or reimbursed was $322,367.
| NOTESTO FINANCIAL STATEMENTS | 15 |
Table of Contents
| Notes to Financial Statements (continued) | S&P 500 Index Master Portfolio |
With respect to the Master Portfolio, the Manager voluntarily agreed to waive its investment advisory fees by the amount of investment advisory fees the Master Portfolio pays to the Manager indirectly through its investment in affiliated money market funds (the “affiliated money market fund waiver”). This amount is included in fees waived and/or reimbursed by the Manager in the Statement of Operations. For the year ended December 31, 2017, the amount waived was $145,086.
The Manager has contractually agreed to waive its investment advisory fee with respect to any portion of the Master Portfolio’s assets invested in affiliated equity and fixed-income mutual funds and affiliated exchange-traded funds that have a contractual management fee through April 30, 2018. The contractual agreement may be terminated upon 90 days’ notice by a majority of the Independent Trustees of MIP or by a vote of a majority of the outstanding voting securities of the Master Portfolio.For the year ended December 31, 2017, there were no such fees waived by the Manager.
Securities Lending: The SEC has issued an exemptive order which permits BTC, an affiliate of the Manager, to serve as securities lending agent for the Master Portfolio, subject to applicable conditions. As securities lending agent, BTC bears all operational costs directly related to securities lending. The Master Portfolio is responsible for fees in connection with the investment of cash collateral received for securities on loan (the “collateral investment fees”). The cash collateral is invested in a money market fund managed by the Manager or its affiliates. However, BTC has agreed to reduce the amount of securities lending income it receives in order to effectively limit the collateral investment fees the Master Portfolio bears to an annual rate of 0.04%. Such money market fund shares will not be subject to a sales load, distribution fee or service fee. The money market fund in which the cash collateral has been invested may, under certain circumstances, impose a liquidity fee of up to 2% of the value redeemed or temporarily restrict redemptions for up to 10 business days during a 90 day period, in the event that the money market fund’s weekly liquid assets fall below certain thresholds.
Securities lending income is equal to the total of income earned from the reinvestment of cash collateral, net of fees and other payments to and from borrowers of securities, and less the collateral investment fees. The Master Portfolio retains a portion of securities lending income and remits a remaining portion to BTC as compensation for its services as securities lending agent.
Pursuant to a securities lending agreement, the Master Portfolio retains 71.5% of securities lending income, and this amount retained can never be less than 65% of the total of securities lending income plus the collateral investment fees. In addition, commencing the business day following the date that the aggregate securities lending income earned across certain funds in the Equity-Liquidity Complex in a calendar year exceeds a specified threshold, the Master Portfolio, pursuant to the securities lending agreement, will retain for the remainder of the calendar year securities lending income in an amount equal to 75% of securities lending income, and this amount retained can never be less than 65% of the total of securities lending income plus the collateral investment fees.
The share of securities lending income earned by the Master Portfolio is shown as securities lending income — affiliated — net in the Statement of Operations. For the year ended December 31, 2017, the Master Portfolio paid BTC $147,119 in total for securities lending agent services and collateral investment fees.
Interfund Lending: In accordance with an exemptive order (the “Order”) from the SEC, the Master Portfolio may participate in a joint lending and borrowing facility for temporary purposes (the “Interfund Lending Program”), subject to compliance with the terms and conditions of the Order, and to the extent permitted by the Master Portfolio’s investment policies and restrictions. The Master Portfolio is currently permitted to borrow and lend under the Interfund Lending Program.
A lending BlackRock fund may lend in aggregate up to 15% of its net assets, but may not lend more than 5% of its net assets to any one borrowing fund through the Interfund Lending Program. A borrowing BlackRock fund may not borrow through the Interfund Lending Program or from any other source more than 33 1/3% of its total assets (or any lower threshold provided for by the fund’s investment restrictions). If a borrowing BlackRock fund’s total outstanding borrowings exceed 10% of its total assets, each of its outstanding interfund loans will be subject to collateralization of at least 102% of the outstanding principal value of the loan. All interfund loans are for temporary or emergency purposes and the interest rate to be charged will be the average of the highest current overnight repurchase agreement rate available to a lending fund and the bank loan rate, as calculated according to a formula established by the Board.
During the year ended December 31, 2017, the Master Portfolio did not participate in the Interfund Lending Program.
Trustees and Officers: Certain trustees and/or officers of MIP are directors and/or officers of BlackRock or its affiliates.
Other Transactions: The Master Portfolio may purchase securities from, or sell securities to, an affiliated fund provided the affiliation is due solely to having a common investment adviser, common officers, or common trustees. For the year ended December 31, 2017, the purchase and sale transactions and any net realized gains (losses) with an affiliated fund in compliance with Rule 17a-7 under the 1940 Act were as follows:
Purchases | Sales | Net Realized Gain (Loss) | ||||||
$257,739,400 | $ | 61,529,396 | $ | (22,687,106 | ) | |||
| 7. | PURCHASES AND SALES |
For the year ended December 31, 2017, purchases and sales of investments, excluding short-term securities, were $3,201,087,023 and $1,278,910,610, respectively.
| 8. | INCOME TAX INFORMATION |
The Master Portfolio is classified as a partnership for U.S. federal income tax purposes. As such, each investor in the Master Portfolio is treated as the owner of its proportionate share of net assets, income, expenses and realized and unrealized gains and losses of the Master Portfolio. Therefore, no U.S. federal income tax provision is required. It is intended that the Master Portfolio’s assets will be managed so an investor in the Master Portfolio can satisfy the requirements of Subchapter M of the Internal Revenue Code of 1986, as amended.
| 16 | 2017 BLACKROCK ANNUAL REPORTTO SHAREHOLDERS |
Table of Contents
| Notes to Financial Statements (continued) | S&P 500 Index Master Portfolio |
The Master Portfolio files U.S. federal and various state and local tax returns. No income tax returns are currently under examination. The statute of limitations on the Master Portfolio’s U.S. federal tax returns generally remains open for each of the four years ended December 31, 2017. The statutes of limitations on the Master Portfolio’s state and local tax returns may remain open for an additional year depending upon the jurisdiction.
Management has analyzed tax laws and regulations and their application to the Master Portfolio as of December 31, 2017, inclusive of the open tax return years, and does not believe that there are any uncertain tax positions that require recognition of a tax liability in the Master Portfolio’s financial statements.
As of December 31, 2017, gross unrealized appreciation and depreciation for investments and derivative financial instruments and derivatives based on cost for U.S. federal income tax purposes were as follows:
Tax cost | $ | 8,239,518,484 | ||
|
| |||
Gross unrealized appreciation | 5,875,909,007 | |||
Gross unrealized depreciation | (225,480,271 | ) | ||
|
| |||
Net unrealized appreciation | $ | 5,650,428,736 | ||
|
|
| 9. | BANK BORROWINGS |
MIP, on behalf of the Master Portfolio, along with certain other funds managed by the Manager and its affiliates (“Participating Funds”), is a party to a 364-day, $2.1 billion credit agreement with a group of lenders. Under this agreement, the Master Portfolio may borrow to fund shareholder redemptions. Excluding commitments designated for certain individual funds, the Participating Funds, including the Master Portfolio, can borrow up to an aggregate commitment amount of $1.6 billion at any time outstanding, subject to asset coverage and other limitations as specified in the agreement. The credit agreement has the following terms: a fee of 0.12% per annum on unused commitment amounts and interest at a rate equal to the higher of (a) one-month LIBOR (but, in any event, not less than 0.00%) on the date the loan is made plus 0.80% per annum or (b) the Fed Funds rate (but, in any event, not less than 0.00%) in effect from time to time plus 0.80% per annum on amounts borrowed. The agreement expires in April 2018 unless extended or renewed. Participating Funds paid administration, legal and arrangement fees, which, if applicable, are included in miscellaneous expenses in the Statement of Operations. These fees were allocated among such funds based upon portions of the aggregate commitment available to them and relative net assets of Participating Funds. During the year ended December 31, 2017, the Master Portfolio did not borrow under the credit agreement.
| 10. | PRINCIPAL RISKS |
In the normal course of business, the Master Portfolio invests in securities or other instruments and may enter into certain transactions, and such activities subject the Master Portfolio to various risks, including among others, fluctuations in the market (market risk) or failure of an issuer to meet all of its obligations. The value of securities or other instruments may also be affected by various factors, including, without limitation: (i) the general economy; (ii) the overall market as well as local, regional or global political and/or social instability; (iii) regulation, taxation or international tax treaties between various countries; or (iv) currency, interest rate and price fluctuations. The Master Portfolio’s prospectus provides details of the risks to which the Master Portfolio is subject.
The Master Portfolio may be exposed to additional risks when reinvesting cash collateral in money market funds that do not seek to maintain a stable NAV per share of $1.00 and which may be subject to redemption gates or liquidity fees under certain circumstances.
Valuation Risk: The market values of equities, such as common stocks and preferred securities or equity related investments, such as futures and options, may decline due to general market conditions which are not specifically related to a particular company. They may also decline due to factors which affect a particular industry or industries. The Master Portfolio may invest in illiquid investments and may experience difficulty in selling those investments in a timely manner at the price that it believes the investments are worth. Prices may fluctuate widely over short or extended periods in response to company, market or economic news. Markets also tend to move in cycles, with periods of rising and falling prices. This volatility may cause the Master Portfolio’s NAV to experience significant increases or decreases over short periods of time. If there is a general decline in the securities and other markets, the NAV of the Master Portfolio may lose value, regardless of the individual results of the securities and other instruments in which the Master Portfolio invests.
Counterparty Credit Risk: The Master Portfolio may be exposed to counterparty credit risk, or the risk that an entity may fail to or be unable to perform on its commitments related to unsettled or open transactions. The Master Portfolio manages counterparty credit risk by entering into transactions only with counterparties that the Manager believes have the financial resources to honor their obligations and by monitoring the financial stability of those counterparties. Financial assets, which potentially expose the Master Portfolio to market, issuer and counterparty credit risks, consist principally of financial instruments and receivables due from counterparties. The extent of the Master Portfolio’s exposure to market, issuer and counterparty credit risks with respect to these financial assets is approximately their value recorded in the Statement of Assets and Liabilities, less any collateral held by the Master Portfolio.
A derivative contract may suffer a mark-to-market loss if the value of the contract decreases due to an unfavorable change in the market rates or values of the underlying instrument. Losses can also occur if the counterparty does not perform under the contract.
With exchange-traded futures, there is less counterparty credit risk to the Master Portfolio since the exchange or clearinghouse, as counterparty to such instruments, guarantees against a possible default. The clearinghouse stands between the buyer and the seller of the contract; therefore, credit risk is limited to failure of the clearinghouse. While offset rights may exist under applicable law, the Master Portfolio does not have a contractual right of offset against a clearing broker or clearinghouse in the event of a default (including the bankruptcy or insolvency). Additionally, credit risk exists in exchange-traded futures with respect to initial and variation margin that is
| NOTESTO FINANCIAL STATEMENTS | 17 |
Table of Contents
| Notes to Financial Statements (continued) | S&P 500 Index Master Portfolio |
held in a clearing broker’s customer accounts. While clearing brokers are required to segregate customer margin from their own assets, in the event that a clearing broker becomes insolvent or goes into bankruptcy and at that time there is a shortfall in the aggregate amount of margin held by the clearing broker for all its clients, typically the shortfall would be allocated on a pro rata basis across all the clearing broker’s customers, potentially resulting in losses to the Master Portfolio.
| 11. | SUBSEQUENT EVENTS |
Management has evaluated the impact of all subsequent events on the Master Portfolio through the date the financial statements were issued and has determined that there were no subsequent events requiring adjustment or additional disclosure in the financial statements.
| 18 | 2017 BLACKROCK ANNUAL REPORTTO SHAREHOLDERS |
Table of Contents
| Report of Independent Registered Public Accounting Firm | S&P 500 Index Master Portfolio |
To the Board of Trustees of Master Investment Portfolio and the Investors of S&P 500 Index Master Portfolio
Opinion on the Financial Statements
We have audited the accompanying statement of assets and liabilities, including the schedule of investments, of S&P 500 Index Master Portfolio (one of the funds constituting Master Investment Portfolio, referred to hereafter as the “Master Portfolio”) as of December 31, 2017, the related statement of operations for the year ended December 31, 2017, the statement of changes in net assets for each of the two years in the period ended December 31, 2017, including the related notes, and the financial highlights for each of the five years in the period ended December 31, 2017 (collectively referred to as the “financial statements”). In our opinion, the financial statements present fairly, in all material respects, the financial position of the Master Portfolio as of December 31, 2017, the results of its operations for the year then ended, the changes in its net assets for each of the two years in the period ended December 31, 2017 and the financial highlights for each of the five years in the period ended December 31, 2017 in conformity with accounting principles generally accepted in the United States of America.
Basis for Opinion
These financial statements are the responsibility of the Master Portfolio’s management. Our responsibility is to express an opinion on the Master Portfolio’s financial statements based on our audits. We are a public accounting firm registered with the Public Company Accounting Oversight Board (United States) (“PCAOB”) and are required to be independent with respect to the Master Portfolio in accordance with the U.S. federal securities laws and the applicable rules and regulations of the Securities and Exchange Commission and the PCAOB.
We conducted our audits of these financial statements in accordance with the standards of the PCAOB. Those standards require that we plan and perform the audit to obtain reasonable assurance about whether the financial statements are free of material misstatement, whether due to error or fraud.
Our audits included performing procedures to assess the risks of material misstatement of the financial statements, whether due to error or fraud, and performing procedures that respond to those risks. Such procedures included examining, on a test basis, evidence regarding the amounts and disclosures in the financial statements. Our audits also included evaluating the accounting principles used and significant estimates made by management, as well as evaluating the overall presentation of the financial statements. Our procedures included confirmation of securities owned as of December 31, 2017 by correspondence with the custodian, transfer agent and brokers; when replies were not received from brokers, we performed other auditing procedures. We believe that our audits provide a reasonable basis for our opinion.
/s/ PricewaterhouseCoopers LLP
Philadelphia, Pennsylvania
February 14, 2018
We have served as the auditor of one or more BlackRock investment companies since 2000.
| REPORT OF INDEPENDENT REGISTERED PUBLIC ACCOUNTING FIRM | 19 |
Table of Contents
Trustee and Officer Information
Independent Trustees (a)
Name Year of Birth (b) | Position(s) Held (Length of Service) (c) | Principal Occupation(s) During Past Five Years | Number of BlackRock-Advised | Public Company and Investment Company Directorships During Past Five Years | ||||
| Rodney D. Johnson 1941 | Chair of the Board and Trustee (Since 2009) | President, Fairmount Capital Advisors, Inc. from 1987 to 2013; Member of the Archdiocesan Investment Committee of the Archdiocese of Philadelphia from 2004 to 2012; Director, The Committee of Seventy (civic) from 2006 to 2012; Director, Fox Chase Cancer Center from 2004 to 2011; Director, The Mainstay (non-profit) since 2016. | 26 RICs consisting of 144 Portfolios | None | ||||
Susan J. Carter 1956 | Trustee (Since 2016) | Director, Pacific Pension Institute since 2014; Advisory Board Member, Center for Private Equity and Entrepreneurship at Tuck School of Business since 1997; Senior Advisor, Commonfund Capital, Inc. (“CCI”) (investment adviser) in 2015; Chief Executive Officer, CCI from 2013 to 2014; President & Chief Executive Officer, CCI from 1997 to 2013; Advisory Board Member, Girls Who Invest since 2015; Advisory Board Member, Bridges Ventures since 2016; Trustee, Financial Accounting Foundation since 2017. | 26 RICs consisting of 144 Portfolios | None | ||||
Collette Chilton 1958 | Trustee (Since 2015) | Chief Investment Officer, Williams College since 2006; Chief Investment Officer, Lucent Asset Management Corporation from 1998 to 2006. | 26 RICs consisting of 144 Portfolios | None | ||||
Neil A. Cotty 1954 | Trustee (Since 2016) | Bank of America Corporation from 1996 to 2015, serving in various senior finance leadership roles, including Chief Accounting Officer, from 2009 to 2015, Chief Financial Officer of Global Banking, Markets and Wealth Management from 2008 to 2009, Chief Accounting Officer from 2004 to 2008, Chief Financial Officer of Consumer Bank from 2003 to 2004, Chief Financial Officer of Global Corporate Investment Bank from 1999 to 2002. | 26 RICs consisting of 144 Portfolios | None | ||||
| Cynthia A. Montgomery 1952 | Trustee (Since 2009) | Professor, Harvard Business School since 1989; Director, McLean Hospital from 2005 to 2012. | 26 RICs consisting of 144 Portfolios | Newell Rubbermaid, Inc. (manufacturing) | ||||
Joseph P. Platt 1947 | Trustee (Since 2009) | General Partner, Thorn Partners, LP (private investments) since 1998; Director, WQED Multi-Media (public broadcasting not-for-profit) since 2001; Chair, Basic Health International (non-profit) since 2015. | 26 RICs consisting of 144 Portfolios | Greenlight Capital Re, Ltd. (reinsurance company); Consol Energy Inc. | ||||
| Robert C. Robb, Jr. 1945 | Trustee (Since 2009) | Partner, Lewis, Eckert, Robb and Company (management and financial consulting firm) since 1981 and Principal since 2010. | 26 RICs consisting of 144 Portfolios | None | ||||
Mark Stalnecker 1951 | Trustee (Since 2015) | Chief Investment Officer, University of Delaware from 1999 to 2013; Trustee, Winterthur Museum and Country Estate from 2001 to 2015; Member of the Investment Committee, Delaware Public Employees’ Retirement System since 2002; Member of the Investment Committee, Christiana Care Health System since 2009; Member of the Investment Committee, Delaware Community Foundation from 2013 to 2014; Director, SEI Private Trust Co. from 2001 to 2014. | 26 RICs consisting of 144 Portfolios | None | ||||
| 20 | 2017 BLACKROCK ANNUAL REPORTTO SHAREHOLDERS |
Table of Contents
Trustee and Officer Information (continued)
Independent Trustees (a)
Name Year of Birth (b) | Position(s) Held | Principal Occupation(s) During Past Five Years | Number of BlackRock-Advised | Public Company and Investment Company Directorships During Past Five Years | ||||||
| Kenneth L. Urish 1951 | Trustee (Since 2009) | Managing Partner, Urish Popeck & Co., LLC (certified public accountants and consultants) since 1976; Past- Chairman of the Professional Ethics Committee of the Pennsylvania Institute of Certified Public Accountants and Committee Member thereof since 2007; Member of External Advisory Board, The Pennsylvania State University Accounting Department since founding in 2001; Principal, UP Strategic Wealth Investment Advisors, LLC since 2013; Trustee, The Holy Family Institute from 2001 to 2010; President and Trustee, Pittsburgh Catholic Publishing Associates from 2003 to 2008; Director, Inter-Tel from 2006 to 2007. | 26 RICs consisting of 144 Portfolios | None | ||||||
| Claire A. Walton 1957 | Trustee (Since 2016) | Chief Operating Officer and Chief Financial Officer of Liberty Square Asset Management, LP from 1998 to 2015; General Partner of Neon Liberty Capital Management, LLC since 2003; Director, Boston Hedge Fund Group since 2009; Director, Woodstock Ski Runners since 2013; Director, Massachusetts Council on Economic Education from 2013 to 2015. | 26 RICs consisting of 144 Portfolios | None | ||||||
Frederick W. Winter 1945 | Trustee (Since 2009) | Director, Alkon Corporation since 1992; Dean Emeritus of the Joseph M. Katz School of Business, University of Pittsburgh, Dean and Professor from 1997 to 2005, Professor until 2013. | 26 RICs consisting of 144 Portfolios | None | ||||||
| Interested Trustees (d) | ||||||||||
Barbara G. Novick 1960 | Trustee (Since 2015) | Vice Chairman of BlackRock, Inc. since 2006; Chair of BlackRock’s Government Relations Steering Committee since 2009; Head of the Global Client Group of BlackRock, Inc. from 1988 to 2008. | 100 RICs consisting of 218 Portfolios | None | ||||||
| John M. Perlowski 1964 | Trustee (Since 2010) | Managing Director of BlackRock, Inc. since 2009; Head of BlackRock Global Accounting and Product Services since 2009; Managing Director and Chief Operating Officer of the Global Product Group at Goldman Sachs Asset Management, L.P. from 2003 to 2009; Treasurer of Goldman Sachs Mutual Funds from 2003 to 2009 and Senior Vice President thereof from 2007 to 2009; Director of Goldman Sachs Offshore Funds from 2002 to 2009; Advisory Director of Family Resource Network (charitable foundation) since 2009. | 127 RICs consisting of 316 Portfolios | None | ||||||
| (a) | The address of each Trustee is c/o BlackRock, Inc., 55 East 52nd Street, New York, NY 10055. |
| (b) | Independent Trustees serve until their resignation, retirement, removal or death, or until December 31 of the year in which they turn 75. The Board may determine to extend the terms of Independent Trustees on a case-by-case basis, as appropriate. |
| (c) | In connection with the acquisition of Barclays Global Investors by BlackRock, Inc. (“BlackRock”) in December 2009, certain Independent Trustees were elected to the Board. As a result, although the chart shows certain Independent Trustees as joining the Board in 2009, those Independent Trustees first became members of the boards of other funds advised by BlackRock Advisors, LLC or is affiliates as follows: Rodney D. Johnson, 1995; Cynthia A. Montgomery, 1994; Joseph P. Platt, 1999; Robert C. Robb, Jr., 1999; Kenneth L. Urish, 1999; and Frederick W. Winter, 1999. |
| (d) | Ms. Novick and Mr. Perlowski are both “interested persons,” as defined in the 1940 Act, of the Trust/MIP based on their positions with BlackRock and its affiliates. Ms. Novick and Mr. Perlowski are also board members of certain complexes of BlackRock registered open-end and closed-end funds. Ms. Novick is a board member of the BlackRock Closed-End Complex and Mr. Perlowski is also a board member of the BlackRock Equity-Bond Complex and the BlackRock Closed-End Complex. |
| TRUSTEEAND OFFICER INFORMATION | 21 |
Table of Contents
Trustee and Officer Information (continued)
| Officers Who Are Not Trustees (a) | ||||
Name Year of Birth (b) | Position(s) Held (Length of Service) (c) | Principal Occupation(s) During Past Five Years | ||
Thomas Callahan 1968 | Vice President (Since 2016) | Managing Director of BlackRock, Inc. since 2013; Head of BlackRock’s Global Cash Management Business since 2016; Co-Head of the Global Cash Management Business from 2014 to 2016; Deputy Head of the Global Cash Management Business from 2013 to 2014; Member of the Cash Management Group Executive Committee since 2013; Chief Executive Officer of NYSE Liffe U.S. from 2008 to 2013. | ||
Jennifer McGovern 1977 | Vice President (Since 2014) | Managing Director of BlackRock, Inc. since 2016; Director of BlackRock, Inc. from 2011 to 2015; Head of Product Structure and Oversight for BlackRock’s U.S. Wealth Advisory Group since 2013; Vice President of BlackRock, Inc. from 2008 to 2010. | ||
Neal J. Andrews 1966 | Chief Financial Officer (Since 2007) | Managing Director of BlackRock, Inc. since 2006; Senior Vice President and Line of Business Head of Fund Accounting and Administration at PNC Global Investment Servicing (U.S.) Inc. from 1992 to 2006. | ||
Jay M. Fife 1970 | Treasurer (Since 2007) | Managing Director of BlackRock, Inc. since 2007; Director of BlackRock, Inc. in 2006; Assistant Treasurer of the MLIM and Fund Asset Management, L.P. advised funds from 2005 to 2006; Director of MLIM Fund Services Group from 2001 to 2006. | ||
Charles Park 1967 | Chief Compliance Officer (Since 2014) | Anti-Money Laundering Compliance Officer for the BlackRock-advised Funds in the Equity-Bond Complex, the Equity- Liquidity Complex and the Closed-End Complex from 2014 to 2015; Chief Compliance Officer of BlackRock Advisors, LLC and the BlackRock-advised Funds in the Equity-Bond Complex, the Equity-Liquidity Complex and the Closed-End Complex since 2014; Principal of and Chief Compliance Officer for iShares® Delaware Trust Sponsor LLC since 2012 and BlackRock Fund Advisors (“BFA”) since 2006; Chief Compliance Officer for the BFA-advised iShares® exchange traded funds since 2006; Chief Compliance Officer for BlackRock Asset Management International Inc. since 2012. | ||
Fernanda Piedra 1969 | Anti-Money Laundering Compliance Officer (Since 2015) | Director of BlackRock, Inc. since 2014; Anti-Money Laundering Compliance Officer and Regional Head of Financial Crime for the Americas at BlackRock, Inc. since 2014; Head of Regulatory Changes and Remediation for the Asset Wealth Management Division of Deutsche Bank from 2010 to 2014; Vice President of Goldman Sachs (Anti-Money Laundering/ Suspicious Activities Group) from 2004 to 2010. | ||
Benjamin Archibald 1975 | Secretary (Since 2012) | Managing Director of BlackRock, Inc. since 2014; Director of BlackRock, Inc. from 2010 to 2013; Secretary of the iShares® exchange traded funds since 2015; Secretary of the BlackRock-advised mutual funds since 2012. | ||
| (a) | The address of each Officer is c/o BlackRock, Inc., 55 East 52nd Street, New York, NY 10055. |
| (b) | Officers of the Trust/MIP serve at the pleasure of the Board. |
Further information about the Trust’s/MIP’s Trustees and Officers is available in the Trust’s/MIP’s Statement of Additional Information, which can be obtained without charge by calling (800) 441-7762.
| Administrator | Transfer Agent | |
| BlackRock Advisors, LLC | BNY Mellon Investment Servicing (US) Inc. | |
| Wilmington, DE 19809 | Wilmington, DE 19809 | |
| Investment Adviser | Distributor | |
| BlackRock Fund Advisors | BlackRock Investments, LLC | |
| San Francisco, CA 94105 | New York, NY 10022 | |
| Accounting Agent and Custodian | Independent Registered Public Accounting Firm | |
| State Street Bank and Trust Company | PricewaterhouseCoopers LLP | |
| Boston, MA 02111 | Philadelphia, PA 19103 | |
| Legal Counsel | ||
| Sidley Austin LLP | ||
| New York, NY 10019 | ||
| Address of the Trust/MIP | ||
| 400 Howard Street | ||
| San Francisco, CA 94105 | ||
| 22 | 2017 BLACKROCK ANNUAL REPORTTO SHAREHOLDERS |
Table of Contents
Additional Information
General Information
House holding
The Fund will mail only one copy of shareholder documents, including prospectuses, annual and semi-annual reports and proxy statements, to shareholders with multiple accounts at the same address. This practice is commonly called “householding” and is intended to reduce expenses and eliminate duplicate mailings of shareholder documents. Mailings of your shareholder documents may be householded indefinitely unless you instruct us otherwise. If you do not want the mailing of these documents to be combined with those for other members of your household, please call the Fund at (800) 441-7762.
Availability of Quarterly Schedule of Investments
The Fund/Master Portfolio file their complete schedule of portfolio holdings with the SEC for the first and third quarters of each fiscal year on Form N-Q. The Fund’s/Master Portfolio’s Forms N-Q are available on the SEC’s website at http://www.sec.gov and may also be reviewed and copied at the SEC’s Public Reference Room in Washington, D.C. Information on the operation of the Public Reference Room or how to access documents on the SEC’s website without charge may be obtained by calling (800) SEC-0330. The Fund’s/Master Portfolio’s Forms N-Q may also be obtained upon request and without charge by calling (800) 441-7762.
Availability of Proxy Voting Policies and Procedures
A description of the policies and procedures that the Fund/Master Portfolio use to determine how to vote proxies relating to portfolio securities is available upon request and without charge (1) by calling (800) 441-7762; (2) at http://www.blackrock.com; and (3) on the SEC’s website at http://www.sec.gov.
Availability of Proxy Voting Record
Information about how the Fund/Master Portfolio voted proxies relating to securities held in the Fund’s/Master Portfolio’s portfolio during the most recent 12-month period ended June 30 is available upon request and without charge (1) at http://www.blackrock.com; or by calling (800) 441-7762; and (2) on the SEC’s website at http://www.sec.gov.
Black Rock’s Mutual Fund Family
Black Rock offers a diverse lineup of open-end mutual funds crossing all investment styles and managed by experts in equity, fixed income and tax-exempt investing. Visit http://www.blackrock.com for more information.
Shareholder Privileges
Account Information
Call us at (800) 441-7762 from 8:00 AM to 6:00 PM ET on any business day to get information about your account balances, recent transactions and share prices. You can also reach us on the Web at http://www.blackrock.com.
Automatic Investment Plans
Investor Class shareholders who want to invest regularly can arrange to have $50 or more automatically deducted from their checking or savings account and invested in any of the BlackRock funds.
Systematic Withdrawal Plans
Investor Class shareholders can establish a systematic withdrawal plan and receive periodic payments of $50 or more from their BlackRock funds, as long as their account balance is at least $10,000.
Retirement Plans
Shareholders may make investments in conjunction with Traditional, Rollover, Roth, Coverdell, Simple IRAs, SEP IRAs and 403(b) Plans.
| ADDITIONAL INFORMATION | 23 |
Table of Contents
Additional Information (continued)
BlackRock Privacy Principles
BlackRock is committed to maintaining the privacy of its current and former fund investors and individual clients (collectively, “Clients”) and to safeguarding their non-public personal information. The following information is provided to help you understand what personal information BlackRock collects, how we protect that information and why in certain cases we share such information with select parties.
If you are located in a jurisdiction where specific laws, rules or regulations require BlackRock to provide you with additional or different privacy-related rights beyond what is set forth below, then BlackRock will comply with those specific laws, rules or regulations.
BlackRock obtains or verifies personal non-public information from and about you from different sources, including the following: (i) information we receive from you or, if applicable, your financial intermediary, on applications, forms or other documents; (ii) information about your transactions with us, our affiliates, or others; (iii) information we receive from a consumer reporting agency; and (iv) from visits to our websites.
BlackRock does not sell or disclose to non-affiliated third parties any non-public personal information about its Clients, except as permitted by law or as is necessary to respond to regulatory requests or to service Client accounts. These non-affiliated third parties are required to protect the confidentiality and security of this information and to use it only for its intended purpose.
We may share information with our affiliates to service your account or to provide you with information about other BlackRock products or services that may be of interest to you. In addition, BlackRock restricts access to non-public personal information about its Clients to those BlackRock employees with a legitimate business need for the information. BlackRock maintains physical, electronic and procedural safeguards that are designed to protect the non-public personal information of its Clients, including procedures relating to the proper storage and disposal of such information.
| 24 | 2017 BLACKROCK ANNUAL REPORTTO SHAREHOLDERS |
Table of Contents
Appendix B
PROXY VOTING POLICIES AND PROCEDURES AND QUARTERLY PORTFOLIO HOLDINGS
(unaudited)
A description of the Transamerica Funds’ proxy voting policies and procedures is available in the Statements of Additional Information of the Funds, available without charge upon request by calling 1-888-233-4339 (toll free) or on the Securities and Exchange Commission’s (“SEC”) website at http://www.sec.gov.
In addition, the Funds are required to file Form N-PX, with their complete proxy voting records for the 12 months ended June 30th, no later than August 31st of each year. The Form is available without charge: (1) from the Funds, upon request by calling 1-888-233-4339; and (2) on the SEC’s website at http://www.sec.gov.
The Transamerica Funds and the Master Portfolio file their complete schedule of portfolio holdings with the SEC for the first and third quarter of each fiscal year on Form N-Q, which is available on the SEC’s website at http://www.sec.gov. The Transamerica Funds’ and the Master Portfolio’s Form N-Q may be reviewed and copied at the SEC’s Public Reference Room in Washington, D.C. Information on the operation of the Public Reference Room may be obtained by calling 1-800-SEC-0330.
You may also visit the Trust’s website at www.transamerica.com for this and other information about the Funds and the Trust.
Important Notice Regarding Delivery of Shareholder Documents
Every year we send shareholders informative materials such as the Transamerica Funds’ Annual Report, Semi-Annual Report, Prospectus, and other required documents that keep you informed regarding your Funds. Transamerica Funds will only send one piece per mailing address, a method that saves your Funds’ money by reducing mailing and printing costs. We will continue to do this unless you tell us not to. To elect to receive individual mailings, simply call a Transamerica Customer Service Representative toll free at 1-888-233-4339, 8 a.m. to 7 p.m. Eastern Time, Monday-Friday. Your request will take effect within 30 days.
Table of Contents
Appendix C
(unaudited)
Your privacy is very important to us. We want you to understand what information we collect and how we use it. We collect and use “nonpublic personal information” in connection with providing our customers with a broad range of financial products and services as effectively and conveniently as possible. We treat nonpublic personal information in accordance with our Privacy Policy.
What Information We Collect and From Whom We Collect It
We may collect nonpublic personal information about you from the following sources:
| • | Information we receive from you on applications or other forms, such as your name, address, and account number; |
| • | Information about your transactions with us, our affiliates, or others, such as your account balance and purchase/redemption history; and |
| • | Information we receive from non-affiliated third parties, including consumer reporting agencies. |
What Information We Disclose and To Whom We Disclose It
We do not disclose any nonpublic personal information about current or former customers to anyone without their express consent, except as permitted by law. We may disclose the nonpublic personal information we collect, as described above, to persons or companies that perform services on our behalf and to other financial institutions with which we have joint marketing agreements. We will require these companies to protect the confidentiality of your nonpublic personal information and to use it only to perform the services for which we have hired them.
Our Security Procedures
We restrict access to your nonpublic personal information and only allow disclosures to persons and companies as permitted by law to assist in providing products or services to you. We maintain physical, electronic, and procedural safeguards to protect your nonpublic personal information and to safeguard the disposal of certain consumer information.
If you have any questions about our Privacy Policy, please call 1-888-233-4339 on any business day between 8 a.m. and 7 p.m. Eastern Time.
Note: This Privacy Policy applies only to customers that have a direct relationship with us or our affiliates. If you own shares of our funds in the name of a third party such as a bank or broker-dealer, its privacy policy may apply to you instead of ours.
Table of Contents
Customer Service: 1-888-233-4339
1801 California St., Suite 5200 Denver, CO 80202
Distributor: Transamerica Capital, Inc.
www.transamerica.com

In an effort to reduce paper mailings and conserve natural resources, we encourage you to visit our website, www.transamerica.com, to set up an account and enroll in eDelivery.
Transamerica Funds are advised by Transamerica Asset Management, Inc. and distributed by Transamerica Capital, Inc.
25834_ARMFP1217
© 2017 Transamerica Capital, Inc.
Table of Contents
| Item 2: | Code of Ethics. |
| (a) | The Registrant has adopted a code of ethics that applies to its principal executive officer, principal financial officer, and any other officers who serve a similar function. |
| (b) | The Registrant’s code of ethics is reasonably designed as described in this Form N-CSR. |
| (c) | During the period covered by the report no amendments were made to the provisions of this code of ethics. |
| (d) | During the period covered by the report, the Registrant did not grant any waivers, including implicit waivers, from the provisions of this code of ethics. |
| (e) | Not Applicable. |
| (f) | The Registrant has filed this code of ethics as an exhibit pursuant to Item 13(a)(1) of Form N-CSR. |
| Item 3: | Audit Committee Financial Experts. |
The Registrant’s Board of Trustees has determined that Sandra N. Bane, and John W. Waechter are “audit committee financial experts,” as such term is defined in Item 3 of Form N-CSR. Ms. Bane, and Mr. Waechter are “independent” under the standards set forth in Item 3 of Form N-CSR. The designation of Ms. Bane, and Mr. Waechter as “audit committee financial experts” pursuant to Item 3 of Form N-CSR does not (i) impose upon them any duties, obligations, or liabilities that are greater than the duties, obligations and liabilities imposed upon them as a member of the Registrant’s audit committee or Board of Trustees in the absence of such designation; or (ii) affect the duties, obligations or liabilities of any other member of the Registrant’s audit committee or Board of Trustees.
| Item 4: | Principal Accountant Fees and Services. |
| Fiscal Year Ended 12/31 (in thousands) | ||||||||||
| 2017 | 2016 | |||||||||
(a) | Audit Fees | $ | 1,382 | $ | 1,080 | |||||
(b) | Audit Related Fees(1) | $ | 72 | $ | 18 | |||||
(c) | Tax Fees(2) | $ | 504 | $ | 259 | |||||
(d) | All Other Fees(3) | $ | 84 | $ | 23 | |||||
| (1) | Audit-Related Fees represent assurance and related services provided that are reasonably related to the performance of the audit of the financial statements of the funds comprising the Registrant, specifically data verification and agreed-upon procedures related to asset securitizations and agreed-upon procedures engagements. |
| (2) | Tax Fees represent tax compliance, tax planning and tax advice services provided in connection with the review of the distributions for excise tax purposes, fiscal year end taxable income calculations and certain fiscal year end shareholder reporting items on behalf of the funds comprising the Registrant. |
| (3) | All Other Fees represent service fees for analysis of potential Passive Foreign Investment Company holdings. |
Table of Contents
| (e)(1) | Audit Committee Pre-Approval Policies and Procedures. Generally, the Registrant’s Audit Committee must preapprove (i) all audit and non-audit services performed for the Registrant by the independent accountant and (ii) all non-audit services performed by the Registrant’s independent accountant for the Registrant’s investment adviser, and certain of the adviser’s affiliates that provide ongoing services to the Registrant, if the services to be provided by the accountant relate directly to the operations and financial reporting of the Registrant. | |
| The Audit Committee may delegate preapproval authority to one or more of its members. The member or members to whom such authority is delegated shall report any preapproval decisions to the Audit Committee at its next scheduled meeting. | ||
| In accordance with the Procedures, the annual audit services engagement terms and fees for the Registrant will be subject to the preapproval of the Audit Committee. In addition to the annual audit services engagement approved by the Audit Committee, the Audit Committee may grant preapproval for other audit services, which are those services that only the independent accountant reasonably can provide. | ||
| Requests or applications to provide services that require separate approval by the Audit Committee will be submitted to the Audit Committee by both the independent accountant and the Registrant’s treasurer, and must include a joint statement as to whether, in their view, the request or application is consistent with the Securities and Exchange Commissions’ rules on auditor independence. | ||
| Management will promptly report to the Chair of the Audit Committee any violation of this Procedure of which it becomes aware. | ||
| (e)(2) | The percentage of services described in paragraphs (b) through (d) of this Item that were approved by the audit committee pursuant to paragraph (c)(7)(i)(C) of Rule 2-01 of Regulation S-X for fiscal years ended 2017 and 2016 was zero. | |
| (f) | Not Applicable. | |
| (g) | Not Applicable. | |
| (h) | The Registrant’s Audit Committee has considered whether the provision of non-audit services that were rendered to the Registrant’s Adviser, and any entity controlling, controlled by, or under common control with the Adviser that provides ongoing services to the Registrant that were not pre-approved pursuant to paragraph (c)(7)(ii) of Rule 2-01 of Regulation S-X is compatible with maintain the principal accountant’s independence. | |
| Item 5: | Audit Committee of Listed Registrants. | |
| The following individuals comprise the standing Audit Committee: Sandra N. Bane, Leo J. Hill, David W. Jennings, Russell A. Kimball, Jr., Frederic A. Nelson, John E. Pelletier, Patricia L. Sawyer and John W. Waechter. | ||
| Item 6: | Schedule of Investments. | |
| (a) | The schedules of investments and consolidated schedules of investments are included in the Semi-Annual Report to shareholders filed under Item 1 of this Form N-CSR. | |
| (b) | Not applicable. | |
Table of Contents
| Item 7: | Disclosure of Proxy Voting Policies and Procedures for Closed-End Management Investment Companies. | |
| Not applicable. | ||
| Item 8: | Portfolio Managers of Closed-End Management Investment Companies. | |
| Not applicable. | ||
| Item 9: | Purchases of Equity Securities by Closed-End Management Investment Company and Affiliated Purchasers. | |
| Not Applicable | ||
| Item 10: | Submission of Matters to a Vote of Security Holders. | |
| There have been no material changes to the procedures by which shareholders may recommend nominees to the Registrant’s Board of Trustees that have been implemented since the Registrant last provided disclosure in response to the requirements of this Item. | ||
| Item 11: | Controls and Procedures. | |
| (a) | The Registrant’s principal executive officer and principal financial officer evaluated the Registrant’s disclosure controls and procedures within 90 days of this filing and have concluded that the Registrant’s disclosure controls and procedures (as defined in Rule 30a-3(c) under the Investment Company Act of 1940, as amended (the “1940 Act”)) are appropriately designed to ensure that information required to be disclosed by the Registrant in the reports that it files on Form N-CSR (a) is accumulated and communicated to Registrant’s management, including its principal executive officer and principal financial officer, to allow timely decisions regarding required disclosure, and (b) is recorded, processed, summarized and reported, within the time periods specified in the rules and forms adopted by the U.S. Securities and Exchange Commission. | |
| (b) | The Registrant’s principal executive officer and principal financial officer are aware of no change in the Registrant’s internal control over financial reporting that occurred during the Registrant’s most recent fiscal quarter that has materially affected, or is reasonably likely to materially affect, the Registrant’s internal control over financial reporting. | |
| Item 12: | Disclosure of Securities Lending Activities for Closed-End Management Investment Companies. | |
| Not Applicable. | ||
| Item 13: | Exhibits. | |
| (a)(1) | The Registrant’s code of ethics (that is the subject of the disclosure required by Item 2(a)) is attached. | |
| (a)(2) | Separate certifications for Registrant’s principal executive officer and principal financial officer, as required by Rule 30a-2(a) under the 1940 Act, are attached. | |
Table of Contents
| (a)(3) | Not applicable. | |
| (b) | A certification for Registrant’s principal executive officer and principal financial officer, as required by Rule 30a-2(b) under the 1940 Act, is attached. The certification furnished pursuant to this paragraph is not deemed to be “filed” for purposes of Section 18 of the Securities Exchange Act of 1934, or otherwise subject to liability of that section. Such certification is not deemed to be incorporated by reference into any filing under the Securities Act of 1933 or the Securities Exchange Act of 1934, except to the extent that the Registrant specifically incorporates it by reference. | |
Table of Contents
SIGNATURES
Pursuant to the requirements of the Securities Exchange Act of 1934 and the Investment Company Act of 1940, the Registrant has duly caused this report to be signed on its behalf by the undersigned, thereunto duly authorized.
Transamerica Funds | ||
| (Registrant) | ||
| By: | /s/ Marijn P. Smit | |
| Marijn P. Smit | ||
| Chief Executive Officer | ||
| (Principal Executive Officer) | ||
| Date: | March 2, 2018 | |
Pursuant to the requirements of the Securities Exchange Act of 1934 and the Investment Company Act of 1940, this report has been signed below by the following persons on behalf of the Registrant and in the capacities and on the dates indicated.
By: | /s/ Marijn P. Smit | |
| Marijn P. Smit | ||
| Chief Executive Officer | ||
| (Principal Executive Officer) | ||
Date: | March 2, 2018 | |
By: | /s/ Vincent J. Toner | |
| Vincent J. Toner | ||
| Treasurer | ||
| (Principal Financial Officer) | ||
Date: | March 2, 2018 | |
Table of Contents
EXHIBIT INDEX
Exhibit No. | Description of Exhibit | |
| 13(a)(1) | Code of Ethics for Principal Executive and Principal Financial Officers | |
| 13(a)(2)(i) | Section 302 N-CSR Certification of Principal Executive Officer | |
| 13(a)(2)(ii) | Section 302 N-CSR Certification of Principal Financial Officer | |
| 13(b) | Section 906 N-CSR Certification of Principal Executive Officer and Principal Financial Officer | |