Table of Contents
As filed with the Securities and Exchange Commission on April 20, 2018
SECURITIES AND EXCHANGE COMMISSION
WASHINGTON, D.C. 20549
FORM N-CSR
CERTIFIED SHAREHOLDER REPORT OF REGISTERED
MANAGEMENT INVESTMENT COMPANIES
Investment Company Act file number: 811-04556
TRANSAMERICA FUNDS
(Exact Name of Registrant as Specified in Charter)
1801 California St., Suite 5200, Denver, CO 80202
(Address of Principal Executive Offices) (Zip Code)
Registrant’s Telephone Number, including Area Code: (720) 493-4256
Tané T. Tyler, Esq., 1801 California St., Suite 5200, Denver, CO 80202
(Name and Address of Agent for Service)
Date of fiscal year end: October 31
Date of reporting period: October 31, 2017
EXPLANATORY NOTE - The Registrant is filing this amendment to its Form N-CSR for the period ended October 31, 2017, originally filed with the Securities and Exchange Commission on January 5, 2018 (Accession Number 0001193125-18-004094) to amend Item 1, “Reports to Shareholders”. The purpose of this amendment is to add the year end information for 2013, 2014 and 2015 onto the Financial Highlights presented on page 58 and page 61 of the Asset Allocation Funds’ annual report for Transamerica Asset Allocation – Moderate Growth Portfolio - Class R and Transamerica Asset Allocation – Moderate Portfolio - Class R. Except as set forth above, this amendment does not amend, update or change any other items or disclosures found in the original Form N-CSR filing.
Table of Contents
| Item 1: | Report(s) to Shareholders. |
The Annual Report is attached.
Table of Contents
TRANSAMERICA FUNDS
ANNUAL REPORT
OCTOBER 31, 2017
Customer Service: 1-888-233-4339
1801 California St., Suite 5200 Denver, CO 80202
Distributor: Transamerica Capital, Inc.
www.transamerica.com

Table of Contents
| 1 | ||||
| 2 | ||||
| 7 | ||||
| 12 | ||||
| 17 | ||||
| 22 | ||||
| 25 | ||||
| 28 | ||||
| 31 | ||||
| 35 | ||||
| 37 | ||||
| 39 | ||||
| 42 | ||||
| 50 | ||||
| 68 | ||||
| 83 | ||||
| 84 | ||||
| 85 | ||||
| 90 | ||||
Proxy Voting Policies and Procedures and Quarterly Portfolio Holdings | 97 | |||
| 98 |
| Transamerica Funds | Annual Report 2017 |
Table of Contents
On behalf of Transamerica Funds, we would like to thank you for your continued support and confidence in our products as we look forward to continuing to serve you and your financial adviser in the future. We value the trust you have placed in us.
This annual report is provided to you to show the investments of your Fund(s). The Securities and Exchange Commission requires that annual and semi-annual reports be sent to all shareholders, and we believe it to be an important part of the investment process. This report provides detailed information about your Fund(s) for the 12-month period ending October 31, 2017.
We believe it is important to understand market conditions over the last year to provide a context for reading this report. In early November of 2016, the surprise election victory of Donald Trump generated a strong reaction in both the equity and fixed income markets. As a result, the final two months of 2016 saw a move upward in stocks, driven by the prospect of less overall government regulation and the potential for legislation out of Washington pertaining to tax reform and enhanced levels of fiscal spending. Longer term interest rates also rose materially during this time in response to anticipation of new economic policies perceived to be more growth oriented and inflationary. Between election-day and calendar year end, the 10-year Treasury yield jumped from 1.88% to 2.45%.
After this initial spike in long term yields, market interest rates fluctuated with the 10-year Treasury yield ranging from a high of 2.62% in March 2017 to a low of 2.05% in September 2017. Much of this movement appeared to be in response to the lack of legislative progress regarding the new administration’s economic agenda. On October 31, 2017, the 10-year Treasury yield closed at 2.38%.
Equity markets were a different story, as most major U.S. market indices, including the Dow Jones Industrial Average, the S&P 500® and the NASDAQ moved higher during the year. The primary catalyst for the ascent in stocks was corporate earnings, as during the first half of 2017 S&P 500® companies posted their strongest levels of earnings growth in five years, as seen by aggregate double digit profit growth in both the first and second quarters. This helped to propel the equity markets even as the progress in Washington regarding new economic policy was significantly slower than anticipated. These strong corporate profit results and lower default rates also helped to support credit markets as high yield bond spreads tightened to their lowest levels in three years.
In regard to the broader economy, gross domestic product (“GDP”) growth exceeded 3% in the second quarter of 2017 for the first time in two years as steady job gains combined with growth in wages and consumer spending. The U.S. Federal Reserve (“Fed”) also moved more quickly toward normalizing short term interest rates, raising the Federal Funds Rate three times, effectively putting an end to the zero interest rate policy that had been in effect since 2008. In September 2017, the Fed announced a formal schedule to finally begin reducing its balance sheet of more than $4 trillion in bonds, which will be implemented over several years.
For the 12-month period ending October 31, 2017, the S&P 500® returned 23.63% while the MSCI EAFE Index, representing international developed market equities, gained 24.01%. During the same period, the Bloomberg Barclays US Aggregate Bond Index returned 0.90%. Please keep in mind that it is important to maintain a diversified portfolio as investment returns have historically been difficult to predict.
In addition to your active involvement in the investment process, we firmly believe that a financial adviser is a key resource to help you build a complete picture of your current and future financial needs. Financial advisers are familiar with the market’s history, including long-term returns and volatility of various asset classes. With your adviser, you can develop an investment program that incorporates factors such as your goals, your investment timeline and your risk tolerance.
Please contact your financial adviser if you have any questions about the contents of this report, and thanks again for the confidence you have placed in us.
Sincerely,

Marijn Smit
President & Chief Executive Officer
Transamerica Funds

Tom Wald, CFA
Chief Investment Officer
Transamerica Funds
The views expressed in this report reflect those of the portfolio managers only and may not necessarily represent the views of the Transamerica Funds. These views are subject to change based upon market conditions. These views should not be relied upon as investment advice and are not indicative of trading intent on behalf of the Transamerica Funds.
Table of Contents
Transamerica Asset Allocation – Conservative Portfolio
(unaudited)
MARKET ENVIRONMENT
The 12-month period ended October 31, 2017 was characterized by rising equity markets around the world. The victory by Donald Trump in the November 2016 U.S. presidential election raised investor hopes for a regime of tax cuts, amped up infrastructure spending, and business deregulation. The equity markets responded positively as these expectations persisted throughout the year while at the same time corporate earnings grew strongly. Over the period, the S&P 500® returned 23.63%. U.S. small caps fared even better, with the Russell 2000® Index gaining 27.85%. Growth stocks significantly outpaced value stocks across all market-cap ranges. In the large-cap realm, for example, the Russell Top 200® Growth Index returned 30.87% versus the Russell Top 200® Value Index’s 18.10% gain.
Foreign stocks were every bit as strong as U.S. stocks. The MSCI EAFE Index of developed foreign markets returned 24.01% in U.S. dollar terms, while the MSCI Emerging Markets Index gained 26.91%. Gains in real estate investment trusts (“REITs”) were more muted globally. The FTSE EPRA/NAREIT Developed REITS Index was up only 4.77% for the period.
Bond returns were subdued as the U.S. Federal Reserve (“Fed”) gradually tightened its monetary policy. The Fed raised the Federal Funds Rate three times during the period (December 2016, March 2017, and June 2017). Also, in September 2017 the Fed announced it would begin reducing its holdings of Treasuries and mortgage bonds by not replacing maturing bonds, effectively shrinking money supply. These moves were well-forecast, and the bond market seemed to take them in stride. Bonds initially sold off sharply after the November 2016 Trump victory (given the expectation for inflationary policies). But bonds clawed back some of those losses throughout 2017 even as the Fed tightened. Overall, Treasury prices retreated only moderately for the period as a whole, pushing the yield on the 10-year Treasury from 1.85% on November 1, 2016 to 2.38% as of October 31, 2017. The Bloomberg Barclays US Aggregate Bond Index still managed to post a positive 0.90% total return. Foreign investment-grade bonds also sold off in November 2016 before recovering ground in 2017’s first half; the Citi WGBI Non-USD Index managed a 0.73% return for the full 12-month period. Meanwhile, U.S. high-yield bonds gained strongly on the back of healthy corporate earnings, with the Bloomberg Barclays US Corporate High-Yield 2% Issuer Capped Index notching an 8.92% return. Emerging markets debt also enjoyed meaningful gains; the JPMorgan EMBI Global Diversified Index returned 6.32% in U.S. dollar terms.
PERFORMANCE
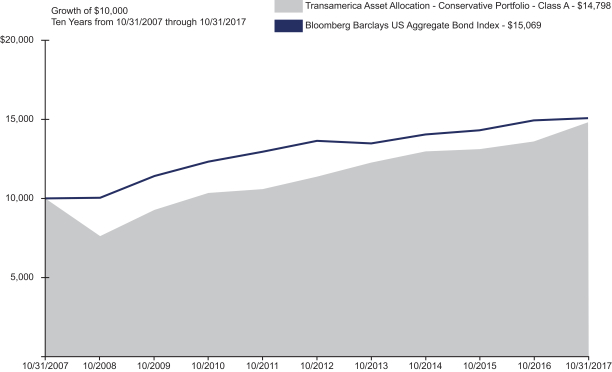
For the year ended October 31, 2017, Transamerica Asset Allocation — Conservative Portfolio Class A returned 8.78%, excluding any sales charges. By comparison, its primary and secondary benchmarks, the Bloomberg Barclays US Aggregate Bond Index and the Wilshire 5000 Total Market IndexSM, returned 0.90% and 23.75%, respectively.
STRATEGY REVIEW
The goal of the Fund has always been to provide investors one-stop participation in the global financial markets, including asset classes beyond those reflected in the primary and secondary benchmarks. The Fund provides a mix of about 35% equity and 65% fixed-income securities under normal conditions. The equity side is intended to cover both domestic and international markets across a range of investment styles, including larger and smaller companies and value and growth stocks. The fixed-income portion normally includes investment-grade and credit-sensitive holdings, shorter- and longer-term bonds, and international bonds. The Fund also normally incorporates emerging markets, and can own real estate securities and alternative strategies such as managed-futures, global-macro, event-driven strategies.
During the reporting period, management’s underweight to U.S. stocks and overweight to foreign developed markets — prompted by lofty U.S. equity valuations — was essentially a wash. Although foreign developed markets have meaningfully outperformed in 2017, the returns of the MSCI EAFE Index and S&P 500® are about the same when one includes the late-2016 post-election surge in U.S. equities. An overweight to emerging markets, however, was significant as emerging-markets equity outperformed both U.S. and foreign developed-market equity. Investing a portion of the foreign equity in small-cap stocks was also a boon. In the bond portfolio, holding duration moderately short of the benchmark and maintaining a diversified credit mix was helpful as prices for longer-term government bonds declined. Overweighting emerging-markets debt benefited the Fund as well. Defensively favoring floating-rate bank loans over fixed-rate bonds in the noninvestment-grade sleeve meant the portfolio missed some of the upside in high-yield bonds, but floating-rate bank loans also outperformed the Bloomberg Barclays US Aggregate Bond Index.
The Fund’s underlying mutual funds held their own as a group. All three of the core bond funds outpaced the Bloomberg Barclays US Aggregate Bond Index, as did all of the other seven fixed-income funds owned during the period, which cover diversifying asset classes such as high-yield bonds, emerging-markets debt, and floating-rate bank loans. Two of the four U.S. large-cap growth funds chalked up gains of more than 30% on the back of a surging technology sector, while both of the U.S. large-cap value funds outpaced the Russell 1000® Value Index by about three percentage points. The international equity funds were mixed, with about half beating their style indexes and half not. The Fund’s stake in three absolute-return funds was the main disappointment, with two of the three suffering negative returns. Those funds are held as a substitute for a small portion of the bond portfolio to help hedge against rising interest rates.
| Transamerica Funds | Annual Report 2017 |
Page 2
Table of Contents
Transamerica Asset Allocation – Conservative Portfolio
(unaudited)
STRATEGY REVIEW (continued)
As of this writing, we believe U.S. equities are overvalued, trading at historically high price/earnings multiples on top of corporate profit margins that are also at the high end of their range. In the third quarter of 2017, the S&P 500® recorded its eighth consecutive quarterly gain. We see signs that investors may have grown complacent, perhaps overlooking the current level of price risk in the equity markets. In fact, many asset classes appear unattractive to us now from a valuation standpoint. We are responding to this environment by positioning defensively in some ways — for example, moderately underweighting equity via a meaningful reduction in U.S. equity, favoring floating-rate bank loans in the bond portfolio’s credit-sensitive sleeve, and hedging against rising rates by limiting bond duration and owning absolute-return strategies in place of bonds. Otherwise we are overweighting the areas where we see remaining value and underweighting what we deem to be overvalued asset classes. Of course we are doing all of this in the context of seeking the appropriate diversification and risk level you have come to expect from the Fund.
Dan McNeela, CFA
Michael Stout, CFA
Co-Portfolio Managers
Morningstar Investment Management LLC
| Asset Allocation | Percentage of Net Assets | |||
U.S. Fixed Income Funds | 53.3 | % | ||
U.S. Equity Funds | 19.3 | |||
International Equity Funds | 13.8 | |||
International Fixed Income Funds | 8.2 | |||
U.S. Alternative Funds | 3.2 | |||
International Alternative Funds | 1.2 | |||
U.S. Mixed Allocation Fund | 1.1 | |||
Net Other Assets (Liabilities) | (0.1 | ) | ||
Total | 100.0 | % | ||
|
| |||
| Transamerica Funds | Annual Report 2017 |
Page 3
Table of Contents
Transamerica Asset Allocation – Conservative Portfolio
(unaudited)
| Average Annual Total Return for Periods Ended 10/31/2017 | ||||||||||||||||
| 1 Year | 5 Year | 10 Years or Since Inception Date of Class | Inception Date | |||||||||||||
Class A (POP) | 2.80 | % | 4.23 | % | 3.41 | % | 03/01/2002 | |||||||||
Class A (NAV) | 8.78 | % | 5.41 | % | 4.00 | % | 03/01/2002 | |||||||||
Bloomberg Barclays US Aggregate Bond Index (A) | 0.90 | % | 2.04 | % | 4.19 | % | ||||||||||
Wilshire 5000 Total Market IndexSM (B) | 23.75 | % | 14.94 | % | 7.62 | % | ||||||||||
Class B (POP) | 2.86 | % | 4.43 | % | 3.43 | % | 03/01/2002 | |||||||||
Class B (NAV) | 7.86 | % | 4.60 | % | 3.43 | % | 03/01/2002 | |||||||||
Class C (POP) | 6.99 | % | 4.67 | % | 3.32 | % | 11/11/2002 | |||||||||
Class C (NAV) | 7.99 | % | 4.67 | % | 3.32 | % | 11/11/2002 | |||||||||
Class I (NAV) | 8.97 | % | 5.69 | % | 6.07 | % | 11/30/2009 | |||||||||
Class R (NAV) | 8.35 | % | 5.06 | % | 3.70 | % | 06/15/2006 | |||||||||
Class T1 (POP) | N/A | N/A | 2.82 | %(C) | 03/17/2017 | |||||||||||
Class T1 (NAV) | N/A | N/A | 5.42 | %(C) | 03/17/2017 | |||||||||||
Advisor Class (NAV) | N/A | N/A | 5.68 | %(C) | 03/03/2017 | |||||||||||
(A) The Bloomberg Barclays US Aggregate Bond Index measures investment grade, U.S. dollar denominated, fixed-rate taxable bonds, including Treasuries, government-related and corporate securities, as well as both mortgage- and asset-backed securities.
(B) The Wilshire 5000 Total Market IndexSM measures the performance of most U.S. domiciled public securities with readily available price data. Companies in the index are weighted by available float and market-capitalization.
(C) Not annualized.
The Fund’s benchmarks are unmanaged indices used as a general measure of market performance. Calculations assume dividends and capital gains are reinvested and do not include any managerial expenses. The 10 Years or the Since Inception of Class calculation is based on the previous 10 years or since the inception date of the class, whichever is more recent. You cannot invest directly in an index.
The performance data presented represents past performance; future results may vary. Performance data does not reflect the deduction of taxes that would be paid on Fund distributions or the redemption of Fund shares. Investment return and principal value will fluctuate so that an investor’s shares, when redeemed, may be worth more or less than their original cost. Current performance may be lower or higher than performance quoted. Please see www.transamerica.com for performance data current to the most recent month-end. Public Offering Price (“POP”) returns include the reinvestment of dividends and capital gains and reflect the maximum sales charge of 5.5% for Class A shares and 2.5% for Class T1 shares or the maximum applicable contingent deferred sales charge (5% in the 1st year, decreasing to 0% after 6 years) for Class B shares and 1% (in the 1st year) for Class C shares. Shares purchased prior to March 1, 2004 are subject to a maximum applicable contingent deferred sales charge (5% in the 1st year, decreasing to 0% after 7 years) for Class B shares and (2% in the 1st year, decreasing to 0% after 2 years) for Class C shares. Net Asset Value (“NAV”) returns include the reinvestment of dividends and capital gains but do not reflect any sales charges. There are no sales charges on Class I, R and Advisor Class shares.
Performance figures reflect any fee waivers and/or expense reimbursements by the Investment Manager. Without such waivers and/or reimbursements, the performance would be lower. Future waivers and/or reimbursements are at the discretion of the Investment Manager.
Performance results do not include adjustments made for financial reporting purposes in accordance with U.S. generally accepted accounting principles and may differ from amounts reported in the Financial Highlights.
Asset allocation, like many investment strategies, offers no guarantee of positive returns, and mutual funds are subject to market risk, including loss of principal. Global/international stock funds and specialty/sector funds are subject to additional market risks. Fees associated with a fund-of-funds may be higher than with other funds. An investment in the Fund is subject to the risks associated with the underlying funds including fixed income investing which is subject to credit risk, inflation risk, and interest rate risk. Investments in small- and medium-sized companies present additional risks such as increased volatility because their earnings are less predictable, their share price more volatile, and their securities less liquid than larger or more established companies.
| Transamerica Funds | Annual Report 2017 |
Page 4
Table of Contents
Transamerica Asset Allocation – Conservative Portfolio
SCHEDULE OF INVESTMENTS
At October 31, 2017
| Shares | Value | |||||||
| INVESTMENT COMPANIES - 100.1% | ||||||||
| International Alternative Funds - 1.2% | ||||||||
Transamerica Global Allocation Liquidating Trust (A) (B) (C) (D) | 7,891 | $ 44,856 | ||||||
Transamerica Global Multifactor Macro (E) | 1,411,433 | 12,660,553 | ||||||
|
| |||||||
| 12,705,409 | ||||||||
|
| |||||||
| International Equity Funds - 13.8% | ||||||||
Transamerica Developing Markets Equity (E) | 3,301,333 | 40,210,235 | ||||||
Transamerica Emerging Markets Equity (E) | 927,522 | 10,276,946 | ||||||
Transamerica International Equity (E) | 2,677,618 | 52,427,764 | ||||||
Transamerica International Equity Opportunities (E) | 2,654,743 | 23,945,786 | ||||||
Transamerica International Small Cap (E) | 1,980,352 | 13,585,215 | ||||||
Transamerica International Small Cap Value (E) | 885,332 | 12,129,053 | ||||||
|
| |||||||
| 152,574,999 | ||||||||
|
| |||||||
| International Fixed Income Funds - 8.2% | ||||||||
Transamerica Emerging Markets Debt (E) | 4,039,046 | 44,187,158 | ||||||
Transamerica Inflation Opportunities (E) | 4,638,567 | 46,617,598 | ||||||
|
| |||||||
| 90,804,756 | ||||||||
|
| |||||||
| U.S. Alternative Funds - 3.2% | ||||||||
Transamerica Arbitrage Strategy Liquidating Trust (A) (B) (C) (D) | 13,251 | 128,670 | ||||||
Transamerica Event Driven (E) | 1,025,083 | 10,568,601 | ||||||
Transamerica Managed Futures Strategy (E) | 3,231,742 | 25,110,638 | ||||||
|
| |||||||
| 35,807,909 | ||||||||
|
| |||||||
| U.S. Equity Funds - 19.3% | ||||||||
Transamerica Capital Growth (E) | 1,050,578 | 18,132,978 | ||||||
Transamerica Concentrated Growth (E) | 827,552 | 14,904,218 | ||||||
Transamerica Dividend Focused (E) | 3,998,005 | 46,096,997 | ||||||
Transamerica Growth (E) | 1,948,768 | 26,990,433 | ||||||
Transamerica Large Cap Value (E) | 3,679,731 | 50,154,737 | ||||||
| Shares | Value | |||||||
| INVESTMENT COMPANIES (continued) | ||||||||
| U.S. Equity Funds (continued) | ||||||||
Transamerica Mid Cap Value (E) | 554,161 | $ 9,431,825 | ||||||
Transamerica Mid Cap Value Opportunities (E) | 349,229 | 4,173,283 | ||||||
Transamerica Multi-Cap Growth (E) | 1,594,355 | 12,691,067 | ||||||
Transamerica Small Cap Core (E) | 410,298 | 4,837,411 | ||||||
Transamerica Small Cap Growth (E) | 361,594 | 2,596,246 | ||||||
Transamerica Small Cap Value (E) | 403,093 | 4,853,236 | ||||||
Transamerica Small Company Growth Liquidating Trust (A) (B) (C) (D) | 1,529 | 950 | ||||||
Transamerica US Growth (E) | 833,010 | 17,551,518 | ||||||
|
| |||||||
| 212,414,899 | ||||||||
|
| |||||||
| U.S. Fixed Income Funds - 53.3% | ||||||||
Transamerica Bond (E) | 6,369,652 | 60,702,787 | ||||||
Transamerica Core Bond (E) | 12,912,097 | 128,733,612 | ||||||
Transamerica Flexible Income (E) | 2,367,976 | 22,164,253 | ||||||
Transamerica Floating Rate (E) | 5,088,924 | 50,736,574 | ||||||
Transamerica High Yield Bond (E) | 47 | 441 | ||||||
Transamerica Intermediate Bond (E) | 9,463,064 | 96,523,248 | ||||||
Transamerica Short-Term Bond (E) | 6,608,090 | 66,345,227 | ||||||
Transamerica Total Return (E) | 15,805,445 | 162,479,972 | ||||||
|
| |||||||
| 587,686,114 | ||||||||
|
| |||||||
| U.S. Mixed Allocation Fund - 1.1% | ||||||||
Transamerica MLP & Energy Income (E) | 1,622,853 | 11,976,658 | ||||||
|
| |||||||
Total Investment Companies | 1,103,970,744 | |||||||
|
| |||||||
Total Investments | 1,103,970,744 | |||||||
Net Other Assets (Liabilities) - (0.1)% | (852,066 | ) | ||||||
|
| |||||||
Net Assets - 100.0% | $ 1,103,118,678 | |||||||
|
| |||||||
SECURITY VALUATION:
Valuation Inputs (F)
| Level 1 - Unadjusted Quoted Prices | Level 2 - Other Significant Observable Inputs | Level 3 - Significant Unobservable Inputs | Value | |||||||||||||
ASSETS | ||||||||||||||||
Investments | ||||||||||||||||
Investment Companies | $ | 1,103,796,268 | $ | — | $ | — | $ | 1,103,796,268 | ||||||||
|
|
|
|
|
|
|
| |||||||||
Total | $ | 1,103,796,268 | $ | — | $ | — | $ | 1,103,796,268 | ||||||||
|
|
|
|
|
|
|
| |||||||||
Investment Companies Measured at Net Asset Value (G) | 174,476 | |||||||||||||||
|
| |||||||||||||||
Total Investments | $ | 1,103,970,744 | ||||||||||||||
|
| |||||||||||||||
FOOTNOTES TO SCHEDULE OF INVESTMENTS:
| (A) | Non-income producing securities. | |
| (B) | Issuer is affiliated with the Fund’s investment manager. | |
| (C) | Illiquid security. At October 31, 2017, the value of such securities amounted to $174,476 or less than 0.1% of the Fund’s net assets. |
The Notes to Financial Statements are an integral part of this report.
| Transamerica Funds | Annual Report 2017 |
Page 5
Table of Contents
Transamerica Asset Allocation – Conservative Portfolio
SCHEDULE OF INVESTMENTS (continued)
At October 31, 2017
FOOTNOTES TO SCHEDULE OF INVESTMENTS (continued):
| (D) | Restricted securities. At October 31, 2017, the value of such securities held by the Fund are as follows: |
| Investments | Description | Acquisition Date | Acquisition Cost | Value | Value as Percentage of Net Assets | |||||||||||||
Investment Companies | Transamerica Global Allocation Liquidating Trust | 07/31/2014 | $ | 81,188 | $ | 44,856 | 0.0 | %(H) | ||||||||||
Investment Companies | Transamerica Arbitrage Strategy Liquidating Trust | 09/18/2015 | 132,510 | 128,670 | 0.0 | (H) | ||||||||||||
Investment Companies | Transamerica Small Company Growth Liquidating Trust | 10/26/2012 | 15,291 | 950 | 0.0 | (H) | ||||||||||||
|
|
|
|
|
| |||||||||||||
Total | $ | 228,989 | $ | 174,476 | 0.0 | %(H) | ||||||||||||
|
|
|
|
|
| |||||||||||||
| (E) | Investment in the Class I2 shares of the affiliated series of Transamerica Funds. | |
| (F) | The Fund recognizes transfers between Levels at the end of the reporting year. There were no transfers between Levels 1, 2 and 3 during the year ended October 31, 2017. Please reference the Security Valuation section of the Notes to Financial Statements for more information regarding security valuation and pricing inputs. | |
| (G) | Certain investments are measured at fair value using the net asset value per share, or its equivalent, practical expedient and have not been classified in the fair value levels. The fair value amount presented is intended to permit reconciliation to the Total Investments amount presented within the Schedule of Investments. | |
| (H) | Percentage rounds to less than 0.1% or (0.1)%. |
The Notes to Financial Statements are an integral part of this report.
| Transamerica Funds | Annual Report 2017 |
Page 6
Table of Contents
Transamerica Asset Allocation – Growth Portfolio
(unaudited)
MARKET ENVIRONMENT
The 12-month period ended October 31, 2017 was characterized by rising equity markets around the world. The victory by Donald Trump in the November 2016 U.S. presidential election raised investor hopes for a regime of tax cuts, amped up infrastructure spending, and business deregulation. The equity markets responded positively as these expectations persisted throughout the year while at the same time corporate earnings grew strongly. Over the period, the S&P 500® returned 23.63%. U.S. small caps fared even better, with the Russell 2000® Index gaining 27.85%. Growth stocks significantly outpaced value stocks across all market-cap ranges. In the large-cap realm, for example, the Russell Top 200® Growth Index returned 30.87% versus the Russell Top 200® Value Index’s 18.10% gain.
Foreign stocks were every bit as strong as U.S. stocks. The MSCI EAFE Index of developed foreign markets returned 24.01% in U.S. dollar terms, while the MSCI Emerging Markets Index gained 26.91%. Gains in real estate investment trusts (“REITs”) were more muted globally. The FTSE EPRA/NAREIT Developed REITS Index was up only 4.77% for the period.
Bond returns were subdued as the U.S. Federal Reserve (“Fed”) gradually tightened its monetary policy. The Fed raised the Federal Funds Rate three times during the period (December, March, and June). Also, in September 2017 the Fed announced it would begin reducing its holdings of Treasuries and mortgage bonds by not replacing maturing bonds, effectively shrinking money supply. These moves were well-forecast, and the bond market seemed to take them in stride. Bonds initially sold off sharply after the November 2016 Trump victory (given the expectation for inflationary policies). But bonds clawed back some of those losses throughout 2017 even as the Fed tightened. Overall, Treasury prices retreated only moderately for the period as a whole, pushing the yield on the 10-year Treasury from 1.85% on November 1, 2016 to 2.38% as of October 31, 2017. The Bloomberg Barclays US Aggregate Bond Index still managed to post a positive 0.90% total return. Foreign investment-grade bonds also sold off in November 2016 before recovering ground in 2017’s first half; the Citi WGBI Non-USD Index managed a 0.73% return for the full 12-month period. Meanwhile, U.S. high-yield bonds gained strongly on the back of healthy corporate earnings, with the Bloomberg Barclays US Corporate High-Yield 2% Issuer Capped Index notching an 8.92% return. Emerging markets debt also enjoyed meaningful gains; the JPMorgan EMBI Global Diversified Index returned 6.32% in U.S. dollar terms.
PERFORMANCE
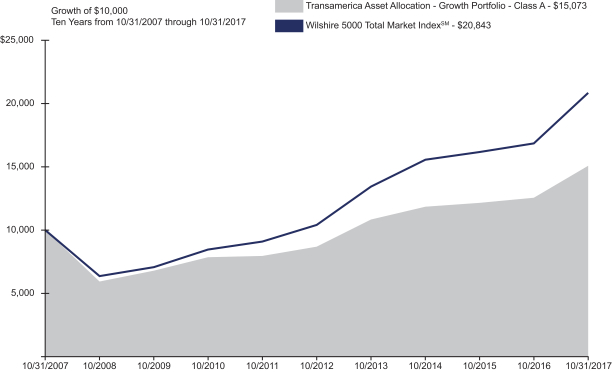
For the year ended October 31, 2017, Transamerica Asset Allocation — Growth Portfolio Class A returned 20.19%, excluding any sales charges. By comparison, its benchmark, the Wilshire 5000 Total Market IndexSM, returned 23.75%.
STRATEGY REVIEW
The goal of the Fund has always been to provide investors one-stop participation in the global equity markets, with a few alternative-strategy funds included for diversification. The equity piece, which makes up more than 90% of the Fund, is intended to cover both domestic and international markets across a range of investment styles, including larger and smaller companies and value and growth stocks. The Fund also normally incorporates emerging markets, and can own real estate securities and alternative strategies such as managed-futures, global-macro, and event-driven strategies.
During the reporting period, management’s underweight to U.S. stocks and overweight to foreign developed markets — prompted by lofty U.S. equity valuations — was essentially a wash. Although foreign developed markets have meaningfully outperformed in 2017, the returns of the MSCI EAFE Index and S&P 500® are about the same when one includes the late-2016 post-election surge in U.S. equities. An overweight to emerging markets, however, was significant as emerging-markets equity outperformed both U.S. and foreign developed-market equity. Investing a portion of the foreign equity in small-cap stocks was also a boon, as international small caps had a good run.
The Fund’s underlying mutual funds held their own as a group. Two of the four U.S. large-cap growth funds chalked up gains of more than 30% on the back of a surging technology sector, while both of the U.S. large-cap value funds outpaced the Russell 1000® Value Index by about three percentage points. These U.S. large-cap funds are core holdings, so their performance has a major impact on the Fund. The U.S. mid- and small-cap funds, which make up a smaller part of the Fund, were not as strong but still experienced healthy gains. The international equity funds were mixed, with about half beating their style indexes and half not. The Fund’s stake in three absolute-return funds was the main disappointment, with two of the three suffering negative returns. Those funds are held for diversification purposes. Another drag was an energy-infrastructure fund that had enjoyed strong 2016 returns but which cooled off in 2017.
As of this writing, we believe U.S. equities are overvalued, trading at historically high price/earnings multiples on top of corporate profit margins that are also at the high end of their range. In the third quarter of 2017, the S&P 500® recorded its eighth consecutive quarterly gain. We see signs that investors may have grown complacent, perhaps overlooking the current level of price risk in the equity markets.
| Transamerica Funds | Annual Report 2017 |
Page 7
Table of Contents
Transamerica Asset Allocation – Growth Portfolio
(unaudited)
STRATEGY REVIEW (continued)
In fact, many asset classes appear unattractive to us now from a valuation standpoint. We are responding to this environment by positioning defensively in some ways — for example, moderately underweighting equity via a meaningful reduction in U.S. equity, holding part of the portfolio in absolute-return strategies, and favoring areas in the global equity market where we see remaining value. Of course we are doing all of this in the context of seeking the appropriate diversification and risk level you have come to expect from the Fund.
Dan McNeela, CFA
Michael Stout, CFA
Co-Portfolio Managers
Morningstar Investment Management LLC
| Asset Allocation | Percentage of Net Assets | |||
U.S. Equity Funds | 53.6 | % | ||
International Equity Funds | 36.8 | |||
U.S. Mixed Allocation Fund | 4.1 | |||
U.S. Alternative Funds | 4.1 | |||
International Alternative Funds | 1.5 | |||
Net Other Assets (Liabilities) | (0.1 | ) | ||
Total | 100.0 | % | ||
|
| |||
| Transamerica Funds | Annual Report 2017 |
Page 8
Table of Contents
Transamerica Asset Allocation – Growth Portfolio
(unaudited)
| Average Annual Total Return for Periods Ended 10/31/2017 | ||||||||||||||||
| 1 Year | 5 Year | 10 Years or Since Inception Date of Class | Inception Date | |||||||||||||
Class A (POP) | 13.55 | % | 10.43 | % | 3.60 | % | 03/01/2002 | |||||||||
Class A (NAV) | 20.19 | % | 11.68 | % | 4.19 | % | 03/01/2002 | |||||||||
Wilshire 5000 Total Market IndexSM (A) | 23.75 | % | 14.94 | % | 7.62 | % | ||||||||||
Class B (POP) | 14.16 | % | 10.65 | % | 3.59 | % | 03/01/2002 | |||||||||
Class B (NAV) | 19.16 | % | 10.78 | % | 3.59 | % | 03/01/2002 | |||||||||
Class C (POP) | 18.31 | % | 10.88 | % | 3.49 | % | 11/11/2002 | |||||||||
Class C (NAV) | 19.31 | % | 10.88 | % | 3.49 | % | 11/11/2002 | |||||||||
Class I (NAV) | 20.52 | % | 12.02 | % | 10.44 | % | 11/30/2009 | |||||||||
Class R (NAV) | 19.94 | % | 11.37 | % | 3.97 | % | 06/15/2006 | |||||||||
Class T1 (POP) | N/A | N/A | 6.99 | %(B) | 03/17/2017 | |||||||||||
Class T1 (NAV) | N/A | N/A | 9.72 | %(B) | 03/17/2017 | |||||||||||
Advisor Class (NAV) | N/A | N/A | 10.40 | %(B) | 03/03/2017 | |||||||||||
(A) The Wilshire 5000 Total Market IndexSM measures the performance of most U.S. domiciled public securities with readily available price data. Companies in the index are weighted by available float and market-capitalization.
(B) Not annualized.
The Fund’s benchmark is an unmanaged index used as a general measure of market performance. Calculations assume dividends and capital gains are reinvested and do not include any managerial expenses. The 10 Years or the Since Inception of Class calculation is based on the previous 10 years or since the inception date of the class, whichever is more recent. You cannot invest directly in an index.
The performance data presented represents past performance; future results may vary. Performance data does not reflect the deduction of taxes that would be paid on Fund distributions or the redemption of Fund shares. Investment return and principal value will fluctuate so that an investor’s shares, when redeemed, may be worth more or less than their original cost. Current performance may be lower or higher than performance quoted. Please see www.transamerica.com for performance data current to the most recent month-end. Public Offering Price (“POP”) returns include the reinvestment of dividends and capital gains and reflect the maximum sales charge of 5.5% for Class A shares and 2.5% for Class T1 shares or the maximum applicable contingent deferred sales charge (5% in the 1st year, decreasing to 0% after 6 years) for Class B shares and 1% (in the 1st year) for Class C shares. Shares purchased prior to March 1, 2004 are subject to a maximum applicable contingent deferred sales charge (5% in the 1st year, decreasing to 0% after 7 years) for Class B shares and (2% in the 1st year, decreasing to 0% after 2 years) for Class C shares. Net Asset Value (“NAV”) returns include the reinvestment of dividends and capital gains but do not reflect any sales charges. There are no sales charges on Class I, R and Advisor Class shares.
Performance figures reflect any fee waivers and/or expense reimbursements by the Investment Manager. Without such waivers and/or reimbursements, the performance would be lower. Future waivers and/or reimbursements are at the discretion of the Investment Manager.
Performance results do not include adjustments made for financial reporting purposes in accordance with U.S. generally accepted accounting principles and may differ from amounts reported in the Financial Highlights.
Asset allocation, like many investment strategies, offers no guarantee of positive returns, and mutual funds are subject to market risk, including loss of principal. Global/international stock funds and specialty/sector funds are subject to additional market risks. Fees associated with a fund-of-funds may be higher than with other funds. Funds that invest in small- and medium-sized companies present additional risks such as increased volatility because their earnings are less predictable, their share price more volatile, and their securities less liquid than larger or more established companies.
| Transamerica Funds | Annual Report 2017 |
Page 9
Table of Contents
Transamerica Asset Allocation – Growth Portfolio
SCHEDULE OF INVESTMENTS
At October 31, 2017
| Shares | Value | |||||||
| INVESTMENT COMPANIES - 100.1% | ||||||||
| International Alternative Funds - 1.5% | ||||||||
Transamerica Global Allocation Liquidating Trust (A) (B) (C) (D) | 5,149 | $ 29,269 | ||||||
Transamerica Global Multifactor Macro (E) | 2,483,438 | 22,276,435 | ||||||
|
| |||||||
| 22,305,704 | ||||||||
|
| |||||||
| International Equity Funds - 36.8% | ||||||||
Transamerica Developing Markets Equity (E) | 13,080,121 | 159,315,874 | ||||||
Transamerica Emerging Markets Equity (E) | 5,501,462 | 60,956,204 | ||||||
Transamerica Global Real Estate Securities (E) | 337,556 | 4,749,417 | ||||||
Transamerica International Equity (E) | 8,150,744 | 159,591,565 | ||||||
Transamerica International Equity Opportunities (E) | 10,009,312 | 90,283,997 | ||||||
Transamerica International Small Cap (E) | 6,138,540 | 42,110,382 | ||||||
Transamerica International Small Cap Value (E) | 3,486,634 | 47,766,890 | ||||||
|
| |||||||
| 564,774,329 | ||||||||
|
| |||||||
| U.S. Alternative Funds - 4.1% | ||||||||
Transamerica Event Driven (E) | 2,230,882 | 23,000,389 | ||||||
Transamerica Managed Futures Strategy (E) | 5,047,844 | 39,221,747 | ||||||
|
| |||||||
| 62,222,136 | ||||||||
|
| |||||||
| U.S. Equity Funds - 53.6% | ||||||||
Transamerica Capital Growth (E) | 3,962,984 | 68,401,098 | ||||||
Transamerica Concentrated Growth (E) | 3,119,226 | 56,177,260 | ||||||
| Shares | Value | |||||||
| INVESTMENT COMPANIES (continued) | ||||||||
| U.S. Equity Funds (continued) | ||||||||
Transamerica Dividend Focused (E) | 14,076,726 | $ 162,304,645 | ||||||
Transamerica Growth (E) | 7,424,352 | 102,827,273 | ||||||
Transamerica Large Cap Value (E) | 13,540,339 | 184,554,822 | ||||||
Transamerica Mid Cap Value (E) | 3,787,672 | 64,466,186 | ||||||
Transamerica Mid Cap Value Opportunities (E) | 2,115,936 | 25,285,436 | ||||||
Transamerica Multi-Cap Growth (E) | 4,163,202 | 33,139,084 | ||||||
Transamerica Small Cap Core (E) | 288,594 | 3,402,519 | ||||||
Transamerica Small Cap Growth (E) | 2,368,990 | 17,009,349 | ||||||
Transamerica Small Cap Value (E) | 3,121,883 | 37,587,472 | ||||||
Transamerica Small Company Growth Liquidating Trust (A) (B) (C) (D) | 5,111 | 3,175 | ||||||
Transamerica US Growth (E) | 3,164,402 | 66,673,941 | ||||||
|
| |||||||
| 821,832,260 | ||||||||
|
| |||||||
| U.S. Mixed Allocation Fund - 4.1% | ||||||||
Transamerica MLP & Energy Income (E) | 8,609,579 | 63,538,694 | ||||||
|
| |||||||
Total Investment Companies (Cost $1,222,399,653) | 1,534,673,123 | |||||||
|
| |||||||
Total Investments (Cost $1,222,399,653) | 1,534,673,123 | |||||||
Net Other Assets (Liabilities) - (0.1)% | (1,744,154 | ) | ||||||
|
| |||||||
Net Assets - 100.0% | $ 1,532,928,969 | |||||||
|
| |||||||
SECURITY VALUATION:
Valuation Inputs (F)
| Level 1 - Unadjusted Quoted Prices | Level 2 - Other Significant Observable Inputs | Level 3 - Significant Unobservable Inputs | Value | |||||||||||||
ASSETS | ||||||||||||||||
Investments | ||||||||||||||||
Investment Companies | $ | 1,534,640,679 | $ | — | $ | — | $ | 1,534,640,679 | ||||||||
|
|
|
|
|
|
|
| |||||||||
Total | $ | 1,534,640,679 | $ | — | $ | — | $ | 1,534,640,679 | ||||||||
|
|
|
|
|
|
|
| |||||||||
Investment Companies Measured at Net Asset Value (G) | 32,444 | |||||||||||||||
|
| |||||||||||||||
Total Investments | $ | 1,534,673,123 | ||||||||||||||
|
| |||||||||||||||
FOOTNOTES TO SCHEDULE OF INVESTMENTS:
| (A) | Non-income producing securities. | |
| (B) | Issuer is affiliated with the Fund’s investment manager. | |
| (C) | Illiquid security. At October 31, 2017, the value of such securities amounted to $32,444 or less than 0.1% of the Fund’s net assets. |
The Notes to Financial Statements are an integral part of this report.
| Transamerica Funds | Annual Report 2017 |
Page 10
Table of Contents
Transamerica Asset Allocation – Growth Portfolio
SCHEDULE OF INVESTMENTS (continued)
At October 31, 2017
FOOTNOTES TO SCHEDULE OF INVESTMENTS (continued):
| (D) | Restricted securities. At October 31, 2017, the value of such securities held by the Fund are as follows: |
| Investments | Description | Acquisition Date | Acquisition Cost | Value | Value as Percentage of Net Assets | |||||||||||||
Investment Companies | Transamerica Global Allocation Liquidating Trust | 07/31/2014 | $ | 52,975 | $ | 29,269 | 0.0 | %(H) | ||||||||||
Investment Companies | Transamerica Small Company Growth Liquidating Trust | 10/26/2012 | 51,111 | 3,175 | 0.0 | (H) | ||||||||||||
|
|
|
|
|
| |||||||||||||
Total | $ | 104,086 | $ | 32,444 | 0.0 | %(H) | ||||||||||||
|
|
|
|
|
| |||||||||||||
| (E) | Investment in the Class I2 shares of the affiliated series of Transamerica Funds. | |
| (F) | The Fund recognizes transfers between Levels at the end of the reporting year. There were no transfers between Levels 1, 2 and 3 during the year ended October 31, 2017. Please reference the Security Valuation section of the Notes to Financial Statements for more information regarding security valuation and pricing inputs. | |
| (G) | Certain investments are measured at fair value using the net asset value per share, or its equivalent, practical expedient and have not been classified in the fair value levels. The fair value amount presented is intended to permit reconciliation to the Total Investments amount presented within the Schedule of Investments. | |
| (H) | Percentage rounds to less than 0.1% or (0.1)%. |
The Notes to Financial Statements are an integral part of this report.
| Transamerica Funds | Annual Report 2017 |
Page 11
Table of Contents
Transamerica Asset Allocation – Moderate Growth Portfolio
(unaudited)
MARKET ENVIRONMENT
The 12-month period ended October 31, 2017 was characterized by rising equity markets around the world. The victory by Donald Trump in the November 2016 U.S. presidential election raised investor hopes for a regime of tax cuts, amped up infrastructure spending, and business deregulation. The equity markets responded positively as these expectations persisted throughout the year while at the same time corporate earnings grew strongly. Over the period, the S&P 500® returned 23.63%. U.S. small caps fared even better, with the Russell 2000® Index gaining 27.85%. Growth stocks significantly outpaced value stocks across all market-cap ranges. In the large-cap realm, for example, the Russell Top 200® Growth Index returned 30.87% versus the Russell Top 200® Value Index’s 18.10% gain.
Foreign stocks were every bit as strong as U.S. stocks. The MSCI EAFE Index of developed foreign markets returned 24.01% in U.S. dollar terms, while the MSCI Emerging Markets Index gained 26.91%. Gains in real estate investment trusts (“REITs”) were more muted globally. The FTSE EPRA/NAREIT Developed REITS Index was up only 4.77% for the period.
Bond returns were subdued as the U.S. Federal Reserve (“Fed”) gradually tightened its monetary policy. The Fed raised the Federal Funds Rate three times during the period (December, March, and June). Also, in September 2017 the Fed announced it would begin reducing its holdings of Treasuries and mortgage bonds by not replacing maturing bonds, effectively shrinking money supply. These moves were well-forecast, and the bond market seemed to take them in stride. Bonds initially sold off sharply after the November 2016 Trump victory (given the expectation for inflationary policies). But bonds clawed back some of those losses throughout 2017 even as the Fed tightened. Overall, Treasury prices retreated only moderately for the period as a whole, pushing the yield on the 10-year Treasury from 1.85% on November 1, 2016 to 2.38% as of October 31, 2017. The Bloomberg Barclays US Aggregate Bond Index still managed to post a positive 0.90% total return. Foreign investment-grade bonds also sold off in November 2016 before recovering ground in 2017’s first half; the Citi WGBI Non-USD Index managed a 0.73% return for the full 12-month period. Meanwhile, U.S. high-yield bonds gained strongly on the back of healthy corporate earnings, with the Bloomberg Barclays US Corporate High-Yield 2% Issuer Capped Index notching an 8.92% return. Emerging markets debt also enjoyed meaningful gains; the JPMorgan EMBI Global Diversified Index returned 6.32% in U.S. dollar terms.
PERFORMANCE
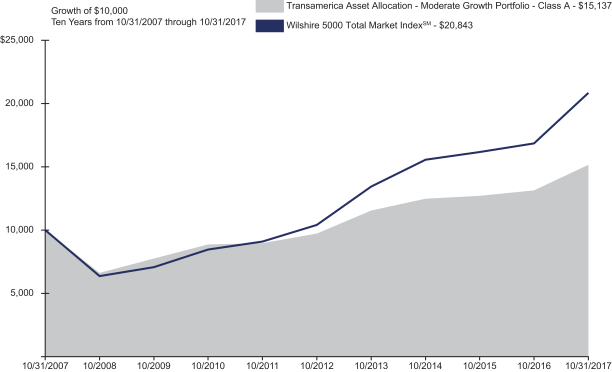
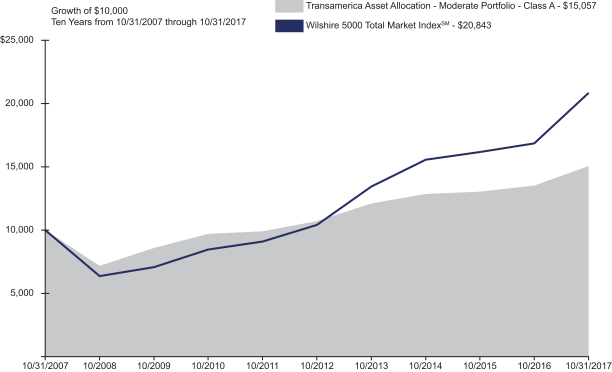
For the year ended October 31, 2017, Transamerica Asset Allocation — Moderate Growth Portfolio Class A returned 15.32%, excluding any sales charges. By comparison, its primary and secondary benchmarks the Wilshire 5000 Total Market IndexSM and the Bloomberg Barclays US Aggregate Bond Index, returned 23.75% and 0.90%, respectively.
STRATEGY REVIEW
The goal of the Fund has always been to provide investors one-stop participation in the global financial markets, including asset classes beyond those reflected in the primary and secondary benchmarks. The Fund provides a mix of about 70% equity and 30% fixed-income securities under normal conditions. The equity side is intended to cover both domestic and international markets across a range of investment styles, including larger and smaller companies and value and growth stocks. The fixed-income portion normally includes investment-grade and credit-sensitive holdings, shorter- and longer-term bonds, and international bonds. The Fund also normally incorporates emerging markets, and can own real estate securities and alternative strategies such as managed-futures, global-macro, event-driven strategies.
During the reporting period, management’s underweight to U.S. stocks and overweight to foreign developed markets — prompted by lofty U.S. equity valuations — was essentially a wash. Although foreign developed markets have meaningfully outperformed in 2017, the returns of the MSCI EAFE Index and S&P 500® are about the same when one includes the late-2016 post-election surge in U.S. equities. An overweight to emerging markets, however, was significant as emerging-markets equity outperformed both U.S. and foreign developed-market equity. Investing a portion of the foreign equity in small-cap stocks was also a boon. In the bond portfolio, holding duration moderately short of the benchmark and maintaining a diversified credit mix was helpful as prices for longer-term government bonds declined. Overweighting emerging-markets debt benefited the Fund as well. Defensively favoring floating-rate bank loans over fixed-rate bonds in the noninvestment-grade sleeve meant the Fund missed some of the upside in high-yield bonds, but floating-rate bank loans also outperformed the Bloomberg Barclays US Aggregate Bond Index.
The Fund’s underlying mutual funds held their own as a group. Two of the four U.S. large-cap growth funds chalked up gains of more than 30% on the back of a surging technology sector, while both of the U.S. large-cap value funds outpaced the Russell 1000® Value Index by about three percentage points. Meanwhile, the underlying bond funds were strong. All three of the core bond funds outpaced the Bloomberg Barclays US Aggregate Bond Index, as did all of the other bond funds owned by the Fund. The international equity funds were mixed, with about half beating their style indexes and half not. The Fund’s stake in three absolute-return funds was the main disappointment, with two of the three suffering negative returns. Those funds are held as a substitute for a small portion of the bond portfolio to help hedge against rising interest rates. Another modest drag was an energy-infrastructure fund that had enjoyed strong 2016 returns but which cooled off in 2017.
| Transamerica Funds | Annual Report 2017 |
Page 12
Table of Contents
Transamerica Asset Allocation – Moderate Growth Portfolio
(unaudited)
STRATEGY REVIEW (continued)
As of this writing, we believe U.S. equities are overvalued, trading at historically high price/earnings multiples on top of corporate profit margins that are also at the high end of their range. In the third quarter of 2017, the S&P 500® recorded its eighth consecutive quarterly gain. We see signs that investors may have grown complacent, perhaps overlooking the current level of price risk in the equity markets. In fact, many asset classes appear unattractive to us now from a valuation standpoint. We are responding to this environment by positioning defensively in some ways — for example, moderately underweighting equity via a meaningful reduction in U.S. equity, favoring floating-rate bank loans in the bond portfolio’s credit-sensitive sleeve, and hedging against rising rates by limiting bond duration and owning absolute-return strategies in place of bonds. Otherwise we are overweighting the areas where we see remaining value and underweighting what we deem to be overvalued asset classes. Of course we are doing all of this in the context of seeking the appropriate diversification and risk level you have come to expect from the Fund.
Dan McNeela, CFA
Michael Stout, CFA
Co-Portfolio Managers
Morningstar Investment Management LLC
| Asset Allocation | Percentage of Net Assets | |||
U.S. Equity Funds | 39.4 | % | ||
International Equity Funds | 27.6 | |||
U.S. Fixed Income Funds | 22.1 | |||
International Fixed Income Funds | 4.2 | |||
U.S. Mixed Allocation Fund | 2.9 | |||
U.S. Alternative Funds | 2.4 | |||
International Alternative Funds | 1.5 | |||
Net Other Assets (Liabilities) | (0.1 | ) | ||
Total | 100.0 | % | ||
|
| |||
| Transamerica Funds | Annual Report 2017 |
Page 13
Table of Contents
Transamerica Asset Allocation – Moderate Growth Portfolio
(unaudited)
| Average Annual Total Return for Periods Ended 10/31/2017 | ||||||||||||||||
| 1 Year | 5 Year | 10 Years or Since Inception Date of Class | Inception Date | |||||||||||||
Class A (POP) | 8.95 | % | 8.03 | % | 3.64 | % | 03/01/2002 | |||||||||
Class A (NAV) | 15.32 | % | 9.26 | % | 4.23 | % | 03/01/2002 | |||||||||
Wilshire 5000 Total Market IndexSM (A) | 23.75 | % | 14.94 | % | 7.62 | % | ||||||||||
Bloomberg Barclays US Aggregate Bond Index (B) | 0.90 | % | 2.04 | % | 4.19 | % | ||||||||||
Class B (POP) | 9.26 | % | 8.22 | % | 3.63 | % | 03/01/2002 | |||||||||
Class B (NAV) | 14.26 | % | 8.37 | % | 3.63 | % | 03/01/2002 | |||||||||
Class C (POP) | 13.48 | % | 8.47 | % | 3.53 | % | 11/11/2002 | |||||||||
Class C (NAV) | 14.48 | % | 8.47 | % | 3.53 | % | 11/11/2002 | |||||||||
Class I (NAV) | 15.62 | % | 9.55 | % | 8.70 | % | 11/30/2009 | |||||||||
Class R (NAV) | 15.03 | % | 9.00 | % | 4.03 | % | 06/15/2006 | |||||||||
Class T1 (POP) | N/A | N/A | 5.11 | %(C) | 03/17/2017 | |||||||||||
Class T1 (NAV) | N/A | N/A | 7.79 | %(C) | 03/17/2017 | |||||||||||
Advisor Class (NAV) | N/A | N/A | 8.29 | %(C) | 03/03/2017 | |||||||||||
(A) The Wilshire 5000 Total Market IndexSM measures the performance of most U.S. domiciled public securities with readily available price data. Companies in the index are weighted by available float and market-capitalization.
(B) The Bloomberg Barclays US Aggregate Bond Index measures investment grade, U.S. dollar denominated, fixed-rate taxable bonds, including Treasuries, government-related and corporate securities, as well as both mortgage- and asset-backed securities.
(C) Not annualized.
The Fund’s benchmarks are unmanaged indices used as a general measure of market performance. Calculations assume dividends and capital gains are reinvested and do not include any managerial expenses. The 10 Years or the Since Inception of Class calculation is based on the previous 10 years or since the inception date of the class, whichever is more recent. You cannot invest directly in an index.
The performance data presented represents past performance; future results may vary. Performance data does not reflect the deduction of taxes that would be paid on Fund distributions or the redemption of Fund shares. Investment return and principal value will fluctuate so that an investor’s shares, when redeemed, may be worth more or less than their original cost. Current performance may be lower or higher than performance quoted. Please see www.transamerica.com for performance data current to the most recent month-end. Public Offering Price (“POP”) returns include the reinvestment of dividends and capital gains and reflect the maximum sales charge of 5.5% for Class A shares and 2.5% for Class T1 shares or the maximum applicable contingent deferred sales charge (5% in the 1st year, decreasing to 0% after 6 years) for Class B shares and 1% (in the 1st year) for Class C shares. Shares purchased prior to March 1, 2004 are subject to a maximum applicable contingent deferred sales charge (5% in the 1st year, decreasing to 0% after 7 years) for Class B shares and (2% in the 1st year, decreasing to 0% after 2 years) for Class C shares. Net Asset Value (“NAV”) returns include the reinvestment of dividends and capital gains but do not reflect any sales charges. There are no sales charges on Class I, R and Advisor Class shares.
Performance figures reflect any fee waivers and/or expense reimbursements by the Investment Manager. Without such waivers and/or reimbursements, the performance would be lower. Future waivers and/or reimbursements are at the discretion of the Investment Manager.
Performance results do not include adjustments made for financial reporting purposes in accordance with U.S. generally accepted accounting principles and may differ from amounts reported in the Financial Highlights.
Asset allocation, like many investment strategies, offers no guarantee of positive returns, and mutual funds are subject to market risk, including loss of principal. Global/international stock funds and specialty/sector funds are subject to additional market risks. Fees associated with a fund-of-funds may be higher than with other funds. An investment in the Fund is subject to the risks associated with the underlying funds including fixed income investing which is subject to credit risk, inflation risk, and interest rate risk. Investment in small-and medium sized companies present additional risks such as increased volatility because their earnings are less predictable, their share price more volatile, and their securities less liquid than larger or more established companies.
| Transamerica Funds | Annual Report 2017 |
Page 14
Table of Contents
Transamerica Asset Allocation – Moderate Growth Portfolio
SCHEDULE OF INVESTMENTS
At October 31, 2017
| Shares | Value | |||||||
| INVESTMENT COMPANIES - 100.1% | ||||||||
| International Alternative Funds - 1.5% | ||||||||
Transamerica Global Allocation Liquidating Trust (A) (B) (C) (D) | 34,418 | $ 195,645 | ||||||
Transamerica Global Multifactor Macro (E) | 4,343,129 | 38,957,870 | ||||||
|
| |||||||
| 39,153,515 | ||||||||
|
| |||||||
| International Equity Funds - 27.6% | ||||||||
Transamerica Developing Markets Equity (E) | 15,044,273 | 183,239,250 | ||||||
Transamerica Emerging Markets Equity (E) | 7,762,043 | 86,003,440 | ||||||
Transamerica Global Real Estate Securities (E) | 849,121 | 11,947,130 | ||||||
Transamerica International Equity (E) | 11,721,573 | 229,508,402 | ||||||
Transamerica International Equity Opportunities (E) | 11,891,204 | 107,258,659 | ||||||
Transamerica International Small Cap (E) | 8,142,074 | 55,854,628 | ||||||
Transamerica International Small Cap Value (E) | 4,672,845 | 64,017,982 | ||||||
|
| |||||||
| 737,829,491 | ||||||||
|
| |||||||
| International Fixed Income Funds - 4.2% | ||||||||
Transamerica Emerging Markets Debt (E) | 7,210,661 | 78,884,630 | ||||||
Transamerica Inflation Opportunities (E) | 3,271,132 | 32,874,879 | ||||||
|
| |||||||
| 111,759,509 | ||||||||
|
| |||||||
| U.S. Alternative Funds - 2.4% | ||||||||
Transamerica Arbitrage Strategy Liquidating Trust (A) (B) (C) (D) | 43,273 | 420,185 | ||||||
Transamerica Event Driven (E) | 2,003,063 | 20,651,584 | ||||||
Transamerica Managed Futures Strategy (E) | 5,505,682 | 42,779,149 | ||||||
|
| |||||||
| 63,850,918 | ||||||||
|
| |||||||
| U.S. Equity Funds - 39.4% | ||||||||
Transamerica Capital Growth (E) | 4,951,416 | 85,461,447 | ||||||
Transamerica Concentrated Growth (E) | 3,840,649 | 69,170,088 | ||||||
Transamerica Dividend Focused (E) | 18,439,291 | 212,605,028 | ||||||
| Shares | Value | |||||||
| INVESTMENT COMPANIES (continued) | ||||||||
| U.S. Equity Funds (continued) | ||||||||
Transamerica Growth (E) | 9,201,037 | $ 127,434,359 | ||||||
Transamerica Large Cap Value (E) | 17,441,577 | 237,728,699 | ||||||
Transamerica Mid Cap Value (E) | 5,276,549 | 89,806,863 | ||||||
Transamerica Mid Cap Value Opportunities (E) | 3,129,610 | 37,398,837 | ||||||
Transamerica Multi-Cap Growth (E) | 7,089,408 | 56,431,688 | ||||||
Transamerica Small Cap Core (E) | 1,134,432 | 13,374,957 | ||||||
Transamerica Small Cap Growth (E) | 1,707,492 | 12,259,790 | ||||||
Transamerica Small Cap Value (E) | 2,233,653 | 26,893,177 | ||||||
Transamerica Small Company Growth Liquidating Trust (A) (B) (C) (D) | 4,660 | 2,894 | ||||||
Transamerica US Growth (E) | 3,963,235 | 83,505,370 | ||||||
|
| |||||||
| 1,052,073,197 | ||||||||
|
| |||||||
| U.S. Fixed Income Funds - 22.1% | ||||||||
Transamerica Bond (E) | 5,138,611 | 48,970,963 | ||||||
Transamerica Core Bond (E) | 13,444,790 | 134,044,560 | ||||||
Transamerica Flexible Income (E) | 3,929,197 | 36,777,282 | ||||||
Transamerica Floating Rate (E) | 6,918,213 | 68,974,583 | ||||||
Transamerica Intermediate Bond (E) | 10,176,528 | 103,800,588 | ||||||
Transamerica Short-Term Bond (E) | 3,513,892 | 35,279,476 | ||||||
Transamerica Total Return (E) | 15,865,694 | 163,099,339 | ||||||
|
| |||||||
| 590,946,791 | ||||||||
|
| |||||||
| U.S. Mixed Allocation Fund - 2.9% | ||||||||
Transamerica MLP & Energy Income (E) | 10,702,596 | 78,985,158 | ||||||
|
| |||||||
Total Investment Companies | 2,674,598,579 | |||||||
|
| |||||||
Total Investments | 2,674,598,579 | |||||||
Net Other Assets (Liabilities) - (0.1)% | (2,117,853 | ) | ||||||
|
| |||||||
Net Assets - 100.0% | $ 2,672,480,726 | |||||||
|
| |||||||
SECURITY VALUATION:
Valuation Inputs (F)
| Level 1 - Unadjusted Quoted Prices | Level 2 - Other Significant Observable Inputs | Level 3 - Significant Unobservable Inputs | Value | |||||||||||||
ASSETS | ||||||||||||||||
Investments | ||||||||||||||||
Investment Companies | $ | 2,673,979,855 | $ | — | $ | — | $ | 2,673,979,855 | ||||||||
|
|
|
|
|
|
|
| |||||||||
Total | $ | 2,673,979,855 | $ | — | $ | — | $ | 2,673,979,855 | ||||||||
|
|
|
|
|
|
|
| |||||||||
Investment Companies Measured at Net Asset Value (G) | 618,724 | |||||||||||||||
|
| |||||||||||||||
Total Investments | $ | 2,674,598,579 | ||||||||||||||
|
| |||||||||||||||
FOOTNOTES TO SCHEDULE OF INVESTMENTS:
| (A) | Non-income producing securities. | |
| (B) | Illiquid security. At October 31, 2017, the value of such securities amounted to $618,724 or less than 0.1% of the Fund’s net assets. |
The Notes to Financial Statements are an integral part of this report.
| Transamerica Funds | Annual Report 2017 |
Page 15
Table of Contents
Transamerica Asset Allocation – Moderate Growth Portfolio
SCHEDULE OF INVESTMENTS (continued)
At October 31, 2017
FOOTNOTES TO SCHEDULE OF INVESTMENTS (continued):
| (C) | Restricted securities. At October 31, 2017, the value of such securities held by the Fund are as follows: |
| Investments | Description | Acquisition Date | Acquisition Cost | Value | Value as Percentage of Net Assets | |||||||||||||
Investment Companies | Transamerica Global Allocation Liquidating Trust | 07/31/2014 | $ | 354,111 | $ | 195,645 | 0.0 | %(H) | ||||||||||
Investment Companies | Transamerica Arbitrage Strategy Liquidating Trust | 09/18/2015 | 432,725 | 420,185 | 0.0 | (H) | ||||||||||||
Investment Companies | Transamerica Small Company Growth Liquidating Trust | 10/26/2012 | 46,600 | 2,894 | 0.0 | (H) | ||||||||||||
|
|
|
|
|
| |||||||||||||
Total | $ | 833,436 | $ | 618,724 | 0.0 | %(H) | ||||||||||||
|
|
|
|
|
| |||||||||||||
| (D) | Issuer is affiliated with the Fund’s investment manager. | |
| (E) | Investment in the Class I2 shares of the affiliated series of Transamerica Funds. | |
| (F) | The Fund recognizes transfers between Levels at the end of the reporting year. There were no transfers between Levels 1, 2 and 3 during the year ended October 31, 2017. Please reference the Security Valuation section of the Notes to Financial Statements for more information regarding security valuation and pricing inputs. | |
| (G) | Certain investments are measured at fair value using the net asset value per share, or its equivalent, practical expedient and have not been classified in the fair value levels. The fair value amount presented is intended to permit reconciliation to the Total Investments amount presented within the Schedule of Investments. | |
| (H) | Percentage rounds to less than 0.1% or (0.1)%. |
The Notes to Financial Statements are an integral part of this report.
| Transamerica Funds | Annual Report 2017 |
Page 16
Table of Contents
Transamerica Asset Allocation – Moderate Portfolio
(unaudited)
MARKET ENVIRONMENT
The 12-month period ended October 31, 2017 was characterized by rising equity markets around the world. The victory by Donald Trump in the November 2016 U.S. presidential election raised investor hopes for a regime of tax cuts, amped up infrastructure spending, and business deregulation. The equity markets responded positively as these expectations persisted throughout the year while at the same time corporate earnings grew strongly. Over the period, the S&P 500® returned 23.63%. U.S. small caps fared even better, with the Russell 2000® Index gaining 27.85%. Growth stocks significantly outpaced value stocks across all market-cap ranges. In the large-cap realm, for example, the Russell Top 200® Growth Index returned 30.87% versus the Russell Top 200® Value Index’s 18.10% gain.
Foreign stocks were every bit as strong as U.S. stocks. The MSCI EAFE Index of developed foreign markets returned 24.01% in U.S. dollar terms, while the MSCI Emerging Markets Index gained 26.91%. Gains in real estate investment trusts (“REITs”) were more muted globally. The FTSE EPRA/NAREIT Developed REITS Index was up only 4.77% for the period.
Bond returns were subdued as the U.S. Federal Reserve (“Fed”) gradually tightened its monetary policy. The Fed raised the Federal Funds Rate three times during the period (December, March, and June). Also, in September 2017 the Fed announced it would begin reducing its holdings of Treasuries and mortgage bonds by not replacing maturing bonds, effectively shrinking money supply. These moves were well-forecast, and the bond market seemed to take them in stride. Bonds initially sold off sharply after the November 2016 Trump victory (given the expectation for inflationary policies). But bonds clawed back some of those losses throughout 2017 even as the Fed tightened. Overall, Treasury prices retreated only moderately for the period as a whole, pushing the yield on the 10-year Treasury from 1.85% on November 1, 2016 to 2.38% as of October 31, 2017. The Bloomberg Barclays US Aggregate Bond Index still managed to post a positive 0.90% total return. Foreign investment-grade bonds also sold off in November 2016 before recovering ground in 2017’s first half; the Citi WGBI Non-USD Index managed a 0.73% return for the full 12-month period. Meanwhile, U.S. high-yield bonds gained strongly on the back of healthy corporate earnings, with the Bloomberg Barclays US Corporate High-Yield 2% Issuer Capped Index notching an 8.92% return. Emerging markets debt also enjoyed meaningful gains; the JPMorgan EMBI Global Diversified Index returned 6.32% in U.S. dollar terms.
PERFORMANCE
For the year ended October 31, 2017, Transamerica Asset Allocation — Moderate Portfolio Class A returned 11.54%, excluding any sales charges. By comparison, its primary and secondary benchmarks, the Wilshire 5000 Total Market IndexSM and the Bloomberg Barclays US Aggregate Bond Index, returned 23.75% and 0.90%, respectively.
STRATEGY REVIEW
The goal of the Fund has always been to provide investors one-stop participation in the global financial markets, including asset classes beyond those reflected in the primary and secondary benchmarks. The Fund provides a mix of about 50% equity and 50% fixed-income securities under normal conditions. The equity side is intended to cover both domestic and international markets across a range of investment styles, including larger and smaller companies and value and growth stocks. The fixed-income portion normally includes investment-grade and credit-sensitive holdings, shorter- and longer-term bonds, and international bonds. The Fund also normally incorporates emerging markets, and can own real estate securities and alternative strategies such as managed-futures, global-macro, event-driven strategies.
During the reporting period, management’s underweight to U.S. stocks and overweight to foreign developed markets — prompted by lofty U.S. equity valuations — was essentially a wash. Although foreign developed markets have meaningfully outperformed in 2017, the returns of the MSCI EAFE Index and S&P 500® are about the same when one includes the late-2016 post-election surge in U.S. equities. An overweight to emerging markets, however, was significant as emerging-markets equity outperformed both U.S. and foreign developed-market equity. Investing a portion of the foreign equity in small-cap stocks was also a boon. In the bond portfolio, holding duration moderately short of the benchmark and maintaining a diversified credit mix was helpful as prices for longer-term government bonds declined. Overweighting emerging-markets debt benefited the Fund as well. Defensively favoring floating-rate bank loans over fixed-rate bonds in the noninvestment-grade sleeve meant the portfolio missed some of the upside in high-yield bonds, but floating-rate bank loans also outperformed the Bloomberg Barclays US Aggregate Bond Index.
The Fund’s underlying mutual funds held their own as a group. Two of the four U.S. large-cap growth funds chalked up gains of more than 30% on the back of a surging technology sector, while both of the U.S. large-cap value funds outpaced the Russell 1000® Value Index by about three percentage points. Meanwhile, the underlying bond funds were strong. All three of the core bond funds outpaced the Bloomberg Barclays US Aggregate Bond Index, as did all of the other bond funds owned by the Fund. The international equity funds were mixed, with about half beating their style indexes and half not. The Fund’s stake in three absolute-return funds was the main disappointment, with two of the three suffering negative returns. Those funds are held as a substitute for a small portion of the bond portfolio to help hedge against rising interest rates. Another modest drag was an energy-infrastructure fund that had enjoyed strong 2016 returns but which cooled off in 2017.
| Transamerica Funds | Annual Report 2017 |
Page 17
Table of Contents
Transamerica Asset Allocation – Moderate Portfolio
(unaudited)
STRATEGY REVIEW (continued)
As of this writing, we believe U.S. equities are overvalued, trading at historically high price/earnings multiples on top of corporate profit margins that are also at the high end of their range. In the third quarter of 2017, the S&P 500® recorded its eighth consecutive quarterly gain. We see signs that investors may have grown complacent, perhaps overlooking the current level of price risk in the equity markets. In fact, many asset classes appear unattractive to us now from a valuation standpoint. We are responding to this environment by positioning defensively in some ways — for example, moderately underweighting equity via a meaningful reduction in U.S. equity, favoring floating-rate bank loans in the bond portfolio’s credit-sensitive sleeve, and hedging against rising rates by limiting bond duration and owning absolute-return strategies in place of bonds. Otherwise we are overweighting the areas where we see remaining value and underweighting what we deem to be overvalued asset classes. Of course we are doing all of this in the context of seeking the appropriate diversification and risk level you have come to expect from the Fund.
Dan McNeela, CFA
Michael Stout, CFA
Co-Portfolio Managers
Morningstar Investment Management LLC
| Asset Allocation | Percentage of Net Assets | |||
U.S. Fixed Income Funds | 40.3 | % | ||
U.S. Equity Funds | 27.9 | |||
International Equity Funds | 19.9 | |||
International Fixed Income Funds | 6.1 | |||
U.S. Alternative Funds | 2.6 | |||
U.S. Mixed Allocation Fund | 1.9 | |||
International Alternative Funds | 1.4 | |||
Net Other Assets (Liabilities) | (0.1 | ) | ||
Total | 100.0 | % | ||
|
| |||
| Transamerica Funds | Annual Report 2017 |
Page 18
Table of Contents
Transamerica Asset Allocation – Moderate Portfolio
(unaudited)
| Average Annual Total Return for Periods Ended 10/31/2017 | ||||||||||||||||
| 1 Year | 5 Year | 10 Years or Since Inception Date of Class | Inception Date | |||||||||||||
Class A (POP) | 5.45 | % | 5.89 | % | 3.59 | % | 03/01/2002 | |||||||||
Class A (NAV) | 11.54 | % | 7.08 | % | 4.18 | % | 03/01/2002 | |||||||||
Wilshire 5000 Total Market IndexSM (A) | 23.75 | % | 14.94 | % | 7.62 | % | ||||||||||
Bloomberg Barclays US Aggregate Bond Index (B) | 0.90 | % | 2.04 | % | 4.19 | % | ||||||||||
Class B (POP) | 5.53 | % | 6.06 | % | 3.58 | % | 03/01/2002 | |||||||||
Class B (NAV) | 10.53 | % | 6.22 | % | 3.58 | % | 03/01/2002 | |||||||||
Class C (POP) | 9.69 | % | 6.31 | % | 3.48 | % | 11/11/2002 | |||||||||
Class C (NAV) | 10.69 | % | 6.31 | % | 3.48 | % | 11/11/2002 | |||||||||
Class I (NAV) | 11.80 | % | 7.35 | % | 7.28 | % | 11/30/2009 | |||||||||
Class R (NAV) | 11.20 | % | 6.82 | % | 3.95 | % | 06/15/2006 | |||||||||
Class T1 (POP) | N/A | N/A | 3.81 | %(C) | 03/17/2017 | |||||||||||
Class T1 (NAV) | N/A | N/A | 6.48 | %(C) | 03/17/2017 | |||||||||||
Advisor Class (NAV) | N/A | N/A | 6.77 | %(C) | 03/03/2017 | |||||||||||
(A) The Wilshire 5000 Total Market IndexSM measures the performance of most U.S. domiciled public securities with readily available price data. Companies in the index are weighted by available float and market-capitalization.
(B) The Bloomberg Barclays US Aggregate Bond Index measures investment grade, U.S. dollar denominated, fixed-rate taxable bonds, including Treasuries, government-related and corporate securities, as well as both mortgage- and asset-backed securities.
(C) Not annualized.
The Fund’s benchmarks are unmanaged indices used as a general measure of market performance. Calculations assume dividends and capital gains are reinvested and do not include any managerial expenses. The 10 Years or the Since Inception of Class calculation is based on the previous 10 years or since the inception date of the class, whichever is more recent. You cannot invest directly in an index.
The performance data presented represents past performance; future results may vary. Performance data does not reflect the deduction of taxes that would be paid on Fund distributions or the redemption of Fund shares. Investment return and principal value will fluctuate so that an investor’s shares, when redeemed, may be worth more or less than their original cost. Current performance may be lower or higher than performance quoted. Please see www.transamerica.com for performance data current to the most recent month-end. Public Offering Price (“POP”) returns include the reinvestment of dividends and capital gains and reflect the maximum sales charge of 5.5% for Class A shares and 2.5% for Class T1 shares or the maximum applicable contingent deferred sales charge (5% in the 1st year, decreasing to 0% after 6 years) for Class B shares and 1% (in the 1st year) for Class C shares. Shares purchased prior to March 1, 2004 are subject to a maximum applicable contingent deferred sales charge (5% in the 1st year, decreasing to 0% after 7 years) for Class B shares and (2% in the 1st year, decreasing to 0% after 2 years) for Class C shares. Net Asset Value (“NAV”) returns include the reinvestment of dividends and capital gains but do not reflect any sales charges. There are no sales charges on Class I, R and Advisor Class shares.
Performance figures reflect any fee waivers and/or expense reimbursements by the Investment Manager. Without such waivers and/or reimbursements, the performance would be lower. Future waivers and/or reimbursements are at the discretion of the Investment Manager.
Performance results do not include adjustments made for financial reporting purposes in accordance with U.S. generally accepted accounting principles and may differ from amounts reported in the Financial Highlights.
Asset allocation, like many investment strategies, offers no guarantee of positive returns, and mutual funds are subject to market risk, including loss of principal. Global/international stock funds and specialty/sector funds are subject to additional market risks. Fees associated with a fund-of-funds may be higher than with other funds. An investment in the Fund is subject to the risks associated with the underlying funds including fixed income investing which is subject to credit risk, inflation risk, and interest rate risk. Investments in small- and medium-sized companies present additional risks such as increased volatility because their earnings are less predictable, their share price more volatile, and their securities less liquid than larger or more established companies
| Transamerica Funds | Annual Report 2017 |
Page 19
Table of Contents
Transamerica Asset Allocation – Moderate Portfolio
SCHEDULE OF INVESTMENTS
At October 31, 2017
| Shares | Value | |||||||
| INVESTMENT COMPANIES - 100.1% | ||||||||
| International Alternative Funds - 1.4% | ||||||||
Transamerica Global Allocation Liquidating Trust (A) (B) (C) (D) | 21,365 | $ 121,446 | ||||||
Transamerica Global Multifactor Macro (E) | 3,056,819 | 27,419,666 | ||||||
|
| |||||||
| 27,541,112 | ||||||||
|
| |||||||
| International Equity Funds - 19.9% | ||||||||
Transamerica Developing Markets Equity (E) | 8,399,923 | 102,311,058 | ||||||
Transamerica Emerging Markets Equity (E) | 4,042,168 | 44,787,222 | ||||||
Transamerica International Equity (E) | 6,377,487 | 124,871,187 | ||||||
Transamerica International Equity Opportunities (E) | 6,076,400 | 54,809,124 | ||||||
Transamerica International Small Cap (E) | 4,395,129 | 30,150,584 | ||||||
Transamerica International Small Cap Value (E) | 2,369,728 | 32,465,268 | ||||||
|
| |||||||
| 389,394,443 | ||||||||
|
| |||||||
| International Fixed Income Funds - 6.1% | ||||||||
Transamerica Emerging Markets Debt (E) | 6,600,627 | 72,210,862 | ||||||
Transamerica Inflation Opportunities (E) | 4,742,154 | 47,658,649 | ||||||
|
| |||||||
| 119,869,511 | ||||||||
|
| |||||||
| U.S. Alternative Funds - 2.6% | ||||||||
Transamerica Arbitrage Strategy Liquidating Trust (A) (B) (C) (D) | 28,370 | 275,475 | ||||||
Transamerica Event Driven (E) | 1,627,937 | 16,784,029 | ||||||
Transamerica Managed Futures Strategy (E) | 4,309,140 | 33,482,018 | ||||||
|
| |||||||
| 50,541,522 | ||||||||
|
| |||||||
| U.S. Equity Funds - 27.9% | ||||||||
Transamerica Capital Growth (E) | 2,544,982 | 43,926,396 | ||||||
Transamerica Concentrated Growth (E) | 2,207,658 | 39,759,929 | ||||||
Transamerica Dividend Focused (E) | 9,663,175 | 111,416,402 | ||||||
Transamerica Growth (E) | 4,662,220 | 64,571,748 | ||||||
Transamerica Large Cap Value (E) | 8,992,869 | 122,572,808 | ||||||
Transamerica Mid Cap Value (E) | 2,451,120 | 41,718,064 | ||||||
| Shares | Value | |||||||
| INVESTMENT COMPANIES (continued) | ||||||||
| U.S. Equity Funds (continued) | ||||||||
Transamerica Mid Cap Value Opportunities (E) | 1,496,732 | $ 17,885,945 | ||||||
Transamerica Multi-Cap Growth (E) | 3,884,143 | 30,917,780 | ||||||
Transamerica Small Cap Core (E) | 674,462 | 7,951,903 | ||||||
Transamerica Small Cap Growth (E) | 1,040,970 | 7,474,165 | ||||||
Transamerica Small Cap Value (E) | 1,346,002 | 16,205,863 | ||||||
Transamerica Small Company Growth Liquidating Trust (A) (B) (C) (D) | 2,887 | 1,793 | ||||||
Transamerica US Growth (E) | 1,982,830 | 41,778,221 | ||||||
|
| |||||||
| 546,181,017 | ||||||||
|
| |||||||
| U.S. Fixed Income Funds - 40.3% | ||||||||
Transamerica Bond (E) | 7,916,956 | 75,448,592 | ||||||
Transamerica Core Bond (E) | 17,595,407 | 175,426,204 | ||||||
Transamerica Flexible Income (E) | 5,560,697 | 52,048,121 | ||||||
Transamerica Floating Rate (E) | 7,283,747 | 72,618,956 | ||||||
Transamerica High Yield Bond (E) | 163 | 1,534 | ||||||
Transamerica Intermediate Bond (E) | 13,132,917 | 133,955,758 | ||||||
Transamerica Short-Term Bond (E) | 6,180,511 | 62,052,334 | ||||||
Transamerica Total Return (E) | 21,230,187 | 218,246,322 | ||||||
|
| |||||||
| 789,797,821 | ||||||||
|
| |||||||
| U.S. Mixed Allocation Fund - 1.9% | ||||||||
Transamerica MLP & Energy Income (E) | 5,210,891 | 38,456,375 | ||||||
|
| |||||||
Total Investment Companies | 1,961,781,801 | |||||||
|
| |||||||
Total Investments | 1,961,781,801 | |||||||
Net Other Assets (Liabilities) - (0.1)% | (1,715,292 | ) | ||||||
|
| |||||||
Net Assets - 100.0% | $ 1,960,066,509 | |||||||
|
| |||||||
SECURITY VALUATION:
Valuation Inputs (F)
| Level 1 - Unadjusted Quoted Prices | Level 2 - Other Significant Observable Inputs | Level 3 - Significant Unobservable Inputs | Value | |||||||||||||
ASSETS | ||||||||||||||||
Investments | ||||||||||||||||
Investment Companies | $ | 1,961,383,087 | $ | — | $ | — | $ | 1,961,383,087 | ||||||||
|
|
|
|
|
|
|
| |||||||||
Total | $ | 1,961,383,087 | $ | — | $ | — | $ | 1,961,383,087 | ||||||||
|
|
|
|
|
|
|
| |||||||||
Investment Companies Measured at Net Asset Value (G) | 398,714 | |||||||||||||||
|
| |||||||||||||||
Total Investments | $ | 1,961,781,801 | ||||||||||||||
|
| |||||||||||||||
FOOTNOTES TO SCHEDULE OF INVESTMENTS:
| (A) | Non-income producing securities. | |
| (B) | Issuer is affiliated with the Fund’s investment manager. | |
| (C) | Illiquid security. At October 31, 2017, the value of such securities amounted to $398,714 or less than 0.1% of the Fund’s net assets. |
The Notes to Financial Statements are an integral part of this report.
| Transamerica Funds | Annual Report 2017 |
Page 20
Table of Contents
Transamerica Asset Allocation – Moderate Portfolio
SCHEDULE OF INVESTMENTS (continued)
At October 31, 2017
FOOTNOTES TO SCHEDULE OF INVESTMENTS (continued):
| (D) | Restricted securities. At October 31, 2017, the value of such securities held by the Fund are as follows: |
| Investments | Description | Acquisition Date | Acquisition Cost | Value | Value as Percentage of Net Assets | |||||||||||||
Investment Companies | Transamerica Global Allocation Liquidating Trust | 07/31/2014 | $ | 219,813 | $ | 121,446 | 0.0 | %(H) | ||||||||||
Investment Companies | Transamerica Arbitrage Strategy Liquidating Trust | 09/18/2015 | 283,697 | 275,475 | 0.0 | (H) | ||||||||||||
Investment Companies | Transamerica Small Company Growth Liquidating Trust | 10/26/2012 | 28,869 | 1,793 | 0.0 | (H) | ||||||||||||
|
|
|
|
|
| |||||||||||||
Total | $ | 532,379 | $ | 398,714 | 0.0 | %(H) | ||||||||||||
|
|
|
|
|
| |||||||||||||
| (E) | Investment in the Class I2 shares of the affiliated series of Transamerica Funds. | |
| (F) | The Fund recognizes transfers between Levels at the end of the reporting year. There were no transfers between Levels 1, 2 and 3 during the year ended October 31, 2017. Please reference the Security Valuation section of the Notes to Financial Statements for more information regarding security valuation and pricing inputs. | |
| (G) | Certain investments are measured at fair value using the net asset value per share, or its equivalent, practical expedient and have not been classified in the fair value levels. The fair value amount presented is intended to permit reconciliation to the Total Investments amount presented within the Schedule of Investments. | |
| (H) | Percentage rounds to less than 0.1% or (0.1)%. |
The Notes to Financial Statements are an integral part of this report.
| Transamerica Funds | Annual Report 2017 |
Page 21
Table of Contents
Transamerica Asset Allocation Intermediate Horizon
(unaudited)
MARKET ENVIRONMENT
With few exceptions, the equity and credit markets were calm during the 12-month period ending on October 31, 2017. Broad U.S. equity markets exhibited historically low volatility and advanced steadily, fueled primarily by a supportive economic environment and strong corporate earnings which grew by double digits during the period. Growth stocks outperformed value stocks, and small cap stocks beat large stocks, although the performance of small caps relative to large caps was inconsistent over the period with large caps gaining consistently while small caps gained in more sporadic fashion. Foreign equity markets were also strong, with both developed and emerging markets posting double-digit gains in the period.
Fixed income markets were primarily driven by higher risk credit assets such as high yield bonds, emerging markets debt and leveraged loans. Like the equity markets, the strong performance in credit was primarily driven by a fundamentally healthy economic backdrop and strong corporate earnings growth, as well as strong risk appetite from investors. In corporate credit markets, refunding activity — the process of refinancing older, higher-coupon debts using new issues with lower coupons — also helped push spreads tighter in the period.
On the economic front, the unemployment rate continued with its almost decade-long decline, reaching 4.1% in October, the lowest reading since December 2000. With the strong employment environment as a backdrop, wage growth pressures picked up, helping to boost overall inflation to above 2%. Gross domestic product (“GDP”) also picked up, posting annual growth of over 3% for each of the past two quarters, the first time this has happened since 2014.
Central banks were also a focus in the period, as the U.S. Federal Reserve (“Fed”) continued on the path toward normalizing monetary policy by increasing the Fed Funds Rate to over 1% while also announcing that it would begin to incrementally and slowly unwind its quantitative easing program. While foreign Central Banks like the European Central Bank and the Bank of Japan are still pursuing very low policy rates and quantitative easing programs, the pace of accommodation has been slowing.
PERFORMANCE
For the year ended October 31, 2017, Transamerica Asset Allocation Intermediate Horizon Class R4 returned 11.67%. By comparison, its primary, secondary, and additional benchmarks, the S&P 500®, the Bloomberg Barclays US Aggregate Bond Index and the Transamerica Asset Allocation Intermediate Horizon Blended Benchmark, returned 23.63%, 0.90% and 12.24%, respectively.
STRATEGY REVIEW
Our asset allocation funds seek to simplify the investment decision and diversification processes by providing investors with a set of funds with pre-determined target asset allocations based on different retirement time horizons. Each asset allocation fund has a unique fixed income and equity allocation.
Transamerica Asset Allocation Intermediate Horizon invests approximately 50% in equity funds and 50% in fixed income funds. The Fund is periodically rebalanced based on how much the underlying holdings drift from the strategic target in an effort to both maintain the target allocations and to redeploy assets incrementally from outperforming holdings into those that are weaker in an effort to continually buy low and sell high.
The Fund’s best-performing holding over the full 12-month period was Transamerica Large Growth with a gain of 29.22%. It was also the largest positive contributor to overall performance and had a target weight in the Fund of 13%. The top performing fixed income holding was Transamerica High Yield Bond which carried a target weight of 6% and produced a total return of 7.97%
The weakest performing holding in the period was Transamerica Inflation-Protected Securities which lost (1.15)% and had a target allocation of 11.8%. It was the only losing position in the past 12 months. The weakest equity fund holding, Transamerica Mid Cap Value Opportunities, still benefited in the strong market environment during the period by producing a total return of 9.06%. It carried a target weighting of 3%.
Christopher A. Staples, CFA
Kane Cotton, CFA
Co-Portfolio Managers
Transamerica Asset Management, Inc.
| Asset Allocation | Percentage of Net Assets | |||
U.S. Fixed Income Funds | 50.8 | % | ||
U.S. Equity Funds | 38.5 | |||
International Equity Fund | 10.7 | |||
Money Market Fund | 0.1 | |||
Net Other Assets (Liabilities) | (0.1 | ) | ||
Total | 100.0 | % | ||
|
| |||
| Transamerica Funds | Annual Report 2017 |
Page 22
Table of Contents
Transamerica Asset Allocation Intermediate Horizon
(unaudited)
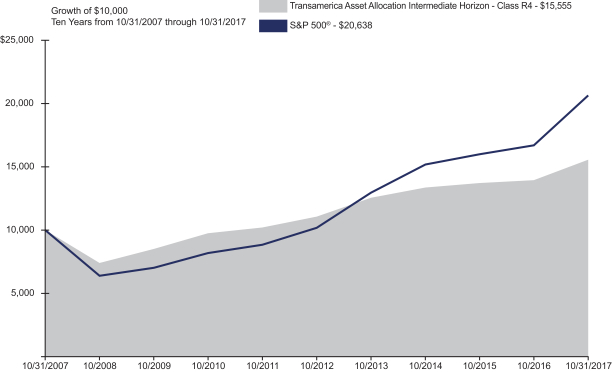
| Average Annual Total Return for Periods Ended 10/31/2017 | ||||||||
1 Year | 5 Year | 10 Years or | Inception Date | |||||||||||||
Class R (NAV) | N/A | N/A | 4.24 | %(A) | 05/19/2017 | |||||||||||
Class R4 (NAV) | 11.67 | % | 7.07 | % | 4.52 | % | 09/11/2000 | |||||||||
S&P 500® (B) | 23.63 | % | 15.18 | % | 7.51 | % | ||||||||||
Bloomberg Barclays US Aggregate Bond Index (C) | 0.90 | % | 2.04 | % | 4.19 | % | ||||||||||
Transamerica Asset Allocation Intermediate Horizon Blended Benchmark (C) (D) (E) (F) (G) (H) (I) (J) | 12.24 | % | 7.66 | % | 5.39 | % | ||||||||||
(A) Not annualized.
(B) The S&P 500® is a market-capitalization weighted index of 500 large U.S. companies with common stock listed on the NYSE or NASDAQ.
(C) The Bloomberg Barclays US Aggregate Bond Index measures investment grade, U.S. dollar denominated, fixed-rate taxable bonds, including Treasuries, government-related and corporate securities, as well as both mortgage- and asset-backed securities.
(D) The Transamerica Asset Allocation Intermediate Horizon Blended Benchmark is composed of the following benchmarks: 38% Russell 3000® Index, 24% Bloomberg Barclays US Aggregate Bond Index, 12% MSCI World Index ex-U.S., 10% Bloomberg Barclays US Treasury Inflation Protected Securities Index, 8% BofA Merrill Lynch 1-3 Year U.S. Treasury Index, 6% BofA Merrill Lynch High Yield Master II Index, and 2% Citigroup 3-Month Treasury Bill Index.
(E) The Russell 3000® Index measures the performance of the largest 3,000 U.S. companies representing approximately 98% of the investable U.S. equity market.
(F) The MSCI World Index ex-U.S. captures large and mid-cap representation across developed markets countries, excluding the U.S.
(G) The Bloomberg Barclays US Treasury Inflation Protected Securities Index is a market value weighted index that tracks inflation-protected securities issued by the U.S. Treasury.
(H) The BofA Merrill Lynch 1-3 Year U.S. Treasury Index tracks the performance of the direct sovereign debt of the U.S. Government having a maturity of at least one year and less than three years.
(I) The BofA Merrill Lynch High Yield Master II Index is comprised of U.S. dollar denominated below investment grade corporate debt publicly issued in the U.S. domestic market with remaining maturities of at least one year.
(J) The Citigroup 3-Month Treasury Bill Index tracks the performance of U.S. Treasury bills with a remaining maturity of three months.
The Fund’s benchmarks are unmanaged indices used as a general measure of market performance. Calculations assume dividends and capital gains are reinvested and do not include any managerial expenses. The 10 Years or the Since Inception of Fund calculation is based on the previous 10 years or since the inception date of the Fund, whichever is more recent. You cannot invest directly in an index.
The performance data presented represents past performance; future results may vary. Performance data does not reflect the deduction of taxes that would be paid on Fund distributions or the redemption of Fund shares. Investment return and principal value will fluctuate so that an investor’s shares, when redeemed, may be worth more or less than their original cost. Current performance may be lower or higher than performance quoted. Please see www.transamerica.com for performance data current to the most recent month-end. Returns include the reinvestment of dividends and capital gains. Fund shares are sold without a sales load.
Performance figures reflect any fee waivers and/or expense reimbursements by the Investment Manager. Without such waivers and/or reimbursements, the performance would be lower. Future waivers and/or reimbursements are at the discretion of the Investment Manager.
Performance results do not include adjustments made for financial reporting purposes in accordance with U.S. generally accepted accounting principles and may differ from amounts reported in the Financial Highlights.
Asset allocation, like many investment strategies, offers no guarantee of positive returns, and mutual funds are subject to market risk, including loss of principal. Global/international stock funds and specialty/sector funds are subject to additional market risks. Fees associated with a fund-of-funds may be higher than with other funds. An investment in the fund is subject to the risks associated with the underlying funds including fixed income investing which is subject to credit risk, inflation risk, and interest rate risk. Investment in small- and medium-sized companies present additional risks such as increased volatility because their earnings are less predictable, their share price more volatile, and their securities less liquid than larger or more established companies.
Russell Investment Group is the source and owner of the trademarks, service marks, and copyrights related to the Russell indexes. Russell® is a trademark of Russell Investment Group.
| Transamerica Funds | Annual Report 2017 |
Page 23
Table of Contents
Transamerica Asset Allocation Intermediate Horizon
SCHEDULE OF INVESTMENTS
At October 31, 2017
| Shares | Value | |||||||
| INVESTMENT COMPANIES - 100.1% | ||||||||
| International Equity Fund - 10.7% | ||||||||
Transamerica International Equity (A) (B) | 2,441,801 | $ 47,810,455 | ||||||
|
| |||||||
| Money Market Fund - 0.1% | ||||||||
Transamerica Government Money Market (A) | 571,541 | 571,541 | ||||||
|
| |||||||
| U.S. Equity Funds - 38.5% | ||||||||
Transamerica Large Growth (A) | 5,299,983 | 62,115,806 | ||||||
Transamerica Large Value Opportunities (A) | 5,355,250 | 57,354,732 | ||||||
Transamerica Mid Cap Growth (A) (B) | 939,841 | 13,458,529 | ||||||
Transamerica Mid Cap Value Opportunities (A) (B) | 1,016,412 | 12,156,291 | ||||||
Transamerica Small Cap Growth (A) (B) | 1,814,276 | 13,044,643 | ||||||
Transamerica Small Cap Value (A) (B) | 1,090,629 | 13,142,083 | ||||||
|
| |||||||
| 171,272,084 | ||||||||
|
| |||||||
| Shares | Value | |||||||
| INVESTMENT COMPANIES (continued) | ||||||||
| U.S. Fixed Income Funds - 50.8% | ||||||||
Transamerica High Quality Bond (A) | 3,693,886 | $ 36,828,042 | ||||||
Transamerica High Yield Bond (A) | 2,994,883 | 28,241,746 | ||||||
Transamerica Inflation-Protected Securities (A) | 5,117,934 | 51,025,807 | ||||||
Transamerica Intermediate Bond (A) | 10,768,548 | 110,054,558 | ||||||
|
| |||||||
| 226,150,153 | ||||||||
|
| |||||||
Total Investment Companies (Cost $422,222,916) | 445,804,233 | |||||||
|
| |||||||
Total Investments | 445,804,233 | |||||||
Net Other Assets (Liabilities) - (0.1)% | (230,989 | ) | ||||||
|
| |||||||
Net Assets - 100.0% | $ 445,573,244 | |||||||
|
| |||||||
SECURITY VALUATION:
Valuation Inputs (C)
| Level 1 - Unadjusted Quoted Prices | Level 2 - Other Significant Observable Inputs | Level 3 - Significant Unobservable Inputs | Value | |||||||||||||
ASSETS | ||||||||||||||||
Investments | ||||||||||||||||
Investment Companies | $ | 445,804,233 | $ | — | $ | — | $ | 445,804,233 | ||||||||
|
|
|
|
|
|
|
| |||||||||
Total Investments | $ | 445,804,233 | $ | — | $ | — | $ | 445,804,233 | ||||||||
|
|
|
|
|
|
|
| |||||||||
FOOTNOTES TO SCHEDULE OF INVESTMENTS:
| (A) | Investment in the Class I3 shares of the affiliated series of Transamerica Funds. | |
| (B) | Non-income producing securities. | |
| (C) | The Fund recognizes transfers between Levels at the end of the reporting period. There were no transfers between Levels 1, 2 and 3 during the period ended October 31, 2017. Please reference the Security Valuation section of the Notes to Financial Statements for more information regarding security valuation and pricing inputs. |
The Notes to Financial Statements are an integral part of this report.
| Transamerica Funds | Annual Report 2017 |
Page 24
Table of Contents
Transamerica Asset Allocation Long Horizon
(unaudited)
MARKET ENVIRONMENT
With few exceptions, the equity and credit markets were calm during the 12-month period ending on October 31, 2017. Broad U.S. equity markets exhibited historically low volatility and advanced steadily, fueled primarily by a supportive economic environment and strong corporate earnings which grew by double digits during the period. Growth stocks outperformed value stocks, and small cap stocks beat large stocks, although the performance of small caps relative to large caps was inconsistent over the period with large caps gaining consistently while small caps gained in more sporadic fashion. Foreign equity markets were also strong, with both developed and emerging markets posting double-digit gains in the period.
Fixed income markets were primarily driven by higher risk credit assets such as high yield bonds, emerging markets debt and leveraged loans. Like the equity markets, the strong performance in credit was primarily driven by a fundamentally healthy economic backdrop and strong corporate earnings growth, as well as strong risk appetite from investors. In corporate credit markets, refunding activity — the process of refinancing older, higher-coupon debts using new issues with lower coupons — also helped push spreads tighter in the period.
On the economic front, the unemployment rate continued with its almost decade-long decline, reaching 4.1% in October, the lowest reading since December 2000. With the strong employment environment as a backdrop, wage growth pressures picked up, helping to boost overall inflation to above 2%. Gross domestic product (“GDP”) also picked up, posting annual growth of over 3% for each of the past two quarters, the first time this has happened since 2014.
Central banks were also a focus in the period, as the U.S. Federal Reserve (“Fed”) continued on the path toward normalizing monetary policy by increasing the Fed Funds Rate to over 1% while also announcing that it would begin to incrementally and slowly unwind its quantitative easing program. While foreign Central Banks like the European Central Bank and the Bank of Japan are still pursuing very low policy rates and quantitative easing programs, the pace of accommodation has been slowing.
PERFORMANCE
For the year ended October 31, 2017, Transamerica Asset Allocation Long Horizon Class R4 returned 19.93%. By comparison, its primary and secondary benchmarks, the S&P 500® and the Transamerica Asset Allocation Long Horizon Blended Benchmark, returned 23.63% and 21.55%, respectively.
STRATEGY REVIEW
Our asset allocation funds seek to simplify the investment decision and diversification processes by providing investors with a set of funds with pre-determined target asset allocations based on different retirement time horizons. Each asset allocation fund has a unique fixed income and equity allocation.
Transamerica Asset Allocation Long Horizon invests approximately 90% in equity funds and 10% in fixed income funds. The Fund is periodically rebalanced based on how much the underlying holdings drift from the strategic target in an effort to both maintain the target allocations and to redeploy assets incrementally from outperforming holdings into those that are weaker in an effort to continually buy low and sell high.
The Fund’s best-performing holding over the full 12-month period was Transamerica Large Growth with a gain of 29.22%. It was also the largest positive contributor to overall performance and had a target weight in the portfolio of 21%. The top performing fixed income fund in the portfolio was Transamerica High Yield Bond which carried a target weight of 2% and produced a total return of 7.97%
The weakest performing holding on the period was Transamerica Inflation-Protected Securities which lost (1.15)% and had a target allocation of 3.3%. It was the only losing position in the past 12 months. The weakest equity fund in the portfolio, Transamerica Mid Cap Value Opportunities, still benefited in the strong market environment during the period by producing a total return of 9.06%. It carried a target weighting of 6%.
Christopher A. Staples, CFA
Kane Cotton, CFA
Co-Portfolio Managers
Transamerica Asset Management, Inc.
| Asset Allocation | Percentage of Net Assets | |||
U.S. Equity Funds | 66.4 | % | ||
International Equity Fund | 23.6 | |||
U.S. Fixed Income Funds | 9.9 | |||
Money Market Fund | 0.2 | |||
Net Other Assets (Liabilities) | (0.1 | ) | ||
Total | 100.0 | % | ||
|
| |||
| Transamerica Funds | Annual Report 2017 |
Page 25
Table of Contents
Transamerica Asset Allocation Long Horizon
(unaudited)

| Average Annual Total Return for Periods Ended 10/31/2017 | ||||||||||||||||
| 1 Year | 5 Year | 10 Years or Since Inception Date of Class | Inception Date | |||||||||||||
Class R (NAV) | N/A | N/A | 6.90 | %(A) | 05/19/2017 | |||||||||||
Class R4 (NAV) | 19.93 | % | 10.88 | % | 4.28 | % | 09/11/2000 | |||||||||
S&P 500® (B) | 23.63 | % | 15.18 | % | 7.51 | % | ||||||||||
Transamerica Asset Allocation Long Horizon Blended Benchmark (C) (D) (E) (F) (G) (H) (I) | 21.55 | % | 12.23 | % | 5.97 | % | ||||||||||
(A) Not annualized.
(B) The S&P 500® is a market-capitalization weighted index of 500 large U.S. companies with common stock listed on the NYSE or NASDAQ.
(C) The Transamerica Asset Allocation Long Horizon Blended Benchmark is composed of the following benchmarks: 66% Russell 3000® Index, 24% MSCI World Index ex-U.S., 4% Bloomberg Barclays US Aggregate Bond Index, 2% Bloomberg Barclays US Treasury Inflation Protected Securities Index, 2% Citigroup 3-Month Treasury Bill Index and 2% BofA Merrill Lynch High Yield Master II Index.
(D) The Russell 3000® Index measures the performance of the largest 3,000 U.S. companies representing approximately 98% of the investable U.S. equity market.
(E) The MSCI World Index ex-U.S. captures large and mid-cap representation across developed markets countries, excluding the U.S.
(F) The Bloomberg Barclays US Aggregate Bond Index measures investment grade, U.S. dollar denominated, fixed-rate taxable bonds, including Treasuries, government-related and corporate securities, as well as both mortgage- and asset-backed securities.
(G) The Bloomberg Barclays US Treasury Inflation Protected Securities Index is a market value weighted index that tracks inflation-protected securities issued by the U.S. Treasury.
(H) The Citigroup 3-Month Treasury Bill Index tracks the performance of U.S. Treasury bills with a remaining maturity of three months.
(I) The BofA Merrill Lynch High Yield Master II Index is comprised of U.S. dollar denominated below investment grade corporate debt publicly issued in the U.S. domestic market with remaining maturities of at least one year.
The Fund’s benchmarks are unmanaged indices used as a general measure of market performance. Calculations assume dividends and capital gains are reinvested and do not include any managerial expenses. The 10 Years or the Since Inception of Fund calculation is based on the previous 10 years or since the inception date of the Fund, whichever is more recent. You cannot invest directly in an index.
The performance data presented represents past performance; future results may vary. Performance data does not reflect the deduction of taxes that would be paid on Fund distributions or the redemption of Fund shares. Investment return and principal value will fluctuate so that an investor’s shares, when redeemed, may be worth more or less than their original cost. Current performance may be lower or higher than performance quoted. Please see www.transamerica.com for performance data current to the most recent month-end. Returns include the reinvestment of dividends and capital gains. Fund shares are sold without a sales load.
Performance figures reflect any fee waivers and/or expense reimbursements by the Investment Manager. Without such waivers and/or reimbursements, the performance would be lower. Future waivers and/or reimbursements are at the discretion of the Investment Manager.
Performance results do not include adjustments made for financial reporting purposes in accordance with U.S. generally accepted accounting principles and may differ from amounts reported in the Financial Highlights.
Asset allocation, like many investment strategies, offers no guarantee of positive returns, and mutual funds are subject to market risk, including loss of principal. Global/international stock funds and specialty/sector funds are subject to additional market risks. Fees associated with a fund-of-funds may be higher than with other funds. An investment in the fund is subject to the risks associated with the underlying funds including fixed income investing which is subject to credit risk, inflation risk, and interest rate risk. Investment in small- and medium-sized companies present additional risks such as increased volatility because their earnings are less predictable, their share price more volatile, and their securities less liquid than larger or more established companies.
Russell Investment Group is the source and owner of the trademarks, service marks, and copyrights related to the Russell indexes. Russell® is a trademark of Russell Investment Group.
| Transamerica Funds | Annual Report 2017 |
Page 26
Table of Contents
Transamerica Asset Allocation Long Horizon
SCHEDULE OF INVESTMENTS
At October 31, 2017
| Shares | Value | |||||||
| INVESTMENT COMPANIES - 100.1% | ||||||||
| International Equity Fund - 23.6% | ||||||||
Transamerica International Equity (A) (B) | 3,122,133 | $ 61,131,357 | ||||||
|
| |||||||
| Money Market Fund - 0.2% | ||||||||
Transamerica Government Money Market (B) | 467,594 | 467,594 | ||||||
|
| |||||||
| U.S. Equity Funds - 66.4% | ||||||||
Transamerica Large Growth (B) | 5,086,706 | 59,616,192 | ||||||
Transamerica Large Value Opportunities (B) | 4,866,045 | 52,115,346 | ||||||
Transamerica Mid Cap Growth (A) (B) | 1,045,934 | 14,977,770 | ||||||
Transamerica Mid Cap Value Opportunities (A) (B) | 1,168,753 | 13,978,291 | ||||||
Transamerica Small Cap Growth (A) (B) | 2,110,262 | 15,172,785 | ||||||
Transamerica Small Cap Value (A) (B) | 1,300,748 | 15,674,015 | ||||||
|
| |||||||
| 171,534,399 | ||||||||
|
| |||||||
| Shares | Value | |||||||
| INVESTMENT COMPANIES (continued) | ||||||||
| U.S. Fixed Income Funds - 9.9% | ||||||||
Transamerica High Quality Bond (B) | 129,250 | $ 1,288,628 | ||||||
Transamerica High Yield Bond (B) | 558,222 | 5,264,029 | ||||||
Transamerica Inflation-Protected Securities (B) | 853,496 | 8,509,352 | ||||||
Transamerica Intermediate Bond (B) | 1,019,792 | 10,422,277 | ||||||
|
| |||||||
| 25,484,286 | ||||||||
|
| |||||||
Total Investment Companies | 258,617,636 | |||||||
|
| |||||||
Total Investments | 258,617,636 | |||||||
Net Other Assets (Liabilities) - (0.1)% | (130,213 | ) | ||||||
|
| |||||||
Net Assets - 100.0% | $ 258,487,423 | |||||||
|
| |||||||
SECURITY VALUATION:
Valuation Inputs (C)
| Level 1 - Unadjusted Quoted Prices | Level 2 - Other Significant Observable Inputs | Level 3 - Significant Unobservable Inputs | Value | |||||||||||||
ASSETS | ||||||||||||||||
Investments | ||||||||||||||||
Investment Companies | $ | 258,617,636 | $ | — | $ | — | $ | 258,617,636 | ||||||||
|
|
|
|
|
|
|
| |||||||||
Total Investments | $ | 258,617,636 | $ | — | $ | — | $ | 258,617,636 | ||||||||
|
|
|
|
|
|
|
| |||||||||
FOOTNOTES TO SCHEDULE OF INVESTMENTS:
| (A) | Non-income producing securities. | |
| (B) | Investment in the Class I3 shares of the affiliated series of Transamerica Funds. | |
| (C) | The Fund recognizes transfers between Levels at the end of the reporting year. There were no transfers between Levels 1, 2 and 3 during the year ended October 31, 2017. Please reference the Security Valuation section of the Notes to Financial Statements for more information regarding security valuation and pricing inputs. |
The Notes to Financial Statements are an integral part of this report.
| Transamerica Funds | Annual Report 2017 |
Page 27
Table of Contents
Transamerica Asset Allocation Short Horizon
(unaudited)
MARKET ENVIRONMENT
With few exceptions, the equity and credit markets were calm during the 12-month period ending on October 31, 2017. Broad U.S. equity markets exhibited historically low volatility and advanced steadily, fueled primarily by a supportive economic environment and strong corporate earnings which grew by double digits during the period. Growth stocks outperformed value stocks, and small cap stocks beat large stocks, although the performance of small caps relative to large caps was inconsistent over the period with large caps gaining consistently while small caps gained in more sporadic fashion. Foreign equity markets were also strong, with both developed and emerging markets posting double-digit gains in the period.
Fixed income markets were primarily driven by higher risk credit assets such as high yield bonds, emerging markets debt and leveraged loans. Like the equity markets, the strong performance in credit was primarily driven by a fundamentally healthy economic backdrop and strong corporate earnings growth, as well as strong risk appetite from investors. In corporate credit markets, refunding activity — the process of refinancing older, higher-coupon debts using new issues with lower coupons — also helped push spreads tighter in the period.
On the economic front, the unemployment rate continued with its almost decade-long decline, reaching 4.1% in October, the lowest reading since December 2000. With the strong employment environment as a backdrop, wage growth pressures picked up, helping to boost overall inflation to above 2%. Gross domestic product (“GDP”) also picked up, posting annual growth of over 3% for each of the past two quarters, the first time this has happened since 2014.
Central banks were also a focus in the period, as the U.S. Federal Reserve (“Fed”) continued on the path toward normalizing monetary policy by increasing the Fed Funds Rate to over 1% while also announcing that it would begin to incrementally and slowly unwind its quantitative easing program. While foreign Central Banks like the European Central Bank and the Bank of Japan are still pursuing very low policy rates and quantitative easing programs, the pace of accommodation has been slowing.
PERFORMANCE
For the year ended October 31, 2017, Transamerica Asset Allocation Short Horizon Class R4 returned 3.85%. By comparison, its primary and secondary benchmarks, the Bloomberg Barclays US Aggregate Bond Index and the Transamerica Asset Allocation Short Horizon Blended Benchmark, returned 0.90% and 3.57%, respectively.
STRATEGY REVIEW
Our asset allocation funds seek to simplify the investment decision and diversification processes by providing investors with a set of funds with pre-determined target asset allocations based on different retirement time horizons. Each asset allocation fund has a unique fixed income and equity allocation.
Transamerica Asset Allocation Short Horizon invests approximately 10% in equity funds and 90% in fixed income funds. The Fund is periodically rebalanced based on how much the underlying holdings drift from the strategic target in an effort to both maintain the target allocations and to redeploy assets incrementally from outperforming holdings into those that are weaker-performing in an effort to continually buy low and sell high.
The Fund’s best-performing holding over the full 12-month period was Transamerica Large Growth with a gain of 29.22%. It was also the largest positive contributor to overall performance and had a target weight in the Fund of 3%. The top performing fixed income fund in the portfolio was Transamerica High Yield Bond which carried a target weight of 10% and produced a total return of 7.97%.
The weakest performing holding for the period was Transamerica Inflation-Protected Securities which lost (1.15)% and had a target allocation of 16.8%. It was the only losing position in the past 12 months. The weakest equity fund in the portfolio, Transamerica Small Cap Core, still benefited in the strong market environment during the period by producing a total return of 17.67%. It carried a target weighting of 2%.
Christopher A. Staples, CFA
Kane Cotton, CFA
Co-Portfolio Managers
Transamerica Asset Management, Inc.
| Asset Allocation | Percentage of Net Assets | |||
U.S. Fixed Income Funds | 88.9 | % | ||
U.S. Equity Funds | 8.7 | |||
International Equity Fund | 2.3 | |||
Money Market Fund | 0.2 | |||
Net Other Assets (Liabilities) | (0.1 | ) | ||
Total | 100.0 | % | ||
|
| |||
| Transamerica Funds | Annual Report 2017 |
Page 28
Table of Contents
Transamerica Asset Allocation Short Horizon
(unaudited)
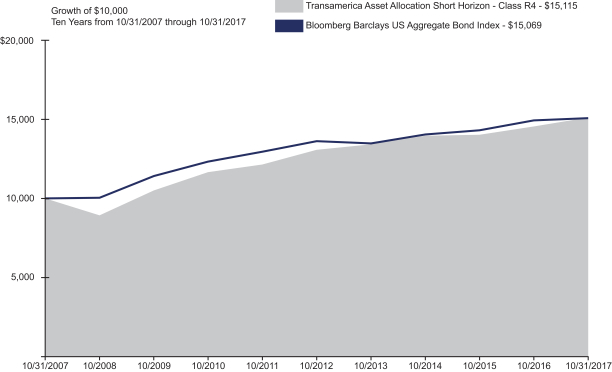
| Average Annual Total Return for Periods Ended 10/31/2017 | ||||||||||||||||
| 1 Year | 5 Year | 10 Years or Since Inception Date of Class | Inception Date | |||||||||||||
Class R (NAV) | N/A | N/A | 1.72 | %(A) | 05/19/2017 | |||||||||||
Class R4 (NAV) | 3.85 | % | 2.94 | % | 4.22 | % | 09/11/2000 | |||||||||
Bloomberg Barclays US Aggregate Bond Index (B) | 0.90 | % | 2.04 | % | 4.19 | % | ||||||||||
Transamerica Asset Allocation Short Horizon Blended Benchmark (B) (C) (D) (E) (F) (G) (H) (I) | 3.57 | % | 3.03 | % | 4.31 | % | ||||||||||
(A) Not annualized.
(B) The Bloomberg Barclays US Aggregate Bond Index measures investment grade, U.S. dollar denominated, fixed-rate taxable bonds, including Treasuries, government-related and corporate securities, as well as both mortgage- and asset-backed securities.
(C) The Transamerica Asset Allocation Short Horizon Blended Benchmark is composed of the following benchmarks: 46% Bloomberg Barclays US Aggregate Bond Index, 17% BofA Merrill Lynch 1-3 Year U.S. Treasury Index, 15% Bloomberg Barclays US Treasury Inflation Protected Securities Index, 10% BofA Merrill Lynch High Yield Master II Index, 8% Russell 3000® Index, 2% MSCI World Index ex-U.S, and 2% Citigroup 3-Month Treasury Bill Index.
(D) The BofA Merrill Lynch 1-3 Year U.S. Treasury Index tracks the performance of the direct sovereign debt of the U.S. Government having a maturity of at least one year and less than three years.
(E) The Bloomberg Barclays US Treasury Inflation Protected Securities Index is a market value weighted index that tracks inflation-protected securities issued by the U.S. Treasury.
(F) The BofA Merrill Lynch High Yield Master II Index is comprised of U.S. dollar denominated below investment grade corporate debt publicly issued in the U.S. domestic market with remaining maturities of at least one year.
(G) The Russell 3000® Index measures the performance of the largest 3,000 U.S. companies representing approximately 98% of the investable U.S. equity market.
(H) The MSCI World Index ex-U.S. captures large and mid-cap representation across developed markets countries, excluding the U.S.
(I) The Citigroup 3-Month Treasury Bill Index tracks the performance of U.S. Treasury bills with a remaining maturity of three months.
The Fund’s benchmarks are unmanaged indices used as a general measure of market performance. Calculations assume dividends and capital gains are reinvested and do not include any managerial expenses. The 10 Years or the Since Inception of Fund calculation is based on the previous 10 years or since the inception date of the Fund, whichever is more recent. You cannot invest directly in an index.
The performance data presented represents past performance; future results may vary. Performance data does not reflect the deduction of taxes that would be paid on Fund distributions or the redemption of Fund shares. Investment return and principal value will fluctuate so that an investor’s shares, when redeemed, may be worth more or less than their original cost. Current performance may be lower or higher than performance quoted. Please see www.transamerica.com for performance data current to the most recent month-end. Returns include the reinvestment of dividends and capital gains. Fund shares are sold without a sales load.
Performance figures reflect any fee waivers and/or expense reimbursements by the Investment Manager. Without such waivers and/or reimbursements, the performance would be lower. Future waivers and/or reimbursements are at the discretion of the Investment Manager.
Performance results do not include adjustments made for financial reporting purposes in accordance with U.S. generally accepted accounting principles and may differ from amounts reported in the Financial Highlights.
Asset allocation, like many investment strategies, offers no guarantee of positive returns, and mutual funds are subject to market risk, including loss of principal. Global/international stock funds and specialty/sector funds are subject to additional market risks. Fees associated with a fund-of-funds may be higher than with other funds. An investment in the fund is subject to the risks associated with the underlying funds including fixed income investing which is subject to credit risk, inflation risk, and interest rate risk. Investment in small- and medium-sized companies present additional risks such as increased volatility because their earnings are less predictable, their share price more volatile, and their securities less liquid than larger or more established companies.
Russell Investment Group is the source and owner of the trademarks, service marks, and copyrights related to the Russell indexes. Russell® is a trademark of Russell Investment Group.
| Transamerica Funds | Annual Report 2017 |
Page 29
Table of Contents
Transamerica Asset Allocation Short Horizon
SCHEDULE OF INVESTMENTS
At October 31, 2017
| Shares | Value | |||||||
| INVESTMENT COMPANIES - 100.1% | ||||||||
| International Equity Fund - 2.3% | ||||||||
Transamerica International Equity (A) (B) | 220,522 | $ 4,317,814 | ||||||
|
| |||||||
| Money Market Fund - 0.2% | ||||||||
Transamerica Government Money Market (B) | 380,432 | 380,432 | ||||||
|
| |||||||
| U.S. Equity Funds - 8.7% | ||||||||
Transamerica Large Growth (B) | 540,303 | 6,332,354 | ||||||
Transamerica Large Value Opportunities (B) | 575,224 | 6,160,653 | ||||||
Transamerica Small Cap Core (A) (B) | 337,100 | 3,977,784 | ||||||
|
| |||||||
| 16,470,791 | ||||||||
|
| |||||||
| U.S. Fixed Income Funds - 88.9% | ||||||||
Transamerica High Quality Bond (B) | 3,150,324 | 31,408,730 | ||||||
Transamerica High Yield Bond (B) | 2,127,972 | 20,066,772 | ||||||
| Shares | Value | |||||||
| INVESTMENT COMPANIES (continued) | ||||||||
| U.S. Fixed Income Funds (continued) | ||||||||
Transamerica Inflation-Protected Securities (B) | 2,929,314 | $ 29,205,256 | ||||||
Transamerica Intermediate Bond (B) | 8,519,890 | 87,073,278 | ||||||
|
| |||||||
| 167,754,036 | ||||||||
|
| |||||||
Total Investment Companies | 188,923,073 | |||||||
|
| |||||||
Total Investments | 188,923,073 | |||||||
Net Other Assets (Liabilities) - (0.1)% | (98,531 | ) | ||||||
|
| |||||||
Net Assets - 100.0% | $ 188,824,542 | |||||||
|
| |||||||
SECURITY VALUATION:
Valuation Inputs (C)
| Level 1 - Unadjusted Quoted Prices | Level 2 - Other Significant Observable Inputs | Level 3 - Significant Unobservable Inputs | Value | |||||||||||||
ASSETS | ||||||||||||||||
Investments | ||||||||||||||||
Investment Companies | $ | 188,923,073 | $ | — | $ | — | $ | 188,923,073 | ||||||||
|
|
|
|
|
|
|
| |||||||||
Total Investments | $ | 188,923,073 | $ | — | $ | — | $ | 188,923,073 | ||||||||
|
|
|
|
|
|
|
| |||||||||
FOOTNOTES TO SCHEDULE OF INVESTMENTS:
| (A) | Non-income producing securities. | |
| (B) | Investment in the Class I3 shares of the affiliated series of Transamerica Funds. | |
| (C) | The Fund recognizes transfers between Levels at the end of the reporting period. There were no transfers between Levels 1, 2 and 3 during the period ended October 31, 2017. Please reference the Security Valuation section of the Notes to Financial Statements for more information regarding security valuation and pricing inputs. |
The Notes to Financial Statements are an integral part of this report.
| Transamerica Funds | Annual Report 2017 |
Page 30
Table of Contents
Transamerica Multi-Manager Alternative Strategies Portfolio
(unaudited)
MARKET ENVIRONMENT
The global synchronized recovery continued into the second half of 2017 with benign inflationary pressures. Both developed market equities, as measured by the MSCI World Index (net), and emerging market equities, as measured by the MSCI Emerging Market Index (net), delivered positive returns with emerging markets outperforming developed equities. In the U.S., the U.S. Federal Reserve (“Fed”) confirmed that they will start normalizing their balance sheet starting in October 2017 and continued to signal that they are looking to hike once more in 2017 if the economy continues to evolve as expected. The third quarter saw U.S. yields drop in July and August due to weaker inflation and heightened geopolitical tensions from North Korea. However, yields bounced back sharply in September as a result of an inflation print surprising to the upside, leading to slightly hawkish commentary out of the Fed. Policy reform also came back into the limelight as the Trump administration gave a fresh impetus to tax reforms in September. In Europe, economic growth remained robust while political uncertainty increased with the results of the German election and the ongoing political developments in Catalonia, Spain.
PERFORMANCE
For the year ended October 31, 2017, Transamerica Multi-Manager Alternative Strategies Portfolio Class A, returned 3.04%, excluding any sales charges. By comparison, its primary and secondary benchmarks, the BofA Merrill Lynch 3-Month Treasury Bill + 3% Wrap Index and the HFRX Global Hedge Fund Index, returned 3.78% and 6.98%, respectively.
STRATEGY REVIEW
Goldman Sachs Asset Management, L.P. (“Goldman Sachs”) took over management of the Fund on July 7, 2017. During the July 7, 2017 to October 31, 2017 period, the Fund outperformed its primary benchmark.
This is a fund-of-funds portfolio which seeks to provide diversification for traditional portfolios and access to active security selection in a single-fund solution. By investing in both “alternative” strategies (such as long/short and event-driven equities) and non-traditional asset classes (such as emerging markets equity and high yield fixed income), the Fund seeks to realize returns that tend to be less dependent on traditional long-only equities.
Over the reporting period, positive performance was primarily driven by the alternative strategies. The long/short equity strategy was a material contributor to returns. The managed futures and event-driven strategies also contributed positively to returns. The master-limited partnership (“MLP”) strategy was the only detractor from returns; however, the strategy was able to outperform broader MLPs. There were no other detractors from performance.
Non-traditional assets posted positive performance across the board. Emerging market assets, both equity and debt, were the top contributors among traditional assets as U.S. dollar weakness and continued positive global growth allowed for emerging market outperformance.
In September 2017, we initiated a view in the Fund to be short duration. This view was a strong contributor to returns, benefiting from an increase in U.S. Treasury yields towards the end of the reporting period.
During the fiscal year, including the period prior to Goldman Sachs’ management, the Fund utilized derivatives. These positions detracted from performance.
Christopher Lvoff, CFA
Raymond Chan, CFA
Lucy Xin
Co-Portfolio Managers
Goldman Sachs Asset Management, L.P.
| Asset Allocation | Percentage of Net Assets | |||
U.S. Alternative Funds | 32.8 | % | ||
International Alternative Funds | 31.5 | |||
International Fixed Income Funds | 16.8 | |||
U.S. Fixed Income Funds | 8.1 | |||
International Equity Funds | 7.1 | |||
U.S. Mixed Allocation Fund | 2.7 | |||
Repurchase Agreement | 1.1 | |||
Net Other Assets (Liabilities)^ | (0.1 | ) | ||
Total | 100.0 | % | ||
|
| |||
| ^ | The Net Other Assets (Liabilities) category may include, but is not limited to, reverse repurchase agreements, forward foreign currency contracts, futures contracts, swap agreements, written options and swaptions, and cash collateral. |
| Transamerica Funds | Annual Report 2017 |
Page 31
Table of Contents
Transamerica Multi-Manager Alternative Strategies Portfolio
(unaudited)
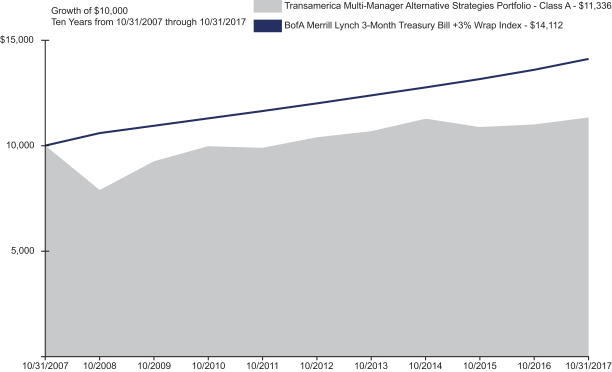
| Average Annual Total Return for Periods Ended 10/31/2017 | ||||||||||||||||
| 1 Year | 5 Year | 10 Years or Since Inception Date of Class | Inception Date | |||||||||||||
Class A (POP) | (2.67 | )% | 0.61 | % | 0.69 | % | 12/28/2006 | |||||||||
Class A (NAV) | 3.04 | % | 1.76 | % | 1.26 | % | 12/28/2006 | |||||||||
BofA Merrill Lynch 3-Month Treasury Bill + 3% Wrap Index (A) | 3.78 | % | 3.28 | % | 3.50 | % | ||||||||||
HFRX Global Hedge Fund Index (B) | 6.98 | % | 2.23 | % | (0.75 | )% | ||||||||||
Class C (POP) | 1.22 | % | 1.00 | % | 0.56 | % | 12/28/2006 | |||||||||
Class C (NAV) | 2.22 | % | 1.00 | % | 0.56 | % | 12/28/2006 | |||||||||
Class I (NAV) | 3.32 | % | 2.08 | % | 2.79 | % | 11/30/2009 | |||||||||
Class R6 (NAV) | 3.41 | % | N/A | (0.04 | )% | 05/29/2015 | ||||||||||
Class T1 (POP) | N/A | N/A | (0.20 | )%(C) | 03/17/2017 | |||||||||||
Class T1 (NAV) | N/A | N/A | 2.38 | %(C) | 03/17/2017 | |||||||||||
(A) The BofA Merrill Lynch 3-Month Treasury Bill + 3% Wrap Index assumes a 3% wrap fee and is comprised of a single issue purchased at the beginning of the month, which is subsequently sold at the end of the month and rolled into a newly selected issue. The issue selected at each month-end rebalancing is the outstanding Treasury Bill that matures closest to, but not beyond, three months from the rebalancing date.
(B) The HFRX Global Hedge Fund Index is designed to measure the daily performance of the overall composition of the hedge fund universe. It is comprised of all eligible hedge fund strategies; including but not limited to convertible arbitrage, distressed securities, equity hedge, equity market neutral, event driven, macro, merger arbitrage, and relative value arbitrage.
(C) Not annualized.
The BofA Merrill Lynch 3-Month Treasury Bill + 3% Wrap Index is an unmanaged index used as a general measure of market performance. The HFRX Global Hedge Fund Index is a passively-managed index designed to measure the daily performance of the overall composition of the hedge fund universe. Calculations assume dividends and capital gains are reinvested and do not include any managerial expenses. The 10 Years or the Since Inception of Class calculation is based on the previous 10 years or since the inception date of the class, whichever is more recent. You cannot invest directly in an index.
The performance data presented represents past performance; future results may vary. Performance data does not reflect the deduction of taxes that would be paid on Fund distributions or the redemption of Fund shares. Investment return and principal value will fluctuate so that an investor’s shares, when redeemed, may be worth more or less than their original cost. Current performance may be lower or higher than performance quoted. Please see www.transamerica.com for performance data current to the most recent month-end. Public Offering Price (“POP”) returns include the reinvestment of dividends and capital gains and reflect the maximum sales charge of 5.5% for Class A shares and 2.5% for Class T1 shares or the maximum applicable contingent deferred sales charge of 1% (in the 1st year) for Class C shares. Net Asset Value (“NAV”) returns include the reinvestment of dividends and capital gains but do not reflect any sales charges. There are no sales charges on Class I and R6 shares.
Performance figures reflect any fee waivers and/or expense reimbursements by the Investment Manager. Without such waivers and/or reimbursements, the performance would be lower. Future waivers and/or reimbursements are at the discretion of the Investment Manager.
Performance results do not include adjustments made for financial reporting purposes in accordance with U.S. generally accepted accounting principles and may differ from amounts reported in the Financial Highlights.
Alternative strategies may not suitable for all investors. Many alternative strategies tend to use sophisticated and aggressive investment techniques. Certain alternative strategies may be tied to hard assets such as commodities, currencies and real estate and may be subject to greater volatility as they may be affected by overall market movements, changes in interest rates or factors affecting a particular industry, commodity or currency, and international economic, political, and regulatory developments.
| Transamerica Funds | Annual Report 2017 |
Page 32
Table of Contents
Transamerica Multi-Manager Alternative Strategies Portfolio
SCHEDULE OF INVESTMENTS
At October 31, 2017
| Shares | Value | |||||||
| INVESTMENT COMPANIES - 99.0% | ||||||||
| International Alternative Funds - 31.5% | ||||||||
Transamerica Global Multifactor Macro (A) | 2,436,136 | $ 21,852,139 | ||||||
Transamerica Unconstrained Bond (A) | 2,886,517 | 29,442,474 | ||||||
|
| |||||||
| 51,294,613 | ||||||||
|
| |||||||
| International Equity Funds - 7.1% | ||||||||
Transamerica Developing Markets Equity (A) | 249,425 | 3,037,995 | ||||||
Transamerica Emerging Markets Equity (A) | 268,478 | 2,974,741 | ||||||
Transamerica Global Real Estate Securities (A) | 399,096 | 5,615,281 | ||||||
|
| |||||||
| 11,628,017 | ||||||||
|
| |||||||
| International Fixed Income Funds - 16.8% | ||||||||
Transamerica Emerging Markets Debt (A) | 1,010,472 | 11,054,563 | ||||||
Transamerica Inflation Opportunities (A) | 1,623,725 | 16,318,435 | ||||||
|
| |||||||
| 27,372,998 | ||||||||
|
| |||||||
| U.S. Alternative Funds - 32.8% | ||||||||
Transamerica Arbitrage Strategy Liquidating Trust (B) (C) (D) (E) | 22,689 | 220,311 | ||||||
Transamerica Event Driven (A) | 1,774,235 | 18,292,366 | ||||||
Transamerica Long/Short Strategy (A) | 2,584,900 | 17,525,621 | ||||||
Transamerica Managed Futures Strategy (A) | 2,225,817 | 17,294,595 | ||||||
|
| |||||||
| 53,332,893 | ||||||||
|
| |||||||
| U.S. Fixed Income Funds - 8.1% | ||||||||
Transamerica Core Bond (A) | 328,682 | 3,276,956 | ||||||
| Shares | Value | |||||||
| INVESTMENT COMPANIES (continued) | ||||||||
| U.S. Fixed Income Funds (continued) | ||||||||
Transamerica High Yield Bond (A) | 1,041,871 | $ 9,824,839 | ||||||
|
| |||||||
| 13,101,795 | ||||||||
|
| |||||||
| U.S. Mixed Allocation Fund - 2.7% | ||||||||
Transamerica MLP & Energy Income (A) | 586,329 | 4,327,108 | ||||||
|
| |||||||
Total Investment Companies (Cost $163,552,494) | 161,057,424 | |||||||
|
| |||||||
| Principal | Value | |||||||
| REPURCHASE AGREEMENT - 1.1% | ||||||||
Fixed Income Clearing Corp. 0.12% (F), dated 10/31/2017, to be repurchased at $1,725,534 on 11/01/2017. Collateralized by a U.S. Government Obligation, 2.63%, due 08/15/2020, and with a value of $1,762,689. | $ 1,725,528 | 1,725,528 | ||||||
|
| |||||||
Total Repurchase Agreement | 1,725,528 | |||||||
|
| |||||||
Total Investments | 162,782,952 | |||||||
Net Other Assets (Liabilities) - (0.1)% | (147,428 | ) | ||||||
|
| |||||||
Net Assets - 100.0% | $ 162,635,524 | |||||||
|
| |||||||
FUTURES CONTRACTS:
| Description | Long/Short | Number of Contracts | Expiration Date | Notional Amount | Value | Unrealized Appreciation | Unrealized Depreciation | |||||||||||||||||||||
10-Year U.S. Treasury Note | Short | (47 | ) | 12/19/2017 | $ | (5,994,703 | ) | $ | (5,872,063 | ) | $ | 122,641 | $ | — | ||||||||||||||
SECURITY VALUATION:
Valuation Inputs (G)
| Level 1 - Unadjusted Quoted Prices | Level 2 - Other Significant Observable Inputs | Level 3 - Significant Unobservable Inputs | Value | |||||||||||||
ASSETS | ||||||||||||||||
Investments | ||||||||||||||||
Investment Companies | $ | 160,837,113 | $ | — | $ | — | $ | 160,837,113 | ||||||||
Repurchase Agreement | — | 1,725,528 | — | 1,725,528 | ||||||||||||
|
|
|
|
|
|
|
| |||||||||
Total | $ | 160,837,113 | $ | 1,725,528 | $ | — | $ | 162,562,641 | ||||||||
|
|
|
|
|
|
|
| |||||||||
Investment Companies Measured at Net Asset Value (H) | 220,311 | |||||||||||||||
|
| |||||||||||||||
Total Investments | 162,782,952 | |||||||||||||||
|
| |||||||||||||||
Other Financial Instruments | ||||||||||||||||
Futures Contracts (I) | $ | 122,641 | $ | — | $ | — | $ | 122,641 | ||||||||
|
|
|
|
|
|
|
| |||||||||
Total Other Financial Instruments | $ | 122,641 | $ | — | $ | — | $ | 122,641 | ||||||||
|
|
|
|
|
|
|
| |||||||||
The Notes to Financial Statements are an integral part of this report.
| Transamerica Funds | Annual Report 2017 |
Page 33
Table of Contents
Transamerica Multi-Manager Alternative Strategies Portfolio
SCHEDULE OF INVESTMENTS (continued)
At October 31, 2017
FOOTNOTES TO SCHEDULE OF INVESTMENTS:
| (A) | Investment in the Class I2 shares of the affiliated series of Transamerica Funds. | |
| (B) | Non-income producing security. | |
| (C) | Issuer is affiliated with the Fund’s investment manager. | |
| (D) | Illiquid security. At October 31, 2017, the value of such securities amounted to $220,311 or 0.1% of the Fund’s net assets. | |
| (E) | Restricted security. At October 31, 2017, the value of such security held by the Fund is as follows: |
| Investments | Description | Acquisition Date | Acquisition Cost | Value | Value as Percentage of Net Assets | |||||||||||||
Investment Companies | Transamerica Arbitrage Strategy Liquidating Trust | 09/18/2015 | $ | 226,886 | $ | 220,311 | 0.1 | % | ||||||||||
| (F) | Rate disclosed reflects the yield at October 31, 2017. | |
| (G) | The Fund recognizes transfers between Levels at the end of the reporting year. There were no transfers between Levels 1, 2 and 3 during the year ended October 31, 2017. Please reference the Security Valuation section of the Notes to Financial Statements for more information regarding security valuation and pricing inputs. | |
| (H) | Certain investments are measured at fair value using the net asset value per share, or its equivalent, practical expedient and have not been classified in the fair value levels. The fair value amount presented is intended to permit reconciliation to the Total Investments amount presented within the Schedule of Investments. | |
| (I) | Futures contracts and/or forward foreign currency contracts are valued at unrealized appreciation (depreciation). |
The Notes to Financial Statements are an integral part of this report.
| Transamerica Funds | Annual Report 2017 |
Page 34
Table of Contents
Understanding Your Funds’ Expenses
(unaudited)
SHAREHOLDER EXPENSES
Fund shareholders may incur two types of costs: transaction costs, including sales charges (loads) on purchases, contingent deferred sales charges on redemptions; and ongoing costs, including management fees, and other fund expenses.
The following examples are intended to help you understand your ongoing costs (in dollars and cents) of investing in the Funds and to compare these costs with the ongoing costs of investing in other funds.
The examples are based on an investment of $1,000 invested at May 1, 2017, and held for the entire period until October 31, 2017.
ACTUAL EXPENSES
The information in the table under the heading “Actual Expenses” provides information about actual account values and actual expenses. You may use the information in these columns, together with the amount you invested, to estimate the expenses that you paid over the period. Simply divide your account value by $1,000 (for example, an $8,600 account value divided by $1,000 = $8.60), then multiply the result by the number in the appropriate column for your share class titled “Expenses Paid During Period” to estimate the expenses you paid on your account during this period. If your account is an IRA, your expenses could have included a $15 annual fee. The amount of any fee paid during the period can decrease your ending account value.
HYPOTHETICAL EXAMPLE FOR COMPARISON PURPOSES
The information in the table under the heading “Hypothetical Expenses” provides information about hypothetical account values and hypothetical expenses based on the Funds’ actual expense ratios and assumed rates of return of 5% per year before expenses, which are not the Funds’ actual returns. The hypothetical account values and expenses may not be used to estimate the actual ending account balance or expenses you paid for the period. You may use this information to compare the ongoing costs of investing in your Fund versus other funds. To do so, compare this 5% hypothetical example with the 5% hypothetical examples that appear in the shareholder reports of the other funds. As in the case of the actual expense example, if your account is subject to an IRA fee, the amount of the fee paid through your account would increase the hypothetical expenses you would have paid during the period and decrease the hypothetical ending account value.
Please note that the expenses shown in the table are meant to highlight your ongoing costs only and do not reflect any transactional costs, such as sales charges and brokerage commissions paid on purchases and sales of Fund shares. Therefore, the information under the heading “Hypothetical Expenses” is useful in comparing ongoing costs only, and will not help you determine the relative total costs of owning different funds. If any of these transaction costs were included, your costs would be higher. The expenses shown in the table do not reflect any fees that may be charged to you by brokers, financial intermediaries, or other financial institutions.
Expense ratios may vary period to period because of various factors, such as an increase in expenses that are not covered by the management fees, expenses and fees of the trustees and their counsel, extraordinary expenses and interest expense.
Actual Expenses | Hypothetical Expenses (A) | |||||||||||||||||||||||
| Fund | Beginning Account Value | Ending Account Value | Expenses Paid During Period | Ending Account Value | Expenses Paid During Period (B) | Annualized Expense Ratio (C) (D) | ||||||||||||||||||
Transamerica Asset Allocation - Conservative Portfolio |
| |||||||||||||||||||||||
Class A | $ | 1,000.00 | $ | 1,041.30 | $ | 2.42(B | ) | $ | 1,022.80 | $ | 2.40 | 0.47 | % | |||||||||||
Class B | 1,000.00 | 1,036.20 | 6.83(B | ) | 1,018.50 | 6.77 | 1.33 | |||||||||||||||||
Class C | 1,000.00 | 1,036.60 | 6.26(B | ) | 1,019.10 | 6.21 | 1.22 | |||||||||||||||||
Class I | 1,000.00 | 1,042.30 | 1.34(B | ) | 1,023.90 | 1.33 | 0.26 | |||||||||||||||||
Class R | 1,000.00 | 1,039.10 | 4.16(B | ) | 1,021.10 | 4.13 | 0.81 | |||||||||||||||||
Class T1 | 1,000.00 | 1,041.50 | 2.06(B | ) | 1,023.20 | 2.04 | 0.40 | |||||||||||||||||
Advisor Class | 1,000.00 | 1,041.70 | 1.80(B | ) | 1,023.40 | 1.79 | 0.35 | |||||||||||||||||
Transamerica Asset Allocation - Growth Portfolio |
| |||||||||||||||||||||||
Class A | 1,000.00 | 1,080.60 | 2.67(B | ) | 1,022.60 | 2.60 | 0.51 | |||||||||||||||||
Class B | 1,000.00 | 1,075.80 | 7.33(B | ) | 1,018.10 | 7.12 | 1.40 | |||||||||||||||||
Class C | 1,000.00 | 1,076.20 | 6.54(B | ) | 1,018.90 | 6.36 | 1.25 | |||||||||||||||||
Class I | 1,000.00 | 1,082.00 | 1.36(B | ) | 1,023.90 | 1.33 | 0.26 | |||||||||||||||||
Class R | 1,000.00 | 1,079.30 | 4.09(B | ) | 1,021.30 | 3.97 | 0.78 | |||||||||||||||||
Class T1 | 1,000.00 | 1,082.00 | 2.05(B | ) | 1,023.20 | 1.99 | 0.39 | |||||||||||||||||
Advisor Class | 1,000.00 | 1,081.30 | 1.89(B | ) | 1,023.40 | 1.84 | 0.36 | |||||||||||||||||
| Transamerica Funds | Annual Report 2017 |
Page 35
Table of Contents
Understanding Your Funds’ Expenses (continued)
(unaudited)
Actual Expenses | Hypothetical Expenses (A) | |||||||||||||||||||||||
| Fund | Beginning Account Value | Ending Account Value | Expenses Paid During Period | Ending Account Value | Expenses Paid During Period (B) | Annualized Expense Ratio (C) (D) | ||||||||||||||||||
Transamerica Asset Allocation - Moderate Growth Portfolio |
| |||||||||||||||||||||||
Class A | $ | 1,000.00 | $ | 1,063.60 | $ | 2.55(B | ) | $ | 1,022.70 | $ | 2.50 | 0.49 | % | |||||||||||
Class B | 1,000.00 | 1,058.20 | 7.00(B | ) | 1,018.40 | 6.87 | 1.35 | |||||||||||||||||
Class C | 1,000.00 | 1,059.30 | 6.38(B | ) | 1,019.00 | 6.26 | 1.23 | |||||||||||||||||
Class I | 1,000.00 | 1,065.20 | 1.30(B | ) | 1,023.90 | 1.28 | 0.25 | |||||||||||||||||
Class R | 1,000.00 | 1,062.40 | 3.90(B | ) | 1,021.40 | 3.82 | 0.75 | |||||||||||||||||
Class T1 | 1,000.00 | 1,063.60 | 2.03(B | ) | 1,023.20 | 1.99 | 0.39 | |||||||||||||||||
Advisor Class | 1,000.00 | 1,064.40 | 1.87(B | ) | 1,023.40 | 1.84 | 0.36 | |||||||||||||||||
Transamerica Asset Allocation - Moderate Portfolio |
| |||||||||||||||||||||||
Class A | 1,000.00 | 1,050.90 | 2.48(B | ) | 1,022.80 | 2.45 | 0.48 | |||||||||||||||||
Class B | 1,000.00 | 1,046.00 | 6.86(B | ) | 1,018.50 | 6.77 | 1.33 | |||||||||||||||||
Class C | 1,000.00 | 1,047.00 | 6.29(B | ) | 1,019.10 | 6.21 | 1.22 | |||||||||||||||||
Class I | 1,000.00 | 1,052.60 | 1.29(B | ) | 1,023.90 | 1.28 | 0.25 | |||||||||||||||||
Class R | 1,000.00 | 1,049.50 | 3.72(B | ) | 1,021.60 | 3.67 | 0.72 | |||||||||||||||||
Class T1 | 1,000.00 | 1,051.70 | 2.02(B | ) | 1,023.20 | 1.99 | 0.39 | |||||||||||||||||
Advisor Class | 1,000.00 | 1,051.00 | 1.86(B | ) | 1,023.40 | 1.84 | 0.36 | |||||||||||||||||
Transamerica Asset Allocation Intermediate Horizon |
| |||||||||||||||||||||||
Class R | 1,000.00 | 1,042.40 | 2.77(E | ) | 1,022.20 | 3.06 | 0.60 | |||||||||||||||||
Class R4 | 1,000.00 | 1,047.30 | 1.55(B | ) | 1,023.70 | 1.53 | 0.30 | |||||||||||||||||
Transamerica Asset Allocation Long Horizon |
| |||||||||||||||||||||||
Class R | 1,000.00 | 1,069.00 | 2.81(E | ) | 1,022.20 | 3.06 | 0.60 | |||||||||||||||||
Class R4 | 1,000.00 | 1,075.50 | 1.73(B | ) | 1,023.50 | 1.68 | 0.33 | |||||||||||||||||
Transamerica Asset Allocation Short Horizon |
| |||||||||||||||||||||||
Class R | 1,000.00 | 1,017.20 | 2.74(E | ) | 1,022.20 | 3.06 | 0.60 | |||||||||||||||||
Class R4 | 1,000.00 | 1,020.80 | 1.58(B | ) | 1,023.60 | 1.58 | 0.31 | |||||||||||||||||
Transamerica Multi-Manager Alternative Strategies Portfolio |
| |||||||||||||||||||||||
Class A | 1,000.00 | 1,025.90 | 3.63(B | ) | 1,021.60 | 3.62 | 0.71 | |||||||||||||||||
Class C | 1,000.00 | 1,020.90 | 7.28(B | ) | 1,018.00 | 7.27 | 1.43 | |||||||||||||||||
Class I | 1,000.00 | 1,027.00 | 1.94(B | ) | 1,023.30 | 1.94 | 0.38 | |||||||||||||||||
Class R6 | 1,000.00 | 1,027.70 | 1.48(B | ) | 1,023.70 | 1.48 | 0.29 | |||||||||||||||||
Class T1 | 1,000.00 | 1,025.90 | 2.76(B | ) | 1,022.50 | 2.75 | 0.54 | |||||||||||||||||
| (A) | 5% return per year before expenses. | |
| (B) | Expenses are calculated using the Funds’ annualized expense ratios (as disclosed in the table), multiplied by the average account value for the period, multiplied by the number of days in the period (184 days), and divided by the number of days in the year (365 days). | |
| (C) | Expense ratios (as disclosed in the table) do not include the expenses of the underlying funds in which the Funds invest. The annualized expense ratios, as stated in the fee table of the Prospectus, may differ from the expense ratios disclosed in this report. | |
| (D) | Expense ratios are based on the most recent six-months; the percentage may differ from the expense ratio displayed in the Financial Highlights which covers a twelve-month period. | |
| (E) | Class commenced operations on May 19, 2017. Actual expenses are calculated using each Fund’s annualized expense ratio (as disclosed in the table), multiplied by the average account value for the period, multiplied by the number of days in the period (165 days), and divided by the number of days in the year (365 days). For comparability purposes, hypothetical expenses assume that the Funds were in operation for the entire six-month period ended October 31, 2017. | |
| Transamerica Funds | Annual Report 2017 |
Page 36
Table of Contents
STATEMENTS OF ASSETS AND LIABILITIES
At October 31, 2017
| Transamerica Asset Allocation – Conservative Portfolio | Transamerica Asset Allocation – Growth Portfolio | Transamerica Asset Allocation – Moderate Growth Portfolio | Transamerica Asset Allocation – Moderate Portfolio | Transamerica Asset Allocation Intermediate Horizon | ||||||||||||||||
Assets: | ||||||||||||||||||||
Affiliated investments, at value (A) | $ | 1,103,970,744 | $ | 1,534,673,123 | $ | 2,674,598,579 | $ | 1,961,781,801 | $ | 445,804,233 | ||||||||||
Receivables and other assets: | ||||||||||||||||||||
Shares of beneficial interest sold | 496,012 | 562,269 | 1,307,418 | 385,831 | 892 | |||||||||||||||
Affiliated investments sold | 258,163 | 826,729 | 859,976 | 1,077,466 | 56,239 | |||||||||||||||
Dividends | 379,455 | — | 438,647 | 552,841 | 137,980 | |||||||||||||||
Total assets | 1,105,104,374 | 1,536,062,121 | 2,677,204,620 | 1,963,797,939 | 445,999,344 | |||||||||||||||
Liabilities: | ||||||||||||||||||||
Payables and other liabilities: | ||||||||||||||||||||
Shares of beneficial interest redeemed | 861,158 | 1,932,991 | 2,221,104 | 1,714,729 | 46,547 | |||||||||||||||
Affiliated investments purchased | 379,455 | — | 438,647 | 552,841 | 148,565 | |||||||||||||||
Investment management fees | 118,939 | 165,213 | 288,813 | 211,670 | 39,101 | |||||||||||||||
Distribution and service fees | 459,594 | 751,388 | 1,334,618 | 950,748 | 191,755 | |||||||||||||||
Transfer agent fees | 75,547 | 154,261 | 228,109 | 148,574 | 132 | |||||||||||||||
Trustees, CCO and deferred compensation fees | 986 | 1,386 | 2,517 | 1,837 | — | |||||||||||||||
Audit and tax fees | 22,446 | 24,867 | 32,135 | 27,887 | — | |||||||||||||||
Custody fees | 5,981 | 6,140 | 14,261 | 7,461 | — | |||||||||||||||
Legal fees | 9,553 | 12,992 | 23,441 | 17,346 | — | |||||||||||||||
Printing and shareholder reports fees | 31,650 | 57,634 | 98,565 | 66,439 | — | |||||||||||||||
Registration fees | 13,840 | 17,246 | 25,204 | 19,709 | — | |||||||||||||||
Other | 6,547 | 9,034 | 16,480 | 12,189 | — | |||||||||||||||
Total liabilities | 1,985,696 | 3,133,152 | 4,723,894 | 3,731,430 | 426,100 | |||||||||||||||
Net assets | $ | 1,103,118,678 | $ | 1,532,928,969 | $ | 2,672,480,726 | $ | 1,960,066,509 | $ | 445,573,244 | ||||||||||
Net assets consist of: | ||||||||||||||||||||
Paid-in capital | $ | 985,431,217 | $ | 1,106,470,280 | $ | 2,092,185,678 | $ | 1,651,839,032 | $ | 455,447,319 | ||||||||||
Undistributed (distributions in excess of) net investment income (loss) | 640,320 | — | 7,885,884 | 11,939,490 | 133,519 | |||||||||||||||
Accumulated net realized gain (loss) | 40,279,070 | 114,185,219 | 173,624,745 | 93,187,793 | (33,588,911 | ) | ||||||||||||||
Net unrealized appreciation (depreciation) on: | ||||||||||||||||||||
Affiliated investments | 76,768,071 | 312,273,470 | 398,784,419 | 203,100,194 | 23,581,317 | |||||||||||||||
Net assets | $ | 1,103,118,678 | $ | 1,532,928,969 | $ | 2,672,480,726 | $ | 1,960,066,509 | $ | 445,573,244 | ||||||||||
Net assets by class: | ||||||||||||||||||||
Class A | $ | 734,113,171 | $ | 830,874,813 | $ | 1,434,214,070 | $ | 1,094,723,983 | $ | — | ||||||||||
Class B | 6,731,340 | 14,456,137 | 24,268,615 | 13,987,223 | — | |||||||||||||||
Class C | 331,668,880 | 628,621,080 | 1,123,771,221 | 786,976,835 | — | |||||||||||||||
Class I | 29,212,738 | 56,252,944 | 85,959,398 | 59,663,992 | — | |||||||||||||||
Class R | 1,359,239 | 2,701,988 | 4,245,814 | 4,693,150 | 424,720,995 | |||||||||||||||
Class R4 | — | — | — | — | 20,852,249 | |||||||||||||||
Class T1 | 10,543 | 10,968 | 10,778 | 10,645 | — | |||||||||||||||
Advisor Class | 22,767 | 11,039 | 10,830 | 10,681 | — | |||||||||||||||
Shares outstanding (unlimited shares, no par value): | ||||||||||||||||||||
Class A | 63,343,981 | 50,820,840 | 99,717,489 | 85,536,829 | — | |||||||||||||||
Class B | 583,425 | 901,152 | 1,667,600 | 1,078,131 | — | |||||||||||||||
Class C | 28,865,344 | 39,726,115 | 78,686,887 | 61,961,477 | — | |||||||||||||||
Class I | 2,513,793 | 3,439,187 | 5,977,544 | 4,662,652 | — | |||||||||||||||
Class R | 116,182 | 166,830 | 296,977 | 369,103 | 40,904,191 | |||||||||||||||
Class R4 | — | — | — | — | 2,008,748 | |||||||||||||||
Class T1 | 907 | 670 | 749 | 831 | — | |||||||||||||||
Advisor Class | 1,955 | 675 | 754 | 835 | — | |||||||||||||||
Net asset value per share: (B) | ||||||||||||||||||||
Class A | $ | 11.59 | $ | 16.35 | $ | 14.38 | $ | 12.80 | $ | — | ||||||||||
Class B | 11.54 | 16.04 | 14.55 | 12.97 | — | |||||||||||||||
Class C | 11.49 | 15.82 | 14.28 | 12.70 | — | |||||||||||||||
Class I | 11.62 | 16.36 | 14.38 | 12.80 | — | |||||||||||||||
Class R | 11.70 | 16.20 | 14.30 | 12.72 | 10.38 | |||||||||||||||
Class R4 | — | — | — | — | 10.38 | |||||||||||||||
Class T1 | 11.62 | 16.37 | 14.39 | 12.81 | — | |||||||||||||||
Advisor Class | 11.65 | 16.35 | 14.37 | (C) | 12.78 | (C) | — | |||||||||||||
Maximum offering price per share: (D) | ||||||||||||||||||||
Class A | $ | 12.26 | $ | 17.30 | $ | 15.22 | $ | 13.54 | $ | — | ||||||||||
Class T1 | $ | 11.92 | $ | 16.79 | $ | 14.76 | $ | 13.14 | $ | — | ||||||||||
|
|
|
|
|
|
|
|
|
| |||||||||||
(A) Affiliated investments, at cost | $ | 1,027,202,673 | $ | 1,222,399,653 | $ | 2,275,814,160 | $ | 1,758,681,607 | $ | 422,222,916 | ||||||||||
| (B) | Net asset value per share for Class B, C, I, R, R4 and Advisor Class Shares represents offering price. The redemption price for Class A, B, C and T1 shares equals net asset value less any applicable contingent deferred sales charge. | |
| (C) | Actual net asset value per share presented differs from calculated net asset value per share due to rounding. | |
| (D) | Maximum offering price per share for Class A and T1 includes an initial sales charge (represented as a percentage of offering price) which is reduced on certain levels of sales as set forth in the prospectus. |
The Notes to Financial Statements are an integral part of this report.
| Transamerica Funds | Annual Report 2017 |
Page 37
Table of Contents
STATEMENTS OF ASSETS AND LIABILITIES (continued)
At October 31, 2017
| Transamerica Asset Allocation Long Horizon | Transamerica Asset Allocation Short Horizon | Transamerica Multi-Manager Alternative Strategies Portfolio | ||||||||||
Assets: | ||||||||||||
Affiliated investments, at value (A) | $ | 258,617,636 | $ | 188,923,073 | $ | 161,057,424 | ||||||
Repurchase agreement, at value (B) | — | — | 1,725,528 | |||||||||
Cash | — | — | 25,766 | |||||||||
Cash collateral pledged at broker: | ||||||||||||
Futures contracts | — | — | 54,285 | |||||||||
Receivables and other assets: | ||||||||||||
Shares of beneficial interest sold | 29,234 | 960 | 21,707 | |||||||||
Affiliated investments sold | 49,271 | 658,435 | — | |||||||||
Interest | — | — | 6 | |||||||||
Dividends | 26,158 | 97,900 | 118,045 | |||||||||
Variation margin receivable on futures contracts | — | — | 3,646 | |||||||||
Total assets | 258,722,299 | 189,680,368 | 163,006,407 | |||||||||
Liabilities: | ||||||||||||
Payables and other liabilities: | ||||||||||||
Shares of beneficial interest redeemed | — | 327,267 | 114,732 | |||||||||
Affiliated investments purchased | 104,663 | 430,028 | 118,045 | |||||||||
Investment management fees | 22,691 | 16,629 | 27,728 | |||||||||
Distribution and service fees | 107,305 | 81,856 | 49,216 | |||||||||
Transfer agent fees | 217 | 46 | 22,571 | |||||||||
Trustees, CCO and deferred compensation fees | — | — | 234 | |||||||||
Audit and tax fees | — | — | 17,414 | |||||||||
Custody fees | — | — | 1,275 | |||||||||
Legal fees | — | — | 1,707 | |||||||||
Printing and shareholder reports fees | — | — | 13,581 | |||||||||
Registration fees | — | — | 3,060 | |||||||||
Other | — | — | 1,320 | |||||||||
Total liabilities | 234,876 | 855,826 | 370,883 | |||||||||
Net assets | $ | 258,487,423 | $ | 188,824,542 | $ | 162,635,524 | ||||||
Net assets consist of: | ||||||||||||
Paid-in capital | $ | 264,338,298 | $ | 188,475,586 | $ | 171,200,900 | ||||||
Undistributed (distributions in excess of) net investment income (loss) | — | 186,918 | 407,519 | |||||||||
Accumulated net realized gain (loss) | (35,230,957 | ) | (1,645,756 | ) | (6,600,466 | ) | ||||||
Net unrealized appreciation (depreciation) on: | ||||||||||||
Investments | 29,380,082 | 1,807,794 | (2,495,070 | ) | ||||||||
Futures contracts | — | — | 122,641 | |||||||||
Net assets | $ | 258,487,423 | $ | 188,824,542 | $ | 162,635,524 | ||||||
Net assets by class: | ||||||||||||
Class A | $ | — | $ | — | $ | 32,239,988 | ||||||
Class C | — | — | 47,545,388 | |||||||||
Class I | — | — | 82,741,499 | |||||||||
Class R | 225,868,844 | 181,866,166 | — | |||||||||
Class R4 | 32,618,579 | 6,958,376 | — | |||||||||
Class R6 | — | — | 98,410 | |||||||||
Class T1 | — | — | 10,239 | |||||||||
Shares outstanding (unlimited shares, no par value): | ||||||||||||
Class A | — | — | 3,260,310 | |||||||||
Class C | — | — | 4,859,045 | |||||||||
Class I | — | — | 8,373,069 | |||||||||
Class R | 21,145,873 | 18,012,685 | — | |||||||||
Class R4 | 3,053,303 | 689,069 | — | |||||||||
Class R6 | — | — | 9,822 | |||||||||
Class T1 | — | — | 1,034 | |||||||||
Net asset value per share: (C) | ||||||||||||
Class A | $ | — | $ | — | $ | 9.89 | ||||||
Class C | — | — | 9.78 | |||||||||
Class I | — | — | 9.88 | |||||||||
Class R | 10.68 | 10.10 | — | |||||||||
Class R4 | 10.68 | 10.10 | — | |||||||||
Class R6 | — | — | 10.02 | |||||||||
Class T1 | — | — | 9.90 | |||||||||
Maximum offering price per share: (D) | ||||||||||||
Class A | $ | — | $ | — | $ | 10.47 | ||||||
Class T1 | $ | — | $ | — | $ | 10.15 | ||||||
|
|
|
|
|
| |||||||
(A) Affiliated investments, at cost | $ | 229,237,554 | $ | 187,115,279 | $ | 163,552,494 | ||||||
(B) Repurchase agreements, at cost | $ | — | $ | — | $ | 1,725,528 | ||||||
| (C) | Net asset value per share for Class C, I, R, R4 and R6 Shares represents offering price. The redemption price for Class A, C and T1 shares equals net asset value less any applicable contingent deferred sales charge. | |
| (D) | Maximum offering price per share for Class A and T1 includes an initial sales charge (represented as a percentage of offering price) which is reduced on certain levels of sales as set forth in the prospectus. |
The Notes to Financial Statements are an integral part of this report.
| Transamerica Funds | Annual Report 2017 |
Page 38
Table of Contents
For the year ended:
| Transamerica Asset Allocation – Conservative Portfolio (A) (B) | Transamerica Asset Allocation – Growth Portfolio (A) (B) | Transamerica Asset Allocation – Moderate Growth Portfolio (A) (B) | Transamerica Asset Allocation – Moderate Portfolio (A) (B) | |||||||||||||
| October 31, 2017 | October 31, 2017 | October 31, 2017 | October 31, 2017 | |||||||||||||
Investment Income: | ||||||||||||||||
Dividend income from affiliated investments | $ | 29,381,807 | $ | 31,562,006 | $ | 65,407,720 | $ | 51,677,718 | ||||||||
Total investment income | 29,381,807 | 31,562,006 | 65,407,720 | 51,677,718 | ||||||||||||
Expenses: | ||||||||||||||||
Investment management fees | 1,352,216 | 1,840,971 | 3,305,593 | 2,442,533 | ||||||||||||
Distribution and service fees: | ||||||||||||||||
Class A | 1,757,592 | 1,963,327 | 3,456,266 | 2,650,345 | ||||||||||||
Class B | 103,123 | 204,809 | 357,117 | 220,627 | ||||||||||||
Class C | 3,627,827 | 6,517,528 | 12,083,725 | 8,560,069 | ||||||||||||
Class R | 5,971 | 12,273 | 22,023 | 27,356 | ||||||||||||
Class T1 | 17 | 16 | 17 | 19 | ||||||||||||
Transfer agent fees | ||||||||||||||||
Class A | 455,695 | 905,612 | 1,255,746 | 824,971 | ||||||||||||
Class B | 18,899 | 52,522 | 78,552 | 41,624 | ||||||||||||
Class C | 260,692 | 684,095 | 1,048,769 | 626,926 | ||||||||||||
Class I | 28,048 | 46,842 | 71,401 | 53,026 | ||||||||||||
Class R | 2,388 | 3,571 | 5,082 | 4,251 | ||||||||||||
Advisor Class | 28 | 14 | 14 | 14 | ||||||||||||
Trustees, CCO and deferred compensation fees | 19,818 | 26,944 | 48,249 | 35,598 | ||||||||||||
Audit and tax fees | 31,877 | 36,426 | 50,450 | 42,391 | ||||||||||||
Custody fees | 31,195 | 31,990 | 62,463 | 39,319 | ||||||||||||
Legal fees | 58,451 | 78,582 | 140,940 | 104,517 | ||||||||||||
Printing and shareholder reports fees | 71,227 | 129,042 | 211,478 | 142,504 | ||||||||||||
Registration fees | 119,300 | 132,283 | 149,304 | 131,543 | ||||||||||||
Other | 20,587 | 26,497 | 44,204 | 33,925 | ||||||||||||
Total expenses | 7,964,951 | 12,693,344 | 22,391,393 | 15,981,558 | ||||||||||||
Net investment income (loss) | 21,416,856 | 18,868,662 | 43,016,327 | 35,696,160 | ||||||||||||
Net realized gain (loss) on: | ||||||||||||||||
Affiliated investments | 9,765,827 | 14,992,730 | 31,130,170 | 14,855,997 | ||||||||||||
Distributions received from affiliated investments | 36,779,363 | 114,051,732 | 157,131,629 | 87,699,944 | ||||||||||||
Net realized gain (loss) | 46,545,190 | 129,044,462 | 188,261,799 | 102,555,941 | ||||||||||||
Net change in unrealized appreciation (depreciation) on: | ||||||||||||||||
Affiliated investments | 22,528,307 | 123,401,606 | 144,735,748 | 72,800,193 | ||||||||||||
Net realized and change in unrealized gain (loss) | 69,073,497 | 252,446,068 | 332,997,547 | 175,356,134 | ||||||||||||
Net increase (decrease) in net assets resulting from operations | $ | 90,490,353 | $ | 271,314,730 | $ | 376,013,874 | $ | 211,052,294 | ||||||||
| (A) | Class T1 commenced operations on March 17, 2017. | |
| (B) | Advisor Class commenced operations on March 3, 2017. |
The Notes to Financial Statements are an integral part of this report.
| Transamerica Funds | Annual Report 2017 |
Page 39
Table of Contents
STATEMENTS OF OPERATIONS (continued)
For the period and year ended:
| Transamerica Asset Allocation Intermediate Horizon (A) | Transamerica Asset Allocation Long Horizon (B) | |||||||||||||||
| October 31, 2017 (C) | December 31, 2016 (D) | October 31, 2017 (C) | December 31, 2016 (D) | |||||||||||||
Investment Income: | ||||||||||||||||
Dividend income from affiliated investments | $ | 3,903,431 | $ | 1,555,304 | $ | 1,077,598 | $ | 384,971 | ||||||||
Total investment income | 3,903,431 | 1,555,304 | 1,077,598 | 384,971 | ||||||||||||
Expenses: | ||||||||||||||||
Investment advisory fees | — | 78,405 | — | 27,759 | ||||||||||||
Investment management fees | 288,703 | — | 164,787 | — | ||||||||||||
Distribution and service fees: | ||||||||||||||||
Class R | 989,030 | — | 540,893 | — | ||||||||||||
Class R4 | 45,570 | — | 50,797 | — | ||||||||||||
Transfer agent fees | ||||||||||||||||
Class R4 | 1,367 | — | 1,524 | — | ||||||||||||
Total expenses before waiver and/or reimbursement and recapture | 1,324,670 | 78,405 | 758,001 | 27,759 | ||||||||||||
Expenses waived and/or reimbursed: | ||||||||||||||||
Class R | (39,740 | ) | — | (21,729 | ) | — | ||||||||||
Class R4 | (4,920 | ) | — | (5,509 | ) | — | ||||||||||
Recapture of previously waived and/or reimbursed fees: | ||||||||||||||||
Class R4 | 86 | — | 15 | — | ||||||||||||
Net expenses | 1,280,096 | 78,405 | 730,778 | 27,759 | ||||||||||||
Net investment income (loss) | 2,623,335 | 1,476,899 | 346,820 | 357,212 | ||||||||||||
Net realized gain (loss) on: | ||||||||||||||||
Affiliated investments | 12,678,749 | 1,766,102 | 20,941,778 | 731,569 | ||||||||||||
Distributions received from affiliated investments | 137,107 | 717,206 | 97,551 | 488,310 | ||||||||||||
Net realized gain (loss) | 12,815,856 | 2,483,308 | 21,039,329 | 1,219,879 | ||||||||||||
Net change in unrealized appreciation (depreciation) on: | ||||||||||||||||
Affiliated investments | 8,732,126 | 408,953 | (344,114 | ) | 342,929 | |||||||||||
Net realized and change in unrealized gain (loss) | 21,547,982 | 2,892,261 | 20,695,215 | 1,562,808 | ||||||||||||
Net increase (decrease) in net assets resulting from operations | $ | 24,171,317 | $ | 4,369,160 | $ | 21,042,035 | $ | 1,920,020 | ||||||||
| (A) | Transamerica Institutional Asset Allocation – Intermediate Horizon reorganized into the Fund on May 19, 2017. Prior to May 19, 2017, information provided reflects Transamerica Institutional Asset Allocation – Intermediate Horizon, which was the accounting and performance survivor of the reorganization. Please reference the Reorganization section of the Notes to the Financial Statements for additional information. | |
| (B) | Transamerica Institutional Asset Allocation – Long Horizon reorganized into the Fund on May 19, 2017. Prior to May 19, 2017, information provided reflects Transamerica Institutional Asset Allocation – Long Horizon, which was the accounting and performance survivor of the reorganization. Please reference the Reorganization section of the Notes to the Financial Statements for additional information. | |
| (C) | The fiscal year end of the Fund is October 31 while the fiscal year end of the accounting and performance survivor is December 31. The Statements of Operations represents activity for the ten months of January 1, 2017 – October 31, 2017. Please reference the Reorganization section of the Notes to the Financial Statements for additional information. | |
| (D) | For the year ended December 31, 2016. |
The Notes to Financial Statements are an integral part of this report.
| Transamerica Funds | Annual Report 2017 |
Page 40
Table of Contents
STATEMENTS OF OPERATIONS (continued)
For the period and year ended:
| Transamerica Asset Allocation Short Horizon (A) | Transamerica Multi-Manager Alternative Strategies Portfolio (B) | |||||||||||
| October 31, 2017 (C) | December 31, 2016 (D) | October 31, 2017 | ||||||||||
Investment Income: | ||||||||||||
Dividend income from affiliated investments | $ | 2,222,615 | $ | 322,079 | $ | 3,213,442 | ||||||
Interest income from repurchase agreements | — | — | 2,713 | |||||||||
Total investment income | 2,222,615 | 322,079 | 3,216,155 | |||||||||
Expenses: | ||||||||||||
Investment advisory fees | — | 12,258 | — | |||||||||
Investment management fees | 112,359 | — | 408,160 | |||||||||
Distribution and service fees: | ||||||||||||
Class A | — | — | 109,898 | |||||||||
Class C | — | — | 573,352 | |||||||||
Class R | 432,872 | — | — | |||||||||
Class R4 | 9,031 | — | — | |||||||||
Class T1 | — | — | 16 | |||||||||
Transfer agent fees | ||||||||||||
Class A | — | — | 80,359 | |||||||||
Class C | — | — | 100,301 | |||||||||
Class I | — | — | 93,745 | |||||||||
Class R4 | 271 | — | — | |||||||||
Class R6 | — | — | 6 | |||||||||
Trustees, CCO and deferred compensation fees | — | — | 3,347 | |||||||||
Audit and tax fees | — | — | 21,895 | |||||||||
Custody fees | — | — | 6,685 | |||||||||
Legal fees | — | — | 19,466 | |||||||||
Printing and shareholder reports fees | — | — | 29,500 | |||||||||
Registration fees | — | — | 72,346 | |||||||||
Other | — | — | 10,202 | |||||||||
Total expenses before waiver and/or reimbursement and recapture | 554,533 | 12,258 | 1,529,278 | |||||||||
Expenses waived and/or reimbursed: | ||||||||||||
Class R | (17,323 | ) | — | — | ||||||||
Class R4 | (985 | ) | — | — | ||||||||
Net expenses | 536,225 | 12,258 | 1,529,278 | |||||||||
Net investment income (loss) | 1,686,390 | 309,821 | 1,686,877 | |||||||||
Net realized gain (loss) on: | ||||||||||||
Affiliated investments | 77,734 | (28,206 | ) | (2,921,288 | ) | |||||||
Distributions received from affiliated investments | — | 7,314 | 1,723,113 | |||||||||
Futures contracts | — | — | (235,189 | ) | ||||||||
Net realized gain (loss) | 77,734 | (20,892 | ) | (1,433,364 | ) | |||||||
Net change in unrealized appreciation (depreciation) on: | ||||||||||||
Affiliated investments | 2,041,418 | 256,358 | 4,384,386 | |||||||||
Futures contracts | — | — | 122,641 | |||||||||
Net change in unrealized appreciation (depreciation) | 2,041,418 | 256,358 | 4,507,027 | |||||||||
Net realized and change in unrealized gain (loss) | 2,119,152 | 235,466 | 3,073,663 | |||||||||
Net increase (decrease) in net assets resulting from operations | $ | 3,805,542 | $ | 545,287 | $ | 4,760,540 | ||||||
| (A) | Transamerica Institutional Asset Allocation – Short Horizon reorganized into the Fund on May 19, 2017. Prior to May 19, 2017, information provided reflects Transamerica Institutional Asset Allocation – Short Horizon, which was the accounting and performance survivor of the reorganization. Please reference the Reorganization section of the Notes to the Financial Statements for additional information. | |
| (B) | Class T1 commenced operations on March 17, 2017. | |
| (C) | The fiscal year end of the Fund is October 31 while the fiscal year end of the accounting and performance survivor is December 31. The Statements of Operations represents activity for the ten months of January 1, 2017 – October 31, 2017. Please reference the Reorganization section of the Notes to the Financial Statements for additional information. | |
| (D) | For the year ended December 31, 2016. |
The Notes to Financial Statements are an integral part of this report.
| Transamerica Funds | Annual Report 2017 |
Page 41
Table of Contents
STATEMENTS OF CHANGES IN NET ASSETS
For the years ended:
| Transamerica Asset Allocation – Conservative Portfolio (A) (B) | Transamerica Asset Allocation – Growth Portfolio (A) (B) | Transamerica Asset Allocation – Moderate Growth Portfolio (A) (B) | ||||||||||||||||||||||
| October 31, 2017 | October 31, 2016 | October 31, 2017 | October 31, 2016 | October 31, 2017 | October 31, 2016 | |||||||||||||||||||
From operations: | ||||||||||||||||||||||||
Net investment income (loss) | $ | 21,416,856 | $ | 18,906,087 | $ | 18,868,662 | $ | 19,096,295 | $ | 43,016,327 | $ | 38,902,429 | ||||||||||||
Net realized gain (loss) | 46,545,190 | 25,280,255 | 129,044,462 | 85,367,869 | 188,261,799 | 125,642,432 | ||||||||||||||||||
Net change in unrealized appreciation (depreciation) | 22,528,307 | (7,886,941 | ) | 123,401,606 | (63,683,427 | ) | 144,735,748 | (84,551,770 | ) | |||||||||||||||
Net increase (decrease) in net assets resulting from operations | 90,490,353 | 36,299,401 | 271,314,730 | 40,780,737 | 376,013,874 | 79,993,091 | ||||||||||||||||||
Dividends and/or distributions to shareholders: | ||||||||||||||||||||||||
Net investment income: | ||||||||||||||||||||||||
Class A | (14,931,504 | ) | (11,083,020 | ) | (11,894,234 | ) | (10,602,704 | ) | (24,110,289 | ) | (21,563,243 | ) | ||||||||||||
Class B | (147,206 | ) | (317,541 | ) | (117,626 | ) | (154,344 | ) | (245,830 | ) | (389,831 | ) | ||||||||||||
Class C | (5,306,501 | ) | (6,687,349 | ) | (5,981,253 | ) | (5,340,712 | ) | (13,096,520 | ) | (12,345,396 | ) | ||||||||||||
Class I | (639,011 | ) | (652,493 | ) | (622,284 | ) | (589,640 | ) | (1,106,276 | ) | (1,059,808 | ) | ||||||||||||
Class R | (21,646 | ) | (26,848 | ) | (29,080 | ) | (28,452 | ) | (69,395 | ) | (75,777 | ) | ||||||||||||
Class T1 | (81 | ) | — | — | — | — | — | |||||||||||||||||
Advisor Class | (193 | ) | — | — | — | — | — | |||||||||||||||||
Total dividends and/or distributions from net investment income | (21,046,142 | ) | (18,767,251 | ) | (18,644,477 | ) | (16,715,852 | ) | (38,628,310 | ) | (35,434,055 | ) | ||||||||||||
Net realized gains: | ||||||||||||||||||||||||
Class A | (16,341,375 | ) | (15,599,535 | ) | (44,340,042 | ) | (51,416,545 | ) | (62,781,715 | ) | (74,571,237 | ) | ||||||||||||
Class B | (330,104 | ) | (757,797 | ) | (1,550,422 | ) | (3,164,671 | ) | (2,053,573 | ) | (4,414,706 | ) | ||||||||||||
Class C | (9,987,404 | ) | (14,884,096 | ) | (40,987,189 | ) | (51,508,074 | ) | (60,465,193 | ) | (80,752,726 | ) | ||||||||||||
Class I | (671,428 | ) | (893,234 | ) | (1,990,298 | ) | (2,397,941 | ) | (2,569,986 | ) | (3,184,273 | ) | ||||||||||||
Class R | (30,764 | ) | (51,369 | ) | (132,876 | ) | (165,692 | ) | (218,672 | ) | (308,153 | ) | ||||||||||||
Total dividends and/or distributions from net realized gains | (27,361,075 | ) | (32,186,031 | ) | (89,000,827 | ) | (108,652,923 | ) | (128,089,139 | ) | (163,231,095 | ) | ||||||||||||
Total dividends and/or distributions to shareholders | (48,407,217 | ) | (50,953,282 | ) | (107,645,304 | ) | (125,368,775 | ) | (166,717,449 | ) | (198,665,150 | ) | ||||||||||||
Capital share transactions: | ||||||||||||||||||||||||
Proceeds from shares sold: | ||||||||||||||||||||||||
Class A | 168,243,022 | 238,518,552 | 102,965,145 | 84,950,169 | 181,963,862 | 171,622,293 | ||||||||||||||||||
Class B | 146,160 | 389,041 | 181,072 | 126,187 | 396,216 | 174,053 | ||||||||||||||||||
Class C | 21,574,905 | 34,367,249 | 38,555,659 | 47,880,111 | 58,293,664 | 78,467,898 | ||||||||||||||||||
Class I | 14,504,832 | 7,247,229 | 36,639,807 | 10,577,512 | 55,995,293 | 17,144,197 | ||||||||||||||||||
Class R | 448,379 | 775,520 | 963,991 | 913,536 | 1,037,918 | 1,114,753 | ||||||||||||||||||
Class T1 | 9,955 | — | 10,000 | — | 9,984 | — | ||||||||||||||||||
Advisor Class | 21,476 | — | 10,000 | — | 10,000 | — | ||||||||||||||||||
| 204,948,729 | 281,297,591 | 179,325,674 | 144,447,515 | 297,706,937 | 268,523,194 | |||||||||||||||||||
Dividends and/or distributions reinvested: | ||||||||||||||||||||||||
Class A | 30,581,585 | 25,858,245 | 54,752,557 | 60,217,193 | 84,250,405 | 92,677,301 | ||||||||||||||||||
Class B | 418,711 | 965,497 | 1,639,886 | 3,251,405 | 2,237,354 | 4,666,920 | ||||||||||||||||||
Class C | 13,171,690 | 18,215,027 | 42,381,136 | 50,835,454 | 65,441,193 | 82,142,836 | ||||||||||||||||||
Class I | 969,945 | 1,147,910 | 2,242,569 | 2,370,204 | 3,106,928 | 3,462,132 | ||||||||||||||||||
Class R | 39,591 | 60,222 | 134,040 | 146,777 | 203,301 | 242,765 | ||||||||||||||||||
Class T1 | 81 | — | — | — | — | — | ||||||||||||||||||
Advisor Class | 193 | — | — | — | — | — | ||||||||||||||||||
| 45,181,796 | 46,246,901 | 101,150,188 | 116,821,033 | 155,239,181 | 183,191,954 | |||||||||||||||||||
Cost of shares redeemed: | ||||||||||||||||||||||||
Class A | (121,101,706 | ) | (93,633,013 | ) | (154,302,416 | ) | (124,556,178 | ) | (277,393,766 | ) | (224,291,468 | ) | ||||||||||||
Class B | (2,922,554 | ) | (3,564,545 | ) | (3,892,858 | ) | (4,723,557 | ) | (7,992,995 | ) | (11,518,422 | ) | ||||||||||||
Class C | (121,069,703 | ) | (91,567,215 | ) | (181,865,340 | ) | (113,192,919 | ) | (377,775,734 | ) | (245,427,910 | ) | ||||||||||||
Class I | (13,183,062 | ) | (10,091,596 | ) | (19,963,731 | ) | (13,436,838 | ) | (32,233,127 | ) | (20,662,865 | ) | ||||||||||||
Class R | (380,003 | ) | (1,129,889 | ) | (818,754 | ) | (1,043,155 | ) | (1,813,526 | ) | (1,882,984 | ) | ||||||||||||
| (258,657,028 | ) | (199,986,258 | ) | (360,843,099 | ) | (256,952,647 | ) | (697,209,148 | ) | (503,783,649 | ) | |||||||||||||
Automatic conversions: | ||||||||||||||||||||||||
Class A | 5,567,433 | 6,781,530 | 12,443,353 | 16,245,805 | 20,663,395 | 25,773,435 | ||||||||||||||||||
Class B | (5,567,433 | ) | (6,781,530 | ) | (12,443,353 | ) | (16,245,805 | ) | (20,663,395 | ) | (25,773,435 | ) | ||||||||||||
| — | — | — | — | — | — | |||||||||||||||||||
Net increase (decrease) in net assets resulting from capital share transactions | (8,526,503 | ) | 127,558,234 | (80,367,237 | ) | 4,315,901 | (244,263,030 | ) | (52,068,501 | ) | ||||||||||||||
Net increase (decrease) in net assets | 33,556,633 | 112,904,353 | 83,302,189 | (80,272,137 | ) | (34,966,605 | ) | (170,740,560 | ) | |||||||||||||||
Net assets: | ||||||||||||||||||||||||
Beginning of year | 1,069,562,045 | 956,657,692 | 1,449,626,780 | 1,529,898,917 | 2,707,447,331 | 2,878,187,891 | ||||||||||||||||||
End of year | $ | 1,103,118,678 | $ | 1,069,562,045 | $ | 1,532,928,969 | $ | 1,449,626,780 | $ | 2,672,480,726 | $ | 2,707,447,331 | ||||||||||||
Undistributed (distributions in excess of) net investment income (loss) | $ | 640,320 | $ | 265,842 | $ | — | $ | (2,846,552 | ) | $ | 7,885,884 | $ | 3,483,348 | |||||||||||
The Notes to Financial Statements are an integral part of this report.
| Transamerica Funds | Annual Report 2017 |
Page 42
Table of Contents
STATEMENTS OF CHANGES IN NET ASSETS (continued)
For the years ended:
| Transamerica Asset Allocation – Conservative Portfolio (A) (B) | Transamerica Asset Allocation – Growth Portfolio (A) (B) | Transamerica Asset Allocation – Moderate Growth Portfolio (A) (B) | ||||||||||||||||||||||
| October 31, 2017 | October 31, 2016 | October 31, 2017 | October 31, 2016 | October 31, 2017 | October 31, 2016 | |||||||||||||||||||
Capital share transactions - shares: | ||||||||||||||||||||||||
Shares issued: | ||||||||||||||||||||||||
Class A | 15,098,248 | 21,743,739 | 6,788,040 | 5,942,349 | 13,406,079 | 13,138,107 | ||||||||||||||||||
Class B | 13,182 | 36,499 | 12,362 | 8,836 | 29,388 | 13,232 | ||||||||||||||||||
Class C | 1,941,012 | 3,172,105 | 2,649,411 | 3,457,485 | 4,358,715 | 6,069,512 | ||||||||||||||||||
Class I | 1,287,059 | 659,923 | 2,410,213 | 737,491 | 4,131,413 | 1,316,263 | ||||||||||||||||||
Class R | 39,239 | 70,529 | 64,344 | 65,556 | 77,147 | 85,715 | ||||||||||||||||||
Class T1 | 900 | — | 670 | — | 749 | — | ||||||||||||||||||
Advisor Class | 1,938 | — | 675 | — | 754 | — | ||||||||||||||||||
| 18,381,578 | 25,682,795 | 11,925,715 | 10,211,717 | 22,004,245 | 20,622,829 | |||||||||||||||||||
Shares reinvested: | ||||||||||||||||||||||||
Class A | 2,807,267 | 2,397,134 | 3,888,673 | 4,246,632 | 6,618,251 | 7,229,119 | ||||||||||||||||||
Class B | 38,971 | 90,185 | 117,808 | 232,575 | 172,374 | 358,718 | ||||||||||||||||||
Class C | 1,226,164 | 1,706,878 | 3,091,257 | 3,673,085 | 5,144,748 | 6,412,399 | ||||||||||||||||||
Class I | 88,742 | 106,161 | 159,614 | 167,387 | 244,640 | 270,691 | ||||||||||||||||||
Class R | 3,607 | 5,546 | 9,588 | 10,417 | 16,021 | 18,996 | ||||||||||||||||||
Class T1 | 7 | — | — | — | — | — | ||||||||||||||||||
Advisor Class | 17 | — | — | — | — | — | ||||||||||||||||||
| 4,164,775 | 4,305,904 | 7,266,940 | 8,330,096 | 12,196,034 | 14,289,923 | |||||||||||||||||||
Shares redeemed: | ||||||||||||||||||||||||
Class A | (10,748,703 | ) | (8,518,473 | ) | (10,168,060 | ) | (8,688,968 | ) | (20,421,366 | ) | (17,236,075 | ) | ||||||||||||
Class B | (261,487 | ) | (326,947 | ) | (259,837 | ) | (334,836 | ) | (578,564 | ) | (878,130 | ) | ||||||||||||
Class C | (10,898,013 | ) | (8,401,227 | ) | (12,341,494 | ) | (8,123,625 | ) | (27,980,918 | ) | (18,929,567 | ) | ||||||||||||
Class I | (1,177,271 | ) | (913,441 | ) | (1,312,929 | ) | (938,887 | ) | (2,384,355 | ) | (1,590,532 | ) | ||||||||||||
Class R | (33,843 | ) | (102,263 | ) | (54,052 | ) | (75,244 | ) | (134,274 | ) | (146,556 | ) | ||||||||||||
| (23,119,317 | ) | (18,262,351 | ) | (24,136,372 | ) | (18,161,560 | ) | (51,499,477 | ) | (38,780,860 | ) | |||||||||||||
Automatic conversions: | ||||||||||||||||||||||||
Class A | 496,567 | 616,089 | 825,921 | 1,136,655 | 1,526,334 | 1,992,220 | ||||||||||||||||||
Class B | (499,197 | ) | (619,128 | ) | (838,984 | ) | (1,157,199 | ) | (1,504,980 | ) | (1,963,526 | ) | ||||||||||||
| (2,630 | ) | (3,039 | ) | (13,063 | ) | (20,544 | ) | 21,354 | 28,694 | |||||||||||||||
Net increase (decrease) in shares outstanding: | ||||||||||||||||||||||||
Class A | 7,653,379 | 16,238,489 | 1,334,574 | 2,636,668 | 1,129,298 | 5,123,371 | ||||||||||||||||||
Class B | (708,531 | ) | (819,391 | ) | (968,651 | ) | (1,250,624 | ) | (1,881,782 | ) | (2,469,706 | ) | ||||||||||||
Class C | (7,730,837 | ) | (3,522,244 | ) | (6,600,826 | ) | (993,055 | ) | (18,477,455 | ) | (6,447,656 | ) | ||||||||||||
Class I | 198,530 | (147,357 | ) | 1,256,898 | (34,009 | ) | 1,991,698 | (3,578 | ) | |||||||||||||||
Class R | 9,003 | (26,188 | ) | 19,880 | 729 | (41,106 | ) | (41,845 | ) | |||||||||||||||
Class T1 | 907 | — | 670 | — | 749 | — | ||||||||||||||||||
Advisor Class | 1,955 | — | 675 | — | 754 | — | ||||||||||||||||||
| (575,594 | ) | 11,723,309 | (4,956,780 | ) | 359,709 | (17,277,844 | ) | (3,839,414 | ) | |||||||||||||||
| (A) | Class T1 commenced operations on March 17, 2017. | |
| (B) | Advisor Class commenced operations on March 3, 2017. |
The Notes to Financial Statements are an integral part of this report.
| Transamerica Funds | Annual Report 2017 |
Page 43
Table of Contents
STATEMENTS OF CHANGES IN NET ASSETS (continued)
For the period and years ended:
| Transamerica Asset Allocation – Moderate Portfolio (A) (B) | Transamerica Asset Allocation Intermediate Horizon (C) (D) | |||||||||||||||||||
| October 31, 2017 | October 31, 2016 | October 31, 2017 (E) | December 31, 2016 | December 31, 2015 | ||||||||||||||||
From operations: | ||||||||||||||||||||
Net investment income (loss) | $ | 35,696,160 | $ | 34,852,795 | $ | 2,623,335 | $ | 1,476,899 | $ | 1,339,597 | ||||||||||
Net realized gain (loss) | 102,555,941 | 65,538,623 | 12,815,856 | 2,483,308 | 4,708,055 | |||||||||||||||
Net change in unrealized appreciation (depreciation) | 72,800,193 | (33,596,416 | ) | 8,732,126 | 408,953 | (5,416,280 | ) | |||||||||||||
Net increase (decrease) in net assets resulting from operations | 211,052,294 | 66,795,002 | 24,171,317 | 4,369,160 | 631,372 | |||||||||||||||
Dividends and/or distributions to shareholders: | ||||||||||||||||||||
Net investment income: | ||||||||||||||||||||
Class A | (19,317,269 | ) | (18,542,583 | ) | — | — | — | |||||||||||||
Class B | (211,241 | ) | (417,134 | ) | — | — | — | |||||||||||||
Class C | (10,165,871 | ) | (12,983,816 | ) | — | — | — | |||||||||||||
Class I | (932,089 | ) | (1,112,676 | ) | — | — | — | |||||||||||||
Class R | (90,627 | ) | (103,010 | ) | (1,852,771 | ) | — | — | ||||||||||||
Class R4 | — | — | (641,358 | ) | (1,480,306 | ) | (1,372,680 | ) | ||||||||||||
Total dividends and/or distributions from net investment income | (30,717,097 | ) | (33,159,219 | ) | (2,494,129 | ) | (1,480,306 | ) | (1,372,680 | ) | ||||||||||
Net realized gains: | ||||||||||||||||||||
Class A | (33,472,899 | ) | (38,536,484 | ) | — | — | — | |||||||||||||
Class B | (912,833 | ) | (1,879,751 | ) | — | — | — | |||||||||||||
Class C | (30,607,704 | ) | (43,906,920 | ) | — | — | — | |||||||||||||
Class I | (1,451,743 | ) | (2,073,175 | ) | — | — | — | |||||||||||||
Class R | (184,525 | ) | (240,557 | ) | — | — | — | |||||||||||||
Total dividends and/or distributions from net realized gains | (66,629,704 | ) | (86,636,887 | ) | — | — | — | |||||||||||||
Total dividends and/or distributions to shareholders | (97,346,801 | ) | (119,796,106 | ) | (2,494,129 | ) | (1,480,306 | ) | (1,372,680 | ) | ||||||||||
Capital share transactions: | ||||||||||||||||||||
Proceeds from shares sold: | ||||||||||||||||||||
Class A | 168,562,758 | 215,836,917 | — | — | — | |||||||||||||||
Class B | 144,044 | 112,271 | — | — | — | |||||||||||||||
Class C | 43,906,340 | 61,469,915 | — | — | — | |||||||||||||||
Class I | 36,669,583 | 14,443,575 | — | — | — | |||||||||||||||
Class R | 1,393,679 | 1,371,028 | 765,372 | — | — | |||||||||||||||
Class R4 | — | — | 4,468,692 | 10,435,762 | 10,588,272 | |||||||||||||||
Class T1 | 9,896 | — | — | — | — | |||||||||||||||
Advisor Class | 10,000 | — | — | — | — | |||||||||||||||
| 250,696,300 | 293,233,706 | 5,234,064 | 10,435,762 | 10,588,272 | ||||||||||||||||
Issued from fund acquisition: | ||||||||||||||||||||
Class R | — | — | 446,964,832 | — | — | |||||||||||||||
Class R4 | — | — | 9,375,346 | — | — | |||||||||||||||
| — | — | 456,340,178 | — | — | ||||||||||||||||
Dividends and/or distributions reinvested: | ||||||||||||||||||||
Class A | 51,314,401 | 54,945,229 | — | — | — | |||||||||||||||
Class B | 1,081,686 | 2,200,048 | — | — | — | |||||||||||||||
Class C | 35,527,915 | 49,137,356 | — | — | — | |||||||||||||||
Class I | �� | 1,901,097 | 2,429,543 | — | — | — | ||||||||||||||
Class R | 248,635 | 300,525 | 1,852,771 | — | — | |||||||||||||||
Class R4 | — | — | 641,358 | 1,480,306 | 1,372,680 | |||||||||||||||
| 90,073,734 | 109,012,701 | 2,494,129 | 1,480,306 | 1,372,680 | ||||||||||||||||
Cost of shares redeemed: | ||||||||||||||||||||
Class A | (201,006,002 | ) | (153,181,661 | ) | — | — | — | |||||||||||||
Class B | (5,227,379 | ) | (6,158,304 | ) | — | — | — | |||||||||||||
Class C | (278,968,953 | ) | (192,514,176 | ) | — | — | — | |||||||||||||
Class I | (25,876,108 | ) | (20,292,177 | ) | — | — | — | |||||||||||||
Class R | (2,513,789 | ) | (1,754,502 | ) | (41,528,965 | ) | — | — | ||||||||||||
Class R4 | — | — | (77,449,724 | ) | (15,611,816 | ) | (24,595,141 | ) | ||||||||||||
| (513,592,231 | ) | (373,900,820 | ) | (118,978,689 | ) | (15,611,816 | ) | (24,595,141 | ) | |||||||||||
Automatic conversions: | ||||||||||||||||||||
Class A | 12,563,940 | 13,022,119 | — | — | — | |||||||||||||||
Class B | (12,563,940 | ) | (13,022,119 | ) | — | — | — | |||||||||||||
| — | — | — | — | — | ||||||||||||||||
Net increase (decrease) in net assets resulting from capital share transactions | (172,822,197 | ) | 28,345,587 | 345,089,682 | (3,695,748 | ) | (12,634,189 | ) | ||||||||||||
Net increase (decrease) in net assets | (59,116,704 | ) | (24,655,517 | ) | 366,766,870 | (806,894 | ) | (13,375,497 | ) | |||||||||||
Net assets: | ||||||||||||||||||||
Beginning of period/year | 2,019,183,213 | 2,043,838,730 | 78,806,374 | 79,613,268 | 92,988,765 | |||||||||||||||
End of period/year | $ | 1,960,066,509 | $ | 2,019,183,213 | $ | 445,573,244 | $ | 78,806,374 | $ | 79,613,268 | ||||||||||
Undistributed (distributions in excess of) net investment income (loss) | $ | 11,939,490 | $ | 6,937,555 | $ | 133,519 | $ | — | $ | — | ||||||||||
The Notes to Financial Statements are an integral part of this report.
| Transamerica Funds | Annual Report 2017 |
Page 44
Table of Contents
STATEMENTS OF CHANGES IN NET ASSETS (continued)
For the period and years ended:
| Transamerica Asset Allocation – Moderate Portfolio (A) (B) | Transamerica Asset Allocation Intermediate Horizon (C) (D) | |||||||||||||||||||
| October 31, 2017 | October 31, 2016 | October 31, 2017 (E) | December 31, 2016 | December 31, 2015 | ||||||||||||||||
Capital share transactions - shares: | ||||||||||||||||||||
Shares issued: | ||||||||||||||||||||
Class A | 13,869,564 | 18,302,657 | — | — | — | |||||||||||||||
Class B | 11,875 | 9,540 | — | — | — | |||||||||||||||
Class C | 3,633,108 | 5,242,495 | — | — | — | |||||||||||||||
Class I | 3,000,942 | 1,216,605 | — | — | — | |||||||||||||||
Class R | 116,508 | 117,050 | 99,172 | — | — | |||||||||||||||
Class R4 | — | — | 448,499 | 1,107,756 | 1,109,686 | |||||||||||||||
Class T1 | 831 | — | — | — | — | |||||||||||||||
Advisor Class | 835 | — | — | — | — | |||||||||||||||
| 20,633,663 | 24,888,347 | 547,671 | 1,107,756 | 1,109,686 | ||||||||||||||||
Shares issued on fund acquisition: | ||||||||||||||||||||
Class R | — | — | 44,696,483 | — | — | |||||||||||||||
Class R4 | — | — | 937,535 | — | — | |||||||||||||||
| — | — | 45,634,018 | — | — | ||||||||||||||||
Shares reinvested: | ||||||||||||||||||||
Class A | 4,431,295 | 4,740,745 | — | — | — | |||||||||||||||
Class B | 91,436 | 186,761 | — | — | — | |||||||||||||||
Class C | 3,070,694 | 4,250,636 | — | — | — | |||||||||||||||
Class I | 164,454 | 210,168 | — | — | — | |||||||||||||||
Class R | 21,564 | 26,065 | 182,393 | — | — | |||||||||||||||
Class R4 | — | — | 64,398 | 157,575 | 145,780 | |||||||||||||||
| 7,779,443 | 9,414,375 | 246,791 | 157,575 | 145,780 | ||||||||||||||||
Shares redeemed: | ||||||||||||||||||||
Class A | (16,419,331 | ) | (12,949,095 | ) | — | — | — | |||||||||||||
Class B | (419,746 | ) | (513,681 | ) | — | — | — | |||||||||||||
Class C | (23,004,730 | ) | (16,331,651 | ) | — | — | — | |||||||||||||
Class I | (2,121,299 | ) | (1,721,895 | ) | — | — | — | |||||||||||||
Class R | (205,851 | ) | (147,768 | ) | (4,073,857 | ) | — | — | ||||||||||||
Class R4 | — | — | (7,667,594 | ) | (1,661,621 | ) | (2,563,246 | ) | ||||||||||||
| (42,170,957 | ) | (31,664,090 | ) | (11,741,451 | ) | (1,661,621 | ) | (2,563,246 | ) | |||||||||||
Automatic conversions: | ||||||||||||||||||||
Class A | 1,028,965 | 1,103,996 | — | — | — | |||||||||||||||
Class B | (1,012,196 | ) | (1,090,225 | ) | — | — | — | |||||||||||||
| 16,769 | 13,771 | — | — | — | ||||||||||||||||
Net increase (decrease) in shares outstanding: | ||||||||||||||||||||
Class A | 2,910,493 | 11,198,303 | — | — | — | |||||||||||||||
Class B | (1,328,631 | ) | (1,407,605 | ) | — | — | — | |||||||||||||
Class C | (16,300,928 | ) | (6,838,520 | ) | — | — | — | |||||||||||||
Class I | 1,044,097 | (295,122 | ) | — | — | — | ||||||||||||||
Class R | (67,779 | ) | (4,653 | ) | 40,904,191 | — | — | |||||||||||||
Class R4 | — | — | (6,217,162 | ) | (396,290 | ) | (1,307,780 | ) | ||||||||||||
Class T1 | 831 | — | — | — | — | |||||||||||||||
Advisor Class | 835 | — | — | — | — | |||||||||||||||
| (13,741,082 | ) | 2,652,403 | 34,687,029 | (396,290 | ) | (1,307,780 | ) | |||||||||||||
| (A) | Class T1 commenced operations on March 17, 2017. | |
| (B) | Advisor Class commenced operations on March 3, 2017. | |
| (C) | Transamerica Institutional Asset Allocation – Intermediate Horizon reorganized into the Fund on May 19, 2017. Prior to May 19, 2017, information provided reflects Transamerica Institutional Asset Allocation – Intermediate Horizon, which was the accounting and performance survivor of the reorganization. Please reference the Reorganization section of the Notes to the Financial Statements for additional information. | |
| (D) | Effective May 19, 2017, the Fund underwent a 1.23-for-1 share split. The Capital share transactions – shares have been retroactively adjusted to reflect the share split. See the Stock Split section of the Notes to Financial Statements for more information. | |
| (E) | The fiscal year end of the Fund is October 31 while the fiscal year end of the accounting and performance survivor is December 31. The Statements of Changes in Net Assets represents activity for the ten months of January 1, 2017 – October 31, 2017. Please reference the Reorganization section of the Notes to the Financial Statements for additional information. |
The Notes to Financial Statements are an integral part of this report.
| Transamerica Funds | Annual Report 2017 |
Page 45
Table of Contents
STATEMENTS OF CHANGES IN NET ASSETS (continued)
For the period and years ended:
| Transamerica Asset Allocation Long Horizon (A) (B) | Transamerica Asset Allocation Short Horizon (C) (D) | |||||||||||||||||||||||
| October 31, 2017 (E) | December 31, 2016 | December 31, 2015 | October 31, 2017 (E) | December 31, 2016 | December 31, 2015 | |||||||||||||||||||
From operations: | ||||||||||||||||||||||||
Net investment income (loss) | $ | 346,820 | $ | 357,212 | $ | 384,275 | $ | 1,686,390 | $ | 309,821 | $ | 308,637 | ||||||||||||
Net realized gain (loss) | 21,039,329 | 1,219,879 | 3,171,019 | 77,734 | (20,892 | ) | (38,859 | ) | ||||||||||||||||
Net change in unrealized appreciation (depreciation) | (344,114 | ) | 342,929 | (3,075,546 | ) | 2,041,418 | 256,358 | (285,090 | ) | |||||||||||||||
Net increase (decrease) in net assets resulting from operations | 21,042,035 | 1,920,020 | 479,748 | 3,805,542 | 545,287 | (15,312 | ) | |||||||||||||||||
Dividends and/or distributions to shareholders: | ||||||||||||||||||||||||
Net investment income: | ||||||||||||||||||||||||
Class R | (219,043 | ) | — | — | (1,351,847 | ) | — | — | ||||||||||||||||
Class R4 | (214,487 | ) | (357,604 | ) | (399,677 | ) | (147,772 | ) | (310,689 | ) | (313,657 | ) | ||||||||||||
Total dividends and/or distributions from net investment income | (433,530 | ) | (357,604 | ) | (399,677 | ) | (1,499,619 | ) | (310,689 | ) | (313,657 | ) | ||||||||||||
Capital share transactions: | ||||||||||||||||||||||||
Proceeds from shares sold: | ||||||||||||||||||||||||
Class R | 446,246 | — | — | 1,206,426 | — | — | ||||||||||||||||||
Class R4 | 1,414,333 | 2,413,487 | 5,057,487 | 951,917 | 1,954,572 | 2,586,242 | ||||||||||||||||||
| 1,860,579 | 2,413,487 | 5,057,487 | 2,158,343 | 1,954,572 | 2,586,242 | |||||||||||||||||||
Issued from fund acquisition: | ||||||||||||||||||||||||
Class R | 249,595,177 | — | — | 197,514,479 | — | — | ||||||||||||||||||
Class R4 | 39,901,367 | — | — | — | — | — | ||||||||||||||||||
| 289,496,544 | — | — | 197,514,479 | — | — | |||||||||||||||||||
Dividends and/or distributions reinvested: | ||||||||||||||||||||||||
Class R | 219,043 | — | — | 1,351,847 | — | — | ||||||||||||||||||
Class R4 | 214,487 | 357,604 | 399,677 | 147,772 | 310,689 | 313,657 | ||||||||||||||||||
| 433,530 | 357,604 | 399,677 | 1,499,619 | 310,689 | 313,657 | |||||||||||||||||||
Cost of shares redeemed: | ||||||||||||||||||||||||
Class R | (40,163,455 | ) | — | — | (20,230,729 | ) | — | — | ||||||||||||||||
Class R4 | (42,237,540 | ) | (4,503,317 | ) | (12,203,415 | ) | (6,319,580 | ) | (2,952,762 | ) | (7,843,832 | ) | ||||||||||||
| (82,400,995 | ) | (4,503,317 | ) | (12,203,415 | ) | (26,550,309 | ) | (2,952,762 | ) | (7,843,832 | ) | |||||||||||||
Net increase (decrease) in net assets resulting from capital share transactions | 209,389,658 | (1,732,226 | ) | (6,746,251 | ) | 174,622,132 | (687,501 | ) | (4,943,933 | ) | ||||||||||||||
Net increase (decrease) in net assets | 229,998,163 | (169,810 | ) | (6,666,180 | ) | 176,928,055 | (452,903 | ) | (5,272,902 | ) | ||||||||||||||
Net assets: | ||||||||||||||||||||||||
Beginning of period/year | 28,489,260 | 28,659,070 | 35,325,250 | 11,896,487 | 12,349,390 | 17,622,292 | ||||||||||||||||||
End of period/year | $ | 258,487,423 | $ | 28,489,260 | $ | 28,659,070 | $ | 188,824,542 | $ | 11,896,487 | $ | 12,349,390 | ||||||||||||
Undistributed (distributions in excess of) net investment income (loss) | $ | — | $ | — | $ | — | $ | 186,918 | $ | — | $ | — | ||||||||||||
The Notes to Financial Statements are an integral part of this report.
| Transamerica Funds | Annual Report 2017 |
Page 46
Table of Contents
STATEMENTS OF CHANGES IN NET ASSETS (continued)
For the period and years ended:
| Transamerica Asset Allocation Long Horizon (A) (B) | Transamerica Asset Allocation Short Horizon (C) (D) | |||||||||||||||||||||||
| October 31, 2017 (E) | December 31, 2016 | December 31, 2015 | October 31, 2017 (E) | December 31, 2016 | December 31, 2015 | |||||||||||||||||||
Capital share transactions - shares: | ||||||||||||||||||||||||
Shares issued: | ||||||||||||||||||||||||
Class R | 55,357 | — | — | 134,991 | — | — | ||||||||||||||||||
Class R4 | 144,324 | 279,226 | 547,623 | 96,154 | 198,981 | 259,461 | ||||||||||||||||||
| 199,681 | 279,226 | 547,623 | 231,145 | 198,981 | 259,461 | |||||||||||||||||||
Shares issued on fund acquisition: | ||||||||||||||||||||||||
Class R | 24,959,518 | — | — | 19,751,448 | — | — | ||||||||||||||||||
Class R4 | 3,990,137 | — | — | — | — | — | ||||||||||||||||||
| 28,949,655 | — | — | 19,751,448 | — | — | |||||||||||||||||||
Shares reinvested: | ||||||||||||||||||||||||
Class R | 21,463 | — | — | 134,734 | — | — | ||||||||||||||||||
Class R4 | 21,416 | 39,868 | 43,822 | 14,799 | 31,615 | 31,965 | ||||||||||||||||||
| 42,879 | 39,868 | 43,822 | 149,533 | 31,615 | 31,965 | |||||||||||||||||||
Shares redeemed: | ||||||||||||||||||||||||
Class R | (3,890,465 | ) | — | — | (2,008,488 | ) | — | — | ||||||||||||||||
Class R4 | (4,142,692 | ) | (512,375 | ) | (1,316,778 | ) | (632,307 | ) | (300,818 | ) | (785,398 | ) | ||||||||||||
| (8,033,157 | ) | (512,375 | ) | (1,316,778 | ) | (2,640,795 | ) | (300,818 | ) | (785,398 | ) | |||||||||||||
Net increase (decrease) in shares outstanding: | ||||||||||||||||||||||||
Class R | 21,145,873 | — | — | 18,012,685 | — | — | ||||||||||||||||||
Class R4 | 13,185 | (193,281 | ) | (725,333 | ) | (521,354 | ) | (70,222 | ) | — | ||||||||||||||
| 21,159,058 | (193,281 | ) | (725,333 | ) | 17,491,331 | (70,222 | ) | (493,972 | ) | |||||||||||||||
| (A) | Transamerica Institutional Asset Allocation – Long Horizon reorganized into the Fund on May 19, 2017. Prior to May 19, 2017, information provided reflects Transamerica Institutional Asset Allocation – Long Horizon, which was the accounting and performance survivor of the reorganization. Please reference the Reorganization section of the Notes to the Financial Statements for additional information. | |
| (B) | Effective May 19, 2017, the Fund underwent a 1.22-for-1 share split. The Capital share transactions – shares have been retroactively adjusted to reflect the share split. See the Stock Split section of the Notes to Financial Statements for more information. | |
| (C) | Transamerica Institutional Asset Allocation – Short Horizon reorganized into the Fund on May 19, 2017. Prior to May 19, 2017, information provided reflects Transamerica Institutional Asset Allocation – Short Horizon, which was the accounting and performance survivor of the reorganization. Please reference the Reorganization section of the Notes to the Financial Statements for additional information. | |
| (D) | Effective May 19, 2017, the Fund underwent a 1.11-for-1 share split. The Capital share transactions – shares have been retroactively adjusted to reflect the share split. See the Stock Split section of the Notes to Financial Statements for more information. | |
(E) | The fiscal year end of the Fund is October 31 while the fiscal year end of the accounting and performance survivor is December 31. The Statements of Changes in Net Assets represents activity for the ten months of January 1, 2017 – October 31, 2017. Please reference the Reorganization section of the Notes to the Financial Statements for additional information. |
The Notes to Financial Statements are an integral part of this report.
| Transamerica Funds | Annual Report 2017 |
Page 47
Table of Contents
STATEMENTS OF CHANGES IN NET ASSETS (continued)
For the years ended:
| Transamerica Multi-Manager Alternative Strategies Portfolio (A) | ||||||||
| October 31, 2017 | October 31, 2016 | |||||||
From operations: | ||||||||
Net investment income (loss) | $ | 1,686,877 | $ | 9,687,269 | ||||
Net realized gain (loss) | (1,433,364 | ) | (4,060,071 | ) | ||||
Net change in unrealized appreciation (depreciation) | 4,507,027 | (5,088,135 | ) | |||||
Net increase (decrease) in net assets resulting from operations | 4,760,540 | 539,063 | ||||||
Dividends and/or distributions to shareholders: | ||||||||
Net investment income: | ||||||||
Class A | (667,194 | ) | (2,433,441 | ) | ||||
Class C | (154,533 | ) | (1,889,157 | ) | ||||
Class I | (1,458,668 | ) | (5,417,255 | ) | ||||
Class R6 | (909 | ) | (913 | ) | ||||
Total dividends and/or distributions from net investment income | (2,281,304 | ) | (9,740,766 | ) | ||||
Net realized gains: | ||||||||
Class A | — | (1,502,187 | ) | |||||
Class C | — | (1,666,391 | ) | |||||
Class I | — | (2,976,476 | ) | |||||
Class R6 | — | (816 | ) | |||||
Total dividends and/or distributions from net realized gains | — | (6,145,870 | ) | |||||
Total dividends and/or distributions to shareholders | (2,281,304 | ) | (15,886,636 | ) | ||||
Capital share transactions: | ||||||||
Proceeds from shares sold: | ||||||||
Class A | 4,822,075 | 9,768,314 | ||||||
Class C | 1,055,657 | 2,525,084 | ||||||
Class I | 31,917,682 | 21,269,628 | ||||||
Class R6 | 40,438 | 6,692 | ||||||
Class T1 | 10,000 | — | ||||||
| 37,845,852 | 33,569,718 | |||||||
Dividends and/or distributions reinvested: | ||||||||
Class A | 633,442 | 3,705,296 | ||||||
Class C | 138,283 | 3,133,312 | ||||||
Class I | 1,318,413 | 6,792,445 | ||||||
Class R6 | 909 | 1,729 | ||||||
| 2,091,047 | 13,632,782 | |||||||
Cost of shares redeemed: | ||||||||
Class A | (34,925,011 | ) | (40,084,187 | ) | ||||
Class C | (27,479,242 | ) | (30,632,307 | ) | ||||
Class I | (60,321,746 | ) | (102,602,237 | ) | ||||
Class R6 | (238 | ) | (56 | ) | ||||
| (122,726,237 | ) | (173,318,787 | ) | |||||
Net increase (decrease) in net assets resulting from capital share transactions | (82,789,338 | ) | (126,116,287 | ) | ||||
Net increase (decrease) in net assets | (80,310,102 | ) | (141,463,860 | ) | ||||
Net assets: | ||||||||
Beginning of year | 242,945,626 | 384,409,486 | ||||||
End of year | $ | 162,635,524 | $ | 242,945,626 | ||||
Undistributed (distributions in excess of) net investment income (loss) | $ | 407,519 | $ | 998,977 | ||||
The Notes to Financial Statements are an integral part of this report.
| Transamerica Funds | Annual Report 2017 |
Page 48
Table of Contents
STATEMENTS OF CHANGES IN NET ASSETS (continued)
For the years ended:
| Transamerica Multi-Manager Alternative Strategies Portfolio (A) | ||||||||
| October 31, 2017 | October 31, 2016 | |||||||
Capital share transactions - shares: | ||||||||
Shares issued: | ||||||||
Class A | 500,226 | 1,013,940 | ||||||
Class C | 109,982 | 266,471 | ||||||
Class I | 3,310,753 | 2,224,465 | ||||||
Class R6 | 4,147 | 707 | ||||||
Class T1 | 1,034 | — | ||||||
| 3,926,142 | 3,505,583 | |||||||
Shares reinvested: | ||||||||
Class A | 66,748 | 394,180 | ||||||
Class C | 14,633 | 335,473 | ||||||
Class I | 139,515 | 724,914 | ||||||
Class R6 | 95 | 182 | ||||||
| 220,991 | 1,454,749 | |||||||
Shares redeemed: | ||||||||
Class A | (3,621,203 | ) | (4,200,079 | ) | ||||
Class C | (2,869,340 | ) | (3,228,158 | ) | ||||
Class I | (6,259,077 | ) | (10,736,708 | ) | ||||
Class R6 | (24 | ) | (6 | ) | ||||
| (12,749,644 | ) | (18,164,951 | ) | |||||
Net increase (decrease) in shares outstanding: | ||||||||
Class A | (3,054,229 | ) | (2,791,959 | ) | ||||
Class C | (2,744,725 | ) | (2,626,214 | ) | ||||
Class I | (2,808,809 | ) | (7,787,329 | ) | ||||
Class R6 | 4,218 | 883 | ||||||
Class T1 | 1,034 | — | ||||||
| (8,602,511 | ) | (13,204,619 | ) | |||||
| (A) | Class T1 commenced operations on March 17, 2017. |
The Notes to Financial Statements are an integral part of this report.
| Transamerica Funds | Annual Report 2017 |
Page 49
Table of Contents
| For a share outstanding during the years indicated: | Transamerica Asset Allocation – Conservative Portfolio | |||||||||||||||||||
| Class A | ||||||||||||||||||||
October 31, 2017 | October 31, 2016 | October 31, 2015 | October 31, 2014 | October 31, 2013 | ||||||||||||||||
Net asset value, beginning of year | $ | 11.18 | $ | 11.40 | $ | 12.38 | $ | 12.33 | $ | 11.73 | ||||||||||
Investment operations: | ||||||||||||||||||||
Net investment income (loss) (A) (B) | 0.24 | 0.23 | (C) | 0.23 | 0.29 | 0.27 | ||||||||||||||
Net realized and unrealized gain (loss) | 0.71 | 0.18 | (0.11 | ) | 0.39 | 0.64 | ||||||||||||||
Total investment operations | 0.95 | 0.41 | 0.12 | 0.68 | 0.91 | |||||||||||||||
Dividends and/or distributions to shareholders: | ||||||||||||||||||||
Net investment income | (0.25 | ) | (0.25 | ) | (0.23 | ) | (0.30 | ) | (0.27 | ) | ||||||||||
Net realized gains | (0.29 | ) | (0.38 | ) | (0.87 | ) | (0.33 | ) | (0.04 | ) | ||||||||||
Total dividends and/or distributions to shareholders | (0.54 | ) | (0.63 | ) | (1.10 | ) | (0.63 | ) | (0.31 | ) | ||||||||||
Net asset value, end of year | $ | 11.59 | $ | 11.18 | $ | 11.40 | $ | 12.38 | $ | 12.33 | ||||||||||
Total return (D) | 8.78 | % | 3.83 | % | 1.07 | % | 5.65 | % | 7.90 | % | ||||||||||
Ratio and supplemental data: | ||||||||||||||||||||
Net assets end of year (000’s) | $ | 734,113 | $ | 622,495 | $ | 449,574 | $ | 416,116 | $ | 451,868 | ||||||||||
Expenses to average net assets (E) | ||||||||||||||||||||
Excluding waiver and/or reimbursement and recapture | 0.47 | % | 0.48 | % | 0.51 | % | 0.53 | % | 0.58 | % | ||||||||||
Including waiver and/or reimbursement and recapture | 0.47 | % | 0.47 | %(C) | 0.51 | % | 0.53 | % | 0.58 | % | ||||||||||
Net investment income (loss) to average net assets (B) | 2.15 | % | 2.12 | %(C) | 1.94 | % | 2.38 | % | 2.30 | % | ||||||||||
Portfolio turnover rate (F) | 18 | % | 4 | % | 11 | % | 26 | % | 6 | % | ||||||||||
| (A) | Calculated based on average number of shares outstanding. | |
| (B) | Recognition of net investment income by the Fund is affected by the timing of the declaration of dividends by the underlying funds in which the Fund invests. | |
| (C) | Please reference the Custody Out-of-Pocket Expense section of the Notes to Financial Statements for more information regarding the reimbursement of custody fees. The amount of the reimbursement on a per share basis was immaterial to the class. The Expenses to average net assets including waiver and/or reimbursement and recapture ratio, and Net investment income (loss) to average net assets ratio would have been 0.01% higher and 0.01% lower, respectively, had the custodian not reimbursed the Fund. | |
| (D) | Total return has been calculated without deduction of the maximum sales charge and contingent deferred sales charge. | |
| (E) | Does not include expenses of the underlying funds in which the Fund invests. | |
| (F) | Does not include portfolio activity of the underlying funds in which the Fund invests. |
| For a share outstanding during the years indicated: | Transamerica Asset Allocation – Conservative Portfolio | |||||||||||||||||||
| Class B | ||||||||||||||||||||
October 31, 2017 | October 31, 2016 | October 31, 2015 | October 31, 2014 | October 31, 2013 | ||||||||||||||||
Net asset value, beginning of year | $ | 11.12 | $ | 11.34 | $ | 12.32 | $ | 12.26 | $ | 11.66 | ||||||||||
Investment operations: | ||||||||||||||||||||
Net investment income (loss) (A) (B) | 0.17 | 0.18 | (C) | 0.15 | 0.21 | 0.19 | ||||||||||||||
Net realized and unrealized gain (loss) | 0.68 | 0.14 | (0.12 | ) | 0.38 | 0.63 | ||||||||||||||
Total investment operations | 0.85 | 0.32 | 0.03 | 0.59 | 0.82 | |||||||||||||||
Dividends and/or distributions to shareholders: | ||||||||||||||||||||
Net investment income | (0.14 | ) | (0.16 | ) | (0.14 | ) | (0.20 | ) | (0.18 | ) | ||||||||||
Net realized gains | (0.29 | ) | (0.38 | ) | (0.87 | ) | (0.33 | ) | (0.04 | ) | ||||||||||
Total dividends and/or distributions to shareholders | (0.43 | ) | (0.54 | ) | (1.01 | ) | (0.53 | ) | (0.22 | ) | ||||||||||
Net asset value, end of year | $ | 11.54 | $ | 11.12 | $ | 11.34 | $ | 12.32 | $ | 12.26 | ||||||||||
Total return (D) | 7.86 | % | 3.01 | % | 0.23 | % | 4.96 | % | 7.13 | % | ||||||||||
Ratio and supplemental data: | ||||||||||||||||||||
Net assets end of year (000’s) | $ | 6,731 | $ | 14,366 | $ | 23,943 | $ | 37,192 | $ | 52,694 | ||||||||||
Expenses to average net assets (E) | ||||||||||||||||||||
Excluding waiver and/or reimbursement and recapture | 1.34 | % | 1.30 | % | 1.29 | % | 1.28 | % | 1.29 | % | ||||||||||
Including waiver and/or reimbursement and recapture | 1.34 | % | 1.29 | %(C) | 1.29 | % | 1.28 | % | 1.29 | % | ||||||||||
Net investment income (loss) to average net assets (B) | 1.52 | % | 1.66 | %(C) | 1.31 | % | 1.73 | % | 1.62 | % | ||||||||||
Portfolio turnover rate (F) | 18 | % | 4 | % | 11 | % | 26 | % | 6 | % | ||||||||||
| (A) | Calculated based on average number of shares outstanding. | |
| (B) | Recognition of net investment income by the Fund is affected by the timing of the declaration of dividends by the underlying funds in which the Fund invests. | |
| (C) | Please reference the Custody Out-of-Pocket Expense section of the Notes to Financial Statements for more information regarding the reimbursement of custody fees. The amount of the reimbursement on a per share basis was immaterial to the class. The Expenses to average net assets including waiver and/or reimbursement and recapture ratio, and Net investment income (loss) to average net assets ratio would have been 0.01% higher and 0.01% lower, respectively, had the custodian not reimbursed the Fund. | |
| (D) | Total return has been calculated without deduction of the maximum contingent deferred sales charge. | |
| (E) | Does not include expenses of the underlying funds in which the Fund invests. | |
| (F) | Does not include portfolio activity of the underlying funds in which the Fund invests. |
The Notes to Financial Statements are an integral part of this report.
| Transamerica Funds | Annual Report 2017 |
Page 50
Table of Contents
FINANCIAL HIGHLIGHTS (continued)
| For a share outstanding during the years indicated: | Transamerica Asset Allocation – Conservative Portfolio | |||||||||||||||||||
| Class C | ||||||||||||||||||||
October 31, 2017 | October 31, 2016 | October 31, 2015 | October 31, 2014 | October 31, 2013 | ||||||||||||||||
Net asset value, beginning of year | $ | 11.08 | $ | 11.30 | $ | 12.29 | $ | 12.24 | $ | 11.64 | ||||||||||
Investment operations: | ||||||||||||||||||||
Net investment income (loss) (A) (B) | 0.17 | 0.17 | (C) | 0.15 | 0.21 | 0.19 | ||||||||||||||
Net realized and unrealized gain (loss) | 0.69 | 0.16 | (0.12 | ) | 0.38 | 0.64 | ||||||||||||||
Total investment operations | 0.86 | 0.33 | 0.03 | 0.59 | 0.83 | |||||||||||||||
Dividends and/or distributions to shareholders: | ||||||||||||||||||||
Net investment income | (0.16 | ) | (0.17 | ) | (0.15 | ) | (0.21 | ) | (0.19 | ) | ||||||||||
Net realized gains | (0.29 | ) | (0.38 | ) | (0.87 | ) | (0.33 | ) | (0.04 | ) | ||||||||||
Total dividends and/or distributions to shareholders | (0.45 | ) | (0.55 | ) | (1.02 | ) | (0.54 | ) | (0.23 | ) | ||||||||||
Net asset value, end of year | $ | 11.49 | $ | 11.08 | $ | 11.30 | $ | 12.29 | $ | 12.24 | ||||||||||
Total return (D) | 7.99 | % | 3.10 | % | 0.26 | % | 4.97 | % | 7.24 | % | ||||||||||
Ratio and supplemental data: | ||||||||||||||||||||
Net assets end of year (000’s) | $ | 331,669 | $ | 405,546 | $ | 453,483 | $ | 508,285 | $ | 548,471 | ||||||||||
Expenses to average net assets (E) | ||||||||||||||||||||
Excluding waiver and/or reimbursement and recapture | 1.23 | % | 1.22 | % | 1.22 | % | 1.22 | % | 1.23 | % | ||||||||||
Including waiver and/or reimbursement and recapture | 1.23 | % | 1.21 | %(C) | 1.22 | % | 1.22 | % | 1.23 | % | ||||||||||
Net investment income (loss) to average net assets (B) | 1.51 | % | 1.56 | %(C) | 1.26 | % | 1.69 | % | 1.63 | % | ||||||||||
Portfolio turnover rate (F) | 18 | % | 4 | % | 11 | % | 26 | % | 6 | % | ||||||||||
| (A) | Calculated based on average number of shares outstanding. | |
| (B) | Recognition of net investment income by the Fund is affected by the timing of the declaration of dividends by the underlying funds in which the Fund invests. | |
| (C) | Please reference the Custody Out-of-Pocket Expense section of the Notes to Financial Statements for more information regarding the reimbursement of custody fees. The amount of the reimbursement on a per share basis was immaterial to the class. The Expenses to average net assets including waiver and/or reimbursement and recapture ratio, and Net investment income (loss) to average net assets ratio would have been 0.01% higher and 0.01% lower, respectively, had the custodian not reimbursed the Fund. | |
| (D) | Total return has been calculated without deduction of the maximum contingent deferred sales charge. | |
| (E) | Does not include expenses of the underlying funds in which the Fund invests. | |
| (F) | Does not include portfolio activity of the underlying funds in which the Fund invests. |
| For a share outstanding during the years indicated: | Transamerica Asset Allocation – Conservative Portfolio | |||||||||||||||||||
| Class I | ||||||||||||||||||||
October 31, 2017 | October 31, 2016 | October 31, 2015 | October 31, 2014 | October 31, 2013 | ||||||||||||||||
Net asset value, beginning of year | $ | 11.21 | $ | 11.42 | $ | 12.40 | $ | 12.35 | $ | 11.75 | ||||||||||
Investment operations: | ||||||||||||||||||||
Net investment income (loss) (A) (B) | 0.28 | 0.28 | (C) | 0.27 | 0.32 | 0.30 | ||||||||||||||
Net realized and unrealized gain (loss) | 0.69 | 0.16 | (0.12 | ) | 0.39 | 0.65 | ||||||||||||||
Total investment operations | 0.97 | 0.44 | 0.15 | 0.71 | 0.95 | |||||||||||||||
Dividends and/or distributions to shareholders: | ||||||||||||||||||||
Net investment income | (0.27 | ) | (0.27 | ) | (0.26 | ) | (0.33 | ) | (0.31 | ) | ||||||||||
Net realized gains | (0.29 | ) | (0.38 | ) | (0.87 | ) | (0.33 | ) | (0.04 | ) | ||||||||||
Total dividends and/or distributions to shareholders | (0.56 | ) | (0.65 | ) | (1.13 | ) | (0.66 | ) | (0.35 | ) | ||||||||||
Net asset value, end of year | $ | 11.62 | $ | 11.21 | $ | 11.42 | $ | 12.40 | $ | 12.35 | ||||||||||
Total return | 8.97 | % | 4.13 | % | 1.33 | % | 5.94 | % | 8.24 | % | ||||||||||
Ratio and supplemental data: | ||||||||||||||||||||
Net assets end of year (000’s) | $ | 29,213 | $ | 25,946 | $ | 28,126 | $ | 32,814 | $ | 28,551 | ||||||||||
Expenses to average net assets (D) | ||||||||||||||||||||
Excluding waiver and/or reimbursement and recapture | 0.26 | % | 0.26 | % | 0.26 | % | 0.26 | % | 0.26 | % | ||||||||||
Including waiver and/or reimbursement and recapture | 0.26 | % | 0.25 | %(C) | 0.26 | % | 0.26 | % | 0.26 | % | ||||||||||
Net investment income (loss) to average net assets (B) | 2.46 | % | 2.50 | %(C) | 2.28 | % | 2.58 | % | 2.47 | % | ||||||||||
Portfolio turnover rate (E) | 18 | % | 4 | % | 11 | % | 26 | % | 6 | % | ||||||||||
| (A) | Calculated based on average number of shares outstanding. | |
| (B) | Recognition of net investment income by the Fund is affected by the timing of the declaration of dividends by the underlying funds in which the Fund invests. | |
| (C) | Please reference the Custody Out-of-Pocket Expense section of the Notes to Financial Statements for more information regarding the reimbursement of custody fees. The amount of the reimbursement on a per share basis was immaterial to the class. The Expenses to average net assets including waiver and/or reimbursement and recapture ratio, and Net investment income (loss) to average net assets ratio would have been 0.01% higher and 0.01% lower, respectively, had the custodian not reimbursed the Fund. | |
| (D) | Does not include expenses of the underlying funds in which the Fund invests. | |
| (E) | Does not include portfolio activity of the underlying funds in which the Fund invests. |
The Notes to Financial Statements are an integral part of this report.
| Transamerica Funds | Annual Report 2017 |
Page 51
Table of Contents
FINANCIAL HIGHLIGHTS (continued)
| For a share outstanding during the years indicated: | Transamerica Asset Allocation – Conservative Portfolio | |||||||||||||||||||
| Class R | ||||||||||||||||||||
October 31, 2017 | October 31, 2016 | October 31, 2015 | October 31, 2014 | October 31, 2013 | ||||||||||||||||
Net asset value, beginning of year | $ | 11.28 | $ | 11.49 | $ | 12.47 | $ | 12.41 | $ | 11.81 | ||||||||||
Investment operations: | ||||||||||||||||||||
Net investment income (loss) (A) (B) | 0.21 | 0.22 | (C) | 0.21 | 0.25 | 0.27 | ||||||||||||||
Net realized and unrealized gain (loss) | 0.70 | 0.15 | (0.13 | ) | 0.40 | 0.61 | ||||||||||||||
Total investment operations | 0.91 | 0.37 | 0.08 | 0.65 | 0.88 | |||||||||||||||
Dividends and/or distributions to shareholders: | ||||||||||||||||||||
Net investment income | (0.20 | ) | (0.20 | ) | (0.19 | ) | (0.26 | ) | (0.24 | ) | ||||||||||
Net realized gains | (0.29 | ) | (0.38 | ) | (0.87 | ) | (0.33 | ) | (0.04 | ) | ||||||||||
Total dividends and/or distributions to shareholders | (0.49 | ) | (0.58 | ) | (1.06 | ) | (0.59 | ) | (0.28 | ) | ||||||||||
Net asset value, end of year | $ | 11.70 | $ | 11.28 | $ | 11.49 | $ | 12.47 | $ | 12.41 | ||||||||||
Total return | 8.35 | % | 3.44 | % | 0.68 | % | 5.40 | % | 7.61 | % | ||||||||||
Ratio and supplemental data: | ||||||||||||||||||||
Net assets end of year (000’s) | $ | 1,359 | $ | 1,209 | $ | 1,532 | $ | 2,051 | $ | 2,439 | ||||||||||
Expenses to average net assets (D) | ||||||||||||||||||||
Excluding waiver and/or reimbursement and recapture | 0.85 | % | 0.86 | % | 0.86 | % | 0.82 | % | 0.81 | % | ||||||||||
Including waiver and/or reimbursement and recapture | 0.85 | % | 0.85 | %(C) | 0.86 | % | 0.82 | % | 0.81 | % | ||||||||||
Net investment income (loss) to average net assets (B) | 1.88 | % | 1.97 | %(C) | 1.77 | % | 2.06 | % | 2.21 | % | ||||||||||
Portfolio turnover rate (E) | 18 | % | 4 | % | 11 | % | 26 | % | 6 | % | ||||||||||
| (A) | Calculated based on average number of shares outstanding. | |
| (B) | Recognition of net investment income by the Fund is affected by the timing of the declaration of dividends by the underlying funds in which the Fund invests. | |
| (C) | Please reference the Custody Out-of-Pocket Expense section of the Notes to Financial Statements for more information regarding the reimbursement of custody fees. The amount of the reimbursement on a per share basis was immaterial to the class. The Expenses to average net assets including waiver and/or reimbursement and recapture ratio, and Net investment income (loss) to average net assets ratio would have been 0.01% higher and 0.01% lower, respectively, had the custodian not reimbursed the Fund. | |
| (D) | Does not include expenses of the underlying funds in which the Fund invests. | |
| (E) | Does not include portfolio activity of the underlying funds in which the Fund invests. |
| For a share outstanding during the period indicated: | Transamerica Asset Allocation – Conservative Portfolio | |||||||
| Class T1 | Advisor Class | |||||||
October 31, 2017 (A) | October 31, 2017 (B) | |||||||
Net asset value, beginning of period | $ | 11.11 | $ | 11.12 | ||||
Investment operations: | ||||||||
Net investment income (loss) (C) (D) | 0.11 | 0.12 | ||||||
Net realized and unrealized gain (loss) | 0.49 | 0.51 | ||||||
Total investment operations | 0.60 | 0.63 | ||||||
Dividends and/or distributions to shareholders: | ||||||||
Net investment income | (0.09 | ) | (0.10 | ) | ||||
Net asset value, end of period | $ | 11.62 | $ | 11.65 | ||||
Total return | 5.42 | %(E)(F) | 5.68 | %(F) | ||||
Ratio and supplemental data: | ||||||||
Net assets end of period (000’s) | $ | 11 | $ | 23 | ||||
Expenses to average net assets (G) | 0.40 | %(H) | 0.35 | %(H) | ||||
Net investment income (loss) to average net assets (D) | 1.59 | %(H) | 1.63 | %(H) | ||||
Portfolio turnover rate (I) | 18 | % | 18 | % | ||||
| (A) | Commenced operations on March 17, 2017. | |
| (B) | Commenced operations on March 3, 2017. | |
| (C) | Calculated based on average number of shares outstanding. | |
| (D) | Recognition of net investment income by the Fund is affected by the timing of the declaration of dividends by the underlying funds in which the Fund invests. | |
| (E) | Total return has been calculated without deduction of the maximum sales charge and contingent deferred sales charge. | |
| (F) | Not annualized. | |
| (G) | Does not include expenses of the underlying funds in which the Fund invests. | |
| (H) | Annualized. | |
| (I) | Does not include portfolio activity of the underlying funds in which the Fund invests. |
The Notes to Financial Statements are an integral part of this report.
| Transamerica Funds | Annual Report 2017 |
Page 52
Table of Contents
FINANCIAL HIGHLIGHTS (continued)
| For a share outstanding during the years indicated: | Transamerica Asset Allocation – Growth Portfolio | |||||||||||||||||||
| Class A | ||||||||||||||||||||
| October 31, 2017 | October 31, 2016 | October 31, 2015 | October 31, 2014 | October 31, 2013 | ||||||||||||||||
Net asset value, beginning of year | $ | 14.71 | $ | 15.57 | $ | 16.35 | $ | 15.26 | $ | 12.37 | ||||||||||
Investment operations: | ||||||||||||||||||||
Net investment income (loss) (A) (B) | 0.23 | 0.23 | (C) | 0.20 | 0.32 | 0.16 | ||||||||||||||
Net realized and unrealized gain (loss) | 2.55 | 0.24 | 0.23 | 1.08 | 2.87 | |||||||||||||||
Total investment operations | 2.78 | 0.47 | 0.43 | 1.40 | 3.03 | |||||||||||||||
Dividends and/or distributions to shareholders: | ||||||||||||||||||||
Net investment income | (0.24 | ) | (0.23 | ) | (0.22 | ) | (0.31 | ) | (0.14 | ) | ||||||||||
Net realized gains | (0.90 | ) | (1.10 | ) | (0.99 | ) | — | — | ||||||||||||
Total dividends and/or distributions to shareholders | (1.14 | ) | (1.33 | ) | (1.21 | ) | (0.31 | ) | (0.14 | ) | ||||||||||
Net asset value, end of year | $ | 16.35 | $ | 14.71 | $ | 15.57 | $ | 16.35 | $ | 15.26 | ||||||||||
Total return (D) | 20.19 | % | 3.28 | % | 2.65 | % | 9.30 | % | 24.75 | % | ||||||||||
Ratio and supplemental data: | ||||||||||||||||||||
Net assets end of year (000’s) | $ | 830,875 | $ | 727,751 | $ | 729,547 | $ | 728,850 | $ | 693,517 | ||||||||||
Expenses to average net assets (E) | ||||||||||||||||||||
Excluding waiver and/or reimbursement and recapture | 0.52 | % | 0.53 | % | 0.53 | % | 0.55 | % | 0.62 | % | ||||||||||
Including waiver and/or reimbursement and recapture | 0.52 | % | 0.52 | %(C) | 0.53 | % | 0.55 | % | 0.62 | % | ||||||||||
Net investment income (loss) to average net assets (B) | 1.53 | % | 1.63 | %(C) | 1.26 | % | 2.02 | % | 1.18 | % | ||||||||||
Portfolio turnover rate (F) | 9 | % | 1 | % | 6 | % | 31 | % | 22 | % | ||||||||||
| (A) | Calculated based on average number of shares outstanding. | |
| (B) | Recognition of net investment income by the Fund is affected by the timing of the declaration of dividends by the underlying funds in which the Fund invests. | |
| (C) | Please reference the Custody Out-of-Pocket Expense section of the Notes to Financial Statements for more information regarding the reimbursement of custody fees. The amount of the reimbursement on a per share basis was immaterial to the class. The Expenses to average net assets including waiver and/or reimbursement and recapture ratio, and Net investment income (loss) to average net assets ratio would have been 0.01% higher and 0.01% lower, respectively, had the custodian not reimbursed the Fund. | |
| (D) | Total return has been calculated without deduction of the maximum sales charge and contingent deferred sales charge. | |
| (E) | Does not include expenses of the underlying funds in which the Fund invests. | |
| (F) | Does not include portfolio activity of the underlying funds in which the Fund invests. |
| For a share outstanding during the years indicated: | Transamerica Asset Allocation – Growth Portfolio | |||||||||||||||||||
| Class B | ||||||||||||||||||||
| October 31, 2017 | October 31, 2016 | October 31, 2015 | October 31, 2014 | October 31, 2013 | ||||||||||||||||
Net asset value, beginning of year | $ | 14.40 | $ | 15.22 | $ | 15.98 | $ | 14.91 | $ | 12.07 | ||||||||||
Investment operations: | ||||||||||||||||||||
Net investment income (loss) (A) (B) | 0.16 | 0.15 | (C) | 0.10 | 0.23 | 0.07 | ||||||||||||||
Net realized and unrealized gain (loss) | 2.45 | 0.18 | 0.19 | 1.03 | 2.80 | |||||||||||||||
Total investment operations | 2.61 | 0.33 | 0.29 | 1.26 | 2.87 | |||||||||||||||
Dividends and/or distributions to shareholders: | ||||||||||||||||||||
Net investment income | (0.07 | ) | (0.05 | ) | (0.06 | ) | (0.19 | ) | (0.03 | ) | ||||||||||
Net realized gains | (0.90 | ) | (1.10 | ) | (0.99 | ) | — | — | ||||||||||||
Total dividends and/or distributions to shareholders | (0.97 | ) | (1.15 | ) | (1.05 | ) | (0.19 | ) | (0.03 | ) | ||||||||||
Net asset value, end of year | $ | 16.04 | $ | 14.40 | $ | 15.22 | $ | 15.98 | $ | 14.91 | ||||||||||
Total return (D) | 19.16 | % | 2.39 | % | 1.79 | % | 8.49 | % | 23.83 | % | ||||||||||
Ratio and supplemental data: | ||||||||||||||||||||
Net assets end of year (000’s) | $ | 14,456 | $ | 26,931 | $ | 47,506 | $ | 73,479 | $ | 98,099 | ||||||||||
Expenses to average net assets (E) | ||||||||||||||||||||
Excluding waiver and/or reimbursement and recapture | 1.41 | % | 1.37 | % | 1.35 | % | 1.34 | % | 1.38 | % | ||||||||||
Including waiver and/or reimbursement and recapture | 1.41 | % | 1.36 | %(C) | 1.35 | % | 1.34 | % | 1.38 | % | ||||||||||
Net investment income (loss) to average net assets (B) | 1.06 | % | 1.10 | %(C) | 0.64 | % | 1.51 | % | 0.51 | % | ||||||||||
Portfolio turnover rate (F) | 9 | % | 1 | % | 6 | % | 31 | % | 22 | % | ||||||||||
| (A) | Calculated based on average number of shares outstanding. | |
| (B) | Recognition of net investment income by the Fund is affected by the timing of the declaration of dividends by the underlying funds in which the Fund invests. | |
| (C) | Please reference the Custody Out-of-Pocket Expense section of the Notes to Financial Statements for more information regarding the reimbursement of custody fees. The amount of the reimbursement on a per share basis was immaterial to the class. The Expenses to average net assets including waiver and/or reimbursement and recapture ratio, and Net investment income (loss) to average net assets ratio would have been 0.01% higher and 0.01% lower, respectively, had the custodian not reimbursed the Fund. | |
| (D) | Total return has been calculated without deduction of the maximum contingent deferred sales charge. | |
| (E) | Does not include expenses of the underlying funds in which the Fund invests. | |
| (F) | Does not include portfolio activity of the underlying funds in which the Fund invests. |
The Notes to Financial Statements are an integral part of this report.
| Transamerica Funds | Annual Report 2017 |
Page 53
Table of Contents
FINANCIAL HIGHLIGHTS (continued)
| For a share outstanding during the years indicated: | Transamerica Asset Allocation – Growth Portfolio | |||||||||||||||||||
| Class C | ||||||||||||||||||||
| October 31, 2017 | October 31, 2016 | October 31, 2015 | October 31, 2014 | October 31, 2013 | ||||||||||||||||
Net asset value, beginning of year | $ | 14.26 | $ | 15.13 | $ | 15.92 | $ | 14.88 | $ | 12.06 | ||||||||||
Investment operations: | ||||||||||||||||||||
Net investment income (loss) (A) (B) | 0.13 | 0.13 | (C) | 0.08 | 0.20 | 0.07 | ||||||||||||||
Net realized and unrealized gain (loss) | 2.46 | 0.21 | 0.23 | 1.06 | 2.81 | |||||||||||||||
Total investment operations | 2.59 | 0.34 | 0.31 | 1.26 | 2.88 | |||||||||||||||
Dividends and/or distributions to shareholders: | ||||||||||||||||||||
Net investment income | (0.13 | ) | (0.11 | ) | (0.11 | ) | (0.22 | ) | (0.06 | ) | ||||||||||
Net realized gains | (0.90 | ) | (1.10 | ) | (0.99 | ) | — | — | ||||||||||||
Total dividends and/or distributions to shareholders | (1.03 | ) | (1.21 | ) | (1.10 | ) | (0.22 | ) | (0.06 | ) | ||||||||||
Net asset value, end of year | $ | 15.82 | $ | 14.26 | $ | 15.13 | $ | 15.92 | $ | 14.88 | ||||||||||
Total return (D) | 19.31 | % | 2.49 | % | 1.91 | % | 8.51 | % | 23.95 | % | ||||||||||
Ratio and supplemental data: | ||||||||||||||||||||
Net assets end of year (000’s) | $ | 628,621 | $ | 660,687 | $ | 716,039 | $ | 736,246 | $ | 710,928 | ||||||||||
Expenses to average net assets (E) | ||||||||||||||||||||
Excluding waiver and/or reimbursement and recapture | 1.26 | % | 1.27 | % | 1.26 | % | 1.26 | % | 1.30 | % | ||||||||||
Including waiver and/or reimbursement and recapture | 1.26 | % | 1.26 | %(C) | 1.26 | % | 1.26 | % | 1.30 | % | ||||||||||
Net investment income (loss) to average net assets (B) | 0.91 | % | 0.93 | %(C) | 0.54 | % | 1.32 | % | 0.51 | % | ||||||||||
Portfolio turnover rate (F) | 9 | % | 1 | % | 6 | % | 31 | % | 22 | % | ||||||||||
| (A) | Calculated based on average number of shares outstanding. | |
| (B) | Recognition of net investment income by the Fund is affected by the timing of the declaration of dividends by the underlying funds in which the Fund invests. | |
| (C) | Please reference the Custody Out-of-Pocket Expense section of the Notes to Financial Statements for more information regarding the reimbursement of custody fees. The amount of the reimbursement on a per share basis was immaterial to the class. The Expenses to average net assets including waiver and/or reimbursement and recapture ratio, and Net investment income (loss) to average net assets ratio would have been 0.01% higher and 0.01% lower, respectively, had the custodian not reimbursed the Fund. | |
| (D) | Total return has been calculated without deduction of the maximum contingent deferred sales charge. | |
| (E) | Does not include expenses of the underlying funds in which the Fund invests. | |
| (F) | Does not include portfolio activity of the underlying funds in which the Fund invests. |
| For a share outstanding during the years indicated: | Transamerica Asset Allocation – Growth Portfolio | |||||||||||||||||||
| Class I | ||||||||||||||||||||
| October 31, 2017 | October 31, 2016 | October 31, 2015 | October 31, 2014 | October 31, 2013 | ||||||||||||||||
Net asset value, beginning of year | $ | 14.72 | $ | 15.59 | $ | 16.37 | $ | 15.28 | $ | 12.39 | ||||||||||
Investment operations: | ||||||||||||||||||||
Net investment income (loss) (A) (B) | 0.23 | 0.28 | (C) | 0.23 | 0.35 | 0.20 | ||||||||||||||
Net realized and unrealized gain (loss) | 2.59 | 0.22 | 0.25 | 1.11 | 2.88 | |||||||||||||||
Total investment operations | 2.82 | 0.50 | 0.48 | 1.46 | 3.08 | |||||||||||||||
Dividends and/or distributions to shareholders: | ||||||||||||||||||||
Net investment income | (0.28 | ) | (0.27 | ) | (0.27 | ) | (0.37 | ) | (0.19 | ) | ||||||||||
Net realized gains | (0.90 | ) | (1.10 | ) | (0.99 | ) | — | — | ||||||||||||
Total dividends and/or distributions to shareholders | (1.18 | ) | (1.37 | ) | (1.26 | ) | (0.37 | ) | (0.19 | ) | ||||||||||
Net asset value, end of year | $ | 16.36 | $ | 14.72 | $ | 15.59 | $ | 16.37 | $ | 15.28 | ||||||||||
Total return | 20.52 | % | 3.52 | % | 2.96 | % | 9.64 | % | 25.21 | % | ||||||||||
Ratio and supplemental data: | ||||||||||||||||||||
Net assets end of year (000’s) | $ | 56,253 | $ | 32,116 | $ | 34,547 | $ | 30,595 | $ | 23,052 | ||||||||||
Expenses to average net assets (D) | ||||||||||||||||||||
Excluding waiver and/or reimbursement and recapture | 0.26 | % | 0.26 | % | 0.26 | % | 0.26 | % | 0.27 | % | ||||||||||
Including waiver and/or reimbursement and recapture | 0.26 | % | 0.25 | %(C) | 0.26 | % | 0.26 | % | 0.27 | % | ||||||||||
Net investment income (loss) to average net assets (B) | 1.50 | % | 1.96 | %(C) | 1.48 | % | 2.19 | % | 1.49 | % | ||||||||||
Portfolio turnover rate (E) | 9 | % | 1 | % | 6 | % | 31 | % | 22 | % | ||||||||||
| (A) | Calculated based on average number of shares outstanding. | |
| (B) | Recognition of net investment income by the Fund is affected by the timing of the declaration of dividends by the underlying funds in which the Fund invests. | |
| (C) | Please reference the Custody Out-of-Pocket Expense section of the Notes to Financial Statements for more information regarding the reimbursement of custody fees. The amount of the reimbursement on a per share basis was immaterial to the class. The Expenses to average net assets including waiver and/or reimbursement and recapture ratio, and Net investment income (loss) to average net assets ratio would have been 0.01% higher and 0.01% lower, respectively, had the custodian not reimbursed the Fund. | |
| (D) | Does not include expenses of the underlying funds in which the Fund invests. | |
| (E) | Does not include portfolio activity of the underlying funds in which the Fund invests. |
The Notes to Financial Statements are an integral part of this report.
| Transamerica Funds | Annual Report 2017 |
Page 54
Table of Contents
FINANCIAL HIGHLIGHTS (continued)
| For a share outstanding during the years indicated: | Transamerica Asset Allocation – Growth Portfolio | |||||||||||||||||||
| Class R | ||||||||||||||||||||
| October 31, 2017 | October 31, 2016 | October 31, 2015 | October 31, 2014 | October 31, 2013 | ||||||||||||||||
Net asset value, beginning of year | $ | 14.57 | $ | 15.45 | $ | 16.24 | $ | 15.16 | $ | 12.27 | ||||||||||
Investment operations: | ||||||||||||||||||||
Net investment income (loss) (A) (B) | 0.18 | 0.21 | (C) | 0.15 | 0.23 | 0.13 | ||||||||||||||
Net realized and unrealized gain (loss) | 2.55 | 0.20 | 0.23 | 1.12 | 2.86 | |||||||||||||||
Total investment operations | 2.73 | 0.41 | 0.38 | 1.35 | 2.99 | |||||||||||||||
Dividends and/or distributions to shareholders: | ||||||||||||||||||||
Net investment income | (0.20 | ) | (0.19 | ) | (0.18 | ) | (0.27 | ) | (0.10 | ) | ||||||||||
Net realized gains | (0.90 | ) | (1.10 | ) | (0.99 | ) | — | — | ||||||||||||
Total dividends and/or distributions to shareholders | (1.10 | ) | (1.29 | ) | (1.17 | ) | (0.27 | ) | (0.10 | ) | ||||||||||
Net asset value, end of year | $ | 16.20 | $ | 14.57 | $ | 15.45 | $ | 16.24 | $ | 15.16 | ||||||||||
Total return | 19.94 | % | 2.90 | % | 2.29 | % | 9.01 | % | 24.51 | % | ||||||||||
Ratio and supplemental data: | ||||||||||||||||||||
Net assets end of year (000’s) | $ | 2,702 | $ | 2,142 | $ | 2,260 | $ | 2,127 | $ | 2,541 | ||||||||||
Expenses to average net assets (D) | ||||||||||||||||||||
Excluding waiver and/or reimbursement and recapture | 0.80 | % | 0.86 | % | 0.83 | % | 0.85 | % | 0.84 | % | ||||||||||
Including waiver and/or reimbursement and recapture | 0.80 | % | 0.85 | %(C) | 0.83 | % | 0.85 | % | 0.84 | % | ||||||||||
Net investment income (loss) to average net assets (B) | 1.19 | % | 1.47 | %(C) | 0.93 | % | 1.47 | % | 0.97 | % | ||||||||||
Portfolio turnover rate (E) | 9 | % | 1 | % | 6 | % | 31 | % | 22 | % | ||||||||||
| (A) | Calculated based on average number of shares outstanding. | |
| (B) | Recognition of net investment income by the Fund is affected by the timing of the declaration of dividends by the underlying funds in which the Fund invests. | |
| (C) | Please reference the Custody Out-of-Pocket Expense section of the Notes to Financial Statements for more information regarding the reimbursement of custody fees. The amount of the reimbursement on a per share basis was immaterial to the class. The Expenses to average net assets including waiver and/or reimbursement and recapture ratio, and Net investment income (loss) to average net assets ratio would have been 0.01% higher and 0.01% lower, respectively, had the custodian not reimbursed the Fund. | |
| (D) | Does not include expenses of the underlying funds in which the Fund invests. | |
| (E) | Does not include portfolio activity of the underlying funds in which the Fund invests. |
| For a share outstanding during the period indicated: | Transamerica Asset Allocation – Growth Portfolio | |||||||
| Class T1 | Advisor Class | |||||||
| October 31, 2017 (A) | October 31, 2017 (B) | |||||||
Net asset value, beginning of period | $ | 14.92 | $ | 14.81 | ||||
Investment operations: | ||||||||
Net investment income (loss) (C) (D) | 0.04 | 0.04 | ||||||
Net realized and unrealized gain (loss) | 1.41 | 1.50 | ||||||
Total investment operations | 1.45 | 1.54 | ||||||
Net asset value, end of period | $ | 16.37 | $ | 16.35 | ||||
Total return | 9.72 | %(E)(F) | 10.40 | %(F) | ||||
Ratio and supplemental data: | ||||||||
Net assets end of period (000’s) | $ | 11 | $ | 11 | ||||
Expenses to average net assets (G) | 0.40 | %(H) | 0.35 | %(H) | ||||
Net investment income (loss) to average net assets (D) | 0.43 | %(H) | 0.43 | %(H) | ||||
Portfolio turnover rate (I) | 9 | % | 9 | % | ||||
| (A) | Commenced operations on March 17, 2017. | |
| (B) | Commenced operations on March 3, 2017. | |
| (C) | Calculated based on average number of shares outstanding. | |
| (D) | Recognition of net investment income by the Fund is affected by the timing of the declaration of dividends by the underlying funds in which the Fund invests. | |
| (E) | Total return has been calculated without deduction of the maximum sales charge and contingent deferred sales charge. | |
| (F) | Not annualized. | |
| (G) | Does not include expenses of the underlying funds in which the Fund invests. | |
| (H) | Annualized. | |
| (I) | Does not include portfolio activity of the underlying funds in which the Fund invests. |
The Notes to Financial Statements are an integral part of this report.
| Transamerica Funds | Annual Report 2017 |
Page 55
Table of Contents
FINANCIAL HIGHLIGHTS (continued)
| For a share outstanding during the years indicated: | Transamerica Asset Allocation – Moderate Growth Portfolio | |||||||||||||||||||
| Class A | ||||||||||||||||||||
October 31, 2017 | October 31, 2016 | October 31, 2015 | October 31, 2014 | October 31, 2013 | ||||||||||||||||
Net asset value, beginning of year | $ | 13.34 | $ | 13.93 | $ | 15.23 | $ | 14.39 | $ | 12.34 | ||||||||||
Investment operations: | ||||||||||||||||||||
Net investment income (loss) (A) (B) | 0.26 | 0.23 | (C) | 0.24 | 0.31 | 0.21 | ||||||||||||||
Net realized and unrealized gain (loss) | 1.67 | 0.20 | 0.05 | 0.83 | 2.06 | |||||||||||||||
Total investment operations | 1.93 | 0.43 | 0.29 | 1.14 | 2.27 | |||||||||||||||
Dividends and/or distributions to shareholders: | ||||||||||||||||||||
Net investment income | (0.25 | ) | (0.23 | ) | (0.27 | ) | (0.30 | ) | (0.22 | ) | ||||||||||
Net realized gains | (0.64 | ) | (0.79 | ) | (1.32 | ) | — | — | ||||||||||||
Total dividends and/or distributions to shareholders | (0.89 | ) | (1.02 | ) | (1.59 | ) | (0.30 | ) | (0.22 | ) | ||||||||||
Net asset value, end of year | $ | 14.38 | $ | 13.34 | $ | 13.93 | $ | 15.23 | $ | 14.39 | ||||||||||
Total return (D) | 15.32 | % | 3.35 | % | 1.93 | % | 8.01 | % | 18.67 | % | ||||||||||
Ratio and supplemental data: | ||||||||||||||||||||
Net assets end of year (000’s) | $ | 1,434,214 | $ | 1,315,381 | $ | 1,301,591 | $ | 1,319,226 | $ | 1,269,265 | ||||||||||
Expenses to average net assets (E) | ||||||||||||||||||||
Excluding waiver and/or reimbursement and recapture | 0.49 | % | 0.50 | % | 0.50 | % | 0.52 | % | 0.58 | % | ||||||||||
Including waiver and/or reimbursement and recapture | 0.49 | % | 0.49 | %(C) | 0.50 | % | 0.52 | % | 0.58 | % | ||||||||||
Net investment income (loss) to average net assets (B) | 1.89 | % | 1.76 | %(C) | 1.68 | % | 2.09 | % | 1.60 | % | ||||||||||
Portfolio turnover rate (F) | 14 | % | 1 | % | 7 | % | 33 | % | 19 | % | ||||||||||
| (A) | Calculated based on average number of shares outstanding. | |
| (B) | Recognition of net investment income by the Fund is affected by the timing of the declaration of dividends by the underlying funds in which the Fund invests. | |
| (C) | Please reference the Custody Out-of-Pocket Expense section of the Notes to Financial Statements for more information regarding the reimbursement of custody fees. The amount of the reimbursement on a per share basis was immaterial to the class. The Expenses to average net assets including waiver and/or reimbursement and recapture ratio, and Net investment income (loss) to average net assets ratio would have been 0.01% higher and 0.01% lower, respectively, had the custodian not reimbursed the Fund. | |
| (D) | Total return has been calculated without deduction of the maximum sales charge and contingent deferred sales charge. | |
| (E) | Does not include expenses of the underlying funds in which the Fund invests. | |
| (F) | Does not include portfolio activity of the underlying funds in which the Fund invests. |
| For a share outstanding during the years indicated: | Transamerica Asset Allocation – Moderate Growth Portfolio | |||||||||||||||||||
| Class B | ||||||||||||||||||||
October 31, 2017 | October 31, 2016 | October 31, 2015 | October 31, 2014 | October 31, 2013 | ||||||||||||||||
Net asset value, beginning of year | $ | 13.44 | $ | 13.97 | $ | 15.23 | $ | 14.38 | $ | 12.32 | ||||||||||
Investment operations: | ||||||||||||||||||||
Net investment income (loss) (A) (B) | 0.18 | 0.15 | (C) | 0.15 | 0.23 | 0.12 | ||||||||||||||
Net realized and unrealized gain (loss) | 1.65 | 0.18 | 0.02 | 0.79 | 2.05 | |||||||||||||||
Total investment operations | 1.83 | 0.33 | 0.17 | 1.02 | 2.17 | |||||||||||||||
Dividends and/or distributions to shareholders: | ||||||||||||||||||||
Net investment income | (0.08 | ) | (0.07 | ) | (0.11 | ) | (0.17 | ) | (0.11 | ) | ||||||||||
Net realized gains | (0.64 | ) | (0.79 | ) | (1.32 | ) | — | — | ||||||||||||
Total dividends and/or distributions to shareholders | (0.72 | ) | (0.86 | ) | (1.43 | ) | (0.17 | ) | (0.11 | ) | ||||||||||
Net asset value, end of year | $ | 14.55 | $ | 13.44 | $ | 13.97 | $ | 15.23 | $ | 14.38 | ||||||||||
Total return (D) | 14.26 | % | 2.55 | % | 1.11 | % | 7.16 | % | 17.72 | % | ||||||||||
Ratio and supplemental data: | ||||||||||||||||||||
Net assets end of year (000’s) | $ | 24,269 | $ | 47,691 | $ | 84,073 | $ | 133,060 | $ | 182,030 | ||||||||||
Expenses to average net assets (E) | ||||||||||||||||||||
Excluding waiver and/or reimbursement and recapture | 1.37 | % | 1.34 | % | 1.32 | % | 1.30 | % | 1.33 | % | ||||||||||
Including waiver and/or reimbursement and recapture | 1.37 | % | 1.33 | %(C) | 1.32 | % | 1.30 | % | 1.33 | % | ||||||||||
Net investment income (loss) to average net assets (B) | 1.31 | % | 1.15 | %(C) | 1.06 | % | 1.52 | % | 0.94 | % | ||||||||||
Portfolio turnover rate (F) | 14 | % | 1 | % | 7 | % | 33 | % | 19 | % | ||||||||||
| (A) | Calculated based on average number of shares outstanding. | |
| (B) | Recognition of net investment income by the Fund is affected by the timing of the declaration of dividends by the underlying funds in which the Fund invests. | |
| (C) | Please reference the Custody Out-of-Pocket Expense section of the Notes to Financial Statements for more information regarding the reimbursement of custody fees. The amount of the reimbursement on a per share basis was immaterial to the class. The Expenses to average net assets including waiver and/or reimbursement and recapture ratio, and Net investment income (loss) to average net assets ratio would have been 0.01% higher and 0.01% lower, respectively, had the custodian not reimbursed the Fund. | |
| (D) | Total return has been calculated without deduction of the maximum contingent deferred sales charge. | |
| (E) | Does not include expenses of the underlying funds in which the Fund invests. | |
| (F) | Does not include portfolio activity of the underlying funds in which the Fund invests. |
The Notes to Financial Statements are an integral part of this report.
| Transamerica Funds | Annual Report 2017 |
Page 56
Table of Contents
FINANCIAL HIGHLIGHTS (continued)
| For a share outstanding during the years indicated: | Transamerica Asset Allocation – Moderate Growth Portfolio | |||||||||||||||||||
| Class C | ||||||||||||||||||||
October 31, 2017 | October 31, 2016 | October 31, 2015 | October 31, 2014 | October 31, 2013 | ||||||||||||||||
Net asset value, beginning of year | $ | 13.24 | $ | 13.82 | $ | 15.12 | $ | 14.30 | $ | 12.26 | ||||||||||
Investment operations: | ||||||||||||||||||||
Net investment income (loss) (A) (B) | 0.17 | 0.14 | (C) | 0.14 | 0.21 | 0.12 | ||||||||||||||
Net realized and unrealized gain (loss) | 1.65 | 0.19 | 0.04 | 0.82 | 2.05 | |||||||||||||||
Total investment operations | 1.82 | 0.33 | 0.18 | 1.03 | 2.17 | |||||||||||||||
Dividends and/or distributions to shareholders: | ||||||||||||||||||||
Net investment income | (0.14 | ) | (0.12 | ) | (0.16 | ) | (0.21 | ) | (0.13 | ) | ||||||||||
Net realized gains | (0.64 | ) | (0.79 | ) | (1.32 | ) | — | — | ||||||||||||
Total dividends and/or distributions to shareholders | (0.78 | ) | (0.91 | ) | (1.48 | ) | (0.21 | ) | (0.13 | ) | ||||||||||
Net asset value, end of year | $ | 14.28 | $ | 13.24 | $ | 13.82 | $ | 15.12 | $ | 14.30 | ||||||||||
Total return (D) | 14.48 | % | 2.60 | % | 1.16 | % | 7.23 | % | 17.88 | % | ||||||||||
Ratio and supplemental data: | ||||||||||||||||||||
Net assets end of year (000’s) | $ | 1,123,771 | $ | 1,286,726 | $ | 1,431,708 | $ | 1,526,267 | $ | 1,506,825 | ||||||||||
Expenses to average net assets (E) | ||||||||||||||||||||
Excluding waiver and/or reimbursement and recapture | 1.24 | % | 1.24 | % | 1.23 | % | 1.23 | % | 1.26 | % | ||||||||||
Including waiver and/or reimbursement and recapture | 1.24 | % | 1.23 | %(C) | 1.23 | % | 1.23 | % | 1.26 | % | ||||||||||
Net investment income (loss) to average net assets (B) | 1.25 | % | 1.05 | %(C) | 0.96 | % | 1.39 | % | 0.92 | % | ||||||||||
Portfolio turnover rate (F) | 14 | % | 1 | % | 7 | % | 33 | % | 19 | % | ||||||||||
| (A) | Calculated based on average number of shares outstanding. | |
| (B) | Recognition of net investment income by the Fund is affected by the timing of the declaration of dividends by the underlying funds in which the Fund invests. | |
| (C) | Please reference the Custody Out-of-Pocket Expense section of the Notes to Financial Statements for more information regarding the reimbursement of custody fees. The amount of the reimbursement on a per share basis was immaterial to the class. The Expenses to average net assets including waiver and/or reimbursement and recapture ratio, and Net investment income (loss) to average net assets ratio would have been 0.01% higher and 0.01% lower, respectively, had the custodian not reimbursed the Fund. | |
| (D) | Total return has been calculated without deduction of the maximum contingent deferred sales charge. | |
| (E) | Does not include expenses of the underlying funds in which the Fund invests. | |
| (F) | Does not include portfolio activity of the underlying funds in which the Fund invests. |
| For a share outstanding during the years indicated: | Transamerica Asset Allocation – Moderate Growth Portfolio | |||||||||||||||||||
| Class I | ||||||||||||||||||||
October 31, 2017 | October 31, 2016 | October 31, 2015 | October 31, 2014 | October 31, 2013 | ||||||||||||||||
Net asset value, beginning of year | $ | 13.34 | $ | 13.93 | $ | 15.23 | $ | 14.40 | $ | 12.36 | ||||||||||
Investment operations: | ||||||||||||||||||||
Net investment income (loss) (A) (B) | 0.27 | 0.27 | (C) | 0.28 | 0.34 | 0.24 | ||||||||||||||
Net realized and unrealized gain (loss) | 1.69 | 0.19 | 0.05 | 0.84 | 2.06 | |||||||||||||||
Total investment operations | 1.96 | 0.46 | 0.33 | 1.18 | 2.30 | |||||||||||||||
Dividends and/or distributions to shareholders: | ||||||||||||||||||||
Net investment income | (0.28 | ) | (0.26 | ) | (0.31 | ) | (0.35 | ) | (0.26 | ) | ||||||||||
Net realized gains | (0.64 | ) | (0.79 | ) | (1.32 | ) | — | — | ||||||||||||
Total dividends and/or distributions to shareholders | (0.92 | ) | (1.05 | ) | (1.63 | ) | (0.35 | ) | (0.26 | ) | ||||||||||
Net asset value, end of year | $ | 14.38 | $ | 13.34 | $ | 13.93 | $ | 15.23 | $ | 14.40 | ||||||||||
Total return | 15.62 | % | 3.63 | % | 2.22 | % | 8.27 | % | 19.00 | % | ||||||||||
Ratio and supplemental data: | ||||||||||||||||||||
Net assets end of year (000’s) | $ | 85,959 | $ | 53,166 | $ | 55,554 | $ | 54,952 | $ | 46,067 | ||||||||||
Expenses to average net assets (D) | ||||||||||||||||||||
Excluding waiver and/or reimbursement and recapture | 0.25 | % | 0.25 | % | 0.25 | % | 0.25 | % | 0.26 | % | ||||||||||
Including waiver and/or reimbursement and recapture | 0.25 | % | 0.24 | %(C) | 0.25 | % | 0.25 | % | 0.26 | % | ||||||||||
Net investment income (loss) to average net assets (B) | 1.96 | % | 2.04 | %(C) | 1.94 | % | 2.30 | % | 1.84 | % | ||||||||||
Portfolio turnover rate (E) | 14 | % | 1 | % | 7 | % | 33 | % | 19 | % | ||||||||||
| (A) | Calculated based on average number of shares outstanding. | |
| (B) | Recognition of net investment income by the Fund is affected by the timing of the declaration of dividends by the underlying funds in which the Fund invests. | |
| (C) | Please reference the Custody Out-of-Pocket Expense section of the Notes to Financial Statements for more information regarding the reimbursement of custody fees. The amount of the reimbursement on a per share basis was immaterial to the class. The Expenses to average net assets including waiver and/or reimbursement and recapture ratio, and Net investment income (loss) to average net assets ratio would have been 0.01% higher and 0.01% lower, respectively, had the custodian not reimbursed the Fund. | |
| (D) | Does not include expenses of the underlying funds in which the Fund invests. | |
| (E) | Does not include portfolio activity of the underlying funds in which the Fund invests. |
The Notes to Financial Statements are an integral part of this report.
| Transamerica Funds | Annual Report 2017 |
Page 57
Table of Contents
FINANCIAL HIGHLIGHTS (continued)
| For a share outstanding during the years indicated: | Transamerica Asset Allocation – Moderate Growth Portfolio | |||||||||||||||||||
| Class R | ||||||||||||||||||||
| October 31, 2017 | October 31, 2016 | October 31, 2015 | October 31, 2014 | October 31, 2013 | ||||||||||||||||
Net asset value, beginning of year | $ | 13.26 | $ | 13.85 | $ | 15.15 | $ | 14.32 | $ | 12.28 | ||||||||||
Investment operations: | ||||||||||||||||||||
Net investment income (loss) (A) (B) | 0.18 | 0.21 | (C) | 0.20 | 0.26 | 0.19 | ||||||||||||||
Net realized and unrealized gain (loss) | 1.70 | 0.18 | 0.05 | 0.84 | 2.04 | |||||||||||||||
Total investment operations | 1.88 | 0.39 | 0.25 | 1.10 | 2.23 | |||||||||||||||
Dividends and/or distributions to shareholders: | ||||||||||||||||||||
Net investment income | (0.20 | ) | (0.19 | ) | (0.23 | ) | (0.27 | ) | (0.19 | ) | ||||||||||
Net realized gains | (0.64 | ) | (0.79 | ) | (1.32 | ) | — | — | ||||||||||||
Total dividends and/or distributions to shareholders | (0.84 | ) | (0.98 | ) | (1.55 | ) | (0.27 | ) | (0.19 | ) | ||||||||||
Net asset value, end of year | $ | 14.30 | $ | 13.26 | $ | 13.85 | $ | 15.15 | $ | 14.32 | ||||||||||
Total return | 15.03 | % | 3.10 | % | 1.65 | % | 7.77 | % | 18.46 | % | ||||||||||
Ratio and supplemental data: | ||||||||||||||||||||
Net assets end of year (000’s) | $ | 4,246 | $ | 4,483 | $ | 5,262 | $ | 5,364 | $ | 5,202 | ||||||||||
Expenses to average net assets (D) | ||||||||||||||||||||
Excluding waiver and/or reimbursement and recapture | 0.76 | % | 0.79 | % | 0.76 | % | 0.75 | % | 0.77 | % | ||||||||||
Including waiver and/or reimbursement and recapture | 0.76 | % | 0.78 | %(C) | 0.76 | % | 0.75 | % | 0.77 | % | ||||||||||
Net investment income (loss) to average net assets (B) | 1.36 | % | 1.61 | %(C) | 1.45 | % | 1.75 | % | 1.42 | % | ||||||||||
Portfolio turnover rate (E) | 14 | % | 1 | % | 7 | % | 33 | % | 19 | % | ||||||||||
| (A) | Calculated based on average number of shares outstanding. | |
| (B) | Recognition of net investment income by the Fund is affected by the timing of the declaration of dividends by the underlying funds in which the Fund invests. | |
| (C) | Please reference the Custody Out-of-Pocket Expense section of the Notes to Financial Statements for more information regarding the reimbursement of custody fees. The amount of the reimbursement on a per share basis was immaterial to the class. The Expenses to average net assets including waiver and/or reimbursement and recapture ratio, and Net investment income (loss) to average net assets ratio would have been 0.01% higher and 0.01% lower, respectively, had the custodian not reimbursed the Fund. | |
| (D) | Does not include expenses of the underlying funds in which the Fund invests. | |
| (E) | Does not include portfolio activity of the underlying funds in which the Fund invests. |
| For a share outstanding during the period indicated: | Transamerica Asset Allocation – | |||||||
Class T1 | Advisor Class | |||||||
October 31, | October 31, 2017 (B) | |||||||
Net asset value, beginning of period | $ | 13.35 | $ | 13.27 | ||||
Investment operations: | ||||||||
Net investment income (loss) (C) (D) | 0.12 | 0.09 | ||||||
Net realized and unrealized gain (loss) | 0.92 | 1.01 | ||||||
Total investment operations | 1.04 | 1.10 | ||||||
Net asset value, end of period | $ | 14.39 | $ | 14.37 | ||||
Total return | 7.79 | %(E)(F) | 8.29 | %(F) | ||||
Ratio and supplemental data: | ||||||||
Net assets end of period (000’s) | $ | 11 | $ | 11 | ||||
Expenses to average net assets (G) | 0.39 | %(H) | 0.35 | %(H) | ||||
Net investment income (loss) to average net assets (D) | 1.36 | %(H) | 1.01 | %(H) | ||||
Portfolio turnover rate (I) | 14 | % | 14 | % | ||||
| (A) | Commenced operations on March 17, 2017. | |
| (B) | Commenced operations on March 3, 2017. | |
(C) | Calculated based on average number of shares outstanding. | |
(D) | Recognition of net investment income by the Fund is affected by the timing of the declaration of dividends by the underlying funds in which the Fund invests. | |
(E) | Total return has been calculated without deduction of the maximum sales charge and contingent deferred sales charge. | |
(F) | Not annualized. | |
(G) | Does not include expenses of the underlying funds in which the Fund invests. | |
(H) | Annualized. | |
| (I) | Does not include portfolio activity of the underlying funds in which the Fund invests. |
The Notes to Financial Statements are an integral part of this report.
| Transamerica Funds | Annual Report 2017 |
Page 58
Table of Contents
FINANCIAL HIGHLIGHTS (continued)
| For a share outstanding during the years indicated: | Transamerica Asset Allocation – Moderate Portfolio | |||||||||||||||||||
| Class A | ||||||||||||||||||||
October 31, 2017 | October 31, 2016 | October 31, 2015 | October 31, 2014 | October 31, 2013 | ||||||||||||||||
Net asset value, beginning of year | $ | 12.11 | $ | 12.46 | $ | 13.56 | $ | 13.58 | $ | 12.26 | ||||||||||
Investment operations: | ||||||||||||||||||||
Net investment income (loss) (A) (B) | 0.25 | 0.24 | (C) | 0.24 | 0.27 | 0.24 | ||||||||||||||
Net realized and unrealized gain (loss) | 1.08 | 0.18 | (0.06 | ) | 0.54 | 1.34 | ||||||||||||||
Total investment operations | 1.33 | 0.42 | 0.18 | 0.81 | 1.58 | |||||||||||||||
Dividends and/or distributions to shareholders: | ||||||||||||||||||||
Net investment income | (0.23 | ) | (0.25 | ) | (0.28 | ) | (0.27 | ) | (0.26 | ) | ||||||||||
Net realized gains | (0.41 | ) | (0.52 | ) | (1.00 | ) | (0.56 | ) | — | |||||||||||
Total dividends and/or distributions to shareholders | (0.64 | ) | (0.77 | ) | (1.28 | ) | (0.83 | ) | (0.26 | ) | ||||||||||
Net asset value, end of year | $ | 12.80 | $ | 12.11 | $ | 12.46 | $ | 13.56 | $ | 13.58 | ||||||||||
Total return (D) | 11.54 | % | 3.71 | % | 1.32 | % | 6.20 | % | 13.13 | % | ||||||||||
Ratio and supplemental data: | ||||||||||||||||||||
Net assets end of year (000’s) | $ | 1,094,724 | $ | 1,000,707 | $ | 890,270 | $ | 899,852 | $ | 900,887 | ||||||||||
Expenses to average net assets | ||||||||||||||||||||
Excluding waiver and/or reimbursement and recapture (E) | 0.48 | % | 0.48 | % | 0.49 | % | 0.52 | % | 0.56 | % | ||||||||||
Including waiver and/or reimbursement and recapture | 0.48 | % | 0.47 | %(C) | 0.49 | % | 0.52 | % | 0.56 | % | ||||||||||
Net investment income (loss) to average net assets (B) | 2.07 | % | 2.04 | %(C) | 1.90 | % | 1.99 | % | 1.89 | % | ||||||||||
Portfolio turnover rate (F) | 13 | % | 2 | % | 10 | % | 27 | % | 21 | |||||||||||
| (A) | Calculated based on average number of shares outstanding. | |
| (B) | Recognition of net investment income by the Fund is affected by the timing of the declaration of dividends by the underlying funds in which the Fund invests. | |
| (C) | Please reference the Custody Out-of-Pocket Expense section of the Notes to Financial Statements for more information regarding the reimbursement of custody fees. The amount of the reimbursement on a per share basis was immaterial to the class. The Expenses to average net assets including waiver and/or reimbursement and recapture ratio, and Net investment income (loss) to average net assets ratio would have been 0.01% higher and 0.01% lower, respectively, had the custodian not reimbursed the Fund. | |
| (D) | Total return has been calculated without deduction of the maximum sales charge and contingent deferred sales charge. | |
| (E) | Does not include expenses of the underlying funds in which the Fund invests. | |
| (F) | Does not include portfolio activity of the underlying funds in which the Fund invests. |
| For a share outstanding during the years indicated: | Transamerica Asset Allocation – Moderate Portfolio | |||||||||||||||||||
| Class B | ||||||||||||||||||||
| October 31, 2017 | October 31, 2016 | October 31, 2015 | October 31, 2014 | October 31, 2013 | ||||||||||||||||
Net asset value, beginning of year | $ | 12.23 | $ | 12.54 | $ | 13.60 | $ | 13.61 | $ | 12.26 | ||||||||||
Investment operations: | ||||||||||||||||||||
Net investment income (loss) (A) (B) | 0.18 | 0.18 | (C) | 0.16 | 0.18 | 0.16 | ||||||||||||||
Net realized and unrealized gain (loss) | 1.06 | 0.15 | (0.08 | ) | 0.52 | 1.34 | ||||||||||||||
Total investment operations | 1.24 | 0.33 | 0.08 | 0.70 | 1.50 | |||||||||||||||
Dividends and/or distributions to shareholders: | ||||||||||||||||||||
Net investment income | (0.09 | ) | (0.12 | ) | (0.14 | ) | (0.15 | ) | (0.15 | ) | ||||||||||
Net realized gains | (0.41 | ) | (0.52 | ) | (1.00 | ) | (0.56 | ) | — | |||||||||||
Total dividends and/or distributions to shareholders | (0.50 | ) | (0.64 | ) | (1.14 | ) | (0.71 | ) | (0.15 | ) | ||||||||||
Net asset value, end of year | $ | 12.97 | $ | 12.23 | $ | 12.54 | $ | 13.60 | $ | 13.61 | ||||||||||
Total return (D) | 10.53 | % | 2.83 | % | 0.54 | % | 5.32 | % | 12.36 | % | ||||||||||
Ratio and supplemental data: | ||||||||||||||||||||
Net assets end of year (000’s) | $ | 13,987 | $ | 29,432 | $ | 47,833 | $ | 71,121 | $ | 95,350 | ||||||||||
Expenses to average net assets (E) | ||||||||||||||||||||
Excluding waiver and/or reimbursement and recapture | 1.34 | % | 1.31 | % | 1.30 | % | 1.30 | % | 1.31 | % | ||||||||||
Including waiver and/or reimbursement and recapture | 1.34 | % | 1.30 | %(C) | 1.30 | % | 1.30 | % | 1.31 | % | ||||||||||
Net investment income (loss) to average net assets (B) | 1.47 | % | 1.47 | %(C) | 1.22 | % | 1.32 | % | 1.21 | % | ||||||||||
Portfolio turnover rate (F) | 13 | % | 2 | % | 10 | % | 27 | % | 21 | % | ||||||||||
| (A) | Calculated based on average number of shares outstanding. | |
| (B) | Recognition of net investment income by the Fund is affected by the timing of the declaration of dividends by the underlying funds in which the Fund invests. | |
| (C) | Please reference the Custody Out-of-Pocket Expense section of the Notes to Financial Statements for more information regarding the reimbursement of custody fees. The amount of the reimbursement on a per share basis was immaterial to the class. The Expenses to average net assets including waiver and/or reimbursement and recapture ratio, and Net investment income (loss) to average net assets ratio would have been 0.01% higher and 0.01% lower, respectively, had the custodian not reimbursed the Fund. | |
| (D) | Total return has been calculated without deduction of the maximum contingent deferred sales charge. | |
| (E) | Does not include expenses of the underlying funds in which the Fund invests. | |
| (F) | Does not include portfolio activity of the underlying funds in which the Fund invests. |
The Notes to Financial Statements are an integral part of this report.
| Transamerica Funds | Annual Report 2017 |
Page 59
Table of Contents
FINANCIAL HIGHLIGHTS (continued)
| For a share outstanding during the years indicated: | Transamerica Asset Allocation – Moderate Portfolio | |||||||||||||||||||
| Class C | ||||||||||||||||||||
October 31, 2017 | October 31, 2016 | October 31, 2015 | October 31, 2014 | October 31, 2013 | ||||||||||||||||
Net asset value, beginning of year | $ | 12.01 | $ | 12.36 | $ | 13.44 | $ | 13.48 | $ | 12.17 | ||||||||||
Investment operations: | ||||||||||||||||||||
Net investment income (loss) (A) (B) | 0.17 | 0.16 | (C) | 0.15 | 0.17 | 0.15 | ||||||||||||||
Net realized and unrealized gain (loss) | 1.06 | 0.17 | (0.05 | ) | 0.53 | 1.34 | ||||||||||||||
Total investment operations | 1.23 | 0.33 | 0.10 | 0.70 | 1.49 | |||||||||||||||
Dividends and/or distributions to shareholders: | ||||||||||||||||||||
Net investment income | (0.13 | ) | (0.16 | ) | (0.18 | ) | (0.18 | ) | (0.18 | ) | ||||||||||
Net realized gains | (0.41 | ) | (0.52 | ) | (1.00 | ) | (0.56 | ) | — | |||||||||||
Total dividends and/or distributions to shareholders | (0.54 | ) | (0.68 | ) | (1.18 | ) | (0.74 | ) | (0.18 | ) | ||||||||||
Net asset value, end of year | $ | 12.70 | $ | 12.01 | $ | 12.36 | $ | 13.44 | $ | 13.48 | ||||||||||
Total return (D) | 10.69 | % | 2.88 | % | 0.70 | % | 5.39 | % | 12.37 | % | ||||||||||
Ratio and supplemental data: | ||||||||||||||||||||
Net assets end of year (000’s) | $ | 786,977 | $ | 939,970 | $ | 1,051,486 | $ | 1,138,082 | $ | 1,142,473 | ||||||||||
Expenses to average net assets (E) | ||||||||||||||||||||
Excluding waiver and/or reimbursement and recapture | 1.22 | % | 1.22 | % | 1.22 | % | 1.22 | % | 1.24 | % | ||||||||||
Including waiver and/or reimbursement and recapture | 1.22 | % | 1.21 | %(C) | 1.22 | % | 1.22 | % | 1.24 | % | ||||||||||
Net investment income (loss) to average net assets (B) | 1.43 | % | 1.40 | %(C) | 1.18 | % | 1.29 | % | 1.21 | % | ||||||||||
Portfolio turnover rate (F) | 13 | % | 2 | % | 10 | % | 27 | % | 21 | % | ||||||||||
| (A) | Calculated based on average number of shares outstanding. | |
| (B) | Recognition of net investment income by the Fund is affected by the timing of the declaration of dividends by the underlying funds in which the Fund invests. | |
| (C) | Please reference the Custody Out-of-Pocket Expense section of the Notes to Financial Statements for more information regarding the reimbursement of custody fees. The amount of the reimbursement on a per share basis was immaterial to the class. The Expenses to average net assets including waiver and/or reimbursement and recapture ratio, and Net investment income (loss) to average net assets ratio would have been 0.01% higher and 0.01% lower, respectively, had the custodian not reimbursed the Fund. | |
| (D) | Total return has been calculated without deduction of the maximum contingent deferred sales charge. | |
| (E) | Does not include expenses of the underlying funds in which the Fund invests. | |
| (F) | Does not include portfolio activity of the underlying funds in which the Fund invests. |
| For a share outstanding during the years indicated: | Transamerica Asset Allocation – Moderate Portfolio | |||||||||||||||||||
| Class I | ||||||||||||||||||||
October 31, 2017 | October 31, 2016 | October 31, 2015 | October 31, 2014 | October 31, 2013 | ||||||||||||||||
Net asset value, beginning of year | $ | 12.11 | $ | 12.46 | $ | 13.56 | $ | 13.59 | $ | 12.28 | ||||||||||
Investment operations: | ||||||||||||||||||||
Net investment income (loss) (A) (B) | 0.28 | 0.28 | (C) | 0.27 | 0.30 | 0.28 | ||||||||||||||
Net realized and unrealized gain (loss) | 1.08 | 0.17 | (0.06 | ) | 0.54 | 1.33 | ||||||||||||||
Total investment operations | 1.36 | 0.45 | 0.21 | 0.84 | 1.61 | |||||||||||||||
Dividends and/or distributions to shareholders: | ||||||||||||||||||||
Net investment income | (0.26 | ) | (0.28 | ) | (0.31 | ) | (0.31 | ) | (0.30 | ) | ||||||||||
Net realized gains | (0.41 | ) | (0.52 | ) | (1.00 | ) | (0.56 | ) | — | |||||||||||
Total dividends and/or distributions to shareholders | (0.67 | ) | (0.80 | ) | (1.31 | ) | (0.87 | ) | (0.30 | ) | ||||||||||
Net asset value, end of year | $ | 12.80 | $ | 12.11 | $ | 12.46 | $ | 13.56 | $ | 13.59 | ||||||||||
Total return | 11.80 | % | 3.97 | % | 1.60 | % | 6.45 | % | 13.41 | % | ||||||||||
Ratio and supplemental data: | ||||||||||||||||||||
Net assets end of year (000’s) | $ | 59,664 | $ | 43,818 | $ | 48,780 | $ | 47,590 | $ | 41,286 | ||||||||||
Expenses to average net assets (D) | ||||||||||||||||||||
Excluding waiver and/or reimbursement and recapture | 0.25 | % | 0.25 | % | 0.25 | % | 0.25 | % | 0.26 | % | ||||||||||
Including waiver and/or reimbursement and recapture | 0.25 | % | 0.24 | %(C) | 0.25 | % | 0.25 | % | 0.26 | % | ||||||||||
Net investment income (loss) to average net assets (B) | 2.26 | % | 2.40 | %(C) | 2.13 | % | 2.21 | % | 2.17 | % | ||||||||||
Portfolio turnover rate (E) | 13 | % | 2 | % | 10 | % | 27 | % | 21 | % | ||||||||||
| (A) | Calculated based on average number of shares outstanding. | |
| (B) | Recognition of net investment income by the Fund is affected by the timing of the declaration of dividends by the underlying funds in which the Fund invests. | |
| (C) | Please reference the Custody Out-of-Pocket Expense section of the Notes to Financial Statements for more information regarding the reimbursement of custody fees. The amount of the reimbursement on a per share basis was immaterial to the class. The Expenses to average net assets including waiver and/or reimbursement and recapture ratio, and Net investment income (loss) to average net assets ratio would have been 0.01% higher and 0.01% lower, respectively, had the custodian not reimbursed the Fund. | |
| (D) | Does not include expenses of the underlying funds in which the Fund invests. | |
| (E) | Does not include portfolio activity of the underlying funds in which the Fund invests. |
The Notes to Financial Statements are an integral part of this report.
| Transamerica Funds | Annual Report 2017 |
Page 60
Table of Contents
FINANCIAL HIGHLIGHTS (continued)
| For a share outstanding during the years indicated: | Transamerica Asset Allocation – Moderate Portfolio | |||||||||||||||||||
| Class R | ||||||||||||||||||||
| October 31, 2017 | October 31, 2016 | October 31, 2015 | October 31, 2014 | October 31, 2013 | ||||||||||||||||
Net asset value, beginning of year | $ | 12.03 | $ | 12.39 | $ | 13.48 | $ | 13.52 | $ | 12.20 | ||||||||||
Investment operations: | ||||||||||||||||||||
Net investment income (loss) (A) (B) | 0.17 | 0.21 | (C) | 0.21 | 0.22 | 0.21 | ||||||||||||||
Net realized and unrealized gain (loss) | 1.13 | 0.17 | (0.05 | ) | 0.55 | 1.34 | ||||||||||||||
Total investment operations | 1.30 | 0.38 | 0.16 | 0.77 | 1.55 | |||||||||||||||
Dividends and/or distributions to shareholders: | ||||||||||||||||||||
Net investment income | (0.20 | ) | (0.22 | ) | (0.25 | ) | (0.25 | ) | (0.23 | ) | ||||||||||
Net realized gains | (0.41 | ) | (0.52 | ) | (1.00 | ) | (0.56 | ) | — | |||||||||||
Total dividends and/or distributions to shareholders | (0.61 | ) | (0.74 | ) | (1.25 | ) | (0.81 | ) | (0.23 | ) | ||||||||||
Net asset value, end of year | $ | 12.72 | $ | 12.03 | $ | 12.39 | $ | 13.48 | $ | 13.52 | ||||||||||
Total return | 11.20 | % | 3.40 | % | 1.17 | % | 5.88 | % | 12.93 | % | ||||||||||
Ratio and supplemental data: | ||||||||||||||||||||
Net assets end of year (000’s) | $ | 4,693 | $ | 5,256 | $ | 5,470 | $ | 5,665 | $ | 4,990 | ||||||||||
Expenses to average net assets (D) | ||||||||||||||||||||
Excluding waiver and/or reimbursement and recapture | 0.73 | % | 0.74 | % | 0.73 | % | 0.73 | % | 0.76 | % | ||||||||||
Including waiver and/or reimbursement and recapture | 0.73 | % | 0.72 | %(C) | 0.73 | % | 0.73 | % | 0.76 | % | ||||||||||
Net investment income (loss) to average net assets (B) | 1.38 | % | 1.80 | %(C) | 1.67 | % | 1.68 | % | 1.67 | % | ||||||||||
Portfolio turnover rate (E) | 13 | % | 2 | % | 10 | % | 27 | % | 21 | % | ||||||||||
| (A) | Calculated based on average number of shares outstanding. | |
| (B) | Recognition of net investment income by the Fund is affected by the timing of the declaration of dividends by the underlying funds in which the Fund invests. | |
| (C) | Please reference the Custody Out-of-Pocket Expense section of the Notes to Financial Statements for more information regarding the reimbursement of custody fees. The amount of the reimbursement on a per share basis was immaterial to the class. The Expenses to average net assets including waiver and/or reimbursement and recapture ratio, and Net investment income (loss) to average net assets ratio would have been 0.01% higher and 0.01% lower, respectively, had the custodian not reimbursed the Fund. | |
| (D) | Does not include expenses of the underlying funds in which the Fund invests. | |
| (E) | Does not include portfolio activity of the underlying funds in which the Fund invests. |
| For a share outstanding during the period indicated: | Transamerica Asset Allocation – Moderate Portfolio | |||||||
| Class T1 | Advisor Class | |||||||
| October 31, 2017 (A) | October 31, 2017 (B) | |||||||
Net asset value, beginning of period | $ | 12.03 | $ | 11.97 | ||||
Investment operations: | ||||||||
Net investment income (loss) (C) (D) | 0.09 | 0.11 | ||||||
Net realized and unrealized gain (loss) | 0.69 | 0.70 | ||||||
Total investment operations | 0.78 | 0.81 | ||||||
Net asset value, end of period | $ | 12.81 | $ | 12.78 | ||||
Total return | 6.48 | %(E)(F) | 6.77 | %(F) | ||||
Ratio and supplemental data: | ||||||||
Net assets end of period (000’s) | $ | 11 | $ | 11 | ||||
Expenses to average net assets (G) | 0.40 | %(H) | 0.35 | %(H) | ||||
Net investment income (loss) to average net assets (D) | 1.21 | %(H) | 1.36 | %(H) | ||||
Portfolio turnover rate (I) | 13 | % | 13 | % | ||||
| (A) | Commenced operations on March 17, 2017. | |
| (B) | Commenced operations on March 3, 2017. | |
| (C) | Calculated based on average number of shares outstanding. | |
| (D) | Recognition of net investment income by the Fund is affected by the timing of the declaration of dividends by the underlying funds in which the Fund invests. | |
| (E) | Total return has been calculated without deduction of the maximum sales charge and contingent deferred sales charge. | |
| (F) | Not annualized. | |
| (G) | Does not include expenses of the underlying funds in which the Fund invests. | |
| (H) | Annualized. | |
| (I) | Does not include portfolio activity of the underlying funds in which the Fund invests. |
The Notes to Financial Statements are an integral part of this report.
| Transamerica Funds | Annual Report 2017 |
Page 61
Table of Contents
FINANCIAL HIGHLIGHTS (continued)
| For a share outstanding during the period indicated: | Transamerica Asset Allocation Intermediate Horizon | |||
| Class R | ||||
| October 31, 2017 (A) | ||||
Net asset value, beginning of period | $ | 10.00 | ||
Investment operations: | ||||
Net investment income (loss) (B) (C) | 0.05 | |||
Net realized and unrealized gain (loss) | 0.37 | |||
Total investment operations | 0.42 | |||
Dividends and/or distributions to shareholders: | ||||
Net investment income | (0.04 | ) | ||
Net asset value, end of period | $ | 10.38 | ||
Total return | 4.24 | %(D) | ||
Ratio and supplemental data: | ||||
Net assets end of period (000’s) | $ | 424,721 | ||
Expenses to average net assets (E) | ||||
Excluding waiver and/or reimbursement and recapture | 0.62 | %(F) | ||
Including waiver and/or reimbursement and recapture | 0.60 | %(F) | ||
Net investment income (loss) to average net assets (C) | 0.99 | %(F) | ||
Portfolio turnover rate (G) | 26 | %(D) | ||
| (A) | Commenced operations on May 19, 2017. | |
| (B) | Calculated based on average number of shares outstanding. | |
| (C) | Recognition of net investment income by the Fund is affected by the timing of the declaration of dividends by the underlying funds in which the Fund invests. | |
| (D) | Not annualized. | |
| (E) | Does not include expenses of the underlying funds in which the Fund invests. | |
| (F) | Annualized. | |
| (G) | Does not include portfolio activity of the underlying funds in which the Fund invests. |
| For a share outstanding during the period and years indicated: | Transamerica Asset Allocation Intermediate Horizon (A) (B) | |||||||||||||||||||||||
| Class R4 | ||||||||||||||||||||||||
| October 31, 2017 (C) | December 31, 2016 | December 31, 2015 | December 31, 2014 | December 31, 2013 | December 31, 2012 | |||||||||||||||||||
Net asset value, beginning of period/year | $ | 9.58 | $ | 9.23 | $ | 9.35 | $ | 9.16 | $ | 8.21 | $ | 7.60 | ||||||||||||
Investment operations: | ||||||||||||||||||||||||
Net investment income (loss) (D) (E) | 0.13 | 0.18 | 0.15 | 0.20 | 0.18 | 0.25 | ||||||||||||||||||
Net realized and unrealized gain (loss) | 0.78 | 0.35 | (0.12 | ) | 0.21 | 0.96 | 0.61 | |||||||||||||||||
Total investment operations | 0.91 | 0.53 | 0.03 | 0.41 | 1.14 | 0.86 | ||||||||||||||||||
Dividends and/or distributions to shareholders: | ||||||||||||||||||||||||
Net investment income | (0.11 | ) | (0.18 | ) | (0.15 | ) | (0.22 | ) | (0.19 | ) | (0.25 | ) | ||||||||||||
Net asset value, end of period/year | $ | 10.38 | $ | 9.58 | $ | 9.23 | $ | 9.35 | $ | 9.16 | $ | 8.21 | ||||||||||||
Total return | 9.53 | %(F) | 5.74 | % | 0.26 | % | 4.50 | % | 14.04 | % | 11.40 | % | ||||||||||||
Ratio and supplemental data: | ||||||||||||||||||||||||
Net assets end of year (000’s) | $ | 20,852 | $ | 78,806 | $ | 79,613 | $ | 92,989 | $ | 121,450 | $ | 158,181 | ||||||||||||
Expenses to average net assets (G) | ||||||||||||||||||||||||
Excluding waiver and/or reimbursement and recapture | 0.21 | %(H) | 0.10 | % | 0.10 | % | 0.10 | % | 0.10 | % | 0.10 | % | ||||||||||||
Including waiver and/or reimbursement and recapture | 0.20 | %(H) | 0.10 | % | 0.10 | % | 0.10 | % | 0.10 | % | 0.10 | % | ||||||||||||
Net investment income (loss) to average net assets (E) | 1.37 | %(H) | 1.88 | % | 1.57 | % | 2.19 | % | 2.07 | % | 3.08 | % | ||||||||||||
Portfolio turnover rate (I) | 26 | %(F) | 45 | % | 42 | % | 76 | % | 69 | % | 62 | % | ||||||||||||
| (A) | Transamerica Institutional Asset Allocation – Intermediate Horizon reorganized into the Fund on May 19, 2017. Prior to May 19, 2017, information provided reflects Transamerica Institutional Asset Allocation – Intermediate Horizon, which was the accounting and performance survivor of the reorganization. Please reference the Reorganization section of the Notes to the Financial Statements for additional information. | |
| (B) | Effective May 19, 2017, the Fund underwent a 1.23-for-1 share split. The per share data has been retroactively adjusted to reflect the share split. See the Stock Split section of the Notes to Financial Statements for more information. | |
| (C) | The fiscal year end of the Fund is October 31 while the fiscal year end of the accounting and performance survivor is December 31. The Financial Highlights represents activity for the ten months of January 1, 2017 - October 31, 2017. Please reference the Reorganization section of the Notes to the Financial Statements for additional information. | |
| (D) | Calculated based on average number of shares outstanding. | |
| (E) | Recognition of net investment income by the Fund is affected by the timing of the declaration of dividends by the underlying funds in which the Fund invests. | |
| (F) | Not annualized. | |
| (G) | Does not include expenses of the underlying funds in which the Fund invests. | |
| (H) | Annualized. | |
| (I) | Does not include portfolio activity of the underlying funds in which the Fund invests. |
The Notes to Financial Statements are an integral part of this report.
| Transamerica Funds | Annual Report 2017 |
Page 62
Table of Contents
FINANCIAL HIGHLIGHTS (continued)
| For a share outstanding during the period indicated: | Transamerica Asset Allocation Long Horizon | |||
| Class R | ||||
| October 31, 2017 (A) | ||||
Net asset value, beginning of period | $ | 10.00 | ||
Investment operations: | ||||
Net investment income (loss) (B) (C) | 0.01 | |||
Net realized and unrealized gain (loss) | 0.68 | |||
Total investment operations | 0.69 | |||
Dividends and/or distributions to shareholders: | ||||
Net investment income | (0.01 | ) | ||
Net asset value, end of period | $ | 10.68 | ||
Total return | 6.90 | %(D) | ||
Ratio and supplemental data: | ||||
Net assets end of period (000’s) | $ | 225,869 | ||
Expenses to average net assets (E) | ||||
Excluding waiver and/or reimbursement and recapture | 0.62 | %(F) | ||
Including waiver and/or reimbursement and recapture | 0.60 | %(F) | ||
Net investment income (loss) to average net assets (C) | 0.14 | %(F) | ||
Portfolio turnover rate (G) | 35 | %(D) | ||
| (A) | Commenced operations on May 19, 2017. | |
| (B) | Calculated based on average number of shares outstanding. | |
| (C) | Recognition of net investment income by the Fund is affected by the timing of the declaration of dividends by the underlying funds in which the Fund invests. | |
| (D) | Not annualized. | |
| (E) | Does not include expenses of the underlying funds in which the Fund invests. | |
| (F) | Annualized. | |
| (G) | Does not include portfolio activity of the underlying funds in which the Fund invests. |
| For a share outstanding during the period and years indicated: | Transamerica Asset Allocation Long Horizon (A) (B) | |||||||||||||||||||||||
| Class R4 | ||||||||||||||||||||||||
October 31, 2017 (C) | December 31, 2016 | December 31, 2015 | December 31, 2014 | December 31, 2013 | December 31, 2012 | |||||||||||||||||||
Net asset value, beginning of period/year | $ | 9.38 | $ | 8.87 | $ | 8.92 | $ | 8.71 | $ | 7.01 | $ | 6.23 | ||||||||||||
Investment operations: | ||||||||||||||||||||||||
Net investment income (loss) (D) (E) | 0.06 | 0.11 | 0.11 | 0.17 | 0.12 | 0.11 | ||||||||||||||||||
Net realized and unrealized gain (loss) | 1.31 | 0.51 | (0.05 | ) | 0.22 | 1.72 | 0.78 | |||||||||||||||||
Total investment operations | 1.37 | 0.62 | 0.06 | 0.39 | 1.84 | 0.89 | ||||||||||||||||||
Dividends and/or distributions to shareholders: | ||||||||||||||||||||||||
Net investment income | (0.07 | ) | (0.11 | ) | (0.11 | ) | (0.18 | ) | (0.14 | ) | (0.11 | ) | ||||||||||||
Net asset value, end of period/year | $ | 10.68 | $ | 9.38 | $ | 8.87 | $ | 8.92 | $ | 8.71 | $ | 7.01 | ||||||||||||
Total return | 14.69 | %(F) | 7.07 | % | 0.63 | % | 4.55 | % | 26.33 | % | 14.36 | % | ||||||||||||
Ratio and supplemental data: | ||||||||||||||||||||||||
Net assets end of period/year (000’s) | $ | 32,618 | $ | 28,489 | $ | 28,659 | $ | 35,325 | $ | 32,711 | $ | 36,047 | ||||||||||||
Expenses to average net assets (G) | ||||||||||||||||||||||||
Excluding waiver and/or reimbursement and recapture | 0.28 | %(H) | 0.10 | % | 0.10 | % | 0.10 | % | 0.10 | % | 0.10 | % | ||||||||||||
Including waiver and/or reimbursement and recapture | 0.26 | %(H) | 0.10 | % | 0.10 | % | 0.10 | % | 0.10 | % | 0.10 | % | ||||||||||||
Net investment income (loss) to average net assets (E) | 0.64 | %(H) | 1.29 | % | 1.19 | % | 1.98 | % | 1.61 | % | 1.54 | % | ||||||||||||
Portfolio turnover rate (I) | 35 | %(F) | 28 | % | 43 | % | 69 | % | 58 | % | 119 | % | ||||||||||||
| (A) | Transamerica Institutional Asset Allocation – Long Horizon reorganized into the Fund on May 19, 2017. Prior to May 19, 2017, information provided reflects Transamerica Institutional Asset Allocation – Long Horizon, which was the accounting and performance survivor of the reorganization. Please reference the Reorganization section of the Notes to the Financial Statements for additional information. | |
| (B) | Effective May 19, 2017, the Fund underwent a 1.22-for-1 share split. The per share data has been retroactively adjusted to reflect the share split. See the Stock Split section of the Notes to Financial Statements for more information. | |
| (C) | The fiscal year end of the Fund is October 31 while the fiscal year end of the accounting and performance survivor is December 31. The Financial Highlights represents activity for the ten months of January 1, 2017 – October 31, 2017. Please reference the Reorganization section of the Notes to the Financial Statements for additional information. | |
| (D) | Calculated based on average number of shares outstanding. | |
| (E) | Recognition of net investment income by the Fund is affected by the timing of the declaration of dividends by the underlying funds in which the Fund invests. | |
| (F) | Not annualized. | |
| (G) | Does not include expenses of the underlying funds in which the Fund invests. | |
| (H) | Annualized. | |
| (I) | Does not include portfolio activity of the underlying funds in which the Fund invests. |
The Notes to Financial Statements are an integral part of this report.
| Transamerica Funds | Annual Report 2017 |
Page 63
Table of Contents
FINANCIAL HIGHLIGHTS (continued)
| For a share outstanding during the period indicated: | Transamerica Asset Allocation Short Horizon | |||
| Class R | ||||
| October 31, 2017 (A) | ||||
Net asset value, beginning of period | $ | 10.00 | ||
Investment operations: | ||||
Net investment income (loss) (B) (C) | 0.08 | |||
Net realized and unrealized gain (loss) | 0.09 | |||
Total investment operations | 0.17 | |||
Dividends and/or distributions to shareholders: | ||||
Net investment income | (0.07 | ) | ||
Net asset value, end of period | $ | 10.10 | ||
Total return | 1.72 | %(D) | ||
Ratio and supplemental data: | ||||
Net assets end of period (000’s) | $ | 181,866 | ||
Expenses to average net assets (E) | ||||
Excluding waiver and/or reimbursement and recapture | 0.62 | %(F) | ||
Including waiver and/or reimbursement and recapture | 0.60 | %(F) | ||
Net investment income (loss) to average net assets (C) | 1.77 | %(F) | ||
Portfolio turnover rate (G) | 22 | %(D) | ||
| (A) | Commenced operations on May 19, 2017. | |
| (B) | Calculated based on average number of shares outstanding. | |
| (C) | Recognition of net investment income by the Fund is affected by the timing of the declaration of dividends by the underlying funds in which the Fund invests. | |
| (D) | Not annualized. | |
| (E) | Does not include expenses of the underlying funds in which the Fund invests. | |
| (F) | Annualized. | |
| (G) | Does not include portfolio activity of the underlying funds in which the Fund invests. |
| For a share outstanding during the period and years indicated: | Transamerica Asset Allocation Short Horizon (A) (B) | |||||||||||||||||||||||
| Class R4 | ||||||||||||||||||||||||
October 31, 2017 (C) | December 31, 2016 | December 31, 2015 | December 31, 2014 | December 31, 2013 | December 31, 2012 | |||||||||||||||||||
Net asset value, beginning of period/year | $ | 9.81 | $ | 9.63 | $ | 9.92 | $ | 9.80 | $ | 9.91 | $ | 9.60 | ||||||||||||
Investment operations: | ||||||||||||||||||||||||
Net investment income (loss) (D) (E) | 0.17 | 0.25 | 0.21 | 0.25 | 0.27 | 0.44 | ||||||||||||||||||
Net realized and unrealized gain (loss) | 0.28 | 0.18 | (0.28 | ) | 0.14 | (0.11 | ) | 0.34 | ||||||||||||||||
Total investment operations | 0.45 | 0.43 | (0.07 | ) | 0.39 | 0.16 | 0.78 | |||||||||||||||||
Dividends and/or distributions to shareholders: | ||||||||||||||||||||||||
Net investment income | (0.16 | ) | (0.25 | ) | (0.22 | ) | (0.27 | ) | (0.27 | ) | (0.47 | ) | ||||||||||||
Net asset value, end of period/year | $ | 10.10 | $ | 9.81 | $ | 9.63 | $ | 9.92 | $ | 9.80 | $ | 9.91 | ||||||||||||
Total return | 4.49 | %(F) | 4.48 | % | (0.72 | )% | 4.07 | % | 1.67 | % | 8.27 | % | ||||||||||||
Ratio and supplemental data: | ||||||||||||||||||||||||
Net assets end of period/year (000’s) | $ | 6,959 | $ | 11,896 | $ | 12,349 | $ | 17,622 | $ | 24,002 | $ | 28,713 | ||||||||||||
Expenses to average net assets (G) | ||||||||||||||||||||||||
Excluding waiver and/or reimbursement and recapture | 0.23 | %(H) | 0.10 | % | 0.10 | % | 0.10 | % | 0.10 | % | 0.10 | % | ||||||||||||
Including waiver and/or reimbursement and recapture | 0.22 | %(H) | 0.10 | % | 0.10 | % | 0.10 | % | 0.10 | % | 0.10 | % | ||||||||||||
Net investment income (loss) to average net assets (E) | 1.98 | %(H) | 2.53 | % | 2.07 | % | 2.55 | % | 2.70 | % | 4.49 | % | ||||||||||||
Portfolio turnover rate (I) | 22 | %(F) | 49 | % | 60 | % | 133 | % | 75 | % | 110 | % | ||||||||||||
| (A) | Transamerica Institutional Asset Allocation – Short Horizon reorganized into the Fund on May 19, 2017. Prior to May 19, 2017, information provided reflects Transamerica Institutional Asset Allocation – Short Horizon, which was the accounting and performance survivor of the reorganization. Please reference the Reorganization section of the Notes to the Financial Statements for additional information. | |
| (B) | Effective May 19, 2017, the Fund underwent a 1.11-for-1 share split. The per share data has been retroactively adjusted to reflect the share split. See the Stock Split section of the Notes to Financial Statements for more information. | |
| (C) | The fiscal year end of the Fund is October 31 while the fiscal year end of the accounting and performance survivor is December 31. The Financial Highlights represents activity for the ten months of January 1, 2017 – October 31, 2017. Please reference the Reorganization section of the Notes to the Financial Statements for additional information. | |
| (D) | Calculated based on average number of shares outstanding. | |
| (E) | Recognition of net investment income by the Fund is affected by the timing of the declaration of dividends by the underlying funds in which the Fund invests. | |
| (F) | Not annualized. | |
| (G) | Does not include expenses of the underlying funds in which the Fund invests. | |
| (H) | Annualized. | |
| (I) | Does not include portfolio activity of the underlying funds in which the Fund invests. |
The Notes to Financial Statements are an integral part of this report.
| Transamerica Funds | Annual Report 2017 |
Page 64
Table of Contents
FINANCIAL HIGHLIGHTS (continued)
| For a share outstanding during the years indicated: | Transamerica Multi-Manager Alternative Strategies Portfolio | |||||||||||||||||||
| Class A | ||||||||||||||||||||
October 31, 2017 | October 31, 2016 | October 31, 2015 | October 31, 2014 | October 31, 2013 | ||||||||||||||||
Net asset value, beginning of year | $ | 9.71 | $ | 10.07 | $ | 10.50 | $ | 10.01 | $ | 9.92 | ||||||||||
Investment operations: | ||||||||||||||||||||
Net investment income (loss) (A) (B) | 0.10 | 0.31 | (C) | 0.11 | 0.05 | 0.14 | ||||||||||||||
Net realized and unrealized gain (loss) | 0.19 | (0.22 | ) | (0.47 | ) | 0.49 | 0.14 | |||||||||||||
Total investment operations | 0.29 | 0.09 | (0.36 | ) | 0.54 | 0.28 | ||||||||||||||
Dividends and/or distributions to shareholders: | ||||||||||||||||||||
Net investment income | (0.11 | ) | (0.28 | ) | (0.07 | ) | (0.05 | ) | (0.19 | ) | ||||||||||
Net realized gains | — | (0.17 | ) | — | — | — | ||||||||||||||
Total dividends and/or distributions to shareholders | (0.11 | ) | (0.45 | ) | (0.07 | ) | (0.05 | ) | (0.19 | ) | ||||||||||
Net asset value, end of year | $ | 9.89 | $ | 9.71 | $ | 10.07 | $ | 10.50 | $ | 10.01 | ||||||||||
Total return (D) | 3.04 | % | 1.07 | % | (3.42 | )% | 5.46 | % | 2.89 | % | ||||||||||
Ratio and supplemental data: | ||||||||||||||||||||
Net assets end of year (000’s) | $ | 32,240 | $ | 61,341 | $ | 91,684 | $ | 129,568 | $ | 200,903 | ||||||||||
Expenses to average net assets (E) | ||||||||||||||||||||
Excluding waiver and/or reimbursement and recapture | 0.73 | % | 0.70 | % | 0.66 | % | 0.72 | % | 0.72 | % | ||||||||||
Including waiver and/or reimbursement and recapture | 0.73 | % | 0.69 | %(C) | 0.66 | % | 0.72 | % | 0.72 | % | ||||||||||
Net investment income (loss) to average net assets (B) | 1.04 | % | 3.28 | %(C) | 1.06 | % | 0.46 | % | 1.42 | % | ||||||||||
Portfolio turnover rate (F) | 65 | % | 42 | % | 80 | % | 79 | % | 116 | % | ||||||||||
| (A) | Calculated based on average number of shares outstanding. | |
| (B) | Recognition of net investment income by the Fund is affected by the timing of the declaration of dividends by the underlying funds in which the Fund invests. | |
| (C) | Please reference the Custody Out-of-Pocket Expense section of the Notes to Financial Statements for more information regarding the reimbursement of custody fees. The amount of the reimbursement on a per share basis was immaterial to the class. The Expenses to average net assets including waiver and/or reimbursement and recapture ratio, and Net investment income (loss) to average net assets ratio would have been 0.01% higher and 0.01% lower, respectively, had the custodian not reimbursed the Fund. | |
| (D) | Total return has been calculated without deduction of the maximum sales charge and contingent deferred sales charge. | |
| (E) | Does not include expenses of the underlying funds in which the Fund invests. | |
| (F) | Does not include portfolio activity of the underlying funds in which the Fund invests. |
| For a share outstanding during the years indicated: | Transamerica Multi-Manager Alternative Strategies Portfolio | |||||||||||||||||||
| Class C | ||||||||||||||||||||
October 31, 2017 | October 31, 2016 | October 31, 2015 | October 31, 2014 | October 31, 2013 | ||||||||||||||||
Net asset value, beginning of year | $ | 9.60 | $ | 9.94 | $ | 10.37 | $ | 9.91 | $ | 9.82 | ||||||||||
Investment operations: | ||||||||||||||||||||
Net investment income (loss) (A) (B) | 0.02 | 0.23 | (C) | 0.03 | (0.03 | ) | 0.08 | |||||||||||||
Net realized and unrealized gain (loss) | 0.18 | (0.20 | ) | (0.46 | ) | 0.49 | 0.13 | |||||||||||||
Total investment operations | 0.20 | 0.03 | (0.43 | ) | 0.46 | 0.21 | ||||||||||||||
Dividends and/or distributions to shareholders: | ||||||||||||||||||||
Net investment income | (0.02 | ) | (0.20 | ) | (0.00 | )(D) | — | (0.12 | ) | |||||||||||
Net realized gains | — | (0.17 | ) | — | — | — | ||||||||||||||
Total dividends and/or distributions to shareholders | (0.02 | ) | (0.37 | ) | (0.00 | )(D) | — | (0.12 | ) | |||||||||||
Net asset value, end of year | $ | 9.78 | $ | 9.60 | $ | 9.94 | $ | 10.37 | $ | 9.91 | ||||||||||
Total return (E) | 2.22 | % | 0.39 | % | (4.11 | )% | 4.64 | % | 2.18 | % | ||||||||||
Ratio and supplemental data: | ||||||||||||||||||||
Net assets end of year (000’s) | $ | 47,545 | $ | 72,959 | $ | 101,656 | $ | 125,950 | $ | 140,309 | ||||||||||
Expenses to average net assets (F) | ||||||||||||||||||||
Excluding waiver and/or reimbursement and recapture | 1.47 | % | 1.45 | % | 1.42 | % | 1.45 | % | 1.44 | % | ||||||||||
Including waiver and/or reimbursement and recapture | 1.47 | % | 1.44 | %(C) | 1.42 | % | 1.45 | % | 1.44 | % | ||||||||||
Net investment income (loss) to average net assets (B) | 0.21 | % | 2.39 | %(C) | 0.28 | % | (0.29 | )% | 0.80 | % | ||||||||||
Portfolio turnover rate (G) | 65 | % | 42 | % | 80 | % | 79 | % | 116 | % | ||||||||||
| (A) | Calculated based on average number of shares outstanding. | |
| (B) | Recognition of net investment income by the Fund is affected by the timing of the declaration of dividends by the underlying funds in which the Fund invests. | |
| (C) | Please reference the Custody Out-of-Pocket Expense section of the Notes to Financial Statements for more information regarding the reimbursement of custody fees. The amount of the reimbursement on a per share basis was immaterial to the class. The Expenses to average net assets including waiver and/or reimbursement and recapture ratio, and Net investment income (loss) to average net assets ratio would have been 0.01% higher and 0.01% lower, respectively, had the custodian not reimbursed the Fund. | |
| (D) | Rounds to less than $0.01 or $(0.01). | |
| (E) | Total return has been calculated without deduction of the maximum contingent deferred sales charge. | |
| (F) | Does not include expenses of the underlying funds in which the Fund invests. | |
| (G) | Does not include portfolio activity of the underlying funds in which the Fund invests. |
The Notes to Financial Statements are an integral part of this report.
| Transamerica Funds | Annual Report 2017 |
Page 65
Table of Contents
FINANCIAL HIGHLIGHTS (continued)
| For a share outstanding during the years indicated: | Transamerica Multi-Manager Alternative Strategies Portfolio | |||||||||||||||||||
| Class I | ||||||||||||||||||||
October 31, 2017 | October 31, 2016 | October 31, 2015 | October 31, 2014 | October 31, 2013 | ||||||||||||||||
Net asset value, beginning of year | $ | 9.71 | $ | 10.07 | $ | 10.52 | $ | 10.03 | $ | 9.94 | ||||||||||
Investment operations: | ||||||||||||||||||||
Net investment income (loss) (A) (B) | 0.12 | 0.36 | (C) | 0.14 | 0.08 | 0.17 | ||||||||||||||
Net realized and unrealized gain (loss) | 0.20 | (0.24 | ) | (0.47 | ) | 0.50 | 0.15 | |||||||||||||
Total investment operations | 0.32 | 0.12 | (0.33 | ) | 0.58 | 0.32 | ||||||||||||||
Dividends and/or distributions to shareholders: | ||||||||||||||||||||
Net investment income | (0.15 | ) | (0.31 | ) | (0.12 | ) | (0.09 | ) | (0.23 | ) | ||||||||||
Net realized gains | — | (0.17 | ) | — | — | — | ||||||||||||||
Total dividends and/or distributions to shareholders | (0.15 | ) | (0.48 | ) | (0.12 | ) | (0.09 | ) | (0.23 | ) | ||||||||||
Net asset value, end of year | $ | 9.88 | $ | 9.71 | $ | 10.07 | $ | 10.52 | $ | 10.03 | ||||||||||
Total return | 3.32 | % | 1.44 | % | (3.19 | )% | 5.81 | % | 3.25 | % | ||||||||||
Ratio and supplemental data: | ||||||||||||||||||||
Net assets end of year (000’s) | $ | 82,742 | $ | 108,591 | $ | 191,022 | $ | 238,046 | $ | 207,733 | ||||||||||
Expenses to average net assets (D) | ||||||||||||||||||||
Excluding waiver and/or reimbursement and recapture | 0.40 | % | 0.38 | % | 0.38 | % | 0.41 | % | 0.39 | % | ||||||||||
Including waiver and/or reimbursement and recapture | 0.40 | % | 0.37 | %(C) | 0.38 | % | 0.41 | % | 0.39 | % | ||||||||||
Net investment income (loss) to average net assets (B) | 1.24 | % | 3.71 | %(C) | 1.31 | % | 0.74 | % | 1.74 | % | ||||||||||
Portfolio turnover rate (E) | 65 | % | 42 | % | 80 | % | 79 | % | 116 | % | ||||||||||
| (A) | Calculated based on average number of shares outstanding. | |
| (B) | Recognition of net investment income by the Fund is affected by the timing of the declaration of dividends by the underlying funds in which the Fund invests. | |
| (C) | Please reference the Custody Out-of-Pocket Expense section of the Notes to Financial Statements for more information regarding the reimbursement of custody fees. The amount of the reimbursement on a per share basis was immaterial to the class. The Expenses to average net assets including waiver and/or reimbursement and recapture ratio, and Net investment income (loss) to average net assets ratio would have been 0.01% higher and 0.01% lower, respectively, had the custodian not reimbursed the Fund. | |
| (D) | Does not include expenses of the underlying funds in which the Fund invests. | |
| (E) | Does not include portfolio activity of the underlying funds in which the Fund invests. |
| For a share outstanding during the period and years indicated: | Transamerica Multi-Manager Alternative Strategies Portfolio | |||||||||||
| Class R6 | ||||||||||||
October 31, 2017 | October 31, 2016 | October 31, 2015 (A) | ||||||||||
Net asset value, beginning of period/year | $ | 9.85 | $ | 10.07 | $ | 10.59 | ||||||
Investment operations: | ||||||||||||
Net investment income (loss) (B) (C) | 0.11 | 0.30 | (D) | 0.04 | ||||||||
Net realized and unrealized gain (loss) | 0.22 | (0.16 | ) | (0.56 | ) | |||||||
Total investment operations | 0.33 | 0.14 | (0.52 | ) | ||||||||
Dividends and/or distributions to shareholders: | ||||||||||||
Net investment income | (0.16 | ) | (0.19 | ) | — | |||||||
Net realized gains | — | (0.17 | ) | — | ||||||||
Total dividends and/or distributions to shareholders | (0.16 | ) | (0.36 | ) | — | |||||||
Net asset value, end of period/year | $ | 10.02 | $ | 9.85 | $ | 10.07 | ||||||
Total return | 3.41 | % | 1.59 | % | (4.91 | )%(E) | ||||||
Ratio and supplemental data: | ||||||||||||
Net assets end of period/year (000’s) | $ | 99 | $ | 55 | $ | 47 | ||||||
Expenses to average net assets (F) | ||||||||||||
Excluding waiver and/or reimbursement and recapture | 0.31 | % | 0.28 | % | 0.28 | %(G) | ||||||
Including waiver and/or reimbursement and recapture | 0.31 | % | 0.26 | %(D) | 0.28 | %(G) | ||||||
Net investment income (loss) to average net assets (C) | 1.15 | % | 3.08 | %(D) | 0.86 | %(G) | ||||||
Portfolio turnover rate (H) | 65 | % | 42 | % | 80 | % | ||||||
| (A) | Commenced operations on May 29, 2015. | |
| (B) | Calculated based on average number of shares outstanding. | |
| (C) | Recognition of net investment income by the Fund is affected by the timing of the declaration of dividends by the underlying funds in which the Fund invests. | |
| (D) | Please reference the Custody Out-of-Pocket Expense section of the Notes to Financial Statements for more information regarding the reimbursement of custody fees. The amount of the reimbursement on a per share basis was immaterial to the class. The Expenses to average net assets including waiver and/or reimbursement and recapture ratio, and Net investment income (loss) to average net assets ratio would have been 0.02% higher and 0.02% lower, respectively, had the custodian not reimbursed the Fund. | |
| (E) | Not annualized. | |
| (F) | Does not include expenses of the underlying funds in which the Fund invests. | |
| (G) | Annualized. | |
| (H) | Does not include portfolio activity of the underlying funds in which the Fund invests. |
The Notes to Financial Statements are an integral part of this report.
| Transamerica Funds | Annual Report 2017 |
Page 66
Table of Contents
FINANCIAL HIGHLIGHTS (continued)
| For a share outstanding during the period indicated: | Transamerica Multi-Manager Alternative Strategies Portfolio | |||
| Class T1 | ||||
October 31, 2017 (A) | ||||
Net asset value, beginning of period | $ | 9.67 | ||
Investment operations: | ||||
Net investment income (loss) (B) (C) | 0.03 | |||
Net realized and unrealized gain (loss) | 0.20 | |||
Total investment operations | 0.23 | |||
Net asset value, end of period | $ | 9.90 | ||
Total return (D) | 2.38 | %(E) | ||
Ratio and supplemental data: | ||||
Net assets end of period (000’s) | $ | 10 | ||
Expenses to average net assets (F) | ||||
Excluding waiver and/or reimbursement and recapture | 0.55 | %(G) | ||
Including waiver and/or reimbursement and recapture | 0.55 | %(G) | ||
Net investment income (loss) to average net assets (C) | 0.51 | %(G) | ||
Portfolio turnover rate (H) | 65 | % | ||
| (A) | Commenced operations on March 17, 2017. | |
| (B) | Calculated based on average number of shares outstanding. | |
| (C) | Recognition of net investment income by the Fund is affected by the timing of the declaration of dividends by the underlying funds in which the Fund invests. | |
| (D) | Total return has been calculated without deduction of the maximum sales charge and contingent deferred sales charge. | |
| (E) | Not annualized. | |
| (F) | Does not include expenses of the underlying funds in which the Fund invests. | |
| (G) | Annualized. | |
| (H) | Does not include portfolio activity of the underlying funds in which the Fund invests. |
The Notes to Financial Statements are an integral part of this report.
| Transamerica Funds | Annual Report 2017 |
Page 67
Table of Contents
At October 31, 2017
1. ORGANIZATION
Transamerica Funds (the “Trust”) is an open-end management investment company registered under the Investment Company Act of 1940, as amended (the “1940 Act”). The Trust applies investment company accounting and reporting guidance. The funds (each, a “Fund” and collectively, the “Funds”) are each a series of the Trust and are listed below. Each class has a public offering price that reflects different sales charges, if any, and expense levels. Class B shares will convert to Class A shares eight years after purchase. Effective November 1, 2013, Class B shares are no longer available to existing investors except for exchanges, and dividend and capital gains reinvestment.
| Fund | Class | |
Transamerica Asset Allocation – Conservative Portfolio (“Asset Allocation – Conservative”) (A) (B) | A,B,C,I,R,T1,Advisor | |
Transamerica Asset Allocation – Growth Portfolio (“Asset Allocation – Growth”) (A) (B) | A,B,C,I,R,T1,Advisor | |
Transamerica Asset Allocation – Moderate Growth Portfolio (“Asset Allocation – Moderate Growth”) (A) (B) | A,B,C,I,R,T1,Advisor | |
Transamerica Asset Allocation – Moderate Portfolio (“Asset Allocation – Moderate”) (A) (B) | A,B,C,I,R,T1,Advisor | |
Transamerica Asset Allocation Intermediate Horizon (“Intermediate Horizon”) (C) | R,R4 | |
Transamerica Asset Allocation Long Horizon (“Long Horizon”) (C) | R,R4 | |
Transamerica Asset Allocation Short Horizon (“Short Horizon”) (C) | R,R4 | |
Transamerica Multi-Manager Alternative Strategies Portfolio (“Multi-Manager Alternative Strategies”) (A) | A,C,I,R6,T1 |
| (A) | Class T1 commenced operations on March 17, 2017. | |
| (B) | Advisor Class commenced operations on March 3, 2017. | |
| (C) | The Funds’ Board of Trustees (the “Board”) approved the reorganization of certain series of Transamerica Asset Allocation Funds and Transamerica Institutional Asset Allocation Funds (“Target Funds”) into new Funds within the Trust. Each Target Fund invested substantially all of its investable assets among certain series of Transamerica Partners Funds Group (“Funds Group”) or Transamerica Partners Institutional Funds Group (“Institutional Funds Group”). Certain series of the Funds Group and Institutional Funds Group invested substantially all of their investable assets in a corresponding series of the Transamerica Partners Portfolios (the “Series Portfolio”). Target Fund investors approved the reorganizations and received newly-issued Class R or Class R4 shares of the new funds, as applicable, in the reorganizations. In each reorganization, the applicable Transamerica Institutional Asset Allocation Fund, a Target Fund was the accounting and performance survivor of the reorganization. Please reference the Reorganization section of the Notes to Financial Statements for more information. |
Each Fund, a “fund of fund”, invests the majority of its assets among certain other series of the Trust (hereafter referred to as “Underlying Funds”). The shareholder reports of the Underlying Funds, including the Schedule of Investments, should be read in conjunction with the Funds’ shareholder reports. The Underlying Funds’ shareholder reports are not covered by this report.
This report must be accompanied or preceded by the Funds’ current prospectuses, which contain additional information about the Funds, including risks, sales charges, and investment objectives and strategies.
Transamerica Asset Management, Inc. (“TAM”) serves as investment manager for the Funds. TAM provides continuous and regular investment management services to the Funds. TAM supervises each Fund’s investments, conducts its investment program and provides supervisory, compliance and administrative services to the Funds.
TAM is responsible for all aspects of the day-to-day management of the Transamerica Asset Allocation Horizon funds. For each of the other funds, TAM currently acts as a “manager of managers” and hires sub-advisers to furnish day-to-day investment advice and recommendations. TAM may, in the future, determine to provide all aspects of the day-to-day management of a Fund without the use of a sub-adviser. When acting as a manager of managers, TAM provides investment management services that include, without limitation, the design and development of the Funds and their investment strategies and the ongoing review and evaluation of those investment strategies including recommending changes in strategy where it believes appropriate or advisable; the selection of one or more sub-advisers for the Funds employing a combination of quantitative and qualitative screens, research, analysis and due diligence; negotiation of sub-advisory agreements and fees; oversight and monitoring of sub-advisers and recommending changes to sub-advisers where it believes appropriate or advisable; recommending fund combinations and liquidations where it believes appropriate or advisable; selection and oversight of transition managers, as needed; regular supervision of the Funds’ investments; regular review and evaluation of sub-adviser performance; daily monitoring of the sub-advisers’ buying and selling of securities for the Funds; regular review of holdings; ongoing trade oversight and analysis; regular monitoring to ensure adherence to investment process; regular calls and periodic on-site visits with sub-advisers; portfolio construction and asset allocation when using multiple sub-advisers for a Fund; risk management oversight and analysis; oversight of negotiation of investment documentation and agreements; design, development, implementation and regular monitoring of the valuation process; periodic due diligence reviews of pricing vendors and vendor methodology; design, development, implementation and regular monitoring of the compliance process; respond to regulatory inquiries and determine appropriate litigation strategy, as needed; review of proxies voted by sub-advisers; oversight of preparation, and review, of materials for meetings of the Funds’ Board of Trustees (the “Board”), participation in these meetings and preparation of regular communications with the Board; oversight of preparation, and review, of prospectuses, shareholder reports and other disclosure materials and regulatory filings for the Funds; oversight of other service providers to the Funds, such as the custodian, the transfer agent, the Funds’ independent accounting firm and legal counsel; supervision of the performance of recordkeeping and shareholder
| Transamerica Funds | Annual Report 2017 |
Page 68
Table of Contents
NOTES TO FINANCIAL STATEMENTS (continued)
At October 31, 2017
1. ORGANIZATION (continued)
relations functions for the Funds; and oversight of cash management services. TAM uses a variety of quantitative and qualitative tools to carry out its investment management services. TAM, not the Funds, is responsible for paying the sub-advisers for their services, and sub-advisory fees are TAM’s expense.
TAM’s investment management services also include the provision of supervisory and administrative services to the Funds. These services include performing certain administrative services for the Funds and supervising and overseeing the administrative, clerical, recordkeeping and bookkeeping services provided to the Funds by State Street Bank and Trust Company (“State Street”), to whom TAM has outsourced the provision of certain services as described below; to the extent agreed upon by TAM and the Funds from time to time, monitoring and verifying the custodian’s daily calculation of Net Asset Values (“NAV”); shareholder relations functions; compliance services; valuation services; assisting in due diligence and in oversight and monitoring of certain activities of sub-advisers and certain aspects of fund investments; assisting with fund combinations and liquidations; oversight of the preparation and filing, and review, of all returns and reports, in connection with federal, state and local taxes; oversight and review of regulatory reporting; supervising and coordinating the Funds’ custodian and dividend disbursing agent and monitoring their services to the Funds; assisting the Funds in preparing reports to shareholders; acting as liaison with the Funds’ independent public accountants and providing, upon request, analyses, fiscal year summaries and other audit related services; assisting in the preparation of agendas and supporting documents for and minutes of meetings of trustees and committees of trustees; assisting in the preparation of regular communications with the trustees; and providing personnel and office space, telephones and other office equipment as necessary in order for TAM to perform supervisory and administrative services to the Funds.
2. SIGNIFICANT ACCOUNTING POLICIES
In preparing the Funds’ financial statements in accordance with Generally Accepted Accounting Principles (“GAAP”) in the United States of America, estimates or assumptions (which could differ from actual results) may be used that affect reported amounts and disclosures. The following is a summary of significant accounting policies followed by the Funds.
Security transactions and investment income: Security transactions are recorded on the trade date. Security gains and losses are calculated on the specific identification basis. Interest income is accrued as earned. Dividend income and capital gain distributions from investment companies, if any, are recorded on the ex-dividend date. Dividends and net realized gain (loss) for the Funds are from investments in shares of investment companies. Income or short-term capital gain distributions received from investment companies are recorded as dividend income. Long-term capital gain distributions received from investment companies are recorded as realized gains.
Multiple class operations, income, and expenses: Income, non-class specific expenses, and realized and unrealized gains and losses are allocated to each class daily based upon net assets. Each class bears its own specific expenses in addition to the allocated non-class specific expenses.
Distributions to shareholders: Distributions are recorded on the ex-dividend date and are determined in accordance with federal income tax regulations, which may differ from GAAP.
Commission recapture: The sub-adviser, to the extent consistent with the best execution and usual commission rate policies and practices, may elect to place security transactions of the Funds with broker/dealers with which other funds or portfolios advised by TAM have established a Commission Recapture Program. A Commission Recapture Program is any arrangement under which a broker/dealer applies a portion of the commissions received by such broker/dealer on the security transactions to the Funds. In no event will commissions paid by the Funds be used to pay expenses that would otherwise be borne by any other funds or portfolios advised by TAM, or by any other party.
There were no commissions recaptured during the year ended October 31, 2017 by the Funds.
Indemnification: In the normal course of business, the Funds enter into contracts that contain a variety of representations that provide general indemnifications. The Funds’ maximum exposure under these arrangements is unknown, as this would involve future claims that may be made against the Funds and/or their affiliates that have not yet occurred. However, based on experience, the Funds expect the risk of loss to be remote.
3. SECURITY VALUATION
All investments in securities are recorded at their estimated fair value. The Funds value their investments at the official close of the New York Stock Exchange (“NYSE”) each day the NYSE is open for business.
| Transamerica Funds | Annual Report 2017 |
Page 69
Table of Contents
NOTES TO FINANCIAL STATEMENTS (continued)
At October 31, 2017
3. SECURITY VALUATION (continued)
The Funds utilize various methods to measure the fair value of their investments on a recurring basis. GAAP establishes a hierarchy that prioritizes inputs to valuation methods. The inputs or methodology used for valuing securities are not necessarily an indication of the risk associated with investing in those securities. The three levels (“Levels”) of inputs of the fair value hierarchy are defined as follows:
Level 1—Unadjusted quoted prices in active markets for identical securities.
Level 2—Inputs, other than quoted prices included in Level 1, which are observable, either directly or indirectly. These inputs may include quoted prices for the identical instrument on an inactive market, prices for similar instruments, interest rates, prepayment speeds, credit risk, yield curves, default rates, and similar data.
Level 3—Unobservable inputs, which may include TAM’s internal valuation committee’s (the “Valuation Committee”) own assumptions in determining the fair value of investments. Factors considered in making this determination may include, but are not limited to, information obtained by contacting the sub-adviser, issuer, analysts, or the appropriate stock exchange (for exchange-traded securities), analysis of the issuer’s financial statements or other available documents and, if necessary, available information concerning other securities in similar circumstances.
The inputs used to measure fair value may fall into different Levels of the fair value hierarchy. In such cases, for disclosure purposes, the Level in the fair value hierarchy that is assigned to the fair value measurement of a security is determined based on the lowest Level input that is significant to the fair value measurement in its entirety. Certain investments that are measured at fair value using NAV per share, or its equivalent, using the “practical expedient” have not been classified in the fair value Levels. The hierarchy classification of inputs used to value the Funds’ investments at October 31, 2017, is disclosed within the Security Valuation section of each Fund’s Schedule of Investments.
Under supervision and approval of the Board, TAM provides day-to-day valuation functions. TAM formed the Valuation Committee to monitor and implement the fair valuation policies and procedures as approved by the Board. These policies and procedures are reviewed at least annually by the Board. The Valuation Committee, among other tasks, monitors for when market quotations are not readily available or are unreliable and determines in good faith the fair value of the portfolio investments. For instances in which daily market quotes are not readily available, securities may be valued, pursuant to procedures adopted by the Board, with reference to other instruments or indices. Depending on the relative significance of valuation inputs, these instruments may be classified in either Level 2 or Level 3 of the fair value hierarchy.
The Valuation Committee may employ a market-based approach which may use related or comparable assets or liabilities, recent transactions, market multiples, book values, and other relevant information for the security to determine the fair value of the security. An income-based valuation approach may also be used in which the anticipated future cash flows of the security are discounted to calculate fair value. Discounts may also be applied due to the nature or duration of any restrictions on the disposition of the securities. When the Funds use fair value methods that rely on significant unobservable inputs to determine a security’s value, the Valuation Committee will choose the method that is believed to accurately reflect fair value. These securities are categorized in Level 3 of the fair value hierarchy. The Valuation Committee reviews fair value measurements on a regular and ad hoc basis and may, as deemed appropriate, update the security valuations as well as the fair valuation guidelines. The Board reviews and considers Valuation Committee determinations at its regularly scheduled meetings.
The availability of observable inputs can vary from security to security and is affected by a wide variety of factors, including, but not limited to, the type of security, whether the security is new and not yet established in the marketplace, the liquidity of markets, and other characteristics particular to the security. To the extent that valuation is based on models or inputs that are less observable or unobservable in the market, the determination of fair value requires more judgment. Accordingly, the degree of judgment exercised in determining fair value is generally greatest for instruments categorized in Level 3. Due to the inherent uncertainty of valuation, the Valuation Committee’s determination of values may differ significantly from values that would have been realized had a ready market for investments existed, and the differences could be material. The Valuation Committee employs various methods for calibrating these valuation approaches, including a regular review of valuation methodologies, key inputs and assumptions, transactional back-testing, and reviews of any market related activity.
Fair value measurements: Descriptions of the valuation techniques applied to the Funds’ significant categories of assets and liabilities measured at fair value on a recurring basis are as follows:
Investment companies: Certain investment companies are valued at the NAV of the underlying funds as the practical expedient. These investment companies are not included within the fair value hierarchy. Certain other investment companies are valued at the actively traded NAV of the underlying funds and no valuation adjustments are applied. These investment companies are categorized in Level 1 of the fair value hierarchy.
| Transamerica Funds | Annual Report 2017 |
Page 70
Table of Contents
NOTES TO FINANCIAL STATEMENTS (continued)
At October 31, 2017
3. SECURITY VALUATION (continued)
Repurchase agreements: Repurchase agreements are valued at cost, which approximates fair value. To the extent the inputs are observable and timely, the values are generally categorized in Level 2 of the fair value hierarchy.
Derivative instruments: Centrally cleared or listed derivatives that are actively traded are valued based on quoted prices from the exchange and are categorized in Level 1 of the fair value hierarchy. Over-the-counter (“OTC”) derivative contracts include forward, swap, swaption, and option contracts related to interest rates, foreign currencies, credit standing of reference entities, equity prices, or commodity prices. Depending on the product and the terms of the transaction, the fair value of the OTC derivative products are modeled taking into account the counterparties’ creditworthiness and using a series of techniques, including simulation models. Many pricing models do not entail material subjectivity because the methodologies employed do not necessitate significant judgments and the pricing inputs are observed from actively quoted markets, as is the case of interest rate swap and option contracts. The majority of OTC derivative products valued by the Funds using pricing models fall into this category and are categorized within Level 2 of the fair value hierarchy or Level 3 if inputs are unobservable.
4. SECURITIES AND OTHER INVESTMENTS
Restricted and illiquid securities: The Funds may invest in unregulated restricted securities. Restricted and illiquid securities are subject to legal or contractual restrictions on resale or are illiquid. Restricted securities generally may be resold in transactions exempt from registration under the Securities Act of 1933. A security may be considered illiquid if it lacks a readily available market or if its valuation has not changed for a certain period of time. Disposal of these securities may involve time-consuming negotiations and expense, and prompt sale at the current valuation may be difficult.
Restricted and illiquid securities held at October 31, 2017, if any, are identified within the Schedule of Investments.
5. BORROWINGS AND OTHER FINANCING TRANSACTIONS
The Funds may engage in borrowing transactions as a means of raising cash to satisfy redemption requests, for other temporary or emergency purposes or, to the extent permitted by their investment policies, to raise additional cash to be invested in other securities or instruments. When the Funds invest borrowing proceeds in other securities, the Funds will bear the risk that the market value of the securities in which the proceeds are invested goes down and is insufficient to repay borrowed proceeds. The Funds may borrow on a secured or on an unsecured basis. If the Funds enter into a secured borrowing arrangement, a portion of the Funds’ assets will be used as collateral. The 1940 Act requires the Funds to maintain asset coverage of at least 300% of the amount of their borrowings. Asset coverage means the ratio that the value of the Funds’ total assets, minus liabilities other than borrowings, bears to the aggregate amount of all borrowings. Although complying with this guideline would have the effect of limiting the amount that the Funds may borrow, it does not otherwise mitigate the risks of entering into borrowing transactions.
Interfund lending: The Funds, along with other funds and portfolios advised by TAM, may participate in an interfund lending program pursuant to exemptive relief granted by the Securities and Exchange Commission on January 18, 2017. This program allows the Funds to lend to each other as well as to other funds and portfolios advised by TAM. Interfund lending transactions are subject to the conditions of the exemptive relief which place limits on the amount of lending or borrowing a Fund may participate in under the program. Interest earned or paid on an interfund lending transaction will be based on the average of certain current market rates. As of October 31, 2017, the Funds have not utilized the program.
Repurchase agreements: In a repurchase agreement, the Funds purchase a security and simultaneously commit to resell that security to the seller at an agreed-upon price on an agreed-upon date. Securities purchased subject to a repurchase agreement are held at the Funds’ custodian, or designated sub-custodian related to tri-party repurchase agreements, and, pursuant to the terms of the repurchase agreement, must be collateralized by securities with an aggregate market value greater than or equal to 100% of the resale price. The Funds will bear the risk of value fluctuations until the securities can be sold and may encounter delays and incur costs in liquidating the securities. In the event of bankruptcy or insolvency of the seller, delays and costs may be incurred.
Repurchase agreements are subject to netting agreements, which are agreements between the Funds and their counterparties that provide for the net settlement of all transactions and collateral with the Funds, through a single payment, in the event of default or termination. Amounts presented within the Schedule of Investments, and as part of Repurchase agreements, at value within the Statements of Assets and Liabilities are shown on a gross basis. The value of the related collateral for each repurchase agreement, as reflected within the Schedule of Investments, exceeds the value of each repurchase agreement at October 31, 2017.
Repurchase agreements at October 31, 2017, if any, are included within the Schedule of Investments and Statements of Assets and Liabilities.
| Transamerica Funds | Annual Report 2017 |
Page 71
Table of Contents
NOTES TO FINANCIAL STATEMENTS (continued)
At October 31, 2017
6. RISK EXPOSURES AND THE USE OF DERIVATIVE INSTRUMENTS
The Funds’ investment objectives allow the Funds to use various types of derivative contracts, including option contracts, swap agreements, futures contracts, and forward foreign currency contracts. Derivatives are investments whose value is primarily derived from underlying assets, indices or reference rates and may be transacted on an exchange or OTC.
Market Risk Factors: In pursuit of the Funds’ investment objectives, the Funds may seek to use derivatives to increase or decrease their exposure to the following market risks:
Interest rate risk: Interest rate risk relates to the fluctuations in the value of fixed income securities due to changes in the prevailing levels of market interest rates.
Foreign exchange rate risk: Foreign exchange rate risk relates to fluctuations in the value of an asset or liability due to changes in the currency exchange rates.
Equity risk: Equity risk relates to the change in value of equity securities as they relate to increases or decreases in the general market.
Credit risk: Credit risk relates to the ability of the issuer of a financial instrument to make further principal or interest payments on an obligation or commitment that it has to the Funds.
Commodity risk: Commodity risk relates to the change in value of commodities or commodity indices as they relate to increases or decreases in the commodities market. Commodities are physical assets that have tangible properties. Examples of these types of assets are crude oil, heating oil, metals, livestock, and agricultural products.
The Funds are also exposed to additional risks from investing in derivatives, such as liquidity and counterparty credit risk. Liquidity risk is the risk that the Funds will be unable to sell or close out the derivative in the open market in a timely manner. Counterparty credit risk is the risk that the counterparty will not be able to fulfill its obligations to the Funds. Investing in derivatives may also involve greater risks than investing directly in the underlying assets, such as losses in excess of any initial investment and collateral received. In addition, there may be the risk that the change in value of the derivative contract does not correspond to the change in value of the underlying instrument.
The Funds’ exposure to market risk factors and other associated risks are discussed by derivative type as follows:
Futures contracts: The Funds are subject to equity and commodity risk, interest rate risk, and foreign exchange rate risk in the normal course of pursuing their investment objectives. The Funds use futures contracts to gain exposure to, or hedge against, changes in the value of equities and commodities, interest rates, or foreign currencies. A futures contract represents a commitment for the future purchase or sale of an asset at a specified price on a specified date. Upon entering into such contracts, the Funds are required to deposit with the broker, either in cash or in securities, an initial margin in an amount equal to a certain percentage of the contract amount. Subsequent payments (variation margin) are paid or received by the Funds, depending on the daily fluctuations in the value of the contract, and are recorded for financial statement purposes as unrealized gains or losses by the Funds. Upon entering into such contracts, the Funds bear the risk of equity and commodity prices, interest rates, or exchange rates moving unexpectedly, in which case, the Funds may not achieve the anticipated benefits of the futures contracts and may realize losses. With futures, there is minimal counterparty credit risk to the Funds since futures are exchange-traded and the exchange’s clearinghouse, as counterparty to all exchange-traded futures, guarantees the futures against default. Futures contracts are generally entered into on a regulated futures exchange and cleared through a clearinghouse associated with the exchange.
Open futures contracts at October 31, 2017, if any, are listed within the Schedule of Investments. Variation margin, if applicable, is shown in Variation margin receivable or payable on futures contracts within the Statements of Assets and Liabilities.
The following is a summary of the location and the Portfolio’s fair values of derivative investments disclosed, if any, within the Statement of Assets and Liabilities, categorized by primary market risk exposure as of October 31, 2017.
Asset Derivatives | ||||||||||||||||||||||||
| Fund/Location | Interest Rate Contracts | Foreign Exchange Contracts | Equity Contracts | Credit Contracts | Commodity Contracts | Total | ||||||||||||||||||
Multi-Manager Alternative Strategies | ||||||||||||||||||||||||
Net unrealized appreciation on futures contracts (A) (B) | $ | 122,641 | $ | — | $ | — | $ | — | $ | — | $ | 122,641 | ||||||||||||
Total | $ | 122,641 | $ | — | $ | — | $ | — | $ | — | $ | 122,641 | ||||||||||||
| (A) | May include exchange-traded derivatives which are not subject to a master netting arrangement, or another similar arrangement. | |
| (B) | Included within cumulative appreciation (depreciation) on futures contracts as reported in the Schedule of Investments. Only current day’s variation margin is reported within the Statements of Assets and Liabilities. |
| Transamerica Funds | Annual Report 2017 |
Page 72
Table of Contents
NOTES TO FINANCIAL STATEMENTS (continued)
At October 31, 2017
6. RISK EXPOSURES AND THE USE OF DERIVATIVE INSTRUMENTS (continued)
The following is a summary of the location and the effect of derivative investments, if any, within the Statements of Operations , categorized by primary market risk exposure as of October 31, 2017.
Realized Gain (Loss) on Derivative Instruments | ||||||||||||||||||||||||
| Fund/Location | Interest Rate Contracts | Foreign Exchange Contracts | Equity Contracts | Credit Contracts | Commodity Contracts | Total | ||||||||||||||||||
Multi-Manager Alternative Strategies | ||||||||||||||||||||||||
Futures contracts | $ | (87 | ) | $ | — | $ | (235,102 | ) | $ | — | $ | — | $ | (235,189 | ) | |||||||||
Total | $ | (87 | ) | $ | — | $ | (235,102 | ) | $ | — | $ | — | $ | (235,189 | ) | |||||||||
Net Change in Unrealized Appreciation (Depreciation) on Derivative Instruments | ||||||||||||||||||||||||
| Fund/Location | Interest Rate Contracts | Foreign Exchange Contracts | Equity Contracts | Credit Contracts | Commodity Contracts | Total | ||||||||||||||||||
Multi-Manager Alternative Strategies | ||||||||||||||||||||||||
Futures contracts | $ | 122,641 | $ | — | $ | — | $ | — | $ | — | $ | 122,641 | ||||||||||||
Total | $ | 122,641 | $ | — | $ | — | $ | — | $ | — | $ | 122,641 | ||||||||||||
The following is a summary of the ending monthly average volume on derivative activity during the year ended October 31, 2017.
| Futures Contracts at Notional Amount | ||||||||
| Fund | Long | Short | ||||||
Multi-Manager Alternative Strategies | — | (723,077 | ) | |||||
7. FEES AND OTHER AFFILIATED TRANSACTIONS
TAM, the Funds’ investment manager, is directly owned by Transamerica Premier Life Insurance Company (“TPLIC”) and AUSA Holding Company (“AUSA”), both of which are indirect, wholly owned subsidiaries of Aegon NV. TPLIC is owned by Commonwealth General Corporation (“Commonwealth”) and Aegon USA, LLC (“Aegon USA”). Commonwealth and AUSA are wholly owned by Aegon USA. Aegon USA is wholly owned by Aegon US Holding Corporation, which is wholly owned by Transamerica Corporation (DE). Transamerica Corporation (DE) is wholly owned by The Aegon Trust, which is wholly owned by Aegon International B.V., which is wholly owned by Aegon NV, a Netherlands corporation, and a publicly traded international insurance group.
Effective July 7, 2017, Goldman Sachs Asset Management, L.P. is the sub-adviser of Multi-Manager Alternative Strategies. Prior to July 7, 2017, Aegon USA Investment Management LLC (“AUIM”) was both an affiliate and a sub-adviser of Multi-Manager Alternative Strategies.
Transamerica Funds Services, Inc. (“TFS”) is the Funds’ transfer agent. Transamerica Capital, Inc. (“TCI”) is the Funds’ distributor/principal underwriter. TAM, AUIM, TFS, and TCI are affiliates of Aegon NV.
Certain officers and trustees of the Funds are also officers and/or trustees of TAM, AUIM, TFS, and TCI. No interested trustee, who is deemed an interested person due to current or former service with TAM or an affiliate of TAM, receives compensation from the Funds.
The Underlying Funds have varied expense and fee levels and the Funds may own different proportions of Underlying Funds at different times, the amount of fees and expenses incurred indirectly by the Funds will vary. Fund expenses do not include expenses of the Underlying Funds in which the Funds invest. The Funds have material ownership interests in the Underlying Funds.
All of the Underlying Funds held within the Funds are considered affiliated transactions to the Funds. Interest, dividends, realized and unrealized gains (losses), if any, are broken out within the Statements of Operations.
Investment management fees: TAM serves as the Funds’ investment manager, performing administration as well as investment advisory services. TAM renders investment advisory, supervisory, and administration services under an investment management agreement and each Fund pays a single management fee, which is reflected in Investment management fees within the Statements of Operations.
| Transamerica Funds | Annual Report 2017 |
Page 73
Table of Contents
NOTES TO FINANCIAL STATEMENTS (continued)
At October 31, 2017
7. FEES AND OTHER AFFILIATED TRANSACTIONS (continued)
Prior to the closing of the Transamerica Partners reorganizations, TAM provided investment advisory services to the Target Funds pursuant to investment advisory agreements. For TAM’s services, the Target Funds paid advisory fees accrued daily and payable monthly, at an annual rate equal to 0.10% of each Target Fund’s daily Average Net Assets (“ANA”). TAM directly paid all other ordinary expenses of the Target Funds, which included fees related to audit, custody, legal, printing, trustees, and registration. For those Funds that were Destination Funds in the Transamerica Partners reorganizations where the accounting and performance survivor is a Target Fund, the investments advisory fees for the applicable Target Fund are included in the Statements of Operations within Investment advisory fees. Please reference the Reorganization section of the Notes to Financial Statements for more information.
Each Fund pays a management fee to TAM based on daily ANA at the following rates. For the Funds impacted by the Transamerica Partners reorganizations, please reference the Reorganization section of the Notes to Financial Statements for more information.
| Fund | Rate | |||
Asset Allocation – Conservative | 0.1225 | % | ||
Asset Allocation – Growth | 0.1225 | % | ||
Asset Allocation – Moderate Growth | 0.1225 | % | ||
Asset Allocation – Moderate | 0.1225 | % | ||
Intermediate Horizon | ||||
Fund | 0.1200 | % | ||
Target Fund (accounting and performance survivor) | 0.1000 | % | ||
Long Horizon | ||||
Fund | 0.1200 | % | ||
Target Fund (accounting and performance survivor) | 0.1000 | % | ||
Short Horizon | ||||
Fund | 0.1200 | % | ||
Target Fund (accounting and performance survivor) | 0.1000 | % | ||
| Fund | Rate | |||
Multi-Manager Alternative Strategies | ||||
Effective July 7, 2017 | ||||
First $500 million | 0.1925 | % | ||
Over $500 million up to $1 billion | 0.1725 | % | ||
Over $1 billion up to $2 billion | 0.1525 | % | ||
Over $2 billion | 0.1425 | % | ||
Prior to July 7, 2017 | ||||
First $500 million | 0.2225 | % | ||
Over $500 million up to $1 billion | 0.2125 | % | ||
Over $1 billion | 0.2025 | % | ||
TAM has contractually agreed to waive fees and/or reimburse Fund expenses to the extent that the total operating expenses excluding, as applicable, acquired fund fees and expenses, interest, taxes, brokerage commissions, dividend and interest expenses on securities sold short, extraordinary expenses, reorganization expenses and other expenses not incurred in the ordinary course of the Funds’ business, exceed the following stated annual operating expense limits to the Funds’ daily ANA. The expenses waived and/or reimbursed, if any, are included in Expenses waived and/or reimbursed within the Statements of Operations. For the Funds impacted by the Transamerica Partners reorganizations, please reference the Reorganization section of the Notes to Financial Statements for more information.
| Fund | Operating Expense Limit | Operating Expense Limit Effective Through | ||||||
Asset Allocation – Conservative |
| |||||||
Effective March 1, 2017 | ||||||||
Class A | 0.70 | % | March 1, 2018 | |||||
Class B, Class C | 1.45 | % | March 1, 2018 | |||||
Class I, Advisor Class (A) | 0.45 | % | March 1, 2018 | |||||
Class R | 0.95 | % | March 1, 2018 | |||||
Class T1 (B) | 0.70 | % | April 1, 2018 | |||||
Prior to March 1, 2017 | ||||||||
Fund Level (C) | 0.45 | % | ||||||
Asset Allocation – Growth |
| |||||||
Effective March 1, 2017 | ||||||||
Class A | 0.70 | % | March 1, 2018 | |||||
Class B, Class C | 1.45 | % | March 1, 2018 | |||||
Class I, Advisor Class (A) | 0.45 | % | March 1, 2018 | |||||
Class R | 0.95 | % | March 1, 2018 | |||||
Class T1 (B) | 0.70 | % | April 1, 2018 | |||||
Prior to March 1, 2017 | ||||||||
Fund Level (C) | 0.45 | % | ||||||
| Fund | Operating Expense Limit | Operating Expense Limit Effective Through | ||||||
Asset Allocation – Moderate Growth |
| |||||||
Effective March 1, 2017 | ||||||||
Class A | 0.70 | % | March 1, 2018 | |||||
Class B, Class C | 1.45 | % | March 1, 2018 | |||||
Class I, Advisor Class (A) | 0.45 | % | March 1, 2018 | |||||
Class R | 0.95 | % | March 1, 2018 | |||||
Class T1 (B) | 0.70 | % | April 1, 2018 | |||||
Prior to March 1, 2017 | ||||||||
Fund Level (C) | 0.45 | % | ||||||
Asset Allocation – Moderate |
| |||||||
Effective March 1, 2017 | ||||||||
Class A | 0.70 | % | March 1, 2018 | |||||
Class B, Class C | 1.45 | % | March 1, 2018 | |||||
Class I, Advisor Class (A) | 0.45 | % | March 1, 2018 | |||||
Class R | 0.95 | % | March 1, 2018 | |||||
Class T1 (B) | 0.70 | % | April 1, 2018 | |||||
Prior to March 1, 2017 | ||||||||
Fund Level (C) | 0.45 | % | ||||||
| Transamerica Funds | Annual Report 2017 |
Page 74
Table of Contents
NOTES TO FINANCIAL STATEMENTS (continued)
At October 31, 2017
7. FEES AND OTHER AFFILIATED TRANSACTIONS (continued)
| Fund | Operating Expense Limit | Operating Expense Limit Effective Through | ||||||
Intermediate Horizon | ||||||||
Effective reorganization date May 19, 2017 | ||||||||
Class R (D) | 0.60 | % | May 1, 2018 | |||||
Class R4 | 0.35 | % | May 1, 2018 | |||||
Prior to reorganization date May 19, 2017 | ||||||||
Target Fund (accounting and performance survivor) | N/A | |||||||
Long Horizon | ||||||||
Effective reorganization date May 19, 2017 | ||||||||
Class R (D) | 0.60 | % | May 1, 2018 | |||||
Class R4 | 0.35 | % | May 1, 2018 | |||||
Prior to reorganization date May 19, 2017 | ||||||||
Target Fund (accounting and performance survivor) | N/A | |||||||
| Fund | Operating Expense Limit | Operating Expense Limit Effective Through | ||||||
Short Horizon | ||||||||
Effective reorganization date May 19, 2017 | ||||||||
Class R (D) | 0.60 | % | May 1, 2018 | |||||
Class R4 | 0.35 | % | May 1, 2018 | |||||
Prior to reorganization date May 19, 2017 | ||||||||
Target Fund (accounting and performance survivor) | N/A | |||||||
Multi-Manager Alternative Strategies |
| |||||||
Effective March 1, 2017 | ||||||||
Class A | 0.80 | % | March 1, 2018 | |||||
Class C | 1.55 | % | March 1, 2018 | |||||
Class I, Class R6 | 0.55 | % | March 1, 2018 | |||||
Class T1 (B) | 0.80 | % | April 1, 2018 | |||||
Prior to March 1, 2017 | ||||||||
Fund Level (C) | 0.55 | % | ||||||
| (A) | Advisor Class commenced operations on March 3, 2017. | |
| (B) | Class T1 commenced operations on March 17, 2017. | |
| (C) | Prior to March 1, 2017, TAM’s expense limitation contractual arrangements with the Funds were applied at the Fund level and excluded distribution fees (Rule 12b-1 fees) for all applicable share classes | |
| (D) | Class commenced operations on May 19, 2017. |
TAM is entitled to recapture expenses accrued by the Funds for fees waived and/or reimbursed during any of the previous 36 months if on any day or month the estimated annualized Funds’ operating expenses are less than the stated annual operating expense limit. Amounts recaptured, if any, by TAM for the year ended October 31, 2017 are disclosed in Recapture of previously waived and/or reimbursed fees within the Statements of Operations.
As of October 31, 2017, the balances available for recapture by TAM for each Fund are as follows:
| Amounts Available from Fiscal Year | ||||||||
| Fund | 2017 | Total | ||||||
Intermediate Horizon | ||||||||
Class R | $ 39,740 | $ | 39,740 | |||||
Class R4 | 4,834 | 4,834 | ||||||
Long Horizon | ||||||||
Class R | $ 21,729 | $ | 21,729 | |||||
Class R4 | 5,494 | 5,494 | ||||||
Short Horizon | ||||||||
Class R | $ 17,323 | $ | 17,323 | |||||
Class R4 | 985 | 985 | ||||||
Distribution and service fees: The Trust has a distribution plan (“Distribution Plan”) pursuant to Rule 12b-1 under the 1940 Act. Pursuant to the Distribution Plan, the Trust entered into a distribution agreement with TCI as the Funds’ distributor.
The Distribution Plan requires the Funds to pay distribution fees to TCI as compensation for various distribution activities, not as reimbursement for specific expenses. Under the Distribution Plan and distribution agreement, TCI, on behalf of the Funds, is authorized to pay various service providers, as direct payment for expenses incurred in connection with distribution of the Funds shares. The distribution and service fees are included in Distribution fees within the Statements of Operations.
| Transamerica Funds | Annual Report 2017 |
Page 75
Table of Contents
NOTES TO FINANCIAL STATEMENTS (continued)
At October 31, 2017
7. FEES AND OTHER AFFILIATED TRANSACTIONS (continued)
Each Fund is authorized under the Distribution Plan to pay fees to TCI based on daily ANA of each class up to the following annual rates:
| Class (A) | Rate | |||
Class A | 0.25 | % | ||
Class B | 1.00 | % | ||
Class C | 1.00 | % | ||
Class R (B) | 0.50 | % | ||
Class R4 (B) | 0.25 | % | ||
Class T1 | 0.25 | % | ||
| (A) | 12b-1 fees are not applicable for Class I, Class R6, and Advisor Class. | |
| (B) | Prior to the Transamerica Partners reorganizations, the Target Funds paid no distribution fees. Please reference the Reorganization section of the notes to Financial Statements for more information. |
Shareholder fees: Class A and Class T1 shares are subject to an initial sales charge, and a contingent deferred sales charge on certain share redemptions. Class B and Class C shares are subject to a contingent deferred sales charge. For the year ended October 31, 2017, underwriter commissions received by TCI from the various sales charges are as follows. Funds and/or classes not listed in the subsequent table do not have shareholder fees.
| Fund | Initial Sales Charge | Contingent Deferred Sales Charge | ||||||
Asset Allocation – Conservative |
| |||||||
Class A | $ | 300,433 | $ | 177 | ||||
Class B | — | 766 | ||||||
Class C | — | 16,333 | ||||||
Asset Allocation – Growth |
| |||||||
Class A | 1,019,306 | 896 | ||||||
Class B | — | 3,711 | ||||||
Class C | — | 40,090 | ||||||
Asset Allocation – Moderate Growth |
| |||||||
Class A | 1,433,155 | 2,431 | ||||||
Class B | — | 3,520 | ||||||
Class C | — | 59,799 | ||||||
| Fund | Initial Sales Charge | Contingent Deferred Sales Charge | ||||||
Asset Allocation – Moderate |
| |||||||
Class A | $ | 814,079 | $ | 464 | ||||
Class B | — | 981 | ||||||
Class C | — | 36,960 | ||||||
Multi-Manager Alternative Strategies |
| |||||||
Class A | 19,043 | — | ||||||
Class C | — | 1,967 | ||||||
Administration and Transfer agent fees: Each Fund pays a management fee to TAM for investment management and administration services. The management fee is reflected in Investment management fees within the Statements of Operations.
Pursuant to a transfer agency agreement, as amended, the Funds pay TFS a fee for providing services based on the number of classes, accounts and transactions relating to each Fund. The Transfer agent fees included within the Statements of Assets and Liabilities and Statements of Operations represent fees paid to TFS, and other unaffiliated parties providing transfer agent related services.
Prior to the closing of the Transamerica Partners reorganizations, TAM provided fund administration and transfer agent services to the Target Funds under a separate administrative services agreement. TAM received no additional compensation for providing administrative services to the Target Funds. TFS provided transfer agency services to the Target Funds and the Target Funds did not pay a separate transfer agency fee. Please reference the Reorganization section of the Notes to Financial Statements for more information.
For the year ended October 31, 2017, transfer agent fees paid and the amounts due to TFS are as follows:
| Fund | Fees Paid to TFS | Fees Due to TFS | ||||||||||
Asset Allocation – Conservative | $ | 730,340 | $ | 61,589 | ||||||||
Asset Allocation – Growth | 1,645,186 | 135,463 | ||||||||||
Asset Allocation – Moderate Growth | 2,374,253 | 194,519 | ||||||||||
Asset Allocation – Moderate | 1,487,422 | 123,670 | ||||||||||
Intermediate Horizon | 1,367 | 132 | ||||||||||
| Transamerica Funds | Annual Report 2017 |
Page 76
Table of Contents
NOTES TO FINANCIAL STATEMENTS (continued)
At October 31, 2017
7. FEES AND OTHER AFFILIATED TRANSACTIONS (continued)
| Fund | Fees Paid to TFS | Fees Due to TFS | ||||||||||
Long Horizon | $ | 1,524 | $ | 217 | ||||||||
Short Horizon | 271 | 46 | ||||||||||
Multi-Manager Alternative Strategies | 268,575 | 20,312 | ||||||||||
Deferred compensation plan: Under a non-qualified deferred compensation plan effective January 1, 1996, as amended and restated January 1, 2010, available to the trustees, compensation may be deferred that would otherwise be payable by the Trust to an independent trustee on a current basis for services rendered as trustee. Deferred compensation amounts will accumulate based on the value of the investment option, as elected by the trustee. Balances pursuant to deferred compensation plan are recorded in Trustees, Chief Compliance Officer (“CCO”) and deferred compensation fees within the Statements of Assets and Liabilities. For the year ended October 31, 2017, amounts included in Trustees, CCO and deferred compensation fees within the Statements of Operations reflect total compensation paid to the independent Board members.
Brokerage commissions: The Funds incurred no brokerage commissions on security transactions placed with affiliates of the adviser or sub-advisers for the year ended October 31, 2017.
8. PRINCIPAL OWNERSHIP
As of October 31, 2017, the Funds had certain individual shareholder(s) and/or omnibus accounts owning more than 10% of total shares outstanding. The Funds have no knowledge if any portion of the unaffiliated shares are owned beneficially. Subscription and redemption activity by concentrated accounts may have a significant effect on operations, and thus may impact Fund performance. Shareholder accounts with over 10% of total shares outstanding are as follows.
| Fund | Number of Individual Shareholders and/or Omnibus Accounts | Total Percentage Interest Held | Total Percentage Held by the Investment Manager and/or Affiliates | |||||||||
Asset Allocation – Conservative | ||||||||||||
Class A | 1 | 67.73 | % | 0.00 | % | |||||||
Class B | 2 | 41.21 | % | 0.00 | % | |||||||
Class C | 3 | 39.70 | % | 0.00 | % | |||||||
Class I | 4 | 77.62 | % | 0.00 | % | |||||||
Class R | 3 | 54.82 | % | 0.00 | % | |||||||
Class T1 | 1 | 100.00 | % | 100.00 | % | |||||||
Advisor Class | 2 | 100.00 | % | 46.41 | % | |||||||
Asset Allocation – Growth | ||||||||||||
Class A | 1 | 30.06 | % | 0.00 | % | |||||||
Class C | 3 | 41.24 | % | 0.00 | % | |||||||
Class I | 4 | 62.86 | % | 0.00 | % | |||||||
Class R | 2 | 39.25 | % | 0.00 | % | |||||||
Class T1 | 1 | 100.00 | % | 100.00 | % | |||||||
Advisor Class | 1 | 100.00 | % | 100.00 | % | |||||||
Asset Allocation – Moderate Growth | ||||||||||||
Class A | 1 | 34.10 | % | 0.00 | % | |||||||
Class B | 2 | 26.11 | % | 0.00 | % | |||||||
Class C | 3 | 41.27 | % | 0.00 | % | |||||||
Class I | 5 | 74.68 | % | 0.00 | % | |||||||
Class R | 3 | 54.98 | % | 0.00 | % | |||||||
Class T1 | 1 | 100.00 | % | 100.00 | % | |||||||
Advisor Class | 1 | 100.00 | % | 100.00 | % | |||||||
| Fund | Number of Individual Shareholders and/or Omnibus Accounts | Total Percentage Interest Held | Total Percentage Held by the Investment Manager and/or Affiliates | |||||||||
Asset Allocation – Moderate | ||||||||||||
Class A | 1 | 50.92 | % | 0.00 | % | |||||||
Class B | 2 | 34.65 | % | 0.00 | % | |||||||
Class C | 3 | 40.60 | % | 0.00 | % | |||||||
Class I | 3 | 64.88 | % | 0.00 | % | |||||||
Class R | 3 | 47.73 | % | 0.00 | % | |||||||
Class T1 | 1 | 100.00 | % | 100.00 | % | |||||||
Advisor Class | 1 | 100.00 | % | 100.00 | % | |||||||
Intermediate Horizon | ||||||||||||
Class R | 1 | 100.00 | % | 100.00 | % | |||||||
Class R4 | 1 | 100.00 | % | 100.00 | % | |||||||
Long Horizon | ||||||||||||
Class R | 1 | 100.00 | % | 100.00 | % | |||||||
Class R4 | 1 | 100.00 | % | 100.00 | % | |||||||
Short Horizon | ||||||||||||
Class R | 1 | 100.00 | % | 100.00 | % | |||||||
Class R4 | 1 | 100.00 | % | 100.00 | % | |||||||
Multi-Manager Alternative Strategies | ||||||||||||
Class A | 2 | 39.30 | % | 0.00 | % | |||||||
Class C | 4 | 56.94 | % | 0.00 | % | |||||||
Class I | 4 | 67.79 | % | 0.00 | % | |||||||
Class R6 | 3 | 99.96 | % | 99.96 | % | |||||||
Class T1 | 1 | 100.00 | % | 100.00 | % | |||||||
| Transamerica Funds | Annual Report 2017 |
Page 77
Table of Contents
NOTES TO FINANCIAL STATEMENTS (continued)
At October 31, 2017
9. PURCHASES AND SALES OF SECURITIES
For the year ended October 31, 2017, the cost of securities purchased and proceeds from securities sold (excluding short-term securities) are as follows:
| Fund | Purchases of Securities | Sales of Securities | ||||||||||
Asset Allocation – Conservative | $ | 202,623,333 | $ | 267,313,051 | ||||||||
Asset Allocation – Growth | 137,249,758 | 338,333,705 | ||||||||||
Asset Allocation – Moderate Growth | 383,909,791 | 818,679,211 | ||||||||||
Asset Allocation – Moderate | 256,427,418 | 543,945,523 | ||||||||||
Intermediate Horizon | 156,659,711 | 270,976,566 | ||||||||||
Long Horizon | 124,686,522 | 206,174,729 | ||||||||||
Short Horizon | 33,314,486 | 57,760,311 | ||||||||||
Multi-Manager Alternative Strategies | 121,830,515 | 194,194,244 | ||||||||||
10. FEDERAL INCOME TAXES AND DISTRIBUTIONS TO SHAREHOLDERS
The Funds have not made any provision for federal income or excise taxes due to their policy to distribute all of their taxable income and capital gains to their shareholders and otherwise qualify as regulated investment companies under Subchapter M of the Internal Revenue Code. The Funds recognize the tax benefits of uncertain tax positions only where the position is “more likely than not” to be sustained assuming examination by tax authorities. The Funds’ federal and state tax returns remain subject to examination by the Internal Revenue Service and state tax authorities for the prior three years. Management has evaluated the Funds’ tax provisions taken for all open tax years, and has concluded that no provision for income tax is required in the Funds’ financial statements. If applicable, the Funds recognize interest accrued related to unrecognized tax benefits in relation to interest and penalties expense in Other within the Statements of Operations. The Funds identify their major tax jurisdictions as U.S. Federal, the state of Colorado, and foreign jurisdictions where the Funds make significant investments; however, the Funds are not aware of any tax positions for which it is reasonably possible that the total amounts of unrecognized tax benefits will change materially in the next twelve months.
Income and capital gain distributions are determined in accordance with income tax regulations, which may differ from GAAP. These differences are primarily due to different treatment for items including, but not limited to, wash sales, mark-to-market on futures contracts, future straddle deferrals, non-real estate investment trust return of capital adjustments from merger target funds, and liquidating trust basis adjustments. Therefore, distributions determined in accordance with tax regulations may differ significantly in amount or character from net investment income and realized gains for financial reporting purposes. Financial reporting records are adjusted for permanent book/tax differences to reflect tax character. The primary permanent differences are due to wash sales from merger target funds, liquidating trust basis adjustments, non-real estate investment trust return of capital adjustments from merger target funds, capital loss carryforwards from merger target funds, capital loss carryforwards expiration, adjustments to prior year accumulated balances, distributions in excess of current earnings, prior year open deferrals from merger target funds, and distribution re-designations. These reclassifications have no impact on net assets or results of operations. Financial records are not adjusted for temporary differences. These permanent reclassifications are as follows:
| Fund | Paid-in Capital | Undistributed (Distributions in Excess of) Net Investment Income (Loss) | Accumulated Net Realized Gain (Loss) | |||||||||
Asset Allocation – Conservative | $ | — | $ | 3,764 | $ | (3,764 | ) | |||||
Asset Allocation – Growth | — | 2,622,367 | (2,622,367 | ) | ||||||||
Asset Allocation – Moderate Growth | — | 14,519 | (14,519 | ) | ||||||||
Asset Allocation – Moderate | — | 22,872 | (22,872 | ) | ||||||||
Intermediate Horizon | (11,087,815 | ) | 4,313 | 11,083,502 | ||||||||
Long Horizon | (13,270,391 | ) | 86,710 | 13,183,681 | ||||||||
Short Horizon | (185,335 | ) | 147 | 185,188 | ||||||||
Multi-Manager Alternative Strategies | — | 2,969 | (2,969 | ) | ||||||||
| Transamerica Funds | Annual Report 2017 |
Page 78
Table of Contents
NOTES TO FINANCIAL STATEMENTS (continued)
At October 31, 2017
10. FEDERAL INCOME TAXES AND DISTRIBUTIONS TO SHAREHOLDERS (continued)
As of October 31, 2017, the approximate cost for U.S. federal income tax purposes, the aggregate investment-level gross/net unrealized appreciation (depreciation) in the value of investment securities (including securities sold short, if any), and the net unrealized appreciation (depreciation) of derivatives were as follows:
| Portfolio | Cost | Gross Appreciation | Gross (Depreciation) | Net Appreciation/ (Depreciation) | ||||||||||||
Asset Allocation – Conservative | $ | 1,032,488,249 | $ | 82,102,065 | $ | (10,619,570 | ) | $ | 71,482,495 | |||||||
Asset Allocation – Growth | 1,234,671,145 | 311,576,182 | (11,574,204 | ) | 300,001,978 | |||||||||||
Asset Allocation – Moderate Growth | 2,291,707,606 | 403,540,680 | (20,649,707 | ) | 382,890,973 | |||||||||||
Asset Allocation – Moderate | 1,767,507,119 | 212,873,991 | (18,599,309 | ) | 194,274,682 | |||||||||||
Intermediate Horizon | 427,582,911 | 20,433,993 | (2,212,671 | ) | 18,221,322 | |||||||||||
Long Horizon | 232,909,220 | 25,722,501 | (14,085 | ) | 25,708,416 | |||||||||||
Short Horizon | 187,959,800 | 2,670,014 | (1,706,741 | ) | 963,273 | |||||||||||
Multi-Manager Alternative Strategies | 166,109,910 | 4,235,287 | (7,562,245 | ) | (3,326,958 | ) | ||||||||||
As of October 31, 2017, the capital loss carryforwards available to offset future realized capital gains are as follows. Funds not listed in the subsequent table do not have capital loss carryforwards.
| Expires on October 31, | Unlimited | |||||||||||
| Fund | 2018 | Short-Term | Long-Term | |||||||||
Intermediate Horizon | $ | 28,228,916 | $ | — | $ | — | ||||||
Long Horizon | 31,559,291 | — | — | |||||||||
Short Horizon | 801,235 | — | — | |||||||||
Multi-Manager Alternative Strategies | — | 2,955,008 | 2,455,827 | |||||||||
During the year ended October 31, 2017, the capital loss carryforwards utilized or expired are as follows. Funds not listed in the subsequent table do not have capital loss carryforwards utilized or expired.
| Fund | Capital Loss Carryforwards Utilized/Expired | |||
Intermediate Horizon | $ | 55,587,662 | ||
Long Horizon | 163,159,124 | |||
Short Horizon | 233,857 | |||
The tax character of distributions paid may differ from the character of distributions shown within the Statements of Changes in Net Assets due to short-term gains being treated as ordinary income for tax purposes. The tax character of distributions paid during 2017 and 2016 are listed below.
| 2017 Distributions Paid From | 2016 Distributions Paid From | |||||||||||||||||||||||
| Fund | Ordinary Income | Long-Term Capital Gain | Return of Capital | Ordinary Income | Long-Term Capital Gain | Return of Capital | ||||||||||||||||||
Asset Allocation – Conservative | $ | 22,899,015 | $ | 25,508,202 | $ | — | $ | 18,818,299 | $ | 32,134,983 | $ | — | ||||||||||||
Asset Allocation – Growth | 18,644,477 | 89,000,827 | — | 16,709,888 | 108,658,887 | — | ||||||||||||||||||
Asset Allocation – Moderate Growth | 38,628,310 | 128,089,139 | — | 35,434,055 | 163,231,095 | — | ||||||||||||||||||
Asset Allocation – Moderate | 30,703,415 | 66,643,386 | — | 33,159,219 | 86,636,887 | — | ||||||||||||||||||
Intermediate Horizon | 2,494,129 | — | — | 1,480,306 | — | — | ||||||||||||||||||
Long Horizon | 433,530 | — | — | 357,604 | — | — | ||||||||||||||||||
Short Horizon | 1,499,619 | — | — | 310,689 | — | — | ||||||||||||||||||
Multi-Manager Alternative Strategies | 2,281,304 | — | — | 9,545,780 | 6,340,856 | — | ||||||||||||||||||
| Transamerica Funds | Annual Report 2017 |
Page 79
Table of Contents
NOTES TO FINANCIAL STATEMENTS (continued)
At October 31, 2017
10. FEDERAL INCOME TAXES AND DISTRIBUTIONS TO SHAREHOLDERS (continued)
As of October 31, 2017, the tax basis components of distributable earnings are as follows:
| Fund | Undistributed Ordinary Income | Undistributed Tax Exempt Income | Undistributed Long-Term Capital Gain | Capital Loss Carryforwards | Late Year Loss Deferral | Other Temporary Differences | Net Unrealized Appreciation (Depreciation) | |||||||||||||||||||||
Asset Allocation – Conservative | $ | 3,372,538 | $ | — | $ | 42,832,428 | $ | — | $ | — | $ | — | $ | 71,482,495 | ||||||||||||||
Asset Allocation – Growth | 2,552,445 | — | 123,904,266 | — | — | — | 300,001,978 | |||||||||||||||||||||
Asset Allocation – Moderate Growth | 16,512,831 | — | 180,891,244 | — | — | — | 382,890,973 | |||||||||||||||||||||
Asset Allocation – Moderate | 17,366,632 | — | 96,586,163 | — | — | — | 194,274,682 | |||||||||||||||||||||
Intermediate Horizon | 133,519 | — | — | (28,228,916 | ) | — | — | 18,221,322 | ||||||||||||||||||||
Long Horizon | — | — | — | (31,559,291 | ) | — | — | 25,708,416 | ||||||||||||||||||||
Short Horizon | 186,918 | — | — | (801,235 | ) | — | — | 963,273 | ||||||||||||||||||||
Multi-Manager Alternative Strategies | 407,519 | — | — | (5,410,835 | ) | — | (235,102 | ) | (3,326,958 | ) | ||||||||||||||||||
11. STOCK SPLIT
Effective as of the close of business on the date listed in the subsequent table, the respective Fund’s Class R4 underwent a stock split. Funds not listed in the table did not have a stock split. There was no impact to the aggregate market value of shares outstanding. The historical capital share activity presented within the Statements of Changes in Net Assets and the per share data presented within the Financial Highlights have been retroactively adjusted to reflect the stock split. The stock split ratios, net effect on the NAV per share, and the number of shares outstanding as of the date indicated were as follows:
| Fund | Date | Share Split Ratio | Shares Prior to Stock Split | Shares After Stock Split | Increase (Decrease) Net Asset Value per Share | Increase (Decrease) Net Shares Outstanding | ||||||||||||||
Intermediate Horizon | May 19, 2017 | 1.23-for-1 | 6,178,610 | 7,629,144 | Decrease | Increase | ||||||||||||||
Long Horizon | May 19, 2017 | 1.22-for-1 | 2,274,630 | 2,783,722 | Decrease | Increase | ||||||||||||||
Short Horizon | May 19, 2017 | 1.11-for-1 | 963,865 | 1,072,255 | Decrease | Increase | ||||||||||||||
12. REORGANIZATION
Following the close of business on the date listed in the subsequent table (the “Reorganization Date”), Target Funds reorganized into new Funds (the “Destination Funds”) within the Trust. The reorganizations into newly organized Destination Funds were as follows:
| Target Fund | Destination Fund/Class | Reorganization Date | ||||
| Intermediate Horizon | May 19, 2017 | |||||
Transamerica Asset Allocation – Intermediate Horizon | Class R | |||||
Transamerica Asset Allocation – Short/Intermediate Horizon | Class R | |||||
Transamerica Institutional Asset Allocation – Intermediate Horizon (A) | Class R4 | |||||
Transamerica Institutional Asset Allocation – Short/Intermediate Horizon | Class R4 | |||||
| Long Horizon | May 19, 2017 | |||||
Transamerica Asset Allocation – Intermediate/Long Horizon | Class R | |||||
Transamerica Asset Allocation – Long Horizon | Class R | |||||
Transamerica Institutional Asset Allocation – Intermediate/Long Horizon | Class R4 | |||||
Transamerica Institutional Asset Allocation – Long Horizon (A) | Class R4 | |||||
| Short Horizon | May 19, 2017 | |||||
Transamerica Asset Allocation – Short Horizon | Class R | |||||
Transamerica Institutional Asset Allocation – Short Horizon (A) | Class R4 | |||||
| (A) | Accounting and performance survivor of the reorganizations. For financial reporting purposes, the accounting and performance survivors’ financial and performance history prior to the reorganization became the financial and performance history of the Destination Fund and is reflected in the Destination Fund’s financial statements and financial highlights. |
Pursuant to an Agreement and Plan of Reorganization, each Target Fund transferred all of its property and assets to the corresponding Destination Fund. The purpose of the transactions was to achieve a more cohesive, focused, and streamlined fund complex. In
| Transamerica Funds | Annual Report 2017 |
Page 80
Table of Contents
NOTES TO FINANCIAL STATEMENTS (continued)
At October 31, 2017
12. REORGANIZATION (continued)
exchange, the applicable Destination Fund assumed all of the liabilities of the applicable Target Fund and issue shares to that Target Fund, as described below. The reorganizations were tax-free for U.S. federal income tax purposes. The cost basis of the investments received from the Target Funds was carried forward to align ongoing reporting of the Destination Funds’ realized and unrealized gains and losses with amounts distributable to shareholders for tax purposes. Shares issued to Target Fund shareholders from the Destination Fund, along with the exchange ratio of the reorganization for the Destination Funds, were as follows (shares of these Destination Funds that were not the accounting and performance survivor of the applicable reorganization are also shown):
| Target Fund | Target Fund Shares | Destination Fund/Class | Destination Fund Shares | Dollar Amount | Exchange Ratio (A) | |||||||||||||
Transamerica Asset Allocation – Intermediate Horizon | 19,476,272 | Intermediate Horizon – Class R | 27,159,060 | $ | 271,590,605 | 1.39 | ||||||||||||
Transamerica Asset Allocation – Short/Intermediate Horizon | 15,572,834 | Intermediate Horizon – Class R | 17,537,423 | 175,374,227 | 1.13 | |||||||||||||
Transamerica Institutional Asset Allocation – Intermediate Horizon (B) | 7,629,144 | Intermediate Horizon – Class R4 | 7,629,144 | 76,291,440 | 1.00 | |||||||||||||
Transamerica Institutional Asset Allocation – Short/Intermediate Horizon | 827,949 | Intermediate Horizon – Class R4 | 937,535 | 9,375,346 | 1.13 | |||||||||||||
Transamerica Asset Allocation – Intermediate/Long Horizon | 11,170,928 | Long Horizon – Class R | 16,767,394 | 167,673,942 | 1.50 | |||||||||||||
Transamerica Asset Allocation – Long Horizon | 5,920,486 | Long Horizon – Class R | 8,192,124 | 81,921,235 | 1.38 | |||||||||||||
Transamerica Institutional Asset Allocation – Intermediate/Long Horizon | 3,139,852 | Long Horizon – Class R4 | 3,990,137 | 39,901,367 | 1.27 | |||||||||||||
Transamerica Institutional Asset Allocation – Long Horizon (B) | 2,783,722 | Long Horizon – Class R4 | 2,783,722 | 27,837,217 | 1.00 | |||||||||||||
Transamerica Asset Allocation – Short Horizon | 17,016,521 | Short Horizon – Class R | 19,751,448 | 197,514,479 | 1.16 | |||||||||||||
Transamerica Institutional Asset Allocation – Short Horizon (B) | 1,072,255 | Short Horizon – Class R4 | 1,072,255 | 10,722,549 | 1.00 | |||||||||||||
| (A) | Calculated by dividing the Destination Fund shares issuable by the Target Fund shares outstanding on Reorganization Date. | |
| (B) | Accounting and performance survivor. |
The net assets of the Target Funds, including unrealized appreciation (depreciation), were combined with those of the Destination Funds. These amounts were as follows:
| Target Fund | Target Fund Unrealized Appreciation (Depreciation) | Target Fund Net Assets | Destination Fund | Destination Fund Net Assets Prior to Reorganization | Net Assets After Reorganization | |||||||||||||
Transamerica Asset Allocation – Intermediate Horizon | $ | 8,469,628 | $ | 271,590,605 | Intermediate Horizon | $ | — | $ | 532,631,618 | |||||||||
Transamerica Asset Allocation – Short/Intermediate Horizon | 1,311,719 | 175,374,227 | ||||||||||||||||
Transamerica Institutional Asset Allocation – Intermediate Horizon (A) | 7,145,960 | 76,291,440 | ||||||||||||||||
Transamerica Institutional Asset Allocation – Short/Intermediate Horizon | 199,758 | 9,375,346 | ||||||||||||||||
Transamerica Asset Allocation – Intermediate/Long Horizon | 11,807,707 | 167,673,942 | Long Horizon | — | 317,333,761 | |||||||||||||
Transamerica Asset Allocation – Long Horizon | 9,422,999 | 81,921,235 | ||||||||||||||||
Transamerica Institutional Asset Allocation – Intermediate/Long Horizon | 5,232,915 | 39,901,367 | ||||||||||||||||
Transamerica Institutional Asset Allocation – Long Horizon (A) | 4,123,183 | 27,837,217 | ||||||||||||||||
| Transamerica Funds | Annual Report 2017 |
Page 81
Table of Contents
NOTES TO FINANCIAL STATEMENTS (continued)
At October 31, 2017
12. REORGANIZATION (continued)
| Target Fund | Target Fund Unrealized Appreciation (Depreciation) | Target Fund Net Assets | Destination Fund | Destination Fund Net Assets Prior to Reorganization | Net Assets After Reorganization | |||||||||||||||
Transamerica Asset Allocation – Short Horizon | $ | (101,572 | ) | $ | 197,514,479 | Short Horizon | $ — | $ | 208,237,028 | |||||||||||
Transamerica Institutional Asset Allocation – Short Horizon (A) | 65,975 | 10,722,549 | ||||||||||||||||||
| (A) | Accounting and performance survivor. |
Assuming the reorganizations had been completed as of the beginning of the annual reporting period of the relevant accounting and performance survivors, the pro forma results of operations for the period ended October 31, 2017 would have been as follows:
| Destination Fund | Reporting Period Beginning Date | Net Investment Income (Loss) | Net Realized and Change in Unrealized Gain (Loss) | Net Increase (Decrease) in Net Assets Resulting from Operations | ||||||||||||
Intermediate Horizon | January 1, 2017 | $ | 3,768,845 | $ | 39,378,392 | $ | 43,147,237 | |||||||||
Long Horizon | January 1, 2017 | 587,772 | 37,825,899 | 38,413,671 | ||||||||||||
Short Horizon | January 1, 2017 | 2,573,215 | 5,401,530 | 7,974,745 | ||||||||||||
Because the combined investment funds have been managed as single integrated funds since the reorganizations were completed, it is not practical to separate the amounts of revenue and earnings of the Target Funds that have been included in the Destination Funds’ Statements of Operations.
13. CUSTODY OUT-OF-POCKET EXPENSE
In December 2015, State Street, the Funds’ custodian, identified inconsistencies in the way in which clients were invoiced for categories of expenses, particularly those deemed out-of-pocket costs, during an 18-year period going back to 1998. The issue was the result of inaccurate billing rates that were not subsequently reviewed or adjusted. The amount of the difference in what was charged and what should have been charged, plus interest, was paid back to the Funds in September 2016 as a reimbursement. The amounts applicable to each Fund, if any, were recognized as a change in accounting estimate and are reflected in Reimbursement of custody fees within the Statements of Operations. This resulted in a decrease in Net expenses and an overall increase in Net assets.
| Transamerica Funds | Annual Report 2017 |
Page 82
Table of Contents
REPORT OF INDEPENDENT REGISTERED PUBLIC ACCOUNTING FIRM
To the Board of Trustees and Shareholders of Transamerica Funds:
We have audited the accompanying statements of assets and liabilities, including the schedules of investments, of Transamerica Asset Allocation – Conservative Portfolio, Transamerica Asset Allocation – Growth Portfolio, Transamerica Asset Allocation – Moderate Growth Portfolio, Transamerica Asset Allocation – Moderate Portfolio, Transamerica Asset Allocation Intermediate Horizon, Transamerica Asset Allocation Long Horizon, Transamerica Asset Allocation Short Horizon, and Transamerica Multi-Manager Alternative Strategies Portfolio (eight of the funds of the Transamerica Funds, hereafter referred to as the “Funds”), as of October 31, 2017, and the related statements of operations, statements of changes in net assets, and the financial highlights for each of the years or periods indicated therein. These financial statements and financial highlights are the responsibility of the Funds’ management. Our responsibility is to express an opinion on these financial statements and financial highlights based on our audits.
We conducted our audits in accordance with the standards of the Public Company Accounting Oversight Board (United States). Those standards require that we plan and perform the audits to obtain reasonable assurance about whether the financial statements and financial highlights are free of material misstatement. We were not engaged to perform an audit of the Funds’ internal control over financial reporting. Our audits included consideration of internal control over financial reporting as a basis for designing audit procedures that are appropriate in the circumstances, but not for the purpose of expressing an opinion on the effectiveness of the Funds’ internal control over financial reporting. Accordingly, we express no such opinion. An audit also includes examining, on a test basis, evidence supporting the amounts and disclosures in the financial statements and financial highlights, assessing the accounting principles used and significant estimates made by management, and evaluating the overall financial statement presentation. Our procedures included confirmation of securities owned as of October 31, 2017, by correspondence with the custodian and others or by other appropriate auditing procedures where replies from others were not received. We believe that our audits provide a reasonable basis for our opinion.
In our opinion, the financial statements and financial highlights referred to above present fairly, in all material respects, the financial position of the aforementioned eight Funds of the Transamerica Funds at October 31, 2017, the results of their operations, the changes in their net assets, and the financial highlights for each of the years or periods indicated therein, in conformity with U.S. generally accepted accounting principles.

Boston, Massachusetts
December 27, 2017
| Transamerica Funds | Annual Report 2017 |
Page 83
Table of Contents
(unaudited)
TAX INFORMATION
For dividends paid during the year ended October 31, 2017, the Funds designated the following maximum amounts of qualified dividend income:
| Fund | Qualified Dividend Income | |||
Asset Allocation – Conservative | $ | 4,709,183 | ||
Asset Allocation – Growth | 16,415,795 | |||
Asset Allocation – Moderate Growth | 24,026,789 | |||
Asset Allocation – Moderate | 12,678,068 | |||
Intermediate Horizon | 635,164 | |||
Short Horizon | 81,338 | |||
Multi-Manager Alternative Strategies | 137,807 | |||
For corporate shareholders, investment income (dividend income plus short-term gains, if any) which qualifies for the maximum dividends received deductions are as follows:
| Fund | Dividend Received Deduction Percentage | |||
Asset Allocation – Conservative | 6 | % | ||
Asset Allocation – Growth | 62 | |||
Asset Allocation – Moderate Growth | 41 | |||
Asset Allocation – Moderate | 27 | |||
Intermediate Horizon | 25 | |||
Short Horizon | 5 | |||
Multi-Manager Alternative Strategies | 3 | |||
For tax purposes, the long-term capital gain designations for the year ended October 31, 2017 are as follows:
| Fund | Long-Term Capital Gain Designation | |||
Asset Allocation – Conservative | $ | 25,508,202 | ||
Asset Allocation – Growth | 89,000,827 | |||
Asset Allocation – Moderate Growth | 128,089,139 | |||
Asset Allocation – Moderate | 66,643,386 | |||
The amounts which represent income derived from sources within, and taxes paid to, foreign countries or possessions of the U.S. are as follows:
| Fund | Foreign Source Income | Foreign Taxes | ||||||
Asset Allocation – Conservative | $ | 3,121,233 | $ | 220,264 | ||||
Asset Allocation – Growth | 11,291,739 | 839,153 | ||||||
Asset Allocation – Moderate Growth | 14,883,008 | 1,094,040 | ||||||
Asset Allocation – Moderate | 7,977,037 | 584,525 | ||||||
Intermediate Horizon | 1,211,223 | 61,096 | ||||||
Long Horizon | 1,548,692 | 78,118 | ||||||
Short Horizon | 109,387 | 5,518 | ||||||
Multi-Manager Alternative Strategies | 112,133 | 11,584 | ||||||
The information and distributions reported herein may differ from the information and distributions taxable to the shareholders for the calendar year ending December 31, 2017. Complete information will be computed and reported in conjunction with your 2017 Form 1099-DIV.
| Transamerica Funds | Annual Report 2017 |
Page 84
Table of Contents
TRANSAMERICA FUNDS
MANAGEMENT AND SUB-ADVISORY AGREEMENTS — CONTRACT RENEWAL
(unaudited)
At a meeting of the Board of Trustees of Transamerica Funds (the “Trustees” or the “Board”) held on June 7-8, 2017, the Board considered the renewal of the management agreement (the “Management Agreement”) between Transamerica Asset Management, Inc. (“TAM”) and Transamerica Funds, on behalf of each of the following funds (each a “Portfolio” and collectively the “Portfolios”):
Transamerica Asset Allocation – Conservative Portfolio | Transamerica Asset Allocation Intermediate Horizon | |
Transamerica Asset Allocation – Growth Portfolio | Transamerica Asset Allocation Long Horizon | |
Transamerica Asset Allocation – Moderate Growth Portfolio | Transamerica Asset Allocation Short Horizon | |
Transamerica Asset Allocation – Moderate Portfolio | Transamerica Multi-Manager Alternative Strategies Portfolio |
For the Portfolios listed in the left column below, the Board also considered the renewal of the investment sub-advisory agreements (each a “Sub-Advisory Agreement,” and collectively the “Sub-Advisory Agreements” and, together with the Management Agreement, the “Agreements”) between TAM and the corresponding sub-advisers listed in the right column below (each a “Sub-Adviser” and collectively the “Sub-Advisers”).
| Portfolio | Sub-Adviser | |
Transamerica Asset Allocation – Conservative Portfolio | Morningstar Investment Management LLC | |
Transamerica Asset Allocation – Growth Portfolio | Morningstar Investment Management LLC | |
Transamerica Asset Allocation – Moderate Growth Portfolio | Morningstar Investment Management LLC | |
Transamerica Asset Allocation – Moderate Portfolio | Morningstar Investment Management LLC | |
Transamerica Multi-Manager Alternative Strategies Portfolio | Aegon USA Investment Management, LLC |
Following its review and consideration, the Board determined that the terms of the Management Agreement and each Sub-Advisory Agreement were reasonable and that the renewal of each of the Agreements was in the best interests of the applicable Portfolio and its shareholders. The Board, including the independent members of the Board (the “Independent Trustees”), unanimously approved the renewal of each of the Agreements through June 30, 2018.
Prior to reaching their decision, the Trustees requested and received from TAM and each Sub-Adviser certain information. They then reviewed such information as they deemed reasonably necessary to evaluate the Agreements, including information they had previously received from TAM and each Sub-Adviser as part of their regular oversight of each Portfolio, and knowledge they gained over time through meeting with TAM and each Sub-Adviser. Among other materials, the Trustees considered comparative fee, expense and performance information prepared by Broadridge Financial Services, Inc. (“Broadridge”), an independent provider of mutual fund performance information, as well as fee, expense and profitability information prepared by TAM. To the extent applicable, the Trustees considered information about fees and performance of comparable funds and/or accounts managed by each Sub-Adviser. In their review, the Trustees also sought to identify Portfolios for which the performance, fees, total expenses and/or profitability appeared to be outliers within their respective peer groups or other comparative metrics, and sought to understand the reasons for such comparative positions.
In their deliberations, the Independent Trustees met privately without representatives of TAM or any Sub-Adviser present and were represented throughout the process by independent legal counsel. In considering the proposed continuation of each of the Agreements, the Trustees evaluated and weighed a number of considerations that they believed to be relevant in light of the legal advice furnished to them by counsel, including independent legal counsel, and made a decision in the exercise of their own business judgment. They based their decisions on the considerations discussed below, among others, although they did not identify any particular consideration or item of information that was controlling of their decisions, and each Trustee may have attributed different weights to the various factors.
Nature, Extent and Quality of the Services Provided
The Board considered the nature, extent and quality of the services provided by TAM and each Sub-Adviser to the applicable Portfolio in the past and the services anticipated to be provided in the future. The Board also considered the investment approach for each Portfolio; the experience, capability and integrity of TAM’s senior management; the financial resources of TAM; TAM’s management oversight process; TAM’s and each Sub-Adviser’s responsiveness to any questions by the Trustees; and the professional qualifications and compensation program of the portfolio management team of each Sub-Adviser. The Trustees noted that they receive, on a quarterly basis, an execution analysis from Capital Institutional Services, Inc. (CAPIS), an independent provider of trade analyses, for each applicable Sub-Adviser and a comparison of trading results against a peer universe of managers.
The Board also considered the continuous and regular investment management and other services provided by TAM, when acting as a manager of managers, for the portion of the management fee it retains from each Portfolio after payment of the sub-advisory fees. The Board noted that the investment management and other services provided by TAM include the design, development and ongoing
| Transamerica Funds | Annual Report 2017 |
Page 85
Table of Contents
TRANSAMERICA FUNDS
MANAGEMENT AND SUB-ADVISORY AGREEMENTS — CONTRACT RENEWAL (continued)
(unaudited)
review and evaluation of each Portfolio and its investment strategy; the selection, oversight and monitoring of one or more investment sub-advisers to perform certain duties with respect to the Portfolios; ongoing portfolio trading oversight and analysis; risk management oversight and analysis; design, development, implementation and ongoing review and evaluation of a process for the valuation of Portfolio investments; design, development, implementation and ongoing review and evaluation of a compliance program for the Portfolios; design, development, implementation and ongoing review and evaluation of a process for the voting of proxies and exercise of rights to consent to corporate action for Portfolio investments; participation in Board meetings and oversight of preparation of materials for the Board, including materials for Board meetings and regular communications with the Board; oversight of preparation of the Portfolios’ prospectuses, statements of additional information, shareholder reports and other disclosure materials and regulatory filings for the Portfolios; and ongoing cash management services. The Board considered that TAM’s investment management services also include the provision of supervisory and administrative services to each Portfolio. The Board also noted that TAM, as part of the services it provides to all Transamerica mutual funds, including the Portfolios, oversees the services provided by the funds’ custodian, transfer agent, independent accountant and legal counsel, and supervises the performance of the recordkeeping and shareholder functions of the funds.
Investment Performance
In addition, the Board considered the short- and longer-term performance, as applicable, of each Portfolio in light of its investment objective, policies and strategies, including relative performance against (i) a peer universe of comparable mutual funds, as prepared by Broadridge, and (ii) the Portfolio’s benchmark(s), in each case for various trailing periods ended December 31, 2016. The Board’s conclusions as to performance are summarized below. In describing a Portfolio’s performance relative to its peer universe, the summary conclusions characterize performance for the relevant periods in relation to whether it was “above,” “below” or “in line with” the peer universe median and do so using quintile rankings prepared by Broadridge. For simplicity, performance is described as “above” median if a Portfolio’s performance ranked anywhere in the first or second quintiles, as “below” median if it ranked anywhere in the fourth or fifth quintiles, or “in line with” the median if it ranked anywhere in the third quintile (i.e., even if its precise return was somewhat above or somewhat below the precise median return).
When considering each Portfolio’s performance, the Trustees considered any representations made by TAM regarding the appropriateness of certain peer groups and benchmarks. They recognized that performance reflects a snapshot of a period as of a specific date, and that consideration of performance data for a different period could generate different performance results. The Trustees also recognized that even longer-term performance can be negatively affected by performance over a short-term period when that short-term performance is significantly below the performance of the comparable benchmark or universe of peer funds.
Transamerica Asset Allocation – Conservative Portfolio. The Board noted that the performance of Class A Shares of the Portfolio was above the median for its peer universe for the past 3- and 5-year periods and in line with the median for the past 1- and 10-year periods. The Board also noted that the performance of Class A Shares of the Portfolio was above its primary benchmark for the past 1- and 5-year periods and below its primary benchmark for the past 3- and 10-year periods
Transamerica Asset Allocation – Growth Portfolio. The Board noted that the performance of Class A Shares of the Portfolio was above the median for its peer universe for the past 1-, 3- and 5-year periods and in line with the median for the past 10-year period. The Board also noted that the performance of Class A Shares of the Portfolio was below its benchmark for the past 1-, 3-, 5- and 10-year periods.
Transamerica Asset Allocation – Moderate Growth Portfolio. The Board noted that the performance of Class A Shares of the Portfolio was in line with the median for its peer universe for the past 1-, 3- and 5-year periods and below the median for the past 10-year period. The Board also noted that the performance of Class A Shares of the Portfolio was below its primary benchmark for the past 1-, 3-, 5- and 10-year periods.
Transamerica Asset Allocation – Moderate Portfolio. The Board noted that the performance of Class A Shares of the Portfolio was in line with the median for its peer universe for the past 1-, 3-, 5- and 10-year periods. The Board also noted that the performance of Class A Shares of the Portfolio was below its primary benchmark for the past 1-, 3-, 5- and 10-year periods.
Transamerica Asset Allocation Intermediate Horizon. The Board noted that the performance of Class R4 Shares of the Portfolio was in line with the median for its peer universe for the past 3-, 5- and 10-year periods and below the median for the past 1-year period. The Board also noted that the performance of Class R4 Shares of the Portfolio was below its primary benchmark for the past 1-, 3-, 5- and 10-year periods. The Trustees noted that the Portfolio had acquired the assets and assumed the liabilities of four Transamerica Partners funds on May 19, 2017. As a result of that transaction, and based on published guidance from the staff of the Securities and Exchange Commission, the Portfolio had assumed the performance history of the performance survivor, Transamerica Institutional Asset Allocation – Intermediate Horizon, effective as of that date in place of its own historical performance record.
| Transamerica Funds | Annual Report 2017 |
Page 86
Table of Contents
TRANSAMERICA FUNDS
MANAGEMENT AND SUB-ADVISORY AGREEMENTS — CONTRACT RENEWAL (continued)
(unaudited)
Transamerica Asset Allocation Long Horizon. The Board noted that the performance of Class R4 Shares of the Portfolio was above the median for its peer universe for the past 3- and 5-year periods and in line with the median for the past 1- and 10-year periods. The Board also noted that the performance of Class R4 Shares of the Portfolio was below its benchmark for the past 1-, 3-, 5- and 10-year periods. The Trustees noted that the Portfolio had acquired the assets and assumed the liabilities of four Transamerica Partners funds on May 19, 2017. As a result of that transaction, and based on published guidance from the staff of the Securities and Exchange Commission, the Portfolio had assumed the performance history of the performance survivor, Transamerica Institutional Asset Allocation – Long Horizon, effective as of that date in place of its own historical performance record.
Transamerica Asset Allocation Short Horizon. The Board noted that the performance of Class R4 Shares of the Portfolio was above the median for its peer universe for the past 1-, 3-, 5- and 10-year periods. The Board also noted that the performance of Class R4 Shares of the Portfolio was above its benchmark for the past 1- and 5-year periods and below its benchmark for the past 3- and 10-year periods. The Trustees noted that the Portfolio had acquired the assets and assumed the liabilities of two Transamerica Partners funds on May 19, 2017. As a result of that transaction, and based on published guidance from the staff of the Securities and Exchange Commission, the Portfolio had assumed the performance history of the performance survivor, Transamerica Institutional Asset Allocation – Short Horizon, effective as of that date in place of its own historical performance record.
Transamerica Multi-Manager Alternative Strategies Portfolio. The Board noted that the performance of Class A Shares of the Portfolio was above the median for its peer universe for the past 10-year period, in line with the median for the past 1-year period, and below the median for the past 3- and 5-year periods. The Board also noted that the performance of Class A Shares of the Portfolio was below its primary benchmark for the past 1-, 3-, 5- and 10-year periods. The Trustees discussed the reasons for the underperformance with TAM and TAM agreed to continue to closely monitor and report to the Board on the performance of the Portfolio. The Board noted that the Portfolio had made certain changes to its investment strategy in March 2016. The Board also noted that Goldman Sachs Asset Management, LP would commence subadvising the Portfolio on or about July 7, 2017.
Based on these considerations, the Board determined that TAM and each Sub-Adviser can provide investment and related services that are appropriate in scope and extent in light of the applicable Portfolio’s investment objectives, policies and strategies and operations, the competitive landscape of the investment company business and investor needs.
Management and Sub-Advisory Fees and Total Expense Ratios
The Board considered the management fee and total expense ratio of each Portfolio, including information provided by Broadridge comparing the management fee and total expense ratio of each Portfolio to the management fees and total expense ratios of comparable investment companies in both a peer group and broader peer universe compiled by Broadridge. The Board’s conclusions as to management fees and total expense ratios are summarized below. In describing a Portfolio’s management fee and total expense ratio relative to its peer group and peer universe, the summary conclusions characterize management fees and total expense ratios for the relevant periods in relation to whether they were “above,” “below” or “in line with” the peer group or peer universe median and do so using quintile rankings prepared by Broadridge. For simplicity, management fees and total expense ratios are described as “above” median if a Portfolio’s management fee or total expense ratio ranked anywhere in the fourth or fifth quintiles, as “below” median if it ranked anywhere in the first or second quintiles, or “in line with” the median if it ranked anywhere in the third quintile (i.e., even if its precise management fee or total expense ratio was somewhat above or somewhat below the precise median management fee or total expense ratio). The Board also considered the fees charged by the Sub-Advisers for sub-advisory services, as well as the portion of a Portfolio’s management fee retained by TAM following payment of the sub-advisory fee(s) and how the portion of the contractual management fee retained by TAM at a specified asset level compared to the portions retained by other investment advisers managing mutual funds with similar investment strategies as calculated by an independent provider of information.
Transamerica Asset Allocation – Conservative Portfolio. The Board noted that the Portfolio’s contractual management fee was below the median for its peer group and in line with the median for its peer universe and that the actual total expenses (i.e., expenses reflecting any waivers and/or reimbursements) of Class A Shares of the Portfolio were above the medians for its peer group and peer universe. The Trustees also considered that TAM has entered into an expense limitation arrangement with the Portfolio, which may result in TAM waiving fees for the benefit of shareholders.
Transamerica Asset Allocation – Growth Portfolio. The Board noted that the Portfolio’s contractual management fee was below the medians for its peer group and peer universe and that the actual total expenses (i.e., expenses reflecting any waivers and/or reimbursements) of Class A Shares of the Portfolio were above the medians for its peer group and peer universe. The Trustees also considered that TAM has entered into an expense limitation arrangement with the Portfolio, which may result in TAM waiving fees for the benefit of shareholders.
Transamerica Asset Allocation – Moderate Growth Portfolio. The Board noted that the Portfolio’s contractual management fee was in line with the medians for its peer group and peer universe and that the actual total expenses (i.e., expenses reflecting any waivers and/
| Transamerica Funds | Annual Report 2017 |
Page 87
Table of Contents
TRANSAMERICA FUNDS
MANAGEMENT AND SUB-ADVISORY AGREEMENTS — CONTRACT RENEWAL (continued)
(unaudited)
or reimbursements) of Class A Shares of the Portfolio were above the median for its peer group and in line with the median for its peer universe. The Trustees also considered that TAM has entered into an expense limitation arrangement with the Portfolio, which may result in TAM waiving fees for the benefit of shareholders.
Transamerica Asset Allocation – Moderate Portfolio. The Board noted that the Portfolio’s contractual management fee was below the median for its peer group and in line with the median for its peer universe and that the actual total expenses (i.e., expenses reflecting any waivers and/or reimbursements) of Class A Shares of the Portfolio were in line with the medians for its peer group and peer universe. The Trustees also considered that TAM has entered into an expense limitation arrangement with the Portfolio, which may result in TAM waiving fees for the benefit of shareholders.
Transamerica Asset Allocation Intermediate Horizon. The Board noted that the Portfolio’s contractual management fee was in line with the medians for its peer group and peer universe and that the actual total expenses (i.e., expenses reflecting any waivers and/or reimbursements) of Class R4 Shares of the Portfolio were below the medians for its peer group and peer universe. The Trustees also considered that TAM has entered into an expense limitation arrangement with the Portfolio, which may result in TAM waiving fees for the benefit of shareholders.
Transamerica Asset Allocation Long Horizon. The Board noted that the Portfolio’s contractual management fee and the actual total expenses (i.e., expenses reflecting any waivers and/or reimbursements) of Class R4 Shares of the Portfolio were below the medians for its peer group and peer universe. The Trustees also considered that TAM has entered into an expense limitation arrangement with the Portfolio, which may result in TAM waiving fees for the benefit of shareholders.
Transamerica Asset Allocation Short Horizon. The Board noted that the Portfolio’s contractual management fee was below the medians for its peer group and peer universe and that the actual total expenses (i.e., expenses reflecting any waivers and/or reimbursements) of Class R4 Shares of the Portfolio were below the median for its peer group and above the median for its peer universe. The Trustees also considered that TAM has entered into an expense limitation arrangement with the Portfolio, which may result in TAM waiving fees for the benefit of shareholders.
Transamerica Multi-Manager Alternative Strategies Portfolio. The Board noted that the Portfolio’s contractual management fee was below the medians for its peer group and peer universe and that the actual total expenses (i.e., expenses reflecting any waivers and/or reimbursements) of Class A Shares of the Portfolio were above the medians for its peer group and peer universe. The Trustees also considered that TAM has entered into an expense limitation arrangement with the Portfolio, which may result in TAM waiving fees for the benefit of shareholders.
On the basis of these considerations, together with the other information it considered, the Board determined that the management and sub-advisory fees to be received by TAM and the Sub-Advisers under the Management Agreement and each Sub-Advisory Agreement are reasonable in light of the services provided.
Cost of Services Provided and Level of Profitability
The Board reviewed information provided by TAM about the cost of providing and procuring fund management services, as well as the costs of the provision of administration, transfer agency and other services, to each Portfolio and to Transamerica Funds as a whole by TAM and its affiliates. The Board considered the profitability of TAM and its affiliates in providing these services for each Portfolio and Transamerica Funds as a whole. The Trustees recognized the competitiveness of the mutual fund industry and the importance of an investment adviser’s long-term profitability, including for maintaining company and management stability and accountability.
The Board also considered the allocation methodology used for calculating the profitability of TAM and its affiliates. The Board noted that the revenue and expense allocation methodology used by TAM to estimate its profitability with respect to its relationship with the Portfolios had been reviewed previously by an independent consultant. The Trustees considered that TAM had not made material changes to this methodology, which had been applied consistently for each Portfolio.
With respect to the Sub-Advisers, the Board noted that the sub-advisory fees are the product of arm’s-length negotiation between TAM and the applicable Sub-Adviser, which is not affiliated with TAM (with the exception of those fees paid to Aegon USA Investment Management, LLC (“AUIM”), which is affiliated with TAM), and are paid by TAM and not the applicable Portfolio. As a result, for those Portfolios not sub-advised by AUIM, the Board focused on the profitability of TAM and its affiliates with respect to the applicable Portfolio. For Transamerica Multi-Manager Alternative Strategies Portfolio, sub-advised by AUIM, the Board noted that information about AUIM’s revenues and expenses was incorporated into the profitability analysis for TAM and its affiliates with respect to the Portfolio. As a result, the Board focused on profitability information for TAM and its affiliates and AUIM in the aggregate.
Based on this information, the Board determined that the profitability of TAM and its affiliates from their relationships with the Portfolios was not excessive.
| Transamerica Funds | Annual Report 2017 |
Page 88
Table of Contents
TRANSAMERICA FUNDS
MANAGEMENT AND SUB-ADVISORY AGREEMENTS — CONTRACT RENEWAL (continued)
(unaudited)
Economies of Scale
The Board considered economies of scale with respect to the management of each Portfolio, whether the Portfolio had appropriately benefited from any economies of scale and whether there was the potential for realization of any future economies of scale. The Board also considered the existence of economies of scale with respect to management of the Transamerica mutual funds overall and the extent to which the Portfolios benefited from any economies of scale. The Board recognized that, as a Portfolio’s assets increase, any economies of scale realized by TAM or a Sub-Adviser may not directly correlate with each other or with any economies of scale that might be realized by the Portfolio. The Board considered each Portfolio’s management fee schedule and the existence of breakpoints, if any, and also considered the extent to which TAM shared economies of scale, if any, with the Portfolios through its undertakings to limit or reimburse Portfolio expenses and to invest in maintaining and developing its capabilities and services. The Board also considered each Sub-Adviser’s sub-advisory fee schedule and the existence of breakpoints, if any, and how such breakpoints relate to any breakpoints in the applicable Portfolio’s management fee schedule. The Trustees concluded that each Portfolio’s fee structure reflected an appropriate sharing of any efficiencies or economies of scale to date and noted that they will have the opportunity to periodically reexamine the appropriateness of the management fees payable to TAM and the fees paid to the Sub-Advisers in light of any economies of scale experienced in the future.
Benefits to TAM, its Affiliates and the Sub-Advisers from their Relationships with the Portfolios
The Board considered other benefits derived by TAM, its affiliates, and/or the Sub-Advisers from their relationships with the Portfolios. The Board noted that TAM does not receive benefits from research obtained with commissions paid to broker-dealers for portfolio transactions (“soft dollars”) as a result of its relationships with the Portfolios.
Other Considerations
The Board noted that TAM has made a substantial commitment to the recruitment and retention of high quality personnel and maintains the financial, compliance and operational resources reasonably necessary to manage each Portfolio in a professional manner that is consistent with the best interests of the Portfolio and its shareholders. In this regard, the Board favorably considered the procedures and policies TAM has in place to enforce compliance with applicable laws and regulations and oversee the portfolio management activities of the Sub-Advisers. The Board also noted that TAM has made a significant entrepreneurial commitment and undertaken certain business risks with respect to the management and success of the Portfolios.
Conclusion
After consideration of the factors described above, as well as other factors, the Trustees, including the Independent Trustees, concluded that the renewal of the Management Agreement and each Sub-Advisory Agreement was in the best interests of the applicable Portfolio and its shareholders and voted to approve the renewal of the Agreements.
| Transamerica Funds | Annual Report 2017 |
Page 89
Table of Contents
Board Members and Officers
(unaudited)
The members of the Board (“Board Members”) and executive officers of each Trust are listed below.
Interested Board Member means a board member who may be deemed an “interested person” (as that term is defined in the 1940 Act) of each Trust because of his current or former service with TAM or an affiliate of TAM. Interested Board Members may also be referred to herein as “Interested Trustees.” Independent Board Member means a Board Member who is not an “interested person” (as defined under the 1940 Act) of the Trust and may also be referred to herein as an “Independent Trustee.”
The Board governs each Fund and is responsible for protecting the interests of the shareholders. The Board Members are experienced executives who meet periodically throughout the year to oversee the business affairs of each Fund and the operation of each Fund by its officers. The Board also reviews the management of each Fund’s assets by the investment manager and its respective sub-adviser.
The Funds are among the Funds managed and sponsored by TAM (collectively, “Transamerica Fund Family”). The Transamerica Fund Family consists of (i) Transamerica ETF Trust (“TET”); (ii) Transamerica Funds (“TF”); (iii) Transamerica Series Trust (“TST”); (iv) Transamerica Partners Funds Group (“TPFG”); (v) Transamerica Partners Funds Group II (“TPFG II”); (vi) Transamerica Partners Funds (“TPP”); and (vii) Transamerica Asset Allocation Variable Funds (“TAAVF”). The Transamerica Fund Family consists of 136 funds as of the date of this Annual Report.
The mailing address of each Board Member is c/o Secretary, 1801 California Street, Suite 5200, Denver, CO 80202.
The Board Members, their age, their positions with the Trust, and their principal occupations for the past five years (their titles may have varied during that period), the number of funds in the Transamerica Fund Family the Board Member oversees, and other board memberships they hold are set forth in the table below. The length of time served is provided from the date a Board Member became a member of the Board.
| Name | Position(s) Held with Trust | Term of Office and Length of Time Served* | Principal Occupation(s) During Past Five Years | Number of Funds in Complex Overseen by Board Member | Other Directorships During the Past Five Years | |||||
INTERESTED BOARD MEMBERS | ||||||||||
Marijn P. Smit (44) | Chairman of the Board, President and Chief Executive Officer | Since 2014 | Chairman of the Board, President and Chief Executive Officer, TF, TST, TPP, TPFG, TPFG II and TAAVF (2014 – present);
Chairman of the Board, President and Chief Executive Officer, TET (2017 – present);
Chairman of the Board, President and Chief Executive Officer, Transamerica Income Shares, Inc. (“TIS”) (2014 – 2015);
Director, Chairman of the Board, President and Chief Executive Officer, Transamerica Asset Management, Inc. (“TAM”) and Transamerica Fund Services, Inc. (“TFS”) (2014 – present);
President, Investment Solutions, Transamerica Investments & Retirement (2014 – 2016);
Vice President, Transamerica Premier Life Insurance Company (2010 – 2016); | 136 | Director, Massachusetts Fidelity Trust Company (2014 – present);Director, Aegon Global Funds (since 2016) | |||||
| Transamerica Funds | Annual Report 2017 |
Page 90
Table of Contents
| Name | Position(s) Held with Trust | Term of Office and Length of Time Served* | Principal Occupation(s) During Past Five Years | Number of Funds in Complex Overseen by Board Member | Other Directorships During the Past Five Years | |||||
INTERESTED BOARD MEMBERS — continued | ||||||||||
| Marijn P. Smit (continued) | Vice President, Transamerica Life Insurance Company (2010 – present);
Senior Vice President, Transamerica Financial Life Insurance Company (2013 – 2016);
Senior Vice President, Transamerica Retirement Advisors, Inc. (2013 – 2016);
Senior Vice President, Transamerica Retirement Solutions Corporation (2012 – present); and
President and Director, Transamerica Stable Value Solutions, Inc. (2010 – 2016). | |||||||||
Alan F. Warrick (69) | Board Member | Since 2012 | Board Member, TF, TST, TPP, TPFG, TPFG II and TAAVF (2012 – present);
Board Member, TIS (2012 – 2015);
Consultant, Aegon USA (2010 – 2011);
Senior Advisor, Lovell Minnick Equity Partners (2010 – present);
Retired (2010 – present); and Managing Director for Strategic Business Development, Aegon USA (1994 – 2010). | 131 | N/A | |||||
INDEPENDENT BOARD MEMBERS | ||||||||||
Sandra N. Bane (65) | Board Member | Since 2008 | Retired (1999 – present);
Board Member, TF, TST, TPP, TPFG, TPFG II and TAAVF (2008 – present);
Board Member, TIS (2008 – 2015);
Board Member, Transamerica Investors, Inc. (“TII”) (2003 – 2010); and
Partner, KPMG (1975 – 1999). | 131 | Big 5 Sporting Goods (2002 – present); (energy services | |||||
Leo J. Hill (61) | Lead Independent Board Member | Since 2002 | Principal, Advisor Network Solutions, LLC (business consulting) (2006 – present);
Board Member, TST (2001 – present);
Board Member, TF (2002 – present);
Board Member, TIS (2002 – 2015);
Board Member, TPP, TPFG, TPFG II and TAAVF (2007 – present); | 131 | Ameris Bancorp (2013 – present); Ameris Bank (2013 – present) | |||||
| Transamerica Funds | Annual Report 2017 |
Page 91
Table of Contents
| Name | Position(s) Held with Trust | Term of Office and Length of Time Served* | Principal Occupation(s) During Past Five Years | Number of Funds in Complex Overseen by Board Member | Other Directorships During the Past Five Years | |||||
INDEPENDENT BOARD MEMBERS — continued | ||||||||||
Leo J. Hill (continued) | Board Member, TII (2008 – 2010);
Market President, Nations Bank of Sun Coast Florida (1998 – 1999);
Chairman, President and Chief Executive Officer, Barnett Banks of Treasure Coast Florida (1994 – 1998);
Executive Vice President and Senior Credit Officer, Barnett Banks of Jacksonville, Florida (1991 – 1994); and
Senior Vice President and Senior Loan Administration Officer, Wachovia Bank of Georgia (1976 – 1991). | |||||||||
David W. Jennings (71) | Board Member | Since 2009 | Board Member, TF, TST, TPP, TPFG, TPFG II and TAAVF (2009 – present);
Board Member, TIS (2009 – 2015);
Board Member, TII (2009 – 2010);
Managing Director, Hilton Capital Management, LLC (2010 – present);
Principal, Maxam Capital Management, LLC (2006 – 2008); and
Principal, Cobble Creek Management LP (2004 – 2006). | 131 | N/A | |||||
Russell A. Kimball, Jr. (73) | Board Member | Since 1986 | General Manager, Sheraton Sand Key Resort (1975 – present);
Board Member, TST (1986 – present);
Board Member, TF, (1986 – 1990), (2002 – present);
Board Member, TIS (2002 – 2015);
Board Member, TPP, TPFG, TPFG II and TAAVF (2007 – present); and
Board Member, TII (2008 – 2010). | 131 | N/A | |||||
| Transamerica Funds | Annual Report 2017 |
Page 92
Table of Contents
| Name | Position(s) Held with Trust | Term of Office and Length of Time Served* | Principal Occupation(s) During Past Five Years | Number of Funds in Complex Overseen by Board Member | Other Directorships During the Past Five Years | |||||
INDEPENDENT BOARD MEMBERS — continued | ||||||||||
Fredric A. Nelson III (60) | Board Member | Since 2017 | Board Member, TF, TST, TPP, TPFG, TPFG II and TAAVF (2017 – present);
Chief Investment Officer (“CIO”), Commonfund (2011 – 2015);
Vice Chairman, CIO, ING Investment Management Americas (2003 – 2009);
Managing Director, JP Morgan Investment Management (1994 – 2003); and
Head of U.S. Equity, Bankers Trust Company (2000 – 2003); Managing Director, (1981 – 1994); Head of Global Quantitative Investments Group (1989 – 1994). | 131 | N/A | |||||
| John Edgar Pelletier (53) | Board Member | Since 2017 | Board Member, TF, TST, TPP, TPFG, TPFG II and TAAVF (2017 – present);
Director, Center for Financial Literacy, Champlain College (2010 – present);
Founder and Principal, Sterling Valley Consulting LLC (a financial services consulting firm) (2009 – present);
Independent Director, The Sentinel Funds and Sentinel Variable Products Trust (2013 – present);
Chief Legal Officer, Eaton Vance Corp. (2007 – 2008); and
Executive Vice President and Chief Operating Officer, Natixis Global Associates (2004 – 2007); General Counsel (1997 – 2004). | 131 | N/A | |||||
Patricia L. Sawyer (67) | Board Member | Since 2007 | Retired (2007 – present);
President/Founder, Smith & Sawyer LLC (management consulting) (1989 – 2007);
Board Member, TF and TST (2007 – present);
Board Member, TIS (2007 – 2015);
Board Member, TII (2008 – 2010);
Board Member, TPP, TPFG, TPFG II and TAAVF (1993 – present); and Trustee, Chair of Finance Committee and Chair of Nominating Committee (1987 – 1996), Bryant University. | 131 | Honorary Trustee, Bryant University (1996 – present) | |||||
| Transamerica Funds | Annual Report 2017 |
Page 93
Table of Contents
| Name | Position(s) Held with Trust | Term of Office and Length of Time Served* | Principal Occupation(s) During Past Five Years | Number of Funds in Complex Overseen by Board Member | Other Directorships During the Past Five Years | |||||
INDEPENDENT BOARD MEMBERS — continued | ||||||||||
John W. Waechter (65) | Board Member | Since 2005 | Partner, Englander Fischer (2016 – present);
Attorney, Englander Fischer (2008 – 2015);
Retired (2004 – 2008);
Board Member, TST (2004 – present);
Board Member, TIS (2004 – 2015);
Board Member, TF (2005 – present);
Board Member, TPP, TPFG, TPFG II and TAAVF (2007 – present);
Board Member, TII (2008 – 2010);
Employee, RBC Dain Rauscher (securities dealer) (2004);
Executive Vice President, Chief Financial Officer and Chief Compliance Officer, William R. Hough & Co. (securities dealer) (1979 – 2004); and
Treasurer, The Hough Group of Funds (1993 – 2004). | 131 | Operation PAR, Inc. (non-profit (2008 – Remember (2013 – (real estate) (2014 – | |||||
| * | Each Board Member shall hold office until: 1) his or her successor is elected and qualified or 2) he or she resigns, retires or his or her term as a Board Member is terminated in accordance with the Trust’s Declaration of Trust. |
| Transamerica Funds | Annual Report 2017 |
Page 94
Table of Contents
Officers:
The mailing address of each officer is c/o Secretary, 1801 California Street, Suite 5200, Denver, CO 80202. The following table shows information about the officers, including their year of birth, their positions held with the Trust and their principal occupations during the past five years (their titles may have varied during that period). Each officer will hold office until his or her successor has been duly elected or appointed or until his or her earlier death, resignation or removal.
| Name: | Position | Term of Office and Length of Time Served* | Principal Occupation(s) or Employment During Past Five Years | |||
Marijn P. Smit (44) | Chairman of the Board, President and Chief Executive Officer | Since 2014 | See Table Above. | |||
Tané T. Tyler (52) | Vice President, Associate General Counsel, Chief Legal Officer and Secretary | Since 2014 | Vice President, Associate General Counsel, Chief Legal Officer and Secretary, Transamerica Funds, TST, TPP, TPFG, TPFG II and TAAVF (2014 – present);
Assistant General Counsel, Chief Legal Officer and Secretary, TIS (2014 – 2015);
Director, Vice President, Assistant General Counsel and Secretary, TAM and TFS (2014 – present);
Senior Vice President, Secretary and General Counsel, ALPS, Inc., ALPS Fund Services, Inc. and ALPS Distributors, Inc. (2004 – 2013); and
Secretary, Liberty All-Star Funds (2005-2013). | |||
Christopher A. Staples (47) | Vice President and Chief Investment Officer, Advisory Services | Since 2005 | Vice President and Chief Investment Officer, Advisory Services (2007 – present), Senior Vice President – Investment Management (2006 – 2007), Vice President – Investment Management (2005 – 2006), Transamerica Funds and TST;
Vice President and Chief Investment Officer, Advisory Services (2007 – 2015), Senior Vice President ��� Investment Management (2006 – 2007), Vice President – Investment Management (2005 – 2006), TIS;
Senior Director, Investments, TPP, TPFG, TPFG II and TAAVF (2007 – present);
Vice President and Chief Investment Officer (2007 – 2010); Vice President – Investment Administration (2005 – 2007), TII;
Director (2005 – present), Senior Vice President (2006 – present), TAM;
Director, TFS (2005 – present); and Assistant Vice President, Raymond James & Associates (1999 – 2004). |
| Transamerica Funds | Annual Report 2017 |
Page 95
Table of Contents
| Name: | Position | Term of Office and Length of Time Served* | Principal Occupation(s) or Employment During Past Five Years | |||
Thomas R. Wald (57) | Chief Investment Officer | Since 2014 | Chief Investment Officer, Transamerica Funds, TST, TPP, TPFG, TPFG II and TAAVF (2014 – present);
Chief Investment Officer, TIS (2014 – 2015);
Senior Vice President and Chief Investment Officer, TAM (2014 – present);
Chief Investment Officer, Transamerica Investments & Retirement (2014 – present);
Vice President and Client Portfolio Manager, Curian Capital, LLC (2012 – 2014);
Portfolio Manager, Tactical Allocation Group, LLC (2010 – 2011);
Mutual Fund Manager, Munder Capital Management (2005 – 2008); and
Mutual Fund Manager, Invesco Ltd. (1997 – 2004). | |||
Vincent J. Toner (47) | Vice President and Treasurer | Since 2014 | Vice President and Treasurer (2014 – present) Transamerica Funds, TST, TPP, TPFG, TPFG II and TAAVF;
Vice President and Treasurer, TIS (2014 – 2015);
Vice President and Treasurer, TAM and TFS (2014 – present);
Senior Vice President and Vice President, Fund Administration, Brown Brothers Harriman (2010 – 2014); and
Vice President Fund Administration & Fund Accounting, Oppenheimer Funds (2007 – 2010) | |||
Scott M. Lenhart (56) | Chief Compliance Officer and Anti-Money Laundering Officer | Since 2014 | Chief Compliance Officer and Anti-Money Laundering Officer, Transamerica Funds, TST, TPP, TPFG, TPFG II and TAAVF (2014 – present), TIS (2014 – 2015);
Chief Compliance Officer and Anti-Money Laundering Officer (2014 – present), Senior Compliance Officer (2008-2014), TAM;
Vice President and Chief Compliance Officer, TFS (2014 – present);
Director of Compliance, Transamerica Investments & Retirement (2014 – present);
Vice President and Chief Compliance Officer, Transamerica Financial Advisors, Inc. (1999 – 2006); and
Assistant Chief Compliance Officer, Raymond James Financial, Inc., Robert Thomas Securities, Inc. (1989 – 1998). | |||
Rhonda A. Mills (51) | Assistant General Counsel, Assistant Secretary | Since 2016 | Assistant Secretary, Transamerica Funds, TST, TPP, TPFG, TPFG II and TAAVF (2016 – present); Assistant General Counsel, TAM (2016 – present), High Level Specialist Attorney, TAM (2014 – 2016); Vice President and Associate Counsel, ALPS Fund Services, Inc. (2011 – 2014); Managing Member, Mills Law, LLC (2010 – 2011); Counsel, Old Mutual Capital (2006 – 2009); Senior Counsel, Great-West Life and Annuity Insurance Company (2004 – 2006); and Securities Counsel, J.D. Edwards (2000 – 2003). |
| * | Elected and serves at the pleasure of the Board of the Trust. |
| Transamerica Funds | Annual Report 2017 |
Page 96
Table of Contents
PROXY VOTING POLICIES AND PROCEDURES AND QUARTERLY PORTFOLIO HOLDINGS
(unaudited)
A description of the Transamerica Funds’ proxy voting policies and procedures is available in the Statements of Additional Information of the Funds, available without charge upon request by calling 1-888-233-4339 (toll free) or on the Securities and Exchange Commission’s (“SEC”) website at http://www.sec.gov.
In addition, the Funds are required to file Form N-PX, with their complete proxy voting records for the 12 months ended June 30th, no later than August 31st of each year. The Form is available without charge: (1) from the Funds, upon request by calling 1-888-233-4339; and (2) on the SEC’s website at http://www.sec.gov.
The Funds file their complete schedule of portfolio holdings with the SEC for the first and third quarter of each fiscal year on Form N-Q, which is available on the SEC’s website at http://www.sec.gov. The Funds’ Form N-Q may be reviewed and copied at the SEC’s Public Reference Room in Washington, D.C. Information on the operation of the Public Reference Room may be obtained by calling 1-800-SEC-0330.
You may also visit the Trust’s website at www.transamerica.com for this and other information about the Funds and the Trust.
Important Notice Regarding Delivery of Shareholder Documents
Every year we send shareholders informative materials such as the Transamerica Funds Annual Report, the Transamerica Funds Prospectus, and other required documents that keep you informed regarding your Funds. Transamerica Funds will only send one piece per mailing address, a method that saves your Funds’ money by reducing mailing and printing costs. We will continue to do this unless you tell us not to. To elect to receive individual mailings, simply call a Transamerica Customer Service Representative toll free at 1-888-233-4339, 8 a.m. to 7 p.m. Eastern Time, Monday-Friday. Your request will take effect within 30 days.
| Transamerica Funds | Annual Report 2017 |
Page 97
Table of Contents
(unaudited)
Your privacy is very important to us. We want you to understand what information we collect and how we use it. We collect and use “nonpublic personal information” in connection with providing our customers with a broad range of financial products and services as effectively and conveniently as possible. We treat nonpublic personal information in accordance with our Privacy Policy.
What Information We Collect and From Whom We Collect It
We may collect nonpublic personal information about you from the following sources:
| • | Information we receive from you on applications or other forms, such as your name, address, and account number; |
| • | Information about your transactions with us, our affiliates, or others, such as your account balance and purchase/redemption history; and |
| • | Information we receive from non-affiliated third parties, including consumer reporting agencies. |
What Information We Disclose and To Whom We Disclose It
We do not disclose any nonpublic personal information about current or former customers to anyone without their express consent, except as permitted by law. We may disclose the nonpublic personal information we collect, as described above, to persons or companies that perform services on our behalf and to other financial institutions with which we have joint marketing agreements. We will require these companies to protect the confidentiality of your nonpublic personal information and to use it only to perform the services for which we have hired them.
Our Security Procedures
We restrict access to your nonpublic personal information and only allow disclosures to persons and companies as permitted by law to assist in providing products or services to you. We maintain physical, electronic, and procedural safeguards to protect your nonpublic personal information and to safeguard the disposal of certain consumer information.
If you have any questions about our Privacy Policy, please call 1-888-233-4339 on any business day between 8 a.m. and 7 p.m. Eastern Time.
Note: This Privacy Policy applies only to customers that have a direct relationship with us or our affiliates. If you own shares of our funds in the name of a third party such as a bank or broker-dealer, its privacy policy may apply to you instead of ours.
| Transamerica Funds | Annual Report 2017 |
Page 98
Table of Contents
Customer Service: 1-888-233-4339
1801 California St., Suite 5200 Denver, CO 80202
Distributor: Transamerica Capital, Inc.
www.transamerica.com

In an effort to reduce paper mailings and conserve natural resources, we encourage you to visit our website, www.transamerica.com, to set up an account and enroll in eDelivery.
Transamerica Funds are advised by Transamerica Asset Management, Inc. and distributed by Transamerica Capital, Inc.
25335_ARMFP1017
© 2017 Transamerica Capital, Inc.
Table of Contents
| Item 2: | Code of Ethics. | |
(a) | The Registrant has adopted a code of ethics that applies to its principal executive officer, principal financial officer, and any other officers who serve a similar function. | |
(b) | The Registrant’s code of ethics is reasonably designed as described in this Form N-CSR. | |
(c) | During the period covered by the report no amendments were made to the provisions of this code of ethics. | |
(d) | During the period covered by the report, the Registrant did not grant any waivers, including implicit waivers, from the provisions of this code of ethics. | |
(e) | Not Applicable. | |
(f) | The Registrant has filed this code of ethics as an exhibit pursuant to Item 13(a)(1) of Form N-CSR. | |
| Item 3: | Audit Committee Financial Experts. | |
| The Registrant’s Board of Trustees has determined that Sandra N. Bane, and John W. Waechter are “audit committee financial experts,” as such term is defined in Item 3 of Form N-CSR. Ms. Bane, and Mr. Waechter are “independent” under the standards set forth in Item 3 of Form N-CSR. The designation of Ms. Bane, and Mr. Waechter as “audit committee financial experts” pursuant to Item 3 of Form N-CSR does not (i) impose upon them any duties, obligations, or liabilities that are greater than the duties, obligations and liabilities imposed upon them as a member of the Registrant’s audit committee or Board of Trustees in the absence of such designation; or (ii) affect the duties, obligations or liabilities of any other member of the Registrant’s audit committee or Board of Trustees. | ||
| Item 4: | Principal Accountant Fees and Services. | |
| Fiscal Year Ended 10/31 (in thousands) | ||||||||||
| 2017 | 2016 | |||||||||
(a) | Audit Fees | 1,382 | $ | 1,080 | ||||||
(b) | Audit Related Fees(1) | 72 | $ | 18 | ||||||
(c) | Tax Fees(2) | 504 | $ | 259 | ||||||
(d) | All Other Fees(3) | 84 | $ | 23 | ||||||
| (1) | Audit-Related Fees represent assurance and related services provided that are reasonably related to the performance of the audit of the financial statements of the funds comprising the Registrant, specifically data verification and agreed-upon procedures related to asset securitizations and agreed-upon procedures engagements. |
| (2) | Tax Fees represent tax compliance, tax planning and tax advice services provided in connection with the review of the distributions for excise tax purposes, fiscal year end taxable income calculations and certain fiscal year end shareholder reporting items on behalf of the funds comprising the Registrant. |
| (3) | All Other Fees represent service fees for analysis of potential Passive Foreign Investment Company holdings. |
Table of Contents
(e)(1) | Audit Committee Pre-Approval Policies and Procedures. Generally, the Registrant’s Audit Committee must preapprove (i) all audit and non-audit services performed for the Registrant by the independent accountant and (ii) all non-audit services performed by the Registrant’s independent accountant for the Registrant’s investment adviser, and certain of the adviser’s affiliates that provide ongoing services to the Registrant, if the services to be provided by the accountant relate directly to the operations and financial reporting of the Registrant. | |
| The Audit Committee may delegate preapproval authority to one or more of its members. The member or members to whom such authority is delegated shall report any preapproval decisions to the Audit Committee at its next scheduled meeting. | ||
| In accordance with the Procedures, the annual audit services engagement terms and fees for the Registrant will be subject to the preapproval of the Audit Committee. In addition to the annual audit services engagement approved by the Audit Committee, the Audit Committee may grant preapproval for other audit services, which are those services that only the independent accountant reasonably can provide. | ||
| Requests or applications to provide services that require separate approval by the Audit Committee will be submitted to the Audit Committee by both the independent accountant and the Registrant’s treasurer, and must include a joint statement as to whether, in their view, the request or application is consistent with the Securities and Exchange Commissions’ rules on auditor independence. | ||
| Management will promptly report to the Chair of the Audit Committee any violation of this Procedure of which it becomes aware. | ||
(e)(2) | The percentage of services described in paragraphs (b) through (d) of this Item that were approved by the audit committee pursuant to paragraph (c)(7)(i)(C) of Rule 2-01 of Regulation S-X for fiscal years ended 2017 and 2016 was zero. | |
(f) | Not Applicable. | |
(g) | Not Applicable. | |
(h) | The Registrant’s Audit Committee has considered whether the provision of non-audit services that were rendered to the Registrant’s Adviser, and any entity controlling, controlled by, or under common control with the Adviser that provides ongoing services to the Registrant that were not pre-approved pursuant to paragraph (c)(7)(ii) of Rule 2-01 of Regulation S-X is compatible with maintain the principal accountant’s independence. | |
| Item 5: | Audit Committee of Listed Registrants. | |
| The following individuals comprise the standing Audit Committee: Sandra N. Bane, Leo J. Hill, David W. Jennings, Russell A. Kimball, Jr., Frederic A. Nelson, John E. Pelletier, Patricia L. Sawyer and John W. Waechter. | ||
Table of Contents
| Item 6: | Schedule of Investments. | |
(a) | The schedules of investments and consolidated schedules of investments are included in the Annual Report to shareholders filed under Item 1 of this Form N-CSR. | |
(b) | Not applicable. | |
| Item 7: | Disclosure of Proxy Voting Policies and Procedures for Closed-End Management Investment Companies. | |
| Not applicable. | ||
| Item 8: | Portfolio Managers of Closed-End Management Investment Companies. | |
| Not applicable. | ||
| Item 9: | Purchases of Equity Securities by Closed-End Management Investment Company and Affiliated Purchasers. | |
| Not Applicable | ||
| Item 10: | Submission of Matters to a Vote of Security Holders. | |
| There have been no material changes to the procedures by which shareholders may recommend nominees to the Registrant’s Board of Trustees that have been implemented since the Registrant last provided disclosure in response to the requirements of this Item. | ||
| Item 11: | Controls and Procedures. | |
(a) | The Registrant’s principal executive officer and principal financial officer evaluated the Registrant’s disclosure controls and procedures within 90 days of this filing and have concluded that the Registrant’s disclosure controls and procedures (as defined in Rule 30a-3(c) under the Investment Company Act of 1940, as amended (the “1940 Act”)) are appropriately designed to ensure that information required to be disclosed by the Registrant in the reports that it files on Form N-CSR (a) is accumulated and communicated to Registrant’s management, including its principal executive officer and principal financial officer, to allow timely decisions regarding required disclosure, and (b) is recorded, processed, summarized and reported, within the time periods specified in the rules and forms adopted by the U.S. Securities and Exchange Commission. | |
(b) | The Registrant’s principal executive officer and principal financial officer are aware of no change in the Registrant’s internal control over financial reporting that occurred during the Registrant’s most recent fiscal quarter that has materially affected, or is reasonably likely to materially affect, the Registrant’s internal control over financial reporting. | |
Table of Contents
| Item 12: | Disclosure of Securities Lending Activities for Closed-End Management Investment Companies. | |
| Not Applicable. | ||
| Item 13: | Exhibits. | |
(a)(1) | The Registrant’s code of ethics (that is the subject of the disclosure required by Item 2(a)) is attached. | |
(a)(2) | Separate certifications for Registrant’s principal executive officer and principal financial officer, as required by Rule 30a-2(a) under the 1940 Act, are attached. | |
(a)(3) | Not applicable. | |
(b) | A certification for Registrant’s principal executive officer and principal financial officer, as required by Rule 30a-2(b) under the 1940 Act, is attached. The certification furnished pursuant to this paragraph is not deemed to be “filed” for purposes of Section 18 of the Securities Exchange Act of 1934, or otherwise subject to liability of that section. Such certification is not deemed to be incorporated by reference into any filing under the Securities Act of 1933 or the Securities Exchange Act of 1934, except to the extent that the Registrant specifically incorporates it by reference. | |
Table of Contents
SIGNATURES
Pursuant to the requirements of the Securities Exchange Act of 1934 and the Investment Company Act of 1940, the Registrant has duly caused this report to be signed on its behalf by the undersigned, thereunto duly authorized.
Transamerica Funds | ||
| (Registrant) | ||
| By: | /s/ Marijn P. Smit | |
| Marijn P. Smit | ||
| Chief Executive Officer | ||
| (Principal Executive Officer) | ||
| Date: | April 20, 2018 | |
Pursuant to the requirements of the Securities Exchange Act of 1934 and the Investment Company Act of 1940, this report has been signed below by the following persons on behalf of the Registrant and in the capacities and on the dates indicated.
| By: | /s/ Marijn P. Smith | |||
| Marijn P. Smit | ||||
| Chief Executive Officer | ||||
| (Principal Executive Officer) | ||||
| Date: | April 20, 2018 | |||
| By: | /s/ Vincent J. Toner | |||
| Vincent J. Toner | ||||
| Treasurer | ||||
| (Principal Financial Officer) | ||||
| Date: | April 20, 2018 | |||
Table of Contents
EXHIBIT INDEX
Exhibit No. | Description of Exhibit | |
| 13(a)(1) | Code of Ethics for Principal Executive and Principal Financial Officers | |
| 13(a)(2)(i) | Section 302 N-CSR Certification of Principal Executive Officer | |
| 13(a)(2)(ii) | Section 302 N-CSR Certification of Principal Financial Officer | |
| 13(b) | Section 906 N-CSR Certification of Principal Executive Officer and Principal Financial Officer | |