Putnam
High Yield
Advantage Fund
Semiannual report
5 | 31 | 14
Message from the Trustees | 1 |
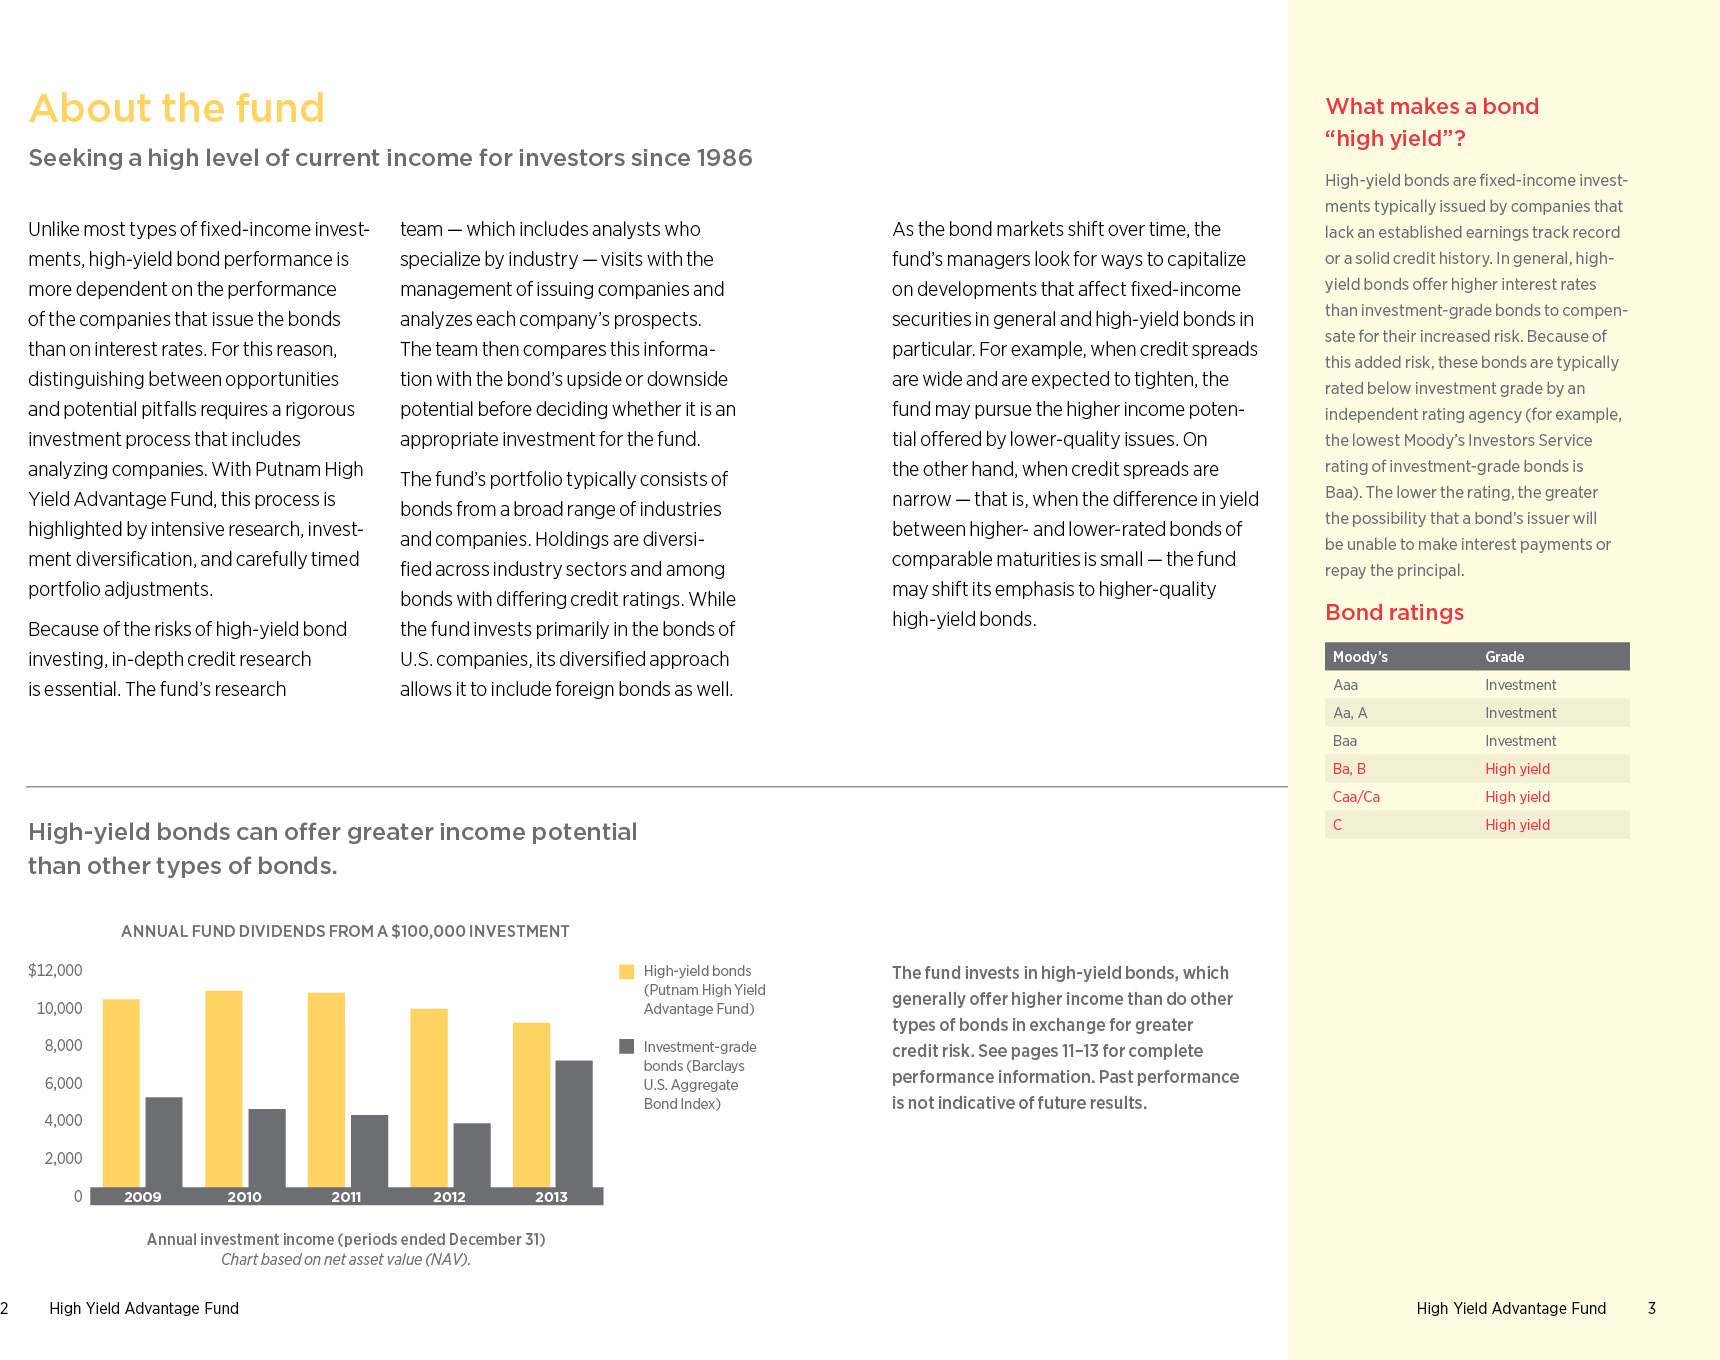
About the fund | 2 |
Performance snapshot | 4 |
Interview with your fund’s portfolio manager | 5 |
Your fund’s performance | 11 |
Your fund’s expenses | 13 |
Terms and definitions | 15 |
Other information for shareholders | 16 |
Financial statements | 17 |
Shareholder meeting results | 60 |
Consider these risks before investing: The value of bonds in the fund’s portfolio may fall or fail to rise over extended periods of time for a variety of reasons, including general financial market conditions, changing market perceptions of the risk of default, changes in government intervention, and factors related to a specific issuer. These factors may also lead to periods of high volatility and reduced liquidity in the bond markets. Lower-rated bonds may offer higher yields in return for more risk. Bond investments are subject to interest-rate risk (the risk of bond prices falling if interest rates rise) and credit risk (the risk of an issuer defaulting on interest or principal payments). Interest-rate risk is generally greater for longer-term bonds, and credit risk is generally greater for below-investment-grade bonds. Risks associated with derivatives include increased investment exposure (which may be considered leverage) and, in the case of over-the-counter instruments, the potential inability to terminate or sell derivatives positions and the potential failure of the other party to the instrument to meet its obligations. Unlike bonds, funds that invest in bonds have fees and expenses. You can lose money by investing in the fund.
Message from the Trustees
Dear Fellow Shareholder:
The performance of financial markets in the first half of 2014 has been marked by a significant degree of stability. Investors have regained a positive outlook as economic growth has improved after the setbacks of a harsh winter. The S&P 500 Index and the Dow Jones Industrial Average have risen to record highs, while Treasury yields have gradually sunk lower. Meanwhile, accommodative central bank policies in the United States and elsewhere continue to foster positive sentiment, notwithstanding the fact that the U.S. Federal Reserve has gradually begun to taper its monthly bond purchases.
The relative calm in financial markets contrasts with new disruptions in global affairs. The outbreaks of violent conflict in Ukraine and Iraq have contributed new uncertainties, particularly with regard to energy prices. Markets have generally taken the initial phases of these events in stride, but the risks that these events pose warrant monitoring.
Complex market conditions reinforce why investors can benefit from seeking advice and maintaining a long-term perspective for their financial programs, rather than responding to short-term market movements. Putnam is prepared to serve investors’ goals through a commitment to ongoing fundamental research and a willingness to incorporate new ways of thinking in its investment strategies. This stance has had a positive impact on performance: Barron’s ranked Putnam second among 55 fund families based on total return across asset classes for the five years ending December 2013.
We encourage you to periodically meet with your financial advisor to discuss the range of investment strategies that Putnam offers. Your advisor can help you assess your individual needs, time horizon, and risk tolerance — important considerations as you work toward your investment goals.
As always, thank you for investing with Putnam.
Respectfully yours,

Robert L. Reynolds
President and Chief Executive Officer
Putnam Investments

Jameson A. Baxter
Chair, Board of Trustees
July 7, 2014
How Barron’s ranked the fund families:
The Barron’s/Lipper Fund Family Ranking published February 8, 2014, ranked Putnam 1 out of 61 for 2009, 14 out of 57 for 2010, 57 out of 58 for 2011, 1 out of 62 for 2012, and 2 out of 64 for 2013 for the 1-year period with funds in five categories: U.S. equity, world equity, mixed asset, taxable bond, and tax-exempt bond. Putnam ranked 43 out of 54 and 46 out of 48 for the 5- and 10-year periods ending 2009, 41 out of 53 and 38 out of 46 for the 5- and 10-year periods ending 2010, 49 out of 53 and 41 out of 45 for the 5- and 10-year periods ending 2011, 27 out of 53 and 36 out of 46 for the 5- and 10-year periods ending 2012, and 2 out of 55 and 32 out of 48 for the 5- and 10-year periods ending 2013, respectively. Only funds with at least one year of performance were included. Returns were calculated minus the effects of sales charges and 12b-1 fees. Rankings were asset weighted, so larger funds had a greater impact on a fund family’s overall ranking, and then weighted by category, with each category assigned a percentage. Past performance is not indicative of future results. Barron’s is a registered trademark of Dow Jones & Company. Lipper ranked Putnam High Yield Advantage Fund 42% (246/590), 60% (243/405), and 21% (58/276) for the 1-, 5-, and 10-year periods, respectively, as of 6/30/14, in the High Yield Funds category. Lipper rankings for class A shares are based on total return without sales charge relative to all share classes of funds with similar objectives as determined by Lipper.
Performance
snapshot
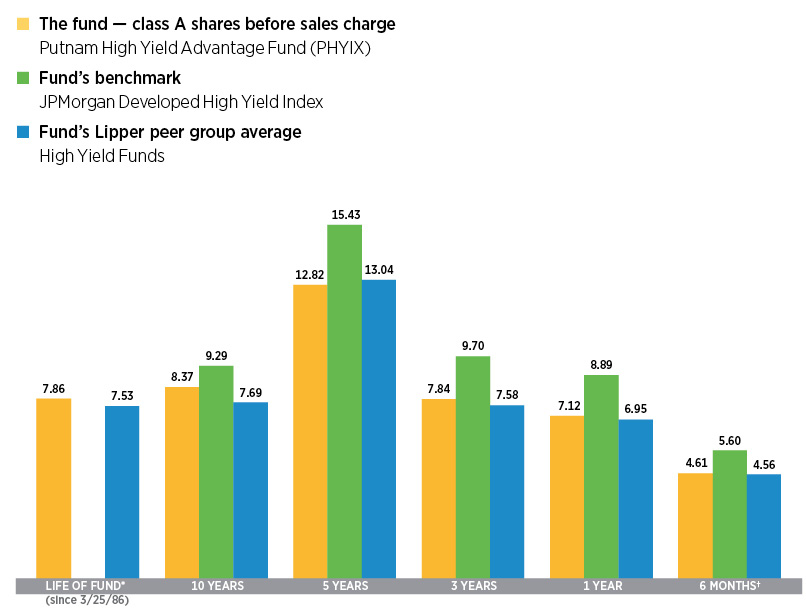
Annualized total return (%) comparison as of 5/31/14
Current performance may be lower or higher than the quoted past performance, which cannot guarantee future results. Share price, principal value, and return will fluctuate, and you may have a gain or a loss when you sell your shares. Performance of class A shares assumes reinvestment of distributions and does not account for taxes. Fund returns in the bar chart do not reflect a sales charge of 4.00%; had they, returns would have been lower. See pages 5 and 11–13 for additional performance information. For a portion of the periods, the fund had expense limitations, without which returns would have been lower. To obtain the most recent month-end performance, visit putnam.com.
* The fund’s benchmark, the JPMorgan Developed High Yield Index, was introduced on 12/31/94, which post-dates the inception of the fund’s class A shares.
† Returns for the six-month period are not annualized, but cumulative.
4 High Yield Advantage Fund
Interview with your fund’s portfolio manager

|
Paul D. Scanlon, CFA |
Paul, what was the market environment like for high-yield bonds during the six months ended May 31, 2014?
Overall, it was a favorable environment for taking credit risk, but there were periods of volatility. The period began with the Federal Reserve surprising investors by announcing, at its December policy meeting, the first reduction in its bond-buying program. Bond yields spiked on the news, with the yield on the benchmark 10-year U.S. Treasury reaching 3.03% by the end of December.
In January, with the central bank beginning the process of reducing its asset purchases, lackluster economic data, coupled with concern about emerging-market [EM] currencies, caused investors to assume a more risk-averse posture. Asset flows shifted toward the relative safety of U.S. Treasuries, pushing the yield on the 10-year note down to 2.65%, its lowest level since mid-November. By February, however, with EM stress abating, market participants were encouraged by the resiliency of U.S. stocks as well as lower Treasury yields. The capital markets were also buoyed by investors largely dismissing weak economic data as a function of severe weather affecting some of the country’s most densely populated regions.
With the Fed reiterating that it is likely to keep its target for short-term interest rates close to zero for a “considerable time” after its bond purchases end, 10-year Treasury yields

Broad market index and fund performance
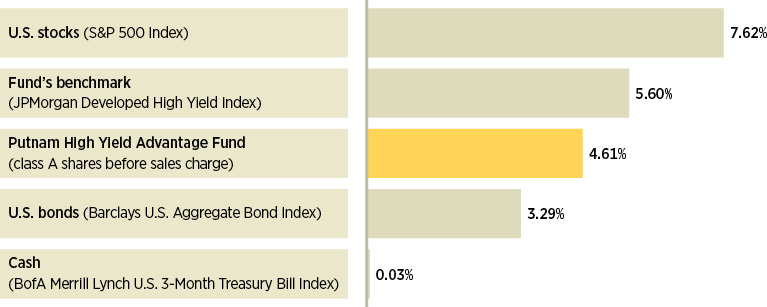
This comparison shows your fund’s performance in the context of broad market indexes for the six months ended 5/31/14. See pages 4 and 11–13 for additional fund performance information. Index descriptions can be found on page 15.
High Yield Advantage Fund 5
declined further in April and May, ending the period at 2.48%.
In the high-yield market, with the search for yield continuing, solid demand supported the asset class. High-yield mutual funds reported $5.7 billion of net new inflows for the calendar year-to-date period ended May 31, 2014, compared with outflows of $4.7 billion in 2013. By credit rating, higher-quality Ba-rated securities outpaced lower-quality B-rated and Caa-rated bonds. From an industry perspective, diversified media, utilities, and telecommunications were the best performers, while metals and mining, retail, and industrials were the worst performers. Year-to-date 2014 high-yield new-issue volume totaled $173.1 billion, compared with $205.1 billion for the same period in 2013 and a record $399 billion for the full year 2013. Refinancing accounted for 58% of year-to-date new-issue volume, followed by mergers and acquisitions at 21%.
The fund slightly outpaced the average return of its Lipper peer group but trailed its benchmark. What factors influenced its relative performance?
At the sector/industry level, overweights in financials, telecommunications, and housing helped the fund’s relative return. Conversely, an underweight in energy, along with adverse positioning in health care, metals and mining, and paper/packaging hampered the fund’s performance versus the benchmark. Additionally, having lighter-than-benchmark exposure to Ba-rated bonds worked against the fund’s relative result.
Credit quality overview
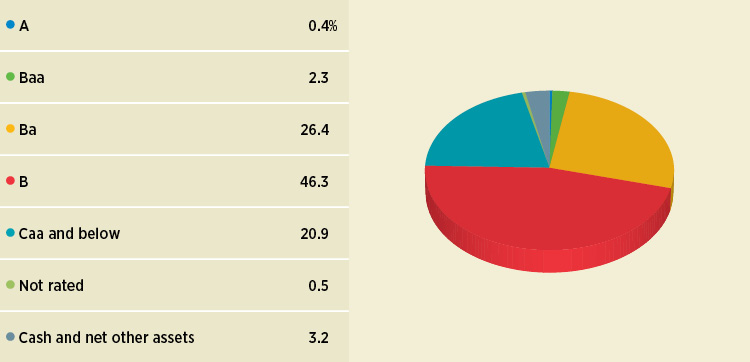
Credit qualities are shown as a percentage of the fund’s net assets as of 5/31/14. A bond rated Baa or higher (Prime-3 or higher, for short-term debt) is considered investment grade. The chart reflects Moody’s ratings; percentages may include bonds or derivatives not rated by Moody’s but rated by Standard & Poor’s (S&P) or, if unrated by S&P, by Fitch ratings, and then included in the closest equivalent Moody’s rating. Ratings may vary over time.
Cash and net other assets, if any, represent the market value weights of cash, derivatives, short-term securities, and other unclassified assets in the portfolio. The fund itself has not been rated by an independent rating agency.
6 High Yield Advantage Fund
“We believe the fundamental
environment for high-yield bonds
remains solid.”
Paul Scanlon
Which holdings helped performance versus the index?
The top individual contributors included overweights in global payments processing company First Data and telecommunication services provider Sprint Communications. Our position in Dallas-based electric utility Energy Future Intermediate Holdings also helped, despite the fact that the company filed for bankruptcy during the period. The firm reached a deal with creditors that calls for breaking off its power generation and retail arms in exchange for reducing debt. German banking and financial services provider Commerzbank was another contributor. With yield spreads on German financial services bonds declining during the period, Commerzbank’s bonds rallied on the prospect that they could be redeemed if the firm decided to raise capital.
Which investments weren’t as productive?
Underweighting or avoiding several strong-performing index components hampered relative performance. These included municipal bond insurer Ambac Financial Group; California-based electric utility Edison International, which we did not hold; Ohio-based utility FirstEnergy; and automaker General Motors [GM]. Ambac, FirstEnergy, and GM were sold during the period.
Top 10 holdings
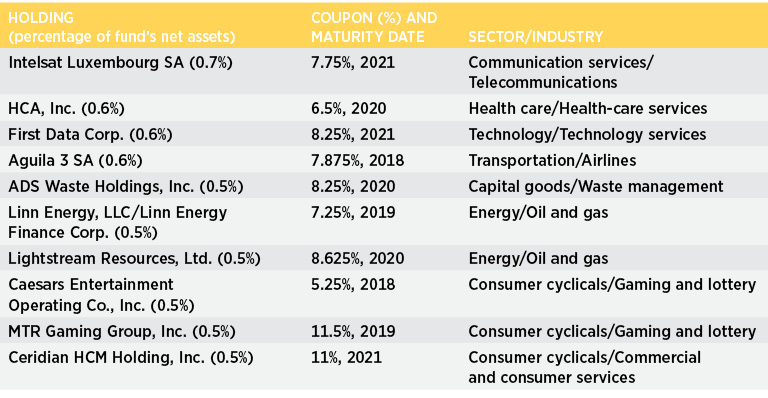
This table shows the fund’s top 10 holdings and the percentage of the fund’s net assets that each represented as of 5/31/14. Short-term holdings and derivatives, if any, are excluded. Holdings may vary over time.
High Yield Advantage Fund 7
What is your view of the credit cycle?
This is a question we’re frequently asked, and at this stage in the cycle, we’re generally positive on the fundamentals underlying the credit cycle. It is noteworthy that distressed Texas electric utility TXU Energy, a sizable issuer in the high-yield and bank-loan markets, declared bankruptcy during the period, but the event was anticipated and did not disrupt either market. Corporations have taken a conservative approach toward managing their assets and liabilities. Many have refinanced debt and lowered their overall borrowing costs, and many are holding substantial cash balances. This conservatism is evident in many of the more recent merger-and-acquisition transactions, where deals were completed using a significant amount of equity, rather than mostly debt. And there have been relatively few large, debt-fueled leveraged buyouts. In fact, there hasn’t been a substantial amount of net new debt issued during the past four to five years. Most of the issuance during that time was from companies that survived the credit crisis and sought to refinance their debt at lower rates.
Credit quality comparison
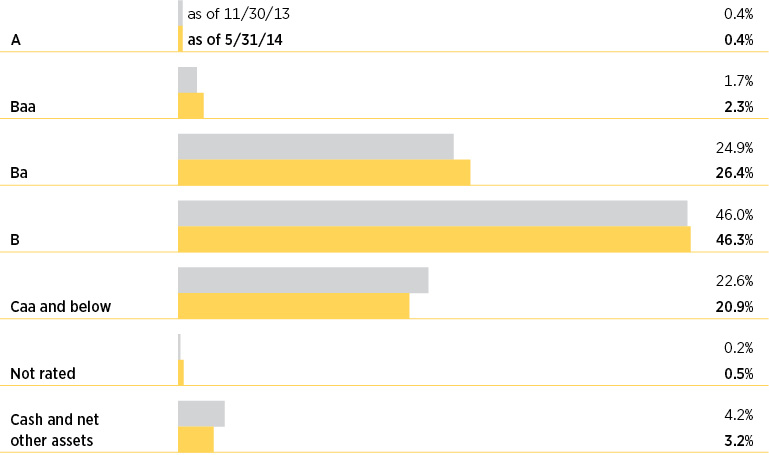
This chart shows how the fund’s credit quality has changed over the past six months. Credit qualities are shown as a percentage of the fund’s net assets. A bond rated Baa or higher (Prime-3 or higher, for short-term debt) is considered investment grade. The chart reflects Moody’s ratings; percentages may include bonds or derivatives not rated by Moody’s but rated by Standard & Poor’s (S&P) or, if unrated by S&P, by Fitch ratings, and then included in the closest equivalent Moody’s rating. Ratings will vary over time.
Cash and net other assets, if any, represent the market value weights of cash, derivatives, short-term securities, and other unclassified assets in the portfolio. The fund itself has not been rated by an independent rating agency.
8 High Yield Advantage Fund
The fund reduced its dividend rate in December 2013. What factors led to that decision?
Reflecting the debt refinancing that occurred during the period, the fund’s monthly distribution rate per class A share was lowered from $0.031 to $0.027. The refinancing of existing high-yield bonds resulted in higher-coupon older bonds being replaced with lower-coupon securities. Similar reductions were made to other share classes.
What is your outlook for the high-yield market over the coming months?
We believe the fundamental environment for high-yield bonds remains solid: The U.S. economy is still in mid-cycle expansion and recent data suggest that it could strengthen during 2014’s second half, high-yield issuers appear to be in reasonably good financial shape, and we believe the default rate is likely to remain below the long-term average for some time.
High-yield credit spreads — the yield advantage offered over U.S. Treasuries — compressed modestly during the period and at period-end were below the historical average level but still above the all-time low. As a result, we have a neutral view of high-yield valuation. That said, absent an external shock to the system, we believe the high-yield asset class may continue generating coupon-like returns in the months ahead. Against this backdrop, we will continue to rely on the strength of Putnam’s credit research to help us find attractive investment opportunities that align with the fund’s overall risk profile.
Thanks for your time and for bringing us up to date, Paul.
The views expressed in this report are exclusively those of Putnam Management and are subject to change. They are not meant as investment advice.
Please note that the holdings discussed in this report may not have been held by the fund for the entire period. Portfolio composition is subject to review in accordance with the fund’s investment strategy and may vary in the future. Current and future portfolio holdings are subject to risk.
Portfolio Manager Paul D. Scanlon is Co-Head of Fixed Income at Putnam. He has an M.B.A. from The University of Chicago Booth School of Business and a B.A. from Colgate University. Paul joined Putnam in 1999 and has been in the investment industry since 1986.
In addition to Paul, your fund’s portfolio managers are Norman P. Boucher and Robert L. Salvin.
High Yield Advantage Fund 9
IN THE NEWS
The unusually harsh winter in the United States and the Ukraine conflict led the World Bank to cut its outlook for global economic growth for 2014. In its June “Global Economic Prospects” report, the bank reduced its global growth forecast to 2.8% from the 3.2% projection it issued in January. Fortunately, the reduction reflects the slowdown that occurred during the winter, and developed economies appear poised to bounce back. Growth in the United States and Europe is expected to quicken as the effects of government spending cuts diminish, more people find jobs, and consumer and corporate demand rebounds, the bank reported. Meanwhile, many emerging-market economies continue to face headwinds. The bank also warned of a “hard landing” in China that could weigh down East Asian countries and hurt commodity exporters.
10 High Yield Advantage Fund
Your fund’s performance |
This section shows your fund’s performance, price, and distribution information for periods ended May 31, 2014, the end of the first half of its current fiscal year. In accordance with regulatory requirements for mutual funds, we also include performance information as of the most recent calendar quarter-end and expense information taken from the fund’s current prospectus. Performance should always be considered in light of a fund’s investment strategy. Data represent past performance. Past performance does not guarantee future results. More recent returns may be less or more than those shown. Investment return and principal value will fluctuate, and you may have a gain or a loss when you sell your shares. Performance information does not reflect any deduction for taxes a shareholder may owe on fund distributions or on the redemption of fund shares. For the most recent month-end performance, please visit the Individual Investors section at putnam.com or call Putnam at 1-800-225-1581. Class R and class Y shares are not available to all investors. See the Terms and Definitions section in this report for definitions of the share classes offered by your fund. |
Fund performance Total return for periods ended 5/31/14
| Class A | Class B | Class C | Class M | Class R | Class Y |
(inception dates) | (3/25/86) | (5/16/94) | (3/30/07) | (12/1/94) | (3/30/07) | (12/31/98) |
| Before sales charge | After sales charge | Before CDSC | After CDSC | Before CDSC | After CDSC | Before sales charge | After sales charge | Net
asset value | Net
asset value |
Annual average | | | | | | | | | | |
(life of fund) | 7.86% | 7.70% | 7.59% | 7.59% | 7.05% | 7.05% | 7.57% | 7.45% | 7.60% | 8.05% |
10 years | 123.32 | 114.39 | 110.48 | 110.48 | 107.34 | 107.34 | 118.23 | 111.14 | 118.24 | 129.30 |
Annual average | 8.37 | 7.92 | 7.73 | 7.73 | 7.56 | 7.56 | 8.12 | 7.76 | 8.12 | 8.65 |
5 years | 82.78 | 75.47 | 76.05 | 74.05 | 76.08 | 76.08 | 80.57 | 74.70 | 80.29 | 85.19 |
Annual average | 12.82 | 11.90 | 11.98 | 11.72 | 11.98 | 11.98 | 12.55 | 11.80 | 12.51 | 13.12 |
3 years | 25.40 | 20.38 | 22.76 | 19.76 | 22.66 | 22.66 | 24.67 | 20.62 | 24.48 | 26.53 |
Annual average | 7.84 | 6.38 | 7.08 | 6.20 | 7.05 | 7.05 | 7.63 | 6.45 | 7.57 | 8.16 |
1 year | 7.12 | 2.84 | 6.44 | 1.44 | 6.46 | 5.46 | 7.09 | 3.61 | 6.93 | 7.56 |
6 months | 4.61 | 0.42 | 4.47 | –0.53 | 4.49 | 3.49 | 4.68 | 1.27 | 4.51 | 4.84 |
Current performance may be lower or higher than the quoted past performance, which cannot guarantee future results. After-sales-charge returns for class A and M shares reflect the deduction of the maximum 4.00% and 3.25% sales charge, respectively, levied at the time of purchase. Class B share returns after contingent deferred sales charge (CDSC) reflect the applicable CDSC, which is 5% in the first year, declining over time to 1% in the sixth year, and is eliminated thereafter. Class C share returns after CDSC reflect a 1% CDSC for the first year that is eliminated thereafter. Class R and Y shares have no initial sales charge or CDSC. Performance for class B, C, M, R, and Y shares before their inception is derived from the historical performance of class A shares, adjusted for the applicable sales charge (or CDSC) and the higher operating expenses for such shares, except for class Y shares, for which 12b-1 fees are not applicable.
For a portion of the periods, the fund had expense limitations, without which returns would have been lower.
Class B share performance reflects conversion to class A shares after eight years.
High Yield Advantage Fund 11
Comparative index returns For periods ended 5/31/14
| JPMorgan Developed High Yield Index | Lipper High Yield Funds category average* |
Annual average (life of fund) | —† | 7.53% |
10 years | 143.10% | 110.48 |
Annual average | 9.29 | 7.69 |
5 years | 104.89 | 84.94 |
Annual average | 15.43 | 13.04 |
3 years | 32.03 | 24.54 |
Annual average | 9.70 | 7.58 |
1 year | 8.89 | 6.95 |
6 months | 5.60 | 4.56 |
Index and Lipper results should be compared with fund performance before sales charge, before CDSC, or at net asset value.
*Over the 6-month, 1-year, 3-year, 5-year, 10-year, and life-of-fund periods ended 5/31/14, there were 622, 586, 473, 406, 276, and 21 funds, respectively, in this Lipper category.
†The fund’s benchmark, the JPMorgan Developed High Yield Index, was introduced on 12/31/94, which post-dates the inception of the fund’s class A shares.
Fund price and distribution information For the six-month period ended 5/31/14
Distributions | Class A | Class B | Class C | Class M | Class R | Class Y |
Number | 6 | 6 | 6 | 6 | 6 | 6 |
Income | $0.162 | $0.138 | $0.138 | $0.156 | $0.156 | $0.168 |
Capital gains | — | — | — | — | — | — |
Total | $0.162 | $0.138 | $0.138 | $0.156 | $0.156 | $0.168 |
Share value | Before
sales charge | After
sales charge | Net asset
value | Net asset
value | Before
sales charge | After
sales charge | Net asset
value | Net asset
value |
11/30/13 | $6.20 | $6.46 | $6.06 | $6.04 | $6.19 | $6.40 | $6.19 | $6.44 |
5/31/14 | 6.32 | 6.58 | 6.19 | 6.17 | 6.32 | 6.53 | 6.31 | 6.58 |
Current rate (end of period) | Before
sales charge | After
sales charge | Net asset
value | Net asset
value | Before
sales charge | After
sales charge | Net asset
value | Net asset
value |
Current dividend rate 1 | 5.13% | 4.92% | 4.46% | 4.47% | 4.94% | 4.78% | 4.94% | 5.11% |
Current 30-day SEC yield 2 | N/A | 3.73 | 3.14 | 3.13 | N/A | 3.52 | 3.64 | 4.13 |
The classification of distributions, if any, is an estimate. Before-sales-charge share value and current dividend rate for class A and M shares, if applicable, do not take into account any sales charge levied at the time of purchase. After-sales-charge share value, current dividend rate, and current 30-day SEC yield, if applicable, are calculated assuming that the maximum sales charge (4.00% for class A shares and 3.25% for class M shares) was levied at the time of purchase. Final distribution information will appear on your year-end tax forms.
1 Most recent distribution, including any return of capital and excluding capital gains, annualized and divided by share price before or after sales charge at period-end.
2 Based only on investment income and calculated using the maximum offering price for each share class, in accordance with SEC guidelines.
12 High Yield Advantage Fund
Fund performance as of most recent calendar quarter Total return for periods ended 6/30/14
| Class A | Class B | Class C | Class M | Class R | Class Y |
(inception dates) | (3/25/86) | (5/16/94) | (3/30/07) | (12/1/94) | (3/30/07) | (12/31/98) |
| Before sales charge | After sales charge | Before CDSC | After CDSC | Before CDSC | After CDSC | Before sales charge | After sales charge | Net
asset value | Net
asset value |
Annual average | | | | | | | | | | |
(life of fund) | 7.87% | 7.71% | 7.60% | 7.60% | 7.06% | 7.06% | 7.58% | 7.45% | 7.61% | 8.06% |
10 years | 122.39 | 113.49 | 109.65 | 109.65 | 106.18 | 106.18 | 116.99 | 109.94 | 117.34 | 128.31 |
Annual average | 8.32 | 7.88 | 7.68 | 7.68 | 7.50 | 7.50 | 8.05 | 7.70 | 8.07 | 8.61 |
5 years | 78.74 | 71.59 | 72.17 | 70.17 | 72.20 | 72.20 | 76.67 | 70.93 | 76.68 | 81.16 |
Annual average | 12.32 | 11.40 | 11.48 | 11.22 | 11.48 | 11.48 | 12.06 | 11.32 | 12.06 | 12.62 |
3 years | 28.10 | 22.97 | 25.05 | 22.05 | 25.14 | 25.14 | 26.94 | 22.82 | 27.16 | 28.95 |
Annual average | 8.60 | 7.14 | 7.74 | 6.87 | 7.76 | 7.76 | 8.28 | 7.09 | 8.34 | 8.84 |
1 year | 10.93 | 6.49 | 10.13 | 5.13 | 10.16 | 9.16 | 10.73 | 7.13 | 10.73 | 11.23 |
6 months | 5.09 | 0.89 | 4.63 | –0.37 | 4.64 | 3.64 | 5.00 | 1.59 | 5.00 | 5.31 |
See the discussion following the fund performance table on page 11 for information about the calculation of fund performance.
Your fund’s expenses |
As a mutual fund investor, you pay ongoing expenses, such as management fees, distribution fees (12b-1 fees), and other expenses. Using the following information, you can estimate how these expenses affect your investment and compare them with the expenses of other funds. You may also pay one-time transaction expenses, including sales charges (loads) and redemption fees, which are not shown in this section and would have resulted in higher total expenses. For more information, see your fund’s prospectus or talk to your financial representative. |
Expense ratios
| Class A | Class B | Class C | Class M | Class R | Class Y |
Total annual operating expenses for the fiscal year ended 11/30/13 | 1.04% | 1.79% | 1.79% | 1.29% | 1.29% | 0.79% |
Annualized expense ratio for the six-month period ended 5/31/14 | 1.04% | 1.79% | 1.79% | 1.29% | 1.29% | 0.79% |
Fiscal-year expense information in this table is taken from the most recent prospectus, is subject to change, and may differ from that shown for the annualized expense ratio and in the financial highlights of this report.
Expenses are shown as a percentage of average net assets.
High Yield Advantage Fund 13
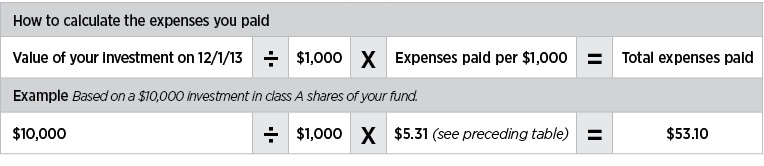
Expenses per $1,000
The following table shows the expenses you would have paid on a $1,000 investment in the fund from December 1, 2013, to May 31, 2014. It also shows how much a $1,000 investment would be worth at the close of the period, assuming actual returns and expenses.
| Class A | Class B | Class C | Class M | Class R | Class Y |
Expenses paid per $1,000*† | $5.31 | $9.12 | $9.13 | $6.58 | $6.58 | $4.03 |
Ending value (after expenses) | $1,046.10 | $1,044.70 | $1,044.90 | $1,046.80 | $1,045.10 | $1,048.40 |
*Expenses for each share class are calculated using the fund’s annualized expense ratio for each class, which represents the ongoing expenses as a percentage of average net assets for the six months ended 5/31/14. The expense ratio may differ for each share class.
†Expenses are calculated by multiplying the expense ratio by the average account value for the period; then multiplying the result by the number of days in the period; and then dividing that result by the number of days in the year.
Estimate the expenses you paid |
To estimate the ongoing expenses you paid for the six months ended May 31, 2014, use the following calculation method. To find the value of your investment on December 1, 2013, call Putnam at 1-800-225-1581. |
|
Compare expenses using the SEC’s method
The Securities and Exchange Commission (SEC) has established guidelines to help investors assess fund expenses. Per these guidelines, the following table shows your fund’s expenses based on a $1,000 investment, assuming a hypothetical 5% annualized return. You can use this information to compare the ongoing expenses (but not transaction expenses or total costs) of investing in the fund with those of other funds. All mutual fund shareholder reports will provide this information to help you make this comparison. Please note that you cannot use this information to estimate your actual ending account balance and expenses paid during the period.
| Class A | Class B | Class C | Class M | Class R | Class Y |
Expenses paid per $1,000*† | $5.24 | $9.00 | $9.00 | $6.49 | $6.49 | $3.98 |
Ending value (after expenses) | $1,019.75 | $1,016.01 | $1,016.01 | $1,018.50 | $1,018.50 | $1,020.99 |
*Expenses for each share class are calculated using the fund’s annualized expense ratio for each class, which represents the ongoing expenses as a percentage of average net assets for the six months ended 5/31/14. The expense ratio may differ for each share class.
†Expenses are calculated by multiplying the expense ratio by the average account value for the six-month period; then multiplying the result by the number of days in the six-month period; and then dividing that result by the number of days in the year.
14 High Yield Advantage Fund
Terms and definitions
Important terms
Total return shows how the value of the fund’s shares changed over time, assuming you held the shares through the entire period and reinvested all distributions in the fund.
Before sales charge, or net asset value, is the price, or value, of one share of a mutual fund, without a sales charge. Before-sales-charge figures fluctuate with market conditions, and are calculated by dividing the net assets of each class of shares by the number of outstanding shares in the class.
After sales charge is the price of a mutual fund share plus the maximum sales charge levied at the time of purchase. After-sales-charge performance figures shown here assume the 4.00% maximum sales charge for class A shares and 3.25% for class M shares.
Contingent deferred sales charge (CDSC) is generally a charge applied at the time of the redemption of class B or C shares and assumes redemption at the end of the period. Your fund’s class B CDSC declines over time from a 5% maximum during the first year to 1% during the sixth year. After the sixth year, the CDSC no longer applies. The CDSC for class C shares is 1% for one year after purchase.
Share classes
Class A shares are generally subject to an initial sales charge and no CDSC (except on certain redemptions of shares bought without an initial sales charge).
Class B shares are not subject to an initial sales charge. They may be subject to a CDSC.
Class C shares are not subject to an initial sales charge and are subject to a CDSC only if the shares are redeemed during the first year.
Class M shares have a lower initial sales charge and a higher 12b-1 fee than class A shares and no CDSC (except on certain redemptions of shares bought without an initial sales charge).
Class R shares are not subject to an initial sales charge or CDSC and are available only to certain employer-sponsored retirement plans.
Class Y shares are not subject to an initial sales charge or CDSC, and carry no 12b-1 fee. They are generally only available to corporate and institutional clients and clients in other approved programs.
Fixed-income terms
Current rate is the annual rate of return earned from dividends or interest of an investment. Current rate is expressed as a percentage of the price of a security, fund share, or principal investment.
Yield curve is a graph that plots the yields of bonds with equal credit quality against their differing maturity dates, ranging from shortest to longest. It is used as a benchmark for other debt, such as mortgage or bank lending rates.
Comparative Indexes
Barclays U.S. Aggregate Bond Index is an unmanaged index of U.S. investment-grade fixed-income securities.
BofA Merrill Lynch U.S. 3-Month Treasury Bill Index is an unmanaged index that seeks to measure the performance of U.S. Treasury bills available in the marketplace.
JPMorgan Developed High Yield Index is an unmanaged index of high-yield fixed-income securities issued in developed countries.
S&P 500 Index is an unmanaged index of common stock performance.
Indexes assume reinvestment of all distributions and do not account for fees. Securities and performance of a fund and an index will differ. You cannot invest directly in an index.
High Yield Advantage Fund 15
Lipper is a third-party industry-ranking entity that ranks mutual funds. Its rankings do not reflect sales charges. Lipper rankings are based on total return at net asset value relative to other funds that have similar current investment styles or objectives as determined by Lipper. Lipper may change a fund’s category assignment at its discretion. Lipper category averages reflect performance trends for funds within a category.
Other information for shareholders
Important notice regarding delivery of shareholder documents
In accordance with Securities and Exchange Commission (SEC) regulations, Putnam sends a single copy of annual and semiannual shareholder reports, prospectuses, and proxy statements to Putnam shareholders who share the same address, unless a shareholder requests otherwise. If you prefer to receive your own copy of these documents, please call Putnam at 1-800-225-1581, and Putnam will begin sending individual copies within 30 days.
Proxy voting
Putnam is committed to managing our mutual funds in the best interests of our shareholders. The Putnam funds’ proxy voting guidelines and procedures, as well as information regarding how your fund voted proxies relating to portfolio securities during the 12-month period ended June 30, 2013, are available in the Individual Investors section of putnam.com, and on the SEC’s website, www.sec.gov. If you have questions about finding forms on the SEC’s website, you may call the SEC at 1-800-SEC-0330. You may also obtain the Putnam funds’ proxy voting guidelines and procedures at no charge by calling Putnam’s Shareholder Services at 1-800-225-1581.
Fund portfolio holdings
The fund will file a complete schedule of its portfolio holdings with the SEC for the first and third quarters of each fiscal year on Form N-Q. Shareholders may obtain the fund’s Forms N-Q on the SEC’s website at www.sec.gov. In addition, the fund’s Forms N-Q may be reviewed and copied at the SEC’s Public Reference Room in Washington, D.C. You may call the SEC at 1-800-SEC-0330 for information about the SEC’s website or the operation of the Public Reference Room.
Trustee and employee fund ownership
Putnam employees and members of the Board of Trustees place their faith, confidence, and, most importantly, investment dollars in Putnam mutual funds. As of May 31, 2014, Putnam employees had approximately $466,000,000 and the Trustees had approximately $113,000,000 invested in Putnam mutual funds. These amounts include investments by the Trustees’ and employees’ immediate family members as well as investments through retirement and deferred compensation plans.
16 High Yield Advantage Fund
A guide to financial statements
These sections of the report, as well as the accompanying Notes, constitute the fund’s financial statements.
The fund’s portfolio lists all the fund’s investments and their values as of the last day of the reporting period. Holdings are organized by asset type and industry sector, country, or state to show areas of concentration and diversification.
Statement of assets and liabilities shows how the fund’s net assets and share price are determined. All investment and non-investment assets are added together. Any unpaid expenses and other liabilities are subtracted from this total. The result is divided by the number of shares to determine the net asset value per share, which is calculated separately for each class of shares. (For funds with preferred shares, the amount subtracted from total assets includes the liquidation preference of preferred shares.)
Statement of operations shows the fund’s net investment gain or loss. This is done by first adding up all the fund’s earnings — from dividends and interest income — and subtracting its operating expenses to determine net investment income (or loss). Then, any net gain or loss the fund realized on the sales of its holdings — as well as any unrealized gains or losses over the period — is added to or subtracted from the net investment result to determine the fund’s net gain or loss for the fiscal period.
Statement of changes in net assets shows how the fund’s net assets were affected by the fund’s net investment gain or loss, by distributions to shareholders, and by changes in the number of the fund’s shares. It lists distributions and their sources (net investment income or realized capital gains) over the current reporting period and the most recent fiscal year-end. The distributions listed here may not match the sources listed in the Statement of operations because the distributions are determined on a tax basis and may be paid in a different period from the one in which they were earned. Dividend sources are estimated at the time of declaration. Actual results may vary. Any non-taxable return of capital cannot be determined until final tax calculations are completed after the end of the fund’s fiscal year.
Financial highlights provide an overview of the fund’s investment results, per-share distributions, expense ratios, net investment income ratios, and portfolio turnover in one summary table, reflecting the five most recent reporting periods. In a semiannual report, the highlights table also includes the current reporting period.
High Yield Advantage Fund 17
The fund’s portfolio 5/31/14 (Unaudited)
| CORPORATE BONDS AND NOTES (88.7%)* | | Principal
amount | Value |
| Advertising and marketing services (0.5%) | | | |
| CBS Outdoor Americas Capital, LLC/CBS Outdoor Americas Capital Corp. 144A company guaranty sr. unsec. notes 5 5/8s, 2024 | | $1,865,000 | $1,916,288 |
| Lamar Media Corp. company guaranty sr. sub. notes 5 7/8s, 2022 | | 1,935,000 | 2,075,288 |
| Lamar Media Corp. 144A company guaranty sr. unsec. notes 5 3/8s, 2024 | | 540,000 | 560,250 |
| | | | 4,551,826 |
| Automotive (1.2%) | | | |
| Chrysler Group, LLC/CG Co-Issuer, Inc. company guaranty notes 8 1/4s, 2021 | | 2,345,000 | 2,673,300 |
| Chrysler Group, LLC/CG Co-Issuer, Inc. company guaranty notes 8s, 2019 | | 665,000 | 726,513 |
| Dana Holding Corp. sr. unsec. unsub. notes 6s, 2023 | | 1,785,000 | 1,887,637 |
| Navistar International Corp. sr. notes 8 1/4s, 2021 | | 2,574,000 | 2,670,525 |
| Schaeffler Finance BV 144A company guaranty sr. notes 7 3/4s, 2017 (Netherlands) | | 565,000 | 634,495 |
| Schaeffler Finance BV 144A company guaranty sr. notes 4 1/4s, 2021 (Netherlands) | | 955,000 | 949,031 |
| Schaeffler Finance BV 144A sr. notes 4 3/4s, 2021 (Netherlands) | | 1,975,000 | 2,019,437 |
| TRW Automotive, Inc. 144A company guaranty sr. unsec. notes 4 1/2s, 2021 | | 475,000 | 498,750 |
| | | | 12,059,688 |
| Basic materials (8.0%) | | | |
| Ainsworth Lumber Co., Ltd. 144A sr. notes 7 1/2s, 2017 (Canada) | | 549,000 | 578,097 |
| ArcelorMittal SA sr. unsec. bonds 10.35s, 2019 (France) | | 3,035,000 | 3,846,862 |
| ArcelorMittal SA sr. unsec. unsub. notes 7 1/2s, 2039 (France) | | 1,415,000 | 1,531,738 |
| Boise Cascade Co. company guaranty sr. unsec. notes 6 3/8s, 2020 | | 2,280,000 | 2,453,850 |
| Celanese US Holdings, LLC company guaranty sr. unsec. unsub. notes 4 5/8s, 2022 (Germany) | | 965,000 | 973,444 |
| Celanese US Holdings, LLC sr. notes 5 7/8s, 2021 (Germany) | | 2,935,000 | 3,239,505 |
| Cemex Finance, LLC 144A company guaranty sr. notes 9 3/8s, 2022 (Mexico) | | 1,145,000 | 1,345,375 |
| Cemex Finance, LLC 144A company guaranty sr. notes 6s, 2024 (Mexico) | | 825,000 | 846,655 |
| Cemex SAB de CV 144A company guaranty sr. notes 7 1/4s, 2021 (Mexico) | | 1,240,000 | 1,343,850 |
| Cemex SAB de CV 144A company guaranty sr. notes 6 1/2s, 2019 (Mexico) | | 1,575,000 | 1,675,485 |
| Cemex SAB de CV 144A company guaranty sr. notes 5 7/8s, 2019 (Mexico) | | 1,385,000 | 1,440,400 |
| CPG Merger Sub, LLC 144A company guaranty sr. unsec. unsub. notes 8s, 2021 | | 1,660,000 | 1,751,300 |
| Eldorado Gold Corp. 144A sr. unsec. notes 6 1/8s, 2020 (Canada) | | 540,000 | 541,458 |
| Exopack Holdings SA 144A company guaranty sr. unsec. notes 7 7/8s, 2019 (Luxembourg) | | 1,875,000 | 1,992,187 |
| Ferro Corp. sr. unsec. notes 7 7/8s, 2018 | | 965,000 | 1,010,838 |
18 High Yield Advantage Fund
| CORPORATE BONDS AND NOTES (88.7%)* cont. | | Principal
amount | Value |
| Basic materials cont. | | | |
| First Quantum Minerals, Ltd. 144A company guaranty sr. unsec. notes 7 1/4s, 2022 (Canada) | | $725,000 | $744,938 |
| First Quantum Minerals, Ltd. 144A company guaranty sr. unsec. notes 7s, 2021 (Canada) | | 1,266,000 | 1,291,320 |
| First Quantum Minerals, Ltd. 144A company guaranty sr. unsec. notes 6 3/4s, 2020 (Canada) | | 211,000 | 215,220 |
| FMG Resources August 2006 Pty, Ltd. 144A sr. notes 8 1/4s, 2019 (Australia) | | 1,290,000 | 1,402,875 |
| FMG Resources August 2006 Pty, Ltd. 144A sr. notes 6 7/8s, 2018 (Australia) | | 2,020,000 | 2,129,080 |
| FMG Resources August 2006 Pty, Ltd. 144A sr. unsec. notes 6 7/8s, 2022 (Australia) | | 755,000 | 801,221 |
| HD Supply, Inc. company guaranty sr. unsec. notes 7 1/2s, 2020 | | 2,020,000 | 2,191,700 |
| HD Supply, Inc. company guaranty sr. unsec. unsub. notes 11 1/2s, 2020 | | 1,240,000 | 1,488,000 |
| Hexion U.S. Finance Corp. company guaranty sr. notes 6 5/8s, 2020 | | 665,000 | 699,913 |
| Hexion U.S. Finance Corp./Hexion Nova Scotia Finance, ULC company guaranty notes 9s, 2020 | | 525,000 | 525,000 |
| Hexion U.S. Finance Corp./Hexion Nova Scotia Finance, ULC company guaranty sr. notes 8 7/8s, 2018 | | 2,020,000 | 2,105,850 |
| Huntsman International, LLC company guaranty sr. unsec. sub. notes 8 5/8s, 2021 | | 1,915,000 | 2,135,224 |
| Huntsman International, LLC company guaranty sr. unsec. sub. notes 8 5/8s, 2020 | | 635,000 | 692,150 |
| Huntsman International, LLC company guaranty sr. unsec. unsub. notes 4 7/8s, 2020 | | 1,860,000 | 1,915,800 |
| Huntsman International, LLC 144A company guaranty sr. unsec. notes 5 1/8s, 2021 | EUR | 335,000 | 471,497 |
| IAMGOLD Corp. 144A company guaranty sr. unsec. notes 6 3/4s, 2020 (Canada) | | $425,000 | 378,250 |
| Ineos Finance PLC 144A company guaranty sr. notes 8 3/8s, 2019 (United Kingdom) | | 830,000 | 910,925 |
| INEOS Group Holdings SA 144A company guaranty sr. unsec. notes 6 1/8s, 2018 (Luxembourg) | | 2,505,000 | 2,595,805 |
| INEOS Group Holdings SA 144A company guaranty sr. unsec. notes 5 7/8s, 2019 (Luxembourg) | | 955,000 | 972,906 |
| JM Huber Corp. 144A sr. unsec. notes 9 7/8s, 2019 | | 2,535,000 | 2,896,237 |
| Louisiana-Pacific Corp. company guaranty sr. unsec. unsub. notes 7 1/2s, 2020 | | 1,705,000 | 1,884,025 |
| Momentive Performance Materials, Inc. company guaranty sr. notes 8 7/8s, 2020 | | 1,799,000 | 1,942,920 |
| New Gold, Inc. 144A company guaranty sr. unsec. unsub. notes 7s, 2020 (Canada) | | 920,000 | 972,900 |
| New Gold, Inc. 144A sr. unsec. notes 6 1/4s, 2022 (Canada) | | 990,000 | 1,022,373 |
| Novelis, Inc. company guaranty sr. unsec. notes 8 3/4s, 2020 | | 1,030,000 | 1,144,588 |
| Perstorp Holding AB 144A company guaranty sr. notes 8 3/4s, 2017 (Sweden) | | 1,925,000 | 2,069,374 |
| PQ Corp. 144A sr. notes 8 3/4s, 2018 | | 1,905,000 | 2,076,450 |
| Roofing Supply Group, LLC/Roofing Supply Finance, Inc. 144A company guaranty sr. unsec. notes 10s, 2020 | | 560,000 | 597,800 |
High Yield Advantage Fund 19
| CORPORATE BONDS AND NOTES (88.7%)* cont. | | Principal
amount | Value |
| Basic materials cont. | | | |
| Ryerson, Inc./Joseph T Ryerson & Son, Inc. company guaranty sr. notes 9s, 2017 | | $680,000 | $730,150 |
| Sealed Air Corp. 144A sr. unsec. notes 6 1/2s, 2020 | | 805,000 | 897,575 |
| Sealed Air Corp. 144A sr. unsec. notes 5 1/4s, 2023 | | 1,280,000 | 1,305,600 |
| Smurfit Kappa Acquisitions 144A company guaranty sr. notes 4 7/8s, 2018 (Ireland) | | 1,210,000 | 1,281,390 |
| Smurfit Kappa Treasury Funding, Ltd. company guaranty sr. unsub. notes 7 1/2s, 2025 (Ireland) | | 940,000 | 1,081,000 |
| Steel Dynamics, Inc. company guaranty sr. unsec. notes 7 5/8s, 2020 | | 115,000 | 123,481 |
| Steel Dynamics, Inc. company guaranty sr. unsec. unsub. notes 6 3/8s, 2022 | | 270,000 | 293,963 |
| Steel Dynamics, Inc. company guaranty sr. unsec. unsub. notes 5 1/4s, 2023 | | 665,000 | 679,963 |
| Taminco Global Chemical Corp. 144A sr. notes 9 3/4s, 2020 (Belgium) | | 2,820,000 | 3,165,450 |
| TMS International Corp. 144A company guaranty sr. unsec. notes 7 5/8s, 2021 | | 425,000 | 453,688 |
| TPC Group, Inc. 144A company guaranty sr. notes 8 3/4s, 2020 | | 1,775,000 | 1,956,938 |
| Tronox Finance, LLC company guaranty sr. unsec. unsub. notes 6 3/8s, 2020 | | 715,000 | 741,813 |
| USG Corp. 144A company guaranty sr. unsec. notes 5 7/8s, 2021 | | 330,000 | 349,800 |
| Weekley Homes, LLC/Weekley Finance Corp. sr. unsec. bonds 6s, 2023 | | 2,650,000 | 2,656,625 |
| | | | 78,562,821 |
| Broadcasting (2.7%) | | | |
| Clear Channel Communications, Inc. company guaranty sr. notes 9s, 2021 | | 805,000 | 859,338 |
| Clear Channel Communications, Inc. company guaranty sr. notes 9s, 2019 | | 3,395,000 | 3,615,674 |
| Clear Channel Worldwide Holdings, Inc. company guaranty sr. unsec. notes 7 5/8s, 2020 | | 1,535,000 | 1,650,125 |
| Clear Channel Worldwide Holdings, Inc. company guaranty sr. unsec. unsub. notes 6 1/2s, 2022 | | 2,585,000 | 2,765,950 |
| Cumulus Media Holdings, Inc. company guaranty sr. unsec. unsub. notes 7 3/4s, 2019 | | 1,760,000 | 1,856,800 |
| Entercom Radio, LLC company guaranty sr. unsec. sub. notes 10 1/2s, 2019 | | 1,590,000 | 1,816,575 |
| Gray Television, Inc. company guaranty sr. unsec. notes 7 1/2s, 2020 | | 2,160,000 | 2,316,600 |
| LIN Television Corp. company guaranty sr. unsec. notes 6 3/8s, 2021 | | 625,000 | 656,250 |
| Nexstar Broadcasting, Inc. company guaranty sr. unsec. unsub. notes 6 7/8s, 2020 | | 1,345,000 | 1,435,787 |
| Sinclair Television Group, Inc. company guaranty sr. unsec. notes 6 3/8s, 2021 | | 1,850,000 | 1,933,250 |
| Sinclair Television Group, Inc. sr. unsec. notes 6 1/8s, 2022 | | 500,000 | 513,750 |
| Sirius XM Radio, Inc. 144A company guaranty sr. unsec. notes 6s, 2024 | | 1,445,000 | 1,484,738 |
| Sirius XM Radio, Inc. 144A sr. unsec. bonds 5 7/8s, 2020 | | 2,100,000 | 2,226,000 |
20 High Yield Advantage Fund
| CORPORATE BONDS AND NOTES (88.7%)* cont. | | Principal
amount | Value |
| Broadcasting cont. | | | |
| Townsquare Radio, LLC/Townsquare Radio, Inc. 144A company guaranty sr. unsec. notes 9s, 2019 | | $1,010,000 | $1,118,574 |
| Univision Communications, Inc. 144A company guaranty sr. unsec. notes 8 1/2s, 2021 | | 1,278,000 | 1,402,605 |
| Univision Communications, Inc. 144A sr. notes 7 7/8s, 2020 | | 700,000 | 770,875 |
| | | | 26,422,891 |
| Building materials (1.2%) | | | |
| Building Materials Corp. of America 144A company guaranty sr. notes 7 1/2s, 2020 | | 1,360,000 | 1,451,800 |
| Building Materials Corp. of America 144A company guaranty sr. notes 7s, 2020 | | 640,000 | 681,600 |
| Building Materials Corp. of America 144A sr. unsec. notes 6 3/4s, 2021 | | 715,000 | 772,200 |
| Jeld-Wen, Inc. 144A sr. notes 12 1/4s, 2017 | | 1,442,000 | 1,568,174 |
| Masonite International Corp. 144A company guaranty sr. notes 8 1/4s, 2021 | | 2,300,000 | 2,507,000 |
| Nortek, Inc. company guaranty sr. unsec. notes 10s, 2018 | | 2,160,000 | 2,343,600 |
| Nortek, Inc. company guaranty sr. unsec. notes 8 1/2s, 2021 | | 1,475,000 | 1,626,187 |
| Owens Corning company guaranty sr. unsec. notes 9s, 2019 | | 424,000 | 534,561 |
| | | | 11,485,122 |
| Cable television (3.7%) | | | |
| Cablevision Systems Corp. sr. unsec. unsub. notes 8 5/8s, 2017 | | 1,190,000 | 1,392,300 |
| Cablevision Systems Corp. sr. unsec. unsub. notes 8s, 2020 | | 470,000 | 536,975 |
| Cablevision Systems Corp. sr. unsec. unsub. notes 7 3/4s, 2018 | | 525,000 | 593,250 |
| CCO Holdings, LLC/CCO Holdings Capital Corp. company guaranty sr. unsec. notes 6 1/2s, 2021 | | 1,655,000 | 1,766,712 |
| CCO Holdings, LLC/CCO Holdings Capital Corp. company guaranty sr. unsec. notes 5 1/4s, 2022 | | 3,115,000 | 3,173,405 |
| CCO Holdings, LLC/CCO Holdings Capital Corp. company guaranty sr. unsec. unsub. bonds 5 1/8s, 2023 | | 2,115,000 | 2,133,505 |
| CCO Holdings, LLC/CCO Holdings Capital Corp. company guaranty sr. unsec. unsub. notes 7 3/8s, 2020 | | 155,000 | 169,531 |
| CCO Holdings, LLC/CCO Holdings Capital Corp. company guaranty sr. unsec. unsub. notes 6 5/8s, 2022 | | 750,000 | 810,938 |
| CCO Holdings, LLC/CCO Holdings Capital Corp. company guaranty sr. unsub. notes 7s, 2019 | | 1,545,000 | 1,635,768 |
| CSC Holdings, LLC sr. unsec. unsub. notes 6 3/4s, 2021 | | 1,710,000 | 1,906,650 |
| CSC Holdings, LLC 144A sr. unsec. notes 5 1/4s, 2024 | | 1,295,000 | 1,295,000 |
| DISH DBS Corp. company guaranty sr. unsec. notes 7 7/8s, 2019 | | 1,600,000 | 1,904,000 |
| DISH DBS Corp. company guaranty sr. unsec. notes 6 3/4s, 2021 | | 1,605,000 | 1,815,655 |
| Lynx II Corp. 144A sr. unsec. notes 6 3/8s, 2023 (United Kingdom) | | 740,000 | 776,075 |
| Mediacom, LLC/Mediacom Capital Corp. sr. unsec. unsub. notes 7 1/4s, 2022 | | 1,110,000 | 1,204,350 |
| Numericable Group SA 144A sr. bonds 6 1/4s, 2024 (France) | | 1,485,000 | 1,555,538 |
| Numericable Group SA 144A sr. bonds 5 5/8s, 2024 (France) | EUR | 275,000 | 396,608 |
| Numericable Group SA 144A sr. notes 6s, 2022 (France) | | $2,755,000 | 2,858,313 |
| Quebecor Media, Inc. sr. unsec. unsub. notes 5 3/4s, 2023 (Canada) | | 1,370,000 | 1,393,975 |
| Quebecor Media, Inc. 144A sr. unsec. notes 7 3/8s, 2021 (Canada) | CAD | 995,000 | 998,028 |
High Yield Advantage Fund 21
| CORPORATE BONDS AND NOTES (88.7%)* cont. | | Principal
amount | Value |
| Cable television cont. | | | |
| Unitymedia Hessen GmbH & Co. KG/Unitymedia NRW GmbH 144A company guaranty sr. notes 7 1/2s, 2019 (Germany) | | $735,000 | $790,125 |
| Videotron, Ltd. company guaranty sr. unsec. unsub. notes 6 7/8s, 2021 (Canada) | CAD | 340,000 | 345,864 |
| Videotron, Ltd. company guaranty sr. unsec. unsub. notes 5s, 2022 (Canada) | | $2,573,000 | 2,634,109 |
| Virgin Media Secured Finance PLC 144A sr. notes 5 3/8s, 2021 (United Kingdom) | | 740,000 | 761,275 |
| WideOpenWest Finance, LLC/WideOpenWest Capital Corp. company guaranty sr. unsec. notes 10 1/4s, 2019 | | 3,330,000 | 3,737,925 |
| | | | 36,585,874 |
| Capital goods (6.0%) | | | |
| ADS Waste Holdings, Inc. company guaranty sr. unsec. notes 8 1/4s, 2020 | | 4,631,000 | 5,013,058 |
| American Axle & Manufacturing, Inc. company guaranty sr. unsec. notes 7 3/4s, 2019 | | 3,900,000 | 4,485,000 |
| American Axle & Manufacturing, Inc. company guaranty sr. unsec. notes 6 5/8s, 2022 | | 500,000 | 543,750 |
| B/E Aerospace, Inc. sr. unsec. unsub. notes 5 1/4s, 2022 | | 525,000 | 557,813 |
| Berry Plastics Corp. company guaranty notes 5 1/2s, 2022 | | 815,000 | 817,038 |
| Berry Plastics Corp. company guaranty unsub. notes 9 3/4s, 2021 | | 705,000 | 812,513 |
| BlueLine Rental Finance Corp. 144A sr. notes 7s, 2019 | | 1,395,000 | 1,492,650 |
| BOE Merger Corp. 144A sr. unsec. notes 9 1/2s, 2017 ‡‡ | | 1,915,000 | 2,010,750 |
| Bombardier, Inc. 144A sr. notes 6 1/8s, 2023 (Canada) | | 585,000 | 598,163 |
| Bombardier, Inc. 144A sr. unsec. notes 7 3/4s, 2020 (Canada) | | 755,000 | 851,263 |
| Briggs & Stratton Corp. company guaranty sr. unsec. notes 6 7/8s, 2020 | | 2,270,000 | 2,519,700 |
| Crown Americas, LLC/Crown Americas Capital Corp. IV company guaranty sr. unsec. notes 4 1/2s, 2023 | | 1,360,000 | 1,322,600 |
| Exide Technologies sr. notes 8 5/8s, 2018 (In default) † | | 890,000 | 516,200 |
| Gestamp Funding Luxembourg SA 144A sr. notes 5 5/8s, 2020 (Luxembourg) | | 1,135,000 | 1,178,980 |
| Kratos Defense & Security Solutions, Inc. company guaranty sr. notes 10s, 2017 | | 645,000 | 679,669 |
| Legrand France SA sr. unsec. unsub. debs 8 1/2s, 2025 (France) | | 2,863,000 | 3,994,224 |
| Manitowoc Co., Inc. (The) company guaranty sr. unsec. notes 5 7/8s, 2022 | | 2,695,000 | 2,883,650 |
| MasTec, Inc. company guaranty sr. unsec. unsub. notes 4 7/8s, 2023 | | 2,975,000 | 2,863,437 |
| Oshkosh Corp. 144A company guaranty sr. unsec. notes 5 3/8s, 2022 | | 975,000 | 1,000,593 |
| Pittsburgh Glass Works, LLC 144A company guaranty sr. notes 8s, 2018 | | 2,295,000 | 2,507,287 |
| Reynolds Group Issuer, Inc./Reynolds Group Issuer, LLC/Reynolds Group Issuer Lu company guaranty sr. notes 7 7/8s, 2019 | | 985,000 | 1,077,343 |
| Reynolds Group Issuer, Inc./Reynolds Group Issuer, LLC/Reynolds Group Issuer Lu company guaranty sr. notes 5 3/4s, 2020 | | 1,850,000 | 1,924,000 |
22 High Yield Advantage Fund
| CORPORATE BONDS AND NOTES (88.7%)* cont. | | Principal
amount | Value |
| Capital goods cont. | | | |
| Reynolds Group Issuer, Inc./Reynolds Group Issuer, LLC/Reynolds Group Issuer Lu company guaranty sr. unsec. unsub. notes 9 7/8s, 2019 | | $2,350,000 | $2,585,000 |
| Reynolds Group Issuer, Inc./Reynolds Group Issuer, LLC/Reynolds Group Issuer Lu company guaranty sr. unsec. unsub. notes 9s, 2019 | | 635,000 | 673,100 |
| Reynolds Group Issuer, Inc./Reynolds Group Issuer, LLC/Reynolds Group Issuer Lu company guaranty sr. unsec. unsub. notes 8 1/4s, 2021 (New Zealand) | | 710,000 | 755,263 |
| Schaeffler Holding Finance BV 144A company guaranty sr. notes 6 7/8s, 2018 (Netherlands) ‡‡ | | 1,670,000 | 1,763,937 |
| Schaeffler Holding Finance BV 144A notes 6 7/8s, 2018 (Netherlands) ‡‡ | EUR | 825,000 | 1,186,856 |
| Tenneco, Inc. company guaranty sr. unsub. notes 6 7/8s, 2020 | | $1,530,000 | 1,673,437 |
| Terex Corp. company guaranty sr. unsec. unsub. notes 6 1/2s, 2020 | | 1,215,000 | 1,316,755 |
| Terex Corp. company guaranty sr. unsec. unsub. notes 6s, 2021 | | 2,550,000 | 2,722,124 |
| Titan International, Inc. 144A company guaranty sr. bonds 6 7/8s, 2020 | | 1,230,000 | 1,271,512 |
| TransDigm, Inc. company guaranty sr. unsec. sub. notes 7 1/2s, 2021 | | 1,305,000 | 1,438,762 |
| TransDigm, Inc. company guaranty sr. unsec. sub. notes 5 1/2s, 2020 | | 990,000 | 994,950 |
| TransDigm, Inc. company guaranty unsec. sub. notes 7 3/4s, 2018 | | 2,100,000 | 2,257,499 |
| TransDigm, Inc. 144A sr. unsec. sub. notes 6 1/2s, 2024 | | 405,000 | 411,075 |
| Vander Intermediate Holding II Corp. 144A sr. unsec. notes 9 3/4s, 2019 ‡‡ | | 770,000 | 816,200 |
| | | | 59,516,151 |
| Coal (0.5%) | | | |
| Alpha Natural Resources, Inc. company guaranty sr. unsec. notes 6 1/4s, 2021 | | 1,410,000 | 969,375 |
| CONSOL Energy, Inc. company guaranty sr. unsec. notes 8 1/4s, 2020 | | 2,100,000 | 2,283,750 |
| CONSOL Energy, Inc. 144A company guaranty sr. unsec. notes 5 7/8s, 2022 | | 1,145,000 | 1,187,937 |
| Peabody Energy Corp. company guaranty sr. unsec. notes 7 3/8s, 2016 | | 550,000 | 609,125 |
| Peabody Energy Corp. company guaranty sr. unsec. unsub. notes 6s, 2018 | | 225,000 | 234,563 |
| | | | 5,284,750 |
| Commercial and consumer services (2.1%) | | | |
| Ceridian HCM Holding, Inc. 144A sr. unsec. notes 11s, 2021 | | 4,055,000 | 4,673,387 |
| Ceridian, LLC company guaranty sr. unsec. notes 12 1/4s, 2015 ‡‡ | | 2,350 | 2,368 |
| Ceridian, LLC sr. unsec. notes 11 1/4s, 2015 | | 645,000 | 649,902 |
| Ceridian, LLC 144A sr. notes 8 7/8s, 2019 | | 505,000 | 570,650 |
| DH Services Luxembourg Sarl 144A company guaranty sr. unsec. notes 7 3/4s, 2020 (Luxembourg) | | 1,755,000 | 1,873,462 |
| Garda World Security Corp. 144A company guaranty sr. unsec. unsub. notes 7 1/4s, 2021 (Canada) | | 2,285,000 | 2,402,562 |
High Yield Advantage Fund 23
| CORPORATE BONDS AND NOTES (88.7%)* cont. | | Principal
amount | Value |
| Commercial and consumer services cont. | | | |
| Igloo Holdings Corp. 144A sr. unsec. unsub. notes 8 1/4s, 2017 ‡‡ | | $2,430,000 | $2,490,749 |
| Lender Processing Services, Inc. company guaranty sr. unsec. unsub. notes 5 3/4s, 2023 | | 2,330,000 | 2,504,749 |
| Sabre Holdings Corp. sr. unsec. unsub. notes 8.35s, 2016 | | 1,175,000 | 1,307,187 |
| Sabre, Inc. 144A sr. notes 8 1/2s, 2019 | | 1,404,000 | 1,558,440 |
| Travelport, LLC company guaranty sr. unsec. sub. notes 11 7/8s, 2016 | | 940,000 | 954,100 |
| Travelport, LLC/Travelport Holdings, Inc. 144A company guaranty sr. unsec. unsub. notes 13 7/8s, 2016 ‡‡ | | 1,651,723 | 1,701,275 |
| | | | 20,688,831 |
| Consumer (0.4%) | | | |
| Gibson Brands, Inc. 144A sr. notes 8 7/8s, 2018 | | 1,925,000 | 1,987,563 |
| Spectrum Brands, Inc. company guaranty sr. unsec. notes 6 5/8s, 2022 | | 90,000 | 98,438 |
| Spectrum Brands, Inc. company guaranty sr. unsec. notes 6 3/8s, 2020 | | 110,000 | 119,213 |
| Spectrum Brands, Inc. company guaranty sr. unsec. unsub. notes 6 3/4s, 2020 | | 1,120,000 | 1,204,000 |
| | | | 3,409,214 |
| Consumer staples (5.8%) | | | |
| Affinion Group, Inc. company guaranty sr. unsec. notes 7 7/8s, 2018 | | 335,000 | 306,525 |
| Ashtead Capital, Inc. 144A company guaranty sr. notes 6 1/2s, 2022 | | 3,629,000 | 3,955,610 |
| Avis Budget Car Rental, LLC/Avis Budget Finance, Inc. company guaranty sr. unsec. unsub. notes 9 3/4s, 2020 | | 470,000 | 534,038 |
| Avis Budget Car Rental, LLC/Avis Budget Finance, Inc. company guaranty sr. unsec. unsub. notes 5 1/2s, 2023 | | 705,000 | 719,100 |
| B&G Foods, Inc. company guaranty sr. unsec. notes 4 5/8s, 2021 | | 945,000 | 935,550 |
| Barry Callebaut Services NV 144A company guaranty sr. unsec. notes 5 1/2s, 2023 (Belgium) | | 1,075,000 | 1,133,046 |
| Burger King Corp. company guaranty sr. unsec. notes 9 7/8s, 2018 | | 550,000 | 592,625 |
| CEC Entertainment, Inc. 144A sr. unsec. notes 8s, 2022 | | 840,000 | 852,600 |
| Constellation Brands, Inc. company guaranty sr. unsec. notes 4 1/4s, 2023 | | 470,000 | 468,825 |
| Constellation Brands, Inc. company guaranty sr. unsec. unsub. notes 7 1/4s, 2016 | | 2,135,000 | 2,391,200 |
| Constellation Brands, Inc. company guaranty sr. unsec. unsub. notes 6s, 2022 | | 1,655,000 | 1,861,875 |
| Corrections Corp. of America company guaranty sr. unsec. notes 4 5/8s, 2023 R | | 1,795,000 | 1,777,050 |
| Corrections Corp. of America company guaranty sr. unsec. notes 4 1/8s, 2020 R | | 380,000 | 379,050 |
| Dave & Buster’s, Inc. company guaranty sr. unsec. unsub. notes 11s, 2018 | | 1,930,000 | 2,049,853 |
| Dean Foods Co. company guaranty sr. unsec. unsub. notes 7s, 2016 | | 1,830,000 | 2,006,138 |
| DineEquity, Inc. company guaranty sr. unsec. notes 9 1/2s, 2018 | | 3,521,000 | 3,798,279 |
| Elizabeth Arden, Inc. sr. unsec. unsub. notes 7 3/8s, 2021 | | 2,790,000 | 2,946,938 |
24 High Yield Advantage Fund
| CORPORATE BONDS AND NOTES (88.7%)* cont. | | Principal
amount | Value |
| Consumer staples cont. | | | |
| ESAL GmbH 144A company guaranty sr. unsec. notes 6 1/4s, 2023 (Brazil) | | $1,275,000 | $1,259,063 |
| Hertz Corp. (The) company guaranty sr. unsec. notes 7 1/2s, 2018 | | 570,000 | 602,063 |
| Hertz Corp. (The) company guaranty sr. unsec. notes 6 1/4s, 2022 | | 1,705,000 | 1,822,219 |
| Hertz Corp. (The) company guaranty sr. unsec. notes 5 7/8s, 2020 | | 945,000 | 999,338 |
| HJ Heinz Co. 144A sr. notes 4 1/4s, 2020 | | 2,130,000 | 2,130,000 |
| JBS USA, LLC/JBS USA Finance, Inc. 144A sr. unsec. notes 8 1/4s, 2020 (Brazil) | | 540,000 | 587,925 |
| JBS USA, LLC/JBS USA Finance, Inc. 144A sr. unsec. notes 7 1/4s, 2021 (Brazil) | | 2,465,000 | 2,659,119 |
| JBS USA, LLC/JBS USA Finance, Inc. 144A sr. unsec. notes 7 1/4s, 2021 (Brazil) | | 480,000 | 518,400 |
| Landry’s Holdings II, Inc. 144A sr. unsec. notes 10 1/4s, 2018 | | 505,000 | 540,350 |
| Landry’s, Inc. 144A sr. unsec. notes 9 3/8s, 2020 | | 4,040,000 | 4,459,150 |
| Prestige Brands, Inc. 144A sr. unsec. notes 5 3/8s, 2021 | | 1,385,000 | 1,416,163 |
| Revlon Consumer Products Corp. company guaranty sr. unsec. notes 5 3/4s, 2021 | | 2,395,000 | 2,430,925 |
| Rite Aid Corp. company guaranty sr. unsec. unsub. notes 9 1/4s, 2020 | | 2,780,000 | 3,169,200 |
| Rite Aid Corp. company guaranty sr. unsub. notes 8s, 2020 | | 445,000 | 490,056 |
| Smithfield Foods, Inc. sr. unsec. unsub. notes 6 5/8s, 2022 | | 1,245,000 | 1,363,275 |
| Smithfield Foods, Inc. 144A sr. unsec. notes 5 7/8s, 2021 | | 360,000 | 379,800 |
| Sun Merger Sub, Inc. 144A sr. unsec. notes 5 1/4s, 2018 | | 1,250,000 | 1,303,125 |
| United Rentals North America, Inc. company guaranty sr. unsec. notes 7 5/8s, 2022 | | 1,165,000 | 1,320,819 |
| United Rentals North America, Inc. company guaranty sr. unsec. notes 5 3/4s, 2024 | | 895,000 | 926,325 |
| United Rentals North America, Inc. company guaranty sr. unsec. unsub. notes 6 1/8s, 2023 | | 1,650,000 | 1,773,750 |
| | | | 56,859,367 |
| Energy (oil field) (1.6%) | | | |
| Calfrac Holdings LP 144A company guaranty sr. unsec. unsub. notes 7 1/2s, 2020 | | 1,185,000 | 1,264,988 |
| Exterran Partners LP/EXLP Finance Corp. 144A company guaranty sr. unsec. notes 6s, 2022 | | 1,960,000 | 1,979,600 |
| Forum Energy Technologies, Inc. 144A sr. unsec. notes 6 1/4s, 2021 | | 1,700,000 | 1,806,250 |
| FTS International, Inc. 144A company guaranty sr. notes 6 1/4s, 2022 | | 1,055,000 | 1,076,100 |
| Hiland Partners LP/Hiland Partners Finance Corp. 144A company guaranty sr. notes 7 1/4s, 2020 | | 1,365,000 | 1,491,263 |
| Hiland Partners LP/Hiland Partners Finance Corp. 144A company guaranty sr. unsec. notes 5 1/2s, 2022 | | 430,000 | 435,375 |
| Key Energy Services, Inc. company guaranty unsec. unsub. notes 6 3/4s, 2021 | | 1,785,000 | 1,865,325 |
| Offshore Group Investment, Ltd. company guaranty sr. notes 7 1/2s, 2019 (Cayman Islands) | | 2,505,000 | 2,630,250 |
High Yield Advantage Fund 25
| CORPORATE BONDS AND NOTES (88.7%)* cont. | | Principal
amount | Value |
| Energy (oil field) cont. | | | |
| Offshore Group Investment, Ltd. company guaranty sr. notes 7 1/8s, 2023 (Cayman Islands) | | $1,695,000 | $1,711,950 |
| Tervita Corp. 144A company guaranty sr. notes 9s, 2018 (Canada) | CAD | 900,000 | 834,419 |
| Tervita Corp. 144A sr. unsec. notes 10 7/8s, 2018 (Canada) | | $455,000 | 447,129 |
| | | | 15,542,649 |
| Entertainment (1.5%) | | | |
| AMC Entertainment, Inc. company guaranty sr. sub. notes 9 3/4s, 2020 | | 1,365,000 | 1,562,925 |
| AMC Entertainment, Inc. company guaranty sr. unsec. sub. notes 5 7/8s, 2022 | | 1,075,000 | 1,112,625 |
| Cedar Fair LP/Canada’s Wonderland Co./Magnum Management Corp. company guaranty sr. unsec. notes 9 1/8s, 2018 | | 255,000 | 269,344 |
| Cedar Fair LP/Canada’s Wonderland Co./Magnum Management Corp. company guaranty sr. unsec. notes 5 1/4s, 2021 | | 945,000 | 968,625 |
| Cedar Fair LP/Canada’s Wonderland Co./Magnum Management Corp. 144A company guaranty sr. unsec. notes 5 3/8s, 2024 | | 430,000 | 433,225 |
| Cinemark USA, Inc. company guaranty sr. unsec. notes 5 1/8s, 2022 | | 1,035,000 | 1,049,231 |
| Cinemark USA, Inc. company guaranty sr. unsec. notes 4 7/8s, 2023 | | 950,000 | 935,750 |
| Cinemark USA, Inc. company guaranty sr. unsec. sub. notes 7 3/8s, 2021 | | 140,000 | 154,875 |
| GLP Capital LP/GLP Financing II, Inc. 144A company guaranty sr. unsec. notes 4 7/8s, 2020 | | 1,720,000 | 1,780,200 |
| GLP Capital LP/GLP Financing II, Inc. 144A company guaranty sr. unsec. notes 4 3/8s, 2018 | | 640,000 | 664,000 |
| Regal Entertainment Group sr. unsec. notes 5 3/4s, 2025 | | 980,000 | 980,000 |
| Regal Entertainment Group sr. unsec. notes 5 3/4s, 2023 | | 1,570,000 | 1,609,250 |
| Regal Entertainment Group sr. unsec. notes 5 3/4s, 2022 | | 340,000 | 351,050 |
| Six Flags Entertainment Corp. 144A company guaranty sr. unsec. unsub. notes 5 1/4s, 2021 | | 2,925,000 | 2,983,500 |
| | | | 14,854,600 |
| Financials (9.7%) | | | |
| A-S Co-Issuer Subsidiary, Inc./A-S Merger Sub., LLC 144A sr. unsec. notes 7 7/8s, 2020 | | 1,700,000 | 1,793,500 |
| Ally Financial, Inc. company guaranty sr. unsec. unsub. notes 8s, 2031 | | 1,000,000 | 1,248,750 |
| Ally Financial, Inc. company guaranty sr. unsec. unsub. notes 8s, 2020 | | 795,000 | 963,938 |
| Ally Financial, Inc. company guaranty sr. unsec. unsub. notes 7 1/2s, 2020 | | 2,300,000 | 2,742,750 |
| Ally Financial, Inc. unsec. sub. notes 8s, 2018 | | 1,331,000 | 1,583,890 |
| American International Group, Inc. jr. sub. FRB bonds 8.175s, 2058 | | 1,905,000 | 2,576,512 |
| Banco Bilbao Vizcaya Argentaria SA jr. unsec. sub. FRB bonds 9s, perpetual maturity (Spain) | | 400,000 | 442,000 |
| BBVA International Preferred SAU bank guaranty jr. unsec. sub. FRB bonds 5.919s, perpetual maturity (Spain) | | 1,780,000 | 1,846,750 |
| CB Richard Ellis Services, Inc. company guaranty sr. unsec. notes 6 5/8s, 2020 | | 1,885,000 | 1,998,100 |
26 High Yield Advantage Fund
| CORPORATE BONDS AND NOTES (88.7%)* cont. | | Principal
amount | Value |
| Financials cont. | | | |
| CBRE Services, Inc. company guaranty sr. unsec. unsub. notes 5s, 2023 | | $285,000 | $287,138 |
| CIT Group, Inc. sr. unsec. notes 5s, 2023 | | 975,000 | 987,188 |
| CIT Group, Inc. sr. unsec. notes 5s, 2022 | | 845,000 | 872,463 |
| CIT Group, Inc. sr. unsec. unsub. notes 5 3/8s, 2020 | | 1,560,000 | 1,669,200 |
| CIT Group, Inc. sr. unsec. unsub. notes 3 7/8s, 2019 | | 660,000 | 667,425 |
| CIT Group, Inc. 144A company guaranty notes 6 5/8s, 2018 | | 1,290,000 | 1,441,574 |
| CIT Group, Inc. 144A company guaranty notes 5 1/2s, 2019 | | 2,140,000 | 2,311,200 |
| Citigroup, Inc. jr. unsec. sub. FRB bonds Ser. B, 5.9s, perpetual maturity | | 1,105,000 | 1,110,525 |
| CNG Holdings, Inc./OH 144A sr. notes 9 3/8s, 2020 | | 1,820,000 | 1,547,000 |
| CNO Financial Group, Inc. 144A company guaranty sr. notes 6 3/8s, 2020 | | 965,000 | 1,047,024 |
| Commerzbank AG 144A unsec. sub. notes 8 1/8s, 2023 (Germany) | | 760,000 | 909,215 |
| Community Choice Financial, Inc. company guaranty sr. notes 10 3/4s, 2019 | | 1,110,000 | 901,875 |
| Credit Acceptance Corp. 144A company guaranty sr. unsec. notes 6 1/8s, 2021 | | 1,140,000 | 1,188,450 |
| CTR Partnership LP/CareTrust Capital Corp. 144A company guaranty sr. unsec. notes 5 7/8s, 2021 R | | 865,000 | 873,650 |
| Dresdner Funding Trust I 144A bonds 8.151s, 2031 | | 3,010,000 | 3,589,425 |
| E*Trade Financial Corp. sr. unsec. unsub. notes 6 3/8s, 2019 | | 2,770,000 | 3,008,913 |
| Genworth Holdings, Inc. company guaranty jr. unsec. sub. FRB bonds 6.15s, 2066 | | 1,005,000 | 947,213 |
| HBOS PLC 144A sr. unsec. sub. notes 6 3/4s, 2018 (United Kingdom) | | 1,375,000 | 1,587,059 |
| HBOS PLC 144A unsec. sub. bonds 6s, 2033 (United Kingdom) | | 650,000 | 707,662 |
| Hockey Merger Sub 2, Inc. 144A sr. unsec. notes 7 7/8s, 2021 | | 1,885,000 | 2,021,663 |
| Icahn Enterprises LP/Icahn Enterprises Finance Corp. company guaranty sr. unsec. notes 6s, 2020 | | 2,940,000 | 3,160,500 |
| Icahn Enterprises LP/Icahn Enterprises Finance Corp. company guaranty sr. unsec. notes 5 7/8s, 2022 | | 1,895,000 | 1,970,800 |
| International Lease Finance Corp. sr. unsec. notes 6 1/4s, 2019 | | 1,440,000 | 1,600,200 |
| iStar Financial, Inc. sr. unsec. notes 7 1/8s, 2018 R | | 1,025,000 | 1,145,438 |
| Liberty Mutual Group, Inc. 144A company guaranty jr. unsec. sub. bonds 7.8s, 2037 | | 970,000 | 1,144,600 |
| Lloyds Bank PLC jr. sub. FRN notes Ser. EMTN, 13s, perpetual maturity (United Kingdom) | GBP | 1,265,000 | 3,532,551 |
| Lloyds Banking Group PLC jr. unsec. sub. FRB bonds 7 1/2s, perpetual maturity (United Kingdom) | | $450,000 | 482,063 |
| MPT Operating Partnership LP/MPT Finance Corp. company guaranty sr. unsec. notes 6 7/8s, 2021 R | | 640,000 | 697,600 |
| MPT Operating Partnership LP/MPT Finance Corp. company guaranty sr. unsec. unsub. notes 6 3/8s, 2022 R | | 780,000 | 836,550 |
| Nationstar Mortgage, LLC/Nationstar Capital Corp. company guaranty sr. unsec. notes 7 7/8s, 2020 | | 945,000 | 954,450 |
| Nationstar Mortgage, LLC/Nationstar Capital Corp. company guaranty sr. unsec. unsub. notes 6 1/2s, 2021 | | 1,620,000 | 1,541,025 |
High Yield Advantage Fund 27
| CORPORATE BONDS AND NOTES (88.7%)* cont. | | Principal
amount | Value |
| Financials cont. | | | |
| Neuberger Berman Group, LLC/Neuberger Berman Finance Corp. 144A sr. unsec. notes 5 7/8s, 2022 | | $1,365,000 | $1,453,725 |
| Neuberger Berman Group, LLC/Neuberger Berman Finance Corp. 144A sr. unsec. notes 5 5/8s, 2020 | | 270,000 | 284,175 |
| Nuveen Investments, Inc. 144A sr. unsec. notes 9 1/8s, 2017 | | 910,000 | 987,350 |
| Ocwen Financial Corp. 144A company guaranty sr. unsec. notes 6 5/8s, 2019 | | 1,060,000 | 1,073,250 |
| PHH Corp. sr. unsec. unsub. notes 7 3/8s, 2019 | | 1,915,000 | 2,154,375 |
| PHH Corp. sr. unsec. unsub. notes 6 3/8s, 2021 | | 2,160,000 | 2,251,800 |
| Provident Funding Associates LP/PFG Finance Corp. 144A company guaranty sr. unsec. notes 6 3/4s, 2021 | | 1,844,000 | 1,876,270 |
| Provident Funding Associates LP/PFG Finance Corp. 144A sr. notes 10 1/8s, 2019 | | 935,000 | 1,019,150 |
| Royal Bank of Scotland Group PLC jr. sub. unsec. FRN notes Ser. U, 7.64s, perpetual maturity (United Kingdom) | | 1,700,000 | 1,802,000 |
| Royal Bank of Scotland Group PLC jr. unsec. sub. FRB bonds 7.648s, perpetual maturity (United Kingdom) | | 3,850,000 | 4,485,250 |
| Royal Bank of Scotland Group PLC unsec. sub. notes 6s, 2023 (United Kingdom) | | 1,010,000 | 1,083,718 |
| SLM Corp. sr. unsec. unsub. notes Ser. MTN, 8.45s, 2018 | | 2,680,000 | 3,155,700 |
| Springleaf Finance Corp. sr. unsec. notes Ser. MTN, 6.9s, 2017 | | 3,415,000 | 3,739,425 |
| Springleaf Finance Corp. sr. unsec. unsub. notes 7 3/4s, 2021 | | 1,140,000 | 1,273,950 |
| Springleaf Finance Corp. sr. unsec. unsub. notes 6s, 2020 | | 1,375,000 | 1,395,625 |
| Stearns Holdings, Inc. 144A company guaranty sr. notes 9 3/8s, 2020 | | 2,493,000 | 2,605,185 |
| TMX Finance, LLC/TitleMax Finance Corp. 144A sr. notes 8 1/2s, 2018 | | 1,170,000 | 1,243,125 |
| USI, Inc./NY 144A sr. unsec. notes 7 3/4s, 2021 | | 2,390,000 | 2,467,675 |
| Walter Investment Management Corp. 144A company guaranty sr. unsec. notes 7 7/8s, 2021 | | 1,365,000 | 1,376,944 |
| | | | 95,666,521 |
| Gaming and lottery (1.8%) | | | |
| Caesars Entertainment Operating Co., Inc. company guaranty sr. notes 9s, 2020 | | 974,000 | 776,765 |
| CCM Merger, Inc. 144A company guaranty sr. unsec. notes 9 1/8s, 2019 | | 1,150,000 | 1,227,625 |
| Great Canadian Gaming Corp. 144A company guaranty sr. unsec. notes 6 5/8s, 2022 (Canada) | CAD | 1,385,000 | 1,359,211 |
| Isle of Capri Casinos, Inc. company guaranty sr. unsec. notes 5 7/8s, 2021 | | $655,000 | 664,825 |
| Isle of Capri Casinos, Inc. company guaranty sr. unsec. sub. notes 8 7/8s, 2020 | | 900,000 | 958,500 |
| Isle of Capri Casinos, Inc. company guaranty sr. unsec. unsub. notes 7 3/4s, 2019 | | 1,145,000 | 1,219,425 |
| MTR Gaming Group, Inc. company guaranty notes 11 1/2s, 2019 | | 4,228,496 | 4,751,772 |
| Penn National Gaming, Inc. 144A sr. unsec. notes 5 7/8s, 2021 | | 2,495,000 | 2,376,488 |
| Rivers Pittsburgh Borrower LP/Rivers Pittsburgh Finance Corp. 144A sr. notes 9 1/2s, 2019 | | 1,066,000 | 1,159,275 |
| ROC Finance, LLC/ROC Finance 1 Corp. 144A notes 12 1/8s, 2018 | | 3,310,000 | 3,599,625 |
| | | | 18,093,511 |
28 High Yield Advantage Fund
| CORPORATE BONDS AND NOTES (88.7%)* cont. | | Principal
amount | Value |
| Health care (7.5%) | | | |
| Acadia Healthcare Co., Inc. company guaranty sr. unsec. notes 6 1/8s, 2021 | | $1,945,000 | $2,032,525 |
| AmSurg Corp. company guaranty sr. unsec. unsub. notes 5 5/8s, 2020 | | 1,480,000 | 1,480,000 |
| Aviv Healthcare Properties LP/Aviv Healthcare Capital Corp. company guaranty sr. unsec. notes 7 3/4s, 2019 | | 1,200,000 | 1,281,000 |
| Aviv Healthcare Properties LP/Aviv Healthcare Capital Corp. company guaranty sr. unsec. notes 6s, 2021 | | 1,645,000 | 1,735,475 |
| Capsugel FinanceCo SCA 144A company guaranty sr. unsec. notes 9 7/8s, 2019 | EUR | 1,365,000 | 2,019,306 |
| Capsugel SA 144A sr. unsec. notes 7s, 2019 (Luxembourg) ‡‡ | | $1,780,000 | 1,828,950 |
| Catamaran Corp. company guaranty sr. unsec. bonds 4 3/4s, 2021 | | 1,173,000 | 1,190,595 |
| Centene Corp. sr. unsec. unsub. notes 4 3/4s, 2022 | | 860,000 | 870,750 |
| CHS/Community Health Systems, Inc. company guaranty sr. notes 5 1/8s, 2018 | | 380,000 | 399,950 |
| CHS/Community Health Systems, Inc. company guaranty sr. unsec. unsub. notes 8s, 2019 | | 625,000 | 685,938 |
| CHS/Community Health Systems, Inc. 144A company guaranty sr. notes 5 1/8s, 2021 | | 305,000 | 309,575 |
| CHS/Community Health Systems, Inc. 144A company guaranty sr. unsec. notes 6 7/8s, 2022 | | 365,000 | 384,163 |
| ConvaTec Finance International SA 144A sr. unsec. notes 8 1/4s, 2019 (Luxembourg) ‡‡ | | 1,347,000 | 1,377,308 |
| ConvaTec Healthcare D Sarl 144A sr. notes 7 3/8s, 2017 (Luxembourg) | EUR | 610,000 | 878,868 |
| ConvaTec Healthcare E SA 144A sr. unsec. notes 10 1/2s, 2018 (Luxembourg) | | $1,078,000 | 1,196,580 |
| Crimson Merger Sub, Inc. 144A sr. unsec. notes 6 5/8s, 2022 | | 2,430,000 | 2,411,775 |
| Endo Finance, LLC 144A company guaranty sr. unsec. notes 5 3/4s, 2022 | | 760,000 | 780,900 |
| Envision Healthcare Corp. company guaranty sr. unsec. notes 8 1/8s, 2019 | | 692,000 | 735,250 |
| Fresenius Medical Care US Finance II, Inc. 144A company guaranty sr. unsec. notes 5 5/8s, 2019 | | 1,315,000 | 1,434,994 |
| Grifols Worldwide Operations, Ltd. 144A sr. unsec. notes 5 1/4s, 2022 (Ireland) | | 425,000 | 437,219 |
| HCA, Inc. company guaranty sr. notes 3 3/4s, 2019 | | 1,450,000 | 1,475,375 |
| HCA, Inc. sr. notes 6 1/2s, 2020 | | 5,040,000 | 5,726,700 |
| HCA, Inc. sr. unsec. notes 7 1/2s, 2022 | | 410,000 | 472,013 |
| Health Net, Inc. sr. unsec. bonds 6 3/8s, 2017 | | 2,980,000 | 3,248,200 |
| IASIS Healthcare, LLC/IASIS Capital Corp. company guaranty sr. unsec. notes 8 3/8s, 2019 | | 1,565,000 | 1,668,681 |
| IMS Health, Inc. 144A sr. unsec. notes 6s, 2020 | | 795,000 | 838,725 |
| Jaguar Holding Co. II/Jaguar Merger Sub, Inc. 144A sr. unsec. notes 9 1/2s, 2019 | | 770,000 | 847,000 |
| JLL/Delta Dutch Newco BV 144A sr. unsec. notes 7 1/2s, 2022 (Netherlands) | | 2,402,000 | 2,462,050 |
| Kinetic Concepts, Inc./KCI USA, Inc. company guaranty notes 10 1/2s, 2018 | | 3,710,000 | 4,224,763 |
High Yield Advantage Fund 29
| CORPORATE BONDS AND NOTES (88.7%)* cont. | | Principal
amount | Value |
| Health care cont. | | | |
| Kinetic Concepts, Inc./KCI USA, Inc. company guaranty sr. unsec. notes 12 1/2s, 2019 | | $405,000 | $464,738 |
| Omega Healthcare Investors, Inc. company guaranty sr. unsec. notes 6 3/4s, 2022 R | | 975,000 | 1,055,438 |
| Omega Healthcare Investors, Inc. 144A sr. unsec. notes 4.95s, 2024 R | | 1,320,000 | 1,329,335 |
| Par Pharmaceutical Cos., Inc. company guaranty sr. unsec. unsub. notes 7 3/8s, 2020 | | 2,380,000 | 2,582,300 |
| Salix Pharmaceuticals, Ltd. 144A company guaranty sr. unsec. notes 6s, 2021 | | 575,000 | 616,688 |
| Service Corp. International sr. unsec. unsub. notes 5 3/8s, 2022 | | 1,780,000 | 1,837,850 |
| Service Corp. International 144A sr. unsec. unsub. notes 5 3/8s, 2024 | | 1,720,000 | 1,743,736 |
| Service Corp. International/US sr. notes 7s, 2017 | | 205,000 | 230,379 |
| Service Corp. International/US sr. unsec. unsub. notes 6 3/4s, 2016 | | 2,005,000 | 2,172,919 |
| Teleflex, Inc. company guaranty sr. unsec. sub. notes 6 7/8s, 2019 | | 1,135,000 | 1,210,194 |
| Teleflex, Inc. 144A company guaranty sr. unsec. notes 5 1/4s, 2024 | | 505,000 | 511,944 |
| Tenet Healthcare Corp. company guaranty sr. bonds 4 1/2s, 2021 | | 825,000 | 818,813 |
| Tenet Healthcare Corp. company guaranty sr. bonds 4 3/8s, 2021 | | 1,455,000 | 1,429,538 |
| Tenet Healthcare Corp. company guaranty sr. notes 6 1/4s, 2018 | | 2,070,000 | 2,282,175 |
| Tenet Healthcare Corp. company guaranty sr. notes 6s, 2020 | | 2,800,000 | 3,010,000 |
| Tenet Healthcare Corp. company guaranty sr. notes 4 3/4s, 2020 | | 340,000 | 344,250 |
| United Surgical Partners International, Inc. company guaranty sr. unsec. unsub. notes 9s, 2020 | | 1,140,000 | 1,262,550 |
| Valeant Pharmaceuticals International 144A company guaranty sr. notes 7s, 2020 | | 250,000 | 266,250 |
| Valeant Pharmaceuticals International 144A company guaranty sr. unsec. notes 6 7/8s, 2018 | | 1,480,000 | 1,557,700 |
| Valeant Pharmaceuticals International 144A company guaranty sr. unsec. notes 6 3/8s, 2020 | | 280,000 | 298,900 |
| Valeant Pharmaceuticals International 144A sr. notes 6 3/4s, 2017 | | 780,000 | 818,025 |
| Valeant Pharmaceuticals International 144A sr. unsec. notes 6 3/4s, 2018 | | 1,125,000 | 1,215,000 |
| Valeant Pharmaceuticals International, Inc. 144A company guaranty sr. unsec. notes 5 5/8s, 2021 | | 135,000 | 140,063 |
| WellCare Health Plans, Inc. sr. unsec. notes 5 3/4s, 2020 | | 2,385,000 | 2,540,025 |
| | | | 74,173,438 |
| Homebuilding (2.2%) | | | |
| Beazer Homes USA, Inc. company guaranty sr. unsec. notes 8 1/8s, 2016 | | 645,000 | 712,725 |
| Brookfield Residential Properties, Inc. 144A company guaranty sr. unsec. notes 6 1/2s, 2020 (Canada) | | 1,845,000 | 1,946,475 |
| Brookfield Residential Properties, Inc./Brookfield Residential US Corp. 144A company guaranty sr. unsec. notes 6 1/8s, 2022 (Canada) | | 915,000 | 944,921 |
30 High Yield Advantage Fund
| CORPORATE BONDS AND NOTES (88.7%)* cont. | | Principal
amount | Value |
| Homebuilding cont. | | | |
| Howard Hughes Corp. (The) 144A sr. unsec. notes 6 7/8s, 2021 | | $2,090,000 | $2,236,300 |
| Lennar Corp. company guaranty sr. unsec. unsub. notes 4 3/4s, 2022 | | 1,545,000 | 1,519,894 |
| Lennar Corp. company guaranty sr. unsec. unsub. notes 4 1/2s, 2019 | | 1,290,000 | 1,309,350 |
| M/I Homes, Inc. company guaranty sr. unsec. notes 8 5/8s, 2018 | | 1,565,000 | 1,670,638 |
| Mattamy Group Corp. 144A sr. unsec. notes 6 1/2s, 2020 (Canada) | | 1,980,000 | 2,004,750 |
| PulteGroup, Inc. company guaranty sr. unsec. notes 7 5/8s, 2017 | | 2,070,000 | 2,393,438 |
| PulteGroup, Inc. company guaranty sr. unsec. unsub. notes 7 7/8s, 2032 | | 1,140,000 | 1,285,350 |
| PulteGroup, Inc. company guaranty sr. unsec. unsub. notes 6s, 2035 | | 215,000 | 202,100 |
| Standard Pacific Corp. company guaranty sr. unsec. notes 6 1/4s, 2021 | | 980,000 | 1,051,050 |
| Taylor Morrison Communities, Inc./Monarch Communities, Inc. 144A company guaranty sr. unsec. notes 7 3/4s, 2020 | | 316,000 | 346,020 |
| Taylor Morrison Communities, Inc./Monarch Communities, Inc. 144A company guaranty sr. unsec. notes 5 5/8s, 2024 | | 710,000 | 697,575 |
| Taylor Morrison Communities, Inc./Monarch Communities, Inc. 144A company guaranty sr. unsec. notes 5 1/4s, 2021 | | 1,110,000 | 1,118,325 |
| Taylor Morrison Communities, Inc./Monarch Communities, Inc. 144A sr. notes 7 3/4s, 2020 | | 1,805,000 | 1,980,988 |
| | | | 21,419,899 |
| Lodging/Tourism (1.3%) | | | |
| FelCor Lodging LP company guaranty sr. notes 10s, 2014 R | | 990,000 | 1,014,750 |
| FelCor Lodging LP company guaranty sr. notes 6 3/4s, 2019 R | | 1,733,000 | 1,845,645 |
| FelCor Lodging LP company guaranty sr. notes 5 5/8s, 2023 R | | 450,000 | 464,063 |
| MGM Resorts International company guaranty sr. unsec. notes 6 7/8s, 2016 | | 535,000 | 583,150 |
| MGM Resorts International company guaranty sr. unsec. notes 6 3/4s, 2020 | | 1,650,000 | 1,829,438 |
| MGM Resorts International company guaranty sr. unsec. notes 5 1/4s, 2020 | | 1,850,000 | 1,921,688 |
| MGM Resorts International company guaranty sr. unsec. unsub. notes 8 5/8s, 2019 | | 1,440,000 | 1,717,200 |
| MGM Resorts International company guaranty sr. unsec. unsub. notes 7 3/4s, 2022 | | 915,000 | 1,072,838 |
| MGM Resorts International company guaranty sr. unsec. unsub. notes 6 5/8s, 2021 | | 360,000 | 399,600 |
| SugarHouse HSP Gaming Prop. Mezz LP/SugarHouse HSP Gaming Finance Corp. 144A sr. notes 6 3/8s, 2021 | | 2,070,000 | 2,018,250 |
| | | | 12,866,622 |
| Media (0.5%) | | | |
| Griffey Intermediate, Inc./Griffey Finance Sub, LLC 144A sr. unsec. notes 7s, 2020 | | 1,710,000 | 1,577,475 |
| Nielsen Co. Luxembourg S.a.r.l. (The) 144A company guaranty sr. unsec. notes 5 1/2s, 2021 (Luxembourg) | | 2,475,000 | 2,574,000 |
| Nielsen Finance, LLC/Nielsen Finance Co. company guaranty sr. unsec. notes 4 1/2s, 2020 | | 777,000 | 786,713 |
| | | | 4,938,188 |
High Yield Advantage Fund 31
| CORPORATE BONDS AND NOTES (88.7%)* cont. | | Principal
amount | Value |
| Oil and gas (10.5%) | | | |
| Access Midstream Partners LP/ACMP Finance Corp. company guaranty sr. unsec. notes 5 7/8s, 2021 | | $980,000 | $1,044,925 |
| Access Midstream Partners LP/ACMP Finance Corp. company guaranty sr. unsec. unsub. notes 6 1/8s, 2022 | | 1,780,000 | 1,940,200 |
| Access Midstream Partners LP/ACMP Finance Corp. company guaranty sr. unsec. unsub. notes 4 7/8s, 2023 | | 1,710,000 | 1,786,950 |
| Antero Resources Corp. 144A company guaranty sr. unsec. notes 5 1/8s, 2022 | | 1,290,000 | 1,325,475 |
| Antero Resources Finance Corp. company guaranty sr. unsec. notes 5 3/8s, 2021 | | 1,405,000 | 1,462,956 |
| Athlon Holdings LP/Athlon Finance Corp. 144A company guaranty sr. unsec. notes 7 3/8s, 2021 | | 2,473,000 | 2,683,205 |
| Athlon Holdings LP/Athlon Finance Corp. 144A company guaranty sr. unsec. notes 6s, 2022 | | 860,000 | 879,350 |
| Atwood Oceanics, Inc. sr. unsec. unsub. notes 6 1/2s, 2020 | | 1,020,000 | 1,081,200 |
| Aurora USA Oil & Gas Inc. 144A company guaranty sr. unsec. notes 9 7/8s, 2017 | | 1,290,000 | 1,428,469 |
| Baytex Energy Corp. 144A company guaranty sr. unsec. notes 5 5/8s, 2024 (Canada) | | 1,120,000 | 1,116,573 |
| Baytex Energy Corp. 144A company guaranty sr. unsec. notes 5 1/8s, 2021 (Canada) | | 1,125,000 | 1,118,295 |
| Chaparral Energy, Inc. company guaranty sr. unsec. notes 9 7/8s, 2020 | | 1,535,000 | 1,734,550 |
| Chaparral Energy, Inc. company guaranty sr. unsec. notes 8 1/4s, 2021 | | 1,900,000 | 2,075,750 |
| Chesapeake Energy Corp. company guaranty sr. unsec. bonds 6 1/4s, 2017 | EUR | 485,000 | 722,632 |
| Chesapeake Energy Corp. company guaranty sr. unsec. notes 6 7/8s, 2020 | | $820,000 | 953,250 |
| Chesapeake Energy Corp. company guaranty sr. unsec. notes 5 3/4s, 2023 | | 470,000 | 524,050 |
| Chesapeake Energy Corp. company guaranty sr. unsec. notes 4 7/8s, 2022 | | 920,000 | 953,350 |
| Chesapeake Oilfield Operating, LLC/Chesapeake Oilfield Finance, Inc. company guaranty sr. unsec. unsub. notes 6 5/8s, 2019 | | 1,650,000 | 1,740,750 |
| Cimarex Energy Co. company guaranty sr. unsec. notes 4 3/8s, 2024 | | 1,080,000 | 1,098,900 |
| Concho Resources, Inc. company guaranty sr. unsec. notes 6 1/2s, 2022 | | 1,720,000 | 1,902,750 |
| Concho Resources, Inc. company guaranty sr. unsec. unsub. notes 5 1/2s, 2023 | | 2,055,000 | 2,198,850 |
| Concho Resources, Inc. company guaranty sr. unsec. unsub. notes 5 1/2s, 2022 | | 1,280,000 | 1,372,800 |
| Connacher Oil and Gas, Ltd. 144A notes 8 1/2s, 2019 (Canada) | | 1,020,000 | 805,800 |
| Denbury Resources, Inc. company guaranty sr. unsec. sub. notes 6 3/8s, 2021 | | 825,000 | 885,844 |
| Denbury Resources, Inc. company guaranty sr. unsec. sub. notes 5 1/2s, 2022 | | 1,705,000 | 1,756,150 |
| EXCO Resources, Inc. company guaranty sr. unsec. notes 7 1/2s, 2018 | | 1,127,000 | 1,152,358 |
32 High Yield Advantage Fund
| CORPORATE BONDS AND NOTES (88.7%)* cont. | | Principal
amount | Value |
| Oil and gas cont. | | | |
| Goodrich Petroleum Corp. company guaranty sr. unsec. unsub. notes 8 7/8s, 2019 | | $2,880,000 | $3,024,000 |
| Gulfport Energy Corp. company guaranty sr. unsec. unsub. notes 7 3/4s, 2020 | | 2,330,000 | 2,516,400 |
| Halcon Resources Corp. company guaranty sr. unsec. unsub. notes 8 7/8s, 2021 | | 4,184,000 | 4,455,960 |
| Hercules Offshore, Inc. 144A company guaranty sr. unsec. notes 7 1/2s, 2021 | | 580,000 | 585,800 |
| Hercules Offshore, Inc. 144A sr. unsec. notes 8 3/4s, 2021 | | 625,000 | 671,875 |
| Kodiak Oil & Gas Corp. company guaranty sr. unsec. unsub. notes 8 1/8s, 2019 | | 3,380,000 | 3,751,800 |
| Kodiak Oil & Gas Corp. company guaranty sr. unsec. unsub. notes 5 1/2s, 2022 | | 525,000 | 536,813 |
| Lightstream Resources, Ltd. 144A sr. unsec. notes 8 5/8s, 2020 (Canada) | | 4,660,000 | 4,846,400 |
| Linn Energy, LLC/Linn Energy Finance Corp. company guaranty sr. unsec. notes 6 1/2s, 2019 | | 275,000 | 289,438 |
| Linn Energy, LLC/Linn Energy Finance Corp. 144A company guaranty sr. unsec. notes 7 1/4s, 2019 | | 4,680,000 | 4,914,000 |
| MEG Energy Corp. 144A company guaranty sr. unsec. notes 6 1/2s, 2021 (Canada) | | 1,835,000 | 1,942,806 |
| MEG Energy Corp. 144A company guaranty sr. unsec. notes 6 3/8s, 2023 (Canada) | | 1,000,000 | 1,060,000 |
| Newfield Exploration Co. sr. unsec. notes 5 3/4s, 2022 | | 1,350,000 | 1,461,375 |
| Newfield Exploration Co. sr. unsec. sub. notes 7 1/8s, 2018 | | 360,000 | 369,900 |
| Newfield Exploration Co. sr. unsec. sub. notes 6 7/8s, 2020 | | 295,000 | 313,438 |
| Newfield Exploration Co. sr. unsec. unsub. notes 5 5/8s, 2024 | | 1,088,000 | 1,158,720 |
| Oasis Petroleum, Inc. company guaranty sr. unsec. notes 6 7/8s, 2023 | | 930,000 | 1,013,700 |
| Oasis Petroleum, Inc. 144A company guaranty sr. unsec. unsub. notes 6 7/8s, 2022 | | 2,230,000 | 2,425,125 |
| Plains Exploration & Production Co. company guaranty sr. unsec. notes 6 3/4s, 2022 | | 1,560,000 | 1,751,100 |
| Range Resources Corp. company guaranty sr. sub. notes 6 3/4s, 2020 | | 640,000 | 692,800 |
| Range Resources Corp. company guaranty sr. unsec. sub. notes 5s, 2022 | | 640,000 | 672,000 |
| Rosetta Resources, Inc. company guaranty sr. unsec. unsub. notes 5 7/8s, 2024 | | 1,290,000 | 1,312,575 |
| Rosetta Resources, Inc. company guaranty sr. unsec. unsub. notes 5 5/8s, 2021 | | 1,360,000 | 1,397,400 |
| Sabine Pass Liquefaction, LLC 144A sr. notes 6 1/4s, 2022 | | 1,445,000 | 1,542,538 |
| Sabine Pass Liquefaction, LLC 144A sr. notes 5 3/4s, 2024 | | 900,000 | 924,750 |
| Sabine Pass Liquefaction, LLC 144A sr. notes 5 5/8s, 2023 | | 905,000 | 929,888 |
| Sabine Pass LNG LP company guaranty sr. notes 7 1/2s, 2016 | | 2,875,000 | 3,184,063 |
| Sabine Pass LNG LP company guaranty sr. notes 6 1/2s, 2020 | | 690,000 | 736,575 |
| Samson Investment Co. 144A sr. unsec. notes 10 3/4s, 2020 | | 3,090,000 | 3,229,050 |
| Seven Generations Energy, Ltd. 144A sr. unsec. notes 8 1/4s, 2020 (Canada) | | 1,520,000 | 1,664,400 |
| Shelf Drilling Holdings, Ltd. 144A sr. notes 8 5/8s, 2018 | | 2,315,000 | 2,488,625 |
High Yield Advantage Fund 33
| CORPORATE BONDS AND NOTES (88.7%)* cont. | | Principal
amount | Value |
| Oil and gas cont. | | | |
| SM Energy Co. sr. unsec. notes 6 5/8s, 2019 | | $540,000 | $573,075 |
| SM Energy Co. sr. unsec. notes 6 1/2s, 2021 | | 690,000 | 746,925 |
| SM Energy Co. sr. unsec. unsub. notes 6 1/2s, 2023 | | 280,000 | 303,450 |
| Unit Corp. company guaranty sr. sub. notes 6 5/8s, 2021 | | 1,845,000 | 1,964,925 |
| Whiting Petroleum Corp. company guaranty sr. unsec. unsub. notes 5 3/4s, 2021 | | 3,405,000 | 3,677,400 |
| Williams Cos., Inc. (The) notes 7 3/4s, 2031 | | 1,113,000 | 1,322,568 |
| Williams Cos., Inc. (The) sr. unsec. notes 7 7/8s, 2021 | | 335,000 | 406,786 |
| WPX Energy, Inc. sr. unsec. unsub. notes 6s, 2022 | | 945,000 | 989,888 |
| WPX Energy, Inc. sr. unsec. unsub. notes 5 1/4s, 2017 | | 2,270,000 | 2,423,225 |
| | | | 104,016,938 |
| Publishing (0.2%) | | | |
| Gannett Co., Inc. 144A company guaranty sr. unsec. notes 5 1/8s, 2020 | | 925,000 | 952,750 |
| Gannett Co., Inc. 144A company guaranty sr. unsec. notes 5 1/8s, 2019 | | 1,175,000 | 1,222,000 |
| | | | 2,174,750 |
| Regional Bells (0.2%) | | | |
| Frontier Communications Corp. sr. unsec. notes 8 1/8s, 2018 | | 1,655,000 | 1,928,075 |
| | | | 1,928,075 |
| Retail (2.5%) | | | |
| Academy, Ltd./Academy Finance Corp. 144A company guaranty sr. unsec. notes 9 1/4s, 2019 | | 995,000 | 1,075,844 |
| Autonation, Inc. company guaranty sr. unsec. notes 6 3/4s, 2018 | | 505,000 | 579,488 |
| Autonation, Inc. company guaranty sr. unsec. unsub. notes 5 1/2s, 2020 | | 1,565,000 | 1,698,024 |
| Bon-Ton Department Stores, Inc. (The) company guaranty notes 10 5/8s, 2017 | | 1,706,000 | 1,706,000 |
| Bon-Ton Department Stores, Inc. (The) company guaranty notes 8s, 2021 | | 640,000 | 611,200 |
| Burlington Coat Factory Warehouse Corp. company guaranty sr. unsec. notes 10s, 2019 | | 1,705,000 | 1,869,105 |
| First Cash Financial Services, Inc. 144A sr. unsec. notes 6 3/4s, 2021 (Mexico) | | 895,000 | 947,581 |
| Jo-Ann Stores Holdings, Inc. 144A sr. unsec. notes 9 3/4s, 2019 ‡‡ | | 705,000 | 731,438 |
| Jo-Ann Stores, Inc. 144A sr. unsec. notes 8 1/8s, 2019 | | 3,315,000 | 3,431,024 |
| L Brands, Inc. company guaranty sr. unsec. notes 6 5/8s, 2021 | | 2,090,000 | 2,351,250 |
| L Brands, Inc. sr. unsec. notes 5 5/8s, 2022 | | 685,000 | 727,813 |
| Neiman Marcus Group, Inc. 144A company guaranty sr. unsec. notes 8 3/4s, 2021 ‡‡ | | 2,245,000 | 2,475,112 |
| Neiman Marcus Group, Inc. 144A company guaranty sr. unsec. notes 8s, 2021 | | 910,000 | 1,001,000 |
| Neiman Marcus Group, LLC (The) company guaranty sr. notes 7 1/8s, 2028 | | 1,230,000 | 1,254,600 |
| Penske Automotive Group, Inc. company guaranty sr. unsec. sub. notes 5 3/4s, 2022 | | 2,025,000 | 2,118,655 |
| Petco Animal Supplies, Inc. 144A company guaranty sr. unsec. notes 9 1/4s, 2018 | | 870,000 | 934,163 |
| Petco Holdings, Inc. 144A sr. unsec. notes 8 1/2s, 2017 ‡‡ | | 925,000 | 945,813 |
| | | | 24,458,110 |
34 High Yield Advantage Fund
| CORPORATE BONDS AND NOTES (88.7%)* cont. | | Principal
amount | Value |
| Technology (4.5%) | | | |
| ACI Worldwide, Inc. 144A company guaranty sr. unsec. unsub. notes 6 3/8s, 2020 | | $1,665,000 | $1,756,574 |
| Alcatel-Lucent USA, Inc. 144A company guaranty sr. unsec. notes 6 3/4s, 2020 | | 3,275,000 | 3,479,687 |
| Avaya, Inc. 144A company guaranty notes 10 1/2s, 2021 | | 1,410,000 | 1,276,050 |
| Avaya, Inc. 144A company guaranty sr. notes 7s, 2019 | | 4,245,000 | 4,202,550 |
| Epicor Software Corp. company guaranty sr. unsec. notes 8 5/8s, 2019 | | 875,000 | 950,469 |
| First Data Corp. company guaranty sr. unsec. notes 12 5/8s, 2021 | | 3,885,000 | 4,671,712 |
| First Data Corp. company guaranty sr. unsec. notes 11 1/4s, 2021 | | 1,710,000 | 1,966,500 |
| First Data Corp. company guaranty sr. unsec. sub. notes 11 3/4s, 2021 | | 3,655,000 | 4,057,050 |
| First Data Corp. 144A company guaranty notes 8 1/4s, 2021 | | 5,115,000 | 5,549,774 |
| First Data Corp. 144A company guaranty sr. notes 7 3/8s, 2019 | | 5,000 | 5,363 |
| First Data Holdings, Inc. 144A sr. unsec. notes 14 1/2s, 2019 ‡‡ | | 1,089,847 | 1,089,847 |
| Freescale Semiconductor, Inc. company guaranty sr. unsec. notes 10 3/4s, 2020 | | 1,409,000 | 1,604,499 |
| Freescale Semiconductor, Inc. 144A company guaranty sr. notes 5s, 2021 | | 800,000 | 815,000 |
| Freescale Semiconductor, Inc. 144A sr. notes 6s, 2022 | | 1,870,000 | 1,991,550 |
| Infor US, Inc. company guaranty sr. unsec. unsub. notes 11 1/2s, 2018 | | 1,160,000 | 1,334,000 |
| Iron Mountain, Inc. company guaranty sr. unsec. unsub. notes 6s, 2023 | | 1,620,000 | 1,721,250 |
| Micron Technology, Inc. 144A sr. unsec. notes 5 7/8s, 2022 | | 1,320,000 | 1,409,100 |
| SoftBank Corp. 144A sr. unsec. notes 4 1/2s, 2020 (Japan) | | 3,455,000 | 3,498,188 |
| SunGard Data Systems, Inc. company guaranty sr. unsec. sub. notes 6 5/8s, 2019 | | 1,040,000 | 1,099,800 |
| SunGard Data Systems, Inc. 144A sr. unsec. notes 7 5/8s, 2020 | | 950,000 | 1,041,438 |
| Syniverse Holdings, Inc. company guaranty sr. unsec. notes 9 1/8s, 2019 | | 687,000 | 741,960 |
| | | | 44,262,361 |
| Telecommunications (5.8%) | | | |
| Altice SA 144A company guaranty sr. notes 7 3/4s, 2022 (Luxembourg) | | 3,035,000 | 3,186,750 |
| Altice SA 144A company guaranty sr. notes 7 1/4s, 2022 (Luxembourg) | EUR | 285,000 | 408,894 |
| Crown Castle International Corp. sr. unsec. notes 5 1/4s, 2023 R | | $2,815,000 | 2,927,600 |
| Crown Castle International Corp. sr. unsec. unsub. notes 4 7/8s, 2022 R | | 870,000 | 896,100 |
| Digicel Group, Ltd. 144A sr. unsec. notes 8 1/4s, 2020 (Jamaica) | | 3,525,000 | 3,798,188 |
| Digicel, Ltd. 144A sr. unsec. notes 8 1/4s, 2017 (Jamaica) | | 1,195,000 | 1,236,825 |
| Hughes Satellite Systems Corp. company guaranty sr. notes 6 1/2s, 2019 | | 1,750,000 | 1,944,688 |
| Hughes Satellite Systems Corp. company guaranty sr. unsec. notes 7 5/8s, 2021 | | 1,800,000 | 2,052,000 |
| Inmarsat Finance PLC 144A company guaranty sr. unsec. notes 4 7/8s, 2022 (United Kingdom) | | 760,000 | 767,600 |
High Yield Advantage Fund 35
| CORPORATE BONDS AND NOTES (88.7%)* cont. | | Principal
amount | Value |
| Telecommunications cont. | | | |
| Intelsat Jackson Holdings SA company guaranty sr. unsec. notes 7 1/2s, 2021 (Bermuda) | | $1,170,000 | $1,281,150 |
| Intelsat Luxembourg SA company guaranty sr. unsec. bonds 8 1/8s, 2023 (Luxembourg) | | 2,345,000 | 2,520,875 |
| Intelsat Luxembourg SA company guaranty sr. unsec. bonds 7 3/4s, 2021 (Luxembourg) | | 6,380,000 | 6,762,800 |
| Level 3 Financing, Inc. company guaranty sr. unsec. unsub. notes 8 5/8s, 2020 | | 1,210,000 | 1,358,225 |
| Level 3 Financing, Inc. company guaranty sr. unsec. unsub. notes 8 1/8s, 2019 | | 270,000 | 294,975 |
| Level 3 Financing, Inc. company guaranty sr. unsec. unsub. notes 7s, 2020 | | 455,000 | 492,538 |
| Level 3 Financing, Inc. 144A company guaranty sr. unsec. notes 6 1/8s, 2021 | | 1,155,000 | 1,221,413 |
| Nil International Telecom SCA 144A company guaranty sr. unsec. notes 7 7/8s, 2019 (Luxembourg) | | 1,225,000 | 1,029,000 |
| Qwest Corp. sr. unsec. notes 6 3/4s, 2021 | | 1,980,000 | 2,273,244 |
| Qwest Corp. sr. unsec. unsub. notes 7 1/4s, 2025 | | 1,285,000 | 1,488,787 |
| SBA Telecommunications, Inc. company guaranty sr. unsec. unsub. notes 5 3/4s, 2020 | | 1,465,000 | 1,545,575 |
| Sprint Capital Corp. company guaranty 6 7/8s, 2028 | | 3,575,000 | 3,664,375 |
| Sprint Communications, Inc. sr. unsec. unsub. notes 8 3/8s, 2017 | | 1,305,000 | 1,531,744 |
| Sprint Communications, Inc. sr. unsec. unsub. notes 7s, 2020 | | 560,000 | 617,400 |
| Sprint Communications, Inc. 144A company guaranty sr. unsec. notes 9s, 2018 | | 2,775,000 | 3,371,625 |
| Sprint Corp. 144A company guaranty sr. unsec. notes 7 7/8s, 2023 | | 4,045,000 | 4,570,850 |
| Sprint Corp. 144A company guaranty sr. unsec. notes 7 1/4s, 2021 | | 2,955,000 | 3,272,663 |
| Wind Acquisition Finance SA company guaranty sr. notes Ser. REGS, 7 3/8s, 2018 (Luxembourg) | EUR | 250,000 | 359,521 |
| Wind Acquisition Finance SA 144A company guaranty sr. notes 7 1/4s, 2018 (Luxembourg) | | $1,415,000 | 1,492,825 |
| Wind Acquisition Finance SA 144A company guaranty sr. unsec. bonds 7 3/8s, 2021 (Luxembourg) | | 960,000 | 993,600 |
| | | | 57,361,830 |
| Telephone (1.5%) | | | |
| CenturyLink, Inc. sr. unsec. unsub. notes 6 3/4s, 2023 | | 1,905,000 | 2,076,450 |
| CenturyLink, Inc. sr. unsec. unsub. notes 5 5/8s, 2020 | | 375,000 | 396,563 |
| T-Mobile USA, Inc. company guaranty sr. unsec. unsub. notes 6.836s, 2023 | | 280,000 | 303,450 |
| T-Mobile USA, Inc. company guaranty sr. unsec. unsub. notes 6.633s, 2021 | | 695,000 | 747,994 |
| T-Mobile USA, Inc. company guaranty sr. unsec. unsub. notes 6 5/8s, 2023 | | 2,055,000 | 2,214,263 |
| T-Mobile USA, Inc. company guaranty sr. unsec. unsub. notes 6.464s, 2019 | | 650,000 | 688,188 |
| T-Mobile USA, Inc. company guaranty sr. unsec. unsub. notes 6 1/4s, 2021 | | 2,422,000 | 2,573,375 |
36 High Yield Advantage Fund
| CORPORATE BONDS AND NOTES (88.7%)* cont. | | Principal
amount | Value |
| Telephone cont. | | | |
| T-Mobile USA, Inc. company guaranty sr. unsec. unsub. notes 6 1/8s, 2022 | | $2,195,000 | $2,321,213 |
| Windstream Corp. company guaranty sr. unsec. unsub. notes 7 7/8s, 2017 | | 1,290,000 | 1,486,725 |
| Windstream Corp. company guaranty sr. unsec. unsub. notes 7 3/4s, 2021 | | 1,425,000 | 1,546,125 |
| Windstream Corp. company guaranty sr. unsec. unsub. notes 6 3/8s, 2023 | | 855,000 | 848,588 |
| | | | 15,202,934 |
| Textiles (0.1%) | | | |
| Hanesbrands, Inc. company guaranty sr. unsec. notes 6 3/8s, 2020 | | 1,110,000 | 1,202,963 |
| | | | 1,202,963 |
| Transportation (1.2%) | | | |
| Aguila 3 SA 144A company guaranty sr. notes 7 7/8s, 2018 (Luxembourg) | | 5,200,000 | 5,515,224 |
| Air Medical Group Holdings, Inc. company guaranty sr. notes 9 1/4s, 2018 | | 2,052,000 | 2,198,205 |
| CHC Helicopter SA company guaranty sr. notes 9 1/4s, 2020 (Canada) | | 2,205,000 | 2,403,450 |
| Watco Cos., LLC/Watco Finance Corp. 144A company guaranty sr. unsec. notes 6 3/8s, 2023 | | 1,380,000 | 1,407,600 |
| | | | 11,524,479 |
| Utilities and power (4.0%) | | | |
| AES Corp./Virginia (The) sr. unsec. notes 8s, 2020 | | 520,000 | 622,700 |
| AES Corp./Virginia (The) sr. unsec. unsub. notes 8s, 2017 | | 2,255,000 | 2,643,987 |
| AES Corp./Virginia (The) sr. unsec. unsub. notes 7 3/8s, 2021 | | 2,177,000 | 2,503,550 |
| AES Corp./Virginia (The) sr. unsec. unsub. notes 4 7/8s, 2023 | | 660,000 | 645,975 |
| Calpine Corp. 144A company guaranty sr. notes 7 7/8s, 2020 | | 1,779,000 | 1,952,452 |
| Calpine Corp. 144A company guaranty sr. notes 6s, 2022 | | 950,000 | 1,018,874 |
| Calpine Corp. 144A company guaranty sr. notes 5 7/8s, 2024 | | 370,000 | 386,650 |
| Colorado Interstate Gas Co., LLC sr. unsec. debs. 6.85s, 2037 | | 1,630,000 | 1,914,674 |
| DPL, Inc. sr. unsec. notes 6 1/2s, 2016 | | 2,290,000 | 2,473,200 |
| El Paso Natural Gas Co., LLC sr. unsec. debs. 8 5/8s, 2022 | | 765,000 | 1,003,612 |
| El Paso, LLC company guaranty sr. notes 7s, 2017 | | 1,160,000 | 1,306,444 |
| El Paso, LLC sr. unsec. notes Ser. GMTN, 7.8s, 2031 | | 705,000 | 762,600 |
| Energy Future Intermediate Holding Co., LLC/EFIH Finance, Inc. sr. notes 10s, 2020 | | 2,690,000 | 2,854,762 |
| Energy Future Intermediate Holding Co., LLC/EFIH Finance, Inc. 144A sr. notes 10s, 2020 | | 560,000 | 595,000 |
| Energy Transfer Equity LP company guaranty sr. unsec. notes 7 1/2s, 2020 | | 1,097,000 | 1,267,034 |
| EP Energy, LLC/EP Energy Finance, Inc. sr. unsec. notes 9 3/8s, 2020 | | 2,825,000 | 3,234,624 |
| EP Energy, LLC/Everest Acquisition Finance, Inc. company guaranty sr. notes 6 7/8s, 2019 | | 1,085,000 | 1,160,950 |
| EP Energy, LLC/Everest Acquisition Finance, Inc. company guaranty sr. unsec. unsub. notes 7 3/4s, 2022 | | 430,000 | 482,138 |
| GenOn Americas Generation, LLC sr. unsec. notes 9 1/8s, 2031 | | 1,280,000 | 1,305,600 |
| GenOn Energy, Inc. sr. unsec. notes 9 7/8s, 2020 | | 740,000 | 801,050 |
| GenOn Energy, Inc. sr. unsec. notes 9 1/2s, 2018 | | 380,000 | 412,300 |
High Yield Advantage Fund 37
| CORPORATE BONDS AND NOTES (88.7%)* cont. | | Principal
amount | Value |
| Utilities and power cont. | | | |
| Kinder Morgan, Inc./DE 144A sr. notes 5s, 2021 | | $990,000 | $997,425 |
| NRG Energy, Inc. company guaranty sr. unsec. notes 7 7/8s, 2021 | | 3,360,000 | 3,738,000 |
| NRG Energy, Inc. company guaranty sr. unsec. notes 7 5/8s, 2018 | | 260,000 | 296,725 |
| Regency Energy Partners LP/Regency Energy Finance Corp. company guaranty sr. unsec. unsub. notes 5 7/8s, 2022 | | 1,665,000 | 1,769,062 |
| Regency Energy Partners LP/Regency Energy Finance Corp. company guaranty sr. unsec. unsub. notes 5 1/2s, 2023 | | 1,110,000 | 1,134,974 |
| Regency Energy Partners LP/Regency Energy Finance Corp. company guaranty sr. unsec. unsub. notes 4 1/2s, 2023 | | 945,000 | 900,113 |
| Tennessee Gas Pipeline Co., LLC sr. unsec. unsub. debs. 7s, 2028 | | 305,000 | 386,601 |
| Texas Competitive/Texas Competitive Electric Holdings Co., LLC 144A company guaranty sr. notes 11 1/2s, 2020 (In default) † | | 745,000 | 661,188 |
| | | | 39,232,264 |
| Total corporate bonds and notes (cost $828,249,642) |
$874,346,667
|
| SENIOR LOANS (6.0%)*c | | Principal
amount | Value |
| Basic materials (0.2%) | | | |
| Atkore International, Inc. bank term loan FRN 4 1/2s, 2021 | | $1,035,000 | $1,033,706 |
| Oxea Sarl bank term loan FRN 8 1/4s, 2020 (Germany) | | 950,000 | 958,313 |
| | | | 1,992,019 |
| Communication services (0.2%) | | | |
| Asurion, LLC bank term loan FRN 8 1/2s, 2021 | | 1,635,000 | 1,673,014 |
| | | | 1,673,014 |
| Consumer cyclicals (2.9%) | | | |
| Burlington Coat Factory Warehouse Corp. bank term loan FRN Ser. B2, 4 1/4s, 2017 | | 202,217 | 203,417 |
| Caesars Entertainment Operating Co., Inc. bank term loan FRN Ser. B6, 5.4s, 2018 | | 5,187,740 | 4,834,325 |
| Caesars Entertainment Operating Co., Inc. bank term loan FRN Ser. B7, 9 3/4s, 2017 | | 695,000 | 687,926 |
| Caesars Growth Properties Holdings, LLC bank term loan FRN 6 1/4s, 2021 | | 2,555,000 | 2,537,754 |
| CCM Merger, Inc. bank term loan FRN Ser. B, 5s, 2017 | | 1,813,098 | 1,809,699 |
| Clear Channel Communications, Inc. bank term loan FRN Ser. D, 6.9s, 2019 | | 4,299,000 | 4,247,567 |
| CPG International, Inc. bank term loan FRN Ser. B, 4 3/4s, 2020 | | 497,500 | 497,500 |
| Getty Images, Inc. bank term loan FRN Ser. B, 4 3/4s, 2019 | | 1,060,166 | 1,022,840 |
| Neiman Marcus Group, Ltd., Inc. bank term loan FRN 4 1/4s, 2020 | | 3,375,353 | 3,366,915 |
| ROC Finance, LLC bank term loan FRN 5s, 2019 | | 1,221,930 | 1,200,546 |
| Travelport, LLC bank term loan FRN 9 1/2s, 2016 | | 3,724,988 | 3,832,082 |
| Travelport, LLC bank term loan FRN 8 3/8s, 2016 ‡‡ | | 1,465,514 | 1,476,964 |
| Univision Communications, Inc. bank term loan FRN 4s, 2020 | | 1,685,000 | 1,678,982 |
| Yonkers Racing Corp. bank term loan FRN 4 1/4s, 2019 | | 943,608 | 929,454 |
| | | | 28,325,971 |
| Consumer staples (0.5%) | | | |
| CEC Entertainment, Inc. bank term loan FRN Ser. B, 4 1/4s, 2021 | | 1,425,000 | 1,411,936 |
| Del Monte Foods, Inc. bank term loan FRN 8 1/4s, 2021 | | 990,000 | 978,863 |
| H.J. Heinz Co. bank term loan FRN Ser. B2, 3 1/2s, 2020 | | 903,175 | 907,461 |
38 High Yield Advantage Fund
| SENIOR LOANS (6.0%)*c cont. | | Principal
amount | Value |
| Consumer staples cont. | | | |
| Libbey Glass, Inc. bank term loan FRN Ser. B, 3 3/4s, 2021 | | $850,000 | $843,979 |
| Rite Aid Corp. bank term loan FRN 4 7/8s, 2021 | | 815,000 | 823,150 |
| | | | 4,965,389 |
| Energy (0.7%) | | | |
| Fieldwood Energy, LLC bank term loan FRN 8 3/8s, 2020 | | 2,835,000 | 2,921,822 |
| Offshore Group Investment, Ltd. bank term loan FRN Ser. B, 5 3/4s, 2019 (Cayman Islands) | | 603,900 | 599,371 |
| Shelf Drilling Holdings, Ltd. bank term loan FRN 10s, 2018 ‡‡ | | 2,430,000 | 2,478,600 |
| Tervita Corp. bank term loan FRN Ser. B, 6 1/4s, 2018 (Canada) | | 1,580,000 | 1,580,000 |
| | | | 7,579,793 |
| Financials (0.3%) | | | |
| iStar Financial, Inc. bank term loan FRN 4 1/2s, 2017 R | | 1,075 | 1,078 |
| iStar Financial, Inc. bank term loan FRN Ser. A2, 7s, 2017 R | | 304,414 | 316,590 |
| Nuveen Investments, Inc. bank term loan FRN 6 1/2s, 2019 | | 2,345,000 | 2,367,864 |
| | | | 2,685,532 |
| Health care (0.8%) | | | |
| Ardent Medical Services, Inc. bank term loan FRN 6 3/4s, 2018 | | 1,214,625 | 1,216,650 |
| CHS/Community Health Systems, Inc. bank term loan FRN Ser. D, 4 1/4s, 2021 | | 1,391,513 | 1,398,905 |
| Emergency Medical Services Corp. bank term loan FRN Ser. B, 4s, 2018 | | 874,439 | 873,345 |
| Grifols Worldwide Operations USA, Inc. bank term loan FRN 3.15s, 2021 | | 1,365,000 | 1,358,601 |
| Ortho-Clinical Diagnostics, Inc. bank term loan FRN Ser. B, 4 3/4s, 2021 | | 795,000 | 798,260 |
| Par Pharmaceutical Cos., Inc. bank term loan FRN Ser. B, 4s, 2019 | | 1,256,305 | 1,252,221 |
| Pharmaceutical Product Development, Inc. bank term loan FRN Ser. B, 4s, 2018 | | 208,449 | 208,449 |
| Sheridan Holdings, Inc. bank term loan FRN 8 1/4s, 2021 | | 435,000 | 444,244 |
| | | | 7,550,675 |
| Transportation (0.2%) | | | |
| Air Medical Group Holdings, Inc. bank term loan FRN 7 5/8s, 2018 ‡‡ | | 1,950,000 | 1,950,000 |
| | | | 1,950,000 |
| Utilities and power (0.2%) | | | |
| Texas Competitive Electric Holdings Co., LLC bank term loan FRN 4.652s, 2017 | | 3,273,299 | 2,618,639 |
| | | | 2,618,639 |
| Total senior loans (cost $59,277,523) |
$59,341,032
|
| CONVERTIBLE BONDS AND NOTES (0.6%)* | | Principal
amount | Value |
| DFC Global Corp. cv. sr. unsec. unsub. notes 3 1/4s, 2017 | | $1,101,000 | $1,078,980 |
| iStar Financial, Inc. cv. sr. unsec. unsub. notes 3s, 2016 R | | 1,563,000 | 2,158,894 |
| Jazz Technologies, Inc. 144A cv. unsec. notes 8s, 2018 | | 776,000 | 838,080 |
| XM Satellite Radio, Inc. 144A cv. company guaranty sr. unsec. sub. notes 7s, 2014 | | 939,000 | 1,697,829 |
| Total convertible bonds and notes (cost $4,943,780) |
$5,773,783
|
High Yield Advantage Fund 39
| SHORT-TERM INVESTMENTS (3.8%)* | Principal
amount/shares | Value |
| Putnam Short Term Investment Fund 0.06% L | 36,400,016 | $36,400,016 |
| U.S. Treasury Bills with effective yields ranging from 0.10% to 0.11%, October 16, 2014 | $770,000 | $769,884 |
| U.S. Treasury Bills with effective yields ranging from 0.09% to 0.13%, August 21, 2014 | 245,000 | 244,982 |
| Total short-term investments (cost $37,414,656) |
$37,414,882
|
| TOTAL INVESTMENTS | |
| Total investments (cost $929,885,601) | $976,876,364 |
|
Key to holding’s currency abbreviations
|
| CAD | Canadian Dollar |
| EUR | Euro |
| GBP | British Pound |
|
Key to holding’s abbreviations
|
| EMTN | Euro Medium Term Notes |
| FRB | Floating Rate Bonds: the rate shown is the current interest rate at the close of the reporting period |
| FRN | Floating Rate Notes: the rate shown is the current interest rate at the close of the reporting period |
| GMTN | Global Medium Term Notes |
| MTN | Medium Term Notes |
| Notes to the fund’s portfolio |
| Unless noted otherwise, the notes to the fund’s portfolio are for the close of the fund’s reporting period, which ran from December 1, 2013 through May 31, 2014 (the reporting period). Within the following notes to the portfolio, references to “ASC 820” represent Accounting Standards Codification 820 Fair Value Measurements and Disclosures and references to “OTC”, if any, represent over-the-counter. |
* | Percentages indicated are based on net assets of $986,202,629. |
† | Non-income-producing security. |
‡‡ | Income may be received in cash or additional securities at the discretion of the issuer. |
c | Senior loans are exempt from registration under the Securities Act of 1933, as amended, but contain certain restrictions on resale and cannot be sold publicly. These loans pay interest at rates which adjust periodically. The interest rates shown for senior loans are the current interest rates at the close of the reporting period. Senior loans are also subject to mandatory and/or optional prepayment which cannot be predicted. As a result, the remaining maturity may be substantially less than the stated maturity shown (Notes 1 and 6). |
L | Affiliated company (Note 5). The rate quoted in the security description is the annualized 7-day yield of the fund at the close of the reporting period. |
R | Real Estate Investment Trust. |
| At the close of the reporting period, the fund maintained liquid assets totaling $37,572 to cover certain derivatives contracts. |
| Debt obligations are considered secured unless otherwise indicated. |
| 144A after the name of an issuer represents securities exempt from registration under Rule 144A under the Securities Act of 1933, as amended. These securities may be resold in transactions exempt from registration, normally to qualified institutional buyers. |
| The dates shown on debt obligations are the original maturity dates. |
40 High Yield Advantage Fund
|
FORWARD CURRENCY CONTRACTS at 5/31/14 (aggregate face value $13,470,128) (Unaudited)
|
| Counterparty | Currency | Contract
type | Delivery
date | Value | Aggregate
face value | Unrealized
appreciation/
(depreciation) |
|
Bank of America N.A.
|
| | Canadian Dollar | Sell | 7/17/14 | $460,628 | $450,960 | $(9,668) |
| | Euro | Sell | 6/18/14 | 3,957,108 | 3,995,561 | 38,453 |
|
Barclays Bank PLC
|
| | British Pound | Sell | 6/18/14 | 3,168,494 | 3,154,602 | (13,892) |
|
Credit Suisse International
|
| | Euro | Sell | 6/18/14 | 286,935 | 289,729 | 2,794 |
|
JPMorgan Chase Bank N.A.
|
| | Canadian Dollar | Sell | 7/17/14 | 485,963 | 476,206 | (9,757) |
|
State Street Bank and Trust Co.
|
| | Canadian Dollar | Sell | 7/17/14 | 1,260,924 | 1,235,121 | (25,803) |
| | Euro | Sell | 6/18/14 | 2,761,661 | 2,791,533 | 29,872 |
|
WestPac Banking Corp.
|
| | Canadian Dollar | Sell | 7/17/14 | 1,098,506 | 1,076,416 | (22,090) |
| Total |
$(10,091)
|
| ASC 820 establishes a three-level hierarchy for disclosure of fair value measurements. The valuation hierarchy is based upon the transparency of inputs to the valuation of the fund’s investments. The three levels are defined as follows: |
| Level 1: Valuations based on quoted prices for identical securities in active markets. |
| Level 2: Valuations based on quoted prices in markets that are not active or for which all significant inputs are observable, either directly or indirectly. |
| Level 3: Valuations based on inputs that are unobservable and significant to the fair value measurement. |
| The following is a summary of the inputs used to value the fund’s net assets as of the close of the reporting period: |
| | Valuation inputs |
| Investments in securities: | Level 1 | Level 2 | Level 3 |
| Convertible bonds and notes | $— | $5,773,783 | $— |
| Corporate bonds and notes | — | 874,346,667 | — |
| Senior loans | — | 59,341,032 | — |
| Short-term investments | 36,400,016 | 1,014,866 | — |
| Totals by level | $36,400,016 | $940,476,348 | $— |
| | Valuation inputs |
| Other financial instruments: | Level 1 | Level 2 | Level 3 |
| Forward currency contracts | $— | $(10,091) | $— |
| Totals by level | $— | $(10,091) | $— |
The accompanying notes are an integral part of these financial statements.
High Yield Advantage Fund 41
| Statement of assets and liabilities 5/31/14 (Unaudited) | |
| ASSETS | |
| Investment in securities, at value (Note 1): | |
| Unaffiliated issuers (identified cost $893,485,585) | $940,476,348 |
| Affiliated issuers (identified cost $36,400,016) (Notes 1 and 5) | 36,400,016 |
| Cash | 59,726 |
| Interest and other receivables | 15,044,423 |
| Receivable for shares of the fund sold | 1,261,589 |
| Receivable for investments sold | 4,827,426 |
| Unrealized appreciation on forward currency contracts (Note 1) | 71,119 |
| Prepaid assets | 65,842 |
| Total assets | 998,206,489 |
| LIABILITIES | |
| Payable for investments purchased | 8,829,595 |
| Payable for shares of the fund repurchased | 1,467,259 |
| Payable for compensation of Manager (Note 2) | 469,836 |
| Payable for custodian fees (Note 2) | 13,454 |
| Payable for investor servicing fees (Note 2) | 246,198 |
| Payable for Trustee compensation and expenses (Note 2) | 314,047 |
| Payable for administrative services (Note 2) | 2,921 |
| Payable for distribution fees (Note 2) | 356,833 |
| Unrealized depreciation on forward currency contracts (Note 1) | 81,210 |
| Other accrued expenses | 222,507 |
| Total liabilities | 12,003,860 |
| Net assets | $986,202,629 |
| | |
| REPRESENTED BY | |
| Paid-in capital (Unlimited shares authorized) (Notes 1 and 4) | $1,002,969,679 |
| Undistributed net investment income (Note 1) | 4,122,202 |
| Accumulated net realized loss on investments and foreign currency transactions (Note 1) | (67,870,244) |
| Net unrealized appreciation of investments and assets and liabilities in foreign currencies | 46,980,992 |
| Total — Representing net assets applicable to capital shares outstanding | $986,202,629 |
| (Continued on next page) | |
The accompanying notes are an integral part of these financial statements.
42 High Yield Advantage Fund
| Statement of assets and liabilities (Continued) | |
| COMPUTATION OF NET ASSET VALUE AND OFFERING PRICE | |
| Net asset value and redemption price per class A share ($563,101,754 divided by 89,031,680 shares) | $6.32 |
| Offering price per class A share (100/96.00 of $6.32)* | $6.58 |
| Net asset value and offering price per class B share ($17,632,718 divided by 2,849,634 shares)** | $6.19 |
| Net asset value and offering price per class C share ($28,596,619 divided by 4,636,499 shares)** | $6.17 |
| Net asset value and redemption price per class M share ($135,807,612 divided by 21,504,490 shares) | $6.32 |
| Offering price per class M share (100/96.75 of $6.32)† | $6.53 |
| Net asset value, offering price and redemption price per class R share ($29,654,397 divided by 4,696,208 shares) | $6.31 |
| Net asset value, offering price and redemption price per class Y share ($211,409,529 divided by 32,137,068 shares) | $6.58 |
* | On single retail sales of less than $100,000. On sales of $100,000 or more the offering price is reduced. |
** | Redemption price per share is equal to net asset value less any applicable contingent deferred sales charge. |
† | On single retail sales of less than $50,000. On sales of $50,000 or more the offering price is reduced. |
The accompanying notes are an integral part of these financial statements.
High Yield Advantage Fund 43
| Statement of operations Six months ended 5/31/14 (Unaudited) | |
| INVESTMENT INCOME | |
| Interest (including interest income of $12,035 from investments in affiliated issuers) (Note 5) | $32,216,743 |
| Total investment income | 32,216,743 |
| EXPENSES | |
| Compensation of Manager (Note 2) | 2,777,090 |
| Investor servicing fees (Note 2) | 761,476 |
| Custodian fees (Note 2) | 16,237 |
| Trustee compensation and expenses (Note 2) | 33,754 |
| Distribution fees (Note 2) | 1,340,851 |
| Administrative services (Note 2) | 13,255 |
| Other | 294,193 |
| Total expenses | 5,236,856 |
| Expense reduction (Note 2) | (818) |
| Net expenses | 5,236,038 |
| Net investment income | 26,980,705 |
| | |
| Net realized gain on investments (Notes 1 and 3) | 7,770,630 |
| Net realized loss on foreign currency transactions (Note 1) | (537,535) |
| Net unrealized appreciation of assets and liabilities in foreign currencies during the period | 479,719 |
| Net unrealized appreciation of investments during the period | 11,194,797 |
| Net gain on investments | 18,907,611 |
| Net increase in net assets resulting from operations | $45,888,316 |
The accompanying notes are an integral part of these financial statements.
44 High Yield Advantage Fund
| Statement of changes in net assets | | |
| INCREASE (DECREASE) IN NET ASSETS | Six months ended 5/31/14* | Year ended 11/30/13 |
| Operations: | | |
| Net investment income | $26,980,705 | $58,367,402 |
| Net realized gain on investments and foreign currency transactions | 7,233,095 | 19,884,608 |
| Net unrealized appreciation (depreciation) of investments and assets and liabilities in foreign currencies | 11,674,516 | (3,365,362) |
| Net increase in net assets resulting from operations | 45,888,316 | 74,886,648 |
| Distributions to shareholders (Note 1): | | |
| From ordinary income | | |
| Net investment income | | |
| Class A | (14,541,656) | (41,244,151) |
| Class B | (390,319) | (933,561) |
| Class C | (640,361) | (1,623,946) |
| Class M | (3,428,136) | (7,399,731) |
| Class R | (684,859) | (1,563,283) |
| Class Y | (5,605,573) | (9,935,475) |
| Redemption fees (Note 1) | — | 9,696 |
| Increase (decrease) from capital share transactions (Note 4) | (38,287,488) | 25,485,428 |
| Total increase (decrease) in net assets | (17,690,076) | 37,681,625 |
| NET ASSETS | | |
| Beginning of period | 1,003,892,705 | 966,211,080 |
| End of period (including undistributed net investment income of $4,122,202 and $2,432,401, respectively) | $986,202,629 | $1,003,892,705 |
* | Unaudited |
The accompanying notes are an integral part of these financial statements.
High Yield Advantage Fund 45
Financial highlights (For a common share outstanding throughout the period)
INVESTMENT OPERATIONS: | LESS DISTRIBUTIONS: | | RATIOS AND SUPPLEMENTAL DATA: |
Period ended | Net asset value, beginning of period | Net investment income (loss)a | Net realized and unrealized gain (loss) on investments | Total from investment operations | From
net investment income | Total
distributions | Redemption
fees | Non-recurring reimbursements | Net asset value, end of period | Total return at net asset value (%)b | Net assets, end of period (in thousands) | Ratio of expenses to average net assets (%)c | Ratio of net investment income (loss) to average net assets (%) | Portfolio turnover (%) |
Class A | | | | | | | | | | | | | | |
May 31, 2014** | $6.20 | .17 | .11 | .28 | (.16) | (.16) | — | — | $6.32 | 4.61* | $563,102 | .52* | 2.74* | 21* |
November 30, 2013 | 6.12 | .36 | .11 | .47 | (.39) | (.39) | —d | — | 6.20 | 7.84 | 565,904 | 1.04 | 5.85 | 49 |
November 30, 2012 | 5.62 | .40 | .50 | .90 | (.40) | (.40) | —d | — | 6.12 | 16.55 | 652,557 | 1.04 | 6.74 | 40 |
November 30, 2011 | 5.90 | .43 | (.27) | .16 | (.44) | (.44) | —d | —e | 5.62 | 2.58 | 510,880 | 1.04 | 7.25 | 57 |
November 30, 2010 | 5.56 | .44 | .32 | .76 | (.42) | (.42) | —d | — | 5.90 | 14.10 | 535,054 | 1.05f | 7.66f | 71 |
November 30, 2009 | 4.05 | .40 | 1.55 | 1.95 | (.44) | (.44) | —d | — | 5.56 | 50.64 | 479,094 | 1.13f | 8.13f | 59 |
Class B | | | | | | | | | | | | | | |
May 31, 2014** | $6.06 | .14 | .13 | .27 | (.14) | (.14) | — | — | $6.19 | 4.47* | $17,633 | .89* | 2.36* | 21* |
November 30, 2013 | 5.99 | .31 | .10 | .41 | (.34) | (.34) | —d | — | 6.06 | 6.98 | 17,154 | 1.79 | 5.07 | 49 |
November 30, 2012 | 5.52 | .35 | .48 | .83 | (.36) | (.36) | —d | — | 5.99 | 15.48 | 15,257 | 1.79 | 5.94 | 40 |
November 30, 2011 | 5.80 | .38 | (.27) | .11 | (.39) | (.39) | —d | —e | 5.52 | 1.84 | 8,076 | 1.79 | 6.50 | 57 |
November 30, 2010 | 5.47 | .39 | .32 | .71 | (.38) | (.38) | —d | — | 5.80 | 13.28 | 7,520 | 1.80f | 6.93f | 71 |
November 30, 2009 | 3.99 | .35 | 1.54 | 1.89 | (.41) | (.41) | —d | — | 5.47 | 49.61 | 9,033 | 1.88f | 7.41f | 59 |
Class C | | | | | | | | | | | | | | |
May 31, 2014** | $6.04 | .14 | .13 | .27 | (.14) | (.14) | — | — | $6.17 | 4.49* | $28,597 | .89* | 2.36* | 21* |
November 30, 2013 | 5.97 | .31 | .10 | .41 | (.34) | (.34) | —d | — | 6.04 | 7.01 | 28,949 | 1.79 | 5.08 | 49 |
November 30, 2012 | 5.50 | .35 | .48 | .83 | (.36) | (.36) | —d | — | 5.97 | 15.52 | 29,271 | 1.79 | 5.95 | 40 |
November 30, 2011 | 5.78 | .37 | (.25) | .12 | (.40) | (.40) | —d | —e | 5.50 | 1.90 | 15,915 | 1.79 | 6.49 | 57 |
November 30, 2010 | 5.46 | .39 | .31 | .70 | (.38) | (.38) | —d | — | 5.78 | 13.13 | 9,464 | 1.80f | 6.92f | 71 |
November 30, 2009 | 3.98 | .35 | 1.54 | 1.89 | (.41) | (.41) | —d | — | 5.46 | 49.80 | 10,020 | 1.88f | 7.16f | 59 |
Class M | | | | | | | | | | | | | | |
May 31, 2014** | $6.19 | .16 | .13 | .29 | (.16) | (.16) | — | — | $6.32 | 4.68* | $135,808 | .64* | 2.61* | 21* |
November 30, 2013 | 6.11 | .34 | .12 | .46 | (.38) | (.38) | —d | — | 6.19 | 7.64 | 134,948 | 1.29 | 5.58 | 49 |
November 30, 2012 | 5.62 | .39 | .49 | .88 | (.39) | (.39) | —d | — | 6.11 | 16.13 | 123,203 | 1.29 | 6.51 | 40 |
November 30, 2011 | 5.90 | .42 | (.27) | .15 | (.43) | (.43) | —d | —e | 5.62 | 2.37 | 130,758 | 1.29 | 7.00 | 57 |
November 30, 2010 | 5.57 | .43 | .31 | .74 | (.41) | (.41) | —d | — | 5.90 | 13.65 | 164,632 | 1.30f | 7.42f | 71 |
November 30, 2009 | 4.05 | .39 | 1.56 | 1.95 | (.43) | (.43) | —d | — | 5.57 | 50.52 | 178,550 | 1.38f | 7.97f | 59 |
Class R | | | | | | | | | | | | | | |
May 31, 2014** | $6.19 | .16 | .12 | .28 | (.16) | (.16) | — | | $6.31 | 4.51* | $29,654 | .64* | 2.61* | 21* |
November 30, 2013 | 6.11 | .35 | .11 | .46 | (.38) | (.38) | —d | — | 6.19 | 7.64 | 24,687 | 1.29 | 5.59 | 49 |
November 30, 2012 | 5.62 | .39 | .49 | .88 | (.39) | (.39) | —d | — | 6.11 | 16.13 | 26,120 | 1.29 | 6.46 | 40 |
November 30, 2011 | 5.90 | .41 | (.26) | .15 | (.43) | (.43) | —d | —e | 5.62 | 2.37 | 16,209 | 1.29 | 6.98 | 57 |
November 30, 2010 | 5.56 | .43 | .32 | .75 | (.41) | (.41) | —d | — | 5.90 | 13.86 | 11,085 | 1.30f | 7.34f | 71 |
November 30, 2009 | 4.05 | .38 | 1.56 | 1.94 | (.43) | (.43) | —d | — | 5.56 | 50.32 | 4,728 | 1.38f | 7.63f | 59 |
Class Y | | | | | | | | | | | | | | |
May 31, 2014** | $6.44 | .19 | .12 | .31 | (.17) | (.17) | — | — | $6.58 | 4.84* | $211,410 | .39* | 2.87* | 21* |
November 30, 2013 | 6.34 | .38 | .12 | .50 | (.40) | (.40) | —d | — | 6.44 | 8.10 | 232,251 | .79 | 6.00 | 49 |
November 30, 2012 | 5.81 | .43 | .52 | .95 | (.42) | (.42) | —d | — | 6.34 | 16.76 | 119,803 | .79 | 6.99 | 40 |
November 30, 2011 | 6.08 | .46 | (.28) | .18 | (.45) | (.45) | —d | —e | 5.81 | 2.88 | 113,815 | .79 | 7.49 | 57 |
November 30, 2010 | 5.71 | .47 | .33 | .80 | (.43) | (.43) | —d | — | 6.08 | 14.49 | 97,130 | .80f | 7.87f | 71 |
November 30, 2009 | 4.15 | .43 | 1.58 | 2.01 | (.45) | (.45) | —d | — | 5.71 | 50.98 | 66,691 | .88f | 8.35f | 59 |
See notes to financial highlights at the end of this section.
The accompanying notes are an integral part of these financial statements.
46 | High Yield Advantage Fund | High Yield Advantage Fund | 47 |
Financial highlights (Continued)
* Not annualized.
** Unaudited.
a Per share net investment income (loss) has been determined on the basis of the weighted average number of shares outstanding during the period.
b Total return assumes dividend reinvestment and does not reflect the effect of sales charges.
c Includes amounts paid through expense offset arrangements and/or brokerage/service arrangements (Note 2). Also excludes acquired fund fees and expenses, if any.
d Amount represents less than $0.01 per share.
e Reflects a non-recurring reimbursement related to restitution amounts in connection with a distribution plan approved by the Securities and Exchange Commission (the SEC) which amounted to less than $0.01 per share outstanding on July 21, 2011. Also reflects a non-recurring reimbursement related to short-term trading related lawsuits, which amounted to less than $0.01 per share outstanding on May 11, 2011.
f Reflects an involuntary contractual expense limitation in effect during the period. For periods prior to November 30, 2009, certain fund expenses were waived in connection with the fund’s investment in Putnam Prime Money Market Fund. As a result of such limitation and/or waivers, the expenses of each class reflect a reduction of the following amounts:
| Percentage of
average net assets |
November 30, 2010 | 0.01% |
November 30, 2009 | 0.09 |
The accompanying notes are an integral part of these financial statements.
48 High Yield Advantage Fund
Notes to financial statements 5/31/14 (Unaudited)
Within the following Notes to financial statements, references to “State Street” represent State Street Bank and Trust Company, references to “the SEC” represent the Securities and Exchange Commission, references to “Putnam Management” represent Putnam Investment Management, LLC, the fund’s manager, an indirect wholly-owned subsidiary of Putnam Investments, LLC and references to “OTC”, if any, represent over-the-counter. Unless otherwise noted, the “reporting period” represents the period from December 1, 2013 through May 31, 2014.
Putnam High Yield Advantage Fund (the fund) is a Massachusetts business trust, which is registered under the Investment Company Act of 1940, as amended, as a diversified open-end management investment company. The investment objective of the fund is to seek high current income. Capital growth is a secondary goal when consistent with achieving high current income. The fund invests mainly in bonds that are obligations of U.S. companies, are below-investment-grade in quality (sometimes referred to as “junk bonds”), and have intermediate- to long-term maturities (three years or longer). The fund may also invest in other debt instruments, including loans. Putnam Management may consider, among other factors, credit, interest rate and prepayment risks, as well as general market conditions, when deciding whether to buy or sell investments. Putnam Management may also use derivatives, such as futures, options, certain foreign currency transactions and swap contracts, for both hedging and non-hedging purposes.
The fund offers class A, class B, class C, class M, class R and class Y shares. Class A and class M shares are sold with a maximum front-end sales charge of 4.00% and 3.25%, respectively, and generally do not pay a contingent deferred sales charge. Class B shares, which convert to class A shares after approximately eight years, do not pay a front-end sales charge and are subject to a contingent deferred sales charge if those shares are redeemed within six years of purchase. Class C shares have a one-year 1.00% contingent deferred sales charge and do not convert to class A shares. Class R shares, which are not available to all investors, are sold at net asset value. The expenses for class A, class B, class C, class M and class R shares may differ based on the distribution fee of each class, which is identified in Note 2. Class Y shares, which are sold at net asset value, are generally subject to the same expenses as class A, class B, class C, class M and class R shares, but do not bear a distribution fee. Class Y shares are not available to all investors.
In the normal course of business, the fund enters into contracts that may include agreements to indemnify another party under given circumstances. The fund’s maximum exposure under these arrangements is unknown as this would involve future claims that may be, but have not yet been, made against the fund. However, the fund’s management team expects the risk of material loss to be remote.
Note 1: Significant accounting policies
The following is a summary of significant accounting policies consistently followed by the fund in the preparation of its financial statements. The preparation of financial statements is in conformity with accounting principles generally accepted in the United States of America and requires management to make estimates and assumptions that affect the reported amounts of assets and liabilities in the financial statements and the reported amounts of increases and decreases in net assets from operations. Actual results could differ from those estimates. Subsequent events after the Statement of assets and liabilities date through the date that the financial statements were issued have been evaluated in the preparation of the financial statements.
A short-term trading fee of 1.00% may have applied to redemptions (including exchanges into another fund) of shares purchased before June 24, 2013 and held for 30 days or less. The short-term trading fee was accounted for as an addition to paid-in-capital. No short-term trading fee applies to shares purchased on or after June 24, 2013.
Investment income, realized and unrealized gains and losses and expenses of the fund are borne pro-rata based on the relative net assets of each class to the total net assets of the fund, except that each class bears expenses unique to that class (including the distribution fees applicable to such classes). Each class votes as a class only with respect to its own distribution plan or other matters on which a class vote is required by law or determined by the Trustees. If the fund were liquidated, shares of each class would receive their pro-rata share of the net assets of the fund. In addition, the Trustees declare separate dividends on each class of shares.
Security valuation Market quotations are not considered to be readily available for certain debt obligations and other investments; such investments are valued on the basis of valuations furnished by an independent pricing service approved by the Trustees or dealers selected by Putnam Management. Such services or dealers determine valuations for normal institutional-size trading units of such securities using methods based on market transactions for comparable securities and various relationships, generally recognized by institutional traders, between securities (which consider such factors as security prices, yields, maturities and ratings). These securities will
High Yield Advantage Fund 49
generally be categorized as Level 2. Securities quoted in foreign currencies, if any, are translated into U.S. dollars at the current exchange rate. Short-term securities with remaining maturities of 60 days or less may be valued at amortized cost, which approximates fair value and are classified as Level 2 securities.
Investments in open-end investment companies (excluding exchange traded funds), if any, which can be classified as Level 1 or Level 2 securities, are valued based on their net asset value. The net asset value of such investment companies equals the total value of their assets less their liabilities and divided by the number of their outstanding shares.
To the extent a pricing service or dealer is unable to value a security or provides a valuation that Putnam Management does not believe accurately reflects the security’s fair value, the security will be valued at fair value by Putnam Management in accordance with policies and procedures approved by the Trustees. Certain investments, including certain restricted and illiquid securities and derivatives, are also valued at fair value following procedures approved by the Trustees. These valuations consider such factors as significant market or specific security events such as interest rate or credit quality changes, various relationships with other securities, discount rates, U.S. Treasury, U.S. swap and credit yields, index levels, convexity exposures and recovery rates. These securities are classified as Level 2 or as Level 3 depending on the priority of the significant inputs.
Such valuations and procedures are reviewed periodically by the Trustees. The fair value of securities is generally determined as the amount that the fund could reasonably expect to realize from an orderly disposition of such securities over a reasonable period of time. By its nature, a fair value price is a good faith estimate of the value of a security in a current sale and does not reflect an actual market price, which may be different by a material amount.
Security transactions and related investment income Security transactions are recorded on the trade date (the date the order to buy or sell is executed). Gains or losses on securities sold are determined on the identified cost basis. Interest income, net of any applicable withholding taxes, is recorded on the accrual basis. All premiums/discounts are amortized/accreted on a yield-to-maturity basis.
The fund earned certain fees in connection with its senior loan purchasing activities. These fees are treated as market discount and are amortized into income in the Statement of operations.
Foreign currency translation The accounting records of the fund are maintained in U.S. dollars. The fair value of foreign securities, currency holdings, and other assets and liabilities is recorded in the books and records of the fund after translation to U.S. dollars based on the exchange rates on that day. The cost of each security is determined using historical exchange rates. Income and withholding taxes are translated at prevailing exchange rates when earned or incurred. The fund does not isolate that portion of realized or unrealized gains or losses resulting from changes in the foreign exchange rate on investments from fluctuations arising from changes in the market prices of the securities. Such gains and losses are included with the net realized and unrealized gain or loss on investments. Net realized gains and losses on foreign currency transactions represent net realized exchange gains or losses on closed forward currency contracts, disposition of foreign currencies, currency gains and losses realized between the trade and settlement dates on securities transactions and the difference between the amount of investment income and foreign withholding taxes recorded on the fund’s books and the U.S. dollar equivalent amounts actually received or paid. Net unrealized appreciation and depreciation of assets and liabilities in foreign currencies arise from changes in the value of open forward currency contracts and assets and liabilities other than investments at the period end, resulting from changes in the exchange rate.
Forward currency contracts The fund buys and sells forward currency contracts, which are agreements between two parties to buy and sell currencies at a set price on a future date. These contracts are used to hedge foreign exchange risk and to gain exposure on currency.
The U.S. dollar value of forward currency contracts is determined using current forward currency exchange rates supplied by a quotation service. The fair value of the contract will fluctuate with changes in currency exchange rates. The contract is marked to market daily and the change in fair value is recorded as an unrealized gain or loss. The fund records a realized gain or loss equal to the difference between the value of the contract at the time it was opened and the value at the time it was closed when the contract matures or by delivery of the currency. The fund could be exposed to risk if the value of the currency changes unfavorably, if the counterparties to the contracts are unable to meet the terms of their contracts or if the fund is unable to enter into a closing position. Risks may exceed amounts recognized on the Statement of assets and liabilities.
Forward currency contracts outstanding at period end, if any, are listed after the fund’s portfolio.
Master agreements The fund is a party to ISDA (International Swaps and Derivatives Association, Inc.) Master Agreements (Master Agreements) with certain counterparties that govern OTC derivative and foreign exchange
50 High Yield Advantage Fund
contracts entered into from time to time. The Master Agreements may contain provisions regarding, among other things, the parties’ general obligations, representations, agreements, collateral requirements, events of default and early termination. With respect to certain counterparties, in accordance with the terms of the Master Agreements, collateral posted to the fund is held in a segregated account by the fund’s custodian and with respect to those amounts which can be sold or repledged, is presented in the fund’s portfolio.
Collateral pledged by the fund is segregated by the fund’s custodian and identified in the fund’s portfolio. Collateral can be in the form of cash or debt securities issued by the U.S. Government or related agencies or other securities as agreed to by the fund and the applicable counterparty. Collateral requirements are determined based on the fund’s net position with each counterparty.
Termination events applicable to the fund may occur upon a decline in the fund’s net assets below a specified threshold over a certain period of time. Termination events applicable to counterparties may occur upon a decline in the counterparty’s long-term and short-term credit ratings below a specified level. In each case, upon occurrence, the other party may elect to terminate early and cause settlement of all derivative and foreign exchange contracts outstanding, including the payment of any losses and costs resulting from such early termination, as reasonably determined by the terminating party. Any decision by one or more of the fund’s counterparties to elect early termination could impact the fund’s future derivative activity.
At the close of the reporting period, the fund had a net liability position of $45,739 on open derivative contracts subject to the Master Agreements. There was no collateral posted by the fund at period end for these agreements.
Interfund lending The fund, along with other Putnam funds, may participate in an interfund lending program pursuant to an exemptive order issued by the SEC. This program allows the fund to borrow from or lend to other Putnam funds that permit such transactions. Interfund lending transactions are subject to each fund’s investment policies and borrowing and lending limits. Interest earned or paid on the interfund lending transaction will be based on the average of certain current market rates. During the reporting period, the fund did not utilize the program.
Lines of credit The fund participates, along with other Putnam funds, in a $392.5 million ($315 million prior to June 27, 2014) unsecured committed line of credit and a $235.5 million ($185 million prior to June 27, 2014) unsecured uncommitted line of credit, both provided by State Street. Borrowings may be made for temporary or emergency purposes, including the funding of shareholder redemption requests and trade settlements. Interest is charged to the fund based on the fund’s borrowing at a rate equal to the Federal Funds rate plus 1.25% for the committed line of credit and the Federal Funds rate plus 1.30% for the uncommitted line of credit. A closing fee equal to 0.04% (0.02% prior to June 27, 2014) of the committed line of credit and 0.04% ($50,000 prior to June 27, 2014) of the uncommitted line of credit has been paid by the participating funds. In addition, a commitment fee of 0.11% per annum on any unutilized portion of the committed line of credit is allocated to the participating funds based on their relative net assets and paid quarterly. During the reporting period, the fund had no borrowings against these arrangements.
Federal taxes It is the policy of the fund to distribute all of its taxable income within the prescribed time period and otherwise comply with the provisions of the Internal Revenue Code of 1986, as amended (the Code), applicable to regulated investment companies. It is also the intention of the fund to distribute an amount sufficient to avoid imposition of any excise tax under Section 4982 of the Code.
The fund is subject to the provisions of Accounting Standards Codification 740 Income Taxes (ASC 740). ASC 740 sets forth a minimum threshold for financial statement recognition of the benefit of a tax position taken or expected to be taken in a tax return. The fund did not have a liability to record for any unrecognized tax benefits in the accompanying financial statements. No provision has been made for federal taxes on income, capital gains or unrealized appreciation on securities held nor for excise tax on income and capital gains. Each of the fund’s federal tax returns for the prior three fiscal years remains subject to examination by the Internal Revenue Service.
The fund may also be subject to taxes imposed by governments of countries in which it invests. Such taxes are generally based on either income or gains earned or repatriated. The fund accrues and applies such taxes to net investment income, net realized gains and net unrealized gains as income and/or capital gains are earned. In some cases, the fund may be entitled to reclaim all or a portion of such taxes, and such reclaim amounts, if any, are reflected as an asset on the fund’s books. In many cases, however, the fund may not receive such amounts for an extended period of time, depending on the country of investment.
High Yield Advantage Fund 51
At November 30, 2013, the fund had a capital loss carryover of $73,745,839 available to the extent allowed by the Code to offset future net capital gain, if any. The amounts of the carryovers and the expiration dates are:
Loss carryover |
Short-term | Long-term | Total | Expiration |
$14,365,590 | $— | $14,365,590 | November 30, 2016 |
59,380,249 | — | 59,380,249 | November 30, 2017 |
Under the Regulated Investment Company Modernization Act of 2010, the fund will be permitted to carry forward capital losses incurred in taxable years beginning after December 22, 2010 for an unlimited period. However, any losses incurred will be required to be utilized prior to the losses incurred in pre-enactment tax years. As a result of this ordering rule, pre-enactment capital loss carryforwards may be more likely to expire unused. Additionally, post-enactment capital losses that are carried forward will retain their character as either short-term or long-term capital losses rather than being considered all short-term as under previous law.
The aggregate identified cost on a tax basis is $931,243,101, resulting in gross unrealized appreciation and depreciation of $49,596,267 and $3,963,004, respectively, or net unrealized appreciation of $45,633,263.
Distributions to shareholders Distributions to shareholders from net investment income are recorded by the fund on the ex-dividend date. Distributions from capital gains, if any, are recorded on the ex-dividend date and paid at least annually. The amount and character of income and gains to be distributed are determined in accordance with income tax regulations, which may differ from generally accepted accounting principles. Dividend sources are estimated at the time of declaration. Actual results may vary. Any non-taxable return of capital cannot be determined until final tax calculations are completed after the end of the fund’s fiscal year. Reclassifications are made to the fund’s capital accounts to reflect income and gains available for distribution (or available capital loss carryovers) under income tax regulations.
Note 2: Management fee, administrative services and other transactions
The fund pays Putnam Management a management fee (based on the fund’s average net assets and computed and paid monthly) at annual rates that may vary based on the average of the aggregate net assets of most open-end funds, as defined in the fund’s management contract, sponsored by Putnam Management. Such annual rates may vary as follows:
0.720% | of the first $5 billion, |
0.670% | of the next $5 billion, |
0.620% | of the next $10 billion, |
0.570% | of the next $10 billion, |
0.520% | of the next $50 billion, |
0.500% | of the next $50 billion, |
0.490% | of the next $100 billion and |
0.485% | of any excess thereafter. |
The fund’s shareholders approved the fund’s current management contract with Putnam Management effective February 27, 2014. Shareholders were asked to approve the fund’s management contract following the death on October 8, 2013 of The Honourable Paul G. Desmarais, who had controlled directly and indirectly a majority of the voting shares of Power Corporation of Canada, the ultimate parent company of Putnam Management. The substantive terms of the management contract, including terms relating to fees, are identical to the terms of the fund’s previous management contract and reflect the rates provided in the table above.
Putnam Management has contractually agreed, through June 30, 2015, to waive fees or reimburse the fund’s expenses to the extent necessary to limit the cumulative expenses of the fund, exclusive of brokerage, interest, taxes, investment-related expenses, extraordinary expenses, acquired fund fees and expenses and payments under the fund’s investor servicing contract, investment management contract and distribution plans, on a fiscal year-to-date basis to an annual rate of 0.20% of the fund’s average net assets over such fiscal year-to-date period. During the reporting period, the fund’s expenses were not reduced as a result of this limit.
Putnam Investments Limited (PIL), an affiliate of Putnam Management, is authorized by the Trustees to manage a separate portion of the assets of the fund as determined by Putnam Management from time to time. Putnam Management pays a quarterly sub-management fee to PIL for its services at an annual rate of 0.40% of the average net assets of the portion of the fund managed by PIL.
52 High Yield Advantage Fund
The fund reimburses Putnam Management an allocated amount for the compensation and related expenses of certain officers of the fund and their staff who provide administrative services to the fund. The aggregate amount of all such reimbursements is determined annually by the Trustees.
Custodial functions for the fund’s assets are provided by State Street. Custody fees are based on the fund’s asset level, the number of its security holdings and transaction volumes.
Putnam Investor Services, Inc., an affiliate of Putnam Management, provides investor servicing agent functions to the fund. Putnam Investor Services, Inc. received fees for investor servicing based on the fund’s retail asset level, the number of shareholder accounts in the fund and the level of defined contribution plan assets in the fund. Investor servicing fees will not exceed an annual rate of 0.32% of the fund’s average net assets. During the reporting period, the expenses for each class of shares related to investor servicing fees were as follows:
Class A | $433,102 |
Class B | 13,339 |
Class C | 21,833 |
Class M | 105,636 |
Class R | 21,135 |
Class Y | 166,431 |
Total | $761,476 |
The fund has entered into expense offset arrangements with Putnam Investor Services, Inc. and State Street whereby Putnam Investor Services, Inc.’s and State Street’s fees are reduced by credits allowed on cash balances. For the reporting period, the fund’s expenses were reduced by $818 under the expense offset arrangements.
Each independent Trustee of the fund receives an annual Trustee fee, of which $600, as a quarterly retainer, has been allocated to the fund, and an additional fee for each Trustees meeting attended. Trustees also are reimbursed for expenses they incur relating to their services as Trustees.
The fund has adopted a Trustee Fee Deferral Plan (the Deferral Plan) which allows the Trustees to defer the receipt of all or a portion of Trustees fees payable on or after July 1, 1995. The deferred fees remain invested in certain Putnam funds until distribution in accordance with the Deferral Plan.
The fund has adopted an unfunded noncontributory defined benefit pension plan (the Pension Plan) covering all Trustees of the fund who have served as a Trustee for at least five years and were first elected prior to 2004. Benefits under the Pension Plan are equal to 50% of the Trustee’s average annual attendance and retainer fees for the three years ended December 31, 2005. The retirement benefit is payable during a Trustee’s lifetime, beginning the year following retirement, for the number of years of service through December 31, 2006. Pension expense for the fund is included in Trustee compensation and expenses in the Statement of operations. Accrued pension liability is included in Payable for Trustee compensation and expenses in the Statement of assets and liabilities. The Trustees have terminated the Pension Plan with respect to any Trustee first elected after 2003.
The fund has adopted distribution plans (the Plans) with respect to its class A, class B, class C, class M and class R shares pursuant to Rule 12b–1 under the Investment Company Act of 1940. The purpose of the Plans is to compensate Putnam Retail Management Limited Partnership, an indirect wholly-owned subsidiary of Putnam Investments, LLC, for services provided and expenses incurred in distributing shares of the fund. The Plans provide for payments by the fund to Putnam Retail Management Limited Partnership at an annual rate of up to 0.35%, 1.00%, 1.00%, 1.00% and 1.00% of the average net assets attributable to class A, class B, class C, class M and class R shares, respectively. The Trustees have approved payment by the fund at an annual rate of 0.25%, 1.00%, 1.00%, 0.50% and 0.50% of the average net assets attributable to class A, class B, class C, class M and class R shares, respectively. During the reporting period, the class specific expenses related to distribution fees were as follows:
Class A | $701,967 |
Class B | 86,487 |
Class C | 141,528 |
Class M | 342,309 |
Class R | 68,560 |
Total | $1,340,851 |
For the reporting period, Putnam Retail Management Limited Partnership, acting as underwriter, received net commissions of $15,873 and $143 from the sale of class A and class M shares, respectively, and received $2,343 and $53 in contingent deferred sales charges from redemptions of class B and class C shares, respectively.
A deferred sales charge of up to 1.00% and 0.40% is assessed on certain redemptions of class A and class M shares, respectively. For the reporting period, Putnam Retail Management Limited Partnership, acting as underwriter, received $40 and no monies on class A and class M redemptions, respectively.
High Yield Advantage Fund 53
Note 3: Purchases and sales of securities
During the reporting period, cost of purchases and proceeds from sales of investment securities other than short-term investments aggregated $198,728.801 and $212,899,701, respectively. There were no purchases or proceeds from sales of long-term U.S. government securities.
Note 4: Capital shares
At the close of the reporting period, there was an unlimited number of shares of beneficial interest authorized. Transactions in capital shares were as follows:
| Six months ended 5/31/14 | Year ended 11/30/13 |
Class A | Shares | Amount | Shares | Amount |
Shares sold | 6,537,038 | $40,850,495 | 35,692,145 | $220,700,326 |
Shares issued in connection with reinvestment of distributions | 2,092,990 | 13,087,419 | 5,316,813 | 32,865,975 |
| 8,630,028 | 53,937,914 | 41,008,958 | 253,566,301 |
Shares repurchased | (10,943,034) | (68,379,151) | (56,352,605) | (347,271,086) |
Net decrease | (2,313,006) | $(14,441,237) | (15,343,647) | $(93,704,785) |
| Six months ended 5/31/14 | Year ended 11/30/13 |
Class B | Shares | Amount | Shares | Amount |
Shares sold | 182,393 | $1,118,976 | 790,180 | $4,801,049 |
Shares issued in connection with reinvestment of distributions | 50,246 | 307,420 | 125,022 | 756,558 |
| 232,639 | 1,426,396 | 915,202 | 5,557,607 |
Shares repurchased | (212,103) | (1,300,188) | (632,451) | (3,821,312) |
Net increase | 20,536 | $126,208 | 282,751 | $1,736,295 |
| Six months ended 5/31/14 | Year ended 11/30/13 |
Class C | Shares | Amount | Shares | Amount |
Shares sold | 362,922 | $2,220,103 | 1,271,289 | $7,693,913 |
Shares issued in connection with reinvestment of distributions | 82,814 | 505,134 | 217,229 | 1,311,055 |
| 445,736 | 2,725,237 | 1,488,518 | 9,004,968 |
Shares repurchased | (598,531) | (3,651,758) | (1,598,979) | (9,640,955) |
Net decrease | (152,795) | $(926,521) | (110,461) | $(635,987) |
| Six months ended 5/31/14 | Year ended 11/30/13 |
Class M | Shares | Amount | Shares | Amount |
Shares sold | 1,952,995 | $12,165,307 | 4,116,672 | $25,455,503 |
Shares issued in connection with reinvestment of distributions | 19,261 | 120,316 | 46,023 | 284,205 |
| 1,972,256 | 12,285,623 | 4,162,695 | 25,739,708 |
Shares repurchased | (2,275,696) | (14,213,547) | (2,508,852) | (15,549,907) |
Net increase (decrease) | (303,440) | $(1,927,924) | 1,653,843 | $10,189,801 |
54 High Yield Advantage Fund
| Six months ended 5/31/14 | Year ended 11/30/13 |
Class R | Shares | Amount | Shares | Amount |
Shares sold | 1,290,999 | $8,060,950 | 1,606,793 | $9,943,796 |
Shares issued in connection with reinvestment of distributions | 109,642 | 684,859 | 253,163 | 1,563,232 |
| 1,400,641 | 8,745,809 | 1,859,956 | 11,507,028 |
Shares repurchased | (694,445) | (4,343,375) | (2,143,207) | (13,216,731) |
Net increase (decrease) | 706,196 | $4,402,434 | (283,251) | $(1,709,703) |
| Six months ended 5/31/14 | Year ended 11/30/13 |
Class Y | Shares | Amount | Shares | Amount |
Shares sold | 7,954,521 | $51,769,245 | 36,859,091 | $235,384,394 |
Shares issued in connection with reinvestment of distributions | 474,856 | 3,085,212 | 1,170,541 | 7,502,533 |
| 8,429,377 | 54,854,457 | 38,029,632 | 242,886,927 |
Shares repurchased | (12,381,105) | (80,374,905) | (20,850,344) | (133,277,120) |
Net increase (decrease) | (3,951,728) | $(25,520,448) | 17,179,288 | $109,609,807 |
At the close of the reporting period, a shareholder of record owned 6.3% of the outstanding shares of the fund.
Note 5: Affiliated transactions
Transactions during the reporting period with Putnam Short Term Investment Fund, which is under common ownership and control, were as follows:
Name of affiliate | Fair value at the beginning of the reporting period | Purchase cost | Sale proceeds | Investment income | Fair value at the end of the reporting period |
Putnam Short Term Investment Fund* | $43,646,708 | $133,353,776 | $140,600,468 | $12,035 | $36,400,016 |
*Management fees charged to Putnam Short Term Investment Fund have been waived by Putnam Management.
Note 6: Senior loan commitments
Senior loans are purchased or sold on a when-issued or delayed delivery basis and may be settled a month or more after the trade date, which from time to time can delay the actual investment of available cash balances; interest income is accrued based on the terms of the securities. Senior loans can be acquired through an agent, by assignment from another holder of the loan, or as a participation interest in another holder’s portion of the loan. When the fund invests in a loan or participation, the fund is subject to the risk that an intermediate participant between the fund and the borrower will fail to meet its obligations to the fund, in addition to the risk that the borrower under the loan may default on its obligations.
Note 7: Market, credit and other risks
In the normal course of business, the fund trades financial instruments and enters into financial transactions where risk of potential loss exists due to changes in the market (market risk) or failure of the contracting party to the transaction to perform (credit risk). The fund may be exposed to additional credit risk that an institution or other entity with which the fund has unsettled or open transactions will default. Investments in foreign securities involve certain risks, including those related to economic instability, unfavorable political developments, and currency fluctuations. The fund may invest in higher yielding, lower rated bonds that may have a higher rate of default.
High Yield Advantage Fund 55
Note 8: Summary of derivative activity
The volume of activity for the reporting period for any derivative type that was held during the period is listed below and was as follows based on an average of the holdings at the end of each fiscal quarter:
Forward currency contracts (contract amount) | $22,000,000 |
The following is a summary of the fair value of derivative instruments as of the close of the reporting period:
Fair value of derivative instruments as of the close of the reporting period
| Asset derivatives | Liability derivatives |
Derivatives not accounted for as hedging instruments under ASC 815 | Statement of
assets and
liabilities location | Fair value | Statement of
assets and
liabilities location | Fair value |
Foreign exchange
contracts | Receivables | $71,119 | Payables | $81,210 |
Total | | $71,119 | | $81,210 |
The following is a summary of realized and change in unrealized gains or losses of derivative instruments on the Statement of operations for the reporting period (see Note 1):
Amount of realized gain or (loss) on derivatives recognized in net gain or (loss) on investments
Derivatives not accounted for as hedging instruments under ASC 815 | Forward currency contracts | Total |
Foreign exchange contracts | $(537,121) | $(537,121) |
Total | $(537,121) | $(537,121) |
Change in unrealized appreciation or (depreciation) on derivatives recognized in net gain or (loss) on investments
Derivatives not accounted for as hedging instruments under ASC 815 | Forward currency contracts | Total |
Foreign exchange contracts | $484,515 | $484,515 |
Total | $484,515 | $484,515 |
56 High Yield Advantage Fund
This page left blank intentionally.
High Yield Advantage Fund 57
Note 9: Offsetting of financial and derivative assets and liabilities
The following table summarizes any derivatives, repurchase agreements and reverse repurchase agreements, at the end of the reporting period, that are subject to an enforceable master netting agreement or similar agreement. For securities lending transactions or borrowing transactions associated with securities sold short, see Note 1, if any. For financial reporting purposes, the fund does not offset financial assets and financial liabilities that are subject to the master netting agreements in the Statement of assets and liabilities.
| Bank of America N.A. | Barclays Bank PLC | Credit Suisse International | JPMorgan Chase Bank N.A. | State Street Bank and Trust Co. | WestPac Banking Corp. | Total |
Assets: | | | | | | | |
Forward currency contracts# | $38,453 | $— | $2,794 | $— | $29,872 | $— | $71,119 |
Total Assets | $38,453 | $— | $2,794 | $— | $29,872 | $— | $71,119 |
Liabilities: | | | | | | | |
Forward currency contracts# | 9,668 | 13,892 | — | 9,757 | 25,803 | 22,090 | 81,210 |
Total Liabilities | $9,668 | $13,892 | $— | $9,757 | $25,803 | $22,090 | $81,210 |
Total Financial and Derivative Net Assets | $28,785 | $(13,892) | $2,794 | $(9,757) | $4,069 | $(22,090) | $(10,091) |
Total collateral received (pledged)†## | $— | $— | $— | $— | $— | $— | $— |
Net amount | $28,785 | $(13,892) | $2,794 | $(9,757) | $4,069 | $(22,090) | $(10,091) |
† | Additional collateral may be required from certain brokers based on individual agreements. |
# | Covered by master netting agreement. (Note 1) |
## | Any over-collateralization of total financial and derivative net assets is not shown. Collateral may include amounts related to unsettled agreements. |
58 | High Yield Advantage Fund | High Yield Advantage Fund | 59 |
Shareholder meeting results (Unaudited)
February 27, 2014 special meeting
At the meeting, each of the nominees for Trustees was elected as follows:
| Votes for | Votes withheld |
Liaquat Ahamed | 104,524,129 | 6,192,663 |
Ravi Akhoury | 104,530,248 | 6,186,544 |
Barbara M. Baumann | 104,624,367 | 6,092,425 |
Jameson A. Baxter | 104,660,794 | 6,055,998 |
Charles B. Curtis | 104,594,399 | 6,122,393 |
Robert J. Darretta | 104,621,409 | 6,095,383 |
Katinka Domotorffy | 104,601,019 | 6,115,773 |
John A. Hill | 104,626,639 | 6,090,153 |
Paul L. Joskow | 104,636,179 | 6,080,613 |
Kenneth R. Leibler | 104,664,565 | 6,052,227 |
Robert E. Patterson | 104,690,630 | 6,026,162 |
George Putnam, III | 104,615,046 | 6,101,746 |
Robert L. Reynolds | 104,646,098 | 6,070,694 |
W. Thomas Stephens | 104,626,798 | 6,089,994 |
A proposal to approve a new management contract between the fund and Putnam Management was approved as follows: |
Votes
for | Votes
against | Abstentions | Broker
non-votes |
89,581,582 | 1,465,543 | 6,386,596 | 13,283,071 |
A proposal to adopt an Amended and Restated Declaration of Trust was approved as follows: |
Votes
for | Votes
against | Abstentions | Broker
non-votes |
89,401,088 | 1,672,427 | 6,360,211 | 13,283,066 |
All tabulations are rounded to the nearest whole number. |
60 High Yield Advantage Fund
Founded over 75 years ago, Putnam Investments was built around the concept that a balance between risk and reward is the hallmark of a well-rounded financial program. We manage over 100 funds across income, value, blend, growth, asset allocation, absolute return, and global sector categories.
Investment Manager
Putnam Investment
Management, LLC
One Post Office Square
Boston, MA 02109
Investment Sub-Manager
Putnam Investments Limited
57–59 St James’s Street
London, England SW1A 1LD
Marketing Services
Putnam Retail Management
One Post Office Square
Boston, MA 02109
Custodian
State Street Bank
and Trust Company
Legal Counsel
Ropes & Gray LLP
Trustees
Jameson A. Baxter, Chair
Liaquat Ahamed
Ravi Akhoury
Barbara M. Baumann
Charles B. Curtis
Robert J. Darretta
Katinka Domotorffy
John A. Hill
Paul L. Joskow
Kenneth R. Leibler
Robert E. Patterson
George Putnam, III
Robert L. Reynolds
W. Thomas Stephens
Officers
Robert L. Reynolds
President
Jonathan S. Horwitz
Executive Vice President,
Principal Executive Officer, and
Compliance Liaison
Steven D. Krichmar
Vice President and
Principal Financial Officer
Robert T. Burns
Vice President and
Chief Legal Officer
Robert R. Leveille
Vice President and
Chief Compliance Officer
Michael J. Higgins
Vice President, Treasurer,
and Clerk
Janet C. Smith
Vice President,
Principal Accounting Officer,
and Assistant Treasurer
Susan G. Malloy
Vice President and
Assistant Treasurer
James P. Pappas
Vice President
Mark C. Trenchard
Vice President and
BSA Compliance Officer
Nancy E. Florek
Vice President, Director of
Proxy Voting and Corporate
Governance, Assistant Clerk,
and Associate Treasurer
This report is for the information of shareholders of Putnam High Yield Advantage Fund. It may also be used as sales literature when preceded or accompanied by the current prospectus, the most recent copy of Putnam’s Quarterly Performance Summary, and Putnam’s Quarterly Ranking Summary. For more recent performance, please visit putnam.com. Investors should carefully consider the investment objectives, risks, charges, and expenses of a fund, which are described in its prospectus. For this and other information or to request a prospectus or summary prospectus, call 1-800-225-1581 toll free. Please read the prospectus carefully before investing. The fund’s Statement of Additional Information contains additional information about the fund’s Trustees and is available without charge upon request by calling 1-800-225-1581.
| |
| Item 3. Audit Committee Financial Expert: |
| |
| Item 4. Principal Accountant Fees and Services: |
| |
| Item 5. Audit Committee of Listed Registrants |
| |
| Item 6. Schedule of Investments: |
| |
| The registrant’s schedule of investments in unaffiliated issuers is included in the report to shareholders in Item 1 above. |
| |
| Item 7. Disclosure of Proxy Voting Policies and Procedures For Closed-End Management Investment Companies: |
| |
| Item 8. Portfolio Managers of Closed-End Investment Companies |
| |
| Item 9. Purchases of Equity Securities by Closed-End Management Investment Companies and Affiliated Purchasers: |
| |
| Item 10. Submission of Matters to a Vote of Security Holders: |
| |
| Item 11. Controls and Procedures: |
| |
| (a) The registrant’s principal executive officer and principal financial officer have concluded, based on their evaluation of the effectiveness of the design and operation of the registrant’s disclosure controls and procedures as of a date within 90 days of the filing date of this report, that the design and operation of such procedures are generally effective to provide reasonable assurance that information required to be disclosed by the registrant in this report is recorded, processed, summarized and reported within the time periods specified in the Commission’s rules and forms. |
| |
| (b) Changes in internal control over financial reporting: Not applicable |
| |
| (a)(2) Separate certifications for the principal executive officer and principal financial officer of the registrant as required by Rule 30a-2(a) under the Investment Company Act of 1940, as amended, are filed herewith. |
| |
| (b) The certifications required by Rule 30a-2(b) under the Investment Company Act of 1940, as amended, are filed herewith. |
| |
| Putnam High Yield Advantage Fund |
| |
| By (Signature and Title): |
| |
| /s/Janet C. Smith
Janet C. Smith
Principal Accounting Officer
|
| |
| Pursuant to the requirements of the Securities Exchange Act of 1934 and the Investment Company Act of 1940, this report has been signed below by the following persons on behalf of the registrant and in the capacities and on the dates indicated. |
| |
| By (Signature and Title): |
| |
| /s/Jonathan S. Horwitz
Jonathan S. Horwitz
Principal Executive Officer
|
| |
| By (Signature and Title): |
| |
| /s/Steven D. Krichmar
Steven D. Krichmar
Principal Financial Officer
|