| | |
| UNITED STATES
SECURITIES AND EXCHANGE COMMISSION |
| | |
| CERTIFIED SHAREHOLDER REPORT OF REGISTERED
MANAGEMENT INVESTMENT COMPANIES
|
| | |
| Investment Company Act file number: | (811-04616) |
| | |
| Exact name of registrant as specified in charter: | Putnam High Yield Advantage Fund |
| | |
| Address of principal executive offices: | One Post Office Square, Boston, Massachusetts 02109 |
| | |
| Name and address of agent for service: | Robert T. Burns, Vice President
One Post Office Square
Boston, Massachusetts 02109 |
| | |
| Copy to: | John W. Gerstmayr, Esq.
Ropes & Gray LLP
800 Boylston Street
Boston, Massachusetts 02199-3600 |
| | |
| Registrant’s telephone number, including area code: | (617) 292-1000 |
| | |
| Date of fiscal year end: | November 30, 2013 |
| | |
| Date of reporting period: | December 1, 2012 — May 31, 2013 |
| | |
|
Item 1. Report to Stockholders: | |
| | |
| The following is a copy of the report transmitted to stockholders pursuant to Rule 30e-1 under the Investment Company Act of 1940: | |

Putnam
High Yield
Advantage Fund
Semiannual report
5 | 31 | 13
| | | |
| Message from the Trustees | 1 | | |
| | |
| About the fund | 2 | | |
| | |
| Performance snapshot | 4 | | |
| | |
| Interview with your fund’s portfolio manager | 5 | | |
| | |
| Your fund’s performance | 11 | | |
| | |
| Your fund’s expenses | 13 | | |
| | |
| Terms and definitions | 15 | | |
| | |
| Other information for shareholders | 16 | | |
| | |
| Financial statements | 17 | | |
| | |
Consider these risks before investing: Lower-rated bonds may offer higher yields in return for more risk. Bond investments are subject to interest-rate risk (the risk of bond prices falling if interest rates rise) and credit risk (the risk of an issuer defaulting on interest or principal payments). Interest-rate risk is greater for longer-term bonds, and credit risk is greater for below-investment-grade bonds. Risks associated with derivatives include increased investment exposure (which may be considered leverage) and, in the case of over-the-counter instruments, the potential inability to terminate or sell derivatives positions and the potential failure of the other party to the instrument to meet its obligations. Unlike bonds, funds that invest in bonds have fees and expenses. Bond prices may fall or fail to rise over time for reasons, including general financial market conditions and factors related to a specific issuer or industry. You can lose money by investing in the fund.
Message from the Trustees
Dear Fellow Shareholder:
Some steadiness has returned to the investing environment, as many economies around the world are either improving or stabilizing. The U.S. equity market achieved record highs in the second quarter, as the nation’s economy slowly healed. Unemployment, housing, and consumer confidence data in the United States have all improved since the beginning of the year. State finances are faring better as well, although the ultimate consequences of federal budget sequestration on state economies remain to be measured.
Against this backdrop of perceived economic progress, the Federal Reserve indicated that it may taper its monetary-easing and asset-purchasing policies. This posed challenges for markets that had become accustomed to the extraordinary programs put in place by the central bank.
Putnam’s investment teams bring astute analysis of key market and policy-related risks to the task of finding the most attractive opportunities for investors. Integrating new thinking into time-tested strategies may prove particularly beneficial as the economy moves into the next stage of the current recovery. Our fixed-income managers, in particular, are cognizant of the risks of Fed policy changes and actively manage the funds to deal with the impact of the changes. When combined with the guidance of a financial advisor, who can help ensure that your portfolio matches your individual goals and tolerance for risk, we believe Putnam’s emphasis on innovative thinking, active investing, and risk management can serve shareholders well.
We would like to extend a welcome to new shareholders of the fund and to thank you for investing with Putnam.

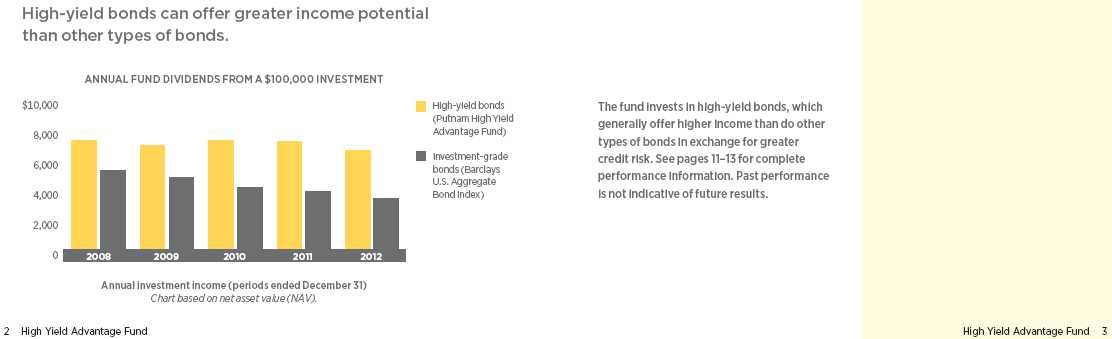
About the fund
Seeking a high level of current income for investors since 1986
Unlike most types of fixed-income investments, high-yield bond performance is more dependent on the performance of the companies that issue the bonds than on interest rates. For this reason, distinguishing between opportunities and potential pitfalls requires a rigorous investment process that includes analyzing companies. With Putnam High Yield Advantage Fund, this process is highlighted by intensive research, investment diversification, and carefully timed portfolio adjustments.
Because of the risks of high-yield bond investing, in-depth credit research is essential. The fund’s research team — which includes analysts who specialize by industry — visits with the management of issuing companies and analyzes each company’s prospects. The team then compares this information to the bond’s upside or downside potential before deciding whether it is an appropriate investment for the fund.
The fund’s portfolio typically consists of bonds from a broad range of industries and companies. Holdings are diversified across industry sectors and among bonds with differing credit ratings. While the fund invests primarily in the bonds of U.S. companies, its diversified approach allows it to include foreign bonds as well.
As the bond markets shift over time, the fund’s managers look for ways to capitalize on developments that affect fixed-income securities in general and high-yield bonds in particular. For example, when credit spreads are wide and are expected to tighten, the fund may pursue the higher income potential offered by lower-quality issues. On the other hand, when credit spreads are narrow — that is, when the difference in yield between higher- and lower-rated bonds of comparable maturities is small — the fund may shift its emphasis to higher-quality high-yield bonds.
What makes a bond “high yield”?
High-yield bonds are fixed-income investments typically issued by companies that lack an established earnings track record or a solid credit history. In general, high-yield bonds offer higher interest rates than investment-grade bonds to compensate for their increased risk. Because of this added risk, these bonds are typically rated below investment grade by an independent rating agency (for example, the lowest Moody’s Investors Service rating of investment-grade bonds is Baa). The lower the rating, the greater the possibility that a bond’s issuer will be unable to make interest payments or repay the principal.
Bond ratings
| | | | | |
| Moody’s | Grade | | | | |
| | | | |
| Aaa | Investment | | | | |
| Aa, A | Investment | | | | |
| Baa | Investment | | | | |
| Ba, B | High yield | | | | |
| Caa/Ca | High yield | | | | |
| C | High yield | | | | |
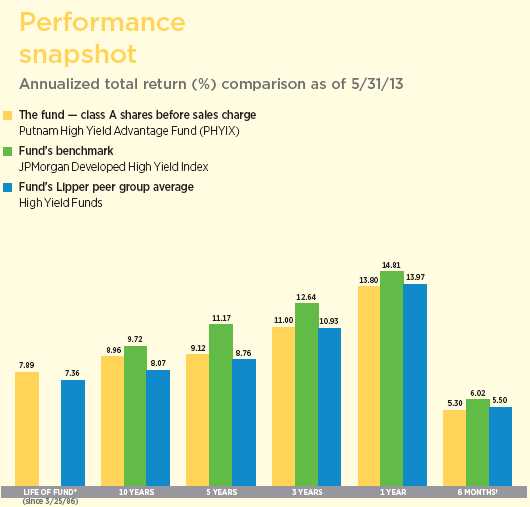
Current performance may be lower or higher than the quoted past performance, which cannot guarantee future results. Share price, principal value, and return will fluctuate, and you may have a gain or a loss when you sell your shares. Performance of class A shares assumes reinvestment of distributions and does not account for taxes. Fund returns in the bar chart do not reflect a sales charge of 4.00%; had they, returns would have been lower. See pages 5 and 11–13 for additional performance information. For a portion of the periods, the fund had expense limitations, without which returns would have been lower. To obtain the most recent month-end performance, visit putnam.com.
* The fund’s benchmark, the JPMorgan Developed High Yield Index, was introduced on 12/31/94, which post-dates the inception of the fund’s class A shares.
† Returns for the six-month period are not annualized, but cumulative.
| |
| 4 | High Yield Advantage Fund |
Interview with your fund’s portfolio manager

Paul, what was the market environment like for high-yield bonds during the six months ended May 31, 2013?
Overall, it was a strong period for the asset class, although rising U.S. Treasury yields hampered high-yield-bond performance during the final month of the period. Credit-sensitive fixed-income categories were bolstered by the improved risk sentiment that resulted from global monetary easing during and prior to the reporting period, and high-yield bonds continued to benefit from persistent investor demand and solid corporate fundamentals. Within the high-yield market, for the year-to-date period through May 31, 2013, transportation was the best-performing industry while housing was the weakest.
During May 2013, as investors increasingly debated when the Federal Reserve would begin to taper its bond-buying programs, Treasury yields rose and bond prices declined. However, because high-yield bonds are generally less sensitive to interest-rate movements than higher-quality, longer maturity bonds and are heavily influenced by the fundamental performance of corporate issuers, their prices fell less than most other fixed-income categories.
Before we discuss the fund’s performance, would you briefly summarize your investment philosophy and process?
From a philosophical perspective, we believe the potential to outperform in the high-yield
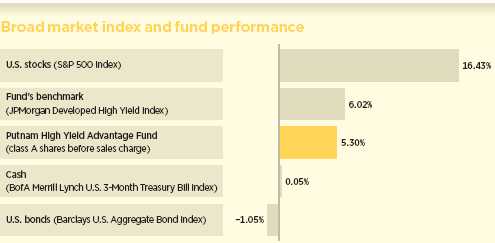
This comparison shows your fund’s performance in the context of broad market indexes for the six months ended 5/31/13. See pages 4 and 11–13 for additional fund performance information. Index descriptions can be found on pages 15–16.
| |
| High Yield Advantage Fund | 5 |
market comes from pursuing capital appreciation in bonds that are backed by improving corporate fundamentals. Consistent with this philosophy, we have an unwavering commitment to rigorous fundamental research. In conducting credit research, we employ classic financial analysis, while also evaluating companies according to the following characteristics: sustainable competitive advantage, viability of the capital structure, free cash flow trends, and adequate downside protection. Our investment process is a blend of “top down,” based on our views of the market’s fundamental, valuation, and technical characteristics, and “bottom up” by which we construct the portfolio with input from portfolio managers and analysts who have specialized expertise in various market segments.
What factors influenced the fund’s relative performance?
At the sector/industry level, overweighting telecommunications, cable/satellite, and financials; underweighting automotive; and beneficial overall positioning in chemicals provided the biggest boost to the fund’s results versus the index. Conversely, security selection in industrials, combined with holding lighter-than-benchmark stakes in metals/mining, diversified media, and transportation, detracted from relative
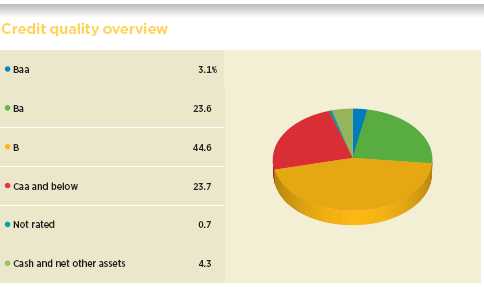
Credit qualities are shown as a percentage of the fund’s net assets as of 5/31/13. Cash and net other assets, if any, represent the market value weights of cash, derivatives, short-term securities, and other unclassified assets in the portfolio. A bond rated Baa or higher (Prime-3 or higher, for short-term debt) is considered investment grade. The chart reflects Moody’s ratings; percentages may include bonds or derivatives not rated by Moody’s but rated by Standard & Poor’s (S&P) or, if unrated by S&P, by Fitch ratings, and then included in the closest equivalent Moody’s rating. Ratings may vary over time.
Credit quality includes bonds and represents only the fixed-income portion of the portfolio. Derivative instruments, including currency forward contracts, are only included to the extent of any unrealized gain or loss on such instruments and are shown in the cash and net other assets category. The fund itself has not been rated by an independent rating agency.
| |
| 6 | High Yield Advantage Fund |
performance and caused the fund to lag its benchmark. From a credit-quality standpoint, modestly overweighting CCC-rated securities aided relative performance, because they outperformed BB-rated and B-rated bonds.

Which holdings helped versus the index?
Travelport, a provider of computerized registration systems to the travel industry, was the top individual contributor, as the company witnessed a substantial year-over-year increase in online bookings, and also resolved a long-standing dispute with American Airlines.
Satellite services provider Intelsat also helped the fund’s performance, thanks to stronger operating margins and continued steady growth.
Additional contributors included Energy Future Holdings, a Dallas-based electric utility; NII Capital, the financing subsidiary of NII Holdings, which provides mobile communications for business customers in Latin America under the Nextel brand; and
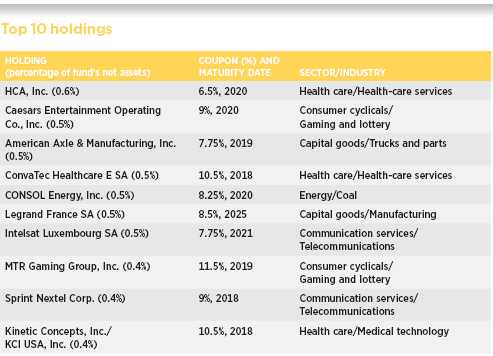
This table shows the fund’s top 10 individual holdings and the percentage of the fund’s net assets that each represented as of 5/31/13. Short-term holdings and derivatives, if any, are excluded. Holdings may vary over time.
| |
| High Yield Advantage Fund | 7 |
Ceridian, a provider of human resources and payroll services.
Which investments weren’t as productive?
Exide Technologies, which makes lead-acid batteries for cars and other machines, was the biggest detractor. The company has suffered from declining profitability, due in part to steep restructuring expenses, weaker-than-expected demand in some markets, and higher lead-input costs. There is also concern that it could be forced to file for bankruptcy protection during the summer.
An underweight position in multinational steel maker ArcelorMittal worked against the fund’s performance, as its bonds posted a solid gain during the period.
What is your outlook for the high-yield market over the coming months?
We evaluate the high-yield market by looking at three key factors: fundamentals, valuation, and “technicals,” or supply and demand dynamics. At period-end, we were neutral on all three.
Looking first at fundamentals, we see an economic landscape marked by countervailing trends. United States gross domestic product [GDP] growth has continued to lag previous economic
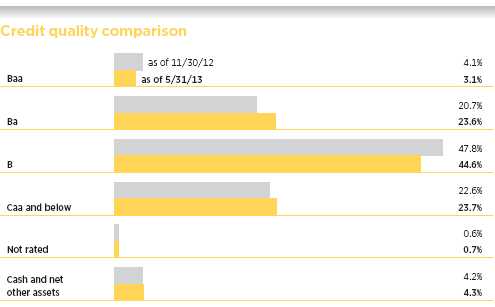
This chart shows how the fund’s credit quality has changed over the past six months. Cash and net other assets, if any, represent the market value weights of cash, derivatives, short-term securities, and other unclassified assets in the portfolio. A bond rated Baa or higher (Prime-3 or higher, for short-term debt) is considered investment grade. The chart reflects Moody’s ratings; percentages may include bonds or derivatives not rated by Moody’s but rated by Standard & Poor’s (S&P) or, if unrated by S&P, by Fitch ratings, and then included in the closest equivalent Moody’s rating. Ratings may vary over time.
Credit quality includes bonds and represents only the fixed-income portion of the portfolio. Derivative instruments, including currency forward contracts, are only included to the extent of any unrealized gain or loss on such instruments and are shown in the cash and net other assets category. The fund itself has not been rated by an independent rating agency.
| |
| 8 | High Yield Advantage Fund |
recoveries. Corporate fundamentals still appear to be reasonably solid, although earnings in various early-cycle industries are showing signs of softening. At the same time, by boosting economic activity and underpinning firmer labor market conditions, the U.S. housing recovery is helping to offset the drag on consumers from fiscal austerity measures.
After bottoming at a record low 5.03% on May 7, the significant sell-off in Treasuries later that month caused U.S. high-yield bond yields — as measured by the JPMorgan Developed High Yield Index — to increase to 5.73% by period-end. After trading as tight as 437 basis points — a basis point is one one-hundredth of one percent — the yield advantage that high-yield bonds offered over Treasuries rose to 482 basis points by period-end. The high-yield default rate ended the period at 1%, which is well below the long-term average of more than 4%. In our view, while high-yield bond yield spreads remain relatively tight by historical standards, these data indicate that the asset class’s absolute yields remain attractive against the backdrop of lower-yielding alternatives elsewhere in the fixed-income marketplace. We believe this is particularly true given the relatively low risk of default at the present time.
As for market technicals, demand for high-yield bonds has been solid in recent months, while new debt issuance in the sector reached record levels. A substantial portion of the new-issue volume was used to refinance existing debt, as corporations sought to lock in attractive long-term rates. Consequently, an environment of both heightened supply and demand suggests, in our view, a relatively neutral technical environment.
Given this outlook, how have you positioned the fund?
The amount of refinancing that has occurred during the past three years has extended the maturity profile of many high-yield issuers, which helps reduce their current debt load. As a result, we believe the prospects for the default rate to remain below the historical average for some time are quite good. That said, given the continuing uncertainty surrounding potential macroeconomic, U.S. fiscal policy, and geopolitical developments, we have modestly reduced the fund’s overall market risk by, among other measures, moderately increasing our cash position.
While past performance does not guarantee future results, it is worth noting that since 1986, high-yield bonds have produced their strongest total returns during periods of relatively slow GDP growth of 2% or less, with the majority of gains coming from income rather than price appreciation.
Thanks for bringing us up to date, Paul.
The views expressed in this report are exclusively those of Putnam Management and are subject to change. They are not meant as investment advice.
Please note that the holdings discussed in this report may not have been held by the fund for the entire period. Portfolio composition is subject to review in accordance with the fund’s investment strategy and may vary in the future. Current and future portfolio holdings are subject to risk.
Portfolio Manager Paul D. Scanlon is Co-Head of Fixed Income at Putnam. He has an M.B.A. from The University of Chicago Booth School of Business and a B.A. from Colgate University. A CFA charterholder, Paul joined Putnam in 1999 and has been in the investment industry since 1986.
In addition to Paul, your fund’s portfolio managers are Norman P. Boucher and Robert L. Salvin.
| |
| High Yield Advantage Fund | 9 |
IN THE NEWS
The World Bank has downgraded its outlook for global economic growth, projecting a somewhat slower expansion in 2013 due to Europe’s deeper-than-expected recession and a recent deceleration in emerging market economies. In its twice-yearly Global Economic Prospects report, the World Bank forecast that global GDP will increase 2.2% this year, a cut to its January outlook of 2.4%. This pace would constitute an approximate continuation of 2012’s moderate growth pace of 2.3%. The world’s large developing economies, such as Brazil, China, India, and Russia, continue to experience less rapid growth than they did before the 2008 global financial crisis and will likely need to stay focused on structural reforms to maintain expansion. China’s economy, in particular, is decelerating, with experts now anticipating that the world’s second-largest economy could experience its slowest growth rate in 23 years. In its report, the World Bank said debt-related uncertainties surrounding the eurozone and fiscal questions in the United States should have less impact on global economic growth in coming years.
| |
| 10 | High Yield Advantage Fund |
Your fund’s performance
This section shows your fund’s performance, price, and distribution information for periods ended May 31, 2013, the end of the first half of its current fiscal year. In accordance with regulatory requirements for mutual funds, we also include performance information as of the most recent calendar quarter-end and expense information taken from the fund’s current prospectus. Performance should always be considered in light of a fund’s investment strategy. Data represent past performance. Past performance does not guarantee future results. More recent returns may be less or more than those shown. Investment return and principal value will fluctuate, and you may have a gain or a loss when you sell your shares. Performance information does not reflect any deduction for taxes a shareholder may owe on fund distributions or on the redemption of fund shares. For the most recent month-end performance, please visit the Individual Investors section at putnam.com or call Putnam at 1-800-225-1581. Class R and class Y shares are not available to all investors. See the Terms and Definitions section in this report for definitions of the share classes offered by your fund.
Fund performance Total return for periods ended 5/31/13
| | | | | | | | | | |
| | Class A | Class B | Class C | Class M | Class R | Class Y |
| (inception dates) | (3/25/86) | (5/16/94) | (3/30/07) | (12/1/94) | (3/30/07) | (12/31/98) |
|
| | Before | After | | | | | Before | After | Net | Net |
| | sales | sales | Before | After | Before | After | sales | sales | asset | asset |
| | charge | charge | CDSC | CDSC | CDSC | CDSC | charge | charge | value | value |
|
| Annual average | | | | | | | | | | |
| (life of fund) | 7.89% | 7.72% | 6.99% | 6.99% | 7.07% | 7.07% | 7.59% | 7.46% | 7.62% | 8.07% |
|
| 10 years | 135.98 | 126.54 | 118.81 | 118.81 | 118.79 | 118.79 | 129.72 | 122.25 | 130.46 | 141.77 |
| Annual average | 8.96 | 8.52 | 8.15 | 8.15 | 8.14 | 8.14 | 8.67 | 8.31 | 8.71 | 9.23 |
|
| 5 years | 54.73 | 48.54 | 48.92 | 46.92 | 48.94 | 48.94 | 52.55 | 47.59 | 52.67 | 56.34 |
| Annual average | 9.12 | 8.24 | 8.29 | 8.00 | 8.29 | 8.29 | 8.81 | 8.10 | 8.83 | 9.35 |
|
| 3 years | 36.76 | 31.29 | 33.57 | 30.57 | 33.73 | 33.73 | 35.48 | 31.08 | 35.49 | 37.76 |
| Annual average | 11.00 | 9.50 | 10.13 | 9.30 | 10.17 | 10.17 | 10.65 | 9.44 | 10.65 | 11.27 |
|
| 1 year | 13.80 | 9.25 | 12.87 | 7.87 | 12.89 | 11.89 | 13.40 | 9.71 | 13.40 | 14.05 |
|
| 6 months | 5.30 | 1.09 | 5.00 | 0.00 | 5.02 | 4.02 | 5.21 | 1.79 | 5.21 | 5.37 |
|
Current performance may be lower or higher than the quoted past performance, which cannot guarantee future results. After-sales-charge returns for class A and M shares reflect the deduction of the maximum 4.00% and 3.25% sales charge, respectively, levied at the time of purchase. Class B share returns after contingent deferred sales charge (CDSC) reflect the applicable CDSC, which is 5% in the first year, declining over time to 1% in the sixth year, and is eliminated thereafter. Class C share returns after CDSC reflect a 1% CDSC for the first year that is eliminated thereafter. Class R and Y shares have no initial sales charge or CDSC. Performance for class B, C, M, R, and Y shares before their inception is derived from the historical performance of class A shares, adjusted for the applicable sales charge (or CDSC) and the higher operating expenses for such shares, except for class Y shares, for which 12b-1 fees are not applicable.
For a portion of the periods, the fund had expense limitations, without which returns would have been lower.
Class B share performance does not reflect conversion to class A shares.
For purchases made after June 24, 2013, the 1.00% short-term trading fee, as described in the fund’s prospectus, no longer applies.
| |
| High Yield Advantage Fund | 11 |
Comparative index returns For periods ended 5/31/13
| | |
| | JPMorgan Developed High | Lipper High Yield Funds |
| | Yield Index | category average* |
|
| Annual average (life of fund) | —† | 7.36% |
|
| 10 years | 152.87% | 118.06 |
| Annual average | 9.72 | 8.07 |
|
| 5 years | 69.83 | 52.47 |
| Annual average | 11.17 | 8.76 |
|
| 3 years | 42.90 | 36.55 |
| Annual average | 12.64 | 10.93 |
|
| 1 year | 14.81 | 13.97 |
|
| 6 months | 6.02 | 5.50 |
|
Index and Lipper results should be compared with fund performance before sales charge, before CDSC, or at net asset value.
* Over the 6-month, 1-year, 3-year, 5-year, 10-year, and life-of-fund periods ended 5/31/13, there were 565, 534, 444, 387, 262, and 22 funds, respectively, in this Lipper category.
† The fund’s benchmark, the JPMorgan Developed High Yield Index, was introduced on 12/31/94, which post-dates the inception of the fund’s class A shares.
Fund price and distribution information For the six-month period ended 5/31/13
| | | | | | | | |
| Distributions | Class A | Class B | Class C | Class M | Class R | Class Y |
|
| Number | 6 | 6 | 6 | 6 | 6 | 6 |
|
| Income | $0.201 | $0.177 | $0.177 | $0.195 | $0.195 | $0.207 |
|
| Capital gains | — | — | — | — | — | — |
|
| Total | $0.201 | $0.177 | $0.177 | $0.195 | $0.195 | $0.207 |
|
| | Before | After | Net | Net | Before | After | Net | Net |
| | sales | sales | asset | asset | sales | sales | asset | asset |
| Share value | charge | charge | value | value | charge | charge | value | value |
|
| 11/31/12 | $6.12 | $6.38 | $5.99 | $5.97 | $6.11 | $6.32 | $6.11 | $6.34 |
|
| 5/31/13 | 6.24 | 6.50 | 6.11 | 6.09 | 6.23 | 6.44 | 6.23 | 6.47 |
|
| | Before | After | Net | Net | Before | After | Net | Net |
| | sales | sales | asset | asset | sales | sales | asset | asset |
| Current rate (end of period) | charge | charge | value | value | charge | charge | value | value |
|
| Current dividend rate 1 | 5.96% | 5.72% | 5.30% | 5.32% | 5.78% | 5.59% | 5.78% | 5.94% |
|
| Current 30-day SEC yield 2 | N/A | 3.80 | 3.20 | 3.20 | N/A | 3.59 | 3.71 | 4.21 |
|
The classification of distributions, if any, is an estimate. Before-sales-charge share value and current dividend rate for class A and M shares, if applicable, do not take into account any sales charge levied at the time of purchase. After-sales-charge share value, current dividend rate, and current 30-day SEC yield, if applicable, are calculated assuming that the maximum sales charge (4.00% for class A shares and 3.25% for class M shares) was levied at the time of purchase. Final distribution information will appear on your year-end tax forms.
1 Most recent distribution, including any return of capital and excluding capital gains, annualized and divided by share price before or after sales charge at period-end.
2 Based only on investment income and calculated using the maximum offering price for each share class, in accordance with SEC guidelines.
| |
| 12 | High Yield Advantage Fund |
Fund performance as of most recent calendar quarter
Total return for periods ended 6/30/13
| | | | | | | | | | |
| | Class A | Class B | Class C | Class M | Class R | Class Y |
| (inception dates) | (3/25/86) | (5/16/94) | (3/30/07) | (12/1/94) | (3/30/07) | (12/31/98) |
|
| | Before | After | | | | | Before | After | Net | Net |
| | sales | sales | Before | After | Before | After | sales | sales | asset | asset |
| | charge | charge | CDSC | CDSC | CDSC | CDSC | charge | charge | value | value |
|
| Annual average | | | | | | | | | | |
| (life of fund) | 7.76% | 7.60% | 6.86% | 6.86% | 6.95% | 6.95% | 7.47% | 7.34% | 7.50% | 7.94% |
|
| 10 years | 123.41 | 114.48 | 106.95 | 106.95 | 106.99 | 106.99 | 117.50 | 110.44 | 118.19 | 128.81 |
| Annual average | 8.37 | 7.93 | 7.54 | 7.54 | 7.55 | 7.55 | 8.08 | 7.72 | 8.11 | 8.63 |
|
| 5 years | 54.05 | 47.89 | 48.23 | 46.23 | 48.25 | 48.25 | 51.87 | 46.93 | 51.97 | 55.98 |
| Annual average | 9.03 | 8.14 | 8.19 | 7.90 | 8.19 | 8.19 | 8.72 | 8.00 | 8.73 | 9.30 |
|
| 3 years | 31.75 | 26.48 | 28.82 | 25.82 | 28.73 | 28.73 | 30.75 | 26.50 | 30.75 | 32.88 |
| Annual average | 9.63 | 8.14 | 8.81 | 7.96 | 8.78 | 8.78 | 9.35 | 8.15 | 9.35 | 9.94 |
|
| 1 year | 8.63 | 4.29 | 7.65 | 2.65 | 7.65 | 6.65 | 8.25 | 4.73 | 8.25 | 8.87 |
|
| 6 months | 1.19 | –2.86 | 0.65 | –4.25 | 0.65 | –0.33 | 0.93 | –2.35 | 0.93 | 1.40 |
|
See the discussion following the Fund performance table on page 11 for information about the calculation of fund performance.
Your fund’s expenses
As a mutual fund investor, you pay ongoing expenses, such as management fees, distribution fees (12b-1 fees), and other expenses. Using the following information, you can estimate how these expenses affect your investment and compare them with the expenses of other funds. You may also pay one-time transaction expenses, including sales charges (loads) and redemption fees, which are not shown in this section and would have resulted in higher total expenses. For more information, see your fund’s prospectus or talk to your financial representative.
Expense ratios
| | | | | | |
| | Class A | Class B | Class C | Class M | Class R | Class Y |
|
| Total annual operating expenses | | | | | | |
| for the fiscal year ended | | | | | | |
| 11/30/12 | 1.04% | 1.79% | 1.79% | 1.29% | 1.29% | 0.79% |
|
| Annualized expense ratio for the | | | | | | |
| six-month period ended 5/31/13 | 1.04% | 1.79% | 1.79% | 1.29% | 1.29% | 0.79% |
|
Fiscal-year expense information in this table is taken from the most recent prospectus, is subject to change, and may differ from that shown for the annualized expense ratio and in the financial highlights of this report. Expenses are shown as a percentage of average net assets.
| |
| High Yield Advantage Fund | 13 |
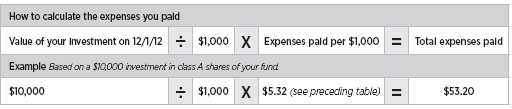
Expenses per $1,000
The following table shows the expenses you would have paid on a $1,000 investment in the fund from December 1, 2012, to May 31, 2013. It also shows how much a $1,000 investment would be worth at the close of the period, assuming actual returns and expenses.
| | | | | | |
| | Class A | Class B | Class C | Class M | Class R | Class Y |
|
| Expenses paid per $1,000*† | $5.32 | $9.15 | $9.15 | $6.60 | $6.60 | $4.04 |
|
| Ending value (after expenses) | $1,053.00 | $1,050.00 | $1,050.20 | $1,052.10 | $1,052.10 | $1,053.70 |
|
* Expenses for each share class are calculated using the fund’s annualized expense ratio for each class, which represents the ongoing expenses as a percentage of average net assets for the six months ended 5/31/13. The expense ratio may differ for each share class.
† Expenses are calculated by multiplying the expense ratio by the average account value for the period; then multiplying the result by the number of days in the period; and then dividing that result by the number of days in the year.
Estimate the expenses you paid
To estimate the ongoing expenses you paid for the six months ended May 31, 2013, use the following calculation method. To find the value of your investment on December 1, 2012, call Putnam at 1-800-225-1581.
Compare expenses using the SEC’s method
The Securities and Exchange Commission (SEC) has established guidelines to help investors assess fund expenses. Per these guidelines, the following table shows your fund’s expenses based on a $1,000 investment, assuming a hypothetical 5% annualized return. You can use this information to compare the ongoing expenses (but not transaction expenses or total costs) of investing in the fund with those of other funds. All mutual fund shareholder reports will provide this information to help you make this comparison. Please note that you cannot use this information to estimate your actual ending account balance and expenses paid during the period.
| | | | | | |
| | Class A | Class B | Class C | Class M | Class R | Class Y |
|
| Expenses paid per $1,000*† | $5.24 | $9.00 | $9.00 | $6.49 | $6.49 | $3.98 |
|
| Ending value (after expenses) | $1,019.75 | $1,016.01 | $1,016.01 | $1,018.50 | $1,018.50 | $1,020.99 |
|
* Expenses for each share class are calculated using the fund’s annualized expense ratio for each class, which represents the ongoing expenses as a percentage of average net assets for the six months ended 5/31/13. The expense ratio may differ for each share class.
† Expenses are calculated by multiplying the expense ratio by the average account value for the period; then multiplying the result by the number of days in the period; and then dividing that result by the number of days in the year.
| |
| 14 | High Yield Advantage Fund |
Terms and definitions
Important terms
Total return shows how the value of the fund’s shares changed over time, assuming you held the shares through the entire period and reinvested all distributions in the fund.
Before sales charge, or net asset value, is the price, or value, of one share of a mutual fund, without a sales charge. Before-sales-charge figures fluctuate with market conditions, and are calculated by dividing the net assets of each class of shares by the number of outstanding shares in the class.
After sales charge is the price of a mutual fund share plus the maximum sales charge levied at the time of purchase. After-sales-charge performance figures shown here assume the 4.00% maximum sales charge for class A shares and 3.25% for class M shares.
Contingent deferred sales charge (CDSC) is generally a charge applied at the time of the redemption of class B or C shares and assumes redemption at the end of the period. Your fund’s class B CDSC declines over time from a 5% maximum during the first year to 1% during the sixth year. After the sixth year, the CDSC no longer applies. The CDSC for class C shares is 1% for one year after purchase.
Share classes
Class A shares are generally subject to an initial sales charge and no CDSC (except on certain redemptions of shares bought without an initial sales charge).
Class B shares are not subject to an initial sales charge. They may be subject to a CDSC.
Class C shares are not subject to an initial sales charge and are subject to a CDSC only if the shares are redeemed during the first year.
Class M shares have a lower initial sales charge and a higher 12b-1 fee than class A shares and no CDSC (except on certain redemptions of shares bought without an initial sales charge).
Class R shares are not subject to an initial sales charge or CDSC and are available only to certain defined contribution plans.
Class Y shares are not subject to an initial sales charge or CDSC, and carry no 12b-1 fee. They are generally only available to corporate and institutional clients and clients in other approved programs.
Fixed-income terms
Current rate is the annual rate of return earned from dividends or interest of an investment. Current rate is expressed as a percentage of the price of a security, fund share, or principal investment.
Yield curve is a graph that plots the yields of bonds with equal credit quality against their differing maturity dates, ranging from shortest to longest. It is used as a benchmark for other debt, such as mortgage or bank lending rates.
Comparative indexes
Barclays U.S. Aggregate Bond Index is an unmanaged index of U.S. investment-grade fixed-income securities.
BofA Merrill Lynch U.S. 3-Month Treasury Bill Index is an unmanaged index that seeks to measure the performance of U.S. Treasury bills available in the marketplace.
JPMorgan Developed High Yield Index is an unmanaged index of high-yield fixed-income securities issued in developed countries.
S&P 500 Index is an unmanaged index of common stock performance.
Indexes assume reinvestment of all distributions and do not account for fees. Securities and performance of a fund and an index will differ. You cannot invest directly in an index.
| |
| High Yield Advantage Fund | 15 |
Lipper is a third-party industry-ranking entity that ranks mutual funds. Its rankings do not reflect sales charges. Lipper rankings are based on total return at net asset value relative to other funds that have similar current investment styles or objectives as determined by Lipper. Lipper may change a fund’s category assignment at its discretion. Lipper category averages reflect performance trends for funds within a category.
Other information for shareholders
Important notice regarding delivery of shareholder documents
In accordance with Securities and Exchange Commission (SEC) regulations, Putnam sends a single copy of annual and semiannual shareholder reports, prospectuses, and proxy statements to Putnam shareholders who share the same address, unless a shareholder requests otherwise. If you prefer to receive your own copy of these documents, please call Putnam at 1-800-225-1581, and Putnam will begin sending individual copies within 30 days.
Proxy voting
Putnam is committed to managing our mutual funds in the best interests of our shareholders. The Putnam funds’ proxy voting guidelines and procedures, as well as information regarding how your fund voted proxies relating to portfolio securities during the 12-month period ended June 30, 2012, are available in the Individual Investors section of putnam.com, and on the SEC’s website, www.sec.gov. If you have questions about finding forms on the SEC’s website, you may call the SEC at 1-800-SEC-0330. You may also obtain the Putnam funds’ proxy voting guidelines and procedures at no charge by calling Putnam’s Shareholder Services at 1-800-225-1581.
Fund portfolio holdings
The fund will file a complete schedule of its portfolio holdings with the SEC for the first and third quarters of each fiscal year on Form N-Q. Shareholders may obtain the fund’s Forms N-Q on the SEC’s website at www.sec.gov. In addition, the fund’s Forms N-Q may be reviewed and copied at the SEC’s Public Reference Room in Washington, D.C. You may call the SEC at 1-800-SEC-0330 for information about the SEC’s website or the operation of the Public Reference Room.
Trustee and employee fund ownership
Putnam employees and members of the Board of Trustees place their faith, confidence, and, most importantly, investment dollars in Putnam mutual funds. As of May 31, 2013, Putnam employees had approximately $385,000,000 and the Trustees had approximately $92,000,000 invested in Putnam mutual funds. These amounts include investments by the Trustees’ and employees’ immediate family members as well as investments through retirement and deferred compensation plans.
| |
| 16 | High Yield Advantage Fund |
Financial statements
A guide to financial statements
These sections of the report, as well as the accompanying Notes, constitute the fund’s financial statements.
The fund’s portfolio lists all the fund’s investments and their values as of the last day of the reporting period. Holdings are organized by asset type and industry sector, country, or state to show areas of concentration and diversification.
Statement of assets and liabilities shows how the fund’s net assets and share price are determined. All investment and non-investment assets are added together. Any unpaid expenses and other liabilities are subtracted from this total. The result is divided by the number of shares to determine the net asset value per share, which is calculated separately for each class of shares. (For funds with preferred shares, the amount subtracted from total assets includes the liquidation preference of preferred shares.)
Statement of operations shows the fund’s net investment gain or loss. This is done by first adding up all the fund’s earnings — from dividends and interest income — and subtracting its operating expenses to determine net investment income (or loss). Then, any net gain or loss the fund realized on the sales of its holdings — as well as any unrealized gains or losses over the period — is added to or subtracted from the net investment result to determine the fund’s net gain or loss for the fiscal period.
Statement of changes in net assets shows how the fund’s net assets were affected by the fund’s net investment gain or loss, by distributions to shareholders, and by changes in the number of the fund’s shares. It lists distributions and their sources (net investment income or realized capital gains) over the current reporting period and the most recent fiscal year-end. The distributions listed here may not match the sources listed in the Statement of operations because the distributions are determined on a tax basis and may be paid in a different period from the one in which they were earned. Dividend sources are estimated at the time of declaration. Actual results may vary. Any non-taxable return of capital cannot be determined until final tax calculations are completed after the end of the fund’s fiscal year.
Financial highlights provide an overview of the fund’s investment results, per-share distributions, expense ratios, net investment income ratios, and portfolio turnover in one summary table, reflecting the five most recent reporting periods. In a semiannual report, the highlights table also includes the current reporting period.
| |
| High Yield Advantage Fund | 17 |
The fund’s portfolio 5/31/13 (Unaudited)
| | | |
| CORPORATE BONDS AND NOTES (88.7%)* | | Principal amount | Value |
|
| Advertising and marketing services (0.5%) | | | |
| Affinion Group, Inc. company guaranty sr. unsec. notes | | | |
| 7 7/8s, 2018 | | $1,430,000 | $1,101,099 |
|
| Affinion Group, Inc. company guaranty sr. unsec. sub. notes | | | |
| 11 1/2s, 2015 | | 975,000 | 833,625 |
|
| Griffey Intermediate, Inc. /Griffey Finance Sub LLC 144A sr. | | | |
| notes 7s, 2020 | | 1,570,000 | 1,589,625 |
|
| Lamar Media Corp. company guaranty sr. sub. notes | | | |
| 5 7/8s, 2022 | | 1,340,000 | 1,447,200 |
|
| | | | 4,971,549 |
| Automotive (1.2%) | | | |
| Chrysler Group, LLC/CG Co-Issuer, Inc. company guaranty notes | | | |
| 8 1/4s, 2021 | | 1,810,000 | 2,045,300 |
|
| Ford Motor Credit Co., LLC sr. unsec. unsub. notes 5 3/4s, 2021 | | 615,000 | 695,726 |
|
| General Motors Financial Co., Inc. 144A sr. unsec. notes | | | |
| 4 1/4s, 2023 | | 655,000 | 638,625 |
|
| Navistar International Corp. sr. notes 8 1/4s, 2021 | | 2,664,000 | 2,743,919 |
|
| Schaeffler Finance BV sr. notes Ser. REGS, 8 3/4s, | | | |
| 2019 (Netherlands) | EUR | 210,000 | 311,160 |
|
| Schaeffler Finance BV 144A company guaranty sr. notes 8 1/2s, | | | |
| 2019 (Netherlands) | | $1,648,000 | 1,870,480 |
|
| Schaeffler Finance BV 144A company guaranty sr. notes 7 3/4s, | | | |
| 2017 (Netherlands) | | 565,000 | 638,450 |
|
| Schaeffler Finance BV 144A sr. notes 4 3/4s, 2021 (Netherlands) | | 1,045,000 | 1,026,713 |
|
| TRW Automotive, Inc. 144A company guaranty sr. notes | | | |
| 7 1/4s, 2017 | | 1,080,000 | 1,240,650 |
|
| TRW Automotive, Inc. 144A company guaranty sr. unsec. notes | | | |
| 4 1/2s, 2021 | | 475,000 | 490,438 |
|
| | | | 11,701,461 |
| Basic materials (7.8%) | | | |
| Ainsworth Lumber Co., Ltd. 144A sr. notes 7 1/2s, | | | |
| 2017 (Canada) | | 610,000 | 661,850 |
|
| ArcelorMittal sr. unsec. bonds 10.35s, 2019 (France) | | 1,490,000 | 1,846,126 |
|
| ArcelorMittal sr. unsec. unsub. notes 7 1/2s, 2039 (France) | | 1,415,000 | 1,422,075 |
|
| Ashland, Inc. 144A company guaranty sr. unsec. unsub. notes | | | |
| 4 3/4s, 2022 | | 1,050,000 | 1,072,313 |
|
| Ashland, Inc. 144A sr. unsec. notes 4 3/4s, 2022 | | 1,120,000 | 1,143,800 |
|
| Atkore International, Inc. company guaranty sr. notes | | | |
| 9 7/8s, 2018 | | 3,835,000 | 4,132,212 |
|
| Axiall Corp. 144A company guaranty sr. unsec. notes | | | |
| 4 7/8s, 2023 | | 160,000 | 160,800 |
|
| Boise Cascade Co. company guaranty sr. unsec. notes | | | |
| 6 3/8s, 2020 | | 695,000 | 745,388 |
|
| Celanese US Holdings, LLC company guaranty sr. unsec. unsub. | | | |
| notes 4 5/8s, 2022 (Germany) | | 965,000 | 989,125 |
|
| Celanese US Holdings, LLC sr. notes 5 7/8s, 2021 (Germany) | | 2,095,000 | 2,309,737 |
|
| Cemex Finance, LLC 144A company guaranty sr. bonds 9 1/2s, | | | |
| 2016 (Mexico) | | 1,880,000 | 1,992,800 |
|
| Cemex Finance, LLC 144A company guaranty sr. notes 9 3/8s, | | | |
| 2022 (Mexico) | | 1,145,000 | 1,282,400 |
|
| |
| 18 | High Yield Advantage Fund |
| | | |
| CORPORATE BONDS AND NOTES (88.7%)* cont. | | Principal amount | Value |
|
| Basic materials cont. | | | |
| CEMEX SAB de CV 144A company guaranty sr. notes 5 7/8s, | | | |
| 2019 (Mexico) | | $580,000 | $577,100 |
|
| Compass Minerals International, Inc. company guaranty | | | |
| sr. unsec. notes 8s, 2019 | | 1,865,000 | 2,023,525 |
|
| Eagle Spinco, Inc. 144A company guaranty sr. unsec. notes | | | |
| 4 5/8s, 2021 | | 200,000 | 201,500 |
|
| Edgen Murray Corp. 144A company guaranty sr. notes | | | |
| 8 3/4s, 2020 | | 920,000 | 959,100 |
|
| Eldorado Gold Corp. 144A sr. unsec. notes 6 1/8s, | | | |
| 2020 (Canada) | | 540,000 | 548,100 |
|
| Ferro Corp. sr. unsec. notes 7 7/8s, 2018 | | 965,000 | 1,020,488 |
|
| FMG Resources August 2006 Pty, Ltd. 144A sr. notes 8 1/4s, | | | |
| 2019 (Australia) | | 930,000 | 981,150 |
|
| FMG Resources August 2006 Pty, Ltd. 144A sr. notes 7s, | | | |
| 2015 (Australia) | | 15,000 | 15,469 |
|
| FMG Resources August 2006 Pty, Ltd. 144A sr. notes 6 7/8s, | | | |
| 2018 (Australia) | | 2,020,000 | 2,055,350 |
|
| FMG Resources August 2006 Pty, Ltd. 144A sr. unsec. notes | | | |
| 6 7/8s, 2022 (Australia) | | 920,000 | 929,200 |
|
| HD Supply, Inc. company guaranty sr. unsec. sub. notes | | | |
| 10 1/2s, 2021 | | 920,000 | 957,950 |
|
| HD Supply, Inc. company guaranty sr. unsec. unsub. notes | | | |
| 11 1/2s, 2020 | | 2,725,000 | 3,201,874 |
|
| HD Supply, Inc. 144A sr. unsec. notes 7 1/2s, 2020 | | 1,460,000 | 1,547,600 |
|
| Hexion U.S. Finance Corp. company guaranty sr. notes | | | |
| 6 5/8s, 2020 | | 570,000 | 592,800 |
|
| Hexion U.S. Finance Corp. 144A sr. notes 6 5/8s, 2020 | | 475,000 | 494,000 |
|
| Hexion U.S. Finance Corp./Hexion Nova Scotia Finance, ULC | | | |
| company guaranty notes 9s, 2020 | | 280,000 | 284,900 |
|
| Hexion U.S. Finance Corp./Hexion Nova Scotia Finance, ULC | | | |
| company guaranty sr. notes 8 7/8s, 2018 | | 1,180,000 | 1,231,625 |
|
| Hexion U.S. Finance Corp./Hexion Nova Scotia Finance, ULC | | | |
| 144A company guaranty sr. notes 8 7/8s, 2018 | | 865,000 | 902,844 |
|
| Huntsman International, LLC company guaranty sr. unsec. sub. | | | |
| notes 8 5/8s, 2021 | | 1,165,000 | 1,301,888 |
|
| Huntsman International, LLC company guaranty sr. unsec. sub. | | | |
| notes 8 5/8s, 2020 | | 2,510,000 | 2,773,550 |
|
| Huntsman International, LLC company guaranty sr. unsec. | | | |
| unsub. notes 4 7/8s, 2020 | | 1,625,000 | 1,641,250 |
|
| IAMGOLD Corp. 144A company guaranty sr. unsec. notes | | | |
| 6 3/4s, 2020 (Canada) | | 2,065,000 | 1,889,475 |
|
| Ineos Finance PLC 144A company guaranty sr. notes 8 3/8s, | | | |
| 2019 (United Kingdom) | | 830,000 | 925,450 |
|
| Ineos Finance PLC 144A company guaranty sr. notes 7 1/2s, | | | |
| 2020 (United Kingdom) | | 375,000 | 411,563 |
|
| INEOS Group Holdings SA 144A company guaranty sr. unsec. | | | |
| notes 6 1/8s, 2018 (Luxembourg) | | 365,000 | 362,263 |
|
| INEOS Group Holdings, Ltd. company guaranty sr. unsec. notes | | | |
| Ser. REGS, 7 7/8s, 2016 (Luxembourg) | EUR | 1,400,000 | 1,843,432 |
|
| Inmet Mining Corp. 144A company guaranty sr. unsec. notes | | | |
| 7 1/2s, 2021 (Canada) | | $375,000 | 382,500 |
|
| |
| High Yield Advantage Fund | 19 |
| | | |
| CORPORATE BONDS AND NOTES (88.7%)* cont. | | Principal amount | Value |
|
| Basic materials cont. | | | |
| JM Huber Corp. 144A sr. unsec. notes 9 7/8s, 2019 | | $2,535,000 | $2,921,587 |
|
| Louisiana-Pacific Corp. company guaranty sr. unsec. unsub. | | | |
| notes 7 1/2s, 2020 | | 805,000 | 907,638 |
|
| LyondellBasell Industries NV sr. unsec. notes 6s, 2021 | | 290,000 | 342,835 |
|
| Momentive Performance Materials, Inc. company guaranty | | | |
| notes 9 1/2s, 2021 | EUR | 465,000 | 534,879 |
|
| Momentive Performance Materials, Inc. company guaranty sr. | | | |
| notes 10s, 2020 | | $560,000 | 603,400 |
|
| Momentive Performance Materials, Inc. company guaranty sr. | | | |
| notes 8 7/8s, 2020 | | 75,000 | 80,625 |
|
| New Gold, Inc. 144A company guaranty sr. unsec. unsub. notes | | | |
| 7s, 2020 (Canada) | | 920,000 | 975,200 |
|
| New Gold, Inc. 144A sr. unsec. notes 6 1/4s, 2022 (Canada) | | 485,000 | 500,520 |
|
| Novelis, Inc. company guaranty sr. unsec. notes 8 3/4s, 2020 | | 1,030,000 | 1,151,025 |
|
| Nufarm Australia Ltd. 144A company guaranty sr. notes 6 3/8s, | | | |
| 2019 (Australia) | | 784,000 | 821,240 |
|
| Orion Engineered Carbons Bondco GmbH 144A company | | | |
| guaranty sr. notes 9 5/8s, 2018 (Germany) | | 160,000 | 178,000 |
|
| Perstorp Holding AB 144A company guaranty sr. notes 8 3/4s, | | | |
| 2017 (Sweden) | | 1,525,000 | 1,574,563 |
|
| PQ Corp. 144A sr. notes 8 3/4s, 2018 | | 1,215,000 | 1,293,975 |
|
| Roofing Supply Group, LLC/Roofing Supply Finance, Inc. 144A | | | |
| company guaranty sr. unsec. notes 10s, 2020 | | 1,360,000 | 1,513,000 |
|
| Ryerson, Inc./Joseph T Ryerson & Son, Inc. 144A company | | | |
| guaranty sr. notes 9s, 2017 | | 1,275,000 | 1,377,000 |
|
| Sealed Air Corp. 144A sr. unsec. notes 6 1/2s, 2020 | | 895,000 | 995,688 |
|
| Sealed Air Corp. 144A sr. unsec. notes 5 1/4s, 2023 | | 1,060,000 | 1,067,950 |
|
| Smurfit Kappa Acquisition company guaranty sr. bonds 7 1/4s, | | | |
| 2017 (Ireland) | EUR | 100,000 | 137,264 |
|
| Smurfit Kappa Acquisitions 144A company guaranty sr. notes | | | |
| 4 7/8s, 2018 (Ireland) | | $1,210,000 | 1,247,797 |
|
| Smurfit Kappa Treasury company guaranty sr. unsec. unsub. | | | |
| debs 7 1/2s, 2025 (Ireland) | | 915,000 | 1,011,075 |
|
| Steel Dynamics, Inc. company guaranty sr. unsec. notes | | | |
| 7 5/8s, 2020 | | 115,000 | 126,788 |
|
| Steel Dynamics, Inc. 144A company guaranty sr. unsec. notes | | | |
| 6 3/8s, 2022 | | 270,000 | 294,300 |
|
| Steel Dynamics, Inc. 144A company guaranty sr. unsec. notes | | | |
| 6 1/8s, 2019 | | 610,000 | 663,375 |
|
| Steel Dynamics, Inc. 144A company guaranty sr. unsec. notes | | | |
| 5 1/4s, 2023 | | 190,000 | 197,600 |
|
| Taminco Global Chemical Corp. 144A sr. notes 9 3/4s, | | | |
| 2020 (Belgium) | | 2,415,000 | 2,734,987 |
|
| TPC Group, Inc. 144A company guaranty sr. notes 8 3/4s, 2020 | | 1,665,000 | 1,756,575 |
|
| Tronox Finance, LLC 144A company guaranty sr. unsec. notes | | | |
| 6 3/8s, 2020 | | 2,045,000 | 2,009,213 |
|
| USG Corp. sr. unsec. notes 9 3/4s, 2018 | | 1,375,000 | 1,619,063 |
|
| Weekley Homes, LLC/Weekley Finance Corp. 144A sr. unsec. | | | |
| notes 6s, 2023 | | 1,680,000 | 1,747,200 |
|
| Weyerhaeuser Co. sr. unsec. unsub. debs. 7 1/8s, 2023 R | | 1,055,000 | 1,310,986 |
|
| | | | 79,509,920 |
| |
| 20 | High Yield Advantage Fund |
| | |
| CORPORATE BONDS AND NOTES (88.7%)* cont. | Principal amount | Value |
|
| Broadcasting (2.3%) | | |
| Clear Channel Communications, Inc. company guaranty sr. | | |
| notes 9s, 2021 | $805,000 | $798,963 |
|
| Clear Channel Communications, Inc. 144A company guaranty sr. | | |
| notes 9s, 2019 | 2,895,000 | 2,909,475 |
|
| Clear Channel Worldwide Holdings, Inc. company guaranty sr. | | |
| unsec. notes 7 5/8s, 2020 | 3,635,000 | 3,862,187 |
|
| Clear Channel Worldwide Holdings, Inc. 144A company | | |
| guaranty sr. unsec. unsub. notes 6 1/2s, 2022 | 1,745,000 | 1,840,975 |
|
| Cumulus Media Holdings, Inc. company guaranty sr. unsec. | | |
| unsub. notes 7 3/4s, 2019 | 1,485,000 | 1,522,125 |
|
| Entercom Radio, LLC company guaranty sr. unsec. sub. notes | | |
| 10 1/2s, 2019 | 1,590,000 | 1,856,325 |
|
| Gray Television, Inc. company guaranty sr. unsec. notes | | |
| 7 1/2s, 2020 | 1,155,000 | 1,235,850 |
|
| LIN Television Corp. company guaranty sr. unsec. notes | | |
| 6 3/8s, 2021 | 625,000 | 665,625 |
|
| Nexstar Broadcasting, Inc. 144A company guaranty sr. unsec. | | |
| unsub. notes 6 7/8s, 2020 | 1,795,000 | 1,911,675 |
|
| Nexstar Broadcasting, Inc./Mission Broadcasting, Inc. company | | |
| guaranty sr. notes 8 7/8s, 2017 | 1,350,000 | 1,468,125 |
|
| Sinclair Television Group, Inc. 144A company guaranty sr. unsec. | | |
| notes 5 3/8s, 2021 | 655,000 | 651,725 |
|
| Sinclair Television Group, Inc. 144A sr. notes 6 1/8s, 2022 | 650,000 | 677,625 |
|
| Univision Communications, Inc. 144A company guaranty sr. | | |
| unsec. notes 8 1/2s, 2021 | 1,533,000 | 1,659,472 |
|
| Univision Communications, Inc. 144A sr. notes 7 7/8s, 2020 | 1,265,000 | 1,385,175 |
|
| XM Satellite Radio, Inc. 144A company guaranty sr. unsec. notes | | |
| 7 5/8s, 2018 | 870,000 | 957,000 |
|
| | | 23,402,322 |
| Building materials (1.0%) | | |
| Building Materials Corp. 144A company guaranty sr. notes | | |
| 7 1/2s, 2020 | 1,360,000 | 1,468,800 |
|
| Building Materials Corp. 144A sr. notes 7s, 2020 | 640,000 | 684,800 |
|
| Jeld-Wen Escrow Corp. 144A sr. notes 12 1/4s, 2017 | 2,135,000 | 2,492,612 |
|
| Masonite International Corp., 144A company guaranty sr. notes | | |
| 8 1/4s, 2021 (Canada) | 2,115,000 | 2,347,650 |
|
| Nortek, Inc. company guaranty sr. unsec. notes 10s, 2018 | 2,160,000 | 2,397,600 |
|
| Owens Corning company guaranty sr. unsec. notes 9s, 2019 | 424,000 | 540,600 |
|
| | | 9,932,062 |
| Cable television (3.0%) | | |
| Bresnan Broadband Holdings, LLC 144A company guaranty sr. | | |
| unsec. unsub. notes 8s, 2018 | 1,070,000 | 1,155,600 |
|
| Cablevision Systems Corp. sr. unsec. unsub. notes 8 5/8s, 2017 | 2,025,000 | 2,359,124 |
|
| Cablevision Systems Corp. sr. unsec. unsub. notes 8s, 2020 | 470,000 | 532,275 |
|
| Cablevision Systems Corp. sr. unsec. unsub. notes 7 3/4s, 2018 | 525,000 | 593,250 |
|
| CCO Holdings, LLC/CCO Holdings Capital Corp. company | | |
| guaranty sr. unsec. notes 6 1/2s, 2021 | 1,655,000 | 1,779,125 |
|
| CCO Holdings, LLC/CCO Holdings Capital Corp. company | | |
| guaranty sr. unsec. notes 5 1/4s, 2022 | 1,290,000 | 1,293,225 |
|
| CCO Holdings, LLC/CCO Holdings Capital Corp. company | | |
| guaranty sr. unsec. unsub. notes 7 3/8s, 2020 | 975,000 | 1,084,688 |
|
| |
| High Yield Advantage Fund | 21 |
| | | |
| CORPORATE BONDS AND NOTES (88.7%)* cont. | | Principal amount | Value |
|
| Cable television cont. | | | |
| CCO Holdings, LLC/CCO Holdings Capital Corp. company | | | |
| guaranty sr. unsec. unsub. notes 6 5/8s, 2022 | | $500,000 | $537,500 |
|
| CCO Holdings, LLC/CCO Holdings Capital Corp. company | | | |
| guaranty sr. unsec. unsub. notes 5 1/8s, 2023 | | 625,000 | 612,500 |
|
| CCO Holdings, LLC/CCO Holdings Capital Corp. company | | | |
| guaranty sr. unsub. notes 7s, 2019 | | 1,545,000 | 1,651,219 |
|
| CSC Holdings, LLC sr. unsec. unsub. notes 6 3/4s, 2021 | | 1,710,000 | 1,910,925 |
|
| DISH DBS Corp. company guaranty sr. unsec. notes 7 7/8s, 2019 | | 1,600,000 | 1,794,000 |
|
| DISH DBS Corp. company guaranty sr. unsec. notes 6 3/4s, 2021 | | 2,105,000 | 2,226,037 |
|
| Mediacom, LLC/Mediacom Capital Corp. sr. unsec. notes | | | |
| 9 1/8s, 2019 | | 775,000 | 856,375 |
|
| Mediacom, LLC/Mediacom Capital Corp. sr. unsec. unsub. notes | | | |
| 7 1/4s, 2022 | | 1,665,000 | 1,810,688 |
|
| Quebecor Media, Inc. sr. unsec. unsub. notes 5 3/4s, | | | |
| 2023 (Canada) | | 1,170,000 | 1,199,250 |
|
| Quebecor Media, Inc. 144A sr. unsec. notes 7 3/8s, | | | |
| 2021 (Canada) | CAD | 995,000 | 1,059,935 |
|
| Unitymedia Hessen GmbH & Co. KG/Unitymedia NRW GmbH | | | |
| 144A company guaranty sr. notes 7 1/2s, 2019 (Germany) | | $735,000 | 792,243 |
|
| Videotron Ltd. company guaranty sr. unsec. unsub. notes 5s, | | | |
| 2022 (Canada) | | 1,998,000 | 2,047,949 |
|
| Videotron Ltd. company guaranty sr. unsec. unsub. notes | | | |
| 6 7/8s, 2021 (Canada) | CAD | 340,000 | 365,606 |
|
| Virgin Media Finance PLC company guaranty sr. unsec. unsub. | | | |
| notes 5 1/4s, 2022 (United Kingdom) | | $600,000 | 605,700 |
|
| Virgin Media Finance PLC company guaranty sr. unsec. unsub. | | | |
| notes 4 7/8s, 2022 (United Kingdom) | | 1,025,000 | 1,030,408 |
|
| WideOpenWest Finance, LLC/WideOpenWest Capital Corp. | | | |
| company guaranty sr. unsec. notes 10 1/4s, 2019 | | 3,295,000 | 3,715,113 |
|
| | | | 31,012,735 |
| Capital goods (6.7%) | | | |
| ADS Waste Holdings, Inc. 144A sr. notes 8 1/4s, 2020 | | 2,725,000 | 2,922,563 |
|
| American Axle & Manufacturing, Inc. company guaranty sr. | | | |
| unsec. notes 7 3/4s, 2019 | | 4,625,000 | 5,284,062 |
|
| ARD Finance SA sr. notes Ser. REGS, 11 1/8s, 2018 | | | |
| (Luxembourg) ‡‡ | EUR | 222,868 | 312,751 |
|
| ARD Finance SA 144A sr. notes 11 1/8s, 2018 (Luxembourg) ‡‡ | | $495,936 | 543,050 |
|
| Ardagh Packaging Finance PLC sr. notes Ser. REGS, 7 3/8s, | | | |
| 2017 (Ireland) | EUR | 860,000 | 1,202,591 |
|
| Ardagh Packaging Finance PLC 144A company guaranty sr. | | | |
| notes 7 3/8s, 2017 (Ireland) | EUR | 480,000 | 671,214 |
|
| Ardagh Packaging Finance PLC/Ardagh MP Holdings USA, Inc. | | | |
| 144A company guaranty sr. notes 7 3/8s, 2017 (Ireland) | | $225,000 | 243,563 |
|
| Ardagh Packaging Finance PLC/Ardagh MP Holdings USA, Inc. | | | |
| 144A sr. notes 4 7/8s, 2022 (Ireland) | | 770,000 | 770,000 |
|
| Ardagh Packaging Finance PLC/Ardagh MP Holdings USA, Inc. | | | |
| 144A sr. unsec. notes 7s, 2020 (Ireland) | | 1,525,000 | 1,586,000 |
|
| B/E Aerospace, Inc. sr. unsec. unsub. notes 6 7/8s, 2020 | | 410,000 | 452,025 |
|
| B/E Aerospace, Inc. sr. unsec. unsub. notes 5 1/4s, 2022 | | 525,000 | 551,250 |
|
| Ball Corp. company guaranty sr. unsec. notes 4s, 2023 | | 385,000 | 369,600 |
|
| Berry Plastics Corp. company guaranty notes 9 1/2s, 2018 | | 1,295,000 | 1,418,025 |
|
| |
| 22 | High Yield Advantage Fund |
| | | |
| CORPORATE BONDS AND NOTES (88.7%)* cont. | | Principal amount | Value |
|
| Capital goods cont. | | | |
| Berry Plastics Corp. company guaranty unsub. notes | | | |
| 9 3/4s, 2021 | | $705,000 | $814,275 |
|
| BOE Merger Corp. 144A sr. unsec. notes 9 1/2s, 2017 ‡‡ | | 1,915,000 | 1,996,388 |
|
| Bombardier, Inc. 144A sr. notes 6 1/8s, 2023 (Canada) | | 995,000 | 1,039,775 |
|
| Bombardier, Inc. 144A sr. unsec. notes 7 3/4s, 2020 (Canada) | | 755,000 | 887,125 |
|
| Briggs & Stratton Corp. company guaranty sr. unsec. notes | | | |
| 6 7/8s, 2020 | | 2,785,000 | 3,147,049 |
|
| Consolidated Container Co. LLC/Consolidated Container | | | |
| Capital, Inc. 144A company guaranty sr. unsec. notes | | | |
| 10 1/8s, 2020 | | 230,000 | 259,325 |
|
| Crown Americas LLC/Crown Americas Capital Corp. IV 144A | | | |
| company guaranty sr. unsec. notes 4 1/2s, 2023 | | 700,000 | 684,250 |
|
| Crown Euro Holdings SA 144A sr. notes 7 1/8s, 2018 (France) | EUR | 370,000 | 521,813 |
|
| Delphi Corp. company guaranty sr. unsec. unsub. notes 5s, 2023 | | $1,410,000 | 1,496,363 |
|
| DH Services Luxembourg Sarl 144A company guaranty | | | |
| sr. unsec. notes 7 3/4s, 2020 (Luxembourg) | | 2,305,000 | 2,483,638 |
|
| Exide Technologies sr. notes 8 5/8s, 2018 (In default) † | | 1,730,000 | 1,115,850 |
|
| Gestamp Funding Luxemburg SA 144A sr. notes 5 5/8s, | | | |
| 2020 (Luxembourg) | | 1,055,000 | 1,031,918 |
|
| GrafTech International, Ltd. 144A company guaranty sr. unsec. | | | |
| notes 6 3/8s, 2020 | | 725,000 | 754,000 |
|
| Kratos Defense & Security Solutions, Inc. company guaranty sr. | | | |
| notes 10s, 2017 | | 1,339,000 | 1,459,510 |
|
| Legrand France SA sr. unsec. unsub. debs 8 1/2s, 2025 (France) | | 3,585,000 | 4,699,706 |
|
| Manitowoc Co., Inc. (The) company guaranty sr. unsec. notes | | | |
| 5 7/8s, 2022 | | 610,000 | 648,125 |
|
| MasTec, Inc. company guaranty sr. unsec. unsub. notes | | | |
| 4 7/8s, 2023 | | 1,070,000 | 1,055,288 |
|
| Mueller Water Products, Inc. company guaranty sr. unsec. | | | |
| unsub. notes 8 3/4s, 2020 | | 160,000 | 180,800 |
|
| Pittsburgh Glass Works, LLC 144A sr. notes 8 1/2s, 2016 | | 3,021,000 | 3,111,630 |
|
| Polypore International, Inc. company guaranty sr. unsec. notes | | | |
| 7 1/2s, 2017 | | 2,900,000 | 3,102,999 |
|
| Rexel SA 144A company guaranty sr. unsec. unsub. notes | | | |
| 6 1/8s, 2019 (France) | | 2,315,000 | 2,500,200 |
|
| Reynolds Group Issuer, Inc. Reynolds Group Issuer, LLC/ | | | |
| Reynolds Group Issuer Lu company guaranty sr. notes | | | |
| 7 7/8s, 2019 | | 985,000 | 1,078,575 |
|
| Reynolds Group Issuer, Inc./Reynolds Group Issuer, LLC/ | | | |
| Reynolds Group Issuer Lu company guaranty sr. notes | | | |
| 5 3/4s, 2020 | | 925,000 | 938,875 |
|
| Reynolds Group Issuer, Inc./Reynolds Group Issuer, LLC/ | | | |
| Reynolds Group Issuer Lu company guaranty sr. unsec. unsub. | | | |
| notes 9 7/8s, 2019 | | 2,665,000 | 2,904,850 |
|
| Reynolds Group Issuer, Inc./Reynolds Group Issuer, LLC/ | | | |
| Reynolds Group Issuer Lu company guaranty sr. unsec. unsub. | | | |
| notes 9s, 2019 | | 635,000 | 666,750 |
|
| Reynolds Group Issuer, Inc./Reynolds Group Issuer, LLC/ | | | |
| Reynolds Group Issuer Lu company guaranty sr. unsec. unsub. | | | |
| notes 8 1/4s, 2021 (New Zealand) | | 440,000 | 448,800 |
|
| |
| High Yield Advantage Fund | 23 |
| | |
| CORPORATE BONDS AND NOTES (88.7%)* cont. | Principal amount | Value |
|
| Capital goods cont. | | |
| Silver II Borrower/Silver II US Holdings, LLC 144A company | | |
| guaranty sr. unsec. unsub. notes 7 3/4s, 2020 (Luxembourg) | $735,000 | $762,563 |
|
| Tenneco, Inc. company guaranty sr. unsec. unsub. notes | | |
| 7 3/4s, 2018 | 625,000 | 676,563 |
|
| Tenneco, Inc. company guaranty sr. unsub. notes 6 7/8s, 2020 | 1,530,000 | 1,667,700 |
|
| Terex Corp. company guaranty sr. unsec. unsub. notes | | |
| 6 1/2s, 2020 | 410,000 | 439,725 |
|
| Terex Corp. company guaranty sr. unsec. unsub. notes 6s, 2021 | 2,550,000 | 2,696,625 |
|
| Thermadyne Holdings Corp. company guaranty sr. | | |
| notes 9s, 2017 | 2,205,000 | 2,403,450 |
|
| TransDigm, Inc. company guaranty unsec. sub. notes | | |
| 7 3/4s, 2018 | 2,100,000 | 2,291,625 |
|
| Triumph Group, Inc. 144A sr. unsec. notes 4 7/8s, 2021 | 1,410,000 | 1,438,200 |
|
| | | 67,731,022 |
| Coal (1.0%) | | |
| Alpha Natural Resources, Inc. company guaranty sr. unsec. | | |
| notes 6 1/4s, 2021 | 460,000 | 411,700 |
|
| Alpha Natural Resources, Inc. company guaranty sr. unsec. | | |
| notes 6s, 2019 | 1,175,000 | 1,057,500 |
|
| CONSOL Energy, Inc. company guaranty sr. unsec. notes | | |
| 8 1/4s, 2020 | 4,355,000 | 4,812,274 |
|
| CONSOL Energy, Inc. company guaranty sr. unsec. | | |
| notes 8s, 2017 | 2,085,000 | 2,230,950 |
|
| Murray Energy Corp. 144A company guaranty sr. notes | | |
| 8 5/8s, 2021 | 190,000 | 196,175 |
|
| Peabody Energy Corp. company guaranty sr. unsec. notes | | |
| 7 3/8s, 2016 | 550,000 | 627,000 |
|
| Peabody Energy Corp. company guaranty sr. unsec. unsub. | | |
| notes 6 1/2s, 2020 | 150,000 | 161,625 |
|
| Peabody Energy Corp. company guaranty sr. unsec. unsub. | | |
| notes 6s, 2018 | 225,000 | 240,750 |
|
| | | 9,737,974 |
| Commercial and consumer services (1.5%) | | |
| Ashtead Capital, Inc. 144A company guaranty sr. notes | | |
| 6 1/2s, 2022 | 700,000 | 759,500 |
|
| Igloo Holdings Corp. 144A sr. unsec. unsub. notes | | |
| 8 1/4s, 2017 ‡‡ | 3,080,000 | 3,164,699 |
|
| Interactive Data Corp. company guaranty sr. unsec. notes | | |
| 10 1/4s, 2018 | 320,000 | 359,200 |
|
| Lender Processing Services, Inc. company guaranty sr. unsec. | | |
| unsub. notes 5 3/4s, 2023 | 2,330,000 | 2,580,475 |
|
| Rural/Metro Corp. 144A sr. unsec. notes 10 1/8s, 2019 | 925,000 | 814,000 |
|
| Sabre Holdings Corp. sr. unsec. unsub. notes 8.35s, 2016 | 2,780,000 | 3,120,549 |
|
| Sabre, Inc. 144A sr. notes 8 1/2s, 2019 | 1,900,000 | 2,094,750 |
|
| Travelport, LLC company guaranty sr. unsec. sub. notes | | |
| 11 7/8s, 2016 | 840,000 | 795,900 |
|
| Travelport, LLC/Travelport Holdings, Inc. 144A company | | |
| guaranty sr. unsec. unsub. notes 13 7/8s, 2016 ‡‡ | 1,004,750 | 1,039,916 |
|
| | | 14,728,989 |
| |
| 24 | High Yield Advantage Fund |
| | |
| CORPORATE BONDS AND NOTES (88.7%)* cont. | Principal amount | Value |
|
| Consumer (0.1%) | | |
| Spectrum Brands Escrow Corp. 144A sr. unsec. notes | | |
| 6 5/8s, 2022 | $90,000 | $97,200 |
|
| Spectrum Brands Escrow Corp. 144A sr. unsec. notes | | |
| 6 3/8s, 2020 | 110,000 | 118,250 |
|
| Spectrum Brands, Inc. company guaranty sr. unsec. unsub. | | |
| notes 6 3/4s, 2020 | 1,120,000 | 1,203,999 |
|
| | | 1,419,449 |
| Consumer staples (6.3%) | | |
| Avis Budget Car Rental, LLC company guaranty sr. unsec. | | |
| unsub. notes 9 3/4s, 2020 | 470,000 | 550,488 |
|
| Avis Budget Car Rental, LLC company guaranty sr. unsec. | | |
| unsub. notes 8 1/4s, 2019 | 430,000 | 468,163 |
|
| Avis Budget Car Rental, LLC/Avis Budget Finance, Inc. 144A | | |
| sr. unsec. notes 5 1/2s, 2023 | 705,000 | 712,050 |
|
| B&G Foods, Inc. company guaranty sr. unsec. notes | | |
| 4 5/8s, 2021 | 945,000 | 945,000 |
|
| Burger King Corp. company guaranty sr. unsec. notes | | |
| 9 7/8s, 2018 | 550,000 | 621,500 |
|
| Carrols Restaurant Group, Inc. company guaranty sr. notes | | |
| 11 1/4s, 2018 | 1,260,000 | 1,422,225 |
|
| Claire’s Stores, Inc. company guaranty sr. notes 8 7/8s, 2019 | 1,875,000 | 2,010,937 |
|
| Claire’s Stores, Inc. 144A company guaranty sr. notes | | |
| 6 1/8s, 2020 | 475,000 | 496,375 |
|
| Claire’s Stores, Inc. 144A company guaranty sr. unsec. notes | | |
| 9 5/8s, 2015 | 494 | 495 |
|
| Claire’s Stores, Inc. 144A sr. notes 9s, 2019 | 2,150,000 | 2,424,125 |
|
| Constellation Brands, Inc. company guaranty sr. unsec. notes | | |
| 4 1/4s, 2023 | 470,000 | 461,775 |
|
| Constellation Brands, Inc. company guaranty sr. unsec. notes | | |
| 3 3/4s, 2021 | 190,000 | 185,250 |
|
| Constellation Brands, Inc. company guaranty sr. unsec. unsub. | | |
| notes 7 1/4s, 2016 | 2,135,000 | 2,460,588 |
|
| Constellation Brands, Inc. company guaranty sr. unsec. unsub. | | |
| notes 6s, 2022 | 735,000 | 825,038 |
|
| Corrections Corp. of America 144A sr. unsec. notes | | |
| 4 5/8s, 2023 R | 475,000 | 482,125 |
|
| Corrections Corp. of America 144A sr. unsec. notes | | |
| 4 1/8s, 2020 R | 380,000 | 381,425 |
|
| Dave & Buster’s, Inc. company guaranty sr. unsec. unsub. | | |
| notes 11s, 2018 | 1,930,000 | 2,166,425 |
|
| Dean Foods Co. company guaranty sr. unsec. unsub. | | |
| notes 7s, 2016 | 1,830,000 | 2,065,613 |
|
| DineEquity, Inc. company guaranty sr. unsec. notes 9 1/2s, 2018 | 3,686,000 | 4,146,750 |
|
| Elizabeth Arden, Inc. sr. unsec. unsub. notes 7 3/8s, 2021 | 1,415,000 | 1,575,956 |
|
| ESAL GmbH 144A company guaranty sr. unsec. notes 6 1/4s, | | |
| 2023 (Austria) | 1,275,000 | 1,276,011 |
|
| Hawk Acquisition Sub, Inc. 144A sr. notes 4 1/4s, 2020 | 2,130,000 | 2,114,024 |
|
| Hertz Corp. (The) company guaranty sr. unsec. notes | | |
| 6 1/4s, 2022 | 870,000 | 945,038 |
|
| Hertz Corp. (The) company guaranty sr. unsec. notes | | |
| 7 1/2s, 2018 | 570,000 | 619,875 |
|
| |
| High Yield Advantage Fund | 25 |
| | | |
| CORPORATE BONDS AND NOTES (88.7%)* cont. | | Principal amount | Value |
|
| Consumer staples cont. | | | |
| Hertz Corp. (The) company guaranty sr. unsec. notes | | | |
| 5 7/8s, 2020 | | $945,000 | $996,975 |
|
| Hertz Holdings Netherlands BV 144A sr. bonds 8 1/2s, | | | |
| 2015 (Netherlands) | EUR | 1,600,000 | 2,185,971 |
|
| JBS USA, LLC/JBS USA Finance, Inc. company guaranty sr. | | | |
| unsec. notes 11 5/8s, 2014 (Brazil) | | $585,000 | 628,875 |
|
| JBS USA, LLC/JBS USA Finance, Inc. 144A sr. unsec. notes | | | |
| 8 1/4s, 2020 (Brazil) | | 540,000 | 592,650 |
|
| JBS USA, LLC/JBS USA Finance, Inc. 144A sr. unsec. notes | | | |
| 7 1/4s, 2021 (Brazil) | | 2,465,000 | 2,643,712 |
|
| Landry’s Holdings II, Inc. 144A sr. unsec. notes 10 1/4s, 2018 | | 1,455,000 | 1,542,300 |
|
| Landry’s Inc. 144A sr. unsec. notes 9 3/8s, 2020 | | 1,595,000 | 1,734,563 |
|
| Libbey Glass, Inc. company guaranty sr. notes 6 7/8s, 2020 | | 864,000 | 937,440 |
|
| Michael Foods, Inc. company guaranty sr. unsec. notes | | | |
| 9 3/4s, 2018 | | 715,000 | 797,225 |
|
| Post Holdings, Inc. company guaranty sr. unsec. notes | | | |
| 7 3/8s, 2022 | | 1,300,000 | 1,447,875 |
|
| Prestige Brands, Inc. company guaranty sr. unsec. notes | | | |
| 8 1/4s, 2018 | | 2,040,000 | 2,203,200 |
|
| Revlon Consumer Products Corp. 144A company guaranty sr. | | | |
| unsec. notes 5 3/4s, 2021 | | 1,890,000 | 1,923,075 |
|
| Rite Aid Corp. company guaranty sr. notes 10 1/4s, 2019 | | 515,000 | 590,319 |
|
| Rite Aid Corp. company guaranty sr. notes 7 1/2s, 2017 | | 1,340,000 | 1,376,850 |
|
| Rite Aid Corp. company guaranty sr. unsec. unsub. notes | | | |
| 9 1/2s, 2017 | | 2,670,000 | 2,763,450 |
|
| Rite Aid Corp. company guaranty sr. unsec. unsub. notes | | | |
| 9 1/4s, 2020 | | 2,280,000 | 2,573,549 |
|
| Rite Aid Corp. company guaranty sr. unsub. notes 8s, 2020 | | 445,000 | 500,625 |
|
| Smithfield Foods, Inc. sr. unsec. unsub. notes 6 5/8s, 2022 | | 1,245,000 | 1,416,188 |
|
| Spectrum Brands Holdings, Inc. company guaranty sr. notes | | | |
| 9 1/2s, 2018 | | 2,405,000 | 2,660,531 |
|
| United Rentals North America, Inc. company guaranty sr. unsec. | | | |
| notes 7 5/8s, 2022 | | 1,605,000 | 1,777,538 |
|
| United Rentals North America, Inc. company guaranty sr. unsec. | | | |
| unsub. notes 9 1/4s, 2019 | | 1,815,000 | 2,044,144 |
|
| Wells Enterprises, Inc. 144A sr. notes 6 3/4s, 2020 | | 965,000 | 1,034,963 |
|
| | | | 63,729,269 |
| Energy (oil field) (0.9%) | | | |
| FTS International Services, LLC/FTS International Bonds, Inc. | | | |
| 144A company guaranty sr. unsec. unsub. notes 8 1/8s, 2018 | | 1,737,000 | 1,849,905 |
|
| Hiland Partners LP/Hiland Partners Finance Corp. 144A | | | |
| company guaranty sr. notes 7 1/4s, 2020 | | 910,000 | 991,900 |
|
| Key Energy Services, Inc. company guaranty unsec. unsub. | | | |
| notes 6 3/4s, 2021 | | 1,785,000 | 1,807,313 |
|
| Offshore Group Investment, Ltd. company guaranty sr. notes | | | |
| 7 1/2s, 2019 (Cayman Islands) | | 2,205,000 | 2,390,616 |
|
| Offshore Group Investment, Ltd. 144A company guaranty sr. | | | |
| notes 7 1/8s, 2023 (Cayman Islands) | | 1,410,000 | 1,455,825 |
|
| Trinidad Drilling, Ltd. 144A sr. unsec. notes 7 7/8s, | | | |
| 2019 (Canada) | | 325,000 | 349,375 |
|
| | | | 8,844,934 |
| |
| 26 | High Yield Advantage Fund |
| | | |
| CORPORATE BONDS AND NOTES (88.7%)* cont. | | Principal amount | Value |
|
| Entertainment (1.1%) | | | |
| AMC Entertainment, Inc. company guaranty sr. sub. notes | | | |
| 9 3/4s, 2020 | | $2,010,000 | $2,321,549 |
|
| Carmike Cinemas, Inc. company guaranty notes 7 3/8s, 2019 | | 820,000 | 904,050 |
|
| Cedar Fair LP/Canada’s Wonderland Co./Magnum Management | | | |
| Corp. company guaranty sr. unsec. notes 9 1/8s, 2018 | | 255,000 | 283,050 |
|
| Cedar Fair LP/Canada’s Wonderland Co./Magnum Management | | | |
| Corp. 144A company guaranty sr. unsec. notes 5 1/4s, 2021 | | 945,000 | 945,000 |
|
| Cinemark USA, Inc. company guaranty sr. unsec. notes | | | |
| 8 5/8s, 2019 | | 160,000 | 179,520 |
|
| Cinemark USA, Inc. company guaranty sr. unsec. notes | | | |
| 5 1/8s, 2022 | | 480,000 | 487,200 |
|
| Cinemark USA, Inc. company guaranty sr. unsec. sub. notes | | | |
| 7 3/8s, 2021 | | 1,105,000 | 1,234,838 |
|
| Cinemark USA, Inc. 144A company guaranty sr. unsec. notes | | | |
| 4 7/8s, 2023 | | 235,000 | 234,119 |
|
| Regal Entertainment Group company guaranty sr. unsec. notes | | | |
| 9 1/8s, 2018 | | 1,930,000 | 2,200,199 |
|
| Regal Entertainment Group sr. unsec. notes 5 3/4s, 2025 | | 730,000 | 726,350 |
|
| Regal Entertainment Group sr. unsec. notes 5 3/4s, 2023 ## | | 705,000 | 706,763 |
|
| Six Flags Entertainment Corp. 144A company guaranty | | | |
| sr. unsec. unsub. notes 5 1/4s, 2021 | | 1,180,000 | 1,185,900 |
|
| | | | 11,408,538 |
| Financials (8.7%) | | | |
| A-S Co-Issuer Subsidiary, Inc./A-S Merger Sub., LLC 144A | | | |
| sr. unsec. notes 7 7/8s, 2020 | | 1,700,000 | 1,793,500 |
|
| ACE Cash Express, Inc. 144A sr. notes 11s, 2019 | | 975,000 | 970,125 |
|
| Air Lease Corp. company guaranty sr. unsec. unsub. notes | | | |
| 4 3/4s, 2020 | | 865,000 | 884,463 |
|
| Air Lease Corp. sr. unsec. notes 6 1/8s, 2017 | | 1,385,000 | 1,492,338 |
|
| Ally Financial, Inc. company guaranty sr. unsec. unsub. | | | |
| notes 8s, 2020 | | 795,000 | 946,050 |
|
| Ally Financial, Inc. company guaranty sr. unsec. unsub. notes | | | |
| 7 1/2s, 2020 | | 2,620,000 | 3,058,849 |
|
| Ally Financial, Inc. unsec. sub. notes 8s, 2018 | | 1,331,000 | 1,557,270 |
|
| American International Group, Inc. jr. sub. FRB bonds | | | |
| 8.175s, 2068 | | 1,905,000 | 2,495,550 |
|
| BBVA International Preferred SAU bank guaranty jr. unsec. sub. | | | |
| FRN notes 5.919s, perpetual maturity (Spain) | | 790,000 | 742,600 |
|
| CB Richard Ellis Services, Inc. company guaranty sr. unsec. notes | | | |
| 6 5/8s, 2020 | | 885,000 | 955,800 |
|
| CB Richard Ellis Services, Inc. company guaranty sr. unsec. sub. | | | |
| notes 11 5/8s, 2017 | | 990,000 | 1,050,390 |
|
| CBRE Services, Inc. company guaranty sr. unsec. unsub. | | | |
| notes 5s, 2023 | | 285,000 | 284,288 |
|
| CIT Group, Inc. sr. unsec. notes 5s, 2022 | | 845,000 | 899,925 |
|
| CIT Group, Inc. sr. unsec. unsub. notes 5 3/8s, 2020 | | 1,145,000 | 1,233,738 |
|
| CIT Group, Inc. 144A company guaranty notes 6 5/8s, 2018 | | 1,290,000 | 1,451,250 |
|
| CIT Group, Inc. 144A company guaranty notes 5 1/2s, 2019 | | 1,975,000 | 2,137,937 |
|
| Citigroup, Inc. unsec. sub. notes 4 3/4s, 2019 | EUR | 565,000 | 736,973 |
|
| CNG Holdings, Inc./OH 144A sr. notes 9 3/8s, 2020 | | $680,000 | 676,600 |
|
| |
| High Yield Advantage Fund | 27 |
| | | |
| CORPORATE BONDS AND NOTES (88.7%)* cont. | | Principal amount | Value |
|
| Financials cont. | | | |
| CNO Financial Group, Inc. 144A company guaranty sr. notes | | | |
| 6 3/8s, 2020 | | $965,000 | $1,051,850 |
|
| Community Choice Financial, Inc. company guaranty sr. notes | | | |
| 10 3/4s, 2019 | | 1,675,000 | 1,649,875 |
|
| Dresdner Funding Trust I 144A bonds 8.151s, 2031 | | 3,310,000 | 3,525,150 |
|
| E*Trade Financial Corp. sr. unsec. unsub. notes 6 3/8s, 2019 | | 2,770,000 | 2,908,500 |
|
| HBOS Capital Funding LP 144A bank guaranty jr. unsec. sub. | | | |
| FRB bonds 6.071s, perpetual maturity (Jersey) | | 1,155,000 | 1,053,938 |
|
| HBOS PLC 144A sr. unsec. sub. notes 6 3/4s, 2018 | | | |
| (United Kingdom) | | 1,800,000 | 2,020,196 |
|
| HBOS PLC 144A unsec. sub. bonds 6s, 2033 (United Kingdom) | | 650,000 | 632,931 |
|
| Hub International Ltd. 144A company guaranty sr. notes | | | |
| 8 1/8s, 2018 | | 365,000 | 389,638 |
|
| Icahn Enterprises LP/Icahn Enterprises Finance Corp. company | | | |
| guaranty sr. unsec. notes 8s, 2018 | | 3,565,000 | 3,778,900 |
|
| International Lease Finance Corp. sr. unsec. notes 6 1/4s, 2019 | | 1,440,000 | 1,569,600 |
|
| International Lease Finance Corp. sr. unsec. unsub. notes | | | |
| 5 7/8s, 2022 | | 1,695,000 | 1,813,650 |
|
| International Lease Finance Corp. sr. unsec. unsub. notes | | | |
| 4 7/8s, 2015 | | 630,000 | 655,200 |
|
| International Lease Finance Corp. sr. unsec. unsub. notes | | | |
| 4 5/8s, 2021 | | 660,000 | 653,400 |
|
| iStar Financial, Inc. sr. unsec. notes 7 1/8s, 2018 R | | 1,025,000 | 1,107,000 |
|
| iStar Financial, Inc. sr. unsec. unsub. notes Ser. B, 9s, 2017 R | | 1,255,000 | 1,455,800 |
|
| LBG Capital No. 1 PLC 144A jr. unsec. sub. FRN notes 8s, | | | |
| perpetual maturity (United Kingdom) | | 785,000 | 835,044 |
|
| Liberty Mutual Group, Inc. 144A company guaranty jr. unsec. | | | |
| sub. FRN notes 7s, 2037 | | 195,000 | 203,775 |
|
| Liberty Mutual Group, Inc. 144A company guaranty jr. unsec. | | | |
| sub. bonds 7.8s, 2037 | | 970,000 | 1,159,150 |
|
| Lloyds TSB Bank PLC jr. sub. FRN notes Ser. EMTN, 13s, | | | |
| perpetual maturity (United Kingdom) | GBP | 1,265,000 | 2,945,275 |
|
| MPT Operating Partnership LP/MPT Finance Corp. company | | | |
| guaranty sr. unsec. notes 6 7/8s, 2021 R | | $640,000 | 707,200 |
|
| MPT Operating Partnership LP/MPT Finance Corp. company | | | |
| guaranty sr. unsec. unsub. notes 6 3/8s, 2022 R | | 915,000 | 1,001,925 |
|
| National Money Mart Co. company guaranty sr. unsec. unsub. | | | |
| notes 10 3/8s, 2016 (Canada) | | 810,000 | 867,713 |
|
| Nationstar Mortgage, LLC/Nationstar Capital Corp. 144A | | | |
| company guaranty sr. unsec. notes 9 5/8s, 2019 | | 410,000 | 469,450 |
|
| Nationstar Mortgage, LLC/Nationstar Capital Corp. 144A | | | |
| company guaranty sr. unsec. notes 7 7/8s, 2020 | | 1,555,000 | 1,702,725 |
|
| Nationstar Mortgage, LLC/Nationstar Capital Corp. 144A | | | |
| company guaranty sr. unsec. unsub. notes 9 5/8s, 2019 | | 270,000 | 307,800 |
|
| Nationstar Mortgage, LLC/Nationstar Capital Corp. 144A | | | |
| company guaranty sr. unsec. unsub. notes 6 1/2s, 2021 | | 800,000 | 816,000 |
|
| Neuberger Berman Group LLC/Neuberger Berman Finance | | | |
| Corp. 144A sr. notes 5 7/8s, 2022 | | 1,365,000 | 1,457,138 |
|
| Neuberger Berman Group LLC/Neuberger Berman Finance | | | |
| Corp. 144A sr. notes 5 5/8s, 2020 | | 685,000 | 724,388 |
|
| Nuveen Investments, Inc. 144A sr. unsec. notes 9 1/2s, 2020 | | 1,275,000 | 1,367,438 |
|
| |
| 28 | High Yield Advantage Fund |
| | | |
| CORPORATE BONDS AND NOTES (88.7%)* cont. | | Principal amount | Value |
|
| Financials cont. | | | |
| Nuveen Investments, Inc. 144A sr. unsec. notes 9 1/8s, 2017 | | $910,000 | $955,500 |
|
| Onex USI Acquisition Corp. 144A sr. unsec. notes 7 3/4s, 2021 | | 1,905,000 | 1,985,963 |
|
| PHH Corp. sr. unsec. unsub. notes 9 1/4s, 2016 | | 1,360,000 | 1,581,000 |
|
| PHH Corp. sr. unsec. unsub. notes 7 3/8s, 2019 | | 1,115,000 | 1,268,313 |
|
| Provident Funding Associates LP/PFG Finance Corp. 144A | | | |
| company guaranty sr. unsec. notes 6 3/4s, 2021 | | 1,515,000 | 1,541,513 |
|
| Provident Funding Associates LP/PFG Finance Corp. 144A | | | |
| sr. notes 10 1/8s, 2019 | | 935,000 | 1,047,200 |
|
| Regions Bank unsec. sub. notes 7 1/2s, 2018 | | 600,000 | 728,087 |
|
| Residential Capital LLC company guaranty jr. notes 9 5/8s, 2015 | | | |
| (In default) † | | 2,855,000 | 3,090,537 |
|
| Royal Bank of Scotland PLC (The) jr. sub. FRN notes Ser. MTN, | | | |
| 7.64s, perpetual maturity (United Kingdom) | | 1,000,000 | 965,000 |
|
| Royal Bank of Scotland PLC (The) jr. unsec. sub. FRB bonds | | | |
| 7.648s, perpetual maturity (United Kingdom) | | 3,850,000 | 4,052,125 |
|
| SLM Corp. sr. unsec. unsub. notes Ser. MTN, 8.45s, 2018 | | 3,455,000 | 3,835,050 |
|
| Springleaf Finance Corp. sr. unsec. notes Ser. MTN, 6.9s, 2017 | | 3,930,000 | 4,072,463 |
|
| Springleaf Finance Corp. 144A sr. unsec. notes 6s, 2020 | | 800,000 | 772,000 |
|
| | | | 88,093,046 |
| Gaming and lottery (2.8%) | | | |
| American Casino & Entertainment Properties LLC | | | |
| sr. notes 11s, 2014 | | 2,160,000 | 2,162,700 |
|
| Caesars Entertainment Operating Co., Inc. company guaranty | | | |
| sr. notes 10s, 2018 | | 407,000 | 252,340 |
|
| Caesars Entertainment Operating Co., Inc. sr. notes | | | |
| 11 1/4s, 2017 | | 1,785,000 | 1,865,325 |
|
| Caesars Entertainment Operating Co., Inc. 144A company | | | |
| guaranty sr. notes 9s, 2020 | | 5,495,000 | 5,288,937 |
|
| CCM Merger, Inc. 144A company guaranty sr. unsec. notes | | | |
| 9 1/8s, 2019 | | 1,150,000 | 1,262,125 |
|
| Great Canadian Gaming Corp. 144A company guaranty | | | |
| sr. unsec. notes 6 5/8s, 2022 (Canada) | CAD | 2,410,000 | 2,454,516 |
|
| Isle of Capri Casinos, Inc. company guaranty sr. unsec. notes | | | |
| 5 7/8s, 2021 | | $655,000 | 651,725 |
|
| Isle of Capri Casinos, Inc. company guaranty sr. unsec. sub. | | | |
| notes 8 7/8s, 2020 | | 1,100,000 | 1,204,500 |
|
| Isle of Capri Casinos, Inc. company guaranty sr. unsec. unsub. | | | |
| notes 7 3/4s, 2019 | | 1,145,000 | 1,236,600 |
|
| Mashantucket Western Pequot Tribe 144A bonds Ser. A, 8 1/2s, | | | |
| 2015 (In default) † | | 1,995,000 | 139,650 |
|
| MTR Gaming Group, Inc. company guaranty notes | | | |
| 11 1/2s, 2019 ‡‡ | | 4,228,496 | 4,540,347 |
|
| Pinnacle Entertainment, Inc. company guaranty sr. unsec. notes | | | |
| 8 5/8s, 2017 | | 410,000 | 428,963 |
|
| Rivers Pittsburgh Borrower LP/Rivers Pittsburgh Finance Corp. | | | |
| 144A sr. notes 9 1/2s, 2019 | | 1,295,000 | 1,424,500 |
|
| ROC Finance, LLC/ROC Finance 1 Corp. 144A notes | | | |
| 12 1/8s, 2018 | | 2,505,000 | 2,905,800 |
|
| Yonkers Racing Corp. 144A sr. notes 11 3/8s, 2016 | | 2,721,000 | 2,891,063 |
|
| | | | 28,709,091 |
| |
| High Yield Advantage Fund | 29 |
| | | |
| CORPORATE BONDS AND NOTES (88.7%)* cont. | | Principal amount | Value |
|
| Health care (7.2%) | | | |
| Acadia Healthcare Co., Inc. 144A company guaranty sr. unsec. | | | |
| notes 6 1/8s, 2021 | | $950,000 | $990,375 |
|
| AmSurg Corp. company guaranty sr. unsec. unsub. notes | | | |
| 5 5/8s, 2020 | | 1,480,000 | 1,539,200 |
|
| Aviv Healthcare Properties LP company guaranty sr. unsec. | | | |
| notes 7 3/4s, 2019 | | 1,200,000 | 1,311,000 |
|
| Biomet, Inc. 144A sr. unsec. notes 6 1/2s, 2020 | | 2,125,000 | 2,236,562 |
|
| Capella Healthcare, Inc. company guaranty sr. unsec. notes | | | |
| 9 1/4s, 2017 | | 1,785,000 | 1,912,181 |
|
| Capsugel FinanceCo SCA 144A company guaranty sr. unsec. | | | |
| notes 9 7/8s, 2019 | EUR | 1,890,000 | 2,789,951 |
|
| CDRT Holding Corp. 144A sr. unsec. notes 9 1/4s, 2017 ‡‡ | | $2,670,000 | 2,743,425 |
|
| CHS/Community Health Systems, Inc. company guaranty | | | |
| sr. notes 5 1/8s, 2018 | | 1,570,000 | 1,644,575 |
|
| CHS/Community Health Systems, Inc. company guaranty | | | |
| sr. unsec. unsub. notes 8s, 2019 | | 625,000 | 687,500 |
|
| ConvaTec Healthcare E SA 144A sr. notes 7 3/8s, | | | |
| 2017 (Luxembourg) | EUR | 610,000 | 849,480 |
|
| ConvaTec Healthcare E SA 144A sr. unsec. notes 10 1/2s, | | | |
| 2018 (Luxembourg) | | $4,333,000 | 4,972,118 |
|
| Emergency Medical Services Corp. company guaranty sr. unsec. | | | |
| notes 8 1/8s, 2019 | | 1,065,000 | 1,160,850 |
|
| Endo Health Solutions, Inc. company guaranty sr. unsec. | | | |
| notes 7s, 2019 | | 895,000 | 962,125 |
|
| Fresenius Medical Care US Finance II, Inc. 144A company | | | |
| guaranty sr. unsec. notes 5 5/8s, 2019 | | 1,315,000 | 1,443,213 |
|
| HCA, Inc. company guaranty sr. notes 8 1/2s, 2019 | | 3,165,000 | 3,449,850 |
|
| HCA, Inc. sr. notes 6 1/2s, 2020 | | 5,040,000 | 5,695,201 |
|
| HCA, Inc. sr. unsec. notes 7 1/2s, 2022 | | 410,000 | 478,675 |
|
| Health Net, Inc. sr. unsec. bonds 6 3/8s, 2017 | | 2,980,000 | 3,199,775 |
|
| IASIS Healthcare, LLC/IASIS Capital Corp. company guaranty | | | |
| sr. unsec. notes 8 3/8s, 2019 | | 1,565,000 | 1,635,425 |
|
| IMS Health, Inc. 144A sr. unsec. notes 6s, 2020 | | 795,000 | 840,713 |
|
| Jaguar Holding Co. I 144A sr. unsec. notes 9 3/8s, 2017 ‡‡ | | 760,000 | 815,100 |
|
| Jaguar Holding Co. II/Jaguar Merger Sub, Inc. 144A sr. unsec. | | | |
| notes 9 1/2s, 2019 | | 1,825,000 | 2,082,781 |
|
| Kinetic Concepts, Inc./KCI USA, Inc. company guaranty notes | | | |
| 10 1/2s, 2018 | | 3,890,000 | 4,259,549 |
|
| Kinetic Concepts, Inc./KCI USA, Inc. company guaranty | | | |
| sr. unsec. notes 12 1/2s, 2019 | | 955,000 | 993,200 |
|
| Multiplan, Inc. 144A company guaranty sr. notes 9 7/8s, 2018 | | 1,515,000 | 1,696,800 |
|
| Omega Healthcare Investors, Inc. company guaranty sr. unsec. | | | |
| notes 6 3/4s, 2022 R | | 975,000 | 1,062,750 |
|
| Service Corporation International sr. notes 7s, 2019 | | 660,000 | 712,800 |
|
| Service Corporation International sr. notes 7s, 2017 | | 205,000 | 234,213 |
|
| Service Corporation International sr. unsec. unsub. notes | | | |
| 6 3/4s, 2016 | | 2,005,000 | 2,225,550 |
|
| Sky Growth Acquisition Corp. 144A company guaranty | | | |
| sr. unsec. notes 7 3/8s, 2020 | | 3,065,000 | 3,256,563 |
|
| |
| 30 | High Yield Advantage Fund |
| | |
| CORPORATE BONDS AND NOTES (88.7%)* cont. | Principal amount | Value |
|
| Health care cont. | | |
| Stewart Enterprises, Inc. company guaranty sr. unsec. notes | | |
| 6 1/2s, 2019 | $1,125,000 | $1,209,375 |
|
| Surgical Care Affiliates, Inc. 144A sr. sub. notes 10s, 2017 | 2,385,000 | 2,480,400 |
|
| Surgical Care Affiliates, Inc. 144A sr. unsec. notes 8 7/8s, 2015 | 577,149 | 580,035 |
|
| Teleflex, Inc. company guaranty sr. unsec. sub. notes | | |
| 6 7/8s, 2019 | 1,135,000 | 1,225,800 |
|
| Tenet Healthcare Corp. company guaranty sr. notes 6 1/4s, 2018 | 2,070,000 | 2,292,524 |
|
| Tenet Healthcare Corp. 144A company guaranty sr. notes | | |
| 4 1/2s, 2021 | 475,000 | 466,688 |
|
| Tenet Healthcare Corp. 144A company guaranty sr. notes | | |
| 4 3/8s, 2021 | 1,455,000 | 1,411,350 |
|
| United Surgical Partners International, Inc. company guaranty | | |
| sr. unsec. unsub. notes 9s, 2020 | 1,140,000 | 1,273,950 |
|
| Valeant Pharmaceuticals International 144A company guaranty | | |
| sr. notes 7s, 2020 | 250,000 | 269,375 |
|
| Valeant Pharmaceuticals International 144A company guaranty | | |
| sr. unsec. notes 6 7/8s, 2018 | 1,480,000 | 1,579,900 |
|
| Valeant Pharmaceuticals International 144A company guaranty | | |
| sr. unsec. notes 6 1/2s, 2016 | 1,185,000 | 1,226,475 |
|
| Valeant Pharmaceuticals International 144A sr. notes | | |
| 6 3/4s, 2017 | 780,000 | 832,650 |
|
| Valeant Pharmaceuticals International 144A company guaranty | | |
| sr. unsec. notes 6 3/4s, 2017 | 280,000 | 295,400 |
|
| | | 73,025,422 |
| Homebuilding (2.0%) | | |
| Beazer Homes USA, Inc. company guaranty sr. notes | | |
| 6 5/8s, 2018 | 750,000 | 812,813 |
|
| Beazer Homes USA, Inc. company guaranty sr. unsec. notes | | |
| 8 1/8s, 2016 | 1,025,000 | 1,137,750 |
|
| Beazer Homes USA, Inc. company guaranty sr. unsec. unsub. | | |
| notes 9 1/8s, 2018 | 190,000 | 205,200 |
|
| Beazer Homes USA, Inc. 144A company guaranty sr. unsec. | | |
| notes 7 1/4s, 2023 | 490,000 | 518,788 |
|
| Brookfield Residential Properties, Inc. 144A company guaranty | | |
| sr. unsec. notes 6 1/2s, 2020 (Canada) | 1,845,000 | 1,974,150 |
|
| K Hovnanian Enterprises, Inc. 144A company guaranty notes | | |
| 9 1/8s, 2020 | 465,000 | 526,613 |
|
| K Hovnanian Enterprises, Inc. 144A sr. notes 7 1/4s, 2020 | 435,000 | 479,588 |
|
| Lennar Corp. 144A company guaranty sr. unsec. notes 5s, 2022 | 630,000 | 630,000 |
|
| M/I Homes, Inc. company guaranty sr. unsec. notes 8 5/8s, 2018 | 2,995,000 | 3,309,474 |
|
| Mattamy Group Corp. 144A sr. unsec. notes 6 1/2s, | | |
| 2020 (Canada) | 1,355,000 | 1,351,613 |
|
| Pulte Group, Inc. company guaranty sr. unsec. notes | | |
| 7 5/8s, 2017 | 2,270,000 | 2,636,037 |
|
| Pulte Group, Inc. company guaranty sr. unsec. unsub. notes | | |
| 7 7/8s, 2032 | 1,215,000 | 1,366,875 |
|
| PulteGroup, Inc. company guaranty sr. unsec. unsub. | | |
| notes 6s, 2035 | 215,000 | 206,400 |
|
| Realogy Corp. 144A company guaranty sr. notes 9s, 2020 | 350,000 | 406,000 |
|
| Realogy Corp. 144A company guaranty sr. notes 7 7/8s, 2019 | 615,000 | 674,963 |
|
| Realogy Corp. 144A company guaranty sr. notes 7 5/8s, 2020 | 525,000 | 594,563 |
|
| |
| High Yield Advantage Fund | 31 |
| | |
| CORPORATE BONDS AND NOTES (88.7%)* cont. | Principal amount | Value |
|
| Homebuilding cont. | | |
| Taylor Morrison Communities, Inc./Monarch Communities, Inc. | | |
| 144A company guaranty sr. unsec. notes 7 3/4s, 2020 | $316,000 | $350,760 |
|
| Taylor Morrison Communities, Inc./Monarch Communities, Inc. | | |
| 144A company guaranty sr. unsec. notes 5 1/4s, 2021 | 660,000 | 664,950 |
|
| Taylor Morrison Communities, Inc./Monarch Communities, Inc. | | |
| 144A sr. notes 7 3/4s, 2020 | 1,805,000 | 2,012,575 |
|
| | | 19,859,112 |
| Household furniture and appliances (0.2%) | | |
| RSI Home Products, Inc. 144A company guaranty notes | | |
| 6 7/8s, 2018 | 1,565,000 | 1,619,775 |
|
| Tempur-Pedic International, Inc. 144A company guaranty | | |
| sr. unsec. unsub. notes 6 7/8s, 2020 | 425,000 | 458,469 |
|
| | | 2,078,244 |
| Lodging/Tourism (1.7%) | | |
| Choice Hotels International, Inc. company guaranty sr. unsec. | | |
| unsub. notes 5 3/4s, 2022 | 650,000 | 723,125 |
|
| CityCenter Holdings LLC/CityCenter Finance Corp. company | | |
| guaranty notes 10 3/4s, 2017 | 3,041,418 | 3,315,145 |
|
| CityCenter Holdings LLC/CityCenter Finance Corp. company | | |
| guaranty sr. notes 7 5/8s, 2016 | 800,000 | 850,000 |
|
| FelCor Lodging LP company guaranty sr. notes 10s, 2014 R | 1,105,000 | 1,209,975 |
|
| FelCor Lodging LP company guaranty sr. notes 6 3/4s, 2019 R | 2,365,000 | 2,524,638 |
|
| FelCor Lodging LP company guaranty sr. notes 5 5/8s, 2023 R | 450,000 | 457,875 |
|
| MGM Resorts International company guaranty sr. unsec. notes | | |
| 7 5/8s, 2017 | 2,235,000 | 2,550,694 |
|
| MGM Resorts International company guaranty sr. unsec. notes | | |
| 6 7/8s, 2016 | 535,000 | 588,500 |
|
| MGM Resorts International company guaranty sr. unsec. notes | | |
| 6 3/4s, 2020 | 1,110,000 | 1,209,900 |
|
| MGM Resorts International company guaranty sr. unsec. unsub. | | |
| notes 8 5/8s, 2019 | 1,440,000 | 1,702,800 |
|
| MGM Resorts International company guaranty sr. unsec. unsub. | | |
| notes 7 3/4s, 2022 | 915,000 | 1,052,250 |
|
| MGM Resorts International company guaranty sr. unsec. unsub. | | |
| notes 6 5/8s, 2021 | 360,000 | 389,700 |
|
| SugarHouse HSP Gaming Prop. Mezz LP/SugarHouse HSP | | |
| Gaming Finance Corp. 144A sr. notes 6 3/8s, 2021 | 345,000 | 346,725 |
|
| | | 16,921,327 |
| Media (0.2%) | | |
| Affinion Group Holdings, Inc. company guaranty sr. unsec. notes | | |
| 11 5/8s, 2015 | 675,000 | 374,625 |
|
| Nielsen Finance, LLC/Nielsen Finance Co. company guaranty | | |
| sr. unsec. notes 7 3/4s, 2018 | 438,000 | 481,800 |
|
| Nielsen Finance, LLC/Nielsen Finance Co. 144A sr. unsec. notes | | |
| 4 1/2s, 2020 | 1,065,000 | 1,070,324 |
|
| | | 1,926,749 |
| Oil and gas (11.0%) | | |
| Access Midstream Partners LP/ACMP Finance Corp. company | | |
| guaranty sr. unsec. unsub. notes 4 7/8s, 2023 | 2,895,000 | 2,858,813 |
|
| Access Midstream Partners, LP/ACMP Finance Corp. company | | |
| guaranty sr. unsec. notes 5 7/8s, 2021 | 980,000 | 1,038,800 |
|
| Access Midstream Partners, LP/ACMP Finance Corp. company | | |
| guaranty sr. unsec. unsub. notes 6 1/8s, 2022 | 500,000 | 535,000 |
|
| |
| 32 | High Yield Advantage Fund |
| | | |
| CORPORATE BONDS AND NOTES (88.7%)* cont. | | Principal amount | Value |
|
| Oil and gas cont. | | | |
| Athlon Holdings LP/Athlon Finance Corp. 144A company | | | |
| guaranty sr. unsec. notes 7 3/8s, 2021 | | $2,473,000 | $2,565,737 |
|
| Atlas Pipeline Partners LP/Atlas Pipeline Finance Corp. 144A | | | |
| company guaranty sr. notes 6 5/8s, 2020 | | 555,000 | 589,688 |
|
| Atwood Oceanics, Inc. sr. unsec. unsub. notes 6 1/2s, 2020 | | 1,020,000 | 1,092,675 |
|
| Aurora USA Oil & Gas Inc., 144A sr. notes 9 7/8s, 2017 | | 1,290,000 | 1,419,000 |
|
| Carrizo Oil & Gas, Inc. company guaranty sr. unsec. notes | | | |
| 8 5/8s, 2018 | | 3,479,000 | 3,792,110 |
|
| Chaparral Energy, Inc. company guaranty sr. unsec. notes | | | |
| 9 7/8s, 2020 | | 1,535,000 | 1,757,575 |
|
| Chaparral Energy, Inc. company guaranty sr. unsec. notes | | | |
| 8 1/4s, 2021 | | 1,900,000 | 2,099,500 |
|
| Chesapeake Energy Corp. company guaranty notes | | | |
| 6 1/2s, 2017 | | 220,000 | 242,000 |
|
| Chesapeake Energy Corp. company guaranty sr. unsec. bonds | | | |
| 6 1/4s, 2017 | EUR | 485,000 | 675,236 |
|
| Chesapeake Energy Corp. company guaranty sr. unsec. notes | | | |
| 9 1/2s, 2015 | | $1,445,000 | 1,611,175 |
|
| Chesapeake Energy Corp. company guaranty sr. unsec. notes | | | |
| 5 3/4s, 2023 | | 470,000 | 488,800 |
|
| Chesapeake Oilfield Operating, LLC/Chesapeake Oilfield | | | |
| Finance, Inc. 144A company guaranty sr. unsec. unsub. notes | | | |
| 6 5/8s, 2019 | | 1,650,000 | 1,732,500 |
|
| Comstock Resources, Inc. company guaranty sr. unsub. notes | | | |
| 8 3/8s, 2017 | | 1,090,000 | 1,144,500 |
|
| Concho Resources, Inc. company guaranty sr. unsec. notes | | | |
| 6 1/2s, 2022 | | 1,720,000 | 1,876,950 |
|
| Concho Resources, Inc. company guaranty sr. unsec. unsub. | | | |
| notes 5 1/2s, 2023 | | 970,000 | 993,038 |
|
| Concho Resources, Inc. company guaranty sr. unsec. unsub. | | | |
| notes 5 1/2s, 2022 | | 1,280,000 | 1,321,600 |
|
| Connacher Oil and Gas, Ltd. 144A notes 8 1/2s, 2019 (Canada) | | 1,410,000 | 817,800 |
|
| Continental Resources, Inc. company guaranty sr. unsec. | | | |
| notes 5s, 2022 | | 3,200,000 | 3,312,000 |
|
| Continental Resources, Inc. 144A company guaranty sr. unsec. | | | |
| unsub. notes 4 1/2s, 2023 | | 710,000 | 717,100 |
|
| Crosstex Energy LP/Crosstex Energy Finance Corp. company | | | |
| guaranty sr. unsec. notes 8 7/8s, 2018 | | 3,480,000 | 3,740,999 |
|
| Crosstex Energy LP/Crosstex Energy Finance Corp. company | | | |
| guaranty sr. unsec. notes 7 1/8s, 2022 | | 555,000 | 593,850 |
|
| CrownRock LP/CrownRock Finance, Inc. 144A sr. unsec. notes | | | |
| 7 1/8s, 2021 | | 960,000 | 988,800 |
|
| Denbury Resources, Inc. company guaranty sr. unsec. sub. notes | | | |
| 8 1/4s, 2020 | | 1,240,000 | 1,385,700 |
|
| Denbury Resources, Inc. company guaranty sr. unsec. sub. notes | | | |
| 6 3/8s, 2021 | | 825,000 | 905,438 |
|
| EXCO Resources, Inc. company guaranty sr. unsec. notes | | | |
| 7 1/2s, 2018 | | 3,140,000 | 3,124,300 |
|
| Ferrellgas LP/Ferrellgas Finance Corp. sr. unsec. notes | | | |
| 9 1/8s, 2017 | | 1,370,000 | 1,452,200 |
|
| |
| High Yield Advantage Fund | 33 |
| | |
| CORPORATE BONDS AND NOTES (88.7%)* cont. | Principal amount | Value |
|
| Oil and gas cont. | | |
| Forbes Energy Services Ltd. company guaranty sr. unsec. | | |
| notes 9s, 2019 | $1,045,000 | $1,024,100 |
|
| Goodrich Petroleum Corp. company guaranty sr. unsec. unsub. | | |
| notes 8 7/8s, 2019 | 2,630,000 | 2,702,325 |
|
| Gulfport Energy Corp. 144A company guaranty sr. unsec. notes | | |
| 7 3/4s, 2020 | 1,625,000 | 1,726,563 |
|
| Halcon Resources Corp. company guaranty sr. unsec. unsub. | | |
| notes 8 7/8s, 2021 | 4,129,000 | 4,201,258 |
|
| Hercules Offshore, Inc. 144A company guaranty sr. notes | | |
| 7 1/8s, 2017 | 390,000 | 419,250 |
|
| Hercules Offshore, Inc. 144A sr. notes 10 1/2s, 2017 | 2,020,000 | 2,171,500 |
|
| Kodiak Oil & Gas Corp. company guaranty sr. unsec. unsub. | | |
| notes 8 1/8s, 2019 | 3,380,000 | 3,802,499 |
|
| Laredo Petroleum, Inc. company guaranty sr. unsec. notes | | |
| 7 3/8s, 2022 | 555,000 | 610,500 |
|
| Laredo Petroleum, Inc. company guaranty sr. unsec. unsub. | | |
| notes 9 1/2s, 2019 | 2,380,000 | 2,695,350 |
|
| Linn Energy LLC/Linn Energy Finance Corp. 144A company | | |
| guaranty sr. unsec. notes 6 1/4s, 2019 | 2,475,000 | 2,493,563 |
|
| Lone Pine Resources Canada, Ltd. company guaranty sr. unsec. | | |
| notes 10 3/8s, 2017 (Canada) | 420,000 | 369,600 |
|
| MEG Energy Corp. 144A company guaranty sr. unsec. notes | | |
| 6 1/2s, 2021 (Canada) | 1,835,000 | 1,899,225 |
|
| MEG Energy Corp. 144A company guaranty sr. unsec. notes | | |
| 6 3/8s, 2023 (Canada) | 1,000,000 | 1,025,000 |
|
| Neon Capital, Ltd. 144A limited recourse notes Ser. 97, 1.105s, | | |
| 2013 (Cayman Islands) F | 6,684,836 | 777,387 |
|
| Newfield Exploration Co. sr. unsec. notes 5 3/4s, 2022 | 1,350,000 | 1,444,500 |
|
| Newfield Exploration Co. sr. unsec. sub. notes 7 1/8s, 2018 | 360,000 | 373,500 |
|
| Newfield Exploration Co. sr. unsec. sub. notes 6 7/8s, 2020 | 295,000 | 315,650 |
|
| Newfield Exploration Co. sr. unsec. unsub. notes 5 5/8s, 2024 | 1,088,000 | 1,142,400 |
|
| Northern Oil and Gas, Inc. company guaranty sr. unsec. | | |
| notes 8s, 2020 | 2,620,000 | 2,724,800 |
|
| Oasis Petroleum, Inc. company guaranty sr. unsec. notes | | |
| 6 7/8s, 2023 | 930,000 | 1,006,725 |
|
| PetroBakken Energy, Ltd. 144A sr. unsec. notes 8 5/8s, | | |
| 2020 (Canada) | 3,760,000 | 3,854,000 |
|
| Plains Exploration & Production Co. company guaranty | | |
| sr. unsec. notes 6 3/4s, 2022 | 2,775,000 | 3,101,063 |
|
| Quicksilver Resources, Inc. sr. notes 11 3/4s, 2016 | 710,000 | 752,600 |
|
| Range Resources Corp. company guaranty sr. sub. notes | | |
| 6 3/4s, 2020 | 640,000 | 692,800 |
|
| Range Resources Corp. company guaranty sr. unsec. sub. | | |
| notes 5s, 2022 | 640,000 | 649,600 |
|
| Rosetta Resources, Inc. company guaranty sr. unsec. notes | | |
| 9 1/2s, 2018 | 2,650,000 | 2,915,000 |
|
| Rosetta Resources, Inc. company guaranty sr. unsec. unsub. | | |
| notes 5 5/8s, 2021 | 565,000 | 566,413 |
|
| Sabine Pass LNG LP company guaranty sr. notes 7 1/2s, 2016 | 2,875,000 | 3,205,625 |
|
| Sabine Pass LNG LP 144A sr. notes 6 1/2s, 2020 | 690,000 | 722,775 |
|
| Samson Investment Co. 144A sr. unsec. notes 9 3/4s, 2020 | 3,905,000 | 4,070,962 |
|
| |
| 34 | High Yield Advantage Fund |
| | |
| CORPORATE BONDS AND NOTES (88.7%)* cont. | Principal amount | Value |
|
| Oil and gas cont. | | |
| SandRidge Energy, Inc. company guaranty sr. unsec. unsub. | | |
| notes 7 1/2s, 2021 | $415,000 | $427,450 |
|
| Seven Generations Energy Ltd. 144A sr. unsec. notes 8 1/4s, | | |
| 2020 (Canada) | 610,000 | 637,450 |
|
| Shelf Drilling Holdings Ltd. 144A sr. notes 8 5/8s, 2018 | 1,510,000 | 1,593,050 |
|
| SM Energy Co. sr. unsec. notes 6 5/8s, 2019 | 715,000 | 766,838 |
|
| SM Energy Co. sr. unsec. notes 6 1/2s, 2021 | 690,000 | 753,825 |
|
| SM Energy Co. sr. unsec. unsub. notes 6 1/2s, 2023 | 280,000 | 308,000 |
|
| Suburban Propane Partners LP/Suburban Energy Finance Corp. | | |
| sr. unsec. notes 7 3/8s, 2021 | 1,135,000 | 1,222,963 |
|
| Unit Corp. company guaranty sr. sub. notes 6 5/8s, 2021 | 1,845,000 | 1,955,700 |
|
| Whiting Petroleum Corp. company guaranty notes 7s, 2014 | 1,245,000 | 1,282,350 |
|
| Williams Cos., Inc. (The) notes 7 3/4s, 2031 | 1,113,000 | 1,368,794 |
|
| Williams Cos., Inc. (The) sr. unsec. notes 7 7/8s, 2021 | 335,000 | 421,029 |
|
| WPX Energy, Inc. sr. unsec. unsub. notes 6s, 2022 | 555,000 | 598,013 |
|
| WPX Energy, Inc. sr. unsec. unsub. notes 5 1/4s, 2017 | 2,270,000 | 2,411,874 |
|
| | | 112,076,753 |
| Publishing (0.1%) | | |
| Cenveo Corp. company guaranty sr. notes 8 7/8s, 2018 | 765,000 | 765,000 |
|
| | | 765,000 |
| Regional Bells (0.8%) | | |
| Cincinnati Bell, Inc. company guaranty sr. unsec. notes | | |
| 8 3/8s, 2020 | 300,000 | 318,750 |
|
| Cincinnati Bell, Inc. company guaranty sr. unsec. sub. notes | | |
| 8 3/4s, 2018 | 170,000 | 174,038 |
|
| Cincinnati Bell, Inc. company guaranty sr. unsec. sub. notes | | |
| 8 1/4s, 2017 | 855,000 | 899,888 |
|
| CyrusOne LP /CyrusOne Finance Corp. 144A company guaranty | | |
| sr. unsec. unsub. notes 6 3/8s, 2022 | 810,000 | 864,675 |
|
| Frontier Communications Corp. sr. unsec. notes 9 1/4s, 2021 | 535,000 | 623,275 |
|
| Frontier Communications Corp. sr. unsec. notes 8 1/2s, 2020 | 2,145,000 | 2,456,024 |
|
| Frontier Communications Corp. sr. unsec. notes 8 1/8s, 2018 | 2,160,000 | 2,486,700 |
|
| Frontier Communications Corp. sr. unsec. unsub. notes | | |
| 7 5/8s, 2024 | 470,000 | 493,500 |
|
| | | 8,316,850 |
| Retail (2.9%) | | |
| Academy, Ltd./Academy Finance Corp. 144A company | | |
| guaranty sr. unsec. notes 9 1/4s, 2019 | 995,000 | 1,114,400 |
|
| Autonation, Inc. company guaranty sr. unsec. notes | | |
| 6 3/4s, 2018 | 505,000 | 580,119 |
|
| Autonation, Inc. company guaranty sr. unsec. unsub. notes | | |
| 5 1/2s, 2020 | 450,000 | 488,250 |
|
| Bon-Ton Department Stores, Inc. (The) company guaranty notes | | |
| 10 5/8s, 2017 | 2,405,000 | 2,420,055 |
|
| Bon-Ton Department Stores, Inc. (The) 144A notes 8s, 2021 | 475,000 | 487,469 |
|
| Burlington Coat Factory Warehouse Corp. company guaranty | | |
| sr. unsec. notes 10s, 2019 | 1,705,000 | 1,903,206 |
|
| Burlington Holdings, LLC/Burlington Holding Finance, Inc. 144A | | |
| sr. unsec. notes 9s, 2018 ‡‡ | 380,000 | 386,175 |
|
| CST Brands, Inc. 144A company guaranty sr. unsec. | | |
| notes 5s, 2023 | 2,220,000 | 2,242,200 |
|
| |
| High Yield Advantage Fund | 35 |
| | |
| CORPORATE BONDS AND NOTES (88.7%)* cont. | Principal amount | Value |
|
| Retail cont. | | |
| Jo-Ann Stores Holdings, Inc. 144A sr. unsec. notes | | |
| 9 3/4s, 2019 ‡‡ | $705,000 | $749,944 |
|
| L Brands, Inc. company guaranty sr. unsec. notes 6 5/8s, 2021 | 2,090,000 | 2,393,049 |
|
| L Brands, Inc. sr. notes 5 5/8s, 2022 | 685,000 | 732,950 |
|
| Macy’s Retail Holdings, Inc. company guaranty sr. unsec. | | |
| notes 5.9s, 2016 | 619,000 | 711,547 |
|
| Michaels Stores, Inc. company guaranty notes 11 3/8s, 2016 | 1,631,000 | 1,706,450 |
|
| Needle Merger Sub Corp. 144A sr. unsec. notes 8 1/8s, 2019 | 2,205,000 | 2,320,762 |
|
| Neiman-Marcus Group, Inc. (The) company guaranty sr. notes | | |
| 7 1/8s, 2028 | 1,230,000 | 1,279,200 |
|
| New Academy Finance Co., LLC/New Academy Finance Corp. | | |
| 144A sr. unsec. notes 8s, 2018 ‡‡ | 2,225,000 | 2,294,531 |
|
| Penske Automotive Group, Inc. 144A company guaranty sr. sub. | | |
| notes 5 3/4s, 2022 | 1,350,000 | 1,422,563 |
|
| PETCO Animal Supplies, Inc. 144A company guaranty sr. notes | | |
| 9 1/4s, 2018 | 870,000 | 950,475 |
|
| Petco Holdings, Inc. 144A sr. notes 8 1/2s, 2017 ‡‡ | 925,000 | 950,438 |
|
| Rent-A-Center, Inc. 144A sr. unsec. notes 4 3/4s, 2021 | 1,110,000 | 1,096,125 |
|
| Toys R Us Property Co., LLC company guaranty sr. notes | | |
| 8 1/2s, 2017 | 1,420,000 | 1,503,425 |
|
| YCC Holdings, LLC/Yankee Finance, Inc. sr. unsec. notes | | |
| 10 1/4s, 2016 (no set date to PIK expiration) ‡‡ | 1,590,000 | 1,635,728 |
|
| | | 29,369,061 |
| Technology (4.1%) | | |
| Alcatel-Lucent USA, Inc. sr. unsec. unsub. notes 6.45s, 2029 | 1,670,000 | 1,340,175 |
|
| Avaya, Inc. 144A company guaranty notes 10 1/2s, 2021 | 1,030,000 | 865,200 |
|
| Avaya, Inc. 144A company guaranty sr. notes 7s, 2019 | 3,345,000 | 3,119,213 |
|
| Ceridian Corp. company guaranty sr. unsec. notes | | |
| 12 1/4s, 2015 ‡‡ | 2,350 | 2,421 |
|
| Ceridian Corp. sr. unsec. notes 11 1/4s, 2015 | 1,560,000 | 1,606,800 |
|
| Ceridian Corp. 144A sr. notes 8 7/8s, 2019 | 940,000 | 1,078,650 |
|
| Ceridian Corp. 144A sr. unsec. notes 11s, 2021 | 1,935,000 | 2,225,250 |
|
| Epicor Software Corp. company guaranty sr. unsec. notes | | |
| 8 5/8s, 2019 | 1,565,000 | 1,701,938 |
|
| First Data Corp. company guaranty sr. unsec. notes | | |
| 12 5/8s, 2021 | 3,480,000 | 3,801,900 |
|
| First Data Corp. 144A company guaranty notes 8 1/4s, 2021 | 3,370,000 | 3,572,199 |
|
| First Data Corp. 144A company guaranty sr. notes 7 3/8s, 2019 | 1,790,000 | 1,888,450 |
|
| First Data Corp. 144A company guaranty sr. unsec. notes | | |
| 11 1/4s, 2021 | 1,300,000 | 1,329,250 |
|
| First Data Corp. 144A company guaranty sr. unsec. sub. notes | | |
| 11 3/4s, 2021 | 1,330,000 | 1,286,775 |
|
| Freescale Semiconductor, Inc. company guaranty sr. unsec. | | |
| notes 10 3/4s, 2020 | 1,409,000 | 1,592,170 |
|
| Freescale Semiconductor, Inc. 144A company guaranty sr. notes | | |
| 10 1/8s, 2018 | 654,000 | 721,035 |
|
| Freescale Semiconductor, Inc. 144A company guaranty sr. notes | | |
| 9 1/4s, 2018 | 2,992,000 | 3,253,799 |
|
| Infor US, Inc. company guaranty sr. unsec. notes 9 3/8s, 2019 | 870,000 | 980,925 |
|
| |
| 36 | High Yield Advantage Fund |
| | |
| CORPORATE BONDS AND NOTES (88.7%)* cont. | Principal amount | Value |
|
| Technology cont. | | |
| Infor US, Inc. company guaranty sr. unsec. unsub. notes | | |
| 11 1/2s, 2018 | $1,160,000 | $1,360,100 |
|
| Iron Mountain, Inc. company guaranty sr. sub. notes | | |
| 7 3/4s, 2019 | 630,000 | 703,238 |
|
| Iron Mountain, Inc. company guaranty sr. unsec. sub. | | |
| notes 8s, 2020 | 75,000 | 78,000 |
|
| Iron Mountain, Inc. sr. sub. notes 8 3/8s, 2021 | 540,000 | 586,575 |
|
| Jazz Technologies, Inc. company guaranty sr. unsec. | | |
| notes 8s, 2015 | 899,000 | 845,060 |
|
| NXP BV/NXP Funding, LLC 144A sr. unsec. notes 5 3/4s, | | |
| 2023 (Netherlands) | 480,000 | 499,200 |
|
| Softbank Corp. 144A sr. unsec. notes 4 1/2s, 2020 (Japan) | 1,805,000 | 1,826,573 |
|
| SunGard Data Systems, Inc. 144A company guaranty sr. sub. | | |
| notes 6 5/8s, 2019 | 1,040,000 | 1,094,600 |
|
| SunGard Data Systems, Inc. 144A sr. unsec. notes 7 5/8s, 2020 | 1,615,000 | 1,776,500 |
|
| Syniverse Holdings, Inc. company guaranty sr. unsec. notes | | |
| 9 1/8s, 2019 | 2,080,000 | 2,272,399 |
|
| | | 41,408,395 |
| Telecommunications (7.2%) | | |
| Clearwire Communications, LLC/Clearwire Finance, Inc. 144A | | |
| company guaranty sr. notes 12s, 2017 | 710,000 | 823,600 |
|
| Clearwire Communications, LLC/Clearwire Finance, Inc. 144A | | |
| company guaranty sr. notes 12s, 2015 | 1,205,000 | 1,287,904 |
|
| Clearwire Communications, LLC/Clearwire Finance, Inc. 144A | | |
| company guaranty sr. notes 12s, 2015 | 525,000 | 561,120 |
|
| Crown Castle International Corp. sr. unsec. notes 7 1/8s, 2019 | 570,000 | 618,450 |
|
| Crown Castle International Corp. sr. unsec. notes 5 1/4s, 2023 | 1,225,000 | 1,240,313 |
|
| Digicel Group, Ltd. 144A sr. notes 10 1/2s, 2018 (Jamaica) | 925,000 | 1,004,458 |
|
| Digicel Group, Ltd. 144A sr. unsec. notes 8 1/4s, 2020 (Jamaica) | 2,195,000 | 2,337,674 |
|
| Digicel, Ltd. 144A sr. unsec. notes 8 1/4s, 2017 (Jamaica) | 1,195,000 | 1,242,800 |
|
| Equinix, Inc. sr. unsec. notes 7s, 2021 | 925,000 | 1,031,375 |
|
| Hughes Satellite Systems Corp. company guaranty sr. notes | | |
| 6 1/2s, 2019 | 1,750,000 | 1,911,875 |
|
| Hughes Satellite Systems Corp. company guaranty sr. unsec. | | |
| notes 7 5/8s, 2021 | 2,205,000 | 2,464,088 |
|
| Intelsat Jackson Holdings SA company guaranty sr. unsec. notes | | |
| 7 1/2s, 2021 (Bermuda) | 1,170,000 | 1,285,538 |
|
| Intelsat Jackson Holdings SA 144A sr. unsec. notes 6 5/8s, | | |
| 2022 (Bermuda) | 740,000 | 770,525 |
|
| Intelsat Luxembourg SA company guaranty sr. unsec. notes | | |
| 11 1/4s, 2017 (Luxembourg) | 1,150,000 | 1,216,699 |
|
| Intelsat Luxembourg SA 144A company guaranty sr. unsec. | | |
| notes 8 1/8s, 2023 (Luxembourg) | 3,315,000 | 3,547,050 |
|
| Intelsat Luxembourg SA 144A sr. unsec. notes 7 3/4s, | | |
| 2021 (Luxembourg) | 4,470,000 | 4,699,088 |
|
| Level 3 Financing, Inc. company guaranty sr. unsec. unsub. | | |
| notes 9 3/8s, 2019 | 1,035,000 | 1,141,088 |
|
| Level 3 Financing, Inc. company guaranty sr. unsec. unsub. | | |
| notes 8 5/8s, 2020 | 1,210,000 | 1,331,000 |
|
| Level 3 Financing, Inc. company guaranty sr. unsec. unsub. | | |
| notes 8 1/8s, 2019 | 270,000 | 292,275 |
|
| |
| High Yield Advantage Fund | 37 |
| | | |
| CORPORATE BONDS AND NOTES (88.7%)* cont. | | Principal amount | Value |
|
| Telecommunications cont. | | | |
| Level 3 Financing, Inc. company guaranty sr. unsec. unsub. | | | |
| notes 7s, 2020 | | $835,000 | $878,838 |
|
| Lynx I Corp. 144A sr. notes 5 3/8s, 2021 | | 740,000 | 767,750 |
|
| Lynx II Corp. 144A sr. unsec. notes 6 3/8s, 2023 | | 740,000 | 773,300 |
|
| MetroPCS Wireless, Inc. company guaranty sr. unsec. notes | | | |
| 7 7/8s, 2018 | | 1,335,000 | 1,455,150 |
|
| MetroPCS Wireless, Inc. 144A company guaranty sr. unsec. | | | |
| unsub. notes 6 5/8s, 2023 | | 2,270,000 | 2,400,525 |
|
| MetroPCS Wireless, Inc. 144A company guaranty sr. unsec. | | | |
| unsub. notes 6 1/4s, 2021 | | 2,210,000 | 2,314,974 |
|
| NII Capital Corp. company guaranty sr. unsec. unsub. notes 10s, | | | |
| 2016 (Mexico) | | 240,000 | 242,400 |
|
| NII Capital Corp. company guaranty sr. unsec. unsub. notes | | | |
| 8 7/8s, 2019 (Mexico) | | 835,000 | 751,500 |
|
| NII Capital Corp. company guaranty sr. unsec. unsub. notes | | | |
| 7 5/8s, 2021 (Mexico) | | 2,235,000 | 1,866,225 |
|
| NII International Telecom Sarl 144A company guaranty sr. unsec. | | | |
| notes 11 3/8s, 2019 (Luxembourg) | | 530,000 | 586,975 |
|
| NII International Telecom Sarl 144A company guaranty sr. unsec. | | | |
| notes 7 7/8s, 2019 (Luxembourg) | | 1,430,000 | 1,390,675 |
|
| PAETEC Holding Corp. company guaranty sr. unsec. notes | | | |
| 9 7/8s, 2018 | | 2,020,000 | 2,297,750 |
|
| Qwest Corp. sr. unsec. notes 6 3/4s, 2021 | | 1,480,000 | 1,700,232 |
|
| Qwest Corp. sr. unsec. unsub. notes 7 1/4s, 2025 | | 1,285,000 | 1,494,963 |
|
| SBA Telecommunications, Inc. company guaranty sr. unsec. | | | |
| notes 8 1/4s, 2019 | | 800,000 | 876,000 |
|
| SBA Telecommunications, Inc. 144A company guaranty | | | |
| sr. unsec. unsub. notes 5 3/4s, 2020 | | 465,000 | 483,600 |
|
| Sprint Capital Corp. company guaranty 6 7/8s, 2028 | | 3,575,000 | 3,575,000 |
|
| Sprint Nextel Corp. sr. notes 8 3/8s, 2017 | | 2,065,000 | 2,379,912 |
|
| Sprint Nextel Corp. sr. unsec. notes 6s, 2016 | | 1,725,000 | 1,863,000 |
|
| Sprint Nextel Corp. sr. unsec. unsub. notes 9 1/8s, 2017 | | 1,315,000 | 1,538,550 |
|
| Sprint Nextel Corp. sr. unsec. unsub. notes 7s, 2020 | | 885,000 | 960,225 |
|
| Sprint Nextel Corp. 144A company guaranty sr. unsec. | | | |
| notes 9s, 2018 | | 3,575,000 | 4,343,625 |
|
| West Corp. company guaranty sr. unsec. notes 8 5/8s, 2018 | | 725,000 | 795,688 |
|
| West Corp. company guaranty sr. unsec. notes 7 7/8s, 2019 | | 1,240,000 | 1,345,400 |
|
| Wind Acquisition Finance SA company guaranty sr. notes | | | |
| Ser. REGS, 7 3/8s, 2018 (Luxembourg) | EUR | 250,000 | 343,797 |
|
| Wind Acquisition Finance SA 144A company guaranty | | | |
| sr. notes 7 1/4s, 2018 (Luxembourg) | | $1,415,000 | 1,475,138 |
|
| Wind Acquisition Finance SA 144A sr. notes 11 3/4s, | | | |
| 2017 (Luxembourg) | | 550,000 | 578,875 |
|
| Wind Acquisition Holdings Finance SA 144A company guaranty | | | |
| sr. notes 12 1/4s, 2017 (Luxembourg) ‡‡ | | 624,744 | 659,105 |
|
| Windstream Corp. company guaranty sr. unsec. notes | | | |
| 6 3/8s, 2023 | | 855,000 | 844,313 |
|
| Windstream Corp. company guaranty sr. unsec. unsub. notes | | | |
| 7 7/8s, 2017 | | 2,290,000 | 2,633,499 |
|
| Windstream Corp. company guaranty sr. unsec. unsub. notes | | | |
| 7 3/4s, 2021 | | 925,000 | 994,375 |
|
| | | | 73,418,279 |
| |
| 38 | High Yield Advantage Fund |
| | |
| CORPORATE BONDS AND NOTES (88.7%)* cont. | Principal amount | Value |
|
| Telephone (0.3%) | | |
| CenturyLink, Inc. sr. unsec. unsub. notes 5 5/8s, 2020 | $375,000 | $387,656 |
|
| Cricket Communications, Inc. company guaranty sr. unsec. | | |
| notes 7 3/4s, 2020 | 2,390,000 | 2,384,024 |
|
| | | 2,771,680 |
| Textiles (0.2%) | | |
| Hanesbrands, Inc. company guaranty sr. unsec. notes | | |
| 6 3/8s, 2020 | 1,110,000 | 1,223,774 |
|
| Hanesbrands, Inc. sr. unsec. notes 8s, 2016 | 490,000 | 524,300 |
|
| | | 1,748,074 |
| Transportation (1.3%) | | |
| Aguila 3 SA 144A company guaranty sr. notes 7 7/8s, | | |
| 2018 (Luxembourg) | 3,795,000 | 4,084,368 |
|
| Air Medical Group Holdings, Inc. company guaranty sr. notes | | |
| 9 1/4s, 2018 | 2,309,000 | 2,528,355 |
|
| CHC Helicopter SA company guaranty sr. notes 9 1/4s, | | |
| 2020 (Canada) | 2,650,000 | 2,842,125 |
|
| Swift Services Holdings, Inc. company guaranty sr. | | |
| notes 10s, 2018 | 2,080,000 | 2,376,400 |
|
| Watco Cos LLC/Watco Finance Corp. 144A company guaranty | | |
| sr. unsec. notes 6 3/8s, 2023 | 1,380,000 | 1,452,450 |
|
| | | 13,283,698 |
| Utilities and power (4.6%) | | |
| AES Corp. (VA) sr. unsec. notes 8s, 2020 | 520,000 | 624,000 |
|
| AES Corp. (VA) sr. unsec. unsub. notes 8s, 2017 | 2,255,000 | 2,643,988 |
|
| AES Corp. (VA) sr. unsec. unsub. notes 7 3/8s, 2021 | 2,177,000 | 2,547,090 |
|
| AES Corp. (VA) sr. unsec. unsub. notes 4 7/8s, 2023 | 660,000 | 648,450 |
|
| Calpine Corp. 144A company guaranty sr. notes 7 7/8s, 2020 | 1,296,000 | 1,422,360 |
|
| Calpine Corp. 144A sr. notes 7 1/4s, 2017 | 2,736,000 | 2,859,119 |
|
| Colorado Interstate Gas Co., LLC debs. 6.85s, 2037 | 1,630,000 | 1,937,583 |
|
| DPL, Inc. sr. unsec. notes 6 1/2s, 2016 | 2,290,000 | 2,467,475 |
|
| El Paso Corp. sr. unsec. notes 7s, 2017 | 1,160,000 | 1,321,279 |
|
| El Paso Corp. sr. unsec. notes Ser. GMTN, 7.8s, 2031 | 705,000 | 785,194 |
|
| El Paso Natural Gas Co. debs. 8 5/8s, 2022 | 765,000 | 1,036,565 |
|
| Energy Future Intermediate Holding Co., LLC/EFIH Finance, Inc. | | |
| sr. notes 10s, 2020 | 1,870,000 | 2,129,463 |
|
| Energy Future Intermediate Holding Co., LLC/EFIH Finance, Inc. | | |
| 144A notes 11 3/4s, 2022 | 2,185,000 | 2,488,169 |
|
| Energy Future Intermediate Holding Co., LLC/EFIH Finance, Inc. | | |
| 144A sr. notes 10s, 2020 | 560,000 | 634,900 |
|
| Energy Transfer Equity LP company guaranty sr. unsec. notes | | |
| 7 1/2s, 2020 | 2,195,000 | 2,518,762 |
|
| EP Energy, LLC/Everest Acquisition Finance, Inc. company | | |
| guaranty sr. notes 6 7/8s, 2019 | 625,000 | 673,438 |
|
| EP Energy, LLC/Everest Acquisition Finance, Inc. company | | |
| guaranty sr. unsec. notes 7 3/4s, 2022 | 430,000 | 479,450 |
|
| EP Energy/EP Energy Finance, Inc. sr. unsec. notes 9 3/8s, 2020 | 3,235,000 | 3,671,725 |
|
| EPE Holdings, LLC/EP Energy Bond Co., Inc. 144A sr. unsec. | | |
| notes 8 1/8s, 2017 ‡‡ | 950,000 | 1,002,250 |
|
| FirstEnergy Corp. sr. unsec. unsub. notes 4 1/4s, 2023 | 605,000 | 596,390 |
|
| GenOn Americas Generation, LLC sr. unsec. notes 9 1/8s, 2031 | 1,280,000 | 1,446,400 |
|
| GenOn Energy, Inc. sr. unsec. notes 9 7/8s, 2020 | 2,330,000 | 2,632,900 |
|
| GenOn Energy, Inc. sr. unsec. notes 9 1/2s, 2018 | 380,000 | 443,650 |
|
| |
| High Yield Advantage Fund | 39 |
| | |
| CORPORATE BONDS AND NOTES (88.7%)* cont. | Principal amount | Value |
|
| Utilities and power cont. | | |
| NGPL PipeCo, LLC 144A sr. notes 9 5/8s, 2019 | $655,000 | $730,325 |
|
| NRG Energy, Inc. company guaranty sr. unsec. notes | | |
| 7 7/8s, 2021 | 3,645,000 | 4,064,174 |
|
| NRG Energy, Inc. company guaranty sr. unsec. notes | | |
| 7 5/8s, 2018 | 260,000 | 293,150 |
|
| NV Energy, Inc. sr. unsec. notes 6 1/4s, 2020 | 935,000 | 1,135,675 |
|
| PNM Resources, Inc. unsec. unsub. notes 9 1/4s, 2015 | 166,000 | 188,410 |
|
| Regency Energy Partners company guaranty sr. unsec. unsub. | | |
| notes 5 1/2s, 2023 | 1,110,000 | 1,165,500 |
|
| Regency Energy Partners 144A company guaranty sr. unsec. | | |
| notes 4 1/2s, 2023 | 945,000 | 935,550 |
|
| Tennessee Gas Pipeline Co., LLC sr. unsec. unsub. debs. 7s, 2028 | 305,000 | 396,459 |
|
| Texas Competitive/Texas Competitive Electric Holdings Co., LLC | | |
| company guaranty notes 15s, 2021 | 1,660,000 | 531,200 |
|
| Texas Competitive/Texas Competitive Electric Holdings Co., LLC | | |
| 144A company guaranty sr. notes 11 1/2s, 2020 | 745,000 | 584,825 |
|
| | | 47,035,868 |
| | | |
| Total corporate bonds and notes (cost $848,785,444) | | $898,936,873 |
| |
| |
| SENIOR LOANS (4.7%)* c | Principal amount | Value |
|
| Academy, Ltd. bank term loan FRN Ser. B, 4 1/2s, 2018 | $343,275 | $346,107 |
|
| Air Medical Group Holdings, Inc. bank term loan FRN | | |
| 7 5/8s, 2018 | 1,950,000 | 1,950,000 |
|
| Alcatel-Lucent USA, Inc. bank term loan FRN Ser. C, | | |
| 7 1/4s, 2018 | 653,363 | 660,169 |
|
| Aot Bedding Super Holdings, LLC bank term loan FRN 5s, 2019 | 882,788 | 887,692 |
|
| Ardent Medical Services, Inc. bank term loan FRN 6 3/4s, 2018 | 1,226,925 | 1,245,329 |
|
| Asurion Corp. bank term loan FRN 11s, 2019 | 1,255,000 | 1,339,713 |
|
| Burlington Coat Factory Warehouse Corp. bank term loan FRN | | |
| Ser. B2, 4 1/4s, 2017 | 212,074 | 213,311 |
|
| Caesars Entertainment Operating Co., Inc. bank term loan FRN | | |
| Ser. B6, 5.454s, 2018 | 4,272,740 | 3,820,097 |
|
| CCM Merger, Inc. bank term loan FRN Ser. B, 5 1/2s, 2017 | 1,907,068 | 1,922,167 |
|
| Chrysler Group, LLC bank term loan FRN Ser. B, 6s, 2017 | 73,872 | 74,730 |
|
| Clear Channel Communications, Inc. bank term loan FRN Ser. D, | | |
| 7.024s, 2019 | 2,479,000 | 2,309,602 |
|
| Cricket Communications, Inc. bank term loan FRN Ser. C, | | |
| 4 3/4s, 2020 | 2,555,000 | 2,566,498 |
|
| Cumulus Media Holdings, Inc. bank term loan FRN 7 1/2s, 2019 | 968,427 | 1,003,936 |
|
| Emergency Medical Services Corp. bank term loan FRN | | |
| Ser. B, 4s, 2018 | 1,362,910 | 1,370,942 |
|
| Frac Tech International, LLC bank term loan FRN Ser. B, | | |
| 8 1/2s, 2016 | 1,861,317 | 1,832,234 |
|
| Golden Nugget, Inc. bank term loan FRN Ser. B, 3.2s, 2014 ‡‡ | 746,911 | 721,143 |
|
| Golden Nugget, Inc. bank term loan FRN Ser. DD, 3.2s, 2014 ‡‡ | 425,146 | 410,479 |
|
| H.J. Heinz Co. bank term loan FRN Ser. B2, 3 1/2s, 2020 | 1,400,000 | 1,413,416 |
|
| Harrah’s bank term loan FRN Ser. B, 9 1/2s, 2016 | 478,913 | 479,910 |
|
| iStar Financial, Inc. bank term loan FRN 4 1/2s, 2017 R | 1,319 | 1,335 |
|
| iStar Financial, Inc. bank term loan FRN Ser. A2, 7s, 2017 R | 365,000 | 388,725 |
|
| |
| 40 | High Yield Advantage Fund |
| | |
| SENIOR LOANS (4.7%)* c cont. | Principal amount | Value |
|
| J.C. Penney Corp., Inc. bank term loan FRN 6s, 2018 | $1,365,000 | $1,383,200 |
|
| Kinetic Concepts, Inc. bank term loan FRN Ser. C1, 5 1/2s, 2018 | 437,792 | 443,716 |
|
| Mirror Bidco Corp. bank term loan FRN 5 1/4s, | | |
| 2019 (Luxembourg) | 857,850 | 864,284 |
|
| Neiman Marcus Group, Inc. (The) bank term loan FRN 4s, 2018 | 1,540,000 | 1,538,351 |
|
| Nuveen Investments, Inc. bank term loan FRN 6 1/2s, 2019 | 2,605,000 | 2,624,537 |
|
| Offshore Group Investment, Ltd. bank term loan FRN Ser. B, | | |
| 5 3/4s, 2019 (Cayman Islands) | 610,000 | 615,592 |
|
| Par Pharmaceutical Cos., Inc. bank term loan FRN Ser. B, | | |
| 4 1/4s, 2019 | 930,331 | 933,045 |
|
| Pharmaceutical Product Development, Inc. bank term loan FRN | | |
| Ser. B, 4 1/4s, 2018 | 721,841 | 727,856 |
|
| Plains Exploration & Production Co. bank term loan FRN Class B, | | |
| 5 1/4s, 2019 | 1,490,000 | 1,489,255 |
|
| Springleaf Financial Funding Co. bank term loan FRN Ser. B, | | |
| 5 1/2s, 2017 | 632,226 | 633,609 |
|
| Tervita Corp. bank term loan FRN Ser. B, 6 1/4s, 2018 (Canada) | 1,596,000 | 1,611,674 |
|
| Texas Competitive Electric Holdings Co., LLC bank term loan | | |
| FRN 4.724s, 2017 | 4,958,299 | 3,590,121 |
|
| Travelport, LLC bank term loan FRN 9 1/2s, 2016 | 2,424,988 | 2,521,988 |
|
| Travelport, LLC bank term loan FRN 8 3/8s, 2016 | 2,852,336 | 2,827,377 |
|
| Univision Communications, Inc. bank term loan FRN Ser. C1, | | |
| 4 1/2s, 2020 | 915,599 | 912,738 |
|
| Total senior loans (cost $47,991,219) | | $47,674,878 |
| |
| |
| CONVERTIBLE BONDS AND NOTES (0.7%)* | Principal amount | Value |
|
| Altra Holdings, Inc. cv. company guaranty sr. unsec. notes | | |
| 2 3/4s, 2031 | $170,000 | $210,588 |
|
| DFC Global Corp. 144A cv. sr. unsec. unsub. notes 3 1/4s, 2017 | 860,000 | 880,468 |
|
| Exide Technologies cv. sr. sub. notes FRN zero %, 2013 | | |
| (In default) † | 1,004,000 | 130,520 |
|
| iStar Financial, Inc. cv. sr. unsec. unsub. notes 3s, 2016 R | 955,000 | 1,190,169 |
|
| Steel Dynamics, Inc. cv. sr. notes 5 1/8s, 2014 | 341,000 | 375,526 |
|
| Terex Corp. cv. company guaranty sr. unsec. sub. notes 4s, 2015 | 485,000 | 1,106,709 |
|
| TRW Automotive, Inc. cv. company guaranty sr. unsec. notes | | |
| 3 1/2s, 2015 | 550,000 | 1,209,835 |
|
| XM Satellite Radio, Inc. 144A cv. company guaranty sr. unsec. | | |
| sub. notes 7s, 2014 | 889,000 | 1,749,107 |
|
| Total convertible bonds and notes (cost $6,073,512) | | $6,852,922 |
| |
| |
| SHORT-TERM INVESTMENTS (3.6%)* | Principal amount/shares | Value |
|
| Putnam Short Term Investment Fund 0.01% L | 35,866,062 | $35,866,062 |
|
| U.S. Treasury Bills with an effective yield of 0.16%, July 25, 2013 | $372,000 | 371,912 |
|
| Total short-term investments (cost $36,237,974) | | $36,237,974 |
| |
| |
| TOTAL INVESTMENTS | | |
|
| Total investments (cost $939,088,149) | | $989,702,647 |
| |
| High Yield Advantage Fund | 41 |
Key to holding’s currency abbreviations
| |
| CAD | Canadian Dollar |
| EUR | Euro |
| GBP | British Pound |
Key to holding’s abbreviations
| |
| EMTN | Euro Medium Term Notes |
| FRB | Floating Rate Bonds: the rate shown is the current interest rate at the close of the reporting period |
| FRN | Floating Rate Notes: the rate shown is the current interest rate at the close of the reporting period |
| GMTN | Global Medium Term Notes |
| MTN | Medium Term Notes |
Notes to the fund’s portfolio
Unless noted otherwise, the notes to the fund’s portfolio are for the close of the fund’s reporting period, which ran from December 1, 2012 through May 31, 2013 (the reporting period). Within the following notes to the portfolio, references to “ASC 820” represent Accounting Standards Codification ASC 820 Fair Value Measurements and Disclosures and references to “OTC”, if any, represent over-the-counter.
* Percentages indicated are based on net assets of $1,013,769,025.
† Non-income-producing security.
‡‡ Income may be received in cash or additional securities at the discretion of the issuer.
## Forward commitment, in part or in entirety (Note 1).
c Senior loans are exempt from registration under the Securities Act of 1933, as amended, but contain certain restrictions on resale and cannot be sold publicly. These loans pay interest at rates which adjust periodically. The interest rates shown for senior loans are the current interest rates at the close of the reporting period. Senior loans are also subject to mandatory and/or optional prepayment which cannot be predicted. As a result, the remaining maturity may be substantially less than the stated maturity shown (Notes 1 and 7).
F Is valued at fair value following procedures approved by the Trustees. Securities may be classified as Level 2 or Level 3 for ASC 820 based on the securities’ valuation inputs.
L Affiliated company (Note 6). The rate quoted in the security description is the annualized 7-day yield of the fund at the close of the reporting period.
R Real Estate Investment Trust.
At the close of the reporting period, the fund maintained liquid assets totaling $615,888 to cover certain derivatives contracts.
Debt obligations are considered secured unless otherwise indicated.
144A after the name of an issuer represents securities exempt from registration under Rule 144A under the Securities Act of 1933, as amended. These securities may be resold in transactions exempt from registration, normally to qualified institutional buyers.
The dates shown on debt obligations are the original maturity dates.
FORWARD CURRENCY CONTRACTS at 5/31/13 (aggregate face value $19,506,705) (Unaudited)
| | | | | | |
| | | | | | | Unrealized |
| | | Contract | Delivery | | Aggregate | appreciation/ |
| Counterparty | Currency | type | date | Value | face value | (depreciation) |
|
| Bank of America N.A. | | | | | |
| | Canadian Dollar | Sell | 7/17/13 | $481,778 | $490,436 | $8,658 |
|
| | Euro | Sell | 6/19/13 | 3,773,468 | 3,769,662 | (3,806) |
|
| Barclays Bank PLC | | | | | |
| | British Pound | Sell | 6/19/13 | 2,872,131 | 2,837,357 | (34,774) |
|
| | Euro | Sell | 6/19/13 | 1,438,805 | 1,439,568 | 763 |
|
| |
| 42 | High Yield Advantage Fund |
FORWARD CURRENCY CONTRACTS at 5/31/13 (aggregate face value $19,506,705) (Unaudited) cont.
| | | | | | |
| | | | | | Unrealized |
| | Contract | Delivery | | Aggregate | appreciation/ |
| Counterparty | Currency | type | date | Value | face value | (depreciation) |
|
| Credit Suisse International | | | | | |
| Euro | Sell | 6/19/13 | $1,346,516 | $1,347,167 | $651 |
|
| Deutsche Bank AG | | | | | |
| Euro | Sell | 6/19/13 | 229,034 | 229,171 | 137 |
|
| Goldman Sachs International | | | | | |
| Euro | Sell | 6/19/13 | 302,345 | 302,320 | (25) |
|
| JPMorgan Chase Bank N.A. | | | | | |
| Canadian Dollar | Sell | 7/17/13 | 508,276 | 517,274 | 8,998 |
|
| Euro | Sell | 6/19/13 | 1,667,579 | 1,668,469 | 890 |
|
| State Street Bank and Trust Co. | | | | | |
| Canadian Dollar | Sell | 7/17/13 | 2,333,349 | 2,374,350 | 41,001 |
|
| Euro | Sell | 6/19/13 | 2,181,670 | 2,182,807 | 1,137 |
|
| UBS AG | | | | | |
| Euro | Sell | 6/19/13 | 2,104,199 | 2,104,796 | 597 |
|
| WestPac Banking Corp. | | | | | |
| Canadian Dollar | Sell | 7/17/13 | 239,058 | 243,328 | 4,270 |
|
| Total | | | | | $28,497 |
ASC 820 establishes a three-level hierarchy for disclosure of fair value measurements. The valuation hierarchy is based upon the transparency of inputs to the valuation of the fund’s investments. The three levels are defined as follows:
Level 1: Valuations based on quoted prices for identical securities in active markets.
Level 2: Valuations based on quoted prices in markets that are not active or for which all significant inputs are observable, either directly or indirectly.
Level 3: Valuations based on inputs that are unobservable and significant to the fair value measurement.
The following is a summary of the inputs used to value the fund’s net assets as of the close of the reporting period:
| | | | |
| | | | | Valuation inputs | |
|
| Investments in securities: | | Level 1 | Level 2 | Level 3 |
|
| Convertible bonds and notes | | $— | $6,852,922 | $— |
|
| Corporate bonds and notes | | — | 898,159,486 | 777,387 |
|
| Senior loans | | — | 47,674,878 | — |
|
| Short-term investments | | 35,866,062 | 371,912 | — |
|
| Totals by level | | $35,866,062 | $953,059,198 | $777,387 |
| | | | | |
| | | | | Valuation inputs | |
|
| Other financial instruments: | | Level 1 | Level 2 | Level 3 |
|
| Forward currency contracts | | $— | $28,497 | $— |
|
| Totals by level | | $— | $28,497 | $— |
At the start and close of the reporting period, Level 3 investments in securities were not considered a significant portion of the fund’s portfolio.
The accompanying notes are an integral part of these financial statements.
| |
| High Yield Advantage Fund | 43 |
Statement of assets and liabilities 5/31/13 (Unaudited)
| |
| ASSETS | |
|
| Investment in securities, at value (Note 1): | |
| Unaffiliated issuers (identified cost $903,222,087) | $953,836,585 |
| Affiliated issuers (identified cost $35,866,062) (Notes 1 and 6) | 35,866,062 |
|
| Cash | 2,532,715 |
|
| Interest and other receivables | 17,531,640 |
|
| Receivable for shares of the fund sold | 750,823 |
|
| Receivable for investments sold | 20,833,100 |
|
| Unrealized appreciation on forward currency contracts (Note 1) | 67,102 |
|
| Total assets | 1,031,418,027 |
| |
| LIABILITIES | |
|
| Payable for investments purchased | 13,870,593 |
|
| Payable for purchases of delayed delivery securities (Note 1) | 705,000 |
|
| Payable for shares of the fund repurchased | 1,407,445 |
|
| Payable for compensation of Manager (Note 2) | 503,066 |
|
| Payable for custodian fees (Note 2) | 9,539 |
|
| Payable for investor servicing fees (Note 2) | 277,926 |
|
| Payable for Trustee compensation and expenses (Note 2) | 276,864 |
|
| Payable for administrative services (Note 2) | 1,896 |
|
| Payable for distribution fees (Note 2) | 414,509 |
|
| Distributions payable to shareholders | 372 |
|
| Unrealized depreciation on forward currency contracts (Note 1) | 38,605 |
|
| Other accrued expenses | 143,187 |
|
| Total liabilities | 17,649,002 |
| | |
| Net assets | $1,013,769,025 |
|
| |
| REPRESENTED BY | |
|
| Paid-in capital (Unlimited shares authorized) (Notes 1 and 4) | $1,037,960,797 |
|
| Undistributed net investment income (Note 1) | 3,577,852 |
|
| Accumulated net realized loss on investments and foreign currency transactions (Note 1) | (78,407,867) |
|
| Net unrealized appreciation of investments and assets and liabilities in foreign currencies | 50,638,243 |
|
| Total — Representing net assets applicable to capital shares outstanding | $1,013,769,025 |
(Continued on next page)
| |
| 44 | High Yield Advantage Fund |
Statement of assets and liabilities (Continued)
| |
| COMPUTATION OF NET ASSET VALUE AND OFFERING PRICE | |
|
| Net asset value and redemption price per class A share | |
| ($701,582,822 divided by 112,458,487 shares) | $6.24 |
|
| Offering price per class A share (100/96.00 of $6.24)* | $6.50 |
|
| Net asset value and offering price per class B share ($17,609,196 divided by 2,882,849 shares)** | $6.11 |
|
| Net asset value and offering price per class C share ($30,273,483 divided by 4,971,274 shares)** | $6.09 |
|
| Net asset value and redemption price per class M share | |
| ($122,139,623 divided by 19,595,766 shares) | $6.23 |
|
| Offering price per class M share (100/96.75 of $6.23)† | $6.44 |
|
| Net asset value, offering price and redemption price per class R share | |
| ($27,143,418 divided by 4,355,267 shares) | $6.23 |
|
| Net asset value, offering price and redemption price per class Y share | |
| ($115,020,483 divided by 17,774,032 shares) | $6.47 |
|
* On single retail sales of less than $100,000. On sales of $100,000 or more the offering price is reduced.
** Redemption price per share is equal to net asset value less any applicable contingent deferred sales charge.
† On single retail sales of less than $50,000. On sales of $50,000 or more the offering price is reduced.
The accompanying notes are an integral part of these financial statements.
| |
| High Yield Advantage Fund | 45 |
Statement of operations Six months ended 5/31/13 (Unaudited)
| |
| INVESTMENT INCOME | |
|
| Interest (net of foreign tax of $3,666) (including interest income of $20,692 from investments | |
| in affiliated issuers) (Note 6) | $35,933,238 |
|
| Total investment income | 35,933,238 |
| |
| EXPENSES | |
|
| Compensation of Manager (Note 2) | 2,951,998 |
|
| Investor servicing fees (Note 2) | 834,759 |
|
| Custodian fees (Note 2) | 15,219 |
|
| Trustee compensation and expenses (Note 2) | 51,118 |
|
| Distribution fees (Note 2) | 1,497,960 |
|
| Administrative services (Note 2) | 18,572 |
|
| Other | 219,188 |
|
| Total expenses | 5,588,814 |
| | |
| Expense reduction (Note 2) | (572) |
|
| Net expenses | 5,588,242 |
| | |
| Net investment income | 30,344,996 |
|
| |
| Net realized gain on investments (Notes 1 and 3) | 10,651,185 |
|
| Net increase from payments by affiliates (Note 2) | 5,437 |
|
| Net realized gain on foreign currency transactions (Note 1) | 247,049 |
|
| Net unrealized appreciation of assets and liabilities in foreign currencies during the period | 60,767 |
|
| Net unrealized appreciation of investments during the period | 11,905,638 |
|
| Net gain on investments | 22,870,076 |
| | |
| Net increase in net assets resulting from operations | $53,215,072 |
|
The accompanying notes are an integral part of these financial statements.
| |
| 46 | High Yield Advantage Fund |
Statement of changes in net assets
| | |
| INCREASE IN NET ASSETS | Six months ended 5/31/13* | Year ended 11/30/12 |
|
| Operations: | | |
| Net investment income | $30,344,996 | $60,674,884 |
|
| Net realized gain on investments | | |
| and foreign currency transactions | 10,903,671 | 7,334,152 |
|
| Net unrealized appreciation of investments and assets | | |
| and liabilities in foreign currencies | 11,966,405 | 65,765,841 |
|
| Net increase in net assets resulting from operations | 53,215,072 | 133,774,877 |
|
| Distributions to shareholders (Note 1): | | |
| From ordinary income | | |
| Net investment income | | |
|
| Class A | (23,155,613) | (39,862,201) |
|
| Class B | (475,072) | (722,360) |
|
| Class C | (866,873) | (1,457,020) |
|
| Class M | (3,897,549) | (8,496,166) |
|
| Class R | (837,718) | (1,442,102) |
|
| Class Y | (3,952,894) | (8,559,900) |
|
| Redemption fees (Note 1) | 5,720 | 17,085 |
|
| Increase from capital share transactions (Note 4) | 27,522,872 | 97,306,379 |
|
| Total increase in net assets | 47,557,945 | 170,558,592 |
| |
| NET ASSETS | | |
|
| Beginning of period | 966,211,080 | 795,652,488 |
|
| End of period (including undistributed net investment | | |
| income of $3,577,852 and $6,418,575, respectively) | $1,013,769,025 | $966,211,080 |
|
* Unaudited
The accompanying notes are an integral part of these financial statements.
| |
| High Yield Advantage Fund | 47 |
Financial highlights (For a common share outstanding throughout the period)
| | | | | | | | | | | | | | |
| INVESTMENT OPERATIONS: | | | | LESS DISTRIBUTIONS: | | | | | RATIOS AND SUPPLEMENTAL DATA: | |
|
| | | | | | | | | | | | | Ratio | Ratio | |
| | | | Net realized | | | | | | | | | of expenses | of net investment | |
| | Net asset value, | | and unrealized | Total from | From | | | | | Total return | Net assets, | to average | income (loss) | Portfolio |
| | beginning | Net investment | gain (loss) | investment | net investment | Total | Redemption | Non-recurring | Net asset value, | at net asset | end of period | net assets | to average | turnover |
| Period ended | of period | income (loss) a | on investments | operations | income | distributions | fees b | reimbursements | end of period | value (%) c | (in thousands) | (%) d | net assets (%) | (%) |
|
| Class A | | | | | | | | | | | | | | |
| May 31, 2013 ** | $6.12 | .18 | .14 | .32 | (.20) | (.20) | — | — | $6.24 | 5.30 * | $701,583 | .52 * | 2.95 * | 25 * |
| November 30, 2012 | 5.62 | .40 | .50 | .90 | (.40) | (.40) | — | — | 6.12 | 16.55 | 652,557 | 1.04 | 6.74 | 40 |
| November 30, 2011 | 5.90 | .43 | (.27) | .16 | (.44) | (.44) | — | — f | 5.62 | 2.58 | 510,880 | 1.04 | 7.25 | 57 |
| November 30, 2010 | 5.56 | .44 | .32 | .76 | (.42) | (.42) | — | — | 5.90 | 14.10 | 535,054 | 1.05 e | 7.66 e | 71 |
| November 30, 2009 | 4.05 | .40 | 1.55 | 1.95 | (.44) | (.44) | — | — | 5.56 | 50.64 | 479,094 | 1.13 e | 8.13 e | 59 |
| November 30, 2008 | 6.05 | .42 | (1.97) | (1.55) | (.45) | (.45) | — | — | 4.05 | (27.33) | 292,694 | 1.10 e | 7.63 e | 34 |
|
| Class B | | | | | | | | | | | | | | |
| May 31, 2013 ** | $5.99 | .16 | .14 | .30 | (.18) | (.18) | — | — | $6.11 | 5.00 * | $17,609 | .89 * | 2.57 * | 25 * |
| November 30, 2012 | 5.52 | .35 | .48 | .83 | (.36) | (.36) | — | — | 5.99 | 15.48 | 15,257 | 1.79 | 5.94 | 40 |
| November 30, 2011 | 5.80 | .38 | (.27) | .11 | (.39) | (.39) | — | — f | 5.52 | 1.84 | 8,076 | 1.79 | 6.50 | 57 |
| November 30, 2010 | 5.47 | .39 | .32 | .71 | (.38) | (.38) | — | — | 5.80 | 13.28 | 7,520 | 1.80 e | 6.93 e | 71 |
| November 30, 2009 | 3.99 | .35 | 1.54 | 1.89 | (.41) | (.41) | — | — | 5.47 | 49.61 | 9,033 | 1.88 e | 7.41 e | 59 |
| November 30, 2008 | 5.96 | .38 | (1.94) | (1.56) | (.41) | (.41) | — | — | 3.99 | (27.84) | 6,036 | 1.85 e | 6.86 e | 34 |
|
| Class C | | | | | | | | | | | | | | |
| May 31, 2013 ** | $5.97 | .16 | .14 | .30 | (.18) | (.18) | — | — | $6.09 | 5.02 * | $30,273 | .89 * | 2.58 * | 25 * |
| November 30, 2012 | 5.50 | .35 | .48 | .83 | (.36) | (.36) | — | — | 5.97 | 15.52 | 29,271 | 1.79 | 5.95 | 40 |
| November 30, 2011 | 5.78 | .37 | (.25) | .12 | (.40) | (.40) | — | — f | 5.50 | 1.90 | 15,915 | 1.79 | 6.49 | 57 |
| November 30, 2010 | 5.46 | .39 | .31 | .70 | (.38) | (.38) | — | — | 5.78 | 13.13 | 9,464 | 1.80 e | 6.92 e | 71 |
| November 30, 2009 | 3.98 | .35 | 1.54 | 1.89 | (.41) | (.41) | — | — | 5.46 | 49.80 | 10,020 | 1.88 e | 7.16 e | 59 |
| November 30, 2008 | 5.95 | .37 | (1.93) | (1.56) | (.41) | (.41) | — | — | 3.98 | (27.87) | 684 | 1.85 e | 6.78 e | 34 |
|
| Class M | | | | | | | | | | | | | | |
| May 31, 2013 ** | $6.11 | .18 | .14 | .32 | (.20) | (.20) | — | — | $6.23 | 5.21 * | $122,140 | .64 * | 2.83 * | 25 * |
| November 30, 2012 | 5.62 | .39 | .49 | .88 | (.39) | (.39) | — | — | 6.11 | 16.13 | 123,203 | 1.29 | 6.51 | 40 |
| November 30, 2011 | 5.90 | .42 | (.27) | .15 | (.43) | (.43) | — | — f | 5.62 | 2.37 | 130,758 | 1.29 | 7.00 | 57 |
| November 30, 2010 | 5.57 | .43 | .31 | .74 | (.41) | (.41) | — | — | 5.90 | 13.65 | 164,632 | 1.30 e | 7.42 e | 71 |
| November 30, 2009 | 4.05 | .39 | 1.56 | 1.95 | (.43) | (.43) | — | — | 5.57 | 50.52 | 178,550 | 1.38 e | 7.97 e | 59 |
| November 30, 2008 | 6.05 | .41 | (1.97) | (1.56) | (.44) | (.44) | — | — | 4.05 | (27.50) | 155,249 | 1.35 e | 7.36 e | 34 |
|
| Class R | | | | | | | | | | | | | | |
| May 31, 2013 ** | $6.11 | .18 | .14 | .32 | (.20) | (.20) | — | — | $6.23 | 5.21 * | $27,143 | .64 * | 2.83 * | 25 * |
| November 30, 2012 | 5.62 | .39 | .49 | .88 | (.39) | (.39) | — | — | 6.11 | 16.13 | 26,120 | 1.29 | 6.46 | 40 |
| November 30, 2011 | 5.90 | .41 | (.26) | .15 | (.43) | (.43) | — | — f | 5.62 | 2.37 | 16,209 | 1.29 | 6.98 | 57 |
| November 30, 2010 | 5.56 | .43 | .32 | .75 | (.41) | (.41) | — | — | 5.90 | 13.86 | 11,085 | 1.30 e | 7.34 e | 71 |
| November 30, 2009 | 4.05 | .38 | 1.56 | 1.94 | (.43) | (.43) | — | — | 5.56 | 50.32 | 4,728 | 1.38 e | 7.63 e | 59 |
| November 30, 2008 | 6.05 | .41 | (1.97) | (1.56) | (.44) | (.44) | — | — | 4.05 | (27.46) | 680 | 1.35 e | 8.31 e | 34 |
|
| Class Y | | | | | | | | | | | | | | |
| May 31, 2013 ** | $6.34 | .20 | .14 | .34 | (.21) | (.21) | — | — | $6.47 | 5.37 * | $115,020 | .40 * | 3.07 * | 25 * |
| November 30, 2012 | 5.81 | .43 | .52 | .95 | (.42) | (.42) | — | — | 6.34 | 16.76 | 119,803 | .79 | 6.99 | 40 |
| November 30, 2011 | 6.08 | .46 | (.28) | .18 | (.45) | (.45) | — | — f | 5.81 | 2.88 | 113,815 | .79 | 7.49 | 57 |
| November 30, 2010 | 5.71 | .47 | .33 | .80 | (.43) | (.43) | — | — | 6.08 | 14.49 | 97,130 | .80 e | 7.87 e | 71 |
| November 30, 2009 | 4.15 | .43 | 1.58 | 2.01 | (.45) | (.45) | — | — | 5.71 | 50.98 | 66,691 | .88 e | 8.35 e | 59 |
| November 30, 2008 | 6.19 | .45 | (2.03) | (1.58) | (.46) | (.46) | — | — | 4.15 | (27.21) | 33,660 | .85 e | 7.94 e | 34 |
|
See notes to financial highlights at the end of this section.
The accompanying notes are an integral part of these financial statements.
| | | |
| 48 | High Yield Advantage Fund | High Yield Advantage Fund | 49 |
Financial highlights (Continued)
* Not annualized.
** Unaudited.
a Per share net investment income (loss) has been determined on the basis of the weighted average number of shares outstanding during the period.
b Amount represents less than $0.01 per share.
c Total return assumes dividend reinvestment and does not reflect the effect of sales charges.
d Includes amounts paid through expense offset arrangements (Note 2).
e Reflects an involuntary contractual expense limitation in effect during the period. For periods prior to November 30, 2009, certain fund expenses were waived in connection with the fund’s investment in Putnam Prime Money Market Fund. As a result of such limitation and/or waivers, the expenses of each class reflect a reduction of the following amounts:
| |
| | Percentage of |
| | average net assets |
|
| November 30, 2010 | 0.01% |
|
| November 30, 2009 | 0.09 |
|
| November 30, 2008 | 0.02 |
|
f Reflects a non-recurring reimbursement related to restitution amounts in connection with a distribution plan approved by the Securities and Exchange Commission (the SEC) which amounted to less than $0.01 per share outstanding on July 21, 2011. Also reflects a non-recurring reimbursement related to short-term trading related lawsuits, which amounted to less than $0.01 per share outstanding on May 11, 2011.
The accompanying notes are an integral part of these financial statements.
| |
| 50 | High Yield Advantage Fund |
Notes to financial statements 5/31/13 (Unaudited)
Within the following Notes to financial statements, references to “State Street” represent State Street Bank and Trust Company, references to “the SEC” represent the Securities and Exchange Commission, references to “Putnam Management” represent Putnam Investment Management, LLC, the fund’s manager, an indirect wholly-owned subsidiary of Putnam Investments, LLC and references to “OTC”, if any, represent over-the-counter. Unless otherwise noted, the “reporting period” represents the period from December 1, 2012 through May 31, 2013.
Putnam High Yield Advantage Fund (the fund) is a Massachusetts business trust, which is registered under the Investment Company Act of 1940, as amended, as a diversified open-end management investment company. The investment objective of the fund is to seek high current income. Capital growth is a secondary objective when consistent with achieving high current income. The fund invests mainly in bonds that are obligations of U.S. companies, are below investment- grade in quality (sometimes referred to as “junk bonds”), and have intermediate- to long term maturities (three years or longer). The fund may also invest in other debt instruments, including loans. Putnam Management may consider, among other factors, credit, interest rate and prepayment risks, as well as general market conditions, when deciding whether to buy or sell investments.
The fund offers class A, class B, class C, class M, class R and class Y shares. Class A and class M shares are sold with a maximum front-end sales charge of 4.00% and 3.25%, respectively, and generally do not pay a contingent deferred sales charge. Class B shares, which convert to class A shares after approximately eight years, do not pay a front-end sales charge and are subject to a contingent deferred sales charge if those shares are redeemed within six years of purchase. Class C shares have a one-year 1.00% contingent deferred sales charge and do not convert to class A shares. Class R shares, which are not available to all investors, are sold at net asset value. The expenses for class A, class B, class C, class M and class R shares may differ based on the distribution fee of each class, which is identified in Note 2. Class Y shares, which are sold at net asset value, are generally subject to the same expenses as class A, class B, class C, class M and class R shares, but do not bear a distribution fee. Class Y shares are not available to all investors.
In the normal course of business, the fund enters into contracts that may include agreements to indemnify another party under given circumstances. The fund’s maximum exposure under these arrangements is unknown as this would involve future claims that may be, but have not yet been, made against the fund. However, the fund’s management team expects the risk of material loss to be remote.
Note 1: Significant accounting policies
The following is a summary of significant accounting policies consistently followed by the fund in the preparation of its financial statements. The preparation of financial statements is in conformity with accounting principles generally accepted in the United States of America and requires management to make estimates and assumptions that affect the reported amounts of assets and liabilities in the financial statements and the reported amounts of increases and decreases in net assets from operations. Actual results could differ from those estimates. Subsequent events after the Statement of assets and liabilities date through the date that the financial statements were issued have been evaluated in the preparation of the financial statements.
For shares purchased before June 24, 2013, a 1.00% redemption fee may apply on shares that are redeemed (either by selling or exchanging into another fund) within 30 days of purchase. The redemption fee is accounted for as an addition to paid-in-capital. No redemption fee will apply to shares purchased on or after June 24, 2013.
Investment income, realized and unrealized gains and losses and expenses of the fund are borne pro-rata based on the relative net assets of each class to the total net assets of the fund, except that each class bears expenses unique to that class (including the distribution fees applicable to such classes). Each class votes as a class only with respect to its own distribution plan or other matters on which a class vote is required by law or determined by the Trustees. If the fund were liquidated, shares of each class would receive their pro-rata share of the net assets of the fund. In addition, the Trustees declare separate dividends on each class of shares.
Security valuation Investments for which market quotations are readily available are valued at the last reported sales price on their principal exchange, or official closing price for certain markets, and are classified as Level 1 securities under Accounting Standards Codification ASC 820 Fair Value Measurements and Disclosures (ASC 820). If no sales are reported, as in the case of some securities that are traded OTC, a security is valued at its last reported bid price and is generally categorized as a Level 2 security.
| |
| High Yield Advantage Fund | 51 |
Investments in open-end investment companies (excluding exchange traded funds), if any, which can be classified as Level 1 or Level 2 securities, are based on their net asset value. The net asset value of such investment companies equals the total value of their assets less their liabilities and divided by the number of their outstanding shares.
Market quotations are not considered to be readily available for certain debt obligations and other investments; such investments are valued on the basis of valuations furnished by an independent pricing service approved by the Trustees or dealers selected by Putnam Management. Such services or dealers determine valuations for normal institutional-size trading units of such securities using methods based on market transactions for comparable securities and various relationships, generally recognized by institutional traders, between securities (which consider such factors as security prices, yields, maturities and ratings). These securities will generally be categorized as Level 2.
Many securities markets and exchanges outside the U.S. close prior to the close of the New York Stock Exchange and therefore the closing prices for securities in such markets or on such exchanges may not fully reflect events that occur after such close but before the close of the New York Stock Exchange. Accordingly, on certain days, the fund will fair value foreign equity securities taking into account multiple factors including movements in the U.S. securities markets, currency valuations and comparisons to the valuation of American Depository Receipts, exchange-traded funds and futures contracts. These securities, which would generally be classified as Level 1 securities, will be transferred to Level 2 of the fair value hierarchy when they are valued at fair value. The number of days on which fair value prices will be used will depend on market activity and it is possible that fair value prices will be used by the fund to a significant extent. Securities quoted in foreign currencies, if any, are translated into U.S. dollars at the current exchange rate.
To the extent a pricing service or dealer is unable to value a security or provides a valuation that Putnam Management does not believe accurately reflects the security’s fair value, the security will be valued at fair value by Putnam Management. Certain investments, including certain restricted and illiquid securities and derivatives, are also valued at fair value following procedures approved by the Trustees. These valuations consider such factors as significant market or specific security events such as interest rate or credit quality changes, various relationships with other securities, discount rates, U.S. Treasury, U.S. swap and credit yields, index levels, convexity exposures and recovery rates. These securities are classified as Level 2 or as Level 3 depending on the priority of the significant inputs.
Such valuations and procedures are reviewed periodically by the Trustees. The fair value of securities is generally determined as the amount that the fund could reasonably expect to realize from an orderly disposition of such securities over a reasonable period of time. By its nature, a fair value price is a good faith estimate of the value of a security in a current sale and does not reflect an actual market price, which may be different by a material amount.
Security transactions and related investment income Security transactions are recorded on the trade date (the date the order to buy or sell is executed). Gains or losses on securities sold are determined on the identified cost basis. Interest income, net of any applicable withholding taxes, is recorded on the accrual basis. All premiums/discounts are amortized/accreted on a yield-to-maturity basis.
Securities purchased or sold on a delayed delivery basis may be settled a month or more after the trade date; interest income is accrued based on the terms of the securities. Losses may arise due to changes in the market value of the underlying securities or if the counterparty does not perform under the contract.
The fund earned certain fees in connection with its senior loan purchasing activities. These fees are treated as market discount and are amortized into income in the Statement of operations.
Foreign currency translation The accounting records of the fund are maintained in U.S. dollars. The market value of foreign securities, currency holdings, and other assets and liabilities is recorded in the books and records of the fund after translation to U.S. dollars based on the exchange rates on that day. The cost of each security is determined using historical exchange rates. Income and withholding taxes are translated at prevailing exchange rates when earned or incurred. The fund does not isolate that portion of realized or unrealized gains or losses resulting from changes in the foreign exchange rate on investments from fluctuations arising from changes in the market prices of the securities. Such gains and losses are included with the net realized and unrealized gain or loss on investments. Net realized gains and losses on foreign currency transactions represent net realized exchange gains or losses on closed forward currency contracts, disposition of foreign currencies, currency gains and losses realized between the trade and settlement dates on securities transactions and the difference between the amount of investment income and foreign withholding taxes recorded on the fund’s books and the U.S. dollar equivalent
| |
| 52 | High Yield Advantage Fund |
amounts actually received or paid. Net unrealized appreciation and depreciation of assets and liabilities in foreign currencies arise from changes in the value of open forward currency contracts and assets and liabilities other than investments at the period end, resulting from changes in the exchange rate.
Forward currency contracts The fund buys and sells forward currency contracts, which are agreements between two parties to buy and sell currencies at a set price on a future date. These contracts are used to hedge foreign exchange risk.
The U.S. dollar value of forward currency contracts is determined using current forward currency exchange rates supplied by a quotation service. The market value of the contract will fluctuate with changes in currency exchange rates. The contract is marked to market daily and the change in market value is recorded as an unrealized gain or loss. The fund records a realized gain or loss equal to the difference between the value of the contract at the time it was opened and the value at the time it was closed when the contract matures or by delivery of the currency. The fund could be exposed to risk if the value of the currency changes unfavorably, if the counterparties to the contracts are unable to meet the terms of their contracts or if the fund is unable to enter into a closing position. Risks may exceed amounts recognized on the Statement of assets and liabilities.
Forward currency contracts outstanding at period end, if any, are listed after the fund’s portfolio. For the fund’s average contract amount, see Note 5.
Master agreements The fund is a party to ISDA (International Swaps and Derivatives Association, Inc.) Master Agreements (Master Agreements) with certain counterparties that govern OTC derivative and foreign exchange contracts entered into from time to time. The Master Agreements may contain provisions regarding, among other things, the parties’ general obligations, representations, agreements, collateral requirements, events of default and early termination. With respect to certain counterparties, in accordance with the terms of the Master Agreements, collateral posted to the fund is held in a segregated account by the fund’s custodian and with respect to those amounts which can be sold or repledged, are presented in the fund’s portfolio.
Collateral pledged by the fund is segregated by the fund’s custodian and identified in the fund’s portfolio. Collateral can be in the form of cash or debt securities issued by the U.S. Government or related agencies or other securities as agreed to by the fund and the applicable counterparty. Collateral requirements are determined based on the fund’s net position with each counterparty.
Termination events applicable to the fund may occur upon a decline in the fund’s net assets below a specified threshold over a certain period of time. Termination events applicable to counterparties may occur upon a decline in the counterparty’s long-term and short-term credit ratings below a specified level. In each case, upon occurrence, the other party may elect to terminate early and cause settlement of all derivative and foreign exchange contracts outstanding, including the payment of any losses and costs resulting from such early termination, as reasonably determined by the terminating party. Any decision by one or more of the fund’s counterparties to elect early termination could impact the fund’s future derivative activity.
At the close of the reporting period, the fund had a net liability position of $34,036 on open derivative contracts subject to the Master Agreements. There was no collateral posted by the fund for these agreements.
Interfund lending The fund, along with other Putnam funds, may participate in an interfund lending program pursuant to an exemptive order issued by the SEC. This program allows the fund to borrow from or lend to other Putnam funds that permit such transactions. Interfund lending transactions are subject to each fund’s investment policies and borrowing and lending limits. Interest earned or paid on the interfund lending transaction will be based on the average of certain current market rates. During the reporting period, the fund did not utilize the program.
Line of credit The fund participates, along with other Putnam funds, in a $315 million unsecured committed line of credit and a $185 million unsecured uncommitted line of credit, both provided by State Street. Borrowings may be made for temporary or emergency purposes, including the funding of shareholder redemption requests and trade settlements. Interest is charged to the fund based on the fund’s borrowing at a rate equal to the Federal Funds rate plus 1.25% for the committed line of credit and the Federal Funds rate plus 1.30% for the uncommitted line of credit. A closing fee equal to 0.02% of the committed line of credit and $50,000 for the uncommitted line of credit has been paid by the participating funds. In addition, a commitment fee of 0.11% per annum on any unutilized portion of the committed line of credit is allocated to the participating funds based on their relative net assets and paid quarterly. During the reporting period, the fund had no borrowings against these arrangements.
Federal taxes It is the policy of the fund to distribute all of its taxable income within the prescribed time period and otherwise comply with the provisions of the Internal Revenue Code of 1986, as amended (the Code), applicable
| |
| High Yield Advantage Fund | 53 |
to regulated investment companies. It is also the intention of the fund to distribute an amount sufficient to avoid imposition of any excise tax under Section 4982 of the Code.
The fund is subject to the provisions of Accounting Standards Codification ASC 740 Income Taxes (ASC 740). ASC 740 sets forth a minimum threshold for financial statement recognition of the benefit of a tax position taken or expected to be taken in a tax return. The fund did not have a liability to record for any unrecognized tax benefits in the accompanying financial statements. No provision has been made for federal taxes on income, capital gains or unrealized appreciation on securities held nor for excise tax on income and capital gains. Each of the fund’s federal tax returns for the prior three fiscal years remains subject to examination by the Internal Revenue Service.
The fund may also be subject to taxes imposed by governments of countries in which it invests. Such taxes are generally based on either income or gains earned or repatriated. The fund accrues and applies such taxes to net investment income, net realized gains and net unrealized gains as income and/or capital gains are earned. In some cases, the fund may be entitled to reclaim all or a portion of such taxes, and such reclaim amounts, if any, are reflected as an asset on the fund’s books. In many cases, however, the fund may not receive such amounts for an extended period of time, depending on the country of investment.
At November 30, 2012, the fund had a capital loss carryover of $89,254,269 available to the extent allowed by the Code to offset future net capital gain, if any. The amounts of the carryovers and the expiration dates are:
| | | |
| Loss carryover |
|
| Short-term | Long-term | Total | Expiration |
|
| $8,720,272 | N/A | $8,720,272 | November 30, 2014 |
|
| 21,153,748 | N/A | 21,153,748 | November 30, 2016 |
|
| 59,380,249 | N/A | 59,380,249 | November 30, 2017 |
|
Under the Regulated Investment Company Modernization Act of 2010, the fund will be permitted to carry forward capital losses incurred in taxable years beginning after December 22, 2010 for an unlimited period. However, any losses incurred will be required to be utilized prior to the losses incurred in pre-enactment tax years. As a result of this ordering rule, pre-enactment capital loss carryforwards may be more likely to expire unused. Additionally, post-enactment capital losses that are carried forward will retain their character as either short-term or long-term capital losses rather than being considered all short-term as under previous law.
The aggregate identified cost on a tax basis is $939,145,418, resulting in gross unrealized appreciation and depreciation of $60,839,384 and $10,282,155, respectively, or net unrealized appreciation of $50,557,229.
Distributions to shareholders Distributions to shareholders from net investment income are recorded by the fund on the ex-dividend date. Distributions from capital gains, if any, are recorded on the ex-dividend date and paid at least annually. The amount and character of income and gains to be distributed are determined in accordance with income tax regulations, which may differ from generally accepted accounting principles. Dividend sources are estimated at the time of declaration. Actual results may vary. Any non-taxable return of capital cannot be determined until final tax calculations are completed after the end of the fund’s fiscal year. Reclassifications are made to the fund’s capital accounts to reflect income and gains available for distribution (or available capital loss carryovers) under income tax regulations.
Note 2: Management fee, administrative services and other transactions
The fund pays Putnam Management a management fee (based on the fund’s average net assets and computed and paid monthly) at annual rates that may vary based on the average of the aggregate net assets of most open-end funds, as defined in the fund’s management contract, sponsored by Putnam Management. Such annual rates may vary as follows:
| | | | |
| 0.720% | of the first $5 billion, | | 0.520% | of the next $50 billion, |
| |
|
| 0.670% | of the next $5 billion, | | 0.500% | of the next $50 billion, |
| |
|
| 0.620% | of the next $10 billion, | | 0.490% | of the next $100 billion and |
| |
|
| 0.570% | of the next $10 billion, | | 0.485% | of any excess thereafter. |
| |
|
Putnam Management has contractually agreed, through June 30, 2014, to waive fees or reimburse the fund’s expenses to the extent necessary to limit the cumulative expenses of the fund, exclusive of brokerage, interest,
| |
| 54 | High Yield Advantage Fund |
taxes, investment-related expenses, extraordinary expenses, acquired fund fees and expenses and payments under the fund’s investor servicing contract, investment management contract and distribution plans, on a fiscal year-to-date basis to an annual rate of 0.20% of the fund’s average net assets over such fiscal year-to-date period. During the reporting period, the fund’s expenses were not reduced as a result of this limit.
Putnam Investments Limited (PIL), an affiliate of Putnam Management, is authorized by the Trustees to manage a separate portion of the assets of the fund as determined by Putnam Management from time to time. Putnam Management pays a quarterly sub-management fee to PIL for its services at an annual rate of 0.40% of the average net assets of the portion of the fund managed by PIL.
Putnam Management voluntarily reimbursed the fund $5,437 for a trading error which occurred during the reporting period. The effect of the loss incurred and the reimbursement by Putnam Management of such amounts had no impact on total return.
The fund reimburses Putnam Management an allocated amount for the compensation and related expenses of certain officers of the fund and their staff who provide administrative services to the fund. The aggregate amount of all such reimbursements is determined annually by the Trustees.
Custodial functions for the fund’s assets are provided by State Street. Custody fees are based on the fund’s asset level, the number of its security holdings and transaction volumes.
Putnam Investor Services, Inc., an affiliate of Putnam Management, provides investor servicing agent functions to the fund. Putnam Investor Services, Inc. received fees for investor servicing based on the fund’s retail asset level, the number of shareholder accounts in the fund and the level of defined contribution plan assets in the fund. Investor servicing fees will not exceed an annual rate of 0.32% of the fund’s average net assets. During the reporting period, the expenses for each class of shares related to investor servicing fees were as follows:
| | | | |
| Class A | $575,702 | | Class R | 21,699 |
| |
|
| Class B | 13,280 | | Class Y | 99,379 |
| |
|
| Class C | 24,078 | | Total | $834,759 |
| |
|
| Class M | 100,621 | | | |
| | |
The fund has entered into expense offset arrangements with Putnam Investor Services, Inc. and State Street whereby Putnam Investor Services, Inc.’s and State Street’s fees are reduced by credits allowed on cash balances. For the reporting period, the fund’s expenses were reduced by $572 under the expense offset arrangements.
Each independent Trustee of the fund receives an annual Trustee fee, of which $758, as a quarterly retainer, has been allocated to the fund, and an additional fee for each Trustees meeting attended. Trustees also are reimbursed for expenses they incur relating to their services as Trustees.
The fund has adopted a Trustee Fee Deferral Plan (the Deferral Plan) which allows the Trustees to defer the receipt of all or a portion of Trustees fees payable on or after July 1, 1995. The deferred fees remain invested in certain Putnam funds until distribution in accordance with the Deferral Plan.
The fund has adopted an unfunded noncontributory defined benefit pension plan (the Pension Plan) covering all Trustees of the fund who have served as a Trustee for at least five years and were first elected prior to 2004. Benefits under the Pension Plan are equal to 50% of the Trustee’s average annual attendance and retainer fees for the three years ended December 31, 2005. The retirement benefit is payable during a Trustee’s lifetime, beginning the year following retirement, for the number of years of service through December 31, 2006. Pension expense for the fund is included in Trustee compensation and expenses in the Statement of operations. Accrued pension liability is included in Payable for Trustee compensation and expenses in the Statement of assets and liabilities. The Trustees have terminated the Pension Plan with respect to any Trustee first elected after 2003.
The fund has adopted distribution plans (the Plans) with respect to its class A, class B, class C, class M and class R shares pursuant to Rule 12b–1 under the Investment Company Act of 1940. The purpose of the Plans is to compensate Putnam Retail Management Limited Partnership, an indirect wholly-owned subsidiary of Putnam Investments, LLC, for services provided and expenses incurred in distributing shares of the fund. The Plans provide for payments by the fund to Putnam Retail Management Limited Partnership at an annual rate of up to 0.35%, 1.00%, 1.00%, 1.00% and 1.00% of the average net assets attributable to class A, class B, class C, class M and class R shares, respectively. The Trustees have approved payment by the fund at an annual rate of 0.25%, 1.00%, 1.00%, 0.50%
| |
| High Yield Advantage Fund | 55 |
and 0.50% of the average net assets attributable to class A, class B, class C, class M and class R shares, respectively. During the reporting period, the class specific expenses related to distribution fees were as follows:
| | | | |
| Class A | $888,969 | | Class M | 311,020 |
| |
|
| Class B | 82,058 | | Class R | 67,054 |
| |
|
| Class C | 148,859 | | Total | $1,497,960 |
| |
|
For the reporting period, Putnam Retail Management Limited Partnership, acting as underwriter, received net commissions of $35,739 and $150 from the sale of class A and class M shares, respectively, and received $8,197 and $403 in contingent deferred sales charges from redemptions of class B and class C shares, respectively.
A deferred sales charge of up to 1.00% and 0.40% is assessed on certain redemptions of class A and class M shares, respectively. For the reporting period, Putnam Retail Management Limited Partnership, acting as underwriter, received $18 and no monies on class A and class M redemptions, respectively.
Note 3: Purchases and sales of securities
During the reporting period, cost of purchases and proceeds from sales of investment securities other than short-term investments aggregated $275,103,327 and $238,530,883, respectively. There were no purchases or proceeds from sales of long-term U.S. government securities.
Note 4: Capital shares
At the close of the reporting period, there was an unlimited number of shares of beneficial interest authorized. Transactions in capital shares were as follows:
| | | | |
| | Six months ended 5/31/13 | Year ended 11/30/12 |
|
| Class A | Shares | Amount | Shares | Amount |
|
| Shares sold | 20,909,954 | $130,015,763 | 34,034,672 | $202,599,367 |
|
| Shares issued in connection with | | | | |
| reinvestment of distributions | 2,831,672 | 17,607,124 | 5,670,687 | 33,574,614 |
|
| | 23,741,626 | 147,622,887 | 39,705,359 | 236,173,981 |
|
| Shares repurchased | (17,971,472) | (112,192,539) | (23,887,276) | (141,992,891) |
|
| Net increase | 5,770,154 | $35,430,348 | 15,818,083 | $94,181,090 |
|
| |
| | Six months ended 5/31/13 | Year ended 11/30/12 |
|
| Class B | Shares | Amount | Shares | Amount |
|
| Shares sold | 533,170 | $3,256,563 | 1,506,951 | $8,803,078 |
|
| Shares issued in connection with | | | | |
| reinvestment of distributions | 63,094 | 384,284 | 93,908 | 547,236 |
|
| | 596,264 | 3,640,847 | 1,600,859 | 9,350,314 |
|
| Shares repurchased | (259,762) | (1,585,297) | (518,250) | (3,027,472) |
|
| Net increase | 336,502 | $2,055,550 | 1,082,609 | $6,322,842 |
|
| |
| | Six months ended 5/31/13 | Year ended 11/30/12 |
|
| Class C | Shares | Amount | Shares | Amount |
|
| Shares sold | 684,279 | $4,171,917 | 2,684,363 | $15,569,195 |
|
| Shares issued in connection with | | | | |
| reinvestment of distributions | 116,464 | 707,278 | 200,002 | 1,160,670 |
|
| | 800,743 | 4,879,195 | 2,884,365 | 16,729,865 |
|
| Shares repurchased | (729,224) | (4,436,127) | (877,499) | (5,107,018) |
|
| Net increase | 71,519 | $443,068 | 2,006,866 | $11,622,847 |
|
| |
| 56 | High Yield Advantage Fund |
| | | | |
| | Six months ended 5/31/13 | Year ended 11/30/12 |
|
| Class M | Shares | Amount | Shares | Amount |
|
| Shares sold | 851,229 | $5,297,886 | 468,594 | $2,800,522 |
|
| Shares issued in connection with | | | | |
| reinvestment of distributions | 24,087 | 149,671 | 49,298 | 291,693 |
|
| | 875,316 | 5,447,557 | 517,892 | 3,092,215 |
|
| Shares repurchased | (1,433,637) | (8,944,826) | (3,622,077) | (21,541,253) |
|
| Net decrease | (558,321) | $(3,497,269) | (3,104,185) | $(18,449,038) |
|
| |
| | Six months ended 5/31/13 | Year ended 11/30/12 |
|
| Class R | Shares | Amount | Shares | Amount |
|
| Shares sold | 930,755 | $5,797,226 | 1,958,340 | $11,604,867 |
|
| Shares issued in connection with | | | | |
| reinvestment of distributions | 134,865 | 837,667 | 243,330 | 1,442,102 |
|
| | 1,065,620 | 6,634,893 | 2,201,670 | 13,046,969 |
|
| Shares repurchased | (983,616) | (6,125,946) | (812,157) | (4,830,060) |
|
| Net increase | 82,004 | $508,947 | 1,389,513 | $8,216,909 |
|
| |
| | Six months ended 5/31/13 | Year ended 11/30/12 |
|
| Class Y | Shares | Amount | Shares | Amount |
|
| Shares sold | 3,547,442 | $22,971,344 | 7,870,709 | $48,345,465 |
|
| Shares issued in connection with | | | | |
| reinvestment of distributions | 560,912 | 3,615,471 | 1,102,272 | 6,764,955 |
|
| | 4,108,354 | 26,586,815 | 8,972,981 | 55,110,420 |
|
| Shares repurchased | (5,243,830) | (34,004,587) | (9,661,199) | (59,698,691) |
|
| Net decrease | (1,135,476) | $(7,417,772) | (688,218) | $(4,588,271) |
|
At the close of the reporting period, a shareholder of record owned 6.3% of the outstanding shares of the fund.
Note 5: Summary of derivative activity
The average volume of activity for the reporting period for any derivative type that was held during the period is listed below and was as follows:
| |
| Forward currency contracts (contract amount) | $19,700,000 |
The following is a summary of the market values of derivative instruments as of the close of the reporting period:
Market values of derivative instruments as of the close of the reporting period
| | | | |
| | Asset derivatives | Liability derivatives |
|
| Derivatives not | | | | |
| accounted for as | Statement of | | Statement of | |
| hedging instruments | assets and | | assets and | |
| under ASC 815 | liabilities location | Market value | liabilities location | Market value |
|
| Foreign exchange | | | | |
| contracts | Receivables | $67,102 | Payables | $38,605 |
|
| Total | | $67,102 | | $38,605 |
|
| |
| High Yield Advantage Fund | 57 |
The following is a summary of realized and change in unrealized gains or losses of derivative instruments on the Statement of operations for the reporting period (see Note 1):
Amount of realized gain or (loss) on derivatives recognized in net gain or (loss) on investments
| | |
| Derivatives not accounted for as hedging | Forward currency | |
| instruments under ASC 815 | contracts | Total |
|
| Foreign exchange contracts | $226,320 | $226,320 |
|
| Total | $226,320 | $226,320 |
|
Change in unrealized appreciation or (depreciation) on derivatives recognized in net gain or (loss) on investments
| | |
| Derivatives not accounted for as hedging | Forward currency | |
| instruments under ASC 815 | contracts | Total |
|
| Foreign exchange contracts | $72,326 | $72,326 |
|
| Total | $72,326 | $72,326 |
|
Note 6: Transactions with affiliated issuers
Transactions during the reporting period with Putnam Money Market Liquidity Fund and Putnam Short Term Investment Fund, which are under common ownership or control, were as follows:
| | | | | |
| | Market value at | | | | Market value |
| | the beginning | | | | at the end of |
| | of the reporting | | | Investment | the reporting |
| Name of affiliate | period | Purchase cost | Sale proceeds | income | period |
|
| Putnam Money Market | | | | | |
| Liquidity Fund* | $40,591,647 | $103,683,370 | $144,275,017 | $14,925 | $— |
|
| Putnam Short Term | | | | | |
| Investment Fund* | — | 103,682,737 | 67,816,675 | 5,767 | 35,866,062 |
|
| Totals | $40,591,647 | $207,366,107 | $212,091,692 | $20,692 | $35,866,062 |
|
* Management fees charged to Putnam Money Market Liquidity Fund and Putnam Short Term Investment Fund have been waived by Putnam Management.
Note 7: Senior loan commitments
Senior loans are purchased or sold on a when-issued or delayed delivery basis and may be settled a month or more after the trade date, which from time to time can delay the actual investment of available cash balances; interest income is accrued based on the terms of the securities. Senior loans can be acquired through an agent, by assignment from another holder of the loan, or as a participation interest in another holder’s portion of the loan. When the fund invests in a loan or participation, the fund is subject to the risk that an intermediate participant between the fund and the borrower will fail to meet its obligations to the fund, in addition to the risk that the borrower under the loan may default on its obligations.
Note 8: Market, credit and other risks
In the normal course of business, the fund trades financial instruments and enters into financial transactions where risk of potential loss exists due to changes in the market (market risk) or failure of the contracting party to the transaction to perform (credit risk). The fund may be exposed to additional credit risk that an institution or other entity with which the fund has unsettled or open transactions will default. Investments in foreign securities involve certain risks, including those related to economic instability, unfavorable political developments, and currency fluctuations. The fund may invest in higher yielding, lower rated bonds that may have a higher rate of default.
| |
| 58 | High Yield Advantage Fund |
Note 9: New accounting pronouncement
In January 2013, ASU 2013–01, “Clarifying the Scope of Disclosures about Offsetting Assets and Liabilities,” amended ASU No. 2011–11, “Disclosures about Offsetting Assets and Liabilities.” The ASUs create new disclosure requirements requiring entities to disclose both gross and net information for derivatives and other financial instruments that are either offset in the Statement of assets and liabilities or subject to an enforceable master netting arrangement or similar agreement. The disclosure requirements are effective for annual reporting periods beginning on or after January 1, 2013 and interim periods within those annual periods. Putnam Management is currently evaluating the application of ASUs 2013–01 and 2011–11 and their impact, if any, on the fund’s financial statements.
| |
| High Yield Advantage Fund | 59 |
Services for shareholders
Investor services
Systematic investment plan Tell us how much you wish to invest regularly — weekly, semimonthly, or monthly — and the amount you choose will be transferred automatically from your checking or savings account. There’s no additional fee for this service, and you can suspend it at any time. This plan may be a great way to save for college expenses or to plan for your retirement.
Please note that regular investing does not guarantee a profit or protect against loss in a declining market. Before arranging a systematic investment plan, consider your financial ability to continue making purchases in periods when prices are low.
Systematic exchange You can make regular transfers from one Putnam fund to another Putnam fund. There are no additional fees for this service, and you can cancel or change your options at any time.
Dividends PLUS You can choose to have the dividend distributions from one of your Putnam funds automatically reinvested in another Putnam fund at no additional charge.
Free exchange privilege You can exchange money between Putnam funds free of charge, as long as they are the same class of shares. A signature guarantee is required if you are exchanging more than $500,000. The fund reserves the right to revise or terminate the exchange privilege.
Reinstatement privilege If you’ve sold Putnam shares or received a check for a dividend or capital gain, you may reinvest the proceeds with Putnam within 90 days of the transaction and they will be reinvested at the fund’s current net asset value — with no sales charge. However, reinstatement of class B shares may have special tax consequences. Ask your financial or tax representative for details.
Check-writing service You have ready access to many Putnam accounts. It’s as simple as writing a check, and there are no special fees or service charges. For more information about the check-writing service, call Putnam or visit our website.
Dollar cost averaging When you’re investing for long-term goals, it’s time, not timing, that counts. Investing on a systematic basis is a better strategy than trying to figure out when the markets will go up or down. This means investing the same amount of money regularly over a long period. This method of investing is called dollar cost averaging. When a fund’s share price declines, your investment dollars buy more shares at lower prices. When it increases, they buy fewer shares. Over time, you will pay a lower average price per share.
For more information
Visit the Individual Investors section at putnam.com A secure section of our website contains complete information on your account, including balances and transactions, updated daily. You may also conduct transactions, such as exchanges, additional investments, and address changes. Log on today to get your password.
Call us toll free at 1-800-225-1581 Ask a helpful Putnam representative or your financial advisor for details about any of these or other services, or see your prospectus.
| |
| 60 | High Yield Advantage Fund |
Fund information
Founded over 75 years ago, Putnam Investments was built around the concept that a balance between risk and reward is the hallmark of a well-rounded financial program. We manage over 100 funds across income, value, blend, growth, asset allocation, absolute return, and global sector categories.
| | |
| Investment Manager | Trustees | Robert T. Burns |
| Putnam Investment | Jameson A. Baxter, Chair | Vice President and |
| Management, LLC | Liaquat Ahamed | Chief Legal Officer |
| One Post Office Square | Ravi Akhoury | |
| Boston, MA 02109 | Barbara M. Baumann | Robert R. Leveille |
| | Charles B. Curtis | Vice President and |
| Investment Sub-Manager | Robert J. Darretta | Chief Compliance Officer |
| Putnam Investments Limited | Katinka Domotorffy | |
| 57–59 St James’s Street | John A. Hill | Michael J. Higgins |
| London, England SW1A 1LD | Paul L. Joskow | Vice President, Treasurer, |
| | Elizabeth T. Kennan | and Clerk |
| Marketing Services | Kenneth R. Leibler | |
| Putnam Retail Management | Robert E. Patterson | Janet C. Smith |
| One Post Office Square | George Putnam, III | Vice President, |
| Boston, MA 02109 | Robert L. Reynolds | Principal Accounting Officer, |
| | W. Thomas Stephens | and Assistant Treasurer |
| Custodian | | |
| State Street Bank | Officers | Susan G. Malloy |
| and Trust Company | Robert L. Reynolds | Vice President and |
| | President | Assistant Treasurer |
| Legal Counsel | | |
| Ropes & Gray LLP | Jonathan S. Horwitz | James P. Pappas |
| | Executive Vice President, | Vice President |
| | Principal Executive Officer, and | |
| | Compliance Liaison | Mark C. Trenchard |
| | | Vice President and |
| | Steven D. Krichmar | BSA Compliance Officer |
| | Vice President and | |
| | Principal Financial Officer | Nancy E. Florek |
| | | Vice President, Director of |
| | | Proxy Voting and Corporate |
| | | Governance, Assistant Clerk, |
| | | and Associate Treasurer |
This report is for the information of shareholders of Putnam High Yield Advantage Fund. It may also be used as sales literature when preceded or accompanied by the current prospectus, the most recent copy of Putnam’s Quarterly Performance Summary, and Putnam’s Quarterly Ranking Summary. For more recent performance, please visit putnam.com. Investors should carefully consider the investment objectives, risks, charges, and expenses of a fund, which are described in its prospectus. For this and other information or to request a prospectus or summary prospectus, call 1-800-225-1581 toll free. Please read the prospectus carefully before investing. The fund’s Statement of Additional Information contains additional information about the fund’s Trustees and is available without charge upon request by calling 1-800-225-1581.
| |
| Item 3. Audit Committee Financial Expert: |
| |
| Item 4. Principal Accountant Fees and Services: |
| |
| Item 5. Audit Committee of Listed Registrants |
| |
| Item 6. Schedule of Investments: |
| |
| The registrant’s schedule of investments in unaffiliated issuers is included in the report to shareholders in Item 1 above. |
| |
| Item 7. Disclosure of Proxy Voting Policies and Procedures For Closed-End Management Investment Companies: |
| |
| Item 8. Portfolio Managers of Closed-End Investment Companies |
| |
| Item 9. Purchases of Equity Securities by Closed-End Management Investment Companies and Affiliated Purchasers: |
| |
| Item 10. Submission of Matters to a Vote of Security Holders: |
| |
| Item 11. Controls and Procedures: |
| |
| (a) The registrant’s principal executive officer and principal financial officer have concluded, based on their evaluation of the effectiveness of the design and operation of the registrant’s disclosure controls and procedures as of a date within 90 days of the filing date of this report, that the design and operation of such procedures are generally effective to provide reasonable assurance that information required to be disclosed by the registrant in this report is recorded, processed, summarized and reported within the time periods specified in the Commission’s rules and forms. |
| |
| (b) Changes in internal control over financial reporting: Not applicable |
| |
| (a)(2) Separate certifications for the principal executive officer and principal financial officer of the registrant as required by Rule 30a-2(a) under the Investment Company Act of 1940, as amended, are filed herewith. |
| |
| (b) The certifications required by Rule 30a-2(b) under the Investment Company Act of 1940, as amended, are filed herewith. |
| |
| Putnam High Yield Advantage Fund |
| |
| By (Signature and Title): |
| |
| /s/Janet C. Smith
Janet C. Smith
Principal Accounting Officer
|
| |
| Pursuant to the requirements of the Securities Exchange Act of 1934 and the Investment Company Act of 1940, this report has been signed below by the following persons on behalf of the registrant and in the capacities and on the dates indicated. |
| |
| By (Signature and Title): |
| |
| /s/Jonathan S. Horwitz
Jonathan S. Horwitz
Principal Executive Officer
|
| |
| By (Signature and Title): |
| |
| /s/Steven D. Krichmar
Steven D. Krichmar
Principal Financial Officer
|