| | | |
| | |
| UNITED STATES |
| SECURITIES AND EXCHANGE COMMISSION |
| Washington, D.C. 20549 |
| |
| FORM N-CSR |
| |
| CERTIFIED SHAREHOLDER REPORT OF REGISTERED |
| MANAGEMENT INVESTMENT COMPANIES |
| | |
| Investment Company Act file number: (811-04616) | |
| | |
| Exact name of registrant as specified in charter: | Putnam High Yield Advantage Fund |
| |
| Address of principal executive offices: One Post Office Square, Boston, Massachusetts 02109 |
| | |
| Name and address of agent for service: | | Beth S. Mazor, Vice President |
| | One Post Office Square |
| | Boston, Massachusetts 02109 |
| | |
| Copy to: | | John W. Gerstmayr, Esq. |
| | Ropes & Gray LLP |
| | One International Place |
| | Boston, Massachusetts 02110 |
| | |
| Registrant’s telephone number, including area code: | (617) 292-1000 |
| | | |
| Date of fiscal year end: November 30, 2010 | | |
| |
| Date of reporting period: December 1, 2009 — May 31, 2010 |
Item 1. Report to Stockholders:
The following is a copy of the report transmitted to stockholders pursuant to Rule 30e-1 under the Investment Company Act of 1940:
Putnam
High Yield
Advantage Fund
Semiannual report
5 | 31 | 10
| |
| Message from the Trustees | 1 |
| About the fund | 2 |
| Performance snapshot | 4 |
| Interview with your fund’s portfolio manager | 5 |
| Your fund’s performance | 10 |
| Your fund’s expenses | 12 |
| Terms and definitions | 14 |
| Other information for shareholders | 15 |
| Financial statements | 16 |
Message from the Trustees
Dear Fellow Shareholder:
The U.S. economy is on the mend, albeit at a slower pace than we would like. Economic growth continues despite the serious national debt issues of a handful of European nations. In the United States, the outlook is one of guarded optimism, with most economists agreeing that a second recession is unlikely and that growth will continue for the balance of the year.
During the spring and early summer, volatility returned to both fixed-income and equity markets. Compared with the solid rebound of 2009, the investment environment for 2010 has become somewhat more challenging — one that requires analysis, insight, innovation, and expertise. We believe these attributes form the very core of Putnam’s analytic, active-management approach.
In other developments, Barbara M. Baumann has been elected to the Board of Trustees of the Putnam Funds, effective July 1, 2010. Ms. Baumann is president and owner of Cross Creek Energy Corporation of Denver, Colorado, a strategic consultant to domestic energy firms and direct investor in energy assets. We also want to thank Elizabeth T. Kennan, who recently retired from the Board of Trustees, for her many years of dedicated and thoughtful leadership.

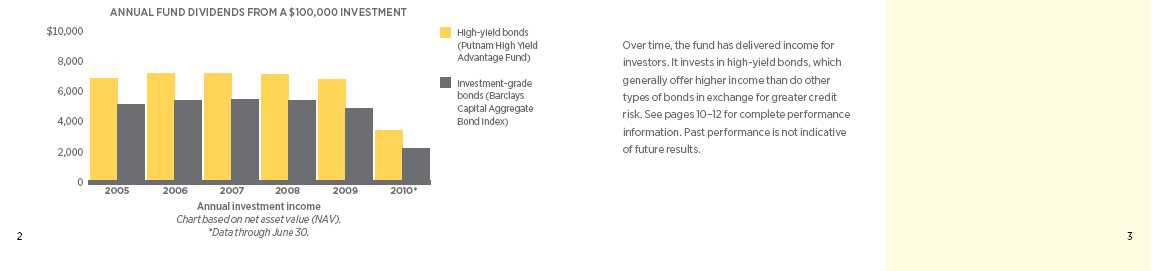
About the fund
Seeking a high level of current income for investors since 1986
Unlike most types of fixed-income investments, high-yield bond performance is more dependent on the performance of the companies that issue the bonds than on interest rates. For this reason, distinguishing between opportunities and potential pitfalls requires a rigorous investment process that includes analyzing companies. With Putnam High Yield Advantage Fund, this process is highlighted by intensive research, investment diversification, and carefully timed portfolio adjustments.
Because of the risks of high-yield bond investing, in-depth credit research is essential. The fund’s research team — which includes analysts who specialize by industry — visits with the management of issuing companies and analyzes each company’s prospects. The team then compares this information to the bond’s upside or downside potential before deciding whether it is an appropriate investment for the fund.
The fund’s portfolio typically consists of bonds from a broad range of industries and companies. Holdings are diversified across industry sectors and among bonds with differing credit ratings. While the fund invests primarily in the bonds of U.S. companies, its diversified approach allows it to include foreign bonds as well. Among these securities, investments in emerging-market bonds may be used to enhance the fund’s appreciation potential. Although diversification does not ensure a profit or protect against a loss and it is possible to lose money in a diversified portfolio, the fund’s diversification can help reduce the volatility that typically comes with higher-risk investments.
As the bond markets shift over time, the fund’s managers look for ways to capitalize on developments that affect fixed-income securities in general and high-yield bonds in particular. For example, when credit spreads are wide and are expected to tighten, the fund may pursue the higher income potential offered by lower-quality issues. On the other hand, when credit spreads are narrow — that is, when the difference in yield between higher- and lower-rated bonds of comparable maturities is small — the fund may shift its emphasis to higher-quality high-yield bonds.
Consider these risks before investing:
Lower-rated bonds may offer higher yields in return for more risk. The use of derivatives involves special risks and may result in losses. Mutual funds that invest in bonds are subject to certain risks including interest-rate risk, credit risk, and inflation risk. As interest rates rise, the prices of bonds fall. Long-term bonds are more exposed to interest-rate risk than short-term bonds. Unlike bonds, bond funds have ongoing fees and expenses.
What makes a bond
“high yield”?
High-yield bonds are fixed-income investments typically issued by companies that lack an established earnings track record or a solid credit history. In general, high-yield bonds offer higher interest rates than investment-grade bonds to compensate for their increased risk. Because of this added risk, these bonds are typically rated below investment grade by an independent rating agency (for example, the lowest Moody’s Investors Service rating of investment-grade bonds is Baa). The lower the rating, the greater the possibility that a bond’s issuer will be unable to make interest payments or repay the principal.
Bond ratings
| | | |
| Moody’s | Grade | | |
| Aaa | Investment | | |
| Aa, A | Investment | | |
| Baa | Investment | | |
| Ba, B | High yield | | |
| Caa/Ca | High yield | | |
| C | High yield | | |
High-yield bonds can offer greater income potential
than other types of bonds.
Performance
snapshot
Annualized total return (%) comparison as of 5/31/10
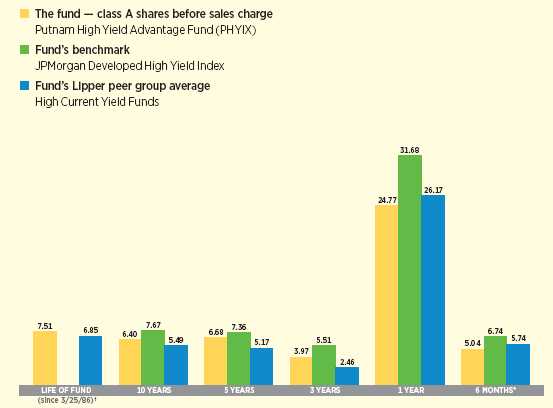
Current performance may be lower or higher than the quoted past performance, which cannot guarantee future results. Share price, principal value, and return will fluctuate, and you may have a gain or a loss when you sell your shares. Performance of class A shares assumes reinvestment of distributions and does not account for taxes. Fund returns in the bar chart do not reflect a sales charge of 4.00%; had they, returns would have been lower. See pages 5 and 10–12 for additional performance information. For a portion of the periods, this fund may have limited expenses, without which returns would have been lower. A 1% short-term trading fee may apply. To obtain the most recent month-end performance, visit putnam.com.
* Returns for the six-month period are not annualized, but cumulative.
† The fund’s benchmark, the JPMorgan Developed High Yield Index, began operations on 12/31/94, which post-dates the inception date of the fund’s class A shares.
4
Interview with your
fund’s portfolio manager
Paul Scanlon
Paul, how did the fund perform for the
six-month period?
Putnam High Yield Advantage Fund class A shares posted a total return of 5.04% during the six-month period. The return was slightly lower than its Lipper peer group, High Current Yield Funds, which had a return of 5.74%. And the fund also underperformed its benchmark, the JPMorgan Developed High Yield Index, which posted a return of 6.74%.
What factors influenced the high-yield
market during the period?
The six-month period began with strong performance in the high-yield market and concluded with an environment challenged by volatility stemming from sovereign debt concerns.
Improvement in corporate fundamentals contributed to the rally. Investors, who had fled the market for fear of increasing defaults, flocked back as they began to see a gradually stabilizing economy and improving corporate business fundamentals.
Another positive factor behind the strong performance was a raft of new issuance. After evaporating during the 2008 market downturn, new issue supply resumed in the second quarter of 2009. Last year, more than $180 billion worth of high-yield debt was brought to market, and about 75% of that was used by high-yield companies to refinance debt. Refinancing helped provide additional financial flexibility for high-yield companies.
The refinancing activity has continued into 2010. Access to the high-yield market as a source of financing improved dramatically in the first part of 2010. This trend has helped many corporate issuers repair their balance sheets — and in some cases
Broad market index and fund performance
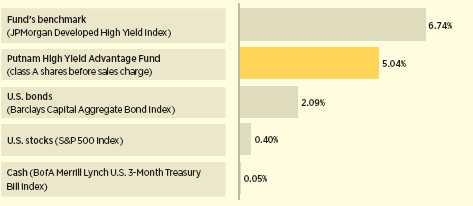
This comparison shows your fund’s performance in the context of broad market indexes for the six months ended 5/31/10. See pages 4 and 10–12 for additional fund performance information. Index descriptions can be found on page 14.
5
avoid default — by pushing out maturities, refinancing bank debt with covenants, and building up liquidity. Year to date through May 31, 2010, the volume of new issuance totaled $118 billion, and the past 12-months’ volume of $248 billion was nearly 35% higher than any other 12-month period. About 69% of the new issuance year to date has been for refinancing.
But by May, the European sovereign debt crisis took center stage in both equity and fixed-income markets as concerns were raised about peripheral eurozone countries. The turmoil had an effect on the credit market as investors moved broadly toward higher-quality investments. Yield spreads widened by about 150 basis points during the month. In May, the high-yield market sustained its worst monthly performance since November 2008, falling –3.32%.
Volatility and uncertainty remain high. But risk appetites are tied more to perceptions of global sovereign debt and other macroeconomic concerns, and not to the underlying domestic credit fundamentals. In fact, corporate bonds are one of the few areas in fixed income where we are seeing underlying fundamental improvement. Nearly 70% of S&P 500 companies beat expectations in the first quarter. Revenue growth has returned, and defaults are steadily declining. Looking back to 2009, the default rate was around 15%. In the first quarter of 2010, the annualized default rate for bonds was under 1%. The historic average is close to 4%. In fact, we expect defaults to trend below historic averages by the end of the year.
Credit quality overview
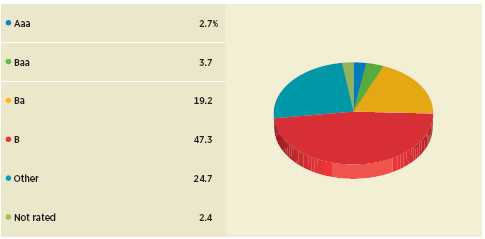
Credit qualities are shown as a percentage of net assets as of 5/31/10. A bond rated Baa or higher (Prime-3 or higher, for short-term debt) is considered investment grade. The chart reflects Moody’s ratings; percentages may include bonds or derivatives not rated by Moody’s but rated by Standard & Poor’s or, if unrated by S&P, by Fitch, and then included in the closest equivalent Moody’s rating. Ratings will vary over time.
Credit quality includes bonds and represents only the fixed-income portion of the portfolio. Derivative instruments, including currency forwards, are only included to the extent of any unrealized gain or loss on such instruments and are shown in the not-rated category. The fund itself has not been rated by an independent rating agency.
6
“Revenue growth has returned, and
defaults are steadily declining. In
fact, we expect defaults to trend
below historic averages by the end
of the year.”
Paul Scanlon
Why did the fund underperform
the benchmark?
Within the high-yield universe, portfolios that had significant allocations to the lowest-rated area of the high-yield market or the bottom areas of corporate capital structure outperformed their peer group over the past six months. The fund did not have these types of allocations.
Another reason that the fund trailed its benchmark during the period resulted from our decision to underweight financials. Typically, the business model for financial issuers is to borrow at a low rate and lend at a higher rate. Since many financial issuers have been downgraded into the high-yield universe, their cost of borrowing has increased. Our view was that many of the issues may now be at a competitive disadvantage compared with their investment-grade counterparts. But many bonds from the financials group entered the high-yield universe at what some considered to be artificially low valuations only to rebound sharply in price as the economy continued to stabilize. The fund’s defensive position hurt its relative performance as the lower-rated tiers of the market outperformed.
What were some of the specific detractors
from the fund’s performance?
One detractor was our overweight position in Harrah’s, the Las Vegas-based casino operator. While our holdings delivered positive results, the unsecured, or riskier, debt of Harrah’s outperformed the securities that we owned in the portfolio. Hence, being conservatively positioned detracted from the fund’s relative performance, although the security did post a positive return.
Another detractor was the fund’s underweight position in CIT, the consumer finance company. This weighting hurt performance as financials
Top 10 holdings
| | |
| HOLDING | COUPON (%) AND | |
| (percentage of fund’s net assets) | MATURITY DATE | SECTOR/INDUSTRY |
|
| Freeport-McMoRan Copper & Gold, Inc. (0.9%) | 8.375%, 2017 | Basic materials/Metals |
| NRG Energy, Inc. (0.8%) | 7.375%, 2016 | Utilities and power/ |
| | | Power producers |
| CIT Group, Inc. (0.7%) | 7%, 2017 | Financials/Financial |
| Owens Corning, Inc. (0.6%) | 9%, 2019 | Consumer cyclicals/ |
| | | Building materials |
| Intelsat Jackson Holding Co. | 11.25%, 2016 | Communication services/ |
| (Bermuda) (0.6%) | | Telecommunications |
| Allison Transmission, Inc. (0.5%) | 11.25%, 2015 | Consumer cyclicals/Automotive |
| LBI Escrow Corp. (0.5%) | 8%, 2017 | Basic materials/Chemicals |
| CCH II, LLC (0.5%) | 13.5%, 2016 | Communication services/ |
| | | Cable television |
| MetroPCS Wireless, Inc. (0.5%) | 9.25%, 2014 | Communication services/ |
| | | Telecommunications |
| Legrand SA (France) (0.5%) | 8.5%, 2025 | Capital goods/Manufacturing |
This table shows the fund’s top 10 holdings and the percentage of the fund’s net assets that each represented as of 5/31/10. Short-term holdings are excluded. Holdings will vary over time.
7
were one of the best-performing areas of the high-yield market during the period.
What holdings contributed to the
fund’s performance?
Legrand, a France-based firm that manufactures wiring devices, cable management systems, and power distribution components, contributed to the fund’s performance. During the period, the European high-yield market performed well, and the company also experienced some fundamental improvements which aided relative performance.
Another contributor to the fund’s performance was Surgical Care Affiliates, which owns ambulatory service centers. The firm experienced fundamental improvements and saw revenue and earnings growth over the period.
What changes have you made in the
positioning of the fund?
During the period, we added more cyclical exposure to the portfolio, with overweights to the consumer products, energy, health-care, building products, metals/minerals, utilities, and communications industries. We’ve added more cyclical exposure because, although we expect weak economic growth, corporate fundamentals continue to improve.
The portfolio also has underweights in aerospace, chemicals, financials, forest
Credit quality comparison
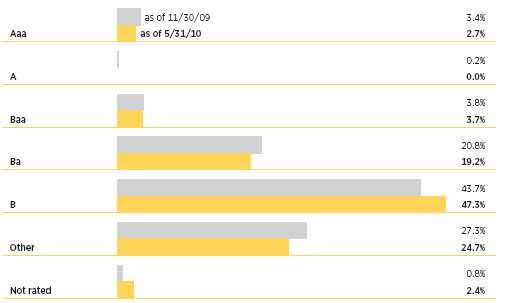
This chart shows how the fund’s credit quality has changed over the past six months. A bond rated Baa or higher (Prime-3 or higher, for short-term debt) is considered investment grade. The chart reflects Moody’s ratings; percentages may include bonds or derivatives not rated by Moody’s but rated by Standard & Poor’s or, if unrated by S&P, by Fitch, and then included in the closest equivalent Moody’s rating. Ratings will vary over time.
Credit quality includes bonds and represents only the fixed-income portion of the portfolio. Derivative instruments, including currency forwards, are only included to the extent of any unrealized gain or loss on such instruments and are shown in the not-rated category. The fund itself has not been rated by an independent rating agency.
8
products, and services. Some industries are poor vehicles for leverage over the long run, including airlines, financials, forest products, and manufacturing. Generally, we have a bias against these industries.
What is your outlook for the
high-yield market?
We believe that the economy will continue to stabilize and exhibit slower, but still positive, growth for the second half of the year. The most recent economic data has also pointed to a continued recovery, with fundamentals on an upward trajectory from trough levels. We believe that high-yield defaults have peaked and will decline even further this year. More than 20% of the high-yield market has defaulted or experienced distressed exchanges over the past two years. This has purged many of the weakest credits from the market. And refinancing has also helped to reduce defaults.
At current spreads, the high-yield market continues to look reasonably attractive when compared with our view of prospective credit costs. Investor demand for corporate credit expected to remain substantial as long as the recovery continues.
We recognize that positive credit cycles may endure for multi-year periods and are constructive on the high-yield market. However, the market may be volatile in the short term as risk premiums are currently being largely driven by global macroeconomic concerns that are transcending both fixed-income and equity asset classes. We expect volatility to remain elevated in the near term but intend to maintain market levels of risk given current valuations for the asset class and improving corporate fundamentals.
While there has been some volatility related to sovereign debt issues, we believe there will be excess spreads even after factoring in potential defaults and recoveries, and high yield continues to represent compelling opportunities for long-term investors.
Thanks for taking the time to speak with us
today, Paul.
The views expressed in this report are exclusively those of Putnam Management. They are not meant as investment advice.
Please note that the holdings discussed in this report may not have been held by the fund for the entire period. Portfolio composition is subject to review in accordance with the fund’s investment strategy and may vary in the future. Current and future portfolio holdings are subject to risk.

Portfolio Manager Paul Scanlon is Team Leader of U.S. Fixed Income High Yield at Putnam. He has an M.B.A. from The University of Chicago Booth School of Business and a B.A. from Colgate University. A CFA charterholder, Paul joined Putnam in 1999 and has been in the investment industry since 1986.
In addition to Paul, your fund’s portfolio managers are Norm Boucher and Rob Salvin.
IN THE NEWS
Despite headlines about market volatility and a slow economic recovery, cash on U.S. corporate balance sheets has hit a record high. The Federal Reserve recently reported that nonfinancial companies were holding $1.84 trillion in cash and other liquid assets as of the end of March. The amount of cash is up 26% from a year ago, the largest increase on record, according to the central bank. Many firms implemented cost-cutting measures and other efficiencies in 2009. Concerned about the strength of the economic recovery and the debt crisis in Europe, companies have been reluctant to spend in recent months. Ultimately, that cash may be deployed on hiring, dividends, mergers, stock repurchases, and other shareholder-friendly activities.
9
Your fund’s performance
This section shows your fund’s performance, price, and distribution information for periods ended May 31, 2010, the end of the first half of its current fiscal year. In accordance with regulatory requirements for mutual funds, we also include performance as of the most recent calendar quarter-end and expense information taken from the fund’s current prospectus. Performance should always be considered in light of a fund’s investment strategy. Data represents past performance. Past performance does not guarantee future results. More recent returns may be less or more than those shown. Investment return and principal value will fluctuate, and you may have a gain or a loss when you sell your shares. Performance information does not reflect any deduction for taxes a shareholder may owe on fund distributions or on the redemption of fund shares. For the most recent month-end performance, please visit the Individual Investors section at putnam.c om or call Putnam at 1-800-225-1581. Class Y shares are generally only available to corporate and institutional clients and clients in other approved programs. See the Terms and Definitions section in this report for definitions of the share classes offered by your fund.
Fund performance Total return for periods ended 5/31/10
| | | | | | | | | | |
| | Class A | Class B | Class C | Class M | Class R | Class Y |
| (inception dates) | (3/25/86) | (5/16/94) | (3/30/07) | (12/1/94) | (3/30/07) | (12/31/98) |
|
| | NAV | POP | NAV | CDSC | NAV | CDSC | NAV | POP | NAV | NAV |
|
| Annual average | | | | | | | | | | |
| (life of fund) | 7.51% | 7.32% | 6.60% | 6.60% | 6.70% | 6.70% | 7.22% | 7.07% | 7.25% | 7.68% |
|
| 10 years | 85.92 | 78.56 | 71.83 | 71.83 | 72.27 | 72.27 | 82.36 | 76.52 | 81.87 | 92.28 |
| Annual average | 6.40 | 5.97 | 5.56 | 5.56 | 5.59 | 5.59 | 6.19 | 5.85 | 6.16 | 6.76 |
|
| 5 years | 38.16 | 32.63 | 33.32 | 31.45 | 33.05 | 33.05 | 36.62 | 32.22 | 36.79 | 39.75 |
| Annual average | 6.68 | 5.81 | 5.92 | 5.62 | 5.88 | 5.88 | 6.44 | 5.74 | 6.47 | 6.92 |
|
| 3 years | 12.40 | 7.85 | 10.06 | 7.43 | 9.92 | 9.92 | 11.80 | 8.25 | 11.91 | 13.19 |
| Annual average | 3.97 | 2.55 | 3.25 | 2.42 | 3.20 | 3.20 | 3.79 | 2.68 | 3.82 | 4.22 |
|
| 1 year | 24.77 | 19.84 | 23.83 | 18.83 | 23.68 | 22.68 | 24.45 | 20.50 | 24.45 | 24.98 |
|
| 6 months | 5.04 | 0.87 | 4.73 | –0.27 | 4.57 | 3.57 | 4.92 | 1.46 | 5.11 | 5.18 |
|
Current performance may be lower or higher than the quoted past performance, which cannot guarantee future results. After-sales-charge returns (public offering price, or POP) for class A and M shares reflect a maximum 4.00% and 3.25% load, respectively. Class B share returns reflect the applicable contingent deferred sales charge (CDSC), which is 5% in the first year, declining to 1% in the sixth year, and is eliminated thereafter. Class C shares reflect a 1% CDSC for the first year that is eliminated thereafter. Class R and Y shares have no initial sales charge or CDSC. Performance for class B, C, M, R, and Y shares before their inception is derived from the historical performance of class A shares, adjusted for the applicable sales charge (or CDSC) and, except for class Y shares, the higher operating expenses for such shares.
For a portion of the periods, this fund may have limited expenses, without which returns would have been lower.
A 1% short-term trading fee may be applied to shares exchanged or sold within 90 days of purchase.
10
Comparative index returns For periods ended 5/31/10
| | |
| | JPMorgan Developed | Lipper High Current Yield Funds |
| | High Yield Index | category average* |
|
| Annual average (life of fund) | —† | 6.85% |
|
| 10 years | 109.33% | 74.26 |
| Annual average | 7.67 | 5.49 |
|
| 5 years | 42.61 | 29.60 |
| Annual average | 7.36 | 5.17 |
|
| 3 years | 17.45 | 8.18 |
| Annual average | 5.51 | 2.46 |
|
| 1 year | 31.68 | 26.17 |
|
| 6 months | 6.74 | 5.74 |
|
Index and Lipper results should be compared to fund performance at net asset value.
* Over the 6-month, 1-year, 3-year, 5-year, 10-year, and life-of-fund periods ended 5/31/10, there were 489, 471, 409, 350, 227, and 26 funds, respectively, in this Lipper category.
† The fund’s benchmark, the JPMorgan Developed High Yield Index, began operations on 12/31/94, which post-dates the inception date of the fund’s class A shares.
Fund price and distribution information For the six-month period ended 5/31/10
| | | | | | | | |
| Distributions | Class A | Class B | Class C | Class M | Class R | Class Y |
|
| Number | 6 | 6 | 6 | 6 | 6 | 6 |
|
| Income | $0.210 | $0.189 | $0.190 | $0.204 | $0.204 | $0.216 |
|
| Capital gains | — | — | — | — | — | — |
|
| Total | $0.210 | $0.189 | $0.190 | $0.204 | $0.204 | $0.216 |
|
| Share value | NAV | POP | NAV | NAV | NAV | POP | NAV | NAV |
|
| 11/30/09 | $5.56 | $5.79 | $5.47 | $5.46 | $5.57 | $5.76 | $5.56 | $5.71 |
|
| 5/31/10 | 5.63 | 5.86 | 5.54 | 5.52 | 5.64 | 5.83 | 5.64 | 5.79 |
|
| Current yield (end of period) | NAV | POP | NAV | NAV | NAV | POP | NAV | NAV |
|
| Current dividend rate 1 | 7.46% | 7.17% | 6.71% | 6.96% | 7.23% | 7.00% | 7.23% | 7.46% |
|
| Current 30-day SEC yield 2 | N/A | 6.77 | 6.27 | 6.28 | N/A | 6.56 | 6.79 | 7.24 |
|
The classification of distributions, if any, is an estimate. Final distribution information will appear on your year-end tax forms.
1 Most recent distribution, excluding capital gains, annualized and divided by NAV or POP at end of period.
2 Based only on investment income and calculated using the maximum offering price for each share class, in accordance with SEC guidelines.
11
Fund performance as of most recent calendar quarter
Total return for periods ended 6/30/10
| | | | | | | | | | |
| | Class A | Class B | Class C | Class M | Class R | Class Y |
| (inception dates) | (3/25/86) | (5/16/94) | (3/30/07) | (12/1/94) | (3/30/07) | (12/31/98) |
|
| | NAV | POP | NAV | CDSC | NAV | CDSC | NAV | POP | NAV | NAV |
|
| Annual average | | | | | | | | | | |
| (life of fund) | 7.53% | 7.35% | 6.62% | 6.62% | 6.72% | 6.72% | 7.24% | 7.09% | 7.27% | 7.70% |
|
| 10 years | 85.29 | 77.99 | 70.94 | 70.94 | 71.86 | 71.86 | 81.41 | 75.41 | 80.91 | 91.30 |
| Annual average | 6.36 | 5.94 | 5.51 | 5.51 | 5.56 | 5.56 | 6.14 | 5.78 | 6.11 | 6.70 |
|
| 5 years | 37.81 | 32.35 | 32.74 | 30.88 | 32.66 | 32.66 | 36.04 | 31.69 | 36.20 | 39.39 |
| Annual average | 6.62 | 5.77 | 5.83 | 5.53 | 5.82 | 5.82 | 6.35 | 5.66 | 6.37 | 6.87 |
|
| 3 years | 15.61 | 11.01 | 13.05 | 10.34 | 13.09 | 13.09 | 14.79 | 11.07 | 14.90 | 16.34 |
| Annual average | 4.95 | 3.54 | 4.17 | 3.33 | 4.19 | 4.19 | 4.71 | 3.56 | 4.74 | 5.17 |
|
| 1 year | 22.30 | 17.37 | 21.37 | 16.37 | 21.44 | 20.44 | 22.03 | 18.01 | 22.03 | 22.57 |
|
| 6 months | 3.36 | –0.83 | 2.83 | –2.14 | 2.86 | 1.86 | 3.07 | –0.26 | 3.07 | 3.37 |
|
Your fund’s expenses
As a mutual fund investor, you pay ongoing expenses, such as management fees, distribution fees (12b-1 fees), and other expenses. In the most recent six-month period, your fund limited these expenses; had it not done so, expenses would have been higher. Using the following information, you can estimate how these expenses affect your investment and compare them with the expenses of other funds. You may also pay one-time transaction expenses, including sales charges (loads) and redemption fees, which are not shown in this section and would have resulted in higher total expenses. For more information, see your fund’s prospectus or talk to your financial representative.
Expense ratios
| | | | | | |
| | Class A | Class B | Class C | Class M | Class R | Class Y |
|
| Total annual operating expenses for the fiscal year | | | | | | |
| ended 11/30/09* | 1.08% | 1.83% | 1.83% | 1.33% | 1.33% | 0.83% |
|
| Annualized expense ratio for the six-month period | | | | | | |
| ended 5/31/10 | 1.07% | 1.82% | 1.82% | 1.32% | 1.32% | 0.82% |
|
Fiscal-year expense information in this table is taken from the most recent prospectus, is subject to change, and may differ from that shown for the annualized expense ratio and in the financial highlights of this report. Expenses are shown as a percentage of average net assets.
* Reflects projected expenses under a new management contract effective 1/1/10 and a new expense arrangement, which gives effect to changes in the allocation of certain expenses among the Putnam funds.
12
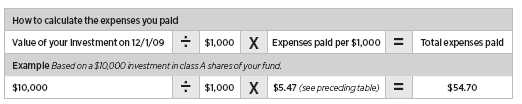
Expenses per $1,000
The following table shows the expenses you would have paid on a $1,000 investment in Putnam High Yield Advantage Fund from December 1, 2009, to May 31, 2010. It also shows how much a $1,000 investment would be worth at the close of the period, assuming actual returns and expenses.
| | | | | | |
| | Class A | Class B | Class C | Class M | Class R | Class Y |
|
| Expenses paid per $1,000*† | $5.47 | $9.29 | $9.28 | $6.74 | $6.75 | $4.19 |
|
| Ending value (after expenses) | $1,050.40 | $1,047.30 | $1,045.70 | $1,049.20 | $1,051.10 | $1,051.80 |
|
* Expenses for each share class are calculated using the fund’s annualized expense ratio for each class, which represents the ongoing expenses as a percentage of average net assets for the six months ended 5/31/10. The expense ratio may differ for each share class.
† Expenses are calculated by multiplying the expense ratio by the average account value for the period; then multiplying the result by the number of days in the period; and then dividing that result by the number of days in the year.
Estimate the expenses you paid
To estimate the ongoing expenses you paid for the six months ended May 31, 2010, use the following calculation method. To find the value of your investment on December 1, 2009, call Putnam at 1-800-225-1581.
Compare expenses using the SEC’s method
The Securities and Exchange Commission (SEC) has established guidelines to help investors assess fund expenses. Per these guidelines, the following table shows your fund’s expenses based on a $1,000 investment, assuming a hypothetical 5% annualized return. You can use this information to compare the ongoing expenses (but not transaction expenses or total costs) of investing in the fund with those of other funds. All mutual fund shareholder reports will provide this information to help you make this comparison. Please note that you cannot use this information to estimate your actual ending account balance and expenses paid during the period.
| | | | | | |
| | Class A | Class B | Class C | Class M | Class R | Class Y |
|
| Expenses paid per $1,000*† | $5.39 | $9.15 | $9.15 | $6.64 | $6.64 | $4.13 |
|
| Ending value (after expenses) | $1,019.60 | $1,015.86 | $1,015.86 | $1,018.35 | $1,018.35 | $1,020.84 |
|
* Expenses for each share class are calculated using the fund’s annualized expense ratio for each class, which represents the ongoing expenses as a percentage of average net assets for the six months ended 5/31/10. The expense ratio may differ for each share class.
† Expenses are calculated by multiplying the expense ratio by the average account value for the period; then multiplying the result by the number of days in the period; and then dividing that result by the number of days in the year.
13
Terms and definitions
Important terms
Total return shows how the value of the fund’s shares changed over time, assuming you held the shares through the entire period and reinvested all distributions in the fund.
Net asset value (NAV) is the price, or value, of one share of a mutual fund, without a sales charge. NAVs fluctuate with market conditions. NAV is calculated by dividing the net assets of each class of shares by the number of outstanding shares in the class.
Public offering price (POP) is the price of a mutual fund share plus the maximum sales charge levied at the time of purchase. POP performance figures shown here assume the 4.00% maximum sales charge for class A shares and 3.25% for class M shares.
Contingent deferred sales charge (CDSC) is generally a charge applied at the time of the redemption of class B or C shares and assumes redemption at the end of the period. Your fund’s class B CDSC declines from a 5% maximum during the first year to 1% during the sixth year. After the sixth year, the CDSC no longer applies. The CDSC for class C shares is 1% for one year after purchase.
Current yield is the annual rate of return earned from dividends or interest of an investment. Current yield is expressed as a percentage of the price of a security, fund share, or principal investment.
Share classes
Class A shares are generally subject to an initial sales charge and no CDSC (except on certain redemptions of shares bought without an initial sales charge).
Class B shares are not subject to an initial sales charge. They may be subject to a CDSC.
Class C shares are not subject to an initial sales charge and are subject to a CDSC only if the shares are redeemed during the first year.
Class M shares have a lower initial sales charge and a higher 12b-1 fee than class A shares and no CDSC (except on certain redemptions of shares bought without an initial sales charge).
Class R shares are not subject to an initial sales charge or CDSC and are available only to certain defined contribution plans.
Class Y shares are not subject to an initial sales charge or CDSC, and carry no 12b-1 fee. They are generally only available to corporate and institutional clients and clients in other approved programs.
Comparative indexes
Barclays Capital Aggregate Bond Index is an unmanaged index of U.S. investment-grade fixed-income securities.
BofA (Bank of America) Merrill Lynch U.S. 3-Month Treasury Bill Index is an unmanaged index that seeks to measure the performance of U.S. Treasury bills available in the marketplace.
JPMorgan Developed High Yield Index is an unmanaged index of high-yield fixed-income securities issued in developed countries.
S&P 500 Index is an unmanaged index of common stock performance.
Indexes assume reinvestment of all distributions and do not account for fees. Securities and performance of a fund and an index will differ. You cannot invest directly in an index.
Lipper is a third-party industry-ranking entity that ranks mutual funds. Its rankings do not reflect sales charges. Lipper rankings are based on total return at net asset value relative to other funds that have similar current investment styles or objectives as determined by Lipper. Lipper may change a fund’s category assignment at its discretion. Lipper category averages reflect performance trends for funds within a category.
14
Other information for shareholders
Important notice regarding delivery
of shareholder documents
In accordance with SEC regulations, Putnam sends a single copy of annual and semiannual shareholder reports, prospectuses, and proxy statements to Putnam shareholders who share the same address, unless a shareholder requests otherwise. If you prefer to receive your own copy of these documents, please call Putnam at 1-800-225-1581, and Putnam will begin sending individual copies within 30 days.
Proxy voting
Putnam is committed to managing our mutual funds in the best interests of our shareholders. The Putnam funds’ proxy voting guidelines and procedures, as well as information regarding how your fund voted proxies relating to portfolio securities during the 12-month period ended June 30, 2009, are available in the Individual Investors section of putnam.com, and on the SEC’s Web site, www.sec.gov. If you have questions about finding forms on the SEC’s Web site, you may call the SEC at 1-800-SEC-0330. You may also obtain the Putnam funds’ proxy voting guidelines and procedures at no charge by calling Putnam’s Shareholder Services at 1-800-225-1581.
Fund portfolio holdings
The fund will file a complete schedule of its portfolio holdings with the SEC for the first and third quarters of each fiscal year on Form N-Q. Shareholders may obtain the fund’s Forms N-Q on the SEC’s Web site at www.sec.gov. In addition, the fund’s Forms N-Q may be reviewed and copied at the SEC’s Public Reference Room in Washington, D.C. You may call the SEC at 1-800-SEC-0330 for information about the SEC’s Web site or the operation of the Public Reference Room.
Trustee and employee
fund ownership
Putnam employees and members of the Board of Trustees place their faith, confidence, and, most importantly, investment dollars in Putnam mutual funds. As of May 31, 2010, Putnam employees had approximately $335,000,000 and the Trustees had approximately $57,000,000 invested in Putnam mutual funds. These amounts include investments by the Trustees’ and employees’ immediate family members as well as investments through retirement and deferred compensation plans.
15
Financial statements
A guide to financial statements
These sections of the report, as well as the accompanying Notes, constitute the fund’s financial statements.
The fund’s portfolio lists all the fund’s investments and their values as of the last day of the reporting period. Holdings are organized by asset type and industry sector, country, or state to show areas of concentration and diversification.
Statement of assets and liabilities shows how the fund’s net assets and share price are determined. All investment and non-investment assets are added together. Any unpaid expenses and other liabilities are subtracted from this total. The result is divided by the number of shares to determine the net asset value per share, which is calculated separately for each class of shares. (For funds with preferred shares, the amount subtracted from total assets includes the liquidation preference of preferred shares.)
Statement of operations shows the fund’s net investment gain or loss. This is done by first adding up all the fund’s earnings — from dividends and interest income — and subtracting its operating expenses to determine net investment income (or loss). Then, any net gain or loss the fund realized on the sales of its holdings — as well as any unrealized gains or losses over the period — is added to or subtracted from the net investment result to determine the fund’s net gain or loss for the fiscal period.
Statement of changes in net assets shows how the fund’s net assets were affected by the fund’s net investment gain or loss, by distributions to shareholders, and by changes in the number of the fund’s shares. It lists distributions and their sources (net investment income or realized capital gains) over the current reporting period and the most recent fiscal year-end. The distributions listed here may not match the sources listed in the Statement of operations because the distributions are determined on a tax basis and may be paid in a different period from the one in which they were earned. Dividend sources are estimated at the time of declaration. Actual results may vary. Any non-taxable return of capital cannot be determined until final tax calculations are completed after the end of the fund’s fiscal year.
Financial highlights provide an overview of the fund’s investment results, per-share distributions, expense ratios, net investment income ratios, and portfolio turnover in one summary table, reflecting the five most recent reporting periods. In a semiannual report, the highlights table also includes the current reporting period.
16
The fund’s portfolio 5/31/10 (Unaudited)
| | | |
| CORPORATE BONDS AND NOTES (86.2%)* | Principal amount | Value |
|
| Advertising and marketing services (0.1%) | | | |
| Lamar Media Corp. 144A sr. sub. notes 7 7/8s, 2018 | | $535,000 | $526,975 |
|
| | | | 526,975 |
| Automotive (3.0%) | | | |
| Affinia Group, Inc. 144A sr. notes 10 3/4s, 2016 | | 1,185,000 | 1,273,875 |
|
| Allison Transmission, Inc. 144A company guaranty sr. unsec. | | | |
| notes 11 1/4s, 2015 ‡‡ | | 3,950,400 | 4,147,920 |
|
| American Axle & Manufacturing, Inc. company | | | |
| guaranty sr. unsec. notes 5 1/4s, 2014 | | 2,865,000 | 2,420,925 |
|
| Dana Corp. escrow sr. notes 5.85s, 2015 (acquired 4/24/08, | | | |
| cost $1,429) (In default) F † ‡ | | 2,135,000 | 2 |
|
| Ford Motor Credit Co., LLC sr. notes 9 7/8s, 2011 | | 1,510,000 | 1,570,400 |
|
| Ford Motor Credit Co., LLC sr. unsec. notes 8 1/8s, 2020 | | 1,925,000 | 1,915,375 |
|
| Ford Motor Credit Co., LLC sr. unsec. unsub. notes 7 1/2s, 2012 | | 740,000 | 752,958 |
|
| General Motors Corp. sr. unsec. notes 8 1/4s, | | | |
| 2023 (In default) † | | 3,010,000 | 940,625 |
|
| General Motors Corp. sr. unsec. unsub. notes 8 3/8s, | | | |
| 2033 (In default) † | | 2,770,000 | 900,250 |
|
| Lear Corp. company guaranty sr. unsec. bond 7 7/8s, 2018 | | 345,000 | 336,375 |
|
| Lear Corp. company guaranty sr. unsec. notes 8 1/8s, 2020 | | 2,750,000 | 2,688,125 |
|
| Navistar International Corp. sr. notes 8 1/4s, 2021 | | 2,595,000 | 2,601,488 |
|
| TRW Automotive, Inc. company guaranty sr. unsec. | | | |
| unsub. notes Ser. REGS, 6 3/8s, 2014 | EUR | 1,725,000 | 2,046,240 |
|
| Visteon Corp. sr. unsec. unsub. notes 7s, 2014 | | $690,000 | 734,850 |
|
| Visteon Corp. 144A sr. unsec. notes 12 1/4s, 2016 | | 350,000 | 409,500 |
|
| | | | 22,738,908 |
| Basic materials (8.1%) | | | |
| Aleris International, Inc. company guaranty sr. unsec. | | | |
| notes 9s, 2014 (In default) † ‡‡ | | 1,905,000 | 10,001 |
|
| AMH Holdings, Inc. sr. disc. unsec. notes 11 1/4s, 2014 | | 705,000 | 701,475 |
|
| Associated Materials, LLC/Associated Materials | | | |
| Finance, Inc. company guaranty sr. notes 9 7/8s, 2016 | | 1,875,000 | 2,015,625 |
|
| Catalyst Paper Corp. company guaranty sr. unsec. | | | |
| unsub. notes 7 3/8s, 2014 (Canada) | | 335,000 | 166,663 |
|
| Clondalkin Acquisition BV 144A company | | | |
| guaranty sr. notes FRN 2.257s, 2013 (Netherlands) | | 1,700,000 | 1,604,375 |
|
| Compass Minerals International, Inc. 144A sr. notes 8s, 2019 | | 1,975,000 | 2,054,000 |
|
| FMG Finance Pty Ltd. 144A sr. sec. notes 10 5/8s, 2016 (Australia) | | 2,580,000 | 2,838,000 |
|
| Freeport-McMoRan Copper & Gold, Inc. sr. unsec. | | | |
| notes 8 3/8s, 2017 | | 6,150,000 | 6,672,750 |
|
| Georgia-Pacific, LLC sr. unsec. unsub. notes 9 1/2s, 2011 | | 1,335,000 | 1,431,788 |
|
| Georgia-Pacific, LLC 144A company guaranty sr. unsec. | | | |
| notes 7s, 2015 | | 85,000 | 85,000 |
|
| HeidelbergCement AG company guaranty sr. unsec. | | | |
| unsub. notes 8s, 2017 (Germany) | EUR | 335,000 | 397,999 |
|
| HeidelbergCement AG company guaranty unsec. | | | |
| unsub. notes 8 1/2s, 2019 (Germany) | EUR | 225,000 | 265,889 |
|
| Hexion U.S. Finance Corp./Hexion Nova Scotia Finance, ULC | | | |
| company guaranty 9 3/4s, 2014 | | $1,320,000 | 1,260,600 |
|
| Huntsman International, LLC 144A sr. sub. notes 8 5/8s, 2020 | | 795,000 | 749,288 |
|
17
| | | |
| CORPORATE BONDS AND NOTES (86.2%)* cont. | Principal amount | Value |
|
| Basic materials cont. | | | |
| Ineos Finance PLC 144A company guaranty sr. notes 9s, 2015 | | | |
| (United Kingdom) | | $860,000 | $851,400 |
|
| Ineos Group Holdings PLC company guaranty sr. notes 7 7/8s, | | | |
| 2016 (United Kingdom) | EUR | 755,000 | 651,552 |
|
| Jefferson Smurfit Corp. company guaranty 8 1/4s, | | | |
| 2012 (In default) † | | $540,000 | 457,650 |
|
| LBI Escrow Corp. 144A sr. notes 8s, 2017 | | 4,050,000 | 4,120,875 |
|
| Lyondell Chemical Co. sr. notes 11s, 2018 | | 2,222,000 | 2,355,320 |
|
| Metals USA, Inc. company guaranty sr. unsec. notes | | | |
| 11 1/8s, 2015 | | 1,280,000 | 1,302,400 |
|
| Momentive Performance Materials, Inc. company | | | |
| guaranty sr. unsec. notes 9 3/4s, 2014 | | 2,735,000 | 2,605,088 |
|
| NewPage Corp. company guaranty sr. notes 11 3/8s, 2014 | | 1,070,000 | 1,000,450 |
|
| NewPage Holding Corp. sr. unsec. unsub. notes FRN 7.527s, 2013 ‡‡ | 678,078 | 84,760 |
|
| Novelis, Inc. company guaranty sr. unsec. notes 11 1/2s, 2015 | | 1,300,000 | 1,410,500 |
|
| Novelis, Inc. company guaranty sr. unsec. notes 7 1/4s, 2015 | | 2,605,000 | 2,441,667 |
|
| PE Paper Escrow GmbH sr. notes Ser. REGS, 11 3/4s, | | | |
| 2014 (Austria) | EUR | 495,000 | 659,043 |
|
| PE Paper Escrow GmbH 144A sr. notes 12s, 2014 (Austria) | | $2,055,000 | 2,250,225 |
|
| Rhodia SA sr. unsec. notes FRN Ser. REGS, 3.394s, | | | |
| 2013 (France) | EUR | 605,000 | 703,410 |
|
| Rohm & Haas Co. sr. unsec. unsub. notes 7.85s, 2029 | | $1,770,000 | 1,923,094 |
|
| Smurfit Capital Funding PLC company guaranty sr. unsec. | | | |
| unsub. notes 7 1/2s, 2025 (Ireland) | | 70,000 | 63,350 |
|
| Smurfit Kappa Acquisition 144A company | | | |
| guaranty sr. notes 7 3/4s, 2019 (Ireland) | EUR | 440,000 | 523,714 |
|
| Smurfit Kappa Funding PLC sr. unsec. sub. notes 7 3/4s, | | | |
| 2015 (Ireland) | | $2,287,000 | 2,226,966 |
|
| Smurfit-Stone Container Corp. sr. notes unsec. | | | |
| unsub. notes 8 3/8s, 2012 (In default) † | | 1,960,000 | 1,641,500 |
|
| Solutia, Inc. company guaranty sr. unsec. notes 8 3/4s, 2017 | | 825,000 | 845,625 |
|
| Solutia, Inc. company guaranty sr. unsec. notes 7 7/8s, 2020 | | 860,000 | 857,850 |
|
| Steel Dynamics, Inc. company guaranty sr. unsec. | | | |
| unsub. notes 6 3/4s, 2015 | | 1,235,000 | 1,191,775 |
|
| Steel Dynamics, Inc. sr. unsec. unsub. notes 7 3/4s, 2016 | | 1,835,000 | 1,830,413 |
|
| Steel Dynamics, Inc. 144A company guaranty sr. unsec. | | | |
| notes 7 5/8s, 2020 | | 555,000 | 549,450 |
|
| Teck Resources, Ltd. sr. notes 10 3/4s, 2019 (Canada) | | 1,265,000 | 1,524,325 |
|
| Teck Resources, Ltd. sr. notes 10 1/4s, 2016 (Canada) | | 2,095,000 | 2,461,625 |
|
| Teck Resources, Ltd. sr. unsec. notes 6 1/8s, 2035 (Canada) | | 820,000 | 785,396 |
|
| Tube City IMS Corp. company guaranty sr. unsec. | | | |
| sub. notes 9 3/4s, 2015 | | 1,550,000 | 1,534,500 |
|
| Verso Paper Holdings, LLC/Verso Paper, Inc. company | | | |
| guaranty Ser. B, 11 3/8s, 2016 | | 825,000 | 715,688 |
|
| Verso Paper Holdings, LLC/Verso Paper, Inc. company | | | |
| guaranty sr. sec. notes FRN Ser. B, 4.094s, 2014 | | 1,675,000 | 1,394,438 |
|
| Verso Paper Holdings, LLC/Verso Paper, Inc. 144A | | | |
| sr. notes 11 1/2s, 2014 | | 1,220,000 | 1,302,350 |
|
| | | | 62,519,852 |
18
| | |
| CORPORATE BONDS AND NOTES (86.2%)* cont. | Principal amount | Value |
|
| Broadcasting (2.4%) | | |
| Belo Corp. sr. unsec. unsub. notes 8s, 2016 | $405,000 | $406,013 |
|
| Clear Channel Communications, Inc. company guaranty unsec. | | |
| unsub. notes 10 3/4s, 2016 | 1,395,000 | 1,032,300 |
|
| Clear Channel Communications, Inc. sr. unsec. notes 5 1/2s, 2014 | 830,000 | 462,725 |
|
| Clear Channel Worldwide Holdings, Inc. 144A company | | |
| guaranty sr. unsec. unsub. notes Ser. A, 9 1/4s, 2017 | 655,000 | 663,188 |
|
| Clear Channel Worldwide Holdings, Inc. 144A company | | |
| guaranty sr. unsec. unsub. notes Ser. B, 9 1/4s, 2017 | 2,170,000 | 2,207,975 |
|
| DIRECTV Holdings, LLC company guaranty sr. unsec. | | |
| notes 7 5/8s, 2016 | 840,000 | 907,200 |
|
| DIRECTV Holdings, LLC company guaranty sr. unsec. | | |
| notes 6 3/8s, 2015 | 800,000 | 825,000 |
|
| DISH DBS Corp. company guaranty sr. unsec. notes 7 7/8s, 2019 | 1,820,000 | 1,838,200 |
|
| Echostar DBS Corp. company guaranty 7 1/8s, 2016 | 1,445,000 | 1,416,100 |
|
| Gray Television, Inc. 144A company | | |
| guaranty sr. notes 10 1/2s, 2015 | 1,740,000 | 1,644,300 |
|
| Nexstar Broadcasting, Inc./Mission Broadcasting, Inc. 144A | | |
| sr. notes 8 7/8s, 2017 | 1,745,000 | 1,727,550 |
|
| Sirius XM Radio, Inc. 144A sr. notes 9 3/4s, 2015 | 755,000 | 800,300 |
|
| Umbrella Acquisition, Inc. 144A company guaranty sr. unsec. | | |
| unsub. notes 9 3/4s, 2015 ‡‡ | 2,215,512 | 1,880,416 |
|
| Univision Communications, Inc. 144A sr. sec. notes 12s, 2014 | 440,000 | 473,000 |
|
| XM Satellite Radio, Inc. 144A company guaranty sr. unsec. | | |
| notes 13s, 2013 | 1,530,000 | 1,675,350 |
|
| XM Satellite Radio, Inc. 144A sr. notes 11 1/4s, 2013 | 370,000 | 395,900 |
|
| Young Broadcasting, Inc. company | | |
| guaranty sr. sub. notes 8 3/4s, 2014 (In default) † | 395,000 | 494 |
|
| Young Broadcasting, Inc. company guaranty sr. unsec. | | |
| sub. notes 10s, 2011 (In default) † | 1,142,000 | 2,284 |
|
| | | 18,358,295 |
| Building materials (1.9%) | | |
| Building Materials Corp. 144A company | | |
| guaranty sr. notes 7 1/2s, 2020 | 1,335,000 | 1,301,625 |
|
| Building Materials Corp. 144A sr. notes 7s, 2020 | 1,430,000 | 1,415,700 |
|
| Goodman Global Group, Inc. 144A sr. disc. notes zero %, 2014 | 3,885,000 | 2,311,575 |
|
| Goodman Global, Inc. company guaranty sr. unsec. | | |
| sub. notes 13 1/2s, 2016 | 1,030,000 | 1,133,000 |
|
| Owens Corning, Inc. company guaranty unsec. | | |
| unsub. notes 9s, 2019 | 4,000,000 | 4,650,000 |
|
| THL Buildco, Inc. (Nortek Holdings, Inc.) sr. notes 11s, 2013 | 3,505,866 | 3,646,101 |
|
| | | 14,458,001 |
| Cable television (2.2%) | | |
| Atlantic Broadband Finance, LLC company guaranty 9 3/8s, 2014 | 855,000 | 863,550 |
|
| Cablevision Systems Corp. sr. unsec. unsub. notes 8s, 2020 | 470,000 | 462,950 |
|
| Cablevision Systems Corp. sr. unsec. unsub. notes 7 3/4s, 2018 | 880,000 | 860,200 |
|
| Cablevision Systems Corp. 144A sr. notes 8 5/8s, 2017 | 1,620,000 | 1,628,100 |
|
| CCH II, LLC sr. notes 13 1/2s, 2016 | 3,554,581 | 4,074,438 |
|
| CCO Holdings LLC/CCO Holdings Capital Corp. 144A company | | |
| guaranty sr. notes 7 7/8s, 2018 | 710,000 | 696,688 |
|
19
| | | |
| CORPORATE BONDS AND NOTES (86.2%)* cont. | Principal amount | Value |
|
| Cable television cont. | | | |
| Cequel Communications Holdings I LLC/Cequel | | | |
| Capital Corp.Capital Corp. 144A sr. notes 8 5/8s, 2017 | | $2,720,000 | $2,624,800 |
|
| Charter Communications Operating LLC/Charter Communications | | | |
| Operating Capital 144A company guaranty sr. notes 8s, 2012 | | 1,470,000 | 1,534,313 |
|
| CSC Holdings, Inc. sr. notes 6 3/4s, 2012 | | 146,000 | 151,110 |
|
| CSC Holdings, Inc. 144A sr. unsec. notes 8 1/2s, 2014 | | 250,000 | 260,000 |
|
| Mediacom Broadband, LLC/Mediacom Broadband Corp. sr. unsec. | | | |
| unsub. notes 8 1/2s, 2015 | | 485,000 | 481,363 |
|
| Mediacom LLC/Mediacom Capital Corp. 144A sr. notes 9 1/8s, 2019 | 675,000 | 668,250 |
|
| NTL Cable PLC sr. notes 9 1/8s, 2016 (United Kingdom) | | 930,000 | 940,463 |
|
| Virgin Media Finance PLC company guaranty sr. notes Ser. 1, | | | |
| 9 1/2s, 2016 (United Kingdom) | | 1,105,000 | 1,132,625 |
|
| Virgin Media Finance PLC company guaranty sr. unsec. | | | |
| unsub. notes 9 1/2s, 2016 (United Kingdom) | EUR | 174,000 | 224,584 |
|
| | | | 16,603,434 |
| Capital goods (3.7%) | | | |
| ACCO Brands Corp. company guaranty sr. notes 10 5/8s, 2015 | | $1,020,000 | 1,104,150 |
|
| Altra Holdings, Inc. 144A sr. notes 8 1/8s, 2016 | | 1,860,000 | 1,855,350 |
|
| BBC Holding Corp. sr. notes 8 7/8s, 2014 | | 890,000 | 854,400 |
|
| Berry Plastics Corp. 144A sr. notes 9 1/2s, 2018 | | 1,250,000 | 1,118,750 |
|
| Cleaver-Brooks, Inc. 144A sr. notes 12 1/4s, 2016 | | 1,505,000 | 1,516,288 |
|
| Kratos Defense & Security Solutions, Inc. 144A | | | |
| sr. notes 10s, 2017 | | 1,745,000 | 1,727,550 |
|
| L-3 Communications Corp. company guaranty Ser. B, 6 3/8s, 2015 | | 1,615,000 | 1,615,000 |
|
| L-3 Communications Corp. company guaranty sr. unsec. | | | |
| sub. notes 6 1/8s, 2014 | | 725,000 | 739,500 |
|
| L-3 Communications Corp. company guaranty sr. unsec. | | | |
| sub. notes 5 7/8s, 2015 | | 575,000 | 570,688 |
|
| Legrand SA unsec. unsub. debs. 8 1/2s, 2025 (France) | | 3,260,000 | 3,897,796 |
|
| Mueller Water Products, Inc. company guaranty sr. unsec. | | | |
| notes 7 3/8s, 2017 | | 2,505,000 | 2,216,925 |
|
| Owens-Brockway Glass Container, Inc. company | | | |
| guaranty 6 3/4s, 2014 | EUR | 695,000 | 837,242 |
|
| Reddy Ice Corp. 144A sr. notes 11 1/4s, 2015 | | $1,245,000 | 1,257,450 |
|
| Ryerson Holding Corp. 144A sr. disc. notes zero %, 2015 | | 2,350,000 | 1,066,313 |
|
| Ryerson Tull, Inc. company guaranty sr. sec. notes 12s, 2015 | | 2,985,000 | 3,037,238 |
|
| TD Funding Corp. 144A company | | | |
| guaranty sr. sub. notes 7 3/4s, 2014 | | 575,000 | 575,000 |
|
| Tenneco Automotive, Inc. company guaranty 8 5/8s, 2014 | | 840,000 | 831,600 |
|
| Tenneco, Inc. company guaranty sr. unsec. notes 8 1/8s, 2015 | | 1,095,000 | 1,092,263 |
|
| Thermadyne Holdings Corp. company guaranty sr. unsec. | | | |
| sub. notes 11 1/2s, 2014 | | 1,581,000 | 1,622,501 |
|
| Transdigm, Inc. company guaranty sr. unsec. | | | |
| sub. notes 7 3/4s, 2014 | | 800,000 | 798,000 |
|
| | | | 28,334,004 |
| Coal (1.6%) | | | |
| Arch Western Finance, LLC company | | | |
| guaranty sr. notes 6 3/4s, 2013 | | 2,715,000 | 2,681,063 |
|
| CONSOL Energy, Inc. 144A company guaranty sr. unsec. | | | |
| notes 8 1/4s, 2020 | | 2,950,000 | 3,012,688 |
|
20
| | | |
| CORPORATE BONDS AND NOTES (86.2%)* cont. | Principal amount | Value |
|
| Coal cont. | | | |
| CONSOL Energy, Inc. 144A company guaranty sr. unsec. | | | |
| notes 8s, 2017 | | $1,735,000 | $1,763,194 |
|
| International Coal Group, Inc. sr. notes 9 1/8s, 2018 | | 1,540,000 | 1,540,000 |
|
| Peabody Energy Corp. company guaranty 7 3/8s, 2016 | | 3,395,000 | 3,522,313 |
|
| | | | 12,519,258 |
| Commercial and consumer services (1.4%) | | | |
| Aramark Corp. company guaranty 8 1/2s, 2015 | | 1,710,000 | 1,705,725 |
|
| Aramark Corp. company guaranty sr. unsec. notes FRN 3.844s, 2015 | 315,000 | 296,100 |
|
| Corrections Corporation of America company | | | |
| guaranty sr. notes 7 3/4s, 2017 | | 2,070,000 | 2,132,100 |
|
| Lender Processing Services, Inc. company | | | |
| guaranty sr. unsec. unsub. notes 8 1/8s, 2016 | | 1,108,000 | 1,168,940 |
|
| National Money Mart Co. 144A company | | | |
| guaranty sr. notes 10 3/8s, 2016 (Canada) | | 1,305,000 | 1,324,575 |
|
| Sabre Holdings Corp. sr. unsec. unsub. notes 8.35s, 2016 | | 2,700,000 | 2,484,000 |
|
| Travelport LLC company guaranty 11 7/8s, 2016 | | 1,055,000 | 1,062,913 |
|
| Travelport LLC company guaranty 9 7/8s, 2014 | | 610,000 | 608,475 |
|
| | | | 10,782,828 |
| Consumer (1.1%) | | | |
| Jarden Corp. company guaranty sr. sub. notes Ser. 1, | | | |
| 7 1/2s, 2020 | EUR | 250,000 | 322,967 |
|
| Jarden Corp. company guaranty sr. unsec. notes 8s, 2016 | | $605,000 | 617,856 |
|
| Jarden Corp. company guaranty sr. unsec. sub. notes 7 1/2s, 2020 | | 360,000 | 352,800 |
|
| Jarden Corp. company guaranty sr. unsec. sub. notes 7 1/2s, 2017 | | 2,255,000 | 2,209,900 |
|
| Visant Corp. company guaranty sr. unsec. sub. notes 7 5/8s, 2012 | | 2,040,000 | 2,039,745 |
|
| Yankee Acquisition Corp. company guaranty sr. notes Ser. B, | | | |
| 8 1/2s, 2015 | | 2,965,000 | 2,972,413 |
|
| | | | 8,515,681 |
| Consumer staples (5.4%) | | | |
| Archibald Candy Corp. company guaranty 10s, | | | |
| 2010 (In default) F † | | 415,457 | 6,416 |
|
| Avis Budget Car Rental, LLC company guaranty sr. unsec. | | | |
| unsub. notes 7 3/4s, 2016 | | 1,475,000 | 1,371,750 |
|
| Avis Budget Car Rental, LLC company guaranty sr. unsec. | | | |
| unsub. notes 7 5/8s, 2014 | | 2,545,000 | 2,417,750 |
|
| Avis Budget Car Rental, LLC 144A company | | | |
| guaranty sr. notes 9 5/8s, 2018 | | 365,000 | 365,000 |
|
| Central Garden & Pet Co. sr. sub. notes 8 1/4s, 2018 | | 1,765,000 | 1,747,350 |
|
| Chiquita Brands International, Inc. sr. notes 7 1/2s, 2014 | | 1,585,000 | 1,537,450 |
|
| Chiquita Brands International, Inc. sr. unsec. | | | |
| unsub. notes 8 7/8s, 2015 | | 290,000 | 282,025 |
|
| Claire’s Stores, Inc. 144A company guaranty sr. unsec. | | | |
| notes 9 5/8s, 2015 (In default) † ‡‡ | | 64,009 | 55,368 |
|
| Constellation Brands, Inc. company guaranty sr. unsec. | | | |
| unsub. notes 7 1/4s, 2016 | | 1,935,000 | 1,925,325 |
|
| Dean Foods Co. company guaranty 7s, 2016 | | 1,080,000 | 992,250 |
|
| Dole Food Co. 144A sr. sec. notes 8s, 2016 | | 1,530,000 | 1,533,825 |
|
| Dole Food Co., Inc. sr. notes 13 7/8s, 2014 | | 741,000 | 855,855 |
|
| Elizabeth Arden, Inc. company guaranty 7 3/4s, 2014 | | 2,645,000 | 2,611,938 |
|
| Games Merger Corp. 144A sr. notes 11s, 2018 | | 2,210,000 | 2,176,850 |
|
21
| | |
| CORPORATE BONDS AND NOTES (86.2%)* cont. | Principal amount | Value |
|
| Consumer staples cont. | | |
| Great Atlantic & Pacific Tea Co. 144A sr. notes 11 3/8s, 2015 | $1,880,000 | $1,729,600 |
|
| Hertz Corp. company guaranty 8 7/8s, 2014 | 2,785,000 | 2,798,925 |
|
| JBS USA LLC/JBS USA Finance, Inc. sr. notes 11 5/8s, 2014 | 585,000 | 642,389 |
|
| Libbey Glass, Inc. 144A sr. notes 10s, 2015 | 695,000 | 721,063 |
|
| Pinnacle Foods Finance LLC sr. notes 9 1/4s, 2015 | 655,000 | 653,363 |
|
| Pinnacle Foods Finance LLC 144A sr. unsec. notes 9 1/4s, 2015 | 630,000 | 628,425 |
|
| Prestige Brands, Inc. 144A company guaranty sr. unsec. | | |
| notes 8 1/4s, 2018 | 1,035,000 | 1,037,588 |
|
| Revlon Consumer Products 144A company | | |
| guaranty sr. notes 9 3/4s, 2015 | 1,050,000 | 1,068,375 |
|
| Rite Aid Corp. company guaranty sr. notes 10 1/4s, 2019 | 515,000 | 524,013 |
|
| Rite Aid Corp. company guaranty sr. notes 7 1/2s, 2017 | 780,000 | 702,000 |
|
| Rite Aid Corp. company guaranty sr. unsec. | | |
| unsub. notes 9 1/2s, 2017 | 1,885,000 | 1,512,713 |
|
| RSC Equipment Rental, Inc. 144A sr. sec. notes 10s, 2017 | 1,010,000 | 1,087,013 |
|
| Smithfield Foods, Inc. sr. unsec. notes 7s, 2011 | 410,000 | 414,100 |
|
| Smithfield Foods, Inc. 144A sr. sec. notes 10s, 2014 | 2,325,000 | 2,489,203 |
|
| Spectrum Brands, Inc. sr. unsec. sub. bonds 12s, 2019 ‡‡ | 1,940,063 | 2,056,467 |
|
| Supervalu, Inc. sr. unsec. notes 8s, 2016 | 1,010,000 | 994,850 |
|
| Tyson Foods, Inc. sr. unsec. unsub. notes 10 1/2s, 2014 | 1,510,000 | 1,774,250 |
|
| Wendy’s/Arby’s Restaurants LLC company guaranty sr. unsec. | | |
| unsub. notes 10s, 2016 | 2,980,000 | 3,076,850 |
|
| | | 41,790,339 |
| Energy (oil field) (2.3%) | | |
| Complete Production Services, Inc. company guaranty 8s, 2016 | 1,255,000 | 1,236,175 |
|
| Expro Finance Luxemburg 144A sr. notes 8 1/2s, 2016 (Luxembourg) | 1,590,000 | 1,542,300 |
|
| Helix Energy Solutions Group, Inc. 144A sr. unsec. | | |
| notes 9 1/2s, 2016 | 3,695,000 | 3,621,100 |
|
| Hercules Offshore, Inc. 144A sr. notes 10 1/2s, 2017 | 790,000 | 734,700 |
|
| Key Energy Services, Inc. company guaranty sr. unsec. | | |
| unsub. notes 8 3/8s, 2014 | 2,220,000 | 2,208,900 |
|
| Offshore Logistics, Inc. company guaranty 6 1/8s, 2013 | 1,455,000 | 1,411,350 |
|
| Oslo Seismic Services, Inc. 1st mtge. 8.28s, 2011 | 716,264 | 723,139 |
|
| Pride International, Inc. sr. unsec. notes 7 3/8s, 2014 | 1,890,000 | 1,927,800 |
|
| Stallion Oilfield Holdings Ltd. 144A sr. notes 10 1/2s, 2015 | 1,785,000 | 1,700,213 |
|
| Thermon Industries, Inc. 144A company | | |
| guaranty sr. notes 9 1/2s, 2017 | 1,700,000 | 1,683,000 |
|
| Trico Shipping AS 144A sr. notes 11 7/8s, 2014 (Norway) | 1,095,000 | 1,021,088 |
|
| | | 17,809,765 |
| Entertainment (0.5%) | | |
| AMC Entertainment, Inc. company guaranty 11s, 2016 | 771,000 | 790,275 |
|
| Cinemark, Inc. company guaranty sr. unsec. notes 8 5/8s, 2019 | 655,000 | 661,550 |
|
| Marquee Holdings, Inc. sr. disc. notes 9.505s, 2014 | 1,840,000 | 1,499,600 |
|
| Universal City Development Partners, Ltd. 144A | | |
| sr. notes 8 7/8s, 2015 | 625,000 | 618,750 |
|
| Universal City Development Partners, Ltd. 144A | | |
| sr. sub. notes 10 7/8s, 2016 | 490,000 | 494,900 |
|
| | | 4,065,075 |
22
| | |
| CORPORATE BONDS AND NOTES (86.2%)* cont. | Principal amount | Value |
|
| Financials (7.5%) | | |
| American General Finance Corp. sr. unsec. notes Ser. MTN, | | |
| 6.9s, 2017 | $3,525,000 | $2,802,375 |
|
| American General Finance Corp. sr. unsec. notes Ser. MTNI, | | |
| Class I, 4 7/8s, 2012 | 1,835,000 | 1,651,500 |
|
| American General Finance Corp. sr. unsec. notes, MTN | | |
| Ser. J, 5 5/8s, 2011 | 565,000 | 542,400 |
|
| BAC Capital Trust VI bank guaranty jr. unsec. | | |
| sub. notes 5 5/8s, 2035 | 1,130,000 | 911,209 |
|
| BAC Capital Trust XI bank guaranty jr. unsec. | | |
| sub. notes 6 5/8s, 2036 | 990,000 | 854,834 |
|
| BankAmerica Capital II bank guaranty jr. unsec. | | |
| sub. notes 8s, 2026 | 405,000 | 392,850 |
|
| CB Richard Ellis Services, Inc. company guaranty sr. unsec. | | |
| sub. notes 11 5/8s, 2017 | 1,040,000 | 1,159,600 |
|
| CIT Group, Inc. sr. bond 7s, 2017 | 6,309,172 | 5,694,028 |
|
| CIT Group, Inc. sr. bond 7s, 2016 | 3,552,978 | 3,224,328 |
|
| CIT Group, Inc. sr. bond 7s, 2015 | 1,176,786 | 1,085,585 |
|
| CIT Group, Inc. sr. bond 7s, 2014 | 761,786 | 716,079 |
|
| CIT Group, Inc. sr. bond 7s, 2013 | 1,616,191 | 1,555,584 |
|
| E*Trade Financial Corp. sr. unsec. notes 7 3/8s, 2013 | 975,000 | 897,000 |
|
| E*Trade Financial Corp. sr. unsec. unsub. notes 12 1/2s, 2017 ‡‡ | 1,450,000 | 1,609,500 |
|
| GMAC, Inc. 144A company guaranty sr. unsec. notes 8s, 2020 | 795,000 | 771,150 |
|
| GMAC, LLC company guaranty sr. unsec. notes 7 1/4s, 2011 | 530,000 | 531,988 |
|
| GMAC, LLC company guaranty sr. unsec. notes 7s, 2012 | 1,473,000 | 1,463,794 |
|
| GMAC, LLC company guaranty sr. unsec. notes 6 7/8s, 2012 | 1,521,000 | 1,501,988 |
|
| GMAC, LLC company guaranty sr. unsec. notes 6 5/8s, 2012 | 1,013,000 | 997,805 |
|
| GMAC, LLC company guaranty sr. unsec. notes Ser. 8, 6 3/4s, 2014 | 1,553,000 | 1,479,233 |
|
| GMAC, LLC company guaranty sr. unsec. unsub. notes 6 7/8s, 2011 | 915,000 | 915,000 |
|
| GMAC, LLC company guaranty sr. unsec. unsub. notes FRN | | |
| 2.452s, 2014 | 156,000 | 128,152 |
|
| GMAC, LLC sr. unsec. unsub. notes 7 1/4s, 2011 | 1,870,000 | 1,876,377 |
|
| GMAC, LLC sr. unsec. unsub. notes 6 7/8s, 2011 | 1,035,000 | 1,033,569 |
|
| GMAC, LLC sr. unsec. unsub. notes 6 3/4s, 2014 | 884,000 | 838,591 |
|
| GMAC, LLC 144A company guaranty sr. unsec. notes 8.3s, 2015 | 895,000 | 898,356 |
|
| HBOS PLC 144A sr. unsec. sub. notes 6 3/4s, 2018 (United Kingdom) | 1,650,000 | 1,557,592 |
|
| HUB International Holdings, Inc. 144A sr. sub. notes 10 1/4s, 2015 | 555,000 | 507,825 |
|
| Icahn Enterprises LP/Ichan Enterprises Finance Corp. 144A | | |
| sr. notes 8s, 2018 | 3,215,000 | 3,022,100 |
|
| iStar Financial, Inc. sr. unsec. unsub. notes Ser. B, 5.95s, 2013 R | 545,000 | 437,363 |
|
| Leucadia National Corp. sr. unsec. notes 8 1/8s, 2015 | 510,000 | 521,475 |
|
| Leucadia National Corp. sr. unsec. notes 7 1/8s, 2017 | 1,362,000 | 1,310,925 |
|
| NB Capital Trust IV jr. unsec. sub. notes 8 1/4s, 2027 | 400,000 | 388,000 |
|
| Nuveen Investments, Inc. company guaranty sr. unsec. | | |
| unsub. notes 10 1/2s, 2015 | 1,695,000 | 1,525,500 |
|
| Provident Funding Associates 144A sr. notes 10 1/4s, 2017 | 885,000 | 880,575 |
|
| Residential Capital LLC company guaranty jr. notes 9 5/8s, 2015 | 3,625,000 | 3,480,000 |
|
| Reynolds Group DL Escrow, Inc./Reynolds Group Escrow, LLC | | |
| 144A sr. sec. notes 7 3/4s, 2016 (Luxembourg) | 780,000 | 772,200 |
|
23
| | | |
| CORPORATE BONDS AND NOTES (86.2%)* cont. | Principal amount | Value |
|
| Financials cont. | | | |
| Reynolds Group Issuer, Inc. 144A sr. notes 8 1/2s, 2018 | | $2,085,000 | $1,980,750 |
|
| Royal Bank of Scotland Group PLC jr. unsec. sub. bonds FRB | | | |
| 7.648s, 2049 (United Kingdom) | EUR | 1,410,000 | 1,071,600 |
|
| SLM Corp. sr. notes Ser. MTN, 8s, 2020 | | $1,235,000 | 1,098,530 |
|
| SLM Corp. sr. unsec. unsub. notes Ser. MTNA, 5s, 2013 | | 3,940,000 | 3,717,485 |
|
| USI Holdings Corp. 144A company guaranty sr. unsec. | | | |
| notes FRN 4.311s, 2014 | | 330,000 | 264,000 |
|
| | | | 58,068,795 |
| Gaming and lottery (3.0%) | | | |
| American Casino & Entertainment Properties LLC sr. notes 11s, 2014 | | 1,460,000 | 1,383,350 |
|
| Ameristar Casinos, Inc. company guaranty sr. unsec. | | | |
| notes 9 1/4s, 2014 | | 1,875,000 | 1,921,875 |
|
| Boyd Gaming Corp. sr. sub. notes 6 3/4s, 2014 | | 380,000 | 342,000 |
|
| Harrah’s Operating Co., Inc. company | | | |
| guaranty sr. notes 10s, 2018 | | 2,712,000 | 2,142,480 |
|
| Harrah’s Operating Co., Inc. company | | | |
| guaranty sr. notes 10s, 2015 | | 435,000 | 380,625 |
|
| Harrah’s Operating Co., Inc. sr. notes 11 1/4s, 2017 | | 3,435,000 | 3,598,163 |
|
| Harrahs Operating Escrow, LLC/Harrahs Escrow Corp. 144A | | | |
| sr. notes 12 3/4s, 2018 | | 660,000 | 610,500 |
|
| Isle of Capri Casinos, Inc. company guaranty 7s, 2014 | | 2,539,000 | 2,193,061 |
|
| Mashantucket Western Pequot Tribe 144A bonds 8 1/2s, | | | |
| 2015 (In default) † | | 1,995,000 | 438,900 |
|
| MGM Mirage, Inc. company guaranty sr. unsec. notes 6 5/8s, 2015 | | 710,000 | 557,350 |
|
| MGM Mirage, Inc. 144A sr. notes 9s, 2020 | | 330,000 | 330,825 |
|
| MGM Mirage, Inc. 144A sr. sec. notes 10 3/8s, 2014 | | 260,000 | 276,250 |
|
| MTR Gaming Group, Inc. company guaranty sr. notes 12 5/8s, 2014 | | 2,085,000 | 2,085,000 |
|
| Penn National Gaming, Inc. 144A sr. unsec. | | | |
| sub. notes 8 3/4s, 2019 | | 385,000 | 390,775 |
|
| Pinnacle Entertainment, Inc. company guaranty sr. unsec. | | | |
| sub. notes 7 1/2s, 2015 | | 1,250,000 | 1,162,500 |
|
| Pinnacle Entertainment, Inc. 144A sr. notes 8 5/8s, 2017 | | 410,000 | 414,100 |
|
| Pinnacle Entertainment, Inc. 144A sr. sub. notes 8 3/4s, 2020 | | 1,165,000 | 1,077,625 |
|
| Station Casinos, Inc. sr. notes 6s, 2012 (In default) † | | 1,600,000 | 100,000 |
|
| Trump Entertainment Resorts, Inc. sec. notes 8 1/2s, | | | |
| 2015 (In default) † | | 3,905,000 | 9,763 |
|
| Wynn Las Vegas, LLC/Wynn Las Vegas Capital Corp. 1st mtge. | | | |
| Ser. EXCH, 6 5/8s, 2014 | | 1,155,000 | 1,143,450 |
|
| Yonkers Racing Corp. 144A sr. notes 11 3/8s, 2016 | | 2,740,000 | 2,931,800 |
|
| | | | 23,490,392 |
| Health care (6.9%) | | | |
| Biomet, Inc. company guaranty sr. unsec. bond 10s, 2017 | | 1,985,000 | 2,099,138 |
|
| Community Health Systems, Inc. company guaranty 8 7/8s, 2015 | | 1,985,000 | 2,032,144 |
|
| DaVita, Inc. company guaranty 6 5/8s, 2013 | | 1,793,000 | 1,779,553 |
|
| DaVita, Inc. company guaranty sr. unsec. sub. notes 7 1/4s, 2015 | | 510,000 | 507,450 |
|
| Elan Finance PLC/Elan Finance Corp. 144A company | | | |
| guaranty sr. notes 8 3/4s, 2016 (Ireland) | | 2,070,000 | 2,028,600 |
|
| HCA, Inc. company guaranty sr. notes 9 5/8s, 2016 ‡‡ | | 2,163,000 | 2,276,558 |
|
| HCA, Inc. sr. sec. notes 9 1/4s, 2016 | | 2,735,000 | 2,864,913 |
|
24
| | |
| CORPORATE BONDS AND NOTES (86.2%)* cont. | Principal amount | Value |
|
| Health care cont. | | |
| HCA, Inc. sr. sec. notes 9 1/8s, 2014 | $2,930,000 | $3,083,825�� |
|
| HCA, Inc. 144A sr. sec. notes 9 7/8s, 2017 | 515,000 | 543,325 |
|
| HCA, Inc. 144A sr. sec. notes 8 1/2s, 2019 | 2,865,000 | 2,993,925 |
|
| Health Management Associates, Inc. sr. notes 6 1/8s, 2016 | 1,765,000 | 1,656,894 |
|
| IASIS Healthcare/IASIS Capital Corp. sr. sub. notes 8 3/4s, 2014 | 660,000 | 660,000 |
|
| Lantheus Medical Imaging, Inc. 144A sr. notes 9 3/4s, 2017 | 1,055,000 | 1,012,800 |
|
| Omnicare, Inc. sr. sub. notes 6 1/8s, 2013 | 514,000 | 510,145 |
|
| Psychiatric Solutions, Inc. company guaranty 7 3/4s, 2015 | 2,195,000 | 2,249,875 |
|
| Psychiatric Solutions, Inc. company guaranty sr. unsec. | | |
| sub. notes 7 3/4s, 2015 | 1,000,000 | 1,025,000 |
|
| Quintiles Transnational Corp. 144A sr. notes 9 1/2s, 2014 ‡‡ | 630,000 | 628,425 |
|
| Select Medical Corp. company guaranty 7 5/8s, 2015 | 1,910,000 | 1,795,400 |
|
| Service Corporation International debs. 7 7/8s, 2013 | 1,185,000 | 1,149,450 |
|
| Service Corporation International sr. notes 7s, 2017 | 205,000 | 198,850 |
|
| Service Corporation International sr. unsec. unsub. notes 6 3/4s, 2016 | 2,005,000 | 1,979,938 |
|
| Stewart Enterprises, Inc. sr. notes 6 1/4s, 2013 | 2,790,000 | 2,706,300 |
|
| Sun Healthcare Group, Inc. company guaranty sr. unsec. | | |
| unsub. notes 9 1/8s, 2015 | 215,000 | 224,138 |
|
| Surgical Care Affiliates, Inc. 144A sr. sub. notes 10s, 2017 | 2,220,000 | 2,181,150 |
|
| Surgical Care Affiliates, Inc. 144A sr. unsec. notes 8 7/8s, 2015 ‡‡ | 1,417,149 | 1,388,806 |
|
| Talecris Biotherapeutics Holdings Corp. 144A sr. unsec. | | |
| notes 7 3/4s, 2016 | 1,160,000 | 1,131,000 |
|
| Tenet Healthcare Corp. 144A company guaranty sr. sec. notes 10s, 2018 | 560,000 | 613,900 |
|
| Tenet Healthcare Corp. 144A company guaranty sr. sec. | | |
| notes 9s, 2015 | 3,480,000 | 3,654,000 |
|
| United Surgical Partners International, Inc. company | | |
| guaranty sr. unsec. sub. notes 8 7/8s, 2017 | 655,000 | 655,000 |
|
| US Oncology Holdings, Inc. sr. unsec. notes FRN 6.643s, 2012 ‡‡ | 2,368,000 | 2,107,520 |
|
| US Oncology, Inc. company guaranty sr. unsec. | | |
| sub. notes 10 3/4s, 2014 | 1,360,000 | 1,388,900 |
|
| Ventas Realty LP/Capital Corp. company guaranty 9s, 2012 R | 3,150,000 | 3,349,571 |
|
| Ventas Realty LP/Capital Corp. sr. notes 6 3/4s, 2017 R | 125,000 | 125,302 |
|
| Ventas Realty LP/Capital Corp. sr. notes 6 5/8s, 2014 R | 690,000 | 693,450 |
|
| | | 53,295,245 |
| Homebuilding (1.6%) | | |
| Beazer Homes USA, Inc. company guaranty sr. unsec. | | |
| unsub. notes 9 1/8s, 2018 | 1,220,000 | 1,146,800 |
|
| Lennar Corp. 144A company guaranty sr. unsec. notes 6.95s, 2018 | 2,085,000 | 1,866,075 |
|
| M/I Schottenstein Homes, Inc. company guaranty sr. unsec. | | |
| notes 6 7/8s, 2012 | 2,320,000 | 2,256,200 |
|
| Realogy Corp. company guaranty sr. notes 11s, 2014 ‡‡ | 459,589 | 386,055 |
|
| Realogy Corp. company guaranty sr. unsec. notes 10 1/2s, 2014 | 3,405,000 | 2,894,250 |
|
| Standard Pacific Corp. company guaranty sr. notes 10 3/4s, 2016 | 1,235,000 | 1,339,975 |
|
| Standard Pacific Corp. company guaranty sr. notes 8 3/8s, 2018 | 685,000 | 654,175 |
|
| Standard Pacific Corp. company guaranty sr. unsec. | | |
| unsub. notes 7s, 2015 | 925,000 | 851,000 |
|
| Standard Pacific Corp. company guaranty sr. unsec. | | |
| unsub. notes 6 1/4s, 2014 | 680,000 | 635,800 |
|
| | | 12,030,330 |
25
| | |
| CORPORATE BONDS AND NOTES (86.2%)* cont. | Principal amount | Value |
|
| Household furniture and appliances (0.3%) | | |
| Sealy Mattress Co. sr. sub. notes 8 1/4s, 2014 | $945,000 | $940,275 |
|
| Sealy Mattress Co. 144A company guaranty sr. sec. | | |
| notes 10 7/8s, 2016 | 1,345,000 | 1,472,775 |
|
| | | 2,413,050 |
| Lodging/Tourism (0.5%) | | |
| FelCor Lodging LP company guaranty sr. notes 10s, 2014 R | 2,645,000 | 2,645,000 |
|
| Host Marriott LP company guaranty Ser. Q, 6 3/4s, 2016 R | 450,000 | 441,000 |
|
| Seminole Hard Rock Entertainment, Inc. 144A sr. notes FRN | | |
| 2.757s, 2014 | 585,000 | 503,100 |
|
| | | 3,589,100 |
| Media (1.7%) | | |
| Affinion Group, Inc. company guaranty 11 1/2s, 2015 | 1,185,000 | 1,223,513 |
|
| Affinion Group, Inc. company guaranty 10 1/8s, 2013 | 605,000 | 615,588 |
|
| Affinity Group, Inc. sr. sub. notes 9s, 2012 | 1,765,000 | 1,235,500 |
|
| Interpublic Group of Companies, Inc. (The) sr. unsec. | | |
| notes 10s, 2017 | 535,000 | 586,494 |
|
| Liberty Media, LLC sr. notes 5.7s, 2013 | 1,120,000 | 1,120,000 |
|
| Nielsen Finance LLC/Nielsen Finance Co. company | | |
| guaranty 10s, 2014 | 1,400,000 | 1,422,750 |
|
| Nielsen Finance LLC/Nielsen Finance Co. company | | |
| guaranty sr. unsec. sub. disc. notes stepped-coupon zero % | | |
| (12 1/2s, 8/1/11), 2016 †† | 2,470,000 | 2,284,750 |
|
| Nielsen Finance LLC/Nielsen Finance Co. sr. notes 11 5/8s, 2014 | 360,000 | 385,200 |
|
| QVC Inc. 144A sr. notes 7 3/8s, 2020 | 885,000 | 858,450 |
|
| QVC Inc. 144A sr. sec. notes 7 1/2s, 2019 | 560,000 | 546,000 |
|
| WMG Acquisition Corp. company guaranty sr. sub. notes 7 3/8s, 2014 | 740,000 | 696,525 |
|
| WMG Acquisition Corp. 144A sr. sec. notes 9 1/2s, 2016 | 1,320,000 | 1,366,200 |
|
| WMG Holdings Corp. company guaranty sr. unsec. disc. | | |
| notes 9 1/2s, 2014 | 380,000 | 372,400 |
|
| | | 12,713,370 |
| Oil and gas (7.9%) | | |
| ATP Oil & Gas Corp. 144A sr. notes 11 7/8s, 2015 | 670,000 | 525,950 |
|
| Chaparral Energy, Inc. company guaranty 8 1/2s, 2015 | 1,128,000 | 1,026,480 |
|
| Chaparral Energy, Inc. company guaranty sr. unsec. | | |
| notes 8 7/8s, 2017 | 1,310,000 | 1,185,550 |
|
| Chesapeake Energy Corp. company guaranty 6 1/2s, 2017 | 220,000 | 213,950 |
|
| Chesapeake Energy Corp. company guaranty sr. unsec. | | |
| notes 9 1/2s, 2015 | 400,000 | 433,000 |
|
| Compton Petroleum Corp. company guaranty 7 5/8s, 2013 (Canada) | 3,170,000 | 2,472,600 |
|
| Comstock Resources, Inc. company | | |
| guaranty sr. unsub. notes 8 3/8s, 2017 | 1,090,000 | 1,073,650 |
|
| Comstock Resources, Inc. sr. notes 6 7/8s, 2012 | 2,015,000 | 2,009,963 |
|
| Connacher Oil and Gas, Ltd. 144A sec. notes 10 1/4s, 2015 (Canada) | 2,630,000 | 2,524,800 |
|
| Connacher Oil and Gas, Ltd. 144A sr. sec. notes 11 3/4s, | | |
| 2014 (Canada) | 1,410,000 | 1,473,450 |
|
| Crosstex Energy/Crosstex Energy Finance Corp. 144A | | |
| sr. notes 8 7/8s, 2018 | 1,785,000 | 1,758,225 |
|
| Denbury Resources, Inc. company guaranty 7 1/2s, 2013 | 179,000 | 179,895 |
|
| Denbury Resources, Inc. company | | |
| guaranty sr. sub. notes 9 3/4s, 2016 | 330,000 | 352,275 |
|
26
| | |
| CORPORATE BONDS AND NOTES (86.2%)* cont. | Principal amount | Value |
|
| Oil and gas cont. | | |
| Denbury Resources, Inc. company guaranty sr. unsec. | | |
| sub. notes 8 1/4s, 2020 | $1,240,000 | $1,274,100 |
|
| Denbury Resources, Inc. sr. sub. notes 7 1/2s, 2015 | 1,895,000 | 1,890,263 |
|
| Ferrellgas LP/Finance sr. notes 6 3/4s, 2014 | 2,890,000 | 2,817,750 |
|
| Ferrellgas Partners LP sr. unsec. notes Ser. UNRE, 6 3/4s, 2014 | 505,000 | 492,375 |
|
| Forest Oil Corp. sr. notes 8s, 2011 | 3,201,000 | 3,329,040 |
|
| Inergy LP/Inergy Finance Corp. sr. unsec. notes 6 7/8s, 2014 | 3,590,000 | 3,518,200 |
|
| Newfield Exploration Co. sr. sub. notes 6 5/8s, 2016 | 300,000 | 298,500 |
|
| Newfield Exploration Co. sr. unsec. sub. notes 7 1/8s, 2018 | 360,000 | 355,500 |
|
| Newfield Exploration Co. sr. unsec. sub. notes 6 5/8s, 2014 | 3,230,000 | 3,238,075 |
|
| OPTI Canada, Inc. company guaranty sr. sec. notes 8 1/4s, | | |
| 2014 (Canada) | 1,360,000 | 1,162,800 |
|
| OPTI Canada, Inc. company guaranty sr. sec. notes 7 7/8s, | | |
| 2014 (Canada) | 3,190,000 | 2,711,500 |
|
| PetroHawk Energy Corp. company guaranty 9 1/8s, 2013 | 3,630,000 | 3,720,750 |
|
| PetroHawk Energy Corp. company guaranty sr. unsec. | | |
| notes 10 1/2s, 2014 | 455,000 | 481,163 |
|
| Petroleum Development Corp. company guaranty sr. unsec. | | |
| notes 12s, 2018 | 1,985,000 | 2,044,550 |
|
| Plains Exploration & Production Co. company guaranty 7 3/4s, 2015 | 365,000 | 355,419 |
|
| Plains Exploration & Production Co. company guaranty 7s, 2017 | 3,065,000 | 2,804,475 |
|
| Quicksilver Resources, Inc. company guaranty 7 1/8s, 2016 | 480,000 | 433,200 |
|
| Quicksilver Resources, Inc. company guaranty sr. unsec. | | |
| notes 8 1/4s, 2015 | 565,000 | 550,875 |
|
| Quicksilver Resources, Inc. sr. notes 11 3/4s, 2016 | 1,265,000 | 1,378,850 |
|
| Range Resources Corp. company guaranty sr. unsec. | | |
| sub. notes 7 1/2s, 2017 | 420,000 | 422,100 |
|
| Rosetta Resources, Inc. 144A company guaranty sr. unsec. | | |
| notes 9 1/2s, 2018 | 1,440,000 | 1,418,400 |
|
| Sabine Pass LNG LP sec. notes 7 1/2s, 2016 | 2,300,000 | 1,909,000 |
|
| Sabine Pass LNG LP sr. sec. notes 7 1/4s, 2013 | 725,000 | 667,000 |
|
| SandRidge Energy, Inc. 144A company guaranty sr. unsec. | | |
| unsub. notes 8s, 2018 | 3,285,000 | 2,940,075 |
|
| SandRidge Energy, Inc. 144A sr. unsec. notes 9 7/8s, 2016 | 570,000 | 561,450 |
|
| Whiting Petroleum Corp. company guaranty 7s, 2014 | 1,245,000 | 1,252,781 |
|
| Williams Cos., Inc. (The) notes 7 3/4s, 2031 | 1,800,000 | 1,963,780 |
|
| Williams Cos., Inc. (The) sr. unsec. notes 7 7/8s, 2021 | 541,000 | 625,278 |
|
| Williams Cos., Inc. (The) 144A notes 6 3/8s, 2010 | 700,000 | 708,340 |
|
| | | 60,555,377 |
| Publishing (0.7%) | | |
| American Media, Inc. sr. unsec. sub. notes company | | |
| guaranty 8 7/8s, 2011 F | 85,000 | 46,963 |
|
| American Media, Inc. 144A company guaranty sr. unsec. | | |
| sub. notes 8 7/8s, 2011 F | 11,090 | 6,127 |
|
| Cengage Learning Acquisitions, Inc. 144A sr. notes 10 1/2s, 2015 | 2,045,000 | 1,855,838 |
|
| Cenveo Corp. company guaranty sr. notes 8 7/8s, 2018 | 1,250,000 | 1,215,625 |
|
| Cenveo Corp. 144A company guaranty sr. unsec. | | |
| notes 10 1/2s, 2016 | 455,000 | 455,569 |
|
27
| | |
| CORPORATE BONDS AND NOTES (86.2%)* cont. | Principal amount | Value |
|
| Publishing cont. | | |
| McClatchy Co. (The) 144A company guaranty sr. notes | | |
| 11 1/2s, 2017 | $1,430,000 | $1,437,150 |
|
| Vertis, Inc. company guaranty sr. sec. notes Ser. A, | | |
| 8 1/2s, 2012 ‡‡ | 647,071 | 587,217 |
|
| | | 5,604,489 |
| Regional Bells (1.2%) | | |
| Cincinnati Bell, Inc. company guaranty sr. unsec. notes 7s, 2015 | 700,000 | 652,750 |
|
| Cincinnati Bell, Inc. company guaranty sr. unsec. | | |
| sub. notes 8 3/4s, 2018 | 650,000 | 601,250 |
|
| Frontier Communications Corp. sr. unsec. notes 8 1/4s, 2014 | 570,000 | 584,963 |
|
| Frontier Communications Corp. sr. unsec. notes 8 1/8s, 2018 | 945,000 | 923,738 |
|
| Frontier Communications Corp. 144A sr. notes 8 1/2s, 2020 | 1,485,000 | 1,462,725 |
|
| Frontier Communications Corp. 144A sr. notes 8 1/4s, 2017 | 1,730,000 | 1,712,700 |
|
| Qwest Communications International, Inc. company | | |
| guaranty 7 1/2s, 2014 | 70,000 | 68,950 |
|
| Qwest Corp. sr. unsec. unsub. notes 8 7/8s, 2012 | 620,000 | 662,625 |
|
| Qwest Corp. sr. unsec. unsub. notes 8 3/8s, 2016 | 1,025,000 | 1,112,125 |
|
| Qwest Corp. sr. unsec. unsub. notes 7 1/4s, 2025 | 1,135,000 | 1,112,300 |
|
| | | 8,894,126 |
| Retail (2.9%) | | |
| Autonation, Inc. company guaranty sr. unsec. notes 6 3/4s, 2018 | 505,000 | 494,900 |
|
| Blockbuster, Inc. 144A company guaranty sr. notes 11 3/4s, 2014 | 1,057,000 | 623,630 |
|
| Bon-Ton Stores, Inc. (The) company guaranty 10 1/4s, 2014 | 2,005,000 | 1,994,975 |
|
| Burlington Coat Factory Warehouse Corp. company | | |
| guaranty sr. unsec. notes 11 1/8s, 2014 | 1,318,000 | 1,360,835 |
|
| Dollar General Corp. company guaranty sr. unsec. | | |
| notes 10 5/8s, 2015 | 1,092,000 | 1,190,280 |
|
| Federated Retail Holdings, Inc. company guaranty sr. unsec. | | |
| notes 5.9s, 2016 | 1,455,000 | 1,445,906 |
|
| Harry & David Operations Corp. company guaranty sr. unsec. | | |
| notes 9s, 2013 | 1,355,000 | 860,425 |
|
| Harry & David Operations Corp. company guaranty sr. unsec. | | |
| notes FRN 5.252s, 2012 | 385,000 | 231,963 |
|
| Limited Brands, Inc. company guaranty sr. unsec. | | |
| unsub. notes 7s, 2020 | 640,000 | 635,200 |
|
| Macy’s Retail Holdings, Inc. company guaranty sr. unsec. | | |
| unsub. notes 8 7/8s, 2015 | 545,000 | 600,863 |
|
| Michaels Stores, Inc. company guaranty 11 3/8s, 2016 | 1,490,000 | 1,532,838 |
|
| Michaels Stores, Inc. company guaranty 10s, 2014 | 1,140,000 | 1,169,925 |
|
| Neiman-Marcus Group, Inc. company guaranty sr. unsec. | | |
| notes 9s, 2015 ‡‡ | 3,251,144 | 3,173,929 |
|
| Neiman-Marcus Group, Inc. company guaranty sr. unsec. | | |
| sub. notes 10 3/8s, 2015 | 820,000 | 807,700 |
|
| Toys R Us Property Co., LLC 144A company | | |
| guaranty sr. unsec. notes 10 3/4s, 2017 | 2,695,000 | 2,984,713 |
|
| Toys R Us Property Co., LLC 144A sr. notes 8 1/2s, 2017 | 1,420,000 | 1,466,150 |
|
| United Auto Group, Inc. company guaranty 7 3/4s, 2016 | 2,240,000 | 2,111,200 |
|
| | | 22,685,432 |
28
| | |
| CORPORATE BONDS AND NOTES (86.2%)* cont. | Principal amount | Value |
|
| Technology (4.4%) | | |
| Advanced Micro Devices, Inc. 144A sr. unsec. notes 8 1/8s, 2017 | $1,130,000 | $1,108,813 |
|
| Ceridian Corp. company guaranty sr. unsec. notes 12 1/4s, 2015 ‡‡ | 1,696,350 | 1,620,014 |
|
| Ceridian Corp. sr. unsec. notes 11 1/4s, 2015 | 2,040,000 | 1,940,550 |
|
| Compucom Systems, Inc. 144A sr. sub. notes 12 1/2s, 2015 | 570,000 | 604,913 |
|
| First Data Corp. company guaranty sr. unsec. notes 10.55s, 2015 ‡‡ | 4,208,513 | 3,251,076 |
|
| First Data Corp. company guaranty sr. unsec. notes 9 7/8s, 2015 | 935,000 | 762,025 |
|
| First Data Corp. company guaranty sr. unsec. sub. notes 11 1/4s, 2016 | 1,960,000 | 1,254,400 |
|
| Freescale Semiconductor, Inc. company guaranty sr. unsec. | | |
| notes 9 1/8s, 2014 ‡‡ | 2,104,933 | 1,820,767 |
|
| Freescale Semiconductor, Inc. company guaranty sr. unsec. | | |
| notes 8 7/8s, 2014 | 1,385,000 | 1,249,963 |
|
| Freescale Semiconductor, Inc. company guaranty sr. unsec. | | |
| sub. notes 10 1/8s, 2016 | 2,052,000 | 1,651,860 |
|
| Freescale Semiconductor, Inc. 144A company | | |
| guaranty sr. notes 10 1/8s, 2018 | 900,000 | 931,500 |
|
| Freescale Semiconductor, Inc. 144A company | | |
| guaranty sr. notes 9 1/4s, 2018 | 1,645,000 | 1,632,663 |
|
| Iron Mountain, Inc. company guaranty 8 3/4s, 2018 | 155,000 | 158,875 |
|
| Iron Mountain, Inc. company guaranty sr. unsec. sub. notes 8s, 2020 | 815,000 | 802,775 |
|
| Iron Mountain, Inc. sr. sub. notes 8 3/8s, 2021 | 540,000 | 548,100 |
|
| Lucent Technologies, Inc. unsec. debs. 6.45s, 2029 | 210,000 | 142,800 |
|
| New ASAT Finance, Ltd. company guaranty 9 1/4s, 2011 | | |
| (Cayman Islands) (In default) F † | 1,235,000 | 107,569 |
|
| NXP BV/NXP Funding, LLC company guaranty Ser. EXCH, 9 1/2s, | | |
| 2015 (Netherlands) | 1,350,000 | 1,162,688 |
|
| NXP BV/NXP Funding, LLC company guaranty sr. sec. notes FRN | | |
| Ser. EXCH, 3.053s, 2013 (Netherlands) | 1,125,000 | 970,313 |
|
| NXP BV/NXP Funding, LLC sec. notes Ser. EXCH, 7 7/8s, 2014 | | |
| (Netherlands) | 2,115,000 | 1,951,088 |
|
| SunGard Data Systems, Inc. company guaranty 10 1/4s, 2015 | 2,347,000 | 2,373,404 |
|
| SunGard Data Systems, Inc. company guaranty 9 1/8s, 2013 | 1,906,000 | 1,925,060 |
|
| Syniverse Technologies, Inc. sr. sub. notes Ser. B, 7 3/4s, 2013 | 1,235,000 | 1,210,300 |
|
| Unisys Corp. sr. unsec. unsub. notes 12 1/2s, 2016 | 485,000 | 526,225 |
|
| Unisys Corp. 144A company guaranty sr. sub. notes 14 1/4s, 2015 | 2,630,000 | 3,063,950 |
|
| Xerox Capital Trust I company guaranty 8s, 2027 | 965,000 | 963,428 |
|
| | | 33,735,119 |
| Telecommunications (7.3%) | | |
| CC Holdings GS V, LLC/Crown Castle GS III Corp. 144A | | |
| sr. sec. notes 7 3/4s, 2017 | 2,370,000 | 2,512,200 |
|
| Clearwire Communications, LLC/Clearwire Finance, Inc. 144A | | |
| company guaranty sr. notes 12s, 2015 | 2,205,000 | 2,138,850 |
|
| Clearwire Communications, LLC/Clearwire Finance, Inc. 144A | | |
| company guaranty sr. notes 12s, 2015 | 1,570,000 | 1,530,750 |
|
| Crown Castle International Corp. sr. unsec. notes 7 1/8s, 2019 | 435,000 | 421,950 |
|
| Digicel Group, Ltd. 144A sr. notes 10 1/2s, 2018 (Jamaica) | 925,000 | 936,563 |
|
| Digicel Group, Ltd. 144A sr. notes 8 1/4s, 2017 (Jamaica) | 1,030,000 | 1,009,400 |
|
| Digicel Group, Ltd. 144A sr. unsec. notes 8 7/8s, 2015 (Jamaica) | 1,360,000 | 1,315,800 |
|
| Inmarsat Finance PLC 144A company guaranty sr. notes 7 3/8s, | | |
| 2017 (United Kingdom) | 760,000 | 758,100 |
|
29
| | | |
| CORPORATE BONDS AND NOTES (86.2%)* cont. | Principal amount | Value |
|
| Telecommunications cont. | | | |
| Intelsat Bermuda, Ltd. company guaranty sr. unsec. | | | |
| notes 11 1/4s, 2017 (Bermuda) | | $3,945,000 | $3,885,825 |
|
| Intelsat Intermediate Holding Co., Ltd. company guaranty | | | |
| sr. unsec. notes 9 1/2s, 2015 (Bermuda) | | 1,040,000 | 1,055,600 |
|
| Intelsat Intermediate Holding Co., Ltd. company | | | |
| guaranty sr. unsec. notes 9 1/4s, 2015 (Bermuda) | | 690,000 | 683,100 |
|
| Intelsat Jackson Holding Co. company guaranty sr. unsec. | | | |
| notes 11 1/4s, 2016 (Bermuda) | | 4,295,000 | 4,541,963 |
|
| Intelsat Subsidiary Holding Co., Ltd. company | | | |
| guaranty sr. unsec. notes 8 7/8s, 2015 (Bermuda) | | 960,000 | 969,600 |
|
| Intelsat Subsidiary Holding Co., Ltd. company | | | |
| guaranty sr. unsec. notes 8 1/2s, 2013 (Bermuda) | | 1,095,000 | 1,103,213 |
|
| Level 3 Financing, Inc. company guaranty 9 1/4s, 2014 | | 2,705,000 | 2,461,550 |
|
| Level 3 Financing, Inc. company guaranty 8 3/4s, 2017 | | 265,000 | 225,250 |
|
| MetroPCS Wireless, Inc. company guaranty sr. unsec. | | | |
| notes 9 1/4s, 2014 | | 3,800,000 | 3,914,000 |
|
| Nextel Communications, Inc. company guaranty sr. unsec. | | | |
| notes Ser. D, 7 3/8s, 2015 | | 2,805,000 | 2,643,713 |
|
| NII Capital Corp. company guaranty sr. unsec. | | | |
| unsub. notes 10s, 2016 | | 2,900,000 | 3,103,000 |
|
| Nordic Telephone Co. Holdings ApS 144A sr. sec. bond | | | |
| 8 7/8s, 2016 (Denmark) | | 455,000 | 466,375 |
|
| PAETEC Holding Corp. company guaranty sr. unsec. | | | |
| unsub. notes 9 1/2s, 2015 | | 540,000 | 525,150 |
|
| PAETEC Holding Corp. 144A company | | | |
| guaranty sr. notes 8 7/8s, 2017 | | 1,280,000 | 1,264,000 |
|
| SBA Telecommunications, Inc. 144A company | | | |
| guaranty sr. notes 8 1/4s, 2019 | | 745,000 | 776,663 |
|
| SBA Telecommunications, Inc. 144A company | | | |
| guaranty sr. notes 8s, 2016 | | 1,365,000 | 1,405,950 |
|
| Sprint Capital Corp. company guaranty 6 7/8s, 2028 | | 3,560,000 | 2,959,250 |
|
| Sprint Nextel Corp. sr. notes 8 3/8s, 2017 | | 2,725,000 | 2,677,313 |
|
| Sprint Nextel Corp. sr. unsec. notes 6s, 2016 | | 535,000 | 476,150 |
|
| West Corp. company guaranty 9 1/2s, 2014 | | 2,370,000 | 2,358,150 |
|
| Wind Acquisition Finance SA 144A sr. notes 11 3/4s, | | | |
| 2017 (Netherlands) | | 2,805,000 | 2,861,100 |
|
| Wind Acquisition Finance SA 144A sr. notes 11 3/4s, | | | |
| 2017 (Netherlands) | EUR | 150,000 | 188,075 |
|
| Wind Acquisition Holdings Finance SA 144A company | | | |
| guaranty sr. notes zero %, 2017 (Italy) ‡‡ | | $1,165,000 | 1,095,100 |
|
| Windstream Corp. company guaranty 8 5/8s, 2016 | | 3,390,000 | 3,356,100 |
|
| Windstream Corp. company guaranty 8 1/8s, 2013 | | 795,000 | 802,950 |
|
| | | | 56,422,753 |
| Telephone (0.6%) | | | |
| Cricket Communications, Inc. company guaranty 9 3/8s, 2014 | | 1,930,000 | 1,944,475 |
|
| Cricket Communications, Inc. company | | | |
| guaranty sr. unsub. notes 7 3/4s, 2016 | | 1,445,000 | 1,466,675 |
|
| Integra Telecom Holdings, Inc. 144A sr. notes 10 3/4s, 2016 | | 1,075,000 | 1,037,375 |
|
| | | | 4,448,525 |
30
| | |
| CORPORATE BONDS AND NOTES (86.2%)* cont. | Principal amount | Value |
|
| Textiles (0.8%) | | |
| Hanesbrands, Inc. company guaranty sr. unsec. notes FRN | | |
| Ser. B, 3.831s, 2014 | $2,785,000 | $2,603,975 |
|
| Hanesbrands, Inc. sr. unsec. notes 8s, 2016 | 980,000 | 994,700 |
|
| Levi Strauss & Co. sr. unsec. notes 8 7/8s, 2016 | 1,135,000 | 1,177,563 |
|
| Levi Strauss & Co. 144A sr. notes 7 5/8s, 2020 | 1,205,000 | 1,174,875 |
|
| | | 5,951,113 |
| Tire and rubber (0.3%) | | |
| Goodyear Tire & Rubber Co. (The) sr. unsec. notes 10 1/2s, 2016 | 2,400,000 | 2,544,000 |
|
| | | 2,544,000 |
| Transportation (0.2%) | | |
| RailAmerica, Inc. company guaranty sr. notes 9 1/4s, 2017 | 1,854,000 | 1,928,160 |
|
| | | 1,928,160 |
| Utilities and power (4.7%) | | |
| AES Corp. (The) sr. unsec. notes 8s, 2020 | 520,000 | 504,400 |
|
| AES Corp. (The) sr. unsec. unsub. notes 8s, 2017 | 2,355,000 | 2,313,788 |
|
| AES Corp. (The) 144A sec. notes 8 3/4s, 2013 | 859,000 | 871,885 |
|
| Calpine Corp. 144A sr. sec. notes 7 1/4s, 2017 | 2,467,000 | 2,312,813 |
|
| Colorado Interstate Gas Co. debs. 6.85s, 2037 (Canada) | 1,430,000 | 1,437,323 |
|
| Dynegy Holdings, Inc. sr. unsec. notes 7 3/4s, 2019 | 1,970,000 | 1,423,325 |
|
| Dynegy-Roseton Danskamme company guaranty Ser. B, 7.67s, 2016 | 2,180,000 | 1,972,900 |
|
| Edison Mission Energy sr. unsec. notes 7 3/4s, 2016 | 755,000 | 547,375 |
|
| Edison Mission Energy sr. unsec. notes 7 1/2s, 2013 | 530,000 | 470,375 |
|
| Edison Mission Energy sr. unsec. notes 7.2s, 2019 | 1,035,000 | 672,750 |
|
| Edison Mission Energy sr. unsec. notes 7s, 2017 | 45,000 | 30,431 |
|
| El Paso Corp. sr. unsec. notes 12s, 2013 | 960,000 | 1,099,200 |
|
| El Paso Corp. sr. unsec. notes 7s, 2017 | 750,000 | 732,581 |
|
| El Paso Corp. sr. unsec. notes Ser. GMTN, 7.8s, 2031 | 705,000 | 669,750 |
|
| El Paso Natural Gas Co. debs. 8 5/8s, 2022 | 765,000 | 899,567 |
|
| Energy Future Holdings Corp. company guaranty sr. unsec. | | |
| notes zero %, 2017 ‡‡ | 1,775,500 | 1,140,759 |
|
| Energy Future Holdings Corp. sr. notes 9 3/4s, 2019 | 977,000 | 925,708 |
|
| Ipalco Enterprises, Inc. sr. sec. notes 8 5/8s, 2011 | 420,000 | 437,850 |
|
| Ipalco Enterprises, Inc. 144A sr. sec. notes 7 1/4s, 2016 | 230,000 | 234,025 |
|
| Mirant Americas Generation, Inc. sr. unsec. notes 9 1/8s, 2031 | 1,245,000 | 1,126,725 |
|
| Mirant Americas Generation, Inc. sr. unsec. notes 8.3s, 2011 | 1,400,000 | 1,428,000 |
|
| Mirant North America, LLC company guaranty 7 3/8s, 2013 | 2,960,000 | 2,967,400 |
|
| NRG Energy, Inc. company guaranty 7 3/8s, 2017 | 935,000 | 902,275 |
|
| NRG Energy, Inc. sr. notes 7 3/8s, 2016 | 6,160,000 | 5,959,800 |
|
| PNM Resources, Inc. unsec. unsub. notes 9 1/4s, 2015 | 275,000 | 294,250 |
|
| Sierra Pacific Resources sr. unsec. notes 8 5/8s, 2014 | 1,550,000 | 1,594,563 |
|
| Sierra Pacific Resources sr. unsec. unsub. notes 6 3/4s, 2017 | 190,000 | 191,167 |
|
| Tennessee Gas Pipeline Co. sr. unsec. unsub. debs. 7s, 2028 | 305,000 | 320,915 |
|
| Texas Competitive Electric Holdings Co., LLC company | | |
| guaranty sr. unsec. notes zero %, 2016 (United Kingdom) ‡‡ | 2,255,093 | 1,465,810 |
|
| Texas Competitive Electric Holdings Co., LLC company guaranty | | |
| sr. unsec. notes Ser. B, 10 1/4s, 2015 (United Kingdom) | 2,430,000 | 1,628,100 |
|
| Utilicorp United, Inc. sr. unsec. notes 7.95s, 2011 | 68,000 | 70,700 |
|
| | | 36,646,510 |
| Total corporate bonds and notes (cost $669,313,140) | | $664,038,301 |
31
| | |
| SENIOR LOANS (5.8%)* c | Principal amount | Value |
|
| Automotive (0.1%) | | |
| Visteon Corp. bank term loan FRN Ser. B, 5 1/4s, 2013 | $675,000 | $722,250 |
|
| | | 722,250 |
| Basic materials (0.4%) | | |
| Ineos Holdings, Ltd. bank term loan FRN Ser. B2, 7.501s, | | |
| 2013 (United Kingdom) | 950,000 | 918,531 |
|
| Ineos Holdings, Ltd. bank term loan FRN Ser. C2, 8.001s, | | |
| 2014 (United Kingdom) | 950,000 | 918,531 |
|
| Smurfit-Stone Container Enterprises, Inc. bank term loan | | |
| FRN 6 3/4s, 2016 U | 1,140,000 | 1,134,903 |
|
| | | 2,971,965 |
| Broadcasting (0.3%) | | |
| Clear Channel Communications, Inc. bank term loan FRN | | |
| Ser. B, 4.0041s, 2016 | 889,253 | 684,169 |
|
| Univision Communications, Inc. bank term loan FRN Ser. B, | | |
| 2.5401s, 2014 | 1,455,000 | 1,247,889 |
|
| | | 1,932,058 |
| Capital goods (—%) | | |
| Hawker Beechcraft Acquisition Co., LLC bank term loan FRN | | |
| Ser. B, 2.3371s, 2014 | 66,055 | 54,275 |
|
| | | 54,275 |
| Communication services (0.1%) | | |
| CCO Holdings, LLC / CCO Holdings Capital Corp. bank term | | |
| loan FRN Ser. D, 3.0378s, 2014 | 1,275,000 | 1,139,850 |
|
| | | 1,139,850 |
| Consumer cyclicals (1.3%) | | |
| CCM Merger, Inc. bank term loan FRN Ser. B, 8 1/2s, 2012 | 2,100,134 | 2,057,694 |
|
| Dex Media West, LLC bank term loan FRN Ser. A, 7 1/2s, 2014 | 282,524 | 259,357 |
|
| GateHouse Media, Inc. bank term loan FRN Ser. B, 2.36s, 2014 | 821,204 | 372,365 |
|
| GateHouse Media, Inc. bank term loan FRN Ser. DD, 2.3416s, 2014 | 306,419 | 138,942 |
|
| Golden Nugget, Inc. bank term loan FRN 3.3651s, 2014 | 135,196 | 106,738 |
|
| Golden Nugget, Inc. bank term loan FRN Ser. B, 3.36s, 2014 | 237,506 | 187,511 |
|
| QVC, Inc. bank term loan FRN 5.8413s, 2014 | 96,498 | 96,197 |
|
| Reynolds Consumer Products, Inc. bank term loan FRN Ser. B, | | |
| 6 1/4s, 2015 | 894,375 | 891,692 |
|
| Six Flags Theme Parks bank term loan FRN 9 1/4s, 2016 | 1,165,000 | 1,169,369 |
|
| Six Flags Theme Parks bank term loan FRN Ser. B, 6s, 2016 | 1,830,000 | 1,817,896 |
|
| Thomas Learning bank term loan FRN Ser. B, 2.79s, 2014 | 895,818 | 773,539 |
|
| Travelport, LLC bank term loan FRN Ser. C, 10 1/2s, 2013 | 277,900 | 275,121 |
|
| Tribune Co. bank term loan FRN Ser. B, 5 1/4s, | | |
| 2014 (In default) † | 3,524,169 | 2,156,351 |
|
| | | 10,302,772 |
| Consumer staples (0.7%) | | |
| Claire’s Stores, Inc. bank term loan FRN 3.0401s, 2014 | 2,274,761 | 1,908,668 |
|
| Pinnacle Foods Holding Corp. bank term loan FRN Ser. B, | | |
| 2.7777s, 2014 | 1,326,835 | 1,245,804 |
|
| Revlon Consumer Products bank term loan FRN 6s, 2015 | 1,205,000 | 1,172,365 |
|
| Rite-Aid Corp. bank term loan FRN 9 1/2s, 2015 | 1,126,047 | 1,141,882 |
|
| Rite-Aid Corp. bank term loan FRN Ser. B, 2.0829s, 2014 | 117,188 | 103,418 |
|
| | | 5,572,137 |
| Energy (0.1%) | | |
| MEG Energy Corp. bank term loan FRN 6s, 2016 (Canada) | 467,650 | 460,782 |
|
| | | 460,782 |
32
| | |
| SENIOR LOANS (5.8%)* c cont. | Principal amount | Value |
|
| Entertainment (0.2%) | | |
| Universal City Development Partners, Ltd. bank term loan | | �� |
| FRN Ser. B, 5.5025s, 2014 | $1,875,300 | $1,866,299 |
|
| | | 1,866,299 |
| Financials (0.6%) | | |
| American General Finance Corp. bank term loan FRN 7 1/4s, 2015 | 1,520,000 | 1,471,360 |
|
| CB Richard Ellis Services, Inc. bank term loan FRN Ser. B, 6s, 2013 | 664,141 | 661,236 |
|
| HUB International Holdings, Inc. bank term loan FRN 6 3/4s, 2014 | 805,950 | 784,794 |
|
| iStar Financial, Inc. bank term loan FRN 1.751s, 2011 | 1,260,000 | 1,141,875 |
|
| Nuveen Investments, Inc. bank term loan FRN Ser. B, 3.3247s, 2014 | 414,735 | 351,413 |
|
| | | 4,410,678 |
| Gaming and lottery (0.1%) | | |
| Harrah’s Operating Co., Inc. bank term loan FRN Ser. B, 7.8155s, 2016 | 493,763 | 494,105 |
|
| | | 494,105 |
| Health care (0.5%) | | |
| Ardent Health Systems bank term loan FRN Ser. B, 6 1/2s, 2016 | 1,675,000 | 1,637,313 |
|
| IASIS Healthcare, LLC/IASIS Capital Corp. bank term loan | | |
| FRN 5.5878s, 2014 | 2,595,962 | 2,355,835 |
|
| Select Medical Corp. bank term loan FRN Ser. B, 2.4841s, 2012 | 235,002 | 225,700 |
|
| | | 4,218,848 |
| Homebuilding (0.1%) | | |
| Realogy Corp. bank term loan FRN 0.081s, 2013 | 128,572 | 108,386 |
|
| Realogy Corp. bank term loan FRN Ser. B, 3.2915s, 2013 | 477,553 | 402,578 |
|
| | | 510,964 |
| Retail (0.1%) | | |
| Burlington Coat Factory Warehouse Corp. bank term loan FRN | | |
| Ser. B, 2.6655s, 2013 | 566,539 | 520,002 |
|
| | | 520,002 |
| Technology (0.3%) | | |
| Compucom Systems, Inc. bank term loan FRN 3.86s, 2014 | 589,375 | 556,959 |
|
| First Data Corp. bank term loan FRN Ser. B1, 3.0872s, 2014 | 1,835,000 | 1,545,988 |
|
| | | 2,102,947 |
| Telecommunications (—%) | | |
| Level 3 Financing, Inc. bank term loan FRN Ser. B, 8.9556s, 2014 | 265,000 | 283,881 |
|
| | | 283,881 |
| Transportation (0.4%) | | |
| Swift Transportation Co., Inc. bank term loan FRN 8 1/4s, 2014 | 3,293,304 | 3,044,248 |
|
| | | 3,044,248 |
| Utilities and power (0.5%) | | |
| TXU Energy Corp. bank term loan FRN Ser. B2, 3.9692s, 2014 | 1,992,985 | 1,531,039 |
|
| TXU Energy Corp. bank term loan FRN Ser. B3, 3.797s, 2014 | 3,262,654 | 2,491,852 |
|
| | | 4,022,891 |
| Total senior loans (cost $47,111,844) | | $44,630,952 |
| |
| |
| CONVERTIBLE BONDS AND NOTES (2.7%)* | Principal amount | Value |
|
| Acquicor Technology, Inc. 144A cv. notes 8s, 2011 | $822,000 | $776,790 |
|
| Advanced Micro Devices, Inc. cv. sr. unsec. notes 6s, 2015 | 1,265,000 | 1,227,050 |
|
| Alexandria Real Estate Equities, Inc. 144A cv. company | | |
| guaranty sr. unsec. notes 3.7s, 2027 R | 1,175,000 | 1,150,031 |
|
| Alliant Techsystems, Inc. cv. company guaranty sr. sub. notes 3s, 2024 | 1,360,000 | 1,421,200 |
|
| Digital Realty Trust LP 144A cv. sr. unsec. notes 5 1/2s, 2029 R | 865,000 | 1,209,919 |
|
| Ford Motor Co. cv. sr. unsec. notes 4 1/4s, 2016 | 700,000 | 983,199 |
|
33
| | | |
| CONVERTIBLE BONDS AND NOTES (2.7%)* cont. | | Principal amount | Value |
|
| General Cable Corp. cv. unsec. sub. notes stepped-coupon | | | |
| 4 1/2s (2 1/4s, 11/15/19) 2029 †† | | $1,185,000 | $1,251,656 |
|
| General Growth Properties, Inc. 144A cv. sr. notes 3.98s, | | | |
| 2027 (In default) † R | | 770,000 | 789,250 |
|
| Jazz Technologies, Inc. cv. company guaranty sr. unsec. | | | |
| unsub. notes 8s, 2011 | | 20,000 | 18,900 |
|
| L-3 Communications Holdings, Inc. cv. company sr. unsec. | | | |
| bonds 3s, 2035 | | 1,133,000 | 1,145,746 |
|
| Leap Wireless International, Inc. cv. sr. unsec. notes 4 1/2s, 2014 | 795,000 | 666,806 |
|
| Level 3 Communications, Inc. cv. sr. unsec. unsub. notes 5 1/4s, 2011 | 480,000 | 460,800 |
|
| Level 3 Communications, Inc. cv. sr. unsec. unsub. notes 3 1/2s, 2012 | 1,000,000 | 905,000 |
|
| Owens Brockway Glass Container, Inc. 144A cv. sr. notes 3s, 2015 | 895,000 | 866,092 |
|
| Pantry, Inc. (The) cv. company guaranty sr. unsec. sub. notes 3s, 2012 | 2,155,000 | 1,961,050 |
|
| Steel Dynamics, Inc. cv. sr. notes 5 1/8s, 2014 | | 510,000 | 563,231 |
|
| Trinity Industries, Inc. cv. unsec. sub. notes 3 7/8s, 2036 | | 2,510,000 | 2,064,475 |
|
| TRW Automotive, Inc. 144A cv. company guaranty sr. notes 3 1/2s, 2015 | 825,000 | 1,005,469 |
|
| Virgin Media, Inc. cv. sr. unsec. notes 6 1/2s, 2016 | | 970,000 | 1,098,525 |
|
| XM Satellite Radio Holdings, Inc. 144A cv. sr. unsec. sub. notes 7s, 2014 | 893,000 | 895,281 |
|
| Total convertible bonds and notes (cost $18,582,112) | | | $20,460,470 |
| |
| |
| ASSET-BACKED SECURITIES (0.4%)* | | Principal amount | Value |
|
| Neon Capital, Ltd. 144A | | | |
| limited recourse sec. notes Ser. 95, 2.319s, 2013 | | | |
| (Cayman Islands) F g | | $3,901,050 | $1,356,547 |
| limited recourse sec. notes Ser. 97, 1.105s, 2013 | | | |
| (Cayman Islands) F g | | 6,684,836 | 1,777,645 |
|
| Total asset-backed securities (cost $2,040,547) | | | $3,134,192 |
| |
| |
| MORTGAGE-BACKED SECURITIES (—%)* | | Principal amount | Value |
|
| Mach One Commercial Mortgage Trust 144A | | | |
| Ser. 04-1A, Class J, 5.45s, 2040 | | $1,000,000 | $67,500 |
| Ser. 04-1A, Class K, 5.45s, 2040 | | 365,000 | 20,988 |
| Ser. 04-1A, Class L, 5.45s, 2040 | | 165,000 | 21,863 |
|
| Total mortgage-backed securities (cost $1,247,229) | | | $110,351 |
| |
| |
| SHORT-TERM INVESTMENTS (2.4%)* | Principal amount/shares | Value |
|
| Putnam Money Market Liquidity Fund - 0.24% e | | 18,423,184 | $18,423,184 |
|
| U.S. Treasury Bills for an effective yield of 0.30%, | | | |
| November 18, 2010 | | $140,000 | 139,738 |
|
| Total short-term investments (cost $18,562,988) | | | $18,562,922 |
| |
| |
| TOTAL INVESTMENTS | | | |
|
| Total investments (cost $756,857,860) | | | $750,937,188 |
34
Key to holding’s currency abbreviations
| |
| EUR | Euro |
| | |
| Key to holding’s abbreviations |
| |
| FRB | Floating Rate Bonds |
| FRN | Floating Rate Notes |
| GMTN | Global Medium Term Notes |
| MTN | Medium Term Notes |
| MTNA | Medium Term Notes Class A |
| MTNI | Medium Term Notes Class I |
Notes to the fund’s portfolio
Unless noted otherwise, the notes to the fund’s portfolio are for the close of the fund’s reporting period, which ran from December 1, 2009 through May 31, 2010 (the reporting period).
* Percentages indicated are based on net assets of $770,309,374.
† Non-income-producing security.
†† The interest rate and date shown parenthetically represent the new interest rate to be paid and the date the fund will begin accruing interest at this rate.
‡ Restricted, excluding 144A securities, as to public resale. The total market value of restricted securities held at the close of the reporting period was $2, or less than 0.1% of net assets.
‡‡ Income may be received in cash or additional securities at the discretion of the issuer.
c Senior loans are exempt from registration under the Securities Act of 1933, as amended, but contain certain restrictions on resale and cannot be sold publicly. These loans pay interest at rates which adjust periodically. The interest rates shown for senior loans are the current interest rates at the close of the reporting period. Senior loans are also subject to mandatory and/or optional prepayment which cannot be predicted. As a result, the remaining maturity may be substantially less than the stated maturity shown (Notes 1 and 7).
e See Note 6 to the financial statements regarding investments in Putnam Money Market Liquidity Fund. The rate quoted in the security description is the annualized 7-day yield of the fund at the close of the reporting period.
F Is valued at fair value following procedures approved by the Trustees. Securities may be classified as Level 2 or Level 3 for Accounting Standards Codification ASC 820 Fair Value Measurements and Disclosures (ASC 820) based on the securities valuation inputs.
g The notes are secured by debt and equity securities and equity participation agreements held by Neon Capital, Ltd.
R Real Estate Investment Trust.
U This security, in part or in entirety, represents unfunded loan commitments (Note 8).
At the close of the reporting period, liquid assets totaling $55,298 have been segregated to cover certain derivatives contracts.
Debt obligations are considered secured unless otherwise indicated.
144A after the name of an issuer represents securities exempt from registration under Rule 144A under the Securities Act of 1933, as amended. These securities may be resold in transactions exempt from registration, normally to qualified institutional buyers.
The rates shown on FRB and FRN are the current interest rates at the close of the reporting period.
The dates shown on debt obligations are the original maturity dates.
| | | | | |
| FORWARD CURRENCY CONTRACTS TO BUY at 5/31/10 (Unaudited) | | | |
| |
| | | Aggregate | | Delivery | Unrealized |
| | Value | face value | | date | (depreciation) |
|
| Euro | $1,351,464 | $1,414,028 | | 6/17/10 | $(62,564) |
|
| Total | | | | | $(62,564) |
35
| | | | | |
| FORWARD CURRENCY CONTRACTS TO SELL at 5/31/10 (Unaudited) | | |
|
| | | Aggregate | | Delivery | Unrealized |
| | Value | face value | | date | appreciation |
|
| Euro | $8,091,695 | $8,675,198 | | 6/17/10 | $583,503 |
|
| Total | | | | | $583,503 |
ASC 820 establishes a three-level hierarchy for disclosure of fair value measurements. The valuation hierarchy is based upon the transparency of inputs to the valuation of the fund’s investments. The three levels are defined as follows:
Level 1 — Valuations based on quoted prices for identical securities in active markets.
Level 2 — Valuations based on quoted prices in markets that are not active or for which all significant inputs are observable, either directly or indirectly.
Level 3 — Valuations based on inputs that are unobservable and significant to the fair value measurement.
The following is a summary of the inputs used to value the fund’s net assets as of the close of the reporting period:
| | | |
| | | Valuation inputs | |
|
| Investments in securities: | Level 1 | Level 2 | Level 3 |
|
| Asset-backed securities | $— | $— | $3,134,192 |
|
| Convertible bonds and notes | — | 20,460,470 | — |
|
| Corporate bonds and notes | — | 663,871,224 | 167,077 |
|
| Mortgage-backed securities | — | 110,351 | — |
|
| Senior loans | — | 44,630,952 | — |
|
| Short-term investments | 18,423,184 | 139,738 | — |
|
| Totals by level | $18,423,184 | $729,212,735 | $3,301,269 |
| | | | |
| | | Valuation inputs | |
|
| Other financial instruments: | Level 1 | Level 2 | Level 3 |
|
| Forward currency contracts to buy | $— | $(62,564) | $— |
|
| Forward currency contracts to sell | — | 583,503 | — |
|
| Totals by level | $— | $520,939 | $— |
At the start and/or close of the reporting period, Level 3 investments in securities and other financial instruments were not considered a significant portion of the fund’s portfolio.
The accompanying notes are an integral part of these financial statements.
36
Statement of assets and liabilities 5/31/10 (Unaudited)
| | |
| ASSETS | | |
|
| Investment in securities, at value (Note 1): | | |
| Unaffiliated issuers (identified cost $738,434,676) | | $732,514,004 |
| Affiliated issuers (identified cost $18,423,184) (Note 6) | | 18,423,184 |
|
| Cash | | 7,780,246 |
|
| Dividends, interest and other receivables | | 15,580,517 |
|
| Receivable for shares of the fund sold | | 4,041,583 |
|
| Receivable for investments sold | | 10,622,587 |
|
| Unrealized appreciation on forward currency contracts (Note 1) | | 583,503 |
|
| Total assets | | 789,545,624 |
| |
| LIABILITIES | | |
|
| Payable for investments purchased | | 15,605,887 |
|
| Payable for purchases of delayed delivery securities (Notes 1 and 8) | | 1,128,600 |
|
| Payable for shares of the fund repurchased | | 1,321,762 |
|
| Payable for compensation of Manager (Note 2) | | 380,635 |
|
| Payable for investor servicing fees (Note 2) | | 105,111 |
|
| Payable for custodian fees (Note 2) | | 5,898 |
|
| Payable for Trustee compensation and expenses (Note 2) | | 195,461 |
|
| Payable for administrative services (Note 2) | | 2,594 |
|
| Payable for distribution fees (Note 2) | | 310,293 |
|
| Unrealized depreciation on forward currency contracts (Note 1) | | 62,564 |
|
| Other accrued expenses | | 117,445 |
|
| Total liabilities | | 19,236,250 |
| |
| Net assets | | $770,309,374 |
|
| |
| REPRESENTED BY | | |
|
| Paid-in capital (Unlimited shares authorized) (Notes 1 and 4) | $1,354,665,427 |
|
| Undistributed net investment income (Note 1) | | 3,596,602 |
|
| Accumulated net realized loss on investments and foreign currency transactions (Note 1) | | (582,543,435) |
|
| Net unrealized depreciation of investments and assets and liabilities in foreign currencies | | (5,409,220) |
|
| Total — Representing net assets applicable to capital shares outstanding | | $770,309,374 |
|
| |
| COMPUTATION OF NET ASSET VALUE AND OFFERING PRICE | | |
|
| Net asset value and redemption price per class A share ($505,588,390 divided by 89,775,556 shares) | $5.63 |
|
| Offering price per class A share (100/96.00 of $5.63)* | | $5.86 |
|
| Net asset value and offering price per class B share ($7,607,267 divided by 1,374,239 shares)** | $5.54 |
|
| Net asset value and offering price per class C share ($8,778,525 divided by 1,589,282 shares)** | $5.52 |
|
| Net asset value and redemption price per class M share ($168,522,471 divided by 29,902,344 shares) | $5.64 |
|
| Offering price per class M share (100/96.75 of $5.64)*** | | $5.83 |
|
| Net asset value, offering price and redemption price per class R share | | |
| ($7,452,236 divided by 1,322,448 shares) | | $5.64 |
|
| Net asset value, offering price and redemption price per class Y share | | |
| ($72,360,485 divided by 12,487,721 shares) | | $5.79 |
|
* On single retail sales of less than $100,000. On sales of $100,000 or more the offering price is reduced.
** Redemption price per share is equal to net asset value less any applicable contingent deferred sales charge.
*** On single retail sales of less than $50,000. On sales of $50,000 or more the offering price is reduced.
The accompanying notes are an integral part of these financial statements.
37
Statement of operations Six months ended 5/31/10 (Unaudited)
| |
| INVESTMENT INCOME | |
|
| Interest (including interest income of $17,222 from investments in affiliated issuers) (Note 6) | $34,365,196 |
|
| Dividends | 43 |
|
| Total investment income | 34,365,239 |
|
| |
| EXPENSES | |
|
| Compensation of Manager (Note 2) | 2,295,297 |
|
| Investor servicing fees (Note 2) | 641,509 |
|
| Custodian fees (Note 2) | 18,354 |
|
| Trustee compensation and expenses (Note 2) | 29,909 |
|
| Administrative services (Note 2) | 21,725 |
|
| Distribution fees — Class A (Note 2) | 638,090 |
|
| Distribution fees — Class B (Note 2) | 42,715 |
|
| Distribution fees — Class C (Note 2) | 46,656 |
|
| Distribution fees — Class M (Note 2) | 440,354 |
|
| Distribution fees — Class R (Note 2) | 16,200 |
|
| Other | 239,071 |
|
| Fees waived and reimbursed by Manager (Note 2) | (42,466) |
|
| Total expenses | 4,387,414 |
| | |
| Expense reduction (Note 2) | (8,415) |
|
| Net expenses | 4,378,999 |
| |
| Net investment income | 29,986,240 |
|
| |
| Net realized gain on investments (Notes 1 and 3) | 19,074,387 |
|
| Net realized gain on swap contracts (Note 1) | 101,173 |
|
| Net realized gain on foreign currency transactions (Note 1) | 1,507,193 |
|
| Net unrealized appreciation of assets and liabilities in foreign currencies during the period | 662,467 |
|
| Net unrealized depreciation of investments, receivable purchase agreements and | |
| swap contracts during the period | (12,963,023) |
|
| Net gain on investments | 8,382,197 |
| |
| Net increase in net assets resulting from operations | $38,368,437 |
|
The accompanying notes are an integral part of these financial statements.
38
Statement of changes in net assets
| | |
| INCREASE IN NET ASSETS | Six months ended 5/31/10* | Year ended 11/30/09 |
|
| Operations: | | |
| Net investment income | $29,986,240 | $49,391,230 |
|
| Net realized gain (loss) on investments and | | |
| foreign currency transactions | 20,682,753 | (59,000,353) |
|
| Net unrealized appreciation (depreciation) of investments | | |
| and assets and liabilities in foreign currencies | (12,300,556) | 254,548,745 |
|
| Net increase in net assets resulting from operations | 38,368,437 | 244,939,622 |
|
| Distributions to shareholders (Note 1): | | |
| From ordinary income | | |
| Net investment income | | |
|
| Class A | (18,767,744) | (34,399,234) |
|
| Class B | (284,510) | (649,232) |
|
| Class C | (312,487) | (478,167) |
|
| Class M | (6,283,356) | (15,148,649) |
|
| Class R | (233,139) | (236,520) |
|
| Class Y | (2,538,973) | (3,922,271) |
|
| Redemption fees (Note 1) | 28,924 | 53,033 |
|
| Increase from capital share transactions (Note 4) | 12,216,121 | 68,953,978 |
|
| Total increase in net assets | 22,193,273 | 259,112,560 |
| |
| |
| NET ASSETS | | |
|
| Beginning of period | 748,116,101 | 489,003,541 |
|
| End of period (including undistributed net investment income | | |
| of $3,596,602 and $2,030,571, respectively) | $770,309,374 | $748,116,101 |
|
| * Unaudited | | |
The accompanying notes are an integral part of these financial statements.
39
Financial highlights (For a common share outstanding throughout the period)
| | | | | | | | | | | | | |
| INVESTMENT OPERATIONS: | LESS DISTRIBUTIONS: | RATIOS AND SUPPLEMENTAL DATA: | |
|
| | | | | | | | | | | | Ratio | Ratio of net | |
| | | | Net realized | | | | | | | | of expenses | investment | |
| | Net asset value, | | and unrealized | Total from | From net | | | Net asset | Total return | Net assets, | to average | income (loss) | |
| | beginning | Net investment | gain (loss) on | investment | investment | Total | Redemption | value, end | at net asset | end of period | net assets | to average | Portfolio |
| Period ended | of period | income (loss) a | investments | operations | income | distributions | fees c | of period | value (%) d | (in thousands) | (%) b,e | net assets (%) b | turnover (%) |
|
| Class A | | | | | | | | | | | | | |
| May 31, 2010 ** | $5.56 | .22 | .06 | .28 | (.21) | (.21) | — | $5.63 | 5.04 * | $505,588 | .53 * | 3.86 * | 40.96 * |
| November 30, 2009 | 4.05 | .40 | 1.55 | 1.95 | (.44) | (.44) | — | 5.56 | 50.64 | 479,094 | 1.13 | 8.13 | 58.99 |
| November 30, 2008 | 6.05 | .42 | (1.97) | (1.55) | (.45) | (.45) | — | 4.05 | (27.33) | 292,694 | 1.10 | 7.63 | 33.57 |
| November 30, 2007 | 6.22 | .44 | (.16) | .28 | (.45) | (.45) | — | 6.05 | 4.50 | 373,890 | 1.08 | 7.04 | 47.50 |
| November 30, 2006 | 5.97 | .45 f | .22 | .67 | (.42) | (.42) | — | 6.22 | 11.71 | 433,782 | 1.04 f | 7.41 f | 45.62 |
| November 30, 2005 | 6.16 | .43 | (.21) | .22 | (.41) | (.41) | — | 5.97 | 3.67 | 440,780 | 1.04 | 7.07 | 33.37 |
|
| Class B | | | | | | | | | | | | | |
| May 31, 2010 ** | $5.47 | .20 | .06 | .26 | (.19) | (.19) | — | $5.54 | 4.73 * | $7,607 | .91 * | 3.49 * | 40.96 * |
| November 30, 2009 | 3.99 | .35 | 1.54 | 1.89 | (.41) | (.41) | — | 5.47 | 49.61 | 9,033 | 1.88 | 7.41 | 58.99 |
| November 30, 2008 | 5.96 | .38 | (1.94) | (1.56) | (.41) | (.41) | — | 3.99 | (27.84) | 6,036 | 1.85 | 6.86 | 33.57 |
| November 30, 2007 | 6.14 | .39 | (.17) | .22 | (.40) | (.40) | — | 5.96 | 3.58 | 11,407 | 1.83 | 6.29 | 47.50 |
| November 30, 2006 | 5.89 | .39 f | .23 | .62 | (.37) | (.37) | — | 6.14 | 10.98 | 16,530 | 1.79 f | 6.69 f | 45.62 |
| November 30, 2005 | 6.08 | .38 | (.21) | .17 | (.36) | (.36) | — | 5.89 | 2.91 | 46,602 | 1.79 | 6.30 | 33.37 |
|
| Class C | | | | | | | | | | | | | |
| May 31, 2010 ** | $5.46 | .20 | .05 | .25 | (.19) | (.19) | — | $5.52 | 4.57 * | $8,779 | .91 * | 3.49 * | 40.96 * |
| November 30, 2009 | 3.98 | .35 | 1.54 | 1.89 | (.41) | (.41) | — | 5.46 | 49.80 | 10,020 | 1.88 | 7.16 | 58.99 |
| November 30, 2008 | 5.95 | .37 | (1.93) | (1.56) | (.41) | (.41) | — | 3.98 | (27.87) | 684 | 1.85 | 6.78 | 33.57 |
| November 30, 2007 † | 6.27 | .26 | (.33) | (.07) | (.25) | (.25) | — | 5.95 | (1.11) * | 776 | 1.23 * | 4.29 * | 47.50 |
|
| Class M | | | | | | | | | | | | | |
| May 31, 2010 ** | $5.57 | .22 | .05 | .27 | (.20) | (.20) | — | $5.64 | 4.92 * | $168,522 | .66 * | 3.74 * | 40.96 * |
| November 30, 2009 | 4.05 | .39 | 1.56 | 1.95 | (.43) | (.43) | — | 5.57 | 50.52 | 178,550 | 1.38 | 7.97 | 58.99 |
| November 30, 2008 | 6.05 | .41 | (1.97) | (1.56) | (.44) | (.44) | — | 4.05 | (27.50) | 155,249 | 1.35 | 7.36 | 33.57 |
| November 30, 2007 | 6.23 | .42 | (.17) | .25 | (.43) | (.43) | — | 6.05 | 4.11 | 275,959 | 1.33 | 6.79 | 47.50 |
| November 30, 2006 | 5.98 | .43 f | .23 | .66 | (.41) | (.41) | — | 6.23 | 11.47 | 349,881 | 1.29 f | 7.17 f | 45.62 |
| November 30, 2005 | 6.17 | .41 | (.20) | .21 | (.40) | (.40) | — | 5.98 | 3.46 | 430,521 | 1.29 | 6.82 | 33.37 |
|
| Class R | | | | | | | | | | | | | |
| May 31, 2010 ** | $5.56 | .21 | .07 | .28 | (.20) | (.20) | — | $5.64 | 5.11 * | $7,452 | .66 * | 3.73 * | 40.96 * |
| November 30, 2009 | 4.05 | .38 | 1.56 | 1.94 | (.43) | (.43) | — | 5.56 | 50.32 | 4,728 | 1.38 | 7.63 | 58.99 |
| November 30, 2008 | 6.05 | .41 | (1.97) | (1.56) | (.44) | (.44) | — | 4.05 | (27.46) | 680 | 1.35 | 8.31 | 33.57 |
| November 30, 2007 † | 6.35 | .29 | (.32) | (.03) | (.27) | (.27) | — | 6.05 | (.57) * | 1 | .89 * | 4.62 * | 47.50 |
|
| Class Y | | | | | | | | | | | | | |
| May 31, 2010 ** | $5.71 | .24 | .06 | .30 | (.22) | (.22) | — | $5.79 | 5.18 * | $72,360 | .41 * | 3.98 * | 40.96 * |
| November 30, 2009 | 4.15 | .43 | 1.58 | 2.01 | (.45) | (.45) | — | 5.71 | 50.98 | 66,691 | .88 | 8.35 | 58.99 |
| November 30, 2008 | 6.19 | .45 | (2.03) | (1.58) | (.46) | (.46) | — | 4.15 | (27.21) | 33,660 | .85 | 7.94 | 33.57 |
| November 30, 2007 | 6.35 | .47 | (.17) | .30 | (.46) | (.46) | — | 6.19 | 4.78 | 50,146 | .83 | 7.27 | 47.50 |
| November 30, 2006 | 6.08 | .47 f | .23 | .70 | (.43) | (.43) | — | 6.35 | 12.05 | 9,925 | .79 f | 7.63 f | 45.62 |
| November 30, 2005 | 6.27 | .45 | (.22) | .23 | (.42) | (.42) | — | 6.08 | 3.80 | 20,411 | .79 | 7.31 | 33.37 |
|
See notes to financial highlights at the end of this section.
The accompanying notes are an integral part of these financial statements.
Financial highlights (Continued)
* Not annualized.
** Unaudited.
† For the period March 30, 2007 (commencement of operations) to November 30, 2007.
a Per share net investment income (loss) has been determined on the basis of the weighted average number of shares outstanding during the period.
b Reflects an involuntary contractual expense limitation in effect during the period. For periods prior to November 30, 2009, certain fund expenses were waived in connection with the fund’s investment in Putnam Prime Money Market Fund. As a result of such limitation and/or waivers, the expenses of each class reflect a reduction of the following amounts (Note 2):
| |
| | Percentage of |
| | average net assets |
|
| May 31, 2010 | 0.01% |
|
| November 30, 2009 | 0.09 |
|
| November 30, 2008 | 0.02 |
|
| November 30, 2007 | <0.01 |
|
| November 30, 2006 | <0.01 |
|
| November 30, 2005 | <0.01 |
|
c Amount represents less than $0.01 per share.
d Total return assumes dividend reinvestment and does not reflect the effect of sales charges.
e Includes amounts paid through expense offset arrangements (Note 2).
f Reflects a non-recurring accrual related to a reimbursement to the fund from Putnam Investments relating to the calculation of certain amounts paid by the fund to Putnam in previous years for transfer agent services, which amounted to less than $0.01 per share and 0.01% of average net assets for the period ended November 30, 2006.
The accompanying notes are an integral part of these financial statements.
42
Notes to financial statements 5/31/10 (Unaudited)
Note 1: Significant accounting policies
Putnam High Yield Advantage Fund (the fund), is a Massachusetts business trust, which is registered under the Investment Company Act of 1940, as amended, as a diversified, open-end management investment company. The fund seeks high current income primarily through a diversified portfolio of higher yielding, lower rated bonds that may have a higher rate of default. Capital growth is a secondary objective when consistent with the objective of high current income. The fund may invest a significant portion of its assets in securitized debt instruments, including mortgage-backed and asset-backed investments. The yields and values of these investments are sensitive to changes in interest rates, the rate of principal payments on the underlying assets and the market’s perception of the issuers. The market for these investments may be volatile and limited, which may make them difficult to buy or sell.
The fund offers class A, class B, class C, class M, class R and class Y shares. Class A and class M shares are sold with a maximum front-end sales charge of 4.00% and 3.25%, respectively, and generally do not pay a contingent deferred sales charge. Class B shares, which convert to class A shares after approximately eight years, do not pay a front-end sales charge and are subject to a contingent deferred sales charge, if those shares are redeemed within six years of purchase. Class C shares have a one-year 1.00% contingent deferred sales charge and do not convert to class A shares. Class R shares, which are offered to qualified employee-benefit plans, are sold at net asset value. The expenses for class A, class B, class C, class M and class R shares may differ based on the distribution fee of each class, which is identified in Note 2. Class Y shares, which are sold at net asset value, are generally subject to the same expenses as class A, class B, class C, class M and class R shares, but do not bear a distribution fee. Class Y shares are generally only available to corporate and institutional clients and clients in other approved programs.
A 1.00% redemption fee may apply on any shares that are redeemed (either by selling or exchanging into another fund) within 90 days of purchase. The redemption fee is accounted for as an addition to paid-in-capital.
Investment income, realized and unrealized gains and losses and expenses of the fund are borne pro-rata based on the relative net assets of each class to the total net assets of the fund, except that each class bears expenses unique to that class (including the distribution fees applicable to such classes). Each class votes as a class only with respect to its own distribution plan or other matters on which a class vote is required by law or determined by the Trustees. If the fund were liquidated, shares of each class would receive their pro-rata share of the net assets of the fund. In addition, the Trustees declare separate dividends on each class of shares.
In the normal course of business, the fund enters into contracts that may include agreements to indemnify another party under given circumstances. The fund’s maximum exposure under these arrangements is unknown as this would involve future claims that may be, but have not yet been, made against the fund. However, the fund’s management team expects the risk of material loss to be remote.
The following is a summary of significant accounting policies consistently followed by the fund in the preparation of its financial statements. The preparation of financial statements is in conformity with accounting principles generally accepted in the United States of America and requires management to make estimates and assumptions that affect the reported amounts of assets and liabilities in the financial statements and the reported amounts of increases and decreases in net assets from operations during the period from December 1, 2009 through May 31, 2010 (the reporting period). Actual results could differ from those estimates. Subsequent events after the Statement of assets and liabilities date through the date that the financial statements were issued have been evaluated in the preparation of the financial statements.
A) Security valuation Market quotations are not considered to be readily available for certain debt obligations; such investments are valued on the basis of valuations furnished by an independent pricing service approved by the Trustees or dealers selected by Putnam Investment Management, LLC (Putnam Management), the fund’s manager, an indirect wholly-owned subsidiary of Putnam Investments, LLC. Such services or dealers determine valuations for normal institutional-size trading units of such securities using methods based on market transactions for comparable securities and various relationships, generally recognized by institutional traders, between securities (which considers such factors as security prices, yields, maturities and ratings). These securities will generally be categorized as Level 2. Securities quoted in foreign currencies, if any, are translated into U.S. dollars at the current exchange rate.
To the extent a pricing service or dealer is unable to value a security or provides a valuation that Putnam Management does not believe accurately reflects the security’s fair value, the security will be valued at fair value by Putnam Management. Certain investments, including certain restricted and illiquid securities and derivatives, are also valued
43
at fair value following procedures approved by the Trustees. These valuations consider such factors as significant market or specific security events such as interest rate or credit quality changes, various relationships with other securities, discount rates, U.S. Treasury, U.S. swap and credit yields, index levels, convexity exposures and recovery rates. These securities are classified as Level 2 or as Level 3 depending on the priority of the significant inputs.
Such valuations and procedures are reviewed periodically by the Trustees. Certain securities may be valued on the basis of a price provided by a single source. The fair value of securities is generally determined as the amount that the fund could reasonably expect to realize from an orderly disposition of such securities over a reasonable period of time. By its nature, a fair value price is a good faith estimate of the value of a security in a current sale and does not reflect an actual market price, which may be different by a material amount.
B) Security transactions and related investment income Security transactions are recorded on the trade date (the date the order to buy or sell is executed). Gains or losses on securities sold are determined on the identified cost basis. Interest income is recorded on the accrual basis. Dividend income, net of applicable withholding taxes, is recognized on the ex-dividend date except that certain dividends from foreign securities, if any, are recognized as soon as the fund is informed of the ex-dividend date. All premiums/discounts are amortized/accreted on a yield-to-maturity basis. Securities purchased or sold on a delayed delivery basis may be settled a month or more after the trade date; interest income is accrued based on the terms of the securities. Losses may arise due to changes in the market value of the underlying securities or if the counterparty does not perform under the contract.
The fund earned certain fees in connection with its senior loan purchasing activities. These fees are treated as market discount and are amortized into income in the Statement of operations.
C) Foreign currency translation The accounting records of the fund are maintained in U.S. dollars. The market value of foreign securities, currency holdings, and other assets and liabilities is recorded in the books and records of the fund after translation to U.S. dollars based on the exchange rates on that day. The cost of each security is determined using historical exchange rates. Income and withholding taxes are translated at prevailing exchange rates when earned or incurred. The fund does not isolate that portion of realized or unrealized gains or losses resulting from changes in the foreign exchange rate on investments from fluctuations arising from changes in the market prices of the securities. Such gains and losses are included with the net realized and unrealized gain or loss on investments. Net realized gains and losses on foreign currency transactions represent net realized exchange gains or losse s on closed forward currency contracts, disposition of foreign currencies, currency gains and losses realized between the trade and settlement dates on securities transactions and the difference between the amount of investment income and foreign withholding taxes recorded on the fund’s books and the U.S. dollar equivalent amounts actually received or paid. Net unrealized appreciation and depreciation of assets and liabilities in foreign currencies arise from changes in the value of open forward currency contracts and assets and liabilities other than investments at the period end, resulting from changes in the exchange rate. Investments in foreign securities involve certain risks, including those related to economic instability, unfavorable political developments, and currency fluctuations, not present with domestic investments.
D) Forward currency contracts The fund may buy and sell forward currency contracts, which are agreements between two parties to buy and sell currencies at a set price on a future date. These contracts are used to protect against a decline in value relative to the U.S. dollar of the currencies in which its portfolio securities are denominated or quoted (or an increase in the value of a currency in which securities a fund intends to buy are denominated, when a fund holds cash reserves and short term investments), or for other investment purposes. The U.S. dollar value of forward currency contracts is determined using current forward currency exchange rates supplied by a quotation service. The market value of the contract will fluctuate with changes in currency exchange rates. The contract is marked to market daily and the change in market value is recorded as an unrealized gain or loss. When the contract is clos ed, the fund records a realized gain or loss equal to the difference between the value of the contract at the time it was opened and the value at the time it was closed. The fund could be exposed to risk if the value of the currency changes unfavorably, if the counterparties to the contracts are unable to meet the terms of their contracts or if the fund is unable to enter into a closing position. Risks may exceed amounts recognized on the Statement of assets and liabilities. Forward currency contracts outstanding at period end, if any, are listed after the fund’s portfolio. The fund had an average contract amount of approximately $11,400,000 on forward currency contracts for the reporting period.
E) Credit default contracts The fund may enter into credit default contracts to provide a measure of protection against risk of loss following a default, or other credit event in respect of issuers within an underlying index or a single issuer, or to gain credit exposure to an underlying index or issuer. In a credit default contract, the protection buyer typically makes an up front payment and a periodic stream of payments to a counterparty, the protection
44
seller, in exchange for the right to receive a contingent payment upon the occurrence of a credit event on the reference obligation or all other equally ranked obligations of the reference entity. Credit events are contract specific but may include bankruptcy, failure to pay, restructuring and obligation acceleration. An upfront payment received by the fund, as the protection seller, is recorded as a liability on the fund’s books. An upfront payment made by the fund, as the protection buyer, is recorded as an asset on the fund’s books. Periodic payments received or paid by the fund are recorded as realized gains or losses. The credit default contracts are marked to market daily based upon quotations from an independent pricing service or market makers and the change, if any, is recorded as an unrealized gain or loss. Upon the occurrence of a credit event, the difference between the par value and market value of the reference obligation, net o f any proportional amount of the upfront payment, is recorded as a realized gain or loss.
In addition to bearing the risk that the credit event will occur, the fund could be exposed to market risk due to unfavorable changes in interest rates or in the price of the underlying security or index or the possibility that the fund may be unable to close out its position at the same time or at the same price as if it had purchased the underlying reference obligations. In certain circumstances, the fund may enter into offsetting credit default contracts which would mitigate its risk of loss. Risks of loss may exceed amounts recognized on the Statement of assets and liabilities. The fund’s maximum risk of loss from counterparty risk, either as the protection seller or as the protection buyer, is the fair value of the contract. This risk may be mitigated by having a master netting arrangement between the fund and the counterparty. Where the fund is a seller of protection, the maximum potential amount of future payments the fund may be required t o make is equal to the notional amount of the relevant credit default contract. Credit default contracts outstanding, including their respective notional amounts at period end, if any, are listed after the fund’s portfolio. The fund had an average notional amount of approximately $500,000 on credit default swap contracts for the reporting period.
F) Master agreements The fund is a party to ISDA (International Swap and Derivatives Association, Inc.) Master Agreements (Master Agreements) with certain counterparties that govern over-the-counter derivative and foreign exchange contracts entered into from time to time. The Master Agreements may contain provisions regarding, among other things, the parties’ general obligations, representations, agreements, collateral requirements, events of default and early termination. With respect to certain counterparties, in accordance with the terms of the Master Agreements, collateral posted to the fund is held in a segregated account by the fund’s custodian and with respect to those amounts which can be sold or repledged, are presented in the fund’s portfolio. Collateral posted to the fund which can not be sold or repledged totaled $287,638 at the close of the reporting period. Collateral pledged by th e fund is segregated by the fund’s custodian and identified in the fund’s portfolio. Collateral can be in the form of cash or debt securities issued by the U.S. Government or related agencies or other securities as agreed to by the fund and the applicable counterparty. Collateral requirements are determined based on the fund’s net position with each counterparty. Termination events applicable to the fund may occur upon a decline in the fund’s net assets below a specified threshold over a certain period of time. Termination events applicable to counterparties may occur upon a decline in the counterparty’s long-term and short-term credit ratings below a specified level. In each case, upon occurrence, the other party may elect to terminate early and cause settlement of all derivative and foreign exchange contracts outstanding, including the payment of any losses and costs resulting from such early termination, as reasonably determined by the terminating party. Any decision by one or mor e of the fund’s counterparties to elect early termination could impact the fund’s future derivative activity.
At the close of the reporting period, the fund had a net liability position of $62,564 on derivative contracts subject to the Master Agreements. There was no collateral posted by the fund.
G) Federal taxes It is the policy of the fund to distribute all of its taxable income within the prescribed time period and otherwise comply with the provisions of the Internal Revenue Code of 1986, as amended (the Code), applicable to regulated investment companies. It is also the intention of the fund to distribute an amount sufficient to avoid imposition of any excise tax under Section 4982 of the Code. The fund is subject to the provisions of Accounting Standards Codification ASC 740 Income Taxes (ASC 740). ASC 740 sets forth a minimum threshold for financial statement recognition of the benefit of a tax position taken or expected to be taken in a tax return. The fund did not have any unrecognized tax benefits in the accompanying financial statements. No provision has been made for federal taxes on income, capital gains or unrea lized appreciation on securities held nor for excise tax on income and capital gains. Each of the fund’s federal tax returns for the prior three fiscal years remains subject to examination by the Internal Revenue Service.
45
At November 30, 2009, the fund had a capital loss carryover of $598,917,449 available to the extent allowed by the Code to offset future net capital gain, if any. The amounts of the carryovers and the expiration dates are:
| | |
| Loss Carryover | | Expiration |
|
| $309,407,794 | | November 30, 2010 |
|
| 104,325,628 | | November 30, 2011 |
|
| 95,929,758 | | November 30, 2012 |
|
| 8,720,272 | | November 30, 2014 |
|
| 21,153,748 | | November 30, 2016 |
|
| 59,380,249 | | November 30, 2017 |
|
The aggregate identified cost on a tax basis is $756,942,253, resulting in gross unrealized appreciation and depreciation of $29,186,799 and $35,191,864, respectively, or net unrealized depreciation of $6,005,065.
H) Distributions to shareholders Distributions to shareholders from net investment income are recorded by the fund on the ex-dividend date. Distributions from capital gains, if any, are recorded on the ex-dividend date and paid at least annually. The amount and character of income and gains to be distributed are determined in accordance with income tax regulations, which may differ from generally accepted accounting principles. Dividend sources are estimated at the time of declaration. Actual results may vary. Any non-taxable return of capital cannot be determined until final tax calculations are completed after the end of the fund’s fiscal year. Reclassifications are made to the fund’s capital accounts to reflect income and gains available for distribution (or available capital loss carryovers) under income tax regulations.
Note 2: Management fee, administrative services and other transactions
Effective January 1, 2010, the fund pays Putnam Management a management fee (based on the fund’s average net assets and computed and paid monthly) at annual rates that may vary based on the average of the aggregate net assets of most open-end funds, as defined in the fund’s management contract, sponsored by Putnam Management. Such annual rates may vary as follows: 0.72% of the first $5 billion, 0.67% of the next $5 billion, 0.62% of the next $10 billion, 0.57% of the next $10 billion, 0.52% of the next $50 billion, 0.50% of the next $50 billion, 0.49% of the next $100 billion, and 0.485% thereafter.
Prior to January 1, 2010, the fund paid Putnam Management for management and investment advisory services quarterly based on the average net assets of the fund. Such fee was based on the following annual rates: 0.70% of the first $500 million of average net assets, 0.60% of the next $500 million, 0.55% of the next $500 million, 0.50% of the next $5 billion, 0.475% of the next $5 billion, 0.455% of then next $5 billion, 0.44% of the next $5 billion, and 0.43% thereafter.
Effective August 1, 2009 through June 30, 2011, Putnam Management has also contractually agreed to reimburse the fund’s expenses to the extent necessary to limit the cumulative expenses of the fund, exclusive of brokerage, interest, taxes, investment-related expenses, extraordinary expenses and payments under the fund’s investor servicing contract, investment management contract and distribution plans, on a fiscal year-to-date basis (or from August 1, 2009 through the fund’s next fiscal year end, as applicable), to an annual rate of 0.20% of the fund’s average net assets over such fiscal year-to-date period (or since August 1, 2009, as applicable). During the reporting period, the fund’s expenses were not reduced as a result of this limit.
Putnam Management has also contractually agreed, from August 1, 2009 through December 31, 2010, to limit the management fee for the fund to an annual rate of 0.60% of the fund’s average net assets. During the reporting period, the fund’s expenses were reduced by $42,466 as a result of this limit.
Putnam Investments Limited (PIL), an affiliate of Putnam Management, is authorized by the Trustees to manage a separate portion of the assets of the fund as determined by Putnam Management from time to time. Putnam Management pays a quarterly sub-management fee to PIL for its services at an annual rate of 0.40% of the average net assets of the portion of the fund managed by PIL.
On September 15, 2008, the fund terminated its outstanding derivatives contracts with Lehman Brothers Special Financing, Inc. (LBSF) in connection with the bankruptcy filing of LBSF’s parent company, Lehman Brothers Holdings, Inc. On September 26, 2008, the fund entered into receivable purchase agreements (Agreements)
46
with other registered investment companies (each a Purchaser) managed by Putnam Management. Under the Agreements, the fund sold to the Purchasers the fund’s right to receive, in the aggregate, $4,975,121 in net payments from LBSF in connection with certain terminated derivatives transactions (the Receivable), in exchange for an initial payment plus (or minus) additional amounts based on the applicable Purchaser’s ultimate realized gain (or loss) on the Receivable. The fund received $1,546,417 from the Purchasers in accordance with the terms of the Agreement.
The fund reimburses Putnam Management an allocated amount for the compensation and related expenses of certain officers of the fund and their staff who provide administrative services to the fund. The aggregate amount of all such reimbursements is determined annually by the Trustees.
Custodial functions for the fund’s assets are provided by State Street Bank and Trust Company (State Street). Custody fees are based on the fund’s asset level, the number of its security holdings and transaction volumes.
Putnam Investor Services, Inc., an affiliate of Putnam Management, provided investor servicing agent functions to the fund. Putnam Investor Services, Inc. received fees for investor servicing, subject to certain limitations, based on the fund’s retail asset level, the number of shareholder accounts in the fund and the level of defined contribution plan assets in the fund. The amounts incurred for investor servicing agent functions during the reporting period are included in Investor servicing fees in the Statement of operations.
The fund has entered into expense offset arrangements with Putnam Investor Services, Inc. and State Street whereby Putnam Investor Services, Inc.’s and State Street’s fees are reduced by credits allowed on cash balances. For the reporting period, the fund’s expenses were reduced by $8,415 under the expense offset arrangements.
Each independent Trustee of the fund receives an annual Trustee fee, of which $561, as a quarterly retainer, has been allocated to the fund, and an additional fee for each Trustees meeting attended. Trustees receive additional fees for attendance at certain committee meetings and industry seminars and for certain compliance-related matters. Trustees also are reimbursed for expenses they incur relating to their services as Trustees.
The fund has adopted a Trustee Fee Deferral Plan (the Deferral Plan) which allows the Trustees to defer the receipt of all or a portion of Trustees fees payable on or after July 1, 1995. The deferred fees remain invested in certain Putnam funds until distribution in accordance with the Deferral Plan.
The fund has adopted an unfunded noncontributory defined benefit pension plan (the Pension Plan) covering all Trustees of the fund who have served as a Trustee for at least five years and were first elected prior to 2004. Benefits under the Pension Plan are equal to 50% of the Trustee’s average annual attendance and retainer fees for the three years ended December 31, 2005. The retirement benefit is payable during a Trustee’s lifetime, beginning the year following retirement, for the number of years of service through December 31, 2006. Pension expense for the fund is included in Trustee compensation and expenses in the Statement of operations. Accrued pension liability is included in Payable for Trustee compensation and expenses in the Statement of assets and liabilities. The Trustees have terminated the Pension Plan with respect to any Trustee first elected after 2003.
The fund has adopted distribution plans (the Plans) with respect to its class A, class B, class C, class M and class R shares pursuant to Rule 12b-1 under the Investment Company Act of 1940. The purpose of the Plans is to compensate Putnam Retail Management Limited Partnership, a wholly-owned subsidiary of Putnam Investments, LLC and Putnam Retail Management GP, Inc., for services provided and expenses incurred in distributing shares of the fund. The Plans provide for payments by the fund to Putnam Retail Management Limited Partnership at an annual rate of up to 0.35%, 1.00%, 1.00%, 1.00% and 1.00% of the average net assets attributable to class A, class B, class C, class M and class R shares, respectively. The Trustees have approved payment by the fund at an annual rate of 0.25%, 1.00%, 1.00%, 0.50% and 0.50% of the average net assets attributable to class A, class B, class C, class M and class R shares, respectively.
For the reporting period, Putnam Retail Management Limited Partnership, acting as underwriter, received net commissions of $20,637 and $342 from the sale of class A and class M shares, respectively, and received $4,861 and $1,646 in contingent deferred sales charges from redemptions of class B and class C shares, respectively.
A deferred sales charge of up to 1.00% and 0.40% is assessed on certain redemptions of class A and class M shares, respectively. For the reporting period, Putnam Retail Management Limited Partnership, acting as underwriter, received no monies on class A and class M share redemptions.
47
Note 3: Purchases and sales of securities
During the reporting period, cost of purchases and proceeds from sales of investment securities other than short-term investments aggregated $321,040,731 and $304,676,749, respectively. There were no purchases or proceeds from sales of U.S. government securities.
Note 4: Capital shares
At the close of the reporting period, there was an unlimited number of shares of beneficial interest authorized. Transactions in capital shares were as follows:
| | | | |
| | Six months ended 5/31/10 | Year ended 11/30/09 |
|
| Class A | Shares | Amount | Shares | Amount |
|
| Shares sold | 18,107,112 | $103,164,746 | 33,589,868 | $163,260,346 |
|
| Shares issued in connection with | | | | |
| reinvestment of distributions | 2,658,311 | 15,195,928 | 5,637,628 | 26,874,648 |
|
| | 20,765,423 | 118,360,674 | 39,227,496 | 190,134,994 |
|
| Shares repurchased | (17,153,902) | (98,228,131) | (25,370,520) | (121,921,478) |
|
| Net increase | 3,611,521 | $20,132,543 | 13,856,976 | $68,213,516 |
|
| |
| | Six months ended 5/31/10 | Year ended 11/30/09 |
|
| Class B | Shares | Amount | Shares | Amount |
|
| Shares sold | 144,969 | $819,302 | 951,048 | $4,377,724 |
|
| Shares issued in connection with | | | | |
| reinvestment of distributions | 30,179 | 169,563 | 87,199 | 405,555 |
|
| | 175,148 | 988,865 | 1,038,247 | 4,783,279 |
|
| Shares repurchased | (452,602) | (2,545,616) | (899,516) | (4,196,886) |
|
| Net increase (decrease) | (277,454) | $(1,556,751) | 138,731 | $586,393 |
|
| |
| | Six months ended 5/31/10 | Year ended 11/30/09 |
|
| Class C | Shares | Amount | Shares | Amount |
|
| Shares sold | 226,613 | $1,284,451 | 2,046,447 | $9,382,853 |
|
| Shares issued in connection with | | | | |
| reinvestment of distributions | 44,714 | 250,682 | 83,794 | 403,775 |
|
| | 271,327 | 1,535,133 | 2,130,241 | 9,786,628 |
|
| Shares repurchased | (517,724) | (2,892,855) | (466,270) | (2,185,808) |
|
| Net increase (decrease) | (246,397) | $(1,357,722) | 1,663,971 | $7,600,820 |
|
| |
| | Six months ended 5/31/10 | Year ended 11/30/09 |
|
| Class M | Shares | Amount | Shares | Amount |
|
| Shares sold | 310,876 | $1,779,266 | 604,607 | $2,884,254 |
|
| Shares issued in connection with | | | | |
| reinvestment of distributions | 24,138 | 138,079 | 63,551 | 299,873 |
|
| | 335,014 | 1,917,345 | 668,158 | 3,184,127 |
|
| Shares repurchased | (2,515,336) | (14,397,503) | (6,901,058) | (33,545,886) |
|
| Net decrease | (2,180,322) | $(12,480,158) | (6,232,900) | $(30,361,759) |
|
48
| | | | |
| | Six months ended 5/31/10 | Year ended 11/30/09 |
|
| Class R | Shares | Amount | Shares | Amount |
|
| Shares sold | 918,081 | $5,261,540 | 1,390,872 | $6,841,671 |
|
| Shares issued in connection with | | | | |
| reinvestment of distributions | 40,167 | 229,969 | 47,595 | 235,463 |
|
| | 958,248 | 5,491,509 | 1,438,467 | 7,077,134 |
|
| Shares repurchased | (485,441) | (2,769,119) | (756,540) | (3,805,363) |
|
| Net increase | 472,807 | $2,722,390 | 681,927 | $3,271,771 |
|
| |
| | Six months ended 5/31/10 | Year ended 11/30/09 |
|
| Class Y | Shares | Amount | Shares | Amount |
|
| Shares sold | 2,696,036 | $15,756,001 | 11,299,565 | $55,416,381 |
|
| Shares issued in connection with | | | | |
| reinvestment of distributions | 376,398 | 2,214,396 | 742,923 | 3,618,197 |
|
| | 3,072,434 | 17,970,397 | 12,042,488 | 59,034,578 |
|
| Shares repurchased | (2,254,914) | (13,214,578) | (8,479,700) | (39,391,341) |
|
| Net increase | 817,520 | $4,755,819 | 3,562,788 | $19,643,237 |
|
Note 5: Summary of derivative activity
The following is a summary of the market values of derivative instruments as of the close of the reporting period:
Market values of derivative instruments as of May 31, 2010
| | | | |
| Asset derivatives | | Liability derivatives |
|
| Derivatives not | | | | |
| accounted for as | Statement of | | Statement of | |
| hedging instruments | assets and | | assets and | |
| under ASC 815 | liabilities location | Market value | liabilities location | Market value |
|
| Foreign exchange | | | | |
| contracts | Receivables | $583,503 | Payables | $62,564 |
|
| Total | | $583,503 | | $62,564 |
|
The following is a summary of realized and change in unrealized gains or losses of derivative instruments on the Statement of operations for the reporting period (see Note 1):
Amount of realized gain or (loss) on derivatives recognized in net gain or (loss) on investments
| | | |
| Derivatives not accounted for as hedging | Forward currency | | |
| instruments under ASC 815 | contracts | Swaps | Total |
|
| Credit contracts | $— | $101,173 | $101,173 |
|
| Foreign exchange contracts | 1,577,285 | — | 1,577,285 |
|
| Total | $1,577,285 | $101,173 | $1,678,458 |
|
Change in unrealized appreciation or (depreciation) on derivatives recognized in net gain or (loss) on investments
| | | |
| Derivatives not accounted for as hedging | Forward currency | | |
| instruments under ASC 815 | contracts | Swaps | Total |
|
| Credit contracts | $— | $8,967 | $8,967 |
|
| Foreign exchange contracts | 675,540 | — | 675,540 |
|
| Total | $675,540 | $8,967 | $684,507 |
|
49
Note 6: Investment in Putnam Money Market Liquidity Fund
The fund invested in Putnam Money Market Liquidity Fund, an open-end management investment company managed by Putnam Management. Investments in Putnam Money Market Liquidity Fund are valued at its closing net asset value each business day. Income distributions earned by the fund are recorded as interest income in the Statement of operations and totaled $17,222 for the reporting period. During the reporting period, cost of purchases and proceeds of sales of investments in Putnam Money Market Liquidity Fund aggregated $156,952,127 and $163,446,652, respectively. Management fees charged to Putnam Money Market Liquidity Fund have been waived by Putnam Management.
Note 7: Senior loan commitments
Senior loans are purchased or sold on a when-issued or delayed delivery basis and may be settled a month or more after the trade date, which from time to time can delay the actual investment of available cash balances; interest income is accrued based on the terms of the securities. Senior loans can be acquired through an agent, by assignment from another holder of the loan, or as a participation interest in another holder’s portion of the loan. When the fund invests in a loan or participation, the fund is subject to the risk that an intermediate participant between the fund and the borrower will fail to meet its obligations to the fund, in addition to the risk that the borrower under the loan may default on its obligations.
Note 8: Unfunded loan commitments
As of the close of the reporting period, the fund had unfunded loan commitments of $1,140,000, which could be extended at the option of the borrower, pursuant to the following loan agreements with the following borrowers:
| |
| Borrower | Unfunded Commitments |
|
| Smurfit-Stone Container Enterprises, Inc. | $1,140,000 |
|
Note 9: Regulatory matters and litigation
In late 2003 and 2004, Putnam Management settled charges brought by the Securities and Exchange Commission (the SEC) and the Massachusetts Securities Division in connection with excessive short-term trading in Putnam funds. Distribution of payments from Putnam Management to certain open-end Putnam funds and their shareholders is expected to be completed in the next several months. These allegations and related matters have served as the general basis for certain lawsuits, including purported class action lawsuits against Putnam Management and, in a limited number of cases, some Putnam funds. Putnam Management believes that these lawsuits will have no material adverse effect on the funds or on Putnam Management’s ability to provide investment management services. In addition, Putnam Management has agreed to bear any costs incurred by the Putnam funds as a result of these matters.
Note 10: Market and credit risk
In the normal course of business, the fund trades financial instruments and enters into financial transactions where risk of potential loss exists due to changes in the market (market risk) or failure of the contracting party to the transaction to perform (credit risk). The fund may be exposed to additional credit risk that an institution or other entity with which the fund has unsettled or open transactions will default.
50
The Putnam family of funds
The following is a list of Putnam’s open-end mutual funds offered to the public. Investors should carefully consider the investment objective, risks, charges, and expenses of a fund before investing. For a prospectus, or a summary prospectus if available, containing this and other information for any Putnam fund or product, call your financial advisor at 1-800-225-1581 and ask for a prospectus. Please read the prospectus carefully before investing.
| |
| Growth | Value |
| Growth Opportunities Fund | Convertible Income-Growth Trust |
| International Growth Fund* ** | Equity Income Fund |
| New Opportunities Fund | The George Putnam Fund of Boston |
| Small Cap Growth Fund* | The Putnam Fund for Growth and Income |
| Vista Fund | International Value Fund* †† |
| Voyager Fund | Mid Cap Value Fund |
| | Small Cap Value Fund* |
| Blend | |
| Asia Pacific Equity Fund* | Income |
| Capital Opportunities Fund* | American Government Income Fund |
| Capital Spectrum Fund‡ | Diversified Income Trust |
| Emerging Markets Equity Fund* | Floating Rate Income Fund |
| Equity Spectrum Fund‡ | Global Income Trust* |
| Europe Equity Fund* | High Yield Advantage Fund* |
| Global Equity Fund* | High Yield Trust* |
| International Capital Opportunities Fund* | Income Fund |
| International Equity Fund* | Money Market Fund† |
| Investors Fund | U.S. Government Income Trust |
| Research Fund | |
* A 1% redemption fee on total assets redeemed or exchanged within 90 days of purchase may be imposed for all share classes of these funds.
† An investment in a money market fund is not insured or guaranteed by the Federal Deposit Insurance Corporation or any other government agency. Although the fund seeks to preserve the value of your investment at $1.00 per share, it is possible to lose money by investing in the fund.
** Prior to January 1, 2010, the fund was known as Putnam International New Opportunities Fund.
†† Prior to January 1, 2010, the fund was known as Putnam International Growth and Income Fund.
51
Tax-free income
AMT-Free Municipal Fund
Tax Exempt Income Fund
Tax Exempt Money Market Fund†
Tax-Free High Yield Fund
State tax-free income funds:
Arizona, California, Massachusetts, Michigan, Minnesota, New Jersey, New York, Ohio, and Pennsylvania
Absolute Return
Absolute Return 100 Fund
Absolute Return 300 Fund
Absolute Return 500 Fund
Absolute Return 700 Fund
Global Sector*
Global Consumer Fund
Global Energy Fund
Global Financials Fund
Global Health Care Fund
Global Industrials Fund
Global Natural Resources Fund
Global Sector Fund
Global Technology Fund
Global Telecommunications Fund
Global Utilities Fund
Asset allocation
Income Strategies Fund
Putnam Asset Allocation Funds — three investment portfolios that spread your money across a variety of stocks, bonds, and money market investments.
The three portfolios:
Asset Allocation: Balanced Portfolio
Asset Allocation: Conservative Portfolio
Asset Allocation: Growth Portfolio
Putnam RetirementReady®
Putnam RetirementReady Funds — 10 investment portfolios that offer diversification among stocks, bonds, and money market instruments and adjust to become more conservative over time based on a target date for withdrawing assets.
The 10 funds:
Putnam RetirementReady 2050 Fund
Putnam RetirementReady 2045 Fund
Putnam RetirementReady 2040 Fund
Putnam RetirementReady 2035 Fund
Putnam RetirementReady 2030 Fund
Putnam RetirementReady 2025 Fund
Putnam RetirementReady 2020 Fund
Putnam RetirementReady 2015 Fund
Putnam RetirementReady 2010 Fund
Putnam RetirementReady Maturity Fund
‡ A 1% redemption fee on total assets redeemed or exchanged within 30 days of purchase may be imposed for all share classes of these funds.
With the exception of money market funds, a 1% redemption fee may be applied to shares exchanged or sold within 7 days of purchase (90 days or 30 days, for certain funds).
Check your account balances and the most recent month-end performance in the Individual Investors section at putnam.com.
52
Fund information
Founded over 70 years ago, Putnam Investments was built around the concept that a balance between risk and reward is the hallmark of a well-rounded financial program. We manage over 100 funds across income, value, blend, growth, asset allocation, absolute return, and global sector categories.
| | |
| Investment Manager | George Putnam, III | Francis J. McNamara, III |
| Putnam Investment | Robert L. Reynolds | Vice President and Chief |
| Management, LLC | W. Thomas Stephens | Legal Officer |
| One Post Office Square | Richard B. Worley | |
| Boston, MA 02109 | | Robert R. Leveille |
| | Officers | Vice President and |
| Investment Sub-Manager | Robert L. Reynolds | Chief Compliance Officer |
| Putnam Investments Limited | President | |
| 57–59 St James’s Street | | Mark C. Trenchard |
| London, England SW1A 1LD | Jonathan S. Horwitz | Vice President and |
| | Executive Vice President, | BSA Compliance Officer |
| Marketing Services | Principal Executive | |
| Putnam Retail Management | Officer, Treasurer and | Judith Cohen |
| One Post Office Square | Compliance Liaison | Vice President, Clerk and |
| Boston, MA 02109 | | Assistant Treasurer |
| Steven D. Krichmar | |
| Custodian | Vice President and | Wanda M. McManus |
| State Street Bank | Principal Financial Officer | Vice President, Senior Associate |
| and Trust Company | | Treasurer and Assistant Clerk |
| Janet C. Smith | |
| Legal Counsel | Vice President, Principal | Nancy E. Florek |
| Ropes & Gray LLP | Accounting Officer and | Vice President, Assistant |
| | Assistant Treasurer | Clerk, Assistant Treasurer |
| Trustees | | and Proxy Manager |
| John A. Hill, Chairman | Susan G. Malloy | |
| Jameson A. Baxter, | Vice President and | |
| Vice Chairman | Assistant Treasurer | |
| Ravi Akhoury | | |
| Barbara M. Baumann | Beth S. Mazor | |
| Charles B. Curtis | Vice President | |
| Robert J. Darretta | | |
| Myra R. Drucker | James P. Pappas | |
| Paul L. Joskow | Vice President | |
| Kenneth R. Leibler | | |
| Robert E. Patterson | | |
| | |
| | |
| | |
| | |
| | |
This report is for the information of shareholders of Putnam High Yield Advantage Fund. It may also be used as sales literature when preceded or accompanied by the current prospectus, the most recent copy of Putnam’s Quarterly Performance Summary, and Putnam’s Quarterly Ranking Summary. For more recent performance, please visit putnam.com. Investors should carefully consider the investment objective, risks, charges, and expenses of a fund, which are described in its prospectus. For this and other information or to request a prospectus, or a summary prospectus if available, call 1-800-225-1581 toll free. Please read the prospectus carefully before investing. The fund’s Statement of Additional Information contains additional information about the fund’s Trustees and is available without charge upon request by calling 1-800-225-1581.
Item 2. Code of Ethics:
Not applicable
Item 3. Audit Committee Financial Expert:
Not applicable
Item 4. Principal Accountant Fees and Services:
Not applicable
Item 5. Audit Committee of Listed Registrants
Not applicable
Item 6. Schedule of Investments:
The registrant’s schedule of investments in unaffiliated issuers is included in the report to shareholders in Item 1 above.
Item 7. Disclosure of Proxy Voting Policies and Procedures For Closed-End Management Investment Companies:
Not applicable
Item 8. Portfolio Managers of Closed-End Investment Companies
Not Applicable
Item 9. Purchases of Equity Securities by Closed-End Management Investment Companies and Affiliated Purchasers:
Not applicable
Item 10. Submission of Matters to a Vote of Security Holders:
Not applicable
Item 11. Controls and Procedures:
(a) The registrant's principal executive officer and principal financial officer have concluded, based on their evaluation of the effectiveness of the design and operation of the registrant's disclosure controls and procedures as of a date within 90 days of the filing date of this report, that the design and operation of such procedures are generally effective to provide reasonable assurance that information required to be disclosed by the registrant in this report is recorded, processed, summarized and reported within the time periods specified in the Commission's rules and forms.
(b) Changes in internal control over financial reporting: Not applicable
Item 12. Exhibits:
(a)(1) Not applicable
(a)(2) Separate certifications for the principal executive officer and principal financial officer of the registrant as required by Rule 30a-2(a) under the Investment Company Act of 1940, as amended, are filed herewith.
(b) The certifications required by Rule 30a-2(b) under the Investment Company Act of 1940, as amended, are filed herewith.
Putnam High Yield Advantage Fund
By (Signature and Title):
/s/Janet C. Smith
Janet C. Smith
Principal Accounting Officer
Date: July 29, 2010
Pursuant to the requirements of the Securities Exchange Act of 1934 and the Investment Company Act of 1940, this report has been signed below by the following persons on behalf of the registrant and in the capacities and on the dates indicated.
By (Signature and Title):
/s/Jonathan S. Horwitz
Jonathan S. Horwitz
Principal Executive Officer
Date: July 29, 2010
By (Signature and Title):
/s/Steven D. Krichmar
Steven D. Krichmar
Principal Financial Officer
Date: July 29, 2010