UNITED STATES
SECURITIES AND EXCHANGE COMMISSION
Washington, D.C. 20549
FORM N-CSR
CERTIFIED SHAREHOLDER REPORT OF REGISTERED
MANAGEMENT INVESTMENT COMPANIES
Investment Company Act file number: (811- 04616 )
Exact name of registrant as specified in charter: Putnam High Yield Advantage Fund
Address of principal executive offices: One Post Office Square, Boston, Massachusetts 02109
| | |
| Name and address of agent for service: | Beth S. Mazor, Vice President |
| | One Post Office Square |
| | Boston, Massachusetts 02109 |
| |
| Copy to: | John W. Gerstmayr, Esq. |
| | Ropes & Gray LLP |
| | One International Place |
| | Boston, Massachusetts 02110 |
| |
| Registrant’s telephone number, including area code: | (617) 292-1000 |
Date of fiscal year end: November 30, 2007
Date of reporting period: December 1, 2006— May 31, 2007
Item 1. Report to Stockholders:
The following is a copy of the report transmitted to stockholders pursuant to Rule 30e-1 under the Investment Company Act of 1940:

What makes Putnam different?

In 1830, Massachusetts Supreme Judicial Court Justice Samuel Putnam established The Prudent Man Rule, a legal foundation for responsible money management.
THE PRUDENT MAN RULE
All that can be required of a trustee to invest is that he shall conduct himself faithfully and exercise a sound discretion. He is to observe how men of prudence, discretion, and intelligence manage their own affairs, not in regard to speculation, but in regard to the permanent disposition of their funds, considering the probable income, as well as the probable safety of the capital to be invested.

A time-honored tradition
in money management
Since 1937, our values have been rooted in a profound sense of responsibility for the money entrusted to us.
A prudent approach to investing
We use a research-driven team approach to seek consistent, dependable, superior investment results over time, although there is no guarantee a fund will meet its objectives.
Funds for every investment goal
We offer a broad range of mutual funds and other financial products so investors and their financial representatives can build diversified portfolios.
A commitment to doing
what’s right for investors
We have below-average expenses and stringent investor protections, and provide a wealth of information about the Putnam funds.
Industry-leading service
We help investors, along with their financial representatives, make informed investment decisions with confidence.
Putnam
High Yield
Advantage Fund
5| 31| 07
Semiannual Report
| |
| Message from the Trustees | 2 |
| About the fund | 4 |
| Performance snapshot | 6 |
| Report from the fund managers | 7 |
| Performance in depth | 13 |
| Expenses | 16 |
| Portfolio turnover | 18 |
| Risk | 19 |
| Your fund’s management | 20 |
| Terms and definitions | 23 |
| Trustee approval of management contract | 25 |
| Other information for shareholders | 31 |
| Financial statements | 32 |
| Shareholder meeting results | 68 |
Cover photograph: © Richard H. Johnson
Message from the Trustees
Dear Fellow Shareholder
Reflecting investor uncertainty about the outlook for the U.S. economy, volatility in the financial markets has been on the rise. After a downturn in March, the Dow Jones Industrial Average recently reached new record-high levels. The upward climb in the stock market has been largely unaffected by higher-trending interest rates since mid-May, though it remains to be seen whether current stock market levels are sustainable. From our perspective, we are encouraged by recent indications of moderate inflation, a low unemployment rate, and a rebound in manufacturing. We consequently believe the U.S. economy will weather this period of uncertainty.
As we communicated in proxy materials recently mailed to all Putnam fund shareholders, on February 1, 2007, Marsh & McLennan Companies, Inc. announced that it had signed a definitive agreement to sell its ownership interest in Putnam Investments Trust, the parent company of Putnam Management and its affiliates, to Great-West Lifeco Inc. Great-West Lifeco is a financial services holding company with operations in Canada, the United States, and Europe and is a member of the Power Financial Corporation group of companies. We are pleased to announce that in mid-May, shareholders voted overwhelmingly in favor of the proposed transaction. While it is still subject to regulatory approvals and other conditions, we currently expect the transaction to be completed this summer.
We would also like to take this opportunity to announce that Putnam President and Chief Executive Officer Ed Haldeman, one of your fund’s Trustees since 2004, has been named President of the Funds, assuming this role from George Putnam, III. This change will enable George Putnam
2
to become an independent Trustee of the funds upon completion of the transaction with Great-West Lifeco. Both George and Ed will continue serving on the Board of Trustees in our collective role of overseeing the Putnam funds on your behalf.
In the following pages, members of your fund’s management team discuss the fund’s performance and strategies for the fiscal period ended May 31, 2007, and provide their outlook for the months ahead. As always, we thank you for your support of the Putnam funds.

Putnam High Yield Advantage Fund:
seeking high current income and capital growth
Unlike most types of fixed-income investments, high-yield bond performance is more dependent on the performance of the companies that issue the bonds than on interest rates. For this reason, distinguishing between opportunities and potential pitfalls requires a rigorous investment process. With Putnam High Yield Advantage Fund, this process is highlighted by intensive research, investment diversification, and carefully timed portfolio adjustments.
Because of the risks of high-yield bond investing, in-depth credit research is essential. The fund’s research team — more than 20 professionals, including analysts who specialize by industry — visits with the management of issuing companies and analyzes each company’s prospects. The team then compares this information to the bond’s potential upside or downside before deciding whether it is an appropriate investment for the fund.
The fund’s portfolio typically consists of bonds from a broad range of industries and companies. Holdings are diversified across industry sectors and among bonds with differing credit ratings. While the fund invests primarily in the bonds of U.S. companies, its diversified approach allows it to include foreign bonds as well. Among these securities, investments in emerging-market bonds may be used to enhance the fund’s appreciation potential. Although diversification does not ensure a profit or protect against a loss and it is possible to lose money in a diversified portfolio, the fund’s diversification can help reduce the volatility that typically comes with higher-risk investments.
As the bond markets shift over time, the fund’s management looks for ways to capitalize on developments that affect fixed-income securities in general and high-yield bonds in particular. For example, when credit spreads are wide and expected to tighten, the fund may pursue the higher income potential offered by lower-quality issues. On the other hand, when credit spreads are narrow — that is, when the difference in yield between higher- and lower-rated bonds of comparable maturities is small — the fund may shift its emphasis to higher-quality high-yield bonds.
Lower-rated bonds may offer higher yields in return for more risk. Mutual funds that invest in bonds are subject to certain risks, including interest-rate risk, credit risk, and inflation risk. As interest rates rise, the prices of bonds fall. Long-term bonds are more exposed to interest-rate risk than short-term bonds. Unlike bonds, bond funds have ongoing fees and expenses.
What makes a bond
“high yield”?
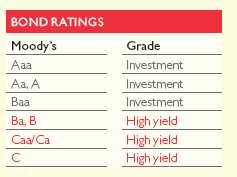
High-yield bonds are fixed-income investments typically issued by companies that lack an established earnings track record or a solid credit history. In general, high-yield bonds offer higher interest rates than investment-grade bonds to compensate for their increased risk. Because of this added risk, these bonds are typically rated below investment grade by an independent rating agency (for example, the lowest Moody’s Investors Service rating of investment-grade bonds is Baa). The lower the rating, the greater the possibility that a bond’s issuer will be unable to make interest payments or repay the principal.
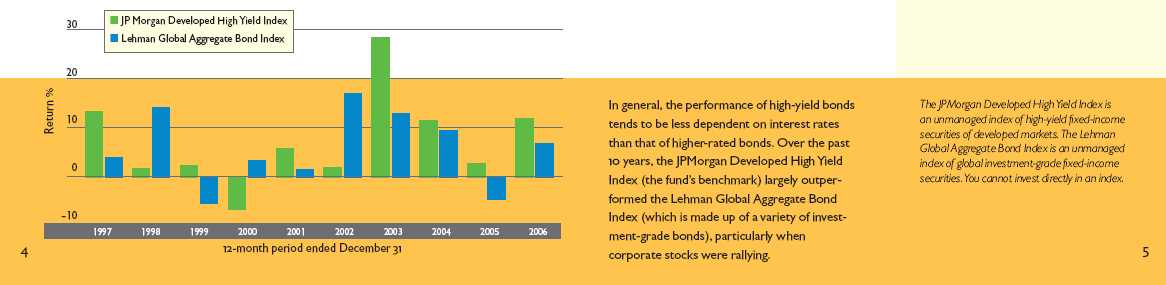
High-yield bonds have historically offered greater
return potential than investment-grade bonds.
Performance snapshot
Putnam High Yield
Advantage Fund
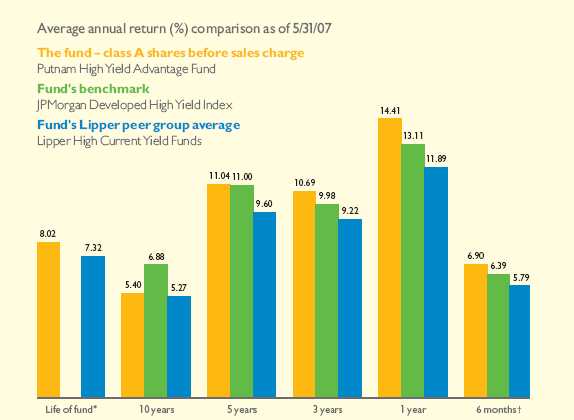
Current performance may be lower or higher than the quoted past performance, which cannot guarantee future results. Share price, principal value, and return will fluctuate, and you may have a gain or a loss when you sell your shares. Performance of class A shares assumes reinvestment of distributions and does not account for taxes. Fund returns in bar chart do not reflect a sales charge. See pages 13 and 14 for additional performance information. For a portion of the periods, this fund may have limited expenses, without which returns would have been lower. A 1% short-term trading fee may apply. To obtain the most recent month-end performance, visit www.putnam.com.
* The inception date of the fund’s benchmark, the JPMorgan Developed High Yield Index, was 12/31/94, which post-dates the 3/25/86 inception date of the fund’s class A shares.
† Returns for the six-month period are not annualized, but cumulative.
6
Report from the fund managers
The period in review
We are pleased to report that for the first six months of your fund’s 2007 fiscal year — which ended May 31, 2007, your fund delivered solid returns, outpacing both its benchmark index and the average for its Lipper group, based on results before sales charges. This outperformance came during a period of continued robust performance by the high-yield market, which was, in turn, driven by the improving financial health of many high-yield issuers. We believe effective security selection was the key driver of performance for the period, as we successfully identified companies whose securities gained value due to merger and acquisition (M&A) activity or because they had reduced debt levels. It is possible that performance might have been stronger if we had not sought to manage the fund’s risk exposure by limiting the allocation to defaulted and distressed bonds, which were among the top performers for the period. At the sector level, your fund benefited from over weight positions, relative to the benchmark, in the energy and consumer products groups, and from underweighting the volatile and somewhat stressed paper and forest products industry. Conversely, the fund’s underweight position in bonds from the transportation and the services sector detracted from performance, although the bonds we did hold from those sectors made a positive contribution.
Market overview
During the semiannual period, high-yield spreads — the yield advantage offered by high-yield bonds over comparable Treasuries — tightened to record levels, reflecting the strong performance of high-yield bonds. Prices of these bonds had appreciated in response to healthy corporate business fundamentals and earnings growth, in combination with very low default rates. There was some volatility at the end of February, due to concerns in the market about the faltering subprime loan market and what effect its problems might have on
7
the broader markets. However, it wasn’t long before the market resumed its upward trend.
Interest rates had remained relatively stable since the Federal Reserve (the Fed) ended its extended program of incrementally raising short-term rates, but the interest-rate landscape began to shift in the last month of the period. With more investors believing that U.S. economic growth was likely to be stronger in the future than in the present, new concerns that inflation might be on the rise arose and drove yields on longer-term bonds up. Since bond prices move in the opposite direction of their yields, rising yields meant declining prices for many longer-term bonds, and as the period ended, we started to see signs of a sell-off in the bond market.
Strategy overview
Your fund maintains a broadly diversi-fied portfolio, seeking to invest in bonds from many different industries and sectors. We believe that this is the best way to pursue consistent returns and manage risk effectively.
During the semiannual period, we emphasized bonds from the middle credit tiers of the high-yield market, which generally meant B-rated securities. Despite their recent strength, we believe the risk/reward profile of lower-rated bonds has become much less attractive, so we trimmed the fund’s exposure to them in order to reduce the
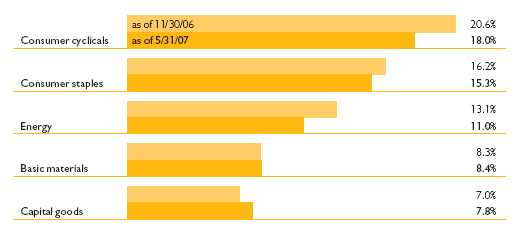
Market sector and fund performance
This comparison shows your fund’s performance in the context of different market sectors for the six months ended 5/31/07. See pages 6 and 13 for additional fund performance information. Index definitions can be found on page 24.
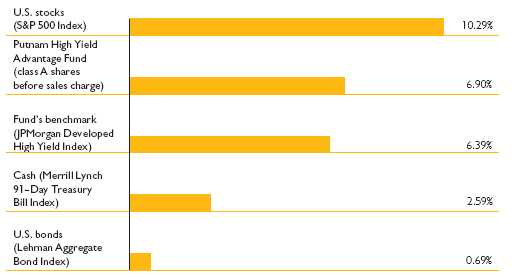
8
portfolio’s credit risk. (Credit risk is the risk that a bond issuer could default and fail to pay interest and repay principal in a timely manner.) While we expect this strategy to prove rewarding over the long term, it held back performance for the period somewhat, as the lowest-rated credits continued to strengthen.
With valuations extended in the high-yield market, we also upgraded credit quality within each credit tier, seeking to mitigate the risk that defaults might rise from their current historically low level. We also added to the fund’s investments in bank loans. These floating-rate loans are issued by banks to high-yield companies, and then traded on the open market. The current environment appears well suited for these investments, because the interest rates they offer rise in concert with any increase in benchmark rates. They also are senior to high-yield bonds, meaning that holders of a company’s bank loans would be paid before investors who hold the firm’s high-yield bonds, should the company default on its debt obligations.
Your fund’s holdings
As noted earlier, your fund’s outperformance of its benchmark was buoyed by the price appreciation of bonds whose issuers were involved in mergers, acquisitions, or refinancing activity. These contributors included Texas-based Triad Hospitals, which was acquired by Community Health Systems; XCL, a Louisiana-based oil and natural gas
Comparison of top sector weightings
This chart shows how the fund’s top weightings have changed over the last six months. Weightings are shown as a percentage of net assets. Holdings will vary over time.
9
exploration and production (E&P) company whose bond prices rose markedly in response to bids for the company; and aircraft company DeCrane Aerospace, a privately held company that refinanced its debt. PRIMEDIA, a leading publisher of targeted media, also advanced as the company sold off assets to reduce debt and thereby improve its financial profile. (The XCL bonds were exchanged for a combination of cash and securities and the DeCrane bonds were called before the end of the period.)
Along with XCL, other top performers came from our overweighting in the energy sector. There, business fundamentals stayed strong, as high global demand outstripped constricted supply. Bonds issued by natural gas companies Williams and El Paso gained value as natural gas prices rose. In addition, Williams, formerly involved in electricity and power generation, arranged during the period to sell this portion of its business to Bear Stearns’ energy-trading subsidiary in order to refocus on its core business of producing, processing, and transporting natural gas, while El Paso, one of North America’s largest independent natural gas producers, sold a pipeline subsidiary in order to reduce its debt.
Other sector allocations that proved fruitful during the period were an overweight position in consumer products and an underweighting of the volatile and somewhat stressed paper and forest
Top holdings
This table shows the fund’s top holdings, and the percentage of the fund’s net assets that each represented, as of 5/31/07. The fund’s holdings will change over time.
| | |
| Holding (percent of fund's net assets) | Coupon (%) and maturity date | Industry |
|
| CCH I, LLC/Capital Corp. sec. notes (1.2%) | 11%, 2015 | Cable television |
|
| General Motors Corp. notes (0.9%) | 7.2%, 2011 | Automotive |
|
| General Motors Acceptance Corp. notes (0.8%) | 6.875%, 2012 | Financial |
|
| Ford Motor Credit Corp. sr. notes (0.8%) | 9.875%, 2011 | Automotive |
|
| General Motors Acceptance Corp. notes (0.7%) | 7.75%, 2010 | Financial |
|
| General Motors Acceptance Corp. notes (0.7%) | 6.75%, 2014 | Financial |
|
| NRG Energy, Inc. sr. notes (0.7%) | 7.375%, 2016 | Power producers |
|
| Neon Capital, Ltd. 144A (Cayman Islands) (0.7%) | 1.686%, 2013 | Broadcasting |
|
| Idearc Inc. 144A sr. notes (0.7%) | 8%, 2016 | Media |
|
| Wimar Opco, LLC. 144A sr. sub. notes (0.6%) | 9.625%, 2014 | Gaming and lottery |
|
10
products group. Lastly, despite some price volatility toward the end of the period, the fund’s overweight position in broadband communications company Charter Communications boosted overall returns. Investors were attracted to the bonds’ competitive yields —commensurate with their relatively low credit quality — at the same time that the company’s financial performance improved.
Although the market was trending downward as the period ended, performance of high-yield bonds remained so strong overall that very few holdings had a negative effect on fund performance. In considering what might have enabled the fund to deliver stronger results, it is more appropriate to look at areas where we did not take full advantage of attractive opportunities. As noted earlier, this applies primarily to the fund’s underweight position in defaulted and distressed securities, relative to the benchmark. During the period, investors’ hunger for additional yield and a benign backdrop that increased their tolerance for risk led to continued demand for these bonds. With yield spreads at historically tight levels, however, we were not comfortable matching the index’s allocation to this area of the market. Among the positive-performing distressed or defaulted index components we underweighted or didn’t include in the portfolio were cable TV company Adelphia; bonds issued by electric utility Calpine; Suncom, which provides telecommunications services in the southeastern United States; and three representatives from the automotive industry — Delco Remy, Dura Automotive, and Federal-Mogul. Fund performance also was curtailed by our underweighting of the transportation and services industries, although holdings we did have in that area delivered respectable returns.
Please note that the holdings discussed in this report may not have been held by the fund for the entire period. Portfolio composition is subject to review in accordance with the fund’s investment strategy and may vary in the future.
11
The outlook for your fund
The following commentary reflects anticipated developments that could affect your fund over the next six months, as well as your management team’s plans for responding to them.
High-yield issuers continue to demonstrate strong financial performance and capital markets have been providing them with ample liquidity. Defaults remain at record lows. However, the longer this supportive environment persists, the more aggressive we believe capital structures are likely to become. Already, high-profile, highly leveraged buyouts are appearing more frequently.
We are beginning the second half of the fiscal year with the portfolio in a modestly defensive posture, having selectively reduced the fund’s exposure to the lowest credit tiers while bolstering its position in the middle-tier credits (those rated single B), which is already larger than that of the benchmark. We are also working to upgrade the credit quality of fund holdings within each credit tier. The fund’s increased allocation to the bank-loan market is intended to provide added protection in case of default, as well as the benefit of higher yields should interest rates continue to rise. While we note that corporate fundamentals remain strong, we can’t ignore the fact that current valuations appear unusually high while yield spreads have narrowed to record levels. As a result, we feel that the cost of assuming an incrementally defensive profile with the portfolio does not seem high. We believe that at this point in the market cycle, selectivity an d investment discipline are more likely to deliver consistent, long-term results than any change in the fund’s allocation to lower-credit, higher-risk investments.
The views expressed in this report are exclusively those of Putnam Management. They are not meant as investment advice.
Lower-rated bonds may offer higher yields in return for more risk. Mutual funds that invest in bonds are subject to certain risks, including interest-rate risk, credit risk, and inflation risk. As interest rates rise, the prices of bonds fall. Long-term bonds are more exposed to interest-rate risk than short-term bonds. Unlike bonds, bond funds have ongoing fees and expenses.
12
Your fund’s performance
This section shows your fund’s performance for periods ended May 31, 2007, the end of the first half of its current fiscal year. In accordance with regulatory requirements for mutual funds, we also include performance as of the most recent calendar quarter-end and expense information taken from the fund’s current prospectus. Performance should always be considered in light of a fund’s investment strategy. Data represents past performance. Past performance does not guarantee future results. More recent returns may be less or more than those shown. Investment return and principal value will fluctuate, and you may have a gain or a loss when you sell your shares. For the most recent month-end performance, please visit www.putnam.com or call Putnam at 1-800-225-1581. Class Y shares are generally only available to corporate and institutional clients and clients in other approved programs. See the Terms and Definitions section in this report for definitions of the share classes offered by your fund.
Fund performance
Total return for periods ended 5/31/07
| | | | | | | | | | |
| | Class A | | Class B | | Class C | | Class M | | Class R | Class Y |
| (inception dates) | (3/25/86) | | (5/16/94) | | (3/30/07) | | (12/1/94) | | (3/30/07) | (12/31/98) |
| | NAV | POP | NAV | CDSC | NAV | CDSC | NAV | POP | NAV | NAV |
|
| Annual average | | | | | | | | | | |
| (life of fund) | 8.02% | 7.82% | 7.09% | 7.09% | 7.20% | 7.20% | 7.71% | 7.54% | 7.75% | 8.18% |
|
| 10 years | 69.16 | 62.77 | 56.28 | 56.28 | 56.76 | 56.76 | 65.77 | 60.45 | 64.94 | 74.54 |
| Annual average | 5.40 | 4.99 | 4.57 | 4.57 | 4.60 | 4.60 | 5.18 | 4.84 | 5.13 | 5.73 |
|
| 5 years | 68.83 | 62.49 | 62.33 | 60.33 | 62.33 | 62.33 | 66.69 | 61.27 | 66.61 | 71.32 |
| Annual average | 11.04 | 10.20 | 10.17 | 9.90 | 10.17 | 10.17 | 10.76 | 10.03 | 10.75 | 11.37 |
|
| 3 years | 35.62 | 30.47 | 32.56 | 29.56 | 32.39 | 32.39 | 34.53 | 30.08 | 34.61 | 36.72 |
| Annual average | 10.69 | 9.27 | 9.85 | 9.02 | 9.80 | 9.80 | 10.39 | 9.16 | 10.41 | 10.99 |
|
| 1 year | 14.41 | 10.20 | 13.54 | 8.54 | 13.48 | 12.48 | 13.99 | 10.32 | 14.18 | 14.67 |
|
| 6 months | 6.90 | 2.93 | 6.42 | 1.42 | 6.37 | 5.37 | 6.62 | 3.15 | 6.87 | 7.02 |
|
Current performance may be lower or higher than the quoted past performance, which cannot guarantee future results. After sales charge returns (public offering price, or POP) for class A and M shares reflect a maximum 3.75% and 3.25% load, respectively. Class B share returns reflect the applicable contingent deferred sales charge (CDSC), which is 5% in the first year, declining to 1% in the sixth year, and is eliminated thereafter. Class C shares reflect a 1% CDSC for the first year and is eliminated thereafter. Class R and Y shares have no initial sales charge or CDSC. Performance for class B, C, M, R, and Y shares before their inception is derived from the historical performance of class A shares, adjusted for the applicable sales charge (or CDSC) and, except for class Y shares, the higher operating expenses for such shares.
For a portion of the periods, this fund may have limited expenses, without which returns would have been lower.
A 1% short-term trading fee may be applied to shares exchanged or sold within 90 days of purchase.
13
Comparative index returns
For periods ended 5/31/07
| | |
| | JPMorgan | Lipper High |
| | Developed High | Current Yield Funds |
| | Yield Index | category average* |
| Annual average | | |
| (life of fund) | —† | 7.32% |
|
| 10 years | 94.57% | 69.28 |
| Annual average | 6.88 | 5.27 |
|
| 5 years | 68.54 | 58.61 |
| Annual average | 11.00 | 9.60 |
|
| 3 years | 33.02 | 30.36 |
| Annual average | 9.98 | 9.22 |
|
| 1 year | 13.11 | 11.89 |
|
| 6 months | 6.39 | 5.79 |
|
Index and Lipper results should be compared to fund performance at net asset value.
* Over the 6-month, 1-year, 3-year, 5-year, 10-year, and life-of-fund periods ended 5/31/07, there were 459, 445, 379, 310, 132, and 28 funds, respectively, in this Lipper category.
† This index began operations on 12/31/94.
Fund performance as of most recent calendar quarter
Total return for periods ended 6/30/07
| | | | | | | | | | |
| | Class A | | Class B | | Class C | | Class M | | Class R | Class Y |
| (inception dates) | (3/25/86) | | (5/16/94) | | (3/30/07) | | (12/1/94) | | (3/30/07) | (12/31/98) |
| | NAV | POP | NAV | CDSC | NAV | CDSC | NAV | POP | NAV | NAV |
|
| Annual average | | | | | | | | | | |
| (life of fund) | 7.90% | 7.70% | 6.97% | 6.97% | 7.08% | 7.08% | 7.60% | 7.43% | 7.63% | 8.06% |
|
| 10 years | 63.75 | 57.61 | 51.23 | 51.23 | 51.71 | 51.71 | 60.30 | 55.06 | 59.68 | 69.04 |
| Annual average | 5.06 | 4.65 | 4.22 | 4.22 | 4.26 | 4.26 | 4.83 | 4.48 | 4.79 | 5.39 |
|
| 5 years | 74.79 | 68.13 | 67.79 | 65.79 | 68.33 | 68.33 | 72.55 | 66.90 | 72.65 | 77.32 |
| Annual average | 11.82 | 10.95 | 10.91 | 10.64 | 10.98 | 10.98 | 11.53 | 10.79 | 11.54 | 12.14 |
|
| 3 years | 31.62 | 26.65 | 28.61 | 25.61 | 28.62 | 28.62 | 30.57 | 26.28 | 30.63 | 32.77 |
| Annual average | 9.59 | 8.19 | 8.75 | 7.90 | 8.75 | 8.75 | 9.30 | 8.09 | 9.32 | 9.91 |
|
| 1 year | 11.87 | 7.75 | 10.99 | 5.99 | 10.88 | 9.88 | 11.46 | 7.88 | 11.62 | 12.18 |
|
| 6 months | 3.93 | 0.07 | 3.59 | -1.41 | 3.51 | 2.51 | 3.66 | 0.28 | 3.88 | 4.11 |
|
14
Fund price and distribution information
For the six-month period ended 5/31/07
| | | | | | | | |
| | | | | | |
| Distributions* | Class A | Class B | Class C | Class M | Class R | Class Y |
|
| Number | 6 | 6 | 2 | 6 | 2 | 6 |
|
| Income | $0.241 | $0.217 | $0.064 | $0.235 | $0.066 | $0.247 |
|
| Capital gains | — | — | — | — | — | — |
|
| Total | $0.241 | $0.217 | $0.064 | $0.235 | $0.066 | $0.247 |
|
| Share value: | NAV | POP | NAV | NAV | NAV | POP | NAV | NAV |
|
| 11/30/06 | $6.22 | $6.46 | $6.14 | — | $6.23 | $6.44 | — | $6.35 |
|
| 3/30/07† | — | — | — | $6.27 | — | — | $6.35 | — |
|
| 5/31/07 | 6.40 | 6.65 | 6.31 | 6.31 | 6.40 | 6.61 | 6.40 | 6.54 |
|
| Current yield | | | | | | |
| (end of period) | | | | | | |
| Current | | | | | | |
| dividend rate1 | 6.38% | 6.14% | 5.71% | 5.71% | 6.19% | 5.99% | 6.19% | 6.42% |
|
| Current 30-day | | | | | | |
| SEC yield2,3 | | | | | | |
| (with expense | | | | | | |
| limitation) | 6.45 | 6.20 | 5.69 | 5.74 | 6.14 | 6.00 | 6.34 | 6.64 |
|
| Current 30-day | | | | | | |
| SEC yield3 | | | | | | |
| (without | | | | | | |
| expense | | | | | | |
| limitation) | 6.44 | 6.19 | 5.68 | 5.73 | 6.13 | 5.99 | 6.33 | 6.63 |
|
* Dividend sources are estimated and may vary based on final tax calculations after the fund's fiscal year-end.
† Inception date of class C and R shares.
1 Most recent distribution, excluding capital gains, annualized and divided by NAV or POP at end of period.
2 For a portion of the period, this fund may have limited expenses, without which yields would have been lower.
3 Based only on investment income, calculated using SEC guidelines.
Fund’s annual operating expenses
For the fiscal year ended 11/30/06
| | | | | | |
| | Class A | Class B | Class C | Class M | Class R | Class Y |
|
| Total annual fund | | | | | | |
| operating expenses | 1.05% | 1.80% | 1.80% | 1.30% | 1.30% | 0.80% |
|
Expense information in this table is taken from the most recent prospectus, is subject to change, and may differ from that shown in the next section and in the financial highlights of this report. Expenses are shown as a percentage of average net assets.
15
Your fund’s expenses
As a mutual fund investor, you pay ongoing expenses, such as management fees, distribution fees (12b-1 fees), and other expenses. In the most recent six-month period, your fund limited these expenses; had it not done so, expenses would have been higher. Using the information below, you can estimate how these expenses affect your investment and compare them with the expenses of other funds. You may also pay onetime transaction expenses, including sales charges (loads) and redemption fees, which are not shown in this section and would have resulted in higher total expenses. For more information, see your fund’s prospectus or talk to your financial advisor.
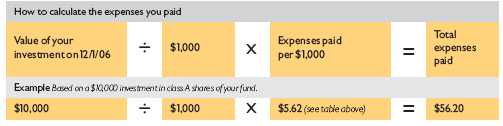
Review your fund’s expenses
The table below shows the expenses you would have paid on a $1,000 investment in Putnam High Yield Advantage Fund from December 1, 2006, to May 31, 2007. It also shows how much a $1,000 investment would be worth at the close of the period, assuming actual returns and expenses.
| | | | | | | | | | | | |
| | | | | | |
| | | Class A | | Class B | | Class C | | Class M | | Class R | | Class Y |
|
| Expenses paid per $1,000* | $ 5.62 | $ 9.47 | $ 3.28 | $ 6.90 | $ 2.39 | $ 4.34 |
|
| Ending value (after expenses) | $1,069.00 | $1,064.20 | $1,016.70 | $1,066.20 | $1,018.30 | $1,070.20 |
|
* Expenses for each share class are calculated using the fund’s annualized expense ratio for each class, which represents the ongoing expenses as a percentage of average net assets for the six months ended 5/31/07. The expense ratio may differ for each share class (see the last table in this section). Expenses are calculated by multiplying the expense ratio by the average account value for the period; then multiplying the result by the number of days in the period; and then dividing that result by the number of days in the year.
Estimate the expenses you paid
To estimate the ongoing expenses you paid for the six months ended May 31, 2007, use the calculation method below. To find the value of your investment on December 1, 2006, go to www.putnam.com and log on to your account. Click on the “Transaction History” tab in your Daily Statement and enter 12/01/2006 in both the “from” and “to” fields. Alternatively, call Putnam at 1-800-225-1581.
16
Compare expenses using the SEC’s method
The Securities and Exchange Commission (SEC) has established guidelines to help investors assess fund expenses. Per these guidelines, the table below shows your fund’s expenses based on a $1,000 investment, assuming a hypothetical 5% annualized return. You can use this information to compare the ongoing expenses (but not transaction expenses or total costs) of investing in the fund with those of other funds. All mutual fund shareholder reports will provide this information to help you make this comparison. Please note that you cannot use this information to estimate your actual ending account balance and expenses paid during the period.
| | | | | | |
| | Class A | Class B | Class C | Class M | Class R | Class Y |
|
| Expenses paid per $1,000* | $ 5.49 | $ 9.25 | $ 3.18 | $ 6.74 | $ 2.32 | $ 4.23 |
|
| Ending value (after expenses) | $1,019.50 | $1,015.76 | $1,005.45 | $1,018.25 | $1,006.32 | $1,020.74 |
|
* Expenses for each share class are calculated using the fund’s annualized expense ratio for each class, which represents the ongoing expenses as a percentage of average net assets for the six months ended 5/31/07. The expense ratio may differ for each share class (see the last table in this section). Expenses are calculated by multiplying the expense ratio by the average account value for the period; then multiplying the result by the number of days in the period; and then dividing that result by the number of days in the year.
Compare expenses using industry averages
You can also compare your fund’s expenses with the average of its peer group, as defined by Lipper, an independent fund-rating agency that ranks funds relative to others that Lipper considers to have similar investment styles or objectives. The expense ratio for each share class shown below indicates how much of your fund’s average net assets have been used to pay ongoing expenses during the period.
| | | | | | |
| | Class A | Class B | Class C | Class M | Class R | Class Y |
|
| Your fund’s annualized | | | | | | |
| expense ratio | 1.09% | 1.84% | 1.84% | 1.34% | 1.34% | 0.84% |
|
| Average annualized expense | | | | | | |
| ratio for Lipper peer group* | 1.12% | 1.87% | 1.87% | 1.37% | 1.37% | 0.87% |
|
* Putnam is committed to keeping fund expenses below the Lipper peer group average expense ratio and will limit our fund expenses if they exceed the Lipper average. The Lipper average is a simple average of front-end load funds in the peer group that excludes 12b-1 fees as well as any expense offset and brokerage service arrangements that may reduce fund expenses. To facilitate the comparison in this presentation, Putnam has adjusted the Lipper average to reflect the 12b-1 fees carried by each class of shares other than class Y shares, which do not incur 12b-1 fees. Investors should note that the other funds in the peer group may be significantly smaller or larger than the fund, and that an asset-weighted average would likely be lower than the simple average. Also, the fund and Lipper report expense data at different times and for different periods. The fund’s expense ratio shown here is annualized data for the most recent six-month period, while the quarterly updated Lipper average is based on the most recent fiscal year-end data available for the peer group funds as of 3/31/07.
17
Your fund’s
portfolio turnover
Putnam funds are actively managed by teams of experts who buy and sell securities based on intensive analysis of companies, industries, economies, and markets. Portfolio turnover is a measure of how often a fund’s managers buy and sell securities for your fund. A portfolio turnover of 100%, for example, means that the managers sold and replaced securities valued at 100% of a fund’s assets within a one-year period. Funds with high turnover may be more likely to generate capital gains and dividends that must be distributed to shareholders as taxable income. High turnover may also cause a fund to pay more brokerage commissions and other transaction costs, which may detract from performance.
Funds that invest in bonds or other fixed-income instruments may have higher turnover than funds that invest only in stocks. Short-term bond funds tend to have higher turnover than longer-term bond funds, because shorter-term bonds will mature or be sold more frequently than longer-term bonds. You can use the table below to compare your fund’s turnover with the average turnover for funds in its Lipper category.
Turnover comparisons
Percentage of holdings that change every year
| | | | | |
| | 2006 | 2005 | 2004 | 2003 | 2002 |
|
| Putnam High Yield | | | | | |
| Advantage Fund | 46% | 33% | 53% | 79% | 60% |
|
| Lipper High Current Yield | | | | | |
| Funds category average | 83% | 73% | 95% | 98% | 99% |
|
Turnover data for the fund is calculated based on the fund's fiscal-year period, which ends on November 30. Turnover data for the fund’s Lipper category is calculated based on the average of the turnover of each fund in the category for its fiscal year ended during the indicated year. Fiscal years vary across funds in the Lipper category, which may limit the comparability of the fund's portfolio turnover rate to the Lipper average. Comparative data for 2006 is based on information available as of 12/31/06.
18
Your fund’s risk
This risk comparison is designed to help you understand how your fund compares with other funds. The comparison utilizes a risk measure developed by Morningstar, an independent fund-rating agency. This risk measure is referred to as the fund’s Morningstar Risk.
Your fund’s Morningstar® Risk

Your fund’s Morningstar Risk is shown alongside that of the average fund in its Morningstar category. The risk bar broadens the comparison by translating the fund’s Morningstar Risk into a percentile, which is based on the fund’s ranking among all funds rated by Morningstar as of June 30, 2007. A higher Morningstar Risk generally indicates that a fund’s monthly returns have varied more widely.
Morningstar determines a fund’s Morningstar Risk by assessing variations in the fund’s monthly returns — with an emphasis on downside variations — over a 3-year period, if available. Those measures are weighted and averaged to produce the fund’s Morningstar Risk. The information shown is provided for the fund’s class A shares only; information for other classes may vary. Morningstar Risk is based on historical data and does not indicate future results. Morningstar does not purport to measure the risk associated with a current investment in a fund, either on an absolute basis or on a relative basis. Low Morningstar Risk does not mean that you cannot lose money on an investment in a fund. Copyright 2007 Morningstar, Inc. All Rights Reserved. The information contained herein (1) is proprietary to Morningstar and/or its content providers; (2) may not be copied or distributed; and (3) is not warranted to be accurate, complete, or timely. Neither Morningstar nor its content providers are responsible for any damages or losses arising from any use of this information.
19
Your fund’s management
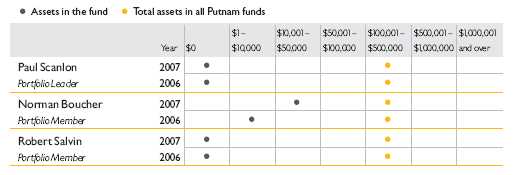
Your fund is managed by the members of the Putnam Fixed-Income High-Yield Team. Paul Scanlon is the Portfolio Leader. Norman Boucher and Robert Salvin are Portfolio Members of your fund. The Portfolio Leader and Portfolio Members coordinate the team’s management of the fund.
For a complete listing of the members of the Putnam Fixed-Income High-Yield Team, including those who are not Portfolio Leaders or Portfolio Members of your fund, visit Putnam’s Individual Investor Web site at www.putnam.com.
Investment team fund ownership
The table below shows how much the fund’s current Portfolio Leader and Portfolio Members have invested in the fund and in all Putnam mutual funds (in dollar ranges). Information shown is as of May 31, 2007, and May 31, 2006.
Trustee and Putnam employee fund ownership
As of May 31, 2007, all of the Trustees of the Putnam funds owned fund shares. The table below shows the approximate value of investments in the fund and all Putnam funds as of that date by the Trustees and Putnam employees. These amounts include investments by the Trustees’ and employees’ immediate family members and investments through retirement and deferred compensation plans.
| | |
| | | Total assets in |
| | Assets in the fund | all Putnam funds |
|
| Trustees | $ 238,000 | $ 96,000,000 |
|
| Putnam employees | $2,117,000 | $476,000,000 |
|
20
Fund manager compensation
The total 2006 fund manager compensation that is attributable to your fund is approximately $430,000. This amount includes a portion of 2006 compensation paid by Putnam Management to the fund managers listed in this section for their portfolio management responsibilities, calculated based on the fund assets they manage taken as a percentage of the total assets they manage. The compensation amount also includes a portion of the 2006 compensation paid to the Group Chief Investment Officer of the fund’s broader investment category for his oversight responsibilities, calculated based on the fund assets he oversees taken as a percentage of the total assets he oversees. This amount does not include compensation attributable to research, trading, administration, executive oversight, systems, compliance, or fund operations functions; nor does it include non-compensation costs. These percentages are determined as of the fund’s fiscal period-end. For personnel who j oined Putnam Management during or after 2006, the calculation reflects annualized 2006 compensation or an estimate of 2007 compensation, as applicable.
Other Putnam funds managed by the Portfolio Leader
and Portfolio Members
Paul Scanlon is also a Portfolio Leader of Putnam Floating Rate Income Fund and Putnam High Yield Trust. He is also a Portfolio Member of Putnam Diversified Income Trust, Putnam Master Intermediate Income Trust, and Putnam Premier Income Trust.
Norman Boucher is also a Portfolio Member of Putnam High Yield Trust.
Robert Salvin is also a Portfolio Leader of Putnam High Income Securities Fund and a Portfolio Member of Putnam Convertible Income-Growth Trust and Putnam High Yield Trust.
Paul Scanlon, Norman Boucher, and Robert Salvin may also manage other accounts and variable trust funds advised by Putnam Management or an affiliate.
Changes in your fund’s Portfolio Leader and Portfolio Members
Your fund’s Portfolio Leader and Portfolio Members did not change during the year ended May 31, 2007.
21
Putnam fund ownership by Putnam’s Executive Board
The table below shows how much the members of Putnam’s Executive Board have invested in all Putnam mutual funds (in dollar ranges). Information shown is as of May 31, 2007, and May 31, 2006.
| | | | | | | | |
| | | | $1 – | $10,001 – | $50,001 – | $100,001 – | $500,001 – | $1,000,001 |
| | Year | $0 | $10,000 | $50,000 | $100,000 | $500,000 | $1,000,000 | and over |
|
| Philippe Bibi | 2007 | | | | | | | • |
|
|
| Chief Technology Officer | 2006 | | | | | | | • |
|
| Joshua Brooks | 2007 | | | | | | | • |
|
|
| Deputy Head of Investments | 2006 | | | | | | | • |
|
| William Connolly | 2007 | | | | | | | • |
|
|
| Head of Retail Management | 2006 | | | | | | | • |
|
| Kevin Cronin | 2007 | | | | | | | • |
|
|
| Head of Investments | 2006 | | | | | | | • |
|
| Charles Haldeman, Jr. | 2007 | | | | | | | • |
|
|
| President and CEO | 2006 | | | | | | | • |
|
| Amrit Kanwal | 2007 | | | | | | • | |
|
|
| Chief Financial Officer | 2006 | | | | | | • | |
|
| Steven Krichmar | 2007 | | | | | | | • |
|
|
| Chief of Operations | 2006 | | | | | | • | |
|
| Francis McNamara, III | 2007 | | | | | | | • |
|
|
| General Counsel | 2006 | | | | | | | • |
|
| Jeffrey Peters | 2007 | | | | | | | • |
|
|
| Head of International Business | N/A | | | | | | | |
|
| Richard Robie, III | 2007 | | | | | | • | |
|
|
| Chief Administrative Officer | 2006 | | | | | | • | |
|
| Edward Shadek | 2007 | | | | | | | • |
|
|
| Deputy Head of Investments | 2006 | | | | | | | • |
|
| Sandra Whiston | 2007 | | | | | | | • |
|
|
| Head of Institutional Management | 2006 | | | | | | • | |
|
N/A indicates the individual was not a member of Putnam’s Executive Board as of 5/31/06.
22
Terms and definitions
Important terms
Total return shows how the value of the fund’s shares changed over time, assuming you held the shares through the entire period and reinvested all distributions in the fund.
Net asset value (NAV) is the price, or value, of one share of a mutual fund, without a sales charge. NAVs fluctuate with market conditions. NAV is calculated by dividing the net assets of each class of shares by the number of outstanding shares in the class.
Public offering price (POP) is the price of a mutual fund share plus the maximum sales charge levied at the time of purchase. POP performance figures shown here assume the 3.75% maximum sales charge for class A shares and 3.25% for class M shares.
Contingent deferred sales charge (CDSC) is generally a charge applied at the time of the redemption of class B shares and assumes redemption at the end of the period. Your fund’s class B CDSC declines from a 5% maximum during the first year to 1% during the sixth year. After the sixth year, the CDSC no longer applies.
Share classes
Class A shares are generally subject to an initial sales charge and no CDSC (except on certain redemptions of shares bought without an initial sales charge).
Class B shares are not subject to an initial sales charge. They may be subject to a CDSC.
Class C shares are not subject to an initial sales charge and are subject to a CDSC only if the shares are redeemed during the first year.
Class M shares have a lower initial sales charge and a higher 12b-1 fee than class A shares and no CDSC (except on certain redemptions of shares bought without an initial sales charge).
Class R shares are not subject to an initial sales charge or CDSC and are available only to certain defined contribution plans.
Class Y shares are not subject to an initial sales charge or CDSC, and carry no 12b-1 fee. They are only available to eligible purchasers, including eligible defined contribution plans or corporate IRAs.
23
Comparative indexes
JPMorgan Developed High Yield Index is an unmanaged index of high-yield fixed-income securities issued in developed countries.
Lehman Aggregate Bond Index is an unmanaged index of U.S. investment-grade fixed-income securities.
Merrill Lynch 91-Day Treasury Bill Index is an unmanaged index that seeks to measure the performance of U.S. Treasury bills available in the marketplace.
S&P 500 Index is an unmanaged index of common stock performance.
Indexes assume reinvestment of all distributions and do not account for fees. Securities and performance of a fund and an index will differ. You cannot invest directly in an index.
Lipper is a third-party industry-ranking entity that ranks mutual funds. Its rankings do not reflect sales charges. Lipper rankings are based on total return at net asset value relative to other funds that have similar current investment styles or objectives as determined by Lipper. Lipper may change a fund’s category assignment at its discretion. Lipper category averages reflect performance trends for funds within a category.
24
Trustee approval of management contract
General conclusions
The Board of Trustees of the Putnam funds oversees the management of each fund and, as required by law, determines annually whether to approve the continuance of your fund’s management contract with Putnam Management and the sub-management contract between Putnam Management’s affiliate, Putnam Investments Limited (“PIL”), and Putnam Management. In this regard, the Board of Trustees, with the assistance of its Contract Committee consisting solely of Trustees who are not “interested persons” (as such term is defined in the Investment Company Act of 1940, as amended) of the Putnam funds (the “Independent Trustees”), requests and evaluates all information it deems reasonably necessary under the circumstances. Over the course of several months ending in June 2006, the Contract Committee met four times to consider the information provided by Putnam Management and other information developed with the assistance of the Board’s in dependent counsel and independent staff. The Contract Committee reviewed and discussed key aspects of this information with all of the Independent Trustees. Upon completion of this review, the Contract Committee recommended, and the Independent Trustees approved, the continuance of your fund’s management contract and sub-management contract, effective July 1, 2006. (Because PIL is an affiliate of Putnam Management and Putnam Management remain fully responsible for all services provided by PIL, the Trustees have not evaluated PIL as a separate entity, and all subsequent references to Putnam Management below include reference to PIL as necessary or appropriate in the context.)
This approval was based on the following conclusions:
• That the fee schedule in effect for your fund represented reasonable compensation in light of the nature and quality of the services being provided to the fund, the fees paid by competitive funds and the costs incurred by Putnam Management in providing such services, and
• That such fee schedule represented an appropriate sharing between fund shareholders and Putnam Management of such economies of scale as may exist in the management of the fund at current asset levels.
These conclusions were based on a comprehensive consideration of all information provided to the Trustees and were not the result of any single factor. Some of the factors that figured particularly in the Trustees’ deliberations and how the Trustees considered these factors are described below, although individual Trustees may have evaluated the information presented differently, giving different weights to various factors. It is also important to recognize that the fee arrangements for your fund and the other Putnam funds are the result of many years of review and discussion between the Independent Trustees and Putnam Management, that certain aspects of such arrangements may receive greater scrutiny in some years than others, and that the Trustees’ conclusions may be based, in part, on their consideration of these same arrangements in prior years.
25
Management fee schedules and categories; total expenses
The Trustees reviewed the management fee schedules in effect for all Putnam funds, including fee levels and breakpoints, and the assignment of funds to particular fee categories. In reviewing fees and expenses, the Trustees generally focused their attention on material changes in circumstances — for example, changes in a fund’s size or investment style, changes in Putnam Management’s operating costs, or changes in competitive practices in the mutual fund industry — that suggest that consideration of fee changes might be warranted. The Trustees concluded that the circumstances did not warrant changes to the management fee structure of your fund, which had been carefully developed over the years, re-examined on many occasions and adjusted where appropriate. The Trustees focused on two areas of particular interest, as discussed further below:
• Competitiveness. The Trustees reviewed comparative fee and expense information for competitive funds, which indicated that, in a custom peer group of competitive funds selected by Lipper Inc., your fund ranked in the 76th percentile in management fees and in the 48th percentile in total expenses (less any applicable 12b-1 fees) as of December 31, 2005 (the first percentile being the least expensive funds and the 100th percentile being the most expensive funds). (Because the fund’s custom peer group is smaller than the fund’s broad Lipper Inc. peer group, this expense information may differ from the Lipper peer expense information found elsewhere in this report.) The Trustees noted that expense ratios for a number of Putnam funds, which show the percentage of fund assets used to pay for management and administrative services, distribution (12b-1) fees and other expenses, had been increasing recently as a result of declining net assets and the natural operation of fee breakpoints.
The Trustees noted that the expense ratio increases described above were currently being controlled by expense limitations implemented in January 2004 and which Putnam Management, in consultation with the Contract Committee, has committed to maintain at least through 2007. These expense limitations give effect to a commitment by Putnam Management that the expense ratio of each open-end fund would be no higher than the average expense ratio of the competitive funds included in the fund’s relevant Lipper universe (exclusive of any applicable 12b-1 charges in each case). The Trustees observed that this commitment to limit fund expenses has served shareholders well since its inception. In order to ensure that the expenses of the Putnam funds continue to meet evolving competitive standards, the Trustees requested, and Putnam Management agreed, to implement an additional expense limitation for certain funds for the twelve months beginning January 1, 2007 equal to the average expense ratio (exclusive of 12b-1 charges) of a custom peer group of competitive funds selected by Lipper based on the size of the fund. This additional expense limitation will be applied to those open-end funds that had above-average expense ratios (exclusive of 12b-1 charges) based on the Lipper custom peer group data for the period ended December 31, 2005. This additional expense limitation will not be applied to your fund.
26
• Economies of scale. Your fund currently has the benefit of breakpoints in its management fee that provide shareholders with significant economies of scale, which means that the effective management fee rate of a fund (as a percentage of fund assets) declines as a fund grows in size and crosses specified asset thresholds. Conversely, as a fund shrinks in size — as has been the case for many Putnam funds in recent years — these breakpoints result in increasing fee levels. In recent years, the Trustees have examined the operation of the existing breakpoint structure during periods of both growth and decline in asset levels. The Trustees concluded that the fee schedules in effect for the funds represented an appropriate sharing of economies of scale at current asset levels. In reaching this conclusion, the Trustees considered the Contract Committee’s stated intent to con tinue to work with Putnam Management to plan for an eventual resumption in the growth of assets, including a study of potential economies that might be produced under various growth assumptions.
In connection with their review of the management fees and total expenses of the Putnam funds, the Trustees also reviewed the costs of the services to be provided and profits to be realized by Putnam Management and its affiliates from the relationship with the funds. This information included trends in revenues, expenses and profitability of Putnam Management and its affiliates relating to the investment management and distribution services provided to the funds. In this regard, the Trustees also reviewed an analysis of Putnam Management’s revenues, expenses and profitability with respect to the funds’ management contracts, allocated on a fund-by-fund basis. Because many of the costs incurred by Putnam Management in managing the funds are not readily identifiable to particular funds, the Trustees observed that the methodology for allocating costs is an important factor in evaluating Putnam Management’s costs and profitability, both as to the Putnam fu nds in the aggregate and as to individual funds. The Trustees reviewed Putnam Management’s cost allocation methodology with the assistance of independent consultants and concluded that this methodology was reasonable and well-considered.
Investment performance
The quality of the investment process provided by Putnam Management represented a major factor in the Trustees’ evaluation of the quality of services provided by Putnam Management under your fund’s management contract. The Trustees were assisted in their review of the Putnam funds’ investment process and performance by the work of the Investment Process Committee of the Trustees and the Investment Oversight Committees of the Trustees, which meet on a regular monthly basis with the funds’ portfolio teams throughout the year. The Trustees concluded that Putnam Management generally provides a high-quality investment process — as measured by the experience and skills of the individuals assigned to the management of fund portfolios, the resources made available to such personnel, and in general the ability of Putnam Management to attract and retain high-quality personnel — but also recognize that this does not guarantee favorable investment results for every fund in every time period. The Trustees considered the investment performance of each fund over multiple time periods
27
and considered information comparing each fund’s performance with various benchmarks and with the performance of competitive funds.
The Trustees noted the satisfactory investment performance of many Putnam funds. They also noted the disappointing investment performance of certain funds in recent years and discussed with senior management of Putnam Management the factors contributing to such underperformance and actions being taken to improve performance. The Trustees recognized that, in recent years, Putnam Management has made significant changes in its investment personnel and processes and in the fund product line to address areas of underperformance. In particular, they noted the important contributions of Putnam Management’s leadership in attracting, retaining and supporting high-quality investment professionals and in systematically implementing an investment process that seeks to merge the best features of fundamental and quantitative analysis. The Trustees indicated their intention to continue to monitor performance trends to assess the effectiveness of these changes and to evaluate whether additional changes to address areas of underperformance are warranted.
In the case of your fund, the Trustees considered that your fund’s class A share cumulative total return performance at net asset value was in the following percentiles of its Lipper Inc. peer group (Lipper High Current Yield Funds) for the one-, three- and five-year periods ended March 31, 2006 (the first percentile being the best performing funds and the 100th percentile being the worst performing funds):
| | |
| One-year period | Three-year period | Five-year period |
|
| 25th | 23rd | 30th |
(Because of the passage of time, these performance results may differ from the performance results for more recent periods shown elsewhere in this report. Over the one-, three- and five-year periods ended March 31, 2006, there were 435, 382, and 310 funds, respectively, in your fund’s Lipper peer group.* Past performance is no guarantee of future performance.)
As a general matter, the Trustees concluded that cooperative efforts between the Trustees and Putnam Management represent the most effective way to address investment performance problems. The Trustees noted that investors in the Putnam funds have, in effect, placed their trust in the Putnam organization, under the oversight of the funds’ Trustees, to make appropriate decisions regarding the management of the funds. Based on the responsiveness of Putnam Management in the recent past to Trustee concerns about investment performance, the Trustees concluded that it is preferable to seek change within Putnam Management to address performance shortcomings. In the Trustees’ view, the alternative of terminating a
* The percentile rankings for your fund’s class A share annualized total return performance in the Lipper High Current Yield Funds category for the one-, five- and ten-year periods ended June 30, 2007, were 16%, 20%, and 53%, respectively. Over the one-, five- and ten-year periods ended June 30, 2007, the fund ranked 71 out of 447, 62 out of 311, and 71 out of 134 funds, respectively. Note that this more recent information was not available when the Trustees approved the continuance of your fund’s management contract.
28
management contract and engaging a new investment adviser for an underperforming fund would entail significant disruptions and would not provide any greater assurance of improved investment performance.
Brokerage and soft-dollar allocations; other benefits
The Trustees considered various potential benefits that Putnam Management may receive in connection with the services it provides under the management contract with your fund. These include benefits related to brokerage and soft-dollar allocations, whereby a portion of the commissions paid by a fund for brokerage may be used to acquire research services that may be useful to Putnam Management in managing the assets of the fund and of other clients. The Trustees indicated their continued intent to monitor the potential benefits associated with the allocation of fund brokerage to ensure that the principle of seeking “best price and execution” remains paramount in the portfolio trading process.
The Trustees’ annual review of your fund’s management contract also included the review of its distributor’s contract and distribution plan with Putnam Retail Management Limited Partnership and the custodian agreement and investor servicing agreement with Putnam Fiduciary Trust Company, all of which provide benefits to affiliates of Putnam Management.
Comparison of retail and institutional fee schedules
The information examined by the Trustees as part of their annual contract review has included for many years information regarding fees charged by Putnam Management and its affiliates to institutional clients such as defined benefit pension plans, college endowments, etc. This information included comparison of such fees with fees charged to the funds, as well as a detailed assessment of the differences in the services provided to these two types of clients. The Trustees observed, in this regard, that the differences in fee rates between institutional clients and the funds are by no means uniform when examined by individual asset sectors, suggesting that differences in the pricing of investment management services to these types of clients reflect to a substantial degree historical competitive forces operating in separate market places. The Trustees considered the fact that fee rates across all asset sectors are higher on average for funds than for institutional cli ents, as well as the differences between the services that Putnam Management provides to the Putnam funds and those that it provides to institutional clients of the firm, but did not rely on such comparisons to any significant extent in concluding that the management fees paid by your fund are reasonable.
29
Approval of new management and sub-management contracts
in connection with pending change in control
As discussed in the “Message from the Trustees” at the beginning of this shareholder report, Marsh & McLennan Companies, Inc. announced on February 1, 2007 that it had signed a defini-tive agreement to sell its ownership interest in Putnam Investments Trust, the parent company of Putnam Management and its affiliates, to Great-West Lifeco Inc., a member of the Power Financial Corporation group of companies. In mid-May, shareholders voted overwhelmingly in favor of the proposed transaction. While the transaction is still subject to regulatory approvals and other conditions, it is currently expected to be completed this summer.
At an in-person meeting on February 8–9, 2007, the Trustees considered the approval of new management contracts for each Putnam fund proposed to become effective upon the closing of the transaction, and the filing of a preliminary proxy statement. At an in-person meeting on March 8–9, 2007, the Trustees considered the approval of the final forms of the proposed new management contracts for each Putnam fund (and, in the case of your fund, the new sub-management contract) and the proxy statement. They reviewed the terms of the proposed new management contracts and the differences between the proposed new management contracts and the current management contracts. They noted that the terms of the proposed new management contracts were substantially identical to the current management contracts, except for certain changes developed at the initiative of the Trustees and designed largely to address inconsistencies among various of the existing contracts, which had been developed and implemented at different times in the past. They noted, in the case of your fund, that the terms of the proposed new sub-management contract were identical to the current sub-management contract, except for the effective date. In considering the approval of the proposed new management contracts (and, in the case of your fund, the new sub-management contract), the Trustees also considered, as discussed further in the proxy statement, various matters relating to the transaction. Finally, in considering the proposed new management contracts (and, in the case of your fund, the new sub-management contract), the Trustees also took into account their deliberations and conclusions (discussed above in the preceding paragraphs of the “Trustee Approval of Management Contract” section) in connection with the most recent annual approval of the continuance of the Putnam funds’ management contracts effective July 1, 2006, and the extensive materials that they had reviewed in connection with that approval process. Based upon the foregoing considerations, on March 9, 2007, the Trustees, including all of the Independent Trustees, unanimously approved the proposed new management contracts (and, in the case of your fund, the new sub-management contract) and determined to recommend their approval to the shareholders of the Putnam funds.
30
Other information
for shareholders
Important notice regarding delivery of shareholder documents
In accordance with SEC regulations, Putnam sends a single copy of annual and semiannual shareholder reports, prospectuses, and proxy statements to Putnam shareholders who share the same address, unless a shareholder requests otherwise. If you prefer to receive your own copy of these documents, please call Putnam at 1-800-225-1581, and Putnam will begin sending individual copies within 30 days.
Proxy voting
Putnam is committed to managing our mutual funds in the best interests of our shareholders. The Putnam funds’ proxy voting guidelines and procedures, as well as information regarding how your fund voted proxies relating to portfolio securities during the 12-month period ended June 30, 2006, are available on the Putnam Individual Investor Web site, www.putnam.com/individual, and on the SEC’s Web site, www.sec.gov. If you have questions about finding forms on the SEC’s Web site, you may call the SEC at 1-800-SEC-0330. You may also obtain the Putnam funds’ proxy voting guidelines and procedures at no charge by calling Putnam’s Shareholder Services at 1-800-225-1581.
Fund portfolio holdings
The fund will file a complete schedule of its portfolio holdings with the SEC for the first and third quarters of each fiscal year on Form N-Q. Shareholders may obtain the fund’s Forms N-Q on the SEC’s Web site at www.sec.gov. In addition, the fund’s Forms N-Q may be reviewed and copied at the SEC’s Public Reference Room in Washington, D.C. You may call the SEC at 1-800-SEC-0330 for information about the SEC’s Web site or the operation of the Public Reference Room.
31
Financial statements
A guide to financial statements
These sections of the report, as well as the accompanying Notes, constitute the fund’s
financial statements.
The fund’s portfolio lists all the fund’s investments and their values as of the last day of the reporting period. Holdings are organized by asset type and industry sector, country, or state to show areas of concentration and diversification.
Statement of assets and liabilities shows how the fund’s net assets and share price are determined. All investment and noninvestment assets are added together. Any unpaid expenses and other liabilities are subtracted from this total. The result is divided by the number of shares to determine the net asset value per share, which is calculated separately for each class of shares. (For funds with preferred shares, the amount subtracted from total assets includes the liquidation preference of preferred shares.)
Statement of operations shows the fund’s net investment gain or loss. This is done by first adding up all the fund’s earnings — from dividends and interest income — and subtracting its operating expenses to determine net investment income (or loss). Then, any net gain or loss the fund realized on the sales of its holdings — as well as any unrealized gains or losses over the period — is added to or subtracted from the net investment result to determine the fund’s net gain or loss for the fiscal period.
Statement of changes in net assets shows how the fund’s net assets were affected by the fund’s net investment gain or loss, by distributions to shareholders, and by changes in the number of the fund’s shares. It lists distributions and their sources (net investment income or realized capital gains) over the current reporting period and the most recent fiscal year-end. The distributions listed here may not match the sources listed in the Statement of operations because the distributions are determined on a tax basis and may be paid in a different period from the one in which they were earned. Dividend sources are estimated at the time of declaration. Actual results may vary. Any non-taxable return of capital cannot be determined until final tax calculations are completed after the end of the fund’s fiscal year.
Financial highlights provide an overview of the fund’s investment results, per-share distributions, expense ratios, net investment income ratios, and portfolio turnover in one summary table, reflecting the five most recent reporting periods. In a semiannual report, the highlight table also includes the current reporting period.
32
The fund’s portfolio 5/31/07 (Unaudited)
| | | | |
| CORPORATE BONDS AND NOTES (85.2%)* | | | | |
|
| | | Principal amount | | Value |
|
| Advertising and Marketing Services (0.2%) | | | | |
| Lamar Media Corp. company guaranty 7 1/4s, 2013 | $ | 1,145,000 | $ | 1,176,488 |
| Lamar Media Corp. company guaranty Ser. B, 6 5/8s, 2015 | | 760,000 | | 756,200 |
| | | | | 1,932,688 |
|
| |
| Automotive (4.1%) | | | | |
| American Axle & Manufacturing, Inc. company guaranty | | | | |
| 7 7/8s, 2017 | | 1,425,000 | | 1,432,125 |
| ArvinMeritor, Inc. sr. unsec. notes 8 1/8s, 2015 | | 380,000 | | 377,625 |
| Dana Corp. notes 5.85s, 2015 | | 2,135,000 | | 1,921,500 |
| Ford Motor Co. notes 7.45s, 2031 | | 2,700,000 | | 2,220,750 |
| Ford Motor Credit Corp. notes 7 7/8s, 2010 | | 3,630,000 | | 3,665,008 |
| Ford Motor Credit Corp. notes 7.8s, 2012 | | 405,000 | | 403,014 |
| Ford Motor Credit Corp. sr. notes 9 7/8s, 2011 | | 5,600,000 | | 6,006,529 |
| Ford Motor Credit Corp. sr. unsec 8s, 2016 | | 795,000 | | 787,583 |
| Ford Motor Credit Corp. sr. unsec. 9 3/4s, 2010 | | 1,970,000 | | 2,088,167 |
| Ford Motor Credit Corp. sr. unsec. FRN 8.105s, 2012 | | 625,000 | | 627,351 |
| General Motors Corp. debs. 9.4s, 2021 | | 425,000 | | 422,875 |
| General Motors Corp. notes 7.2s, 2011 | | 6,985,000 | | 6,705,600 |
| Meritor Automotive, Inc. notes 6.8s, 2009 | | 282,000 | | 277,065 |
| Tenneco Automotive, Inc. company guaranty 8 5/8s, 2014 | | 3,030,000 | | 3,211,800 |
| Tenneco Automotive, Inc. sec. notes Ser. B, 10 1/4s, 2013 | | 205,000 | | 224,219 |
| UCI Holdco, Inc. 144A sr. notes 12.355s, 2013 ‡‡ | | 1,898,864 | | 1,960,577 |
| United Components, Inc. sr. sub. notes 9 3/8s, 2013 | | 300,000 | | 311,250 |
| | | | | 32,643,038 |
|
| |
| Basic Materials (8.3%) | | | | |
| Abitibi-Consolidated, Inc. notes 7 3/4s, 2011 (Canada) | | 1,220,000 | | 1,119,350 |
| Abitibi-Consolidated, Inc. notes 6s, 2013 (Canada) | | 1,175,000 | | 975,250 |
| AK Steel Corp. company guaranty 7 3/4s, 2012 | | 2,785,000 | | 2,865,069 |
| Aleris International, Inc. 144A sr. notes 9s, 2014 | | 1,470,000 | | 1,572,900 |
| Aleris International, Inc. 144A sr. sub. notes 10s, 2016 | | 1,660,000 | | 1,745,075 |
| Builders FirstSource, Inc. company guaranty FRN9.61s, 2012 | | 1,545,000 | | 1,570,106 |
| Century Aluminum Co. company guaranty 7 1/2s, 2014 | | 1,135,000 | | 1,183,238 |
| Chaparral Steel Co. company guaranty 10s, 2013 | | 4,210,000 | | 4,694,150 |
| Cognis Holding GmbH & Co. 144A sr. notes 12.876s, | | | | |
| 2015 (Germany) ‡‡ | EUR | 716,759 | | 1,029,343 |
| Covalence Specialty Materials Corp. 144A | | | | |
| sr. sub. notes 10 1/4s, 2016 | $ | 2,305,000 | | 2,362,625 |
| Freeport-McMoRan Copper & Gold, Inc. sr. unsec. bond | | | | |
| 8 3/8s, 2017 | | 4,070,000 | | 4,441,388 |
| Freeport-McMoRan Copper & Gold, Inc. sr. unsec. | | | | |
| notes 8 1/4s, 2015 (S) | | 2,030,000 | | 2,192,400 |
| Georgia-Pacific Corp. debs. 9 1/2s, 2011 | | 3,215,000 | | 3,508,369 |
| Gerdau Ameristeel Corp. sr. notes 10 3/8s, 2011 (Canada) | | 1,922,000 | | 2,032,515 |
| Graphic Packaging International Corp sr. notes 8 1/2s, 2011 | | 1,080,000 | | 1,124,550 |
| Hercules, Inc. company guaranty 6 3/4s, 2029 | | 425,000 | | 425,000 |
33
| | | | |
| CORPORATE BONDS AND NOTES (85.2%)* continued | | | | |
|
| | | Principal amount | | Value |
|
| Basic Materials continued | | | | |
| Hexion Nova Scotia Finance ULC sec. notes 9 3/4s, 2014 ## | $ | 310,000 | $ | 334,025 |
| Hexion U.S. Finance Corp./Hexion Nova Scotia | | | | |
| Finance, ULC 144A sr. notes 9 3/4s, 2014 | | 1,585,000 | | 1,707,838 |
| Huntsman, LLC company guaranty 11 5/8s, 2010 | | 3,000 | | 3,225 |
| Jefferson Smurfit Corp. company guaranty 8 1/4s, 2012 | | 1,200,000 | | 1,227,000 |
| Lyondell Chemical Co. company guaranty 8 1/4s, 2016 | | 940,000 | | 1,017,550 |
| Lyondell Chemical Co. company guaranty 8s, 2014 | | 1,505,000 | | 1,591,538 |
| Lyondell Chemical Co. company guaranty 6 7/8s, 2017 | | 60,000 | | 60,150 |
| MacDermid, Inc. 144A sr. sub. notes 9 1/2s, 2017 | | 2,045,000 | | 2,157,475 |
| MDP Acquisitions PLC sr. notes 9 5/8s, 2012 (Ireland) | | 161,000 | | 169,855 |
| Metals USA, Inc. sec. notes 11 1/8s, 2015 | | 1,085,000 | | 1,217,913 |
| Momentive Performance Materials, Inc. 144A | | | | |
| sr. notes 9 3/4s, 2014 (S) | | 3,655,000 | | 3,819,475 |
| Mosaic Co. (The) 144A sr. notes 7 5/8s, 2016 | | 1,115,000 | | 1,184,688 |
| Mosaic Co. (The) 144A sr. notes 7 3/8s, 2014 | | 670,000 | | 698,475 |
| Nalco Co. sr. sub. notes 8 7/8s, 2013 | | 2,795,000 | | 2,997,638 |
| NewPage Corp. company guaranty 10s, 2012 | | 820,000 | | 905,075 |
| NewPage Holding Corp. sr. notes FRN 12.36s, 2013 ‡‡ | | 287,521 | | 287,880 |
| Norske Skog Canada, Ltd. company guaranty Ser. D, | | | | |
| 8 5/8s, 2011 (Canada) | | 735,000 | | 736,838 |
| Novelis, Inc. company guaranty 7 1/4s, 2015 | | 2,315,000 | | 2,442,325 |
| PQ Corp. company guaranty 7 1/2s, 2013 | | 600,000 | | 624,000 |
| Rockwood Specialties Group, Inc. company | | | | |
| guaranty 7 5/8s, 2014 | EUR | 1,680,000 | | 2,376,499 |
| Smurfit-Stone Container Enterprises, Inc. 144A | | | | |
| sr. notes 8s, 2017 | $ | 1,240,000 | | 1,249,300 |
| Steel Dynamics, Inc. 144A sr. notes 6 3/4s, 2015 | | 2,655,000 | | 2,641,725 |
| Tube City IMS Corp. 144A sr. sub. notes 9 3/4s, 2015 | | 1,455,000 | | 1,527,750 |
| Ucar Finance, Inc. company guaranty 10 1/4s, 2012 | | 221,000 | | 233,155 |
| Verso Paper Holdings, LLC. and Verson Paper, Inc. | | | | |
| 144A sec. notes 9 1/8s, 2014 | | 540,000 | | 572,400 |
| Wheeling-Pittsburgh Steel Corp. sr. notes Ser. A, | | | | |
| 5s, 2011 ‡‡ | | 256,436 | | 199,700 |
| Wheeling-Pittsburgh Steel Corp. sr. notes Ser. B, | | | | |
| 6s, 2010 ‡‡ | | 159,303 | | 124,057 |
| | | | | 64,948,877 |
|
| |
| Broadcasting (2.2%) | | | | |
| DirecTV Holdings, LLC company guaranty 6 3/8s, 2015 | | 3,515,000 | | 3,409,550 |
| Echostar DBS Corp. company guaranty 7s, 2013 | | 1,495,000 | | 1,530,506 |
| Echostar DBS Corp. company guaranty 6 5/8s, 2014 | | 270,000 | | 270,000 |
| Echostar DBS Corp. sr. notes 6 3/8s, 2011 | | 4,585,000 | | 4,602,194 |
| Ion Media Networks, Inc. 144A sec. FRN 11.606s, 2013 | | 995,000 | | 1,037,288 |
| Ion Media Networks, Inc. 144A sec. FRN 8.606s, 2012 | | 1,200,000 | | 1,225,500 |
| LIN Television Corp. company guaranty Ser. B, 6 1/2s, 2013 | | 235,000 | | 237,350 |
| Sirius Satellite Radio, Inc. sr. unsecd. | | | | |
| notes 9 5/8s, 2013 | | 2,060,000 | | 2,065,150 |
34
| | | | |
| CORPORATE BONDS AND NOTES (85.2%)* continued | | | | |
|
| | | Principal amount | | Value |
|
| Broadcasting continued | | | | |
| Univision Communications, Inc. 144A | | | | |
| sr. notes 9 3/4s, 2015 ‡‡ | $ | 1,080,000 | $ | 1,117,800 |
| Young Broadcasting, Inc. company guaranty 10s, 2011 | | 1,142,000 | | 1,161,985 |
| Young Broadcasting, Inc. sr. sub. notes 8 3/4s, 2014 | | 395,000 | | 386,113 |
| | | | | 17,043,436 |
|
| |
| Building Materials (0.9%) | | | | |
| Associated Materials, Inc. company guaranty 9 3/4s, 2012 | | 610,000 | | 638,975 |
| NTK Holdings, Inc. sr. disc. notes zero %, 2014 | | 1,765,000 | | 1,323,750 |
| Texas Industries, Inc. sr. unsecd. notes 7 1/4s, 2013 | | 2,000,000 | | 2,070,000 |
| THL Buildco, Inc. (Nortek Holdings, Inc.) | | | | |
| sr. sub. notes 8 1/2s, 2014 | | 2,755,000 | | 2,734,338 |
| | | | | 6,767,063 |
|
| |
| Cable Television (3.0%) | | | | |
| Atlantic Broadband Finance, LLC company | | | | |
| guaranty 9 3/8s, 2014 | | 1,530,000 | | 1,577,813 |
| CCH I Holdings, LLC company guaranty 12 1/8s, 2015 | | 25,000 | | 25,375 |
| CCH I, LLC/Capital Corp. sec. notes 11s, 2015 | | 8,844,000 | | 9,617,850 |
| CCH II, LLC/Capital Corp. sr. notes Ser. B, 10 1/4s, 2010 | | 2,545,000 | | 2,704,063 |
| CCH, LLC/Capital Corp. sr. notes 10 1/4s, 2010 | | 515,000 | | 548,475 |
| CSC Holdings, Inc. debs. 7 5/8s, 2018 | | 630,000 | | 633,150 |
| CSC Holdings, Inc. sr. notes 6 3/4s, 2012 | | 2,635,000 | | 2,602,063 |
| CSC Holdings, Inc. sr. notes Ser. B, 7 5/8s, 2011 | | 1,445,000 | | 1,481,125 |
| NTL Cable PLC sr. notes 9 1/8s, 2016 (United Kingdom) | | 820,000 | | 891,750 |
| Rainbow National Services, LLC 144A | | | | |
| sr. notes 8 3/4s, 2012 | | 2,445,000 | | 2,610,038 |
| Rainbow National Services, LLC 144A | | | | |
| sr. sub. debs. 10 3/8s, 2014 | | 505,000 | | 566,863 |
| | | | | 23,258,565 |
|
| |
| Capital Goods (6.5%) | | | | |
| Alliant Techsystems, Inc. sr. sub. notes 6 3/4s, 2016 | | 1,210,000 | | 1,228,150 |
| Allied Waste North America, Inc. company | | | | |
| guaranty 6 7/8s, 2017 | | 2,665,000 | | 2,714,969 |
| American Railcar Industries, Inc. sr. unsec. 7 1/2s, 2014 | | 355,000 | | 366,538 |
| Baldor Electric Co. company guaranty 8 5/8s, 2017 | | 2,160,000 | | 2,305,800 |
| Belden CDT, Inc. 144A sr. sub. notes 7s, 2017 | | 1,065,000 | | 1,090,413 |
| Berry Plastics Holding Corp. sec. notes 8 7/8s, 2014 | | 1,890,000 | | 1,937,250 |
| Bombardier, Inc. 144A sr. notes 8s, 2014 (Canada) (S) | | 1,525,000 | | 1,624,125 |
| Crown Americas, LLC/Crown Americas Capital Corp. | | | | |
| sr. notes 7 5/8s, 2013 | | 1,880,000 | | 1,950,500 |
| General Cable Corp. 144A sr. notes 7 1/8s, 2017 | | 1,250,000 | | 1,265,625 |
| General Cable Corp. 144A sr. notes FRN 7.725s, 2015 | | 235,000 | | 235,588 |
| Greenbrier Cos., Inc. company guaranty 8 3/8s, 2015 | | 1,990,000 | | 2,009,900 |
| Hawker Beechcraft Acquisition Co., LLC 144A | | | | |
| sr. notes 8 7/8s, 2015 ‡‡ | | 510,000 | | 538,050 |
| Hawker Beechcraft Acquisition Co., LLC 144A | | | | |
| sr. notes 8 1/2s, 2015 | | 1,520,000 | | 1,603,600 |
35
| | | | |
| CORPORATE BONDS AND NOTES (85.2%)* continued | | | | |
|
| | | Principal amount | | Value |
|
| Capital Goods continued | | | | |
| Hawker Beechcraft Acquisition Co., LLC 144A | | | | |
| sr. sub. notes 9 3/4s, 2017 | $ | 1,515,000 | $ | 1,621,050 |
| Hexcel Corp. sr. sub. notes 6 3/4s, 2015 | | 1,510,000 | | 1,517,550 |
| L-3 Communications Corp. company guaranty 6 1/8s, 2013 | | 2,950,000 | | 2,920,500 |
| L-3 Communications Corp. sr. sub. notes 5 7/8s, 2015 | | 575,000 | | 560,625 |
| L-3 Communications Corp. sr. sub. notes Class B, | | | | |
| 6 3/8s, 2015 | | 2,460,000 | | 2,453,850 |
| Legrand SA debs. 8 1/2s, 2025 (France) | | 3,850,000 | | 4,591,125 |
| Manitowoc Co., Inc. (The) company guaranty 10 1/2s, 2012 | | 1,377,000 | | 1,468,226 |
| Manitowoc Co., Inc. (The) sr. notes 7 1/8s, 2013 | | 975,000 | | 1,004,250 |
| Milacron Escrow Corp. sec. notes 11 1/2s, 2011 | | 1,885,000 | | 1,922,700 |
| Mueller Water Products, Inc. 144A | | | | |
| sr. sub. notes 7 3/8s, 2017 | | 770,000 | | 778,271 |
| Owens-Brockway Glass company guaranty 8 7/8s, 2009 | | 105,000 | | 107,231 |
| Owens-Brockway Glass Container, Inc. company | | | | |
| guaranty 6 3/4s, 2014 | EUR | 2,505,000 | | 3,467,706 |
| RBS Global, Inc. / Rexnord Corp. company | | | | |
| guaranty 9 1/2s, 2014 | $ | 1,650,000 | | 1,773,750 |
| Solo Cup Co. sr. sub. notes 8 1/2s, 2014 | | 610,000 | | 533,750 |
| TD Funding Corp. 144A sr. sub. notes 7 3/4s, 2014 | | 1,700,000 | | 1,768,000 |
| Tekni-Plex, Inc. secd. notes 10 7/8s, 2012 | | 2,525,000 | | 2,853,250 |
| Titan International, Inc. company guaranty 8s, 2012 | | 1,975,000 | | 2,034,250 |
| WCA Waste Corp. company guaranty 9 1/4s, 2014 | | 790,000 | | 842,338 |
| | | | | 51,088,930 |
|
| |
| Commercial and Consumer Services (0.1%) | | | | |
| iPayment, Inc. company guaranty 9 3/4s, 2014 | | 735,000 | | 755,213 |
|
| |
| Communication Services (7.2%) | | | | |
| American Cellular Corp. company guaranty 9 1/2s, 2009 | | 785,000 | | 783,038 |
| American Cellular Corp. sr. notes Ser. B, 10s, 2011 | | 233,000 | | 244,941 |
| American Tower Corp. sr. notes 7 1/2s, 2012 | | 1,300,000 | | 1,355,250 |
| BCM Ireland Finance Ltd. 144A FRN 9.061s, 2016 | | | | |
| (Cayman Islands) | EUR | 630,000 | | 874,575 |
| Centennial Cellular Operating Co., LLC company | | | | |
| guaranty 10 1/8s, 2013 | $ | 845,000 | | 913,656 |
| Centennial Communications Corp. sr. notes 10s, 2013 | | 1,270,000 | | 1,377,950 |
| Centennial Communications Corp. sr. notes FRN | | | | |
| 11.099s, 2013 | | 420,000 | | 441,525 |
| Cincinnati Bell, Inc. company guaranty 7s, 2015 | | 885,000 | | 885,000 |
| Citizens Communications Co. notes 9 1/4s, 2011 | | 1,465,000 | | 1,618,825 |
| Cricket Communications, Inc. company | | | | |
| guaranty 9 3/8s, 2014 | | 2,350,000 | | 2,491,000 |
| Digicel Group, Ltd. 144A sr. notes 8 7/8s, 2015 (Bermuda) | | 1,650,000 | | 1,635,563 |
| Digicel, Ltd. 144A sr. notes 9 1/4s, 2012 (Jamaica) | | 1,375,000 | | 1,459,219 |
| Dobson Cellular Systems sec. notes 9 7/8s, 2012 | | 1,625,000 | | 1,775,313 |
| Dobson Communications Corp. sr. notes FRN | | | | |
| 9.606s, 2012 | | 855,000 | | 880,650 |
| Inmarsat Finance PLC company guaranty stepped-coupon | | | | |
| zero % (10 3/8s, 11/15/08), 2012 (United Kingdom) †† | | 3,566,000 | | 3,423,360 |
36
| | | | |
| CORPORATE BONDS AND NOTES (85.2%)* continued | | | | |
|
| | | Principal amount | | Value |
|
| Communication Services continued | | | | |
| Intelsat Bermuda, Ltd. company guaranty FRN 8.876s, | | | | |
| 2015 (Bermuda) | $ | 660,000 | $ | 674,850 |
| Intelsat Bermuda, Ltd. sr. unsec. 11 1/4s, 2016 (Bermuda) | | 3,835,000 | | 4,381,488 |
| Intelsat Intermediate Holding Co., Ltd. company | | | | |
| guaranty stepped-coupon zero % (9 1/4s, 2/1/10), | | | | |
| 2015 (Bermuda) †† | | 690,000 | | 579,600 |
| Intelsat Subsidiary Holding Co., Ltd. sr. notes 8 1/2s, | | | | |
| 2013 (Bermuda) | | 795,000 | | 825,806 |
| iPCS, Inc. 144A sec. FRN 7.48s, 2013 | | 680,000 | | 681,700 |
| Level 3 Financing, Inc. company guaranty 12 1/4s, 2013 | | 890,000 | | 1,041,300 |
| Level 3 Financing, Inc. 144A sr. notes 9 1/4s, 2014 | | 1,865,000 | | 1,946,594 |
| Level 3 Financing, Inc. 144A sr. notes 8 3/4s, 2017 | | 1,070,000 | | 1,098,088 |
| MetroPCS Wireless Inc. 144A sr. notes 9 1/4s, 2014 | | 2,305,000 | | 2,443,300 |
| MetroPCS Wireless, Inc. 144A sr. notes 9 1/4s, 2014 ## | | 440,000 | | 465,850 |
| Nordic Telephone Co. Holdings ApS 144A | | | | |
| sr. notes 8 7/8s, 2016 (Denmark) | | 380,000 | | 411,825 |
| PanAmSat Corp. company guaranty 9s, 2014 | | 1,025,000 | | 1,107,000 |
| Qwest Communications International, Inc. company | | | | |
| guaranty 7 1/2s, 2014 | | 3,885,000 | | 4,011,263 |
| Qwest Corp. debs. 7 1/4s, 2025 | | 1,135,000 | | 1,160,538 |
| Qwest Corp. notes 8 7/8s, 2012 | | 2,515,000 | | 2,760,213 |
| Qwest Corp. sr. notes 7 5/8s, 2015 | | 5,000 | | 5,300 |
| Rural Cellular Corp. sr. notes 9 7/8s, 2010 | | 665,000 | | 699,081 |
| Rural Cellular Corp. sr. sub. FRN 11.106s, 2012 | | 545,000 | | 564,756 |
| Rural Cellular Corp. sr. sub. notes 9 3/4s, 2010 | | 1,090,000 | | 1,125,425 |
| Rural Cellular Corp. 144A sr. sub. notes FRN 8.36s, 2013 | | 935,000 | | 937,338 |
| Syniverse Technologies, Inc. sr. sub. notes Ser. B, 7 3/4s, 2013 | | 1,330,000 | | 1,290,100 |
| Time Warner Telecom, Inc. company guaranty 9 1/4s, 2014 | | 1,605,000 | | 1,723,369 |
| West Corp. company guaranty 11s, 2016 | | 520,000 | | 562,900 |
| West Corp. company guaranty 9 1/2s, 2014 | | 765,000 | | 805,163 |
| Windstream Corp. company guaranty 8 5/8s, 2016 | | 2,880,000 | | 3,146,400 |
| Windstream Corp. company guaranty 8 1/8s, 2013 | | 1,530,000 | | 1,644,750 |
| | | | | 56,253,862 |
|
| |
| Consumer (0.6%) | | | | |
| Jostens IH Corp. company guaranty 7 5/8s, 2012 | | 4,540,000 | | 4,642,150 |
|
| |
| Consumer Goods (2.2%) | | | | |
| Church & Dwight Co., Inc. company guaranty 6s, 2012 | | 1,805,000 | | 1,773,413 |
| Elizabeth Arden, Inc. company guaranty 7 3/4s, 2014 | | 2,215,000 | | 2,275,913 |
| Jarden Corp. company guaranty 7 1/2s, 2017 | | 1,430,000 | | 1,458,600 |
| Playtex Products, Inc. company guaranty 9 3/8s, 2011 | | 1,960,000 | | 2,021,250 |
| Playtex Products, Inc. company guaranty 8s, 2011 | | 3,505,000 | | 3,653,963 |
| Prestige Brands, Inc. sr. sub. notes 9 1/4s, 2012 | | 2,313,000 | | 2,411,303 |
| Spectrum Brands, Inc. company guaranty 11 1/4s, 2013 ‡‡ | | 1,370,000 | | 1,342,600 |
| Spectrum Brands, Inc. company guaranty 7 3/8s, 2015 | | 2,490,000 | | 2,110,275 |
| | | | | 17,047,317 |
37
| | | | |
| CORPORATE BONDS AND NOTES (85.2%)* continued | | | | |
|
| | | Principal amount | | Value |
|
| Consumer Services (0.6%) | | | | |
| Rental Services Corp. 144A bonds 9 1/2s, 2014 | $ | 1,595,000 | $ | 1,714,625 |
| United Rentals NA, Inc. sr. sub. notes 7s, 2014 | | 3,135,000 | | 3,197,700 |
| | | | | 4,912,325 |
|
| |
| Energy (10.1%) | | | | |
| Arch Western Finance, LLC sr. notes 6 3/4s, 2013 | | 4,050,000 | | 4,034,813 |
| Bluewater Finance, Ltd. company guaranty 10 1/4s, | | | | |
| 2012 (Cayman Islands) | | 1,585,000 | | 1,656,325 |
| Chaparral Energy, Inc. 144A sr. notes 8 7/8s, 2017 | | 1,675,000 | | 1,700,125 |
| CHC Helicopter Corp. sr. sub. notes 7 3/8s, 2014 (Canada) | | 3,325,000 | | 3,266,813 |
| Chesapeake Energy Corp. sr. notes 7 1/2s, 2013 | | 3,385,000 | | 3,528,863 |
| Chesapeake Energy Corp. sr. notes 7s, 2014 | | 1,125,000 | | 1,158,750 |
| Cimarex Energy Co. sr. notes 7 1/8s, 2017 | | 675,000 | | 683,438 |
| Complete Production Services, Inc. 144A | | | | |
| sr. notes 8s, 2016 | | 2,535,000 | | 2,636,400 |
| Compton Petroleum Corp. company guaranty 7 5/8s, | | | | |
| 2013 (Canada) | | 3,215,000 | | 3,247,150 |
| Comstock Resources, Inc. sr. notes 6 7/8s, 2012 | | 1,775,000 | | 1,735,063 |
| Denbury Resources, Inc. sr. sub. notes 7 1/2s, 2015 | | 1,525,000 | | 1,570,750 |
| Dresser-Rand Group, Inc. company guaranty 7 3/8s, 2014 | | 1,070,000 | | 1,088,725 |
| Encore Acquisition Co. sr. sub. notes 6 1/4s, 2014 | | 880,000 | | 819,500 |
| Encore Acquisition Co. sr. sub. notes 6s, 2015 | | 3,290,000 | | 2,993,900 |
| EXCO Resources, Inc. company guaranty 7 1/4s, 2011 | | 3,265,000 | | 3,297,650 |
| Forest Oil Corp. sr. notes 8s, 2011 | | 2,365,000 | | 2,483,250 |
| Hanover Compressor Co. sr. notes 9s, 2014 | | 1,315,000 | | 1,416,913 |
| Hanover Equipment Trust sec. notes Ser. B, 8 3/4s, 2011 | | 645,000 | | 665,963 |
| Harvest Operations Corp. sr. notes 7 7/8s, 2011 (Canada) | | 2,350,000 | | 2,314,750 |
| Hilcorp Energy I LP/Hilcorp Finance Co. 144A | | | | |
| sr. notes 9s, 2016 | | 770,000 | | 821,975 |
| Hornbeck Offshore Services, Inc. sr. notes Ser. B, | | | | |
| 6 1/8s, 2014 | | 955,000 | | 915,606 |
| Inergy LP/Inergy Finance Corp. sr. notes 6 7/8s, 2014 | | 3,750,000 | | 3,712,500 |
| Massey Energy Co. sr. notes 6 5/8s, 2010 | | 1,615,000 | | 1,598,850 |
| Newfield Exploration Co. sr. sub. notes 6 5/8s, 2014 | | 2,095,000 | | 2,105,475 |
| Offshore Logistics, Inc. company guaranty 6 1/8s, 2013 | | 1,860,000 | | 1,799,550 |
| Oslo Seismic Services, Inc. 1st mtge. 8.28s, 2011 | | 1,605,522 | | 1,630,623 |
| Pacific Energy Partners/Pacific Energy Finance Corp. | | | | |
| sr. notes 7 1/8s, 2014 | | 1,350,000 | | 1,408,608 |
| Peabody Energy Corp. company guaranty 7 3/8s, 2016 | | 930,000 | | 984,638 |
| Peabody Energy Corp. sr. notes 5 7/8s, 2016 | | 2,610,000 | | 2,518,650 |
| PetroHawk Energy Corp. company guaranty 9 1/8s, 2013 | | 3,855,000 | | 4,144,125 |
| Plains Exploration & Production Co. company | | | | |
| guaranty 7s, 2017 | | 1,560,000 | | 1,552,200 |
| Pogo Producing Co. sr. sub. notes 7 7/8s, 2013 | | 955,000 | | 1,002,750 |
| Pogo Producing Co. sr. sub. notes 6 7/8s, 2017 | | 2,040,000 | | 2,065,500 |
| Pride International, Inc. sr. notes 7 3/8s, 2014 | | 3,300,000 | | 3,399,000 |
| Quicksilver Resources, Inc. company guaranty 7 1/8s, 2016 | | 1,370,000 | | 1,359,725 |
| Sabine Pass LNG LP 144A sec. notes 7 1/2s, 2016 | | 1,290,000 | | 1,322,250 |
38
| | | | |
| CORPORATE BONDS AND NOTES (85.2%)* continued | | | | |
|
| | | Principal amount | | Value |
|
| Energy continued | | | | |
| Stallion Oilfield Services/Stallion Oilfield | | | | |
| Finance Corp. 144A sr. unsec. notes 9 3/4s, 2015 | $ | 1,820,000 | $ | 1,901,900 |
| Targa Resources, Inc. 144A company guaranty 8 1/2s, 2013 | | 2,115,000 | | 2,199,600 |
| Whiting Petroleum Corp. company guaranty 7s, 2014 | | 2,530,000 | | 2,454,100 |
| | | | | 79,196,766 |
|
| |
| Entertainment (1.5%) | | | | |
| AMC Entertainment, Inc. company guaranty 11s, 2016 | | 1,061,000 | | 1,210,866 |
| AMC Entertainment, Inc. sr. sub. notes 8s, 2014 | | 305,000 | | 314,913 |
| Avis Budget Car Rental, LLC 144A sr. notes 7 3/4s, 2016 | | 1,475,000 | | 1,530,313 |
| Avis Budget Car Rental, LLC 144A sr. notes 7 5/8s, 2014 | | 965,000 | | 1,001,188 |
| Cinemark, Inc. sr. disc. notes stepped-coupon zero % | | | | |
| (9 3/4s, 3/15/09), 2014 †† | | 2,410,000 | | 2,226,238 |
| Hertz Corp. company guaranty 8 7/8s, 2014 | | 1,940,000 | | 2,087,925 |
| Marquee Holdings, Inc. sr. disc. | | | | |
| notes stepped-coupon zero % (12s, 8/15/09), 2014 †† | | 1,840,000 | | 1,628,400 |
| Universal City Florida Holding Co. sr. notes 8 3/8s, 2010 | | 545,000 | | 561,350 |
| Universal City Florida Holding Co. sr. notes FRN | | | | |
| 10.106s, 2010 | | 950,000 | | 980,875 |
| | | | | 11,542,068 |
|
| |
| Financial (4.1%) | | | | |
| Crescent Real Estate Equities LP notes 7 1/2s,2007 (R) | | 1,205,000 | | 1,215,544 |
| E*Trade Financial Corp. sr. unsec. notes 8s, 2011 | | 3,350,000 | | 3,513,313 |
| Finova Group, Inc. notes 7 1/2s, 2009 | | 2,962,000 | | 666,450 |
| General Motors Acceptance Corp. notes 7 3/4s, 2010 | | 5,565,000 | | 5,715,945 |
| General Motors Acceptance Corp. notes 7s, 2012 | | 605,000 | | 611,111 |
| General Motors Acceptance Corp. notes 6 7/8s, 2012 | | 5,980,000 | | 6,009,117 |
| General Motors Acceptance Corp. notes 6 3/4s, 2014 | | 5,730,000 | | 5,711,630 |
| GMAC LLC unsub. notes 6 5/8s, 2012 | | 1,600,000 | | 1,590,271 |
| Leucadia National Corp. 144A sr. notes 7 1/8s, 2017 | | 1,230,000 | | 1,214,625 |
| Petroplus Finance, Ltd. company guaranty 6 3/4s, | | | | |
| 2014 (Bermuda) | | 1,695,000 | | 1,697,119 |
| Realogy Corp. 144A sr. notes 10 1/2s, 2014 (R) | | 4,415,000 | | 4,431,556 |
| USI Holdings Corp. 144A sr. notes FRN 9.23s, 2014 | | 290,000 | | 290,725 |
| | | | | 32,667,406 |
|
| |
| Food (1.7%) | | | | |
| Archibald Candy Corp. company guaranty 10s, | | | | |
| 2007 (In default) (F) † | | 424,297 | | 22,170 |
| Chiquita Brands International, Inc. sr. notes 8 7/8s, 2015 | | 290,000 | | 285,650 |
| Chiquita Brands International, Inc. sr. notes 7 1/2s, 2014 | | 1,665,000 | | 1,552,613 |
| Dean Foods Co. company guaranty 7s, 2016 | | 1,220,000 | | 1,216,950 |
| Del Monte Corp. company guaranty 6 3/4s, 2015 | | 1,320,000 | | 1,320,000 |
| Del Monte Corp. sr. sub. notes 8 5/8s, 2012 | | 2,625,000 | | 2,756,250 |
| Nutro Products, Inc. 144A sr. notes FRN 9.37s, 2013 | | 930,000 | | 976,500 |
| Pilgrim’s Pride Corp. sr. unsec 7 5/8s, 2015 | | 2,045,000 | | 2,101,238 |
| Pinnacle Foods Finance LLC 144A | | | | |
| sr. sub. notes 10 5/8s, 2017 | | 885,000 | | 900,488 |
39
| | | | |
| CORPORATE BONDS AND NOTES (85.2%)* continued | | | | |
|
| | | Principal amount | | Value |
|
| Food continued | | | | |
| Swift & Co. company guaranty 10 1/8s, 2009 | $ | 1,575,000 | $ | 1,634,063 |
| Swift & Co. sr. sub. notes 12 1/2s, 2010 | | 770,000 | | 804,650 |
| | | | | 13,570,572 |
|
| |
| Gaming & Lottery (3.5%) | | | | |
| Boyd Gaming Corp. sr. sub. notes 7 3/4s, 2012 | | 545,000 | | 567,481 |
| Boyd Gaming Corp. sr. sub. notes 7 1/8s, 2016 | | 2,110,000 | | 2,110,000 |
| Boyd Gaming Corp. sr. sub. notes 6 3/4s, 2014 | | 440,000 | | 443,850 |
| MGM Mirage, Inc. company guaranty 8 1/2s, 2010 | | 1,670,000 | | 1,778,550 |
| MGM Mirage, Inc. company guaranty 6s, 2009 | | 3,320,000 | | 3,303,400 |
| Pinnacle Entertainment, Inc. sr. sub. notes 8 3/4s, 2013 | | 50,000 | | 53,000 |
| Pinnacle Entertainment, Inc. sr. sub. notes 8 1/4s, 2012 | | 2,947,000 | | 3,068,564 |
| Scientific Games Corp. company guaranty 6 1/4s, 2012 | | 2,215,000 | | 2,176,238 |
| Station Casinos, Inc. sr. notes 6s, 2012 | | 2,740,000 | | 2,657,800 |
| Trump Entertainment Resorts, Inc. sec. notes 8 1/2s, 2015 | | 4,290,000 | | 4,391,888 |
| Wimar Opco, LLC. 144A sr. sub. notes 9 5/8s, 2014 | | 4,915,000 | | 4,964,150 |
| Wynn Las Vegas, LLC/Wynn Las Vegas Capital Corp. | | | | |
| 1stmtge. 6 5/8s, 2014 (S) | | 2,310,000 | | 2,318,663 |
| | | | | 27,833,584 |
|
| |
| Health Care (5.7%) | | | | |
| Accellent, Inc. company guaranty 10 1/2s, 2013 | | 1,810,000 | | 1,866,563 |
| Community Health Systems, Inc. | | | | |
| sr. sub. notes 6 1/2s, 2012 | | 690,000 | | 715,013 |
| DaVita, Inc. company guaranty 6 5/8s, 2013 | | 1,605,000 | | 1,613,025 |
| Elan Finance PLC/Elan Finance Corp. company | | | | |
| guaranty 7 3/4s, 2011 (Ireland) | | 1,240,000 | | 1,264,800 |
| HCA, Inc. sr. notes 7 7/8s, 2011 | | 930,000 | | 961,388 |
| HCA, Inc. 144A sec. notes 9 1/4s, 2016 | | 3,185,000 | | 3,491,556 |
| HCA, Inc. 144A sec. notes 9 1/8s, 2014 | | 2,120,000 | | 2,300,200 |
| HCA, Inc. 144A sec. sr. notes 9 5/8s, 2016 ‡‡ | | 2,730,000 | | 3,009,825 |
| Health Management Associates, Inc. sr. notes 6 1/8s, 2016 | | 1,665,000 | | 1,591,790 |
| IASIS Healthcare/IASIS Capital Corp. | | | | |
| sr. sub. notes 8 3/4s, 2014 | | 135,000 | | 141,750 |
| MedQuest, Inc. company guaranty Ser. B, 11 7/8s, 2012 | | 1,365,000 | | 1,102,238 |
| Omnicare, Inc. sr. sub. notes 6 1/8s, 2013 | | 699,000 | | 672,788 |
| Psychiatric Solutions, Inc. company guaranty 7 3/4s, 2015 | | 2,235,000 | | 2,299,256 |
| Select Medical Corp. company guaranty 7 5/8s, 2015 | | 2,070,000 | | 1,914,750 |
| Service Corporation International debs. 7 7/8s, 2013 | | 1,185,000 | | 1,236,049 |
| Service Corporation International sr. notes 7s, 2017 | | 740,000 | | 735,375 |
| Service Corporation International sr. notes 6 3/4s, 2016 | | 2,650,000 | | 2,606,938 |
| Stewart Enterprises, Inc. sr. notes 6 1/4s, 2013 | | 3,010,000 | | 2,949,800 |
| Sun Healthcare Group, Inc. 144A | | | | |
| sr. sub. notes 9 1/8s, 2015 | | 1,180,000 | | 1,239,000 |
| Tenet Healthcare Corp. notes 7 3/8s, 2013 | | 2,560,000 | | 2,412,800 |
| Tenet Healthcare Corp. sr. notes 9 7/8s, 2014 | | 1,050,000 | | 1,076,250 |
| Universal Hospital Services, Inc. 144A sec. FRN 8.76s, 2015 | | 155,000 | | 157,325 |
| Universal Hospital Services, Inc. 144A sec. | | | | |
| notes 8 1/2s, 2015 ‡‡ | | 100,000 | | 102,125 |
40
| | | | |
| CORPORATE BONDS AND NOTES (85.2%)* continued | | | | |
|
| | | Principal amount | | Value |
|
| Health Care continued | | | | |
| US Oncology, Inc. company guaranty 9s, 2012 | $ | 2,335,000 | $ | 2,440,075 |
| Vanguard Health Holding Co. II, LLC | | | | |
| sr. sub. notes 9s, 2014 | | 1,895,000 | | 1,985,013 |
| Ventas Realty LP/Capital Corp. company guaranty 9s, 2012 (R) | | 2,230,000 | | 2,492,025 |
| Ventas Realty LP/Capital Corp. company guaranty | | | | |
| 6 3/4s, 2010 (R) | | 865,000 | | 885,544 |
| Ventas Realty LP/Capital Corp. sr. notes 6 5/8s, 2014 (R) | | 690,000 | | 700,350 |
| Ventas Realty LP/Capital Corp. sr. notes 6 1/2s, 2016 (R) | | 850,000 | | 858,500 |
| | | | | 44,822,111 |
|
| |
| Homebuilding (0.7%) | | | | |
| K. Hovnanian Enterprises, Inc. company guaranty 8 7/8s, 2012 | | 770,000 | | 765,188 |
| Meritage Homes Corp. company guaranty 6 1/4s, 2015 (S) | | 1,650,000 | | 1,563,375 |
| Meritage Homes Corp. sr. notes 7s, 2014 | | 245,000 | | 237,956 |
| Standard Pacific Corp. sr. notes 7 3/4s, 2013 | | 875,000 | | 857,500 |
| Standard Pacific Corp. sr. notes 6 1/2s, 2008 | | 545,000 | | 545,000 |
| TOUSA, Inc. company guaranty 9s, 2010 | | 1,300,000 | | 1,244,750 |
| | | | | 5,213,769 |
|
| |
| Household Furniture and Appliances (0.5%) | | | | |
| Sealy Mattress Co. sr. sub. notes 8 1/4s, 2014 | | 3,765,000 | | 3,934,425 |
|
| |
| Lodging/Tourism (0.5%) | | | | |
| FelCor Lodging LP company guaranty 8 1/2s, 2008 (R) | | 955,000 | | 1,019,463 |
| Host Marriott LP company guaranty Ser. Q, 6 3/4s, 2016 (R) | | 45,000 | | 45,619 |
| Host Marriott LP sr. notes Ser. M, 7s, 2012 (R) | | 2,955,000 | | 3,006,713 |
| | | | | 4,071,795 |
|
| |
| Media (1.9%) | | | | |
| Affinion Group, Inc. company guaranty 11 1/2s, 2015 | | 1,340,000 | | 1,497,450 |
| Affinion Group, Inc. company guaranty 10 1/8s, 2013 | | 2,210,000 | | 2,419,950 |
| Affinity Group, Inc. sr. sub. notes 9s, 2012 | | 2,000,000 | | 2,100,000 |
| Idearc Inc. 144A sr. notes 8s, 2016 | | 5,060,000 | | 5,243,425 |
| Interpublic Group of Companies, Inc. notes 6 1/4s, 2014 | | 495,000 | | 464,681 |
| Nielsen Finance LLC/Nielsen Finance Co. 144A | | | | |
| sr. disc. notes stepped-coupon zero % (12 1/2s, | | | | |
| 8/2/11), 2016 †† | | 1,930,000 | | 1,404,075 |
| Nielsen Finance LLC/Nielsen Finance Co. 144A | | | | |
| sr. notes 10s, 2014 | | 1,645,000 | | 1,793,050 |
| | | | | 14,922,631 |
|
| |
| Publishing (2.2%) | | | | |
| American Media, Inc. company guaranty 8 7/8s, 2011 | | 550,000 | | 543,125 |
| American Media, Inc. company guaranty Ser. B, | | | | |
| 10 1/4s, 2009 | | 1,875,000 | | 1,839,844 |
| CanWest Media, Inc. company guaranty 8s, 2012 (Canada) | | 1,196,600 | | 1,235,490 |
| Cenveo Corp., sr. sub. notes 7 7/8s, 2013 | | 700,000 | | 694,750 |
| Dex Media, Inc. disc. notes stepped-coupon zero % | | | | |
| (9s, 11/15/08), 2013 †† | | 935,000 | | 878,900 |
| Dex Media, Inc. notes 8s, 2013 | | 545,000 | | 569,525 |
41
| | | | |
| CORPORATE BONDS AND NOTES (85.2%)* continued | | | | |
|
| | | Principal amount | | Value |
|
| Publishing continued | | | | |
| PRIMEDIA, Inc. company guaranty 8 7/8s, 2011 | $ | 5,000 | $ | 5,150 |
| PRIMEDIA, Inc. sr. notes 8s, 2013 | | 2,350,000 | | 2,485,125 |
| R.H. Donnelley Corp. sr. disc. notes Ser. A-2, | | | | |
| 6 7/8s, 2013 | | 1,545,000 | | 1,521,825 |
| R.H. Donnelley Corp. sr. notes 6 7/8s, 2013 | | 765,000 | | 753,525 |
| R.H. Donnelley Corp. sr. notes Ser. A-3, 8 7/8s, 2016 | | 1,540,000 | | 1,659,350 |
| Reader’s Digest Association, Inc. (The) 144A | | | | |
| sr. sub. notes 9s, 2017 | | 1,750,000 | | 1,725,938 |
| Vertis, Inc. company guaranty Ser. B, 10 7/8s, 2009 | | 2,575,000 | | 2,575,000 |
| Vertis, Inc. 144A sub. notes 13 1/2s, 2009 | | 880,000 | | 761,200 |
| | | | | 17,248,747 |
|
| |
| Restaurants (0.3%) | | | | |
| Buffets, Inc. company guaranty 12 1/2s, 2014 | | 2,360,000 | | 2,407,200 |
|
| |
| Retail (1.9%) | | | | |
| Asbury Automotive Group, Inc. sr. sub. notes 8s, 2014 | | 1,925,000 | | 1,968,313 |
| Autonation, Inc. company guaranty 7s, 2014 | | 380,000 | | 383,800 |
| Autonation, Inc. company guaranty FRN 7.356s, 2013 | | 590,000 | | 595,900 |
| Harry & David Holdings, Inc. company guaranty 9s, 2013 | | 1,355,000 | | 1,422,750 |
| Harry & David Holdings, Inc. company guaranty FRN | | | | |
| 10.36s, 2012 | | 385,000 | | 393,663 |
| Michaels Stores, Inc. 144A sr. sub. notes 11 3/8s, 2016 | | 2,095,000 | | 2,314,975 |
| Movie Gallery, Inc. sr. unsecd. notes 11s, 2012 | | 840,000 | | 722,400 |
| Neiman-Marcus Group, Inc. company guaranty 9s, 2015 | | 1,280,000 | | 1,404,800 |
| Rite Aid Corp. company guaranty 9 3/8s, 2015 | | 1,570,000 | | 1,577,816 |
| Rite Aid Corp. company guaranty 7 1/2s, 2015 | | 1,325,000 | | 1,346,531 |
| Rite Aid Corp. secd. notes 7 1/2s, 2017 | | 180,000 | | 180,000 |
| United Auto Group, Inc. 144A sr. sub. notes 7 3/4s, 2016 | | 1,690,000 | | 1,706,900 |
| Victoria Acquisition II BV 144A sr. unsec. 12.061s, | | | | |
| 2015 (Netherlands) ‡‡ | | 491,040 | | 667,202 |
| | | | | 14,685,050 |
|
| |
| Technology (6.4%) | | | | |
| Activant Solutions, Inc. company guaranty 9 1/2s, 2016 | | 985,000 | | 985,000 |
| Advanced Micro Devices, Inc. sr. notes 7 3/4s, 2012 | | 1,398,000 | | 1,373,535 |
| Amkor Technologies, Inc. sr. notes 7 3/4s, 2013 | | 1,910,000 | | 1,874,188 |
| Amkor Technologies, Inc. sr. unsecd. notes 9 1/4s, 2016 | | 955,000 | | 1,000,363 |
| Avago Technologies Finance company guaranty 10 1/8s, | | | | |
| 2013 (Singapore) | | 395,000 | | 430,550 |
| Avago Technologies Finance company guaranty FRN | | | | |
| 10.86s, 2013 (Singapore) | | 35,000 | | 36,444 |
| Celestica, Inc. sr. sub. notes 7 7/8s, 2011 (Canada) | | 750,000 | | 742,500 |
| Celestica, Inc. sr. sub. notes 7 5/8s, 2013 (Canada) | | 905,000 | | 866,538 |
| CHR Intermediate Holding Corp. 144A | | | | |
| sr. notes 12.61s, 2013 ‡‡ | | 850,000 | | 845,750 |
| Compucom Systems, Inc. 144A sr. notes 12s, 2014 | | 1,580,000 | | 1,730,100 |
| Freescale Semiconductor, Inc. 144A sr. notes 9 1/8s,2014 ‡‡ | | 1,970,000 | | 1,950,300 |
42
| | | | |
| CORPORATE BONDS AND NOTES (85.2%)* continued | | | | |
|
| | | Principal amount | | Value |
|
| Technology continued | | | | |
| Freescale Semiconductor, Inc. 144A sr. notes 8 7/8s, 2014 | $ | 3,935,000 | $ | 3,939,919 |
| Freescale Semiconductor, Inc. 144A | | | | |
| sr. sub. notes 10 1/8s, 2016 (S) | | 1,970,000 | | 1,972,463 |
| Iron Mountain, Inc. company guaranty 8 3/4s, 2018 | | 670,000 | | 725,275 |
| Iron Mountain, Inc. company guaranty 8 5/8s, 2013 | | 2,560,000 | | 2,617,600 |
| Iron Mountain, Inc. sr. sub. notes 8 1/4s, 2011 | | 175,000 | | 174,781 |
| Lucent Technologies, Inc. debs. 6.45s, 2029 | | 2,755,000 | | 2,551,819 |
| Lucent Technologies, Inc. notes 5 1/2s, 2008 | | 520,000 | | 518,700 |
| New ASAT Finance, Ltd. company guaranty 9 1/4s, 2011 | | | | |
| (Cayman Islands) | | 1,235,000 | | 1,037,400 |
| Nortel Networks, Ltd. 144A company guaranty 10 3/4s, | | | | |
| 2016 (Canada) | | 575,000 | | 652,625 |
| Nortel Networks, Ltd. 144A company guaranty FRN | | | | |
| 9.606s, 2011 (Canada) | | 1,770,000 | | 1,907,175 |
| NXP BV/NXP Funding, LLC 144A sec. FRN 8.106s, | | | | |
| 2013 (Netherlands) | | 1,660,000 | | 1,709,800 |
| NXP BV/NXP Funding, LLC 144A sec. notes 7 7/8s, | | | | |
| 2014 (Netherlands) | | 2,772,000 | | 2,855,160 |
| Open Solutions, Inc. 144A sr. sub. notes 9 3/4s, 2015 | | 1,140,000 | | 1,182,750 |
| Seagate Technology Hdd Holdings company | | | | |
| guaranty 6.8s, 2016 (Cayman Islands) | | 940,000 | | 930,190 |
| Solectron Global Finance Corp. company guaranty 8s, 2016 | | 790,000 | | 795,925 |
| SunGard Data Systems, Inc. company guaranty 10 1/4s, 2015 | | 2,576,000 | | 2,817,500 |
| SunGard Data Systems, Inc. company guaranty 9 1/8s, 2013 | | 4,502,000 | | 4,783,375 |
| TDS Investor Corp. 144A sr. notes 9 7/8s, 2014 | | 745,000 | | 802,738 |
| TDS Investor Corp. 144A sr. sub. notes 11 7/8s, 2016 | | 495,000 | | 558,113 |
| UGS Capital Corp. II 144A sr. notes 10.348s, 2011 ‡‡ | | 819,358 | | 841,890 |
| UGS Corp. company guaranty 10s, 2012 | | 1,080,000 | | 1,176,527 |
| Unisys Corp. sr. notes 8s, 2012 | | 1,395,000 | | 1,401,975 |
| Xerox Corp. sr. notes 7 5/8s, 2013 | | 605,000 | | 635,024 |
| Xerox Corp. sr. notes 6 7/8s, 2011 | | 1,265,000 | | 1,316,561 |
| Xerox Corp. unsec. sr. notes 6 3/4s, 2017 | | 750,000 | | 776,138 |
| | | | | 50,516,691 |
|
| |
| Textiles (1.2%) | | | | |
| Hanesbrands, Inc. 144A sr. notes FRN 8.735s, 2014 | | 2,630,000 | | 2,728,625 |
| Levi Strauss & Co. sr. notes 9 3/4s, 2015 | | 3,140,000 | | 3,410,825 |
| Levi Strauss & Co. sr. notes 8 7/8s, 2016 | | 1,490,000 | | 1,581,263 |
| Oxford Industries, Inc. sr. notes 8 7/8s, 2011 | | 1,740,000 | | 1,809,600 |
| | | | | 9,530,313 |
|
| |
| Tire & Rubber (0.1%) | | | | |
| Goodyear Tire & Rubber Co. (The) 144A | | | | |
| sr. notes 8 5/8s, 2011 | | 890,000 | | 961,200 |
|
| |
| Utilities & Power (7.0%) | | | | |
| AES Corp. (The) 144A sec. notes 9s, 2015 | | 2,960,000 | | 3,159,800 |
| AES Corp. (The) 144A sec. notes 8 3/4s, 2013 | | 3,055,000 | | 3,249,756 |
| CMS Energy Corp. sr. notes 8.9s, 2008 | | 870,000 | | 900,869 |
43
| | | | |
| CORPORATE BONDS AND NOTES (85.2%)* continued | | | | |
|
| | | Principal amount | | Value |
|
| Utilities & Power continued | | | | |
| CMS Energy Corp. sr. notes 8 1/2s, 2011 | $ | 490,000 | $ | 532,448 |
| CMS Energy Corp. sr. notes 7 3/4s, 2010 | | 740,000 | | 778,612 |
| Colorado Interstate Gas Co. debs. 6.85s, 2037 | | 1,430,000 | | 1,477,370 |
| Colorado Interstate Gas Co. sr. notes 5.95s, 2015 | | 405,000 | | 401,928 |
| Dynegy-Roseton Danskamme company guaranty Ser. A, | | | | |
| 7.27s, 2010 | | 1,460,000 | | 1,489,200 |
| Dynegy-Roseton Danskamme company guaranty Ser. B, | | | | |
| 7.67s, 2016 | | 2,180,000 | | 2,294,450 |
| Edison Mission Energy sr. unsec. notes 7 3/4s, 2016 | | 735,000 | | 764,400 |
| Edison Mission Energy sr. unsec. notes 7 1/2s, 2013 | | 885,000 | | 909,338 |
| Edison Mission Energy 144A sr. notes 7.2s, 2019 | | 1,370,000 | | 1,364,863 |
| Edison Mission Energy 144A sr. notes 7s, 2017 | | 960,000 | | 956,400 |
| El Paso Natural Gas Co. debs. 8 5/8s, 2022 | | 765,000 | | 920,436 |
| El Paso Production Holding Co. company | | | | |
| guaranty 7 3/4s, 2013 | | 4,150,000 | | 4,384,334 |
| Ferrellgas LP/Finance sr. notes 6 3/4s, 2014 | | 2,200,000 | | 2,183,500 |
| Mirant Americas Generation, Inc. sr. notes 8.3s, 2011 | | 1,530,000 | | 1,637,100 |
| Mirant North America, LLC company guaranty 7 3/8s, 2013 | | 2,440,000 | | 2,580,300 |
| Nevada Power Co. 2nd mtge. 9s, 2013 | | 1,366,000 | | 1,467,604 |
| NRG Energy, Inc. company guaranty 7 3/8s, 2017 | | 935,000 | | 972,400 |
| NRG Energy, Inc. sr. notes 7 3/8s, 2016 | | 5,065,000 | | 5,254,938 |
| Orion Power Holdings, Inc. sr. notes 12s, 2010 | | 940,000 | | 1,082,175 |
| SEMCO Energy, Inc. sr. notes 7 3/4s, 2013 | | 1,990,000 | | 2,046,681 |
| Sierra Pacific Power Co. general ref. mtge. 6 1/4s, 2012 | | 485,000 | | 491,652 |
| Sierra Pacific Resources sr. notes 8 5/8s, 2014 | | 1,630,000 | | 1,751,212 |
| Teco Energy, Inc. notes 7.2s, 2011 | | 680,000 | | 712,023 |
| Teco Energy, Inc. notes 7s, 2012 | | 1,165,000 | | 1,220,879 |
| Teco Energy, Inc. sr. notes 6 3/4s, 2015 | | 140,000 | | 145,808 |
| Tennessee Gas Pipeline Co. debs. 7s, 2028 | | 305,000 | | 320,812 |
| Tennessee Gas Pipeline Co. unsec. notes 7 1/2s, 2017 | | 610,000 | | 667,986 |
| Transcontinental Gas Pipeline Corp. debs. 7 1/4s, 2026 | | 1,055,000 | | 1,140,719 |
| Utilicorp United, Inc. sr. notes 9.95s, 2011 | | 68,000 | | 74,257 |
| Williams Cos., Inc. (The) notes 8 3/4s, 2032 (S) | | 2,150,000 | | 2,558,500 |
| Williams Cos., Inc. (The) notes 7 3/4s, 2031 | | 1,225,000 | | 1,341,375 |
| Williams Cos., Inc. (The) notes 7 5/8s, 2019 | | 2,170,000 | | 2,381,575 |
| Williams Cos., Inc. (The) 144A notes 6 3/8s, 2010 | | 700,000 | | 711,375 |
| Williams Partners LP/ Williams Partners | | | | |
| Finance Corp. company guaranty 7 1/4s, 2017 | | 705,000 | | 747,300 |
| | | | | 55,074,375 |
|
| |
| Total corporate bonds and notes (cost $654,780,129) | | | $ | 669,492,167 |
|
| |
| |
| SENIOR LOANS (4.7%)* (c) | | | | |
|
| | | Principal amount | | Value |
|
| Automotive (0.1%) | | | | |
| Dana Corp. bank term loan FRN 7.88s, 2008 | $ | 450,000 | $ | 450,985 |
44
| | | | |
| SENIOR LOANS (4.7%)* (c) continued | | | | |
|
| | | Principal amount | | Value |
|
| Basic Materials (0.1%) | | | | |
| Freeport-McMoRan Copper & Gold, Inc. bank term loan | | | | |
| FRN Ser. B, 7.07s, 2014 | $ | 344,747 | $ | 345,886 |
| Novelis, Inc. bank term loan FRN 7.61s, 2012 | | 145,891 | | 145,982 |
| Novelis, Inc. bank term loan FRN Ser. B, 7.59s, 2012 | | 253,389 | | 253,547 |
| | | | | 745,415 |
|
| |
| Broadcasting (0.1%) | | | | |
| Univision Communications, Inc. bank term loan FRN | | | | |
| Ser. B, 7.855s, 2014 | | 620,134 | | 619,240 |
| Univision Communications, Inc. bank term loan FRN | | | | |
| Ser. DD, 7.61s, 2014 (U) | | 39,866 | | 39,808 |
| Young Broadcasting, Inc. bank term loan FRN Ser. B, | | | | |
| 7 7/8s, 2012 | | 79,840 | | 80,259 |
| | | | | 739,307 |
|
| |
| Capital Goods (0.5%) | | | | |
| Fenwal Controls of Japan, LTD. bank term loan FRN | | | | |
| 7.61s, 2014 (Japan) | | 1,585,714 | | 1,585,714 |
| Fenwal Controls of Japan, LTD. bank term loan FRN | | | | |
| Ser. DD, 7.61s, 2014 (Japan) | | 264,286 | | 264,286 |
| McKechnie Holdings, LLC bank term loan FRN 10.34s, | | | | |
| 2015 (United Kingdom) | | 495,000 | | 500,775 |
| Wesco Aircraft Hardware Corp. bank term loan FRN | | | | |
| 11.1s, 2014 | | 1,275,000 | | 1,302,094 |
| Wesco Aircraft Hardware Corp. bank term loan FRN | | | | |
| 7.6s, 2013 | | 396,333 | | 398,934 |
| | | | | 4,051,803 |
|
| |
| Communication Services (—%) | | | | |
| Leap Wireless International, Inc. bank term loan FRN | | | | |
| Ser. B, 7.6s, 2013 | | 198,500 | | 200,187 |
|
| |
| Consumer Cyclicals (1.4%) | | | | |
| Adesa, Inc. bank term loan FRN 7.57s, 2013 | | 650,000 | | 654,144 |
| Claire’s Stores, Inc. bank term loan FRN 8.1s, 2014 | | 2,110,000 | | 2,100,110 |
| Federal Mogul Corp. bank term loan FRN Ser. A, 7.57s, 2008 | | 1,165,000 | | 1,159,175 |
| Federal Mogul Corp. bank term loan FRN Ser. B, 7.82s, 2008 | | 2,700,000 | | 2,686,500 |
| Neiman Marcus Group, Inc. bank term loan FRN Ser. B, | | | | |
| 7.346s, 2013 | | 330,245 | | 332,644 |
| Oshkosh Truck Corp. bank term loan FRN Ser. B, 7.1s, 2013 | | 850,000 | | 853,187 |
| Tribune Co. bank term loan FRN Ser. B, 8.35s, 2014 | | 3,065,000 | | 3,062,263 |
| Trump Hotel & Casino Resort, Inc. bank term loan FRN | | | | |
| 7.605s, 2012 | | 209,470 | | 210,452 |
| Trump Hotel & Casino Resort, Inc. bank term loan FRN | | | | |
| Ser. B-1, 7.62s, 2012 | | 208,939 | | 209,919 |
| | | | | 11,268,394 |
45
| | | | |
| SENIOR LOANS (4.7%)* (c) continued | | | | |
|
| | | Principal amount | | Value |
|
| Consumer Staples (0.6%) | | | | |
| Aramark Corp. bank term loan FRN 7.475s, 2014 | $ | 1,243,375 | $ | 1,251,570 |
| Aramark Corp. bank term loan FRN 7.445s, 2014 | | 88,860 | | 89,446 |
| Charter Communications, Inc. bank term loan FRN | | | | |
| 7.36s, 2014 | | 290,910 | | 290,910 |
| Mediacom Communications Corp. bank term loan FRN | | | | |
| Ser. C, 7.1s, 2015 | | 1,231,289 | | 1,232,828 |
| National Cinimedia, Inc. bank term loan FRN 7.09s, 2015 | | 300,000 | | 300,161 |
| Pinnacle Foods Holding Corp. bank term loan FRN | | | | |
| Ser. B, 8.099s, 2014 | | 1,060,000 | | 1,067,685 |
| Six Flags Theme Parks bank term loan FRN 7.6s, 2015 | | 785,000 | | 789,252 |
| | | | | 5,021,852 |
|
| |
| Energy (0.5%) | | | | |
| Key Energy Services, Inc. bank term loan FRN 7.86s, 2010 | | 310,000 | | 311,550 |
| Key Energy Services, Inc. bank term loan FRN Ser. B, | | | | |
| 7.854s, 2012 | | 324,179 | | 325,800 |
| Sandridge Energy bank term loan FRN 8.985s, 2014 | | 675,000 | | 695,250 |
| Sandridge Energy bank term loan FRN 8 5/8s, 2015 | | 2,825,000 | | 2,909,750 |
| | | | | 4,242,350 |
|
| |
| Financial (0.2%) | | | | |
| Realogy Corp. bank term loan FRN 8.32s, 2013 | | 256,667 | | 256,767 |
| Realogy Corp. bank term loan FRN Ser. B, 8.35s, 2013 | | 953,333 | | 953,706 |
| | | | | 1,210,473 |
|
| |
| Health Care (0.8%) | | | | |
| Health Management Associates, Inc. bank term loan | | | | |
| FRN 7.1s, 2014 | | 1,845,000 | | 1,852,432 |
| Healthsouth Corp. bank term loan FRN Ser. B, 7.849s, 2013 | | 2,089,774 | | 2,103,905 |
| IASIS Healthcare, LLC/IASIS Capital Corp. bank term | | | | |
| loan FRN 10.606s, 2014 | | 1,775,000 | | 1,786,094 |
| Psychiatric Solutions, Inc. bank term loan FRN | | | | |
| Ser. B, 7.082s, 2012 | | 215,000 | | 215,224 |
| VWR International, Inc. bank term loan FRN Ser. B, | | | | |
| 7.61s, 2011 | | 24,980 | | 25,058 |
| | | | | 5,982,713 |
|
| |
| Retail (0.1%) | | | | |
| Michaels Stores, Inc. bank term loan FRN Ser. B, | | | | |
| 7 5/8s, 2013 | | 790,000 | | 793,315 |
|
| |
| Tire & Rubber (0.2%) | | | | |
| Goodyear Tire & Rubber Co. (The) bank term loan FRN | | | | |
| 7.1s, 2010 | | 1,400,000 | | 1,403,877 |
|
| |
| Transportation (0.1%) | | | | |
| United Airlines Corp. bank term loan FRN Ser. B, | | | | |
| 7 3/8s, 2014 | | 425,000 | | 425,299 |
|
| |
| Total senior loans (cost $36,382,071) | | | $ | 36,535,970 |
46
| | | | |
| CONVERTIBLE BONDS AND NOTES (1.3%)* | | | | |
|
| | | Principal amount | | Value |
|
| Acquicor Technology, Inc. 144A cv. notes 8s, 2011 | $ | 822,000 | $ | 756,240 |
| DRS Technologies, Inc. 144A cv. unsec. notes 2s, 2026 | | 3,085,000 | | 3,162,125 |
| LIN Television Corp. cv. sr. sub. notes 2 1/2s, 2033 | | 640,000 | | 621,600 |
| NII Holdings, Inc. 144A cv. sr. unsec. notes 3 1/8s, 2012 | | 1,298,000 | | 1,298,000 |
| Omnicare, Inc. cv. debs. Ser. OCR, 3 1/4s, 2035 | | 2,655,000 | | 2,260,069 |
| Sinclair Broadcast Group, Inc. cv. sr. sub. notes stepped-coupon | | | | |
| 4 7/8s (2s, 1/15/11) 2018 †† | | 1,060,000 | | 1,034,825 |
| Trinity Industries, Inc. cv. sub. notes 3 7/8s, 2036 | | 1,060,000 | | 1,222,975 |
|
| Total convertible bonds and notes (cost $10,057,741) | | | $ | 10,355,834 |
|
| |
| |
| ASSET-BACKED SECURITIES (1.2%)* | | | | |
|
| | | Principal amount | | Value |
|
| Neon Capital, Ltd. 144A | | | | |
| limited recourse sec. notes Ser. 95, 2.319s, 2013 | | | | |
| (Cayman Islands) (F) (g) | $ | 3,901,050 | $ | 1,427,382 |
| limited recourse sec. notes Ser. 94, 1.686s, 2013 | | | | |
| (Cayman Islands) (F) (g) | | 6,271,893 | | 5,247,586 |
| limited recourse sec. notes Ser. 97, 1.105s, 2013 | | | | |
| (Cayman Islands) (F) (g) | | 6,684,836 | | 2,778,265 |
|
| Total asset-backed securities (cost $10,751,384) | | | $ | 9,453,233 |
|
| |
| |
| COLLATERALIZED MORTGAGE OBLIGATIONS (0.5%)* | | | | |
|
| | | Principal amount | | Value |
|
| DLJ Commercial Mortgage Corp. 144A Ser. 98-CF2, | | | | |
| Class B5, 5.95s, 2031 | $ | 1,581,791 | $ | 1,480,952 |
| GE Capital Commercial Mortgage Corp. 144A Ser. 00-1, | | | | |
| Class G, 6.131s, 2033 | | 1,025,000 | | 933,724 |
| Mach One Commercial Mortgage Trust 144A | | | | |
| Ser. 04-1A, Class J, 5.45s, 2040 | | 1,000,000 | | 839,061 |
| Ser. 04-1A, Class K, 5.45s, 2040 | | 365,000 | | 293,369 |
| Ser. 04-1A, Class L, 5.45s, 2040 | | 165,000 | | 122,087 |
|
| Total collateralized mortgage obligations (cost $3,123,108) | | | $ | 3,669,193 |
|
| |
| |
| FOREIGN GOVERNMENT BONDS AND NOTES (0.2%)* (cost $1,580,990) | | |
|
| | | Principal amount | | Value |
|
| Argentina (Republic of ) FRB 5.475s, 2012 | $ | 1,698,750 | $ | 1,629,667 |
47
| | | | |
| SHORT-TERM INVESTMENTS (6.3%)* | | | | |
|
| | | Principal amount/shares | | Value |
|
| Short-term investments held as collateral for loaned | | | | |
| securities with yields ranging from 5.08% to 5.46% | | | | |
| and due dates ranging from June 1, 2007 to July 30, 2007 (d) | $ | 8,537,255 | $ | 8,521,550 |
| Putnam Prime Money Market Fund (e) | | 41,278,200 | | 41,278,200 |
|
| Total short-term investments (cost $49,799,750) | | | $ | 49,799,750 |
|
| |
| TOTAL INVESTMENTS | | | | |
|
| Total investments (cost $766,475,173) | | | $ | 780,935,814 |
* Percentages indicated are based on net assets of $785,574,231.
† Non-income-producing security.
†† The interest rate and date shown parenthetically represent the new interest rate to be paid and the date the fund will begin accruing interest at this rate.
‡‡ Income may be received in cash or additional securities at the discretion of the issuer.
## Forward commitments (Note 1).
(c) Senior loans are exempt from registration under the Securities Act of 1933, as amended, but contain certain restrictions on resale and cannot be sold publicly. These loans pay interest at rates which adjust periodically. The interest rate shown for senior loans are the current interest rates at May 31, 2007. Senior loans are also subject to mandatory and/or optional prepayment which cannot be predicted. As a result, the remaining maturity may be substantially less than the stated maturity shown (Notes 1 and 6).
(d) See Note 1 to the financial statements.
(e) See Note 5 to the financial statements regarding investments in Putnam Prime Money Market Fund.
(F) Security is valued at fair value following procedures approved by the Trustees.
(g) The notes are secured by debt and equity securities and equity participation agreements held by Neon Capital, Ltd. (R) Real Estate Investment Trust.
(S) Securities on loan, in part or in entirety, at May 31, 2007.
(U) A portion of the position represents unfunded loan commitments (Note 7).
At May 31, 2007, liquid assets totaling $28,978,832 have been designated as collateral for open forward commitments, swap contracts and forward contracts.
144A after the name of an issuer represents securities exempt from registration under Rule 144A under the Securities Act of 1933, as amended. These securities may be resold in transactions exempt from registration, normally to qualified institutional buyers.
The rates shown on Floating Rate Bonds (FRB) and Floating Rate Notes (FRN) are the current interest rates at May 31, 2007.
The dates shown on debt obligations are the original maturity dates.
FORWARD CURRENCY CONTRACTS TO BUY at 5/31/07 (aggregate face value $2,268,465) (Unaudited)
| | | | | |
| | | | | | Unrealized |
| | | Aggregate | | Delivery | appreciation/ |
| | Value | face value | | date | (depreciation) |
|
| Canadian Dollar | $ 564,727 | $ 524,811 | | 7/18/07 | $ 39,916 |
| Euro | 1,728,521 | 1,743,654 | | 6/20/07 | (15,133) |
|
| Total | | | | | $ 24,783 |
48
| | | | | | | |
| FORWARD CURRENCY CONTRACTS TO SELL at 5/31/07 (Unaudited) | | |
|
| | | | | | Aggregate | Delivery | Unrealized |
| | | | Value | | face value | date | depreciation |
|
| Euro | | | $12,134,373 | | $11,855,690 | 6/20/07 | $(278,683) |
|
| |
| |
| CREDIT DEFAULT CONTRACTS OUTSTANDING at 5/31/07 (Unaudited) | | |
|
| | | Upfront | | | | Fixed payments | Unrealized |
| Swap counterparty / | | premium | Notional | | Termination | received (paid) | by appreciation/ |
| Referenced debt* | | received (paid)** | amount | | date | fund per annum | (depreciation) |
|
| Bank of America, N.A. | | | | | | | |
| L-3 Communications | | | | | | | |
| Corp. 7 5/8%, 6/15/12 | | — | $ 650,000 | | 6/20/11 | (90 bp) | $ (263) |
|
| Bear, Stearns Credit Products, Inc. | | | | | | |
| Claire’s Stores, 9 5/8%, | | | | | | | |
| 6/1/15 | | — | 255,000 | | 6/20/12 | 230 bp | (366) |
|
| Citibank, N.A. | | | | | | | |
| Ford Motor Co., 7.45%, | | | | | | | |
| 7/16/31 | | — | 770,000 | | 6/20/07 | 620 bp | 12,314 |
|
| Credit Suisse First Boston International | | | | | |
| Ford Motor Co., 7.45%, | | | | | | | |
| 7/16/31 | | — | 365,000 | | 9/20/07 | (485 bp) | (8,363) |
|
| Ford Motor Co., 7.45%, | | | | | | | |
| 7/16/31 | | — | 1,725,000 | | 9/20/07 | (487.5 bp) | (39,752) |
|
| Ford Motor Co., 7.45%, | | | | | | | |
| 7/16/31 | | — | 2,090,000 | | 9/20/08 | 725 bp | 167,973 |
|
| L-3 Communications | | | | | | | |
| Corp. 7 5/8%, 6/15/12 | | — | 985,000 | | 3/20/12 | (91 bp) | 3,511 |
|
| Credit Suisse International | | | | | | | |
| Advanced Micro Devices, | | | | | | | |
| 7 3/4%, 11/1/12 | | — | 495,000 | | 6/20/09 | (165 bp) | (5,105) |
|
| DJ CDX NA HY Series 8 | | | | | | | |
| Index | | (393,937) | 14,325,000 | | 6/20/10 | 275 bp | 1,870 |
|
| Dynegy Holdings Inc., | | | | | | | |
| 6 7/8%, 4/1/11 | | — | 720,000 | | 6/20/17 | 297 bp | 1,521 |
|
| Deutsche Bank AG | | | | | | | |
| Ford Motor Co., 7.45%, | | | | | | | |
| 7/16/31 | | — | 1,078,000 | | 6/20/07 | 595 bp | 16,542 |
|
| Goldman Sachs Capital Markets, L.P. | | | | | | |
| Ford Motor Co., 7.45%, | | | | | | | |
| 7/16/31 | | — | 770,000 | | 6/20/07 | 630 bp | 12,516 |
|
| Goldman Sachs International | | | | | | |
| Any one of the underlying securities | | | | | | |
| in the basket of BB CMBS securities | — | 1,485,000 | | (a) | 2.461% | 98,035 |
|
| General Motors Corp., | | | | | | | |
| 7 1/8%, 7/15/13 | | — | 365,000 | | 9/20/07 | (425 bp) | (6,686) |
|
| General Motors Corp., | | | | | | | |
| 7 1/8%, 7/15/13 | | — | 365,000 | | 9/20/08 | 620 bp | 23,380 |
|
| General Motors Corp., | | | | | | | |
| 7 1/8%, 7/15/13 | | — | 1,725,000 | | 9/20/08 | 620 bp | 110,496 |
|
| General Motors Corp., | | | | | | | |
| 7 1/8%, 7/15/13 | | — | 1,725,000 | | 9/20/07 | (427.5 bp) | (31,818) |
|
| L-3 Communications | | | | | | | |
| Corp. 7 5/8%, 6/15/12 | | — | 405,000 | | 9/20/11 | (108 bp) | (3,628) |
|
49
CREDIT DEFAULT CONTRACTS OUTSTANDING at 5/31/07 (Unaudited) continued
| | | | | | | |
| | | Upfront | | | | Fixed payments | Unrealized |
| Swap counterparty / | | premium | Notional | | Termination | received (paid) | by appreciation/ |
| Referenced debt* | | received (paid)** | amount | | date | fund per annum | (depreciation) |
|
| JPMorgan Chase Bank, N.A. | | | | | | | |
| Ford Motor Co., 7.45%, | | | | | | | |
| 7/16/31 | | — | $ 295,000 | | 9/20/07 | (345 bp) | $ (3,752) |
|
| Ford Motor Co., 7.45%, | | | | | | | |
| 7/16/31 | | — | 1,005,000 | | 6/20/07 | 665 bp | 17,251 |
|
| Ford Motor Co., 7.45%, | | | | | | | |
| 7/16/31 | | — | 770,000 | | 6/20/07 | 635 bp | 12,618 |
|
| Ford Motor Co., 7.45%, | | | | | | | |
| 7/16/31 | | — | 295,000 | | 9/20/08 | 550 bp | 16,429 |
|
| General Motors Corp., | | | | | | | |
| 7 1/8%, 7/15/13 | | — | 295,000 | | 9/20/07 | (350 bp) | (4,710) |
|
| General Motors Corp., | | | | | | | |
| 7 1/8%, 7/15/13 | | — | 295,000 | | 9/20/08 | 500 bp | 14,080 |
|
| Lehman Brothers Special Financing, Inc. | | | | | |
| Solectron Global | | | | | | | |
| Finance Ltd, 8%, 3/15/16 | | — | 605,000 | | 3/20/12 | 390 bp | 18,150 |
|
| Merrill Lynch Capital Services, Inc. | | | | | |
| Ford Motor Co., 7.45%, | | | | | | | |
| 7/16/31 | | — | 860,000 | | 9/20/07 | (345 bp) | (13,436) |
|
| Ford Motor Co., 7.45%, | | | | | | | |
| 7/16/31 | | — | 860,000 | | 9/20/08 | 570 bp | 50,412 |
|
| General Motors Corp., | | | | | | | |
| 7 1/8%, 7/15/13 | | — | 1,205,000 | | 9/20/08 | 500 bp | 57,513 |
|
| General Motors Corp., | | | | | | | |
| 7 1/8%, 7/15/13 | | — | 1,205,000 | | 9/20/07 | (335 bp) | (16,372) |
|
| Merrill Lynch International | | | | | | | |
| Dynegy Holdings Inc., | | | | | | | |
| 6 7/8%, 4/1/11 | | — | 720,000 | | 6/20/17 | 295 bp | 485 |
|
| Morgan Stanley Capital Services, Inc. | | | | | |
| Advanced Micro Devices, | | | | | | | |
| 7 3/4%, 11/1/12 | | — | 50,000 | | 6/20/09 | 190 bp | 102 |
|
| Dynegy Holdings Inc., | | | | | | | |
| 6 7/8%, 4/1/11 | | — | 720,000 | | 6/20/12 | 225 bp | 3,683 |
|
| Ford Motor Co., 7.45%, | | | | | | | |
| 7/16/31 | | — | 295,000 | | 9/20/08 | 560 bp | 16,575 |
|
| Ford Motor Co., 7.45%, | | | | | | | |
| 7/16/31 | | — | 295,000 | | 9/20/07 | (345 bp) | (4,135) |
|
| General Motors Corp., | | | | | | | |
| 7 1/8%, 7/15/13 | | — | 295,000 | | 9/20/07 | (335 bp) | (4,121) |
|
| General Motors Corp., | | | | | | | |
| 7 1/8%, 7/15/13 | | — | 295,000 | | 9/20/08 | 500 bp | 14,043 |
|
| Oshkosh Truck Corp, T/L B L | | — | 1,075,000 | | 6/20/12 | 114 bp | 3,001 |
|
| Total | | | | | | | $529,993 |
* Payments related to the reference debt are made upon a credit default event.
** Upfront premium is based on the difference between the original spread on issue and the market spread on day of execution.
(a) Terminating on the date on which the notional amount is reduced to zero or the date on which the assets securing the reference entity are liquidated.
The accompanying notes are an integral part of these financial statements.
50
Statement of assets and liabilities 5/31/07 (Unaudited)
| | |
| ASSETS | | |
|
| Investment in securities, at value, including $8,327,826 of securities on loan (Note 1): | | |
| Unaffiliated issuers (identified cost $725,196,973) | | $ 739,657,614 |
| Affiliated issuers (identified cost $41,278,200) (Note 5) | | 41,278,200 |
|
| Cash | | 6,755,156 |
|
| Foreign currency (cost $1,028,574) (Note 1) | | 1,040,146 |
|
| Interest and other receivables | | 15,364,015 |
|
| Receivable for shares of the fund sold | | 1,495,536 |
|
| Receivable for securities sold | | 10,917,752 |
|
| Receivable for open forward contracts (Note 1) | | 39,916 |
|
| Unrealized appreciation on swap contracts (Note 1) | | 672,500 |
|
| Premium paid on swap contracts (Note 1) | | 393,937 |
|
| Total assets | | 817,614,772 |
|
| |
| LIABILITIES | | |
|
| Payable for securities purchased | | 18,931,338 |
|
| Payable for purchases of delayed delivery securities (Note 1) | | 40,185 |
|
| Payable for shares of the fund repurchased | | 2,027,453 |
|
| Payable for compensation of Manager (Notes 2 and 5) | | 1,311,060 |
|
| Payable for investor servicing and custodian fees (Note 2) | | 23,715 |
|
| Payable for Trustee compensation and expenses (Note 2) | | 244,695 |
|
| Payable for administrative services (Note 2) | | 1,654 |
|
| Payable for distribution fees (Note 2) | | 331,341 |
|
| Payable for open forward currency contracts (Note 1) | | 293,816 |
|
| Payable for closed forward currency contracts (Note 1) | | 84,652 |
|
| Unrealized depreciation on swap contracts (Note 1) | | 142,507 |
|
| Collateral on securities loaned, at value (Note 1) | | 8,521,550 |
|
| Other accrued expenses | | 86,575 |
|
| Total liabilities | | 32,040,541 |
|
| Net assets | | $ 785,574,231 |
|
| |
| REPRESENTED BY | | |
|
| Paid-in capital (Unlimited shares authorized) (Notes 1 and 4) | $ 2,013,255,276 |
|
| Undistributed net investment income (Note 1) | | 5,753,989 |
|
| Accumulated net realized loss on investments (Note 1) | (1,248,201,217) |
|
| Net unrealized appreciation of investments | | |
| and assets and liabilities in foreign currencies | | 14,766,183 |
|
| Total — Representing net assets applicable to capital shares outstanding | | $ 785,574,231 |
(Continued on next page)
51
Statement of assets and liabilities (Continued)
| | |
| COMPUTATION OF NET ASSET VALUE AND OFFERING PRICE | | |
|
| Net asset value and redemption price per class A share | | |
| ($433,648,063 divided by 67,787,285 shares) | | $6.40 |
|
| Offering price per class A share | | |
| (100/96.25 of $6.40)* | | $6.65 |
|
| Net asset value and offering price per class B share | | |
| ($14,302,794 divided by 2,266,795 shares)** | | $6.31 |
|
| Net asset value and redemption price per class C share | | |
| ($41,108 divided by 6,519 shares)** | | $6.31 |
|
| Net asset value and redemption price per class M share | | |
| ($319,845,331 divided by 49,940,870 shares) | | $6.40 |
|
| Offering price per class M share | | |
| (100/96.75 of $6.40)*** | | $6.61 |
|
| Net asset value, offering price and redemption price per class R share | | |
| ($1,018 divided by 159 shares) | | $6.40 |
|
| Net asset value, offering price and redemption price per class Y share | | |
| ($17,735,917 divided by 2,711,868 shares) | | $6.54 |
* On single retail sales of less than $100,000. On sales of $100,000 or more the offering price is reduced.
** Redemption price per share is equal to net asset value less any applicable contingent deferred sales charge.
*** On single retail sales of less than $50,000. On sales of $50,000 or more the offering price is reduced.
The accompanying notes are an integral part of these financial statements.
52
Statement of operations Six months ended 5/31/07 (Unaudited)
| |
| INVESTMENT INCOME | |
|
| Interest (including interest income of $1,083,374 | |
| from investments in affiliated issuers) (Note 5) | $ 31,580,733 |
|
| Securities lending | 6,372 |
|
| Total investment income | 31,587,105 |
|
| |
| EXPENSES | |
|
| Compensation of Manager (Note 2) | 2,634,465 |
|
| Investor servicing fees (Note 2) | 386,070 |
|
| Custodian fees (Note 2) | 57,523 |
|
| Trustee compensation and expenses (Note 2) | 36,169 |
|
| Administrative services (Note 2) | 16,234 |
|
| Distribution fees — Class A (Note 2) | 541,571 |
|
| Distribution fees — Class B (Note 2) | 74,606 |
|
| Distribution fees — Class C (Note 2) | 27 |
|
| Distribution fees — Class M (Note 2) | 837,724 |
|
| Distribution fees — Class R (Note 2) | 1 |
|
| Other | 215,428 |
|
| Non-recurring cost (Notes 2 and 8) | 476 |
|
| Cost assumed by Manager (Notes 2 and 8) | (476) |
|
| Fees waived and reimbursed by Manager (Note 5) | (17,340) |
|
| Total expenses | 4,782,478 |
|
| Expense reduction (Note 2) | (107,544) |
|
| Net expenses | 4,674,934 |
|
| Net investment income | 26,912,171 |
|
| Net realized gain on investments (Notes 1 and 3) | 38,787,031 |
|
| Net increase from payments by affiliate (Note 2) | 68,401 |
|
| Net realized gain on swap contracts (Note 1) | 582,423 |
|
| Net realized loss on foreign currency transactions (Note 1) | (412,990) |
|
| Net unrealized appreciation of assets and liabilities | |
| in foreign currencies during the period | 489,354 |
|
| Net unrealized depreciation of investments | |
| and swap contracts during the period | (13,813,738) |
|
| Net gain on investments | 25,700,481 |
|
| Net increase in net assets resulting from operations | $ 52,612,652 |
The accompanying notes are an integral part of these financial statements.
53
Statement of changes in net assets
| | |
| DECREASE IN NET ASSETS | | |
|
| | Six months ended | Year ended |
| | 5/31/07* | 11/30/06 |
|
| Operations: | | |
| Net investment income | $ 26,912,171 | $ 63,055,692 |
|
| Net realized gain (loss) on investments | | |
| and foreign currency transactions | 39,024,865 | (4,750,603) |
|
| Net unrealized appreciation (depreciation) of investments | | |
| and assets and liabilities in foreign currencies | (13,324,384) | 35,937,325 |
|
| Net increase in net assets resulting from operations | 52,612,652 | 94,242,414 |
|
| Distributions to shareholders: (Note 1) | | |
|
| From ordinary income | | |
|
| Net investment income | | |
|
| Class A | (16,540,993) | (30,716,391) |
|
| Class B | (535,268) | (1,640,684) |
|
| Class C | (167) | — |
|
| Class M | (12,577,238) | (26,501,892) |
|
| Class R | (10) | — |
|
| Class Y | (433,375) | (657,482) |
|
| Redemption fees (Note 1) | 9,576 | 10,834 |
|
| Decrease from capital share transactions (Note 4) | (47,079,964) | (162,931,570) |
|
| Total decrease in net assets | (24,544,787) | (128,194,771) |
|
| |
| NET ASSETS | | |
| Beginning of period | 810,119,018 | 938,313,789 |
|
| End of period (including undistributed net investment | | |
| income of $5,753,989 and $8,928,869, respectively) | $785,574,231 | $ 810,119,018 |
* Unaudited
The accompanying notes are an integral part of these financial statements.
54
This page left blank intentionally.
55
Financial highlights (For a common share outstanding throughout the period)
| | | | | | | | | | | | | | |
| INVESTMENT OPERATIONS: | | | | LESS DISTRIBUTIONS: | | | | | RATIOS AND SUPPLEMENTAL DATA: |
| | | | | | | | | | | | | | |
| | | | Net | | | | | | | Total | | | Ratio of net | |
| | Net asset | | realized and | Total | From | | | | Net asset | return | Net | Ratio of | investment | |
| | value, | Net | unrealized | from | net | From | | | value, | at net | assets, | expenses to | income (loss) | Portfolio |
| | beginning | investment | gain (loss) on | investment | investment | return of | Total | Redemption | end | asset | end of period | average net | to average | turnover |
| Period ended | of period | income (loss)(a) | investments | operations | income | capital | distributions | fees | of period | value (%)(b) | (in thousands) | assets (%)(c) | net assets (%) | (%) |
|
| CLASS A | | | | | | | | | | | | | | |
| May 31, 2007** | $6.22 | .22(d) | .20 | .42 | (.24) | — | (.24) | —(f) | $6.40 | 6.90* | $433,648 | .54* (d) | 3.44* (d) | 40.32* |
| November 30, 2006 | 5.97 | .45(d,e) | .22 | .67 | (.42) | — | (.42) | —(f) | 6.22 | 11.71 | 433,782 | 1.04(d,e) | 7.41(d,e) | 45.62 |
| November 30, 2005 | 6.16 | .43(d) | (.21) | .22 | (.41) | — | (.41) | —(f) | 5.97 | 3.67 | 440,780 | 1.04(d) | 7.07(d) | 33.37 |
| November 30, 2004 | 5.88 | .43(d) | .29 | .72 | (.44) | — | (.44) | —(f) | 6.16 | 12.72 | 484,372 | 1.07(d) | 7.22(d) | 53.33 |
| November 30, 2003 | 5.17 | .48 | .73 | 1.21 | (.50) | — | (.50) | — | 5.88 | 24.65 | 507,140 | 1.03 | 8.61 | 78.78 |
| November 30, 2002 | 5.84 | .56 | (.62) | (.06) | (.58) | (.03) | (.61) | — | 5.17 | (.93) | 462,586 | 1.03 | 10.35 | 60.35 |
|
| |
| CLASS B | | | | | | | | | | | | | | |
| May 31, 2007** | $6.14 | .19(d) | .20 | .39 | (.22) | — | (.22) | —(f) | $6.31 | 6.42* | $14,303 | .92* (d) | 3.07* (d) | 40.32* |
| November 30, 2006 | 5.89 | .39(d,e) | .23 | .62 | (.37) | — | (.37) | —(f) | 6.14 | 10.98 | 16,530 | 1.79(d,e) | 6.69(d,e) | 45.62 |
| November 30, 2005 | 6.08 | .38(d) | (.21) | .17 | (.36) | — | (.36) | —(f) | 5.89 | 2.91 | 46,602 | 1.79(d) | 6.30(d) | 33.37 |
| November 30, 2004 | 5.81 | .38(d) | .28 | .66 | (.39) | — | (.39) | —(f) | 6.08 | 11.84 | 123,263 | 1.82(d) | 6.50(d) | 53.33 |
| November 30, 2003 | 5.12 | .43 | .72 | 1.15 | (.46) | — | (.46) | — | 5.81 | 23.56 | 199,990 | 1.78 | 7.94 | 78.78 |
| November 30, 2002 | 5.79 | .52 | (.62) | (.10) | (.54) | (.03) | (.57) | — | 5.12 | (1.71) | 258,113 | 1.78 | 9.58 | 60.35 |
|
| |
| CLASS C | | | | | | | | | | | | | | |
| May 31, 2007†** | $6.27 | .07(d) | .03 | .10 | (.06) | — | (.06) | —(f) | $6.31 | 1.67* | $41 | .32* (d) | 1.08* (d) | 40.32* |
|
| |
| CLASS M | | | | | | | | | | | | | | |
| May 31, 2007** | $6.23 | .21(d) | .20 | .41 | (.24) | — | (.24) | —(f) | $6.40 | 6.62* | $319,845 | .67* (d) | 3.32* (d) | 40.32* |
| November 30, 2006 | 5.98 | .43(d,e) | .23 | .66 | (.41) | — | (.41) | —(f) | 6.23 | 11.47 | 349,881 | 1.29(d,e) | 7.17(d,e) | 45.62 |
| November 30, 2005 | 6.17 | .41(d) | (.20) | .21 | (.40) | — | (.40) | —(f) | 5.98 | 3.46 | 430,521 | 1.29(d) | 6.82(d) | 33.37 |
| November 30, 2004 | 5.89 | .42(d) | .29 | .71 | (.43) | — | (.43) | —(f) | 6.17 | 12.47 | 573,455 | 1.32(d) | 6.98(d) | 53.33 |
| November 30, 2003 | 5.18 | .47 | .73 | 1.20 | (.49) | — | (.49) | — | 5.89 | 24.32 | 638,046 | 1.28 | 8.34 | 78.78 |
| November 30, 2002 | 5.85 | .55 | (.62) | (.07) | (.57) | (.03) | (.60) | — | 5.18 | (1.15) | 534,636 | 1.28 | 10.10 | 60.35 |
|
| |
| CLASS R | | | | | | | | | | | | | | |
| May 31, 2007†** | $6.35 | .10(d) | .02 | .12 | (.07) | — | (.07) | —(f) | $6.40 | 1.83* | $1 | .23* (d) | 1.56* (d) | 40.32* |
|
| |
| CLASS Y | | | | | | | | | | | | | | |
| May 31, 2007** | $6.35 | .23(d) | .21 | .44 | (.25) | — | (.25) | —(f) | $6.54 | 7.02* | $17,736 | .42* (d) | 3.54* (d) | 40.32* |
| November 30, 2006 | 6.08 | .47(d,e) | .23 | .70 | (.43) | — | (.43) | —(f) | 6.35 | 12.05 | 9,925 | .79(d,e) | 7.63(d,e) | 45.62 |
| November 30, 2005 | 6.27 | .45(d) | (.22) | .23 | (.42) | — | (.42) | —(f) | 6.08 | 3.80 | 20,411 | .79(d) | 7.31(d) | 33.37 |
| November 30, 2004 | 5.97 | .45(d) | .30 | .75 | (.45) | — | (.45) | —(f) | 6.27 | 13.09 | 26,684 | .82(d) | 7.46(d) | 53.33 |
| November 30, 2003 | 5.23 | .50 | .76 | 1.26 | (.52) | — | (.52) | — | 5.97 | 25.21 | 24,253 | .78 | 8.83 | 78.78 |
| November 30, 2002 | 5.88 | .59 | (.62) | (.03) | (.59) | (.03) | (.62) | — | 5.23 | (.36) | 15,562 | .78 | 10.60 | 60.35 |
|
See notes to financial highlights at the end of this section.
The accompanying notes are an integral part of these financial statements.
Financial highlights (Continued)
* Not annualized.
** Unaudited.
† For the period March 30, 2007 (commencement of operations) to May 31, 2007.
(a) Per share net investment income (loss) has been determined on the basis of the weighted average number of shares outstanding during the period.
(b) Total return assumes dividend reinvestment and does not reflect the effect of sales charges.
(c) Includes amounts paid through expense offset arrangements (Note 2).
(d) Reflects waivers of certain fund expenses in connection with investments in Putnam Prime Money Market Fund during the period. As a result of such waivers, the expenses of each class, reflect a reduction of the following amounts (Note 5):
| |
| | Percentage |
| | of average |
| | net assets |
|
| May 31, 2007 | <0.01% |
|
| November 30, 2006 | <0.01 |
|
| November 30, 2005 | <0.01 |
|
| November 30, 2004 | <0.01 |
|
(e) Reflects a non-recurring accrual related to a reimbursement to the fund from Putnam Investments relating to the calculation of certain amounts paid by the fund to Putnam in previous years for transfer agent services, which amounted to less than $0.01 per share and 0.01% of average net assets for the period ended November 30, 2006.
(f) Amount represents less than $0.01 per share.
The accompanying notes are an integral part of these financial statements.
58
Notes to financial statements 5/31/07 (Unaudited)
Note 1: Significant accounting policies
Putnam High Yield Advantage Fund (the “fund”), a Massachusetts business trust, is registered under the Investment Company Act of 1940, as amended, as a diversified, open-end management investment company. The fund seeks high current income primarily through a diversified portfolio of higher yielding, lower rated bonds that may have a higher rate of default. Capital growth is a secondary objective when consistent with the objective of high current income.
The fund offers class A, class B, class C, class M, class R and class Y shares. The fund began offering class C and class R shares on March 30, 2007. Class A and class M shares are sold with a maximum front-end sales charge of 3.75% and 3.25%, respectively, and generally do not pay a contingent deferred sales charge. Class B shares, which convert to class A shares after approximately eight years, do not pay a front-end sales charge and are subject to a contingent deferred sales charge if those shares are redeemed within six years of purchase. Class C shares have a one-year 1.00% contingent deferred sales charge and do not convert to class A shares. Class R shares, which are offered to qualified employee-benefit plans, are sold without a front-end sales charge or a contingent deferred sales charge. The expenses for class A, class B, class C, class M and class R shares may differ based on the distribution fee of each class, which is identified in Note 2. Class Y share s, which are sold at net asset value, are generally subject to the same expenses as class A, class B, class C, class M and class R shares, but do not bear a distribution fee. Class Y shares are sold to certain eligible purchasers including certain defined contribution plans (including corporate IRAs), bank trust departments and trust companies.
Effective October 2, 2006, a 1.00% redemption fee may apply on any shares purchased on or after such date that are redeemed (either by selling or exchanging into another fund) within 90 days of purchase. The redemption fee is accounted for as an addition to paid-in-capital. Prior to October 2, 2006, a 2.00% redemption fee applied to any shares that were redeemed (either by selling or exchanging into another fund) within 5 days of purchase. A 1.00% redemption fee applied to any shares that were redeemed (either by selling or exchanging into another fund) within 6–90 days of purchase.
Investment income, realized and unrealized gains and losses and expenses of the fund are borne pro-rata based on the relative net assets of each class to the total net assets of the fund, except that each class bears expenses unique to that class (including the distribution fees applicable to such classes). Each class votes as a class only with respect to its own distribution plan or other matters on which a class vote is required by law or determined by the Trustees. If the fund were liquidated, shares of each class would receive their pro-rata share of the net assets of the fund. In addition, the Trustees declare separate dividends on each class of shares.
In the normal course of business, the fund enters into contracts that may include agreements to indemnify another party under given circumstances. The fund’s maximum exposure under these arrangements is unknown as this would involve future claims that may be, but have not yet been, made against the fund. However, the fund expects the risk of material loss to be remote.
The following is a summary of significant accounting policies consistently followed by the fund in the preparation of its financial statements. The preparation of financial statements is in conformity with accounting principles generally accepted in the United States of America and requires management to make estimates and assumptions that affect the reported amounts of assets and liabilities in the financial statements and the reported amounts of increases and decreases in net assets from operations during the reporting period. Actual results could differ from those estimates.
A) Security valuation Market quotations are not considered to be readily available for certain debt obligations; such investments are valued on the basis of valuations furnished by an independent pricing service approved by the Trustees or
59
dealers selected by Putnam Investment Management, LLC (“Putnam Management”), the fund’s manager, an indirect wholly-owned subsidiary of Putnam, LLC. Such services or dealers determine valuations for normal institutional-size trading units of such securities using methods based on market transactions for comparable securities and various relationships, generally recognized by institutional traders, between securities. Securities quoted in foreign currencies, if any, are translated into U.S. dollars at the current exchange rate. Certain investments, including certain restricted securities, are also valued at fair value following procedures approved by the Trustees. Such valuations and procedures are reviewed periodically by the Trustees. The fair value of securities is generally determined as the amount that the fund could reasonably expect to realize from an orderly disposition of such securities over a reasonable period of time. By its nature, a fair value price is a good faith estimate of the value of a security at a given point in time and does not reflect an actual market price, which may be different by a material amount.
B) Joint trading account Pursuant to an exemptive order from the Securities and Exchange Commission (the “SEC”), the fund may transfer uninvested cash balances, including cash collateral received under security lending arrangements, into a joint trading account along with the cash of other registered investment companies and certain other accounts managed by Putnam Management. These balances may be invested in issues of high-grade short-term investments having maturities of up to 397 days for collateral received under security lending arrangements and up to 90 days for other cash investments.
C) Repurchase agreements The fund, or any joint trading account, through its custodian, receives delivery of the underlying securities, the market value of which at the time of purchase is required to be in an amount at least equal to the resale price, including accrued interest. Collateral for certain tri-party repurchase agreements is held at the counterparty’s custodian in a segregated account for the benefit of the fund and the counterparty. Putnam Management is responsible for determining that the value of these underlying securities is at all times at least equal to the resale price, including accrued interest.
D) Security transactions and related investment income Security transactions are recorded on the trade date (the date the order to buy or sell is executed). Gains or losses on securities sold are determined on the identified cost basis. Interest income is recorded on the accrual basis. All premiums/discounts are amortized/accreted on a yield-to-maturity basis. Securities purchased or sold on a forward commitment basis may be settled a month or more after the trade date; interest income is accrued based on the terms of the securities. Losses may arise due to changes in the market value of the underlying securities or if the counterparty does not perform under the contract. The fund earned certain fees in connection with its senior loan purchasing activities. These fees are treated as market discount and are recorded as income in the Statement of operations.
E) Foreign currency translation The accounting records of the fund are maintained in U.S. dollars. The market value of foreign securities, currency holdings, and other assets and liabilities are recorded in the books and records of the fund after translation to U.S. dollars based on the exchange rates on that day. The cost of each security is determined using historical exchange rates. Income and withholding taxes are translated at prevailing exchange rates when earned or incurred. The fund does not isolate that portion of realized or unrealized gains or losses resulting from changes in the foreign exchange rate on investments from fluctuations arising from changes in the market prices of the securities. Such gains and losses are included with the net realized and unrealized gain or loss on investments. Net realized gains and losses on foreign currency transactions represent net realized exchange gains or losses on closed f orward currency contracts, disposition of foreign currencies, currency gains and losses realized between the trade and settlement dates on securities transactions
60
and the difference between the amount of investment income and foreign withholding taxes recorded on the fund’s books and the U.S. dollar equivalent amounts actually received or paid. Net unrealized appreciation and depreciation of assets and liabilities in foreign currencies arise from changes in the value of open forward currency contracts and assets and liabilities other than investments at the period end, resulting from changes in the exchange rate. Investments in foreign securities involve certain risks, including those related to economic instability, unfavorable political developments, and currency fluctuations, not present with domestic investments.
F) Forward currency contracts The fund may buy and sell forward currency contracts, which are agreements between two parties to buy and sell currencies at a set price on a future date. These contracts are used to protect against a decline in value relative to the U.S. dollar of the currencies in which its portfolio securities are denominated or quoted (or an increase in the value of a currency in which securities a fund intends to buy are denominated, when a fund holds cash reserves and short term investments), or for other investment purposes. The U.S. dollar value of forward currency contracts is determined using current forward currency exchange rates supplied by a quotation service. The market value of the contract will fluctuate with changes in currency exchange rates. The contract is marked to market daily and the change in market value is recorded as an unrealized gain or loss. When the contract is closed, the fund r ecords a realized gain or loss equal to the difference between the value of the contract at the time it was opened and the value at the time it was closed. The fund could be exposed to risk if the value of the currency changes unfavorably, if the counterparties to the contracts are unable to meet the terms of their contracts or if the fund is unable to enter into a closing position. Risks may exceed amounts recognized on the Statement of assets and liabilities. Forward currency contracts outstanding at period end, if any, are listed after the fund’s portfolio.
G) Credit default contracts The fund may enter into credit default contracts where one party, the protection buyer, makes an upfront or periodic payment to a counter party, the protection seller, in exchange for the right to receive a contingent payment. The maximum amount of the payment may equal the notional amount, at par, of the underlying index or security as a result of a related credit event. Payments are made upon a credit default event of the disclosed primary referenced obligation or all other equally ranked obligations of the reference entity. An upfront payment received by the fund, as the protection seller, is recorded as a liability on the fund’s books. An upfront payment made by the fund, as the protection buyer, is recorded as an asset on the fund’s books. Periodic payments received or paid by the fund are recorded as realized gains or losses. The credit default contracts are marked to market daily based upon quotations from an independent pricing service or market makers and the change, if any, is recorded as unrealized gain or loss. Payments received or made as a result of a credit event or termination of the contract are recognized, net of a proportional amount of the upfront payment, as realized gains or losses. In addition to bearing the risk that the credit event will occur, the fund could be exposed to market risk due to unfavorable changes in interest rates or in the price of the underlying security or index, the possibility that the fund may be unable to close out its position at the same time or at the same price as if it had purchased comparable publicly traded securities or that the counterparty may default on its obligation to perform. Risks of loss may exceed amounts recognized on the Statement of assets and liabilities. Credit default contracts outstanding at period end, if any, are listed after the fund’s portfolio.
H) Securities lending The fund may lend securities, through its agents, to qualified borrowers in order to earn additional income. The loans are collateralized by cash and/or securities in an amount at least equal to the market value of the securities loaned. The market value of securities
61
loaned is determined daily and any additional required collateral is allocated to the fund on the next business day. The risk of borrower default will be borne by the fund’s agents; the fund will bear the risk of loss with respect to the investment of the cash collateral. Income from securities lending is included in investment income on the Statement of operations. At May 31, 2007, the value of securities loaned amounted to $8,327,826. The fund received cash collateral of $8,521,550 which is pooled with collateral of other Putnam funds into 47 issues of high-grade short-term investments.
I) Federal taxes It is the policy of the fund to distribute all of its taxable income within the prescribed time and otherwise comply with the provisions of the Internal Revenue Code of 1986 (the “Code”) applicable to regulated investment companies. It is also the intention of the fund to distribute an amount sufficient to avoid imposition of any excise tax under Section 4982 of the Code, as amended. Therefore, no provision has been made for federal taxes on income, capital gains or unrealized appreciation on securities held nor for excise tax on income and capital gains.
At November 30, 2006 , the fund had a capital loss carryover of $1,287,196,863 available to the extent allowed by the Code to offset future net capital gain, if any. The amount of the carryover and the expiration dates are:
| |
| Loss Carryover | Expiration |
|
| $286,189,145 | November 30, 2007 |
|
| 217,396,296 | November 30, 2008 |
|
| 265,227,969 | November 30, 2009 |
|
| 309,407,794 | November 30, 2010 |
|
| 104,325,628 | November 30, 2011 |
|
| 95,929,758 | November 30, 2012 |
|
| 8,720,273 | November 30, 2014 |
|
The aggregate identified cost on a tax basis is $758,007,803, resulting in gross unrealized appreciation and depreciation of $24,011,327 and $1,083,316, respectively, or net unrealized appreciation of $22,928,011.
J) Distributions to shareholders Distributions to shareholders from net investment income are recorded by the fund on the ex-dividend date. Distributions from capital gains, if any, are recorded on the ex-dividend date and paid at least annually. The amount and character of income and gains to be distributed are determined in accordance with income tax regulations, which may differ from generally accepted accounting principles. Dividend sources are estimated at the time of declaration. Actual results may vary. Any non-taxable return of capital cannot be determined until final tax calculations are completed after the end of the fund’s fiscal year. Reclassifications are made to the fund’s capital accounts to reflect income and gains available for distribution (or available capital loss carryovers) under income tax regulations.
Note 2: Management fee, administrative
services and other transactions
Putnam Management is paid for management and investment advisory services quarterly based on the average net assets of the fund. Such fee is based on the following annual rates: 0.70% of the first $500 million of average net assets, 0.60% of the next $500 million, 0.55% of the next $500 million, 0.50% of the next $5 billion, 0.475% of the next $5 billion, 0.455% of the next $5 billion, 0.44% of the next $5 billion, and 0.43% thereafter.
Putnam Management has agreed to waive fees and reimburse expenses of the fund through November 30, 2007 to the extent necessary to ensure that the fund’s expenses do not exceed the simple average of the expenses of all front-end load funds viewed by Lipper Inc. as having the same investment classification or objective as the fund. The expense reimbursement is based on a comparison of the fund’s expenses with the average annualized operating expenses of the funds in its Lipper peer group for each calendar quarter during the fund’s last fiscal year, excluding 12b-1 fees and without giving effect to any expense offset and brokerage service arrangements that
62
may reduce fund expenses. For the period ended May 31, 2007, Putnam Management did not waive any of its management fee from the fund.
For the period ended May 31, 2007, Putnam Management has assumed $476 of legal, shareholder servicing and communication, audit and Trustee fees incurred by the fund in connection with certain legal and regulatory matters (including those described in Note 8).
Putnam Investments Limited (“PIL”), an affiliate of Putnam Management, is authorized by the Trustees to manage a separate portion of the assets of the fund as determined by Putnam Management from time to time. Putnam Management pays a quarterly sub-management fee to PIL for its services at an annual rate of 0.40% of the average net assets of the portion of the fund managed by PIL.
Putnam Management voluntarily reimbursed the fund $68,401 for a trading error which occurred during the period. The effect of the losses incurred and the reimbursement by Putnam Management of such losses had no impact on total return.
The fund reimburses Putnam Management an allocated amount for the compensation and related expenses of certain officers of the fund and their staff who provide administrative services to the fund. The aggregate amount of all such reimbursements is determined annually by the Trustees.
Custodial functions for the fund’s assets were provided by Putnam Fiduciary Trust Company (“PFTC”), a subsidiary of Putnam, LLC, and by State Street Bank and Trust Company. Custody fees are based on the fund’s asset level, the number of its security holdings and transaction volumes. Putnam Investor Services, a division of PFTC, provided investor servicing agent functions to the fund. Putnam Investor Services received fees for investor servicing based on the number of shareholder accounts in the fund and the level of defined contribution plan assets in the fund. During the period ended May 31, 2007, the fund incurred $435,270 for custody and investor servicing agent functions provided by PFTC.
The fund has entered into arrangements with PFTC and State Street Bank and Trust Company whereby PFTC’s and State Street Bank and Trust Company’s fees are reduced by credits allowed on cash balances. For the six months ended May 31, 2007, the fund's expenses were reduced by $107,544 under these arrangements.
Each independent Trustee of the fund receives an annual Trustee fee, of which $406, as a quarterly retainer, has been allocated to the fund, and an additional fee for each Trustees meeting attended. Trustees receive additional fees for attendance at certain committee meetings, industry seminars and for certain compliance-related matters. Trustees also are reimbursed for expenses they incur relating to their services as Trustees. George Putnam, III, who was not an independent Trustee during the period, also receives the foregoing fees for his services as Trustee.
The fund has adopted a Trustee Fee Deferral Plan (the “Deferral Plan”) which allows the Trustees to defer the receipt of all or a portion of Trustees fees payable on or after July 1, 1995. The deferred fees remain invested in certain Putnam funds until distribution in accordance with the Deferral Plan.
The fund has adopted an unfunded noncontributory defined benefit pension plan (the “Pension Plan”) covering all Trustees of the fund who have served as a Trustee for at least five years and were first elected prior to 2004. Benefits under the Pension Plan are equal to 50% of the Trustee’s average annual attendance and retainer fees for the three years ended December 31, 2005. The retirement benefit is payable during a Trustee’s lifetime, beginning the year following retirement, for the number of years of service through December 31, 2006. Pension expense for the fund is included in Trustee compensation and expenses in the Statement of operations. Accrued pension liability is included in Payable for Trustee compensation and expenses in the Statement of assets and liabilities. The Trustees have terminated the
63
Pension Plan with respect to any Trustee first elected after 2003.
The fund has adopted distribution plans (the “Plans”) with respect to its class A, class B, class C, class M and class R shares pursuant to Rule 12b-1 under the Investment Company Act of 1940. The purpose of the Plans is to compensate Putnam Retail Management, a wholly-owned subsidiary of Putnam, LLC and Putnam Retail Management GP, Inc., for services provided and expenses incurred in distributing shares of the fund. The Plans provide for payments by the fund to Putnam Retail Management at an annual rate of up to 0.35%, 1.00%, 1.00% , 1.00% and 1.00% of the average net assets attributable to class A, class B, class C, class M and class R shares, respectively. The Trustees have approved payment by the fund at an annual rate of 0.25%, 1.00%, 1.00%, 0.50% and 0.50% of the average net assets attributable to class A, class B, class C, class M and class R shares, respectively. For the six months ended May 31, 2007, Putnam Retail Management, acting as underwriter , received net commissions of $8,756 and $165 from the sale of class A and class M shares, respectively, and received $4,772 and no monies in contingent deferred sales charges from redemptions of class B and class C shares, respectively.
A deferred sales charge of up to 1.00% and 0.40% is assessed on certain redemptions of class A and class M shares, respectively. For the six months ended May 31, 2007, Putnam Retail Management, acting as underwriter, received no monies on class A and class M redemptions, respectively.
Note 3: Purchases and sales of securities
During the six months ended May 31, 2007, cost of purchases and proceeds from sales of investment securities other than short-term investments aggregated $301,591,413 and $378,705,950, respectively. There were no purchases or sales of U.S. government securities.
Note 4: Capital shares
At May 31, 2007, there was an unlimited number of shares of beneficial interest authorized. Transactions in capital shares were as follows:
| | | | |
| CLASS A | | Shares | | Amount |
|
| Six months ended 5/31/07: | | |
| Shares sold | | 3,902,344 | $ | 24,691,052 |
|
| Shares issued | | | | |
| in connection | | | | |
| with reinvestment | | | | |
| of distributions | | 1,786,320 | | 11,223,628 |
|
| | | 5,688,664 | | 35,914,680 |
|
| Shares | | | | |
| repurchased | | (7,652,840) | | (48,382,720) |
|
| Net decrease | | (1,964,176) | $ | (12,468,040) |
| |
| Year ended 11/30/06: | | |
| Shares sold | | 9,407,143 | $ | 56,566,960 |
|
| Shares issued | | | | |
| in connection | | | | |
| with reinvestment | | | | |
| of distributions | | 3,340,140 | | 20,100,869 |
|
| | | 12,747,283 | | 76,667,829 |
|
| Shares | | | | |
| repurchased | | (16,874,475) | (101,829,737) |
|
| Net decrease | | (4,127,192) | $ | (25,161,908) |
64
| | | | |
| CLASS B | | Shares | | Amount |
|
| Six months ended 5/31/07: | | |
| Shares sold | | 318,645 | | 1,999,885 |
|
| Shares issued | | | | |
| in connection | | | | |
| with reinvestment | | | | |
| of distributions | | 50,177 | | 310,888 |
|
| | | 368,822 | | 2,310,773 |
|
| Shares | | | | |
| repurchased | | (796,033) | | (4,949,711) |
|
| Net decrease | | (427,211) | | (2,638,938) |
| |
| Year ended 11/30/06: | | | | |
| Shares sold | | 60,277 | $ | 358,109 |
|
| Shares issued | | | | |
| in connection | | | | |
| with reinvestment | | | | |
| of distributions | | 154,421 | | 915,469 |
|
| | | 214,698 | | 1,273,578 |
|
| Shares | | | | |
| repurchased | | (5,434,629) | | (32,208,035) |
|
| Net decrease | | (5,219,931) | $ | (30,934,457) |
|
| |
| CLASS C | | Shares | | Amount |
|
| For the period 3/30/07 (commencement of operations) |
| to 5/31/07: | | | | |
| Shares sold | | 6,774 | $ | 42,605 |
|
| Shares issued | | | | |
| in connection | | | | |
| with reinvestment | | | | |
| of distributions | | 27 | | 167 |
|
| | | 6,801 | | 42,772 |
|
| Shares | | | | |
| repurchased | | (282) | | (1,778) |
|
| Net increase | | 6,519 | $ | 40,994 |
| | | | |
| CLASS M | | Shares | | Amount |
|
| Six months ended 5/31/07: | | |
| Shares sold | | 94,006 | $ | 593,442 |
|
| Shares issued | | | | |
| in connection | | | | |
| with reinvestment | | | | |
| of distributions | | 33,354 | | 209,843 |
|
| | | 127,360 | | 803,285 |
|
| Shares | | | | |
| repurchased | | (6,367,742) | (40,295,029) |
|
| Net decrease | | (6,240,382) | $ (39,491,744) |
| |
| Year ended 11/30/06: | | |
| Shares sold | | 728,276 | $ | 4,413,472 |
|
| Shares issued | | | | |
| in connection | | | | |
| with reinvestment | | | | |
| of distributions | | 68,756 | | 414,512 |
|
| | | 797,032 | | 4,827,984 |
|
| Shares | | | | |
| repurchased | | (16,645,915) | (100,744,961) |
|
| Net decrease | | (15,848,883) | $ (95,916,977) |
|
| |
| CLASS R | | Shares | | Amount |
|
| For the period 3/30/07 (commencement of operations) |
| to 5/31/07: | | | | |
| Shares sold | | 157 | $ | 1,000 |
|
| Shares issued | | | | |
| in connection | | | | |
| with reinvestment | | | | |
| of distributions | | 2 | | 10 |
|
| | | 159 | | 1,010 |
|
| Shares | | | | |
| repurchased | | — | | — |
|
| Net increase | | 159 | $ | 1,010 |
65
| | | | |
| CLASS Y | | Shares | | Amount |
|
| Six months ended 5/31/07: | | |
| Shares sold | | 1,280,981 | $ | 8,325,520 |
|
| Shares issued | | | | |
| in connection | | | | |
| with reinvestment | | | | |
| of distributions | | 66,710 | | 429,060 |
|
| | | 1,347,691 | | 8,754,580 |
|
| Shares | | | | |
| repurchased | | (198,813) | | (1,277,826) |
|
| Net increase | | 1,148,878 | $ | 7,476,754 |
| |
| Year ended 11/30/06: | | | | |
| Shares sold | | 215,290 | $ | 1,325,604 |
|
| Shares issued | | | | |
| in connection | | | | |
| with reinvestment | | | | |
| of distributions | | 99,097 | | 608,551 |
|
| | | 314,387 | | 1,934,155 |
|
| Shares | | | | |
| repurchased | | (2,108,299) | (12,852,383) |
|
| Net decrease | | (1,793,912) | $ | (10,918,228) |
At May 31, 2007, Putnam, LLC owned 161 class C shares and 159 class R shares of the fund (2.5% of class C shares and 100% of class R shares outstanding), valued at $1,016 and $1,018, respectively.
Note 5: Investment in Putnam Prime Money Market Fund
The fund invests in Putnam Prime Money Market Fund, an open-end management investment company managed by Putnam Management. Investments in Putnam Prime Money Market Fund are valued at its closing net asset value each business day. Management fees paid by the fund are reduced by an amount equal to the management and administrative services fees paid by Putnam Prime Money Market Fund with respect to assets invested by the fund in Putnam Prime Money Market Fund. For the period ended May 31, 2007, management fees paid were reduced by $17,340 relating to the fund’s investment in Putnam Prime Money Market Fund. Income distributions earned by the fund are recorded as income in the Statement of operations and totaled $1,083,374 for the period ended May 31, 2007. During the period ended May 31, 2007, cost of purchases and proceeds of sales of investments in Putnam Prime Money Market Fund aggregated $148,517,407 and $126,536,794, respe ctively.
Note 6: Senior loan commitments
Senior loans are purchased or sold on a when-issued or delayed delivery basis and may be settled a month or more after the trade date, which from time to time can delay the actual investment of available cash balances; interest income is accrued based on the terms of the securities. Senior loans can be acquired through an agent, by assignment from another holder of the loan, or as a participation interest in another holder’s portion of the loan. When the fund invests in a loan or participation, the fund is subject to the risk that an intermediate participant between the fund and the borrower will fail to meet its obligations to the fund, in addition to the risk that the borrower under the loan may default on its obligations.
Note7: Unfunded loan commitments
As of May 31, 2007, the fund had unfunded loan commitments of $39,866, which could be extended at the option of the borrower, pursuant to the following loan agreements with the following borrowers:
| |
| Borrower | Unfunded Commitments |
| |
| Univision | |
| Communications, Inc. | $39,866 |
|
Note 8: Regulatory matters and litigation
In late 2003 and 2004, Putnam Management settled charges brought by the Securities and Exchange Commission (the “SEC”) and the Massachusetts Securities Division (“MSD”) in connection with excessive short-term trading by certain former Putnam employees and, in the case of charges
66
brought by the MSD, excessive short-term trading by participants in some Putnam-administered 401(k) plans. Putnam Management agreed to pay $193.5 million in penalties and restitution, of which $153.5 million will be distributed to certain open-end Putnam funds and their shareholders after the SEC and MSD approve a distribution plan being developed by an independent consultant. The allegations of the SEC and MSD and related matters have served as the general basis for certain lawsuits, including purported class action lawsuits filed against Putnam Management and, in a limited number of cases, against some Putnam funds. Putnam Management believes that these lawsuits will have no material adverse effect on the funds or on Putnam Management’s ability to provide investment management services. In addition, Putnam Management has agreed to bear any costs incurred by the Putnam funds as a result of these matters.
Putnam Management and Putnam Retail Management are named as defendants in a civil suit in which the plaintiffs allege that the management and distribution fees paid by certain Putnam funds were excessive and seek recovery under the Investment Company Act of 1940. Putnam Management and Putnam Retail Management have contested the plaintiffs’ claims and the matter is currently pending in the U.S. District Court for the District of Massachusetts. Based on currently available information, Putnam Management believes that this action is without merit and that it is unlikely to have a material effect on Putnam Management’s and Putnam Retail Management’s ability to provide services to their clients, including the fund.
Note 9: New accounting pronouncements
In June 2006, the Financial Accounting Standards Board (“FASB”) issued Interpretation No. 48, Accounting for Uncertainty in Income Taxes (the “Interpretation”). The Interpretation prescribes a minimum threshold for financial statement recognition of the benefit of a tax position taken or expected to be taken by a filer in the filer’s tax return. The Interpretation is not expected to have a material effect on the fund's financial statements. However, the conclusions regarding the Interpretation may be subject to review and adjustment at a later date based on factors including, but not limited to, further implementation guidance expected from the FASB, and on-going analysis of tax laws, regulations and interpretations thereof.
In September 2006, the FASB issued Statement of Financial Accounting Standards No. 157, Fair Value Measurements (the “Standard”). The Standard defines fair value, sets out a framework for measuring fair value and requires additional disclosures about fair value measurements. The Standard applies to fair value measurements already required or permitted by existing standards. The Standard is effective for financial statements issued for fiscal years beginning after November 15, 2007 and interim periods within those fiscal years. Putnam Management is currently evaluating what impact the adoption of the Standard will have on the fund’s financial statements.
67
Shareholder meeting results (Unaudited)
May 15, 2007 meeting
A proposal to approve a new management contract between the fund and Putnam Investment Management, LLC was approved as follows:
| | |
| Votes for | Votes against | Abstentions |
|
| 97,888,469 | 1,800,377 | 2,245,360 |
|
All tabulations rounded to the nearest whole number.
68
Fund information
Founded nearly 70 years ago, Putnam Investments was built around the concept that a balance between risk and reward is the hallmark of a well-rounded financial program. We manage over 100 mutual funds in growth, value, blend, fixed income, and international.
| | |
| Investment Manager | Robert E. Patterson | James P. Pappas |
| Putnam Investment | George Putnam, III | Vice President |
| Management, LLC | W. Thomas Stephens | |
| One Post Office Square | Richard B. Worley | Richard S. Robie, III |
| Boston, MA 02109 | | Vice President |
| Officers | |
| Investment Sub-Manager | Charles E. Haldeman, Jr. | Francis J. McNamara, III |
| Putnam Investments Limited | President | Vice President and |
| 57-59 St. James’s Street | | Chief Legal Officer |
| London, England SW1A 1LD | Charles E. Porter | |
| Executive Vice President, | Robert R. Leveille |
| Marketing Services | Principal Executive Officer, | Vice President and |
| Putnam Retail Management | Associate Treasurer and | Chief Compliance Officer |
| One Post Office Square | Compliance Liaison | |
| Boston, MA 02109 | | Mark C. Trenchard |
| Jonathan S. Horwitz | Vice President and |
| Custodian | Senior Vice President | BSA Compliance Officer |
| State Street Bank | and Treasurer | |
| and Trust Company | | Judith Cohen |
| Steven D. Krichmar | Vice President, Clerk and |
| Legal Counsel | Vice President and Principal | Assistant Treasurer |
| Ropes & Gray LLP | Financial Officer | |
| | Wanda M. McManus |
| Trustees | Janet C. Smith | Vice President, Senior Associate |
| John A. Hill, Chairman | Vice President, Principal | Treasurer and Assistant Clerk |
| Jameson Adkins Baxter, | Accounting Officer and | |
| Vice Chairman | Assistant Treasurer | Nancy E. Florek |
| Charles B. Curtis | | Vice President, Assistant Clerk, |
| Myra R. Drucker | Susan G. Malloy | Assistant Treasurer |
| Charles E. Haldeman, Jr. | Vice President and | and Proxy Manager |
| Paul L. Joskow | Assistant Treasurer | |
| Elizabeth T. Kennan | | |
| Kenneth R. Leibler | Beth S. Mazor | |
| Vice President | |
| | |
| | |
This report is for the information of shareholders of Putnam High Yield Advantage Fund. It may also be used as sales literature when preceded or accompanied by the current prospectus, the most recent copy of Putnam’s Quarterly Performance Summary, and Putnam’s Quarterly Ranking Summary. For more recent performance, please visit www.putnam.com. Investors should carefully consider the investment objective, risks, charges, and expenses of a fund, which are described in its prospectus. For this and other information or to request a prospectus, call 1-800-225-1581 toll free. Please read the prospectus carefully before investing. The fund’s Statement of Additional Information contains additional information about the fund’s Trustees and is available without charge upon request by calling 1-800-225-1581.

Item 2. Code of Ethics:
Not applicable
Item 3. Audit Committee Financial Expert:
Not applicable
Item 4. Principal Accountant Fees and Services:
Not applicable
Item 5. Audit Committee of Listed Registrants
Not applicable
Item 6. Schedule of Investments:
The registrant’s schedule of investments in unaffiliated issuers is included in the report to
shareholders in Item 1 above.
Item 7. Disclosure of Proxy Voting Policies and Procedures For Closed-End Management
Investment Companies:
Not applicable
Item 8. Portfolio Managers of Closed-End Investment Companies
Not Applicable
Item 9. Purchases of Equity Securities by Closed-End Management Investment Companies and
Affiliated Purchasers:
Not applicable
Item 10. Submission of Matters to a Vote of Security Holders:
Not applicable
Item 11. Controls and Procedures:
(a) The registrant's principal executive officer and principal financial officer have concluded, based on their evaluation of the effectiveness of the design and operation of the registrant's disclosure controls and procedures as of a date within 90 days of the filing date of this report, that the design and operation of such procedures are generally effective to provide reasonable assurance that information required to be disclosed by the registrant in this report is recorded, processed, summarized and reported within the time periods specified in the Commission's rules and forms.
(b) Changes in internal control over financial reporting: Not applicable
Item 12. Exhibits:
(a)(1) Not applicable
(a)(2) Separate certifications for the principal executive officer and principal financial officer of the registrant as required by Rule 30a-2(a) under the Investment Company Act of 1940, as amended, are filed herewith.
(b) The certifications required by Rule 30a-2(b) under the Investment Company Act of 1940, as amended, are filed herewith.
SIGNATURES
Pursuant to the requirements of the Securities Exchange Act of 1934 and the Investment Company Act of 1940, the registrant has duly caused this report to be signed on its behalf by the undersigned, thereunto duly authorized.
Putnam High Yield Advantage Fund
By (Signature and Title):
/s/Janet C. Smith
Janet C. Smith
Principal Accounting Officer
Date: July 26, 2007
Pursuant to the requirements of the Securities Exchange Act of 1934 and the Investment Company Act of 1940, this report has been signed below by the following persons on behalf of the registrant and in the capacities and on the dates indicated.
By (Signature and Title):
/s/Charles E. Porter
Charles E. Porter
Principal Executive Officer
Date: July 26, 2007
By (Signature and Title):
/s/Steven D. Krichmar
Steven D. Krichmar
Principal Financial Officer
Date: July 26, 2007