| | | |
| UNITED STATES |
| SECURITIES AND EXCHANGE COMMISSION |
| Washington, D.C. 20549 |
| |
| FORM N-CSR |
| |
| CERTIFIED SHAREHOLDER REPORT OF REGISTERED |
| MANAGEMENT INVESTMENT COMPANIES |
| | |
| Investment Company Act file number: (811-04616) | |
| |
| Exact name of registrant as specified in charter: | Putnam High Yield Advantage Fund |
| |
| Address of principal executive offices: One Post Office Square, Boston, Massachusetts 02109 |
| | |
| Name and address of agent for service: | | Beth S. Mazor, Vice President |
| | | One Post Office Square |
| | | Boston, Massachusetts 02109 |
| | | |
| Copy to: | | John W. Gerstmayr, Esq. |
| | | Ropes & Gray LLP |
| | | One International Place |
| | | Boston, Massachusetts 02110 |
| | |
| Registrant’s telephone number, including area code: | (617) 292-1000 |
| | | |
| Date of fiscal year end: November 30, 2009 | | |
| |
| Date of reporting period: December 1, 2008 — May 31, 2009 |
Item 1. Report to Stockholders:
The following is a copy of the report transmitted to stockholders pursuant to Rule 30e-1 under the Investment Company Act of 1940:

Since 1937, when George Putnam created a prudent mix of stocks and bonds in a single, professionally managed portfolio, we have championed the wisdom of the balanced approach. Today, we offer a world of equity, fixed-income, multi-asset, and absolute-return portfolios so investors can pursue a range of financial goals. Our seasoned portfolio managers seek superior results over time, backed by original, fundamental research on a global scale. We believe in service excellence, in the value of experienced financial advice, and in putting clients first in everything we do.
In 1830, Massachusetts Supreme Judicial Court Justice Samuel Putnam established The Prudent Man Rule, a legal foundation for responsible money management.

THE PRUDENT MAN RULE
All that can be required of a trustee to invest is that he shall conduct himself faithfully and exercise a sound discretion. He is to observe how men of prudence, discretion, and intelligence manage their own affairs, not in regard to speculation, but in regard to the permanent disposition of their funds, considering the probable income, as well as the probable safety of the capital to be invested.

Putnam
High Yield
Advantage Fund
Semiannual Report
5 | 31 | 09
| | |
| Message from the Trustees | 2 | |
| |
| About the fund | 4 | |
| |
| Performance snapshot | 6 | |
| |
| Interview with your fund’s Portfolio Manager | 7 | |
| |
| Performance in depth | 11 | |
| |
| Expenses | 13 | |
| |
| Portfolio turnover | 15 | |
| |
| Your fund’s management | 16 | |
| |
| Terms and definitions | 17 | |
| |
| Trustee approval of management contract | 18 | |
| |
| Other information for shareholders | 23 | |
| |
| Financial statements | 24 | |
| |
Message from the Trustees
Dear Fellow Shareholder:
Following many months of painful losses, the stock market finally reversed course this spring and posted solid gains. Returns in the fixed-income area have been more mixed, with Treasuries losing ground but corporate and high-yield debt rebounding. We are pleased to report that, in many instances, Putnam mutual fund performance has also been strong in recent months, demonstrating the power of active portfolio management and the substantial efforts of an investment team infused with new talent and a singular focus.
Putnam Investments and the Board of Trustees continue to evolve during this exciting time of renewal. After several years of steady leadership, Charles E. “Ed” Haldeman, Jr. has stepped down as President of the Putnam Funds and as a member of the Board of Trustees of the Funds. Effective July 1, 2009, Robert L. Reynolds, President and Chief Executive Officer of Putnam Investments and a Trustee of the Putnam Funds, replaced Mr. Haldeman as President of the Putnam Funds.
In other developments at Putnam, Walter C. Donovan, a 25-year investment industry veteran, has joined the firm as Chief Investment Officer. Mr. Donovan will oversee a reinvigorated investment organization strengthened by the recent arrival of several industry-leading senior portfolio managers, research analysts, and traders.
Ravi Akhoury has been elected to the Board of Trustees of the Putnam Funds and W. Thomas Stephens has rejoined the Board. From 1992 to 2007, Mr. Akhoury was Chairman and CEO of MacKay Shields, a multi-product investment management
2
firm with more than $40 billion in assets under management. Mr. Stephens retired in December 2008 as Chairman and Chief Executive Officer of Boise Cascade, L.L.C., a paper, forest products, and timberland assets company.
We would like to take this opportunity to welcome new shareholders to the fund and to thank all of our investors for your continued confidence in Putnam.
About the fund
Seeking a high level of current income for investors since 1986
Unlike most types of fixed-income investments, high-yield bond performance is more dependent on the performance of the companies that issue the bonds than on interest rates. For this reason, distinguishing between opportunities and potential pitfalls requires a rigorous investment process that includes analyzing companies. With Putnam High Yield Advantage Fund, this process is highlighted by intensive research, investment diversification, and carefully timed portfolio adjustments.
Because of the risks of high-yield bond investing, in-depth credit research is essential. The fund’s research team — which includes analysts who specialize by industry — visits with the management of issuing companies and analyzes each company’s prospects. The team then compares this information to the bond’s upside or downside potential before deciding whether it is an appropriate investment for the fund.
The fund’s portfolio typically consists of bonds from a broad range of industries and companies. Holdings are diversified across industry sectors and among bonds with differing credit ratings. While the fund invests primarily in the bonds of U.S. companies, its diversified approach allows it to include foreign bonds as well. Among these securities, investments in emerging-market bonds may be used to enhance the fund’s appreciation potential. Although diversification does not ensure a profit or protect against a loss and it is possible to lose money in a diversified portfolio, the fund’s diversification can help reduce the volatility that typically comes with higher-risk investments.
As the bond markets shift over time, the fund’s managers look for ways to capitalize on developments that affect fixed-income securities in general and high-yield bonds in particular. For example, when credit spreads are wide and are expected to tighten, the fund may pursue the higher income potential offered by lower-quality issues. On the other hand, when credit spreads are narrow — that is, when the difference in yield between higher- and lower-rated bonds of comparable maturities is small — the fund may shift its emphasis to higher-quality high-yield bonds.
Lower-rated bonds may offer higher yields in return for more risk. The use of derivatives involves special risks and may result in losses. Mutual funds that invest in bonds are subject to certain risks including interest-rate risk, credit risk, and inflation risk. As interest rates rise, the prices of bonds fall. Long-term bonds are more exposed to interest-rate risk than short-term bonds. Unlike bonds, bond funds have ongoing fees and expenses.
What makes a bond
“high yield”?
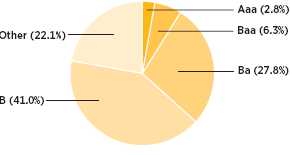
High-yield bonds are fixed-income investments typically issued by companies that lack an established earnings track record or a solid credit history. In general, high-yield bonds offer higher interest rates than investment-grade bonds to compensate for their increased risk. Because of this added risk, these bonds are typically rated below investment grade by an independent rating agency (for example, the lowest Moody’s Investors Service rating of investment-grade bonds is Baa). The lower the rating, the greater the possibility that a bond’s issuer will be unable to make interest payments or repay the principal.
Bond ratings
| | |
| Moody’s | Grade | |
| |
| Aaa | Investment | |
| |
| Aa, A | Investment | |
| |
| Baa | Investment | |
| |
| Ba, B | High yield | |
| |
| Caa/Ca | High yield | |
| |
| C | High yield | |
| |
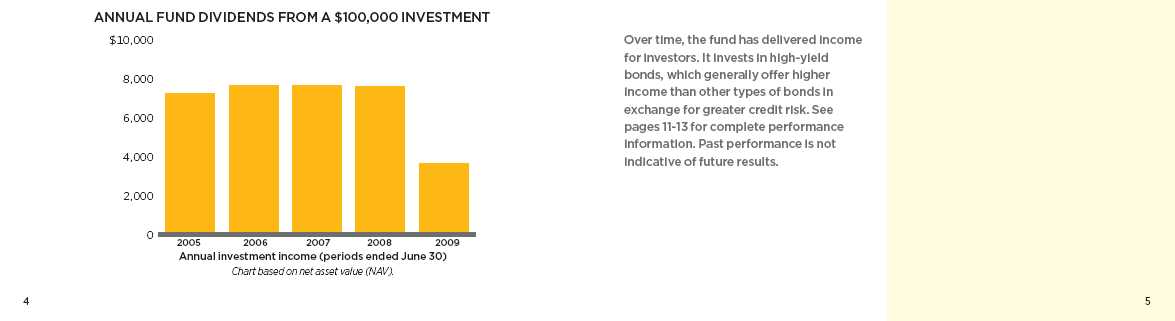
High-yield bonds can offer greater income potential than other types
of bonds.
Performance
snapshot
Average annual total return (%) comparison as of 5/31/09

Current performance may be lower or higher than the quoted past performance, which cannot guarantee future results. Share price, principal value, and return will fluctuate, and you may have a gain or a loss when you sell your shares. Performance of class A shares assumes reinvestment of distributions and does not account for taxes. Fund returns in the bar chart do not reflect a sales charge of 4.00%; had they, returns would have been lower. See pages 7 and 11–13 for additional performance information. For a portion of the periods, this fund may have limited expenses, withoutwhich returns would have been lower. Due to market volatility, current performance may be higher or lower than performance shown. A 1% short-term trading fee may apply. To obtain the most recent month-end performance, visit putnam.com.
* Returns for the six-month period are not annualized, but cumulative.
† The fund’s benchmark, the JPMorgan Developed High Yield Index, was introduced on 12/31/94, which postdates the 3/25/86 date of the fund’s class A shares.
6
Interview with your
fund’s Portfolio Manager
Paul Scanlon
Paul, how did the fund perform during the six months ended May 31, 2009?
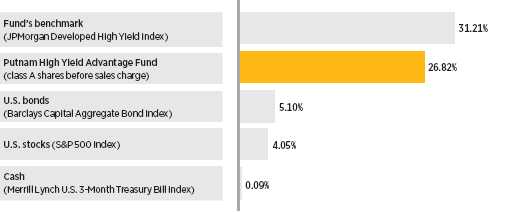
The fund benefited from a strong rally in the high-yield market and posted a very strong absolute return of 26.82% during the period. This beat the 24.55% average registered by the fund’s Lipper peer group, High Current Yield Funds, but underperformed its benchmark, the JPMorgan Developed High Yield Index, which rose 31.21%.
What factors helped the high-yield market post such strong returns over the past six months?
It’s important to look back over the last year to help frame 2009’s strong performance. A sharp decline in the high yield market due to the deterioration of the U.S. economy, a downturn in corporate business fundamentals, and very negative market technicals had characterized 2008. In this environment, high-yield spreads rose to a historically wide level of 1,900 basis points in mid-December. This spread widening resulted from massive market dislocations and illiquidity that hampered all asset classes, and arose despite relatively low default rates. From that peak through the end of the period, yield spreads narrowed by about 800 basis points as the trajectory of the economy became clearer and investors reentered the asset class. This spread tightening, which has been the most dramatic move I’ve seen in my career, led to very strong performance for high-yield bonds. The market
Broad market index and fund performance
This comparison shows your fund’s performance in the context of broad market indexes for the six months ended 5/31/09. See page 6 and pages 11–13 for additional fund performance information. Index descriptions can be found on page 17.
7
recovery resulted from more positive investor sentiment amid signs of stabilization in the U.S. economy, with the more economically sensitive and riskier segments of high yield performing best.
Why did the fund underperform its benchmark during the period?
The fund had been defensively positioned over the last 18 months. While this helped relative performance as the market sold off in 2008, the bias toward higher-quality bonds hurt relative performance as the high-yield market rallied dramatically and lower-quality and distressed segments within high yield performed best. From a sector perspective, an underweight to financials, many of which are fallen angels, hurt relative performance. In addition, underweighting housing and services — two economically sensitive areas that outperformed as the market rallied —detracted further. Conversely, overweighting the energy, health-care, cable TV, and wireless telecommunications sectors helped the fund’s relative performance. Finally, our allocation to floating-rate bank loans issued on behalf of high-yield companies also bolstered returns, as loans as an asset class outperformed bonds during the period.
What strategy did you pursue during the six-month period?
We remained overweight in the upper credit-quality tiers of the high-yield market. We are skeptical about lower-rated issues because, like many market participants, we believe that defaults are poised to further increase and feel that recovery values — what an investor can expect to get back in the event of a bankruptcy — are going to test record lows. We also maintained a significant stake in bank loans, which we had purchased at very attractive valuations when they tumbled in 2007 and 2008. At this point in the credit cycle, the loans offered the additional benefit of being higher in a company’s capital structure and by being secured by the assets of the company. Both of these attributes help
Top 10 holdings
This table shows the fund’s top 10 holdings and the percentage of the fund’s net assets that each represented as of 5/31/09. Holdings will vary over time.
| | |
| Coupon (%) and | |
| HOLDING (percentage of fund’s net assets) | maturity date | Sector/industry |
|
| NRG Energy, Inc. (1.0%) | 7 3/8%, 2016 | Utilities and power/Power producers |
| Freeport-McMoRan Copper & | 8 3/8%, 2017 | Basic materials/Metals |
| Gold, Inc. (0.8%) | | |
| HCA, Inc. (0.8%) | 9 1/4%, 2016 | Health care/Health care |
| Intelsat Bermuda, Ltd. (Bermuda) (0.8%) | 11 1/4%, 2016 | Communication services/ |
| | | Telecommunications |
| Energy Future Holdings Corp. (0.6%) | 3 7/8%, 2014 | Utilities and power/Electric utilities |
| Peabody Energy Corp. (0.6%) | 7 3/8%, 2016 | Energy/Coal |
| Arch Western Finance, LLC (0.6%) | 6 3/4%, 2013 | Energy/Coal |
| Qwest Corp. (0.6%) | 8 7/8%, 2012 | Communication services/Regional Bells |
| EchoStar DBS Corp. (0.6%) | 6 3/8%, 2011 | Consumer cyclicals/Broadcasting |
| Chesapeake Energy Corp. (0.6%) | 7 1/2%, 2013 | Energy/Oil and gas |
8
an investor recoup a higher recovery value than high-yield bonds, which are lower in the issuer’s capital structure, in the event of a default. At the sector level, we were overweight in issuers in less economically cyclical sectors, such as energy, health care, cable TV, and wireless. Underweights were held in financials, housing, and services.
Which holdings detracted from performance relative to the benchmark?
We underweighted real estate finance company Residential Capital [ResCap] because of our concerns that the housing market would continue to struggle going forward. However, the company is a subsidiary of General Motors Acceptance Corp. [GMAC], the financing arm of General Motors. During the period, GMAC received a significant capital infusion from the U.S. Treasury, making it much less likely that ResCap would default, and these expectations buoyed results. Our underweight to the bond constrained relative performance, and we sold the holding prior to the end of the period. Another holding that underper-formed was magazine and supermarket tabloid publisher American Media, which encountered problems due to declining advertising and circulation trends. As a result, the firm went through an out-of-court restructuring, causing its bonds to fall in price. However, we believe that the issue still has good relative value, and we continue to hold the bonds.
Which investments contributed to returns?
We believe that the role of the high-yield manager is not only to decide which issues to own, but also to choose which part of the issuer’s capital structure to invest in. For example, cable TV company Charter Communications restructured its debt by converting some of its bonds into equity shares during the period. Our investments in Charter were in a part of its capital structure that benefited performance, as the bonds we held had a greater equity cushion due to restructuring, which
Credit quality overview
Credit qualities shown as a percentage of portfolio value as of 5/31/09. A bond rated Baa or higher (MIG3/VMIG3 or higher, for short-term debt) is considered investment grade. The chart reflects Moody’s ratings; percentages may include bonds not rated by Moody’s but considered by Putnam Management to be of comparable quality. Ratings will vary over time.
9
caused the price of the issues to rise. An overweight allocation to GMAC also buoyed performance. As I mentioned earlier, at the end of December, GMAC received significant capital from the federal government, a move that made default less likely and caused the issue’s price to rise dramatically.
Paul, what’s your outlook?
I believe the economy will remain weak, but the worst part of the economic contraction is likely behind us and there have been recent signs of slowing in the pace of decline and some stabilization. Despite the plunge in economic activity that began last fall, first-quarter corporate earnings, though still weak, surprised to the upside of greatly diminished expectations. We expect the default rate to rise more, although we believe that we are now closer to the peak in the current default cycle. Although high-yield bond prices have rallied year-to-date, valuations still remain very attractive on a historical basis, especially in the highest-quality tier of the high-yield market. Market technicals — that is, issues of supply and demand — have improved markedly, as new issuance has resumed at the same time that additional funds have been flowing into the asset class.
Against this varied backdrop, we believe the higher-quality tiers of our market offer the most value, particularly as the credit cycle turns and defaults increase. From a sector perspective, we anticipate remaining overweight in groups offering stable businesses and valuable physical assets, including energy, cable TV, health care, wireless telecom, and utilities. At the same time, we’ll look to underweight economically sensitive areas, such as chemicals, financials, housing, forest products, technology, retail, and services.
Thanks for taking the time to speak with us today, Paul.
The views expressed in this report are exclusively those of Putnam Management. They are not meant as investment advice.
IN THE NEWS
Citigroup and General Motors Corp. were removed from the Dow Jones Industrial Average (DJIA) on June 1, 2009. Citigroup was dropped due to its substantial restructuring process, and General Motors because of its bankruptcy, an automatic disqualifier for DJIA membership. Dow Jones & Company, which manages the average, announced that the two companies were replaced by Travelers Companies and Cisco Systems. The DJIA, which consists of 30 stocks, is a widely cited measure of U.S. stock market performance. When the index was introduced 113 years ago, it included just 12 industrial companies. In 1928, it expanded to 30 stocks, and a divisor was introduced to adjust for the effects of stock splits, stock distributions, and stock substitutions. Index components change on a regular basis for varying reasons; the most recent modification occurred in September 2008, when Kraft Foods repla ced American International Group. General Electric is the only stock in the current DJIA that was part of the original index in 1896.
Please note that the holdings discussed in this report may not have been held by the fund for the entire period. Portfolio composition is subject to review in accordance with the fund’s investment strategy and may vary in the future. Current and future portfolio holdings are subject to risk.
10
Your fund’s performance
This section shows your fund’s performance, price, and distribution information for periods ended May 31, 2009, the end of the first half of its current fiscal year. In accordance with regulatory requirements for mutual funds, we also include performance as of the most recent calendar quarter-end and expense information taken from the fund’s current prospectus. Performance should always be considered in light of a fund’s investment strategy. Data represents past performance. Past performance does not guarantee future results. More recent returns may be less or more than those shown. Investment return and principal value will fluctuate, and you may have a gain or a loss when you sell your shares. Performance information does not reflect any deduction for taxes a shareholder may owe on fund distributions or on the redemption of fund shares. For the most recent month-end performance, please visit the Individual Investors section of putnam.com or call Put nam at 1-800-225-1581. Class Y shares are generally only available to corporate and institutional clients and clients in other approved programs. See the Terms and Definitions section in this report for definitions of the share classes offered by your fund.
Fund performance Total return for periods ended 5/31/09
| | | | | | | | | | |
| | Class A | Class B | Class C | Class M | Class R | Class Y |
| (inception dates) | (3/25/86) | (5/16/94) | (3/30/07) | (12/1/94) | (3/30/07) | (12/31/98) |
|
| | NAV | POP | NAV | CDSC | NAV | CDSC | NAV | POP | NAV | NAV |
|
| Annual average | | | | | | | | | | |
| (life of fund) | 6.82% | 6.63% | 5.92% | 5.92% | 6.02% | 6.02% | 6.53% | 6.38% | 6.56% | 6.99% |
|
| 10 years | 46.75 | 40.92 | 35.75 | 35.75 | 36.22 | 36.22 | 43.97 | 39.21 | 43.65 | 52.06 |
| Annual average | 3.91 | 3.49 | 3.10 | 3.10 | 3.14 | 3.14 | 3.71 | 3.36 | 3.69 | 4.28 |
|
| 5 years | 22.18 | 17.35 | 17.83 | 16.16 | 17.66 | 17.66 | 20.86 | 16.86 | 21.04 | 23.82 |
| Annual average | 4.09 | 3.25 | 3.34 | 3.04 | 3.31 | 3.31 | 3.86 | 3.17 | 3.89 | 4.37 |
|
| 3 years | 3.08 | –1.04 | 0.92 | –1.51 | 0.85 | 0.85 | 2.40 | –0.89 | 2.67 | 3.85 |
| Annual average | 1.02 | –0.35 | 0.31 | –0.51 | 0.28 | 0.28 | 0.79 | –0.30 | 0.88 | 1.27 |
|
| 1 year | –9.32 | –13.01 | –9.96 | –14.09 | –9.95 | –10.77 | –9.53 | –12.49 | –9.46 | –9.20 |
|
| 6 months | 26.82 | 21.71 | 26.54 | 21.54 | 26.66 | 25.66 | 26.90 | 22.66 | 26.96 | 27.07 |
|
Current performance may be lower or higher than the quoted past performance, which cannot guarantee future results. After-sales-charge returns (public offering price, or POP) for class A and M shares reflect a maximum 4.00% and 3.25% load, respectively. Class B share returns reflect the applicable contingent deferred sales charge (CDSC), which is 5% in the first year, declining to 1% in the sixth year, and is eliminated thereafter. Class C shares reflect a 1% CDSC for the first year that is eliminated thereafter. Class R and Y shares have no initial sales charge or CDSC. Performance for class B, C, M, R, and Y shares before their inception is derived from the historical performance of class A shares, adjusted for the applicable sales charge (or CDSC) and, except for class Y shares, the higher operating expenses for such shares.
For a portion of the periods, this fund may have limited expenses, without which returns would have been lower.
Due to market volatility, current performance may be higher or lower than performance shown. A 1% short-term trading fee may be applied to shares exchanged or sold within 90 days of purchase.
11
Comparative index returns For periods ended 5/31/09
| | |
| | | Lipper High Current Yield Funds |
| | JPMorgan Developed High Yield Index | category average* |
|
| Annual average (life of fund) | —† | 6.07% |
|
| 10 years | 53.36% | 32.94 |
| Annual average | 4.37 | 2.49 |
|
| 5 years | 18.65 | 11.12 |
| Annual average | 3.48 | 1.81 |
|
| 3 years | 0.88 | –4.27 |
| Annual average | 0.29 | –1.80 |
|
| 1 year | –9.75 | –12.32 |
|
| 6 months | 31.21 | 24.55 |
|
Index and Lipper results should be compared to fund performance at net asset value.
* Over the 6-month, 1-year, 3-year, 5-year, 10-year, and life-of-fund periods ended 5/31/09, there were 475, 460, 389, 335, 205, and 27 funds, respectively, in this Lipper category.
† This index began operations on 12/31/94.
Fund price and distribution information For the six-month period ended 5/31/09
| | | | | | | | |
| Distributions | Class A | Class B | Class C | Class M | Class R | Class Y |
|
| Number | 6 | 6 | 6 | 6 | 6 | 6 |
|
| Income | $0.230 | $0.215 | $0.217 | $0.224 | $0.226 | $0.236 |
|
| Capital gains | — | — | — | — | — | — |
|
| Total | $0.230 | $0.215 | $0.217 | $0.224 | $0.226 | $0.236 |
|
| Share value | NAV | POP | NAV | NAV | NAV | POP | NAV | NAV |
|
| 11/30/08 | $4.05 | $4.22 | $3.99 | $3.98 | $4.05 | $4.19 | $4.05 | $4.15 |
|
| 5/31/09 | 4.87 | 5.07 | 4.80 | 4.79 | 4.88 | 5.04 | 4.88 | 5.00 |
|
| Current yield (end of period) | NAV | POP | NAV | NAV | NAV | POP | NAV | NAV |
|
| Current dividend rate 1 | 8.62% | 8.28% | 8.00% | 8.02% | 8.36% | 8.10% | 8.36% | 8.64% |
|
| Current 30-day SEC yield 2,3 | | | | | | | | |
| (with expense limitation) | N/A | 8.94 | 8.51 | 8.43 | N/A | 8.81 | 9.05 | 9.55 |
|
| Current 30-day SEC yield 3 | | | | | | | | |
| (without expense limitation) | N/A | 8.92 | 8.48 | 8.40 | N/A | 8.78 | 9.02 | 9.52 |
|
The classification of distributions, if any, is an estimate. Final distribution information will appear on your year-end tax forms.
1 Most recent distribution, excluding capital gains, annualized and divided by NAV or POP at end of period.
2 For a portion of the period, this fund may have limited expenses, without which yields would have been lower.
3 Based only on investment income and calculated using the maximum offering price for each share class, in accordance with SEC guidelines.
12
Fund performance as of most recent calendar quarter
Total return for periods ended 6/30/09
| | | | | | | | | | |
| | Class A | Class B | Class C | Class M | Class R | Class Y |
| (inception dates) | (3/25/86) | (5/16/94) | (3/30/07) | (12/1/94) | (3/30/07) | (12/31/98) |
|
| | NAV | POP | NAV | CDSC | NAV | CDSC | NAV | POP | NAV | NAV |
|
| Annual average | | | | | | | | | | |
| (life of fund) | 6.94% | 6.75% | 6.03% | 6.03% | 6.13% | 6.13% | 6.64% | 6.49% | 6.67% | 7.10% |
|
| 10 years | 51.18 | 45.12 | 39.63 | 39.63 | 40.15 | 40.15 | 47.99 | 43.24 | 47.61 | 56.51 |
| Annual average | 4.22 | 3.79 | 3.39 | 3.39 | 3.43 | 3.43 | 4.00 | 3.66 | 3.97 | 4.58 |
|
| 5 years | 24.42 | 19.54 | 19.79 | 18.10 | 19.78 | 19.78 | 22.82 | 18.79 | 22.99 | 26.02 |
| Annual average | 4.47 | 3.63 | 3.68 | 3.38 | 3.68 | 3.68 | 4.20 | 3.50 | 4.23 | 4.73 |
|
| 3 years | 5.75 | 1.53 | 3.38 | 0.89 | 3.25 | 3.25 | 4.85 | 1.47 | 5.10 | 6.48 |
| Annual average | 1.88 | 0.51 | 1.11 | 0.30 | 1.07 | 1.07 | 1.59 | 0.49 | 1.67 | 2.11 |
|
| 1 year | –4.39 | –8.23 | –5.19 | –9.52 | –5.16 | –6.03 | –4.82 | –7.86 | –4.76 | –4.23 |
|
| 6 months | 25.35 | 20.44 | 25.09 | 20.09 | 24.90 | 23.90 | 25.18 | 21.11 | 25.24 | 25.62 |
|
Fund’s annual operating expenses For the fiscal year ended 11/30/08
| | | | | | |
| | Class A | Class B | Class C | Class M | Class R | Class Y |
|
| Net expenses* | 1.11% | 1.86% | 1.86% | 1.36% | 1.36% | 0.86% |
|
| Total annual fund operating expenses | 1.13 | 1.88 | 1.88 | 1.38 | 1.38 | 0.88 |
|
* Reflects Putnam Management’s decision to contractually limit expenses through 11/30/09.
Expense information in this table is taken from the most recent prospectus, is subject to change, and may differ from that shown in the next section and in the financial highlights of this report. Expenses are shown as a percentage of average net assets.
Your fund’s expenses
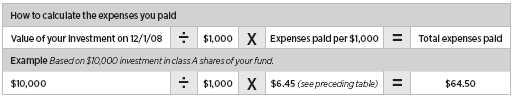
As a mutual fund investor, you pay ongoing expenses, such as management fees, distribution fees (12b-1 fees), and other expenses. In the most recent six-month period, your fund limited these expenses; had it not done so, expenses would have been higher. Using the following information, you can estimate how these expenses affect your investment and compare them with the expenses of other funds. You may also pay one-time transaction expenses, including sales charges (loads) and redemption fees, which are not shown in this section and would have resulted in higher total expenses. For more information, see your fund’s prospectus or talk to your financial representative.
Review your fund’s expenses
The following table shows the expenses you would have paid on a $1,000 investment in Putnam High Yield Advantage Fund from December 1, 2008, to May 31, 2009. It also shows how much a $1,000 investment would be worth at the close of the period, assuming actual returns and expenses.
| | | | | | |
| | Class A | Class B | Class C | Class M | Class R | Class Y |
|
| Expenses paid per $1,000* | $6.45 | $10.67 | $10.68 | $7.86 | $7.87 | $5.04 |
|
| Ending value (after expenses) | $1,268.20 | $1,265.40 | $1,266.60 | $1,269.00 | $1,269.60 | $1,270.70 |
|
* Expenses for each share class are calculated using the fund’s annualized expense ratio for each class, which represents the ongoing expenses as a percentage of average net assets for the six months ended 5/31/09. The expense ratio may differ for each share class (see the last table in this section). Expenses are calculated by multiplying the expense ratio by the average account value for the period; then multiplying the result by the number of days in the period; and then dividing that result by the number of days in the year.
Estimate the expenses you paid
To estimate the ongoing expenses you paid for the six months ended May 31, 2009, use the following calculation method. To find the value of your investment on December 1, 2008, call Putnam at 1-800-225-1581.
Compare expenses using the SEC’s method
The Securities and Exchange Commission (SEC) has established guidelines to help investors assess fund expenses. Per these guidelines, the following table shows your fund’s expenses based on a $1,000 investment, assuming a hypothetical 5% annualized return. You can use this information to compare the ongoing expenses (but not transaction expenses or total costs) of investing in the fund with those of other funds. All mutual fund shareholder reports will provide this information to help you make this comparison. Please note that you cannot use this information to estimate your actual ending account balance and expenses paid during the period.
| | | | | | |
| | Class A | Class B | Class C | Class M | Class R | Class Y |
|
| Expenses paid per $1,000* | $5.74 | $9.50 | $9.50 | $6.99 | $6.99 | $4.48 |
|
| Ending value (after expenses) | $1,019.25 | $1,015.51 | $1,015.51 | $1,018.00 | $1,018.00 | $1,020.49 |
|
* Expenses for each share class are calculated using the fund’s annualized expense ratio for each class, which represents the ongoing expenses as a percentage of average net assets for the six months ended 5/31/09. The expense ratio may differ for each share class (see the last table in this section). Expenses are calculated by multiplying the expense ratio by the average account value for the period; then multiplying the result by the number of days in the period; and then dividing that result by the number of days in the year.
14
Compare expenses using industry averages
You can also compare your fund’s expenses with the average of its peer group, as defined by Lipper, an independent fund-rating agency that ranks funds relative to others that Lipper considers to have similar investment styles or objectives. The expense ratio for each share class shown indicates how much of your fund’s average net assets have been used to pay ongoing expenses during the period.
| | | | | | |
| | Class A | Class B | Class C | Class M | Class R | Class Y |
|
| Your fund’s annualized | | | | | | |
| expense ratio | 1.14% | 1.89% | 1.89% | 1.39% | 1.39% | 0.89% |
|
| Average annualized expense | | | | | | |
| ratio for Lipper peer group* | 1.15% | 1.90% | 1.90% | 1.40% | 1.40% | 0.90% |
|
* Putnam keeps fund expenses below the Lipper peer group average expense ratio by limiting our fund expenses if they exceed the Lipper average. The Lipper average is a simple average of front-end load funds in the peer group that excludes 12b-1 fees as well as any expense offset and brokerage/service arrangements that may reduce fund expenses. To facilitate the comparison in this presentation, Putnam has adjusted the Lipper average to reflect 12b-1 fees. Investors should note that the other funds in the peer group may be significantly smaller or larger than the fund, and that an asset-weighted average would likely be lower than the simple average. Also, the fund and Lipper report expense data at different times; the fund’s expense ratio shown here is annualized data for the most recent six-month period, while the quarterly updated Lipper average is based on the most recent fiscal year-end data available for the peer group funds as of 3/31/09.
Your fund’s portfolio turnover
Putnam funds are actively managed by experts who buy and sell securities based on intensive analysis of companies, industries, economies, and markets. Portfolio turnover is a measure of how often a fund’s managers buy and sell securities for your fund. A portfolio turnover of 100%, for example, means that the managers sold and replaced securities valued at 100% of a fund’s average portfolio value within a given period. Funds with high turnover may be more likely to generate capital gains that must be distributed to shareholders as taxable income. High turnover may also cause a fund to pay more brokerage commissions and other transaction costs, which may detract from performance.
Funds that invest in bonds or other fixed-income instruments may have higher turnover than funds that invest only in stocks. Short-term bond funds tend to have higher turnover than longer-term bond funds, because shorter-term bonds will mature or be sold more frequently than longer-term bonds. You can use the following table to compare your fund’s turnover with the average turnover for funds in its Lipper category.
Turnover comparisons Percentage of holdings that change every year
| | | | | |
| | 2008 | 2007 | 2006 | 2005 | 2004 |
|
| Putnam High Yield Advantage Fund | 34% | 48% | 46% | 33% | 53% |
|
| Lipper High Current Yield Fund | | | | | |
| category average | 81% | 83% | 83% | 73% | 95% |
|
Turnover data for the fund is calculated based on the fund's fiscal-year period, which ends on November 30. Turnover data for the fund's Lipper category is calculated based on the average of the turnover of each fund in the category for its fiscal year ended during the indicated year. Fiscal years vary across funds in the Lipper category, which may limit the comparability of the fund's portfolio turnover rate to the Lipper average. Comparative data for 2008 is based on information available as of 12/31/08.
15
Your fund’s management
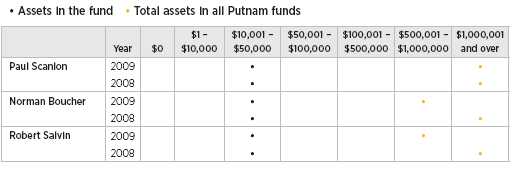
In addition to Paul Scanlon, your fund’s Portfolio Managers are Norman Boucher and Robert Salvin.
Portfolio management fund ownership
The following table shows how much the fund’s current Portfolio Managers have invested in the fund and in all Putnam mutual funds (in dollar ranges). Information shown is as of May 31, 2009, and May 31, 2008.
Trustee and Putnam employee fund ownership
As of May 31, 2009, all of the Trustees of the Putnam funds owned fund shares. The following table shows the approximate value of investments in the fund and all Putnam funds as of that date by the Trustees and Putnam employees. These amounts include investments by the Trustees’ and employees’ immediate family members and investments through retirement and deferred compensation plans.
| | |
| | Assets in the fund | Total assets in all Putnam funds |
|
| Trustees | $216,000 | $36,000,000 |
|
| Putnam employees | $2,594,000 | $357,000,000 |
|
Other Putnam funds managed by the Portfolio Managers
Paul Scanlon is also a Portfolio Manager of Putnam Absolute Return 100 Fund, Putnam Absolute Return 300 Fund, Putnam Diversified Income Trust, Putnam Floating Rate Income Fund, Putnam High Yield Trust, Putnam Master Intermediate Income Trust, and Putnam Premier Income Trust.
Norman Boucher is also a Portfolio Manager of Putnam Floating Rate Income Fund and Putnam High Yield Trust.
Robert Salvin is also a Portfolio Manager of Putnam Convertible Income-Growth Trust, Putnam Floating Rate Income Fund, Putnam High Income Securities Fund, and Putnam High Yield Trust.
Paul Scanlon, Norman Boucher, and Robert Salvin may also manage other accounts and variable trust funds advised by Putnam Management or an affiliate.
16
Terms and definitions
Important terms
Total return shows how the value of the fund’s shares changed over time, assuming you held the shares through the entire period and reinvested all distributions in the fund.
Net asset value (NAV) is the price, or value, of one share of a mutual fund, without a sales charge. NAVs fluctuate with market conditions. NAV is calculated by dividing the net assets of each class of shares by the number of outstanding shares in the class.
Public offering price (POP) is the price of a mutual fund share plus the maximum sales charge levied at the time of purchase. POP performance figures shown here assume the 4.00% maximum sales charge for class A shares and 3.25% for class M shares.
Contingent deferred sales charge (CDSC) is generally a charge applied at the time of the redemption of class B or C shares and assumes redemption at the end of the period. Your fund’s class B CDSC declines from a 5% maximum during the first year to 1% during the sixth year. After the sixth year, the CDSC no longer applies. The CDSC for class C shares is 1% for one year after purchase.
Current yield is the annual rate of return earned from dividends or interest of an investment. Current yield is expressed as a percentage of the price of a security, fund share, or principal investment.
Share classes
Class A shares are generally subject to an initial sales charge and no CDSC (except on certain redemptions of shares bought without an initial sales charge).
Class B shares are not subject to an initial sales charge. They may be subject to a CDSC.
Class C shares are not subject to an initial sales charge and are subject to a CDSC only if the shares are redeemed during the first year.
Class M shares have a lower initial sales charge and a higher 12b-1 fee than class A shares and no CDSC (except on certain redemptions of shares bought without an initial sales charge).
Class R shares are not subject to an initial sales charge or CDSC and are available only to certain defined contribution plans.
Class Y shares are not subject to an initial sales charge or CDSC, and carry no 12b-1 fee. They are generally only available to corporate and institutional clients and clients in other approved programs.
Comparative indexes
Barclays Capital Aggregate Bond Index is an unmanaged index of U.S. investment-grade fixed-income securities.
JPMorgan Developed High Yield Index is an unmanaged index of high-yield fixed-income securities issued in developed countries.
Merrill Lynch U.S. 3-Month Treasury Bill Index is an unmanaged index that seeks to measure the performance of U.S. Treasury bills available in the marketplace.
S&P 500 Index is an unmanaged index of common stock performance.
Indexes assume reinvestment of all distributions and do not account for fees. Securities and performance of a fund and an index will differ. You cannot invest directly in an index.
Lipper is a third-party industry-ranking entity that ranks mutual funds. Its rankings do not reflect sales charges. Lipper rankings are based on total return at net asset value relative to other funds that have similar current investment styles or objectives as determined by Lipper. Lipper may change a fund’s category assignment at its discretion. Lipper category averages reflect performance trends for funds within a category.
17
Trustee approval of management contract
General conclusions
The Board of Trustees of the Putnam funds oversees the management of each fund and, as required by law, determines annually whether to approve the continuance of your fund’s management contract with Putnam Investment Management (“Putnam Management”) and the sub-management contract, in respect of your fund, between Putnam Management’s affiliate, Putnam Investments Limited (“PIL”), and Putnam Management. In this regard, the Board of Trustees, with the assistance of its Contract Committee consisting solely of Trustees who are not “interested persons” (as such term is defined in the Investment Company Act of 1940, as amended) of the Putnam funds (the “Independent Trustees”), requests and evaluates all information it deems reasonably necessary under the circumstances. Over the course of several months ending in June 2008, the Contract Committee met several times to consider the information provided by Putnam Management an d other information developed with the assistance of the Board’s independent counsel and independent staff. The Contract Committee reviewed and discussed key aspects of this information with all of the Independent Trustees. The Contract Committee recommended, and the Independent Trustees approved, the continuance of your fund’s management and sub-management contracts, effective July 1, 2008. (Because PIL is an affiliate of Putnam Management and Putnam Management remains fully responsible for all services provided by PIL, the Trustees have not evaluated PIL as a separate entity, and all subsequent references to Putnam Management below should be deemed to include reference to PIL as necessary or appropriate in the context.)
The Independent Trustees’ approval was based on the following conclusions:
• That the fee schedule in effect for your fund represented reasonable compensation in light of the nature and quality of the services being provided to the fund, the fees paid by competitive funds and the costs incurred by Putnam Management in providing such services, and
• That this fee schedule represented an appropriate sharing between fund shareholders and Putnam Management of such economies of scale as may exist in the management of the fund at current asset levels.
These conclusions were based on a comprehensive consideration of all information provided to the Trustees, were subject to the continued application of certain expense reductions and waivers and other considerations noted below, and were not the result of any single factor. Some of the factors that figured particularly in the Trustees’ deliberations and how the Trustees considered these factors are described below, although individual Trustees may have evaluated the information presented differently, giving different weights to various factors. It is also important to recognize that the fee arrangements for your fund and the other Putnam funds are the result of many years of review and discussion between the Independent Trustees and Putnam Management, that certain aspects of such arrangements may receive greater scrutiny in some years than others, and that the Trustees’ conclusions may be based, in part, on their consideration of these same arrangements in prior years.
Management fee schedules and
categories; total expenses
The Trustees reviewed the management fee schedules in effect for all Putnam funds, including fee levels and breakpoints, and the assignment of funds to particular fee categories. In reviewing fees and expenses,
18
the Trustees generally focused their attention on material changes in circumstances — for example, changes in a fund’s size or investment style, changes in Putnam Management’s operating costs or responsibilities, or changes in competitive practices in the mutual fund industry — that suggest that consideration of fee changes might be warranted. The Trustees concluded that the circumstances did not warrant changes to the management fee structure of your fund, which had been carefully developed over the years, re-examined on many occasions and adjusted where appropriate. In this regard, the Trustees also noted that shareholders of your fund voted in 2007 to approve new management contracts containing an identical fee structure. The Trustees focused on two areas of particular interest, as discussed further below:
• Competitiveness. The Trustees reviewed comparative fee and expense information for competitive funds, which indicated that, in a custom peer group of competitive funds selected by Lipper Inc., your fund ranked in the 79th percentile in management fees and in the 41st percentile in total expenses (less any applicable 12b-1 fees) as of December 31, 2007 (the first percentile being the least expensive funds and the 100th percentile being the most expensive funds). (Because the fund’s custom peer group is smaller than the fund’s broad Lipper Inc. peer group, this expense information may differ from the Lipper peer expense information found elsewhere in this report.) The Trustees noted that expense ratios for a number of Putnam funds, which show the percentage of fund assets used to pay for management and administrative services, distribution (12b-1) fees and other expenses, h ad been increasing recently as a result of declining net assets and the natural operation of fee breakpoints.
The Trustees noted that the expense ratio increases described above were currently being controlled by expense limitations initially implemented in January 2004. The Trustees have received a commitment from Putnam Management and its parent company to continue this program through at least June 30, 2009. These expense limitations give effect to a commitment by Putnam Management that the expense ratio of each open-end fund would be no higher than the average expense ratio of the competitive funds included in the fund’s relevant Lipper universe (exclusive of any applicable 12b-1 charges in each case). The Trustees observed that this commitment to limit fund expenses has served shareholders well since its inception.
In order to ensure that the expenses of the Putnam funds continue to meet evolving competitive standards, the Trustees requested, and Putnam Management agreed, to extend for the twelve months beginning July 1, 2008, an additional expense limitation for certain funds at an amount equal to the average expense ratio (exclusive of 12b-1 charges) of a custom peer group of competitive funds selected by Lipper to correspond to the size of the fund. This additional expense limitation will be applied to those open-end funds that had above-average expense ratios (exclusive of 12b-1 charges) based on the custom peer group data for the period ended December 31, 2007. This additional expense limitation will not be applied to your fund because it had a below-average expense ratio relative to its custom peer group.
In addition, the Trustees devoted particular attention to analyzing the Putnam funds’ fees and expenses relative to those of competitors in fund complexes of comparable size and with a comparable mix of asset categories. The Trustees concluded that this analysis did not reveal any matters requiring further attention at the current time.
• Economies of scale. Your fund currently has the benefit of breakpoints in its management fee that provide shareholders with significant
19
economies of scale, which means that the effective management fee rate of the fund (as a percentage of fund assets) declines as the fund grows in size and crosses specified asset thresholds. Conversely, if the fund shrinks in size — as has been the case for many Putnam funds in recent years — these breakpoints result in increasing fee levels. In recent years, the Trustees have examined the operation of the existing breakpoint structure during periods of both growth and decline in asset levels. The Trustees concluded that the fee schedule in effect for your fund represented an appropriate sharing of economies of scale at current asset levels.
In connection with their review of the management fees and total expenses of the Putnam funds, the Trustees also reviewed the costs of the services to be provided and profits to be realized by Putnam Management and its affiliates from the relationship with the funds. This information included trends in revenues, expenses and profitability of Putnam Management and its affiliates relating to the investment management and distribution services provided to the funds. In this regard, the Trustees also reviewed an analysis of Putnam Management’s revenues, expenses and profitability with respect to the funds’ management contracts, allocated on a fund-by-fund basis.
Investment performance
The quality of the investment process provided by Putnam Management represented a major factor in the Trustees’ evaluation of the quality of services provided by Putnam Management under your fund’s management contract. The Trustees were assisted in their review of the Putnam funds’ investment process and performance by the work of the Investment Oversight Coordinating Committee of the Trustees and the Investment Oversight Committees of the Trustees, which had met on a regular monthly basis with the funds’ portfolio teams throughout the year. The Trustees concluded that Putnam Management generally provides a high-quality investment process — as measured by the experience and skills of the individuals assigned to the management of fund portfolios, the resources made available to such personnel, and in general the ability of Putnam Management to attract and retain high-quality personnel — but also recogn ized that this does not guarantee favorable investment results for every fund in every time period. The Trustees considered the investment performance of each fund over multiple time periods and considered information comparing each fund’s performance with various benchmarks and with the performance of competitive funds.
While the Trustees noted the satisfactory investment performance of certain Putnam funds, they considered the disappointing investment performance of many funds in recent periods, particularly over periods in 2007 and 2008. They discussed with senior management of Putnam Management the factors contributing to such underperformance and actions being taken to improve performance. The Trustees recognized that, in recent years, Putnam Management has taken steps to strengthen its investment personnel and processes to address areas of underperformance, including recent efforts to further centralize Putnam Management’s equity research function. In this regard, the Trustees took into consideration efforts by Putnam Management to improve its ability to assess and mitigate investment risk in individual funds, across asset classes, and across the complex as a whole. The Trustees indicated their intention to continue to monitor performance trends to assess the effectivenes s of these efforts and to evaluate whether additional changes to address areas of underperformance are warranted.
In the case of your fund, the Trustees considered that your fund’s class A share cumulative total return performance at net asset value was in the following percentiles of its Lipper Inc. peer group (Lipper High Current Yield Funds) for
20
the one-year, three-year and five-year periods ended December 31, 2007 (the first percentile being the best-performing funds and the 100th percentile being the worst-performing funds):
| | |
| One-year period | 11th | |
| |
| Three-year period | 8th | |
| |
| Five-year period | 15th | |
| |
(Because of the passage of time, these performance results may differ from the performance results for more recent periods shown elsewhere in this report.) Over the one-year, three-year and five-year periods ended December 31, 2007, there were 455, 388, and 334 funds, respectively, in your fund’s Lipper peer group.* Past performance is no guarantee of future returns.
As a general matter, the Trustees believe that cooperative efforts between the Trustees and Putnam Management represent the most effective way to address investment performance problems. The Trustees noted that investors in the Putnam funds have, in effect, placed their trust in the Putnam organization, under the oversight of the funds’ Trustees, to make appropriate decisions regarding the management of the funds. Based on the responsiveness of Putnam Management in the recent past to Trustee concerns about investment performance, the Trustees concluded that it is preferable to seek change within Putnam Management to address performance shortcomings. In the Trustees’ view, the alternative of engaging a new investment adviser for an underperforming fund would entail significant disruptions and would not provide any greater assurance of improved investment performance.
Brokerage and soft-dollar allocations;
other benefits
The Trustees considered various potential benefits that Putnam Management may receive in connection with the services it provides under the management contract with your fund. These include benefits related to brokerage and soft-dollar allocations, whereby a portion of the commissions paid by a fund for brokerage may be used to acquire research services that may be useful to Putnam Management in managing the assets of the fund and of other clients. The Trustees considered changes made in 2008, at Putnam Management’s request, to the Putnam funds’ brokerage allocation policy, which expanded the permitted categories of brokerage and research services payable with soft dollars and increased the permitted soft dollar allocation to third-party services over what had been authorized in previous years. The Trustees indicated their continued intent to monitor the potential benefits associated with the allocation of fund brokerage and trends in industry practice to ensure that the principle of seeking “best price and execution” remains paramount in the portfolio trading process.
The Trustees’ annual review of your fund’s management contract arrangements also included the review of its distributor’s contract and distribution plan with Putnam Retail Management Limited Partnership and the investor servicing agreement with Putnam Fiduciary Trust Company (“PFTC”), each of which provides benefits to affiliates of Putnam Management. In the case of the investor servicing agreement, the Trustees considered that certain shareholder servicing functions
* The percentile rankings for your fund’s class A share annualized total return performance in the Lipper High Current Yield Funds category for the one-year, five-year, and ten-year periods ended June 30, 2009, were 33%, 9%, and 25%, respectively. Over the one-year, five-year, and ten-year periods ended June 30, 2009, your fund ranked 150th out of 462, 28th out of 333, and 49th out of 202 funds, respectively. Note that this more recent information was not available when the Trustees approved the continuance of your fund’s management contract.
21
were shifted to a third-party service provider by PFTC in 2007.
Comparison of retail and institutional
fee schedules
The information examined by the Trustees as part of their annual contract review has included for many years information regarding fees charged by Putnam Management and its affiliates to institutional clients such as defined benefit pension plans, college endowments, etc. This information included comparisons of such fees with fees charged to the funds, as well as a detailed assessment of the differences in the services provided to these two types of clients. The Trustees observed, in this regard, that the differences in fee rates between institutional clients and mutual funds are by no means uniform when examined by individual asset sectors, suggesting that differences in the pricing of investment management services to these types of clients reflect to a substantial degree historical competitive forces operating in separate market places. The Trustees considered the fact that fee rates across different asset classes are typicall y higher on average for mutual funds than for institutional clients, as well as the differences between the services that Putnam Management provides to the Putnam funds and those that it provides to institutional clients of the firm, but did not rely on such comparisons to any significant extent in concluding that the management fees paid by your fund are reasonable.
22
Other information for shareholders
Important notice regarding delivery
of shareholder documents
In accordance with SEC regulations, Putnam sends a single copy of annual and semiannual shareholder reports, prospectuses, and proxy statements to Putnam shareholders who share the same address, unless a shareholder requests otherwise. If you prefer to receive your own copy of these documents, please call Putnam at 1-800-225-1581, and Putnam will begin sending individual copies within 30 days.
Proxy voting
Putnam is committed to managing our mutual funds in the best interests of our shareholders. The Putnam funds’ proxy voting guidelines and procedures, as well as information regarding how your fund voted proxies relating to portfolio securities during the 12-month period ended June 30, 2008, are available in the Individual Investors section of putnam.com, and on the SEC’s Web site, www.sec.gov. If you have questions about finding forms on the SEC’s Web site, you may call the SEC at 1-800-SEC-0330. You may also obtain the Putnam funds’ proxy voting guidelines and procedures at no charge by calling Putnam’s Shareholder Services at 1-800-225-1581.
Fund portfolio holdings
The fund will file a complete schedule of its portfolio holdings with the SEC for the first and third quarters of each fiscal year on Form N-Q. Shareholders may obtain the fund’s Forms N-Q on the SEC’s Web site at www.sec.gov. In addition, the fund’s Forms N-Q may be reviewed and copied at the SEC’s Public Reference Room in Washington, D.C. You may call the SEC at 1-800-SEC-0330 for information about the SEC’s Web site or the operation of the Public Reference Room.
23
Financial statements
A guide to financial statements
These sections of the report, as well as the accompanying Notes, constitute the fund’s financial statements.
The fund’s portfolio lists all the fund’s investments and their values as of the last day of the reporting period. Holdings are organized by asset type and industry sector, country, or state to show areas of concentration and diversification.
Statement of assets and liabilities shows how the fund’s net assets and share price are determined. All investment and noninvestment assets are added together. Any unpaid expenses and other liabilities are subtracted from this total. The result is divided by the number of shares to determine the net asset value per share, which is calculated separately for each class of shares. (For funds with preferred shares, the amount subtracted from total assets includes the liquidation preference of preferred shares.)
Statement of operations shows the fund’s net investment gain or loss. This is done by first adding up all the fund’s earnings — from dividends and interest income — and subtracting its operating expenses to determine net investment income (or loss). Then, any net gain or loss the fund realized on the sales of its holdings — as well as any unrealized gains or losses over the period — is added to or subtracted from the net investment result to determine the fund’s net gain or loss for the fiscal period.
Statement of changes in net assets shows how the fund’s net assets were affected by the fund’s net investment gain or loss, by distributions to shareholders, and by changes in the number of the fund’s shares. It lists distributions and their sources (net investment income or realized capital gains) over the current reporting period and the most recent fiscal year-end. The distributions listed here may not match the sources listed in the Statement of operations because the distributions are determined on a tax basis and may be paid in a different period from the one in which they were earned. Dividend sources are estimated at the time of declaration. Actual results may vary. Any non-taxable return of capital cannot be determined until final tax calculations are completed after the end of the fund’s fiscal year.
Financial highlights provide an overview of the fund’s investment results, per-share distributions, expense ratios, net investment income ratios, and portfolio turnover in one summary table, reflecting the five most recent reporting periods. In a semiannual report, the highlight table also includes the current reporting period.
24
| | | |
| The fund’s portfolio 5/31/09 (Unaudited) | | | |
| |
| |
| CORPORATE BONDS AND NOTES (80.0%)* | Principal amount | Value |
|
| Advertising and marketing services (0.2%) | | | |
| Lamar Media Corp. company guaranty 7 1/4s, 2013 | | $1,230,000 | $1,125,450 |
|
| Lamar Media Corp. 144A sr. notes 9 3/4s, 2014 | | 280,000 | 288,400 |
|
| Vertis, Inc. company guaranty sr. sec. notes Ser. A, | | | |
| zero %, 2012 ‡‡ | | 542,138 | 41,338 |
|
| | | | 1,455,188 |
| Automotive (2.5%) | | | |
| Dana Corp. escrow sr. notes 5.85s, 2015 (In default) † | | 2,135,000 | 214 |
|
| Ford Motor Credit Co., LLC notes 7 7/8s, 2010 | | 3,200,000 | 3,045,862 |
|
| Ford Motor Credit Co., LLC sr. notes 9 7/8s, 2011 | | 3,695,000 | 3,380,925 |
|
| Ford Motor Credit Co., LLC sr. unsec. notes 9 3/4s, 2010 | | 2,790,000 | 2,664,450 |
|
| Ford Motor Credit Co., LLC unsec. notes 7 3/8s, 2009 | | 1,345,000 | 1,311,827 |
|
| Ford Motor Credit Corp. sr. notes 7 1/4s, 2011 | | 205,000 | 176,909 |
|
| Tenneco Automotive, Inc. sec. notes Ser. B, 10 1/4s, 2013 | | 2,135,000 | 1,974,875 |
|
| Tenneco, Inc. sr. unsec. notes company guaranty 8 1/8s, 2015 | | 775,000 | 569,625 |
|
| TRW Automotive, Inc. company guaranty sr. unsec. unsub. | | | |
| notes Ser. REGS, 6 3/8s, 2014 | EUR | 125,000 | 90,092 |
|
| TRW Automotive, Inc. 144A company guaranty sr. notes | | | |
| 7 1/4s, 2017 | | $2,095,000 | 1,466,500 |
|
| TRW Automotive, Inc. 144A company guaranty sr. unsec. unsub. | | | |
| notes 7s, 2014 | | 550,000 | 404,250 |
|
| | | | 15,085,529 |
| Basic materials (8.0%) | | | |
| Airgas, Inc. 144A company | | | |
| guaranty sr. sub. notes 7 1/8s, 2018 | | 2,345,000 | 2,186,713 |
|
| AK Steel Corp. company guaranty sr. unsec. notes 7 3/4s, 2012 | | 1,270,000 | 1,193,800 |
|
| Aleris International, Inc. company guaranty sr. unsec. notes 9s, | | | |
| 2014 (In default) † ‡‡ | | 1,905,000 | 7,144 |
|
| Aleris International, Inc. company guaranty sr. unsec. sub. notes | | | |
| 10s, 2016 (In default) † | | 1,090,000 | 4,088 |
|
| Builders FirstSource, Inc. company guaranty sr. notes FRN | | | |
| 5.133s, 2012 | | 1,675,000 | 741,188 |
|
| Clondalkin Acquisition BV 144A company guaranty sr. notes | | | |
| FRN 3.32s, 2013 (Netherlands) | | 1,165,000 | 768,900 |
|
| Compass Minerals International, Inc. 144A sr. notes 8s, 2019 | | 1,385,000 | 1,371,150 |
|
| Dow Chemical Co. (The) sr. unsec. notes 7.6s, 2014 | | 995,000 | 1,007,143 |
|
| Freeport-McMoRan Copper & Gold, Inc. sr. unsec. notes | | | |
| 8 3/8s, 2017 | | 5,150,000 | 5,137,125 |
|
| Freeport-McMoRan Copper & Gold, Inc. sr. unsec. notes | | | |
| 8 1/4s, 2015 | | 2,030,000 | 2,035,075 |
|
| Georgia-Pacific Corp. sr. unsec. unsub. notes 9 1/2s, 2011 | | 1,900,000 | 1,952,250 |
|
| Gerdau Ameristeel Corp. sr. notes 10 3/8s, 2011 (Canada) | | 2,007,000 | 2,057,175 |
|
| Graphic Packaging International Corp sr. notes 8 1/2s, 2011 | | 1,770,000 | 1,752,300 |
|
| Hexion U.S. Finance Corp./Hexion Nova Scotia Finance, | | | |
| ULC company guaranty 9 3/4s, 2014 | | 875,000 | 376,250 |
|
| Huntsman International, LLC company guaranty sr. unsec. | | | |
| sub. notes Ser. Regs 6 7/8s, 2013 | EUR | 1,060,000 | 936,245 |
|
| Huntsman International, LLC company guaranty sr. unsec. sub. | | | |
| notes 7 7/8s, 2014 | | $660,000 | 452,100 |
|
| International Paper Co. sr. unsec. notes 9 3/8s, 2019 | | 770,000 | 758,450 |
|
| International Paper Co. sr. unsec. notes 7.4s, 2014 | | 2,085,000 | 2,056,807 |
|
25
| | | |
| CORPORATE BONDS AND NOTES (80.0%)* cont. | Principal amount | Value |
|
| Basic materials cont. | | | |
| Jefferson Smurfit Corp. company guaranty 8 1/4s, 2012 | | $540,000 | $170,100 |
|
| Metals USA, Inc. sec. notes 11 1/8s, 2015 | | 1,645,000 | 1,237,863 |
|
| Momentive Performance Materials, Inc. company guaranty | | | |
| sr. unsec. notes 9 3/4s, 2014 | | 1,875,000 | 712,500 |
|
| Mosaic Co. (The) 144A sr. unsec. unsub. notes 7 5/8s, 2016 | | 2,235,000 | 2,223,825 |
|
| Mosaic Co. (The) 144A sr. unsec. unsub. notes 7 3/8s, 2014 | | 670,000 | 680,137 |
|
| Nalco Co. 144A sr. notes 8 1/4s, 2017 | | 365,000 | 366,825 |
|
| NewPage Holding Corp. sr. unsec. unsub. notes FRN | | | |
| 8.579s, 2013 ‡‡ | | 625,796 | 68,838 |
|
| Norske Skog Canada, Ltd. company guaranty Ser. D, 8 5/8s, | | | |
| 2011 (Canada) | | 2,031,000 | 1,183,058 |
|
| Novelis, Inc. company guaranty 7 1/4s, 2015 | | 1,995,000 | 1,311,713 |
|
| Rio Tinto Finance USA LTD company guaranty sr. unsec. notes | | | |
| 8.95s, 2014 (United Kingdom) | | 555,000 | 596,464 |
|
| Rockwood Specialties Group, Inc. company guaranty | | | |
| 7 5/8s, 2014 | EUR | 470,000 | 611,068 |
|
| Smurfit Kappa Funding PLC sr. unsec. sub. notes 7 3/4s, | | | |
| 2015 (Ireland) | | $2,287,000 | 1,555,160 |
|
| Steel Dynamics, Inc. company guaranty sr. unsec. unsub. notes | | | |
| 7 3/8s, 2012 | | 310,000 | 285,200 |
|
| Steel Dynamics, Inc. company guaranty sr. unsec. unsub. notes | | | |
| 6 3/4s, 2015 | | 2,900,000 | 2,472,250 |
|
| Steel Dynamics, Inc. 144A sr. notes 7 3/4s, 2016 | | 1,085,000 | 924,963 |
|
| Stone Container Corp. sr. notes 8 3/8s, 2012 | | 1,960,000 | 617,400 |
|
| Teck Resources, Ltd. sr. unsec. notes 6 1/8s, 2035 (Canada) | | 820,000 | 534,320 |
|
| Teck Resources, Ltd. 144A sr. sec. notes 10 3/4s, 2019 (Canada) | | 1,265,000 | 1,301,369 |
|
| Teck Resources, Ltd. 144A sr. sec. notes 10 1/4s, 2016 (Canada) | | 1,905,000 | 1,928,813 |
|
| Teck Resources, Ltd. 144A sr. sec. notes 9 3/4s, 2014 (Canada) | | 1,585,000 | 1,577,075 |
|
| Tube City IMS Corp. company guaranty sr. unsec. sub. notes | | | |
| 9 3/4s, 2015 | | 1,530,000 | 872,100 |
|
| Verso Paper Holdings, LLC./Verso Paper, Inc. 144A sr. sec. notes | | | |
| 11 1/2s, 2014 | | 635,000 | 590,550 |
|
| Verso Paper Holdings, LLC/Verso Paper, Inc. company guaranty | | | |
| 11 3/8s, 2016 | | 855,000 | 350,550 |
|
| Verso Paper Holdings, LLC/Verso Paper, Inc. company guaranty | | | |
| sr. sec. notes FRN Ser. B, 4.778s, 2014 | | 860,000 | 464,400 |
|
| Verso Paper Holdings, LLC/Verso Paper, Inc. sec. notes | | | |
| 9 1/8s, 2014 | | 2,430,000 | 1,445,850 |
|
| | | | 48,876,294 |
| Broadcasting (1.6%) | | | |
| Clear Channel Communications, Inc. sr. unsec. notes 7.65s, 2010 | | 610,000 | 268,400 |
|
| Clear Channel Communications, Inc. sr. unsec. notes 5 1/2s, 2014 | | 285,000 | 44,175 |
|
| DIRECTV Holdings, LLC company guaranty sr. unsec. notes | | | |
| 7 5/8s, 2016 | | 1,315,000 | 1,272,263 |
|
| DIRECTV Holdings, LLC company guaranty sr. unsec. notes | | | |
| 6 3/8s, 2015 | | 3,145,000 | 2,861,950 |
|
| EchoStar DBS Corp. sr. notes 6 3/8s, 2011 | | 3,700,000 | 3,575,125 |
|
| Univision Communications, Inc. 144A company guaranty unsec. | | | |
| notes zero %, 2015 ‡‡ | | 1,460,000 | 452,600 |
|
| XM Satellite Radio, Inc. 144A company guaranty sr. unsec. notes | | | |
| 13s, 2013 | | 2,105,000 | 1,515,600 |
|
26
| | | |
| CORPORATE BONDS AND NOTES (80.0%)* cont. | Principal amount | Value |
|
| Broadcasting cont. | | | |
| Young Broadcasting, Inc. company guaranty sr. sub. notes 8 3/4s, | | | |
| 2014 (In default) † | | $395,000 | $1,481 |
|
| Young Broadcasting, Inc. company guaranty sr. unsec. sub. notes | | | |
| 10s, 2011 (In default) † | | 1,142,000 | 8,565 |
|
| | | | 10,000,159 |
| Building materials (1.2%) | | | |
| Associated Materials, Inc. company guaranty 9 3/4s, 2012 | | 2,970,000 | 2,509,650 |
|
| Masco Corp. sr. unsec. unsub. notes 6 1/8s, 2016 | | 1,185,000 | 967,820 |
|
| NTK Holdings, Inc. sr. unsec. disc. notes stepped-coupon zero % | | | |
| (10 3/4s, 9/1/09), 2014 †† | | 1,765,000 | 174,294 |
|
| Owens Corning, Inc. company guaranty sr. unsec. notes | | | |
| 6 1/2s, 2016 | | 1,655,000 | 1,439,951 |
|
| Texas Industries, Inc. sr. unsec. notes 7 1/4s, 2013 | | 715,000 | 614,900 |
|
| Texas Industries, Inc. 144A company guaranty sr. unsec. notes | | | |
| 7 1/4s, 2013 | | 360,000 | 309,600 |
|
| THL Buildco, Inc. (Nortek Holdings, Inc.) sr. sec. notes 10s, 2013 | | 345,000 | 223,388 |
|
| THL Buildco, Inc. (Nortek Holdings, Inc.) sr. sub. notes | | | |
| 8 1/2s, 2014 | | 3,495,000 | 926,175 |
|
| | | | 7,165,778 |
| Cable television (1.9%) | | | |
| Atlantic Broadband Finance, LLC company guaranty | | | |
| 9 3/8s, 2014 | | 710,000 | 599,950 |
|
| Cablevision Systems Corp. sr. unsec. notes Ser. B, 8s, 2012 | | 2,010,000 | 1,974,825 |
|
| CCH I Holdings, LLC company guaranty sr. unsec. unsub. notes | | | |
| 12 1/8s, 2015 (In default) † | | 25,000 | 250 |
|
| CCH I, LLC sec. notes 11s, 2015 (In default) † | | 2,792,000 | 321,080 |
|
| CCH II, LLC sr. unsec. notes 10 1/4s, 2010 (In default) † | | 290,000 | 287,100 |
|
| CCH II, LLC sr. unsec. notes Ser. B, 10 1/4s, 2010 (In default) † | | 3,205,000 | 3,140,900 |
|
| CCO Holdings LLC/CCO Holdings Capital Corp. sr. unsec. notes | | | |
| 8 3/4s, 2013 (In default) † | | 1,075,000 | 983,625 |
|
| CSC Holdings, Inc. sr. notes 6 3/4s, 2012 | | 2,145,000 | 2,069,925 |
|
| CSC Holdings, Inc. 144A sr. unsec. notes 8 1/2s, 2014 | | 405,000 | 402,975 |
|
| Rainbow National Services, LLC 144A sr. notes 8 3/4s, 2012 | | 1,730,000 | 1,749,463 |
|
| | | | 11,530,093 |
| Capital goods (5.0%) | | | |
| Alliant Techsystems, Inc. sr. sub. notes 6 3/4s, 2016 | | 2,810,000 | 2,606,275 |
|
| Allied Waste North America, Inc. company guaranty sr. unsub. | | | |
| sec. notes 7 7/8s, 2013 | | 355,000 | 361,213 |
|
| Baldor Electric Co. company guaranty 8 5/8s, 2017 | | 1,670,000 | 1,528,050 |
|
| BE Aerospace, Inc. sr. unsec. unsub. notes 8 1/2s, 2018 | | 2,970,000 | 2,806,650 |
|
| Berry Plastics Corp. company guaranty sr. notes FRN | | | |
| 5.881s, 2015 | | 1,745,000 | 1,494,156 |
|
| Bombardier, Inc. 144A sr. unsec. notes FRN 4.406s, | | | |
| 2013 (Canada) | EUR | 870,000 | 1,023,545 |
|
| Bombardier, Inc. 144A unsec. notes 6 3/4s, 2012 (Canada) | | $1,530,000 | 1,407,600 |
|
| Crown Americas, LLC/Crown Americas Capital Corp. sr. notes | | | |
| 7 5/8s, 2013 | | 1,960,000 | 1,911,000 |
|
| General Cable Corp. company guaranty sr. unsec. notes FRN | | | |
| 3.583s, 2015 | | 1,900,000 | 1,539,000 |
|
| Hawker Beechcraft Acquisition Co., LLC sr. sub. notes | | | |
| 9 3/4s, 2017 | | 1,770,000 | 548,700 |
|
27
| | | |
| CORPORATE BONDS AND NOTES (80.0%)* cont. | Principal amount | Value |
|
| Capital goods cont. | | | |
| Hawker Beechcraft Acquisition Co., LLC sr. unsec. notes | | | |
| 8 1/2s, 2015 | | $200,000 | $84,000 |
|
| Hexcel Corp. sr. sub. notes 6 3/4s, 2015 | | 1,720,000 | 1,556,600 |
|
| L-3 Communications Corp. company guaranty Ser. B, | | | |
| 6 3/8s, 2015 | | 2,985,000 | 2,716,350 |
|
| L-3 Communications Corp. company guaranty sr. unsec. sub. | | | |
| notes 6 1/8s, 2014 | | 725,000 | 667,000 |
|
| L-3 Communications Corp. company guaranty sr. unsec. sub. | | | |
| notes 5 7/8s, 2015 | | 575,000 | 511,750 |
|
| Legrand SA unsec. unsub. debs. 8 1/2s, 2025 (France) | | 3,185,000 | 2,737,762 |
|
| Owens-Brockway Glass Container, Inc. company guaranty | | | |
| 6 3/4s, 2014 | EUR | 695,000 | 913,422 |
|
| Ryerson Tull, Inc. company guaranty sr. sec. notes 12 1/4s, 2015 | | $1,635,000 | 1,103,625 |
|
| TD Funding Corp. company guaranty 7 3/4s, 2014 | | 1,780,000 | 1,717,700 |
|
| Terex Corp. company guaranty 7 3/8s, 2014 | | 1,750,000 | 1,605,625 |
|
| Titan International, Inc. company guaranty 8s, 2012 | | 2,150,000 | 1,849,000 |
|
| | | | 30,689,023 |
| Coal (1.2%) | | | |
| Arch Western Finance, LLC company guaranty sr. sec. notes | | | |
| 6 3/4s, 2013 | | 4,165,000 | 3,790,150 |
|
| Peabody Energy Corp. company guaranty 7 3/8s, 2016 | | 4,020,000 | 3,829,050 |
|
| | | | 7,619,200 |
| Commercial and consumer services (1.6%) | | | |
| Aramark Corp. company guaranty 8 1/2s, 2015 | | 3,210,000 | 3,061,538 |
|
| Corrections Corporation of America company guaranty sr. notes | | | |
| 7 3/4s, 2017 | | 1,820,000 | 1,779,050 |
|
| Expedia, Inc. sr. unsec. notes company guaranty 7.456s, 2018 | | 550,000 | 528,000 |
|
| Expedia, Inc. 144A company guaranty sr. notes 8 1/2s, 2016 | | 1,430,000 | 1,337,050 |
|
| Lender Processing Services, Inc. company guaranty sr. unsec. | | | |
| unsub. notes 8 1/8s, 2016 | | 1,985,000 | 1,955,225 |
|
| Travelport LLC company guaranty 11 7/8s, 2016 | | 390,000 | 202,800 |
|
| Travelport LLC company guaranty 9 7/8s, 2014 | | 1,125,000 | 708,750 |
|
| | | | 9,572,413 |
| Conglomerates (0.2%) | | | |
| SPX Corp. sr. unsec. notes 7 5/8s, 2014 (acquired 11/3/08, | | | |
| cost $1,283,500) ‡ | | 1,510,000 | 1,464,700 |
|
| | | | 1,464,700 |
| Consumer (0.6%) | | | |
| Jostens IH Corp. company guaranty 7 5/8s, 2012 | | 2,040,000 | 2,009,400 |
|
| Yankee Acquisition Corp. company guaranty Ser. B, 8 1/2s, 2015 | | 2,680,000 | 2,023,400 |
|
| | | | 4,032,800 |
| Consumer staples (5.1%) | | | |
| Archibald Candy Corp. company guaranty 10s,2009 (In default) † F�� | | 415,457 | 6,416 |
|
| Avis Budget Car Rental, LLC company guaranty sr. unsec. unsub. | | | |
| notes 7 3/4s, 2016 | | 1,475,000 | 1,054,625 |
|
| Avis Budget Car Rental, LLC company guaranty sr. unsec. unsub. | | | |
| notes 7 5/8s, 2014 | | 965,000 | 689,975 |
|
| Chiquita Brands International, Inc. sr. notes 7 1/2s, 2014 | | 2,060,000 | 1,709,800 |
|
| Chiquita Brands International, Inc. sr. unsec. unsub. notes | | | |
| 8 7/8s, 2015 | | 290,000 | 246,500 |
|
| Claire’s Stores, Inc. 144A company guaranty sr. unsec. notes | | | |
| 9 5/8s, 2015 (In default) † ‡‡ | | 57,853 | 15,620 |
|
28
| | |
| CORPORATE BONDS AND NOTES (80.0%)* cont. | Principal amount | Value |
|
| Consumer staples cont. | | |
| Constellation Brands, Inc. company guaranty sr. unsec. notes | | |
| 7 1/4s, 2017 | $275,000 | $256,438 |
|
| Constellation Brands, Inc. company guaranty sr. unsec. unsub. | | |
| notes 7 1/4s, 2016 | 2,715,000 | 2,531,738 |
|
| Del Monte Corp. sr. sub. notes 8 5/8s, 2012 | 2,625,000 | 2,638,125 |
|
| Dole Food Co. 144A sr. unsec. notes 13 7/8s, 2014 | 1,965,000 | 2,102,550 |
|
| Elizabeth Arden, Inc. company guaranty 7 3/4s, 2014 | 2,645,000 | 2,221,800 |
|
| Hertz Corp. company guaranty 8 7/8s, 2014 | 2,310,000 | 2,102,100 |
|
| Jarden Corp. company guaranty 7 1/2s, 2017 | 3,185,000 | 2,755,025 |
|
| Jarden Corp. sr. unsec. 8s, 2016 | 605,000 | 585,338 |
|
| Pinnacle Foods Finance LLC sr. notes 9 1/4s, 2015 | 655,000 | 584,588 |
|
| Prestige Brands, Inc. sr. sub. notes 9 1/4s, 2012 | 2,178,000 | 2,134,440 |
|
| Rite Aid Corp. company guaranty 9 1/2s, 2017 | 1,885,000 | 1,225,250 |
|
| Rite Aid Corp. sec. notes 7 1/2s, 2017 | 180,000 | 141,300 |
|
| Sealy Mattress Co. sr. sub. notes 8 1/4s, 2014 | 945,000 | 746,550 |
|
| Sealy Mattress Co. 144A sr. sec. notes 10 7/8s, 2016 | 1,400,000 | 1,435,000 |
|
| Smithfield Foods, Inc. sr. unsec. notes 7s, 2011 | 410,000 | 352,600 |
|
| Smithfield Foods, Inc. sr. unsec. notes Ser. B, 7 3/4s, 2013 | 1,420,000 | 1,072,100 |
|
| Spectrum Brands, Inc. company guaranty 7 3/8s, 2015 | | |
| (In default) † | 1,990,000 | 1,009,925 |
|
| Spectrum Brands, Inc. sr. unsec. sub. notes company guaranty | | |
| sr. unsec. sub. notes stepped-coupon 12 1/2s (12 3/4s, 10/2/09), | | |
| 2013 (In default) † †† ‡‡ | 1,370,000 | 664,450 |
|
| Supervalu, Inc. sr. unsec. notes 8s, 2016 | 1,010,000 | 989,800 |
|
| Tyson Foods, Inc. 144A sr. unsec. notes 10 1/2s, 2014 | 1,185,000 | 1,256,100 |
|
| United Rentals NA, Inc. company guaranty 6 1/2s, 2012 | 555,000 | 518,925 |
|
| | | 31,047,078 |
| Energy (oil field) (1.8%) | | |
| Complete Production Services, Inc. company guaranty 8s, 2016 | 1,440,000 | 1,166,400 |
|
| Helix Energy Solutions Group, Inc. 144A sr. unsec. notes | | |
| 9 1/2s, 2016 | 3,400,000 | 2,805,000 |
|
| Hornbeck Offshore Services, Inc. sr. notes Ser. B, 6 1/8s, 2014 | 955,000 | 838,013 |
|
| Key Energy Services, Inc. company guaranty sr. unsec. unsub. | | |
| notes 8 3/8s, 2014 | 2,220,000 | 1,953,600 |
|
| Oslo Seismic Services, Inc. 1st mtge. 8.28s, 2011 | 1,036,482 | 1,054,102 |
|
| Pride International, Inc. sr. unsec. notes 7 3/8s, 2014 | 1,890,000 | 1,882,913 |
|
| Stallion Oilfield Services/Stallion Oilfield Finance Corp. 144A | | |
| sr. unsec. notes 9 3/4s, 2015 | 1,480,000 | 355,200 |
|
| Weatherford International, Ltd. company guaranty sr. unsec. | | |
| notes 9 5/8s, 2019 | 605,000 | 682,790 |
|
| | | 10,738,018 |
| Entertainment (0.7%) | | |
| AMC Entertainment, Inc. company guaranty 11s, 2016 | 431,000 | 433,155 |
|
| Cinemark, Inc. sr. unsec. disc. notes 9 3/4s, 2014 | 775,000 | 786,625 |
|
| Marquee Holdings, Inc. sr. disc. notes 12s, 2014 | 1,840,000 | 1,490,400 |
|
| Universal City Development Partners, Ltd. sr. unsec. unsub. notes | | |
| 11 3/4s, 2010 | 1,470,000 | 1,411,200 |
|
| | | 4,121,380 |
29
| | |
| CORPORATE BONDS AND NOTES (80.0%)* cont. | Principal amount | Value |
|
| Financials (3.0%) | | |
| E*Trade Financial Corp. sr. unsec. notes 8s, 2011 | $2,455,000 | $1,644,850 |
|
| FireKeepers Development Authority 144A sr. sec. notes | | |
| 13 7/8s, 2015 | 275,000 | 247,500 |
|
| GMAC, LLC sr. unsec. unsub. notes 7 3/4s, 2010 | 400,000 | 383,368 |
|
| GMAC, LLC sr. unsec. unsub. notes 7 1/4s, 2011 | 380,000 | 339,220 |
|
| GMAC, LLC 144A company guaranty sr. unsec. unsub. notes | | |
| 7 3/4s, 2010 | 1,961,000 | 1,872,755 |
|
| GMAC, LLC 144A company guaranty sr. unsec. unsub. notes | | |
| 7 1/4s, 2011 | 1,285,000 | 1,169,350 |
|
| GMAC, LLC 144A company guaranty sr. unsec. unsub. notes | | |
| 7s, 2012 | 1,473,000 | 1,288,875 |
|
| GMAC, LLC 144A company guaranty sr. unsec. unsub. notes | | |
| 6 7/8s, 2012 | 3,786,000 | 3,274,890 |
|
| GMAC, LLC 144A company guaranty sr. unsec. unsub. notes | | |
| 6 7/8s, 2011 | 655,000 | 586,225 |
|
| GMAC, LLC 144A company guaranty sr. unsec. unsub. notes | | |
| 6 3/4s, 2014 | 1,553,000 | 1,296,755 |
|
| GMAC, LLC 144A company guaranty sr. unsec. unsub. notes | | |
| 6 5/8s, 2012 | 1,013,000 | 876,245 |
|
| GMAC, LLC 144A company guaranty sr. unsec. unsub. notes | | |
| FRN 2.868s, 2014 | 156,000 | 117,000 |
|
| HUB International Holdings, Inc. 144A sr. sub. notes 10 1/4s, 2015 | 555,000 | 344,100 |
|
| HUB International Holdings, Inc. 144A sr. unsec. unsub. notes | | |
| 9s, 2014 | 320,000 | 240,000 |
|
| iStar Financial, Inc. sr. unsec. unsub. notes 8 5/8s, 2013 R | 355,000 | 177,500 |
|
| iStar Financial, Inc. sr. unsec. unsub. notes 5.65s, 2011 R | 885,000 | 495,600 |
|
| Leucadia National Corp. sr. unsec. notes 8 1/8s, 2015 | 510,000 | 452,625 |
|
| Leucadia National Corp. sr. unsec. notes 7 1/8s, 2017 | 1,460,000 | 1,126,025 |
|
| Liberty Mutual Group 144A company guaranty jr. sub. notes FRB | | |
| 10 3/4s, 2058 | 815,000 | 510,877 |
|
| Nuveen Investments, Inc. 144A sr. notes 10 1/2s, 2015 | 1,195,000 | 639,325 |
|
| Universal City Florida Holding Co. sr. notes 8 3/8s, 2010 | 245,000 | 175,175 |
|
| Universal City Florida Holding Co. sr. unsec. notes FRN | | |
| 5.778s, 2010 | 1,110,000 | 793,650 |
|
| USI Holdings Corp. 144A company guaranty sr. unsec. notes FRN | | |
| 4.758s, 2014 | 330,000 | 180,675 |
|
| | | 18,232,585 |
| Gaming and lottery (1.8%) | | |
| Boyd Gaming Corp. sr. sub. notes 7 1/8s, 2016 | 1,250,000 | 887,500 |
|
| Boyd Gaming Corp. sr. sub. notes 6 3/4s, 2014 | 1,020,000 | 795,600 |
|
| Harrah’s Operating Co., Inc. company guaranty sr. sec. notes | | |
| Ser. A144, 10s, 2018 | 2,712,000 | 1,810,260 |
|
| Harrahs Operating Escrow, LLC/Harrahs Escrow Corp. 144A | | |
| sr. sec. notes 11 1/4s, 2017 | 640,000 | 620,800 |
|
| Isle of Capri Casinos, Inc. company guaranty 7s, 2014 | 14,000 | 10,850 |
|
| Mashantucket Western Pequot Tribe 144A bonds 8 1/2s, 2015 | 1,995,000 | 778,050 |
|
| MGM Mirage, Inc. company guaranty 6 3/4s, 2013 | 345,000 | 229,425 |
|
| MGM Mirage, Inc. company guaranty sr. unsec. notes | | |
| 7 5/8s, 2017 | 830,000 | 531,200 |
|
| MGM Mirage, Inc. 144A sr. sec. notes 10 3/8s, 2014 | 260,000 | 267,800 |
|
30
| | |
| CORPORATE BONDS AND NOTES (80.0%)* cont. | Principal amount | Value |
|
| Gaming and lottery cont. | | |
| Pinnacle Entertainment, Inc. company guaranty sr. unsec. sub. | | |
| notes 7 1/2s, 2015 | $1,250,000 | $1,043,750 |
|
| Pinnacle Entertainment, Inc. sr. sub. notes 8 1/4s, 2012 | 2,357,000 | 2,298,075 |
|
| Station Casinos, Inc. sr. notes 6s, 2012 (In default) † | 1,600,000 | 576,000 |
|
| Trump Entertainment Resorts, Inc. sec. notes 8 1/2s, 2015 | | |
| (In default) † | 3,905,000 | 468,600 |
|
| Wynn Las Vegas, LLC/Wynn Las Vegas Capital Corp. 1st mtge. | | |
| 6 5/8s, 2014 | 1,155,000 | 988,969 |
|
| | | 11,306,879 |
| Health care (9.2%) | | |
| Biomet, Inc. company guaranty sr. unsec. bond 10s, 2017 | 1,985,000 | 2,029,663 |
|
| Community Health Systems, Inc. company guaranty 8 7/8s, 2015 | 2,505,000 | 2,476,819 |
|
| DaVita, Inc. company guaranty 6 5/8s, 2013 | 2,025,000 | 1,898,438 |
|
| Elan Finance PLC/Elan Finance Corp. company guaranty 7 3/4s, | | |
| 2011 (Ireland) | 2,975,000 | 2,722,125 |
|
| Fresenius US Finance II, Inc. 144A sr. unsec. notes 9s, 2015 | 1,245,000 | 1,288,575 |
|
| HCA, Inc. company guaranty sr. notes 9 5/8s, 2016 ‡‡ | 1,393,000 | 1,333,798 |
|
| HCA, Inc. sr. sec. notes 9 1/4s, 2016 | 5,145,000 | 5,054,963 |
|
| HCA, Inc. sr. sec. notes 9 1/8s, 2014 | 3,525,000 | 3,463,313 |
|
| HCA, Inc. sr. unsec. notes 7 7/8s, 2011 | 930,000 | 906,750 |
|
| HCA, Inc. 144A sr. sec. notes 9 7/8s, 2017 | 515,000 | 515,000 |
|
| HCA, Inc. 144A sr. sec. notes 8 1/2s, 2019 | 1,600,000 | 1,564,000 |
|
| Health Management Associates, Inc. sr. notes 6 1/8s, 2016 | 2,585,000 | 2,197,250 |
|
| IASIS Healthcare/IASIS Capital Corp. sr. sub. notes 8 3/4s, 2014 | 660,000 | 645,150 |
|
| Omnicare, Inc. company guaranty 6 3/4s, 2013 | 185,000 | 167,888 |
|
| Omnicare, Inc. sr. sub. notes 6 1/8s, 2013 | 514,000 | 466,455 |
|
| Psychiatric Solutions, Inc. company guaranty 7 3/4s, 2015 | 2,195,000 | 1,975,500 |
|
| Psychiatric Solutions, Inc. 144A sr. sub. notes 7 3/4s, 2015 | 505,000 | 454,500 |
|
| Select Medical Corp. company guaranty 7 5/8s, 2015 | 3,210,000 | 2,535,900 |
|
| Service Corporation International debs. 7 7/8s, 2013 | 1,185,000 | 1,131,675 |
|
| Service Corporation International sr. unsec. unsub. notes | | |
| 6 3/4s, 2016 | 2,005,000 | 1,844,600 |
|
| Stewart Enterprises, Inc. sr. notes 6 1/4s, 2013 | 2,790,000 | 2,524,950 |
|
| Sun Healthcare Group, Inc. company guaranty sr. unsec. unsub. | | |
| notes 9 1/8s, 2015 | 1,575,000 | 1,553,344 |
|
| Surgical Care Affiliates, Inc. 144A sr. sub. notes 10s, 2017 | 1,540,000 | 1,232,000 |
|
| Surgical Care Affiliates, Inc. 144A sr. unsec. notes 8 7/8s, 2015 ‡‡ | 1,290,000 | 1,032,000 |
|
| Tenet Healthcare Corp. 144A company guaranty sr. sec. notes | | |
| 10s, 2018 | 2,250,000 | 2,351,250 |
|
| Tenet Healthcare Corp. 144A company guaranty sr. sec. notes | | |
| 9s, 2015 | 1,985,000 | 2,024,700 |
|
| United Surgical Partners International, Inc. company guaranty | | |
| sr. unsec. sub. notes 8 7/8s, 2017 | 655,000 | 558,388 |
|
| US Oncology, Inc. company guaranty 9s, 2012 | 2,915,000 | 2,915,000 |
|
| US Oncology, Inc. company guaranty sr. unsec. sub. notes | | |
| 10 3/4s, 2014 | 265,000 | 252,413 |
|
| Vanguard Health Holding Co. II, LLC sr. sub. notes 9s, 2014 | 3,436,000 | 3,367,280 |
|
31
| | |
| CORPORATE BONDS AND NOTES (80.0%)* cont. | Principal amount | Value |
|
| Health care cont. | | |
| Ventas Realty LP/Capital Corp. company guaranty 9s, 2012 R | $3,150,000 | $3,244,500 |
|
| Ventas Realty LP/Capital Corp. sr. notes 6 5/8s, 2014 R | 690,000 | 646,875 |
|
| | | 56,375,062 |
| Homebuilding (0.6%) | | |
| D.R. Horton, Inc. company guaranty sr. unsec. unsub. notes | | |
| Ser. MTN, 6s, 2011 | 675,000 | 649,688 |
|
| Meritage Homes Corp. company guaranty 6 1/4s, 2015 | 1,490,000 | 1,121,225 |
|
| Meritage Homes Corp. sr. notes 7s, 2014 | 245,000 | 191,100 |
|
| Realogy Corp. company guaranty sr. unsec. notes 10 1/2s, 2014 R | 3,860,000 | 1,418,550 |
|
| | | 3,380,563 |
| Lodging/Tourism (0.7%) | | |
| FelCor Lodging LP company guaranty 9s, 2011 R | 955,000 | 816,525 |
|
| Host Marriott LP company guaranty Ser. Q, 6 3/4s, 2016 R | 450,000 | 387,000 |
|
| Host Marriott LP sr. notes Ser. M, 7s, 2012 R | 2,445,000 | 2,347,200 |
|
| Seminole Hard Rock Entertainment, Inc. 144A sr. sec. notes FRN | | |
| 3.82s, 2014 | 1,100,000 | 748,000 |
|
| | | 4,298,725 |
| Media (1.6%) | | |
| Affinion Group, Inc. company guaranty 11 1/2s, 2015 | 930,000 | 802,125 |
|
| Affinion Group, Inc. company guaranty 10 1/8s, 2013 | 1,770,000 | 1,663,800 |
|
| Affinity Group, Inc. sr. sub. notes 9s, 2012 | 1,765,000 | 992,813 |
|
| Interpublic Group of Companies, Inc. notes 6 1/4s, 2014 | 100,000 | 85,250 |
|
| Interpublic Group of Companies, Inc. (The) sr. unsec. unsub. notes | | |
| FRN 2.883s, 2010 | 510,000 | 469,200 |
|
| Liberty Media, LLC sr. notes 5.7s, 2013 | 680,000 | 579,700 |
|
| Liberty Media, LLC sr. unsec. notes 7 7/8s, 2009 | 845,000 | 836,550 |
|
| Nielsen Finance LLC/Nielsen Finance Co. company guaranty | | |
| 10s, 2014 | 1,700,000 | 1,619,250 |
|
| Nielsen Finance LLC/Nielsen Finance Co. company guaranty | | |
| sr. unsec. sub. disc. notes stepped-coupon zero % (12 1/2s, | | |
| 8/1/11), 2016 †† | 2,060,000 | 1,318,400 |
|
| NTL Cable PLC sr. notes 9 1/8s, 2016 (United Kingdom) | 930,000 | 897,450 |
|
| Virgin Media Finance PLC company guaranty sr. notes Ser. 1, | | |
| 9 1/2s, 2016 (United Kingdom) | 250,000 | 238,935 |
|
| | | 9,503,473 |
| Oil and gas (8.7%) | | |
| Chaparral Energy, Inc. company guaranty 8 1/2s, 2015 | 444,000 | 255,300 |
|
| Chaparral Energy, Inc. company guaranty sr. unsec. notes | | |
| 8 7/8s, 2017 | 1,310,000 | 754,888 |
|
| Chesapeake Energy Corp. company guaranty 6 1/2s, 2017 | 220,000 | 182,050 |
|
| Chesapeake Energy Corp. company guaranty sr. unsec. notes | | |
| 9 1/2s, 2015 | 400,000 | 395,000 |
|
| Chesapeake Energy Corp. sr. notes 7 1/2s, 2013 | 3,815,000 | 3,567,025 |
|
| Compton Petroleum Corp. company guaranty 7 5/8s, | | |
| 2013 (Canada) | 3,650,000 | 1,825,000 |
|
| Comstock Resources, Inc. sr. notes 6 7/8s, 2012 | 2,015,000 | 1,873,950 |
|
| Connacher Oil and Gas, Ltd. 144A sec. notes 10 1/4s, | | |
| 2015 (Canada) | 2,360,000 | 1,498,600 |
|
| Denbury Resources, Inc. company guaranty 7 1/2s, 2013 | 179,000 | 171,840 |
|
| Denbury Resources, Inc. company guaranty sr. sub. notes | | |
| 9 3/4s, 2016 | 330,000 | 336,600 |
|
32
| | |
| CORPORATE BONDS AND NOTES (80.0%)* cont. | Principal amount | Value |
|
| Oil and gas cont. | | |
| Denbury Resources, Inc. sr. sub. notes 7 1/2s, 2015 | $2,045,000 | $1,932,525 |
|
| Encore Acquisition Co. sr. sub. notes 6s, 2015 | 2,295,000 | 1,893,375 |
|
| Ferrellgas LP/Finance sr. notes 8 3/4s, 2012 | 250,000 | 230,000 |
|
| Ferrellgas LP/Finance sr. notes 6 3/4s, 2014 | 2,890,000 | 2,629,900 |
|
| Ferrellgas LP/Finance 144A sr. notes 6 3/4s, 2014 | 175,000 | 159,250 |
|
| Forest Oil Corp. sr. notes 8s, 2011 | 3,105,000 | 3,089,475 |
|
| Harvest Operations Corp. sr. notes 7 7/8s, 2011 | 2,350,000 | 1,974,000 |
|
| Hilcorp Energy I LP/Hilcorp Finance Co. 144A sr. unsec. notes | | |
| 7 3/4s, 2015 | 1,225,000 | 1,053,500 |
|
| Newfield Exploration Co. sr. sub. notes 6 5/8s, 2016 | 300,000 | 270,000 |
|
| Newfield Exploration Co. sr. unsec. sub. notes 7 1/8s, 2018 | 860,000 | 771,850 |
|
| Newfield Exploration Co. sr. unsec. sub. notes 6 5/8s, 2014 | 3,230,000 | 2,971,600 |
|
| OPTI Canada, Inc. company guaranty sr. sec. notes 8 1/4s, | | |
| 2014 (Canada) | 620,000 | 427,800 |
|
| OPTI Canada, Inc. company guaranty sr. sec. notes 7 7/8s, | | |
| 2014 (Canada) | 1,405,000 | 948,375 |
|
| Pacific Energy Partners/Pacific Energy Finance Corp. sr. notes | | |
| 7 1/8s, 2014 | 1,350,000 | 1,350,849 |
|
| PetroHawk Energy Corp. company guaranty 9 1/8s, 2013 | 2,150,000 | 2,112,375 |
|
| PetroHawk Energy Corp. 144A sr. notes 10 1/2s, 2014 | 455,000 | 466,375 |
|
| Petroleum Development Corp. company guaranty sr. unsec. | | |
| notes 12s, 2018 | 1,340,000 | 998,300 |
|
| Petroplus Finance, Ltd. company guaranty 6 3/4s, | | |
| 2014 (Bermuda) | 1,920,000 | 1,603,200 |
|
| Plains Exploration & Production Co. company guaranty | | |
| 7 3/4s, 2015 | 365,000 | 340,363 |
|
| Plains Exploration & Production Co. company guaranty 7s, 2017 | 3,065,000 | 2,666,550 |
|
| Quicksilver Resources, Inc. company guaranty 7 1/8s, 2016 | 480,000 | 350,400 |
|
| Quicksilver Resources, Inc. company guaranty sr. unsec. notes | | |
| 8 1/4s, 2015 | 565,000 | 471,775 |
|
| Range Resources Corp. company guaranty sr. unsec. sub. notes | | |
| 7 1/2s, 2017 | 420,000 | 399,000 |
|
| Sabine Pass LNG LP sec. notes 7 1/2s, 2016 | 2,300,000 | 1,863,000 |
|
| SandRidge Energy, Inc. company guaranty sr. unsec. unsub. | | |
| FRN 4.833s, 2014 | 675,000 | 533,459 |
|
| SandRidge Energy, Inc. 144A company guaranty sr. unsec. unsub. | | |
| notes 8s, 2018 | 2,115,000 | 1,787,175 |
|
| Targa Resources, Inc. company guaranty sr. unsec. notes | | |
| 8 1/2s, 2013 | 3,215,000 | 2,298,725 |
|
| Whiting Petroleum Corp. company guaranty 7s, 2014 | 2,530,000 | 2,264,350 |
|
| Williams Cos., Inc. (The) notes 7 3/4s, 2031 | 2,430,000 | 2,101,950 |
|
| Williams Cos., Inc. (The) sr. unsec. notes 7 7/8s, 2021 | 730,000 | 708,100 |
|
| Williams Cos., Inc. (The) sr. unsec. notes 7 5/8s, 2019 | 1,395,000 | 1,360,125 |
|
| Williams Cos., Inc. (The) 144A notes 6 3/8s, 2010 | 700,000 | 700,378 |
|
| | | 53,588,352 |
| Publishing (0.3%) | | |
| American Media, Inc. sr. unsec. sub. notes company guaranty | | |
| 8 7/8s, 2011 F | 85,000 | 28,539 |
|
| American Media, Inc. 144A company guaranty sr. unsec. sub. | | |
| notes 8 7/8s, 2011 F | 11,090 | 3,723 |
|
33
| | |
| CORPORATE BONDS AND NOTES (80.0%)* cont. | Principal amount | Value |
|
| Publishing cont. | | |
| CanWest Media, Inc. company guaranty 8s, 2012 (Canada) | | |
| (In default) † | $1,356,600 | $379,848 |
|
| Cenveo Corp. 144A company guaranty sr. unsec. notes | | |
| 10 1/2s, 2016 | 1,110,000 | 796,425 |
|
| Quebecor Media, Inc. sr. unsec. notes Ser. *, 7 3/4s, | | |
| 2016 (Canada) | 410,000 | 363,875 |
|
| Reader’s Digest Association, Inc. (The) company guaranty | | |
| sr. unsec. sub. notes 9s, 2017 | 1,980,000 | 79,200 |
|
| | | 1,651,610 |
| Regional Bells (1.4%) | | |
| Cincinnati Bell, Inc. company guaranty 7s, 2015 | 1,005,000 | 922,088 |
|
| Citizens Communications Co. notes 9 1/4s, 2011 | 1,660,000 | 1,720,175 |
|
| Frontier Communications Corp. sr. unsec. notes 8 1/4s, 2014 | 940,000 | 918,850 |
|
| Qwest Communications International, Inc. company guaranty | | |
| 7 1/2s, 2014 | 140,000 | 128,800 |
|
| Qwest Corp. sr. unsec. unsub. notes 8 7/8s, 2012 | 3,555,000 | 3,581,663 |
|
| Qwest Corp. sr. unsec. unsub. notes 7 1/4s, 2025 | 1,135,000 | 862,600 |
|
| Qwest Corp. 144A sr. unsec. notes 8 3/8s, 2016 | 400,000 | 393,000 |
|
| Valor Telecommunications Enterprises LLC/Finance Corp. | | |
| company guaranty sr. unsec. unsub. notes 7 3/4s, 2015 | 200,000 | 197,000 |
|
| | | 8,724,176 |
| Retail (1.9%) | | |
| Bon-Ton Stores, Inc. (The) company guaranty 10 1/4s, 2014 | 1,355,000 | 650,400 |
|
| Burlington Coat Factory Warehouse Corp. company guaranty | | |
| sr. unsec. notes 11 1/8s, 2014 | 1,705,000 | 1,236,125 |
|
| Dollar General Corp. company guaranty sr. unsec. notes | | |
| 10 5/8s, 2015 | 1,045,000 | 1,105,088 |
|
| Hanesbrands, Inc. company guaranty sr. unsec. notes FRN | | |
| Ser. B, 5.698s, 2014 | 2,930,000 | 2,358,650 |
|
| Harry & David Operations Corp. company guaranty sr. unsec. | | |
| notes 9s, 2013 | 1,355,000 | 475,944 |
|
| Harry & David Operations Corp. company guaranty sr. unsec. | | |
| notes FRN 5.668s, 2012 | 385,000 | 136,194 |
|
| Michaels Stores, Inc. company guaranty 11 3/8s, 2016 | 1,490,000 | 812,050 |
|
| Michaels Stores, Inc. company guaranty 10s, 2014 | 890,000 | 640,800 |
|
| Neiman-Marcus Group, Inc. company guaranty sr. unsec. notes | | |
| 9s, 2015 ‡‡ | 2,955,321 | 1,581,097 |
|
| Staples, Inc. sr. unsec. notes 9 3/4s, 2014 | 1,125,000 | 1,243,125 |
|
| United Auto Group, Inc. company guaranty 7 3/4s, 2016 | 1,690,000 | 1,301,300 |
|
| | | 11,540,773 |
| Technology (3.4%) | | |
| Activant Solutions, Inc. company guaranty 9 1/2s, 2016 | 985,000 | 721,513 |
|
| Advanced Micro Devices, Inc. sr. notes 7 3/4s, 2012 | 5,000 | 3,325 |
|
| Amkor Technologies, Inc. sr. notes 7 3/4s, 2013 | 1,735,000 | 1,552,825 |
|
| Avago Technologies Finance company guaranty sr. unsec. sub. notes | | |
| 11 7/8s, 2015 (Singapore) | 390,000 | 358,114 |
|
| Avago Technologies Finance company guaranty sr. unsec. notes | | |
| 10 1/8s, 2013 (Singapore) | 855,000 | 821,869 |
|
| Avago Technologies Finance company guaranty FRN 6.168s, | | |
| 2013 (Singapore) | 7,000 | 5,915 |
|
| Celestica, Inc. sr. sub. notes 7 5/8s, 2013 (Canada) | 1,140,000 | 1,111,500 |
|
34
| | | |
| CORPORATE BONDS AND NOTES (80.0%)* cont. | Principal amount | Value |
| Technology cont. | | | |
| Ceridian Corp. sr. unsec. notes 11 1/4s, 2015 | | $1,605,000 | $1,253,906 |
|
| Compucom Systems, Inc. sr. sub. notes 12 1/2s, 2015 | | 570,000 | 438,900 |
|
| First Data Corp. company guaranty sr. unsec. notes 9 7/8s, 2015 | | 1,195,000 | 812,600 |
|
| Flextronics International, Ltd. sr. unsec. sub. notes 6 1/4s, | | | |
| 2014 (Singapore) | | 690,000 | 617,550 |
|
| Freescale Semiconductor, Inc. company guaranty sr. unsec. notes | | | |
| 8 7/8s, 2014 | | 5,150,000 | 2,317,500 |
|
| Freescale Semiconductor, Inc. company guaranty sr. unsec. sub. | | | |
| notes 10 1/8s, 2016 | | 272,000 | 72,080 |
|
| Iron Mountain, Inc. company guaranty 8 3/4s, 2018 | | 155,000 | 150,738 |
|
| Iron Mountain, Inc. company guaranty 8 5/8s, 2013 | | 785,000 | 786,963 |
|
| Iron Mountain, Inc. company guaranty sr. unsec. sub. notes | | | |
| 8s, 2020 | | 1,430,000 | 1,322,750 |
|
| Lucent Technologies, Inc. unsec. debs. 6.45s, 2029 | | 210,000 | 119,700 |
|
| New ASAT Finance, Ltd. company guaranty 9 1/4s, 2011 | | | |
| (Cayman Islands) (In default) † | | 1,235,000 | 4,631 |
|
| Sanmina Corp. sr. unsec. sub. notes 8 1/8s, 2016 | | 1,040,000 | 582,400 |
|
| Seagate Technology Hdd Holdings company guaranty 6.8s, 2016 | | 1,065,000 | 809,711 |
|
| Seagate Technology International 144A company guaranty | | | |
| sr. sec. notes 10s, 2014 (Cayman Islands) | | 590,000 | 595,900 |
|
| SunGard Data Systems, Inc. company guaranty 10 1/4s, 2015 | | 2,407,000 | 2,184,353 |
|
| SunGard Data Systems, Inc. company guaranty 9 1/8s, 2013 | | 3,298,000 | 3,174,325 |
|
| Syniverse Technologies, Inc. sr. sub. notes Ser. B, 7 3/4s, 2013 | | 1,235,000 | 1,059,013 |
|
| | | | 20,878,081 |
| Telecommunications (6.4%) | | | |
| American Tower Corp. sr. notes 7 1/2s, 2012 | | 1,020,000 | 1,039,125 |
|
| American Tower Corp. sr. unsec. notes 7s, 2017 | | 705,000 | 680,325 |
|
| American Tower Corp. 144A sr. unsec. notes 7 1/4s, 2019 | | 570,000 | 555,750 |
|
| BCM Ireland Finance Ltd. 144A FRN 6.281s, 2016 | | | |
| (Cayman Islands) | EUR | 630,000 | 356,126 |
|
| CC Holdings GS V, LLC/Crown Castle GS III Corp. 144A sr. sec. | | | |
| notes 7 3/4s, 2017 | | $590,000 | 581,150 |
|
| Centennial Cellular Operating Co., LLC company guaranty | | | |
| 10 1/8s, 2013 | | 845,000 | 870,350 |
|
| Centennial Communications Corp. sr. unsec. notes FRN | | | |
| 6.958s, 2013 | | 420,000 | 418,950 |
|
| Crown Castle International Corp. sr. unsec. notes 9s, 2015 | | 610,000 | 613,050 |
|
| Digicel Group, Ltd. 144A sr. unsec. notes 8 7/8s, 2015 (Jamaica) | | 1,100,000 | 880,000 |
|
| Digicel, Ltd. 144A sr. unsec. unsub. notes 9 1/4s, 2012 (Jamaica) | | 1,545,000 | 1,475,475 |
|
| Inmarsat Finance PLC company guaranty 10 3/8s, 2012 | | | |
| (United Kingdom) | | 2,216,000 | 2,288,020 |
|
| Intelsat Bermuda, Ltd. company guaranty sr. unsec. notes 11 1/4s, | | | |
| 2016 (Bermuda) | | 4,565,000 | 4,690,538 |
|
| Intelsat Intermediate Holding Co., Ltd. company guaranty | | | |
| sr. unsec. notes stepped-coupon zero % (9 1/4s, 2/1/10), | | | |
| 2015 (Bermuda) †† | | 690,000 | 622,725 |
|
| Intelsat Intermediate Holding Co., Ltd. 144A company guaranty | | | |
| sr. unsec. disc notes stepped-coupon zero % (9 1/2s, 2/1/10), | | | |
| 2015 (Bermuda) †† | | 2,165,000 | 1,953,913 |
|
35
| | | |
| CORPORATE BONDS AND NOTES (80.0%)* cont. | Principal amount | Value |
|
| Telecommunications cont. | | | |
| Intelsat Subsidiary Holding Co., Ltd. 144A sr. unsec. notes 8 7/8s, | | | |
| 2015 (Bermuda) | | $960,000 | $945,293 |
|
| Intelsat Subsidiary Holding Co., Ltd. 144A sr. unsec. notes 8 1/2s, | | | |
| 2013 (Bermuda) | | 1,275,000 | 1,249,500 |
|
| Level 3 Financing, Inc. company guaranty 9 1/4s, 2014 | | 2,520,000 | 1,968,750 |
|
| Level 3 Financing, Inc. company guaranty 8 3/4s, 2017 | | 265,000 | 186,494 |
|
| MetroPCS Wireless, Inc. company guaranty sr. unsec. notes | | | |
| 9 1/4s, 2014 | | 3,445,000 | 3,457,919 |
|
| Nextel Communications, Inc. company guaranty sr. unsec. notes | | | |
| Ser. D, 7 3/8s, 2015 | | 2,805,000 | 2,222,963 |
|
| Nordic Telephone Co. Holdings ApS 144A sr. sec. bond 8 7/8s, | | | |
| 2016 (Denmark) | | 455,000 | 455,000 |
|
| PAETEC Holding Corp. company guaranty sr. unsec. unsub. | | | |
| notes 9 1/2s, 2015 | | 1,020,000 | 923,100 |
|
| Sprint Capital Corp. company guaranty 7 5/8s, 2011 | | 565,000 | 557,938 |
|
| Sprint Capital Corp. company guaranty 6 7/8s, 2028 | | 3,560,000 | 2,492,000 |
|
| West Corp. company guaranty 9 1/2s, 2014 | | 1,955,000 | 1,759,500 |
|
| Wind Acquisition Finance SA notes 9 3/4s, 2015 (Netherlands) | EUR | 860,000 | 1,191,045 |
|
| Windstream Corp. company guaranty 8 5/8s, 2016 | | $2,895,000 | 2,844,338 |
|
| Windstream Corp. company guaranty 8 1/8s, 2013 | | 2,160,000 | 2,124,900 |
|
| | | | 39,404,237 |
| Telephone (0.9%) | | | |
| Cricket Communications, Inc. company guaranty 9 3/8s, 2014 | | 2,985,000 | 2,970,075 |
|
| Cricket Communications, Inc. 144A sr. sec. notes 7 3/4s, 2016 | | 1,005,000 | 974,850 |
|
| iPCS, Inc. company guaranty sr. sec. notes FRN 3.153s, 2013 | | 680,000 | 562,700 |
|
| Time Warner Telecom, Inc. company guaranty 9 1/4s, 2014 | | 805,000 | 807,013 |
|
| | | | 5,314,638 |
| Textiles (0.6%) | | | |
| Levi Strauss & Co. sr. unsec. notes 8 7/8s, 2016 | | 1,135,000 | 1,066,900 |
|
| Levi Strauss & Co. sr. unsec. unsub. notes 9 3/4s, 2015 | | 2,590,000 | 2,499,350 |
|
| Oxford Industries, Inc. sr. notes 8 7/8s, 2011 | | 305,000 | 271,450 |
|
| | | | 3,837,700 |
| Tire and rubber (0.2%) | | | |
| Goodyear Tire & Rubber Co. (The) sr. notes 9s, 2015 | | 605,000 | 577,775 |
|
| Goodyear Tire & Rubber Co. (The) sr. unsec. notes 10 1/2s, 2016 | | 800,000 | 796,000 |
|
| | | | 1,373,775 |
| Transportation (0.2%) | | | |
| Offshore Logistics, Inc. company guaranty 6 1/8s, 2013 | | 1,455,000 | 1,273,125 |
|
| | | | 1,273,125 |
| Utilities and power (7.5%) | | | |
| AES Corp. (The) sr. unsec. notes 8s, 2020 | | 520,000 | 457,600 |
|
| AES Corp. (The) sr. unsec. unsub. notes 8s, 2017 | | 1,065,000 | 990,450 |
|
| AES Corp. (The) 144A sec. notes 8 3/4s, 2013 | | 2,102,000 | 2,133,530 |
|
| Allegheny Energy Supply 144A sr. unsec. bond 8 1/4s, 2012 | | 1,335,000 | 1,387,814 |
|
| Ameren Corp. sr. unsec. notes 8 7/8s, 2014 | | 1,325,000 | 1,359,166 |
|
| CMS Energy Corp. sr. notes 8 1/2s, 2011 | | 490,000 | 494,907 |
|
| CMS Energy Corp. sr. notes 7 3/4s, 2010 | | 1,190,000 | 1,202,977 |
|
| Colorado Interstate Gas Co. debs. 6.85s, 2037 (Canada) | | 1,430,000 | 1,201,384 |
|
| Dynegy Holdings, Inc. sr. unsec. notes 8 3/8s, 2016 | | 555,000 | 446,775 |
|
| Dynegy-Roseton Danskamme company guaranty Ser. B, | | | |
| 7.67s, 2016 | | 2,180,000 | 1,831,200 |
|
36
| | |
| CORPORATE BONDS AND NOTES (80.0%)* cont. | Principal amount | Value |
|
| Utilities and power cont. | | |
| Edison Mission Energy sr. unsec. notes 7 3/4s, 2016 | $755,000 | $585,125 |
|
| Edison Mission Energy sr. unsec. notes 7 1/2s, 2013 | 175,000 | 147,438 |
|
| Edison Mission Energy sr. unsec. notes 7.2s, 2019 | 1,920,000 | 1,298,400 |
|
| Edison Mission Energy sr. unsec. notes 7s, 2017 | 45,000 | 32,625 |
|
| El Paso Corp. sr. notes Ser. MTN, 7.8s, 2031 | 705,000 | 553,425 |
|
| El Paso Corp. sr. unsec. notes 12s, 2013 | 420,000 | 462,000 |
|
| El Paso Natural Gas Co. debs. 8 5/8s, 2022 | 765,000 | 798,906 |
|
| Inergy LP/Inergy Finance Corp. sr. unsec. notes 6 7/8s, 2014 | 3,720,000 | 3,403,800 |
|
| Ipalco Enterprises, Inc. sr. sec. notes 8 5/8s, 2011 | 805,000 | 809,025 |
|
| Ipalco Enterprises, Inc. 144A sr. sec. notes 7 1/4s, 2016 | 230,000 | 220,800 |
|
| Mirant Americas Generation, Inc. sr. unsec. notes 8.3s, 2011 | 2,010,000 | 2,004,975 |
|
| Mirant North America, LLC company guaranty 7 3/8s, 2013 | 2,960,000 | 2,834,200 |
|
| NiSource Finance Corp. company guaranty sr. unsec. notes | | |
| 10 3/4s, 2016 | 495,000 | 539,338 |
|
| NiSource Finance Corp. company guaranty sr. unsec. unsub. | | |
| notes 6.8s, 2019 | 1,345,000 | 1,205,061 |
|
| NiSource Finance Corp. company guaranty sr. unsec. unsub. | | |
| notes 5.4s, 2014 | 660,000 | 585,597 |
|
| NRG Energy, Inc. company guaranty 7 3/8s, 2017 | 935,000 | 881,238 |
|
| NRG Energy, Inc. sr. notes 7 3/8s, 2016 | 6,535,000 | 6,151,069 |
|
| Oncor Electric Delivery Co. sec. bonds 5.95s, 2013 | 1,930,000 | 1,967,546 |
|
| Orion Power Holdings, Inc. sr. unsec. notes 12s, 2010 | 2,025,000 | 2,090,813 |
|
| Sierra Pacific Power Co. general ref. mtge. 6 1/4s, 2012 | 485,000 | 493,483 |
|
| Sierra Pacific Resources sr. unsec. notes 8 5/8s, 2014 | 1,940,000 | 1,910,900 |
|
| Teco Finance, Inc. company guaranty sr. unsec. unsub. notes | | |
| 7.2s, 2011 | 680,000 | 695,915 |
|
| Teco Finance, Inc. company guaranty sr. unsec. unsub. notes | | |
| 7s, 2012 | 1,165,000 | 1,170,111 |
|
| Teco Finance, Inc. company guaranty sr. unsec. unsub. notes | | |
| 6 3/4s, 2015 | 140,000 | 132,077 |
|
| Tennessee Gas Pipeline Co. sr. unsec. unsub. debs. 7 1/2s, 2017 | 610,000 | 618,281 |
|
| Tennessee Gas Pipeline Co. sr. unsec. unsub. debs. 7s, 2028 | 305,000 | 267,552 |
|
| Texas-New Mexico Power Co. 144A 1st mtge. sec. 9 1/2s, 2019 | 1,430,000 | 1,468,362 |
|
| Transcontinental Gas Pipeline Corp. sr. unsec. debs. 7 1/4s, 2026 | 1,055,000 | 982,844 |
|
| Utilicorp United, Inc. sr. unsec. notes 7.95s, 2011 | 68,000 | 69,699 |
|
| | | 45,886,408 |
| Total corporate bonds and notes (cost $561,453,210) | | $489,967,815 |
| |
| |
| SENIOR LOANS (10.5%)* c | Principal amount | Value |
|
| Automotive (0.4%) | | |
| Dana Corp. bank term loan FRN 7 1/4s, 2015 | $756,324 | $357,633 |
|
| TRW Automotive, Inc. bank term loan FRN Ser. B, 1.938s, 2014 | 2,165,000 | 1,887,159 |
|
| | | 2,244,792 |
| Basic materials (0.6%) | | |
| Huntsman International, LLC bank term loan FRN Ser. B, | | |
| 2.178s, 2012 | 1,709,085 | 1,450,052 |
|
| Lyondell Chemical Co. bank term loan FRN 11.425s, 2009 | 250,000 | 256,125 |
|
| NewPage Holding Corp. bank term loan FRN 4.74s, 2014 | 953,297 | 766,383 |
|
37
| | |
| SENIOR LOANS (10.5%)* c cont. | Principal amount | Value |
|
| Basic materials cont. | | |
| Rockwood Specialties Group, Inc. bank term loan FRN Ser. E, | | |
| 2.129s, 2012 | $427,785 | $398,910 |
|
| Verso Paper Holdings LLC/Verso Paper, Inc. bank term loan FRN | | |
| Ser. B, 3s, 2013 | 862,570 | 819,441 |
|
| | | 3,690,911 |
| Broadcasting (0.2%) | | |
| Univision Communications, Inc. bank term loan FRN Ser. B, | | |
| 2.879s, 2014 | 1,850,000 | 1,260,775 |
|
| | | 1,260,775 |
| Capital goods (0.4%) | | |
| Hawker Beechcraft Acquisition Co., LLC bank term loan FRN | | |
| 3.22s, 2014 | 28,680 | 16,459 |
|
| Hawker Beechcraft Acquisition Co., LLC bank term loan FRN | | |
| Ser. B, 2.689s, 2014 | 565,785 | 324,698 |
|
| Hexcel Corp. bank term loan FRN 6 1/4s, 2014 | 280,000 | 277,200 |
|
| Sensata Technologies BV bank term loan FRN 2.379s, 2013 | | |
| (Netherlands) | 352,502 | 247,926 |
|
| Sequa Corp. bank term loan FRN 3.879s, 2014 | 579,632 | 436,173 |
|
| Wesco Aircraft Hardware Corp. bank term loan FRN 6.18s, 2014 | 570,000 | 416,100 |
|
| Wesco Aircraft Hardware Corp. bank term loan FRN 2.68s, 2013 | 634,000 | 518,612 |
|
| | | 2,237,168 |
| Communication services (0.6%) | | |
| Cebridge Connections, Inc. bank term loan FRN 4.911s, 2014 | 615,000 | 497,958 |
|
| Cebridge Connections, Inc. bank term loan FRN Ser. B, | | |
| 2.397s, 2013 | 249,364 | 224,774 |
|
| Charter Communications, Inc. bank term loan FRN 5 1/4s, 2014 | 1,275,000 | 920,869 |
|
| Fairpoint Communications, Inc. bank term loan FRN Ser. B, | | |
| 5 3/4s, 2015 | 1,785,559 | 1,252,123 |
|
| Mediacom Communications Corp. bank term loan FRN Ser. C, | | |
| 1.79s, 2015 | 1,192,698 | 1,066,471 |
|
| | | 3,962,195 |
| Consumer cyclicals (2.8%) | | |
| Allison Transmission, Inc. bank term loan FRN Ser. B, 3.147s, 2014 | 2,382,911 | 1,837,820 |
|
| Building Materials Holdings Corp. bank term loan FRN 5.658s, 2014 | 1,170,000 | 986,700 |
|
| CCM Merger, Inc. bank term loan FRN Ser. B, 8 1/2s, 2012 | 1,856,714 | 1,406,461 |
|
| Citadel Communications bank term loan FRN Ser. B, 2.953s, 2014 | 760,000 | 347,067 |
|
| Dex Media West, LLC/Dex Media Finance Co. bank term loan FRN | | |
| Ser. B, 7s, 2014 | 400,000 | 326,333 |
|
| GateHouse Media, Inc. bank term loan FRN Ser. B, 2.629s, 2014 | 822,935 | 169,289 |
|
| GateHouse Media, Inc. bank term loan FRN Ser. DD, 2.629s, 2014 | 307,065 | 63,168 |
|
| Golden Nugget, Inc. bank term loan FRN Ser. B, 2.32s, 2014 | 238,636 | 141,989 |
|
| Golden Nugget, Inc. bank term loan FRN Ser. DD, 2.476s, 2014 | 136,136 | 81,001 |
|
| Goodman Global Holdings, Inc. bank term loan FRN Ser. B, | | |
| 6 1/2s, 2011 | 1,423,100 | 1,312,810 |
|
| Lear Corp. bank term loan FRN 3.161s, 2013 | 2,150,230 | 1,422,736 |
|
| Navistar Financial Corp. bank term loan FRN 4.333s, 2012 | 940,000 | 783,893 |
|
| Navistar International Corp. bank term loan FRN 3.678s, 2012 | 2,585,000 | 2,155,706 |
|
| Neiman Marcus Group, Inc. (The) bank term loan FRN Ser. B, | | |
| 2.629s, 2013 | 570,000 | 400,306 |
|
| Six Flags Theme Parks bank term loan FRN 2.879s, 2015 | 3,037,348 | 2,306,216 |
|
| Thomas Learning bank term loan FRN Ser. B, 2.898s, 2014 | 1,900,000 | 1,482,891 |
|
38
| | |
| SENIOR LOANS (10.5%)* c cont. | Principal amount | Value |
|
| Consumer cyclicals cont. | | |
| Travelport bank term loan FRN Ser. B, 3.215s, 2013 | $49,559 | $36,162 |
|
| Travelport bank term loan FRN Ser. DD, 2.879s, 2013 | 378,779 | 278,538 |
|
| Tribune Co. bank term loan FRN Ser. B, 5 1/4s, 2014 (In default) † | 3,524,169 | 1,070,956 |
|
| United Components, Inc. bank term loan FRN Ser. D, 3.21s, 2012 | 194,222 | 157,320 |
|
| Visteon Corp. bank term loan FRN Ser. B, 4 1/4s, 2013 | 675,000 | 246,544 |
|
| VNU Group BV bank term loan FRN Ser. B, 2.382s, | | |
| 2013 (Netherlands) | 275,000 | 242,129 |
|
| | | 17,256,035 |
| Consumer staples (0.6%) | | |
| Dole Food Co., Inc. bank term loan FRN Ser. B, 7.965s, 2013 | 211,188 | 209,538 |
|
| Dole Food Co., Inc. bank term loan FRN Ser. C, 7.974s, 2013 | 786,906 | 780,759 |
|
| Dole Food Co., Inc. bank term loan FRN Ser. C, 1.139s, 2013 | 120,499 | 119,558 |
|
| Pinnacle Foods Holding Corp. bank term loan FRN Ser. B, | | |
| 3.129s, 2014 | 1,359,413 | 1,148,461 |
|
| Rite-Aid Corp. bank term loan FRN Ser. B, 2.379s, 2014 | 118,800 | 95,634 |
|
| RSC Equipment Rental, Inc. bank term loan FRN 4.129s, 2013 | 1,665,000 | 1,215,450 |
|
| | | 3,569,400 |
| Financials (0.1%) | | |
| Nuveen Investments, Inc. bank term loan FRN Ser. B, | | |
| 3.379s, 2014 | 455,400 | 325,232 |
|
| | | 325,232 |
| Gaming and lottery (0.1%) | | |
| Isle of Capri Casinos, Inc. bank term loan FRN 2.97s, 2014 | 641,552 | 542,112 |
|
| Isle of Capri Casinos, Inc. bank term loan FRN Ser. A, 2.97s, 2014 | 203,121 | 171,637 |
|
| Isle of Capri Casinos, Inc. bank term loan FRN Ser. B, 2.178s, 2014 | 256,621 | 216,845 |
|
| | | 930,594 |
| Health care (1.5%) | | |
| Bausch & Lomb, Inc. bank term loan FRN Ser. B, 4.47s, 2015 | 363,217 | 315,999 |
|
| Bausch & Lomb, Inc. bank term loan FRN Ser. DD, 4.206s, 2015 U | 91,954 | 80,000 |
|
| Biomet, Inc. bank term loan FRN Ser. B, 4.142s, 2015 | 546,922 | 513,628 |
|
| Community Health Systems, Inc. bank term loan FRN Ser. B, | | |
| 3.447s, 2014 | 1,562,515 | 1,386,377 |
|
| Community Health Systems, Inc. bank term loan FRN Ser. DD, | | |
| 2.879s, 2014 | 81,539 | 72,347 |
|
| Fenwal Controls of Japan, Ltd. bank term loan FRN 3.506s, | | |
| 2014 (Japan) | 423,008 | 321,839 |
|
| Fenwal Controls of Japan, Ltd. bank term loan FRN Ser. DD, | | |
| 3.506s, 2014 (Japan) | 47,101 | 35,836 |
|
| Health Management Associates, Inc. bank term loan FRN | | |
| 2.97s, 2014 | 1,713,877 | 1,479,933 |
|
| Healthsouth Corp. bank term loan FRN Ser. B, 3.129s, 2013 | 1,461,563 | 1,342,202 |
|
| IASIS Healthcare, LLC/IASIS Capital Corp. bank term loan FRN | | |
| 6.289s, 2014 | 2,449,602 | 1,751,466 |
|
| Select Medical Corp. bank term loan FRN Ser. B, 2.716, 2012 | 330,000 | 295,020 |
|
| Surgical Care Affiliates, Inc. bank term loan FRN Ser. B, | | |
| 3.22s, 2015 | 288,001 | 244,081 |
|
| United Surgical Partners International, Inc. bank term loan FRN | | |
| 2.69s, 2014 | 1,282,984 | 1,148,271 |
|
| | | 8,986,999 |
39
| | |
| SENIOR LOANS (10.5%)* c cont. | Principal amount | Value |
|
| Homebuilding (0.1%) | | |
| Realogy Corp. bank term loan FRN 0.261s, 2013 | $252,175 | $175,262 |
|
| Realogy Corp. bank term loan FRN Ser. B, 4.177s, 2013 | 936,650 | 650,972 |
|
| | | 826,234 |
| Oil and gas (0.2%) | | |
| Quicksilver Resources, Inc. bank term loan FRN 7 3/4s, 2013 | 580,768 | 569,153 |
|
| Targa Resources, Inc. bank term loan FRN 2.879s, 2012 | 398,362 | 368,200 |
|
| Targa Resources, Inc. bank term loan FRN Ser. C, 0.754s, 2012 | 229,325 | 211,962 |
|
| | | 1,149,315 |
| Retail (0.3%) | | |
| Burlington Coat Factory Warehouse Corp. bank term loan FRN | | |
| Ser. B, 2.854s, 2013 | 580,000 | 402,375 |
|
| Dollar General Corp. bank term loan FRN Ser. B1, 3.475s, 2013 | 1,275,000 | 1,193,947 |
|
| Michaels Stores, Inc. bank term loan FRN Ser. B, 2.879s, 2013 | 774,121 | 552,851 |
|
| | | 2,149,173 |
| Technology (0.8%) | | |
| Compucom Systems, Inc. bank term loan FRN 3.93s, 2014 | 595,933 | 512,502 |
|
| First Data Corp. bank term loan FRN Ser. B1, 2.879s, 2014 | 2,706,426 | 1,984,149 |
|
| First Data Corp. bank term loan FRN Ser. B3, 2.879s, 2014 | 1,572,670 | 1,153,947 |
|
| Flextronics International, Ltd. bank term loan FRN Ser. B, 3.381s, | | |
| 2014 (Singapore) | 225,363 | 180,516 |
|
| Flextronics International, Ltd. bank term loan FRN Ser. B, 2.879s, | | |
| 2014 (Singapore) | 784,262 | 628,194 |
|
| Freescale Semiconductor, Inc. bank term loan FRN 12 1/2s, 2014 | 573,398 | 420,014 |
|
| Freescale Semiconductor, Inc. bank term loan FRN Ser. B, | | |
| 2.168s, 2013 | 470,534 | 288,594 |
|
| | | 5,167,916 |
| Telecommunications (—%) | | |
| Level 3 Financing, Inc. bank term loan FRN Ser. B, 11 1/2s, 2014 | 130,000 | 132,763 |
|
| | | 132,763 |
| Tire and rubber (0.4%) | | |
| Goodyear Tire & Rubber Co. (The) bank term loan FRN | | |
| 2.07s, 2010 | 2,664,000 | 2,227,354 |
|
| | | 2,227,354 |
| Utilities and power (1.4%) | | |
| Calpine Corp. bank term loan FRN Ser. B, 4.095s, 2014 | 2,732,468 | 2,358,036 |
|
| Energy Future Holdings Corp. bank term loan FRN Ser. B2, | | |
| 3.882s, 2014 | 5,601,640 | 3,856,729 |
|
| Energy Future Holdings Corp. bank term loan FRN Ser. B3, | | |
| 3.882s, 2014 | 3,260,350 | 2,228,449 |
|
| | | 8,443,214 |
| Total senior loans (cost $77,783,601) | | $64,560,070 |
| |
| |
| CONVERTIBLE BONDS AND NOTES (3.2%)* | Principal amount | Value |
|
| Acquicor Technology, Inc. 144A cv. notes 8s, 2011 | $822,000 | $238,380 |
|
| Advanced Micro Devices, Inc. cv. sr. unsec. notes 5 3/4s, 2012 | 1,025,000 | 636,781 |
|
| ArcelorMittal cv. sr. unsec. unsub. notes 5s, 2014 (Luxembourg) | 620,000 | 785,850 |
|
| Digital Realty Trust LP 144A cv. sr. unsec. notes 5 1/2s, 2029 R | 865,000 | 844,846 |
|
| General Cable Corp. cv. company guaranty sr. unsec. notes | | |
| 1s, 2012 | 855,000 | 674,381 |
|
40
| | |
| CONVERTIBLE BONDS AND NOTES (3.2%)* cont. | Principal amount | Value |
|
| General Growth Properties, Inc. 144A cv. sr. notes 3.98s, 2027 | | |
| (In default) † R | $1,425,000 | $491,625 |
|
| International Game Technology 144A cv. sr. unsec. | | |
| notes 3 1/4s, 2014 | 845,000 | 948,766 |
|
| Interpublic Group of Companies, Inc. (The) cv. sr. unsec. notes | | |
| 4 1/4s, 2023 | 1,055,000 | 929,719 |
|
| Jazz Technologies, Inc. cv. company guaranty 8s, 2011 | 20,000 | 5,800 |
|
| Lamar Advertising Co. cv. sr. unsec. unsub. notes Ser. B, | | |
| 2 7/8s, 2010 | 1,015,000 | 933,800 |
|
| Leap Wireless International, Inc. 144A cv. sr. unsec. notes | | |
| 4 1/2s, 2014 | 795,000 | 636,000 |
|
| LifePoint Hospitals, Inc. cv. sr. sub. notes 3 1/2s, 2014 | 2,930,000 | 2,402,600 |
|
| Massey Energy Co. cv. company guaranty sr. unsub. notes | | |
| 3 1/4s, 2015 | 3,212,000 | 2,139,995 |
|
| Maxtor Corp. cv. sr. debs. 2 3/8s, 2012 | 1,220,000 | 989,725 |
|
| NII Holdings, Inc. cv. unsec. notes 3 1/8s, 2012 | 175,000 | 130,813 |
|
| NII Holdings, Inc. 144A cv. sr. unsec. notes 3 1/8s, 2012 | 998,000 | 746,005 |
|
| Pantry, Inc. (The) cv. sr. sub. notes 3s, 2012 | 2,155,000 | 1,715,919 |
|
| Regal Entertainment Group 144A cv. sr. unsec. notes 6 1/4s, 2011 | 570,000 | 542,925 |
|
| Sirius Satellite Radio, Inc. cv. sr. unsec. notes 3 1/4s, 2011 | 1,147,000 | 642,320 |
|
| Transocean, Inc. cv. sr. unsec. notes Ser. C, 1 1/2s, 2037 | | |
| (Switzerland) | 1,620,000 | 1,421,550 |
|
| Trinity Industries, Inc. cv. sub. notes 3 7/8s, 2036 | 1,310,000 | 735,238 |
|
| Virgin Media, Inc. 144A cv. sr. unsec. notes 6 1/2s, 2016 | 1,265,000 | 978,794 |
|
| XM Satellite Radio Holdings, Inc. 144A cv. sr. unsec. sub. notes | | |
| 7s, 2014 | 353,000 | 133,258 |
|
| Total convertible bonds and notes (cost $19,967,974) | | $19,705,090 |
| |
| |
| ASSET-BACKED SECURITIES (0.4%)* | Principal amount | Value |
|
| Neon Capital, Ltd. 144A | | |
| limited recourse sec. notes Ser. 95, 2.319s, 2013 | | |
| (Cayman Islands) F g | $3,901,050 | $1,188,790 |
| limited recourse sec. notes Ser. 97, 1.105s, 2013 | | |
| (Cayman Islands) F g | 6,684,836 | 1,393,180 |
|
| Total asset-backed securities (cost $2,040,547) | | $2,581,970 |
|
| |
| U.S. GOVERNMENT AGENCY MORTGAGE OBLIGATIONS (0.1%)* | Principal amount | Value |
|
| Federal National Mortgage Association Pass-Through Certificates | | |
| 5 1/2s, May 1, 2033 i | $548,604 | $572,512 |
|
| Total U.S. government agency mortgage obligations | | |
| (cost $572,512) | | $572,512 |
|
| |
| FOREIGN GOVERNMENT BONDS AND NOTES (0.1%)* | Principal amount | Value |
|
| Argentina (Republic of) bonds FRB 1.597s, 2013 | $2,000,000 | $508,000 |
|
| Total foreign government bonds and notes (cost $770,000) | | $508,000 |
41
| | |
| MORTGAGE-BACKED SECURITIES (0.1%)* | Principal amount | Value |
|
| GE Capital Commercial Mortgage Corp. 144A Ser. 00-1, Class G, | | |
| 6.131s, 2033 | $1,025,000 | $300,663 |
|
| Mach One Commercial Mortgage Trust 144A | | |
| Ser. 04-1A, Class J, 5.45s, 2040 | 1,000,000 | 60,000 |
| Ser. 04-1A, Class K, 5.45s, 2040 | 365,000 | 18,250 |
| Ser. 04-1A, Class L, 5.45s, 2040 | 165,000 | 6,600 |
|
| Total mortgage-backed securities (cost $2,152,767) | | $385,513 |
|
| |
| SHORT-TERM INVESTMENTS (3.7%)* | Principal amount/shares | Value |
|
| Putnam Money Market Liquidity Fund e | 22,708,294 | $22,708,294 |
|
| U.S. Treasury Bills for an effective yield of 0.70%, | | |
| December 17, 2009 ## | $250,000 | 249,037 |
|
| Total short-term investments (cost $22,957,331) | | $22,957,331 |
|
| |
| TOTAL INVESTMENTS | | |
|
| Total investments (cost $687,697,942) | | $601,238,301 |
| | |
| Key to holding’s currency abbreviations |
| |
| EUR | Euro |
| Key to other fixed-income security abbreviations |
| |
| FRB | Floating Rate Bonds |
| FRN | Floating Rate Notes |
| MTN | Medium Term Notes |
* Percentages indicated are based on net assets of $612,522,268.
† Non-income-producing security.
†† The interest rate and date shown parenthetically represent the new interest rate to be paid and the date the fund will begin accruing interest at this rate.
‡ Restricted, excluding 144A securities, as to public resale. The total market value of restricted securities held at May 31, 2009 was $1,464,700, or 0.2% of net assets.
‡‡ Income may be received in cash or additional securities at the discretion of the issuer.
## This security was pledged and segregated with the custodian for collateral on certain derivative contracts at May 31, 2009.
c Senior loans are exempt from registration under the Securities Act of 1933, as amended, but contain certain restrictions on resale and cannot be sold publicly. These loans pay interest at rates which adjust periodically. The interest rates shown for senior loans are the current interest rates at May 31, 2009. Senior loans are also subject to mandatory and/or optional prepayment which cannot be predicted. As a result, the remaining maturity may be substantially less than the stated maturity shown (Notes 1 and 7).
e See Note 6 to the financial statements regarding investments in Putnam Money Market Liquidity Fund.
F Is valued at fair value following procedures approved by the Trustees. Securities may be classified as a Level 2 or Level 3 for SFAS 157 disclosures based on the securities valuation inputs.
g The notes are secured by debt and equity securities and equity participation agreements held by Neon Capital, Ltd.
i Security purchased with cash or received, that was pledged to the fund for collateral on certain derivative contracts (Note 1).
R Real Estate Investment Trust.
U This security, in part or in entirety, represents unfunded loan commitments (Note 8).
42
At May 31, 2009, liquid assets totaling $3,414,658 have been designated as collateral for open swap contracts and forward contracts.
Debt obligations are considered secured unless otherwise indicated.
144A after the name of an issuer represents securities exempt from registration under Rule 144A under the Securities Act of 1933, as amended. These securities may be resold in transactions exempt from registration, normally to qualified institutional buyers.
The rates shown on FRB and FRN are the current interest rates at May 31, 2009.
The dates shown on debt obligations are the original maturity dates.
| | | | | |
| FORWARD CURRENCY CONTRACTS TO BUY at 5/31/09 (Unaudited) | |
| |
| | | Aggregate | | Delivery | Unrealized |
| | Value | face value | | date | appreciation |
|
| Euro | $1,833,535 | $1,736,354 | | 6/17/09 | $97,181 |
|
| Total | | | | | $97,181 |
|
| |
| FORWARD CURRENCY CONTRACTS TO SELL at 5/31/09 (Unaudited) | |
| |
| | | Aggregate | | Delivery | Unrealized |
| | Value | face value | | date | (depreciation) |
|
| Euro | $7,188,880 | $6,807,041 | | 6/17/09 | $(381,839) |
|
| Total | | | | | $(381,839) |
| | | | | | | |
| CREDIT DEFAULT CONTRACTS OUTSTANDING at 5/31/09 (Unaudited) | | |
| |
| | | Upfront | | | | Fixed payments | |
| | | premium | | | Termi- | received | Unrealized |
| Swap counterparty / | | received | Notional | | nation | (paid) by fund | appreciation/ |
| Referenced debt* | Rating*** | (paid)** | amount | | date | per annum | (depreciation) |
|
| Bank of America, N.A. | | | | | | | |
| Nalco Co., 7.75%, | | | | | | | |
| 11/15/11 | Ba2 | $— | $400,000 | | 9/20/12 | 350 bp | $(9,027) |
|
| Visteon Corp., 7%, | | | | | | | |
| 3/10/14 | — | (179,297) | 675,000 | | 9/20/13 | (500 bp) | 455,109 |
|
| Citibank, N.A. | | | | | | | |
| Lear Corp., T/L | | | | | | | |
| Bank Loan | — | — | 370,000 | | 6/20/13 | (225 bp) | 153,638 |
|
| Lear Corp., T/L | | | | | | | |
| Bank Loan | Caa1 | — | 370,000 | | 6/20/13 | 700 bp | (134,856) |
|
| Credit Suisse International | | | | | | |
| Advanced Micro | | | | | | | |
| Devices, Inc., | | | | | | | |
| 7 3/4%, 11/1/12 | Caa1 | — | 495,000 | | 6/20/09 | 165 bp | (4,533) |
|
| Deutsche Bank AG | | | | | | | |
| Nalco Co., 7.75%, | | | | | | | |
| 11/15/11 | Ba2 | — | 370,000 | | 12/20/12 363 bp | (11,991) |
|
| JPMorgan Chase Bank, N.A. | | | | | | |
| Claire’s Stores, | | | | | | | |
| 9 5/8%, 6/1/15 | Caa1 | — | 255,000 | | 6/20/12 | 230 bp | (117,523) |
|
| Sanmina-Sci Corp., | | | | | | | |
| 8 1/8%, 3/1/16 | B3 | — | 255,000 | | 6/20/13 | 595 bp | (93,316) |
|
43
| | | | | | | |
| CREDIT DEFAULT CONTRACTS OUTSTANDING at 5/31/09 (Unaudited) cont. | | |
| |
| | | Upfront | | | | Fixed payments | |
| | | premium | | | Termi- | received | Unrealized |
| Swap counterparty / | | received | Notional | | nation | (paid) by fund | appreciation/ |
| Referenced debt* | Rating*** | (paid)** | amount | | date | per annum | (depreciation) |
|
| Morgan Stanley Capital Services, Inc. | | | | | |
| Advanced Micro | | | | | | | |
| Devices, Inc., | | | | | | | |
| 7 3/4%, 11/1/12 | Caa1 | $— | $50,000 | | 6/20/09 | 190 bp | $(317) |
|
| Nalco Co., 7.75%, | | | | | | | |
| 11/15/11 | Ba2 | — | 405,000 | | 9/20/12 | 330 bp | (12,722) |
|
| Nalco Co., 7.75%, | | | | | | | |
| 11/15/11 | Ba2 | — | 530,000 | | 3/20/13 | 460 bp | 2,904 |
|
| UBS, AG | | | | | | | |
| Meritage Homes | | | | | | | |
| Corp., 7%, 5/1/14 | — | — | 1,270,000 | | 9/20/13 | (760 bp) | (22,595) |
|
| Total | | | | | | | $204,771 |
* Payments related to the reference debt are made upon a credit default event.
** Upfront premium is based on the difference between the original spread on issue and the market spread on day of execution.
*** Ratings are presented for credit default contracts in which the fund has sold protection on the underlying referenced debt. Ratings for an underlying index represent the average of the ratings of all the securities included in that index. The Moody’s or Standard & Poor’s ratings are believed to be the most recent ratings available at May 31, 2009.
In September 2006, the FASB issued Statement of Financial Accounting Standards No. 157, Fair Value Measurements (” SFAS 157” ). SFAS 157 is effective for financial statements issued for fiscal years beginning after November 15, 2007 and interim periods within those fiscal years. While the adoption of SFAS 157 does not have a material effect on the fund’s net asset value, it does require additional disclosures about fair value measurements. SFAS 157 establishes a three-level hierarchy for disclosure of fair value measurements. The valuation hierarchy is based upon the transparency of inputs to the valuation of the fund’s investments. The three levels are defined as follows:
Level 1 — Valuations based on quoted prices for identical securities in active markets.
Level 2 — Valuations based on quoted prices in markets that are not active or for which all significant inputs are observable, either directly or indirectly.
Level 3 — Valuations based on inputs that are unobservable and significant to the fair value measurement. The following is a summary of the inputs used to value the fund’s net assets as of May 31, 2009:
| | |
| Valuation inputs | Investments in securities | Other financial instruments |
|
| Level 1 | $22,708,294 | $— |
|
| Level 2 | 575,909,359 | (79,887) |
|
| Level 3 | 2,620,648 | — |
|
| Total | $601,238,301 | $(79,887) |
Other financial instruments include futures, written options, TBA sale commitments, swaps and forward contracts which are valued at the unrealized appreciation/(depreciation) on the instrument.
44
| | |
| The following is a reconciliation of Level 3 assets as of May 31, 2009: | |
| | Investment in securities | Other financial instruments |
|
| Balance as of November 30, 2008 | $1,926,296 | $— |
|
| Accrued discounts/premiums | — | — |
|
| Realized gain/(loss) | (39,458) | — |
|
| Change in net unrealized appreciation/(depreciation) | 1,060,388 | — |
|
| Net purchases/sales | (8,840) | — |
|
| Net transfers in and/or out of Level 3 | (317,738) | — |
|
| Balance as of May 31, 2009 | $2,620,648 | $— |
Other financial instruments include futures, written options, TBA sale commitments, swaps and forward contracts which are valued at the unrealized appreciation/(depreciation) on the instrument.
The accompanying notes are an integral part of these financial statements.
45
Statement of assets and liabilities 5/31/09 (Unaudited)
| |
| ASSETS | |
|
| Investment in securities, at value, (Note 1): | |
| Unaffiliated issuers (identified cost $664,989,648) | $578,530,007 |
| Affiliated issuers (identified cost $22,708,294) (Note 6) | 22,708,294 |
|
| Cash | 4,329,857 |
|
| Interest and other receivables | 12,348,355 |
|
| Receivable for shares of the fund sold | 5,786,218 |
|
| Receivable for investments sold | 5,704,237 |
|
| Receivable for sales of delayed delivery securities (Notes 1, 7 and 8) | 69,702 |
|
| Unrealized appreciation on swap contracts (Note 1) | 611,651 |
|
| Unrealized appreciation on forward currency contracts (Note 1) | 97,181 |
|
| Receivable for receivable purchase agreement (Note 2) | 1,282,159 |
|
| Premium paid on swap contracts (Note 1) | 179,297 |
|
| Total assets | 631,646,958 |
| |
| |
| LIABILITIES | |
|
| Payable for investments purchased | 15,318,829 |
|
| Payable for purchases of delayed delivery securities (Notes 1, 7 and 8) | 92,793 |
|
| Payable for shares of the fund repurchased | 951,839 |
|
| Payable for compensation of Manager (Note 2) | 757,353 |
|
| Payable for investor servicing fees (Note 2) | 93,375 |
|
| Payable for custodian fees (Note 2) | 7,583 |
|
| Payable for Trustee compensation and expenses (Note 2) | 184,702 |
|
| Payable for administrative services (Note 2) | 2,290 |
|
| Payable for distribution fees (Note 2) | 235,396 |
|
| Unrealized depreciation on forward currency contracts (Note 1) | 381,839 |
|
| Unrealized depreciation on swap contracts (Note 1) | 406,880 |
|
| Collateral on certain derivative contracts, at value (Note 1) | 572,512 |
|
| Other accrued expenses | 119,299 |
|
| Total liabilities | 19,124,690 |
| |
| Net assets | $612,522,268 |
| |
| |
| REPRESENTED BY | |
|
| Paid-in capital (Unlimited shares authorized) (Notes 1 and 4) | $1,561,131,502 |
|
| Undistributed net investment income (Note 1) | 2,346,385 |
|
| Accumulated net realized loss on investments and foreign currency transactions (Note 1) | (865,707,635) |
|
| Net unrealized depreciation of investments and assets and liabilities in foreign currencies | (85,247,984) |
|
| Total — Representing net assets applicable to capital shares outstanding | $612,522,268 |
| |
| (Continued on next page) | |
46
| |
| Statement of assets and liabilities (Continued) | |
|
| |
| COMPUTATION OF NET ASSET VALUE AND OFFERING PRICE | |
|
| Net asset value and redemption price per class A share | |
| ($385,551,849 divided by 79,119,478 shares) | $4.87 |
|
| Offering price per class A share (100/96.00 of $4.87)* | $5.07 |
|
| Net asset value and offering price per class B share ($7,822,996 divided by 1,630,848 shares)** | $4.80 |
|
| Net asset value and offering price per class C share ($5,379,391 divided by 1,123,402 shares)** | $4.79 |
|
| Net asset value and redemption price per class M share | |
| ($173,086,577 divided by 35,482,323 shares) | $4.88 |
|
| Offering price per class M share (100/96.75 of $4.88)*** | $5.04 |
|
| Net asset value, offering price and redemption price per class R share | |
| ($2,848,348 divided by 583,972 shares) | $4.88 |
|
| Net asset value, offering price and redemption price per class Y share | |
| ($37,833,107 divided by 7,563,035 shares) | $5.00 |
|
* On single retail sales of less than $100,000. On sales of $100,000 or more the offering price is reduced.
** Redemption price per share is equal to net asset value less any applicable contingent deferred sales charge.
*** On single retail sales of less than $50,000. On sales of $50,000 or more the offering price is reduced.
The accompanying notes are an integral part of these financial statements.
47
Statement of operations Six months ended 5/31/09 (Unaudited)
| |
| INVESTMENT INCOME | |
|
| Interest (including interest income of $12,695 from investments in affiliated issuers) (Note 6) | $26,328,637 |
|
| Total investment income | 26,328,637 |
| |
| |
| EXPENSES | |
|
| Compensation of Manager (Note 2) | 1,830,854 |
|
| Investor servicing fees (Note 2) | 527,830 |
|
| Custodian fees (Note 2) | 8,637 |
|
| Trustee compensation and expenses (Note 2) | 24,485 |
|
| Administrative services (Note 2) | 18,973 |
|
| Distribution fees — Class A (Note 2) | 402,036 |
|
| Distribution fees — Class B (Note 2) | 34,254 |
|
| Distribution fees — Class C (Note 2) | 20,283 |
|
| Distribution fees — Class M (Note 2) | 402,300 |
|
| Distribution fees — Class R (Note 2) | 4,053 |
|
| Other | 280,483 |
|
| Fees waived and reimbursed by Manager (Note 2) | (348,511) |
|
| Total expenses | 3,205,677 |
| | |
| Expense reduction (Note 2) | (2,754) |
|
| Net expenses | 3,202,923 |
| |
| Net investment income | 23,125,714 |
|
| |
| Net realized loss on investments (Notes 1 and 3) | (56,858,799) |
|
| Net realized loss on swap contracts (Note 1) | (176,805) |
|
| Net realized gain on foreign currency transactions (Note 1) | 343,928 |
|
| Net unrealized depreciation of assets and liabilities in foreign currencies during the period | (830,383) |
|
| Net unrealized appreciation of investments and swap contracts during the period | 163,239,808 |
|
| Net gain on investments | 105,717,749 |
| |
| Net increase in net assets resulting from operations | $128,843,463 |
|
The accompanying notes are an integral part of these financial statements.
48
Statement of changes in net assets
| | |
| INCREASE (DECREASE) IN NET ASSETS | Six months ended 5/31/09* | Year ended 11/30/08 |
|
| Operations: | | |
| Net investment income | $23,125,714 | $50,083,426 |
|
| Net realized loss on investments and foreign currency transactions | (56,691,676) | (23,912,595) |
|
| Net unrealized appreciation (depreciation) of investments | | |
| and assets and liabilities in foreign currencies | 162,409,425 | (219,923,776) |
|
| Net increase (decrease) in net assets resulting from operations | 128,843,463 | (193,752,945) |
|
| Distributions to shareholders (Note 1): | | |
| From ordinary income | | |
| Net investment income | | |
|
| Class A | (16,911,894) | (30,111,585) |
|
| Class B | (338,751) | (699,500) |
|
| Class C | (186,096) | (59,660) |
|
| Class M | (8,288,700) | (18,631,132) |
|
| Class R | (82,243) | (15,384) |
|
| Class Y | (1,814,765) | (3,458,029) |
|
| Redemption fees (Note 1) | 30,610 | 36,189 |
|
| Increase from capital share transactions (Note 4) | 22,267,103 | 23,515,661 |
|
| Total increase (decrease) in net assets | 123,518,727 | (223,176,385) |
| |
| |
| NET ASSETS | | |
|
| Beginning of period | 489,003,541 | 712,179,926 |
|
| End of period (including undistributed net investment | | |
| income of $2,346,385 and $6,843,120, respectively) | $612,522,268 | $489,003,541 |
|
| * Unaudited | | |
The accompanying notes are an integral part of these financial statements.
49
Financial highlights (For a common share outstanding throughout the period)
| | | | | | | | | | | | | |
| INVESTMENT OPERATIONS: | LESS DISTRIBUTIONS: | RATIOS AND SUPPLEMENTAL DATA: | |
|
| | | | | | | | | | | | Ratio | Ratio of net | |
| | | | Net realized | | | | | | | | of expenses | investment | |
| | Net asset value, | Net | and unrealized | Total from | | | | Net asset | Total return | Net assets, | to average | income (loss) | |
| | beginning | investment | gain (loss) on | investment | From net | Total | Redemption | value, end of | at net asset | end of period | net assets | to average net | Portfolio |
| Period ended | of period | income (loss) a,b | investments | operations | investment income | distributions | fees c | period | value (%) d | (in thousands) | (%) b,e | assets (%) b | turnover (%) |
|
| Class A | | | | | | | | | | | | | |
| May 31, 2009 ** | $4.05 | .19 | .86 | 1.05 | (.23) | (.23) | — | $4.87 | 26.82 * | $385,552 | .57 * | 4.41 * | 21.72 * |
| November 30, 2008 | 6.05 | .42 | (1.97) | (1.55) | (.45) | (.45) | — | 4.05 | (27.33) | 292,694 | 1.10 | 7.63 | 33.57 |
| November 30, 2007 | 6.22 | .44 | (.16) | .28 | (.45) | (.45) | — | 6.05 | 4.50 | 373,890 | 1.08 | 7.04 | 47.50 |
| November 30, 2006 | 5.97 | .45 f | .22 | .67 | (.42) | (.42) | — | 6.22 | 11.71 | 433,782 | 1.04 f | 7.41 f | 45.62 |
| November 30, 2005 | 6.16 | .43 | (.21) | .22 | (.41) | (.41) | — | 5.97 | 3.67 | 440,780 | 1.04 | 7.07 | 33.37 |
| November 30, 2004 | 5.88 | .43 | .29 | .72 | (.44) | (.44) | — | 6.16 | 12.72 | 484,372 | 1.07 | 7.22 | 53.33 |
|
| Class B | | | | | | | | | | | | | |
| May 31, 2009 ** | $3.99 | .17 | .86 | 1.03 | (.22) | (.22) | — | $4.80 | 26.54 * | $7,823 | .94 * | 4.03 * | 21.72 * |
| November 30, 2008 | 5.96 | .38 | (1.94) | (1.56) | (.41) | (.41) | — | 3.99 | (27.84) | 6,036 | 1.85 | 6.86 | 33.57 |
| November 30, 2007 | 6.14 | .39 | (.17) | .22 | (.40) | (.40) | — | 5.96 | 3.58 | 11,407 | 1.83 | 6.29 | 47.50 |
| November 30, 2006 | 5.89 | .39 f | .23 | .62 | (.37) | (.37) | — | 6.14 | 10.98 | 16,530 | 1.79 f | 6.69 f | 45.62 |
| November 30, 2005 | 6.08 | .38 | (.21) | .17 | (.36) | (.36) | — | 5.89 | 2.91 | 46,602 | 1.79 | 6.30 | 33.37 |
| November 30, 2004 | 5.81 | .38 | .28 | .66 | (.39) | (.39) | — | 6.08 | 11.84 | 123,263 | 1.82 | 6.50 | 53.33 |
|
| Class C | | | | | | | | | | | | | |
| May 31, 2009 ** | $3.98 | .17 | .86 | 1.03 | (.22) | (.22) | — | $4.79 | 26.66 * | $5,379 | .94 * | 3.89 * | 21.72 * |
| November 30, 2008 | 5.95 | .37 | (1.93) | (1.56) | (.41) | (.41) | — | 3.98 | (27.87) | 684 | 1.85 | 6.78 | 33.57 |
| November 30, 2007 † | 6.27 | .26 | (.33) | (.07) | (.25) | (.25) | — | 5.95 | (1.11) * | 776 | 1.23 * | 4.29 * | 47.50 |
|
| Class M | | | | | | | | | | | | | |
| May 31, 2009 ** | $4.05 | .19 | .86 | 1.05 | (.22) | (.22) | — | $4.88 | 26.90 * | $173,087 | .69 * | 4.30 * | 21.72 * |
| November 30, 2008 | 6.05 | .41 | (1.97) | (1.56) | (.44) | (.44) | — | 4.05 | (27.50) | 155,249 | 1.35 | 7.36 | 33.57 |
| November 30, 2007 | 6.23 | .42 | (.17) | .25 | (.43) | (.43) | — | 6.05 | 4.11 | 275,959 | 1.33 | 6.79 | 47.50 |
| November 30, 2006 | 5.98 | .43 f | .23 | .66 | (.41) | (.41) | — | 6.23 | 11.47 | 349,881 | 1.29 f | 7.17 f | 45.62 |
| November 30, 2005 | 6.17 | .41 | (.20) | .21 | (.40) | (.40) | — | 5.98 | 3.46 | 430,521 | 1.29 | 6.82 | 33.37 |
| November 30, 2004 | 5.89 | .42 | .29 | .71 | (.43) | (.43) | — | 6.17 | 12.47 | 573,455 | 1.32 | 6.98 | 53.33 |
|
| Class R | | | | | | | | | | | | | |
| May 31, 2009 ** | $4.05 | .18 | .88 | 1.06 | (.23) | (.23) | — | $4.88 | 26.96 * | $2,848 | .69 * | 4.18 * | 21.72 * |
| November 30, 2008 | 6.05 | .41 | (1.97) | (1.56) | (.44) | (.44) | — | 4.05 | (27.46) | 680 | 1.35 | 8.31 | 33.57 |
| November 30, 2007 † | 6.35 | .29 | (.32) | (.03) | (.27) | (.27) | — | 6.05 | (.57) * | 1 | .89 * | 4.62 * | 47.50 |
|
| Class Y | | | | | | | | | | | | | |
| May 31, 2009 ** | $4.15 | .20 | .89 | 1.09 | (.24) | (.24) | — | $5.00 | 27.07 * | $37,833 | .44 * | 4.57 * | 21.72 * |
| November 30, 2008 | 6.19 | .45 | (2.03) | (1.58) | (.46) | (.46) | — | 4.15 | (27.21) | 33,660 | .85 | 7.94 | 33.57 |
| November 30, 2007 | 6.35 | .47 | (.17) | .30 | (.46) | (.46) | — | 6.19 | 4.78 | 50,146 | .83 | 7.27 | 47.50 |
| November 30, 2006 | 6.08 | .47 f | .23 | .70 | (.43) | (.43) | — | 6.35 | 12.05 | 9,925 | .79 f | 7.63 f | 45.62 |
| November 30, 2005 | 6.27 | .45 | (.22) | .23 | (.42) | (.42) | — | 6.08 | 3.80 | 20,411 | .79 | 7.31 | 33.37 |
| November 30, 2004 | 5.97 | .45 | .30 | .75 | (.45) | (.45) | — | 6.27 | 13.09 | 26,684 | .82 | 7.46 | 53.33 |
|
| |
| See notes to financial highlights at the end of this section. | |
The accompanying notes are an integral part of these financial statements.
Financial highlights (Continued)
* Not annualized.
**Unaudited.
† For the period March 30, 2007 (commencement of operations) to November 30, 2007.
a Per share net investment income (loss) has been determined on the basis of the weighted average number of shares outstanding during the period.
b Reflects an involuntary contractual expense limitation in effect during the period. For periods prior to May 31, 2009, certain fund expenses were waived in connection with the fund’s investment in Putnam Prime Money Market Fund. As a result of such limitation and/or waivers, the expenses of each class reflect a reduction of the following amounts (Note 2):
| |
| | Percentage of |
| | average net assets |
|
| May 31, 2009 | 0.07% |
|
| November 30, 2008 | 0.02 |
|
| November 30, 2007 | <0.01 |
|
| November 30, 2006 | <0.01 |
|
| November 30, 2005 | <0.01 |
|
| November 30, 2004 | <0.01 |
|
c Amount represents less than $0.01 per share.
d Total return assumes dividend reinvestment and does not reflect the effect of sales charges.
e Includes amounts paid through expense offset arrangements (Note 2).
f Reflects a non-recurring accrual related to a reimbursement to the fund from Putnam Investments relating to the calculation of certain amounts paid by the fund to Putnam in previous years for transfer agent services, which amounted to less than $0.01 per share and 0.01% of average net assets for the period ended November 30, 2006.
The accompanying notes are an integral part of these financial statements.
52
Notes to financial statements 5/31/09 (Unaudited)
Note 1: Significant accounting policies
Putnam High Yield Advantage Fund (the “fund”), a Massachusetts business trust, is registered under the Investment Company Act of 1940, as amended, as a diversified, open-end management investment company. The fund seeks high current income primarily through a diversified portfolio of higher yielding, lower rated bonds that may have a higher rate of default. Capital growth is a secondary objective when consistent with the objective of high current income. The fund may invest a significant portion of its assets in securitized debt instruments, including mortgage-backed and asset-backed investments. The yields and values of these investments are sensitive to changes in interest rates, the rate of principal payments on the underlying assets and the market’s perception of the issuers. The market for these investments may be volatile and limited, which may make them difficult to buy or sell.
The fund offers class A, class B, class C, class M, class R and class Y shares. Class A and class M shares are sold with a maximum front-end sales charge of 4.00% and 3.25%, respectively, and generally do not pay a contingent deferred sales charge. Class B shares, which convert to class A shares after approximately eight years, do not pay a front-end sales charge and are subject to a contingent deferred sales charge, if those shares are redeemed within six years of purchase. Class C shares have a one-year 1.00% contingent deferred sales charge and do not convert to class A shares. Class R shares, which are offered to qualified employee-benefit plans, are sold at net asset value. The expenses for class A, class B, class C, class M and class R shares may differ based on the distribution fee of each class, which is identified in Note 2. Class Y shares, which are sold at net asset value, are generally subject to the same expenses as class A, class B, class C, class M an d class R shares, but do not bear a distribution fee. Class Y shares are generally only available to corporate and institutional clients and clients in other approved programs.
A 1.00% redemption fee may apply on any shares that are redeemed (either by selling or exchanging into another fund) within 90 days of purchase. The redemption fee is accounted for as an addition to paid-in-capital.
Investment income, realized and unrealized gains and losses and expenses of the fund are borne pro-rata based on the relative net assets of each class to the total net assets of the fund, except that each class bears expenses unique to that class (including the distribution fees applicable to such classes). Each class votes as a class only with respect to its own distribution plan or other matters on which a class vote is required by law or determined by the Trustees. If the fund were liquidated, shares of each class would receive their pro-rata share of the net assets of the fund. In addition, the Trustees declare separate dividends on each class of shares.
In the normal course of business, the fund enters into contracts that may include agreements to indemnify another party under given circumstances. The fund’s maximum exposure under these arrangements is unknown as this would involve future claims that may be, but have not yet been, made against the fund. However, the fund’s management team expects the risk of material loss to be remote.
The following is a summary of significant accounting policies consistently followed by the fund in the preparation of its financial statements. The preparation of financial statements is in conformity with accounting principles generally accepted in the United States of America and requires management to make estimates and assumptions that affect the reported amounts of assets and liabilities in the financial statements and the reported amounts of increases and decreases in net assets from operations during the reporting period. Actual results could differ from those estimates.
A) Security valuation Market quotations are not considered to be readily available for certain debt obligations; such investments are valued on the basis of valuations furnished by an independent pricing service approved by the Trustees or dealers selected by Putnam Investment Management, LLC (“Putnam Management”), the fund’s manager, a wholly-owned subsidiary of Putnam Investments, LLC. Such services or dealers determine valuations for normal institutional-size trading units of such securities using methods based on market transactions for comparable securities and various relationships, generally recognized by institutional traders, between securities. Securities quoted in foreign currencies, if any, are translated into U.S. dollars at the current exchange rate. To the extent a pricing service or dealer is unable to value a security or provides a valuation which Putnam Management does not believe accurately reflects the security’s fair value, the security will be valued at fair value by Putnam Management. Certain investments, including certain restricted and illiquid securities and derivatives, are also valued at fair value following procedures approved by the Trustees. Such valuations and procedures are reviewed periodically by the Trustees. Certain securities may be valued on the basis of a price provided by a single source. The fair value of securities is generally determined as the amount that the fund could reasonably expect to realize from an
53
orderly disposition of such securities over a reasonable period of time. By its nature, a fair value price is a good faith estimate of the value of a security at a given point in time and does not reflect an actual market price, which may be different by a material amount.
B) Security transactions and related investment income Security transactions are recorded on the trade date (the date the order to buy or sell is executed). Gains or losses on securities sold are determined on the identified cost basis. Interest income is recorded on the accrual basis. All premiums/discounts are amortized/accreted on a yield-to-maturity basis. Securities purchased or sold on a delayed delivery basis may be settled a month or more after the trade date; interest income is accrued based on the terms of the securities. Losses may arise due to changes in the market value of the underlying securities or if the counterparty does not perform under the contract.
The fund earned certain fees in connection with its senior loan purchasing activities. These fees are treated as market discount and are recorded as income in the Statement of operations.
C) Foreign currency translation The accounting records of the fund are maintained in U.S. dollars. The market value of foreign securities, currency holdings, and other assets and liabilities is recorded in the books and records of the fund after translation to U.S. dollars based on the exchange rates on that day. The cost of each security is determined using historical exchange rates. Income and withholding taxes are translated at prevailing exchange rates when earned or incurred. The fund does not isolate that portion of realized or unrealized gains or losses resulting from changes in the foreign exchange rate on investments from fluctuations arising from changes in the market prices of the securities. Such gains and losses are included with the net realized and unrealized gain or loss on investments. Net realized gains and losses on foreign currency transactions represent net realized exchange gains or losses on closed fo rward currency contracts, disposition of foreign currencies, currency gains and losses realized between the trade and settlement dates on securities transactions and the difference between the amount of investment income and foreign withholding taxes recorded on the fund’s books and the U.S. dollar equivalent amounts actually received or paid. Net unrealized appreciation and depreciation of assets and liabilities in foreign currencies arise from changes in the value of open forward currency contracts and assets and liabilities other than investments at the period end, resulting from changes in the exchange rate. Investments in foreign securities involve certain risks, including those related to economic instability, unfavorable political developments, and currency fluctuations, not present with domestic investments.
D) Forward currency contracts The fund may buy and sell forward currency contracts, which are agreements between two parties to buy and sell currencies at a set price on a future date. These contracts are used to protect against a decline in value relative to the U.S. dollar of the currencies in which its portfolio securities are denominated or quoted (or an increase in the value of a currency in which securities a fund intends to buy are denominated, when a fund holds cash reserves and short term investments), or for other investment purposes. The U.S. dollar value of forward currency contracts is determined using current forward currency exchange rates supplied by a quotation service. The market value of the contract will fluctuate with changes in currency exchange rates. The contract is marked to market daily and the change in market value is recorded as an unrealized gain or loss. When the contract is closed, the fund r ecords a realized gain or loss equal to the difference between the value of the contract at the time it was opened and the value at the time it was closed. The fund could be exposed to risk if the value of the currency changes unfavorably, if the counterparties to the contracts are unable to meet the terms of their contracts or if the fund is unable to enter into a closing position. Risks may exceed amounts recognized on the Statement of assets and liabilities. Forward currency contracts outstanding at period end, if any, are listed after the fund’s portfolio.
E) Credit default contracts The fund may enter into credit default contracts to provide a measure of protection against risk of loss following a default, or other credit event in respect of issuers within an underlying index or a single issuer, or to gain credit exposure to an underlying index or issuer. In a credit default contract, the protection buyer typically makes an up front payment and a periodic stream of payments to a counterparty, the protection seller, in exchange for the right to receive a contingent payment upon the occurrence of a credit event on the reference obligation or all other equally ranked obligations of the reference entity. Credit events are contract specific but may include bankruptcy, failure to pay, restructuring and obligation acceleration. An upfront payment received by the fund, as the protection seller, is recorded as a liability on the fund’s books. An upfront payment made by the fund, as the protection buyer, is recorded as an asset on the fund’s books. Periodic payments received or paid by the fund are recorded as realized gains or losses. The credit default contracts are marked to market daily based upon quotations from an independent pricing service or market makers and the change, if any, is recorded as an unrealized gain or loss. Upon the occurrence of a credit event, the difference between the par value and market value of the reference obligation, net
54
of any proportional amount of the upfront payment, is recorded as a realized gain or loss.
In addition to bearing the risk that the credit event will occur, the fund could be exposed to market risk due to unfavorable changes in interest rates or in the price of the underlying security or index or the possibility that the fund may be unable to close out its position at the same time or at the same price as if it had purchased the underlying reference obligations. In certain circumstances, the fund may enter into offsetting credit default contracts which would mitigate its risk of loss. Risks of loss may exceed amounts recognized on the Statement of assets and liabilities. The fund’s maximum risk of loss from counterparty risk, either as the protection seller or as the protection buyer, is the fair value of the contract. This risk may be mitigated by having a master netting arrangement between the fund and the counterparty. Where the fund is a seller of protection, the maximum potential amount of future payments the fund may be required to make is equa l to the notional amount of the relevant credit default contract. Credit default contracts outstanding, including their respective notional amounts at period end, if any, are listed after the fund’s portfolio.
F) Master agreements The fund is a party to ISDA (International Swap and Derivatives Association, Inc.) Master Agreements (“Master Agreements”) with certain counterparties that govern over the counter derivative and foreign exchange contracts entered into from time to time. The Master Agreements may contain provisions regarding, among other things, the parties’ general obligations, representations, agreements, collateral requirements, events of default and early termination. With respect to certain counterparties, in accordance with the terms of the Master Agreements, collateral posted to the fund is held in a segregated account by the fund’s custodian and with respect to those amounts which can be sold or repledged, are presented in the fund’s portfolio; collateral pledged by the fund is segregated by the fund’s custodian and identified in the fund’s portfolio. Collateral can be in the fo rm of cash or debt securities issued by the U.S. Government or related agencies or other securities as agreed to by the fund and the applicable counterparty. Collateral requirements are determined based on the fund’s net position with each counterparty. Termination events applicable to the fund may occur upon a decline in the fund’s net assets below a specified threshold over a certain period of time. Termination events applicable to counterparties may occur upon a decline in the counterparty’s long-term and short-term credit ratings below a specified level. In each case, upon occurrence, the other party may elect to terminate early and cause settlement of all derivative and foreign exchange contracts outstanding, including the payment of any losses and costs resulting from such early termination, as reasonably determined by the terminating party. Any decision by one or more of the fund’s counterparties to elect early termination could impact the fund&# 146;s future derivative activity.
At May 31, 2009, the fund had net unrealized losses of $602,866 on derivative contracts subject to the Master Agreements. Collateral posted by the fund totaled $249,550.
G) Federal taxes It is the policy of the fund to distribute all of its taxable income within the prescribed time and otherwise comply with the provisions of the Internal Revenue Code of 1986, as amended (the “Code”), applicable to regulated investment companies. It is also the intention of the fund to distribute an amount sufficient to avoid imposition of any excise tax under Section 4982 of the Code. The fund is subject to the provisions of FASB Interpretation No. 48, Accounting for Uncertainties in Income Taxes (“FIN 48”). FIN 48 sets forth a minimum threshold for financial statement recognition of the benefit of a tax position taken or expected to be taken in a tax return. The fund did not have any unrecognized tax benefits in the accompanying financial statements. No provision has been made for federal taxes on income, cap ital gains or unrealized appreciation on securities held nor for excise tax on income and capital gains. Each of the fund’s federal tax returns for the prior three fiscal years remains subject to examination by the Internal Revenue Service and state departments of revenue.
At November 30, 2008, the fund had a capital loss carryover of $804,765,169 available to the extent allowed by the Code to offset future net capital gain, if any. The amount of the carryover and the expiration dates are:
| | | |
| Loss Carryover | Expiration | |
| |
| $265,227,969 | November 30, 2009 | |
| |
| 309,407,794 | November 30, 2010 | |
| |
| 104,325,628 | November 30, 2011 | |
| |
| 95,929,758 | November 30, 2012 | |
| |
| 8,720,272 | November 30, 2014 | |
| |
| 21,153,748 | November 30, 2016 | |
| |
The aggregate identified cost on a tax basis is $687,727,810, resulting in gross unrealized appreciation and depreciation of $18,390,026 and $104,879,535, respectively, or net unrealized depreciation of $86,489,509.
55
H) Distributions to shareholders Distributions to shareholders from net investment income are recorded by the fund on the ex-dividend date. Distributions from capital gains, if any, are recorded on the ex-dividend date and paid at least annually. The amount and character of income and gains to be distributed are determined in accordance with income tax regulations, which may differ from generally accepted accounting principles. Dividend sources are estimated at the time of declaration. Actual results may vary. Any non-taxable return of capital cannot be determined until final tax calculations are completed after the end of the fund’s fiscal year. Reclassifications are made to the fund’s capital accounts to reflect income and gains available for distribution (or available capital loss carryovers) under income tax regulations.
Note 2: Management fee, administrative
services and other transactions
The fund pays Putnam Management for management and investment advisory services quarterly based on the average net assets of the fund. Such fee is based on the following annual rates: 0.70% of the first $500 million of average net assets, 0.60% of the next $500 million, 0.55% of the next $500 million, 0.50% of the next $5 billion, 0.475% of the next $5 billion, 0.455% of the next $5 billion, 0.44% of the next $5 billion, and 0.43% thereafter.
Putnam Management has agreed to waive fees and reimburse expenses of the fund through November 30, 2009 to the extent necessary to ensure that the fund’s expenses do not exceed the simple average of the expenses of all front-end load funds viewed by Lipper Inc. as having the same investment classification or objective as the fund. The expense reimbursement is based on a comparison of the fund’s expenses with the average annualized operating expenses of the funds in its Lipper peer group for each calendar quarter during the fund’s last fiscal year, excluding 12b-1 fees and without giving effect to any expense offset and brokerage/service arrangements that may reduce fund expenses. For the six months ended May 31, 2009, Putnam Management waived $348,511 of its management fee from the fund.
Putnam Investments Limited (“PIL”), an affiliate of Putnam Management, is authorized by the Trustees to manage a separate portion of the assets of the fund as determined by Putnam Management from time to time. Putnam Management pays a quarterly sub-management fee to PIL for its services at an annual rate of 0.40% of the average net assets of the portion of the fund managed by PIL.
On September 26, 2008, the fund entered into Agreements with other registered investment companies (each a “Purchaser”) managed by Putnam Management. Under the Agreements, the fund sold to the Purchasers the fund’s right to receive, in the aggregate, $4,975,120 in net payments from Lehman Brothers Special Financing, Inc. in connection with certain terminated derivatives transactions (the “Receivable”), in each case in exchange for an initial payment plus (or minus) additional amounts based on the applicable Purchaser’s ultimate realized gain (or loss) on the Receivable. The Receivable will be offset against the funds net receivable from Lehman Brothers Special Financing, Inc. which is included in the Statement of assets and liabilities within Receivable for investments sold. The Agreements, which are included in the Statement of assets and liabilities, are valued at fair value following procedures app roved by the Trustees. All remaining payments under the agreements will be recorded as realized gain or loss.
The fund reimburses Putnam Management an allocated amount for the compensation and related expenses of certain officers of the fund and their staff who provide administrative services to the fund. The aggregate amount of all such reimbursements is determined annually by the Trustees.
Custodial functions for the fund’s assets are provided by State Street Bank and Trust Company (“State Street”). Custody fees are based on the fund’s asset level, the number of its security holdings and transaction volumes.
Putnam Investor Services, Inc., an affiliate of Putnam Management, provided investor servicing agent functions to the fund. Prior to December 31, 2008, these services were provided by Putnam Investor Services, a division of Putnam Fiduciary Trust Company (“PFTC”), which is an affiliate of Putnam Management. Putnam Investor Services, Inc. and Putnam Investor Services received fees for investor servicing, subject to certain limitations, based on the number of shareholder accounts in the fund and the level of defined contribution plan assets in the fund. The amounts incurred for investor servicing agent functions provided by affiliates of Putnam Management during the six months ended May 31, 2009 are included in Investor servicing fees in the Statement of operations.
The fund has entered into expense offset arrangements with PFTC and State Street whereby PFTC’s and State Street’s fees are reduced by credits allowed on cash balances. For the six months ended May 31, 2009, the fund’s expenses were reduced by $2,754 under the expense offset arrangements.
Each independent Trustee of the fund receives an annual Trustee fee, of which $523, as a quarterly retainer, has been allocated to the fund, and an additional fee for each Trustees meeting attended. Trustees receive additional fees for attendance at certain committee meetings and industry seminars and for
56
certain compliance-related matters. Trustees also are reimbursed for expenses they incur relating to their services as Trustees.
The fund has adopted a Trustee Fee Deferral Plan (the “Deferral Plan”) which allows the Trustees to defer the receipt of all or a portion of Trustees fees payable on or after July 1, 1995. The deferred fees remain invested in certain Putnam funds until distribution in accordance with the Deferral Plan.
The fund has adopted an unfunded noncontributory defined benefit pension plan (the “Pension Plan”) covering all Trustees of the fund who have served as a Trustee for at least five years and were first elected prior to 2004. Benefits under the Pension Plan are equal to 50% of the Trustee’s average annual attendance and retainer fees for the three years ended December 31, 2005. The retirement benefit is payable during a Trustee’s lifetime, beginning the year following retirement, for the number of years of service through December 31, 2006. Pension expense for the fund is included in Trustee compensation and expenses in the Statement of operations. Accrued pension liability is included in Payable for Trustee compensation and expenses in the Statement of assets and liabilities. The Trustees have terminated the Pension Plan with respect to any Trustee first elected after 2003.
The fund has adopted distribution plans (the “Plans”) with respect to its class A, class B, class C, class M and class R shares pursuant to Rule 12b-1 under the Investment Company Act of 1940. The purpose of the Plans is to compensate Putnam Retail Management Limited Partnership, a wholly-owned subsidiary of Putnam Investments, LLC and Putnam Retail Management GP, Inc., for services provided and expenses incurred in distributing shares of the fund.
The Plans provide for payments by the fund to Putnam Retail Management Limited Partnership at an annual rate of up to 0.35%, 1.00%, 1.00%, 1.00% and 1.00% of the average net assets attributable to class A, class B, class C, class M and class R shares, respectively. The Trustees have approved payment by the fund at an annual rate of 0.25%, 1.00%, 1.00%, 0.50% and 0.50% of the average net assets attributable to class A, class B, class C, class M and class R shares, respectively.
For the six months ended May 31, 2009, Putnam Retail Management Limited Partnership, acting as underwriter, received net commissions of $14,175 and $241 from the sale of class A and class M shares, respectively, and received $3,401 and $23 in contingent deferred sales charges from redemptions of class B and class C shares, respectively.
A deferred sales charge of up to 1.00% and 0.40% is assessed on certain redemptions of class A and class M shares, respectively. For the six months ended May 31, 2009, Putnam Retail Management Limited Partnership, acting as underwriter, received no monies on class A and class M redemptions.
Note 3: Purchases and sales of securities
During the six months ended May 31, 2009, cost of purchases and proceeds from sales of investment securities other than short-term investments aggregated $141,452,898 and $107,028,147, respectively. There were no purchases or sales of U.S. government securities.
Note 4: Capital shares
At May 31, 2009, there was an unlimited number of shares of beneficial interest authorized. Transactions in capital shares were as follows:
| | | | |
| | Six months ended 5/31/09 | Year ended 11/30/08 |
|
| Class A | Shares | Amount | Shares | Amount |
|
| Shares sold | 16,105,799 | $70,623,568 | 27,260,133 | $154,948,900 |
|
| Shares issued in connection with | 3,018,916 | 13,018,566 | 4,011,079 | 21,807,632 |
| reinvestment of distributions | | | | |
|
| | 19,124,715 | 83,642,134 | 31,271,212 | 176,756,532 |
|
| Shares repurchased | (12,312,296) | (52,664,405) | (20,811,101) | (112,787,499) |
|
| Net increase | 6,812,419 | $30,977,729 | 10,460,111 | $63,969,033 |
|
57
| | | | |
| | Six months ended 5/31/09 | Year ended 11/30/08 |
|
| Class B | Shares | Amount | Shares | Amount |
|
| Shares sold | 617,309 | $2,639,864 | 461,800 | $2,543,879 |
|
| Shares issued in connection with | 49,896 | 211,651 | 78,751 | 427,580 |
| reinvestment of distributions | | | | |
|
| | 667,205 | 2,851,515 | 540,551 | 2,971,459 |
|
| Shares repurchased | (549,319) | (2,370,126) | (941,326) | (5,139,601) |
|
| Net increase (decrease) | 117,886 | $481,389 | (400,775) | $(2,168,142) |
|
| |
| | Six months ended 5/31/09 | Year ended 11/30/08 |
|
| Class C | Shares | Amount | Shares | Amount |
|
| Shares sold | 1,321,433 | $5,612,493 | 312,222 | $1,698,873 |
|
| Shares issued in connection with | 37,446 | 161,720 | 9,330 | 50,490 |
| reinvestment of distributions | | | | |
|
| | 1,358,879 | 5,774,213 | 321,552 | 1,749,363 |
|
| Shares repurchased | (407,185) | (1,869,971) | (280,234) | (1,587,892) |
|
| Net increase | 951,694 | $3,904,242 | 41,318 | $161,471 |
|
| |
| | Six months ended 5/31/09 | Year ended 11/30/08 |
|
| Class M | Shares | Amount | Shares | Amount |
|
| Shares sold | 293,082 | $1,231,438 | 1,526,458 | $8,511,796 |
|
| Shares issued in connection with | 36,805 | 158,506 | 60,255 | 331,789 |
| reinvestment of distributions | | | | |
|
| | 329,887 | 1,389,944 | 1,586,713 | 8,843,585 |
|
| Shares repurchased | (3,163,130) | (13,780,681) | (8,871,387) | (48,682,080) |
|
| Net decrease | (2,833,243) | $(12,390,737) | (7,284,674) | $(39,838,495) |
|
| |
| | Six months ended 5/31/09 | Year ended 11/30/08 |
|
| Class R | Shares | Amount | Shares | Amount |
|
| Shares sold | 612,824 | $2,714,468 | 195,256 | $1,022,712 |
|
| Shares issued in connection with | 18,720 | 82,243 | 3,262 | 15,384 |
| reinvestment of distributions | | | | |
|
| | 631,544 | 2,796,711 | 198,518 | 1,038,096 |
|
| Shares repurchased | (215,286) | (929,727) | (31,046) | (158,199) |
|
| Net increase | 416,258 | $1,866,984 | 167,472 | $879,897 |
|
| |
| | Six months ended 5/31/09 | Year ended 11/30/08 |
|
| Class Y | Shares | Amount | Shares | Amount |
|
| Shares sold | 5,766,522 | $25,513,744 | 6,494,344 | $37,360,347 |
|
| Shares issued in connection with | 413,664 | 1,814,765 | 619,059 | 3,458,029 |
| reinvestment of distributions | | | | |
|
| | 6,180,186 | 27,328,509 | 7,113,403 | 40,818,376 |
|
| Shares repurchased | (6,724,564) | (29,901,013) | (7,113,250) | (40,306,479) |
|
| Net increase (decrease) | (544,378) | $(2,572,504) | 153 | $511,897 |
|
58
Note 5: Summary of derivative activity
The following is a summary of the market values of derivative instruments as of May 31, 2009:
| | | | |
| | Asset derivatives 2009 | Liability derivatives 2009 |
|
| Derivatives not accounted | Balance | | Balance | |
| for as hedging instruments | sheet | Market | sheet | Market |
| under Statement 133 | location | value | location | value |
|
| Foreign exchange | | | | |
| contracts | Receivables | $97,181 | Payables | $381,839 |
|
| Credit contracts | Receivables | 611,651 | Payables | 406,880 |
|
| Total | | $708,832 | | $788,719 |
|
The following is a summary of realized and unrealized gains or losses of derivative instruments on the statement of operations for the period ended May 31, 2009 (see Note 1).
| | | |
| Amount of realized gain (loss) on derivatives recognized in income | |
| |
| Derivatives not accounted | Forward | | |
| for as hedging instruments | Currency | | |
| under Statement 133 | Contracts | Swaps | Total |
|
| Foreign exchange contracts | $329,482 | $— | $329,482 |
|
| Credit contracts | — | (176,805) | (176,805) |
|
| Total | $329,482 | $(176,805) | $152,677 |
|
Change in unrealized appreciation or (depreciation) on derivatives recognized in income
| | | |
| Derivatives not accounted | Forward | | |
| for as hedging instruments | Currency | | |
| under Statement 133 | Contracts | Swaps | Total |
|
| Foreign exchange contracts | $(849,960) | $— | ($849,960) |
|
| Credit contracts | — | 525,933 | 525,933 |
|
| Total | $(849,960) | $525,933 | $(324,027) |
|
Note 6: Investment in Putnam Money Market
Liquidity Fund
The fund invested in Putnam Money Market Liquidity Fund, an open-end management investment company managed by Putnam Management. Investments in Putnam Money Market Liquidity Fund are valued at its closing net asset value each business day. Income distributions earned by the fund are recorded as interest income in the Statement of operations and totaled $12,695 for the six months ended May 31, 2009. During the six months ended May 31, 2009, cost of purchases and proceeds of sales of investments in Putnam Money Market Liquidity Fund aggregated $46,958,098 and $24,249,804, respectively. Management fees charged to Putnam Money Market Liquidity Fund have been waived by Putnam Management.
Note 7: Senior loan commitments
Senior loans are purchased or sold on a when-issued or delayed delivery basis and may be settled a month or more after the trade date, which from time to time can delay the actual investment of available cash balances; interest income is accrued based on the terms of the securities. Senior loans can be acquired through an agent, by assignment from another holder of the loan, or as a participation interest in another holder’s portion of the loan. When the fund invests in a loan or participation, the fund is subject to the risk that an intermediate participant between the fund and the borrower will fail to meet its obligations to the fund, in addition to the risk that the borrower under the loan may default on its obligations.
Note 8: Unfunded loan commitments
As of May 31, 2009, the fund had unfunded loan commitments of $22,988, which could be extended at the option of the borrower, pursuant to the following loan agreements with the following borrowers:
| | | |
| Borrower | Unfunded commitments | | |
| | |
| Bausch & Lomb, Inc. | $22,988 | | |
| | |
59
Note 9: Regulatory matters and litigation
In late 2003 and 2004, Putnam Management settled charges brought by the Securities and Exchange Commission (the “SEC”) and the Massachusetts Securities Division in connection with excessive short-term trading in Putnam funds. Distribution of payments from Putnam Management to certain open-end Putnam funds and their shareholders is expected to be completed in the next several months. These allegations and related matters have served as the general basis for certain lawsuits, including purported class action lawsuits against Putnam Management and, in a limited number of cases, some Putnam funds. Putnam Management believes that these lawsuits will have no material adverse effect on the funds or on Putnam Management’s ability to provide investment management services. In addition, Putnam Management has agreed to bear any costs incurred by the Putnam funds as a result of these matters.
Note 10: New accounting pronouncement
In April 2009, FASB issued FASB Staff Position FSP FAS 157-4, which amends FASB Statement No. 157, Fair Value Measurements, and is effective for interim and annual periods ending after June 15, 2009. FSP FAS 157-4 provides additional guidance when the volume and level of activity for the asset or liability measured at fair value has significantly decreased. Additionally, FSP FAS 157-4 expands disclosure by reporting entities with respect to categories of assets and liabilities carried at fair value. Putnam Management believes applying the provisions of FSP FAS 157-4 will not have a material impact on the fund’s financial statements.
Note 11: Market and credit risk
In the normal course of business, the fund trades finan-cial instruments and enters into financial transactions where risk of potential loss exists due to changes in the market (market risk) or failure of the contracting party to the transaction to perform (credit risk). The fund may be exposed to additional credit risk that an institution or other entity with which the fund has unsettled or open transactions will default.
60
Fund information
Founded over 70 years ago, Putnam Investments was built around the concept that a balance between risk and reward is the hallmark of a well-rounded financial program. We manage over 100 mutual funds across income, value, blend, growth, asset allocation, absolute return, and global sector categories.
| | |
| Investment Manager | George Putnam, III | James P. Pappas |
| Putnam Investment | Robert L. Reynolds | Vice President |
| Management, LLC | W. Thomas Stephens | |
| One Post Office Square | Richard B. Worley | Francis J. McNamara, III |
| Boston, MA 02109 | | Vice President and |
| | Officers | Chief Legal Officer |
| Investment Sub-Manager | Robert L. Reynolds | |
| Putnam Investments Limited | President | Robert R. Leveille |
| 57–59 St James’s Street | | Vice President and |
| London, England SW1A 1LD | Charles E. Porter | Chief Compliance Officer |
| | Executive Vice President, | |
| Marketing Services | Principal Executive Officer, | Mark C. Trenchard |
| Putnam Retail Management | Associate Treasurer and | Vice President and |
| One Post Office Square | Compliance Liaison | BSA Compliance Officer |
| Boston, MA 02109 | | |
| Jonathan S. Horwitz | Judith Cohen |
| Custodian | Senior Vice President | Vice President, Clerk and |
| State Street Bank and | and Treasurer | Assistant Treasurer |
| Trust Company | | |
| Steven D. Krichmar | Wanda M. McManus |
| Legal Counsel | Vice President and | Vice President, Senior Associate |
| Ropes & Gray LLP | Principal Financial Officer | Treasurer and Assistant Clerk |
| | | |
| Trustees | Janet C. Smith | Nancy E. Florek |
| John A. Hill, Chairman | Vice President, Principal | Vice President, Assistant Clerk, |
| Jameson A. Baxter, | Accounting Officer and | Assistant Treasurer and |
| Vice Chairman | Assistant Treasurer | Proxy Manager |
| Ravi Akhoury | | |
| Charles B. Curtis | Susan G. Malloy | |
| Robert J. Darretta | Vice President and | |
| Myra R. Drucker | Assistant Treasurer | |
| Paul L. Joskow | | |
| Elizabeth T. Kennan | Beth S. Mazor | |
| Kenneth R. Leibler | Vice President | |
| Robert E. Patterson | | |
| | |
This report is for the information of shareholders of Putnam High Yield Advantage Fund. It may also be used as sales literature when preceded or accompanied by the current prospectus, the most recent copy of Putnam’s Quarterly Performance Summary, and Putnam’s Quarterly Ranking Summary. For more recent performance, please visit putnam.com. Investors should carefully consider the investment objective, risks, charges, and expenses of a fund, which are described in its prospectus. For this and other information or to request a prospectus, call 1-800-225-1581 toll free. Please read the prospectus carefully before investing. The fund’s Statement of Additional Information contains additional information about the fund’s Trustees and is available without charge upon request by calling 1-800-225-1581.

Item 2. Code of Ethics:
Not applicable
Item 3. Audit Committee Financial Expert:
Not applicable
Item 4. Principal Accountant Fees and Services:
Not applicable
Item 5. Audit Committee of Listed Registrants
Not applicable
Item 6. Schedule of Investments:
The registrant’s schedule of investments in unaffiliated issuers is included in the report to shareholders in Item 1 above.
Item 7. Disclosure of Proxy Voting Policies and Procedures For Closed-End Management Investment Companies:
Not applicable
Item 8. Portfolio Managers of Closed-End Investment Companies
Not Applicable
Item 9. Purchases of Equity Securities by Closed-End Management Investment Companies and Affiliated Purchasers:
Not applicable
Item 10. Submission of Matters to a Vote of Security Holders:
Not applicable
Item 11. Controls and Procedures:
(a) The registrant's principal executive officer and principal financial officer have concluded, based on their evaluation of the effectiveness of the design and operation of the registrant's disclosure controls and procedures as of a date within 90 days of the filing date of this report, that the design and operation of such procedures are generally effective to provide reasonable assurance that information required to be disclosed by the registrant in this report is recorded, processed, summarized and reported within the time periods specified in the Commission's rules and forms.
(b) Changes in internal control over financial reporting: Not applicable
Item 12. Exhibits:
(a)(1) Not applicable
(a)(2) Separate certifications for the principal executive officer and principal financial officer of the registrant as required by Rule 30a-2(a) under the Investment Company Act of 1940, as amended, are filed herewith.
(b) The certifications required by Rule 30a-2(b) under the Investment Company Act of 1940, as amended, are filed herewith.
SIGNATURES
Pursuant to the requirements of the Securities Exchange Act of 1934 and the Investment Company Act of 1940, the registrant has duly caused this report to be signed on its behalf by the undersigned, thereunto duly authorized.
Putnam High Yield Advantage Fund
By (Signature and Title):
/s/Janet C. Smith
Janet C. Smith
Principal Accounting Officer
Date: July 29, 2009
Pursuant to the requirements of the Securities Exchange Act of 1934 and the Investment Company Act of 1940, this report has been signed below by the following persons on behalf of the registrant and in the capacities and on the dates indicated.
By (Signature and Title):
/s/Charles E. Porter
Charles E. Porter
Principal Executive Officer
Date: July 29, 2009
By (Signature and Title):
/s/Steven D. Krichmar
Steven D. Krichmar
Principal Financial Officer
Date: July 29, 2009