UNITED STATES
SECURITIES AND EXCHANGE COMMISSION
Washington, D.C. 20549
FORM N-CSR
CERTIFIED SHAREHOLDER REPORT
OF
REGISTERED MANAGEMENT INVESTMENT COMPANIES
| Investment Company Act file number: | 811-04570 |
Name of Registrant: | Vanguard New York Tax-Free Funds |
Address of Registrant: | P.O. Box 2600 |
| Valley Forge, PA 19482 | |
Name and address of agent for service: | Heidi Stam, Esquire |
| P.O. Box 876 | |
| Valley Forge, PA 19482 | |
Registrant’s telephone number, including area code: (610) 669-1000 | |
Date of fiscal year end: November 30 | |
Date of reporting period: December 1, 2013 – May 31, 2014 | |
Item 1: Reports to Shareholders | |
|
Semiannual Report | May 31, 2014
|
| Vanguard New York Tax-Exempt Funds |
Vanguard’s Principles for Investing Success
We want to give you the best chance of investment success. These principles,
grounded in Vanguard’s research and experience, can put you on the right path.
Goals. Create clear, appropriate investment goals.
Balance. Develop a suitable asset allocation using broadly diversified funds. Cost. Minimize cost.
Discipline. Maintain perspective and long-term discipline.
A single theme unites these principles: Focus on the things you can control.
We believe there is no wiser course for any investor.
| Contents | |
| Your Fund’s Total Returns. | 1 |
| Chairman’s Letter. | 2 |
| Advisor’s Report. | 8 |
| New York Tax-Exempt Money Market Fund. | 11 |
| New York Long-Term Tax-Exempt Fund. | 28 |
| About Your Fund’s Expenses. | 64 |
| Trustees Approve Advisory Arrangements. | 66 |
| Glossary. | 67 |
Please note: The opinions expressed in this report are just that—informed opinions. They should not be considered promises or advice.
Also, please keep in mind that the information and opinions cover the period through the date on the front of this report. Of course, the
risks of investing in your fund are spelled out in the prospectus.
See the Glossary for definitions of investment terms used in this report.
About the cover: The ship’s wheel represents leadership and guidance, essential qualities in navigating difficult seas.
This one is a replica based on an 18th-century British vessel. The HMSVanguard, another ship of that era, served as the
flagship for British Admiral Horatio Nelson when he defeated a French fleet at the Battle of the Nile.
Your Fund’s Total Returns
| Six Months Ended May 31, 2014 | |||||
| Taxable- | |||||
| SEC | Equivalent | Income | Capital | Total | |
| Yield | Yield | Returns | Returns | Returns | |
| Vanguard New York Tax-Exempt Money Market Fund | 0.01% | 0.02% | 0.00% | 0.00% | 0.00% |
| New York Tax-Exempt Money Market Funds Average | 0.00 | ||||
| New York Tax-Exempt Money Market Funds Average: Derived from data provided by Lipper, a Thomson Reuters Company. | |||||
| Vanguard New York Long-Term Tax-Exempt Fund | |||||
| Investor Shares | 2.39% | 4.63% | 1.91% | 4.77% | 6.68% |
| Admiral™ Shares | 2.47 | 4.79 | 1.96 | 4.77 | 6.73 |
| Barclays NY Municipal Bond Index | 5.16 | ||||
| New York Municipal Debt Funds Average | 6.47 |
New York Municipal Debt Funds Average: Derived from data provided by Lipper, a Thomson Reuters Company.
7-day SEC yield for the New York Tax-Exempt Money Market Fund; 30-day SEC yield for the New York Long-Term Tax-Exempt Fund.
The calculation of taxable-equivalent yield assumes a typical itemized tax return and is based on the maximum federal tax rate of 43.4% and
the maximum income tax rate for the state. Local taxes were not considered. Please see the prospectus for a detailed explanation of the
calculation.
Admiral Shares carry lower expenses and are available to investors who meet certain account-balance requirements.
| Your Fund’s Performance at a Glance | ||||
| November 30, 2013, Through May 31, 2014 | ||||
| Distributions Per Share | ||||
| Starting | Ending | Income | Capital | |
| Share Price | Share Price | Dividends | Gains | |
| Vanguard New York Tax-Exempt Money | ||||
| Market Fund | $1.00 | $1.00 | $0.000 | $0.000 |
| Vanguard New York Long-Term Tax-Exempt | ||||
| Fund | ||||
| Investor Shares | $11.11 | $11.64 | $0.206 | $0.000 |
| Admiral Shares | 11.11 | 11.64 | 0.211 | 0.000 |
1

Dear Shareholder,
Putting recent challenges in the rearview mirror, municipal bonds rebounded in the six months ended May 31, 2014.
The bond market as a whole came under pressure in 2013 as interest rates headed higher on the prospect of reduced support from the Federal Reserve. News headlines about the fiscal challenges facing Detroit and Puerto Rico further concerned muni investors. But the tide turned at the beginning of this year as interest rates unexpectedly reversed course, rekindling investor demand for bonds in general, especially those offering higher yields.
That focus on yield helped lower-rated and longer-dated muni bonds—those segments of the muni market hardest hit by last year’s rise in rates—produce the biggest gains for the six months. Vanguard New York Long-Term Tax-Exempt Fund fared well in this environment, with Investor Shares returning 6.68% and Admiral Shares 6.73%. The share of return generated by price appreciation was more than double that of interest income, helping the fund notch its best fiscal first-half return since 2009, and one of its highest ever. But we shouldn’t expect such exceptionally strong returns of municipal bonds to continue, especially given current low bond yields.
It’s pleasing to note that the Long-Term Fund performed better than its benchmark and its peer group, thanks largely to its allocation to longer maturities and its advisor’s success in finding pockets of relative value in the market.
2
With the Fed still holding short-term interest rates at 0%–0.25%, the return for Vanguard New York Tax-Exempt Money Market Fund and the average for its peer group were zero.
Stronger demand for muni bonds drove their yields lower. The 30-day SEC yield for Investor Shares of the Long-Term Fund slipped from 3.09% on November 30 to 2.39% at the end of May. The 7-day SEC yield for the Money Market Fund closed the half year at 0.01%, on par with where it began.
Please note: The funds are permitted to invest in securities whose income is subject to the alternative minimum tax (AMT). As of May 31, the Long-Term Fund owned no securities that would generate income distributions subject to the AMT, but the Money Market Fund did.
Taxable bond yields retreated, and stocks kept on rising
Over the six months, the broad U.S. taxable bond market returned 3.28%. The yield of the benchmark 10-year Treasury note ended the period at 2.47%, down from 2.74% on November 30 and almost 3% on December 31. (Bond prices and yields move in opposite directions.)
It’s worth remembering that these low yields imply lower future returns: As yields tumble, the scope for further declines—and increases in prices—diminishes. This, of course, is true of both taxable and tax-exempt bonds.
| Market Barometer | |||
| Total Returns | |||
| Periods Ended May 31, 2014 | |||
| Six | One | Five Years | |
| Months | Year | (Annualized) | |
| Bonds | |||
| Barclays U.S. Aggregate Bond Index (Broad taxable | |||
| market) | 3.28% | 2.71% | 4.96% |
| Barclays Municipal Bond Index (Broad tax-exempt market) | 5.63 | 3.05 | 5.59 |
| Citigroup Three-Month U.S. Treasury Bill Index | 0.00 | 0.04 | 0.07 |
| Stocks | |||
| Russell 1000 Index (Large-caps) | 7.71% | 20.90% | 18.77% |
| Russell 2000 Index (Small-caps) | -0.10 | 16.79 | 19.32 |
| Russell 3000 Index (Broad U.S. market) | 7.08 | 20.57 | 18.82 |
| FTSE All-World ex US Index (International) | 4.79 | 14.65 | 10.79 |
| CPI | |||
| Consumer Price Index | 2.07% | 2.13% | 2.15% |
3
Short-term interest rates continued to restrict returns for savings accounts as well as money market funds.
International bond markets (as measured by the Barclays Global Aggregate Index ex USD) returned 3.69%.
U.S. stocks, meanwhile, returned about 7% for the half year. Results were positive in five of the six months, declining in January as investors focused on China’s slow growth but then resuming their spirited advance. The Standard & Poor’s 500 Index closed the period at a record high.
International stocks, in aggregate, advanced about 5%. Emerging markets and the developed markets of the Pacific region showed some improvement after declines related to the slowdown in China. But they still lagged the robust performance of European stocks.
Limited supply buoyed N.Y. munis, as did renewed appetite for yield
The past half year serves as an example of how holding steady with your investments can work out better than trying to time the markets. Last spring, the Fed began bracing investors for a scaling back of its massive bond-buying program that was designed to speed the economy’s recovery. Many investors reasonably assumed that reduced demand from the Fed for Treasuries and mortgage-backed government bonds could hurt overall bond prices, which did decline through the end of 2013.
| Expense Ratios | |||
| Your Fund Compared With Its Peer Group | |||
| Investor | Admiral | Peer Group | |
| Shares | Shares | Average | |
| New York Tax-Exempt Money Market | |||
| Fund | 0.16% | — | 0.19% |
| New York Long-Term Tax-Exempt Fund | 0.20 | 0.12% | 1.00 |
The fund expense ratios shown are from the prospectus dated March 27, 2014, and represent estimated costs for the current fiscal year. For
the six months ended May 31, 2014, the funds’ annualized expense ratios were: for the New York Tax-Exempt Money Market Fund, 0.08%;
and for the New York Long-Term Tax-Exempt Fund, 0.20% for Investor Shares and 0.12% for Admiral Shares. The six-month expense ratio for
the New York Tax-Exempt Money Market Fund reflects a temporary reduction in operating expenses (described in Note B of the Notes to
Financial Statements). Before this reduction, the fund’s annualized six-month expense ratio was 0.16%. Peer-group expense ratios are derived
from data provided by Lipper, a Thomson Reuters Company, and capture information through year-end 2013.
Peer groups: For the New York Tax-Exempt Money Market Fund, New York Tax-Exempt Money Market Funds; for the New York Long-Term
Tax-Exempt Fund, New York Municipal Debt Funds.
4
The markets rarely evolve precisely as expected, however, and investors who exited the bond market in the second half of 2013 or sought safety in short-term
maturities in anticipation of the Fed’s cutback missed out on the strong recovery that began early this year among longer-dated and lower-rated bonds in particular.
| Despite the headlines, muni credit quality remains strong |
| News reports tracking Detroit’s bankruptcy proceedings and Puerto Rico’s continuing fiscal |
| struggles have added to investors’ concerns about the financial strength of state and local |
| governments across the country. But it would be a mistake to paint the more than 55,000 |
| issuers in the $3.7 trillion municipal bond market with the same brush.1 |
| To be sure, some muni issuers face challenges because of unfunded pensions and health |
| care costs. That’s why we believe that in-depth credit research and monitoring are particularly |
| important when investing in this segment of the bond market. That said, U.S. investment-grade |
| muni bonds have a high credit-quality profile overall, especially compared with their corporate |
| counterparts. As the chart below illustrates, more than 60% of bonds in the Barclays Municipal |
| Bond Index fall into the two highest credit-rating categories (Aaa and Aa) as measured by |
| Moody’s Investors Service. The comparable figure for bonds in the Barclays U.S. Corporate |
| Investment Grade Bond Index is about 11%. |
| Municipal and corporate investment-grade bonds compared by credit rating |
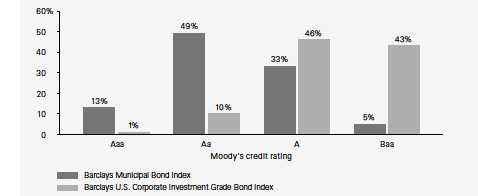
| Note: Data as of May 30, 2014. |
| Sources: Moody’s Investors Service, Barclays, and Vanguard. |
| 1 Number of issuers is from the Municipal Securities Rulemaking Board; size of the municipal bond market is from |
| the Securities Industry and Financial Markets Association. |
5
Various developments were behind the reversal in demand for bonds, including winter-related weakness in the U.S. economy, the slow-down in China, and political and economic turmoil in some emerging markets.
The rebound in the muni market was even sharper than for bonds as a whole. Muni yields reached attractive levels in the new year both on an absolute basis and relative to Treasuries and corporate bonds, and that enticed banks, insurance companies, and hedge funds to buy. Individuals in high income-tax brackets—the traditional buyer base for munis—stepped back in as well, given the added allure of tax-exempt securities in light of those buyers’ increased tax rates.
Even as demand for munis grew over the six months, their supply shrank. New York municipalities, like many of their counterparts across the country, continued to shy away from initiating capital projects. That trend, coming at the same time that refinancing to cut borrowing costs had largely run its course, contributed to a significant drop in issuance from a year earlier.
With investors searching for yield, the interest rate risk and credit risk taken by the Long-Term Fund’s advisor, Vanguard Fixed Income Group, were generally well-rewarded. The advisor’s outsized allocations to longer maturities in particular helped the fund outpace its peer-group average by more than 20 basis points and its benchmark by more than 150 basis points. (A basis point is one-hundredth of a percentage point.)
Credit analysis, an increasingly important tool for navigating the muni market, was a positive as well. Our in-house analysts’ original, in-depth research helped the advisor identify individual issues offering relative value. It also helped the advisor largely steer clear of bonds for which investors might not be adequately compensated for the risk being taken, or that might bring excessive volatility to the fund (as with Puerto Rican bonds, for example).
For better results later, pull the savings lever now
Given the nature of my job, I’m often asked for investment advice—whether I’m at an industry conference or a family gathering. The best guidance I can give? Develop good savings habits. Being a dedicated saver is the first and most important step to becoming a successful investor.
Jack Brennan, my friend and predecessor as Vanguard CEO, devoted an entire chapter to the topic of savings in his 2002 book, Straight Talk on Investing. I think it’s the most valuable chapter in a very valuable book.
As Jack noted, saving is integral to investing. Vanguard’s deeply held investment principles––goals, balance, cost, and discipline––mean nothing if you have no savings to invest in the first place.
6
We can’t control how the financial markets perform, but we can control how much we save. And it’s those savings that can most affect how much wealth we build.
A Vanguard research paper found that “increasing the savings rate can have substantially more positive impact on wealth accumulation than shifting to a more aggressive portfolio.” (You can read the full paper, Penny Saved, Penny Earned, at vanguard.com/research.)
Small shifts from spending to savings can make a meaningful difference. Here’s an example, similar to one Jack cites in his book: A $3 latte each business day adds up to about $750 per year. If instead of buying lattes, you invested that $750 annually and earned a 3% return including reinvested dividends, you’d end up with about $20,100 after 20 years.
There are a variety of ways to save effectively. First and foremost, if at all possible, contribute to a 401(k) or an IRA, or a similar plan, to maximize any tax-advantaged opportunities. Whatever you do, pay yourself first. As Warren Buffett said, “Don’t save what is left after spending; spend what is left after saving.”
As always, thank you for investing with Vanguard.
Sincerely,

F. William McNabb III
Chairman and Chief Executive Officer
June 11, 2014
7
Advisor’s Report
For the six months ended May 31, 2014, Vanguard New York Long-Term Tax-Exempt Fund returned 6.68% for Investor Shares and 6.73% for Admiral Shares. Those performances were well ahead of the 5.16% result for the fund’s benchmark, the Barclays New York Municipal Bond Index. They were also better than the average return of 6.47% for peer-group funds. The flat return of Vanguard New York Tax-Exempt Money Market Fund, which matched the average return of its peers, was a consequence of Federal Reserve policy.
The investment environment
Despite a challenging start, the municipal market performed strongly at the national level and in New York State over the half year. Cheap valuations and reduced supply pulled investors back into the market. Muni bonds’ tax-exempt status was a draw as well for higher-income investors because of the tax-rate increases in 2013.
As the six-month period began, muni bond valuations were low, given the sharp slump last year precipitated by talk of the Fed’s tapering its bond-buying program. The Fed, however, eventually persuaded the markets that dialing back its purchases of about $85 billion per month of U.S. Treasuries and mortgage-backed securities did not mean it would soon raise interest rates. Starting in January, it gradually reduced its purchases even as bond yields moved lower.
| Yields of Tax-Exempt Municipal Securities | ||
| (AAA-Rated General-Obligation Issues) | ||
| November 30, | May 31, | |
| Maturity | 2013 | 2014 |
| 2 years | 0.33% | 0.15% |
| 5 years | 1.16 | 0.86 |
| 10 years | 2.65 | 2.05 |
| 30 years | 4.10 | 3.26 |
| Source: Vanguard. | ||
8
At times, media attention to the fiscal woes of Puerto Rico and Detroit also weighed on investor sentiment. In February, Puerto Rico, the third-largest bond issuer after California and New York, saw its general obligation bonds downgraded to junk status by major credit-rating agencies as it struggled with a weak economy, a budget deficit, and a large debt load.
And Detroit’s bankruptcy proceedings took some sharp turns amid wrangling over how much pension funds and bondholders would receive in a final settlement. The news flow turned more positive toward the end of the half year for both places, but they remained in difficult straits.
Muni investors began to look past such outliers to see that many issuers have made further progress in putting their fiscal houses in order following the Great Recession. New York State tax revenues have been rising for a number of years with the economy improving and the unemployment rate falling. Many local governments are in better shape as well now that property taxes, which make up a substantial part of their total revenues, have started to pick up with the recovery in the housing market.
As for spending, the Empire State and many of its municipalities remained in austerity mode, trying to contain costs and taking steps to reform pensions and benefits where possible. (Just after the half year ended, Moody’s Investors Service upgraded New York State general obligation bonds to reflect progress made.) This belt-tightening, along with fewer opportunities to cut borrowing costs through refinancing, contributed to a decline in the volume of muni bonds issued in New York.
Management of the funds
For the six months, we focused in the Long-Term Fund on opportunities where we believed we would be well-compensated for holding more risk than the benchmark. That proved to be the case with our overweight allocation to longer-maturity bonds. These securities, which had fallen out of favor in 2013 as investors expected interest rates to keep rising, contributed to our performance in the first five months of 2014 as rates actually moved lower.
We also held premium callable bonds in the belief that they offered a better total return profile versus par bonds and longer noncallable bonds. With the economy improving and investors reaching for yield, our lower-rated holdings also performed well.
For the Money Market Fund, the Fed’s policy of anchoring short-term rates near zero remained a challenge. Nevertheless, we were able to support returns using several relative value and income strategies involving credit sectors, security selection, and structural opportunities.
9
A look ahead
After munis’ strong performance over the six months put them at much fuller valuations, returns may be more modest for the rest of 2014, with income—rather than price appreciation—the likely primary driver of performance.
We expect U.S. economic growth to accelerate, allowing the Fed to wrap up its bond purchases by year-end and to begin slowly tightening the federal funds target rate in the second half of 2015. The tightening is likely to end, however, at a level below the historical average.
After the strong rally that left yields relatively low, we are entering the second half of the Long-Term Fund’s fiscal year in a more defensive stance, with a shorter-than-benchmark duration. And because investors are likely to keep reaching for yield, we remain comfortable with our overweight to bonds with longer maturities and lower credit-quality ratings as well as to sectors offering an attractive reward for the level of risk taken. Because an eventual tightening of monetary policy is likely to mean more market volatility, we will continue to maintain above-average liquidity to take advantage of any pricing dislocations that may occur.
Whatever the markets may bring, our experienced team of portfolio managers, traders, and credit analysts will continue to seek out opportunities to add to fund performance through security selection.
Christopher W. Alwine, CFA, Principal,
Head of Municipal Bond Funds
Pamela Wisehaupt Tynan, Principal,
Head of Municipal Money Market Funds
Mathew M. Kiselak, Principal,
Portfolio Manager
Adam M. Ferguson, CFA,
Portfolio Manager
Justin A. Schwartz, CFA,
Portfolio Manager
Vanguard Fixed Income Group
June 17, 2014
10
New York Tax-Exempt Money Market Fund
Fund Profile
As of May 31, 2014
| Financial Attributes | |
| Ticker Symbol | VYFXX |
| Expense Ratio1 | 0.16% |
| 7-Day SEC Yield | 0.01% |
| Average Weighted | |
| Maturity | 30 days |
| Distribution by Credit Quality (% of portfolio) | |
| First Tier | 100.0% |
| For information about these ratings, see the Glossary entry for Credit Quality. | |
1 The expense ratio shown is from the prospectus dated March 27, 2014, and represents estimated costs for the current fiscal year. For the six
months ended May 31, 2014, the annualized expense ratio was 0.08%, reflecting a temporary reduction in operating expenses (described in Note B
of the Notes to Financial Statements). Before this reduction, the expense ratio was 0.16%.
11
New York Tax-Exempt Money Market Fund
Performance Summary
Investment returns will fluctuate. All of the returns in this report represent past performance, which is not a guarantee of future results that may be achieved by the fund. (Current performance may be lower or higher than the performance data cited. For performance data current to the most recent month-end, visit our website at vanguard.com/performance.) The returns shown do not reflect taxes that a shareholder would pay on fund distributions. An investment in a money market fund is not insured or guaranteed by the Federal Deposit Insurance Corporation or any other government agency. Although the fund seeks to preserve the value of your investment at $1 per share, it is possible to lose money by investing in the fund. The fund’s 7-day SEC yield reflects its current earnings more closely than do the average annual returns.
| Fiscal-Year Total Returns (%): November 30, 2003, Through May 31, 2014 | ||
| NY Tax-Exempt | ||
| Money Mkt | ||
| Funds Avg | ||
| Fiscal Year | Total Returns | Total Returns |
| 2004 | 1.03% | 0.58% |
| 2005 | 2.18 | 1.70 |
| 2006 | 3.28 | 2.81 |
| 2007 | 3.60 | 3.12 |
| 2008 | 2.32 | 1.88 |
| 2009 | 0.36 | 0.24 |
| 2010 | 0.10 | 0.01 |
| 2011 | 0.06 | 0.04 |
| 2012 | 0.03 | 0.00 |
| 2013 | 0.01 | 0.00 |
| 2014 | 0.00 | 0.00 |
| 7-day SEC yield (5/31/2014): 0.01% | ||
| New York Tax-Exempt Money Market Funds Average: Derived from data provided by Lipper, a Thomson Reuters Company. | ||
| Note: For 2014, performance data reflect the six months ended May 31, 2014. | ||
| Average Annual Total Returns: Periods Ended March 31, 2014 | ||||
| This table presents returns through the latest calendar quarter—rather than through the end of the fiscal period. | ||||
| Securities and Exchange Commission rules require that we provide this information. | ||||
| Inception | One | Five | Ten | |
| Date | Year | Years | Years | |
| New York Tax-Exempt Money | ||||
| Market Fund | 9/3/1997 | 0.01% | 0.07% | 1.26% |
See Financial Highlights for dividend information.
12
New York Tax-Exempt Money Market Fund
Financial Statements (unaudited)
Statement of Net Assets
As of May 31, 2014
The fund reports a complete list of its holdings in various monthly and quarterly regulatory filings. The fund publishes its holdings on a monthly basis at vanguard.com and files them with the Securities and Exchange Commission on Form N-MFP. The fund’s Form N-MFP filings become public 60 days after the relevant month-end, and may be viewed at sec.gov or via a link on the “Portfolio Holdings” page on vanguard.com. For the second and fourth fiscal quarters, the lists appear in the fund’s semiannual and annual reports to shareholders. For the first and third fiscal quarters, the fund files the lists with the SEC on Form N-Q. Shareholders can look up the fund’s Forms N-Q on the SEC’s website at sec.gov. Forms N-Q may also be reviewed and copied at the SEC’s Public Reference Room (see the back cover of this report for further information).
| Face | Market | |||
| Maturity | Amount | Value | ||
| Coupon | Date | ($000) | ($000) | |
| Tax-Exempt Municipal Bonds (101.4%) | ||||
| New York (101.4%) | ||||
| Albany NY Industrial Development Agency | ||||
| Civic Facility Revenue (CHF Holland Suites | ||||
| LLC Project) VRDO | 0.060% | 6/6/14 LOC | 10,430 | 10,430 |
| Albany NY Industrial Development Agency | ||||
| Revenue (The College of St. Rose Project) | ||||
| VRDO | 0.060% | 6/6/14 LOC | 13,250 | 13,250 |
| Bayport-Blue Point NY Union Free School | ||||
| District TAN | 1.000% | 6/26/14 | 10,500 | 10,506 |
| 1 BlackRock Muni New York Intermediate | ||||
| Duration Fund VRDP VRDO | 0.140% | 6/6/14 LOC | 7,000 | 7,000 |
| 1 BlackRock New York Municipal Income | ||||
| Quality Trust Fund VRDP VRDO | 0.140% | 6/6/14 LOC | 10,000 | 10,000 |
| 1 BlackRock New York Municipal Income | ||||
| Trust Fund II VRDP VRDO | 0.140% | 6/6/14 LOC | 16,800 | 16,800 |
| Columbia County NY Capital Resource Corp. | ||||
| Civic Facility Revenue (Columbia Memorial | ||||
| Hospital Project) VRDO | 0.070% | 6/6/14 LOC | 4,600 | 4,600 |
| Columbia County NY Industrial Development | ||||
| Agency Civic Facility Revenue (Columbia | ||||
| Memorial Hospital Project) VRDO | 0.070% | 6/6/14 LOC | 4,580 | 4,580 |
| Commack NY Union Free School District TAN | 1.000% | 6/26/14 | 28,000 | 28,016 |
| Delaware Valley NY Industrial Development | ||||
| Authority Revenue (Delaware Valley Hospital) | ||||
| VRDO | 0.070% | 6/6/14 LOC | 3,980 | 3,980 |
| Erie County NY Fiscal Stability Authority BAN | 1.000% | 7/31/14 | 29,720 | 29,757 |
| 1 Erie County NY Industrial Development Agency | ||||
| School Facility Revenue (Buffalo City School | ||||
| District Project) TOB VRDO | 0.070% | 6/6/14 | 17,350 | 17,350 |
| Franklin County NY Civic Development Corp. | ||||
| Revenue VRDO | 0.070% | 6/6/14 LOC | 4,400 | 4,400 |
| Geneva NY Industrial Development Agency Civic | ||||
| Facility Revenue (Colleges of the Seneca Project) | ||||
| VRDO | 0.060% | 6/6/14 LOC | 17,590 | 17,590 |
| Half Hollow Hills NY Central School District TAN | 0.750% | 6/26/14 | 21,750 | 21,758 |
| Hauppauge NY Union Free School District TAN | 1.250% | 6/27/14 | 11,500 | 11,509 |
13
New York Tax-Exempt Money Market Fund
| Face | Market | |||
| Maturity | Amount | Value | ||
| Coupon | Date | ($000) | ($000) | |
| Long Island NY Power Authority Electric | ||||
| System Revenue VRDO | 0.070% | 6/2/14 LOC | 20,200 | 20,200 |
| Massapequa NY Union Free School District TAN | 1.500% | 6/20/14 | 6,000 | 6,004 |
| Monroe County NY Industrial Development | ||||
| Agency Civic Facility Revenue (Nazareth College) | ||||
| VRDO | 0.060% | 6/6/14 LOC | 5,860 | 5,860 |
| Nassau County NY Interim Finance Authority | ||||
| Sales Tax Revenue VRDO | 0.060% | 6/6/14 | 2,200 | 2,200 |
| Nassau County NY Interim Finance Authority | ||||
| Sales Tax Revenue VRDO | 0.060% | 6/6/14 | 38,400 | 38,400 |
| New York City NY GO | 5.000% | 8/1/14 | 1,000 | 1,008 |
| New York City NY GO | 5.000% | 11/1/14 (Prere.) | 4,470 | 4,559 |
| New York City NY GO | 5.000% | 3/1/15 | 3,125 | 3,238 |
| New York City NY GO | 5.000% | 3/1/15 (Prere.) | 3,445 | 3,570 |
| New York City NY GO | 5.000% | 4/1/15 (Prere.) | 1,520 | 1,581 |
| New York City NY GO VRDO | 0.060% | 6/2/14 LOC | 6,300 | 6,300 |
| New York City NY GO VRDO | 0.060% | 6/2/14 LOC | 17,500 | 17,500 |
| New York City NY GO VRDO | 0.060% | 6/2/14 LOC | 14,300 | 14,300 |
| New York City NY GO VRDO | 0.100% | 6/2/14 | 7,320 | 7,320 |
| New York City NY GO VRDO | 0.100% | 6/2/14 | 13,575 | 13,575 |
| New York City NY GO VRDO | 0.100% | 6/2/14 | 6,000 | 6,000 |
| New York City NY GO VRDO | 0.100% | 6/2/14 | 8,000 | 8,000 |
| New York City NY GO VRDO | 0.100% | 6/2/14 | 1,100 | 1,100 |
| New York City NY Housing Development Corp. | ||||
| Multi-Family Housing Revenue | ||||
| (201 Pearl Street) VRDO | 0.050% | 6/6/14 LOC | 10,000 | 10,000 |
| 1 New York City NY Housing Development Corp. | ||||
| Multi-Family Housing Revenue TOB VRDO | 0.080% | 6/2/14 | 1,900 | 1,900 |
| 1 New York City NY Housing Development Corp. | ||||
| Multi-Family Housing Revenue TOB VRDO | 0.120% | 6/6/14 | 5,105 | 5,105 |
| 1 New York City NY Housing Development Corp. | ||||
| Multi-Family Housing Revenue TOB VRDO | 0.120% | 6/6/14 | 16,380 | 16,380 |
| New York City NY Housing Development Corp. | ||||
| Multi-Family Mortgage Revenue | ||||
| (461 Dean Street) VRDO | 0.050% | 6/6/14 LOC | 33,000 | 33,000 |
| New York City NY Housing Development Corp. | ||||
| Multi-Family Mortgage Revenue | ||||
| (89 Murray Street Development) VRDO | 0.070% | 6/6/14 LOC | 15,800 | 15,800 |
| New York City NY Housing Development Corp. | ||||
| Multi-Family Mortgage Revenue | ||||
| (Bruckner by the Bridge) VRDO | 0.040% | 6/6/14 LOC | 16,800 | 16,800 |
| New York City NY Housing Development Corp. | ||||
| Multi-Family Mortgage Revenue | ||||
| (First Avenue Development)VRDO | 0.070% | 6/6/14 LOC | 10,000 | 10,000 |
| New York City NY Housing Development Corp. | ||||
| Multi-Family Mortgage Revenue | ||||
| (Markham Gardens Apartments) VRDO | 0.070% | 6/6/14 LOC | 6,800 | 6,800 |
| New York City NY Housing Development Corp. | ||||
| Multi-Family Rental Housing Revenue | ||||
| (100 Jane Street) VRDO | 0.070% | 6/6/14 LOC | 11,750 | 11,750 |
| New York City NY Housing Development Corp. | ||||
| Multi-Family Rental Housing Revenue | ||||
| (1133 Manhattan Avenue) VRDO | 0.060% | 6/6/14 LOC | 4,000 | 4,000 |
| New York City NY Housing Development Corp. | ||||
| Multi-Family Rental Housing Revenue | ||||
| (2 Gold Street) VRDO | 0.050% | 6/6/14 | 19,800 | 19,800 |
14
New York Tax-Exempt Money Market Fund
| Face | Market | |||
| Maturity | Amount | Value | ||
| Coupon | Date | ($000) | ($000) | |
| New York City NY Housing Development Corp. | ||||
| Multi-Family Rental Housing Revenue | ||||
| (90 West Street) VRDO | 0.050% | 6/6/14 LOC | 5,870 | 5,870 |
| New York City NY Housing Development Corp. | ||||
| Multi-Family Rental Housing Revenue | ||||
| (Atlantic Court Apartments) VRDO | 0.080% | 6/6/14 LOC | 48,100 | 48,100 |
| New York City NY Housing Development Corp. | ||||
| Multi-Family Rental Housing Revenue | ||||
| (Ocean Gate Development) VRDO | 0.050% | 6/6/14 LOC | 8,445 | 8,445 |
| New York City NY Housing Development Corp. | ||||
| Multi-Family Rental Housing Revenue | ||||
| (One Columbus Place Development) VRDO | 0.070% | 6/6/14 LOC | 22,000 | 22,000 |
| New York City NY Housing Development Corp. | ||||
| Multi-Family Rental Housing Revenue | ||||
| (Rivereast Apartments) VRDO | 0.050% | 6/6/14 LOC | 20,000 | 20,000 |
| New York City NY Housing Development Corp. | ||||
| Multi-Family Rental Housing Revenue | ||||
| (Royal Charter Properties) VRDO | 0.050% | 6/6/14 LOC | 12,000 | 12,000 |
| New York City NY Industrial Development | ||||
| Agency Civic Facility Revenue | ||||
| (Mercy College Project) VRDO | 0.060% | 6/6/14 LOC | 11,005 | 11,005 |
| New York City NY Industrial Development | �� | |||
| Agency Civic Facility Revenue (MSMC Realty | ||||
| Corp. Project) VRDO | 0.070% | 6/6/14 LOC | 2,635 | 2,635 |
| New York City NY Industrial Development | ||||
| Agency Civic Facility Revenue (New York | ||||
| Congregational Nursing Center Project) VRDO | 0.070% | 6/6/14 LOC | 8,520 | 8,520 |
| New York City NY Industrial Development | ||||
| Agency Civic Facility Revenue (New York | ||||
| Law School) VRDO | 0.050% | 6/6/14 LOC | 14,390 | 14,390 |
| New York City NY Municipal Water Finance | ||||
| Authority Water & Sewer System Revenue CP | 0.090% | 6/10/14 | 6,250 | 6,250 |
| New York City NY Municipal Water Finance | ||||
| Authority Water & Sewer System Revenue CP | 0.090% | 6/12/14 | 11,000 | 11,000 |
| 1 New York City NY Municipal Water Finance | ||||
| Authority Water & Sewer System Revenue | ||||
| TOB VRDO | 0.060% | 6/6/14 | 18,000 | 18,000 |
| 1 New York City NY Municipal Water Finance | ||||
| Authority Water & Sewer System Revenue | ||||
| TOB VRDO | 0.060% | 6/6/14 | 10,000 | 10,000 |
| 1 New York City NY Municipal Water Finance | ||||
| Authority Water & Sewer System Revenue | ||||
| TOB VRDO | 0.070% | 6/6/14 | 2,000 | 2,000 |
| 1 New York City NY Municipal Water Finance | ||||
| Authority Water & Sewer System Revenue | ||||
| TOB VRDO | 0.070% | 6/6/14 | 7,695 | 7,695 |
| New York City NY Municipal Water Finance | ||||
| Authority Water & Sewer System Revenue | ||||
| VRDO | 0.060% | 6/2/14 | 4,000 | 4,000 |
| New York City NY Municipal Water Finance | ||||
| Authority Water & Sewer System Revenue | ||||
| VRDO | 0.060% | 6/2/14 | 18,300 | 18,300 |
| New York City NY Municipal Water Finance | ||||
| Authority Water & Sewer System Revenue | ||||
| VRDO | 0.040% | 6/6/14 | 34,600 | 34,600 |
15
New York Tax-Exempt Money Market Fund
| Face | Market | ||||
| Maturity | Amount | Value | |||
| Coupon | Date | ($000) | ($000) | ||
| 1 | New York City NY Sales Tax Asset Receivable | ||||
| Corp. Revenue TOB VRDO | 0.060% | 6/6/14 | 10,000 | 10,000 | |
| 1 | New York City NY Transitional Finance Authority | ||||
| Building Aid Revenue TOB VRDO | 0.060% | 6/6/14 LOC | 9,950 | 9,950 | |
| 1 | New York City NY Transitional Finance Authority | ||||
| Building Aid Revenue TOB VRDO | 0.060% | 6/6/14 | 15,210 | 15,210 | |
| New York City NY Transitional Finance Authority | |||||
| Future Tax Revenue | 2.000% | 11/1/14 | 1,000 | 1,008 | |
| New York City NY Transitional Finance Authority | |||||
| Future Tax Revenue | 5.000% | 11/1/14 | 6,300 | 6,428 | |
| 1 | New York City NY Transitional Finance Authority | ||||
| Future Tax Revenue TOB VRDO | 0.060% | 6/6/14 | 6,200 | 6,200 | |
| 1 | New York City NY Transitional Finance Authority | ||||
| Future Tax Revenue TOB VRDO | 0.060% | 6/6/14 | 23,900 | 23,900 | |
| 1 | New York City NY Transitional Finance Authority | ||||
| Future Tax Revenue TOB VRDO | 0.070% | 6/6/14 | 6,000 | 6,000 | |
| 1 | New York City NY Transitional Finance Authority | ||||
| Future Tax Revenue TOB VRDO | 0.070% | 6/6/14 | 5,000 | 5,000 | |
| 1 | New York City NY Transitional Finance Authority | ||||
| Future Tax Revenue TOB VRDO | 0.080% | 6/6/14 | 5,000 | 5,000 | |
| New York City NY Transitional Finance Authority | |||||
| Future Tax Revenue VRDO | 0.050% | 6/6/14 | 7,650 | 7,650 | |
| New York City NY Transitional Finance Authority | |||||
| Recovery Revenue VRDO | 0.050% | 6/6/14 | 10,965 | 10,965 | |
| New York City NY Transitional Finance Authority | |||||
| Revenue VRDO | 0.070% | 6/2/14 | 10,000 | 10,000 | |
| 2,3 | New York City NY Trust for Cultural Resources | ||||
| Revenue (American Museum of Natural History) | |||||
| PUT | 0.000% | 12/2/14 | 14,000 | 14,000 | |
| 2,3 | New York City NY Trust for Cultural Resources | ||||
| Revenue (American Museum of Natural History) | |||||
| PUT | 0.070% | 3/2/15 | 12,500 | 12,500 | |
| New York City NY Trust for Cultural Resources | |||||
| Revenue (American Museum of Natural History) | |||||
| VRDO | 0.040% | 6/6/14 | 500 | 500 | |
| New York City NY Trust for Cultural Resources | |||||
| Revenue (Asia Society) VRDO | 0.070% | 6/6/14 LOC | 7,360 | 7,360 | |
| New York City NY Trust for Cultural Resources | |||||
| Revenue (School of American Ballet Inc.) | |||||
| VRDO | 0.040% | 6/6/14 LOC | 7,080 | 7,080 | |
| New York City NY Trust for Cultural Resources | |||||
| Revenue (The Metropolitan Museum of Art) | |||||
| VRDO | 0.060% | 6/6/14 | 40,100 | 40,100 | |
| New York City NY Trust for Cultural Resources | |||||
| Revenue (The Metropolitan Museum of Art) | |||||
| VRDO | 0.060% | 6/6/14 | 59,460 | 59,460 | |
| New York Liberty Development Corp. Revenue | |||||
| (Greenwich LLC) VRDO | 0.070% | 6/6/14 LOC | 20,000 | 20,000 | |
| New York Liberty Development Corp. Revenue | |||||
| PUT | 0.150% | 3/19/15 | 29,965 | 29,965 | |
| New York Liberty Development Corp. Revenue | |||||
| PUT | 0.150% | 3/19/15 | 50,000 | 50,000 | |
| New York Liberty Development Corp. Revenue | |||||
| PUT | 0.150% | 3/19/15 | 4,000 | 4,000 | |
| 1 | New York Metropolitan Transportation Authority | ||||
| Revenue (Dedicated Petroleum Tax) TOB VRDO | 0.060% | 6/6/14 (13) | 3,100 | 3,100 |
16
New York Tax-Exempt Money Market Fund
| Face | Market | |||
| Maturity | Amount | Value | ||
| Coupon | Date | ($000) | ($000) | |
| 1 New York Metropolitan Transportation Authority | ||||
| Revenue (Dedicated Tax Fund) TOB VRDO | 0.060% | 6/6/14 LOC | 6,980 | 6,980 |
| New York Metropolitan Transportation Authority | ||||
| Revenue (Dedicated Tax Fund) VRDO | 0.050% | 6/6/14 LOC | 14,800 | 14,800 |
| New York Metropolitan Transportation Authority | ||||
| Revenue (Dedicated Tax Fund) VRDO | 0.050% | 6/6/14 LOC | 28,670 | 28,670 |
| 1 New York Metropolitan Transportation Authority | ||||
| Revenue (Service Contract) TOB VRDO | 0.070% | 6/6/14 | 4,495 | 4,495 |
| New York Metropolitan Transportation Authority | ||||
| Revenue CP | 0.100% | 9/9/14 LOC | 15,625 | 15,625 |
| 1 New York Metropolitan Transportation Authority | ||||
| Revenue TOB VRDO | 0.070% | 6/6/14 (13) | 2,000 | 2,000 |
| 1 New York Metropolitan Transportation Authority | ||||
| Revenue TOB VRDO | 0.070% | 6/6/14 (13)(4) | 15,000 | 15,000 |
| New York State Dormitory Authority Revenue | ||||
| (Blythedale Children’s Hospital) VRDO | 0.060% | 6/6/14 LOC | 9,500 | 9,500 |
| New York State Dormitory Authority Revenue | ||||
| (Catholic Health System Obligated Group) VRDO | 0.070% | 6/6/14 LOC | 2,270 | 2,270 |
| New York State Dormitory Authority Revenue | ||||
| (Catholic Health System Obligated Group) VRDO | 0.070% | 6/6/14 LOC | 3,790 | 3,790 |
| New York State Dormitory Authority Revenue | ||||
| (Catholic Health System Obligated Group) VRDO | 0.070% | 6/6/14 LOC | 13,400 | 13,400 |
| New York State Dormitory Authority Revenue | ||||
| (Catholic Health System Obligated Group) VRDO | 0.070% | 6/6/14 LOC | 6,130 | 6,130 |
| 1 New York State Dormitory Authority Revenue | ||||
| (Columbia University) TOB VRDO | 0.060% | 6/6/14 | 9,235 | 9,235 |
| New York State Dormitory Authority Revenue | ||||
| (Columbia University) VRDO | 0.030% | 6/6/14 | 40,150 | 40,150 |
| New York State Dormitory Authority Revenue | ||||
| (Cornell University) CP | 0.090% | 6/5/14 | 6,500 | 6,500 |
| 1 New York State Dormitory Authority Revenue | ||||
| (Cornell University) TOB PUT | 0.120% | 9/18/14 | 12,700 | 12,700 |
| New York State Dormitory Authority Revenue | ||||
| (Cornell University) VRDO | 0.070% | 6/6/14 | 6,675 | 6,675 |
| 1 New York State Dormitory Authority Revenue | ||||
| (Fordham University) TOB VRDO | 0.080% | 6/6/14 (13) | 5,000 | 5,000 |
| New York State Dormitory Authority Revenue | ||||
| (Le Moyne College) VRDO | 0.060% | 6/6/14 LOC | 4,270 | 4,270 |
| 1 New York State Dormitory Authority Revenue | ||||
| (Memorial Sloan-Kettering Cancer Center) | ||||
| TOB VRDO | 0.070% | 6/6/14 | 7,860 | 7,860 |
| 1 New York State Dormitory Authority Revenue | ||||
| (Mental Health Services Facilities Improvement) | ||||
| TOB VRDO | 0.120% | 6/6/14 | 15,785 | 15,785 |
| 1 New York State Dormitory Authority Revenue | ||||
| (Mental Health Services Facilities Improvement) | ||||
| TOB VRDO | 0.150% | 6/6/14 | 4,000 | 4,000 |
| New York State Dormitory Authority Revenue | ||||
| (Mental Health Services Facilities Improvement) | ||||
| VRDO | 0.060% | 6/6/14 LOC | 2,035 | 2,035 |
| New York State Dormitory Authority Revenue | ||||
| (Mental Health Services Facilities Improvement) | ||||
| VRDO | 0.060% | 6/6/14 LOC | 63,215 | 63,215 |
| New York State Dormitory Authority Revenue | ||||
| (Mental Health Services) | 5.000% | 2/15/15 (Prere.) | 5,115 | 5,290 |
17
New York Tax-Exempt Money Market Fund
| Face | Market | |||
| Maturity | Amount | Value | ||
| Coupon | Date | ($000) | ($000) | |
| New York State Dormitory Authority Revenue | ||||
| (New York Law School) VRDO | 0.050% | 6/6/14 LOC | 8,465 | 8,465 |
| New York State Dormitory Authority Revenue | ||||
| (New York Public Library) VRDO | 0.050% | 6/6/14 LOC | 12,725 | 12,725 |
| New York State Dormitory Authority Revenue | ||||
| (New York Public Library) VRDO | 0.050% | 6/6/14 LOC | 9,000 | 9,000 |
| New York State Dormitory Authority Revenue | ||||
| (Personal Income Tax) | 5.000% | 3/15/15 | 1,500 | 1,557 |
| 1 New York State Dormitory Authority Revenue | ||||
| (Personal Income Tax) TOB VRDO | 0.080% | 6/6/14 | 6,000 | 6,000 |
| New York State Dormitory Authority Revenue | ||||
| (Rockefeller University) VRDO | 0.040% | 6/6/14 | 16,900 | 16,900 |
| New York State Dormitory Authority Revenue | ||||
| (Rockefeller University) VRDO | 0.060% | 6/6/14 | 3,800 | 3,800 |
| New York State Dormitory Authority Revenue | ||||
| (St. John’s University) VRDO | 0.050% | 6/6/14 LOC | 30,000 | 30,000 |
| 1 New York State Dormitory Authority Revenue | ||||
| (State University Educational Facilities) | ||||
| TOB VRDO | 0.060% | 6/6/14 LOC | 10,150 | 10,150 |
| New York State Dormitory Authority Revenue | ||||
| (University of Rochester) VRDO | 0.050% | 6/6/14 LOC | 8,400 | 8,400 |
| 1 New York State Dormitory Authority Revenue | ||||
| (Vassar College) TOB VRDO | 0.060% | 6/6/14 | 3,815 | 3,815 |
| 1 New York State Environmental Facilities Corp. | ||||
| Revenue (Personal Income Tax) TOB VRDO | 0.070% | 6/6/14 | 3,185 | 3,185 |
| New York State Environmental Facilities Corp. | ||||
| Revenue (State Clean Water & Drinking Water | ||||
| Revolving Funds) | 5.000% | 6/15/14 (Prere.) | 4,710 | 4,719 |
| New York State Environmental Facilities Corp. | ||||
| Revenue (State Clean Water & Drinking Water | ||||
| Revolving Funds) | 5.250% | 6/15/14 | 1,650 | 1,653 |
| New York State Environmental Facilities Corp. | ||||
| Revenue (State Clean Water & Drinking Water | ||||
| Revolving Funds) | 5.000% | 8/15/14 | 5,780 | 5,838 |
| 1 New York State Environmental Facilities Corp. | ||||
| Revenue (State Clean Water & Drinking Water | ||||
| Revolving Funds) TOB VRDO | 0.070% | 6/6/14 | 3,645 | 3,645 |
| New York State Environmental Facilities Corp. | ||||
| Revenue (State Revolving Funds) | 3.000% | 11/15/14 | 2,155 | 2,182 |
| New York State Environmental Facilities Corp. | ||||
| Revenue (State Revolving Funds) | 5.000% | 6/15/15 | 10,750 | 11,291 |
| New York State GO | 3.000% | 3/1/15 | 13,245 | 13,527 |
| New York State GO TOB VRDO | 0.060% | 6/6/14 | 3,270 | 3,270 |
| New York State Housing Finance Agency | ||||
| Housing Revenue (10 Liberty Street) VRDO | 0.060% | 6/6/14 LOC | 15,020 | 15,020 |
| New York State Housing Finance Agency Housing | ||||
| Revenue (20 River Terrace Housing) VRDO | 0.050% | 6/6/14 LOC | 11,000 | 11,000 |
| New York State Housing Finance Agency Housing | ||||
| Revenue (320 West 38th Street) VRDO | 0.060% | 6/6/14 LOC | 4,500 | 4,500 |
| New York State Housing Finance Agency Housing | ||||
| Revenue (East 84th Street) VRDO | 0.070% | 6/6/14 LOC | 20,800 | 20,800 |
| New York State Housing Finance Agency Housing | ||||
| Revenue (Saville) VRDO | 0.070% | 6/6/14 LOC | 45,000 | 45,000 |
| New York State Housing Finance Agency Revenue | ||||
| (Clinton Park) VRDO | 0.040% | 6/6/14 LOC | 10,000 | 10,000 |
18
New York Tax-Exempt Money Market Fund
| Face | Market | |||
| Maturity | Amount | Value | ||
| Coupon | Date | ($000) | ($000) | |
| New York State Housing Finance Agency Revenue | ||||
| (Dock Street Rental LLC) VRDO | 0.040% | 6/6/14 LOC | 11,000 | 11,000 |
| New York State Housing Finance Agency Revenue | ||||
| (Maestro West Chelsea Housing) VRDO | 0.060% | 6/6/14 LOC | 5,000 | 5,000 |
| New York State Housing Finance Agency Revenue | ||||
| (Personal Income Tax) VRDO | 0.040% | 6/6/14 | 2,600 | 2,600 |
| New York State Housing Finance Agency Revenue | ||||
| (Riverside Center) VRDO | 0.070% | 6/6/14 LOC | 7,000 | 7,000 |
| New York State Local Government Assistance | ||||
| Corp. Revenue VRDO | 0.060% | 6/6/14 | 600 | 600 |
| New York State Mortgage Agency Homeowner | ||||
| Mortgage Revenue VRDO | 0.090% | 6/2/14 | 3,180 | 3,180 |
| New York State Mortgage Agency Homeowner | ||||
| Mortgage Revenue VRDO | 0.100% | 6/2/14 | 6,200 | 6,200 |
| New York State Mortgage Agency Homeowner | ||||
| Mortgage Revenue VRDO | 0.100% | 6/2/14 | 9,950 | 9,950 |
| New York State Mortgage Agency Homeowner | ||||
| Mortgage Revenue VRDO | 0.100% | 6/2/14 | 11,200 | 11,200 |
| New York State Mortgage Agency Homeowner | ||||
| Mortgage Revenue VRDO | 0.060% | 6/6/14 | 5,000 | 5,000 |
| New York State Mortgage Agency Homeowner | ||||
| Mortgage Revenue VRDO | 0.060% | 6/6/14 | 8,500 | 8,500 |
| New York State Mortgage Agency Homeowner | ||||
| Mortgage Revenue VRDO | 0.070% | 6/6/14 | 15,000 | 15,000 |
| New York State Mortgage Agency Homeowner | ||||
| Mortgage Revenue VRDO | 0.080% | 6/6/14 | 15,000 | 15,000 |
| New York State Mortgage Agency Homeowner | ||||
| Mortgage Revenue VRDO | 0.080% | 6/6/14 | 12,295 | 12,295 |
| New York State Municipal Bond Bank | 4.000% | 12/1/14 | 3,665 | 3,735 |
| New York State Power Authority Revenue | 5.000% | 11/15/14 | 2,000 | 2,044 |
| New York State Power Authority Revenue CP | 0.090% | 8/5/14 | 17,860 | 17,860 |
| New York State Power Authority Revenue CP | 0.100% | 9/9/14 | 3,300 | 3,300 |
| New York State Power Authority Revenue PUT | 0.100% | 9/2/14 | 22,600 | 22,600 |
| New York State Urban Development Corp. | ||||
| Revenue (Personal Income Tax) | 5.000% | 12/15/14 | 1,000 | 1,026 |
| New York State Urban Development Corp. | ||||
| Revenue (Personal Income Tax) | 5.000% | 12/15/14 | 10,000 | 10,260 |
| New York State Urban Development Corp. | ||||
| Revenue (Personal Income Tax) | 5.000% | 3/15/15 | 1,000 | 1,038 |
| 1 New York State Urban Development Corp. | ||||
| Revenue (Personal Income Tax) TOB VRDO | 0.070% | 6/6/14 | 7,500 | 7,500 |
| New York State Urban Development Corp. | ||||
| Revenue (Service Contract) VRDO | 0.040% | 6/6/14 LOC | 9,700 | 9,700 |
| New York State Urban Development Corp. | ||||
| Revenue (Service Contract) VRDO | 0.040% | 6/6/14 LOC | 33,500 | 33,500 |
| New York State Urban Development Corp. | ||||
| Revenue (Service Contract) VRDO | 0.060% | 6/6/14 | 44,070 | 44,070 |
| North Hempstead NY BAN | 0.500% | 4/8/15 | 14,250 | 14,279 |
| North Hempstead NY GO | 2.000% | 7/15/14 | 1,560 | 1,563 |
| North Hempstead NY GO | 2.000% | 2/1/15 | 3,130 | 3,168 |
| North Hempstead NY GO | 2.000% | 4/1/15 | 1,016 | 1,031 |
| 1 Nuveen New York AMT-Free Municipal | ||||
| Income Fund VRDP VRDO | 0.120% | 6/6/14 LOC | 20,000 | 20,000 |
| 1 Nuveen New York AMT-Free Municipal | ||||
| Income Fund VRDP VRDO | 0.120% | 6/6/14 LOC | 31,000 | 31,000 |
19
New York Tax-Exempt Money Market Fund
| Face | Market | |||
| Maturity | Amount | Value | ||
| Coupon | Date | ($000) | ($000) | |
| 1 Nuveen New York AMT-Free Municipal | ||||
| Income Fund VRDP VRDO | 0.120% | 6/6/14 LOC | 36,500 | 36,500 |
| 1 Nuveen New York Performance Plus | ||||
| Municipal Fund VRDP VRDO | 0.150% | 6/6/14 LOC | 10,000 | 10,000 |
| Onondaga County NY Industrial Development | ||||
| Agency Civic Facility Revenue (Crouse Health | ||||
| Hospital Inc. Project) VRDO | 0.070% | 6/6/14 LOC | 4,950 | 4,950 |
| Onondaga County NY Industrial Development | ||||
| Agency Civic Facility Revenue (Crouse Health | ||||
| Hospital Inc. Project) VRDO | 0.070% | 6/6/14 LOC | 7,940 | 7,940 |
| Onondaga County NY Industrial Development | ||||
| Agency Civic Facility Revenue (Syracuse | ||||
| Home Association Project) VRDO | 0.070% | 6/6/14 LOC | 5,610 | 5,610 |
| Oyster Bay - East Norwich NY Central | ||||
| School District TAN | 1.500% | 6/20/14 | 5,000 | 5,003 |
| Port Authority of New York & New Jersey | ||||
| Revenue CP | 0.090% | 9/10/14 | 5,000 | 5,000 |
| 1 Port Authority of New York & New Jersey | ||||
| Revenue TOB VRDO | 0.080% | 6/6/14 | 2,900 | 2,900 |
| 1 Port Authority of New York & New Jersey | ||||
| Revenue TOB VRDO | 0.110% | 6/6/14 | 3,495 | 3,495 |
| 1 Port Authority of New York & New Jersey | ||||
| Revenue TOB VRDO | 0.110% | 6/6/14 | 8,000 | 8,000 |
| 1 Port Authority of New York & New Jersey | ||||
| Revenue TOB VRDO | 0.110% | 6/6/14 | 6,500 | 6,500 |
| Saratoga County NY Capital Resource Corp. | ||||
| Revenue (Saratoga Hospital Project) VRDO | 0.070% | 6/6/14 LOC | 3,125 | 3,125 |
| Suffolk County NY Industrial Development | ||||
| Agency Civic Facility Revenue (St. Anthony’s | ||||
| High School) VRDO | 0.050% | 6/6/14 LOC | 9,500 | 9,500 |
| Three Village NY Central School District TAN | 1.250% | 6/26/14 | 26,000 | 26,019 |
| Tompkins County NY Industrial Development | ||||
| Agency Civic Facility Revenue | ||||
| (Cornell University) VRDO | 0.050% | 6/6/14 | 7,935 | 7,935 |
| Tompkins County NY Industrial Development | ||||
| Agency Civic Facility Revenue (Cornell University) | ||||
| VRDO | 0.050% | 6/6/14 | 15,390 | 15,390 |
| Tompkins County NY Industrial Development | ||||
| Agency Civic Facility Revenue (Ithaca College) | ||||
| VRDO | 0.060% | 6/6/14 LOC | 25,760 | 25,760 |
| 1 Triborough Bridge & Tunnel Authority New York | ||||
| Revenue TOB VRDO | 0.070% | 6/6/14 | 2,660 | 2,660 |
| 1 Triborough Bridge & Tunnel Authority New York | ||||
| Revenue TOB VRDO | 0.070% | 6/6/14 | 4,950 | 4,950 |
| 1 Triborough Bridge & Tunnel Authority New York | ||||
| Revenue TOB VRDO | 0.090% | 6/6/14 | 9,500 | 9,500 |
| Triborough Bridge & Tunnel Authority New York | ||||
| Revenue VRDO | 0.060% | 6/2/14 LOC | 4,000 | 4,000 |
| Triborough Bridge & Tunnel Authority New York | ||||
| Revenue VRDO | 0.060% | 6/2/14 LOC | 3,400 | 3,400 |
| Triborough Bridge & Tunnel Authority New York | ||||
| Revenue VRDO | 0.070% | 6/2/14 LOC | 8,000 | 8,000 |
| Triborough Bridge & Tunnel Authority New York | ||||
| Revenue VRDO | 0.070% | 6/2/14 LOC | 12,940 | 12,940 |
| Triborough Bridge & Tunnel Authority New York | ||||
| Revenue VRDO | 0.070% | 6/2/14 LOC | 11,430 | 11,430 |
20
New York Tax-Exempt Money Market Fund
| Face | Market | ||||
| Maturity | Amount | Value | |||
| Coupon | Date | ($000) | ($000) | ||
| Triborough Bridge & Tunnel Authority New York | |||||
| Revenue VRDO | 0.060% | 6/6/14 LOC | 6,500 | 6,500 | |
| Triborough Bridge & Tunnel Authority New York | |||||
| Revenue VRDO | 0.060% | 6/6/14 LOC | 7,670 | 7,670 | |
| 1 | Utility Debt Securitization Authority New York | ||||
| Revenue TOB VRDO | 0.060% | 6/6/14 | 6,650 | 6,650 | |
| 1 | Utility Debt Securitization Authority New York | ||||
| Revenue TOB VRDO | 0.070% | 6/6/14 | 24,985 | 24,985 | |
| 1 | Utility Debt Securitization Authority New York | ||||
| Revenue TOB VRDO | 0.070% | 6/6/14 | 37,500 | 37,500 | |
| 1 | Utility Debt Securitization Authority New York | ||||
| Revenue TOB VRDO | 0.080% | 6/6/14 | 2,500 | 2,500 | |
| Westchester County NY GO | 4.000% | 6/1/14 | 9,375 | 9,375 | |
| Westchester County NY GO | 5.000% | 7/1/14 | 8,930 | 8,966 | |
| 2,410,431 | |||||
| Total Tax-Exempt Municipal Bonds (Cost $2,410,431) | 2,410,431 | ||||
| Other Assets and Liabilities (-1.4%) | |||||
| Other Assets | 13,775 | ||||
| Liabilities | (46,640) | ||||
| (32,865) | |||||
| Net Assets (100%) | |||||
| Applicable to 2,377,370,234 outstanding $.001 par value shares of | |||||
| beneficial interest (unlimited authorization) | 2,377,566 | ||||
| Net Asset Value Per Share | $1.00 | ||||
| At May 31, 2014, net assets consisted of: | |||||
| Amount | |||||
| ($000) | |||||
| Paid-in Capital | 2,377,565 | ||||
| Undistributed Net Investment Income | — | ||||
| Accumulated Net Realized Gains | 1 | ||||
| Net Assets | 2,377,566 | ||||
See Note A in Notes to Financial Statements.
1 Security exempt from registration under Rule 144A of the Securities Act of 1933. Such securities may be sold in transactions exempt
from registration, normally to qualified institutional buyers. At May 31, 2014, the aggregate value of these securities was $521,080,000,
representing 21.9% of net assets.
2 Adjustable-rate security.
3 Security purchased on a when-issued or delayed-delivery basis for which the fund has not taken delivery as of May 31, 2014.
A key to abbreviations and other references follows the Statement of Net Assets.
See accompanying Notes, which are an integral part of the Financial Statements.
21
New York Tax-Exempt Money Market Fund
Key to Abbreviations
ARS—Auction Rate Security.
BAN—Bond Anticipation Note.
COP—Certificate of Participation.
CP—Commercial Paper.
FR—Floating Rate.
GAN—Grant Anticipation Note.
GO—General Obligation Bond.
PUT—Put Option Obligation.
RAN—Revenue Anticipation Note.
TAN—Tax Anticipation Note.
TOB—Tender Option Bond.
TRAN—Tax Revenue Anticipation Note.
VRDO—Variable Rate Demand Obligation.
VRDP—Variable Rate Demand Preferred.
(ETM)—Escrowed to Maturity.
(Prere.)—Prerefunded.
Scheduled principal and interest payments are guaranteed by:
(1) MBIA (Municipal Bond Investors Assurance).
(2) AMBAC (Ambac Assurance Corporation).
(3) FGIC (Financial Guaranty Insurance Company).
(4) AGM (Assured Guaranty Municipal Corporation).
(5) BIGI (Bond Investors Guaranty Insurance).
(6) Connie Lee Inc.
(7) FHA (Federal Housing Authority).
(8) CapMAC (Capital Markets Assurance Corporation).
(9) American Capital Access Financial Guaranty Corporation.
(10) XL Capital Assurance Inc.
(11) CIFG (CDC IXIS Financial Guaranty).
(12) AGC (Assured Guaranty Corporation).
(13) BHAC (Berkshire Hathaway Assurance Corporation).
(14) NPFG (National Public Finance Guarantee Corporation).
(15) BAM (Build America Mutual Assurance Company).
(16) MAC (Municipal Assurance Corporation).
(17) RAA (Radian Asset Assurance Inc.).
The insurance does not guarantee the market value of the municipal bonds.
LOC—Scheduled principal and interest payments are guaranteed by bank letter of credit.
| New York Tax-Exempt Money Market Fund | |
| Statement of Operations | |
| Six Months Ended | |
| May 31, 2014 | |
| ($000) | |
| Investment Income | |
| Income | |
| Interest | 1,082 |
| Total Income | 1,082 |
| Expenses | |
| The Vanguard Group—Note B | |
| Investment Advisory Services | 230 |
| Management and Administrative | 1,375 |
| Marketing and Distribution | 334 |
| Custodian Fees | 16 |
| Shareholders’ Reports | 5 |
| Trustees’ Fees and Expenses | 1 |
| Total Expenses | 1,961 |
| Expense Reduction—Note B | (1,001) |
| Net Expenses | 960 |
| Net Investment Income | 122 |
| Realized Net Gain (Loss) on Investment Securities | 1 |
| Net Increase (Decrease) in Net Assets Resulting from Operations | 123 |
See accompanying Notes, which are an integral part of the Financial Statements.
23
New York Tax-Exempt Money Market Fund
Statement of Changes in Net Assets
| Six Months Ended | Year Ended | |
| May 31, | November 30, | |
| 2014 | 2013 | |
| ($000) | ($000) | |
| Increase (Decrease) in Net Assets | ||
| Operations | ||
| Net Investment Income | 122 | 377 |
| Realized Net Gain (Loss) | 1 | — |
| Net Increase (Decrease) in Net Assets Resulting from Operations | 123 | 377 |
| Distributions | ||
| Net Investment Income | (122) | (377) |
| Realized Capital Gain | — | — |
| Total Distributions | (122) | (377) |
| Capital Share Transactions (at $1.00 per share) | ||
| Issued | 761,863 | 1,605,605 |
| Issued in Lieu of Cash Distributions | 120 | 369 |
| Redeemed | (867,761) | (1,760,374) |
| Net Increase (Decrease) from Capital Share Transactions | (105,778) | (154,400) |
| Total Increase (Decrease) | (105,777) | (154,400) |
| Net Assets | ||
| Beginning of Period | 2,483,343 | 2,637,743 |
| End of Period | 2,377,566 | 2,483,343 |
See accompanying Notes, which are an integral part of the Financial Statements.
24
New York Tax-Exempt Money Market Fund
Financial Highlights
| Six Months | ||||||
| Ended | ||||||
| For a Share Outstanding | May 31, | Year Ended November 30, | ||||
| Throughout Each Period | 2014 | 2013 | 2012 | 2011 | 2010 | 2009 |
| Net Asset Value, Beginning of Period | $1.00 | $1.00 | $1.00 | $1.00 | $1.00 | $1.00 |
| Investment Operations | ||||||
| Net Investment Income | .00005 | .0001 | .0003 | .001 | .001 | .004 |
| Net Realized and Unrealized Gain (Loss) | ||||||
| on Investments | — | — | — | — | — | — |
| Total from Investment Operations | .00005 | .0001 | .0003 | .001 | .001 | .004 |
| Distributions | ||||||
| Dividends from Net Investment Income | (.00005) | (.0001) | (.0003) | (.001) | (.001) | (.004) |
| Distributions from Realized Capital Gains | — | — | — | — | — | — |
| Total Distributions | (.00005) | (.0001) | (.0003) | (.001) | (.001) | (.004) |
| Net Asset Value, End of Period | $1.00 | $1.00 | $1.00 | $1.00 | $1.00 | $1.00 |
| Total Return1 | 0.00% | 0.01% | 0.03% | 0.06% | 0.10% | 0.36% |
| Ratios/Supplemental Data | ||||||
| Net Assets, End of Period (Millions) | $2,378 | $2,483 | $2,638 | $2,846 | $3,295 | $3,917 |
| Ratio of Total Expenses to | ||||||
| Average Net Assets | 0.08%2 | 0.12%2 | 0.15%2 | 0.16%2 | 0.17% | 0.17%3 |
| Ratio of Net Investment Income to | ||||||
| Average Net Assets | 0.01% | 0.01% | 0.03% | 0.06% | 0.10% | 0.37% |
The expense ratio and net income ratio for the current period have been annualized.
1 Total returns do not include account service fees that may have applied in the periods shown. Fund prospectuses provide information about
any applicable account service fees.
2 The ratio of total expenses to average net assets before an expense reduction was 0.16% for 2014, 0.16% for 2013, 0.16% for 2012, and
0.17% for 2011. See Note B in Notes to Financial Statements.
3 Includes fees to participate in the Treasury Temporary Guarantee Program for Money Market Funds of 0.04% for 2009.
See accompanying Notes, which are an integral part of the Financial Statements.
25
New York Tax-Exempt Money Market Fund
Notes to Financial Statements
Vanguard New York Tax-Exempt Money Market Fund is registered under the Investment Company Act of 1940 as an open-end investment company, or mutual fund. The fund invests in debt instruments of municipal issuers whose ability to meet their obligations may be affected by economic and political developments in the state.
A. The following significant accounting policies conform to generally accepted accounting principles for U.S. investment companies. The fund consistently follows such policies in preparing its financial statements.
1. Security Valuation: Securities are valued as of the close of trading on the New York Stock Exchange (generally 4 p.m., Eastern time) on the valuation date. Securities are valued at amortized cost, which approximates market value.
2. Federal Income Taxes: The fund intends to continue to qualify as a regulated investment company and distribute all of its income. Management has analyzed the fund’s tax positions taken for all open federal income tax years (November 30, 2010–2013), and for the period ended May 31, 2014, and has concluded that no provision for federal income tax is required in the fund’s financial statements.
3. Distributions: Distributions from net investment income are declared daily and paid on the first business day of the following month.
4. Credit Facility: The fund and certain other funds managed by The Vanguard Group participate in a $2.89 billion committed credit facility provided by a syndicate of lenders pursuant to a credit agreement that may be renewed annually; each fund is individually liable for its borrowings, if any, under the credit facility. Borrowings may be utilized for temporary and emergency purposes, and are subject to the fund’s regulatory and contractual borrowing restrictions. The participating funds are charged administrative fees and an annual commitment fee of 0.06% of the undrawn amount of the facility; these fees are allocated to the funds based on a method approved by the fund’s board of trustees and included in Management and Administrative expenses on the fund’s Statement of Operations. Any borrowings under this facility bear interest at a rate equal to the higher of the federal funds rate or LIBOR reference rate plus an agreed-upon spread.
The fund had no borrowings outstanding at May 31, 2014, or at any time during the period then ended.
5. Other: Interest income is accrued daily. Premiums and discounts on debt securities purchased are amortized and accreted, respectively, to interest income over the lives of the respective securities. Security transactions are accounted for on the date securities are bought or sold. Costs used to determine realized gains (losses) on the sale of investment securities are those of the specific securities sold.
B. The Vanguard Group furnishes at cost investment advisory, corporate management, administrative, marketing, and distribution services. The costs of such services are allocated to the fund based on methods approved by the board of trustees. The fund has committed to provide up to 0.40% of its net assets in capital contributions to Vanguard. At May 31, 2014, the fund had contributed capital of $252,000 to Vanguard (included in Other Assets), representing 0.01% of the fund’s net assets and 0.10% of Vanguard’s capitalization. The fund’s trustees and officers are also directors and officers of Vanguard. Vanguard and the board of trustees have agreed to temporarily limit certain net operating expenses in excess of the fund’s daily yield so as to maintain a zero or positive yield for the fund. Vanguard and the board of trustees may terminate the temporary expense limitation at any time.
For the period ended May 31, 2014, Vanguard’s expenses were reduced by $1,001,000 (an effective annual rate of 0.08% of the fund’s average net assets).
26
New York Tax-Exempt Money Market Fund
C. Various inputs may be used to determine the value of the fund’s investments. These inputs are summarized in three broad levels for financial statement purposes. The inputs or methodologies used to value securities are not necessarily an indication of the risk associated with investing in those securities.
Level 1—Quoted prices in active markets for identical securities.
Level 2—Other significant observable inputs (including quoted prices for similar securities, interest rates, prepayment speeds, credit risk, etc.).
Level 3—Significant unobservable inputs (including the fund’s own assumptions used to determine the fair value of investments).
At May 31, 2014, 100% of the market value of the fund’s investments was determined using amortized cost, in accordance with rules under the Investment Company Act of 1940. Amortized cost approximates the current fair value of a security, but since the value is not obtained from a quoted price in an active market, securities valued at amortized cost are considered to be valued using Level 2 inputs.
D. Management has determined that no material events or transactions occurred subsequent to May 31, 2014, that would require recognition or disclosure in these financial statements.
27
New York Long-Term Tax-Exempt Fund
Fund Profile
As of May 31, 2014
| Share-Class Characteristics | |||
| Investor | Admiral | ||
| Shares | Shares | ||
| Ticker Symbol | VNYTX | VNYUX | |
| Expense Ratio1 | 0.20% | 0.12% | |
| 30-Day SEC Yield | 2.39% | 2.47% | |
| Financial Attributes | |||
| Barclays | |||
| NY | Barclays | ||
| Muni | Municipal | ||
| Bond | Bond | ||
| Fund | Index | Index | |
| Number of Bonds | 628 | 6,007 | 46,274 |
| Yield to Maturity | |||
| (before expenses) | 2.5% | 2.2% | 2.3% |
| Average Coupon | 4.7% | 4.9% | 4.8% |
| Average Duration | 6.3 years | 7.1 years | 7.2 years |
| Average Stated | |||
| Maturity | 16.7 years | 14.0 years | 13.4 years |
| Short-Term | |||
| Reserves | 5.5% | — | — |
| Volatility Measures | ||
| Barclays NY | Barclays | |
| Muni Bond | Municipal | |
| Index | Bond Index | |
| R-Squared | 0.98 | 0.98 |
| Beta | 1.15 | 1.10 |
| These measures show the degree and timing of the fund’s fluctuations compared with the indexes over 36 months. | ||
| Distribution by Stated Maturity | ||
| (% of portfolio) | ||
| Under 1 Year | 8.3% | |
| 1 - 3 Years | 2.3 | |
| 3 - 5 Years | 2.5 | |
| 5 - 10 Years | 11.8 | |
| 10 - 20 Years | 37.0 | |
| 20 - 30 Years | 31.8 | |
| Over 30 Years | 6.3 | |
| Distribution by Credit Quality (% of portfolio) | ||
| AAA | 19.5% | |
| AA | 50.3 | |
| A | 24.1 | |
| BBB | 4.8 | |
| BB | 0.4 | |
| B | 0.4 | |
| Not Rated | 0.5 | |
| For information about these ratings, see the Glossary entry for Credit Quality. | ||
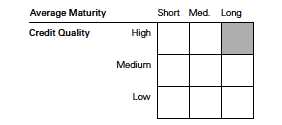
Investment Focus
1 The expense ratios shown are from the prospectus dated March 27, 2014, and represent estimated costs for the current fiscal year. For the six
months ended May 31, 2014, the annualized expense ratios were 0.20% for Investor Shares and 0.12% for Admiral Shares.
28
New York Long-Term Tax-Exempt Fund
Performance Summary
All of the returns in this report represent past performance, which is not a guarantee of future results that may be achieved by the fund. (Current performance may be lower or higher than the performance data cited. For performance data current to the most recent month-end, visit our website at vanguard.com/performance.) Note, too, that both investment returns and principal value can fluctuate widely, so an investor’s shares, when sold, could be worth more or less than their original cost. The returns shown do not reflect taxes that a shareholder would pay on fund distributions or on the sale of fund shares.
| Fiscal-Year Total Returns (%): November 30, 2003, Through May 31, 2014 | ||||
| Barclays NY | ||||
| Muni Bond | ||||
| Investor Shares | Index | |||
| Fiscal Year | Income Returns | Capital Returns | Total Returns | Total Returns |
| 2004 | 4.29% | -0.81% | 3.48% | 3.84% |
| 2005 | 4.27 | -1.24 | 3.03 | 3.59 |
| 2006 | 4.51 | 2.17 | 6.68 | 6.02 |
| 2007 | 4.33 | -2.76 | 1.57 | 2.89 |
| 2008 | 4.03 | -8.66 | -4.63 | -3.17 |
| 2009 | 4.57 | 8.69 | 13.26 | 14.51 |
| 2010 | 3.93 | 0.27 | 4.20 | 4.60 |
| 2011 | 3.96 | 1.81 | 5.77 | 6.04 |
| 2012 | 3.77 | 7.03 | 10.80 | 9.38 |
| 2013 | 3.27 | -7.65 | -4.38 | -3.06 |
| 2014 | 1.91 | 4.77 | 6.68 | 5.16 |
| Note: For 2014, performance data reflect the six months ended May 31, 2014. | ||||
Average Annual Total Returns: Periods Ended March 31, 2014
This table presents returns through the latest calendar quarter—rather than through the end of the fiscal period.
Securities and Exchange Commission rules require that we provide this information.
| Ten Years | ||||||
| Inception Date | One Year | Five Years | Income | Capital | Total | |
| Investor Shares | 4/7/1986 | 0.48% | 5.46% | 4.08% | -0.09% | 3.99% |
| Admiral Shares | 5/14/2001 | 0.56 | 5.54 | 4.16 | -0.09 | 4.07 |
See Financial Highlights for dividend and capital gains information.
29
New York Long-Term Tax-Exempt Fund
Financial Statements (unaudited)
Statement of Net Assets
As of May 31, 2014
The fund reports a complete list of its holdings in regulatory filings four times in each fiscal year, at the quarter-ends. For the second and fourth fiscal quarters, the lists appear in the fund’s semiannual and annual reports to shareholders. For the first and third fiscal quarters, the fund files the lists with the Securities and Exchange Commission on Form N-Q. Shareholders can look up the fund’s Forms N-Q on the SEC’s website at sec.gov. Forms N-Q may also be reviewed and copied at the SEC’s Public Reference Room (see the back cover of this report for further information).
| Face | Market | |||
| Maturity | Amount | Value | ||
| Coupon | Date | ($000) | ($000) | |
| Tax-Exempt Municipal Bonds (99.2%) | ||||
| New York (98.7%) | ||||
| Albany NY Capital Resource Corp. Revenue | ||||
| (St. Peter’s Hospital) | 6.000% | 11/15/25 | 325 | 377 |
| Albany NY Industrial Development Agency Civic | ||||
| Facility Revenue (St. Peter’s Hospital Project) | 5.750% | 11/15/22 | 1,225 | 1,396 |
| Albany NY Industrial Development Agency Civic | ||||
| Facility Revenue (St. Peter’s Hospital Project) | 5.250% | 11/15/27 | 5,000 | 5,364 |
| Albany NY Industrial Development Agency Civic | ||||
| Facility Revenue (University at Albany | ||||
| Foundation Student Housing Corp. - Empire | ||||
| Commons North Project) | 5.375% | 5/1/29 (12) | 3,455 | 3,794 |
| Albany NY Industrial Development Agency Civic | ||||
| Facility Revenue (University at Albany | ||||
| Foundation Student Housing Corp. - Empire | ||||
| Commons North Project) | 5.500% | 5/1/32 (12) | 2,550 | 2,795 |
| Albany NY Industrial Development Agency Civic | ||||
| Facility Revenue (University at Albany | ||||
| Foundation Student Housing Corp. - Empire | ||||
| Commons South Project) | 5.375% | 5/1/29 (12) | 4,395 | 4,827 |
| Albany NY Industrial Development Agency Civic | ||||
| Facility Revenue (University at Albany | ||||
| Foundation Student Housing Corp. - Empire | ||||
| Commons South Project) | 5.500% | 5/1/32 (12) | 1,500 | 1,644 |
| Albany NY Industrial Development Agency Civic | ||||
| Facility Revenue (University at Albany | ||||
| Foundation Student Housing Corp. - Empire | ||||
| Commons West Project) | 5.375% | 5/1/29 (12) | 3,415 | 3,751 |
| Amherst NY Development Corp. Student | ||||
| Housing Facility Revenue | 5.000% | 10/1/40 (4) | 2,500 | 2,662 |
| Amherst NY Development Corp. Student | ||||
| Housing Facility Revenue | 5.000% | 10/1/45 | 3,800 | 4,032 |
| Battery Park City Authority New York Revenue | 5.000% | 11/1/31 | 2,500 | 2,894 |
| Brooklyn NY Local Development Corp. PILOT | ||||
| Revenue (Barclays Center Project) | 5.750% | 7/15/20 | 1,550 | 1,788 |
| Brooklyn NY Local Development Corp. PILOT | ||||
| Revenue (Barclays Center Project) | 6.000% | 7/15/30 | 9,275 | 10,235 |
| Brooklyn NY Local Development Corp. PILOT | ||||
| Revenue (Barclays Center Project) | 0.000% | 7/15/31 | 3,655 | 1,548 |
30
New York Long-Term Tax-Exempt Fund
| Face | Market | |||
| Maturity | Amount | Value | ||
| Coupon | Date | ($000) | ($000) | |
| Brooklyn NY Local Development Corp. PILOT | ||||
| Revenue (Barclays Center Project) | 0.000% | 7/15/32 | 1,500 | 599 |
| Brooklyn NY Local Development Corp. PILOT | ||||
| Revenue (Barclays Center Project) | 0.000% | 7/15/33 | 2,160 | 812 |
| Brooklyn NY Local Development Corp. PILOT | ||||
| Revenue (Barclays Center Project) | 6.250% | 7/15/40 | 5,275 | 5,809 |
| Brooklyn NY Local Development Corp. PILOT | ||||
| Revenue (Barclays Center Project) | 6.375% | 7/15/43 | 13,250 | 14,603 |
| Broome County NY Public Safety Facility | ||||
| Project COP | 5.250% | 4/1/15 (ETM) | 235 | 236 |
| Dutchess County NY Local Development Corp. | ||||
| Revenue (Health Quest Systems Inc. Project) | 5.000% | 7/1/34 | 650 | 707 |
| Dutchess County NY Local Development Corp. | ||||
| Revenue (Health Quest Systems Inc. Project) | 5.000% | 7/1/44 | 2,000 | 2,141 |
| Dutchess County NY Local Development Corp. | ||||
| Revenue (Vassar College) | 5.000% | 1/1/37 | 1,000 | 1,099 |
| Dutchess County NY Local Development Corp. | ||||
| Revenue (Vassar College) | 5.000% | 1/1/39 | 1,000 | 1,091 |
| Erie County NY GO | 5.000% | 4/1/20 | 1,540 | 1,788 |
| Erie County NY GO | 5.000% | 4/1/21 | 1,645 | 1,911 |
| Erie County NY GO | 5.000% | 4/1/22 | 1,630 | 1,918 |
| Erie County NY GO | 5.000% | 4/1/23 | 1,000 | 1,163 |
| Erie County NY GO | 5.000% | 4/1/24 | 750 | 863 |
| Erie County NY GO | 5.000% | 4/1/25 | 560 | 639 |
| Erie County NY GO | 5.000% | 4/1/26 | 700 | 795 |
| Erie County NY Industrial Development Agency | ||||
| School Facility Revenue (Buffalo City School | ||||
| District Project) | 5.000% | 5/1/23 | 6,500 | 7,697 |
| Erie County NY Industrial Development Agency | ||||
| School Facility Revenue (Buffalo City School | ||||
| District Project) | 5.000% | 5/1/25 | 6,000 | 6,987 |
| Erie County NY Industrial Development Agency | ||||
| School Facility Revenue (Buffalo City School | ||||
| District Project) | 5.250% | 5/1/25 | 3,695 | 4,291 |
| Freeport NY GO | 5.000% | 1/15/22 | 2,265 | 2,672 |
| Freeport NY GO | 5.000% | 1/15/23 | 2,335 | 2,720 |
| Freeport NY GO | 5.000% | 1/15/24 | 2,540 | 2,926 |
| Hempstead NY GO | 5.000% | 1/15/15 | 1,000 | 1,031 |
| Hempstead NY Local Development Corp. | ||||
| Revenue (Adelphi University) | 5.000% | 9/1/38 | 2,000 | 2,169 |
| Hempstead NY Local Development Corp. | ||||
| Revenue (Adelphi University) | 5.000% | 9/1/43 | 7,600 | 8,189 |
| Hempstead NY Local Development Corp. | ||||
| Revenue (Hofstra University) | 5.000% | 7/1/22 | 2,130 | 2,466 |
| Hempstead NY Local Development Corp. | ||||
| Revenue (Hofstra University) | 5.000% | 7/1/23 | 3,350 | 3,818 |
| Hempstead NY Local Development Corp. | ||||
| Revenue (Hofstra University) | 5.000% | 7/1/28 | 1,300 | 1,434 |
| Hempstead NY Local Development Corp. | ||||
| Revenue (Hofstra University) | 5.000% | 7/1/41 | 2,365 | 2,529 |
| Hudson Yards Infrastructure Corp. | ||||
| New York Revenue | 4.500% | 2/15/47 (14) | 3,620 | 3,664 |
| Hudson Yards Infrastructure Corp. | ||||
| New York Revenue | 5.000% | 2/15/47 | 11,100 | 11,470 |
31
New York Long-Term Tax-Exempt Fund
| Face | Market | |||
| Maturity | Amount | Value | ||
| Coupon | Date | ($000) | ($000) | |
| Hudson Yards Infrastructure Corp. | ||||
| New York Revenue | 5.000% | 2/15/47 (3) | 10,000 | 10,333 |
| Hudson Yards Infrastructure Corp. | ||||
| New York Revenue | 5.250% | 2/15/47 | 5,925 | 6,363 |
| Hudson Yards Infrastructure Corp. | ||||
| New York Revenue | 5.750% | 2/15/47 | 19,620 | 22,411 |
| Long Island NY Power Authority Electric | ||||
| System Revenue | 5.250% | 6/1/16 (Prere.) | 7,500 | 8,246 |
| Long Island NY Power Authority Electric | ||||
| System Revenue | 5.000% | 12/1/17 (3) | 120 | 133 |
| Long Island NY Power Authority Electric | ||||
| System Revenue | 5.000% | 12/1/17 | 100 | 111 |
| Long Island NY Power Authority Electric | ||||
| System Revenue | 5.250% | 4/1/19 | 15,000 | 17,394 |
| Long Island NY Power Authority Electric | ||||
| System Revenue | 5.000% | 5/1/21 | 2,000 | 2,309 |
| Long Island NY Power Authority Electric | ||||
| System Revenue | 0.000% | 6/1/24 (4) | 19,830 | 14,836 |
| Long Island NY Power Authority Electric | ||||
| System Revenue | 5.000% | 12/1/24 (14) | 1,000 | 1,081 |
| Long Island NY Power Authority Electric | ||||
| System Revenue | 5.000% | 9/1/25 | 1,500 | 1,689 |
| Long Island NY Power Authority Electric | ||||
| System Revenue | 0.000% | 6/1/27 (4) | 15,905 | 10,278 |
| Long Island NY Power Authority Electric | ||||
| System Revenue | 4.500% | 5/1/28 (14) | 1,880 | 1,990 |
| Long Island NY Power Authority Electric | ||||
| System Revenue | 6.250% | 4/1/33 | 2,000 | 2,349 |
| Long Island NY Power Authority Electric | ||||
| System Revenue | 5.000% | 9/1/37 | 7,325 | 7,867 |
| Monroe County NY Industrial Development | ||||
| Agency School Facility Revenue (Rochester | ||||
| Schools Modernization Project) | 5.000% | 5/1/21 | 3,815 | 4,497 |
| Monroe County NY Industrial Development | ||||
| Corp. Mortgage Revenue (Unity Hospital | ||||
| Rochester Project) | 5.500% | 8/15/23 | 5,000 | 5,296 |
| Monroe County NY Industrial Development | ||||
| Corp. Mortgage Revenue (Unity Hospital | ||||
| Rochester Project) | 5.750% | 8/15/30 | 3,500 | 4,215 |
| Monroe County NY Industrial Development | ||||
| Corp. Mortgage Revenue (Unity Hospital | ||||
| Rochester Project) | 5.750% | 8/15/35 | 3,000 | 3,610 |
| Monroe County NY Industrial Development | ||||
| Corp. Mortgage Revenue (Unity Hospital | ||||
| Rochester Project) | 5.500% | 8/15/40 | 3,700 | 4,266 |
| Monroe County NY Industrial Development | ||||
| Corp. Revenue (Rochester General Hospital) | 5.000% | 12/1/37 | 2,600 | 2,786 |
| Monroe County NY Industrial Development | ||||
| Corp. Revenue (Rochester General Hospital) | 5.000% | 12/1/42 | 5,305 | 5,629 |
| Monroe County NY Industrial Development | ||||
| Corp. Revenue (St. John Fisher College Project) | 5.500% | 6/1/39 | 1,500 | 1,646 |
| Monroe County NY Industrial Development | ||||
| Corp. Revenue (St. John Fisher College Project) | 5.000% | 6/1/44 | 2,500 | 2,612 |
32
New York Long-Term Tax-Exempt Fund
| Face | Market | |||
| Maturity | Amount | Value | ||
| Coupon | Date | ($000) | ($000) | |
| Monroe County NY Industrial Development | ||||
| Corp. Revenue (University of Rochester) | 5.000% | 7/1/30 | 4,880 | 5,518 |
| Monroe County NY Industrial Development | ||||
| Corp. Revenue (University of Rochester) | 5.000% | 7/1/43 | 3,585 | 3,953 |
| Nassau County NY GO | 5.000% | 10/1/20 | 9,025 | 10,526 |
| Nassau County NY Local Economic Assistance | ||||
| & Financing Corp. Revenue (South Nassau | ||||
| Communities Hospital) | 5.000% | 7/1/21 | 4,430 | 5,060 |
| Nassau County NY Local Economic Assistance | ||||
| & Financing Corp. Revenue (South Nassau | ||||
| Communities Hospital) | 5.000% | 7/1/22 | 2,225 | 2,575 |
| Nassau County NY Local Economic Assistance | ||||
| & Financing Corp. Revenue (South Nassau | ||||
| Communities Hospital) | 5.000% | 7/1/27 | 5,695 | 6,237 |
| Nassau County NY Local Economic Assistance | ||||
| & Financing Corp. Revenue (South Nassau | ||||
| Communities Hospital) | 5.000% | 7/1/31 | 2,000 | 2,130 |
| Nassau County NY Local Economic Assistance | ||||
| & Financing Corp. Revenue (South Nassau | ||||
| Communities Hospital) | 5.000% | 7/1/37 | 1,000 | 1,058 |
| Nassau County NY Local Economic Assistance | ||||
| & Financing Corp. Revenue (Winthrop | ||||
| University Hospital Association Project) | 5.000% | 7/1/27 | 4,000 | 4,381 |
| Nassau County NY Local Economic Assistance | ||||
| & Financing Corp. Revenue (Winthrop | ||||
| University Hospital Association Project) | 5.000% | 7/1/32 | 775 | 824 |
| Nassau County NY Local Economic Assistance | ||||
| & Financing Corp. Revenue (Winthrop | ||||
| University Hospital Association Project) | 5.000% | 7/1/37 | 8,190 | 8,572 |
| Nassau County NY Local Economic Assistance | ||||
| & Financing Corp. Revenue (Winthrop | ||||
| University Hospital Association Project) | 5.000% | 7/1/42 | 3,000 | 3,123 |
| Nassau County NY Local Economic Assistance | ||||
| Corp. Revenue (Catholic Health Services of | ||||
| Long Island Obligated Group Project) | 5.000% | 7/1/23 | 700 | 810 |
| Nassau County NY Local Economic Assistance | ||||
| Corp. Revenue (Catholic Health Services of | ||||
| Long Island Obligated Group Project) | 5.000% | 7/1/24 | 500 | 577 |
| Nassau County NY Local Economic Assistance | ||||
| Corp. Revenue (Catholic Health Services of | ||||
| Long Island Obligated Group Project) | 5.000% | 7/1/25 | 1,400 | 1,600 |
| Nassau County NY Local Economic Assistance | ||||
| Corp. Revenue (Catholic Health Services of | ||||
| Long Island Obligated Group Project) | 5.000% | 7/1/28 | 1,500 | 1,672 |
| Nassau County NY Local Economic Assistance | ||||
| Corp. Revenue (Catholic Health Services of | ||||
| Long Island Obligated Group Project) | 5.000% | 7/1/30 | 1,750 | 1,934 |
| Nassau County NY Local Economic Assistance | ||||
| Corp. Revenue (Catholic Health Services of | ||||
| Long Island Obligated Group Project) | 5.000% | 7/1/31 | 1,000 | 1,100 |
| Nassau County NY Local Economic Assistance | ||||
| Corp. Revenue (Catholic Health Services of | ||||
| Long Island Obligated Group Project) | 5.000% | 7/1/34 | 850 | 920 |
33
New York Long-Term Tax-Exempt Fund
| Face | Market | |||
| Maturity | Amount | Value | ||
| Coupon | Date | ($000) | ($000) | |
| Nassau County NY Tobacco Settlement | ||||
| Corp. Revenue | 5.250% | 6/1/26 | 1,500 | 1,391 |
| Nassau County NY Tobacco Settlement | ||||
| Corp. Revenue | 5.000% | 6/1/35 | 3,585 | 2,928 |
| New York City NY Capital Resources Corp. | ||||
| Revenue (Loan Enhanced Assistance | ||||
| Program) VRDO | 0.120% | 6/6/14 LOC | 4,020 | 4,020 |
| New York City NY GO | 5.200% | 8/1/14 (4) | 5 | 5 |
| New York City NY GO | 5.000% | 11/1/14 (Prere.) | 1,360 | 1,388 |
| New York City NY GO | 5.000% | 8/1/15 (Prere.) | 3,490 | 3,686 |
| New York City NY GO | 5.000% | 9/1/15 (Prere.) | 3,885 | 4,117 |
| New York City NY GO | 5.000% | 2/1/16 (Prere.) | 5 | 5 |
| New York City NY GO | 5.000% | 9/1/17 | 70 | 74 |
| New York City NY GO | 5.000% | 8/1/21 | 2,000 | 2,333 |
| New York City NY GO | 5.000% | 8/1/21 | 995 | 1,070 |
| New York City NY GO | 5.250% | 9/1/21 | 5,750 | 6,699 |
| New York City NY GO | 5.000% | 8/1/22 | 4,250 | 4,957 |
| New York City NY GO | 5.000% | 8/1/22 | 4,000 | 4,691 |
| New York City NY GO | 5.000% | 8/1/22 | 10,000 | 10,939 |
| New York City NY GO | 5.250% | 8/15/22 | 10,000 | 11,659 |
| New York City NY GO | 5.250% | 9/1/22 | 17,000 | 19,844 |
| New York City NY GO | 5.000% | 10/1/22 | 2,985 | 3,375 |
| New York City NY GO | 5.000% | 8/1/23 | 5,000 | 5,957 |
| New York City NY GO | 5.000% | 8/1/23 | 5,000 | 6,006 |
| New York City NY GO | 5.000% | 11/1/23 | 3,165 | 3,225 |
| New York City NY GO | 5.000% | 4/1/24 | 10,000 | 11,822 |
| New York City NY GO | 5.000% | 8/1/24 | 15,000 | 17,876 |
| New York City NY GO | 5.250% | 8/15/24 | 15,000 | 17,422 |
| New York City NY GO | 5.000% | 1/1/25 | 10,000 | 11,019 |
| New York City NY GO | 5.000% | 8/1/25 | 2,010 | 2,116 |
| New York City NY GO | 5.000% | 8/1/25 | 10,540 | 12,273 |
| New York City NY GO | 5.000% | 10/1/25 | 10,000 | 11,249 |
| New York City NY GO | 5.000% | 1/1/26 | 1,360 | 1,497 |
| New York City NY GO | 5.000% | 8/15/26 | 14,500 | 16,495 |
| New York City NY GO | 5.250% | 8/15/26 | 5,100 | 5,869 |
| New York City NY GO | 5.000% | 8/1/27 | 9,900 | 11,548 |
| New York City NY GO | 5.000% | 5/15/28 | 4,500 | 5,174 |
| New York City NY GO | 5.000% | 8/1/28 | 7,000 | 8,071 |
| New York City NY GO | 5.000% | 8/1/28 | 1,915 | 2,185 |
| New York City NY GO | 6.250% | 10/15/28 | 1,035 | 1,235 |
| New York City NY GO | 5.625% | 4/1/29 | 3,000 | 3,528 |
| New York City NY GO | 5.000% | 8/1/29 | 2,500 | 2,846 |
| New York City NY GO | 5.000% | 8/1/30 | 2,335 | 2,693 |
| New York City NY GO | 5.000% | 8/1/30 | 2,185 | 2,488 |
| New York City NY GO | 5.000% | 8/1/30 | 6,220 | 7,130 |
| New York City NY GO | 5.000% | 3/1/31 | 6,000 | 6,819 |
| New York City NY GO | 5.450% | 4/1/31 | 8,500 | 9,856 |
| New York City NY GO | 5.000% | 8/1/31 | 1,500 | 1,693 |
| New York City NY GO | 5.000% | 8/1/31 | 3,000 | 3,414 |
| New York City NY GO | 5.000% | 8/1/32 | 2,985 | 3,368 |
| New York City NY GO | 5.000% | 10/1/33 | 6,500 | 7,264 |
| New York City NY GO | 5.000% | 10/1/34 | 2,000 | 2,226 |
| New York City NY GO | 5.000% | 8/1/35 | 3,500 | 3,895 |
| New York City NY GO | 5.375% | 4/1/36 | 4,000 | 4,598 |
34
New York Long-Term Tax-Exempt Fund
| Face | Market | |||
| Maturity | Amount | Value | ||
| Coupon | Date | ($000) | ($000) | |
| New York City NY GO | 5.000% | 10/1/36 | 3,000 | 3,327 |
| New York City NY GO | 5.000% | 3/1/37 | 6,790 | 7,541 |
| New York City NY GO VRDO | 0.060% | 6/2/14 LOC | 19,100 | 19,100 |
| New York City NY GO VRDO | 0.060% | 6/2/14 LOC | 10,800 | 10,800 |
| New York City NY GO VRDO | 0.060% | 6/2/14 LOC | 7,750 | 7,750 |
| New York City NY GO VRDO | 0.070% | 6/2/14 LOC | 2,300 | 2,300 |
| New York City NY GO VRDO | 0.070% | 6/2/14 | 7,900 | 7,900 |
| New York City NY GO VRDO | 0.100% | 6/2/14 | 4,700 | 4,700 |
| New York City NY Health & Hospital Corp. | ||||
| Revenue (Health System) | 5.000% | 2/15/21 | 2,000 | 2,295 |
| New York City NY Health & Hospital Corp. | ||||
| Revenue (Health System) | 5.000% | 2/15/24 | 3,000 | 3,352 |
| New York City NY Health & Hospital Corp. | ||||
| Revenue (Health System) | 5.000% | 2/15/30 | 3,300 | 3,609 |
| New York City NY Housing Development Corp. | ||||
| Multi-Family Housing Revenue | 5.250% | 7/1/28 | 2,700 | 3,134 |
| New York City NY Housing Development Corp. | ||||
| Multi-Family Housing Revenue | 5.250% | 7/1/29 | 3,035 | 3,509 |
| New York City NY Housing Development Corp. | ||||
| Multi-Family Housing Revenue | 4.750% | 11/1/29 | 5,220 | 5,491 |
| New York City NY Housing Development Corp. | ||||
| Multi-Family Housing Revenue | 4.750% | 11/1/29 | 2,520 | 2,669 |
| New York City NY Housing Development Corp. | ||||
| Multi-Family Housing Revenue | 5.250% | 7/1/30 | 2,605 | 2,997 |
| New York City NY Housing Development Corp. | ||||
| Multi-Family Housing Revenue | 5.050% | 11/1/38 | 3,195 | 3,419 |
| New York City NY Housing Development Corp. | ||||
| Multi-Family Housing Revenue | 5.550% | 11/1/39 | 3,500 | 3,735 |
| New York City NY Housing Development Corp. | ||||
| Multi-Family Housing Revenue | 5.000% | 11/1/42 | 2,600 | 2,723 |
| New York City NY Housing Development Corp. | ||||
| Multi-Family Housing Revenue | 5.200% | 11/1/45 | 3,065 | 3,287 |
| New York City NY Housing Development Corp. | ||||
| Multi-Family Housing Revenue | 5.700% | 11/1/46 | 7,155 | 7,660 |
| New York City NY Industrial Development Agency | ||||
| Civic Facility Revenue (Civil Liberties | ||||
| Union) VRDO | 0.070% | 6/2/14 LOC | 2,505 | 2,505 |
| New York City NY Industrial Development Agency | ||||
| Civic Facility Revenue (MSMC Realty Corp. | ||||
| Project) VRDO | 0.070% | 6/6/14 LOC | 2,230 | 2,230 |
| New York City NY Industrial Development Agency | ||||
| Civic Facility Revenue (United Jewish Appeal- | ||||
| Federation of Jewish Philanthropies of | ||||
| New York, Inc.) | 5.000% | 7/1/34 | 4,850 | 5,375 |
| New York City NY Industrial Development Agency | ||||
| PILOT Revenue (Queens Baseball | ||||
| Stadium Project) | 6.125% | 1/1/29 (12) | 1,750 | 2,035 |
| New York City NY Industrial Development Agency | ||||
| PILOT Revenue (Queens Baseball | ||||
| Stadium Project) | 6.375% | 1/1/39 (12) | 4,000 | 4,669 |
| New York City NY Industrial Development Agency | ||||
| PILOT Revenue (Yankee Stadium Project) | 0.000% | 3/1/34 (12) | 10,285 | 4,298 |
| New York City NY Industrial Development Agency | ||||
| PILOT Revenue (Yankee Stadium Project) | 0.000% | 3/1/35 (12) | 4,305 | 1,709 |
35
New York Long-Term Tax-Exempt Fund
| Face | Market | |||
| Maturity | Amount | Value | ||
| Coupon | Date | ($000) | ($000) | |
| New York City NY Industrial Development Agency | ||||
| PILOT Revenue (Yankee Stadium Project) | 5.000% | 3/1/36 (14) | 9,670 | 9,880 |
| New York City NY Industrial Development Agency | ||||
| PILOT Revenue (Yankee Stadium Project) | 7.000% | 3/1/49 (12) | 8,000 | 9,640 |
| New York City NY Industrial Development Agency | ||||
| Special Facility Revenue (New York Stock | ||||
| Exchange Project) | 5.000% | 5/1/29 | 2,020 | 2,236 |
| New York City NY Municipal Water Finance | ||||
| Authority Water & Sewer System Revenue | 5.000% | 6/15/14 (Prere.) | 1,000 | 1,002 |
| New York City NY Municipal Water Finance | ||||
| Authority Water & Sewer System Revenue | 0.000% | 6/15/17 | 10,000 | 9,781 |
| New York City NY Municipal Water Finance | ||||
| Authority Water & Sewer System Revenue | 0.000% | 6/15/18 | 4,250 | 4,102 |
| New York City NY Municipal Water Finance | ||||
| Authority Water & Sewer System Revenue | 0.000% | 6/15/21 | 4,490 | 3,944 |
| New York City NY Municipal Water Finance | ||||
| Authority Water & Sewer System Revenue | 5.000% | 6/15/23 | 2,500 | 3,049 |
| New York City NY Municipal Water Finance | ||||
| Authority Water & Sewer System Revenue | 5.000% | 6/15/29 | 7,535 | 8,151 |
| New York City NY Municipal Water Finance | ||||
| Authority Water & Sewer System Revenue | 5.000% | 6/15/29 | 2,000 | 2,305 |
| New York City NY Municipal Water Finance | ||||
| Authority Water & Sewer System Revenue | 5.000% | 6/15/30 | 5,000 | 5,233 |
| New York City NY Municipal Water Finance | ||||
| Authority Water & Sewer System Revenue | 5.000% | 6/15/31 | 1,500 | 1,706 |
| New York City NY Municipal Water Finance | ||||
| Authority Water & Sewer System Revenue | 5.000% | 6/15/32 | 6,000 | 6,715 |
| New York City NY Municipal Water Finance | ||||
| Authority Water & Sewer System Revenue | 5.000% | 6/15/32 (4) | 8,000 | 8,322 |
| New York City NY Municipal Water Finance | ||||
| Authority Water & Sewer System Revenue | 5.000% | 6/15/32 | 12,385 | 14,017 |
| New York City NY Municipal Water Finance | ||||
| Authority Water & Sewer System Revenue | 5.250% | 6/15/32 | 15,000 | 16,897 |
| New York City NY Municipal Water Finance | ||||
| Authority Water & Sewer System Revenue | 5.000% | 6/15/34 | 6,000 | 6,757 |
| New York City NY Municipal Water Finance | ||||
| Authority Water & Sewer System Revenue | 5.000% | 6/15/35 | 10,000 | 11,212 |
| New York City NY Municipal Water Finance | ||||
| Authority Water & Sewer System Revenue | 5.000% | 6/15/39 | 11,430 | 12,575 |
| New York City NY Municipal Water Finance | ||||
| Authority Water & Sewer System Revenue | 5.000% | 6/15/40 | 5,000 | 5,487 |
| New York City NY Municipal Water Finance | ||||
| Authority Water & Sewer System Revenue | 5.250% | 6/15/40 | 13,355 | 15,037 |
| New York City NY Municipal Water Finance | ||||
| Authority Water & Sewer System Revenue | 5.250% | 6/15/40 | 7,500 | 8,445 |
| New York City NY Municipal Water Finance | ||||
| Authority Water & Sewer System Revenue | 5.500% | 6/15/40 | 18,500 | 21,147 |
| New York City NY Municipal Water Finance | ||||
| Authority Water & Sewer System Revenue | 5.750% | 6/15/40 | 10,075 | 11,586 |
| New York City NY Municipal Water Finance | ||||
| Authority Water & Sewer System Revenue | 5.750% | 6/15/40 | 5,700 | 6,536 |
| New York City NY Municipal Water Finance | ||||
| Authority Water & Sewer System Revenue | 5.000% | 6/15/43 | 4,000 | 4,338 |
36
New York Long-Term Tax-Exempt Fund
| Face | Market | |||
| Maturity | Amount | Value | ||
| Coupon | Date | ($000) | ($000) | |
| New York City NY Municipal Water Finance | ||||
| Authority Water & Sewer System Revenue | 5.375% | 6/15/43 | 14,500 | 16,674 |
| New York City NY Municipal Water Finance | ||||
| Authority Water & Sewer System Revenue | 5.500% | 6/15/43 | 5,855 | 6,792 |
| New York City NY Municipal Water Finance | ||||
| Authority Water & Sewer System Revenue | 5.000% | 6/15/44 | 8,470 | 9,218 |
| New York City NY Municipal Water Finance | ||||
| Authority Water & Sewer System Revenue | 5.000% | 6/15/44 | 5,000 | 5,416 |
| New York City NY Municipal Water Finance | ||||
| Authority Water & Sewer System Revenue | 5.000% | 6/15/46 | 5,000 | 5,471 |
| New York City NY Municipal Water Finance | ||||
| Authority Water & Sewer System Revenue | 5.000% | 6/15/47 | 8,000 | 8,741 |
| 2 New York City NY Municipal Water Finance | ||||
| Authority Water & Sewer System Revenue | ||||
| TOB VRDO | 0.070% | 6/2/14 | 3,415 | 3,415 |
| 2 New York City NY Municipal Water Finance | ||||
| Authority Water & Sewer System Revenue | ||||
| TOB VRDO | 0.070% | 6/2/14 | 1,500 | 1,500 |
| New York City NY Sales Tax Asset Receivable | ||||
| Corp. Revenue | 5.000% | 10/15/32 (4) | 7,000 | 7,119 |
| New York City NY Transitional Finance Authority | ||||
| Building Aid Revenue | 5.000% | 1/15/24 (14) | 6,740 | 7,395 |
| New York City NY Transitional Finance Authority | ||||
| Building Aid Revenue | 5.250% | 1/15/25 | 9,500 | 11,074 |
| New York City NY Transitional Finance Authority | ||||
| Building Aid Revenue | 5.000% | 7/15/25 (14) | 5,200 | 5,705 |
| New York City NY Transitional Finance Authority | ||||
| Building Aid Revenue | 5.250% | 1/15/26 | 5,000 | 5,814 |
| New York City NY Transitional Finance Authority | ||||
| Building Aid Revenue | 5.000% | 7/15/26 (14) | 6,150 | 6,747 |
| New York City NY Transitional Finance Authority | ||||
| Building Aid Revenue | 5.000% | 7/15/28 | 2,805 | 3,222 |
| New York City NY Transitional Finance Authority | ||||
| Building Aid Revenue | 5.000% | 7/15/29 | 5,000 | 5,705 |
| New York City NY Transitional Finance Authority | ||||
| Building Aid Revenue | 5.000% | 1/15/30 | 500 | 567 |
| New York City NY Transitional Finance Authority | ||||
| Building Aid Revenue | 5.000% | 7/15/31 | 1,260 | 1,422 |
| New York City NY Transitional Finance Authority | ||||
| Building Aid Revenue | 5.000% | 7/15/31 | 1,585 | 1,785 |
| New York City NY Transitional Finance Authority | ||||
| Building Aid Revenue | 5.000% | 1/15/32 | 500 | 560 |
| New York City NY Transitional Finance Authority | ||||
| Building Aid Revenue | 5.000% | 7/15/32 | 4,000 | 4,491 |
| New York City NY Transitional Finance Authority | ||||
| Building Aid Revenue | 5.125% | 1/15/33 | 7,000 | 7,830 |
| New York City NY Transitional Finance Authority | ||||
| Building Aid Revenue | 5.000% | 7/15/33 | 8,180 | 9,170 |
| New York City NY Transitional Finance Authority | ||||
| Building Aid Revenue | 5.125% | 1/15/34 | 10,000 | 11,100 |
| New York City NY Transitional Finance Authority | ||||
| Building Aid Revenue | 5.000% | 1/15/37 (12)(3) | 12,120 | 13,151 |
| New York City NY Transitional Finance Authority | ||||
| Building Aid Revenue | 5.000% | 7/15/37 | 10,000 | 11,082 |
37
New York Long-Term Tax-Exempt Fund
| Face | Market | |||
| Maturity | Amount | Value | ||
| Coupon | Date | ($000) | ($000) | |
| New York City NY Transitional Finance Authority | ||||
| Building Aid Revenue | 5.250% | 7/15/37 | 3,250 | 3,669 |
| New York City NY Transitional Finance Authority | ||||
| Building Aid Revenue | 5.250% | 1/15/39 | 7,110 | 8,001 |
| New York City NY Transitional Finance Authority | ||||
| Building Aid Revenue | 5.000% | 7/15/40 | 5,200 | 5,726 |
| New York City NY Transitional Finance Authority | ||||
| Future Tax Revenue | 5.000% | 8/1/16 (Prere.) | 5 | 6 |
| New York City NY Transitional Finance Authority | ||||
| Future Tax Revenue | 5.000% | 5/1/24 | 7,710 | 8,982 |
| New York City NY Transitional Finance Authority | ||||
| Future Tax Revenue | 5.000% | 11/1/24 | 3,000 | 3,555 |
| New York City NY Transitional Finance Authority | ||||
| Future Tax Revenue | 5.250% | 11/1/25 | 1,000 | 1,187 |
| New York City NY Transitional Finance Authority | ||||
| Future Tax Revenue | 5.250% | 11/1/26 | 1,000 | 1,184 |
| New York City NY Transitional Finance Authority | ||||
| Future Tax Revenue | 5.000% | 2/1/27 | 2,000 | 2,317 |
| New York City NY Transitional Finance Authority | ||||
| Future Tax Revenue | 5.000% | 11/1/27 | 6,725 | 7,497 |
| New York City NY Transitional Finance Authority | ||||
| Future Tax Revenue | 5.000% | 2/1/28 | 2,000 | 2,324 |
| New York City NY Transitional Finance Authority | ||||
| Future Tax Revenue | 5.250% | 2/1/29 | 2,000 | 2,341 |
| New York City NY Transitional Finance Authority | ||||
| Future Tax Revenue | 5.000% | 5/1/29 | 5,000 | 5,709 |
| New York City NY Transitional Finance Authority | ||||
| Future Tax Revenue | 5.250% | 2/1/30 | 1,500 | 1,736 |
| New York City NY Transitional Finance Authority | ||||
| Future Tax Revenue | 5.000% | 5/1/30 | 5,000 | 5,699 |
| New York City NY Transitional Finance Authority | ||||
| Future Tax Revenue | 5.000% | 11/1/30 | 8,500 | 9,330 |
| New York City NY Transitional Finance Authority | ||||
| Future Tax Revenue | 5.000% | 2/1/31 | 2,000 | 2,270 |
| New York City NY Transitional Finance Authority | ||||
| Future Tax Revenue | 5.000% | 11/1/31 | 3,575 | 4,058 |
| New York City NY Transitional Finance Authority | ||||
| Future Tax Revenue | 5.000% | 2/1/32 | 7,300 | 8,300 |
| New York City NY Transitional Finance Authority | ||||
| Future Tax Revenue | 5.000% | 2/1/34 | 2,195 | 2,471 |
| New York City NY Transitional Finance Authority | ||||
| Future Tax Revenue | 5.000% | 5/1/34 | 5,000 | 5,644 |
| New York City NY Transitional Finance Authority | ||||
| Future Tax Revenue | 5.000% | 2/1/35 | 7,500 | 8,334 |
| New York City NY Transitional Finance Authority | ||||
| Future Tax Revenue | 5.000% | 2/1/35 | 10,000 | 11,150 |
| New York City NY Transitional Finance Authority | ||||
| Future Tax Revenue | 5.500% | 11/1/35 | 3,000 | 3,484 |
| New York City NY Transitional Finance Authority | ||||
| Future Tax Revenue | 5.000% | 11/1/38 | 2,000 | 2,219 |
| New York City NY Transitional Finance Authority | ||||
| Future Tax Revenue | 5.000% | 11/1/39 | 3,750 | 4,203 |
| New York City NY Transitional Finance Authority | ||||
| Future Tax Revenue | 5.000% | 11/1/42 | 5,000 | 5,546 |
38
New York Long-Term Tax-Exempt Fund
| Face | Market | |||
| Maturity | Amount | Value | ||
| Coupon | Date | ($000) | ($000) | |
| 2 New York City NY Transitional Finance Authority | ||||
| Future Tax Revenue TOB VRDO | 0.080% | 6/2/14 | 1,930 | 1,930 |
| New York City NY Trust for Cultural Resources | ||||
| Revenue (American Museum of Natural | ||||
| History) VRDO | 0.070% | 6/2/14 | 31,505 | 31,505 |
| New York City NY Trust for Cultural Resources | ||||
| Revenue (American Museum of Natural | ||||
| History) VRDO | 0.080% | 6/2/14 | 23,940 | 23,940 |
| New York City NY Trust for Cultural Resources | ||||
| Revenue (Lincoln Center for the Performing | ||||
| Arts Inc.) VRDO | 0.080% | 6/2/14 LOC | 16,360 | 16,360 |
| New York City NY Trust for Cultural Resources | ||||
| Revenue (Museum of Modern Art) | 5.000% | 4/1/22 | 1,365 | 1,660 |
| New York City NY Trust for Cultural Resources | ||||
| Revenue (Museum of Modern Art) | 5.000% | 4/1/23 | 1,830 | 2,239 |
| New York City NY Trust for Cultural Resources | ||||
| Revenue (Museum of Modern Art) | 5.000% | 4/1/31 | 4,845 | 5,447 |
| New York City NY Trust for Cultural Resources | ||||
| Revenue (The Juilliard School) | 5.000% | 1/1/34 | 4,000 | 4,492 |
| New York City NY Trust for Cultural Resources | ||||
| Revenue (The Juilliard School) | 5.000% | 1/1/39 | 4,000 | 4,474 |
| New York City NY Trust for Cultural Resources | ||||
| Revenue (Whitney Museum of American Art) | 5.000% | 7/1/21 | 1,000 | 1,161 |
| New York City NY Trust for Cultural Resources | ||||
| Revenue (Whitney Museum of American Art) | 5.000% | 7/1/31 | 7,000 | 7,591 |
| New York City NY Trust for Cultural Resources | ||||
| Revenue (Wildlife Conservation Society) | 5.000% | 8/1/33 | 6,000 | 6,746 |
| New York City NY Trust for Cultural Resources | ||||
| Revenue (Wildlife Conservation Society) | 5.000% | 8/1/42 | 1,500 | 1,643 |
| New York Liberty Development Corp. Revenue | 5.000% | 11/15/31 | 10,835 | 11,879 |
| New York Liberty Development Corp. Revenue | 5.000% | 12/15/41 | 11,750 | 12,699 |
| New York Liberty Development Corp. Revenue | 5.000% | 9/15/43 | 14,360 | 15,382 |
| New York Liberty Development Corp. Revenue | 5.250% | 12/15/43 | 6,750 | 7,438 |
| New York Liberty Development Corp. Revenue | 5.125% | 1/15/44 | 17,000 | 18,121 |
| New York Liberty Development Corp. Revenue | 5.000% | 11/15/44 | 21,910 | 23,677 |
| New York Liberty Development Corp. Revenue | 5.125% | 11/15/44 | 4,200 | 4,584 |
| New York Liberty Development Corp. Revenue | 5.625% | 7/15/47 | 6,055 | 6,658 |
| New York Liberty Development Corp. Revenue | 6.375% | 7/15/49 | 16,725 | 18,319 |
| New York Liberty Development Corp. Revenue | 5.750% | 11/15/51 | 21,395 | 23,994 |
| New York Liberty Development Corp. Revenue | ||||
| (7 World Trade Center Project) | 5.000% | 9/15/31 | 5,000 | 5,657 |
| New York Liberty Development Corp. Revenue | ||||
| (7 World Trade Center Project) | 5.000% | 9/15/32 | 5,000 | 5,627 |
| New York Liberty Development Corp. Revenue | ||||
| (7 World Trade Center Project) | 5.000% | 9/15/40 | 4,680 | 5,141 |
| New York Liberty Development Corp. Revenue | ||||
| (7 World Trade Center Project) | 5.000% | 3/15/44 | 4,965 | 5,196 |
| New York Liberty Development Corp. Revenue | ||||
| (Goldman Sachs Headquarters) | 5.250% | 10/1/35 | 46,500 | 54,345 |
| New York Liberty Development Corp. Revenue | ||||
| (Goldman Sachs Headquarters) | 5.500% | 10/1/37 | 6,510 | 7,804 |
| New York Metropolitan Transportation | ||||
| Authority Revenue | 4.750% | 11/15/15 (Prere.) | 8,600 | 9,170 |
39
New York Long-Term Tax-Exempt Fund
| Face | Market | |||
| Maturity | Amount | Value | ||
| Coupon | Date | ($000) | ($000) | |
| New York Metropolitan Transportation | ||||
| Authority Revenue | 5.000% | 11/15/23 | 2,300 | 2,581 |
| New York Metropolitan Transportation | ||||
| Authority Revenue | 5.000% | 11/15/23 | 1,000 | 1,190 |
| New York Metropolitan Transportation | ||||
| Authority Revenue | 5.000% | 11/15/23 | 4,500 | 5,050 |
| New York Metropolitan Transportation | ||||
| Authority Revenue | 6.250% | 11/15/23 | 5,000 | 5,972 |
| New York Metropolitan Transportation | ||||
| Authority Revenue | 5.000% | 11/15/24 | 1,000 | 1,120 |
| New York Metropolitan Transportation | ||||
| Authority Revenue | 5.000% | 11/15/25 | 1,000 | 1,134 |
| New York Metropolitan Transportation | ||||
| Authority Revenue | 5.000% | 11/15/26 | 3,000 | 3,402 |
| New York Metropolitan Transportation | ||||
| Authority Revenue | 5.000% | 11/15/26 | 10,000 | 11,525 |
| New York Metropolitan Transportation | ||||
| Authority Revenue | 5.000% | 11/15/26 | 2,330 | 2,675 |
| New York Metropolitan Transportation | ||||
| Authority Revenue | 5.000% | 11/15/27 | 4,945 | 5,631 |
| New York Metropolitan Transportation | ||||
| Authority Revenue | 5.000% | 11/15/27 (14) | 2,500 | 2,788 |
| New York Metropolitan Transportation | ||||
| Authority Revenue | 5.000% | 11/15/27 | 5,000 | 5,710 |
| New York Metropolitan Transportation | ||||
| Authority Revenue | 5.000% | 11/15/28 | 2,250 | 2,509 |
| New York Metropolitan Transportation | ||||
| Authority Revenue | 5.000% | 11/15/28 | 4,000 | 4,487 |
| New York Metropolitan Transportation | ||||
| Authority Revenue | 5.250% | 11/15/28 | 1,000 | 1,134 |
| New York Metropolitan Transportation | ||||
| Authority Revenue | 6.500% | 11/15/28 | 5,000 | 6,011 |
| New York Metropolitan Transportation | ||||
| Authority Revenue | 5.250% | 11/15/29 | 1,000 | 1,130 |
| New York Metropolitan Transportation | ||||
| Authority Revenue | 5.000% | 11/15/30 | 3,715 | 3,970 |
| New York Metropolitan Transportation | ||||
| Authority Revenue | 5.250% | 11/15/30 | 1,150 | 1,296 |
| New York Metropolitan Transportation | ||||
| Authority Revenue | 5.000% | 11/15/31 | 10,000 | 10,810 |
| New York Metropolitan Transportation | ||||
| Authority Revenue | 5.000% | 11/15/32 | 1,500 | 1,668 |
| New York Metropolitan Transportation | ||||
| Authority Revenue | 5.000% | 11/15/32 | 2,050 | 2,278 |
| New York Metropolitan Transportation | ||||
| Authority Revenue | 5.000% | 11/15/33 | 3,500 | 3,876 |
| New York Metropolitan Transportation | ||||
| Authority Revenue | 5.250% | 11/15/37 | 5,000 | 5,672 |
| New York Metropolitan Transportation | ||||
| Authority Revenue | 5.000% | 11/15/38 | 15,000 | 16,356 |
| New York Metropolitan Transportation | ||||
| Authority Revenue | 5.250% | 11/15/38 | 1,000 | 1,103 |
| New York Metropolitan Transportation | ||||
| Authority Revenue | 5.250% | 11/15/39 | 5,000 | 5,614 |
40
New York Long-Term Tax-Exempt Fund
| Face | Market | |||
| Maturity | Amount | Value | ||
| Coupon | Date | ($000) | ($000) | |
| New York Metropolitan Transportation | ||||
| Authority Revenue | 5.250% | 11/15/40 | 10,000 | 11,004 |
| New York Metropolitan Transportation | ||||
| Authority Revenue | 5.000% | 11/15/41 | 2,000 | 2,145 |
| New York Metropolitan Transportation | ||||
| Authority Revenue | 5.000% | 11/15/42 | 4,000 | 4,323 |
| New York Metropolitan Transportation | ||||
| Authority Revenue | 5.000% | 11/15/42 | 5,000 | 5,424 |
| New York Metropolitan Transportation | ||||
| Authority Revenue (Dedicated Petroleum Tax) | 5.250% | 11/15/28 | 5,000 | 5,867 |
| New York Metropolitan Transportation | ||||
| Authority Revenue (Dedicated Petroleum Tax) | 5.250% | 11/15/29 | 4,000 | 4,668 |
| New York Metropolitan Transportation | ||||
| Authority Revenue (Dedicated Petroleum Tax) | 5.250% | 11/15/30 | 4,000 | 4,575 |
| New York Metropolitan Transportation | ||||
| Authority Revenue (Dedicated Tax Fund) | 5.000% | 11/15/29 | 6,975 | 8,061 |
| New York Metropolitan Transportation | ||||
| Authority Revenue (Dedicated Tax Fund) | 5.000% | 11/15/31 | 11,000 | 12,597 |
| New York Metropolitan Transportation | ||||
| Authority Revenue (Dedicated Tax Fund) | 5.000% | 11/15/33 | 5,000 | 5,603 |
| New York Metropolitan Transportation | ||||
| Authority Revenue (Dedicated Tax Fund) | 5.625% | 11/15/39 | 500 | 574 |
| New York Metropolitan Transportation | ||||
| Authority Revenue (Transit Revenue) | 5.000% | 11/15/22 | 5,000 | 5,625 |
| New York Metropolitan Transportation | ||||
| Authority Revenue (Transit Revenue) | 5.000% | 11/15/41 | 10,000 | 10,808 |
| New York Metropolitan Transportation | ||||
| Authority Revenue (Transit Revenue) PUT | 5.000% | 11/15/14 | 40,550 | 41,411 |
| New York State Convention Center Development | ||||
| Corp. Revenue (Hotel Unit Fee) | 5.000% | 11/15/30 (2) | 3,600 | 3,779 |
| New York State Dormitory Authority Hospital | ||||
| Revenue (Albany Medical Center Hospital) | 5.000% | 8/15/18 (4) | 12,575 | 12,691 |
| New York State Dormitory Authority Hospital | ||||
| Revenue (Catskill Regional Medical Center) | 5.250% | 2/15/15 (Prere.) | 2,825 | 2,927 |
| New York State Dormitory Authority Hospital | ||||
| Revenue (Catskill Regional Medical Center) | 5.250% | 2/15/15 (Prere.) | 1,120 | 1,160 |
| New York State Dormitory Authority Hospital | ||||
| Revenue (Catskill Regional Medical Center) | 5.250% | 2/15/15 (Prere.) | 2,420 | 2,507 |
| New York State Dormitory Authority Hospital | ||||
| Revenue (Catskill Regional Medical Center) | 5.250% | 2/15/15 (Prere.) | 2,555 | 2,647 |
| New York State Dormitory Authority Hospital | ||||
| Revenue (Catskill Regional Medical Center) | 5.250% | 2/15/15 (Prere.) | 1,680 | 1,740 |
| New York State Dormitory Authority Hospital | ||||
| Revenue (Hudson Valley Hospital Center) | 5.000% | 8/15/27 (4) | 4,500 | 4,991 |
| New York State Dormitory Authority Lease | ||||
| Revenue (State University Dormitory Facilities) | 5.000% | 7/1/24 | 3,000 | 3,520 |
| New York State Dormitory Authority Lease | ||||
| Revenue (State University Dormitory Facilities) | 5.000% | 7/1/26 | 1,000 | 1,164 |
| New York State Dormitory Authority Lease | ||||
| Revenue (State University Dormitory Facilities) | 5.000% | 7/1/29 | 4,000 | 4,652 |
| New York State Dormitory Authority Lease | ||||
| Revenue (State University Dormitory Facilities) | 5.000% | 7/1/30 | 1,000 | 1,149 |
| New York State Dormitory Authority Lease | ||||
| Revenue (State University Dormitory Facilities) | 5.000% | 7/1/35 | 1,000 | 1,120 |
41
New York Long-Term Tax-Exempt Fund
| Face | Market | |||
| Maturity | Amount | Value | ||
| Coupon | Date | ($000) | ($000) | |
| New York State Dormitory Authority Lease | ||||
| Revenue (State University Dormitory Facilities) | 5.000% | 7/1/41 | 11,000 | 11,955 |
| New York State Dormitory Authority Lease | ||||
| Revenue (State University Dormitory Facilities) | 5.000% | 7/1/42 | 17,760 | 19,464 |
| New York State Dormitory Authority Revenue | ||||
| (Brooklyn Law School) | 5.000% | 7/1/22 (ETM) | 2,985 | 3,658 |
| New York State Dormitory Authority Revenue | ||||
| (Brooklyn Law School) | 5.000% | 7/1/22 (Prere.) | 2,290 | 2,829 |
| New York State Dormitory Authority Revenue | ||||
| (Brooklyn Law School) | 5.000% | 7/1/22 (Prere.) | 1,630 | 2,014 |
| New York State Dormitory Authority Revenue | ||||
| (Brooklyn Law School) | 5.000% | 7/1/26 | 1,630 | 1,802 |
| New York State Dormitory Authority Revenue | ||||
| (Brooklyn Law School) | 5.000% | 7/1/27 | 1,210 | 1,332 |
| New York State Dormitory Authority Revenue | ||||
| (Brooklyn Law School) | 5.000% | 7/1/28 | 1,000 | 1,095 |
| New York State Dormitory Authority Revenue | ||||
| (Brooklyn Law School) | 5.000% | 7/1/29 | 1,000 | 1,087 |
| New York State Dormitory Authority Revenue | ||||
| (Catholic Health System Obligated Group) | 5.000% | 7/1/32 | 710 | 746 |
| New York State Dormitory Authority Revenue | ||||
| (City University System) | 5.000% | 7/1/25 | 4,670 | 5,318 |
| New York State Dormitory Authority Revenue | ||||
| (Columbia University) | 5.000% | 10/1/22 | 4,395 | 5,427 |
| New York State Dormitory Authority Revenue | ||||
| (Columbia University) | 5.000% | 7/1/40 | 16,095 | 18,373 |
| New York State Dormitory Authority Revenue | ||||
| (Columbia University) | 5.000% | 10/1/41 | 1,825 | 2,024 |
| New York State Dormitory Authority Revenue | ||||
| (Cornell University) | 5.000% | 7/1/31 | 6,905 | 7,440 |
| New York State Dormitory Authority Revenue | ||||
| (Cornell University) | 5.000% | 7/1/35 | 1,500 | 1,613 |
| New York State Dormitory Authority Revenue | ||||
| (Cornell University) VRDO | 0.070% | 6/6/14 | 5,300 | 5,300 |
| New York State Dormitory Authority Revenue | ||||
| (Culinary Institute of America) | 4.000% | 7/1/15 | 250 | 258 |
| New York State Dormitory Authority Revenue | ||||
| (Culinary Institute of America) | 4.000% | 7/1/16 | 355 | 374 |
| New York State Dormitory Authority Revenue | ||||
| (Culinary Institute of America) | 5.000% | 7/1/17 | 300 | 329 |
| New York State Dormitory Authority Revenue | ||||
| (Culinary Institute of America) | 5.000% | 7/1/18 | 325 | 362 |
| New York State Dormitory Authority Revenue | ||||
| (Culinary Institute of America) | 5.000% | 7/1/19 | 250 | 281 |
| New York State Dormitory Authority Revenue | ||||
| (Culinary Institute of America) | 5.000% | 7/1/20 | 400 | 451 |
| New York State Dormitory Authority Revenue | ||||
| (Culinary Institute of America) | 5.000% | 7/1/21 | 300 | 339 |
| New York State Dormitory Authority Revenue | ||||
| (Culinary Institute of America) | 5.000% | 7/1/28 | 540 | 584 |
| New York State Dormitory Authority Revenue | ||||
| (Culinary Institute of America) | 5.500% | 7/1/33 | 1,000 | 1,097 |
| New York State Dormitory Authority Revenue | ||||
| (Culinary Institute of America) | 5.000% | 7/1/34 | 350 | 367 |
42
New York Long-Term Tax-Exempt Fund
| Face | Market | |||
| Maturity | Amount | Value | ||
| Coupon | Date | ($000) | ($000) | |
| New York State Dormitory Authority Revenue | ||||
| (Culinary Institute of America) | 5.000% | 7/1/42 | 600 | 627 |
| New York State Dormitory Authority Revenue | ||||
| (Culinary Institute of America) | 5.750% | 7/1/43 | 7,085 | 7,750 |
| New York State Dormitory Authority Revenue | ||||
| (Fordham University) | 4.000% | 7/1/21 | 250 | 277 |
| New York State Dormitory Authority Revenue | ||||
| (Fordham University) | 5.000% | 7/1/22 | 200 | 236 |
| New York State Dormitory Authority Revenue | ||||
| (Fordham University) | 5.500% | 7/1/36 | 3,000 | 3,374 |
| New York State Dormitory Authority Revenue | ||||
| (Long Island University) | 5.000% | 9/1/26 | 2,355 | 2,581 |
| New York State Dormitory Authority Revenue | ||||
| (Long Island University) | 5.000% | 9/1/27 | 1,520 | 1,648 |
| New York State Dormitory Authority Revenue | ||||
| (Memorial Sloan-Kettering Cancer Center) | 5.000% | 7/1/21 | 2,000 | 2,403 |
| New York State Dormitory Authority Revenue | ||||
| (Memorial Sloan-Kettering Cancer Center) | 5.000% | 7/1/23 | 1,490 | 1,761 |
| New York State Dormitory Authority Revenue | ||||
| (Memorial Sloan-Kettering Cancer Center) | 5.000% | 7/1/30 | 9,000 | 9,605 |
| New York State Dormitory Authority Revenue | ||||
| (Memorial Sloan-Kettering Cancer Center) | 5.000% | 7/1/36 | 1,000 | 1,101 |
| New York State Dormitory Authority Revenue | ||||
| (Mental Health Services Facilities Improvement) | 5.000% | 2/15/15 (Prere.) | 600 | 620 |
| New York State Dormitory Authority Revenue | ||||
| (Mental Health Services Facilities Improvement) | 5.000% | 2/15/15 (Prere.) | 6,575 | 6,800 |
| New York State Dormitory Authority Revenue | ||||
| (Mental Health Services Facilities Improvement) | 5.000% | 2/15/28 (4) | 500 | 565 |
| New York State Dormitory Authority Revenue | ||||
| (Mental Health Services Facilities Improvement) | 5.000% | 2/15/30 | 50 | 51 |
| New York State Dormitory Authority Revenue | ||||
| (Miriam Osborn Memorial Home Association) | 5.000% | 7/1/26 | 740 | 797 |
| New York State Dormitory Authority Revenue | ||||
| (Miriam Osborn Memorial Home Association) | 5.000% | 7/1/27 | 650 | 694 |
| New York State Dormitory Authority Revenue | ||||
| (Miriam Osborn Memorial Home Association) | 5.000% | 7/1/29 | 1,000 | 1,065 |
| New York State Dormitory Authority Revenue | ||||
| (Miriam Osborn Memorial Home Association) | 5.000% | 7/1/42 | 500 | 526 |
| New York State Dormitory Authority Revenue | ||||
| (Mount Sinai Hospital Obligated Group) | 5.000% | 7/1/22 | 3,500 | 3,993 |
| New York State Dormitory Authority Revenue | ||||
| (Mount Sinai Hospital Obligated Group) | 5.000% | 7/1/23 | 4,500 | 5,123 |
| New York State Dormitory Authority Revenue | ||||
| (Mount Sinai Hospital Obligated Group) | 5.000% | 7/1/26 | 1,500 | 1,672 |
| New York State Dormitory Authority Revenue | ||||
| (Mount Sinai School of Medicine of New York | ||||
| University) | 5.000% | 7/1/20 | 1,000 | 1,171 |
| New York State Dormitory Authority Revenue | ||||
| (Mount Sinai School of Medicine of New York | ||||
| University) | 5.000% | 7/1/21 | 1,000 | 1,150 |
| New York State Dormitory Authority Revenue | ||||
| (Mount Sinai School of Medicine of New York | ||||
| University) | 5.150% | 7/1/24 (14) | 2,000 | 2,310 |
43
New York Long-Term Tax-Exempt Fund
| Face | Market | |||
| Maturity | Amount | Value | ||
| Coupon | Date | ($000) | ($000) | |
| New York State Dormitory Authority Revenue | ||||
| (New York University Hospitals Center) | 5.000% | 7/1/20 | 3,000 | 3,295 |
| New York State Dormitory Authority Revenue | ||||
| (New York University Hospitals Center) | 5.000% | 7/1/22 | 8,000 | 8,561 |
| New York State Dormitory Authority Revenue | ||||
| (New York University Hospitals Center) | 5.750% | 7/1/31 | 1,000 | 1,120 |
| New York State Dormitory Authority Revenue | ||||
| (New York University Hospitals Center) | 6.000% | 7/1/40 | 1,000 | 1,122 |
| New York State Dormitory Authority Revenue | ||||
| (New York University) | 5.000% | 7/1/30 | 6,625 | 7,489 |
| New York State Dormitory Authority Revenue | ||||
| (New York University) | 5.000% | 7/1/37 | 4,200 | 4,653 |
| New York State Dormitory Authority Revenue | ||||
| (New York University) | 5.000% | 7/1/37 | 3,250 | 3,600 |
| New York State Dormitory Authority Revenue | ||||
| (New York University) | 5.000% | 7/1/38 | 15,700 | 17,588 |
| New York State Dormitory Authority Revenue | ||||
| (New York University) | 5.000% | 7/1/39 | 10,000 | 11,233 |
| New York State Dormitory Authority Revenue | ||||
| (New York University) | 5.000% | 7/1/42 | 10,000 | 11,041 |
| New York State Dormitory Authority Revenue | ||||
| (New York University) | 5.000% | 7/1/43 | 4,000 | 4,454 |
| New York State Dormitory Authority Revenue | ||||
| (North Shore - Long Island Jewish | ||||
| Obligated Group) | 5.000% | 5/1/20 | 2,520 | 2,928 |
| New York State Dormitory Authority Revenue | ||||
| (North Shore - Long Island Jewish | ||||
| Obligated Group) | 5.000% | 11/1/20 | 3,965 | 4,272 |
| New York State Dormitory Authority Revenue | ||||
| (North Shore - Long Island Jewish | ||||
| Obligated Group) | 5.000% | 5/1/21 | 1,000 | 1,167 |
| New York State Dormitory Authority Revenue | ||||
| (North Shore - Long Island Jewish | ||||
| Obligated Group) | 5.000% | 11/1/21 | 4,035 | 4,342 |
| New York State Dormitory Authority Revenue | ||||
| (North Shore - Long Island Jewish | ||||
| Obligated Group) | 5.000% | 5/1/22 | 1,465 | 1,710 |
| New York State Dormitory Authority Revenue | ||||
| (North Shore - Long Island Jewish | ||||
| Obligated Group) | 5.000% | 11/1/22 | 4,285 | 4,605 |
| New York State Dormitory Authority Revenue | ||||
| (North Shore - Long Island Jewish | ||||
| Obligated Group) | 5.000% | 5/1/26 | 1,000 | 1,110 |
| New York State Dormitory Authority Revenue | ||||
| (North Shore - Long Island Jewish | ||||
| Obligated Group) | 5.000% | 11/1/26 | 5,495 | 5,757 |
| New York State Dormitory Authority Revenue | ||||
| (North Shore - Long Island Jewish | ||||
| Obligated Group) | 5.000% | 11/1/26 | 1,800 | 1,886 |
| New York State Dormitory Authority Revenue | ||||
| (North Shore - Long Island Jewish | ||||
| Obligated Group) | 5.000% | 5/1/32 | 7,000 | 7,573 |
44
New York Long-Term Tax-Exempt Fund
| Face | Market | |||
| Maturity | Amount | Value | ||
| Coupon | Date | ($000) | ($000) | |
| New York State Dormitory Authority Revenue | ||||
| (North Shore - Long Island Jewish | ||||
| Obligated Group) | 5.250% | 5/1/34 | 1,000 | 1,098 |
| New York State Dormitory Authority Revenue | ||||
| (North Shore - Long Island Jewish | ||||
| Obligated Group) | 5.000% | 5/1/39 | 4,000 | 4,345 |
| New York State Dormitory Authority Revenue | ||||
| (North Shore - Long Island Jewish | ||||
| Obligated Group) | 5.000% | 5/1/41 | 2,500 | 2,672 |
| New York State Dormitory Authority Revenue | ||||
| (Pace University) | 5.000% | 5/1/25 | 1,300 | 1,407 |
| New York State Dormitory Authority Revenue | ||||
| (Pace University) | 5.000% | 5/1/28 | 1,500 | 1,603 |
| New York State Dormitory Authority Revenue | ||||
| (Pace University) | 5.000% | 5/1/29 | 740 | 788 |
| New York State Dormitory Authority Revenue | ||||
| (Personal Income Tax) | 5.000% | 3/15/15 (Prere.) | 7,500 | 7,788 |
| New York State Dormitory Authority Revenue | ||||
| (Personal Income Tax) | 5.000% | 3/15/23 (4) | 4,200 | 4,350 |
| New York State Dormitory Authority Revenue | ||||
| (Personal Income Tax) | 5.000% | 2/15/24 | 4,150 | 5,077 |
| New York State Dormitory Authority Revenue | ||||
| (Personal Income Tax) | 5.000% | 12/15/24 | 3,635 | 4,329 |
| New York State Dormitory Authority Revenue | ||||
| (Personal Income Tax) | 5.000% | 3/15/27 | 5,000 | 5,804 |
| New York State Dormitory Authority Revenue | ||||
| (Personal Income Tax) | 5.000% | 3/15/28 | 2,185 | 2,536 |
| New York State Dormitory Authority Revenue | ||||
| (Personal Income Tax) | 5.000% | 3/15/28 | 2,225 | 2,561 |
| New York State Dormitory Authority Revenue | ||||
| (Personal Income Tax) | 5.000% | 3/15/29 | 3,790 | 4,366 |
| New York State Dormitory Authority Revenue | ||||
| (Personal Income Tax) | 5.000% | 3/15/30 | 3,480 | 3,990 |
| New York State Dormitory Authority Revenue | ||||
| (Personal Income Tax) | 5.000% | 2/15/33 | 5,000 | 5,599 |
| New York State Dormitory Authority Revenue | ||||
| (Personal Income Tax) | 5.000% | 3/15/33 | 6,615 | 7,416 |
| New York State Dormitory Authority Revenue | ||||
| (Personal Income Tax) | 5.000% | 12/15/35 | 10,000 | 10,947 |
| New York State Dormitory Authority Revenue | ||||
| (Personal Income Tax) | 5.750% | 3/15/36 | 10,000 | 11,647 |
| New York State Dormitory Authority Revenue | ||||
| (Personal Income Tax) | 5.000% | 2/15/37 | 7,600 | 8,440 |
| New York State Dormitory Authority Revenue | ||||
| (Personal Income Tax) | 5.000% | 3/15/38 | 5,000 | 5,630 |
| New York State Dormitory Authority Revenue | ||||
| (Personal Income Tax) | 5.250% | 3/15/38 | 18,000 | 20,539 |
| New York State Dormitory Authority Revenue | ||||
| (Personal Income Tax) | 5.000% | 2/15/40 | 6,000 | 6,565 |
| New York State Dormitory Authority Revenue | ||||
| (Personal Income Tax) | 5.000% | 3/15/41 | 10,000 | 10,931 |
| New York State Dormitory Authority Revenue | ||||
| (Pratt Institute) | 5.000% | 7/1/29 (12) | 3,750 | 4,055 |
45
New York Long-Term Tax-Exempt Fund
| Face | Market | |||
| Maturity | Amount | Value | ||
| Coupon | Date | ($000) | ($000) | |
| New York State Dormitory Authority Revenue | ||||
| (Rochester Institute of Technology) | 5.000% | 7/1/23 | 750 | 882 |
| New York State Dormitory Authority Revenue | ||||
| (Rochester Institute of Technology) | 5.000% | 7/1/24 | 1,000 | 1,166 |
| New York State Dormitory Authority Revenue | ||||
| (Rochester Institute of Technology) | 5.000% | 7/1/25 | 1,355 | 1,566 |
| New York State Dormitory Authority Revenue | ||||
| (Rochester Institute of Technology) | 5.000% | 7/1/34 | 750 | 826 |
| New York State Dormitory Authority Revenue | ||||
| (Rochester Institute of Technology) | 5.000% | 7/1/38 | 1,250 | 1,366 |
| New York State Dormitory Authority Revenue | ||||
| (Rochester Institute of Technology) | 5.000% | 7/1/40 | 2,000 | 2,228 |
| New York State Dormitory Authority Revenue | ||||
| (Rochester Institute of Technology) | 5.000% | 7/1/42 | 3,000 | 3,262 |
| New York State Dormitory Authority Revenue | ||||
| (Rockefeller University) | 5.000% | 7/1/33 | 2,670 | 3,051 |
| New York State Dormitory Authority Revenue | ||||
| (Rockefeller University) | 5.000% | 7/1/34 | 2,720 | 3,097 |
| New York State Dormitory Authority Revenue | ||||
| (Rockefeller University) | 5.000% | 7/1/37 | 965 | 1,086 |
| New York State Dormitory Authority Revenue | ||||
| (Rockefeller University) | 5.000% | 7/1/38 | 9,000 | 10,132 |
| New York State Dormitory Authority Revenue | ||||
| (School Districts Financing Program) | 5.000% | 10/1/21 | 6,495 | 7,630 |
| New York State Dormitory Authority Revenue | ||||
| (School Districts Financing Program) | 5.000% | 4/1/22 | 2,930 | 3,445 |
| New York State Dormitory Authority Revenue | ||||
| (School Districts Financing Program) | 5.000% | 10/1/22 (4) | 1,000 | 1,187 |
| New York State Dormitory Authority Revenue | ||||
| (School Districts Financing Program) | 5.000% | 10/1/22 | 1,340 | 1,581 |
| New York State Dormitory Authority Revenue | ||||
| (School Districts Financing Program) | 5.000% | 10/1/24 (15) | 3,250 | 3,808 |
| New York State Dormitory Authority Revenue | ||||
| (School Districts Financing Program) | 5.000% | 10/1/25 (4) | 2,860 | 3,321 |
| New York State Dormitory Authority Revenue | ||||
| (School Districts Financing Program) | 5.000% | 10/1/26 | 1,000 | 1,138 |
| 3 New York State Dormitory Authority Revenue | ||||
| (School Districts Financing Program) | 5.000% | 10/1/27 (4) | 1,000 | 1,164 |
| 3 New York State Dormitory Authority Revenue | ||||
| (School Districts Financing Program) | 5.000% | 10/1/28 (4) | 1,000 | 1,153 |
| 3 New York State Dormitory Authority Revenue | ||||
| (School Districts Financing Program) | 5.000% | 10/1/29 (4) | 1,500 | 1,717 |
| New York State Dormitory Authority Revenue | ||||
| (St. John’s University) | 5.250% | 7/1/32 (14) | 9,000 | 9,489 |
| New York State Dormitory Authority Revenue | ||||
| (St. John’s University) | 5.000% | 7/1/44 | 10,000 | 10,874 |
| New York State Dormitory Authority Revenue | ||||
| (State University Dormitory Facilities) | 5.000% | 7/1/27 | 2,500 | 2,899 |
| New York State Dormitory Authority Revenue | ||||
| (State University Dormitory Facilities) | 5.250% | 7/1/31 | 2,500 | 2,865 |
| New York State Dormitory Authority Revenue | ||||
| (State University Dormitory Facilities) | 5.000% | 7/1/43 | 2,000 | 2,189 |
| New York State Dormitory Authority Revenue | ||||
| (State University Educational Facilities) | 5.000% | 5/15/25 | 5,000 | 5,813 |
46
New York Long-Term Tax-Exempt Fund
| Face | Market | |||
| Maturity | Amount | Value | ||
| Coupon | Date | ($000) | ($000) | |
| New York State Dormitory Authority Revenue | ||||
| (State University Educational Facilities) | 5.000% | 5/15/26 | 8,000 | 9,242 |
| New York State Dormitory Authority Revenue | ||||
| (State University Educational Facilities) | 5.000% | 5/15/27 | 5,000 | 5,741 |
| New York State Dormitory Authority Revenue | ||||
| (Teachers College) | 5.000% | 7/1/31 | 1,750 | 1,945 |
| New York State Dormitory Authority Revenue | ||||
| (Teachers College) | 5.000% | 7/1/42 | 2,000 | 2,167 |
| New York State Dormitory Authority Revenue | ||||
| (The New School) | 5.250% | 7/1/30 | 3,000 | 3,318 |
| New York State Dormitory Authority Revenue | ||||
| (The New School) | 5.000% | 7/1/31 (14) | 3,665 | 3,911 |
| New York State Dormitory Authority Revenue | ||||
| (The New School) | 5.500% | 7/1/40 | 5,000 | 5,469 |
| New York State Dormitory Authority Revenue | ||||
| (The New School) | 6.000% | 7/1/50 | 5,575 | 6,220 |
| New York State Dormitory Authority Revenue | ||||
| (University of Rochester) | 5.000% | 7/1/22 | 1,000 | 1,100 |
| New York State Dormitory Authority Revenue | ||||
| (University of Rochester) | 5.000% | 7/1/32 | 8,405 | 9,097 |
| New York State Dormitory Authority Revenue | ||||
| (University of Rochester) VRDO | 0.070% | 6/2/14 LOC | 5,200 | 5,200 |
| New York State Dormitory Authority Revenue | ||||
| (Vassar College) | 5.000% | 7/1/46 | 2,500 | 2,746 |
| New York State Dormitory Authority Revenue | ||||
| (Yeshiva University) | 4.000% | 11/1/14 | 750 | 756 |
| New York State Dormitory Authority Revenue | ||||
| (Yeshiva University) | 3.750% | 9/1/17 | 790 | 814 |
| New York State Dormitory Authority Revenue | ||||
| (Yeshiva University) | 5.000% | 11/1/17 | 1,055 | 1,137 |
| New York State Dormitory Authority Revenue | ||||
| (Yeshiva University) | 5.250% | 7/1/19 (2) | 2,425 | 2,428 |
| New York State Dormitory Authority Revenue | ||||
| (Yeshiva University) | 5.000% | 9/1/20 | 210 | 230 |
| New York State Dormitory Authority Revenue | ||||
| (Yeshiva University) | 5.250% | 7/1/21 (2) | 1,850 | 1,852 |
| New York State Dormitory Authority Revenue | ||||
| (Yeshiva University) | 5.250% | 7/1/22 (2) | 3,425 | 3,428 |
| New York State Dormitory Authority Revenue | ||||
| (Yeshiva University) | 5.000% | 9/1/28 | 745 | 765 |
| New York State Dormitory Authority Revenue | ||||
| (Yeshiva University) | 5.125% | 7/1/34 (2) | 1,000 | 1,000 |
| New York State Dormitory Authority Revenue | ||||
| (Yeshiva University) | 5.000% | 11/1/40 | 1,000 | 1,002 |
| New York State Dormitory Authority Sales | ||||
| Tax Revenue | 5.000% | 3/15/35 | 3,000 | 3,355 |
| New York State Dormitory Authority Sales | ||||
| Tax Revenue | 5.000% | 3/15/38 | 1,200 | 1,338 |
| New York State Dormitory Authority Sales | ||||
| Tax Revenue | 5.000% | 3/15/43 | 13,685 | 15,139 |
| 2 New York State Dormitory Authority Sales | ||||
| Tax Revenue TOB VRDO | 0.070% | 6/6/14 | 7,500 | 7,500 |
47
New York Long-Term Tax-Exempt Fund
| Face | Market | |||
| Maturity | Amount | Value | ||
| Coupon | Date | ($000) | ($000) | |
| New York State Energy Research & Development | ||||
| Authority Pollution Control Revenue (Rochester | ||||
| Gas & Electric Corp. Project) PUT | 5.000% | 8/1/16 (14) | 7,750 | 8,371 |
| New York State Environmental Facilities Corp. | ||||
| Revenue (Personal Income Tax) | 5.250% | 12/15/24 | 8,000 | 9,373 |
| New York State Environmental Facilities Corp. | ||||
| Revenue (State Clean Water & Drinking Water | ||||
| Revolving Funds) | 5.000% | 6/15/14 (Prere.) | 3,000 | 3,006 |
| New York State Environmental Facilities Corp. | ||||
| Revenue (State Clean Water & Drinking Water | ||||
| Revolving Funds) | 5.000% | 6/15/14 (Prere.) | 5,000 | 5,010 |
| New York State Environmental Facilities Corp. | ||||
| Revenue (State Clean Water & Drinking Water | ||||
| Revolving Funds) | 4.000% | 8/15/15 | 1,400 | 1,464 |
| New York State Environmental Facilities Corp. | ||||
| Revenue (State Clean Water & Drinking Water | ||||
| Revolving Funds) | 5.000% | 6/15/22 | 4,950 | 5,565 |
| New York State Environmental Facilities Corp. | ||||
| Revenue (State Clean Water & Drinking Water | ||||
| Revolving Funds) | 5.000% | 6/15/25 | 5,775 | 6,883 |
| New York State Environmental Facilities Corp. | ||||
| Revenue (State Clean Water & Drinking Water | ||||
| Revolving Funds) | 5.000% | 6/15/25 | 2,000 | 2,355 |
| New York State Environmental Facilities Corp. | ||||
| Revenue (State Clean Water & Drinking Water | ||||
| Revolving Funds) | 5.000% | 6/15/25 | 4,540 | 4,760 |
| New York State Environmental Facilities Corp. | ||||
| Revenue (State Clean Water & Drinking Water | ||||
| Revolving Funds) | 5.000% | 6/15/31 | 5,870 | 6,829 |
| New York State Environmental Facilities Corp. | ||||
| Revenue (State Clean Water & Drinking Water | ||||
| Revolving Funds) | 5.000% | 6/15/31 | 2,000 | 2,315 |
| New York State Environmental Facilities Corp. | ||||
| Revenue (State Clean Water & Drinking Water | ||||
| Revolving Funds) | 5.000% | 6/15/32 | 5,000 | 5,800 |
| New York State Environmental Facilities Corp. | ||||
| Revenue (State Clean Water & Drinking Water | ||||
| Revolving Funds) | 5.000% | 9/15/32 | 2,900 | 3,230 |
| New York State Environmental Facilities Corp. | ||||
| Revenue (State Clean Water & Drinking Water | ||||
| Revolving Funds) | 5.000% | 6/15/34 | 3,000 | 3,011 |
| New York State Environmental Facilities Corp. | ||||
| Revenue (State Clean Water & Drinking Water | ||||
| Revolving Funds) | 5.000% | 6/15/36 | 1,500 | 1,692 |
| New York State Environmental Facilities Corp. | ||||
| Revenue (State Clean Water & Drinking Water | ||||
| Revolving Funds) | 5.000% | 6/15/41 | 5,900 | 6,506 |
| New York State Environmental Facilities Corp. | ||||
| Revenue (State Revolving Funds) | 5.000% | 5/15/15 | 2,075 | 2,173 |
| New York State Environmental Facilities Corp. | ||||
| Revenue (State Revolving Funds) | 3.000% | 11/15/15 | 1,195 | 1,242 |
| New York State Environmental Facilities Corp. | ||||
| Revenue (State Revolving Funds) | 5.000% | 11/15/16 | 3,010 | 3,355 |
48
New York Long-Term Tax-Exempt Fund
| Face | Market | |||
| Maturity | Amount | Value | ||
| Coupon | Date | ($000) | ($000) | |
| New York State Environmental Facilities Corp. | ||||
| Revenue (State Revolving Funds) | 5.000% | 11/15/27 | 3,000 | 3,507 |
| New York State Environmental Facilities Corp. | ||||
| Revenue (State Revolving Funds) | 5.000% | 5/15/41 | 3,505 | 3,861 |
| New York State Environmental Facilities Corp. | ||||
| Revenue (State Revolving Funds) | 5.000% | 5/15/43 | 5,000 | 5,622 |
| New York State Environmental Facilities Corp. | ||||
| Water Facilities Revenue (United Water New | ||||
| Rochelle Inc. Project) | 4.875% | 9/1/40 | 4,000 | 4,174 |
| New York State GO | 5.000% | 3/1/28 | 14,550 | 17,052 |
| New York State GO | 5.000% | 2/15/39 | 9,500 | 10,661 |
| New York State Housing Finance Agency | ||||
| Housing Revenue | 3.750% | 11/1/37 | 1,555 | 1,519 |
| New York State Housing Finance Agency | ||||
| Housing Revenue | 3.850% | 11/1/42 | 1,405 | 1,374 |
| New York State Housing Finance Agency | ||||
| Revenue (Dock Street Rental LLC) VRDO | 0.040% | 6/6/14 LOC | 6,700 | 6,700 |
| New York State Housing Finance Agency | ||||
| Revenue (Personal Income Tax) | 5.000% | 3/15/38 | 15,245 | 16,900 |
| New York State Local Government Assistance | ||||
| Corp. Revenue | 5.500% | 4/1/17 | 2,015 | 2,218 |
| New York State Mortgage Agency Homeowner | ||||
| Mortgage Revenue | 2.625% | 4/1/41 | 2,460 | 2,540 |
| New York State Mortgage Agency Revenue | ||||
| (NYHELP’s Education Loan) | 4.750% | 11/1/24 | 1,840 | 1,969 |
| New York State Power Authority Revenue | 5.000% | 11/15/38 | 1,000 | 1,110 |
| New York State Thruway Authority Revenue | 5.000% | 1/1/26 | 2,545 | 2,916 |
| New York State Thruway Authority Revenue | 5.000% | 1/1/27 (14) | 2,000 | 2,225 |
| New York State Thruway Authority Revenue | 5.000% | 1/1/28 (14) | 2,500 | 2,781 |
| New York State Thruway Authority Revenue | 5.000% | 1/1/30 | 4,000 | 4,456 |
| New York State Thruway Authority Revenue | 5.000% | 1/1/31 | 8,500 | 9,426 |
| New York State Thruway Authority Revenue | 5.000% | 1/1/32 (4) | 8,625 | 8,983 |
| New York State Thruway Authority Revenue | 5.000% | 1/1/37 | 13,000 | 14,235 |
| New York State Thruway Authority Revenue | 5.000% | 1/1/42 | 9,765 | 10,511 |
| New York State Thruway Authority Revenue | ||||
| (Highway & Bridge Trust Fund) | 5.000% | 10/1/15 (Prere.) | 3,260 | 3,470 |
| New York State Thruway Authority Revenue | ||||
| (Highway & Bridge Trust Fund) | 5.000% | 4/1/18 (2) | 21,240 | 22,594 |
| New York State Thruway Authority Revenue | ||||
| (Highway & Bridge Trust Fund) | 5.000% | 4/1/24 | 10,000 | 11,744 |
| New York State Thruway Authority Revenue | ||||
| (Highway & Bridge Trust Fund) | 5.000% | 4/1/26 (2) | 150 | 166 |
| New York State Thruway Authority Revenue | ||||
| (Highway & Bridge Trust Fund) | 5.000% | 4/1/26 | 10,000 | 11,561 |
| New York State Thruway Authority Revenue | ||||
| (Highway & Bridge Trust Fund) | 5.000% | 4/1/27 | 2,000 | 2,295 |
| New York State Thruway Authority Revenue | ||||
| (Highway & Bridge Trust Fund) | 5.000% | 4/1/28 | 9,000 | 10,112 |
| New York State Thruway Authority Revenue | ||||
| (Highway & Bridge Trust Fund) | 5.000% | 4/1/28 | 2,000 | 2,296 |
| New York State Thruway Authority Revenue | ||||
| (Highway & Bridge Trust Fund) | 5.000% | 4/1/29 | 2,000 | 2,282 |
| New York State Thruway Authority Revenue | ||||
| (Highway & Bridge Trust Fund) | 5.000% | 4/1/30 | 2,000 | 2,289 |
49
New York Long-Term Tax-Exempt Fund
| Face | Market | |||
| Maturity | Amount | Value | ||
| Coupon | Date | ($000) | ($000) | |
| New York State Thruway Authority Revenue | ||||
| (Highway & Bridge Trust Fund) | 5.000% | 4/1/32 | 6,100 | 6,811 |
| New York State Thruway Authority Revenue | ||||
| (Personal Income Tax) | 5.000% | 3/15/15 (Prere.) | 4,250 | 4,413 |
| New York State Thruway Authority Revenue | ||||
| (Personal Income Tax) | 5.000% | 3/15/24 | 2,500 | 2,935 |
| New York State Thruway Authority Revenue | ||||
| (Personal Income Tax) | 5.000% | 3/15/25 | 2,305 | 2,696 |
| New York State Thruway Authority Revenue | ||||
| (Personal Income Tax) | 5.000% | 3/15/30 | 1,500 | 1,723 |
| New York State Thruway Authority Revenue | ||||
| (Personal Income Tax) | 5.000% | 3/15/30 | 2,735 | 3,161 |
| New York State Thruway Authority Revenue | ||||
| (Personal Income Tax) | 5.000% | 3/15/31 | 1,500 | 1,714 |
| New York State Urban Development Corp. | ||||
| Revenue | 5.625% | 1/1/28 | 3,860 | 4,417 |
| New York State Urban Development Corp. | ||||
| Revenue (Personal Income Tax) | 5.000% | 3/15/15 (Prere.) | 7,860 | 8,162 |
| New York State Urban Development Corp. | ||||
| Revenue (Personal Income Tax) | 5.000% | 3/15/33 | 3,000 | 3,401 |
| New York State Urban Development Corp. | ||||
| Revenue (Personal Income Tax) | 5.000% | 3/15/33 (14) | 2,500 | 2,783 |
| New York State Urban Development Corp. | ||||
| Revenue (Personal Income Tax) | 5.000% | 3/15/37 | 7,000 | 7,653 |
| New York State Urban Development Corp. | ||||
| Revenue (Personal Income Tax) | 5.000% | 3/15/43 | 10,000 | 11,023 |
| New York State Urban Development Corp. | ||||
| Revenue (Service Contract) | 5.000% | 1/1/21 | 1,355 | 1,560 |
| New York State Urban Development Corp. | ||||
| Revenue (Service Contract) | 5.250% | 1/1/24 | 10,000 | 11,457 |
| Niagara Falls NY Bridge Commission Revenue | 5.250% | 10/1/15 (14) | 1,085 | 1,103 |
| Niagara Falls NY Bridge Commission Revenue | 6.250% | 10/1/20 (14) | 8,685 | 10,958 |
| Niagara Falls NY Bridge Commission Revenue | 6.250% | 10/1/21 (14) | 9,230 | 11,823 |
| Niagara NY Area Development Corp. Revenue | ||||
| (Niagara University Project) | 4.000% | 5/1/15 | 250 | 257 |
| Niagara NY Area Development Corp. Revenue | ||||
| (Niagara University Project) | 5.000% | 5/1/26 | 320 | 349 |
| Niagara NY Area Development Corp. Revenue | ||||
| (Niagara University Project) | 5.000% | 5/1/30 | 2,750 | 2,949 |
| Onondaga County NY Civic Development Corp. | ||||
| Revenue (Le Moyne College) | 5.000% | 7/1/32 | 1,000 | 1,059 |
| Onondaga County NY Civic Development Corp. | ||||
| Revenue (Le Moyne College) | 5.000% | 7/1/42 | 1,750 | 1,833 |
| Onondaga County NY Civic Development Corp. | ||||
| Revenue (St. Joseph’s Hospital & Health Center) | 5.000% | 7/1/25 | 3,750 | 3,860 |
| Onondaga County NY Industrial Development | ||||
| Agency Civic Facility Revenue (Syracuse | ||||
| University Project) VRDO | 0.070% | 6/6/14 LOC | 10,870 | 10,870 |
| Onondaga County NY Trust For Cultural Resources | ||||
| Revenue (Syracuse University Project) | 5.000% | 12/1/31 | 1,000 | 1,147 |
| Onondaga County NY Trust For Cultural Resources | ||||
| Revenue (Syracuse University Project) | 5.000% | 12/1/32 | 1,265 | 1,445 |
| Onondaga County NY Trust For Cultural Resources | ||||
| Revenue (Syracuse University Project) | 5.000% | 12/1/38 | 6,000 | 6,697 |
50
New York Long-Term Tax-Exempt Fund
| Face | Market | |||
| Maturity | Amount | Value | ||
| Coupon | Date | ($000) | ($000) | |
| Port Authority of New York & New | ||||
| Jersey Revenue | 5.000% | 12/1/23 | 4,500 | 5,536 |
| Port Authority of New York & New | ||||
| Jersey Revenue | 5.000% | 8/15/28 (4) | 10,000 | 11,172 |
| Port Authority of New York & New | ||||
| Jersey Revenue | 5.000% | 7/15/32 | 6,500 | 7,380 |
| Port Authority of New York & New | ||||
| Jersey Revenue | 5.000% | 7/15/33 | 6,000 | 6,333 |
| Port Authority of New York & New | ||||
| Jersey Revenue | 5.000% | 7/15/35 | 6,500 | 7,361 |
| Port Authority of New York & New | ||||
| Jersey Revenue | 5.250% | 7/15/36 | 4,000 | 4,514 |
| Port Authority of New York & New | ||||
| Jersey Revenue | 5.000% | 7/15/39 | 10,765 | 12,147 |
| Port Authority of New York & New | ||||
| Jersey Revenue | 5.000% | 10/15/39 | 1,480 | 1,671 |
| Port Authority of New York & New | ||||
| Jersey Revenue | 5.000% | 1/15/41 | 12,500 | 13,577 |
| Port Authority of New York & New Jersey | ||||
| Special Obligation Revenue (John F. | ||||
| Kennedy International Air Terminal LLC) | 5.500% | 12/1/31 | 7,000 | 7,680 |
| Port Authority of New York & New Jersey | ||||
| Special Obligation Revenue (John F. | ||||
| Kennedy International Air Terminal LLC) | 6.000% | 12/1/36 | 4,000 | 4,478 |
| Port Authority of New York & New Jersey | ||||
| Special Obligation Revenue (John F. | ||||
| Kennedy International Air Terminal LLC) | 6.000% | 12/1/42 | 7,000 | 7,795 |
| St. Lawrence County NY Industrial Development | ||||
| Civic Facility Revenue (St. Lawrence University) | 5.000% | 7/1/23 | 345 | 407 |
| St. Lawrence County NY Industrial Development | ||||
| Civic Facility Revenue (St. Lawrence University) | 5.000% | 7/1/24 | 300 | 351 |
| St. Lawrence County NY Industrial Development | ||||
| Civic Facility Revenue (St. Lawrence University) | 5.000% | 7/1/43 | 7,190 | 7,768 |
| Suffolk County NY Economic Development Corp. | ||||
| Revenue (Catholic Health Services) | 5.000% | 7/1/28 | 10,750 | 11,649 |
| Suffolk County NY Industrial Development | ||||
| Agency Civic Facility Revenue (Institute of | ||||
| Technology Project) | 5.250% | 3/1/19 | 500 | 517 |
| Suffolk County NY Industrial Development | ||||
| Agency Civic Facility Revenue (Institute of | ||||
| Technology Project) | 5.250% | 3/1/20 | 1,000 | 1,033 |
| Suffolk County NY Industrial Development | ||||
| Agency Civic Facility Revenue (Institute of | ||||
| Technology Project) | 5.000% | 3/1/26 | 2,000 | 2,036 |
| Suffolk County NY Judicial Facilities Agency | ||||
| Lease Revenue (H. Lee Dennison Building) | 5.000% | 11/1/33 | 7,500 | 7,999 |
| Suffolk NY Tobacco Asset Securitization | ||||
| Corp. Revenue | 5.000% | 6/1/32 | 2,675 | 2,806 |
| Suffolk NY Tobacco Asset Securitization | ||||
| Corp. Revenue | 5.250% | 6/1/37 | 3,300 | 3,465 |
| Tobacco Settlement Financing Corp. | ||||
| New York Revenue | 5.000% | 6/1/21 | 2,500 | 2,715 |
| Tobacco Settlement Financing Corp. | ||||
| New York Revenue | 5.000% | 6/1/22 | 5,000 | 5,599 |
51
New York Long-Term Tax-Exempt Fund
| Face | Market | |||
| Maturity | Amount | Value | ||
| Coupon | Date | ($000) | ($000) | |
| Tompkins County NY Industrial | ||||
| Development Agency Civic Facility Revenue | ||||
| (Cornell University) | 5.000% | 7/1/37 | 3,375 | 3,748 |
| Triborough Bridge & Tunnel Authority | ||||
| New York Revenue | 5.000% | 1/1/23 | 1,500 | 1,797 |
| Triborough Bridge & Tunnel Authority | ||||
| New York Revenue | 5.000% | 11/15/23 | 4,000 | 4,859 |
| Triborough Bridge & Tunnel Authority | ||||
| New York Revenue | 5.000% | 11/15/24 | 4,000 | 4,783 |
| Triborough Bridge & Tunnel Authority | ||||
| New York Revenue | 5.000% | 1/1/25 | 2,000 | 2,351 |
| Triborough Bridge & Tunnel Authority | ||||
| New York Revenue | 5.000% | 1/1/26 | 2,000 | 2,324 |
| Triborough Bridge & Tunnel Authority | ||||
| New York Revenue | 5.000% | 11/15/26 | 15,000 | 17,664 |
| Triborough Bridge & Tunnel Authority | ||||
| New York Revenue | 5.000% | 1/1/27 | 6,400 | 7,389 |
| Triborough Bridge & Tunnel Authority | ||||
| New York Revenue | 5.000% | 1/1/28 | 2,500 | 2,862 |
| Triborough Bridge & Tunnel Authority | ||||
| New York Revenue | 5.000% | 11/15/28 | 2,675 | 2,905 |
| Triborough Bridge & Tunnel Authority | ||||
| New York Revenue | 5.000% | 11/15/31 | 6,990 | 7,946 |
| Triborough Bridge & Tunnel Authority | ||||
| New York Revenue | 5.000% | 11/15/33 | 3,385 | 3,787 |
| Triborough Bridge & Tunnel Authority | ||||
| New York Revenue | 5.000% | 11/15/37 | 13,310 | 14,860 |
| Triborough Bridge & Tunnel Authority | ||||
| New York Revenue | 5.250% | 11/15/38 | 25,000 | 28,056 |
| 2 Triborough Bridge & Tunnel Authority | ||||
| New York Revenue TOB VRDO | 0.070% | 6/6/14 | 4,000 | 4,000 |
| Triborough Bridge & Tunnel Authority | ||||
| New York Revenue VRDO | 0.070% | 6/2/14 LOC | 4,000 | 4,000 |
| Troy NY Capital Resource Corp. Revenue | ||||
| (Rensselaer Polytechnic Institute Project) | 5.000% | 9/1/30 | 1,500 | 1,624 |
| Troy NY Capital Resource Corp. Revenue | ||||
| (Rensselaer Polytechnic Institute Project) | 5.125% | 9/1/40 | 3,650 | 3,908 |
| United Nations Development Corp. | ||||
| New York Revenue | 5.000% | 7/1/20 | 3,340 | 3,835 |
| Utility Debt Securitization Authority | ||||
| New York Revenue | 5.000% | 12/15/29 | 10,000 | 11,840 |
| Utility Debt Securitization Authority | ||||
| New York Revenue | 5.000% | 12/15/30 | 10,000 | 11,776 |
| Utility Debt Securitization Authority | ||||
| New York Revenue | 5.000% | 12/15/31 | 7,000 | 8,192 |
| Utility Debt Securitization Authority | ||||
| New York Revenue | 5.000% | 12/15/32 | 4,650 | 5,421 |
| Utility Debt Securitization Authority | ||||
| New York Revenue | 5.000% | 12/15/33 | 3,150 | 3,647 |
| Utility Debt Securitization Authority | ||||
| New York Revenue | 5.000% | 12/15/34 | 5,130 | 5,921 |
| Utility Debt Securitization Authority | ||||
| New York Revenue | 5.000% | 12/15/35 | 2,570 | 2,955 |
52
New York Long-Term Tax-Exempt Fund
| Face | Market | |||
| Maturity | Amount | Value | ||
| Coupon | Date | ($000) | ($000) | |
| Utility Debt Securitization Authority | ||||
| New York Revenue | 5.000% | 12/15/41 | 15,000 | 16,941 |
| Westchester County NY GO | 4.000% | 6/1/15 | 9,760 | 10,138 |
| Westchester County NY GO | 5.000% | 7/1/15 | 9,380 | 9,875 |
| Westchester County NY GO | 5.000% | 7/1/16 | 9,850 | 10,814 |
| Westchester County NY GO | 5.000% | 7/1/17 | 10,340 | 11,729 |
| Westchester County NY Health Care | ||||
| Corp. Revenue | 5.000% | 11/1/14 | 2,000 | 2,037 |
| Westchester County NY Health Care | ||||
| Corp. Revenue | 5.000% | 11/1/21 | 2,500 | 2,853 |
| Westchester County NY Health Care | ||||
| Corp. Revenue | 6.125% | 11/1/37 | 2,100 | 2,378 |
| Westchester County NY Local Development | ||||
| Corp. Revenue (Kendal on Hudson Project) | 2.000% | 1/1/15 | 250 | 251 |
| Westchester County NY Local Development | ||||
| Corp. Revenue (Kendal on Hudson Project) | 5.000% | 1/1/28 | 1,350 | 1,441 |
| Westchester County NY Local Development | ||||
| Corp. Revenue (Kendal on Hudson Project) | 5.000% | 1/1/34 | 1,450 | 1,535 |
| Westchester County NY Local Development | ||||
| Corp. Revenue (Pace University) | 5.000% | 5/1/34 | 1,500 | 1,550 |
| Westchester County NY Local Development | ||||
| Corp. Revenue (Pace University) | 5.500% | 5/1/42 | 3,000 | 3,211 |
| Yonkers NY GO | 5.000% | 10/1/20 | 1,000 | 1,146 |
| 3,311,258 | ||||
| Guam (0.2%) | ||||
| Guam Government Waterworks Authority | ||||
| Water & Waste Water System Revenue | 5.500% | 7/1/43 | 7,000 | 7,472 |
| Puerto Rico (0.0%) | ||||
| Puerto Rico Public Finance Corp. Revenue | 6.000% | 8/1/26 (ETM) | 860 | 1,145 |
| Virgin Islands (0.3%) | ||||
| Virgin Islands Public Finance Authority Revenue | 5.250% | 10/1/14 (Prere.) | 2,000 | 2,034 |
| Virgin Islands Public Finance Authority Revenue | 5.000% | 10/1/25 | 1,100 | 1,180 |
| Virgin Islands Public Finance Authority Revenue | 5.000% | 10/1/32 | 4,900 | 5,282 |
| 8,496 | ||||
| Total Tax-Exempt Municipal Bonds (Cost $3,123,272) | 3,328,371 | |||
| Other Assets and Liabilities (0.8%) | ||||
| Other Assets | 47,492 | |||
| Liabilities | (19,265) | |||
| 28,227 | ||||
| Net Assets (100%) | 3,356,598 | |||
53
New York Long-Term Tax-Exempt Fund
| At May 31, 2014, net assets consisted of: | |
| Amount | |
| ($000) | |
| Paid-in Capital | 3,179,166 |
| Undistributed Net Investment Income | — |
| Accumulated Net Realized Losses | (27,549) |
| Unrealized Appreciation (Depreciation) | |
| Investment Securities | 205,099 |
| Futures Contracts | (118) |
| Net Assets | 3,356,598 |
| Investor Shares—Net Assets | |
| Applicable to 34,783,540 outstanding $.001 par value shares of | |
| beneficial interest (unlimited authorization) | 404,772 |
| Net Asset Value Per Share—Investor Shares | $11.64 |
| Admiral Shares—Net Assets | |
| Applicable to 253,661,579 outstanding $.001 par value shares of | |
| beneficial interest (unlimited authorization) | 2,951,826 |
| Net Asset Value Per Share—Admiral Shares | $11.64 |
See Note A in Notes to Financial Statements.
1 Securities with a value of $802,000 have been segregated as initial margin for open futures contracts.
2 Security exempt from registration under Rule 144A of the Securities Act of 1933. Such securities may be sold in transactions exempt from
registration, normally to qualified institutional buyers. At May 31, 2014, the aggregate value of these securities was $18,345,000,
representing 0.5% of net assets.
3 Security purchased on a when-issued or delayed-delivery basis for which the fund has not taken delivery as of May 31, 2014.
A key to abbreviations and other references follows the Statement of Net Assets.
See accompanying Notes, which are an integral part of the Financial Statements.
54
New York Long-Term Tax-Exempt Fund
Key to Abbreviations
ARS—Auction Rate Security.
BAN—Bond Anticipation Note.
COP—Certificate of Participation.
CP—Commercial Paper.
FR—Floating Rate.
GAN—Grant Anticipation Note.
GO—General Obligation Bond.
PILOT—Payments in Lieu of Taxes.
PUT—Put Option Obligation.
RAN—Revenue Anticipation Note.
TAN—Tax Anticipation Note.
TOB—Tender Option Bond.
TRAN—Tax Revenue Anticipation Note.
VRDO—Variable Rate Demand Obligation.
VRDP—Variable Rate Demand Preferred.
(ETM)—Escrowed to Maturity.
(Prere.)—Prerefunded.
Scheduled principal and interest payments are guaranteed by:
(1) MBIA (Municipal Bond Investors Assurance).
(2) AMBAC (Ambac Assurance Corporation).
(3) FGIC (Financial Guaranty Insurance Company).
(4) AGM (Assured Guaranty Municipal Corporation).
(5) BIGI (Bond Investors Guaranty Insurance).
(6) Connie Lee Inc.
(7) FHA (Federal Housing Authority).
(8) CapMAC (Capital Markets Assurance Corporation).
(9) American Capital Access Financial Guaranty Corporation.
(10) XL Capital Assurance Inc.
(11) CIFG (CDC IXIS Financial Guaranty).
(12) AGC (Assured Guaranty Corporation).
(13) BHAC (Berkshire Hathaway Assurance Corporation).
(14) NPFG (National Public Finance Guarantee Corporation).
(15) BAM (Build America Mutual Assurance Company).
(16) MAC (Municipal Assurance Corporation).
(17) RAA (Radian Asset Assurance Inc.).
The insurance does not guarantee the market value of the municipal bonds.
LOC—Scheduled principal and interest payments are guaranteed by bank letter of credit.
55
New York Long-Term Tax-Exempt Fund
Statement of Operations
| Six Months Ended | |
| May 31, 2014 | |
| ($000) | |
| Investment Income | |
| Income | |
| Interest | 60,982 |
| Total Income | 60,982 |
| Expenses | |
| The Vanguard Group—Note B | |
| Investment Advisory Services | 145 |
| Management and Administrative—Investor Shares | 319 |
| Management and Administrative—Admiral Shares | 1,258 |
| Marketing and Distribution—Investor Shares | 51 |
| Marketing and Distribution—Admiral Shares | 259 |
| Custodian Fees | 19 |
| Shareholders’ Reports—Investor Shares | 4 |
| Shareholders’ Reports—Admiral Shares | 4 |
| Trustees’ Fees and Expenses | 1 |
| Total Expenses | 2,060 |
| Net Investment Income | 58,922 |
| Realized Net Gain (Loss) | |
| Investment Securities Sold | 4,776 |
| Futures Contracts | (700) |
| Realized Net Gain (Loss) | 4,076 |
| Change in Unrealized Appreciation (Depreciation) | |
| Investment Securities | 144,912 |
| Futures Contracts | (118) |
| Change in Unrealized Appreciation (Depreciation) | 144,794 |
| Net Increase (Decrease) in Net Assets Resulting from Operations | 207,792 |
See accompanying Notes, which are an integral part of the Financial Statements.
56
New York Long-Term Tax-Exempt Fund
Statement of Changes in Net Assets
| Six Months Ended | Year Ended | |
| May 31, | November 30, | |
| 2014 | 2013 | |
| ($000) | ($000) | |
| Increase (Decrease) in Net Assets | ||
| Operations | ||
| Net Investment Income | 58,922 | 115,798 |
| Realized Net Gain (Loss) | 4,076 | 18,878 |
| Change in Unrealized Appreciation (Depreciation) | 144,794 | (289,441) |
| Net Increase (Decrease) in Net Assets Resulting from Operations | 207,792 | (154,765) |
| Distributions | ||
| Net Investment Income | ||
| Investor Shares | (7,196) | (15,926) |
| Admiral Shares | (51,726) | (99,872) |
| Realized Capital Gain | ||
| Investor Shares | — | — |
| Admiral Shares | — | — |
| Total Distributions | (58,922) | (115,798) |
| Capital Share Transactions | ||
| Investor Shares | (4,373) | (97,681) |
| Admiral Shares | 123,752 | (40,968) |
| Net Increase (Decrease) from Capital Share Transactions | 119,379 | (138,649) |
| Total Increase (Decrease) | 268,249 | (409,212) |
| Net Assets | ||
| Beginning of Period | 3,088,349 | 3,497,561 |
| End of Period | 3,356,598 | 3,088,349 |
See accompanying Notes, which are an integral part of the Financial Statements.
57
New York Long-Term Tax-Exempt Fund
Financial Highlights
| Investor Shares | ||||||
| Six Months | ||||||
| Ended | ||||||
| For a Share Outstanding | May 31, | Year Ended November 30, | ||||
| Throughout Each Period | 2014 | 2013 | 2012 | 2011 | 2010 | 2009 |
| Net Asset Value, Beginning of Period | $11.11 | $12.03 | $11.24 | $11.04 | $11.01 | $10.13 |
| Investment Operations | ||||||
| Net Investment Income | . 206 | . 397 | .405 | .420 | .429 | .442 |
| Net Realized and Unrealized Gain (Loss) | ||||||
| on Investments | .530 | (.920) | .790 | .200 | .032 | .880 |
| Total from Investment Operations | .736 | (.523) | 1.195 | .620 | .461 | 1.322 |
| Distributions | ||||||
| Dividends from Net Investment Income | (. 206) | (. 397) | (. 405) | (. 420) | (. 429) | (. 442) |
| Distributions from Realized Capital Gains | — | — | — | — | — | — |
| Total Distributions | (. 206) | (. 397) | (. 405) | (. 420) | (. 429) | (. 442) |
| Net Asset Value, End of Period | $11.64 | $11.11 | $12.03 | $11.24 | $11.04 | $11.01 |
| Total Return1 | 6.68% | -4.38% | 10.80% | 5.77% | 4.20% | 13.26% |
| Ratios/Supplemental Data | ||||||
| Net Assets, End of Period (Millions) | $405 | $391 | $528 | $498 | $596 | $732 |
| Ratio of Total Expenses to | ||||||
| Average Net Assets | 0.20% | 0.20% | 0.20% | 0.20% | 0.20% | 0.20% |
| Ratio of Net Investment Income to | ||||||
| Average Net Assets | 3.67% | 3.47% | 3.48% | 3.82% | 3.84% | 4.13% |
| Portfolio Turnover Rate | 26% | 23% | 16% | 22% | 29% | 29% |
| The expense ratio, net income ratio, and turnover rate for the current period have been annualized. | ||||||
| 1 Total returns do not include account service fees that may have applied in the periods shown. Fund prospectuses provide information about | ||||||
| any applicable account service fees. | ||||||
See accompanying Notes, which are an integral part of the Financial Statements.
58
New York Long-Term Tax-Exempt Fund
Financial Highlights
| Admiral Shares | ||||||
| Six Months | ||||||
| Ended | ||||||
| For a Share Outstanding | May 31, | Year Ended November 30, | ||||
| Throughout Each Period | 2014 | 2013 | 2012 | 2011 | 2010 | 2009 |
| Net Asset Value, Beginning of Period | $11.11 | $12.03 | $11.24 | $11.04 | $11.01 | $10.13 |
| Investment Operations | ||||||
| Net Investment Income | . 211 | .406 | .414 | .428 | .438 | .451 |
| Net Realized and Unrealized Gain (Loss) | ||||||
| on Investments | .530 | (.920) | .790 | .200 | .032 | .880 |
| Total from Investment Operations | .741 | (.514) | 1.204 | .628 | .470 | 1.331 |
| Distributions | ||||||
| Dividends from Net Investment Income | (. 211) | (. 406) | (. 414) | (. 428) | (. 438) | (. 451) |
| Distributions from Realized Capital Gains | — | — | — | — | — | — |
| Total Distributions | (. 211) | (. 406) | (. 414) | (. 428) | (. 438) | (. 451) |
| Net Asset Value, End of Period | $11.64 | $11.11 | $12.03 | $11.24 | $11.04 | $11.01 |
| Total Return | 6.73% | -4.31% | 10.89% | 5.85% | 4.28% | 13.35% |
| Ratios/Supplemental Data | ||||||
| Net Assets, End of Period (Millions) | $2,952 | $2,697 | $2,970 | $2,527 | $2,448 | $2,253 |
| Ratio of Total Expenses to | ||||||
| Average Net Assets | 0.12% | 0.12% | 0.12% | 0.12% | 0.12% | 0.12% |
| Ratio of Net Investment Income to | ||||||
| Average Net Assets | 3.75% | 3.55% | 3.56% | 3.90% | 3.92% | 4.21% |
| Portfolio Turnover Rate | 26% | 23% | 16% | 22% | 29% | 29% |
| The expense ratio, net income ratio, and turnover rate for the current period have been annualized. | ||||||
See accompanying Notes, which are an integral part of the Financial Statements.
59
New York Long-Term Tax-Exempt Fund
Notes to Financial Statements
Vanguard New York Long-Term Tax-Exempt Fund is registered under the Investment Company Act of 1940 as an open-end investment company, or mutual fund. The fund invests in debt instruments of municipal issuers whose ability to meet their obligations may be affected by economic and political developments in the state. The fund offers two classes of shares: Investor Shares and Admiral Shares. Investor Shares are available to any investor who meets the fund’s minimum purchase requirements. Admiral Shares are designed for investors who meet certain administrative, service, and account-size criteria.
A. The following significant accounting policies conform to generally accepted accounting principles for U.S. investment companies. The fund consistently follows such policies in preparing its financial statements.
1. Security Valuation: Securities are valued as of the close of trading on the New York Stock Exchange (generally 4 p.m., Eastern time) on the valuation date. Bonds, and temporary cash investments acquired over 60 days to maturity, are valued using the latest bid prices or using valuations based on a matrix system (which considers such factors as security prices, yields, maturities, and ratings), both as furnished by independent pricing services. Other temporary cash investments are valued at amortized cost, which approximates market value. Securities for which market quotations are not readily available, or whose values have been affected by events occurring before the fund’s pricing time but after the close of the securities’ primary markets, are valued by methods deemed by the board of trustees to represent fair value.
2. Futures Contracts: The fund uses futures contracts to invest in fixed income asset classes with greater efficiency and lower cost than is possible through direct investment, to add value when these instruments are attractively priced, or to adjust sensitivity to changes in interest rates. The primary risks associated with the use of futures contracts are imperfect correlation between changes in market values of bonds held by the fund and the prices of futures contracts, and the possibility of an illiquid market. Counterparty risk involving futures is mitigated because a regulated clearinghouse is the counterparty instead of the clearing broker. To further mitigate counterparty risk, the fund trades futures contracts on an exchange, monitors the financial strength of its clearing brokers and clearinghouse, and has entered into clearing agreements with its clearing brokers. The clearinghouse imposes initial margin requirements to secure the fund’s performance and requires daily settlement of variation margin representing changes in the market value of each contract.
Futures contracts are valued at their quoted daily settlement prices. The aggregate notional amounts of the contracts are not recorded in the Statement of Net Assets. Fluctuations in the value of the contracts are recorded in the Statement of Net Assets as an asset (liability) and in the Statement of Operations as unrealized appreciation (depreciation) until the contracts are closed, when they are recorded as realized futures gains (losses).
During the six months ended May 31, 2014, the fund’s average investments in long and short futures contracts each represented less than 1% of net assets, based on quarterly average aggregate settlement values.
3. Federal Income Taxes: The fund intends to continue to qualify as a regulated investment company and distribute all of its income. Management has analyzed the fund’s tax positions taken for all open federal income tax years (November 30, 2010–2013), and for the period ended May 31, 2014, and has concluded that no provision for federal income tax is required in the fund’s financial statements.
60
New York Long-Term Tax-Exempt Fund
4. Distributions: Distributions from net investment income are declared daily and paid on the first business day of the following month. Annual distributions from realized capital gains, if any, are recorded on the ex-dividend date.
5. Credit Facility: The fund and certain other funds managed by The Vanguard Group participate in a $2.89 billion committed credit facility provided by a syndicate of lenders pursuant to a credit agreement that may be renewed annually; each fund is individually liable for its borrowings, if any, under the credit facility. Borrowings may be utilized for temporary and emergency purposes, and are subject to the fund’s regulatory and contractual borrowing restrictions. The participating funds are charged administrative fees and an annual commitment fee of 0.06% of the undrawn amount of the facility; these fees are allocated to the funds based on a method approved by the fund’s board of trustees and included in Management and Administrative expenses on the fund’s Statement of Operations. Any borrowings under this facility bear interest at a rate equal to the higher of the federal funds rate or LIBOR reference rate plus an agreed-upon spread.
The fund had no borrowings outstanding at May 31, 2014, or at any time during the period then ended.
6. Other: Interest income is accrued daily. Premiums and discounts on debt securities purchased are amortized and accreted, respectively, to interest income over the lives of the respective securities. Security transactions are accounted for on the date securities are bought or sold. Costs used to determine realized gains (losses) on the sale of investment securities are those of the specific securities sold.
Each class of shares has equal rights as to assets and earnings, except that each class separately bears certain class-specific expenses related to maintenance of shareholder accounts (included in Management and Administrative expenses) and shareholder reporting. Marketing and distribution expenses are allocated to each class of shares based on a method approved by the board of trustees. Income, other non-class-specific expenses, and gains and losses on investments are allocated to each class of shares based on its relative net assets.
B. The Vanguard Group furnishes at cost investment advisory, corporate management, administrative, marketing, and distribution services. The costs of such services are allocated to the fund based on methods approved by the board of trustees. The fund has committed to provide up to 0.40% of its net assets in capital contributions to Vanguard. At May 31, 2014, the fund had contributed capital of $346,000 to Vanguard (included in Other Assets), representing 0.01% of the fund’s net assets and 0.14% of Vanguard’s capitalization. The fund’s trustees and officers are also directors and officers of Vanguard.
C. Various inputs may be used to determine the value of the fund’s investments. These inputs are summarized in three broad levels for financial statement purposes. The inputs or methodologies used to value securities are not necessarily an indication of the risk associated with investing in those securities.
Level 1—Quoted prices in active markets for identical securities.
Level 2—Other significant observable inputs (including quoted prices for similar securities, interest rates, prepayment speeds, credit risk, etc.).
Level 3—Significant unobservable inputs (including the fund’s own assumptions used to determine the fair value of investments).
61
New York Long-Term Tax-Exempt Fund
| The following table summarizes the market value of the fund’s investments as of May 31, 2014, based | |||
| on the inputs used to value them: | |||
| Level 1 | Level 2 | Level 3 | |
| Investments | ($000) | ($000) | ($000) |
| Tax-Exempt Municipal Bonds | — | 3,328,371 | — |
| Futures Contracts—Assets1 | 44 | — | — |
| Total | 44 | 3,328,371 | — |
| 1 Represents variation margin on the last day of the reporting period. | |||
| D. At May 31, 2014, the aggregate settlement value of open futures contracts and the related | ||||
| unrealized appreciation (depreciation) were: | ||||
| ($000) | ||||
| Aggregate | ||||
| Number of | Settlement | Unrealized | ||
| Long (Short) | Value | Appreciation | ||
| Futures Contracts | Expiration | Contracts | Long (Short) | (Depreciation) |
| 10-Year U.S. Treasury Note | September 2014 | (400) | (50,206) | (118) |
Unrealized appreciation (depreciation) on open futures contracts is required to be treated as realized gain (loss) for tax purposes.
E. Capital gain distributions are determined on a tax basis and may differ from realized capital gains for financial reporting purposes. Differences may be permanent or temporary. Permanent differences are reclassified among capital accounts in the financial statements to reflect their tax character. Temporary differences arise when gains or losses are recognized in different periods for financial statement and tax purposes. These differences will reverse at some time in the future.
The fund’s tax-basis capital gains and losses are determined only at the end of each fiscal year. For tax purposes, at November 30, 2013, the fund had available capital losses totaling $31,057,000 to offset future net capital gains of $23,603,000 through November 30, 2017, and $7,454,000 through November 30, 2019. The fund will use these capital losses to offset net taxable capital gains, if any, realized during the year ending November 30, 2014; should the fund realize net capital losses for the year, the losses will be added to the loss carryforward balance above.
At May 31, 2014, the cost of investment securities for tax purposes was $3,123,840,000. Net unrealized appreciation of investment securities for tax purposes was $204,531,000, consisting of unrealized gains of $209,682,000 on securities that had risen in value since their purchase and $5,151,000 in unrealized losses on securities that had fallen in value since their purchase.
F. During the six months ended May 31, 2014, the fund purchased $405,483,000 of investment securities and sold $392,619,000 of investment securities, other than temporary cash investments.
62
New York Long-Term Tax-Exempt Fund
| G. Capital share transactions for each class of shares were: | ||||
| Six Months Ended | Year Ended | |||
| May 31, 2014 | November 30, 2013 | |||
| Amount | Shares | Amount | Shares | |
| ($000) | (000) | ($000) | (000) | |
| Investor Shares | ||||
| Issued | 58,643 | 5,156 | 94,737 | 8,173 |
| Issued in Lieu of Cash Distributions | 5,865 | 516 | 12,478 | 1,091 |
| Redeemed | (68,881) | (6,089) | (204,896) | (17,925) |
| Net Increase (Decrease)—Investor Shares | (4,373) | (417) | (97,681) | (8,661) |
| Admiral Shares | ||||
| Issued | 287,517 | 25,385 | 521,392 | 45,376 |
| Issued in Lieu of Cash Distributions | 36,261 | 3,191 | 71,456 | 6,259 |
| Redeemed | (200,026) | (17,812) | (633,816) | (55,535) |
| Net Increase (Decrease)—Admiral Shares | 123,752 | 10,764 | (40,968) | (3,900) |
H. Management has determined that no material events or transactions occurred subsequent to May 31, 2014, that would require recognition or disclosure in these financial statements.
63
About Your Fund’s Expenses
As a shareholder of the fund, you incur ongoing costs, which include costs for portfolio management, administrative services, and shareholder reports (like this one), among others. Operating expenses, which are deducted from a fund’s gross income, directly reduce the investment return of the fund.
A fund’s expenses are expressed as a percentage of its average net assets. This figure is known as the expense ratio. The following examples are intended to help you understand the ongoing costs (in dollars) of investing in your fund and to compare these costs with those of other mutual funds. The examples are based on an investment of $1,000 made at the beginning of the period shown and held for the entire period.
The accompanying table illustrates your fund’s costs in two ways:
• Based on actual fund return. This section helps you to estimate the actual expenses that you paid over the period. The ”Ending Account Value“ shown is derived from the fund‘s actual return, and the third column shows the dollar amount that would have been paid by an investor who started with $1,000 in the fund. You may use the information here, together with the amount you invested, to estimate the expenses that you paid over the period.
To do so, simply divide your account value by $1,000 (for example, an $8,600 account value divided by $1,000 = 8.6), then multiply the result by the number given for your fund under the heading ”Expenses Paid During Period.“
• Based on hypothetical 5% yearly return. This section is intended to help you compare your fund‘s costs with those of other mutual funds. It assumes that the fund had a yearly return of 5% before expenses, but that the expense ratio is unchanged. In this case—because the return used is not the fund’s actual return—the results do not apply to your investment. The example is useful in making comparisons because the Securities and Exchange Commission requires all mutual funds to calculate expenses based on a 5% return. You can assess your fund’s costs by comparing this hypothetical example with the hypothetical examples that appear in shareholder reports of other funds.
Note that the expenses shown in the table are meant to highlight and help you compare ongoing costs only and do not reflect transaction costs incurred by the fund for buying and selling securities. Further, the expenses do not include any purchase, redemption, or account service fees described in the fund prospectus. If such fees were applied to your account, your costs would be higher. Your fund does not carry a “sales load.”
The calculations assume no shares were bought or sold during the period. Your actual costs may have been higher or lower, depending on the amount of your investment and the timing of any purchases or redemptions.
You can find more information about the fund’s expenses, including annual expense ratios, in the Financial Statements section of this report. For additional information on operating expenses and other shareholder costs, please refer to your fund’s current prospectus.
64
| Six Months Ended May 31, 2014 | |||
| Beginning | Ending | Expenses | |
| Account Value | Account Value | Paid During | |
| 11/30/2013 | 5/31/2014 | Period | |
| Based on Actual Fund Return | |||
| New York Tax-Exempt Money Market Fund | $1,000.00 | $1,000.05 | $0.40 |
| New York Long-Term Tax-Exempt Fund | |||
| Investor Shares | $1,000.00 | $1,066.84 | $1.03 |
| Admiral Shares | 1,000.00 | 1,067.27 | 0.62 |
| Based on Hypothetical 5% Yearly Return | |||
| New York Tax-Exempt Money Market Fund | $1,000.00 | $1,024.53 | $0.40 |
| New York Long-Term Tax-Exempt Fund | |||
| Investor Shares | $1,000.00 | $1,023.93 | $1.01 |
| Admiral Shares | 1,000.00 | 1,024.33 | 0.61 |
The calculations are based on expenses incurred in the most recent six-month period. The fund’s annualized six-month expense ratios for that
period are: for the New York Tax-Exempt Money Market Fund, 0.08%; and for the New York Long-Term Tax-Exempt Fund, 0.20% for Investor
Shares and 0.12% for Admiral Shares. (The six-month expense ratio for the New York Tax-Exempt Money Market Fund reflects a temporary
reduction in operating expenses, described in Note B of the Notes to Financial Statements. Before the reduction, the fund’s annualized
six-month expense ratio was 0.16%.) The dollar amounts shown as “Expenses Paid” are equal to the annualized expense ratio multiplied by
the average account value over the period, multiplied by the number of days in the most recent six-month period, then divided by the number
of days in the most recent 12-month period.
65
Trustees Approve Advisory Arrangements
The board of trustees of Vanguard New York Tax-Exempt Money Market Fund and Vanguard New York Long-Term Tax-Exempt Fund has renewed each fund’s investment advisory arrangement with The Vanguard Group, Inc. (Vanguard). Vanguard—through its Fixed Income Group—serves as the investment advisor for each of the funds. The board determined that continuing the funds’ internalized management structure was in the best interests of each fund and its shareholders.
The board based its decision upon an evaluation of the advisor’s investment staff, portfolio management process, and performance. The trustees considered the factors discussed below, among others. However, no single factor determined whether the board approved the arrangements. Rather, it was the totality of the circumstances that drove the board’s decision.
Nature, extent, and quality of services
The board considered the quality of each fund’s investment management services over both the short and long term, and took into account the organizational depth and stability of the advisor. The board noted that Vanguard has been managing investments for more than three decades. The Fixed Income Group adheres to a sound, disciplined investment management process; the team has considerable experience, stability, and depth.
The board concluded that Vanguard’s experience, stability, depth, and performance, among other factors, warranted continuation of each advisory arrangement.
Investment performance
The board considered the short- and long-term performance of each fund, including any periods of outperformance or underperformance relative to a benchmark index (as applicable) and peer group. The board concluded that the performance was such that each advisory arrangement should continue. Information about the funds’ most recent performance can be found in the Performance Summary sections of this report.
Cost
The board concluded that each fund’s expense ratio was well below the average expense ratio charged by funds in its peer group and that each fund’s advisory fee rate was also well below its peer-group average. Information about the funds’ expenses appears in the About Your Fund’s Expenses section of this report as well as in the Financial Statements sections.
The board does not conduct a profitability analysis of Vanguard, because of Vanguard’s unique “at-cost” structure. Unlike most other mutual fund management companies, Vanguard is owned by the funds it oversees, and produces “profits” only in the form of reduced expenses for fund shareholders.
The benefit of economies of scale
The board concluded that each fund’s at-cost arrangement with Vanguard ensures that the funds will realize economies of scale as they grow, with the cost to shareholders declining as fund assets increase.
The board will consider whether to renew the advisory arrangements again after a one-year period.
66
Glossary
7-Day SEC Yield and 30-Day SEC Yield. A money market fund’s 7-day SEC yield is calculated by annualizing its income distributions for the previous seven days, as required by the U.S. Securities and Exchange Commission. For other funds, 30-day SEC yield is derived using a formula specified by the commission. Under the formula, data related to the fund’s security holdings in the previous 30 days are used to calculate the fund’s hypothetical net income for that period, which is then annualized and divided by the fund’s estimated average net assets over the calculation period. For the purposes of this calculation, a security’s income is based on its current market yield to maturity (for bonds), its actual income (for asset-backed securities), or its projected dividend yield (for stocks). Because the SEC yield represents hypothetical annualized income, it will differ—at times significantly—from the fund’s actual experience. As a result, the fund’s income distributions may be higher or lower than implied by the SEC yield.
Average Coupon. The average interest rate paid on the fixed income securities held by a fund. It is expressed as a percentage of face value.
Average Duration. An estimate of how much the value of the bonds held by a fund will fluctuate in response to a change in interest rates. To see how the value could change, multiply the average duration by the change in rates. If interest rates rise by 1 percentage point, the value of the bonds in a fund with an average duration of five years would decline by about 5%. If rates decrease by a percentage point, the value would rise by 5%.
Average Stated Maturity. The average length of time until fixed income securities held by a fund reach maturity and are repaid using the maturity date of the security. The figure reflects the proportion of fund assets represented by each security; it also reflects any futures contracts held. In general, the longer the average stated maturity, the more a fund’s share price will fluctuate in response to changes in market interest rates.
Average Weighted Maturity. The average length of time until fixed income securities held by a fund reach maturity and are repaid. The figure reflects the proportion of fund assets represented by each security.
Beta. A measure of the magnitude of a fund’s past share-price fluctuations in relation to the ups and downs of a given market index. The index is assigned a beta of 1.00. Compared with a given index, a fund with a beta of 1.20 typically would have seen its share price rise or fall by 12% when the index rose or fell by 10%. For this report, beta is based on returns over the past 36 months for both the fund and the index. Note that a fund’s beta should be reviewed in conjunction with its R-squared (see definition). The lower the R-squared, the less correlation there is between the fund and the index, and the less reliable beta is as an indicator of volatility.
67
Credit Quality. For Vanguard money market funds, the Distribution by Credit Quality table includes tier ratings for consistency with SEC Rule 2a-7 under the Investment Company Act of 1940, which governs money market funds. A First Tier security is one that is eligible for money market funds and has been rated in the highest short-term rating category for debt obligations by the requisite nationally recognized statistical rating organizations. An unrated security is First Tier if it represents quality comparable to that of a rated security, as determined in accordance with SEC Rule 2a-7. A Second Tier security is one that is eligible for money market funds and is not a First Tier security. For Vanguard tax-exempt bond funds, credit-quality ratings are measured on a scale that generally ranges from AAA (highest) to D (lowest). “Not Rated” is used to classify securities for which a rating is not available. Credit-quality ratings are obtained from Moody’s and S&P, and the higher rating for each issue is used.
Expense Ratio. A fund’s total annual operating expenses expressed as a percentage of the fund’s average net assets. The expense ratio includes management and administrative expenses, but does not include the transaction costs of buying and selling portfolio securities.
Inception Date. The date on which the assets of a fund (or one of its share classes) are first invested in accordance with the fund’s investment objective. For funds with a subscription period, the inception date is the day after that period ends. Investment performance is measured from the inception date.
R-Squared. A measure of how much of a fund’s past returns can be explained by the returns from the market in general, as measured by a given index. If a fund’s total returns were precisely synchronized with an index’s returns, its R-squared would be 1.00. If the fund’s returns bore no relationship to the index’s returns, its R-squared would be 0. For this report, R-squared is based on returns over the past 36 months for both the fund and the index.
Short-Term Reserves. The percentage of a fund invested in highly liquid, short-term securities that can be readily converted to cash.
Yield to Maturity. The rate of return an investor would receive if the fixed income securities held by a fund were held to their maturity dates.
68
This page intentionally left blank.
This page intentionally left blank.
This page intentionally left blank.
The People Who Govern Your Fund
The trustees of your mutual fund are there to see that the fund is operated and managed in your best interests since, as a shareholder, you are a part owner of the fund. Your fund’s trustees also serve on the board of directors of The Vanguard Group, Inc., which is owned by the Vanguard funds and provides services to them on an at-cost basis.
A majority of Vanguard’s board members are independent, meaning that they have no affiliation with Vanguard or the funds they oversee, apart from the sizable personal investments they have made as private individuals. The independent board members have distinguished backgrounds in business, academia, and public service. Each of the trustees and executive officers oversees 177 Vanguard funds.
The following table provides information for each trustee and executive officer of the fund. More information about the trustees is in the Statement of Additional Information, which can be obtained, without charge, by contacting Vanguard at 800-662-7447, or online at vanguard.com.
| InterestedTrustee1 | and Delphi Automotive LLP (automotive components); |
| Senior Advisor at New Mountain Capital. | |
| F. William McNabb III | |
| Born 1957. Trustee Since July 2009. Chairman of the | Amy Gutmann |
| Board. Principal Occupation(s) During the Past Five | Born 1949. Trustee Since June 2006. Principal |
| Years: Chairman of the Board of The Vanguard Group, | Occupation(s) During the Past Five Years: President of |
| Inc., and of each of the investment companies served | the University of Pennsylvania; Christopher H. Browne |
| by The Vanguard Group, since January 2010; Director | Distinguished Professor of Political Science, School of |
| of The Vanguard Group since 2008; Chief Executive | Arts and Sciences, and Professor of Communication, |
| Officer and President of The Vanguard Group, and of | Annenberg School for Communication, with secondary |
| each of the investment companies served by The | faculty appointments in the Department of Philosophy, |
| Vanguard Group, since 2008; Director of Vanguard | School of Arts and Sciences, and at the Graduate |
| Marketing Corporation; Managing Director of The | School of Education, University of Pennsylvania; |
| Vanguard Group (1995–2008). | Trustee of the National Constitution Center; Chair |
| of the Presidential Commission for the Study of | |
| Bioethical Issues. | |
| IndependentTrustees | |
| JoAnn Heffernan Heisen | |
| Emerson U. Fullwood | Born 1950. Trustee Since July 1998. Principal |
| Occupation(s) During the Past Five Years: Corporate | |
| Born 1948. Trustee Since January 2008. Principal | Vice President and Chief Global Diversity Officer |
| Occupation(s) During the Past Five Years: Executive | (retired 2008) and Member of the Executive |
| Chief Staff and Marketing Officer for North America | Committee (1997–2008) of Johnson & Johnson |
| and Corporate Vice President (retired 2008) of Xerox | (pharmaceuticals/medical devices/consumer |
| Corporation (document management products and | products); Director of Skytop Lodge Corporation |
| services); Executive in Residence and 2009–2010 | (hotels), the University Medical Center at Princeton, |
| Distinguished Minett Professor at the Rochester | the Robert Wood Johnson Foundation, and the Center |
| Institute of Technology; Director of SPX Corporation | for Talent Innovation; Member of the Advisory Board |
| (multi-industry manufacturing), the United Way of | of the Maxwell School of Citizenship and Public Affairs |
| Rochester, Amerigroup Corporation (managed health | at Syracuse University. |
| care), the University of Rochester Medical Center, | |
| Monroe Community College Foundation, and North | F. Joseph Loughrey |
| Carolina A&T University. | Born 1949. Trustee Since October 2009. Principal |
| Occupation(s) During the Past Five Years: President | |
| Rajiv L. Gupta | and Chief Operating Officer (retired 2009) of Cummins |
| Born 1945. Trustee Since December 2001.2 | Inc. (industrial machinery); Chairman of the Board |
| Principal Occupation(s) During the Past Five Years: | of Hillenbrand, Inc. (specialized consumer services), |
| Chairman and Chief Executive Officer (retired 2009) | and of Oxfam America; Director of SKF AB (industrial |
| and President (2006–2008) of Rohm and Haas Co. | machinery), Hyster-Yale Materials Handling, Inc. |
| (chemicals); Director of Tyco International, Ltd. | (forklift trucks), the Lumina Foundation for Education, |
| (diversified manufacturing and services), Hewlett- | |
| Packard Co. (electronic computer manufacturing), |
| and the V Foundation for Cancer Research; Member | Executive Officers | |
| of the Advisory Council for the College of Arts and | ||
| Letters and of the Advisory Board to the Kellogg | Glenn Booraem | |
| Institute for International Studies, both at the | Born 1967. Controller Since July 2010. Principal | |
| University of Notre Dame. | Occupation(s) During the Past Five Years: Principal | |
| of The Vanguard Group, Inc.; Controller of each of | ||
| Mark Loughridge | the investment companies served by The Vanguard | |
| Born 1953. Trustee Since March 2012. Principal | Group; Assistant Controller of each of the investment | |
| Occupation(s) During the Past Five Years: Senior Vice | companies served by The Vanguard Group (2001–2010). | |
| President and Chief Financial Officer (retired 2013) | ||
| at IBM (information technology services); Fiduciary | Thomas J. Higgins | |
| Member of IBM’s Retirement Plan Committee (2004– | Born 1957. Chief Financial Officer Since September | |
| 2013); Member of the Council on Chicago Booth. | 2008. Principal Occupation(s) During the Past Five | |
| Years: Principal of The Vanguard Group, Inc.; Chief | ||
| Scott C. Malpass | Financial Officer of each of the investment companies | |
| Born 1962. Trustee Since March 2012. Principal | served by The Vanguard Group; Treasurer of each of | |
| Occupation(s) During the Past Five Years: Chief | the investment companies served by The Vanguard | |
| Investment Officer and Vice President at the University | Group (1998–2008). | |
| of Notre Dame; Assistant Professor of Finance at the | ||
| Mendoza College of Business at Notre Dame; Member | Kathryn J. Hyatt | |
| of the Notre Dame 403(b) Investment Committee; | Born 1955. Treasurer Since November 2008. Principal | |
| Board Member of TIFF Advisory Services, Inc. | Occupation(s) During the Past Five Years: Principal of | |
| (investment advisor); Member of the Investment | The Vanguard Group, Inc.; Treasurer of each of the | |
| Advisory Committees of the Financial Industry | investment companies served by The Vanguard | |
| Regulatory Authority (FINRA) and of Major League | Group; Assistant Treasurer of each of the investment | |
| Baseball. | companies served by The Vanguard Group (1988–2008). | |
| André F. Perold | Heidi Stam | |
| Born 1952. Trustee Since December 2004. Principal | Born 1956. Secretary Since July 2005. Principal | |
| Occupation(s) During the Past Five Years: George | Occupation(s) During the Past Five Years: Managing | |
| Gund Professor of Finance and Banking, Emeritus | Director of The Vanguard Group, Inc.; General Counsel | |
| at the Harvard Business School (retired 2011); | of The Vanguard Group; Secretary of The Vanguard | |
| Chief Investment Officer and Managing Partner of | Group and of each of the investment companies | |
| HighVista Strategies LLC (private investment firm); | served by The Vanguard Group; Director and Senior | |
| Director of Rand Merchant Bank; Overseer of the | Vice President of Vanguard Marketing Corporation. | |
| Museum of Fine Arts Boston. | ||
| Vanguard Senior ManagementTeam | ||
| Alfred M. Rankin, Jr. | ||
| Born 1941. Trustee Since January 1993. Principal | Mortimer J. Buckley | Chris D. McIsaac |
| Occupation(s) During the Past Five Years: Chairman, | Kathleen C. Gubanich | Michael S. Miller |
| President, and Chief Executive Officer of NACCO | Paul A. Heller | James M. Norris |
| Industries, Inc. (housewares/lignite), and of Hyster- | Martha G. King | Glenn W. Reed |
| Yale Materials Handling, Inc. (forklift trucks); Chairman | John T. Marcante | |
| of the Board of University Hospitals of Cleveland. | ||
| Peter F. Volanakis | Chairman Emeritus and Senior Advisor | |
| Born 1955. Trustee Since July 2009. Principal | ||
| Occupation(s) During the Past Five Years: President | John J. Brennan | |
| and Chief Operating Officer (retired 2010) of Corning | Chairman, 1996–2009 | |
| Incorporated (communications equipment); Trustee of | Chief Executive Officer and President, 1996–2008 | |
| Colby-Sawyer College; Member of the Advisory Board | ||
| of the Norris Cotton Cancer Center and of the Advisory | Founder | |
| Board of the Parthenon Group (strategy consulting). | ||
| John C. Bogle | ||
| Chairman and Chief Executive Officer, 1974–1996 | ||
1 Mr. McNabb is considered an “interested person,” as defined in the Investment Company Act of 1940, because he is an officer of the
Vanguard funds.
2 December 2002 for Vanguard Equity Income Fund, the Vanguard Municipal Bond Funds, and the Vanguard State Tax-Exempt Funds.
 | ||
| P.O. Box 2600 | ||
| Valley Forge, PA 19482-2600 | ||
| Connect with Vanguard® > vanguard.com | ||
| Fund Information > 800-662-7447 | CFA® is a trademark owned by CFA Institute. | |
| Direct Investor Account Services > 800-662-2739 | ||
| Institutional Investor Services > 800-523-1036 | ||
| Text Telephone for People | ||
| With Hearing Impairment > 800-749-7273 | ||
| This material may be used in conjunction | ||
| with the offering of shares of any Vanguard | ||
| fund only if preceded or accompanied by | ||
| the fund’s current prospectus. | ||
| All comparative mutual fund data are from Lipper, a | ||
| Thomson Reuters Company, or Morningstar, Inc., unless | ||
| otherwise noted. | ||
| You can obtain a free copy of Vanguard’s proxy voting | ||
| guidelines by visiting vanguard.com/proxyreporting or by | ||
| calling Vanguard at 800-662-2739. The guidelines are | ||
| also available from the SEC’s website, sec.gov. In | ||
| addition, you may obtain a free report on how your fund | ||
| voted the proxies for securities it owned during the 12 | ||
| months ended June 30. To get the report, visit either | ||
| vanguard.com/proxyreporting or sec.gov. | ||
| You can review and copy information about your fund at | ||
| the SEC’s Public Reference Room in Washington, D.C. To | ||
| find out more about this public service, call the SEC at | ||
| 202-551-8090. Information about your fund is also | ||
| available on the SEC’s website, and you can receive | ||
| copies of this information, for a fee, by sending a | ||
| request in either of two ways: via e-mail addressed to | ||
| publicinfo@sec.gov or via regular mail addressed to the | ||
| Public Reference Section, Securities and Exchange | ||
| Commission, Washington, DC 20549-1520. | ||
| © 2014 The Vanguard Group, Inc. | ||
| All rights reserved. | ||
| Vanguard Marketing Corporation, Distributor. | ||
| Q762 072014 | ||
Item 2: Code of Ethics.
Not Applicable.
Item 3:
Not Applicable.
Item 4: Principal Accountant Fees and Services.
Not. Applicable.
Item 5: Audit Committee of Listed Registrants.
Not Applicable.
Item 6: Investments.
Not Applicable.
Item 7: Disclosure of Proxy Voting Policies and Procedures for Closed-End Management Investment Companies.
Not Applicable.
Item 8: Portfolio Managers of Closed-End Management Investment Companies.
Not Applicable.
Item 9: Purchase of Equity Securities by Closed-End Management Investment Company and Affiliated Purchasers.
Not Applicable.
Item 10: Submission of Matters to a Vote of Security Holders.
Not Applicable.
Item 11: Controls and Procedures.
(a) Disclosure Controls and Procedures. The Principal Executive and Financial Officers concluded that the Registrant’s Disclosure Controls and Procedures are effective based on their evaluation of the Disclosure Controls and Procedures as of a date within 90 days of the filing date of this report.
(b) Internal Control Over Financial Reporting. There were no significant changes in Registrant’s Internal Control Over Financial Reporting or in other factors that could
significantly affect this control subsequent to the date of the evaluation, including any corrective actions with regard to significant deficiencies and material weaknesses.
Item 12: Exhibits.
(a) Certifications.
Pursuant to the requirements of the Securities Exchange Act of 1934 and the Investment Company Act of 1940, the registrant has duly caused this report to be signed on its behalf by the undersigned, thereunto duly authorized.
| VANGUARD NEW YORK TAX-FREE FUNDS | |
| BY: | /s/ F. WILLIAM MCNABB III* |
| F. WILLIAM MCNABB III | |
| CHIEF EXECUTIVE OFFICER | |
Date: July 17, 2014
Pursuant to the requirements of the Securities Exchange Act of 1934 and the Investment Company Act of 1940, this report has been signed below by the following persons on behalf of the registrant and in the capacities and on the dates indicated.
| VANGUARD NEW YORK TAX-FREE FUNDS | |
| BY: | /s/ F. WILLIAM MCNABB III* |
| F. WILLIAM MCNABB III | |
| CHIEF EXECUTIVE OFFICER | |
| Date: July 17, 2014 | |
| VANGUARD NEW YORK TAX-FREE FUNDS | |
| BY: | /s/ THOMAS J. HIGGINS* |
| THOMAS J. HIGGINS | |
| CHIEF FINANCIAL OFFICER | |
Date: July 17, 2014
* By: /s/ Heidi Stam
Heidi Stam, pursuant to a Power of Attorney filed on April 22, 2014 see file Number
2-17620, Incorporated by Reference.