UNITED STATES
SECURITIES AND EXCHANGE COMMISSION
Washington, D.C. 20549
FORM N-CSR
CERTIFIED SHAREHOLDER REPORT
OF
REGISTERED MANAGEMENT INVESTMENT COMPANIES
| Investment Company Act file number: 811-04570 | ||
| Name of Registrant: | Vanguard New York Tax-Free Funds | |
Address of Registrant: | P.O. Box 2600 | |
| Valley Forge, PA 19482 | ||
| Name and address of agent for service: | Anne E. Robinson, Esquire | |
| P.O. Box 876 | ||
| Valley Forge, PA 19482 | ||
| Registrant’s telephone number, including area code: (610) 669-1000 |
Date of fiscal year end: November 30 |
Date of reporting period: November 30, 2016 – May 31, 2017 |
Item 1: Reports to Shareholders |
Semiannual Report | May 31, 2017
Vanguard New York Tax-Exempt Funds
Vanguard New York Municipal Money Market Fund
Vanguard New York Long-Term Tax-Exempt Fund
A new format, unwavering commitment
As you begin reading this report, you’ll notice that we’ve made some improvements to the opening sections—based on feedback from you, our clients.
Page 1 starts with a new ”Your Fund’s Performance at a Glance,” a concise, handy summary of how your fund performed during the period.
In the renamed ”Chairman’s Perspective,” Bill McNabb will focus on enduring principles and investment insights.
We’ve modified some tables, and eliminated some redundancy, but we haven’t removed any information.
At Vanguard, we’re always looking for better ways to communicate and to help you make sound investment decisions. Thank you for entrusting your assets to us.
| Contents | |
| Your Fund’s Performance at a Glance. | 1 |
| Chairman’s Perspective. | 3 |
| Advisor’s Report. | 7 |
| New York Municipal Money Market Fund. | 11 |
| New York Long-Term Tax-Exempt Fund. | 29 |
| About Your Fund’s Expenses. | 77 |
| Trustees Approve Advisory Arrangements. | 79 |
| Glossary. | 81 |
Please note: The opinions expressed in this report are just that—informed opinions. They should not be considered promises or advice.
Also, please keep in mind that the information and opinions cover the period through the date on the front of this report. Of course, the
risks of investing in your fund are spelled out in the prospectus.
See the Glossary for definitions of investment terms used in this report.
About the cover: No matter what language you speak, Vanguard has one consistent message and set of principles. Our primary
focus is on you, our clients. We conduct our business with integrity as a faithful steward of your assets. This message is shown
translated into seven languages, reflecting our expanding global presence.
Your Fund’s Performance at a Glance
• For the six months ended May 31, 2017, Vanguard New York Long-Term Tax-Exempt Fund returned over 5%. That put it a little ahead of its benchmark and more than half a percentage point ahead of the average return of its peers. Vanguard New York Municipal Money Market Fund (formerly Vanguard New York Tax-Exempt Money Market Fund) returned 0.30%, outpacing its peer-group average.
• Demand for municipal bonds slumped in the wake of the U.S. presidential election but later rebounded. Supply in New York remained roughly on par with the year-earlier period.
• Because longer-dated and lower-quality investment-grade bonds were hit the hardest, their recovery was more pronounced. The bond fund’s structural tilt toward those securities compared with its benchmark contributed to its outperformance.
• Money market returns were modest as short-term interest rates have edged up since last summer but remain low from a historical perspective.
| Total Returns: Six Months Ended May 31, 2017 | |||||
| Taxable- | |||||
| SEC | Equivalent | Income | Capital | Total | |
| Yield | Yield | Returns | Returns | Returns | |
| Vanguard New York Municipal Money Market Fund | 0.65% | 1.26% | 0.30% | 0.00% | 0.30% |
| New York Tax-Exempt Money Market Funds | |||||
| Average | 0.11 | ||||
| New York Tax-Exempt Money Market Funds Average: Derived from data provided by Lipper, a Thomson Reuters Company. | |||||
| Vanguard New York Long-Term Tax-Exempt Fund | |||||
| Investor Shares | 2.19% | 4.24% | 1.68% | 3.51% | 5.19% |
| Admiral™ Shares | 2.30 | 4.46 | 1.73 | 3.51 | 5.24 |
| Bloomberg Barclays NY Municipal Bond Index | 5.11 | ||||
| New York Municipal Debt Funds Average | 4.55 | ||||
| New York Municipal Debt Funds Average: Derived from data provided by Lipper, a Thomson Reuters Company. | |||||
7-day SEC yield for the New York Municipal Money Market Fund; 30-day SEC yield for the New York Long-Term Tax-Exempt Fund.
The calculation of taxable-equivalent yield assumes a typical itemized tax return and is based on the maximum federal tax rate of 43.4% and
the maximum income tax rate for the state. Local taxes were not considered. Please see the prospectus for a detailed explanation of the
calculation.
Admiral Shares carry lower expenses and are available to investors who meet certain account-balance requirements.
1
| Expense Ratios | |||
| Your Fund Compared With Its Peer Group | |||
| Investor | Admiral | Peer Group | |
| Shares | Shares | Average | |
| New York Municipal Money Market Fund | 0.16% | — | 0.17% |
| New York Long-Term Tax-Exempt Fund | 0.19 | 0.09% | 0.94 |
The fund expense ratios shown are from the prospectus dated March 28, 2017, and represent estimated costs for the current fiscal year. For
the six months ended May 31, 2017, the funds’ annualized expense ratios were: for the New York Municipal Money Market Fund, 0.16%; and
for the New York Long-Term Tax-Exempt Fund, 0.19% for Investor Shares and 0.09% for Admiral Shares. Peer-group expense ratios are
derived from data provided by Lipper, a Thomson Reuters Company, and capture information through year-end 2016.
Peer groups: For the New York Municipal Money Market Fund, New York Tax-Exempt Money Market Funds; for the New York Long-Term
Tax-Exempt Fund, New York Municipal Debt Funds. In most, if not all, cases, the expense ratios for funds in the peer groups are based on net
operating expenses after reimbursement and/or fee waivers by fund sponsors. In contrast, the Vanguard money market funds’ expense ratios
in the table above do not reflect expense reductions.
2
Chairman’s Perspective

Bill McNabb
Chairman and Chief Executive Officer
Dear Shareholder,
At the end of May, we completed the latest round of expense ratio changes for our U.S.-based funds. The estimated savings for our investors during the six-month period was more than $300 million across our fund lineup—another record for us.1
That’s a remarkable amount, but it’s also business as usual here at Vanguard. After all, we’ve been cutting costs for investors for more than 40 years. Indeed, we’ve become so synonymous with driving down costs that when other investment companies lower their fees, the financial press often refers to it as the “Vanguard effect.”
To be sure, high costs persist in some areas of the industry. But the good news is, our 40-year campaign to lower costs seems to be approaching its mathematical limits, with some fund expenses now near zero not just at Vanguard but at other investment companies as well.
What makes investors successful?
While we’ll continue our drive for cost efficiency, we’ll also keep vigorously promoting our three other linchpin investment principles:
• Goals. Create clear, appropriate investment goals.
• Balance. Develop a suitable asset allocation using broadly diversified funds.
1 This figure represents cumulative net savings from expense ratio changes for all Vanguard fund share classes announced from December 2016
through May 2017. The estimated savings is the difference between prior and current expense ratios multiplied by average assets under
management (AUM). Average AUM is based on averaging one month’s daily average assets over the 12 months of each fund’s fiscal year.
3
• Discipline. Maintain perspective and long-term discipline.
Today, these tenets are more relevant than ever. They’re essential elements of our Personal Advisor Services recommendations, the model portfolios we develop for financial advisors, and our target-date funds.
We’re convinced that as investors increasingly adopt low-cost portfolios, focusing on goals, balance, and discipline could make the difference between achieving financial objectives and falling short.
Of course, there’s nothing new about our philosophy. And it seems simple enough. But unfortunately, we all have built-in behavioral biases that can make it hard to stick to the plan. We might, for example, allow natural inertia to keep us from rebalancing our portfolios to control risk, or we may become too wedded to an opinion or approach.
Lessons from the last crisis
Although it can be difficult at times to follow proven investing principles, it’s not impossible, even under the most challenging circumstances.
During the financial crisis of 2008–2009, various media outlets asked me whether our investors were pulling out of the
| Market Barometer | |||
| Total Returns | |||
| Periods Ended May 31, 2017 | |||
| Six | One | Five Years | |
| Months | Year | (Annualized) | |
| Stocks | |||
| Russell 1000 Index (Large-caps) | 10.55% | 17.48% | 15.37% |
| Russell 2000 Index (Small-caps) | 4.33 | 20.36 | 14.04 |
| Russell 3000 Index (Broad U.S. market) | 10.06 | 17.69 | 15.26 |
| FTSE All-World ex US Index (International) | 16.80 | 18.45 | 8.86 |
| Bonds | |||
| Bloomberg Barclays U.S. Aggregate Bond Index | |||
| (Broad taxable market) | 2.52% | 1.58% | 2.24% |
| Bloomberg Barclays Municipal Bond Index | |||
| (Broad tax-exempt market) | 5.16 | 1.46 | 3.31 |
| Citigroup Three-Month U.S. Treasury Bill Index | 0.26 | 0.41 | 0.12 |
| CPI | |||
| Consumer Price Index | 1.40% | 1.87% | 1.27% |
4
market and running for the hills. In actuality, we didn’t see that at Vanguard. Our clients were certainly nervous, and they contacted us more often. But for the most part, they didn’t engage in the excessive, panicked trading that can be so destructive to building wealth. Those who relied on financial advisors who follow our philosophy were wisely counseled to stay the course.
The accompanying chart shows the importance of patience and discipline. Investors who maintained a 60% stock/ 40% bond mix through the bear market were amply rewarded afterward, while those who fled stocks when they hit bottom were left far behind.
It’s not different this time
Today, nearly a decade after the global financial crisis, the world seems very different. Market indexes recently hit a series of all-time highs. With the wind at their backs and the increasing availability of low-cost funds, investors may be tempted to ask, “What could go wrong?” The answer is, “A lot.” Performance chasing and market-timing won’t be any more effective with low-cost funds than they are with high-cost funds.
| Reacting to volatility can hurt returns |
| Investors who kept a balanced portfolio through the 2008–2009 crash were rewarded |
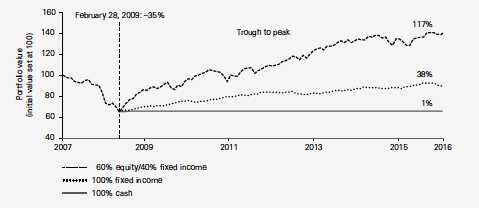
| Notes: On October 31, 2007, close to the equity market’s peak, the value of a hypothetical 60/40 portfolio is set at 100. Subsequent returns |
| are calculated relative to this starting value of 100. It is assumed that all dividends and income are reinvested in the components of the |
| indexes. The initial allocation for the portfolios was 42% U.S. stocks, 18% international stocks, and 40% U.S. bonds. The rebalanced portfolio |
| is returned to this allocation every month-end. Returns for the U.S. stock allocation are based on the MSCI US Broad Market Index. Returns for |
| the international stock allocation are based on the MSCI All Country World Index ex USA. Returns for the bond allocation are based on the |
| Bloomberg Barclays U.S. Aggregate Bond Index. Returns for the cash allocation are based on the Citigroup 3-Month U.S. Treasury Bill Index. |
| Sources: Vanguard, using data provided by Thomson Reuters Datastream. |
5
Whether markets are sunny or stormy, investors need to stick to their investment plans, maintain balanced and diversified portfolios, and think long-term.
We strive to help investors follow the principles that lead to enduring success. I’d like to think that will be the real “Vanguard effect.”
As always, thank you for investing with Vanguard.
Sincerely,

F. William McNabb III
Chairman and Chief Executive Officer
June 14, 2017
6
Advisor’s Report
For the six months ended May 31, 2017, Vanguard New York Long-Term Tax-Exempt Fund returned 5.19% for Investor Shares and 5.24% for Admiral Shares. Those results were better than the 5.11% return of its benchmark, the Bloomberg Barclays New York Municipal Bond Index, which includes bonds across the maturity spectrum, and the 4.55% average return of its peers.
Vanguard New York Municipal Money Market Fund, which as we noted in our last report has changed its name from Vanguard New York Tax-Exempt Money Market Fund, returned 0.30%; its peer average was 0.11%.
The Long-Term Fund’s 30-day SEC yield rose and then fell, finishing the period little changed. The Money Market Fund’s 7-day SEC yield climbed from 0.44% to 0.65%.
Please note that the funds are permitted to invest in securities that would generate income distributions subject to the alternative minimum tax (AMT). As of the end of the fiscal half year, however, only the Money Market Fund owned such securities.
The investment environment
During the period, the Federal Reserve increased interest rates twice; the second move, in March, put the federal funds rate at 0.75%–1% and marked just the third time the Fed had raised rates since the
| Yields of Tax-Exempt Municipal Securities | ||
| (AAA-Rated General Obligation Issues) | ||
| November 31, | May 31, | |
| Maturity | 2016 | 2017 |
| 2 years | 1.16% | 0.89% |
| 5 years | 1.85 | 1.22 |
| 10 years | 2.52 | 1.90 |
| 30 years | 3.26 | 2.74 |
| Source: Vanguard. | ||
7
financial crisis. (The Fed raised rates again in June, after the close of the funds’ fiscal half year.)
The Fed’s decisions signaled a normalization of monetary policy and came as the U.S. economy posted mostly positive results. Fourth-quarter economic growth was in line with estimates. But GDP growth was lackluster in the first quarter of 2017, largely because of a drop-off in consumer spending. The housing and manufacturing sectors reported decent activity during the six months, and in May unemployment declined to 4.3%, its lowest level in 16 years. Trends in commodity prices were mixed, but wages ticked up, supporting the outlook for inflation.
The Fed’s positive outlook on economic expansion carried over to the U.S. stock market, where several indexes hit record highs during the period. Strong corporate earnings played a part in the rally, along with the resilient economy. The prospect of tax reform, increased infrastructure spending, and greater deregulation also contributed to a shift toward riskier assets, although that sentiment tapered off toward the end of the period as investors realized that the Trump administration’s legislative agenda might take time to materialize.
New York’s economy grew a little faster than that of the United States as a whole, according to a gauge of current economic conditions published monthly by the Federal Reserve Bank of Philadelphia. The bank’s index for the Empire State rose more than 2% from November 2016 through April 2017, the latest month for which data are available, while the increase nationally was just above 1%. (Each state’s index incorporates data on nonfarm payroll employment, the jobless rate, average hours worked in manufacturing, and inflation-adjusted wage and salary payments.)
New York’s overall credit profile is stable. The state budget for fiscal year 2018 was passed late, but it holds spending growth to a targeted limit of 2% for the seventh consecutive year. Weakness in personal income tax receipts has been partly offset by increases elsewhere in state tax revenues, including corporate tax receipts.
Although muni bond issuance at the national level dipped compared with a year earlier, New York issuance was more or less flat, and demand remained solid given the state’s relatively high income tax rates. Longer-dated securities and those toward the lower end of the investment-grade credit spectrum tended to perform the best.
Management of the funds
We made no significant shifts in the funds’ positioning during the six months. The Long-Term Fund remained structurally overweighted to securities toward the long end of the yield curve compared with its benchmark, which spans all maturities.
8
Our stance helped relative performance as longer-dated securities returned more than shorter-dated ones.
In terms of credit exposure, the fund’s overweight allocation to investment-grade securities with lower credit-quality ratings, and to the A-rated segment in particular, boosted relative performance as well.
The municipal market offers more opportunities to add value through security selection than many taxable markets do. Over the period, selection worked out well in a number of segments, including local and state general obligation bonds, but it detracted in others.
Underweighting some sectors that outperformed, including special assessment, transportation, and school districts, also detracted over this short time frame.
In the Money Market Fund, we maintained fairly high liquidity and a short weighted average maturity in order to benefit sooner from any rise in interest rates. We also continued to favor variable-rate demand notes, as their coupons reset periodically to reflect the prevailing rate environment. That positioning, along with the fund’s low expense ratio, helped us outperform the peer-group average for the period.
A look ahead
Absent an unexpected external shock, the U.S. economy looks set to continue its steady growth, with real GDP likely to be about 2% for 2017, or maybe closer to 2.5% if implementation of the administration’s agenda has a positive effect on the economy. Although job growth may slow given the tightening in the labor market, competition for labor could push up the pace of annual wage increases. That should provide some support to inflation in the short term, but not so much as to make it significantly overshoot the central bank’s 2% target.
The Fed raised rates again on June 14 and indicated it would begin to reduce its balance sheet before year-end. We’re encouraged by the Fed’s gradual and dovish approach to normalizing monetary policy and expect it will stay on that path in 2018, given the structural anti-inflationary forces still at work in the global economy.
If growth and inflation remain modest, the cost of borrowing shouldn’t get out of hand, especially if yields in the United States remain attractive compared with those of other developed economies. International demand should help cap how high U.S. bond yields can rise.
The pro-business, pro-growth agenda of the new administration could give the economy a boost, but it remains to be seen what will get passed into law and what the financial markets’ reaction will be. We will be closely monitoring developments that could cloud the outlook for munis, such as changes to marginal tax rates for individuals and corporations, a cap on the level of tax
9
exemption for munis, and increased muni issuance if infrastructure spending ramps up significantly.
Although we may see more volatility in the second half of 2017, we would expect munis to continue to offer relative stability and a steady stream of income. Whatever the markets may bring, our experienced team of portfolio managers, traders, and credit analysts will continue to seek opportunities to produce competitive returns.
Christopher W. Alwine, CFA, Principal,
Head of Municipal Group
Adam Ferguson, CFA, Portfolio Manager
John P. Grimes, CFA, Portfolio Manager
Vanguard Fixed Income Group
June 16, 2017
10
New York Municipal Money Market Fund
Fund Profile
As of May 31, 2017
| Financial Attributes | |
| Ticker Symbol | VYFXX |
| Expense Ratio1 | 0.16% |
| 7-Day SEC Yield | 0.65% |
| Average Weighted | |
| Maturity | 23 days |
1 The expense ratio shown is from the prospectus dated March 28, 2017, and represents estimated costs for the current fiscal year. For the six
months ended May 31, 2017, the annualized expense ratio was 0.16%.
11
New York Municipal Money Market Fund
Performance Summary
Investment returns will fluctuate. All of the returns in this report represent past performance, which is not a guarantee of future results that may be achieved by the fund. (Current performance may be lower or higher than the performance data cited. For performance data current to the most recent month-end, visit our website at vanguard.com/performance.) The returns shown do not reflect taxes that a shareholder would pay on fund distributions. The fund is only available to retail investors (natural persons). You could lose money by investing in the fund. Although the fund seeks to preserve the value of your investment at $1.00 per share, it cannot guarantee it will do so. The fund may impose a fee upon the sale of your shares or may temporarily suspend your ability to sell shares if the fund’s liquidity falls below required minimums because of market conditions or other factors. An investment in the fund is not insured or guaranteed by the Federal Deposit Insurance Corporation or any other government agency. The fund’s sponsor has no legal obligation to provide financial support to the fund, and you should not expect that the sponsor will provide financial support to the fund at any time.
The fund’s 7-day SEC yield reflects its current earnings more closely than do the average annual returns.
| Fiscal-Year Total Returns (%): November 30, 2006, Through May 31, 2017 | ||
| NY Tax-Exempt | ||
| Money Mkt | ||
| Funds Avg | ||
| Fiscal Year | Total Returns | Total Returns |
| 2007 | 3.60% | 3.12% |
| 2008 | 2.32 | 1.88 |
| 2009 | 0.36 | 0.24 |
| 2010 | 0.10 | 0.01 |
| 2011 | 0.06 | 0.04 |
| 2012 | 0.03 | 0.00 |
| 2013 | 0.01 | 0.00 |
| 2014 | 0.01 | 0.00 |
| 2015 | 0.01 | 0.00 |
| 2016 | 0.26 | 0.08 |
| 2017 | 0.30 | 0.11 |
| 7-day SEC yield (5/31/2017): 0.65% | ||
| New York Tax-Exempt Money Market Funds Average: Derived from data provided by Lipper, a Thomson Reuters Company. | ||
| Note: For 2017, performance data reflect the six months ended May 31, 2017. | ||
Average Annual Total Returns: Periods Ended March 31, 2017
This table presents returns through the latest calendar quarter—rather than through the end of the fiscal period.
Securities and Exchange Commission rules require that we provide this information.
| Inception | One | Five | Ten | |
| Date | Year | Years | Years | |
| New York Municipal Money | ||||
| Market Fund | 9/3/1997 | 0.43% | 0.10% | 0.57% |
See Financial Highlights for dividend information.
12
New York Municipal Money Market Fund
Financial Statements (unaudited)
Statement of Net Assets
As of May 31, 2017
The fund reports a complete list of its holdings in various monthly and quarterly regulatory filings. The fund publishes its holdings on a monthly basis at vanguard.com and files them with the Securities and Exchange Commission on Form N-MFP. The fund’s Form N-MFP filings may be viewed at sec.gov or via a link on the “Portfolio Holdings” page on vanguard.com. For the second and fourth fiscal quarters, the lists appear in the fund’s semiannual and annual reports to shareholders. For the first and third fiscal quarters, the fund files the lists with the SEC on Form N-Q. Shareholders can look up the fund’s Forms N-Q on the SEC’s website at sec.gov. Forms N-Q may also be reviewed and copied at the SEC’s Public Reference Room (see the back cover of this report for further information).
| Face | Market | |||
| Maturity | Amount | Value• | ||
| Coupon | Date | ($000) | ($000) | |
| Tax-Exempt Municipal Bonds (101.7%) | ||||
| New York (101.7%) | ||||
| Albany NY Industrial Development Agency Civic | ||||
| Facility Revenue (CHF Holland Suites LLC Project) | ||||
| VRDO | 0.800% | 6/7/17 LOC | 8,635 | 8,635 |
| 1 Battery Park City Authority New York Revenue TOB | ||||
| VRDO | 0.840% | 6/1/17 LOC | 2,200 | 2,200 |
| Columbia County NY Capital Resource Corp. Civic | ||||
| Facility Revenue (Columbia Memorial Hospital | ||||
| Project) VRDO | 0.800% | 6/7/17 LOC | 3,400 | 3,400 |
| Columbia County NY Industrial Development | ||||
| Agency Civic Facility Revenue (Columbia | ||||
| Memorial Hospital Project) VRDO | 0.800% | 6/7/17 LOC | 3,960 | 3,960 |
| Commack NY Union Free School District TAN | 2.000% | 6/27/17 | 12,500 | 12,509 |
| Delaware Valley NY Industrial Development | ||||
| Authority Revenue (Delaware Valley Hospital) | ||||
| VRDO | 0.800% | 6/7/17 LOC | 3,015 | 3,015 |
| East Greenbush NY Central School District BAN | 2.000% | 2/9/18 | 13,535 | 13,617 |
| 1 Erie County NY Industrial Development Agency | ||||
| School Facility Revenue (Buffalo City School | ||||
| District Project) TOB VRDO | 0.810% | 6/7/17 | 6,665 | 6,665 |
| Franklin County NY Civic Development Corp. | ||||
| Revenue VRDO | 0.800% | 6/7/17 LOC | 5,200 | 5,200 |
| Geneva NY Industrial Development Agency Civic | ||||
| Facility Revenue (Colleges of the Seneca Project) | ||||
| VRDO | 0.810% | 6/7/17 LOC | 16,230 | 16,230 |
| Grand Island NY BAN | 2.000% | 10/12/17 | 8,400 | 8,429 |
| Half Hollow Hills NY Central School District TAN | 2.000% | 6/27/17 | 20,000 | 20,016 |
| Hauppauge NY Union Free School District TAN | 1.500% | 6/23/17 | 7,250 | 7,253 |
| Huntington NY Union Free School District TAN | 2.000% | 6/23/17 | 9,000 | 9,006 |
| 2 Kenmore-Tonawanda NY Union Free School | ||||
| District BAN | 2.000% | 6/14/18 | 10,000 | 10,085 |
| Kings Park NY Central School District BAN | 2.000% | 7/19/17 | 10,500 | 10,518 |
| 2 Kingston NY City School District BAN | 2.000% | 6/14/18 | 20,000 | 20,170 |
| Lancaster NY Central School District BAN | 2.000% | 6/15/17 | 10,534 | 10,538 |
| Lindenhurst NY Union Free School District TAN | 2.000% | 6/22/17 | 9,500 | 9,505 |
| Middle Country NY Central School District TAN | 2.000% | 6/27/17 | 19,250 | 19,268 |
13
New York Municipal Money Market Fund
| Face | Market | |||
| Maturity | Amount | Value• | ||
| Coupon | Date | ($000) | ($000) | |
| Monroe County NY Industrial Development Agency | ||||
| Civic Facility Revenue (Nazareth College) VRDO | 0.800% | 6/7/17 LOC | 7,090 | 7,090 |
| Nassau County NY Industrial Development Agency | ||||
| Civic Facility Revenue (Cold Spring Harbor | ||||
| Laboratory) VRDO | 0.770% | 6/1/17 | 16,270 | 16,270 |
| Nassau County NY Interim Finance Authority Sales | ||||
| Tax Revenue VRDO | 0.730% | 6/7/17 | 21,045 | 21,045 |
| Nassau County NY Interim Finance Authority Sales | ||||
| Tax Revenue VRDO | 0.730% | 6/7/17 | 11,000 | 11,000 |
| Nassau County NY Interim Finance Authority Sales | ||||
| Tax Revenue VRDO | 0.750% | 6/7/17 | 1,800 | 1,800 |
| Nassau County NY Interim Finance Authority VRDO | 0.770% | 6/7/17 | 1,800 | 1,800 |
| New Rochelle NY BAN | 2.000% | 3/2/18 | 7,058 | 7,106 |
| New York City NY Build NYC Resource Corp. | ||||
| Revenue (Asia Society Project) VRDO | 0.760% | 6/7/17 LOC | 6,000 | 6,000 |
| New York City NY GO | 5.000% | 8/1/17 | 3,135 | 3,157 |
| New York City NY GO | 5.000% | 8/1/17 | 10,000 | 10,070 |
| 1 New York City NY GO TOB VRDO | 0.810% | 6/7/17 | 7,500 | 7,500 |
| New York City NY GO VRDO | 0.790% | 6/1/17 LOC | 1,000 | 1,000 |
| New York City NY GO VRDO | 0.790% | 6/1/17 LOC | 1,900 | 1,900 |
| New York City NY GO VRDO | 0.800% | 6/1/17 | 7,700 | 7,700 |
| New York City NY GO VRDO | 0.800% | 6/1/17 | 3,200 | 3,200 |
| New York City NY GO VRDO | 0.800% | 6/1/17 | 3,200 | 3,200 |
| New York City NY GO VRDO | 0.800% | 6/1/17 | 2,800 | 2,800 |
| New York City NY GO VRDO | 0.820% | 6/1/17 LOC | 200 | 200 |
| New York City NY GO VRDO | 0.820% | 6/1/17 LOC | 17,985 | 17,985 |
| New York City NY GO VRDO | 0.760% | 6/7/17 LOC | 3,500 | 3,500 |
| New York City NY GO VRDO | 0.760% | 6/7/17 LOC | 6,750 | 6,750 |
| New York City NY GO VRDO | 0.770% | 6/7/17 LOC | 2,445 | 2,445 |
| New York City NY GO VRDO | 0.770% | 6/7/17 LOC | 5,200 | 5,200 |
| New York City NY GO VRDO | 0.790% | 6/7/17 | 59,200 | 59,200 |
| New York City NY GO VRDO | 0.800% | 6/7/17 LOC | 6,000 | 6,000 |
| New York City NY Health & Hospital Corp. Revenue | ||||
| (Health System) VRDO | 0.780% | 6/7/17 LOC | 11,900 | 11,900 |
| New York City NY Housing Development Corp. | ||||
| Multi-Family Housing Revenue (201 Pearl Street) | ||||
| VRDO | 0.750% | 6/7/17 LOC | 5,000 | 5,000 |
| 1 New York City NY Housing Development Corp. | ||||
| Multi-Family Housing Revenue TOB VRDO | 0.830% | 6/7/17 | 6,665 | 6,665 |
| New York City NY Housing Development Corp. | ||||
| Multi-Family Housing Revenue VRDO | 0.760% | 6/7/17 | 9,150 | 9,150 |
| New York City NY Housing Development Corp. | ||||
| Multi-Family Mortgage Revenue (89 Murray | ||||
| Street Development) VRDO | 0.800% | 6/7/17 LOC | 15,800 | 15,800 |
| New York City NY Housing Development Corp. | ||||
| Multi-Family Mortgage Revenue (Elliot Chelsea | ||||
| Development) VRDO | 0.770% | 6/7/17 LOC | 2,000 | 2,000 |
| New York City NY Housing Development Corp. | ||||
| Multi-Family Mortgage Revenue (Granville Payne | ||||
| Apartments) VRDO | 0.770% | 6/7/17 LOC | 5,310 | 5,310 |
| New York City NY Housing Development Corp. | ||||
| Multi-Family Mortgage Revenue (West 26th | ||||
| Street Development) VRDO | 0.780% | 6/7/17 LOC | 12,700 | 12,700 |
14
New York Municipal Money Market Fund
| Face | Market | |||
| Maturity | Amount | Value• | ||
| Coupon | Date | ($000) | ($000) | |
| New York City NY Housing Development Corp. | ||||
| Multi-Family Rental Housing Revenue (1133 | ||||
| Manhattan Avenue) VRDO | 0.800% | 6/7/17 LOC | 25,470 | 25,470 |
| New York City NY Housing Development Corp. | ||||
| Multi-Family Rental Housing Revenue (2 Gold | ||||
| Street) VRDO | 0.750% | 6/7/17 LOC | 6,000 | 6,000 |
| New York City NY Housing Development Corp. | ||||
| Multi-Family Rental Housing Revenue (90 West | ||||
| Street) VRDO | 0.750% | 6/7/17 LOC | 2,300 | 2,300 |
| New York City NY Housing Development Corp. | ||||
| Multi-Family Rental Housing Revenue (Atlantic | ||||
| Court Apartments) VRDO | 0.800% | 6/7/17 LOC | 23,100 | 23,100 |
| New York City NY Housing Development Corp. | ||||
| Multi-Family Rental Housing Revenue (Ocean | ||||
| Gate Development) VRDO | 0.760% | 6/7/17 LOC | 8,445 | 8,445 |
| New York City NY Housing Development Corp. | ||||
| Multi-Family Rental Housing Revenue (Rivereast | ||||
| Apartments) VRDO | 0.760% | 6/7/17 LOC | 20,000 | 20,000 |
| New York City NY Housing Development Corp. | ||||
| Multi-Family Rental Housing Revenue (Royal | ||||
| Charter Properties) VRDO | 0.800% | 6/7/17 LOC | 6,000 | 6,000 |
| New York City NY Industrial Development Agency | ||||
| Civic Facility Revenue (Mercy College Project) | ||||
| VRDO | 0.750% | 6/7/17 LOC | 9,430 | 9,430 |
| New York City NY Industrial Development Agency | ||||
| Civic Facility Revenue (New York Congregational | ||||
| Nursing Center Project) VRDO | 0.800% | 6/7/17 LOC | 2,570 | 2,570 |
| 1 New York City NY Municipal Water Finance | ||||
| Authority Water & Sewer System Revenue | ||||
| TOB VRDO | 0.810% | 6/7/17 | 3,000 | 3,000 |
| 1 New York City NY Municipal Water Finance | ||||
| Authority Water & Sewer System Revenue | ||||
| TOB VRDO | 0.810% | 6/7/17 | 7,700 | 7,700 |
| New York City NY Municipal Water Finance | ||||
| Authority Water & Sewer System Revenue VRDO | 0.790% | 6/1/17 | 1,295 | 1,295 |
| New York City NY Municipal Water Finance | ||||
| Authority Water & Sewer System Revenue VRDO | 0.790% | 6/1/17 | 3,550 | 3,550 |
| New York City NY Municipal Water Finance | ||||
| Authority Water & Sewer System Revenue VRDO | 0.790% | 6/1/17 | 7,800 | 7,800 |
| New York City NY Municipal Water Finance | ||||
| Authority Water & Sewer System Revenue VRDO | 0.790% | 6/1/17 | 2,100 | 2,100 |
| New York City NY Municipal Water Finance | ||||
| Authority Water & Sewer System Revenue VRDO | 0.790% | 6/1/17 | 8,755 | 8,755 |
| New York City NY Municipal Water Finance | ||||
| Authority Water & Sewer System Revenue VRDO | 0.790% | 6/1/17 | 17,500 | 17,500 |
| New York City NY Municipal Water Finance | ||||
| Authority Water & Sewer System Revenue VRDO | 0.830% | 6/1/17 | 3,000 | 3,000 |
| New York City NY Municipal Water Finance | ||||
| Authority Water & Sewer System Revenue VRDO | 0.840% | 6/1/17 | 10,010 | 10,010 |
| New York City NY Municipal Water Finance | ||||
| Authority Water & Sewer System Revenue VRDO | 0.760% | 6/7/17 | 26,350 | 26,350 |
| New York City NY Municipal Water Finance | ||||
| Authority Water & Sewer System Revenue VRDO | 0.780% | 6/7/17 | 2,500 | 2,500 |
15
New York Municipal Money Market Fund
| Face | Market | |||
| Maturity | Amount | Value• | ||
| Coupon | Date | ($000) | ($000) | |
| New York City NY Municipal Water Finance | ||||
| Authority Water & Sewer System Revenue VRDO | 0.780% | 6/7/17 | 600 | 600 |
| New York City NY Municipal Water Finance | ||||
| Authority Water & Sewer System Revenue VRDO | 0.790% | 6/7/17 | 9,000 | 9,000 |
| 1 New York City NY Sales Tax Asset Receivable | ||||
| Corp. Revenue TOB VRDO | 0.800% | 6/7/17 | 3,335 | 3,335 |
| 1 New York City NY Sales Tax Asset Receivable | ||||
| Corp. Revenue TOB VRDO | 0.800% | 6/7/17 | 5,250 | 5,250 |
| 1 New York City NY Transitional Finance Authority | ||||
| Building Aid Revenue TOB VRDO | 0.820% | 6/7/17 | 5,000 | 5,000 |
| 1 New York City NY Transitional Finance Authority | ||||
| Building Aid Revenue TOB VRDO | 0.830% | 6/7/17 | 15,210 | 15,210 |
| 1 New York City NY Transitional Finance Authority | ||||
| Building Aid Revenue TOB VRDO | 0.830% | 6/7/17 | 5,000 | 5,000 |
| New York City NY Transitional Finance Authority | ||||
| Future Tax Revenue | 5.000% | 5/1/18 (Prere.) | 10,000 | 10,369 |
| 1 New York City NY Transitional Finance Authority | ||||
| Future Tax Revenue TOB VRDO | 0.800% | 6/7/17 | 5,000 | 5,000 |
| 1 New York City NY Transitional Finance Authority | ||||
| Future Tax Revenue TOB VRDO | 0.810% | 6/7/17 | 6,000 | 6,000 |
| 1 New York City NY Transitional Finance Authority | ||||
| Future Tax Revenue TOB VRDO | 0.810% | 6/7/17 | 5,000 | 5,000 |
| 1 New York City NY Transitional Finance Authority | ||||
| Future Tax Revenue TOB VRDO | 0.810% | 6/7/17 | 2,890 | 2,890 |
| 1 New York City NY Transitional Finance Authority | ||||
| Future Tax Revenue TOB VRDO | 0.810% | 6/7/17 | 6,300 | 6,300 |
| New York City NY Transitional Finance Authority | ||||
| Future Tax Revenue VRDO | 0.790% | 6/1/17 | 3,800 | 3,800 |
| New York City NY Transitional Finance Authority | ||||
| Future Tax Revenue VRDO | 0.790% | 6/1/17 | 2,700 | 2,700 |
| New York City NY Transitional Finance Authority | ||||
| Future Tax Revenue VRDO | 0.790% | 6/1/17 | 21,775 | 21,775 |
| New York City NY Transitional Finance Authority | ||||
| Future Tax Revenue VRDO | 0.790% | 6/1/17 | 1,900 | 1,900 |
| New York City NY Transitional Finance Authority | ||||
| Future Tax Revenue VRDO | 0.790% | 6/1/17 | 30,310 | 30,310 |
| New York City NY Transitional Finance Authority | ||||
| Future Tax Revenue VRDO | 0.790% | 6/1/17 | 3,900 | 3,900 |
| New York City NY Transitional Finance Authority | ||||
| Future Tax Revenue VRDO | 0.800% | 6/1/17 | 5,200 | 5,200 |
| New York City NY Transitional Finance Authority | ||||
| Future Tax Revenue VRDO | 0.750% | 6/7/17 | 1,000 | 1,000 |
| New York City NY Transitional Finance Authority | ||||
| Future Tax Revenue VRDO | 0.750% | 6/7/17 LOC | 4,600 | 4,600 |
| 3 New York City NY Trust for Cultural Resources | ||||
| Revenue (American Museum of Natural History) | ||||
| PUT | 0.830% | 1/5/18 | 10,240 | 10,240 |
| New York City NY Trust for Cultural Resources | ||||
| Revenue (The Metropolitan Museum of Art) | ||||
| VRDO | 0.760% | 6/7/17 | 37,100 | 37,100 |
| New York City NY Trust for Cultural Resources | ||||
| Revenue (The Metropolitan Museum of Art) | ||||
| VRDO | 0.760% | 6/7/17 | 45,600 | 45,600 |
16
New York Municipal Money Market Fund
| Face | Market | |||
| Maturity | Amount | Value• | ||
| Coupon | Date | ($000) | ($000) | |
| 1 New York City NY Trust for Cultural Resources | ||||
| Revenue (Wildlife Conservation Society) TOB | ||||
| VRDO | 0.810% | 6/7/17 | 5,335 | 5,335 |
| 1 New York Convention Center Development Corp. | ||||
| Revenue TOB VRDO | 0.810% | 6/7/17 | 10,400 | 10,400 |
| 1 New York Convention Center Development Corp. | ||||
| Revenue TOB VRDO | 0.930% | 6/7/17 | 7,020 | 7,020 |
| 1 New York Liberty Development Corp. Revenue | ||||
| (7 World Trade Center Project) TOB VRDO | 0.930% | 6/7/17 | 8,000 | 8,000 |
| 1 New York Liberty Development Corp. Revenue | ||||
| (Bank of America Tower at One Bryant Park | ||||
| Project) TOB VRDO | 0.810% | 6/7/17 | 29,000 | 29,000 |
| New York Liberty Development Corp. Revenue | ||||
| (Greenwich LLC) VRDO | 0.800% | 6/7/17 LOC | 20,000 | 20,000 |
| 1 New York Metropolitan Transportation Authority | ||||
| Revenue (Dedicated Tax Fund) TOB VRDO | 0.800% | 6/7/17 | 3,330 | 3,330 |
| 1 New York Metropolitan Transportation Authority | ||||
| Revenue (Dedicated Tax Fund) TOB VRDO | 0.800% | 6/7/17 | 6,400 | 6,400 |
| 1 New York Metropolitan Transportation Authority | ||||
| Revenue (Dedicated Tax Fund) TOB VRDO | 0.860% | 6/7/17 | 5,350 | 5,350 |
| New York Metropolitan Transportation Authority | ||||
| Revenue (Dedicated Tax Fund) VRDO | 0.780% | 6/7/17 LOC | 22,100 | 22,100 |
| New York Metropolitan Transportation Authority | ||||
| Revenue (Service Contract) | 5.500% | 7/1/17 (ETM) | 7,040 | 7,067 |
| 1 New York Metropolitan Transportation Authority | ||||
| Revenue (Service Contract) TOB VRDO | 0.800% | 6/7/17 | 4,500 | 4,500 |
| New York Metropolitan Transportation Authority | ||||
| Revenue VRDO | 0.790% | 6/1/17 LOC | 1,100 | 1,100 |
| New York Metropolitan Transportation Authority | ||||
| Revenue VRDO | 0.830% | 6/1/17 LOC | 11,155 | 11,155 |
| New York Metropolitan Transportation Authority | ||||
| Revenue VRDO | 0.760% | 6/7/17 LOC | 18,300 | 18,300 |
| New York Metropolitan Transportation Authority | ||||
| Revenue VRDO | 0.760% | 6/7/17 LOC | 4,275 | 4,275 |
| New York Metropolitan Transportation Authority | ||||
| Revenue VRDO | 0.790% | 6/7/17 LOC | 19,800 | 19,800 |
| New York NY GO | 0.840% | 6/1/17 LOC | 1,500 | 1,500 |
| New York State Dormitory Authority Revenue | ||||
| (Catholic Health System Obligated Group) VRDO | 0.800% | 6/7/17 LOC | 2,680 | 2,680 |
| New York State Dormitory Authority Revenue | ||||
| (Catholic Health System Obligated Group) VRDO | 0.800% | 6/7/17 LOC | 10,600 | 10,600 |
| New York State Dormitory Authority Revenue | ||||
| (Catholic Health System Obligated Group) VRDO | 0.800% | 6/7/17 LOC | 4,855 | 4,855 |
| New York State Dormitory Authority Revenue | ||||
| (Catholic Health System Obligated Group) VRDO | 0.800% | 6/7/17 LOC | 2,265 | 2,265 |
| New York State Dormitory Authority Revenue | ||||
| (Columbia University) VRDO | 0.720% | 6/7/17 | 15,400 | 15,400 |
| New York State Dormitory Authority Revenue | ||||
| (Cornell University) CP | 0.920% | 6/8/17 | 1,000 | 1,000 |
| New York State Dormitory Authority Revenue | ||||
| (Cornell University) CP | 0.910% | 7/19/17 | 11,000 | 11,000 |
| New York State Dormitory Authority Revenue | ||||
| (Cornell University) VRDO | 0.760% | 6/7/17 | 4,800 | 4,800 |
17
New York Municipal Money Market Fund
| Face | Market | |||
| Maturity | Amount | Value• | ||
| Coupon | Date | ($000) | ($000) | |
| New York State Dormitory Authority Revenue | ||||
| (Cornell University) VRDO | 0.760% | 6/7/17 | 15,700 | 15,700 |
| New York State Dormitory Authority Revenue | ||||
| (Fordham University) VRDO | 0.760% | 6/7/17 LOC | 9,695 | 9,695 |
| New York State Dormitory Authority Revenue | ||||
| (Le Moyne College) VRDO | 0.800% | 6/7/17 LOC | 3,785 | 3,785 |
| 1 New York State Dormitory Authority Revenue | ||||
| (Memorial Sloan-Kettering Cancer Center) TOB | ||||
| VRDO | 0.810% | 6/7/17 | 7,860 | 7,860 |
| New York State Dormitory Authority Revenue | ||||
| (Mental Health Services Facilities Improvement) | ||||
| VRDO | 0.790% | 6/7/17 LOC | 5,005 | 5,005 |
| New York State Dormitory Authority Revenue | ||||
| (Mental Health Services Facilities Improvement) | ||||
| VRDO | 0.790% | 6/7/17 LOC | 51,015 | 51,015 |
| 1 New York State Dormitory Authority Revenue | ||||
| (Personal Income Tax) TOB VRDO | 0.800% | 6/7/17 | 11,000 | 11,000 |
| 1 New York State Dormitory Authority Revenue | ||||
| (Personal Income Tax) TOB VRDO | 0.800% | 6/7/17 | 7,500 | 7,500 |
| 1 New York State Dormitory Authority Revenue | ||||
| (Personal Income Tax) TOB VRDO | 0.800% | 6/7/17 | 5,500 | 5,500 |
| 1 New York State Dormitory Authority Revenue | ||||
| (Personal Income Tax) TOB VRDO | 0.810% | 6/7/17 | 6,000 | 6,000 |
| 1 New York State Dormitory Authority Revenue | ||||
| (Personal Income Tax) TOB VRDO | 0.810% | 6/7/17 | 4,000 | 4,000 |
| 1 New York State Dormitory Authority Revenue | ||||
| (Personal Income Tax) TOB VRDO | 0.810% | 6/7/17 | 4,375 | 4,375 |
| New York State Dormitory Authority Revenue | ||||
| (Rockefeller University) VRDO | 0.760% | 6/7/17 | 16,000 | 16,000 |
| New York State Dormitory Authority Revenue | ||||
| (Rockefeller University) VRDO | 0.800% | 6/7/17 | 44,100 | 44,100 |
| New York State Dormitory Authority Revenue | ||||
| (St. John’s University) VRDO | 0.750% | 6/7/17 LOC | 31,460 | 31,460 |
| New York State Dormitory Authority Revenue | ||||
| (University of Rochester) VRDO | 0.780% | 6/7/17 LOC | 3,800 | 3,800 |
| 1 New York State Dormitory Authority Revenue | ||||
| (Vassar College) TOB VRDO | 0.930% | 6/7/17 | 6,430 | 6,430 |
| 1 New York State Dormitory Authority Sales Tax | ||||
| Revenue TOB VRDO | 0.800% | 6/7/17 | 17,370 | 17,370 |
| 1 New York State Dormitory Authority Sales Tax | ||||
| Revenue TOB VRDO | 0.800% | 6/7/17 | 7,500 | 7,500 |
| 1 New York State Dormitory Authority Sales Tax | ||||
| Revenue TOB VRDO | 0.810% | 6/7/17 | 3,365 | 3,365 |
| 1 New York State Dormitory Authority Sales Tax | ||||
| Revenue TOB VRDO | 0.820% | 6/7/17 | 11,000 | 11,000 |
| New York State Energy Research & Development | ||||
| Authority Revenue (Consolidated Edison Co. of | ||||
| New York, Inc. Project) VRDO | 0.770% | 6/7/17 LOC | 12,000 | 12,000 |
| 1 New York State Environmental Facilities Corp. | ||||
| Revenue (State Clean Water & Drinking Water | ||||
| Revolving Funds) TOB VRDO | 0.800% | 6/7/17 | 3,650 | 3,650 |
| New York State Environmental Facilities Corp. Solid | ||||
| Waste Disposal Revenue (Waste Management Inc.) | ||||
| VRDO | 0.800% | 6/7/17 LOC | 3,000 | 3,000 |
18
New York Municipal Money Market Fund
| Face | Market | |||
| Maturity | Amount | Value• | ||
| Coupon | Date | ($000) | ($000) | |
| New York State Housing Finance Agency Housing | ||||
| Revenue (316 Eleventh Avenue) VRDO | 0.750% | 6/7/17 LOC | 6,500 | 6,500 |
| New York State Housing Finance Agency Housing | ||||
| Revenue (625 W 57th St) VRDO | 0.760% | 6/7/17 LOC | 4,400 | 4,400 |
| New York State Housing Finance Agency Housing | ||||
| Revenue (625 W 57th St) VRDO | 0.770% | 6/7/17 LOC | 15,150 | 15,150 |
| New York State Housing Finance Agency Housing | ||||
| Revenue (855 6th Avenue) VRDO | 0.750% | 6/7/17 LOC | 24,500 | 24,500 |
| New York State Housing Finance Agency Housing | ||||
| Revenue (855 6th Avenue) VRDO | 0.750% | 6/7/17 LOC | 14,500 | 14,500 |
| New York State Housing Finance Agency Housing | ||||
| Revenue (855 6th Avenue) VRDO | 0.750% | 6/7/17 LOC | 2,400 | 2,400 |
| New York State Housing Finance Agency Housing | ||||
| Revenue (Clinton Park Phase II) VRDO | 0.760% | 6/7/17 LOC | 10,000 | 10,000 |
| New York State Housing Finance Agency Housing | ||||
| Revenue (Dock Street Rental LLC) VRDO | 0.750% | 6/7/17 LOC | 14,800 | 14,800 |
| New York State Housing Finance Agency Housing | ||||
| Revenue (Dock Street) VRDO | 0.750% | 6/7/17 LOC | 11,500 | 11,500 |
| New York State Housing Finance Agency Housing | ||||
| Revenue (East 84th Street) VRDO | 0.800% | 6/7/17 LOC | 20,800 | 20,800 |
| New York State Housing Finance Agency Housing | ||||
| Revenue (McCarthy Manor Apartments) VRDO | 0.760% | 6/7/17 LOC | 6,800 | 6,800 |
| New York State Housing Finance Agency Housing | ||||
| Revenue (Saville) VRDO | 0.800% | 6/7/17 LOC | 28,000 | 28,000 |
| New York State Housing Finance Agency Housing | ||||
| Revenue (West 17th Street) VRDO | 0.740% | 6/7/17 LOC | 4,600 | 4,600 |
| New York State Housing Finance Agency Housing | ||||
| Revenue (West 20th Street) VRDO | 0.760% | 6/7/17 LOC | 14,000 | 14,000 |
| 1 New York State Housing Finance Agency Housing | ||||
| Revenue TOB VRDO | 0.870% | 6/7/17 | 6,810 | 6,810 |
| New York State Housing Finance Agency Revenue | ||||
| (Maestro West Chelsea Housing) VRDO | 0.770% | 6/7/17 LOC | 27,600 | 27,600 |
| New York State Housing Finance Agency Revenue | ||||
| (Ocean Park Acquisition LP) VRDO | 0.760% | 6/7/17 LOC | 7,100 | 7,100 |
| New York State Housing Finance Agency Revenue | ||||
| (Remeeder Houses Apartments) VRDO | 0.760% | 6/7/17 LOC | 6,500 | 6,500 |
| New York State Housing Finance Agency Revenue | ||||
| (Riverside Center) VRDO | 0.770% | 6/7/17 LOC | 7,000 | 7,000 |
| New York State Housing Finance Agency Revenue | ||||
| (Service Contract) VRDO | 0.740% | 6/7/17 LOC | 14,715 | 14,715 |
| New York State Local Government Assistance | ||||
| Corp. Revenue VRDO | 0.750% | 6/7/17 | 42,905 | 42,905 |
| New York State Mortgage Agency Homeowner | ||||
| Mortgage Revenue VRDO | 0.790% | 6/1/17 | 3,800 | 3,800 |
| New York State Mortgage Agency Homeowner | ||||
| Mortgage Revenue VRDO | 0.850% | 6/1/17 | 5,850 | 5,850 |
| New York State Mortgage Agency Homeowner | ||||
| Mortgage Revenue VRDO | 0.850% | 6/1/17 | 12,345 | 12,345 |
| New York State Mortgage Agency Homeowner | ||||
| Mortgage Revenue VRDO | 0.850% | 6/1/17 | 5,480 | 5,480 |
| New York State Mortgage Agency Homeowner | ||||
| Mortgage Revenue VRDO | 0.760% | 6/7/17 | 18,700 | 18,700 |
| New York State Mortgage Agency Homeowner | ||||
| Mortgage Revenue VRDO | 0.760% | 6/7/17 | 10,385 | 10,385 |
19
New York Municipal Money Market Fund
| Face | Market | |||
| Maturity | Amount | Value• | ||
| Coupon | Date | ($000) | ($000) | |
| New York State Mortgage Agency Homeowner | ||||
| Mortgage Revenue VRDO | 0.770% | 6/7/17 | 22,145 | 22,145 |
| New York State Mortgage Agency Homeowner | ||||
| Mortgage Revenue VRDO | 0.780% | 6/7/17 | 15,000 | 15,000 |
| 1 New York State Thruway Authority Revenue TOB | ||||
| VRDO | 0.810% | 6/7/17 | 13,000 | 13,000 |
| 1 New York State Urban Development Corp. | ||||
| Revenue (Personal Income Tax) TOB VRDO | 0.800% | 6/7/17 | 7,500 | 7,500 |
| 1 New York State Urban Development Corp. | ||||
| Revenue (Personal Income Tax) TOB VRDO | 0.810% | 6/7/17 | 5,850 | 5,850 |
| New York State Urban Development Corp. | ||||
| Revenue (Service Contract) VRDO | 0.780% | 6/7/17 | 2,000 | 2,000 |
| New York State Urban Development Corp. | ||||
| Revenue (Service Contract) VRDO | 0.800% | 6/7/17 LOC | 4,180 | 4,180 |
| 1 New York State Urban Development Corp. | ||||
| Revenue TOB VRDO | 0.850% | 6/7/17 | 4,085 | 4,085 |
| 1 Nuveen New York AMT-Free Quality Municipal | ||||
| Income Fund VRDP VRDO | 0.860% | 6/7/17 LOC | 31,000 | 31,000 |
| 1 Nuveen New York AMT-Free Quality Municipal | ||||
| Income Fund VRDP VRDO | 0.860% | 6/7/17 LOC | 12,000 | 12,000 |
| 1 Nuveen New York AMT-Free Quality Municipal | ||||
| Income Fund VRDP VRDO | 0.860% | 6/7/17 LOC | 20,000 | 20,000 |
| 1 Nuveen New York AMT-Free Quality Municipal | ||||
| Income Fund VRDP VRDO | 0.860% | 6/7/17 LOC | 27,500 | 27,500 |
| 1 Nuveen New York Quality Municipal Fund VRDP | ||||
| VRDO | 0.910% | 6/7/17 LOC | 34,500 | 34,500 |
| Onondaga County NY Industrial Development | ||||
| Agency Civic Facility Revenue (Crouse Health | ||||
| Hospital Inc. Project) VRDO | 0.800% | 6/7/17 LOC | 3,465 | 3,465 |
| Onondaga County NY Industrial Development | ||||
| Agency Civic Facility Revenue (Crouse Health | ||||
| Hospital Inc. Project) VRDO | 0.800% | 6/7/17 LOC | 7,170 | 7,170 |
| Onondaga County NY Industrial Development | ||||
| Agency Civic Facility Revenue (Syracuse Home | ||||
| Association Project) VRDO | 0.800% | 6/7/17 LOC | 4,635 | 4,635 |
| Orchard Park NY Central School District BAN | 3.000% | 4/6/18 | 11,000 | 11,167 |
| Port Authority of New York & New Jersey Revenue | 5.000% | 7/15/17 | 4,275 | 4,296 |
| Port Authority of New York & New Jersey Revenue | ||||
| CP | 0.950% | 7/18/17 | 6,250 | 6,250 |
| Port Authority of New York & New Jersey Revenue | ||||
| CP | 0.930% | 7/25/17 | 13,650 | 13,650 |
| 1 Port Authority of New York & New Jersey Revenue | ||||
| TOB VRDO | 0.810% | 6/7/17 | 8,500 | 8,500 |
| 1 Port Authority of New York & New Jersey Revenue | ||||
| TOB VRDO | 0.830% | 6/7/17 | 2,900 | 2,900 |
| 1 Port Authority of New York & New Jersey Revenue | ||||
| TOB VRDO | 0.840% | 6/7/17 | 1,050 | 1,050 |
| 1 Port Authority of New York & New Jersey Revenue | ||||
| TOB VRDO | 0.860% | 6/7/17 | 6,500 | 6,500 |
| 1 Port Authority of New York & New Jersey Revenue | ||||
| TOB VRDO | 0.860% | 6/7/17 | 5,560 | 5,560 |
| 1 Port Authority of New York & New Jersey Revenue | ||||
| TOB VRDO | 0.860% | 6/7/17 | 5,300 | 5,300 |
20
New York Municipal Money Market Fund
| Face | Market | |||
| Maturity | Amount | Value• | ||
| Coupon | Date | ($000) | ($000) | |
| 1 Port Authority of New York & New Jersey Revenue | ||||
| TOB VRDO | 0.880% | 6/7/17 | 2,260 | 2,260 |
| Rensselaer County NY GO | 2.000% | 8/11/17 | 9,600 | 9,623 |
| Scarsdale NY Union Free School District BAN | 2.000% | 6/22/17 | 5,000 | 5,003 |
| Smithtown NY Central School District TAN | 1.500% | 6/30/17 | 9,600 | 9,605 |
| South Country NY Central School District TAN | 2.000% | 6/27/17 | 11,500 | 11,510 |
| South Huntington NY Union Free School District | ||||
| TAN | 2.000% | 6/27/17 | 6,000 | 6,005 |
| Syosset NY Central School District TAN | 1.500% | 6/27/17 | 4,500 | 4,502 |
| Tarrytowns NY Union Free School District BAN | 2.000% | 7/12/17 | 8,845 | 8,858 |
| Three Village NY Central School District TAN | 2.000% | 6/27/17 | 26,000 | 26,024 |
| Tompkins County NY Industrial Development | ||||
| Agency Civic Facility Revenue (Ithaca College) | ||||
| VRDO | 0.800% | 6/7/17 LOC | 23,075 | 23,075 |
| 1 Triborough Bridge & Tunnel Authority New York | ||||
| Revenue TOB VRDO | 0.800% | 6/7/17 | 6,665 | 6,665 |
| 1 Triborough Bridge & Tunnel Authority New York | ||||
| Revenue TOB VRDO | 0.800% | 6/7/17 | 4,195 | 4,195 |
| 1 Triborough Bridge & Tunnel Authority New York | ||||
| Revenue TOB VRDO | 0.810% | 6/7/17 | 3,750 | 3,750 |
| Triborough Bridge & Tunnel Authority New York | ||||
| Revenue VRDO | 0.770% | 6/7/17 LOC | 17,340 | 17,340 |
| Triborough Bridge & Tunnel Authority New York | ||||
| Revenue VRDO | 0.770% | 6/7/17 LOC | 14,435 | 14,435 |
| Ulster County NY BAN | 2.000% | 11/22/17 | 6,958 | 6,994 |
| 1 Utility Debt Securitization Authority New York | ||||
| Revenue TOB VRDO | 0.800% | 6/7/17 | 6,750 | 6,750 |
| 1 Utility Debt Securitization Authority New York | ||||
| Revenue TOB VRDO | 0.810% | 6/7/17 | 1,000 | 1,000 |
| Wappingers NY Central School District BAN | 2.000% | 7/7/17 | 15,322 | 15,336 |
| Warwick Valley Central School District BAN | 2.000% | 7/7/17 | 5,000 | 5,006 |
| West Babylon NY Union Free School District BAN | 2.000% | 8/4/17 | 9,500 | 9,521 |
| West Babylon NY Union Free School District TAN | 2.000% | 6/23/17 | 15,000 | 15,012 |
| Westchester County NY GO | 2.000% | 12/15/17 | 25,000 | 25,116 |
| Williamsville NY Central School District BAN | 2.000% | 6/14/17 | 8,225 | 8,228 |
| Total Tax-Exempt Municipal Bonds (Cost $2,327,114) | 2,327,114 |
21
New York Municipal Money Market Fund
| Amount | |
| ($000) | |
| Other Assets and Liabilities (-1.7%) | |
| Other Assets | |
| Investment in Vanguard | 150 |
| Receivables for Investment Securities Sold | 935 |
| Receivables for Accrued Income | 6,247 |
| Receivables for Capital Shares Issued | 2,608 |
| Other Assets | 4,207 |
| Total Other Assets | 14,147 |
| Liabilities | |
| Payables for Investment Securities Purchased | (45,355) |
| Payables for Capital Shares Redeemed | (2,235) |
| Payables for Distributions | (44) |
| Payables to Vanguard | (4,324) |
| Total Liabilities | (51,958) |
| Net Assets (100%) | |
| Applicable to 2,289,063,056 outstanding $.001 par value shares of | |
| beneficial interest (unlimited authorization) | 2,289,303 |
| Net Asset Value Per Share | $1.00 |
| At May 31, 2017, net assets consisted of: | |
| Amount | |
| ($000) | |
| Paid-in Capital | 2,289,262 |
| Undistributed Net Investment Income | — |
| Accumulated Net Realized Gains | 41 |
| Net Assets | 2,289,303 |
• See Note A in Notes to Financial Statements.
1 Security exempt from registration under Rule 144A of the Securities Act of 1933. Such securities may be sold in transactions exempt from
registration, normally to qualified institutional buyers. At May 31, 2017, the aggregate value of these securities was $484,275,000,
representing 21.2% of net assets.
2 Security purchased on a when-issued or delayed-delivery basis for which the fund has not taken delivery as of May 31, 2017.
3 Adjustable-rate security.
A key to abbreviations and other references follows the Statement of Net Assets.
See accompanying Notes, which are an integral part of the Financial Statements.
22
New York Municipal Money Market Fund
Key to Abbreviations
ARS—Auction Rate Security.
BAN—Bond Anticipation Note.
COP—Certificate of Participation.
CP—Commercial Paper.
FR—Floating Rate.
GAN—Grant Anticipation Note.
GO—General Obligation Bond.
PILOT—Payments in Lieu of Taxes.
PUT—Put Option Obligation.
RAN—Revenue Anticipation Note.
TAN—Tax Anticipation Note.
TOB—Tender Option Bond.
TRAN—Tax Revenue Anticipation Note.
VRDO—Variable Rate Demand Obligation.
VRDP—Variable Rate Demand Preferred.
(ETM)—Escrowed to Maturity.
(Prere.)—Prerefunded.
Scheduled principal and interest payments are guaranteed by:
(1) MBIA (Municipal Bond Investors Assurance).
(2) AMBAC (Ambac Assurance Corporation).
(3) FGIC (Financial Guaranty Insurance Company).
(4) AGM (Assured Guaranty Municipal Corporation).
(5) BIGI (Bond Investors Guaranty Insurance).
(6) Connie Lee Inc.
(7) FHA (Federal Housing Authority).
(8) CapMAC (Capital Markets Assurance Corporation).
(9) American Capital Access Financial Guaranty Corporation.
(10) XL Capital Assurance Inc.
(11) CIFG (CDC IXIS Financial Guaranty).
(12) AGC (Assured Guaranty Corporation).
(13) BHAC (Berkshire Hathaway Assurance Corporation).
(14) NPFG (National Public Finance Guarantee Corporation).
(15) BAM (Build America Mutual Assurance Company).
(16) MAC (Municipal Assurance Corporation).
(17) RAA (Radian Asset Assurance Inc.).
(18) SBLF (Michigan School Bond Loan Fund).
The insurance does not guarantee the market value of the municipal bonds.
LOC—Scheduled principal and interest payments are guaranteed by bank letter of credit.
23
New York Municipal Money Market Fund
| Statement of Operations | |
| Six Months Ended | |
| May 31, 2017 | |
| ($000) | |
| Investment Income | |
| Income | |
| Interest | 8,186 |
| Total Income | 8,186 |
| Expenses | |
| The Vanguard Group—Note B | |
| Investment Advisory Services | 300 |
| Management and Administrative | 1,144 |
| Marketing and Distribution | 252 |
| Custodian Fees | 10 |
| Shareholders’ Reports | 13 |
| Trustees’ Fees and Expenses | 1 |
| Total Expenses | 1,720 |
| Net Investment Income | 6,466 |
| Realized Net Gain (Loss) on Investment Securities Sold | 42 |
| Net Increase (Decrease) in Net Assets Resulting from Operations | 6,508 |
See accompanying Notes, which are an integral part of the Financial Statements.
24
New York Municipal Money Market Fund
| Statement of Changes in Net Assets | ||
| Six Months Ended | Year Ended | |
| May 31, | November 30, | |
| 2017 | 2016 | |
| ($000) | ($000) | |
| Increase (Decrease) in Net Assets | ||
| Operations | ||
| Net Investment Income | 6,466 | 5,222 |
| Realized Net Gain (Loss) | 42 | (1) |
| Net Increase (Decrease) in Net Assets Resulting from Operations | 6,508 | 5,221 |
| Distributions | ||
| Net Investment Income | (6,467) | (5,223) |
| Realized Capital Gain | — | — |
| Total Distributions | (6,467) | (5,223) |
| Capital Share Transactions (at $1.00 per share) | ||
| Issued | 776,304 | 1,130,330 |
| Issued in Lieu of Cash Distributions | 6,225 | 5,056 |
| Redeemed | (551,973) | (1,266,500) |
| Net Increase (Decrease) from Capital Share Transactions | 230,556 | (131,114) |
| Total Increase (Decrease) | 230,597 | (131,116) |
| Net Assets | ||
| Beginning of Period | 2,058,706 | 2,189,822 |
| End of Period1 | 2,289,303 | 2,058,706 |
1 Net Assets—End of Period includes undistributed (overdistributed) net investment income of $0 and $1,000.
See accompanying Notes, which are an integral part of the Financial Statements.
25
New York Municipal Money Market Fund
| Financial Highlights | ||||||
| Six Months | ||||||
| Ended | ||||||
| For a Share Outstanding | May 31, | Year Ended November 30, | ||||
| Throughout Each Period | 2017 | 2016 | 2015 | 2014 | 2013 | 2012 |
| Net Asset Value, Beginning of Period | $1.00 | $1.00 | $1.00 | $1.00 | $1.00 | $1.00 |
| Investment Operations | ||||||
| Net Investment Income | .003 | .003 | .0001 | .0001 | .0001 | .0003 |
| Net Realized and Unrealized Gain (Loss) | ||||||
| on Investments | — | — | — | — | — | — |
| Total from Investment Operations | .003 | .003 | .0001 | .0001 | .0001 | .0003 |
| Distributions | ||||||
| Dividends from Net Investment Income | (.003) | (.003) | (.0001) | (.0001) | (.0001) | (.0003) |
| Distributions from Realized Capital Gains | — | — | — | — | — | — |
| Total Distributions | (.003) | (.003) | (.0001) | (.0001) | (.0001) | (.0003) |
| Net Asset Value, End of Period | $1.00 | $1.00 | $1.00 | $1.00 | $1.00 | $1.00 |
| Total Return1 | 0.30% | 0.26% | 0.01% | 0.01% | 0.01% | 0.03% |
| Ratios/Supplemental Data | ||||||
| Net Assets, End of Period (Millions) | $2,289 | $2,059 | $2,190 | $2,292 | $2,483 | $2,638 |
| Ratio of Expenses to | ||||||
| Average Net Assets | 0.16% | 0.13%2 | 0.06%2 | 0.07%2 | 0.12%2 | 0.15%2 |
| Ratio of Net Investment Income to | ||||||
| Average Net Assets | 0.60% | 0.25% | 0.01% | 0.01% | 0.01% | 0.03% |
The expense ratio and net investment income ratio for the current period have been annualized.
1 Total returns do not include account service fees that may have applied in the periods shown. Fund prospectuses provide information about
any applicable account service fees.
2 The ratio of total expenses to average net assets before an expense reduction was 0.16% for 2016, 0.16% for 2015, 0.16% for 2014, 0.16%
for 2013, and 0.16% for 2012. See Note B in Notes to Financial Statements.
See accompanying Notes, which are an integral part of the Financial Statements.
26
New York Municipal Money Market Fund
Notes to Financial Statements
Vanguard New York Municipal Money Market Fund is registered under the Investment Company Act of 1940 as an open-end investment company, or mutual fund. The fund invests in debt instruments of municipal issuers whose ability to meet their obligations may be affected by economic and political developments in the state. The fund changed its name from Vanguard New York Tax-Exempt Money Market Fund to Vanguard New York Municipal Money Market Fund in March 2017.
A. The following significant accounting policies conform to generally accepted accounting principles for U.S. investment companies. The fund consistently follows such policies in preparing its financial statements.
1. Security Valuation: Securities are valued as of the close of trading on the New York Stock Exchange (generally 4 p.m., Eastern time) on the valuation date. Securities are valued at amortized cost, which approximates market value.
2. Federal Income Taxes: The fund intends to continue to qualify as a regulated investment company and distribute all of its income. Management has analyzed the fund’s tax positions taken for all open federal income tax years (November 30, 2013–2016), and for the period ended May 31, 2017, and has concluded that no provision for federal income tax is required in the fund’s financial statements.
3. Distributions: Distributions from net investment income are declared daily and paid on the first business day of the following month.
4. Credit Facility: The fund and certain other funds managed by The Vanguard Group (“Vanguard”) participate in a $3.1 billion committed credit facility provided by a syndicate of lenders pursuant to a credit agreement that may be renewed annually; each fund is individually liable for its borrowings, if any, under the credit facility. Borrowings may be utilized for temporary and emergency purposes, and are subject to the fund’s regulatory and contractual borrowing restrictions. The participating funds are charged administrative fees and an annual commitment fee of 0.10% of the undrawn amount of the facility; these fees are allocated to the funds based on a method approved by the fund’s board of trustees and included in Management and Administrative expenses on the fund’s Statement of Operations. Any borrowings under this facility bear interest at a rate based upon the higher of the one-month London Interbank Offered Rate, federal funds effective rate, or overnight bank funding rate plus an agreed-upon spread.
The fund had no borrowings outstanding at May 31, 2017, or at any time during the period then ended.
5. Other: Interest income is accrued daily. Premiums and discounts on debt securities purchased are amortized and accreted, respectively, to interest income over the lives of the respective securities. Security transactions are accounted for on the date securities are bought or sold. Costs used to determine realized gains (losses) on the sale of investment securities are those of the specific securities sold.
B. In accordance with the terms of a Funds’ Service Agreement (the “FSA”) between Vanguard and the fund, Vanguard furnishes to the fund investment advisory, corporate management, administrative, marketing, and distribution services at Vanguard’s cost of operations (as defined by the FSA). These costs of operations are allocated to the fund based on methods and guidelines approved by the board of trustees. Vanguard does not require reimbursement in the current period for certain costs of operations (such as deferred compensation/benefits and risk/insurance costs); the fund’s liability for these costs of operations is included in Payables to Vanguard on the Statement of Net Assets.
27
New York Municipal Money Market Fund
Upon the request of Vanguard, the fund may invest up to 0.40% of its net assets as capital in Vanguard. At May 31, 2017, the fund had contributed to Vanguard capital in the amount of $150,000, representing 0.01% of the fund’s net assets and 0.06% of Vanguard’s capitalization. The fund’s trustees and officers are also directors and employees, respectively, of Vanguard.
Vanguard and the board of trustees have agreed to temporarily limit certain net operating expenses in excess of the fund’s daily yield in order to maintain a zero or positive yield for the fund. Vanguard and the board of trustees may terminate the temporary expense limitation at any time. The fund is not obligated to repay this amount to Vanguard. For the period ended May 31, 2017, the fund did not receive an expense reduction from Vanguard.
C. Various inputs may be used to determine the value of the fund’s investments. These inputs are summarized in three broad levels for financial statement purposes. The inputs or methodologies used to value securities are not necessarily an indication of the risk associated with investing in those securities.
Level 1—Quoted prices in active markets for identical securities.
Level 2—Other significant observable inputs (including quoted prices for similar securities, interest rates, prepayment speeds, credit risk, etc.).
Level 3—Significant unobservable inputs (including the fund’s own assumptions used to determine the fair value of investments).
At May 31, 2017, 100% of the market value of the fund’s investments was determined using amortized cost, in accordance with rules under the Investment Company Act of 1940. Amortized cost approximates the current fair value of a security, but since the value is not obtained from a quoted price in an active market, securities valued at amortized cost are considered to be valued using Level 2 inputs.
D. The fund purchased securities from and sold securities to other Vanguard funds or accounts managed by Vanguard or its affiliates, in accordance with procedures adopted by the board of trustees in compliance with Rule 17a-7 of the Investment Company Act of 1940. For the six months ended May 31, 2017, such purchases and sales were $133,400,000 and $150,260,000, respectively.
E. Management has determined that no material events or transactions occurred subsequent to May 31, 2017, that would require recognition or disclosure in these financial statements.
28
New York Long-Term Tax-Exempt Fund
| Fund Profile | |||
| As of May 31, 2017 | |||
| Share-Class Characteristics | |||
| Investor | Admiral | ||
| Shares | Shares | ||
| Ticker Symbol | VNYTX | VNYUX | |
| Expense Ratio1 | 0.19% | 0.09% | |
| 30-Day SEC Yield | 2.19% | 2.30% | |
| Financial Attributes | |||
| Bloomberg | Bloomberg | ||
| Barclays NY | Barclays | ||
| Muni Bond | Municipal | ||
| Fund | Index Bond Index | ||
| Number of Bonds | 950 | 6,083 | 50,785 |
| Yield to Maturity | |||
| (before expenses) | 2.3% | 2.0% | 2.1% |
| Average Coupon | 4.8% | 4.9% | 4.8% |
| Average Duration | 6.6 years | 5.8 years | 6.2 years |
| Average Stated | |||
| Maturity | 17.4 years | 13.7 years | 12.9 years |
| Short-Term | |||
| Reserves | 2.5% | — | — |
| Volatility Measures | ||
| Bloomberg | Bloomberg | |
| Barclays NY | Barclays | |
| Muni Bond | Municipal | |
| Index | Bond Index | |
| R-Squared | 0.98 | 0.98 |
| Beta | 1.10 | 1.07 |
These measures show the degree and timing of the fund’s fluctuations compared with the indexes over 36 months.
| Distribution by Stated Maturity | |
| (% of portfolio) | |
| Under 1 Year | 3.9% |
| 1 - 3 Years | 10.9 |
| 3 - 5 Years | 20.2 |
| 5 - 10 Years | 57.8 |
| 10 - 20 Years | 6.7 |
| 20 - 30 Years | 0.5 |
Distribution by Credit Quality (% of portfolio)
| AAA | 21.7% |
| AA | 48.4 |
| A | 21.8 |
| BBB | 5.5 |
| B | 0.4 |
| Not Rated | 2.2 |
Credit-quality ratings are obtained from Moody's and S&P, and the higher rating for each issue is shown. "Not Rated" is used to
classify securities for which a rating is not available. Not rated securities include a fund's investment in Vanguard Market Liquidity
Fund or Vanguard Municipal Cash Management Fund, each of which invests in high-quality money market instruments and may
serve as a cash management vehicle for the Vanguard funds, trusts, and accounts. For more information about these ratings, see
the Glossary entry for Credit Quality.
1 The expense ratios shown are from the prospectus dated March 28, 2017, and represent estimated costs for the current fiscal year. For the six
months ended May 31, 2017, the annualized expense ratios were 0.19% for Investor Shares and 0.09% for Admiral Shares.
29
New York Long-Term Tax-Exempt Fund
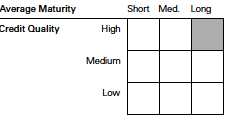
Investment Focus
30
New York Long-Term Tax-Exempt Fund
Performance Summary
All of the returns in this report represent past performance, which is not a guarantee of future results that may be achieved by the fund. (Current performance may be lower or higher than the performance data cited. For performance data current to the most recent month-end, visit our website at vanguard.com/performance.) Note, too, that both investment returns and principal value can fluctuate widely, so an investor’s shares, when sold, could be worth more or less than their original cost. The returns shown do not reflect taxes that a shareholder would pay on fund distributions or on the sale of fund shares.
| Fiscal-Year Total Returns (%): November 30, 2006, Through May 31, 2017 | ||||
| Bloomberg | ||||
| Barclays NY | ||||
| Muni Bond | ||||
| Investor Shares | Index | |||
| Fiscal Year | Income Returns | Capital Returns | Total Returns | Total Returns |
| 2007 | 4.33% | -2.76% | 1.57% | 2.89% |
| 2008 | 4.03 | -8.66 | -4.63 | -3.17 |
| 2009 | 4.57 | 8.69 | 13.26 | 14.51 |
| 2010 | 3.93 | 0.27 | 4.20 | 4.60 |
| 2011 | 3.96 | 1.81 | 5.77 | 6.04 |
| 2012 | 3.77 | 7.03 | 10.80 | 9.38 |
| 2013 | 3.27 | -7.65 | -4.38 | -3.06 |
| 2014 | 3.77 | 5.94 | 9.71 | 7.84 |
| 2015 | 3.38 | 0.59 | 3.97 | 3.23 |
| 2016 | 3.11 | -2.87 | 0.24 | -0.20 |
| 2017 | 1.68 | 3.51 | 5.19 | 5.11 |
| Note: For 2017, performance data reflect the six months ended May 31, 2017. | ||||
Average Annual Total Returns: Periods Ended March 31, 2017
This table presents returns through the latest calendar quarter—rather than through the end of the fiscal period.
Securities and Exchange Commission rules require that we provide this information.
| Ten Years | ||||||
| Inception Date | One Year | Five Years | Income | Capital | Total | |
| Investor Shares | 4/7/1986 | 0.06% | 3.76% | 3.78% | 0.38% | 4.16% |
| Admiral Shares | 5/14/2001 | 0.16 | 3.85 | 3.86 | 0.38 | 4.24 |
See Financial Highlights for dividend and capital gains information.
31
New York Long-Term Tax-Exempt Fund
Financial Statements (unaudited)
Statement of Net Assets
As of May 31, 2017
The fund reports a complete list of its holdings in regulatory filings four times in each fiscal year, at the quarter-ends. For the second and fourth fiscal quarters, the lists appear in the fund’s semiannual and annual reports to shareholders. For the first and third fiscal quarters, the fund files the lists with the Securities and Exchange Commission on Form N-Q. Shareholders can look up the fund’s Forms N-Q on the SEC’s website at sec.gov. Forms N-Q may also be reviewed and copied at the SEC’s Public Reference Room (see the back cover of this report for further information).
| Face | Market | |||
| Maturity | Amount | Value• | ||
| Coupon | Date | ($000) | ($000) | |
| Tax-Exempt Municipal Bonds (99.6%) | ||||
| New York (99.5%) | ||||
| Albany NY Capital Resource Corp. Revenue | ||||
| St. Peter’s Hospital) | 6.000% | 11/15/20 (Prere.) | 325 | 379 |
| Albany NY Capital Resource Corp. Revenue | ||||
| (St. Peter’s Hospital) | 6.125% | 11/15/20 (Prere.) | 150 | 176 |
| Albany NY Industrial Development Agency Civic | ||||
| Facility Revenue (St. Peter’s Hospital Project) | 5.250% | 11/15/17 (Prere.) | 5,000 | 5,100 |
| Albany NY Industrial Development Agency Civic | ||||
| Facility Revenue (St. Peter’s Hospital Project) | 5.750% | 11/15/17 (Prere.) | 3,840 | 3,926 |
| Albany NY Industrial Development Agency Civic | ||||
| Facility Revenue (University at Albany Foundation | ||||
| Student Housing Corp. - Empire Commons North | ||||
| Project) | 5.375% | 5/1/19 (Prere.) | 3,455 | 3,746 |
| Albany NY Industrial Development Agency Civic | ||||
| Facility Revenue (University at Albany Foundation | ||||
| Student Housing Corp. - Empire Commons | ||||
| North Project) | 5.500% | 5/1/19 (Prere.) | 2,550 | 2,771 |
| Albany NY Industrial Development Agency Civic | ||||
| Facility Revenue (University at Albany Foundation | ||||
| Student Housing Corp. - Empire Commons | ||||
| South Project) | 5.375% | 5/1/19 (Prere.) | 4,395 | 4,766 |
| Albany NY Industrial Development Agency Civic | ||||
| Facility Revenue (University at Albany Foundation | ||||
| Student Housing Corp. - Empire Commons | ||||
| South Project) | 5.500% | 5/1/19 (Prere.) | 1,500 | 1,630 |
| Albany NY Industrial Development Agency Civic | ||||
| Facility Revenue (University at Albany Foundation | ||||
| Student Housing Corp. - Empire Commons | ||||
| West Project) | 5.375% | 5/1/19 (Prere.) | 3,415 | 3,703 |
| Amherst NY Development Corp. Student Housing | ||||
| Facility Revenue | 5.000% | 10/1/40 (4) | 2,500 | 2,751 |
| Amherst NY Development Corp. Student Housing | ||||
| Facility Revenue | 5.000% | 10/1/45 | 3,800 | 4,181 |
| Arlington NY Central School District GO | 4.000% | 5/15/27 | 1,000 | 1,139 |
| Battery Park City Authority New York Revenue | 5.000% | 11/1/31 | 2,500 | 3,006 |
| 1 Battery Park City Authority New York Revenue | ||||
| TOB VRDO | 0.840% | 6/1/17 LOC | 3,700 | 3,700 |
32
New York Long-Term Tax-Exempt Fund
| Face | Market | |||
| Maturity | Amount | Value• | ||
| Coupon | Date | ($000) | ($000) | |
| Brooklyn NY Local Development Corp. PILOT | ||||
| Revenue (Barclays Center Project) | 5.750% | 1/15/20 (Prere.) | 1,550 | 1,739 |
| Brooklyn NY Local Development Corp. PILOT | ||||
| Revenue (Barclays Center Project) | 6.000% | 1/15/20 (Prere.) | 16,025 | 18,079 |
| Brooklyn NY Local Development Corp. PILOT | ||||
| Revenue (Barclays Center Project) | 6.250% | 1/15/20 (Prere.) | 5,475 | 6,212 |
| Brooklyn NY Local Development Corp. PILOT | ||||
| Revenue (Barclays Center Project) | 6.375% | 1/15/20 (Prere.) | 19,390 | 22,063 |
| Brooklyn NY Local Development Corp. PILOT | ||||
| Revenue (Barclays Center Project) | 6.500% | 1/15/20 (Prere.) | 2,250 | 2,567 |
| Brooklyn NY Local Development Corp. PILOT | ||||
| Revenue (Barclays Center Project) | 0.000% | 7/15/31 | 3,655 | 2,115 |
| Brooklyn NY Local Development Corp. PILOT | ||||
| Revenue (Barclays Center Project) | 0.000% | 7/15/32 | 1,745 | 962 |
| Brooklyn NY Local Development Corp. PILOT | ||||
| Revenue (Barclays Center Project) | 0.000% | 7/15/33 | 2,160 | 1,138 |
| Brooklyn NY Local Development Corp. PILOT | ||||
| Revenue (Barclays Center Project) | 0.000% | 7/15/46 | 450 | 127 |
| Brooklyn NY Local Development Corp. PILOT | ||||
| Revenue (Brooklyn Events Center) | 5.000% | 7/15/24 | 1,800 | 2,121 |
| Brooklyn NY Local Development Corp. PILOT | ||||
| Revenue (Brooklyn Events Center) | 5.000% | 7/15/25 | 1,655 | 1,964 |
| Brooklyn NY Local Development Corp. PILOT | ||||
| Revenue (Brooklyn Events Center) | 5.000% | 7/15/26 | 3,000 | 3,577 |
| Brooklyn NY Local Development Corp. PILOT | ||||
| Revenue (Brooklyn Events Center) | 5.000% | 7/15/27 | 4,175 | 4,971 |
| Brooklyn NY Local Development Corp. PILOT | ||||
| Revenue (Brooklyn Events Center) | 5.000% | 7/15/28 | 2,275 | 2,692 |
| Brooklyn NY Local Development Corp. PILOT | ||||
| Revenue (Brooklyn Events Center) | 5.000% | 7/15/30 | 2,500 | 2,915 |
| Brooklyn NY Local Development Corp. PILOT | ||||
| Revenue (Brooklyn Events Center) | 5.000% | 7/15/42 | 5,900 | 6,638 |
| Broome County NY Industrial Development Agency | ||||
| Revenue (Good Shepherd Village Project) | 6.875% | 7/1/18 (Prere.) | 3,250 | 3,461 |
| Buffalo & Erie County NY Industrial Land | ||||
| Development Corp. Revenue | 5.000% | 11/15/24 | 1,395 | 1,606 |
| Buffalo & Erie County NY Industrial Land | ||||
| Development Corp. Revenue | 5.000% | 7/1/25 | 2,000 | 2,367 |
| Buffalo & Erie County NY Industrial Land | ||||
| Development Corp. Revenue | 5.000% | 11/15/25 | 1,590 | 1,831 |
| Buffalo & Erie County NY Industrial Land | ||||
| Development Corp. Revenue | 5.000% | 11/15/37 | 4,515 | 4,846 |
| Buffalo & Erie County NY Industrial Land | ||||
| Development Corp. Revenue | 5.000% | 7/1/40 | 1,500 | 1,637 |
| Buffalo NY Municipal Water Finance Authority | ||||
| Revenue | 5.000% | 7/1/24 | 500 | 598 |
| Buffalo NY Municipal Water Finance Authority | ||||
| Revenue | 5.000% | 7/1/25 | 500 | 606 |
| Buffalo NY Municipal Water Finance Authority | ||||
| Revenue | 5.000% | 7/1/26 | 1,000 | 1,196 |
| Buffalo NY Municipal Water Finance Authority | ||||
| Revenue | 5.000% | 7/1/28 | 2,000 | 2,357 |
| Buffalo NY Municipal Water Finance Authority | ||||
| Revenue | 5.000% | 7/1/29 | 500 | 585 |
33
New York Long-Term Tax-Exempt Fund
| Face | Market | |||
| Maturity | Amount | Value• | ||
| Coupon | Date | ($000) | ($000) | |
| Dobbs Ferry NY Local Development Corp. | ||||
| Revenue (Mercy College Project) | 5.000% | 7/1/39 | 2,715 | 3,054 |
| Dobbs Ferry NY Local Development Corp. | ||||
| Revenue (Mercy College Project) | 5.000% | 7/1/44 | 2,510 | 2,811 |
| Dutchess County NY Local Development Corp. | ||||
| Revenue (Culinary Institute of America Project) | 5.000% | 7/1/27 | 350 | 414 |
| Dutchess County NY Local Development Corp. | ||||
| Revenue (Culinary Institute of America Project) | 5.000% | 7/1/28 | 200 | 236 |
| Dutchess County NY Local Development Corp. | ||||
| Revenue (Culinary Institute of America Project) | 5.000% | 7/1/29 | 250 | 293 |
| Dutchess County NY Local Development Corp. | ||||
| Revenue (Culinary Institute of America Project) | 5.000% | 7/1/30 | 200 | 233 |
| Dutchess County NY Local Development Corp. | ||||
| Revenue (Culinary Institute of America Project) | 5.000% | 7/1/31 | 200 | 232 |
| Dutchess County NY Local Development Corp. | ||||
| Revenue (Culinary Institute of America Project) | 5.000% | 7/1/32 | 240 | 278 |
| Dutchess County NY Local Development Corp. | ||||
| Revenue (Culinary Institute of America Project) | 5.000% | 7/1/33 | 200 | 230 |
| Dutchess County NY Local Development Corp. | ||||
| Revenue (Culinary Institute of America Project) | 5.000% | 7/1/41 | 215 | 243 |
| Dutchess County NY Local Development Corp. | ||||
| Revenue (Culinary Institute of America Project) | 5.000% | 7/1/46 | 300 | 337 |
| Dutchess County NY Local Development Corp. | ||||
| Revenue (Health Quest Systems Inc. Project) | 5.000% | 7/1/28 | 1,505 | 1,787 |
| Dutchess County NY Local Development Corp. | ||||
| Revenue (Health Quest Systems Inc. Project) | 5.000% | 7/1/28 | 2,000 | 2,375 |
| Dutchess County NY Local Development Corp. | ||||
| Revenue (Health Quest Systems Inc. Project) | 5.000% | 7/1/29 | 1,595 | 1,878 |
| Dutchess County NY Local Development Corp. | ||||
| Revenue (Health Quest Systems Inc. Project) | 5.000% | 7/1/34 | 650 | 728 |
| Dutchess County NY Local Development Corp. | ||||
| Revenue (Health Quest Systems Inc. Project) | 5.000% | 7/1/44 | 2,000 | 2,207 |
| Dutchess County NY Local Development Corp. | ||||
| Revenue (Marist College Project) | 5.000% | 7/1/45 | 1,240 | 1,390 |
| Dutchess County NY Local Development Corp. | ||||
| Revenue (Vassar College Project) | 5.000% | 7/1/33 | 1,105 | 1,328 |
| Dutchess County NY Local Development Corp. | ||||
| Revenue (Vassar College Project) | 5.000% | 7/1/34 | 1,345 | 1,609 |
| Dutchess County NY Local Development Corp. | ||||
| Revenue (Vassar College Project) | 5.000% | 7/1/35 | 1,200 | 1,430 |
| Dutchess County NY Local Development Corp. | ||||
| Revenue (Vassar College Project) | 5.000% | 7/1/37 | 1,000 | 1,185 |
| Dutchess County NY Local Development Corp. | ||||
| Revenue (Vassar College Project) | 5.000% | 7/1/42 | 7,240 | 8,519 |
| Dutchess County NY Local Development Corp. | ||||
| Revenue (Vassar College Project) | 4.000% | 7/1/46 | 5,500 | 5,784 |
| Erie County NY GO | 5.000% | 4/1/25 | 560 | 646 |
| Erie County NY Industrial Development Agency | ||||
| School Facility Revenue (Buffalo City School | ||||
| District Project) | 5.000% | 5/1/25 | 4,000 | 4,655 |
| 1 Erie County NY Industrial Development Agency | ||||
| School Facility Revenue (Buffalo City School | ||||
| District Project) TOB VRDO | 0.830% | 6/7/17 | 6,035 | 6,035 |
| Haverstraw-Stony Point NY Central School District | ||||
| GO | 5.000% | 10/15/31 (4) | 1,100 | 1,297 |
34
New York Long-Term Tax-Exempt Fund
| Face | Market | |||
| Maturity | Amount | Value• | ||
| Coupon | Date | ($000) | ($000) | |
| Haverstraw-Stony Point NY Central School District | ||||
| GO | 5.000% | 10/15/33 (4) | 300 | 352 |
| Haverstraw-Stony Point NY Central School District | ||||
| GO | 5.000% | 10/15/34 (4) | 500 | 585 |
| Haverstraw-Stony Point NY Central School District | ||||
| GO | 5.000% | 10/15/36 (4) | 1,000 | 1,164 |
| Hempstead NY GO | 4.000% | 4/1/29 (4) | 6,000 | 6,668 |
| Hempstead NY Local Development Corp. Revenue | ||||
| (Adelphi University) | 5.000% | 10/1/28 | 1,320 | 1,541 |
| Hempstead NY Local Development Corp. Revenue | ||||
| (Adelphi University) | 5.000% | 9/1/43 | 5,000 | 5,575 |
| Hempstead NY Local Development Corp. Revenue | ||||
| (Hofstra University) | 5.000% | 7/1/22 | 2,130 | 2,415 |
| Hempstead NY Local Development Corp. Revenue | ||||
| (Hofstra University) | 5.000% | 7/1/23 | 3,350 | 3,821 |
| Hempstead NY Local Development Corp. Revenue | ||||
| (Hofstra University) | 5.000% | 7/1/28 | 1,300 | 1,463 |
| Hempstead NY Local Development Corp. Revenue | ||||
| (Hofstra University) | 5.000% | 7/1/41 | 2,815 | 3,129 |
| Hempstead NY Local Development Corp. Revenue | ||||
| (Molloy College) | 5.750% | 7/1/23 | 1,600 | 1,729 |
| Hempstead NY Local Development Corp. Revenue | ||||
| (Molloy College) | 5.000% | 7/1/29 | 2,170 | 2,435 |
| Hempstead NY Local Development Corp. Revenue | ||||
| (Molloy College) | 5.000% | 7/1/34 | 1,800 | 1,975 |
| Hempstead NY Local Development Corp. Revenue | ||||
| (Molloy College) | 5.000% | 7/1/39 | 1,645 | 1,788 |
| Hempstead NY Local Development Corp. Revenue | ||||
| (Molloy College) | 5.000% | 7/1/44 | 1,670 | 1,808 |
| Hudson Yards Infrastructure Corp. New York | ||||
| Revenue | 5.000% | 2/15/31 | 5,000 | 6,033 |
| Hudson Yards Infrastructure Corp. New York | ||||
| Revenue | 5.000% | 2/15/32 | 2,500 | 3,000 |
| Hudson Yards Infrastructure Corp. New York | ||||
| Revenue | 5.000% | 2/15/33 | 2,000 | 2,387 |
| Hudson Yards Infrastructure Corp. New York | ||||
| Revenue | 5.000% | 2/15/34 | 2,300 | 2,732 |
| Hudson Yards Infrastructure Corp. New York | ||||
| Revenue | 5.000% | 2/15/35 | 3,300 | 3,907 |
| Hudson Yards Infrastructure Corp. New York | ||||
| Revenue | 5.000% | 2/15/36 | 3,000 | 3,541 |
| Hudson Yards Infrastructure Corp. New York | ||||
| Revenue | 5.000% | 2/15/37 | 2,500 | 2,944 |
| Hudson Yards Infrastructure Corp. New York | ||||
| Revenue | 5.000% | 2/15/38 | 3,000 | 3,524 |
| Hudson Yards Infrastructure Corp. New York | ||||
| Revenue | 5.000% | 2/15/39 | 4,500 | 5,278 |
| Hudson Yards Infrastructure Corp. New York | ||||
| Revenue | 5.000% | 2/15/42 | 9,500 | 11,107 |
| Hudson Yards Infrastructure Corp. New York | ||||
| Revenue | 4.000% | 2/15/44 | 10,000 | 10,534 |
| Hudson Yards Infrastructure Corp. New York | ||||
| Revenue | 5.000% | 2/15/45 | 4,500 | 5,245 |
| Hudson Yards Infrastructure Corp. New York | ||||
| Revenue | 5.250% | 2/15/47 | 7,925 | 8,822 |
35
New York Long-Term Tax-Exempt Fund
| Face | Market | |||
| Maturity | Amount | Value• | ||
| Coupon | Date | ($000) | ($000) | |
| Hudson Yards Infrastructure Corp. New York | ||||
| Revenue | 5.750% | 2/15/47 | 28,525 | 32,500 |
| Long Island NY Power Authority Electric System | ||||
| Revenue | 5.250% | 4/1/19 (ETM) | 930 | 1,003 |
| Long Island NY Power Authority Electric System | ||||
| Revenue | 5.250% | 4/1/19 (ETM) | 1,520 | 1,640 |
| Long Island NY Power Authority Electric System | ||||
| Revenue | 6.250% | 4/1/19 (Prere.) | 2,225 | 2,439 |
| Long Island NY Power Authority Electric System | ||||
| Revenue | 0.000% | 6/1/24 (4) | 19,830 | 17,173 |
| Long Island NY Power Authority Electric System | ||||
| Revenue | 5.000% | 9/1/25 | 1,500 | 1,739 |
| Long Island NY Power Authority Electric System | ||||
| Revenue | 5.000% | 9/1/26 | 3,400 | 3,915 |
| Long Island NY Power Authority Electric System | ||||
| Revenue | 5.000% | 9/1/26 | 1,000 | 1,211 |
| Long Island NY Power Authority Electric System | ||||
| Revenue | 0.000% | 6/1/27 (4) | 15,905 | 12,358 |
| Long Island NY Power Authority Electric System | ||||
| Revenue | 5.000% | 9/1/28 | 1,000 | 1,189 |
| Long Island NY Power Authority Electric System | ||||
| Revenue | 5.000% | 9/1/29 | 1,550 | 1,758 |
| Long Island NY Power Authority Electric System | ||||
| Revenue | 5.000% | 9/1/34 | 4,500 | 5,117 |
| Long Island NY Power Authority Electric System | ||||
| Revenue | 5.000% | 9/1/35 | 6,000 | 6,801 |
| Long Island NY Power Authority Electric System | ||||
| Revenue | 5.000% | 9/1/36 | 2,000 | 2,316 |
| Long Island NY Power Authority Electric System | ||||
| Revenue | 5.000% | 9/1/37 | 7,625 | 8,490 |
| Long Island NY Power Authority Electric System | ||||
| Revenue | 5.000% | 5/1/38 | 11,005 | 12,234 |
| Long Island NY Power Authority Electric System | ||||
| Revenue | 5.000% | 9/1/39 | 5,500 | 6,200 |
| Long Island NY Power Authority Electric System | ||||
| Revenue | 5.000% | 9/1/41 | 2,500 | 2,875 |
| Long Island NY Power Authority Electric System | ||||
| Revenue | 5.000% | 9/1/44 | 17,550 | 19,797 |
| Madison County NY Capital Resource Corp. | ||||
| Revenue (Colgate University Project) | 5.000% | 7/1/40 | 1,495 | 1,746 |
| Madison County NY Capital Resource Corp. | ||||
| Revenue (Colgate University Project) | 5.000% | 7/1/43 | 6,000 | 6,977 |
| Monroe County NY Industrial Development Corp. | ||||
| Mortgage Revenue (Unity Hospital Rochester | ||||
| Project) | 5.500% | 8/15/23 | 3,780 | 3,794 |
| Monroe County NY Industrial Development Corp. | ||||
| Mortgage Revenue (Unity Hospital Rochester | ||||
| Project) | 5.750% | 8/15/30 | 3,500 | 4,041 |
| Monroe County NY Industrial Development Corp. | ||||
| Mortgage Revenue (Unity Hospital Rochester | ||||
| Project) | 5.750% | 8/15/35 | 3,000 | 3,464 |
| Monroe County NY Industrial Development Corp. | ||||
| Mortgage Revenue (Unity Hospital Rochester | ||||
| Project) | 5.500% | 8/15/40 | 3,700 | 4,221 |
36
New York Long-Term Tax-Exempt Fund
| Face | Market | |||
| Maturity | Amount | Value• | ||
| Coupon | Date | ($000) | ($000) | |
| Monroe County NY Industrial Development Corp. | ||||
| Revenue (Rochester General Hospital) | 5.000% | 12/1/27 | 1,550 | 1,857 |
| Monroe County NY Industrial Development Corp. | ||||
| Revenue (Rochester General Hospital) | 5.000% | 12/1/29 | 1,000 | 1,178 |
| Monroe County NY Industrial Development Corp. | ||||
| Revenue (Rochester General Hospital) | 5.000% | 12/1/34 | 1,100 | 1,263 |
| Monroe County NY Industrial Development Corp. | ||||
| Revenue (Rochester General Hospital) | 5.000% | 12/1/35 | 1,055 | 1,208 |
| Monroe County NY Industrial Development Corp. | ||||
| Revenue (Rochester General Hospital) | 5.000% | 12/1/36 | 1,100 | 1,255 |
| Monroe County NY Industrial Development Corp. | ||||
| Revenue (Rochester General Hospital) | 5.000% | 12/1/37 | 2,600 | 2,856 |
| Monroe County NY Industrial Development Corp. | ||||
| Revenue (Rochester General Hospital) | 5.000% | 12/1/42 | 5,305 | 5,783 |
| Monroe County NY Industrial Development Corp. | ||||
| Revenue (Rochester General Hospital) | 5.000% | 12/1/46 | 5,000 | 5,628 |
| Monroe County NY Industrial Development Corp. | ||||
| Revenue (St. John Fisher College Project) | 5.500% | 6/1/39 | 1,500 | 1,750 |
| Monroe County NY Industrial Development Corp. | ||||
| Revenue (St. John Fisher College Project) | 5.000% | 6/1/44 | 2,500 | 2,775 |
| Monroe County NY Industrial Development Corp. | ||||
| Revenue (University of Rochester Project) | 5.000% | 7/1/31 | 2,000 | 2,453 |
| Monroe County NY Industrial Development Corp. | ||||
| Revenue (University of Rochester Project) | 5.000% | 7/1/32 | 1,300 | 1,583 |
| Monroe County NY Industrial Development Corp. | ||||
| Revenue (University of Rochester Project) | 5.000% | 7/1/35 | 1,700 | 2,035 |
| Monroe County NY Industrial Development Corp. | ||||
| Revenue (University of Rochester Project) | 5.000% | 7/1/36 | 1,000 | 1,194 |
| Monroe County NY Industrial Development Corp. | ||||
| Revenue (University of Rochester) | 5.000% | 7/1/29 | 1,250 | 1,520 |
| Monroe County NY Industrial Development Corp. | ||||
| Revenue (University of Rochester) | 5.000% | 7/1/30 | 4,880 | 5,727 |
| Monroe County NY Industrial Development Corp. | ||||
| Revenue (University of Rochester) | 5.000% | 7/1/31 | 1,000 | 1,200 |
| Monroe County NY Industrial Development Corp. | ||||
| Revenue (University of Rochester) | 5.000% | 7/1/32 | 1,640 | 1,958 |
| Monroe County NY Industrial Development Corp. | ||||
| Revenue (University of Rochester) | 5.000% | 7/1/33 | 1,400 | 1,663 |
| Monroe County NY Industrial Development Corp. | ||||
| Revenue (University of Rochester) | 5.000% | 7/1/37 | 1,000 | 1,171 |
| Monroe County NY Industrial Development Corp. | ||||
| Revenue (University of Rochester) | 4.000% | 7/1/39 | 1,500 | 1,616 |
| Monroe County NY Industrial Development Corp. | ||||
| Revenue (University of Rochester) | 5.000% | 7/1/45 | 4,030 | 4,586 |
| Nassau County NY GO | 5.000% | 4/1/24 | 5,000 | 6,007 |
| Nassau County NY GO | 5.000% | 1/1/27 | 3,000 | 3,630 |
| Nassau County NY GO | 5.000% | 1/1/28 | 2,815 | 3,372 |
| Nassau County NY GO | 5.000% | 4/1/29 | 4,320 | 4,998 |
| Nassau County NY GO | 5.000% | 4/1/34 | 5,740 | 6,490 |
| Nassau County NY GO | 5.000% | 4/1/35 | 1,500 | 1,692 |
| Nassau County NY Interim Finance Authority VRDO | 0.770% | 6/7/17 | 3,520 | 3,520 |
| Nassau County NY Local Economic Assistance & | ||||
| Financing Corp. Revenue (South Nassau | ||||
| Communities Hospital) | 5.000% | 7/1/21 | 4,430 | 5,031 |
37
New York Long-Term Tax-Exempt Fund
| Face | Market | |||
| Maturity | Amount | Value• | ||
| Coupon | Date | ($000) | ($000) | |
| Nassau County NY Local Economic Assistance & | ||||
| Financing Corp. Revenue (South Nassau | ||||
| Communities Hospital) | 5.000% | 7/1/22 | 2,225 | 2,581 |
| Nassau County NY Local Economic Assistance & | ||||
| Financing Corp. Revenue (South Nassau | ||||
| Communities Hospital) | 5.000% | 7/1/27 | 7,765 | 8,769 |
| Nassau County NY Local Economic Assistance & | ||||
| Financing Corp. Revenue (South Nassau | ||||
| Communities Hospital) | 5.000% | 7/1/31 | 2,000 | 2,212 |
| Nassau County NY Local Economic Assistance & | ||||
| Financing Corp. Revenue (South Nassau | ||||
| Communities Hospital) | 5.000% | 7/1/37 | 1,000 | 1,088 |
| Nassau County NY Local Economic Assistance & | ||||
| Financing Corp. Revenue (Winthrop University | ||||
| Hospital Association Project) | 5.000% | 7/1/27 | 4,000 | 4,507 |
| Nassau County NY Local Economic Assistance & | ||||
| Financing Corp. Revenue (Winthrop University | ||||
| Hospital Association Project) | 5.000% | 7/1/32 | 995 | 1,096 |
| Nassau County NY Local Economic Assistance & | ||||
| Financing Corp. Revenue (Winthrop University | ||||
| Hospital Association Project) | 5.000% | 7/1/37 | 8,190 | 8,896 |
| Nassau County NY Local Economic Assistance & | ||||
| Financing Corp. Revenue (Winthrop University | ||||
| Hospital Association Project) | 5.000% | 7/1/42 | 3,025 | 3,267 |
| Nassau County NY Local Economic Assistance | ||||
| Corp. Revenue (Catholic Health Services of Long | ||||
| Island Obligated Group Project) | 5.000% | 7/1/23 | 700 | 820 |
| Nassau County NY Local Economic Assistance | ||||
| Corp. Revenue (Catholic Health Services of | ||||
| Long Island Obligated Group Project) | 5.000% | 7/1/24 | 500 | 592 |
| Nassau County NY Local Economic Assistance | ||||
| Corp. Revenue (Catholic Health Services of | ||||
| Long Island Obligated Group Project) | 5.000% | 7/1/25 | 1,400 | 1,641 |
| Nassau County NY Local Economic Assistance | ||||
| Corp. Revenue (Catholic Health Services of | ||||
| Long Island Obligated Group Project) | 5.000% | 7/1/28 | 1,690 | 1,920 |
| Nassau County NY Local Economic Assistance | ||||
| Corp. Revenue (Catholic Health Services of | ||||
| Long Island Obligated Group Project) | 5.000% | 7/1/28 | 1,500 | 1,718 |
| Nassau County NY Local Economic Assistance | ||||
| Corp. Revenue (Catholic Health Services of | ||||
| Long Island Obligated Group Project) | 5.000% | 7/1/29 | 1,565 | 1,762 |
| Nassau County NY Local Economic Assistance | ||||
| Corp. Revenue (Catholic Health Services of | ||||
| Long Island Obligated Group Project) | 5.000% | 7/1/30 | 1,750 | 1,978 |
| Nassau County NY Local Economic Assistance | ||||
| Corp. Revenue (Catholic Health Services of | ||||
| Long Island Obligated Group Project) | 5.000% | 7/1/31 | 1,000 | 1,125 |
| Nassau County NY Local Economic Assistance | ||||
| Corp. Revenue (Catholic Health Services of | ||||
| Long Island Obligated Group Project) | 5.000% | 7/1/34 | 1,970 | 2,190 |
| New Rochelle NY Corporate Local Development | ||||
| Revenue (Iona College Project) | 5.000% | 7/1/25 | 325 | 381 |
| New Rochelle NY Corporate Local Development | ||||
| Revenue (Iona College Project) | 5.000% | 7/1/26 | 335 | 389 |
38
New York Long-Term Tax-Exempt Fund
| Face | Market | |||
| Maturity | Amount | Value• | ||
| Coupon | Date | ($000) | ($000) | |
| New Rochelle NY Corporate Local Development | ||||
| Revenue (Iona College Project) | 5.000% | 7/1/27 | 425 | 490 |
| New Rochelle NY Corporate Local Development | ||||
| Revenue (Iona College Project) | 5.000% | 7/1/28 | 375 | 429 |
| New Rochelle NY Corporate Local Development | ||||
| Revenue (Iona College Project) | 5.000% | 7/1/33 | 1,135 | 1,264 |
| New Rochelle NY Corporate Local Development | ||||
| Revenue (Iona College Project) | 5.000% | 7/1/35 | 1,000 | 1,106 |
| New Rochelle NY Corporate Local Development | ||||
| Revenue (Iona College Project) | 5.000% | 7/1/40 | 1,250 | 1,370 |
| New Rochelle NY Corporate Local Development | ||||
| Revenue (Iona College Project) | 5.000% | 7/1/45 | 2,005 | 2,190 |
| New York City NY Build NYC Resource Corp. | ||||
| Revenue (Ethical Culture Fieldston Project) | 5.000% | 6/1/23 | 850 | 1,012 |
| New York City NY Build NYC Resource Corp. | ||||
| Revenue (Ethical Culture Fieldston Project) | 5.000% | 6/1/24 | 740 | 893 |
| New York City NY Build NYC Resource Corp. | ||||
| Revenue (Methodist Hospital Project) | 5.000% | 7/1/23 | 1,400 | 1,655 |
| New York City NY Build NYC Resource Corp. | ||||
| Revenue (Methodist Hospital Project) | 5.000% | 7/1/25 | 1,325 | 1,571 |
| New York City NY Build NYC Resource Corp. | ||||
| Revenue (Methodist Hospital Project) | 5.000% | 7/1/27 | 1,000 | 1,163 |
| New York City NY Build NYC Resource Corp. | ||||
| Revenue (New York Law School Project) | 5.000% | 7/1/20 | 1,775 | 1,933 |
| New York City NY Build NYC Resource Corp. | ||||
| Revenue (New York Law School Project) | 5.000% | 7/1/21 | 1,875 | 2,082 |
| New York City NY Build NYC Resource Corp. | ||||
| Revenue (New York Law School Project) | 5.000% | 7/1/22 | 3,010 | 3,396 |
| New York City NY Build NYC Resource Corp. | ||||
| Revenue (New York Law School Project) | 5.000% | 7/1/29 | 1,890 | 2,146 |
| New York City NY Build NYC Resource Corp. | ||||
| Revenue (New York Law School Project) | 5.000% | 7/1/36 | 5,000 | 5,521 |
| New York City NY Build NYC Resource Corp. | ||||
| Revenue (New York Law School Project) | 5.000% | 7/1/41 | 1,875 | 2,053 |
| New York City NY Build NYC Resource Corp. | ||||
| Revenue (Queens College) | 5.000% | 6/1/27 | 200 | 243 |
| New York City NY Build NYC Resource Corp. | ||||
| Revenue (Queens College) | 5.000% | 6/1/28 | 270 | 326 |
| New York City NY Build NYC Resource Corp. | ||||
| Revenue (Queens College) | 5.000% | 6/1/29 | 225 | 270 |
| New York City NY Build NYC Resource Corp. | ||||
| Revenue (Queens College) | 5.000% | 6/1/30 | 310 | 370 |
| New York City NY Build NYC Resource Corp. | ||||
| Revenue (Queens College) | 5.000% | 6/1/32 | 660 | 779 |
| New York City NY Build NYC Resource Corp. | ||||
| Revenue (Queens College) | 5.000% | 6/1/33 | 660 | 777 |
| New York City NY Build NYC Resource Corp. | ||||
| Revenue (Queens College) | 5.000% | 6/1/34 | 580 | 682 |
| New York City NY Build NYC Resource Corp. | ||||
| Revenue (Queens College) | 5.000% | 6/1/38 | 1,000 | 1,146 |
| New York City NY Build NYC Resource Corp. | ||||
| Revenue (YMCA of Greater New York) | 5.000% | 8/1/29 | 1,000 | 1,176 |
| New York City NY Build NYC Resource Corp. | ||||
| Revenue (YMCA of Greater New York) | 4.000% | 8/1/36 | 1,100 | 1,147 |
39
New York Long-Term Tax-Exempt Fund
| Face | Market | |||
| Maturity | Amount | Value• | ||
| Coupon | Date | ($000) | ($000) | |
| New York City NY Capital Resources Corp. Revenue | ||||
| (Loan Enhanced Assistance Program) VRDO | 0.840% | 6/7/17 LOC | 3,435 | 3,435 |
| New York City NY GO | 5.000% | 10/1/17 (Prere.) | 455 | 461 |
| New York City NY GO | 5.250% | 8/15/18 (Prere.) | 1,235 | 1,300 |
| New York City NY GO | 6.250% | 10/15/18 (Prere.) | 990 | 1,063 |
| New York City NY GO | 5.375% | 4/1/19 (Prere.) | 2,785 | 3,010 |
| New York City NY GO | 5.450% | 4/1/19 (Prere.) | 8,180 | 8,853 |
| New York City NY GO | 5.625% | 4/1/19 (Prere.) | 2,890 | 3,137 |
| New York City NY GO | 5.000% | 8/1/23 | 5,000 | 6,057 |
| New York City NY GO | 5.000% | 8/1/24 | 4,000 | 4,866 |
| New York City NY GO | 5.000% | 8/1/25 | 75 | 90 |
| New York City NY GO | 5.000% | 8/1/26 | 5,000 | 6,023 |
| New York City NY GO | 5.000% | 8/1/26 | 4,370 | 5,380 |
| New York City NY GO | 5.000% | 8/1/26 | 3,000 | 3,711 |
| New York City NY GO | 5.000% | 8/1/27 | 4,550 | 5,461 |
| New York City NY GO | 5.000% | 8/1/27 | 9,900 | 11,775 |
| New York City NY GO | 5.000% | 8/1/27 | 5,000 | 6,191 |
| New York City NY GO | 5.000% | 8/1/28 | 4,000 | 4,803 |
| New York City NY GO | 5.000% | 8/1/28 | 3,710 | 4,282 |
| New York City NY GO | 5.000% | 8/1/28 | 3,000 | 3,638 |
| New York City NY GO | 5.000% | 8/1/28 | 5,000 | 6,140 |
| New York City NY GO | 6.250% | 10/15/28 | 45 | 48 |
| New York City NY GO | 5.625% | 4/1/29 | 110 | 119 |
| New York City NY GO | 5.000% | 8/1/29 | 2,500 | 2,854 |
| New York City NY GO | 5.000% | 8/1/29 | 5,000 | 5,963 |
| New York City NY GO | 5.000% | 8/1/29 | 8,500 | 10,263 |
| New York City NY GO | 5.000% | 8/1/29 | 5,000 | 6,091 |
| New York City NY GO | 5.000% | 8/1/30 | 2,185 | 2,485 |
| New York City NY GO | 5.000% | 8/1/30 | 6,220 | 7,281 |
| New York City NY GO | 5.000% | 8/1/30 | 2,335 | 2,738 |
| New York City NY GO | 5.000% | 8/1/30 | 3,000 | 3,587 |
| New York City NY GO | 5.000% | 8/1/30 | 5,000 | 6,040 |
| New York City NY GO | 5.000% | 8/1/30 | 4,690 | 5,666 |
| New York City NY GO | 5.000% | 3/1/31 | 6,000 | 6,945 |
| New York City NY GO | 5.450% | 4/1/31 | 320 | 345 |
| New York City NY GO | 4.000% | 8/1/31 | 2,775 | 3,092 |
| New York City NY GO | 5.000% | 8/1/31 | 3,000 | 3,399 |
| New York City NY GO | 5.000% | 8/1/31 | 2,000 | 2,355 |
| New York City NY GO | 5.000% | 8/1/31 | 1,500 | 1,723 |
| New York City NY GO | 5.000% | 8/1/31 | 2,230 | 2,535 |
| New York City NY GO | 5.000% | 8/1/31 | 5,000 | 5,960 |
| New York City NY GO | 5.000% | 12/1/31 | 1,770 | 2,139 |
| New York City NY GO | 5.000% | 3/1/32 | 5,000 | 5,773 |
| New York City NY GO | 4.000% | 8/1/32 | 1,935 | 2,141 |
| New York City NY GO | 5.000% | 8/1/32 | 4,000 | 4,688 |
| New York City NY GO | 5.000% | 8/1/32 | 2,985 | 3,375 |
| New York City NY GO | 5.000% | 3/1/33 | 7,500 | 8,624 |
| New York City NY GO | 5.000% | 8/1/33 | 2,875 | 3,395 |
| New York City NY GO | 5.000% | 8/1/33 | 1,000 | 1,160 |
| New York City NY GO | 5.000% | 10/1/33 | 6,500 | 7,475 |
| New York City NY GO | 5.000% | 10/1/34 | 2,000 | 2,284 |
| New York City NY GO | 5.000% | 8/1/35 | 3,500 | 3,935 |
| New York City NY GO | 5.000% | 12/1/35 | 2,500 | 2,970 |
| New York City NY GO | 5.375% | 4/1/36 | 1,215 | 1,307 |
| New York City NY GO | 5.000% | 6/1/36 | 910 | 1,056 |
40
New York Long-Term Tax-Exempt Fund
| Face | Market | |||
| Maturity | Amount | Value• | ||
| Coupon | Date | ($000) | ($000) | |
| New York City NY GO | 4.000% | 8/1/36 | 2,500 | 2,689 |
| New York City NY GO | 5.000% | 10/1/36 | 3,000 | 3,385 |
| New York City NY GO | 5.000% | 3/1/37 | 6,790 | 7,760 |
| New York City NY GO | 5.000% | 8/1/37 | 4,000 | 4,700 |
| New York City NY GO | 5.000% | 8/1/38 | 10,000 | 11,714 |
| New York City NY GO | 5.000% | 12/1/41 | 8,000 | 9,350 |
| New York City NY GO | 4.000% | 12/1/43 | 1,835 | 1,942 |
| New York City NY GO VRDO | 0.790% | 6/1/17 LOC | 7,400 | 7,400 |
| New York City NY GO VRDO | 0.800% | 6/1/17 | 3,500 | 3,500 |
| New York City NY GO VRDO | 0.800% | 6/1/17 | 25,325 | 25,325 |
| New York City NY GO VRDO | 0.770% | 6/7/17 LOC | 3,000 | 3,000 |
| New York City NY GO VRDO | 0.790% | 6/7/17 LOC | 3,800 | 3,800 |
| New York City NY Health & Hospital Corp. | ||||
| Revenue (Health System) | 5.000% | 2/15/24 | 3,000 | 3,284 |
| New York City NY Health & Hospital Corp. | ||||
| Revenue (Health System) | 5.000% | 2/15/30 | 3,300 | 3,557 |
| New York City NY Health & Hospital Corp. | ||||
| Revenue (Health System) VRDO | 0.750% | 6/7/17 LOC | 1,640 | 1,640 |
| New York City NY Housing Development Corp. | ||||
| Capital Fund Grant Program Revenue | ||||
| (New York City Housing Authority Program) | 5.000% | 7/1/23 | 1,000 | 1,202 |
| New York City NY Housing Development Corp. | ||||
| Multi-Family Housing Revenue | 5.250% | 7/1/28 | 2,700 | 3,172 |
| New York City NY Housing Development Corp. | ||||
| Multi-Family Housing Revenue | 5.250% | 7/1/29 | 3,035 | 3,554 |
| New York City NY Housing Development Corp. | ||||
| Multi-Family Housing Revenue | 3.375% | 11/1/29 | 1,500 | 1,544 |
| New York City NY Housing Development Corp. | ||||
| Multi-Family Housing Revenue | 4.750% | 11/1/29 | 5,220 | 5,449 |
| New York City NY Housing Development Corp. | ||||
| Multi-Family Housing Revenue | 4.750% | 11/1/29 | 2,520 | 2,609 |
| New York City NY Housing Development Corp. | ||||
| Multi-Family Housing Revenue | 3.375% | 11/15/29 | 3,500 | 3,641 |
| New York City NY Housing Development Corp. | ||||
| Multi-Family Housing Revenue | 5.250% | 7/1/30 | 2,605 | 3,034 |
| New York City NY Housing Development Corp. | ||||
| Multi-Family Housing Revenue | 3.700% | 11/1/30 | 3,000 | 3,135 |
| New York City NY Housing Development Corp. | ||||
| Multi-Family Housing Revenue | 3.700% | 11/15/34 | 5,000 | 5,214 |
| New York City NY Housing Development Corp. | ||||
| Multi-Family Housing Revenue | 3.550% | 11/1/35 | 3,000 | 3,058 |
| New York City NY Housing Development Corp. | ||||
| Multi-Family Housing Revenue | 5.550% | 11/1/39 | 3,500 | 3,649 |
| New York City NY Housing Development Corp. | ||||
| Multi-Family Housing Revenue | 3.750% | 11/1/40 | 3,000 | 3,066 |
| New York City NY Housing Development Corp. | ||||
| Multi-Family Housing Revenue | 5.000% | 11/1/42 | 2,600 | 2,803 |
| New York City NY Housing Development Corp. | ||||
| Multi-Family Housing Revenue | 5.700% | 11/1/46 | 7,155 | 7,494 |
| New York City NY Housing Development Corp. | ||||
| Multi-Family Housing Revenue PUT | 2.950% | 2/1/26 | 7,000 | 7,251 |
| New York City NY Housing Development Corp. | ||||
| Multi-Family Housing Revenue PUT | 2.950% | 2/1/26 | 5,000 | 5,158 |
| New York City NY Housing Development Corp. | ||||
| Multi-Family Mortgage Revenue (8 Spruce Street) | 3.500% | 2/15/48 | 5,000 | 5,085 |
41
New York Long-Term Tax-Exempt Fund
| Face | Market | |||
| Maturity | Amount | Value• | ||
| Coupon | Date | ($000) | ($000) | |
| New York City NY Industrial Development Agency | ||||
| Civic Facility Revenue (CASA Project) VRDO | 0.800% | 6/7/17 LOC | 9,585 | 9,585 |
| New York City NY Industrial Development Agency | ||||
| Civic Facility Revenue (United Jewish | ||||
| Appeal-Federation of Jewish Philanthropies of | ||||
| New York, Inc.) | 5.000% | 7/1/34 | 4,850 | 5,399 |
| New York City NY Industrial Development Agency | ||||
| PILOT Revenue (Queens Baseball Stadium | ||||
| Project) | 6.125% | 1/1/29 (12) | 1,750 | 1,891 |
| New York City NY Industrial Development Agency | ||||
| PILOT Revenue (Queens Baseball Stadium | ||||
| Project) | 6.375% | 1/1/39 (12) | 4,000 | 4,335 |
| New York City NY Industrial Development Agency | ||||
| PILOT Revenue (Yankee Stadium Project) | 0.000% | 3/1/34 (12) | 5,285 | 2,880 |
| New York City NY Industrial Development Agency | ||||
| PILOT Revenue (Yankee Stadium Project) | 0.000% | 3/1/35 (12) | 4,305 | 2,243 |
| New York City NY Industrial Development Agency | ||||
| PILOT Revenue (Yankee Stadium Project) | 7.000% | 3/1/49 (12) | 34,550 | 38,013 |
| New York City NY Industrial Development Agency | ||||
| Special Facility Revenue (New York Stock | ||||
| Exchange Project) | 5.000% | 5/1/29 | 2,020 | 2,164 |
| New York City NY Municipal Water Finance | ||||
| Authority Water & Sewer System Revenue | 0.000% | 6/15/17 | 10,000 | 9,997 |
| New York City NY Municipal Water Finance | ||||
| Authority Water & Sewer System Revenue | 0.000% | 6/15/18 | 4,250 | 4,210 |
| New York City NY Municipal Water Finance | ||||
| Authority Water & Sewer System Revenue | 5.750% | 6/15/18 (Prere.) | 2,320 | 2,439 |
| New York City NY Municipal Water Finance | ||||
| Authority Water & Sewer System Revenue | 0.000% | 6/15/21 | 4,490 | 4,238 |
| New York City NY Municipal Water Finance | ||||
| Authority Water & Sewer System Revenue | 5.000% | 6/15/27 | 5,000 | 6,198 |
| New York City NY Municipal Water Finance | ||||
| Authority Water & Sewer System Revenue | 5.000% | 6/15/28 | 10,000 | 12,311 |
| New York City NY Municipal Water Finance | ||||
| Authority Water & Sewer System Revenue | 5.000% | 6/15/29 | 2,000 | 2,286 |
| New York City NY Municipal Water Finance | ||||
| Authority Water & Sewer System Revenue | 5.000% | 6/15/31 | 1,500 | 1,697 |
| New York City NY Municipal Water Finance | ||||
| Authority Water & Sewer System Revenue | 5.000% | 6/15/32 | 12,385 | 13,989 |
| New York City NY Municipal Water Finance | ||||
| Authority Water & Sewer System Revenue | 5.250% | 6/15/32 | 10,000 | 10,824 |
| New York City NY Municipal Water Finance | ||||
| Authority Water & Sewer System Revenue | 5.000% | 6/15/34 | 6,000 | 6,978 |
| New York City NY Municipal Water Finance | ||||
| Authority Water & Sewer System Revenue | 5.000% | 6/15/35 | 10,000 | 11,587 |
| New York City NY Municipal Water Finance | ||||
| Authority Water & Sewer System Revenue | 5.000% | 6/15/36 | 7,500 | 8,971 |
| New York City NY Municipal Water Finance | ||||
| Authority Water & Sewer System Revenue | 5.000% | 6/15/36 | 5,000 | 5,795 |
| New York City NY Municipal Water Finance | ||||
| Authority Water & Sewer System Revenue | 5.000% | 6/15/37 | 2,500 | 2,925 |
| New York City NY Municipal Water Finance | ||||
| Authority Water & Sewer System Revenue | 5.000% | 6/15/37 | 10,000 | 11,885 |
| New York City NY Municipal Water Finance | ||||
| Authority Water & Sewer System Revenue | 5.000% | 6/15/37 | 4,955 | 5,797 |
42
New York Long-Term Tax-Exempt Fund
| Face | Market | |||
| Maturity | Amount | Value• | ||
| Coupon | Date | ($000) | ($000) | |
| New York City NY Municipal Water Finance | ||||
| Authority Water & Sewer System Revenue | 5.000% | 6/15/38 | 10,000 | 11,886 |
| New York City NY Municipal Water Finance | ||||
| Authority Water & Sewer System Revenue | 4.000% | 6/15/39 | 5,025 | 5,413 |
| New York City NY Municipal Water Finance | ||||
| Authority Water & Sewer System Revenue | 5.000% | 6/15/39 | 7,500 | 8,739 |
| New York City NY Municipal Water Finance | ||||
| Authority Water & Sewer System Revenue | 5.000% | 6/15/39 | 5,405 | 6,298 |
| New York City NY Municipal Water Finance | ||||
| Authority Water & Sewer System Revenue | 5.000% | 6/15/40 | 5,000 | 5,385 |
| New York City NY Municipal Water Finance | ||||
| Authority Water & Sewer System Revenue | 5.250% | 6/15/40 | 13,355 | 14,456 |
| New York City NY Municipal Water Finance | ||||
| Authority Water & Sewer System Revenue | 5.250% | 6/15/40 | 7,500 | 8,118 |
| New York City NY Municipal Water Finance | ||||
| Authority Water & Sewer System Revenue | 5.500% | 6/15/40 | 18,500 | 20,114 |
| New York City NY Municipal Water Finance | ||||
| Authority Water & Sewer System Revenue | 5.750% | 6/15/40 | 7,755 | 8,150 |
| New York City NY Municipal Water Finance | ||||
| Authority Water & Sewer System Revenue | 5.000% | 6/15/43 | 15,385 | 17,160 |
| New York City NY Municipal Water Finance | ||||
| Authority Water & Sewer System Revenue | 5.375% | 6/15/43 | 10,000 | 11,303 |
| New York City NY Municipal Water Finance | ||||
| Authority Water & Sewer System Revenue | 5.500% | 6/15/43 | 2,500 | 2,841 |
| New York City NY Municipal Water Finance | ||||
| Authority Water & Sewer System Revenue | 5.000% | 6/15/44 | 10,000 | 11,092 |
| New York City NY Municipal Water Finance | ||||
| Authority Water & Sewer System Revenue | 5.000% | 6/15/44 | 8,470 | 9,487 |
| New York City NY Municipal Water Finance | ||||
| Authority Water & Sewer System Revenue | 5.000% | 6/15/45 | 5,000 | 5,712 |
| New York City NY Municipal Water Finance | ||||
| Authority Water & Sewer System Revenue | 5.000% | 6/15/45 | 3,430 | 3,824 |
| New York City NY Municipal Water Finance | ||||
| Authority Water & Sewer System Revenue | 5.000% | 6/15/46 | 24,465 | 27,727 |
| New York City NY Municipal Water Finance | ||||
| Authority Water & Sewer System Revenue | 5.000% | 6/15/46 | 14,405 | 16,582 |
| New York City NY Municipal Water Finance | ||||
| Authority Water & Sewer System Revenue | 5.000% | 6/15/47 | 7,455 | 8,511 |
| New York City NY Municipal Water Finance | ||||
| Authority Water & Sewer System Revenue | 5.000% | 6/15/47 | 10,500 | 12,269 |
| New York City NY Municipal Water Finance | ||||
| Authority Water & Sewer System Revenue VRDO | 0.790% | 6/1/17 | 100 | 100 |
| New York City NY Municipal Water Finance | ||||
| Authority Water & Sewer System Revenue VRDO | 0.790% | 6/1/17 | 1,000 | 1,000 |
| New York City NY Municipal Water Finance | ||||
| Authority Water & Sewer System Revenue VRDO | 0.840% | 6/1/17 | 400 | 400 |
| New York City NY Municipal Water Finance | ||||
| Authority Water & Sewer System Revenue VRDO | 0.780% | 6/7/17 | 700 | 700 |
| New York City NY Municipal Water Finance | ||||
| Authority Water & Sewer System Revenue VRDO | 0.790% | 6/7/17 | 5,775 | 5,775 |
| New York City NY Sales Tax Asset Receivable | ||||
| Corp. Revenue | 5.000% | 10/15/26 | 3,000 | 3,688 |
| New York City NY Sales Tax Asset Receivable | ||||
| Corp. Revenue | 5.000% | 10/15/27 | 4,000 | 4,885 |
43
New York Long-Term Tax-Exempt Fund
| Face | Market | |||
| Maturity | Amount | Value• | ||
| Coupon | Date | ($000) | ($000) | |
| New York City NY Sales Tax Asset Receivable | ||||
| Corp. Revenue | 5.000% | 10/15/28 | 8,665 | 10,520 |
| New York City NY Sales Tax Asset Receivable | ||||
| Corp. Revenue | 5.000% | 10/15/29 | 16,000 | 19,354 |
| New York City NY Sales Tax Asset Receivable | ||||
| Corp. Revenue | 5.000% | 10/15/30 | 2,775 | 3,340 |
| New York City NY Sales Tax Asset Receivable | ||||
| Corp. Revenue | 5.000% | 10/15/31 | 11,000 | 13,185 |
| New York City NY Transitional Finance Authority | ||||
| Building Aid Revenue | 5.000% | 7/15/26 | 1,970 | 2,412 |
| New York City NY Transitional Finance Authority | ||||
| Building Aid Revenue | 5.000% | 7/15/28 | 2,805 | 3,274 |
| New York City NY Transitional Finance Authority | ||||
| Building Aid Revenue | 5.000% | 7/15/29 | 5,000 | 5,814 |
| New York City NY Transitional Finance Authority | ||||
| Building Aid Revenue | 5.000% | 7/15/31 | 1,585 | 1,789 |
| New York City NY Transitional Finance Authority | ||||
| Building Aid Revenue | 5.000% | 7/15/31 | 4,260 | 4,935 |
| New York City NY Transitional Finance Authority | ||||
| Building Aid Revenue | 5.000% | 1/15/32 | 500 | 531 |
| New York City NY Transitional Finance Authority | ||||
| Building Aid Revenue | 5.000% | 7/15/32 | 4,000 | 4,493 |
| New York City NY Transitional Finance Authority | ||||
| Building Aid Revenue | 5.125% | 1/15/33 | 7,000 | 7,452 |
| New York City NY Transitional Finance Authority | ||||
| Building Aid Revenue | 5.000% | 7/15/33 | 8,205 | 9,454 |
| New York City NY Transitional Finance Authority | ||||
| Building Aid Revenue | 5.000% | 7/15/33 | 5,000 | 5,836 |
| New York City NY Transitional Finance Authority | ||||
| Building Aid Revenue | 5.125% | 1/15/34 | 10,000 | 10,623 |
| New York City NY Transitional Finance Authority | ||||
| Building Aid Revenue | 5.000% | 7/15/36 | 5,000 | 5,791 |
| New York City NY Transitional Finance Authority | ||||
| Building Aid Revenue | 5.000% | 7/15/37 | 13,885 | 15,918 |
| New York City NY Transitional Finance Authority | ||||
| Building Aid Revenue | 5.250% | 7/15/37 | 3,250 | 3,673 |
| New York City NY Transitional Finance Authority | ||||
| Building Aid Revenue | 5.250% | 1/15/39 | 7,110 | 7,555 |
| New York City NY Transitional Finance Authority | ||||
| Building Aid Revenue | 4.000% | 7/15/40 | 11,385 | 12,066 |
| New York City NY Transitional Finance Authority | ||||
| Building Aid Revenue | 5.000% | 7/15/40 | 5,200 | 5,810 |
| New York City NY Transitional Finance Authority | ||||
| Building Aid Revenue | 5.000% | 7/15/40 | 2,000 | 2,313 |
| New York City NY Transitional Finance Authority | ||||
| Building Aid Revenue | 5.000% | 7/15/40 | 9,410 | 10,801 |
| New York City NY Transitional Finance Authority | ||||
| Building Aid Revenue | 5.000% | 7/15/41 | 2,000 | 2,310 |
| New York City NY Transitional Finance Authority | ||||
| Building Aid Revenue | 5.000% | 7/15/43 | 1,410 | 1,612 |
| New York City NY Transitional Finance Authority | ||||
| Future Tax Revenue | 5.000% | 11/1/17 (Prere.) | 6,725 | 6,841 |
| New York City NY Transitional Finance Authority | ||||
| Future Tax Revenue | 5.000% | 5/1/19 (Prere.) | 3,740 | 4,029 |
44
New York Long-Term Tax-Exempt Fund
| Face | Market | |||
| Maturity | Amount | Value• | ||
| Coupon | Date | ($000) | ($000) | |
| New York City NY Transitional Finance Authority | ||||
| Future Tax Revenue | 5.000% | 5/1/19 (Prere.) | 15 | 16 |
| New York City NY Transitional Finance Authority | ||||
| Future Tax Revenue | 5.500% | 11/1/20 (Prere.) | 1,305 | 1,499 |
| New York City NY Transitional Finance Authority | ||||
| Future Tax Revenue | 5.250% | 2/1/21 (Prere.) | 185 | 213 |
| New York City NY Transitional Finance Authority | ||||
| Future Tax Revenue | 5.250% | 2/1/21 (Prere.) | 1,225 | 1,409 |
| New York City NY Transitional Finance Authority | ||||
| Future Tax Revenue | 5.000% | 11/1/27 | 2,500 | 3,068 |
| New York City NY Transitional Finance Authority | ||||
| Future Tax Revenue | 5.250% | 2/1/29 | 775 | 885 |
| New York City NY Transitional Finance Authority | ||||
| Future Tax Revenue | 5.000% | 11/1/29 | 5,000 | 6,110 |
| New York City NY Transitional Finance Authority | ||||
| Future Tax Revenue | 5.000% | 2/1/30 | 5,000 | 6,033 |
| New York City NY Transitional Finance Authority | ||||
| Future Tax Revenue | 5.250% | 2/1/30 | 1,315 | 1,500 |
| New York City NY Transitional Finance Authority | ||||
| Future Tax Revenue | 5.000% | 8/1/30 | 4,825 | 5,744 |
| New York City NY Transitional Finance Authority | ||||
| Future Tax Revenue | 5.000% | 2/1/31 | 2,500 | 2,966 |
| New York City NY Transitional Finance Authority | ||||
| Future Tax Revenue | 5.000% | 2/1/31 | 2,000 | 2,246 |
| New York City NY Transitional Finance Authority | ||||
| Future Tax Revenue | 5.000% | 11/1/31 | 3,575 | 3,994 |
| New York City NY Transitional Finance Authority | ||||
| Future Tax Revenue | 5.000% | 2/1/32 | 7,300 | 8,497 |
| New York City NY Transitional Finance Authority | ||||
| Future Tax Revenue | 5.000% | 11/1/32 | 12,000 | 14,585 |
| New York City NY Transitional Finance Authority | ||||
| Future Tax Revenue | 5.000% | 11/1/32 | 5,350 | 6,404 |
| New York City NY Transitional Finance Authority | ||||
| Future Tax Revenue | 5.000% | 8/1/33 | 2,850 | 3,345 |
| New York City NY Transitional Finance Authority | ||||
| Future Tax Revenue | 5.000% | 8/1/33 | 10,260 | 12,160 |
| New York City NY Transitional Finance Authority | ||||
| Future Tax Revenue | 5.000% | 11/1/33 | 5,000 | 6,038 |
| New York City NY Transitional Finance Authority | ||||
| Future Tax Revenue | 5.000% | 11/1/33 | 9,500 | 11,308 |
| New York City NY Transitional Finance Authority | ||||
| Future Tax Revenue | 5.000% | 2/1/34 | 2,195 | 2,547 |
| New York City NY Transitional Finance Authority | ||||
| Future Tax Revenue | 5.000% | 5/1/34 | 5,000 | 5,836 |
| New York City NY Transitional Finance Authority | ||||
| Future Tax Revenue | 5.000% | 8/1/34 | 10,000 | 11,688 |
| New York City NY Transitional Finance Authority | ||||
| Future Tax Revenue | 4.000% | 11/1/34 | 3,880 | 4,225 |
| New York City NY Transitional Finance Authority | ||||
| Future Tax Revenue | 5.000% | 2/1/35 | 7,500 | 8,331 |
| New York City NY Transitional Finance Authority | ||||
| Future Tax Revenue | 5.000% | 2/1/35 | 10,000 | 11,392 |
| New York City NY Transitional Finance Authority | ||||
| Future Tax Revenue | 5.000% | 2/1/35 | 5,500 | 6,565 |
45
New York Long-Term Tax-Exempt Fund
| Face | Market | |||
| Maturity | Amount | Value• | ||
| Coupon | Date | ($000) | ($000) | |
| New York City NY Transitional Finance Authority | ||||
| Future Tax Revenue | 4.000% | 8/1/35 | 3,600 | 3,932 |
| New York City NY Transitional Finance Authority | ||||
| Future Tax Revenue | 5.500% | 11/1/35 | 1,695 | 1,928 |
| New York City NY Transitional Finance Authority | ||||
| Future Tax Revenue | 4.000% | 2/1/36 | 4,000 | 4,345 |
| New York City NY Transitional Finance Authority | ||||
| Future Tax Revenue | 5.000% | 2/1/36 | 5,000 | 5,954 |
| New York City NY Transitional Finance Authority | ||||
| Future Tax Revenue | 5.000% | 8/1/36 | 11,600 | 13,475 |
| New York City NY Transitional Finance Authority | ||||
| Future Tax Revenue | 5.000% | 8/1/37 | 5,000 | 5,838 |
| New York City NY Transitional Finance Authority | ||||
| Future Tax Revenue | 5.000% | 8/1/38 | 10,000 | 11,741 |
| New York City NY Transitional Finance Authority | ||||
| Future Tax Revenue | 5.000% | 11/1/38 | 2,000 | 2,250 |
| New York City NY Transitional Finance Authority | ||||
| Future Tax Revenue | 5.000% | 2/1/39 | 5,000 | 5,820 |
| New York City NY Transitional Finance Authority | ||||
| Future Tax Revenue | 5.000% | 8/1/39 | 7,160 | 8,262 |
| New York City NY Transitional Finance Authority | ||||
| Future Tax Revenue | 5.000% | 11/1/39 | 3,750 | 4,175 |
| New York City NY Transitional Finance Authority | ||||
| Future Tax Revenue | 5.000% | 2/1/41 | 15,000 | 17,273 |
| New York City NY Transitional Finance Authority | ||||
| Future Tax Revenue | 5.000% | 2/1/42 | 3,505 | 3,959 |
| New York City NY Transitional Finance Authority | ||||
| Future Tax Revenue | 5.000% | 8/1/42 | 2,500 | 2,872 |
| New York City NY Transitional Finance Authority | ||||
| Future Tax Revenue | 4.000% | 2/1/44 | 5,250 | 5,570 |
| New York City NY Transitional Finance Authority | ||||
| Future Tax Revenue VRDO | 0.800% | 6/1/17 | 1,700 | 1,700 |
| New York City NY Transitional Finance Authority | ||||
| Future Tax Revenue VRDO | 0.750% | 6/7/17 | 7,300 | 7,300 |
| New York City NY Trust for Cultural Resources | ||||
| Revenue (The Juilliard School) | 5.000% | 1/1/34 | 4,000 | 4,237 |
| New York City NY Trust for Cultural Resources | ||||
| Revenue (The Juilliard School) | 5.000% | 1/1/39 | 4,000 | 4,235 |
| New York City NY Trust for Cultural Resources | ||||
| Revenue (Whitney Museum of American Art) | 5.000% | 7/1/31 | 7,000 | 7,805 |
| New York City NY Trust for Cultural Resources | ||||
| Revenue (Wildlife Conservation Society) | 5.000% | 8/1/33 | 4,000 | 4,655 |
| New York Convention Center Development Corp. | ||||
| Revenue | 0.000% | 11/15/32 | 2,000 | 1,169 |
| New York Convention Center Development Corp. | ||||
| Revenue | 5.000% | 11/15/33 | 3,000 | 3,516 |
| New York Convention Center Development Corp. | ||||
| Revenue | 0.000% | 11/15/34 | 3,000 | 1,584 |
| New York Convention Center Development Corp. | ||||
| Revenue | 0.000% | 11/15/36 | 4,000 | 1,914 |
| New York Convention Center Development Corp. | ||||
| Revenue | 0.000% | 11/15/37 | 2,340 | 1,070 |
| New York Convention Center Development Corp. | ||||
| Revenue | 0.000% | 11/15/38 | 3,500 | 1,525 |
46
New York Long-Term Tax-Exempt Fund
| Face | Market | |||
| Maturity | Amount | Value• | ||
| Coupon | Date | ($000) | ($000) | |
| New York Convention Center Development Corp. | ||||
| Revenue | 0.000% | 11/15/39 | 4,000 | 1,668 |
| New York Convention Center Development Corp. | ||||
| Revenue | 5.000% | 11/15/40 | 12,915 | 14,894 |
| New York Convention Center Development Corp. | ||||
| Revenue | 0.000% | 11/15/41 | 13,570 | 5,128 |
| New York Convention Center Development Corp. | ||||
| Revenue | 5.000% | 11/15/45 | 4,000 | 4,603 |
| 1 New York Counties Tobacco Trust Revenue | 6.250% | 6/1/41 | 10,000 | 10,416 |
| New York Liberty Development Corp. Revenue | 5.000% | 11/15/31 | 10,835 | 12,283 |
| New York Liberty Development Corp. Revenue | 5.000% | 12/15/41 | 14,750 | 16,572 |
| New York Liberty Development Corp. Revenue | 5.000% | 9/15/43 | 14,360 | 16,080 |
| New York Liberty Development Corp. Revenue | 5.250% | 12/15/43 | 6,750 | 7,685 |
| New York Liberty Development Corp. Revenue | 5.125% | 1/15/44 | 24,000 | 26,073 |
| New York Liberty Development Corp. Revenue | 5.000% | 11/15/44 | 20,000 | 22,238 |
| New York Liberty Development Corp. Revenue | 5.125% | 11/15/44 | 4,200 | 4,692 |
| New York Liberty Development Corp. Revenue | 5.625% | 7/15/47 | 6,055 | 6,663 |
| New York Liberty Development Corp. Revenue | 6.375% | 7/15/49 | 18,225 | 19,839 |
| New York Liberty Development Corp. Revenue | 5.750% | 11/15/51 | 25,000 | 28,712 |
| New York Liberty Development Corp. Revenue | ||||
| (7 World Trade Center Project) | 5.000% | 9/15/31 | 5,000 | 5,763 |
| New York Liberty Development Corp. Revenue | ||||
| (7 World Trade Center Project) | 5.000% | 9/15/32 | 5,000 | 5,756 |
| New York Liberty Development Corp. Revenue | ||||
| (7 World Trade Center Project) | 5.000% | 9/15/40 | 4,680 | 5,325 |
| New York Liberty Development Corp. Revenue | ||||
| (7 World Trade Center Project) | 5.000% | 3/15/44 | 4,965 | 5,419 |
| New York Liberty Development Corp. Revenue | ||||
| (Goldman Sachs Headquarters) | 5.250% | 10/1/35 | 58,965 | 74,217 |
| New York Liberty Development Corp. Revenue | ||||
| (Goldman Sachs Headquarters) | 5.500% | 10/1/37 | 9,565 | 12,479 |
| New York Metropolitan Transportation Authority | ||||
| Revenue | 5.000% | 11/15/17 (Prere.) | 2,500 | 2,548 |
| New York Metropolitan Transportation Authority | ||||
| Revenue | 6.250% | 11/15/18 (Prere.) | 4,000 | 4,311 |
| New York Metropolitan Transportation Authority | ||||
| Revenue | 6.250% | 11/15/18 (Prere.) | 40 | 43 |
| New York Metropolitan Transportation Authority | ||||
| Revenue | 6.500% | 11/15/18 (Prere.) | 310 | 335 |
| New York Metropolitan Transportation Authority | ||||
| Revenue | 5.000% | 11/15/23 | 1,000 | 1,207 |
| New York Metropolitan Transportation Authority | ||||
| Revenue | 6.250% | 11/15/23 | 960 | 1,035 |
| New York Metropolitan Transportation Authority | ||||
| Revenue | 5.000% | 11/15/26 | 2,330 | 2,689 |
| New York Metropolitan Transportation Authority | ||||
| Revenue | 5.000% | 11/15/26 | 10,000 | 11,744 |
| New York Metropolitan Transportation Authority | ||||
| Revenue | 5.000% | 11/15/27 | 5,000 | 5,767 |
| New York Metropolitan Transportation Authority | ||||
| Revenue | 5.000% | 11/15/27 | 5,000 | 6,053 |
| New York Metropolitan Transportation Authority | ||||
| Revenue | 5.000% | 11/15/27 | 5,000 | 6,165 |
| New York Metropolitan Transportation Authority | ||||
| Revenue | 5.000% | 11/15/28 | 6,385 | 7,685 |
47
New York Long-Term Tax-Exempt Fund
| Face | Market | |||
| Maturity | Amount | Value• | ||
| Coupon | Date | ($000) | ($000) | |
| New York Metropolitan Transportation Authority | ||||
| Revenue | 5.000% | 11/15/28 | 4,250 | 5,115 |
| New York Metropolitan Transportation Authority | ||||
| Revenue | 5.250% | 11/15/28 | 1,000 | 1,133 |
| New York Metropolitan Transportation Authority | ||||
| Revenue | 6.500% | 11/15/28 | 960 | 1,038 |
| New York Metropolitan Transportation Authority | ||||
| Revenue | 5.000% | 11/15/29 | 3,000 | 3,583 |
| New York Metropolitan Transportation Authority | ||||
| Revenue | 5.000% | 11/15/29 | 5,000 | 5,972 |
| New York Metropolitan Transportation Authority | ||||
| Revenue | 5.250% | 11/15/29 | 1,000 | 1,132 |
| New York Metropolitan Transportation Authority | ||||
| Revenue | 5.000% | 11/15/30 | 3,000 | 3,623 |
| New York Metropolitan Transportation Authority | ||||
| Revenue | 5.250% | 11/15/30 | 1,150 | 1,300 |
| New York Metropolitan Transportation Authority | ||||
| Revenue | 5.250% | 11/15/30 | 6,540 | 7,915 |
| New York Metropolitan Transportation Authority | ||||
| Revenue | 4.000% | 11/15/32 | 3,000 | 3,248 |
| New York Metropolitan Transportation Authority | ||||
| Revenue | 5.000% | 11/15/32 | 1,500 | 1,711 |
| New York Metropolitan Transportation Authority | ||||
| Revenue | 5.000% | 11/15/32 | 2,050 | 2,331 |
| New York Metropolitan Transportation Authority | ||||
| Revenue | 5.000% | 11/15/32 | 5,000 | 5,823 |
| New York Metropolitan Transportation Authority | ||||
| Revenue | 5.000% | 11/15/33 | 3,500 | 3,976 |
| New York Metropolitan Transportation Authority | ||||
| Revenue | 5.000% | 11/15/35 | 3,000 | 3,486 |
| New York Metropolitan Transportation Authority | ||||
| Revenue | 5.000% | 11/15/35 | 3,250 | 3,777 |
| New York Metropolitan Transportation Authority | ||||
| Revenue | 4.000% | 11/15/36 | 1,030 | 1,095 |
| New York Metropolitan Transportation Authority | ||||
| Revenue | 5.000% | 11/15/37 | 6,875 | 8,061 |
| New York Metropolitan Transportation Authority | ||||
| Revenue | 5.250% | 11/15/37 | 5,000 | 5,845 |
| New York Metropolitan Transportation Authority | ||||
| Revenue | 5.000% | 11/15/38 | 10,000 | 11,216 |
| New York Metropolitan Transportation Authority | ||||
| Revenue | 5.250% | 11/15/38 | 1,000 | 1,142 |
| New York Metropolitan Transportation Authority | ||||
| Revenue | 5.250% | 11/15/39 | 5,000 | 5,754 |
| New York Metropolitan Transportation Authority | ||||
| Revenue | 5.250% | 11/15/40 | 10,000 | 11,170 |
| New York Metropolitan Transportation Authority | ||||
| Revenue | 5.000% | 11/15/41 | 2,000 | 2,250 |
| New York Metropolitan Transportation Authority | ||||
| Revenue | 5.000% | 11/15/42 | 4,000 | 4,507 |
| New York Metropolitan Transportation Authority | ||||
| Revenue | 5.000% | 11/15/42 | 5,000 | 5,591 |
| New York Metropolitan Transportation Authority | ||||
| Revenue | 5.250% | 11/15/55 | 2,045 | 2,334 |
48
New York Long-Term Tax-Exempt Fund
| Face | Market | |||
| Maturity | Amount | Value• | ||
| Coupon | Date | ($000) | ($000) | |
| New York Metropolitan Transportation Authority | ||||
| Revenue | 5.000% | 11/15/56 | 7,700 | 8,755 |
| New York Metropolitan Transportation Authority | ||||
| Revenue | 5.250% | 11/15/56 | 5,000 | 5,779 |
| New York Metropolitan Transportation Authority | ||||
| Revenue | 5.250% | 11/15/56 | 6,500 | 7,562 |
| New York Metropolitan Transportation Authority | ||||
| Revenue | 5.250% | 11/15/57 | 4,000 | 4,660 |
| New York Metropolitan Transportation Authority | ||||
| Revenue (Dedicated Petroleum Tax) | 5.250% | 11/15/19 (Prere.) | 5,000 | 5,524 |
| New York Metropolitan Transportation Authority | ||||
| Revenue (Dedicated Petroleum Tax) | 5.250% | 11/15/19 (Prere.) | 4,000 | 4,419 |
| New York Metropolitan Transportation Authority | ||||
| Revenue (Dedicated Petroleum Tax) | 5.250% | 11/15/19 (Prere.) | 4,000 | 4,419 |
| New York Metropolitan Transportation Authority | ||||
| Revenue (Dedicated Tax Fund) | 5.625% | 11/15/18 (Prere.) | 90 | 96 |
| New York Metropolitan Transportation Authority | ||||
| Revenue (Dedicated Tax Fund) | 5.625% | 11/15/18 (Prere.) | 410 | 438 |
| New York Metropolitan Transportation Authority | ||||
| Revenue (Dedicated Tax Fund) | 5.000% | 11/15/29 | 6,975 | 8,191 |
| New York Metropolitan Transportation Authority | ||||
| Revenue (Dedicated Tax Fund) | 5.250% | 11/15/30 | 2,500 | 3,117 |
| New York Metropolitan Transportation Authority | ||||
| Revenue (Dedicated Tax Fund) | 5.000% | 11/15/31 | 11,000 | 12,772 |
| New York Metropolitan Transportation Authority | ||||
| Revenue (Dedicated Tax Fund) | 5.250% | 11/15/31 | 2,500 | 3,102 |
| New York Metropolitan Transportation Authority | ||||
| Revenue (Dedicated Tax Fund) | 5.250% | 11/15/32 | 2,500 | 3,085 |
| New York Metropolitan Transportation Authority | ||||
| Revenue (Dedicated Tax Fund) | 4.000% | 11/15/33 | 10,000 | 10,976 |
| New York Metropolitan Transportation Authority | ||||
| Revenue (Dedicated Tax Fund) | 5.000% | 11/15/33 | 5,000 | 5,692 |
| New York Metropolitan Transportation Authority | ||||
| Revenue (Dedicated Tax Fund) | 5.000% | 11/15/34 | 1,700 | 2,027 |
| New York Metropolitan Transportation Authority | ||||
| Revenue (Dedicated Tax Fund) | 5.000% | 11/15/36 | 8,000 | 9,497 |
| New York Metropolitan Transportation Authority | ||||
| Revenue (Dedicated Tax Fund) | 5.000% | 11/15/47 | 13,000 | 15,272 |
| New York Metropolitan Transportation Authority | ||||
| Revenue (Hudson Yards Development) | 5.000% | 11/15/46 | 16,065 | 17,236 |
| New York Metropolitan Transportation Authority | ||||
| Revenue (Hudson Yards Development) | 5.000% | 11/15/51 | 15,000 | 16,314 |
| New York Metropolitan Transportation Authority | ||||
| Revenue (Hudson Yards Development) | 5.000% | 11/15/56 | 17,000 | 18,749 |
| New York Metropolitan Transportation Authority | ||||
| Revenue (Transit Revenue) | 6.500% | 11/15/18 (Prere.) | 3,730 | 4,034 |
| New York Metropolitan Transportation Authority | ||||
| Revenue (Transit Revenue) | 5.000% | 11/15/41 | 10,000 | 11,273 |
| 1 New York Metropolitan Transportation Authority | ||||
| Revenue TOB VRDO | 0.810% | 6/7/17 | 7,500 | 7,500 |
| New York State Dormitory Authority Hospital | ||||
| Revenue (Hudson Valley Hospital Center) | 5.000% | 8/15/17 (Prere.) | 4,325 | 4,362 |
| New York State Dormitory Authority Lease | ||||
| Revenue (State University Dormitory Facilities) | 5.000% | 7/1/21 (Prere.) | 1,000 | 1,158 |
49
New York Long-Term Tax-Exempt Fund
| Face | Market | |||
| Maturity | Amount | Value• | ||
| Coupon | Date | ($000) | ($000) | |
| New York State Dormitory Authority Lease | ||||
| Revenue (State University Dormitory Facilities) | 5.000% | 7/1/21 (Prere.) | 1,000 | 1,158 |
| New York State Dormitory Authority Lease | ||||
| Revenue (State University Dormitory Facilities) | 5.000% | 7/1/21 (Prere.) | 4,000 | 4,632 |
| New York State Dormitory Authority Lease | ||||
| Revenue (State University Dormitory Facilities) | 5.000% | 7/1/21 (Prere.) | 3,000 | 3,474 |
| New York State Dormitory Authority Lease | ||||
| Revenue (State University Dormitory Facilities) | 5.000% | 7/1/32 | 1,530 | 1,799 |
| New York State Dormitory Authority Lease | ||||
| Revenue (State University Dormitory Facilities) | 5.000% | 7/1/35 | 1,000 | 1,124 |
| New York State Dormitory Authority Lease | ||||
| Revenue (State University Dormitory Facilities) | 5.000% | 7/1/41 | 11,000 | 12,281 |
| New York State Dormitory Authority Lease | ||||
| Revenue (State University Dormitory Facilities) | 5.000% | 7/1/42 | 13,500 | 15,294 |
| New York State Dormitory Authority Revenue | 5.000% | 10/1/27 | 2,700 | 3,289 |
| New York State Dormitory Authority Revenue | 5.000% | 10/1/28 | 3,000 | 3,625 |
| New York State Dormitory Authority Revenue | 5.000% | 10/1/29 | 2,250 | 2,696 |
| 2 New York State Dormitory Authority Revenue | 5.000% | 10/1/30 (4) | 9,570 | 11,728 |
| New York State Dormitory Authority Revenue | ||||
| (Barnard College) | 5.000% | 7/1/26 | 750 | 906 |
| New York State Dormitory Authority Revenue | ||||
| (Barnard College) | 4.000% | 7/1/31 | 1,100 | 1,188 |
| New York State Dormitory Authority Revenue | ||||
| (Barnard College) | 4.000% | 7/1/32 | 1,340 | 1,440 |
| New York State Dormitory Authority Revenue | ||||
| (Barnard College) | 5.000% | 7/1/43 | 1,185 | 1,351 |
| New York State Dormitory Authority Revenue | ||||
| (Brooklyn Law School) | 5.000% | 7/1/26 | 1,630 | 1,837 |
| New York State Dormitory Authority Revenue | ||||
| (Brooklyn Law School) | 5.000% | 7/1/27 | 1,210 | 1,357 |
| New York State Dormitory Authority Revenue | ||||
| (Brooklyn Law School) | 5.000% | 7/1/28 | 1,000 | 1,118 |
| New York State Dormitory Authority Revenue | ||||
| (Brooklyn Law School) | 5.000% | 7/1/29 | 1,000 | 1,114 |
| New York State Dormitory Authority Revenue | ||||
| (Catholic Health System Obligated Group) | 5.000% | 7/1/32 | 710 | 774 |
| New York State Dormitory Authority Revenue | ||||
| (City University System) VRDO | 0.760% | 6/7/17 LOC | 1,910 | 1,910 |
| New York State Dormitory Authority Revenue | ||||
| (Columbia University) | 5.000% | 10/1/31 | 500 | 610 |
| New York State Dormitory Authority Revenue | ||||
| (Columbia University) | 5.000% | 10/1/41 | 1,825 | 2,051 |
| New York State Dormitory Authority Revenue | ||||
| (Columbia University) | 5.000% | 10/1/46 | 1,250 | 1,472 |
| New York State Dormitory Authority Revenue | ||||
| (Cornell University) | 5.000% | 7/1/40 | 5,000 | 5,537 |
| New York State Dormitory Authority Revenue | ||||
| (Culinary Institute of America) | 5.000% | 7/1/17 | 300 | 301 |
| New York State Dormitory Authority Revenue | ||||
| (Culinary Institute of America) | 5.000% | 7/1/18 | 325 | 337 |
| New York State Dormitory Authority Revenue | ||||
| (Culinary Institute of America) | 5.000% | 7/1/19 | 250 | 267 |
| New York State Dormitory Authority Revenue | ||||
| (Culinary Institute of America) | 5.000% | 7/1/20 | 400 | 437 |
50
New York Long-Term Tax-Exempt Fund
| Face | Market | |||
| Maturity | Amount | Value• | ||
| Coupon | Date | ($000) | ($000) | |
| New York State Dormitory Authority Revenue | ||||
| (Culinary Institute of America) | 5.000% | 7/1/21 | 300 | 335 |
| New York State Dormitory Authority Revenue | ||||
| (Culinary Institute of America) | 5.000% | 7/1/28 | 540 | 595 |
| New York State Dormitory Authority Revenue | ||||
| (Culinary Institute of America) | 5.500% | 7/1/33 | 1,000 | 1,138 |
| New York State Dormitory Authority Revenue | ||||
| (Culinary Institute of America) | 5.000% | 7/1/34 | 350 | 378 |
| New York State Dormitory Authority Revenue | ||||
| (Culinary Institute of America) | 5.000% | 7/1/42 | 600 | 642 |
| New York State Dormitory Authority Revenue | ||||
| (Culinary Institute of America) | 5.750% | 7/1/43 | 7,085 | 8,140 |
| New York State Dormitory Authority Revenue | ||||
| (Fordham University) | 5.000% | 7/1/28 | 400 | 488 |
| New York State Dormitory Authority Revenue | ||||
| (Fordham University) | 5.000% | 7/1/29 | 1,300 | 1,573 |
| New York State Dormitory Authority Revenue | ||||
| (Fordham University) | 5.000% | 7/1/31 | 1,200 | 1,434 |
| New York State Dormitory Authority Revenue | ||||
| (Fordham University) | 5.000% | 7/1/33 | 1,000 | 1,181 |
| New York State Dormitory Authority Revenue | ||||
| (Fordham University) | 5.000% | 7/1/34 | 755 | 887 |
| New York State Dormitory Authority Revenue | ||||
| (Fordham University) | 5.000% | 7/1/35 | 500 | 585 |
| New York State Dormitory Authority Revenue | ||||
| (Fordham University) | 5.000% | 7/1/36 | 1,350 | 1,576 |
| New York State Dormitory Authority Revenue | ||||
| (Fordham University) | 5.500% | 7/1/36 | 3,000 | 3,443 |
| New York State Dormitory Authority Revenue | ||||
| (Icahn School of Medicine at Mount Sinai) | 5.000% | 7/1/26 | 2,500 | 3,012 |
| New York State Dormitory Authority Revenue | ||||
| (Icahn School of Medicine at Mount Sinai) | 5.000% | 7/1/31 | 3,000 | 3,458 |
| New York State Dormitory Authority Revenue | ||||
| (Icahn School of Medicine at Mount Sinai) | 5.000% | 7/1/33 | 7,325 | 8,375 |
| New York State Dormitory Authority Revenue | ||||
| (Icahn School of Medicine at Mount Sinai) | 5.000% | 7/1/35 | 3,500 | 3,980 |
| New York State Dormitory Authority Revenue | ||||
| (Icahn School of Medicine at Mount Sinai) | 5.000% | 7/1/40 | 7,500 | 8,421 |
| New York State Dormitory Authority Revenue | ||||
| (Le Moyne College) VRDO | 0.800% | 6/7/17 LOC | 1,145 | 1,145 |
| New York State Dormitory Authority Revenue | ||||
| (Long Island University) | 5.000% | 9/1/26 | 2,355 | 2,642 |
| New York State Dormitory Authority Revenue | ||||
| (Long Island University) | 5.000% | 9/1/27 | 1,520 | 1,696 |
| New York State Dormitory Authority Revenue | ||||
| (Memorial Sloan-Kettering Cancer Center) | 5.000% | 7/1/36 | 1,000 | 1,126 |
| New York State Dormitory Authority Revenue | ||||
| (Mental Health Services Facilities Improvement) | 5.000% | 8/15/18 (Prere.) | 465 | 488 |
| New York State Dormitory Authority Revenue | ||||
| (Mental Health Services Facilities Improvement) | 5.000% | 2/15/28 (4) | 35 | 37 |
| New York State Dormitory Authority Revenue | ||||
| (Mental Health Services Facilities Improvement) | ||||
| VRDO | 0.790% | 6/7/17 LOC | 1,000 | 1,000 |
| New York State Dormitory Authority Revenue | ||||
| (Miriam Osborn Memorial Home Association) | 5.000% | 7/1/26 | 740 | 780 |
51
New York Long-Term Tax-Exempt Fund
| Face | Market | |||
| Maturity | Amount | Value• | ||
| Coupon | Date | ($000) | ($000) | |
| New York State Dormitory Authority Revenue | ||||
| (Miriam Osborn Memorial Home Association) | 5.000% | 7/1/27 | 650 | 683 |
| New York State Dormitory Authority Revenue | ||||
| (Miriam Osborn Memorial Home Association) | 5.000% | 7/1/29 | 1,000 | 1,047 |
| New York State Dormitory Authority Revenue | ||||
| (Miriam Osborn Memorial Home Association) | 5.000% | 7/1/42 | 500 | 518 |
| New York State Dormitory Authority Revenue | ||||
| (Mount Sinai Hospital Obligated Group) | 5.000% | 7/1/22 | 3,500 | 3,900 |
| New York State Dormitory Authority Revenue | ||||
| (Mount Sinai Hospital Obligated Group) | 5.000% | 7/1/23 | 4,500 | 5,007 |
| New York State Dormitory Authority Revenue | ||||
| (Mount Sinai Hospital Obligated Group) | 5.000% | 7/1/26 | 1,500 | 1,654 |
| New York State Dormitory Authority Revenue | ||||
| (Mount Sinai School of Medicine of New | ||||
| York University) | 5.150% | 7/1/24 (14) | 2,000 | 2,389 |
| New York State Dormitory Authority Revenue | ||||
| (New York University Hospitals Center) | 5.000% | 7/1/17 (Prere.) | 8,000 | 8,028 |
| New York State Dormitory Authority Revenue | ||||
| (New York University Hospitals Center) | 5.750% | 7/1/20 (Prere.) | 1,000 | 1,140 |
| New York State Dormitory Authority Revenue | ||||
| (New York University Hospitals Center) | 6.000% | 7/1/20 (Prere.) | 1,000 | 1,147 |
| New York State Dormitory Authority Revenue | ||||
| (New York University Hospitals Center) | 5.000% | 7/1/22 | 900 | 1,044 |
| New York State Dormitory Authority Revenue | ||||
| (New York University Hospitals Center) | 5.000% | 7/1/26 | 670 | 796 |
| New York State Dormitory Authority Revenue | ||||
| (New York University Hospitals Center) | 5.000% | 7/1/27 | 650 | 788 |
| New York State Dormitory Authority Revenue | ||||
| (New York University Hospitals Center) | 5.000% | 7/1/28 | 700 | 842 |
| New York State Dormitory Authority Revenue | ||||
| (New York University Hospitals Center) | 5.000% | 7/1/29 | 1,500 | 1,789 |
| New York State Dormitory Authority Revenue | ||||
| (New York University Hospitals Center) | 5.000% | 7/1/32 | 745 | 870 |
| New York State Dormitory Authority Revenue | ||||
| (New York University Hospitals Center) | 5.000% | 7/1/33 | 400 | 465 |
| New York State Dormitory Authority Revenue | ||||
| (New York University) | 5.000% | 7/1/19 (Prere.) | 5,000 | 5,420 |
| New York State Dormitory Authority Revenue | ||||
| (New York University) | 5.000% | 7/1/28 | 4,500 | 5,591 |
| New York State Dormitory Authority Revenue | ||||
| (New York University) | 5.000% | 7/1/29 | 1,000 | 1,196 |
| New York State Dormitory Authority Revenue | ||||
| (New York University) | 5.000% | 7/1/30 | 2,000 | 2,431 |
| New York State Dormitory Authority Revenue | ||||
| (New York University) | 5.000% | 7/1/30 | 6,625 | 7,691 |
| New York State Dormitory Authority Revenue | ||||
| (New York University) | 5.000% | 7/1/30 | 1,000 | 1,188 |
| New York State Dormitory Authority Revenue | ||||
| (New York University) | 5.000% | 7/1/30 | 5,000 | 6,101 |
| New York State Dormitory Authority Revenue | ||||
| (New York University) | 5.000% | 7/1/31 | 865 | 1,022 |
| New York State Dormitory Authority Revenue | ||||
| (New York University) | 5.000% | 7/1/32 | 1,000 | 1,176 |
| New York State Dormitory Authority Revenue | ||||
| (New York University) | 5.000% | 7/1/33 | 2,365 | 2,767 |
52
New York Long-Term Tax-Exempt Fund
| Face | Market | |||
| Maturity | Amount | Value• | ||
| Coupon | Date | ($000) | ($000) | |
| New York State Dormitory Authority Revenue | ||||
| (New York University) | 5.000% | 7/1/33 | 12,000 | 14,370 |
| 2 New York State Dormitory Authority Revenue | ||||
| (New York University) | 4.000% | 7/1/35 | 6,000 | 6,502 |
| 2 New York State Dormitory Authority Revenue | ||||
| (New York University) | 4.000% | 7/1/36 | 6,000 | 6,486 |
| New York State Dormitory Authority Revenue | ||||
| (New York University) | 5.000% | 7/1/37 | 4,200 | 4,813 |
| New York State Dormitory Authority Revenue | ||||
| (New York University) | 5.000% | 7/1/37 | 3,250 | 3,724 |
| New York State Dormitory Authority Revenue | ||||
| (New York University) | 5.000% | 7/1/42 | 10,000 | 11,329 |
| New York State Dormitory Authority Revenue | ||||
| (New York University) | 5.000% | 7/1/48 | 3,000 | 3,462 |
| New York State Dormitory Authority Revenue | ||||
| (North Shore - Long Island Jewish Obligated | ||||
| Group) | 5.000% | 5/1/26 | 1,000 | 1,126 |
| New York State Dormitory Authority Revenue | ||||
| (North Shore - Long Island Jewish Obligated | ||||
| Group) | 5.000% | 5/1/27 | 1,535 | 1,849 |
| New York State Dormitory Authority Revenue | ||||
| (North Shore - Long Island Jewish Obligated | ||||
| Group) | 5.000% | 5/1/28 | 2,000 | 2,392 |
| New York State Dormitory Authority Revenue | ||||
| (North Shore - Long Island Jewish Obligated | ||||
| Group) | 5.000% | 5/1/29 | 7,910 | 9,389 |
| New York State Dormitory Authority Revenue | ||||
| (North Shore - Long Island Jewish Obligated | ||||
| Group) | 5.000% | 5/1/30 | 2,000 | 2,357 |
| New York State Dormitory Authority Revenue | ||||
| (North Shore - Long Island Jewish Obligated | ||||
| Group) | 5.000% | 5/1/32 | 7,000 | 7,793 |
| New York State Dormitory Authority Revenue | ||||
| (North Shore - Long Island Jewish Obligated | ||||
| Group) | 5.000% | 5/1/32 | 2,500 | 2,917 |
| New York State Dormitory Authority Revenue | ||||
| (North Shore - Long Island Jewish Obligated | ||||
| Group) | 5.000% | 5/1/33 | 3,500 | 4,068 |
| New York State Dormitory Authority Revenue | ||||
| (North Shore - Long Island Jewish Obligated | ||||
| Group) | 5.250% | 5/1/34 | 1,000 | 1,121 |
| New York State Dormitory Authority Revenue | ||||
| (North Shore - Long Island Jewish Obligated | ||||
| Group) | 5.000% | 5/1/36 | 3,000 | 3,445 |
| New York State Dormitory Authority Revenue | ||||
| (North Shore - Long Island Jewish Obligated | ||||
| Group) | 5.000% | 5/1/39 | 4,000 | 4,421 |
| New York State Dormitory Authority Revenue | ||||
| (North Shore - Long Island Jewish Obligated | ||||
| Group) | 5.000% | 5/1/41 | 2,500 | 2,749 |
| New York State Dormitory Authority Revenue | ||||
| (North Shore - Long Island Jewish Obligated | ||||
| Group) | 5.000% | 5/1/43 | 2,050 | 2,320 |
53
New York Long-Term Tax-Exempt Fund
| Face | Market | |||
| Maturity | Amount | Value• | ||
| Coupon | Date | ($000) | ($000) | |
| New York State Dormitory Authority Revenue | ||||
| (Orange Regional Medical Center Obligated | ||||
| Group) | 5.000% | 12/1/27 | 1,200 | 1,389 |
| New York State Dormitory Authority Revenue | ||||
| (Orange Regional Medical Center Obligated | ||||
| Group) | 5.000% | 12/1/28 | 1,300 | 1,493 |
| New York State Dormitory Authority Revenue | ||||
| (Orange Regional Medical Center Obligated | ||||
| Group) | 5.000% | 12/1/30 | 1,100 | 1,243 |
| New York State Dormitory Authority Revenue | ||||
| (Orange Regional Medical Center Obligated | ||||
| Group) | 5.000% | 12/1/31 | 1,200 | 1,350 |
| New York State Dormitory Authority Revenue | ||||
| (Orange Regional Medical Center Obligated | ||||
| Group) | 5.000% | 12/1/33 | 1,000 | 1,115 |
| New York State Dormitory Authority Revenue | ||||
| (Orange Regional Medical Center Obligated | ||||
| Group) | 5.000% | 12/1/35 | 1,000 | 1,109 |
| New York State Dormitory Authority Revenue | ||||
| (Orange Regional Medical Center Obligated | ||||
| Group) | 5.000% | 12/1/37 | 1,000 | 1,103 |
| New York State Dormitory Authority Revenue | ||||
| (Pace University) | 5.000% | 5/1/19 | 355 | 376 |
| New York State Dormitory Authority Revenue | ||||
| (Pace University) | 5.000% | 5/1/23 (Prere.) | 30 | 36 |
| New York State Dormitory Authority Revenue | ||||
| (Pace University) | 5.000% | 5/1/23 (Prere.) | 30 | 36 |
| New York State Dormitory Authority Revenue | ||||
| (Pace University) | 5.000% | 5/1/23 (Prere.) | 20 | 24 |
| New York State Dormitory Authority Revenue | ||||
| (Pace University) | 5.000% | 5/1/25 | 1,270 | 1,413 |
| New York State Dormitory Authority Revenue | ||||
| (Pace University) | 5.000% | 5/1/28 | 1,470 | 1,617 |
| New York State Dormitory Authority Revenue | ||||
| (Pace University) | 5.000% | 5/1/29 | 1,560 | 1,707 |
| New York State Dormitory Authority Revenue | ||||
| (Personal Income Tax) | 5.000% | 12/15/26 | 5,825 | 6,876 |
| New York State Dormitory Authority Revenue | ||||
| (Personal Income Tax) | 5.000% | 2/15/27 | 1,670 | 2,031 |
| New York State Dormitory Authority Revenue | ||||
| (Personal Income Tax) | 5.000% | 12/15/28 | 3,000 | 3,526 |
| New York State Dormitory Authority Revenue | ||||
| (Personal Income Tax) | 5.000% | 2/15/29 | 5,000 | 5,958 |
| New York State Dormitory Authority Revenue | ||||
| (Personal Income Tax) | 5.000% | 2/15/30 | 6,000 | 7,188 |
| New York State Dormitory Authority Revenue | ||||
| (Personal Income Tax) | 5.000% | 3/15/30 | 3,480 | 3,930 |
| New York State Dormitory Authority Revenue | ||||
| (Personal Income Tax) | 5.000% | 2/15/33 | 5,000 | 5,733 |
| New York State Dormitory Authority Revenue | ||||
| (Personal Income Tax) | 5.000% | 3/15/33 | 6,615 | 7,602 |
| New York State Dormitory Authority Revenue | ||||
| (Personal Income Tax) | 5.250% | 3/15/33 | 1,750 | 2,111 |
| New York State Dormitory Authority Revenue | ||||
| (Personal Income Tax) | 5.000% | 2/15/34 | 3,500 | 4,162 |
54
New York Long-Term Tax-Exempt Fund
| Face | Market | |||
| Maturity | Amount | Value• | ||
| Coupon | Date | ($000) | ($000) | |
| New York State Dormitory Authority Revenue | ||||
| (Personal Income Tax) | 5.000% | 2/15/35 | 3,510 | 4,164 |
| New York State Dormitory Authority Revenue | ||||
| (Personal Income Tax) | 5.000% | 3/15/35 | 4,305 | 5,064 |
| New York State Dormitory Authority Revenue | ||||
| (Personal Income Tax) | 5.000% | 3/15/36 | 1,000 | 1,174 |
| New York State Dormitory Authority Revenue | ||||
| (Personal Income Tax) | 5.750% | 3/15/36 | 10,000 | 10,834 |
| New York State Dormitory Authority Revenue | ||||
| (Personal Income Tax) | 5.000% | 2/15/37 | 11,600 | 13,217 |
| New York State Dormitory Authority Revenue | ||||
| (Personal Income Tax) | 5.000% | 3/15/37 | 5,000 | 5,752 |
| New York State Dormitory Authority Revenue | ||||
| (Personal Income Tax) | 5.000% | 3/15/38 | 5,000 | 5,337 |
| New York State Dormitory Authority Revenue | ||||
| (Personal Income Tax) | 5.000% | 3/15/38 | 3,695 | 4,253 |
| New York State Dormitory Authority Revenue | ||||
| (Personal Income Tax) | 5.250% | 3/15/38 | 18,000 | 19,299 |
| New York State Dormitory Authority Revenue | ||||
| Personal Income Tax) | 5.000% | 2/15/39 | 5,030 | 5,807 |
| New York State Dormitory Authority Revenue | ||||
| (Personal Income Tax) | 5.000% | 2/15/40 | 12,230 | 13,846 |
| New York State Dormitory Authority Revenue | ||||
| (Personal Income Tax) | 5.000% | 3/15/41 | 10,000 | 11,055 |
| New York State Dormitory Authority Revenue | ||||
| (Personal Income Tax) | 5.000% | 3/15/41 | 5,000 | 5,705 |
| New York State Dormitory Authority Revenue | ||||
| (Pratt Institute) | 5.000% | 7/1/19 (Prere.) | 3,750 | 4,066 |
| New York State Dormitory Authority Revenue | ||||
| (Pratt Institute) | 5.000% | 7/1/23 | 400 | 474 |
| New York State Dormitory Authority Revenue | ||||
| (Pratt Institute) | 5.000% | 7/1/25 | 500 | 596 |
| New York State Dormitory Authority Revenue | ||||
| (Pratt Institute) | 5.000% | 7/1/27 | 420 | 510 |
| New York State Dormitory Authority Revenue | ||||
| (Pratt Institute) | 5.000% | 7/1/28 | 1,000 | 1,172 |
| New York State Dormitory Authority Revenue | ||||
| (Pratt Institute) | 5.000% | 7/1/29 | 500 | 582 |
| New York State Dormitory Authority Revenue | ||||
| (Pratt Institute) | 5.000% | 7/1/29 | 1,000 | 1,195 |
| New York State Dormitory Authority Revenue | ||||
| (Pratt Institute) | 5.000% | 7/1/30 | 500 | 593 |
| New York State Dormitory Authority Revenue | ||||
| (Pratt Institute) | 5.000% | 7/1/31 | 500 | 590 |
| New York State Dormitory Authority Revenue | ||||
| (Pratt Institute) | 5.000% | 7/1/34 | 2,000 | 2,273 |
| New York State Dormitory Authority Revenue | ||||
| (Pratt Institute) | 5.000% | 7/1/39 | 1,750 | 1,973 |
| New York State Dormitory Authority Revenue | ||||
| (Pratt Institute) | 5.000% | 7/1/39 | 1,205 | 1,384 |
| New York State Dormitory Authority Revenue | ||||
| (Rochester Institute of Technology) | 5.000% | 7/1/25 | 1,355 | 1,576 |
| New York State Dormitory Authority Revenue | ||||
| (Rochester Institute of Technology) | 5.000% | 7/1/38 | 2,250 | 2,532 |
55
New York Long-Term Tax-Exempt Fund
| Face | Market | |||
| Maturity | Amount | Value• | ||
| Coupon | Date | ($000) | ($000) | |
| New York State Dormitory Authority Revenue | ||||
| (Rochester Institute of Technology) | 5.000% | 7/1/40 | 2,000 | 2,198 |
| New York State Dormitory Authority Revenue | ||||
| (Rochester Institute of Technology) | 5.000% | 7/1/42 | 3,000 | 3,365 |
| New York State Dormitory Authority Revenue | ||||
| (Rockefeller University) | 5.000% | 7/1/33 | 2,670 | 3,082 |
| New York State Dormitory Authority Revenue | ||||
| (Rockefeller University) | 5.000% | 7/1/34 | 2,720 | 3,127 |
| New York State Dormitory Authority Revenue | ||||
| (Rockefeller University) | 5.000% | 7/1/38 | 9,000 | 10,275 |
| New York State Dormitory Authority Revenue | ||||
| (School Districts Financing Program) | 5.000% | 10/1/25 (4) | 2,860 | 3,379 |
| New York State Dormitory Authority Revenue | ||||
| (School Districts Financing Program) | 5.000% | 10/1/26 | 1,000 | 1,152 |
| New York State Dormitory Authority Revenue | ||||
| (School Districts Financing Program) | 5.000% | 10/1/26 | 1,425 | 1,769 |
| New York State Dormitory Authority Revenue | ||||
| (School Districts Financing Program) | 5.000% | 10/1/27 (4) | 1,000 | 1,198 |
| New York State Dormitory Authority Revenue | ||||
| (School Districts Financing Program) | 5.000% | 10/1/28 (4) | 1,000 | 1,193 |
| New York State Dormitory Authority Revenue | ||||
| (School Districts Financing Program) | 5.000% | 10/1/29 (4) | 1,500 | 1,777 |
| New York State Dormitory Authority Revenue | ||||
| (School Districts Financing Program) | 5.000% | 10/1/31 (4) | 750 | 878 |
| New York State Dormitory Authority Revenue | ||||
| (School Districts Financing Program) | 5.000% | 10/1/32 (4) | 1,000 | 1,165 |
| New York State Dormitory Authority Revenue | ||||
| (School Districts Financing Program) | 5.000% | 10/1/33 (4) | 1,000 | 1,160 |
| New York State Dormitory Authority Revenue | ||||
| (School Districts Financing Program) | 5.000% | 10/1/33 | 600 | 703 |
| New York State Dormitory Authority Revenue | ||||
| (School Districts Financing Program) | 5.000% | 10/1/34 (4) | 1,000 | 1,156 |
| New York State Dormitory Authority Revenue | ||||
| (School Districts Financing Program) | 5.000% | 10/1/34 | 520 | 606 |
| New York State Dormitory Authority Revenue | ||||
| (St. John’s University) | 5.250% | 7/1/17 (Prere.) | 9,000 | 9,033 |
| New York State Dormitory Authority Revenue | ||||
| (St. John’s University) | 5.000% | 7/1/26 | 740 | 891 |
| New York State Dormitory Authority Revenue | ||||
| (St. John’s University) | 5.000% | 7/1/27 | 650 | 778 |
| New York State Dormitory Authority Revenue | ||||
| (St. John’s University) | 5.000% | 7/1/31 | 1,500 | 1,741 |
| New York State Dormitory Authority Revenue | ||||
| (St. John’s University) | 5.000% | 7/1/44 | 2,500 | 2,769 |
| New York State Dormitory Authority Revenue | ||||
| (State University Dormitory Facilities) | 5.000% | 7/1/26 | 1,300 | 1,529 |
| New York State Dormitory Authority Revenue | ||||
| (State University Dormitory Facilities) | 5.000% | 7/1/27 | 2,500 | 2,920 |
| New York State Dormitory Authority Revenue | ||||
| (State University Dormitory Facilities) | 5.000% | 7/1/29 | 2,250 | 2,589 |
| New York State Dormitory Authority Revenue | ||||
| (State University Dormitory Facilities) | 5.000% | 7/1/31 | 1,000 | 1,215 |
| New York State Dormitory Authority Revenue | ||||
| (State University Dormitory Facilities) | 5.250% | 7/1/31 | 2,500 | 2,913 |
56
New York Long-Term Tax-Exempt Fund
| Face | Market | |||
| Maturity | Amount | Value• | ||
| Coupon | Date | ($000) | ($000) | |
| New York State Dormitory Authority Revenue | ||||
| (State University Dormitory Facilities) | 5.000% | 7/1/32 | 1,825 | 2,204 |
| New York State Dormitory Authority Revenue | ||||
| (State University Dormitory Facilities) | 5.000% | 7/1/35 | 2,000 | 2,384 |
| New York State Dormitory Authority Revenue | ||||
| (State University Dormitory Facilities) | 5.000% | 7/1/36 | 1,500 | 1,782 |
| New York State Dormitory Authority Revenue | ||||
| (State University Educational Facilities) | 5.000% | 5/15/26 | 8,000 | 9,343 |
| New York State Dormitory Authority Revenue | ||||
| (State University Educational Facilities) | 5.000% | 5/15/27 | 5,000 | 5,834 |
| New York State Dormitory Authority Revenue | ||||
| (State University Educational Facilities) | 5.000% | 5/15/28 | 3,000 | 3,494 |
| New York State Dormitory Authority Revenue | ||||
| (Teachers College) | 5.000% | 7/1/30 | 505 | 612 |
| New York State Dormitory Authority Revenue | ||||
| (Teachers College) | 4.000% | 7/1/31 | 1,000 | 1,086 |
| New York State Dormitory Authority Revenue | ||||
| (Teachers College) | 5.000% | 7/1/31 | 1,750 | 2,003 |
| New York State Dormitory Authority Revenue | ||||
| (Teachers College) | 5.000% | 7/1/32 | 575 | 689 |
| New York State Dormitory Authority Revenue | ||||
| (Teachers College) | 4.000% | 7/1/33 | 1,200 | 1,283 |
| New York State Dormitory Authority Revenue | ||||
| (Teachers College) | 5.000% | 7/1/42 | 2,000 | 2,230 |
| New York State Dormitory Authority Revenue | ||||
| (The New School) | 5.250% | 7/1/20 (Prere.) | 3,000 | 3,374 |
| New York State Dormitory Authority Revenue | ||||
| (The New School) | 5.500% | 7/1/20 (Prere.) | 5,000 | 5,662 |
| New York State Dormitory Authority Revenue | ||||
| (The New School) | 6.000% | 7/1/20 (Prere.) | 5,575 | 6,397 |
| New York State Dormitory Authority Revenue | ||||
| (The New School) | 5.000% | 7/1/37 | 3,500 | 4,041 |
| New York State Dormitory Authority Revenue | ||||
| (The New School) | 5.000% | 7/1/40 | 3,000 | 3,386 |
| New York State Dormitory Authority Revenue | ||||
| (The New School) | 5.000% | 7/1/41 | 6,685 | 7,677 |
| New York State Dormitory Authority Revenue | ||||
| (The New School) | 5.000% | 7/1/45 | 3,000 | 3,380 |
| New York State Dormitory Authority Revenue | ||||
| (The New School) | 5.000% | 7/1/46 | 9,110 | 10,341 |
| New York State Dormitory Authority Revenue | ||||
| (Yeshiva University) | 3.750% | 9/1/17 (ETM) | 135 | 136 |
| New York State Dormitory Authority Revenue | ||||
| (Yeshiva University) | 3.750% | 9/1/17 (ETM) | 25 | 25 |
| New York State Dormitory Authority Revenue | ||||
| (Yeshiva University) | 3.750% | 9/1/17 | 630 | 632 |
| New York State Dormitory Authority Revenue | ||||
| (Yeshiva University) | 5.000% | 11/1/17 (ETM) | 390 | 396 |
| New York State Dormitory Authority Revenue | ||||
| (Yeshiva University) | 5.000% | 11/1/17 | 665 | 671 |
| New York State Dormitory Authority Revenue | ||||
| (Yeshiva University) | 5.000% | 11/1/18 (ETM) | 390 | 410 |
| New York State Dormitory Authority Revenue | ||||
| (Yeshiva University) | 5.000% | 11/1/18 | 660 | 680 |
57
New York Long-Term Tax-Exempt Fund
| Face | Market | |||
| Maturity | Amount | Value• | ||
| Coupon | Date | ($000) | ($000) | |
| New York State Dormitory Authority Revenue | ||||
| (Yeshiva University) | 4.000% | 9/1/19 (Prere.) | 15 | 16 |
| New York State Dormitory Authority Revenue | ||||
| (Yeshiva University) | 5.000% | 9/1/19 (Prere.) | 65 | 71 |
| New York State Dormitory Authority Revenue | ||||
| (Yeshiva University) | 5.000% | 9/1/19 (Prere.) | 20 | 22 |
| New York State Dormitory Authority Revenue | ||||
| (Yeshiva University) | 5.000% | 9/1/19 (Prere.) | 350 | 381 |
| New York State Dormitory Authority Revenue | ||||
| (Yeshiva University) | 5.000% | 9/1/19 (Prere.) | 130 | 142 |
| New York State Dormitory Authority Revenue | ||||
| (Yeshiva University) | 5.000% | 9/1/19 (Prere.) | 10 | 11 |
| New York State Dormitory Authority Revenue | ||||
| (Yeshiva University) | 5.000% | 9/1/19 (Prere.) | 5 | 5 |
| New York State Dormitory Authority Revenue | ||||
| (Yeshiva University) | 5.000% | 9/1/19 (Prere.) | 55 | 60 |
| New York State Dormitory Authority Revenue | ||||
| (Yeshiva University) | 5.000% | 9/1/19 (Prere.) | 20 | 22 |
| New York State Dormitory Authority Revenue | ||||
| (Yeshiva University) | 5.000% | 9/1/20 | 285 | 296 |
| New York State Dormitory Authority Revenue | ||||
| (Yeshiva University) | 5.000% | 11/1/20 (ETM) | 1,325 | 1,478 |
| New York State Dormitory Authority Revenue | ||||
| (Yeshiva University) | 5.000% | 11/1/20 | 2,265 | 2,396 |
| New York State Dormitory Authority Revenue | ||||
| (Yeshiva University) | 5.000% | 11/1/21 (ETM) | 285 | 326 |
| New York State Dormitory Authority Revenue | ||||
| (Yeshiva University) | 5.000% | 11/1/21 (Prere.) | 370 | 428 |
| New York State Dormitory Authority Revenue | ||||
| (Yeshiva University) | 5.000% | 11/1/21 | 495 | 529 |
| New York State Dormitory Authority Revenue | ||||
| (Yeshiva University) | 5.000% | 9/1/22 | 1,640 | 1,693 |
| New York State Dormitory Authority Revenue | ||||
| (Yeshiva University) | 4.000% | 9/1/23 | 1,235 | 1,243 |
| New York State Dormitory Authority Revenue | ||||
| (Yeshiva University) | 5.000% | 9/1/26 | 75 | 76 |
| New York State Dormitory Authority Revenue | ||||
| (Yeshiva University) | 5.000% | 9/1/27 | 1,595 | 1,616 |
| New York State Dormitory Authority Revenue | ||||
| (Yeshiva University) | 5.000% | 9/1/28 | 595 | 601 |
| New York State Dormitory Authority Revenue | ||||
| (Yeshiva University) | 5.000% | 11/1/40 | 630 | 621 |
| New York State Dormitory Authority Sales Tax | ||||
| Revenue | 5.000% | 3/15/27 | 3,000 | 3,683 |
| New York State Dormitory Authority Sales Tax | ||||
| Revenue | 5.000% | 3/15/31 | 8,975 | 10,601 |
| New York State Dormitory Authority Sales Tax | ||||
| Revenue | 5.000% | 3/15/32 | 2,650 | 3,117 |
| New York State Dormitory Authority Sales Tax | ||||
| Revenue | 5.000% | 3/15/33 | 4,840 | 5,757 |
| New York State Dormitory Authority Sales Tax | ||||
| Revenue | 5.000% | 3/15/33 | 5,000 | 5,871 |
| New York State Dormitory Authority Sales Tax | ||||
| Revenue | 5.000% | 3/15/34 | 5,000 | 5,861 |
58
New York Long-Term Tax-Exempt Fund
| Face | Market | |||
| Maturity | Amount | Value• | ||
| Coupon | Date | ($000) | ($000) | |
| New York State Dormitory Authority Sales Tax | ||||
| Revenue | 5.000% | 3/15/35 | 5,240 | 6,128 |
| New York State Dormitory Authority Sales Tax | ||||
| Revenue | 5.000% | 3/15/36 | 5,000 | 5,962 |
| New York State Dormitory Authority Sales Tax | ||||
| Revenue | 5.000% | 3/15/36 | 7,995 | 9,268 |
| New York State Dormitory Authority Sales Tax | ||||
| Revenue | 5.000% | 3/15/37 | 5,000 | 5,783 |
| New York State Dormitory Authority Sales Tax | ||||
| Revenue | 5.000% | 3/15/38 | 1,200 | 1,375 |
| New York State Dormitory Authority Sales Tax | ||||
| Revenue | 5.000% | 3/15/42 | 5,000 | 5,833 |
| New York State Dormitory Authority Sales Tax | ||||
| Revenue | 5.000% | 3/15/43 | 13,685 | 15,510 |
| New York State Energy Research & Development | ||||
| Authority Pollution Control Revenue | ||||
| (Consolidated Edison Co. of New York Inc. Project) | 1.610% | 5/1/32 (10) | 4,725 | 4,300 |
| New York State Energy Research & Development | ||||
| Authority Pollution Control Revenue (Consolidated | ||||
| Edison Co. of New York Inc. Project) | 1.610% | 5/1/32 (10) | 3,525 | 3,208 |
| New York State Energy Research & Development | ||||
| Authority Pollution Control Revenue (Consolidated | ||||
| Edison Co. of New York Inc. Project) | 1.610% | 5/1/32 (10) | 3,250 | 2,958 |
| New York State Energy Research & Development | ||||
| Authority Pollution Control Revenue (Niagara | ||||
| Mohawk Corp.) | 2.612% | 12/1/25 (2) | 2,535 | 2,434 |
| 3 New York State Environmental Facilities Corp. | ||||
| Revenue (State Clean Water & Drinking Water | ||||
| Revolving Funds) | 5.000% | 9/15/17 (Prere.) | 2,900 | 2,935 |
| New York State Environmental Facilities Corp. | ||||
| Revenue (State Clean Water & Drinking Water | ||||
| Revolving Funds) | 5.000% | 6/15/29 | 3,000 | 3,719 |
| New York State Environmental Facilities Corp. | ||||
| Revenue (State Clean Water & Drinking Water | ||||
| Revolving Funds) | 5.000% | 6/15/30 | 3,000 | 3,691 |
| New York State Environmental Facilities Corp. | ||||
| Revenue (State Clean Water & Drinking Water | ||||
| Revolving Funds) | 5.000% | 6/15/31 | 2,000 | 2,280 |
| New York State Environmental Facilities Corp. | ||||
| Revenue (State Clean Water & Drinking Water | ||||
| Revolving Funds) | 5.000% | 6/15/31 | 5,870 | 6,959 |
| New York State Environmental Facilities Corp. | ||||
| Revenue (State Clean Water & Drinking Water | ||||
| Revolving Funds) | 5.000% | 6/15/32 | 5,000 | 5,908 |
| New York State Environmental Facilities Corp. | ||||
| Revenue (State Clean Water & Drinking Water | ||||
| Revolving Funds) | 5.000% | 6/15/32 | 2,500 | 3,082 |
| New York State Environmental Facilities Corp. | ||||
| Revenue (State Clean Water & Drinking Water | ||||
| Revolving Funds) | 5.000% | 6/15/32 | 5,000 | 6,010 |
| New York State Environmental Facilities Corp. | ||||
| Revenue (State Clean Water & Drinking Water | ||||
| Revolving Funds) | 5.000% | 6/15/33 | 4,000 | 4,899 |
59
New York Long-Term Tax-Exempt Fund
| Face | Market | |||
| Maturity | Amount | Value• | ||
| Coupon | Date | ($000) | ($000) | |
| New York State Environmental Facilities Corp. | ||||
| Revenue (State Clean Water & Drinking Water | ||||
| Revolving Funds) | 5.000% | 6/15/34 | 5,000 | 6,094 |
| New York State Environmental Facilities Corp. | ||||
| Revenue (State Clean Water & Drinking Water | ||||
| Revolving Funds) | 5.000% | 6/15/34 | 4,145 | 4,898 |
| New York State Environmental Facilities Corp. | ||||
| Revenue (State Clean Water & Drinking Water | ||||
| Revolving Funds) | 5.000% | 6/15/35 | 2,500 | 3,032 |
| New York State Environmental Facilities Corp. | ||||
| Revenue (State Clean Water & Drinking Water | ||||
| Revolving Funds) | 5.000% | 6/15/35 | 3,000 | 3,595 |
| New York State Environmental Facilities Corp. | ||||
| Revenue (State Clean Water & Drinking Water | ||||
| Revolving Funds) | 4.000% | 6/15/36 | 2,500 | 2,746 |
| New York State Environmental Facilities Corp. | ||||
| Revenue (State Clean Water & Drinking Water | ||||
| Revolving Funds) | 5.000% | 6/15/36 | 1,500 | 1,701 |
| New York State Environmental Facilities Corp. | ||||
| Revenue (State Clean Water & Drinking Water | ||||
| Revolving Funds) | 5.000% | 6/15/41 | 5,900 | 6,664 |
| New York State Environmental Facilities Corp. | ||||
| Revenue (State Clean Water & Drinking Water | ||||
| Revolving Funds) | 5.000% | 6/15/41 | 3,000 | 3,587 |
| New York State Environmental Facilities Corp. | ||||
| Revenue (State Clean Water & Drinking Water | ||||
| Revolving Funds) | 5.000% | 6/15/42 | 11,130 | 13,314 |
| New York State Environmental Facilities Corp. | ||||
| Revenue (State Clean Water & Drinking Water | ||||
| Revolving Funds) | 4.000% | 6/15/46 | 5,435 | 5,831 |
| New York State Environmental Facilities Corp. | ||||
| Revenue (State Revolving Funds) | 5.000% | 9/15/40 | 2,370 | 2,783 |
| New York State Environmental Facilities Corp. | ||||
| Revenue (State Revolving Funds) | 5.000% | 5/15/41 | 3,505 | 3,944 |
| New York State Environmental Facilities Corp. | ||||
| Revenue (State Revolving Funds) | 5.000% | 3/15/45 | 5,000 | 5,791 |
| New York State Environmental Facilities Corp. | ||||
| Water Facilities Revenue (United Water New | ||||
| Rochelle Inc. Project) | 4.875% | 9/1/40 | 4,000 | 4,345 |
| New York State GO | 5.000% | 3/1/28 | 14,550 | 17,385 |
| New York State GO | 5.000% | 2/15/39 | 9,500 | 10,119 |
| New York State Housing Finance Agency Housing | ||||
| Revenue | 3.850% | 11/1/42 | 1,405 | 1,430 |
| New York State Housing Finance Agency Housing | ||||
| Revenue (625 W 57th St) VRDO | 0.770% | 6/7/17 LOC | 1,500 | 1,500 |
| 3 New York State Housing Finance Agency Revenue | ||||
| (Personal Income Tax) | 5.000% | 9/15/17 (Prere.) | 15,245 | 15,429 |
| New York State Liberty Development Corp. Liberty | ||||
| Revenue (3 World Trade Center Project) | 5.000% | 11/15/44 | 3,000 | 3,216 |
| New York State Local Government Assistance Corp. | ||||
| Revenue VRDO | 0.750% | 6/7/17 | 1,200 | 1,200 |
| New York State Mortgage Agency Homeowner | ||||
| Mortgage Revenue | 2.625% | 4/1/41 | 1,485 | 1,507 |
| New York State Mortgage Agency Revenue | ||||
| (NYHELP’s Education Loan) | 4.750% | 11/1/24 | 355 | 374 |
60
| New York Long-Term Tax-Exempt Fund | ||||
| Face | Market | |||
| Maturity | Amount | Value• | ||
| Coupon | Date | ($000) | ($000) | |
| New York State Power Authority Revenue | 5.000% | 11/15/38 | 1,000 | 1,134 |
| New York State Thruway Authority Revenue | 5.000% | 1/1/26 | 2,545 | 2,938 |
| New York State Thruway Authority Revenue | 5.000% | 1/1/28 | 5,150 | 6,116 |
| New York State Thruway Authority Revenue | 5.000% | 1/1/29 | 4,000 | 4,741 |
| New York State Thruway Authority Revenue | 5.000% | 1/1/29 | 1,200 | 1,442 |
| New York State Thruway Authority Revenue | 5.000% | 1/1/30 | 2,500 | 2,942 |
| New York State Thruway Authority Revenue | 5.000% | 1/1/30 | 4,000 | 4,551 |
| New York State Thruway Authority Revenue | 5.000% | 1/1/30 | 1,700 | 2,022 |
| New York State Thruway Authority Revenue | 5.000% | 1/1/31 | 5,500 | 6,428 |
| New York State Thruway Authority Revenue | 5.000% | 1/1/31 | 8,500 | 9,655 |
| New York State Thruway Authority Revenue | 5.000% | 1/1/31 | 2,900 | 3,423 |
| New York State Thruway Authority Revenue | 5.000% | 1/1/32 | 4,070 | 4,735 |
| New York State Thruway Authority Revenue | 5.000% | 1/1/32 | 2,970 | 3,488 |
| New York State Thruway Authority Revenue | 5.000% | 1/1/33 | 2,340 | 2,734 |
| New York State Thruway Authority Revenue | 5.000% | 1/1/37 | 9,000 | 10,185 |
| New York State Thruway Authority Revenue | 4.000% | 1/1/38 | 1,255 | 1,317 |
| New York State Thruway Authority Revenue | 5.000% | 1/1/41 | 2,500 | 2,870 |
| New York State Thruway Authority Revenue | 5.000% | 1/1/42 | 9,765 | 11,010 |
| New York State Thruway Authority Revenue | 5.000% | 1/1/46 | 5,000 | 5,711 |
| New York State Thruway Authority Revenue | 5.000% | 1/1/51 | 5,700 | 6,428 |
| New York State Thruway Authority Revenue | 5.250% | 1/1/56 | 7,400 | 8,554 |
| New York State Thruway Authority Revenue | ||||
| (Highway & Bridge Trust Fund) | 5.000% | 4/1/26 | 10,000 | 11,628 |
| New York State Thruway Authority Revenue | ||||
| (Highway & Bridge Trust Fund) | 5.000% | 4/1/28 | 2,000 | 2,276 |
| New York State Thruway Authority Revenue | ||||
| (Highway & Bridge Trust Fund) | 5.000% | 4/1/29 | 2,000 | 2,271 |
| New York State Thruway Authority Revenue | ||||
| (Highway & Bridge Trust Fund) | 5.000% | 4/1/30 | 2,000 | 2,258 |
| New York State Thruway Authority Revenue | ||||
| (Highway & Bridge Trust Fund) | 5.000% | 4/1/32 | 7,975 | 9,123 |
| New York State Thruway Authority Revenue | ||||
| (Personal Income Tax) | 5.000% | 3/15/30 | 2,735 | 3,056 |
| New York State Thruway Authority Revenue | ||||
| (Personal Income Tax) | 5.000% | 3/15/30 | 1,500 | 1,769 |
| New York State Thruway Authority Revenue | ||||
| (Personal Income Tax) | 5.000% | 3/15/31 | 1,500 | 1,767 |
| New York State Urban Development Corp. | ||||
| Revenue | 5.000% | 3/15/35 | 5,000 | 5,978 |
| New York State Urban Development Corp. | ||||
| Revenue (Personal Income Tax) | 5.000% | 3/15/26 | 3,365 | 4,091 |
| New York State Urban Development Corp. | ||||
| Revenue (Personal Income Tax) | 5.000% | 3/15/32 | 5,000 | 5,882 |
| New York State Urban Development Corp. | ||||
| Revenue (Personal Income Tax) | 5.000% | 3/15/33 | 3,000 | 3,513 |
| New York State Urban Development Corp. | ||||
| Revenue (Personal Income Tax) | 5.000% | 3/15/43 | 10,000 | 11,242 |
| Niagara Falls NY Bridge Commission Revenue | 6.250% | 10/1/20 (14) | 8,685 | 10,098 |
| Niagara Falls NY Bridge Commission Revenue | 6.250% | 10/1/21 (14) | 9,230 | 11,118 |
| Niagara NY Area Development Corp. Revenue | ||||
| (Niagara University Project) | 5.000% | 5/1/26 | 320 | 360 |
| Niagara NY Area Development Corp. Revenue | ||||
| (Niagara University Project) | 5.000% | 5/1/30 | 2,750 | 3,049 |
| 1 Nuveen New York AMT-Free Quality Municipal | ||||
| Income Fund VRDP VRDO | 0.960% | 6/7/17 LOC | 2,500 | 2,500 |
61
| New York Long-Term Tax-Exempt Fund | ||||
| Face | Market | |||
| Maturity | Amount | Value• | ||
| Coupon | Date | ($000) | ($000) | |
| Onondaga County NY Civic Development Corp. | ||||
| Revenue (Jewish Home of Central New York | ||||
| Obligated Group) | 5.500% | 3/1/24 | 3,000 | 2,992 |
| Onondaga County NY Civic Development Corp. | ||||
| Revenue (Jewish Home of Central New York | ||||
| Obligated Group) | 5.250% | 3/1/31 | 2,000 | 1,889 |
| Onondaga County NY Civic Development Corp. | ||||
| Revenue (Le Moyne College) | 5.000% | 7/1/28 | 450 | 514 |
| Onondaga County NY Civic Development Corp. | ||||
| Revenue (Le Moyne College) | 5.000% | 7/1/30 | 450 | 507 |
| Onondaga County NY Civic Development Corp. | ||||
| Revenue (Le Moyne College) | 5.000% | 7/1/32 | 1,000 | 1,078 |
| Onondaga County NY Civic Development Corp. | ||||
| Revenue (Le Moyne College) | 5.000% | 7/1/33 | 575 | 637 |
| Onondaga County NY Civic Development Corp. | ||||
| Revenue (Le Moyne College) | 5.000% | 7/1/35 | 635 | 698 |
| Onondaga County NY Civic Development Corp. | ||||
| Revenue (Le Moyne College) | 5.000% | 7/1/40 | 1,940 | 2,103 |
| Onondaga County NY Civic Development Corp. | ||||
| Revenue (Le Moyne College) | 5.000% | 7/1/42 | 1,750 | 1,859 |
| Onondaga County NY Civic Development Corp. | ||||
| Revenue (Le Moyne College) | 5.000% | 7/1/45 | 2,450 | 2,662 |
| Onondaga County NY Civic Development Corp. | ||||
| Revenue (St. Joseph’s Hospital & Health Center) | 5.000% | 7/1/19 (Prere.) | 6,000 | 6,503 |
| Onondaga County NY Trust For Cultural Resources | ||||
| Revenue (Abby Lane Housing Corp. Project) | 5.000% | 5/1/35 | 1,140 | 1,311 |
| Onondaga County NY Trust For Cultural Resources | ||||
| Revenue (Abby Lane Housing Corp. Project) | 5.000% | 5/1/36 | 1,475 | 1,692 |
| Onondaga County NY Trust For Cultural Resources | ||||
| Revenue (Abby Lane Housing Corp. Project) | 5.000% | 5/1/40 | 1,200 | 1,365 |
| Onondaga County NY Trust For Cultural Resources | ||||
| Revenue (Syracuse University Project) | 5.000% | 12/1/31 | 1,000 | 1,175 |
| Otsego County NY Capital Resource Corp. Revenue | ||||
| (Hartwick College) | 4.000% | 10/1/19 | 650 | 672 |
| Otsego County NY Capital Resource Corp. Revenue | ||||
| (Hartwick College) | 5.000% | 10/1/20 | 655 | 704 |
| Port Authority of New York & New Jersey Revenue | 5.000% | 9/1/28 | 2,000 | 2,420 |
| Port Authority of New York & New Jersey Revenue | 5.000% | 10/15/29 | 3,500 | 4,226 |
| Port Authority of New York & New Jersey Revenue | 5.000% | 5/1/32 | 2,500 | 2,756 |
| Port Authority of New York & New Jersey Revenue | 5.000% | 7/15/32 | 6,500 | 7,199 |
| Port Authority of New York & New Jersey Revenue | 5.000% | 5/1/33 | 3,500 | 3,845 |
| Port Authority of New York & New Jersey Revenue | 5.000% | 10/15/33 | 1,750 | 2,070 |
| Port Authority of New York & New Jersey Revenue | 5.000% | 9/1/34 | 1,290 | 1,517 |
| Port Authority of New York & New Jersey Revenue | 5.000% | 7/15/35 | 6,500 | 7,155 |
| Port Authority of New York & New Jersey Revenue | 5.250% | 7/15/36 | 4,000 | 4,484 |
| Port Authority of New York & New Jersey Revenue | 5.000% | 7/15/39 | 10,765 | 11,822 |
| Port Authority of New York & New Jersey Revenue | 5.000% | 1/15/41 | 10,000 | 11,086 |
| Port Authority of New York & New Jersey Revenue | 5.000% | 10/15/41 | 13,000 | 15,100 |
| Port Authority of New York & New Jersey Revenue | 5.000% | 5/1/45 | 8,765 | 10,052 |
| Port Authority of New York & New Jersey Revenue | 5.000% | 11/15/46 | 3,000 | 3,499 |
| Port Authority of New York & New Jersey Revenue | 5.000% | 10/15/47 | 6,000 | 7,030 |
| Port Authority of New York & New Jersey Revenue | 5.250% | 10/15/55 | 7,750 | 9,025 |
| Port Authority of New York & New Jersey Revenue | 5.250% | 11/15/56 | 10,000 | 11,794 |
62
| New York Long-Term Tax-Exempt Fund | ||||
| Face | Market | |||
| Maturity | Amount | Value• | ||
| Coupon | Date | ($000) | ($000) | |
| Port Authority of New York & New Jersey Special | ||||
| Obligation Revenue (John F. Kennedy | ||||
| International Air Terminal LLC) | 5.500% | 12/1/31 | 7,000 | 7,757 |
| Port Authority of New York & New Jersey Special | ||||
| Obligation Revenue (John F. Kennedy | ||||
| International Air Terminal LLC) | 6.000% | 12/1/36 | 4,000 | 4,514 |
| Port Authority of New York & New Jersey Special | ||||
| Obligation Revenue (John F. Kennedy | ||||
| International Air Terminal LLC) | 6.000% | 12/1/42 | 9,365 | 10,544 |
| St. Lawrence County NY Industrial Development | ||||
| Civic Facility Revenue (St. Lawrence University) | 5.000% | 7/1/28 | 310 | 373 |
| St. Lawrence County NY Industrial Development | ||||
| Civic Facility Revenue (St. Lawrence University) | 5.000% | 7/1/29 | 660 | 789 |
| St. Lawrence County NY Industrial Development | ||||
| Civic Facility Revenue (St. Lawrence University) | 5.000% | 7/1/31 | 450 | 531 |
| St. Lawrence County NY Industrial Development | ||||
| Civic Facility Revenue (St. Lawrence University) | 5.000% | 7/1/34 | 830 | 965 |
| St. Lawrence County NY Industrial Development | ||||
| Civic Facility Revenue (St. Lawrence University) | 5.000% | 7/1/35 | 1,510 | 1,750 |
| St. Lawrence County NY Industrial Development | ||||
| Civic Facility Revenue (St. Lawrence University) | 5.000% | 7/1/36 | 545 | 630 |
| St. Lawrence County NY Industrial Development | ||||
| Civic Facility Revenue (St. Lawrence University) | 5.000% | 7/1/43 | 8,870 | 9,776 |
| Suffolk County NY Economic Development Corp. | ||||
| Revenue (Catholic Health Services) | 5.000% | 7/1/21 (Prere.) | 1,570 | 1,816 |
| Suffolk County NY Economic Development Corp. | ||||
| Revenue (Catholic Health Services) | 5.000% | 7/1/28 | 9,180 | 10,103 |
| Suffolk County NY Economic Development Corp. | ||||
| Revenue (Catholic Health Services) | 5.000% | 7/1/28 | 1,500 | 1,704 |
| Suffolk County NY Economic Development Corp. | ||||
| Revenue (Catholic Health Services) | 5.000% | 7/1/29 | 3,000 | 3,377 |
| Suffolk County NY GO | 5.000% | 5/15/26 (4) | 5,770 | 6,847 |
| Suffolk County NY Judicial Facilities Agency Lease | ||||
| Revenue (H. Lee Dennison Building) | 5.000% | 11/1/33 | 7,900 | 8,850 |
| Suffolk NY Tobacco Asset Securitization Corp. | ||||
| Revenue | 5.000% | 6/1/32 | 2,675 | 2,901 |
| Suffolk NY Tobacco Asset Securitization Corp. | ||||
| Revenue | 5.250% | 6/1/37 | 3,300 | 3,593 |
| Tobacco Settlement Financing Corp. New York | ||||
| Revenue | 5.000% | 6/1/26 | 2,500 | 2,950 |
| Tobacco Settlement Financing Corp. New York | ||||
| Revenue | 5.000% | 6/1/30 | 5,000 | 5,747 |
| Tobacco Settlement Financing Corp. New York | ||||
| Revenue | 5.000% | 6/1/33 | 5,000 | 5,682 |
| Tobacco Settlement Financing Corp. New York | ||||
| Revenue | 5.000% | 6/1/34 | 6,000 | 6,803 |
| Tobacco Settlement Financing Corp. New York | ||||
| Revenue | 5.000% | 6/1/36 | 2,085 | 2,335 |
| Tobacco Settlement Financing Corp. New York | ||||
| Revenue | 5.000% | 6/1/41 | 7,000 | 7,714 |
| Tompkins County NY Development Corp. | ||||
| Revenue (Ithaca College) | 5.000% | 7/1/32 | 1,555 | 1,794 |
| Tompkins County NY Development Corp. | ||||
| Revenue (Ithaca College) | 5.000% | 7/1/33 | 1,605 | 1,843 |
63
| New York Long-Term Tax-Exempt Fund | ||||
| Face | Market | |||
| Maturity | Amount | Value• | ||
| Coupon | Date | ($000) | ($000) | |
| Tompkins County NY Industrial Development | ||||
| Agency Civic Facility Revenue (Cornell University) | 5.000% | 7/1/37 | 7,130 | 7,888 |
| Triborough Bridge & Tunnel Authority New York | ||||
| Revenue | 5.000% | 11/15/24 | 4,000 | 4,806 |
| Triborough Bridge & Tunnel Authority New York | ||||
| Revenue | 5.000% | 1/1/25 | 2,000 | 2,320 |
| Triborough Bridge & Tunnel Authority New York | ||||
| Revenue | 5.000% | 1/1/26 | 2,000 | 2,320 |
| Triborough Bridge & Tunnel Authority New York | ||||
| Revenue | 5.000% | 11/15/26 | 500 | 615 |
| Triborough Bridge & Tunnel Authority New York | ||||
| Revenue | 5.000% | 11/15/26 | 10,000 | 11,851 |
| Triborough Bridge & Tunnel Authority New York | ||||
| Revenue | 5.000% | 11/15/27 | 925 | 1,128 |
| Triborough Bridge & Tunnel Authority New York | ||||
| Revenue | 5.000% | 1/1/28 | 2,500 | 2,897 |
| Triborough Bridge & Tunnel Authority New York | ||||
| Revenue | 5.000% | 11/15/28 | 600 | 726 |
| Triborough Bridge & Tunnel Authority New York | ||||
| Revenue | 5.000% | 11/15/29 | 725 | 873 |
| Triborough Bridge & Tunnel Authority New York | ||||
| Revenue | 5.000% | 11/15/30 | 500 | 599 |
| Triborough Bridge & Tunnel Authority New York | ||||
| Revenue | 5.000% | 11/15/30 | 2,175 | 2,691 |
| Triborough Bridge & Tunnel Authority New York | ||||
| Revenue | 5.000% | 11/15/31 | 6,990 | 8,179 |
| Triborough Bridge & Tunnel Authority New York | ||||
| Revenue | 5.000% | 11/15/31 | 3,000 | 3,639 |
| Triborough Bridge & Tunnel Authority New York | ||||
| Revenue | 5.000% | 11/15/31 | 2,750 | 3,377 |
| Triborough Bridge & Tunnel Authority New York | ||||
| Revenue | 5.000% | 11/15/33 | 2,000 | 2,357 |
| Triborough Bridge & Tunnel Authority New York | ||||
| Revenue | 5.000% | 11/15/33 | 1,500 | 1,814 |
| Triborough Bridge & Tunnel Authority New York | ||||
| Revenue | 5.000% | 11/15/34 | 3,000 | 3,610 |
| Triborough Bridge & Tunnel Authority New York | ||||
| Revenue | 5.000% | 11/15/36 | 2,500 | 2,944 |
| Triborough Bridge & Tunnel Authority New York | ||||
| Revenue | 5.000% | 11/15/36 | 5,000 | 5,936 |
| Triborough Bridge & Tunnel Authority New York | ||||
| Revenue | 5.000% | 11/15/37 | 2,500 | 2,934 |
| Triborough Bridge & Tunnel Authority New York | ||||
| Revenue | 5.000% | 11/15/37 | 5,000 | 5,950 |
| Triborough Bridge & Tunnel Authority New York | ||||
| Revenue | 5.000% | 11/15/38 | 3,000 | 3,558 |
| Triborough Bridge & Tunnel Authority New York | ||||
| Revenue | 5.000% | 11/15/40 | 2,525 | 2,925 |
| Triborough Bridge & Tunnel Authority New York | ||||
| Revenue | 5.000% | 11/15/41 | 7,500 | 8,799 |
| Triborough Bridge & Tunnel Authority New York | ||||
| Revenue | 5.000% | 11/15/42 | 4,600 | 5,417 |
| Triborough Bridge & Tunnel Authority New York | ||||
| Revenue | 5.250% | 11/15/45 | 4,000 | 4,710 |
64
| New York Long-Term Tax-Exempt Fund | ||||
| Face | Market | |||
| Maturity | Amount | Value• | ||
| Coupon | Date | ($000) | ($000) | |
| Troy NY Capital Resource Corp. Revenue | ||||
| (Rensselaer Polytechnic Institute Project) | 5.000% | 8/1/23 | 1,000 | 1,182 |
| Troy NY Capital Resource Corp. Revenue | ||||
| (Rensselaer Polytechnic Institute Project) | 5.000% | 8/1/24 | 1,000 | 1,198 |
| Troy NY Capital Resource Corp. Revenue | ||||
| (Rensselaer Polytechnic Institute Project) | 5.000% | 8/1/25 | 1,000 | 1,213 |
| Troy NY Capital Resource Corp. Revenue | ||||
| (Rensselaer Polytechnic Institute Project) | 5.000% | 8/1/26 | 1,000 | 1,212 |
| Troy NY Capital Resource Corp. Revenue | ||||
| (Rensselaer Polytechnic Institute Project) | 5.000% | 8/1/27 | 1,600 | 1,923 |
| Troy NY Capital Resource Corp. Revenue | ||||
| (Rensselaer Polytechnic Institute Project) | 5.000% | 8/1/28 | 1,000 | 1,192 |
| Troy NY Capital Resource Corp. Revenue | ||||
| (Rensselaer Polytechnic Institute Project) | 5.000% | 9/1/30 | 1,500 | 1,654 |
| Troy NY Capital Resource Corp. Revenue | ||||
| (Rensselaer Polytechnic Institute Project) | 5.125% | 9/1/40 | 3,650 | 4,003 |
| Utility Debt Securitization Authority New York | ||||
| Revenue | 5.000% | 6/15/27 | 3,000 | 3,710 |
| Utility Debt Securitization Authority New York | ||||
| Revenue | 5.000% | 12/15/28 | 10,000 | 12,395 |
| Utility Debt Securitization Authority New York | ||||
| Revenue | 5.000% | 12/15/29 | 7,000 | 8,343 |
| Utility Debt Securitization Authority New York | ||||
| Revenue | 5.000% | 12/15/30 | 10,000 | 11,878 |
| Utility Debt Securitization Authority New York | ||||
| Revenue | 5.000% | 12/15/31 | 7,000 | 8,281 |
| Utility Debt Securitization Authority New York | ||||
| Revenue | 5.000% | 12/15/32 | 9,650 | 11,377 |
| Utility Debt Securitization Authority New York | ||||
| Revenue | 5.000% | 12/15/33 | 3,150 | 3,699 |
| Utility Debt Securitization Authority New York | ||||
| Revenue | 5.000% | 12/15/33 | 7,755 | 9,283 |
| Utility Debt Securitization Authority New York | ||||
| Revenue | 5.000% | 12/15/34 | 5,130 | 6,004 |
| Utility Debt Securitization Authority New York | ||||
| Revenue | 5.000% | 12/15/36 | 23,700 | 28,110 |
| Utility Debt Securitization Authority New York | ||||
| Revenue | 5.000% | 12/15/41 | 27,400 | 31,723 |
| Westchester County NY GO | 5.000% | 7/1/17 (ETM) | 200 | 201 |
| Westchester County NY GO | 5.000% | 7/1/17 | 9,280 | 9,313 |
| Westchester County NY GO | 5.000% | 7/1/17 (ETM) | 860 | 863 |
| Westchester County NY GO | 5.000% | 1/1/21 | 1,550 | 1,767 |
| Westchester County NY Health Care Corp. | ||||
| Revenue | 6.000% | 11/1/20 (Prere.) | 85 | 99 |
| Westchester County NY Health Care Corp. | ||||
| Revenue | 6.125% | 11/1/20 (Prere.) | 1,865 | 2,179 |
| Westchester County NY Health Care Corp. | ||||
| Revenue | 5.000% | 11/1/21 | 2,500 | 2,871 |
| Westchester County NY Health Care Corp. | ||||
| Revenue | 5.000% | 11/1/25 | 1,810 | 2,026 |
| Westchester County NY Health Care Corp. | ||||
| Revenue | 6.000% | 11/1/30 | 15 | 17 |
| Westchester County NY Health Care Corp. | ||||
| Revenue | 6.125% | 11/1/37 | 235 | 261 |
65
| New York Long-Term Tax-Exempt Fund | ||||
| Face | Market | |||
| Maturity | Amount | Value• | ||
| Coupon | Date | ($000) | ($000) | |
| Westchester County NY Local Development Corp. | ||||
| Revenue (Kendal on Hudson Project) | 3.000% | 1/1/18 | 900 | 909 |
| Westchester County NY Local Development Corp. | ||||
| Revenue (Kendal on Hudson Project) | 5.000% | 1/1/28 | 1,350 | 1,510 |
| Westchester County NY Local Development Corp. | ||||
| Revenue (Kendal on Hudson Project) | 5.000% | 1/1/34 | 1,555 | 1,699 |
| Westchester County NY Local Development Corp. | ||||
| Revenue (Pace University) | 5.000% | 5/1/34 | 1,500 | 1,627 |
| Westchester County NY Local Development Corp. | ||||
| Revenue (Pace University) | 5.500% | 5/1/42 | 5,750 | 6,328 |
| Westchester County NY Local Development Corp. | ||||
| Revenue (Westchester Medical Center) | 5.000% | 11/1/27 | 1,000 | 1,162 |
| Westchester County NY Local Development Corp. | ||||
| Revenue (Westchester Medical Center) | 5.000% | 11/1/28 | 1,000 | 1,154 |
| Westchester County NY Local Development Corp. | ||||
| Revenue (Westchester Medical Center) | 5.000% | 11/1/29 | 1,000 | 1,145 |
| Westchester County NY Local Development Corp. | ||||
| Revenue (Westchester Medical Center) | 5.000% | 11/1/34 | 2,500 | 2,793 |
| Westchester County NY Local Development Corp. | ||||
| Revenue (Westchester Medical Center) | 5.000% | 11/1/46 | 15,495 | 16,881 |
| Yonkers NY GO | 5.000% | 10/1/20 | 1,000 | 1,113 |
| 4,240,537 | ||||
| Guam (0.1%) | ||||
| Guam Government Waterworks Authority Water | ||||
| & Waste Water System Revenue | 5.000% | 7/1/29 | 1,000 | 1,125 |
| Puerto Rico (0.0%) | ||||
| Puerto Rico Public Finance Corp. Revenue | 6.000% | 8/1/26 (ETM) | 860 | 1,108 |
| Total Tax-Exempt Municipal Bonds (Cost $4,024,475) | 4,242,770 | |||
| Amount | ||||
| ($000) | ||||
| Other Assets and Liabilities (0.4%) | ||||
| Other Assets | ||||
| Investment in Vanguard | 280 | |||
| Receivables for Accrued Income | 48,711 | |||
| Receivables for Capital Shares Issued | 1,871 | |||
| Other Assets | 462 | |||
| Total Other Assets | 51,324 | |||
| Liabilities | ||||
| Payables for Investment Securities Purchased | (24,130) | |||
| Payables for Capital Shares Redeemed | (1,667) | |||
| Payables for Distributions | (3,110) | |||
| Payables to Vanguard | (3,987) | |||
| Other Liabilities | (176) | |||
| Total Liabilities | (33,070) | |||
| Net Assets (100%) | 4,261,024 | |||
66
| New York Long-Term Tax-Exempt Fund | |
| At May 31, 2017, net assets consisted of: | |
| Amount | |
| ($000) | |
| Paid-in Capital | 4,030,987 |
| Undistributed Net Investment Income | 99 |
| Accumulated Net Realized Gains | 11,920 |
| Unrealized Appreciation (Depreciation) | |
| Investment Securities | 218,295 |
| Futures Contracts | (277) |
| Net Assets | 4,261,024 |
| Investor Shares—Net Assets | |
| Applicable to 41,090,211 outstanding $.001 par value shares of | |
| beneficial interest (unlimited authorization) | 486,041 |
| Net Asset Value Per Share—Investor Shares | $11.83 |
| Admiral Shares—Net Assets | |
| Applicable to 319,139,097 outstanding $.001 par value shares of | |
| beneficial interest (unlimited authorization) | 3,774,983 |
| Net Asset Value Per Share—Admiral Shares | $11.83 |
• See Note A in Notes to Financial Statements.
1 Security exempt from registration under Rule 144A of the Securities Act of 1933. Such securities may be sold in transactions exempt from
registration, normally to qualified institutional buyers. At May 31, 2017, the aggregate value of these securities was $30,151,000,
representing 0.7% of net assets.
2 Security purchased on a when-issued or delayed-delivery basis for which the fund has not taken delivery as of May 31, 2017.
3 Securities with a value of $1,518,000 have been segregated as initial margin for open futures contracts.
A key to abbreviations and other references follows the Statement of Net Assets.
See accompanying Notes, which are an integral part of the Financial Statements.
67
New York Long-Term Tax-Exempt Fund
Key to Abbreviations
ARS—Auction Rate Security.
BAN—Bond Anticipation Note.
COP—Certificate of Participation.
CP—Commercial Paper.
FR—Floating Rate.
GAN—Grant Anticipation Note.
GO—General Obligation Bond.
PILOT—Payments in Lieu of Taxes.
PUT—Put Option Obligation.
RAN—Revenue Anticipation Note.
TAN—Tax Anticipation Note.
TOB—Tender Option Bond.
TRAN—Tax Revenue Anticipation Note.
VRDO—Variable Rate Demand Obligation.
VRDP—Variable Rate Demand Preferred.
(ETM)—Escrowed to Maturity.
(Prere.)—Prerefunded.
Scheduled principal and interest payments are guaranteed by:
(1) MBIA (Municipal Bond Investors Assurance).
(2) AMBAC (Ambac Assurance Corporation).
(3) FGIC (Financial Guaranty Insurance Company).
(4) AGM (Assured Guaranty Municipal Corporation).
(5) BIGI (Bond Investors Guaranty Insurance).
(6) Connie Lee Inc.
(7) FHA (Federal Housing Authority).
(8) CapMAC (Capital Markets Assurance Corporation).
(9) American Capital Access Financial Guaranty Corporation.
(10) XL Capital Assurance Inc.
(11) CIFG (CDC IXIS Financial Guaranty).
(12) AGC (Assured Guaranty Corporation).
(13) BHAC (Berkshire Hathaway Assurance Corporation).
(14) NPFG (National Public Finance Guarantee Corporation).
(15) BAM (Build America Mutual Assurance Company).
(16) MAC (Municipal Assurance Corporation).
(17) RAA (Radian Asset Assurance Inc.).
(18) SBLF (Michigan School Bond Loan Fund).
The insurance does not guarantee the market value of the municipal bonds.
LOC—Scheduled principal and interest payments are guaranteed by bank letter of credit.
68
New York Long-Term Tax-Exempt Fund
| Statement of Operations | |
| Six Months Ended | |
| May 31, 2017 | |
| ($000) | |
| Investment Income | |
| Income | |
| Interest | 69,281 |
| Total Income | 69,281 |
| Expenses | |
| The Vanguard Group—Note B | |
| Investment Advisory Services | 282 |
| Management and Administrative—Investor Shares | 336 |
| Management and Administrative—Admiral Shares | 1,177 |
| Marketing and Distribution—Investor Shares | 52 |
| Marketing and Distribution—Admiral Shares | 152 |
| Custodian Fees | 18 |
| Shareholders’ Reports—Investor Shares | 13 |
| Shareholders’ Reports—Admiral Shares | 14 |
| Trustees’ Fees and Expenses | 1 |
| Total Expenses | 2,045 |
| Net Investment Income | 67,236 |
| Realized Net Gain (Loss) | |
| Investment Securities Sold | 14,314 |
| Futures Contracts | (448) |
| Realized Net Gain (Loss) | 13,866 |
| Change in Unrealized Appreciation (Depreciation) | |
| Investment Securities | 128,495 |
| Futures Contracts | (277) |
| Change in Unrealized Appreciation (Depreciation) | 128,218 |
| Net Increase (Decrease) in Net Assets Resulting from Operations | 209,320 |
See accompanying Notes, which are an integral part of the Financial Statements.
69
New York Long-Term Tax-Exempt Fund
| Statement of Changes in Net Assets | ||
| Six Months Ended | Year Ended | |
| May 31, | November 30, | |
| 2017 | 2016 | |
| ($000) | ($000) | |
| Increase (Decrease) in Net Assets | ||
| Operations | ||
| Net Investment Income | 67,236 | 140,685 |
| Realized Net Gain (Loss) | 13,866 | 22,255 |
| Change in Unrealized Appreciation (Depreciation) | 128,218 | (146,318) |
| Net Increase (Decrease) in Net Assets Resulting from Operations | 209,320 | 16,622 |
| Distributions | ||
| Net Investment Income | ||
| Investor Shares | (7,418) | (15,169) |
| Admiral Shares | (59,652) | (123,965) |
| Realized Capital Gain1 | ||
| Investor Shares | (2,383) | (386) |
| Admiral Shares | (18,628) | (3,246) |
| Total Distributions | (88,081) | (142,766) |
| Capital Share Transactions | ||
| Investor Shares | 12,241 | 52,873 |
| Admiral Shares | 140,712 | 90,286 |
| Net Increase (Decrease) from Capital Share Transactions | 152,953 | 143,159 |
| Total Increase (Decrease) | 274,192 | 17,015 |
| Net Assets | ||
| Beginning of Period | 3,986,832 | 3,969,817 |
| End of Period2 | 4,261,024 | 3,986,832 |
1 Includes fiscal 2017 and 2016 short-term gain distributions totaling $2,967,000 and $0, respectively. Short-term gain distributions are
treated as ordinary income dividends for tax purposes.
2 Net Assets—End of Period includes undistributed (overdistributed) net investment income of $99,000 and $49,000.
See accompanying Notes, which are an integral part of the Financial Statements.
70
New York Long-Term Tax-Exempt Fund
| Financial Highlights | ||||||
| Investor Shares | ||||||
| Six Months | ||||||
| Ended | ||||||
| For a Share Outstanding | May 31, | Year Ended November 30, | ||||
| Throughout Each Period | 2017 | 2016 | 2015 | 2014 | 2013 | 2012 |
| Net Asset Value, Beginning of Period | $11.49 | $11.84 | $11.77 | $11.11 | $12.03 | $11.24 |
| Investment Operations | ||||||
| Net Investment Income | .188 | .384 | .390 | .404 | .397 | .405 |
| Net Realized and Unrealized Gain (Loss) | ||||||
| on Investments | . 401 | (. 343) | . 070 | . 660 | (. 920) | .790 |
| Total from Investment Operations | .589 | .041 | .460 | 1.064 | (.523) | 1.195 |
| Distributions | ||||||
| Dividends from Net Investment Income | (.187) | (. 380) | (. 390) | (. 404) | (. 397) | (. 405) |
| Distributions from Realized Capital Gains | (.062) | (.011) | — | — | — | — |
| Total Distributions | (. 249) | (. 391) | (. 390) | (. 404) | (. 397) | (. 405) |
| Net Asset Value, End of Period | $11.83 | $11.49 | $11.84 | $11.77 | $11.11 | $12.03 |
| Total Return1 | 5.19% | 0.24% | 3.97% | 9.71% | -4.38% | 10.80% |
| Ratios/Supplemental Data | ||||||
| Net Assets, End of Period (Millions) | $486 | $460 | $423 | $417 | $391 | $528 |
| Ratio of Total Expenses to | ||||||
| Average Net Assets | 0.19% | 0.19% | 0.20% | 0.20% | 0.20% | 0.20% |
| Ratio of Net Investment Income to | ||||||
| Average Net Assets | 3.24% | 3.18% | 3.26% | 3.57% | 3.47% | 3.48% |
| Portfolio Turnover Rate | 17% | 18% | 17% | 27% | 23% | 16% |
The expense ratio, net investment income ratio, and turnover rate for the current period have been annualized.
1 Total returns do not include account service fees that may have applied in the periods shown. Fund prospectuses provide information about
any applicable account service fees.
See accompanying Notes, which are an integral part of the Financial Statements.
71
New York Long-Term Tax-Exempt Fund
| Financial Highlights | ||||||
| Admiral Shares | ||||||
| Six Months | ||||||
| Ended | ||||||
| For a Share Outstanding | May 31, | Year Ended November 30, | ||||
| Throughout Each Period | 2017 | 2016 | 2015 | 2014 | 2013 | 2012 |
| Net Asset Value, Beginning of Period | $11.49 | $11.84 | $11.77 | $11.11 | $12.03 | $11.24 |
| Investment Operations | ||||||
| Net Investment Income | .194 | . 396 | .400 | .413 | .406 | .414 |
| Net Realized and Unrealized Gain (Loss) | ||||||
| on Investments | . 401 | (. 343) | . 070 | . 660 | (. 920) | .790 |
| Total from Investment Operations | .595 | .053 | .470 | 1.073 | (.514) | 1.204 |
| Distributions | ||||||
| Dividends from Net Investment Income | (.193) | (. 392) | (. 400) | (. 413) | (. 406) | (. 414) |
| Distributions from Realized Capital Gains | (.062) | (.011) | — | — | — | — |
| Total Distributions | (. 255) | (. 403) | (. 400) | (. 413) | (. 406) | (. 414) |
| Net Asset Value, End of Period | $11.83 | $11.49 | $11.84 | $11.77 | $11.11 | $12.03 |
| Total Return1 | 5.24% | 0.34% | 4.06% | 9.80% | -4.31% | 10.89% |
| Ratios/Supplemental Data | ||||||
| Net Assets, End of Period (Millions) | $3,775 | $3,527 | $3,547 | $3,187 | $2,697 | $2,970 |
| Ratio of Total Expenses to | ||||||
| Average Net Assets | 0.09% | 0.09% | 0.12% | 0.12% | 0.12% | 0.12% |
| Ratio of Net Investment Income to | ||||||
| Average Net Assets | 3.34% | 3.28% | 3.34% | 3.65% | 3.55% | 3.56% |
| Portfolio Turnover Rate | 17% | 18% | 17% | 27% | 23% | 16% |
The expense ratio, net investment income ratio, and turnover rate for the current period have been annualized.
1 Total returns do not include account service fees that may have applied in the periods shown. Fund prospectuses provide information about
any applicable account service fees.
See accompanying Notes, which are an integral part of the Financial Statements.
72
New York Long-Term Tax-Exempt Fund
Notes to Financial Statements
Vanguard New York Long-Term Tax-Exempt Fund is registered under the Investment Company Act of 1940 as an open-end investment company, or mutual fund. The fund invests in debt instruments of municipal issuers whose ability to meet their obligations may be affected by economic and political developments in the state. The fund offers two classes of shares: Investor Shares and Admiral Shares. Investor Shares are available to any investor who meets the fund’s minimum purchase requirements. Admiral Shares are designed for investors who meet certain administrative, service, and account-size criteria.
A. The following significant accounting policies conform to generally accepted accounting principles for U.S. investment companies. The fund consistently follows such policies in preparing its financial statements.
1. Security Valuation: Securities are valued as of the close of trading on the New York Stock Exchange (generally 4 p.m., Eastern time) on the valuation date. Bonds and temporary cash investments are valued using the latest bid prices or using valuations based on a matrix system (which considers such factors as security prices, yields, maturities, and ratings), both as furnished by independent pricing services. Securities for which market quotations are not readily available, or whose values have been affected by events occurring before the fund’s pricing time but after the close of the securities’ primary markets, are valued by methods deemed by the board of trustees to represent fair value.
2. Futures Contracts: The fund uses futures contracts to invest in fixed income asset classes with greater efficiency and lower cost than is possible through direct investment, to add value when these instruments are attractively priced, or to adjust sensitivity to changes in interest rates. The primary risks associated with the use of futures contracts are imperfect correlation between changes in market values of bonds held by the fund and the prices of futures contracts, and the possibility of an illiquid market. Counterparty risk involving futures is mitigated because a regulated clearinghouse is the counterparty instead of the clearing broker. To further mitigate counterparty risk, the fund trades futures contracts on an exchange, monitors the financial strength of its clearing brokers and clearinghouse, and has entered into clearing agreements with its clearing brokers. The clearinghouse imposes initial margin requirements to secure the fund’s performance and requires daily settlement of variation margin representing changes in the market value of each contract.
Futures contracts are valued at their quoted daily settlement prices. The aggregate settlement values of the contracts are not recorded in the Statement of Net Assets. Fluctuations in the value of the contracts are recorded in the Statement of Net Assets as an asset (liability) and in the Statement of Operations as unrealized appreciation (depreciation) until the contracts are closed, when they are recorded as realized futures gains (losses).
During the six months ended May 31, 2017, the fund’s average investments in long and short futures contracts represented 2% and 2% of net assets, respectively, based on the average of aggregate settlement values at each quarter-end during the period.
3. Federal Income Taxes: The fund intends to continue to qualify as a regulated investment company and distribute all of its income. Management has analyzed the fund’s tax positions taken for all open federal income tax years (November 30, 2013–2016), and for the period ended May 31, 2017, and has concluded that no provision for federal income tax is required in the fund’s financial statements.
4. Distributions: Distributions from net investment income are declared daily and paid on the first business day of the following month. Annual distributions from realized capital gains, if any, are recorded on the ex-dividend date.
73
New York Long-Term Tax-Exempt Fund
5. Credit Facility: The fund and certain other funds managed by The Vanguard Group (“Vanguard”) participate in a $3.1 billion committed credit facility provided by a syndicate of lenders pursuant to a credit agreement that may be renewed annually; each fund is individually liable for its borrowings, if any, under the credit facility. Borrowings may be utilized for temporary and emergency purposes, and are subject to the fund’s regulatory and contractual borrowing restrictions. The participating funds are charged administrative fees and an annual commitment fee of 0.10% of the undrawn amount of the facility; these fees are allocated to the funds based on a method approved by the fund’s board of trustees and included in Management and Administrative expenses on the fund’s Statement of Operations. Any borrowings under this facility bear interest at a rate based upon the higher of the one-month London Interbank Offered Rate, federal funds effective rate, or overnight bank funding rate plus an agreed-upon spread.
The fund had no borrowings outstanding at May 31, 2017, or at any time during the period then ended.
6. Other: Interest income is accrued daily. Premiums and discounts on debt securities purchased are amortized and accreted, respectively, to interest income over the lives of the respective securities. Security transactions are accounted for on the date securities are bought or sold. Costs used to determine realized gains (losses) on the sale of investment securities are those of the specific securities sold.
Each class of shares has equal rights as to assets and earnings, except that each class separately bears certain class-specific expenses related to maintenance of shareholder accounts (included in Management and Administrative expenses) and shareholder reporting. Marketing and distribution expenses are allocated to each class of shares based on a method approved by the board of trustees. Income, other non-class-specific expenses, and gains and losses on investments are allocated to each class of shares based on its relative net assets.
B. In accordance with the terms of a Funds’ Service Agreement (the “FSA”) between Vanguard and the fund, Vanguard furnishes to the fund investment advisory, corporate management, administrative, marketing, and distribution services at Vanguard’s cost of operations (as defined by the FSA). These costs of operations are allocated to the fund based on methods and guidelines approved by the board of trustees. Vanguard does not require reimbursement in the current period for certain costs of operations (such as deferred compensation/benefits and risk/insurance costs); the fund’s liability for these costs of operations is included in Payables to Vanguard on the Statement of Net Assets.
Upon the request of Vanguard, the fund may invest up to 0.40% of its net assets as capital in Vanguard. At May 31, 2017, the fund had contributed to Vanguard capital in the amount of $280,000, representing 0.01% of the fund’s net assets and 0.11% of Vanguard’s capitalization. The fund’s trustees and officers are also directors and employees, respectively, of Vanguard.
C. Various inputs may be used to determine the value of the fund’s investments. These inputs are summarized in three broad levels for financial statement purposes. The inputs or methodologies used to value securities are not necessarily an indication of the risk associated with investing in those securities.
Level 1—Quoted prices in active markets for identical securities.
Level 2—Other significant observable inputs (including quoted prices for similar securities, interest rates, prepayment speeds, credit risk, etc.).
Level 3—Significant unobservable inputs (including the fund’s own assumptions used to determine the fair value of investments).
74
New York Long-Term Tax-Exempt Fund
The following table summarizes the market value of the fund’s investments as of May 31, 2017, based on the inputs used to value them:
| Level 1 | Level 2 | Level 3 | |
| Investments | ($000) | ($000) | ($000) |
| Tax-Exempt Municipal Bonds | — | 4,242,770 | — |
| Futures Contracts—Assets1 | 37 | — | — |
| Futures Contracts—Liabilities1 | (176) | — | — |
| Total | (139) | 4,242,770 | — |
| 1 Represents variation margin on the last day of the reporting period. | |||
D. At May 31, 2017, the aggregate settlement value of open futures contracts and the related unrealized appreciation (depreciation) were:
| ($000) | ||||
| Aggregate | ||||
| Number of | Settlement | Unrealized | ||
| Long (Short) | Value | Appreciation | ||
| Futures Contracts | Expiration | Contracts | Long (Short) | (Depreciation) |
| 5-Year U.S. Treasury Note | September 2017 | 695 | 82,227 | 119 |
| Ultra 10-Year U.S. Treasury Note | September 2017 | (358) | (48,593) | (256) |
| 2-Year U.S. Treasury Note | September 2017 | 165 | 35,720 | 32 |
| 30-Year U.S. Treasury Bond | September 2017 | (103) | (15,843) | (165) |
| 10-Year U.S. Treasury Note | September 2017 | (61) | (7,704) | (7) |
| (277) | ||||
Unrealized appreciation (depreciation) on open futures contracts is required to be treated as realized gain (loss) for tax purposes.
E. Capital gain distributions are determined on a tax basis and may differ from realized capital gains for financial reporting purposes. Differences may be permanent or temporary. Permanent differences are reclassified among capital accounts in the financial statements to reflect their tax character. Temporary differences arise when gains or losses are recognized in different periods for financial statement and tax purposes. These differences will reverse at some time in the future. The fund’s tax-basis capital gains and losses are determined only at the end of each fiscal year.
At May 31, 2017, the cost of investment securities for tax purposes was $4,026,420,000. Net unrealized appreciation of investment securities for tax purposes was $216,350,000, consisting of unrealized gains of $223,879,000 on securities that had risen in value since their purchase and $7,529,000 in unrealized losses on securities that had fallen in value since their purchase.
F. During the six months ended May 31, 2017, the fund purchased $509,931,000 of investment securities and sold $337,049,000 of investment securities, other than temporary cash investments.
The fund purchased securities from and sold securities to other Vanguard funds or accounts managed by Vanguard or its affiliates, in accordance with procedures adopted by the board of trustees in compliance with Rule 17a-7 of the Investment Company Act of 1940. For the six months ended May 31, 2017, such purchases and sales were $82,950,000 and $131,550,000, respectively; these amounts are included in the purchases and sales of investment securities noted above.
75
New York Long-Term Tax-Exempt Fund
| G. Capital share transactions for each class of shares were: | ||||
| Six Months Ended | Year Ended | |||
| May 31, 2017 | November 30, 2016 | |||
| Amount | Shares | Amount | Shares | |
| ($000) | (000) | ($000) | (000) | |
| Investor Shares | ||||
| Issued | 82,189 | 7,083 | 181,747 | 15,060 |
| Issued in Lieu of Cash Distributions | 8,124 | 701 | 12,823 | 1,064 |
| Redeemed | (78,072) | (6,745) | (141,697) | (11,770) |
| Net Increase (Decrease)—Investor Shares | 12,241 | 1,039 | 52,873 | 4,354 |
| Admiral Shares | ||||
| Issued | 433,666 | 37,418 | 696,797 | 57,767 |
| Issued in Lieu of Cash Distributions | 57,327 | 4,944 | 84,193 | 6,989 |
| Redeemed | (350,281) | (30,297) | (690,704) | (57,342) |
| Net Increase (Decrease)—Admiral Shares | 140,712 | 12,065 | 90,286 | 7,414 |
H. Management has determined that no material events or transactions occurred subsequent to May 31, 2017, that would require recognition or disclosure in these financial statements.
76
About Your Fund’s Expenses
As a shareholder of the fund, you incur ongoing costs, which include costs for portfolio management, administrative services, and shareholder reports (like this one), among others. Operating expenses, which are deducted from a fund’s gross income, directly reduce the investment return of the fund.
A fund’s expenses are expressed as a percentage of its average net assets. This figure is known as the expense ratio. The following examples are intended to help you understand the ongoing costs (in dollars) of investing in your fund and to compare these costs with those of other mutual funds. The examples are based on an investment of $1,000 made at the beginning of the period shown and held for the entire period.
The accompanying table illustrates your fund’s costs in two ways:
• Based on actual fund return. This section helps you to estimate the actual expenses that you paid over the period. The ”Ending Account Value“ shown is derived from the fund‘s actual return, and the third column shows the dollar amount that would have been paid by an investor who started with $1,000 in the fund. You may use the information here, together with the amount you invested, to estimate the expenses that you paid over the period.
To do so, simply divide your account value by $1,000 (for example, an $8,600 account value divided by $1,000 = 8.6), then multiply the result by the number given for your fund under the heading ”Expenses Paid During Period.“
• Based on hypothetical 5% yearly return. This section is intended to help you compare your fund‘s costs with those of other mutual funds. It assumes that the fund had a yearly return of 5% before expenses, but that the expense ratio is unchanged. In this case—because the return used is not the fund’s actual return—the results do not apply to your investment. The example is useful in making comparisons because the Securities and Exchange Commission requires all mutual funds to calculate expenses based on a 5% return. You can assess your fund’s costs by comparing this hypothetical example with the hypothetical examples that appear in shareholder reports of other funds.
Note that the expenses shown in the table are meant to highlight and help you compare ongoing costs only and do not reflect transaction costs incurred by the fund for buying and selling securities. Further, the expenses do not include any purchase, redemption, or account service fees described in the fund prospectus. If such fees were applied to your account, your costs would be higher. Your fund does not carry a “sales load.”
The calculations assume no shares were bought or sold during the period. Your actual costs may have been higher or lower, depending on the amount of your investment and the timing of any purchases or redemptions.
You can find more information about the fund’s expenses, including annual expense ratios, in the Financial Statements section of this report. For additional information on operating expenses and other shareholder costs, please refer to your fund’s current prospectus.
77
| Six Months Ended May 31, 2017 | |||
| Beginning | Ending | Expenses | |
| Account Value | Account Value | Paid During | |
| 11/30/2016 | 5/31/2017 | Period | |
| Based on Actual Fund Return | |||
| New York Municipal Money Market Fund | $1,000.00 | $1,002.99 | $0.80 |
| New York Long-Term Tax-Exempt Fund | |||
| Investor Shares | $1,000.00 | $1,051.87 | $0.97 |
| Admiral Shares | 1,000.00 | 1,052.40 | 0.46 |
| Based on Hypothetical 5% Yearly Return | |||
| New York Municipal Money Market Fund | $1,000.00 | $1,024.13 | $0.81 |
| New York Long-Term Tax-Exempt Fund | |||
| Investor Shares | $1,000.00 | $1,023.98 | $0.96 |
| Admiral Shares | 1,000.00 | 1,024.48 | 0.45 |
The calculations are based on expenses incurred in the most recent six-month period. The funds’ annualized six-month expense ratios for that
period are: for the New York Municipal Money Market Fund, 0.16%; and for the New York Long-Term Tax-Exempt Fund, 0.19% for Investor
Shares and 0.09% for Admiral Shares. The dollar amounts shown as “Expenses Paid” are equal to the annualized expense ratio multiplied by
the average account value over the period, multiplied by the number of days in the most recent six-month period, then divided by the number
of days in the most recent 12-month period (182/365).
78
Trustees Approve Advisory Arrangements
The board of trustees of Vanguard New York Municipal Money Market Fund and Vanguard New York Long-Term Tax-Exempt Fund has renewed each fund’s investment advisory arrangement with The Vanguard Group, Inc. (Vanguard), through its Fixed Income Group. The board determined that continuing the funds’ internalized management structure was in the best interests of each fund and its shareholders.
The board based its decision upon an evaluation of the advisor’s investment staff, portfolio management process, and performance. This evaluation included information provided to the board by Vanguard’s Portfolio Review Department, which is responsible for fund and advisor oversight and product management. The Portfolio Review Department met regularly with the advisor and made monthly presentations to the board during the fiscal year that directed the board’s focus to relevant information and topics.
The board, or an investment committee made up of board members, also received information throughout the year during advisor presentations. For each advisor presentation, the board was provided with letters and reports that included information about, among other things, the advisory firm and the advisor’s assessment of the investment environment, portfolio performance, and portfolio characteristics.
In addition, the board received monthly reports, which included a Market and Economic Report, a Fund Dashboard Monthly Summary, and a Fund Performance Report.
Prior to their meeting, the trustees were provided with a memo and materials that summarized the information they received over the course of the year. They also considered the factors discussed below, among others. However, no single factor determined whether the board approved the arrangements. Rather, it was the totality of the circumstances that drove the board’s decision.
Nature, extent, and quality of services
The board reviewed the quality of each fund’s investment management services over both the short and long term and took into account the organizational depth and stability of the advisor. The board considered that Vanguard has been managing investments for more than three decades. The Fixed Income Group adheres to a sound, disciplined investment management process; the team has considerable experience, stability, and depth.
The board concluded that Vanguard’s experience, stability, depth, and performance, among other factors, warranted continuation of each advisory arrangement.
Investment performance
The board considered the short- and long-term performance of each fund, including any periods of outperformance or underperformance compared with a benchmark index (as applicable) and peer group. The board concluded that the performance was such that each advisory arrangement should continue. Information about each fund’s most recent performance can be found in the Performance Summary sections of this report.
Cost
The board concluded that the New York Long-Term Tax-Exempt Fund’s expense ratio was well below the average expense ratio charged by funds in its peer group and that the fund’s advisory expenses were also well below its peer-group average. The board also concluded that the New York Municipal Money Market Fund’s expense ratio was reasonable compared with the average expense ratio
79
charged by funds in its peer group and that the fund’s advisory expenses were well below its peer-group average. Information about the funds’ expenses appears in the About Your Fund’s Expenses section of this report as well as in the Financial Statements sections.
The board does not conduct a profitability analysis of Vanguard, because of Vanguard’s unique “at-cost” structure. Unlike most other mutual fund management companies, Vanguard is owned by the funds it oversees and produces “profits” only in the form of reduced expenses for fund shareholders.
The benefit of economies of scale
The board concluded that each fund’s at-cost arrangement with Vanguard ensures that the funds will realize economies of scale as they grow, with the cost to shareholders declining as fund assets increase.
The board will consider whether to renew the advisory arrangements again after a one-year period.
80
Glossary
7-Day SEC Yield and 30-Day SEC Yield. A money market fund’s 7-day SEC yield is calculated by annualizing its income distributions for the previous seven days, as required by the U.S. Securities and Exchange Commission. For other funds, 30-day SEC yield is derived using a formula specified by the commission. Under the formula, data related to the fund’s security holdings in the previous 30 days are used to calculate the fund’s hypothetical net income for that period, which is then annualized and divided by the fund’s estimated average net assets over the calculation period. For the purposes of this calculation, a security’s income is based on its current market yield to maturity (for bonds), its actual income (for asset-backed securities), or its projected dividend yield (for stocks). Because the SEC yield represents hypothetical annualized income, it will differ—at times significantly—from the fund’s actual experience. As a result, the fund’s income distributions may be higher or lower than implied by the SEC yield.
Average Coupon. The average interest rate paid on the fixed income securities held by a fund. It is expressed as a percentage of face value.
Average Duration. An estimate of how much the value of the bonds held by a fund will fluctuate in response to a change in interest rates. To see how the value could change, multiply the average duration by the change in rates. If interest rates rise by 1 percentage point, the value of the bonds in a fund with an average duration of five years would decline by about 5%. If rates decrease by a percentage point, the value would rise by 5%.
Average Stated Maturity. The average length of time until fixed income securities held by a fund reach maturity and are repaid using the maturity date of the security. The figure reflects the proportion of fund assets represented by each security; it also reflects any futures contracts held. In general, the longer the average stated maturity, the more a fund’s share price will fluctuate in response to changes in market interest rates.
Average Weighted Maturity. The average length of time until fixed income securities held by a fund reach maturity and are repaid. The figure reflects the proportion of fund assets represented by each security.
Beta. A measure of the magnitude of a fund’s past share-price fluctuations in relation to the ups and downs of a given market index. The index is assigned a beta of 1.00. Compared with a given index, a fund with a beta of 1.20 typically would have seen its share price rise or fall by 12% when the index rose or fell by 10%. For this report, beta is based on returns over the past 36 months for both the fund and the index. Note that a fund’s beta should be reviewed in conjunction with its R-squared (see definition). The lower the R-squared, the less correlation there is between the fund and the index, and the less reliable beta is as an indicator of volatility.
Credit Quality. Credit-quality ratings are measured on a scale that generally ranges from AAA (highest) to D (lowest). Credit-quality ratings are obtained from Moody’s and S&P, and the higher rating for each issue is used. ”Not Rated” is used to classify securities for which a rating is not available. Not rated securities include a fund’s investment in Vanguard Market Liquidity Fund or Vanguard Municipal Cash Management Fund, each of which invests in high-quality money market instruments and may serve as a cash management vehicle for the Vanguard funds, trusts, and accounts.
81
Expense Ratio. A fund’s total annual operating expenses expressed as a percentage of the fund’s average net assets. The expense ratio includes management and administrative expenses, but does not include the transaction costs of buying and selling portfolio securities.
Inception Date. The date on which the assets of a fund (or one of its share classes) are first invested in accordance with the fund’s investment objective. For funds with a subscription period, the inception date is the day after that period ends. Investment performance is measured from the inception date.
R-Squared. A measure of how much of a fund’s past returns can be explained by the returns from the market in general, as measured by a given index. If a fund’s total returns were precisely synchronized with an index’s returns, its R-squared would be 1.00. If the fund’s returns bore no relationship to the index’s returns, its R-squared would be 0. For this report, R-squared is based on returns over the past 36 months for both the fund and the index.
Short-Term Reserves. The percentage of a fund invested in highly liquid, short-term securities that can be readily converted to cash.
Yield to Maturity. The rate of return an investor would receive if the fixed income securities held by a fund were held to their maturity dates.
82
The Vanguard Municipal Bond Funds are not sponsored, endorsed, issued, sold, or promoted by Barclays Risk Analytics and
Index Solutions Limited or any of its affiliates (“Barclays”). Barclays makes no representation or warranty, express or implied,
to the owners or purchasers of the Vanguard Municipal Bond Funds or any member of the public regarding the advisability of
investing in securities generally or in the Vanguard Municipal Bond Funds particularly or the ability of the Bloomberg Barclays
Indices to track general bond market performance. Barclays has not passed on the legality or suitability of the Vanguard
Municipal Bond Funds with respect to any person or entity. Barclays’ only relationship to Vanguard and the Vanguard Municipal
Bond Funds is the licensing of the Bloomberg Barclays Indices, which are determined, composed, and calculated by Barclays
without regard to Vanguard or the Vanguard Municipal Bond Funds or any owners or purchasers of the Vanguard Municipal
Bond Funds. Barclays has no obligation to take the needs of Vanguard, the Vanguard Municipal Bond Funds, or the owners
of the Vanguard Municipal Bond Funds into consideration in determining, composing, or calculating the Bloomberg Barclays
Indices. Barclays is not responsible for and has not participated in the determination of the timing of, prices at, or quantities of
the Vanguard Municipal Bond Funds to be issued. Barclays has no obligation or liability in connection with the administration,
marketing, or trading of the Vanguard Municipal Bond Funds.
BARCLAYS SHALL HAVE NO LIABILITY TO THIRD PARTIES FOR THE QUALITY, ACCURACY AND/OR COMPLETENESS OF THE
INDEX OR ANY DATA INCLUDED THEREIN OR FOR INTERRUPTIONS IN THE DELIVERY OF THE INDEX. BARCLAYS MAKES
NO WARRANTY, EXPRESS OR IMPLIED, AS TO RESULTS TO BE OBTAINED BY OWNERS OF THE VANGUARD MUNICIPAL
BOND FUNDS OR ANY OTHER PERSON OR ENTITY FROM THE USE OF THE INDEX OR ANY DATA INCLUDED THEREIN IN
CONNECTION WITH THE RIGHTS LICENSED HEREUNDER OR FOR ANY OTHER USE. BARCLAYS RESERVES THE RIGHT
TO CHANGE THE METHODS OF CALCULATION OR PUBLICATION, OR TO CEASE THE CALCULATION OR PUBLICATION OF
THE BLOOMBERG BARCLAYS INDICES, AND BARCLAYS SHALL NOT BE LIABLE FOR ANY MISCALCULATION OF OR ANY
INCORRECT, DELAYED OR INTERRUPTED PUBLICATION WITH RESPECT TO ANY OF THE BLOOMBERG BARCLAYS INDICES.
BARCLAYS MAKES NO EXPRESS OR IMPLIED WARRANTIES, AND HEREBY EXPRESSLY DISCLAIMS ALL WARRANTIES
OF MERCHANTABILITY OR FITNESS FOR A PARTICULAR PURPOSE OR USE WITH RESPECT TO THE INDEX OR ANY DATA
INCLUDED THEREIN. BARCLAYS SHALL NOT BE LIABLE FOR ANY DAMAGES, INCLUDING, WITHOUT LIMITATION, ANY
INDIRECT OR CONSEQUENTIAL DAMAGES RESULTING FROM THE USE OF THE INDEX OR ANY DATA INCLUDED THEREIN.
© 2017 Barclays. Used with Permission.
Source: Barclays Global Family of Indices. Copyright 2017, Barclays. All rights reserved.
83
The People Who Govern Your Fund
The trustees of your mutual fund are there to see that the fund is operated and managed in your best interests since, as a shareholder, you are a part owner of the fund. Your fund’s trustees also serve on the board of directors of The Vanguard Group, Inc., which is owned by the Vanguard funds and provides services to them on an at-cost basis.
A majority of Vanguard’s board members are independent, meaning that they have no affiliation with Vanguard or the funds they oversee, apart from the sizable personal investments they have made as private individuals. The independent board members have distinguished backgrounds in business, academia, and public service. Each of the trustees and executive officers oversees 197 Vanguard funds.
The following table provides information for each trustee and executive officer of the fund. The mailing address of the trustees and officers is P.O. Box 876, Valley Forge, PA 19482. More information about the trustees is in the Statement of Additional Information, which can be obtained, without charge, by contacting Vanguard at 800-662-7447, or online at vanguard.com.
Interested Trustee1
F. William McNabb III
Born 1957. Trustee Since July 2009. Chairman of the Board. Principal Occupation(s) During the Past Five Years and Other Experience: Chairman of the Board of The Vanguard Group, Inc., and of each of the investment companies served by The Vanguard Group, since January 2010; Director of The Vanguard Group since 2008; Chief Executive Officer and President of The Vanguard Group, and of each of the investment companies served by The Vanguard Group, since 2008; Director of Vanguard Marketing Corporation; Managing Director of The Vanguard Group (1995–2008).
Independent Trustees
Emerson U. Fullwood
Born 1948. Trustee Since January 2008. Principal Occupation(s) During the Past Five Years and Other Experience: Executive Chief Staff and Marketing Officer for North America and Corporate Vice President (retired 2008) of Xerox Corporation (document management products and services); Executive in Residence and 2009–2010 Distinguished Minett Professor at the Rochester Institute of Technology; Lead Director of SPX FLOW, Inc. (multi-industry manufacturing); Director of the United Way of Rochester, the University of Rochester Medical Center, Monroe Community College Foundation, North Carolina A&T University, and Roberts Wesleyan College; Trustee of the University of Rochester.
Rajiv L. Gupta
Born 1945. Trustee Since December 2001.2 Principal Occupation(s) During the Past Five Years and Other Experience: Chairman and Chief Executive Officer (retired 2009) and President (2006–2008) of Rohm and Haas Co. (chemicals); Director of Arconic Inc. (diversified manufacturer), HP Inc. (printer and personal computer manufacturing), and Delphi Automotive plc (automotive components); Senior Advisor at New Mountain Capital.
Amy Gutmann
Born 1949. Trustee Since June 2006. Principal Occupation(s) During the Past Five Years and Other Experience: President of the University of Pennsylvania; Christopher H. Browne Distinguished Professor of Political Science, School of Arts and Sciences, and Professor of Communication, Annenberg School for Communication, with secondary faculty appointments in the Department of Philosophy, School of Arts and Sciences, and at the Graduate School of Education, University of Pennsylvania; Trustee of the National Constitution Center.
JoAnn Heffernan Heisen
Born 1950. Trustee Since July 1998. Principal Occupation(s) During the Past Five Years and Other Experience: Corporate Vice President and Member of the Executive Committee (1997–2008), Chief Global Diversity Officer (retired 2008), Vice President and Chief Information Officer (1997–2006), Controller (1995–1997), Treasurer (1991–1995), and Assistant Treasurer (1989–1991) of Johnson & Johnson (pharmaceuticals/medical devices/consumer products); Director of Skytop Lodge Corporation (hotels) and the Robert Wood Johnson Foundation; Member of the Advisory Board of the Institute for Women’s Leadership at Rutgers University.
F. Joseph Loughrey
Born 1949. Trustee Since October 2009. Principal Occupation(s) During the Past Five Years and Other Experience: President and Chief Operating Officer (retired 2009) of Cummins Inc. (industrial machinery); Chairman of the Board of Hillenbrand, Inc. (specialized consumer services), Oxfam America, and the Lumina Foundation for Education; Director of SKF AB (industrial machinery), Hyster-Yale Materials Handling, Inc. (forklift trucks), and the V Foundation for Cancer
Research; Member of the Advisory Council for the College of Arts and Letters and Chair of the Advisory Board to the Kellogg Institute for International Studies, both at the University of Notre Dame.
Mark Loughridge
Born 1953. Trustee Since March 2012. Principal Occupation(s) During the Past Five Years and Other Experience: Senior Vice President and Chief Financial Officer (retired 2013) at IBM (information technology services); Fiduciary Member of IBM’s Retirement Plan Committee (2004–2013); Director of the Dow Chemical Company; Member of the Council on Chicago Booth.
Scott C. Malpass
Born 1962. Trustee Since March 2012. Principal Occupation(s) During the Past Five Years and Other Experience: Chief Investment Officer and Vice President at the University of Notre Dame; Assistant Professor of Finance at the Mendoza College of Business at Notre Dame; Member of the Notre Dame 403(b) Investment Committee, the Board of Advisors for Spruceview Capital Partners, and the Investment Advisory Committee of Major League Baseball; Board Member of TIFF Advisory Services, Inc., and Catholic Investment Services, Inc. (investment advisors); Member of the Board of Superintendence of the Institute for the Works of Religion.
André F. Perold
Born 1952. Trustee Since December 2004. Principal Occupation(s) During the Past Five Years and Other Experience: George Gund Professor of Finance and Banking, Emeritus at the Harvard Business School (retired 2011); Chief Investment Officer and Co-Managing Partner of HighVista Strategies LLC (private investment firm); Overseer of the Museum of Fine Arts Boston.
Peter F. Volanakis
Born 1955. Trustee Since July 2009. Principal Occupation(s) During the Past Five Years and Other Experience: President and Chief Operating Officer (retired 2010) of Corning Incorporated (communications equipment); Chairman of the Board of Trustees of Colby-Sawyer College; Member of the Board of Hypertherm, Inc. (industrial cutting systems, software, and consumables).
Executive Officers
Glenn Booraem
Born 1967. Investment Stewardship Officer Since February 2017. Principal Occupation(s) During the Past Five Years and Other Experience: Principal of The Vanguard Group, Inc.; Treasurer (2015–2017), Controller (2010–2015), and Assistant Controller (2001–2010) of each of the investment companies served by The Vanguard Group.
Thomas J. Higgins
Born 1957. Chief Financial Officer Since September 2008. Principal Occupation(s) During the Past Five Years and Other Experience: Principal of The Vanguard Group, Inc.; Chief Financial Officer of each of the investment companies served by The Vanguard Group; Treasurer of each of the investment companies served by The Vanguard Group (1998–2008).
Peter Mahoney
Born 1974. Controller Since May 2015. Principal Occupation(s) During the Past Five Years and Other Experience: Principal of The Vanguard Group, Inc.; Controller of each of the investment companies served by The Vanguard Group; Head of International Fund Services at The Vanguard Group (2008–2014).
Anne E. Robinson
Born 1970. Secretary Since September 2016. Principal Occupation(s) During the Past Five Years and Other Experience: Managing Director of The Vanguard Group, Inc.; General Counsel of The Vanguard Group; Secretary of The Vanguard Group and of each of the investment companies served by The Vanguard Group; Director and Senior Vice President of Vanguard Marketing Corporation; Managing Director and General Counsel of Global Cards and Consumer Services at Citigroup (2014–2016); Counsel at American Express (2003–2014).
Michael Rollings
Born 1963. Treasurer Since February 2017. Principal Occupation(s) During the Past Five Years and Other Experience: Managing Director of The Vanguard Group, Inc.; Treasurer of each of the investment companies served by The Vanguard Group; Executive Vice President and Chief Financial Officer of MassMutual Financial Group (2006–2016).
| Vanguard Senior Management Team | |
| Mortimer J. Buckley | James M. Norris |
| John James | Thomas M. Rampulla |
| Martha G. King | Glenn W. Reed |
| John T. Marcante | Karin A. Risi |
| Chris D. McIsaac | |
| Chairman Emeritus and Senior Advisor | |
| John J. Brennan | |
| Chairman, 1996–2009 | |
| Chief Executive Officer and President, 1996–2008 | |
| Founder | |
| John C. Bogle | |
| Chairman and Chief Executive Officer, 1974–1996 | |
1 Mr. McNabb is considered an “interested person,” as defined in the Investment Company Act of 1940, because he is an officer of the Vanguard funds.
2 December 2002 for Vanguard Equity Income Fund, the Vanguard Municipal Bond Funds, and the Vanguard State Tax-Exempt Funds.
 | ||
| P.O. Box 2600 | ||
| Valley Forge, PA 19482-2600 | ||
| Connect with Vanguard® > vanguard.com | ||
| Fund Information > 800-662-7447 | CFA® is a registered trademark owned by CFA Institute. | |
| Direct Investor Account Services > 800-662-2739 | ||
| Institutional Investor Services > 800-523-1036 | ||
| Text Telephone for People | ||
| Who Are Deaf or Hard of Hearing> 800-749-7273 | ||
| This material may be used in conjunction | ||
| with the offering of shares of any Vanguard | ||
| fund only if preceded or accompanied by | ||
| the fund’s current prospectus. | ||
| All comparative mutual fund data are from Lipper, a | ||
| Thomson Reuters Company, or Morningstar, Inc., unless | ||
| otherwise noted. | ||
| You can obtain a free copy of Vanguard’s proxy voting | ||
| guidelines by visiting vanguard.com/proxyreporting or by | ||
| calling Vanguard at 800-662-2739. The guidelines are | ||
| also available from the SEC’s website, sec.gov. In | ||
| addition, you may obtain a free report on how your fund | ||
| voted the proxies for securities it owned during the 12 | ||
| months ended June 30. To get the report, visit either | ||
| vanguard.com/proxyreporting or sec.gov. | ||
| You can review and copy information about your fund at | ||
| the SEC’s Public Reference Room in Washington, D.C. To | ||
| find out more about this public service, call the SEC at | ||
| 202-551-8090. Information about your fund is also | ||
| available on the SEC’s website, and you can receive | ||
| copies of this information, for a fee, by sending a | ||
| request in either of two ways: via email addressed to | ||
| publicinfo@sec.gov or via regular mail addressed to the | ||
| Public Reference Section, Securities and Exchange | ||
| Commission, Washington, DC 20549-1520. | ||
| © 2017 The Vanguard Group, Inc. | ||
| All rights reserved. | ||
| Vanguard Marketing Corporation, Distributor. | ||
| Q762 072017 | ||
Item 2: Code of Ethics. The Registrant has adopted a code of ethics that applies to the Registrant’s principal executive officer, principal financial officer, principal accounting officer or controller or persons performing similar functions. The Code of Ethics was amended during the reporting period covered by this report to make certain technical, non-material changes.
Item 3: Audit Committee Financial Expert.
Not Applicable.
Item 4: Principal Accountant Fees and Services.
(a) Audit Fees.
Not Applicable.
Item 5: Audit Committee of Listed Registrants.
Not Applicable.
Item 6: Investments.
Not Applicable.
Item 7: Disclosure of Proxy Voting Policies and Procedures for Closed-End Management Investment Companies.
Not Applicable.
Item 8: Portfolio Managers of Closed-End Management Investment Companies.
Not Applicable.
Item 9: Purchase of Equity Securities by Closed-End Management Investment Company and Affiliated Purchasers.
Not Applicable.
Item 10: Submission of Matters to a Vote of Security Holders.
Not Applicable.
Item 11: Controls and Procedures.
(a) Disclosure Controls and Procedures. The Principal Executive and Financial Officers concluded that the Registrant’s Disclosure Controls and Procedures are effective
0448435, v0.64
based on their evaluation of the Disclosure Controls and Procedures as of a date within 90 days of the filing date of this report.
(b) Internal Control Over Financial Reporting. There were no significant changes in Registrant’s Internal Control Over Financial Reporting or in other factors that could significantly affect this control subsequent to the date of the evaluation, including any corrective actions with regard to significant deficiencies and material weaknesses.
Item 12: Exhibits.
(a) Certifications.
Pursuant to the requirements of the Securities Exchange Act of 1934 and the Investment Company Act of 1940, the registrant has duly caused this report to be signed on its behalf by the undersigned, thereunto duly authorized.
| VANGUARD NEW YORK TAX-FREE FUNDS | |
| BY: | /s/ F. WILLIAM MCNABB III* |
| F. WILLIAM MCNABB III | |
| CHIEF EXECUTIVE OFFICER | |
| Date: July 18, 2017 | |
Pursuant to the requirements of the Securities Exchange Act of 1934 and the Investment Company Act of 1940, this report has been signed below by the following persons on behalf of the registrant and in the capacities and on the dates indicated.
| VANGUARD NEW YORK TAX-FREE FUNDS | |
| BY: | /s/ F. WILLIAM MCNABB III* |
| F. WILLIAM MCNABB III | |
| CHIEF EXECUTIVE OFFICER | |
| Date: July 18, 2017 | |
| VANGUARD NEW YORK TAX-FREE FUNDS | |
| BY: | /s/ THOMAS J. HIGGINS* |
| THOMAS J. HIGGINS | |
| CHIEF FINANCIAL OFFICER | |
| Date: July 18, 2017 | |
* By: /s/ Anne E. Robinson
Anne E. Robinson, pursuant to a Power of Attorney filed on October 4, 2016 see file Number
33-32548, Incorporated by Reference.