UNITED STATES
SECURITIES AND EXCHANGE COMMISSION
Washington, D.C. 20549
FORM N-CSR
CERTIFIED SHAREHOLDER REPORT OF
REGISTERED MANAGEMENT INVESTMENT COMPANIES
Investment Company Act file number: 811-04570
Name of Registrant: Vanguard New York Tax-Free Funds
Address of Registrant:
P.O. Box 2600
Valley Forge, PA 19482
Name and address of agent for service:
Heidi Stam, Esquire
P.O. Box 876
Valley Forge, PA 19482
Registrant’s telephone number, including area code: (610) 669-1000
Date of fiscal year end: November 30
Date of reporting period: December 1, 2014 – November 30, 2015
Item 1: Reports to Shareholders
Annual Report | November 30, 2015
Vanguard New York Tax-Exempt Funds
Vanguard New York Tax-Exempt Money Market Fund
Vanguard New York Long-Term Tax-Exempt Fund
Vanguard’s Principles for Investing Success
We want to give you the best chance of investment success. These principles, grounded in Vanguard’s research and experience, can put you on the right path.
Goals. Create clear, appropriate investment goals.
Balance. Develop a suitable asset allocation using broadly diversified funds. Cost. Minimize cost.
Discipline. Maintain perspective and long-term discipline.
A single theme unites these principles: Focus on the things you can control.
We believe there is no wiser course for any investor.
| Contents | |
| Your Fund’s Total Returns. | 1 |
| Chairman’s Letter. | 2 |
| Advisor’s Report. | 8 |
| New York Tax-Exempt Money Market Fund. | 12 |
| New York Long-Term Tax-Exempt Fund. | 31 |
| About Your Fund’s Expenses. | 77 |
| Glossary. | 79 |
Please note: The opinions expressed in this report are just that—informed opinions. They should not be considered promises or advice. Also, please keep in mind that the information and opinions cover the period through the date on the front of this report. Of course, the risks of investing in your fund are spelled out in the prospectus.
See the Glossary for definitions of investment terms used in this report.
About the cover: Pictured is a sailing block on the Brilliant, a 1932 schooner docked in Mystic, Connecticut. A type of pulley, the sailing block helps coordinate the setting of the sails. At Vanguard, the intricate coordination of technology and people allows us to help millions of clients around the world reach their financial goals.
| Your Fund’s Total Returns | |||||
| Fiscal Year Ended November 30, 2015 | |||||
| Taxable- | |||||
| SEC | Equivalent | Income | Capital | Total | |
| Yield | Yield | Returns | Returns | Returns | |
| Vanguard New York Tax-Exempt Money Market | |||||
| Fund | 0.01% | 0.02% | 0.01% | 0.00% | 0.01% |
| New York Tax-Exempt Money Market Funds | |||||
| Average | 0.00 | ||||
| New York Tax-Exempt Money Market Funds Average: Derived from data provided by Lipper, a Thomson Reuters Company. | |||||
| Vanguard New York Long-Term Tax-Exempt Fund | |||||
| Investor Shares | 2.06% | 3.99% | 3.38% | 0.59% | 3.97% |
| Admiral™ Shares | 2.14 | 4.15 | 3.47 | 0.59 | 4.06 |
| Barclays NY Municipal Bond Index | 3.23 | ||||
| New York Municipal Debt Funds Average | 3.05 | ||||
New York Municipal Debt Funds Average: Derived from data provided by Lipper, a Thomson Reuters Company.
7-day SEC yield for the New York Tax-Exempt Money Market Fund; 30-day SEC yield for the New York Long-Term Tax-Exempt Fund.
The calculation of taxable-equivalent yield assumes a typical itemized tax return and is based on the maximum federal tax rate of 43.4% and the maximum income tax rate for the state. Local taxes were not considered. Please see the prospectus for a detailed explanation of the calculation.
Admiral Shares carry lower expenses and are available to investors who meet certain account-balance requirements.
| Your Fund’s Performance at a Glance | ||||
| November 30, 2014, Through November 30, 2015 | ||||
| Distributions Per Share | ||||
| Starting | Ending | |||
| Share | Share | Income | Capital | |
| Price | Price | Dividends | Gains | |
| Vanguard New York Tax-Exempt Money Market | ||||
| Fund | $1.00 | $1.00 | $0.000 | $0.000 |
| Vanguard New York Long-Term Tax-Exempt Fund | ||||
| Investor Shares | $11.77 | $11.84 | $0.390 | $0.000 |
| Admiral Shares | 11.77 | 11.84 | 0.400 | 0.000 |
1

Chairman’s Letter
Dear Shareholder,
The broad U.S. municipal bond market performed relatively well for the 12 months ended November 30, 2015, which, compared with recent fiscal years, was a less turbulent period for munis. Its return of about 3% was more than 2 percentage points above that of taxable bonds.
Vanguard New York Long-Term Tax-Exempt Fund came in a step or two ahead of the broad muni market, returning 3.97% for Investor Shares and 4.06% for Admiral Shares.
Interest income was the main driver of performance, although the fund’s capital return was also positive. Short-term muni yields moved higher amid expectations that the Federal Reserve would soon begin to normalize monetary policy. Intermediate- and long-term muni yields, on the other hand, experienced some ups and downs driven in part by supply-and-demand factors, but they generally finished the fiscal year a little lower than where they had started. (Bond yields and prices move in opposite directions.)
The Long-Term Fund outpaced the 3.23% return of its benchmark index and the 3.05% average return of its peer group.
With bond prices rising overall, the fund’s 30-day SEC yield slid over the period from 2.13% to 2.06% for Investor Shares and from 2.21% to 2.14% for Admiral Shares.
2
Vanguard New York Tax-Exempt Money Market Fund returned 0.01%, constrained by the Fed’s near-zero policy for short-term interest rates. Its average peer return was 0.00%. The fund’s 7-day SEC yield both began and finished the fiscal year at 0.01%.
Please note that the funds are permitted to invest in securities whose income is subject to the alternative minimum tax (AMT). As of November 30, the Long-Term Fund owned no securities that would generate income distributions subject to the AMT, but the Money Market Fund did.
As I’ve discussed previously, we’re making some changes to Vanguard’s lineup of money market funds in response to regulatory changes adopted in 2014 by the Securities and Exchange Commission.
Most notably, we plan to designate the New York Tax-Exempt Money Market Fund as a “retail fund,” along with all our national and state-specific tax-exempt money market funds. This change, which will take place ahead of the October 2016 compliance date, will enable individual investors to continue to access these very liquid, high-quality funds at a stable net asset value of $1 per share.
Bonds managed slight gains as investors waited for the Fed
Bond returns were muted for the 12 months as a whole. Prices rose and fell while investors digested the Fed’s latest statements about when it might begin to raise short-term interest rates. At times, both taxable and tax-exempt bonds benefited from demand for a safe haven.
| Market Barometer | |||
| Average Annual Total Returns | |||
| Periods Ended November 30, 2015 | |||
| One | Three | Five | |
| Year | Years | Years | |
| Bonds | |||
| Barclays U.S. Aggregate Bond Index (Broad taxable | |||
| market) | 0.97% | 1.50% | 3.09% |
| Barclays Municipal Bond Index (Broad tax-exempt market) | 3.10 | 2.49 | 4.79 |
| Citigroup Three-Month U.S. Treasury Bill Index | 0.02 | 0.02 | 0.04 |
| Stocks | |||
| Russell 1000 Index (Large-caps) | 2.53% | 16.10% | 14.32% |
| Russell 2000 Index (Small-caps) | 3.51 | 14.92 | 12.02 |
| Russell 3000 Index (Broad U.S. market) | 2.58 | 16.00 | 14.13 |
| FTSE All-World ex US Index (International) | -6.43 | 3.85 | 3.41 |
| CPI | |||
| Consumer Price Index | 0.50% | 1.02% | 1.64% |
3
The broad U.S. taxable bond market returned 0.97%. Interest income more than offset bond price declines. Although the yield of the 10-year Treasury note ended November at 2.22%, almost unchanged from 2.25% a year earlier, the yields of shorter-term bonds rose, especially in the second half of the period. For example, the 1-year Treasury yield climbed from 0.12% a year ago to 0.48%.
International bond markets (as measured by the Barclays Global Aggregate Index ex USD) returned about –8%, held back by the dollar’s strength against many foreign currencies. Without this currency effect, results were positive.
The Fed’s 0%–0.25% target for short-term rates continued to limit returns for money market funds and savings accounts. (In mid-December, soon after the close of the fund’s reporting period, the Fed raised the target to 0.25%–0.5%.)
The broad U.S. stock market produced modest returns
U.S. stocks traveled a bumpy route on their way to returns that approached 3% for the period. They dropped sharply in August and slid further in September amid fears about the ripple effects of China’s slowing growth, before rebounding strongly in October.
| Expense Ratios | |||
| Your Fund Compared With Its Peer Group | |||
| Investor | Admiral | Peer Group | |
| Shares | Shares | Average | |
| New York Tax-Exempt Money Market Fund | 0.16% | — | 0.13% |
| New York Long-Term Tax-Exempt Fund | 0.20 | 0.12% | 0.99 |
The fund expense ratios shown are from the prospectus dated March 26, 2015, and represent estimated costs for the current fiscal year. For the fiscal year ended November 30, 2015, the funds’ expense ratios were: for the New York Tax-Exempt Money Market Fund, 0.06%; and for the New York Long-Term Tax-Exempt Fund, 0.20% for Investor Shares and 0.12% for Admiral Shares. Peer-group expense ratios are derived from data provided by Lipper, a Thomson Reuters Company, and capture information through year-end 2014. The expense ratio for the New York Tax-Exempt Money Market Fund reflects a temporary reduction in operating expenses (described in Note B of the Notes to Financial Statements). Before the reduction, the expense ratio was 0.16%.
Peer groups: For the New York Tax-Exempt Money Market Fund, New York Tax-Exempt Money Market Funds; for the New York Long-Term Tax-Exempt Fund, New York Municipal Debt Funds. In most, if not all, cases, the expense ratios for funds in the peer groups are based on net operating expenses after reimbursement and/or fee waivers by fund sponsors. In contrast, the Vanguard money market funds’ expense ratios in the table above do not reflect expense reductions.
4
International stocks returned about –6%, also held back by the dollar’s strength. Returns for emerging markets, which were especially affected by the concerns about China, trailed those of developed Pacific and European markets.
Positioning proved to be key to the bond fund’s performance
Nationwide, demand for municipal bonds was solid, not only from individual investors looking for tax-exempt income but also from nontraditional buyers such as banks and insurance companies. Municipals benefited as well from some of the safe-haven demand that helped Treasury bonds amid concerns about Greece and the slower growth in China. In New York, high tax rates for residents, along with an expanding economy and rising state tax revenues, added to muni bonds’ allure. At the same time, supply increased only modestly.
The demand was not felt evenly across the yield curve, however. Investors shied away from short-term bonds given the prospect of a Fed rate increase, preferring the higher yields (and greater risk) of longer-dated and lower-rated bonds.
In that environment, the Long-Term Fund, which primarily holds securities maturing in ten years or more, had an advantage over its benchmark, which spans all maturities. New York munis maturing in less than five years returned roughly 1% on average for the benchmark, for example, while returns for those maturing in ten years or more averaged around 4%.
| Total Returns | |
| Ten Years Ended November 30, 2015 | |
| Average | |
| Annual Return | |
| New York Tax-Exempt Money Market Fund | 0.97% |
| New York Tax-Exempt Money Market Funds Average | 0.80 |
| New York Tax-Exempt Money Market Funds Average: Derived from data provided by Lipper, a Thomson Reuters Company. | |
| New York Long-Term Tax-Exempt Fund Investor Shares | 4.54% |
| Barclays NY Municipal Bond Index | 4.71 |
| New York Municipal Debt Funds Average | 4.01 |
| New York Municipal Debt Funds Average: Derived from data provided by Lipper, a Thomson Reuters Company. | |
The figures shown represent past performance, which is not a guarantee of future results. (Current performance may be lower or higher than the performance data cited. For performance data current to the most recent month-end, visit our website at vanguard.com/performance.) Note, too, that both investment returns and principal value can fluctuate widely, so an investor’s shares, when sold, could be worth more or less than their original cost.
5
Results by credit quality varied less, but the tilt toward lower-quality investment-grade bonds by the fund’s advisor, Vanguard Fixed Income Group, worked in its favor.
The advisor added value by overweighting premium callable bonds, which typically trade at prices that compensate holders for the risk that they might be redeemed before maturity. Switching out individual issues whose valuations had risen for more attractively priced securities helped as well.
For more information about the advisor’s approach and the funds’ positioning during the year, please see the Advisor’s Report that follows this letter.
Credit research and low costs supported results over a decade
Although the most recent fiscal year was relatively calm for the broad municipal bond market, that wasn’t the case over the past decade. A small number of widely publicized bankruptcies took place, including in Detroit. And tax revenues shrank during the Great Recession and its aftermath, further straining already challenged borrowers.
Through it all, the Vanguard New York Tax-Exempt Funds have benefited from the expertise and experience of our team of in-house credit analysts working closely with the portfolio management team to
Credit research: A key part of Vanguard’s investment process
When our funds buy a municipal bond, fund shareholders are lending money to a school district, turnpike authority, hospital, university, or other tax-exempt borrower. We expect those loans to be repaid. That’s why credit research is a pillar of our investment process and why our credit analysts work closely with our portfolio managers and traders.
Our credit team conducts an objective, thorough, and independent analysis of each issuer’s overall creditworthiness. This quantitative and qualitative approach may include testing the sensitivity of projected cash flows, analyzing demographic and economic drivers, negotiating legal covenants, meeting with the issuer’s officials, and, of course, digging into financial statements.
Credit analysts look to identify opportunities or problems among any bonds we own or are considering. Their informed opinions help us understand and manage risk, sidestep troubled issuers, and uncover value.
Our senior municipal credit analysts average more than 23 years of industry experience and more than 10 years at Vanguard. This experience, along with stability in our team structure, helps ensure consistency in credit exposure and risk management across funds with similar objectives.
6
identify and understand the risks and opportunities of the bonds we own or are considering for inclusion. (For more on the credit team, see the insight box on page 6.)
For the ten years ended November 30, 2015, this rigorous approach—and Vanguard’s low costs—helped the Long-Term Fund return 4.54% for Investor Shares and 4.62% for Admiral Shares, well ahead of the 4.01% average return of its peer group but a step behind its benchmark. The Money Market Fund (+0.97%) also did better than its peer group (+0.80%).
A final note about a key member of our municipal bond fund management team: Pamela Wisehaupt Tynan, who joined Vanguard in 1982 and has been a longtime muni bond fund manager with us, has announced her retirement effective at the end of February 2016. We are grateful for her dedication in successfully managing a number of our funds for more than two decades. Pam also developed a deep and talented team of portfolio managers and traders to oversee Vanguard’s tax-exempt money market funds. I know that our short-term muni bond team is in good hands, as we’ve appointed Justin Schwartz to succeed Pam. Justin joined Vanguard in 2004 and has worked closely with Pam since 2005.
A dose of discipline is crucial when markets become volatile
The developments over the past few months remind us that nobody can control the direction of the markets or reliably predict where they’ll go in the short term. However, investors can control how they react to unstable and turbulent markets.
During periods of market adversity, it’s more important than ever to keep sight of one of Vanguard’s key principles: Maintain perspective and long-term discipline. Whether you’re investing for yourself or on behalf of clients, your success is affected greatly by how you respond—or don’t respond—during turbulent markets. (You can read Vanguard’s Principles for Investing Success at vanguard.com/research.)
As I’ve written in the past, the best course for long-term investors is generally to ignore daily market moves and not make decisions based on emotion. This is also a good time to evaluate your portfolio and make sure your asset allocation is aligned with your time horizon, goals, and risk tolerance.
The markets are unpredictable and often confounding. Keeping your long-term plans clearly in focus can help you weather these periodic storms.
As always, thank you for investing with Vanguard.
Sincerely,
F. William McNabb III
Chairman and Chief Executive Officer
January 7, 2016
7
Advisor’s Report
For the fiscal year ended November 30, 2015, Vanguard New York Long-Term Tax-Exempt Fund posted a return of 3.97% for Investor Shares and 4.06% for Admiral Shares. Those performances were ahead of the 3.23% return for the benchmark, the Barclays New York Municipal Bond Index. They were also better than the average return of 3.05% for peer-group funds. Vanguard New York Tax-Exempt Money Market Fund returned 0.01%; the average for its peer funds was 0.00%.
The investment environment
The fiscal year began soon after the Federal Reserve wrapped up its multiyear stimulative bond-buying program. Attention turned to when the Fed would begin to raise rates, a question that preoccupied investors globally, in both the bond and the stock markets, throughout the period.
The Fed made clear that the timing of its first rate increase in almost a decade would depend on the overall health of the economy and on the picture for employment and inflation in particular. Those data points generally moved in the right direction. GDP growth almost ground to a halt in the first calendar quarter of 2015, in part because of a harsh winter and a West Coast port strike, but it recovered in the second and third quarters. Job growth was generally strong. The national unemployment rate fell over the fiscal year from 5.8% to 5.0%—a level not seen since April 2008. And inflation, although under pressure from falling energy and import prices, was expected to move in the medium term toward the Fed’s 2% target.
| Yields of Tax-Exempt Municipal Securities | ||
| (AAA-Rated General-Obligation Issues) | ||
| November 30, | November 30, | |
| Maturity | 2014 | 2015 |
| 2 years | 0.38% | 0.72% |
| 5 years | 1.15 | 1.26 |
| 10 years | 2.08 | 2.02 |
| 30 years | 3.01 | 2.96 |
| Source: Vanguard. |
8
But growth outside the United States was spotty. The Greek debt crisis weighed on prospects for the euro zone for a substantial part of the fiscal year, and concerns about Chinese policymakers’ ability to engineer a soft landing for their country’s economy rattled global markets in the summer.
International concerns may have contributed to the Fed’s decision to hold off raising rates during the period covered in this report. (In mid-December, just after the close of the period, the Fed did raise the federal funds target rate, from 0%–0.25% to 0.25%–0.5%.) Short-term U.S. Treasury rates nevertheless moved higher over the 12 months in anticipation of Fed action, while longer-term Treasury rates dipped a bit. The New York municipal yield curve also flattened.
New York’s economy grew slightly faster than that of the United States as a whole, according to a gauge of current economic conditions published monthly by the Federal Reserve Bank of Philadelphia. The bank’s index for the Empire State climbed by a little more than 3% from November 2014 through October 2015, while the increase in the index at the national level was a little less than 3%. (Each state’s index incorporates data on nonfarm payroll employment, the jobless rate, average hours worked in manufacturing, and inflation-adjusted wage and salary payments.)
New York State finances benefited from a continued rise in tax revenues as well as windfalls from bank and insurance company settlements. Borrowing also went up, but at a more modest pace than municipal bond issuance nationwide.
On the demand side, investors still looking for yield helped longer-dated and lower-rated bonds outperform.
Management of the funds
At Vanguard, we strive to add value through a diversified mix of strategies—primarily, duration and yield-curve positioning, credit-quality decisions, and security selection. We don’t try to hit home runs, preferring to consistently hit singles and doubles. Risk management is key in our investment processes. And we collaborate closely with Vanguard’s experienced team of credit analysts. They perform an objective, thorough, and independent analysis of the overall creditworthiness of every issuer whose bonds we own or are considering buying.
We made no significant shifts during the period in the Long-Term Fund’s portfolio strategy or positioning. In a relatively range-bound environment for bond yields and credit spreads, we believed that picking up additional yield would be a source of outperformance. To do this, we started and ended with a tilt toward lower-quality and longer-dated bonds compared with the benchmark’s credit and maturity profiles. This strategy, which served us well, was part of our defensive posture while awaiting the Fed’s first move, as longer-dated bond yields are influenced more by inflation expectations than by short-term borrowing costs.
9
We added value by holding premium callable bonds. Because these bonds may be redeemed before maturity, exposing investors to reinvestment risk, they offer attractive yields and favorable total return potential across many interest rate scenarios.
We were also highly selective among general obligation bonds, instead favoring revenue bonds that have more identifiable cash-flow streams to service the debt.
For the Money Market Fund, the low interest rate environment remained challenging but not unfamiliar. We continued to look for opportunities to support returns through risk management, security selection, and credit analysis.
A look ahead
Although the U.S. economy’s growth rate slowed in the third calendar quarter, we believe it is on track to average about 2.5% or a bit higher in 2016. Inflation should remain tempered by oil prices, which seem to have settled into a range far below their summer 2014 peak.
The monetary-tightening cycle that the Fed has just initiated is likely to be slow and gradual. Moreover, it may well end at a level below the historical average, given the moderate pace of economic growth in the United States, the fragile pace of growth abroad, and the modest outlook for inflation. These expectations are already largely built into bond market prices.
On the money market front, the coming year is likely to be interesting given the expectation of rising interest rates and the anticipated shifting of assets before the October 2016 date for complying with new Securities and Exchange Commission rules. As previously mentioned, we plan to designate the New York Tax-Exempt Money Market Fund as a retail fund, along with all our national and state-specific tax-exempt money market funds—giving investors continued access to stable-value offerings.
Apart from Fed policy, interest rates are likely to remain range-bound. We expect their floor to be set, at least in part, by the strength of the U.S. economy. The cap will be determined by global conditions, including the relative strength of the dollar, slower growth overseas, and foreign central bank policies—which have driven down bond yields abroad.
As rates fell in recent years, we captured many opportunities for price appreciation. We don’t see much scope for credit spreads to tighten significantly, nor do we expect them to widen back out. Given the macroeconomic environment and current valuations for muni and taxable bonds, we expect to keep seeking to add value through a combination of duration and maturity positioning, credit-quality calls, and security selection.
10
Because market volatility may increase as interest rates move higher, we will continue to hold above-average levels of liquidity that will give us the “dry powder” to take advantage of any pricing dislocations that may arise.
And, as always, our experienced team of portfolio managers, traders, and credit analysts will seek out opportunities to add to the funds’ performance, whatever the markets may bring.
Christopher W. Alwine, CFA, Principal, Head of Municipal Bond Funds Pamela Wisehaupt Tynan, Principal, Head of Municipal Money Market Funds Mathew M. Kiselak, Principal, Portfolio Manager Adam M. Ferguson, CFA, Portfolio Manager Justin A. Schwartz, CFA, Portfolio Manager Vanguard Fixed Income Group December 18, 2015
11
New York Tax-Exempt Money Market Fund
| Fund Profile | |
| As of November 30, 2015 | |
| Financial Attributes | |
| Ticker Symbol | VYFXX |
| Expense Ratio1 | 0.16% |
| 7-Day SEC Yield | 0.01% |
| Average Weighted | |
| Maturity | 37 days |
| Distribution by Credit Quality (% of portfolio) | |
| First Tier | 100.0% |
A First Tier security is one that is eligible for money market funds and has been rated in the highest short-term rating category for debt obligations by nationally recognized statistical rating organizations. Credit-quality ratings are obtained from Moody's, Fitch, and S&P. For securities rated by all three agencies, where two of them are in agreement and assign the highest rating category, the highest rating applies. If a security is only rated by two agencies, and their ratings are in different categories, the lower of the ratings applies. An unrated security is First Tier if it represents quality comparable to that of a rated security, as determined in accordance with SEC Rule 2a-7. For more information about these ratings, see the Glossary entry for Credit Quality.
1 The expense ratio shown is from the prospectus dated March 26, 2015, and represents estimated costs for the current fiscal year. For the fiscal year ended November 30, 2015, the expense ratio was 0.06%, reflecting a temporary reduction in operating expenses (described in Note B of the Notes to Financial Statements). Before this reduction, the expense ratio was 0.16%.
12
New York Tax-Exempt Money Market Fund
Performance Summary
Investment returns will fluctuate. All of the returns in this report represent past performance, which is not a guarantee of future results that may be achieved by the fund. (Current performance may be lower or higher than the performance data cited. For performance data current to the most recent month-end, visit our website at vanguard.com/performance.) The returns shown do not reflect taxes that a shareholder would pay on fund distributions. An investment in a money market fund is not insured or guaranteed by the Federal Deposit Insurance Corporation or any other government agency. Although the fund seeks to preserve the value of your investment at $1 per share, it is possible to lose money by investing in the fund. The fund’s 7-day SEC yield reflects its current earnings more closely than do the average annual returns.
Cumulative Performance: November 30, 2005, Through November 30, 2015
Initial Investment of $10,000
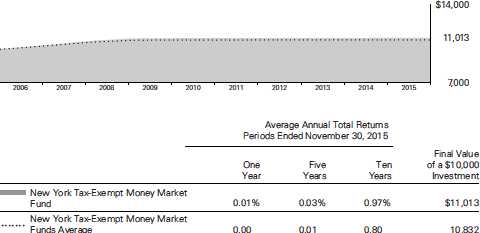
New York Tax-Exempt Money Market Funds Average: Derived from data provided by Lipper, a Thomson Reuters Company.
See Financial Highlights for dividend information.
13
| New York Tax-Exempt Money Market Fund | ||
| Fiscal-Year Total Returns (%): November 30, 2005, Through November 30, 2015 | ||
| NY Tax-Exempt | ||
| Money Mkt | ||
| Funds Avg | ||
| Fiscal Year | Total Returns | Total Returns |
| 2006 | 3.28% | 2.81% |
| 2007 | 3.60 | 3.12 |
| 2008 | 2.32 | 1.88 |
| 2009 | 0.36 | 0.24 |
| 2010 | 0.10 | 0.01 |
| 2011 | 0.06 | 0.04 |
| 2012 | 0.03 | 0.00 |
| 2013 | 0.01 | 0.00 |
| 2014 | 0.01 | 0.00 |
| 2015 | 0.01 | 0.00 |
| 7-day SEC yield (11/30/2015): 0.01% | ||
| New York Tax-Exempt Money Market Funds Average: Derived from data provided by Lipper, a Thomson Reuters Company. | ||
Average Annual Total Returns: Periods Ended September 30, 2015
This table presents returns through the latest calendar quarter—rather than through the end of the fiscal period.
Securities and Exchange Commission rules require that we provide this information.
| Inception | One | Five | Ten | |
| Date | Year | Years | Years | |
| New York Tax-Exempt Money | ||||
| Market Fund | 9/3/1997 | 0.01% | 0.03% | 1.01% |
14
New York Tax-Exempt Money Market Fund
Financial Statements
Statement of Net Assets
As of November 30, 2015
The fund reports a complete list of its holdings in various monthly and quarterly regulatory filings. The fund publishes its holdings on a monthly basis at vanguard.com and files them with the Securities and Exchange Commission on Form N-MFP. The fund’s Form N-MFP filings become public 60 days after the relevant month-end, and may be viewed at sec.gov or via a link on the “Portfolio Holdings” page on vanguard.com. For the second and fourth fiscal quarters, the lists appear in the fund’s semiannual and annual reports to shareholders. For the first and third fiscal quarters, the fund files the lists with the SEC on Form N-Q. Shareholders can look up the fund’s Forms N-Q on the SEC’s website at sec.gov. Forms N-Q may also be reviewed and copied at the SEC’s Public Reference Room (see the back cover of this report for further information).
| Face | Market | |||
| Maturity | Amount | Value | ||
| Coupon | Date | ($000) | ($000) | |
| Tax-Exempt Municipal Bonds (100.6%) | ||||
| New York (100.6%) | ||||
| Albany County NY BAN | 2.000% | 5/27/16 | 28,562 | 28,796 |
| Albany NY Industrial Development Agency | ||||
| Civic Facility Revenue (CHF Holland Suites LLC | ||||
| Project) VRDO | 0.010% | 12/7/15 LOC | 9,855 | 9,855 |
| Babylon NY BAN | 2.000% | 7/1/16 | 14,650 | 14,788 |
| Columbia County NY Capital Resource Corp. | ||||
| Civic Facility Revenue (Columbia Memorial | ||||
| Hospital Project) VRDO | 0.020% | 12/7/15 LOC | 3,800 | 3,800 |
| Columbia County NY Industrial Development | ||||
| Agency Civic Facility Revenue | ||||
| (Columbia Memorial HospitalProject) VRDO | 0.020% | 12/7/15 LOC | 4,140 | 4,140 |
| Connetquot NY Central School District TAN | 1.500% | 6/27/16 | 5,000 | 5,035 |
| Delaware Valley NY Industrial Development | ||||
| Authority Revenue (Delaware Valley Hospital) | ||||
| VRDO | 0.020% | 12/7/15 LOC | 3,315 | 3,315 |
| 1 Erie County NY Industrial Development Agency | ||||
| School Facility Revenue (Buffalo City School | ||||
| District Project) TOB VRDO | 0.020% | 12/7/15 | 6,665 | 6,665 |
| Franklin County NY Civic Development Corp. | ||||
| Revenue VRDO | 0.020% | 12/7/15 LOC | 4,300 | 4,300 |
| Geneva NY Industrial Development Agency | ||||
| Civic Facility Revenue (Colleges of the | ||||
| Seneca Project) VRDO | 0.020% | 12/7/15 LOC | 16,715 | 16,715 |
| Half Hollow Hills NY Central School District TAN | 2.000% | 6/28/16 | 20,500 | 20,706 |
| Hauppauge NY Union Free School District TAN | 2.000% | 6/24/16 | 5,000 | 5,049 |
| Irondequoit NY GO | 2.000% | 4/22/16 | 6,500 | 6,540 |
| Lancaster NY Central School District BAN | 2.000% | 6/16/16 | 19,131 | 19,304 |
| Lindenhurst NY Union Free School District TAN | 1.500% | 6/20/16 | 9,750 | 9,816 |
| Long Beach NY City School District RAN | 2.000% | 6/30/16 | 7,250 | 7,307 |
| Massapequa NY Union Free School District BAN | 2.000% | 7/22/16 | 6,000 | 6,058 |
| Middle Country NY Central School District TAN | 1.500% | 6/27/16 | 7,250 | 7,299 |
| Middletown NY City School District BAN | 2.000% | 6/29/16 | 23,980 | 24,191 |
| Monroe County NY Industrial Development | ||||
| Agency Civic Facility Revenue (Nazareth College) | ||||
| VRDO | 0.010% | 12/7/15 LOC | 5,660 | 5,660 |
15
New York Tax-Exempt Money Market Fund
| Face | Market | |||
| Maturity | Amount | Value | ||
| Coupon | Date | ($000) | ($000) | |
| Nassau County NY Industrial Development | ||||
| Agency Civic Facility Revenue (Cold Spring | ||||
| Harbor Laboratory) VRDO | 0.010% | 12/1/15 | 7,450 | 7,450 |
| Nassau County NY Interim Finance Authority | ||||
| Sales Tax Revenue VRDO | 0.010% | 12/7/15 | 11,200 | 11,200 |
| Nassau County NY Interim Finance Authority | ||||
| Sales Tax Revenue VRDO | 0.010% | 12/7/15 | 30,175 | 30,175 |
| New York City NY Build NYC Resource Corp. | ||||
| Revenue (Asia Society Project) VRDO | 0.010% | 12/7/15 LOC | 6,000 | 6,000 |
| New York City NY GO | 2.000% | 3/1/16 | 14,975 | 15,040 |
| New York City NY GO | 5.000% | 4/1/16 (Prere.) | 3,000 | 3,047 |
| 1 New York City NY GO TOB VRDO | 0.010% | 12/7/15 | 10,095 | 10,095 |
| New York City NY GO VRDO | 0.010% | 12/1/15 LOC | 14,230 | 14,230 |
| New York City NY GO VRDO | 0.010% | 12/1/15 | 3,000 | 3,000 |
| New York City NY GO VRDO | 0.010% | 12/1/15 | 5,100 | 5,100 |
| New York City NY GO VRDO | 0.010% | 12/1/15 LOC | 8,050 | 8,050 |
| New York City NY GO VRDO | 0.010% | 12/1/15 LOC | 2,725 | 2,725 |
| New York City NY GO VRDO | 0.010% | 12/7/15 | 4,500 | 4,500 |
| New York City NY Health & Hospital Corp. | ||||
| Revenue (Health System) VRDO | 0.010% | 12/7/15 LOC | 6,400 | 6,400 |
| New York City NY Housing Development Corp. | ||||
| Multi-Family Housing Revenue (201 Pearl Street) | ||||
| VRDO | 0.010% | 12/7/15 LOC | 5,000 | 5,000 |
| 1 New York City NY Housing Development Corp. | ||||
| Multi-Family Housing Revenue TOB VRDO | 0.040% | 12/7/15 | 6,665 | 6,665 |
| 1 New York City NY Housing Development Corp. | ||||
| Multi-Family Housing Revenue TOB VRDO | 0.040% | 12/7/15 | 11,730 | 11,730 |
| 1 New York City NY Housing Development Corp. | ||||
| Multi-Family Housing Revenue TOB VRDO | 0.060% | 12/7/15 | 6,730 | 6,730 |
| New York City NY Housing Development Corp. | ||||
| Multi-Family Housing Revenue VRDO | 0.020% | 12/7/15 | 6,000 | 6,000 |
| New York City NY Housing Development Corp. | ||||
| Multi-Family Mortgage Revenue | ||||
| (89 Murray Street Development) VRDO | 0.020% | 12/7/15 LOC | 15,800 | 15,800 |
| New York City NY Housing Development Corp. | ||||
| Multi-Family Mortgage Revenue | ||||
| (First Avenue Development) VRDO | 0.020% | 12/7/15 LOC | 10,000 | 10,000 |
| New York City NY Housing Development Corp. | ||||
| Multi-Family Mortgage Revenue | ||||
| (Markham Gardens Apartments) VRDO | 0.020% | 12/7/15 LOC | 6,800 | 6,800 |
| New York City NY Housing Development Corp. | ||||
| Multi-Family Rental Housing Revenue | ||||
| (100 Jane Street) VRDO | 0.020% | 12/7/15 LOC | 15,250 | 15,250 |
| New York City NY Housing Development Corp. | ||||
| Multi-Family Rental Housing Revenue | ||||
| (1133 Manhattan Avenue) VRDO | 0.010% | 12/7/15 LOC | 16,670 | 16,670 |
| New York City NY Housing Development Corp. | ||||
| Multi-Family Rental Housing Revenue | ||||
| (2 Gold Street) VRDO | 0.010% | 12/7/15 | 6,000 | 6,000 |
| New York City NY Housing Development Corp. | ||||
| Multi-Family Rental Housing Revenue | ||||
| (90 West Street) VRDO | 0.010% | 12/7/15 LOC | 5,870 | 5,870 |
16
| New York Tax-Exempt Money Market Fund | ||||
| Face | Market | |||
| Maturity | Amount | Value | ||
| Coupon | Date | ($000) | ($000) | |
| New York City NY Housing Development Corp. | ||||
| Multi-Family Rental Housing Revenue | ||||
| (Atlantic Court Apartments) VRDO | 0.020% | 12/7/15 LOC | 23,100 | 23,100 |
| New York City NY Housing Development Corp. | ||||
| Multi-Family Rental Housing Revenue | ||||
| (Ocean Gate Development) VRDO | 0.010% | 12/7/15 LOC | 8,445 | 8,445 |
| New York City NY Housing Development Corp. | ||||
| Multi-Family Rental Housing Revenue | ||||
| (One Columbus Place Development) VRDO | 0.020% | 12/7/15 LOC | 22,000 | 22,000 |
| New York City NY Housing Development Corp. | ||||
| Multi-Family Rental Housing Revenue | ||||
| (Rivereast Apartments) VRDO | 0.020% | 12/7/15 LOC | 20,000 | 20,000 |
| New York City NY Housing Finance Agency | ||||
| Revenue (900 Eighth Avenue) VRDO | 0.010% | 12/7/15 LOC | 25,000 | 25,000 |
| New York City NY Industrial Development Agency | ||||
| Civic Facility Revenue (Mercy College Project) | ||||
| VRDO | 0.020% | 12/7/15 LOC | 9,980 | 9,980 |
| New York City NY Industrial Development Agency | ||||
| Civic Facility Revenue (New York Congregational | ||||
| Nursing Center Project) VRDO | 0.010% | 12/7/15 LOC | 8,020 | 8,020 |
| New York City NY Industrial Development Agency | ||||
| Civic Facility Revenue (New York Law School) | ||||
| VRDO | 0.010% | 12/7/15 LOC | 13,620 | 13,620 |
| 1 New York City NY Municipal Water Finance | ||||
| Authority Water & Sewer System Revenue | ||||
| TOB VRDO | 0.010% | 12/7/15 | 10,000 | 10,000 |
| New York City NY Municipal Water Finance | ||||
| Authority Water & Sewer System Revenue | ||||
| VRDO | 0.010% | 12/1/15 | 3,750 | 3,750 |
| New York City NY Municipal Water Finance | ||||
| Authority Water & Sewer System Revenue | ||||
| VRDO | 0.010% | 12/1/15 | 3,145 | 3,145 |
| New York City NY Municipal Water Finance | ||||
| Authority Water & Sewer System Revenue | ||||
| VRDO | 0.010% | 12/1/15 | 6,900 | 6,900 |
| New York City NY Municipal Water Finance | ||||
| Authority Water & Sewer System Revenue | ||||
| VRDO | 0.010% | 12/1/15 | 3,700 | 3,700 |
| New York City NY Municipal Water Finance | ||||
| Authority Water & Sewer System Revenue | ||||
| VRDO | 0.010% | 12/1/15 | 5,080 | 5,080 |
| New York City NY Municipal Water Finance | ||||
| Authority Water & Sewer System Revenue | ||||
| VRDO | 0.010% | 12/1/15 | 20,900 | 20,900 |
| New York City NY Municipal Water Finance | ||||
| Authority Water & Sewer System Revenue | ||||
| VRDO | 0.010% | 12/1/15 | 900 | 900 |
| New York City NY Municipal Water Finance | ||||
| Authority Water & Sewer System Revenue | ||||
| VRDO | 0.010% | 12/1/15 | 7,125 | 7,125 |
| New York City NY Municipal Water Finance | ||||
| Authority Water & Sewer System Revenue | ||||
| VRDO | 0.010% | 12/7/15 | 5,000 | 5,000 |
17
| New York Tax-Exempt Money Market Fund | ||||
| Face | Market | |||
| Maturity | Amount | Value | ||
| Coupon | Date | ($000) | ($000) | |
| New York City NY Municipal Water Finance | ||||
| Authority Water & Sewer System Revenue | ||||
| VRDO | 0.010% | 12/3/15 | 2,500 | 2,500 |
| 1 New York City NY Sales Tax Asset | ||||
| Receivable Corp. Revenue TOB VRDO | 0.020% | 12/7/15 | 3,140 | 3,140 |
| 1 New York City NY Sales Tax Asset | ||||
| Receivable Corp. Revenue TOB VRDO | 0.020% | 12/7/15 | 3,335 | 3,335 |
| 1 New York City NY Sales Tax Asset | ||||
| Receivable Corp. Revenue TOB VRDO | 0.020% | 12/7/15 | 5,250 | 5,250 |
| 1 New York City NY Transitional Finance Authority | ||||
| Building Aid Revenue TOB VRDO | 0.010% | 12/7/15 | 15,210 | 15,210 |
| 1 New York City NY Transitional Finance Authority | ||||
| Building Aid Revenue TOB VRDO | 0.020% | 12/7/15 | 3,000 | 3,000 |
| 1 New York City NY Transitional Finance Authority | ||||
| Future Tax Revenue TOB VRDO | 0.010% | 12/7/15 | 6,300 | 6,300 |
| 1 New York City NY Transitional Finance Authority | ||||
| Future Tax Revenue TOB VRDO | 0.020% | 12/7/15 | 2,890 | 2,890 |
| 1 New York City NY Transitional Finance Authority | ||||
| Future Tax Revenue TOB VRDO | 0.020% | 12/7/15 | 6,000 | 6,000 |
| 1 New York City NY Transitional Finance Authority | ||||
| Future Tax Revenue TOB VRDO | 0.020% | 12/7/15 | 3,000 | 3,000 |
| 1 New York City NY Transitional Finance Authority | ||||
| Future Tax Revenue TOB VRDO | 0.020% | 12/7/15 | 5,000 | 5,000 |
| 1 New York City NY Transitional Finance Authority | ||||
| Future Tax Revenue TOB VRDO | 0.020% | 12/7/15 | 5,000 | 5,000 |
| New York City NY Transitional Finance Authority | ||||
| Future Tax Revenue VRDO | 0.010% | 12/1/15 | 7,900 | 7,900 |
| New York City NY Transitional Finance Authority | ||||
| Future Tax Revenue VRDO | 0.010% | 12/1/15 | 11,000 | 11,000 |
| New York City NY Transitional Finance Authority | ||||
| Future Tax Revenue VRDO | 0.010% | 12/7/15 | 2,200 | 2,200 |
| New York City NY Transitional Finance Authority | ||||
| Recovery Revenue VRDO | 0.010% | 12/1/15 | 1,500 | 1,500 |
| New York City NY Transitional Finance Authority | ||||
| Recovery Revenue VRDO | 0.010% | 12/1/15 | 1,900 | 1,900 |
| New York City NY Transitional Finance Authority | ||||
| Recovery Revenue VRDO | 0.010% | 12/7/15 | 10,965 | 10,965 |
| 2 New York City NY Trust for Cultural Resources | ||||
| Revenue (American Museum of Natural History) | ||||
| PUT | 0.020% | 2/26/16 | 16,500 | 16,500 |
| 2 New York City NY Trust for Cultural Resources | ||||
| Revenue (American Museum of Natural History) | ||||
| PUT | 0.020% | 6/10/16 | 15,000 | 15,000 |
| New York City NY Trust for Cultural Resources | ||||
| Revenue (School of American Ballet Inc.) VRDO | 0.010% | 12/7/15 LOC | 7,900 | 7,900 |
| New York City NY Trust for Cultural Resources | ||||
| Revenue (The Metropolitan Museum of Art) | ||||
| VRDO | 0.010% | 12/7/15 | 32,100 | 32,100 |
| New York City NY Trust for Cultural Resources | ||||
| Revenue (The Metropolitan Museum of Art) | ||||
| VRDO | 0.010% | 12/7/15 | 48,960 | 48,960 |
| 1 New York Convention Center Development Corp. | ||||
| Revenue TOB VRDO | 0.020% | 12/7/15 | 10,400 | 10,400 |
18
New York Tax-Exempt Money Market Fund
| Face | Market | |||
| Maturity | Amount | Value | ||
| Coupon | Date | ($000) | ($000) | |
| New York Liberty Development Corp. Revenue | ||||
| (Greenwich LLC) VRDO | 0.010% | 12/7/15 LOC | 20,000 | 20,000 |
| New York Metropolitan Transportation Authority | ||||
| Revenue | 0.500% | 3/1/16 | 20,000 | 20,006 |
| New York Metropolitan Transportation Authority | ||||
| Revenue (Dedicated Tax Fund) VRDO | 0.010% | 12/1/15 LOC | 22,970 | 22,970 |
| New York Metropolitan Transportation Authority | ||||
| Revenue (Dedicated Tax Fund) VRDO | 0.010% | 12/7/15 LOC | 4,800 | 4,800 |
| 1 New York Metropolitan Transportation Authority | ||||
| Revenue (Service Contract) TOB VRDO | 0.020% | 12/7/15 | 4,500 | 4,500 |
| 1 New York Metropolitan Transportation Authority | ||||
| Revenue TOB VRDO | 0.020% | 12/7/15 (13)(4) | 11,000 | 11,000 |
| New York Metropolitan Transportation Authority | ||||
| Revenue VRDO | 0.010% | 12/7/15 LOC | 6,000 | 6,000 |
| New York Metropolitan Transportation Authority | ||||
| Revenue VRDO | 0.010% | 12/7/15 LOC | 9,800 | 9,800 |
| New York Metropolitan Transportation Authority | ||||
| Revenue VRDO | 0.010% | 12/7/15 LOC | 3,275 | 3,275 |
| New York Metropolitan Transportation Authority | ||||
| Revenue VRDO | 0.010% | 12/7/15 LOC | 10,000 | 10,000 |
| New York Municipal Bond Bank Agency | ||||
| Special School Purpose Revenue | 4.000% | 12/1/15 | 8,790 | 8,790 |
| New York State Dormitory Authority Revenue | ||||
| (Blythedale Children’s Hospital) VRDO | 0.010% | 12/7/15 LOC | 8,900 | 8,900 |
| New York State Dormitory Authority Revenue | ||||
| (Catholic Health System Obligated Group) VRDO | 0.020% | 12/7/15 LOC | 2,270 | 2,270 |
| New York State Dormitory Authority Revenue | ||||
| (Catholic Health System Obligated Group) VRDO | 0.020% | 12/7/15 LOC | 3,075 | 3,075 |
| New York State Dormitory Authority Revenue | ||||
| (Catholic Health System Obligated Group) VRDO | 0.020% | 12/7/15 LOC | 11,500 | 11,500 |
| New York State Dormitory Authority Revenue | ||||
| (Catholic Health System Obligated Group) VRDO | 0.020% | 12/7/15 LOC | 5,295 | 5,295 |
| New York State Dormitory Authority Revenue | ||||
| (City University of New York) | 5.000% | 7/1/16 | 395 | 396 |
| New York State Dormitory Authority Revenue | ||||
| (Columbia University) | 5.000% | 7/1/16 | 1,090 | 1,119 |
| New York State Dormitory Authority Revenue | ||||
| (Columbia University) VRDO | 0.010% | 12/7/15 | 43,400 | 43,400 |
| New York State Dormitory Authority Revenue | ||||
| (Cornell University) CP | 0.070% | 1/25/16 | 6,000 | 6,000 |
| New York State Dormitory Authority Revenue | ||||
| (Cornell University) CP | 0.060% | 2/3/16 | 5,000 | 5,000 |
| 1 New York State Dormitory Authority Revenue | ||||
| (Cornell University) TOB VRDO | 0.030% | 12/7/15 | 12,700 | 12,700 |
| New York State Dormitory Authority Revenue | ||||
| (Cornell University) VRDO | 0.010% | 12/7/15 | 17,605 | 17,605 |
| New York State Dormitory Authority Revenue | ||||
| (Cornell University) VRDO | 0.010% | 12/7/15 | 10,695 | 10,695 |
| 1 New York State Dormitory Authority Revenue | ||||
| (Fordham University) TOB VRDO | 0.020% | 12/7/15 (13) | 5,000 | 5,000 |
| New York State Dormitory Authority Revenue | ||||
| (Le Moyne College) VRDO | 0.010% | 12/7/15 LOC | 3,965 | 3,965 |
19
| New York Tax-Exempt Money Market Fund | ||||
| Face | Market | |||
| Maturity | Amount | Value | ||
| Coupon | Date | ($000) | ($000) | |
| 1 New York State Dormitory Authority Revenue | ||||
| (Memorial Sloan-Kettering Cancer Center) | ||||
| TOB VRDO | 0.020% | 12/7/15 | 7,860 | 7,860 |
| New York State Dormitory Authority Revenue | ||||
| (Mental Health Services Facilities Improvement) | 5.000% | 2/15/16 | 1,435 | 1,449 |
| New York State Dormitory Authority Revenue | ||||
| (Mental Health Services Facilities Improvement) | 5.000% | 2/15/16 | 1,000 | 1,010 |
| New York State Dormitory Authority Revenue | ||||
| (Mental Health Services Facilities Improvement) | ||||
| VRDO | 0.010% | 12/7/15 LOC | 1,935 | 1,935 |
| New York State Dormitory Authority Revenue | ||||
| (Mental Health Services Facilities Improvement) | ||||
| VRDO | 0.010% | 12/7/15 LOC | 60,715 | 60,715 |
| New York State Dormitory Authority Revenue | ||||
| (New York Law School) VRDO | 0.010% | 12/7/15 LOC | 6,700 | 6,700 |
| New York State Dormitory Authority Revenue | ||||
| (Personal Income Tax) | 5.000% | 2/15/16 | 1,385 | 1,399 |
| 1 New York State Dormitory Authority Revenue | ||||
| (Personal Income Tax) TOB VRDO | 0.020% | 12/7/15 | 6,000 | 6,000 |
| 1 New York State Dormitory Authority Revenue | ||||
| (Personal Income Tax) TOB VRDO | 0.020% | 12/7/15 | 4,000 | 4,000 |
| 1 New York State Dormitory Authority Revenue | ||||
| (Personal Income Tax) TOB VRDO | 0.020% | 12/7/15 | 11,000 | 11,000 |
| 1 New York State Dormitory Authority Revenue | ||||
| (Personal Income Tax) TOB VRDO | 0.020% | 12/7/15 | 5,000 | 5,000 |
| 1 New York State Dormitory Authority Revenue | ||||
| (Personal Income Tax) TOB VRDO | 0.020% | 12/7/15 | 8,330 | 8,330 |
| New York State Dormitory Authority Revenue | ||||
| (Rockefeller University) VRDO | 0.010% | 12/7/15 | 6,300 | 6,300 |
| New York State Dormitory Authority Revenue | ||||
| (Rockefeller University) VRDO | 0.010% | 12/7/15 | 43,100 | 43,100 |
| New York State Dormitory Authority Revenue | ||||
| (Royal Charter Properties) VRDO | 0.010% | 12/7/15 LOC | 13,500 | 13,500 |
| New York State Dormitory Authority Revenue | ||||
| (St. John’s University) VRDO | 0.010% | 12/7/15 LOC | 29,195 | 29,195 |
| 1 New York State Dormitory Authority Revenue | ||||
| (Vassar College) TOB VRDO | 0.010% | 12/7/15 | 4,815 | 4,815 |
| New York State Dormitory Authority | ||||
| Sales Tax Revenue | 3.000% | 3/15/16 | 7,515 | 7,576 |
| 1 New York State Dormitory Authority | ||||
| Sales Tax Revenue TOB VRDO | 0.010% | 12/7/15 | 11,580 | 11,580 |
| 1 New York State Dormitory Authority | ||||
| Sales Tax Revenue TOB VRDO | 0.020% | 12/7/15 | 3,365 | 3,365 |
| New York State Environmental Facilities Corp. | ||||
| Revenue (Personal Income Tax) | 5.000% | 12/15/15 | 1,000 | 1,002 |
| New York State Environmental Facilities Corp. | ||||
| Revenue (State Clean Water & Drinking Water | ||||
| Revolving Funds) | 2.000% | 6/15/16 | 3,875 | 3,911 |
| 1 New York State Environmental Facilities Corp. | ||||
| Revenue (State Clean Water & Drinking Water | ||||
| Revolving Funds) TOB VRDO | 0.020% | 12/7/15 | 3,645 | 3,645 |
| New York State Environmental Facilities Corp. | ||||
| Revenue (State Revolving Funds) | 5.000% | 3/15/16 | 6,423 | 6,512 |
| New York State GO | 5.000% | 4/15/16 | 7,675 | 7,812 |
20
| New York Tax-Exempt Money Market Fund | ||||
| Face | Market | |||
| Maturity | Amount | Value | ||
| Coupon | Date | ($000) | ($000) | |
| New York State GO | 5.000% | 4/15/16 | 37,975 | 38,653 |
| New York State Housing Finance Agency | ||||
| Housing Revenue (20 River Terrace Housing) | ||||
| VRDO | 0.010% | 12/7/15 LOC | 4,300 | 4,300 |
| New York State Housing Finance Agency | ||||
| Housing Revenue (316 11th Avenue) VRDO | 0.010% | 12/7/15 LOC | 10,000 | 10,000 |
| New York State Housing Finance Agency | ||||
| Housing Revenue (625 W 57th St) VRDO | 0.010% | 12/7/15 LOC | 6,250 | 6,250 |
| New York State Housing Finance Agency | ||||
| Housing Revenue (855 6th Avenue) VRDO | 0.010% | 12/7/15 LOC | 7,500 | 7,500 |
| New York State Housing Finance Agency | ||||
| Housing Revenue (855 6th Avenue) VRDO | 0.010% | 12/7/15 LOC | 3,500 | 3,500 |
| New York State Housing Finance Agency | ||||
| Housing Revenue (Avalon Bowery Place I) VRDO | 0.010% | 12/7/15 LOC | 7,700 | 7,700 |
| New York State Housing Finance Agency | ||||
| Housing Revenue (College Arms Apartments) | ||||
| VRDO | 0.010% | 12/7/15 | 10,390 | 10,390 |
| New York State Housing Finance Agency | ||||
| Housing Revenue (East 84th Street) VRDO | 0.020% | 12/7/15 LOC | 20,800 | 20,800 |
| New York State Housing Finance Agency | ||||
| Housing Revenue (McCarthy Manor Apartments) | ||||
| VRDO | 0.010% | 12/7/15 LOC | 6,800 | 6,800 |
| New York State Housing Finance Agency | ||||
| Housing Revenue (Riverside Center 2) VRDO | 0.010% | 12/7/15 LOC | 5,200 | 5,200 |
| New York State Housing Finance Agency | ||||
| Housing Revenue (Riverside Center 2) VRDO | 0.010% | 12/7/15 LOC | 8,200 | 8,200 |
| New York State Housing Finance Agency | ||||
| Housing Revenue (Saville) VRDO | 0.020% | 12/7/15 LOC | 33,000 | 33,000 |
| New York State Housing Finance Agency | ||||
| Housing Revenue (West 17th Street) VRDO | 0.010% | 12/7/15 LOC | 4,600 | 4,600 |
| New York State Housing Finance Agency Revenue | ||||
| (Clinton Park) VRDO | 0.010% | 12/7/15 LOC | 13,500 | 13,500 |
| New York State Housing Finance Agency Revenue | ||||
| (Dock Street Rental LLC) VRDO | 0.010% | 12/7/15 LOC | 14,800 | 14,800 |
| New York State Housing Finance Agency Revenue | ||||
| (Maestro West Chelsea Housing) VRDO | 0.010% | 12/7/15 LOC | 5,000 | 5,000 |
| New York State Housing Finance Agency Revenue | ||||
| (Riverside Center) VRDO | 0.010% | 12/7/15 LOC | 7,000 | 7,000 |
| New York State Local Government | ||||
| Assistance Corp. Revenue VRDO | 0.010% | 12/7/15 | 17,600 | 17,600 |
| New York State Mortgage Agency | ||||
| Homeowner Mortgage Revenue VRDO | 0.020% | 12/1/15 | 15,440 | 15,440 |
| New York State Mortgage Agency | ||||
| Homeowner Mortgage Revenue VRDO | 0.020% | 12/1/15 | 6,500 | 6,500 |
| New York State Mortgage Agency | ||||
| Homeowner Mortgage Revenue VRDO | 0.020% | 12/1/15 | 4,800 | 4,800 |
| New York State Mortgage Agency | ||||
| Homeowner Mortgage Revenue VRDO | 0.010% | 12/7/15 | 5,000 | 5,000 |
| New York State Mortgage Agency | ||||
| Homeowner Mortgage Revenue VRDO | 0.010% | 12/7/15 | 25,400 | 25,400 |
| New York State Mortgage Agency | ||||
| Homeowner Mortgage Revenue VRDO | 0.020% | 12/7/15 | 11,705 | 11,705 |
| New York State Power Authority Revenue CP | 0.030% | 12/15/15 | 7,298 | 7,298 |
| New York State Power Authority Revenue CP | 0.040% | 12/15/15 | 13,044 | 13,044 |
21
| New York Tax-Exempt Money Market Fund | ||||
| Face | Market | |||
| Maturity | Amount | Value | ||
| Coupon | Date | ($000) | ($000) | |
| New York State Power Authority Revenue CP | 0.040% | 1/4/16 | 3,399 | 3,399 |
| New York State Power Authority Revenue CP | 0.050% | 1/6/16 | 7,500 | 7,500 |
| New York State Power Authority Revenue CP | 0.040% | 1/14/16 | 2,840 | 2,840 |
| New York State Power Authority Revenue PUT | 0.140% | 3/1/16 | 22,600 | 22,600 |
| New York State Thruway Authority Revenue | ||||
| (Highway & Bridge Trust Fund) | 5.000% | 4/1/16 | 2,000 | 2,031 |
| New York State Thruway Authority Revenue | ||||
| (Highway & Bridge Trust Fund) | 5.000% | 4/1/16 | 5,050 | 5,131 |
| New York State Thruway Authority Revenue | ||||
| (Personal Income Tax) | 5.000% | 3/15/16 (Prere.) | 6,000 | 6,083 |
| New York State Thruway Authority Revenue | ||||
| (Personal Income Tax) | 5.000% | 3/15/16 (Prere.) | 3,450 | 3,497 |
| New York State Thruway Authority Revenue | ||||
| (Personal Income Tax) | 5.000% | 3/15/16 | 3,000 | 3,042 |
| New York State Urban Development Corp | ||||
| Revenue (Personal Income Tax) | 5.000% | 3/15/16 | 13,600 | 13,789 |
| New York State Urban Development Corp. | ||||
| Revenue | 5.000% | 12/15/15 (Prere.) | 2,000 | 2,004 |
| New York State Urban Development Corp. | ||||
| Revenue | 5.000% | 1/1/16 | 7,045 | 7,073 |
| New York State Urban Development Corp. | ||||
| Revenue (Personal Income Tax) | 5.000% | 12/15/15 | 2,000 | 2,004 |
| 1 New York State Urban Development Corp. | ||||
| Revenue (Personal Income Tax) TOB VRDO | 0.020% | 12/7/15 | 7,500 | 7,500 |
| 1 New York State Urban Development Corp. | ||||
| Revenue (Personal Income Tax) TOB VRDO | 0.020% | 12/7/15 | 5,850 | 5,850 |
| New York State Urban Development Corp. | ||||
| Revenue (Service Contract) | 5.000% | 1/1/16 | 1,120 | 1,124 |
| New York State Urban Development Corp. | ||||
| Revenue (Service Contract) | 5.000% | 1/1/16 | 5,925 | 5,949 |
| New York State Urban Development Corp. | ||||
| Revenue (Service Contract) VRDO | 0.010% | 12/7/15 LOC | 9,700 | 9,700 |
| New York State Urban Development Corp. | ||||
| Revenue (Service Contract) VRDO | 0.010% | 12/7/15 LOC | 7,100 | 7,100 |
| New York State Urban Development Corp. | ||||
| Revenue (Service Contract) VRDO | 0.010% | 12/7/15 | 14,170 | 14,170 |
| North Hempstead NY BAN | 0.850% | 4/6/16 | 11,462 | 11,486 |
| North Hempstead NY BAN | 0.850% | 4/6/16 | 2,365 | 2,370 |
| 1 Nuveen New York AMT-Free Municipal | ||||
| Income Fund VRDP VRDO | 0.070% | 12/7/15 LOC | 20,000 | 20,000 |
| 1 Nuveen New York AMT-Free Municipal | ||||
| Income Fund VRDP VRDO | 0.070% | 12/7/15 LOC | 31,000 | 31,000 |
| 1 Nuveen New York AMT-Free Municipal | ||||
| Income Fund VRDP VRDO | 0.070% | 12/7/15 LOC | 44,500 | 44,500 |
| 1 Nuveen New York Dividend Advantage | ||||
| Municipal Fund VRDP VRDO | 0.090% | 12/7/15 LOC | 34,500 | 34,500 |
| Onondaga County NY Industrial Development | ||||
| Agency Civic Facility Revenue (Crouse Health | ||||
| Hospital Inc. Project) VRDO | 0.020% | 12/7/15 LOC | 4,470 | 4,470 |
| Onondaga County NY Industrial Development | ||||
| Agency Civic Facility Revenue (Crouse Health | ||||
| Hospital Inc. Project) VRDO | 0.020% | 12/7/15 LOC | 7,440 | 7,440 |
22
| New York Tax-Exempt Money Market Fund | ||||
| Face | Market | |||
| Maturity | Amount | Value | ||
| Coupon | Date | ($000) | ($000) | |
| Onondaga County NY Industrial Development | ||||
| Agency Civic Facility Revenue (Syracuse Home | ||||
| Association Project) VRDO | 0.010% | 12/7/15 LOC | 5,330 | 5,330 |
| Oyster Bay - East Norwich NY Central School | ||||
| District TAN | 2.000% | 6/24/16 | 5,500 | 5,547 |
| Port Authority of New York & New Jersey | ||||
| Revenue | 2.000% | 5/1/16 | 6,515 | 6,563 |
| 1 Port Authority of New York & New Jersey | ||||
| Revenue TOB VRDO | 0.020% | 12/7/15 | 8,500 | 8,500 |
| 1 Port Authority of New York & New Jersey | ||||
| Revenue TOB VRDO | 0.030% | 12/7/15 | 2,900 | 2,900 |
| 1 Port Authority of New York & New Jersey | ||||
| Revenue TOB VRDO | 0.040% | 12/7/15 | 1,710 | 1,710 |
| 1 Port Authority of New York & New Jersey | ||||
| Revenue TOB VRDO | 0.040% | 12/7/15 | 1,050 | 1,050 |
| 1 Port Authority of New York & New Jersey | ||||
| Revenue TOB VRDO | 0.040% | 12/7/15 | 6,500 | 6,500 |
| Saratoga County NY Capital Resource Corp. | ||||
| Revenue (Saratoga Hospital Project) VRDO | 0.020% | 12/7/15 LOC | 3,120 | 3,120 |
| Smithtown NY Central School District TAN | 2.000% | 6/30/16 | 10,000 | 10,100 |
| South Country NY Central School District TAN | 2.000% | 6/27/16 | 10,500 | 10,604 |
| Southampton NY Union Free School District TAN | 1.500% | 6/27/16 | 9,000 | 9,063 |
| Suffolk County NY Industrial Development | ||||
| Agency Civic Facility Revenue (St. Anthony’s | ||||
| High School) VRDO | 0.020% | 12/7/15 LOC | 9,200 | 8,900 |
| Suffolk County NY Water Authority BAN | 4.000% | 1/15/16 | 35,400 | 35,565 |
| Syracuse NY Industrial Development Agency | ||||
| Civic Facility Revenue (Syracuse University | ||||
| Project) VRDO | 0.010% | 12/7/15 LOC | 7,275 | 7,275 |
| Tompkins County NY Industrial Development | ||||
| Agency Civic Facility Revenue | ||||
| (Cornell University) VRDO | 0.010% | 12/7/15 | 7,555 | 7,555 |
| Tompkins County NY Industrial Development | ||||
| Agency Civic Facility Revenue (Ithaca College) | ||||
| VRDO | 0.010% | 12/7/15 LOC | 24,000 | 24,000 |
| 1 Triborough Bridge & Tunnel Authority New York | ||||
| Revenue TOB VRDO | 0.020% | 12/7/15 | 2,660 | 2,660 |
| Triborough Bridge & Tunnel Authority New York | ||||
| Revenue VRDO | 0.010% | 12/1/15 LOC | 7,545 | 7,545 |
| Triborough Bridge & Tunnel Authority New York | ||||
| Revenue VRDO | 0.010% | 12/7/15 LOC | 4,000 | 4,000 |
| Triborough Bridge & Tunnel Authority New York | ||||
| Revenue VRDO | 0.010% | 12/7/15 LOC | 8,000 | 8,000 |
| Ulster County NY BAN | 2.000% | 11/23/16 | 8,812 | 8,938 |
| 1 Utility Debt Securitization Authority New York | ||||
| Revenue TOB VRDO | 0.010% | 12/7/15 | 6,650 | 6,650 |
| West Babylon NY Union Free School District TAN | 2.000% | 6/24/16 | 8,350 | 8,428 |
| Williamsville NY Central School District BAN | 2.000% | 6/15/16 | 6,928 | 6,988 |
| Total Tax-Exempt Municipal Bonds (Cost $2,197,876) | 2,197,876 | |||
23
| New York Tax-Exempt Money Market Fund | |
| Amount | |
| ($000) | |
| Other Assets and Liabilities (-0.6%) | |
| Other Assets | |
| Investment in Vanguard | 190 |
| Receivables for Investment Securities Sold | 1,205 |
| Receivables for Accrued Income | 3,600 |
| Receivables for Capital Shares Issued | 4,630 |
| Other Assets | 4,825 |
| Total Other Assets | 14,450 |
| Liabilities | |
| Payables for Investment Securities Purchased | (13,500) |
| Payables for Capital Shares Redeemed | (3,511) |
| Payables to Vanguard | (5,493) |
| Total Liabilities | (22,504) |
| Net Assets (100%) | |
| Applicable to 2,189,620,952 outstanding $.001 par value shares of | |
| beneficial interest (unlimited authorization) | 2,189,822 |
| Net Asset Value Per Share | $1.00 |
| At November 30, 2015, net assets consisted of: | |
| Amount | |
| ($000) | |
| Paid-in Capital | 2,189,820 |
| Undistributed Net Investment Income | 2 |
| Net Assets | 2,189,822 |
- See Note A in Notes to Financial Statements.
- Security exempt from registration under Rule 144A of the Securities Act of 1933. Such securities may be sold in transactions exempt from registration, normally to qualified institutional buyers. At November 30, 2015, the aggregate value of these securities was $392,525,000, representing 18.0% of net assets.
- Adjustable-rate security.
A key to abbreviations and other references follows the Statement of Net Assets. See accompanying Notes, which are an integral part of the Financial Statements.
24
New York Tax-Exempt Money Market Fund
Key to Abbreviations
ARS—Auction Rate Security.
BAN—Bond Anticipation Note.
COP—Certificate of Participation.
CP—Commercial Paper.
FR—Floating Rate.
GAN—Grant Anticipation Note.
GO—General Obligation Bond.
PILOT—Payments in Lieu of Taxes.
PUT—Put Option Obligation.
RAN—Revenue Anticipation Note.
TAN—Tax Anticipation Note.
TOB—Tender Option Bond.
TRAN—Tax Revenue Anticipation Note.
VRDO—Variable Rate Demand Obligation.
VRDP—Variable Rate Demand Preferred.
(ETM)—Escrowed to Maturity.
(Prere.)—Prerefunded.
Scheduled principal and interest payments are guaranteed by:
(1) MBIA (Municipal Bond Investors Assurance).
(2) AMBAC (Ambac Assurance Corporation).
(3) FGIC (Financial Guaranty Insurance Company).
(4) AGM (Assured Guaranty Municipal Corporation).
(5) BIGI (Bond Investors Guaranty Insurance).
(6) Connie Lee Inc.
(7) FHA (Federal Housing Authority).
(8) CapMAC (Capital Markets Assurance Corporation).
(9) American Capital Access Financial Guaranty Corporation.
(10) XL Capital Assurance Inc.
(11) CIFG (CDC IXIS Financial Guaranty).
(12) AGC (Assured Guaranty Corporation).
(13) BHAC (Berkshire Hathaway Assurance Corporation).
(14) NPFG (National Public Finance Guarantee Corporation).
(15) BAM (Build America Mutual Assurance Company).
(16) MAC (Municipal Assurance Corporation).
(17) RAA (Radian Asset Assurance Inc.).
The insurance does not guarantee the market value of the municipal bonds.
LOC—Scheduled principal and interest payments are guaranteed by bank letter of credit.
25
| New York Tax-Exempt Money Market Fund | |
| Statement of Operations | |
| Year Ended | |
| November 30, 2015 | |
| ($000) | |
| Investment Income | |
| Income | |
| Interest | 1,633 |
| Total Income | 1,633 |
| Expenses | |
| The Vanguard Group—Note B | |
| Investment Advisory Services | 465 |
| Management and Administrative | 2,512 |
| Marketing and Distribution | 552 |
| Custodian Fees | 25 |
| Auditing Fees | 29 |
| Shareholders’ Reports | 11 |
| Trustees’ Fees and Expenses | 2 |
| Total Expenses | 3,596 |
| Expense Reduction—Note B | (2,190) |
| Net Expenses | 1,406 |
| Net Investment Income | 227 |
| Realized Net Gain (Loss) on Investment Securities Sold | 2 |
| Net Increase (Decrease) in Net Assets Resulting from Operations | 229 |
See accompanying Notes, which are an integral part of the Financial Statements.
26
| New York Tax-Exempt Money Market Fund | ||
| Statement of Changes in Net Assets | ||
| Year Ended November 30, | ||
| 2015 | 2014 | |
| ($000) | ($000) | |
| Increase (Decrease) in Net Assets | ||
| Operations | ||
| Net Investment Income | 227 | 238 |
| Realized Net Gain (Loss) | 2 | 2 |
| Net Increase (Decrease) in Net Assets Resulting from Operations | 229 | 240 |
| Distributions | ||
| Net Investment Income | (225) | (238) |
| Realized Capital Gain | — | — |
| Total Distributions | (225) | (238) |
| Capital Share Transactions (at $1.00 per share) | ||
| Issued | 1,259,422 | 1,361,127 |
| Issued in Lieu of Cash Distributions | 220 | 233 |
| Redeemed | (1,361,922) | (1,552,607) |
| Net Increase (Decrease) from Capital Share Transactions | (102,280) | (191,247) |
| Total Increase (Decrease) | (102,276) | (191,245) |
| Net Assets | ||
| Beginning of Period | 2,292,098 | 2,483,343 |
| End of Period1 | 2,189,822 | 2,292,098 |
1 Net Assets—End of Period includes undistributed (overdistributed) net investment income of $2,000 and $0.
See accompanying Notes, which are an integral part of the Financial Statements.
27
| New York Tax-Exempt Money Market Fund | |||||
| Financial Highlights | |||||
| For a Share Outstanding | Year Ended November 30, | ||||
| Throughout Each Period | 2015 | 2014 | 2013 | 2012 | 2011 |
| Net Asset Value, Beginning of Period | $1.00 | $1.00 | $1.00 | $1.00 | $1.00 |
| Investment Operations | |||||
| Net Investment Income | .0001 | .0001 | .0001 | .0003 | .001 |
| Net Realized and Unrealized Gain (Loss) | |||||
| on Investments | — | — | — | — | — |
| Total from Investment Operations | .0001 | .0001 | .0001 | .0003 | .001 |
| Distributions | |||||
| Dividends from Net Investment Income | (.0001) | (.0001) | (.0001) | (.0003) | (.001) |
| Distributions from Realized Capital Gains | — | — | — | — | — |
| Total Distributions | (.0001) | (.0001) | (.0001) | (.0003) | (.001) |
| Net Asset Value, End of Period | $1.00 | $1.00 | $1.00 | $1.00 | $1.00 |
| Total Return1 | 0.01% | 0.01% | 0.01% | 0.03% | 0.06% |
| Ratios/Supplemental Data | |||||
| Net Assets, End of Period (Millions) | $2,190 | $2,292 | $2,483 | $2,638 | $2,846 |
| Ratio of Total Expenses to Average Net Assets2 | 0.06% | 0.07% | 0.12% | 0.15% | 0.16% |
| Ratio of Net Investment Income to | |||||
| Average Net Assets | 0.01% | 0.01% | 0.01% | 0.03% | 0.06% |
1 Total returns do not include account service fees that may have applied in the periods shown. Fund prospectuses provide information about any applicable account service fees.
2 The ratio of total expenses to average net assets before an expense reduction was 0.16% for 2015, 0.16% for 2014, 0.16% for 2013, 0.16% for 2012, and 0.17% for 2011. See Note B in Notes to Financial Statements.
See accompanying Notes, which are an integral part of the Financial Statements.
28
New York Tax-Exempt Money Market Fund
Notes to Financial Statements
Vanguard New York Tax-Exempt Money Market Fund is registered under the Investment Company Act of 1940 as an open-end investment company, or mutual fund. The fund invests in debt instruments of municipal issuers whose ability to meet their obligations may be affected by economic and political developments in the state.
A. The following significant accounting policies conform to generally accepted accounting principles for U.S. investment companies. The fund consistently follows such policies in preparing its financial statements.
1. Security Valuation: Securities are valued as of the close of trading on the New York Stock Exchange (generally 4 p.m., Eastern time) on the valuation date. Securities are valued at amortized cost, which approximates market value.
2. Federal Income Taxes: The fund intends to continue to qualify as a regulated investment company and distribute all of its income. Management has analyzed the fund’s tax positions taken for all open federal income tax years (November 30, 2012–2015), and has concluded that no provision for federal income tax is required in the fund’s financial statements.
3. Distributions: Distributions from net investment income are declared daily and paid on the first business day of the following month.
4. Credit Facility: The fund and certain other funds managed by The Vanguard Group (“Vanguard”) participate in a $3 billion committed credit facility provided by a syndicate of lenders pursuant to a credit agreement that may be renewed annually; each fund is individually liable for its borrowings, if any, under the credit facility. Borrowings may be utilized for temporary and emergency purposes, and are subject to the fund’s regulatory and contractual borrowing restrictions. The participating funds are charged administrative fees and an annual commitment fee of 0.06% of the undrawn amount of the facility; these fees are allocated to the funds based on a method approved by the fund’s board of trustees and included in Management and Administrative expenses on the fund’s Statement of Operations. Any borrowings under this facility bear interest at a rate equal to the higher of the federal funds rate or LIBOR reference rate plus an agreed-upon spread.
The fund had no borrowings outstanding at November 30, 2015, or at any time during the period then ended.
5. Other: Interest income is accrued daily. Premiums and discounts on debt securities purchased are amortized and accreted, respectively, to interest income over the lives of the respective securities. Security transactions are accounted for on the date securities are bought or sold. Costs used to determine realized gains (losses) on the sale of investment securities are those of the specific securities sold.
B. In accordance with the terms of a Funds’ Service Agreement (the “FSA”) between Vanguard and the fund, Vanguard furnishes to the fund investment advisory, corporate management, administrative, marketing, and distribution services at Vanguard’s cost of operations (as defined by the FSA). These costs of operations are allocated to the fund based on methods and guidelines approved by the board of trustees. Vanguard does not require reimbursement in the current period for certain costs of operations (such as deferred compensation/benefits and risk/insurance costs); the fund’s liability for these costs of operations is included in Payables to Vanguard on the Statement of Net Assets.
29
New York Tax-Exempt Money Market Fund
Upon the request of Vanguard, the fund may invest up to 0.40% of its net assets as capital in Vanguard. At November 30, 2015, the fund had contributed to Vanguard capital in the amount of $190,000, representing 0.01% of the fund’s net assets and 0.08% of Vanguard’s capitalization. The fund’s trustees and officers are also directors and employees, respectively, of Vanguard.
Vanguard and the board of trustees have agreed to temporarily limit certain net operating expenses in excess of the fund’s daily yield in order to maintain a zero or positive yield for the fund. Vanguard and the board of trustees may terminate the temporary expense limitation at any time. For the year ended November 30, 2015, Vanguard’s expenses were reduced by $2,190,000 (an effective annual rate of 0.10% of the fund’s average net assets); the fund is not obligated to repay this amount to Vanguard.
C. Various inputs may be used to determine the value of the fund’s investments. These inputs are summarized in three broad levels for financial statement purposes. The inputs or methodologies used to value securities are not necessarily an indication of the risk associated with investing in those securities.
Level 1—Quoted prices in active markets for identical securities.
Level 2—Other significant observable inputs (including quoted prices for similar securities, interest rates, prepayment speeds, credit risk, etc.).
Level 3—Significant unobservable inputs (including the fund’s own assumptions used to determine the fair value of investments).
At November 30, 2015, 100% of the market value of the fund’s investments was determined using amortized cost, in accordance with rules under the Investment Company Act of 1940. Amortized cost approximates the current fair value of a security, but since the value is not obtained from a quoted price in an active market, securities valued at amortized cost are considered to be valued using Level 2 inputs.
D. Management has determined that no material events or transactions occurred subsequent to November 30, 2015, that would require recognition or disclosure in these financial statements.
30
New York Long-Term Tax-Exempt Fund
| Fund Profile | |||
| As of November 30, 2015 | |||
| Share-Class Characteristics | |||
| Investor | Admiral | ||
| Shares | Shares | ||
| Ticker Symbol | VNYTX | VNYUX | |
| Expense Ratio1 | 0.20% | 0.12% | |
| 30-Day SEC Yield | 2.06% | 2.14% | |
| Financial Attributes | |||
| Barclays | |||
| NY | Barclays | ||
| Muni | Municipal | ||
| Bond | Bond | ||
| Fund | Index | Index | |
| Number of Bonds | 836 | 6,121 | 47,840 |
| Yield to Maturity | |||
| (before expenses) | 2.2% | 2.0% | 2.2% |
| Average Coupon | 4.8% | 4.9% | 4.8% |
| Average Duration | 6.1 years | 6.2 years | 6.4 years |
| Average Stated | |||
| Maturity | 16.8 years | 13.7 years | 13.1 years |
| Short-Term | |||
| Reserves | 5.9% | — | — |
| Volatility Measures | ||
| Barclays NY | Barclays | |
| Muni Bond | Municipal | |
| Index | Bond Index | |
| R-Squared | 0.98 | 0.98 |
| Beta | 1.17 | 1.13 |
These measures show the degree and timing of the fund’s fluctuations compared with the indexes over 36 months.
| Distribution by Stated Maturity | |
| (% of portfolio) | |
| Under 1 Year | 5.2% |
| 1 - 3 Years | 3.5 |
| 3 - 5 Years | 2.1 |
| 5 - 10 Years | 10.2 |
| 10 - 20 Years | 42.3 |
| 20 - 30 Years | 31.0 |
| Over 30 Years | 5.7 |
Distribution by Credit Quality (% of portfolio)
| AAA | 22.6% |
| AA | 48.5 |
| A | 20.1 |
| BBB | 6.2 |
| BB | 0.4 |
| B | 0.4 |
| Not Rated | 1.8 |
Credit-quality ratings are obtained from Moody's and S&P, and the higher rating for each issue is shown. "Not Rated" is used to classify securities for which a rating is not available. Not rated securities include a fund's investment in Vanguard Market Liquidity Fund or Vanguard Municipal Cash Management Fund, each of which invests in high-quality money market instruments and may serve as a cash management vehicle for the Vanguard funds, trusts, and accounts. For more information about these ratings, see the Glossary entry for Credit Quality.
1 The expense ratios shown are from the prospectus dated March 26, 2015, and represent estimated costs for the current fiscal year. For the fiscal year ended November 30, 2015, the expense ratios were 0.20% for Investor Shares and 0.12% for Admiral Shares.
31
New York Long-Term Tax-Exempt Fund
Performance Summary
All of the returns in this report represent past performance, which is not a guarantee of future results that may be achieved by the fund. (Current performance may be lower or higher than the performance data cited. For performance data current to the most recent month-end, visit our website at vanguard.com/performance.) Note, too, that both investment returns and principal value can fluctuate widely, so an investor’s shares, when sold, could be worth more or less than their original cost. The returns shown do not reflect taxes that a shareholder would pay on fund distributions or on the sale of fund shares.
Cumulative Performance: November 30, 2005, Through November 30, 2015
Initial Investment of $10,000
| Average Annual Total Returns | |||||
| Periods Ended November 30, 2015 | |||||
| Final Value | |||||
| One | Five | Ten | of a $10,000 | ||
| Year | Years | Years | Investment | ||
| New York Long-Term Tax-Exempt Fund | |||||
| Investor Shares | 3.97% | 5.03% | 4.54% | $15,588 | |
| •••••••• | Barclays NY Municipal Bond Index | 3.23 | 4.59 | 4.71 | 15,839 |
| – – – – | New York Municipal Debt Funds | ||||
| Average | 3.05 | 4.45 | 4.01 | 14,822 | |
| Barclays Municipal Bond Index | 3.10 | 4.79 | 4.73 | 15,878 | |
| New York Municipal Debt Funds Average: Derived from data provided by Lipper, a Thomson Reuters Company. | |||||
| Final Value | |||||
| One | Five | Ten | of a $50,000 | ||
| Year | Years | Years | Investment | ||
| New York Long-Term Tax-Exempt Fund | |||||
| Admiral Shares | 4.06% | 5.12% | 4.62% | $78,545 | |
| Barclays NY Municipal Bond Index | 3.23 | 4.59 | 4.71 | 79,193 | |
| Barclays Municipal Bond Index | 3.10 | 4.79 | 4.73 | 79,388 | |
See Financial Highlights for dividend and capital gains information.
32
| New York Long-Term Tax-Exempt Fund | ||||
| Fiscal-Year Total Returns (%): November 30, 2005, Through November 30, 2015 | ||||
| Barclays NY | ||||
| Muni Bond | ||||
| Investor Shares | Index | |||
| Fiscal Year | Income Returns | Capital Returns | Total Returns | Total Returns |
| 2006 | 4.51% | 2.17% | 6.68% | 6.02% |
| 2007 | 4.33 | -2.76 | 1.57 | 2.89 |
| 2008 | 4.03 | -8.66 | -4.63 | -3.17 |
| 2009 | 4.57 | 8.69 | 13.26 | 14.51 |
| 2010 | 3.93 | 0.27 | 4.20 | 4.60 |
| 2011 | 3.96 | 1.81 | 5.77 | 6.04 |
| 2012 | 3.77 | 7.03 | 10.80 | 9.38 |
| 2013 | 3.27 | -7.65 | -4.38 | -3.06 |
| 2014 | 3.77 | 5.94 | 9.71 | 7.84 |
| 2015 | 3.38 | 0.59 | 3.97 | 3.23 |
Average Annual Total Returns: Periods Ended September 30, 2015
This table presents returns through the latest calendar quarter—rather than through the end of the fiscal period.
Securities and Exchange Commission rules require that we provide this information.
| Ten Years | ||||||
| Inception Date | One Year | Five Years | Income | Capital | Total | |
| Investor Shares | 4/7/1986 | 3.73% | 4.33% | 3.97% | 0.43% | 4.40% |
| Admiral Shares | 5/14/2001 | 3.82 | 4.41 | 4.05 | 0.43 | 4.48 |
33
New York Long-Term Tax-Exempt Fund
Financial Statements
Statement of Net Assets
As of November 30, 2015
The fund reports a complete list of its holdings in regulatory filings four times in each fiscal year, at the quarter-ends. For the second and fourth fiscal quarters, the lists appear in the fund’s semiannual and annual reports to shareholders. For the first and third fiscal quarters, the fund files the lists with the Securities and Exchange Commission on Form N-Q. Shareholders can look up the fund’s Forms N-Q on the SEC’s website at sec.gov. Forms N-Q may also be reviewed and copied at the SEC’s Public Reference Room (see the back cover of this report for further information).
| Face | Market | |||
| Maturity | Amount | Value | ||
| Coupon | Date | ($000) | ($000) | |
| Tax-Exempt Municipal Bonds (99.1%) | ||||
| New York (98.8%) | ||||
| Albany NY Capital Resource Corp. Revenue | ||||
| (St. Peter’s Hospital) | 6.000% | 11/15/20 (Prere.) | 325 | 398 |
| Albany NY Capital Resource Corp. Revenue | ||||
| (St. Peter’s Hospital) | 6.125% | 11/15/20 (Prere.) | 150 | 185 |
| Albany NY Industrial Development Agency Civic | ||||
| Facility Revenue (St. Peter’s Hospital Project) | 5.250% | 11/15/17 (Prere.) | 5,000 | 5,439 |
| Albany NY Industrial Development Agency Civic | ||||
| Facility Revenue (St. Peter’s Hospital Project) | 5.750% | 11/15/17 (Prere.) | 3,840 | 4,215 |
| Albany NY Industrial Development Agency | ||||
| Civic Facility Revenue (University at Albany | ||||
| Foundation Student Housing Corp. - | ||||
| Empire Commons North Project) | 5.375% | 5/1/29 (12) | 3,455 | 3,917 |
| Albany NY Industrial Development Agency | ||||
| Civic Facility Revenue (University at Albany | ||||
| Foundation Student Housing Corp. - | ||||
| Empire Commons North Project) | 5.500% | 5/1/32 (12) | 2,550 | 2,889 |
| Albany NY Industrial Development Agency | ||||
| Civic Facility Revenue (University at Albany | ||||
| Foundation Student Housing Corp. - | ||||
| Empire Commons South Project) | 5.375% | 5/1/29 (12) | 4,395 | 4,983 |
| Albany NY Industrial Development Agency | ||||
| Civic Facility Revenue (University at Albany | ||||
| Foundation Student Housing Corp. - | ||||
| Empire Commons South Project) | 5.500% | 5/1/32 (12) | 1,500 | 1,699 |
| Albany NY Industrial Development Agency | ||||
| Civic Facility Revenue (University at Albany | ||||
| Foundation Student Housing Corp. - | ||||
| Empire Commons West Project) | 5.375% | 5/1/29 (12) | 3,415 | 3,872 |
| Amherst NY Development Corp. | ||||
| Student Housing Facility Revenue | 5.000% | 10/1/40 (4) | 2,500 | 2,820 |
| Amherst NY Development Corp. | ||||
| Student Housing Facility Revenue | 5.000% | 10/1/45 | 3,800 | 4,287 |
| Battery Park City Authority New York Revenue | 5.000% | 11/1/31 | 2,500 | 2,921 |
| Brooklyn NY Local Development Corp. | ||||
| PILOT Revenue (Barclays Center Project) | 5.750% | 7/15/20 | 1,550 | 1,755 |
| Brooklyn NY Local Development Corp. | ||||
| PILOT Revenue (Barclays Center Project) | 6.000% | 7/15/30 | 16,025 | 18,116 |
34
| New York Long-Term Tax-Exempt Fund | ||||
| Face | Market | |||
| Maturity | Amount | Value | ||
| Coupon | Date | ($000) | ($000) | |
| Brooklyn NY Local Development Corp. | ||||
| PILOT Revenue (Barclays Center Project) | 6.500% | 7/15/30 | 2,250 | 2,593 |
| Brooklyn NY Local Development Corp. | ||||
| PILOT Revenue (Barclays Center Project) | 0.000% | 7/15/31 | 3,655 | 1,815 |
| Brooklyn NY Local Development Corp. | ||||
| PILOT Revenue (Barclays Center Project) | 0.000% | 7/15/32 | 1,500 | 707 |
| Brooklyn NY Local Development Corp. | ||||
| PILOT Revenue (Barclays Center Project) | 0.000% | 7/15/33 | 2,160 | 952 |
| Brooklyn NY Local Development Corp. | ||||
| PILOT Revenue (Barclays Center Project) | 6.250% | 7/15/40 | 5,475 | 6,210 |
| Brooklyn NY Local Development Corp. | ||||
| PILOT Revenue (Barclays Center Project) | 6.375% | 7/15/43 | 17,790 | 20,276 |
| Broome County NY Industrial Development | ||||
| Agency Revenue (Good Shepherd Village Project) | 6.875% | 7/1/18 (Prere.) | 3,250 | 3,739 |
| Buffalo & Erie County NY Industrial Land | ||||
| Development Corp. Revenue | 5.000% | 11/15/24 | 1,395 | 1,567 |
| Buffalo & Erie County NY Industrial Land | ||||
| Development Corp. Revenue | 5.000% | 7/1/25 | 2,000 | 2,341 |
| Buffalo & Erie County NY Industrial Land | ||||
| Development Corp. Revenue | 5.000% | 11/15/25 | 1,590 | 1,786 |
| Buffalo & Erie County NY Industrial Land | ||||
| Development Corp. Revenue | 5.000% | 11/15/37 | 4,515 | 4,784 |
| Buffalo & Erie County NY Industrial Land | ||||
| Development Corp. Revenue | 5.000% | 7/1/40 | 1,500 | 1,655 |
| Buffalo NY Municipal Water Finance Authority | ||||
| Revenue | 5.000% | 7/1/24 | 500 | 599 |
| Buffalo NY Municipal Water Finance Authority | ||||
| Revenue | 5.000% | 7/1/25 | 500 | 604 |
| Buffalo NY Municipal Water Finance Authority | ||||
| Revenue | 5.000% | 7/1/26 | 1,000 | 1,195 |
| Buffalo NY Municipal Water Finance Authority | ||||
| Revenue | 5.000% | 7/1/28 | 2,000 | 2,345 |
| Buffalo NY Municipal Water Finance Authority | ||||
| Revenue | 5.000% | 7/1/29 | 500 | 582 |
| Dobbs Ferry NY Local Development Corp. | ||||
| Revenue (Mercy College Project) | 5.000% | 7/1/39 | 2,715 | 2,996 |
| Dobbs Ferry NY Local Development Corp. | ||||
| Revenue (Mercy College Project) | 5.000% | 7/1/44 | 2,510 | 2,746 |
| Dutchess County NY Local Development Corp. | ||||
| Revenue (Health Quest Systems Inc. Project) | 5.000% | 7/1/34 | 650 | 718 |
| Dutchess County NY Local Development Corp. | ||||
| Revenue (Health Quest Systems Inc. Project) | 5.000% | 7/1/44 | 2,000 | 2,179 |
| Dutchess County NY Local Development Corp. | ||||
| Revenue (Marist College Project) | 5.000% | 7/1/45 | 1,240 | 1,390 |
| Erie County NY GO | 5.000% | 4/1/22 | 1,630 | 1,934 |
| Erie County NY GO | 5.000% | 4/1/23 | 1,000 | 1,186 |
| Erie County NY GO | 5.000% | 4/1/25 | 560 | 654 |
| Erie County NY Industrial Development Agency | ||||
| School Facility Revenue (Buffalo City School | ||||
| District Project) | 5.000% | 5/1/23 | 5,000 | 5,994 |
| Erie County NY Industrial Development Agency | ||||
| School Facility Revenue (Buffalo City School | ||||
| District Project) | 5.000% | 5/1/25 | 4,000 | 4,715 |
35
| New York Long-Term Tax-Exempt Fund | ||||
| Face | Market | |||
| Maturity | Amount | Value | ||
| Coupon | Date | ($000) | ($000) | |
| Erie County NY Industrial Development Agency | ||||
| School Facility Revenue (Buffalo City School | ||||
| District Project) | 5.250% | 5/1/25 | 3,695 | 4,356 |
| Freeport NY GO | 5.000% | 1/15/23 | 2,335 | 2,721 |
| Freeport NY GO | 5.000% | 1/15/24 | 2,540 | 2,935 |
| Hempstead NY Local Development Corp. | ||||
| Revenue (Adelphi University) | 5.000% | 10/1/28 | 1,320 | 1,526 |
| Hempstead NY Local Development Corp. | ||||
| Revenue (Adelphi University) | 5.000% | 9/1/43 | 5,000 | 5,541 |
| Hempstead NY Local Development Corp. | ||||
| Revenue (Hofstra University) | 5.000% | 7/1/22 | 2,130 | 2,475 |
| Hempstead NY Local Development Corp. | ||||
| Revenue (Hofstra University) | 5.000% | 7/1/23 | 3,350 | 3,854 |
| Hempstead NY Local Development Corp. | ||||
| Revenue (Hofstra University) | 5.000% | 7/1/28 | 1,300 | 1,450 |
| Hempstead NY Local Development Corp. | ||||
| Revenue (Hofstra University) | 5.000% | 7/1/41 | 2,815 | 3,062 |
| Hempstead NY Local Development Corp. | ||||
| Revenue (Molloy College) | 5.000% | 7/1/16 | 100 | 102 |
| Hempstead NY Local Development Corp. | ||||
| Revenue (Molloy College) | 5.750% | 7/1/23 | 1,600 | 1,787 |
| Hempstead NY Local Development Corp. | ||||
| Revenue (Molloy College) | 5.000% | 7/1/29 | 2,170 | 2,420 |
| Hempstead NY Local Development Corp. | ||||
| Revenue (Molloy College) | 5.000% | 7/1/34 | 1,800 | 1,978 |
| Hempstead NY Local Development Corp. | ||||
| Revenue (Molloy College) | 5.000% | 7/1/39 | 1,645 | 1,786 |
| Hempstead NY Local Development Corp. | ||||
| Revenue (Molloy College) | 5.000% | 7/1/44 | 1,670 | 1,802 |
| Hudson Yards Infrastructure Corp. | ||||
| New York Revenue | 5.000% | 2/15/47 (3) | 11,235 | 11,683 |
| Hudson Yards Infrastructure Corp. | ||||
| New York Revenue | 5.000% | 2/15/47 | 12,370 | 12,863 |
| Hudson Yards Infrastructure Corp. | ||||
| New York Revenue | 5.250% | 2/15/47 | 7,925 | 8,702 |
| Hudson Yards Infrastructure Corp. | ||||
| New York Revenue | 5.750% | 2/15/47 | 28,525 | 32,550 |
| Long Island NY Power Authority | ||||
| Electric System Revenue | 5.250% | 6/1/16 (Prere.) | 7,500 | 7,686 |
| Long Island NY Power Authority | ||||
| Electric System Revenue | 5.000% | 12/1/17 | 100 | 104 |
| Long Island NY Power Authority | ||||
| Electric System Revenue | 5.250% | 4/1/19 | 5,000 | 5,642 |
| Long Island NY Power Authority | ||||
| Electric System Revenue | 6.250% | 4/1/19 (Prere.) | 2,225 | 2,614 |
| Long Island NY Power Authority | ||||
| Electric System Revenue | 5.000% | 5/1/21 | 2,000 | 2,331 |
| Long Island NY Power Authority | ||||
| Electric System Revenue | 0.000% | 6/1/24 (4) | 19,830 | 16,185 |
| Long Island NY Power Authority | ||||
| Electric System Revenue | 5.000% | 9/1/25 | 1,500 | 1,744 |
| Long Island NY Power Authority | ||||
| Electric System Revenue | 5.000% | 9/1/26 | 3,400 | 3,917 |
36
| New York Long-Term Tax-Exempt Fund | |||||
| Face | Market | ||||
| Maturity | Amount | Value | |||
| Coupon | Date | ($000) | ($000) | ||
| 1 | Long Island NY Power Authority | ||||
| Electric System Revenue | 5.000% | 9/1/26 | 1,000 | 1,192 | |
| Long Island NY Power Authority | |||||
| Electric System Revenue | 0.000% | 6/1/27 (4) | 15,905 | 11,503 | |
| Long Island NY Power Authority | |||||
| Electric System Revenue | 4.500% | 5/1/28 (14) | 1,880 | 1,935 | |
| 1 | Long Island NY Power Authority | ||||
| Electric System Revenue | 5.000% | 9/1/28 | 1,000 | 1,173 | |
| Long Island NY Power Authority | |||||
| Electric System Revenue | 5.000% | 9/1/34 | 4,500 | 5,099 | |
| Long Island NY Power Authority | |||||
| Electric System Revenue | 5.000% | 9/1/35 | 6,000 | 6,784 | |
| Long Island NY Power Authority | |||||
| Electric System Revenue | 5.000% | 9/1/37 | 7,325 | 8,054 | |
| Long Island NY Power Authority | |||||
| Electric System Revenue | 5.000% | 5/1/38 | 11,005 | 12,029 | |
| Long Island NY Power Authority | |||||
| Electric System Revenue | 5.000% | 9/1/39 | 5,500 | 6,165 | |
| Long Island NY Power Authority | |||||
| Electric System Revenue | 5.000% | 9/1/44 | 9,140 | 10,180 | |
| 2 | Long Island NY Power Authority | ||||
| Electric System Revenue PUT | 0.785% | 11/1/18 | 3,000 | 2,981 | |
| Madison County NY Capital Resource Corp. | |||||
| Revenue (Colgate University Project) | 5.000% | 7/1/40 | 1,495 | 1,706 | |
| Madison County NY Capital Resource Corp. | |||||
| Revenue (Colgate University Project) | 5.000% | 7/1/43 | 6,000 | 6,801 | |
| Monroe County NY Industrial Development Corp. | |||||
| Mortgage Revenue (Unity Hospital | |||||
| Rochester Project) | 5.500% | 8/15/23 | 4,120 | 4,138 | |
| Monroe County NY Industrial Development Corp. | |||||
| Mortgage Revenue (Unity Hospital | |||||
| Rochester Project) | 5.750% | 8/15/30 | 3,500 | 4,136 | |
| Monroe County NY Industrial Development Corp. | |||||
| Mortgage Revenue (Unity Hospital | |||||
| Rochester Project) | 5.750% | 8/15/35 | 3,000 | 3,545 | |
| Monroe County NY Industrial Development Corp. | |||||
| Mortgage Revenue (Unity Hospital | |||||
| Rochester Project) | 5.500% | 8/15/40 | 3,700 | 4,315 | |
| Monroe County NY Industrial Development Corp. | |||||
| Revenue (Rochester General Hospital) | 5.000% | 12/1/37 | 2,600 | 2,851 | |
| Monroe County NY Industrial Development Corp. | |||||
| Revenue (Rochester General Hospital) | 5.000% | 12/1/42 | 5,305 | 5,775 | |
| Monroe County NY Industrial Development Corp. | |||||
| Revenue (St. John Fisher College Project) | 5.500% | 6/1/39 | 1,500 | 1,678 | |
| Monroe County NY Industrial Development Corp. | |||||
| Revenue (St. John Fisher College Project) | 5.000% | 6/1/44 | 2,500 | 2,666 | |
| Monroe County NY Industrial Development Corp. | |||||
| Revenue (University of Rochester) | 5.000% | 7/1/29 | 1,250 | 1,495 | |
| Monroe County NY Industrial Development Corp. | |||||
| Revenue (University of Rochester) | 5.000% | 7/1/30 | 4,880 | 5,689 | |
| Monroe County NY Industrial Development Corp. | |||||
| Revenue (University of Rochester) | 5.000% | 7/1/31 | 1,000 | 1,183 | |
| Monroe County NY Industrial Development Corp. | |||||
| Revenue (University of Rochester) | 5.000% | 7/1/32 | 1,640 | 1,931 | |
37
| New York Long-Term Tax-Exempt Fund | ||||
| Face | Market | |||
| Maturity | Amount | Value | ||
| Coupon | Date | ($000) | ($000) | |
| Monroe County NY Industrial Development Corp. | ||||
| Revenue (University of Rochester) | 5.000% | 7/1/33 | 1,400 | 1,641 |
| Monroe County NY Industrial Development Corp. | ||||
| Revenue (University of Rochester) | 5.000% | 7/1/37 | 1,000 | 1,157 |
| Monroe County NY Industrial Development Corp. | ||||
| Revenue (University of Rochester) | 4.000% | 7/1/39 | 1,500 | 1,551 |
| Monroe County NY Industrial Development Corp. | ||||
| Revenue (University of Rochester) | 5.000% | 7/1/45 | 4,030 | 4,561 |
| Nassau County NY GO | 5.000% | 10/1/20 | 9,025 | 10,436 |
| Nassau County NY GO | 5.000% | 4/1/24 | 5,000 | 5,948 |
| Nassau County NY GO | 5.000% | 4/1/29 | 4,320 | 5,012 |
| Nassau County NY GO | 5.000% | 4/1/34 | 5,740 | 6,428 |
| Nassau County NY GO | 5.000% | 4/1/35 | 1,500 | 1,677 |
| Nassau County NY Interim Finance Authority | ||||
| Sales Tax Revenue VRDO | 0.010% | 12/7/15 | 6,600 | 6,600 |
| Nassau County NY Local Economic Assistance | ||||
| & Financing Corp. Revenue (South Nassau | ||||
| Communities Hospital) | 5.000% | 7/1/21 | 4,430 | 5,101 |
| Nassau County NY Local Economic Assistance | ||||
| & Financing Corp. Revenue (South Nassau | ||||
| Communities Hospital) | 5.000% | 7/1/22 | 2,225 | 2,587 |
| Nassau County NY Local Economic Assistance | ||||
| & Financing Corp. Revenue (South Nassau | ||||
| Communities Hospital) | 5.000% | 7/1/27 | 5,695 | 6,371 |
| Nassau County NY Local Economic Assistance | ||||
| & Financing Corp. Revenue (South Nassau | ||||
| Communities Hospital) | 5.000% | 7/1/31 | 2,000 | 2,190 |
| Nassau County NY Local Economic Assistance | ||||
| & Financing Corp. Revenue (South Nassau | ||||
| Communities Hospital) | 5.000% | 7/1/37 | 1,000 | 1,083 |
| Nassau County NY Local Economic Assistance | ||||
| & Financing Corp. Revenue (Winthrop University | ||||
| Hospital Association Project) | 5.000% | 7/1/27 | 4,000 | 4,402 |
| Nassau County NY Local Economic Assistance | ||||
| & Financing Corp. Revenue (Winthrop University | ||||
| Hospital Association Project) | 5.000% | 7/1/32 | 995 | 1,072 |
| Nassau County NY Local Economic Assistance | ||||
| & Financing Corp. Revenue (Winthrop University | ||||
| Hospital Association Project) | 5.000% | 7/1/37 | 8,190 | 8,792 |
| Nassau County NY Local Economic Assistance | ||||
| & Financing Corp. Revenue (Winthrop University | ||||
| Hospital Association Project) | 5.000% | 7/1/42 | 3,000 | 3,195 |
| Nassau County NY Local Economic Assistance | ||||
| Corp. Revenue (Catholic Health Services of | ||||
| Long Island Obligated Group Project) | 5.000% | 7/1/23 | 700 | 821 |
| Nassau County NY Local Economic Assistance | ||||
| Corp. Revenue (Catholic Health Services of | ||||
| Long Island Obligated Group Project) | 5.000% | 7/1/24 | 500 | 589 |
| Nassau County NY Local Economic Assistance | ||||
| Corp. Revenue (Catholic Health Services of | ||||
| Long Island Obligated Group Project) | 5.000% | 7/1/25 | 1,400 | 1,630 |
| Nassau County NY Local Economic Assistance | ||||
| Corp. Revenue (Catholic Health Services of | ||||
| Long Island Obligated Group Project) | 5.000% | 7/1/28 | 1,690 | 1,919 |
38
| New York Long-Term Tax-Exempt Fund | ||||
| Face | Market | |||
| Maturity | Amount | Value | ||
| Coupon | Date | ($000) | ($000) | |
| Nassau County NY Local Economic Assistance | ||||
| Corp. Revenue (Catholic Health Services of | ||||
| Long Island Obligated Group Project) | 5.000% | 7/1/28 | 1,500 | 1,709 |
| Nassau County NY Local Economic Assistance | ||||
| Corp. Revenue (Catholic Health Services of | ||||
| Long Island Obligated Group Project) | 5.000% | 7/1/29 | 1,565 | 1,766 |
| Nassau County NY Local Economic Assistance | ||||
| Corp. Revenue (Catholic Health Services of | ||||
| Long Island Obligated Group Project) | 5.000% | 7/1/30 | 1,750 | 1,970 |
| Nassau County NY Local Economic Assistance | ||||
| Corp. Revenue (Catholic Health Services of | ||||
| Long Island Obligated Group Project) | 5.000% | 7/1/31 | 1,000 | 1,120 |
| Nassau County NY Local Economic Assistance | ||||
| Corp. Revenue (Catholic Health Services of | ||||
| Long Island Obligated Group Project) | 5.000% | 7/1/34 | 1,970 | 2,175 |
| New Rochelle NY Corporate Local Development | ||||
| Revenue (Iona College Project) | 5.000% | 7/1/25 | 325 | 381 |
| New Rochelle NY Corporate Local Development | ||||
| Revenue (Iona College Project) | 5.000% | 7/1/26 | 335 | 391 |
| New Rochelle NY Corporate Local Development | ||||
| Revenue (Iona College Project) | 5.000% | 7/1/27 | 425 | 493 |
| New Rochelle NY Corporate Local Development | ||||
| Revenue (Iona College Project) | 5.000% | 7/1/28 | 375 | 431 |
| New Rochelle NY Corporate Local Development | ||||
| Revenue (Iona College Project) | 5.000% | 7/1/31 | 1,000 | 1,119 |
| New Rochelle NY Corporate Local Development | ||||
| Revenue (Iona College Project) | 5.000% | 7/1/33 | 1,135 | 1,262 |
| New Rochelle NY Corporate Local Development | ||||
| Revenue (Iona College Project) | 5.000% | 7/1/35 | 1,000 | 1,105 |
| New Rochelle NY Corporate Local Development | ||||
| Revenue (Iona College Project) | 5.000% | 7/1/40 | 1,250 | 1,365 |
| New Rochelle NY Corporate Local Development | ||||
| Revenue (Iona College Project) | 5.000% | 7/1/45 | 1,500 | 1,628 |
| New York City NY Build NYC Resource Corp. | ||||
| Revenue (Ethical Culture Fieldston Project) | 5.000% | 6/1/23 | 850 | 1,009 |
| New York City NY Build NYC Resource Corp. | ||||
| Revenue (Ethical Culture Fieldston Project) | 5.000% | 6/1/24 | 740 | 885 |
| New York City NY Build NYC Resource Corp. | ||||
| Revenue (Methodist Hospital Project) | 5.000% | 7/1/23 | 1,400 | 1,626 |
| New York City NY Build NYC Resource Corp. | ||||
| Revenue (Methodist Hospital Project) | 5.000% | 7/1/25 | 1,325 | 1,537 |
| New York City NY Build NYC Resource Corp. | ||||
| Revenue (Methodist Hospital Project) | 5.000% | 7/1/27 | 1,000 | 1,142 |
| New York City NY Build NYC Resource Corp. | ||||
| Revenue (Queens College) | 5.000% | 6/1/27 | 200 | 238 |
| New York City NY Build NYC Resource Corp. | ||||
| Revenue (Queens College) | 5.000% | 6/1/28 | 270 | 319 |
| New York City NY Build NYC Resource Corp. | ||||
| Revenue (Queens College) | 5.000% | 6/1/29 | 225 | 263 |
| New York City NY Build NYC Resource Corp. | ||||
| Revenue (Queens College) | 5.000% | 6/1/30 | 310 | 361 |
| New York City NY Build NYC Resource Corp. | ||||
| Revenue (Queens College) | 5.000% | 6/1/31 | 800 | 926 |
39
| New York Long-Term Tax-Exempt Fund | ||||
| Face | Market | |||
| Maturity | Amount | Value | ||
| Coupon | Date | ($000) | ($000) | |
| New York City NY Build NYC Resource Corp. | ||||
| Revenue (Queens College) | 5.000% | 6/1/32 | 660 | 761 |
| New York City NY Build NYC Resource Corp. | ||||
| Revenue (Queens College) | 5.000% | 6/1/33 | 660 | 758 |
| New York City NY Build NYC Resource Corp. | ||||
| Revenue (Queens College) | 5.000% | 6/1/34 | 580 | 662 |
| New York City NY Build NYC Resource Corp. | ||||
| Revenue (Queens College) | 5.000% | 6/1/38 | 1,000 | 1,126 |
| New York City NY Build NYC Resource Corp. | ||||
| Revenue (YMCA of Greater New York) | 5.000% | 8/1/29 | 1,000 | 1,131 |
| New York City NY Build NYC Resource Corp. | ||||
| Revenue (YMCA of Greater New York) | 4.000% | 8/1/36 | 1,100 | 1,107 |
| New York City NY Capital Resources Corp. | ||||
| Revenue (Loan Enhanced Assistance Program) | ||||
| VRDO | 0.080% | 12/7/15 LOC | 3,535 | 3,535 |
| New York City NY GO | 5.000% | 2/1/16 (Prere.) | 5 | 5 |
| New York City NY GO | 5.000% | 8/1/16 (Prere.) | 95 | 98 |
| New York City NY GO | 5.000% | 1/1/17 (Prere.) | 6,850 | 7,179 |
| New York City NY GO | 5.000% | 1/1/17 (Prere.) | 935 | 980 |
| New York City NY GO | 5.250% | 8/15/18 (Prere.) | 1,235 | 1,376 |
| New York City NY GO | 6.250% | 10/15/18 (Prere.) | 990 | 1,138 |
| New York City NY GO | 5.000% | 8/1/21 | 995 | 1,003 |
| New York City NY GO | 5.000% | 8/1/21 | 2,000 | 2,266 |
| New York City NY GO | 5.250% | 9/1/21 | 5,750 | 6,405 |
| New York City NY GO | 5.000% | 8/1/22 | 5,000 | 6,017 |
| New York City NY GO | 5.000% | 8/1/22 | 7,500 | 9,025 |
| New York City NY GO | 5.000% | 8/1/22 | 4,250 | 4,803 |
| New York City NY GO | 5.000% | 8/1/22 | 4,000 | 4,671 |
| New York City NY GO | 5.250% | 8/15/22 | 10,000 | 11,105 |
| New York City NY GO | 5.250% | 9/1/22 | 12,000 | 13,358 |
| New York City NY GO | 5.000% | 10/1/22 | 2,985 | 3,219 |
| New York City NY GO | 5.000% | 8/1/23 | 5,000 | 6,083 |
| New York City NY GO | 5.000% | 8/1/24 | 4,000 | 4,881 |
| New York City NY GO | 5.250% | 8/15/24 | 13,765 | 15,221 |
| New York City NY GO | 5.000% | 8/1/25 | 2,000 | 2,456 |
| New York City NY GO | 5.000% | 8/1/25 | 10,540 | 12,388 |
| New York City NY GO | 5.000% | 1/1/26 | 425 | 445 |
| New York City NY GO | 5.000% | 8/1/26 | 5,000 | 6,010 |
| New York City NY GO | 5.000% | 8/1/26 | 4,370 | 5,344 |
| New York City NY GO | 5.000% | 8/15/26 | 14,500 | 15,892 |
| New York City NY GO | 5.250% | 8/15/26 | 5,100 | 5,623 |
| New York City NY GO | 5.000% | 4/1/27 | 5,000 | 5,872 |
| New York City NY GO | 5.000% | 8/1/27 | 15,290 | 17,897 |
| New York City NY GO | 5.000% | 8/1/27 | 4,550 | 5,421 |
| New York City NY GO | 5.000% | 8/1/27 | 9,900 | 11,825 |
| New York City NY GO | 5.000% | 5/15/28 | 4,500 | 5,025 |
| New York City NY GO | 5.000% | 8/1/28 | 3,710 | 4,324 |
| New York City NY GO | 5.000% | 8/1/28 | 3,000 | 3,621 |
| New York City NY GO | 5.000% | 8/1/28 | 7,000 | 7,861 |
| New York City NY GO | 5.000% | 8/1/28 | 4,000 | 4,789 |
| New York City NY GO | 5.000% | 8/1/28 | 1,915 | 2,225 |
| New York City NY GO | 6.250% | 10/15/28 | 45 | 52 |
| New York City NY GO | 5.625% | 4/1/29 | 3,000 | 3,409 |
| New York City NY GO | 5.000% | 8/1/29 | 5,000 | 5,933 |
40
| New York Long-Term Tax-Exempt Fund | ||||
| Face | Market | |||
| Maturity | Amount | Value | ||
| Coupon | Date | ($000) | ($000) | |
| New York City NY GO | 5.000% | 8/1/29 | 2,500 | 2,899 |
| New York City NY GO | 5.000% | 8/1/30 | 2,335 | 2,711 |
| New York City NY GO | 5.000% | 8/1/30 | 3,000 | 3,561 |
| New York City NY GO | 5.000% | 8/1/30 | 2,185 | 2,550 |
| New York City NY GO | 5.000% | 8/1/30 | 6,220 | 7,332 |
| New York City NY GO | 5.000% | 3/1/31 | 6,000 | 6,993 |
| New York City NY GO | 5.450% | 4/1/31 | 8,500 | 9,596 |
| New York City NY GO | 5.000% | 8/1/31 | 2,000 | 2,330 |
| New York City NY GO | 5.000% | 8/1/31 | 3,000 | 3,502 |
| New York City NY GO | 5.000% | 8/1/31 | 1,500 | 1,740 |
| New York City NY GO | 5.000% | 3/1/32 | 5,000 | 5,795 |
| New York City NY GO | 5.000% | 8/1/32 | 4,000 | 4,661 |
| New York City NY GO | 5.000% | 8/1/32 | 2,985 | 3,484 |
| New York City NY GO | 5.000% | 3/1/33 | 7,500 | 8,661 |
| New York City NY GO | 5.000% | 10/1/33 | 6,500 | 7,485 |
| New York City NY GO | 5.000% | 10/1/34 | 2,000 | 2,294 |
| New York City NY GO | 5.000% | 8/1/35 | 3,500 | 4,041 |
| New York City NY GO | 5.375% | 4/1/36 | 4,000 | 4,503 |
| New York City NY GO | 5.000% | 6/1/36 | 910 | 1,052 |
| New York City NY GO | 5.000% | 10/1/36 | 3,000 | 3,463 |
| New York City NY GO | 5.000% | 3/1/37 | 6,790 | 7,755 |
| New York City NY GO VRDO | 0.010% | 12/1/15 | 1,600 | 1,600 |
| New York City NY GO VRDO | 0.010% | 12/1/15 | 2,000 | 2,000 |
| New York City NY GO VRDO | 0.010% | 12/7/15 | 5,100 | 5,100 |
| New York City NY Health & Hospital Corp. | ||||
| Revenue (Health System) | 5.000% | 2/15/21 | 2,000 | 2,289 |
| New York City NY Health & Hospital Corp. | ||||
| Revenue (Health System) | 5.000% | 2/15/24 | 3,000 | 3,386 |
| New York City NY Health & Hospital Corp. | ||||
| Revenue (Health System) | 5.000% | 2/15/30 | 3,300 | 3,636 |
| New York City NY Housing Development Corp. | ||||
| Capital Fund Grant Program Revenue | ||||
| (New York City Housing Authority Program) | 5.000% | 7/1/23 | 1,000 | 1,207 |
| New York City NY Housing Development Corp. | ||||
| Multi-Family Housing Revenue | 5.250% | 7/1/28 | 2,700 | 3,195 |
| New York City NY Housing Development Corp. | ||||
| Multi-Family Housing Revenue | 5.250% | 7/1/29 | 3,035 | 3,576 |
| New York City NY Housing Development Corp. | ||||
| Multi-Family Housing Revenue | 3.375% | 11/1/29 | 1,500 | 1,499 |
| New York City NY Housing Development Corp. | ||||
| Multi-Family Housing Revenue | 4.750% | 11/1/29 | 5,220 | 5,449 |
| New York City NY Housing Development Corp. | ||||
| Multi-Family Housing Revenue | 4.750% | 11/1/29 | 2,520 | 2,644 |
| New York City NY Housing Development Corp. | ||||
| Multi-Family Housing Revenue | 3.375% | 11/15/29 | 3,500 | 3,567 |
| New York City NY Housing Development Corp. | ||||
| Multi-Family Housing Revenue | 5.250% | 7/1/30 | 2,605 | 3,056 |
| New York City NY Housing Development Corp. | ||||
| Multi-Family Housing Revenue | 3.700% | 11/1/30 | 3,000 | 3,074 |
| New York City NY Housing Development Corp. | ||||
| Multi-Family Housing Revenue | 3.650% | 11/1/34 | 3,000 | 3,029 |
| New York City NY Housing Development Corp. | ||||
| Multi-Family Housing Revenue | 3.700% | 11/15/34 | 5,000 | 5,153 |
41
| New York Long-Term Tax-Exempt Fund | ||||
| Face | Market | |||
| Maturity | Amount | Value | ||
| Coupon | Date | ($000) | ($000) | |
| New York City NY Housing Development Corp. | ||||
| Multi-Family Housing Revenue | 5.050% | 11/1/38 | 3,055 | 3,217 |
| New York City NY Housing Development Corp. | ||||
| Multi-Family Housing Revenue | 5.550% | 11/1/39 | 3,500 | 3,719 |
| New York City NY Housing Development Corp. | ||||
| Multi-Family Housing Revenue | 5.000% | 11/1/42 | 2,600 | 2,767 |
| New York City NY Housing Development Corp. | ||||
| Multi-Family Housing Revenue | 5.700% | 11/1/46 | 7,155 | 7,602 |
| New York City NY Housing Development Corp. | ||||
| Multi-Family Mortgage Revenue (8 Spruce Street) | 3.500% | 2/15/48 | 11,000 | 11,017 |
| New York City NY Industrial Development Agency | ||||
| Civic Facility Revenue (New York Law School) | ||||
| VRDO | 0.010% | 12/7/15 LOC | 2,800 | 2,800 |
| New York City NY Industrial Development Agency | ||||
| Civic Facility Revenue (United Jewish Appeal- | ||||
| Federation of Jewish Philanthropies of | ||||
| New York, Inc.) | 5.000% | 7/1/34 | 4,850 | 5,423 |
| New York City NY Industrial Development Agency | ||||
| PILOT Revenue (Queens Baseball Stadium | ||||
| Project) | 6.125% | 1/1/29 (12) | 1,750 | 1,970 |
| New York City NY Industrial Development Agency | ||||
| PILOT Revenue (Queens Baseball Stadium | ||||
| Project) | 6.375% | 1/1/39 (12) | 4,000 | 4,539 |
| New York City NY Industrial Development Agency | ||||
| PILOT Revenue (Yankee Stadium Project) | 0.000% | 3/1/34 (12) | 10,285 | 5,109 |
| New York City NY Industrial Development Agency | ||||
| PILOT Revenue (Yankee Stadium Project) | 0.000% | 3/1/35 (12) | 4,305 | 2,022 |
| New York City NY Industrial Development Agency | ||||
| PILOT Revenue (Yankee Stadium Project) | 5.000% | 3/1/36 (14) | 9,670 | 9,925 |
| New York City NY Industrial Development Agency | ||||
| PILOT Revenue (Yankee Stadium Project) | 7.000% | 3/1/49 (12) | 33,850 | 39,627 |
| New York City NY Industrial Development Agency | ||||
| Special Facility Revenue (New York Stock | ||||
| Exchange Project) | 5.000% | 5/1/29 | 2,020 | 2,239 |
| New York City NY Municipal Water Finance | ||||
| Authority Water & Sewer System Revenue | 0.000% | 6/15/17 | 10,000 | 9,871 |
| New York City NY Municipal Water Finance | ||||
| Authority Water & Sewer System Revenue | 0.000% | 6/15/18 | 4,250 | 4,125 |
| New York City NY Municipal Water Finance | ||||
| Authority Water & Sewer System Revenue | 0.000% | 6/15/21 | 4,490 | 4,060 |
| New York City NY Municipal Water Finance | ||||
| Authority Water & Sewer System Revenue | 5.000% | 6/15/27 | 5,000 | 6,119 |
| New York City NY Municipal Water Finance | ||||
| Authority Water & Sewer System Revenue | 5.000% | 6/15/28 | 10,000 | 12,107 |
| New York City NY Municipal Water Finance | ||||
| Authority Water & Sewer System Revenue | 5.000% | 6/15/29 | 2,000 | 2,282 |
| New York City NY Municipal Water Finance | ||||
| Authority Water & Sewer System Revenue | 5.000% | 6/15/29 | 2,000 | 2,323 |
| New York City NY Municipal Water Finance | ||||
| Authority Water & Sewer System Revenue | 5.000% | 6/15/31 | 1,500 | 1,742 |
| New York City NY Municipal Water Finance | ||||
| Authority Water & Sewer System Revenue | 5.000% | 6/15/32 | 6,000 | 6,558 |
| New York City NY Municipal Water Finance | ||||
| Authority Water & Sewer System Revenue | 5.000% | 6/15/32 | 12,385 | 14,386 |
42
| New York Long-Term Tax-Exempt Fund | ||||
| Face | Market | |||
| Maturity | Amount | Value | ||
| Coupon | Date | ($000) | ($000) | |
| New York City NY Municipal Water Finance | ||||
| Authority Water & Sewer System Revenue | 5.250% | 6/15/32 | 10,000 | 11,312 |
| New York City NY Municipal Water Finance | ||||
| Authority Water & Sewer System Revenue | 5.000% | 6/15/34 | 6,000 | 6,892 |
| New York City NY Municipal Water Finance | ||||
| Authority Water & Sewer System Revenue | 5.000% | 6/15/35 | 10,000 | 11,457 |
| New York City NY Municipal Water Finance | ||||
| Authority Water & Sewer System Revenue | 5.000% | 6/15/36 | 5,000 | 5,769 |
| New York City NY Municipal Water Finance | ||||
| Authority Water & Sewer System Revenue | 5.000% | 6/15/37 | 3,305 | 3,832 |
| New York City NY Municipal Water Finance | ||||
| Authority Water & Sewer System Revenue | 5.000% | 6/15/37 | 2,500 | 2,899 |
| New York City NY Municipal Water Finance | ||||
| Authority Water & Sewer System Revenue | 5.000% | 6/15/39 | 5,405 | 6,243 |
| New York City NY Municipal Water Finance | ||||
| Authority Water & Sewer System Revenue | 5.000% | 6/15/39 | 7,500 | 8,662 |
| New York City NY Municipal Water Finance | ||||
| Authority Water & Sewer System Revenue | 5.000% | 6/15/40 | 5,000 | 5,576 |
| New York City NY Municipal Water Finance | ||||
| Authority Water & Sewer System Revenue | 5.250% | 6/15/40 | 7,500 | 8,428 |
| New York City NY Municipal Water Finance | ||||
| Authority Water & Sewer System Revenue | 5.250% | 6/15/40 | 13,355 | 15,008 |
| New York City NY Municipal Water Finance | ||||
| Authority Water & Sewer System Revenue | 5.500% | 6/15/40 | 18,500 | 20,990 |
| New York City NY Municipal Water Finance | ||||
| Authority Water & Sewer System Revenue | 5.750% | 6/15/40 | 10,075 | 11,219 |
| New York City NY Municipal Water Finance | ||||
| Authority Water & Sewer System Revenue | 5.750% | 6/15/40 | 13,400 | 14,868 |
| New York City NY Municipal Water Finance | ||||
| Authority Water & Sewer System Revenue | 5.000% | 6/15/43 | 15,385 | 17,519 |
| New York City NY Municipal Water Finance | ||||
| Authority Water & Sewer System Revenue | 5.375% | 6/15/43 | 10,000 | 11,631 |
| New York City NY Municipal Water Finance | ||||
| Authority Water & Sewer System Revenue | 5.500% | 6/15/43 | 2,500 | 2,927 |
| New York City NY Municipal Water Finance | ||||
| Authority Water & Sewer System Revenue | 5.000% | 6/15/44 | 8,470 | 9,690 |
| New York City NY Municipal Water Finance | ||||
| Authority Water & Sewer System Revenue | 5.000% | 6/15/44 | 10,000 | 11,349 |
| New York City NY Municipal Water Finance | ||||
| Authority Water & Sewer System Revenue | 5.000% | 6/15/45 | 5,000 | 5,652 |
| New York City NY Municipal Water Finance | ||||
| Authority Water & Sewer System Revenue | 5.000% | 6/15/46 | 15,000 | 17,152 |
| New York City NY Municipal Water Finance | ||||
| Authority Water & Sewer System Revenue | 5.000% | 6/15/46 | 7,650 | 8,610 |
| 3 New York City NY Municipal Water Finance | ||||
| Authority Water & Sewer System Revenue | ||||
| TOB VRDO | 0.010% | 12/1/15 | 1,500 | 1,500 |
| New York City NY Municipal Water Finance | ||||
| Authority Water & Sewer System Revenue | ||||
| VRDO | 0.010% | 12/1/15 | 6,300 | 6,300 |
| New York City NY Municipal Water Finance | ||||
| Authority Water & Sewer System Revenue | ||||
| VRDO | 0.010% | 12/1/15 | 4,900 | 4,900 |
43
| New York Long-Term Tax-Exempt Fund | ||||
| Face | Market | |||
| Maturity | Amount | Value | ||
| Coupon | Date | ($000) | ($000) | |
| New York City NY Municipal Water Finance | ||||
| Authority Water & Sewer System Revenue | ||||
| VRDO | 0.010% | 12/1/15 | 1,500 | 1,500 |
| New York City NY Municipal Water Finance | ||||
| Authority Water & Sewer System Revenue | ||||
| VRDO | 0.010% | 12/1/15 | 500 | 500 |
| New York City NY Municipal Water Finance | ||||
| Authority Water & Sewer System Revenue | ||||
| VRDO | 0.010% | 12/1/15 | 6,000 | 6,000 |
| New York City NY Municipal Water Finance | ||||
| Authority Water & Sewer System Revenue | ||||
| VRDO | 0.010% | 12/1/15 | 4,600 | 4,600 |
| New York City NY Municipal Water Finance | ||||
| Authority Water & Sewer System Revenue | ||||
| VRDO | 0.010% | 12/1/15 | 2,100 | 2,100 |
| New York City NY Municipal Water Finance | ||||
| Authority Water & Sewer System Revenue | ||||
| VRDO | 0.010% | 12/1/15 | 1,600 | 1,600 |
| New York City NY Municipal Water Finance | ||||
| Authority Water & Sewer System Revenue | ||||
| VRDO | 0.010% | 12/1/15 | 5,500 | 5,500 |
| New York City NY Municipal Water Finance | ||||
| Authority Water & Sewer System Revenue | ||||
| VRDO | 0.010% | 12/7/15 | 5,200 | 5,200 |
| New York City NY Sales Tax Asset Receivable | ||||
| Corp. Revenue | 5.000% | 10/15/26 | 3,000 | 3,683 |
| New York City NY Sales Tax Asset Receivable | ||||
| Corp. Revenue | 5.000% | 10/15/27 | 4,000 | 4,871 |
| New York City NY Sales Tax Asset Receivable | ||||
| Corp. Revenue | 5.000% | 10/15/28 | 8,665 | 10,503 |
| New York City NY Sales Tax Asset Receivable | ||||
| Corp. Revenue | 5.000% | 10/15/29 | 16,000 | 19,279 |
| New York City NY Sales Tax Asset Receivable | ||||
| Corp. Revenue | 5.000% | 10/15/30 | 2,775 | 3,319 |
| New York City NY Sales Tax Asset Receivable | ||||
| Corp. Revenue | 5.000% | 10/15/31 | 11,000 | 13,090 |
| New York City NY Transitional Finance Authority | ||||
| Building Aid Revenue | 5.000% | 1/15/24 (14) | 6,740 | 7,040 |
| New York City NY Transitional Finance Authority | ||||
| Building Aid Revenue | 5.250% | 1/15/25 | 9,500 | 10,669 |
| New York City NY Transitional Finance Authority | ||||
| Building Aid Revenue | 5.000% | 7/15/25 (14) | 5,200 | 5,431 |
| New York City NY Transitional Finance Authority | ||||
| Building Aid Revenue | 5.250% | 1/15/26 | 5,000 | 5,614 |
| New York City NY Transitional Finance Authority | ||||
| Building Aid Revenue | 5.000% | 7/15/26 | 1,970 | 2,386 |
| New York City NY Transitional Finance Authority | ||||
| Building Aid Revenue | 5.000% | 7/15/26 (14) | 6,150 | 6,423 |
| New York City NY Transitional Finance Authority | ||||
| Building Aid Revenue | 5.000% | 7/15/28 | 2,805 | 3,280 |
| New York City NY Transitional Finance Authority | ||||
| Building Aid Revenue | 5.000% | 7/15/29 | 5,000 | 5,812 |
| New York City NY Transitional Finance Authority | ||||
| Building Aid Revenue | 5.000% | 1/15/30 | 500 | 553 |
44
| New York Long-Term Tax-Exempt Fund | ||||
| Face | Market | |||
| Maturity | Amount | Value | ||
| Coupon | Date | ($000) | ($000) | |
| New York City NY Transitional Finance Authority | ||||
| Building Aid Revenue | 5.000% | 7/15/31 | 1,585 | 1,840 |
| New York City NY Transitional Finance Authority | ||||
| Building Aid Revenue | 5.000% | 7/15/31 | 4,260 | 4,895 |
| New York City NY Transitional Finance Authority | ||||
| Building Aid Revenue | 5.000% | 1/15/32 | 500 | 551 |
| New York City NY Transitional Finance Authority | ||||
| Building Aid Revenue | 5.000% | 7/15/32 | 4,000 | 4,641 |
| New York City NY Transitional Finance Authority | ||||
| Building Aid Revenue | 5.125% | 1/15/33 | 7,000 | 7,732 |
| New York City NY Transitional Finance Authority | ||||
| Building Aid Revenue | 5.000% | 7/15/33 | 5,000 | 5,776 |
| New York City NY Transitional Finance Authority | ||||
| Building Aid Revenue | 5.000% | 7/15/33 | 8,205 | 9,359 |
| New York City NY Transitional Finance Authority | ||||
| Building Aid Revenue | 5.125% | 1/15/34 | 10,000 | 11,039 |
| New York City NY Transitional Finance Authority | ||||
| Building Aid Revenue | 5.000% | 7/15/36 | 5,000 | 5,720 |
| New York City NY Transitional Finance Authority | ||||
| Building Aid Revenue | 5.000% | 1/15/37 (12)(3) | 12,120 | 12,626 |
| New York City NY Transitional Finance Authority | ||||
| Building Aid Revenue | 5.000% | 7/15/37 | 13,885 | 15,542 |
| New York City NY Transitional Finance Authority | ||||
| Building Aid Revenue | 5.250% | 7/15/37 | 3,250 | 3,801 |
| New York City NY Transitional Finance Authority | ||||
| Building Aid Revenue | 5.250% | 1/15/39 | 7,110 | 7,876 |
| New York City NY Transitional Finance Authority | ||||
| Building Aid Revenue | 5.000% | 7/15/40 | 5,975 | 6,785 |
| New York City NY Transitional Finance Authority | ||||
| Building Aid Revenue | 5.000% | 7/15/40 | 2,000 | 2,284 |
| New York City NY Transitional Finance Authority | ||||
| Building Aid Revenue | 5.000% | 7/15/40 | 5,200 | 5,930 |
| New York City NY Transitional Finance Authority | ||||
| Building Aid Revenue | 5.000% | 7/15/41 | 2,000 | 2,279 |
| New York City NY Transitional Finance Authority | ||||
| Building Aid Revenue | 5.000% | 7/15/43 | 1,410 | 1,589 |
| New York City NY Transitional Finance Authority | ||||
| Future Tax Revenue | 5.000% | 8/1/16 (Prere.) | 5 | 5 |
| New York City NY Transitional Finance Authority | ||||
| Future Tax Revenue | 5.000% | 5/1/17 (Prere.) | 5,620 | 5,962 |
| New York City NY Transitional Finance Authority | ||||
| Future Tax Revenue | 5.000% | 11/1/17 (Prere.) | 6,725 | 7,263 |
| New York City NY Transitional Finance Authority | ||||
| Future Tax Revenue | 5.000% | 5/1/19 (Prere.) | 3,740 | 4,222 |
| New York City NY Transitional Finance Authority | ||||
| Future Tax Revenue | 5.000% | 5/1/19 (Prere.) | 15 | 17 |
| New York City NY Transitional Finance Authority | ||||
| Future Tax Revenue | 5.000% | 5/1/24 | 3,970 | 4,472 |
| New York City NY Transitional Finance Authority | ||||
| Future Tax Revenue | 5.000% | 11/1/24 | 3,000 | 3,574 |
| New York City NY Transitional Finance Authority | ||||
| Future Tax Revenue | 5.000% | 11/1/25 | 3,000 | 3,707 |
| New York City NY Transitional Finance Authority | ||||
| Future Tax Revenue | 5.250% | 11/1/25 | 1,000 | 1,176 |
45
| New York Long-Term Tax-Exempt Fund | ||||
| Face | Market | |||
| Maturity | Amount | Value | ||
| Coupon | Date | ($000) | ($000) | |
| New York City NY Transitional Finance Authority | ||||
| Future Tax Revenue | 5.250% | 11/1/26 | 1,000 | 1,173 |
| New York City NY Transitional Finance Authority | ||||
| Future Tax Revenue | 5.000% | 2/1/27 | 2,000 | 2,324 |
| New York City NY Transitional Finance Authority | ||||
| Future Tax Revenue | 5.000% | 11/1/27 | 2,500 | 3,027 |
| New York City NY Transitional Finance Authority | ||||
| Future Tax Revenue | 5.000% | 2/1/28 | 2,000 | 2,318 |
| New York City NY Transitional Finance Authority | ||||
| Future Tax Revenue | 5.250% | 2/1/29 | 2,000 | 2,338 |
| New York City NY Transitional Finance Authority | ||||
| Future Tax Revenue | 5.000% | 5/1/29 | 4,985 | 5,599 |
| New York City NY Transitional Finance Authority | ||||
| Future Tax Revenue | 5.000% | 11/1/29 | 5,000 | 6,014 |
| New York City NY Transitional Finance Authority | ||||
| Future Tax Revenue | 5.250% | 2/1/30 | 1,500 | 1,753 |
| New York City NY Transitional Finance Authority | ||||
| Future Tax Revenue | 5.000% | 5/1/30 | 5,000 | 5,585 |
| New York City NY Transitional Finance Authority | ||||
| Future Tax Revenue | 5.000% | 8/1/30 | 4,825 | 5,698 |
| New York City NY Transitional Finance Authority | ||||
| Future Tax Revenue | 5.000% | 11/1/30 | 2,880 | 3,034 |
| New York City NY Transitional Finance Authority | ||||
| Future Tax Revenue | 5.000% | 2/1/31 | 2,500 | 2,949 |
| New York City NY Transitional Finance Authority | ||||
| Future Tax Revenue | 5.000% | 2/1/31 | 2,000 | 2,314 |
| New York City NY Transitional Finance Authority | ||||
| Future Tax Revenue | 5.000% | 11/1/31 | 3,575 | 4,091 |
| New York City NY Transitional Finance Authority | ||||
| Future Tax Revenue | 5.000% | 2/1/32 | 7,300 | 8,465 |
| New York City NY Transitional Finance Authority | ||||
| Future Tax Revenue | 5.000% | 11/1/32 | 5,350 | 6,348 |
| New York City NY Transitional Finance Authority | ||||
| Future Tax Revenue | 5.000% | 8/1/33 | 2,850 | 3,320 |
| New York City NY Transitional Finance Authority | ||||
| Future Tax Revenue | 5.000% | 8/1/33 | 10,260 | 12,074 |
| New York City NY Transitional Finance Authority | ||||
| Future Tax Revenue | 5.000% | 11/1/33 | 9,500 | 11,218 |
| New York City NY Transitional Finance Authority | ||||
| Future Tax Revenue | 5.000% | 2/1/34 | 2,195 | 2,528 |
| New York City NY Transitional Finance Authority | ||||
| Future Tax Revenue | 5.000% | 5/1/34 | 5,000 | 5,783 |
| New York City NY Transitional Finance Authority | ||||
| Future Tax Revenue | 5.000% | 8/1/34 | 10,000 | 11,607 |
| New York City NY Transitional Finance Authority | ||||
| Future Tax Revenue | 5.000% | 2/1/35 | 7,500 | 8,698 |
| New York City NY Transitional Finance Authority | ||||
| Future Tax Revenue | 5.000% | 2/1/35 | 10,000 | 11,433 |
| New York City NY Transitional Finance Authority | ||||
| Future Tax Revenue | 5.500% | 11/1/35 | 3,000 | 3,533 |
| New York City NY Transitional Finance Authority | ||||
| Future Tax Revenue | 5.000% | 8/1/36 | 11,600 | 13,388 |
| New York City NY Transitional Finance Authority | ||||
| Future Tax Revenue | 5.000% | 8/1/37 | 5,000 | 5,797 |
46
| New York Long-Term Tax-Exempt Fund | ||||
| Face | Market | |||
| Maturity | Amount | Value | ||
| Coupon | Date | ($000) | ($000) | |
| New York City NY Transitional Finance Authority | ||||
| Future Tax Revenue | 5.000% | 11/1/38 | 2,000 | 2,242 |
| New York City NY Transitional Finance Authority | ||||
| Future Tax Revenue | 5.000% | 11/1/39 | 3,750 | 4,279 |
| New York City NY Transitional Finance Authority | ||||
| Future Tax Revenue | 5.000% | 2/1/41 | 13,000 | 14,880 |
| New York City NY Transitional Finance Authority | ||||
| Future Tax Revenue | 5.000% | 2/1/42 | 3,505 | 3,922 |
| New York City NY Transitional Finance Authority | ||||
| Future Tax Revenue | 5.000% | 8/1/42 | 2,500 | 2,844 |
| New York City NY Transitional Finance Authority | ||||
| Future Tax Revenue VRDO | 0.010% | 12/1/15 | 2,000 | 2,000 |
| New York City NY Transitional Finance Authority | ||||
| Future Tax Revenue VRDO | 0.010% | 12/7/15 | 8,000 | 8,000 |
| New York City NY Transitional Finance Authority | ||||
| Recovery Revenue VRDO | 0.010% | 12/1/15 | 1,285 | 1,285 |
| New York City NY Transitional Finance Authority | ||||
| Recovery Revenue VRDO | 0.010% | 12/1/15 | 3,200 | 3,200 |
| New York City NY Transitional Finance Authority | ||||
| Recovery Revenue VRDO | 0.010% | 12/1/15 | 1,035 | 1,035 |
| New York City NY Trust for Cultural Resources | ||||
| Revenue (Museum of Modern Art) | 5.000% | 4/1/31 | 4,845 | 5,316 |
| New York City NY Trust for Cultural Resources | ||||
| Revenue (The Juilliard School) | 5.000% | 1/1/34 | 4,000 | 4,412 |
| New York City NY Trust for Cultural Resources | ||||
| Revenue (The Juilliard School) | 5.000% | 1/1/39 | 4,000 | 4,412 |
| New York City NY Trust for Cultural Resources | ||||
| Revenue (The Metropolitan Museum of Art) | ||||
| VRDO | 0.010% | 12/7/15 | 5,500 | 5,500 |
| New York City NY Trust for Cultural Resources | ||||
| Revenue (Whitney Museum of American Art) | 5.000% | 7/1/21 | 1,000 | 1,158 |
| New York City NY Trust for Cultural Resources | ||||
| Revenue (Whitney Museum of American Art) | 5.000% | 7/1/31 | 7,000 | 7,739 |
| New York City NY Trust for Cultural Resources | ||||
| Revenue (Wildlife Conservation Society) | 5.000% | 8/1/33 | 4,000 | 4,633 |
| New York Convention Center Development Corp. | ||||
| Revenue | 5.000% | 11/15/33 | 3,000 | 3,496 |
| New York Convention Center Development Corp. | ||||
| Revenue | 5.000% | 11/15/40 | 12,915 | 14,752 |
| New York Convention Center Development Corp. | ||||
| Revenue | 5.000% | 11/15/45 | 4,000 | 4,540 |
| 3 New York Counties Tobacco Trust Revenue | 6.250% | 6/1/41 | 5,000 | 5,196 |
| New York Liberty Development Corp. Revenue | 5.000% | 11/15/31 | 10,835 | 12,319 |
| New York Liberty Development Corp. Revenue | 5.000% | 12/15/41 | 14,750 | 16,586 |
| New York Liberty Development Corp. Revenue | 5.000% | 9/15/43 | 14,360 | 15,856 |
| New York Liberty Development Corp. Revenue | 5.250% | 12/15/43 | 6,750 | 7,756 |
| New York Liberty Development Corp. Revenue | 5.125% | 1/15/44 | 24,000 | 26,533 |
| New York Liberty Development Corp. Revenue | 5.000% | 11/15/44 | 20,000 | 22,260 |
| New York Liberty Development Corp. Revenue | 5.125% | 11/15/44 | 4,200 | 4,708 |
| New York Liberty Development Corp. Revenue | 5.625% | 7/15/47 | 6,055 | 6,871 |
| New York Liberty Development Corp. Revenue | 6.375% | 7/15/49 | 18,225 | 20,530 |
| New York Liberty Development Corp. Revenue | 5.750% | 11/15/51 | 23,590 | 27,216 |
| New York Liberty Development Corp. Revenue | ||||
| (7 World Trade Center Project) | 5.000% | 9/15/31 | 5,000 | 5,802 |
47
| New York Long-Term Tax-Exempt Fund | ||||
| Face | Market | |||
| Maturity | Amount | Value | ||
| Coupon | Date | ($000) | ($000) | |
| New York Liberty Development Corp. Revenue | ||||
| (7 World Trade Center Project) | 5.000% | 9/15/32 | 5,000 | 5,761 |
| New York Liberty Development Corp. Revenue | ||||
| (7 World Trade Center Project) | 5.000% | 9/15/40 | 4,680 | 5,372 |
| New York Liberty Development Corp. Revenue | ||||
| (7 World Trade Center Project) | 5.000% | 3/15/44 | 4,965 | 5,408 |
| New York Liberty Development Corp. Revenue | ||||
| (Goldman Sachs Headquarters) | 5.250% | 10/1/35 | 50,770 | 60,486 |
| New York Liberty Development Corp. Revenue | ||||
| (Goldman Sachs Headquarters) | 5.500% | 10/1/37 | 9,565 | 11,752 |
| 4 New York Metropolitan Transportation Authority | ||||
| Revenue | 0.463% | 11/1/22 (4) | 3,750 | 3,642 |
| New York Metropolitan Transportation Authority | ||||
| Revenue | 5.000% | 11/15/23 | 4,500 | 4,859 |
| New York Metropolitan Transportation Authority | ||||
| Revenue | 5.000% | 11/15/23 | 1,000 | 1,210 |
| New York Metropolitan Transportation Authority | ||||
| Revenue | 6.250% | 11/15/23 | 5,000 | 5,754 |
| New York Metropolitan Transportation Authority | ||||
| Revenue | 5.000% | 11/15/24 | 1,000 | 1,079 |
| New York Metropolitan Transportation Authority | ||||
| Revenue | 5.000% | 11/15/25 | 1,000 | 1,107 |
| New York Metropolitan Transportation Authority | ||||
| Revenue | 5.000% | 11/15/26 | 2,330 | 2,695 |
| New York Metropolitan Transportation Authority | ||||
| Revenue | 5.000% | 11/15/26 | 3,000 | 3,322 |
| New York Metropolitan Transportation Authority | ||||
| Revenue | 5.000% | 11/15/26 | 10,000 | 11,865 |
| New York Metropolitan Transportation Authority | ||||
| Revenue | 5.000% | 11/15/27 | 5,000 | 5,997 |
| New York Metropolitan Transportation Authority | ||||
| Revenue | 5.000% | 11/15/27 | 5,000 | 5,767 |
| New York Metropolitan Transportation Authority | ||||
| Revenue | 5.000% | 11/15/27 | 4,945 | 5,476 |
| New York Metropolitan Transportation Authority | ||||
| Revenue | 5.000% | 11/15/27 (14) | 2,500 | 2,687 |
| New York Metropolitan Transportation Authority | ||||
| Revenue | 5.000% | 11/15/28 | 6,385 | 7,590 |
| New York Metropolitan Transportation Authority | ||||
| Revenue | 5.000% | 11/15/28 | 4,250 | 5,052 |
| New York Metropolitan Transportation Authority | ||||
| Revenue | 5.000% | 11/15/28 | 2,250 | 2,457 |
| New York Metropolitan Transportation Authority | ||||
| Revenue | 5.000% | 11/15/28 | 4,000 | 4,429 |
| New York Metropolitan Transportation Authority | ||||
| Revenue | 5.250% | 11/15/28 | 1,000 | 1,165 |
| New York Metropolitan Transportation Authority | ||||
| Revenue | 6.500% | 11/15/28 | 5,000 | 5,787 |
| New York Metropolitan Transportation Authority | ||||
| Revenue | 5.000% | 11/15/29 | 3,000 | 3,544 |
| New York Metropolitan Transportation Authority | ||||
| Revenue | 5.250% | 11/15/29 | 1,000 | 1,165 |
| New York Metropolitan Transportation Authority | ||||
| Revenue | 5.000% | 11/15/30 | 3,715 | 4,049 |
48
| New York Long-Term Tax-Exempt Fund | ||||
| Face | Market | |||
| Maturity | Amount | Value | ||
| Coupon | Date | ($000) | ($000) | |
| New York Metropolitan Transportation Authority | ||||
| Revenue | 5.250% | 11/15/30 | 6,540 | 7,880 |
| New York Metropolitan Transportation Authority | ||||
| Revenue | 5.250% | 11/15/30 | 1,150 | 1,339 |
| New York Metropolitan Transportation Authority | ||||
| Revenue | 5.000% | 11/15/32 | 5,000 | 5,755 |
| New York Metropolitan Transportation Authority | ||||
| Revenue | 5.000% | 11/15/32 | 1,500 | 1,730 |
| New York Metropolitan Transportation Authority | ||||
| Revenue | 5.000% | 11/15/32 | 2,050 | 2,352 |
| New York Metropolitan Transportation Authority | ||||
| Revenue | 5.000% | 11/15/33 | 3,500 | 4,023 |
| New York Metropolitan Transportation Authority | ||||
| Revenue | 5.000% | 11/15/35 | 3,000 | 3,452 |
| New York Metropolitan Transportation Authority | ||||
| Revenue | 5.250% | 11/15/37 | 5,000 | 5,815 |
| New York Metropolitan Transportation Authority | ||||
| Revenue | 5.000% | 11/15/38 | 10,000 | 11,249 |
| New York Metropolitan Transportation Authority | ||||
| Revenue | 5.250% | 11/15/38 | 1,000 | 1,175 |
| New York Metropolitan Transportation Authority | ||||
| Revenue | 5.250% | 11/15/39 | 5,000 | 5,833 |
| New York Metropolitan Transportation Authority | ||||
| Revenue | 5.250% | 11/15/40 | 10,000 | 11,417 |
| New York Metropolitan Transportation Authority | ||||
| Revenue | 5.000% | 11/15/41 | 2,000 | 2,265 |
| New York Metropolitan Transportation Authority | ||||
| Revenue | 5.000% | 11/15/42 | 4,000 | 4,441 |
| New York Metropolitan Transportation Authority | ||||
| Revenue | 5.000% | 11/15/42 | 5,000 | 5,586 |
| New York Metropolitan Transportation Authority | ||||
| Revenue | 5.000% | 11/15/45 | 5,180 | 5,823 |
| New York Metropolitan Transportation Authority | ||||
| Revenue | 5.250% | 11/15/55 | 2,045 | 2,318 |
| New York Metropolitan Transportation Authority | ||||
| Revenue (Dedicated Petroleum Tax) | 5.250% | 11/15/28 | 5,000 | 5,682 |
| New York Metropolitan Transportation Authority | ||||
| Revenue (Dedicated Petroleum Tax) | 5.250% | 11/15/29 | 4,000 | 4,576 |
| New York Metropolitan Transportation Authority | ||||
| Revenue (Dedicated Petroleum Tax) | 5.250% | 11/15/30 | 4,000 | 4,569 |
| New York Metropolitan Transportation Authority | ||||
| Revenue (Dedicated Tax Fund) | 5.000% | 11/15/29 | 6,975 | 8,263 |
| New York Metropolitan Transportation Authority | ||||
| Revenue (Dedicated Tax Fund) | 5.000% | 11/15/31 | 11,000 | 12,934 |
| New York Metropolitan Transportation Authority | ||||
| Revenue (Dedicated Tax Fund) | 5.000% | 11/15/33 | 5,000 | 5,840 |
| New York Metropolitan Transportation Authority | ||||
| Revenue (Dedicated Tax Fund) | 5.625% | 11/15/39 | 500 | 562 |
| New York Metropolitan Transportation Authority | ||||
| Revenue (Dedicated Tax Fund) VRDO | 0.010% | 12/1/15 LOC | 2,685 | 2,685 |
| New York Metropolitan Transportation Authority | ||||
| Revenue (Transit Revenue) | 5.000% | 11/15/22 | 5,000 | 5,401 |
| New York Metropolitan Transportation Authority | ||||
| Revenue (Transit Revenue) | 5.000% | 11/15/41 | 10,000 | 11,115 |
49
| New York Long-Term Tax-Exempt Fund | ||||
| Face | Market | |||
| Maturity | Amount | Value | ||
| Coupon | Date | ($000) | ($000) | |
| New York State Dormitory Authority Hospital | ||||
| Revenue (Albany Medical Center Hospital) | 5.000% | 8/15/18 (4) | 7,820 | 7,850 |
| New York State Dormitory Authority Hospital | ||||
| Revenue (Hudson Valley Hospital Center) | 5.000% | 8/15/27 (4) | 4,360 | 4,637 |
| New York State Dormitory Authority Lease | ||||
| Revenue (State University Dormitory Facilities) | 5.000% | 7/1/24 | 3,000 | 3,483 |
| New York State Dormitory Authority Lease | ||||
| Revenue (State University Dormitory Facilities) | 5.000% | 7/1/26 | 1,000 | 1,154 |
| New York State Dormitory Authority Lease | ||||
| Revenue (State University Dormitory Facilities) | 5.000% | 7/1/29 | 4,000 | 4,674 |
| New York State Dormitory Authority Lease | ||||
| Revenue (State University Dormitory Facilities) | 5.000% | 7/1/30 | 1,000 | 1,163 |
| New York State Dormitory Authority Lease | ||||
| Revenue (State University Dormitory Facilities) | 5.000% | 7/1/32 | 1,530 | 1,792 |
| New York State Dormitory Authority Lease | ||||
| Revenue (State University Dormitory Facilities) | 5.000% | 7/1/35 | 1,000 | 1,142 |
| New York State Dormitory Authority Lease | ||||
| Revenue (State University Dormitory Facilities) | 5.000% | 7/1/41 | 11,000 | 12,540 |
| New York State Dormitory Authority Lease | ||||
| Revenue (State University Dormitory Facilities) | 5.000% | 7/1/42 | 13,500 | 15,205 |
| New York State Dormitory Authority Revenue | ||||
| (Barnard College) | 5.000% | 7/1/26 | 750 | 909 |
| New York State Dormitory Authority Revenue | ||||
| (Barnard College) | 4.000% | 7/1/31 | 1,100 | 1,168 |
| New York State Dormitory Authority Revenue | ||||
| (Barnard College) | 4.000% | 7/1/32 | 1,340 | 1,413 |
| New York State Dormitory Authority Revenue | ||||
| (Brooklyn Law School) | 5.000% | 7/1/26 | 1,630 | 1,822 |
| New York State Dormitory Authority Revenue | ||||
| (Brooklyn Law School) | 5.000% | 7/1/27 | 1,210 | 1,345 |
| New York State Dormitory Authority Revenue | ||||
| (Brooklyn Law School) | 5.000% | 7/1/28 | 1,000 | 1,105 |
| New York State Dormitory Authority Revenue | ||||
| (Brooklyn Law School) | 5.000% | 7/1/29 | 1,000 | 1,099 |
| New York State Dormitory Authority Revenue | ||||
| (Catholic Health System Obligated Group) | 5.000% | 7/1/32 | 710 | 775 |
| New York State Dormitory Authority Revenue | ||||
| (City University System) | 5.000% | 7/1/25 | 4,670 | 5,119 |
| New York State Dormitory Authority Revenue | ||||
| (Columbia University) | 5.000% | 7/1/40 | 5,000 | 5,681 |
| New York State Dormitory Authority Revenue | ||||
| (Columbia University) | 5.000% | 10/1/41 | 1,825 | 2,120 |
| New York State Dormitory Authority Revenue | ||||
| (Cornell University) | 5.000% | 7/1/35 | 1,500 | 1,537 |
| New York State Dormitory Authority Revenue | ||||
| (Culinary Institute of America) | 4.000% | 7/1/16 | 355 | 361 |
| New York State Dormitory Authority Revenue | ||||
| (Culinary Institute of America) | 5.000% | 7/1/17 | 300 | 315 |
| New York State Dormitory Authority Revenue | ||||
| (Culinary Institute of America) | 5.000% | 7/1/18 | 325 | 350 |
| New York State Dormitory Authority Revenue | ||||
| (Culinary Institute of America) | 5.000% | 7/1/19 | 250 | 275 |
| New York State Dormitory Authority Revenue | ||||
| (Culinary Institute of America) | 5.000% | 7/1/20 | 400 | 447 |
50
| New York Long-Term Tax-Exempt Fund | ||||
| Face | Market | |||
| Maturity | Amount | Value | ||
| Coupon | Date | ($000) | ($000) | |
| New York State Dormitory Authority Revenue | ||||
| (Culinary Institute of America) | 5.000% | 7/1/21 | 300 | 339 |
| New York State Dormitory Authority Revenue | ||||
| (Culinary Institute of America) | 5.000% | 7/1/28 | 540 | 599 |
| New York State Dormitory Authority Revenue | ||||
| (Culinary Institute of America) | 5.500% | 7/1/33 | 1,000 | 1,138 |
| New York State Dormitory Authority Revenue | ||||
| (Culinary Institute of America) | 5.000% | 7/1/34 | 350 | 380 |
| New York State Dormitory Authority Revenue | ||||
| (Culinary Institute of America) | 5.000% | 7/1/42 | 600 | 636 |
| New York State Dormitory Authority Revenue | ||||
| (Culinary Institute of America) | 5.750% | 7/1/43 | 7,085 | 8,108 |
| New York State Dormitory Authority Revenue | ||||
| (Fordham University) | 4.000% | 7/1/21 | 250 | 278 |
| New York State Dormitory Authority Revenue | ||||
| (Fordham University) | 5.500% | 7/1/36 | 3,000 | 3,551 |
| New York State Dormitory Authority Revenue | ||||
| (Icahn School of Medicine at Mount Sinai) | 5.000% | 7/1/26 | 2,500 | 2,937 |
| New York State Dormitory Authority Revenue | ||||
| (Icahn School of Medicine at Mount Sinai) | 5.000% | 7/1/31 | 3,000 | 3,410 |
| New York State Dormitory Authority Revenue | ||||
| (Icahn School of Medicine at Mount Sinai) | 5.000% | 7/1/33 | 7,325 | 8,258 |
| New York State Dormitory Authority Revenue | ||||
| (Icahn School of Medicine at Mount Sinai) | 5.000% | 7/1/35 | 3,500 | 3,933 |
| New York State Dormitory Authority Revenue | ||||
| (Icahn School of Medicine at Mount Sinai) | 5.000% | 7/1/40 | 7,500 | 8,377 |
| New York State Dormitory Authority Revenue | ||||
| (Long Island University) | 5.000% | 9/1/26 | 2,355 | 2,623 |
| New York State Dormitory Authority Revenue | ||||
| (Long Island University) | 5.000% | 9/1/27 | 1,520 | 1,683 |
| New York State Dormitory Authority Revenue | ||||
| (Memorial Sloan-Kettering Cancer Center) | 5.000% | 7/1/21 | 2,000 | 2,370 |
| New York State Dormitory Authority Revenue | ||||
| (Memorial Sloan-Kettering Cancer Center) | 5.000% | 7/1/23 | 1,490 | 1,779 |
| New York State Dormitory Authority Revenue | ||||
| (Memorial Sloan-Kettering Cancer Center) | 5.000% | 7/1/36 | 1,000 | 1,138 |
| New York State Dormitory Authority Revenue | ||||
| (Mental Health Services Facilities Improvement) | 5.000% | 2/15/28 (4) | 500 | 548 |
| New York State Dormitory Authority Revenue | ||||
| (Miriam Osborn Memorial Home Association) | 5.000% | 7/1/26 | 740 | 793 |
| New York State Dormitory Authority Revenue | ||||
| (Miriam Osborn Memorial Home Association) | 5.000% | 7/1/27 | 650 | 692 |
| New York State Dormitory Authority Revenue | ||||
| (Miriam Osborn Memorial Home Association) | 5.000% | 7/1/29 | 1,000 | 1,062 |
| New York State Dormitory Authority Revenue | ||||
| (Miriam Osborn Memorial Home Association) | 5.000% | 7/1/42 | 500 | 525 |
| New York State Dormitory Authority Revenue | ||||
| (Mount Sinai Hospital Obligated Group) | 5.000% | 7/1/22 | 3,500 | 4,063 |
| New York State Dormitory Authority Revenue | ||||
| (Mount Sinai Hospital Obligated Group) | 5.000% | 7/1/23 | 4,500 | 5,188 |
| New York State Dormitory Authority Revenue | ||||
| (Mount Sinai Hospital Obligated Group) | 5.000% | 7/1/26 | 1,500 | 1,701 |
| New York State Dormitory Authority Revenue | ||||
| (Mount Sinai School of Medicine of | ||||
| New York University) | 5.000% | 7/1/21 | 1,000 | 1,142 |
51
| New York Long-Term Tax-Exempt Fund | ||||
| Face | Market | |||
| Maturity | Amount | Value | ||
| Coupon | Date | ($000) | ($000) | |
| New York State Dormitory Authority Revenue | ||||
| (Mount Sinai School of Medicine of | ||||
| New York University) | 5.150% | 7/1/24 (14) | 2,000 | 2,328 |
| New York State Dormitory Authority Revenue | ||||
| (New York University Hospitals Center) | 5.000% | 7/1/17 (Prere.) | 8,000 | 8,518 |
| New York State Dormitory Authority Revenue | ||||
| (New York University Hospitals Center) | 5.000% | 7/1/20 | 3,000 | 3,073 |
| New York State Dormitory Authority Revenue | ||||
| (New York University Hospitals Center) | 5.000% | 7/1/22 | 900 | 1,057 |
| New York State Dormitory Authority Revenue | ||||
| (New York University Hospitals Center) | 5.000% | 7/1/25 | 1,000 | 1,186 |
| New York State Dormitory Authority Revenue | ||||
| (New York University Hospitals Center) | 5.000% | 7/1/26 | 670 | 788 |
| New York State Dormitory Authority Revenue | ||||
| (New York University Hospitals Center) | 5.750% | 7/1/31 | 1,000 | 1,146 |
| New York State Dormitory Authority Revenue | ||||
| (New York University Hospitals Center) | 6.000% | 7/1/40 | 1,000 | 1,141 |
| 5 New York State Dormitory Authority Revenue | ||||
| (New York University) | 5.000% | 7/1/18 (Prere.) | 15,700 | 17,320 |
| New York State Dormitory Authority Revenue | ||||
| (New York University) | 5.000% | 7/1/30 | 2,000 | 2,390 |
| New York State Dormitory Authority Revenue | ||||
| (New York University) | 5.000% | 7/1/30 | 6,625 | 7,734 |
| New York State Dormitory Authority Revenue | ||||
| (New York University) | 5.000% | 7/1/37 | 4,200 | 4,790 |
| New York State Dormitory Authority Revenue | ||||
| (New York University) | 5.000% | 7/1/37 | 3,250 | 3,707 |
| New York State Dormitory Authority Revenue | ||||
| (New York University) | 5.000% | 7/1/39 | 5,000 | 5,571 |
| New York State Dormitory Authority Revenue | ||||
| (New York University) | 5.000% | 7/1/42 | 10,000 | 11,282 |
| New York State Dormitory Authority Revenue | ||||
| (New York University) | 5.000% | 7/1/48 | 3,000 | 3,399 |
| New York State Dormitory Authority Revenue | ||||
| (North Shore - Long Island Jewish Obligated | ||||
| Group) | 5.000% | 11/1/16 (Prere.) | 3,965 | 4,133 |
| New York State Dormitory Authority Revenue | ||||
| (North Shore - Long Island Jewish Obligated | ||||
| Group) | 5.000% | 11/1/16 (Prere.) | 4,035 | 4,206 |
| New York State Dormitory Authority Revenue | ||||
| (North Shore - Long Island Jewish Obligated | ||||
| Group) | 5.000% | 11/1/16 (Prere.) | 4,285 | 4,467 |
| New York State Dormitory Authority Revenue | ||||
| (North Shore - Long Island Jewish Obligated | ||||
| Group) | 5.000% | 11/1/16 (Prere.) | 5,495 | 5,728 |
| New York State Dormitory Authority Revenue | ||||
| (North Shore - Long Island Jewish Obligated | ||||
| Group) | 5.000% | 11/1/16 (Prere.) | 1,800 | 1,876 |
| New York State Dormitory Authority Revenue | ||||
| (North Shore - Long Island Jewish Obligated | ||||
| Group) | 5.000% | 5/1/20 | 2,520 | 2,879 |
| New York State Dormitory Authority Revenue | ||||
| (North Shore - Long Island Jewish Obligated | ||||
| Group) | 5.000% | 5/1/21 | 1,000 | 1,160 |
52
| New York Long-Term Tax-Exempt Fund | ||||
| Face | Market | |||
| Maturity | Amount | Value | ||
| Coupon | Date | ($000) | ($000) | |
| New York State Dormitory Authority Revenue | ||||
| (North Shore - Long Island Jewish Obligated | ||||
| Group) | 5.000% | 5/1/22 | 1,465 | 1,716 |
| New York State Dormitory Authority Revenue | ||||
| (North Shore - Long Island Jewish Obligated | ||||
| Group) | 5.000% | 5/1/26 | 1,000 | 1,122 |
| New York State Dormitory Authority Revenue | ||||
| (North Shore - Long Island Jewish Obligated | ||||
| Group) | 5.000% | 5/1/27 | 1,535 | 1,809 |
| New York State Dormitory Authority Revenue | ||||
| (North Shore - Long Island Jewish Obligated | ||||
| Group) | 5.000% | 5/1/28 | 2,000 | 2,340 |
| New York State Dormitory Authority Revenue | ||||
| (North Shore - Long Island Jewish Obligated | ||||
| Group) | 5.000% | 5/1/29 | 7,910 | 9,185 |
| New York State Dormitory Authority Revenue | ||||
| (North Shore - Long Island Jewish Obligated | ||||
| Group) | 5.000% | 5/1/30 | 2,000 | 2,309 |
| New York State Dormitory Authority Revenue | ||||
| (North Shore - Long Island Jewish Obligated | ||||
| Group) | 5.000% | 5/1/32 | 2,500 | 2,874 |
| New York State Dormitory Authority Revenue | ||||
| (North Shore - Long Island Jewish Obligated | ||||
| Group) | 5.000% | 5/1/32 | 7,000 | 7,695 |
| New York State Dormitory Authority Revenue | ||||
| (North Shore - Long Island Jewish Obligated | ||||
| Group) | 5.000% | 5/1/33 | 3,500 | 4,012 |
| New York State Dormitory Authority Revenue | ||||
| (North Shore - Long Island Jewish Obligated | ||||
| Group) | 5.250% | 5/1/34 | 1,000 | 1,109 |
| New York State Dormitory Authority Revenue | ||||
| (North Shore - Long Island Jewish Obligated | ||||
| Group) | 5.000% | 5/1/36 | 3,000 | 3,384 |
| New York State Dormitory Authority Revenue | ||||
| (North Shore - Long Island Jewish Obligated | ||||
| Group) | 5.000% | 5/1/39 | 4,000 | 4,381 |
| New York State Dormitory Authority Revenue | ||||
| (North Shore - Long Island Jewish Obligated | ||||
| Group) | 5.000% | 5/1/41 | 2,500 | 2,727 |
| New York State Dormitory Authority Revenue | ||||
| (North Shore - Long Island Jewish Obligated | ||||
| Group) | 5.000% | 5/1/43 | 2,050 | 2,264 |
| New York State Dormitory Authority Revenue | ||||
| (Pace University) | 5.000% | 5/1/25 | 1,300 | 1,425 |
| New York State Dormitory Authority Revenue | ||||
| (Pace University) | 5.000% | 5/1/28 | 1,500 | 1,618 |
| New York State Dormitory Authority Revenue | ||||
| (Pace University) | 5.000% | 5/1/29 | 815 | 875 |
| New York State Dormitory Authority Revenue | ||||
| (Personal Income Tax) | 5.000% | 12/15/16 (Prere.) | 10,000 | 10,467 |
| New York State Dormitory Authority Revenue | ||||
| (Personal Income Tax) | 5.000% | 3/15/26 | 5,000 | 6,141 |
| New York State Dormitory Authority Revenue | ||||
| (Personal Income Tax) | 5.000% | 12/15/26 | 5,825 | 6,930 |
53
| New York Long-Term Tax-Exempt Fund | ||||
| Face | Market | |||
| Maturity | Amount | Value | ||
| Coupon | Date | ($000) | ($000) | |
| New York State Dormitory Authority Revenue | ||||
| (Personal Income Tax) | 5.000% | 2/15/27 | 1,670 | 2,027 |
| New York State Dormitory Authority Revenue | ||||
| (Personal Income Tax) | 5.000% | 3/15/27 | 5,000 | 5,796 |
| New York State Dormitory Authority Revenue | ||||
| (Personal Income Tax) | 5.000% | 3/15/28 | 2,185 | 2,524 |
| New York State Dormitory Authority Revenue | ||||
| (Personal Income Tax) | 5.000% | 3/15/28 | 2,225 | 2,467 |
| New York State Dormitory Authority Revenue | ||||
| (Personal Income Tax) | 5.000% | 3/15/29 | 3,790 | 4,365 |
| New York State Dormitory Authority Revenue | ||||
| (Personal Income Tax) | 5.000% | 2/15/30 | 6,000 | 7,113 |
| New York State Dormitory Authority Revenue | ||||
| (Personal Income Tax) | 5.000% | 3/15/30 | 3,480 | 4,038 |
| New York State Dormitory Authority Revenue | ||||
| (Personal Income Tax) | 5.000% | 2/15/33 | 5,000 | 5,752 |
| New York State Dormitory Authority Revenue | ||||
| (Personal Income Tax) | 5.000% | 3/15/33 | 6,615 | 7,622 |
| New York State Dormitory Authority Revenue | ||||
| (Personal Income Tax) | 5.750% | 3/15/36 | 10,000 | 11,443 |
| New York State Dormitory Authority Revenue | ||||
| (Personal Income Tax) | 5.000% | 2/15/37 | 11,600 | 13,200 |
| New York State Dormitory Authority Revenue | ||||
| (Personal Income Tax) | 5.000% | 3/15/37 | 5,000 | 5,717 |
| New York State Dormitory Authority Revenue | ||||
| (Personal Income Tax) | 5.000% | 3/15/38 | 3,695 | 4,216 |
| New York State Dormitory Authority Revenue | ||||
| (Personal Income Tax) | 5.000% | 3/15/38 | 5,000 | 5,556 |
| New York State Dormitory Authority Revenue | ||||
| (Personal Income Tax) | 5.250% | 3/15/38 | 18,000 | 20,147 |
| New York State Dormitory Authority Revenue | ||||
| (Personal Income Tax) | 5.000% | 2/15/39 | 5,030 | 5,769 |
| New York State Dormitory Authority Revenue | ||||
| (Personal Income Tax) | 5.000% | 2/15/40 | 12,230 | 13,760 |
| New York State Dormitory Authority Revenue | ||||
| (Personal Income Tax) | 5.000% | 3/15/41 | 10,000 | 11,529 |
| New York State Dormitory Authority Revenue | ||||
| (Personal Income Tax) | 5.000% | 3/15/41 | 5,000 | 5,682 |
| New York State Dormitory Authority Revenue | ||||
| (Pratt Institute) | 5.000% | 7/1/23 | 400 | 478 |
| New York State Dormitory Authority Revenue | ||||
| (Pratt Institute) | 5.000% | 7/1/25 | 500 | 597 |
| New York State Dormitory Authority Revenue | ||||
| (Pratt Institute) | 5.000% | 7/1/28 | 1,000 | 1,157 |
| New York State Dormitory Authority Revenue | ||||
| (Pratt Institute) | 5.000% | 7/1/29 | 500 | 574 |
| New York State Dormitory Authority Revenue | ||||
| (Pratt Institute) | 5.000% | 7/1/29 (12) | 3,750 | 4,144 |
| New York State Dormitory Authority Revenue | ||||
| (Pratt Institute) | 5.000% | 7/1/34 | 2,000 | 2,254 |
| New York State Dormitory Authority Revenue | ||||
| (Pratt Institute) | 5.000% | 7/1/39 | 1,750 | 1,946 |
| New York State Dormitory Authority Revenue | ||||
| (Rochester Institute of Technology) | 5.000% | 7/1/25 | 1,355 | 1,595 |
54
| New York Long-Term Tax-Exempt Fund | ||||
| Face | Market | |||
| Maturity | Amount | Value | ||
| Coupon | Date | ($000) | ($000) | |
| New York State Dormitory Authority Revenue | ||||
| (Rochester Institute of Technology) | 5.000% | 7/1/38 | 2,250 | 2,528 |
| New York State Dormitory Authority Revenue | ||||
| (Rochester Institute of Technology) | 5.000% | 7/1/40 | 2,000 | 2,263 |
| New York State Dormitory Authority Revenue | ||||
| (Rochester Institute of Technology) | 5.000% | 7/1/42 | 3,000 | 3,350 |
| New York State Dormitory Authority Revenue | ||||
| (Rockefeller University) | 5.000% | 7/1/33 | 2,670 | 3,083 |
| New York State Dormitory Authority Revenue | ||||
| (Rockefeller University) | 5.000% | 7/1/34 | 2,720 | 3,130 |
| New York State Dormitory Authority Revenue | ||||
| (Rockefeller University) | 5.000% | 7/1/38 | 9,000 | 10,259 |
| New York State Dormitory Authority Revenue | ||||
| (School Districts Financing Program) | 5.000% | 10/1/19 | 4,610 | 5,229 |
| New York State Dormitory Authority Revenue | ||||
| (School Districts Financing Program) | 5.000% | 10/1/20 (15) | 4,990 | 5,780 |
| New York State Dormitory Authority Revenue | ||||
| (School Districts Financing Program) | 5.000% | 10/1/21 | 6,495 | 7,604 |
| New York State Dormitory Authority Revenue | ||||
| (School Districts Financing Program) | 5.000% | 10/1/22 | 1,340 | 1,589 |
| New York State Dormitory Authority Revenue | ||||
| (School Districts Financing Program) | 5.000% | 10/1/25 (4) | 2,860 | 3,398 |
| New York State Dormitory Authority Revenue | ||||
| (School Districts Financing Program) | 5.000% | 10/1/26 (15) | 4,375 | 5,246 |
| New York State Dormitory Authority Revenue | ||||
| (School Districts Financing Program) | 5.000% | 10/1/26 | 1,000 | 1,165 |
| New York State Dormitory Authority Revenue | ||||
| (School Districts Financing Program) | 5.000% | 10/1/27 (4) | 1,000 | 1,185 |
| New York State Dormitory Authority Revenue | ||||
| (School Districts Financing Program) | 5.000% | 10/1/28 (4) | 1,000 | 1,177 |
| New York State Dormitory Authority Revenue | ||||
| (School Districts Financing Program) | 5.000% | 10/1/29 (4) | 1,500 | 1,754 |
| New York State Dormitory Authority Revenue | ||||
| (School Districts Financing Program) | 5.000% | 10/1/31 (4) | 750 | 867 |
| New York State Dormitory Authority Revenue | ||||
| (School Districts Financing Program) | 5.000% | 10/1/32 (4) | 1,000 | 1,152 |
| New York State Dormitory Authority Revenue | ||||
| (School Districts Financing Program) | 5.000% | 10/1/33 (4) | 1,000 | 1,149 |
| New York State Dormitory Authority Revenue | ||||
| (School Districts Financing Program) | 5.000% | 10/1/34 (4) | 1,000 | 1,146 |
| New York State Dormitory Authority Revenue | ||||
| (St. John’s University) | 5.250% | 7/1/17 (Prere.) | 9,000 | 9,630 |
| New York State Dormitory Authority Revenue | ||||
| (St. John’s University) | 5.000% | 7/1/26 | 1,100 | 1,314 |
| New York State Dormitory Authority Revenue | ||||
| (St. John’s University) | 5.000% | 7/1/27 | 650 | 769 |
| New York State Dormitory Authority Revenue | ||||
| (St. John’s University) | 5.000% | 7/1/30 | 1,665 | 1,921 |
| New York State Dormitory Authority Revenue | ||||
| (St. John’s University) | 5.000% | 7/1/31 | 1,500 | 1,723 |
| New York State Dormitory Authority Revenue | ||||
| (St. John’s University) | 5.000% | 7/1/44 | 2,500 | 2,781 |
| New York State Dormitory Authority Revenue | ||||
| (State University Dormitory Facilities) | 5.000% | 7/1/26 | 1,300 | 1,542 |
55
| New York Long-Term Tax-Exempt Fund | ||||
| Face | Market | |||
| Maturity | Amount | Value | ||
| Coupon | Date | ($000) | ($000) | |
| New York State Dormitory Authority Revenue | ||||
| (State University Dormitory Facilities) | 5.000% | 7/1/27 | 2,500 | 2,943 |
| New York State Dormitory Authority Revenue | ||||
| (State University Dormitory Facilities) | 5.000% | 7/1/29 | 2,250 | 2,624 |
| New York State Dormitory Authority Revenue | ||||
| (State University Dormitory Facilities) | 5.250% | 7/1/31 | 2,500 | 2,950 |
| New York State Dormitory Authority Revenue | ||||
| (State University Educational Facilities) | 5.000% | 5/15/26 | 8,000 | 9,413 |
| New York State Dormitory Authority Revenue | ||||
| (State University Educational Facilities) | 5.000% | 5/15/27 | 5,000 | 5,876 |
| New York State Dormitory Authority Revenue | ||||
| (State University Educational Facilities) | 5.000% | 5/15/28 | 3,000 | 3,510 |
| New York State Dormitory Authority Revenue | ||||
| (Teachers College) | 5.000% | 7/1/31 | 1,750 | 1,998 |
| New York State Dormitory Authority Revenue | ||||
| (Teachers College) | 5.000% | 7/1/42 | 2,000 | 2,236 |
| New York State Dormitory Authority Revenue | ||||
| (The New School) | 5.000% | 7/1/16 (Prere.) | 3,665 | 3,766 |
| New York State Dormitory Authority Revenue | ||||
| (The New School) | 6.000% | 7/1/20 (Prere.) | 5,575 | 6,749 |
| New York State Dormitory Authority Revenue | ||||
| (The New School) | 5.250% | 7/1/30 | 3,000 | 3,403 |
| New York State Dormitory Authority Revenue | ||||
| (The New School) | 5.000% | 7/1/40 | 3,000 | 3,385 |
| New York State Dormitory Authority Revenue | ||||
| (The New School) | 5.500% | 7/1/40 | 5,000 | 5,681 |
| New York State Dormitory Authority Revenue | ||||
| (The New School) | 5.000% | 7/1/45 | 3,000 | 3,364 |
| New York State Dormitory Authority Revenue | ||||
| (University of Rochester) | 5.000% | 1/1/17 (Prere.) | 8,405 | 8,798 |
| New York State Dormitory Authority Revenue | ||||
| (University of Rochester) | 5.000% | 1/1/17 (Prere.) | 1,000 | 1,047 |
| New York State Dormitory Authority Revenue | ||||
| (University of Rochester) VRDO | 0.010% | 12/7/15 LOC | 10,000 | 10,000 |
| New York State Dormitory Authority Revenue | ||||
| (Vassar College) | 5.000% | 7/1/46 | 2,500 | 2,647 |
| New York State Dormitory Authority Revenue | ||||
| (Wyckoff Heights Medical Center) | 5.000% | 2/15/21 | 1,000 | 1,172 |
| New York State Dormitory Authority Revenue | ||||
| (Wyckoff Heights Medical Center) | 5.000% | 8/15/21 | 1,250 | 1,479 |
| New York State Dormitory Authority Revenue | ||||
| (Yeshiva University) | 3.750% | 9/1/17 (ETM) | 135 | 141 |
| New York State Dormitory Authority Revenue | ||||
| (Yeshiva University) | 3.750% | 9/1/17 | 655 | 667 |
| New York State Dormitory Authority Revenue | ||||
| (Yeshiva University) | 5.000% | 11/1/17 (ETM) | 390 | 417 |
| New York State Dormitory Authority Revenue | ||||
| (Yeshiva University) | 5.000% | 11/1/17 | 665 | 694 |
| New York State Dormitory Authority Revenue | ||||
| (Yeshiva University) | 5.000% | 11/1/18 (ETM) | 390 | 429 |
| New York State Dormitory Authority Revenue | ||||
| (Yeshiva University) | 5.000% | 11/1/18 | 660 | 698 |
| New York State Dormitory Authority Revenue | ||||
| (Yeshiva University) | 5.000% | 9/1/19 (Prere.) | 65 | 74 |
56
| New York Long-Term Tax-Exempt Fund | ||||
| Face | Market | |||
| Maturity | Amount | Value | ||
| Coupon | Date | ($000) | ($000) | |
| New York State Dormitory Authority Revenue | ||||
| (Yeshiva University) | 5.000% | 9/1/19 (Prere.) | 20 | 23 |
| New York State Dormitory Authority Revenue | ||||
| (Yeshiva University) | 5.000% | 9/1/19 (Prere.) | 350 | 397 |
| New York State Dormitory Authority Revenue | ||||
| (Yeshiva University) | 5.000% | 9/1/19 (Prere.) | 130 | 147 |
| New York State Dormitory Authority Revenue | ||||
| (Yeshiva University) | 5.000% | 9/1/20 | 295 | 313 |
| New York State Dormitory Authority Revenue | ||||
| (Yeshiva University) | 5.000% | 11/1/20 (ETM) | 1,325 | 1,521 |
| New York State Dormitory Authority Revenue | ||||
| (Yeshiva University) | 5.000% | 11/1/20 | 2,265 | 2,441 |
| New York State Dormitory Authority Revenue | ||||
| (Yeshiva University) | 5.000% | 11/1/21 (ETM) | 285 | 332 |
| New York State Dormitory Authority Revenue | ||||
| (Yeshiva University) | 5.000% | 11/1/21 (Prere.) | 370 | 437 |
| New York State Dormitory Authority Revenue | ||||
| (Yeshiva University) | 5.000% | 11/1/21 | 495 | 535 |
| New York State Dormitory Authority Revenue | ||||
| (Yeshiva University) | 5.000% | 9/1/26 | 80 | 82 |
| New York State Dormitory Authority Revenue | ||||
| (Yeshiva University) | 5.000% | 9/1/27 | 1,650 | 1,693 |
| New York State Dormitory Authority Revenue | ||||
| (Yeshiva University) | 5.000% | 9/1/28 | 615 | 629 |
| New York State Dormitory Authority Revenue | ||||
| (Yeshiva University) | 5.000% | 11/1/40 | 630 | 630 |
| New York State Dormitory Authority | ||||
| Sales Tax Revenue | 5.000% | 3/15/26 | 3,000 | 3,696 |
| New York State Dormitory Authority | ||||
| Sales Tax Revenue | 5.000% | 3/15/27 | 3,000 | 3,656 |
| New York State Dormitory Authority | ||||
| Sales Tax Revenue | 5.000% | 3/15/31 | 8,975 | 10,535 |
| New York State Dormitory Authority | ||||
| Sales Tax Revenue | 5.000% | 3/15/32 | 2,650 | 3,098 |
| New York State Dormitory Authority | ||||
| Sales Tax Revenue | 5.000% | 3/15/33 | 5,000 | 5,821 |
| New York State Dormitory Authority | ||||
| Sales Tax Revenue | 5.000% | 3/15/34 | 5,000 | 5,801 |
| New York State Dormitory Authority | ||||
| Sales Tax Revenue | 5.000% | 3/15/35 | 5,240 | 6,062 |
| New York State Dormitory Authority | ||||
| Sales Tax Revenue | 5.000% | 3/15/36 | 7,995 | 9,205 |
| New York State Dormitory Authority | ||||
| Sales Tax Revenue | 5.000% | 3/15/37 | 5,000 | 5,749 |
| New York State Dormitory Authority | ||||
| Sales Tax Revenue | 5.000% | 3/15/38 | 1,200 | 1,359 |
| New York State Dormitory Authority | ||||
| Sales Tax Revenue | 5.000% | 3/15/43 | 13,685 | 15,379 |
| 3 New York State Dormitory Authority | ||||
| Sales Tax Revenue TOB VRDO | 0.020% | 12/7/15 | 7,500 | 7,500 |
| New York State Energy Research & Development | ||||
| Authority Pollution Control Revenue Consolidated | ||||
| Edison Co. of New York Inc. Project) | 0.148% | 5/1/32 (10) | 3,250 | 2,925 |
57
| New York Long-Term Tax-Exempt Fund | ||||
| Face | Market | |||
| Maturity | Amount | Value | ||
| Coupon | Date | ($000) | ($000) | |
| New York State Energy Research & Development | ||||
| Authority Pollution Control Revenue (Consolidated | ||||
| Edison Co. of New York Inc. Project) | 0.148% | 5/1/32 (10) | 3,525 | 3,172 |
| New York State Energy Research & Development | ||||
| Authority Pollution Control Revenue (Consolidated | ||||
| Edison Co. of New York Inc. Project) | 0.148% | 5/1/32 (10) | 2,225 | 2,002 |
| New York State Energy Research & Development | ||||
| Authority Pollution Control Revenue | ||||
| (Rochester Gas & Electric Corp. Project) PUT | 5.000% | 8/1/16 (14) | 7,750 | 7,952 |
| New York State Environmental Facilities Corp. | ||||
| Revenue (Personal Income Tax) | 5.250% | 12/15/24 | 8,000 | 8,982 |
| New York State Environmental Facilities Corp. | ||||
| Revenue (State Clean Water & Drinking Water | ||||
| Revolving Funds) | 5.000% | 9/15/17 (Prere.) | 2,900 | 3,121 |
| New York State Environmental Facilities Corp. | ||||
| Revenue (State Clean Water & Drinking Water | ||||
| Revolving Funds) | 5.000% | 6/15/25 | 1,985 | 1,993 |
| New York State Environmental Facilities Corp. | ||||
| Revenue (State Clean Water & Drinking Water | ||||
| Revolving Funds) | 5.000% | 6/15/25 | 2,000 | 2,369 |
| New York State Environmental Facilities Corp. | ||||
| Revenue (State Clean Water & Drinking Water | ||||
| Revolving Funds) | 5.000% | 6/15/31 | 2,000 | 2,328 |
| New York State Environmental Facilities Corp. | ||||
| Revenue (State Clean Water & Drinking Water | ||||
| Revolving Funds) | 5.000% | 6/15/31 | 5,870 | 6,855 |
| New York State Environmental Facilities Corp. | ||||
| Revenue (State Clean Water & Drinking Water | ||||
| Revolving Funds) | 5.000% | 6/15/32 | 5,000 | 5,817 |
| New York State Environmental Facilities Corp. | ||||
| Revenue (State Clean Water & Drinking Water | ||||
| Revolving Funds) | 5.000% | 6/15/32 | 5,000 | 5,980 |
| New York State Environmental Facilities Corp. | ||||
| Revenue (State Clean Water & Drinking Water | ||||
| Revolving Funds) | 5.000% | 6/15/33 | 5,000 | 5,952 |
| New York State Environmental Facilities Corp. | ||||
| Revenue (State Clean Water & Drinking Water | ||||
| Revolving Funds) | 5.000% | 6/15/34 | 4,145 | 4,861 |
| New York State Environmental Facilities Corp. | ||||
| Revenue (State Clean Water & Drinking Water | ||||
| Revolving Funds) | 5.000% | 6/15/34 | 3,000 | 3,051 |
| New York State Environmental Facilities Corp. | ||||
| Revenue (State Clean Water & Drinking Water | ||||
| Revolving Funds) | 5.000% | 6/15/36 | 1,500 | 1,734 |
| New York State Environmental Facilities Corp. | ||||
| Revenue (State Clean Water & Drinking Water | ||||
| Revolving Funds) | 5.000% | 6/15/41 | 5,900 | 6,777 |
| New York State Environmental Facilities Corp. | ||||
| Revenue (State Revolving Funds) | 5.000% | 11/15/16 (ETM) | 5 | 5 |
| New York State Environmental Facilities Corp. | ||||
| Revenue (State Revolving Funds) | 5.000% | 11/15/16 | 3,005 | 3,141 |
| New York State Environmental Facilities Corp. | ||||
| Revenue (State Revolving Funds) | 5.000% | 11/15/27 | 3,000 | 3,467 |
| New York State Environmental Facilities Corp. | ||||
| Revenue (State Revolving Funds) | 5.000% | 9/15/40 | 2,370 | 2,743 |
58
| New York Long-Term Tax-Exempt Fund | ||||
| Face | Market | |||
| Maturity | Amount | Value | ||
| Coupon | Date | ($000) | ($000) | |
| New York State Environmental Facilities Corp. | ||||
| Revenue (State Revolving Funds) | 5.000% | 5/15/41 | 3,505 | 3,874 |
| New York State Environmental Facilities Corp. | ||||
| Revenue (State Revolving Funds) | 5.000% | 3/15/45 | 5,000 | 5,731 |
| New York State Environmental Facilities Corp. | ||||
| Water Facilities Revenue (United Water | ||||
| New Rochelle Inc. Project) | 4.875% | 9/1/40 | 4,000 | 4,224 |
| New York State GO | 5.000% | 3/1/28 | 14,550 | 17,337 |
| New York State GO | 5.000% | 2/15/39 | 9,500 | 10,579 |
| New York State Housing Finance Agency | ||||
| Housing Revenue | 3.850% | 11/1/42 | 1,405 | 1,411 |
| New York State Housing Finance Agency Revenue | ||||
| (Personal Income Tax) | 5.000% | 3/15/38 | 15,245 | 16,272 |
| New York State Housing Finance Agency Revenue | ||||
| (Personal Income Tax) VRDO | 0.010% | 12/7/15 | 26,100 | 26,100 |
| New York State Liberty Development Corp. | ||||
| Liberty Revenue (3 World Trade Center Project) | 5.375% | 11/15/40 | 3,000 | 3,151 |
| New York State Liberty Development Corp. | ||||
| Liberty Revenue (3 World Trade Center Project) | 5.000% | 11/15/44 | 14,000 | 14,308 |
| New York State Local Government Assistance | ||||
| Corp. Revenue | 5.500% | 4/1/17 | 1,655 | 1,725 |
| New York State Local Government Assistance | ||||
| Corp. Revenue VRDO | 0.010% | 12/7/15 | 11,300 | 11,300 |
| New York State Local Government Assistance | ||||
| Corp. Revenue VRDO | 0.010% | 12/7/15 | 2,000 | 2,000 |
| New York State Mortgage Agency Homeowner | ||||
| Mortgage Revenue | 2.625% | 4/1/41 | 1,895 | 1,937 |
| New York State Mortgage Agency Revenue | ||||
| (NYHELP’s Education Loan) | 4.750% | 11/1/24 | 1,340 | 1,432 |
| New York State Power Authority Revenue | 5.000% | 11/15/38 | 1,000 | 1,118 |
| New York State Thruway Authority Revenue | 5.000% | 5/1/19 | 9,485 | 10,654 |
| New York State Thruway Authority Revenue | 5.000% | 1/1/26 | 2,545 | 2,993 |
| New York State Thruway Authority Revenue | 5.000% | 1/1/27 (14) | 2,000 | 2,145 |
| New York State Thruway Authority Revenue | 5.000% | 1/1/28 (14) | 2,500 | 2,682 |
| New York State Thruway Authority Revenue | 5.000% | 1/1/28 | 5,150 | 6,181 |
| New York State Thruway Authority Revenue | 5.000% | 1/1/29 | 4,000 | 4,751 |
| New York State Thruway Authority Revenue | 5.000% | 1/1/30 | 2,500 | 2,954 |
| New York State Thruway Authority Revenue | 5.000% | 1/1/30 | 4,000 | 4,588 |
| New York State Thruway Authority Revenue | 5.000% | 1/1/31 | 5,500 | 6,465 |
| New York State Thruway Authority Revenue | 5.000% | 1/1/31 | 8,500 | 9,708 |
| New York State Thruway Authority Revenue | 5.000% | 1/1/32 | 4,070 | 4,762 |
| New York State Thruway Authority Revenue | 5.000% | 1/1/37 | 9,000 | 10,133 |
| New York State Thruway Authority Revenue | 5.000% | 1/1/42 | 9,765 | 10,913 |
| New York State Thruway Authority Revenue | ||||
| (Highway & Bridge Trust Fund) | 5.000% | 4/1/17 (Prere.) | 150 | 159 |
| New York State Thruway Authority Revenue | ||||
| (Highway & Bridge Trust Fund) | 5.000% | 4/1/24 | 5,000 | 5,984 |
| New York State Thruway Authority Revenue | ||||
| (Highway & Bridge Trust Fund) | 5.000% | 4/1/26 | 10,000 | 11,850 |
| New York State Thruway Authority Revenue | ||||
| (Highway & Bridge Trust Fund) | 5.000% | 4/1/27 | 2,000 | 2,290 |
| New York State Thruway Authority Revenue | ||||
| (Highway & Bridge Trust Fund) | 5.000% | 4/1/28 | 9,000 | 9,909 |
| New York State Thruway Authority Revenue | ||||
| (Highway & Bridge Trust Fund) | 5.000% | 4/1/28 | 2,000 | 2,290 |
59
| New York Long-Term Tax-Exempt Fund | ||||
| Face | Market | |||
| Maturity | Amount | Value | ||
| Coupon | Date | ($000) | ($000) | |
| New York State Thruway Authority Revenue | ||||
| (Highway & Bridge Trust Fund) | 5.000% | 4/1/29 | 2,000 | 2,302 |
| New York State Thruway Authority Revenue | ||||
| (Highway & Bridge Trust Fund) | 5.000% | 4/1/30 | 2,000 | 2,302 |
| New York State Thruway Authority Revenue | ||||
| (Highway & Bridge Trust Fund) | 5.000% | 4/1/32 | 7,975 | 9,126 |
| New York State Thruway Authority Revenue | ||||
| (Personal Income Tax) | 5.000% | 3/15/24 | 2,500 | 2,921 |
| New York State Thruway Authority Revenue | ||||
| (Personal Income Tax) | 5.000% | 3/15/25 | 2,305 | 2,693 |
| New York State Thruway Authority Revenue | ||||
| (Personal Income Tax) | 5.000% | 3/15/30 | 1,500 | 1,748 |
| New York State Thruway Authority Revenue | ||||
| (Personal Income Tax) | 5.000% | 3/15/30 | 2,735 | 3,170 |
| New York State Thruway Authority Revenue | ||||
| (Personal Income Tax) | 5.000% | 3/15/31 | 1,500 | 1,741 |
| New York State Urban Development Corp. | ||||
| Revenue | 5.625% | 1/1/28 | 3,860 | 4,360 |
| New York State Urban Development Corp. | ||||
| Revenue (Personal Income Tax) | 5.000% | 3/15/26 | 3,365 | 4,089 |
| New York State Urban Development Corp. | ||||
| Revenue (Personal Income Tax) | 5.000% | 3/15/32 | 5,000 | 5,841 |
| New York State Urban Development Corp. | ||||
| Revenue (Personal Income Tax) | 5.000% | 3/15/33 | 3,000 | 3,443 |
| New York State Urban Development Corp. | ||||
| Revenue (Personal Income Tax) | 5.000% | 3/15/33 (14) | 2,500 | 2,718 |
| New York State Urban Development Corp. | ||||
| Revenue (Personal Income Tax) | 5.000% | 3/15/36 | 2,740 | 3,035 |
| New York State Urban Development Corp. | ||||
| Revenue (Personal Income Tax) | 5.000% | 3/15/37 | 7,000 | 7,348 |
| New York State Urban Development Corp. | ||||
| Revenue (Personal Income Tax) | 5.000% | 3/15/43 | 10,000 | 11,245 |
| New York State Urban Development Corp. | ||||
| Revenue (Service Contract) | 5.000% | 1/1/21 | 1,355 | 1,554 |
| New York State Urban Development Corp. | ||||
| Revenue (Service Contract) | 5.250% | 1/1/24 | 10,000 | 11,050 |
| New York State Urban Development Corp. | ||||
| Revenue (Service Contract) VRDO | 0.010% | 12/7/15 | 900 | 900 |
| Niagara Falls NY Bridge Commission Revenue | 6.250% | 10/1/20 (14) | 8,685 | 10,634 |
| Niagara Falls NY Bridge Commission Revenue | 6.250% | 10/1/21 (14) | 9,230 | 11,586 |
| Niagara NY Area Development Corp. Revenue | ||||
| (Niagara University Project) | 5.000% | 5/1/26 | 320 | 353 |
| Niagara NY Area Development Corp. Revenue | ||||
| (Niagara University Project) | 5.000% | 5/1/30 | 2,750 | 2,979 |
| Niagara NY Frontier Transportation Authority | ||||
| Airport Revenue (Buffalo Niagara International | ||||
| Airport) | 4.000% | 4/1/16 | 1,000 | 1,012 |
| 3 Nuveen New York AMT-Free Municipal Income | ||||
| Fund VRDP VRDO | 0.120% | 12/7/15 LOC | 2,500 | 2,500 |
| Onondaga County NY Civic Development Corp. | ||||
| Revenue (Jewish Home of Central New York | ||||
| Obligated Group) | 5.500% | 3/1/24 | 3,000 | 3,004 |
| Onondaga County NY Civic Development Corp. | ||||
| Revenue (Jewish Home of Central New York | ||||
| Obligated Group) | 5.250% | 3/1/31 | 2,000 | 1,894 |
60
| New York Long-Term Tax-Exempt Fund | ||||
| Face | Market | |||
| Maturity | Amount | Value | ||
| Coupon | Date | ($000) | ($000) | |
| Onondaga County NY Civic Development Corp. | ||||
| Revenue (Le Moyne College) | 5.000% | 7/1/28 | 450 | 507 |
| Onondaga County NY Civic Development Corp. | ||||
| Revenue (Le Moyne College) | 5.000% | 7/1/30 | 450 | 500 |
| Onondaga County NY Civic Development Corp. | ||||
| Revenue (Le Moyne College) | 5.000% | 7/1/32 | 1,000 | 1,077 |
| Onondaga County NY Civic Development Corp. | ||||
| Revenue (Le Moyne College) | 5.000% | 7/1/33 | 575 | 630 |
| Onondaga County NY Civic Development Corp. | ||||
| Revenue (Le Moyne College) | 5.000% | 7/1/35 | 635 | 690 |
| Onondaga County NY Civic Development Corp. | ||||
| Revenue (Le Moyne College) | 5.000% | 7/1/40 | 1,940 | 2,095 |
| Onondaga County NY Civic Development Corp. | ||||
| Revenue (Le Moyne College) | 5.000% | 7/1/42 | 1,750 | 1,858 |
| Onondaga County NY Civic Development Corp. | ||||
| Revenue (Le Moyne College) | 5.000% | 7/1/45 | 2,450 | 2,627 |
| Onondaga County NY Civic Development Corp. | ||||
| Revenue (St. Joseph’s Hospital & Health Center) | 5.000% | 7/1/25 | 6,000 | 6,441 |
| Onondaga County NY Trust For Cultural Resources | ||||
| Revenue (Syracuse University Project) | 5.000% | 12/1/31 | 1,000 | 1,165 |
| Otsego County NY Capital Resource Corp. | ||||
| Revenue (Hartwick College) | 4.000% | 10/1/19 | 650 | 692 |
| Otsego County NY Capital Resource Corp. | ||||
| Revenue (Hartwick College) | 5.000% | 10/1/20 | 655 | 730 |
| Otsego County NY Capital Resource Corp. | ||||
| Revenue (Hartwick College) | 5.000% | 10/1/45 | 3,000 | 3,194 |
| Port Authority of New York & New Jersey | ||||
| Revenue | 5.000% | 8/15/28 (4) | 10,000 | 10,726 |
| Port Authority of New York & New Jersey | ||||
| Revenue | 5.000% | 9/1/28 | 2,000 | 2,394 |
| Port Authority of New York & New Jersey | ||||
| Revenue | 5.000% | 5/1/29 | 2,200 | 2,512 |
| Port Authority of New York & New Jersey | ||||
| Revenue | 5.000% | 10/15/29 | 3,500 | 4,214 |
| Port Authority of New York & New Jersey | ||||
| Revenue | 5.000% | 5/1/30 | 2,345 | 2,677 |
| Port Authority of New York & New Jersey | ||||
| Revenue | 5.000% | 5/1/31 | 2,300 | 2,626 |
| Port Authority of New York & New Jersey | ||||
| Revenue | 5.000% | 5/1/32 | 2,500 | 2,852 |
| Port Authority of New York & New Jersey | ||||
| Revenue | 5.000% | 7/15/32 | 6,500 | 7,443 |
| Port Authority of New York & New Jersey | ||||
| Revenue | 5.000% | 5/1/33 | 3,500 | 3,992 |
| Port Authority of New York & New Jersey | ||||
| Revenue | 5.000% | 10/15/33 | 1,750 | 2,070 |
| Port Authority of New York & New Jersey | ||||
| Revenue | 5.000% | 9/1/34 | 1,290 | 1,496 |
| Port Authority of New York & New Jersey | ||||
| Revenue | 5.000% | 7/15/35 | 6,500 | 7,397 |
| Port Authority of New York & New Jersey | ||||
| Revenue | 5.250% | 7/15/36 | 4,000 | 4,590 |
| Port Authority of New York & New Jersey | ||||
| Revenue | 5.000% | 7/15/39 | 10,765 | 12,179 |
61
| New York Long-Term Tax-Exempt Fund | ||||
| Face | Market | |||
| Maturity | Amount | Value | ||
| Coupon | Date | ($000) | ($000) | |
| Port Authority of New York & New Jersey | ||||
| Revenue | 5.000% | 1/15/41 | 10,000 | 11,251 |
| Port Authority of New York & New Jersey | ||||
| Revenue | 5.000% | 10/15/41 | 5,000 | 5,775 |
| Port Authority of New York & New Jersey | ||||
| Revenue | 5.000% | 5/1/45 | 4,000 | 4,581 |
| Port Authority of New York & New Jersey | ||||
| Revenue | 4.000% | 10/15/45 | 3,000 | 3,119 |
| Port Authority of New York & New Jersey | ||||
| Revenue | 5.250% | 10/15/55 | 7,750 | 8,937 |
| Port Authority of New York & New Jersey | ||||
| Special Obligation Revenue (John F. Kennedy | ||||
| International Air Terminal LLC) | 5.500% | 12/1/31 | 7,000 | 8,031 |
| Port Authority of New York & New Jersey | ||||
| Special Obligation Revenue (John F. Kennedy | ||||
| International Air Terminal LLC) | 6.000% | 12/1/36 | 4,000 | 4,667 |
| Port Authority of New York & New Jersey | ||||
| Special Obligation Revenue (John F. Kennedy | ||||
| International Air Terminal LLC) | 6.000% | 12/1/42 | 9,365 | 10,926 |
| St. Lawrence County NY Industrial Development | ||||
| Civic Facility Revenue (St. Lawrence University) | 5.000% | 7/1/43 | 8,870 | 9,845 |
| Suffolk County NY Economic Development Corp. | ||||
| Revenue (Catholic Health Services) | 5.000% | 7/1/28 | 1,500 | 1,685 |
| Suffolk County NY Economic Development Corp. | ||||
| Revenue (Catholic Health Services) | 5.000% | 7/1/28 | 10,750 | 11,892 |
| Suffolk County NY Economic Development Corp. | ||||
| Revenue (Catholic Health Services) | 5.000% | 7/1/29 | 3,000 | 3,348 |
| Suffolk County NY Industrial Development Agency | ||||
| Civic Facility Revenue (Institute of | ||||
| Technology Project) | 5.250% | 3/1/19 | 500 | 505 |
| Suffolk County NY Industrial Development Agency | ||||
| Civic Facility Revenue (Institute of | ||||
| Technology Project) | 5.250% | 3/1/20 | 1,000 | 1,015 |
| Suffolk County NY Industrial Development Agency | ||||
| Civic Facility Revenue (Institute of | ||||
| Technology Project) | 5.000% | 3/1/26 | 1,995 | 2,028 |
| Suffolk County NY Judicial Facilities Agency | ||||
| Lease Revenue (H. Lee Dennison Building) | 5.000% | 11/1/33 | 7,900 | 8,616 |
| Suffolk NY Tobacco Asset Securitization Corp. | ||||
| Revenue | 5.000% | 6/1/32 | 2,675 | 2,924 |
| Suffolk NY Tobacco Asset Securitization Corp. | ||||
| Revenue | 5.250% | 6/1/37 | 3,300 | 3,599 |
| Tobacco Settlement Financing Corp. New York | ||||
| Revenue | 5.000% | 6/1/22 | 5,000 | 5,316 |
| Tompkins County NY Development Corp. | ||||
| Revenue (Ithaca College) | 5.000% | 7/1/32 | 1,555 | 1,779 |
| Tompkins County NY Development Corp. | ||||
| Revenue (Ithaca College) | 5.000% | 7/1/33 | 1,605 | 1,832 |
| Tompkins County NY Industrial Development | ||||
| Agency Civic Facility Revenue (Cornell University) | 5.000% | 7/1/37 | 7,130 | 8,145 |
| Triborough Bridge & Tunnel Authority New York | ||||
| Revenue | 5.000% | 1/1/23 | 1,500 | 1,792 |
| Triborough Bridge & Tunnel Authority New York | ||||
| Revenue | 5.000% | 11/15/24 | 4,000 | 4,825 |
62
| New York Long-Term Tax-Exempt Fund | ||||
| Face | Market | |||
| Maturity | Amount | Value | ||
| Coupon | Date | ($000) | ($000) | |
| Triborough Bridge & Tunnel Authority New York | ||||
| Revenue | 5.000% | 1/1/25 | 2,000 | 2,353 |
| Triborough Bridge & Tunnel Authority New York | ||||
| Revenue | 5.000% | 1/1/26 | 2,000 | 2,336 |
| Triborough Bridge & Tunnel Authority New York | ||||
| Revenue | 5.000% | 11/15/26 | 10,000 | 11,896 |
| Triborough Bridge & Tunnel Authority New York | ||||
| Revenue | 5.000% | 11/15/26 | 500 | 615 |
| Triborough Bridge & Tunnel Authority New York | ||||
| Revenue | 5.000% | 1/1/27 | 6,400 | 7,435 |
| Triborough Bridge & Tunnel Authority New York | ||||
| Revenue | 5.000% | 11/15/27 | 925 | 1,126 |
| Triborough Bridge & Tunnel Authority New York | ||||
| Revenue | 5.000% | 1/1/28 | 2,500 | 2,906 |
| Triborough Bridge & Tunnel Authority New York | ||||
| Revenue | 5.000% | 11/15/28 | 600 | 726 |
| Triborough Bridge & Tunnel Authority New York | ||||
| Revenue | 5.000% | 11/15/28 | 2,675 | 2,956 |
| Triborough Bridge & Tunnel Authority New York | ||||
| Revenue | 5.000% | 11/15/29 | 725 | 869 |
| Triborough Bridge & Tunnel Authority New York | ||||
| Revenue | 5.000% | 11/15/30 | 500 | 596 |
| Triborough Bridge & Tunnel Authority New York | ||||
| Revenue | 5.000% | 11/15/31 | 2,225 | 2,639 |
| Triborough Bridge & Tunnel Authority New York | ||||
| Revenue | 5.000% | 11/15/31 | 6,990 | 8,105 |
| Triborough Bridge & Tunnel Authority New York | ||||
| Revenue | 5.000% | 11/15/33 | 2,000 | 2,351 |
| Triborough Bridge & Tunnel Authority New York | ||||
| Revenue | 5.000% | 11/15/33 | 3,385 | 3,686 |
| Triborough Bridge & Tunnel Authority New York | ||||
| Revenue | 5.000% | 11/15/36 | 2,500 | 2,923 |
| Triborough Bridge & Tunnel Authority New York | ||||
| Revenue | 5.000% | 11/15/37 | 2,500 | 2,916 |
| Triborough Bridge & Tunnel Authority New York | ||||
| Revenue | 5.000% | 11/15/37 | 10,000 | 10,872 |
| Triborough Bridge & Tunnel Authority New York | ||||
| Revenue | 5.250% | 11/15/38 | 15,000 | 16,384 |
| Triborough Bridge & Tunnel Authority New York | ||||
| Revenue | 5.000% | 11/15/40 | 1,000 | 1,151 |
| Triborough Bridge & Tunnel Authority New York | ||||
| Revenue | 5.250% | 11/15/45 | 4,000 | 4,675 |
| 3 Triborough Bridge & Tunnel Authority New York | ||||
| Revenue TOB VRDO | 0.020% | 12/7/15 | 4,000 | 4,000 |
| Triborough Bridge & Tunnel Authority New York | ||||
| Revenue VRDO | 0.010% | 12/7/15 LOC | 6,700 | 6,700 |
| 1 Troy NY Capital Resource Corp. Revenue | ||||
| (Rensselaer Polytechnic Institute Project) | 5.000% | 8/1/23 | 1,000 | 1,182 |
| 1 Troy NY Capital Resource Corp. Revenue | ||||
| (Rensselaer Polytechnic Institute Project) | 5.000% | 8/1/24 | 1,000 | 1,191 |
| 1 Troy NY Capital Resource Corp. Revenue | ||||
| (Rensselaer Polytechnic Institute Project) | 5.000% | 8/1/25 | 1,000 | 1,198 |
| 1 Troy NY Capital Resource Corp. Revenue | ||||
| (Rensselaer Polytechnic Institute Project) | 5.000% | 8/1/26 | 1,000 | 1,194 |
63
| New York Long-Term Tax-Exempt Fund | ||||
| Face | Market | |||
| Maturity | Amount | Value | ||
| Coupon | Date | ($000) | ($000) | |
| 1 Troy NY Capital Resource Corp. Revenue | ||||
| (Rensselaer Polytechnic Institute Project) | 5.000% | 8/1/27 | 1,600 | 1,900 |
| 1 Troy NY Capital Resource Corp. Revenue | ||||
| (Rensselaer Polytechnic Institute Project) | 5.000% | 8/1/28 | 1,000 | 1,175 |
| Troy NY Capital Resource Corp. Revenue | ||||
| (Rensselaer Polytechnic Institute Project) | 5.000% | 9/1/30 | 1,500 | 1,686 |
| Troy NY Capital Resource Corp. Revenue | ||||
| (Rensselaer Polytechnic Institute Project) | 5.125% | 9/1/40 | 3,650 | 4,088 |
| United Nations Development Corp. New York | ||||
| Revenue | 5.000% | 7/1/20 | 3,340 | 3,760 |
| Utility Debt Securitization Authority New York | ||||
| Revenue | 5.000% | 6/15/27 | 3,000 | 3,708 |
| Utility Debt Securitization Authority New York | ||||
| Revenue | 5.000% | 12/15/27 | 5,000 | 6,201 |
| Utility Debt Securitization Authority New York | ||||
| Revenue | 5.000% | 12/15/29 | 5,000 | 5,974 |
| Utility Debt Securitization Authority New York | ||||
| Revenue | 5.000% | 12/15/30 | 10,000 | 11,883 |
| Utility Debt Securitization Authority New York | ||||
| Revenue | 5.000% | 12/15/30 | 1,300 | 1,578 |
| Utility Debt Securitization Authority New York | ||||
| Revenue | 5.000% | 12/15/31 | 7,000 | 8,284 |
| Utility Debt Securitization Authority New York | ||||
| Revenue | 5.000% | 12/15/32 | 9,650 | 11,382 |
| Utility Debt Securitization Authority New York | ||||
| Revenue | 5.000% | 12/15/33 | 3,150 | 3,703 |
| Utility Debt Securitization Authority New York | ||||
| Revenue | 5.000% | 12/15/34 | 5,130 | 6,010 |
| Utility Debt Securitization Authority New York | ||||
| Revenue | 5.000% | 12/15/36 | 5,000 | 5,919 |
| Utility Debt Securitization Authority New York | ||||
| Revenue | 5.000% | 12/15/41 | 15,000 | 17,210 |
| Westchester County NY GO | 5.000% | 7/1/16 (ETM) | 190 | 195 |
| Westchester County NY GO | 5.000% | 7/1/16 | 9,660 | 9,931 |
| Westchester County NY GO | 5.000% | 7/1/17 (ETM) | 200 | 214 |
| Westchester County NY GO | 5.000% | 7/1/17 | 10,140 | 10,848 |
| Westchester County NY Health Care Corp. | ||||
| Revenue | 5.000% | 11/1/21 | 2,500 | 2,892 |
| Westchester County NY Health Care Corp. | ||||
| Revenue | 6.125% | 11/1/37 | 2,100 | 2,361 |
| Westchester County NY Local Development Corp. | ||||
| Revenue (Kendal on Hudson Project) | 3.000% | 1/1/18 | 900 | 926 |
| Westchester County NY Local Development Corp. | ||||
| Revenue (Kendal on Hudson Project) | 5.000% | 1/1/28 | 1,350 | 1,476 |
| Westchester County NY Local Development Corp. | ||||
| Revenue (Kendal on Hudson Project) | 5.000% | 1/1/34 | 1,450 | 1,553 |
| Westchester County NY Local Development Corp. | ||||
| Revenue (Pace University) | 5.000% | 5/1/34 | 1,500 | 1,610 |
| Westchester County NY Local Development Corp. | ||||
| Revenue (Pace University) | 5.500% | 5/1/42 | 3,000 | 3,314 |
| Western Nassau County NY Water Authority | ||||
| Water System Revenue | 5.000% | 4/1/40 | 2,000 | 2,256 |
| Yonkers NY GO | 5.000% | 10/1/20 | 1,000 | 1,152 |
| Yonkers NY GO | 5.000% | 3/15/22 (4) | 1,600 | 1,850 |
64
| New York Long-Term Tax-Exempt Fund | ||||
| Face | Market | |||
| Maturity | Amount | Value | ||
| Coupon | Date | ($000) | ($000) | |
| Yonkers NY GO | 5.000% | 3/15/23 (4) | 1,250 | 1,435 |
| Yonkers NY GO | 5.000% | 3/15/25 (4) | 1,000 | 1,136 |
| 3,923,030 | ||||
| Virgin Islands (0.3%) | ||||
| Virgin Islands Public Finance Authority Revenue | 5.000% | 10/1/25 | 4,200 | 4,548 |
| Virgin Islands Public Finance Authority Revenue | 5.000% | 10/1/32 | 4,900 | 5,236 |
| 9,784 | ||||
| Puerto Rico (0.0%) | ||||
| Puerto Rico Public Finance Corp. Revenue | 6.000% | 8/1/26 (ETM) | 860 | 1,147 |
| Guam (0.0%) | ||||
| Guam Government Waterworks Authority Water | ||||
| & Waste Water System Revenue | 5.000% | 7/1/29 | 1,000 | 1,114 |
| Total Tax-Exempt Municipal Bonds (Cost $3,698,959) | 3,935,075 | |||
| Amount | ||||
| ($000) | ||||
| Other Assets and Liabilities (0.9%) | ||||
| Other Assets | ||||
| Investment in Vanguard | 342 | |||
| Receivables for Accrued Income | 46,398 | |||
| Receivables for Capital Shares Issued | 3,849 | |||
| Other Assets | 2,841 | |||
| Total Other Assets | 53,430 | |||
| Liabilities | ||||
| Payables for Investment Securities Purchased | (10,028) | |||
| Payables for Capital Shares Redeemed | (1,021) | |||
| Payables for Distributions | (3,447) | |||
| Payables to Vanguard | (4,171) | |||
| Other Liabilities | (21) | |||
| Total Liabilities | (18,688) | |||
| Net Assets (100%) | 3,969,817 | |||
65
| New York Long-Term Tax-Exempt Fund | |
| At November 30, 2015, net assets consisted of: | |
| Amount | |
| ($000) | |
| Paid-in Capital | 3,732,005 |
| Undistributed Net Investment Income | — |
| Accumulated Net Realized Gains | 1,694 |
| Unrealized Appreciation (Depreciation) | |
| Investment Securities | 236,116 |
| Futures Contracts | 2 |
| Net Assets | 3,969,817 |
| Investor Shares—Net Assets | |
| Applicable to 35,697,175 outstanding $.001 par value shares of | |
| beneficial interest (unlimited authorization) | 422,568 |
| Net Asset Value Per Share—Investor Shares | $11.84 |
| Admiral Shares—Net Assets | |
| Applicable to 299,660,632 outstanding $.001 par value shares of | |
| beneficial interest (unlimited authorization) | 3,547,249 |
| Net Asset Value Per Share—Admiral Shares | $11.84 |
- See Note A in Notes to Financial Statements.
- Security purchased on a when-issued or delayed-delivery basis for which the fund has not taken delivery as of November 30, 2015.
- Adjustable-rate security.
- Security exempt from registration under Rule 144A of the Securities Act of 1933. Such securities may be sold in transactions exempt from registration, normally to qualified institutional buyers. At November 30, 2015, the aggregate value of these securities was $20,696,000, representing 0.5% of net assets.
- The average or expected maturity is shorter than the final maturity shown because of the possibility of interim principal payments and prepayments or the possibility of the issue being called.
- Securities with a value of $883,000 have been segregated as initial margin for open futures contracts. A key to abbreviations and other references follows the Statement of Net Assets.
See accompanying Notes, which are an integral part of the Financial Statements.
66
New York Long-Term Tax-Exempt Fund
Key to Abbreviations
ARS—Auction Rate Security.
BAN—Bond Anticipation Note.
COP—Certificate of Participation.
CP—Commercial Paper.
FR—Floating Rate.
GAN—Grant Anticipation Note.
GO—General Obligation Bond.
PILOT—Payments in Lieu of Taxes.
PUT—Put Option Obligation.
RAN—Revenue Anticipation Note.
TAN—Tax Anticipation Note.
TOB—Tender Option Bond.
TRAN—Tax Revenue Anticipation Note.
VRDO—Variable Rate Demand Obligation.
VRDP—Variable Rate Demand Preferred.
(ETM)—Escrowed to Maturity.
(Prere.)—Prerefunded.
Scheduled principal and interest payments are guaranteed by:
(1) MBIA (Municipal Bond Investors Assurance).
(2) AMBAC (Ambac Assurance Corporation).
(3) FGIC (Financial Guaranty Insurance Company).
(4) AGM (Assured Guaranty Municipal Corporation).
(5) BIGI (Bond Investors Guaranty Insurance).
(6) Connie Lee Inc.
(7) FHA (Federal Housing Authority).
(8) CapMAC (Capital Markets Assurance Corporation).
(9) American Capital Access Financial Guaranty Corporation.
(10) XL Capital Assurance Inc.
(11) CIFG (CDC IXIS Financial Guaranty).
(12) AGC (Assured Guaranty Corporation).
(13) BHAC (Berkshire Hathaway Assurance Corporation).
(14) NPFG (National Public Finance Guarantee Corporation).
(15) BAM (Build America Mutual Assurance Company).
(16) MAC (Municipal Assurance Corporation).
(17) RAA (Radian Asset Assurance Inc.).
The insurance does not guarantee the market value of the municipal bonds.
LOC—Scheduled principal and interest payments are guaranteed by bank letter of credit.
67
| New York Long-Term Tax-Exempt Fund | |
| Statement of Operations | |
| Year Ended | |
| November 30, 2015 | |
| ($000) | |
| Investment Income | |
| Income | |
| Interest | 131,025 |
| Total Income | 131,025 |
| Expenses | |
| The Vanguard Group—Note B | |
| Investment Advisory Services | 386 |
| Management and Administrative—Investor Shares | 687 |
| Management and Administrative—Admiral Shares | 3,150 |
| Marketing and Distribution—Investor Shares | 97 |
| Marketing and Distribution—Admiral Shares | 398 |
| Custodian Fees | 41 |
| Auditing Fees | 34 |
| Shareholders’ Reports—Investor Shares | 10 |
| Shareholders’ Reports—Admiral Shares | 9 |
| Trustees’ Fees and Expenses | 3 |
| Total Expenses | 4,815 |
| Net Investment Income | 126,210 |
| Realized Net Gain (Loss) | |
| Investment Securities Sold | 15,142 |
| Futures Contracts | (339) |
| Realized Net Gain (Loss) | 14,803 |
| Change in Unrealized Appreciation (Depreciation) | |
| Investment Securities | 7,809 |
| Futures Contracts | 2 |
| Change in Unrealized Appreciation (Depreciation) | 7,811 |
| Net Increase (Decrease) in Net Assets Resulting from Operations | 148,824 |
See accompanying Notes, which are an integral part of the Financial Statements.
68
| New York Long-Term Tax-Exempt Fund | ||
| Statement of Changes in Net Assets | ||
| Year Ended November 30, | ||
| 2015 | 2014 | |
| ($000) | ($000) | |
| Increase (Decrease) in Net Assets | ||
| Operations | ||
| Net Investment Income | 126,210 | 118,791 |
| Realized Net Gain (Loss) | 14,803 | 19,431 |
| Change in Unrealized Appreciation (Depreciation) | 7,811 | 168,120 |
| Net Increase (Decrease) in Net Assets Resulting from Operations | 148,824 | 306,342 |
| Distributions | ||
| Net Investment Income | ||
| Investor Shares | (14,063) | (14,141) |
| Admiral Shares | (112,144) | (104,650) |
| Realized Capital Gain | ||
| Investor Shares | — | — |
| Admiral Shares | — | — |
| Total Distributions | (126,207) | (118,791) |
| Capital Share Transactions | ||
| Investor Shares | 1,288 | 5,394 |
| Admiral Shares | 341,878 | 322,740 |
| Net Increase (Decrease) from Capital Share Transactions | 343,166 | 328,134 |
| Total Increase (Decrease) | 365,783 | 515,685 |
| Net Assets | ||
| Beginning of Period | 3,604,034 | 3,088,349 |
| End of Period1 | 3,969,817 | 3,604,034 |
| 1 Net Assets—End of Period includes undistributed (overdistributed) net investment income of $0 and $0. | ||
See accompanying Notes, which are an integral part of the Financial Statements.
69
| New York Long-Term Tax-Exempt Fund | |||||
| Financial Highlights | |||||
| Investor Shares | |||||
| For a Share Outstanding | Year Ended November 30, | ||||
| Throughout Each Period | 2015 | 2014 | 2013 | 2012 | 2011 |
| Net Asset Value, Beginning of Period | $11.77 | $11.11 | $12.03 | $11.24 | $11.04 |
| Investment Operations | |||||
| Net Investment Income | . 390 | . 404 | .397 | .405 | .420 |
| Net Realized and Unrealized Gain (Loss) | |||||
| on Investments | .070 | .660 | (.920) | .790 | .200 |
| Total from Investment Operations | .460 | 1.064 | (.523) | 1.195 | .620 |
| Distributions | |||||
| Dividends from Net Investment Income | (.390) | (.404) | (.397) | (.405) | (.420) |
| Distributions from Realized Capital Gains | — | — | — | — | — |
| Total Distributions | (.390) | (.404) | (.397) | (.405) | (.420) |
| Net Asset Value, End of Period | $11.84 | $11.77 | $11.11 | $12.03 | $11.24 |
| Total Return1 | 3.97% | 9.71% | -4.38% | 10.80% | 5.77% |
| Ratios/Supplemental Data | |||||
| Net Assets, End of Period (Millions) | $423 | $417 | $391 | $528 | $498 |
| Ratio of Total Expenses to Average Net Assets | 0.20% | 0.20% | 0.20% | 0.20% | 0.20% |
| Ratio of Net Investment Income to | |||||
| Average Net Assets | 3.26% | 3.57% | 3.47% | 3.48% | 3.82% |
| Portfolio Turnover Rate | 17% | 27% | 23% | 16% | 22% |
1 Total returns do not include account service fees that may have applied in the periods shown. Fund prospectuses provide information about any applicable account service fees.
See accompanying Notes, which are an integral part of the Financial Statements.
70
| New York Long-Term Tax-Exempt Fund | |||||
| Financial Highlights | |||||
| Admiral Shares | |||||
| For a Share Outstanding | Year Ended November 30, | ||||
| Throughout Each Period | 2015 | 2014 | 2013 | 2012 | 2011 |
| Net Asset Value, Beginning of Period | $11.77 | $11.11 | $12.03 | $11.24 | $11.04 |
| Investment Operations | |||||
| Net Investment Income | . 400 | .413 | .406 | .414 | .428 |
| Net Realized and Unrealized Gain (Loss) | |||||
| on Investments | .070 | .660 | (.920) | .790 | .200 |
| Total from Investment Operations | .470 | 1.073 | (.514) | 1.204 | .628 |
| Distributions | |||||
| Dividends from Net Investment Income | (.400) | (.413) | (.406) | (.414) | (.428) |
| Distributions from Realized Capital Gains | — | — | — | — | — |
| Total Distributions | (.400) | (.413) | (.406) | (.414) | (.428) |
| Net Asset Value, End of Period | $11.84 | $11.77 | $11.11 | $12.03 | $11.24 |
| Total Return1 | 4.06% | 9.80% | -4.31% | 10.89% | 5.85% |
| Ratios/Supplemental Data | |||||
| Net Assets, End of Period (Millions) | $3,547 | $3,187 | $2,697 | $2,970 | $2,527 |
| Ratio of Total Expenses to Average Net Assets | 0.12% | 0.12% | 0.12% | 0.12% | 0.12% |
| Ratio of Net Investment Income to | |||||
| Average Net Assets | 3.34% | 3.65% | 3.55% | 3.56% | 3.90% |
| Portfolio Turnover Rate | 17% | 27% | 23% | 16% | 22% |
1 Total returns do not include account service fees that may have applied in the periods shown. Fund prospectuses provide information about any applicable account service fees.
See accompanying Notes, which are an integral part of the Financial Statements.
71
New York Long-Term Tax-Exempt Fund
Notes to Financial Statements
Vanguard New York Long-Term Tax-Exempt Fund is registered under the Investment Company Act of 1940 as an open-end investment company, or mutual fund. The fund invests in debt instruments of municipal issuers whose ability to meet their obligations may be affected by economic and political developments in the state. The fund offers two classes of shares: Investor Shares and Admiral Shares. Investor Shares are available to any investor who meets the fund’s minimum purchase requirements. Admiral Shares are designed for investors who meet certain administrative, service, and account-size criteria.
A. The following significant accounting policies conform to generally accepted accounting principles for U.S. investment companies. The fund consistently follows such policies in preparing its financial statements.
1. Security Valuation: Securities are valued as of the close of trading on the New York Stock Exchange (generally 4 p.m., Eastern time) on the valuation date. Bonds, and temporary cash investments acquired over 60 days to maturity, are valued using the latest bid prices or using valuations based on a matrix system (which considers such factors as security prices, yields, maturities, and ratings), both as furnished by independent pricing services. Other temporary cash investments are valued at amortized cost, which approximates market value. Securities for which market quotations are not readily available, or whose values have been affected by events occurring before the fund’s pricing time but after the close of the securities’ primary markets, are valued by methods deemed by the board of trustees to represent fair value.
2. Futures Contracts: The fund uses futures contracts to invest in fixed income asset classes with greater efficiency and lower cost than is possible through direct investment, to add value when these instruments are attractively priced, or to adjust sensitivity to changes in interest rates. The primary risks associated with the use of futures contracts are imperfect correlation between changes in market values of bonds held by the fund and the prices of futures contracts, and the possibility of an illiquid market. Counterparty risk involving futures is mitigated because a regulated clearinghouse is the counterparty instead of the clearing broker. To further mitigate counterparty risk, the fund trades futures contracts on an exchange, monitors the financial strength of its clearing brokers and clearinghouse, and has entered into clearing agreements with its clearing brokers. The clearinghouse imposes initial margin requirements to secure the fund’s performance and requires daily settlement of variation margin representing changes in the market value of each contract.
Futures contracts are valued at their quoted daily settlement prices. The aggregate settlement values of the contracts are not recorded in the Statement of Net Assets. Fluctuations in the value of the contracts are recorded in the Statement of Net Assets as an asset (liability) and in the Statement of Operations as unrealized appreciation (depreciation) until the contracts are closed, when they are recorded as realized futures gains (losses).
During the year ended November 30, 2015, the fund’s average investments in long and short futures contracts represented less than 1% of net assets, based on the average of aggregate settlement values at each quarter-end during the period.
3. Federal Income Taxes: The fund intends to continue to qualify as a regulated investment company and distribute all of its income. Management has analyzed the fund’s tax positions taken for all open federal income tax years (November 30, 2012–2015), and has concluded that no provision for federal income tax is required in the fund’s financial statements.
72
New York Long-Term Tax-Exempt Fund
4. Distributions: Distributions from net investment income are declared daily and paid on the first business day of the following month. Annual distributions from realized capital gains, if any, are recorded on the ex-dividend date.
5. Credit Facility: The fund and certain other funds managed by The Vanguard Group (“Vanguard”) participate in a $3 billion committed credit facility provided by a syndicate of lenders pursuant to a credit agreement that may be renewed annually; each fund is individually liable for its borrowings, if any, under the credit facility. Borrowings may be utilized for temporary and emergency purposes, and are subject to the fund’s regulatory and contractual borrowing restrictions. The participating funds are charged administrative fees and an annual commitment fee of 0.06% of the undrawn amount of the facility; these fees are allocated to the funds based on a method approved by the fund’s board of trustees and included in Management and Administrative expenses on the fund’s Statement of Operations. Any borrowings under this facility bear interest at a rate equal to the higher of the federal funds rate or LIBOR reference rate plus an agreed-upon spread.
The fund had no borrowings outstanding at November 30, 2015, or at any time during the period then ended.
6. Other: Interest income is accrued daily. Premiums and discounts on debt securities purchased are amortized and accreted, respectively, to interest income over the lives of the respective securities. Security transactions are accounted for on the date securities are bought or sold. Costs used to determine realized gains (losses) on the sale of investment securities are those of the specific securities sold.
Each class of shares has equal rights as to assets and earnings, except that each class separately bears certain class-specific expenses related to maintenance of shareholder accounts (included in Management and Administrative expenses) and shareholder reporting. Marketing and distribution expenses are allocated to each class of shares based on a method approved by the board of trustees. Income, other non-class-specific expenses, and gains and losses on investments are allocated to each class of shares based on its relative net assets.
B. In accordance with the terms of a Funds’ Service Agreement (the “FSA”) between Vanguard and the fund, Vanguard furnishes to the fund investment advisory, corporate management, administrative, marketing, and distribution services at Vanguard’s cost of operations (as defined by the FSA). These costs of operations are allocated to the fund based on methods and guidelines approved by the board of trustees. Vanguard does not require reimbursement in the current period for certain costs of operations (such as deferred compensation/benefits and risk/insurance costs); the fund’s liability for these costs of operations is included in Payables to Vanguard on the Statement of Net Assets.
Upon the request of Vanguard, the fund may invest up to 0.40% of its net assets as capital in Vanguard. At November 30, 2015, the fund had contributed to Vanguard capital in the amount of $342,000, representing 0.01% of the fund’s net assets and 0.14% of Vanguard’s capitalization. The fund’s trustees and officers are also directors and employees, respectively, of Vanguard.
C. Various inputs may be used to determine the value of the fund’s investments. These inputs are summarized in three broad levels for financial statement purposes. The inputs or methodologies used to value securities are not necessarily an indication of the risk associated with investing in those securities.
73
New York Long-Term Tax-Exempt Fund
Level 1—Quoted prices in active markets for identical securities.
Level 2—Other significant observable inputs (including quoted prices for similar securities, interest rates, prepayment speeds, credit risk, etc.).
Level 3—Significant unobservable inputs (including the fund’s own assumptions used to determine the fair value of investments).
The following table summarizes the market value of the fund’s investments as of November 30, 2015, based on the inputs used to value them:
| Level 1 | Level 2 | Level 3 | |
| Investments | ($000) | ($000) | ($000) |
| Tax-Exempt Municipal Bonds | — | 3,935,075 | — |
| Futures Contracts—Assets1 | 12 | — | — |
| Futures Contracts—Liabilities1 | (21) | — | — |
| Total | (9) | 3,935,075 | — |
| 1 Represents variation margin on the last day of the reporting period. |
D. At November 30, 2015, the aggregate settlement value of open futures contracts and the related unrealized appreciation (depreciation) were:
| ($000) | ||||
| Aggregate | ||||
| Number of | Settlement | Unrealized | ||
| Long (Short) | Value | Appreciation | ||
| Futures Contracts | Expiration | Contracts | Long (Short) | (Depreciation) |
| 5-Year U.S. Treasury Note | March 2016 | 99 | 11,749 | 2 |
Unrealized appreciation (depreciation) on open futures contracts is required to be treated as realized gain (loss) for tax purposes.
E. Capital gain distributions are determined on a tax basis and may differ from realized capital gains for financial reporting purposes. Differences may be permanent or temporary. Permanent differences are reclassified among capital accounts in the financial statements to reflect their tax character. Temporary differences arise when gains or losses are recognized in different periods for financial statement and tax purposes. These differences will reverse at some time in the future.
The fund used a tax accounting practice to treat a portion of the price of capital shares redeemed during the year as distributions from realized capital gains. Accordingly, the fund has reclassified $918,000 from accumulated net realized gains to paid-in capital.
The fund used capital loss carryforwards of $9,965,000 to offset taxable capital gains realized during the year ended November 30, 2015, reducing the amount of capital gains that would otherwise be available to distribute to shareholders. For tax purposes, at November 30, 2015, the fund had short-term and long-term capital gains of $3,000 and $3,639,000, respectively, available for distribution. Short-term gain distributions are treated as ordinary income dividends for tax purposes.
At November 30, 2015, the cost of investment securities for tax purposes was $3,700,905,000. Net unrealized appreciation of investment securities for tax purposes was $234,170,000, consisting of unrealized gains of $235,766,000 on securities that had risen in value since their purchase and $1,596,000 in unrealized losses on securities that had fallen in value since their purchase.
74
New York Long-Term Tax-Exempt Fund
F. During the year ended November 30, 2015, the fund purchased $1,069,759,000 of investment securities and sold $592,388,000 of investment securities, other than temporary cash investments.
| G. Capital share transactions for each class of shares were: | ||||
| Year Ended November 30, | ||||
| 2015 | 2014 | |||
| Amount | Shares | Amount | Shares | |
| ($000) | (000) | ($000) | (000) | |
| Investor Shares | ||||
| Issued | 105,922 | 9,130 | 109,466 | 9,348 |
| Issued in Lieu of Cash Distributions | 11,814 | 1,002 | 11,679 | 1,012 |
| Redeemed | (116,448) | (9,897) | (115,751) | (10,098) |
| Net Increase (Decrease)—Investor Shares | 1,288 | 235 | 5,394 | 262 |
| Admiral Shares | ||||
| Issued | 694,995 | 58,971 | 583,940 | 50,732 |
| Issued in Lieu of Cash Distributions | 75,223 | 6,378 | 72,354 | 6,273 |
| Redeemed | (428,340) | (36,356) | (333,554) | (29,235) |
| Net Increase (Decrease) —Admiral Shares | 341,878 | 28,993 | 322,740 | 27,770 |
H. Management has determined that no material events or transactions occurred subsequent to November 30, 2015, that would require recognition or disclosure in these financial statements.
75
Report of Independent Registered Public Accounting Firm
To the Board of Trustees of Vanguard New York Tax-Free Funds and the Shareholders of Vanguard New York Tax-Exempt Money Market Fund and Vanguard New York Long-Term Tax-Exempt Fund:
In our opinion, the accompanying statements of net assets and the related statements of operations and of changes in net assets and the financial highlights present fairly, in all material respects, the financial position of Vanguard New York Tax-Exempt Money Market Fund and Vanguard New York Long-Term Tax-Exempt Fund (constituting Vanguard New York Tax-Free Funds, hereafter referred to as the “Funds”) at November 30, 2015, the results of each of their operations for the year then ended, the changes in each of their net assets for each of the two years in the period then ended, and the financial highlights for each of the five years in the period then ended, in conformity with accounting principles generally accepted in the United States of America. These financial statements and financial highlights (hereafter referred to as “financial statements”) are the responsibility of the Funds’ management. Our responsibility is to express an opinion on these financial statements based on our audits. We conducted our audits of these financial statements in accordance with the standards of the Public Company Accounting Oversight Board (United States). Those standards require that we plan and perform the audit to obtain reasonable assurance about whether the financial statements are free of material misstatement. An audit includes examining, on a test basis, evidence supporting the amounts and disclosures in the financial statements, assessing the accounting principles used and significant estimates made by management, and evaluating the overall financial statement presentation. We believe that our audits, which included confirmation of securities at November 30, 2015 by correspondence with the custodian and brokers and the application of alternative auditing procedures where securities purchased had not been received, provide a reasonable basis for our opinion.
/s/PricewaterhouseCoopers LLP
Philadelphia, Pennsylvania
January 13, 2016
Special 2015 tax information (unaudited) for Vanguard New York Long-Term Tax-Exempt Fund
This information for the fiscal year ended November 30, 2015, is included pursuant to provisions of the Internal Revenue Code.
Each fund designates 100% of its income dividends as exempt-interest dividends.
The Long-Term Tax-Exempt Fund distributed $918,000 as capital gain dividends (from net long-term capital gains) to shareholders during the fiscal year.
76
About Your Fund’s Expenses
As a shareholder of the fund, you incur ongoing costs, which include costs for portfolio management, administrative services, and shareholder reports (like this one), among others. Operating expenses, which are deducted from a fund’s gross income, directly reduce the investment return of the fund.
A fund’s expenses are expressed as a percentage of its average net assets. This figure is known as the expense ratio. The following examples are intended to help you understand the ongoing costs (in dollars) of investing in your fund and to compare these costs with those of other mutual funds. The examples are based on an investment of $1,000 made at the beginning of the period shown and held for the entire period.
The accompanying table illustrates your fund’s costs in two ways:
• Based on actual fund return. This section helps you to estimate the actual expenses that you paid over the period. The ”Ending Account Value“ shown is derived from the fund‘s actual return, and the third column shows the dollar amount that would have been paid by an investor who started with $1,000 in the fund. You may use the information here, together with the amount you invested, to estimate the expenses that you paid over the period.
To do so, simply divide your account value by $1,000 (for example, an $8,600 account value divided by $1,000 = 8.6), then multiply the result by the number given for your fund under the heading ”Expenses Paid During Period.“
• Based on hypothetical 5% yearly return. This section is intended to help you compare your fund‘s costs with those of other mutual funds. It assumes that the fund had a yearly return of 5% before expenses, but that the expense ratio is unchanged. In this case—because the return used is not the fund’s actual return—the results do not apply to your investment. The example is useful in making comparisons because the Securities and Exchange Commission requires all mutual funds to calculate expenses based on a 5% return. You can assess your fund’s costs by comparing this hypothetical example with the hypothetical examples that appear in shareholder reports of other funds.
Note that the expenses shown in the table are meant to highlight and help you compare ongoing costs only and do not reflect transaction costs incurred by the fund for buying and selling securities. Further, the expenses do not include any purchase, redemption, or account service fees described in the fund prospectus. If such fees were applied to your account, your costs would be higher. Your fund does not carry a “sales load.”
The calculations assume no shares were bought or sold during the period. Your actual costs may have been higher or lower, depending on the amount of your investment and the timing of any purchases or redemptions.
You can find more information about the fund’s expenses, including annual expense ratios, in the Financial Statements section of this report. For additional information on operating expenses and other shareholder costs, please refer to your fund’s current prospectus.
77
| Six Months Ended November 30, 2015 | |||
| Beginning | Ending | Expenses | |
| Account Value | Account Value | Paid During | |
| 5/31/2015 | 11/30/2015 | Period | |
| Based on Actual Fund Return | |||
| New York Tax-Exempt Money Market Fund | $1,000.00 | $1,000.05 | $0.35 |
| New York Long-Term Tax-Exempt Fund | |||
| Investor Shares | $1,000.00 | $1,027.90 | $1.07 |
| Admiral Shares | 1,000.00 | 1,028.31 | 0.66 |
| Based on Hypothetical 5% Yearly Return | |||
| New York Tax-Exempt Money Market Fund | $1,000.00 | $1,024.72 | $0.36 |
| New York Long-Term Tax-Exempt Fund | |||
| Investor Shares | $1,000.00 | $1,024.02 | $1.07 |
| Admiral Shares | 1,000.00 | 1,024.42 | 0.66 |
The calculations are based on expenses incurred in the most recent six-month period. The fund’s annualized six-month expense ratios for that period are: for the New York Tax-Exempt Money Market Fund, 0.07%; and for the New York Long-Term Tax-Exempt Fund, 0.21% for Investor Shares and 0.13% for Admiral Shares. (The six-month expense ratio for the New York Tax-Exempt Money Market Fund reflects a temporary reduction in operating expenses, described in Note B of the Notes to Financial Statements. Before the reduction, the fund’s annualized six-month expense ratio was 0.16%.) The dollar amounts shown as “Expenses Paid” are equal to the annualized expense ratio multiplied by the average account value over the period, multiplied by the number of days in the most recent six-month period, then divided by the number of days in the most recent 12-month period (183/365).
78
Glossary
7-Day SEC Yield and 30-Day SEC Yield. A money market fund’s 7-day SEC yield is calculated by annualizing its income distributions for the previous seven days, as required by the U.S. Securities and Exchange Commission. For other funds, 30-day SEC yield is derived using a formula specified by the commission. Under the formula, data related to the fund’s security holdings in the previous 30 days are used to calculate the fund’s hypothetical net income for that period, which is then annualized and divided by the fund’s estimated average net assets over the calculation period. For the purposes of this calculation, a security’s income is based on its current market yield to maturity (for bonds), its actual income (for asset-backed securities), or its projected dividend yield (for stocks). Because the SEC yield represents hypothetical annualized income, it will differ—at times significantly—from the fund’s actual experience. As a result, the fund’s income distributions may be higher or lower than implied by the SEC yield.
Average Coupon. The average interest rate paid on the fixed income securities held by a fund. It is expressed as a percentage of face value.
Average Duration. An estimate of how much the value of the bonds held by a fund will fluctuate in response to a change in interest rates. To see how the value could change, multiply the average duration by the change in rates. If interest rates rise by 1 percentage point, the value of the bonds in a fund with an average duration of five years would decline by about 5%. If rates decrease by a percentage point, the value would rise by 5%.
Average Stated Maturity. The average length of time until fixed income securities held by a fund reach maturity and are repaid using the maturity date of the security. The figure reflects the proportion of fund assets represented by each security; it also reflects any futures contracts held. In general, the longer the average stated maturity, the more a fund’s share price will fluctuate in response to changes in market interest rates.
Average Weighted Maturity. The average length of time until fixed income securities held by a fund reach maturity and are repaid. The figure reflects the proportion of fund assets represented by each security.
Beta. A measure of the magnitude of a fund’s past share-price fluctuations in relation to the ups and downs of a given market index. The index is assigned a beta of 1.00. Compared with a given index, a fund with a beta of 1.20 typically would have seen its share price rise or fall by 12% when the index rose or fell by 10%. For this report, beta is based on returns over the past 36 months for both the fund and the index. Note that a fund’s beta should be reviewed in conjunction with its R-squared (see definition). The lower the R-squared, the less correlation there is between the fund and the index, and the less reliable beta is as an indicator of volatility.
79
Credit Quality. For Vanguard money market funds, the Distribution by Credit Quality table includes tier ratings for consistency with SEC Rule 2a-7 under the Investment Company Act of 1940, which governs money market funds. A First Tier security is one that is eligible for money market funds and has been rated in the highest short-term rating category for debt obligations by the requisite nationally recognized statistical rating organizations. Credit-quality ratings are obtained from Moody’s, Fitch, and S&P. For securities rated by all three agencies, where two of them are in agreement and assign the highest rating category, the highest rating applies. If a security is only rated by two agencies, and their ratings are in different categories, the lower of the ratings applies. An unrated security is First Tier if it represents quality comparable to that of a rated security, as determined in accordance with SEC Rule 2a-7. A Second Tier security is one that is eligible for money market funds and is not a First Tier security. For Vanguard tax-exempt bond funds, credit-quality ratings are measured on a scale that generally ranges from AAA (highest) to D (lowest). Credit-quality ratings are obtained from Moody’s and S&P, and the higher rating for each issue is used. ”Not Rated” is used to classify securities for which a rating is not available. Not rated securities include a fund’s investment in Vanguard Market Liquidity Fund or Vanguard Municipal Cash Management Fund, each of which invests in high-quality money market instruments and may serve as a cash management vehicle for the Vanguard funds, trusts, and accounts.
Expense Ratio. A fund’s total annual operating expenses expressed as a percentage of the fund’s average net assets. The expense ratio includes management and administrative expenses, but does not include the transaction costs of buying and selling portfolio securities.
Inception Date. The date on which the assets of a fund (or one of its share classes) are first invested in accordance with the fund’s investment objective. For funds with a subscription period, the inception date is the day after that period ends. Investment performance is measured from the inception date.
R-Squared. A measure of how much of a fund’s past returns can be explained by the returns from the market in general, as measured by a given index. If a fund’s total returns were precisely synchronized with an index’s returns, its R-squared would be 1.00. If the fund’s returns bore no relationship to the index’s returns, its R-squared would be 0. For this report, R-squared is based on returns over the past 36 months for both the fund and the index.
Short-Term Reserves. The percentage of a fund invested in highly liquid, short-term securities that can be readily converted to cash.
Yield to Maturity. The rate of return an investor would receive if the fixed income securities held by a fund were held to their maturity dates.
80
This page intentionally left blank.
This page intentionally left blank.
This page intentionally left blank.
The People Who Govern Your Fund
The trustees of your mutual fund are there to see that the fund is operated and managed in your best interests since, as a shareholder, you are a part owner of the fund. Your fund’s trustees also serve on the board of directors of The Vanguard Group, Inc., which is owned by the Vanguard funds and provides services to them on an at-cost basis.
A majority of Vanguard’s board members are independent, meaning that they have no affiliation with Vanguard or the funds they oversee, apart from the sizable personal investments they have made as private individuals. The independent board members have distinguished backgrounds in business, academia, and public service. Each of the trustees and executive officers oversees 194 Vanguard funds.
The following table provides information for each trustee and executive officer of the fund. More information about the trustees is in the Statement of Additional Information, which can be obtained, without charge, by contacting Vanguard at 800-662-7447, or online at vanguard.com.
InterestedTrustee1
F. William McNabb III
Born 1957. Trustee Since July 2009. Chairman of the Board. Principal Occupation(s) During the Past Five Years and Other Experience: Chairman of the Board of The Vanguard Group, Inc., and of each of the investment companies served by The Vanguard Group, since January 2010; Director of The Vanguard Group since 2008; Chief Executive Officer and President of The Vanguard Group, and of each of the investment companies served by The Vanguard Group, since 2008; Director of Vanguard Marketing Corporation; Managing Director of The Vanguard Group (1995–2008).
IndependentTrustees
Emerson U. Fullwood
Born 1948. Trustee Since January 2008. Principal Occupation(s) During the Past Five Years and Other Experience: Executive Chief Staff and Marketing Officer for North America and Corporate Vice President (retired 2008) of Xerox Corporation (document management products and services); Executive in Residence and 2009–2010 Distinguished Minett Professor at the Rochester Institute of Technology; Director of SPX Corporation (multi-industry manufacturing), the United Way of Rochester, the University of Rochester Medical Center, Monroe Community College Foundation, and North Carolina A&T University.
Rajiv L. Gupta
Born 1945. Trustee Since December 2001.2 Principal Occupation(s) During the Past Five Years and Other Experience: Chairman and Chief Executive Officer (retired 2009) and President (2006–2008) of Rohm and Haas Co. (chemicals); Director of Tyco International PLC (diversified manufacturing and services), Hewlett-Packard Co. (electronic computer manufacturing), and Delphi Automotive PLC (automotive components); Senior Advisor at New Mountain Capital.
Amy Gutmann
Born 1949. Trustee Since June 2006. Principal Occupation(s) During the Past Five Years and Other Experience: President of the University of Pennsylvania; Christopher H. Browne Distinguished Professor of Political Science, School of Arts and Sciences, and Professor of Communication, Annenberg School for Communication, with secondary faculty appointments in the Department of Philosophy, School of Arts and Sciences, and at the Graduate School of Education, University of Pennsylvania; Trustee of the National Constitution Center; Chair of the Presidential Commission for the Study of Bioethical Issues.
JoAnn Heffernan Heisen
Born 1950. Trustee Since July 1998. Principal Occupation(s) During the Past Five Years and Other Experience: Corporate Vice President and Chief Global Diversity Officer (retired 2008) and Member of the Executive Committee (1997–2008) of Johnson & Johnson (pharmaceuticals/medical devices/consumer products); Director of Skytop Lodge Corporation (hotels) and the Robert Wood Johnson Foundation; Member of the Advisory Board of the Institute for Women’s Leadership at Rutgers University.
F. Joseph Loughrey
Born 1949. Trustee Since October 2009. Principal Occupation(s) During the Past Five Years and Other Experience: President and Chief Operating Officer (retired 2009) of Cummins Inc. (industrial machinery); Chairman of the Board of Hillenbrand, Inc. (specialized consumer services), and of Oxfam America; Director of SKF AB (industrial machinery), Hyster-Yale Materials Handling, Inc. (forklift trucks), the Lumina Foundation for Education, and the V Foundation for Cancer Research; Member of the Advisory Council for the College of Arts and Letters and of the Advisory Board to the Kellogg Institute for International Studies, both at the University of Notre Dame.
Mark Loughridge
Born 1953. Trustee Since March 2012. Principal Occupation(s) During the Past Five Years and Other Experience: Senior Vice President and Chief Financial Officer (retired 2013) at IBM (information technology services); Fiduciary Member of IBM’s Retirement Plan Committee (2004–2013); Director of the Dow Chemical Company; Member of the Council on Chicago Booth.
Scott C. Malpass
Born 1962. Trustee Since March 2012. Principal Occupation(s) During the Past Five Years and Other Experience: Chief Investment Officer and Vice President at the University of Notre Dame; Assistant Professor of Finance at the Mendoza College of Business at Notre Dame; Member of the Notre Dame 403(b) Investment Committee; Board Member of TIFF Advisory Services, Inc., and Catholic Investment Services, Inc. (investment advisors); Member of the Investment Advisory Committee of Major League Baseball.
André F. Perold
Born 1952. Trustee Since December 2004. Principal Occupation(s) During the Past Five Years and Other Experience: George Gund Professor of Finance and Banking, Emeritus at the Harvard Business School (retired 2011); Chief Investment Officer and Managing Partner of HighVista Strategies LLC (private investment firm); Director of Rand Merchant Bank; Overseer of the Museum of Fine Arts Boston.
Peter F. Volanakis
Born 1955. Trustee Since July 2009. Principal Occupation(s) During the Past Five Years and Other Experience: President and Chief Operating Officer (retired 2010) of Corning Incorporated (communications equipment); Trustee of Colby-Sawyer College; Member of the Advisory Board of the Norris Cotton Cancer Center and of the Advisory Board of the Parthenon Group (strategy consulting).
Executive Officers
Glenn Booraem
Born 1967. Treasurer Since May 2015. Principal Occupation(s) During the Past Five Years and Other Experience: Principal of The Vanguard Group, Inc.; Treasurer of each of the investment companies served by The Vanguard Group; Controller of each of the investment companies served by The Vanguard Group (2010–2015); Assistant Controller of each of the investment companies served by The Vanguard Group (2001–2010).
Thomas J. Higgins
Born 1957. Chief Financial Officer Since September 2008. Principal Occupation(s) During the Past Five Years and Other Experience: Principal of The Vanguard Group, Inc.; Chief Financial Officer of each of the investment companies served by The Vanguard Group; Treasurer of each of the investment companies served by The Vanguard Group (1998–2008).
Peter Mahoney
Born 1974. Controller Since May 2015. Principal Occupation(s) During the Past Five Years and Other Experience: Head of Global Fund Accounting at The Vanguard Group, Inc.; Controller of each of the investment companies served by The Vanguard Group; Head of International Fund Services at The Vanguard Group (2008–2014).
Heidi Stam
Born 1956. Secretary Since July 2005. Principal Occupation(s) During the Past Five Years and Other Experience: Managing Director of The Vanguard Group, Inc.; General Counsel of The Vanguard Group; Secretary of The Vanguard Group and of each of the investment companies served by The Vanguard Group; Director and Senior Vice President of Vanguard Marketing Corporation.
Vanguard Senior Management Team
Mortimer J. Buckley
Kathleen C. Gubanich
Paul A. Heller
Martha G. King
John T. Marcante
Chris D. McIsaac
James M. Norris
Thomas M. Rampulla
Glenn W. Reed
Karin A. Risi
Chairman Emeritus and Senior Advisor
John J. Brennan
Chairman, 1996–2009
Chief Executive Officer and President, 1996–2008
Founder John C. Bogle
Chairman and Chief Executive Officer, 1974–1996
1 Mr. McNabb is considered an “interested person,” as defined in the Investment Company Act of 1940, because he is an officer of the Vanguard funds.
2 December 2002 for Vanguard Equity Income Fund, the Vanguard Municipal Bond Funds, and the Vanguard State Tax-Exempt Funds.

| P.O. Box 2600 |
| Valley Forge, PA 19482-2600 |
Connect with Vanguard® > vanguard.com
| Fund Information > 800-662-7447 | CFA® is a registered trademark owned by CFA Institute. |
| Direct Investor Account Services > 800-662-2739 | |
| Institutional Investor Services > 800-523-1036 | |
| Text Telephone for People | |
| Who Are Deaf or Hard of Hearing> 800-749-7273 | |
| This material may be used in conjunction | |
| with the offering of shares of any Vanguard | |
| fund only if preceded or accompanied by | |
| the fund’s current prospectus. | |
| All comparative mutual fund data are from Lipper, a | |
| Thomson Reuters Company, or Morningstar, Inc., unless | |
| otherwise noted. | |
| You can obtain a free copy of Vanguard’s proxy voting | |
| guidelines by visiting vanguard.com/proxyreporting or by | |
| calling Vanguard at 800-662-2739. The guidelines are | |
| also available from the SEC’s website, sec.gov. In | |
| addition, you may obtain a free report on how your fund | |
| voted the proxies for securities it owned during the 12 | |
| months ended June 30. To get the report, visit either | |
| vanguard.com/proxyreporting or sec.gov. | |
| You can review and copy information about your fund at | |
| the SEC’s Public Reference Room in Washington, D.C. To | |
| find out more about this public service, call the SEC at | |
| 202-551-8090. Information about your fund is also | |
| available on the SEC’s website, and you can receive | |
| copies of this information, for a fee, by sending a | |
| request in either of two ways: via email addressed to | |
| publicinfo@sec.gov or via regular mail addressed to the | |
| Public Reference Section, Securities and Exchange | |
| Commission, Washington, DC 20549-1520. | |
| © 2016 The Vanguard Group, Inc. | |
| All rights reserved. | |
| Vanguard Marketing Corporation, Distributor. | |
| Q760 012016 | |
Item 2: Code of Ethics. The Registrant has adopted a code of ethics that applies to the Registrant’s principal executive officer, principal financial officer, principal accounting officer or controller or persons performing similar functions. The Code of Ethics was amended during the reporting period covered by this report to make certain technical, non-material changes.
Item 3: Audit Committee Financial Expert. The following members of the Audit Committee have been determined by the Registrant’s Board of Trustees to be Audit Committee Financial Experts serving on its Audit Committee, and to be independent: Rajiv L. Gupta, Amy Gutmann, JoAnn Heffernan Heisen, F. Joseph Loughrey, Mark Loughridge, Scott C. Malpass, and André F. Perold.
Item 4: Principal Accountant Fees and Services.
(a) Audit Fees.
Audit Fees of the Registrant
Fiscal Year Ended November 30, 2015: $63,000
Fiscal Year Ended November 30, 2014: $60,000
Aggregate Audit Fees of Registered Investment Companies in the Vanguard Group.
Fiscal Year Ended November 30, 2015: $7,000,200
Fiscal Year Ended November 30, 2014: $6,605,127
Includes fees billed in connection with audits of the Registrant, other registered investment companies in the Vanguard complex, The Vanguard Group, Inc. and Vanguard Marketing Corporation.
(b) Audit-Related Fees.
Fiscal Year Ended November 30, 2015: $2,899,096
Fiscal Year Ended November 30, 2014: $2,176,479
Includes fees billed in connection with assurance and related services provided to the Registrant, other registered investment companies in the Vanguard complex, The Vanguard Group, Inc., and Vanguard Marketing Corporation.
(c) Tax Fees.
Fiscal Year Ended November 30, 2015: $353,389
Fiscal Year Ended November 30, 2014: $316,869
Includes fees billed in connection with tax compliance, planning, and advice services provided to the Registrant, other registered investment companies in the Vanguard complex, The Vanguard Group, Inc., and Vanguard Marketing Corporation.
(d) All Other Fees.
Fiscal Year Ended November 30, 2015: $202,313
Fiscal Year Ended November 30, 2014: $198,163
Includes fees billed for services related to tax reported information provided to the Registrant, other registered investment companies in the Vanguard complex, The Vanguard Group, Inc., and Vanguard Marketing Corporation.
(e) (1) Pre-Approval Policies. The policy of the Registrant’s Audit Committee is to consider and, if appropriate, approve before the principal accountant is engaged for such services, all specific audit and non-audit services provided to: the Registrant, other registered investment companies in the Vanguard complex, The Vanguard Group, Inc., and entities controlled by The Vanguard Group, Inc. that provide ongoing services to the Registrant. In making a determination, the Audit Committee considers whether the services are consistent with maintaining the principal accountant’s independence.
In the event of a contingency situation in which the principal accountant is needed to provide services in between scheduled Audit Committee meetings, the Chairman of the Audit Committee would be called on to consider and, if appropriate, pre-approve audit or permitted non-audit services in an amount sufficient to complete services through the next Audit Committee meeting, and to determine if such services would be consistent with maintaining the accountant’s independence. At the next scheduled Audit Committee meeting, services and fees would be presented to the Audit Committee for formal consideration, and, if appropriate, approval by the entire Audit Committee. The Audit Committee would again consider whether such services and fees are consistent with maintaining the principal accountant’s independence.
The Registrant’s Audit Committee is informed at least annually of all audit and non-audit services provided by the principal accountant to the Vanguard complex, whether such services are provided to: the Registrant, other registered investment companies in the Vanguard complex, The Vanguard Group, Inc., or other entities controlled by The Vanguard Group, Inc. that provide ongoing services to the Registrant.
(2) No percentage of the principal accountant’s fees or services were approved pursuant to the waiver provision of paragraph (c)(7)(i)(C) of Rule 2-01 of Regulation S-X.
(f) For the most recent fiscal year, over 50% of the hours worked under the principal accountant’s engagement were not performed by persons other than full-time, permanent employees of the principal accountant.
(g) Aggregate Non-Audit Fees.
Fiscal Year Ended November 30, 2015: $555,702
Fiscal Year Ended November 30, 2014: $515,032
Includes fees billed for non-audit services provided to the Registrant, other registered investment companies in the Vanguard complex, The Vanguard Group, Inc., and Vanguard Marketing Corporation.
(h) For the most recent fiscal year, the Audit Committee has determined that the provision of all non-audit services was consistent with maintaining the principal accountant’s independence.
Item 5: Audit Committee of Listed Registrants.
Not Applicable.
Item 6: Investments.
Not Applicable.
Item 7: Disclosure of Proxy Voting Policies and Procedures for Closed-End Management Investment Companies.
Not Applicable.
Item 8: Portfolio Managers of Closed-End Management Investment Companies.
Not Applicable.
Item 9: Purchase of Equity Securities by Closed-End Management Investment Company and Affiliated Purchasers.
Not Applicable.
Item 10: Submission of Matters to a Vote of Security Holders.
Not Applicable.
Item 11: Controls and Procedures.
(a) Disclosure Controls and Procedures. The Principal Executive and Financial Officers concluded that the Registrant’s Disclosure Controls and Procedures are effective based on their evaluation of the Disclosure Controls and Procedures as of a date within 90 days of the filing date of this report.
(b) Internal Control Over Financial Reporting. There were no significant changes in Registrant’s Internal Control Over Financial Reporting or in other factors that could significantly affect this control subsequent to the date of the evaluation, including any corrective actions with regard to significant deficiencies and material weaknesses.
Item 12: Exhibits.
(a) Code of Ethics.
(b) Certifications.
Pursuant to the requirements of the Securities Exchange Act of 1934 and the Investment Company Act of 1940, the registrant has duly caused this report to be signed on its behalf by the undersigned, thereunto duly authorized.
| VANGUARD NEW YORK TAX-FREE FUNDS | |
| By: | /s/ F. WILLIAM MCNABB III* |
| F. WILLIAM MCNABB III | |
| CHIEF EXECUTIVE OFFICER | |
| Date: January 19, 2016 | |
Pursuant to the requirements of the Securities Exchange Act of 1934 and the Investment Company Act of 1940, this report has been signed below by the following persons on behalf of the registrant and in the capacities and on the dates indicated.
| VANGUARD NEW YORK TAX-FREE FUNDS | |
| By: | /s/ F. WILLIAM MCNABB III* |
| F. WILLIAM MCNABB III | |
| CHIEF EXECUTIVE OFFICER | |
| Date: January 19, 2016 | |
| VANGUARD NEW YORK TAX-FREE FUNDS | |
| By: | /s/ THOMAS J. HIGGINS* |
| THOMAS J. HIGGINS | |
| CHIEF FINANCIAL OFFICER | |
| Date: January 19, 2016 | |
* By: /s/ Heidi Stam
Heidi Stam, pursuant to a Power of Attorney filed on April 22, 2014 see file Number 2-17620, Incorporated by Reference.