UNITED STATES
SECURITIES AND EXCHANGE COMMISSION
Washington, D.C. 20549
FORM N-CSR
CERTIFIED SHAREHOLDER REPORT
OF
REGISTERED MANAGEMENT INVESTMENT COMPANIES
Investment Company Act file number: 811-04570
Name of Registrant: |
| Vanguard New York Tax-Free Funds |
Address of Registrant: |
| P.O. Box 2600 |
|
| Valley Forge, PA 19482 |
|
|
|
Name and address of agent for service: |
| Anne E. Robinson, Esquire |
|
| P.O. Box 876 |
|
| Valley Forge, PA 19482 |
Registrant’s telephone number, including area code: (610) 669-1000
Date of fiscal year end: November 30
Date of reporting period: December 1, 2017—November 30, 2018
Item 1: Reports to Shareholders

Annual Report | November 30, 2018
Vanguard New York Tax-Exempt Funds
|
Vanguard New York Municipal Money Market Fund
Vanguard New York Long-Term Tax-Exempt Fund
See the inside front cover for important information about access to your fund’s annual and semiannual shareholder reports.
|
Important information about access to shareholder reports
Beginning on January 1, 2021, as permitted by regulations adopted by the Securities and Exchange Commission, paper copies of your fund’s annual and semiannual shareholder reports will no longer be sent to you by mail, unless you specifically request them. Instead, you will be notified by mail each time a report is posted on the website and will be provided with a link to access the report.
If you have already elected to receive shareholder reports electronically, you will not be affected by this change and do not need to take any action. You may elect to receive shareholder reports and other communications from the fund electronically by contacting your financial intermediary (such as a broker-dealer or bank) or, if you invest directly with the fund, by calling Vanguard at one of the phone numbers on the back cover of this report or by logging on to vanguard.com.
You may elect to receive paper copies of all future shareholder reports free of charge. If you invest through a financial intermediary, you can contact the intermediary to request that you continue to receive paper copies. If you invest directly with the fund, you can call Vanguard at one of the phone numbers on the back cover of this report or log on to vanguard.com. Your election to receive paper copies will apply to all the funds you hold through an intermediary or directly with Vanguard.
Contents |
|
|
|
A Note From Our CEO | 1 |
Your Fund’s Performance at a Glance | 2 |
Advisor’s Report | 3 |
About Your Fund’s Expenses | 7 |
New York Municipal Money Market Fund | 9 |
New York Long-Term Tax-Exempt Fund | 30 |
Please note: The opinions expressed in this report are just that—informed opinions. They should not be considered promises or advice. Also, please keep in mind that the information and opinions cover the period through the date on the front of this report. Of course, the risks of investing in your fund are spelled out in the prospectus.
A Note From Our CEO

Tim Buckley
President and Chief Executive Officer
Dear Shareholder,
Over the years, I’ve found that prudent investors exhibit a common trait: discipline. No matter how the markets move or what new investing fad hits the headlines, those who stay focused on their goals and tune out the noise are set up for long-term success.
The prime gateway to investing is saving, and you don’t usually become a saver without a healthy dose of discipline. Savers make the decision to sock away part of their income, which means spending less and delaying gratification, no matter how difficult that may be.
Of course, disciplined investing extends beyond diligent saving. The financial markets, in the short term especially, are unpredictable; I have yet to meet the investor who can time them perfectly. It takes discipline to resist the urge to go all-in when markets are frothy or to retreat when things look bleak.
Staying put with your investments is one strategy for handling volatility. Another, rebalancing, requires even more discipline because it means steering your money away from strong performers and toward poorer performers.
Patience—a form of discipline—is also the friend of long-term investors. Higher returns are the potential reward for weathering the market’s turbulence and uncertainty.
It’s important to be prepared for that turbulence, whenever it appears. Don’t panic. Don’t chase returns or look for answers outside the asset classes you trust. And be sure to rebalance periodically, even when there’s turmoil.
Whether you’re a master of self-control, get a boost from technology, or work with a professional advisor, know that discipline is necessary to get the most out of your investment portfolio. And know that Vanguard is with you for the entire ride.
Thank you for your continued loyalty.
Sincerely,
![]()
Mortimer J. Buckley
President and Chief Executive Officer
December 18, 2018
Your Fund’s Performance at a Glance
· For the 12 months ended November 30, 2018, Vanguard New York Long-Term Tax-Exempt Fund returned 0.48% for Investor Shares and 0.56% for Admiral™ Shares. It underperformed its benchmark. Vanguard New York Municipal Money Market Fund returned 1.24%, outperforming the average return of its peers.
· Although fundamentals remained solid, New York municipal bonds went through a bumpy patch with the passing of new federal tax legislation in December 2017. Prices declined, especially among longer-dated securities.
· The Long-Term Fund benefited from its holdings in lower-quality investment-grade bonds but was hurt by security selection and a duration longer than that of its benchmark.
· Money market returns moved higher in response to the actions of the Federal Reserve, which raised rates four times during the period and indicated that more hikes would follow.
Market Barometer
|
| Average Annual Total Returns | ||
|
| Periods Ended November 30, 2018 | ||
|
| One Year | Three Years | Five Years |
Stocks |
|
|
|
|
Russell 1000 Index (Large-caps) |
| 5.92% | 11.94% | 10.89% |
Russell 2000 Index (Small-caps) |
| 0.57 | 10.08 | 7.50 |
Russell 3000 Index (Broad U.S. market) |
| 5.53 | 11.80 | 10.62 |
FTSE All-World ex US Index (International) |
| -7.98 | 5.59 | 2.17 |
|
|
|
|
|
Bonds |
|
|
|
|
Bloomberg Barclays U.S. Aggregate Bond Index |
| -1.34% | 1.33% | 2.03% |
Bloomberg Barclays Municipal Bond Index |
| 1.13 | 2.13 | 3.52 |
FTSE Three-Month U.S. Treasury Bill Index |
| 1.76 | 0.92 | 0.55 |
|
|
|
|
|
CPI |
|
|
|
|
Consumer Price Index |
| 2.18% | 2.02% | 1.58% |
Advisor’s Report
For the 12 months ended November 30, 2018, Vanguard New York Long-Term Tax-Exempt Fund returned 0.48% for Investor Shares and 0.56% for Admiral Shares. Those results lagged both the 0.86% return of the benchmark, the Bloomberg Barclays New York Municipal Bond Index, which includes bonds across the maturity spectrum.
Vanguard New York Municipal Money Market Fund returned 1.24%, outpacing the average return of its peers, which was 0.83%.
As municipal bond prices fell, yields rose. The Long-Term Fund’s 30-day SEC yield climbed 89 basis points to 3.06% for Investor Shares and 85 basis points to 3.12% for Admiral Shares over the period. The Money Market Fund’s 7-day SEC yield climbed 74 basis points to 1.58%. (A basis point is one one-hundredth of a percentage point.)
The funds are permitted to invest in securities that can generate income distributions subject to the alternative minimum tax (AMT). As of the end of the fiscal year, however, only the Money Market Fund owned such securities.
The investment environment
Macroeconomic fundamentals remained supportive throughout the year. The U.S. economy expanded at a robust pace, boosted by tax cuts and more government spending. The unemployment rate dropped to 3.7%, an almost 50-year low, and inflation moved up to hover near the Federal Reserve’s target of 2%.
Yields of Tax-Exempt Municipal Securities
(National Averages, AAA-Rated General Obligation Issues)
|
| November 30, | November 30, |
Maturity |
| 2017 | 2018 |
2 years |
| 1.57% | 1.98% |
5 years |
| 1.76 | 2.16 |
10 years |
| 2.15 | 2.55 |
30 years |
| 2.79 | 3.27 |
Source: Vanguard.
The Fed continued to normalize monetary policy through further cuts to its balance sheet and four additional increases to the federal funds target rate, putting it at 2%–2.25%. (The Fed made another quarter-percentage-point hike just after the close of the period.)
Despite the robust backdrop, the markets experienced some volatility. They swooned in late January on concerns that wage gains might push inflation higher and lead to the Fed raising rates more aggressively. October was another rough patch. Trade tensions with China intensified, and Fed Chairman Jerome Powell commented on how much higher rates might go, although he went on to tamp down expectations in late November.
The muni market also had to contend with the new federal tax law that was passed in December 2017, which affected supply. One significant change is that municipalities can no longer issue bonds to advance-refund outstanding tax-exempt debt. The tax bill also included a provision— which was dropped just before passage— to eliminate tax exemptions for private-activity bonds issued for airports and not-for-profit hospitals and colleges. All of this resulted in a much higher level of New York muni issuance in December 2017 than a year earlier, and it’s been lower than usual since then.
The reduction in the statutory federal corporate tax rate to 21% also affected demand for munis, as it made their tax-equivalent yields a little less attractive to nontraditional buyers such as banks and insurance companies (a fairly narrow segment of the market). Municipalities responded by structuring issuance more for traditional buyers, which boosted usable supply for retail investors and mutual funds. A cap on deductions for state and local taxes and mortgage interest payments has also added to the attractiveness of muni bonds for New York residents. Overall, those factors helped improve the balance between supply and demand.
Bouts of volatility aside, muni bond yields largely took their cues from the U.S. Treasury market, where yields across the maturity spectrum ended the period higher.
New York’s overall credit profile remains stable. (Standard & Poor’s November downgrades of the state’s sales tax and personal income tax bonds were a result of the firm’s application of its revised criteria for priority-lien tax revenue debt.) The state budget for fiscal year 2019 was passed on time. It kept spending growth to a targeted limit of 2% for the eighth consecutive year, even with significant increases in spending for education and urgently needed New York City subway repairs. Thanks to higher-than-expected revenues, the state ended the 2018 fiscal year on March 31 with a General Fund surplus, and results through September 2018 were in line with projections. Amazon’s new headquarters in the New York City neighborhood of Long Island City is expected to create 25,000 new jobs.
Although that will benefit the regional economy, it will also put additional pressure on infrastructure, including transportation, schools, and housing.
Management of the funds
The Long-Term Fund’s duration (a measure in years of a portfolio’s sensitivity to changes in interest rates) is structurally longer than that of its benchmark, which includes bonds of all maturities. That difference in duration was the primary detractor from the fund’s relative performance during this period of rising rates.
The Long-Term Fund’s overweight credit exposure helped its relative performance. The fund’s tilt toward bonds rated A and BBB, on the lower rungs of the investment-grade credit ladder, was in place mainly to capture their additional yield, especially as credit spreads versus Treasuries were fairly tight. Over the 12 months, however, lower-rung New York munis, especially those rated BBB, performed better than their higher-quality counterparts. As measured by the Bloomberg Barclays New York Municipal Bond Index, BBB-rated munis returned 2.42%, compared with 0.54% for AAA-rated munis.
Our deep and experienced bench of credit analysts helps us navigate this large, fragmented market. Security selection played out well in some segments, including special assessment bonds, but detracted in a number of others during the period, including local general obligation bonds and airport/port revenue bonds.
Adding premium callable bonds worked in our favor. These securities, which may be redeemed before maturity, generally offer attractive yields and favorable total return potential across many interest rate scenarios.
In the Money Market Fund, we maintained fairly high levels of liquidity. We also continued to hold variable-rate demand notes; their coupons reset periodically to reflect the prevailing interest rate environment. That positioning, along with a low expense ratio, helped the fund outperform its peers.
The outlook
In the absence of any external shocks, the U.S. economy is on pace to break above its long-term potential growth rate in 2018 and 2019. The front-loaded effects of tax cuts and increased government spending on top of solid fundamentals should boost growth before it later drops back toward 2%. Along with some upward pressure on wages reflecting the tight labor market, this may push up U.S. core inflation through the first part of 2019. Against that backdrop, the Fed is likely to raise rates further and keep trimming the amount of Treasuries and mortgage-backed securities on its balance sheet.
We see this bounce as cyclical, however. We expect long-term structural pressures from an aging population, global sourcing of goods and labor, and technological disruptions to result in moderate long-run growth and inflation.
We may see bouts of volatility in the bond market related to shifting expectations for inflation and interest rates. Other potential volatility triggers we’ll be watching include an intensification of trade disputes, flare-ups in geopolitical tensions, uncertainty over Brexit, and government spending in Italy.
We anticipate a convergence in global monetary policy. Central banks in developed countries should adopt less accommodative stances—some raising rates, some planning to do so, some reducing quantitative easing. Withdrawing that accommodation unexpectedly or too quickly could rattle the markets.
As always, our experienced team of portfolio managers, credit analysts, and traders will continue to seek out opportunities to add to the funds’ performance, whatever the markets may bring.
Paul M. Malloy, CFA, Principal,
Head of Municipal Bond Group
Adam M. Ferguson, CFA, Portfolio Manager
John P. Grimes, CFA, Portfolio Manager
Vanguard Fixed Income Group
December 18, 2018
About Your Fund’s Expenses
As a shareholder of the fund, you incur ongoing costs, which include costs for portfolio management, administrative services, and shareholder reports (like this one), among others. Operating expenses, which are deducted from a fund’s gross income, directly reduce the investment return of the fund.
A fund’s expenses are expressed as a percentage of its average net assets. This figure is known as the expense ratio. The following examples are intended to help you understand the ongoing costs (in dollars) of investing in your fund and to compare these costs with those of other mutual funds. The examples are based on an investment of $1,000 made at the beginning of the period shown and held for the entire period.
The accompanying table illustrates your fund’s costs in two ways:
· Based on actual fund return. This section helps you to estimate the actual expenses that you paid over the period. The “Ending Account Value” shown is derived from the fund’s actual return, and the third column shows the dollar amount that would have been paid by an investor who started with $1,000 in the fund. You may use the information here, together with the amount you invested, to estimate the expenses that you paid over the period.
To do so, simply divide your account value by $1,000 (for example, an $8,600 account value divided by $1,000 = 8.6), then multiply the result by the number given for your fund under the heading “Expenses Paid During Period.”
· Based on hypothetical 5% yearly return. This section is intended to help you compare your fund’s costs with those of other mutual funds. It assumes that the fund had a yearly return of 5% before expenses, but that the expense ratio is unchanged. In this case—because the return used is not the fund’s actual return—the results do not apply to your investment. The example is useful in making comparisons because the Securities and Exchange Commission requires all mutual funds to calculate expenses based on a 5% return. You can assess your fund’s costs by comparing this hypothetical example with the hypothetical examples that appear in shareholder reports of other funds.
Note that the expenses shown in the table are meant to highlight and help you compare ongoing costs only and do not reflect transaction costs incurred by the fund for buying and selling securities. Further, the expenses do not include any purchase, redemption, or account service fees described in the fund prospectus. If such fees were applied to your account, your costs would be higher. Your fund does not carry a “sales load.”
The calculations assume no shares were bought or sold during the period. Your actual costs may have been higher or lower, depending on the amount of your investment and the timing of any purchases or redemptions.
You can find more information about the fund’s expenses, including annual expense ratios, in the Financial Statements section of this report. For additional information on operating expenses and other shareholder costs, please refer to your fund’s current prospectus.
Six Months Ended November 30, 2018
|
| Beginning |
| Ending |
| Expenses |
|
| Account Value |
| Account Value |
| Paid During |
|
| 5/31/2018 |
| 11/30/2018 |
| Period |
Based on Actual Fund Return |
|
|
|
|
|
|
New York Municipal Money Market Fund |
| $1,000.00 |
| $1,006.60 |
| $0.80 |
New York Long-Term Tax-Exempt Fund |
|
|
|
|
|
|
Investor Shares |
| $1,000.00 |
| $999.61 |
| $0.75 |
Admiral Shares |
| 1,000.00 |
| 999.94 |
| 0.45 |
Based on Hypothetical 5% Yearly Return |
|
|
|
|
|
|
New York Municipal Money Market Fund |
| $1,000.00 |
| $1,024.27 |
| $0.81 |
New York Long-Term Tax-Exempt Fund |
|
|
|
|
|
|
Investor Shares |
| $1,000.00 |
| $1,024.32 |
| $0.76 |
Admiral Shares |
| 1,000.00 |
| 1,024.62 |
| 0.46 |
The calculations are based on expenses incurred in the most recent six-month period. The funds’ annualized six-month expense ratios for that period are: for the New York Municipal Money Market Fund, 0.16%; and for the New York Long-Term Tax-Exempt Fund, 0.15% for Investor Shares and 0.09% for Admiral Shares. The dollar amounts shown as “Expenses Paid” are equal to the annualized expense ratio multiplied by the average account value over the period, multiplied by the number of days in the most recent six-month period, then divided by the number of days in the most recent 12-month period (183/365).
New York Municipal Money Market Fund
Performance Summary
Investment returns will fluctuate. All of the returns in this report represent past performance, which is not a guarantee of future results that may be achieved by the fund. (Current performance may be lower or higher than the performance data cited. For performance data current to the most recent month-end, visit our website at vanguard.com/performance.) The returns shown do not reflect taxes that a shareholder would pay on fund distributions. The fund is only available to retail investors (natural persons). You could lose money by investing in the fund. Although the fund seeks to preserve the value of your investment at $1 per share, it cannot guarantee it will do so. The fund may impose a fee upon sale of your shares or may temporarily suspend your ability to sell shares if the fund’s liquidity falls below required minimums because of market conditions or other factors. An investment in the fund is not insured or guaranteed by the Federal Deposit Insurance Corporation or any other government agency. The fund’s sponsor has no legal obligation to provide financial support to the fund, and you should not expect that the sponsor will provide financial support to the fund at any time. The fund’s 7-day SEC yield reflects its current earnings more closely than do the average annual returns.
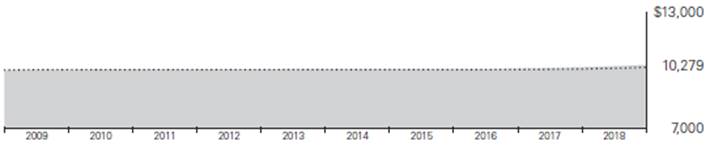
Cumulative Performance: November 30, 2008, Through November 30, 2018
Initial Investment of $10,000
|
| Average Annual Total Returns
|
| |||
|
| One | Five | Ten | Final Value | |
| New York Municipal Money Market Fund |
| 1.24% | 0.44% | 0.28% | $10,279 |
| New York Tax-Exempt Money Market Funds Average |
| 0.83 | 0.23 | 0.15 | 10,146 |
New York Tax-Exempt Money Market Funds Average: Derived from data provided by Lipper, a Thomson Reuters Company.
Average Annual Total Returns: Periods Ended September 30, 2018
This table presents returns through the latest calendar quarter—rather than through the end of the fiscal period.
Securities and Exchange Commission rules require that we provide this information.
|
| Inception Date |
| One Year | Five Years | Ten Years |
New York Municipal Money Market Fund |
| 9/3/1997 |
| 1.12% | 0.39% | 0.29% |
See Financial Highlights for dividend information.
New York Municipal Money Market Fund
Distribution by Issuer
As of November 30, 2018
Tax-Exempt Securities | 100% |
New York Municipal Money Market Fund
Financial Statements
Statement of Net Assets
As of November 30, 2018
The fund reports a complete list of its holdings in various monthly and quarterly regulatory filings. The fund publishes its holdings on a monthly basis at vanguard.com and files them with the Securities and Exchange Commission on Form N-MFP. The fund’s Form N-MFP filings may be viewed at sec.gov or via a link on the “Portfolio Holdings” page on vanguard.com. For the second and fourth fiscal quarters, the lists appear in the fund’s semiannual and annual reports to shareholders. For the first and third fiscal quarters, the fund files the lists with the SEC on Form N-Q. Shareholders can look up the fund’s Forms N-Q on the SEC’s website at sec.gov.
|
|
|
|
|
|
| Face |
| Market |
|
|
|
|
| Maturity |
|
| Amount |
| Value· |
|
|
| Coupon |
| Date |
|
| ($000 | ) | ($000 | ) |
Tax-Exempt Municipal Bonds (99.0%) |
|
|
|
|
|
|
|
|
|
|
New York (99.0%) |
|
|
|
|
|
|
|
|
|
|
Albany NY Industrial Development Agency Civic Facility Revenue (CHF Holland Suites LLC Project) VRDO |
| 1.700% |
| 12/7/18 |
| LOC | 8,025 |
| 8,025 |
|
Albany NY Industrial Development Agency Housing Revenue (South Mall Towers Project) VRDO |
| 1.760% |
| 12/7/18 |
| LOC | 6,020 |
| 6,020 |
|
1 Battery Park City Authority New York Revenue TOB VRDO |
| 1.780% |
| 12/3/18 |
| LOC | 17,440 |
| 17,440 |
|
Bellmore NY Union Free School District BANS |
| 3.000% |
| 6/28/19 |
|
| 11,965 |
| 12,044 |
|
1 City of New York NY GO TOB VRDO |
| 1.720% |
| 12/7/18 |
|
| 7,500 |
| 7,500 |
|
Columbia County NY Capital Resource Corp. Civic Facility Revenue (Columbia Memorial Hospital Project) VRDO |
| 1.740% |
| 12/7/18 |
| LOC | 2,500 |
| 2,500 |
|
Columbia County NY Industrial Development Agency Civic Facility Revenue (Columbia Memorial Hospital Project) VRDO |
| 1.740% |
| 12/7/18 |
| LOC | 3,570 |
| 3,570 |
|
Connetquot Central School District of Islip NY GO |
| 3.000% |
| 6/27/19 |
|
| 15,600 |
| 15,697 |
|
Delaware Valley NY Industrial Development Authority Revenue (Delaware Valley Hospital) VRDO |
| 1.740% |
| 12/7/18 |
| LOC | 2,350 |
| 2,350 |
|
East Greenbush NY Central School District BAN |
| 2.000% |
| 2/8/19 |
|
| 11,575 |
| 11,584 |
|
East Irondequoit Central School District NY BANS |
| 2.750% |
| 6/28/19 |
|
| 6,500 |
| 6,523 |
|
East Meadow NY Union Free School District BAN |
| 2.500% |
| 3/1/19 |
|
| 500 |
| 501 |
|
1 Erie County NY Industrial Development Agency School Facility Revenue (Buffalo City School District Project) TOB VRDO |
| 1.710% |
| 12/7/18 |
|
| 6,665 |
| 6,665 |
|
Franklin County NY Civic Development Corp. Revenue VRDO |
| 1.740% |
| 12/7/18 |
| LOC | 4,800 |
| 4,800 |
|
Geneva NY Industrial Development Agency Civic Facility Revenue (Colleges of the Seneca Project) VRDO |
| 1.720% |
| 12/7/18 |
| LOC | 15,290 |
| 15,290 |
|
New York Municipal Money Market Fund
|
|
|
|
|
|
| Face |
| Market |
|
|
|
|
| Maturity |
|
| Amount |
| Value· |
|
|
| Coupon |
| Date |
|
| ($000 | ) | ($000 | ) |
2 Goshen NY Central School District BANS |
| 3.000% |
| 12/6/19 |
|
| 20,087 |
| 20,264 |
|
Hampton Bays NY Union Free School District BANS |
| 3.000% |
| 6/19/19 |
|
| 5,587 |
| 5,616 |
|
Hampton Bays NY Union Free School District BANS |
| 3.000% |
| 6/20/19 |
|
| 6,200 |
| 6,233 |
|
Hauppauge NY Union Free School District TANS |
| 3.000% |
| 6/21/19 |
|
| 12,200 |
| 12,275 |
|
Herricks NY Union Free School District TANS |
| 3.000% |
| 6/21/19 |
|
| 3,000 |
| 3,016 |
|
Huntington NY Union Free School District TANS |
| 3.000% |
| 6/21/19 |
|
| 16,000 |
| 16,088 |
|
Island Trees NY Union Free School District BAN |
| 3.000% |
| 5/31/19 |
|
| 16,500 |
| 16,597 |
|
Islip NY Union Free School District TANS |
| 3.000% |
| 6/21/19 |
|
| 19,000 |
| 19,107 |
|
Jefferson NY BANS |
| 3.000% |
| 11/1/19 |
|
| 6,500 |
| 6,553 |
|
Kenmore-Tonawanda NY Union Free School District BAN |
| 3.000% |
| 6/13/19 |
|
| 12,373 |
| 12,452 |
|
Lindenhurst NY Union Free School District BANS |
| 2.750% |
| 6/26/19 |
|
| 6,000 |
| 6,025 |
|
Longwood NY Central School District Suffolk County GO |
| 3.000% |
| 6/21/19 |
|
| 10,000 |
| 10,066 |
|
Mechanicville NY School District BANS |
| 3.000% |
| 6/21/19 |
|
| 11,660 |
| 11,736 |
|
Metropolitan Transportation Authority NY Revenue VRDO |
| 1.700% |
| 12/7/18 |
| LOC | 11,468 |
| 11,467 |
|
Middle Country Central NY School District At Centereach GO |
| 3.000% |
| 6/25/19 |
|
| 10,000 |
| 10,066 |
|
Monroe County NY Industrial Development Agency Civic Facility Revenue (Nazareth College) VRDO |
| 1.750% |
| 12/7/18 |
| LOC | 6,865 |
| 6,865 |
|
1 Monroe County NY Industrial Development Corp. Revenue (University of Rochester) TOB VRDO |
| 1.720% |
| 12/7/18 |
|
| 4,350 |
| 4,350 |
|
1 Nassau County NY GO TOB VRDO |
| 1.720% |
| 12/7/18 |
| LOC | 5,000 |
| 5,000 |
|
Nassau County NY Interim Finance Authority Sales Tax Revenue VRDO |
| 1.680% |
| 12/7/18 |
|
| 18,945 |
| 18,945 |
|
Nassau County NY Interim Finance Authority Sales Tax Revenue VRDO |
| 1.690% |
| 12/7/18 |
|
| 15,525 |
| 15,525 |
|
New Rochelle NY BAN |
| 2.500% |
| 3/1/19 |
|
| 8,152 |
| 8,171 |
|
New Rochelle NY City School District BAN |
| 3.000% |
| 7/12/19 |
|
| 25,000 |
| 25,184 |
|
1 New York City Housing Development Corp. Revenue TOB VRDO |
| 1.720% |
| 12/7/18 |
|
| 7,500 |
| 7,500 |
|
New York City NY Capital Resources Corp. Revenue (Loan Enhanced Assistance Program) VRDO |
| 1.730% |
| 12/7/18 |
| LOC | 20,375 |
| 20,375 |
|
New York City NY Capital Resources Corp. Revenue (Loan Enhanced Assistance Program) VRDO |
| 1.730% |
| 12/7/18 |
| LOC | 3,180 |
| 3,180 |
|
1,3 New York City NY GO TOB PUT |
| 1.840% |
| 1/17/19 |
|
| 4,860 |
| 4,860 |
|
1 New York City NY GO TOB VRDO |
| 1.780% |
| 12/3/18 |
| LOC | 69,800 |
| 69,800 |
|
New York City NY GO VRDO |
| 1.730% |
| 12/3/18 |
|
| 14,320 |
| 14,320 |
|
New York City NY GO VRDO |
| 1.730% |
| 12/3/18 |
|
| 2,418 |
| 2,418 |
|
New York City NY GO VRDO |
| 1.740% |
| 12/3/18 |
|
| 3,500 |
| 3,500 |
|
New York City NY GO VRDO |
| 1.740% |
| 12/3/18 |
| LOC | 2,220 |
| 2,220 |
|
New York City NY GO VRDO |
| 1.740% |
| 12/3/18 |
| LOC | 2,225 |
| 2,225 |
|
New York City NY GO VRDO |
| 1.750% |
| 12/3/18 |
| LOC | 7,090 |
| 7,090 |
|
New York Municipal Money Market Fund
|
|
|
|
|
|
| Face |
| Market |
|
|
|
|
| Maturity |
|
| Amount |
| Value· |
|
|
| Coupon |
| Date |
|
| ($000 | ) | ($000 | ) |
New York City NY GO VRDO |
| 1.760% |
| 12/3/18 |
|
| 4,400 |
| 4,400 |
|
New York City NY GO VRDO |
| 1.760% |
| 12/3/18 |
|
| 4,600 |
| 4,600 |
|
New York City NY GO VRDO |
| 1.680% |
| 12/7/18 |
| LOC | 6,100 |
| 6,100 |
|
New York City NY Health & Hospital Corp. Revenue (Health System) VRDO |
| 1.680% |
| 12/7/18 |
| LOC | 1,110 |
| 1,110 |
|
New York City NY Housing Development Corp. Multi-Family Housing Revenue (201 Pearl Street) VRDO |
| 1.650% |
| 12/7/18 |
| LOC | 15,495 |
| 15,495 |
|
New York City NY Housing Development Corp. Multi-Family Housing Revenue PUT |
| 1.800% |
| 2/1/19 |
|
| 9,000 |
| 9,000 |
|
1 New York City NY Housing Development Corp. Multi-Family Housing Revenue TOB VRDO |
| 1.700% |
| 12/7/18 |
|
| 3,750 |
| 3,750 |
|
1 New York City NY Housing Development Corp. Multi-Family Housing Revenue TOB VRDO |
| 1.700% |
| 12/7/18 |
|
| 7,500 |
| 7,500 |
|
1 New York City NY Housing Development Corp. Multi-Family Housing Revenue TOB VRDO |
| 1.720% |
| 12/7/18 |
|
| 14,455 |
| 14,455 |
|
1 New York City NY Housing Development Corp. Multi-Family Housing Revenue TOB VRDO |
| 1.740% |
| 12/7/18 |
|
| 6,665 |
| 6,665 |
|
New York City NY Housing Development Corp. Multi-Family Mortgage Revenue (89 Murray Street Development) VRDO |
| 1.750% |
| 12/7/18 |
| LOC | 15,450 |
| 15,450 |
|
New York City NY Housing Development Corp. Multi-Family Mortgage Revenue (941 Hoe Avenue Apartments) VRDO |
| 1.760% |
| 12/7/18 |
| LOC | 6,660 |
| 6,660 |
|
New York City NY Housing Development Corp. Multi-Family Mortgage Revenue (Aldus Street Apartments) VRDO |
| 1.760% |
| 12/7/18 |
| LOC | 8,100 |
| 8,100 |
|
New York City NY Housing Development Corp. Multi-Family Mortgage Revenue (Bruckner by the Bridge) VRDO |
| 1.710% |
| 12/7/18 |
| LOC | 6,725 |
| 6,725 |
|
New York City NY Housing Development Corp. Multi-Family Mortgage Revenue (Elliot Chelsea Development) VRDO |
| 1.710% |
| 12/7/18 |
| LOC | 100 |
| 100 |
|
New York City NY Housing Development Corp. Multi-Family Mortgage Revenue (Granville Payne Apartments) VRDO |
| 1.760% |
| 12/7/18 |
| LOC | 5,310 |
| 5,310 |
|
New York City NY Housing Development Corp. Multi-Family Mortgage Revenue (Markham Gardens Apartments) VRDO |
| 1.750% |
| 12/7/18 |
| LOC | 16,000 |
| 16,000 |
|
New York City NY Housing Development Corp. Multi-Family Mortgage Revenue (Villa Avenue Apartments) VRDO |
| 1.780% |
| 12/7/18 |
| LOC | 5,990 |
| 5,990 |
|
New York City NY Housing Development Corp. Multi-Family Mortgage Revenue (West 26th Street Development) VRDO |
| 1.660% |
| 12/7/18 |
| LOC | 12,700 |
| 12,700 |
|
New York City NY Housing Development Corp. Multi-Family Rental Housing Revenue (Ocean Gate Development) VRDO |
| 1.760% |
| 12/7/18 |
| LOC | 7,845 |
| 7,845 |
|
New York City NY Housing Development Corp. Multi-Family Rental Housing Revenue (Rivereast Apartments) VRDO |
| 1.760% |
| 12/7/18 |
| LOC | 30,700 |
| 30,700 |
|
New York City NY Housing Development Corp. Multi-Family Rental Housing Revenue (Royal Charter Properties) VRDO |
| 1.710% |
| 12/7/18 |
| LOC | 4,700 |
| 4,700 |
|
New York Municipal Money Market Fund
|
|
|
|
|
|
| Face |
| Market |
|
|
|
|
| Maturity |
|
| Amount |
| Value· |
|
|
| Coupon |
| Date |
|
| ($000) |
| ($000) |
|
New York City NY Housing Development Corp. Multi-Family Rental Housing Revenue (The Balton) VRDO |
| 1.680% |
| 12/7/18 |
| LOC | 5,300 |
| 5,300 |
|
New York City NY Housing Development Corp. Sustainable Neighborhood Revenue VRDO |
| 1.700% |
| 12/7/18 |
|
| 33,800 |
| 33,800 |
|
New York City NY Housing Development Corp. VRDO (BX Parkview Associates LLC) |
| 1.710% |
| 12/7/18 |
| LOC | 5,935 |
| 5,935 |
|
New York City NY Housing Finance Agency Revenue (Parkledge Apartments) VRDO |
| 1.740% |
| 12/7/18 |
| LOC | 25,785 |
| 25,785 |
|
New York City NY Industrial Development Agency Civic Facility Revenue (New York Congregational Nursing Center Project) VRDO |
| 1.740% |
| 12/7/18 |
| LOC | 2,205 |
| 2,205 |
|
1 New York City NY Municipal Water Finance Authority Water & Sewer System Revenue TOB VRDO |
| 1.780% |
| 12/3/18 |
| LOC | 7,500 |
| 7,500 |
|
1 New York City NY Municipal Water Finance Authority Water & Sewer System Revenue TOB VRDO |
| 1.780% |
| 12/3/18 |
| LOC | 56,000 |
| 56,000 |
|
1 New York City NY Municipal Water Finance Authority Water & Sewer System Revenue TOB VRDO |
| 1.710% |
| 12/7/18 |
|
| 11,375 |
| 11,375 |
|
1 New York City NY Municipal Water Finance Authority Water & Sewer System Revenue TOB VRDO |
| 1.720% |
| 12/7/18 |
|
| 7,400 |
| 7,400 |
|
1 New York City NY Municipal Water Finance Authority Water & Sewer System Revenue TOB VRDO |
| 1.720% |
| 12/7/18 |
|
| 6,440 |
| 6,440 |
|
1 New York City NY Municipal Water Finance Authority Water & Sewer System Revenue TOB VRDO |
| 1.720% |
| 12/7/18 |
|
| 8,200 |
| 8,200 |
|
1 New York City NY Municipal Water Finance Authority Water & Sewer System Revenue TOB VRDO |
| 1.720% |
| 12/7/18 |
|
| 3,000 |
| 3,000 |
|
1 New York City NY Municipal Water Finance Authority Water & Sewer System Revenue TOB VRDO |
| 1.720% |
| 12/7/18 |
|
| 5,650 |
| 5,650 |
|
New York City NY Municipal Water Finance Authority Water & Sewer System Revenue VRDO |
| 1.700% |
| 12/3/18 |
|
| 4,070 |
| 4,070 |
|
New York City NY Municipal Water Finance Authority Water & Sewer System Revenue VRDO |
| 1.710% |
| 12/3/18 |
|
| 3,700 |
| 3,700 |
|
New York City NY Municipal Water Finance Authority Water & Sewer System Revenue VRDO |
| 1.730% |
| 12/3/18 |
|
| 8,700 |
| 8,700 |
|
New York City NY Municipal Water Finance Authority Water & Sewer System Revenue VRDO |
| 1.690% |
| 12/7/18 |
|
| 22,625 |
| 22,625 |
|
New York City NY Municipal Water Finance Authority Water & Sewer System Revenue VRDO |
| 1.710% |
| 12/7/18 |
|
| 22,385 |
| 22,385 |
|
1 New York City NY Municipal Water Finance Authority Water & Sewer System Revenue TOB VRDO |
| 1.710% |
| 12/7/18 |
|
| 8,325 |
| 8,325 |
|
New York Municipal Money Market Fund
|
|
|
|
|
|
| Face |
| Market |
|
|
|
|
| Maturity |
|
| Amount |
| Value· |
|
|
| Coupon |
| Date |
|
| ($000) |
| ($000) |
|
1 New York City NY Sales Tax Asset Receivable Corp. Revenue TOB VRDO |
| 1.720% |
| 12/7/18 |
|
| 3,335 |
| 3,335 |
|
1 New York City NY Sales Tax Asset Receivable Corp. Revenue TOB VRDO |
| 1.720% |
| 12/7/18 |
|
| 5,250 |
| 5,250 |
|
1 New York City NY Transitional Finance Authority Building Aid Revenue TOB VRDO |
| 1.710% |
| 12/7/18 |
|
| 7,000 |
| 7,000 |
|
1 New York City NY Transitional Finance Authority Building Aid Revenue TOB VRDO |
| 1.710% |
| 12/7/18 |
|
| 9,375 |
| 9,375 |
|
1 New York City NY Transitional Finance Authority Building Aid Revenue TOB VRDO |
| 1.710% |
| 12/7/18 |
|
| 2,210 |
| 2,210 |
|
1 New York City NY Transitional Finance Authority Building Aid Revenue TOB VRDO |
| 1.710% |
| 12/7/18 |
|
| 5,915 |
| 5,915 |
|
1 New York City NY Transitional Finance Authority Future Tax Revenue TOB VRDO |
| 1.710% |
| 12/7/18 |
|
| 13,500 |
| 13,500 |
|
1 New York City NY Transitional Finance Authority Future Tax Revenue TOB VRDO |
| 1.720% |
| 12/7/18 |
|
| 5,000 |
| 5,000 |
|
1 New York City NY Transitional Finance Authority Future Tax Revenue TOB VRDO |
| 1.720% |
| 12/7/18 |
|
| 2,035 |
| 2,035 |
|
1 New York City NY Transitional Finance Authority Future Tax Revenue TOB VRDO |
| 1.720% |
| 12/7/18 |
|
| 7,500 |
| 7,500 |
|
1 New York City NY Transitional Finance Authority Future Tax Revenue TOB VRDO |
| 1.720% |
| 12/7/18 |
|
| 2,890 |
| 2,890 |
|
1 New York City NY Transitional Finance Authority Future Tax Revenue TOB VRDO |
| 1.720% |
| 12/7/18 |
| LOC | 11,800 |
| 11,800 |
|
1 New York City NY Transitional Finance Authority Future Tax Revenue TOB VRDO |
| 1.720% |
| 12/7/18 |
|
| 6,300 |
| 6,300 |
|
New York City NY Transitional Finance Authority Future Tax Revenue VRDO |
| 1.730% |
| 12/3/18 |
|
| 1,500 |
| 1,500 |
|
New York City NY Transitional Finance Authority Future Tax Revenue VRDO |
| 1.730% |
| 12/3/18 |
|
| 9,490 |
| 9,490 |
|
New York City NY Transitional Finance Authority Future Tax Revenue VRDO |
| 1.760% |
| 12/3/18 |
|
| 24,000 |
| 24,000 |
|
New York City NY Transitional Finance Authority Future Tax Revenue VRDO |
| 1.720% |
| 12/7/18 |
| LOC | 4,625 |
| 4,625 |
|
New York City NY Transitional Finance Authority Future Tax Revenue VRDO |
| 1.760% |
| 12/7/18 |
| LOC | 3,845 |
| 3,845 |
|
1 New York City NY Transitional Finance Authority Future Tax Secured Revenue TOB VRDO |
| 1.720% |
| 12/7/18 |
|
| 9,750 |
| 9,750 |
|
New York City NY Transitional Finance Authority Recovery Revenue VRDO |
| 1.710% |
| 12/7/18 |
|
| 2,740 |
| 2,740 |
|
New York City NY Transitional Finance Authority Revenue VRDO |
| 1.760% |
| 12/3/18 |
|
| 1,950 |
| 1,950 |
|
3 New York City NY Trust for Cultural Resources Revenue (American Museum of Natural History) PUT |
| 1.710% |
| 7/9/19 |
|
| 17,245 |
| 17,245 |
|
New York City NY Trust for Cultural Resources Revenue (The Metropolitan Museum of Art) VRDO |
| 1.630% |
| 12/7/18 |
|
| 32,450 |
| 32,450 |
|
New York City NY Trust for Cultural Resources Revenue (The Metropolitan Museum of Art) VRDO |
| 1.630% |
| 12/7/18 |
|
| 22,340 |
| 22,340 |
|
1 New York City NY Trust for Cultural Resources Revenue (Wildlife Conservation Society) TOB VRDO |
| 1.720% |
| 12/7/18 |
|
| 5,335 |
| 5,335 |
|
New York Municipal Money Market Fund
|
|
|
|
|
|
| Face |
| Market |
|
|
|
|
| Maturity |
|
| Amount |
| Value· |
|
|
| Coupon |
| Date |
|
| ($000) |
| ($000) |
|
1 New York City Transitional Finance Authority Building Aid Revenue TOB VRDO |
| 1.710% |
| 12/7/18 |
|
| 4,000 |
| 4,000 |
|
1 New York City Transitional Finance Authority Future Tax Secured Revenue TOB VRDO |
| 1.710% |
| 12/7/18 |
|
| 8,760 |
| 8,760 |
|
1 New York City Transitional Finance Authority Future Tax Secured Revenue TOB VRDO |
| 1.720% |
| 12/7/18 |
|
| 6,000 |
| 6,000 |
|
New York City Transitional Finance Authority Future Tax Secured Revenue VRDO |
| 1.700% |
| 12/7/18 |
| LOC | 18,950 |
| 18,950 |
|
New York Housing Finance Authority VRDO (Gurnee Housing Preservation LP) |
| 1.730% |
| 12/7/18 |
| LOC | 6,700 |
| 6,700 |
|
1 New York Liberty Development Corp. Revenue (7 World Trade Center Project) TOB VRDO |
| 1.840% |
| 12/7/18 |
|
| 8,000 |
| 8,000 |
|
1 New York Liberty Development Corp. Revenue (Bank of America Tower at One Bryant Park Project) TOB VRDO |
| 1.720% |
| 12/7/18 |
|
| 29,000 |
| 29,000 |
|
New York Liberty Development Corp. Revenue (Greenwich LLC) VRDO |
| 1.730% |
| 12/7/18 |
| LOC | 10,000 |
| 10,000 |
|
1 New York Liberty Development Corp. Revenue TOB VRDO |
| 1.770% |
| 12/7/18 |
|
| 16,295 |
| 16,295 |
|
1 New York Metropolitan Transportation Authority Revenue (Dedicated Tax Fund) TOB VRDO |
| 1.710% |
| 12/7/18 |
|
| 12,800 |
| 12,800 |
|
1 New York Metropolitan Transportation Authority Revenue (Dedicated Tax Fund) TOB VRDO |
| 1.720% |
| 12/7/18 |
|
| 3,750 |
| 3,750 |
|
1 New York Metropolitan Transportation Authority Revenue (Dedicated Tax Fund) TOB VRDO |
| 1.720% |
| 12/7/18 |
|
| 5,350 |
| 5,350 |
|
1 New York Metropolitan Transportation Authority Revenue (Dedicated Tax Fund) TOB VRDO |
| 1.720% |
| 12/7/18 |
|
| 7,130 |
| 7,130 |
|
1 New York Metropolitan Transportation Authority Revenue (Dedicated Tax Fund) TOB VRDO |
| 1.720% |
| 12/7/18 |
|
| 3,330 |
| 3,330 |
|
New York Metropolitan Transportation Authority Revenue (Dedicated Tax Fund) VRDO |
| 1.680% |
| 12/7/18 |
| LOC | 42,975 |
| 42,975 |
|
1 New York Metropolitan Transportation Authority Revenue TOB VRDO |
| 1.710% |
| 12/7/18 |
|
| 11,000 |
| 11,000 |
|
1 New York Metropolitan Transportation Authority Revenue TOB VRDO |
| 1.720% |
| 12/7/18 |
| LOC | 35,000 |
| 35,000 |
|
New York Metropolitan Transportation Authority Revenue VRDO |
| 1.710% |
| 12/3/18 |
| LOC | 9,890 |
| 9,890 |
|
New York Metropolitan Transportation Authority Revenue VRDO |
| 1.720% |
| 12/3/18 |
| LOC | 13,640 |
| 13,640 |
|
New York Metropolitan Transportation Authority Revenue VRDO |
| 1.670% |
| 12/7/18 |
| LOC | 9,620 |
| 9,620 |
|
New York Metropolitan Transportation Authority Revenue VRDO |
| 1.670% |
| 12/7/18 |
| LOC | 19,211 |
| 19,210 |
|
1 New York NY GO TOB VRDO |
| 1.720% |
| 12/7/18 |
| LOC | 5,000 |
| 5,000 |
|
1 New York NY GO TOB VRDO |
| 1.720% |
| 12/7/18 |
|
| 6,665 |
| 6,665 |
|
1 New York NY GO TOB VRDO |
| 1.720% |
| 12/7/18 |
| LOC | 13,000 |
| 13,000 |
|
New York State Dormitory Authority Revenue (Blythedale Children’s Hospital) VRDO |
| 1.700% |
| 12/7/18 |
| LOC | 20,285 |
| 20,285 |
|
New York Municipal Money Market Fund
|
|
|
|
|
|
| Face |
| Market |
|
|
|
|
| Maturity |
|
| Amount |
| Value· |
|
|
| Coupon |
| Date |
|
| ($000) |
| ($000) |
|
New York State Dormitory Authority Revenue (Catholic Health System Obligated Group) VRDO |
| 1.720% |
| 12/7/18 |
| LOC | 1,880 |
| 1,880 |
|
New York State Dormitory Authority Revenue (Catholic Health System Obligated Group) VRDO |
| 1.720% |
| 12/7/18 |
| LOC | 8,770 |
| 8,770 |
|
New York State Dormitory Authority Revenue (Catholic Health System Obligated Group) VRDO |
| 1.720% |
| 12/7/18 |
| LOC | 3,915 |
| 3,915 |
|
New York State Dormitory Authority Revenue (Catholic Health System Obligated Group) VRDO |
| 1.720% |
| 12/7/18 |
| LOC | 8,500 |
| 8,500 |
|
New York State Dormitory Authority Revenue (Cornell University) CP |
| 2.000% |
| 5/21/19 |
|
| 17,000 |
| 17,000 |
|
1 New York State Dormitory Authority Revenue (Cornell University) TOB VRDO |
| 1.720% |
| 12/7/18 |
|
| 15,000 |
| 15,000 |
|
New York State Dormitory Authority Revenue (Cornell University) VRDO |
| 1.680% |
| 12/7/18 |
|
| 14,400 |
| 14,400 |
|
New York State Dormitory Authority Revenue (Cornell University) VRDO |
| 1.680% |
| 12/7/18 |
|
| 4,720 |
| 4,720 |
|
New York State Dormitory Authority Revenue (Fordham University) VRDO |
| 1.700% |
| 12/7/18 |
| LOC | 6,310 |
| 6,310 |
|
1 New York State Dormitory Authority Revenue (Memorial Sloan-Kettering Cancer Center) TOB VRDO |
| 1.710% |
| 12/7/18 |
|
| 7,860 |
| 7,860 |
|
New York State Dormitory Authority Revenue (Mental Health Services Facilities Improvement) VRDO |
| 1.690% |
| 12/7/18 |
| LOC | 37,680 |
| 37,680 |
|
New York State Dormitory Authority Revenue (Mental Health Services Facilities Improvement) VRDO |
| 1.690% |
| 12/7/18 |
| LOC | 4,715 |
| 4,715 |
|
1,3 New York State Dormitory Authority Revenue (New York University) TOB PUT |
| 1.820% |
| 2/28/19 |
|
| 4,400 |
| 4,400 |
|
1 New York State Dormitory Authority Revenue (Personal Income Tax) TOB VRDO |
| 1.720% |
| 12/7/18 |
|
| 6,000 |
| 6,000 |
|
1 New York State Dormitory Authority Revenue (Personal Income Tax) TOB VRDO |
| 1.720% |
| 12/7/18 |
|
| 8,750 |
| 8,750 |
|
1 New York State Dormitory Authority Revenue (Personal Income Tax) TOB VRDO |
| 1.720% |
| 12/7/18 |
|
| 6,250 |
| 6,250 |
|
1 New York State Dormitory Authority Revenue Personal Income Tax) TOB VRDO |
| 1.720% |
| 12/7/18 |
|
| 7,500 |
| 7,500 |
|
1 New York State Dormitory Authority Revenue (Personal Income Tax) TOB VRDO |
| 1.720% |
| 12/7/18 |
|
| 14,675 |
| 14,675 |
|
1 New York State Dormitory Authority Revenue (Personal Income Tax) TOB VRDO |
| 1.720% |
| 12/7/18 |
|
| 4,000 |
| 4,000 |
|
New York State Dormitory Authority Revenue (Rockefeller University) VRDO |
| 1.650% |
| 12/7/18 |
|
| 9,400 |
| 9,400 |
|
New York State Dormitory Authority Revenue (University of Rochester) VRDO |
| 1.760% |
| 12/3/18 |
| LOC | 1,500 |
| 1,500 |
|
1 New York State Dormitory Authority Revenue TOB VRDO |
| 1.710% |
| 12/7/18 |
|
| 7,500 |
| 7,500 |
|
New York State Dormitory Authority Sales Tax Revenue |
| 5.000% |
| 3/15/19 |
|
| 3,500 |
| 3,532 |
|
1 New York State Dormitory Authority Sales Tax Revenue TOB VRDO |
| 1.710% |
| 12/7/18 |
|
| 11,200 |
| 11,200 |
|
New York Municipal Money Market Fund
|
|
|
|
|
|
| Face |
| Market |
|
|
|
|
| Maturity |
|
| Amount |
| Value· |
|
|
| Coupon |
| Date |
|
| ($000) |
| ($000) |
|
1 New York State Dormitory Authority Sales Tax Revenue TOB VRDO |
| 1.710% |
| 12/7/18 |
|
| 5,625 |
| 5,625 |
|
1 New York State Dormitory Authority Sales Tax Revenue TOB VRDO |
| 1.710% |
| 12/7/18 |
|
| 7,845 |
| 7,845 |
|
1 New York State Dormitory Authority Sales Tax Revenue TOB VRDO |
| 1.710% |
| 12/7/18 |
|
| 15,600 |
| 15,600 |
|
1 New York State Dormitory Authority Sales Tax Revenue TOB VRDO |
| 1.710% |
| 12/7/18 |
|
| 23,000 |
| 23,000 |
|
1 New York State Dormitory Authority Sales Tax Revenue TOB VRDO |
| 1.710% |
| 12/7/18 |
|
| 12,100 |
| 12,100 |
|
1 New York State Dormitory Authority Sales Tax Revenue TOB VRDO |
| 1.720% |
| 12/7/18 |
|
| 17,370 |
| 17,370 |
|
1 New York State Dormitory Authority Sales Tax Revenue TOB VRDO |
| 1.720% |
| 12/7/18 |
|
| 7,500 |
| 7,500 |
|
1 New York State Dormitory Authority Sales Tax Revenue TOB VRDO |
| 1.720% |
| 12/7/18 |
|
| 7,500 |
| 7,500 |
|
1 New York State Dormitory Authority Sales Tax Revenue TOB VRDO |
| 1.720% |
| 12/7/18 |
|
| 16,265 |
| 16,265 |
|
1 New York State Dormitory Authority Sales Tax Revenue TOB VRDO |
| 1.720% |
| 12/7/18 |
|
| 3,365 |
| 3,365 |
|
1 New York State Dormitory Authority TOB VRDO |
| 1.710% |
| 12/7/18 |
|
| 6,185 |
| 6,185 |
|
1 New York State Dormitory Authority TOB VRDO |
| 1.720% |
| 12/7/18 |
|
| 7,000 |
| 7,000 |
|
New York State Energy Research & Development Authority Revenue (Consolidated Edison Co. of New York, Inc. Project) VRDO |
| 1.690% |
| 12/7/18 |
| LOC | 23,200 |
| 23,200 |
|
New York State Energy Research & Development Authority Revenue (Consolidated Edison Co. of New York, Inc. Project) VRDO |
| 1.700% |
| 12/7/18 |
| LOC | 14,200 |
| 14,200 |
|
New York State Energy Research & Development Authority Revenue (Consolidated Edison Co. of New York Inc. Project) VRDO |
| 1.750% |
| 12/7/18 |
| LOC | 45,600 |
| 45,600 |
|
New York State Environmental Facilities Corp. Solid Waste Disposal Revenue (Waste Management Inc.) VRDO |
| 1.770% |
| 12/7/18 |
| LOC | 3,100 |
| 3,100 |
|
New York State Housing Finance Agency Housing Revenue (10 Barclay Street) VRDO |
| 1.690% |
| 12/7/18 |
| LOC | 14,000 |
| 14,000 |
|
New York State Housing Finance Agency Housing Revenue (100 Maiden Lane) VRDO |
| 1.690% |
| 12/7/18 |
| LOC | 19,300 |
| 19,300 |
|
New York State Housing Finance Agency Housing Revenue (316 11th Avenue) VRDO |
| 1.710% |
| 12/7/18 |
| LOC | 10,500 |
| 10,500 |
|
New York State Housing Finance Agency Housing Revenue (600 W 42nd Street) VRDO |
| 1.720% |
| 12/7/18 |
| LOC | 11,000 |
| 11,000 |
|
New York State Housing Finance Agency Housing Revenue (600 W 42nd Street) VRDO |
| 1.760% |
| 12/7/18 |
| LOC | 15,000 |
| 15,000 |
|
New York State Housing Finance Agency Housing Revenue (Clinton Park Phase II) VRDO |
| 1.720% |
| 12/7/18 |
| LOC | 18,405 |
| 18,405 |
|
New York State Housing Finance Agency Housing Revenue (Dock Street) VRDO |
| 1.690% |
| 12/7/18 |
| LOC | 11,500 |
| 11,500 |
|
New York Municipal Money Market Fund
|
|
|
|
|
|
| Face |
| Market |
|
|
|
|
| Maturity |
|
| Amount |
| Value· |
|
|
| Coupon |
| Date |
|
| ($000) |
| ($000) |
|
New York State Housing Finance Agency Housing Revenue (West 17th Street) VRDO |
| 1.690% |
| 12/7/18 |
| LOC | 19,600 |
| 19,600 |
|
New York State Housing Finance Agency Housing Revenue (West 20th Street) VRDO |
| 1.760% |
| 12/7/18 |
| LOC | 3,800 |
| 3,800 |
|
New York State Housing Finance Agency Housing Revenue (West 23rd Street) VRDO |
| 1.740% |
| 12/7/18 |
| LOC | 54,000 |
| 54,000 |
|
1 New York State Housing Finance Agency Housing Revenue TOB VRDO |
| 1.760% |
| 12/7/18 |
|
| 6,810 |
| 6,810 |
|
New York State Housing Finance Agency Revenue (Helena Housing) VRDO |
| 1.760% |
| 12/7/18 |
| LOC | 24,500 |
| 24,500 |
|
New York State Housing Finance Agency Revenue (Sea Park West LP) VRDO |
| 1.740% |
| 12/7/18 |
| LOC | 14,100 |
| 14,100 |
|
New York State Housing Finance Agency Revenue (Tower 31) VRDO |
| 1.710% |
| 12/7/18 |
| LOC | 38,000 |
| 38,000 |
|
New York State Housing Finance Agency Revenue (Tribeca Pointe LLC) VRDO |
| 1.710% |
| 12/7/18 |
| LOC | 5,600 |
| 5,600 |
|
New York State Local Government Assistance Corp. Revenue VRDO |
| 1.650% |
| 12/7/18 |
|
| 19,540 |
| 19,540 |
|
New York State Local Government Assistance Corp. Revenue VRDO |
| 1.650% |
| 12/7/18 |
|
| 57,930 |
| 57,930 |
|
New York State Mortgage Agency Homeowner Mortgage Revenue VRDO |
| 1.810% |
| 12/3/18 |
|
| 2,190 |
| 2,190 |
|
New York State Mortgage Agency Homeowner Mortgage Revenue VRDO |
| 1.810% |
| 12/3/18 |
|
| 21,645 |
| 21,645 |
|
New York State Mortgage Agency Homeowner Mortgage Revenue VRDO |
| 1.810% |
| 12/3/18 |
|
| 12,230 |
| 12,230 |
|
New York State Mortgage Agency Homeowner Mortgage Revenue VRDO |
| 1.690% |
| 12/7/18 |
|
| 49,200 |
| 49,200 |
|
New York State Mortgage Agency Homeowner Mortgage Revenue VRDO |
| 1.740% |
| 12/7/18 |
|
| 15,000 |
| 15,000 |
|
New York State Power Authority Revenue CP |
| 1.730% |
| 12/3/18 |
|
| 54,213 |
| 54,213 |
|
New York State Power Authority Revenue CP |
| 1.730% |
| 12/4/18 |
|
| 3,716 |
| 3,716 |
|
New York State Power Authority Revenue CP |
| 1.740% |
| 12/4/18 |
|
| 11,000 |
| 11,000 |
|
New York State Power Authority Revenue CP |
| 1.750% |
| 12/4/18 |
|
| 9,500 |
| 9,500 |
|
New York State Power Authority Revenue CP |
| 1.770% |
| 12/5/18 |
|
| 23,429 |
| 23,429 |
|
New York State Power Authority Revenue CP |
| 1.760% |
| 12/6/18 |
|
| 1,379 |
| 1,379 |
|
New York State Power Authority Revenue CP |
| 1.780% |
| 12/18/18 |
|
| 29,944 |
| 29,944 |
|
1 New York State Power Authority Revenue TOB VRDO |
| 1.710% |
| 12/7/18 |
| (13)(1) | 6,835 |
| 6,835 |
|
1 New York State Thruway Authority Revenue (Highway & Bridge Trust Fund) TOB VRDO |
| 1.710% |
| 12/7/18 |
|
| 8,470 |
| 8,470 |
|
New York State Urban Development Corp. Revenue (Personal Income Tax) |
| 5.000% |
| 3/15/19 |
|
| 1,400 |
| 1,413 |
|
New York State Urban Development Corp. Revenue (Personal Income Tax) |
| 5.000% |
| 3/15/19 |
|
| 1,225 |
| 1,236 |
|
1 New York State Urban Development Corp. Revenue (Personal Income Tax) TOB VRDO |
| 1.720% |
| 12/7/18 |
|
| 10,300 |
| 10,300 |
|
1 New York State Urban Development Corp. Revenue (Personal Income Tax) TOB VRDO |
| 1.720% |
| 12/7/18 |
|
| 5,850 |
| 5,850 |
|
1 New York State Urban Development Corp. Revenue (Personal Income Tax) TOB VRDO |
| 1.720% |
| 12/7/18 |
|
| 3,750 |
| 3,750 |
|
New York State Urban Development Corp. Revenue (Service Contract) |
| 5.500% |
| 1/1/19 |
| (12) | 10,000 |
| 10,030 |
|
New York Municipal Money Market Fund
|
|
|
|
|
|
| Face |
| Market |
|
|
|
|
| Maturity |
|
| Amount |
| Value· |
|
|
| Coupon |
| Date |
|
| ($000) |
| ($000) |
|
New York State Urban Development Corp. Revenue (Service Contract) VRDO |
| 1.650% |
| 12/7/18 |
| LOC | 3,680 |
| 3,680 |
|
1 New York State Urban Development Corp. Revenue TOB VRDO |
| 1.720% |
| 12/7/18 |
|
| 2,800 |
| 2,800 |
|
1 New York State Urban Development Corp. Revenue TOB VRDO |
| 1.720% |
| 12/7/18 |
|
| 9,000 |
| 9,000 |
|
1 New York State Urban Development Corp. Revenue TOB VRDO |
| 1.720% |
| 12/7/18 |
|
| 6,720 |
| 6,720 |
|
1 New York State Urban Development Corp. TOB VRDO |
| 1.710% |
| 12/7/18 |
|
| 6,890 |
| 6,890 |
|
1 New York State Urban Development Corp. TOB VRDO |
| 1.720% |
| 12/7/18 |
|
| 3,750 |
| 3,750 |
|
North Babylon NY Union Free School District TANS |
| 3.000% |
| 2/20/19 |
|
| 10,000 |
| 10,025 |
|
1 Nuveen New York AMT-Free Quality Municipal Income Fund VRDP VRDO |
| 1.730% |
| 12/7/18 |
| LOC | 27,500 |
| 27,500 |
|
1 Nuveen New York AMT-Free Quality Municipal Income Fund VRDP VRDO |
| 1.750% |
| 12/7/18 |
| LOC | 20,000 |
| 20,000 |
|
1 Nuveen New York AMT-Free Quality Municipal Income Fund VRDP VRDO |
| 1.750% |
| 12/7/18 |
| LOC | 22,000 |
| 22,000 |
|
1 Nuveen New York AMT-Free Quality Municipal Income Fund VRDP VRDO |
| 1.750% |
| 12/7/18 |
| LOC | 46,200 |
| 46,200 |
|
1 Nuveen New York Quality Municipal Fund VRDP VRDO |
| 1.800% |
| 12/7/18 |
| LOC | 34,700 |
| 34,700 |
|
Nyack NY Union Free School District BANS |
| 2.750% |
| 6/21/19 |
|
| 9,485 |
| 9,537 |
|
Onondaga County NY Industrial Development Agency Civic Facility Revenue (Syracuse Home Association Project) VRDO |
| 1.740% |
| 12/7/18 |
| LOC | 4,315 |
| 4,315 |
|
Port Authority of New York & New Jersey Revenue CP |
| 1.750% |
| 12/3/18 |
|
| 3,800 |
| 3,800 |
|
Port Authority of New York & New Jersey Revenue CP |
| 1.800% |
| 12/18/18 |
|
| 8,545 |
| 8,545 |
|
Port Authority of New York & New Jersey Revenue CP |
| 1.780% |
| 1/4/19 |
|
| 11,750 |
| 11,750 |
|
Port Authority of New York & New Jersey Revenue CP |
| 1.790% |
| 1/11/19 |
|
| 7,410 |
| 7,410 |
|
Port Authority of New York & New Jersey Revenue CP |
| 1.820% |
| 1/16/19 |
|
| 7,110 |
| 7,110 |
|
Port Authority of New York & New Jersey Revenue CP |
| 1.800% |
| 1/18/19 |
|
| 13,775 |
| 13,775 |
|
Port Authority of New York & New Jersey Revenue CP |
| 1.830% |
| 2/13/19 |
|
| 10,825 |
| 10,825 |
|
Port Authority of New York & New Jersey Revenue CP |
| 1.810% |
| 2/14/19 |
|
| 23,150 |
| 23,150 |
|
Port Authority of New York & New Jersey Revenue CP |
| 1.850% |
| 2/20/19 |
|
| 4,115 |
| 4,115 |
|
Port Authority of New York & New Jersey Revenue CP |
| 1.850% |
| 2/27/19 |
|
| 13,670 |
| 13,670 |
|
1 Port Authority of New York & New Jersey Revenue TOB VRDO |
| 1.720% |
| 12/7/18 |
|
| 8,500 |
| 8,500 |
|
1 Port Authority of New York & New Jersey Revenue TOB VRDO |
| 1.740% |
| 12/7/18 |
|
| 3,900 |
| 3,900 |
|
1 Port Authority of New York & New Jersey Revenue TOB VRDO |
| 1.740% |
| 12/7/18 |
|
| 3,100 |
| 3,100 |
|
New York Municipal Money Market Fund
|
|
|
|
|
|
| Face |
| Market |
|
|
|
|
| Maturity |
|
| Amount |
| Value· |
|
|
| Coupon |
| Date |
|
| ($000) |
| ($000) |
|
1 Port Authority of New York & New Jersey Revenue TOB VRDO |
| 1.740% |
| 12/7/18 |
|
| 11,500 |
| 11,500 |
|
1 Port Authority of New York & New Jersey Revenue TOB VRDO |
| 1.760% |
| 12/7/18 |
|
| 2,260 |
| 2,260 |
|
1 Port Authority of New York & New Jersey Revenue TOB VRDO |
| 1.770% |
| 12/7/18 |
|
| 6,500 |
| 6,500 |
|
1 Port Authority of New York & New Jersey TOB VRDO |
| 1.760% |
| 12/7/18 |
|
| 2,790 |
| 2,790 |
|
1 Regional Transportation Authority NY TOB VRDO |
| 1.700% |
| 12/7/18 |
|
| 7,500 |
| 7,500 |
|
Riverhead NY Central School District TANS |
| 3.500% |
| 6/27/19 |
|
| 5,000 |
| 5,041 |
|
Rockville Centre NY Union Free School District GO |
| 3.000% |
| 6/25/19 |
|
| 12,500 |
| 12,585 |
|
Sag Harbor NY Union Free School District TANS |
| 3.000% |
| 6/25/19 |
|
| 7,000 |
| 7,039 |
|
Shenendehowa NY Central School District BANS |
| 3.000% |
| 6/26/19 |
|
| 11,200 |
| 11,279 |
|
Smithtown NY Central School District TANS |
| 3.000% |
| 6/28/19 |
|
| 50,000 |
| 50,294 |
|
South Country NY Central School District at Brookhaven TANS |
| 3.000% |
| 6/27/19 |
|
| 20,000 |
| 20,115 |
|
Southampton NY Union Free School District TANS |
| 2.750% |
| 6/26/19 |
|
| 6,000 |
| 6,028 |
|
Syracuse NY Industrial Development Agency Civic Facility Revenue (Syracuse University Project) VRDO |
| 1.680% |
| 12/7/18 |
| LOC | 1,050 |
| 1,050 |
|
Tompkins County NY Industrial Development Agency Civic Facility Revenue (Ithaca College) VRDO |
| 1.700% |
| 12/7/18 |
| LOC | 21,135 |
| 21,135 |
|
1 Triborough Bridge & Tunnel Authority New York Revenue TOB VRDO |
| 1.720% |
| 12/7/18 |
|
| 3,750 |
| 3,750 |
|
1 Triborough Bridge & Tunnel Authority New York Revenue TOB VRDO |
| 1.720% |
| 12/7/18 |
|
| 4,195 |
| 4,195 |
|
Triborough Bridge & Tunnel Authority New York Revenue VRDO |
| 1.710% |
| 12/3/18 |
| LOC | 21,000 |
| 21,000 |
|
Triborough Bridge & Tunnel Authority New York Revenue VRDO |
| 1.720% |
| 12/3/18 |
| LOC | 12,900 |
| 12,900 |
|
Triborough Bridge & Tunnel Authority New York Revenue VRDO |
| 1.730% |
| 12/3/18 |
| LOC | 16,995 |
| 16,995 |
|
1 Triborough Bridge & Tunnel Authority New York TOB VRDO |
| 1.710% |
| 12/7/18 |
|
| 14,000 |
| 14,000 |
|
Union Endicott NY Central School District BANS |
| 2.500% |
| 6/28/19 |
|
| 5,300 |
| 5,319 |
|
1 Utility Debt Securitization Authority New York Revenue TOB VRDO |
| 1.710% |
| 12/7/18 |
|
| 6,750 |
| 6,750 |
|
1 Utility Debt Securitization Authority New York Revenue TOB VRDO |
| 1.710% |
| 12/7/18 |
|
| 5,250 |
| 5,250 |
|
1 Utility Debt Securitization Authority New York Revenue TOB VRDO |
| 1.720% |
| 12/7/18 |
|
| 1,000 |
| 1,000 |
|
Wappingers NY Central School District BAN |
| 3.250% |
| 8/14/19 |
|
| 17,556 |
| 17,706 |
|
Washingtonville NY Central School District BAN |
| 2.750% |
| 6/26/19 |
|
| 10,300 |
| 10,358 |
|
West Babylon NY Union Free School District TANS |
| 3.000% |
| 6/21/19 |
|
| 7,500 |
| 7,543 |
|
New York Municipal Money Market Fund
|
|
|
|
|
|
| Face |
| Market |
|
|
|
| Maturity |
|
| Amount |
| Value· |
|
| Coupon |
| Date |
|
| ($000) |
| ($000) |
West Hempstead NY Union Free School District BANS |
| 2.750% |
| 6/14/19 |
|
| 5,000 |
| 5,021 |
Williamsville NY Central School District BANS |
| 3.000% |
| 6/12/19 |
|
| 6,805 |
| 6,849 |
Total Tax-Exempt Municipal Bonds (Cost $3,181,424) |
|
|
|
|
|
|
|
| 3,181,424 |
|
|
|
|
|
|
|
|
| Amount |
|
|
|
|
|
|
|
|
| ($000) |
Other Assets and Liabilities (1.0%) |
|
|
|
|
|
|
|
|
|
Other Assets |
|
|
|
|
|
|
|
|
|
Investment in Vanguard |
|
|
|
|
|
|
|
| 165 |
Receivables for Investment Securities Sold |
|
|
|
|
|
|
|
| 43,560 |
Receivables for Accrued Income |
|
|
|
|
|
|
|
| 9,055 |
Receivables for Capital Shares Issued |
|
|
|
|
|
|
|
| 7,984 |
Other Assets |
|
|
|
|
|
|
|
| 4,160 |
Total Other Assets |
|
|
|
|
|
|
|
| 64,924 |
Liabilities |
|
|
|
|
|
|
|
|
|
Payables for Investment Securities Purchased |
|
|
|
|
|
|
|
| (27,069) |
Payables for Capital Shares Redeemed |
|
|
|
|
|
|
|
| (4,727) |
Payables for Distributions |
|
|
|
|
|
|
|
| (261) |
Payables to Vanguard |
|
|
|
|
|
|
|
| (236) |
Other Liabilities |
|
|
|
|
|
|
|
| (3) |
Total Liabilities |
|
|
|
|
|
|
|
| (32,296) |
Net Assets (100%) |
|
|
|
|
|
|
|
|
|
Applicable to 3,213,857,015 outstanding $.001 par value shares of beneficial interest (unlimited authorization) |
|
|
|
| 3,214,052 | ||||
Net Asset Value Per Share |
|
|
|
|
|
|
|
| $1.00 |
At November 30, 2018, net assets consisted of:
|
|
|
|
|
|
|
|
| Amount |
|
|
|
|
|
|
|
|
| ($000) |
Paid-in Capital |
|
|
|
|
|
|
|
| 3,214,056 |
Total Distributable Earnings (Loss) |
|
|
|
|
|
|
|
| (4) |
Net Assets |
|
|
|
|
|
|
|
| 3,214,052 |
· See Note A in Notes to Financial Statements.
1 Security exempt from registration under Rule 144A of the Securities Act of 1933. Such securities may be sold in transactions exempt from registration, normally to qualified institutional buyers. At November 30, 2018, the aggregate value of these securities was $1,066,710,000, representing 33.2% of net assets.
2 Security purchased on a when-issued or delayed-delivery basis for which the fund has not taken delivery as of November 30, 2018.
3 Adjustable-rate security based upon SIFMA Municipal Swap Index Yield plus spread.
A key to abbreviations and other references follows the Statement of Net Assets.
See accompanying Notes, which are an integral part of the Financial Statements.
New York Municipal Money Market Fund
Key to Abbreviations
ARS—Auction Rate Security.
BAN—Bond Anticipation Note.
COP—Certificate of Participation.
CP—Commercial Paper.
FR—Floating Rate.
GAN—Grant Anticipation Note.
GO—General Obligation Bond.
PILOT—Payments in Lieu of Taxes.
PUT—Put Option Obligation.
RAN—Revenue Anticipation Note.
TAN—Tax Anticipation Note.
TOB—Tender Option Bond.
TRAN—Tax Revenue Anticipation Note.
VRDO—Variable Rate Demand Obligation.
VRDP—Variable Rate Demand Preferred.
(ETM)—Escrowed to Maturity.
(Prere.)—Prerefunded.
Scheduled principal and interest payments are guaranteed by:
(1) MBIA (Municipal Bond Investors Assurance).
(2) AMBAC (Ambac Assurance Corporation).
(3) FGIC (Financial Guaranty Insurance Company).
(4) AGM (Assured Guaranty Municipal Corporation).
(5) BIGI (Bond Investors Guaranty Insurance).
(6) Connie Lee Inc.
(7) FHA (Federal Housing Authority).
(8) CapMAC (Capital Markets Assurance Corporation).
(9) American Capital Access Financial Guaranty Corporation.
(10) XL Capital Assurance Inc.
(11) CIFG (CDC IXIS Financial Guaranty).
(12) AGC (Assured Guaranty Corporation).
(13) BHAC (Berkshire Hathaway Assurance Corporation).
(14) NPFG (National Public Finance Guarantee Corporation).
(15) BAM (Build America Mutual Assurance Company).
(16) MAC (Municipal Assurance Corporation).
(17) RAA (Radian Asset Assurance Inc.).
(18) SBLF (Michigan School Bond Loan Fund).
(19) TPSF (Texas Permanent School Fund).
The insurance does not guarantee the market value of the municipal bonds.
LOC—Scheduled principal and interest payments are guaranteed by bank letter of credit.
New York Municipal Money Market Fund
Statement of Operations
|
| Year Ended |
|
|
| November 30, 2018 |
|
|
| ($000 | ) |
Investment Income |
|
|
|
Income |
|
|
|
Interest |
| 40,247 |
|
Total Income |
| 40,247 |
|
Expenses |
|
|
|
The Vanguard Group—Note B |
|
|
|
Investment Advisory Services |
| 731 |
|
Management and Administrative |
| 3,188 |
|
Marketing and Distribution |
| 611 |
|
Custodian Fees |
| 23 |
|
Auditing Fees |
| 29 |
|
Shareholders’ Reports and Proxy |
| 10 |
|
Trustees’ Fees and Expenses |
| 2 |
|
Total Expenses |
| 4,594 |
|
Net Investment Income |
| 35,653 |
|
Realized Net Gain (Loss) on Investment Securities Sold |
| (1 | ) |
Net Increase (Decrease) in Net Assets Resulting from Operations |
| 35,652 |
|
See accompanying Notes, which are an integral part of the Financial Statements.
New York Municipal Money Market Fund
Statement of Changes in Net Assets
|
| Year Ended November 30, |
| ||
|
| 2018 |
| 2017 |
|
|
| ($000 | ) | ($000 | ) |
Increase (Decrease) in Net Assets |
|
|
|
|
|
Operations |
|
|
|
|
|
Net Investment Income |
| 35,653 |
| 15,086 |
|
Realized Net Gain (Loss) |
| (1 | ) | (5 | ) |
Net Increase (Decrease) in Net Assets Resulting from Operations |
| 35,652 |
| 15,081 |
|
Distributions |
|
|
|
|
|
Net Investment Income |
| (35,651 | ) | (15,086 | ) |
Realized Capital Gain |
| — |
| — |
|
Total Distributions |
| (35,651 | ) | (15,086 | ) |
Capital Share Transactions (at $1.00 per share) |
|
|
|
|
|
Issued |
| 2,342,201 |
| 1,366,665 |
|
Issued in Lieu of Cash Distributions |
| 33,556 |
| 14,477 |
|
Redeemed |
| (1,585,680 | ) | (1,015,869 | ) |
Net Increase (Decrease) from Capital Share Transactions |
| 790,077 |
| 365,273 |
|
Total Increase (Decrease) |
| 790,078 |
| 365,268 |
|
Net Assets |
|
|
|
|
|
Beginning of Period |
| 2,423,974 |
| 2,058,706 |
|
End of Period |
| 3,214,052 |
| 2,423,974 |
|
See accompanying Notes, which are an integral part of the Financial Statements.
New York Municipal Money Market Fund
Financial Highlights
For a Share Outstanding |
|
|
|
|
| Year Ended November 30, |
| ||||
Throughout Each Period |
| 2018 |
| 2017 |
| 2016 |
| 2015 |
| 2014 |
|
Net Asset Value, Beginning of Period |
| $1.00 |
| $1.00 |
| $1.00 |
| $1.00 |
| $1.00 |
|
Investment Operations |
|
|
|
|
|
|
|
|
|
|
|
Net Investment Income |
| .0121 |
| .0071 |
| .003 |
| .0001 |
| .0001 |
|
Net Realized and Unrealized Gain (Loss) on Investments |
| — |
| — |
| — |
| — |
| — |
|
Total from Investment Operations |
| .012 |
| .007 |
| .003 |
| .0001 |
| .0001 |
|
Distributions |
|
|
|
|
|
|
|
|
|
|
|
Dividends from Net Investment Income |
| (.012 | ) | (.007 | ) | (.003 | ) | (.0001 | ) | (.0001 | ) |
Distributions from Realized Capital Gains |
| — |
| — |
| — |
| — |
| — |
|
Total Distributions |
| (.012 | ) | (.007 | ) | (.003 | ) | (.0001 | ) | (.0001 | ) |
Net Asset Value, End of Period |
| $1.00 |
| $1.00 |
| $1.00 |
| $1.00 |
| $1.00 |
|
|
|
|
|
|
|
|
|
|
|
|
|
Total Return2 |
| 1.24% |
| 0.67% |
| 0.26% |
| 0.01% |
| 0.01% |
|
|
|
|
|
|
|
|
|
|
|
|
|
Ratios/Supplemental Data |
|
|
|
|
|
|
|
|
|
|
|
Net Assets, End of Period (Millions) |
| $3,214 |
| $2,424 |
| $2,059 |
| $2,190 |
| $2,292 |
|
Ratio of Total Expenses to Average Net Assets |
| 0.16% |
| 0.16% |
| 0.13%3 |
| 0.06%3 |
| 0.07%3 |
|
Ratio of Net Investment Income to Average Net Assets |
| 1.24% |
| 0.67% |
| 0.25% |
| 0.01% |
| 0.01% |
|
1 Calculated based on average shares outstanding.
2 Total returns do not include account service fees that may have applied in the periods shown. Fund prospectuses provide information about any applicable account service fees.
3 The ratio of total expenses to average net assets before an expense reduction was 0.16% for 2016, 0.16% for 2015, and 0.16% for 2014. Vanguard and the board of trustees have agreed to temporarily limit certain net operating expenses in excess of the fund’s daily yield in order to maintain a zero or positive yield for the fund. The fund is not obligated to repay this amount to Vanguard.
See accompanying Notes, which are an integral part of the Financial Statements.
New York Municipal Money Market Fund
Notes to Financial Statements
Vanguard New York Municipal Money Market Fund is registered under the Investment Company Act of 1940 as an open-end investment company, or mutual fund. The fund invests in debt instruments of municipal issuers whose ability to meet their obligations may be affected by economic and political developments in the state.
A. The following significant accounting policies conform to generally accepted accounting principles for U.S. investment companies. The fund consistently follows such policies in preparing its financial statements.
1. Security Valuation: Securities are valued as of the close of trading on the New York Stock Exchange (generally 4 p.m., Eastern time) on the valuation date. Securities are valued at amortized cost, which approximates market value.
2. Federal Income Taxes: The fund intends to continue to qualify as a regulated investment company and distribute all of its income. Management has analyzed the fund’s tax positions taken for all open federal income tax years (November 30, 2015–2018), and has concluded that no provision for federal income tax is required in the fund’s financial statements.
3. Distributions: Distributions from net investment income are declared daily and paid on the first business day of the following month. Annual distributions from realized capital gains, if any, are recorded on the ex-dividend date. Distributions are determined on a tax basis and may differ from net investment income and realized capital gains for financial reporting purposes.
4. Credit Facility: The fund and certain other funds managed by The Vanguard Group (“Vanguard”) participate in a $3.1 billion committed credit facility provided by a syndicate of lenders pursuant to a credit agreement that may be renewed annually; each fund is individually liable for its borrowings, if any, under the credit facility. Borrowings may be utilized for temporary and emergency purposes, and are subject to the fund’s regulatory and contractual borrowing restrictions. The participating funds are charged administrative fees and an annual commitment fee of 0.10% of the undrawn amount of the facility; these fees are allocated to the funds based on a method approved by the fund’s board of trustees and included in Management and Administrative expenses on the fund’s Statement of Operations. Any borrowings under this facility bear interest at a rate based upon the higher of the one-month London Interbank Offered Rate, federal funds effective rate, or overnight bank funding rate plus an agreed-upon spread.
The fund had no borrowings outstanding at November 30, 2018, or at any time during the period then ended.
5. Other: Interest income is accrued daily. Premiums and discounts on debt securities purchased are amortized and accreted, respectively, to interest income over the lives of the respective securities. Security transactions are accounted for on the date securities are bought or sold. Costs used to determine realized gains (losses) on the sale of investment securities are those of the specific securities sold.
B. In accordance with the terms of a Funds’ Service Agreement (the “FSA”) between Vanguard and the fund, Vanguard furnishes to the fund investment advisory, corporate management, administrative, marketing, and distribution services at Vanguard’s cost of operations (as defined by the FSA). These costs of operations are allocated to the fund based on methods and guidelines approved by the board of trustees. Vanguard does not require reimbursement in the current period for certain costs of
New York Municipal Money Market Fund
operations (such as deferred compensation/benefits and risk/insurance costs); the fund’s liability for these costs of operations is included in Payables to Vanguard on the Statement of Net Assets. All other costs of operations payable to Vanguard are generally settled twice a month.
Upon the request of Vanguard, the fund may invest up to 0.40% of its net assets as capital in Vanguard. At November 30, 2018, the fund had contributed to Vanguard capital in the amount of $165,000, representing 0.01% of the fund’s net assets and 0.07% of Vanguard’s capitalization. The fund’s trustees and officers are also directors and employees, respectively, of Vanguard.
C. Various inputs may be used to determine the value of the fund’s investments. These inputs are summarized in three broad levels for financial statement purposes. The inputs or methodologies used to value securities are not necessarily an indication of the risk associated with investing in those securities.
Level 1—Quoted prices in active markets for identical securities.
Level 2—Other significant observable inputs (including quoted prices for similar securities, interest rates, prepayment speeds, credit risk, etc.).
Level 3—Significant unobservable inputs (including the fund’s own assumptions used to determine the fair value of investments). Any investments valued with significant unobservable inputs are noted on the Statement of Net Assets.
At November 30, 2018, 100% of the market value of the fund’s investments was determined using amortized cost, in accordance with rules under the Investment Company Act of 1940. Amortized cost approximates the current fair value of a security, but since the value is not obtained from a quoted price in an active market, securities valued at amortized cost are considered to be valued using Level 2 inputs.
D. Permanent differences between book-basis and tax-basis components of net assets, if any, are reclassified among capital accounts in the financial statements to reflect their tax character. These reclassifications have no effect on net assets or net asset value per share.
Temporary differences between book-basis and tax-basis components of total distributable earnings (loss) arise when certain items of income, gain, or loss are recognized in different periods for financial statement and tax purposes; these differences will reverse at some time in the future. The differences are primarily related to the tax deferral of losses on wash sales and payables for distributions. As of period end, the tax-basis components of total distributable earnings (loss) are detailed in the table as follows:
|
| Amount |
|
|
| ($000 | ) |
Undistributed Ordinary Income |
| — |
|
Undistributed Tax-Exempt Income |
| 264 |
|
Undistributed Long-Term Gains |
| — |
|
Capital Loss Carryforwards (Non-expiring) |
| (7 | ) |
Net Unrealized Gains (Losses) |
| — |
|
New York Municipal Money Market Fund
As of November 30, 2018, gross unrealized appreciation and depreciation for investments based on cost for U.S. federal income tax purposes were as follows:
| Amount |
| ($000) |
Tax Cost | 3,181,424 |
Gross Unrealized Appreciation | — |
Gross Unrealized Depreciation | — |
Net Unrealized Appreciation (Depreciation) | — |
E. The fund purchased securities from and sold securities to other Vanguard funds or accounts managed by Vanguard or its affiliates, in accordance with procedures adopted by the board of trustees in compliance with Rule 17a-7 of the Investment Company Act of 1940. For the year ended November 30, 2018, such purchases and sales were $267,980,000 and $356,658,000, respectively.
F. Management has determined that no events or transactions occurred subsequent to November 30, 2018, that would require recognition or disclosure in these financial statements.
New York Long-Term Tax-Exempt Fund
Performance Summary
All of the returns in this report represent past performance, which is not a guarantee of future results that may be achieved by the fund. (Current performance may be lower or higher than the performance data cited. For performance data current to the most recent month-end, visit our website at vanguard.com/performance.) Note, too, that both investment returns and principal value can fluctuate widely, so an investor’s shares, when sold, could be worth more or less than their original cost. The returns shown do not reflect taxes that a shareholder would pay on fund distributions or on the sale of fund shares.
Cumulative Performance: November 30, 2008, Through November 30, 2018
Initial Investment of $10,000
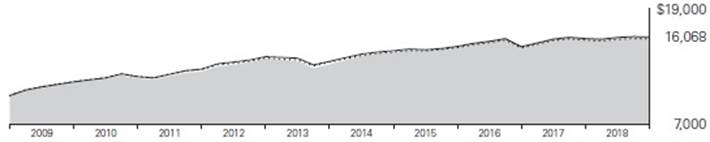
|
|
| Average Annual Total Returns Periods Ended November 30, 2018
| Final Value of a $10,000 | ||
|
|
| One | Five | Ten | |
|
|
| Year | Years | Years | Investment |
| New York Long-Term Tax-Exempt Fund Investor Shares |
| 0.48% | 3.97% | 4.86% | $16,068 |
| Bloomberg Barclays NY Municipal Bond Index |
| 0.86 | 3.37 | 4.74 | 15,893 |
| Bloomberg Barclays Municipal Bond Index |
| 1.13 | 3.52 | 4.88 | 16,101 |
|
|
|
|
|
| Final Value |
|
|
| One | Five | Ten | of a $50,000 |
|
|
| Year | Years | Years | Investment |
New York Long-Term Tax-Exempt Fund Admiral Shares |
| 0.56% | 4.06% | 4.94% | $81,013 | |
Bloomberg Barclays NY Municipal Bond Index |
| 0.86 | 3.37 | 4.74 | 79,467 | |
Bloomberg Barclays Municipal Bond Index |
| 1.13 | 3.52 | 4.88 | 80,506 | |
See Financial Highlights for dividend and capital gains information.
New York Long-Term Tax-Exempt Fund
Average Annual Total Returns: Periods Ended September 30, 2018
This table presents returns through the latest calendar quarter—rather than through the end of the fiscal period. Securities and Exchange Commission rules require that we provide this information.
|
|
|
|
|
| Ten Years |
| Inception Date | One Year | Five Years | Income | Capital | Total |
Investor Shares | 4/7/1986 | -0.22% | 4.04% | 3.63% | 1.11% | 4.74% |
Admiral Shares | 5/14/2001 | -0.14 | 4.13 | 3.72 | 1.11 | 4.83 |
New York Long-Term Tax-Exempt Fund
Distribution by Stated Maturity
As of November 30, 2018
Under 1 Year |
| 4.3 | % |
1 - 3 Years |
| 3.7 |
|
3 - 5 Years |
| 0.9 |
|
5 - 10 Years |
| 7.7 |
|
10 - 20 Years |
| 46.1 |
|
20 - 30 Years |
| 32.4 |
|
Over 30 Years |
| 4.9 |
|
New York Long-Term Tax-Exempt Fund
Financial Statements
Statement of Net Assets
As of November 30, 2018
The fund reports a complete list of its holdings in regulatory filings four times in each fiscal year, at the quarter-ends. For the second and fourth fiscal quarters, the lists appear in the fund’s semiannual and annual reports to shareholders. For the first and third fiscal quarters, the fund files the lists with the Securities and Exchange Commission on Form N-Q. Shareholders can look up the fund’s Forms N-Q on the SEC’s website at sec.gov.
|
|
|
|
|
| Face | Market |
|
|
| Maturity |
|
| Amount | Value· |
|
| Coupon | Date |
|
| ($000) | ($000) |
Tax-Exempt Municipal Bonds (98.7%) |
|
|
|
|
|
| |
New York (98.5%) |
|
|
|
|
|
| |
| Albany NY Capital Resource Corp. Revenue (St. Peter’s Hospital) | 6.000% | 11/15/20 |
| (Prere.) | 325 | 350 |
| Albany NY Capital Resource Corp. Revenue (St. Peter’s Hospital) | 6.125% | 11/15/20 |
| (Prere.) | 150 | 162 |
| Albany NY Industrial Development Agency Civic Facility Revenue (University at Albany Foundation Student Housing Corp.— Empire Commons North Project) | 5.375% | 5/1/19 |
| (Prere.) | 3,455 | 3,506 |
| Albany NY Industrial Development Agency Civic Facility Revenue (University at Albany Foundation Student Housing Corp.— Empire Commons North Project) | 5.500% | 5/1/19 |
| (Prere.) | 2,550 | 2,589 |
| Albany NY Industrial Development Agency Civic Facility Revenue (University at Albany Foundation Student Housing Corp.— Empire Commons South Project) | 5.375% | 5/1/19 |
| (Prere.) | 4,395 | 4,460 |
| Albany NY Industrial Development Agency Civic Facility Revenue (University at Albany Foundation Student Housing Corp.— Empire Commons South Project) | 5.500% | 5/1/19 |
| (Prere.) | 1,500 | 1,523 |
| Albany NY Industrial Development Agency Civic Facility Revenue (University at Albany Foundation Student Housing Corp.— Empire Commons West Project) | 5.375% | 5/1/19 |
| (Prere.) | 3,415 | 3,465 |
| Amherst NY Development Corp. Revenue (Daemen College Project) | 5.000% | 10/1/43 |
|
| 1,000 | 1,047 |
| Amherst NY Development Corp. Revenue (Daemen College Project) | 5.000% | 10/1/48 |
|
| 1,000 | 1,043 |
| Amherst NY Development Corp. Student Housing Facility Revenue | 5.000% | 10/1/20 |
| (Prere.) | 2,500 | 2,638 |
| Amherst NY Development Corp. Student Housing Facility Revenue | 5.000% | 10/1/20 |
| (Prere.) | 3,800 | 4,010 |
| Brooklyn NY Local Development Corp. PILOT Revenue (Barclays Center Project) | 6.250% | 1/15/20 |
| (Prere.) | 5,475 | 5,743 |
| Brooklyn NY Local Development Corp. PILOT Revenue (Barclays Center Project) | 6.375% | 1/15/20 |
| (Prere.) | 19,390 | 20,366 |
| Brooklyn NY Local Development Corp. PILOT Revenue (Barclays Center Project) | 0.000% | 7/15/31 |
|
| 10,890 | 6,592 |
New York Long-Term Tax-Exempt Fund
|
|
|
|
|
| Face | Market |
|
|
| Maturity |
|
| Amount | Value· |
|
| Coupon | Date |
|
| ($000) | ($000) |
| Brooklyn NY Local Development Corp. PILOT Revenue (Barclays Center Project) | 0.000% | 7/15/32 |
|
| 1,745 | 1,003 |
| Brooklyn NY Local Development Corp. PILOT Revenue (Barclays Center Project) | 0.000% | 7/15/33 |
|
| 2,160 | 1,182 |
| Brooklyn NY Local Development Corp. PILOT Revenue (Barclays Center Project) | 0.000% | 7/15/35 |
|
| 1,750 | 840 |
| Brooklyn NY Local Development Corp. PILOT Revenue (Barclays Center Project) | 0.000% | 7/15/45 |
|
| 960 | 274 |
| Brooklyn NY Local Development Corp. PILOT Revenue (Barclays Center Project) | 0.000% | 7/15/46 |
|
| 450 | 122 |
| Brooklyn NY Local Development Corp. PILOT Revenue (Brooklyn Events Center) | 5.000% | 7/15/24 |
|
| 1,800 | 1,993 |
| Brooklyn NY Local Development Corp. PILOT Revenue (Brooklyn Events Center) | 5.000% | 7/15/25 |
|
| 1,655 | 1,849 |
| Brooklyn NY Local Development Corp. PILOT Revenue (Brooklyn Events Center) | 5.000% | 7/15/26 |
|
| 3,000 | 3,356 |
| Brooklyn NY Local Development Corp. PILOT Revenue (Brooklyn Events Center) | 5.000% | 7/15/27 |
|
| 6,575 | 7,340 |
| Brooklyn NY Local Development Corp. PILOT Revenue (Brooklyn Events Center) | 5.000% | 7/15/28 |
|
| 6,275 | 6,963 |
| Brooklyn NY Local Development Corp. PILOT Revenue (Brooklyn Events Center) | 5.000% | 7/15/30 |
|
| 7,990 | 8,783 |
| Brooklyn NY Local Development Corp. PILOT Revenue (Brooklyn Events Center) | 5.000% | 7/15/42 |
|
| 24,760 | 26,266 |
| Buffalo & Erie County NY Industrial Land Development Corp. Revenue | 5.000% | 11/15/24 |
|
| 1,395 | 1,517 |
| Buffalo & Erie County NY Industrial Land Development Corp. Revenue | 5.000% | 7/1/25 |
|
| 2,015 | 2,272 |
| Buffalo & Erie County NY Industrial Land Development Corp. Revenue | 5.000% | 11/15/25 |
|
| 1,590 | 1,739 |
| Buffalo & Erie County NY Industrial Land Development Corp. Revenue | 5.000% | 11/15/37 |
|
| 4,515 | 4,717 |
| Buffalo & Erie County NY Industrial Land Development Corp. Revenue | 5.000% | 7/1/40 |
|
| 5,270 | 5,564 |
| Buffalo & Erie County NY Industrial Land Development Corp. Revenue (Catholic Health System Obligated Group) | 5.000% | 7/1/30 |
|
| 1,155 | 1,258 |
| Buffalo & Erie County NY Industrial Land Development Corp. Revenue (Catholic Health System Obligated Group) | 5.250% | 7/1/35 |
|
| 1,500 | 1,624 |
| Buffalo & Fort Erie NY Public Bridge Authority Revenue | 5.000% | 1/1/42 |
|
| 2,250 | 2,486 |
| Buffalo & Fort Erie NY Public Bridge Authority Revenue | 5.000% | 1/1/47 |
|
| 3,000 | 3,301 |
| Buffalo NY Municipal Water Finance Authority Revenue | 5.000% | 7/1/24 |
|
| 500 | 566 |
| Buffalo NY Municipal Water Finance Authority Revenue | 5.000% | 7/1/25 |
|
| 510 | 585 |
| Buffalo NY Municipal Water Finance Authority Revenue | 5.000% | 7/1/26 |
|
| 1,000 | 1,144 |
| Buffalo NY Municipal Water Finance Authority Revenue | 5.000% | 7/1/28 |
|
| 2,010 | 2,278 |
| Buffalo NY Municipal Water Finance Authority Revenue | 5.000% | 7/1/29 |
|
| 500 | 565 |
New York Long-Term Tax-Exempt Fund
|
|
|
|
|
| Face | Market |
|
|
| Maturity |
|
| Amount | Value· |
|
| Coupon | Date |
|
| ($000) | ($000) |
| Dobbs Ferry NY Local Development Corp. Revenue (Mercy College Project) | 5.000% | 7/1/39 |
|
| 2,715 | 2,937 |
| Dobbs Ferry NY Local Development Corp. Revenue (Mercy College Project) | 5.000% | 7/1/44 |
|
| 2,510 | 2,700 |
| Dutchess County NY Local Development Corp. Revenue (Culinary Institute of America Project) | 5.000% | 7/1/26 |
|
| 300 | 340 |
| Dutchess County NY Local Development Corp. Revenue (Culinary Institute of America Project) | 5.000% | 7/1/27 |
|
| 700 | 787 |
| Dutchess County NY Local Development Corp. Revenue (Culinary Institute of America Project) | 5.000% | 7/1/28 |
|
| 950 | 1,062 |
| Dutchess County NY Local Development Corp. Revenue (Culinary Institute of America Project) | 5.000% | 7/1/29 |
|
| 250 | 285 |
| Dutchess County NY Local Development Corp. Revenue (Culinary Institute of America Project) | 5.000% | 7/1/29 |
|
| 500 | 557 |
| Dutchess County NY Local Development Corp. Revenue (Culinary Institute of America Project) | 5.000% | 7/1/30 |
|
| 220 | 250 |
| Dutchess County NY Local Development Corp. Revenue (Culinary Institute of America Project) | 5.000% | 7/1/30 |
|
| 380 | 422 |
| Dutchess County NY Local Development Corp. Revenue (Culinary Institute of America Project) | 5.000% | 7/1/31 |
|
| 575 | 635 |
| Dutchess County NY Local Development Corp. Revenue (Culinary Institute of America Project) | 5.000% | 7/1/32 |
|
| 450 | 505 |
| Dutchess County NY Local Development Corp. Revenue (Culinary Institute of America Project) | 5.000% | 7/1/32 |
|
| 240 | 264 |
| Dutchess County NY Local Development Corp. Revenue (Culinary Institute of America Project) | 5.000% | 7/1/33 |
|
| 450 | 503 |
| Dutchess County NY Local Development Corp. Revenue (Culinary Institute of America Project) | 5.000% | 7/1/33 |
|
| 200 | 219 |
| Dutchess County NY Local Development Corp. Revenue (Culinary Institute of America Project) | 5.000% | 7/1/36 |
|
| 170 | 185 |
| Dutchess County NY Local Development Corp. Revenue (Culinary Institute of America Project) | 5.000% | 7/1/41 |
|
| 415 | 446 |
| Dutchess County NY Local Development Corp. Revenue (Culinary Institute of America Project) | 5.000% | 7/1/46 |
|
| 300 | 321 |
| Dutchess County NY Local Development Corp. Revenue (Culinary Institute of America) | 5.000% | 7/1/25 |
|
| 500 | 563 |
| Dutchess County NY Local Development Corp. Revenue (Health Quest Systems Inc. Project) | 5.000% | 7/1/28 |
|
| 1,505 | 1,710 |
New York Long-Term Tax-Exempt Fund
|
|
|
|
|
| Face | Market |
|
|
| Maturity |
|
| Amount | Value· |
|
| Coupon | Date |
|
| ($000) | ($000) |
| Dutchess County NY Local Development Corp. Revenue (Health Quest Systems Inc. Project) | 5.000% | 7/1/28 |
|
| 2,000 | 2,272 |
| Dutchess County NY Local Development Corp. Revenue (Health Quest Systems Inc. Project) | 5.000% | 7/1/29 |
|
| 1,595 | 1,803 |
| Dutchess County NY Local Development Corp. Revenue (Health Quest Systems Inc. Project) | 5.000% | 7/1/34 |
|
| 650 | 708 |
| Dutchess County NY Local Development Corp. Revenue (Health Quest Systems Inc. Project) | 5.000% | 7/1/44 |
|
| 2,000 | 2,144 |
| Dutchess County NY Local Development Corp. Revenue (Marist College Project) | 5.000% | 7/1/45 |
|
| 1,240 | 1,365 |
| Dutchess County NY Local Development Corp. Revenue (Vassar College Project) | 5.000% | 7/1/33 |
|
| 1,105 | 1,261 |
| Dutchess County NY Local Development Corp. Revenue (Vassar College Project) | 5.000% | 7/1/34 |
|
| 1,345 | 1,531 |
| Dutchess County NY Local Development Corp. Revenue (Vassar College Project) | 5.000% | 7/1/35 |
|
| 1,200 | 1,361 |
| Dutchess County NY Local Development Corp. Revenue (Vassar College Project) | 5.000% | 7/1/37 |
|
| 1,000 | 1,127 |
| Dutchess County NY Local Development Corp. Revenue (Vassar College Project) | 5.000% | 7/1/42 |
|
| 7,240 | 8,089 |
| Dutchess County NY Local Development Corp. Revenue (Vassar College Project) | 4.000% | 7/1/46 |
|
| 5,500 | 5,564 |
| Erie County NY Fiscal Stability Authority Revenue | 4.000% | 9/1/31 |
|
| 1,000 | 1,074 |
| Erie County NY Fiscal Stability Authority Revenue | 4.000% | 9/1/33 |
|
| 600 | 639 |
| Erie County NY Fiscal Stability Authority Revenue | 5.000% | 9/1/39 |
|
| 1,000 | 1,132 |
| Erie County NY GO | 5.000% | 4/1/25 |
|
| 560 | 608 |
| Haverstraw-Stony Point NY Central School District GO | 5.000% | 10/15/31 |
| (4) | 1,100 | 1,221 |
| Haverstraw-Stony Point NY Central School District GO | 5.000% | 10/15/33 |
| (4) | 300 | 332 |
| Haverstraw-Stony Point NY Central School District GO | 5.000% | 10/15/34 |
| (4) | 500 | 552 |
| Haverstraw-Stony Point NY Central School District GO | 5.000% | 10/15/36 |
| (4) | 1,000 | 1,100 |
| Hempstead NY GO | 4.000% | 4/1/29 |
| (4) | 6,000 | 6,400 |
| Hempstead NY Local Development Corp. Revenue (Adelphi University) | 5.000% | 10/1/28 |
|
| 1,320 | 1,477 |
| Hempstead NY Local Development Corp. Revenue (Adelphi University) | 5.000% | 9/1/43 |
|
| 5,000 | 5,390 |
| Hempstead NY Local Development Corp. Revenue (Hofstra University) | 5.000% | 7/1/22 |
|
| 2,130 | 2,280 |
| Hempstead NY Local Development Corp. Revenue (Hofstra University) | 5.000% | 7/1/28 |
|
| 1,300 | 1,387 |
| Hempstead NY Local Development Corp. Revenue (Hofstra University) | 5.000% | 7/1/41 |
|
| 2,815 | 2,981 |
| Hempstead NY Local Development Corp. Revenue (Molloy College) | 5.000% | 7/1/27 |
|
| 1,740 | 1,968 |
| Hempstead NY Local Development Corp. Revenue (Molloy College) | 5.000% | 7/1/29 |
|
| 2,170 | 2,347 |
| Hempstead NY Local Development Corp. Revenue (Molloy College) | 5.000% | 7/1/30 |
|
| 670 | 742 |
New York Long-Term Tax-Exempt Fund
|
|
|
|
|
| Face | Market |
|
|
| Maturity |
|
| Amount | Value· |
|
| Coupon | Date |
|
| ($000) | ($000) |
| Hempstead NY Local Development Corp. Revenue (Molloy College) | 5.000% | 7/1/32 |
|
| 370 | 406 |
| Hempstead NY Local Development Corp. Revenue (Molloy College) | 5.000% | 7/1/34 |
|
| 1,800 | 1,911 |
| Hempstead NY Local Development Corp. Revenue (Molloy College) | 5.000% | 7/1/38 |
|
| 870 | 944 |
| Hempstead NY Local Development Corp. Revenue (Molloy College) | 5.000% | 7/1/38 |
|
| 480 | 517 |
| Hempstead NY Local Development Corp. Revenue (Molloy College) | 5.000% | 7/1/39 |
|
| 1,645 | 1,730 |
| Hempstead NY Local Development Corp. Revenue (Molloy College) | 5.000% | 7/1/43 |
|
| 1,025 | 1,102 |
| Hempstead NY Local Development Corp. Revenue (Molloy College) | 5.000% | 7/1/44 |
|
| 1,670 | 1,747 |
| Hempstead NY Local Development Corp. Revenue (Molloy College) | 5.000% | 7/1/48 |
|
| 1,100 | 1,177 |
| Hudson Yards Infrastructure Corp. New York Revenue | 5.250% | 2/15/21 |
| (Prere.) | 350 | 375 |
| Hudson Yards Infrastructure Corp. New York Revenue | 5.750% | 2/15/21 |
| (Prere.) | 17,665 | 19,105 |
| Hudson Yards Infrastructure Corp. New York Revenue | 5.000% | 2/15/31 |
|
| 5,000 | 5,749 |
| Hudson Yards Infrastructure Corp. New York Revenue | 5.000% | 2/15/32 |
|
| 2,500 | 2,861 |
| Hudson Yards Infrastructure Corp. New York Revenue | 5.000% | 2/15/33 |
|
| 2,000 | 2,276 |
| Hudson Yards Infrastructure Corp. New York Revenue | 5.000% | 2/15/34 |
|
| 14,000 | 15,858 |
| Hudson Yards Infrastructure Corp. New York Revenue | 5.000% | 2/15/36 |
|
| 5,200 | 5,846 |
| Hudson Yards Infrastructure Corp. New York Revenue | 5.000% | 2/15/37 |
|
| 3,600 | 4,036 |
| Hudson Yards Infrastructure Corp. New York Revenue | 5.000% | 2/15/38 |
|
| 3,000 | 3,354 |
| Hudson Yards Infrastructure Corp. New York Revenue | 5.000% | 2/15/39 |
|
| 4,500 | 5,021 |
| Hudson Yards Infrastructure Corp. New York Revenue | 5.000% | 2/15/42 |
|
| 17,750 | 19,699 |
| Hudson Yards Infrastructure Corp. New York Revenue | 4.000% | 2/15/44 |
|
| 11,000 | 11,084 |
| Hudson Yards Infrastructure Corp. New York Revenue | 5.000% | 2/15/45 |
|
| 9,500 | 10,493 |
| Hudson Yards Infrastructure Corp. New York Revenue | 5.250% | 2/15/47 |
|
| 7,575 | 8,026 |
| Hudson Yards Infrastructure Corp. New York Revenue | 5.750% | 2/15/47 |
|
| 10,860 | 11,626 |
| Long Island NY Power Authority Electric System Revenue | 5.250% | 4/1/19 |
| (ETM) | 1,520 | 1,537 |
| Long Island NY Power Authority Electric System Revenue | 5.250% | 4/1/19 |
| (ETM) | 930 | 941 |
| Long Island NY Power Authority Electric System Revenue | 6.250% | 4/1/19 |
| (Prere.) | 2,225 | 2,257 |
| Long Island NY Power Authority Electric System Revenue | 0.000% | 6/1/24 |
| (4) | 19,830 | 17,059 |
New York Long-Term Tax-Exempt Fund
|
|
|
|
|
| Face | Market |
|
|
| Maturity |
|
| Amount | Value· |
|
| Coupon | Date |
|
| ($000) | ($000) |
| Long Island NY Power Authority Electric System Revenue | 5.000% | 9/1/25 |
|
| 1,500 | 1,634 |
| Long Island NY Power Authority Electric System Revenue | 5.000% | 9/1/26 |
|
| 3,400 | 3,704 |
| Long Island NY Power Authority Electric System Revenue | 5.000% | 9/1/26 |
|
| 1,000 | 1,146 |
| Long Island NY Power Authority Electric System Revenue | 5.000% | 9/1/26 |
|
| 510 | 595 |
| Long Island NY Power Authority Electric System Revenue | 0.000% | 6/1/27 |
| (4) | 15,905 | 12,218 |
| Long Island NY Power Authority Electric System Revenue | 5.000% | 9/1/27 |
|
| 865 | 1,015 |
| Long Island NY Power Authority Electric System Revenue | 5.000% | 9/1/28 |
|
| 1,010 | 1,146 |
| Long Island NY Power Authority Electric System Revenue | 5.000% | 9/1/29 |
|
| 1,550 | 1,684 |
| Long Island NY Power Authority Electric System Revenue | 5.000% | 9/1/29 |
|
| 1,000 | 1,161 |
| Long Island NY Power Authority Electric System Revenue | 5.000% | 9/1/30 |
|
| 1,010 | 1,164 |
| Long Island NY Power Authority Electric System Revenue | 5.000% | 9/1/33 |
|
| 750 | 853 |
| Long Island NY Power Authority Electric System Revenue | 5.000% | 9/1/34 |
|
| 4,500 | 4,979 |
| Long Island NY Power Authority Electric System Revenue | 5.000% | 9/1/34 |
|
| 1,000 | 1,131 |
| Long Island NY Power Authority Electric System Revenue | 5.000% | 9/1/35 |
|
| 2,400 | 2,733 |
| Long Island NY Power Authority Electric System Revenue | 5.000% | 9/1/35 |
|
| 6,000 | 6,622 |
| Long Island NY Power Authority Electric System Revenue | 5.000% | 9/1/35 |
|
| 1,500 | 1,690 |
| Long Island NY Power Authority Electric System Revenue | 5.000% | 9/1/36 |
|
| 2,285 | 2,590 |
| Long Island NY Power Authority Electric System Revenue | 5.000% | 9/1/36 |
|
| 2,000 | 2,226 |
| Long Island NY Power Authority Electric System Revenue | 5.000% | 9/1/37 |
|
| 2,150 | 2,431 |
| Long Island NY Power Authority Electric System Revenue | 5.000% | 9/1/37 |
|
| 7,625 | 8,219 |
| Long Island NY Power Authority Electric System Revenue | 5.000% | 9/1/38 |
|
| 2,150 | 2,426 |
| Long Island NY Power Authority Electric System Revenue | 5.000% | 9/1/39 |
|
| 5,500 | 5,964 |
| Long Island NY Power Authority Electric System Revenue | 5.000% | 9/1/41 |
|
| 2,500 | 2,752 |
| Long Island NY Power Authority Electric System Revenue | 5.000% | 9/1/42 |
|
| 7,500 | 8,287 |
| Long Island NY Power Authority Electric System Revenue | 5.000% | 9/1/44 |
|
| 17,550 | 18,908 |
| Long Island NY Power Authority Electric System Revenue | 5.000% | 9/1/47 |
|
| 7,000 | 7,712 |
| Madison County NY Capital Resource Corp. Revenue (Colgate University Project) | 5.000% | 7/1/40 |
|
| 1,495 | 1,654 |
New York Long-Term Tax-Exempt Fund
|
|
|
|
| Face | Market |
|
|
| Maturity |
| Amount | Value· |
|
| Coupon | Date |
| ($000) | ($000) |
| Madison County NY Capital Resource Corp. Revenue (Colgate University Project) | 5.000% | 7/1/43 |
| 6,000 | 6,613 |
| Monroe County NY Industrial Development Corp. Mortgage Revenue (Unity Hospital Rochester Project) | 5.500% | 8/15/23 |
| 1,835 | 1,841 |
| Monroe County NY Industrial Development Corp. Mortgage Revenue (Unity Hospital Rochester Project) | 5.750% | 8/15/30 |
| 3,500 | 3,782 |
| Monroe County NY Industrial Development Corp. Mortgage Revenue (Unity Hospital Rochester Project) | 5.750% | 8/15/35 |
| 3,000 | 3,242 |
| Monroe County NY Industrial Development Corp. Mortgage Revenue (Unity Hospital Rochester Project) | 5.500% | 8/15/40 |
| 3,700 | 3,953 |
| Monroe County NY Industrial Development Corp. Revenue (Nazareth College of Rochester Project) | 5.000% | 10/1/32 |
| 600 | 664 |
| Monroe County NY Industrial Development Corp. Revenue (Nazareth College of Rochester Project) | 4.000% | 10/1/47 |
| 1,300 | 1,257 |
| Monroe County NY Industrial Development Corp. Revenue (Rochester General Hospital) | 5.000% | 12/1/27 |
| 1,550 | 1,775 |
| Monroe County NY Industrial Development Corp. Revenue (Rochester General Hospital) | 5.000% | 12/1/29 |
| 1,000 | 1,134 |
| Monroe County NY Industrial Development Corp. Revenue (Rochester General Hospital) | 5.000% | 12/1/34 |
| 1,100 | 1,221 |
| Monroe County NY Industrial Development Corp. Revenue (Rochester General Hospital) | 5.000% | 12/1/35 |
| 1,055 | 1,167 |
| Monroe County NY Industrial Development Corp. Revenue (Rochester General Hospital) | 5.000% | 12/1/36 |
| 1,100 | 1,213 |
| Monroe County NY Industrial Development Corp. Revenue (Rochester General Hospital) | 5.000% | 12/1/37 |
| 2,600 | 2,775 |
| Monroe County NY Industrial Development Corp. Revenue (Rochester General Hospital) | 5.000% | 12/1/42 |
| 5,635 | 5,974 |
| Monroe County NY Industrial Development Corp. Revenue (Rochester General Hospital) | 5.000% | 12/1/46 |
| 5,000 | 5,387 |
| Monroe County NY Industrial Development Corp. Revenue (St. John Fisher College Project) | 5.500% | 6/1/39 |
| 1,500 | 1,687 |
| Monroe County NY Industrial Development Corp. Revenue (St. John Fisher College Project) | 5.000% | 6/1/44 |
| 2,500 | 2,696 |
| Monroe County NY Industrial Development Corp. Revenue (University of Rochester Project) | 5.000% | 7/1/31 |
| 2,000 | 2,315 |
| Monroe County NY Industrial Development Corp. Revenue (University of Rochester Project) | 4.000% | 7/1/32 |
| 1,780 | 1,868 |
| Monroe County NY Industrial Development Corp. Revenue (University of Rochester Project) | 4.000% | 7/1/32 |
| 1,270 | 1,333 |
| Monroe County NY Industrial Development Corp. Revenue (University of Rochester Project) | 5.000% | 7/1/32 |
| 1,300 | 1,500 |
New York Long-Term Tax-Exempt Fund
|
|
|
|
|
| Face | Market |
|
|
| Maturity |
|
| Amount | Value· |
|
| Coupon | Date |
|
| ($000) | ($000) |
| Monroe County NY Industrial Development Corp. Revenue (University of Rochester Project) | 4.000% | 7/1/33 |
|
| 1,650 | 1,723 |
| Monroe County NY Industrial Development Corp. Revenue (University of Rochester Project) | 4.000% | 7/1/36 |
|
| 1,000 | 1,027 |
| Monroe County NY Industrial Development Corp. Revenue (University of Rochester Project) | 4.000% | 7/1/36 |
|
| 900 | 924 |
| Monroe County NY Industrial Development Corp. Revenue (University of Rochester Project) | 5.000% | 7/1/36 |
|
| 1,000 | 1,134 |
| Monroe County NY Industrial Development Corp. Revenue (University of Rochester Project) | 4.000% | 7/1/43 |
|
| 5,000 | 5,043 |
| Monroe County NY Industrial Development Corp. Revenue (University of Rochester) | 5.000% | 7/1/23 |
| (Prere.) | 4,880 | 5,506 |
| Monroe County NY Industrial Development Corp. Revenue (University of Rochester) | 5.000% | 7/1/29 |
|
| 1,250 | 1,423 |
| Monroe County NY Industrial Development Corp. Revenue (University of Rochester) | 5.000% | 7/1/31 |
|
| 1,000 | 1,131 |
| Monroe County NY Industrial Development Corp. Revenue (University of Rochester) | 5.000% | 7/1/32 |
|
| 1,640 | 1,847 |
| Monroe County NY Industrial Development Corp. Revenue (University of Rochester) | 5.000% | 7/1/33 |
|
| 1,400 | 1,570 |
| Monroe County NY Industrial Development Corp. Revenue (University of Rochester) | 5.000% | 7/1/37 |
|
| 1,000 | 1,112 |
| Monroe County NY Industrial Development Corp. Revenue (University of Rochester) | 4.000% | 7/1/39 |
|
| 1,500 | 1,518 |
| Monroe County NY Industrial Development Corp. Revenue (University of Rochester) | 5.000% | 7/1/45 |
|
| 4,030 | 4,437 |
| Nassau County NY GO | 5.000% | 4/1/34 |
|
| 5,740 | 6,277 |
| Nassau County NY GO | 5.000% | 4/1/35 |
|
| 1,500 | 1,638 |
| Nassau County NY Interim Finance Authority Sales Tax Revenue VRDO | 1.720% | 12/7/18 |
|
| 2,500 | 2,500 |
| Nassau County NY Local Economic Assistance & Financing Corp. Revenue (South Nassau Communities Hospital) | 5.000% | 7/1/22 |
|
| 2,225 | 2,416 |
| Nassau County NY Local Economic Assistance & Financing Corp. Revenue (South Nassau Communities Hospital) | 5.000% | 7/1/27 |
|
| 7,765 | 8,361 |
| Nassau County NY Local Economic Assistance & Financing Corp. Revenue (South Nassau Communities Hospital) | 5.000% | 7/1/31 |
|
| 2,000 | 2,140 |
| Nassau County NY Local Economic Assistance & Financing Corp. Revenue (South Nassau Communities Hospital) | 5.000% | 7/1/37 |
|
| 1,000 | 1,061 |
| Nassau County NY Local Economic Assistance & Financing Corp. Revenue (Winthrop University Hospital Association Project) | 5.000% | 7/1/27 |
|
| 4,000 | 4,278 |
| Nassau County NY Local Economic Assistance & Financing Corp. Revenue (Winthrop University Hospital Association Project) | 5.000% | 7/1/32 |
|
| 1,535 | 1,624 |
New York Long-Term Tax-Exempt Fund
|
|
|
|
| Face | Market |
|
|
| Maturity |
| Amount | Value· |
|
| Coupon | Date |
| ($000) | ($000) |
| Nassau County NY Local Economic Assistance & Financing Corp. Revenue (Winthrop University Hospital Association Project) | 5.000% | 7/1/37 |
| 8,245 | 8,647 |
| Nassau County NY Local Economic Assistance & Financing Corp. Revenue (Winthrop University Hospital Association Project) | 5.000% | 7/1/42 |
| 3,025 | 3,152 |
| Nassau County NY Local Economic Assistance Corp. Revenue (Catholic Health Services of Long Island Obligated Group Project) | 5.000% | 7/1/23 |
| 700 | 772 |
| Nassau County NY Local Economic Assistance Corp. Revenue (Catholic Health Services of Long Island Obligated Group Project) | 5.000% | 7/1/24 |
| 500 | 559 |
| Nassau County NY Local Economic Assistance Corp. Revenue (Catholic Health Services of Long Island Obligated Group Project) | 5.000% | 7/1/25 |
| 1,400 | 1,562 |
| Nassau County NY Local Economic Assistance Corp. Revenue (Catholic Health Services of Long Island Obligated Group Project) | 5.000% | 7/1/28 |
| 1,500 | 1,643 |
| Nassau County NY Local Economic Assistance Corp. Revenue (Catholic Health Services of Long Island Obligated Group Project) | 5.000% | 7/1/28 |
| 1,690 | 1,851 |
| Nassau County NY Local Economic Assistance Corp. Revenue (Catholic Health Services of Long Island Obligated Group Project) | 5.000% | 7/1/29 |
| 1,565 | 1,703 |
| Nassau County NY Local Economic Assistance Corp. Revenue (Catholic Health Services of Long Island Obligated Group Project) | 5.000% | 7/1/30 |
| 1,750 | 1,893 |
| Nassau County NY Local Economic Assistance Corp. Revenue (Catholic Health Services of Long Island Obligated Group Project) | 5.000% | 7/1/31 |
| 1,000 | 1,077 |
| Nassau County NY Local Economic Assistance Corp. Revenue (Catholic Health Services of Long Island Obligated Group Project) | 5.000% | 7/1/34 |
| 2,170 | 2,314 |
| New Rochelle NY Corporate Local Development Revenue (Iona College Project) | 5.000% | 7/1/22 |
| 270 | 289 |
| New Rochelle NY Corporate Local Development Revenue (Iona College Project) | 5.000% | 7/1/25 |
| 325 | 360 |
| New Rochelle NY Corporate Local Development Revenue (Iona College Project) | 5.000% | 7/1/26 |
| 335 | 370 |
| New Rochelle NY Corporate Local Development Revenue (Iona College Project) | 5.000% | 7/1/27 |
| 425 | 469 |
| New Rochelle NY Corporate Local Development Revenue (Iona College Project) | 5.000% | 7/1/28 |
| 375 | 412 |
| New Rochelle NY Corporate Local Development Revenue (Iona College Project) | 5.000% | 7/1/33 |
| 1,135 | 1,227 |
| New Rochelle NY Corporate Local Development Revenue (Iona College Project) | 5.000% | 7/1/35 |
| 1,000 | 1,076 |
| New Rochelle NY Corporate Local Development Revenue (Iona College Project) | 5.000% | 7/1/40 |
| 1,250 | 1,331 |
| New Rochelle NY Corporate Local Development Revenue (Iona College Project) | 5.000% | 7/1/45 |
| 2,030 | 2,155 |
| New York City NY Build NYC Resource Corp. Revenue (Ethical Culture Fieldston Project) | 5.000% | 6/1/24 |
| 750 | 847 |
New York Long-Term Tax-Exempt Fund
|
|
|
|
|
| Face | Market |
|
|
| Maturity |
|
| Amount | Value· |
|
| Coupon | Date |
|
| ($000) | ($000) |
| New York City NY Build NYC Resource Corp. Revenue (Methodist Hospital Project) | 5.000% | 7/1/23 |
|
| 1,400 | 1,552 |
| New York City NY Build NYC Resource Corp. Revenue (Methodist Hospital Project) | 5.000% | 7/1/25 |
|
| 1,325 | 1,482 |
| New York City NY Build NYC Resource Corp. Revenue (Methodist Hospital Project) | 5.000% | 7/1/27 |
|
| 1,000 | 1,105 |
| New York City NY Build NYC Resource Corp. Revenue (New York Law School Project) | 5.000% | 7/1/20 |
|
| 1,775 | 1,835 |
| New York City NY Build NYC Resource Corp. Revenue (New York Law School Project) | 5.000% | 7/1/21 |
|
| 1,875 | 1,971 |
| New York City NY Build NYC Resource Corp. Revenue (New York Law School Project) | 5.000% | 7/1/22 |
|
| 3,010 | 3,204 |
| New York City NY Build NYC Resource Corp. Revenue (New York Law School Project) | 5.000% | 7/1/29 |
|
| 1,890 | 2,010 |
| New York City NY Build NYC Resource Corp. Revenue (New York Law School Project) | 5.000% | 7/1/36 |
|
| 5,000 | 5,205 |
| New York City NY Build NYC Resource Corp. Revenue (New York Law School Project) | 5.000% | 7/1/41 |
|
| 1,875 | 1,935 |
| New York City NY Build NYC Resource Corp. Revenue (Queens College) | 5.000% | 6/1/27 |
|
| 200 | 224 |
| New York City NY Build NYC Resource Corp. Revenue (Queens College) | 5.000% | 6/1/28 |
|
| 270 | 301 |
| New York City NY Build NYC Resource Corp. Revenue (Queens College) | 5.000% | 6/1/29 |
|
| 225 | 250 |
| New York City NY Build NYC Resource Corp. Revenue (Queens College) | 5.000% | 6/1/30 |
|
| 310 | 344 |
| New York City NY Build NYC Resource Corp. Revenue (Queens College) | 5.000% | 6/1/32 |
|
| 660 | 731 |
| New York City NY Build NYC Resource Corp. Revenue (Queens College) | 5.000% | 6/1/33 |
|
| 660 | 730 |
| New York City NY Build NYC Resource Corp. Revenue (Queens College) | 5.000% | 6/1/34 |
|
| 580 | 640 |
| New York City NY Build NYC Resource Corp. Revenue (Queens College) | 5.000% | 6/1/38 |
|
| 1,000 | 1,099 |
| New York City NY Build NYC Resource Corp. Revenue (YMCA of Greater New York) | 5.000% | 8/1/29 |
|
| 1,000 | 1,112 |
| New York City NY Build NYC Resource Corp. Revenue (YMCA of Greater New York) | 4.000% | 8/1/36 |
|
| 1,120 | 1,130 |
| New York City NY GO | 5.625% | 4/1/19 |
| (Prere.) | 2,890 | 2,927 |
| New York City NY GO | 5.000% | 8/1/26 |
|
| 3,070 | 3,568 |
| New York City NY GO | 5.000% | 8/1/27 |
|
| 4,560 | 5,163 |
| New York City NY GO | 5.000% | 8/1/28 |
|
| 3,000 | 3,422 |
| New York City NY GO | 5.000% | 8/1/28 |
|
| 4,000 | 4,523 |
| New York City NY GO | 5.000% | 8/1/28 |
|
| 2,275 | 2,697 |
| New York City NY GO | 5.000% | 8/1/28 |
|
| 3,710 | 3,993 |
| New York City NY GO | 5.000% | 8/1/29 |
|
| 5,010 | 5,632 |
| New York City NY GO | 5.000% | 8/1/29 |
|
| 5,185 | 6,092 |
| New York City NY GO | 5.000% | 8/1/29 |
|
| 8,515 | 9,758 |
| New York City NY GO | 5.000% | 8/1/29 |
|
| 5,000 | 5,776 |
| New York City NY GO | 5.000% | 8/1/30 |
|
| 3,000 | 3,383 |
| New York City NY GO | 5.000% | 8/1/30 |
|
| 6,220 | 6,885 |
| New York City NY GO | 5.000% | 8/1/30 |
|
| 4,720 | 5,417 |
| New York City NY GO | 5.000% | 8/1/30 |
|
| 4,000 | 4,668 |
| New York City NY GO | 5.000% | 8/1/30 |
|
| 2,335 | 2,601 |
New York Long-Term Tax-Exempt Fund
|
|
|
|
| Face | Market | |
|
|
| Maturity |
| Amount | Value· | |
|
| Coupon | Date |
| ($000) | ($000) | |
| New York City NY GO | 5.000% | 8/1/30 |
| 5,025 | 5,767 | |
| New York City NY GO | 5.000% | 3/1/31 |
| 6,000 | 6,577 | |
| New York City NY GO | 4.000% | 8/1/31 |
| 2,775 | 2,928 | |
| New York City NY GO | 5.000% | 8/1/31 |
| 5,815 | 6,705 | |
| New York City NY GO | 5.000% | 8/1/31 |
| 1,440 | 1,672 | |
| New York City NY GO | 5.000% | 8/1/31 |
| 3,000 | 3,198 | |
| New York City NY GO | 5.000% | 8/1/31 |
| 1,500 | 1,626 | |
| New York City NY GO | 5.000% | 8/1/31 |
| 2,000 | 2,244 | |
| New York City NY GO | 5.000% | 8/1/31 |
| 5,000 | 5,667 | |
| New York City NY GO | 5.000% | 12/1/31 |
| 1,770 | 2,029 | |
| New York City NY GO | 5.000% | 3/1/32 |
| 5,000 | 5,475 | |
| New York City NY GO | 4.000% | 8/1/32 |
| 1,935 | 2,033 | |
| New York City NY GO | 5.000% | 8/1/32 |
| 4,000 | 4,451 | |
| New York City NY GO | 5.000% | 8/1/32 |
| 3,735 | 4,316 | |
| New York City NY GO | 5.000% | 8/1/32 |
| 2,985 | 3,178 | |
| New York City NY GO | 5.000% | 3/1/33 |
| 7,500 | 8,202 | |
| New York City NY GO | 5.000% | 8/1/33 |
| 1,010 | 1,113 | |
| New York City NY GO | 5.000% | 8/1/33 |
| 2,875 | 3,231 | |
| New York City NY GO | 5.000% | 10/1/33 |
| 6,500 | 7,057 | |
| New York City NY GO | 4.000% | 8/1/34 |
| 3,000 | 3,131 | |
| New York City NY GO | 5.000% | 10/1/34 |
| 2,000 | 2,169 | |
1 | New York City NY GO | 5.000% | 12/1/34 |
| 5,000 | 5,771 | |
| New York City NY GO | 5.000% | 8/1/35 |
| 3,500 | 3,721 | |
| New York City NY GO | 5.000% | 10/1/35 |
| 1,945 | 2,211 | |
| New York City NY GO | 5.000% | 12/1/35 |
| 2,500 | 2,821 | |
| New York City NY GO | 5.000% | 6/1/36 |
| 910 | 1,007 | |
| New York City NY GO | 4.000% | 8/1/36 |
| 2,500 | 2,571 | |
| New York City NY GO | 5.000% | 10/1/36 |
| 5,000 | 5,662 | |
| New York City NY GO | 5.000% | 10/1/36 |
| 3,000 | 3,192 | |
| New York City NY GO | 5.000% | 3/1/37 |
| 6,790 | 7,389 | |
| New York City NY GO | 5.000% | 3/1/37 |
| 7,500 | 8,476 | |
| New York City NY GO | 5.000% | 8/1/37 |
| 4,000 | 4,465 | |
| New York City NY GO | 5.000% | 3/1/38 |
| 7,500 | 8,451 | |
| New York City NY GO | 5.000% | 8/1/38 |
| 10,000 | 11,135 | |
| New York City NY GO | 5.000% | 10/1/38 |
| 6,500 | 7,324 | |
| New York City NY GO | 5.000% | 10/1/39 |
| 6,140 | 6,893 | |
| New York City NY GO | 4.000% | 10/1/41 |
| 6,000 | 6,053 | |
| New York City NY GO | 5.000% | 12/1/41 |
| 8,000 | 8,877 | |
| New York City NY GO | 4.000% | 3/1/42 |
| 7,000 | 7,054 | |
| New York City NY GO | 5.000% | 4/1/43 |
| 5,000 | 5,588 | |
| New York City NY GO | 4.000% | 12/1/43 |
| 1,835 | 1,853 | |
| New York City NY GO | 5.000% | 3/1/44 |
| 5,000 | 5,575 | |
| New York City NY GO | 5.000% | 4/1/45 |
| 5,000 | 5,579 | |
| New York City NY GO VRDO | 1.730% | 12/3/18 |
| LOC | 1,000 | 1,000 |
| New York City NY GO VRDO | 1.730% | 12/3/18 |
|
| 1,012 | 1,012 |
| New York City NY GO VRDO | 1.730% | 12/3/18 |
|
| 5,800 | 5,800 |
| New York City NY GO VRDO | 1.740% | 12/3/18 |
| LOC | 1,600 | 1,600 |
| New York City NY GO VRDO | 1.750% | 12/3/18 |
| LOC | 2,600 | 2,600 |
| New York City NY GO VRDO | 1.690% | 12/7/18 |
| LOC | 3,155 | 3,155 |
| New York City NY Housing Development Corp. Capital Fund Grant Program Revenue (New York City Housing Authority Program) | 5.000% | 7/1/23 |
| 1,000 | 1,113 | |
| New York City NY Housing Development Corp. Multi-Family Housing Revenue | 5.250% | 7/1/28 |
| 2,700 | 2,969 | |
New York Long-Term Tax-Exempt Fund
|
|
|
|
|
| Face | Market |
|
|
| Maturity |
|
| Amount | Value· |
|
| Coupon | Date |
|
| ($000) | ($000) |
| New York City NY Housing Development Corp. Multi-Family Housing Revenue | 5.250% | 7/1/29 |
|
| 3,035 | 3,333 |
| New York City NY Housing Development Corp. Multi-Family Housing Revenue | 4.750% | 11/1/29 |
|
| 5,220 | 5,263 |
| New York City NY Housing Development Corp. Multi-Family Housing Revenue | 4.750% | 11/1/29 |
|
| 2,520 | 2,541 |
| New York City NY Housing Development Corp. Multi-Family Housing Revenue | 5.250% | 7/1/30 |
|
| 2,605 | 2,853 |
| New York City NY Housing Development Corp. Multi-Family Housing Revenue | 3.700% | 11/1/30 |
|
| 3,000 | 3,050 |
| New York City NY Housing Development Corp. Multi-Family Housing Revenue | 3.700% | 11/15/34 |
|
| 5,000 | 5,097 |
| New York City NY Housing Development Corp. Multi-Family Housing Revenue | 3.550% | 11/1/35 |
|
| 3,000 | 2,959 |
| New York City NY Housing Development Corp. Multi-Family Housing Revenue | 5.550% | 11/1/39 |
|
| 3,500 | 3,530 |
| New York City NY Housing Development Corp. Multi-Family Housing Revenue | 3.750% | 11/1/40 |
|
| 3,000 | 2,947 |
| New York City NY Housing Development Corp. Multi-Family Housing Revenue | 5.000% | 11/1/42 |
|
| 2,600 | 2,690 |
1 | New York City NY Housing Development Corp. Multi-Family Housing Revenue | 4.250% | 11/1/43 |
|
| 7,000 | 7,118 |
| New York City NY Housing Development Corp. Multi-Family Housing Revenue | 5.700% | 11/1/46 |
|
| 7,155 | 7,218 |
| New York City NY Housing Development Corp. Multi-Family Housing Revenue | 4.000% | 11/1/53 |
|
| 15,000 | 14,916 |
| New York City NY Housing Development Corp. Multi-Family Housing Revenue (Sustainable Neighborhood) | 3.900% | 11/1/48 |
|
| 4,000 | 3,944 |
| New York City NY Housing Development Corp. Multi-Family Housing Revenue PUT | 2.950% | 2/1/26 |
|
| 7,000 | 6,973 |
| New York City NY Housing Development Corp. Multi-Family Housing Revenue PUT | 2.950% | 2/1/26 |
|
| 5,000 | 4,981 |
| New York City NY Housing Development Corp. Multi-Family Mortgage Revenue (8 Spruce Street) | 3.500% | 2/15/48 |
|
| 5,000 | 4,963 |
| New York City NY Housing Development Corp. Multi-Family Rental Housing Revenue (Royal Charter Properties) VRDO | 1.710% | 12/7/18 |
| LOC | 6,305 | 6,305 |
| New York City NY Industrial Development Agency Civic Facility Revenue (United Jewish Appeal-Federation of Jewish Philanthropies of New York, Inc.) | 5.000% | 7/1/34 |
|
| 4,865 | 5,230 |
| New York City NY Industrial Development Agency PILOT Revenue (Queens Baseball Stadium Project) | 6.125% | 1/1/29 |
| (12) | 1,750 | 1,756 |
| New York City NY Industrial Development Agency PILOT Revenue (Queens Baseball Stadium Project) | 6.375% | 1/1/39 |
| (12) | 4,000 | 4,013 |
| New York City NY Industrial Development Agency PILOT Revenue (Yankee Stadium Project) | 0.000% | 3/1/34 |
| (12) | 5,285 | 2,955 |
New York Long-Term Tax-Exempt Fund
|
|
|
|
|
| Face | Market |
|
|
| Maturity |
|
| Amount | Value· |
|
| Coupon | Date |
|
| ($000) | ($000) |
| New York City NY Industrial Development Agency PILOT Revenue (Yankee Stadium Project) | 0.000% | 3/1/35 |
| (12) | 4,305 | 2,288 |
| New York City NY Industrial Development Agency PILOT Revenue (Yankee Stadium Project) | 7.000% | 3/1/49 |
| (12) | 14,550 | 14,758 |
| New York City NY Municipal Water Finance Authority Water & Sewer System Revenue | 0.000% | 6/15/21 |
|
| 4,490 | 4,255 |
| New York City NY Municipal Water Finance Authority Water & Sewer System Revenue | 5.000% | 6/15/21 |
| (Prere.) | 15,385 | 16,530 |
| New York City NY Municipal Water Finance Authority Water & Sewer System Revenue | 5.000% | 6/15/21 |
| (Prere.) | 10,010 | 10,755 |
| New York City NY Municipal Water Finance Authority Water & Sewer System Revenue | 5.000% | 6/15/28 |
|
| 10,045 | 11,536 |
| New York City NY Municipal Water Finance Authority Water & Sewer System Revenue | 5.000% | 6/15/32 |
|
| 3,000 | 3,400 |
| New York City NY Municipal Water Finance Authority Water & Sewer System Revenue | 5.000% | 6/15/32 |
|
| 7,385 | 7,854 |
| New York City NY Municipal Water Finance Authority Water & Sewer System Revenue | 5.000% | 6/15/34 |
|
| 6,125 | 6,684 |
| New York City NY Municipal Water Finance Authority Water & Sewer System Revenue | 5.000% | 6/15/34 |
|
| 3,000 | 3,378 |
| New York City NY Municipal Water Finance Authority Water & Sewer System Revenue | 5.000% | 6/15/35 |
|
| 10,000 | 10,899 |
| New York City NY Municipal Water Finance Authority Water & Sewer System Revenue | 5.000% | 6/15/35 |
|
| 3,000 | 3,368 |
| New York City NY Municipal Water Finance Authority Water & Sewer System Revenue | 5.000% | 6/15/36 |
|
| 7,500 | 8,483 |
| New York City NY Municipal Water Finance Authority Water & Sewer System Revenue | 5.000% | 6/15/36 |
|
| 3,000 | 3,356 |
| New York City NY Municipal Water Finance Authority Water & Sewer System Revenue | 5.000% | 6/15/36 |
|
| 5,035 | 5,561 |
| New York City NY Municipal Water Finance Authority Water & Sewer System Revenue | 4.000% | 6/15/37 |
|
| 11,150 | 11,311 |
| New York City NY Municipal Water Finance Authority Water & Sewer System Revenue | 5.000% | 6/15/37 |
|
| 4,965 | 5,513 |
| New York City NY Municipal Water Finance Authority Water & Sewer System Revenue | 5.000% | 6/15/37 |
|
| 2,500 | 2,776 |
| New York City NY Municipal Water Finance Authority Water & Sewer System Revenue | 5.000% | 6/15/37 |
|
| 10,000 | 11,287 |
| New York City NY Municipal Water Finance Authority Water & Sewer System Revenue | 5.000% | 6/15/38 |
|
| 10,000 | 11,243 |
| New York City NY Municipal Water Finance Authority Water & Sewer System Revenue | 4.000% | 6/15/39 |
|
| 5,025 | 5,076 |
| New York City NY Municipal Water Finance Authority Water & Sewer System Revenue | 5.000% | 6/15/39 |
|
| 6,915 | 7,639 |
| New York City NY Municipal Water Finance Authority Water & Sewer System Revenue | 5.000% | 6/15/39 |
|
| 7,500 | 8,285 |
| New York City NY Municipal Water Finance Authority Water & Sewer System Revenue | 5.000% | 6/15/40 |
|
| 10,000 | 11,310 |
| New York City NY Municipal Water Finance Authority Water & Sewer System Revenue | 5.000% | 6/15/44 |
|
| 8,470 | 9,036 |
| New York City NY Municipal Water Finance Authority Water & Sewer System Revenue | 5.000% | 6/15/45 |
|
| 5,000 | 5,416 |
New York Long-Term Tax-Exempt Fund
|
|
|
|
|
| Face | Market |
|
|
| Maturity |
|
| Amount | Value· |
|
| Coupon
| Date
|
|
| ($000)
| ($000)
|
| New York City NY Municipal Water Finance Authority Water & Sewer System Revenue | 5.000% | 6/15/46 |
|
| 14,405 | 15,798 |
| New York City NY Municipal Water Finance Authority Water & Sewer System Revenue | 5.000% | 6/15/46 |
|
| 24,465 | 26,330 |
| New York City NY Municipal Water Finance Authority Water & Sewer System Revenue | 5.000% | 6/15/46 |
|
| 15,000 | 16,647 |
| New York City NY Municipal Water Finance Authority Water & Sewer System Revenue | 4.000% | 6/15/47 |
|
| 1,150 | 1,152 |
| New York City NY Municipal Water Finance Authority Water & Sewer System Revenue | 5.000% | 6/15/47 |
|
| 10,500 | 11,625 |
| New York City NY Municipal Water Finance Authority Water & Sewer System Revenue | 5.000% | 6/15/47 |
|
| 7,455 | 8,067 |
| New York City NY Municipal Water Finance Authority Water & Sewer System Revenue | 5.000% | 6/15/48 |
|
| 4,805 | 5,344 |
2 | New York City NY Municipal Water Finance Authority Water & Sewer System Revenue TOB VRDO | 1.780% | 12/3/18 |
| LOC | 1,700 | 1,700 |
| New York City NY Municipal Water Finance Authority Water & Sewer System Revenue VRDO | 1.710% | 12/3/18 |
|
| 5,700 | 5,700 |
| New York City NY Municipal Water Finance Authority Water & Sewer System Revenue VRDO | 1.720% | 12/3/18 |
|
| 10,900 | 10,900 |
| New York City NY Municipal Water Finance Authority Water & Sewer System Revenue VRDO | 1.730% | 12/3/18 |
|
| 2,000 | 2,000 |
| New York City NY Municipal Water Finance Authority Water & Sewer System Revenue VRDO | 1.760% | 12/3/18 |
|
| 6,210 | 6,210 |
| New York City NY Municipal Water Finance Authority Water & Sewer System Revenue VRDO | 1.690% | 12/10/18 |
|
| 8,000 | 8,000 |
| New York City NY Sales Tax Asset Receivable Corp. Revenue | 5.000% | 10/15/29 |
|
| 16,000 | 18,141 |
| New York City NY Sales Tax Asset Receivable Corp. Revenue | 5.000% | 10/15/30 |
|
| 2,775 | 3,138 |
| New York City NY Transitional Finance Authority Building Aid Revenue | 5.000% | 7/15/26 |
|
| 1,970 | 2,250 |
| New York City NY Transitional Finance Authority Building Aid Revenue | 5.000% | 7/15/28 |
|
| 2,805 | 3,059 |
| New York City NY Transitional Finance Authority Building Aid Revenue | 5.000% | 7/15/29 |
|
| 5,000 | 5,447 |
| New York City NY Transitional Finance Authority Building Aid Revenue | 5.000% | 7/15/31 |
|
| 2,800 | 3,259 |
| New York City NY Transitional Finance Authority Building Aid Revenue | 5.000% | 7/15/31 |
|
| 1,585 | 1,687 |
| New York City NY Transitional Finance Authority Building Aid Revenue | 5.000% | 7/15/31 |
|
| 4,295 | 4,668 |
| New York City NY Transitional Finance Authority Building Aid Revenue | 5.000% | 7/15/32 |
|
| 1,910 | 2,215 |
| New York City NY Transitional Finance Authority Building Aid Revenue | 5.000% | 7/15/32 |
|
| 3,750 | 4,348 |
| New York City NY Transitional Finance Authority Building Aid Revenue | 5.000% | 7/15/32 |
|
| 4,000 | 4,253 |
New York Long-Term Tax-Exempt Fund
|
|
|
|
|
| Face | Market |
|
|
| Maturity |
|
| Amount | Value· |
|
| Coupon | Date |
|
| ($000) | ($000) |
| New York City NY Transitional Finance Authority Building Aid Revenue | 5.000% | 7/15/33 |
|
| 5,000 | 5,771 |
| New York City NY Transitional Finance Authority Building Aid Revenue | 5.000% | 7/15/33 |
|
| 5,000 | 5,549 |
| New York City NY Transitional Finance Authority Building Aid Revenue | 5.000% | 7/15/33 |
|
| 8,205 | 8,901 |
| New York City NY Transitional Finance Authority Building Aid Revenue | 5.000% | 7/15/34 |
|
| 3,000 | 3,446 |
| New York City NY Transitional Finance Authority Building Aid Revenue | 5.000% | 7/15/35 |
|
| 2,725 | 3,087 |
| New York City NY Transitional Finance Authority Building Aid Revenue | 4.000% | 7/15/36 |
|
| 3,520 | 3,608 |
| New York City NY Transitional Finance Authority Building Aid Revenue | 4.000% | 7/15/36 |
|
| 3,100 | 3,170 |
| New York City NY Transitional Finance Authority Building Aid Revenue | 5.000% | 7/15/36 |
|
| 5,000 | 5,695 |
| New York City NY Transitional Finance Authority Building Aid Revenue | 5.000% | 7/15/36 |
|
| 5,000 | 5,508 |
| New York City NY Transitional Finance Authority Building Aid Revenue | 4.000% | 7/15/37 |
|
| 5,050 | 5,159 |
| New York City NY Transitional Finance Authority Building Aid Revenue | 5.000% | 7/15/37 |
|
| 13,885 | 15,012 |
| New York City NY Transitional Finance Authority Building Aid Revenue | 5.250% | 7/15/37 |
|
| 3,250 | 3,479 |
| New York City NY Transitional Finance Authority Building Aid Revenue | 4.000% | 7/15/38 |
|
| 14,190 | 14,439 |
| New York City NY Transitional Finance Authority Building Aid Revenue | 4.000% | 7/15/38 |
|
| 5,000 | 5,088 |
| New York City NY Transitional Finance Authority Building Aid Revenue | 5.000% | 7/15/38 |
|
| 3,000 | 3,391 |
| New York City NY Transitional Finance Authority Building Aid Revenue | 4.000% | 7/15/39 |
|
| 3,000 | 3,041 |
| New York City NY Transitional Finance Authority Building Aid Revenue | 4.000% | 7/15/40 |
|
| 5,000 | 5,040 |
| New York City NY Transitional Finance Authority Building Aid Revenue | 5.000% | 7/15/40 |
|
| 2,000 | 2,199 |
| New York City NY Transitional Finance Authority Building Aid Revenue | 5.000% | 7/15/40 |
|
| 5,200 | 5,488 |
| New York City NY Transitional Finance Authority Building Aid Revenue | 5.000% | 7/15/40 |
|
| 9,410 | 10,278 |
| New York City NY Transitional Finance Authority Building Aid Revenue | 5.000% | 7/15/41 |
|
| 2,000 | 2,197 |
| New York City NY Transitional Finance Authority Building Aid Revenue | 5.000% | 7/15/43 |
|
| 1,410 | 1,537 |
| New York City NY Transitional Finance Authority Building Aid Revenue | 5.000% | 7/15/43 |
|
| 3,000 | 3,365 |
| New York City NY Transitional Finance Authority Building Aid Revenue | 4.000% | 7/15/46 |
|
| 3,000 | 3,021 |
| New York City NY Transitional Finance Authority Building Aid Revenue | 3.500% | 7/15/47 |
|
| 8,510 | 7,857 |
| New York City NY Transitional Finance Authority Future Tax Revenue | 5.000% | 5/1/19 |
| (Prere.) | 15 | 15 |
| New York City NY Transitional Finance Authority Future Tax Revenue | 5.500% | 11/1/20 |
| (Prere.) | 1,305 | 1,390 |
New York Long-Term Tax-Exempt Fund
|
|
|
|
|
| Face | Market |
|
|
| Maturity |
|
| Amount | Value· |
|
| Coupon
| Date
|
|
| ($000)
| ($000)
|
| New York City NY Transitional Finance Authority Future Tax Revenue | 5.250% | 2/1/21 |
| (Prere.) | 185 | 197 |
| New York City NY Transitional Finance Authority Future Tax Revenue | 5.250% | 2/1/21 |
| (Prere.) | 1,225 | 1,308 |
| New York City NY Transitional Finance Authority Future Tax Revenue | 5.000% | 11/1/27 |
|
| 2,530 | 2,893 |
| New York City NY Transitional Finance Authority Future Tax Revenue | 5.000% | 11/1/29 |
|
| 5,050 | 5,764 |
| New York City NY Transitional Finance Authority Future Tax Revenue | 5.000% | 8/1/30 |
|
| 4,825 | 5,395 |
| New York City NY Transitional Finance Authority Future Tax Revenue | 5.000% | 2/1/31 |
|
| 2,500 | 2,806 |
| New York City NY Transitional Finance Authority Future Tax Revenue | 5.000% | 2/1/32 |
|
| 7,300 | 7,962 |
| New York City NY Transitional Finance Authority Future Tax Revenue | 5.000% | 11/1/32 |
|
| 5,370 | 6,075 |
| New York City NY Transitional Finance Authority Future Tax Revenue | 5.000% | 11/1/32 |
|
| 12,000 | 13,762 |
| New York City NY Transitional Finance Authority Future Tax Revenue | 5.000% | 8/1/33 |
|
| 10,275 | 11,546 |
| New York City NY Transitional Finance Authority Future Tax Revenue | 5.000% | 11/1/33 |
|
| 9,500 | 10,715 |
| New York City NY Transitional Finance Authority Future Tax Revenue | 5.000% | 2/1/34 |
|
| 2,195 | 2,382 |
| New York City NY Transitional Finance Authority Future Tax Revenue | 5.000% | 5/1/34 |
|
| 5,035 | 5,489 |
| New York City NY Transitional Finance Authority Future Tax Revenue | 5.000% | 8/1/34 |
|
| 10,000 | 11,110 |
| New York City NY Transitional Finance Authority Future Tax Revenue | 4.000% | 11/1/34 |
|
| 3,880 | 4,037 |
| New York City NY Transitional Finance Authority Future Tax Revenue | 5.000% | 2/1/35 |
|
| 5,500 | 6,201 |
| New York City NY Transitional Finance Authority Future Tax Revenue | 5.000% | 2/1/35 |
|
| 7,500 | 7,891 |
| New York City NY Transitional Finance Authority Future Tax Revenue | 5.000% | 2/1/35 |
|
| 10,000 | 10,673 |
| New York City NY Transitional Finance Authority Future Tax Revenue | 4.000% | 8/1/35 |
|
| 3,600 | 3,720 |
| New York City NY Transitional Finance Authority Future Tax Revenue | 4.000% | 2/1/36 |
|
| 4,000 | 4,108 |
| New York City NY Transitional Finance Authority Future Tax Revenue | 5.000% | 2/1/36 |
|
| 5,000 | 5,619 |
| New York City NY Transitional Finance Authority Future Tax Revenue | 4.000% | 8/1/36 |
|
| 5,000 | 5,136 |
| New York City NY Transitional Finance Authority Future Tax Revenue | 5.000% | 8/1/36 |
|
| 11,600 | 12,837 |
| New York City NY Transitional Finance Authority Future Tax Revenue | 4.000% | 5/1/37 |
|
| 10,000 | 10,229 |
| New York City NY Transitional Finance Authority Future Tax Revenue | 4.000% | 8/1/37 |
|
| 5,000 | 5,117 |
| New York City NY Transitional Finance Authority Future Tax Revenue | 5.000% | 8/1/37 |
|
| 5,000 | 5,555 |
| New York City NY Transitional Finance Authority Future Tax Revenue | 5.000% | 8/1/38 |
|
| 10,000 | 11,127 |
New York Long-Term Tax-Exempt Fund
|
|
|
|
|
| Face | Market |
|
|
| Maturity |
|
| Amount | Value· |
|
| Coupon | Date |
|
| ($000) | ($000) |
|
|
|
|
|
|
|
|
| New York City NY Transitional Finance Authority Future Tax Revenue | 5.000% | 2/1/39 |
|
| 5,000 | 5,521 |
| New York City NY Transitional Finance Authority Future Tax Revenue | 5.000% | 2/1/41 |
|
| 15,000 | 16,480 |
| New York City NY Transitional Finance Authority Future Tax Revenue | 5.000% | 2/1/42 |
|
| 3,505 | 3,723 |
| New York City NY Transitional Finance Authority Future Tax Revenue | 4.000% | 8/1/42 |
|
| 1,845 | 1,865 |
| New York City NY Transitional Finance Authority Future Tax Revenue | 4.000% | 8/1/42 |
|
| 5,000 | 5,055 |
| New York City NY Transitional Finance Authority Future Tax Revenue | 5.000% | 8/1/42 |
|
| 2,500 | 2,727 |
| New York City NY Transitional Finance Authority Future Tax Revenue | 4.000% | 5/1/43 |
|
| 1,000 | 1,009 |
| New York City NY Transitional Finance Authority Future Tax Revenue | 4.000% | 5/1/44 |
|
| 9,000 | 9,070 |
2 | New York City NY Transitional Finance Authority Future Tax Revenue TOB VRDO | 1.700% | 12/7/18 |
|
| 6,335 | 6,335 |
| New York City NY Transitional Finance Authority Future Tax Revenue VRDO | 1.760% | 12/3/18 |
|
| 4,400 | 4,400 |
| New York City NY Transitional Finance Authority Revenue | 4.000% | 8/1/ 38 |
|
| 4,500 | 4,594 |
| New York City NY Transitional Finance Authority Revenue VRDO | 1.760% | 12/3/18 |
|
| 3,000 | 3,000 |
| New York City NY Trust for Cultural Resources Revenue (Whitney Museum of American Art) | 5.000% | 7/1/ 31 |
|
| 7,000 | 7,372 |
| New York City NY Trust for Cultural Resources Revenue (Wildlife Conservation Society) | 5.000% | 8/1/33 |
|
| 4,000 | 4,402 |
| New York City Transitional Finance Authority Building Aid Revenue | 5.000% | 7/15/37 |
|
| 8,000 | 9,077 |
| New York Convention Center Development Corp. Revenue | 0.000% | 11/15/32 |
|
| 2,000 | 1,167 |
| New York Convention Center Development Corp. Revenue | 0.000% | 11/15/33 |
|
| 2,000 | 1,108 |
| New York Convention Center Development Corp. Revenue | 5.000% | 11/15/33 |
|
| 3,000 | 3,374 |
| New York Convention Center Development Corp. Revenue | 0.000% | 11/15/34 |
|
| 3,000 | 1,575 |
| New York Convention Center Development Corp. Revenue | 0.000% | 11/15/36 |
|
| 6,000 | 2,836 |
| New York Convention Center Development Corp. Revenue | 0.000% | 11/15/37 |
|
| 2,340 | 1,051 |
| New York Convention Center Development Corp. Revenue | 0.000% | 11/15/38 |
|
| 3,500 | 1,489 |
| New York Convention Center Development Corp. Revenue | 0.000% | 11/15/39 |
|
| 4,000 | 1,614 |
| New York Convention Center Development Corp. Revenue | 5.000% | 11/15/40 |
|
| 12,915 | 14,285 |
| New York Convention Center Development Corp. Revenue | 0.000% | 11/15/41 |
|
| 13,570 | 4,932 |
| New York Convention Center Development Corp. Revenue | 5.000% | 11/15/45 |
|
| 4,000 | 4,411 |
2 | New York Counties Tobacco Trust Revenue | 6.250% | 6/1/41 |
|
| 10,000 | 10,244 |
| New York Counties Tobacco Trust Revenue | 5.000% | 6/1/51 |
|
| 3,000 | 3,024 |
New York Long-Term Tax-Exempt Fund
|
|
|
|
|
| Face | Market |
|
|
| Maturity |
|
| Amount | Value· |
|
| Coupon
| Date
|
|
| ($000)
| ($000)
|
|
|
|
|
|
|
|
|
| New York Liberty Development Corp. Revenue | 5.000% | 11/15/31 |
|
| 10,845 | 11,563 |
| New York Liberty Development Corp. Revenue | 5.000% | 12/15/41 |
|
| 14,750 | 15,762 |
| New York Liberty Development Corp. Revenue | 5.000% | 9/15/43 |
|
| 14,360 | 15,306 |
| New York Liberty Development Corp. Revenue | 5.250% | 12/15/43 |
|
| 6,750 | 7,301 |
| New York Liberty Development Corp. Revenue | 5.125% | 1/15/44 |
|
| 24,000 | 24,693 |
| New York Liberty Development Corp. Revenue | 5.000% | 11/15/44 |
|
| 20,000 | 21,184 |
| New York Liberty Development Corp. Revenue | 5.125% | 11/15/44 |
|
| 4,200 | 4,478 |
| New York Liberty Development Corp. Revenue | 5.625% | 7/15/47 |
|
| 6,055 | 6,268 |
| New York Liberty Development Corp. Revenue | 6.375% | 7/15/49 |
|
| 18,225 | 18,916 |
| New York Liberty Development Corp. Revenue | 5.750% | 11/15/51 |
|
| 25,000 | 27,302 |
| New York Liberty Development Corp. Revenue (7 World Trade Center Project) | 5.000% | 9/15/31 |
|
| 5,000 | 5,417 |
| New York Liberty Development Corp. Revenue (7 World Trade Center Project) | 5.000% | 9/15/32 |
|
| 5,000 | 5,412 |
| New York Liberty Development Corp. Revenue (7 World Trade Center Project) | 5.000% | 9/15/40 |
|
| 4,680 | 5,035 |
| New York Liberty Development Corp. Revenue (7 World Trade Center Project) | 5.000% | 3/15/44 |
|
| 5,965 | 6,337 |
| New York Liberty Development Corp. Revenue (Goldman Sachs Headquarters) | 5.250% | 10/1/35 |
|
| 58,965 | 70,911 |
| New York Liberty Development Corp. Revenue (Goldman Sachs Headquarters) | 5.500% | 10/1/37 |
|
| 9,565 | 11,959 |
| New York Metropolitan Transportation Authority Revenue | 5.250% | 11/15/20 |
| (Prere.) | 1,000 | 1,064 |
| New York Metropolitan Transportation Authority Revenue | 5.250% | 11/15/20 |
| (Prere.) | 1,000 | 1,064 |
| New York Metropolitan Transportation Authority Revenue | 5.250% | 11/15/20 |
| (Prere.) | 1,150 | 1,224 |
| New York Metropolitan Transportation Authority Revenue | 5.250% | 11/15/20 |
| (Prere.) | 10,000 | 10,643 |
| New York Metropolitan Transportation Authority Revenue | 5.000% | 11/15/21 |
| (Prere.) | 765 | 831 |
| New York Metropolitan Transportation Authority Revenue | 5.000% | 11/15/21 |
| (Prere.) | 1,235 | 1,342 |
| New York Metropolitan Transportation Authority Revenue | 5.250% | 11/15/21 |
| (Prere.) | 1,000 | 1,094 |
| New York Metropolitan Transportation Authority Revenue | 5.000% | 11/15/22 |
| (Prere.) | 1,925 | 2,142 |
| New York Metropolitan Transportation Authority Revenue | 5.000% | 11/15/22 |
| (Prere.) | 1,160 | 1,290 |
| New York Metropolitan Transportation Authority Revenue | 5.000% | 11/15/22 |
| (Prere.) | 3,325 | 3,699 |
| New York Metropolitan Transportation Authority Revenue | 5.000% | 11/15/22 |
| (Prere.) | 3,070 | 3,415 |
| New York Metropolitan Transportation Authority Revenue | 5.000% | 5/15/23 |
| (Prere.) | 2,050 | 2,309 |
| New York Metropolitan Transportation Authority Revenue | 5.000% | 11/15/26 |
|
| 10,085 | 10,964 |
| New York Metropolitan Transportation Authority Revenue | 0.000% | 11/15/27 |
|
| 2,240 | 1,674 |
| New York Metropolitan Transportation Authority Revenue | 5.000% | 11/15/28 |
|
| 6,385 | 7,219 |
| New York Metropolitan Transportation Authority Revenue | 5.000% | 11/15/28 |
|
| 4,250 | 4,805 |
New York Long-Term Tax-Exempt Fund
|
|
|
|
|
| Face | Market |
|
|
| Maturity |
|
| Amount | Value· |
|
| Coupon | Date |
|
| ($000) | ($000) |
|
|
|
|
|
|
|
|
| New York Metropolitan Transportation Authority Revenue | 5.000% | 11/15/28 |
|
| 4,020 | 4,681 |
| New York Metropolitan Transportation Authority Revenue | 0.000% | 11/15/29 |
|
| 6,510 | 4,457 |
| New York Metropolitan Transportation Authority Revenue | 5.000% | 11/15/29 |
|
| 3,000 | 3,372 |
| New York Metropolitan Transportation Authority Revenue | 5.000% | 11/15/29 |
|
| 5,000 | 5,619 |
| New York Metropolitan Transportation Authority Revenue | 5.000% | 11/15/30 |
|
| 3,000 | 3,378 |
| New York Metropolitan Transportation Authority Revenue | 5.250% | 11/15/30 |
|
| 6,540 | 7,435 |
| New York Metropolitan Transportation Authority Revenue | 4.000% | 11/15/31 |
|
| 7,500 | 7,849 |
| New York Metropolitan Transportation Authority Revenue | 4.000% | 11/15/32 |
|
| 3,000 | 3,112 |
| New York Metropolitan Transportation Authority Revenue | 4.000% | 11/15/32 |
|
| 7,500 | 7,818 |
| New York Metropolitan Transportation Authority Revenue | 5.000% | 11/15/32 |
|
| 1,500 | 1,610 |
| New York Metropolitan Transportation Authority Revenue | 5.000% | 11/15/32 |
|
| 5,000 | 5,521 |
| New York Metropolitan Transportation Authority Revenue | 5.000% | 11/15/33 |
|
| 1, 575 | 1,690 |
| New York Metropolitan Transportation Authority Revenue | 5.000% | 11/15/35 |
|
| 3,000 | 3,299 |
| New York Metropolitan Transportation Authority Revenue | 5.000% | 11/15/35 |
|
| 3,250 | 3,573 |
| New York Metropolitan Transportation Authority Revenue | 4.000% | 11/15/36 |
|
| 1, 045 | 1,063 |
| New York Metropolitan Transportation Authority Revenue | 4.000% | 11/15/37 |
|
| 3,000 | 3,040 |
| New York Metropolitan Transportation Authority Revenue | 5.250% | 11/15/37 |
|
| 5,000 | 5,532 |
| New York Metropolitan Transportation Authority Revenue | 5.000% | 11/15/38 |
|
| 10,020 | 10,672 |
| New York Metropolitan Transportation Authority Revenue | 5.250% | 11/15/39 |
|
| 5,000 | 5,453 |
| New York Metropolitan Transportation Authority Revenue | 5.000% | 11/15/41 |
|
| 5,515 | 5,899 |
| New York Metropolitan Transportation Authority Revenue | 5.000% | 11/15/42 |
|
| 5,010 | 5,330 |
| New York Metropolitan Transportation Authority Revenue | 5.000% | 11/15/42 |
|
| 930 | 994 |
| New York Metropolitan Transportation Authority Revenue | 4.000% | 11/15/46 |
|
| 5,000 | 5,004 |
| New York Metropolitan Transportation Authority Revenue | 5.250% | 11/15/55 |
|
| 2,045 | 2,224 |
| New York Metropolitan Transportation Authority Revenue | 5.000% | 11/15/56 |
|
| 7,700 | 8,290 |
| New York Metropolitan Transportation Authority Revenue | 5.250% | 11/15/56 |
|
| 6,500 | 7,081 |
| New York Metropolitan Transportation Authority Revenue | 5.250% | 11/15/56 |
|
| 5,000 | 5,422 |
New York Long-Term Tax-Exempt Fund
|
|
|
|
|
| Face | Market |
|
|
| Maturity |
|
| Amount | Value· |
|
| Coupon | Date |
|
| ($000) | ($000) |
|
|
|
|
|
|
|
|
| New York Metropolitan Transportation Authority Revenue | 5.250% | 11/15/57 |
|
| 4,000 | 4,370 |
| New York Metropolitan Transportation Authority Revenue (Dedicated Petroleum Tax) | 5.250% | 11/15/19 |
| (Prere.) | 5,000 | 5,163 |
| New York Metropolitan Transportation Authority Revenue (Dedicated Petroleum Tax) | 5.250% | 11/15/19 |
| (Prere.) | 4,000 | 4,130 |
| New York Metropolitan Transportation Authority Revenue (Dedicated Petroleum Tax) | 5.250% | 11/15/19 |
| (Prere.) | 4,000 | 4,130 |
| New York Metropolitan Transportation Authority Revenue (Dedicated Tax Fund) | 5.000% | 11/15/21 |
| (Prere.) | 5,000 | 5,435 |
| New York Metropolitan Transportation Authority Revenue (Dedicated Tax Fund) | 5.000% | 11/15/21 |
| (Prere.) | 745 | 810 |
| New York Metropolitan Transportation Authority Revenue (Dedicated Tax Fund) | 5.000% | 11/15/21 |
| (Prere.) | 1,595 | 1,734 |
| New York Metropolitan Transportation Authority Revenue (Dedicated Tax Fund) | 5.000% | 11/15/26 |
|
| 1,585 | 1,705 |
| New York Metropolitan Transportation Authority Revenue (Dedicated Tax Fund) | 5.000% | 11/15/27 |
|
| 3,405 | 3,661 |
| New York Metropolitan Transportation Authority Revenue (Dedicated Tax Fund) | 5.000% | 11/15/29 |
|
| 6,975 | 7,629 |
| New York Metropolitan Transportation Authority Revenue (Dedicated Tax Fund) | 5.250% | 11/15/30 |
|
| 2,585 | 3,029 |
| New York Metropolitan Transportation Authority Revenue (Dedicated Tax Fund) | 5.000% | 11/15/31 |
|
| 11,000 | 12,014 |
| New York Metropolitan Transportation Authority Revenue (Dedicated Tax Fund) | 5.250% | 11/15/31 |
|
| 2,655 | 3,097 |
| New York Metropolitan Transportation Authority Revenue (Dedicated Tax Fund) | 5.250% | 11/15/32 |
|
| 2,500 | 2,907 |
| New York Metropolitan Transportation Authority Revenue (Dedicated Tax Fund) | 4.000% | 11/15/33 |
|
| 10,000 | 10,570 |
| New York Metropolitan Transportation Authority Revenue (Dedicated Tax Fund) | 5.000% | 11/15/34 |
|
| 1,700 | 1,920 |
| New York Metropolitan Transportation Authority Revenue (Dedicated Tax Fund) | 5.000% | 11/15/35 |
|
| 12,020 | 13,545 |
| New York Metropolitan Transportation Authority Revenue (Dedicated Tax Fund) | 5.000% | 11/15/36 |
|
| 8,000 | 8,973 |
| New York Metropolitan Transportation Authority Revenue (Dedicated Tax Fund) | 5.000% | 11/15/46 |
|
| 5,000 | 5,531 |
| New York Metropolitan Transportation Authority Revenue (Dedicated Tax Fund) | 5.000% | 11/15/47 |
|
| 5,000 | 5,576 |
| New York Metropolitan Transportation Authority Revenue (Dedicated Tax Fund) | 5.000% | 11/15/47 |
|
| 13,000 | 14,425 |
| New York Metropolitan Transportation Authority Revenue (Dedicated Tax Fund) | 5.250% | 11/15/57 |
|
| 5,865 | 6,643 |
| New York Metropolitan Transportation Authority Revenue (Hudson Yards Development) | 5.000% | 11/15/51 |
|
| 21,375 | 22,522 |
| New York Metropolitan Transportation Authority Revenue (Hudson Yards Development) | 5.000% | 11/15/56 |
|
| 22,000 | 23,272 |
2 | New York Metropolitan Transportation Authority Revenue TOB VRDO | 1.770% | 12/7/18 |
|
| 11,605 | 11,605 |
2 | New York Metropolitan Transportation Authority Revenue TOB VRDO | 1.940% | 12/7/18 |
|
| 7,500 | 7,500 |
New York Long-Term Tax-Exempt Fund
|
|
|
|
|
| Face | Market |
|
|
| Maturity |
|
| Amount | Value· |
|
| Coupon | Date |
|
| ($000) | ($000) |
|
|
|
|
|
|
|
|
| New York NY GO | 5.000% | 8/1/27 |
|
| 5,140 | 6,082 |
| New York NY GO | 5.000% | 8/1/28 |
|
| 4,530 | 5,329 |
| New York NY GO | 5.000% | 3/1/39 |
|
| 5,315 | 5,975 |
| New York NY GO | 3.500% | 4/1/46 |
|
| 3,000 | 2,775 |
| New York State Dormitory Authority Lease Revenue (State University Dormitory Facilities) | 5.000% | 7/1/21 |
| (Prere.) | 1,000 | 1,076 |
| New York State Dormitory Authority Lease Revenue (State University Dormitory Facilities) | 5.000% | 7/1/32 |
|
| 1,530 | 1,729 |
| New York State Dormitory Authority Lease Revenue (State University Dormitory Facilities) | 5.000% | 7/1/35 |
|
| 1,000 | 1,064 |
| New York State Dormitory Authority Lease Revenue (State University Dormitory Facilities) | 5.000% | 7/1/41 |
|
| 11,000 | 11,679 |
| New York State Dormitory Authority Lease Revenue (State University Dormitory Facilities) | 5.000% | 7/1/42 |
|
| 13,500 | 14,499 |
| New York State Dormitory Authority Revenue | 5.000% | 10/1/27 |
|
| 2,700 | 3,139 |
| New York State Dormitory Authority Revenue | 5.000% | 10/1/28 |
|
| 3,060 | 3,537 |
| New York State Dormitory Authority Revenue | 5.000% | 1/15/29 |
|
| 3,125 | 3,669 |
| New York State Dormitory Authority Revenue | 5.000% | 10/1/29 |
|
| 3,000 | 3,461 |
| New York State Dormitory Authority Revenue | 5.000% | 10/1/29 |
|
| 2,250 | 2,589 |
| New York State Dormitory Authority Revenue | 5.000% | 1/15/30 |
|
| 1,525 | 1,776 |
| New York State Dormitory Authority Revenue | 5.000% | 10/1/30 |
| (4) | 9,570 | 11,084 |
| New York State Dormitory Authority Revenue | 5.000% | 10/1/30 |
|
| 2,000 | 2,295 |
| New York State Dormitory Authority Revenue | 5.000% | 1/15/31 |
|
| 5,000 | 5,801 |
| New York State Dormitory Authority Revenue | 5.000% | 7/1/31 |
|
| 1,400 | 1,642 |
| New York State Dormitory Authority Revenue | 5.000% | 10/1/31 |
|
| 2,000 | 2,288 |
| New York State Dormitory Authority Revenue | 5.000% | 7/1/32 |
|
| 1,000 | 1,168 |
| New York State Dormitory Authority Revenue | 5.000% | 7/1/33 |
|
| 1,210 | 1,406 |
| New York State Dormitory Authority Revenue | 5.000% | 3/15/35 |
|
| 5,000 | 5,722 |
| New York State Dormitory Authority Revenue | 4.000% | 7/1/35 |
|
| 1,355 | 1,413 |
| New York State Dormitory Authority Revenue | 5.000% | 3/15/39 |
|
| 5,000 | 5,653 |
| New York State Dormitory Authority Revenue | 4.000% | 3/15/47 |
|
| 5,000 | 5,050 |
| New York State Dormitory Authority Revenue | 4.000% | 3/15/48 |
|
| 5,000 | 5,046 |
| New York State Dormitory Authority Revenue (Barnard College) | 5.000% | 7/1/26 |
|
| 750 | 862 |
| New York State Dormitory Authority Revenue (Barnard College) | 4.000% | 7/1/31 |
|
| 1,100 | 1,147 |
| New York State Dormitory Authority Revenue (Barnard College) | 4.000% | 7/1/32 |
|
| 1,340 | 1,393 |
| New York State Dormitory Authority Revenue (Barnard College) | 5.000% | 7/1/43 |
|
| 1,185 | 1,309 |
| New York State Dormitory Authority Revenue (Brooklyn Law School) | 5.000% | 7/1/26 |
|
| 1,630 | 1,768 |
| New York State Dormitory Authority Revenue (Brooklyn Law School) | 5.000% | 7/1/27 |
|
| 1,210 | 1,308 |
| New York State Dormitory Authority Revenue (Brooklyn Law School) | 5.000% | 7/1/28 |
|
| 1,000 | 1,078 |
| New York State Dormitory Authority Revenue (Brooklyn Law School) | 5.000% | 7/1/29 |
|
| 1,000 | 1,075 |
New York Long-Term Tax-Exempt Fund
|
|
|
|
|
| Face | Market |
|
|
| Maturity |
|
| Amount | Value· |
|
| Coupon | Date |
|
| ($000) | ($000) |
|
|
|
|
|
|
|
|
| New York State Dormitory Authority Revenue (Catholic Health System Obligated Group) | 5.000% | 7/1/32 |
|
| 710 | 741 |
| New York State Dormitory Authority Revenue (Columbia University) | 5.000% | 10/1/31 |
|
| 510 | 591 |
| New York State Dormitory Authority Revenue (Columbia University) | 5.000% | 10/1/38 |
|
| 5,000 | 5,782 |
| New York State Dormitory Authority Revenue (Columbia University) | 5.000% | 10/1/46 |
|
| 1,250 | 1,405 |
| New York State Dormitory Authority Revenue (Columbia University) | 5.000% | 10/1/48 |
|
| 12,255 | 15,614 |
| New York State Dormitory Authority Revenue (Culinary Institute of America) | 5.000% | 7/1/19 |
|
| 250 | 254 |
| New York State Dormitory Authority Revenue (Culinary Institute of America) | 5.000% | 7/1/20 |
|
| 215 | 224 |
| New York State Dormitory Authority Revenue (Culinary Institute of America) | 5.000% | 7/1/21 |
|
| 300 | 319 |
| New York State Dormitory Authority Revenue (Culinary Institute of America) | 5.000% | 7/1/28 |
|
| 540 | 578 |
| New York State Dormitory Authority Revenue (Culinary Institute of America) | 5.500% | 7/1/33 |
|
| 1,000 | 1,105 |
| New York State Dormitory Authority Revenue (Culinary Institute of America) | 5.000% | 7/1/34 |
|
| 350 | 371 |
| New York State Dormitory Authority Revenue (Culinary Institute of America) | 5.000% | 7/1/42 |
|
| 600 | 631 |
| New York State Dormitory Authority Revenue (Culinary Institute of America) | 5.750% | 7/1/43 |
|
| 7,105 | 7,842 |
| New York State Dormitory Authority Revenue (Fordham University) | 5.500% | 7/1/21 |
| (Prere.) | 3,000 | 3,269 |
| New York State Dormitory Authority Revenue (Fordham University) | 5.000% | 7/1/28 |
|
| 400 | 461 |
| New York State Dormitory Authority Revenue (Fordham University) | 5.000% | 7/1/29 |
|
| 850 | 984 |
| New York State Dormitory Authority Revenue (Fordham University) | 5.000% | 7/1/29 |
|
| 1,300 | 1,489 |
| New York State Dormitory Authority Revenue (Fordham University) | 5.000% | 7/1/30 |
|
| 515 | 593 |
| New York State Dormitory Authority Revenue (Fordham University) | 5.000% | 7/1/31 |
|
| 1,400 | 1,606 |
| New York State Dormitory Authority Revenue (Fordham University) | 5.000% | 7/1/31 |
|
| 1,200 | 1,362 |
| New York State Dormitory Authority Revenue (Fordham University) | 4.000% | 7/1/33 |
|
| 500 | 521 |
| New York State Dormitory Authority Revenue (Fordham University) | 5.000% | 7/1/33 |
|
| 1,000 | 1,127 |
| New York State Dormitory Authority Revenue (Fordham University) | 4.000% | 7/1/34 |
|
| 1,660 | 1,720 |
| New York State Dormitory Authority Revenue (Fordham University) | 5.000% | 7/1/34 |
|
| 755 | 847 |
| New York State Dormitory Authority Revenue (Fordham University) | 4.000% | 7/1/35 |
|
| 1,650 | 1,702 |
| New York State Dormitory Authority Revenue (Fordham University) | 5.000% | 7/1/35 |
|
| 500 | 560 |
| New York State Dormitory Authority Revenue (Fordham University) | 5.000% | 7/1/36 |
|
| 1,350 | 1,504 |
New York Long-Term Tax-Exempt Fund
|
|
|
|
|
| Face | Market |
|
|
| Maturity |
|
| Amount | Value· |
|
| Coupon | Date |
|
| ($000) | ($000) |
|
|
|
|
|
|
|
|
| New York State Dormitory Authority Revenue (Fordham University) VRDO | 1.700% | 12/7/18 |
| LOC | 1,300 | 1,300 |
| New York State Dormitory Authority Revenue (Icahn School of Medicine at Mount Sinai) | 5.000% | 7/1/26 |
|
| 2,500 | 2,851 |
| New York State Dormitory Authority Revenue (Icahn School of Medicine at Mount Sinai) | 5.000% | 7/1/31 |
|
| 3,000 | 3,348 |
| New York State Dormitory Authority Revenue (Icahn School of Medicine at Mount Sinai) | 5.000% | 7/1/33 |
|
| 7,335 | 8,144 |
| New York State Dormitory Authority Revenue (Icahn School of Medicine at Mount Sinai) | 5.000% | 7/1/35 |
|
| 3,500 | 3,869 |
| New York State Dormitory Authority Revenue (Icahn School of Medicine at Mount Sinai) | 5.000% | 7/1/40 |
|
| 7,500 | 8,197 |
| New York State Dormitory Authority Revenue (Long Island University) | 5.000% | 9/1/26 |
|
| 2,355 | 2,520 |
| New York State Dormitory Authority Revenue (Long Island University) | 5.000% | 9/1/27 |
|
| 1,520 | 1,621 |
| New York State Dormitory Authority Revenue (Memorial Sloan-Kettering Cancer Center) | 5.000% | 7/1/27 |
|
| 5,035 | 6,041 |
| New York State Dormitory Authority Revenue (Memorial Sloan-Kettering Cancer Center) | 5.000% | 7/1/29 |
|
| 1,100 | 1,296 |
| New York State Dormitory Authority Revenue (Memorial Sloan-Kettering Cancer Center) | 5.000% | 7/1/30 |
|
| 2,000 | 2,341 |
| New York State Dormitory Authority Revenue (Memorial Sloan-Kettering Cancer Center) | 5.000% | 7/1/32 |
|
| 1,875 | 2,173 |
| New York State Dormitory Authority Revenue (Memorial Sloan-Kettering Cancer Center) | 4.000% | 7/1/34 |
|
| 3,000 | 3,130 |
| New York State Dormitory Authority Revenue (Memorial Sloan-Kettering Cancer Center) | 4.000% | 7/1/35 |
|
| 1,420 | 1,473 |
| New York State Dormitory Authority Revenue (Memorial Sloan-Kettering Cancer Center) | 5.000% | 7/1/36 |
|
| 1,000 | 1,075 |
| New York State Dormitory Authority Revenue (Memorial Sloan-Kettering Cancer Center) | 4.000% | 7/1/37 |
|
| 1,350 | 1,386 |
| New York State Dormitory Authority Revenue (Memorial Sloan-Kettering Cancer Center) | 5.000% | 7/1/42 |
|
| 5,000 | 5,573 |
| New York State Dormitory Authority Revenue (Memorial Sloan-Kettering Cancer Center) | 4.000% | 7/1/47 |
|
| 16,500 | 16,633 |
| New York State Dormitory Authority Revenue (Miriam Osborn Memorial Home Association) | 5.000% | 7/1/26 |
|
| 740 | 752 |
| New York State Dormitory Authority Revenue (Miriam Osborn Memorial Home Association) | 5.000% | 7/1/27 |
|
| 650 | 660 |
| New York State Dormitory Authority Revenue (Miriam Osborn Memorial Home Association) | 5.000% | 7/1/29 |
|
| 1,000 | 1,014 |
| New York State Dormitory Authority Revenue (Miriam Osborn Memorial Home Association) | 5.000% | 7/1/42 |
|
| 500 | 506 |
| New York State Dormitory Authority Revenue (Montefiore Obligated Group) | 5.000% | 8/1/29 |
|
| 3,000 | 3,408 |
| New York State Dormitory Authority Revenue (Montefiore Obligated Group) | 5.000% | 8/1/30 |
|
| 3,000 | 3,385 |
| New York State Dormitory Authority Revenue (Montefiore Obligated Group) | 4.000% | 8/1/37 |
|
| 3,420 | 3,411 |
| New York State Dormitory Authority Revenue (Montefiore Obligated Group) | 4.000% | 8/1/38 |
|
| 3,000 | 2,973 |
New York Long-Term Tax-Exempt Fund
|
|
|
|
|
| Face | Market |
|
|
| Maturity |
|
| Amount | Value· |
|
| Coupon | Date |
|
| ($000) | ($000) |
|
|
|
|
|
|
|
|
| New York State Dormitory Authority Revenue (Mount Sinai School of Medicine of New York University) | 5.150% | 7/1/24 |
| (14) | 2,000 | 2,220 |
| New York State Dormitory Authority Revenue (New York University Hospitals Center) | 5.750% | 7/1/20 |
| (Prere.) | 1,000 | 1,059 |
| New York State Dormitory Authority Revenue (New York University Hospitals Center) | 6.000% | 7/1/20 |
| (Prere.) | 1,000 | 1,063 |
| New York State Dormitory Authority Revenue (New York University Hospitals Center) | 5.000% | 7/1/22 |
|
| 910 | 996 |
| New York State Dormitory Authority Revenue (New York University Hospitals Center) | 5.000% | 7/1/26 |
|
| 670 | 757 |
| New York State Dormitory Authority Revenue (New York University Hospitals Center) | 5.000% | 7/1/27 |
|
| 670 | 771 |
| New York State Dormitory Authority Revenue (New York University Hospitals Center) | 5.000% | 7/1/28 |
|
| 700 | 801 |
| New York State Dormitory Authority Revenue (New York University Hospitals Center) | 5.000% | 7/1/29 |
|
| 1,500 | 1,708 |
| New York State Dormitory Authority Revenue (New York University Hospitals Center) | 5.000% | 7/1/32 |
|
| 745 | 838 |
| New York State Dormitory Authority Revenue (New York University Hospitals Center) | 5.000% | 7/1/33 |
|
| 400 | 448 |
| New York State Dormitory Authority Revenue (New York University) | 5.000% | 7/1/28 |
|
| 4,510 | 5,250 |
| New York State Dormitory Authority Revenue (New York University) | 5.000% | 7/1/29 |
|
| 1,000 | 1,135 |
| New York State Dormitory Authority Revenue (New York University) | 5.000% | 7/1/30 |
|
| 2,000 | 2,286 |
| New York State Dormitory Authority Revenue (New York University) | 5.000% | 7/1/30 |
|
| 6,625 | 7,219 |
| New York State Dormitory Authority Revenue (New York University) | 5.000% | 7/1/30 |
|
| 5,065 | 5,836 |
| New York State Dormitory Authority Revenue (New York University) | 5.000% | 7/1/30 |
|
| 1,000 | 1,130 |
| New York State Dormitory Authority Revenue (New York University) | 5.000% | 7/1/31 |
|
| 865 | 974 |
| New York State Dormitory Authority Revenue (New York University) | 5.000% | 7/1/32 |
|
| 1,000 | 1,122 |
| New York State Dormitory Authority Revenue (New York University) | 5.000% | 7/1/33 |
|
| 2,365 | 2,645 |
| New York State Dormitory Authority Revenue (New York University) | 4.000% | 7/1/35 |
|
| 6,010 | 6,253 |
| New York State Dormitory Authority Revenue (New York University) | 4.000% | 7/1/36 |
|
| 6,025 | 6,224 |
| New York State Dormitory Authority Revenue (New York University) | 5.000% | 7/1/37 |
|
| 4,200 | 4,552 |
| New York State Dormitory Authority Revenue (New York University) | 5.000% | 7/1/37 |
|
| 3,250 | 3,523 |
| New York State Dormitory Authority Revenue (New York University) | 5.000% | 7/1/42 |
|
| 10,000 | 10,810 |
| New York State Dormitory Authority Revenue (New York University) | 4.000% | 7/1/43 |
|
| 14,320 | 14,535 |
| New York State Dormitory Authority Revenue (New York University) | 5.000% | 7/1/48 |
|
| 8,000 | 8,908 |
New York Long-Term Tax-Exempt Fund
|
|
|
|
|
| Face | Market |
|
|
| Maturity |
|
| Amount | Value· |
|
| Coupon | Date |
|
| ($000) | ($000) |
|
|
|
|
|
|
|
|
| New York State Dormitory Authority Revenue (North Shore - Long Island Jewish Obligated Group) | 5.000% | 5/1/21 |
| (Prere.) | 2,500 | 2,678 |
| New York State Dormitory Authority Revenue (North Shore - Long Island Jewish Obligated Group) | 5.000% | 5/1/21 |
| (Prere.) | 1,000 | 1,071 |
| New York State Dormitory Authority Revenue (North Shore - Long Island Jewish Obligated Group) | 5.000% | 5/1/21 |
| (Prere.) | 7,000 | 7,498 |
| New York State Dormitory Authority Revenue (North Shore - Long Island Jewish Obligated Group) | 5.250% | 5/1/21 |
| (Prere.) | 1,000 | 1,077 |
| New York State Dormitory Authority Revenue (North Shore - Long Island Jewish Obligated Group) | 5.000% | 5/1/27 |
|
| 1,595 | 1,807 |
| New York State Dormitory Authority Revenue (North Shore - Long Island Jewish Obligated Group) | 5.000% | 5/1/28 |
|
| 2,000 | 2,251 |
| New York State Dormitory Authority Revenue (North Shore - Long Island Jewish Obligated Group) | 5.000% | 5/1/29 |
|
| 7,910 | 8,862 |
| New York State Dormitory Authority Revenue (North Shore - Long Island Jewish Obligated Group) | 5.000% | 5/1/30 |
|
| 2,000 | 2,229 |
| New York State Dormitory Authority Revenue (North Shore - Long Island Jewish Obligated Group) | 5.000% | 5/1/32 |
|
| 2,500 | 2,768 |
| New York State Dormitory Authority Revenue (North Shore - Long Island Jewish Obligated Group) | 5.000% | 5/1/33 |
|
| 3,500 | 3,865 |
| New York State Dormitory Authority Revenue (North Shore - Long Island Jewish Obligated Group) | 5.000% | 5/1/36 |
|
| 3,000 | 3,281 |
| New York State Dormitory Authority Revenue (North Shore - Long Island Jewish Obligated Group) | 5.000% | 5/1/39 |
|
| 4,000 | 4,271 |
| New York State Dormitory Authority Revenue (North Shore - Long Island Jewish Obligated Group) | 5.000% | 5/1/43 |
|
| 2,050 | 2,210 |
| New York State Dormitory Authority Revenue (Orange Regional Medical Center Obligated Group) | 5.000% | 12/1/27 |
|
| 1,200 | 1,349 |
| New York State Dormitory Authority Revenue (Orange Regional Medical Center Obligated Group) | 5.000% | 12/1/28 |
|
| 1,300 | 1,451 |
| New York State Dormitory Authority Revenue (Orange Regional Medical Center Obligated Group) | 5.000% | 12/1/30 |
|
| 1,100 | 1,214 |
| New York State Dormitory Authority Revenue (Orange Regional Medical Center Obligated Group) | 5.000% | 12/1/31 |
|
| 1,200 | 1,319 |
| New York State Dormitory Authority Revenue (Orange Regional Medical Center Obligated Group) | 5.000% | 12/1/33 |
|
| 1,000 | 1,087 |
New York Long-Term Tax-Exempt Fund
|
|
|
|
|
| Face | Market |
|
|
| Maturity |
|
| Amount | Value· |
|
| Coupon | Date |
|
| ($000) | ($000) |
|
|
|
|
|
|
|
|
| New York State Dormitory Authority Revenue (Orange Regional Medical Center Obligated Group) | 5.000% | 12/1/35 |
|
| 1,000 | 1,076 |
| New York State Dormitory Authority Revenue (Orange Regional Medical Center Obligated Group) | 5.000% | 12/1/37 |
|
| 1,000 | 1,071 |
| New York State Dormitory Authority Revenue (Pace University) | 5.000% | 5/1/19 |
|
| 355 | 359 |
| New York State Dormitory Authority Revenue (Pace University) | 5.000% | 5/1/23 |
| (Prere.) | 30 | 34 |
| New York State Dormitory Authority Revenue (Pace University) | 5.000% | 5/1/23 |
| (Prere.) | 30 | 34 |
| New York State Dormitory Authority Revenue (Pace University) | 5.000% | 5/1/23 |
| (Prere.) | 20 | 22 |
| New York State Dormitory Authority Revenue (Pace University) | 5.000% | 5/1/25 |
|
| 1,270 | 1,368 |
| New York State Dormitory Authority Revenue (Pace University) | 5.000% | 5/1/28 |
|
| 1,470 | 1,567 |
| New York State Dormitory Authority Revenue (Pace University) | 5.000% | 5/1/29 |
|
| 1,560 | 1,657 |
| New York State Dormitory Authority Revenue (Personal Income Tax) | 5.000% | 3/15/19 |
| (Prere.) | 5,000 | 5,046 |
| New York State Dormitory Authority Revenue (Personal Income Tax) | 5.250% | 3/15/19 |
| (Prere.) | 18,000 | 18,175 |
| New York State Dormitory Authority Revenue (Personal Income Tax) | 5.750% | 3/15/19 |
| (Prere.) | 10,000 | 10,111 |
| New York State Dormitory Authority Revenue (Personal Income Tax) | 5.000% | 2/15/27 |
|
| 1,695 | 1,934 |
| New York State Dormitory Authority Revenue (Personal Income Tax) | 5.000% | 2/15/28 |
|
| 5,120 | 6,001 |
| New York State Dormitory Authority Revenue (Personal Income Tax) | 5.000% | 2/15/29 |
|
| 5,015 | 5,846 |
| New York State Dormitory Authority Revenue (Personal Income Tax) | 5.000% | 2/15/29 |
|
| 5,000 | 5,585 |
| New York State Dormitory Authority Revenue (Personal Income Tax) | 5.000% | 2/15/30 |
|
| 6,000 | 6,750 |
| New York State Dormitory Authority Revenue (Personal Income Tax) | 5.000% | 2/15/31 |
|
| 3,000 | 3,466 |
| New York State Dormitory Authority Revenue (Personal Income Tax) | 5.000% | 2/15/33 |
|
| 1,450 | 1,555 |
| New York State Dormitory Authority Revenue (Personal Income Tax) | 5.000% | 3/15/33 |
|
| 6,615 | 7,107 |
| New York State Dormitory Authority Revenue (Personal Income Tax) | 5.250% | 3/15/33 |
|
| 1,750 | 2,000 |
| New York State Dormitory Authority Revenue (Personal Income Tax) | 4.000% | 2/15/34 |
|
| 5,000 | 5,216 |
| New York State Dormitory Authority Revenue (Personal Income Tax) | 5.000% | 2/15/34 |
|
| 3,500 | 3,950 |
| New York State Dormitory Authority Revenue (Personal Income Tax) | 4.000% | 2/15/35 |
|
| 5,000 | 5,187 |
| New York State Dormitory Authority Revenue (Personal Income Tax) | 5.000% | 2/15/35 |
|
| 3,510 | 3,948 |
| New York State Dormitory Authority Revenue (Personal Income Tax) | 5.000% | 3/15/35 |
|
| 4,305 | 4,807 |
New York Long-Term Tax-Exempt Fund
|
|
|
|
|
| Face | Market |
|
|
| Maturity |
|
| Amount | Value· |
|
| Coupon | Date |
|
| ($000) | ($000) |
|
|
|
|
|
|
|
|
| New York State Dormitory Authority Revenue (Personal Income Tax) | 5.000% | 2/15/36 |
|
| 3,000 | 3,361 |
| New York State Dormitory Authority Revenue (Personal Income Tax) | 5.000% | 3/15/36 |
|
| 1,000 | 1,113 |
| New York State Dormitory Authority Revenue (Personal Income Tax) | 5.000% | 2/15/37 |
|
| 11,600 | 12,404 |
| New York State Dormitory Authority Revenue (Personal Income Tax) | 5.000% | 2/15/37 |
|
| 5,000 | 5,594 |
| New York State Dormitory Authority Revenue (Personal Income Tax) | 5.000% | 3/15/37 |
|
| 5,000 | 5,516 |
| New York State Dormitory Authority Revenue (Personal Income Tax) | 5.000% | 2/15/38 |
|
| 7,430 | 8,291 |
| New York State Dormitory Authority Revenue (Personal Income Tax) | 5.000% | 3/15/38 |
|
| 3,705 | 4,083 |
| New York State Dormitory Authority Revenue (Personal Income Tax) | 5.000% | 2/15/39 |
|
| 5,030 | 5,529 |
| New York State Dormitory Authority Revenue (Personal Income Tax) | 5.000% | 2/15/40 |
|
| 12,230 | 13,058 |
| New York State Dormitory Authority Revenue (Personal Income Tax) | 5.000% | 2/15/40 |
|
| 9,190 | 10,252 |
| New York State Dormitory Authority Revenue (Personal Income Tax) | 5.000% | 3/15/41 |
|
| 5,000 | 5,492 |
| New York State Dormitory Authority Revenue (Personal Income Tax) | 5.000% | 2/15/42 |
|
| 1,500 | 1,660 |
| New York State Dormitory Authority Revenue (Personal Income Tax) | 4.000% | 2/15/44 |
|
| 15,000 | 15,175 |
| New York State Dormitory Authority Revenue (Pratt Institute) | 5.000% | 7/1/19 |
| (Prere.) | 3,750 | 3,818 |
| New York State Dormitory Authority Revenue (Pratt Institute) | 5.000% | 7/1/23 |
|
| 400 | 444 |
| New York State Dormitory Authority Revenue (Pratt Institute) | 5.000% | 7/1/25 |
|
| 500 | 562 |
| New York State Dormitory Authority Revenue (Pratt Institute) | 5.000% | 7/1/27 |
|
| 420 | 483 |
| New York State Dormitory Authority Revenue (Pratt Institute) | 5.000% | 7/1/28 |
|
| 1,000 | 1,113 |
| New York State Dormitory Authority Revenue (Pratt Institute) | 5.000% | 7/1/29 |
|
| 500 | 554 |
| New York State Dormitory Authority Revenue (Pratt Institute) | 5.000% | 7/1/29 |
|
| 1,010 | 1,149 |
| New York State Dormitory Authority Revenue (Pratt Institute) | 5.000% | 7/1/30 |
|
| 500 | 566 |
| New York State Dormitory Authority Revenue (Pratt Institute) | 5.000% | 7/1/31 |
|
| 500 | 564 |
| New York State Dormitory Authority Revenue (Pratt Institute) | 5.000% | 7/1/34 |
|
| 2,000 | 2,194 |
| New York State Dormitory Authority Revenue (Pratt Institute) | 5.000% | 7/1/39 |
|
| 1,750 | 1,902 |
| New York State Dormitory Authority Revenue (Pratt Institute) | 5.000% | 7/1/39 |
|
| 1,205 | 1,328 |
| New York State Dormitory Authority Revenue (Rochester Institute of Technology) | 5.000% | 7/1/38 |
|
| 2,275 | 2,446 |
| New York State Dormitory Authority Revenue (Rochester Institute of Technology) | 5.000% | 7/1/40 |
|
| 2,000 | 2,078 |
New York Long-Term Tax-Exempt Fund
|
|
|
|
|
| Face | Market |
|
|
| Maturity |
|
| Amount | Value· |
|
| Coupon | Date |
|
| ($000) | ($000) |
|
|
|
|
|
|
|
|
| New York State Dormitory Authority Revenue (Rochester Institute of Technology) | 5.000% | 7/1/42 |
|
| 3,000 | 3,220 |
| New York State Dormitory Authority Revenue (Rockefeller University) | 5.000% | 7/1/33 |
|
| 2,670 | 2,914 |
| New York State Dormitory Authority Revenue (Rockefeller University) | 5.000% | 7/1/34 |
|
| 2,720 | 2,966 |
| New York State Dormitory Authority Revenue (School Districts Financing Program) | 5.000% | 10/1/26 |
|
| 1,000 | 1,087 |
| New York State Dormitory Authority Revenue (School Districts Financing Program) | 5.000% | 10/1/26 |
|
| 1,425 | 1,666 |
| New York State Dormitory Authority Revenue (School Districts Financing Program) | 5.000% | 10/1/27 |
| (4) | 1,000 | 1,127 |
| New York State Dormitory Authority Revenue (School Districts Financing Program) | 5.000% | 10/1/28 |
| (4) | 1,000 | 1,123 |
| New York State Dormitory Authority Revenue (School Districts Financing Program) | 5.000% | 10/1/29 |
| (4) | 1,500 | 1,680 |
| New York State Dormitory Authority Revenue (School Districts Financing Program) | 5.000% | 10/1/31 |
| (4) | 750 | 831 |
| New York State Dormitory Authority Revenue (School Districts Financing Program) | 5.000% | 10/1/32 |
| (4) | 1,000 | 1,111 |
| New York State Dormitory Authority Revenue (School Districts Financing Program) | 5.000% | 10/1/33 |
| (4) | 1,000 | 1,107 |
| New York State Dormitory Authority Revenue (School Districts Financing Program) | 5.000% | 10/1/33 |
|
| 600 | 680 |
| New York State Dormitory Authority Revenue (School Districts Financing Program) | 5.000% | 10/1/34 |
| (4) | 1,000 | 1,104 |
| New York State Dormitory Authority Revenue (School Districts Financing Program) | 5.000% | 10/1/34 |
|
| 520 | 587 |
| New York State Dormitory Authority Revenue (St. John’s University) | 5.000% | 7/1/26 |
|
| 740 | 850 |
| New York State Dormitory Authority Revenue (St. John’s University) | 5.000% | 7/1/27 |
|
| 650 | 744 |
| New York State Dormitory Authority Revenue (St. John’s University) | 5.000% | 7/1/31 |
|
| 1,500 | 1,688 |
| New York State Dormitory Authority Revenue (St. John’s University) | 5.000% | 7/1/44 |
|
| 2,500 | 2,682 |
| New York State Dormitory Authority Revenue (State University Dormitory Facilities) | 5.000% | 7/1/26 |
|
| 1,300 | 1,450 |
| New York State Dormitory Authority Revenue (State University Dormitory Facilities) | 5.000% | 7/1/29 |
|
| 2,250 | 2,436 |
| New York State Dormitory Authority Revenue (State University Dormitory Facilities) | 5.000% | 7/1/31 |
|
| 1,000 | 1,152 |
| New York State Dormitory Authority Revenue (State University Dormitory Facilities) | 5.250% | 7/1/31 |
|
| 2,500 | 2,801 |
| New York State Dormitory Authority Revenue (State University Dormitory Facilities) | 5.000% | 7/1/32 |
|
| 1,825 | 2,095 |
| New York State Dormitory Authority Revenue (State University Dormitory Facilities) | 5.000% | 7/1/35 |
|
| 2,000 | 2,265 |
| New York State Dormitory Authority Revenue (State University Dormitory Facilities) | 5.000% | 7/1/36 |
|
| 1,500 | 1,691 |
| New York State Dormitory Authority Revenue (State University Educational Facilities) | 5.000% | 5/15/27 |
|
| 5,035 | 5,481 |
| New York State Dormitory Authority Revenue (State University Educational Facilities) | 5.000% | 5/15/28 |
|
| 3,000 | 3,265 |
New York Long-Term Tax-Exempt Fund
|
|
|
|
|
| Face | Market |
|
|
| Maturity |
|
| Amount | Value· |
|
| Coupon | Date |
|
| ($000) | ($000) |
|
|
|
|
|
|
|
|
| New York State Dormitory Authority Revenue (Teachers College) | 5.000% | 7/1/30 |
|
| 505 | 580 |
| New York State Dormitory Authority Revenue (Teachers College) | 4.000% | 7/1/31 |
|
| 1,000 | 1,051 |
| New York State Dormitory Authority Revenue (Teachers College) | 5.000% | 7/1/31 |
|
| 1,750 | 1,889 |
| New York State Dormitory Authority Revenue (Teachers College) | 5.000% | 7/1/32 |
|
| 575 | 654 |
| New York State Dormitory Authority Revenue (Teachers College) | 4.000% | 7/1/33 |
|
| 1,200 | 1,248 |
| New York State Dormitory Authority Revenue (Teachers College) | 5.000% | 7/1/42 |
|
| 2,000 | 2,142 |
| New York State Dormitory Authority Revenue (The New School) | 5.250% | 7/1/20 |
| (Prere.) | 3,000 | 3,155 |
| New York State Dormitory Authority Revenue (The New School) | 5.500% | 7/1/20 |
| (Prere.) | 5,000 | 5,277 |
| New York State Dormitory Authority Revenue (The New School) | 6.000% | 7/1/20 |
| (Prere.) | 5,575 | 5,927 |
| New York State Dormitory Authority Revenue (The New School) | 5.000% | 7/1/37 |
|
| 3,500 | 3,864 |
| New York State Dormitory Authority Revenue (The New School) | 5.000% | 7/1/40 |
|
| 3,000 | 3,277 |
| New York State Dormitory Authority Revenue (The New School) | 5.000% | 7/1/41 |
|
| 6,685 | 7,316 |
| New York State Dormitory Authority Revenue (The New School) | 5.000% | 7/1/45 |
|
| 3,000 | 3,268 |
| New York State Dormitory Authority Revenue (The New School) | 5.000% | 7/1/46 |
|
| 9,110 | 9,930 |
| New York State Dormitory Authority Revenue (Yeshiva University) | 4.000% | 9/1/19 |
| (Prere.) | 15 | 15 |
| New York State Dormitory Authority Revenue (Yeshiva University) | 5.000% | 9/1/19 |
| (Prere.) | 65 | 66 |
| New York State Dormitory Authority Revenue (Yeshiva University) | 5.000% | 9/1/19 |
| (Prere.) | 20 | 20 |
| New York State Dormitory Authority Revenue (Yeshiva University) | 5.000% | 9/1/19 |
| (Prere.) | 350 | 358 |
| New York State Dormitory Authority Revenue (Yeshiva University) | 5.000% | 9/1/19 |
| (Prere.) | 10 | 10 |
| New York State Dormitory Authority Revenue (Yeshiva University) | 5.000% | 9/1/19 |
| (Prere.) | 5 | 5 |
| New York State Dormitory Authority Revenue (Yeshiva University) | 5.000% | 9/1/19 |
| (Prere.) | 55 | 56 |
| New York State Dormitory Authority Revenue (Yeshiva University) | 5.000% | 9/1/19 |
| (Prere.) | 20 | 20 |
| New York State Dormitory Authority Revenue (Yeshiva University) | 5.000% | 9/1/19 |
| (Prere.) | 130 | 133 |
| New York State Dormitory Authority Revenue (Yeshiva University) | 5.000% | 9/1/20 |
|
| 185 | 188 |
| New York State Dormitory Authority Revenue (Yeshiva University) | 5.000% | 11/1/20 |
|
| 2,265 | 2,325 |
| New York State Dormitory Authority Revenue (Yeshiva University) | 5.000% | 11/1/21 |
| (ETM) | 285 | 309 |
| New York State Dormitory Authority Revenue (Yeshiva University) | 5.000% | 11/1/21 |
| (Prere.) | 370 | 400 |
New York Long-Term Tax-Exempt Fund
|
|
|
|
|
| Face | Market |
|
|
| Maturity |
|
| Amount | Value· |
|
| Coupon | Date |
|
| ($000) | ($000) |
|
|
|
|
|
|
|
|
| New York State Dormitory Authority Revenue (Yeshiva University) | 5.000% | 11/1/21 |
|
| 495 | 514 |
| New York State Dormitory Authority Revenue (Yeshiva University) | 5.000% | 9/1/22 |
|
| 1,640 | 1,666 |
| New York State Dormitory Authority Revenue (Yeshiva University) | 4.000% | 9/1/23 |
|
| 1,235 | 1,246 |
| New York State Dormitory Authority Revenue (Yeshiva University) | 5.000% | 9/1/26 |
|
| 75 | 76 |
| New York State Dormitory Authority Revenue (Yeshiva University) | 5.000% | 9/1/27 |
|
| 1,595 | 1,611 |
| New York State Dormitory Authority Revenue (Yeshiva University) | 5.000% | 9/1/28 |
|
| 595 | 600 |
| New York State Dormitory Authority Sales Tax Revenue | 5.000% | 3/15/31 |
|
| 8,975 | 9,989 |
| New York State Dormitory Authority Sales Tax Revenue | 5.000% | 3/15/32 |
|
| 2,650 | 2,944 |
| New York State Dormitory Authority Sales Tax Revenue | 5.000% | 3/15/33 |
|
| 5,000 | 5,544 |
| New York State Dormitory Authority Sales Tax Revenue | 5.000% | 3/15/33 |
|
| 4,840 | 5,449 |
| New York State Dormitory Authority Sales Tax Revenue | 5.000% | 3/15/34 |
|
| 5,000 | 5,534 |
| New York State Dormitory Authority Sales Tax Revenue | 5.000% | 3/15/35 |
|
| 5,240 | 5,791 |
| New York State Dormitory Authority Sales Tax Revenue | 5.000% | 3/15/35 |
|
| 5,000 | 5,650 |
| New York State Dormitory Authority Sales Tax Revenue | 5.000% | 3/15/36 |
|
| 5,000 | 5,630 |
| New York State Dormitory Authority Sales Tax Revenue | 5.000% | 3/15/36 |
|
| 7,995 | 8,824 |
| New York State Dormitory Authority Sales Tax Revenue | 5.000% | 3/15/36 |
|
| 1,000 | 1,128 |
| New York State Dormitory Authority Sales Tax Revenue | 5.000% | 3/15/36 |
|
| 10,000 | 11,418 |
| New York State Dormitory Authority Sales Tax Revenue | 5.000% | 3/15/37 |
|
| 5,000 | 5,510 |
| New York State Dormitory Authority Sales Tax Revenue | 5.000% | 3/15/37 |
|
| 3,600 | 4,048 |
| New York State Dormitory Authority Sales Tax Revenue | 5.000% | 3/15/38 |
|
| 5,000 | 5,666 |
| New York State Dormitory Authority Sales Tax Revenue | 5.000% | 3/15/38 |
|
| 1,200 | 1,301 |
| New York State Dormitory Authority Sales Tax Revenue | 5.000% | 3/15/41 |
|
| 10,000 | 11,138 |
| New York State Dormitory Authority Sales Tax Revenue | 5.000% | 3/15/42 |
|
| 5,000 | 5,525 |
| New York State Dormitory Authority Sales Tax Revenue | 5.000% | 3/15/42 |
|
| 12,280 | 13,668 |
| New York State Dormitory Authority Sales Tax Revenue | 5.000% | 3/15/43 |
|
| 13,685 | 14,805 |
| New York State Dormitory Authority Sales Tax Revenue | 5.000% | 3/15/43 |
|
| 4,085 | 4,541 |
| New York State Dormitory Authority Sales Tax Revenue | 4.000% | 3/15/44 |
|
| 12,885 | 13,054 |
New York Long-Term Tax-Exempt Fund
|
|
|
|
|
| Face | Market |
|
|
| Maturity |
|
| Amount | Value· |
|
| Coupon | Date |
|
| ($000) | ($000) |
|
|
|
|
|
|
|
|
| New York State Dormitory Authority Sales Tax Revenue | 4.000% | 3/15/47 |
|
| 7,570 | 7,639 |
| New York State Energy Research & Development Authority Pollution Control Revenue (New York State Electric & Gas Corp.) | 3.500% | 10/1/29 |
|
| 4,000 | 4,014 |
| New York State Environmental Facilities Corp. Revenue | 5.000% | 8/15/31 |
|
| 1,335 | 1,559 |
| New York State Environmental Facilities Corp. Revenue | 5.000% | 8/15/34 |
|
| 1,000 | 1,155 |
| New York State Environmental Facilities Corp. Revenue | 5.000% | 8/15/35 |
|
| 1,385 | 1,593 |
| New York State Environmental Facilities Corp. Revenue | 5.000% | 8/15/36 |
|
| 1,000 | 1,145 |
| New York State Environmental Facilities Corp. Revenue | 5.000% | 8/15/37 |
|
| 1,400 | 1,599 |
| New York State Environmental Facilities Corp. Revenue | 5.000% | 8/15/41 |
|
| 1,000 | 1,127 |
| New York State Environmental Facilities Corp. Revenue | 5.000% | 8/15/42 |
|
| 1,000 | 1,127 |
| New York State Environmental Facilities Corp. Revenue (State Clean Water & Drinking Water Revolving Funds) | 5.000% | 6/15/30 |
|
| 3,045 | 3,515 |
| New York State Environmental Facilities Corp. Revenue (State Clean Water & Drinking Water Revolving Funds) | 5.000% | 6/15/31 |
|
| 5,870 | 6,490 |
| New York State Environmental Facilities Corp. Revenue (State Clean Water & Drinking Water Revolving Funds) | 5.000% | 6/15/32 |
|
| 5,000 | 5,675 |
| New York State Environmental Facilities Corp. Revenue (State Clean Water & Drinking Water Revolving Funds) | 5.000% | 6/15/32 |
|
| 5,000 | 5,521 |
| New York State Environmental Facilities Corp. Revenue (State Clean Water & Drinking Water Revolving Funds) | 5.000% | 6/15/32 |
|
| 2,515 | 2,924 |
| New York State Environmental Facilities Corp. Revenue (State Clean Water & Drinking Water Revolving Funds) | 5.000% | 6/15/33 |
|
| 4,000 | 4,634 |
| New York State Environmental Facilities Corp. Revenue (State Clean Water & Drinking Water Revolving Funds) | 5.000% | 6/15/34 |
|
| 4,145 | 4,625 |
| New York State Environmental Facilities Corp. Revenue (State Clean Water & Drinking Water Revolving Funds) | 5.000% | 6/15/34 |
|
| 5,010 | 5,771 |
| New York State Environmental Facilities Corp. Revenue (State Clean Water & Drinking Water Revolving Funds) | 5.000% | 6/15/35 |
|
| 2,500 | 2,870 |
| New York State Environmental Facilities Corp. Revenue (State Clean Water & Drinking Water Revolving Funds) | 5.000% | 6/15/35 |
|
| 3,000 | 3,404 |
| New York State Environmental Facilities Corp. Revenue (State Clean Water & Drinking Water Revolving Funds) | 4.000% | 6/15/36 |
|
| 2,500 | 2,604 |
New York Long-Term Tax-Exempt Fund
|
|
|
|
|
| Face | Market |
|
|
| Maturity |
|
| Amount | Value· |
|
| Coupon | Date |
|
| ($000) | ($000) |
|
|
|
|
|
|
|
|
| New York State Environmental Facilities Corp. Revenue (State Clean Water & Drinking Water Revolving Funds) | 4.000% | 6/15/37 |
|
| 5,610 | 5,828 |
| New York State Environmental Facilities Corp. Revenue (State Clean Water & Drinking Water Revolving Funds) | 5.000% | 6/15/41 |
|
| 3,000 | 3,355 |
| New York State Environmental Facilities Corp. Revenue (State Clean Water & Drinking Water Revolving Funds) | 5.000% | 6/15/42 |
|
| 11,310 | 12,720 |
| New York State Environmental Facilities Corp. Revenue (State Clean Water & Drinking Water Revolving Funds) | 4.000% | 6/15/46 |
|
| 5,435 | 5,548 |
| New York State Environmental Facilities Corp. Revenue (State Revolving Funds) | 5.000% | 9/15/40 |
|
| 2,370 | 2,629 |
| New York State Environmental Facilities Corp. Revenue (State Revolving Funds) | 5.000% | 3/15/45 |
|
| 5,000 | 5,529 |
| New York State Environmental Facilities Corp. Water Facilities Revenue (United Water New Rochelle Inc. Project) | 4.875% | 9/1/40 |
|
| 4,000 | 4,140 |
| New York State Housing Finance Agency Affordable Housing Revenue | 3.250% | 11/1/41 |
|
| 3,145 | 2,776 |
| New York State Housing Finance Agency Affordable Housing Revenue | 3.850% | 11/1/42 |
|
| 1,405 | 1,390 |
| New York State Housing Finance Agency Affordable Housing Revenue | 3.850% | 11/1/43 |
|
| 1,140 | 1,124 |
| New York State Housing Finance Agency Affordable Housing Revenue | 3.950% | 11/1/48 |
|
| 1,500 | 1,490 |
| New York State Housing Finance Agency Housing Revenue | 3.875% | 11/1/48 |
|
| 1,830 | 1,825 |
| New York State Housing Finance Agency Housing Revenue | 3.900% | 11/1/48 |
|
| 1,665 | 1,636 |
| New York State Housing Finance Agency Revenue | 3.800% | 11/1/43 |
|
| 2,325 | 2,248 |
| New York State Housing Finance Agency Revenue | 3.875% | 11/1/48 |
|
| 2,635 | 2,628 |
| New York State Mortgage Agency Homeowner Mortgage Revenue | 4.100% | 10/1/38 |
|
| 4,300 | 4,360 |
| New York State Mortgage Agency Homeowner Mortgage Revenue | 3.750% | 10/1/43 |
|
| 3,400 | 3,303 |
| New York State Mortgage Agency Homeowner Mortgage Revenue | 3.800% | 10/1/48 |
|
| 10,255 | 9,796 |
| New York State Thruway Authority Revenue | 5.000% | 1/1/28 |
|
| 5,215 | 5,880 |
| New York State Thruway Authority Revenue | 5.000% | 1/1/29 |
|
| 4,040 | 4,540 |
| New York State Thruway Authority Revenue | 5.000% | 1/1/29 |
|
| 1,220 | 1,384 |
| New York State Thruway Authority Revenue | 5.000% | 1/1/30 |
|
| 2,650 | 2,967 |
| New York State Thruway Authority Revenue | 5.000% | 1/1/30 |
|
| 4,000 | 4,265 |
| New York State Thruway Authority Revenue | 5.000% | 1/1/30 |
|
| 1,700 | 1,918 |
| New York State Thruway Authority Revenue | 5.000% | 1/1/31 |
|
| 5,500 | 6,139 |
| New York State Thruway Authority Revenue | 5.000% | 1/1/31 |
|
| 8,500 | 9,050 |
| New York State Thruway Authority Revenue | 5.000% | 1/1/31 |
|
| 2,900 | 3,257 |
| New York State Thruway Authority Revenue | 5.000% | 1/1/32 |
|
| 4,115 | 4,571 |
| New York State Thruway Authority Revenue | 5.000% | 1/1/32 |
|
| 2,970 | 3,322 |
| New York State Thruway Authority Revenue | 5.000% | 1/1/33 |
|
| 1,800 | 2,058 |
| New York State Thruway Authority Revenue | 5.000% | 1/1/33 |
|
| 2,340 | 2,606 |
New York Long-Term Tax-Exempt Fund
|
|
|
|
|
| Face | Market |
|
|
| Maturity |
|
| Amount | Value· |
|
| Coupon | Date |
|
| ($000) | ($000) |
|
|
|
|
|
|
|
|
| New York State Thruway Authority Revenue | 5.000% | 1/1/34 |
|
| 2,865 | 3,261 |
| New York State Thruway Authority Revenue | 5.000% | 1/1/35 |
|
| 3,100 | 3,516 |
| New York State Thruway Authority Revenue | 4.000% | 1/1/36 |
|
| 1,250 | 1,293 |
| New York State Thruway Authority Revenue | 5.000% | 1/1/37 |
|
| 9,050 | 9,575 |
| New York State Thruway Authority Revenue | 4.000% | 1/1/38 |
|
| 1,255 | 1,274 |
| New York State Thruway Authority Revenue | 5.000% | 1/1/41 |
|
| 2,500 | 2,736 |
| New York State Thruway Authority Revenue | 5.000% | 1/1/42 |
|
| 9,765 | 10,279 |
| New York State Thruway Authority Revenue | 5.000% | 3/15/42 |
|
| 4,105 | 4,577 |
| New York State Thruway Authority Revenue | 5.000% | 1/1/46 |
|
| 5,000 | 5,427 |
| New York State Thruway Authority Revenue | 5.000% | 1/1/51 |
|
| 5,700 | 6,150 |
| New York State Thruway Authority Revenue | 5.250% | 1/1/56 |
|
| 7,400 | 8,089 |
| New York State Thruway Authority Revenue (Personal Income Tax) | 5.000% | 3/15/31 |
|
| 1,500 | 1,653 |
| New York State Urban Development Corp. Revenue (Personal Income Tax) | 5.000% | 3/15/32 |
|
| 5,000 | 5,578 |
| New York State Urban Development Corp. Revenue (Personal Income Tax) | 5.000% | 3/15/33 |
|
| 3,000 | 3,283 |
| New York State Urban Development Corp. Revenue (Personal Income Tax) | 5.000% | 3/15/40 |
|
| 5,000 | 5,607 |
| New York State Urban Development Corp. Revenue (Personal Income Tax) | 5.000% | 3/15/43 |
|
| 10,000 | 10,848 |
| Niagara NY Area Development Corp. Revenue (Niagara University Project) | 5.000% | 5/1/26 |
|
| 320 | 348 |
| Niagara NY Area Development Corp. Revenue (Niagara University Project) | 5.000% | 5/1/30 |
|
| 2,750 | 2,964 |
2 | Nuveen New York AMT-Free Quality Municipal Income Fund VRDP VRDO | 1.790% | 12/7/18 |
| LOC | 2,500 | 2,500 |
| Onondaga County NY Civic Development Corp. Revenue (Jewish Home of Central New York Obligated Group) | 5.500% | 3/1/24 |
|
| 3,000 | 2,990 |
| Onondaga County NY Civic Development Corp. Revenue (Jewish Home of Central New York Obligated Group) | 5.250% | 3/1/31 |
|
| 2,000 | 1,824 |
| Onondaga County NY Civic Development Corp. Revenue (Le Moyne College) | 5.000% | 7/1/28 |
|
| 450 | 494 |
| Onondaga County NY Civic Development Corp. Revenue (Le Moyne College) | 5.000% | 7/1/29 |
|
| 475 | 519 |
| Onondaga County NY Civic Development Corp. Revenue (Le Moyne College) | 5.000% | 7/1/30 |
|
| 450 | 488 |
| Onondaga County NY Civic Development Corp. Revenue (Le Moyne College) | 5.000% | 7/1/32 |
|
| 1,000 | 1,050 |
| Onondaga County NY Civic Development Corp. Revenue (Le Moyne College) | 5.000% | 7/1/33 |
|
| 575 | 619 |
| Onondaga County NY Civic Development Corp. Revenue (Le Moyne College) | 5.000% | 7/1/35 |
|
| 635 | 679 |
| Onondaga County NY Civic Development Corp. Revenue (Le Moyne College) | 5.000% | 7/1/40 |
|
| 1,940 | 2,050 |
| Onondaga County NY Civic Development Corp. Revenue (Le Moyne College) | 5.000% | 7/1/42 |
|
| 1,780 | 1,844 |
| Onondaga County NY Civic Development Corp. Revenue (Le Moyne College) | 5.000% | 7/1/45 |
|
| 2,450 | 2,577 |
| Onondaga County NY Civic Development Corp. Revenue (St. Joseph’s Hospital & Health Center) | 5.000% | 7/1/19 |
| (Prere.) | 6,000 | 6,109 |
New York Long-Term Tax-Exempt Fund
|
|
|
|
|
| Face | Market |
|
|
| Maturity |
|
| Amount | Value· |
|
| Coupon | Date |
|
| ($000) | ($000) |
| Onondaga County NY Trust For Cultural Resources Revenue (Abby Lane Housing Corp. Project) | 5.000% | 5/1/35 |
|
| 1,140 | 1,253 |
| Onondaga County NY Trust For Cultural Resources Revenue (Abby Lane Housing Corp. Project) | 5.000% | 5/1/36 |
|
| 1,475 | 1,615 |
| Onondaga County NY Trust For Cultural Resources Revenue (Abby Lane Housing Corp. Project) | 5.000% | 5/1/40 |
|
| 1,200 | 1,290 |
| Onondaga County NY Trust For Cultural Resources Revenue (Syracuse University Project) | 5.000% | 12/1/31 |
|
| 1,000 | 1,116 |
| Onondaga NY Civic Development Corp. Revenue (Le Moyne College Project) | 5.000% | 1/1/32 |
|
| 510 | 564 |
| Onondaga NY Civic Development Corp. Revenue (Le Moyne College Project) | 5.000% | 1/1/33 |
|
| 540 | 594 |
| Onondaga NY Civic Development Corp. Revenue (Le Moyne College Project) | 5.000% | 1/1/34 |
|
| 565 | 618 |
| Onondaga NY Civic Development Corp. Revenue (Le Moyne College Project) | 5.000% | 1/1/35 |
|
| 595 | 649 |
| Onondaga NY Civic Development Corp. Revenue (Le Moyne College Project) | 5.000% | 1/1/36 |
|
| 625 | 679 |
| Onondaga NY Civic Development Corp. Revenue (Le Moyne College Project) | 5.000% | 1/1/37 |
|
| 355 | 384 |
| Onondaga NY Civic Development Corp. Revenue (Le Moyne College Project) | 5.000% | 1/1/38 |
|
| 285 | 308 |
| Onondaga NY Civic Development Corp. Revenue (Le Moyne College Project) | 5.000% | 1/1/43 |
|
| 1,000 | 1,071 |
| Otsego County NY Capital Resource Corp. Revenue (Hartwick College) | 4.000% | 10/1/19 |
|
| 650 | 652 |
| Otsego County NY Capital Resource Corp. Revenue (Hartwick College) | 5.000% | 10/1/20 |
|
| 655 | 668 |
| Port Authority of New York & New Jersey Revenue | 5.000% | 10/15/29 |
|
| 3,500 | 4,015 |
| Port Authority of New York & New Jersey Revenue | 5.000% | 7/15/32 |
|
| 5,010 | 5,855 |
| Port Authority of New York & New Jersey Revenue | 5.000% | 10/15/33 |
|
| 1,750 | 1,973 |
| Port Authority of New York & New Jersey Revenue | 5.000% | 9/1/34 |
|
| 1,290 | 1,431 |
| Port Authority of New York & New Jersey Revenue | 5.000% | 11/15/35 |
|
| 3,015 | 3,444 |
| Port Authority of New York & New Jersey Revenue | 5.250% | 7/15/36 |
|
| 4,000 | 4,233 |
| Port Authority of New York & New Jersey Revenue | 4.000% | 9/1/38 |
|
| 1,750 | 1,787 |
| Port Authority of New York & New Jersey Revenue | 5.000% | 10/15/41 |
|
| 13,000 | 14,397 |
| Port Authority of New York & New Jersey Revenue | 5.000% | 11/15/42 |
|
| 3,000 | 3,370 |
| Port Authority of New York & New Jersey Revenue | 4.000% | 9/1/43 |
|
| 10,000 | 10,161 |
| Port Authority of New York & New Jersey Revenue | 5.000% | 5/1/45 |
|
| 8,765 | 9,630 |
New York Long-Term Tax-Exempt Fund
|
|
|
|
|
| Face | Market |
|
|
| Maturity |
|
| Amount | Value· |
|
| Coupon | Date |
|
| ($000) | ($000) |
|
|
|
|
|
|
|
|
| Port Authority of New York & New Jersey Revenue | 5.000% | 11/15/46 |
|
| 3,000 | 3,321 |
| Port Authority of New York & New Jersey Revenue | 5.000% | 11/15/47 |
|
| 8,000 | 8,941 |
| Port Authority of New York & New Jersey Revenue | 5.000% | 9/1/48 |
|
| 9,250 | 10,403 |
| Port Authority of New York & New Jersey Revenue | 5.250% | 10/15/55 |
|
| 7,750 | 8,656 |
3 | Port Authority of New York & New Jersey Revenue | 5.250% | 11/15/56 |
|
| 10,000 | 11,212 |
| Port Authority of New York & New Jersey Revenue | 5.000% | 4/15/57 |
|
| 2,000 | 2,202 |
| Port Authority of New York & New Jersey Revenue | 5.000% | 5/15/57 |
|
| 2,000 | 2,217 |
| Port Authority of New York & New Jersey Revenue | 5.250% | 11/15/57 |
|
| 11,450 | 12,931 |
| Port Authority of New York & New Jersey Special Obligation Revenue (John F. Kennedy International Air Terminal LLC) | 5.500% | 12/1/31 |
|
| 7,025 | 7,470 |
| Port Authority of New York & New Jersey Special Obligation Revenue (John F. Kennedy International Air Terminal LLC) | 6.000% | 12/1/42 |
|
| 6,865 | 7,308 |
| Saratoga County NY Capital Resource Corp. Revenue (Skidmore College) | 5.000% | 7/1/32 |
|
| 220 | 253 |
| Saratoga County NY Capital Resource Corp. Revenue (Skidmore College) | 5.000% | 7/1/33 |
|
| 175 | 200 |
| Saratoga County NY Capital Resource Corp. Revenue (Skidmore College) | 5.000% | 7/1/34 |
|
| 225 | 256 |
| Saratoga County NY Capital Resource Corp. Revenue (Skidmore College) | 5.000% | 7/1/35 |
|
| 225 | 255 |
| Saratoga County NY Capital Resource Corp. Revenue (Skidmore College) | 5.000% | 7/1/36 |
|
| 500 | 564 |
| Saratoga County NY Capital Resource Corp. Revenue (Skidmore College) | 5.000% | 7/1/38 |
|
| 300 | 337 |
| Saratoga County NY Capital Resource Corp. Revenue (Skidmore College) | 5.000% | 7/1/43 |
|
| 3,550 | 3,952 |
| Saratoga County NY Capital Resource Corp. Revenue (Skidmore College) | 5.000% | 7/1/48 |
|
| 4,520 | 5,009 |
| St. Lawrence County NY Industrial Development Civic Facility Revenue (St. Lawrence University) | 5.000% | 7/1/28 |
|
| 310 | 354 |
| St. Lawrence County NY Industrial Development Civic Facility Revenue (St. Lawrence University) | 5.000% | 7/1/29 |
|
| 660 | 749 |
| St. Lawrence County NY Industrial Development Civic Facility Revenue (St. Lawrence University) | 5.000% | 7/1/31 |
|
| 450 | 506 |
| St. Lawrence County NY Industrial Development Civic Facility Revenue (St. Lawrence University) | 5.000% | 7/1/34 |
|
| 830 | 930 |
| St. Lawrence County NY Industrial Development Civic Facility Revenue (St. Lawrence University) | 5.000% | 7/1/35 |
|
| 1,510 | 1,689 |
New York Long-Term Tax-Exempt Fund
|
|
|
|
|
| Face | Market |
|
|
| Maturity |
|
| Amount | Value· |
|
| Coupon | Date |
|
| ($000) | ($000) |
|
|
|
|
|
|
|
|
| St. Lawrence County NY Industrial Development Civic Facility Revenue (St. Lawrence University) | 5.000% | 7/1/36 |
|
| 545 | 608 |
| St. Lawrence County NY Industrial Development Civic Facility Revenue (St. Lawrence University) | 5.000% | 7/1/43 |
|
| 8,870 | 9,475 |
| Suffolk County NY Economic Development Corp. Revenue (Catholic Health Services) | 5.000% | 7/1/21 |
| (Prere.) | 1,570 | 1,687 |
| Suffolk County NY Economic Development Corp. Revenue (Catholic Health Services) | 5.000% | 7/1/28 |
|
| 1,500 | 1,643 |
| Suffolk County NY Economic Development Corp. Revenue (Catholic Health Services) | 5.000% | 7/1/28 |
|
| 14,180 | 15,030 |
| Suffolk County NY Economic Development Corp. Revenue (Catholic Health Services) | 5.000% | 7/1/29 |
|
| 3,000 | 3,265 |
| Suffolk County NY Judicial Facilities Agency Lease Revenue (H. Lee Dennison Building) | 5.000% | 11/1/33 |
|
| 7,900 | 8,448 |
| Suffolk County NY Water Authority Water System Revenue | 3.250% | 6/1/43 |
|
| 580 | 518 |
| Suffolk NY Tobacco Asset Securitization Corp. Revenue | 5.000% | 6/1/32 |
|
| 2,675 | 2,804 |
| Suffolk NY Tobacco Asset Securitization Corp. Revenue | 5.250% | 6/1/37 |
|
| 3,300 | 3,475 |
| Tobacco Settlement Financing Corp. New York Revenue | 5.000% | 6/1/26 |
|
| 2,790 | 3,132 |
| Tobacco Settlement Financing Corp. New York Revenue | 5.000% | 6/1/28 |
|
| 4,650 | 5,187 |
| Tobacco Settlement Financing Corp. New York Revenue | 5.000% | 6/1/29 |
|
| 5,000 | 5,531 |
| Tobacco Settlement Financing Corp. New York Revenue | 5.000% | 6/1/30 |
|
| 5,225 | 5,736 |
| Tobacco Settlement Financing Corp. New York Revenue | 5.000% | 6/1/32 |
|
| 1,015 | 1,104 |
| Tobacco Settlement Financing Corp. New York Revenue | 5.000% | 6/1/33 |
|
| 5,000 | 5,406 |
| Tobacco Settlement Financing Corp. New York Revenue | 5.000% | 6/1/34 |
|
| 6,000 | 6,460 |
| Tobacco Settlement Financing Corp. New York Revenue | 5.000% | 6/1/36 |
|
| 5,835 | 6,217 |
| Tobacco Settlement Financing Corp. New York Revenue | 5.000% | 6/1/41 |
|
| 17,480 | 17,831 |
| Tobacco Settlement Financing Corp. New York Revenue | 5.000% | 6/1/45 |
|
| 6,840 | 6,548 |
| Tompkins County NY Development Corp. Revenue (Ithaca College) | 5.000% | 7/1/32 |
|
| 1,555 | 1,734 |
| Tompkins County NY Development Corp. Revenue (Ithaca College) | 5.000% | 7/1/33 |
|
| 1,605 | 1,787 |
| Triborough Bridge & Tunnel Authority New York Revenue | 0.000% | 11/15/29 |
|
| 2,620 | 1,798 |
| Triborough Bridge & Tunnel Authority New York Revenue | 5.000% | 11/15/29 |
|
| 725 | 827 |
| Triborough Bridge & Tunnel Authority New York Revenue | 5.000% | 11/15/30 |
|
| 500 | 570 |
| Triborough Bridge & Tunnel Authority New York Revenue | 5.000% | 11/15/30 |
|
| 2,230 | 2,591 |
New York Long-Term Tax-Exempt Fund
|
|
|
|
| Face | Market | |
|
|
| Maturity |
| Amount | Value· | |
|
| Coupon | Date |
| ($000) | ($000) | |
|
|
|
|
|
|
| |
| Triborough Bridge & Tunnel Authority New York Revenue | 5.000% | 11/15/31 |
| 5,000 | 6,102 | |
| Triborough Bridge & Tunnel Authority New York Revenue | 5.000% | 11/15/31 |
| 6,990 | 7,715 | |
| Triborough Bridge & Tunnel Authority New York Revenue | 5.000% | 11/15/31 |
| 8,995 | 10,445 | |
| Triborough Bridge & Tunnel Authority New York Revenue | 5.000% | 11/15/31 |
| 3,010 | 3,446 | |
| Triborough Bridge & Tunnel Authority New York Revenue | 0.000% | 11/15/32 |
| 3,000 | 1,806 | |
| Triborough Bridge & Tunnel Authority New York Revenue | 5.000% | 11/15/33 |
| 2,000 | 2,260 | |
| Triborough Bridge & Tunnel Authority New York Revenue | 5.000% | 11/15/33 |
| 1,540 | 1,765 | |
| Triborough Bridge & Tunnel Authority New York Revenue | 5.000% | 11/15/34 |
| 3,090 | 3,526 | |
| Triborough Bridge & Tunnel Authority New York Revenue | 5.000% | 11/15/35 |
| 5,000 | 5,789 | |
| Triborough Bridge & Tunnel Authority New York Revenue | 5.000% | 11/15/36 |
| 5,000 | 5,603 | |
| Triborough Bridge & Tunnel Authority New York Revenue | 5.000% | 11/15/37 |
| 5,010 | 5,669 | |
| Triborough Bridge & Tunnel Authority New York Revenue | 5.000% | 11/15/37 |
| 2,500 | 2,811 | |
| Triborough Bridge & Tunnel Authority New York Revenue | 5.000% | 11/15/38 |
| 3,000 | 3,378 | |
| Triborough Bridge & Tunnel Authority New York Revenue | 5.000% | 11/15/40 |
| 2,525 | 2,806 | |
| Triborough Bridge & Tunnel Authority New York Revenue | 5.000% | 11/15/41 |
| 7,500 | 8,310 | |
| Triborough Bridge & Tunnel Authority New York Revenue | 5.000% | 11/15/42 |
| 4,600 | 5,144 | |
| Triborough Bridge & Tunnel Authority New York Revenue | 5.000% | 11/15/42 |
| 7,500 | 8,431 | |
| Triborough Bridge & Tunnel Authority New York Revenue | 5.000% | 11/15/43 |
| 10,000 | 11,301 | |
| Triborough Bridge & Tunnel Authority New York Revenue | 5.000% | 11/15/44 |
| 6,325 | 7,142 | |
| Triborough Bridge & Tunnel Authority New York Revenue | 5.250% | 11/15/45 |
| 4,000 | 4,544 | |
| Triborough Bridge & Tunnel Authority New York Revenue | 5.000% | 11/15/47 |
| 5,835 | 6,484 | |
| Triborough Bridge & Tunnel Authority New York Revenue (MTA Bridges and Tunnels) | 4.000% | 11/15/48 |
| 10,000 | 10,031 | |
| Troy NY Capital Resource Corp. Revenue (Rensselaer Polytechnic Institute Project) | 5.000% | 8/1/23 |
| 1,000 | 1,112 | |
| Troy NY Capital Resource Corp. Revenue (Rensselaer Polytechnic Institute Project) | 5.000% | 8/1/24 |
| 1,000 | 1,129 | |
| Troy NY Capital Resource Corp. Revenue (Rensselaer Polytechnic Institute Project) | 5.000% | 8/1/25 |
| 1,000 | 1,143 | |
| Troy NY Capital Resource Corp. Revenue (Rensselaer Polytechnic Institute Project) | 5.000% | 8/1/26 |
| 1,000 | 1,145 | |
| Troy NY Capital Resource Corp. Revenue (Rensselaer Polytechnic Institute Project) | 5.000% | 8/1/27 |
| 1,600 | 1,819 | |
New York Long-Term Tax-Exempt Fund
|
|
|
|
|
| Face | Market |
|
|
| Maturity |
|
| Amount | Value· |
|
| Coupon | Date |
|
| ($000) | ($000) |
|
|
|
|
|
|
|
|
| Troy NY Capital Resource Corp. Revenue (Rensselaer Polytechnic Institute Project) | 5.000% | 8/1/28 |
|
| 1,000 | 1,130 |
| Troy NY Capital Resource Corp. Revenue (Rensselaer Polytechnic Institute Project) | 5.000% | 9/1/30 |
|
| 1,500 | 1,560 |
| Troy NY Capital Resource Corp. Revenue (Rensselaer Polytechnic Institute Project) | 5.125% | 9/1/40 |
|
| 3,650 | 3,797 |
| Utility Debt Securitization Authority New York Revenue | 5.000% | 12/15/29 |
|
| 7,015 | 7,836 |
| Utility Debt Securitization Authority New York Revenue | 5.000% | 12/15/30 |
|
| 10,000 | 11,145 |
| Utility Debt Securitization Authority New York Revenue | 5.000% | 12/15/31 |
|
| 7,000 | 7,794 |
| Utility Debt Securitization Authority New York Revenue | 5.000% | 12/15/32 |
|
| 9,650 | 10,726 |
| Utility Debt Securitization Authority New York Revenue | 5.000% | 12/15/33 |
|
| 3,150 | 3,496 |
| Utility Debt Securitization Authority New York Revenue | 5.000% | 12/15/33 |
|
| 7,755 | 8,805 |
| Utility Debt Securitization Authority New York Revenue | 5.000% | 12/15/34 |
|
| 5,185 | 5,748 |
| Utility Debt Securitization Authority New York Revenue | 5.000% | 12/15/36 |
|
| 23,700 | 26,652 |
| Utility Debt Securitization Authority New York Revenue | 5.000% | 12/15/38 |
|
| 3,010 | 3,435 |
| Utility Debt Securitization Authority New York Revenue | 5.000% | 12/15/39 |
|
| 3,000 | 3,416 |
| Utility Debt Securitization Authority New York Revenue | 5.000% | 12/15/40 |
|
| 3,000 | 3,408 |
| Utility Debt Securitization Authority New York Revenue | 5.000% | 12/15/41 |
|
| 27,400 | 29,914 |
| Utility Debt Securitization Authority New York Revenue | 5.000% | 12/15/41 |
|
| 3,000 | 3,403 |
| Westchester County NY Health Care Corp. Revenue | 6.000% | 11/1/20 |
| (Prere.) | 85 | 91 |
| Westchester County NY Health Care Corp. Revenue | 6.125% | 11/1/20 |
| (Prere.) | 1,865 | 2,009 |
| Westchester County NY Health Care Corp. Revenue | 5.000% | 11/1/21 |
|
| 2,500 | 2,669 |
| Westchester County NY Health Care Corp. Revenue | 5.000% | 11/1/25 |
|
| 1,810 | 1,923 |
| Westchester County NY Health Care Corp. Revenue | 5.000% | 11/1/30 |
|
| 11,710 | 12,342 |
| Westchester County NY Health Care Corp. Revenue | 6.000% | 11/1/30 |
|
| 15 | 16 |
| Westchester County NY Health Care Corp. Revenue | 6.125% | 11/1/37 |
|
| 235 | 250 |
| Westchester County NY Local Development Corp. Revenue (Kendal on Hudson Project) | 5.000% | 1/1/28 |
|
| 1,350 | 1,431 |
| Westchester County NY Local Development Corp. Revenue (Kendal on Hudson Project) | 5.000% | 1/1/34 |
|
| 1,555 | 1,624 |
| Westchester County NY Local Development Corp. Revenue (Pace University) | 5.000% | 5/1/34 |
|
| 4,615 | 4,904 |
| Westchester County NY Local Development Corp. Revenue (Pace University) | 5.500% | 5/1/42 |
|
| 6,250 | 6,705 |
New York Long-Term Tax-Exempt Fund
|
|
|
|
| Face | Market | ||
|
|
| Maturity |
| Amount | Value· | ||
|
| Coupon | Date |
| ($000) | ($000) | ||
|
|
|
|
|
|
| ||
| Westchester County NY Local Development Corp. Revenue (Purchase Housing Corp. II Project) | 5.000% | 6/1/37 |
| 1,275 | 1,394 | ||
| Westchester County NY Local Development Corp. Revenue (Purchase Housing Corp. II Project) | 5.000% | 6/1/47 |
| 1,045 | 1,126 | ||
| Westchester County NY Local Development Corp. Revenue (Westchester Medical Center) | 5.000% | 11/1/27 |
| 1,000 | 1,113 | ||
| Westchester County NY Local Development Corp. Revenue (Westchester Medical Center) | 5.000% | 11/1/28 |
| 1,000 | 1,106 | ||
| Westchester County NY Local Development Corp. Revenue (Westchester Medical Center) | 5.000% | 11/1/29 |
| 1,000 | 1,100 | ||
| Westchester County NY Local Development Corp. Revenue (Westchester Medical Center) | 5.000% | 11/1/34 |
| 2,500 | 2,687 | ||
| Westchester County NY Local Development Corp. Revenue (Westchester Medical Center) | 5.000% | 11/1/46 |
| 15,495 | 16,238 | ||
| Westchester NY Tobacco Asset Securitization Revenue | 5.000% | 6/1/45 |
| 5,325 |
| 5,338 | |
|
|
|
|
|
|
|
| |
|
|
|
|
|
| 4,316,309 | ||
Guam (0.2%) |
|
|
|
|
| |||
| Guam Government Business Privilege Tax Revenue | 5.000% | 11/15/27 |
| 450 | 494 | ||
| Guam Government Waterworks Authority Water & Waste Water System Revenue | 5.000% | 7/1/29 |
| 1,000 | 1,063 | ||
| Guam Power Authority Revenue | 5.000% | 10/1/31 |
| 5,980 |
| 6,509 | |
|
|
|
|
|
|
|
| |
|
|
|
|
|
| 8,066 | ||
Total Tax-Exempt Municipal Bonds (Cost $4,292,157) |
|
|
| 4,324,375 | ||||
|
|
|
|
|
|
| ||
|
|
|
|
|
| Amount | ||
|
|
|
|
|
| ($000) | ||
Other Assets and Liabilities (1.3%) |
|
|
|
|
| |||
Other Assets |
|
|
|
|
| |||
Investment in Vanguard |
|
|
|
| 234 | |||
Receivables for Investment Securities Sold |
|
|
|
| 19,732 | |||
Receivables for Accrued Income |
|
|
|
| 53,513 | |||
Receivables for Capital Shares Issued |
|
|
|
| 6,610 | |||
Variation Margin Receivable—Futures Contracts |
|
|
|
| 59 | |||
Other Assets |
|
|
|
| 479 | |||
Total Other Assets |
|
|
|
| 80,627 | |||
Liabilities |
|
|
|
|
| |||
Payables for Investment Securities Purchased |
|
|
|
| (12,845) | |||
Payables for Capital Shares Redeemed |
|
|
|
| (4,653) | |||
Payables for Distributions |
|
|
|
| (3,156) | |||
Payables to Vanguard |
|
|
|
| (2,745) | |||
Variation Margin Payable—Futures Contracts |
|
|
|
| (88) | |||
Total Liabilities |
|
|
|
| (23,487) | |||
Net Assets (100%) |
|
|
|
| 4,381,515 | |||
New York Long-Term Tax-Exempt Fund
At November 30, 2018, net assets consisted of: |
|
| Amount |
| ($000) |
Paid-in Capital | 4,342,664 |
Total Distributable Earnings (Loss) | 38,851 |
Net Assets | 4,381,515 |
|
|
Investor Shares—Net Assets |
|
Applicable to 37,488,681 outstanding $.001 par value shares of beneficial interest (unlimited authorization) | 425,112 |
Net Asset Value Per Share—Investor Shares | $11.34 |
|
|
Admiral Shares—Net Assets |
|
Applicable to 348,896,973 outstanding $.001 par value shares of beneficial interest (unlimited authorization) | 3,956,403 |
Net Asset Value Per Share—Admiral Shares | $11.34 |
· See Note A in Notes to Financial Statements.
1 Security purchased on a when-issued or delayed-delivery basis for which the fund has not taken delivery as of November 30, 2018.
2 Security exempt from registration under Rule 144A of the Securities Act of 1933. Such securities may be sold in transactions exempt from registration, normally to qualified institutional buyers. At November 30, 2018, the aggregate value of these securities was $39,884,000, representing 0.9% of net assets.
3 Securities with a value of $734,000 have been segregated as initial margin for open futures contracts.
A key to abbreviations and other references follows the Statement of Net Assets.
See accompanying Notes, which are an integral part of the Financial Statements.
New York Long-Term Tax-Exempt Fund
Key to Abbreviations
ARS—Auction Rate Security.
BAN—Bond Anticipation Note.
COP—Certificate of Participation.
CP—Commercial Paper.
FR—Floating Rate.
GAN—Grant Anticipation Note.
GO—General Obligation Bond.
PILOT—Payments in Lieu of Taxes.
PUT—Put Option Obligation.
RAN—Revenue Anticipation Note.
TAN—Tax Anticipation Note.
TOB—Tender Option Bond.
TRAN—Tax Revenue Anticipation Note.
VRDO—Variable Rate Demand Obligation.
VRDP—Variable Rate Demand Preferred.
(ETM)—Escrowed to Maturity.
(Prere.)—Prerefunded.
Scheduled principal and interest payments are guaranteed by:
(1) MBIA (Municipal Bond Investors Assurance).
(2) AMBAC (Ambac Assurance Corporation).
(3) FGIC (Financial Guaranty Insurance Company).
(4) AGM (Assured Guaranty Municipal Corporation).
(5) BIGI (Bond Investors Guaranty Insurance).
(6) Connie Lee Inc.
(7) FHA (Federal Housing Authority).
(8) CapMAC (Capital Markets Assurance Corporation).
(9) American Capital Access Financial Guaranty Corporation.
(10) XL Capital Assurance Inc.
(11) CIFG (CDC IXIS Financial Guaranty).
(12) AGC (Assured Guaranty Corporation).
(13) BHAC (Berkshire Hathaway Assurance Corporation).
(14) NPFG (National Public Finance Guarantee Corporation).
(15) BAM (Build America Mutual Assurance Company).
(16) MAC (Municipal Assurance Corporation).
(17) RAA (Radian Asset Assurance Inc.).
(18) SBLF (Michigan School Bond Loan Fund).
(19) TPSF (Texas Permanent School Fund).
The insurance does not guarantee the market value of the municipal bonds.
LOC—Scheduled principal and interest payments are guaranteed by bank letter of credit.
New York Long-Term Tax-Exempt Fund
Derivative Financial Instruments Outstanding as of Period End |
Futures Contracts |
|
|
|
|
|
|
|
|
|
|
|
|
|
|
|
| ($000) |
|
|
|
|
|
|
|
| Value and |
|
|
|
| Number of |
|
|
| Unrealized |
|
|
|
| Long (Short) |
| Notional |
| Appreciation |
|
| Expiration |
| Contracts |
| Amount |
| (Depreciation) |
Long Futures Contracts |
|
|
|
|
|
|
|
|
5-Year U.S. Treasury Note |
| March 2019 |
| 728 |
| 82,236 |
| 120 |
2-Year U.S. Treasury Note |
| March 2019 |
| 238 |
| 50,214 |
| 25 |
Ultra 10-Year U.S. Treasury Note |
| March 2019 |
| 121 |
| 15,306 |
| 42 |
10-Year U.S. Treasury Note |
| March 2019 |
| 10 |
| 1,195 |
| — |
|
|
|
|
|
|
|
| 187 |
|
|
|
|
|
|
|
|
|
Short Futures Contracts |
|
|
|
|
|
|
|
|
Ultra Long U.S. Treasury Bond |
| March 2019 |
| (221) |
| (33,682) |
| (73) |
30-Year U.S. Treasury Bond |
| March 2019 |
| (56) |
| (7,835) |
| (5) |
|
|
|
|
|
|
|
| (78) |
|
|
|
|
|
|
|
| 109 |
See accompanying Notes, which are an integral part of the Financial Statements.
New York Long-Term Tax-Exempt Fund
Statement of Operations
|
| Year Ended |
|
| November 30, 2018 |
|
| ($000) |
Investment Income |
|
|
Income |
|
|
Interest |
| 150,349 |
Total Income |
| 150,349 |
Expenses |
|
|
The Vanguard Group—Note B |
|
|
Investment Advisory Services |
| 565 |
Management and Administrative—Investor Shares |
| 602 |
Management and Administrative—Admiral Shares |
| 2,758 |
Marketing and Distribution—Investor Shares |
| 93 |
Marketing and Distribution—Admiral Shares |
| 260 |
Custodian Fees |
| 26 |
Auditing Fees |
| 35 |
Shareholders’ Reports and Proxy—Investor Shares |
| 10 |
Shareholders’ Reports and Proxy—Admiral Shares |
| 14 |
Trustees’ Fees and Expenses |
| 3 |
Total Expenses |
| 4,366 |
Net Investment Income |
| 145,983 |
Realized Net Gain (Loss) |
|
|
Investment Securities Sold |
| 12,005 |
Futures Contracts |
| (1,653) |
Realized Net Gain (Loss) |
| 10,352 |
Change in Unrealized Appreciation (Depreciation) |
|
|
Investment Securities |
| (134,269) |
Futures Contracts |
| 330 |
Change in Unrealized Appreciation (Depreciation) |
| (133,939) |
Net Increase (Decrease) in Net Assets Resulting from Operations |
| 22,396 |
See accompanying Notes, which are an integral part of the Financial Statements.
New York Long-Term Tax-Exempt Fund
Statement of Changes in Net Assets
|
| Year Ended November 30, | |||
|
| 2018 |
| 2017 | |
|
| ($000) |
| ($000) | |
Increase (Decrease) in Net Assets |
|
|
|
| |
Operations |
|
|
|
| |
Net Investment Income |
| 145,983 |
| 137,189 | |
Realized Net Gain (Loss) |
| 10,352 |
| 21,498 | |
Change in Unrealized Appreciation (Depreciation) |
| (133,939) |
| 76,466 | |
Net Increase (Decrease) in Net Assets Resulting from Operations |
| 22,396 |
| 235,153 | |
Distributions |
|
|
|
| |
Net Investment Income |
|
|
|
| |
Investor Shares |
| (14,523) |
| (14,863) | |
Admiral Shares |
| (131,460) |
| (122,231) | |
Realized Capital Gain1 |
|
|
|
| |
Investor Shares |
| (2,221) |
| (2,383) | |
Admiral Shares |
| (18,905) |
| (18,628) | |
Total Distributions |
| (167,109) |
| (158,105) | |
Capital Share Transactions |
|
|
|
| |
Investor Shares |
| (24,058) |
| (5,091) | |
Admiral Shares |
| 157,745 |
| 333,752 | |
Net Increase (Decrease) from Capital Share Transactions |
| 133,687 |
| 328,661 | |
Total Increase (Decrease) |
| (11,026) |
| 405,709 | |
Net Assets |
|
|
|
| |
Beginning of Period |
| 4,392,541 |
| 3,986,832 | |
End of Period |
| 4,381,515 |
| 4,392,541 | |
1 Includes fiscal 2018 and 2017 short-term gain distributions totaling $150,000 and $2,967,000, respectively. Short-term gain distributions are treated as ordinary income dividends for tax purposes.
See accompanying Notes, which are an integral part of the Financial Statements.
New York Long-Term Tax-Exempt Fund
Financial Highlights
Investor Shares
For a Share Outstanding |
| Year Ended November 30, |
| ||||||||
Throughout Each Period |
| 2018 |
| 2017 |
| 2016 |
| 2015 |
| 2014 |
|
Net Asset Value, Beginning of Period |
| $11.71 |
| $11.49 |
| $11.84 |
| $11.77 |
| $11.11 |
|
Investment Operations |
|
|
|
|
|
|
|
|
|
|
|
Net Investment Income |
| .369 | 1 | .372 | 1 | .384 |
| .390 |
| .404 |
|
Net Realized and Unrealized Gain (Loss) on Investments |
| (.314 | ) | .282 |
| (.343 | ) | .070 |
| .660 |
|
Total from Investment Operations |
| .055 |
| .654 |
| .041 |
| .460 |
| 1.064 |
|
Distributions |
|
|
|
|
|
|
|
|
|
|
|
Dividends from Net Investment Income |
| (.369 | ) | (.372 | ) | (.380 | ) | (.390 | ) | (.404 | ) |
Distributions from Realized Capital Gains |
| (.056 | ) | (.062 | ) | (.011 | ) | — |
| — |
|
Total Distributions |
| (.425 | ) | (.434 | ) | (.391 | ) | (.390 | ) | (.404 | ) |
Net Asset Value, End of Period |
| $11.34 |
| $11.71 |
| $11.49 |
| $11.84 |
| $11.77 |
|
|
|
|
|
|
|
|
|
|
|
|
|
Total Return2 |
| 0.48% |
| 5.76% |
| 0.24% |
| 3.97% |
| 9.71% |
|
|
|
|
|
|
|
|
|
|
|
|
|
Ratios/Supplemental Data |
|
|
|
|
|
|
|
|
|
|
|
Net Assets, End of Period (Millions) |
| $425 |
| $464 |
| $460 |
| $423 |
| $417 |
|
Ratio of Total Expenses to Average Net Assets |
| 0.17% |
| 0.19% |
| 0.19% |
| 0.20% |
| 0.20% |
|
Ratio of Net Investment Income to Average Net Assets |
| 3.21% |
| 3.18% |
| 3.18% |
| 3.26% |
| 3.57% |
|
Portfolio Turnover Rate |
| 18% |
| 16% |
| 18% |
| 17% |
| 27% |
|
1 Calculated based on average shares outstanding.
2 Total returns do not include account service fees that may have applied in the periods shown. Fund prospectuses provide information about any applicable account service fees.
See accompanying Notes, which are an integral part of the Financial Statements.
New York Long-Term Tax-Exempt Fund
Financial Highlights
Admiral Shares
For a Share Outstanding |
| Year Ended November 30, |
| ||||||||
Throughout Each Period |
| 2018 |
| 2017 |
| 2016 |
| 2015 |
| 2014 |
|
Net Asset Value, Beginning of Period |
| $11.71 |
| $11.49 |
| $11.84 |
| $11.77 |
| $11.11 |
|
Investment Operations |
|
|
|
|
|
|
|
|
|
|
|
Net Investment Income |
| .378 | 1 | .384 | 1 | .396 |
| .400 |
| .413 |
|
Net Realized and Unrealized Gain (Loss) on Investments |
| (.314 | ) | .282 |
| (.343 | ) | .070 |
| .660 |
|
Total from Investment Operations |
| .064 |
| .666 |
| .053 |
| .470 |
| 1.073 |
|
Distributions |
|
|
|
|
|
|
|
|
|
|
|
Dividends from Net Investment Income |
| (.378 | ) | (.384 | ) | (.392 | ) | (.400 | ) | (.413 | ) |
Distributions from Realized Capital Gains |
| (.056 | ) | (.062 | ) | (.011 | ) | — |
| — |
|
Total Distributions |
| (.434 | ) | (.446 | ) | (.403 | ) | (.400 | ) | (.413 | ) |
Net Asset Value, End of Period |
| $11.34 |
| $11.71 |
| $11.49 |
| $11.84 |
| $11.77 |
|
|
|
|
|
|
|
|
|
|
|
|
|
Total Return2 |
| 0.56% |
| 5.87% |
| 0.34% |
| 4.06% |
| 9.80% |
|
|
|
|
|
|
|
|
|
|
|
|
|
Ratios/Supplemental Data |
|
|
|
|
|
|
|
|
|
|
|
Net Assets, End of Period (Millions) |
| $3,956 |
| $3,929 |
| $3,527 |
| $3,547 |
| $3,187 |
|
Ratio of Total Expenses to Average Net Assets |
| 0.09% |
| 0.09% |
| 0.09% |
| 0.12% |
| 0.12% |
|
Ratio of Net Investment Income to Average Net Assets |
| 3.29% |
| 3.28% |
| 3.28% |
| 3.34% |
| 3.65% |
|
Portfolio Turnover Rate |
| 18% |
| 16% |
| 18% |
| 17% |
| 27% |
|
1 Calculated based on average shares outstanding.
2 Total returns do not include account service fees that may have applied in the periods shown. Fund prospectuses provide information about any applicable account service fees.
See accompanying Notes, which are an integral part of the Financial Statements.
New York Long-Term Tax-Exempt Fund
Notes to Financial Statements
Vanguard New York Long-Term Tax-Exempt Fund is registered under the Investment Company Act of 1940 as an open-end investment company, or mutual fund. The fund invests in debt instruments of municipal issuers whose ability to meet their obligations may be affected by economic and political developments in the state. The fund offers two classes of shares: Investor Shares and Admiral Shares. Investor Shares are available to any investor who meets the fund’s minimum purchase requirements. Admiral Shares are designed for investors who meet certain administrative, service, and account-size criteria.
A. The following significant accounting policies conform to generally accepted accounting principles for U.S. investment companies. The fund consistently follows such policies in preparing its financial statements.
1. Security Valuation: Securities are valued as of the close of trading on the New York Stock Exchange (generally 4 p.m., Eastern time) on the valuation date. Bonds and temporary cash investments are valued using the latest bid prices or using valuations based on a matrix system (which considers such factors as security prices, yields, maturities, and ratings), both as furnished by independent pricing services. Securities for which market quotations are not readily available, or whose values have been affected by events occurring before the fund’s pricing time but after the close of the securities’ primary markets, are valued by methods deemed by the board of trustees to represent fair value.
2. Futures Contracts: The fund uses futures contracts to invest in fixed income asset classes with greater efficiency and lower cost than is possible through direct investment, to add value when these instruments are attractively priced, or to adjust sensitivity to changes in interest rates. The primary risks associated with the use of futures contracts are imperfect correlation between changes in market values of bonds held by the fund and the prices of futures contracts, and the possibility of an illiquid market. Counterparty risk involving futures is mitigated because a regulated clearinghouse is the counterparty instead of the clearing broker. To further mitigate counterparty risk, the fund trades futures contracts on an exchange, monitors the financial strength of its clearing brokers and clearinghouse, and has entered into clearing agreements with its clearing brokers. The clearinghouse imposes initial margin requirements to secure the fund’s performance and requires daily settlement of variation margin representing changes in the market value of each contract. Any assets pledged as initial margin for open contracts are noted in the Statement of Net Assets.
Futures contracts are valued at their quoted daily settlement prices. The notional amounts of the contracts are not recorded in the Statement of Net Assets. Fluctuations in the value of the contracts are recorded in the Statement of Net Assets as an asset (liability) and in the Statement of Operations as unrealized appreciation (depreciation) until the contracts are closed, when they are recorded as realized futures gains (losses).
During the year ended November 30, 2018, the fund’s average investments in long and short futures contracts represented 2% and less than 1% of net assets, respectively, based on the average of the notional amounts at each quarter-end during the period.
3. Federal Income Taxes: The fund intends to continue to qualify as a regulated investment company and distribute all of its income. Management has analyzed the fund’s tax positions taken for all open federal income tax years (November 30, 2015–2018), and has concluded that no provision for federal income tax is required in the fund’s financial statements.
New York Long-Term Tax-Exempt Fund
4. Distributions: Distributions from net investment income are declared daily and paid on the first business day of the following month. Annual distributions from realized capital gains, if any, are recorded on the ex-dividend date. Distributions are determined on a tax basis and may differ from net investment income and realized capital gains for financial reporting purposes.
5. Credit Facility: The fund and certain other funds managed by The Vanguard Group (“Vanguard”) participate in a $3.1 billion committed credit facility provided by a syndicate of lenders pursuant to a credit agreement that may be renewed annually; each fund is individually liable for its borrowings, if any, under the credit facility. Borrowings may be utilized for temporary and emergency purposes, and are subject to the fund’s regulatory and contractual borrowing restrictions. The participating funds are charged administrative fees and an annual commitment fee of 0.10% of the undrawn amount of the facility; these fees are allocated to the funds based on a method approved by the fund’s board of trustees and included in Management and Administrative expenses on the fund’s Statement of Operations. Any borrowings under this facility bear interest at a rate based upon the higher of the one-month London Interbank Offered Rate, federal funds effective rate, or overnight bank funding rate plus an agreed-upon spread.
The fund had no borrowings outstanding at November 30, 2018, or at any time during the period then ended.
6. Other: Interest income is accrued daily. Premiums and discounts on debt securities purchased are amortized and accreted, respectively, to interest income over the lives of the respective securities. Security transactions are accounted for on the date securities are bought or sold. Costs used to determine realized gains (losses) on the sale of investment securities are those of the specific securities sold.
Each class of shares has equal rights as to assets and earnings, except that each class separately bears certain class-specific expenses related to maintenance of shareholder accounts (included in Management and Administrative expenses), shareholder reporting, and the proxy. Marketing and distribution expenses are allocated to each class of shares based on a method approved by the board of trustees. Income, other non-class-specific expenses, and gains and losses on investments are allocated to each class of shares based on its relative net assets.
B. In accordance with the terms of a Funds’ Service Agreement (the “FSA”) between Vanguard and the fund, Vanguard furnishes to the fund investment advisory, corporate management, administrative, marketing, and distribution services at Vanguard’s cost of operations (as defined by the FSA). These costs of operations are allocated to the fund based on methods and guidelines approved by the board of trustees. Vanguard does not require reimbursement in the current period for certain costs of operations (such as deferred compensation/benefits and risk/insurance costs); the fund’s liability for these costs of operations is included in Payables to Vanguard on the Statement of Net Assets. All other costs of operations payable to Vanguard are generally settled twice a month.
Upon the request of Vanguard, the fund may invest up to 0.40% of its net assets as capital in Vanguard. At November 30, 2018, the fund had contributed to Vanguard capital in the amount of $234,000, representing 0.01% of the fund’s net assets and 0.09% of Vanguard’s capitalization. The fund’s trustees and officers are also directors and employees, respectively, of Vanguard.
C. Various inputs may be used to determine the value of the fund’s investments. These inputs are summarized in three broad levels for financial statement purposes. The inputs or methodologies used to value securities are not necessarily an indication of the risk associated with investing in those securities.
New York Long-Term Tax-Exempt Fund
Level 1—Quoted prices in active markets for identical securities.
Level 2—Other significant observable inputs (including quoted prices for similar securities, interest rates, prepayment speeds, credit risk, etc.).
Level 3—Significant unobservable inputs (including the fund’s own assumptions used to determine the fair value of investments). Any investments valued with significant unobservable inputs are noted on the Statement of Net Assets.
The following table summarizes the market value of the fund’s investments as of November 30, 2018, based on the inputs used to value them:
|
| Level 1 |
| Level 2 |
| Level 3 |
|
Investments |
| ($000 | ) | ($000 | ) | ($000 | ) |
Tax-Exempt Municipal Bonds |
| — |
| 4,324,375 |
| — |
|
Futures Contracts—Assets1 |
| 59 |
| — |
| — |
|
Futures Contracts—Liabilities1 |
| (88 | ) | — |
| — |
|
Total |
| (29 | ) | 4,324,375 |
| — |
|
1 Represents variation margin on the last day of the reporting period.
D. Permanent differences between book-basis and tax-basis components of net assets are reclassified among capital accounts in the financial statements to reflect their tax character. These reclassifications have no effect on net assets or net asset value per share. As of period end, permanent differences primarily attributable to the accounting for distributions in connection with fund share redemptions were reclassified between the following accounts:
|
| Amount |
|
|
| ($000 | ) |
Paid-in Capital |
| 1,200 |
|
Total Distributable Earnings (Loss) |
| (1,200 | ) |
Temporary differences between book-basis and tax-basis components of total distributable earnings (loss) arise when certain items of income, gain, or loss are recognized in different periods for financial statement and tax purposes; these differences will reverse at some time in the future. The differences are primarily related to the tax deferral of losses on wash sales and straddles, the realization of unrealized gains or losses on certain futures contracts, and payables for distributions. As of period end, the tax-basis components of total distributable earnings (loss) are detailed in the table as follows:
|
| Amount |
|
|
| ($000 | ) |
Undistributed Ordinary Income |
| — |
|
Undistributed Tax-Exempt Income |
| 5,707 |
|
Undistributed Long-Term Gains |
| 9,586 |
|
Capital Loss Carryforwards (Non-expiring) |
| — |
|
Net Unrealized Gains (Losses) |
| 29,264 |
|
New York Long-Term Tax-Exempt Fund
As of November 30, 2018, gross unrealized appreciation and depreciation for investments and derivatives based on cost for U.S. federal income tax purposes were as follows:
|
| Amount |
|
|
| ($000 | ) |
Tax Cost |
| 4,295,111 |
|
Gross Unrealized Appreciation |
| 76,617 |
|
Gross Unrealized Depreciation |
| (47,353 | ) |
Net Unrealized Appreciation (Depreciation) |
| 29,264 |
|
E. During the year ended November 30, 2018, the fund purchased $952,240,000 of investment securities and sold $775,948,000 of investment securities, other than temporary cash investments.
The fund purchased securities from and sold securities to other Vanguard funds or accounts managed by Vanguard or its affiliates, in accordance with procedures adopted by the board of trustees in compliance with Rule 17a-7 of the Investment Company Act of 1940. For the year ended November 30, 2018, such purchases and sales were $148,185,000 and $158,656,000, respectively; these amounts are included in the purchases and sales of investment securities noted above.
F. Capital share transactions for each class of shares were:
|
| Year Ended November 30, |
| ||||||
|
|
|
| 2018 |
|
|
| 2017 |
|
|
| Amount |
| Shares |
| Amount |
| Shares |
|
|
| ($000 | ) | (000 | ) | ($000 | ) | (000 | ) |
Investor Shares |
|
|
|
|
|
|
|
|
|
Issued |
| 118,256 |
| 10,269 |
| 142,825 |
| 12,208 |
|
Issued in Lieu of Cash Distributions |
| 14,212 |
| 1,234 |
| 14,329 |
| 1,226 |
|
Redeemed |
| (156,526 | ) | (13,631 | ) | (162,245 | ) | (13,868 | ) |
Net Increase (Decrease)—Investor Shares |
| (24,058 | ) | (2,128 | ) | (5,091 | ) | (434 | ) |
Admiral Shares |
|
|
|
|
|
|
|
|
|
Issued |
| 785,715 |
| 68,307 |
| 778,945 |
| 66,603 |
|
Issued in Lieu of Cash Distributions |
| 109,806 |
| 9,538 |
| 102,548 |
| 8,774 |
|
Redeemed |
| (737,776 | ) | (64,409 | ) | (547,741 | ) | (46,991 | ) |
Net Increase (Decrease)—Admiral Shares |
| 157,745 |
| 13,436 |
| 333,752 |
| 28,386 |
|
G. Management has determined that no events or transactions occurred subsequent to November 30, 2018, that would require recognition or disclosure in these financial statements.
Report of Independent Registered Public Accounting Firm
To the Board of Trustees of Vanguard New York Tax-Free Funds and Shareholders of Vanguard New York Municipal Money Market Fund and Vanguard New York Long-Term Tax-Exempt Fund
Opinions on the Financial Statements
We have audited the accompanying statements of net assets of Vanguard New York Municipal Money Market Fund and Vanguard New York Long-Term Tax-Exempt Fund (constituting Vanguard New York Tax-Free Funds, hereafter collectively referred to as the “Funds”) as of November 30, 2018, the related statements of operations for the year ended November 30, 2018, the statements of changes in net assets for each of the two years in the period ended November 30, 2018, including the related notes, and the financial highlights for each of the five years in the period ended November 30, 2018 (collectively referred to as the “financial statements”). In our opinion, the financial statements present fairly, in all material respects, the financial position of each of the Funds as of November 30, 2018, the results of each of their operations for the year then ended, the changes in each of their net assets for each of the two years in the period ended November 30, 2018 and each of the financial highlights for each of the five years in the period ended November 30, 2018 in conformity with accounting principles generally accepted in the United States of America.
Basis for Opinions
These financial statements are the responsibility of the Funds’ management. Our responsibility is to express an opinion on the Funds’ financial statements based on our audits. We are a public accounting firm registered with the Public Company Accounting Oversight Board (United States) (“PCAOB”) and are required to be independent with respect to the Funds in accordance with the U.S. federal securities laws and the applicable rules and regulations of the Securities and Exchange Commission and the PCAOB.
We conducted our audits of these financial statements in accordance with the standards of the PCAOB. Those standards require that we plan and perform the audit to obtain reasonable assurance about whether the financial statements are free of material misstatement, whether due to error or fraud.
Our audits included performing procedures to assess the risks of material misstatement of the financial statements, whether due to error or fraud, and performing procedures that respond to those risks. Such procedures included examining, on a test basis, evidence regarding the amounts and disclosures in the financial statements. Our audits also included evaluating the accounting principles used and significant estimates made by management, as well as evaluating the overall presentation of the financial statements. Our procedures included confirmation of securities owned as of November 30, 2018 by correspondence with the custodian and brokers; when replies were not received from brokers, we performed other auditing procedures. We believe that our audits provide a reasonable basis for our opinions.
/s/PricewaterhouseCoopers LLP
Philadelphia, Pennsylvania
January 17, 2019
We have served as the auditor of one or more investment companies in The Vanguard Group of Funds since 1975.
Special 2018 tax information (unaudited) for Vanguard New York Tax-Exempt Funds
This information for the fiscal year ended November 30, 2018, is included pursuant to provisions of the Internal Revenue Code.
The Long-Term Tax-Exempt Fund distributed $22,181,000 as capital gain dividends (20% rate gain distributions) to shareholders during the fiscal year.
For nonresident alien shareholders, 100% of short-term capital gain dividends distributed by the fund are qualified short-term capital gains.
Each fund designates 100% of its income dividends as exempt-interest dividends.
BLOOMBERG is a trademark and service mark of Bloomberg Finance L.P. BARCLAYS is a trademark and service mark of Barclays Bank Plc, used under license. Bloomberg Finance L.P. and its affiliates, including Bloomberg Index Services Limited (BISL) (collectively, Bloomberg), or Bloomberg’s licensors, own all proprietary rights in the Bloomberg Barclays NY Municipal Bond Index (Index or Bloomberg Barclays Index).
Neither Barclays Bank Plc, Barclays Capital Inc., or any affiliate (collectively Barclays) or Bloomberg is the issuer or producer of the New York Long-Term Tax-Exempt Fund and neither Bloomberg nor Barclays has any responsibilities, obligations or duties to investors in the New York Long-Term Tax-Exempt Fund. The Index is licensed for use by The Vanguard Group, Inc. (Vanguard) as the sponsor of the New York Long-Term Tax-Exempt Fund. Bloomberg and Barclays’ only relationship with Vanguard in respect of the Index is the licensing of the Index, which is determined, composed and calculated by BISL, or any successor thereto, without regard to the Issuer or the New York Long-Term Tax-Exempt Fund or the owners of the New York Long-Term Tax-Exempt Fund.
Additionally, Vanguard may for itself execute transaction(s) with Barclays in or relating to the Index in connection with the New York Long-Term Tax-Exempt Fund. Investors acquire the New York Long-Term Tax-Exempt Fund from Vanguard and investors neither acquire any interest in the Index nor enter into any relationship of any kind whatsoever with Bloomberg or Barclays upon making an investment in the New York Long-Term Tax-Exempt Fund. The New York Long-Term Tax-Exempt Fund is not sponsored, endorsed, sold or promoted by Bloomberg or Barclays. Neither Bloomberg nor Barclays makes any representation or warranty, express or implied regarding the advisability of investing in the New York Long-Term Tax-Exempt Fund or the advisability of investing in securities generally or the ability of the Index to track corresponding or relative market performance. Neither Bloomberg nor Barclays has passed on the legality or suitability of the New York Long-Term Tax-Exempt Fund with respect to any person or entity. Neither Bloomberg nor Barclays is responsible for and has not participated in the determination of the timing of, prices at, or quantities of the New York Long-Term Tax-Exempt Fund to be issued. Neither Bloomberg nor Barclays has any obligation to take the needs of the Issuer or the owners of the New York Long-Term Tax-Exempt Fund or any other third party into consideration in determining, composing or calculating the Index. Neither Bloomberg nor Barclays has any obligation or liability in connection with administration, marketing or trading of the New York Long-Term Tax-Exempt Fund.
The licensing agreement between Bloomberg and Barclays is solely for the benefit of Bloomberg and Barclays and not for the benefit of the owners of the New York Long-Term Tax-Exempt Fund, investors or other third parties. In addition, the licensing agreement between Vanguard and Bloomberg is solely for the benefit of Vanguard and Bloomberg and not for the benefit of the owners of the New York Long-Term Tax-Exempt Fund, investors or other third parties.
NEITHER BLOOMBERG NOR BARCLAYS SHALL HAVE ANY LIABILITY TO THE ISSUER, INVESTORS OR TO OTHER THIRD PARTIES FOR THE QUALITY, ACCURACY AND/OR COMPLETENESS OF THE BLOOMBERG BARCLAYS INDEX OR ANY DATA INCLUDED THEREIN OR FOR INTERRUPTIONS IN THE DELIVERY OF THE BLOOMBERG BARCLAYS INDEX. NEITHER BLOOMBERG NOR BARCLAYS MAKES ANY WARRANTY, EXPRESS OR IMPLIED, AS TO RESULTS TO BE OBTAINED BY THE ISSUER, THE INVESTORS OR ANY OTHER PERSON OR ENTITY FROM THE USE OF THE BLOOMBERG BARCLAYS INDEX OR ANY DATA INCLUDED THEREIN. NEITHER BLOOMBERG NOR BARCLAYS MAKES ANY EXPRESS OR IMPLIED WARRANTIES, AND EACH HEREBY EXPRESSLY DISCLAIMS ALL WARRANTIES OF MERCHANTABILITY OR FITNESS FOR A PARTICULAR PURPOSE OR USE WITH RESPECT TO THE BLOOMBERG BARCLAYS INDEX OR ANY DATA INCLUDED THEREIN. BLOOMBERG RESERVES THE RIGHT TO CHANGE THE METHODS OF CALCULATION OR PUBLICATION, OR TO CEASE THE CALCULATION OR PUBLICATION OF THE BLOOMBERG BARCLAYS INDEX, AND NEITHER BLOOMBERG NOR BARCLAYS SHALL BE LIABLE FOR ANY MISCALCULATION OF OR ANY INCORRECT, DELAYED OR INTERRUPTED PUBLICATION WITH RESPECT TO ANY OF THE BLOOMBERG BARCLAYS INDEX. NEITHER BLOOMBERG NOR BARCLAYS SHALL BE LIABLE FOR ANY DAMAGES, INCLUDING, WITHOUT LIMITATION, ANY SPECIAL, INDIRECT OR CONSEQUENTIAL DAMAGES, OR ANY LOST PROFITS AND EVEN IF ADVISED OF THE POSSIBILITY OF SUCH, RESULTING FROM THE USE OF THE BLOOMBERG BARCLAYS INDEX OR ANY DATA INCLUDED THEREIN OR WITH RESPECT TO THE NEW YORK LONG-TERM TAX-EXEMPT FUND.
None of the information supplied by Bloomberg or Barclays and used in this publication may be reproduced in any manner without the prior written permission of both Bloomberg and Barclays Capital, the investment banking division of Barclays Bank Plc. Barclays Bank Plc is registered in England No. 1026167. Registered office 1 Churchill Place London E14 5HP.
© 2019 Bloomberg. Used with Permission.
Source: Bloomberg Index Services Limited. Copyright 2019, Bloomberg. All rights reserved.
This page intentionally left blank.
This page intentionally left blank.
This page intentionally left blank.
This page intentionally left blank.
The People Who Govern Your Fund
The trustees of your mutual fund are there to see that the fund is operated and managed in your best interests since, as a shareholder, you are a part owner of the fund. Your fund’s trustees also serve on the board of directors of The Vanguard Group, Inc., which is owned by the Vanguard funds and provides services to them.
A majority of Vanguard’s board members are independent, meaning that they have no affiliation with Vanguard or the funds they oversee, apart from the sizable personal investments they have made as private individuals. The independent board members have distinguished backgrounds in business, academia, and public service. Each of the trustees and executive officers oversees 212 Vanguard funds.
Information for each trustee and executive officer of the fund appears below. The mailing address of the trustees and officers is P.O. Box 876, Valley Forge, PA 19482. More information about the trustees is in the Statement of Additional Information, which can be obtained, without charge, by contacting Vanguard at 800-662-7447, or online at vanguard.com.
Interested Trustees1
F. William McNabb III
Born in 1957. Trustee since July 2009. Principal occupation(s) during the past five years and other experience: chairman of the board (January 2010–present) of Vanguard and of each of the investment companies served by Vanguard, trustee (2009–present) of each of the investment companies served by Vanguard, and director (2008–present) of Vanguard. Chief executive officer and president (2008–2017) of Vanguard and each of the investment companies served by Vanguard, managing director (1995–2008) of Vanguard, and director (1997–2018) of Vanguard Marketing Corporation. Director (2018–present) of UnitedHealth Group.
Mortimer J. Buckley
Born in 1969. Trustee since January 2018. Principal occupation(s) during the past five years and other experience: chief executive officer (January 2018–present) of Vanguard; chief executive officer, president, and trustee (January 2018–present) of each of the investment companies served by Vanguard; president and director (2017–present) of Vanguard; and president (February 2018–present) of Vanguard Marketing Corporation. Chief investment officer (2013–2017), managing director (2002–2017), head of the Retail Investor Group (2006–2012), and chief information officer (2001–2006) of Vanguard. Chairman of the board (2011–2017) of the Children’s Hospital of Philadelphia.
Independent Trustees
Emerson U. Fullwood
Born in 1948. Trustee since January 2008. Principal occupation(s) during the past five years and other experience: executive chief staff and marketing officer for North America and corporate vice president (retired 2008) of Xerox Corporation (document management products and services). Former president of the Worldwide Channels Group, Latin America, and Worldwide Customer Service and executive chief staff officer of Developing Markets of Xerox. Executive in residence and 2009–2010 Distinguished Minett Professor at the Rochester Institute of Technology. Lead director of SPX FLOW, Inc. (multi-industry manufacturing). Director of the University of Rochester Medical Center, the Monroe Community College Foundation, the United Way of Rochester, North Carolina A&T University, and Roberts Wesleyan College. Trustee of the University of Rochester.
Amy Gutmann
Born in 1949. Trustee since June 2006. Principal occupation(s) during the past five years and other experience: president (2004–present) of the University of Pennsylvania. Christopher H. Browne Distinguished Professor of Political Science, School of Arts and Sciences, and professor of communication, Annenberg School for Communication, with secondary faculty appointments in the Department of Philosophy, School of Arts and Sciences, and at the Graduate School of Education, University of Pennsylvania. Trustee of the National Constitution Center.
1 Mr. McNabb and Mr. Buckley are considered “interested persons,” as defined in the Investment Company Act of 1940, because they are officers of the Vanguard funds.
JoAnn Heffernan Heisen
Born in 1950. Trustee since July 1998. Principal occupation(s) during the past five years and other experience: corporate vice president of Johnson & Johnson (pharmaceuticals/medical devices/consumer products) and member of its executive committee (1997–2008). Chief global diversity officer (retired 2008), vice president and chief information officer (1997–2006), controller (1995–1997), treasurer (1991–1995), and assistant treasurer (1989–1991) of Johnson & Johnson. Director of Skytop Lodge Corporation (hotels) and the Robert Wood Johnson Foundation. Member of the advisory board of the Institute for Women’s Leadership at Rutgers University.
F. Joseph Loughrey
Born in 1949. Trustee since October 2009. Principal occupation(s) during the past five years and other experience: president and chief operating officer (retired 2009) and vice chairman of the board (2008–2009) of Cummins Inc. (industrial machinery). Chairman of the board of Hillenbrand, Inc. (specialized consumer services), Oxfam America, and the Lumina Foundation for Education. Director of the V Foundation for Cancer Research. Member of the advisory council for the College of Arts and Letters and chair of the advisory board to the Kellogg Institute for International Studies, both at the University of Notre Dame.
Mark Loughridge
Born in 1953. Trustee since March 2012. Principal occupation(s) during the past five years and other experience: senior vice president and chief financial officer (retired 2013) of IBM (information technology services). Fiduciary member of IBM’s Retirement Plan Committee (2004–2013), senior vice president and general manager (2002–2004) of IBM Global Financing, vice president and controller (1998–2002) of IBM, and a variety of other prior management roles at IBM. Member of the Council on Chicago Booth.
Scott C. Malpass
Born in 1962. Trustee since March 2012. Principal occupation(s) during the past five years and other experience: chief investment officer (1989–present) and vice president (1996–present) of the University of Notre Dame. Assistant professor of finance at the Mendoza College of Business, University of Notre Dame, and member of the Notre Dame 403(b) Investment Committee. Chairman of the board of TIFF Advisory Services, Inc. Member of the board of Catholic Investment Services, Inc. (investment advisors), the board of advisors for Spruceview Capital Partners, and the board of superintendence of the Institute for the Works of Religion.
Deanna Mulligan
Born in 1963. Trustee since January 2018. Principal occupation(s) during the past five years and other experience: president (2010–present) and chief executive officer (2011–present) of The Guardian Life Insurance Company of America. Chief operating officer (2010–2011) and executive vice president (2008–2010) of Individual Life and Disability of The Guardian Life Insurance Company of America. Member of the board of The Guardian Life Insurance Company of America, the American Council of Life Insurers, the Partnership for New York City (business leadership), and the Committee Encouraging Corporate Philanthropy. Trustee of the Economic Club of New York and the Bruce Museum (arts and science). Member of the Advisory Council for the Stanford Graduate School of Business.
André F. Perold
Born in 1952. Trustee since December 2004. Principal occupation(s) during the past five years and other experience: George Gund Professor of Finance and Banking, Emeritus at the Harvard Business School (retired 2011). Chief investment officer and co-managing partner of HighVista Strategies LLC (private investment firm). Overseer of the Museum of Fine Arts Boston.
Sarah Bloom Raskin
Born in 1961. Trustee since January 2018. Principal occupation(s) during the past five years and other experience: deputy secretary (2014–2017) of the United States Department of the Treasury. Governor (2010–2014) of the Federal Reserve Board. Commissioner (2007–2010) of financial regulation for the State of Maryland. Member of the board of directors (2012–2014) of Neighborhood Reinvestment Corporation. Director of i(x) Investments, LLC.
Peter F. Volanakis
Born in 1955. Trustee since July 2009. Principal occupation(s) during the past five years and other experience: president and chief operating officer (retired 2010) of Corning Incorporated (communications equipment) and director of Corning Incorporated (2000–2010) and Dow Corning (2001–2010). Director (2012) of SPX Corporation (multi-industry manufacturing). Overseer of the Amos Tuck School of Business Administration, Dartmouth College (2001–2013). Chairman of the board of trustees of Colby-Sawyer College. Member of the Board of Hypertherm Inc. (industrial cutting systems, software, and consumables).
Executive Officers
Glenn Booraem
Born in 1967. Principal occupation(s) during the past five years and other experience: principal of Vanguard. Investment stewardship officer (2017–present), treasurer (2015–2017), controller (2010–2015), and assistant controller (2001–2010) of each of the investment companies served by Vanguard.
Christine M. Buchanan
Born in 1970. Principal occupation(s) during the past five years and other experience: principal of Vanguard and global head of Fund Administration at Vanguard. Treasurer (2017–present) of each of the investment companies served by Vanguard. Partner (2005–2017) at KPMG LLP (audit, tax, and advisory services).
Brian Dvorak
Born in 1973. Principal occupation(s) during the past five years and other experience: principal of Vanguard. Chief compliance officer (2017–present) of Vanguard and each of the investment companies served by Vanguard. Assistant vice president (2017–present) of Vanguard Marketing Corporation. Vice president and director of Enterprise Risk Management (2011–2013) at Oppenheimer Funds, Inc.
Thomas J. Higgins
Born in 1957. Principal occupation(s) during the past five years and other experience: principal of Vanguard. Chief financial officer (2008–present) and treasurer (1998–2008) of each of the investment companies served by Vanguard.
Peter Mahoney
Born in 1974. Principal occupation(s) during the past five years and other experience: principal of Vanguard. Controller (2015–present) of each of the investment companies served by Vanguard. Head of International Fund Services (2008–2014) at Vanguard.
Anne E. Robinson
Born in 1970. Principal occupation(s) during the past five years and other experience: general counsel (2016–present) of Vanguard. Secretary (2016–present) of Vanguard and of each of the investment companies served by Vanguard. Managing director (2016–present) of Vanguard. Director and senior vice president (2016–2018) of Vanguard Marketing Corporation. Managing director and general counsel of Global Cards and Consumer Services (2014–2016) at Citigroup. Counsel (2003–2014) at American Express.
Michael Rollings
Born in 1963. Principal occupation(s) during the past five years and other experience: finance director (2017–present) and treasurer (2017) of each of the investment companies served by Vanguard. Managing director (2016–present) of Vanguard. Chief financial officer (2016–present) of Vanguard. Director (2016–present) of Vanguard Marketing Corporation. Executive vice president and chief financial officer (2006–2016) of MassMutual Financial Group.
Vanguard Senior Management Team
Joseph Brennan | Chris D. McIsaac |
Mortimer J. Buckley | James M. Norris |
Gregory Davis | Thomas M. Rampulla |
John James | Karin A. Risi |
Martha G. King | Anne E. Robinson |
John T. Marcante | Michael Rollings |
Chairman Emeritus and Senior Advisor
John J. Brennan
Chairman, 1996–2009
Chief Executive Officer and President, 1996–2008
Founder
John C. Bogle
Chairman and Chief Executive Officer, 1974–1996
|
|
|
|
| P.O. Box 2600 |
| Valley Forge, PA 19482-2600 |

Connect with Vanguard® > vanguard.com
Fund Information > 800-662-7447
Direct Investor Account Services > 800-662-2739
Institutional Investor Services > 800-523-1036
Text Telephone for People
Who Are Deaf or Hard of Hearing > 800-749-7273
This material may be used in conjunction with the offering of shares of any Vanguard fund only if preceded or accompanied by the fund’s current prospectus.
All comparative mutual fund data are from Lipper, a Thomson Reuters Company, or Morningstar, Inc., unless otherwise noted.
You can obtain a free copy of Vanguard’s proxy voting guidelines by visiting vanguard.com/proxyreporting or by calling Vanguard at 800-662-2739. The guidelines are also available from the SEC’s website, sec.gov. In addition, you may obtain a free report on how your fund voted the proxies for securities it owned during the 12 months ended June 30. To get the report, visit either vanguard.com/proxyreporting or sec.gov.
You can review information about your fund on the SEC’s website, and you can receive copies of this information, for a fee, by sending a request via email addressed to publicinfo@sec.gov.
CFA® is a registered trademark owned by CFA Institute.
| © 2019 The Vanguard Group, Inc. |
| All rights reserved. |
| Vanguard Marketing Corporation, Distributor. |
|
|
| Q760 012019 |
Item 2: Code of Ethics. The Registrant has adopted a code of ethics that applies to the Registrant’s principal executive officer, principal financial officer, principal accounting officer or controller or persons performing similar functions. The Code of Ethics was amended during the reporting period covered by this report to make certain technical, non-material changes.
Item 3: Audit Committee Financial Expert. All members of the Audit Committee have been determined by the Registrant’s Board of Trustees to be Audit Committee Financial Experts and to be independent: JoAnn Heffernan Heisen, F. Joseph Loughrey, Mark Loughridge, Sarah Bloom Raskin, and Peter F. Volanakis.
Item 4: Principal Accountant Fees and Services.
(a) Audit Fees.
Audit Fees of the Registrant.
Fiscal Year Ended November 30, 2018: $64,000
Fiscal Year Ended November 30, 2017: $66,000
Aggregate Audit Fees of Registered Investment Companies in the Vanguard Group.
Fiscal Year Ended November 30, 2018: $9,734,277
Fiscal Year Ended November 30, 2017: $8,424,459
Includes fees billed in connection with audits of the Registrant, other registered investment companies in the Vanguard complex, The Vanguard Group, Inc. and Vanguard Marketing Corporation.
(b) Audit-Related Fees.
Fiscal Year Ended November 30, 2018: $5,581,336
Fiscal Year Ended November 30, 2017: $3,194,093
Includes fees billed in connection with assurance and related services provided to the Registrant, other registered investment companies in the Vanguard complex, The Vanguard Group, Inc., and Vanguard Marketing Corporation.
(c) Tax Fees.
Fiscal Year Ended November 30, 2018: $347,985
Fiscal Year Ended November 30, 2017: $274,313
Includes fees billed in connection with tax compliance, planning, and advice services provided to the Registrant, other registered investment companies in the Vanguard complex, The Vanguard Group, Inc., and Vanguard Marketing Corporation.
(d) All Other Fees.
Fiscal Year Ended November 30, 2018: $0
Fiscal Year Ended November 30, 2017: $0
Includes fees billed for services related to tax reported information provided to the Registrant, other registered investment companies in the Vanguard complex, The Vanguard Group, Inc., and Vanguard Marketing Corporation.
(e) (1) Pre-Approval Policies. The policy of the Registrant’s Audit Committee is to consider and, if appropriate, approve before the principal accountant is engaged for such services, all specific audit and non-audit services provided to: the Registrant, other registered investment companies in the Vanguard complex, The Vanguard Group, Inc., and entities controlled by The Vanguard Group, Inc. that provide ongoing services to the Registrant. In making a determination, the Audit Committee considers whether the services are consistent with maintaining the principal accountant’s independence.
In the event of a contingency situation in which the principal accountant is needed to provide services in between scheduled Audit Committee meetings, the Chairman of the Audit Committee would be called on to consider and, if appropriate, pre-approve audit or permitted non-audit services in an amount sufficient to complete services through the next Audit Committee meeting, and to determine if such services would be consistent with maintaining the accountant’s independence. At the next scheduled Audit Committee meeting, services and fees would be presented to the Audit Committee for formal consideration, and, if appropriate, approval by the entire Audit Committee. The Audit Committee would again consider whether such services and fees are consistent with maintaining the principal accountant’s independence.
The Registrant’s Audit Committee is informed at least annually of all audit and non-audit services provided by the principal accountant to the Vanguard complex, whether such services are provided to: the Registrant, other registered investment companies in the Vanguard complex, The Vanguard Group, Inc., or other entities controlled by The Vanguard Group, Inc. that provide ongoing services to the Registrant.
(2) No percentage of the principal accountant’s fees or services were approved pursuant to the waiver provision of paragraph (c)(7)(i)(C) of Rule 2-01 of Regulation S-X.
(f) For the most recent fiscal year, over 50% of the hours worked under the principal accountant’s engagement were not performed by persons other than full-time, permanent employees of the principal accountant.
(g) Aggregate Non-Audit Fees.
Fiscal Year Ended November 30, 2018: $347,985
Fiscal Year Ended November 30, 2017: $274,313
Includes fees billed for non-audit services provided to the Registrant, other registered investment companies in the Vanguard complex, The Vanguard Group, Inc., and Vanguard Marketing Corporation.
(h) For the most recent fiscal year, the Audit Committee has determined that the provision of all non-audit services was consistent with maintaining the principal accountant’s independence.
Item 5: Audit Committee of Listed Registrants.
The Registrant is a listed issuer as defined in rule 10A-3 under the Securities Exchange Act of 1934 (“Exchange Act”). The Registrant has a separately-designated standing audit committee established in accordance with Section 3(a)(58)(A) of the Exchange Act. The Registrant’s audit committee members are: JoAnn Heffernan Heisen, F. Joseph Loughrey, Mark Loughridge, Sarah Bloom Raskin, and Peter F. Volanakis.
Item 6: Investments.
Not Applicable.
Item 7: Disclosure of Proxy Voting Policies and Procedures for Closed-End Management Investment Companies.
Not Applicable.
Item 8: Portfolio Managers of Closed-End Management Investment Companies.
Not Applicable.
Item 9: Purchase of Equity Securities by Closed-End Management Investment Company and Affiliated Purchasers.
Not Applicable.
Item 10: Submission of Matters to a Vote of Security Holders.
Not Applicable.
Item 11: Controls and Procedures.
(a) Disclosure Controls and Procedures. The Principal Executive and Financial Officers concluded that the Registrant’s Disclosure Controls and Procedures are effective based on their evaluation of the Disclosure Controls and Procedures as of a date within 90 days of the filing date of this report.
(b) Internal Control Over Financial Reporting. There were no significant changes in Registrant’s Internal Control Over Financial Reporting or in other factors that could significantly affect this control subsequent to the date of the evaluation, including any corrective actions with regard to significant deficiencies and material weaknesses.
Item 12: Disclosure of Securities Lending Activities for Closed-End Management Investment Companies.
Not Applicable.
Item 13: Exhibits.
(a) Code of Ethics.
(b) Certifications.
Pursuant to the requirements of the Securities Exchange Act of 1934 and the Investment Company Act of 1940, the registrant has duly caused this report to be signed on its behalf by the undersigned, thereunto duly authorized.
| VANGUARD NEW YORK TAX-FREE FUNDS | |
|
| |
BY: | /s/ MORTIMER J. BUCKLEY* |
|
|
|
|
| MORTIMER J. BUCKLEY |
|
| CHIEF EXECUTIVE OFFICER |
|
Date: January 22, 2019
Pursuant to the requirements of the Securities Exchange Act of 1934 and the Investment Company Act of 1940, this report has been signed below by the following persons on behalf of the registrant and in the capacities and on the dates indicated.
| VANGUARD NEW YORK TAX-FREE FUNDS | |
|
| |
BY: | /s/ MORTIMER J. BUCKLEY * |
|
|
|
|
| MORTIMER J. BUCKLEY |
|
| CHIEF EXECUTIVE OFFICER |
|
| ||
Date: January 22, 2019 | ||
| ||
| VANGUARD NEW YORK TAX-FREE FUNDS | |
|
| |
BY: | /s/ THOMAS J. HIGGINS* |
|
|
|
|
| THOMAS J. HIGGINS |
|
| CHIEF FINANCIAL OFFICER |
|
|
| |
Date: January 22, 2019 |
| |
* By: /s/ Anne E. Robinson
Anne E. Robinson, pursuant to a Power of Attorney filed on January 18, 2018 see file Number 33-32216, Incorporated by Reference.