UNITED STATES
SECURITIES AND EXCHANGE COMMISSION
Washington, D.C. 20549
FORM N-CSR
CERTIFIED SHAREHOLDER REPORT
OF
REGISTERED MANAGEMENT INVESTMENT COMPANIES
Investment Company Act file number: 811-4571
Name of Registrant: Vanguard Pennsylvania Tax-Free Funds
Address of Registrant:
P.O. Box 2600
Valley Forge, PA 19482
Name and address of agent for service:
Heidi Stam, Esquire
P.O. Box 876
Valley Forge, PA 19482
Registrant’s telephone number, including area code: (610) 669-1000
Date of fiscal year end: November 30
Date of reporting period: December 1, 2011 – May 31, 2012
Item 1: Reports to Shareholders
 |
| |
| Semiannual Report | May 31, 2012 |
| |
| Vanguard Pennsylvania Tax-Exempt Funds |
| Vanguard Pennsylvania Tax-Exempt Money Market Fund |
| Vanguard Pennsylvania Long-Term Tax-Exempt Fund |
> Investor demand for municipal bonds has been strong since early 2011.
> For the six months ended May 31, 2012, Vanguard Pennsylvania Long-Term Tax-Exempt Fund returned 5.75% for Investor Shares and 5.80% for Admiral Shares, putting the fund in line with its benchmark but behind the average return of its peers.
> Vanguard Pennsylvania Tax-Exempt Money Market Fund returned 0.02%, reflecting the Federal Reserve’s policy of low interest rates.
| |
| Contents | |
| Your Fund’s Total Returns. | 1 |
| Chairman’s Letter. | 2 |
| Advisor’s Report. | 7 |
| Pennsylvania Tax-Exempt Money Market Fund. | 10 |
| Pennsylvania Long-Term Tax-Exempt Fund. | 26 |
| About Your Fund’s Expenses. | 54 |
| Trustees Approve Advisory Arrangement. | 56 |
| Glossary. | 57 |
Please note: The opinions expressed in this report are just that—informed opinions. They should not be considered promises or advice. Also, please keep in mind that the information and opinions cover the period through the date on the front of this report. Of course, the risks of investing in your fund are spelled out in the prospectus.
See the Glossary for definitions of investment terms used in this report.
About the cover: Vanguard was named for the HMS Vanguard, flagship of British Admiral Horatio Nelson. A ship—whose performance and safety depend on the work of all hands—has served as a fitting metaphor for the Vanguard crew as we strive to help clients reach their financial goals.
Your Fund’s Total Returns
| | | | | |
| Six Months Ended May 31, 2012 | | | | | |
| | | Taxable- | | | |
| | SEC | Equivalent | Income | Capital | Total |
| | Yields | Yields | Returns | Returns | Returns |
| Vanguard Pennsylvania Tax-Exempt Money | | | | | |
| Market Fund | 0.04% | 0.06% | 0.02% | 0.00% | 0.02% |
| Pennsylvania Tax-Exempt Money Market Funds | | | | | |
| Average | | | | | 0.01 |
| Pennsylvania Tax-Exempt Money Market Funds Average: Derived from data provided by Lipper Inc. |
| Vanguard Pennsylvania Long-Term Tax-Exempt Fund |
| Investor Shares | 2.34% | 3.71% | 1.91% | 3.84% | 5.75% |
| Admiral™ Shares | 2.42 | 3.84 | 1.96 | 3.84 | 5.80 |
| Barclays PA Municipal Bond Index | | | | | 5.80 |
| Pennsylvania Municipal Debt Funds Average | | | | | 6.70 |
Pennsylvania Municipal Debt Funds Average: Derived from data provided by Lipper Inc.
7-day SEC yield for the Pennsylvania Tax-Exempt Money Market Fund; 30-day SEC yield for the Pennsylvania Long-Term Tax-Exempt Fund.
The calculation of taxable-equivalent yield assumes a typical itemized tax return and is based on the maximum federal tax rate of 35% and
the maximum income tax rate for the state. Local taxes were not considered. Please see the prospectus for a detailed explanation of the
calculation.
Admiral Shares carry lower expenses and are available to investors who meet certain account-balance requirements.
| | | | |
| Your Fund’s Performance at a Glance | | | | |
| November 30, 2011, Through May 31, 2012 | | | | |
| | | | Distributions Per Share |
| | Starting | Ending | Income | Capital |
| | Share Price | Share Price | Dividends | Gains |
| Vanguard Pennsylvania Tax-Exempt Money | | | | |
| Market Fund | $1.00 | $1.00 | $0.000 | $0.000 |
| Vanguard Pennsylvania Long-Term Tax-Exempt | | | | |
| Fund | | | | |
| Investor Shares | $11.20 | $11.63 | $0.211 | $0.000 |
| Admiral Shares | 11.20 | 11.63 | 0.216 | 0.000 |
1

Chairman’s Letter
Dear Shareholder,
The Pennsylvania municipal bond market turned in a strong performance during the six months ended May 31, 2012, outpacing the broad U.S. taxable bond market by more than 2 percentage points even as the fiscal situation of the state and local governments remained challenging.
Vanguard Pennsylvania Long-Term Tax-Exempt Fund returned 5.75% for Investor Shares and 5.80% for Admiral Shares. While the fund kept pace with the 5.80% return of its benchmark index, its focus on higher-quality bonds led it to underperform its peer group’s average return of 6.70%.
Because of the Federal Reserve’s efforts to keep short-term interest rates anchored near zero, returns were far more modest for shorter-term securities, especially money market instruments. Vanguard Pennsylvania Tax-Exempt Money Market Fund returned 0.02%, compared with the 0.01% average return of its state peer group for the half-year.
Lower-quality and longer-maturity bonds performed best in the period, as many investors were willing to take on greater credit and interest rate risk for more potential yield. As a result of the solid demand for munis, capital appreciation accounted for about two-thirds of the Long-Term Fund’s total return.
2
As bond prices rose, the fund’s 30-day SEC yield for Investor Shares fell to 2.34% from 2.98% over the half year. (Bond yields and prices move in opposite directions.) The Money Market Fund’s 7-day SEC yield of 0.04% on May 31 was a little higher than the 0.01% yield of six months earlier.
Please note that in March we replaced the benchmark index for the Pennsylvania Long-Term Tax-Exempt Fund. The new index is a better gauge for the fund because, unlike the prior benchmark, it is limited to tax-exempt bonds from Pennsylvania issuers. There are no changes to the fund’s objective, investment strategies, or policies.
Both funds are permitted to invest in securities whose income is subject to the alternative minimum tax (AMT). As of May 31, the Long-Term Fund owned no securities that would generate income distributions subject to the AMT, but the Money Market Fund did.
Bonds benefited from investors seeking safety and yields
Pennsylvania municipal bonds’ return of almost 6% was well ahead of the broad U.S. taxable bond market’s return of about 3.5% for the half-year.
| | | |
| Market Barometer | | | |
| | | | Total Returns |
| | | Periods Ended May 31, 2012 |
| | Six | One | Five Years |
| | Months | Year | (Annualized) |
| Bonds | | | |
| Barclays U.S. Aggregate Bond Index (Broad taxable | | | |
| market) | 3.46% | 7.12% | 6.72% |
| Barclays Municipal Bond Index (Broad tax-exempt market) | 5.75 | 10.40 | 5.87 |
| Citigroup Three-Month U.S. Treasury Bill Index | 0.02 | 0.04 | 0.95 |
| |
| Stocks | | | |
| Russell 1000 Index (Large-caps) | 6.23% | -1.23% | -0.75% |
| Russell 2000 Index (Small-caps) | 4.06 | -8.88 | -0.73 |
| Dow Jones U.S. Total Stock Market Index | 6.06 | -1.88 | -0.45 |
| MSCI All Country World Index ex USA (International) | -4.04 | -20.49 | -5.55 |
| |
| CPI | | | |
| Consumer Price Index | 1.58% | 1.70% | 2.02% |
3
The yields of U.S. Treasury bonds, which flirted with higher levels early in the period, reached record lows by the end of the six months as some investors fled to the perceived safety of government-issued securities, helping them post a solid return of just under 3%. At the same time, corporate bonds, which found favor with investors seeking higher yields, returned well over 6%.
U.S. stocks significantly outpaced their international counterparts
The six months ended May 31 were marked by volatility in a pattern that has become all too familiar. At the start of the period, global stock markets rose as the U.S. economy seemed to be strengthening and Europe experienced a temporary lull in its debt crisis.
Stocks later reversed course amid news of dwindling economic growth at home and trouble abroad as Europe’s debt drama once again intensified, causing renewed concern among investors. Despite erasing some earlier gains, U.S. stocks returned more than 6% for the six months.
International stocks didn’t fare as well, returning about –4% for the half-year. European companies were the worst performers. Concerns focused on Greece and Spain, but healthier markets throughout Europe felt the effects of resurgent investor worries about indebtedness. Emerging markets and the developed markets of the Pacific region were also hurt by signs of slowing growth.
| | | |
| Expense Ratios | | | |
| Your Fund Compared With Its Peer Group | | | |
| | Investor | Admiral | Peer Group |
| | Shares | Shares | Average |
| Pennsylvania Tax-Exempt Money | | | |
| Market Fund | 0.17% | — | 0.33% |
| Pennsylvania Long-Term Tax-Exempt | | | |
| Fund | 0.20 | 0.12% | 1.06 |
The fund expense ratios shown are from the prospectus dated March 28, 2012, and represent estimated costs for the current fiscal year. For the six months ended May 31, 2012, the funds’ annualized expense ratios were: for the Pennsylvania Tax-Exempt Money Market Fund, 0.14%; and for the Pennsylvania Long-Term Tax-Exempt Fund, 0.20% for Investor Shares and 0.12% for Admiral Shares. The six-month expense ratio for the Pennsylvania Tax-Exempt Money Market Fund reflects a temporary reduction in operating expenses (described in Note B of the Notes to Financial Statements). Before this reduction, the fund’s annualized six-month expense ratio was 0.16%. Peer-group expense ratios are derived from data provided by Lipper Inc. and capture information through year-end 2011.
Peer groups: For the Pennsylvania Tax-Exempt Money Market Fund, Pennsylvania Tax-Exempt Money Market Funds; for the Pennsylvania Long-Term Tax-Exempt Fund, Pennsylvania Municipal Debt Funds.
4
For municipal bonds, rising supply was matched by increased demand
The severity of the Great Recession has left the finances of many state and local governments in disarray. The sharp drop in tax revenues had these entities scrambling to make similar cuts to their expenditures, ratcheting up uncertainty in some quarters about their creditworthiness. The situation has remained strained, especially for local governments, because they depend heavily on property tax revenues. Such revenues have continued to fall, as they respond with a lag to the declines seen in property values.
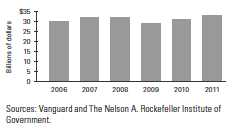
However, overall tax revenues have continued the upward, if uneven, trend that began in 2010 for most states, according to data from The Nelson A. Rockefeller Institute of Government. During the past six months, the U.S. economy inched forward, the employment situation showed some improvement, and consumer spending ticked up, all of which helped drive tax revenues higher for many states, including the Keystone State (see the accompanying chart).
At the same time, Pennsylvania state and local governments have shied away from initiating significant new spending projects. Although issuance of tax-exempt municipal bonds increased significantly from a year earlier, much of it was aimed at refinancing existing debt at lower rates of interest. States and municipalities benefit from refinancing because it reduces their debt servicing costs.
While overall supply rose in the Pennsylvania municipal bond market, so did demand. The hunt for yield spurred many investors to move into bonds with longer maturities (despite the potential for sharp declines in price should interest rates rise) and lower credit ratings.
Yields—particularly for long-term issues—hit levels that made municipal bonds attractive even to unconventional investors such as banks.
The outperformance of longer-maturity bonds over shorter-term securities contributed to the Long-Term Fund��s return during this period. Demand for the higher yields offered by these bonds drove their prices up, which translated into capital appreciation for the fund.
Relative to its benchmark, the fund also gained from its exposure to essential-service bonds, such as those that finance water and sewer treatment facilities, which benefit from a consistent income stream dedicated to servicing the debt.
Pennsylvania tax revenues are recovering
5
(Their general-obligation counterparts, which depend on general tax revenues, are more affected by economic cycles.) The fund also benefited from its holdings in the health care sector, especially hospital bonds, where the fund’s advisor saw attractive returns for the level of risk involved.
On the other hand, as I mentioned earlier, the fund’s orientation toward higher-quality securities held back its performance somewhat.
During the half-year, the advisor maintained its systematic and rigorous approach to assessing the credit quality of each security considered for purchase. With hundreds of issuers in this fragmented market, such fundamental credit analysis remained critical in determining where the best opportunities might be for the advisor to add value to the fund.
With yields so low for so long, what’s a bond investor to do?
Bond yields sure aren’t what they used to be. Those of some Treasuries hit all-time lows during the past six months, and municipal bond yields fell to levels not seen since the 1960s. This is unhappy news for investors who count on bond income for their spending needs.
An alternative approach to the income question is based on “total return.” With this approach, you rely not only on income from your holdings but also on cash realized from selling some of them according to a careful plan. The goal is to maintain your preferred asset mix and, thus, a more diversified and stable risk profile. An income-only spending strategy, by contrast, can lead you to tilt your asset mix away from your target in favor of bonds and narrow segments of the stock market, such as stocks with high dividend yields.
For more information on this topic, you may want to download the Vanguard research paper Spending From a Portfolio: Implications of a Total-Return Approach Versus an Income Approach for Taxable Investors. It is available at vanguard.com/ research.
Whether yields are high or low, rising or falling, we believe that holding bonds in a portfolio is always useful. They are there to help cushion volatility when, not if, more risky assets such as stocks happen to perform poorly.
As always, thank you for entrusting your assets to Vanguard.
Sincerely,

F. William McNabb III
Chairman and Chief Executive Officer
June 15, 2012
6
Advisor’s Report
For the six months ended May 31, 2012, Vanguard Pennsylvania Tax-Exempt Money Market Fund returned 0.02%. Vanguard Pennsylvania Long-Term Tax-Exempt Fund returned 5.75% for Investor Shares and 5.80% for Admiral Shares. The Long-Term Fund matched its new benchmark index, which returned 5.80%, but lagged the 6.70% average return of peer-group funds. (The move to a new benchmark is discussed in the Chairman’s Letter.)
The investment environment
The half-year saw generally declining yields in the municipal bond market. The Federal Reserve continued to anchor the shortest-term yields near zero and reiterated its view that rates would remain very low through late 2014. The most direct impact of this policy, of course, has been on
money market funds, including the Pennsylvania Tax-Exempt Money Market Fund. At the opposite end of the maturity spectrum, the Fed continued to execute a bond-buying program aimed at lowering longer-term yields. (Yields fall as demand for bonds rises, boosting prices.)
Economic concerns also contributed to the slide in yields. Investors nervous about the uneven pace of U.S. economic growth and the further unraveling of Europe’s fiscal situation fled to the perceived safety of U.S. Treasury securities and municipal bonds. Moreover, demand for municipal bonds has been robust since early 2011, when the muni market recovered from a five-month slide in prices and a wave of fund withdrawals accompanied by overblown fears of systemic defaults.
| | |
| Yields of Tax-Exempt Municipal Securities | | |
| (AAA-Rated General-Obligation Issues) | | |
| | November 30, | May 31, |
| Maturity | 2011 | 2012 |
| 2 years | 0.42% | 0.33% |
| 5 years | 1.12 | 0.75 |
| 10 years | 2.22 | 1.79 |
| 30 years | 3.84 | 3.08 |
| Source: Vanguard. |
7
Patient investors in the Pennsylvania Long-Term Tax-Exempt Fund have done well since then: From January 31, 2011, to May 31, 2012, the fund returned about 15%, compared with about 10% for taxable bonds and not quite 4% for stocks (based on the Barclays U.S. Aggregate Bond Index and the Dow Jones U.S. Total Stock Market Index).
Municipal bonds’ strong performance took place as most state and local governments continued to wrestle with finances tattered by the Great Recession, and Pennsylvania was no exception.
Fortunately, Pennsylvania’s economy appears to be recovering a bit more quickly than the nation’s, according to a gauge of current economic conditions for each state that is published by the Federal Reserve Bank of Philadelphia. The bank’s index for Pennsylvania rose by almost 8% from its low point in December 2009 to May 2012, compared with a 6% rise for the national economy. (The index combines data on jobs, manufacturing, and wages and salaries.)
Like many other issuers nationwide, Pennsylvania state and local governments are taking advantage of low interest rates to call in and replace higher-interest bonds; at the same time, they are limiting outlays for new projects. Nationally, during the six months ended May 31, about two-thirds of the $160 billion in new issues were refinancings, compared with an average of one-third over the 15 years through 2010.
Management of the funds
As the Federal Reserve’s operations at both ends of the maturity spectrum lowered yields, many muni investors grew willing to accept greater risk to obtain higher yields. Many have turned to high-yield muni bonds, exposing themselves to greater credit risk, while others have moved to longer-maturity bonds, which would respond with greater price declines should interest rates rise. It’s a phenomenon we would normally look for in the later stages of an economic recovery, when the typical pace of expansion would be stronger, state and local finances healthier, and confidence higher.
Nonetheless, the Long-Term Fund has benefited from this market environment. The demand for longer-term bonds has boosted the prices of holdings in our portfolio; we had underweighted shorter-maturity bonds and overweighted longer-maturity bonds. We have also taken advantage of the steep yield curve—that is, the wide difference between shorter-and longer-term yields that has resulted from the Fed’s policies. A steep yield curve can produce price gains as bonds move closer to their maturity.
8
In all market conditions, of course, in-depth credit analysis is an essential aspect of our process. In selecting bonds to add to or sell from our portfolios, we combine our traders’ focus on finding value with our credit analysts’ prudent views about the financial structure and economic environment of issuers. Two broad themes in the current market are an emphasis on essential-service bonds and a move away from local-government general-obligation issues, although there are always exceptions. In addition, we have focused on attractively valued issues in health care, emphasizing hospitals—one recent example was an issue from the University of Pennsylvania Health System.
Another significant driver of return during the reporting period was our holdings of zero-coupon bonds in the 10- to 20-year maturity range. Tactical adjustments to our duration position in response to the ebbs and flows of bond issuance also helped returns.
Our underweighting of lower-rated bonds did detract slightly from the fund’s returns. We have taken great care in choosing among such bonds despite investors’ heightened appetite for risk and subsequent price appreciation for these assets. Given their risk profiles, we expect to continue to underweight them.
As we have noted earlier, the Federal Reserve has tamped down short-term interest rates to an unprecedented degree, a policy that has understandably concerned shareholders in the Pennsylvania Tax-Exempt Money Market Fund. Despite the difficulties presented by near-zero yields, we have not altered our strategy of emphasizing investment in high-quality money market assets. At the same time, the low short-term rates have provided another source of debt-service savings to fiscally stressed state and local governments.
John M. Carbone, Principal, Portfolio Manager
James M. D’Arcy, Portfolio Manager
Pamela Wisehaupt Tynan, Principal, Head of Municipal Money Market Funds
Christopher W. Alwine, CFA, Principal, Head of Municipal Bond Funds
Vanguard Fixed Income Group
June 18, 2012
9
Pennsylvania Tax-Exempt Money Market Fund
Fund Profile
As of May 31, 2012
| |
| Financial Attributes | |
| Ticker Symbol | VPTXX |
| Expense Ratio1 | 0.17% |
| 7-Day SEC Yield | 0.04% |
| Average Weighted | |
| Maturity | 30 days |
| |
| Distribution by Credit Quality (% of portfolio) |
| First Tier | 100.0% |
For information about these ratings, see the Glossary entry for Credit Quality.
1 The expense ratio shown is from the prospectus dated March 28, 2012, and represents estimated costs for the current fiscal year. For the six months ended May 31, 2012, the annualized expense ratio was 0.14%, reflecting a temporary reduction in operating expenses (described in Note B of the Notes to Financial Statements). Before this reduction, the expense ratio was 0.16%.
10
Pennsylvania Tax-Exempt Money Market Fund
Performance Summary
Investment returns will fluctuate. All of the returns in this report represent past performance, which is not a guarantee of future results that may be achieved by the fund. (Current performance may be lower or higher than the performance data cited. For performance data current to the most recent month-end, visit our website at vanguard.com/performance.) The returns shown do not reflect taxes that a shareholder would pay on fund distributions. An investment in a money market fund is not insured or guaranteed by the Federal Deposit Insurance Corporation or any other government agency. Although the fund seeks to preserve the value of your investment at $1 per share, it is possible to lose money by investing in the fund. The fund’s 7-day SEC yield reflects its current earnings more closely than do the average annual returns.
| | |
| Fiscal-Year Total Returns (%): November 30, 2001, Through May 31, 2012 | |
| | | PA Tax-Exempt |
| | | Money Mkt |
| | | Funds Avg |
| Fiscal Year | Total Returns | Total Returns |
| 2002 | 1.32% | 0.98% |
| 2003 | 0.91 | 0.56 |
| 2004 | 1.05 | 0.60 |
| 2005 | 2.19 | 1.72 |
| 2006 | 3.31 | 2.85 |
| 2007 | 3.64 | 3.14 |
| 2008 | 2.42 | 1.93 |
| 2009 | 0.50 | 0.22 |
| 2010 | 0.12 | 0.00 |
| 2011 | 0.06 | 0.00 |
| 2012 | 0.02 | 0.01 |
7-day SEC yield (5/31/2012): 0.04%
Pennsylvania Tax-Exempt Money Market Funds Average: Derived from data provided by Lipper Inc.
Note: For 2012, performance data reflect the six months ended May 31, 2012.
Average Annual Total Returns: Periods Ended March 31, 2012
This table presents returns through the latest calendar quarter—rather than through the end of the fiscal period.
Securities and Exchange Commission rules require that we provide this information.
| | | | |
| | Inception | One | Five | Ten |
| | Date | Year | Years | Years |
| Pennsylvania Tax-Exempt Money | | | | |
| Market Fund | 6/13/1988 | 0.03% | 1.10% | 1.50% |
See Financial Highlights for dividend information.
11
Pennsylvania Tax-Exempt Money Market Fund
Financial Statements (unaudited)
Statement of Net Assets
As of May 31, 2012
The fund reports a complete list of its holdings in various monthly and quarterly regulatory filings. The fund publishes its holdings on a monthly basis at vanguard.com and files them with the Securities and Exchange Commission on Form N-MFP. The fund’s Form N-MFP filings become public 60 days after the relevant month-end, and may be viewed at sec.gov or via a link on the “Portfolio Holdings” page on vanguard.com. For the second and fourth fiscal quarters, the lists appear in the fund’s semiannual and annual reports to shareholders. For the first and third fiscal quarters, the fund files the lists with the SEC on Form N-Q. Shareholders can look up the fund’s Forms N-Q on the SEC’s website at sec.gov. Forms N-Q may also be reviewed and copied at the SEC’s Public Reference Room (see the back cover of this report for further information).
| | | | |
| | | | Face | Market |
| | | Maturity | Amount | Value |
| | Coupon | Date | ($000) | ($000) |
| Tax-Exempt Municipal Bonds (101.1%) | | | | |
| Pennsylvania (99.2%) | | | | |
| Allegheny County PA GO VRDO | 0.190% | 6/7/12 LOC | 14,455 | 14,455 |
| Allegheny County PA GO VRDO | 0.190% | 6/7/12 LOC | 32,290 | 32,290 |
| Allegheny County PA Higher Education Building | | | | |
| Authority University Revenue (Carnegie Mellon | | | | |
| University) VRDO | 0.170% | 6/1/12 | 80,420 | 80,420 |
| Allegheny County PA Higher Education Building | | | | |
| Authority University Revenue (Point | | | | |
| Park University) VRDO | 0.180% | 6/7/12 LOC | 15,300 | 15,300 |
| 1 Allegheny County PA Hospital Development | | | | |
| Authority Revenue (University of Pittsburgh | | | | |
| Medical Center) TOB VRDO | 0.180% | 6/7/12 | 68,595 | 68,595 |
| 1 Allegheny County PA Hospital Development | | | | |
| Authority Revenue (University of Pittsburgh | | | | |
| Medical Center) TOB VRDO | 0.180% | 6/7/12 LOC | 7,000 | 7,000 |
| Allegheny County PA Industrial Development | | | | |
| Authority Health Care Revenue (Vincentian | | | | |
| Collaborative System) VRDO | 0.180% | 6/7/12 LOC | 7,725 | 7,725 |
| Allegheny County PA Industrial Development | | | | |
| Authority Revenue (Western Pennsylvania | | | | |
| School for Blind Children) PUT | 0.500% | 7/1/12 | 6,750 | 6,750 |
| Beaver County PA Industrial Development | | | | |
| Authority Pollution Control Revenue | | | | |
| (Metropolitan Edison Co. Project) VRDO | 0.180% | 6/7/12 LOC | 10,000 | 10,000 |
| Beaver County PA Industrial Development | | | | |
| Authority Revenue (FirstEnergy Generation | | | | |
| Project) VRDO | 0.160% | 6/1/12 LOC | 20,000 | 20,000 |
| Berks County PA Industrial Development | | | | |
| Authority Revenue (Kutztown University) VRDO | 0.180% | 6/7/12 LOC | 12,485 | 12,485 |
| 2 Berks County PA Municipal Authority Revenue | | | | |
| (Reading Hospital & Medical Center Project) PUT | 0.340% | 8/2/12 | 9,900 | 9,900 |
| 1 Berks County PA Municipal Authority Revenue | | | | |
| (Reading Hospital & Medical Center Project) | | | | |
| TOB VRDO | 0.190% | 6/7/12 | 97,890 | 97,890 |
12
Pennsylvania Tax-Exempt Money Market Fund
| | | | |
| | | | Face | Market |
| | | Maturity | Amount | Value |
| | Coupon | Date | ($000) | ($000) |
| 1 Berks County PA Municipal Authority Revenue | | | | |
| (Reading Hospital & Medical Center Project) | | | | |
| TOB VRDO | 0.250% | 6/7/12 | 9,750 | 9,750 |
| Berks County PA Municipal Authority Revenue | | | | |
| (Reading Hospital & Medical Center Project) | | | | |
| VRDO | 0.180% | 6/7/12 | 9,600 | 9,600 |
| 1 Bethlehem PA Area School District GO TOB VRDO | 0.180% | 6/7/12 LOC | 8,985 | 8,985 |
| 1 BlackRock MuniYield Pennsylvania Quality Fund | | | | |
| VRDP VRDO | 0.320% | 6/7/12 LOC | 15,300 | 15,300 |
| Bucks County PA Industrial Development | | | | |
| Authority Hospital Revenue (Grand View | | | | |
| Hospital) VRDO | 0.140% | 6/7/12 LOC | 28,235 | 28,235 |
| Bucks County PA Industrial Development | | | | |
| Authority Revenue (Pennswood Village | | | | |
| Project) VRDO | 0.280% | 6/7/12 LOC | 8,320 | 8,320 |
| Butler County PA General Authority Revenue | | | | |
| (Erie School District Project) VRDO | 0.180% | 6/7/12 LOC | 2,600 | 2,600 |
| Cambria County PA Industrial Development | | | | |
| Authority Revenue (American National | | | | |
| Red Cross) VRDO | 0.170% | 6/7/12 LOC | 5,045 | 5,045 |
| 1 Central Bradford PA Progress Authority Revenue | | | | |
| (Robert Packer Hospital) TOB VRDO | 0.180% | 6/7/12 LOC | 15,995 | 15,995 |
| Chambersburg PA Authority Revenue (Wilson | | | | |
| College Project) VRDO | 0.260% | 6/7/12 LOC | 31,180 | 31,180 |
| Chester County PA Industrial Development | | | | |
| Authority Student Housing Revenue (University | | | | |
| Student Housing LLC Project) VRDO | 0.160% | 6/7/12 LOC | 25,350 | 25,350 |
| 1 Chester County PA Industrial Development | | | | |
| Authority Water Facilities Revenue | | | | |
| (Aqua Pennsylvania Inc. Project) TOB VRDO | 0.230% | 6/7/12 (13) | 15,935 | 15,935 |
| Cumberland County PA Municipal Authority | | | | |
| (Wesley Affiliated Services Inc. Obligated Group) | 7.125% | 1/1/13 (Prere.) | 1,500 | 1,574 |
| Dauphin County PA General Authority Hospital | | | | |
| Revenue (Reading Hospital & Medical Center | | | | |
| Project) VRDO | 0.170% | 6/7/12 | 4,900 | 4,900 |
| Delaware County PA Authority Hospital Revenue | | | | |
| (Crozer-Chester Medical Center Obligated | | | | |
| Group) VRDO | 0.180% | 6/7/12 LOC | 10,410 | 10,410 |
| Delaware County PA Authority Revenue | | | | |
| (Haverford College) VRDO | 0.130% | 6/7/12 | 29,545 | 29,545 |
| Delaware County PA Industrial Development | | | | |
| Authority Airport Facilities Revenue | | | | |
| (United Parcel Service Inc.) VRDO | 0.170% | 6/1/12 | 28,200 | 28,200 |
| Delaware County PA Industrial Development | | | | |
| Authority Resource Recovery Facility Revenue | | | | |
| (General Electric Capital Corp.) VRDO | 0.160% | 6/7/12 | 3,200 | 3,200 |
| Delaware County PA Industrial Development | | | | |
| Authority Resource Recovery Facility Revenue | | | | |
| (General Electric Capital Corp.) VRDO | 0.160% | 6/7/12 | 8,595 | 8,595 |
| Delaware County PA Industrial Development | | | | |
| Authority Resource Recovery Facility Revenue | | | | |
| (General Electric Capital Corp.) VRDO | 0.160% | 6/7/12 | 46,800 | 46,800 |
| Delaware County PA Industrial Development | | | | |
| Authority Resource Recovery Facility Revenue | | | | |
| (General Electric Capital Corp.) VRDO | 0.160% | 6/7/12 | 11,630 | 11,630 |
13
Pennsylvania Tax-Exempt Money Market Fund
| | | | |
| | | | Face | Market |
| | | Maturity | Amount | Value |
| | Coupon | Date | ($000) | ($000) |
| 1 Delaware County PA Industrial Development | | | | |
| Authority Revenue (Aqua Pennsylvania Inc. | | | | |
| Project) TOB VRDO | 0.230% | 6/7/12 (13) | 2,515 | 2,515 |
| Delaware County PA Industrial Development | | | | |
| Authority Revenue (Resource Recovery) VRDO | 0.160% | 6/7/12 | 1,235 | 1,235 |
| Delaware County PA Industrial Development | | | | |
| Authority Revenue (Resource Recovery) VRDO | 0.160% | 6/7/12 | 1,800 | 1,800 |
| Delaware County PA Industrial Development | | | | |
| Authority Revenue (Resource Recovery) VRDO | 0.160% | 6/7/12 | 1,000 | 1,000 |
| Delaware County PA Industrial Development | | | | |
| Authority Revenue (Resource Recovery) VRDO | 0.160% | 6/7/12 | 18,350 | 18,350 |
| Delaware County PA Industrial Development | | | | |
| Authority Revenue (Resource Recovery) VRDO | 0.160% | 6/7/12 | 4,910 | 4,910 |
| Delaware County PA Industrial Development | | | | |
| Authority Revenue (Resource Recovery) VRDO | 0.160% | 6/7/12 | 7,955 | 7,955 |
| Delaware County PA Industrial Development | | | | |
| Authority Solid Waste Revenue | | | | |
| (Scott Paper Co.) VRDO | 0.190% | 6/7/12 | 20,375 | 20,375 |
| Delaware County PA Industrial Development | | | | |
| Authority Solid Waste Revenue | | | | |
| (Scott Paper Co.) VRDO | 0.190% | 6/7/12 | 20,000 | 20,000 |
| Delaware County PA Industrial Development | | | | |
| Authority Solid Waste Revenue | | | | |
| (Scott Paper Co.) VRDO | 0.190% | 6/7/12 | 14,900 | 14,900 |
| Delaware River Port Authority Pennsylvania & | | | | |
| New Jersey Revenue VRDO | 0.150% | 6/7/12 LOC | 23,000 | 23,000 |
| Dover PA Area School District GO | 5.375% | 4/1/13 (Prere.) | 1,000 | 1,043 |
| 1 Downingtown PA Area School District | | | | |
| GO TOB VRDO | 0.180% | 6/7/12 | 8,200 | 8,200 |
| Emmaus PA General Authority Revenue VRDO | 0.170% | 6/7/12 LOC | 83,300 | 83,300 |
| Emmaus PA General Authority Revenue VRDO | 0.190% | 6/7/12 LOC | 3,700 | 3,700 |
| Emmaus PA General Authority Revenue VRDO | 0.190% | 6/7/12 LOC | 1,100 | 1,100 |
| Emmaus PA General Authority Revenue VRDO | 0.190% | 6/7/12 LOC | 1,200 | 1,200 |
| Emmaus PA General Authority Revenue VRDO | 0.190% | 6/7/12 LOC | 2,200 | 2,200 |
| Emmaus PA General Authority Revenue VRDO | 0.190% | 6/7/12 LOC | 4,800 | 4,800 |
| Emmaus PA General Authority Revenue VRDO | 0.190% | 6/7/12 LOC | 6,900 | 6,900 |
| Emmaus PA General Authority Revenue VRDO | 0.190% | 6/7/12 LOC | 4,985 | 4,985 |
| Emmaus PA General Authority Revenue VRDO | 0.190% | 6/7/12 LOC | 17,400 | 17,400 |
| Emmaus PA General Authority Revenue VRDO | 0.190% | 6/7/12 LOC | 7,000 | 7,000 |
| Emmaus PA General Authority Revenue VRDO | 0.190% | 6/7/12 LOC | 8,000 | 8,000 |
| Emmaus PA General Authority Revenue VRDO | 0.190% | 6/7/12 LOC | 15,000 | 15,000 |
| Emmaus PA General Authority Revenue VRDO | 0.190% | 6/7/12 LOC | 9,600 | 9,600 |
| Erie County PA Hospital Authority Revenue | | | | |
| (Hamot Health Foundation) VRDO | 0.170% | 6/1/12 LOC | 2,205 | 2,205 |
| Geisinger Health System Authority of | | | | |
| Pennsylvania Revenue (Penn State | | | | |
| Geisinger Health System) VRDO | 0.140% | 6/1/12 | 3,900 | 3,900 |
| Geisinger Health System Authority of | | | | |
| Pennsylvania Revenue (Penn State | | | | |
| Geisinger Health System) VRDO | 0.150% | 6/1/12 | 6,100 | 6,100 |
| 1 Geisinger Health System Authority of | | | | |
| Pennsylvania Revenue TOB VRDO | 0.180% | 6/7/12 | 3,150 | 3,150 |
| Haverford Township PA School District GO VRDO | 0.190% | 6/7/12 LOC | 5,000 | 5,000 |
| 1 Hempfield PA School District GO TOB VRDO | 0.180% | 6/7/12 LOC | 5,000 | 5,000 |
| Lancaster County PA Hospital Authority Revenue | | | | |
| (Masonic Homes Project) VRDO | 0.230% | 6/1/12 LOC | 13,310 | 13,310 |
14
Pennsylvania Tax-Exempt Money Market Fund
| | | | |
| | | | Face | Market |
| | | Maturity | Amount | Value |
| | Coupon | Date | ($000) | ($000) |
| Lower Merion PA School District GO VRDO | 0.160% | 6/7/12 LOC | 6,000 | 6,000 |
| Lower Merion PA School District GO VRDO | 0.160% | 6/7/12 LOC | 10,885 | 10,885 |
| 1 Luzerne County PA Industrial Development | | | | |
| Authority Water Facility Revenue | | | | |
| (Pennsylvania-American Water Co.) TOB VRDO | 0.240% | 6/7/12 (13) | 5,000 | 5,000 |
| 1 Manheim Township PA School District | | | | |
| GO TOB VRDO | 0.180% | 6/7/12 LOC | 7,135 | 7,135 |
| Montgomery County PA Industrial Development | | | | |
| Authority Revenue | | | | |
| (Friends’ Central School Project) VRDO | 0.180% | 6/7/12 LOC | 2,615 | 2,615 |
| Montgomery County PA Industrial Development | | | | |
| Authority Revenue | | | | |
| (Friends’ Central School Project) VRDO | 0.180% | 6/7/12 LOC | 6,420 | 6,420 |
| Montgomery County PA TRAN | 1.500% | 12/31/12 | 25,000 | 25,196 |
| Moon Industrial Development Authority | | | | |
| Pennsylvania Mortgage Revenue | | | | |
| (Providence Point Project) VRDO | 0.210% | 6/7/12 LOC | 55,770 | 55,770 |
| North Pocono PA School District GO | 5.000% | 3/15/13 (Prere.) | 10,000 | 10,374 |
| 1 Northampton County PA General Purpose | | | | |
| Authority University Revenue | | | | |
| (Lafayette College) TOB VRDO | 0.200% | 6/7/12 | 17,585 | 17,585 |
| 1 Northampton County PA General Purpose | | | | |
| Authority University Revenue | | | | |
| (Lehigh University) TOB VRDO | 0.170% | 6/7/12 LOC | 21,360 | 21,360 |
| Northampton County PA General Purpose | | | | |
| Authority University Revenue | | | | |
| (Lehigh University) VRDO | 0.160% | 6/7/12 | 11,500 | 11,500 |
| Northampton County PA General Purpose | | | | |
| Authority University Revenue | | | | |
| (Lehigh University) VRDO | 0.170% | 6/7/12 | 4,100 | 4,100 |
| 1 Nuveen Pennsylvania Investment Quality | | | | |
| Municipal Fund VRDP VRDO | 0.320% | 6/7/12 LOC | 25,000 | 25,000 |
| Owen J. Roberts School District Pennsylvania GO | 5.500% | 8/15/12 (Prere.) | 1,520 | 1,537 |
| Pennsbury PA School District GO | 5.500% | 7/15/12 (Prere.) | 3,625 | 3,648 |
| 1 Pennsylvania Economic Development Financing | | | | |
| Authority Exempt Facilities Revenue | | | | |
| (PPL Energy Supply LLC Project) TOB VRDO | 0.200% | 6/7/12 LOC | 9,995 | 9,995 |
| Pennsylvania Economic Development Financing | | | | |
| Authority Exempt Facilities Revenue | | | | |
| (PSEG Power LLC Project) VRDO | 0.160% | 6/7/12 LOC | 44,500 | 44,500 |
| Pennsylvania Economic Development Financing | | | | |
| Authority Exempt Facilities Revenue | | | | |
| (York Water Co. Project) VRDO | 0.210% | 6/7/12 LOC | 5,000 | 5,000 |
| Pennsylvania Economic Development Financing | | | | |
| Authority Revenue (Convention Center Project) | 5.000% | 6/15/12 | 2,000 | 2,004 |
| 1 Pennsylvania Economic Development Financing | | | | |
| Authority Water Facilities Revenue | | | | |
| (Aqua Pennsylvania Inc. Project) TOB VRDO | 0.190% | 6/7/12 (13) | 9,900 | 9,900 |
| 1 Pennsylvania Economic Development Financing | | | | |
| Authority Water Facilities Revenue | | | | |
| (Aqua Pennsylvania Inc. Project) TOB VRDO | 0.250% | 6/7/12 | 7,495 | 7,495 |
| 1 Pennsylvania Economic Development Financing | | | | |
| Authority Water Facilities Revenue | | | | |
| (Waste Management) TOB VRDO | 0.200% | 6/7/12 | 9,995 | 9,995 |
| Pennsylvania GO | 5.500% | 6/1/12 | 10,430 | 10,430 |
| Pennsylvania GO | 5.000% | 7/1/12 | 22,275 | 22,363 |
15
Pennsylvania Tax-Exempt Money Market Fund
| | | | |
| | | | Face | Market |
| | | Maturity | Amount | Value |
| | Coupon | Date | ($000) | ($000) |
| Pennsylvania GO | 6.250% | 7/1/12 | 1,000 | 1,005 |
| Pennsylvania GO | 5.000% | 7/15/12 | 9,030 | 9,082 |
| Pennsylvania GO | 5.000% | 7/15/12 | 8,110 | 8,157 |
| Pennsylvania GO | 5.000% | 9/1/12 | 7,130 | 7,214 |
| Pennsylvania GO | 5.000% | 10/1/12 | 500 | 508 |
| Pennsylvania GO | 2.000% | 11/15/12 | 20,760 | 20,928 |
| Pennsylvania GO | 5.000% | 1/1/13 (Prere.) | 5,000 | 5,141 |
| Pennsylvania GO | 5.000% | 1/1/13 (Prere.) | 2,325 | 2,389 |
| Pennsylvania GO | 5.000% | 1/1/13 (Prere.) | 1,425 | 1,465 |
| Pennsylvania GO | 5.000% | 1/1/13 (Prere.) | 20,000 | 20,560 |
| Pennsylvania GO | 5.500% | 1/1/13 | 6,770 | 6,975 |
| Pennsylvania GO | 5.250% | 2/1/13 | 2,500 | 2,583 |
| Pennsylvania GO | 5.500% | 2/1/13 | 1,100 | 1,139 |
| Pennsylvania GO | 5.000% | 2/15/13 | 12,600 | 13,028 |
| Pennsylvania GO | 5.000% | 5/1/13 | 2,795 | 2,918 |
| 1 Pennsylvania GO TOB VRDO | 0.200% | 6/1/12 | 21,010 | 21,010 |
| 1 Pennsylvania GO TOB VRDO | 0.160% | 6/7/12 | 11,475 | 11,475 |
| 1 Pennsylvania GO TOB VRDO | 0.180% | 6/7/12 | 7,000 | 7,000 |
| 1 Pennsylvania GO TOB VRDO | 0.190% | 6/7/12 | 2,200 | 2,200 |
| 1 Pennsylvania GO TOB VRDO | 0.200% | 6/7/12 | 19,515 | 19,515 |
| 1 Pennsylvania Higher Educational Facilities Authority | | | | |
| Revenue (Drexel University) TOB VRDO | 0.200% | 6/7/12 LOC | 14,890 | 14,890 |
| Pennsylvania Higher Educational Facilities Authority | | | | |
| Revenue (Drexel University) VRDO | 0.230% | 6/1/12 LOC | 3,305 | 3,305 |
| Pennsylvania Higher Educational Facilities Authority | | | | |
| Revenue (Drexel University) VRDO | 0.160% | 6/7/12 LOC | 3,975 | 3,975 |
| 1 Pennsylvania Higher Educational Facilities Authority | | | | |
| Revenue (Foundation for Indiana University of | | | | |
| Pennsylvania Student Housing) TOB VRDO | 0.180% | 6/7/12 LOC | 10,195 | 10,195 |
| Pennsylvania Higher Educational Facilities Authority | | | | |
| Revenue (Foundation for Indiana University of | | | | |
| Pennsylvania Student Housing) VRDO | 0.160% | 6/7/12 LOC | 45,825 | 45,825 |
| Pennsylvania Higher Educational Facilities Authority | | | | |
| Revenue (Higher Education System) | 3.000% | 6/15/12 | 3,060 | 3,063 |
| Pennsylvania Higher Educational Facilities Authority | | | | |
| Revenue (St. Joseph’s University) VRDO | 0.170% | 6/7/12 LOC | 14,000 | 14,000 |
| Pennsylvania Higher Educational Facilities Authority | | | | |
| Revenue (Trustees of the | | | | |
| University of Pennsylvania) | 5.000% | 7/15/12 | 2,110 | 2,122 |
| 1 Pennsylvania Higher Educational Facilities Authority | | | | |
| Revenue (Trustees of the | | | | |
| University of Pennsylvania) TOB VRDO | 0.200% | 6/7/12 | 5,000 | 5,000 |
| Pennsylvania Higher Educational Facilities Authority | | | | |
| Revenue (University of Pennsylvania | | | | |
| Health System) | 5.000% | 8/15/12 | 6,325 | 6,387 |
| Pennsylvania Higher Educational Facilities Authority | | | | |
| Revenue (University of Pennsylvania | | | | |
| Health System) VRDO | 0.160% | 6/7/12 | 25,300 | 25,300 |
| Pennsylvania Higher Educational Facilities Authority | | | | |
| Revenue Bonds (Thomas Jefferson University) | 5.000% | 1/1/13 (Prere.) | 3,390 | 3,484 |
| 1 Pennsylvania Housing Finance Agency Single | | | | |
| Family Mortgage Revenue TOB VRDO | 0.240% | 6/7/12 | 4,855 | 4,855 |
| Pennsylvania Housing Finance Agency Single | | | | |
| Family Mortgage Revenue VRDO | 0.180% | 6/7/12 | 22,715 | 22,715 |
| Pennsylvania Housing Finance Agency Single | | | | |
| Family Mortgage Revenue VRDO | 0.180% | 6/7/12 | 21,810 | 21,810 |
16
Pennsylvania Tax-Exempt Money Market Fund
| | | | |
| | | | Face | Market |
| | | Maturity | Amount | Value |
| | Coupon | Date | ($000) | ($000) |
| Pennsylvania Housing Finance Agency Single | | | | |
| Family Mortgage Revenue VRDO | 0.180% | 6/7/12 | 16,000 | 16,000 |
| Pennsylvania Housing Finance Agency Single | | | | |
| Family Mortgage Revenue VRDO | 0.180% | 6/7/12 LOC | 5,315 | 5,315 |
| Pennsylvania Housing Finance Agency Single | | | | |
| Family Mortgage Revenue VRDO | 0.190% | 6/7/12 | 9,295 | 9,295 |
| Pennsylvania Housing Finance Agency Single | | | | |
| Family Mortgage Revenue VRDO | 0.190% | 6/7/12 | 26,655 | 26,655 |
| Pennsylvania Housing Finance Agency Single | | | | |
| Family Mortgage Revenue VRDO | 0.190% | 6/7/12 LOC | 13,795 | 13,795 |
| 1 Pennsylvania Intergovernmental Cooperation | | | | |
| Authority Special Tax Revenue (Philadelphia | | | | |
| Funding Program) TOB VRDO | 0.180% | 6/7/12 | 5,050 | 5,050 |
| Pennsylvania State University Revenue PUT | 0.300% | 6/1/12 | 17,850 | 17,850 |
| Pennsylvania State University Revenue PUT | 0.220% | 6/1/13 | 40,000 | 40,000 |
| 1 Pennsylvania State University Revenue TOB VRDO | 0.170% | 6/7/12 LOC | 36,755 | 36,755 |
| 1 Pennsylvania State University Revenue TOB VRDO | 0.180% | 6/7/12 | 4,395 | 4,395 |
| 1 Pennsylvania State University Revenue TOB VRDO | 0.180% | 6/7/12 | 5,500 | 5,500 |
| 2 Pennsylvania Turnpike Commission Revenue | 0.230% | 12/1/12 | 8,725 | 8,725 |
| 1 Pennsylvania Turnpike Commission Revenue | | | | |
| TOB VRDO | 0.190% | 6/7/12 | 12,620 | 12,620 |
| 1 Pennsylvania Turnpike Commission Revenue | | | | |
| TOB VRDO | 0.200% | 6/7/12 LOC | 9,920 | 9,920 |
| 1 Pennsylvania Turnpike Commission Revenue | | | | |
| TOB VRDO | 0.200% | 6/7/12 LOC | 5,205 | 5,205 |
| Philadelphia PA Airport Revenue VRDO | 0.170% | 6/7/12 LOC | 17,250 | 17,250 |
| Philadelphia PA Airport Revenue VRDO | 0.170% | 6/7/12 LOC | 9,500 | 9,500 |
| 1 Philadelphia PA Authority Industrial Development | | | | |
| Revenue (Girard Estate Aramark Project) VRDO | 0.240% | 6/7/12 LOC | 3,400 | 3,400 |
| Philadelphia PA Authority Industrial Development | | | | |
| Revenue (Inglis House Project) VRDO | 0.160% | 6/7/12 | 9,200 | 9,200 |
| Philadelphia PA Gas Works Revenue VRDO | 0.150% | 6/7/12 LOC | 40,000 | 40,000 |
| Philadelphia PA GO | 2.000% | 6/29/12 | 6,000 | 6,008 |
| Philadelphia PA GO VRDO | 0.150% | 6/7/12 LOC | 26,775 | 26,775 |
| 1 Philadelphia PA Hospitals & Higher Education | | | | |
| Facilities Authority Hospital Revenue (Children’s | | | | |
| Hospital of Philadelphia Project) TOB VRDO | 0.180% | 6/7/12 | 4,765 | 4,765 |
| Philadelphia PA Hospitals & Higher Education | | | | |
| Facilities Authority Hospital Revenue (Children’s | | | | |
| Hospital of Philadelphia Project) VRDO | 0.200% | 6/1/12 | 22,800 | 22,800 |
| Philadelphia PA Hospitals & Higher Education | | | | |
| Facilities Authority Hospital Revenue (Children’s | | | | |
| Hospital of Philadelphia Project) VRDO | 0.200% | 6/1/12 | 2,900 | 2,900 |
| Philadelphia PA Hospitals & Higher Education | | | | |
| Facilities Authority Hospital Revenue (Children’s | | | | |
| Hospital of Philadelphia Project) VRDO | 0.200% | 6/1/12 | 2,760 | 2,760 |
| Philadelphia PA Hospitals & Higher Education | | | | |
| Facilities Authority Hospital Revenue (Children’s | | | | |
| Hospital of Philadelphia Project) VRDO | 0.200% | 6/1/12 | 6,450 | 6,450 |
| Philadelphia PA Industrial Development Authority | | | | |
| Lease Revenue VRDO | 0.180% | 6/7/12 LOC | 15,800 | 15,800 |
| Philadelphia PA Industrial Development Authority | | | | |
| Revenue (William Penn Charter School) VRDO | 0.180% | 6/7/12 LOC | 4,700 | 4,700 |
| Philadelphia PA School District GO | 5.625% | 8/1/12 (Prere.) | 5,000 | 5,045 |
| Philadelphia PA School District GO | 5.625% | 8/1/12 (Prere.) | 2,000 | 2,018 |
| Philadelphia PA School District GO | 5.625% | 8/1/12 (Prere.) | 2,250 | 2,271 |
17
Pennsylvania Tax-Exempt Money Market Fund
| | | | |
| | | | Face | Market |
| | | Maturity | Amount | Value |
| | Coupon | Date | ($000) | ($000) |
| Philadelphia PA School District GO | 5.625% | 8/1/12 (Prere.) | 5,500 | 5,550 |
| Philadelphia PA School District GO VRDO | 0.140% | 6/7/12 LOC | 5,205 | 5,205 |
| Philadelphia PA School District GO VRDO | 0.160% | 6/7/12 LOC | 32,200 | 32,200 |
| 1 Philadelphia PA Water & Waste Water Revenue | | | | |
| TOB VRDO | 0.190% | 6/7/12 (13) | 45,210 | 45,210 |
| 1 Philadelphia PA Water & Waste Water Revenue | | | | |
| TOB VRDO | 0.200% | 6/7/12 LOC | 6,865 | 6,865 |
| Philadelphia PA Water & Waste Water Revenue | | | | |
| VRDO | 0.170% | 6/7/12 LOC | 18,400 | 18,400 |
| Ridley PA School District GO VRDO | 0.190% | 6/7/12 LOC | 9,770 | 9,770 |
| South Fork PA Hospital Authority Hospital | | | | |
| Revenue (Conemaugh Valley Memorial | | | | |
| Hospital Project) VRDO | 0.170% | 6/7/12 LOC | 28,170 | 28,170 |
| 1 Southcentral Pennsylvania General Authority | | | | |
| Revenue (WellSpan Health Obligated Group) | | | | |
| TOB VRDO | 0.190% | 6/7/12 | 9,970 | 9,970 |
| St. Mary’s Hospital Authority Bucks County PA | | | | |
| Revenue (Catholic Health Initiatives) VRDO | 0.230% | 6/7/12 | 24,200 | 24,200 |
| State Public School Building Authority | | | | |
| Pennsylvania School Revenue (North Allegheny | | | | |
| School District Project) VRDO | 0.180% | 6/7/12 | 18,130 | 18,130 |
| Temple University of the Commonwealth System | | | | |
| of Higher Education Pennsylvania University | | | | |
| Funding Obligation BAN | 1.250% | 12/12/12 | 70,065 | 70,449 |
| Union County PA Higher Educational Facilities | | | | |
| Financing Authority University Revenue | | | | |
| (Bucknell University) VRDO | 0.160% | 6/7/12 | 4,500 | 4,500 |
| University of Pittsburgh of the Commonwealth | | | | |
| System of Higher Education Pennsylvania | | | | |
| (University Capital Project) RAN | 2.000% | 6/18/12 | 30,000 | 30,023 |
| University of Pittsburgh PA Revenue CP | 0.160% | 6/5/12 | 17,670 | 17,670 |
| University of Pittsburgh PA Revenue CP | 0.150% | 6/8/12 | 25,000 | 25,000 |
| University of Pittsburgh PA Revenue CP | 0.200% | 8/2/12 | 8,950 | 8,950 |
| 1 University of Pittsburgh PA Revenue TOB VRDO | 0.200% | 6/7/12 | 5,395 | 5,395 |
| Washington County PA Hospital Authority | | | | |
| Revenue (Washington Hospital Project) VRDO | 0.180% | 6/7/12 LOC | 8,860 | 8,860 |
| Westmoreland County PA Industrial | | | | |
| Development Authority Revenue (White | | | | |
| Consolidated Industries, Inc. Project) PUT | 0.330% | 6/1/12 LOC | 6,940 | 6,940 |
| Wilkes-Barre PA Finance Authority College | | | | |
| Revenue (King’s College Project) VRDO | 0.180% | 6/7/12 LOC | 7,435 | 7,435 |
| York County PA Industrial Development Authority | | | | |
| Revenue (Crescent Industries Inc. Project) VRDO | 0.280% | 6/7/12 LOC | 3,360 | 3,360 |
| | | | | 2,511,091 |
| Puerto Rico (1.9%) | | | | |
| Puerto Rico Electric Power Authority Revenue | 5.000% | 7/1/12 (Prere.) | 2,000 | 2,028 |
| Puerto Rico Electric Power Authority Revenue | 5.125% | 7/1/12 (Prere.) | 3,075 | 3,118 |
| Puerto Rico Electric Power Authority Revenue | 5.250% | 7/1/12 (Prere.) | 1,075 | 1,090 |
| Puerto Rico Electric Power Authority Revenue | 5.375% | 7/1/12 (Prere.) | 1,800 | 1,826 |
| Puerto Rico GO | 5.000% | 7/1/12 (Prere.) | 3,530 | 3,544 |
| Puerto Rico GO | 5.000% | 7/1/12 (Prere.) | 6,760 | 6,787 |
18
Pennsylvania Tax-Exempt Money Market Fund
| | | | | |
| | | | | Face | Market |
| | | | Maturity | Amount | Value |
| | | Coupon | Date | ($000) | ($000) |
| 1 | Puerto Rico Sales Tax Financing Corp. Revenue | | | | |
| | TOB VRDO | 0.250% | 6/7/12 | 8,250 | 8,250 |
| 1 | Puerto Rico Sales Tax Financing Corp. Revenue | | | | |
| | TOB VRDO | 0.250% | 6/7/12 | 20,934 | 20,934 |
| | | | | | 47,577 |
| Total Tax-Exempt Municipal Bonds (Cost $2,558,668) | | | | 2,558,668 |
| Other Assets and Liabilities (-1.1%) | | | | |
| Other Assets | | | | 32,389 |
| Liabilities | | | | (59,116) |
| | | | | | (26,727) |
| Net Assets (100%) | | | | |
| Applicable to 2,531,971,404 outstanding $.001 par value shares of | | | |
| beneficial interest (unlimited authorization) | | | | 2,531,941 |
| Net Asset Value Per Share | | | | $1.00 |
| |
| At May 31, 2012, net assets consisted of: | |
| | Amount |
| | ($000) |
| Paid-in Capital | 2,532,041 |
| Undistributed Net Investment Income | — |
| Accumulated Net Realized Losses | (100) |
| Net Assets | 2,531,941 |
See Note A in Notes to Financial Statements.
1 Security exempt from registration under Rule 144A of the Securities Act of 1933. Such securities may be sold in transactions exempt from registration, normally to qualified institutional buyers. At May 31, 2012, the aggregate value of these securities was $652,154,000, representing 25.8% of net assets.
2 Adjustable-rate security.
A key to abbreviations and other references follows the Statement of Net Assets.
See accompanying Notes, which are an integral part of the Financial Statements.
19
Pennsylvania Tax-Exempt Money Market Fund
Key to Abbreviations
ARS—Auction Rate Security.
BAN—Bond Anticipation Note.
COP—Certificate of Participation.
CP—Commercial Paper.
FR—Floating Rate.
GAN—Grant Anticipation Note.
GO—General Obligation Bond.
PUT—Put Option Obligation.
RAN—Revenue Anticipation Note.
TAN—Tax Anticipation Note.
TOB—Tender Option Bond.
TRAN—Tax Revenue Anticipation Note.
VRDO—Variable Rate Demand Obligation.
VRDP—Variable Rate Demand Preferred.
(ETM)—Escrowed to Maturity.
(Prere.)—Prerefunded.
Scheduled principal and interest payments are guaranteed by:
(1) MBIA (Municipal Bond Investors Assurance).
(2) AMBAC (Ambac Assurance Corporation).
(3) FGIC (Financial Guaranty Insurance Company).
(4) AGM (Assured Guaranty Municipal Corporation).
(5) BIGI (Bond Investors Guaranty Insurance).
(6) Connie Lee Inc.
(7) FHA (Federal Housing Authority).
(8) CapMAC (Capital Markets Assurance Corporation).
(9) American Capital Access Financial Guaranty Corporation.
(10) XL Capital Assurance Inc.
(11) CIFG (CDC IXIS Financial Guaranty).
(12) Assured Guaranty Corporation.
(13) Berkshire Hathaway Assurance Corporation.
(14) National Public Finance Guarantee Corporation.
The insurance does not guarantee the market value of the municipal bonds.
LOC—Scheduled principal and interest payments are guaranteed by bank letter of credit.
20
Pennsylvania Tax-Exempt Money Market Fund
| |
| Statement of Operations | |
| |
| | Six Months Ended |
| | May 31, 2012 |
| | ($000) |
| Investment Income | |
| Income | |
| Interest | 2,239 |
| Total Income | 2,239 |
| Expenses | |
| The Vanguard Group—Note B | |
| Investment Advisory Services | 225 |
| Management and Administrative | 1,428 |
| Marketing and Distribution | 416 |
| Custodian Fees | 17 |
| Shareholders’ Reports | 9 |
| Trustees’ Fees and Expenses | 1 |
| Total Expenses | 2,096 |
| Expense Reduction—Note B | (248) |
| Net Expenses | 1,848 |
| Net Investment Income | 391 |
| Realized Net Gain (Loss) on Investment Securities Sold | 39 |
| Net Increase (Decrease) in Net Assets Resulting from Operations | 430 |
See accompanying Notes, which are an integral part of the Financial Statements.
21
Pennsylvania Tax-Exempt Money Market Fund
| | |
| Statement of Changes in Net Assets | | |
| |
| | Six Months Ended | Year Ended |
| | May 31, | November 30, |
| | 2012 | 2011 |
| | ($000) | ($000) |
| Increase (Decrease) in Net Assets | | |
| Operations | | |
| Net Investment Income | 391 | 1,829 |
| Realized Net Gain (Loss) | 39 | 7 |
| Net Increase (Decrease) in Net Assets Resulting from Operations | 430 | 1,836 |
| Distributions | | |
| Net Investment Income | (391) | (1,829) |
| Realized Capital Gain | — | — |
| Total Distributions | (391) | (1,829) |
| Capital Share Transactions (at $1.00) | | |
| Issued | 847,926 | 1,849,724 |
| Issued in Lieu of Cash Distributions | 379 | 1,767 |
| Redeemed | (965,206) | (2,209,660) |
| Net Increase (Decrease) from Capital Share Transactions | (116,901) | (358,169) |
| Total Increase (Decrease) | (116,862) | (358,162) |
| Net Assets | | |
| Beginning of Period | 2,648,803 | 3,006,965 |
| End of Period | 2,531,941 | 2,648,803 |
See accompanying Notes, which are an integral part of the Financial Statements.
22
Pennsylvania Tax-Exempt Money Market Fund
| | | | | | |
| Financial Highlights | | | | | | |
| |
| |
| Six Months | | | | | |
| | Ended | | | | | |
| For a Share Outstanding | May 31, | | | Year Ended November 30, |
| Throughout Each Period | 2012 | 2011 | 2010 | 2009 | 2008 | 2007 |
| Net Asset Value, Beginning of Period | $1.00 | $1.00 | $1.00 | $1.00 | $1.00 | $1.00 |
| Investment Operations | | | | | | |
| Net Investment Income | .0002 | .001 | .001 | .005 | .024 | .036 |
| Net Realized and Unrealized Gain (Loss) | | | | | | |
| on Investments | — | — | — | — | — | — |
| Total from Investment Operations | .0002 | .001 | .001 | .005 | .024 | .036 |
| Distributions | | | | | | |
| Dividends from Net Investment Income | (.0002) | (.001) | (.001) | (.005) | (.024) | (.036) |
| Distributions from Realized Capital Gains | — | — | — | — | — | — |
| Total Distributions | (.0002) | (.001) | (.001) | (.005) | (.024) | (.036) |
| Net Asset Value, End of Period | $1.00 | $1.00 | $1.00 | $1.00 | $1.00 | $1.00 |
| |
| Total Return1 | 0.02% | 0.06% | 0.12% | 0.50% | 2.42% | 3.64% |
| |
| Ratios/Supplemental Data | | | | | | |
| Net Assets, End of Period (Millions) | $2,532 | $2,649 | $3,007 | $3,328 | $3,867 | $4,167 |
| Ratio of Expenses to | | | | | | |
| Average Net Assets | 0.14%2 | 0.16%2 | 0.17% | 0.17%3 | 0.11%3 | 0.10% |
| Ratio of Net Investment Income to | | | | | | |
| Average Net Assets | 0.03% | 0.06% | 0.12% | 0.51% | 2.39% | 3.57% |
The expense ratio and net income ratio for the current period have been annualized.
1 Total returns do not include account service fees that may have applied in the periods shown. Fund prospectuses provide information about any applicable account service fees.
2 The ratio of total expenses to average net assets before an expense reduction was 0.16% for 2012 and 0.17% for 2011. See Note B in Notes to Financial Statements.
3 Includes fees to participate in the Treasury Temporary Guarantee Program for Money Market Funds of 0.04% for 2009 and 0.01% for 2008.
See accompanying Notes, which are an integral part of the Financial Statements.
23
Pennsylvania Tax-Exempt Money Market Fund
Notes to Financial Statements
Vanguard Pennsylvania Tax-Exempt Money Market Fund is registered under the Investment Company Act of 1940 as an open-end investment company, or mutual fund. The fund invests in debt instruments of municipal issuers whose ability to meet their obligations may be affected by economic and political developments in the state.
A. The following significant accounting policies conform to generally accepted accounting principles for U.S. mutual funds. The fund consistently follows such policies in preparing its financial statements.
1. Security Valuation: Securities are valued at amortized cost, which approximates market value.
2. Federal Income Taxes: The fund intends to continue to qualify as a regulated investment company and distribute all of its income. Management has analyzed the fund’s tax positions taken for all open federal income tax years (November 30, 2008–2011), and for the period ended May 31, 2012, and has concluded that no provision for federal income tax is required in the fund’s financial statements.
3. Distributions: Distributions from net investment income are declared daily and paid on the first business day of the following month.
4. Other: Interest income is accrued daily. Premiums and discounts on debt securities purchased are amortized and accreted, respectively, to interest income over the lives of the respective securities. Security transactions are accounted for on the date securities are bought or sold. Costs used to determine realized gains (losses) on the sale of investment securities are those of the specific securities sold.
B. The Vanguard Group furnishes at cost investment advisory, corporate management, administrative, marketing, and distribution services. The costs of such services are allocated to the fund under methods approved by the board of trustees. The fund has committed to provide up to 0.40% of its net assets in capital contributions to Vanguard. At May 31, 2012, the fund had contributed capital of $370,000 to Vanguard (included in Other Assets), representing 0.00% of the fund’s net assets and 0.15% of Vanguard’s capitalization. The fund’s trustees and officers are also directors and officers of Vanguard. Vanguard and the board of trustees have agreed to temporarily limit certain net operating expenses in excess of the fund’s daily yield so as to maintain a zero or positive yield for the fund. Vanguard and the board of trustees may terminate the temporary expense limitation at any time. For the period ended May 31, 2012, Vanguard’s management and administrative expenses were reduced by $248,000 (an effective annual rate of 0.02% of the fund’s average net assets).
C. Various inputs may be used to determine the value of the fund’s investments. These inputs are summarized in three broad levels for financial statement purposes. The inputs or methodologies used to value securities are not necessarily an indication of the risk associated with investing in those securities.
Level 1—Quoted prices in active markets for identical securities.
Level 2—Other significant observable inputs (including quoted prices for similar securities, interest rates, prepayment speeds, credit risk, etc.).
Level 3—Significant unobservable inputs (including the fund’s own assumptions used to determine the fair value of investments).
24
Pennsylvania Tax-Exempt Money Market Fund
At May 31, 2012, 100% of the market value of the fund’s investments was determined using amortized cost, in accordance with rules under the Investment Company Act of 1940. Amortized cost approximates the current fair value of a security, but since the value is not obtained from a quoted price in an active market, securities valued at amortized cost are considered to be valued using Level 2 inputs.
D. In preparing the financial statements as of May 31, 2012, management considered the impact of subsequent events for potential recognition or disclosure in these financial statements.
25
Pennsylvania Long-Term Tax-Exempt Fund
Fund Profile
As of May 31, 2012
| | |
| Share-Class Characteristics | |
| | Investor | Admiral |
| | Shares | Shares |
| Ticker Symbol | VPAIX | VPALX |
| Expense Ratio1 | 0.20% | 0.12% |
| 30-Day SEC Yield | 2.34% | 2.42% |
| | | |
| Financial Attributes | | | |
| |
| |
| | | Barclays | |
| | | PA | Barclays |
| | | Muni | Municipal |
| | | Bond | Bond |
| | Fund | Index | Index |
| Number of Bonds | 505 | 1,491 | 46,824 |
| Yield to Maturity | | | |
| (before expenses) | 2.5% | 2.6% | 2.4% |
| Average Coupon | 4.6% | 4.9% | 4.9% |
| Average Duration | 6.0 years | 7.8 years | 7.3 years |
| Average Effective | | | |
| Maturity | 5.7 years | 6.0 years | 5.7 years |
| Short-Term | | | |
| Reserves | 6.8% | — | — |
| | |
| Volatility Measures | | |
| | | Barclays |
| | Barclays PA | Municipal |
| | Muni Bond | Bond |
| | Index | Index |
| R-Squared | 0.98 | 0.99 |
| Beta | 1.07 | 0.98 |
These measures show the degree and timing of the fund’s fluctuations compared with the indexes over 36 months.
| |
| Distribution by Maturity (% of portfolio) | |
| Under 1 Year | 10.6% |
| 1 - 3 Years | 9.0 |
| 3 - 5 Years | 21.1 |
| 5 - 10 Years | 53.7 |
| 10 - 20 Years | 5.3 |
| 20 - 30 Years | 0.3 |
| |
| Distribution by Credit Quality (% of portfolio) |
| AAA | 4.3% |
| AA | 59.7 |
| A | 25.8 |
| BBB | 8.4 |
| BB | 0.3 |
| Not Rated | 1.5 |
For information about these ratings, see the Glossary entry for Credit Quality.
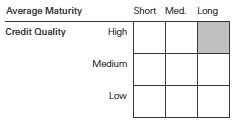
Investment Focus
1 The expense ratios shown are from the prospectus dated March 28, 2012, and represent estimated costs for the current fiscal year. For the six months ended May 31, 2012, the annualized expense ratios were 0.20% for Investor Shares and 0.12% for Admiral Shares.
26
Pennsylvania Long-Term Tax-Exempt Fund
Performance Summary
All of the returns in this report represent past performance, which is not a guarantee of future results that may be achieved by the fund. (Current performance may be lower or higher than the performance data cited. For performance data current to the most recent month-end, visit our website at vanguard.com/performance.) Note, too, that both investment returns and principal value can fluctuate widely, so an investor’s shares, when sold, could be worth more or less than their original cost. The returns shown do not reflect taxes that a shareholder would pay on fund distributions or on the sale of fund shares.
| | | | |
| Fiscal-Year Total Returns (%): November 30, 2001, Through May 31, 2012 | |
| | | | | Barclays PA |
| | | | | Muni Bond |
| | | | Investor Shares | Index |
| Fiscal Year | Income Returns | Capital Returns | Total Returns | Total Returns |
| 2002 | 4.99% | 1.50% | 6.49% | 6.42% |
| 2003 | 4.62 | 2.68 | 7.30 | 6.71 |
| 2004 | 4.59 | -1.27 | 3.32 | 3.83 |
| 2005 | 4.54 | -1.44 | 3.10 | 3.68 |
| 2006 | 4.72 | 1.58 | 6.30 | 5.77 |
| 2007 | 4.50 | -2.20 | 2.30 | 3.40 |
| 2008 | 4.19 | -8.67 | -4.48 | -1.82 |
| 2009 | 4.67 | 7.65 | 12.32 | 13.08 |
| 2010 | 4.10 | 0.18 | 4.28 | 4.31 |
| 2011 | 4.16 | 1.91 | 6.07 | 6.47 |
| 2012 | 1.91 | 3.84 | 5.75 | 5.80 |
| Note: For 2012, performance data reflect the six months ended May 31, 2012. |
Average Annual Total Returns: Periods Ended March 31, 2012
This table presents returns through the latest calendar quarter—rather than through the end of the fiscal period.
Securities and Exchange Commission rules require that we provide this information.
| | | | | | |
| | | | | | | Ten Years |
| | Inception Date | One Year | Five Years | Income | Capital | Total |
| Investor Shares | 4/7/1986 | 11.82% | 4.66% | 4.48% | 0.53% | 5.01% |
| Admiral Shares | 5/14/2001 | 11.91 | 4.74 | 4.55 | 0.53 | 5.08 |
See Financial Highlights for dividend and capital gains information.
27
Pennsylvania Long-Term Tax-Exempt Fund
Financial Statements (unaudited)
Statement of Net Assets
As of May 31, 2012
The fund reports a complete list of its holdings in regulatory filings four times in each fiscal year, at the quarter-ends. For the second and fourth fiscal quarters, the lists appear in the fund’s semiannual and annual reports to shareholders. For the first and third fiscal quarters, the fund files the lists with the Securities and Exchange Commission on Form N-Q. Shareholders can look up the fund’s Forms N-Q on the SEC’s website at sec.gov. Forms N-Q may also be reviewed and copied at the SEC’s Public Reference Room (see the back cover of this report for further information).
| | | | |
| | | | Face | Market |
| | | Maturity | Amount | Value |
| | Coupon | Date | ($000) | ($000) |
| Tax-Exempt Municipal Bonds (99.8%) | | | | |
| Pennsylvania (97.8%) | | | | |
| Abington PA School District GO | 5.000% | 4/1/32 (4) | 1,495 | 1,577 |
| Allegheny County PA GO | 5.375% | 11/1/12 (Prere.) | 2,645 | 2,702 |
| Allegheny County PA GO | 5.375% | 11/1/12 (Prere.) | 2,000 | 2,043 |
| Allegheny County PA GO | 5.375% | 11/1/12 (Prere.) | 2,880 | 2,942 |
| Allegheny County PA GO | 5.375% | 11/1/12 (Prere.) | 3,725 | 3,805 |
| Allegheny County PA GO | 5.375% | 11/1/16 (14) | 4,100 | 4,171 |
| Allegheny County PA GO | 5.375% | 11/1/17 (14) | 3,600 | 3,661 |
| Allegheny County PA GO | 5.000% | 11/1/22 | 2,425 | 2,835 |
| Allegheny County PA GO | 5.000% | 11/1/23 | 2,570 | 2,988 |
| Allegheny County PA GO | 5.000% | 11/1/29 | 4,000 | 4,254 |
| Allegheny County PA Higher Education Building | | | | |
| Authority University Revenue | | | | |
| (Carnegie Mellon University) | 5.000% | 3/1/24 | 6,750 | 8,230 |
| Allegheny County PA Higher Education Building | | | | |
| Authority University Revenue | | | | |
| (Carnegie Mellon University) VRDO | 0.170% | 6/1/12 | 21,000 | 21,000 |
| Allegheny County PA Higher Education Building | | | | |
| Authority University Revenue | | | | |
| (Chatham University) | 5.000% | 9/1/30 | 1,545 | 1,674 |
| Allegheny County PA Higher Education Building | | | | |
| Authority University Revenue | | | | |
| (Chatham University) | 5.000% | 9/1/35 | 1,000 | 1,053 |
| Allegheny County PA Higher Education Building | | | | |
| Authority University Revenue | | | | |
| (Duquesne University) | 5.250% | 3/1/26 | 4,005 | 4,554 |
| Allegheny County PA Higher Education Building | | | | |
| Authority University Revenue | | | | |
| (Duquesne University) | 5.500% | 3/1/28 | 1,940 | 2,221 |
| Allegheny County PA Higher Education Building | | | | |
| Authority University Revenue | | | | |
| (Duquesne University) | 5.500% | 3/1/29 | 1,700 | 1,939 |
| Allegheny County PA Higher Education Building | | | | |
| Authority University Revenue | | | | |
| (Duquesne University) | 5.500% | 3/1/31 | 770 | 878 |
| Allegheny County PA Hospital Development | | | | |
| Authority Revenue (University of Pittsburgh | | | | |
| Medical Center) | 5.000% | 6/15/13 | 2,000 | 2,092 |
28
Pennsylvania Long-Term Tax-Exempt Fund
| | | | |
| | | | Face | Market |
| | | Maturity | Amount | Value |
| | Coupon | Date | ($000) | ($000) |
| Allegheny County PA Hospital Development | | | | |
| Authority Revenue (University of Pittsburgh | | | | |
| Medical Center) | 5.000% | 6/15/14 | 1,500 | 1,630 |
| Allegheny County PA Hospital Development | | | | |
| Authority Revenue (University of Pittsburgh | | | | |
| Medical Center) | 5.000% | 9/1/14 | 25,000 | 27,387 |
| Allegheny County PA Hospital Development | | | | |
| Authority Revenue (University of Pittsburgh | | | | |
| Medical Center) | 5.000% | 6/15/15 | 2,000 | 2,234 |
| Allegheny County PA Hospital Development | | | | |
| Authority Revenue (University of Pittsburgh | | | | |
| Medical Center) | 5.000% | 5/15/18 | 7,000 | 8,291 |
| Allegheny County PA Hospital Development | | | | |
| Authority Revenue (University of Pittsburgh | | | | |
| Medical Center) | 5.000% | 6/15/18 | 7,000 | 7,465 |
| Allegheny County PA Hospital Development | | | | |
| Authority Revenue (University of Pittsburgh | | | | |
| Medical Center) | 1.032% | 2/1/21 | 5,000 | 4,786 |
| Allegheny County PA Hospital Development | | | | |
| Authority Revenue (University of Pittsburgh | | | | |
| Medical Center) | 6.000% | 7/1/23 (14) | 5,745 | 7,480 |
| Allegheny County PA Hospital Development | | | | |
| Authority Revenue (University of Pittsburgh | | | | |
| Medical Center) | 6.000% | 7/1/26 (14) | 4,625 | 5,995 |
| Allegheny County PA Hospital Development | | | | |
| Authority Revenue (University of Pittsburgh | | | | |
| Medical Center) | 6.000% | 7/1/27 (14) | 9,325 | 12,077 |
| Allegheny County PA Hospital Development | | | | |
| Authority Revenue (University of Pittsburgh | | | | |
| Medical Center) | 5.375% | 8/15/29 | 4,000 | 4,495 |
| Allegheny County PA Hospital Development | | | | |
| Authority Revenue (University of Pittsburgh | | | | |
| Medical Center) | 1.132% | 2/1/37 | 3,000 | 2,471 |
| Allegheny County PA Hospital Development | | | | |
| Authority Revenue (University of Pittsburgh | | | | |
| Medical Center) | 5.625% | 8/15/39 | 10,800 | 12,032 |
| 1 Allegheny County PA Hospital Development | | | | |
| Authority Revenue (University of Pittsburgh | | | | |
| Medical Center) TOB VRDO | 0.180% | 6/7/12 | 4,900 | 4,900 |
| Allegheny County PA Industrial Development | | | | |
| Authority Revenue (University of Pittsburgh | | | | |
| Medical Center Children’s Hospital) VRDO | 0.180% | 6/7/12 LOC | 4,800 | 4,800 |
| Allegheny County PA Port Authority Revenue | 5.750% | 3/1/29 | 7,500 | 8,787 |
| Allegheny County PA Sanitation Authority | | | | |
| Sewer Revenue | 5.500% | 12/1/16 (ETM) | 11,295 | 12,496 |
| Allegheny County PA Sanitation Authority | | | | |
| Sewer Revenue | 5.000% | 6/1/19 (4) | 3,250 | 3,859 |
| Allegheny County PA Sanitation Authority | | | | |
| Sewer Revenue | 5.000% | 12/1/24 (14) | 6,000 | 6,646 |
| Allegheny County PA Sanitation Authority | | | | |
| Sewer Revenue | 5.000% | 6/1/26 (4) | 4,925 | 5,635 |
| Allegheny County PA Sanitation Authority | | | | |
| Sewer Revenue | 5.000% | 6/1/30 (4) | 3,500 | 3,980 |
| Allegheny County PA Sanitation Authority | | | | |
| Sewer Revenue | 5.000% | 12/1/32 (14) | 12,000 | 12,808 |
| Annville Cleona PA School District GO | 6.000% | 3/1/28 (4) | 1,500 | 1,624 |
29
Pennsylvania Long-Term Tax-Exempt Fund
| | | | |
| | | | Face | Market |
| | | Maturity | Amount | Value |
| | Coupon | Date | ($000) | ($000) |
| Annville Cleona PA School District GO | 6.000% | 3/1/31 (4) | 2,475 | 2,661 |
| Beaver County PA Hospital Authority Revenue | | | | |
| (Heritage Valley Health System Inc.) | 5.000% | 5/15/23 | 1,750 | 2,029 |
| Beaver County PA Hospital Authority Revenue | | | | |
| (Heritage Valley Health System Inc.) | 5.000% | 5/15/25 | 1,620 | 1,843 |
| Beaver County PA Hospital Authority Revenue | | | | |
| (Heritage Valley Health System Inc.) | 5.000% | 5/15/28 | 2,000 | 2,218 |
| Bensalem Township PA School District GO | 5.250% | 6/15/24 (14) | 3,700 | 4,339 |
| Berks County PA GO | 0.000% | 11/15/13 (14) | 7,250 | 7,163 |
| Berks County PA GO | 0.000% | 11/15/14 (14) | 8,615 | 8,407 |
| Berks County PA GO | 0.000% | 11/15/15 (14) | 6,250 | 5,994 |
| Berks County PA Municipal Authority Hospital | | | | |
| Revenue (Reading Hospital & Medical | | | | |
| Center Project) | 5.700% | 10/1/14 (14) | 2,435 | 2,567 |
| Berks County PA Municipal Authority Revenue | | | | |
| (Reading Hospital & Medical Center Project) | 5.500% | 11/1/31 | 3,500 | 4,000 |
| Berks County PA Municipal Authority Revenue | | | | |
| (Reading Hospital & Medical Center Project) | 5.750% | 11/1/39 | 4,615 | 5,252 |
| Blair County PA Hospital Authority Hospital | | | | |
| Revenue (Altoona Hospital Project) | 5.500% | 7/1/16 (2) | 6,480 | 6,957 |
| Blair County PA Hospital Authority Revenue | | | | |
| (Altoona Regional Health System) | 6.000% | 11/15/39 | 13,500 | 14,217 |
| Bristol Borough PA School District GO | 5.250% | 9/1/15 (Prere.) | 3,635 | 4,187 |
| Bucks County PA GO | 5.000% | 6/1/19 | 2,500 | 3,126 |
| Bucks County PA Industrial Development | | | | |
| Authority Revenue (Pennswood Village Project) | 6.000% | 10/1/12 (Prere.) | 2,600 | 2,675 |
| Bucks County PA Water & Sewer Authority | | | | |
| Water System Revenue | 5.000% | 12/1/29 (4) | 2,000 | 2,296 |
| Bucks County PA Water & Sewer Authority | | | | |
| Water System Revenue | 5.000% | 12/1/33 (4) | 2,000 | 2,272 |
| Bucks County PA Water & Sewer Authority | | | | |
| Water System Revenue | 5.000% | 12/1/37 (4) | 3,500 | 3,918 |
| Butler County PA General Authority Revenue | | | | |
| (Erie School District Project) VRDO | 0.180% | 6/7/12 LOC | 9,840 | 9,840 |
| Catholic Health East Pennsylvania Health | | | | |
| Systems Revenue | 5.375% | 11/15/14 (Prere.) | 3,000 | 3,338 |
| Catholic Health East Pennsylvania Health | | | | |
| Systems Revenue | 5.500% | 11/15/14 (Prere.) | 1,400 | 1,562 |
| Central Bradford PA Progress Authority Revenue | | | | |
| (Guthrie Healthcare System) | 5.500% | 12/1/31 | 7,000 | 8,173 |
| Central Bradford PA Progress Authority Revenue | | | | |
| (Guthrie Healthcare System) | 5.375% | 12/1/41 | 3,000 | 3,359 |
| Central Bucks PA School District GO | 5.000% | 5/15/18 (Prere.) | 6,000 | 7,418 |
| Centre County PA Hospital Authority Revenue | | | | |
| (Mount Nittany Medical Center Project) | 6.250% | 11/15/41 | 2,250 | 2,558 |
| Centre County PA Hospital Authority Revenue | | | | |
| (Mount Nittany Medical Center Project) | 7.000% | 11/15/46 | 5,000 | 5,936 |
| Chambersburg PA Area School District GO | 5.250% | 3/1/29 (14) | 3,805 | 4,188 |
| Chambersburg PA Area School District GO | 5.250% | 2/1/37 | 2,535 | 2,751 |
| Chester County PA GO | 5.000% | 7/15/26 | 4,345 | 5,015 |
| Chester County PA GO | 5.000% | 7/15/27 | 5,000 | 5,772 |
| Chester County PA GO | 5.000% | 11/15/30 | 3,740 | 4,481 |
| Chester County PA GO | 5.000% | 11/15/31 | 2,350 | 2,803 |
| Chester County PA GO | 5.000% | 11/15/32 | 1,000 | 1,185 |
30
Pennsylvania Long-Term Tax-Exempt Fund
| | | | |
| | | | Face | Market |
| | | Maturity | Amount | Value |
| | Coupon | Date | ($000) | ($000) |
| Chester County PA Health & Education Facilities | | | | |
| Authority Revenue (Devereux Foundation) | 5.000% | 11/1/18 | 700 | 760 |
| Chester County PA Health & Education Facilities | | | | |
| Authority Revenue (Devereux Foundation) | 5.000% | 11/1/20 | 650 | 694 |
| Chester County PA Health & Education Facilities | | | | |
| Authority Revenue (Devereux Foundation) | 5.000% | 11/1/22 | 795 | 838 |
| Chester County PA Health & Education Facilities | | | | |
| Authority Revenue (Devereux Foundation) | 5.000% | 11/1/31 | 4,500 | 4,631 |
| Chester County PA Health & Education Facilities | | | | |
| Authority Revenue (Jefferson Health System) | 5.000% | 5/15/31 | 2,720 | 2,991 |
| Chester County PA Health & Education Facilities | | | | |
| Authority Revenue (Jefferson Health System) | 5.000% | 5/15/40 | 30,485 | 32,911 |
| Chester County PA School Authority Revenue | 5.000% | 4/1/23 (2) | 2,670 | 2,863 |
| Chester County PA School Authority Revenue | 5.000% | 4/1/24 (2) | 1,000 | 1,067 |
| Chester County PA School Authority Revenue | 5.000% | 4/1/26 (2) | 1,575 | 1,668 |
| Clarion County PA Industrial Development | | | | |
| Authority Revenue (Clarion University | | | | |
| Foundation Inc. Student Housing Project) | 5.000% | 7/1/32 (10) | 4,980 | 4,998 |
| Clarion County PA Industrial Development | | | | |
| Authority Revenue (Clarion University | | | | |
| Foundation Inc. Student Housing Project) | 5.000% | 7/1/37 (10) | 6,360 | 6,288 |
| Coatesville PA School District GO | 5.250% | 8/15/14 (Prere.) | 6,645 | 7,357 |
| Commonwealth Financing Authority | | | | |
| Pennsylvania Revenue | 5.250% | 6/1/23 (14) | 13,535 | 15,096 |
| Cumberland County PA Municipal Authority | | | | |
| Retirement Community Revenue | | | | |
| (Wesley Affiliated Services Inc.) | 7.250% | 1/1/13 (Prere.) | 7,360 | 7,730 |
| Cumberland County PA Municipal Authority | | | | |
| Revenue (Diakon Lutheran Social | | | | |
| Ministries Project) | 5.000% | 1/1/27 | 2,700 | 2,766 |
| Cumberland County PA Municipal Authority | | | | |
| Revenue (Diakon Lutheran Social | | | | |
| Ministries Project) | 5.000% | 1/1/36 | 6,750 | 6,805 |
| Cumberland County PA Municipal Authority | | | | |
| Revenue (Diakon Lutheran Social | | | | |
| Ministries Project) | 6.375% | 1/1/39 | 2,000 | 2,160 |
| Dallas PA School District GO | 5.000% | 4/1/29 (11) | 5,385 | 5,781 |
| Dauphin County PA General Authority Health | | | | |
| System Revenue (Pinnacle Health | | | | |
| System Project) | 6.000% | 6/1/36 | 15,000 | 16,709 |
| Dauphin County PA General Authority Hospital | | | | |
| Revenue (Western Pennsylvania Hospital Project) | 5.500% | 7/1/13 (ETM) | 1,105 | 1,136 |
| Delaware County PA Authority Hospital Revenue | | | | |
| (Crozer-Keystone Obligated Group) | 5.000% | 12/15/31 | 5,000 | 4,813 |
| Delaware County PA Authority University | | | | |
| Revenue (Villanova University) | 5.000% | 8/1/24 (14) | 4,000 | 4,275 |
| Delaware County PA Authority University | | | | |
| Revenue (Villanova University) | 5.000% | 12/1/26 | 1,000 | 1,138 |
| Delaware County PA Authority University | | | | |
| Revenue (Villanova University) | 5.000% | 12/1/28 | 1,000 | 1,125 |
| Delaware County PA Authority University | | | | |
| Revenue (Villanova University) | 5.250% | 12/1/31 | 600 | 682 |
| Delaware County PA GO | 5.000% | 10/1/13 | 2,900 | 3,082 |
| Delaware County PA GO | 5.000% | 10/1/14 | 3,905 | 4,317 |
| Delaware County PA GO | 5.000% | 10/1/16 | 3,240 | 3,828 |
31
Pennsylvania Long-Term Tax-Exempt Fund
| | | | |
| | | | Face | Market |
| | | Maturity | Amount | Value |
| | Coupon | Date | ($000) | ($000) |
| Delaware County PA Industrial Development | | | | |
| Authority Pollution Control Revenue | | | | |
| (PECO Energy Co. Project) | 4.000% | 12/1/12 | 13,000 | 13,202 |
| Delaware County PA Industrial Development | | | | |
| Authority Solid Waste Revenue | | | | |
| (Scott Paper Co.) VRDO | 0.190% | 6/7/12 | 3,960 | 3,960 |
| Delaware County PA Industrial Development | | | | |
| Authority Solid Waste Revenue | | | | |
| (Scott Paper Co.) VRDO | 0.190% | 6/7/12 | 1,300 | 1,300 |
| Delaware River Joint Toll Bridge Commission | | | | |
| Pennsylvania & New Jersey Revenue | 5.250% | 7/1/19 (14) | 1,645 | 1,830 |
| Delaware River Joint Toll Bridge Commission | | | | |
| Pennsylvania & New Jersey Revenue | 5.500% | 7/1/19 (14) | 4,835 | 5,953 |
| Delaware River Joint Toll Bridge Commission | | | | |
| Pennsylvania & New Jersey Revenue | 5.250% | 7/1/20 (14) | 1,735 | 1,930 |
| Delaware River Joint Toll Bridge Commission | | | | |
| Pennsylvania & New Jersey Revenue | 5.500% | 7/1/20 (14) | 5,105 | 6,325 |
| Delaware River Joint Toll Bridge Commission | | | | |
| Pennsylvania & New Jersey Revenue | 5.250% | 7/1/21 (14) | 1,825 | 2,030 |
| Delaware River Joint Toll Bridge Commission | | | | |
| Pennsylvania & New Jersey Revenue | 5.250% | 7/1/22 (14) | 1,920 | 2,136 |
| Delaware River Joint Toll Bridge Commission | | | | |
| Pennsylvania & New Jersey Revenue | 5.250% | 7/1/23 (14) | 2,020 | 2,247 |
| Delaware River Port Authority Pennsylvania & | | | | |
| New Jersey Revenue | 5.700% | 1/1/23 (4) | 8,345 | 8,366 |
| Delaware River Port Authority Pennsylvania & | | | | |
| New Jersey Revenue | 5.000% | 1/1/35 | 10,000 | 10,908 |
| Delaware River Port Authority Pennsylvania & | | | | |
| New Jersey Revenue VRDO | 0.170% | 6/7/12 LOC | 1,800 | 1,800 |
| Downingtown PA Area School District GO | 5.000% | 11/1/18 | 4,750 | 5,847 |
| Doylestown PA Hospital Authority | | | | |
| Hospital Revenue | 5.000% | 7/1/20 (12) | 5,060 | 5,542 |
| Doylestown PA Hospital Authority | | | | |
| Hospital Revenue | 5.000% | 7/1/21 (12) | 3,000 | 3,264 |
| Doylestown PA Hospital Authority | | | | |
| Hospital Revenue | 5.000% | 7/1/22 (12) | 3,455 | 3,725 |
| East Stroudsburg PA Area School District GO | 5.000% | 9/1/29 (4) | 7,085 | 7,722 |
| Emmaus PA General Authority Revenue VRDO | 0.190% | 6/7/12 LOC | 4,300 | 4,300 |
| Erie County PA GO | 5.000% | 9/1/15 (Prere.) | 5,525 | 6,330 |
| Erie County PA Hospital Authority Revenue | | | | |
| (Hamot Health Foundation) | 5.000% | 11/1/35 (11) | 7,000 | 7,308 |
| Erie PA School District GO | 0.000% | 5/1/16 (ETM) | 3,175 | 3,069 |
| Franklin County PA Industrial Development | | | | |
| Authority Revenue (Chambersburg | | | | |
| Hospital Project) | 5.375% | 7/1/42 | 17,500 | 18,576 |
| Geisinger Health System Authority of | | | | |
| Pennsylvania Revenue (Penn State Geisinger | | | | |
| Health System) | 5.125% | 6/1/34 | 5,000 | 5,501 |
| Geisinger Health System Authority of | | | | |
| Pennsylvania Revenue (Penn State Geisinger | | | | |
| Health System) | 5.250% | 6/1/39 | 20,735 | 22,795 |
| Geisinger Health System Authority of | | | | |
| Pennsylvania Revenue (Penn State Geisinger | | | | |
| Health System) VRDO | 0.140% | 6/1/12 | 1,400 | 1,400 |
32
Pennsylvania Long-Term Tax-Exempt Fund
| | | | |
| | | | Face | Market |
| | | Maturity | Amount | Value |
| | Coupon | Date | ($000) | ($000) |
| Geisinger Health System Authority of | | | | |
| Pennsylvania Revenue (Penn State Geisinger | | | | |
| Health System) VRDO | 0.150% | 6/1/12 | 14,200 | 14,200 |
| 1 Geisinger Health System Authority of | | | | |
| Pennsylvania Revenue TOB VRDO | 0.180% | 6/7/12 | 5,225 | 5,225 |
| Gettysburg PA Area School District GO | 5.000% | 1/15/20 | 2,510 | 3,072 |
| Hazleton PA Area School District GO | 6.000% | 3/1/16 (14) | 18,245 | 19,793 |
| Hazleton PA Area School District GO | 0.000% | 3/1/17 (14) | 4,425 | 3,980 |
| Hazleton PA Area School District GO | 0.000% | 3/1/22 (14) | 5,265 | 3,817 |
| Hempfield PA Area School District | | | | |
| (Westmoreland County) GO | 5.000% | 9/15/15 (Prere.) | 5,030 | 5,768 |
| Hempfield PA School District GO | 5.000% | 10/15/29 | 4,045 | 4,621 |
| Hempfield PA School District GO | 5.000% | 10/15/30 | 2,920 | 3,335 |
| Indiana County PA Industrial Development | | | | |
| Authority Pollution Control Revenue (New York | | | | |
| State Electric & Gas Corp. Project) PUT | 3.000% | 6/3/13 | 5,000 | 5,072 |
| Kiski PA Area School District GO | 4.000% | 3/1/22 (4) | 1,000 | 1,134 |
| Kiski PA Area School District GO | 4.000% | 3/1/23 (4) | 1,875 | 2,099 |
| Lackawanna County PA GO | 5.000% | 9/15/29 (4) | 3,745 | 3,882 |
| Lackawanna County PA GO | 5.000% | 9/15/29 (2) | 1,975 | 1,982 |
| Lake Lehman PA School District GO | 0.000% | 4/1/14 (14) | 1,290 | 1,263 |
| Lake Lehman PA School District GO | 0.000% | 4/1/15 (14) | 1,295 | 1,247 |
| Lake Lehman PA School District GO | 0.000% | 4/1/16 (14) | 1,310 | 1,226 |
| Lake Lehman PA School District GO | 0.000% | 4/1/17 (14) | 1,315 | 1,190 |
| Lake Lehman PA School District GO | 0.000% | 4/1/18 (14) | 1,000 | 875 |
| Lancaster County PA GO | 5.000% | 11/1/32 (4) | 5,000 | 5,581 |
| Lancaster County PA Hospital Authority Revenue | | | | |
| (Lancaster General Hospital) | 5.000% | 3/15/26 | 4,955 | 5,336 |
| Lancaster County PA Hospital Authority Revenue | | | | |
| (Lancaster General Hospital) | 5.000% | 3/15/36 | 12,370 | 12,958 |
| Lancaster County PA Hospital Authority Revenue | | | | |
| (Willow Valley Retirement Project) | 5.875% | 6/1/21 | 820 | 822 |
| Lancaster PA Higher Education Authority College | | | | |
| Revenue (Franklin & Marshall College) | 5.000% | 4/15/22 | 1,135 | 1,243 |
| Lancaster PA Higher Education Authority College | | | | |
| Revenue (Franklin & Marshall College) | 5.000% | 4/15/27 | 2,775 | 2,967 |
| Lancaster PA Higher Education Authority College | | | | |
| Revenue (Franklin & Marshall College) | 5.000% | 4/15/37 | 4,000 | 4,316 |
| Latrobe PA Industrial Development Authority | | | | |
| College Revenue (St. Vincent College Project) | 5.700% | 5/1/31 | 1,995 | 2,007 |
| Lebanon County PA Health Facilities Authority | | | | |
| Health Center Revenue (Good Samaritan | | | | |
| Hospital Project) | 6.000% | 11/15/35 | 10,500 | 10,555 |
| Lehigh County PA General Purpose Hospital | | | | |
| Authority Revenue (Lehigh Valley | | | | |
| Health Network) | 5.375% | 7/1/14 (4) | 900 | 912 |
| Lehigh County PA General Purpose Hospital | | | | |
| Authority Revenue (Lehigh Valley | | | | |
| Health Network) | 7.000% | 7/1/16 (14) | 3,360 | 3,746 |
| Lehigh County PA General Purpose Hospital | | | | |
| Authority Revenue (Lehigh Valley | | | | |
| Health Network) | 5.000% | 7/1/35 (4) | 10,000 | 10,664 |
| Lehigh County PA Industrial Development | | | | |
| Authority Pollution Control Revenue | | | | |
| (PPL Electric Utilities Corp. Project) | 4.750% | 2/15/27 (3) | 4,360 | 4,475 |
33
Pennsylvania Long-Term Tax-Exempt Fund
| | | | |
| | | | Face | Market |
| | | Maturity | Amount | Value |
| | Coupon | Date | ($000) | ($000) |
| Lower Merion PA School District GO | 5.000% | 9/1/28 | 7,845 | 8,932 |
| Lower Merion PA School District GO | 5.000% | 9/1/30 | 8,670 | 9,801 |
| Lower Merion PA School District GO | 5.000% | 9/1/32 | 5,000 | 5,674 |
| Luzerne County PA GO | 0.000% | 11/15/12 (Prere.) | 2,390 | 1,781 |
| Luzerne County PA GO | 0.000% | 11/15/12 (Prere.) | 2,360 | 1,873 |
| Luzerne County PA GO | 5.250% | 12/15/21 (14) | 5,320 | 5,944 |
| Luzerne County PA Industrial Development | | | | |
| Authority Water Facility Revenue | | | | |
| (Pennsylvania-American Water Co.) | 5.500% | 12/1/39 | 10,000 | 11,080 |
| Lycoming County PA Authority College Revenue | | | | |
| (Pennsylvania College of Technology) | 5.000% | 5/1/26 | 2,000 | 2,244 |
| Lycoming County PA Authority College Revenue | | | | |
| (Pennsylvania College of Technology) | 5.250% | 10/1/27 (12) | 5,395 | 5,959 |
| Lycoming County PA Authority College Revenue | | | | |
| (Pennsylvania College of Technology) | 5.000% | 7/1/30 | 5,565 | 6,105 |
| Lycoming County PA Authority College Revenue | | | | |
| (Pennsylvania College of Technology) | 5.500% | 10/1/37 (12) | 6,650 | 7,225 |
| McKeesport PA Area School District GO | 0.000% | 10/1/14 (14) | 2,040 | 1,939 |
| McKeesport PA Area School District GO | 0.000% | 10/1/15 (14) | 2,040 | 1,872 |
| McKeesport PA Area School District GO | 0.000% | 10/1/16 (14) | 4,655 | 4,120 |
| McKeesport PA Area School District GO | 0.000% | 10/1/18 (2) | 2,650 | 2,306 |
| McKeesport PA Area School District GO | 0.000% | 10/1/18 (ETM) | 425 | 387 |
| Monroe County PA Hospital Authority Revenue | | | | |
| (Pocono Medical Center) | 5.000% | 1/1/27 | 2,000 | 2,073 |
| Monroe County PA Hospital Authority Revenue | | | | |
| (Pocono Medical Center) | 5.125% | 1/1/37 | 3,000 | 3,074 |
| Monroe County PA Hospital Authority Revenue | | | | |
| (Pocono Medical Center) | 5.000% | 1/1/41 | 2,000 | 2,079 |
| Monroe County PA Hospital Authority Revenue | | | | |
| (Pocono Medical Center) | 5.250% | 1/1/43 | 6,450 | 6,637 |
| Montgomery County PA GO | 5.000% | 10/15/28 | 13,235 | 14,889 |
| Montgomery County PA GO | 5.000% | 10/15/31 | 6,450 | 7,256 |
| Montgomery County PA Higher Education & | | | | |
| Health Authority Hospital Revenue (Abington | | | | |
| Memorial Hospital) | 5.000% | 6/1/25 | 5,000 | 5,337 |
| Montgomery County PA Higher Education & | | | | |
| Health Authority Hospital Revenue (Abington | | | | |
| Memorial Hospital) | 5.125% | 6/1/33 | 13,545 | 14,248 |
| Montgomery County PA Higher Education & | | | | |
| Health Authority Revenue (Catholic Health East) | 5.375% | 11/15/14 (Prere.) | 2,175 | 2,428 |
| Montgomery County PA Higher Education & | | | | |
| Health Authority Revenue (Dickinson College) | 5.000% | 5/1/31 (11) | 5,750 | 6,052 |
| Montgomery County PA Higher Education & | | | | |
| Health Authority Revenue | | | | |
| (Holy Redeemer Health System) | 5.250% | 1/1/36 | 16,000 | 16,067 |
| Montgomery County PA Industrial Development | | | | |
| Authority Revenue (Hill School) | 5.000% | 8/15/25 (14) | 6,500 | 6,960 |
| Montgomery County PA Industrial Development | | | | |
| Authority Revenue (Hill School) | 5.000% | 8/15/26 (14) | 3,550 | 3,786 |
| Montgomery County PA Industrial Development | | | | |
| Authority Revenue (Hill School) | 5.000% | 8/15/27 (14) | 3,300 | 3,511 |
| Montgomery County PA Industrial Development | | | | |
| Authority Revenue (New Regional | | | | |
| Medical Center Project) | 5.250% | 8/1/33 | 7,000 | 7,795 |
34
Pennsylvania Long-Term Tax-Exempt Fund
| | | | |
| | | | Face | Market |
| | | Maturity | Amount | Value |
| | Coupon | Date | ($000) | ($000) |
| Montgomery County PA Industrial Development | | | | |
| Authority Revenue (New Regional Medical | | | | |
| Center Project) | 5.375% | 8/1/38 | 14,415 | 15,921 |
| Montgomery County PA Industrial Development | | | | |
| Authority Revenue (Philadelphia Presbyterian | | | | |
| Homes Inc. Project) | 6.625% | 12/1/30 | 1,065 | 1,180 |
| Moon Area School District PA GO | 5.000% | 11/15/28 (4) | 5,000 | 5,555 |
| Mount Lebanon PA School District GO | 5.000% | 2/15/13 (Prere.) | 9,280 | 9,593 |
| Mount Lebanon PA School District GO | 5.000% | 2/15/34 | 5,500 | 6,114 |
| North Pocono PA School District GO | 5.000% | 3/15/26 (14) | 4,035 | 4,278 |
| Northampton County PA General Purpose | | | | |
| Authority Hospital Revenue | | | | |
| (St. Luke’s Hospital Project) | 5.250% | 8/15/23 | 1,250 | 1,349 |
| Northampton County PA General Purpose | | | | |
| Authority Hospital Revenue | | | | |
| (St. Luke’s Hospital Project) | 5.375% | 8/15/28 | 6,675 | 7,032 |
| Northampton County PA General Purpose | | | | |
| Authority Hospital Revenue | | | | |
| (St. Luke’s Hospital Project) | 5.500% | 8/15/35 | 2,500 | 2,627 |
| Northampton County PA General Purpose | | | | |
| Authority Hospital Revenue | | | | |
| (St. Luke’s Hospital Project) | 5.500% | 8/15/40 | 5,000 | 5,207 |
| Northampton County PA General Purpose | | | | |
| Authority University Revenue | | | | |
| (Lafayette College) VRDO | 0.170% | 6/7/12 | 2,200 | 2,200 |
| Northampton County PA General Purpose | | | | |
| Authority University Revenue | | | | |
| (Lehigh University) | 5.000% | 11/15/39 | 2,595 | 2,820 |
| Northampton County PA General Purpose | | | | |
| Authority University Revenue | | | | |
| (Lehigh University) VRDO | 0.160% | 6/7/12 | 4,350 | 4,350 |
| Northampton County PA General Purpose | | | | |
| Authority University Revenue | | | | |
| (Lehigh University) VRDO | 0.170% | 6/7/12 | 1,200 | 1,200 |
| Northampton County PA General Purpose | | | | |
| Authority University Revenue | | | | |
| (Lehigh University) VRDO | 0.170% | 6/7/12 | 4,810 | 4,810 |
| Owen J. Roberts School District Pennsylvania GO | 5.500% | 8/15/17 (4) | 1,495 | 1,510 |
| Parkland PA School District GO | 5.375% | 9/1/15 (14) | 3,050 | 3,494 |
| Parkland PA School District GO | 5.375% | 9/1/16 (14) | 2,000 | 2,374 |
| Pennsbury PA School District GO | 5.250% | 8/1/24 (4) | 9,135 | 9,901 |
| Pennsylvania Economic Development Financing | | | | |
| Authority Exempt Facilities Revenue | | | | |
| (Allegheny Energy Supply Co. LLC Project) | 7.000% | 7/15/39 | 7,000 | 8,169 |
| Pennsylvania Economic Development Financing | | | | |
| Authority Exempt Facilities Revenue | | | | |
| (PPL Energy Supply LLC Project) PUT | 3.000% | 9/1/15 | 8,500 | 8,678 |
| Pennsylvania Economic Development Financing | | | | |
| Authority Exempt Facilities Revenue | | | | |
| (PPL Energy Supply LLC Project) PUT | 3.000% | 9/1/15 | 5,570 | 5,687 |
| Pennsylvania Economic Development Financing | | | | |
| Authority Exempt Facilities Revenue | | | | |
| (PPL Energy Supply LLC Project) PUT | 3.000% | 9/1/15 | 4,500 | 4,594 |
| Pennsylvania Economic Development Financing | | | | |
| Authority Pollution Control Revenue | | | | |
| (PPL Electric Utilities Corp. Project) | 4.000% | 10/1/23 | 7,500 | 7,916 |
35
Pennsylvania Long-Term Tax-Exempt Fund
| | | | |
| | | | Face | Market |
| | | Maturity | Amount | Value |
| | Coupon | Date | ($000) | ($000) |
| Pennsylvania Economic Development Financing | | | | |
| Authority Water Facilities Revenue (American | | | | |
| Water Co. Project) | 6.200% | 4/1/39 | 5,000 | 5,814 |
| Pennsylvania Economic Development Financing | | | | |
| Authority Water Facilities Revenue | | | | |
| (Aqua Pennsylvania Inc. Project) | 5.000% | 10/1/39 | 5,500 | 6,037 |
| Pennsylvania Economic Development Financing | | | | |
| Authority Water Facilities Revenue | | | | |
| (Aqua Pennsylvania Inc. Project) | 4.750% | 11/15/40 | 2,500 | 2,703 |
| Pennsylvania Economic Development Financing | | | | |
| Authority Water Facilities Revenue | | | | |
| (Aqua Pennsylvania Inc. Project) | 5.000% | 11/15/40 | 8,975 | 9,876 |
| Pennsylvania Economic Development Financing | | | | |
| Authority Water Facilities Revenue | | | | |
| (Aqua Pennsylvania Inc. Project) | 5.000% | 12/1/43 | 7,500 | 8,286 |
| Pennsylvania GO | 5.000% | 9/1/13 | 1,200 | 1,272 |
| Pennsylvania GO | 5.000% | 2/15/14 | 4,930 | 5,324 |
| Pennsylvania GO | 5.250% | 7/1/15 | 15,000 | 17,177 |
| Pennsylvania GO | 5.000% | 2/15/16 | 16,000 | 18,589 |
| Pennsylvania GO | 5.000% | 3/15/16 | 11,855 | 13,813 |
| Pennsylvania GO | 5.000% | 4/15/16 | 18,690 | 21,838 |
| Pennsylvania GO | 5.375% | 7/1/16 (14) | 3,025 | 3,605 |
| Pennsylvania GO | 5.000% | 8/1/16 | 5,000 | 5,899 |
| Pennsylvania GO | 5.000% | 5/1/17 | 6,000 | 7,200 |
| Pennsylvania GO | 5.000% | 7/1/17 | 16,000 | 19,283 |
| Pennsylvania GO | 5.375% | 7/1/17 | 2,800 | 3,427 |
| Pennsylvania GO | 5.000% | 8/1/17 | 10,000 | 12,078 |
| Pennsylvania GO | 5.000% | 11/1/17 | 2,000 | 2,431 |
| Pennsylvania GO | 5.000% | 11/1/17 (Prere.) | 3,500 | 4,296 |
| Pennsylvania GO | 5.000% | 2/15/18 | 12,745 | 15,518 |
| Pennsylvania GO | 5.000% | 5/1/18 | 26,150 | 31,988 |
| Pennsylvania GO | 5.000% | 5/1/19 | 18,520 | 22,951 |
| Pennsylvania GO | 5.000% | 7/1/19 | 31,900 | 39,655 |
| Pennsylvania GO | 5.375% | 7/1/19 (14) | 9,915 | 12,575 |
| Pennsylvania GO | 5.000% | 7/1/20 | 6,225 | 7,800 |
| Pennsylvania GO | 5.000% | 11/15/20 | 8,740 | 11,002 |
| Pennsylvania GO | 5.000% | 6/1/21 | 8,000 | 10,080 |
| Pennsylvania GO | 5.375% | 7/1/21 | 16,000 | 20,618 |
| Pennsylvania GO | 4.375% | 2/1/24 (14) | 2,300 | 2,373 |
| Pennsylvania GO | 5.000% | 11/15/24 | 16,870 | 20,665 |
| Pennsylvania GO | 5.000% | 11/15/25 | 12,000 | 14,584 |
| Pennsylvania GO | 5.000% | 6/1/26 | 10,000 | 12,186 |
| Pennsylvania GO | 5.000% | 11/15/26 | 6,705 | 8,097 |
| Pennsylvania GO | 5.000% | 6/1/27 | 10,000 | 12,117 |
| Pennsylvania GO | 5.000% | 6/1/28 | 10,000 | 12,043 |
| 1 Pennsylvania GO TOB VRDO | 0.180% | 6/7/12 | 1,000 | 1,000 |
| 1 Pennsylvania GO TOB VRDO | 0.180% | 6/7/12 | 2,820 | 2,820 |
| Pennsylvania Higher Educational Facilities | | | | |
| Authority Revenue (Bryn Mawr College) | 5.000% | 12/1/37 (2) | 13,170 | 14,611 |
| Pennsylvania Higher Educational Facilities | | | | |
| Authority Revenue (Drexel University) | 5.000% | 5/1/32 (14) | 4,950 | 5,283 |
| Pennsylvania Higher Educational Facilities | | | | |
| Authority Revenue (Drexel University) | 5.000% | 5/1/37 (14) | 9,600 | 10,231 |
| Pennsylvania Higher Educational Facilities | | | | |
| Authority Revenue (Drexel University) VRDO | 0.160% | 6/7/12 LOC | 1,600 | 1,600 |
36
Pennsylvania Long-Term Tax-Exempt Fund
| | | | |
| | | | Face | Market |
| | | Maturity | Amount | Value |
| | Coupon | Date | ($000) | ($000) |
| Pennsylvania Higher Educational Facilities | | | | |
| Authority Revenue (Drexel University) VRDO | 0.160% | 6/7/12 LOC | 8,000 | 8,000 |
| Pennsylvania Higher Educational Facilities | | | | |
| Authority Revenue (Foundation for Indiana | | | | |
| University of Pennsylvania Student Housing) | 0.764% | 7/1/17 (10) | 4,430 | 4,188 |
| Pennsylvania Higher Educational Facilities | | | | |
| Authority Revenue (Foundation for Indiana | | | | |
| University of Pennsylvania Student Housing) | 5.125% | 7/1/39 (10) | 10,000 | 10,065 |
| Pennsylvania Higher Educational Facilities | | | | |
| Authority Revenue (Foundation for Indiana | | | | |
| University of Pennsylvania Student Housing) | 5.000% | 7/1/41 | 500 | 515 |
| Pennsylvania Higher Educational Facilities | | | | |
| Authority Revenue | | | | |
| (Gwynedd Mercy College) VRDO | 0.150% | 6/7/12 LOC | 3,100 | 3,100 |
| Pennsylvania Higher Educational Facilities | | | | |
| Authority Revenue (Higher Education System) | 5.000% | 6/15/24 | 8,445 | 9,908 |
| Pennsylvania Higher Educational Facilities | | | | |
| Authority Revenue (Higher Education System) | 5.000% | 6/15/29 | 4,000 | 4,691 |
| Pennsylvania Higher Educational Facilities | | | | |
| Authority Revenue (Higher Education System) | 5.000% | 6/15/30 | 1,595 | 1,831 |
| Pennsylvania Higher Educational Facilities | | | | |
| Authority Revenue (Higher Education System) | 5.000% | 6/15/30 | 3,615 | 4,224 |
| Pennsylvania Higher Educational Facilities | | | | |
| Authority Revenue (Higher Education System) | 5.000% | 6/15/31 | 1,670 | 1,910 |
| Pennsylvania Higher Educational Facilities | | | | |
| Authority Revenue (Higher Education System) | 5.000% | 6/15/34 | 5,535 | 6,251 |
| Pennsylvania Higher Educational Facilities | | | | |
| Authority Revenue (Higher Education System) | 5.000% | 6/15/39 | 1,270 | 1,416 |
| Pennsylvania Higher Educational Facilities | | | | |
| Authority Revenue (Kings College) VRDO | 0.180% | 6/7/12 LOC | 9,100 | 9,100 |
| Pennsylvania Higher Educational Facilities | | | | |
| Authority Revenue (La Salle University) | 5.500% | 5/1/26 | 6,680 | 6,827 |
| Pennsylvania Higher Educational Facilities | | | | |
| Authority Revenue (La Salle University) | 5.250% | 5/1/27 | 3,000 | 3,187 |
| Pennsylvania Higher Educational Facilities | | | | |
| Authority Revenue (La Salle University) | 5.000% | 5/1/37 | 3,250 | 3,367 |
| Pennsylvania Higher Educational Facilities | | | | |
| Authority Revenue (Philadelphia University) | 5.125% | 6/1/25 | 3,500 | 3,562 |
| Pennsylvania Higher Educational Facilities | | | | |
| Authority Revenue (Philadelphia University) | 5.250% | 6/1/32 | 6,350 | 6,417 |
| Pennsylvania Higher Educational Facilities | | | | |
| Authority Revenue (Robert Morris College) PUT | 0.400% | 5/1/13 LOC | 2,000 | 2,000 |
| Pennsylvania Higher Educational Facilities | | | | |
| Authority Revenue (Slippery Rock | | | | |
| University Foundation) | 5.000% | 7/1/31 (10) | 10,260 | 10,500 |
| Pennsylvania Higher Educational Facilities | | | | |
| Authority Revenue (Slippery Rock | | | | |
| University Foundation) | 5.000% | 7/1/37 (10) | 3,500 | 3,543 |
| Pennsylvania Higher Educational Facilities | | | | |
| Authority Revenue (St. Joseph’s University) | 5.000% | 11/1/34 | 4,000 | 4,361 |
| Pennsylvania Higher Educational Facilities | | | | |
| Authority Revenue (St. Joseph’s University) | 5.000% | 11/1/40 | 7,270 | 7,855 |
| Pennsylvania Higher Educational Facilities | | | | |
| Authority Revenue (Susquehanna | | | | |
| University) VRDO | 0.180% | 6/7/12 LOC | 4,900 | 4,900 |
37
Pennsylvania Long-Term Tax-Exempt Fund
| | | | |
| | | | Face | Market |
| | | Maturity | Amount | Value |
| | Coupon | Date | ($000) | ($000) |
| Pennsylvania Higher Educational Facilities | | | | |
| Authority Revenue (Temple University) | 5.000% | 4/1/23 (14) | 12,200 | 13,803 |
| Pennsylvania Higher Educational Facilities | | | | |
| Authority Revenue (Temple University) | 5.000% | 4/1/24 (14) | 12,680 | 14,311 |
| Pennsylvania Higher Educational Facilities | | | | |
| Authority Revenue (Thomas Jefferson University) | 5.375% | 1/1/13 (Prere.) | 4,435 | 4,567 |
| Pennsylvania Higher Educational Facilities | | | | |
| Authority Revenue (Thomas Jefferson University) | 5.000% | 9/1/39 (2) | 9,000 | 9,437 |
| Pennsylvania Higher Educational Facilities | | | | |
| Authority Revenue (Thomas Jefferson University) | 5.000% | 3/1/40 | 1,000 | 1,092 |
| Pennsylvania Higher Educational Facilities | | | | |
| Authority Revenue (Trustees of the | | | | |
| University of Pennsylvania) | 5.000% | 9/1/17 | 3,420 | 4,118 |
| Pennsylvania Higher Educational Facilities | | | | |
| Authority Revenue (Trustees of the | | | | |
| University of Pennsylvania) | 5.000% | 9/1/23 | 1,130 | 1,366 |
| Pennsylvania Higher Educational Facilities | | | | |
| Authority Revenue (Trustees of the | | | | |
| University of Pennsylvania) | 5.000% | 9/1/27 | 1,285 | 1,521 |
| Pennsylvania Higher Educational Facilities | | | | |
| Authority Revenue (Trustees of the | | | | |
| University of Pennsylvania) | 5.000% | 9/1/28 | 3,390 | 3,993 |
| Pennsylvania Higher Educational Facilities | | | | |
| Authority Revenue (Trustees of the | | | | |
| University of Pennsylvania) | 5.000% | 9/1/29 | 1,600 | 1,881 |
| Pennsylvania Higher Educational Facilities | | | | |
| Authority Revenue (Trustees of the | | | | |
| University of Pennsylvania) | 5.000% | 9/1/30 | 2,260 | 2,646 |
| Pennsylvania Higher Educational Facilities | | | | |
| Authority Revenue (Trustees of the | | | | |
| University of Pennsylvania) | 5.000% | 9/1/41 | 9,400 | 10,697 |
| Pennsylvania Higher Educational Facilities | | | | |
| Authority Revenue (University of Pennsylvania | | | | |
| Health System) | 5.000% | 8/15/24 | 1,250 | 1,445 |
| Pennsylvania Higher Educational Facilities | | | | |
| Authority Revenue (University of Pennsylvania | | | | |
| Health System) | 5.250% | 8/15/25 | 2,500 | 2,921 |
| Pennsylvania Higher Educational Facilities | | | | |
| Authority Revenue (University of Pennsylvania | | | | |
| Health System) | 5.000% | 8/15/30 | 3,055 | 3,482 |
| Pennsylvania Higher Educational Facilities | | | | |
| Authority Revenue (University of Pennsylvania | | | | |
| Health System) | 5.000% | 8/15/31 | 3,860 | 4,381 |
| Pennsylvania Higher Educational Facilities | | | | |
| Authority Revenue (University of Pennsylvania | | | | |
| Health System) | 5.000% | 8/15/32 | 2,000 | 2,261 |
| Pennsylvania Higher Educational Facilities | | | | |
| Authority Revenue (University of Pennsylvania | | | | |
| Health System) | 5.750% | 8/15/41 | 4,000 | 4,618 |
| Pennsylvania Higher Educational Facilities | | | | |
| Authority Revenue (University of Pennsylvania | | | | |
| Health System) | 5.000% | 8/15/42 | 4,195 | 4,599 |
| Pennsylvania Higher Educational Facilities | | | | |
| Authority Revenue (University of Pennsylvania | | | | |
| Health System) VRDO | 0.160% | 6/7/12 | 8,700 | 8,700 |
38
Pennsylvania Long-Term Tax-Exempt Fund
| | | | |
| | | | Face | Market |
| | | Maturity | Amount | Value |
| | Coupon | Date | ($000) | ($000) |
| Pennsylvania Higher Educational Facilities | | | | |
| Authority Revenue (University of Pittsburgh | | | | |
| Medical Center) | 5.000% | 5/15/18 | 1,375 | 1,629 |
| Pennsylvania Higher Educational Facilities | | | | |
| Authority Revenue (University of Scranton) | 5.000% | 11/1/28 (10) | 4,080 | 4,328 |
| Pennsylvania Higher Educational Facilities | | | | |
| Authority Revenue (University of the Sciences) | 5.000% | 11/1/25 (12) | 2,285 | 2,565 |
| Pennsylvania Higher Educational Facilities | | | | |
| Authority Revenue (University of the Sciences) | 5.000% | 11/1/27 (12) | 1,800 | 1,994 |
| Pennsylvania Higher Educational Facilities | | | | |
| Authority Revenue (University of the Sciences) | 5.000% | 11/1/37 (12) | 5,745 | 6,171 |
| Pennsylvania Higher Educational Facilities | | | | |
| Authority Revenue (Widener University) | 5.000% | 7/15/20 | 2,360 | 2,439 |
| Pennsylvania Higher Educational Facilities | | | | |
| Authority Revenue (Widener University) | 5.000% | 7/15/26 | 1,200 | 1,247 |
| Pennsylvania Higher Educational Facilities | | | | |
| Authority Revenue (Widener University) | 5.400% | 7/15/36 | 3,000 | 3,113 |
| Pennsylvania Higher Educational Facilities | | | | |
| Authority Student Housing Revenue | | | | |
| (University Properties Inc.) | 6.000% | 7/1/21 | 1,000 | 1,152 |
| Pennsylvania Higher Educational Facilities | | | | |
| Authority Student Housing Revenue | | | | |
| (University Properties Inc.) | 5.000% | 7/1/31 | 3,000 | 3,115 |
| Pennsylvania Higher Educational Facilities | | | | |
| Authority Student Housing Revenue | | | | |
| (University Properties Inc.) | 5.000% | 7/1/42 | 2,500 | 2,555 |
| Pennsylvania Housing Finance Agency | | | | |
| Single Family Mortgage Revenue | 4.125% | 10/1/25 | 1,500 | 1,584 |
| Pennsylvania Housing Finance Agency | | | | |
| Single Family Mortgage Revenue | 5.000% | 10/1/25 | 2,000 | 2,213 |
| Pennsylvania Housing Finance Agency | | | | |
| Single Family Mortgage Revenue | 4.500% | 10/1/30 | 1,500 | 1,571 |
| Pennsylvania Housing Finance Agency | | | | |
| Single Family Mortgage Revenue | 4.750% | 10/1/39 | 4,075 | 4,157 |
| Pennsylvania Industrial Development Authority | | | | |
| Economic Development Revenue | 5.500% | 7/1/12 (Prere.) | 575 | 583 |
| Pennsylvania Industrial Development Authority | | | | |
| Economic Development Revenue | 5.500% | 7/1/17 (2) | 7,000 | 7,097 |
| Pennsylvania Industrial Development Authority | | | | |
| Economic Development Revenue | 5.500% | 7/1/18 (Prere.) | 2,470 | 3,119 |
| Pennsylvania Industrial Development Authority | | | | |
| Economic Development Revenue | 5.500% | 7/1/18 (2) | 7,630 | 7,735 |
| Pennsylvania Industrial Development Authority | | | | |
| Economic Development Revenue | 5.500% | 7/1/19 (2) | 10,040 | 10,176 |
| Pennsylvania Industrial Development Authority | | | | |
| Economic Development Revenue | 5.500% | 7/1/20 (2) | 4,495 | 4,555 |
| Pennsylvania Industrial Development Authority | | | | |
| Economic Development Revenue | 5.000% | 7/1/21 | 3,000 | 3,632 |
| Pennsylvania Industrial Development Authority | | | | |
| Economic Development Revenue | 5.500% | 7/1/21 (2) | 8,130 | 8,239 |
| Pennsylvania Industrial Development Authority | | | | |
| Economic Development Revenue | 5.500% | 7/1/23 | 17,530 | 20,394 |
| Pennsylvania Intergovernmental Cooperation | | | | |
| Authority Special Tax Revenue | | | | |
| (Philadelphia Funding Program) | 5.000% | 6/15/20 | 6,000 | 7,452 |
39
Pennsylvania Long-Term Tax-Exempt Fund
| | | | |
| | | | Face | Market |
| | | Maturity | Amount | Value |
| | Coupon | Date | ($000) | ($000) |
| Pennsylvania Intergovernmental Cooperation | | | | |
| Authority Special Tax Revenue | | | | |
| (Philadelphia Funding Program) | 5.000% | 6/15/21 | 2,000 | 2,442 |
| Pennsylvania Intergovernmental Cooperation | | | | |
| Authority Special Tax Revenue | | | | |
| (Philadelphia Funding Program) | 5.000% | 6/15/22 | 3,230 | 3,896 |
| Pennsylvania Public School Building Authority | | | | |
| Lease Revenue (School District of Philadelphia) | 5.000% | 6/1/27 (4) | 12,880 | 13,840 |
| Pennsylvania Public School Building Authority | | | | |
| Lease Revenue (School District of Philadelphia) | 5.000% | 6/1/31 (4) | 18,305 | 19,478 |
| Pennsylvania State University Revenue | 5.250% | 8/15/18 | 1,200 | 1,487 |
| Pennsylvania State University Revenue | 5.000% | 8/15/19 | 920 | 1,101 |
| Pennsylvania State University Revenue | 5.000% | 3/1/20 | 1,930 | 2,349 |
| Pennsylvania State University Revenue | 5.000% | 3/1/22 | 1,250 | 1,487 |
| Pennsylvania State University Revenue | 5.000% | 3/1/23 | 2,020 | 2,377 |
| Pennsylvania State University Revenue | 5.250% | 8/15/23 | 2,000 | 2,578 |
| Pennsylvania State University Revenue | 5.000% | 8/15/24 | 2,000 | 2,284 |
| Pennsylvania State University Revenue | 5.000% | 9/1/24 | 10,625 | 11,501 |
| Pennsylvania State University Revenue | 5.000% | 9/1/24 | 3,000 | 3,322 |
| Pennsylvania State University Revenue | 5.250% | 8/15/25 | 5,360 | 7,003 |
| Pennsylvania State University Revenue | 5.000% | 3/1/26 | 4,800 | 5,537 |
| Pennsylvania State University Revenue | 5.000% | 3/1/28 | 1,000 | 1,144 |
| Pennsylvania State University Revenue | 5.000% | 9/1/29 | 7,625 | 8,219 |
| Pennsylvania State University Revenue | 5.000% | 9/1/29 | 2,500 | 2,744 |
| Pennsylvania State University Revenue | 5.000% | 9/1/34 | 6,325 | 6,835 |
| 1 Pennsylvania State University Revenue TOB VRDO | 0.170% | 6/7/12 LOC | 9,500 | 9,500 |
| Pennsylvania State University Revenue VRDO | 0.160% | 6/7/12 | 1,300 | 1,300 |
| Pennsylvania Turnpike Commission | | | | |
| Motor License Fund Revenue | 5.000% | 12/1/41 | 1,000 | 1,106 |
| Pennsylvania Turnpike Commission | | | | |
| Oil Franchise Tax Revenue | 5.000% | 12/1/13 (Prere.) | 6,000 | 6,424 |
| Pennsylvania Turnpike Commission | | | | |
| Oil Franchise Tax Revenue | 5.000% | 12/1/26 (2) | 4,000 | 4,460 |
| Pennsylvania Turnpike Commission | | | | |
| Oil Franchise Tax Revenue | 5.000% | 12/1/27 (2) | 3,000 | 3,333 |
| Pennsylvania Turnpike Commission Revenue | 3.000% | 6/1/12 (12) | 2,015 | 2,015 |
| Pennsylvania Turnpike Commission Revenue | 3.000% | 6/1/13 (12) | 2,500 | 2,563 |
| Pennsylvania Turnpike Commission Revenue | 4.000% | 6/1/14 (12) | 1,565 | 1,669 |
| Pennsylvania Turnpike Commission Revenue | 5.000% | 12/1/20 | 11,375 | 13,681 |
| Pennsylvania Turnpike Commission Revenue | 5.000% | 12/1/24 | 1,000 | 1,179 |
| Pennsylvania Turnpike Commission Revenue | 5.000% | 12/1/25 | 16,665 | 19,086 |
| Pennsylvania Turnpike Commission Revenue | 5.250% | 7/15/27 (4) | 4,000 | 5,026 |
| Pennsylvania Turnpike Commission Revenue | 5.375% | 6/1/28 | 12,785 | 14,101 |
| Pennsylvania Turnpike Commission Revenue | 5.250% | 7/15/28 (4) | 9,375 | 11,821 |
| Pennsylvania Turnpike Commission Revenue | 5.000% | 12/1/30 | 3,400 | 3,874 |
| Pennsylvania Turnpike Commission Revenue | 5.000% | 12/1/30 | 4,600 | 5,197 |
| Pennsylvania Turnpike Commission Revenue | 5.500% | 12/1/31 (2) | 17,610 | 19,237 |
| Pennsylvania Turnpike Commission Revenue | 5.250% | 12/1/32 (2) | 16,000 | 17,381 |
| Pennsylvania Turnpike Commission Revenue | 5.500% | 6/1/33 | 17,920 | 19,753 |
| Pennsylvania Turnpike Commission Revenue | 5.250% | 6/1/36 | 12,435 | 13,353 |
| Pennsylvania Turnpike Commission Revenue | 6.000% | 12/1/36 | 2,500 | 3,040 |
| Pennsylvania Turnpike Commission Revenue | 6.500% | 12/1/36 | 3,000 | 3,620 |
| Pennsylvania Turnpike Commission Revenue | 5.000% | 12/1/37 | 5,000 | 5,563 |
| Pennsylvania Turnpike Commission Revenue | 5.000% | 12/1/37 | 8,650 | 9,235 |
| Pennsylvania Turnpike Commission Revenue | 6.250% | 6/1/38 (12) | 21,595 | 26,108 |
| Pennsylvania Turnpike Commission Revenue | 5.000% | 12/1/38 | 7,500 | 8,190 |
40
Pennsylvania Long-Term Tax-Exempt Fund
| | | | |
| | | | Face | Market |
| | | Maturity | Amount | Value |
| | Coupon | Date | ($000) | ($000) |
| Pennsylvania Turnpike Commission Revenue | 5.000% | 6/1/39 (12) | 18,000 | 19,340 |
| Pennsylvania Turnpike Commission Revenue | 5.250% | 6/1/39 | 35,750 | 38,636 |
| Pennsylvania Turnpike Commission Revenue | 5.750% | 6/1/39 | 23,000 | 25,764 |
| Pennsylvania Turnpike Commission Revenue | 5.000% | 12/1/40 | 7,500 | 8,025 |
| Pennsylvania Turnpike Commission Revenue | 5.300% | 12/1/41 | 22,000 | 23,938 |
| Pennsylvania Turnpike Commission Revenue | 5.000% | 12/1/42 | 5,000 | 5,517 |
| 1 Pennsylvania Turnpike Commission Revenue | | | | |
| TOB VRDO | 0.250% | 6/7/12 | 9,000 | 9,000 |
| Pennsylvania Turnpike Commission Revenue | | | | |
| VRDO | 0.190% | 6/7/12 | 5,200 | 5,200 |
| Philadelphia Authority for Industrial Development | | | | |
| (Chestnut Hill College Project) VRDO | 0.180% | 6/7/12 LOC | 4,410 | 4,410 |
| Philadelphia PA Airport Parking Authority Revenue | 5.000% | 9/1/13 | 3,260 | 3,416 |
| Philadelphia PA Airport Parking Authority Revenue | 5.125% | 2/15/24 (2) | 1,045 | 1,047 |
| Philadelphia PA Airport Parking Authority Revenue | 5.250% | 9/1/24 | 4,025 | 4,576 |
| Philadelphia PA Airport Parking Authority Revenue | 5.125% | 9/1/29 | 5,975 | 6,549 |
| Philadelphia PA Airport Revenue | 5.000% | 6/15/17 | 1,000 | 1,153 |
| Philadelphia PA Airport Revenue | 5.000% | 6/15/19 | 3,120 | 3,691 |
| Philadelphia PA Airport Revenue | 5.000% | 6/15/20 | 4,670 | 5,539 |
| Philadelphia PA Airport Revenue | 5.000% | 6/15/23 | 3,000 | 3,445 |
| Philadelphia PA Airport Revenue | 5.000% | 6/15/24 | 5,000 | 5,690 |
| Philadelphia PA Airport Revenue | 5.000% | 6/15/25 | 8,505 | 9,613 |
| Philadelphia PA Gas Works Revenue | 5.375% | 7/1/15 (4) | 3,000 | 3,327 |
| Philadelphia PA Gas Works Revenue | 5.375% | 7/1/16 (4) | 13,280 | 15,054 |
| Philadelphia PA Gas Works Revenue | 5.000% | 8/1/16 | 3,000 | 3,352 |
| Philadelphia PA Gas Works Revenue | 5.250% | 8/1/17 | 2,000 | 2,276 |
| Philadelphia PA Gas Works Revenue | 5.375% | 7/1/18 (4) | 11,555 | 13,254 |
| Philadelphia PA Gas Works Revenue | 5.000% | 10/1/37 (2) | 3,000 | 3,080 |
| Philadelphia PA Gas Works Revenue VRDO | 0.150% | 6/7/12 LOC | 1,000 | 1,000 |
| Philadelphia PA GO | 5.000% | 12/15/17 (4) | 5,555 | 6,490 |
| Philadelphia PA GO | 5.000% | 8/1/18 (14) | 6,170 | 6,734 |
| Philadelphia PA GO | 5.000% | 8/1/19 (14) | 7,735 | 8,397 |
| Philadelphia PA GO | 5.000% | 8/1/20 (14) | 8,005 | 8,589 |
| Philadelphia PA GO | 5.000% | 8/1/21 (14) | 6,235 | 6,653 |
| Philadelphia PA GO | 5.875% | 8/1/31 | 800 | 868 |
| Philadelphia PA GO | 6.000% | 8/1/36 | 7,430 | 8,630 |
| Philadelphia PA GO | 7.125% | 7/15/38 (12) | 3,500 | 4,010 |
| Philadelphia PA GO | 6.500% | 8/1/41 | 3,785 | 4,561 |
| Philadelphia PA Hospitals & Higher Education | | | | |
| Facilities Authority Hospital Revenue | | | | |
| (Children’s Hospital of Philadelphia Project) | 5.000% | 7/1/32 | 19,440 | 22,097 |
| Philadelphia PA Hospitals & Higher Education | | | | |
| Facilities Authority Hospital Revenue | | | | |
| (Children’s Hospital of Philadelphia Project) | 5.000% | 7/1/41 | 2,500 | 2,725 |
| Philadelphia PA Hospitals & Higher Education | | | | |
| Facilities Authority Hospital Revenue | | | | |
| (Children’s Hospital of Philadelphia Project) VRDO | 0.200% | 6/1/12 | 1,340 | 1,340 |
| Philadelphia PA Hospitals & Higher Education | | | | |
| Facilities Authority Hospital Revenue | | | | |
| (Children’s Hospital of Philadelphia Project) VRDO | 0.200% | 6/1/12 | 18,600 | 18,600 |
| Philadelphia PA Hospitals & Higher Education | | | | |
| Facilities Authority Hospital Revenue | | | | |
| (Children’s Hospital of Philadelphia Project) VRDO | 0.200% | 6/1/12 | 12,200 | 12,200 |
| Philadelphia PA Hospitals & Higher Education | | | | |
| Facilities Authority Hospital Revenue (Temple | | | | |
| University Health System Obligated Group) | 5.500% | 7/1/30 | 5,000 | 5,111 |
41
Pennsylvania Long-Term Tax-Exempt Fund
| | | | |
| | | | Face | Market |
| | | Maturity | Amount | Value |
| | Coupon | Date | ($000) | ($000) |
| Philadelphia PA Industrial Development | | | | |
| Authority Lease Revenue VRDO | 0.180% | 6/7/12 LOC | 19,300 | 19,300 |
| Philadelphia PA Municipal Authority Revenue | 6.500% | 4/1/34 | 3,250 | 3,626 |
| Philadelphia PA Municipal Authority Revenue | 6.500% | 4/1/39 | 9,500 | 10,552 |
| Philadelphia PA School District GO | 5.625% | 8/1/12 (Prere.) | 3,500 | 3,531 |
| Philadelphia PA School District GO | 5.625% | 8/1/12 (Prere.) | 1,000 | 1,009 |
| Philadelphia PA School District GO | 5.625% | 8/1/12 (Prere.) | 1,000 | 1,009 |
| Philadelphia PA School District GO | 5.000% | 9/1/18 | 2,845 | 3,263 |
| Philadelphia PA School District GO | 5.000% | 9/1/19 | 2,120 | 2,443 |
| Philadelphia PA School District GO | 5.250% | 9/1/22 | 7,500 | 8,727 |
| Philadelphia PA School District GO | 5.250% | 9/1/23 | 7,500 | 8,677 |
| Philadelphia PA School District GO | 5.000% | 6/1/26 (14) | 5,000 | 5,921 |
| Philadelphia PA School District GO | 6.000% | 9/1/38 | 20,000 | 22,832 |
| Philadelphia PA Water & Waste Water Revenue | 5.250% | 11/1/12 (Prere.) | 5,040 | 5,145 |
| Philadelphia PA Water & Waste Water Revenue | 5.250% | 11/1/12 (Prere.) | 5,460 | 5,574 |
| Philadelphia PA Water & Waste Water Revenue | 5.375% | 11/1/12 (Prere.) | 4,155 | 4,244 |
| Philadelphia PA Water & Waste Water Revenue | 5.000% | 6/15/16 | 10,000 | 11,455 |
| Philadelphia PA Water & Waste Water Revenue | 5.600% | 8/1/18 (ETM) | 925 | 1,139 |
| Philadelphia PA Water & Waste Water Revenue | 5.250% | 1/1/32 | 5,000 | 5,480 |
| Philadelphia PA Water & Waste Water Revenue | 5.000% | 8/1/35 (4) | 7,000 | 7,750 |
| Philadelphia PA Water & Waste Water Revenue | 5.000% | 1/1/36 | 10,500 | 11,463 |
| Philadelphia PA Water & Waste Water Revenue | 5.250% | 1/1/36 | 9,975 | 10,859 |
| Philadelphia PA Water & Waste Water Revenue | 5.000% | 8/1/40 (4) | 7,000 | 7,683 |
| Philadelphia PA Water & Waste Water Revenue | 5.000% | 1/1/41 | 3,000 | 3,257 |
| Pittsburgh PA GO | 5.500% | 9/1/14 (2) | 6,475 | 6,729 |
| Pittsburgh PA School District GO | 5.375% | 9/1/14 (4) | 1,755 | 1,927 |
| Pittsburgh PA School District GO | 5.500% | 9/1/16 (4) | 4,000 | 4,684 |
| Pittsburgh PA School District GO | 5.500% | 9/1/18 (4) | 2,880 | 3,509 |
| Pittsburgh PA School District GO | 5.000% | 9/1/23 | 1,630 | 1,951 |
| Pittsburgh PA School District GO | 5.000% | 9/1/24 | 1,000 | 1,182 |
| Pittsburgh PA Water & Sewer Authority Revenue | 5.125% | 6/1/12 (Prere.) | 3,000 | 3,000 |
| Pittsburgh PA Water & Sewer Authority Revenue | 7.250% | 9/1/14 (ETM) | 9,450 | 10,214 |
| Pittsburgh PA Water & Sewer Authority Revenue | 0.000% | 9/1/27 (ETM) | 1,935 | 1,244 |
| Pittsburgh PA Water & Sewer Authority Revenue | 0.000% | 9/1/27 (14) | 10,830 | 5,389 |
| Pittsburgh PA Water & Sewer Authority Revenue | 0.000% | 9/1/28 (ETM) | 1,365 | 839 |
| Pittsburgh PA Water & Sewer Authority Revenue | 0.000% | 9/1/29 (14) | 20,000 | 8,869 |
| Pocono Mountain PA School District GO | 5.000% | 9/1/31 (4) | 3,000 | 3,205 |
| Radnor Township PA School District GO | 5.000% | 8/15/15 (Prere.) | 835 | 955 |
| Radnor Township PA School District GO | 5.000% | 2/15/35 (4) | 1,665 | 1,823 |
| Reading PA Area Water Authority Revenue | 5.000% | 12/1/31 | 1,000 | 1,097 |
| Reading PA Area Water Authority Revenue | 5.250% | 12/1/36 | 1,000 | 1,096 |
| Reading PA School District GO | 5.000% | 1/15/29 (4) | 5,000 | 5,339 |
| Scranton PA School District GO | 5.250% | 6/15/27 (10) | 2,750 | 2,983 |
| Scranton PA School District GO | 5.250% | 6/15/31 (10) | 2,375 | 2,552 |
| Scranton-Lackawanna PA Health & Welfare | | | | |
| Authority Revenue (University of Scranton) | 5.000% | 11/1/32 (10) | 3,850 | 4,156 |
| Shamokin-Coal Township PA Joint Sewer | | | | |
| Authority Sewer Revenue | 5.000% | 7/1/30 (4) | 5,340 | 5,676 |
| Shamokin-Coal Township PA Joint Sewer | | | | |
| Authority Sewer Revenue | 5.000% | 7/1/36 (4) | 6,500 | 6,830 |
| Snyder County PA Higher Education Authority | | | | |
| University Revenue | | | | |
| (Susquehanna University Project) | 5.000% | 1/1/30 (11) | 5,000 | 5,256 |
| Somerset PA Area School District GO | 5.000% | 3/15/25 (4) | 7,090 | 7,812 |
| South Fork PA Hospital Authority Hospital Revenue | | | | |
| (Conemaugh Valley Memorial Hospital Project) | 5.750% | 7/1/18 (6) | 6,285 | 6,691 |
42
Pennsylvania Long-Term Tax-Exempt Fund
| | | | |
| | | | Face | Market |
| | | Maturity | Amount | Value |
| | Coupon | Date | ($000) | ($000) |
| Southcentral Pennsylvania General Authority | | | | |
| Revenue (WellSpan Health Obligated Group) | 6.000% | 6/1/25 | 20,000 | 23,198 |
| Southeastern Pennsylvania Transportation | | | | |
| Authority Revenue | 5.000% | 3/1/27 | 6,100 | 6,929 |
| Southeastern Pennsylvania Transportation | | | | |
| Authority Revenue | 5.000% | 3/1/28 | 5,000 | 5,650 |
| State Public School Building Authority | | | | |
| Pennsylvania School Revenue | | | | |
| (Philadelphia School District Project) | 5.250% | 6/1/13 (Prere.) | 9,280 | 9,740 |
| Swarthmore Borough Authority | | | | |
| PA College Revenue | 5.000% | 9/15/30 | 21,000 | 23,706 |
| Union County PA Higher Educational Facilities | | | | |
| Financing Authority University Revenue | | | | |
| (Bucknell University) | 5.000% | 4/1/37 | 2,245 | 2,565 |
| Union County PA Higher Educational Facilities | | | | |
| Financing Authority University Revenue | | | | |
| (Bucknell University) | 5.000% | 4/1/42 | 2,000 | 2,276 |
| Unionville-Chadds Ford PA School District GO | 5.000% | 6/1/32 | 6,440 | 7,304 |
| University of Pittsburgh of the Commonwealth | | | | |
| System of Higher Education Pennsylvania | | | | |
| Revenue (University Capital Project) | 5.500% | 9/15/24 | 3,000 | 3,690 |
| University of Pittsburgh of the Commonwealth | | | | |
| System of Higher Education Pennsylvania | | | | |
| Revenue (University Capital Project) | 5.250% | 9/15/29 | 14,000 | 16,408 |
| University of Pittsburgh of the Commonwealth | | | | |
| System of Higher Education Pennsylvania | | | | |
| Revenue (University Capital Project) | 5.250% | 9/15/34 | 10,100 | 11,549 |
| Washington County PA Hospital Authority | | | | |
| Revenue (Washington Hospital Project) | 5.125% | 7/1/12 (2) | 1,935 | 1,940 |
| Washington County PA Hospital Authority | | | | |
| Revenue (Washington Hospital Project) | 5.250% | 7/1/13 (2) | 2,035 | 2,096 |
| Washington County PA Hospital Authority | | | | |
| Revenue (Washington Hospital Project) | 5.375% | 7/1/14 (2) | 1,640 | 1,733 |
| Washington County PA Hospital Authority | | | | |
| Revenue (Washington Hospital Project) | 5.375% | 7/1/15 (2) | 2,250 | 2,429 |
| Washington County PA Hospital Authority | | | | |
| Revenue (Washington Hospital Project) | 5.500% | 7/1/16 (2) | 2,375 | 2,625 |
| West Chester PA Area School District GO | 5.000% | 5/15/28 (14) | 7,480 | 8,294 |
| Westmoreland County PA Industrial Development | | | | |
| Authority Revenue (Excela Health Project) | 5.125% | 7/1/30 | 1,200 | 1,264 |
| Westmoreland County PA Municipal | | | | |
| Authority Revenue | 5.250% | 8/15/15 (Prere.) | 3,490 | 4,018 |
| Westmoreland County PA Municipal | | | | |
| Authority Revenue | 6.125% | 7/1/17 (ETM) | 6,390 | 7,335 |
| Westmoreland County PA Municipal | | | | |
| Authority Service Water Revenue | 0.000% | 8/15/15 (3) | 5,000 | 4,790 |
| Westmoreland County PA Municipal | | | | |
| Authority Service Water Revenue | 0.000% | 8/15/23 (14) | 5,000 | 3,491 |
| Westmoreland County PA Municipal | | | | |
| Authority Service Water Revenue | 0.000% | 8/15/24 (14) | 4,000 | 2,665 |
| Wilkes-Barre PA Finance Authority College | | | | |
| Revenue (King’s College Project) VRDO | 0.180% | 6/7/12 LOC | 2,645 | 2,645 |
| Wilkes-Barre PA Finance Authority Revenue | | | | |
| (University of Scranton Project) | 5.000% | 11/1/35 | 1,010 | 1,106 |
| Wilkes-Barre PA Finance Authority Revenue | | | | |
| (University of Scranton Project) | 5.000% | 11/1/40 | 4,990 | 5,421 |
43
Pennsylvania Long-Term Tax-Exempt Fund
| | | | |
| | | | Face | Market |
| | | Maturity | Amount | Value |
| | Coupon | Date | ($000) | ($000) |
| Wilkes-Barre PA Finance Authority Revenue | | | | |
| (Wilkes University Project) | 5.000% | 3/1/27 | 2,200 | 2,265 |
| Wilkes-Barre PA Finance Authority Revenue | | | | |
| (Wilkes University Project) | 5.000% | 3/1/37 | 3,000 | 3,029 |
| Wyoming PA Area School District GO | 5.000% | 9/1/26 (14) | 2,000 | 2,147 |
| Wyoming PA Area School District GO | 5.000% | 9/1/29 (14) | 5,020 | 5,342 |
| York County PA GO | 5.000% | 6/1/33 (14) | 6,000 | 6,610 |
| York County PA Solid Waste & Refuse | | | | |
| Authority Revenue | 5.500% | 12/1/13 (14) | 6,750 | 7,239 |
| York County PA Solid Waste & Refuse | | | | |
| Authority Revenue | 5.500% | 12/1/14 (14) | 4,050 | 4,512 |
| | | | | 3,087,639 |
| Puerto Rico (1.9%) | | | | |
| Puerto Rico Electric Power Authority Revenue | 5.500% | 7/1/20 | 5,300 | 6,213 |
| Puerto Rico Electric Power Authority Revenue | 5.250% | 7/1/21 (14) | 5,000 | 5,760 |
| Puerto Rico Highway & Transportation | | | | |
| Authority Revenue | 5.500% | 7/1/19 (ETM) | 13,120 | 16,883 |
| Puerto Rico Highway & Transportation | | | | |
| Authority Revenue | 5.500% | 7/1/19 (14) | 2,880 | 3,306 |
| Puerto Rico Infrastructure Financing | | | | |
| Authority Special Tax Revenue | 5.500% | 7/1/23 (2) | 10,000 | 11,337 |
| Puerto Rico Infrastructure Financing | | | | |
| Authority Special Tax Revenue | 0.000% | 7/1/30 (3) | 14,905 | 5,643 |
| Puerto Rico Infrastructure Financing | | | | |
| Authority Special Tax Revenue | 0.000% | 7/1/31 (3) | 28,695 | 10,095 |
| Puerto Rico Public Buildings Authority | | | | |
| Government Facilities Revenue | 5.750% | 7/1/22 (ETM) | 10 | 13 |
| | | | | 59,250 |
| Virgin Islands (0.1%) | | | | |
| Virgin Islands Public Finance Authority Revenue | 5.000% | 10/1/12 | 2,000 | 2,021 |
| Virgin Islands Public Finance Authority Revenue | 5.250% | 10/1/20 | 1,750 | 1,860 |
| | | | | 3,881 |
| Total Tax-Exempt Municipal Bonds (Cost $2,945,312) | | | | 3,150,770 |
| Other Assets and Liabilities (0.2%) | | | | |
| Other Assets | | | | 46,396 |
| Liabilities | | | | (41,433) |
| | | | | 4,963 |
| Net Assets (100%) | | | | 3,155,733 |
44
Pennsylvania Long-Term Tax-Exempt Fund
| |
| At May 31, 2012, net assets consisted of: | |
| | Amount |
| | ($000) |
| Paid-in Capital | 2,963,584 |
| Undistributed Net Investment Income | — |
| Accumulated Net Realized Losses | (13,309) |
| Unrealized Appreciation (Depreciation) | 205,458 |
| Net Assets | 3,155,733 |
| |
| Investor Shares—Net Assets | |
| Applicable to 43,209,240 outstanding $.001 par value shares of | |
| beneficial interest (unlimited authorization) | 502,516 |
| Net Asset Value Per Share—Investor Shares | $11.63 |
| |
| Admiral Shares—Net Assets | |
| Applicable to 228,138,843 outstanding $.001 par value shares of | |
| beneficial interest (unlimited authorization) | 2,653,217 |
| Net Asset Value Per Share—Admiral Shares | $11.63 |
See Note A in Notes to Financial Statements.
1 Security exempt from registration under Rule 144A of the Securities Act of 1933. Such securities may be sold in transactions exempt from registration, normally to qualified instittional buyers. At May 31, 2012, the aggregate value of these securities was $32,445,000, representing 1.0% of net assets.
A key to abbreviations and other references follows the Statement of Net Assets.
See accompanying Notes, which are an integral part of the Financial Statements.
45
Pennsylvania Long-Term Tax-Exempt Fund
Key to Abbreviations
ARS—Auction Rate Security.
BAN—Bond Anticipation Note.
COP—Certificate of Participation.
CP—Commercial Paper.
FR—Floating Rate.
GAN—Grant Anticipation Note.
GO—General Obligation Bond.
PUT—Put Option Obligation.
RAN—Revenue Anticipation Note.
TAN—Tax Anticipation Note.
TOB—Tender Option Bond.
TRAN—Tax Revenue Anticipation Note.
VRDO—Variable Rate Demand Obligation.
VRDP—Variable Rate Demand Preferred.
(ETM)—Escrowed to Maturity.
(Prere.)—Prerefunded.
Scheduled principal and interest payments are guaranteed by:
(1) MBIA (Municipal Bond Investors Assurance).
(2) AMBAC (Ambac Assurance Corporation).
(3) FGIC (Financial Guaranty Insurance Company).
(4) AGM (Assured Guaranty Municipal Corporation).
(5) BIGI (Bond Investors Guaranty Insurance).
(6) Connie Lee Inc.
(7) FHA (Federal Housing Authority).
(8) CapMAC (Capital Markets Assurance Corporation).
(9) American Capital Access Financial Guaranty Corporation.
(10) XL Capital Assurance Inc.
(11) CIFG (CDC IXIS Financial Guaranty).
(12) Assured Guaranty Corporation.
(13) Berkshire Hathaway Assurance Corporation.
(14) National Public Finance Guarantee Corporation.
The insurance does not guarantee the market value of the municipal bonds.
LOC—Scheduled principal and interest payments are guaranteed by bank letter of credit.
46
Pennsylvania Long-Term Tax-Exempt Fund
| |
| Statement of Operations | |
| |
| | Six Months Ended |
| | May 31, 2012 |
| | ($000) |
| Investment Income | |
| Income | |
| Interest | 59,443 |
| Total Income | 59,443 |
| Expenses | |
| The Vanguard Group—Note B | |
| Investment Advisory Services | 91 |
| Management and Administrative—Investor Shares | 389 |
| Management and Administrative—Admiral Shares | 1,185 |
| Marketing and Distribution—Investor Shares | 74 |
| Marketing and Distribution—Admiral Shares | 268 |
| Custodian Fees | 19 |
| Shareholders’ Reports—Investor Shares | 7 |
| Shareholders’ Reports—Admiral Shares | 4 |
| Trustees’ Fees and Expenses | 1 |
| Total Expenses | 2,038 |
| Net Investment Income | 57,405 |
| Realized Net Gain (Loss) | |
| Investment Securities Sold | 8,836 |
| Futures Contracts | (81) |
| Realized Net Gain (Loss) | 8,755 |
| Change in Unrealized Appreciation (Depreciation) of Investment Securities | 105,369 |
| Net Increase (Decrease) in Net Assets Resulting from Operations | 171,529 |
See accompanying Notes, which are an integral part of the Financial Statements.
47
Pennsylvania Long-Term Tax-Exempt Fund
| | |
| Statement of Changes in Net Assets | | |
| |
| | Six Months Ended | Year Ended |
| | May 31, | November 30, |
| | 2012 | 2011 |
| | ($000) | ($000) |
| Increase (Decrease) in Net Assets | | |
| Operations | | |
| Net Investment Income | 57,405 | 116,071 |
| Realized Net Gain (Loss) | 8,755 | (4,285) |
| Change in Unrealized Appreciation (Depreciation) | 105,369 | 54,300 |
| Net Increase (Decrease) in Net Assets Resulting from Operations | 171,529 | 166,086 |
| Distributions | | |
| Net Investment Income | | |
| Investor Shares | (8,943) | (18,677) |
| Admiral Shares | (48,462) | (97,394) |
| Realized Capital Gain | | |
| Investor Shares | — | — |
| Admiral Shares | — | — |
| Total Distributions | (57,405) | (116,071) |
| Capital Share Transactions | | |
| Investor Shares | 14,822 | (75,104) |
| Admiral Shares | 91,969 | (44,731) |
| Net Increase (Decrease) from Capital Share Transactions | 106,791 | (119,835) |
| Total Increase (Decrease) | 220,915 | (69,820) |
| Net Assets | | |
| Beginning of Period | 2,934,818 | 3,004,638 |
| End of Period | 3,155,733 | 2,934,818 |
See accompanying Notes, which are an integral part of the Financial Statements.
48
Pennsylvania Long-Term Tax-Exempt Fund
Financial Highlights
| | | | | | |
| Investor Shares | | | | | | |
| Six Months | | | | | |
| | Ended | | | | | |
| For a Share Outstanding | May 31, | | | Year Ended November 30, |
| Throughout Each Period | 2012 | 2011 | 2010 | 2009 | 2008 | 2007 |
| Net Asset Value, Beginning of Period | $11.20 | $10.99 | $10.97 | $10.19 | $11.18 | $11.47 |
| Investment Operations | | | | | | |
| Net Investment Income | .211 | .438 | .446 | .456 | .483 | .505 |
| Net Realized and Unrealized Gain (Loss) | | | | | | |
| on Investments | .430 | .210 | .020 | .780 | (.968) | (.252) |
| Total from Investment Operations | .641 | .648 | .466 | 1.236 | (.485) | .253 |
| Distributions | | | | | | |
| Dividends from Net Investment Income | (.211) | (.438) | (.446) | (.456) | (.483) | (.505) |
| Distributions from Realized Capital Gains | — | — | — | — | (.022) | (.038) |
| Total Distributions | (.211) | (.438) | (.446) | (.456) | (.505) | (.543) |
| Net Asset Value, End of Period | $11.63 | $11.20 | $10.99 | $10.97 | $10.19 | $11.18 |
| |
| Total Return1 | 5.75% | 6.07% | 4.28% | 12.32% | -4.48% | 2.30% |
| |
| Ratios/Supplemental Data | | | | | | |
| Net Assets, End of Period (Millions) | $503 | $470 | $537 | $657 | $593 | $636 |
| Ratio of Total Expenses to | | | | | | |
| Average Net Assets | 0.20% | 0.20% | 0.20% | 0.20% | 0.15% | 0.15% |
| Ratio of Net Investment Income to | | | | | | |
| Average Net Assets | 3.67% | 4.00% | 4.01% | 4.26% | 4.46% | 4.50% |
| Portfolio Turnover Rate | 17% | 9% | 18% | 14% | 24% | 14% |
The expense ratio, net income ratio, and turnover rate for the current period have been annualized.
1 Total returns do not include account service fees that may have applied in the periods shown. Fund prospectuses provide information about any applicable account service fees.
See accompanying Notes, which are an integral part of the Financial Statements.
49
Pennsylvania Long-Term Tax-Exempt Fund
Financial Highlights
| | | | | | |
| Admiral Shares | | | | | | |
| Six Months | | | | | |
| | Ended | | | | | |
| For a Share Outstanding | May 31, | | | Year Ended November 30, |
| Throughout Each Period | 2012 | 2011 | 2010 | 2009 | 2008 | 2007 |
| Net Asset Value, Beginning of Period | $11.20 | $10.99 | $10.97 | $10.19 | $11.18 | $11.47 |
| Investment Operations | | | | | | |
| Net Investment Income | .216 | .447 | .455 | .464 | .491 | .513 |
| Net Realized and Unrealized Gain (Loss) | | | | | | |
| on Investments | .430 | .210 | .020 | .780 | (.968) | (.252) |
| Total from Investment Operations | .646 | .657 | .475 | 1.244 | (.477) | .261 |
| Distributions | | | | | | |
| Dividends from Net Investment Income | (.216) | (.447) | (.455) | (.464) | (.491) | (.513) |
| Distributions from Realized Capital Gains | — | — | — | — | (.022) | (.038) |
| Total Distributions | (.216) | (.447) | (.455) | (.464) | (.513) | (.551) |
| Net Asset Value, End of Period | $11.63 | $11.20 | $10.99 | $10.97 | $10.19 | $11.18 |
| |
| Total Return1 | 5.80% | 6.15% | 4.36% | 12.41% | -4.41% | 2.38% |
| |
| Ratios/Supplemental Data | | | | | | |
| Net Assets, End of Period (Millions) | $2,653 | $2,465 | $2,467 | $2,167 | $1,815 | $1,834 |
| Ratio of Total Expenses to | | | | | | |
| Average Net Assets | 0.12% | 0.12% | 0.12% | 0.12% | 0.08% | 0.08% |
| Ratio of Net Investment Income to | | | | | | |
| Average Net Assets | 3.75% | 4.08% | 4.09% | 4.34% | 4.53% | 4.57% |
| Portfolio Turnover Rate | 17% | 9% | 18% | 14% | 24% | 14% |
The expense ratio, net income ratio, and turnover rate for the current period have been annualized.
1 Total returns do not include account service fees that may have applied in the periods shown. Fund prospectuses provide information about any applicable account service fees.
See accompanying Notes, which are an integral part of the Financial Statements.
50
Pennsylvania Long-Term Tax-Exempt Fund
Notes to Financial Statements
Vanguard Pennsylvania Long-Term Tax-Exempt Fund is registered under the Investment Company Act of 1940 as an open-end investment company, or mutual fund. The fund invests in debt instruments of municipal issuers whose ability to meet their obligations may be affected by economic and political developments in the state. The fund offers two classes of shares: Investor Shares and Admiral Shares. Investor Shares are available to any investor who meets the fund’s minimum purchase requirements. Admiral Shares are designed for investors who meet certain administrative, service, and account-size criteria.
A. The following significant accounting policies conform to generally accepted accounting principles for U.S. mutual funds. The fund consistently follows such policies in preparing its financial statements.
1. Security Valuation: Bonds, and temporary cash investments acquired over 60 days to maturity, are valued using the latest bid prices or using valuations based on a matrix system (which considers such factors as security prices, yields, maturities, and ratings), both as furnished by independent pricing services. Other temporary cash investments are valued at amortized cost, which approximates market value. Securities for which market quotations are not readily available, or whose values have been affected by events occurring before the fund’s pricing time but after the close of the securities’ primary markets, are valued by methods deemed by the board of trustees to represent fair value.
2. Futures Contracts: The fund uses futures contracts to invest in fixed income asset classes with greater efficiency and lower cost than is possible through direct investment, to add value when these instruments are attractively priced, or to adjust sensitivity to changes in interest rates. The primary risks associated with the use of futures contracts are imperfect correlation between changes in market values of bonds held by the fund and the prices of futures contracts, and the possibility of an illiquid market.
Futures contracts are valued based upon their quoted daily settlement prices. The aggregate principal amounts of the contracts are not recorded in the Statement of Net Assets. Fluctuations in the value of the contracts are recorded in the Statement of Net Assets as an asset (liability) and in the Statement of Operations as unrealized appreciation (depreciation) until the contracts are closed, when they are recorded as realized futures gains (losses).
The fund had no open futures contracts at May 31, 2012.
3. Federal Income Taxes: The fund intends to continue to qualify as a regulated investment company and distribute all of its income. Management has analyzed the fund’s tax positions taken for all open federal income tax years (November 30, 2008–2011), and for the period ended May 31, 2012, and has concluded that no provision for federal income tax is required in the fund’s financial statements.
4. Distributions: Distributions from net investment income are declared daily and paid on the first business day of the following month. Annual distributions from realized capital gains, if any, are recorded on the ex-dividend date.
5. Other: Interest income is accrued daily. Premiums and discounts on debt securities purchased are amortized and accreted, respectively, to interest income over the lives of the respective securities. Security transactions are accounted for on the date securities are bought or sold. Costs used to determine realized gains (losses) on the sale of investment securities are those of the specific securities sold.
51
Pennsylvania Long-Term Tax-Exempt Fund
Each class of shares has equal rights as to assets and earnings, except that each class separately bears certain class-specific expenses related to maintenance of shareholder accounts (included in Management and Administrative expenses) and shareholder reporting. Marketing and distribution expenses are allocated to each class of shares based on a method approved by the board of trustees. Income, other non-class-specific expenses, and gains and losses on investments are allocated to each class of shares based on its relative net assets.
B. The Vanguard Group furnishes at cost investment advisory, corporate management, administrative, marketing, and distribution services. The costs of such services are allocated to the fund under methods approved by the board of trustees. The fund has committed to provide up to 0.40% of its net assets in capital contributions to Vanguard. At May 31, 2012, the fund had contributed capital of $456,000 to Vanguard (included in Other Assets), representing 0.00% of the fund’s net assets and 0.18% of Vanguard’s capitalization. The fund’s trustees and officers are also directors and officers of Vanguard.
C. Various inputs may be used to determine the value of the fund’s investments. These inputs are summarized in three broad levels for financial statement purposes. The inputs or methodologies used to value securities are not necessarily an indication of the risk associated with investing in those securities.
Level 1—Quoted prices in active markets for identical securities.
Level 2—Other significant observable inputs (including quoted prices for similar securities, interest rates, prepayment speeds, credit risk, etc.).
Level 3—Significant unobservable inputs (including the fund’s own assumptions used to determine the fair value of investments).
At May 31, 2012, 100% of the market value of the fund’s investments was determined based on Level 2 inputs.
D. Capital gain distributions are determined on a tax basis and may differ from realized capital gains for financial reporting purposes. Differences may be permanent or temporary. Permanent differences are reclassified among capital accounts in the financial statements to reflect their tax character. Temporary differences arise when gains or losses are recognized in different periods for financial statement and tax purposes; these differences will reverse at some time in the future.
The fund’s tax-basis capital gains and losses are determined only at the end of each fiscal year. For tax purposes, at November 30, 2011, the fund had available capital loss carryforwards totaling $14,266,000 to offset future net capital gains of $13,421,000 through November 30, 2016, and $845,000 through November 30, 2019. The fund will use these capital losses to offset net taxable capital gains, if any, realized during the year ending November 30, 2012; should the fund realize net capital losses for the year, the losses will be added to the loss carryforward balance above.
The fund had realized losses totaling $7,798,000 through November 30, 2011, which are deferred for tax purposes and reduce the amount of tax-basis unrealized appreciation on investment securities.
At May 31, 2012, the cost of investment securities for tax purposes was $2,953,110,000. Net unrealized appreciation of investment securities for tax purposes was $197,660,000, consisting of unrealized gains of $201,622,000 on securities that had risen in value since their purchase and $3,962,000 in unrealized losses on securities that had fallen in value since their purchase.
52
Pennsylvania Long-Term Tax-Exempt Fund
E. During the six months ended May 31, 2012, the fund purchased $275,685,000 of investment securities and sold $249,072,000 of investment securities, other than temporary cash investments.
F. Capital share transactions for each class of shares were:
| | | | |
| | Six Months Ended | | Year Ended |
| | | May 31, 2012 | November 30, 2011 |
| | Amount | Shares | Amount | Shares |
| | ($000) | (000) | ($000) | (000) |
| Investor Shares | | | | |
| Issued | 68,039 | 5,918 | 103,853 | 9,489 |
| Issued in Lieu of Cash Distributions | 6,364 | 552 | 13,556 | 1,239 |
| Redeemed | (59,581) | (5,202) | (192,513) | (17,693) |
| Net Increase (Decrease)—Investor Shares | 14,822 | 1,268 | (75,104) | (6,965) |
| Admiral Shares | | | | |
| Issued | 178,131 | 15,491 | 297,109 | 27,190 |
| Issued in Lieu of Cash Distributions | 31,454 | 2,726 | 63,345 | 5,791 |
| Redeemed | (117,616) | (10,232) | (405,185) | (37,424) |
| Net Increase (Decrease)—Admiral Shares | 91,969 | 7,985 | (44,731) | (4,443) |
G. In preparing the financial statements as of May 31, 2012, management considered the impact of subsequent events for potential recognition or disclosure in these financial statements.
53
About Your Fund’s Expenses
As a shareholder of the fund, you incur ongoing costs, which include costs for portfolio management, administrative services, and shareholder reports (like this one), among others. Operating expenses, which are deducted from a fund’s gross income, directly reduce the investment return of the fund.
A fund’s expenses are expressed as a percentage of its average net assets. This figure is known as the expense ratio. The following examples are intended to help you understand the ongoing costs (in dollars) of investing in your fund and to compare these costs with those of other mutual funds. The examples are based on an investment of $1,000 made at the beginning of the period shown and held for the entire period.
The accompanying table illustrates your fund’s costs in two ways:
• Based on actual fund return. This section helps you to estimate the actual expenses that you paid over the period. The ”Ending Account Value“ shown is derived from the fund‘s actual return, and the third column shows the dollar amount that would have been paid by an investor who started with $1,000 in the fund. You may use the information here, together with the amount you invested, to estimate the expenses that you paid over the period.
To do so, simply divide your account value by $1,000 (for example, an $8,600 account value divided by $1,000 = 8.6), then multiply the result by the number given for your fund under the heading ”Expenses Paid During Period.“
• Based on hypothetical 5% yearly return. This section is intended to help you compare your fund‘s costs with those of other mutual funds. It assumes that the fund had a yearly return of 5% before expenses, but that the expense ratio is unchanged. In this case—because the return used is not the fund’s actual return—the results do not apply to your investment. The example is useful in making comparisons because the Securities and Exchange Commission requires all mutual funds to calculate expenses based on a 5% return. You can assess your fund’s costs by comparing this hypothetical example with the hypothetical examples that appear in shareholder reports of other funds.
Note that the expenses shown in the table are meant to highlight and help you compare ongoing costs only and do not reflect transaction costs incurred by the fund for buying and selling securities. Further, the expenses do not include any purchase, redemption, or account service fees described in the fund prospectus. If such fees were applied to your account, your costs would be higher. Your fund does not carry a “sales load.”
The calculations assume no shares were bought or sold during the period. Your actual costs may have been higher or lower, depending on the amount of your investment and the timing of any purchases or redemptions.
You can find more information about the fund’s expenses, including annual expense ratios, in the Financial Statements section of this report. For additional information on operating expenses and other shareholder costs, please refer to your fund’s current prospectus.
54
| | | |
| Six Months Ended May 31, 2012 | | | |
| | Beginning | Ending | Expenses |
| | Account Value | Account Value | Paid During |
| | 11/30/2011 | 5/31/2012 | Period |
| Based on Actual Fund Return | | | |
| Pennsylvania Tax-Exempt Money Market Fund | $1,000.00 | $1,000.15 | $0.70 |
| Pennsylvania Long-Term Tax-Exempt Fund | | | |
| Investor Shares | $1,000.00 | $1,057.55 | $1.03 |
| Admiral Shares | 1,000.00 | 1,057.97 | 0.62 |
| Based on Hypothetical 5% Yearly Return | | | |
| Pennsylvania Tax-Exempt Money Market Fund | $1,000.00 | $1,024.30 | $0.71 |
| Pennsylvania Long-Term Tax-Exempt Fund | | | |
| Investor Shares | $1,000.00 | $1,024.00 | $1.01 |
| Admiral Shares | 1,000.00 | 1,024.40 | 0.61 |
The calculations are based on expenses incurred in the most recent six-month period. The funds’ annualized six-month expense ratios for that period are: for the Pennsylvania Tax-Exempt Money Market Fund, 0.14%; and for the Pennsylvania Long-Term Tax-Exempt Fund, 0.20% for Investor Shares and 0.12% for Admiral Shares. (The six-month expense ratio for the Pennsylvania Tax-Exempt Money Market Fund reflects a temporary reduction in operating expenses, described in Note B of the Notes to Financial Statements. Before this reduction, the fund’s annualized six-month expense ratio was 0.16%.) The dollar amounts shown as “Expenses Paid” are equal to the annualized expense ratio multiplied by the average account value over the period, multiplied by the number of days in the most recent six-month period, then divided by the number of days in the most recent 12-month period.
55
Trustees Approve Advisory Arrangement
The board of trustees of Vanguard Pennsylvania Tax-Exempt Money Market Fund and Vanguard Pennsylvania Long-Term Tax-Exempt Fund has renewed each fund’s investment advisory arrangement with The Vanguard Group, Inc. Vanguard—through its Fixed Income Group—serves as the investment advisor for the funds. The board determined that continuing the funds’ internalized management structure was in the best interests of the funds and their shareholders.
The board based its decision upon an evaluation of the advisor’s investment staff, portfolio management process, and performance. The trustees considered the factors discussed below, among others. However, no single factor determined whether the board approved the arrangement. Rather, it was the totality of the circumstances that drove the board’s decision.
Nature, extent, and quality of services
The board considered the quality of the funds’ investment management over both the short and long term, and took into account the organizational depth and stability of the advisor. The board noted that Vanguard has been managing investments for more than three decades. The Fixed Income Group adheres to a sound, disciplined investment management process; the team has considerable experience, stability, and depth.
The board concluded that Vanguard’s experience, stability, depth, and performance, among other factors, warranted continuation of the advisory arrangement.
Investment performance
The board considered the short- and long-term performance of the funds, including any periods of outperformance or underperformance of relevant benchmarks and peer groups. The board concluded that the funds have performed in line with expectations and that their results have been consistent with their investment strategies. Information about the funds’ most recent performance can be found in the Performance Summary sections of this report.
Cost
The board concluded that each fund’s expense ratio was well below the average expense ratio charged by funds in its peer group and that the funds’ advisory fee rates were also well below their peer-group averages. Information about the funds’ expenses appears in the About Your Fund’s Expenses section of this report as well as in the Financial Statements sections.
The board does not conduct a profitability analysis of Vanguard, because of Vanguard’s unique “at-cost” structure. Unlike most other mutual fund management companies, Vanguard is owned by the funds it oversees, and produces “profits” only in the form of reduced expenses for fund shareholders.
The benefit of economies of scale
The board concluded that the funds’ low-cost arrangement with Vanguard ensures that the funds will realize economies of scale as they grow, with the cost to shareholders declining as fund assets increase.
The board will consider whether to renew the advisory arrangement again after a one-year period.
56
Glossary
7-Day SEC Yield and 30-Day SEC Yield. A money market fund’s 7-day SEC yield is calculated by annualizing its income distributions for the previous seven days, as required by the U.S. Securities and Exchange Commission. For other funds, 30-day SEC yield is derived using a formula specified by the commission. Under the formula, data related to the fund’s security holdings in the previous 30 days are used to calculate the fund’s hypothetical net income for that period, which is then annualized and divided by the fund’s estimated average net assets over the calculation period. For the purposes of this calculation, a security’s income is based on its current market yield to maturity (for bonds), its actual income (for asset-backed securities), or its projected dividend yield (for stocks). Because the SEC yield represents hypothetical annualized income, it will differ—at times significantly—from the fund’s actual experience. As a result, the fund’s income distributions may be higher or lower than implied by the SEC yield.
Average Coupon. The average interest rate paid on the fixed income securities held by a fund. It is expressed as a percentage of face value.
Average Duration. An estimate of how much the value of the bonds held by a fund will fluctuate in response to a change in interest rates. To see how the value could change, multiply the average duration by the change in rates. If interest rates rise by 1 percentage point, the value of the bonds in a fund with an average duration of five years would decline by about 5%. If rates decrease by a percentage point, the value would rise by 5%.
Average Effective Maturity. The average length of time until fixed income securities held by a fund reach maturity and are repaid, taking into consideration the possibility that the issuer may call the bond before its maturity date. The figure reflects the proportion of fund assets represented by each security; it also reflects any futures contracts held. In general, the longer the average effective maturity, the more a fund’s share price will fluctuate in response to changes in market interest rates.
Average Weighted Maturity. The average length of time until fixed income securities held by a fund reach maturity and are repaid. The figure reflects the proportion of fund assets represented by each security.
Beta. A measure of the magnitude of a fund’s past share-price fluctuations in relation to the ups and downs of a given market index. The index is assigned a beta of 1.00. Compared with a given index, a fund with a beta of 1.20 typically would have seen its share price rise or fall by 12% when the index rose or fell by 10%. For this report, beta is based on returns over the past 36 months for both the fund and the index. Note that a fund’s beta should be reviewed in conjunction with its R-squared (see definition). The lower the R-squared, the less correlation there is between the fund and the index, and the less reliable beta is as an indicator of volatility.
57
Credit Quality. For Vanguard money market funds, the Distribution by Credit Quality table includes tier ratings for consistency with SEC Rule 2a-7 under the Investment Company Act of 1940, which governs money market funds. A First Tier security is one that is eligible for money market funds and has been rated in the highest short-term rating category for debt obligations by the requisite nationally recognized statistical rating organizations. An unrated security is First Tier if it represents quality comparable to that of a rated security, as determined in accordance with SEC Rule 2a-7. A Second Tier security is one that is eligible for money market funds and is not a First Tier security. For Vanguard tax-exempt bond funds, credit-quality ratings are measured on a scale that generally ranges from AAA (highest) to D (lowest). “Not Rated” is used to classify securities for which a rating is not available. Credit-quality ratings are obtained from Moody’s and S&P, and the higher rating for each issue is used.
Expense Ratio. A fund’s total annual operating expenses expressed as a percentage of the fund’s average net assets. The expense ratio includes management and administrative expenses, but does not include the transaction costs of buying and selling portfolio securities.
Inception Date. The date on which the assets of a fund (or one of its share classes) are first invested in accordance with the fund’s investment objective. For funds with a subscription period, the inception date is the day after that period ends. Investment performance is measured from the inception date.
R-Squared. A measure of how much of a fund’s past returns can be explained by the returns from the market in general, as measured by a given index. If a fund’s total returns were precisely synchronized with an index’s returns, its R-squared would be 1.00. If the fund’s returns bore no relationship to the index’s returns, its R-squared would be 0. For this report, R-squared is based on returns over the past 36 months for both the fund and the index.
Short-Term Reserves. The percentage of a fund invested in highly liquid, short-term securities that can be readily converted to cash.
Yield to Maturity. The rate of return an investor would receive if the fixed income securities held by a fund were held to their maturity dates.
58
This page intentionally left blank.
The People Who Govern Your Fund
The trustees of your mutual fund are there to see that the fund is operated and managed in your best interests since, as a shareholder, you are a part owner of the fund. Your fund’s trustees also serve on the board of directors of The Vanguard Group, Inc., which is owned by the Vanguard funds and provides services to them on an at-cost basis.
A majority of Vanguard’s board members are independent, meaning that they have no affiliation with Vanguard or the funds they oversee, apart from the sizable personal investments they have made as private individuals. The independent board members have distinguished backgrounds in business, academia, and public service. Each of the trustees and executive officers oversees 179 Vanguard funds.
The following table provides information for each trustee and executive officer of the fund. More information about the trustees is in the Statement of Additional Information, which can be obtained, without charge, by contacting Vanguard at 800-662-7447, or online at vanguard.com.
| |
| InterestedTrustee1 | and Delphi Automotive LLP (automotive components); |
| | Senior Advisor at New Mountain Capital; Trustee of |
| F. William McNabb III | The Conference Board. |
| Born 1957. Trustee Since July 2009. Chairman of the | |
| Board. Principal Occupation(s) During the Past Five | Amy Gutmann |
| Years: Chairman of the Board of The Vanguard Group, | Born 1949. Trustee Since June 2006. Principal |
| Inc., and of each of the investment companies served | Occupation(s) During the Past Five Years: President |
| by The Vanguard Group, since January 2010; Director | of the University of Pennsylvania; Christopher H. |
| of The Vanguard Group since 2008; Chief Executive | Browne Distinguished Professor of Political Science |
| Officer and President of The Vanguard Group and of | in the School of Arts and Sciences with secondary |
| each of the investment companies served by The | appointments at the Annenberg School for |
| Vanguard Group since 2008; Director of Vanguard | Communication and the Graduate School of Education |
| Marketing Corporation; Managing Director of The | of the University of Pennsylvania; Member of the |
| Vanguard Group (1995–2008). | National Commission on the Humanities and Social |
| | Sciences; Trustee of Carnegie Corporation of New |
| IndependentTrustees | York and of the National Constitution Center; Chair |
| of the U. S. Presidential Commission for the Study |
| Emerson U. Fullwood | of Bioethical Issues. |
| Born 1948. Trustee Since January 2008. Principal | |
| Occupation(s) During the Past Five Years: Executive | JoAnn Heffernan Heisen |
| Chief Staff and Marketing Officer for North America | Born 1950. Trustee Since July 1998. Principal |
| and Corporate Vice President (retired 2008) of Xerox | Occupation(s) During the Past Five Years: Corporate |
| Corporation (document management products and | Vice President and Chief Global Diversity Officer |
| services); Executive in Residence and 2010 | (retired 2008) and Member of the Executive |
| Distinguished Minett Professor at the Rochester | Committee (1997–2008) of Johnson & Johnson |
| Institute of Technology; Director of SPX Corporation | (pharmaceuticals/medical devices/consumer |
| (multi-industry manufacturing), the United Way of | products); Director of Skytop Lodge Corporation |
| Rochester, Amerigroup Corporation (managed health | (hotels), the University Medical Center at Princeton, |
| care), the University of Rochester Medical Center, | the Robert Wood Johnson Foundation, and the Center |
| Monroe Community College Foundation, and North | for Talent Innovation; Member of the Advisory Board |
| Carolina A&T University. | of the Maxwell School of Citizenship and Public Affairs |
| at Syracuse University. |
|
| Rajiv L. Gupta | |
| Born 1945. Trustee Since December 2001.2 | F. Joseph Loughrey |
| Principal Occupation(s) During the Past Five Years: | Born 1949. Trustee Since October 2009. Principal |
| Chairman and Chief Executive Officer (retired 2009) | Occupation(s) During the Past Five Years: President |
| and President (2006–2008) of Rohm Haas Co. | and Chief Operating Officer (retired 2009) of Cummins |
| (chemicals); Director of Tyco International, Ltd. | Inc. (industrial machinery); Director of SKF AB |
| (diversified manufacturing and services), Hewlett- | (industrial machinery), Hillenbrand, Inc. (specialized |
| Packard Co. (electronic computer manufacturing), | consumer services), the Lumina Foundation for |
| | |
| Education, and Oxfam America; Chairman of the | Executive Officers | |
| Advisory Council for the College of Arts and Letters | | |
| and Member of the Advisory Board to the Kellogg | Glenn Booraem | |
| Institute for International Studies at the University | Born 1967. Controller Since July 2010. Principal |
| of Notre Dame. | Occupation(s) During the Past Five Years: Principal |
| | of The Vanguard Group, Inc.; Controller of each of |
| Mark Loughridge | the investment companies served by The Vanguard |
| Born 1953. Trustee Since March 2012. Principal | Group; Assistant Controller of each of the investment |
| Occupation(s) During the Past Five Years: Senior Vice | companies served by The Vanguard Group (2001–2010). |
| President and Chief Financial Officer at IBM (information | | |
| technology services); Fiduciary Member of IBM’s | Thomas J. Higgins | |
| Retirement Plan Committee. | Born 1957. Chief Financial Officer Since September |
| | 2008. Principal Occupation(s) During the Past Five |
| Scott C. Malpass | Years: Principal of The Vanguard Group, Inc.; Chief |
| Born 1962. Trustee Since March 2012. Principal | Financial Officer of each of the investment companies |
| Occupation(s) During the Past Five Years: Chief | served by The Vanguard Group; Treasurer of each of |
| Investment Officer and Vice President at the University | the investment companies served by The Vanguard |
| of Notre Dame; Assistant Professor of Finance at the | Group (1998–2008). | |
| Mendoza College of Business at Notre Dame; Member | | |
| of the Notre Dame 403(b) Investment Committee; | Kathryn J. Hyatt | |
| Director of TIFF Advisory Services, Inc. (investment | Born 1955. Treasurer Since November 2008. Principal |
| advisor); Member of the Investment Advisory | Occupation(s) During the Past Five Years: Principal of |
| Committees of the Financial Industry Regulatory | The Vanguard Group, Inc.; Treasurer of each of the |
| Authority (FINRA) and of Major League Baseball. | investment companies served by The Vanguard |
| | Group; Assistant Treasurer of each of the investment |
| André F. Perold | companies served by The Vanguard Group (1988–2008). |
| Born 1952. Trustee Since December 2004. Principal | | |
| Occupation(s) During the Past Five Years: George | Heidi Stam | |
| Gund Professor of Finance and Banking at the Harvard | Born 1956. Secretary Since July 2005. Principal |
| Business School (retired 2011); Chief Investment | Occupation(s) During the Past Five Years: Managing |
| Officer and Managing Partner of HighVista Strategies | Director of The Vanguard Group, Inc.; General Counsel |
| LLC (private investment firm); Director of Rand | of The Vanguard Group; Secretary of The Vanguard |
| Merchant Bank; Overseer of the Museum of Fine | Group and of each of the investment companies |
| Arts Boston. | served by The Vanguard Group; Director and Senior |
| | Vice President of Vanguard Marketing Corporation. |
| Alfred M. Rankin, Jr. | | |
| Born 1941. Trustee Since January 1993. Principal | Vanguard Senior ManagementTeam |
| Occupation(s) During the Past Five Years: Chairman, | | |
| President, and Chief Executive Officer of NACCO | Mortimer J. Buckley | Michael S. Miller |
| Industries, Inc. (forklift trucks/housewares/lignite); | Kathleen C. Gubanich | James M. Norris |
| Director of Goodrich Corporation (industrial products/ | Paul A. Heller | Glenn W. Reed |
| aircraft systems and services) and the National | Martha G. King | George U. Sauter |
| Association of Manufacturers; Chairman of the Board | Chris D. McIsaac | |
| of the Federal Reserve Bank of Cleveland and of | | |
| University Hospitals of Cleveland; Advisory Chairman | Chairman Emeritus and Senior Advisor |
| of the Board of The Cleveland Museum of Art. | | |
| | John J. Brennan | |
| Peter F. Volanakis | Chairman, 1996–2009 | |
| Born 1955. Trustee Since July 2009. Principal | Chief Executive Officer and President, 1996–2008 |
| Occupation(s) During the Past Five Years: President | | |
| and Chief Operating Officer (retired 2010) of Corning | | |
| Incorporated (communications equipment); Director | Founder | |
| of SPX Corporation (multi-industry manufacturing); | | |
| Overseer of the Amos Tuck School of Business | John C. Bogle | |
| Administration at Dartmouth College; Advisor to the | Chairman and Chief Executive Officer, 1974–1996 |
| Norris Cotton Cancer Center. | | |
1 Mr. McNabb is considered an “interested person,” as defined in the Investment Company Act of 1940, because he is an officer of the Vanguard funds.
2 December 2002 for Vanguard Equity Income Fund, Vanguard Growth Equity Fund, the Vanguard Municipal Bond Funds, and the Vanguard State Tax-Exempt Funds.
|  |
| P.O. Box 2600 |
| Valley Forge, PA 19482-2600 |
Connect with Vanguard® > vanguard.com
| |
| Fund Information > 800-662-7447 | CFA® is a trademark owned by CFA Institute. |
| Direct Investor Account Services > 800-662-2739 | |
| Institutional Investor Services > 800-523-1036 | |
| Text Telephone for People | |
| With Hearing Impairment > 800-749-7273 | |
| |
| This material may be used in conjunction | |
| with the offering of shares of any Vanguard | |
| fund only if preceded or accompanied by | |
| the fund’s current prospectus. | |
| |
| All comparative mutual fund data are from Lipper Inc. or | |
| Morningstar, Inc., unless otherwise noted. | |
| |
| You can obtain a free copy of Vanguard’s proxy voting | |
| guidelines by visiting vanguard.com/proxyreporting or by | |
| calling Vanguard at 800-662-2739. The guidelines are | |
| also available from the SEC’s website, sec.gov. In | |
| addition, you may obtain a free report on how your fund | |
| voted the proxies for securities it owned during the 12 | |
| months ended June 30. To get the report, visit either | |
| vanguard.com/proxyreporting or sec.gov. | |
| |
| You can review and copy information about your fund at | |
| the SEC’s Public Reference Room in Washington, D.C. To | |
| find out more about this public service, call the SEC at | |
| 202-551-8090. Information about your fund is also | |
| available on the SEC’s website, and you can receive | |
| copies of this information, for a fee, by sending a | |
| request in either of two ways: via e-mail addressed to | |
| publicinfo@sec.gov or via regular mail addressed to the | |
| Public Reference Section, Securities and Exchange | |
| Commission, Washington, DC 20549-1520. | |
| | © 2012 The Vanguard Group, Inc. |
| | All rights reserved. |
| | Vanguard Marketing Corporation, Distributor. |
| |
| | Q772 072012 |
Item 2:
Not Applicable.
Item 3:
Not Applicable.
Item 4: Principal Accountant Fees and Services.
Not Applicable.
Item 5: Audit Committee of Listed Registrants.
Not Applicable.
Item 6: Investments.
Not Applicable.
Item 7: Disclosure of Proxy Voting Policies and Procedures for Closed-End Management Investment Companies.
Not Applicable.
Item 8: Portfolio Managers of Closed-End Management Investment Companies.
Not Applicable.
Item 9: Purchase of Equity Securities by Closed-End Management Investment Company and Affiliated Purchasers.
Not Applicable.
Item 10: Submission of Matters to a Vote of Security Holders.
Not Applicable.
Item 11: Controls and Procedures.
(a) Disclosure Controls and Procedures. The Principal Executive and Financial Officers concluded that the Registrant's Disclosure Controls and Procedures are effective based on their evaluation of the Disclosure Controls and Procedures as of a date within 90 days of the filing date of this report.
(b) Internal Control Over Financial Reporting. There were no significant changes in Registrant’s Internal Control Over Financial Reporting or in other factors that could significantly affect this control subsequent to the date of the evaluation, including any corrective actions with regard to significant deficiencies and material weaknesses.
Item 12: Exhibits.
(a) Certifications.
Pursuant to the requirements of the Securities Exchange Act of 1934 and the Investment Company Act of 1940, the registrant has duly caused this report to be signed on its behalf by the undersigned, thereunto duly authorized.
| |
| | VANGUARD PENNSYLVANIA TAX-FREE FUNDS |
| |
| By: | /s/ F. WILLIAM MCNABB III* |
| | F. WILLIAM MCNABB III |
| | CHIEF EXECUTIVE OFFICER |
| |
| Date: July 25, 2012 |
Pursuant to the requirements of the Securities Exchange Act of 1934 and the Investment Company Act of 1940, this report has been signed below by the following persons on behalf of the registrant and in the capacities and on the dates indicated.
| |
| | VANGUARD PENNSYLVANIA TAX-FREE FUNDS |
| |
| By: | /s/ F. WILLIAM MCNABB III* |
| | F. WILLIAM MCNABB III |
| | CHIEF EXECUTIVE OFFICER |
| |
| Date: July 25, 2012 |
| |
| | VANGUARD PENNSYLVANIA TAX-FREE FUNDS |
| |
| By: | /s/ THOMAS J. HIGGINS* |
| | THOMAS J. HIGGINS |
| | CHIEF FINANCIAL OFFICER |
| |
| Date: July 25, 2012 |
* By: /s/ Heidi Stam
Heidi Stam, pursuant to a Power of Attorney filed on March 27, 2012 see file Number 2-11444, Incorporated by Reference.