- BCO Dashboard
- Financials
- Filings
-
Holdings
- Transcripts
- ETFs
- Insider
- Institutional
- Shorts
-
8-K Filing
The Brink's Company (BCO) 8-KResults of Operations and Financial Condition
Filed: 1 Feb 13, 12:00am




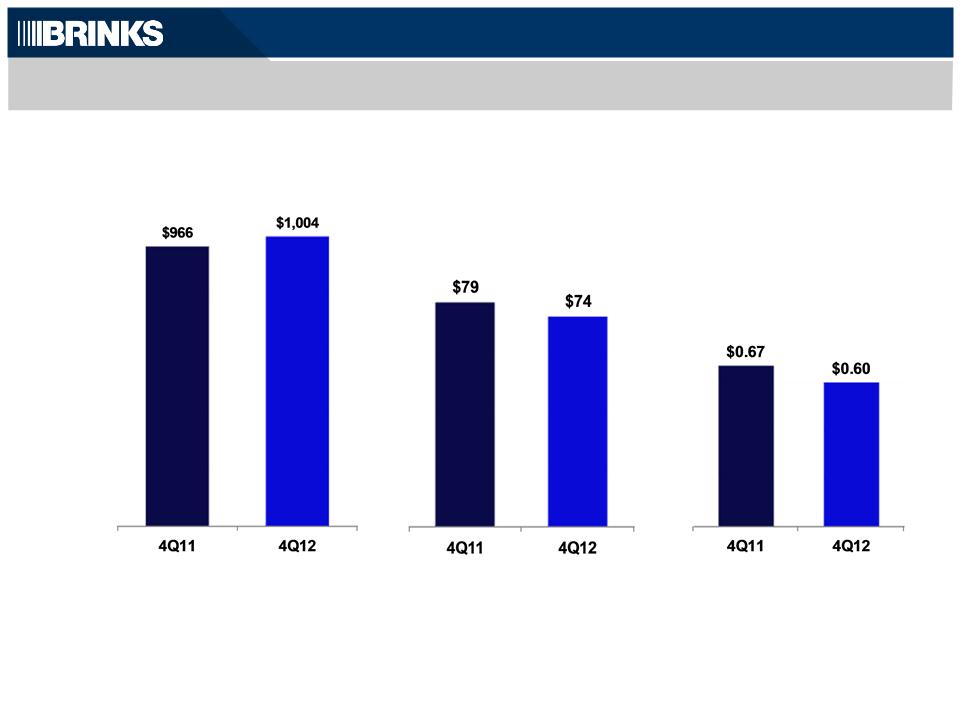
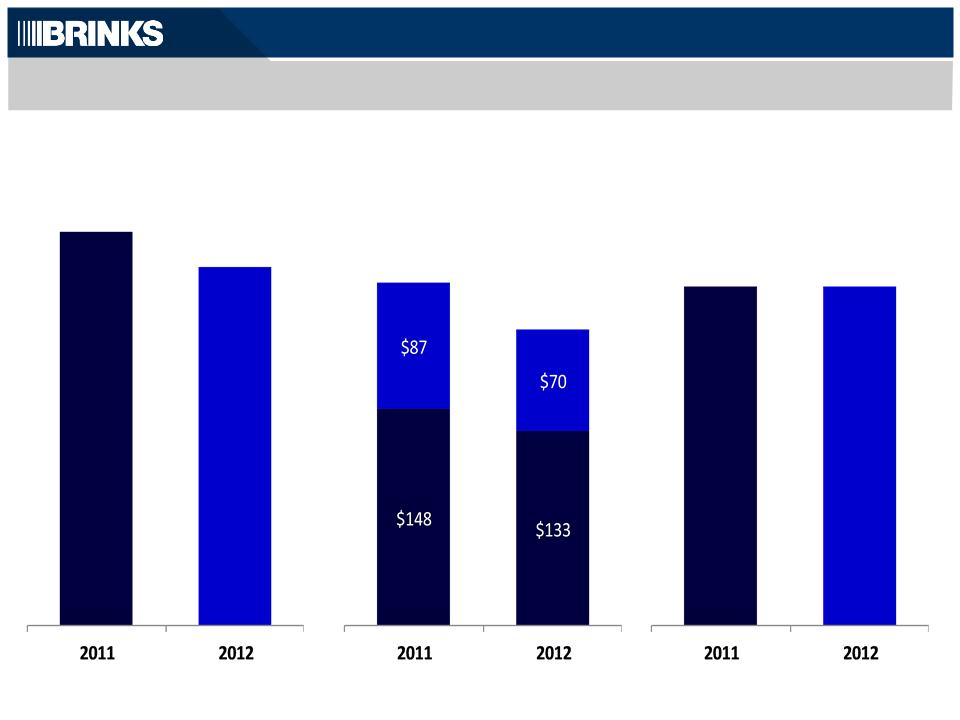
Margin | 8.1% | 7.4% |
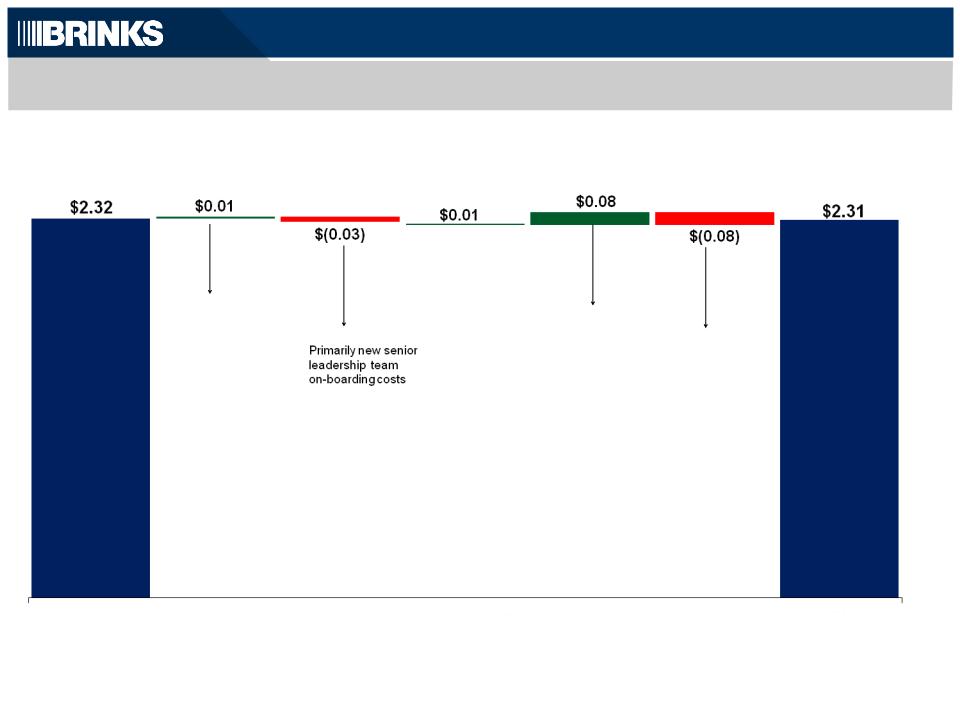
Full Year | $3,756 | $3,833 | $267 | $268 | $2.32 | $2.31 | ||
Margin | 7.1% | 7.0% |
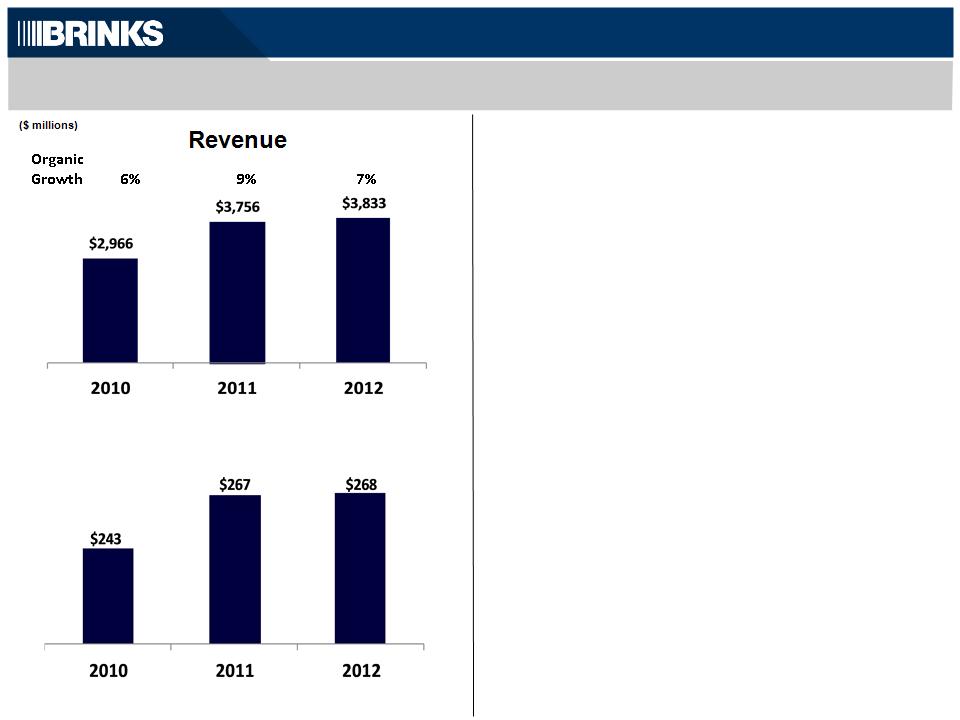
Margin | 8.2% | 7.1% | 7.0% |



Estimated Contributions to U.S. Plans | ||||||||||||||
2012A | 2013 | 2014 | 2015 | 2016 | 2017 | |||||||||
US Pension | $ 37 | 14 | 29 | 42 | 44 | 38 | ||||||||
UMWA | 0 | 0 | 0 | 0 | 0 | 0 | ||||||||
Black Lung/Other | 7 | 5 | 5 | 5 | 4 | 4 | ||||||||
Total | $ 44 | 19 | 34 | 47 | 48 | 42 | ||||||||
DISCOUNTED CASH FLOWS AT PLAN DISCOUNT RATES - RECONCILED TO AMOUNTS REPORTED UNDER U.S. GAAP | |||||||||||
December 31, 2012 | |||||||||||
Primary U.S. pension plan (b) | UMWA plans (c) | Other unfunded U.S. plans | Total | ||||||||
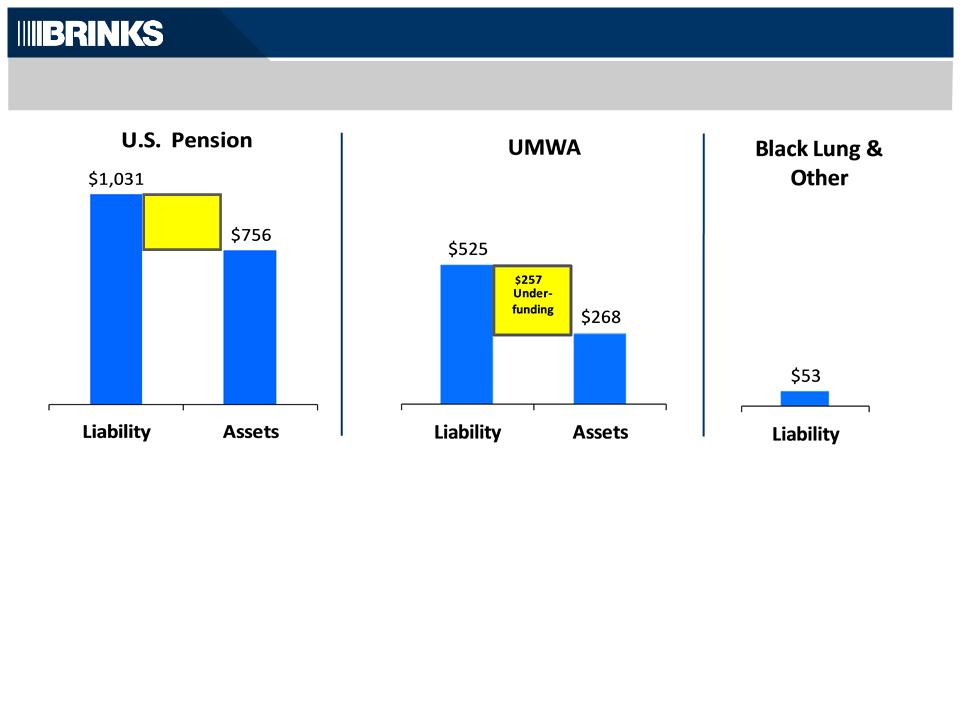
Funded status of U.S. retirement plans - GAAP | $ | 263 | 257 | 65 | 585 | ||||||
Present value of projected earnings of plan assets (a) | (65) | (15) | - | (80) | |||||||
Discounted cash flows at plan discount rates - Non-GAAP | $ | 198 | 242 | 65 | 505 | ||||||
Plan discount rate | 4.20% | 3.90% | |||||||||
Expected return of assets | 8.00% | 8.25% | |||||||||

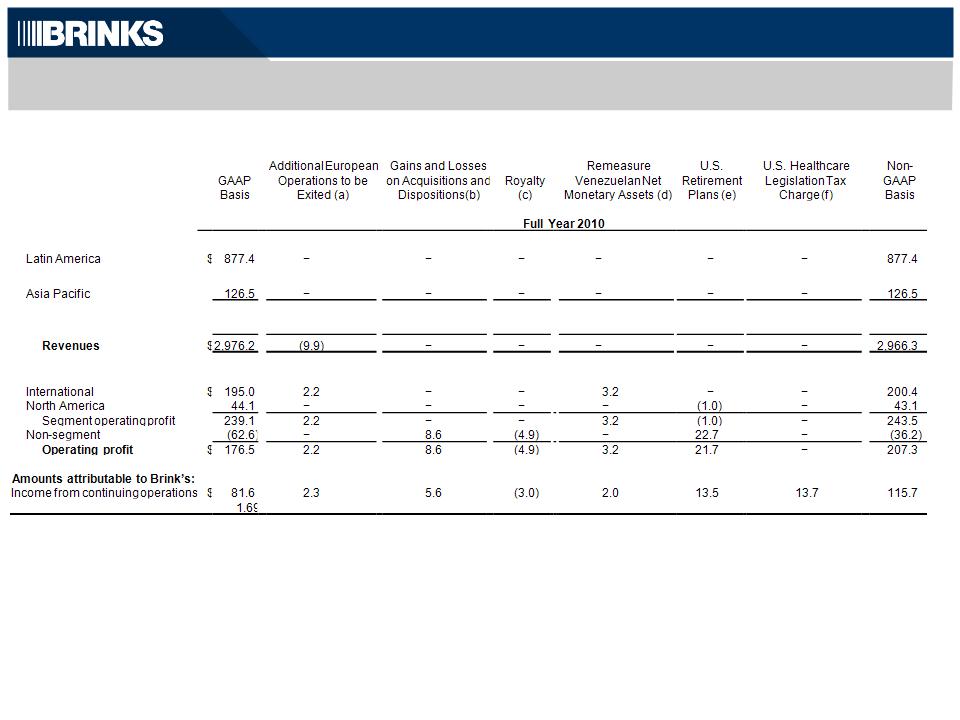
Full Year 2011 | ||||||
Operating | EPS | |||||
Sale of U.S. Document Destruction business | $ | (6.7) | (0.09) | |||
Gains on available-for-sale equity and debt securities | − | (0.05) | ||||
Acquisition of controlling interests | (2.5) | (0.05) | ||||
Sale of former operating assets | (0.5) | (0.01) | ||||
$ | (9.7) | (0.20) | ||||
NON-GAAP CASH FLOWS FROM OPERATING ACTIVITIES - RECONCILED TO AMOUNTS REPORTED UNDER U.S. GAAP | ||||||
2012 | 2011 | |||||
Cash flows from operating activities - GAAP | $ | 250.5 | $ | 247.0 | ||
Decrease (increase) in certain customer obligations (a) | (15.7) | 11.7 | ||||
Discontinued operations (b) | 11.3 | 11.4 | ||||
Cash flows from operating activities - Non-GAAP | $ | 246.1 | $ | 270.1 | ||
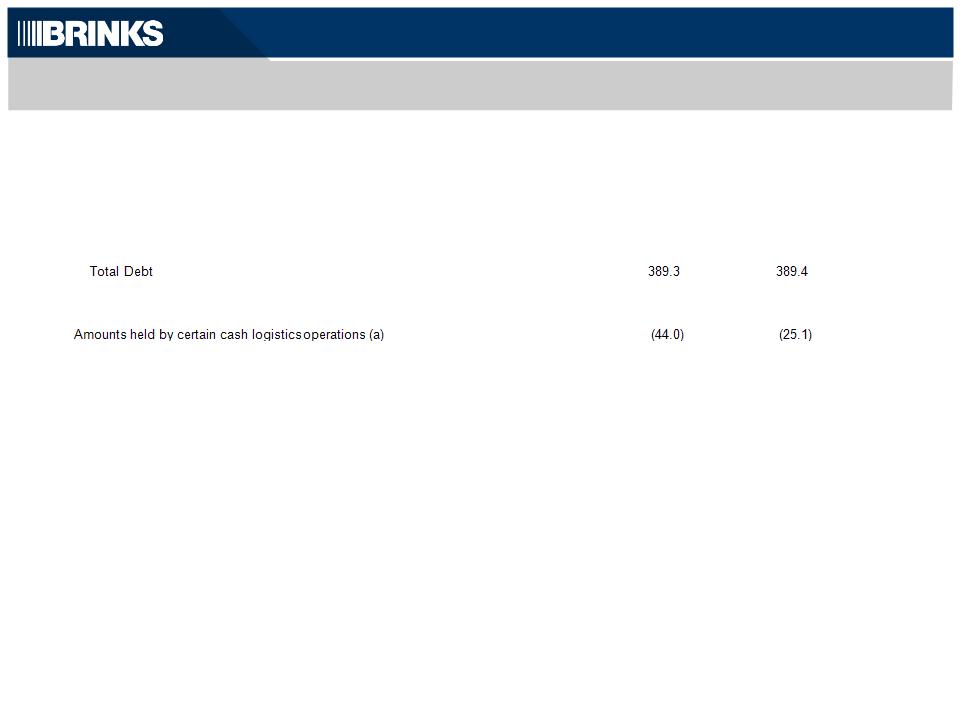
NET DEBT RECONCILED TO GAAP | December 31, | |||||||
2012 | 2011 | |||||||
Debt: | ||||||||
Short-term debt | $ | 26.7 | 25.4 | |||||
Long-term debt | 362.6 | 364.0 | ||||||
Less: | ||||||||
Cash and cash equivalents | 201.7 | 182.9 | ||||||
Cash and cash equivalents available for general corporate purposes | 157.7 | 157.8 | ||||||
Net Debt | $ | 231.6 | 231.6 | |||||