United States
Securities and Exchange Commission
Washington, D.C. 20549
Amended
Form N-CSR
Certified Shareholder Report of Registered
Management Investment Companies
811-4577
(Investment Company Act File Number)
Federated Income Securities Trust
(Exact Name of Registrant as Specified in Charter)
Federated Investors Funds
4000 Ericsson Drive
Warrendale, Pennsylvania 15086-7561
(Address of Principal Executive Offices)
(412) 288-1900
(Registrant’s Telephone Number)
John W. McGonigle, Esquire
Federated Investors Tower
1001 Liberty Avenue
Pittsburgh, Pennsylvania 15222-3779
(Name and Address of Agent for Service)
(Notices should be sent to the Agent for Service)
Date of Fiscal Year End: 10/31/09
Date of Reporting Period: 10/31/09
| Item 1. | Reports to Stockholders |
Federated Muni and Stock Advantage FundEstablished 2003
A Portfolio of Federated Income Securities Trust
ANNUAL SHAREHOLDER REPORTOctober 31, 2009
Class A Shares
Class B Shares
Class C Shares
Class F Shares
FINANCIAL HIGHLIGHTS
SHAREHOLDER EXPENSE EXAMPLE
MANAGEMENT'S DISCUSSION OF FUND PERFORMANCE
PORTFOLIO OF INVESTMENTS SUMMARY TABLES
PORTFOLIO OF INVESTMENTS
STATEMENT OF ASSETS AND LIABILITIES
STATEMENT OF OPERATIONS
STATEMENT OF CHANGES IN NET ASSETS
NOTES TO FINANCIAL STATEMENTS
REPORT OF INDEPENDENT REGISTERED PUBLIC ACCOUNTING FIRM
BOARD OF TRUSTEES AND TRUST OFFICERS
EVALUATION AND APPROVAL OF ADVISORY CONTRACT
VOTING PROXIES ON FUND PORTFOLIO SECURITIES
QUARTERLY PORTFOLIO SCHEDULE
Financial Highlights - Class A Shares
(For a Share Outstanding Throughout Each Period)
| Year Ended October 31 | 2009 | 2008 | 2007 | 2006 | 2005 |
| Net Asset Value, Beginning of Period | $9.46 | $12.08 | $12.09 | $11.10 | $10.69 |
| Income From Investment Operations: | | | | | |
| Net investment income | 0.34 | 0.39 | 0.37 | 0.38 | 0.37 |
| Net realized and unrealized gain (loss) on investments, foreign currency transactions, futures contracts and swap contracts | 0.49 | (2.27) | 0.20 | 0.96 | 0.42 |
| TOTAL FROM INVESTMENT OPERATIONS | 0.83 | (1.88) | 0.57 | 1.34 | 0.79 |
| Less Distributions: | | | | | |
| Distributions from net investment income | (0.34) | (0.39) | (0.38) | (0.35) | (0.38) |
| Distributions from net realized gain on investments, foreign currency transactions and futures contracts | — | (0.35) | (0.20) | — | — |
| TOTAL DISTRIBUTIONS | (0.34) | (0.74) | (0.58) | (0.35) | (0.38) |
| Net Asset Value, End of Period | $9.95 | $9.46 | $12.08 | $12.09 | $11.10 |
| Total Return1 | 9.07% | (16.39)% | 4.79% | 12.31% | 7.49% |
| Ratios to Average Net Assets: | | | | | |
| Net expenses | 1.00%2 | 1.00%2 | 1.00%2 | 1.00%2 | 0.80%2 |
| Net investment income | 3.60% | 3.47% | 3.12% | 3.32% | 3.44% |
| Expense waiver/reimbursement3 | 0.47% | 0.45% | 0.44% | 0.45% | 0.67% |
| Supplemental Data: | | | | | |
| Net assets, end of period (000 omitted) | $384,555 | $404,311 | $588,344 | $465,673 | $314,215 |
| Portfolio turnover | 80% | 87% | 72% | 42% | 9% |
| 1 | Based on net asset value, which does not reflect the sales charge, redemption fee or contingent deferred sales charge, if applicable. |
| 2 | The net expense ratio is calculated without reduction for expense offset arrangements. The net expense ratios are 0.98%, 1.00%, 1.00%, 1.00% and 0.80% for the years ended October 31, 2009, 2008, 2007, 2006 and 2005, respectively, after taking into account these expense reductions. |
| 3 | This expense decrease is reflected in both the net expense and the net investment income ratios shown above. |
See Notes which are an integral part of the Financial Statements
Annual Shareholder Report1
Financial Highlights - Class B Shares
(For a Share Outstanding Throughout Each Period)
| Year Ended October 31 | 2009 | 2008 | 2007 | 2006 | 2005 |
| Net Asset Value, Beginning of Period | $9.46 | $12.07 | $12.09 | $11.10 | $10.69 |
| Income From Investment Operations: | | | | | |
| Net investment income | 0.27 | 0.30 | 0.28 | 0.29 | 0.27 |
| Net realized and unrealized gain (loss) on investments, foreign currency transactions, futures contracts and swap contracts | 0.48 | (2.25) | 0.19 | 0.97 | 0.42 |
| TOTAL FROM INVESTMENT OPERATIONS | 0.75 | (1.95) | 0.47 | 1.26 | 0.69 |
| Less Distributions: | | | | | |
| Distributions from net investment income | (0.27) | (0.31) | (0.29) | (0.27) | (0.28) |
| Distributions from net realized gain on investments, foreign currency transactions and futures contracts | — | (0.35) | (0.20) | — | — |
| TOTAL DISTRIBUTIONS | (0.27) | (0.66) | (0.49) | (0.27) | (0.28) |
| Net Asset Value, End of Period | $9.94 | $9.46 | $12.07 | $12.09 | $11.10 |
| Total Return1 | 8.14% | (16.95)% | 3.93% | 11.48% | 6.53% |
| Ratios to Average Net Assets: | | | | | |
| Net expenses | 1.75%2 | 1.75%2 | 1.75%2 | 1.75%2 | 1.70%2 |
| Net investment income | 2.85% | 2.72% | 2.37% | 2.58% | 2.56% |
| Expense waiver/reimbursement3 | 0.47% | 0.45% | 0.44% | 0.45% | 0.52% |
| Supplemental Data: | | | | | |
| Net assets, end of period (000 omitted) | $55,826 | $59,324 | $81,930 | $70,323 | $57,182 |
| Portfolio turnover | 80% | 87% | 72% | 42% | 9% |
| 1 | Based on net asset value, which does not reflect the sales charge, redemption fee or contingent deferred sales charge, if applicable. |
| 2 | The net expense ratio is calculated without reduction for expense offset arrangements. The net expense ratios are 1.73%, 1.75%, 1.75%, 1.75% and 1.70% for the years ended October 31, 2009, 2008, 2007, 2006 and 2005, respectively, after taking into account these expense reductions. |
| 3 | This expense decrease is reflected in both the net expense and the net investment income ratios shown above. |
See Notes which are an integral part of the Financial Statements
Annual Shareholder Report2
Financial Highlights - Class C Shares
(For a Share Outstanding Throughout Each Period)
| Year Ended October 31 | 2009 | 2008 | 2007 | 2006 | 2005 |
| Net Asset Value, Beginning of Period | $9.46 | $12.07 | $12.09 | $11.10 | $10.68 |
| Income From Investment Operations: | | | | | |
| Net investment income | 0.27 | 0.30 | 0.28 | 0.29 | 0.27 |
| Net realized and unrealized gain (loss) on investments, foreign currency transactions, futures contracts and swap contracts | 0.48 | (2.25) | 0.19 | 0.97 | 0.43 |
| TOTAL FROM INVESTMENT OPERATIONS | 0.75 | (1.95) | 0.47 | 1.26 | 0.70 |
| Less Distributions: | | | | | |
| Distributions from net investment income | (0.27) | (0.31) | (0.29) | (0.27) | (0.28) |
| Distributions from net realized gain on investments, foreign currency transactions and futures contracts | — | (0.35) | (0.20) | — | — |
| TOTAL DISTRIBUTIONS | (0.27) | (0.66) | (0.49) | (0.27) | (0.28) |
| Net Asset Value, End of Period | $9.94 | $9.46 | $12.07 | $12.09 | $11.10 |
| Total Return1 | 8.15% | (16.95)% | 3.94% | 11.48% | 6.63% |
| Ratios to Average Net Assets: | | | | | |
| Net expenses | 1.75%2 | 1.75%2 | 1.75%2 | 1.75%2 | 1.70%2 |
| Net investment income | 2.86% | 2.72% | 2.37% | 2.57% | 2.56% |
| Expense waiver/reimbursement3 | 0.47% | 0.45% | 0.44% | 0.45% | 0.52% |
| Supplemental Data: | | | | | |
| Net assets, end of period (000 omitted) | $113,830 | $122,165 | $181,358 | $122,419 | $79,891 |
| Portfolio turnover | 80% | 87% | 72% | 42% | 9% |
| 1 | Based on net asset value, which does not reflect the sales charge, redemption fee or contingent deferred sales charge, if applicable. |
| 2 | The net expense ratio is calculated without reduction for expense offset arrangements. The net expense ratios are 1.73%, 1.75%, 1.75%, 1.75% and 1.70% for the years ended October 31, 2009, 2008, 2007, 2006 and 2005, respectively, after taking into account these expense reductions. |
| 3 | This expense decrease is reflected in both the net expense and the net investment income ratios shown above. |
See Notes which are an integral part of the Financial Statements
Annual Shareholder Report3
Financial Highlights - Class F Shares
(For a Share Outstanding Throughout Each Period)
| Year Ended October 31, | Period Ended
10/31/20071 |
| 2009 | 2008 |
| Net Asset Value, Beginning of Period | $9.46 | $12.08 | $12.27 |
| Income From Investment Operations: | | | |
| Net investment income | 0.35 | 0.39 | 0.14 |
| Net realized and unrealized gain (loss) on investments, foreign currency transactions and futures contracts | 0.49 | (2.26) | (0.18) |
| TOTAL FROM INVESTMENT OPERATIONS | 0.84 | (1.87) | (0.04) |
| Less Distributions: | | | |
| Distributions from net investment income | (0.35) | (0.40) | (0.15) |
| Distributions from net realized gain on investments and foreign currency transactions | — | (0.35) | — |
| TOTAL DISTRIBUTIONS | (0.35) | (0.75) | (0.15) |
| Net Asset Value, End of Period | $9.95 | $9.46 | $12.08 |
| Total Return2 | 9.20% | (16.32)% | (0.31)% |
| Ratios to Average Net Assets: | | | |
| Net expenses | 0.89%3 | 0.92%3 | 0.96%3,4 |
| Net investment income | 3.70% | 3.58% | 3.16%4 |
| Expense waiver/reimbursement5 | 0.47% | 0.45% | 0.44%4 |
| Supplemental Data: | | | |
| Net assets, end of period (000 omitted) | $16,032 | $13,588 | $10,589 |
| Portfolio turnover | 80% | 87% | 72%6 |
| 1 | Reflects operations for the period from May 31, 2007 (date of initial public investment) to October 31, 2007. |
| 2 | Based on net asset value, which does not reflect the sales charge, redemption fee or contingent deferred sales charge, if applicable. Total returns for periods of less than one year are not annualized. |
| 3 | The net expense ratio is calculated without reduction for expense offset arrangements. The net expense ratios are 0.87%, 0.92% and 0.96% for the years ended October 31, 2009 and 2008 and for the period ended October 31, 2007, respectively, after taking into account these expense reductions. |
| 4 | Computed on an annualized basis. |
| 5 | This expense decrease is reflected in both the net expense and the net investment income ratios shown above. |
| 6 | Portfolio turnover is calculated at the Fund level. Percentage indicated was calculated for the year ended October 31, 2007. |
See Notes which are an integral part of the Financial Statements
Annual Shareholder Report4
Shareholder Expense Example (unaudited)
As a shareholder of the Fund, you incur two types of costs: (1) transaction costs, including sales charges (loads) on purchase or redemption payments; and (2) ongoing costs, including management fees and to the extent applicable, distribution (12b-1) fees and/or shareholder services fees and other Fund expenses. This Example is intended to help you to understand your ongoing costs (in dollars) of investing in the Fund and to compare these costs with the ongoing costs of investing in other mutual funds. It is based on an investment of $1,000 invested at the beginning of the period and held for the entire period from May 1, 2009 to October 31, 2009.
ACTUAL EXPENSES
The first section of the table below provides information about actual account values and actual expenses. You may use the information in this section, together with the amount you invested, to estimate the expenses that you incurred over the period. Simply divide your account value by $1,000 (for example, an $8,600 account value divided by $1,000 = 8.6), then multiply the result by the number in the first section under the heading entitled “Expenses Paid During Period” to estimate the expenses attributable to your investment during this period.
HYPOTHETICAL EXAMPLE FOR COMPARISON PURPOSES
The second section of the table below provides information about hypothetical account values and hypothetical expenses based on the Fund's actual expense ratio and an assumed rate of return of 5% per year before expenses, which is not the Fund's actual return. Thus, you should not use the hypothetical account values and expenses to estimate the actual ending account balance or your expenses for the period. Rather, these figures are required to be provided to enable you to compare the ongoing costs of investing in the Fund with other funds. To do so, compare this 5% hypothetical example with the 5% hypothetical examples that appear in the shareholder reports of the other funds.
Annual Shareholder Report5
Please note that the expenses shown in the table are meant to highlight your ongoing costs only and do not reflect any transaction costs, such as sales charges (loads) on purchase or redemption payments. Therefore, the second section of the table is useful in comparing ongoing costs only, and will not help you determine the relative total costs of owning different funds. In addition, if these transaction costs were included, your costs would have been higher. | Beginning
Account Value
5/1/2009 | Ending
Account Value
10/31/2009 | Expenses Paid
During Period1 |
| Actual: | | | |
| Class A Shares | $1,000 | $1,098.70 | $5.29 |
| Class B Shares | $1,000 | $1,093.50 | $9.23 |
| Class C Shares | $1,000 | $1,093.50 | $9.23 |
| Class F Shares | $1,000 | $1,099.40 | $4.66 |
Hypothetical (assuming a 5% return
before expenses): | | | |
| Class A Shares | $1,000 | $1,020.16 | $5.09 |
| Class B Shares | $1,000 | $1,016.38 | $8.89 |
| Class C Shares | $1,000 | $1,016.38 | $8.89 |
| Class F Shares | $1,000 | $1,020.77 | $4.48 |
| 1 | Expenses are equal to the Fund's annualized net expense ratios, multiplied by the average account value over the period, multiplied by 184/365 (to reflect the one-half-year period). The annualized net expense ratios are as follows: |
| Class A Shares | 1.00% |
| Class B Shares | 1.75% |
| Class C Shares | 1.75% |
| Class F Shares | 0.88% |
Annual Shareholder Report6
Performance data quoted represents past performance which is no guarantee of future results. Investment return and principal value will fluctuate so that an investor's shares, when redeemed, may be worth more or less than their original cost. Mutual fund performance changes over time and current performance may be lower or higher than what is stated. For current to the most recent month-end performance and after-tax returns, visit FederatedInvestors.com or call 1-800-341-7400.
Management's Discussion of Fund Performance
The Fund's total return, based on net asset value, for the 12-month reporting period ended October 31, 2009, was 9.07% for Class A Shares, 8.14% for Class B Shares, 8.15% for Class C Shares and 9.20% for Class F Shares. These returns were lower than the 15.92% total return of the Morningstar Conservative Allocation Funds Average.1
| 1 | Morningstar figures represent the average total returns reported by all mutual funds designated by Morningstar, Inc. as falling into the category indicated. They do not reflect sales charges. The total return for the 12-month reporting period for the Fund's benchmark indexes, the Barclays Capital Municipal Bond Index (formerly the Lehman Brothers Municipal Bond Index) (BCMB) and the Russell 1000 Value Index (RU1000V), were 13.6% and 4.78%, respectively. The BCMB is a broad market performance benchmark for the tax-exempt bond market. To be included in the BCMB, bonds must have a minimum credit rating of at least Baa3/BBB-, an outstanding par value of at least $7 million, be issued as part of a transaction of at least $75 million that took place after December 31, 1990 and have at least one year of remaining maturity. The index includes both zero coupon bonds and bonds subject to the alternative minimum tax. Remarketed issues, taxable municipal bonds, bonds with floating rates, and derivatives, are excluded from the index. The RU1000V measures the performance of those Russell 1000 companies with lower price-to-book ratios and lower forecasted growth values. The indexes are not adjusted to reflect sales charges, expenses and other fees that the Securities and Exchange Commission (SEC) requires to be reflected in the Fund's performance. The indexes are unmanaged, and it is not possible to invest directly in an index. The Fund's total return for the most recently completed fiscal year reflected actual cash flows, transaction costs and other expenses which are not reflected in the total return of the BCMB or RU1000V. 2009 Morningstar, Inc. All Rights Reserved. The information on Morningstar figures contained herein: (1) is proprietary to Morningstar and/or its content providers; (2) may not be copied or distributed; and (3) is not warranted to be accurate, complete or timely. Neither Morningstar nor its content providers are responsible for any damages or losses arising from any use of this information. Past performance is no guarantee of future results. |
Annual Shareholder Report7
The Fund's investment strategy focused on income earning investments, specifically high-quality, dividend-paying stocks and intermediate and long-term tax-exempt municipal bonds to achieve the Fund's primary income objective and secondary capital appreciation objective. The most significant factors affecting the Fund's performance during the reporting period were: (a) the Fund's allocation between stocks and tax-exempt municipal bonds; (b) the selection of equity securities of similar issuers (referred to as sectors); (c) the selection of tax-exempt municipal securities with different maturities (expressed by a yield curve showing the relative yield of similar securities with different maturities), different credit characteristics or different structural attributes; and (d) the effective duration of the Fund's tax-exempt municipal bond portfolio.The following discussion will focus on the performance of the Fund's Class F Shares. The 9.20% total return of the Class F Shares for the reporting period consisted of 5.18% in price performance and 4.02% in reinvested dividends.
MARKET OVERVIEW
During the 12-month reporting period, global equity markets experienced extreme volatility, with markets appearing to bottom in March 2009 and rebounding sharply higher. The financial market crisis intensified in the latter part of 2008 and into 2009, with the stress spilling into the non-financial sectors of the economy, including the consumer sector. By March 2009, the U.S. government had implemented the Troubled Asset Relief Program (TARP), as well as a number of other programs to strengthen the capital structure of the financial system. In mid-March, the equity markets began to rebound with the help of global infusion of monetary and fiscal stimuli. In the United States, the federal government also introduced a number of stimulus plans for the consumer and non-financial sectors of the economy to help spur demand. As economic indicators began to show signs of stabilization, and in some cases improvement, the market maintained its upward trajectory into the latter part of 2009.
Annual Shareholder Report8
The S&P 500 Index2 returned 9.80% for the 12-month reporting period. The Nasdaq Composite Index3 returned 20.09% for the reporting period. In general, for the Fund's full fiscal year, stocks with lower dividend yields outperformed those with higher dividend yields; smaller market capitalization stocks outperformed larger capitalization stocks; growth outperformed value; and cyclical stocks outperformed stocks defensively driven. The S&P 500 Index performance in the Information Technology, Consumer Discretionary and Materials sectors dominated weak performance in the Telecommunications, Utilities and Financials sectors during the reporting period.U.S. Treasury yields fell to multigenerational lows in December 2008 as the U.S. recession and financial market volatility intensified. Subsequently, U.S. Treasury yields rose across the yield curve and were highly volatile as financial conditions improved and the U.S. economy began to recover. The 10-year U.S. Treasury yield ranged from 2.08% to 3.98% during the 12-month reporting period, ending at 3.41%, down 0.60% from a year earlier. The 30- year U.S. Treasury yield ranged from 2.52% to 4.76%, ending the period at 4.23%, down 0.12% during the period. The 2-year U.S. Treasury yield ended the period at 0.90%, down 0.66% during the period.
Yields on long-term, tax-exempt municipal securities rose and credit spreads widened during late 2008 as heavy redemptions from long-term, tax-exempt municipal mutual funds and distress among key municipal dealers and hedge Funds produced heavy selling of long-term securities. Yields on high-quality, intermediate and short-term, tax-exempt municipal securities edged lower at the same time as market participants favored lower risk securities. In contrast, during 2009, yields on tax-exempt municipal securities fell sharply and credit spreads narrowed as financial market conditions improved, worst-case fears regarding the U.S. economy faded, and tax-exempt municipal bond mutual funds experienced record inflows. Municipal Market Data (MMD)4 2-, 10- and 30-year AAA tax-exempt municipal yields fell 1.78%, 1.28% and 1.13%, respectively, during the 12-month reporting period. As the sharp risk aversion that dominated early in the reporting period abated, long-term securities outperformed short-term and intermediate securities, and lower credit quality bonds sharply outperformed higher credit quality securities.
| 2 | The S&P 500 Index is an unmanaged capitalization-weighted index of 500 stocks designed to measure performance of the broad domestic economy through changes in the aggregate market value of 500 stocks representing all major industries. The index is unmanaged and, unlike the Fund, is not affected by cash flows. Investments cannot be made directly in an index. |
| 3 | The Nasdaq Composite Index is an index that measures all Nasdaq domestic and non-U.S.-based common stocks listed on the Nasdaq stock market. The index is unmanaged and, unlike the Fund, is not affected by cash flows. Investments cannot be made directly in an index. |
| 4 | MMD is a market data provider that produces daily generic yield curve of investment grade municipal bonds based on a survey of municipal securities dealers and observed trades. The MMD AAA yield curve is a widely used reference for top credit quality municipal bonds in the marketplace. |
Annual Shareholder Report9
PORTFOLIO ALLOCATION
During the 12-month reporting period, the Fund's portfolio was allocated between stocks and tax-exempt municipal bonds to reflect the Fund's primary investment objective of tax advantaged income5 and its secondary objective of capital appreciation. The principal factors used in the allocation decision were: 1) maintenance of at least 50% exposure to tax-exempt municipal securities in order to comply with IRS rules governing the payment of tax-exempt dividends from the tax-exempt municipal portion of the portfolio; 2) the Fund's ability to pay and maintain an attractive level of dividends; and 3) the expected relative total return of tax-exempt municipal bonds and stocks. The allocation of the Funds investments at the end of the reporting period on October 31, 2009, was 58.40% tax-exempt municipal bonds, 39% stocks, and 2.60% municipal cash equivalents. Early in the reporting period, the allocation was skewed more heavily toward tax-exempt municipal bonds and away from stocks as portfolio managers adopted a defensive stance, with allocation toward tax-exempt municipal bonds at times reaching approximately 64%.
The Fund's allocation had a material effect on performance because tax-exempt municipal bonds and stocks had divergent total returns. For the 12-month reporting period, the Russell 1000® Value Index (RU1000V) posted a total return of 4.78%, while the BCMB posted a total return of 13.60%. Weighting these benchmarks (60% BCMB and 40% RU1000V), the blended benchmark return was 10.06% versus 9.20% for the Fund's Class F Shares during the reporting period. For the reporting period, the total return on the Fund's Class F Shares underperformed the weighted benchmark.
| 5 | Fund income may be subject to state and local taxes. Although this Fund pursues tax-advantaged income and seeks to invest primarily in securities whose interest is not subject to the federal alternative minimum tax, there are no assurances that it will achieve these goals. |
Annual Shareholder Report10
SECTOR AND SECURITY SELECTION - EQUITY STOCKS
The equity component return of the portfolio was generally in line with the overall performance of the RU1000V during the 12-month reporting period. During the reporting period, the Fund's equity portfolio managers focused on realization of the Fund's tax-advantaged income and total return objectives by purchasing and holding income producing equity securities with favorable valuation levels. Value strategies generally underperformed growth strategies and smaller capitalizations outperformed larger capitalizations during the reporting period, which were both negative influences on the Fund's performance.
Sector allocations contributed positively, while stock selection negatively contributed to the Fund's equity performance. Overweights (as compared to the RU1000V) in the Information Technology and Materials sectors and a large underweight in the Financials and Utilities sectors enhanced the Fund's performance during the reporting period. Detracting from performance were sector underweights (as compared to the RU1000V) in the Consumer Discretionary sector and a sector overweight (as compared to the RU1000V) in Health Care. The Fund was positively impacted by stock selection in the Industrials, Energy and Health Care sectors and negatively impacted by stock selection in the Financials, Consumer Discretionary and Utilities sectors.
SECURITY SELECTION - TAX-EXEMPT MUNICIPAL BONDS
The bond portfolio manager's strategies were to: 1) invest only in tax-exempt municipal bonds whose interest is not intended to be subject to (or not a specific preference item for purposes of) the federal alternative minimum tax for individuals or corporations; 2) maintain exposure to intermediate and long-term tax-exempt municipal bonds to seek to capture the income advantages of such securities relative to tax-exempt municipal bonds with shorter maturities; 3) maintain a significant weighting in low investment-grade and noninvestment-grade bonds,6 or equivalents, given their typical income advantages; and 4) adjust portfolio duration,7 or sensitivity to interest rates, and yield curve exposures in an effort to seek to enhance bond portfolio total return as market interest rates fluctuated.
Although tax-exempt municipal bonds posted strong total returns, they sharply underperformed high-yield corporate bonds, emerging market debt and investment-grade corporate bonds. This relative performance of tax-exempt municipal bonds was a negative influence on Fund performance relative to many Funds in the Morningstar Conservative Allocation Funds Category.
| 6 | Investment grade securities are securities that are rated at least BBB or unrated securities of a comparable quality. Noninvestment-grade securities are securities that are not rated at least BBB or unrated securities of a comparable quality. Credit ratings are an indication of the risk that a security will default. They do not protect a security from credit risk. Lower-rated bonds typically offer higher yields to help creditworthiness, greater price volatility, more risk to principal and income than with higher-rated securities and increased possibilities of default. |
| 7 | Duration is a measure of a security's price sensitivity to changes in interest rates. Securities with longer durations are more sensitive to changes in interest rates than securities with shorter durations. |
Annual Shareholder Report11
The performance of the tax-exempt municipal bond component of the Fund's portfolio mildly lagged the return of the BCMB during the reporting period. This underperformance was largely due to the timing and valuation of transactions that reduced the Fund's significant weighting in BBB and lower rated (or non-rated comparable quality) tax-exempt municipal bonds. The bond portfolio manager reduced this weighting to about 20%, on average, for the reporting period, from about 28%, on average, in the Fund's prior fiscal year, with a significant portion of this reduction taking place during late 2008 and early 2009. This reduction in portfolio exposure was intended to diminish the Fund's downside risk in the event of a steeper U.S. economic contraction and intensifying risk aversion. However, the U.S. economy subsequently bottomed and credit spreads narrowed sharply. Despite the ill-timed exposure reduction, the Fund's overall exposure to BBB and lower-rated, (or non-rated comparable quality) bonds exceeded that of the BCMB, contributing positively to relative performance as credit spreads narrowed.8
The Fund's yield curve positioning contributed positively to Fund relative performance. The Fund maintained a large weighting in long-term, tax-exempt municipal bonds with maturities of 17 years or more, the allocation to which averaged 46.9% of the Fund's bond portfolio over the reporting period. The portion of the BCMB that exceeded 17 years in remaining maturity posted the strongest returns of any maturity ranges within the index, outperforming the BCMB by more than 3.50%.
DURATION - TAX-EXEMPT MUNICIPAL BONDS
Over the 12-month reporting period, the duration of the Fund's tax-exempt municipal bond portfolio averaged 8.6 years, which was longer than the duration of the BCMB, which averaged about 6.6 years during the period. This longer duration reflected the Fund's focus on intermediate and long-term securities given their yield advantages. The Fund's longer duration relative to the BCMB provided a small positive contribution to the Fund's relative performance as tax-exempt municipal market yields fell during the reporting period. The contribution was limited because the Fund maintained a heavy weighting in long-term bonds with premium coupons pricing to call dates of 10 years or shorter, which underperformed the longest duration, low coupon long-term bonds given the sharp drop in tax-exempt municipal yields. The bond portfolio manager in general favored premium coupon securities as they tended to exhibit diminished market volatility and maintained better secondary market liquidity over interest rate cycles compared to low coupon and zero coupon long-term bonds.
| 8 | Bond prices are sensitive to changes in interest rates and interest rate spreads between bonds of varying credit quality. A rise in interest rates or interest rate spreads can cause a decline in their prices. |
Annual Shareholder Report12
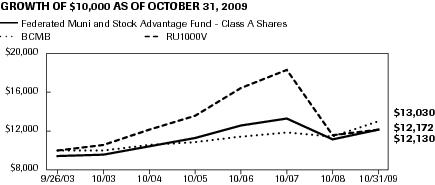
GROWTH OF A $10,000 INVESTMENT - CLASS A SHARES
The graph below illustrates the hypothetical investment of $10,0001 in Federated Muni and Stock Advantage Fund (Class A Shares) (the “Fund”) from September 26, 2003 (start of performance) to October 31, 2009, compared to the Barclays Capital Municipal Bond Index (BCMB)2 and the Russell 1000 Value Index (RU1000V).2
| Average Annual Total Returns3 for the Period Ended 10/31/2009 | |
| 1 Year | 3.07% |
| 5 Years | 1.75% |
| Start of Performance (9/26/2003) | 3.22% |
Performance data quoted represents past performance which is no guarantee of future results. Investment return and principal value will fluctuate so that an investor's shares, when redeemed, may be worth more or less than their original cost. Mutual fund performance changes over time and current performance may be lower or higher than what is stated. For current to the most recent month-end performance and after-tax returns, visit FederatedInvestors.com or call 1-800-341-7400. Returns shown do not reflect the deduction of taxes that a shareholder would pay on Fund distributions or the redemption of Fund shares. Mutual funds are not obligations of or guaranteed by any bank and are not federally insured. Total returns shown include the maximum sales charge of 5.50%.
| 1 | Represents a hypothetical investment of $10,000 in the Fund after deducting the maximum sales charge of 5.50% ($10,000 investment minus $550 sales charge = $9,450). The Fund's performance assumes the reinvestment of all dividends and distributions. The BCMB and the RU1000V have been adjusted to reflect reinvestment of dividends on securities in the indexes. |
| 2 | The BCMB and RU1000V are not adjusted to reflect sales charges, expenses or other fees that the Securities and Exchange Commission (SEC) requires to be reflected in the Fund's performance. The BCMB is a broad market performance benchmark for the tax-exempt bond market. To be included in the BCMB, bonds must have a minimum credit rating of at least Baa3/BBB-, an outstanding par value of at least $7 million, be issued as part of a transaction of at least $75 million that took place after December 31, 1990 and have at least one year of remaining maturity. The index includes both zero coupon bonds and bonds subject to the alternative minimum tax. Remarketed issues, taxable municipal bonds, bonds with floating rates, and derivatives, are excluded from the index. The RU1000V measures the performance of those Russell 1000 companies with lower price-to-book ratios and lower forecasted growth values. The indexes are unmanaged and, unlike the Fund, are not affected by cash flows. It is not possible to invest directly in an index. |
| 3 | Total returns quoted reflect all applicable sales charges. |
Annual Shareholder Report13
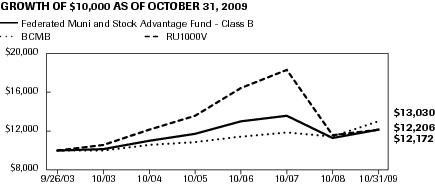
GROWTH OF A $10,000 INVESTMENT - CLASS B SHARES
The graph below illustrates the hypothetical investment of $10,0001 in Federated Muni and Stock Advantage Fund (Class B Shares) (the “Fund”) from September 26, 2003 (start of performance) to October 31, 2009, compared to the Barclays Capital Municipal Bond Index (BCMB)2 and the Russell 1000 Value Index (RU1000V).2
| Average Annual Total Returns3 for the Period Ended 10/31/2009 | |
| 1 Year | 2.64% |
| 5 Years | 1.74% |
| Start of Performance (9/26/2003) | 3.32% |
Performance data quoted represents past performance which is no guarantee of future results. Investment return and principal value will fluctuate so that an investor's shares, when redeemed, may be worth more or less than their original cost. Mutual fund performance changes over time and current performance may be lower or higher than what is stated. For current to the most recent month-end performance and after-tax returns, visit FederatedInvestors.com or call 1-800-341-7400. Returns shown do not reflect the deduction of taxes that a shareholder would pay on Fund distributions or the redemption of Fund shares. Mutual funds are not obligations of or guaranteed by any bank and are not federally insured. Total returns shown include the maximum contingent deferred sales charge of 5.50%, as applicable.
| 1 | Represents a hypothetical investment of $10,000 in the Fund. The maximum contingent deferred sales charge is 5.50% on any redemption less than one year from the purchase date. The Fund's performance assumes the reinvestment of all dividends and distributions. The BCMB and the RU1000V have been adjusted to reflect reinvestment of dividends on securities in the indexes. |
| 2 | The BCMB and RU1000V are not adjusted to reflect sales charges, expenses or other fees that the SEC requires to be reflected in the Fund's performance. The BCMB is a broad market performance benchmark for the tax-exempt bond market. To be included in the BCMB, bonds must have a minimum credit rating of at least Baa3/BBB-, an outstanding par value of at least $7 million, be issued as part of a transaction of at least $75 million that took place after December 31, 1990 and have at least one year of remaining maturity. The index includes both zero coupon bonds and bonds subject to the alternative minimum tax. Remarketed issues, taxable municipal bonds, bonds with floating rates, and derivatives, are excluded from the index. The RU1000V measures the performance of those Russell 1000 companies with lower price-to-book ratios and lower forecasted growth values. The indexes are unmanaged and, unlike the Fund, are not affected by cash flows. It is not possible to invest directly in an index. |
| 3 | Total returns quoted reflect all applicable contingent deferred sales charges. |
Annual Shareholder Report14
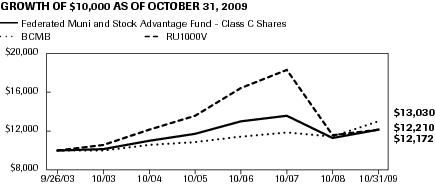
GROWTH OF A $10,000 INVESTMENT - CLASS C SHARES
The graph below illustrates the hypothetical investment of $10,0001 in Federated Muni and Stock Advantage Fund (Class C Shares) (the “Fund”) from September 26, 2003 (start of performance) to October 31, 2009, compared to the Barclays Capital Municipal Bond Index (BCMB)2 and the Russell 1000 Value Index (RU1000V).2
| Average Annual Total Returns3 for the Period Ended 10/31/2009 | |
| 1 Year | 7.15% |
| 5 Years | 2.10% |
| Start of Performance (9/26/2003) | 3.33% |
Performance data quoted represents past performance which is no guarantee of future results. Investment return and principal value will fluctuate so that an investor's shares, when redeemed, may be worth more or less than their original cost. Mutual fund performance changes over time and current performance may be lower or higher than what is stated. For current to the most recent month-end performance and after-tax returns, visit FederatedInvestors.com or call 1-800-341-7400. Returns shown do not reflect the deduction of taxes that a shareholder would pay on Fund distributions or the redemption of Fund shares. Mutual funds are not obligations of or guaranteed by any bank and are not federally insured. Total returns shown include the 1.00% contingent deferred sales charge, as applicable.
| 1 | Represents a hypothetical investment of $10,000 in the Fund. A 1.00% contingent deferred sales charge would be applied to any redemption less than one year from the purchase date. The Fund's performance assumes the reinvestment of all dividends and distributions. The BCMB and RU1000V have been adjusted to reflect reinvestment of dividends on securities in the indexes. |
| 2 | The BCMB and RU1000V are not adjusted to reflect sales charges, expenses or other fees that the SEC requires to be reflected in the Fund's performance. The BCMB is a broad market performance benchmark for the tax-exempt bond market. To be included in the BCMB, bonds must have a minimum credit rating of at least Baa3/BBB-, an outstanding par value of at least $7 million, be issued as part of a transaction of at least $75 million that took place after December 31, 1990, and have at least one year of remaining maturity. The index includes both zero coupon bonds and bonds subject to the alternative minimum tax. Remarketed issues, taxable municipal bonds, bonds with floating rates, and derivatives, are excluded from the index. The RU1000V measures the performance of those Russell 1000 companies with lower price-to-book ratios and lower forecasted growth values. The indexes are unmanaged and, unlike the Fund, are not affected by cash flows. It is not possible to invest directly in an index. |
| 3 | Total returns quoted reflect all applicable contingent deferred sales charges. |
Annual Shareholder Report15
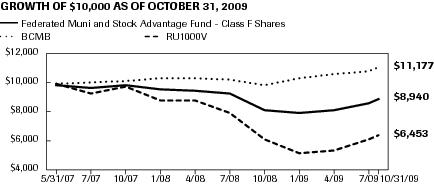
GROWTH OF A $10,000 INVESTMENT - CLASS F SHARES
The graph below illustrates the hypothetical investment of $10,0001 in Federated Muni and Stock Advantage Fund (Class F Shares) (the “Fund”) from May 31, 2007 (start of performance) to October 31, 2009, compared to the Barclays Capital Municipal Bond Index (BCMB)2 and the Russell 1000 Value Index (RU1000V).2
| Average Annual Total Returns3 for the Period Ended 10/31/2009 | |
| 1 Year | 7.06% |
| Start of Performance (5/31/2007) | -4.52% |
Performance data quoted represents past performance which is no guarantee of future results. Investment return and principal value will fluctuate so that an investor's shares, when redeemed, may be worth more or less than their original cost. Mutual fund performance changes over time and current performance may be lower or higher than what is stated. For current to the most recent month-end performance and after-tax returns, visit FederatedInvestors.com or call 1-800-341-7400. Returns shown do not reflect the deduction of taxes that a shareholder would pay on Fund distributions or the redemption of Fund shares. Mutual funds are not obligations of or guaranteed by any bank and are not federally insured. Total returns shown include the maximum sales charge of 1.00% and the 1.00% contingent deferred sales charge, as applicable.
| 1 | Represents a hypothetical investment of $10,000 in the Fund after deducting the maximum sales charge of 1.00% ($10,000 investment minus $100 sales charge = $9,900). A 1.00% contingent deferred sales charge would be applied to any redemption less than four years from the purchase date. The Fund's performance assumes the reinvestment of all dividends and distributions. The BCMB and RU1000V have been adjusted to reflect reinvestment of dividends on securities in the indexes. |
| 2 | The BCMB and RU1000V are not adjusted to reflect sales charges, expenses or other fees that the SEC requires to be reflected in the Fund's performance. The BCMB is a broad market performance benchmark for the tax-exempt bond market. To be included in the BCMB, bonds must have a minimum credit rating of at least Baa3/BBB-, an outstanding par value of at least $7 million, be issued as part of a transaction of at least $75 million that took place after December 31, 1990, and have at least one year of remaining maturity. The index includes both zero coupon bonds and bonds subject to the alternative minimum tax. Remarketed issues, taxable municipal bonds, bonds with floating rates, and derivatives, are excluded from the index. The RU1000V measures the performance of those Russell 1000 companies with lower price-to-book ratios and lower forecasted growth values. The indexes are unmanaged and, unlike the Fund, are not affected by cash flows. It is not possible to invest directly in an index. |
| 3 | Total returns quoted reflect all applicable sales charges and contingent deferred sales charges. |
Annual Shareholder Report16
Portfolio of Investments Summary Tables (unaudited)
At October 31, 2009, the Fund's portfolio composition1 was as follows:
| Sector | | Percentage of
Total Net Assets |
| Tax-Exempt, Fixed Income Securities | | 58.1% |
| Equity Securities | | 38.8% |
| Cash Equivalents2 | | 2.5% |
| Other Assets and Liabilities — Net3 | | 0.6% |
| TOTAL | | 100.0% |
At October 31, 2009, the Fund's sector composition4 for its equity securities was as follows:
| Sector Composition | | Percentage of
Equity Securities |
| Energy | | 21.0% |
| Financials | | 19.6% |
| Health Care | | 11.1% |
| Industrials | | 10.9% |
| Information Technology | | 10.1% |
| Consumer Staples | | 7.5% |
| Telecommunication Services | | 6.7% |
| Consumer Discretionary | | 6.6% |
| Utilities | | 3.3% |
| Materials | | 3.2% |
| TOTAL | | 100.0% |
| 1 | See the Fund's Prospectus and Statement of Additional Information for a description of the types of securities in which the Fund invests. |
| 2 | Cash Equivalents include any investments in tax-exempt, variable rate instruments. |
| 3 | Assets, other than investments in securities, less liabilities. See Statement of Assets and Liabilities. |
| 4 | Sector classifications are based upon, and individual portfolio securities are assigned to, the classifications of the Global Industry Classification Standard (GICS) except that the adviser assigns a classification to securities not classified by the GICS and to securities for which the adviser does not have access to the classification made by the GICS. |
Annual Shareholder Report17
At October 31, 2009, the Fund's sector composition5 for its tax-exempt securities was as follows:| Sector Composition | | Percentage of
Municipal Securities |
| General Obligation — State | | 14.8% |
| General Obligation — Local | | 14.1% |
| Hospital | | 12.7% |
| Special Tax | | 9.1% |
| Transportation | | 8.6% |
| Industrial Revenue | | 7.8% |
| Water and Sewer | | 7.5% |
| Public Power | | 6.7% |
| Education | | 4.6% |
| Pre-refunded | | 4.4% |
| Other Securities6 | | 9.7% |
| TOTAL | | 100.0% |
| 5 | Sector classifications and the assignment of holdings to such sectors, are based upon the economic sector and/or revenue source of the underlying obligor, as determined by the Fund's Adviser. For securities that have been enhanced by a third party including bond insurers and banks, sector classifications are based upon the economic sector and/or revenue source of the underlying obligor, as determined by the Fund's Adviser. Pre-refunded securities are those whose debt service is paid from escrowed assets, usually U.S. government securities. |
| 6 | For purposes of this table, sector classifications constitute 90.3% of the Fund's total investments in tax-exempt securities. Remaining tax-exempt security sectors have been aggregated under the designation “Other Securities.” |
Annual Shareholder Report18
Portfolio of Investments
October 31, 2009
|
| Principal Amount or Shares | | | Value |
| | Common Stocks – 38.8% | |
| | Consumer Discretionary – 2.5% | |
| 164,700 | | Comcast Corp., Class A | 2,388,150 |
| 44,300 | | Family Dollar Stores, Inc. | 1,253,690 |
| 15,625 | | Genuine Parts Co. | 546,719 |
| 94,270 | | Home Depot, Inc. | 2,365,234 |
| 65,430 | | Leggett and Platt, Inc. | 1,264,762 |
| 52,690 | | M.D.C. Holdings, Inc. | 1,718,748 |
| 10,400 | | McDonald's Corp. | 609,544 |
| 18,305 | | Penney (J.C.) Co., Inc. | 606,445 |
| 123,770 | | Time Warner, Inc. | 3,727,952 |
| | TOTAL | 14,481,244 |
| | Consumer Staples – 2.9% | |
| 106,410 | | Archer-Daniels-Midland Co. | 3,205,069 |
| 9,655 | | Kimberly-Clark Corp. | 590,500 |
| 45,470 | | Kraft Foods, Inc., Class A | 1,251,334 |
| 12,055 | | PepsiCo, Inc. | 729,930 |
| 80,495 | | Procter & Gamble Co. | 4,668,710 |
| 124,930 | 1 | Wal-Mart Stores, Inc. | 6,206,523 |
| | TOTAL | 16,652,066 |
| | Energy – 8.2% | |
| 57,960 | | BP PLC, ADR | 3,281,695 |
| 68,460 | | Chevron Corp. | 5,239,928 |
| 118,105 | | ConocoPhillips | 5,926,509 |
| 22,275 | | Diamond Offshore Drilling, Inc. | 2,121,694 |
| 66,595 | | ENI S.p.A, ADR | 3,301,780 |
| 271,160 | | El Paso Corp. | 2,660,080 |
| 33,890 | | EnCana Corp. | 1,877,167 |
| 130,515 | | Exxon Mobil Corp. | 9,354,010 |
| 15,790 | | Murphy Oil Corp. | 965,401 |
| 8,305 | | Occidental Petroleum Corp. | 630,183 |
| 36,590 | | Royal Dutch Shell PLC | 2,173,812 |
| 25,520 | | Santos Ltd., ADR | 1,387,522 |
| 14,645 | | Sasol Ltd., ADR | 547,577 |
| 28,590 | | Technip SA | 1,811,176 |
| 29,035 | | Tenaris SA, ADR | 1,034,227 |
Annual Shareholder Report19
|
| 70,630 | | Total SA, ADR | 4,242,744 |
| | TOTAL | 46,555,505 |
| | Financials – 7.6% | |
| 87,585 | | Ace, Ltd. | 4,498,366 |
| 52,915 | | Aflac, Inc. | 2,195,443 |
| 47,250 | | American Financial Group, Inc., Ohio | 1,162,350 |
| 27,105 | | Aspen Insurance Holdings Ltd. | 699,309 |
| 81,445 | | Assurant, Inc. | 2,437,649 |
| 40,750 | | Axis Capital Holdings Ltd. | 1,177,267 |
| 428,975 | | Bank of America Corp. | 6,254,455 |
| 95,195 | | Chubb Corp. | 4,618,861 |
| 260,645 | | Citigroup, Inc. | 1,066,038 |
| 7,010 | | Everest Re Group Ltd. | 613,305 |
| 108,050 | | JPMorgan Chase & Co. | 4,513,248 |
| 76,850 | | Morgan Stanley | 2,468,422 |
| 21,150 | | NYSE Euronext | 546,728 |
| 16,345 | | PartnerRe Ltd. | 1,250,066 |
| 117,030 | | The Travelers Cos, Inc. | 5,826,924 |
| 45,440 | | Validus Holdings Ltd. | 1,149,632 |
| 101,440 | | Wells Fargo & Co. | 2,791,629 |
| | TOTAL | 43,269,692 |
| | Health Care – 4.3% | |
| 12,055 | | Abbott Laboratories | 609,621 |
| 10,885 | | Baxter International, Inc. | 588,443 |
| 24,945 | | Bayer AG, ADR | 1,726,194 |
| 135,550 | | Bristol-Myers Squibb Co. | 2,954,990 |
| 127,145 | | Johnson & Johnson | 7,507,912 |
| 16,065 | | Medtronic, Inc. | 573,521 |
| 114,475 | | Merck & Co., Inc. | 3,540,712 |
| 80,615 | | PDL BioPharma, Inc. | 677,972 |
| 373,915 | | Pfizer, Inc. | 6,367,773 |
| | TOTAL | 24,547,138 |
| | Industrials – 4.2% | |
| 15,245 | | Boeing Co. | 728,711 |
| 18,035 | | CSX Corp. | 760,716 |
| 16,460 | | Cooper Industries PLC | 636,838 |
| 35,725 | | Dover Corp. | 1,346,118 |
Annual Shareholder Report20
|
| 30,445 | | General Dynamics Corp. | 1,908,902 |
| 617,355 | | General Electric Co. | 8,803,482 |
| 16,090 | | Honeywell International, Inc. | 577,470 |
| 49,480 | | ITT Corp. | 2,508,636 |
| 2,220 | | Mitsui & Co., ADR | 580,108 |
| 13,060 | | Norfolk Southern Corp. | 608,857 |
| 79,770 | | Tyco International Ltd. | 2,676,283 |
| 9,715 | | Union Pacific Corp. | 535,685 |
| 10,910 | | United Parcel Service, Inc. | 585,649 |
| 31,225 | | United Technologies Corp. | 1,918,776 |
| | TOTAL | 24,176,231 |
| | Information Technology – 3.9% | |
| 58,180 | | Harris Corp. | 2,427,270 |
| 98,055 | | Intel Corp. | 1,873,831 |
| 53,305 | | International Business Machines Corp. | 6,429,116 |
| 45,630 | | Intersil Holding Corp. | 572,657 |
| 56,200 | | Linear Technology Corp. | 1,454,456 |
| 92,500 | | Microchip Technology, Inc. | 2,216,300 |
| 114,645 | | Microsoft Corp. | 3,179,106 |
| 87,665 | | National Semiconductor Corp. | 1,134,385 |
| 85,580 | | Siliconware Precision Industries Company — ADR | 575,953 |
| 80,765 | | Texas Instruments, Inc. | 1,893,939 |
| 77,250 | | Xerox Corp. | 580,920 |
| | TOTAL | 22,337,933 |
| | Materials – 1.3% | |
| 15,215 | | Air Products & Chemicals, Inc. | 1,173,533 |
| 21,985 | | Bemis Co., Inc. | 567,873 |
| 22,325 | | Du Pont (E.I.) de Nemours & Co. | 710,381 |
| 13,615 | | Nucor Corp. | 542,558 |
| 22,640 | | PPG Industries, Inc. | 1,277,575 |
| 12,590 | | Rio Tinto PLC, ADR | 2,241,398 |
| 23,680 | | Sensient Technologies Corp. | 598,867 |
| | TOTAL | 7,112,185 |
| | Telecommunication Services – 2.6% | |
| 241,890 | | AT&T, Inc. | 6,209,316 |
| 131,800 | | BCE, Inc. | 3,160,564 |
| 22,670 | | CenturyTel, Inc. | 735,868 |
Annual Shareholder Report21
|
| 24,550 | | France Telecommunications, ADR | 619,151 |
| 188,325 | | Qwest Communications International, Inc. | 676,087 |
| 23,080 | | TELUS Corp. | 682,014 |
| 121,690 | | Vodafone Group PLC, ADR | 2,700,301 |
| | TOTAL | 14,783,301 |
| | Utilities – 1.3% | |
| 88,815 | | CMS Energy Corp. | 1,181,239 |
| 60,555 | | Exelon Corp. | 2,843,663 |
| 18,595 | | NSTAR | 575,515 |
| 19,420 | | PPL Corp. | 571,725 |
| 73,250 | | Public Service Enterprises Group, Inc. | 2,182,850 |
| | TOTAL | 7,354,992 |
| | TOTAL COMMON STOCKS
(IDENTIFIED COST $208,408,395) | 221,270,287 |
| | MUNICIPAL BONDS – 58.1% | |
| | Alabama – 0.4% | |
| $1,050,000 | | Courtland, AL IDB, (International Paper Co.), PCR Refunding Bonds (Series 2005A), 5.000%, 06/01/2025 | 949,526 |
| 1,370,000 | | Montgomery, AL BMC Special Care Facilities Finance Authority, (Health Care Authority for Baptist Health, AL), Refunding Revenue Bonds (Series 2004-C), 5.125%, 11/15/2024 | 1,320,570 |
| | TOTAL | 2,270,096 |
| | Alaska – 0.2% | |
| 1,000,000 | | Alaska Municipal Bond Bank, Revenue Bonds, 5.250%, (National Public Finance Guarantee Corporation INS), 12/01/2022 | 1,038,440 |
| | Arizona – 2.3% | |
| 4,315,000 | | Phoenix, AZ Civic Improvement Corp. — Airport System, Senior Lien Airport Revenue Refunding Bonds (Series 2008C), 5.000%, 07/01/2022 | 4,465,076 |
| 5,525,000 | | Phoenix, AZ Civic Improvement Corp. — Excise Tax, Excise Tax Revenue Bonds, 5.000%, (FGIC INS, National Public Finance Guarantee Corporation INS), 07/01/2030 | 5,570,747 |
| 2,000,000 | | Salt River Project, AZ Agricultural Improvement & Power District, Electric System Revenue Bonds (Series 2008A), 5.000%, 01/01/2028 | 2,120,920 |
| 669,000 | | Tempe, AZ IDA, (Friendship Village of Tempe), Senior Living Refunding Revenue Bonds (Series 2004A), 5.375%, 12/01/2013 | 669,254 |
| | TOTAL | 12,825,997 |
| | Arkansas – 0.2% | |
| 1,000,000 | | Independence County, AR, (Entergy Arkansas, Inc.), PCR Refunding Bonds (Series 2005), 5.000%, 01/01/2021 | 969,960 |
Annual Shareholder Report22
|
| | California – 5.0% | |
| $150,000 | | Bay Area Toll Authority, CA, San Francisco Bay Area Toll Bridge Revenue Bonds (Series 2007F), 5.000%, 04/01/2024 | 159,295 |
| 570,000 | | California Health Facilities Financing Authority, Health Facility Revenue Bonds (Series 2004I), 4.95% TOBs (Catholic Healthcare West), Mandatory Tender 7/1/2014 | 600,022 |
| 100,000 | | California Infrastructure & Economic Development Bank, (Walt Disney Family Museum), Revenue Bonds (Series 2008), 5.000%, 02/01/2023 | 103,060 |
| 400,000 | | California State Department of Water Resources Power Supply Program, Revenue Bonds (Series 2008H), 5.000%, (FSA INS), 05/01/2022 | 421,044 |
| 1,470,000 | | California State, (California State Fiscal Recovery Fund), Refunding Economic Recovery Bonds (Series 2009A), 5.000%, 07/01/2018 | 1,536,150 |
| 300,000 | | California State, Refunding UT GO Bonds, 5.000%, 12/01/2017 | 314,961 |
| 3,000,000 | | California State, UT GO Bonds, 5.000%, 11/01/2022 | 3,024,990 |
| 315,000 | | California State, UT GO Bonds, 5.250%, 02/01/2019 | 326,800 |
| 250,000 | | California State, Various Purpose UT GO Bonds, 5.250%, 11/01/2018 | 262,660 |
| 900,000 | | California State, Various Purpose UT GO Bonds, 5.000%, 11/01/2021 | 922,338 |
| 3,000,000 | | California State, Various Purpose UT GO Bonds, 5.250%, 10/01/2020 | 3,130,710 |
| 300,000 | | California State, Various Purpose UT GO Bonds, 5.250%, 11/01/2019 | 312,897 |
| 1,100,000 | | California State, Various Purpose UT GO Bonds, 5.500%, 03/01/2026 | 1,133,264 |
| 3,000,000 | | California State, Various Purpose UT GO Bonds, 6.000%, 04/01/2038 | 3,179,100 |
| 100,000 | | California Statewide Communities Development Authority, (Daughters of Charity Health System), Revenue Bonds (Series 2005A), 5.250%, 07/01/2035 | 87,402 |
| 100,000 | | California Statewide Communities Development Authority, (Front Porch at Walnut Village), Revenue Bonds (Series 2007A), 5.125%, 04/01/2037 | 81,955 |
| 1,000,000 | | Chula Vista, CA, (San Diego Gas & Electric Co.), Industrial Development Refunding Revenue Bonds (Series 2004-B), 5.875%, 02/15/2034 | 1,078,590 |
| 500,000 | | Chula Vista, CA, (San Diego Gas & Electric Co.), Industrial Development Refunding Revenue Bonds (Series 2004-D), 5.875%, 01/01/2034 | 539,295 |
| 300,000 | | Eastern Municipal Water District of Riverside County, CA, Water & Sewer Revenue Fixed Rate COPs (Series 2008H), 5.000%, 07/01/2026 | 312,399 |
| 860,000 | | Glendale, CA Unified School District, UT GO Bonds (Series 2003F), 5.000%, (National Public Finance Guarantee Corporation INS), 09/01/2023 | 893,084 |
| 50,000 | | Irvine, CA Assessment District No. 04-20, Special Assessment Bonds (Group One), 5.000%, 09/02/2030 | 41,650 |
| 300,000 | | Los Angeles, CA Community College District, GO Bonds (2001 Election 2008 Series E-1), 5.000%, 08/01/2033 | 307,458 |
Annual Shareholder Report23
|
| $1,390,000 | | Los Angeles, CA Unified School District, UT GO Bonds (Series 2009D), 5.000%, 01/01/2034 | 1,405,846 |
| 200,000 | 2 | Regents of the University of California Medical Center, LIBOR Floating Rate Index Bonds (Series 2007C-2), (National Public Finance Guarantee Corporation INS), 1.035%, 05/15/2043 | 130,700 |
| 150,000 | | Regents of University of California, General Revenue Bonds (Series 2008L), 5.000%, 05/15/2025 | 159,039 |
| 5,000,000 | | Regents of University of California, General Revenue Bonds (Series 2009O), 5.750%, 05/15/2029 | 5,616,550 |
| 50,000 | | Roseville, CA Natural Gas Financing Authority, Gas Revenue Bonds (Series 2007), 5.000%, 02/15/2028 | 45,606 |
| 1,000,000 | | Trustees of the California State University, Revenue Bonds (Series A), 5.125%, (AMBAC INS), 11/01/2026 | 1,015,970 |
| 1,545,000 | | Yucaipa Valley Water District, CA, Water System Revenue COPs (Series 2004A), 5.250%, (National Public Finance Guarantee Corporation INS), 09/01/2023 | 1,581,277 |
| | TOTAL | 28,724,112 |
| | Colorado – 1.2% | |
| 1,500,000 | | Colorado Educational & Cultural Facilities Authority, (Peak to Peak Charter School Project), Refunding Revenue Bonds, 5.250%, (Syncora Guarantee, Inc. INS), 08/15/2019 | 1,534,080 |
| 710,000 | | Colorado Health Facilities Authority, (Evangelical Lutheran Good Samaritan Society), Health Facilities Revenue Bonds (Series 2004A), 5.250%, 06/01/2034 | 666,207 |
| 495,000 | | Colorado Health Facilities Authority, (Evangelical Lutheran Good Samaritan Society), Health Facilities Revenue Bonds (Series 2005), 5.250%, 06/01/2023 | 494,025 |
| 1,590,000 | | Colorado State Higher Education Capital Construction Lease Purchase Financing Program, COPs (Series 2008), 5.500%, 11/01/2027 | 1,680,105 |
| 1,250,000 | | Conservatory Metropolitan District, CO, LT GO Bonds, 6.750%, (United States Treasury PRF 12/1/2013@102), 12/01/2034 | 1,519,025 |
| 1,000,000 | | Denver, CO Health & Hospital Authority, Revenue Bonds, 6.250%, (United States Treasury PRF 12/1/2014@100), 12/01/2033 | 1,201,160 |
| | TOTAL | 7,094,602 |
| | Connecticut – 0.2% | |
| 1,100,000 | | Connecticut State, UT GO Bonds (Series 2009A), 5.000%, 02/15/2029 | 1,193,489 |
| | District of Columbia – 1.3% | |
| 1,000,000 | | District of Columbia Water & Sewer Authority, Public Utility Subordinated Lien Refunding Revenue Bonds (Series 2008A), 5.000%, (Assured Guaranty Corp. INS), 10/01/2023 | 1,057,980 |
| 5,000,000 | | District of Columbia, UT GO Bonds (Series 2004A), 5.000%, (FSA INS), 06/01/2025 | 5,208,800 |
Annual Shareholder Report24
|
| $1,000,000 | | Washington Metropolitan Area Transit Authority, Gross Revenue Transit Bonds (Series 2009A), 5.125%, 07/01/2032 | 1,045,310 |
| | TOTAL | 7,312,090 |
| | Florida – 3.5% | |
| 1,265,000 | | Broward County, FL Airport System, Airport System Refunding Revenue Bonds (Series 2009O), 5.375%, 10/01/2029 | 1,288,807 |
| 640,000 | | East Homestead, FL Community Development District, Special Assessment Revenue Bonds (Series 2005), 5.450%, 05/01/2036 | 470,874 |
| 2,275,000 | | Florida State Department of Children & Families, (Florida State), (South Florida Evaluation Treatment Center) COPs, 5.000%, 10/01/2020 | 2,373,917 |
| 3,000,000 | | Florida State Education System, Facilities Revenue Bonds (Series 2005A), 5.000%, (National Public Finance Guarantee Corporation INS), 05/01/2027 | 3,019,860 |
| 1,100,000 | | Miami-Dade County, FL Aviation, Revenue Bonds (Series 2008B), 5.000%, (Assured Guaranty Corp. INS), 10/01/2023 | 1,155,671 |
| 380,000 | | Orlando, FL Urban Community Development District, Capital Improvement Revenue Bonds, 6.000%, 5/01/2020 | 325,231 |
| 5,000,000 | | Orlando, FL Utilities Commission, Utility System Revenue Bonds (Series 2009A), 5.250%, 10/01/2039 | 5,281,200 |
| 3,000,000 | | Palm Beach County, FL, Public Improvement Revenue Bonds (Series 2008-2), 5.375%, 11/01/2028 | 3,236,310 |
| 1,705,000 | | Tolomato Community Development District, FL, Special Assessment Revenue Bonds (Series 2006), 5.400%, 5/01/2037 | 1,089,563 |
| 1,500,000 | | Volusia County, FL Education Facility Authority, (Embry-Riddle Aeronautical University, Inc.), Educational Facilities Refunding Revenue Bonds (Series 2005), 5.000%, (Radian Asset Assurance, Inc. INS), 10/15/2025 | 1,389,390 |
| 485,000 | | Winter Garden Village at Fowler Groves Community Development District, FL, Special Assessment Bonds (Series 2006), 5.650%, 5/01/2037 | 418,157 |
| | TOTAL | 20,048,980 |
| | Georgia – 1.6% | |
| 5,000,000 | | Athens-Clarke County, GA Water & Sewerage, Revenue Bonds (Series 2008), 5.625%, 01/01/2028 | 5,581,650 |
| 3,000,000 | | Atlanta, GA Water & Wastewater, Revenue Bonds (Series 2009A), 6.250%, 11/01/2034 | 3,190,320 |
| 615,000 | | Atlanta, GA, (Eastside Tax Allocation District), Tax Allocation Bonds (Series 2005B), 5.600%, 01/01/2030 | 535,794 |
| | TOTAL | 9,307,764 |
| | Guam – 0.1% | |
| 565,000 | | Guam Government LO (Section 30), Bonds (Series 2009A), 5.625%, 12/01/2029 | 568,644 |
Annual Shareholder Report25
|
| | Hawaii – 0.2% | |
| $1,250,000 | | Hawaii State Department of Budget & Finance, (Hawaiian Electric Co., Inc.), Special Purpose Revenue Bonds (Series 2009), 6.500%, 07/01/2039 | 1,330,113 |
| | Illinois – 1.3% | |
| 2,615,000 | | Chicago, IL Housing Authority Capital Program, Refunding Revenue Bonds, 5.000%, (FSA INS), 07/01/2017 | 2,809,373 |
| 1,180,000 | | Chicago, IL O'Hare International Airport, General Airport Third Lien Revenue Bonds (Series 2005A), 5.250%, (National Public Finance Guarantee Corporation INS), 01/01/2026 | 1,221,359 |
| 1,000,000 | | Chicago, IL Park District, LT GO Bonds (Series 2004A), 5.000%, (AMBAC INS), 01/01/2026 | 1,031,400 |
| 415,000 | | DuPage County, IL, (Naperville Campus LLC), Special Tax Bonds (Series 2006), 5.625%, 03/01/2036 | 299,294 |
| 1,000,000 | | Illinois Finance Authority, (Friendship Village of Schaumburg), Revenue Bonds (Series 2005A), 5.625%, 02/15/2037 | 791,080 |
| 875,000 | | Illinois Finance Authority, (Landing at Plymouth Place), Revenue Bonds (Series 2005A), 6.000%, 05/15/2025 | 750,680 |
| 625,000 | | Illinois Finance Authority, (Landing at Plymouth Place), Revenue Bonds (Series 2005A), 6.000%, 05/15/2037 | 490,150 |
| | TOTAL | 7,393,336 |
| | Indiana – 0.7% | |
| 2,500,000 | | Indiana Health & Educational Facility Financing Authority, (Baptist Homes of Indiana), Revenue Bonds (Series 2005), 5.250%, 11/15/2035 | 2,146,225 |
| 2,500,000 | | St. Joseph County, IN Hospital Authority, (Madison Center Obligated Group), Health Facilities Revenue Bonds (Series 2005), 5.375%, 02/15/2034 | 1,965,425 |
| | TOTAL | 4,111,650 |
| | Iowa – 0.2% | |
| 2,035,000 | | Iowa Finance Authority, (Deerfield Retirement Community, Inc.), Senior Living Facility Refunding Revenue Bonds (Series 2007A), 5.500%, 11/15/2037 | 1,331,032 |
| | Kansas – 0.5% | |
| 2,605,000 | | Kansas State Development Finance Authority, (Adventist Health System/Sunbelt Obligated Group), Hospital Revenue Bonds (Series 2009D), 5.000%, 11/15/2029 | 2,578,924 |
| | Louisiana – 0.7% | |
| 1,000,000 | | St. John the Baptist Parish, LA, (Marathon Oil Corp.), Environmental Improvement Refunding Revenue Bonds (Series 1998), 5.350%, 12/01/2013 | 994,160 |
| 3,000,000 | | St. John the Baptist Parish, LA, (Marathon Oil Corp.), Revenue Bonds (Series 2007A), 5.125%, 06/01/2037 | 2,713,290 |
| | TOTAL | 3,707,450 |
Annual Shareholder Report26
|
| | Maryland – 0.1% | |
| $500,000 | | Maryland State IDFA, (Our Lady of Good Counsel High School), EDRBs (Series 2005A), 6.000%, 05/01/2035 | 437,720 |
| | Massachusetts – 1.7% | |
| 4,000,000 | | Commonwealth of Massachusetts, UT GO Bonds (Series 2009A), 5.000%, 03/01/2034 | 4,153,960 |
| 5,000,000 | | Massachusetts Bay Transportation Authority General Transportation System, Assessment Bonds (Series 2008A), 5.250%, 07/01/2034 | 5,329,250 |
| | TOTAL | 9,483,210 |
| | Michigan – 2.0% | |
| 5,000,000 | | Detroit, MI City School District, UT GO Bonds (Series 2005A), 5.000%, (FSA INS), 05/01/2017 | 5,224,700 |
| 4,370,000 | | Detroit, MI, UT GO Bonds (Series 2008-A), 5.000%, (Assured Guaranty Corp. INS), 04/01/2024 | 4,125,105 |
| 1,000,000 | | Michigan State Hospital Finance Authority, (Oakwood Obligated Group), Revenue Bonds, 5.500%, 11/01/2013 | 1,040,820 |
| 1,000,000 | | Riverview, MI Community School District, Refunding UT GO Bonds, 5.000%, (Q-SBLF GTD), 05/01/2021 | 1,052,780 |
| | TOTAL | 11,443,405 |
| | Mississippi – 0.2% | |
| 900,000 | | Mississippi Hospital Equipment & Facilities Authority, (Southwest Mississippi Regional Medical Center), Refunding & Improvement Revenue Bonds, 5.750%, 04/01/2023 | 857,115 |
| | Missouri – 0.6% | |
| 1,500,000 | | Missouri Development Finance Board, (Branson, MO), Infrastructure Facilities Revenue Bonds (Series 2004A), 5.250%, 12/01/2019 | 1,510,860 |
| 2,000,000 | | Missouri State HEFA, (BJC Health System, MO), Health Facilities Revenue Bonds, 5.250%, 05/15/2018 | 2,079,740 |
| | TOTAL | 3,590,600 |
| | Nevada – 1.2% | |
| 3,585,000 | | Clark County, NV School District, LT GO School Bonds (2007C), 5.000%, 06/15/2025 | 3,693,375 |
| 500,000 | | Clark County, NV, (Summerlin-Mesa SID No. 151), Special Assessment Revenue Bonds (Series 2005), 5.000%, 08/01/2025 | 329,485 |
| 2,000,000 | | Clark County, NV, IDRBs (Series 2003C), 5.45% TOBs (Southwest Gas Corp.), Mandatory Tender 3/1/2013 | 2,046,300 |
| 245,000 | | Henderson, NV, (Falls at Lake Las Vegas LID No. T-16), LID No. T-16 LT Obligation Improvement Bonds, 5.100%, 03/01/2022 | 110,000 |
| 580,000 | | Henderson, NV, (Falls at Lake Las Vegas LID No. T-16), LID No. T-16 LT Obligation Improvement Bonds, 5.125%, 03/01/2025 | 260,124 |
Annual Shareholder Report27
|
| $655,000 | | Las Vegas Valley, NV Water District, Refunding LT GO Bonds (Series 2003B), 5.000%, (National Public Finance Guarantee Corporation INS), 06/01/2027 | 664,687 |
| | TOTAL | 7,103,971 |
| | New Jersey – 1.2% | |
| 2,225,000 | | New Jersey EDA, (New Jersey State), School Facilities Construction Bonds (Series 2008Y), 5.000%, 09/01/2019 | 2,435,952 |
| 1,000,000 | | New Jersey EDA, (Winchester Gardens at Ward Homestead), First Mortgage Refunding Revenue Bonds (Series 2004A), 4.800%, 11/01/2013 | 1,010,260 |
| 3,050,000 | | Tobacco Settlement Financing Corp., NJ, Revenue Bonds, 7.000%, (United States Treasury PRF 6/1/2013@100), 06/01/2041 | 3,617,026 |
| | TOTAL | 7,063,238 |
| | New Mexico – 0.5% | |
| 2,000,000 | | Albuquerque Bernalillo County, NM Water Utility Authority, Joint Water & Sewer System Improvement Revenue Bonds (Series 2009A-1), 5.250%, 07/01/2034 | 2,100,420 |
| 500,000 | 3,4 | Jicarilla, NM Apache Nation, Revenue Bonds, 5.500%, 09/01/2023 | 520,380 |
| | TOTAL | 2,620,800 |
| | New York – 6.0% | |
| 500,000 | | Dutchess County, NY IDA, (St. Francis Hospital and Health Centers), Civic Facility Revenue Bonds (Series 2004B), 7.500%, 03/01/2029 | 486,040 |
| 200,000 | | Long Island Power Authority, NY, Electric System Revenue Bonds (Series C), 5.000%, 09/01/2022 | 204,678 |
| 4,000,000 | 2 | New York City, NY IDA, (Yankee Stadium LLC), CPI PILOT Revenue Bonds (Series 2006), (FGIC INS), 0.000%, 03/01/2021 | 2,741,560 |
| 665,000 | | New York City, NY Municipal Water Finance Authority, Water & Sewer System Revenue Bonds (Series 2009A), 5.750%, 06/15/2040 | 733,389 |
| 5,000,000 | | New York City, NY Municipal Water Finance Authority, Water & Sewer System Second General Resolution Revenue Bonds (Series Fiscal 2009EE), 5.250%, 06/15/2040 | 5,274,450 |
| 2,000,000 | | New York City, NY Transitional Finance Authority, Building Aid Revenue Bonds (Series 2009 S-5), 5.000%, 01/15/2031 | 2,063,920 |
| 1,000,000 | | New York City, NY Transitional Finance Authority, Future Tax Secured Bonds (2003 Series C), 5.250%, (AMBAC INS), 08/01/2022 | 1,038,060 |
| 40,000 | | New York City, NY, UT GO Bonds (Fiscal 2003 Series J), 5.500%, 06/01/2023 | 41,672 |
| 350,000 | | New York City, NY, UT GO Bonds (Fiscal 2004 Series D), 5.250%, 10/15/2020 | 366,138 |
| 800,000 | | New York City, NY, UT GO Bonds (Fiscal 2004 Series I), 5.000%, 08/01/2019 | 839,952 |
| 1,500,000 | | New York City, NY, UT GO Bonds (Fiscal 2005 Series C), 5.250%, 08/15/2024 | 1,563,000 |
Annual Shareholder Report28
|
| $1,000,000 | | New York City, NY, UT GO Bonds (Fiscal 2005 Series D), 5.000%, 11/01/2025 | 1,030,750 |
| 2,215,000 | | New York City, NY, UT GO Bonds (Fiscal 2006 Series E-1), 5.000%, 08/01/2023 | 2,299,990 |
| 5,000,000 | | New York City, NY, UT GO Bonds (Series 2009E-1), 5.250%, 10/15/2017 | 5,604,250 |
| 2,500,000 | | New York State Thruway Authority, (New York State Personal Income Tax Revenue Bond Fund), Revenue Bonds (Series 2007A), 5.250%, 03/15/2026 | 2,716,250 |
| 500,000 | | Tobacco Settlement Financing Corp., NY, (New York State), Asset-Backed Revenue Bonds (Series 2003A-1), 5.500%, 06/01/2018 | 523,695 |
| 900,000 | | Tobacco Settlement Financing Corp., NY, (New York State), Revenue Bonds (Series 2003C-1), 5.500%, 06/01/2018 | 942,651 |
| 500,000 | | Tobacco Settlement Financing Corp., NY, (New York State), Revenue Bonds (Series 2003C-1), 5.500%, 06/01/2022 | 524,380 |
| 5,000,000 | | Triborough Bridge & Tunnel Authority, NY, General Revenue Bonds (Series 2009A-2), 5.000%, 11/15/2029 | 5,290,550 |
| | TOTAL | 34,285,375 |
| | North Carolina – 2.3% | |
| 6,500,000 | | Johnston Memorial Hospital Authority, NC, (Johnston Memorial
Hospital), FHA Insured Mortgage Revenue Bonds (Series 2008), 5.250%, (FSA INS), 10/01/2024 | 6,768,905 |
| 1,750,000 | | North Carolina Eastern Municipal Power Agency, Power System Revenue Bonds (Series 2009C), 5.000%, 01/01/2026 | 1,782,095 |
| 1,000,000 | | North Carolina Medical Care Commission, (Arc of North Carolina Projects), Health Care Housing Revenue Bonds (Series 2004A), 5.800%, 10/01/2034 | 953,160 |
| 2,000,000 | | North Carolina Medical Care Commission, (Pennybyrn at Maryfield), Healthcare Facilities Revenue Bonds (Series 2005A), 5.650%, 10/01/2025 | 1,580,120 |
| 625,000 | | North Carolina Municipal Power Agency No. 1, Electric Refunding Revenue Bonds (Series 2009A), 5.000%, 01/01/2030 | 630,450 |
| 1,535,000 | | North Carolina Municipal Power Agency No. 1, Revenue Bonds (Series 2008C), 5.250%, 01/01/2020 | 1,659,734 |
| | TOTAL | 13,374,464 |
| | Ohio – 2.4% | |
| 2,850,000 | | American Municipal Power-Ohio, Inc., Prairie State Energy Campus Project Revenue Bonds (Series 2008A), 5.000%, 02/15/2016 | 3,132,264 |
| 3,680,000 | | Buckeye Tobacco Settlement Financing Authority, OH, Tobacco Settlement Asset-Backed Bonds (Series 2007A), 6.500%, 06/01/2047 | 2,964,534 |
| 220,000 | | Cleveland-Cuyahoga County, OH Port Authority, (Port of Cleveland Bond Fund), Development Revenue Bonds (Series 2005B), 5.125%, 05/15/2025 | 179,758 |
Annual Shareholder Report29
|
| $2,545,000 | | Ohio State Air Quality Development Authority, (FirstEnergy Generation Corp.), 5.700%, 08/01/2020 | 2,650,694 |
| 1,000,000 | | Ohio State Air Quality Development Authority, Environmental Improvement Refunding Revenue Bonds (Series 1995), 5.00% TOBs (Marathon Oil Corp.), Mandatory Tender 11/1/2011 | 1,052,370 |
| 1,000,000 | | Ohio State Higher Educational Facility Commission, (Mount Union College), Revenue Bonds, 5.250%, 10/01/2026 | 1,029,150 |
| 2,000,000 | | Ohio State University, General Receipts Bonds (2008A), 5.000%, 12/01/2028 | 2,121,300 |
| 375,000 | | Toledo-Lucas County, OH Port Authority, (Crocker Park Public Improvement Project), Special Assessment Revenue Bonds, 5.250%, 12/01/2023 | 334,380 |
| 400,000 | | Toledo-Lucas County, OH Port Authority, (CSX Corp.), Revenue Bonds, 6.450%, 12/15/2021 | 445,744 |
| | TOTAL | 13,910,194 |
| | Pennsylvania – 2.8% | |
| 300,000 | | Allegheny County, PA Higher Education Building Authority, (Chatham College), Revenue Bonds (Series 2002B), 5.250%, 11/15/2016 | 300,243 |
| 1,300,000 | | Allegheny County, PA IDA, (United States Steel Corp.), Environmental Improvement Refunding Revenue Bonds (Series 2005), 5.500%, 11/01/2016 | 1,247,506 |
| 85,000 | | Allegheny County, PA IDA, Revenue Bonds (Series 2002B), 5.000%, (National Public Finance Guarantee Corporation INS), 11/01/2022 | 86,420 |
| 2,000,000 | | Allegheny County, PA, UT GO Bonds (Series C-61), 5.000%, (Assured Guaranty Corp. INS), 12/01/2022 | 2,175,680 |
| 1,500,000 | | Pennsylvania State Higher Education Facilities Authority, (Carnegie Mellon University), Revenue Bonds (Series 2009), 5.000%, 08/01/2021 | 1,640,340 |
| 250,000 | | Pennsylvania State Higher Education Facilities Authority, (Dickinson College), Revenue Bonds (Series 2003AA1), 5.000%, (Radian Asset Assurance, Inc. INS), 11/01/2026 | 234,730 |
| 500,000 | | Pennsylvania State Higher Education Facilities Authority, (Messiah College), Revenue Bonds (Series AA), 5.500%, (Radian Asset Assurance, Inc. INS), 11/01/2022 | 504,640 |
| 500,000 | | Pennsylvania State Higher Education Facilities Authority, (UPMC Health System), Health System Revenue Bonds (Series A), 6.250%, 01/15/2018 | 517,930 |
| 1,000,000 | | Pennsylvania State Higher Education Facilities Authority, (UPMC Health System), Revenue Bonds (Series 2001A), 6.000%, 01/15/2022 | 1,028,990 |
| 500,000 | | Pennsylvania State Higher Education Facilities Authority, (UPMC Health System), Revenue Bonds, Series A, 6.000%, 01/15/2031 | 516,050 |
| 3,000,000 | | Pennsylvania State Turnpike Commission, Turnpike Subordinate Revenue Bonds (Series 2009D), 5.500%, 12/01/2041 | 3,074,520 |
Annual Shareholder Report30
|
| $500,000 | | Philadelphia Authority for Industrial Development, (PresbyHomes Germantown/Morrisville), Senior Living Revenue Bonds (Series 2005A), 5.625%, 07/01/2035 | 398,105 |
| 4,000,000 | | Philadelphia, PA Water & Wastewater System, Water and Wastewater Revenue Bonds (Series 2009A), 5.250%, 01/01/2032 | 4,037,360 |
| | TOTAL | 15,762,514 |
| | Puerto Rico – 0.6% | |
| 3,000,000 | | Puerto Rico Sales Tax Financing Corp., Sales Tax Revenue Bonds (First Subordinate Series 2009A), 6.000%, 08/01/2042 | 3,141,750 |
| | South Carolina – 1.1% | |
| 2,200,000 | | Georgetown County, SC Environmental Improvements, (International Paper Co.), Refunding Revenue Bonds, 5.700%, 04/01/2014 | 2,279,684 |
| 810,000 | | Lancaster County, SC, (Sun City Carolina Lakes Improvement District), Assessment Revenue Bonds (Series 2006), 5.450%, 12/01/2037 | 615,778 |
| 60,000 | | South Carolina Jobs-EDA, (Bon Secours Health System), EDRBs, Series 2002A, 5.500%, (United States Treasury PRF 11/15/2012@100), 11/15/2023 | 67,587 |
| 325,000 | | South Carolina Jobs-EDA, (Bon Secours Health System), Health System Revenue Bonds (Series A), 5.625%, (United States Treasury PRF 11/15/2012@100), 11/15/2030 | 367,305 |
| 2,500,000 | | South Carolina State Public Service Authority (Santee Cooper), Revenue Obligations (Series 2008A), 5.500%, 01/01/2038 | 2,670,475 |
| | TOTAL | 6,000,829 |
| | South Dakota – 0.7% | |
| 4,020,000 | | Educational Enhancement Funding Corp., SD, Tobacco Revenue Bonds (Series 2002B), 6.500%, 06/01/2032 | 3,881,511 |
| | Texas – 7.2% | |
| 1,545,000 | | Bexar County, Health Facilities Development Corp., (Army Retirement Residence Foundation), Refunding Revenue Bonds (Series 2007), 5.000%, 07/01/2033 | 1,265,170 |
| 5,000,000 | | Dallas, TX Area Rapid Transit, Senior Lien Sales Tax Revenue Bonds, 5.250%, 12/01/2038 | 5,269,300 |
| 1,000,000 | | Decatur, TX Hospital Authority, (Wise Regional Health System), Hospital Revenue Bonds (Series 2004A), 7.125%, 09/01/2034 | 966,940 |
| 3,570,000 | | Harris County, TX Cultural Education Facilities Finance Corp., (Methodist Hospital, Harris County, TX), Revenue Bonds (Series 2008B), 5.250%, 12/01/2016 | 3,898,083 |
| 1,000,000 | | Harris County, TX, Refunding Sr. Lien Toll Road Revenue Bonds, 5.000%, (National Public Finance Guarantee Corporation INS), 08/15/2027 | 1,029,520 |
| 1,250,000 | | Houston, TX Airport System, Senior Lien Refunding Revenue Bonds (Series 2009A), 5.000%, 07/01/2019 | 1,346,925 |
Annual Shareholder Report31
|
| $7,025,000 | | LaVernia, TX ISD, Refunding School Building UT GO Bonds, 5.000%, (PSFG GTD), 08/15/2037 | 7,232,237 |
| 2,000,000 | | Lower Colorado River Authority, TX, (LCRA Transmission Services Corp.), Refunding Revenue Bonds (Series 2008), 5.250%, (Berkshire Hathaway Assurance Corp. INS), 05/15/2028 | 2,128,700 |
| 1,000,000 | | Lower Colorado River Authority, TX, (LCRA Transmission Services Corp.), Refunding Revenue Bonds (Series 2008), 5.750%, 05/15/2023 | 1,065,730 |
| 1,000,000 | | Lower Colorado River Authority, TX, Transmission Contract Refunding Revenue Bonds (Series 2003C), 5.250%, (AMBAC INS), 05/15/2018 | 1,062,740 |
| 500,000 | | North Central Texas HFDC, (Children's Medical Center of Dallas), Hospital Revenue Refunding Bonds (Series 2002), 5.250%, (AMBAC INS), 08/15/2022 | 513,255 |
| 750,000 | | Port of Corpus Christi, TX IDC, (Valero Energy Corp.), Revenue Refunding Bonds (Series C), 5.400%, 04/01/2018 | 740,347 |
| 500,000 | | Sabine River Authority, TX, (Southwestern Electric Power Co.), PCR Refunding Bonds (Series 2006), 4.950%, (National Public Finance Guarantee Corporation INS), 03/01/2018 | 504,350 |
| 250,000 | | Sabine River Authority, TX, (Texas Competitive Electric Holdings Co. LLC), PCR Refunding Bonds (Series 2003B), 6.150%, 08/01/2022 | 129,318 |
| 2,000,000 | | Tarrant County, TX Cultural Education Facilities Finance Corp., (Air Force Village), Retirement Facility Revenue Bonds (Series 2007), 5.125%, 05/15/2037 | 1,647,320 |
| 3,880,000 | | Texas State Department of Housing & Community Affairs, Residential Mortgage Revenue Bonds (Series 2009A), 5.300%, 07/01/2034 | 3,948,792 |
| 2,425,000 | | Texas State Transportation Commission, (Texas State), Mobility Fund Bonds (Series 2005A), 5.000%, 04/01/2026 | 2,556,532 |
| 5,675,000 | | Texas State, Water Financial Assistance UT GO Bonds (Series 2004C&D), 5.000%, 08/01/2027 | 5,945,584 |
| | TOTAL | 41,250,843 |
| | Virginia – 1.1% | |
| 4,485,000 | | Tobacco Settlement Financing Corp., VA, Revenue Bonds, 5.625%, (United States Agency PRF 6/1/2015@100), 06/01/2037 | 5,204,529 |
| 1,170,000 | | Virginia Peninsula Port Authority, (Brinks Co. (The)), Coal Terminal Refunding Revenue Bonds (Series 2003), 6.000%, 04/01/2033 | 1,192,616 |
| | TOTAL | 6,397,145 |
| | Washington – 3.3% | |
| 1,160,000 | | Energy Northwest, WA, Wind Project Revenue Bonds, 5.000%, (AMBAC INS), 07/01/2023 | 1,175,532 |
| 3,650,000 | | Port of Tacoma, WA, LT GO Bonds (Series 2008A), 5.000%, (FSA INS), 12/01/2030 | 3,786,547 |
| 500,000 | | Skagit County, WA Public Hospital District No. 1, (Skagit Valley Hospital), Refunding Revenue Bonds (Series 2003), 6.000%, 12/01/2018 | 506,460 |
Annual Shareholder Report32
|
| $1,000,000 | | Skagit County, WA Public Hospital District No. 1, (Skagit Valley Hospital), UT GO Bonds (Series 2004), 5.500%, (National Public Finance Guarantee Corporation INS), 12/01/2023 | 1,033,030 |
| 820,000 | | Tacoma, WA Water, Refunding Revenue Bonds, 5.000%, (FSA INS), 12/01/2023 | 850,242 |
| 500,000 | | Tacoma, WA Water, Refunding Revenue Bonds, 5.000%, (FSA INS), 12/01/2022 | 521,985 |
| 5,000,000 | | Washington State Health Care Facilities Authority, (Highline Medical Center), FHA Insured Mortgage Revenue Bonds (Series 2008), 6.250%, (FHA INS), 08/01/2036 | 5,383,150 |
| 5,000,000 | | Washington State, UT GO Bonds (Series 2009C), 5.000%, 02/01/2022 | 5,507,150 |
| | TOTAL | 18,764,096 |
| | West Virginia – 0.6% | |
| 1,000,000 | | Ohio County, WV County Commission, (Fort Henry Centre Tax Increment Financing District No. 1), Tax Increment Revenue Bonds (Series 2005A), 5.625%, 06/01/2034 | 876,660 |
| 2,900,000 | | Pleasants County, WV County Commission, (Allegheny Energy Supply Company LLC), PCR Revenue Refunding Bonds (Series 2007F), 5.250%, 10/15/2037 | 2,661,823 |
| | TOTAL | 3,538,483 |
| | Wisconsin – 2.4% | |
| 2,780,000 | | Badger, WI Tobacco Asset Securitization Corp., Asset-Backed Revenue Bonds, 6.125%, (United States Treasury and Agency PRF), 06/01/2027 | 3,035,510 |
| 4,665,000 | | Wisconsin State General Fund Appropriation, (Wisconsin State), Revenue Bonds (Series 2009A), 5.750%, 05/01/2033 | 5,029,523 |
| 160,000 | | Wisconsin State HEFA, (Blood Center of Wisconsin, Inc.), Revenue Bonds (Series 2004), 5.750%, 06/01/2034 | 161,851 |
| 250,000 | | Wisconsin State HEFA, (Southwest Health Center), Revenue Bonds (Series 2004A), 6.250%, 04/01/2034 | 206,333 |
| 5,000,000 | | Wisconsin State, UT GO Bonds (Series 2003C), 5.000%, 05/01/2024 | 5,217,350 |
| | TOTAL | 13,650,567 |
| | Wyoming – 0.5% | |
| 2,800,000 | | Sweetwater County, WY PCRB, (Idaho Power Co.), PCR Refunding Bonds (Series 2006), 5.250%, 07/15/2026 | 2,897,720 |
| | TOTAL MUNICIPAL BONDS
(IDENTIFIED COST $329,794,586) | 331,262,229 |
| | Short-Term Municipals – 2.5%;5 | |
| | New Hampshire – 0.2% | |
| 1,170,000 | | New Hampshire Higher Educational & Health Facilities Authority, (Series 2001A) Weekly VRDNs (Dartmouth-Hitchcock Obligated Group), (FSA INS), 0.300%, 11/5/2009 | 1,170,000 |
Annual Shareholder Report33
|
| | New York – 0.3% | |
| $1,850,000 | | New York City, NY, (Fiscal 2008 Subseries L-5) Daily VRDNs, (Dexia Credit Local LIQ), 0.240%, 11/2/2009 | 1,850,000 |
| | Ohio – 0.7% | |
| 4,000,000 | | Franklin County, OH Hospital Facility Authority, (Series 2008E) Weekly VRDNs (Nationwide Children's Hospital), (JPMorgan Chase Bank, N.A. LIQ), 0.200%, 11/5/2009 | 4,000,000 |
| | Pennsylvania – 1.3% | |
| 6,060,000 | | Philadelphia, PA Authority for Industrial Development, (Series 2007A) Daily VRDNs (Fox Chase Cancer Center), (Citizens Bank of Pennsylvania LOC), 0.350%, 11/2/2009 | 6,060,000 |
| 1,400,000 | | Philadelphia, PA Hospitals & Higher Education Facilities Authority, (Series 2005A) Daily VRDNs (Children's Hospital of Philadelphia), (Bank of America N.A. LIQ), 0.180%, 11/2/2009 | 1,400,000 |
| | TOTAL | 7,460,000 |
| | TOTAL SHORT-TERM MUNICIPALS
(AT COST) | 14,480,000 |
| | TOTAL INVESTMENTS — 99.4%
(IDENTIFIED COST $552,682,981)6 | 567,012,516 |
| | OTHER ASSETS AND LIABILITIES - NET — 0.6%7 | 3,230,463 |
| | TOTAL NET ASSETS — 100% | $570,242,979 |
On October 31, 2009, the fund held no securities that were subject to the federal alternative minimum tax (AMT).
| 1 | Non-income producing security. |
| 2 | Denotes variable rate and floating rate obligations for which the current rate is shown. |
| 3 | Denotes a restricted security that either: (a) cannot be offered for public sale without first being registered, or being able to take advantage of an exemption from registration, under the Securities Act of 1933; or (b) is subject to a contractual restriction on public sales. At October 31, 2009, these restricted securities amounted to $520,380, which represented 0.1% of total net assets. |
| 4 | Denotes a restricted security that may be resold without restriction to “qualified institutional buyers” as defined in Rule 144A under the Securities Act of 1933 and that the Fund has determined to be liquid under criteria established by the Fund's Board of Trustees (the “Trustees”). At October 31, 2009, these liquid restricted securities amounted to $520,380, which represented 0.1% of total net assets. |
| 5 | Current rate and next reset date shown for Variable Rate Demand Notes. |
| 6 | The cost of investments for federal tax purposes amounts to $553,988,351. |
| 7 | Assets, other than investments in securities, less liabilities. See Statement of Assets and Liabilities. |
Note: The categories of investments are shown as a percentage of total net assets at October 31, 2009.
Annual Shareholder Report34
Various inputs are used in determining the value of the Fund's investments. These inputs are summarized in the three broad levels listed below:Level 1 — quoted prices in active markets for identical securities
Level 2 — other significant observable inputs (including quoted prices for similar securities, interest rates, prepayment speeds, credit risk, etc.)
Level 3 — significant unobservable inputs (including the Fund's own assumptions in determining the fair value of investments)
The inputs or methodology used for valuing securities are not an indication of the risk associated with investing in those securities.
The following is a summary of the inputs used, as of October 31, 2009, in valuing the Fund's assets carried at fair value:
| Valuation Inputs | | | | |
| Level 1 —
Quoted
Prices and
Investments in
Mutual Funds | Level 2 —
Other
Significant
Observable
Inputs | Level 3 —
Significant
Unobservable
Inputs | Total |
| Equity Securities: | | | | |
| Domestic | $177,855,429 | $ — | $ — | $177,855,429 |
| International | 43,414,858 | — | — | 43,414,858 |
| Debt Securities: | | | | |
| Municipal Bonds | — | 331,262,229 | — | 331,262,229 |
| Short-Term Municipals | — | 14,480,000 | — | 14,480,000 |
| TOTAL SECURITIES | $221,270,287 | $345,742,229 | $ — | $567,012,516 |
Annual Shareholder Report35
The following acronyms are used throughout this portfolio:| ADR | — American Depositary Receipt |
| AMBAC | — American Municipal Bond Assurance Corporation |
| COPs | — Certificates of Participation |
| EDRBs | — Economic Development Revenue Bonds |
| EDA | — Economic Development Authority |
| FGIC | — Financial Guaranty Insurance Company |
| FHA | — Federal Housing Administration |
| FSA | — Financial Security Assurance |
| GO | — General Obligation |
| GTD | — Guaranteed |
| HEFA | — Health and Education Facilities Authority |
| HFDC | — Health Facility Development Corporation |
| IDA | — Industrial Development Authority |
| IDB | — Industrial Development Bond |
| IDC | — Industrial Development Corporation |
| IDFA | — Industrial Development Finance Authority |
| IDRBs | — Industrial Development Revenue Bonds |
| INS | — Insured |
| ISD | — Independent School District |
| LIBOR | — London Interbank Offered Rate |
| LID | — Local Improvement District |
| LIQ | — Liquidity Agreement |
| LO | — Limited Obligation |
| LOC | — Letter of Credit |
| LT | — Limited Tax |
| PCR | — Pollution Control Revenue |
| PCRB | — Pollution Control Revenue Bond |
| PRF | — Prerefunded |
| PSFG | — Permanent School Fund Guarantee |
| Q-SBLF | — Qualified State Bond Loan Fund |
| SID | — Special Improvement District |
| TOBs | — Tender Option Bonds |
| UT | — Unlimited Tax |
| VRDNs | — Variable Rate Demand Notes |
See Notes which are an integral part of the Financial Statements
Annual Shareholder Report36
Statement of Assets and Liabilities
October 31, 2009
| Assets: | | |
| Total investments in securities, at value (identified cost $552,682,981) | | $567,012,516 |
| Cash | | 88,770 |
| Income receivable | | 5,756,698 |
| Receivable for investments sold | | 627,321 |
| Receivable for shares sold | | 461,213 |
| TOTAL ASSETS | | 573,946,518 |
| Liabilities: | | |
| Payable for investments purchased | $2,069,797 | |
| Payable for shares redeemed | 1,140,482 | |
| Payable for Directors'/Trustees' fees | 2,041 | |
| Payable for distribution services fee (Note 5) | 111,093 | |
| Payable for shareholder services fee (Note 5) | 229,564 | |
| Accrued expenses | 150,562 | |
| TOTAL LIABILITIES | | 3,703,539 |
| Net assets for 57,346,150 shares outstanding | | $570,242,979 |
| Net Assets Consist of: | | |
| Paid-in capital | | $663,428,181 |
| Net unrealized appreciation of investments and translation of assets and liabilities in foreign currency | | 14,329,514 |
| Accumulated net realized loss on investments, foreign currency transactions, futures contracts and swap contracts | | (108,098,035) |
| Undistributed net investment income | | 583,319 |
| TOTAL NET ASSETS | | $570,242,979 |
Annual Shareholder Report37
Statement of Assets and Liabilities — continued| Net Asset Value, Offering Price and Redemption Proceeds Per Share | | |
| Class A Shares: | | |
| Net asset value per share ($384,554,594 ÷ 38,666,643 shares outstanding), no par value, unlimited shares authorized | | $9.95 |
| Offering price per share (100/94.50 of $9.95) | | $10.53 |
| Redemption proceeds per share | | $9.95 |
| Class B Shares: | | |
Net asset value per share ($55,826,361 ÷ 5,615,996 shares outstanding),
no par value, unlimited shares authorized | | $9.94 |
| Offering price per share | | $9.94 |
| Redemption proceeds per share (94.50/100 of $9.94) | | $9.39 |
| Class C Shares: | | |
| Net asset value per share ($113,829,678 ÷ 11,451,461 shares outstanding), no par value, unlimited shares authorized | | $9.94 |
| Offering price per share | | $9.94 |
| Redemption proceeds per share (99.00/100 of $9.94) | | $9.84 |
| Class F Shares: | | |
Net asset value per share ($16,032,346 ÷ 1,612,050 shares outstanding),
no par value, unlimited shares authorized | | $9.95 |
| Offering price per share (100/99.00 of $9.95) | | $10.05 |
| Redemption proceeds per share (99.00/100 of $9.95) | | $9.85 |
See Notes which are an integral part of the Financial Statements
Annual Shareholder Report38
Statement of Operations
Year Ended October 31, 2009
| Investment Income: | | | |
| Interest | | | $17,529,703 |
| Dividends (net of foreign taxes withheld of $112,286) | | | 8,313,225 |
| TOTAL INCOME | | | 25,842,928 |
| Expenses: | | | |
| Investment adviser fee (Note 5) | | $5,636,977 | |
| Administrative personnel and services fee (Note 5) | | 437,632 | |
| Custodian fees | | 36,360 | |
| Transfer and dividend disbursing agent fees and expenses | | 392,192 | |
| Directors'/Trustees' fees | | 6,924 | |
| Auditing fees | | 25,300 | |
| Legal fees | | 4,910 | |
| Portfolio accounting fees | | 167,865 | |
| Distribution services fee — Class B Shares (Note 5) | | 415,954 | |
| Distribution services fee — Class C Shares (Note 5) | | 848,574 | |
| Shareholder services fee — Class A Shares (Note 5) | | 945,306 | |
| Shareholder services fee — Class B Shares (Note 5) | | 138,651 | |
| Shareholder services fee — Class C Shares (Note 5) | | 277,879 | |
| Shareholder services fee — Class F Shares (Note 5) | | 18,840 | |
| Account administration fee — Class A Shares | | 699 | |
| Account administration fee — Class C Shares | | 215 | |
| Account administration fee — Class F Shares | | 153 | |
| Share registration costs | | 35,009 | |
| Printing and postage | | 52,572 | |
| Insurance premiums | | 5,960 | |
| Miscellaneous | | 8,588 | |
| TOTAL EXPENSES | | 9,456,560 | |
Annual Shareholder Report39
Statement of Operations — continued| Waivers and Expense Reduction: | | | |
| Waiver of investment adviser fee (Note 5) | $(2,546,354) | | |
| Waiver of administrative personnel and services fee (Note 5) | (8,658) | | |
| Fees paid indirectly from directed brokerage arrangements (Note 6) | (103,107) | | |
| TOTAL WAIVERS AND EXPENSE REDUCTION | | $(2,658,119) | |
| Net expenses | | | $6,798,441 |
| Net investment income | | | 19,044,487 |
| Realized and Unrealized Gain (Loss) on Investments and Foreign Currency Transactions: | | | |
| Net realized loss on investments and foreign currency transactions | | | (65,371,234) |
| Net change in unrealized depreciation of investments and translation of assets and liabilities in foreign currency | | | 92,700,829 |
| Net realized and unrealized gain on investments and foreign currency transactions | | | 27,329,595 |
| Change in net assets resulting from operations | | | $46,374,082 |
See Notes which are an integral part of the Financial Statements
Annual Shareholder Report40
Statement of Changes in Net Assets
| Year Ended October 31 | 2009 | 2008 |
| Increase (Decrease) in Net Assets | | |
| Operations: | | |
| Net investment income | $19,044,487 | $24,795,820 |
| Net realized loss on investments and foreign currency transactions | (65,371,234) | (39,982,913) |
| Net change in unrealized appreciation/depreciation of investments and translation of assets and liabilities in foreign currency | 92,700,829 | (113,006,730) |
| CHANGE IN NET ASSETS RESULTING FROM OPERATIONS | 46,374,082 | (128,193,823) |
| Distributions to Shareholders: | | |
| Distributions from net investment income | | |
| Class A Shares | (13,713,590) | (18,297,770) |
| Class B Shares | (1,588,579) | (2,070,761) |
| Class C Shares | (3,247,895) | (4,474,350) |
| Class F Shares | (540,576) | (508,077) |
| Distributions from net realized gain on investments and foreign currency transactions | | |
| Class A Shares | — | (16,606,423) |
| Class B Shares | — | (2,334,035) |
| Class C Shares | — | (5,144,128) |
| Class F Shares | — | (344,232) |
| CHANGE IN NET ASSETS RESULTING FROM DISTRIBUTIONS TO SHAREHOLDERS | (19,090,640) | (49,779,776) |
| Share Transactions: | | |
| Proceeds from sale of shares | 84,433,383 | 106,195,090 |
| Proceeds from shares issued in connection with the tax-free transfer of assets from Federated Stock and California Muni Fund | 7,529,084 | — |
| Net asset value of shares issued to shareholders in payment of distributions declared | 16,339,448 | 42,785,891 |
| Cost of shares redeemed | (164,730,604) | (233,839,011) |
| CHANGE IN NET ASSETS RESULTING FROM SHARE TRANSACTIONS | (56,428,689) | (84,858,030) |
| Change in net assets | (29,145,247) | (262,831,629) |
| Net Assets: | | |
| Beginning of period | 599,388,226 | 862,219,855 |
| End of period (including undistributed net investment income of $583,319 and $657,255, respectively) | $570,242,979 | $599,388,226 |
See Notes which are an integral part of the Financial Statements
Annual Shareholder Report41
Notes to Financial Statements
October 31, 2009
1. ORGANIZATION
Federated Income Securities Trust (the “Trust”) is registered under the Investment Company Act of 1940, as amended (the “Act”), as an open-end management investment company. The Trust consists of seven portfolios. The financial statements included herein are only those of Federated Muni and Stock Advantage Fund (the “Fund”), a diversified portfolio. The financial statements of the other portfolios are presented separately. The assets of each portfolio are segregated and a shareholder's interest is limited to the portfolio in which shares are held. Each portfolio pays its own expenses. The Fund offers four classes of shares: Class A Shares, Class B Shares, Class C Shares and Class F Shares. All shares of the Fund have equal rights with respect to voting, except on class-specific matters. The investment objective of the Fund is to provide tax-advantaged income with a secondary objective of capital appreciation.
On March 27, 2009, the Fund received assets from Federated Stock and California Muni Fund as the result of a tax-free reorganization, as follows:
Shares of
the Fund
Issued | Federated Stock
and California
Muni Fund
Net Assets
Received | Unrealized
Depreciation1 | Net Assets
of the Fund
Immediately
Prior to
Combination | Net Assets
of the Fund
Immediately
After
Combination |
| 838,385 | $7,529,084 | $(849,128) | $535,404,080 | $542,933,164 |
| 1 | Unrealized Depreciation is included in the Federated Stock and California Muni Fund Net Assets Received amount shown above. |
2. SIGNIFICANT ACCOUNTING POLICIES
The following is a summary of significant accounting policies consistently followed by the Fund in the preparation of its financial statements. These policies are in conformity with U.S. generally accepted accounting principles (GAAP).
Investment Valuation
In calculating its net asset value (NAV), the Fund generally values investments as follows:
- Fixed-income securities acquired with remaining maturities greater than 60 days are fair valued using price evaluations provided by a pricing service approved by the Trustees.
- Fixed-income securities acquired with remaining maturities of 60 days or less are valued at their cost (adjusted for the accretion of any discount or amortization of any premium).
- Equity securities listed on an exchange or traded through a regulated market system are valued at their last reported sale price or official closing price in their principal exchange or market.
- Derivative contracts listed on exchanges are valued at their reported settlement or closing price.
- Over-the-counter (OTC) derivative contracts are fair valued using price evaluations provided by a pricing service approved by the Trustees.
- Shares of other mutual funds are valued based upon their reported NAVs.
Annual Shareholder Report42
If the Fund cannot obtain a price or price evaluation from a pricing service for an investment, the Fund may attempt to value the investment based upon the mean of bid and asked quotations or fair value the investment based on price evaluations, from one or more dealers. If any price, quotation, price evaluation or other pricing source is not readily available when the NAV is calculated, the Fund uses the fair value of the investment determined in accordance with the procedures described below. There can be no assurance that the Fund could purchase or sell an investment at the price used to calculate the Fund's NAV.Fair Valuation and Significant Events Procedures
The Trustees have authorized the use of pricing services to provide evaluations of the current fair value of certain investments for purposes of calculating the NAV. Factors considered by pricing services in evaluating an investment include the yields or prices of investments of comparable quality, coupon, maturity, call rights and other potential prepayments, terms and type, reported transactions, indications as to values from dealers, and general market conditions. Some pricing services provide a single price evaluation reflecting the bid-side of the market for an investment (a “bid” evaluation). Other pricing services offer both bid evaluations and price evaluations indicative of a price between the prices bid and asked for the investment (a “mid” evaluation). The Fund normally uses bid evaluations for U.S. Treasury and Agency securities, mortgage-backed securities and municipal securities. The Fund normally uses mid evaluations for other types of fixed-income securities and OTC derivative contracts. In the event that market quotations and price evaluations are not available for an investment, the fair value of the investment is determined in accordance with procedures adopted by the Trustees.
The Trustees also have adopted procedures requiring an investment to be priced at its fair value whenever the Adviser determines that a significant event affecting the value of the investment has occurred between the time as of which the price of the investment would otherwise be determined and the time as of which the NAV is computed. An event is considered significant if there is both an affirmative expectation that the investment's value will change in response to the event and a reasonable basis for quantifying the resulting change in value. Examples of significant events that may occur after the close of the principal market on which a security is traded, or after the time of a price evaluation provided by a pricing service or a dealer, include:
- With respect to securities traded in foreign markets, significant trends in U.S. equity markets or in the trading of foreign securities index futures or options contracts;
- With respect to price evaluations of fixed-income securities determined before the close of regular trading on the NYSE, actions by the Federal Reserve Open Market Committee and other significant trends in U.S. fixed-income markets;
- Political or other developments affecting the economy or markets in which an issuer conducts its operations or its securities are traded; and
- Announcements concerning matters such as acquisitions, recapitalizations, litigation developments, a natural disaster affecting the issuer's operations or regulatory changes or market developments affecting the issuer's industry.
The Trustees have approved the use of a pricing service to determine the fair value of equity securities traded principally in foreign markets when the Adviser determines that there has been a significant trend in the U.S. equity markets or in index futures trading. For other significant events, the Fund may seek to obtain more current quotations or price evaluations from alternative pricing sources. If a reliable alternative pricing source is not available, the Fund will determine the fair value of the investment using another method approved by the Trustees.
Annual Shareholder Report43
Investment Income, Gains and Losses, Expenses and DistributionsInvestment transactions are accounted for on a trade-date basis. Realized gains and losses from investment transactions are recorded on an identified-cost basis. Interest income and expenses are accrued daily. Dividend income and distributions to shareholders are recorded on the ex-dividend date. Foreign dividends are recorded on the ex-dividend date or when the Fund is informed of the ex-dividend date. Distributions of net investment income are declared and paid monthly. Non-cash dividends included in dividend income, if any, are recorded at fair value. Investment income, realized gains and losses, and certain fund-level expenses are allocated to each class based on relative average daily net assets, except that each class may bear certain expenses unique to that class such as account administration, distribution services and shareholder services fees. Dividends are declared separately for each class. No class has preferential dividend rights; differences in per share dividend rates are generally due to differences in separate class expenses.
Premium and Discount Amortization
All premiums and discounts on fixed-income securities are amortized/accreted for financial statement purposes.
Federal Taxes
It is the Fund's policy to comply with the Subchapter M provision of the Internal Revenue Code (the “Code”) and to distribute to shareholders each year substantially all of its income. Accordingly, no provision for federal income tax is necessary. As of and during the year ended October 31, 2009, the Fund did not have a liability for any uncertain tax positions. The Fund recognizes interest and penalties, if any, related to tax liabilities as income tax expense in the Statement of Operations. As of October 31, 2009, tax years 2006 through 2009 remain subject to examination by the Fund's major tax jurisdictions, which include the United States of America and the Commonwealth of Massachusetts.
The Fund may be subject to taxes imposed by governments of countries in which it invests. Such taxes are generally based on either income or gains earned or repatriated. The Fund accrues and applies such taxes to net investment income, net realized gains and net unrealized gains as income and/or gains are earned.
When-Issued and Delayed Delivery Transactions
The Fund may engage in when-issued or delayed delivery transactions. The Fund records when-issued securities on the trade date and maintains security positions such that sufficient liquid assets will be available to make payment for the securities purchased. Securities purchased on a when-issued or delayed delivery basis are marked to market daily and begin earning interest on the settlement date. Losses may occur on these transactions due to changes in market conditions or the failure of counterparties to perform under the contract.
Swap Contracts
Swap contracts involve two parties that agree to exchange the returns (or the differential in rates of return) earned or realized on particular predetermined investments, instruments, indices or other measures. The gross returns to be exchanged or “swapped” between parties are generally calculated with respect to a “notional amount” for a predetermined period of time. The Fund may enter into interest rate, total return, credit default, currency and other swap agreements. Risks may arise upon entering into swap agreements from the potential inability of the counterparties to meet the terms of their contract from unanticipated changes in the value of the swap agreement.
Annual Shareholder Report44
The Fund is subject to interest rate risk exposure in the normal course of pursuing its investment objectives. Because the Fund holds fixed rate bonds, the value of these bonds may decrease if interest rates rise. The Fund may enter into interest rate swap contracts to manage duration. Interest rate swap agreements generally involve the agreement by the Fund to pay the counterparty a fixed or floating interest rate on a fixed notional amount and to receive a fixed or floating rate on a fixed notional amount, but may also involve the agreement to pay or receive payments derived from changes in interest rates. Periodic payments are generally made during the life of the swap agreement according to the terms and conditions of the agreement and at termination or maturity. The Fund's maximum risk of loss from counterparty credit risk is the discounted value of the net cash flows to be received from/paid to the counterparty over the contract's remaining life, to the extent the amount is positive. This risk is mitigated by having a master netting arrangement between the Fund and the counterparty and by the posting of collateral by the counterparty to the Fund to cover the Fund's exposure to the counterparty.Upfront payments received or paid by the Fund will be reflected as an asset or liability on the Statement of Assets and Liabilities. Changes in the value of swap contracts are included in “Swaps, at value” on the Statement of Assets and Liabilities, and periodic payments are reported as “Net realized gain (loss) on swap contracts” on the Statement of Operations.
At October 31, 2009, the Fund had no outstanding swap contracts.
Foreign Currency Translation
The accounting records of the Fund are maintained in U.S. dollars. All assets and liabilities denominated in foreign currencies (FCs) are translated into U.S. dollars based on the rates of exchange of such currencies against U.S. dollars on the date of valuation. Purchases and sales of securities, income and expenses are translated at the rate of exchange quoted on the respective date that such transactions are recorded. The Fund does not isolate that portion of the results of operations resulting from changes in foreign exchange rates on investments from the fluctuations arising from changes in market prices of securities held. Such fluctuations are included with the net realized and unrealized gain or loss from investments.
Reported net realized foreign exchange gains or losses arise from sales of portfolio securities, sales and maturities of short-term securities, sales of FCs, currency gains or losses realized between the trade and settlement dates on securities transactions, the difference between the amounts of dividends, interest and foreign withholding taxes recorded on the Fund's books, and the U.S. dollar equivalent of the amounts actually received or paid. Net unrealized foreign exchange gains and losses arise from changes in the value of assets and liabilities other than investments in securities at fiscal year end, resulting from changes in the exchange rate.
Restricted Securities
Restricted securities are securities that either: (a) cannot be offered for public sale without first being registered, or being able to take advantage of an exemption from registration, under the Securities Act of 1933; or (b) are subject to contractual restrictions on public sales. In some cases, when a security cannot be offered for public sale without first being registered, the issuer of the restricted security has agreed to register such securities for resale, at the issuer's expense, either upon demand by the Fund or in connection with another registered offering of the securities. Many such restricted securities may be resold in the secondary market in transactions exempt from registration. Restricted securities may be determined to be Annual Shareholder Report45
liquid under criteria established by the Trustees. The Fund will not incur any registration costs upon such resales. The Fund's restricted securities are valued at the price provided by dealers in the secondary market or, if no market prices are available, at the fair value as determined in accordance with procedures established by and under the general supervision of the Trustees.Additional Disclosure Related to Derivative Instruments
The Effect of Derivative Instruments on the Statement of Operations for the Year Ended October 31, 2009
| Amount of Realized Gain or (Loss) on Derivatives Recognized in Income |
| Forward
Currency
Contracts |
| Foreign exchange contracts | $724 |
Other
The preparation of financial statements in conformity with GAAP requires management to make estimates and assumptions that affect the amounts of assets, liabilities, expenses and revenues reported in the financial statements. Actual results could differ from those estimated.
3. SHARES OF BENEFICIAL INTEREST
The following tables summarize share activity:
| Year Ended October 31 | 2009 | 2008 |
| Class A Shares: | Shares | Amount | Shares | Amount |
| Shares sold | 6,502,043 | $60,323,072 | 6,125,306 | $67,424,747 |
| Shares issued in connection with the tax-free transfer of assets from Federated Stock and California Muni Fund | 619,367 | 5,562,217 | — | — |
| Shares issued to shareholders in payment of distributions declared | 1,323,899 | 12,347,962 | 2,846,124 | 31,814,762 |
| Shares redeemed | (12,498,238) | (116,701,747) | (14,974,755) | (163,347,364) |
NET CHANGE RESULTING
FROM CLASS A SHARE TRANSACTIONS | (4,052,929) | $(38,468,496) | (6,003,325) | $(64,107,855) |
| Year Ended October 31 | 2009 | 2008 |
| Class B Shares: | Shares | Amount | Shares | Amount |
| Shares sold | 522,738 | $4,874,981 | 644,932 | $7,166,573 |
| Shares issued to shareholders in payment of distributions declared | 140,608 | 1,309,193 | 326,498 | 3,657,716 |
| Shares redeemed | (1,318,448) | (12,319,932) | (1,488,668) | (16,057,682) |
NET CHANGE RESULTING
FROM CLASS B SHARE TRANSACTIONS | (655,102) | $(6,135,758) | (517,238) | $(5,233,393) |
Annual Shareholder Report46
| Year Ended October 31 | 2009 | 2008 |
| Class C Shares: | Shares | Amount | Shares | Amount |
| Shares sold | 1,612,662 | $15,048,979 | 2,077,328 | $23,025,394 |
| Shares issued in connection with the tax-free transfer of assets from Federated Stock and California Muni Fund | 219,018 | 1,966,867 | — | — |
| Shares issued to shareholders in payment of distributions declared | 232,301 | 2,162,734 | 579,774 | 6,501,426 |
| Shares redeemed | (3,527,262) | (32,649,128) | (4,769,570) | (51,366,815) |
NET CHANGE RESULTING
FROM CLASS C SHARE TRANSACTIONS | (1,463,281) | $(13,470,548) | (2,112,468) | $(21,839,995) |
| Year Ended October 31 | 2009 | 2008 |
| Class F Shares: | Shares | Amount | Shares | Amount |
| Shares sold | 447,149 | $4,186,351 | 771,288 | $8,578,376 |
| Shares issued to shareholders in payment of distributions declared | 55,609 | 519,559 | 73,247 | 811,987 |
| Shares redeemed | (326,444) | (3,059,797) | (285,714) | (3,067,150) |
| NET CHANGE RESULTING FROM CLASS F SHARE TRANSACTIONS | 176,314 | $1,646,113 | 558,821 | $6,323,213 |
| NET CHANGE RESULTING FROM FUND SHARE TRANSACTIONS | (5,994,998) | $(56,428,689) | (8,074,210) | $(84,858,030) |
4. FEDERAL TAX INFORMATION
The timing and character of income and capital gain distributions are determined in accordance with income tax regulations, which may differ from GAAP. These differences are due in part to differing treatments for foreign currency transactions, capital loss carryforward acquired through a tax-free reorganization and discount accretion/premium amortization on debt securities.
For the year ended October 31, 2009, permanent differences identified and reclassified among the components of net assets were as follows:
| Increase (Decrease) |
| Paid-In Capital | Undistributed
Net Investment
Income (Loss) | Accumulated
Net Realized
Gain (Loss) |
| $1,484,494 | $(27,783) | $(1,456,711) |
Net investment income (loss), net realized gains (losses), and net assets were not affected by this reclassification.
The tax character of distributions as reported on the Statement of Changes in Net Assets for the years ended October 31, 2009 and 2008, was as follows:
Annual Shareholder Report47
| 2009 | 2008 |
| Tax-exempt income | $12,942,415 | $19,278,022 |
| Ordinary income | $6,148,225 | $6,072,936 |
| Long-term capital gains | $ — | $24,428,818 |
As of October 31, 2009, the components of distributable earnings on a tax basis were as follows:
| Undistributed ordinary income | $189,605 |
| Undistributed tax-exempt income | $393,714 |
| Net unrealized appreciation | $13,024,144 |
| Capital loss carryforwards | $(106,792,665) |
The difference between book-basis and tax-basis net unrealized appreciation/depreciation is attributable in part to differing treatments for the deferral of losses on wash sales and discount accretion/premium amortization on debt securities.
At October 31, 2009, the cost of investments for federal tax purposes was $553,988,351. The net unrealized appreciation of investments for federal tax purposes excluding any unrealized depreciation resulting from changes in foreign currency exchange rates was $13,024,165. This consists of net unrealized appreciation from investments for those securities having an excess of value over cost of $30,961,404 and net unrealized depreciation from investments for those securities having an excess of cost over value of $17,937,239.
At October 31, 2009, the Fund had a capital loss carryforward of $106,792,665 which will reduce the Fund's taxable income arising from future net realized gains on investments, if any, to the extent permitted by the Code and thus will reduce the amount of distributions to shareholders which would otherwise be necessary to relieve the Fund of any liability for federal income tax. Pursuant to the Code, such capital loss carryforward will expire as follows:
| Expiration Year | Expiration Amount |
| 2014 | $136,753 |
| 2015 | $759,500 |
| 2016 | $37,853,113 |
| 2017 | $68,043,299 |
As a result of the tax-free transfer of assets from Federated Stock and California Muni Fund, the use of certain capital loss carryforwards listed above may be limited.
5. INVESTMENT ADVISER FEE AND OTHER TRANSACTIONS WITH AFFILIATES
Investment Adviser Fee
Federated Equity Management Company of Pennylvania is the Fund's investment adviser (the “Adviser”). The advisory agreement between the Fund and the Adviser provides for an annual fee equal to 1.00% of the Fund's average daily net assets. Subject to the terms described in the Expense Limitation note, the Adviser may voluntarily choose to waive any portion of its fee. The Adviser can modify or terminate this voluntary waiver at any time at its sole discretion. For the year ended October 31, 2009, the Adviser voluntarily waived $2,546,354 of its fee.
Annual Shareholder Report48
Certain of the Fund's assets are managed by Federated Investment Management Company (the “Sub-Adviser”). Under the terms of a sub-advisory agreement between the Adviser and the Sub-Adviser, the Sub-Adviser receives an allocable portion of the Fund's adviser fee. The fee is paid by the Adviser out of its resources and is not an incremental Fund expense. For the year ended October 31, 2009, the Sub-Adviser earned a fee of $890,516.Administrative Fee
Federated Administrative Services (FAS), under the Administrative Services Agreement, provides the Fund with administrative personnel and services. The fee paid to FAS is based on the average aggregate daily net assets of certain Federated funds as specified below:
| Administrative Fee | Average Aggregate Daily Net Assets
of the Federated Funds |
| 0.150% | on the first $5 billion |
| 0.125% | on the next $5 billion |
| 0.100% | on the next $10 billion |
| 0.075% | on assets in excess of $20 billion |
The administrative fee received during any fiscal year shall be at least $150,000 per portfolio and $40,000 per each additional class of Shares. Subject to the terms described in the Expense Limitation note, FAS may voluntarily choose to waive any portion of its fee. FAS can modify
or terminate this voluntary waiver at any time at its sole discretion. For the year ended
October 31, 2009, the net fee paid to FAS was 0.076% of average daily net assets of the Fund. FAS waived $8,658 of its fee.
Distribution Services Fee
The Fund has adopted a Distribution Plan (the “Plan”) pursuant to Rule 12b-1 under the Act. Under the terms of the Plan, the Fund will compensate Federated Securities Corp. (FSC), the principal distributor, from the daily net assets of the Fund's Class A Shares, Class B Shares and Class C Shares to finance activities intended to result in the sale of these shares. The Plan provides that the Fund may incur distribution expenses at the following percentages of average daily net assets annually, to compensate FSC:
| Share Class Name | Percentage of Average Daily
Net Assets of Class |
| Class A Shares | 0.05% |
| Class B Shares | 0.75% |
| Class C Shares | 0.75% |
Subject to the terms described in the Expense Limitation note, FSC may voluntarily choose to waive any portion of its fee. FSC can modify or terminate this voluntary waiver at any time at its sole discretion. When FSC receives fees, it may pay some or all of them to financial intermediaries whose customers purchase shares. For the year ended October 31, 2009, FSC retained $104,363 of fees paid by the Fund. For the year ended October 31, 2009, the Fund's Class A Shares did not incur a distribution services fee, however it may begin to incur this fee upon approval of the Trustees.
Annual Shareholder Report49
Sales ChargesFront-end sales charges and contingent deferred sales charges (CDSC) do not represent expenses of the Fund. They are deducted from the proceeds of sales of Fund shares prior to investment or from redemption proceeds prior to remittance, as applicable. For the year ended October 31, 2009, FSC retained $116,118 in sales charges from the sale of Class A Shares. FSC also retained $3,448 of CDSC relating to redemptions of Class A Shares, $7,594 relating to redemptions of Class C Shares and $3,428 relating to redemptions of Class F Shares.
Shareholder Services Fee
The Fund may pay fees (Service Fees) up to 0.25% of the average daily net assets of the Fund's Class A Shares, Class B Shares, Class C Shares and Class F Shares to financial intermediaries or to Federated Shareholder Services Company (FSSC) for providing services to shareholders and maintaining shareholder accounts. Subject to the terms described in the Expense Limitation note, FSSC may voluntarily reimburse the Fund for shareholder services fees. This voluntary reimbursement can be modified or terminated at any time. For the year ended October 31, 2009, FSSC did not receive any fees paid by the Fund.
Interfund Transactions
During the year ended October 31, 2009, the Fund engaged in purchase and sale transactions with funds that have a common investment adviser (or affiliated investment advisers), common Directors/Trustees, and/or common Officers. These purchase and sale transactions complied with Rule 17a-7 under the Act and amounted to $318,126,703 and $301,899,189, respectively.
Expense Limitation
The Adviser and its affiliates (which may include FSC, FAS and FSSC) have voluntarily agreed to waive their fees and/or reimburse expenses so that the total operating expenses (as shown in the financial highlights) paid by the Fund's Class A Shares, Class B Shares, Class C Shares and Class F Shares (after the voluntary waivers and reimbursements) will not exceed 1.00%, 1.75%, 1.75% and 1.00%, respectively, through the later of (the “Termination Date”): (a) December 31, 2010; or (b) the date of the Fund's next effective Prospectus. While the Adviser and its affiliates currently do not anticipate terminating these arrangements prior to the Termination Date, these arrangements may only be terminated prior to the Termination Date with the agreement of the Trustees.
General
Certain Officers and Trustees of the Fund are Officers and Directors or Trustees of the above companies.
6. EXPENSE Reduction
The Fund directs portfolio trades to a broker that in turn pays a portion of the Fund's operating expenses. For the year ended October 31, 2009, the Fund's expenses were reduced by $103,107 under these arrangements.
7. Investment TRANSACTIONS
Purchases and sales of investments, excluding long-term U.S. government securities and short-term obligations, for the year ended October 31, 2009, were as follows:
| Purchases | $429,812,042 |
| Sales | $497,526,697 |
Annual Shareholder Report50
8. LINE OF CREDIT
The Fund participates in a $100,000,000 unsecured, uncommitted revolving line of credit (LOC) agreement with PNC Bank. The LOC was made available for extraordinary or emergency purposes, primarily for financing redemption payments. Borrowings are charged interest at a rate offered to the Fund by PNC Bank at the time of the borrowing. As of October 31, 2009, there were no outstanding loans. During the year ended October 31, 2009, the Fund did not utilize the LOC.
9. INTERFUND LENDING
Pursuant to an Exemptive Order issued by the Securities and Exchange Commission (SEC), the Fund, along with other funds advised by subsidiaries of Federated Investors, Inc., may participate in an interfund lending program. This program provides an alternative credit facility allowing the Fund to borrow from other participating affiliated funds. As of October 31, 2009, there were no outstanding loans. During the year ended October 31, 2009, the program was not utilized.
10. Legal Proceedings
Since October 2003, Federated Investors, Inc. and related entities (collectively, “Federated”) and various Federated funds (Federated Funds) have been named as defendants in several class action lawsuits now pending in the United States District Court for the District of Maryland. The lawsuits were purportedly filed on behalf of people who purchased, owned and/or redeemed shares of Federated-sponsored mutual funds during specified periods beginning November 1, 1998. The suits are generally similar in alleging that Federated engaged in illegal and improper trading practices including market timing and late trading in concert with certain institutional traders, which allegedly caused financial injury to the mutual fund shareholders. These lawsuits began to be filed shortly after Federated's first public announcement that it had received requests for information on shareholder trading activities in the Federated Funds from the SEC, the Office of the New York State Attorney General (NYAG) and other authorities. In that regard, on November 28, 2005, Federated announced that it had reached final settlements with the SEC and the NYAG with respect to those matters. As Federated previously reported in 2004, it has already paid approximately $8.0 million to certain funds as determined by an independent consultant. As part of these settlements, Federated agreed to pay for the benefit of fund shareholders additional disgorgement and a civil money penalty in the aggregate amount of an additional $72 million. Federated entities have also been named as defendants in several additional lawsuits that are now pending in the United States District Court for the Western District of Pennsylvania, alleging, among other things, excessive advisory and Rule 12b-1 fees. The Board of the Federated Funds retained the law firm of Dickstein Shapiro LLP to represent the Federated Funds in these lawsuits. Federated and the Federated Funds, and their respective counsel have been defending this litigation, and none of the Federated Funds remains a defendant in any of the lawsuits (though some could potentially receive any recoveries as nominal defendants). Additional lawsuits based upon similar allegations may be filed in the future. The potential impact of these lawsuits, all of which seek unquantified damages, attorneys' fees and expenses, and future potential similar suits is uncertain. Although we do not believe that these lawsuits will have a material adverse effect on the Federated Funds, there can be no assurance that these suits, the ongoing adverse publicity and/or other developments resulting from the regulatory investigations will not result in increased Federated Fund redemptions, reduced sales of Federated Fund shares, or other adverse consequences for the Federated Funds.
Annual Shareholder Report51
11. Subsequent eventsManagement has evaluated subsequent events through December 24, 2009, the date the financial statements were issued, and determined that no events have occurred that require additional disclosure.
12. FEDERAL TAX INFORMATION (UNAUDITED)
For the year ended October 31, 2009, 67.79% of the distributions from net investment income is exempt from federal income tax, other than the federal AMT.
For the fiscal year ended October 31, 2009, 100% of total ordinary income (including short-term capital gain) distributions made by the Fund are qualifying dividends which may be subject to a maximum tax rate of 15%, as provided for by the Jobs and Growth Tax Relief Act of 2003. Complete information is reported in conjunction with the reporting of your distributions on Form 1099-DIV.
Of the ordinary income (including short-term capital gain) distributions made by the Fund during the year ended October 31, 2009, 100% qualify for the dividend received deduction available to corporate shareholders.
Annual Shareholder Report52
Report of Independent Registered Public Accounting Firm
TO THE BOARD OF Trustees OF Federated Income Securities Trust AND SHAREHOLDERS OF Federated Muni & Stock Advantage Fund:
We have audited the accompanying statement of assets and liabilities of Federated Muni & Stock Advantage Fund (the “Fund”), one of the portfolios constituting Federated Income Securities Trust, including the portfolio of investments, as of October 31, 2009, and the related statement of operations for the year then ended, the statement of changes in net assets for each of the two years in the period then ended, and the financial highlights for each of the periods indicated therein. These financial statements and financial highlights are the responsibility of the Fund's management. Our responsibility is to express an opinion on these financial statements and financial highlights based on our audits.
We conducted our audits in accordance with standards of the Public Company Accounting Oversight Board (United States). Those standards require that we plan and perform the audit to obtain reasonable assurance about whether the financial statements and financial highlights are free of material misstatement. We were not engaged to perform an audit of the Fund's internal control over financial reporting. Our audits included consideration of internal control over financial reporting as a basis for designing audit procedures that are appropriate in the circumstances, but not for the purpose of expressing an opinion on the effectiveness of the Fund's internal control over financial reporting. Accordingly, we express no such opinion. An audit also includes examining, on a test basis, evidence supporting the amounts and disclosures in the financial statements and financial highlights, assessing the accounting principles used and significant estimates made by management, and evaluating the overall financial statement presentation. Our procedures included confirmation of securities owned as of October 31, 2009, by correspondence with the custodian and brokers, or by other appropriate auditing procedures where replies from brokers were not received. We believe that our audits provide a reasonable basis for our opinion.
In our opinion, the financial statements and financial highlights referred to above present fairly, in all material respects, the financial position of Federated Muni & Stock Advantage Fund, a portfolio of Federated Income Securities Trust, at October 31, 2009, the results of its operations for the year then ended, the changes in its net assets for each of the two years in the period then ended, and the financial highlights for each of the periods indicated therein, in conformity with U.S. generally accepted accounting principles.
Boston, Massachusetts
December 24, 2009
Annual Shareholder Report53
Board of Trustees and Trust Officers
The Board is responsible for managing the Trust's business affairs and for exercising all the Trust's powers except those reserved for the shareholders. The following tables give information about each Board member and the senior officers of the Fund. Where required, the tables separately list Board members who are “interested persons” of the Fund (i.e., “Interested” Board members) and those who are not (i.e., “Independent” Board members). Unless otherwise noted, the address of each person listed is Federated Investors Tower, 1001 Liberty Avenue, Pittsburgh, PA 15222. The address of all Independent Board members listed is 4000 Ericsson Drive, Warrendale, PA 15086-7561; Attention: Mutual Fund Board. As of December 31, 2008, the Trust comprised seven portfolios, and the Federated Fund Complex consisted of 40 investment companies (comprising 149 portfolios). Unless otherwise noted, each Officer is elected annually. Unless otherwise noted, each Board member oversees all portfolios in the Federated Fund Complex and serves for an indefinite term. The Fund's Statement of Additional Information includes additional information about Trust Trustees and is available, without charge and upon request, by calling 1-800-341-7400.
Interested TRUSTEES Background
Name
Birth Date
Positions Held with Trust
Date Service Began | Principal Occupation(s) for Past Five Years,
Other Directorships Held and Previous Position(s) |
John F. Donahue*
Birth Date: July 28, 1924
TRUSTEE
Began serving: January 1986 | Principal Occupations: Director or Trustee of the Federated Fund Complex; Chairman and Director, Federated Investors, Inc.; Chairman of the Federated Fund Complex's Executive Committee.
Previous Positions: Chairman of the Federated Fund Complex; Trustee, Federated Investment Management Company; Chairman and Director, Federated Investment Counseling. |
J. Christopher Donahue*
Birth Date: April 11, 1949
PRESIDENT AND TRUSTEE
Began serving: January 2000 | Principal Occupations: Principal Executive Officer and President of the Federated Fund Complex; Director or Trustee of some of the Funds in the Federated Fund Complex; President, Chief Executive Officer and Director, Federated Investors, Inc.; Chairman and Trustee, Federated Investment Management Company; Trustee, Federated Investment Counseling; Chairman and Director, Federated Global Investment Management Corp.; Chairman, Federated Equity Management Company of Pennsylvania and Passport Research, Ltd. (investment advisory subsidiary of Federated); Trustee, Federated Shareholder Services Company; Director, Federated Services Company.
Previous Positions: President, Federated Investment Counseling; President and Chief Executive Officer, Federated Investment Management Company, Federated Global Investment Management Corp. and Passport Research, Ltd. |
| * | Family relationships and reasons for “interested” status: John F. Donahue is the father of J. Christopher Donahue; both are “interested” due to their beneficial ownership of shares of Federated Investors, Inc. and the positions they hold with Federated and its subsidiaries. |
Annual Shareholder Report54
INDEPENDENT TRUSTEES Background
Name
Birth Date
Positions Held with Trust
Date Service Began | Principal Occupation(s) for Past Five Years,
Other Directorships Held and Previous Position(s) |
John T. Conroy, Jr., Ph.D.
Birth Date: June 23, 1937
TRUSTEE
Began serving: November 1991 | Principal Occupations: Director or Trustee of the Federated Fund Complex; Chairman of the Board, Investment Properties Corporation; Partner or Trustee in private real estate ventures in Southwest Florida; Assistant Professor in Theology, Blessed Edmund Rice School for Pastoral Ministry.
Previous Positions: President, Investment Properties Corporation; Senior Vice President, John R. Wood and Associates, Inc., Realtors; President, Naples Property Management, Inc. and Northgate Village Development Corporation. |
Nicholas P. Constantakis
Birth Date: September 3, 1939
TRUSTEE
Began serving: February 1998 | Principal Occupation: Director or Trustee of the Federated Fund Complex.
Other Directorship Held: Director and Chairman of the Audit Committee, Michael Baker Corporation (architecture, engineering and construction services).
Previous Position: Partner, Andersen Worldwide SC. |
John F. Cunningham
Birth Date: March 5, 1943
TRUSTEE
Began serving: January 1999 | Principal Occupation: Director or Trustee of the Federated Fund Complex.
Other Directorships Held: Chairman, President and Chief Executive Officer, Cunningham & Co., Inc. (strategic business consulting); Trustee Associate, Boston College.
Previous Positions: Director, Redgate Communications and EMC Corporation (computer storage systems); Chairman of the Board and Chief Executive Officer, Computer Consoles, Inc.; President and Chief Operating Officer, Wang Laboratories; Director, First National Bank of Boston; Director, Apollo Computer, Inc. |
Maureen Lally-Green
Birth Date: July 5, 1949
TRUSTEE
Began serving: August 2009 | Principal Occupations: Director or Trustee of the Federated Fund Complex; Director, Office of Church Relations, Diocese of Pittsburgh; Adjunct Professor of Law, Duquesne University School of Law.
Other Directorships Held: Director, Auberle; Trustee St. Francis University; Director, Ireland Institute of Pittsburgh; Director, UPMC Mercy Hospital; Regent, St. Vincent Seminary; Director, Epilepsy Foundation of Western and Central Pennsylvania; Director, Saint Thomas More Society, Allegheny County; Director, Carlow University.
Previous Position: Pennsylvania Superior Court Judge. |
Annual Shareholder Report55
Name
Birth Date
Positions Held with Trust
Date Service Began | Principal Occupation(s) for Past Five Years,
Other Directorships Held and Previous Position(s) |
Peter E. Madden
Birth Date: March 16, 1942
TRUSTEE
Began serving: November 1991 | Principal Occupation: Director or Trustee and Chairman of the Board of the Federated Fund Complex.
Other Directorship Held: Board of Overseers, Babson College.
Previous Positions: Representative, Commonwealth of Massachusetts General Court; President, Chief Operating Officer and Director, State Street Bank and Trust Company and State Street Corporation (retired); Director, VISA USA and VISA International; Chairman and Director, Massachusetts Bankers Association; Director, Depository Trust Corporation; Director, The Boston Stock Exchange. |
Charles F. Mansfield, Jr.
Birth Date: April 10, 1945
TRUSTEE
Began serving: January 2000 | Principal Occupations: Director or Trustee and Chairman of the Audit Committee of the Federated Fund Complex; Management Consultant.
Previous Positions: Chief Executive Officer, PBTC International Bank; Partner, Arthur Young & Company (now Ernst & Young LLP); Chief Financial Officer of Retail Banking Sector, Chase Manhattan Bank; Senior Vice President, HSBC Bank USA (formerly, Marine Midland Bank); Vice President, Citibank; Assistant Professor of Banking and Finance, Frank G. Zarb School of Business, Hofstra University; Executive Vice President DVC Group, Inc. (marketing, communications and technology). |
R. James Nicholson
Birth Date: February 4, 1938
TRUSTEE
Began serving: January 2008 | Principal Occupations: Director or Trustee of the Federated Fund Complex; Senior Counsel, Brownstein Hyatt Farber Schrek, P.C.; Former Secretary of the U.S. Dept. of Veterans Affairs; Former U.S. Ambassador to the Holy See; Former Chairman of the Republican National Committee.
Other Directorships Held: Director, Horatio Alger Association; Director, The Daniels Fund.
Previous Positions: Colonel, U.S. Army Reserve; Partner, Calkins, Kramer, Grimshaw and Harring, P.C.; General Counsel, Colorado Association of Housing and Building; Chairman and CEO, Nicholson Enterprises, Inc. (real estate holding company); Chairman and CEO, Renaissance Homes of Colorado. |
Thomas M. O'Neill
Birth Date: June 14, 1951
TRUSTEE
Began serving: October 2006 | Principal Occupations: Director or Trustee of the Federated Fund Complex; Managing Director and Partner, Navigator Management Company, L.P. (investment and strategic consulting).
Other Directorships Held: Board of Overseers, Children's Hospital of Boston; Visiting Committee on Athletics, Harvard College.
Previous Positions: Chief Executive Officer and President, Managing Director and Chief Investment Officer, Fleet Investment Advisors; President and Chief Executive Officer, Aeltus Investment Management, Inc.; General Partner, Hellman, Jordan Management Co., Boston, MA; Chief Investment Officer, The Putnam Companies, Boston, MA; Credit Analyst and Lending Officer, Fleet Bank; Director and Consultant, EZE Castle Software (investment order management software); Director, Midway Pacific (lumber). |
Annual Shareholder Report56
Name
Birth Date
Positions Held with Trust
Date Service Began | Principal Occupation(s) for Past Five Years,
Other Directorships Held and Previous Position(s) |
John S. Walsh
Birth Date: November 28, 1957
TRUSTEE
Began serving: January 2000 | Principal Occupations: Director or Trustee of the Federated Fund Complex; President and Director, Heat Wagon, Inc. (manufacturer of construction temporary heaters); President and Director, Manufacturers Products, Inc. (distributor of portable construction heaters); President, Portable Heater Parts, a division of Manufacturers Products, Inc.
Previous Position: Vice President, Walsh & Kelly, Inc. |
James F. Will
Birth Date: October 12, 1938
TRUSTEE
Began serving: April 2006 | Principal Occupations: Director or Trustee of the Federated Fund Complex; formerly, Vice Chancellor and President, Saint Vincent College.
Other Directorships Held: Trustee, Saint Vincent College; Alleghany Corporation.
Previous Positions: Chairman, President and Chief Executive Officer, Armco, Inc.; President and Chief Executive Officer, Cyclops Industries; President and Chief Operating Officer, Kaiser Steel Corporation. |
OFFICERS
Name
Birth Date
Address
Positions Held with Trust
Date Service Began | Principal Occupation(s) for Past Five Years
and Previous Position(s) |
John W. McGonigle
Birth Date: October 26, 1938
EXECUTIVE VICE PRESIDENT AND SECRETARY
Began serving: January 1986 | Principal Occupations: Executive Vice President and Secretary of the Federated Fund Complex; Vice Chairman, Executive Vice President, Secretary and Director, Federated Investors, Inc.
Previous Positions: Trustee, Federated Investment Management Company and Federated Investment Counseling; Director, Federated Global Investment Management Corp., Federated Services Company and Federated Securities Corp. |
Richard A. Novak
Birth Date: December 25, 1963
TREASURER
Began serving: January 2006 | Principal Occupations: Principal Financial Officer and Treasurer of the Federated Fund Complex; Senior Vice President, Federated Administrative Services; Financial and Operations Principal for Federated Securities Corp., Edgewood Services, Inc. and Southpointe Distribution Services, Inc.
Previous Positions: Controller of Federated Investors, Inc.; Vice President, Finance of Federated Services Company; held various financial management positions within The Mercy Hospital of Pittsburgh; Auditor, Arthur Andersen & Co. |
Richard B. Fisher
Birth Date: May 17, 1923
VICE PRESIDENT
Began serving: January 1986 | Principal Occupations: Vice Chairman or Vice President of some of the Funds in the Federated Fund Complex; Vice Chairman, Federated Investors, Inc.; Chairman, Federated Securities Corp.
Previous Positions: President and Director or Trustee of some of the Funds in the Federated Fund Complex; Executive Vice President, Federated Investors, Inc.; Director and Chief Executive Officer, Federated Securities Corp. |
Annual Shareholder Report57
Name
Birth Date
Address
Positions Held with Trust
Date Service Began | Principal Occupation(s) for Past Five Years
and Previous Position(s) |
Brian P. Bouda
Birth Date: February 28, 1947
CHIEF COMPLIANCE OFFICER AND SENIOR VICE PRESIDENT
Began serving: August 2004 | Principal Occupations: Senior Vice President and Chief Compliance Officer of the Federated Fund Complex; Vice President and Chief Compliance Officer of Federated Investors, Inc. and Chief Compliance Officer of its subsidiaries. Mr. Bouda joined Federated in 1999 and is a member of the American Bar Association and the State Bar Association of Wisconsin. |
Stephen F. Auth
Birth Date: September 3, 1956
450 Lexington Avenue
Suite 3700
New York, NY 10017-3943
CHIEF INVESTMENT OFFICER
Began serving: May 2004 | Principal Occupations: Mr. Auth is Chief Investment Officer of this Fund and various other Funds in the Federated Fund Complex; Executive Vice President, Federated Investment Counseling, Federated Global Investment Management Corp. and Federated Equity Management Company of Pennsylvania.
Previous Positions: Executive Vice President, Federated Investment Management Company, and Passport Research, Ltd. (Investment advisory subsidiary of Federated); Senior Vice President, Global Portfolio Management Services Division; Senior Vice President, Federated Investment Management Company and Passport Research, Ltd.; Senior Managing Director and Portfolio Manager, Prudential Investments. |
Robert J. Ostrowski
Birth Date: April 26, 1963
CHIEF INVESTMENT OFFICER
Began serving: May 2004 | Principal Occupations: Robert J. Ostrowski joined Federated in 1987 as an Investment Analyst and became a Portfolio Manager in 1990. He was named Chief Investment Officer of taxable fixed-income products in 2004 and also serves as a Senior Portfolio Manager. He has been a Senior Vice President of the Fund's Adviser since 1997. Mr. Ostrowski is a Chartered Financial Analyst. He received his M.S. in Industrial Administration from Carnegie Mellon University. |
Joseph M. Balestrino
Birth Date: November 3, 1954
VICE PRESIDENT
Began serving: November 1998 | Principal Occupations: Joseph M. Balestrino is Vice President of the Trust. Mr. Balestrino joined Federated in 1986 and has been a Senior Portfolio Manager and Senior Vice President of the Fund's Adviser since 1998. He was a Portfolio Manager and a Vice President of the Fund's Adviser from 1995 to 1998. Mr. Balestrino served as a Portfolio Manager and an Assistant Vice President of the Adviser from 1993 to 1995. Mr. Balestrino is a Chartered Financial Analyst and received his Master's Degree in Urban and Regional Planning from the University of Pittsburgh. |
Randall S. Bauer
Birth Date: November 16, 1957
VICE PRESIDENT
Began serving: November 1998 | Principal Occupations: Randall S. Bauer is Vice President of the Trust. Mr. Bauer joined Federated in 1989 and has been a Portfolio Manager and a Vice President of the Fund's Sub-Adviser since 1994 and a Senior Vice President of the Fund's Sub-Adviser beginning 2007. Mr. Bauer is a Chartered Financial Analyst and received his M.B.A. in Finance from the Pennsylvania State University. |
John L. Nichol
Birth Date: May 21, 1963
VICE PRESIDENT
Began serving: May 2004 | Principal Occupations: John L. Nichol has been the Fund's Portfolio Manager since 2003. He is Vice President of the Trust. Mr. Nichol joined Federated in September 2000 as an Assistant Vice President/Senior Investment Analyst. He has been a Portfolio Manager since December 2000 and was named a Vice President of the Fund's Adviser in July 2001. Mr. Nichol served as a portfolio manager and analyst for the Public Employees Retirement System of Ohio from 1992 through August 2000. Mr. Nichol is a Chartered Financial Analyst. He received his M.B.A. with an emphasis in Finance and Management and Information Science from the Ohio State University. |
Annual Shareholder Report58
Evaluation and Approval of Advisory Contract - May 2009
Federated Muni and Stock Advantage Fund (the “Fund”)
The Fund's Board reviewed the Fund's investment advisory and subadvisory contracts at meetings held in May 2009. The Board's decision regarding these contracts reflects the exercise of its business judgment on whether to continue the existing arrangements.
In this connection, the Federated funds' Board had previously appointed a Senior Officer, whose duties include specified responsibilities relating to the process by which advisory fees are to be charged to a Federated fund. The Senior Officer has the authority to retain consultants, experts, or staff as may be reasonably necessary to assist in the performance of his duties, reports directly to the Board, and may be terminated only with the approval of a majority of the independent members of the Board. The Senior Officer prepared and furnished to the Board an independent, written evaluation that covered topics discussed below. The Board considered that evaluation, along with other information, in deciding to approve the advisory and subadvisory contracts.
During its review of these contracts, the Board considered compensation and benefits received by the Adviser and subadviser. This included the fees received for services provided to the Fund by other entities in the Federated organization and research services received by the Adviser from brokers that execute Federated fund trades, as well as advisory fees. The Board is also familiar with and considered judicial decisions concerning allegedly excessive investment advisory fees, which have indicated that the following factors may be relevant to an Adviser's fiduciary duty with respect to its receipt of compensation from a fund: the nature and quality of the services provided by the Adviser, including the performance of the fund; the Adviser's cost of providing the services; the extent to which the Adviser may realize “economies of scale” as a fund grows larger; any indirect benefits that may accrue to the Adviser and its affiliates as a result of the Adviser's relationship with a fund; performance and expenses of comparable funds; and the extent to which the independent Board members are fully informed about all facts the Board deems relevant bearing on the Adviser's services and fees. The Board further considered management fees (including any components thereof) charged to institutional and other clients of the Adviser and subadviser for what might be viewed as like services, and the cost to the Adviser and its affiliates of supplying services pursuant to the management fee agreements, excluding any intra-corporate profit and profit margins of the Adviser and its affiliates for supplying such services. The Board was aware of these factors and was guided by them in its review of the Fund's advisory and subadvisory contracts to the extent it considered them to be appropriate and relevant, as discussed further below.
Annual Shareholder Report59
The Board considered and weighed these circumstances in light of its substantial accumulated experience in governing the Fund and working with Federated on matters relating to the Federated funds, and was assisted in its deliberations by independent legal counsel. Throughout the year, the Board has requested and received substantial and detailed information about the Fund and the Federated organization that was in addition to the extensive materials that comprise and accompany the Senior Officer's evaluation. Federated provided much of this information at each regular meeting of the Board, and furnished additional reports in connection with the particular meeting at which the Board's formal review of the advisory and subadvisory contracts occurred. Between regularly scheduled meetings, the Board also received information on particular matters as the need arose. Thus, the Board's consideration of the advisory and subadvisory contracts included review of the Senior Officer's evaluation, accompanying data and additional reports covering such matters as: the Adviser's and subadviser's investment philosophy, revenue, profitability, personnel and processes; investment and operating strategies; the Fund's short- and long-term performance (in absolute terms, both on a gross basis and net of expenses, as well as in relationship to its particular investment program and certain competitor or “peer group” funds and/or other benchmarks, as appropriate), and comments on the reasons for performance; the Fund's investment objectives; the Fund's expenses (including the advisory fee itself and the overall expense structure of the Fund, both in absolute terms and relative to similar and/or competing funds, with due regard for contractual or voluntary expense limitations); the use and allocation of brokerage commissions derived from trading the Fund's portfolio securities (if any); and the nature, quality and extent of the advisory and other services provided to the Fund by the Adviser and its affiliates. The Board also considered the preferences and expectations of Fund shareholders and their relative sophistication; the continuing state of competition in the mutual fund industry and market practices; the range of comparable fees for similar funds in the mutual fund industry; the Fund's relationship to the Federated family of funds which include a comprehensive array of funds with different investment objectives, policies and strategies which are available for exchange without the incurrence of additional sales charges; compliance and audit reports concerning the Federated funds and the Federated companies that service them (including communications from regulatory agencies), as well as Federated's responses to any issues raised therein; and relevant developments in the mutual fund industry and how the Federated funds and/or Federated are responding to them. The Board's evaluation process is evolutionary. The criteria considered and the emphasis placed on relevant criteria change in recognition of changing circumstances in the mutual fund marketplace. Annual Shareholder Report60
With respect to the Fund's performance and expenses in particular, the Board has found the use of comparisons to other mutual funds with comparable investment programs to be particularly useful, given the high degree of competition in the mutual fund business. The Board focused on comparisons with other similar mutual funds more heavily than non-mutual fund products or services because it is believed that they are more relevant. For example, other mutual funds are the products most like the Fund, they are readily available to Fund shareholders as alternative investment vehicles, and they are the type of investment vehicle in fact chosen and maintained by the Fund's investors. The range of their fees and expenses therefore appears to be a generally reliable indication of what consumers have found to be reasonable in the precise marketplace in which the Fund competes. The Fund's ability to deliver competitive performance when compared to its peer group was a useful indicator of how the Adviser is executing the Fund's investment program, which in turn assisted the Board in reaching a conclusion that the nature, extent, and quality of the Adviser's investment management services were such as to warrant continuation of the advisory contract. In this regard, the Senior Officer has reviewed Federated's fees for providing advisory services to products outside the Federated family of funds (e.g., institutional and separate accounts). He concluded that mutual funds and institutional accounts are inherently different products. Those differences include, but are not limited to, different types of targeted investors; being subject to different laws and regulations; different legal structures; different average account sizes; different associated costs; different portfolio management techniques made necessary by different cash flows; and portfolio manager time spent in review of securities pricing. The Senior Officer did not consider these fee schedules to be determinative in judging the appropriateness of mutual fund advisory contracts.The Senior Officer reviewed reports compiled by Federated, using data supplied by independent fund ranking organizations, regarding the performance of, and fees charged by, other mutual funds, noting his view that comparisons to fund peer groups are highly important in judging the reasonableness of proposed fees.
For the one-year, three-year and five-year periods covered by the report, the Fund's performance was above the median of the relevant peer group.
The Board also received financial information about Federated, including reports on the compensation and benefits Federated derived from its relationships with the Federated funds. These reports covered not only the fees under the advisory contracts, but also fees received by Federated's subsidiaries for providing other services to the Federated funds under separate contracts (e.g., for serving as the Federated funds' administrator). The reports also discussed any indirect benefit Federated may derive from its receipt of research services from brokers who execute Federated fund trades. In addition, the Board considered the fact that, in order for a fund to be competitive in the marketplace, Federated and its affiliates frequently waived fees and/or Annual Shareholder Report61
reimbursed expenses and have disclosed to fund investors and/or indicated to the Board their intention to do so in the future, where appropriate. Moreover, the Board receives regular reports regarding the institution or elimination of these voluntary waivers.Federated furnished reports, requested by the Senior Officer, that reported revenues on a fund-by-fund basis and made estimates of the allocation of expenses on a fund-by-fund basis, using allocation methodologies specified by the Senior Officer. The Senior Officer noted that, although they may apply consistent allocation processes, the inherent difficulties in allocating costs (and the unavoidable arbitrary aspects of that exercise) and the lack of consensus on how to allocate those costs may render such allocation reports unreliable. The allocation reports were considered in the analysis by the Board but were determined to be of limited use.
The Board and the Senior Officer also reviewed a report compiled by Federated comparing profitability information for Federated to other publicly held fund management companies. In this regard, the Senior Officer noted the limited availability of such information, but nonetheless concluded that Federated's profit margins did not appear to be excessive and the Board agreed.
The Senior Officer's evaluation also discussed the notion of possible realization of “economies of scale” as a fund grows larger. The Board considered in this regard that the Adviser has made significant and long-term investments in areas that support all of the Federated funds, such as personnel and processes for the portfolio management, compliance, and risk management functions; and systems technology; and that the benefits of these efforts (as well as any economies, should they exist) were likely to be enjoyed by the fund complex as a whole. Finally, the Board also noted the absence of any applicable regulatory or industry guidelines on this subject, which (as discussed in the Senior Officer's evaluation) is compounded by the lack of any common industry practice or general pattern with respect to structuring fund advisory fees with “breakpoints” that serve to reduce the fee as the fund attains a certain size. The Senior Officer did not recommend institution of breakpoints in pricing Federated's fund advisory services at this time.
It was noted in the materials for the Board meeting that for the period covered by the report, the Fund's investment advisory fee, after waivers and expense reimbursements, if any, was above the median of the relevant peer group. The Board reviewed the fees and other expenses of the Fund with the Adviser and was satisfied that the overall expense structure of the Fund remained competitive. The Board will continue to monitor advisory fees and other expenses borne by the Fund.
The Senior Officer's evaluation noted his belief that the information and observations contained in his evaluation supported a finding that the proposed management fees are reasonable, and that Federated appeared to provide appropriate administrative services to the Fund for the fees paid. Under these Annual Shareholder Report62
circumstances, no changes were recommended to, and no objection was raised to, the continuation of the Fund's advisory and subadvisory contracts. The Board concluded that the nature, quality and scope of services provided the Fund by the Adviser and its affiliates were satisfactory.In its decision to continue an existing investment advisory contract, the Board was mindful of the potential disruptions of the Fund's operations and various risks, uncertainties and other effects that could occur as a result of a decision to terminate or not renew an advisory contract. In particular, the Board recognized that many shareholders have invested in the Fund on the strength of the Adviser's industry standing and reputation and with the expectation that the Adviser will have a continuing role in providing advisory services to the Fund. Thus, the Board's approval of the advisory contract reflected the fact that it is the shareholders who have effectively selected the Adviser by virtue of having invested in the Fund.
The Board based its decision to approve the advisory and subadvisory contracts on the totality of the circumstances and relevant factors and with a view to past and future long-term considerations. Not all of the factors and considerations identified above were necessarily relevant to the Fund, nor did the Board consider any one of them to be determinative. With respect to the factors that were relevant, the Board's decision to approve the contract reflects its determination that Federated's performance and actions provided a satisfactory basis to support the decision to continue the existing arrangements.
Annual Shareholder Report63
Voting Proxies on Fund Portfolio Securities
A description of the policies and procedures that the Fund uses to determine how to vote proxies, if any, relating to securities held in the Fund's portfolio is available, without charge and upon request, by calling 1-800-341-7400. A report on “Form N-PX” of how the Fund voted any such proxies during the most recent 12-month period ended June 30 is available from Federated's Web site at FederatedInvestors.com. To access this information from the “Products” section of the Web site, click on the “Prospectuses and Regulatory Reports” link under “Related Information,” then select the appropriate link opposite the name of the Fund; or select the name of the Fund and from the Fund's page, click on the “Prospectuses and Regulatory Reports” link. Form N-PX filings are also available at the SEC's Web site at www.sec.gov.
Quarterly Portfolio Schedule
The Fund files with the SEC a complete schedule of its portfolio holdings, as of the close of the first and third quarters of its fiscal year, on “Form N-Q.” These filings are available on the SEC's Web site at www.sec.gov and may be reviewed and copied at the SEC's Public Reference Room in Washington, DC. (Call 1-800-SEC-0330 for information on the operation of the Public Reference Room.) You may also access this information from the “Products” section of Federated's Web site at FederatedInvestors.com by clicking on “Portfolio Holdings” under “Related Information,” then selecting the appropriate link opposite the name of the Fund; or select the name of the Fund and from the Fund's page, click on the “Portfolio Holdings” link.
Annual Shareholder Report64
Mutual funds are not bank deposits or obligations, are not guaranteed by any bank and are not insured or guaranteed by the U.S. government, the Federal Deposit Insurance Corporation, the Federal Reserve Board or any other government agency. Investment in mutual funds involves investment risk, including the possible loss of principal.
This Report is authorized for distribution to prospective investors only when preceded or accompanied by the Fund's Prospectus, which contains facts concerning its objective and policies, management fees, expenses and other information.
Federated Muni and Stock Advantage Fund
Federated Investors Funds
4000 Ericsson Drive
Warrendale, PA 15086-7561
Contact us at FederatedInvestors.com
or call 1-800-341-7400.
Federated Securities Corp., Distributor
Cusip 31420C837
Cusip 31420C829
Cusip 31420C811
Cusip 31420C720
31285 (12/09)
Federated is a registered mark of Federated Investors, Inc.
2009 © Federated Investors, Inc.
SIGNATURES
Pursuant to the requirements of the Securities Exchange Act of 1934 and the Investment Company Act of 1940, the registrant has duly caused this report to be signed on its behalf by the undersigned, thereunto duly authorized.
| | |
| Registrant Federated Income Securities Trust |
| |
| By | | /S/ RICHARD A. NOVAK |
| | Richard A. Novak, Principal Financial Officer |
| |
| Date | | June 22, 2010 |
Pursuant to the requirements of the Securities Exchange Act of 1934 and the Investment Company Act of 1940, this report has been signed below by the following persons on behalf of the registrant and in the capacities and on the dates indicated.
| | |
| |
| By | | /S/ J. CHRISTOPHER DONAHUE |
| | J. Christopher Donahue, Principal Executive Officer |
| |
| Date | | June 22, 2010 |
| | |
| |
| By | | /S/ RICHARD A. NOVAK |
| | Richard A. Novak, Principal Financial Officer |
| |
| Date | | June 22, 2010 |
2