United States
Securities and Exchange Commission
Washington, D.C. 20549
Form N-CSR
Certified Shareholder Report of Registered Management Investment Companies
811-4577
(Investment Company Act File Number)
Federated Income Securities Trust
_______________________________________________________________
(Exact Name of Registrant as Specified in Charter)
Federated Investors Funds
4000 Ericsson Drive
Warrendale, Pennsylvania 15086-7561
(Address of Principal Executive Offices)
(412) 288-1900
(Registrant's Telephone Number)
John W. McGonigle, Esquire
Federated Investors Tower
1001 Liberty Avenue
Pittsburgh, Pennsylvania 15222-3779
(Name and Address of Agent for Service)
(Notices should be sent to the Agent for Service)
Date of Fiscal Year End: 3/31/10
Date of Reporting Period: 3/31/10
Item 1. Reports to Stockholders
Federated Fund for U.S. Government SecuritiesEstablished 1969
A Portfolio of Federated Income Securities Trust
ANNUAL SHAREHOLDER REPORTMarch 31, 2010
Class A Shares
Class B Shares
Class C Shares
FINANCIAL HIGHLIGHTS
SHAREHOLDER EXPENSE EXAMPLE
MANAGEMENT'S DISCUSSION OF FUND PERFORMANCE
PORTFOLIO OF INVESTMENTS SUMMARY TABLE
PORTFOLIO OF INVESTMENTS
STATEMENT OF ASSETS AND LIABILITIES
STATEMENT OF OPERATIONS
STATEMENT OF CHANGES IN NET ASSETS
NOTES TO FINANCIAL STATEMENTS
REPORT OF INDEPENDENT REGISTERED PUBLIC ACCOUNTING FIRM
BOARD OF TRUSTEES AND TRUST OFFICERS
EVALUATION AND APPROVAL OF ADVISORY CONTRACT
VOTING PROXIES ON FUND PORTFOLIO SECURITIES
QUARTERLY PORTFOLIO SCHEDULE
Financial Highlights - Class A Shares
(For a Share Outstanding Throughout Each Period)
| Year Ended March 31 | 2010 | 2009 | 2008 | 2007 | 2006 |
| Net Asset Value, Beginning of Period | $7.70 | $7.75 | $7.68 | $7.57 | $7.73 |
| Income From Investment Operations: | | | | | |
| Net investment income | 0.311 | 0.341 | 0.361 | 0.37 | 0.341 |
| Net realized and unrealized gain (loss) on investments and futures contracts | 0.10 | (0.03) | 0.08 | 0.09 | (0.17) |
| TOTAL FROM INVESTMENT OPERATIONS | 0.41 | 0.31 | 0.44 | 0.46 | 0.17 |
| Less Distributions: | | | | | |
| Distributions from net investment income | (0.34) | (0.36) | (0.37) | (0.35) | (0.33) |
| Net Asset Value, End of Period | $7.77 | $7.70 | $7.75 | $7.68 | $7.57 |
| Total Return2 | 5.42% | 4.17% | 5.96% | 6.26% | 2.24% |
| Ratios to Average Net Assets: | | | | | |
| Net expenses | 0.95% | 0.95% | 0.94% | 0.93% | 0.86% |
| Net investment income | 3.95% | 4.42% | 4.76% | 4.77% | 4.39% |
| Expense waiver/reimbursement3 | 0.01% | 0.03% | 0.05% | 0.05% | 0.02% |
| Supplemental Data: | | | | | |
| Net assets, end of period (000 omitted) | $590,559 | $599,122 | $642,170 | $652,110 | $712,643 |
| Portfolio turnover | 121% | 142% | 168% | 189% | 111% |
| Portfolio turnover (excluding purchases and sales from dollar-roll transactions) | 26% | 26% | 39% | 87% | 69% |
| 1 | Per share numbers have been calculated using the average shares method. |
| 2 | Based on net asset value, which does not reflect the sales charge, redemption fee or contingent deferred sales charge, if applicable. |
| 3 | This expense decrease is reflected in both the net expense and net investment income ratios shown above. |
See Notes which are an integral part of the Financial Statements
Annual Shareholder Report1
Financial Highlights - Class B Shares
(For a Share Outstanding Throughout Each Period)
| Year Ended March 31 | 2010 | 2009 | 2008 | 2007 | 2006 |
| Net Asset Value, Beginning of Period | $7.70 | $7.75 | $7.68 | $7.56 | $7.73 |
| Income From Investment Operations: | | | | | |
| Net investment income | 0.251 | 0.281 | 0.311 | 0.30 | 0.291 |
| Net realized and unrealized gain (loss) on investments and futures contracts | 0.09 | (0.03) | 0.08 | 0.11 | (0.19) |
| TOTAL FROM INVESTMENT OPERATIONS | 0.34 | 0.25 | 0.39 | 0.41 | 0.10 |
| Less Distributions: | | | | | |
| Distributions from net investment income | (0.28) | (0.30) | (0.32) | (0.29) | (0.27) |
| Net Asset Value, End of Period | $7.76 | $7.70 | $7.75 | $7.68 | $7.56 |
| Total Return2 | 4.49% | 3.38% | 5.17% | 5.58% | 1.31% |
| Ratios to Average Net Assets: | | | | | |
| Net expenses | 1.70% | 1.70% | 1.69% | 1.69% | 1.63% |
| Net investment income | 3.20% | 3.67% | 4.01% | 4.01% | 3.69% |
| Expense waiver/reimbursement3 | 0.01% | 0.03% | 0.05% | 0.04% | 0.00%4 |
| Supplemental Data: | | | | | |
| Net assets, end of period (000 omitted) | $75,194 | $99,200 | $118,494 | $147,943 | $188,747 |
| Portfolio turnover | 121% | 142% | 168% | 189% | 111% |
| Portfolio turnover (excluding purchases and sales from dollar-roll transactions) | 26% | 26% | 39% | 87% | 69% |
| 1 | Per share numbers have been calculated using the average shares method. |
| 2 | Based on net asset value, which does not reflect the sales charge, redemption fee or contingent deferred sales charge, if applicable. |
| 3 | This expense decrease is reflected in both the net expense and net investment income ratios shown above. |
| 4 | Represents less than 0.01%. |
See Notes which are an integral part of the Financial Statements
Annual Shareholder Report2
Financial Highlights - Class C Shares
(For a Share Outstanding Throughout Each Period)
| Year Ended March 31 | 2010 | 2009 | 2008 | 2007 | 2006 |
| Net Asset Value, Beginning of Period | $7.70 | $7.75 | $7.67 | $7.56 | $7.73 |
| Income From Investment Operations: | | | | | |
| Net investment income | 0.251 | 0.281 | 0.311 | 0.30 | 0.281 |
| Net realized and unrealized gain (loss) on investments and futures contracts | 0.09 | (0.03) | 0.09 | 0.11 | (0.18) |
| TOTAL FROM INVESTMENT OPERATIONS | 0.34 | 0.25 | 0.40 | 0.41 | 0.10 |
| Less Distributions: | | | | | |
| Distributions from net investment income | (0.28) | (0.30) | (0.32) | (0.30) | (0.27) |
| Net Asset Value, End of Period | $7.76 | $7.70 | $7.75 | $7.67 | $7.56 |
| Total Return2 | 4.51% | 3.40% | 5.31% | 5.47% | 1.31% |
| Ratios to Average Net Assets: | | | | | |
| Net expenses | 1.70% | 1.70% | 1.69% | 1.68% | 1.63% |
| Net investment income | 3.19% | 3.67% | 4.02% | 4.02% | 3.67% |
| Expense waiver/reimbursement3 | 0.01% | 0.03% | 0.05% | 0.04% | 0.00%4 |
| Supplemental Data: | | | | | |
| Net assets, end of period (000 omitted) | $69,256 | $58,191 | $42,593 | $42,926 | $52,764 |
| Portfolio turnover | 121% | 142% | 168% | 189% | 111% |
| Portfolio turnover (excluding purchases and sales from dollar-roll transactions) | 26% | 26% | 39% | 87% | 69% |
| 1 | Per share numbers have been calculated using the average shares method. |
| 2 | Based on net asset value, which does not reflect the sales charge, redemption fee or contingent deferred sales charge, if applicable. |
| 3 | This expense decrease is reflected in both the net expense and the net investment income ratios shown above. |
| 4 | Represents less than 0.01%. |
See Notes which are an integral part of the Financial Statements
Annual Shareholder Report3
Shareholder Expense Example (unaudited)
As a shareholder of the Fund, you incur two types of costs: (1) transaction costs, including sales charges (loads) on purchase or redemption payments; and (2) ongoing costs, including management fees and to the extent applicable, distribution (12b-1) fees and/or shareholder services fees and other Fund expenses. This Example is intended to help you to understand your ongoing costs (in dollars) of investing in the Fund and to compare these costs with the ongoing costs of investing in other mutual funds. It is based on an investment of $1,000 invested at the beginning of the period and held for the entire period from October 1, 2009 to March 31, 2010.
ACTUAL EXPENSES
The first section of the table below provides information about actual account values and actual expenses. You may use the information in this section, together with the amount you invested, to estimate the expenses that you incurred over the period. Simply divide your account value by $1,000 (for example, an $8,600 account value divided by $1,000 = 8.6), then multiply the result by the number in the first section under the heading entitled “Expenses Paid During Period” to estimate the expenses attributable to your investment during this period.
HYPOTHETICAL EXAMPLE FOR COMPARISON PURPOSES
The second section of the table below provides information about hypothetical account values and hypothetical expenses based on the Fund's actual expense ratio and an assumed rate of return of 5% per year before expenses, which is not the Fund's actual return. Thus, you should not use the hypothetical account values and expenses to estimate the actual ending account balance or your expenses for the period. Rather, these figures are required to be provided to enable you to compare the ongoing costs of investing in the Fund with other funds. To do so, compare this 5% hypothetical example with the 5% hypothetical examples that appear in the shareholder reports of the other funds.
Annual Shareholder Report4
Please note that the expenses shown in the table are meant to highlight your ongoing costs only and do not reflect any transaction costs, such as sales charges (loads) on purchase or redemption payments. Therefore, the second section of the table is useful in comparing ongoing costs only, and will not help you determine the relative total costs of owning different funds. In addition, if these transaction costs were included, your costs would have been higher. | Beginning
Account Value
10/1/2009 | Ending
Account Value
3/31/2010 | Expenses Paid
During Period1 |
| Actual: | | | |
| Class A Shares | $1,000 | $1,021.40 | $4.79 |
| Class B Shares | $1,000 | $1,016.20 | $8.55 |
| Class C Shares | $1,000 | $1,016.30 | $8.55 |
Hypothetical (assuming a 5% return
before expenses): | | | |
| Class A Shares | $1,000 | $1,020.19 | $4.78 |
| Class B Shares | $1,000 | $1,016.45 | $8.55 |
| Class C Shares | $1,000 | $1,016.45 | $8.55 |
| 1 | Expenses are equal to the Fund's annualized net expense ratios, multiplied by the average account value over the period, multiplied by 182/365 (to reflect the one-half-year period). The annualized net expense ratios are as follows: |
| Class A Shares | 0.95% |
| Class B Shares | 1.70% |
| Class C Shares | 1.70% |
Annual Shareholder Report5
Performance data quoted represents past performance which is no guarantee of future results. Investment return and principal value will fluctuate so that an investor's shares, when redeemed, may be worth more or less than their original cost. Mutual fund performance changes over time and current performance may be lower or higher than what is stated. For current to the most recent month-end performance and after-tax returns, visit FederatedInvestors.com or call 1-800-341-7400.
Management's Discussion of Fund Performance (unaudited)
The Fund's total return, based on net asset value, for the 12-month reporting period ended March 31, 2010, was 5.42% for the Class A Shares, 4.49% for the Class B Shares and 4.51% for the Class C Shares. The total return for the Class A Shares consisted of 4.51% of taxable dividends and 0.91% of appreciation in the net asset value of the shares. The Fund's benchmark, Barclays Capital Mortgage-Backed Securities Index (Index),1 had a total return of 5.21% during the same period. The Fund's total return for the most recently completed fiscal year reflected actual cash flows, transaction costs and other expenses not reflected in the total return of the Index.
The Fund's investment returns were most significantly impacted by strategies that focused on: (a) sector allocation; and (b) security selection.
For the purposes of the following, the discussion will focus on performance of the Fund's Class A Shares.
MARKET OVERVIEW
During the 12-month reporting period, market yields increased as investor demand for non-Treasury securities increased. Specifically, two- and 10-year Treasury yields increased 22 and 116 basis points to 1.02% and 3.83%, respectively.
Massive government stimuli and security purchase programs stabilized distressed asset markets and aided financial market function. Among numerous government programs, the Federal Reserve's (the Fed's) agency mortgage-backed securities (MBS)2 purchase program produced the greatest impact. The Fed's stated commitment was the purchase of $1.25 trillion agency-issued MBS. The Fed also initiated buying programs for $300 billion of Treasuries and $200 billion of agency debt. Not surprisingly, the overwhelming size of these programs propelled the agency debt and agency MBS sectors to strong gains relative to Treasuries.
| 1 | Barclays Capital Mortgage-Backed Securities Index is an unmanaged index comprised of all fixed-income securities backed by mortgage pools of GNMA, FNMA and the FHLMC, including GNMA graduated payment mortgages. The index is not adjusted to reflect sales charges, expenses or other fees that the Securities and Exchange Commission (SEC) requires to be reflected in the Fund's performance. Indexes are unmanaged, and unlike the Fund, are not affected by cash flows. Investments cannot be made in an index. |
| 2 | The value of some mortgage-backed securities may be particularly sensitive to changes in prevailing interest rates, and although the securities are generally supported by some form of government or private insurance, there is no assurance that private guarantors or insurers will meet their obligations. |
Annual Shareholder Report6
SECTOR ALLOCATION
Outside of a small cash position, the Fund was fully invested in agency, non-agency and commercial mortgage-backed securities. Non-agency and commercial MBS posted strong returns relative to those issued by Fannie Mae, Freddie Mac and Ginnie Mae. Sector allocation provided a significant performance benefit.
SECURITY SELECTION
Within the agency MBS allocation, hybrid adjustable rate mortgage securities as well as higher coupon fixed rate MBS and monthly adjustable collateralized mortgage obligations performed notably well. Security selection proved beneficial.
GROWTH OF A $10,000 INVESTMENT — CLASS A SHARES
The graph below illustrates the hypothetical investment of $10,0001 in Federated Fund for U.S. Government Securities (Class A Shares) (the “Fund”) from March 31, 2000 to March 31, 2010 compared to the Barclays Capital Mortgage-Backed Securities Index (BCMBS)2 and the Lipper U.S. Mortgage Funds Average (LUSMFA).3
| Average Annual Total Returns4 for the Period Ended 3/31/2010 |
| 1 Year | 0.71% |
| 5 Years | 3.85% |
| 10 Years | 4.98% |
| 1 | Represents a hypothetical investment of $10,000 in the Fund after deducting the maximum sales charge of 4.50% ($10,000 investment minus $450 sales charge = $9,550). The Fund's performance assumes the reinvestment of all dividends and distributions. The BCMBS and the LUSMFA have been adjusted to reflect reinvestment of dividends on securities in the index and average. |
| 2 | The BCMBS is not adjusted to reflect sales charges, expenses or other fees that the Securities and Exchange Commission (SEC) requires to be reflected in the Fund's performance. The index is unmanaged and, unlike the Fund, is not affected by cash flows. It is not possible to invest directly in an index. |
| 3 | The LUSMFA represents the average of the total returns reported by all of the mutual funds designated by Lipper, Inc. as falling in the respective category indicated, and is not adjusted to reflect any sales charges. However, these total returns are reported net of expenses or other fees that the SEC requires to be reflected in a fund's performance. It is not possible to invest directly in an average. |
| 4 | Total returns quoted reflect all applicable sales charges. |
Annual Shareholder Report7
Performance data quoted represents past performance which is no guarantee of future results. Investment return and principal value will fluctuate so that an investor's shares, when redeemed, may be worth more or less than their original cost. Mutual fund performance changes over time and current performance may be lower or higher than what is stated. For current to the most recent month-end performance and after-tax returns, visit FederatedInvestors.com or call 1-800-341-7400. Returns shown do not reflect the deduction of taxes that a shareholder would pay on Fund distributions or the redemption of Fund shares. Mutual funds are not obligations of or guaranteed by any bank and are not federally insured. Total returns shown include the maximum sales charge of 4.50%.
GROWTH OF A $10,000 INVESTMENT — CLASS B SHARES
The graph below illustrates the hypothetical investment of $10,0001 in Federated Fund for U.S. Government Securities (Class B Shares) (the “Fund”) from March 31, 2000 to March 31, 2010 compared to the Barclays Capital Mortgage-Backed Securities Index (BCMBS)2 and the Lipper U.S. Mortgage Funds Average (LUSMFA).3
| Average Annual Total Returns4 for the Period Ended 3/31/2010 |
| 1 Year | -1.01% |
| 5 Years | 3.63% |
| 10 Years | 4.80% |
Annual Shareholder Report8
Performance data quoted represents past performance which is no guarantee of future results. Investment return and principal value will fluctuate so that an investor's shares, when redeemed, may be worth more or less than their original cost. Mutual fund performance changes over time and current performance may be lower or higher than what is stated. For current to the most recent month-end performance and after-tax returns, visit FederatedInvestors.com or call 1-800-341-7400. Returns shown do not reflect the deduction of taxes that a shareholder would pay on Fund distributions or the redemption of Fund shares. Mutual funds are not obligations of or guaranteed by any bank and are not federally insured. Total returns shown include the maximum contingent deferred sales charge of 5.50% as applicable.
| 1 | Represents a hypothetical investment of $10,000 in the Fund. The maximum contingent deferred sales charge is 5.50% on any redemption less than one year from the purchase date. The Fund's performance assumes the reinvestment of all dividends and distributions. The BCMBS and the LUSMFA have been adjusted to reflect reinvestment of dividends on securities in the index and average. |
| 2 | The BCMBS is not adjusted to reflect sales charges, expenses or other fees that the SEC requires to be reflected in the Fund's performance. The index is unmanaged and, unlike the Fund, is not affected by cash flows. It is not possible to invest directly in an index. |
| 3 | The LUSMFA represents the average of the total returns reported by all of the mutual funds designated by Lipper, Inc. as falling in the respective category indicated, and is not adjusted to reflect any sales charges. However, these total returns are reported net of expenses or other fees that the SEC requires to be reflected in a fund's performance. It is not possible to invest directly in an average. |
| 4 | Total returns quoted reflect all applicable contingent deferred sales charges. |
Annual Shareholder Report9
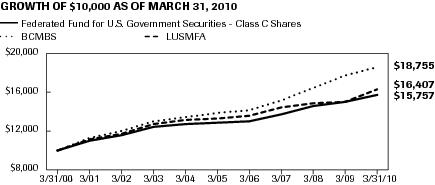
GROWTH OF A $10,000 INVESTMENT — CLASS C SHARES
The graph below illustrates the hypothetical investment of $10,0001 in Federated Fund for U.S. Government Securities (Class C Shares) (the “Fund”) from March 31, 2000 to March 31, 2010 compared to the Barclays Capital Mortgage-Backed Securities Index (BCMBS)2 and the Lipper U.S. Mortgage Funds Average (LUSMFA).3
| Average Annual Total Returns4 for the Period Ended 3/31/2010 |
| 1 Year | 3.51% |
| 5 Years | 3.99% |
| 10 Years | 4.65% |
Performance data quoted represents past performance which is no guarantee of future results. Investment return and principal value will fluctuate so that an investor's shares, when redeemed, may be worth more or less than their original cost. Mutual fund performance changes over time and current performance may be lower or higher than what is stated. For current to the most recent month-end performance and after-tax returns, visit FederatedInvestors.com or call 1-800-341-7400. Returns shown do not reflect the deduction of taxes that a shareholder would pay on Fund distributions or the redemption of Fund shares. Mutual funds are not obligations of or guaranteed by any bank and are not federally insured. Total returns shown include the 1.00% contingent deferred sales charge as applicable.
| 1 | Represents a hypothetical investment of $10,000 in the Fund. A 1.00% contingent deferred sales charge would be applied on any redemption less than one year from the purchase date. The Fund's performance assumes the reinvestment of all dividends and distributions. The BCMBS and the LUSMFA have been adjusted to reflect reinvestment of dividends on securities in the index and average. |
| 2 | The BCMBS is not adjusted to reflect sales charges, expenses or other fees that the SEC requires to be reflected in the Fund's performance. The index is unmanaged and, unlike the Fund, is not affected by cash flows. It is not possible to invest directly in an index. |
| 3 | The LUSMFA represents the average of the total returns reported by all of the mutual funds designated by Lipper, Inc. as falling in the respective category indicated, and is not adjusted to reflect any sales charges. However, these total returns are reported net of expenses or other fees that the SEC requires to be reflected in a fund's performance. It is not possible to invest directly in an average. |
| 4 | Total returns quoted reflect all applicable contingent deferred sales charges. |
Annual Shareholder Report10
Portfolio of Investments Summary Table (unaudited)
At March 31, 2010, the Fund's portfolio composition1 was as follows:
| Type of Investments | Percentage of
Total Net Assets |
| U.S. Government Agency Mortgage-Backed Securities | 97.2% |
| Non-Agency Mortgage-Backed Securities | 4.6% |
| Repurchase Agreement — Collateral2 | 0.8% |
| Cash Equivalents3 | 7.6% |
| Other Assets and Liabilities — Net4 | (10.2)% |
| TOTAL | 100.0% |
| 1 | See the Fund's Prospectus and Statement of Additional Information for a description of the principal types of securities in which the Fund invests. |
| 2 | Includes a repurchase agreement purchased with cash collateral or proceeds received in dollar-roll transactions, as well as cash covering when-issued and delayed delivery transactions. |
| 3 | Cash Equivalents include any investments in money market mutual funds and/or overnight repurchase agreements. |
| 4 | Assets, other than investments in securities, less liabilities. See Statement of Assets and Liabilities. |
Annual Shareholder Report11
Portfolio of Investments
March 31, 2010
Principal
Amount
or Shares | | | Value |
| | Mortgage-Backed Securities – 91.4% | |
| | Federal Home Loan Mortgage Corporation – 50.2% | |
| $103,111,433 | 1 | 4.500%, 6/1/2019 - 5/1/2040 | 105,266,915 |
| 111,179,992 | | 5.000%, 2/1/2019 - - 10/1/2039 | 116,104,482 |
| 108,772,388 | | 5.500%, 5/1/2016 - - 10/1/2037 | 115,370,832 |
| 21,061,470 | | 6.000%, 10/1/2017 - - 10/1/2038 | 22,650,418 |
| 6,825,081 | | 6.500%, 10/1/2037 - - 10/1/2038 | 7,416,562 |
| 637,504 | | 7.000%, 12/1/2031 | 713,147 |
| 1,284,140 | | 7.500%, 9/1/2013 - - 8/1/2031 | 1,410,058 |
| 168,717 | | 8.000%, 12/1/2029 | 187,188 |
| 12 | | 12.500%, 10/1/2012 | 13 |
| 366 | | 14.750%, 8/1/2011 | 385 |
| 215 | | 15.500%, 8/1/2011 | 237 |
| | TOTAL | 369,120,237 |
| | Federal National Mortgage Association – 36.9% | |
| 4,087,676 | | 4.500%, 12/1/2019 | 4,301,882 |
| 112,414,943 | 1 | 5.000%, 6/1/2023 - - 5/1/2040 | 116,935,377 |
| 47,254,758 | | 5.500%, 12/1/2013 - - 9/1/2037 | 49,887,441 |
| 68,870,623 | | 6.000%, 10/1/2028 - - 4/1/2038 | 74,132,632 |
| 22,274,935 | | 6.500%, 4/1/2029 - - 8/1/2037 | 24,069,625 |
| 1,711,996 | | 7.000%, 8/1/2028 - - 1/1/2032 | 1,924,546 |
| 161,855 | | 7.500%, 1/1/2030 - - 10/1/2031 | 177,591 |
| 131 | | 11.000%, 10/1/2010 | 131 |
| 3,297 | | 11.750%, 10/1/2015 | 3,836 |
| 9 | | 12.000%, 1/1/2013 | 9 |
| 1,234 | | 12.750%, 8/1/2014 | 1,391 |
| 481 | | 13.000%, 8/1/2015 | 572 |
| 2,372 | | 15.000%, 10/1/2012 | 2,633 |
| | TOTAL | 271,437,666 |
| | Government National Mortgage Association – 4.3% | |
| 18,384,847 | | 5.000%, 11/20/2038 - 9/20/2039 | 19,088,641 |
| 5,438,891 | | 5.500%, 12/20/2038 | 5,750,352 |
| 4,199,104 | | 6.000%, 9/20/2038 | 4,499,767 |
| 1,530,558 | | 7.500%, 12/15/2023 - - 7/15/2030 | 1,677,044 |
| 136,403 | | 8.250%, 5/15/2030 - - 10/15/2030 | 152,174 |
| 128,729 | | 8.375%, 8/15/2030 | 143,297 |
Annual Shareholder Report12
Principal
Amount
or Shares | | | Value |
| $102,407 | | 8.500%, 12/15/2029 | 115,009 |
| 304 | | 11.250%, 9/20/2015 | 352 |
| | TOTAL | 31,426,636 |
| | TOTAL MORTGAGE-BACKED SECURITIES
(IDENTIFIED COST $635,391,297) | 671,984,539 |
| | Collateralized Mortgage Obligations – 9.4% | |
| | Federal Home Loan Mortgage Corporation – 3.0% | |
| 9,206,476 | | 0.560%, 5/15/2036, REMIC 3160 FD | 9,061,267 |
| 5,128,216 | | 0.540%, 6/15/2036, REMIC 3175 FE | 5,048,341 |
| 5,613,398 | | 0.610%, 7/15/2036, REMIC 3179 FP | 5,547,467 |
| 2,215,348 | | 0.630%, 8/15/2036, REMIC 3206 FE | 2,186,687 |
| | TOTAL | 21,843,762 |
| | Federal National Mortgage Association – 2.8% | |
| 1,490,520 | | 0.496%, 10/25/2031, REMIC 2005-63 FC | 1,460,742 |
| 2,592,034 | | 0.646%, 6/25/2036, REMIC 2006-43 FL | 2,556,372 |
| 7,067,341 | | 0.546%, 7/25/2036, REMIC 2006-58 FP | 6,950,108 |
| 2,909,022 | | 0.596%, 9/25/2036, REMIC 2006-81 FB | 2,863,243 |
| 3,173,373 | | 0.626%, 10/25/2036, REMIC 2006-93 FM | 3,122,382 |
| 15,407,982 | | 4.500%, 6/1/2039, REMIC 396 2 | 4,044,535 |
| | TOTAL | 20,997,382 |
| | Non-Agency Mortgage – 3.6% | |
| 5,976,790 | | Countrywide Home Loans 2007-14, Class A18, 6.000%, 9/25/2037 | 5,273,421 |
| 2,757,518 | | Credit Suisse Mortgage Capital Certificate 2007-4, Class 4A2, 5.500%, 6/25/2037 | 2,616,979 |
| 3,419,215 | | First Horizon Alternative Mortgage Securities 2005-FA7, Class 2A1, 5.000%, 9/25/2020 | 2,932,036 |
| 5,518,225 | | Harborview Mortgage Loan Trust 2006-4, Class 2A1A, 0.437%, 5/19/2047 | 2,968,983 |
| 5,704,838 | | Lehman Mortgage Trust 2007-9, Class 1A1, 6.000%, 10/25/2037 | 5,166,706 |
| 3,969 | 2,3 | Lehman Structured Securities Corp. 2001-GE3, Class A, 0.000%, 5/28/2018 | 2,761 |
| 568,170 | 2,3 | Lehman Structured Securities Corp. 2002-GE1, Class A, 0.000%, 7/26/2024 | 451,979 |
| 6,544,868 | 2,3 | Salomon Brothers Mortgage Sec. VII 1999-4, Class IO, 2.547%, 12/25/2027 | 238,888 |
| 4,119,858 | 2,3 | Structured Asset Securities Corp. 1998-RF4, Class AIO, 6.300%, 8/15/2028 | 455,656 |
| 5,498,611 | | Structured Asset Securities Corp. 2005-17, Class 5A1, 5.500%, 10/25/2035 | 4,607,429 |
Annual Shareholder Report13
Principal
Amount
or Shares | | | Value |
| $3,354,263 | | Washington Mutual 2006-AR1, Class 2A1B, 1.533%, 1/25/2046 | 1,669,961 |
| | TOTAL | 26,384,799 |
| | TOTAL COLLATERALIZED MORTGAGE OBLIGATIONS
(IDENTIFIED COST $76,645,750) | 69,225,943 |
| | Commercial Mortgage-Backed Securities – 1.0% | |
| | Commercial Mortgage – 1.0% | |
| 3,750,000 | | Bank of America Commercial Mortgage Inc., Class A3, 5.449%, 1/15/2049 | 3,854,863 |
| 4,000,000 | | Citigroup/Deutsche Bank Commercial Mortgage 2007-CD4, Class A3, 5.293%, 12/11/2049 | 3,737,535 |
| | TOTAL COMMERCIAL MORTGAGE-BACKED SECURITIES
(IDENTIFIED COST $7,632,725) | 7,592,398 |
| | MUTUAL FUND – 7.6% | |
| 55,485,883 | 4,5 | Government Obligations Fund, Institutional Shares, 0.02%
(AT NET ASSET VALUE) | 55,485,883 |
| | Repurchase Agreement – 0.8% | |
| $5,479,000 | 6 | Interest in $12,649,000 joint repurchase agreement 0.16%, dated 3/11/2010 under which CS First Boston LLC will repurchase a security provided as collateral for $12,650,855 on 4/13/2010. The security provided as collateral at the end of the period was a U.S. Government Agency security maturing on 11/15/2037 and the market value of that underlying security was $13,030,428. (segregated pending settlement of dollar-roll transactions). (AT COST) | 5,479,000 |
| | TOTAL INVESTMENTS — 110.2%
(IDENTIFIED COST $780,634,655)7 | 809,767,763 |
| | OTHER ASSETS AND LIABILITIES - NET — (10.2)%8 | (74,757,883) |
| | TOTAL NET ASSETS — 100% | $735,009,880 |
| 1 | All or a portion of these To Be Announced (TBAs) securities are subject to dollar-roll transactions. |
| 2 | Denotes a restricted security that either: (a) cannot be offered for public sale without first being registered, or being able to take advantage of an exemption from registration, under the Securities Act of 1933; or (b) is subject to a contractual restriction on public sales. At March 31, 2010, these restricted securities amounted to $1,149,284, which represented 0.2% of total net assets. |
| 3 | Market quotations and price evaluations are not available. Fair value determined in accordance with procedures established by and under the general supervision of the Board of Trustees (the “Trustees”). |
| 4 | Affiliated company. |
| 5 | 7-Day net yield. |
| 6 | Although the repurchase date is more than seven days after the date of purchase, the Fund has the right to terminate the repurchase agreement at any time with seven-days' notice. |
| 7 | The cost of investments for federal tax purposes amounts to $780,469,696. |
| 8 | Assets, other than investment in securities, less liabilities. See Statement of Assets and Liabilities. A significant portion of this balance is the result of dollar-roll transactions as of March 31, 2010. |
Annual Shareholder Report14
Note: The categories of investments are shown as a percentage of total net assets at March 31, 2010.Various inputs are used in determining the value of the Fund's investments. These inputs are summarized in the three broad levels listed below:
Level 1 — quoted prices in active markets for identical securities
Level 2 — other significant observable inputs (including quoted prices for similar securities, interest rates, prepayment speeds, credit risk, etc.)
Level 3 — significant unobservable inputs (including the Fund's own assumptions in determining the fair value of investments)
The inputs or methodology used for valuing securities are not an indication of the risk associated with investing in those securities.
The following is a summary of the inputs used, as of March 31, 2010, in valuing the Fund's assets carried at fair value:
| Valuation Inputs | | | | |
| Level 1 -
Quoted
Prices and
Investments in
Mutual Funds | Level 2 -
Other
Significant
Observable
Inputs | Level 3 -
Significant
Unobservable
Inputs | Total |
| Debt Securities: | | | | |
| Mortgage-Backed Securities | $ — | $671,984,539 | $ — | $671,984,539 |
| Collateralized Mortgage Obligations | — | 68,076,659 | 1,149,284 | 69,225,943 |
| Commercial Mortgage-Backed Securities | — | 7,592,398 | — | 7,592,398 |
| Mutual Fund | 55,485,883 | — | — | 55,485,883 |
| Repurchase Agreement | — | 5,479,000 | — | 5,479,000 |
| TOTAL SECURITIES | $55,485,883 | $753,132,596 | $1,149,284 | $809,767,763 |
Annual Shareholder Report15
Following is a reconciliation of assets in which significant unobservable inputs (Level 3) were used in determining fair value: | Investments in
Debt Securities |
| Balance as of April 1, 2009 | $1,384,553 |
| Realized gain | 25,300 |
| Change in unrealized depreciation | 36,746 |
| Net purchases (sales) | (297,315) |
| Balance as of March 31, 2010 | $1,149,284 |
| The total change in unrealized depreciation included in the Statement of Operations attributable to investments still held at March 31, 2010. | $36,746 |
The following acronym is used throughout this portfolio:
| REMIC | — Real Estate Mortgage Investment Conduit |
See Notes which are an integral part of the Financial Statements
Annual Shareholder Report16
Statement of Assets and Liabilities
March 31, 2010
| Assets: | | |
| Total investments in securities, at value including $55,485,883 of investments in an affiliated issuer (Note 5) (identified cost $780,634,655) | | $809,767,763 |
| Cash | | 5,967 |
| Income receivable | | 2,832,279 |
| Receivable for investments sold | | 50,824,648 |
| Receivable for shares sold | | 573,362 |
| TOTAL ASSETS | | 864,004,019 |
| Liabilities: | | |
| Payable for investments purchased | $126,729,661 | |
| Payable for shares redeemed | 1,032,964 | |
| Income distribution payable | 610,353 | |
| Payable for Directors'/Trustees' fees | 855 | |
| Payable for distribution services fee (Note 5) | 92,803 | |
| Payable for shareholder services fee (Note 5) | 258,515 | |
| Accrued expenses | 268,988 | |
| TOTAL LIABILITIES | | 128,994,139 |
| Net assets for 94,656,917 shares outstanding | | $735,009,880 |
| Net Assets Consist of: | | |
| Paid-in capital | | $755,705,935 |
| Net unrealized appreciation of investments | | 29,133,108 |
| Accumulated net realized loss on investments and futures contracts | | (49,762,295) |
| Distributions in excess of net investment income | | (66,868) |
| TOTAL NET ASSETS | | $735,009,880 |
| Net Asset Value, Offering Price and Redemption Proceeds Per Share | | |
| Class A Shares: | | |
| Net asset value per share ($590,559,453 ÷ 76,049,263 shares outstanding), no par value, unlimited shares authorized | | $7.77 |
| Offering price per share (100/95.50 of $7.77) | | $8.14 |
| Redemption proceeds per share | | $7.77 |
| Class B Shares: | | |
Net asset value per share ($75,194,066 ÷ 9,684,130 shares outstanding),
no par value, unlimited shares authorized | | $7.76 |
| Offering price per share | | $7.76 |
| Redemption proceeds per share (94.50/100 of $7.76) | | $7.33 |
| Class C Shares: | | |
Net asset value per share ($69,256,361 ÷ 8,923,524 shares outstanding),
no par value, unlimited shares authorized | | $7.76 |
| Offering price per share | | $7.76 |
| Redemption proceeds per share (99.00/100 of $7.76) | | $7.68 |
See Notes which are an integral part of the Financial Statements
Annual Shareholder Report17
Statement of Operations
Year Ended March 31, 2010
| Investment Income: | | | |
| Interest | | | $36,432,083 |
| Dividends received from an affiliated issuer (Note 5) | | | 36,834 |
| TOTAL INCOME | | | 36,468,917 |
| Expenses: | | | |
| Investment adviser fee (Note 5) | | $3,453,874 | |
| Administrative personnel and services fee (Note 5) | | 577,616 | |
| Custodian fees | | 39,844 | |
| Transfer and dividend disbursing agent fees and expenses | | 835,621 | |
| Directors'/Trustees' fees | | 6,303 | |
| Auditing fees | | 23,531 | |
| Legal fees | | 5,567 | |
| Portfolio accounting fees | | 193,709 | |
| Distribution services fee — Class B Shares (Note 5) | | 653,729 | |
| Distribution services fee — Class C Shares (Note 5) | | 474,686 | |
| Shareholder services fee — Class A Shares (Note 5) | | 1,480,445 | |
| Shareholder services fee — Class B Shares (Note 5) | | 217,910 | |
| Shareholder services fee — Class C Shares (Note 5) | | 157,926 | |
| Account administration fee — Class A Shares | | 1,088 | |
| Share registration costs | | 51,475 | |
| Printing and postage | | 61,629 | |
| Insurance premiums | | 5,691 | |
| Miscellaneous | | 15,771 | |
| TOTAL EXPENSES | | 8,256,415 | |
| Waiver and Reimbursement (Note 5): | | | |
| Reimbursement of investment adviser fee | $(33,396) | | |
| Waiver of administrative personnel and services fee | (11,524) | | |
| TOTAL WAIVER AND REIMBURSEMENT | | (44,920) | |
| Net expenses | | | 8,211,495 |
| Net investment income | | | 28,257,422 |
| Realized and Unrealized Gain (Loss) on Investments and Futures Contracts: | | | |
| Net realized loss on investments | | | (4,313,722) |
| Net realized loss on futures contracts | | | (169,211) |
| Net change in unrealized appreciation of investments | | | 13,266,505 |
| Net realized and unrealized gain on investments and futures contracts | | | 8,783,572 |
| Change in net assets resulting from operations | | | $37,040,994 |
See Notes which are an integral part of the Financial Statements
Annual Shareholder Report18
Statement of Changes in Net Assets
| Year Ended
3/31/2010 | Year Ended
3/31/2009 |
| Increase (Decrease) in Net Assets | | |
| Operations: | | |
| Net investment income | $28,257,422 | $32,279,249 |
| Net realized loss on investments and futures contracts | (4,482,933) | (1,363,854) |
| Net change in unrealized appreciation/depreciation of investments and futures contracts | 13,266,505 | (2,049,093) |
| CHANGE IN NET ASSETS RESULTING FROM OPERATIONS | 37,040,994 | 28,866,302 |
| Distributions to Shareholders: | | |
| Distributions from net investment income | | |
| Class A Shares | (25,925,958) | (28,461,009) |
| Class B Shares | (3,138,215) | (4,123,526) |
| Class C Shares | (2,311,828) | (1,868,837) |
| CHANGE IN NET ASSETS RESULTING FROM DISTRIBUTIONS TO SHAREHOLDERS | (31,376,001) | (34,453,372) |
| Share Transactions: | | |
| Proceeds from sale of shares | 125,277,560 | 139,226,749 |
| Net asset value of shares issued to shareholders in payment of distributions declared | 23,426,385 | 24,921,634 |
| Cost of shares redeemed | (175,871,396) | (205,306,668) |
| CHANGE IN NET ASSETS RESULTING FROM SHARE TRANSACTIONS | (27,167,451) | (41,158,285) |
| Change in net assets | (21,502,458) | (46,745,355) |
| Net Assets: | | |
| Beginning of period | 756,512,338 | 803,257,693 |
| End of period (including undistributed (distributions in excess of) net investment income of $(66,868) and $155,681, respectively) | $735,009,880 | $756,512,338 |
See Notes which are an integral part of the Financial Statements
Annual Shareholder Report19
Notes to Financial Statements
March 31, 2010
1. ORGANIZATION
Federated Income Securities Trust (the “Trust”) is registered under the Investment Company Act of 1940, as amended (the “Act”), as a diversified, open-end management investment company. The Trust consists of seven portfolios. The financial statements included herein are only those of Federated Fund for U.S. Government Securities (the “Fund”). The financial statements of the other portfolios are presented separately. The assets of each portfolio are segregated and a shareholder's interest is limited to the portfolio in which shares are held. Each portfolio pays its own expenses. The Fund offers three classes of shares: Class A Shares, Class B Shares and Class C Shares. All shares of the Fund have equal rights with respect to voting, except on class-specific matters. The investment objective of the Fund is to provide current income.
2. SIGNIFICANT ACCOUNTING POLICIES
The following is a summary of significant accounting policies consistently followed by the Fund in the preparation of its financial statements. These policies are in conformity with U.S. generally accepted accounting principles (GAAP).
Investment Valuation
In calculating its net asset value (NAV), the Fund generally values investments as follows:
- Fixed-income securities acquired with remaining maturities greater than 60 days are fair valued using price evaluations provided by a pricing service approved by the Trustees.
- Fixed-income securities acquired with remaining maturities of 60 days or less are valued at their cost (adjusted for the accretion of any discount or amortization of any premium).
- Shares of other mutual funds are valued based upon their reported NAVs.
- Derivative contracts listed on exchanges are valued at their reported settlement or closing price.
- Over-the-counter (OTC) derivative contracts are fair valued using price evaluations provided by a pricing service approved by the Trustees.
If the Fund cannot obtain a price or price evaluation from a pricing service for an investment, the Fund may attempt to value the investment based upon the mean of bid and asked quotations or fair value the investment based on price evaluations, from one or more dealers. If any price, quotation, price evaluation or other pricing source is not readily available when the NAV is calculated, the Fund uses the fair value of the investment determined in accordance with the procedures described below. There can be no assurance that the Fund could purchase or sell an investment at the price used to calculate the Fund's NAV.
Fair Valuation and Significant Events Procedures
The Trustees have authorized the use of pricing services to provide evaluations of the current fair value of certain investments for purposes of calculating the NAV. Factors considered by pricing services in evaluating an investment include the yields or prices of investments of comparable quality, coupon, maturity, call rights and other potential prepayments, terms and type, reported transactions, indications as to values from dealers and general market conditions. Some pricing services provide a single price evaluation reflecting the bid-side of the market for an investment (a “bid” evaluation). Other pricing services offer both bid evaluations and price evaluations indicative of a price between the prices bid and asked for the investment (a “mid” evaluation). The Fund normally uses bid evaluations for U.S. Treasury Annual Shareholder Report20
and Agency securities and mortgage-backed securities. The Fund normally uses mid evaluations for other types of fixed-income securities and OTC derivative contracts. In the event that market quotations and price evaluations are not available for an investment, the fair value of the investment is determined in accordance with procedures adopted by the Trustees.The Trustees also have adopted procedures requiring an investment to be priced at its fair value whenever the Adviser determines that a significant event affecting the value of the investment has occurred between the time as of which the price of the investment would otherwise be determined and the time as of which the NAV is computed. An event is considered significant if there is both an affirmative expectation that the investment's value will change in response to the event and a reasonable basis for quantifying the resulting change in value. Examples of significant events that may occur after the close of the principal market on which a security is traded, or after the time of a price evaluation provided by a pricing service or a dealer, include:
- With respect to price evaluations of fixed-income securities determined before the close of regular trading on the NYSE, actions by the Federal Reserve Open Market Committee and other significant trends in U.S. fixed-income markets;
- Political or other developments affecting the economy or markets in which an issuer conducts its operations or its securities are traded; and
- Announcements concerning matters such as acquisitions, recapitalizations, litigation developments, a natural disaster affecting the issuer's operations or regulatory changes or market developments affecting the issuer's industry.
The Fund may seek to obtain more current quotations or price evaluations from alternative pricing sources. If a reliable alternative pricing source is not available, the Fund will determine the fair value of the investment using another method approved by the Trustees.
Repurchase Agreements
It is the policy of the Fund to require the other party to a repurchase agreement to transfer to the Fund's custodian or sub-custodian eligible securities or cash with a market value (after transaction costs) at least equal to the repurchase price to be paid under the repurchase agreement. The eligible securities are transferred to accounts with the custodian or sub-custodian in which the Fund holds a “securities entitlement” and exercises “control” as those terms are defined in the Uniform Commercial Code. The Fund has established procedures for monitoring the market value of the transferred securities and requiring the transfer of additional eligible securities if necessary to equal at least the repurchase price. These procedures also allow the other party to require securities to be transferred from the account to the extent that their market value exceeds the repurchase price or in exchange for other eligible securities of equivalent market value.
The insolvency of the other party or other failure to repurchase the securities may delay the disposition of the underlying securities or cause the Fund to receive less than the full repurchase price. Under the terms of the repurchase agreement, any amounts received by the Fund in excess of the repurchase price and related transaction costs must be remitted to the other party.
The Fund may enter into repurchase agreements in which eligible securities are transferred into joint trading accounts maintained by the custodian or sub-custodian for investment companies and other clients advised by the Fund's Adviser and its affiliates. The Fund will participate on a pro rata basis with the other investment companies and clients in its share of the securities transferred under such repurchase agreements and in its share of proceeds from any repurchase or other disposition of such securities.
Annual Shareholder Report21
Investment Income, Gains and Losses, Expenses and DistributionsInvestment transactions are accounted for on a trade-date basis. Realized gains and losses from investment transactions are recorded on an identified-cost basis. Interest income and expenses are accrued daily. Distributions to shareholders are recorded on the ex-dividend date. Distributions of net investment income are declared and paid monthly. Investment income, realized and unrealized gains and losses, and certain fund-level expenses are allocated to each class based on relative average daily net assets, except that each class may bear certain expenses unique to that class such as account administration, distribution services and shareholder services fees. Dividends are declared separately for each class. No class has preferential dividend rights; differences in per share dividend rates are generally due to differences in separate class expenses.
Premium and Discount Amortization/ Paydown Gains and Losses
All premiums and discounts on fixed-income securities are amortized/accreted for financial statement purposes. Gains and losses realized on principal payment of mortgage-backed securities (paydown gains and losses) are classified as part of investment income.
Federal Taxes
It is the Fund's policy to comply with the Subchapter M provision of the Internal Revenue Code (the “Code”) and to distribute to shareholders each year substantially all of its income. Accordingly, no provision for federal income tax is necessary. As of and during the year ended March 31, 2010, the Fund did not have a liability for any uncertain tax positions. The Fund recognizes interest and penalties, if any, related to tax liabilities as income tax expense in the Statement of Operations. As of March 31, 2010, tax years 2007 through 2010 remain subject to examination by the Fund's major tax jurisdictions, which include the United States of America and the Commonwealth of Massachusetts.
When-Issued and Delayed Delivery Transactions
The Fund may engage in when-issued or delayed delivery transactions. The Fund records when-issued securities on the trade date and maintains security positions such that sufficient liquid assets will be available to make payment for the securities purchased. Securities purchased on a when-issued or delayed delivery basis are marked to market daily and begin earning interest on the settlement date. Losses may occur on these transactions due to changes in market conditions or the failure of counterparties to perform under the contract.
The Fund may transact in To Be Announced Securities (TBAs). As with other delayed delivery transactions, a seller agrees to issue TBAs at a future date. However, the seller does not specify the particular securities to be delivered. Instead, the Fund agrees to accept any security that meets specified terms such as issuer, interest rate and terms of underlying mortgages. The Fund records TBAs on the trade date utilizing information associated with the specified terms of the transaction as opposed to the specific mortgages. TBAs are marked to market daily and begin earning interest on the settlement date. Losses may occur due to the fact that the actual underlying mortgages received may be less favorable than those anticipated by the Fund.
Futures Contracts
The Fund may purchase and sell financial futures contracts to manage cash flows, enhance yield and to potentially reduce transaction costs. Upon entering into a financial futures contract with a broker, the Fund is required to deposit in a segregated account a specified amount of cash or U.S. government securities. Futures contracts are valued daily and Annual Shareholder Report22
unrealized gains or losses are recorded in a “variation margin” account. Daily, the Fund receives from or pays to the broker a specified amount of cash based upon changes in the variation margin account. When a contract is closed, the Fund recognizes a realized gain or loss. Futures contracts have market risks, including the risk that the change in the value of the contract may not correlate with the changes in the value of the underlying securities. There is minimal counterparty risk to the Fund since futures are exchange traded and the exchange's clearinghouse, as counterparty to all exchange traded futures, guarantees the futures against default.At March 31, 2010, the Fund had no outstanding futures contracts.
Dollar-Roll Transactions
The Fund may engage in dollar-roll transactions in which the Fund sells mortgage-backed securities with a commitment to buy similar (same type, coupon and maturity), but not identical mortgage-backed securities on a future date at a lower price. Normally, one or both securities involved are TBA mortgage-backed securities. The Fund treats dollar-roll transactions as purchases and sales. Dollar-rolls are subject to interest rate risks and credit risks.
Restricted Securities
The Fund may purchase securities which are considered restricted. Restricted securities are securities that either: (a) cannot be offered for public sale without first being registered, or being able to take advantage of an exemption from registration, under the Securities Act of 1933; or (b) are subject to contractual restrictions on public sales. In some cases, when a security cannot be offered for public sale without first being registered, the issuer of the restricted security has agreed to register such securities for resale, at the issuer's expense, either upon demand by the Fund or in connection with another registered offering of the securities. Many such restricted securities may be resold in the secondary market in transactions exempt from registration. Restricted securities may be determined to be liquid under criteria established by the Trustees. The Fund will not incur any registration costs upon such resales. The Fund's restricted securities are valued at the price provided by dealers in the secondary market or, if no market prices are available, at the fair value as determined in accordance with procedures established by and under the general supervision of the Trustees.
Additional information on restricted securities, excluding securities purchased under Rule 144A, if applicable, that have been deemed liquid by the Trustees, held at March 31, 2010, is as follows:
| Security | Acquisition Date | Acquisition Cost | Market Value |
| Lehman Structured Securities Corp. 2001-GE3, Class A, 0.000%, 5/28/2018 | 8/15/2001 | $3,601 | $2,761 |
| Lehman Structured Securities Corp. 2002-GE1, Class A, 0.000%, 7/26/2024 | 1/29/2002 | $471,932 | $451,979 |
| Salomon Brothers Mortgage Sec. VII 1999-4, Class IO, 2.547%, 12/25/2027 | 4/20/1999-5/25/1999 | $214,575 | $238,888 |
| Structured Asset Securities Corp. 1998-RF4, Class AIO, 6.300%, 8/15/2028 | 12/15/1999 | $904,613 | $455,656 |
Annual Shareholder Report23
Additional Disclosure Related to Derivative Instruments
The Effect of Derivative Instruments on the Statement of Operations for the Year Ended March 31, 2010
| Amount of Realized Gain or (Loss) on Derivatives Recognized in Income |
| Futures |
| Interest rate contracts | $(169,211) |
Other
The preparation of financial statements in conformity with GAAP requires management to make estimates and assumptions that affect the amounts of assets, liabilities, expenses and revenues reported in the financial statements. Actual results could differ from those estimated.
3. SHARES OF BENEFICIAL INTEREST
The following tables summarize share activity:
| Year Ended March 31 | 2010 | 2009 |
| Class A Shares: | Shares | Amount | Shares | Amount |
| Shares sold | 10,917,309 | $84,815,333 | 12,368,099 | $94,003,766 |
| Shares issued to shareholders in payment of distributions declared | 2,463,329 | 19,108,138 | 2,693,990 | 20,407,384 |
| Shares redeemed | (15,097,973) | (116,991,551) | (20,141,852) | (152,854,440) |
NET CHANGE RESULTING
FROM CLASS A
SHARE TRANSACTIONS | (1,717,335) | $(13,068,080) | (5,079,763) | $(38,443,290) |
| Year Ended March 31 | 2010 | 2009 |
| Class B Shares: | Shares | Amount | Shares | Amount |
| Shares sold | 1,147,305 | $8,915,923 | 2,092,038 | $15,864,419 |
| Shares issued to shareholders in payment of distributions declared | 341,235 | 2,645,371 | 431,304 | 3,266,758 |
| Shares redeemed | (4,682,698) | (36,295,413) | (4,936,032) | (37,478,427) |
NET CHANGE RESULTING
FROM CLASS B
SHARE TRANSACTIONS | (3,194,158) | $(24,734,119) | (2,412,690) | $(18,347,250) |
Annual Shareholder Report24
| Year Ended March 31 | 2010 | 2009 |
| Class C Shares: | Shares | Amount | Shares | Amount |
| Shares sold | 4,064,568 | $31,546,304 | 3,866,375 | $29,358,564 |
| Shares issued to shareholders in payment of distributions declared | 215,702 | 1,672,876 | 164,774 | 1,247,492 |
| Shares redeemed | (2,913,538) | (22,584,432) | (1,971,252) | (14,973,801) |
NET CHANGE RESULTING
FROM CLASS C
SHARE TRANSACTIONS | 1,366,732 | $10,634,748 | 2,059,897 | $15,632,255 |
NET CHANGE RESULTING
FROM FUND
SHARE TRANSACTIONS | (3,544,761) | $(27,167,451) | (5,432,556) | $(41,158,285) |
4. FEDERAL TAX INFORMATION
The timing and character of income and capital gain distributions are determined in accordance with income tax regulations, which may differ from GAAP. These differences are due in part to differing treatments for litigation payments and dollar-roll transactions.
For the year ended March 31, 2010, permanent differences identified and reclassified among the components of net assets were as follows:
| Increase (Decrease) |
| Paid-In Capital | Undistributed
Net Investment
Income (Loss) | Accumulated
Net Realized
Gain (Loss) |
| $(113,912) | $2,896,030 | $(2,782,118) |
Net investment income (loss), net realized gains (losses), and net assets were not affected by this reclassification.
The tax character of distributions as reported on the Statement of Changes in Net Assets for the years ended March 31, 2010 and 2009, was as follows:
| 2010 | 2009 |
| Ordinary income | $31,376,001 | $34,453,372 |
As of March 31, 2010, the components of distributable earnings on a tax basis were as follows:
| Distributions in excess of ordinary income | $(65,122) |
| Net unrealized appreciation | $29,298,067 |
| Capital loss carryforwards and deferrals | $(49,929,000) |
The difference between book-basis and tax-basis net unrealized appreciation/depreciation is attributable in part to differing treatments for REMIC and dollar-roll transactions.
At March 31, 2010, the cost of investments for federal tax purposes was $780,469,696. The net unrealized appreciation of investments for federal tax purposes was $29,298,067. This consists of net unrealized appreciation from investments for those securities having an excess of value over cost of $38,347,706 and net unrealized depreciation from investments for those securities having an excess of cost over value of $9,049,639.
Annual Shareholder Report25
At March 31, 2010, the Fund had a capital loss carryforward of $49,878,237 which will reduce the Fund's taxable income arising from future net realized gains on investments, if any, to the extent permitted by the Code and thus will reduce the amount of distributions to shareholders which would otherwise be necessary to relieve the Fund of any liability for federal income tax. Pursuant to the Code, such capital loss carryforward will expire as follows:| Expiration Year | Expiration Amount |
| 2012 | $3,247,713 |
| 2013 | $10,382,357 |
| 2014 | $4,881,984 |
| 2015 | $21,792,738 |
| 2017 | $726,216 |
| 2018 | $8,847,229 |
Under current tax regulations, capital losses on securities transactions realized after October 31 may be deferred and treated as occurring on the first day of the following fiscal year. As of March 31, 2010, for federal income tax purposes, post October losses of $50,763 were deferred to April 1, 2010.
5. INVESTMENT ADVISER FEE AND OTHER TRANSACTIONS WITH AFFILIATES
Investment Adviser Fee
Federated Investment Management Company is the Fund's investment adviser (the “Adviser”). The advisory agreement between the Fund and the Adviser provides for an annual fee equal to: (a) a maximum of 0.25% of the average daily net assets of the Fund; and (b) 4.50% of the gross income of the Fund. Subject to the terms described in the Expense Limitation note, the Adviser may voluntarily choose to waive any portion of its fee.
Administrative Fee
Federated Administrative Services (FAS), under the Administrative Services Agreement, provides the Fund with administrative personnel and services. The fee paid to FAS is based on the average aggregate daily net assets of certain Federated funds as specified below:
| Administrative Fee | Average Aggregate Daily Net Assets
of the Federated Funds |
| 0.150% | on the first $5 billion |
| 0.125% | on the next $5 billion |
| 0.100% | on the next $10 billion |
| 0.075% | on assets in excess of $20 billion |
The administrative fee received during any fiscal year shall be at least $150,000 per portfolio and $40,000 per each additional class of Shares. Subject to the terms described in the Expense Limitation note, FAS may voluntarily choose to waive any portion of its fee. For the year ended March 31, 2010, the net fee paid to FAS was 0.076% of average daily net assets of the Fund. FAS waived $11,524 of its fee.
Annual Shareholder Report26
Distribution Services FeeThe Fund has adopted a Distribution Plan (the “Plan”) pursuant to Rule 12b-1 under the Act. Under the terms of the Plan, the Fund will compensate Federated Securities Corp. (FSC), the principal distributor, from the daily net assets of the Fund's Class B Shares and Class C Shares to finance activities intended to result in the sale of these shares. The Plan provides that the Fund may incur distribution expenses at the following percentages of average daily net assets annually, to compensate FSC:
| Share Class Name | Percentage of Average Daily
Net Assets of Class |
| Class B Shares | 0.75% |
| Class C Shares | 0.75% |
Subject to the terms described in the Expense Limitation note, FSC may voluntarily choose to waive any portion of its fee. When FSC receives fees, it may pay some or all of them to financial intermediaries whose customers purchase shares. For the year ended March 31, 2010, FSC retained $112,321 of fees paid by the Fund.
Sales Charges
Front-end sales charges and contingent deferred sales charges (CDSC) do not represent expenses of the Fund. They are deducted from the proceeds of sales of Fund shares prior to investment or from redemption proceeds prior to remittance, as applicable. For the year ended March 31, 2010, FSC retained $54,336 in sales charges from the sale of Class A Shares. FSC also retained $18,750 of CDSC relating to redemptions of Class A Shares and $14,501 relating to redemptions of Class C Shares.
Shareholder Services Fee
The Fund may pay fees (Service Fees) up to 0.25% of the average daily net assets of the Fund's Class A Shares, Class B Shares and Class C Shares to financial intermediaries or to Federated Shareholder Services Company (FSSC) for providing services to shareholders and maintaining shareholder accounts. Subject to the terms described in the Expense Limitation note, FSSC may voluntarily reimburse the Fund for Service Fees. For the year ended March 31, 2010, FSSC received $711,126 of fees paid by the Fund.
Expense Limitation
The Adviser and its affiliates (which may include FSC, FAS and FSSC) have voluntarily agreed to waive their fees and/or reimburse expenses so that the total annual fund operating expenses (as shown in the financial highlights) paid by the Fund's Class A Shares, Class B Shares and Class C Shares (after the voluntary waivers and reimbursements) will not exceed 0.95%, 1.70% and 1.70%, respectively (the “Fee Limit”), through the later of (the “Termination Date”): (a) May 31, 2011; or (b) the date of the Fund's next effective Prospectus. While the Adviser and its affiliates currently do not anticipate terminating or increasing these arrangements prior to the Termination Date, these arrangements may only be terminated or the Fee Limit increased prior to the Termination Date with the agreement of the Trustees.
General
Certain Officers and Trustees of the Fund are Officers and Directors or Trustees of the above companies.
Annual Shareholder Report27
Transactions with Affiliated CompaniesAffiliated holdings are mutual funds which are managed by the Adviser or an affiliate of the Adviser. The Adviser has agreed to reimburse the Fund for certain investment adviser fees as a result of transactions in other affiliated mutual funds. For the year ended March 31, 2010, the Adviser reimbursed $33,396. Transactions with the affiliated company during the year ended March 31, 2010, were as follows:
| Affiliate | Balance of
Shares Held
3/31/2009 | Purchases/
Additions | Sales/
Reductions | Balance of
Shares Held
3/31/2010 | Value | Dividend
Income |
| Government Obligations Fund, Institutional Shares | 44,198,140 | 294,895,635 | 283,607,892 | 55,485,883 | $55,485,883 | $36,834 |
6. Investment TRANSACTIONS
Purchases and sales of investments, excluding long-term U.S. government securities and short-term obligations for the year ended March 31, 2010, were as follows:
| Purchases | $13,275,832 |
| Sales | $33,454,227 |
7. LINE OF CREDIT
The Fund participates in a $100,000,000 unsecured, uncommitted revolving line of credit (LOC) agreement with PNC Bank. The LOC was made available for extraordinary or emergency purposes, primarily for financing redemption payments. Borrowings are charged interest at a rate offered to the Fund by PNC Bank at the time of the borrowing. As of March 31, 2010, there were no outstanding loans. During the year ended March 31, 2010, the Fund did not utilize the LOC.
8. INTERFUND LENDING
Pursuant to an Exemptive Order issued by the Securities and Exchange Commission, the Fund, along with other funds advised by subsidiaries of Federated Investors, Inc., may participate in an interfund lending program. This program provides an alternative credit facility allowing the Fund to borrow from other participating affiliated funds. As of March 31, 2010, there were no outstanding loans. During the year ended March 31, 2010, the program was not utilized.
9. Legal Proceedings
Since October 2003, Federated Investors, Inc. and related entities (collectively, “Federated”), and various Federated sponsored mutual funds (Federated Funds) have been named as defendants in several class action lawsuits now pending in the United States District Court for the District of Maryland. The lawsuits were purportedly filed on behalf of people who purchased, owned and/or redeemed shares of certain Federated Funds during specified periods beginning November 1, 1998. The suits are generally similar in alleging that Federated engaged in illegal and improper trading practices including market timing and late trading in concert with certain institutional traders, which allegedly caused financial injury to the mutual fund shareholders. Federated without admitting the validity of any claim has reached a preliminary settlement with the Plaintiffs in these cases. Any settlement would have to be approved by the Court. Federated entities have also been named as defendants in several additional lawsuits that are now pending in the United States District Court for the Western Annual Shareholder Report28
District of Pennsylvania. These lawsuits have been consolidated into a single action alleging excessive advisory fees involving one of the Federated Funds. The Board of the Federated Funds retained the law firm of Dickstein Shapiro LLP to represent the Federated Funds in these lawsuits. Federated and the Federated Funds, and their respective counsel, have been defending this litigation, and none of the Federated Funds remains a defendant in any of the lawsuits. Additional lawsuits based upon similar allegations may be filed in the future. The potential impact of these lawsuits, all of which seek monetary damages, attorneys' fees and expenses, and future potential similar suits is uncertain. Although we do not believe that these lawsuits will have a material adverse effect on the Federated Funds, there can be no assurance that these suits, ongoing adverse publicity and/or other developments resulting from the allegations in these matters will not result in increased redemptions, or reduced sales of shares of the Federated Funds or other adverse consequences for the Federated Funds.10. Subsequent events
Management has evaluated subsequent events through the date the financial statements were issued, and determined that no events have occurred that require additional disclosure.
Annual Shareholder Report29
Report of Independent Registered Public Accounting Firm
TO THE BOARD OF Trustees OF Federated Income Securities Trust AND SHAREHOLDERS OF Federated Fund for U.S. Government Securities:
We have audited the accompanying statement of assets and liabilities of Federated Fund for U.S. Government Securities (the “Fund”) (one of the portfolios comprising Federated Income Securities Trust), including the portfolio of investments, as of March 31, 2010, and the related statement of operations for the year then ended, the statement of changes in net assets for each of the two years in the period then ended, and the financial highlights for each of the five years in the period then ended. These financial statements and financial highlights are the responsibility of the Fund's management. Our responsibility is to express an opinion on these financial statements and financial highlights based on our audits.
We conducted our audits in accordance with standards of the Public Company Accounting Oversight Board (United States). Those standards require that we plan and perform the audit to obtain reasonable assurance about whether the financial statements and financial highlights are free of material misstatement. We were not engaged to perform an audit of the Fund's internal control over financial reporting. Our audits included consideration of internal control over financial reporting as a basis for designing audit procedures that are appropriate in the circumstances, but not for the purpose of expressing an opinion on the effectiveness of the Fund's internal control over financial reporting. Accordingly, we express no such opinion. An audit also includes examining, on a test basis, evidence supporting the amounts and disclosures in the financial statements and financial highlights, assessing the accounting principles used and significant estimates made by management, and evaluating the overall financial statement presentation. Our procedures included confirmation of securities owned as of March 31, 2010, by correspondence with the custodian and others or by other appropriate auditing procedures where replies from others were not received. We believe that our audits provide a reasonable basis for our opinion.
In our opinion, the financial statements and financial highlights referred to above present fairly, in all material respects, the financial position of Federated Fund for U.S. Government Securities , a portfolio of Federated Income Securities Trust, at March 31, 2010, the results of its operations for the year then ended, the changes in its net assets for each of the two years in the period then ended, and the financial highlights for each of the five years in the period then ended, in conformity with U.S. generally accepted accounting principles.
Boston, Massachusetts
May 17, 2010
Annual Shareholder Report30
Board of Trustees and Trust Officers
The Board is responsible for managing the Trust's business affairs and for exercising all the Trust's powers except those reserved for the shareholders. The following tables give information about each Board member and the senior officers of the Fund. Where required, the tables separately list Board members who are “interested persons” of the Fund (i.e., “Interested” Board members) and those who are not (i.e., “Independent” Board members). Unless otherwise noted, the address of each person listed is Federated Investors Tower, 1001 Liberty Avenue, Pittsburgh, PA 15222. The address of all Independent Board members listed is 4000 Ericsson Drive, Warrendale, PA 15086-7561; Attention: Mutual Fund Board. As of December 31, 2009, the Trust comprised seven portfolio(s), and the Federated Fund Complex consisted of 43 investment companies (comprising 145 portfolios). Unless otherwise noted, each Officer is elected annually. Unless otherwise noted, each Board member oversees all portfolios in the Federated Fund Complex and serves for an indefinite term. The Fund's Statement of Additional Information includes additional information about Trust Trustees and is available, without charge and upon request, by calling 1-800-341-7400.
Interested TRUSTEES Background
Name
Birth Date
Positions Held with Trust
Date Service Began | Principal Occupation(s) for Past Five Years,
Other Directorships Held and Previous Position(s) |
John F. Donahue*
Birth Date: July 28, 1924
TRUSTEE
Began serving: January 1986 | Principal Occupations: Director or Trustee of the Federated Fund Complex; Chairman and Director, Federated Investors, Inc.; Chairman of the Federated Fund Complex's Executive Committee.
Previous Positions: Chairman of the Federated Fund Complex; Trustee, Federated Investment Management Company; Chairman and Director, Federated Investment Counseling. |
J. Christopher Donahue*
Birth Date: April 11, 1949
PRESIDENT AND TRUSTEE
Began serving: January 2000 | Principal Occupations: Principal Executive Officer and President of the Federated Fund Complex; Director or Trustee of some of the Funds in the Federated Fund Complex; President, Chief Executive Officer and Director, Federated Investors, Inc.; Chairman and Trustee, Federated Investment Management Company; Trustee, Federated Investment Counseling; Chairman and Director, Federated Global Investment Management Corp.; Chairman, Federated Equity Management Company of Pennsylvania and Passport Research, Ltd. (investment advisory subsidiary of Federated); Trustee, Federated Shareholder Services Company; Director, Federated Services Company.
Previous Positions: President, Federated Investment Counseling; President and Chief Executive Officer, Federated Investment Management Company, Federated Global Investment Management Corp. and Passport Research, Ltd. |
| * | Family relationships and reasons for “interested” status: John F. Donahue is the father of J. Christopher Donahue; both are “interested” due to their beneficial ownership of shares of Federated Investors, Inc. and the positions they hold with Federated and its subsidiaries. |
Annual Shareholder Report31
INDEPENDENT TRUSTEES Background
Name
Birth Date
Positions Held with Trust
Date Service Began | Principal Occupation(s) for Past Five Years,
Other Directorships Held, Previous Position(s) and Qualifications |
John T. Conroy, Jr., Ph.D.
Birth Date: June 23, 1937
TRUSTEE
Began serving: November 1991 | Principal Occupations: Director or Trustee of the Federated Fund Complex; Chairman of the Board, Investment Properties Corporation; Partner or Trustee in private real estate ventures in Southwest Florida; Assistant Professor in Theology, Blessed Edmund Rice School for Pastoral Ministry.
Previous Positions: President, Investment Properties Corporation; Senior Vice President, John R. Wood and Associates, Inc., Realtors; President, Naples Property Management, Inc. and Northgate Village Development Corporation.
Qualifications: Business management and director experience. |
Nicholas P. Constantakis, CPA
Birth Date: September 3, 1939
TRUSTEE
Began serving: February 1998 | Principal Occupation: Director or Trustee of the Federated Fund Complex.
Other Directorship Held: Director and Chairman of the Audit Committee, Michael Baker Corporation (architecture, engineering and construction services).
Previous Position: Partner, Andersen Worldwide SC.
Qualifications: Public accounting and director experience. |
John F. Cunningham
Birth Date: March 5, 1943
TRUSTEE
Began serving: January 1999 | Principal Occupation: Director or Trustee of the Federated Fund Complex.
Other Directorships Held: Chairman, President and Chief Executive Officer, Cunningham & Co., Inc. (strategic business consulting); Trustee Associate, Boston College.
Previous Positions: Director, Redgate Communications and EMC Corporation (computer storage systems); Chairman of the Board and Chief Executive Officer, Computer Consoles, Inc.; President and Chief Operating Officer, Wang Laboratories; Director, First National Bank of Boston; Director, Apollo Computer, Inc.
Qualifications: Business management and director experience. |
Maureen Lally-Green
Birth Date: July 5, 1949
TRUSTEE
Began serving: August 2009 | Principal Occupations: Director or Trustee of the Federated Fund Complex; Director, Office of Church Relations, Diocese of Pittsburgh; Adjunct Professor of Law, Duquesne University School of Law.
Other Directorships Held: Director, Auberle; Trustee St. Francis University; Director, Ireland Institute of Pittsburgh; Director, UPMC Mercy Hospital; Regent, St. Vincent Seminary; Director, Epilepsy Foundation of Western and Central Pennsylvania; Director, Saint Thomas More Society, Allegheny County; Director, Carlow University.
Previous Position: Pennsylvania Superior Court Judge.
Qualifications: Legal and director experience. |
Annual Shareholder Report32
Name
Birth Date
Positions Held with Trust
Date Service Began | Principal Occupation(s) for Past Five Years,
Other Directorships Held, Previous Position(s) and Qualifications |
Peter E. Madden
Birth Date: March 16, 1942
TRUSTEE
Began serving: November 1991 | Principal Occupation: Director or Trustee, and Chairman of the Board of Directors or Trustees, of the Federated Fund Complex.
Other Directorship Held: Board of Overseers, Babson College.
Previous Positions: Representative, Commonwealth of Massachusetts General Court; President, Chief Operating Officer and Director, State Street Bank and Trust Company and State Street Corporation (retired); Director, VISA USA and VISA International; Chairman and Director, Massachusetts Bankers Association; Director, Depository Trust Corporation; Director, The Boston Stock Exchange.
Qualifications: Business management, mutual fund services and director experience. |
Charles F. Mansfield, Jr.
Birth Date: April 10, 1945
TRUSTEE
Began serving: January 2000 | Principal Occupations: Director or Trustee and Chairman of the Audit Committee of the Federated Fund Complex; Management Consultant.
Previous Positions: Chief Executive Officer, PBTC International Bank; Partner, Arthur Young & Company (now Ernst & Young LLP); Chief Financial Officer of Retail Banking Sector, Chase Manhattan Bank; Senior Vice President, HSBC Bank USA (formerly, Marine Midland Bank); Vice President, Citibank; Assistant Professor of Banking and Finance, Frank G. Zarb School of Business, Hofstra University; Executive Vice President DVC Group, Inc. (marketing, communications and technology).
Qualifications: Banking, business management, public accounting and director experience. |
R. James Nicholson
Birth Date: February 4, 1938
TRUSTEE
Began serving: January 2008 | Principal Occupations: Director or Trustee of the Federated Fund Complex; Senior Counsel, Brownstein Hyatt Farber Schrek, P.C.; Former Secretary of the U.S. Dept. of Veterans Affairs; Former U.S. Ambassador to the Holy See; Former Chairman of the Republican National Committee.
Other Directorships Held: Director, Horatio Alger Association; Director, The Daniels Fund.
Previous Positions: Colonel, U.S. Army Reserve; Partner, Calkins, Kramer, Grimshaw and Harring, P.C.; General Counsel, Colorado Association of Housing and Building; Chairman and CEO, Nicholson Enterprises, Inc. (real estate holding company); Chairman and CEO, Renaissance Homes of Colorado.
Qualifications: Legal, government, business management and mutual fund director experience. |
Annual Shareholder Report33
Name
Birth Date
Positions Held with Trust
Date Service Began | Principal Occupation(s) for Past Five Years,
Other Directorships Held, Previous Position(s) and Qualifications |
Thomas M. O'Neill
Birth Date: June 14, 1951
TRUSTEE
Began serving: October 2006 | Principal Occupations: Director or Trustee of the Federated Fund Complex; Sole Proprietor, Navigator Management Company (investment and strategic consulting).
Other Directorships Held: Board of Overseers, Children's Hospital of Boston; Visiting Committee on Athletics, Harvard College.
Previous Positions: Chief Executive Officer and President, Managing Director and Chief Investment Officer, Fleet Investment Advisors; President and Chief Executive Officer, Aeltus Investment Management, Inc.; General Partner, Hellman, Jordan Management Co., Boston, MA; Chief Investment Officer, The Putnam Companies, Boston, MA; Credit Analyst and Lending Officer, Fleet Bank; Director and Consultant, EZE Castle Software (investment order management software); Director, Midway Pacific (lumber).
Qualifications: Business management, mutual fund, director and investment experience. |
John S. Walsh
Birth Date: November 28, 1957
TRUSTEE
Began serving: January 2000 | Principal Occupations: Director or Trustee of the Federated Fund Complex; President and Director, Heat Wagon, Inc. (manufacturer of construction temporary heaters); President and Director, Manufacturers Products, Inc. (distributor of portable construction heaters); President, Portable Heater Parts, a division of Manufacturers Products, Inc.
Previous Position: Vice President, Walsh & Kelly, Inc.
Qualifications: Business management and director experience. |
James F. Will
Birth Date: October 12, 1938
TRUSTEE
Began serving: April 2006 | Principal Occupations: Director or Trustee of the Federated Fund Complex; formerly, Vice Chancellor and President, Saint Vincent College.
Other Directorships Held: Trustee, Saint Vincent College; Alleghany Corporation.
Previous Positions: Chairman, President and Chief Executive Officer, Armco, Inc.; President and Chief Executive Officer, Cyclops Industries; President and Chief Operating Officer, Kaiser Steel Corporation.
Qualifications: Business management, education and director experience. |
Annual Shareholder Report34
OFFICERS
Name
Birth Date
Address
Positions Held with Trust
Date Service Began | Principal Occupation(s) for Past Five Years
and Previous Position(s) |
John W. McGonigle
Birth Date: October 26, 1938
EXECUTIVE VICE PRESIDENT AND SECRETARY
Began serving: January 1986 | Principal Occupations: Executive Vice President and Secretary of the Federated Fund Complex; Vice Chairman, Executive Vice President, Secretary and Director, Federated Investors, Inc.
Previous Positions: Trustee, Federated Investment Management Company and Federated Investment Counseling; Director, Federated Global Investment Management Corp., Federated Services Company and Federated Securities Corp. |
Richard A. Novak
Birth Date: December 25, 1963
TREASURER
Began serving: January 2006 | Principal Occupations: Principal Financial Officer and Treasurer of the Federated Fund Complex; Senior Vice President, Federated Administrative Services; Financial and Operations Principal for Federated Securities Corp., Edgewood Services, Inc. and Southpointe Distribution Services, Inc.
Previous Positions: Controller of Federated Investors, Inc.; Vice President, Finance of Federated Services Company; held various financial management positions within The Mercy Hospital of Pittsburgh; Auditor, Arthur Andersen & Co. |
Richard B. Fisher
Birth Date: May 17, 1923
VICE PRESIDENT
Began serving: January 1986 | Principal Occupations: Vice Chairman or Vice President of some of the Funds in the Federated Fund Complex; Vice Chairman, Federated Investors, Inc.; Chairman, Federated Securities Corp.
Previous Positions: President and Director or Trustee of some of the Funds in the Federated Fund Complex; Executive Vice President, Federated Investors, Inc.; Director and Chief Executive Officer, Federated Securities Corp. |
Brian P. Bouda
Birth Date: February 28, 1947
CHIEF COMPLIANCE OFFICER AND SENIOR VICE PRESIDENT
Began serving: August 2004 | Principal Occupations: Senior Vice President and Chief Compliance Officer of the Federated Fund Complex; Vice President and Chief Compliance Officer of Federated Investors, Inc. and Chief Compliance Officer of its subsidiaries. Mr. Bouda joined Federated in 1999 and is a member of the American Bar Association and the State Bar Association of Wisconsin. |
Stephen F. Auth
Birth Date: September 3, 1956
450 Lexington Avenue
Suite 3700
New York, NY 10017-3943
CHIEF INVESTMENT OFFICER
Began serving: May 2004 | Principal Occupations: Mr. Auth is Chief Investment Officer of this Fund and various other Funds in the Federated Fund Complex; Executive Vice President, Federated Investment Counseling, Federated Global Investment Management Corp. and Federated Equity Management Company of Pennsylvania.
Previous Positions: Executive Vice President, Federated Investment Management Company, and Passport Research, Ltd. (investment advisory subsidiary of Federated); Senior Vice President, Global Portfolio Management Services Division; Senior Vice President, Federated Investment Management Company and Passport Research, Ltd.; Senior Managing Director and Portfolio Manager, Prudential Investments. |
Annual Shareholder Report35
Name
Birth Date
Address
Positions Held with Trust
Date Service Began | Principal Occupation(s) for Past Five Years
and Previous Position(s) |
Robert J. Ostrowski
Birth Date: April 26, 1963
CHIEF INVESTMENT OFFICER
Began serving: May 2004 | Principal Occupations: Robert J. Ostrowski joined Federated in 1987 as an Investment Analyst and became a Portfolio Manager in 1990. He was named Chief Investment Officer of taxable fixed-income products in 2004 and also serves as a Senior Portfolio Manager. He has been a Senior Vice President of the Fund's Adviser since 1997. Mr. Ostrowski has received the Chartered Financial Analyst designation. He received his M.S. in Industrial Administration from Carnegie Mellon University. |
Joseph M. Balestrino
Birth Date: November 3, 1954
VICE PRESIDENT
Began serving: November 1998 | Principal Occupations: Joseph M. Balestrino is Vice President of the Trust. Mr. Balestrino joined Federated in 1986 and has been a Senior Portfolio Manager and Senior Vice President of the Fund's Adviser since 1998. He was a Portfolio Manager and a Vice President of the Fund's Adviser from 1995 to 1998. Mr. Balestrino served as a Portfolio Manager and an Assistant Vice President of the Adviser from 1993 to 1995. Mr. Balestrino has received the Chartered Financial Analyst designation and a Master's Degree in Urban and Regional Planning from the University of Pittsburgh. |
Randall S. Bauer
Birth Date: November 16, 1957
VICE PRESIDENT
Began serving: November 1998 | Principal Occupations: Randall S. Bauer has been the Fund's Portfolio Manager since October 1995. He is Vice President of the Trust. Mr. Bauer joined Federated in 1989 and has been a Portfolio Manager and a Vice President of the Fund's Adviser since 1994, and a Senior Vice President of the Fund's Adviser beginning 2007. Mr. Bauer has received the Chartered Financial Analyst designation and an M.B.A. in Finance from the Pennsylvania State University. |
John L. Nichol
Birth Date: May 21, 1963
VICE PRESIDENT
Began serving: May 2004 | Principal Occupations: John L. Nichol is Vice President of the Trust. Mr. Nichol joined Federated in September 2000 as an Assistant Vice President/Senior Investment Analyst. He has been a Portfolio Manager since December 2000 and was named a Vice President of the Fund's Adviser in July 2001. Mr. Nichol served as a portfolio manager and analyst for the Public Employees Retirement System of Ohio from 1992 through August 2000. Mr. Nichol has received the Chartered Financial Analyst designation. He received his M.B.A. with an emphasis in Finance and Management and Information Science from the Ohio State University. |
Annual Shareholder Report36
Evaluation and Approval of Advisory Contract - May 2009
FEDERATED FUND FOR U.S. GOVERNMENT SECURITIES (THE “FUND”)
The Fund's Board reviewed the Fund's investment advisory contract at meetings held in May 2009. The Board's decision regarding the contract reflects the exercise of its business judgment on whether to continue the existing arrangements.
In this connection, the Federated funds' Board had previously appointed a Senior Officer, whose duties include specified responsibilities relating to the process by which advisory fees are to be charged to a Federated fund. The Senior Officer has the authority to retain consultants, experts, or staff as may be reasonably necessary to assist in the performance of his duties, reports directly to the Board, and may be terminated only with the approval of a majority of the independent members of the Board. The Senior Officer prepared and furnished to the Board an independent, written evaluation that covered topics discussed below. The Board considered that evaluation, along with other information, in deciding to approve the advisory contract.
During its review of the contract, the Board considered compensation and benefits received by the Adviser. This included the fees received for services provided to the Fund by other entities in the Federated organization and research services received by the Adviser from brokers that execute Federated fund trades, as well as advisory fees. The Board is also familiar with and considered judicial decisions concerning allegedly excessive investment advisory fees, which have indicated that the following factors may be relevant to an Adviser's fiduciary duty with respect to its receipt of compensation from a fund: the nature and quality of the services provided by the Adviser, including the performance of the fund; the Adviser's cost of providing the services; the extent to which the Adviser may realize “economies of scale” as a fund grows larger; any indirect benefits that may accrue to the Adviser and its affiliates as a result of the Adviser's relationship with a fund; performance and expenses of comparable funds; and the extent to which the independent Board members are fully informed about all facts the Board deems relevant bearing on the Adviser's services and fees. The Board further considered management fees (including any components thereof) charged to institutional and other clients of the Adviser for what might be viewed as like services, and the cost to the Adviser and its affiliates of supplying services pursuant to the management fee agreements, excluding any intra-corporate profit and profit margins of the Adviser and its affiliates for supplying such services. The Board was aware of these factors and was guided by them in its review of the Fund's advisory contract to the extent it considered them to be appropriate and relevant, as discussed further below.
Annual Shareholder Report37
The Board considered and weighed these circumstances in light of its substantial accumulated experience in governing the Fund and working with Federated on matters relating to the Federated funds, and was assisted in its deliberations by independent legal counsel. Throughout the year, the Board has requested and received substantial and detailed information about the Fund and the Federated organization that was in addition to the extensive materials that comprise and accompany the Senior Officer's evaluation. Federated provided much of this information at each regular meeting of the Board, and furnished additional reports in connection with the particular meeting at which the Board's formal review of the advisory contract occurred. Between regularly scheduled meetings, the Board also received information on particular matters as the need arose. Thus, the Board's consideration of the advisory contract included review of the Senior Officer's evaluation, accompanying data and additional reports covering such matters as: the Adviser's investment philosophy, revenue, profitability, personnel and processes; investment and operating strategies; the Fund's short- and long-term performance (in absolute terms, both on a gross basis and net of expenses, as well as in relationship to its particular investment program and certain competitor or “peer group” funds and/or other benchmarks, as appropriate), and comments on the reasons for performance; the Fund's investment objectives; the Fund's expenses (including the advisory fee itself and the overall expense structure of the Fund, both in absolute terms and relative to similar and/or competing funds, with due regard for contractual or voluntary expense limitations); the use and allocation of brokerage commissions derived from trading the Fund's portfolio securities (if any); and the nature, quality and extent of the advisory and other services provided to the Fund by the Adviser and its affiliates. The Board also considered the preferences and expectations of Fund shareholders and their relative sophistication; the continuing state of competition in the mutual fund industry and market practices; the range of comparable fees for similar funds in the mutual fund industry; the Fund's relationship to the Federated family of funds which include a comprehensive array of funds with different investment objectives, policies and strategies which are available for exchange without the incurrence of additional sales charges; compliance and audit reports concerning the Federated funds and the Federated companies that service them (including communications from regulatory agencies), as well as Federated's responses to any issues raised therein; and relevant developments in the mutual fund industry and how the Federated funds and/or Federated are responding to them. The Board's evaluation process is evolutionary. The criteria considered and the emphasis placed on relevant criteria change in recognition of changing circumstances in the mutual fund marketplace. With respect to the Fund's performance and expenses in particular, the Board has found the use of comparisons to other mutual funds with comparable investment programs to be particularly useful, given the high degree of competition in the mutual fund business. The Board focused on comparisons Annual Shareholder Report38
with other similar mutual funds more heavily than non-mutual fund products or services because it is believed that they are more relevant. For example, other mutual funds are the products most like the Fund, they are readily available to Fund shareholders as alternative investment vehicles, and they are the type of investment vehicle in fact chosen and maintained by the Fund's investors. The range of their fees and expenses therefore appears to be a generally reliable indication of what consumers have found to be reasonable in the precise marketplace in which the Fund competes. The Fund's ability to deliver competitive performance when compared to its peer group was a useful indicator of how the Adviser is executing the Fund's investment program, which in turn assisted the Board in reaching a conclusion that the nature, extent, and quality of the Adviser's investment management services were such as to warrant continuation of the advisory contract. In this regard, the Senior Officer has reviewed Federated's fees for providing advisory services to products outside the Federated family of funds (e.g., institutional and separate accounts). He concluded that mutual funds and institutional accounts are inherently different products. Those differences include, but are not limited to, different types of targeted investors; being subject to different laws and regulations; different legal structures; different average account sizes; different associated costs; different portfolio management techniques made necessary by different cash flows and portfolio manager time spent in review of securities pricing. The Senior Officer did not consider these fee schedules to be determinative in judging the appropriateness of mutual fund advisory contracts.The Senior Officer reviewed reports compiled by Federated, using data supplied by independent fund ranking organizations, regarding the performance of, and fees charged by, other mutual funds, noting his view that comparisons to fund peer groups are highly important in judging the reasonableness of proposed fees.
The Fund's performance fell below the median of the relevant peer group for the one-year, three-year and five-year periods covered by the report. The Board discussed the Fund's performance with the Adviser and recognized the efforts being undertaken by the Adviser. The Board will continue to monitor these efforts and the performance of the Fund.
The Board also received financial information about Federated, including reports on the compensation and benefits Federated derived from its relationships with the Federated funds. These reports covered not only the fees under the advisory contracts, but also fees received by Federated's subsidiaries for providing other services to the Federated funds under separate contracts (e.g., for serving as the Federated funds' administrator). The reports also discussed any indirect benefit Federated may derive from its receipt of research services from brokers who execute Federated fund trades. In addition, the Board considered the fact that, in order for a fund to be competitive in the marketplace, Federated and its affiliates frequently waived fees and/or Annual Shareholder Report39
reimbursed expenses and have disclosed to fund investors and/or indicated to the Board their intention to do so in the future, where appropriate. Moreover, the Board receives regular reports regarding the institution or elimination of these voluntary waivers.Federated furnished reports, requested by the Senior Officer, that reported revenues on a fund-by-fund basis and made estimates of the allocation of expenses on a fund-by-fund basis, using allocation methodologies specified by the Senior Officer. The Senior Officer noted that, although they may apply consistent allocation processes, the inherent difficulties in allocating costs (and the unavoidable arbitrary aspects of that exercise) and the lack of consensus on how to allocate those costs may render such allocation reports unreliable. The allocation reports were considered in the analysis by the Board but were determined to be of limited use.
The Board and the Senior Officer also reviewed a report compiled by Federated comparing profitability information for Federated to other publicly held fund management companies. In this regard, the Senior Officer noted the limited availability of such information, but nonetheless concluded that Federated's profit margins did not appear to be excessive and the Board agreed.
The Senior Officer's evaluation also discussed the notion of possible realization of “economies of scale” as a fund grows larger. The Board considered in this regard that the Adviser has made significant and long-term investments in areas that support all of the Federated funds, such as personnel and processes for the portfolio management, compliance, and risk management functions; and systems technology; and that the benefits of these efforts (as well as any economies, should they exist) were likely to be enjoyed by the fund complex as a whole. Finally, the Board also noted the absence of any applicable regulatory or industry guidelines on this subject, which (as discussed in the Senior Officer's evaluation) is compounded by the lack of any common industry practice or general pattern with respect to structuring fund advisory fees with “breakpoints” that serve to reduce the fee as the fund attains a certain size. The Senior Officer did not recommend institution of additional breakpoints in pricing Federated's fund advisory services at this time.
It was noted in the materials for the Board meeting that for the period covered by the report, the Fund's investment advisory fee, after waivers and expense reimbursements, if any, was above the median of the relevant peer group. The Board reviewed the fees and other expenses of the Fund with the Adviser and was satisfied that the overall expense structure of the Fund remained competitive. The Board will continue to monitor advisory fees and other expenses borne by the Fund.
The Senior Officer's evaluation noted his belief that the information and observations contained in his evaluation supported a finding that the proposed management fees are reasonable, and that Federated appeared to provide appropriate administrative services to the Fund for the fees paid. Under these Annual Shareholder Report40
circumstances, no changes were recommended to, and no objection was raised to, the continuation of the Fund's advisory contract. The Board concluded that the nature, quality and scope of services provided the Fund by the Adviser and its affiliates were satisfactory.In its decision to continue an existing investment advisory contract, the Board was mindful of the potential disruptions of the Fund's operations and various risks, uncertainties and other effects that could occur as a result of a decision to terminate or not renew an advisory contract. In particular, the Board recognized that many shareholders have invested in the Fund on the strength of the Adviser's industry standing and reputation and with the expectation that the Adviser will have a continuing role in providing advisory services to the Fund. Thus, the Board's approval of the advisory contract reflected the fact that it is the shareholders who have effectively selected the Adviser by virtue of having invested in the Fund.
The Board based its decision to approve the advisory contract on the totality of the circumstances and relevant factors and with a view to past and future long-term considerations. Not all of the factors and considerations identified above were necessarily relevant to the Fund, nor did the Board consider any one of them to be determinative. With respect to the factors that were relevant, the Board's decision to approve the contract reflects its determination that Federated's performance and actions provided a satisfactory basis to support the decision to continue the existing arrangements.
Annual Shareholder Report41
Voting Proxies on Fund Portfolio Securities
A description of the policies and procedures that the Fund uses to determine how to vote proxies, if any, relating to securities held in the Fund's portfolio is available, without charge and upon request, by calling 1-800-341-7400. A report on “Form N-PX” of how the Fund voted any such proxies during the most recent 12-month period ended June 30 is available from Federated's Web site at FederatedInvestors.com. To access this information from the “Products” section of the Web site, click on the “Prospectuses and Regulatory Reports” link under “Related Information,” then select the appropriate link opposite the name of the Fund; or select the name of the Fund and from the Fund's page, click on the “Prospectuses and Regulatory Reports” link. Form N-PX filings are also available at the SEC's Web site at www.sec.gov.
Quarterly Portfolio Schedule
The Fund files with the SEC a complete schedule of its portfolio holdings, as of the close of the first and third quarters of its fiscal year, on “Form N-Q.” These filings are available on the SEC's Web site at www.sec.gov and may be reviewed and copied at the SEC's Public Reference Room in Washington, DC. (Call 1-800-SEC-0330 for information on the operation of the Public Reference Room.) You may also access this information from the “Products” section of Federated's Web site at FederatedInvestors.com by clicking on “Portfolio Holdings” under “Related Information,” then selecting the appropriate link opposite the name of the Fund; or select the name of the Fund and from the Fund's page, click on the “Portfolio Holdings” link.
Annual Shareholder Report42
Mutual funds are not bank deposits or obligations, are not guaranteed by any bank and are not insured or guaranteed by the U.S. government, the Federal Deposit Insurance Corporation, the Federal Reserve Board or any other government agency. Investment in mutual funds involves investment risk, including the possible loss of principal.
This Report is authorized for distribution to prospective investors only when preceded or accompanied by the Fund's Prospectus, which contains facts concerning its objective and policies, management fees, expenses and other information.
Federated Fund for U.S. Government Securities
Federated Investors Funds
4000 Ericsson Drive
Warrendale, PA 15086-7561
Contact us at FederatedInvestors.com
or call 1-800-341-7400.
Federated Securities Corp., Distributor
Cusip 31420C704
Cusip 31420C803
Cusip 31420C886
28390 (5/10)
Federated is a registered mark of Federated Investors, Inc.
2010 Federated Investors, Inc.
Federated Real Return Bond FundEstablished 2006
A Portfolio of Federated Income Securities Trust
ANNUAL SHAREHOLDER REPORTMarch 31, 2010
Class A Shares
Class C Shares
Institutional Shares
FINANCIAL HIGHLIGHTS
SHAREHOLDER EXPENSE EXAMPLE
MANAGEMENT'S DISCUSSION OF FUND PERFORMANCE
PORTFOLIO OF INVESTMENTS SUMMARY TABLE
PORTFOLIO OF INVESTMENTS
STATEMENT OF ASSETS AND LIABILITIES
STATEMENT OF OPERATIONS
STATEMENT OF CHANGES IN NET ASSETS
NOTES TO FINANCIAL STATEMENTS
REPORT OF INDEPENDENT REGISTERED PUBLIC ACCOUNTING FIRM
BOARD OF TRUSTEES AND TRUST OFFICERS
EVALUATION AND APPROVAL OF ADVISORY CONTRACT
VOTING PROXIES ON FUND PORTFOLIO SECURITIES
QUARTERLY PORTFOLIO SCHEDULE
Financial Highlights - Class A Shares
(For a Share Outstanding Throughout Each Period)
| Year Ended March 31, | Period Ended
3/31/20071 |
| 2010 | 2009 | 2008 |
| Net Asset Value, Beginning of Period | $10.26 | $10.91 | $10.18 | $10.00 |
| Income From Investment Operations: | | | | |
| Net investment income | 0.202 | 0.252 | 0.59 | 0.07 |
| Net realized and unrealized gain (loss) on investments and swap contracts | 0.55 | (0.45) | 0.73 | 0.19 |
| TOTAL FROM INVESTMENT OPERATIONS | 0.75 | (0.20) | 1.32 | 0.26 |
| Less Distributions: | | | | |
| Distributions from net investment income | (0.21) | (0.32) | (0.59) | (0.08) |
| Distributions from net realized gain on investments | — | — | (0.00)3 | — |
| Return of capital4 | — | (0.13)2 | — | — |
| TOTAL DISTRIBUTIONS | (0.21) | (0.45) | (0.59) | (0.08) |
| Net Asset Value, End of Period | $10.80 | $10.26 | $10.91 | $10.18 |
| Total Return5 | 7.33% | (1.83)% | 13.48% | 2.58% |
| Ratios to Average Net Assets: | | | | |
| Net expenses | 0.70% | 0.70% | 0.64% | 0.70%6 |
| Net investment income | 1.86% | 2.54% | 4.25% | 1.58%6 |
| Expense waiver/reimbursement7 | 1.97% | 2.95% | 5.74% | 17.28%6 |
| Supplemental Data: | | | | |
| Net assets, end of period (000 omitted) | $24,543 | $13,603 | $4,289 | $103 |
| Portfolio turnover | 7% | 28% | 66% | 0% |
| 1 | Reflects operations for the period from October 18, 2006 (date of initial public investment) to March 31, 2007. |
| 2 | Per share numbers have been calculated using the average shares method. |
| 3 | Represents less than $0.01. |
| 4 | Represents a return of capital for federal income tax purposes. |
| 5 | Based on net asset value, which does not reflect the sales charge, redemption fee or contingent deferred sales charge, if applicable. Total returns for periods of less than one year are not annualized. |
| 6 | Computed on an annualized basis. |
| 7 | This expense decrease is reflected in both the net expense and the net investment income ratios shown above. |
See Notes which are an integral part of the Financial Statements
Annual Shareholder Report1
Financial Highlights - Class C Shares
(For a Share Outstanding Throughout Each Period)
| Year Ended March 31, | Period Ended
3/31/20071 |
| 2010 | 2009 | 2008 |
| Net Asset Value, Beginning of Period | $10.26 | $10.91 | $10.18 | $10.00 |
| Income From Investment Operations: | | | | |
| Net investment income | 0.102 | 0.212 | 0.53 | 0.02 |
| Net realized and unrealized gain (loss) on investments and swap contracts | 0.59 | (0.45) | 0.71 | 0.22 |
| TOTAL FROM INVESTMENT OPERATIONS | 0.69 | (0.24) | 1.24 | 0.24 |
| Less Distributions: | | | | |
| Distributions from net investment income | (0.15) | (0.28) | (0.51) | (0.06) |
| Distributions from net realized gain on investments | — | — | (0.00)3 | — |
| Return of capital4 | — | (0.13)2 | — | — |
| TOTAL DISTRIBUTIONS | (0.15) | (0.41) | (0.51) | (0.06) |
| Net Asset Value, End of Period | $10.80 | $10.26 | $10.91 | $10.18 |
| Total Return5 | 6.77% | (2.23)% | 12.69% | 2.44% |
| Ratios to Average Net Assets: | | | | |
| Net expenses | 1.45% | 1.45% | 1.43% | 1.44%6 |
| Net investment income | 0.96% | 2.08% | 3.79% | 0.84%6 |
| Expense waiver/reimbursement7 | 1.95% | 3.05% | 5.87% | 17.28%6 |
| Supplemental Data: | | | | |
| Net assets, end of period (000 omitted) | $16,353 | $8,927 | $5,477 | $31 |
| Portfolio turnover | 7% | 28% | 66% | 0% |
| 1 | Reflects operations for the period from October 18, 2006 (date of initial public investment) to March 31, 2007. |
| 2 | Per share numbers have been calculated using the average shares method. |
| 3 | Represents less than $0.01. |
| 4 | Represents a return of capital for federal income tax purposes. |
| 5 | Based on net asset value, which does not reflect the sales charge, redemption fee or contingent deferred sales charge, if applicable. Total returns for periods of less than one year are not annualized. |
| 6 | Computed on an annualized basis. |
| 7 | This expense decrease is reflected in both the net expense and the net investment income ratios shown above. |
See Notes which are an integral part of the Financial Statements
Annual Shareholder Report2
Financial Highlights - Institutional Shares
(For a Share Outstanding Throughout Each Period)
| Year Ended March 31, | Period Ended
3/31/20071 |
| 2010 | 2009 | 2008 |
| Net Asset Value, Beginning of Period | $10.26 | $10.91 | $10.18 | $10.00 |
| Income From Investment Operations: | | | | |
| Net investment income | 0.292 | 0.372 | 0.59 | 0.08 |
| Net realized and unrealized gain (loss) on investments and swap contracts | 0.47 | (0.55) | 0.75 | 0.18 |
| TOTAL FROM INVESTMENT OPERATIONS | 0.76 | (0.18) | 1.34 | 0.26 |
| Less Distributions: | | | | |
| Distributions from net investment income | (0.22) | (0.34) | (0.61) | (0.08) |
| Distributions from net realized gain on investments | — | — | (0.00)3 | — |
| Return of capital4 | — | (0.13)2 | — | — |
| TOTAL DISTRIBUTIONS | (0.22) | (0.47) | (0.61) | (0.08) |
| Net Asset Value, End of Period | $10.80 | $10.26 | $10.91 | $10.18 |
| Total Return5 | 7.48% | (1.69)% | 13.74% | 2.62% |
| Ratios to Average Net Assets: | | | | |
| Net expenses | 0.45% | 0.45% | 0.45% | 0.45%6 |
| Net investment income | 2.75% | 3.69% | 6.32% | 1.83%6 |
| Expense waiver/reimbursement7 | 1.85% | 3.11% | 12.80% | 17.28%6 |
| Supplemental Data: | | | | |
| Net assets, end of period (000 omitted) | $4,115 | $314 | $284 | $2,545 |
| Portfolio turnover | 7% | 28% | 66% | 0% |
| 1 | Reflects operations for the period from October 18, 2006 (date of initial public investment) to March 31, 2007. |
| 2 | Per share numbers have been calculated using the average shares method. |
| 3 | Represents less than $0.01. |
| 4 | Represents a return of capital for federal income tax purposes. |
| 5 | Based on net asset value. Total returns for periods of less than one year are not annualized. |
| 6 | Computed on an annualized basis. |
| 7 | This expense decrease is reflected in both the net expense and the net investment income ratios shown above. |
See Notes which are an integral part of the Financial Statements
Annual Shareholder Report3
Shareholder Expense Example (unaudited)
As a shareholder of the Fund, you incur two types of costs: (1) transaction costs, including sales charges (loads) on purchase or redemption payments; and (2) ongoing costs, including management fees and to the extent applicable, distribution (12b-1) fees and/or shareholder services fees and other Fund expenses. This Example is intended to help you to understand your ongoing costs (in dollars) of investing in the Fund and to compare these costs with the ongoing costs of investing in other mutual funds. It is based on an investment of $1,000 invested at the beginning of the period and held for the entire period from October 1, 2009 to March 31, 2010.
ACTUAL EXPENSES
The first section of the table below provides information about actual account values and actual expenses. You may use the information in this section, together with the amount you invested, to estimate the expenses that you incurred over the period. Simply divide your account value by $1,000 (for example, an $8,600 account value divided by $1,000 = 8.6), then multiply the result by the number in the first section under the heading entitled “Expenses Paid During Period” to estimate the expenses attributable to your investment during this period.
HYPOTHETICAL EXAMPLE FOR COMPARISON PURPOSES
The second section of the table below provides information about hypothetical account values and hypothetical expenses based on the Fund's actual expense ratio and an assumed rate of return of 5% per year before expenses, which is not the Fund's actual return. Thus, you should not use the hypothetical account values and expenses to estimate the actual ending account balance or your expenses for the period. Rather, these figures are required to be provided to enable you to compare the ongoing costs of investing in the Fund with other funds. To do so, compare this 5% hypothetical example with the 5% hypothetical examples that appear in the shareholder reports of the other funds.
Annual Shareholder Report4
Please note that the expenses shown in the table are meant to highlight your ongoing costs only and do not reflect any transaction costs, such as sales charges (loads) on purchase or redemption payments. Therefore, the second section of the table is useful in comparing ongoing costs only, and will not help you determine the relative total costs of owning different funds. In addition, if these transaction costs were included, your costs would have been higher. | Beginning
Account Value
10/1/2009 | Ending
Account Value
3/31/2010 | Expenses Paid
During Period1 |
| Actual: | | | |
| Class A Shares | $1,000 | $1,034.80 | $3.55 |
| Class C Shares | $1,000 | $1,030.40 | $7.34 |
| Institutional Shares | $1,000 | $1,036.00 | $2.28 |
Hypothetical (assuming a 5% return
before expenses): | | | |
| Class A Shares | $1,000 | $1,021.44 | $3.53 |
| Class C Shares | $1,000 | $1,017.70 | $7.29 |
| Institutional Shares | $1,000 | $1,022.69 | $2.27 |
| 1 | Expenses are equal to the Fund's annualized net expense ratios, multiplied by the average account value over the period, multiplied by 182/365 (to reflect the one-half-year period). The annualized net expense ratios are as follows: |
| Class A Shares | 0.70% |
| Class C Shares | 1.45% |
| Institutional Shares | 0.45% |
Annual Shareholder Report5
Performance data quoted represents past performance which is no guarantee of future results. Investment return and principal value will fluctuate so that an investor's shares, when redeemed, may be worth more or less than their original cost. Mutual fund performance changes over time and current performance may be lower or higher than what is stated. For current to the most recent month-end performance and after-tax returns, visit FederatedInvestors.com or call 1-800-341-7400.
Management's Discussion of Fund Performance (unaudited)
The Fund's total return, based on net asset value, for the 12-month reporting period ended March 31, 2010, was 7.48% for the Institutional Shares, 7.33% for the Class A Shares and 6.77% for the Class C Shares. The Fund's benchmark, Barclays Capital U.S. TIPS Index (Index),1 had a total return of 6.18% during the same period. The Fund's total return for the most recently completed fiscal year reflected actual cash flows, transaction costs and other expenses not reflected in the total return of the Index.
During the reporting period, the most significant factors affecting the Fund's performance relative to the Index were: (a) the interest rate sensitivity of the Fund relative to the Index (referred to as “duration”);2 (b) the allocation of the portfolio among securities of different maturities (referred to as the “yield curve”); and (c) the allocation of Fund assets to different sectors of the fixed-income market than the sector represented in the Index (referred to as “sector allocation”).
For the purposes of the following, the discussion will focus on the performance of the Fund's Institutional Shares.
MARKET OVERVIEW
The 12-month reporting period marked the beginning of the end of both the financial crisis and the economic recession. Previously, the markets had been characterized by tremendous uncertainty and fear, which pummeled riskier asset classes, such as equities and corporate bonds, while generating a powerful bid for the perceived safety of Treasury securities.
| 1 | Barclays Capital U.S. TIPS Index represents an unmanaged market index made up of U.S. Treasury Inflation-Protected Securities (TIPS). The Index is not adjusted to reflect sales charges, expenses or other fees that the Securities and Exchange Commission (SEC) requires to be reflected in the Fund's performance. Indexes are unmanaged, and it is not possible to invest directly in an index. |
| 2 | Duration is a measure of a security's price sensitivity to changes in interest rates. Securities with longer durations are more sensitive to changes in interest rates than securities of shorter durations. |
Annual Shareholder Report6
Governments across the globe aggressively fought to stabilize both the financial markets and the economy, providing support to systemically critical financial institutions, and providing unprecedented amounts of fiscal and monetary stimuli (including quantitative easing). The tide finally began to turn in March 2009, and the equity and credit markets rallied from that point through March 31, 2010. Thanks in no small part to help from the government, the economy emerged from recession in the second quarter of 2009. The export sector was boosted by recovering growth overseas; manufacturing industries were helped by inventory restocking from depressed levels; the housing market showed signs of stabilization and job losses began to moderate and finally turned into job gains by the first quarter of 2010.Treasury Inflation-Protected Securities (TIPS) began 2009 at the cheapest valuations relative to nominal Treasuries in their history and proceeded to richen relative to nominal Treasuries into year end. The outperformance was due to reduced fears of long-term deflation, a weaker dollar, an uptick in commodity prices, improved liquidity and increased demand from both foreign central banks (as a hedge against dollar depreciation) and pension funds (for diversification relative to equity markets). TIPS weakened modestly in the first quarter of 2010 as broad measures of consumer price inflation began to decelerate. Inflation historically continues to decline for up to two years after the onset of economic recovery. Declining inflation readings reduce the principal accrual to TIPS.
DURATION
The Fund significantly reduced its interest rate sensitivity (duration) during the fourth quarter of 2009, which significantly helped performance relative to the Index. It is important to emphasize that the Fund operates within a duration range of 0% to 120% of its benchmark.
YIELD CURVE
The Fund's overweight to shorter and longer maturities and underweight of intermediate maturities hurt performance relative to the Index.
SECTOR ALLOCATION
The Fund maintained an overweight to both investment-grade and high-yield corporates throughout the reporting period. These two sectors are not represented in the Index. The Fund's allocation to these two sectors through both derivatives and core funds3 significantly boosted performance, relative to the Index, as spreads tightened significantly in these two sectors.
| 3 | The Fund invests in high-yield fixed-income securities by investing in High Yield Bond Portfolio (HYCORE). HYCORE is an affiliated investment company that is registered under the Investment Company Act of 1940, but not the Securities Act of 1933. HYCORE is available for sale only to Federated Investment Counseling through a discretionary advisory relationship. HYCORE will not be offered or sold to any other person or entity. |
Annual Shareholder Report7
GROWTH OF A $10,000 INVESTMENT - CLASS A SHARES
The graph below illustrates the hypothetical investment of $10,0001 in the Federated Real Return Bond Fund (Class A Shares) (the “Fund”) from October 18, 2006 (start of performance) to March 31, 2010, compared to the Barclays Capital U.S. TIPS Index (BCTIPS).2
| Average Annual Total Returns3 for the Period Ended 3/31/2010 |
| 1 Year | 2.53% |
| Start of Performance (10/18/2006) | 4.69% |
Performance data quoted represents past performance which is no guarantee of future results. Investment return and principal value will fluctuate so that an investor's shares, when redeemed, may be worth more or less than their original cost. Mutual fund performance changes over time and current performance may be lower or higher than what is stated. For current to the most recent month-end performance and after-tax returns, visit FederatedInvestors.com or call 1-800-341-7400. Returns shown do not reflect the deduction of taxes that a shareholder would pay on Fund distributions or the redemption of Fund shares. Mutual funds are not obligations of or guaranteed by any bank and are not federally insured. Total return shown includes the maximum sales charge of 4.50%.
| 1 | Represents a hypothetical investment of $10,000 in the Fund after deducting the maximum sales charge of 4.50% ($10,000 investment minus $450 sales charge = $9,550). The Fund's performance assumes the reinvestment of all dividends and distributions. The BCTIPS has been adjusted to reflect reinvestment of dividends on securities in the index. |
| 2 | The BCTIPS is not adjusted to reflect sales charges, expenses or other fees that the Securities and Exchange Commission (SEC) requires to be reflected in the Fund's performance. The index is unmanaged and, unlike the Fund, is not affected by cash flows. It is not possible to invest directly in an index. |
| 3 | Total returns quoted reflect all applicable sales charges. |
Annual Shareholder Report8
GROWTH OF A $10,000 INVESTMENT - CLASS C SHARES
The graph below illustrates the hypothetical investment of $10,0001 in the Federated Real Return Bond Fund (Class C Shares) (the “Fund”) from October 18, 2006 (start of performance) to March 31, 2010, compared to the Barclays Capital U.S. TIPS Index (BCTIPS).2
| Average Annual Total Returns3 for the Period Ended 3/31/2010 |
| 1 Year | 5.77% |
| Start of Performance (10/18/2006) | 5.55% |
Performance data quoted represents past performance which is no guarantee of future results. Investment return and principal value will fluctuate so that an investor's shares, when redeemed, may be worth more or less than their original cost. Mutual fund performance changes over time and current performance may be lower or higher than what is stated. For current to the most recent month-end performance and after-tax returns, visit FederatedInvestors.com or call 1-800-341-7400. Returns shown do not reflect the deduction of taxes that a shareholder would pay on Fund distributions or the redemption of Fund shares. Mutual funds are not obligations of or guaranteed by any bank and are not federally insured. Total return shown includes the 1.00% contingent deferred sales charge as applicable.
| 1 | Represents a hypothetical investment of $10,000 in the Fund. A 1.00% contingent deferred sales charge would be applied to any redemption less than one year from the purchase date. The Fund's performance assumes the reinvestment of all dividends and distributions. The BCTIPS has been adjusted to reflect reinvestment of dividends on securities in the index. |
| 2 | The BCTIPS is not adjusted to reflect sales charges, expenses or other fees that the SEC requires to be reflected in the Fund's performance. The index is unmanaged and, unlike the Fund, is not affected by cash flows. It is not possible to invest directly in an index. |
| 3 | Total returns quoted reflect all applicable contingent deferred sales charges. |
Annual Shareholder Report9
GROWTH OF A $10,000 INVESTMENT - Institutional SHARES
The graph below illustrates the hypothetical investment of $10,0001 in the Federated Real Return Bond Fund (Institutional Shares) (the “Fund”) from October 18, 2006 (start of performance) to March 31, 2010, compared to the Barclays Capital U.S. TIPS Index (BCTIPS).2
| Average Annual Total Returns for the Period Ended 3/31/2010 |
| 1 Year | 7.48% |
| Start of Performance (10/18/2006) | 6.26% |
Performance data quoted represents past performance which is no guarantee of future results. Investment return and principal value will fluctuate so that an investor's shares, when redeemed, may be worth more or less than their original cost. Mutual fund performance changes over time and current performance may be lower or higher than what is stated. For current to the most recent month-end performance and after-tax returns, visit FederatedInvestors.com or call 1-800-341-7400. Returns shown do not reflect the deduction of taxes that a shareholder would pay on Fund distributions or the redemption of Fund shares. Mutual funds are not obligations of or guaranteed by any bank and are not federally insured.
| 1 | Represents a hypothetical investment of $10,000 in the Fund. The Fund's performance assumes the reinvestment of all dividends and distributions. The BCTIPS has been adjusted to reflect reinvestment of dividends on securities in the index. |
| 2 | The BCTIPS is not adjusted to reflect sales charges, expenses or other fees that the SEC requires to be reflected in the Fund's performance. The index is unmanaged and, unlike the Fund, is not affected by cash flows. It is not possible to invest directly in an index. |
Annual Shareholder Report10
Portfolio of Investments Summary Table (unaudited)
At March 31, 2010, the Fund's portfolio composition1 was as follows:
| Percentage of
Total Net Assets2 |
| U.S. Treasury Inflation-Protected Securities | 54.5% |
| Synthetic Inflation-Protected Corporate Debt Securities3 | 36.6% |
| High Yield Securities | 4.7% |
| Other Security Types4,5 | 0.0% |
| Cash Equivalents6 | 3.2% |
| Other Assets and Liabilities — Net7 | 1.0% |
| TOTAL | 100.0% |
| 1 | See the Fund's Prospectus and Statement of Additional Information for a description of these security types. |
| 2 | As of the date specified above, the Fund owned shares of one or more affiliated investment companies. For purposes of this table, the affiliated investment company (other than an affiliated money market mutual fund) is not treated as a single portfolio security, but rather the Fund is treated as owning a pro rata portion of each security and each other asset and liability owned by the affiliated investment company. Accordingly, the percentages of total net assets shown in the table will differ from those presented on the Portfolio of Investments. |
| 3 | Represents a combination of credit default swaps and Inflation-Protected U.S. Treasury Securities. Percentage is based upon the notional amount of the swaps plus (minus) any unrealized appreciation (depreciation) on the swaps. More complete information regarding the Fund's direct investments in credit default swaps including unrealized appreciation (depreciation) and notional values (or amounts) of such contracts can be found in the table at the end of the Portfolio of Investments included in this report. |
| 4 | Other Security Types consist of common stock and preferred stock. |
| 5 | Represents less than 0.1%. |
| 6 | Cash Equivalents include any investments in money market mutual funds and/or overnight repurchase agreements. |
| 7 | Assets, other than investments in securities, less liabilities. See Statement of Assets and Liabilities. Also includes a pro rata share of net assets owned by affiliated investment companies. |
Annual Shareholder Report11
Portfolio of Investments
March 31, 2010
| Shares | | | Value |
| | MUTUAL FUNDS – 98.6%;1 | |
| 3,714,730 | | Federated Inflation-Protected Securities Core Fund | 39,747,609 |
| 532,870 | | High Yield Bond Portfolio | 3,405,037 |
| 1,244,557 | 2 | Prime Value Obligations Fund, Institutional Shares, 0.13% | 1,244,557 |
| | TOTAL INVESTMENTS — 98.6%
(IDENTIFIED COST $43,187,649)3 | 44,397,203 |
| | OTHER ASSETS AND LIABILITIES - NET — 1.4%4 | 613,468 |
| | TOTAL NET ASSETS — 100% | $45,010,671 |
At March 31, 2010, the Fund had the following open swap contracts:
Credit
Default
Swap
Counterparty | Goldman
Sachs
& Co. | Merrill
Lynch,
Pierce,
Fenner &
Smith | Goldman
Sachs
& Co. | Goldman
Sachs
& Co. | Bank of
America
Securities
LLC | Net
Unrealized
Appreciation
of Credit
Default
Swaps |
| Reference Entity | Series 11
Investment
Grade Index | Series 11
Investment
Grade Index | Series 12
Investment
Grade Index | Series 13
Investment
Grade Index | Series 14
Investment
Grade Index | |
| Buy/Sell | Sell | Sell | Sell | Sell | Sell | |
| Pay/Receive Fixed Rate | 1.50% | 1.50% | 1.00% | 1.00% | 1.00% | |
| Expiration Date | 12/20/2013 | 12/20/2013 | 6/20/2014 | 12/20/2014 | 6/20/2015 | |
| Implied Credit Spread at 3/31/20105 | 0.33% | 0.33% | 0.45% | 0.87% | 1.02% | |
| Notional Amount | $1,984,000 | $1,984,000 | $2,976,000 | $12,000,000 | $7,000,000 | |
| Market Value | $39,974 | $39,974 | $27,222 | $92,096 | $39,838 | |
Upfront Premiums Paid/
(Received) | $(43,792) | $(43,067) | $(38,904) | $21,407 | $45,019 | |
Unrealized
Appreciation/(Depreciation) | $83,766 | $83,041 | $66,126 | $70,689 | $(5,181) | $298,441 |
Net Unrealized Appreciation on the Swap Contracts is included in “Other Assets andLiabilities — Net.”
| 1 | Affiliated companies. |
| 2 | 7-Day net yield. |
| 3 | The cost of investments for federal tax purposes amounts to $43,432,036. |
| 4 | Assets, other than investments in securities, less liabilities. See Statement of Assets and Liabilities. |
Annual Shareholder Report12
| 5 | Implied credit spreads, represented in absolute terms, utilized in determining the market value of credit default swap agreements serve as an indicator of the current status of the payment/performance risk and represent the likelihood or risk of default for the credit derivative. The implied credit spread of a particular referenced entity reflects the cost of buying/selling protection and may include upfront payments required to be made to enter into the agreement. Wider credit spreads represent a deterioration of the referenced entity's credit soundness and a greater likelihood or risk of default or other credit event occurring as defined under the terms of the agreement. A credit spread identified as “Defaulted” indicates a credit event has occurred for the referenced entity or obligation. |
Note: The categories of investments are shown as a percentage of total net assets at March 31, 2010.
Various inputs are used in determining the value of the Fund's investments. These inputs are summarized in the three broad levels listed below:
Level 1 — quoted prices in active markets for identical securities
Level 2 — other significant observable inputs (including quoted prices for similar securities, interest rates, prepayment speeds, credit risk, etc.)
Level 3 — significant unobservable inputs (including the Fund's own assumptions in determining the fair value of investments)
The inputs or methodology used for valuing securities are not an indication of the risk associated with investing in those securities.
The following is a summary of the inputs used, as of March 31, 2010, in valuing the Fund's assets carried at fair value:
| Valuation Inputs |
| Level 1 -
Quoted
Prices and
Investments in
Mutual Funds | Level 2 -
Other
Significant
Observable
Inputs | Level 3 -
Significant
Unobservable
Inputs | Total |
| Mutual Funds | $44,397,203 | $ — | $ — | $44,397,203 |
| OTHER FINANCIAL INSTRUMENTS* | $ — | $298,441 | $ — | $298,441 |
| * | Other financial instruments include swap contracts. |
See Notes which are an integral part of the Financial Statements
Annual Shareholder Report13
Statement of Assets and Liabilities
March 31, 2010
| Assets: | | |
| Total investments in affiliated issuers (Note 5), at value (identified cost $43,187,649) | | $44,397,203 |
| Receivable for shares sold | | 473,838 |
| Receivable for periodic payments from swap contracts | | 7,758 |
| Swaps, at value (net premiums received $59,337) | | 239,104 |
| TOTAL ASSETS | | 45,117,903 |
| Liabilities: | | |
| Payable for shares redeemed | $11,018 | |
| Payable for transfer and dividend disbursing agent fees and expenses | 26,096 | |
| Payable for auditing fees | 27,600 | |
| Payable for portfolio accounting fees | 11,413 | |
| Payable for distribution services fee (Note 5) | 10,256 | |
| Payable for shareholder services fee (Note 5) | 11,029 | |
| Payable for share registration costs | 5,021 | |
| Accrued expenses | 4,799 | |
| TOTAL LIABILITIES | | 107,232 |
| Net assets for 4,169,057 shares outstanding | | $45,010,671 |
| Net Assets Consist of: | | |
| Paid-in capital | | $43,862,678 |
| Net unrealized appreciation of investments and swap contracts | | 1,507,995 |
| Accumulated net realized loss on investments and swap contracts | | (407,843) |
| Undistributed net investment income | | 47,841 |
| TOTAL NET ASSETS | | $45,010,671 |
| Net Asset Value, Offering Price and Redemption Proceeds Per Share | | |
| Class A Shares: | | |
| Net asset value per share ($24,542,707 ÷ 2,273,225 shares outstanding), no par value, unlimited shares authorized | | $10.80 |
| Offering price per share (100/95.50 of $10.80) | | $11.31 |
| Redemption proceeds per share | | $10.80 |
| Class C Shares: | | |
| Net asset value per share ($16,352,702 ÷ 1,514,778 shares outstanding), no par value, unlimited shares authorized | | $10.80 |
| Offering price per share | | $10.80 |
| Redemption proceeds per share (99.00/100 of $10.80) | | $10.69 |
| Institutional Shares: | | |
| Net asset value per share ($4,115,262 ÷ 381,054 shares outstanding), no par value, unlimited shares authorized | | $10.80 |
| Offering price per share | | $10.80 |
| Redemption proceeds per share | | $10.80 |
See Notes which are an integral part of the Financial Statements
Annual Shareholder Report14
Statement of Operations
Year Ended March 31, 2010
| Investment Income: | | | |
| Dividends received from affiliated issuers (Note 5) | | | $706,565 |
| Expenses: | | | |
| Investment adviser fee (Note 5) | | $111,782 | |
| Administrative personnel and services fee (Note 5) | | 230,000 | |
| Custodian fees | | 6,584 | |
| Transfer and dividend disbursing agent fees and expenses | | 139,308 | |
| Directors'/Trustees' fees | | 1,569 | |
| Auditing fees | | 27,631 | |
| Legal fees | | 8,284 | |
| Portfolio accounting fees | | 67,543 | |
| Distribution services fee — Class C Shares (Note 5) | | 93,085 | |
| Shareholder services fee — Class A Shares (Note 5) | | 35,324 | |
| Shareholder services fee — Class C Shares (Note 5) | | 31,013 | |
| Share registration costs | | 44,178 | |
| Printing and postage | | 31,130 | |
| Insurance premiums | | 4,356 | |
| Miscellaneous | | 1,463 | |
| TOTAL EXPENSES | | 833,250 | |
| Waivers and Reimbursements (Note 5): | | | |
| Waiver/reimbursement of investment adviser fee | $(111,782) | | |
| Waiver of administrative personnel and services fee | (44,722) | | |
| Reimbursement of other operating expenses | (390,199) | | |
| TOTAL WAIVERS AND REIMBURSEMENTS | | (546,703) | |
| Net expenses | | | 286,547 |
| Net investment income | | | 420,018 |
| Realized and Unrealized Gain (Loss) on Investments and Swap Contracts: | | | |
| Net realized loss on investments in affiliated issuers | | | (57,536) |
| Net realized gain on swap contracts | | | 125,444 |
| Net change in unrealized appreciation of investments | | | 1,007,735 |
| Net change in unrealized depreciation of swap contracts | | | 353,207 |
| Net realized and unrealized gain on investments and swap contracts | | | 1,428,850 |
| Change in net assets resulting from operations | | | $1,848,868 |
See Notes which are an integral part of the Financial Statements
Annual Shareholder Report15
Statement of Changes in Net Assets
| Year Ended March 31 | 2010 | 2009 |
| Increase (Decrease) in Net Assets | | |
| Operations: | | |
| Net investment income | $420,018 | $392,446 |
| Net realized gain (loss) on investments in affiliated issuers and swap contracts | 67,908 | (282,620) |
| Net change in unrealized appreciation/depreciation of investments and swap contracts | 1,360,942 | (340,423) |
| CHANGE IN NET ASSETS RESULTING FROM OPERATIONS | 1,848,868 | (230,597) |
| Distributions to Shareholders: | | |
| Distributions from net investment income | | |
| Class A Shares | (315,463) | (220,069) |
| Class C Shares | (179,974) | (138,953) |
| Institutional Shares | (42,486) | (8,987) |
| Return of capital | | |
| Class A Shares | — | (127,495) |
| Class C Shares | — | (77,993) |
| Institutional Shares | — | (3,494) |
| CHANGE IN NET ASSETS RESULTING FROM DISTRIBUTIONS TO SHAREHOLDERS | (537,923) | (576,991) |
| Share Transactions: | | |
| Proceeds from sale of shares | 31,386,843 | 26,101,846 |
| Net asset value of shares issued to shareholders in payment of distributions declared | 372,847 | 307,549 |
| Cost of shares redeemed | (10,904,571) | (12,806,201) |
| CHANGE IN NET ASSETS RESULTING FROM SHARE TRANSACTIONS | 20,855,119 | 13,603,194 |
| Change in net assets | 22,166,064 | 12,795,606 |
| Net Assets: | | |
| Beginning of period | 22,844,607 | 10,049,001 |
| End of period (including undistributed net investment income of $47,841 and $57,138, respectively) | $45,010,671 | $22,844,607 |
See Notes which are an integral part of the Financial Statements
Annual Shareholder Report16
Notes to Financial Statements
March 31, 2010
1. ORGANIZATION
Federated Income Securities Trust (the “Trust”) is registered under the Investment Company Act of 1940, as amended (the “Act”), as a diversified, open-end management investment company. The Trust consists of seven portfolios. The financial statements included herein are only those of Federated Real Return Bond Fund (the “Fund”). The financial statements of the other portfolios are presented separately. The assets of each portfolio are segregated and a shareholder's interest is limited to the portfolio in which shares are held. Each portfolio pays its own expenses. The Fund offers three classes of shares: Class A Shares, Class C Shares and Institutional Shares. All shares of the Fund have equal rights with respect to voting, except on class-specific matters. The investment objective of the Fund is to provide current income and real total returns.
2. SIGNIFICANT ACCOUNTING POLICIES
The following is a summary of significant accounting policies consistently followed by the Fund in the preparation of its financial statements. These policies are in conformity with U.S. generally accepted accounting principles (GAAP).
Investment Valuation
In calculating its net asset value (NAV), the Fund generally values investments as follows:
- Shares of other mutual funds are valued based upon their reported NAVs.
- Fixed-income securities acquired with remaining maturities greater than 60 days are fair valued using price evaluations provided by a pricing service approved by the Board of Trustees (the “Trustees”).
- Fixed-income securities acquired with remaining maturities of 60 days or less are valued at their cost (adjusted for the accretion of any discount or amortization of any premium).
- Derivative contracts listed on exchanges are valued at their reported settlement or closing price.
- Over-the-counter (OTC) derivative contracts are fair valued using price evaluations provided by a pricing service approved by the Trustees.
If the Fund cannot obtain a price or price evaluation from a pricing service for an investment, the Fund may attempt to value the investment based upon the mean of bid and asked quotations or fair value the investment based on price evaluations, from one or more dealers. If any price, quotation, price evaluation or other pricing source is not readily available when the NAV is calculated, the Fund uses the fair value of the investment determined in accordance with the procedures described below. There can be no assurance that the Fund could purchase or sell an investment at the price used to calculate the Fund's NAV.
Fair Valuation and Significant Events Procedures
The Trustees have authorized the use of pricing services to provide evaluations of the current fair value of certain investments for purposes of calculating the NAV. Factors considered by pricing services in evaluating an investment include the yields or prices of investments of comparable quality, coupon, maturity, call rights and other potential prepayments, terms and type, reported transactions, indications as to values from dealers and general market conditions. Some pricing services provide a single price evaluation reflecting the bid-side of the market for an investment (a “bid” evaluation). Other pricing services offer both bid evaluations and price evaluations indicative of a price between the prices bid and asked for Annual Shareholder Report17
the investment (a “mid” evaluation). The Fund normally uses bid evaluations for U.S. Treasury and Agency securities and mortgage-backed securities. The Fund normally uses mid evaluations for other types of fixed-income securities and OTC derivative contracts. In the event that market quotations and price evaluations are not available for an investment, the fair value of the investment is determined in accordance with procedures adopted by the Trustees.The Trustees also have adopted procedures requiring an investment to be priced at its fair value whenever the Adviser determines that a significant event affecting the value of the investment has occurred between the time as of which the price of the investment would otherwise be determined and the time as of which the NAV is computed. An event is considered significant if there is both an affirmative expectation that the investment's value will change in response to the event and a reasonable basis for quantifying the resulting change in value. Examples of significant events that may occur after the close of the principal market on which a security is traded, or after the time of a price evaluation provided by a pricing service or a dealer, include:
- With respect to securities traded in foreign markets, significant trends in U.S. equity markets or in the trading of foreign securities index futures or options contracts;
- With respect to price evaluations of fixed-income securities determined before the close of regular trading on the NYSE, actions by the Federal Reserve Open Market Committee and other significant trends in U.S. fixed-income markets;
- Political or other developments affecting the economy or markets in which an issuer conducts its operations or its securities are traded; and
- Announcements concerning matters such as acquisitions, recapitalizations, litigation developments, a natural disaster affecting the issuer's operations or regulatory changes or market developments affecting the issuer's industry.
The Trustees have approved the use of a pricing service to determine the fair value of equity securities traded principally in foreign markets when the Adviser determines that there has been a significant trend in the U.S. equity markets or in index futures trading. For other significant events, the Fund may seek to obtain more current quotations or price evaluations from alternative pricing sources. If a reliable alternative pricing source is not available, the Fund will determine the fair value of the investment using another method approved by the Trustees.
Repurchase Agreements
It is the policy of the Fund to require the other party to a repurchase agreement to transfer to the Fund's custodian or sub-custodian eligible securities or cash with a market value (after transaction costs) at least equal to the repurchase price to be paid under the repurchase agreement. The eligible securities are transferred to accounts with the custodian or sub-custodian in which the Fund holds a “securities entitlement” and exercises “control” as those terms are defined in the Uniform Commercial Code. The Fund has established procedures for monitoring the market value of the transferred securities and requiring the transfer of additional eligible securities if necessary to equal at least the repurchase price. These procedures also allow the other party to require securities to be transferred from the account to the extent that their market value exceeds the repurchase price or in exchange for other eligible securities of equivalent market value.
The insolvency of the other party or other failure to repurchase the securities may delay the disposition of the underlying securities or cause the Fund to receive less than the full repurchase price. Under the terms of the repurchase agreement, any amounts received by the Fund in excess of the repurchase price and related transaction costs must be remitted to the other party.
Annual Shareholder Report18
The Fund may enter into repurchase agreements in which eligible securities are transferred into joint trading accounts maintained by the custodian or sub-custodian for investment companies and other clients advised by the Fund's Adviser and its affiliates. The Fund will participate on a pro rata basis with the other investment companies and clients in its share of the securities transferred under such repurchase agreements and in its share of proceeds from any repurchase or other disposition of such securities.Investment Income, Gains and Losses, Expenses and Distributions
Investment transactions are accounted for on a trade-date basis. Realized gains and losses from investment transactions are recorded on an identified-cost basis. Interest income and expenses are accrued daily. Dividend income and distributions to shareholders are recorded on the ex-dividend date. Foreign dividends are recorded on the ex-dividend date or when the Fund is informed of the ex-dividend date. Positive or negative inflation adjustments on Treasury Inflation-Protected Securities are included in interest income. Distributions of net investment income are declared and paid quarterly. Investment income, realized and unrealized gains and losses and certain fund-level expenses are allocated to each class based on relative average daily net assets, except that each class may bear certain expenses unique to that class such as distribution services and shareholder services fees. Dividends are declared separately for each class. No class has preferential dividend rights; differences in per share dividend rates are generally due to differences in separate class expenses.
Premium and Discount Amortization
All premiums and discounts on fixed-income securities are amortized/accreted for financial statement purposes.
Federal Taxes
It is the Fund's policy to comply with the Subchapter M provision of the Internal Revenue Code (the “Code”) and to distribute to shareholders each year substantially all of its income. Accordingly, no provision for federal income tax is necessary. As of and during the year ended March 31, 2010, the Fund did not have a liability for any uncertain tax positions. The Fund recognizes interest and penalties, if any, related to tax liabilities as income tax expense in the Statement of Operations. As of March 31, 2010, tax years 2007 through 2010 remain subject to examination by the Fund's major tax jurisdictions, which include the United States of America and the Commonwealth of Massachusetts.
When-Issued and Delayed Delivery Transactions
The Fund may engage in when-issued or delayed delivery transactions. The Fund records when-issued securities on the trade date and maintains security positions such that sufficient liquid assets will be available to make payment for the securities purchased. Securities purchased on a when-issued or delayed delivery basis are marked to market daily and begin earning interest on the settlement date. Losses may occur on these transactions due to changes in market conditions or the failure of counterparties to perform under the contract.
Swap Contracts
Swap contracts involve two parties that agree to exchange the returns (or the differential in rates of return) earned or realized on particular predetermined investments, instruments, indices or other measures. The gross returns to be exchanged or “swapped” between parties are generally calculated with respect to a “notional amount” for a predetermined period of time. The Fund may enter into interest rate, total return, credit default and other swap agreements. Risks may arise upon entering into swap agreements from the potential inability Annual Shareholder Report19
of the counterparties to meet the terms of their contract from unanticipated changes in the value of the swap agreement. The Fund uses credit default swaps to manage exposure to a given issuer or sector by either selling protection to increase exposure, or buying protection to reduce exposure. The “buyer” in a credit default swap is obligated to pay the “seller” a periodic stream of payments over the term of the contract provided that no event of default on an underlying reference obligation has occurred. If an event of default occurs, the seller must pay the buyer the full notional value, or the “par value,” of the reference obligation in exchange for the reference obligation. In connection with these agreements, securities may be identified as collateral in accordance with the terms of the respective swap agreements to provide assets of value and recourse in the event of default or bankruptcy/insolvency. Recovery values are assumed by market makers considering either industry standard recovery rates or entity specific factors and considerations until a credit event occurs. If a credit event has occurred, the recovery value is typically determined by a facilitated auction whereby a minimum number of allowable broker bids, together with a specific valuation method, are used to calculate the settlement value. The maximum amount of the payment that may occur, as a result of a credit event payable by the protection seller, is equal to the notional amount of the underlying index or security. The Fund's maximum exposure to loss of the notional value of credit default swaps outstanding at March 31, 2010 is $25,944,000. The Fund's maximum risk of loss from counterparty credit risk, either as the protection buyer or as the protection seller, is the fair value of the contract. This risk is mitigated by having a master netting arrangement between the Fund and the counterparty and by the posting of collateral by the counterparty to the Fund to cover the Fund's exposure to the counterparty.Upfront payments received or paid by the Fund will be reflected as an asset or liability on the Statement of Assets and Liabilities. Changes in the value of swap contracts are included in “Swaps, at value” on the Statement of Assets and Liabilities, and periodic payments are reported as “Net realized gain (loss) on swap contracts” on the Statement of Operations.
Swap contracts outstanding at period end are listed after the Fund's Portfolio of Investments.
Additional Disclosure Related to Derivative Instruments
Fair Value of Derivative Instruments
| Asset | Liability |
| Statement of
Assets and
Liabilities
Location | Fair
Value | Statement of
Assets and
Liabilities
Location | Fair
Value |
Derivatives not accounted for as
hedging instruments under
ASC Topic 815 | | | | |
| Credit contracts | Receivable for
periodic payments
from swap contracts | $7,758 | — | — |
| Credit contracts | Swaps, at value | 239,104 | — | — |
TOTAL DERIVATIVES NOT
ACCOUNTED FOR AS
HEDGING INSTRUMENTS
UNDER ASC TOPIC 815 | | $246,862 | — | — |
Annual Shareholder Report20
The Effect of Derivative Instruments on the Statement of Operations for the Year Ended March 31, 2010
| Amount of Realized Gain or (Loss) on Derivatives Recognized in Income |
| Credit
Default
Swaps |
| Credit contracts | $125,444 |
| Change in Unrealized Appreciation or (Depreciation) on Derivatives Recognized in Income |
| Credit
Default
Swaps |
| Credit contracts | $353,207 |
Other
The preparation of financial statements in conformity with GAAP requires management to make estimates and assumptions that affect the amounts of assets, liabilities, expenses and revenues reported in the financial statements. Actual results could differ from those estimated.
3. shares of beneficial interest
The following tables summarize share activity:
| Year Ended March 31 | 2010 | 2009 |
| Class A Shares: | Shares | Amount | Shares | Amount |
| Shares sold | 1,768,122 | $18,942,581 | 1,737,705 | $17,835,023 |
| Shares issued to shareholders in payment of distributions declared | 24,711 | 260,986 | 17,832 | 185,824 |
| Shares redeemed | (845,486) | (8,886,869) | (822,710) | (8,249,668) |
NET CHANGE RESULTING
FROM CLASS A
SHARE TRANSACTIONS | 947,347 | $10,316,698 | 932,827 | $9,771,179 |
| Year Ended March 31 | 2010 | 2009 |
| Class C Shares: | Shares | Amount | Shares | Amount |
| Shares sold | 804,588 | $8,474,824 | 800,520 | $8,229,545 |
| Shares issued to shareholders in payment of distributions declared | 9,145 | 96,292 | 10,625 | 111,473 |
| Shares redeemed | (169,298) | (1,771,599) | (442,741) | (4,556,533) |
NET CHANGE RESULTING
FROM CLASS C
SHARE TRANSACTIONS | 644,435 | $6,799,517 | 368,404 | $3,784,485 |
Annual Shareholder Report21
| Year Ended March 31 | 2010 | 2009 |
| Institutional Shares: | Shares | Amount | Shares | Amount |
| Shares sold | 371,647 | $3,969,438 | 3,677 | $37,278 |
| Shares issued to shareholders in payment of distributions declared | 1,455 | 15,569 | 978 | 10,252 |
| Shares redeemed | (22,687) | (246,103) | — | — |
NET CHANGE RESULTING
FROM INSTITUTIONAL
SHARE TRANSACTIONS | 350,415 | $3,738,904 | 4,655 | $47,530 |
NET CHANGE RESULTING
FROM FUND
SHARE TRANSACTIONS | 1,942,197 | $20,855,119 | 1,305,886 | $13,603,194 |
4. FEDERAL TAX INFORMATION
The timing and character of income and capital gain distributions are determined in accordance with income tax regulations, which may differ from GAAP. These differences are due to differing treatments for swap income reclassifications.
For the year ended March 31, 2010, permanent differences identified and reclassified among the components of net assets were as follows:
| Increase (Decrease) |
| Undistributed Net Investment (Loss) | Accumulated
Net Realized
Gain (Loss) |
| $108,608 | $(108,608) |
Net investment income (loss), net realized gains (losses) and net assets were not affected by this reclassification.
The tax character of distributions as reported on the Statement of Changes in Net Assets for the years ended March 31, 2010 and 2009, was as follows:
| 2010 | 2009 |
| Ordinary income | $537,923 | $368,009 |
| Return of capital | — | $208,982 |
As of March 31, 2010, the components of distributable earnings on a tax basis were as follows:
| Undistributed ordinary income | $343,928 |
| Net unrealized appreciation | $965,167 |
| Capital loss carryforwards and deferrals | $(161,102) |
The difference between book-basis and tax-basis net unrealized appreciation/depreciation is attributable to differing treatments for the deferral of losses on wash sales.
At March 31, 2010, the cost of investments for federal tax purposes was $43,432,036. The net unrealized appreciation of investments for federal tax purposes excluding any unrealized appreciation resulting from swap contracts was $965,167. This consists of net unrealized appreciation from investments for those securities having an excess of value over cost of $965,167.
Annual Shareholder Report22
At March 31, 2010, the Fund had a capital loss carryforward of $161,084 which will reduce the Fund's taxable income arising from future net realized gains on investments, if any, to the extent permitted by the Code and thus will reduce the amount of distributions to shareholders which would otherwise be necessary to relieve the Fund of any liability for federal income tax. Pursuant to the Code, such capital loss carryforward will expire as follows:| Expiration Year | Expiration Amount |
| 2017 | $47,776 |
| 2018 | $113,308 |
Under current tax regulations, capital losses on securities transactions realized after October 31 may be deferred and treated as occurring on the first day of the following fiscal year. As of March 31, 2010, for federal income tax purposes, post-October losses of $18 were deferred to April 1, 2010.
5. INVESTMENT ADVISER FEE AND OTHER TRANSACTIONS WITH AFFILIATES
Investment Adviser Fee
Federated Investment Management Company is the Fund's investment adviser (the “Adviser”). The advisory agreement between the Fund and the Adviser provides for an annual fee equal to 0.40% of the Fund's average daily net assets. Subject to the terms described in the Expense Limitation note, the Adviser may voluntarily choose to waive any portion of its fee and/or reimburse certain operating expenses of the Fund. For the year ended March 31, 2010, the Adviser voluntarily waived $110,620 of its fee and voluntarily reimbursed $390,199 of other operating expenses.
Administrative Fee
Federated Administrative Services (FAS), under the Administrative Services Agreement, provides the Fund with administrative personnel and services. The fee paid to FAS is based on the average aggregate daily net assets of certain Federated funds as specified below:
| Administrative Fee | Average Aggregate Daily Net Assets
of the Federated Funds |
| 0.150% | on the first $5 billion |
| 0.125% | on the next $5 billion |
| 0.100% | on the next $10 billion |
| 0.075% | on assets in excess of $20 billion |
The administrative fee received during any fiscal year shall be at least $150,000 per portfolio and $40,000 per each additional class of Shares. Subject to the terms described in the Expense Limitation note, FAS may voluntarily choose to waive any portion of its fee. For the year ended March 31, 2010, FAS waived $44,722 of its fee. The net fee paid to FAS was 0.663% of average daily net assets of the Fund. The Fund is currently being charged the minimum administrative fee; therefore the fee as a percentage of average daily net assets is greater than the amounts presented in the chart above.
Annual Shareholder Report23
Distribution Services FeeThe Fund has adopted a Distribution Plan (the “Plan”) pursuant to Rule 12b-1 under the Act. Under the terms of the Plan, the Fund will compensate Federated Securities Corp. (FSC), the principal distributor, from the daily net assets of the Fund's Class A Shares and Class C Shares to finance activities intended to result in the sale of these shares. The Plan provides that the Fund may incur distribution expenses at the following percentages of average daily net assets annually, to compensate FSC:
| Share Class Name | Percentage of Average Daily
Net Assets of Class |
| Class A Shares | 0.05% |
| Class C Shares | 0.75% |
Subject to the terms described in the Expense Limitation note, FSC may voluntarily choose to waive any portion of its fee. When FSC receives fees, it may pay some or all of them to financial intermediaries whose customers purchase shares. For the year ended March 31, 2010, FSC retained $34,449 of fees paid by the Fund. For the year ended March 31, 2010, the Fund's Class A Shares did not incur a distribution services fee; however, it may begin to incur this fee upon approval of the Trustees.
Sales Charges
Front-end sales charges and contingent deferred sales charges (CDSC) do not represent expenses of the Fund. They are deducted from the proceeds of sales of Fund shares prior to investment or from redemption proceeds prior to remittance, as applicable. For the year ended March 31, 2010, FSC retained $22,379 in sales charges from the sale of Class A Shares. FSC also retained $1,925 of CDSC relating to redemptions of Class C Shares.
Shareholder Services Fee
The Fund may pay fees (Service Fees) up to 0.25% of the average daily net assets of the Fund's Class A Shares, Class C Shares and Institutional Shares to financial intermediaries or to Federated Shareholder Services Company (FSSC) for providing services to shareholders and maintaining shareholder accounts. Subject to the terms described in the Expense Limitation note, FSSC may voluntarily reimburse the Fund for Service Fees. For the year ended March 31, 2010, FSSC received $1,286 of fees paid by the Fund. For the year ended March 31, 2010, the Fund's Institutional Shares did not incur a shareholder services fee.
Expense Limitation
The Adviser and its affiliates (which may include FSC, FAS and FSSC) have voluntarily agreed to waive their fees and/or reimburse expenses so that the total annual fund operating expenses (as shown in the financial highlights) paid by the Fund's Class A Shares, Class C Shares and Institutional Shares (after the voluntary waivers and reimbursements) will not exceed 0.70%, 1.45% and 0.45%, respectively, (the “Fee Limit”) through the later of (the “Termination Date”): (a) May 31, 2011; or (b) the date of the Fund's next effective Prospectus. While the Adviser and its affiliates currently do not anticipate terminating or increasing these arrangements prior to the Termination Date, these arrangements may only be terminated or the Fee Limit increased prior to the Termination Date with the agreement of the Trustees.
General
Certain Officers and Trustees of the Fund are Officers and Directors or Trustees of the above companies.
Annual Shareholder Report24
Transactions with Affiliated CompaniesAffiliated holdings are mutual funds which are managed by the Adviser or an affiliate of the Adviser. The Adviser has agreed to reimburse the Fund for certain investment adviser fees as a result of transactions in other affiliated mutual funds. For the year ended March 31, 2010, the Adviser reimbursed $1,162. Transactions with affiliated companies during the year ended March 31, 2010, were as follows:
| Affiliates | Balance of
Shares Held
3/31/2009 | Purchases/
Additions | Sales/
Reductions | Balance of
Shares Held
3/31/2010 | Value | Dividend
Income |
Federated Inflation-
Protected Securities
Core Fund | 2,104,941 | 1,795,513 | 185,724 | 3,714,730 | $39,747,609 | $569,111 |
High Yield
Bond Portfolio | 110,006 | 422,864 | — | 532,870 | 3,405,037 | 133,994 |
Prime Value
Obligations Fund,
Institutional Shares | 736,689 | 24,269,352 | 23,761,484 | 1,244,557 | 1,244,557 | 3,460 |
TOTAL OF
AFFILIATED
TRANSACTIONS | 2,951,636 | 26,487,729 | 23,947,208 | 5,492,157 | $44,397,203 | $706,565 |
Pursuant to an Exemptive Order issued by the Securities and Exchange Commission (SEC), the Fund may invest in portfolios of Federated Core Trust (Core Trust), which is managed by Federated Investment Management Company, the Fund's adviser. Core Trust is an open-end management company, registered under the Act, available only to registered investment companies and other institutional investors. The investment objective of Federated Inflation-Protected Securities Core Fund (IPCORE), a portfolio of Core Trust, is to provide total return consistent with investment in inflation-protected securities. Federated Investors, Inc. receives no advisory or administrative fees from the Funds within the Core Trust. Income distributions from Core Trust are declared daily and paid monthly, and are recorded by the Fund as dividend income. Capital gain distributions, if any, from Core Trust are declared and paid annually, and are recorded by the Fund as capital gains. The performance of the Fund is directly affected by the performance of the Core Trust. The financial statements of IPCORE for the year ended December 31, 2009 are included within this report to illustrate the security holdings, financial condition, results of operations and changes in net assets of the Portfolio in which the Fund invested 88.3% of its net assets at March 31, 2010. The financial statements of IPCORE should be read in conjunction with the Fund's financial statements. The valuation of the securities held by IPCORE is discussed in the notes to its financial statements. A copy of the Core Trust's financial statements is available on the EDGAR Database on the SEC's Web site or upon request from the Fund.
Annual Shareholder Report25
6. Investment TRANSACTIONSPurchases and sales of investments, excluding long-term U.S. government securities and short-term obligations, for the year ended March 31, 2010, were as follows:
| Purchases | $21,707,247 |
| Sales | $1,950,000 |
7. risk of investing in underlying funds
Each of the underlying Funds in which the Fund invests has its own investment risks, and these risks can affect the value of the Fund's investments and therefore the value of the Fund's shares. To the extent that the Fund invests more of its assets in one Underlying Fund than in another, the Fund will have greater exposure to the risks of that Underlying Fund.
8. LINE OF CREDIT
The Fund participates in a $100,000,000 unsecured, uncommitted revolving line of credit (LOC) agreement with PNC Bank. The LOC was made available for extraordinary or emergency purposes, primarily for financing redemption payments. Borrowings are charged interest at a rate offered to the Fund by PNC Bank at the time of the borrowing. As of March 31, 2010, there were no outstanding loans. During the year ended March 31, 2010, the Fund did not utilize the LOC.
9. INTERFUND LENDING
Pursuant to an Exemptive Order issued by the SEC, the Fund, along with other funds advised by subsidiaries of Federated Investors, Inc., may participate in an interfund lending program. This program provides an alternative credit facility allowing the Fund to borrow from other participating affiliated funds. As of March 31, 2010, there were no outstanding loans. During the year ended March 31, 2010, the program was not utilized.
10. Legal Proceedings
Since October 2003, Federated Investors, Inc. and related entities (collectively, “Federated”), and various Federated sponsored mutual funds (Federated Funds) have been named as defendants in several class action lawsuits now pending in the United States District Court for the District of Maryland. The lawsuits were purportedly filed on behalf of people who purchased, owned and/or redeemed shares of certain Federated Funds during specified periods beginning November 1, 1998. The suits are generally similar in alleging that Federated engaged in illegal and improper trading practices including market timing and late trading in concert with certain institutional traders, which allegedly caused financial injury to the mutual fund shareholders. Federated without admitting the validity of any claim has reached a preliminary settlement with the Plaintiffs in these cases. Any settlement would have to be approved by the Court. Federated entities have also been named as defendants in several additional lawsuits that are now pending in the United States District Court for the Western District of Pennsylvania. These lawsuits have been consolidated into a single action alleging excessive advisory fees involving one of the Federated Funds. The Board of the Federated Funds retained the law firm of Dickstein Shapiro LLP to represent the Federated Funds in these lawsuits. Federated and the Federated Funds, and their respective counsel, have been defending this litigation, and none of the Federated Funds remains a defendant in any of the lawsuits. Additional lawsuits based upon similar allegations may be filed in the future. The potential impact of these lawsuits, all of which seek monetary damages, attorneys' fees and expenses, and future potential similar suits is uncertain. Although we do not believe that these Annual Shareholder Report26
lawsuits will have a material adverse effect on the Federated Funds, there can be no assurance that these suits, ongoing adverse publicity and/or other developments resulting from the allegations in these matters will not result in increased redemptions, or reduced sales, of shares of the Federated Funds or other adverse consequences for the Federated Funds.11. Subsequent events
Management has evaluated subsequent events through the date the financial statements were issued, and determined that no events have occurred that require additional disclosure.
Annual Shareholder Report27
Report of Independent Registered Public Accounting Firm
TO THE BOARD OF Trustees OF Federated Income securities trust AND SHAREHOLDERS of Federated Real Return Bond Fund:
We have audited the accompanying statement of assets and liabilities of Federated Real Return Bond Fund (the “Fund”) (one of the portfolios comprising Federated Income Securities Trust), including the portfolio of investments, as of March 31, 2010, and the related statement of operations for the year then ended, the statement of changes in net assets for each of the two years in the period then ended and the financial highlights for each of the periods indicated therein. These financial statements and financial highlights are the responsibility of the Fund's management. Our responsibility is to express an opinion on these financial statements and financial highlights based on our audits.
We conducted our audits in accordance with standards of the Public Company Accounting Oversight Board (United States). Those standards require that we plan and perform the audit to obtain reasonable assurance about whether the financial statements and financial highlights are free of material misstatement. We were not engaged to perform an audit of the Fund's internal control over financial reporting. Our audits included consideration of internal control over financial reporting as a basis for designing audit procedures that are appropriate in the circumstances, but not for the purpose of expressing an opinion on the effectiveness of the Fund's internal control over financial reporting. Accordingly, we express no such opinion. An audit also includes examining, on a test basis, evidence supporting the amounts and disclosures in the financial statements and financial highlights, assessing the accounting principles used and significant estimates made by management, and evaluating the overall financial statement presentation. Our procedures included confirmation of securities owned as of March 31, 2010 by correspondence with the custodian and others. We believe that our audits provide a reasonable basis for our opinion.
In our opinion, the financial statements and financial highlights referred to above present fairly, in all material respects, the financial position of Federated Real Return Bond Fund , a portfolio of Federated Income Securities Trust, at March 31, 2010, the results of its operations for the year then ended, the changes in its net assets for each of the two years in the period then ended, and the financial highlights for each of the periods indicated therein, in conformity with U.S. generally accepted accounting principles.
Boston, Massachusetts
May 17, 2010
Annual Shareholder Report28
Board of Trustees and Trust Officers
The Board is responsible for managing the Trust's business affairs and for exercising all the Trust's powers except those reserved for the shareholders. The following tables give information about each Board member and the senior officers of the Fund. Where required, the tables separately list Board members who are “interested persons” of the Fund (i.e., “Interested” Board members) and those who are not (i.e., “Independent” Board members). Unless otherwise noted, the address of each person listed is Federated Investors Tower, 1001 Liberty Avenue, Pittsburgh, PA 15222. The address of all Independent Board members listed is 4000 Ericsson Drive, Warrendale, PA 15086-7561; Attention: Mutual Fund Board. As of December 31, 2009, the Trust comprised seven portfolio(s), and the Federated Fund Complex consisted of 43 investment companies (comprising 145 portfolios). Unless otherwise noted, each Officer is elected annually. Unless otherwise noted, each Board member oversees all portfolios in the Federated Fund Complex and serves for an indefinite term. The Fund's Statement of Additional Information includes additional information about Trust Trustees and is available, without charge and upon request, by calling 1-800-341-7400.
Interested TRUSTEES Background
Name
Birth Date
Positions Held with Trust
Date Service Began | Principal Occupation(s) for Past Five Years,
Other Directorships Held and Previous Position(s) |
John F. Donahue*
Birth Date: July 28, 1924
TRUSTEE
Began serving: January 1986 | Principal Occupations: Director or Trustee of the Federated Fund Complex; Chairman and Director, Federated Investors, Inc.; Chairman of the Federated Fund Complex's Executive Committee.
Previous Positions: Chairman of the Federated Fund Complex; Trustee, Federated Investment Management Company; Chairman and Director, Federated Investment Counseling. |
J. Christopher Donahue*
Birth Date: April 11, 1949
PRESIDENT AND TRUSTEE
Began serving: January 2000 | Principal Occupations: Principal Executive Officer and President of the Federated Fund Complex; Director or Trustee of some of the Funds in the Federated Fund Complex; President, Chief Executive Officer and Director, Federated Investors, Inc.; Chairman and Trustee, Federated Investment Management Company; Trustee, Federated Investment Counseling; Chairman and Director, Federated Global Investment Management Corp.; Chairman, Federated Equity Management Company of Pennsylvania and Passport Research, Ltd. (investment advisory subsidiary of Federated); Trustee, Federated Shareholder Services Company; Director, Federated Services Company.
Previous Positions: President, Federated Investment Counseling; President and Chief Executive Officer, Federated Investment Management Company, Federated Global Investment Management Corp. and Passport Research, Ltd. |
| * | Family relationships and reasons for “interested” status: John F. Donahue is the father of J. Christopher Donahue; both are “interested” due to their beneficial ownership of shares of Federated Investors, Inc. and the positions they hold with Federated and its subsidiaries. |
Annual Shareholder Report29
INDEPENDENT TRUSTEES Background
Name
Birth Date
Positions Held with Trust
Date Service Began | Principal Occupation(s) for Past Five Years,
Other Directorships Held, Previous Position(s) and Qualifications |
John T. Conroy, Jr., Ph.D.
Birth Date: June 23, 1937
TRUSTEE
Began serving: November 1991 | Principal Occupations: Director or Trustee of the Federated Fund Complex; Chairman of the Board, Investment Properties Corporation; Partner or Trustee in private real estate ventures in Southwest Florida; Assistant Professor in Theology, Blessed Edmund Rice School for Pastoral Ministry.
Previous Positions: President, Investment Properties Corporation; Senior Vice President, John R. Wood and Associates, Inc., Realtors; President, Naples Property Management, Inc. and Northgate Village Development Corporation.
Qualifications: Business management and director experience. |
Nicholas P. Constantakis, CPA
Birth Date: September 3, 1939
TRUSTEE
Began serving: February 1998 | Principal Occupation: Director or Trustee of the Federated Fund Complex.
Other Directorship Held: Director and Chairman of the Audit Committee, Michael Baker Corporation (architecture, engineering and construction services).
Previous Position: Partner, Andersen Worldwide SC.
Qualifications: Public accounting and director experience. |
John F. Cunningham
Birth Date: March 5, 1943
TRUSTEE
Began serving: January 1999 | Principal Occupation: Director or Trustee of the Federated Fund Complex.
Other Directorships Held: Chairman, President and Chief Executive Officer, Cunningham & Co., Inc. (strategic business consulting); Trustee Associate, Boston College.
Previous Positions: Director, Redgate Communications and EMC Corporation (computer storage systems); Chairman of the Board and Chief Executive Officer, Computer Consoles, Inc.; President and Chief Operating Officer, Wang Laboratories; Director, First National Bank of Boston; Director, Apollo Computer, Inc.
Qualifications: Business management and director experience. |
Maureen Lally-Green
Birth Date: July 5, 1949
TRUSTEE
Began serving: August 2009 | Principal Occupations: Director or Trustee of the Federated Fund Complex; Director, Office of Church Relations, Diocese of Pittsburgh; Adjunct Professor of Law, Duquesne University School of Law.
Other Directorships Held: Director, Auberle; Trustee St. Francis University; Director, Ireland Institute of Pittsburgh; Director, UPMC Mercy Hospital; Regent, St. Vincent Seminary; Director, Epilepsy Foundation of Western and Central Pennsylvania; Director, Saint Thomas More Society, Allegheny County; Director, Carlow University.
Previous Position: Pennsylvania Superior Court Judge.
Qualifications: Legal and director experience. |
Annual Shareholder Report30
Name
Birth Date
Positions Held with Trust
Date Service Began | Principal Occupation(s) for Past Five Years,
Other Directorships Held, Previous Position(s) and Qualifications |
Peter E. Madden
Birth Date: March 16, 1942
TRUSTEE
Began serving: November 1991 | Principal Occupation: Director or Trustee, and Chairman of the Board of Directors or Trustees, of the Federated Fund Complex.
Other Directorship Held: Board of Overseers, Babson College.
Previous Positions: Representative, Commonwealth of Massachusetts General Court; President, Chief Operating Officer and Director, State Street Bank and Trust Company and State Street Corporation (retired); Director, VISA USA and VISA International; Chairman and Director, Massachusetts Bankers Association; Director, Depository Trust Corporation; Director, The Boston Stock Exchange.
Qualifications: Business management, mutual fund services and director experience. |
Charles F. Mansfield, Jr.
Birth Date: April 10, 1945
TRUSTEE
Began serving: January 2000 | Principal Occupations: Director or Trustee and Chairman of the Audit Committee of the Federated Fund Complex; Management Consultant.
Previous Positions: Chief Executive Officer, PBTC International Bank; Partner, Arthur Young & Company (now Ernst & Young LLP); Chief Financial Officer of Retail Banking Sector, Chase Manhattan Bank; Senior Vice President, HSBC Bank USA (formerly, Marine Midland Bank); Vice President, Citibank; Assistant Professor of Banking and Finance, Frank G. Zarb School of Business, Hofstra University; Executive Vice President DVC Group, Inc. (marketing, communications and technology).
Qualifications: Banking, business management, public accounting and director experience. |
R. James Nicholson
Birth Date: February 4, 1938
TRUSTEE
Began serving: January 2008 | Principal Occupations: Director or Trustee of the Federated Fund Complex; Senior Counsel, Brownstein Hyatt Farber Schrek, P.C.; Former Secretary of the U.S. Dept. of Veterans Affairs; Former U.S. Ambassador to the Holy See; Former Chairman of the Republican National Committee.
Other Directorships Held: Director, Horatio Alger Association; Director, The Daniels Fund.
Previous Positions: Colonel, U.S. Army Reserve; Partner, Calkins, Kramer, Grimshaw and Harring, P.C.; General Counsel, Colorado Association of Housing and Building; Chairman and CEO, Nicholson Enterprises, Inc. (real estate holding company); Chairman and CEO, Renaissance Homes of Colorado.
Qualifications: Legal, government, business management and mutual fund director experience. |
Annual Shareholder Report31
Name
Birth Date
Positions Held with Trust
Date Service Began | Principal Occupation(s) for Past Five Years,
Other Directorships Held, Previous Position(s) and Qualifications |
Thomas M. O'Neill
Birth Date: June 14, 1951
TRUSTEE
Began serving: October 2006 | Principal Occupations: Director or Trustee of the Federated Fund Complex; Sole Proprietor, Navigator Management Company (investment and strategic consulting).
Other Directorships Held: Board of Overseers, Children's Hospital of Boston; Visiting Committee on Athletics, Harvard College.
Previous Positions: Chief Executive Officer and President, Managing Director and Chief Investment Officer, Fleet Investment Advisors; President and Chief Executive Officer, Aeltus Investment Management, Inc.; General Partner, Hellman, Jordan Management Co., Boston, MA; Chief Investment Officer, The Putnam Companies, Boston, MA; Credit Analyst and Lending Officer, Fleet Bank; Director and Consultant, EZE Castle Software (investment order management software); Director, Midway Pacific (lumber).
Qualifications: Business management, mutual fund, director and investment experience. |
John S. Walsh
Birth Date: November 28, 1957
TRUSTEE
Began serving: January 2000 | Principal Occupations: Director or Trustee of the Federated Fund Complex; President and Director, Heat Wagon, Inc. (manufacturer of construction temporary heaters); President and Director, Manufacturers Products, Inc. (distributor of portable construction heaters); President, Portable Heater Parts, a division of Manufacturers Products, Inc.
Previous Position: Vice President, Walsh & Kelly, Inc.
Qualifications: Business management and director experience. |
James F. Will
Birth Date: October 12, 1938
TRUSTEE
Began serving: April 2006 | Principal Occupations: Director or Trustee of the Federated Fund Complex; formerly, Vice Chancellor and President, Saint Vincent College.
Other Directorships Held: Trustee, Saint Vincent College; Alleghany Corporation.
Previous Positions: Chairman, President and Chief Executive Officer, Armco, Inc.; President and Chief Executive Officer, Cyclops Industries; President and Chief Operating Officer, Kaiser Steel Corporation.
Qualifications: Business management, education and director experience. |
Annual Shareholder Report32
OFFICERS
Name
Birth Date
Address
Positions Held with Trust
Date Service Began | Principal Occupation(s) for Past Five Years
and Previous Position(s) |
John W. McGonigle
Birth Date: October 26, 1938
EXECUTIVE VICE PRESIDENT AND SECRETARY
Began serving: January 1986 | Principal Occupations: Executive Vice President and Secretary of the Federated Fund Complex; Vice Chairman, Executive Vice President, Secretary and Director, Federated Investors, Inc.
Previous Positions: Trustee, Federated Investment Management Company and Federated Investment Counseling; Director, Federated Global Investment Management Corp., Federated Services Company and Federated Securities Corp. |
Richard A. Novak
Birth Date: December 25, 1963
TREASURER
Began serving: January 2006 | Principal Occupations: Principal Financial Officer and Treasurer of the Federated Fund Complex; Senior Vice President, Federated Administrative Services; Financial and Operations Principal for Federated Securities Corp., Edgewood Services, Inc. and Southpointe Distribution Services, Inc.
Previous Positions: Controller of Federated Investors, Inc.; Vice President, Finance of Federated Services Company; held various financial management positions within The Mercy Hospital of Pittsburgh; Auditor, Arthur Andersen & Co. |
Richard B. Fisher
Birth Date: May 17, 1923
VICE PRESIDENT
Began serving: January 1986 | Principal Occupations: Vice Chairman or Vice President of some of the Funds in the Federated Fund Complex; Vice Chairman, Federated Investors, Inc.; Chairman, Federated Securities Corp.
Previous Positions: President and Director or Trustee of some of the Funds in the Federated Fund Complex; Executive Vice President, Federated Investors, Inc.; Director and Chief Executive Officer, Federated Securities Corp. |
Brian P. Bouda
Birth Date: February 28, 1947
CHIEF COMPLIANCE OFFICER AND SENIOR VICE PRESIDENT
Began serving: August 2004 | Principal Occupations: Senior Vice President and Chief Compliance Officer of the Federated Fund Complex; Vice President and Chief Compliance Officer of Federated Investors, Inc. and Chief Compliance Officer of its subsidiaries. Mr. Bouda joined Federated in 1999 and is a member of the American Bar Association and the State Bar Association of Wisconsin. |
Stephen F. Auth
Birth Date: September 3, 1956
450 Lexington Avenue
Suite 3700
New York, NY 10017-3943
CHIEF INVESTMENT OFFICER
Began serving: May 2004 | Principal Occupations: Mr. Auth is Chief Investment Officer of this Fund and various other Funds in the Federated Fund Complex; Executive Vice President, Federated Investment Counseling, Federated Global Investment Management Corp. and Federated Equity Management Company of Pennsylvania.
Previous Positions: Executive Vice President, Federated Investment Management Company, and Passport Research, Ltd. (investment advisory subsidiary of Federated); Senior Vice President, Global Portfolio Management Services Division; Senior Vice President, Federated Investment Management Company and Passport Research, Ltd.; Senior Managing Director and Portfolio Manager, Prudential Investments. |
Annual Shareholder Report33
Name
Birth Date
Address
Positions Held with Trust
Date Service Began | Principal Occupation(s) for Past Five Years
and Previous Position(s) |
Robert J. Ostrowski
Birth Date: April 26, 1963
CHIEF INVESTMENT OFFICER
Began serving: May 2004 | Principal Occupations: Robert J. Ostrowski joined Federated in 1987 as an Investment Analyst and became a Portfolio Manager in 1990. He was named Chief Investment Officer of taxable fixed-income products in 2004 and also serves as a Senior Portfolio Manager. He has been a Senior Vice President of the Fund's Adviser since 1997. Mr. Ostrowski has received the Chartered Financial Analyst designation. He received his M.S. in Industrial Administration from Carnegie Mellon University. |
Joseph M. Balestrino
Birth Date: November 3, 1954
VICE PRESIDENT
Began serving: November 1998 | Principal Occupations: Joseph M. Balestrino is Vice President of the Trust. Mr. Balestrino joined Federated in 1986 and has been a Senior Portfolio Manager and Senior Vice President of the Fund's Adviser since 1998. He was a Portfolio Manager and a Vice President of the Fund's Adviser from 1995 to 1998. Mr. Balestrino served as a Portfolio Manager and an Assistant Vice President of the Adviser from 1993 to 1995. Mr. Balestrino has received the Chartered Financial Analyst designation and a Master's Degree in Urban and Regional Planning from the University of Pittsburgh. |
Randall S. Bauer
Birth Date: November 16, 1957
VICE PRESIDENT
Began serving: November 1998 | Principal Occupations: Randall S. Bauer is Vice President of the Trust. Mr. Bauer joined Federated in 1989 and has been a Portfolio Manager and a Vice President of the Fund's Adviser since 1994 and a Senior Vice President of the Fund's Adviser beginning 2007. Mr. Bauer has received the Chartered Financial Analyst designation and an M.B.A. in Finance from the Pennsylvania State University. |
John L. Nichol
Birth Date: May 21, 1963
VICE PRESIDENT
Began serving: May 2004 | Principal Occupations: John L. Nichol is Vice President of the Trust. Mr. Nichol joined Federated in September 2000 as an Assistant Vice President/Senior Investment Analyst. He has been a Portfolio Manager since December 2000 and was named a Vice President of the Fund's Adviser in July 2001. Mr. Nichol served as a portfolio manager and analyst for the Public Employees Retirement System of Ohio from 1992 through August 2000. Mr. Nichol has received the Chartered Financial Analyst designation. He received his M.B.A. with an emphasis in Finance and Management and Information Science from the Ohio State University. |
Annual Shareholder Report34
Evaluation and Approval of Advisory Contract - May 2009
Federated Real Return Bond Fund (the “Fund”)
The Fund's Board reviewed the Fund's investment advisory contract at meetings held in May 2009. The Board's decision regarding the contract reflects the exercise of its business judgment on whether to continue the existing arrangements.
In this connection, the Federated funds' Board had previously appointed a Senior Officer, whose duties include specified responsibilities relating to the process by which advisory fees are to be charged to a Federated fund. The Senior Officer has the authority to retain consultants, experts, or staff as may be reasonably necessary to assist in the performance of his duties, reports directly to the Board, and may be terminated only with the approval of a majority of the independent members of the Board. The Senior Officer prepared and furnished to the Board an independent, written evaluation that covered topics discussed below. The Board considered that evaluation, along with other information, in deciding to approve the advisory contract.
During its review of the contract, the Board considered compensation and benefits received by the Adviser. This included the fees received for services provided to the Fund by other entities in the Federated organization and research services received by the Adviser from brokers that execute Federated fund trades, as well as advisory fees. The Board is also familiar with and considered judicial decisions concerning allegedly excessive investment advisory fees, which have indicated that the following factors may be relevant to an Adviser's fiduciary duty with respect to its receipt of compensation from a fund: the nature and quality of the services provided by the Adviser, including the performance of the fund; the Adviser's cost of providing the services; the extent to which the Adviser may realize “economies of scale” as a fund grows larger; any indirect benefits that may accrue to the Adviser and its affiliates as a result of the Adviser's relationship with a fund; performance and expenses of comparable funds; and the extent to which the independent Board members are fully informed about all facts the Board deems relevant bearing on the Adviser's services and fees. The Board further considered management fees (including any components thereof) charged to institutional and other clients of the Adviser for what might be viewed as like services, and the cost to the Adviser and its affiliates of supplying services pursuant to the management fee agreements, excluding any intra-corporate profit and profit margins of the Adviser and its affiliates for supplying such services. The Board was aware of these factors and was guided by them in its review of the Fund's advisory contract to the extent it considered them to be appropriate and relevant, as discussed further below.
Annual Shareholder Report35
The Board considered and weighed these circumstances in light of its substantial accumulated experience in governing the Fund and working with Federated on matters relating to the Federated funds, and was assisted in its deliberations by independent legal counsel. Throughout the year, the Board has requested and received substantial and detailed information about the Fund and the Federated organization that was in addition to the extensive materials that comprise and accompany the Senior Officer's evaluation. Federated provided much of this information at each regular meeting of the Board, and furnished additional reports in connection with the particular meeting at which the Board's formal review of the advisory contract occurred. Between regularly scheduled meetings, the Board also received information on particular matters as the need arose. Thus, the Board's consideration of the advisory contract included review of the Senior Officer's evaluation, accompanying data and additional reports covering such matters as: the Adviser's investment philosophy, revenue, profitability, personnel and processes; investment and operating strategies; the Fund's short- and long-term performance (in absolute terms, both on a gross basis and net of expenses, as well as in relationship to its particular investment program and certain competitor or “peer group” funds and/or other benchmarks, as appropriate), and comments on the reasons for performance; the Fund's investment objectives; the Fund's expenses (including the advisory fee itself and the overall expense structure of the Fund, both in absolute terms and relative to similar and/or competing funds, with due regard for contractual or voluntary expense limitations); the use and allocation of brokerage commissions derived from trading the Fund's portfolio securities (if any); and the nature, quality and extent of the advisory and other services provided to the Fund by the Adviser and its affiliates. The Board also considered the preferences and expectations of Fund shareholders and their relative sophistication; the continuing state of competition in the mutual fund industry and market practices; the range of comparable fees for similar funds in the mutual fund industry; the Fund's relationship to the Federated family of funds which include a comprehensive array of funds with different investment objectives, policies and strategies which are available for exchange without the incurrence of additional sales charges; compliance and audit reports concerning the Federated funds and the Federated companies that service them (including communications from regulatory agencies), as well as Federated's responses to any issues raised therein; and relevant developments in the mutual fund industry and how the Federated funds and/or Federated are responding to them. The Board's evaluation process is evolutionary. The criteria considered and the emphasis placed on relevant criteria change in recognition of changing circumstances in the mutual fund marketplace. With respect to the Fund's performance and expenses in particular, the Board has found the use of comparisons to other mutual funds with comparable investment programs to be particularly useful, given the high degree of competition in the mutual fund business. The Board focused on comparisons Annual Shareholder Report36
with other similar mutual funds more heavily than non-mutual fund products or services because it is believed that they are more relevant. For example, other mutual funds are the products most like the Fund, they are readily available to Fund shareholders as alternative investment vehicles, and they are the type of investment vehicle in fact chosen and maintained by the Fund's investors. The range of their fees and expenses therefore appears to be a generally reliable indication of what consumers have found to be reasonable in the precise marketplace in which the Fund competes. The Fund's ability to deliver competitive performance when compared to its peer group was a useful indicator of how the Adviser is executing the Fund's investment program, which in turn assisted the Board in reaching a conclusion that the nature, extent, and quality of the Adviser's investment management services were such as to warrant continuation of the advisory contract. In this regard, the Senior Officer has reviewed Federated's fees for providing advisory services to products outside the Federated family of funds (e.g., institutional and separate accounts). He concluded that mutual funds and institutional accounts are inherently different products. Those differences include, but are not limited to, different types of targeted investors; being subject to different laws and regulations; different legal structures; different average account sizes; different associated costs; different portfolio management techniques made necessary by different cash flows; and portfolio manager time spent in review of securities pricing. The Senior Officer did not consider these fee schedules to be determinative in judging the appropriateness of mutual fund advisory contracts.The Senior Officer reviewed reports compiled by Federated, using data supplied by independent fund ranking organizations, regarding the performance of, and fees charged by, other mutual funds, noting his view that comparisons to fund peer groups are highly important in judging the reasonableness of proposed fees.
For the one-year period covered by the report, the Fund's performance was above the median of the relevant peer group.
The Board also received financial information about Federated, including reports on the compensation and benefits Federated derived from its relationships with the Federated funds. These reports covered not only the fees under the advisory contracts, but also fees received by Federated's subsidiaries for providing other services to the Federated funds under separate contracts (e.g., for serving as the Federated funds' administrator). The reports also discussed any indirect benefit Federated may derive from its receipt of research services from brokers who execute Federated fund trades. In addition, the Board considered the fact that, in order for a fund to be competitive in the marketplace, Federated and its affiliates frequently waived fees and/or reimbursed expenses and have disclosed to fund investors and/or indicated to the Board their intention to do so in the future, where appropriate. Moreover, the Board receives regular reports regarding the institution or elimination of these voluntary waivers.
Annual Shareholder Report37
Federated furnished reports, requested by the Senior Officer, that reported revenues on a fund-by-fund basis and made estimates of the allocation of expenses on a fund-by-fund basis, using allocation methodologies specified by the Senior Officer. The Senior Officer noted that, although they may apply consistent allocation processes, the inherent difficulties in allocating costs (and the unavoidable arbitrary aspects of that exercise) and the lack of consensus on how to allocate those costs may render such allocation reports unreliable. The allocation reports were considered in the analysis by the Board but were determined to be of limited use.The Board and the Senior Officer also reviewed a report compiled by Federated comparing profitability information for Federated to other publicly held fund management companies. In this regard, the Senior Officer noted the limited availability of such information, but nonetheless concluded that Federated's profit margins did not appear to be excessive and the Board agreed.
The Senior Officer's evaluation also discussed the notion of possible realization of “economies of scale” as a fund grows larger. The Board considered in this regard that the Adviser has made significant and long-term investments in areas that support all of the Federated funds, such as personnel and processes for the portfolio management, compliance, and risk management functions; and systems technology; and that the benefits of these efforts (as well as any economies, should they exist) were likely to be enjoyed by the fund complex as a whole. Finally, the Board also noted the absence of any applicable regulatory or industry guidelines on this subject, which (as discussed in the Senior Officer's evaluation) is compounded by the lack of any common industry practice or general pattern with respect to structuring fund advisory fees with “breakpoints” that serve to reduce the fee as the fund attains a certain size. The Senior Officer did not recommend institution of breakpoints in pricing Federated's fund advisory services at this time.
It was noted in the materials for the Board meeting that for the period covered by the report, the Fund's investment advisory fee was waived in its entirety. The Board reviewed the contractual fee rate and other expenses of the Fund with the Adviser and was satisfied that the overall expense structure of the Fund remained competitive.
The Senior Officer's evaluation noted his belief that the information and observations contained in his evaluation supported a finding that the proposed management fees are reasonable, and that Federated appeared to provide appropriate administrative services to the Fund for the fees paid. Under these circumstances, no changes were recommended to, and no objection was raised to, the continuation of the Fund's advisory contract. The Board concluded that the nature, quality and scope of services provided the Fund by the Adviser and its affiliates were satisfactory.
Annual Shareholder Report38
In its decision to continue an existing investment advisory contract, the Board was mindful of the potential disruptions of the Fund's operations and various risks, uncertainties and other effects that could occur as a result of a decision to terminate or not renew an advisory contract. In particular, the Board recognized that many shareholders have invested in the Fund on the strength of the Adviser's industry standing and reputation and with the expectation that the Adviser will have a continuing role in providing advisory services to the Fund. Thus, the Board's approval of the advisory contract reflected the fact that it is the shareholders who have effectively selected the Adviser by virtue of having invested in the Fund.The Board based its decision to approve the advisory contract on the totality of the circumstances and relevant factors and with a view to past and future long-term considerations. Not all of the factors and considerations identified above were necessarily relevant to the Fund, nor did the Board consider any one of them to be determinative. With respect to the factors that were relevant, the Board's decision to approve the contract reflects its determination that Federated's performance and actions provided a satisfactory basis to support the decision to continue the existing arrangements.
Annual Shareholder Report39
Financial Highlights - Federated Inflation-Protected Securities Core Fund
(For a Share Outstanding Throughout Each Period)
| Year Ended December 31, | Period
Ended
12/31/20061 |
| 2009 | 2008 | 2007 |
| Net Asset Value, Beginning of Period | $9.99 | $10.60 | $10.00 | $10.00 |
| Income From Investment Operations: | | | | |
| Net investment income (loss) | 0.22 | 0.50 | 0.58 | (0.03)2 |
| Net realized and unrealized gain (loss) on investments and futures contracts | 0.74 | (0.46) | 0.61 | 0.04 |
| TOTAL FROM INVESTMENT OPERATIONS | 0.96 | 0.04 | 1.19 | 0.01 |
| Less Distributions: | | | | |
| Distributions from net investment income | (0.17) | (0.54) | (0.58) | (0.00)3,4 |
| Distributions from net realized gain on investments and futures contracts | — | (0.02) | (0.01) | (0.01)4 |
| Return of capital5 | — | (0.09)2 | — | — |
| TOTAL DISTRIBUTIONS | (0.17) | (0.65) | (0.59) | (0.01) |
| Net Asset Value, End of Period | $10.78 | $9.99 | $10.60 | $10.00 |
| Total Return6 | 9.69% | 0.14% | 12.34% | 0.13% |
| Ratios to Average Net Assets: | | | | |
| Net expenses | 0.05% | 0.05% | 0.05% | 0.05%7 |
| Net investment income (loss) | 2.21% | 4.14% | 5.68% | (1.69)%7 |
| Expense waiver/reimbursement8 | 1.04% | 1.96% | 7.79% | 12.34%7 |
| Supplemental Data: | | | | |
| Net assets, end of period (000 omitted) | $28,758 | $17,241 | $6,508 | $2,400 |
| Portfolio turnover | 19% | 129% | 29% | 25% |
| 1 | Reflects operations for the period from October 18, 2006 (date of initial investment) to December 31, 2006. |
| 2 | Per share numbers have been calculated using the average shares method. |
| 3 | Represents less than $0.01. |
| 4 | Certain amounts have been reclassified to permit comparison, based on the final 2006 tax return. Net assets were not affected by this reclassification. |
| 5 | Represents a return of capital for federal income tax purposes. |
| 6 | Based on net asset value, which does not reflect the sales charge, redemption fee or contingent deferred sales charge, if applicable. Total returns for periods of less than one year are not annualized. |
| 7 | Computed on an annualized basis. |
| 8 | This expense decrease is reflected in both the net expense and the net investment income (loss) ratios shown above. |
See Notes which are an integral part of the Financial Statements
Annual Shareholder Report40
Shareholder Expense Example (unaudited) -
Federated Inflation-Protected Securities Core Fund
As a shareholder of the Fund, you incur ongoing costs, including to the extent applicable, management fees, distribution (12b-1) fees and/or shareholder services fees and other Fund expenses. This Example is intended to help you to understand your ongoing costs (in dollars) of investing in the Fund and to compare these costs with the ongoing costs of investing in other mutual funds. It is based on an investment of $1,000 invested at the beginning of the period and held for the entire period from July 1, 2009 to December 31, 2009.
ACTUAL EXPENSES
The first section of the table below provides information about actual account values and actual expenses. You may use the information in this section, together with the amount you invested, to estimate the expenses that you incurred over the period. Simply divide your account value by $1,000 (for example, an $8,600 account value divided by $1,000 = 8.6), then multiply the result by the number in the first section under the heading entitled “Expenses Paid During Period” to estimate the expenses attributable to your investment during this period.
HYPOTHETICAL EXAMPLE FOR COMPARISON PURPOSES
The second section of the table below provides information about hypothetical account values and hypothetical expenses based on the Fund's actual expense ratio and an assumed rate of return of 5% per year before expenses, which is not the Fund's actual return. Thus, you should not use the hypothetical account values and expenses to estimate the actual ending account balance or your expenses for the period. Rather, these figures are required to be provided to enable you to compare the ongoing costs of investing in the Fund with other funds. To do so, compare this 5% hypothetical example with the 5% hypothetical examples that appear in the shareholder reports of the other funds.
Please note that the expenses shown in the table are meant to highlight your ongoing costs only. Therefore, the second section of the table is useful in comparing ongoing costs only, and will not help you determine the relative total costs of owning different funds.
| Beginning
Account Value
7/1/2009 | Ending
Account Value
12/31/2009 | Expenses Paid
During Period1 |
| Actual | $1,000 | $1,053.70 | $0.26 |
Hypothetical (assuming a 5% return
before expenses) | $1,000 | $1,024.95 | $0.26 |
| 1 | Expenses are equal to the Fund's annualized net expense ratio of 0.05%, multiplied by the average account value over the period, multiplied by 184/365 (to reflect the one-half-year period). |
Annual Shareholder Report41
Performance data quoted represents past performance which is no guarantee of future results. Investment return and principal value will fluctuate so that an investor's shares, when redeemed, may be worth more or less than their original cost.
Management's Discussion of Fund Performance (unaudited) - Federated Inflation-Protected Securities Core Fund
The Fund's total return, based on net asset value, for the 12-month reporting period ended December 31, 2009 was 9.69%. The total return of the Fund's benchmark, the Barclays Capital U.S. Treasury Inflation-Protected Securities Index1 (Index), was 11.41% for the same period. The Fund's total return for the most recently completed fiscal year reflected actual cash flows, transaction costs and other expenses which were not reflected in the total return of the Index.
During the period, the most significant factors affecting the Fund's performance relative to the Index were: (1) the interest rate sensitivity of the Fund relative to the Index (referred to as duration); (2) the allocation of the portfolio among securities of different maturities (referred to as the yield curve); and (3) the selection of individual securities within each sector.
MARKET OVERVIEW
The fiscal year was composed of two very different periods - one from December 31, 2008 to March 9, 2009, and another for the remainder of 2009. The first period, the end of which coincided with the nadir in the stock market, was characterized by tremendous uncertainty and fear in the financial markets. Investors flocked to the safety of government securities, with Treasury Bills at times trading at negative yields. Riskier asset classes such as equities and corporate bonds were pummeled as investors feared that massive losses at banks would result in a long and painful global recession.
| 1 | The Barclays Capital U.S. Treasury Inflation-Protected Securities Index is an unmanaged composite that tracks the broad Treasury inflation protected securities market. It is not possible to invest directly in an index. The Index is not adjusted to reflect sales charges, expenses, or other fees that the Securities and Exchange Commission requires to be reflected in the Fund's performance. The Fund's total return for the most recently completed fiscal year reflected actual cash flows, transactions costs and other expenses which were not reflected in the total return of the Index. |
Annual Shareholder Report42
Governments across the globe fought back, however, by providing support to systemically critical financial institutions, guaranteeing money market funds and providing unprecedented amounts of fiscal and monetary stimuli, including quantitative easing. The tide finally began to turn in March 2009, and the equity and credit markets rallied from that point through the end of the year. Thanks in no small part to help from the government, the economy emerged from recession in the third quarter of 2009. Job losses began to moderate, the export sector was boosted by recovering growth overseas and a weaker dollar, the manufacturing sector was helped by inventory restocking from depressed levels and the housing market showed signs of stabilization. Nonetheless, significant headwinds to economic growth remained, including growing problems in the commercial mortgage market, stagnant wage growth, high unemployment and the inability or unwillingness of banks to ramp up credit creation.Treasury inflation-protected securities began 2009 at the lowest valuations relative to nominal Treasuries in their history and proceeded to richen relative to nominal Treasuries throughout the year. This outperformance was due to reduced fears of long-term deflation, a weaker dollar, an uptick in commodity prices and increased demand from both foreign central banks and pension funds.
Fund Performance
The Fund's interest rate sensitivity, or duration, detracted from performance relative to the Index in the first nine months of 2009, but boosted relative returns in the fourth quarter, as the Fund was positioned for rising interest rates. The Fund's overweight to longer maturities and underweight to intermediate maturities detracted from returns in 2009. Early in the year, an overweight to securities with minimal principal inflation accrual helped performance, as investors valued the deflation floor in these securities.
Annual Shareholder Report43
GROWTH OF A $10,000 INVESTMENT
The graph below illustrates the hypothetical investment of $10,0001 in the Federated Inflation-Protected Securities Core Fund (the “Fund”) from October 18, 2006 (start of performance) to December 31, 2009, compared to the Barclays Capital U.S. Treasury Inflation-Protected Securities Index (BCUSTIPS).2
| Average Annual Total Returns for the Period Ended 12/31/2009 | |
| 1 Year | 9.69% |
| Start of Performance (10/18/2006) | 6.82% |
Performance data quoted represents past performance which is no guarantee of future results. Investment return and principal value will fluctuate so that an investor's shares, when redeemed, may be worth more or less than their original cost. Mutual fund performance changes over time and current performance may be lower or higher than what is stated. For current to the most recent month-end performance and after-tax returns, call 1-800-341-7400. Returns shown do not reflect the deduction of taxes that a shareholder would pay on Fund distributions or the redemption of Fund shares. Mutual funds are not obligations of or guaranteed by any bank and are not federally insured.
| 1 | Represents a hypothetical investment of $10,000 in the Fund. The Fund's performance assumes the reinvestment of all dividends and distributions. The BCUSTIPS has been adjusted to reflect reinvestment of dividends on securities in the index. |
| 2 | The BCUSTIPS is not adjusted to reflect sales loads, expenses or other fees that the Securities and Exchange Commission requires to be reflected in the Fund's performance. The index is unmanaged and, unlike the Fund, is not affected by cash flows. It is not possible to invest directly in an index. |
Annual Shareholder Report44
Portfolio of Investments Summary Table (unaudited) - Federated Inflation-Protected Securities Core Fund
At December 31, 2009, the Fund's portfolio composition1 was as follows:
| Type of Investment | Percentage of
Total Net Assets |
| U.S. Treasury Inflation-Protected Securities (TIPS) | 97.3% |
| Derivative Contracts2 | 1.1% |
| Cash Equivalents3 | 1.9% |
| Other Assets and Liabilities — Net4 | (0.3)% |
| TOTAL | 100.0% |
| 1 | See the Fund's Confidential Private Offering Memorandum for a description of the types of securities in which the Fund invests. |
| 2 | Based upon net unrealized appreciation (depreciation) or value of the derivative contracts as applicable. Derivative contracts may consist of futures, forwards, options and swaps. The impact of a derivative contract on the Fund's performance may be larger than its unrealized appreciation (depreciation) or value may indicate. In many cases, the notional value or amount of a derivative contract may provide a better indication of the contract's significance to the portfolio. More complete information regarding the Fund's direct investments in derivative contracts, including unrealized appreciation (depreciation), value and notional values or amounts of such contracts, can be found in the table at the end of the Portfolio of Investments included in this report. |
| 3 | Cash Equivalents include any investments in money market mutual funds and/or overnight repurchase agreements. |
| 4 | Assets, other than investments in securities and derivative contracts, less liabilities. See Statement of Assets and Liabilities. |
Annual Shareholder Report45
Portfolio of Investments - Federated Inflation-Protected Core Fund
December 31, 2009
Principal
Amount
or Shares | | | Value |
| | U.S. Treasury – 97.3% | |
| | Treasury Securities – 97.3% | |
| $802,767 | | U.S. Treasury Inflation — Protected Bond, 2.375%, 1/15/2025 | 847,543 |
| 1,089,140 | | U.S. Treasury Inflation — Protected Bond, 2.000%, 1/15/2026 | 1,094,623 |
| 4,746,556 | | U.S. Treasury Inflation — Protected Bond, 1.750%, 1/15/2028 | 4,552,896 |
| 1,089,090 | | U.S. Treasury Inflation — Protected Note, 2.375%, 4/15/2011 | 1,120,796 |
| 2,301,382 | | U.S. Treasury Inflation — Protected Note, 2.500%, 7/15/2016 | 2,506,881 |
| 621,020 | | U.S. Treasury Inflation — Protected Note, 3.500%, 1/15/2011 | 644,324 |
| 486,968 | | U.S. Treasury Inflation — Protected Note, 3.375%, 1/15/2012 | 520,695 |
| 1,089,140 | | U.S. Treasury Inflation — Protected Note, 2.000%, 1/15/2016 | 1,150,406 |
| 2,358,246 | | U.S. Treasury Inflation — Protected Note, 2.375%, 1/15/2017 | 2,548,026 |
| 2,373,278 | | U.S. Treasury Inflation — Protected Note, 1.625%, 1/15/2018 | 2,429,873 |
| 656,115 | | U.S. Treasury Inflation — Protected Note, 0.875%, 4/15/2010 | 658,205 |
| 941,584 | | U.S. Treasury Inflation — Protected Note, 1.875%, 7/15/2013 | 991,717 |
| 1,555,904 | | U.S. Treasury Inflation — Protected Note, 1.875%, 7/15/2015 | 1,639,597 |
| 1,265,525 | | U.S. Treasury Inflation — Protected Note, 1.875%, 7/15/2019 | 1,326,622 |
| 1,580,160 | | U.S. Treasury Inflation — Protected Note, 2.625%, 7/15/2017 | 1,738,927 |
| 1,303,198 | | U.S. Treasury Inflation — Protected Note, 1.375%, 7/15/2018 | 1,306,464 |
| 745,703 | | U.S. Treasury Inflation — Protected Note, 2.000%, 4/15/2012 | 779,488 |
| 2,096,597 | 1 | U.S. Treasury Inflation — Protected Note, 0.625%, 4/15/2013 | 2,131,662 |
| | TOTAL U.S. TREASURY
(IDENTIFIED COST $26,353,104) | 27,988,745 |
| | Mutual Fund – 1.9% | |
| 544,888 | 2,3 | Government Obligations Fund, Institutional Shares, 0.04%
(AT NET ASSET VALUE) | 544,888 |
| | TOTAL INVESTMENTS — 99.2%
(IDENTIFIED COST $26,897,992)4 | 28,533,633 |
| | OTHER ASSETS AND LIABILITIES - NET — 0.8%5 | 224,325 |
| | TOTAL NET ASSETS — 100% | $28,757,958 |
At December 31, 2009, the Fund had the following outstanding futures contracts:
| Description | Number of
Contracts | Notional
Value | Expiration
Date | Unrealized
Appreciation |
| 6U.S. Treasury Bond 30 Year Short Futures | 26 | $2,999,750 | March 2010 | $151,584 |
Annual Shareholder Report46
| Description | Number of
Contracts | Notional
Value | Expiration
Date | Unrealized
Appreciation |
| 6U.S. Treasury Note 2 Year Short Futures | 17 | $3,676,516 | March 2010 | $3,151 |
| 6U.S. Treasury Note 10 Year Short Futures | 57 | $6,580,828 | March 2010 | $150,838 |
| UNREALIZED APPRECIATION ON FUTURES CONTRACTS | $305,573 |
Unrealized Appreciation on Futures Contracts is included in “Other Assets and Liabilities — Net.”
| 1 | Pledged as collateral to ensure the Fund is able to satisfy the obligations of its outstanding futures contracts. |
| 2 | Affiliated company. |
| 3 | 7-Day net yield. |
| 4 | The cost of investments for federal tax purposes amounts to $26,917,802. |
| 5 | Assets, other than investments in securities, less liabilities. See Statement of Assets and Liabilities. |
| 6 | Non-income producing security. |
Note: The categories of investments are shown as a percentage of total net assets at December 31, 2009.
Various inputs are used in determining the value of the Fund's investments. These inputs are summarized in the three broad levels listed below:
Level 1 — quoted prices in active markets for identical securities
Level 2 — other significant observable inputs (including quoted prices for similar securities, interest rates, prepayment speeds, credit risk, etc.)
Level 3 — significant unobservable inputs (including the Fund's own assumptions in determining the fair value of investments)
The inputs or methodology used for valuing securities are not an indication of the risk associated with investing in those securities.
The following is a summary of the inputs used, as of December 31, 2009, in valuing the Fund's assets carried at fair value:
| Valuation Inputs | | | | |
| Level 1 -
Quoted
Prices and
Investments in
Mutual Funds | Level 2 -
Other
Significant
Observable
Inputs | Level 3 -
Significant
Unobservable
Inputs | Total |
| Debt Securities: | | | | |
| U.S. Treasury | $ — | $27,988,745 | $ — | $27,988,745 |
| Mutual Fund | 544,888 | — | — | 544,888 |
| TOTAL SECURITIES | $544,888 | $27,988,745 | $ — | $28,533,633 |
| OTHER FINANCIAL INSTRUMENTS* | $305,573 | $ — | $ — | $305,573 |
| * | Other financial instruments include futures contracts. |
See Notes which are an integral part of the Financial Statements
Annual Shareholder Report47
Statement of Assets and Liabilities - Federated Inflation-Protected Securities Core Fund
December 31, 2009
| Assets: | | |
Total investments in securities, at value including $544,888 of investments in an affiliated issuer (Note 5)
(identified cost $26,897,992) | | $28,533,633 |
| Income receivable | | 228,017 |
| Receivable for daily variation margin | | 38,453 |
| TOTAL ASSETS | | 28,800,103 |
| Liabilities: | | |
| Payable for custodian fees | $1,616 | |
| Payable for transfer and dividend disbursing agent fees and expenses | 3,411 | |
| Payable for Directors'/Trustees' fees | 1,144 | |
| Payable for auditing fees | 23,569 | |
| Payable for portfolio accounting fees | 11,101 | |
| Accrued expenses | 1,304 | |
| TOTAL LIABILITIES | | 42,145 |
| Net assets for 2,666,677 shares outstanding | | $28,757,958 |
| Net Assets Consist of: | | |
| Paid-in capital | | $27,977,131 |
| Net unrealized appreciation of investments and futures contracts | | 1,941,214 |
| Accumulated net realized loss on investments and futures contracts | | (1,186,019) |
| Undistributed net investment income | | 25,632 |
| TOTAL NET ASSETS | | $28,757,958 |
| Net Asset Value, Offering Price and Redemption Proceeds Per Share: | | |
| $28,757,958 ÷ 2,666,677 shares outstanding, no par value, unlimited shares authorized | | $10.78 |
See Notes which are an integral part of the Financial Statements
Annual Shareholder Report48
Statement of Operations - Federated Inflation-Protected Securities Core Fund
Year Ended December 31, 2009
| Investment Income: | | | |
| Dividends received from an affiliated issuer (Note 5) | | | $1,500 |
| Interest (net of TIPS deflation adjustment) | | | 516,169 |
| TOTAL INCOME | | | 517,669 |
| Expenses: | | | |
| Administrative personnel and services fee (Note 5) | | $150,000 | |
| Custodian fees | | 5,762 | |
| Transfer and dividend disbursing agent fees and expenses | | 13,125 | |
| Directors'/Trustees' fees | | 3,694 | |
| Auditing fees | | 23,600 | |
| Legal fees | | 6,838 | |
| Portfolio accounting fees | | 43,219 | |
| Insurance premiums | | 4,059 | |
| Miscellaneous | | 35 | |
| TOTAL EXPENSES | | 250,332 | |
| Waiver and Reimbursement (Note 5): | | | |
| Waiver of administrative personnel and services fee | $(150,000) | | |
| Reimbursement of other operating expenses | (87,805) | | |
| TOTAL WAIVER AND REIMBURSEMENT | | (237,805) | |
| Net expenses | | | 12,527 |
| Net investment income | | | 505,142 |
| Realized and Unrealized Gain (Loss) on Investments and Futures Contracts: | | | |
| Net realized loss on investments | | | (15,600) |
| Net realized loss on futures contracts | | | (141,563) |
| Net change in unrealized appreciation of investments | | | 1,543,944 |
| Net change in unrealized depreciation of futures contracts | | | 340,642 |
| Net realized and unrealized gain on investments and futures contracts | | | 1,727,423 |
| Change in net assets resulting from operations | | | $2,232,565 |
See Notes which are an integral part of the Financial Statements
Annual Shareholder Report49
Statement of Changes in Net Assets - Federated Inflation-Protected Securities Core Fund
| Year Ended December 31 | 2009 | 2008 |
| Increase (Decrease) in Net Assets | | |
| Operations: | | |
| Net investment income | $505,142 | $544,146 |
| Net realized loss on investments and futures contracts | (157,163) | (1,026,805) |
| Net change in unrealized appreciation/depreciation of investments and futures contracts | 1,884,586 | (106,159) |
| CHANGE IN NET ASSETS RESULTING FROM OPERATIONS | 2,232,565 | (588,818) |
| Distributions to Shareholders: | | |
| Distributions from net investment income | (415,644) | (608,474) |
| Distributions from net realized gain on investments and futures contracts | — | (19,058) |
| Return of capital | — | (119,815) |
| CHANGE IN NET ASSETS RESULTING FROM DISTRIBUTIONS TO SHAREHOLDERS | (415,644) | (747,347) |
| Share Transactions: | | |
| Proceeds from sale of shares | 12,500,000 | 18,550,000 |
| Net asset value of shares issued to shareholders in payment of distributions declared | — | 19,067 |
| Cost of shares redeemed | (2,800,000) | (6,500,000) |
| CHANGE IN NET ASSETS RESULTING FROM SHARE TRANSACTIONS | 9,700,000 | 12,069,067 |
| Change in net assets | 11,516,921 | 10,732,902 |
| Net Assets: | | |
| Beginning of period | 17,241,037 | 6,508,135 |
| End of period (including undistributed (distributions in excess of) net investment income of $25,632 and $(64,328), respectively) | $28,757,958 | $17,241,037 |
See Notes which are an integral part of the Financial Statements
Annual Shareholder Report50
Notes to Financial Statements - Federated Inflation-Protected Securities Core Fund
December 31, 2009
1. ORGANIZATION
Federated Core Trust (the “Trust”) is registered under the Investment Company Act of 1940, as amended (the “Act”), as an open-end management investment company. The Trust consists of four diversified portfolios. The financial statements included herein are only those of Federated Inflation-Protected Securities Core Fund (the “Fund”). The financial statements of the other portfolios are presented separately. The assets of each portfolio are segregated and a shareholder's interest is limited to the portfolio in which shares are held. Each portfolio pays its own expenses. The Fund's investment objective is to provide total return. Currently, Shares of the Fund are being offered for investment only to investment companies, or insurance company separate accounts, common or commingled trust funds or similar organizations or entities that are “accredited investors” within the meaning of Regulation D of the Securities Act of 1933.
2. SIGNIFICANT ACCOUNTING POLICIES
The following is a summary of significant accounting policies consistently followed by the Fund in the preparation of its financial statements. These policies are in conformity with U.S. generally accepted accounting principles (GAAP).
Investment Valuation
In calculating its net asset value (NAV), the Fund generally values investments as follows:
- Fixed-income securities acquired with remaining maturities greater than 60 days are fair valued using price evaluations provided by a pricing service approved by the Board of Trustees (the “Trustees”).
- Fixed-income securities acquired with remaining maturities of 60 days or less are valued at their cost (adjusted for the accretion of any discount or amortization of any premium).
- Shares of other mutual funds are valued based upon their reported NAVs.
- Derivative contracts listed on exchanges are valued at their reported settlement or closing price.
- Over-the-counter (OTC) derivative contracts are fair valued using price evaluations provided by a pricing service approved by the Trustees.
If the Fund cannot obtain a price or price evaluation from a pricing service for an investment, the Fund may attempt to value the investment based upon the mean of bid and asked quotations or fair value the investment based on price evaluations, from one or more dealers. If any price, quotation, price evaluation or other pricing source is not readily available when the NAV is calculated, the Fund uses the fair value of the investment determined in accordance with the procedures described below. There can be no assurance that the Fund could purchase or sell an investment at the price used to calculate the Fund's NAV.
Fair Valuation and Significant Events Procedures
The Trustees have authorized the use of pricing services to provide evaluations of the current fair value of certain investments for purposes of calculating the NAV. Factors considered by pricing services in evaluating an investment include the yields or prices of investments of comparable quality, coupon, maturity, call rights and other potential prepayments, terms and type, reported transactions, indications as to values from dealers and general market Annual Shareholder Report51
conditions. Some pricing services provide a single price evaluation reflecting the bid-side of the market for an investment (a “bid” evaluation). Other pricing services offer both bid evaluations and price evaluations indicative of a price between the prices bid and asked for the investment (a “mid” evaluation). The Fund normally uses bid evaluations for U.S. Treasury and Agency securities, mortgage-backed securities and municipal securities. The Fund normally uses mid evaluations for other types of fixed-income securities and OTC derivative contracts. In the event that market quotations and price evaluations are not available for an investment, the fair value of the investment is determined in accordance with procedures adopted by the Trustees.The Trustees also have adopted procedures requiring an investment to be priced at its fair value whenever the Adviser determines that a significant event affecting the value of the investment has occurred between the time as of which the price of the investment would otherwise be determined and the time as of which the NAV is computed. An event is considered significant if there is both an affirmative expectation that the investment's value will change in response to the event and a reasonable basis for quantifying the resulting change in value. Examples of significant events that may occur after the close of the principal market on which a security is traded, or after the time of a price evaluation provided by a pricing service or a dealer, include:
- With respect to price evaluations of fixed-income securities determined before the close of regular trading on the NYSE, actions by the Federal Reserve Open Market Committee and other significant trends in U.S. fixed-income markets;
- Political or other developments affecting the economy or markets in which an issuer conducts its operations or its securities are traded; and
- Announcements concerning matters such as acquisitions, recapitalizations, litigation developments, a natural disaster affecting the issuer's operations or regulatory changes or market developments affecting the issuer's industry.
For other significant events, the Fund may seek to obtain more current quotations or price evaluations from alternative pricing sources. If a reliable alternative pricing source is not available, the Fund will determine the fair value of the investment using another method approved by the Trustees.
Repurchase Agreements
It is the policy of the Fund to require the other party to a repurchase agreement to transfer to the Fund's custodian or sub-custodian eligible securities or cash with a market value (after transaction costs) at least equal to the repurchase price to be paid under the repurchase agreement. The eligible securities are transferred to accounts with the custodian or sub-custodian in which the Fund holds a “securities entitlement” and exercises “control” as those terms are defined in the Uniform Commercial Code. The Fund has established procedures for monitoring the market value of the transferred securities and requiring the transfer of additional eligible securities if necessary to equal at least the repurchase price. These procedures also allow the other party to require securities to be transferred from the account to the extent that their market value exceeds the repurchase price or in exchange for other eligible securities of equivalent market value.
With respect to agreements to repurchase U.S. government securities and cash items, the Fund treats the repurchase agreement as an investment in the underlying securities and not as an obligation of the other party to the repurchase agreement. Other repurchase agreements are treated as obligations of the other party secured by the underlying securities. Nevertheless, the insolvency of the other party or other failure to repurchase the securities Annual Shareholder Report52
may delay the disposition of the underlying securities or cause the Fund to receive less than the full repurchase price. Under the terms of the repurchase agreement, any amounts received by the Fund in excess of the repurchase price and related transaction costs must be remitted to the other party.The Fund may enter into repurchase agreements in which eligible securities are transferred into joint trading accounts maintained by the custodian or sub-custodian for investment companies and other clients advised by the Fund's Adviser and its affiliates. The Fund will participate on a pro rata basis with the other investment companies and clients in its share of the securities transferred under such repurchase agreements and in its share of proceeds from any repurchase or other disposition of such securities.
Investment Income, Expenses and Distributions
Investment transactions are accounted for on a trade-date basis. Realized gains and losses from investment transactions are recorded on an identified-cost basis. Interest income and expenses are accrued daily. Dividend income and distributions to shareholders are recorded on the ex-dividend date. Positive or negative inflation adjustments on Treasury Inflation-Protected Securities (TIPS) are included in interest income. Distributions of net investment income, if any, are declared and paid quarterly.
Premium and Discount Amortization
All premiums and discounts on fixed-income securities are amortized/accreted for financial statement purposes.
Federal Taxes
It is the Fund's policy to comply with the Subchapter M provision of the Internal Revenue Code (the “Code”) and to distribute to shareholders each year substantially all of its income. Accordingly, no provision for federal income tax is necessary. As of and during the year ended December 31, 2009, the Fund did not have a liability for any uncertain tax positions. The Fund recognizes interest and penalties, if any, related to tax liabilities as income tax expense in the Statement of Operations. As of December 31, 2009, tax years 2006 through 2009 remain subject to examination by the Fund's major tax jurisdictions, which include the United States of America and the Commonwealth of Massachusetts.
When-Issued and Delayed Delivery Transactions
The Fund may engage in when-issued or delayed delivery transactions. The Fund records when-issued securities on the trade date and maintains security positions such that sufficient liquid assets will be available to make payment for the securities purchased. Securities purchased on a when-issued or delayed delivery basis are marked to market daily and begin earning interest on the settlement date. Losses may occur on these transactions due to changes in market conditions or the failure of counterparties to perform under the contract.
Futures Contracts
The Fund purchases financial futures contracts to manage cash flows, enhance yield and to potentially reduce transaction costs. Upon entering into a futures contract with a broker, the Fund is required to deposit in a segregated account a specified amount of cash or U.S. government securities. Futures contracts are valued daily and unrealized gains or losses are recorded in a “variation margin” account. Daily, the Fund receives from or pays to the broker a specified amount of cash based upon changes in the variation margin account. When a contract is closed, the Fund recognizes a realized gain or loss. Futures contracts have market Annual Shareholder Report53
risks, including the risk that the change in the value of the contract may not correlate with the changes in the value of the underlying securities. There is minimal counterparty risk to the Fund since futures are exchange traded and the exchange's clearinghouse, as counterparty to all exchange traded futures, guarantees the futures against default.Futures contracts outstanding at period end are listed after the Fund's Portfolio of Investments.
Additional Disclosure Related to Derivative Instruments
Fair Value of Derivative Instruments
| Asset | | Liability | |
| Statement of
Assets and
Liabilities
Location | Fair
Value | Statement of
Assets and
Liabilities
Location | Fair
Value |
| Derivatives not accounted for as hedging instruments under ASC Topic 815 | | | | |
| Interest rate contracts | Receivable for daily variation margin | $305,573* | — | $ — |
| * | Includes cumulative appreciation/depreciation of futures contracts as reported in the footnotes to the Portfolio of Investments. Only the current day's variation margin is reported within the Statement of Assets and Liabilities. |
The Effect of Derivative Instruments on the Statement of Operations for the Year Ended December 31, 2009
| Amount of Realized Gain or (Loss) on Derivatives Recognized in Income |
| Futures |
| Interest rate contracts | $(141,563) |
| Change in Unrealized Appreciation or (Depreciation) on Derivatives Recognized in Income |
| Futures |
| Interest rate contracts | $340,642 |
Other
The preparation of financial statements in conformity with GAAP requires management to make estimates and assumptions that affect the amounts of assets, liabilities, expenses and revenues reported in the financial statements. Actual results could differ from those estimated.
Annual Shareholder Report54
3. SHARES OF BENEFICIAL INTERESTThe following table summarizes share activity:
| Year Ended December 31 | 2009 | 2008 |
| Shares sold | 1,213,212 | 1,731,664 |
| Shares issued to shareholders in payment of distributions declared | — | 1,700 |
| Shares redeemed | (272,685) | (621,198) |
| NET CHANGE RESULTING FROM FUND SHARE TRANSACTIONS | 940,527 | 1,112,166 |
4. FEDERAL TAX INFORMATION
The timing and character of income and capital gain distributions are determined in accordance with income tax regulations, which may differ from GAAP. These differences are due in part to differing treatments for TIPS.
For the year ended December 31, 2009, permanent differences identified and reclassified among the components of net assets were as follows:
| Increase (Decrease) |
| Paid-In Capital | Undistributed
Net Investment
Income (Loss) | Accumulated
Net Realized
Gain (Loss) |
| $(197) | $462 | $(265) |
Net investment income (loss), net realized gains (losses) and net assets were not affected by this reclassification.
The tax character of distributions as reported on the Statement of Changes in Net Assets for the years ended December 31, 2009 and 2008, was as follows:
| 2009 | 2008 |
| Ordinary income1 | $415,644 | $617,279 |
| Long-term capital gains | $ — | $10,253 |
| Return of capital | $ — | $119,815 |
| 1 | For tax purposes, short-term capital gain distributions are considered ordinary income distributions. |
As of December 31, 2009, the components of distributable earnings on a tax basis were as follows:
| Undistributed ordinary income | $25,632 |
| Net unrealized appreciation | $1,615,831 |
| Capital loss carryforwards | $(860,636) |
The difference between book-basis and tax-basis net unrealized appreciation/depreciation to differing treatments for the deferral of losses on wash sales.
At December 31, 2009, the cost of investments for federal tax purposes was $26,917,802. The net unrealized appreciation of investments for federal tax purposes excluding any unrealized appreciation resulting from futures contracts was $1,615,831. This consists of net unrealized appreciation from investments for those securities having an excess of value over cost of $1,625,929 and net unrealized depreciation from investments for those securities having an excess of cost over value of $10,098.
Annual Shareholder Report55
At December 31, 2009, the Fund had a capital loss carryforward of $860,636 which will reduce the Fund's taxable income arising from future net realized gains on investments, if any, to the extent permitted by the Code and thus will reduce the amount of distributions to shareholders which would otherwise be necessary to relieve the Fund of any liability for federal income tax. Pursuant to the Code, such capital loss carryforward will expire in 2016.The Fund used capital loss carryforwards of $190,160 to offset taxable capital gains realized during the year ended December 31, 2009.
5. INVESTMENT ADVISER FEE AND OTHER TRANSACTIONS WITH AFFILIATES
Investment Adviser Fee
Federated Investment Management Company is the Fund's investment adviser (the “Adviser”), subject to direction of the Trustees. The Adviser provides investment adviser services at no fee, because all investors in the Fund are other Federated funds, insurance company separate accounts, common or commingled trust funds or similar organizations or entities that are “accredited investors” within the meaning of Regulation D of the 1933 Act.
The Adviser may voluntarily choose to reimburse certain operating expenses of the Fund. The Adviser can modify or terminate this voluntary reimbursement at any time at its sole discretion. For the year ended December 31, 2009, the Adviser voluntarily reimbursed $87,805 of other operating expenses.
Administrative Fee
Federated Administrative Services (FAS), under the Administrative Services Agreement, provides the Fund with administrative personnel and services. The fee paid to FAS is based on the average aggregate daily net assets of certain Federated funds as specified below:
| Administrative Fee | Average Aggregate Daily Net Assets
of the Federated Funds |
| 0.150% | on the first $5 billion |
| 0.125% | on the next $5 billion |
| 0.100% | on the next $10 billion |
| 0.075% | on assets in excess of $20 billion |
The administrative fee received during any fiscal year shall be at least $150,000 per portfolio and $40,000 per each additional class of Shares. FAS may voluntarily choose to waive any portion of its fee. FAS can modify or terminate this voluntary waiver at any time at its sole discretion. For the year ended December 31, 2009, FAS waived its entire fee of $150,000.
General
Certain Officers and Trustees of the Fund are Officers and Directors or Trustees of the above companies.
Annual Shareholder Report56
Transactions with Affiliated Companies and Affiliated HoldingsAffiliated holdings are mutual funds which are managed by the Adviser or an affiliate of the Adviser. Transactions with the affiliated company during the year ended December 31, 2009 were as follows:
| Affiliate | Balance of
Shares Held
12/31/2008 | Purchases/
Additions | Sales/
Reductions | Balance of
Shares Held
12/31/2009 | Value | Dividend
Income |
| Government Obligations Fund, Institutional Shares | 1,395,650 | 6,591,884 | 7,442,646 | 544,888 | $544,888 | $1,500 |
6. LINE OF CREDIT
The Fund participates in a $100,000,000 unsecured, uncommitted revolving line of credit (LOC) agreement with PNC Bank. The LOC was made available for extraordinary or emergency purposes, primarily for financing redemption payments. Borrowings are charged interest at a rate offered to the Fund by PNC Bank at the time of the borrowing. As of December 31, 2009, there were no outstanding loans. During the year ended December 31, 2009, the Fund did not utilize the LOC.
7. INTERFUND LENDING
Pursuant to an Exemptive Order issued by the Securities and Exchange Commission (SEC), the Fund, along with other funds advised by subsidiaries of Federated Investors, Inc., may participate in an interfund lending program. This program provides an alternative credit facility allowing the Fund to borrow from other participating affiliated funds. As of December 31, 2009, there were no outstanding loans. During the year ended December 31, 2009, the program was not utilized.
8. Legal Proceedings
Since October 2003, Federated Investors, Inc. and related entities (collectively, “Federated”) and various Federated funds (“Federated Funds”) have been named as defendants in several class action lawsuits now pending in the United States District Court for the District of Maryland. The lawsuits were purportedly filed on behalf of people who purchased, owned and/or redeemed shares of Federated-sponsored mutual funds during specified periods beginning November 1, 1998. The suits are generally similar in alleging that Federated engaged in illegal and improper trading practices including market timing and late trading in concert with certain institutional traders, which allegedly caused financial injury to the mutual fund shareholders. These lawsuits began to be filed shortly after Federated's first public announcement that it had received requests for information on shareholder trading activities in the Federated Funds from the SEC, the Office of the New York State Attorney General (“NYAG”) and other authorities. In that regard, on November 28, 2005, Federated announced that it had reached final settlements with the SEC and the NYAG with respect to those matters. As Federated previously reported in 2004, it has already paid approximately $8.0 million to certain funds as determined by an independent consultant. As part of these settlements, Federated agreed to pay for the benefit of fund shareholders additional disgorgement and a civil money penalty in the aggregate amount of an additional $72 million. Federated entities have also been named as defendants in several additional lawsuits that are now pending in the United States District Court for the Western District of Pennsylvania, alleging, among other things, excessive advisory and Rule 12b-1 fees. The Board of the Federated Funds retained the Annual Shareholder Report57
law firm of Dickstein Shapiro LLP to represent the Federated Funds in these lawsuits. Federated and the Federated Funds, and their respective counsel have been defending this litigation, and none of the Federated Funds remains a defendant in any of the lawsuits (though some could potentially receive any recoveries as nominal defendants). Additional lawsuits based upon similar allegations may be filed in the future. The potential impact of these lawsuits, all of which seek unquantified damages, attorneys' fees and expenses, and future potential similar suits is uncertain. Although we do not believe that these lawsuits will have a material adverse effect on the Federated Funds, there can be no assurance that these suits, the ongoing adverse publicity and/or other developments resulting from the regulatory investigations will not result in increased Federated Fund redemptions, reduced sales of Federated Fund shares, or other adverse consequences for the Federated Funds.9. Subsequent events
Management has evaluated subsequent events through February 22, 2010, the date the financial statements were issued, and determined that no events have occurred that require additional disclosure.
Annual Shareholder Report58
Report of Independent Registered Public Accounting Firm
TO THE BOARD OF Trustees of Federated Core trust AND SHAREHOLDERS OF Federated Inflation-Protected Securities Core Fund:
We have audited the accompanying statement of assets and liabilities of Federated Inflation-Protected Securities Core Fund (the “Fund”) (one of the portfolios constituting Federated Core Trust), including the portfolio of investments, as of December 31, 2009, and the related statement of operations for the year then ended, the statement of changes in net assets for each of the two years in the period then ended, and the financial highlights for each of the periods indicated therein. These financial statements and financial highlights are the responsibility of the Fund's management. Our responsibility is to express an opinion on these financial statements and financial highlights based on our audits.
We conducted our audits in accordance with standards of the Public Company Accounting Oversight Board (United States). Those standards require that we plan and perform the audit to obtain reasonable assurance about whether the financial statements and financial highlights are free of material misstatement. We were not engaged to perform an audit of the Fund's internal control over financial reporting. Our audits included consideration of internal control over financial reporting as a basis for designing audit procedures that are appropriate in the circumstances, but not for the purpose of expressing an opinion on the effectiveness of the Fund's internal control over financial reporting. Accordingly, we express no such opinion. An audit also includes examining, on a test basis, evidence supporting the amounts and disclosures in the financial statements and financial highlights, assessing the accounting principles used and significant estimates made by management, and evaluating the overall financial statement presentation. Our procedures included confirmation of securities owned as of December 31, 2009, by correspondence with the custodian and brokers. We believe that our audits provide a reasonable basis for our opinion.
In our opinion, the financial statements and financial highlights referred to above present fairly, in all material respects, the financial position of Federated Inflation-Protected Securities Core Fund, a portfolio of Federated Core Trust, at December 31, 2009, the results of its operations for the year then ended, the changes in its net assets for each of the two years in the period then ended, and the financial highlights for each of the periods indicated therein, in conformity with U.S. generally accepted accounting principles.
Boston, Massachusetts
February 22, 2010
Annual Shareholder Report59
Voting Proxies on Fund Portfolio Securities
A description of the policies and procedures that the Fund uses to determine how to vote proxies, if any, relating to securities held in the Fund's portfolio is available, without charge and upon request, by calling 1-800-341-7400. A report on “Form N-PX” of how the Fund voted any such proxies during the most recent 12-month period ended June 30 is available from Federated's Web site at FederatedInvestors.com. To access this information from the “Products” section of the Web site, click on the “Prospectuses and Regulatory Reports” link under “Related Information,” then select the appropriate link opposite the name of the Fund; or select the name of the Fund and from the Fund's page, click on the “Prospectuses and Regulatory Reports” link. Form N-PX filings are also available at the SEC's Web site at www.sec.gov.
Quarterly Portfolio Schedule
The Fund files with the SEC a complete schedule of its portfolio holdings, as of the close of the first and third quarters of its fiscal year, on “Form N-Q.” These filings are available on the SEC's Web site at www.sec.gov and may be reviewed and copied at the SEC's Public Reference Room in Washington, DC. (Call 1-800-SEC-0330 for information on the operation of the Public Reference Room.) You may also access this information from the “Products” section of Federated's Web site at FederatedInvestors.com by clicking on “Portfolio Holdings” under “Related Information,” then selecting the appropriate link opposite the name of the Fund; or select the name of the Fund and from the Fund's page, click on the “Portfolio Holdings” link.
Annual Shareholder Report60
Mutual funds are not bank deposits or obligations, are not guaranteed by any bank and are not insured or guaranteed by the U.S. government, the Federal Deposit Insurance Corporation, the Federal Reserve Board or any other government agency. Investment in mutual funds involves investment risk, including the possible loss of principal.
This Report is authorized for distribution to prospective investors only when preceded or accompanied by the Fund's Prospectus, which contains facts concerning its objective and policies, management fees, expenses and other information.
Federated Real Return Bond Fund
Federated Investors Funds
4000 Ericsson Drive
Warrendale, PA 15086-7561
Contact us at FederatedInvestors.com
or call 1-800-341-7400.
Federated Securities Corp., Distributor
Cusip 31420C779
Cusip 31420C761
Cusip 31420C753
36727 (5/10)
Federated is a registered mark of Federated Investors, Inc.
2010 Federated Investors, Inc.
Item 2. Code of Ethics
(a) As of the end of the period covered by this report, the registrant has adopted a code of ethics (the "Section 406 Standards for Investment Companies - Ethical Standards for Principal Executive and Financial Officers") that applies to the registrant's Principal Executive Officer and Principal Financial Officer; the registrant's Principal Financial Officer also serves as the Principal Accounting Officer.
(c) Not Applicable
(d) Not Applicable
(e) Not Applicable
(f)(3) The registrant hereby undertakes to provide any person, without charge, upon request, a copy of the code of ethics. To request a copy of the code of ethics, contact the registrant at 1-800-341-7400, and ask for a copy of the Section 406 Standards for Investment Companies - Ethical Standards for Principal Executive and Financial Officers.
Item 3. Audit Committee Financial Expert
The registrant's Board has determined that each of the following members of the Board's Audit Committee is an “audit committee financial expert,” and is "independent," for purposes of this Item: Nicholas P. Constantakis, Charles F. Mansfield, Jr. and Thomas M. O’Neill.
Item 4. Principal Accountant Fees and Services
(a) Audit Fees billed to the registrant for the two most recent fiscal years:
Fiscal year ended 2010 - $187,500
Fiscal year ended 2009 - $171,600
(b) Audit-Related Fees billed to the registrant for the two most recent fiscal years:
Fiscal year ended 2010 - $156
Fiscal year ended 2009 - $0
Audit Committee Meeting.
Amount requiring approval of the registrant’s audit committee pursuant to paragraph (c)(7)(ii) of Rule 2-01 of Regulation S-X, $0 and $3,805 respectively. Fiscal year ended 2009- Audit consent fee for N-14 merger document.
(c) Tax Fees billed to the registrant for the two most recent fiscal years:
Fiscal year ended 2010 - $0
Fiscal year ended 2009 - $0
Amount requiring approval of the registrant’s audit committee pursuant to paragraph (c)(7)(ii) of Rule 2-01 of Regulation S-X, $0 and $0 respectively.
(d) All Other Fees billed to the registrant for the two most recent fiscal years:
Fiscal year ended 2010 - $0
Fiscal year ended 2009 - $0
Amount requiring approval of the registrant’s audit committee pursuant to paragraph (c)(7)(ii) of Rule 2-01 of Regulation S-X, $54,143 and $24,206 respectively. Fiscal year ended 2010- Fees related to technical assistance and valuation matters for fund acquisitions and service fee for analysis of potential Passive Foreign Investment Company holdings. Fiscal year ended 2009- Fees related to technical assistance and valuation matters for fund acquisitions, service fee for analysis of potential Passive Foreign Investment Company holdings and discussions related to accounting for REMICs.
(e)(1) Audit Committee Policies regarding Pre-approval of Services.
The Audit Committee is required to pre-approve audit and non-audit services performed by the independent auditor in order to assure that the provision of such services do not impair the auditor’s independence. Unless a type of service to be provided by the independent auditor has received general pre-approval, it will require specific pre-approval by the Audit Committee. Any proposed services exceeding pre-approved cost levels will require specific pre-approval by the Audit Committee.
Certain services have the general pre-approval of the Audit Committee. The term of the general pre-approval is 12 months from the date of pre-approval, unless the Audit Committee specifically provides for a different period. The Audit Committee will annually review the services that may be provided by the independent auditor without obtaining specific pre-approval from the Audit Committee and may grant general pre-approval for such services. The Audit Committee will revise the list of general pre-approved services from time to time, based on subsequent determinations. The Audit Committee will not delegate its responsibilities to pre-approve services performed by the independent auditor to management.
The Audit Committee has delegated pre-approval authority to its Chairman. The Chairman will report any pre-approval decisions to the Audit Committee at its next scheduled meeting. The Committee will designate another member with such pre-approval authority when the Chairman is unavailable.
AUDIT SERVICES
The annual Audit services engagement terms and fees will be subject to the specific pre-approval of the Audit Committee. The Audit Committee must approve any changes in terms, conditions and fees resulting from changes in audit scope, registered investment company (RIC) structure or other matters.
In addition to the annual Audit services engagement specifically approved by the Audit Committee, the Audit Committee may grant general pre-approval for other Audit Services, which are those services that only the independent auditor reasonably can provide. The Audit Committee has pre-approved certain Audit services, all other Audit services must be specifically pre-approved by the Audit Committee.
AUDIT-RELATED SERVICES
Audit-related services are assurance and related services that are reasonably related to the performance of the audit or review of the Company’s financial statements or that are traditionally performed by the independent auditor. The Audit Committee believes that the provision of Audit-related services does not impair the independence of the auditor, and has pre-approved certain Audit-related services, all other Audit-related services must be specifically pre-approved by the Audit Committee.
TAX SERVICES
The Audit Committee believes that the independent auditor can provide Tax services to the Company such as tax compliance, tax planning and tax advice without impairing the auditor’s independence. However, the Audit Committee will not permit the retention of the independent auditor in connection with a transaction initially recommended by the independent auditor, the purpose of which may be tax avoidance and the tax treatment of which may not be supported in the Internal Revenue Code and related regulations. The Audit Committee has pre-approved certain Tax services, all Tax services involving large and complex transactions must be specifically pre-approved by the Audit Committee.
ALL OTHER SERVICES
With respect to the provision of services other than audit, review or attest services the pre-approval requirement is waived if:
| (1) | The aggregate amount of all such services provided constitutes no more than five percent of the total amount of revenues paid by the registrant, the registrant’s adviser (not including any sub-adviser whose role is primarily portfolio management and is subcontracted with or overseen by another investment adviser), and any entity controlling, controlled by, or under common control with the investment adviser that provides ongoing services to the registrant to its accountant during the fiscal year in which the services are provided; |
| (2) | Such services were not recognized by the registrant, the registrant’s adviser (not including any sub-adviser whose role is primarily portfolio management and is subcontracted with or overseen by another investment adviser), and any entity controlling, controlled by, or under common control with the investment adviser that provides ongoing services to the registrant at the time of the engagement to be non-audit services; and |
| (3) | Such services are promptly brought to the attention of the Audit Committee of the issuer and approved prior to the completion of the audit by the Audit Committee or by one or more members of the Audit Committee who are members of the board of directors to whom authority to grant such approvals has been delegated by the Audit Committee. |
The Audit Committee may grant general pre-approval to those permissible non-audit services classified as All Other services that it believes are routine and recurring services, and would not impair the independence of the auditor.
The SEC’s rules and relevant guidance should be consulted to determine the precise definitions of prohibited non-audit services and the applicability of exceptions to certain of the prohibitions.
PRE-APPROVAL FEE LEVELS
Pre-approval fee levels for all services to be provided by the independent auditor will be established annually by the Audit Committee. Any proposed services exceeding these levels will require specific pre-approval by the Audit Committee.
PROCEDURES
Requests or applications to provide services that require specific approval by the Audit Committee will be submitted to the Audit Committee by both the independent auditor and the Principal Accounting Officer and/or Internal Auditor, and must include a joint statement as to whether, in their view, the request or application is consistent with the SEC’s rules on auditor independence.
(e)(2) Percentage of services identified in items 4(b) through 4(d) that were approved by the registrants audit committee pursuant to paragraph (c)(7)(i)(C) of Rule 2-01 of Regulation S-X:
4(b)
Fiscal year ended 2010 – 0%
Fiscal year ended 2009 - 0%
Percentage of services provided to the registrants investment adviser and any entity controlling, controlled by, or under common control with the investment adviser that provides ongoing services to the registrant that were approved by the registrants audit committee pursuant to paragraph (c)(7)(i)(C) of Rule 2-01 of Regulation S-X, 0% and 0% respectively.
4(c)
Fiscal year ended 2010 – 0%
Fiscal year ended 2009 – 0%
Percentage of services provided to the registrants investment adviser and any entity controlling, controlled by, or under common control with the investment adviser that provides ongoing services to the registrant that were approved by the registrants audit committee pursuant to paragraph (c)(7)(i)(C) of Rule 2-01 of Regulation S-X, 0% and 0% respectively.
4(d)
Fiscal year ended 2010 – 0%
Fiscal year ended 2009 – 0%
Percentage of services provided to the registrants investment adviser and any entity controlling, controlled by, or under common control with the investment adviser that provides ongoing services to the registrant that were approved by the registrants audit committee pursuant to paragraph (c)(7)(i)(C) of Rule 2-01 of Regulation S-X, 0% and 0% respectively.
| (g) | Non-Audit Fees billed to the registrant, the registrant’s investment adviser, and certain entities controlling, controlled by or under common control with the investment adviser: |
Fiscal year ended 2010 - $481,931
Fiscal year ended 2009 - $294,678
(h) The registrant’s Audit Committee has considered that the provision of non-audit services that were rendered to the registrant’s adviser (not including any sub-adviser whose role is primarily portfolio management and is subcontracted with or overseen by another investment adviser), and any entity controlling, controlled by, or under common control with the investment adviser that provides ongoing services to the registrant that were not pre-approved pursuant to paragraph (c)(7)(ii) of Rule 2-01 of Regulation S-X is compatible with maintaining the principal accountant’s independence.
Item 5. Audit Committee of Listed Registrants
Not Applicable
Item 6. Schedule of Investments
Not Applicable
| Item 7. | Disclosure of Proxy Voting Policies and Procedures for Closed-End Management Investment Companies |
| Item 8. | Portfolio Managers of Closed-End Management Investment Companies |
| Item 9. | Purchases of Equity Securities by Closed-End Management Investment Company and Affiliated Purchasers |
Item 10. Submission of Matters to a Vote of Security Holders
Not Applicable
Item 11. Controls and Procedures
(a) The registrant’s President and Treasurer have concluded that the
registrant’s disclosure controls and procedures (as defined in rule 30a-3(c) under the Act) are effective in design and operation and are sufficient to form the basis of the certifications required by Rule 30a-(2) under the Act, based on their evaluation of these disclosure controls and procedures within 90 days of the filing date of this report on Form N-CSR.
(b) There were no changes in the registrant’s internal control over financial reporting (as defined in rule 30a-3(d) under the Act) during the last fiscal quarter that have materially affected, or are reasonably likely to materially affect, the registrant’s internal control over financial reporting.
Item 12. Exhibits
SIGNATURES
Pursuant to the requirements of the Securities Exchange Act of 1934 and the Investment Company Act of 1940, the registrant has duly caused this report to be signed on its behalf by the undersigned, thereunto duly authorized.
| Registrant | Federated Income Securities Trust |
| | |
| By | /S/ Richard A. Novak |
| | Richard A. Novak, Principal Financial Officer |
| Date | May 17, 2010 |
| | |
| | |
| Pursuant to the requirements of the Securities Exchange Act of 1934 and the Investment Company Act of 1940, this report has been signed below by the following persons on behalf of the registrant and in the capacities and on the dates indicated. |
| | |
| | |
| By | /S/ J. Christopher Donahue |
| | J. Christopher Donahue, Principal Executive Officer |
| Date | May 17, 2010 |
| | |
| | |
| By | /S/ Richard A. Novak |
| | Richard A. Novak, Principal Financial Officer |
| Date | May 17, 2010 |