United States
Securities and Exchange Commission
Washington, D.C. 20549
Form N-CSR
Certified Shareholder Report of Registered Management Investment Companies
811-4577
(Investment Company Act File Number)
Federated Income Securities Trust
_______________________________________________________________
(Exact Name of Registrant as Specified in Charter)
Federated Investors Funds
4000 Ericsson Drive
Warrendale, Pennsylvania 15086-7561
(Address of Principal Executive Offices)
(412) 288-1900
(Registrant's Telephone Number)
John W. McGonigle, Esquire
Federated Investors Tower
1001 Liberty Avenue
Pittsburgh, Pennsylvania 15222-3779
(Name and Address of Agent for Service)
(Notices should be sent to the Agent for Service)
Date of Fiscal Year End: 10/31/2012
Date of Reporting Period: 10/31/2012
Item 1. Reports to Stockholders

Annual Shareholder Report
October 31, 2012
| Share Class | Ticker |
| A | FMUAX |
| B | FMNBX |
| C | FMUCX |
| F | FMUFX |
| Institutional | FMUIX |
Federated Muni and Stock Advantage Fund
Fund Established 2003
A Portfolio of Federated Income Securities Trust
Dear Valued Shareholder,
I am pleased to present the Annual Shareholder Report for your fund covering the period from November 1, 2011 through October 31, 2012. This report includes Management's Discussion of Fund Performance, a complete listing of your fund's holdings, performance information and financial statements along with other important fund information.
In addition, our website, FederatedInvestors.com, offers easy access to Federated resources that include timely fund updates, economic and market insights from our investment strategists, and financial planning tools. We invite you to register to take full advantage of its capabilities.
Thank you for investing with Federated. I hope you find this information useful and look forward to keeping you informed.
Sincerely,
J. Christopher Donahue, President
Not FDIC Insured • May Lose Value • No Bank Guarantee
Management's Discussion of Fund Performance (unaudited)
The Fund's total return, based on net asset value, for the 12-month reporting period ended October 31, 2012, was 12.87% for Class A Shares, 11.93% for Class B Shares, 11.94% for Class C Shares, 12.87% for Class F Shares and 13.05% for Institutional Shares. The total return of the Morningstar Conservative Allocation Funds Average1 was 7.85%.
The Fund's investment strategy focused on income earning investments, specifically high-quality, dividend-paying stocks and intermediate- and long-term, tax-exempt municipal bonds to achieve the Fund's primary tax-advantaged income objective and secondary capital appreciation objective. The most significant factors that affected the Fund's performance during the reporting period were: (a) the Fund's allocation between stocks and tax-exempt municipal bonds; (b) the selection of equity securities of similar issuers (referred to as “sectors”) and the selection of specific equity securities within those sectors; (c) the selection of tax-exempt municipal securities with different maturities (expressed by a yield curve showing the relative yield of similar securities with different maturities), different credit characteristics or different structural attributes, and from different sectors; and (d) the effective duration of the Fund's tax-exempt municipal bond portfolio.
The following discussion will focus on the performance of the Fund's Institutional Shares. The 13.05% total return of the Institutional Shares for the reporting period consisted of 8.65% in price performance and 4.40% in reinvested dividends.
MARKET OVERVIEW
During the 12-month reporting period, global equity markets experienced continued volatility similar to what was seen in the prior year. The first quarter of the year was characterized in general by improved equity markets, which were driven by better than expected U.S. economic indicators such as unemployment rate, retail sales, manufacturing data and an improvement in the housing market. However, during the second quarter of 2012, the factors that had aided the market in its rally began to reverse course. In the United States, economic data such as retail sales, nonfarm payroll growth, manufacturing activity and gross domestic product (GDP) were weaker than expected. Conditions abroad also added to the market's overall woes, such as the continued European sovereign fiscal concerns, a threat of a sharp decline in the Chinese economy and an overall synchronized global slowdown. By the third quarter and into the fourth quarter, however, despite macroeconomic data continuing to remain weak in the United States and globally, the equity markets began a powerful rally when the Federal Open Market Committee (FOMC)
Annual Shareholder Report
announced a third round of quantitative easing as well as pledged to extend its 0% target funds rate policy to at least mid-2015. Markets further rallied apparently on the hope that the European sovereign debt issues would continue to stabilize.
The Standard and Poor's 500 Index (“S&P 500”)2 returned 15.21% and the Nasdaq Composite Index3 returned 12.32% for the reporting period. In general, for the reporting period, larger market capitalization stocks outperformed smaller market capitalization stocks, value stocks outperformed growth stocks and defensive stocks outperformed cyclical stocks. In the S&P 500, strong performance from the Telecom Services, Health Care and Consumer Discretionary sectors dominated relatively weaker performance in the Energy, Materials and Utilities sectors during the reporting period.
U.S. Treasury yields declined during the reporting period as U.S. economic growth faded and global economic growth declined. Yields initially increased early in the reporting period amid indications of an accelerating U.S. economic expansion, but declined sharply as both U.S. and global economic indicators weakened, the Federal Reserve expanded its outright bond purchases and risks to growth came into focus stemming from the threat of the simultaneous spending cuts and tax increases in the United States slated to take place at the end of 2012 (i.e., the “fiscal cliff”) absent any legislative action. During the reporting period, the 10-year U.S. Treasury yield ranged from 2.38% in March 2012 to 1.43% in July 2012, ending at 1.72%, down 48 basis points for the reporting period. The 30-year Treasury yield ranged from 3.48% to 2.46%, ending the reporting period at 2.85%, down 31 basis points.
Strong demand for tax-exempt municipal bonds and falling Treasury yields drove tax-exempt municipal yields sharply lower for the reporting period. Although the U.S. Presidential election prompted significant uncertainty regarding U.S. tax policy, elevated ratios of municipal to Treasury yields supported strong demand from individuals, mutual funds and banks. Issuance of tax-exempt municipal bonds increased relative to 2011 as issuers capitalized on the lowest municipal market yields since the 1960s to refinance debt. Municipal Market Data (MMD)4 10- and 30-year “AAA” tax-exempt municipal yields declined 67 and 93 basis points, respectively, during the reporting period.
PORTFOLIO ALLOCATION
During the 12-month reporting period, the Fund's portfolio was allocated between stocks and tax-exempt municipal bonds to reflect the Fund's primary investment objective of tax-advantaged-income5 and its secondary objective of capital appreciation. The factors used in the allocation decision were: (1) maintenance of at least 50% exposure to tax-exempt municipal securities in order to comply with Internal Revenue Service rules governing the payment of tax-exempt dividends from the tax-exempt municipal bond portion of the Fund's portfolio; (2) the Fund's ability to pay and maintain an attractive level of
Annual Shareholder Report
dividends; and (3) the expected relative total return of tax-exempt municipal bonds and stocks. The allocation at the end of the reporting period was 53.1% tax-exempt municipal bonds, 44.0% stocks and 2.9% cash equivalents or other assets.
The Fund's portfolio allocation during the reporting period helped the Fund's performance. For the reporting period, the Dow Jones U.S. Select Dividend Index (DJSDI) posted a total return of 15.54% while the S&P Municipal Bond Index (“S&P Muni Index”) posted a total return of 9.57%.1 Weighting these indexes (60% S&P Muni Index and 40% DJSDI), the custom blended index return was 11.98% for the reporting period. For the reporting period, the 13.05% total return of the Fund's Institutional Shares outperformed the custom blended index.
SECTOR AND SECURITY SELECTION–EQUITY STOCKS
During the 12-month reporting period, the Fund's equity holdings were positioned within a diversified portfolio of dividend-paying stocks with favorable valuations and improving business fundamentals. The portfolio continued to aim for a balanced yield, dividend growth and total return growth strategy. The return of the equity component of the Fund's portfolio outperformed the DJSDI during the reporting period as the Fund's equity portfolio managers focused on realization of the Fund's tax-advantaged income and capital appreciation objectives by purchasing and holding income producing equity securities with favorable valuation levels.
Both sector allocation and stock selection positively contributed to the Fund's equity performance relative to the DJSDI. Overweight positions in the Health Care and Telecom Services sectors and an underweight position in the Utilities and Industrials sectors enhanced the Fund's performance during the reporting period. Detracting from performance was a sector overweight in the Energy and Information Technology sectors as well as an underweight in the Materials and Consumer Discretionary sectors. The Fund had notable positive stock selection in the Consumer Staples, Utilities and Consumer Discretionary sectors and negative stock selection in the Health Care and Energy sectors.
SECTOR AND SECURITY SELECTION–TAX-EXEMPT MUNICIPAL BONDS
During the 12-month reporting period, the bond portfolio manager's strategies were to: (1) invest only in tax-exempt municipal bonds whose interest is not subject to (or not a specific preference item for purposes of) the federal alternative minimum tax for individuals or corporations; (2) maintain exposure to intermediate and long-term tax-exempt municipal bonds to seek to capture the income advantages of such securities relative to tax-exempt municipal bonds with shorter maturities; (3) maintain a significant weighting in low investment-grade and non-investment grade bonds, or equivalents,6 given their income advantages; and (4) adjust portfolio duration,7 or sensitivity to interest rates, and yield curve exposures in an effort to enhance bond portfolio total return as market interest rates fluctuate.8
Annual Shareholder Report
The Funds's tax-exempt municipal bond portfolio outperformed the return of the S&P Muni Index during the reporting period. This favorable relative performance was due to the portfolio's long duration compared to the S&P Muni Index, its overweight position in “A”-rated, “BBB”-rated securities and speculative grade securities (or unrated securities of comparable quality), which outperformed the S&P Muni Index, and favorable individual security selection. Favorable sector allocation–including underweight positions in general obligation bonds and overweight positions in tobacco settlement revenue bonds–also contributed positively to Fund performance relative to the S&P Muni Index.
DURATION–TAX-EXEMPT MUNICIPAL BONDS
During the 12-month reporting period, the duration of the Fund's tax-exempt municipal bond portfolio averaged about 5.7 years, which was longer than the duration of the S&P Muni Index, which averaged about 5.1 years. This longer duration reflected the Fund's focus on intermediate- and long-term securities through its allocation of portfolio holdings. The Fund's longer duration relative to the S&P Muni Index provided a positive contribution to Fund performance relative to the S&P Muni Index as tax-exempt municipal market yields fell sharply.
| 1 | Morningstar figures represent the average total returns reported by all mutual funds designated by Morningstar, Inc. as falling into the category indicated. They do not reflect sales charges. The total return for the 12-month reporting period for the Fund's broad-based securities market indexes, the S&P Municipal Bond Index (“S&P Muni Index”) and the Dow Jones U.S. Select Dividend Index (DJSDI), were 9.57% and 15.49%, respectively. The Fund's total return for the most recently completed fiscal year reflected cash flows, transaction costs and other expenses, which were not reflected in the total return of the S&P Muni Index or the DJSDI. Please see the footnotes to the line graphs under “Fund Performance and Growth of a $10,000 Investment” below for the definitions of, and more information about, the Morningstar Conservative Allocation Funds Average, S&P Muni Index and DJSDI. |
| 2 | The S&P 500 Index is a capitalization-weighted index of 500 stocks designed to measure performance of the broad domestic economy through changes in the aggregate market value of 500 stocks representing all major industries. The index is unmanaged, and it is not possible to invest directly in an index. |
| 3 | The Nasdaq Composite Index is an index that measures all Nasdaq domestic and non-U.S.-based common stocks listed on the Nasdaq stock market. The index is unmanaged, and it is not possible to invest directly in an index. |
| 4 | MMD is a market data provider that produces daily generic yield curve of investment-grade municipal bonds based on a survey of municipal securities dealers and observed trades. The MMD “AAA” yield curve is a widely used reference for top credit quality municipal bonds in the marketplace. Investment-grade municipal bonds are rated at least “BBB” by Standard & Poor's or another nationally recognized statistical ratings organization (or are comparable unrated municipal bonds). |
| 5 | Fund income may be subject to state and local taxes. Although this Fund pursues tax-advantaged income and seeks to invest primarily in securities whose interest is not subject to the federal alternative minimum tax, there are no assurances that it will achieve these goals. |
Annual Shareholder Report
| 6 | Investment-grade securities and noninvestment-grade securities may either be: (a) rated by a nationally recognized statistical ratings organization or rating agency; or (b) unrated securities that the Fund's Adviser believes are of comparable quality. The rating agencies that provided the ratings for rated securities include Standard & Poor's, Moody's Investor Services, Inc. and Fitch Rating Service. When ratings vary, the highest rating is used. Credit ratings of “AA” or better are considered to be high credit quality; credit ratings of “A” are considered high or medium/good quality; and credit ratings of “BBB” are considered to be medium/good credit quality, and the lowest category of investment-grade securities; credit ratings of “BB” and below are lower-rated, noninvestment-grade securities or junk bonds; and credit ratings of “CCC” or below are noninvestment-grade securities that have high default risk. Any credit quality breakdown does not give effect to the impact of any credit derivative investments made by the Fund. Credit ratings are an indication of the risk that a security will default. They do not protect a security from credit risk. Lower rated bonds typically offer higher yields to help compensate investors for the increased risk associated with them. Among these risks are lower creditworthiness, greater price volatility, more risk to principal and income than with higher rated securities and increased possibilities of default. |
| 7 | Duration is a measure of a security's price sensitivity to changes in interest rates. Securities with longer durations are more sensitive to changes in interest rates than securities with shorter durations. For purposes of this Management's Discussion of Fund Performance, duration is determined using a third-party analytical system. |
| 8 | Bond prices are sensitive to changes in interest rates and interest rate spreads between bonds or varying credit quality. A rise in interest rates or interest rate spreads can cause a decline in their prices. |
Annual Shareholder Report
FUND PERFORMANCE AND GROWTH OF A $10,000 INVESTMENT
The Average Annual Total Return Table below shows returns for each class averaged over the stated periods. The graphs below illustrate the hypothetical investment of $10,0001 in the Federated Muni and Stock Advantage Fund (the “Fund”) from September 26, 2003 (or later, if applicable) to October 31, 2012, compared to the S&P Municipal Bond Index (“S&P Muni Index”)2 and the Dow Jones U.S. Select Dividend Index (DJSDI).2
Average Annual Total Returns for the Period Ended 10/31/2012
(returns reflect all applicable sales charges and contingent deferred sales charges as specified below in footnote #1)
| Share Class | 1 Year | 5 Years | Start of
Performance3 |
| Class A Shares | 6.62% | 2.49% | 5.24% |
| Class B Shares | 6.43% | 2.53% | 5.16% |
| Class C Shares | 10.94% | 2.88% | 5.06% |
| Class F Shares | 10.74% | 3.49% | 3.16% |
| Institutional Shares | 13.05% | 3.59% | 5.51% |
Performance data quoted represents past performance which is no guarantee of future results. Investment return and principal value will fluctuate so that an investor's shares, when redeemed, may be worth more or less than their original cost. Mutual fund performance changes over time and current performance may be lower or higher than what is stated. For current to the most recent month-end performance and after-tax returns, visit FederatedInvestors.com or call 1-800-341-7400. Returns shown do not reflect the deduction of taxes that a shareholder would pay on Fund distributions or the redemption of Fund shares. Mutual funds are not obligations of or guaranteed by any bank and are not federally insured.
Annual Shareholder Report
Growth of a $10,000 Investment–CLASS A SHARES
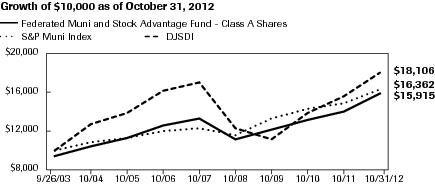
| Federated Muni and Stock Advantage Fund - | Class A Shares | S&P Muni Index | DJSDI |
| 9/26/2003 | 9,450 | 10,000 | 10,000 |
| 10/31/2003 | 9,632 | 10,268 | 10,633 |
| 10/31/2004 | 10,512 | 10,924 | 12,828 |
| 10/31/2005 | 11,300 | 11,290 | 13,992 |
| 10/31/2006 | 12,691 | 11,994 | 16,203 |
| 10/31/2007 | 13,302 | 12,326 | 17,051 |
| 10/31/2008 | 11,122 | 11,669 | 12,276 |
| 10/31/2009 | 12,130 | 13,320 | 11,251 |
| 10/31/2010 | 13,245 | 14,393 | 13,875 |
| 10/31/2011 | 14,101 | 14,933 | 15,671 |
| 10/31/2012 | 15,915 | 16,362 | 18,106 |
41 graphic description end -->
| ■ | Total returns shown include the maximum sales charge of 5.50% ($10,000 investment minus $550 sales charge = $9,450). |
Growth of a $10,000 Investment–CLASS B SHARES
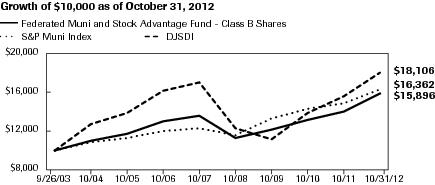
| Federated Muni and Stock Advantage Fund - | Class B Shares | S&P Muni Index | DJSDI |
| 9/26/2003 | 10,000 | 10,000 | 10,000 |
| 10/31/2003 | 10,186 | 10,268 | 10,633 |
| 10/31/2004 | 11,012 | 10,924 | 12,828 |
| 10/31/2005 | 11,731 | 11,290 | 13,992 |
| 10/31/2006 | 13,077 | 11,994 | 16,203 |
| 10/31/2007 | 13,591 | 12,326 | 17,051 |
| 10/31/2008 | 11,287 | 11,669 | 12,276 |
| 10/31/2009 | 12,206 | 13,320 | 11,251 |
| 10/31/2010 | 13,229 | 14,393 | 13,875 |
| 10/31/2011 | 14,083 | 14,933 | 15,671 |
| 10/31/2012 | 15,896 | 16,362 | 18,106 |
41 graphic description end -->
| ■ | Total returns shown include the maximum contingent deferred sales charge of 5.50% as applicable. |
Annual Shareholder Report
Growth of a $10,000 Investment–CLASS C SHARES
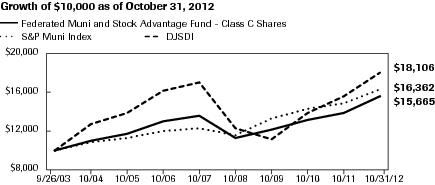
| Federated Muni and Stock Advantage Fund - | Class C Shares | S&P Muni Index | DJSDI |
| 9/26/2003 | 10,000 | 10,000 | 10,000 |
| 10/31/2003 | 10,186 | 10,268 | 10,633 |
| 10/31/2004 | 11,003 | 10,924 | 12,828 |
| 10/31/2005 | 11,732 | 11,290 | 13,992 |
| 10/31/2006 | 13,079 | 11,994 | 16,203 |
| 10/31/2007 | 13,593 | 12,326 | 17,051 |
| 10/31/2008 | 11,290 | 11,669 | 12,276 |
| 10/31/2009 | 12,210 | 13,320 | 11,251 |
| 10/31/2010 | 13,232 | 14,393 | 13,875 |
| 10/31/2011 | 13,994 | 14,933 | 15,671 |
| 10/31/2012 | 15,665 | 16,362 | 18,106 |
41 graphic description end -->
| ■ | Total returns shown include the maximum contingent deferred sales charge of 1.00% as applicable. |
Growth of a $10,000 Investment–CLASS F SHARES
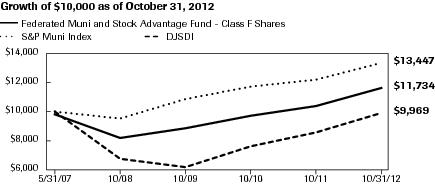
| Federated Muni and Stock Advantage Fund - | Class F Shares | S&P Muni Index | DJSDI |
| 5/31/2007 | 9,900 | 10,000 | 10,000 |
| 10/31/2007 | 9,773 | 10,130 | 9,388 |
| 10/31/2008 | 8,178 | 9,590 | 6,759 |
| 10/31/2009 | 8,930 | 10,946 | 6,195 |
| 10/31/2010 | 9,766 | 11,829 | 7,640 |
| 10/31/2011 | 10,396 | 12,272 | 8,628 |
| 10/31/2012 | 11,734 | 13,447 | 9,969 |
41 graphic description end -->
| ■ | Total returns shown include the maximum sales charge of 1.00% ($10,000 investment minus $100 sales charge = $9,900). |
Annual Shareholder Report
Growth of a $10,000 Investment–Institutional SHARES3
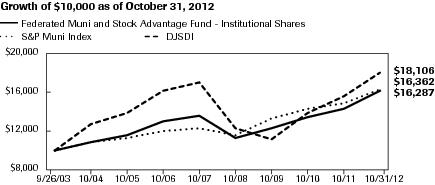
| Federated Muni and Stock Advantage Fund - | Institutional Shares | S&P Muni Index | DJSDI |
| 9/26/2003 | 10,000 | 10,000 | 10,000 |
| 10/31/2003 | 10,173 | 10,268 | 10,633 |
| 10/31/2004 | 10,904 | 10,924 | 12,828 |
| 10/31/2005 | 11,649 | 11,290 | 13,992 |
| 10/31/2006 | 13,056 | 11,994 | 16,203 |
| 10/31/2007 | 13,656 | 12,326 | 17,051 |
| 10/31/2008 | 11,394 | 11,669 | 12,276 |
| 10/31/2009 | 12,400 | 13,320 | 11,251 |
| 10/31/2010 | 13,513 | 14,393 | 13,875 |
| 10/31/2011 | 14,407 | 14,933 | 15,671 |
| 10/31/2012 | 16,287 | 16,362 | 18,106 |
41 graphic description end -->
| 1 | Represents a hypothetical investment of $10,000 in the Fund after deducting applicable sales charges: for Class A Shares, the maximum sales charge of 5.50% ($10,000 investment minus $550 sales charge = $9,450); for Class B Shares, the maximum contingent deferred sales charge is 5.50% on any redemption less than one year from the purchase date; for Class C Shares, the maximum contingent deferred sales charge is 1.00% on any redemption less than one year from the purchase date; for Class F Shares, the maximum sales charge of 1.00% ($10,000 investment minus $100 sales charge = $9,900), and the contingent deferred sales charge is 1.00% on any redemption less than four years from the purchase date. The Fund's performance assumes the reinvestment of all dividends and distributions. The S&P Muni Index and DJSDI have been adjusted to reflect reinvestment of dividends on securities in the indexes. |
| 2 | The S&P Muni Index is a broad, comprehensive, market value-weighted index composed of approximately 55,000 bond issues that are exempt from U.S. federal income taxes or subject to the AMT. Eligibility criteria for inclusion in the S&P Muni Index include, but are not limited to: the bond issuer must be a state (including the Commonwealth of Puerto Rico and U.S. territories) or a local government or a state or local government entity where interest on the bond is exempt from U.S. federal income taxes or subject to the AMT; the bond must be held by a mutual fund for which Standard & Poor's Securities Evaluations, Inc. provides prices; it must be denominated in U.S. dollars and have a minimum par amount of $2 million; and the bond must have a minimum term to maturity and/or call date greater than or equal to one calendar month. The S&P Muni Index is rebalanced monthly. The DJSDI's universe is defined as all dividend-paying companies in the Dow Jones U.S. Total Market Index that have a non-negative historical five-year dividend per-share growth rate, a five year average dividend earnings-per-share ratio of less than or equal to 60%, and three-month average daily trading volume of 200,000 shares. Current index components are included in the universe regardless of their dividend payout ratio. The Dow Jones U.S. Total Market index is a rules-governed, broad-market benchmark that represents approximately 95% of the U.S. market capitalization. The S&P Muni Index and DJSDI are not adjusted to reflect sales charges, expenses and other fees that the Securities and Exchange Commission requires to be reflected in the Fund's performance. The S&P Muni Index and DJSDI are unmanaged, and, unlike the Fund, are not affected by cash flows. It is not possible to invest directly in an index. |
| 3 | The Fund's Class A Shares, Class B Shares and Class C Shares commenced operations on 9/26/2003. The Fund's Class F Shares and Institutional Shares commenced operations on 5/31/2007 and 12/29/2010, respectively. For the period prior to the commencement of operations of the Institutional Shares, the performance information shown for the Fund's Institutional Shares is for the Fund's Class A Shares. The performance of the Class A Shares also has been adjusted to reflect the expenses of the Institutional Shares for the periods (2004 and 2005) in which the expenses for Class A Shares were lower than the expenses for the Institutional Shares. For the other periods (2006 through December 28, 2010), the performance of the Class A Shares has not been adjusted to reflect the expenses of the Institutional Shares, since the Institutional Shares have a lower expense ratio than the expense ratio of Class A Shares during those periods. The performance of Class A Shares also has been adjusted to reflect the absence of sales charges and adjusted to remove any voluntary waiver of fund expenses related to Class A Shares during the period prior to commencement of the Institutional Shares. |
Annual Shareholder Report
Portfolio of Investments Summary Tables (unaudited)
At October 31, 2012, the Fund's portfolio composition1 was as follows:
| Security Type | Percentage of
Total Net Assets |
| Tax-Exempt, Fixed Income Securities | 53.1% |
| Equity Securities | 44.0% |
| Derivative Contracts2,3 | (0.0)% |
| Cash Equivalents4 | 2.3% |
| Other Assets and Liabilities—Net5 | 0.6% |
| TOTAL | 100.0% |
At October 31, 2012, the Fund's sector composition6 for its equity securities was as follows:
| Sector Composition | Percentage of
Equity Securities |
| Telecommunication Services | 19.3% |
| Health Care | 18.4% |
| Consumer Staples | 15.3% |
| Energy | 13.9% |
| Consumer Discretionary | 10.4% |
| Utilities | 9.8% |
| Financials | 5.6% |
| Industrials | 4.4% |
| Information Technology | 1.6% |
| Materials | 1.3% |
| TOTAL | 100.0% |
Annual Shareholder Report
At October 31, 2012, the Fund's sector composition7 for its tax-exempt securities was as follows:
| Sector Composition | Percentage of
Municipal Securities |
| Hospital | 14.2% |
| Transportation | 13.6% |
| Special Tax | 11.8% |
| Industrial Development Bond/Pollution Control Revenue | 8.9% |
| General Obligation—State | 7.8% |
| Water and Sewer | 7.2% |
| Pre-refunded | 6.8% |
| Senior Care | 5.7% |
| Education | 5.6% |
| Public Power | 5.4% |
| Other8 | 13.0% |
| TOTAL | 100.0% |
| 1 | See the Fund's Prospectus and Statement of Additional Information for a description of the types of securities in which the Fund invests. |
| 2 | Based upon net unrealized appreciation (depreciation) or value of the derivative contracts as applicable. Derivative contracts may consist of futures, forwards, options and swaps. The impact of a derivative contract on the Fund's performance may be larger than its unrealized appreciation (depreciation) or value may indicate. In many cases, the notional value or amount of a derivative contract may provide a better indication of the contract's significance to the portfolio. More complete information regarding the Fund's direct investments in derivative contracts, including unrealized appreciation (depreciation), value and notional values or amounts of such contracts, can be found in the table at the end of the Portfolio of Investments included in this Report. |
| 3 | Represents less than 0.1%. |
| 4 | Cash equivalents include any investments in tax-exempt, variable rate instruments. |
| 5 | Assets, other than investments in securities and derivative contracts, less liabilities. See Statement of Assets and Liabilities. |
| 6 | Sector classifications are based upon, and individual portfolio securities are assigned to, the classifications of the Global Industry Classification Standard (GICS) except that the Adviser assigns a classification to securities not classified by the GICS and to securities for which the Adviser does not have access to the classification made by the GICS. |
| 7 | Sector classifications and the assignment of holding to such sectors, are based upon the economic sector and/or revenue source of the underlying obligor, as determined by the Fund's Adviser. For securities that have been enhanced by a third party including bond insurers and banks, sector classifications are based upon the economic sector and/or revenue source of the underlying obligor, as determined by the Fund's Adviser. Pre-refunded securities are those whose debt service is paid from escrowed assets, usually U.S. government securities. |
| 8 | For purposes of this table, sector classifications constitute 87.0% of the Fund's total investments in
tax-exempt securities. Remaining tax-exempt security sectors have been aggregated under the designation “Other.” |
Annual Shareholder Report
Portfolio of Investments
October 31, 2012
Shares or
Principal
Amount | | | Value |
| | COMMON STOCKS—44.0% | |
| | Consumer Discretionary—4.6% | |
| 146,600 | | American Eagle Outfitters, Inc. | $3,059,542 |
| 57,200 | | GameStop Corp. | 1,305,876 |
| 214,740 | | Gannett Co., Inc. | 3,629,106 |
| 26,700 | | Garmin Ltd. | 1,014,333 |
| 45,080 | | Limited Brands | 2,158,881 |
| 135,720 | | Meredith Corp. | 4,542,549 |
| 77,205 | | National CineMedia, Inc. | 1,193,589 |
| 319,320 | | Regal Entertainment Group | 4,904,755 |
| 21,570 | | Six Flags Entertainment Corp. | 1,231,863 |
| | TOTAL | 23,040,494 |
| | Consumer Staples—6.7% | |
| 204,520 | | Altria Group, Inc. | 6,503,736 |
| 41,585 | | ConAgra Foods, Inc. | 1,157,726 |
| 67,510 | | Heinz (H.J.) Co. | 3,882,500 |
| 69,750 | | Kimberly-Clark Corp. | 5,820,638 |
| 38,550 | | Lorillard, Inc. | 4,472,186 |
| 23,920 | | Philip Morris International Inc. | 2,118,355 |
| 236,085 | | Reynolds American, Inc. | 9,830,579 |
| | TOTAL | 33,785,720 |
| | Energy—6.1% | |
| 98,295 | | ARC Resources Ltd. | 2,386,637 |
| 70,199 | | Baytex Energy Corp. | 3,194,538 |
| 89,230 | | Bonavista Energy Corp. | 1,600,110 |
| 93,680 | | ConocoPhillips | 5,419,388 |
| 84,785 | | Crescent Point Energy Corp. | 3,522,981 |
| 69,550 | | Royal Dutch Shell PLC | 4,762,784 |
| 104,600 | | Ship Finance International LTD | 1,608,748 |
| 90,500 | | Total SA, ADR | 4,561,200 |
| 74,894 | | Vermilion Energy Inc. | 3,580,664 |
| | TOTAL | 30,637,050 |
| | Financials—2.5% | |
| 22,100 | | Bank of Hawaii Corp. | 975,936 |
| 13,110 | | Canadian Imperial Bank of Commerce | 1,030,184 |
| 103,185 | | Cincinnati Financial Corp. | 4,110,890 |
Annual Shareholder Report
Shares or
Principal
Amount | | | Value |
| | COMMON STOCKS—continued | |
| | Financials—continued | |
| 148,420 | | Hudson City Bancorp, Inc. | $1,259,344 |
| 94,220 | | Mercury General Corp. | 3,818,737 |
| 125,955 | | Old Republic International Corp. | 1,244,435 |
| | TOTAL | 12,439,526 |
| | Health Care—8.1% | |
| 229,515 | | Bristol-Myers Squibb Co. | 7,631,374 |
| 163,250 | | GlaxoSmithKline PLC, ADR | 7,329,925 |
| 49,680 | | Johnson & Johnson | 3,518,338 |
| 148,415 | | Lilly (Eli) & Co. | 7,217,421 |
| 161,385 | | Merck & Co., Inc. | 7,363,998 |
| 302,390 | | Pfizer, Inc. | 7,520,439 |
| | TOTAL | 40,581,495 |
| | Industrials—1.9% | |
| 85,940 | | Deluxe Corp. | 2,707,969 |
| 94,835 | | Donnelley (R.R.) & Sons Co. | 950,247 |
| 213,160 | | General Electric Co. | 4,489,150 |
| 104,290 | | Pitney Bowes, Inc. | 1,497,604 |
| | TOTAL | 9,644,970 |
| | Information Technology—0.7% | |
| 18,805 | | CA, Inc. | 423,488 |
| 61,990 | | Intel Corp. | 1,340,534 |
| 10,505 | | KLA-Tencor Corp. | 488,693 |
| 43,540 | | Seagate Technology | 1,189,513 |
| | TOTAL | 3,442,228 |
| | Materials—0.6% | |
| 53,900 | | LyondellBasell Industries NV, Class A | 2,877,721 |
| | Telecommunication Services—8.5% | |
| 241,970 | | AT&T, Inc. | 8,369,742 |
| 191,165 | | BCE, Inc. | 8,346,264 |
| 259,465 | | CenturyLink, Inc. | 9,958,266 |
| 359,800 | | Frontier Communications Corp. | 1,698,256 |
| 113,725 | | Telecom of New Zealand-ADR | 1,108,819 |
| 223,230 | | Verizon Communications | 9,964,987 |
| 112,590 | | Vodafone Group PLC, ADR | 3,064,700 |
| | TOTAL | 42,511,034 |
| | Utilities—4.3% | |
| 95,105 | | Ameren Corp. | 3,127,052 |
Annual Shareholder Report
Shares or
Principal
Amount | | | Value |
| | COMMON STOCKS—continued | |
| | Utilities—continued | |
| 26,220 | | American Electric Power Co., Inc. | $1,165,217 |
| 47,075 | | DTE Energy Co. | 2,923,357 |
| 16,200 | | Duke Energy Corp. | 1,064,178 |
| 10,810 | | FirstEnergy Corp. | 494,233 |
| 31,100 | | Integrys Energy Group, Inc. | 1,680,644 |
| 101,555 | | National Grid PLC, ADR | 5,789,651 |
| 27,845 | | Pepco Holdings, Inc. | 553,280 |
| 10,030 | | Pinnacle West Capital Corp. | 531,289 |
| 53,415 | | PPL Corp. | 1,580,016 |
| 16,390 | | Public Service Enterprises Group, Inc. | 525,136 |
| 97,900 | | Scottish & Southern Energy PLC, ADR | 2,322,188 |
| | TOTAL | 21,756,241 |
| | TOTAL COMMON STOCKS (IDENTIFIED COST $192,457,724) | 220,716,479 |
| | MUNICIPAL BONDS—53.1% | |
| | Alabama—0.9% | |
| $2,000,000 | | Alabama State Port Authority, Docks Facilities Revenue Bonds (Series 2010), 5.750%, 10/01/2030 | 2,335,840 |
| 700,000 | | Alabama State Port Authority, Docks Facilities Revenue Bonds (Series 2010), 6.000%, 10/01/2040 | 822,185 |
| 1,370,000 | | Montgomery, AL BMC Special Care Facilities Finance Authority, (Health Care Authority for Baptist Health, AL), Revenue Refunding Bonds (Series 2004-C), 5.125%, 11/15/2024 | 1,405,401 |
| | TOTAL | 4,563,426 |
| | Arizona—0.3% | |
| 1,545,000 | | Apache County, AZ IDA, (Tucson Electric Power Co.), PCRBs (Series 2012A), 4.500%, 03/01/2030 | 1,618,094 |
| | California—3.5% | |
| 570,000 | | California Health Facilities Financing Authority, Health Facility Revenue Bonds (Series 2004I), 4.95% TOBs (Catholic Healthcare West), Mandatory Tender 7/1/2014 | 606,525 |
| 1,000,000 | | California State Public Works Board, Lease Revenue Bonds (Series 2012G), 5.000%, 11/01/2037 | 1,089,500 |
| 3,000,000 | | California State, UT GO Bonds, 5.000%, 11/01/2022 | 3,508,260 |
| 2,500,000 | | California State, Various Purpose Refunding GO Bonds, 5.000%, 02/01/2038 | 2,779,400 |
| 2,000,000 | | California Statewide CDA, (Sutter Health), Refunding Revenue Bonds (Series 2011D), 5.250%, 08/15/2031 | 2,313,500 |
| 3,000,000 | | San Francisco, CA City & County Airport Commission, Second Series Revenue Bonds (Series 2009E), 6.000%, 05/01/2039 | 3,547,350 |
Annual Shareholder Report
Shares or
Principal
Amount | | | Value |
| | MUNICIPAL BONDS—continued | |
| | California—continued | |
| $2,000,000 | | San Jose, CA Airport, Airport Revenue Bonds (Series 2011A-2), 5.000%, 03/01/2031 | $2,219,700 |
| 1,545,000 | | Yucaipa Valley Water District, CA, Water System Revenue COP (Series 2004A), 5.250%, (National Public Finance Guarantee Corporation INS), 09/01/2023 | 1,613,722 |
| | TOTAL | 17,677,957 |
| | Colorado—1.5% | |
| 2,500,000 | | Colorado Health Facilities Authority, (Covenant Retirement Communities, Inc.), Revenue Refunding Bonds (Series 2012A), 5.000%, 12/01/2033 | 2,616,850 |
| 600,000 | | Colorado Health Facilities Authority, (Total Longterm Care National Obligated Group), Revenue Bonds (Series 2010A), 6.000%, 11/15/2030 | 680,910 |
| 430,000 | | Colorado State Higher Education Capital Construction Lease Purchase Financing Program, COP (Series 2008), 5.500%, (United States Treasury & Agency PRF 11/1/2018@100), 11/01/2027 | 538,283 |
| 1,160,000 | | Colorado State Higher Education Capital Construction Lease Purchase Financing Program, COP (Series 2008), 5.500%, 11/01/2027 | 1,345,774 |
| 1,242,000 | | Conservatory Metropolitan District, CO, LT GO Bonds, 6.750%, (United States Treasury PRF 12/1/2013@102), 12/01/2034 | 1,346,253 |
| 1,000,000 | | Denver, CO Health & Hospital Authority, Revenue Bonds, 6.250%, (United States Treasury PRF 12/1/2014@100), 12/01/2033 | 1,120,500 |
| | TOTAL | 7,648,570 |
| | District of Columbia—1.8% | |
| 2,000,000 | | District of Columbia Income Tax Revenue, Income Tax Secured Revenue Refunding Bonds (Series 2010A), 5.000%, 12/01/2019 | 2,494,820 |
| 5,000,000 | | District of Columbia, UT GO Bonds (Series 2004A), 5.000%, (United States Treasury & Agency PRF 6/1/2015@100), 06/01/2025 | 5,581,350 |
| 1,000,000 | | Washington Metropolitan Area Transit Authority, Gross Revenue Transit Bonds (Series 2009A), 5.125%, 07/01/2032 | 1,138,500 |
| | TOTAL | 9,214,670 |
| | Florida—3.1% | |
| 630,000 | | East Homestead, FL Community Development District, Special Assessment Revenue Bonds (Series 2005), 5.450%, 05/01/2036 | 639,708 |
| 1,055,000 | | Florida Higher Educational Facilities Financing Authority, (Nova Southeastern University), Revenue Refunding Bonds (Series 2012A), 5.000%, 04/01/2027 | 1,168,940 |
| 3,000,000 | | Florida State Education System, Facilities Revenue Bonds (Series 2005A), 5.000%, (National Public Finance Guarantee Corporation INS), 05/01/2027 | 3,288,720 |
| 665,000 | | Jacksonville, FL Sales Tax, Refunding Revenue Bonds (Series 2012), 5.000%, 10/01/2021 | 807,496 |
| 1,000,000 | | Jacksonville, FL Sales Tax, Refunding Revenue Bonds (Series 2012), 5.000%, 10/01/2029 | 1,161,120 |
Annual Shareholder Report
Shares or
Principal
Amount | | | Value |
| | MUNICIPAL BONDS—continued | |
| | Florida—continued | |
| $1,250,000 | | Jacksonville, FL Sales Tax, Refunding Revenue Bonds (Series 2012A), 5.000%, 10/01/2029 | $1,451,400 |
| 1,750,000 | | Miami Beach, FL Health Facilities Authority, (Mt. Sinai Medical Center, FL), Hospital Revenue Refunding Bonds (Series 2012), 5.000%, 11/15/2029 | 1,925,613 |
| 1,100,000 | | Miami-Dade County, FL Aviation, Revenue Bonds (Series 2008B), 5.000%, (Assured Guaranty Corp. INS), 10/01/2023 | 1,247,763 |
| 300,000 | | Orlando, FL Urban Community Development District, Capital Improvement Revenue Bonds, 6.000%, 05/01/2020 | 300,345 |
| 1,555,000 | | Tolomato Community Development District, FL, Special Assessment Revenue Bonds (Series 2006), 5.400%, 05/01/2037 | 1,522,951 |
| 1,500,000 | | Volusia County, FL Education Facility Authority, (Embry-Riddle Aeronautical University, Inc.), Educational Facilities Refunding Revenue Bonds (Series 2005), 5.000%, (Radian Asset Assurance, Inc. INS), 10/15/2025 | 1,585,365 |
| 455,000 | | Winter Garden Village at Fowler Groves Community Development District, FL, Special Assessment Bonds (Series 2006), 5.650%, 05/01/2037 | 473,264 |
| | TOTAL | 15,572,685 |
| | Georgia—2.4% | |
| 5,000,000 | | Athens-Clarke County, GA Water & Sewerage, Revenue Bonds (Series 2008), 5.625%, 01/01/2028 | 5,887,650 |
| 3,000,000 | | Atlanta, GA Water & Wastewater, Revenue Bonds (Series 2009A), 6.250%, 11/01/2034 | 3,637,860 |
| 615,000 | | Atlanta, GA, (Eastside Tax Allocation District), Tax Allocation Bonds (Series 2005B), 5.600%, 01/01/2030 | 661,027 |
| 1,500,000 | | DeKalb Private Hospital Authority, GA, (Children's Healthcare of Atlanta, Inc.), RACs (Series 2009), 5.000%, 11/15/2024 | 1,713,600 |
| | TOTAL | 11,900,137 |
| | Guam—0.2% | |
| 565,000 | | Guam Government LO (Section 30), Bonds (Series 2009A), 5.625%, 12/01/2029 | 634,077 |
| 500,000 | | Guam Power Authority, Revenue Bonds (Series 2012A), 5.000%, 10/01/2034 | 540,710 |
| | TOTAL | 1,174,787 |
| | Hawaii—0.3% | |
| 1,250,000 | | Hawaii State Department of Budget & Finance, (Hawaiian Electric Co., Inc.), Special Purpose Revenue Bonds (Series 2009), 6.500%, 07/01/2039 | 1,463,888 |
| | Illinois—3.9% | |
| 2,615,000 | | Chicago, IL Housing Authority Capital Program, Refunding Revenue Bonds, 5.000%, (Assured Guaranty Municipal Corp. INS), 07/01/2017 | 2,960,494 |
Annual Shareholder Report
Shares or
Principal
Amount | | | Value |
| | MUNICIPAL BONDS—continued | |
| | Illinois—continued | |
| $1,180,000 | | Chicago, IL O'Hare International Airport, General Airport Third Lien Revenue Bonds (Series 2005A), 5.250%, (National Public Finance Guarantee Corporation INS), 01/01/2026 | $1,307,818 |
| 1,000,000 | | Chicago, IL O'Hare International Airport, General Airport Third Lien Revenue Bonds (Series 2011A), 5.750%, 01/01/2039 | 1,180,370 |
| 1,390,000 | | Chicago, IL, UT GO Bonds (Project Series 2011A), 5.250%, 01/01/2035 | 1,565,626 |
| 415,000 | | DuPage County, IL, (Naperville Campus LLC), Special Tax Bonds (Series 2006), 5.625%, 03/01/2036 | 415,652 |
| 1,000,000 | | Illinois Finance Authority, (Friendship Village of Schaumburg), Revenue Bonds (Series 2005A), 5.625%, 02/15/2037 | 1,006,300 |
| 875,000 | | Illinois Finance Authority, (Landing at Plymouth Place), Revenue Bonds (Series 2005A), 6.000%, 05/15/2025 | 816,532 |
| 625,000 | | Illinois Finance Authority, (Landing at Plymouth Place), Revenue Bonds (Series 2005A), 6.000%, 05/15/2037 | 534,725 |
| 2,500,000 | | Illinois State, UT GO Bonds (Series 2008), 5.000%, 04/01/2028 | 2,721,525 |
| 460,000 | | Illinois State, UT GO Refunding Bonds (Series May 2012), 5.000%, 08/01/2025 | 516,258 |
| 1,500,000 | | Metropolitan Pier & Exposition Authority, IL, McCormick Place Expansion Project Bonds (Series 2010A), 5.500%, 06/15/2050 | 1,683,135 |
| 2,200,000 | | Railsplitter Tobacco Settlement Authority, IL, Tobacco Settlement Revenue Bonds (Series 2010), 6.000%, 06/01/2028 | 2,611,840 |
| 2,000,000 | | University of Illinois, Auxiliary Facilities System Revenue Bonds (Series 2011A), 5.500%, 04/01/2031 | 2,335,400 |
| | TOTAL | 19,655,675 |
| | Indiana—1.8% | |
| 2,500,000 | | Indiana Health & Educational Facility Financing Authority, (Baptist Homes of Indiana), Revenue Bonds (Series 2005), 5.250%, 11/15/2035 | 2,584,925 |
| 1,415,000 | | Indiana State Finance Authority, (CWA Authority), First Lien Wastewater Utility Revenue Bonds (Series 2012A), 5.000%, 10/01/2029 | 1,668,129 |
| 1,095,000 | | Indiana State Finance Authority, (Ohio Valley Electric Corp.), Midwestern Disaster Relief Revenue Bonds (Series 2012A), 5.000%, 06/01/2032 | 1,174,300 |
| 2,128,470 | 1,2 | St. Joseph County, IN Hospital Authority, (Madison Center Obligated Group), Health Facilities Revenue Bonds (Series 2005), 5.375%, 02/15/2034 | 255,608 |
| 2,500,000 | | Whiting, IN Environmental Facilities, (BP PLC), Revenue Bonds (Series 2009), 5.250%, 01/01/2021 | 3,075,450 |
| | TOTAL | 8,758,412 |
| | Iowa—1.0% | |
| 1,910,000 | | Iowa Finance Authority, (Alcoa, Inc.), Midwestern Disaster Area Revenue Bonds (Series 2012), 4.750%, 08/01/2042 | 1,945,717 |
Annual Shareholder Report
Shares or
Principal
Amount | | | Value |
| | MUNICIPAL BONDS—continued | |
| | Iowa—continued | |
| $1,035,000 | | Iowa Finance Authority, (Deerfield Retirement Community, Inc.), Senior Living Facility Revenue Refunding Bonds (Series 2007A), 5.500%, 11/15/2037 | $926,573 |
| 2,000,000 | | Tobacco Settlement Authority, IA, Tobacco Settlement Asset-Backed Bonds (Series 2005C), 5.375%, 06/01/2038 | 1,849,740 |
| | TOTAL | 4,722,030 |
| | Kansas—0.6% | |
| 2,605,000 | | Kansas State Development Finance Authority, (Adventist Health System/Sunbelt Obligated Group), Hospital Revenue Bonds (Series 2009D), 5.000%, 11/15/2029 | 2,907,414 |
| | Kentucky—0.8% | |
| 1,500,000 | | Kentucky Turnpike Authority, Economic Development Road Revenue & Revenue Refunding Bonds (Series 2011A), 5.000%, 07/01/2019 | 1,863,075 |
| 2,000,000 | | Louisville & Jefferson County, KY Metropolitan Government, (Catholic Health Initiatives), Revenue Bonds (Series 2012A), 5.000%, 12/01/2035 | 2,252,820 |
| | TOTAL | 4,115,895 |
| | Louisiana—0.1% | |
| 470,000 | | St. Charles Parish, LA Gulf Opportunity Zone, Revenue Bonds (Series 2010), 4.00% TOBs (Valero Energy Corp.), Mandatory Tender 6/1/2022 | 515,867 |
| | Maine—0.2% | |
| 900,000 | | Maine Health & Higher Educational Facilities Authority, (Maine General Medical Center), Revenue Bonds (Series 2011), 6.750%, 07/01/2041 | 1,082,628 |
| | Maryland—0.4% | |
| 530,000 | | Maryland State EDC, (CONSOL Energy, Inc.), Port Facilities Refunding Revenue Bonds (Series 2010), 5.750%, 09/01/2025 | 577,308 |
| 925,000 | | Maryland State EDC, (Ports America Chesapeake, Inc. ), Revenue Bonds (Series B), 5.750%, 06/01/2035 | 1,044,140 |
| 500,000 | | Maryland State IDFA, (Our Lady of Good Counsel High School), EDRBs (Series 2005A), 6.000%, 05/01/2035 | 523,810 |
| | TOTAL | 2,145,258 |
| | Massachusetts—0.8% | |
| 3,195,000 | | Massachusetts HEFA, (Northeastern University), Revenue Bonds (Series 2010A), 5.000%, 10/01/2025 | 3,712,462 |
| | Michigan—1.3% | |
| 2,500,000 | | Michigan State Hospital Finance Authority, (Henry Ford Health System, MI), Refunding Revenue Bonds (Series 2006A), 5.250%, 11/15/2032 | 2,671,175 |
| 1,000,000 | | Michigan State Hospital Finance Authority, (Oakwood Obligated Group), Revenue Bonds, 5.500%, 11/01/2013 | 1,048,330 |
Annual Shareholder Report
Shares or
Principal
Amount | | | Value |
| | MUNICIPAL BONDS—continued | |
| | Michigan—continued | |
| $1,000,000 | | Michigan Strategic Fund, (Michigan State), LT Obligation Revenue Bonds (Series 2011), 5.250%, 10/15/2026 | $1,155,020 |
| 1,500,000 | | Saginaw, MI Hospital Finance Authority, (Covenant Medical Center, Inc.), Hospital Revenue Refunding Bonds (Series 2010H), 5.000%, 07/01/2030 | 1,601,190 |
| | TOTAL | 6,475,715 |
| | Minnesota—0.2% | |
| 665,000 | | Tobacco Securitization Authority, MN, Minnesota Tobacco Settlement Revenue Bonds (Series 2011B), 5.250%, 03/01/2031 | 740,690 |
| | Missouri—0.7% | |
| 1,500,000 | | Missouri Development Finance Board, (Branson, MO), Infrastructure Facilities Revenue Bonds (Series 2004A), 5.250%, 12/01/2019 | 1,592,805 |
| 2,000,000 | | Missouri State HEFA, (BJC Health System, MO), Health Facilities Revenue Bonds, 5.250%, 05/15/2018 | 2,053,840 |
| | TOTAL | 3,646,645 |
| | Nebraska—1.0% | |
| 2,000,000 | | Central Plains Energy Project, Gas Project Revenue Bonds (Project No. 3) (Series 2012), 5.000%, (Goldman Sachs & Co. GTD), 09/01/2042 | 2,136,260 |
| 625,000 | | Nebraska Investment Finance Authority, SFH Revenue Bonds (Series 2010A), 5.700%, 09/01/2031 | 678,738 |
| 2,000,000 | | Nebraska Public Power District, General Revenue Bonds (Series 2012A), 5.000%, 01/01/2029 | 2,383,800 |
| | TOTAL | 5,198,798 |
| | Nevada—0.5% | |
| 490,000 | | Clark County, NV, (Summerlin-Mesa SID No. 151), Special Assessment Revenue Bonds (Series 2005), 5.000%, 08/01/2025 | 395,342 |
| 2,000,000 | | Clark County, NV, IDRB (Series 2003C), 5.45% TOBs (Southwest Gas Corp.), Mandatory Tender 3/1/2013 | 2,026,740 |
| | TOTAL | 2,422,082 |
| | New Jersey—2.3% | |
| 2,000,000 | | New Jersey EDA, (NJ Dedicated Cigarette Excise Tax), Cigarette Tax Revenue Refunding Bonds (Series 2012), 5.000%, 06/15/2020 | 2,324,840 |
| 600,000 | | New Jersey EDA, (NJ Dedicated Cigarette Excise Tax), Cigarette Tax Revenue Refunding Bonds (Series 2012), 5.000%, 06/15/2023 | 690,576 |
| 1,580,000 | | New Jersey EDA, (NJ Dedicated Cigarette Excise Tax), Revenue Bonds (Series 2004), 5.750%, (United States Treasury PRF 6/15/2014@100), 06/15/2029 | 1,717,981 |
| 1,200,000 | | New Jersey State Transportation Trust Fund Authority, (New Jersey State), Transportation System Bonds (Series 2011A), 6.000%, 06/15/2035 | 1,480,920 |
| 2,000,000 | | New Jersey Turnpike Authority, Turnpike Revenue Bonds (Series 2012A), 5.000%, 01/01/2032 | 2,327,120 |
Annual Shareholder Report
Shares or
Principal
Amount | | | Value |
| | MUNICIPAL BONDS—continued | |
| | New Jersey—continued | |
| $3,050,000 | | Tobacco Settlement Financing Corp., NJ, Revenue Bonds, 7.000%, (United States Treasury PRF 6/1/2013@100), 06/01/2041 | $3,170,414 |
| | TOTAL | 11,711,851 |
| | New Mexico—0.1% | |
| 500,000 | 3,4 | Jicarilla, NM Apache Nation, Revenue Bonds, 5.500%, 09/01/2023 | 516,765 |
| | New York—4.7% | |
| 2,000,000 | | Brooklyn Arena Local Development Corporation, NY, Pilot Revenue Bonds (Series 2009), 6.375%, 07/15/2043 | 2,339,820 |
| 2,000,000 | | Erie County, NY IDA, (Buffalo, NY City School District), School Facility Refunding Revenue Bonds (Series 2011B), 5.000%, 05/01/2020 | 2,452,420 |
| 1,500,000 | | Hudson Yards Infrastructure Corp. NY, Hudson Yards Senior Revenue Bonds (Series 2012A), 5.750%, 02/15/2047 | 1,771,020 |
| 4,000,000 | | New York City, NY IDA, (Yankee Stadium LLC), CPI Pilot Revenue Bonds (Series 2006), (FGIC INS), 2.5120%, 03/01/2021 | 3,905,360 |
| 5,000,000 | | New York City, NY, UT GO Bonds (Series 2009E-1), 5.250%, 10/15/2017 | 6,049,850 |
| 2,500,000 | | New York Liberty Development Corporation, (4 World Trade Center), Liberty Revenue Bonds (Series 2011), 5.750%, 11/15/2051 | 2,947,475 |
| 1,250,000 | | New York State Thruway Authority, (New York State Thruway Authority—General Revenue ), General Revenue Bonds (Series 2012I), 5.000%, 01/01/2037 | 1,424,288 |
| 2,000,000 | | New York State, UT GO Bonds (Series 2011A), 5.000%, 02/15/2020 | 2,497,440 |
| | TOTAL | 23,387,673 |
| | North Carolina—0.8% | |
| 2,000,000 | | North Carolina Medical Care Commission, (Pennybyrn at Maryfield), Healthcare Facilities Revenue Bonds (Series 2005A), 5.650%, 10/01/2025 | 1,958,140 |
| 1,535,000 | | North Carolina Municipal Power Agency No. 1, Revenue Bonds (Series 2008C), 5.250%, 01/01/2020 | 1,803,410 |
| | TOTAL | 3,761,550 |
| | Ohio—2.4% | |
| 2,850,000 | | American Municipal Power-Ohio, Inc., (American Municipal Power, Prairie State Energy Campus Project), Revenue Bonds (Series 2008A), 5.000%, 02/15/2016 | 3,214,059 |
| 1,680,000 | | Buckeye Tobacco Settlement Financing Authority, OH, Tobacco Settlement Asset-Backed Bonds (Series A-2), 6.500%, 06/01/2047 | 1,570,985 |
| 1,000,000 | | Cleveland, OH Airport System, Revenue Bonds (Series 2012A), 5.000%, 01/01/2031 | 1,114,220 |
| 1,000,000 | | Lorain County, OH Port Authority, (United States Steel Corp.), Recovery Zone Facility Revenue Bonds (Series 2010), 6.750%, 12/01/2040 | 1,087,430 |
Annual Shareholder Report
Shares or
Principal
Amount | | | Value |
| | MUNICIPAL BONDS—continued | |
| | Ohio—continued | |
| $1,000,000 | | Lucas County, OH, (ProMedica Healthcare Obligated Group), Revenue Bonds (Series 2011A), 6.000%, 11/15/2041 | $1,212,130 |
| 2,545,000 | | Ohio State Air Quality Development Authority, (FirstEnergy Solutions Corp.), Revenue Bonds (Series 2009A), 5.700%, 08/01/2020 | 3,034,353 |
| 375,000 | | Toledo-Lucas County, OH Port Authority, (Crocker Park Public Improvement Project), Special Assessment Revenue Bonds, 5.250%, 12/01/2023 | 393,847 |
| 400,000 | | Toledo-Lucas County, OH Port Authority, (CSX Corp.), Revenue Bonds, 6.450%, 12/15/2021 | 511,240 |
| | TOTAL | 12,138,264 |
| | Oklahoma—0.2% | |
| 1,000,000 | | Tulsa, OK Industrial Authority, (Montereau, Inc.), Senior Living Community Revenue Bonds (Series 2010A), 7.250%, 11/01/2045 | 1,134,280 |
| | Pennsylvania—3.6% | |
| 1,300,000 | | Allegheny County, PA IDA, (United States Steel Corp.), Environmental Improvement Refunding Revenue Bonds (Series 2005), 5.500%, 11/01/2016 | 1,363,583 |
| 2,785,000 | | Allentown, PA Neighborhood Improvement Zone Development Authority, Tax Revenue Bonds (Series 2012A), 5.000%, 05/01/2042 | 2,951,348 |
| 1,000,000 | | Chester County, PA IDA, (Collegium Charter School), Revenue Bonds (Series 2012A), 5.250%, 10/15/2032 | 993,860 |
| 2,120,000 | | Montgomery County, PA Higher Education & Health Authority Hospital, (Dickinson College), Revenue Bonds (Series 2006FF1), 5.000%, (CIFG Assurance NA INS), 05/01/2028 | 2,251,186 |
| 1,000,000 | | Northampton County, PA General Purpose Authority, (St. Luke's Hospital of Bethlehem), Hospital Revenue Bonds (Series 2008A), 5.250%, 08/15/2024 | 1,085,210 |
| 2,500,000 | | Northampton County, PA General Purpose Authority, (St. Luke's Hospital of Bethlehem), Hospital Revenue Bonds (Series 2008A), 5.500%, 08/15/2035 | 2,708,025 |
| 250,000 | | Pennsylvania State Higher Education Facilities Authority, (Dickinson College), Revenue Bonds (Series 2003AA1), 5.000%, (United States Treasury PRF 11/01/2013 @100), (Radian Asset Assurance Inc. INS), 11/01/2026 | 261,645 |
| 650,000 | | Pennsylvania State Higher Education Facilities Authority, (LaSalle University), Revenue Bonds (Series 2012), 5.000%, 05/01/2037 | 707,616 |
| 500,000 | | Pennsylvania State Higher Education Facilities Authority, (Messiah College), Revenue Bonds (Series AA), 5.500%, (Radian Asset Assurance, Inc., INS), 11/01/2022 | 520,430 |
| 3,000,000 | | Pennsylvania State Turnpike Commission, Turnpike Subordinate Revenue Bonds (Series 2009D), 5.500%, 12/01/2041 | 3,387,480 |
| 500,000 | | Philadelphia Authority for Industrial Development, (PresbyHomes Germantown/Morrisville), Senior Living Revenue Bonds (Series 2005A), 5.625%, 07/01/2035 | 506,190 |
Annual Shareholder Report
Shares or
Principal
Amount | | | Value |
| | MUNICIPAL BONDS—continued | |
| | Pennsylvania—continued | |
| $1,110,000 | | Philadelphia, PA Hospitals & Higher Education Facilities Authority, (Temple University Health System Obligated Group), Hospital Revenue Bonds (Series 2012A), 5.625%, 07/01/2042 | $1,177,432 |
| | TOTAL | 17,914,005 |
| | Puerto Rico—1.1% | |
| 2,310,000 | | Puerto Rico Commonwealth Aqueduct & Sewer Authority, Senior Lien Revenue Bonds (Series 2012A), 5.250%, 07/01/2042 | 2,327,256 |
| 850,000 | | Puerto Rico Industrial, Tourist, Educational, Medical & Environmental Control Facilities Financing Authority, (Inter American University of Puerto Rico), Higher Education Revenue Refunding Bonds, 5.000%, 10/01/2019 | 959,556 |
| 2,000,000 | | Puerto Rico Sales Tax Financing Corp., Sales Tax Revenue Bonds (First Subordinate Series 2010A), 5.500%, 08/01/2037 | 2,144,140 |
| | TOTAL | 5,430,952 |
| | South Carolina—0.6% | |
| 2,200,000 | | Georgetown County, SC Environmental Improvements, (International Paper Co.), Refunding Revenue Bonds, 5.700%, 04/01/2014 | 2,340,074 |
| 710,000 | | Lancaster County, SC, (Sun City Carolina Lakes Improvement District), Assessment Revenue Bonds (Series 2006), 5.450%, 12/01/2037 | 706,123 |
| | TOTAL | 3,046,197 |
| | South Dakota—0.8% | |
| 4,020,000 | | Educational Enhancement Funding Corp., SD, Tobacco Revenue Bonds (Series 2002B), 6.500%, 06/01/2032 | 4,140,520 |
| | Tennessee—0.5% | |
| 1,000,000 | | Johnson City, TN Health & Education Facilities Board, (Mountain States Health Alliance), Hospital Revenue Bonds (Series 2012A), 5.000%, 08/15/2042 | 1,076,920 |
| 1,280,000 | | Tennessee Energy Acquisition Corp., Gas Revenue Bonds (Series 2006A), 5.250%, (Goldman Sachs & Co. GTD), 09/01/2023 | 1,468,339 |
| | TOTAL | 2,545,259 |
| | Texas—4.4% | |
| 1,545,000 | | Bexar County, TX HFDC, (Army Retirement Residence Foundation), Refunding Revenue Bonds (Series 2007), 5.000%, 07/01/2033 | 1,574,494 |
| 2,000,000 | | Central Texas Regional Mobility Authority, Senior Lien Revenue Bonds (Series 2011), 6.250%, 01/01/2046 | 2,336,560 |
| 500,000 | | Clifton Higher Education Finance Corporation, TX, (Idea Public Schools ), Education Revenue Bonds (Series 2012), 5.000%, 08/15/2042 | 526,835 |
| 2,000,000 | | Dallas-Fort Worth, TX International Airport, Joint Revenue Refunding Bonds (Series 2012B), 5.000%, 11/01/2035 | 2,250,820 |
| 1,000,000 | | Decatur, TX Hospital Authority, (Wise Regional Health System), Hospital Revenue Bonds (Series 2004A), 7.125%, 09/01/2034 | 1,061,380 |
Annual Shareholder Report
Shares or
Principal
Amount | | | Value |
| | MUNICIPAL BONDS—continued | |
| | Texas—continued | |
| $3,570,000 | | Harris County, TX Cultural Education Facilities Finance Corp., (Methodist Hospital, Harris County, TX), Revenue Bonds (Series 2008B), 5.250%, 12/01/2016 | $4,164,334 |
| 265,000 | | Houston, TX Higher Education Finance Corp., (Cosmos Foundation, Inc.), Education Revenue Bonds (Series 2011A), 6.875%, 05/15/2041 | 337,941 |
| 1,665,000 | | North Texas Tollway Authority, System First Tier Revenue Refunding Bonds (Series 2011B), 5.000%, 01/01/2038 | 1,836,012 |
| 2,000,000 | | Tarrant County, TX Cultural Education Facilities Finance Corp., (Air Force Village), Retirement Facility Revenue Bonds (Series 2007), 5.125%, 05/15/2037 | 2,014,840 |
| 2,965,000 | | Texas Municipal Gas Acquisition & Supply Corp. I, Gas Supply Senior Lien Revenue Bonds (Series 2006A), 5.250%, (Merrill Lynch & Co., Inc. GTD), 12/15/2026 | 3,431,839 |
| 2,320,000 | | Texas State Department of Housing & Community Affairs, Residential Mortgage Revenue Bonds (Series 2009A), 5.300%, 07/01/2034 | 2,515,437 |
| | TOTAL | 22,050,492 |
| | Virginia—1.5% | |
| 1,000,000 | | Chesapeake, VA, (Chesapeake, VA Transportation System), Senior Toll Road Revenue Bonds (Series 2012A), 5.000%, 07/15/2047 | 1,078,820 |
| 4,485,000 | | Tobacco Settlement Financing Corp., VA, Revenue Bonds, 5.625%, (United States Agency PRF 6/1/2015@100), 06/01/2037 | 5,078,366 |
| 1,170,000 | | Virginia Peninsula Port Authority, (Brinks Co. (The)), Coal Terminal Revenue Refunding Bonds (Series 2003), 6.000%, 04/01/2033 | 1,191,294 |
| | TOTAL | 7,348,480 |
| | Washington—1.2% | |
| 3,650,000 | | Port of Tacoma, WA, LT GO Bonds (Series 2008A), 5.000%, (Assured Guaranty Municipal Corp. INS), 12/01/2030 | 4,141,363 |
| 1,615,000 | | Washington State Health Care Facilities Authority, (Kadlec Regional Medical Center), Revenue Bonds (Series 2012), 5.000%, 12/01/2042 | 1,662,465 |
| | TOTAL | 5,803,828 |
| | West Virginia—0.2% | |
| 1,000,000 | | Ohio County, WV County Commission, (Fort Henry Centre Tax Increment Financing District No. 1), Tax Increment Revenue Bonds (Series 2005A), 5.625%, 06/01/2034 | 1,018,060 |
| | Wisconsin—1.1% | |
| 4,665,000 | | Wisconsin State General Fund Appropriation, (Wisconsin State), Revenue Bonds (Series 2009A), 5.750%, 05/01/2033 | 5,575,561 |
| | Wyoming—0.3% | |
| 1,250,000 | | Laramie County, WY, (Cheyenne Regional Medical Center), Hospital Revenue Bonds (Series 2012), 5.000%, 05/01/2037 | 1,372,375 |
| | TOTAL MUNICIPAL BONDS
(IDENTIFIED COST $246,219,783) | 265,829,897 |
Annual Shareholder Report
Shares or
Principal
Amount | | | Value |
| | SHORT-TERM MUNICIPALS—2.3%5 | |
| | Michigan—0.4% | |
| $2,000,000 | | St. Joseph, MI Hospital Finance Authority, (Series 2006) Weekly VRDNs (Lakeland Hospitals at Niles & St. Joseph Obligated Group) , (Assured Guaranty Municipal Corp. INS, JPMorgan Chase Bank, N.A. LIQ), 0.27%, 11/1/2012 | $2,000,000 |
| | New York—0.6% | |
| 3,000,000 | | New York City, NY Municipal Water Finance Authority, Second General Resolution (Fiscal 2007 Series CC-2) Daily VRDNs, (Bank of Nova Scotia, Toronto LIQ), 0.21%, 11/1/2012 | 3,000,000 |
| | Pennsylvania—0.7% | |
| 1,750,000 | | Beaver County, PA IDA, (Series 2006-B) Daily VRDNs (FirstEnergy Solutions Corp.), (Citibank NA, New York LOC), 0.22%, 11/1/2012 | 1,750,000 |
| 2,000,000 | | Pittsburgh, PA Water & Sewer Authority, (Series B-1 of 2007) Weekly VRDNs, (Assured Guaranty Municipal Corp. INS, JPMorgan Chase Bank, N.A. LIQ), 0.31%, 11/1/2012 | 2,000,000 |
| | TOTAL | 3,750,000 |
| | Texas—0.6% | |
| 3,000,000 | | Harris County, TX Education Facilities Finance Corp., (Series 2008A) Daily VRDNs (Young Men's Christian Association of the Greater Houston Area), (JPMorgan Chase Bank, N.A. LOC), 0.23%, 11/1/2012 | 3,000,000 |
| | TOTAL SHORT-TERM MUNICIPALS
(AT AMORTIZED COST) | 11,750,000 |
| | TOTAL INVESTMENTS—99.4%
(IDENTIFIED COST $450,427,507)6 | 498,296,376 |
| | OTHER ASSETS AND LIABILITIES - NET—0.6%7 | 2,833,669 |
| | TOTAL NET ASSETS—100% | $501,130,045 |
At October 31, 2012, the Fund had the following open futures contracts:
| Description | Number of
Contracts | Notional
Value | Expiration
Date | Unrealized
Depreciation |
| 1United States 10-Year Short Futures | 25 | $3,325,781 | December 2012 | $(12,876) |
Unrealized Depreciation on Futures Contracts is included in “Other Assets and
Liabilities—Net.”
At October 31, 2012, the Fund holds no securities that are subject to the federal alternative minimum tax (AMT) (unaudited).
| 1 | Non-income producing security. |
| 2 | Security in default. |
| 3 | Denotes a restricted security that either: (a) cannot be offered for public sale without first being registered, or being able to take advantage of an exemption from registration, under the Securities Act of 1933; or (b) is subject to a contractual restriction on public sales. At October 31, 2012, this restricted security amounted to $516,765, which represented 0.1% of total net assets. |
Annual Shareholder Report
| 4 | Denotes a restricted security that may be resold without restriction to “qualified institutional buyers” as defined in Rule 144A under the Securities Act of 1933 and that the Fund has determined to be liquid under criteria established by the Fund's Board of Trustees (the “Trustees”). At October 31, 2012, this liquid restricted security amounted to $516,765, which represented 0.1% of total net assets. |
| 5 | Current rate and next reset date shown for Variable Rate Demand Notes. |
| 6 | The cost of investments for federal tax purposes amounts to $451,302,047. |
| 7 | Assets, other than investments in securities, less liabilities. See Statement of Assets and Liabilities. |
Note: The categories of investments are shown as a percentage of total net assets at October 31, 2012.
Various inputs are used in determining the value of the Fund's investments. These inputs are summarized in the three broad levels listed below:
Level 1—quoted prices in active markets for identical securities, including investment companies with daily net asset values, if applicable.
Level 2—other significant observable inputs (including quoted prices for similar securities, interest rates, prepayment speeds, credit risk, etc.). Also includes securities valued at amortized cost.
Level 3—significant unobservable inputs (including the Fund's own assumptions in determining the fair value of investments).
The inputs or methodology used for valuing securities are not an indication of the risk associated with investing in those securities.
The following is a summary of the inputs used, as of October 31, 2012, in valuing the Fund's assets carried at fair value:
| Valuation Inputs | | | | |
| Level 1—
Quoted
Prices and
Investments in
Mutual Funds | Level 2—
Other
Significant
Observable
Inputs | Level 3—
Significant
Unobservable
Inputs | Total |
| Equity Securities: | | | | |
| Common Stock | | | | |
| Domestic | $161,425,520 | $— | $— | $161,425,520 |
| International | 59,290,959 | — | — | 59,290,959 |
| Debt Securities: | | | | |
| Municipal Bonds | — | 265,829,897 | — | 265,829,897 |
| Short-Term Municipals | — | 11,750,000 | — | 11,750,000 |
| TOTAL SECURITIES | $220,716,479 | $277,579,897 | $— | $498,296,376 |
| OTHER FINANCIAL INSTRUMENTS* | $(12,876) | $— | $— | $(12,876) |
| * | Other financial instruments include futures contracts.
|
Annual Shareholder Report
The following acronyms are used throughout this portfolio:
| ADR | —American Depositary Receipt |
| CDA | —Community Development Administration |
| COP | —Certificate of Participation |
| EDA | —Economic Development Authority |
| EDC | —Economic Development Corporation |
| EDRBs | —Economic Development Revenue Bonds |
| FGIC | —Financial Guaranty Insurance Company |
| GO | —General Obligation |
| GTD | —Guaranteed |
| HEFA | —Health and Education Facilities Authority |
| HFDC | —Health Facility Development Corporation |
| IDA | —Industrial Development Authority |
| IDFA | —Industrial Development Finance Authority |
| IDRB | —Industrial Development Revenue Bond |
| INS | —Insured |
| LIQ | —Liquidity Agreement |
| LO | —Limited Obligation |
| LOC | —Letter of Credit |
| LT | —Limited Tax |
| PCRBs | —Pollution Control Revenue Bonds |
| PRF | —Pre-refunded |
| RACs | —Revenue Anticipation Certificates |
| SFH | —Single Family Housing |
| SID | —Special Improvement District |
| TOBs | —Tender Option Bonds |
| UT | —Unlimited Tax |
| VRDNs | —Variable Rate Demand Notes |
See Notes which are an integral part of the Financial Statements
Annual Shareholder Report
Financial Highlights–Class A Shares
(For a Share Outstanding Throughout Each Period)
| Year Ended October 31 | 2012 | 2011 | 2010 | 2009 | 2008 |
| Net Asset Value, Beginning of Period | $10.75 | $10.52 | $9.95 | $9.46 | $12.08 |
| Income From Investment Operations: | | | | | |
| Net investment income | 0.42 | 0.42 | 0.34 | 0.34 | 0.39 |
| Net realized and unrealized gain (loss) on investments, futures contracts, swap contracts, written options and foreign currency transactions | 0.94 | 0.24 | 0.56 | 0.49 | (2.27) |
| TOTAL FROM INVESTMENT OPERATIONS | 1.36 | 0.66 | 0.90 | 0.83 | (1.88) |
| Less Distributions: | | | | | |
| Distributions from net investment income | (0.42) | (0.43) | (0.33) | (0.34) | (0.39) |
| Distributions from net realized gain on investments, futures contracts, written options and foreign currency transactions | — | — | — | — | (0.35) |
| TOTAL DISTRIBUTIONS | (0.42) | (0.43) | (0.33) | (0.34) | (0.74) |
| Net Asset Value, End of Period | $11.69 | $10.75 | $10.52 | $9.95 | $9.46 |
| Total Return1 | 12.87% | 6.46% | 9.19% | 9.07% | (16.39)% |
| Ratios to Average Net Assets: | | | | | |
| Net expenses | 1.00% | 1.00%2 | 1.00%2 | 1.00%2 | 1.00%2 |
| Net investment income | 3.73% | 4.01% | 3.23% | 3.60% | 3.47% |
| Expense waiver/reimbursement3 | 0.46% | 0.48% | 0.45% | 0.47% | 0.45% |
| Supplemental Data: | | | | | |
| Net assets, end of period (000 omitted) | $303,053 | $267,566 | $348,191 | $384,555 | $404,311 |
| Portfolio turnover | 24% | 34% | 72% | 80% | 87% |
| 1 | Based on net asset value, which does not reflect the sales charge, redemption fee or contingent deferred sales charge, if applicable. |
| 2 | The net expense ratio is calculated without reduction for expense offset arrangements. The net expense ratios are 1.00%, 1.00%, 0.98% and 1.00% for the years ended October 31, 2011, 2010, 2009 and 2008, respectively, after taking into account these expense reductions. |
| 3 | This expense decrease is reflected in both the net expense and net investment income ratios shown above. |
See Notes which are an integral part of the Financial Statements
Annual Shareholder Report
Financial Highlights–Class B Shares
(For a Share Outstanding Throughout Each Period)
| Year Ended October 31 | 2012 | 2011 | 2010 | 2009 | 2008 |
| Net Asset Value, Beginning of Period | $10.75 | $10.51 | $9.94 | $9.46 | $12.07 |
| Income From Investment Operations: | | | | | |
| Net investment income | 0.34 | 0.34 | 0.26 | 0.27 | 0.30 |
| Net realized and unrealized gain (loss) on investments, futures contracts, swap contracts, written options and foreign currency transactions | 0.92 | 0.25 | 0.56 | 0.48 | (2.25) |
| TOTAL FROM INVESTMENT OPERATIONS | 1.26 | 0.59 | 0.82 | 0.75 | (1.95) |
| Less Distributions: | | | | | |
| Distributions from net investment income | (0.33) | (0.35) | (0.25) | (0.27) | (0.31) |
| Distributions from net realized gain on investments, futures contracts, written options and foreign currency transactions | — | — | — | — | (0.35) |
| TOTAL DISTRIBUTIONS | (0.33) | (0.35) | (0.25) | (0.27) | (0.66) |
| Net Asset Value, End of Period | $11.68 | $10.75 | $10.51 | $9.94 | $9.46 |
| Total Return1 | 11.93% | 5.76% | 8.37% | 8.14% | (16.95)% |
| Ratios to Average Net Assets: | | | | | |
| Net expenses | 1.75% | 1.75%2 | 1.75%2 | 1.75%2 | 1.75%2 |
| Net investment income | 2.99% | 3.25% | 2.48% | 2.85% | 2.72% |
| Expense waiver/reimbursement3 | 0.46% | 0.48% | 0.45% | 0.47% | 0.45% |
| Supplemental Data: | | | | | |
| Net assets, end of period (000 omitted) | $34,930 | $43,675 | $50,781 | $55,826 | $59,324 |
| Portfolio turnover | 24% | 34% | 72% | 80% | 87% |
| 1 | Based on net asset value, which does not reflect the sales charge, redemption fee or contingent deferred sales charge, if applicable. |
| 2 | The net expense ratio is calculated without reduction for expense offset arrangements. The net expense ratios are 1.75%, 1.75%, 1.73% and 1.75% for the years ended October 31, 2011, 2010, 2009 and 2008, respectively, after taking into account these expense reductions. |
| 3 | This expense decrease is reflected in both the net expense and net investment income ratios shown above. |
See Notes which are an integral part of the Financial Statements
Annual Shareholder Report
Financial Highlights–Class C Shares
(For a Share Outstanding Throughout Each Period)
| Year Ended October 31 | 2012 | 2011 | 2010 | 2009 | 2008 |
| Net Asset Value, Beginning of Period | $10.75 | $10.51 | $9.94 | $9.46 | $12.07 |
| Income From Investment Operations: | | | | | |
| Net investment income | 0.34 | 0.34 | 0.26 | 0.27 | 0.30 |
| Net realized and unrealized gain (loss) on investments, futures contracts, swap contracts, written options and foreign currency transactions | 0.93 | 0.25 | 0.56 | 0.48 | (2.25) |
| TOTAL FROM INVESTMENT OPERATIONS | 1.27 | 0.59 | 0.82 | 0.75 | (1.95) |
| Less Distributions: | | | | | |
| Distributions from net investment income | (0.34) | (0.35) | (0.25) | (0.27) | (0.31) |
| Distributions from net realized gain on investments, futures contracts, written options and foreign currency transactions | — | — | — | — | (0.35) |
| TOTAL DISTRIBUTIONS | (0.34) | (0.35) | (0.25) | (0.27) | (0.66) |
| Net Asset Value, End of Period | $11.68 | $10.75 | $10.51 | $9.94 | $9.46 |
| Total Return1 | 11.94% | 5.76% | 8.37% | 8.15% | (16.95)% |
| Ratios to Average Net Assets: | | | | | |
| Net expenses | 1.75% | 1.75%2 | 1.75%2 | 1.75%2 | 1.75%2 |
| Net investment income | 2.98% | 3.25% | 2.48% | 2.86% | 2.72% |
| Expense waiver/reimbursement3 | 0.46% | 0.48% | 0.45% | 0.47% | 0.45% |
| Supplemental Data: | | | | | |
| Net assets, end of period (000 omitted) | $105,994 | $86,120 | $101,822 | $113,830 | $122,165 |
| Portfolio turnover | 24% | 34% | 72% | 80% | 87% |
| 1 | Based on net asset value, which does not reflect the sales charge, redemption fee or contingent deferred sales charge, if applicable. |
| 2 | The net expense ratio is calculated without reduction for expense offset arrangements. The net expense ratios are 1.75%, 1.75%, 1.73% and 1.75% for the years ended October 31, 2011, 2010, 2009 and 2008, respectively, after taking into account these expense reductions. |
| 3 | This expense decrease is reflected in both the net expense and net investment income ratios shown above. |
See Notes which are an integral part of the Financial Statements
Annual Shareholder Report
Financial Highlights–Class F Shares
(For a Share Outstanding Throughout Each Period)
| Year Ended October 31 | 2012 | 2011 | 2010 | 2009 | 2008 |
| Net Asset Value, Beginning of Period | $10.75 | $10.52 | $9.95 | $9.46 | $12.08 |
| Income From Investment Operations: | | | | | |
| Net investment income | 0.43 | 0.42 | 0.33 | 0.35 | 0.39 |
| Net realized and unrealized gain (loss) on investments, futures contracts, swap contracts, written options and foreign currency transactions | 0.93 | 0.24 | 0.57 | 0.49 | (2.26) |
| TOTAL FROM INVESTMENT OPERATIONS | 1.36 | 0.66 | 0.90 | 0.84 | (1.87) |
| Less Distributions: | | | | | |
| Distributions from net investment income | (0.42) | (0.43) | (0.33) | (0.35) | (0.40) |
| Distributions from net realized gain on investments, futures contracts, written options and foreign currency transactions | — | — | — | — | (0.35) |
| TOTAL DISTRIBUTIONS | (0.42) | (0.43) | (0.33) | (0.35) | (0.75) |
| Net Asset Value, End of Period | $11.69 | $10.75 | $10.52 | $9.95 | $9.46 |
| Total Return1 | 12.87% | 6.45% | 9.21% | 9.20% | (16.32)% |
| Ratios to Average Net Assets: | | | | | |
| Net expenses | 1.00% | 1.00%2 | 0.99%2 | 0.89%2 | 0.92%2 |
| Net investment income | 3.71% | 4.00% | 3.24% | 3.70% | 3.58% |
| Expense waiver/reimbursement3 | 0.46% | 0.48% | 0.45% | 0.47% | 0.45% |
| Supplemental Data: | | | | | |
| Net assets, end of period (000 omitted) | $36,638 | $18,876 | $18,299 | $16,032 | $13,588 |
| Portfolio turnover | 24% | 34% | 72% | 80% | 87% |
| 1 | Based on net asset value, which does not reflect the sales charge, redemption fee or contingent deferred sales charge, if applicable. |
| 2 | The net expense ratio is calculated without reduction for expense offset arrangements. The net expense ratios are 1.00%, 0.99%, 0.87% and 0.92% for the years ended October 31, 2011, 2010, 2009 and 2008, respectively, after taking into account these expense reductions. |
| 3 | This expense decrease is reflected in both the net expense and net investment income ratios shown above. |
See Notes which are an integral part of the Financial Statements
Annual Shareholder Report
Financial Highlights–Institutional Shares
(For a Share Outstanding Throughout Each Period)
| Year
Ended
10/31/2012 | Period
Ended
10/31/20111 |
| Net Asset Value, Beginning of Period | $10.75 | $10.29 |
| Income From Investment Operations: | | |
| Net investment income | 0.44 | 0.34 |
| Net realized and unrealized gain on investments, futures contracts and foreign currency transactions | 0.94 | 0.48 |
| TOTAL FROM INVESTMENT OPERATIONS | 1.38 | 0.82 |
| Less Distributions: | | |
| Distributions from net investment income | (0.45) | (0.36) |
| Net Asset Value, End of Period | $11.68 | $10.75 |
| Total Return2 | 13.05% | 8.05% |
| Ratios to Average Net Assets: | | |
| Net expenses | 0.75% | 0.75%3,4 |
| Net investment income | 3.90% | 4.14%3 |
| Expense waiver/reimbursement5 | 0.46% | 0.51%3 |
| Supplemental Data: | | |
| Net assets, end of period (000 omitted) | $20,514 | $3,149 |
| Portfolio turnover | 24% | 34%6 |
| 1 | Reflect operations for the period from December 29, 2010 (date of initial investment) to October 31, 2011. |
| 2 | Based on net asset value. Total returns for periods of less than one year are not annualized. |
| 3 | Computed on an annualized basis. |
| 4 | The net expense ratio is calculated without reduction for expense offset arrangements. The net expense ratio is 0.75% for the period ended October 31, 2011, after taking into account this expense reduction. |
| 5 | This expense decrease is reflected in both the net expense and net investment income ratios shown above. |
| 6 | Portfolio turnover is calculated at the Fund level. Percentage indicated was calculated for the fiscal year ended October 31, 2011. |
See Notes which are an integral part of the Financial Statements
Annual Shareholder Report
Statement of Assets and Liabilities
October 31, 2012
| Assets: | | |
| Total investment in securities, at value (identified cost $450,427,507) | | $498,296,376 |
| Restricted cash (Note 2) | | 27,500 |
| Income receivable | | 4,610,001 |
| Receivable for shares sold | | 1,245,991 |
| Receivable for investments sold | | 37,244 |
| TOTAL ASSETS | | 504,217,112 |
| Liabilities: | | |
| Bank overdraft | $550,652 | |
| Payable for investments purchased | 2,062,950 | |
| Payable for shares redeemed | 31,594 | |
| Payable for daily variation margin | 8,985 | |
| Payable for Transfer and dividend disbursing agent fees and expenses | 52,638 | |
| Payable for shareholder services fee (Note 5) | 166,878 | |
| Payable for distribution services fee (Note 5) | 89,743 | |
| Payable for Directors'/Trustees' fees | 1,049 | |
| Accrued expenses | 122,578 | |
| TOTAL LIABILITIES | | 3,087,067 |
| Net assets for 42,890,694 shares outstanding | | $501,130,045 |
| Net Assets Consist of: | | |
| Paid-in capital | | $517,399,286 |
| Net unrealized appreciation of investments and futures contracts | | 47,855,993 |
| Accumulated net realized loss on investments, futures contracts, swap contracts, written options and foreign currency transactions | | (64,646,798) |
| Undistributed net investment income | | 521,564 |
| TOTAL NET ASSETS | | $501,130,045 |
Annual Shareholder Report
Statement of Assets and Liabilities–continued
| Net Asset Value, Offering Price and Redemption Proceeds Per Share | | |
| Class A Shares: | | |
| Net asset value per share ($303,053,011 ÷ 25,933,534 shares outstanding), no par value, unlimited shares authorized | | $11.69 |
| Offering price per share (100/94.50 of $11.69) | | $12.37 |
| Redemption proceeds per share | | $11.69 |
| Class B Shares: | | |
| Net asset value per share ($34,930,345 ÷ 2,990,424 shares outstanding), no par value, unlimited shares authorized | | $11.68 |
| Offering price per share | | $11.68 |
| Redemption proceeds per share (94.50/100 of $11.68) | | $11.04 |
| Class C Shares: | | |
| Net asset value per share ($105,994,218 ÷ 9,075,361 shares outstanding), no par value, unlimited shares authorized | | $11.68 |
| Offering price per share | | $11.68 |
| Redemption proceeds per share (99.00/100 of $11.68) | | $11.56 |
| Class F Shares: | | |
| Net asset value per share ($36,638,118 ÷ 3,135,357 shares outstanding), no par value, unlimited shares authorized | | $11.69 |
| Offering price per share (100/99.00 of $11.69) | | $11.81 |
| Redemption proceeds per share (99.00/100 of $11.69) | | $11.57 |
| Institutional Shares: | | |
| Net asset value per share ($20,514,353 ÷ 1,756,018 shares outstanding), no par value, unlimited shares authorized | | $11.68 |
| Offering price per share | | $11.68 |
| Redemption proceeds per share | | $11.68 |
See Notes which are an integral part of the Financial Statements
Annual Shareholder Report
Statement of Operations
Year Ended October 31, 2012
| Investment Income: | | | |
| Interest | | | $11,284,457 |
| Dividends (net of foreign taxes withheld of $298,366) | | | 10,259,586 |
| TOTAL INCOME | | | 21,544,043 |
| Expenses: | | | |
| Investment adviser fee (Note 5) | | $4,551,795 | |
| Administrative fee (Note 5) | | 355,128 | |
| Custodian fees | | 26,685 | |
| Transfer and dividend disbursing agent fees and expenses | | 282,652 | |
| Directors'/Trustees' fees | | 3,740 | |
| Auditing fees | | 25,900 | |
| Legal fees | | 21,542 | |
| Portfolio accounting fees | | 143,289 | |
| Distribution services fee (Note 5) | | 999,002 | |
| Shareholder services fee (Note 5) | | 1,111,634 | |
| Account administration fee (Note 2) | | 1,147 | |
| Share registration costs | | 73,596 | |
| Printing and postage | | 41,353 | |
| Insurance premiums | | 4,582 | |
| Miscellaneous | | 6,758 | |
| TOTAL EXPENSES | | 7,648,803 | |
| Waivers and Reimbursement (Note 5): | | | |
| Waiver of investment adviser fee | $(2,093,784) | | |
| Waiver of administrative fee | (7,085) | | |
| Reimbursement of shareholder services fee | (400) | | |
| TOTAL WAIVERS AND REIMBURSEMENT | | (2,101,269) | |
| Net expenses | | | 5,547,534 |
| Net investment income | | | 15,996,509 |
| Realized and Unrealized Gain (Loss) on Investments, Futures Contracts and Foreign Currency Transactions: | | | |
| Net realized gain on investments and foreign currency transactions | | | 9,325,801 |
| Net realized loss on futures contracts | | | (111,702) |
| Net change in unrealized appreciation of investments and translation of assets and liabilities in foreign currency | | | 27,406,973 |
| Net change in unrealized depreciation of futures contracts | | | (12,876) |
| Net realized and unrealized gain on investments, futures contracts and foreign currency transactions | | | 36,608,196 |
| Change in net assets resulting from operations | | | $52,604,705 |
See Notes which are an integral part of the Financial Statements
Annual Shareholder Report
Statement of Changes in Net Assets
| Year Ended October 31 | 2012 | 2011 |
| Increase (Decrease) in Net Assets | | |
| Operations: | | |
| Net investment income | $15,996,509 | $17,155,166 |
| Net realized gain on investments, futures contracts, written options and foreign currency transactions | 9,214,099 | 5,632,871 |
| Net change in unrealized appreciation/depreciation of investments, futures contracts, written options and translation of assets and liabilities in foreign currency | 27,394,097 | 3,384,396 |
| CHANGE IN NET ASSETS RESULTING FROM OPERATIONS | 52,604,705 | 26,172,433 |
| Distributions to Shareholders: | | |
| Distributions from net investment income | | |
| Class A Shares | (10,651,026) | (12,095,898) |
| Class B Shares | (1,137,646) | (1,551,400) |
| Class C Shares | (2,815,242) | (3,032,708) |
| Class F Shares | (980,573) | (737,453) |
| Institutional Shares | (337,921) | (51,695) |
| CHANGE IN NET ASSETS RESULTING FROM DISTRIBUTIONS TO SHAREHOLDERS | (15,922,408) | (17,469,154) |
| Share Transactions: | | |
| Proceeds from sale of shares | 132,210,494 | 39,139,192 |
| Net asset value of shares issued to shareholders in payment of distributions declared | 14,334,647 | 15,082,392 |
| Cost of shares redeemed | (101,484,061) | (162,630,779) |
| CHANGE IN NET ASSETS RESULTING FROM SHARE TRANSACTIONS | 45,061,080 | (108,409,195) |
| Change in net assets | 81,743,377 | (99,705,916) |
| Net Assets: | | |
| Beginning of period | 419,386,668 | 519,092,584 |
| End of period (including undistributed net investment income of $521,564 and $480,208, respectively) | $501,130,045 | $419,386,668 |
See Notes which are an integral part of the Financial Statements
Annual Shareholder Report
Notes to Financial Statements
October 31, 2012
1. Organization
Federated Income Securities Trust (the “Trust”) is registered under the Investment Company Act of 1940, as amended (the “Act”), as an open-end management investment company. The Trust consists of nine portfolios. The financial statements included herein are only those of Federated Muni and Stock Advantage Fund (the “Fund”), a diversified portfolio. The financial statements of the other portfolios are presented separately. The assets of each portfolio are segregated and a shareholder's interest is limited to the portfolio in which shares are held. Each portfolio pays its own expenses. The Fund offers five classes of shares: Class A Shares, Class B Shares, Class C Shares, Class F Shares and Institutional Shares. All shares of the Fund have equal rights with respect to voting, except on class-specific matters. The investment objective of the Fund is to provide tax-advantaged income with a secondary objective of capital appreciation.
Effective December 29, 2010, the Fund began offering Institutional Shares.
2. Significant Accounting Policies
The following is a summary of significant accounting policies consistently followed by the Fund in the preparation of its financial statements. These policies are in conformity with U.S. generally accepted accounting principles (GAAP).
Investment Valuation
In calculating its net asset value (NAV), the Fund generally values investments as follows:
| ■ | Fixed-income securities acquired with remaining maturities greater than 60 days are fair valued using price evaluations provided by a pricing service approved by the Trustees. |
| ■ | Fixed-income securities acquired with remaining maturities of 60 days or less are valued at their cost (adjusted for the accretion of any discount or amortization of any premium), which approximates market value. |
| ■ | Equity securities listed on an exchange or traded through a regulated market system are valued at their last reported sale price or official closing price in their principal exchange or market. |
| ■ | Derivative contracts listed on exchanges are valued at their reported settlement or closing price. |
| ■ | Over-the-counter (OTC) derivative contracts are fair valued using price evaluations provided by a pricing service approved by the Trustees. |
| ■ | Shares of other mutual funds are valued based upon their reported NAVs. |
| ■ | For securities that are fair valued in accordance with procedures established by and under the general supervision of the Trustees, certain factors may be considered such as: the purchase price of a security, information obtained by contacting the issuer, analysis of the issuer's financial statements or other available documents, fundamental analytical data, the nature and duration of restrictions on disposition, the movement of the market in which the security is normally traded and public trading in similar securities of the issuer or comparable issuers. |
Annual Shareholder Report
If the Fund cannot obtain a price or price evaluation from a pricing service for an investment, the Fund may attempt to value the investment based upon the mean of bid and asked quotations or fair value the investment based on price evaluations, from one or more dealers. If any price, quotation, price evaluation or other pricing source is not readily available when the NAV is calculated, the Fund uses the fair value of the investment determined in accordance with the procedures described below. There can be no assurance that the Fund could purchase or sell an investment at the price used to calculate the Fund's NAV.
Fair Valuation and Significant Events Procedures
The Trustees have appointed a Valuation Committee comprised of officers of the Fund, Federated Equity Management Company of Pennsylvania (“Adviser”) and the Adviser's affiliated companies to determine fair value of securities and in overseeing the calculation of the NAV. The Trustees have also authorized the use of pricing services recommended by the Valuation Committee to provide fair value evaluations of the current value of certain investments for purposes of calculating the NAV. The Valuation Committee employs various methods for reviewing third-party pricing service evaluations including periodic reviews of third-party pricing services' policies, procedures and valuation methods (including key inputs and assumptions), transactional back-testing, comparisons of evaluations of different pricing services and review of price challenges by the Adviser based on recent market activity. In the event that market quotations and price evaluations are not available for an investment, the Valuation Committee determines the fair value of the investment in accordance with procedures adopted by the Trustees. The Trustees periodically review and approve the fair valuations made by the Valuation Committee and any changes made to the procedures.
Factors considered by pricing services in evaluating an investment include the yields or prices of investments of comparable quality, coupon, maturity, call rights and other potential prepayments, terms and type, reported transactions, indications as to values from dealers and general market conditions. Some pricing services provide a single price evaluation reflecting the bid-side of the market for an investment (a “bid” evaluation). Other pricing services offer both bid evaluations and price evaluations indicative of a price between the prices bid and asked for the investment (a “mid” evaluation). The Fund normally uses bid evaluations for U.S. Treasury and Agency securities, mortgage-backed securities and municipal securities. The Fund normally uses mid evaluations for other types of fixed-income securities and OTC derivative contracts. In the event that market quotations and price evaluations are not available for an investment, the fair value of the investment is determined in accordance with procedures adopted by the Trustees.
The Trustees also have adopted procedures requiring an investment to be priced at its fair value whenever the Adviser determines that a significant event affecting the value of the investment has occurred between the time as of which the price of the investment would otherwise be determined and the time as of which the NAV is computed. An event is considered significant if there is both an affirmative expectation that the investment's value will change in response to the event and a reasonable basis for quantifying the resulting change in value. Examples of significant events that may occur after the close of the principal market on which a security is traded, or after the time of a price evaluation provided by a pricing service or a dealer, include:
| ■ | With respect to securities traded in foreign markets, significant trends in U.S. equity markets or in the trading of foreign securities index futures contracts; |
| ■ | Political or other developments affecting the economy or markets in which an issuer conducts its operations or its securities are traded; and |
Annual Shareholder Report
| ■ | Announcements concerning matters such as acquisitions, recapitalizations, litigation developments, a natural disaster affecting the issuer's operations or regulatory changes or market developments affecting the issuer's industry. |
The Trustees have approved the use of a pricing service to determine the fair value of equity securities traded principally in foreign markets when the Adviser determines that there has been a significant trend in the U.S. equity markets or in index futures trading. For other significant events, the Fund may seek to obtain more current quotations or price evaluations from alternative pricing sources. If a reliable alternative pricing source is not available, the Fund will determine the fair value of the investment using another method approved by the Trustees.
Investment Income, Gains and Losses, Expenses and Distributions
Investment transactions are accounted for on a trade-date basis. Realized gains and losses from investment transactions are recorded on an identified-cost basis. Interest income and expenses are accrued daily. Dividend income and distributions to shareholders are recorded on the ex-dividend date. Foreign dividends are recorded on the ex-dividend date or when the Fund is informed of the ex-dividend date. Distributions of net investment income are declared and paid monthly. Non-cash dividends included in dividend income, if any, are recorded at fair value. Investment income, realized gains and losses, and certain fund-level expenses are allocated to each class based on relative average daily net assets, except that Class A Shares, Class B Shares, Class C Shares, Class F Shares and Institutional Shares may bear account administration fees, distribution services fees and shareholder services fees unique to those classes. For the year ended October 31, 2012, account administration fees for the Fund were as follows:
| Account
Administration
Fees Incurred |
| Class A Shares | $618 |
| Class C Shares | 234 |
| Class F Shares | 295 |
| TOTAL | $1,147 |
Dividends are declared separately for each class. No class has preferential dividend rights; differences in per share dividend rates are generally due to differences in separate class expenses.
Premium and Discount Amortization
All premiums and discounts on fixed-income securities are amortized/accreted using the effective interest rate method.
Federal Taxes
It is the Fund's policy to comply with the Subchapter M provision of the Internal Revenue Code (the “Code”) and to distribute to shareholders each year substantially all of its income. Accordingly, no provision for federal income tax is necessary. As of and during the year ended October 31, 2012, the Fund did not have a liability for any uncertain tax positions. The Fund
Annual Shareholder Report
recognizes interest and penalties, if any, related to tax liabilities as income tax expense in the Statement of Operations. As of October 31, 2012, tax years 2009 through 2012 remain subject to examination by the Fund's major tax jurisdictions, which include the United States of America and the Commonwealth of Massachusetts.
The Fund may be subject to taxes imposed by governments of countries in which it invests. Such taxes are generally based on either income or gains earned or repatriated. The Fund accrues and applies such taxes to net investment income, net realized gains and net unrealized gains as income and/or gains are earned.
When-Issued and Delayed Delivery Transactions
The Fund may engage in when-issued or delayed delivery transactions. The Fund records when-issued securities on the trade date and maintains security positions such that sufficient liquid assets will be available to make payment for the securities purchased. Securities purchased on a when-issued or delayed delivery basis are marked to market daily and begin earning interest on the settlement date. Losses may occur on these transactions due to changes in market conditions or the failure of counterparties to perform under the contract.
Futures Contracts
The Fund purchases and sells financial futures contracts to manage cash flows, enhance yield, manage duration and to potentially reduce transaction costs. Upon entering into a financial futures contract with a broker, the Fund is required to deposit in a segregated account a specified amount of cash or U.S. government securities which is shown as Restricted cash in the Statement of Assets and Liabilities. Futures contracts are valued daily and unrealized gains or losses are recorded in a “variation margin” account. Daily, the Fund receives from or pays to the broker a specified amount of cash based upon changes in the variation margin account. When a contract is closed, the Fund recognizes a realized gain or loss. Futures contracts have market risks, including the risk that the change in the value of the contract may not correlate with the changes in the value of the underlying securities. There is minimal counterparty risk to the Fund since futures are exchange traded and the exchange's clearinghouse, as counterparty to all exchange traded futures, guarantees the futures against default.
Futures contracts outstanding at period end are listed after the Fund's Portfolio of Investments.
The average notional value of futures contracts held by the Fund throughout the period was $2,603,576. This is based on amounts held as of each month-end throughout the fiscal period.
Foreign Exchange Contracts
The Fund may enter into foreign exchange contracts for the delayed delivery of securities or foreign currency exchange transactions. The Fund may enter into foreign exchange contracts to protect assets against adverse changes in foreign currency exchange rates or exchange control regulations. Purchased contracts are used to acquire exposure to foreign currencies, whereas, contracts to sell are used to hedge the Fund's securities against currency fluctuations. Risks may arise upon entering into these transactions from the potential inability of counterparties to meet the terms of their commitments and from unanticipated movements in security prices or foreign exchange rates. The foreign exchange contracts are adjusted by the daily exchange rate of the underlying currency and any gains or losses are recorded for financial statement purposes as unrealized until the settlement date.
At October 31, 2012, the Fund had no outstanding foreign exchange contracts.
Annual Shareholder Report
Foreign Currency Translation
The accounting records of the Fund are maintained in U.S. dollars. All assets and liabilities denominated in foreign currencies (FCs) are translated into U.S. dollars based on the rates of exchange of such currencies against U.S. dollars on the date of valuation. Purchases and sales of securities, income and expenses are translated at the rate of exchange quoted on the respective date that such transactions are recorded. The Fund does not isolate that portion of the results of operations resulting from changes in foreign exchange rates on investments from the fluctuations arising from changes in market prices of securities held. Such fluctuations are included with the net realized and unrealized gain or loss from investments.
Reported net realized foreign exchange gains or losses arise from sales of portfolio securities, sales and maturities of short-term securities, sales of FCs, currency gains or losses realized between the trade and settlement dates on securities transactions, the difference between the amounts of dividends, interest and foreign withholding taxes recorded on the Fund's books, and the U.S. dollar equivalent of the amounts actually received or paid. Net unrealized foreign exchange gains and losses arise from changes in the value of assets and liabilities other than investments in securities at fiscal year end, resulting from changes in the exchange rate.
Option Contracts
The Fund buys or sells put and call options to maintain flexibility, produce income or hedge. The seller (writer) of an option receives a payment or premium, from the buyer, which the writer keeps regardless of whether the buyer exercises the option. When the Fund writes a put or call option, an amount equal to the premium received is recorded as a liability and subsequently marked to market to reflect the current value of the option written. Premiums received from writing options which expire are treated as realized gains. The Fund, as a writer of an option, bears the market risk of an unfavorable change in the price of the underlying reference instrument. When the Fund purchases a put or call option, an amount equal to the premium paid is recorded as an increase to the cost of the investment and subsequently marked to market to reflect the current value of the option purchased. Premiums paid for purchasing options which expire are treated as realized losses. Premiums received/paid for writing/purchasing options which are exercised or closed are added to the proceeds or offset against amounts paid on the underlying reference instrument to determine the realized gain or loss. The risk associated with purchasing put and call options is limited to the premium paid. Options can trade on securities or commodities exchanges. In this case, the exchange sets all the terms of the contract except for the price. Most exchanges require investors to maintain margin accounts through their brokers to cover their potential obligations to the exchange. This protects investors against potential defaults by the counterparty.
At October 31, 2012, the Fund had no outstanding written options contracts.
The average notional amount of purchased options held by the Fund throughout the period was $64,561. This is based on amounts held as of each month-end throughout the fiscal period.
Restricted Securities
The Fund may purchase securities which are considered restricted. Restricted securities are securities that either: (a) cannot be offered for public sale without first being registered, or being able to take advantage of an exemption from registration, under the Securities Act of 1933; or (b) are subject to contractual restrictions on public sales. In some cases, when a restricted security has agreed to register such securities for resale, at the issuer's expense,
Annual Shareholder Report
either upon demand by the Fund or in connection with another registered offering of the securities. Many such restricted securities may be resold in the secondary market in transactions exempt from registration. Restricted securities may be determined to be liquid under criteria established by the Trustees. The Fund will not incur any registration costs upon such resales. The Fund's restricted securities are valued at the price provided by dealers in the secondary market or, if no market prices are available, at the fair value as determined in accordance with procedures established by and under the general supervision of the Trustees.
Additional Disclosure Related to Derivative Instruments
| Fair Value of Derivative Instruments |
| Liability |
| Statement of
Assets and
Liabilities
Location | Fair
Value |
Derivatives not accounted for as hedging
instruments under ASC Topic 815 | | |
| Equity contracts | Payable for daily
variation margin | $12,876* |
| * | Includes cumulative appreciation/depreciation of futures contracts as reported in the footnotes to the Portfolio of Investments. Only the current day's variation margin is reported within the Statement of Assets and Liabilities. |
The Effect of Derivative Instruments on the Statement of Operations for the Year Ended October 31, 2012
| Amount of Realized Gain or (Loss) on Derivatives Recognized in Income |
| Futures | Options
Purchased | Total |
| Equity contracts | $(111,702) | $(419,645) | $(531,347) |
| Change in Unrealized Appreciation or (Depreciation) on Derivatives Recognized in Income |
| Futures | Options
Purchased | Total |
| Equity contracts | $(12,876) | $406,295 | $393,419 |
Other
The preparation of financial statements in conformity with GAAP requires management to make estimates and assumptions that affect the amounts of assets, liabilities, expenses and revenues reported in the financial statements. Actual results could differ from those estimated.
Annual Shareholder Report
3. Shares of Beneficial Interest
The following tables summarize share activity:
| Year Ended October 31 | 2012 | 2011 |
| Class A Shares: | Shares | Amount | Shares | Amount |
| Shares sold | 6,025,748 | $68,536,525 | 2,158,522 | $22,625,696 |
| Shares issued to shareholders in payment of distributions declared | 876,714 | 9,883,094 | 1,028,523 | 10,765,631 |
| Shares redeemed | (5,852,981) | (66,260,270) | (11,408,726) | (119,550,900) |
NET CHANGE RESULTING FROM
CLASS A SHARE TRANSACTIONS | 1,049,481 | $12,159,349 | (8,221,681) | $(86,159,573) |
| Year Ended October 31 | 2012 | 2011 |
| Class B Shares: | Shares | Amount | Shares | Amount |
| Shares sold | 293,789 | $3,356,166 | 165,895 | $1,739,065 |
| Shares issued to shareholders in payment of distributions declared | 90,940 | 1,021,023 | 128,811 | 1,347,620 |
| Shares redeemed | (1,458,081) | (16,349,011) | (1,061,416) | (11,153,709) |
NET CHANGE RESULTING FROM
CLASS B SHARE TRANSACTIONS | (1,073,352) | $(11,971,822) | (766,710) | $(8,067,024) |
| Year Ended October 31 | 2012 | 2011 |
| Class C Shares: | Shares | Amount | Shares | Amount |
| Shares sold | 2,175,645 | $24,800,505 | 747,294 | $7,837,404 |
| Shares issued to shareholders in payment of distributions declared | 193,667 | 2,182,354 | 215,023 | 2,249,854 |
| Shares redeemed | (1,307,260) | (14,732,759) | (2,635,300) | (27,527,501) |
NET CHANGE RESULTING FROM
CLASS C SHARE TRANSACTIONS | 1,062,052 | $12,250,100 | (1,672,983) | $(17,440,243) |
| Year Ended October 31 | 2012 | 2011 |
| Class F Shares: | Shares | Amount | Shares | Amount |
| Shares sold | 1,536,310 | $17,504,370 | 346,316 | $3,643,290 |
| Shares issued to shareholders in payment of distributions declared | 84,546 | 957,328 | 65,901 | 690,406 |
| Shares redeemed | (241,020) | (2,713,031) | (396,594) | (4,166,715) |
NET CHANGE RESULTING FROM
CLASS F SHARE TRANSACTIONS | 1,379,836 | $15,748,667 | 15,623 | $166,981 |
Annual Shareholder Report
| Year Ended October 31 | 2012 | 20111 |
| Institutional Shares: | Shares | Amount | Shares | Amount |
| Shares sold | 1,561,762 | $18,012,928 | 312,409 | $3,293,737 |
| Shares issued to shareholders in payment of distributions declared | 25,523 | 290,848 | 2,743 | 28,881 |
| Shares redeemed | (124,233) | (1,428,990) | (22,186) | (231,954) |
NET CHANGE RESULTING FROM
INSTITUTIONAL SHARE TRANSACTIONS | 1,463,052 | $16,874,786 | 292,966 | $3,090,664 |
NET CHANGE RESULTING FROM
TOTAL FUND SHARE TRANSACTIONS | 3,881,069 | $45,061,080 | (10,352,785) | $(108,409,195) |
| 1 | Reflects operations for the period from December 29, 2010 (date of initial investment) to October 31, 2011. |
4. Federal Tax Information
The timing and character of income and capital gain distributions are determined in accordance with income tax regulations, which may differ from GAAP. These differences are due to differing treatments for foreign currency transactions, defaulted securities and discount accretion/premium amortization on debt securities.
For the year ended October 31, 2012, permanent differences identified and reclassified among the components of net assets were as follows:
| Increase (Decrease) |
| Paid-In Capital | Undistributed
Net Investment
Income (Loss) | Accumulated
Net Realized
Gain (Loss) |
| $(419,475) | $(32,745) | $452,220 |
Net investment income (loss), net realized gains (losses) and net assets were not affected by this reclassification.
The tax character of distributions as reported on the Statement of Changes in Net Assets for the years ended October 31, 2012 and 2011, was as follows:
| 2012 | 2011 |
| Tax-exempt income | $8,232,939 | $9,499,382 |
| Ordinary income | $7,689,469 | $7,969,772 |
As of October 31, 2012, the components of distributable earnings on a tax basis were as follows:
| Undistributed tax-exempt income | $269,330 |
| Undistributed ordinary income | $252,234 |
| Net unrealized appreciation | $46,994,329 |
| Capital loss carryforwards | $(63,785,134) |
The difference between book-basis and tax-basis net unrealized appreciation/depreciation is attributable in part to differing treatments for the deferral of losses on wash sales, defaulted bonds and discount accretion/premium amortization on debt securities.
Annual Shareholder Report
At October 31, 2012, the cost of investments for federal tax purposes was $451,302,047. The net unrealized appreciation of investments for federal tax purposes excluding futures contracts was $46,994,329. This consists of net unrealized appreciation from investments for those securities having an excess of value over cost of $55,008,503 and net unrealized depreciation from investments for those securities having an excess of cost over value of $8,014,174.
At October 31, 2012, the Fund had a capital loss carryforward of $63,785,134 which will reduce the Fund's taxable income arising from future net realized gains on investments, if any, to the extent permitted by the Code, thereby reducing the amount of distributions to shareholders which would otherwise be necessary to relieve the Fund of any liability for federal income tax. Pursuant to the Code, a net capital loss incurred in taxable years beginning on or before December 22, 2010, is characterized as short-term and may be carried forward for a maximum of eight tax years (“Carryforward Limit”), whereas a net capital loss incurred in taxable years beginning after December 22, 2010, retains its character as either short-term or long-term, does not expire and is required to be utilized prior to the losses which have a Carryforward Limit.
The following schedule summarizes the Fund's capital loss carryforward and expiration year:
| Expiration Year | Short-Term | Long-Term | Total |
| 2017 | $63,785,134 | NA | $63,785,134 |
The Fund used capital loss carryforwards of $9,511,371 to offset taxable capital gains realized during the year ended October 31, 2012.
5. Investment Adviser Fee and Other Transactions With Affiliates
Investment Adviser Fee
The advisory agreement between the Fund and the Adviser provides for an annual fee equal to 1.00% of the Fund's average daily net assets. Subject to the terms described in the Expense Limitation note, the Adviser may voluntarily choose to waive any portion of its fee. For the year ended October 31, 2012, the Adviser voluntarily waived $2,093,784 of its fee.
Certain of the Fund's assets are managed by Federated Investment Management Company (the “Sub-Adviser”). Under the terms of a sub-advisory agreement between the Adviser and the Sub-Adviser, the Sub-Adviser receives an allocable portion of the Fund's adviser fee. The fee is paid by the Adviser out of its resources and is not an incremental Fund expense. For the year ended October 31, 2012, the Sub-Adviser earned a fee of $632,978.
Annual Shareholder Report
Administrative Fee
Federated Administrative Services (FAS), under the Administrative Services Agreement, provides the Fund with administrative personnel and services. The fee paid to FAS is based on the average aggregate daily net assets of certain Federated funds as specified below, plus certain out-of-pocket expenses:
| Administrative Fee | Average Aggregate Daily Net Assets
of the Federated Funds |
| 0.150% | on the first $5 billion |
| 0.125% | on the next $5 billion |
| 0.100% | on the next $10 billion |
| 0.075% | on assets in excess of $20 billion |
Prior to September 1, 2012, the administrative fee received during any fiscal year was at least $150,000 per portfolio and $40,000 per each additional class of Shares. Subject to the terms described in the Expense Limitation note, FAS may voluntarily choose to waive any portion of its fee. For the year ended October 31, 2012, FAS waived $7,085 of its fee. The net fee paid to FAS was 0.076% of average daily net assets of the Fund.
Distribution Services Fee
The Fund has adopted a Distribution Plan (the “Plan”) pursuant to Rule 12b-1 under the Act. Under the terms of the Plan, the Fund will compensate Federated Securities Corp. (FSC), the principal distributor, from the daily net assets of the Fund's Class A Shares, Class B Shares and Class C Shares to finance activities intended to result in the sale of these shares. The Plan provides that the Fund may incur distribution expenses at the following percentages of average daily net assets annually, to compensate FSC:
| Share Class Name | Percentage of Average Daily
Net Assets of Class |
| Class A Shares | 0.05% |
| Class B Shares | 0.75% |
| Class C Shares | 0.75% |
Subject to the terms described in the Expense Limitation note, FSC may voluntarily choose to waive any portion of its fee. For the year ended October 31, 2012, distribution services fees for the Fund were as follows:
| Distribution
Services Fees
Incurred |
| Class B Shares | $286,762 |
| Class C Shares | 712,240 |
| TOTAL | $999,002 |
When FSC receives fees, it may pay some or all of them to financial intermediaries whose customers purchase shares. For the year ended October 31, 2012, FSC retained $178,692 of fees paid by the Fund. For the year ended October 31, 2012, the Fund's Class A Shares did not incur a distribution services fee; however it may begin to incur this fee upon approval of the Trustees.
Annual Shareholder Report
Sales Charges
Front-end sales charges and contingent deferred sales charges (CDSC) do not represent expenses of the Fund. They are deducted from the proceeds of sales of Fund shares prior to investment or from redemption proceeds prior to remittance, as applicable. For the year ended October 31, 2012, FSC retained $136,457 in sales charges from the sale of Class A Shares. FSC also retained $9,279 of CDSC relating to redemptions of Class B Shares, $8,259 relating to redemptions of Class C Shares and $7,039 relating to redemptions of Class F Shares.
Shareholder Services Fee
The Fund may pay fees (“Service Fees”) up to 0.25% of the average daily net assets of the Fund's Class A Shares, Class B Shares, Class C Shares and Class F Shares to financial intermediaries or to Federated Shareholder Services Company (FSSC) for providing services to shareholders and maintaining shareholder accounts. Subject to the terms described in the Expense Limitation note, FSSC may voluntarily reimburse the Fund for Service Fees. For the year ended October 31, 2012, Service Fees for the Fund were as follows:
| Service Fees
Incurred | Service Fees
Reimbursed |
| Class A Shares | $713,161 | $— |
| Class B Shares | 95,588 | — |
| Class C Shares | 237,204 | — |
| Class F Shares | 65,681 | (400) |
| TOTAL | $1,111,634 | $(400) |
For the year ended October 31, 2012, FSSC received $30,265 of Service Fees paid by the Fund.
Expense Limitation
The Adviser and its affiliates (which may include FSC, FAS and FSSC) have voluntarily agreed to waive their fees and/or reimburse expenses so that the total annual fund operating expenses (as shown in the financial highlights) paid by the Fund's Class A Shares, Class B Shares, Class C Shares, Class F Shares and Institutional Shares (after the voluntary waivers and reimbursements) will not exceed 1.00%, 1.75%, 1.75%, 1.00% and 0.75% (the “Fee Limit”), respectively, up to but not including the later of (the “Termination Date”): (a) January 1, 2014; or (b) the date of the Fund's next effective Prospectus. While the Adviser and its affiliates currently do not anticipate terminating or increasing these arrangements prior to the Termination Date, these arrangements may only be terminated or the Fee Limit increased prior to the Termination Date with the agreement of the Trustees.
Interfund Transactions
During the year ended October 31, 2012, the Fund engaged in purchase and sale transactions with funds that have a common investment adviser (or affiliated investment advisers), common Directors/Trustees and/or common Officers. These purchase and sale transactions complied with Rule 17a-7 under the Act and amounted to $184,205,000 and $224,155,000, respectively.
General
Certain Officers and Trustees of the Fund are Officers and Directors or Trustees of the above companies.
Annual Shareholder Report
6. Investment Transactions
Purchases and sales of investments, excluding long-term U.S. government securities and short-term obligations for the year ended October 31, 2012, were as follows:
| Purchases | $157,608,356 |
| Sales | $106,440,400 |
7. Line of Credit
The Fund participates in a $100,000,000 unsecured, uncommitted revolving line of credit (LOC) agreement with PNC Bank. The LOC was made available for extraordinary or emergency purposes, primarily for financing redemption payments. Borrowings are charged interest at a rate offered to the Fund by PNC Bank at the time of the borrowing. As of October 31, 2012, there were no outstanding loans. During the year ended October 31, 2012, the Fund did not utilize the LOC.
8. Interfund Lending
Pursuant to an Exemptive Order issued by the Securities and Exchange Commission, the Fund, along with other funds advised by subsidiaries of Federated Investors, Inc., may participate in an interfund lending program. This program provides an alternative credit facility allowing the Fund to borrow from other participating affiliated funds. As of October 31, 2012, there were no outstanding loans. During the year ended October 31, 2012, the program was not utilized.
9. Federal Tax Information (unaudited)
For the year ended October 31, 2012, 51.71% of the distributions from net investment income is exempt from federal income tax, other than the federal AMT.
For the fiscal year ended October 31, 2012, 100% of total ordinary income distributions made by the Fund are qualifying dividends which may be subject to a maximum tax rate of 15%, as provided for by the Jobs and Growth Tax Relief Act of 2003. Complete information is reported in conjunction with the reporting of your distributions on Form 1099-DIV.
Of the ordinary income distributions made by the Fund during the year ended October 31, 2012, 95.83% qualify for the dividend received deduction available to corporate shareholders.
Annual Shareholder Report
Report of Independent Registered Public Accounting Firm
TO THE BOARD OF Trustees OF Federated Income Securities Trust AND SHAREHOLDERS OF Federated Muni & Stock Advantage Fund:
We have audited the accompanying statement of assets and liabilities of Federated Muni & Stock Advantage Fund (the “Fund”) (one of the portfolios constituting Federated Income Securities Trust), including the portfolio of investments, as of October 31, 2012, and the related statement of operations for the year then ended, the statement of changes in net assets for each of the two years in the period then ended, and the financial highlights for each of the periods indicated therein. These financial statements and financial highlights are the responsibility of the Fund's management. Our responsibility is to express an opinion on these financial statements and financial highlights based on our audits.
We conducted our audits in accordance with standards of the Public Company Accounting Oversight Board (United States). Those standards require that we plan and perform the audit to obtain reasonable assurance about whether the financial statements and financial highlights are free of material misstatement. We were not engaged to perform an audit of the Fund's internal control over financial reporting. Our audits included consideration of internal control over financial reporting as a basis for designing audit procedures that are appropriate in the circumstances, but not for the purpose of expressing an opinion on the effectiveness of the Fund's internal control over financial reporting. Accordingly, we express no such opinion. An audit also includes examining, on a test basis, evidence supporting the amounts and disclosures in the financial statements and financial highlights, assessing the accounting principles used and significant estimates made by management, and evaluating the overall financial statement presentation. Our procedures included confirmation of securities owned as of October 31, 2012, by correspondence with the custodian and others or by other appropriate auditing procedures where replies from others were not received. We believe that our audits provide a reasonable basis for our opinion.
In our opinion, the financial statements and financial highlights referred to above present fairly, in all material respects, the financial position of Federated Muni & Stock Advantage Fund, a portfolio of Federated Income Securities Trust, at October 31, 2012, the results of its operations for the year then ended, the changes in its net assets for each of the two years in the period then ended, and the financial highlights for each of the periods indicated therein, in conformity with U.S. generally accepted accounting principles.
Boston, Massachusetts
December 24, 2012
Annual Shareholder Report
Shareholder Expense Example (unaudited)
As a shareholder of the Fund, you incur two types of costs: (1) transaction costs, including sales charges (loads) on purchase or redemption payments; and (2) ongoing costs, including management fees and to the extent applicable, distribution (12b-1) fees and/or shareholder services fees and other Fund expenses. This Example is intended to help you to understand your ongoing costs (in dollars) of investing in the Fund and to compare these costs with the ongoing costs of investing in other mutual funds. It is based on an investment of $1,000 invested at the beginning of the period and held for the entire period from May 1, 2012 to October 31, 2012.
ACTUAL EXPENSES
The first section of the table below provides information about actual account values and actual expenses. You may use the information in this section, together with the amount you invested, to estimate the expenses that you incurred over the period. Simply divide your account value by $1,000 (for example, an $8,600 account value divided by $1,000 = 8.6), then multiply the result by the number in the first section under the heading entitled “Expenses Paid During Period” to estimate the expenses attributable to your investment during this period.
HYPOTHETICAL EXAMPLE FOR COMPARISON PURPOSES
The second section of the table below provides information about hypothetical account values and hypothetical expenses based on the Fund's actual expense ratio and an assumed rate of return of 5% per year before expenses, which is not the Fund's actual return. Thus, you should not use the hypothetical account values and expenses to estimate the actual ending account balance or your expenses for the period. Rather, these figures are required to be provided to enable you to compare the ongoing costs of investing in the Fund with other funds. To do so, compare this 5% hypothetical example with the 5% hypothetical examples that appear in the shareholder reports of the other funds.
Annual Shareholder Report
Please note that the expenses shown in the table are meant to highlight your ongoing costs only and do not reflect any transaction costs, such as sales charges (loads) on purchase or redemption payments. Therefore, the second section of the table is useful in comparing ongoing costs only, and will not help you determine the relative total costs of owning different funds. In addition, if these transaction costs were included, your costs would have been higher.
| Beginning
Account Value
5/1/2012 | Ending
Account Value
10/31/2012 | Expenses Paid
During Period1 |
| Actual: | | | |
| Class A Shares | $1,000 | $1,048.60 | $5.15 |
| Class B Shares | $1,000 | $1,043.80 | $8.99 |
| Class C Shares | $1,000 | $1,043.80 | $8.99 |
| Class F Shares | $1,000 | $1,048.60 | $5.15 |
| Institutional Shares | $1,000 | $1,049.00 | $3.86 |
Hypothetical (assuming a 5% return
before expenses): | | | |
| Class A Shares | $1,000 | $1,020.11 | $5.08 |
| Class B Shares | $1,000 | $1,016.34 | $8.87 |
| Class C Shares | $1,000 | $1,016.34 | $8.87 |
| Class F Shares | $1,000 | $1,020.11 | $5.08 |
| Institutional Shares | $1,000 | $1,021.37 | $3.81 |
| 1 | Expenses are equal to the Fund's annualized net expense ratios, multiplied by the average account value over the period, multiplied by 184/366 (to reflect the one-half-year period). The annualized net expense ratios are as follows: |
| Class A Shares | 1.00% |
| Class B Shares | 1.75% |
| Class C Shares | 1.75% |
| Class F Shares | 1.00% |
| Institutional Shares | 0.75% |
Annual Shareholder Report
Board of Trustees and Trust Officers
The Board of Trustees is responsible for managing the Trust's business affairs and for exercising all the Trust's powers except those reserved for the shareholders. The following tables give information about each Trustee and the senior officers of the Fund. Where required, the tables separately list Trustees who are “interested persons” of the Fund (i.e., “Interested” Trustees) and those who are not (i.e., “Independent” Trustees). Unless otherwise noted, the address of each person listed is Federated Investors Tower, 1001 Liberty Avenue, Pittsburgh, PA 15222. The address of all Independent Trustees listed is 4000 Ericsson Drive, Warrendale, PA 15086-7561; Attention: Mutual Fund Board. As of December 31, 2011, the Trust comprised nine portfolio(s), and the Federated Fund Family consisted of 43 investment companies (comprising 134 portfolios). Unless otherwise noted, each Officer is elected annually. Unless otherwise noted, each Trustee oversees all portfolios in the Federated Fund Family and serves for an indefinite term. The Fund's Statement of Additional Information includes additional information about Trust Trustees and is available, without charge and upon request, by calling 1-800-341-7400.
Interested Trustees Background
Name
Birth Date
Positions Held with Trust
Date Service Began | Principal Occupation(s) for Past Five Years,
Other Directorships Held and Previous Position(s) |
John F. Donahue*
Birth Date: July 28, 1924
Trustee
Began serving: January 1986 | Principal Occupations: Director or Trustee of the Federated Fund Family; Chairman and Director, Federated Investors, Inc.; Chairman of the Federated Fund Family's Executive Committee.
Previous Positions: Chairman of the Federated Fund Family; Trustee, Federated Investment Management Company; Chairman and Director, Federated Investment Counseling. |
J. Christopher Donahue*
Birth Date: April 11, 1949
President and Trustee
Began serving: January 2000 | Principal Occupations: Principal Executive Officer and President of the Federated Fund Family; Director or Trustee of some of the Funds in the Federated Fund Family; President, Chief Executive Officer and Director, Federated Investors, Inc.; Chairman and Trustee, Federated Investment Management Company; Trustee, Federated Investment Counseling; Chairman and Director, Federated Global Investment Management Corp.; Chairman, Federated Equity Management Company of Pennsylvania and Passport Research, Ltd. (investment advisory subsidiary of Federated); Trustee, Federated Shareholder Services Company; Director, Federated Services Company.
Previous Positions: President, Federated Investment Counseling; President and Chief Executive Officer, Federated Investment Management Company, Federated Global Investment Management Corp. and Passport Research, Ltd. |
| * | Family relationships and reasons for “interested” status: John F. Donahue is the father of J. Christopher Donahue; both are “interested” due to their beneficial ownership of shares of Federated Investors, Inc. and the positions they hold with Federated and its subsidiaries. |
Annual Shareholder Report
INDEPENDENT Trustees Background
Name
Birth Date
Positions Held with Trust
Date Service Began | Principal Occupation(s) for Past Five Years,
Other Directorships Held, Previous Position(s) and Qualifications |
Nicholas P. Constantakis, CPA
Birth Date: September 3, 1939
Trustee
Began serving: February 1998 | Principal Occupation: Director or Trustee of the Federated Fund Family.
Other Directorship Held: Director, Chairman of the Audit Committee, and member of the Compensation Committee, Michael Baker Corporation (architecture, engineering and construction services).
Previous Position: Partner, Andersen Worldwide SC.
Qualifications: Public accounting and director experience. |
John F. Cunningham
Birth Date: March 5, 1943
Trustee
Began serving: January 1999 | Principal Occupation: Director or Trustee of the Federated Fund Family.
Other Directorships Held: Chairman, President and Chief Executive Officer, Cunningham & Co., Inc. (strategic business consulting); Trustee Associate, Boston College.
Previous Positions: Director, Redgate Communications and EMC Corporation (computer storage systems); Chairman of the Board and Chief Executive Officer, Computer Consoles, Inc.; President and Chief Operating Officer, Wang Laboratories; Director, First National Bank of Boston; Director, Apollo Computer, Inc.
Qualifications: Business management and director experience. |
Maureen Lally-Green
Birth Date: July 5, 1949
Trustee
Began serving: August 2009 | Principal Occupations: Director or Trustee of the Federated Fund Family; Director, Office of Church Relations, Diocese of Pittsburgh; Adjunct Professor of Law, Duquesne University School of Law.
Other Directorships Held: Director, Auberle; Member, Pennsylvania State Board of Education; Director, Saint Vincent College; Director, Ireland Institute of Pittsburgh; Chair and Director, UPMC Mercy Hospital; Regent, St. Vincent Seminary; Director, Epilepsy Foundation of Western and Central Pennsylvania; Director, Saint Thomas More Society, Allegheny County; Director, Our Campaign for the Church Alive, Inc.
Previous Position: Pennsylvania Superior Court Judge.
Qualifications: Legal and director experience. |
Peter E. Madden
Birth Date: March 16, 1942
Trustee
Began serving: November 1991 | Principal Occupation: Director or Trustee, and Chairman of the Board of Directors or Trustees, of the Federated Fund Family.
Previous Positions: Representative, Commonwealth of Massachusetts General Court; President, Chief Operating Officer and Director, State Street Bank and Trust Company and State Street Corporation (retired); Director, VISA USA and VISA International; Chairman and Director, Massachusetts Bankers Association; Director, Depository Trust Corporation; Director, The Boston Stock Exchange.
Qualifications: Business management, mutual fund services and director experience. |
Annual Shareholder Report
Name
Birth Date
Positions Held with Trust
Date Service Began | Principal Occupation(s) for Past Five Years,
Other Directorships Held, Previous Position(s) and Qualifications |
Charles F. Mansfield, Jr.
Birth Date: April 10, 1945
Trustee
Began serving: January 2000 | Principal Occupations: Director or Trustee of the Federated Fund Family; Management Consultant.
Previous Positions: Chief Executive Officer, PBTC International Bank; Partner, Arthur Young & Company (now Ernst & Young LLP); Chief Financial Officer of Retail Banking Sector, Chase Manhattan Bank; Senior Vice President, HSBC Bank USA (formerly Marine Midland Bank); Vice President, Citibank; Assistant Professor of Banking and Finance, Frank G. Zarb School of Business, Hofstra University; Executive Vice President, DVC Group, Inc. (marketing, communications and technology).
Qualifications: Banking, business management, education and director experience. |
Thomas M. O'Neill
Birth Date: June 14, 1951
Trustee
Began serving: October 2006 | Principal Occupations: Director or Trustee, Vice Chairman of the Audit Committee of the Federated Fund Family; Sole Proprietor, Navigator Management Company (investment and strategic consulting).
Other Directorships Held: Board of Overseers, Children's Hospital of Boston; Visiting Committee on Athletics, Harvard College; Board of Directors, Medicines for Humanity; Board of Directors, The Golisano Children's Museum of Naples, Florida.
Previous Positions: Chief Executive Officer and President, Managing Director and Chief Investment Officer, Fleet Investment Advisors; President and Chief Executive Officer, Aeltus Investment Management, Inc.; General Partner, Hellman, Jordan Management Co., Boston, MA; Chief Investment Officer, The Putnam Companies, Boston, MA; Credit Analyst and Lending Officer, Fleet Bank; Director and Consultant, EZE Castle Software (investment order management software); Director, Midway Pacific (lumber).
Qualifications: Business management, mutual fund, director and investment experience. |
John S. Walsh
Birth Date: November 28, 1957
Trustee
Began serving: January 2000 | Principal Occupations: Director or Trustee, Chairman of the Audit Committee of the Federated Fund Family; President and Director, Heat Wagon, Inc. (manufacturer of construction temporary heaters); President and Director, Manufacturers Products, Inc. (distributor of portable construction heaters); President, Portable Heater Parts, a division of Manufacturers Products, Inc.
Previous Position: Vice President, Walsh & Kelly, Inc.
Qualifications: Business management and director experience. |
Annual Shareholder Report
OFFICERS
Name
Birth Date
Address
Positions Held with Trust
Date Service Began | Principal Occupation(s) for Past Five Years
and Previous Position(s) |
John W. McGonigle
Birth Date: October 26, 1938
EXECUTIVE VICE PRESIDENT AND SECRETARY
Officer since: January 1986 | Principal Occupations: Executive Vice President and Secretary of the Federated Fund Family; Vice Chairman, Executive Vice President, Secretary and Director, Federated Investors, Inc.
Previous Positions: Trustee, Federated Investment Management Company and Federated Investment Counseling; Director, Federated Global Investment Management Corp., Federated Services Company and Federated Securities Corp. |
Richard A. Novak
Birth Date: December 25, 1963
TREASURER
Officer since: January 2006 | Principal Occupations: Principal Financial Officer and Treasurer of the Federated Fund Family; Senior Vice President, Federated Administrative Services; Financial and Operations Principal for Federated Securities Corp., Edgewood Services, Inc. and Southpointe Distribution Services, Inc.
Previous Positions: Controller of Federated Investors, Inc.; Vice President, Finance of Federated Services Company; held various financial management positions within The Mercy Hospital of Pittsburgh; Auditor, Arthur Andersen & Co. |
Richard B. Fisher
Birth Date: May 17, 1923
VICE PRESIDENT
Officer since: January 1986 | Principal Occupations: Vice Chairman or Vice President of some of the Funds in the Federated Fund Family; Vice Chairman, Federated Investors, Inc.; Chairman, Federated Securities Corp.
Previous Positions: President and Director or Trustee of some of the Funds in the Federated Fund Family; Executive Vice President, Federated Investors, Inc.; Director and Chief Executive Officer, Federated Securities Corp. |
Peter J. Germain
Birth Date: September 3, 1959
CHIEF LEGAL OFFICER
Officer since: January 2005 | Principal Occupations: Mr. Germain is Chief Legal Officer of the Federated Fund Family. He is General Counsel and Vice President, Federated Investors, Inc.; President, Federated Administrative Services and Federated Administrative Services, Inc.; Vice President, Federated Securities Corp.; Secretary, Federated Private Asset Management, Inc.; and Secretary, Retirement Plan Service Company of America. Mr. Germain joined Federated in 1984 and is a member of the Pennsylvania Bar Association.
Previous Positions: Deputy General Counsel, Special Counsel, Managing Director of Mutual Fund Services, Federated Investors, Inc.; Senior Vice President, Federated Services Company; and Senior Corporate Counsel, Federated Investors, Inc. |
Brian P. Bouda
Birth Date: February 28, 1947
CHIEF COMPLIANCE OFFICER AND SENIOR VICE PRESIDENT
Officer since: August 2004 | Principal Occupations: Senior Vice President and Chief Compliance Officer of the Federated Fund Family; Vice President and Chief Compliance Officer of Federated Investors, Inc. and Chief Compliance Officer of its subsidiaries. Mr. Bouda joined Federated in 1999 and is a member of the American Bar Association and the State Bar Association of Wisconsin. |
Annual Shareholder Report
Name
Birth Date
Address
Positions Held with Trust
Date Service Began | Principal Occupation(s) for Past Five Years
and Previous Position(s) |
Stephen F. Auth
Birth Date: September 3, 1956
450 Lexington Avenue
Suite 3700
New York, NY 10017-3943
CHIEF INVESTMENT OFFICER
Officer since: May 2004 | Principal Occupations: Mr. Auth is Chief Investment Officer of this Fund and various other Funds in the Federated Fund Family; Executive Vice President, Federated Investment Counseling, Federated Global Investment Management Corp. and Federated Equity Management Company of Pennsylvania.
Previous Positions: Executive Vice President, Federated Investment Management Company, and Passport Research, Ltd. (investment advisory subsidiary of Federated); Senior Vice President, Global Portfolio Management Services Division; Senior Vice President, Federated Investment Management Company and Passport Research, Ltd.; Senior Managing Director and Portfolio Manager, Prudential Investments. |
Robert J. Ostrowski
Birth Date: April 26, 1963
Chief Investment Officer
Officer since: May 2004 | Principal Occupations: Robert J. Ostrowski joined Federated in 1987 as an Investment Analyst and became a Portfolio Manager in 1990. He was named Chief Investment Officer of taxable fixed-income products in 2004 and also serves as a Senior Portfolio Manager. Mr. Ostrowski became an Executive Vice President of the Fund's Sub-Adviser in 2009 and served as a Senior Vice President of the Fund's Sub-Adviser from 1997 to 2009. Mr. Ostrowski has received the Chartered Financial Analyst designation. He received his M.S. in Industrial Administration from Carnegie Mellon University. |
R. J. Gallo
Birth Date: June 10, 1969
Vice President
Officer since: June 2012
Portfolio Manager since: September 2003 | Principal Occupations: R.J. Gallo, Senior Portfolio Manager and Head of the Municipal Bond Investment Group has been the Fund's Portfolio Manager since September 2003. He is Vice President of the Trust with respect to the Fund. Mr. Gallo joined Federated in 2000 as an Investment Analyst. He became a Senior Vice President of the Fund's Adviser in 2011. From 2005 to 2010 Mr. Gallo served as Vice President and from January 2002 through 2004 and as a Assistant Vice President of the Fund's Adviser. He has been a Portfolio Manager since December 2002. From 1996 to 2000, Mr. Gallo was a Financial Analyst and Trader at the Federal Reserve Bank of New York. Mr. Gallo has received the Chartered Financial Analyst designation and a Master's in Public Affairs with a concentration in Economics and Public Policy from Princeton University. |
John L. Nichol
Birth Date: May 21, 1963
VICE PRESIDENT
Officer since: May 2004
Portfolio Manager since: September 2003 | Principal Occupations: John L. Nichol has been the Fund's Portfolio Manager since September 2003. He is Vice President of the Trust with respect to the Fund. Mr. Nichol joined Federated in September 2000 as an Assistant Vice President/Senior Investment Analyst. He has been a Portfolio Manager since December 2000 and was named a Vice President of the Fund's Adviser in July 2001. Mr. Nichol served as a portfolio manager and analyst for the Public Employees Retirement System of Ohio from 1992 through August 2000. Mr. Nichol has received the Chartered Financial Analyst designation. He received his M.B.A. with an emphasis in Finance and Management and Information Science from the Ohio State University. |
Annual Shareholder Report
Evaluation and Approval of Advisory Contract–May 2012
Federated Muni and Stock Advantage Fund (the “Fund”)
Following a review and recommendation of approval by the Fund's independent trustees, the Fund's Board reviewed and approved at its May 2012 meetings the Fund's investment advisory and subadvisory contracts for an additional one-year term. The Board's decision regarding these contracts reflects the exercise of its business judgment on whether to continue the existing arrangements.
In this connection, the Federated Funds' Board had previously appointed a Senior Officer, whose duties include specified responsibilities relating to the process by which advisory fees are to be charged to a Federated fund. The Senior Officer has the authority to retain consultants, experts, or staff as may be reasonably necessary to assist in the performance of his duties, reports directly to the Board, and may be terminated only with the approval of a majority of the independent members of the Board. The Senior Officer prepared and furnished to the Board an independent, written evaluation that covered topics discussed below (the “Evaluation”). The Board considered that Evaluation, along with other information, in deciding to approve the advisory and subadvisory contracts.
The Board is also familiar with and considered judicial decisions concerning allegedly excessive investment advisory fees, which have indicated that the following factors may be relevant to an Adviser's fiduciary duty with respect to its receipt of compensation from a fund: the nature and quality of the services provided by the Adviser to a fund and its shareholders, including the performance and expenses of the fund and of comparable funds; the Adviser's cost of providing the services, including the profitability to the Adviser of providing advisory services to a fund; the extent to which the Adviser may realize “economies of scale” as a fund grows larger and, if such economies exist, whether they have been shared with a fund and its shareholders; any “fall-out financial benefits” that accrue to the Adviser because of its relationship with a fund (including research services received from brokers that execute fund trades and any fees paid to affiliates of the Adviser for services rendered to a fund); comparative fee structures, including a comparison of fees paid to the Adviser with those paid by similar funds; and the extent to which the Board members are fully informed about all facts the Board deems relevant to its consideration of the Adviser's services and fees. Consistent with these judicial decisions, the Board also considered management fees (including any components thereof) charged to institutional and other clients of the Adviser and subadviser for what might be viewed as like services. The Board was aware of these factors and was guided by them in its review of the Fund's advisory and subadvisory contracts to the extent it considered them to be appropriate and relevant, as discussed further below.
Annual Shareholder Report
The Board considered and weighed these circumstances in light of its substantial accumulated experience in governing the Fund and working with Federated on matters relating to the Federated funds, and was assisted in its deliberations by independent legal counsel. Throughout the year, and in connection with its May meetings, the Board requested and received substantial and detailed information about the Fund and the Federated organization that was in addition to the extensive materials that comprise and accompany the Senior Officer's Evaluation. Federated provided much of this information at each regular meeting of the Board, and furnished additional substantial information in connection with the May meeting at which the Board's formal review of the advisory and subadvisory contracts occurred. At this May meeting, senior management of the Adviser also met with the independent trustees and their counsel to discuss the materials presented and any other matters thought relevant by the Adviser or the trustees. Between regularly scheduled meetings, the Board also received information on particular matters as the need arose. Thus, the Board's consideration of the advisory and subadvisory contracts included review of the Senior Officer's Evaluation, accompanying data and additional information covering such matters as: the Adviser's and subadviser's investment philosophy, revenue, profitability, personnel and processes; investment and operating strategies; the Fund's short- and long-term performance (in absolute terms, both on a gross basis and net of expenses, as well as in relationship to its particular investment program and certain competitor or “peer group” funds and/or other benchmarks, as appropriate), and comments on the reasons for performance; the Fund's investment objectives; the Fund's expenses (including the advisory fee itself and the overall expense structure of the Fund, both in absolute terms and relative to similar and/or competing funds, with due regard for contractual or voluntary expense limitations); the use and allocation of brokerage commissions derived from trading the Fund's portfolio securities (if any); and the nature, quality and extent of the advisory and other services provided to the Fund by the Adviser and its affiliates. The Board also considered the preferences and expectations of Fund shareholders; the entrepreneurial risk assumed by the Adviser in sponsoring the funds; the continuing state of competition in the mutual fund industry and market practices; the range of comparable fees for similar funds in the mutual fund industry; the Fund's relationship to the Federated family of funds which include a comprehensive array of funds with different investment objectives, policies and strategies which are available for exchange without the incurrence of additional sales charges; compliance and audit reports concerning the Federated funds and the Federated companies that service them (including communications from regulatory agencies), as well as Federated's responses to any issues raised therein; and relevant developments in the mutual fund industry and how the Federated
Annual Shareholder Report
funds and/or Federated are responding to them. The Board's evaluation process is evolutionary. The criteria considered and the emphasis placed on relevant criteria change in recognition of changing circumstances in the mutual fund marketplace.
While mindful that courts have cautioned against giving such comparisons too much weight, the Board has found the use of comparisons of the Fund's fees and expenses to other mutual funds with comparable investment programs to be relevant, given the high degree of competition in the mutual fund business. The Board focused on comparisons with other similar mutual funds more heavily than non-mutual fund products or services because it is believed that they are more relevant. For example, other mutual funds are the products most like the Fund, they are readily available to Fund shareholders as alternative investment vehicles, and they are the type of investment vehicle in fact chosen and maintained by the Fund's investors. The range of their fees and expenses therefore appears to be a generally reliable indication of what consumers have found to be reasonable in the precise marketplace in which the Fund competes. In this regard, the Senior Officer has reviewed Federated's fees for providing advisory services to products outside the Federated family of funds (e.g., institutional and separate accounts). He concluded that mutual funds and institutional accounts are inherently different products. Those differences include, but are not limited to, different types of targeted investors; being subject to different laws and regulations; different legal structures; different average account sizes; different associated costs; different portfolio management techniques made necessary by different cash flows; and portfolio manager time spent in review of securities pricing. The Senior Officer did not consider these fee schedules to be determinative in judging the appropriateness of mutual fund advisory contracts.
The Fund's ability to deliver competitive performance when compared to its peer group was also deemed to be relevant by the Board as a useful indicator of how the Adviser is executing the Fund's investment program, which in turn assisted the Board in reaching a conclusion that the nature, extent, and quality of the Adviser's investment management services were such as to warrant continuation of the advisory and subadvisory contracts.
The Senior Officer reviewed information compiled by Federated, using data supplied by independent fund ranking organizations, regarding the performance of, and fees charged by, other mutual funds, noting his view that comparisons to fund peer groups are relevant in judging the reasonableness of proposed fees.
For the periods covered by the Evaluation, the Fund's performance for the one-year period was above the median of the relevant peer group, and the Fund's performance fell below the median of the relevant peer group for the three-year and five-year period. The Board discussed the Fund's performance with the Adviser and recognized the efforts being undertaken by the Adviser. The Board will continue to monitor these efforts and the perfromance of the Fund.
Annual Shareholder Report
The Board also received financial information about Federated, including information regarding the compensation and benefits Federated derived from its relationships with the Federated funds. This information covered not only the fees under the advisory contracts, but also fees received by Federated's subsidiaries for providing other services to the Federated funds under separate contracts (e.g., for serving as the Federated funds' administrator). The information also detailed any indirect benefit Federated may derive from its receipt of research services from brokers who execute Federated fund trades. In addition, the Board considered the fact that, in order for a fund to be competitive in the marketplace, Federated and its affiliates frequently waived fees and/or reimbursed expenses and have disclosed to fund investors and/or indicated to the Board their intention to do so in the future, where appropriate. Moreover, the Board receives regular reporting as to the institution or elimination of these voluntary waivers.
Federated furnished information, requested by the Senior Officer, that reported revenues on a fund-by-fund basis and made estimates of the allocation of expenses on a fund-by-fund basis, using allocation methodologies specified by the Senior Officer. The Senior Officer noted that, although they may apply consistent allocation processes, the inherent difficulties in allocating costs (and the unavoidable arbitrary aspects of that exercise) and the lack of consensus on how to allocate those costs may render such allocation information unreliable. The allocation information was considered in the analysis by the Board but was determined to be of limited use.
The Board and the Senior Officer also reviewed information compiled by Federated comparing profitability information for Federated to other publicly held fund management companies. In this regard, the Senior Officer noted the limited availability of such information, but nonetheless concluded that Federated's profit margins did not appear to be excessive.
The Senior Officer's Evaluation also discussed the notion of possible realization of “economies of scale” as a fund grows larger. The Board considered in this regard that the Adviser has made significant and long-term investments in areas that support all of the Federated funds, such as personnel and processes for the portfolio management, shareholder services, compliance, internal audit, and risk management functions; and systems technology; and that the benefits of these efforts (as well as any economies, should they exist) were likely to be enjoyed by the fund complex as a whole. Finally, the Board also noted the absence of any applicable regulatory or industry guidelines on this subject, which (as discussed in the Senior Officer's Evaluation) is compounded by the lack of any common industry practice or general pattern with respect to structuring fund advisory fees with “breakpoints” that serve to reduce the fee as the fund attains a certain size. The Senior Officer did not recommend institution of breakpoints in pricing Federated's fund advisory services at this time.
Annual Shareholder Report
It was noted in the materials for the Board meeting that, for the period covered by the Evaluation, the Fund's investment advisory fee, after waivers and expense reimbursements, if any, was above the median of the relevant peer group. The Board reviewed the fees and other expenses of the Fund with the Adviser and was satisfied that the overall expense structure of the Fund remained competitive. The Board will continue to monitor advisory fees and other expenses borne by the Fund.
The Senior Officer noted that, considering the totality of the circumstances, and all of the factors referenced within his Evaluation, he had concluded that, subject to comments and recommendations made within his Evaluation, his observations and the information accompanying the Evaluation supported a finding by the Board that the management fees for each of the funds was reasonable and that Federated appeared to provide appropriate advisory and administrative services to the Fund for the fees paid. Under these circumstances, no changes were recommended to, and no objection was raised to, the continuation of the Fund's advisory and subadvisory contracts.
In its decision to continue an existing investment advisory contract, the Board was mindful of the potential disruptions of the Fund's operations and various risks, uncertainties and other effects that could occur as a result of a decision to terminate or not renew an advisory contract. In particular, the Board recognized that many shareholders have invested in the Fund on the strength of the Adviser's industry standing and reputation and with the expectation that the Adviser will have a continuing role in providing advisory services to the Fund. Thus, the Board's approval of the advisory contract reflected the fact that it is the shareholders who have effectively selected the Adviser by virtue of having invested in the Fund. The Board concluded that, in light of the factors discussed above, including the nature, quality and scope of the services provided to the Fund by the Adviser and its affiliates, continuation of the advisory contract was appropriate.
The Board based its decision to approve the advisory and subadvisory contracts on the totality of the circumstances and relevant factors and with a view to past and future long-term considerations. Not all of the factors and considerations identified above were necessarily relevant to the Fund, nor did the Board consider any one of them to be determinative. With respect to the factors that were relevant, the Board's decision to approve the contract reflects its determination that Federated's performance and actions provided a satisfactory basis to support the decision to continue the existing arrangements.
Annual Shareholder Report
Voting Proxies on Fund Portfolio Securities
A description of the policies and procedures that the Fund uses to determine how to vote proxies, if any, relating to securities held in the Fund's portfolio is available, without charge and upon request, by calling 1-800-341-7400. A report on “Form N-PX” of how the Fund voted any such proxies during the most recent 12-month period ended June 30 is available from Federated's website at FederatedInvestors.com. To access this information from the home page, select “All” under “Asset Classes.” Select a fund name and share class, if applicable, to go to the Fund Overview page. On the Fund Overview page, select the “Documents” tab. At the bottom of that page, select “Proxy Voting Record Report (Form N-PX).” Form N-PX filings are also available at the SEC's website at www.sec.gov.
Quarterly Portfolio Schedule
The Fund files with the SEC a complete schedule of its portfolio holdings, as of the close of the first and third quarters of its fiscal year, on “Form N-Q.” These filings are available on the SEC's website at www.sec.gov and may be reviewed and copied at the SEC's Public Reference Room in Washington, DC. (Call 1-800-SEC-0330 for information on the operation of the Public Reference Room.) You may also access this information from the “Products” section of Federated's website at FederatedInvestors.com. From the home page, select “All” under “Asset Classes.” Select a fund name and share class, if applicable, to go to the Fund Overview page. On the Fund Overview page, select the “Documents” tab. At the bottom of that page, select “Form N-Q.”
Annual Shareholder Report
Mutual funds are not bank deposits or obligations, are not guaranteed by any bank and are not insured or guaranteed by the U.S. government, the Federal Deposit Insurance Corporation, the Federal Reserve Board or any other government agency. Investment in mutual funds involves investment risk, including the possible loss of principal.
This Report is authorized for distribution to prospective investors only when preceded or accompanied by the Fund's Prospectus, which contains facts concerning its objective and policies, management fees, expenses and other information.
Federated Muni and Stock Advantage Fund
Federated Investors Funds
4000 Ericsson Drive
Warrendale, PA 15086-7561
Contact us at FederatedInvestors.com
or call 1-800-341-7400.
Federated Securities Corp., Distributor
CUSIP 31420C837
CUSIP 31420C829
CUSIP 31420C811
CUSIP 31420C720
CUSIP 31420C654
31285 (12/12)
Federated is a registered trademark of Federated Investors, Inc.
2012 ©Federated Investors, Inc.
Item 2. Code of Ethics
(a) As of the end of the period covered by this report, the registrant has adopted a code of ethics (the "Section 406 Standards for Investment Companies - Ethical Standards for Principal Executive and Financial Officers") that applies to the registrant's Principal Executive Officer and Principal Financial Officer; the registrant's Principal Financial Officer also serves as the Principal Accounting Officer.
(c) Not Applicable
(d) Not Applicable
(e) Not Applicable
(f)(3) The registrant hereby undertakes to provide any person, without charge, upon request, a copy of the code of ethics. To request a copy of the code of ethics, contact the registrant at 1-800-341-7400, and ask for a copy of the Section 406 Standards for Investment Companies - Ethical Standards for Principal Executive and Financial Officers.
Item 3. Audit Committee Financial Expert
The registrant's Board has determined that each of the following members of the Board's Audit Committee is an “audit committee financial expert,” and is "independent," for purposes of this Item: Nicholas P. Constantakis, Charles F. Mansfield, Jr., Thomas M. O'Neill and John S. Walsh.
Item 4. Principal Accountant Fees and Services
(a) Audit Fees billed to the registrant for the two most recent fiscal years:
Fiscal year ended 2012 - $222,500
Fiscal year ended 2011 - $209,550
(b) Audit-Related Fees billed to the registrant for the two most recent fiscal years:
Fiscal year ended 2012 - $0
Fiscal year ended 2011 - $122
Travel to Audit Committee meetings.
Amount requiring approval of the registrant’s audit committee pursuant to paragraph (c)(7)(ii) of Rule 2-01 of Regulation S-X, $0 and $0 respectively.
(c) Tax Fees billed to the registrant for the two most recent fiscal years:
Fiscal year ended 2012 - $0
Fiscal year ended 2011 - $0
Amount requiring approval of the registrant’s audit committee pursuant to paragraph (c)(7)(ii) of Rule 2-01 of Regulation S-X, $2,504 and $2,474 respectively. Fiscal year ended 2012- Tax preparation fees for fiscal year end 2011. Fiscal year ended 2011- Tax preparation fees for fiscal year end 2011.
(d) All Other Fees billed to the registrant for the two most recent fiscal years:
Fiscal year ended 2012 - $0
Fiscal year ended 2011 - $0
Amount requiring approval of the registrant’s audit committee pursuant to paragraph (c)(7)(ii) of Rule 2-01 of Regulation S-X, $16,345 and $36,504 respectively. Fiscal year ended 2012- Service fees for analysis of potential Passive Foreign Investment Company holdings. Fiscal year ended 2011 – Service fees for analysis of potential Passive Foreign Investment Company holdings.
(e)(1) Audit Committee Policies regarding Pre-approval of Services.
The Audit Committee is required to pre-approve audit and non-audit services performed by the independent auditor in order to assure that the provision of such services do not impair the auditor’s independence. Unless a type of service to be provided by the independent auditor has received general pre-approval, it will require specific pre-approval by the Audit Committee. Any proposed services exceeding pre-approved cost levels will require specific pre-approval by the Audit Committee.
Certain services have the general pre-approval of the Audit Committee. The term of the general pre-approval is 12 months from the date of pre-approval, unless the Audit Committee specifically provides for a different period. The Audit Committee will annually review the services that may be provided by the independent auditor without obtaining specific pre-approval from the Audit Committee and may grant general pre-approval for such services. The Audit Committee will revise the list of general pre-approved services from time to time, based on subsequent determinations. The Audit Committee will not delegate its responsibilities to pre-approve services performed by the independent auditor to management.
The Audit Committee has delegated pre-approval authority to its Chairman. The Chairman will report any pre-approval decisions to the Audit Committee at its next scheduled meeting. The Committee will designate another member with such pre-approval authority when the Chairman is unavailable.
AUDIT SERVICES
The annual Audit services engagement terms and fees will be subject to the specific pre-approval of the Audit Committee. The Audit Committee must approve any changes in terms, conditions and fees resulting from changes in audit scope, registered investment company (RIC) structure or other matters.
In addition to the annual Audit services engagement specifically approved by the Audit Committee, the Audit Committee may grant general pre-approval for other Audit Services, which are those services that only the independent auditor reasonably can provide. The Audit Committee has pre-approved certain Audit services, all other Audit services must be specifically pre-approved by the Audit Committee.
AUDIT-RELATED SERVICES
Audit-related services are assurance and related services that are reasonably related to the performance of the audit or review of the Company’s financial statements or that are traditionally performed by the independent auditor. The Audit Committee believes that the provision of Audit-related services does not impair the independence of the auditor, and has pre-approved certain Audit-related services, all other Audit-related services must be specifically pre-approved by the Audit Committee.
TAX SERVICES
The Audit Committee believes that the independent auditor can provide Tax services to the Company such as tax compliance, tax planning and tax advice without impairing the auditor’s independence. However, the Audit Committee will not permit the retention of the independent auditor in connection with a transaction initially recommended by the independent auditor, the purpose of which may be tax avoidance and the tax treatment of which may not be supported in the Internal Revenue Code and related regulations. The Audit Committee has pre-approved certain Tax services, all Tax services involving large and complex transactions must be specifically pre-approved by the Audit Committee.
ALL OTHER SERVICES
With respect to the provision of services other than audit, review or attest services the pre-approval requirement is waived if:
| (1) | The aggregate amount of all such services provided constitutes no more than five percent of the total amount of revenues paid by the registrant, the registrant’s adviser (not including any sub-adviser whose role is primarily portfolio management and is subcontracted with or overseen by another investment adviser), and any entity controlling, controlled by, or under common control with the investment adviser that provides ongoing services to the registrant to its accountant during the fiscal year in which the services are provided; |
| (2) | Such services were not recognized by the registrant, the registrant’s adviser (not including any sub-adviser whose role is primarily portfolio management and is subcontracted with or overseen by another investment adviser), and any entity controlling, controlled by, or under common control with the investment adviser that provides ongoing services to the registrant at the time of the engagement to be non-audit services; and |
| (3) | Such services are promptly brought to the attention of the Audit Committee of the issuer and approved prior to the completion of the audit by the Audit Committee or by one or more members of the Audit Committee who are members of the board of directors to whom authority to grant such approvals has been delegated by the Audit Committee. |
The Audit Committee may grant general pre-approval to those permissible non-audit services classified as All Other services that it believes are routine and recurring services, and would not impair the independence of the auditor.
The SEC’s rules and relevant guidance should be consulted to determine the precise definitions of prohibited non-audit services and the applicability of exceptions to certain of the prohibitions.
PRE-APPROVAL FEE LEVELS
Pre-approval fee levels for all services to be provided by the independent auditor will be established annually by the Audit Committee. Any proposed services exceeding these levels will require specific pre-approval by the Audit Committee.
PROCEDURES
Requests or applications to provide services that require specific approval by the Audit Committee will be submitted to the Audit Committee by both the independent auditor and the Principal Accounting Officer and/or Internal Auditor, and must include a joint statement as to whether, in their view, the request or application is consistent with the SEC’s rules on auditor independence.
(e)(2) Percentage of services identified in items 4(b) through 4(d) that were approved by the registrants audit committee pursuant to paragraph (c)(7)(i)(C) of Rule 2-01 of Regulation S-X:
4(b)
Fiscal year ended 2012 – 0%
Fiscal year ended 2011 - 0%
Percentage of services provided to the registrants investment adviser and any entity controlling, controlled by, or under common control with the investment adviser that provides ongoing services to the registrant that were approved by the registrants audit committee pursuant to paragraph (c)(7)(i)(C) of Rule 2-01 of Regulation S-X, 0% and 0% respectively.
4(c)
Fiscal year ended 2012 – 0%
Fiscal year ended 2011 – 0%
Percentage of services provided to the registrants investment adviser and any entity controlling, controlled by, or under common control with the investment adviser that provides ongoing services to the registrant that were approved by the registrants audit committee pursuant to paragraph (c)(7)(i)(C) of Rule 2-01 of Regulation S-X, 0% and 0% respectively.
4(d)
Fiscal year ended 2012 – 0%
Fiscal year ended 2011 – 0%
Percentage of services provided to the registrants investment adviser and any entity controlling, controlled by, or under common control with the investment adviser that provides ongoing services to the registrant that were approved by the registrants audit committee pursuant to paragraph (c)(7)(i)(C) of Rule 2-01 of Regulation S-X, 0% and 0% respectively.
| (g) | Non-Audit Fees billed to the registrant, the registrant’s investment adviser, and certain entities controlling, controlled by or under common control with the investment adviser: |
Fiscal year ended 2012 - $394,437
Fiscal year ended 2011 - $442,204
(h) The registrant’s Audit Committee has considered that the provision of non-audit services that were rendered to the registrant’s adviser (not including any sub-adviser whose role is primarily portfolio management and is subcontracted with or overseen by another investment adviser), and any entity controlling, controlled by, or under common control with the investment adviser that provides ongoing services to the registrant that were not pre-approved pursuant to paragraph (c)(7)(ii) of Rule 2-01 of Regulation S-X is compatible with maintaining the principal accountant’s independence.
Item 5. Audit Committee of Listed Registrants
Not Applicable
Item 6. Schedule of Investments
(a) The registrant’s Schedule of Investments is included as part of the Report to Stockholders filed under Item 1 of this form.
(b) Not Applicable; Fund had no divestments during the reporting period covered since the previous Form N-CSR filing.
Item 7. Disclosure of Proxy Voting Policies and Procedures for Closed-End Management Investment Companies
Item 8. Portfolio Managers of Closed-End Management Investment Companies
Item 9. Purchases of Equity Securities by Closed-End Management Investment Company and Affiliated Purchasers
Item 10. Submission of Matters to a Vote of Security Holders
Not Applicable
Item 11. Controls and Procedures
(a) The registrant’s President and Treasurer have concluded that the
registrant’s disclosure controls and procedures (as defined in rule 30a-3(c) under the Act) are effective in design and operation and are sufficient to form the basis of the certifications required by Rule 30a-(2) under the Act, based on their evaluation of these disclosure controls and procedures within 90 days of the filing date of this report on Form N-CSR.
(b) There were no changes in the registrant’s internal control over financial reporting (as defined in rule 30a-3(d) under the Act) during the second fiscal quarter of the period covered by this report that have materially affected, or are reasonably likely to materially affect, the registrant’s internal control over financial reporting.
Item 12. Exhibits
(a)(1) Code of Ethics- Not Applicable to this Report.
(a)(2) Certifications of Principal Executive Officer and Principal Financial Officer.
(a)(3) Not Applicable.
(b) Certifications pursuant to 18 U.S.C. Section 1350.
SIGNATURES
Pursuant to the requirements of the Securities Exchange Act of 1934 and the Investment Company Act of 1940, the registrant has duly caused this report to be signed on its behalf by the undersigned, thereunto duly authorized.
Registrant Federated Income Securities Trust
By /S/ Richard A. Novak
Richard A. Novak, Principal Financial Officer
Date December 21, 2012
Pursuant to the requirements of the Securities Exchange Act of 1934 and the Investment Company Act of 1940, this report has been signed below by the following persons on behalf of the registrant and in the capacities and on the dates indicated.
By /S/ J. Christopher Donahue
J. Christopher Donahue, Principal Executive Officer
Date December 21, 2012
By /S/ Richard A. Novak
Richard A. Novak, Principal Financial Officer
Date December 21, 2012