United States
Securities and Exchange Commission
Washington, D.C. 20549
Form N-CSR
Certified Shareholder Report of Registered Management Investment Companies
811-4577
(Investment Company Act File Number)
Federated Income Securities Trust
_______________________________________________________________
(Exact Name of Registrant as Specified in Charter)
Federated Investors Funds
4000 Ericsson Drive
Warrendale, Pennsylvania 15086-7561
(Address of Principal Executive Offices)
(412) 288-1900
(Registrant's Telephone Number)
John W. McGonigle, Esquire
Federated Investors Tower
1001 Liberty Avenue
Pittsburgh, Pennsylvania 15222-3779
(Name and Address of Agent for Service)
(Notices should be sent to the Agent for Service)
Date of Fiscal Year End: 11/30/2012
Date of Reporting Period: 11/30/2012
Item 1. Reports to Stockholders

Annual Shareholder Report
November 30, 2012
| Share Class | Ticker |
| A | CAPAX |
| B | CAPBX |
| C | CAPCX |
| F | CAPFX |
| Institutional | CAPSX |
Federated Capital Income Fund
Fund Established 1988
A Portfolio of Federated Income Securities Trust
Dear Valued Shareholder,
I am pleased to present the Annual Shareholder Report for your fund covering the period from December 1, 2011 through November 30, 2012. This report includes Management's Discussion of Fund Performance, a complete listing of your fund's holdings, performance information and financial statements along with other important fund information.
In addition, our website, FederatedInvestors.com, offers easy access to Federated resources that include timely fund updates, economic and market insights from our investment strategists, and financial planning tools. We invite you to register to take full advantage of its capabilities.
Thank you for investing with Federated. I hope you find this information useful and look forward to keeping you informed.
Sincerely,
J. Christopher Donahue, President
Not FDIC Insured • May Lose Value • No Bank Guarantee
Management's Discussion of Fund Performance (unaudited)
The Fund's total return, based on net asset value for the 12-month reporting period ended November 30, 2012, was 12.45% for Class A Shares, 11.58% for Class B Shares, 11.76% for Class C Shares, 12.46% for Class F Shares and 12.24% for Institutional Shares. The total return of the Dow Jones U.S. Select Dividend Index (DJSDI) was 13.53% for the same period. The Barclays High Yield 2% Issuer Capped Index (BHY2%ICI) returned 17.02%, the Barclays Mortgage-Backed Securities Index (BMB) returned 3.17% and the Barclays Emerging Market Bond Index (BEMB) returned 18.46%. Weighting these benchmarks (40%DJSDI, 20% BHY2%ICI, 20% BMB and 20% BEMB), the blended benchmark1 return was 13.07% for the reporting period. The Fund's total return for the reporting period reflected actual cash flows, transaction costs and other expenses which were not reflected in the total returns for the DJSDI, BHY2%ICI, BMB or BEMB.
The Fund's investment strategy focused on income earning investments, specifically income producing and growing equity securities and high current yield fixed-income securities, to achieve the Fund's primary current income investment objective and secondary capital appreciation investment objective.
The following discussion will focus on the performance of the Fund's Class F Shares. The 12.46% total return of the Class F Shares for the reporting period consisted of 6.32% in price appreciation and 6.14% in reinvested dividends.
MARKET OVERVIEW
During the 12-month reporting period, global equity markets experienced continued volatility similar to what was seen in 2011. In general, the first quarter of 2012 was characterized by improved equity markets, which were driven by better than expected U.S. economic indicators such as unemployment rate, retail sales, manufacturing data and an improvement in the housing market. However, during the second quarter of 2012, the factors that had aided the market in its first quarter rally began to reverse course. In the United States, economic data such as retail sales, nonfarm payroll growth, manufacturing activity and gross domestic product (GDP) were weaker than expected. Conditions abroad also added to the market's overall volatility. The continued European sovereign fiscal concerns, a threat of a sharp decline in the Chinese economy and an overall synchronized global slowdown all caused investor angst which impacted general market conditions negatively. By the third quarter, despite macroeconomic data continuing to remain weak in the United States and globally, the equity markets began a powerful rally when, primarily, U.S. and European Central Banks signaled additional measures to meet market and investor concerns. The rally continued into the fourth quarter, only to be stalled by discussions around the
Annual Shareholder Report
threat of the simultaneous spending cuts and tax increases in the United States that are slated to take place at the end of 2012 (i.e., the “fiscal cliff”), which created significant uncertainty for markets and investors heading into the New Year.
The S&P 500 Index2 returned 16.13% and the Nasdaq Composite Index3 returned 16.41% for the reporting period. In general, for the full fiscal year, value stocks outperformed growth stocks and defensive stocks outperformed cyclical stocks. The S&P 500 Index's performance in the Financials, Consumer Discretionary and Telecom Services sectors dominated weaker performance in the Energy, Utilities and Materials sectors.
On the fixed-income side, interest rates moved lower over the 12-month reporting period. Intermediate-term maturity yields fell the most (30-45 basis points) while long-term maturities fell 10-15 basis points. As a result, the “ belly of the yield curve” or the 5-10-year maturity range, fell considerably over the reporting period. A major influence that caused U.S. Treasury rates to fall precipitously was the continuation of “ Operation Twist” by the Federal Reserve, a program that entails buying of longer-term Treasury securities. The 5-year Treasury yield fell 0.31% over the reporting period, ending at 0.62% while the 30-year Treasury yield fell 0.12% to 2.81%.
PORTFOLIO ALLOCATION
During the reporting period, the Fund's portfolio was allocated between stocks and fixed-income securities in a manner reflecting the Fund's primary investment objective of income and its secondary objective of capital appreciation. Factors used in making this allocation were: (1) the Fund's ability to pay and maintain an attractive level of dividends; and (2) the expected relative total return of fixed-income securities and stocks. The allocation at the end of the reporting period on November 30, 2012 was 48.2% fixed-income securities, 44.1% stocks and 7.7% cash equivalents.
The Fund's allocation had a negative effect on performance because fixed-income securities underperformed stocks.
SECTOR AND SECURITY SELECTION–EQUITY
The equity component of the portfolio was positioned within a diversified portfolio of dividend paying securities4 with favorable valuations, strong balance sheets and improving business fundamentals. The portfolio continues to aim for high-yield and consistent dividend growth. During the 12-month reporting period, the equity component of the portfolio underperformed the DJSDI.
Annual Shareholder Report
Sector allocations contributed positively, while stock selection negatively contributed to the overall performance of the Fund. An overweight position (as compared with the blended benchmark) in the Health Care and Telecom Services sectors and an underweight position in the Utilities and Industrials sectors enhanced the Fund's performance. Detracting from performance was negative stock selection in the Energy and Telecom Services sectors which was partially offset by positive stock selection in the Financials and Utilities sectors.
SECTOR AND SECURITY SELECTION–BONDS5
Sector allocation was a significant positive contributor to Fund performance, as the Fund maintained the vast majority of assets in a combination of high-yield6 and emerging market7 bonds, among the best performing sectors of all bond markets. The Fund was overweight the high-yield sector by a considerable amount for the majority of the reporting period while it was neutral in emerging market bonds. The overall extra yield from these sectors and the portfolio's lower-quality bias helped performance considerably. The Fund also maintained a minority position in high-quality bonds, which also aided in performance, as its high-quality bonds generated a positive return, but far less than high-yield and emerging markets.
Overall security selection was a large negative contributor to Fund performance, as the emerging market component underperformed its benchmark (BEMB) by a considerable amount while the high-yield component also underperformed its benchmark (BHY2%ICI) but by a much more modest amount, although the performance varied widely by bond sector. Mortgage-backed bond security8 selection also underperformed the BMB, while selection within the commercial mortgage-backed securities added value. Portfolio trading and positioning also added value to the results.
| 1 | Barclays Capital changed the name of the BHY2%ICI Index from “Barclays Capital High Yield 2% Issuer Capped Index” to “Barclays High Yield 2% Issuer Caped Index.” Barclays Capital changed the name of the BMB Index from “Barclays Capital Mortgage-Backed Securities Index” to “Barclays Mortgage-Backed Securities Index.” Barclays changed the name of the BEMB Index from “Barclays Capital Emerging Market Bond Index” to “Barclays Emerging Market Bond Index.” The Dow Jones Select Dividend Index's universe is defined as all dividend-paying companies in the Dow Jones U.S. Total Market Index that have a non-negative historical five-year dividend per-share growth rate, a five-year average dividend earnings per share ratio of less than or equal to 60%, and three-month average daily trading volume of 200,000 shares. Current index components are included in the universe regardless of their dividend payout ratio. The Dow Jones U.S. Total Market index is a rules-governed, broad-market benchmark that represents approximately 95% of the U.S. market capitalization. The BHY2%ICI is the 2% Issuer Cap component of the Barclays U.S. Corporate High Yield Index (BHYI). The BHYI is an index that covers all fixed-income securities having a maximum quality rating of “Ba1,” a minimum outstanding of $150 million and at least one year to maturity. The BMB is an index comprised of all fixed-income securities mortgage pools owned by GNMA, FNMA and FHLMC, including GNMA Graduated Payment Mortgages. The BEMB tracks total returns for external-currency-denominated debt instruments of the emerging markets: Brady bonds, loans, Eurobonds and U.S. dollar-denominated local market instruments. Countries covered are Argentina, Brazil, Bulgaria, Ecuador, Mexico, Morocco, Nigeria, Panama, Peru, the Philippines, Poland, Russia and Venezuela. The indexes are unmanaged, and it is not possible to invest directly in an index. |
Annual Shareholder Report
| 2 | The S&P 500 Index is a capitalization-weighted index of 500 stocks designed to measure performance of the broad domestic economy through changes in the aggregate market value of 500 stocks representing all major industries. The index is unmanaged, and it is not possible to invest directly in an index. |
| 3 | The Nasdaq Composite Index is an index that measures all Nasdaq domestic and non-U.S.-based common stocks listed on the Nasdaq stock market. The index is unmanaged, and it is not possible to invest directly in an index. |
| 4 | There are no guarantees that dividend-paying stocks will continue to pay dividends. In addition, dividend-paying stocks may not experience the same capital appreciation potential as non-dividend paying stocks. |
| 5 | Bond prices are sensitive to changes in interest rates, and a rise in interest rates can cause a decline in their prices. |
| 6 | High-yield, lower-rated securities generally entail greater market, credit/default and liquidity risks, and may be more volatile than investment-grade securities. |
| 7 | International investing involves special risks including currency risk, increased volatility of foreign securities, political risks and differences in auditing and other financial standards. Prices of emerging markets securities can be significantly more volatile than the prices of securities in developed countries, and currency risk and political risks are accentuated in emerging markets. |
| 8 | The value of some mortgage-backed securities may be particularly sensitive to changes in the prevailing interest rates, and although the securities are generally supported by some form of government or private insurance, there is no assurance that private guarantors or insurers will meet their obligations. |
Annual Shareholder Report
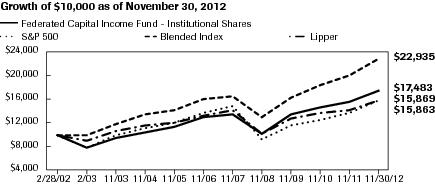
FUND PERFORMANCE AND GROWTH OF A $10,000 INVESTMENT
The Fund's Institutional Shares commenced operations on March 30, 2012. The Fund offers four other classes: Class A Shares, Class B Shares, Class C Shares and Class F Shares. For the period prior to the commencement of operations of the Institutional Shares, the performance information shown is for the Fund's Class A Shares. The performance of the Class A Shares has not been adjusted to reflect the expenses of the Institutional Shares, since the Institutional Shares have a lower expense ratio than the expenses of the Class A Shares. The performance of the Class A Shares has been adjusted to reflect the absence of sales charges and to remove any voluntary waiver of Fund expenses related to the Class A Shares that may have occurred during the period prior to the commencement of operations of the Institutional Shares. The Average Annual Total Return table below shows returns for each class averaged over the stated periods. The graphs below illustrate the hypothetical investment of $10,0001 in the Federated Capital Income Fund (the “Fund”) from February 28, 2002 to November 30, 2012, compared to the Standard & Poor's 500 Index (S& P 500),2,3 a broad-based market index; a blend of indexes comprised of 40% Dow Jones Select Dividend Index (DJSDI)3/20% Barclays Emerging Market Bond Index (BEMB)3/20% Barclays High Yield 2% Issuer Capped Index (BHY2%ICI)3/20% Barclays Mortgage-Backed Securities Index (BMB)3 (the “Blended Index”)2,4 and the Lipper Mixed-Asset Target Allocation Median Classification (Lipper).2
Average Annual Total Returns for the Period Ended 11/30/2012
(returns reflect all applicable sales charges and contingent deferred sales charges as specified below in footnote #1)
| Share Class | 1 Year | 5 Years | 10 Years |
| Class A Shares | 6.30% | 4.10% | 7.42% |
| Class B Shares | 6.08% | 4.17% | 7.38% |
| Class C Shares | 10.76% | 4.52% | 7.25% |
| Class F Shares | 10.30% | 5.10% | 7.94% |
| Institutional Shares | 12.24% | 5.24% | 8.02% |
Performance data quoted represents past performance which is no guarantee of future results. Investment return and principal value will fluctuate so that an investor's shares, when redeemed, may be worth more or less than their original cost. Mutual fund performance changes over time and current performance may be lower or higher than what is stated. For current to the most recent month-end performance and after-tax returns, visit FederatedInvestors.com or call 1-800-341-7400. Returns shown do not reflect the deduction of taxes that a shareholder would pay on Fund distributions or the redemption of Fund shares. Mutual funds are not obligations of or guaranteed by any bank and are not federally insured.
Annual Shareholder Report
Growth of a $10,000 Investment–CLASS A shares

| Federated Capital Income Fund- Class A Shares | C000024648 | S&P 500 | Blended Index | Lipper |
| 2/28/2002 | 9,450 | 10,000 | 10,000 | 10,000 |
| 2/28/2003 | 7,377 | 7,732 | 9,978 | 8,983 |
| 11/30/2003 | 8,867 | 9,856 | 11,930 | 10,559 |
| 11/30/2004 | 9,898 | 11,123 | 13,567 | 11,531 |
| 11/30/2005 | 10,644 | 12,063 | 14,352 | 12,060 |
| 11/30/2006 | 12,246 | 13,780 | 16,154 | 13,262 |
| 11/30/2007 | 12,796 | 14,844 | 16,631 | 14,135 |
| 11/30/2008 | 9,652 | 9,190 | 12,991 | 10,158 |
| 11/30/2009 | 12,718 | 11,522 | 16,392 | 12,736 |
| 11/30/2010 | 13,891 | 12,667 | 18,605 | 13,845 |
| 11/30/2011 | 14,720 | 13,659 | 20,271 | 14,334 |
| 11/30/2012 | 16,553 | 15,863 | 22,935 | 15,869 |
41 graphic description end -->
| ■ | Total returns shown include the maximum sales charge of 5.50% ($10,000 investment minus $550 sales charge = $9,450). |
Growth of a $10,000 Investment–CLASS b shares
| Federated Capital Income Fund- Class B Shares | C000024649 | S&P 500 | Blended Index | Lipper |
| 2/28/2002 | 10,000 | 10,000 | 10,000 | 10,000 |
| 2/28/2003 | 7,736 | 7,732 | 9,978 | 8,983 |
| 11/30/2003 | 9,261 | 9,856 | 11,930 | 10,559 |
| 11/30/2004 | 10,258 | 11,123 | 13,567 | 11,531 |
| 11/30/2005 | 10,933 | 12,063 | 14,352 | 12,060 |
| 11/30/2006 | 12,500 | 13,780 | 16,154 | 13,262 |
| 11/30/2007 | 12,963 | 14,844 | 16,631 | 14,135 |
| 11/30/2008 | 9,707 | 9,190 | 12,991 | 10,158 |
| 11/30/2009 | 12,708 | 11,522 | 16,392 | 12,736 |
| 11/30/2010 | 13,773 | 12,667 | 18,605 | 13,845 |
| 11/30/2011 | 14,576 | 13,659 | 20,271 | 14,334 |
| 11/30/2012 | 16,390 | 15,863 | 22,935 | 15,869 |
41 graphic description end -->
| ■ | Total returns shown include the maximum contingent deferred sales charge of 5.50%, as applicable. |
Annual Shareholder Report
Growth of a $10,000 Investment–CLASS c shares
| Federated Capital Income Fund- Class C Shares | C000024650 | S&P 500 | Blended Index | Lipper |
| 2/28/2002 | 10,000 | 10,000 | 10,000 | 10,000 |
| 2/28/2003 | 7,746 | 7,732 | 9,978 | 8,983 |
| 11/30/2003 | 9,259 | 9,856 | 11,930 | 10,559 |
| 11/30/2004 | 10,257 | 11,123 | 13,567 | 11,531 |
| 11/30/2005 | 10,947 | 12,063 | 14,352 | 12,060 |
| 11/30/2006 | 12,504 | 13,780 | 16,154 | 13,262 |
| 11/30/2007 | 12,969 | 14,844 | 16,631 | 14,135 |
| 11/30/2008 | 9,708 | 9,190 | 12,991 | 10,158 |
| 11/30/2009 | 12,715 | 11,522 | 16,392 | 12,736 |
| 11/30/2010 | 13,765 | 12,667 | 18,605 | 13,845 |
| 11/30/2011 | 14,478 | 13,659 | 20,271 | 14,334 |
| 11/30/2012 | 16,180 | 15,863 | 22,935 | 15,869 |
41 graphic description end -->
| ■ | Total returns shown include the maximum contingent deferred sales charge of 1.00%, as applicable. |
Growth of a $10,000 Investment–CLASS f shares
| Federated Capital Income Fund- Class F Shares | C000024651 | S&P 500 | Blended Index | Lipper |
| 2/28/2002 | 9,900 | 10,000 | 10,000 | 10,000 |
| 2/28/2003 | 7,728 | 7,732 | 9,978 | 8,983 |
| 11/30/2003 | 9,289 | 9,856 | 11,930 | 10,559 |
| 11/30/2004 | 10,369 | 11,123 | 13,567 | 11,531 |
| 11/30/2005 | 11,136 | 12,063 | 14,352 | 12,060 |
| 11/30/2006 | 12,816 | 13,780 | 16,154 | 13,262 |
| 11/30/2007 | 13,394 | 14,844 | 16,631 | 14,135 |
| 11/30/2008 | 10,116 | 9,190 | 12,991 | 10,158 |
| 11/30/2009 | 13,325 | 11,522 | 16,392 | 12,736 |
| 11/30/2010 | 14,535 | 12,667 | 18,605 | 13,845 |
| 11/30/2011 | 15,423 | 13,659 | 20,271 | 14,334 |
| 11/30/2012 | 17,345 | 15,863 | 22,935 | 15,869 |
41 graphic description end -->
| ■ | Total returns shown include the maximum sales charge of 1.00% ($10,000 investment minus $100 sales charge = $9,900) and the maximum contingent deferred sales charge of 1.00%, as applicable. |
Annual Shareholder Report
Growth of a $10,000 INVESTMENT–INSTITUTIONAL SHARES
| Federated Capital Income Fund- Institutional Shares | C000114947 | S&P 500 | Blended Index | Lipper |
| 2/28/2002 | 10,000 | 10,000 | 10,000 | 10,000 |
| 2/28/2003 | 7,806 | 7,732 | 9,978 | 8,983 |
| 11/30/2003 | 9,383 | 9,856 | 11,930 | 10,559 |
| 11/30/2004 | 10,474 | 11,123 | 13,567 | 11,531 |
| 11/30/2005 | 11,264 | 12,063 | 14,352 | 12,060 |
| 11/30/2006 | 12,959 | 13,780 | 16,154 | 13,262 |
| 11/30/2007 | 13,541 | 14,844 | 16,631 | 14,135 |
| 11/30/2008 | 10,214 | 9,190 | 12,991 | 10,158 |
| 11/30/2009 | 13,458 | 11,522 | 16,392 | 12,736 |
| 11/30/2010 | 14,700 | 12,667 | 18,605 | 13,845 |
| 11/30/2011 | 15,577 | 13,659 | 20,271 | 14,334 |
| 11/30/2012 | 17,483 | 15,863 | 22,935 | 15,869 |
41 graphic description end -->
| 1 | Represents a hypothetical investment of $10,000 in the Fund after deducting applicable sales charges: For Class A Shares the maximum sales charge of 5.50% ($10,000 investment minus $550 sales charge = $9,450); for Class B Shares, the maximum contingent deferred sales charge is 5.50% on any redemption less than one year from the purchase date; for Class C Shares, a 1.00% contingent deferred sales charge would be applied on any redemption less than one year from the purchase date; for Class F Shares, the maximum sales charge of 1.00% ($10,000 investment minus $100 sales charge = $9,900) and a contingent deferred sales charge of 1.00% would be applied on any redemption less than four years from the purchase date. The Fund's performance assumes the reinvestment of all dividends and distributions. The S&P 500, Blended Index and Lipper have been adjusted to reflect reinvestment of dividends and distributions on securities in the indexes and average. |
| 2 | The S&P 500 and Blended Index are not adjusted to reflect sales charges, expenses or other fees that the Securities and Exchange Commission (SEC) requires to be reflected in the Fund's performance. Lipper represents the average of the total returns reported by all of the mutual funds designated by Lipper, Inc. as falling into the category indicated, and is not adjusted to reflect any sales charges. However, these total returns are reported net of expenses or other fees that the SEC requires to be reflected in a mutual fund's performance. The indexes are unmanaged and, unlike the Fund, are not affected by cash flows. It is not possible to invest directly in an index or an average. |
| 3 | Barclays Capital changed the name of the BEMB, BHY2%ICI and the BMB indexes from “Barclays Capital Emerging Market Bond Index,” “Barclays Capital High Yield 2% Issuer Capped Index” and “ Barclays Capital Mortgage-Backed Securities Index” to “Barclays Emerging Market Bond Index,” “Barclays High Yield 2% Issuer Capped Index” and “Barclays Mortgage-Backed Securities Index.” The S&P 500 is a capitalization-weighted index of 500 stocks designed to measure performance of the broad domestic economy through changes in the aggregate market value of 500 stocks representing all major industries. The DJSDI is a dividend-weighted index intended to represent the 100 stocks in the Dow Jones U.S. Total Market Index that have the highest indicated annual dividend yield. The BEMB tracks total returns for external-currency-denominated debt instruments of the emerging markets. The BHY2%ICI is the 2% Issuer Cap component of the Barclays U.S. Corporate High Yield Index. The Barclays U.S. Corporate High Yield Index is an unmanaged index that includes all fixed-income securities having a maximum quality rating of Ba1, a minimum amount outstanding of $150 million and at least one year to maturity. The BMB is composed of all fixed securities mortgage pools owned by GNMA, FNMA and FHLMC. Indexes are unmanaged, and investments cannot be made directly in an index. |
| 4 | Effective January 31, 2012, the Fund's blended benchmark was changed from 40% Russell 1000 Value Index, 20% Barclays High Yield 2% Issuer Capped Index, 20% Barclays Emerging Market Bond Index, 20% Barclays Mortgage-Backed Securities Index to 40% Dow Jones Select Dividend Index, 20% Barclays High Yield 2% Issuer Capped Index, 20% Barclays Emerging Market Bond Index, 20% Barclays Mortgage-Backed Securities Index. |
Annual Shareholder Report
Portfolio of Investments Summary Tables (unaudited)
At November 30, 2012, the Fund's portfolio composition1 was as follows:
| Security Type | Percentage of
Total Net Assets |
| Domestic Equity Securities | 34.5% |
| Domestic Fixed-Income Securities | 22.6% |
| International Fixed-Income Securities | 9.1% |
| International Equity Securities | 8.9% |
| Foreign Governments/Agencies | 8.1% |
| U.S. Government Agency Mortgage-Backed Securities | 7.1% |
| U.S. Treasury | 0.6% |
| Non-Agency Mortgage-Backed Securities | 0.4% |
| Floating Rate Loan2 | 0.0% |
| Derivative Contracts2,3 | (0.0)% |
| Cash Equivalents4 | 9.1% |
| Other Assets and Liabilities—Net5 | (0.4)% |
| TOTAL | 100.0% |
| 1 | See the Fund's Prospectus for a description of the principal types of securities in which the Fund invests. As of the date specified above, the Fund owned shares of one or more affiliated investment companies. For purposes of this table, the affiliated investment company (other than an affiliated money market mutual fund) is not treated as a single portfolio security, but rather the Fund is treated as owning a pro rata portion of each security and each other asset and liability owned by the affiliated investment company. Accordingly, the percentages of total net assets shown in the table will differ from those presented on the Portfolio of Investments. |
| 2 | Represents less than 0.1%. |
| 3 | Based upon net unrealized appreciation (depreciation) or value of the derivative contracts as applicable. Derivative contracts may consist of futures, forwards, options and swaps. The impact of a derivative contract on the Fund's performance may be larger than its unrealized appreciation (depreciation) or value may indicate. In many cases, the notional value or amount of a derivative contract may provide a better indication of the contract's significance to the portfolio. More complete information regarding the Fund's direct investments in derivative contracts, including unrealized appreciation (depreciation), value, and notional values or amounts of such contracts, can be found in the table at the end of the Portfolio of Investments included in this Report. |
| 4 | Cash Equivalents include any investments in money market mutual funds and/or overnight repurchase agreements. |
| 5 | Assets, other than investments in securities and derivative contracts, less liabilities. See Statement of Assets and Liabilities. |
Annual Shareholder Report
At November 30, 2012, the Fund's sector composition6 for its equity securities was as follows:
| Sector Composition | Percentage of
Equity Securities |
| Financials | 16.0% |
| Health Care | 14.6% |
| Utilities | 13.0% |
| Industrials | 11.0% |
| Energy | 10.9% |
| Consumer Staples | 10.6% |
| Telecommunication Services | 10.6% |
| Consumer Discretionary | 8.8% |
| Materials | 3.5% |
| Information Technology | 1.0% |
| TOTAL | 100.0% |
| 6 | Sector classifications are based upon, and individual portfolio securities are assigned to, the classifications of the Global Industry Classification Standard (GICS) except that the Adviser assigns a classification to securities not classified by the GICS and to securities for which the Adviser does not have access to the classification made by the GICS. |
Annual Shareholder Report
Portfolio of Investments
November 30, 2012
Shares or
Principal
Amount | | | Value |
| | | COMMON STOCKS—32.4% | |
| | | Consumer Discretionary—3.2% | |
| 57,890 | | American Eagle Outfitters, Inc. | $1,227,268 |
| 80,400 | | GameStop Corp. | 2,110,500 |
| 100,225 | | Gannett Co., Inc. | 1,794,027 |
| 43,535 | | Limited Brands | 2,270,350 |
| 159,590 | | Meredith Corp. | 4,976,016 |
| 68,050 | | Regal Entertainment Group | 1,060,219 |
| 30,635 | | Six Flags Entertainment Corp. | 1,883,440 |
| 8,805 | | Target Corp. | 555,860 |
| | | TOTAL | 15,877,680 |
| | | Consumer Staples—4.6% | |
| 154,465 | | Altria Group, Inc. | 5,222,462 |
| 38,270 | | ConAgra Foods, Inc. | 1,142,742 |
| 27,070 | | Kimberly-Clark Corp. | 2,320,440 |
| 38,590 | | Lorillard, Inc. | 4,675,564 |
| 56,620 | | Philip Morris International, Inc. | 5,089,006 |
| 93,800 | | Reynolds American, Inc. | 4,100,936 |
| | | TOTAL | 22,551,150 |
| | | Energy—4.4% | |
| 85,140 | | ARC Resources Ltd. | 2,132,464 |
| 76,490 | | Baytex Energy Corp. | 3,395,791 |
| 77,290 | | Bonavista Energy Corp. | 1,282,266 |
| 80,380 | | ConocoPhillips | 4,576,837 |
| 87,795 | | Crescent Point Energy Corp. | 3,447,811 |
| 39,215 | | Royal Dutch Shell PLC | 2,626,229 |
| 78,559 | | Vermilion Energy, Inc. | 3,996,952 |
| | | TOTAL | 21,458,350 |
| | | Financials—2.5% | |
| 33,300 | | Bank of Hawaii Corp. | 1,447,551 |
| 41,275 | | Cincinnati Financial Corp. | 1,672,463 |
| 124,550 | | Hospitality Properties Trust | 2,827,285 |
| 306,595 | | Hudson City Bancorp, Inc. | 2,471,156 |
| 86,555 | | Mercury General Corp. | 3,602,419 |
| | | TOTAL | 12,020,874 |
Annual Shareholder Report
Shares or
Principal
Amount | | | Value |
| | | COMMON STOCKS—continued | |
| | | Health Care—6.3% | |
| 15,790 | | Abbott Laboratories | $1,026,350 |
| 109,278 | | Bristol-Myers Squibb Co. | 3,565,741 |
| 106,785 | | GlaxoSmithKline PLC, ADR | 4,592,823 |
| 61,980 | | Johnson & Johnson | 4,321,866 |
| 99,005 | | Lilly (Eli) & Co. | 4,855,205 |
| 149,680 | | Merck & Co., Inc. | 6,630,824 |
| 237,765 | | Pfizer, Inc. | 5,948,880 |
| | | TOTAL | 30,941,689 |
| | | Industrials—2.4% | |
| 72,805 | | Deluxe Corp. | 2,096,784 |
| 86,745 | | Donnelley (R.R.) & Sons Co. | 815,403 |
| 344,305 | | General Electric Co. | 7,275,165 |
| 67,200 | | Pitney Bowes, Inc. | 751,968 |
| 12,420 | | United Parcel Service, Inc. | 908,026 |
| | | TOTAL | 11,847,346 |
| | | Information Technology—0.4% | |
| 10,985 | | Harris Corp. | 517,723 |
| 57,270 | | Intel Corp. | 1,120,774 |
| 20,080 | | Seagate Technology | 504,008 |
| | | TOTAL | 2,142,505 |
| | | Materials—0.6% | |
| 57,184 | | LyondellBasell Industries, Class A | 2,843,760 |
| | | Telecommunication Services—4.6% | |
| 165,619 | | AT&T, Inc. | 5,652,576 |
| 103,375 | | BCE, Inc. | 4,372,763 |
| 89,300 | | CenturyLink, Inc. | 3,468,412 |
| 103,990 | | Verizon Communications | 4,588,039 |
| 106,415 | | Vodafone Group PLC, ADR | 2,745,507 |
| 205,500 | | Windstream Corp. | 1,722,090 |
| | | TOTAL | 22,549,387 |
| | | Utilities—3.4% | |
| 14,670 | | Ameren Corp. | 439,660 |
| 26,415 | | American Electric Power Co., Inc. | 1,126,600 |
| 45,450 | | DTE Energy Co. | 2,753,361 |
| 81,375 | | Huaneng Power International, Inc., ADR | 2,774,074 |
| 27,770 | | Integrys Energy Group, Inc. | 1,476,531 |
| 47,355 | | National Grid PLC, ADR | 2,682,187 |
Annual Shareholder Report
Shares or
Principal
Amount | | | Value |
| | | COMMON STOCKS—continued | |
| | | Utilities—continued | |
| 80,160 | | NiSource, Inc. | $1,937,467 |
| 51,450 | | Pepco Holdings, Inc. | 1,015,623 |
| 9,600 | | Pinnacle West Capital Corp. | 494,016 |
| 77,135 | | SSE PLC, ADR | 1,784,132 |
| | | TOTAL | 16,483,651 |
| | | TOTAL COMMON STOCKS
(IDENTIFIED COST $137,747,733) | 158,716,392 |
| | | Corporate Bonds—2.6% | |
| | | Basic Industry - Paper—0.0% | |
| $220,000 | | Westvaco Corp., Sr. Deb., 7.500%, 06/15/2027 | 245,087 |
| | | Communications Equipment—0.5% | |
| 5,404,000 | | Liberty Media Group, Conv. Bond, 3.500%, 01/15/2031 | 2,619,751 |
| | | Consumer Non-Cyclical - Tobacco—0.2% | |
| 750,000 | | Lorillard Tobacco Co., Sr. Unsecd. Note, 7.000%, 08/04/2041 | 908,911 |
| | | Diversified Telecommunication Services—0.7% | |
| 3,100,000 | | Level 3 Communications, Inc., Conv. Bond, 15.000%, 01/15/2013 | 3,219,908 |
| | | Energy - Independent—0.1% | |
| 450,000 | | Petroleos Mexicanos, 6.500%, 06/02/2041 | 568,125 |
| | | Financial Institution - Banking—0.5% | |
| 450,000 | | Bank of America Corp., Sub. Note, 6.500%, 09/15/2037 | 509,181 |
| 450,000 | | Merrill Lynch & Co., Inc., Sub. Note, 7.750%, 05/14/2038 | 589,347 |
| 950,000 | | Morgan Stanley, Sr. Unsecd. Note, Series MTN, 6.250%, 08/09/2026 | 1,103,433 |
| | | TOTAL | 2,201,961 |
| | | Financial Institution - Brokerage—0.2% | |
| 600,000 | | Jefferies Group, Inc., Sr. Unsecd. Note, 6.250%, 01/15/2036 | 615,000 |
| 450,000 | 1,2 | Legg Mason, Inc., Sr. Unsecd. Note, Series 144A, 5.500%, 05/21/2019 | 494,943 |
| | | TOTAL | 1,109,943 |
| | | Financial Institution - Finance Noncaptive—0.1% | |
| 400,000 | | HSBC Finance Capital Trust IX, Note, 5.911%, 11/30/2035 | 397,000 |
| | | Marine—0.1% | |
| 871,000 | | Dryships, Inc., Conv. Bond, 5.000%, 12/01/2014 | 673,718 |
| | | Utility - Electric—0.2% | |
| 900,000 | 1,2 | Enel Finance International SA, Company Guarantee, Series 144A, 6.000%, 10/07/2039 | 867,528 |
| | | TOTAL CORPORATE BONDS
(IDENTIFIED COST $12,081,144) | 12,811,932 |
Annual Shareholder Report
Shares or
Principal
Amount | | | Value |
| | | Preferred Stocks—10.9% | |
| | | Consumer Discretionary—0.6% | |
| 62,805 | | Goodyear Tire & Rubber Co., Conv. Pfd., 5.875%, 4/1/2014, Annual Dividend $2.94 | $2,822,457 |
| | | Energy—0.3% | |
| 39,200 | | Apache Corp., Conv. Pfd., 6.00%, 8/1/2013, Annual Dividend $3.00 | 1,741,656 |
| | | Financials—4.5% | |
| 78,710 | | Citigroup, Inc., Conv. Pfd., 7.50%, 12/15/2012, Annual Dividend $7.50 | 7,898,549 |
| 238,400 | | Hartford Financial, Conv. Bond, Series F, 7.25%, 4/1/2013, Annual Dividend $1.81 | 4,782,304 |
| 44,100 | | New York Community Capital Trust V, Conv. Pfd., 6.00%, 11/01/2051, Annual Dividend $3.00 | 2,205,000 |
| 105,500 | | Synovus Financial Corp., Conv. Pfd., 8.25%, 5/15/2013, Annual Dividend $2.06 | 2,204,950 |
| 1,750 | | Wells Fargo Co., Series L, Pfd., 7.50%, 12/31/2049, Annual Dividend $75.00 | 2,163,000 |
| 47,800 | | Wintrust Financial Corp., Conv. Pfd., 7.50%, 12/15/2013, Annual Dividend $3.75 | 2,646,619 |
| | | TOTAL | 21,900,422 |
| | | Industrials—2.4% | |
| 488,000 | 1,2 | 2010 Swift Mandatory Common Exchange, Conv. Pfd., Series 144A, 6.00%, 12/31/2013, Annual Dividend $0.66 | 4,256,580 |
| 89,200 | | Continental Finance Trust II, Conv. Pfd., 6.00%, 11/15/2030, Annual Dividend $3.00 | 3,046,456 |
| 77,800 | | United Technologies Corp., Conv. Pfd., 7.50%, 8/1/2015, Annual Dividend $5.54 | 4,257,216 |
| | | TOTAL | 11,560,252 |
| | | Materials—0.9% | |
| 124,665 | | Anglogold Ashanti Holding, Conv. Pfd., 6.000%, 9/15/2013, Annual Dividend $3.00 | 4,613,852 |
| | | Utilities—2.2% | |
| 75,840 | | AES Trust III, Conv. Pfd., 6.75%, 10/15/2029, Annual Dividend $3.38 | 3,784,416 |
| 55,000 | | NextEra Energy, Inc., Conv. Pfd., 7.00%, 9/01/2013, Annual Dividend $3.50 | 2,942,500 |
| 78,905 | | PPL Corp., Conv. Pfd., 9.50%, 7/1/2013, Annual Dividend $4.75 | 4,252,979 |
| | | TOTAL | 10,979,895 |
| | | TOTAL PREFERRED STOCKS
(IDENTIFIED COST $56,959,933) | 53,618,534 |
| | | Collateralized Mortgage Obligations—1.8% | |
| $1,500,000 | | Citigroup Commercial Mortgage Trust 2012-GC8, A4, 2.977%, 9/10/2045 | 1,577,799 |
| 830,000 | | Commercial Mortgage Pass-Through Certificates 2012-CR1 AM, 3.912%, 5/15/2045 | 905,466 |
Annual Shareholder Report
Shares or
Principal
Amount | | | Value |
| | | Collateralized Mortgage Obligations—continued | |
| $1,315,000 | | Commercial Mortgage Pass-Through Certificates 2012-CR1 B, 4.612%, 5/15/2045 | $1,445,741 |
| 100,000 | | Commercial Mortgage Pass-Through Certificates 2012-LC4 B, 4.934%, 12/10/2044 | 112,629 |
| 1,175,000 | | GS Mortgage Securities Corp. II 2012-GCJ7 AS, 4.085%, 5/10/2045 | 1,277,277 |
| 1,415,000 | | GS Mortgage Securities Corp. II 2012-GCJ7 BB, 4.740%, 5/10/2045 | 1,577,232 |
| 950,000 | | Morgan Stanley Capital I 2007-IQ16 AM, 6.1096%, 12/12/2049 | 1,097,534 |
| 875,000 | | WF-RBS Commercial Mortgage Trust 2012-C6 A4, 3.440%, 4/15/2045 | 942,680 |
| | | TOTAL COLLATERALIZED MORTGAGE OBLIGATIONS
(IDENTIFIED COST $8,401,779) | 8,936,358 |
| | | Mortgage-Backed SecuritY—0.4% | |
| 1,900,000 | | Federal National Mortgage Association, 3.000%, 12/1/2042
(IDENTIFIED COST $1,997,008) | 1,998,267 |
| | | U.S. Treasury—0.6% | |
| 1,796,497 | 3 | U.S. Treasury Inflation-Protected Note, 0.625%, 7/15/2021 | 2,056,709 |
| 200,000 | | U.S. Treasury Bond, 2.750%, 8/15/2042 | 197,841 |
| 500,000 | | U.S. Treasury Note, 3.500%, 5/15/2020 | 585,535 |
| | | TOTAL U.S. TREASURY
(IDENTIFIED COST $2,762,065) | 2,840,085 |
| | | MUTUAL FUNDS—51.1%4 | |
| 2,249,246 | | Emerging Markets Fixed Income Core Fund | 78,114,948 |
| 3,489,445 | | Federated Mortgage Core Portfolio | 35,627,229 |
| 35,941,405 | 5 | Federated Prime Value Obligations Fund, Institutional Shares, 0.15% | 35,941,405 |
| 15,176,484 | | High Yield Bond Portfolio | 101,075,384 |
| | | TOTAL MUTUAL FUNDS
(IDENTIFIED COST $225,720,966) | 250,758,966 |
| | | TOTAL INVESTMENTS—99.8%
(IDENTIFIED COST $445,670,628)6 | 489,680,534 |
| | | OTHER ASSETS AND LIABILITIES - NET—0.2%7 | 1,051,171 |
| | | TOTAL NET ASSETS—100% | $490,731,705 |
Annual Shareholder Report
At November 30, 2012, the Fund had the following outstanding futures contracts:
| Description | Number of
Contracts | Notional
Value | Expiration
Date | Unrealized
Depreciation |
| 8United States Treasury Bonds, 30-Year Short Futures | 45 | $6,752,813 | March 2013 | $(61,625) |
| 8United States Treasury Bonds, Ultra Long Short Futures | 17 | $2,820,938 | March 2013 | $(22,749) |
| 8United States Treasury Notes, 5-Year Short Futures | 5 | $623,594 | March 2013 | $(2,160) |
| UNREALIZED DEPRECIATION ON FUTURES CONTRACTS | $(86,534) |
Unrealized Depreciation on Futures Contracts is included in “Other Assets and Liabilities—Net.”
| 1 | Denotes a restricted security that either: (a) cannot be offered for public sale without first being registered, or being able to take advantage of an exemption from registration, under the Securities Act of 1933; or (b) is subject to a contractual restriction on public sales. At November 30, 2012, these restricted securities amounted to $5,619,051, which represented 1.1% of total net assets. |
| 2 | Denotes a restricted security that may be resold without restriction to “qualified institutional buyers” as defined in Rule 144A under the Securities Act of 1933 and that the Fund has determined to be liquid under criteria established by the Fund's Board of Trustees (the “Trustees”). At November 30, 2012, these liquid restricted securities amounted to $5,619,051, which represented 1.1% of total net assets. |
| 3 | Pledged as collateral to ensure the Fund is able to satisfy the obligations of its outstanding futures contracts. |
| 4 | Affiliated holdings. |
| 5 | 7-Day net yield. |
| 6 | The cost of investments for federal tax purposes amounts to $450,341,669. |
| 7 | Assets, other than investments in securities, less liabilities. See Statement of Assets and Liabilities. |
| 8 | Non-income producing security. |
Note: The categories of investments are shown as a percentage of total net assets at November 30, 2012.
Various inputs are used in determining the value of the Fund's investments. These inputs are summarized in the three broad levels listed below:
Level 1— quoted prices in active markets for identical securities, including investment companies with daily net asset values, if applicable.
Level 2— other significant observable inputs (including quoted prices for similar securities, interest rates, prepayment speeds, credit risk, etc.). Also includes securities valued at amortized cost.
Level 3— significant unobservable inputs (including the Fund's own assumptions in determining the fair value of investments).
The inputs or methodology used for valuing securities are not an indication of the risk associated with investing in those securities.
Annual Shareholder Report
The following is a summary of the inputs used, as of November 30, 2012, in valuing the Fund's assets carried at fair value:
| Valuation Inputs |
| | Level 1—
Quoted
Prices and
Investments in
Mutual Funds1 | Level 2—
Other
Significant
Observable
Inputs | Level 3—
Significant
Unobservable
Inputs | Total |
| Equity Securities: | | | | |
| Common Stock | | | | |
| Domestic | $119,535,625 | $— | $— | $119,535,625 |
| International | 39,180,767 | — | — | 39,180,767 |
| Preferred Stock | | | | |
| Domestic | 39,055,027 | 9,949,6552 | — | 49,004,682 |
| International | 4,613,852 | — | — | 4,613,852 |
| Debt Securities: | | | | |
| Corporate Bonds | — | 12,811,932 | — | 12,811,932 |
| Collateralized Mortgage Obligations | — | 8,936,358 | — | 8,936,358 |
| Mortgage-Backed Security | — | 1,998,267 | — | 1,998,267 |
| U.S. Treasury | — | 2,840,085 | — | 2,840,085 |
| Mutual Funds | 250,758,966 | — | — | 250,758,966 |
| TOTAL SECURITIES | $453,144,237 | $36,536,297 | $— | $489,680,534 |
| OTHER FINANCIAL INSTRUMENTS3 | $(86,534) | $— | $— | $(86,534) |
| 1 | Emerging Markets Fixed Income Core Fund, Federated Mortgage Core Portfolio and High Yield Bond Portfolio are affiliated holdings offered only to registered investment companies and other accredited investors. |
| 2 | Includes $4,253,282 of preferred stocks transferred from Level 1 to Level 2 because securities ceased trading during the period and fair values were obtained using valuation techniques utilizing observable market data. Transfers shown represent the value of the securities at the beginning of the period. |
| 3 | Other financial instruments include futures contracts. |
The following acronym is used throughout this portfolio:
| ADR | —American Depositary Receipt |
See Notes which are an integral part of the Financial Statements
Annual Shareholder Report
Financial Highlights–Class A Shares
(For a Share Outstanding Throughout Each Period)
| Year Ended November 30 | 2012 | 2011 | 2010 | 2009 | 2008 |
| Net Asset Value, Beginning of Period | $7.60 | $7.56 | $7.26 | $5.81 | $8.08 |
| Income From Investment Operations: | | | | | |
| Net investment income | 0.441 | 0.39 | 0.361 | 0.371 | 0.34 |
| Net realized and unrealized gain (loss) on investments, futures contracts, swap contracts, options and foreign currency transactions | 0.48 | 0.06 | 0.29 | 1.42 | (2.26) |
| TOTAL FROM INVESTMENT OPERATIONS | 0.92 | 0.45 | 0.65 | 1.79 | (1.92) |
| Less Distributions: | | | | | |
| Distributions from net investment income | (0.44) | (0.41) | (0.35) | (0.34) | (0.35) |
| Net Asset Value, End of Period | $8.08 | $7.60 | $7.56 | $7.26 | $5.81 |
| Total Return2 | 12.45% | 5.97% | 9.22% | 31.77% | (24.57)% |
| Ratios to Average Net Assets: | | | | | |
| Net expenses | 1.02% | 1.30%3 | 1.31%3 | 1.29%3 | 1.31%3 |
| Net investment income | 5.49% | 5.07% | 4.89% | 5.75% | 4.83% |
| Expense waiver/reimbursement4 | 0.28% | 0.01% | 0.01% | 0.06% | 0.01% |
| Supplemental Data: | | | | | |
| Net assets, end of period (000 omitted) | $261,743 | $216,352 | $222,958 | $234,443 | $211,560 |
| Portfolio turnover | 37% | 31% | 53% | 59% | 84% |
| 1 | Per share numbers have been calculated using the average shares method. |
| 2 | Based on net asset value, which does not reflect the sales charge, redemption fee or contingent deferred sales charge, if applicable. |
| 3 | The net expense ratios are calculated without reduction for expense offset arrangements. The net expense ratios are 1.30%, 1.30%, 1.28% and 1.31% for the years ended November 30, 2011, 2010, 2009 and 2008, respectively, after taking into account these expense reductions. |
| 4 | This expense decrease is reflected in both the net expense and the net investment income ratios shown above. |
See Notes which are an integral part of the Financial Statements
Annual Shareholder Report
Financial Highlights–Class B Shares
(For a Share Outstanding Throughout Each Period)
| Year Ended November 30 | 2012 | 2011 | 2010 | 2009 | 2008 |
| Net Asset Value, Beginning of Period | $7.62 | $7.57 | $7.28 | $5.82 | $8.09 |
| Income From Investment Operations: | | | | | |
| Net investment income | 0.381 | 0.33 | 0.311 | 0.321 | 0.29 |
| Net realized and unrealized gain (loss) on investments, futures contracts, swap contracts, options and foreign currency transactions | 0.49 | 0.07 | 0.28 | 1.43 | (2.27) |
| TOTAL FROM INVESTMENT OPERATIONS | 0.87 | 0.40 | 0.59 | 1.75 | (1.98) |
| Less Distributions: | | | | | |
| Distributions from net investment income | (0.39) | (0.35) | (0.30) | (0.29) | (0.29) |
| Net Asset Value, End of Period | $8.10 | $7.62 | $7.57 | $7.28 | $5.82 |
| Total Return2 | 11.58% | 5.29% | 8.24% | 30.91% | (25.12)% |
| Ratios to Average Net Assets: | | | | | |
| Net expenses | 1.77% | 2.05%3 | 2.06%3 | 2.04%3 | 2.06%3 |
| Net investment income | 4.73% | 4.31% | 4.14% | 5.01% | 4.06% |
| Expense waiver/reimbursement4 | 0.28% | 0.01% | 0.01% | 0.06% | 0.01% |
| Supplemental Data: | | | | | |
| Net assets, end of period (000 omitted) | $34,123 | $30,721 | $35,494 | $36,945 | $33,998 |
| Portfolio turnover | 37% | 31% | 53% | 59% | 84% |
| 1 | Per share numbers have been calculated using the average shares method. |
| 2 | Based on net asset value, which does not reflect the sales charge, redemption fee or contingent deferred sales charge, if applicable. |
| 3 | The net expense ratios are calculated without reduction for expense offset arrangements. The net expense ratios are 2.05%, 2.06%, 2.03% and 2.06% for the years ended November 30, 2011, 2010, 2009 and 2008, respectively, after taking into account these expense reductions. |
| 4 | This expense decrease is reflected in both the net expense and the net investment income ratios shown above. |
See Notes which are an integral part of the Financial Statements
Annual Shareholder Report
Financial Highlights–Class C Shares
(For a Share Outstanding Throughout Each Period)
| Year Ended November 30 | 2012 | 2011 | 2010 | 2009 | 2008 |
| Net Asset Value, Beginning of Period | $7.60 | $7.56 | $7.27 | $5.81 | $8.08 |
| Income From Investment Operations: | | | | | |
| Net investment income | 0.381 | 0.34 | 0.311 | 0.321 | 0.29 |
| Net realized and unrealized gain (loss) on investments, futures contracts, swap contracts, options and foreign currency transactions | 0.50 | 0.05 | 0.28 | 1.43 | (2.27) |
| TOTAL FROM INVESTMENT OPERATIONS | 0.88 | 0.39 | 0.59 | 1.75 | (1.98) |
| Less Distributions: | | | | | |
| Distributions from net investment income | (0.39) | (0.35) | (0.30) | (0.29) | (0.29) |
| Net Asset Value, End of Period | $8.09 | $7.60 | $7.56 | $7.27 | $5.81 |
| Total Return2 | 11.76% | 5.18% | 8.26% | 30.98% | (25.15)% |
| Ratios to Average Net Assets: | | | | | |
| Net expenses | 1.75% | 2.05%3 | 2.06%3 | 2.04%3 | 2.06%3 |
| Net investment income | 4.77% | 4.33% | 4.16% | 4.95% | 4.08% |
| Expense waiver/reimbursement4 | 0.30% | 0.01% | 0.01% | 0.06% | 0.01% |
| Supplemental Data: | | | | | |
| Net assets, end of period (000 omitted) | $88,605 | $46,443 | $39,705 | $35,510 | $27,098 |
| Portfolio turnover | 37% | 31% | 53% | 59% | 84% |
| 1 | Per share numbers have been calculated using the average shares method. |
| 2 | Based on net asset value, which does not reflect the sales charge, redemption fee or contingent deferred sales charge, if applicable. |
| 3 | The net expense ratios are calculated without reduction for expense offset arrangements. The net expense ratios are 2.05%, 2.05%, 2.03% and 2.06% for the years ended November 30, 2011, 2010, 2009 and 2008, respectively, after taking into account these expense reductions. |
| 4 | This expense decrease is reflected in both the net expense and the net investment income ratios shown above. |
See Notes which are an integral part of the Financial Statements
Annual Shareholder Report
Financial Highlights–Class F Shares
(For a Share Outstanding Throughout Each Period)
| Year Ended November 30 | 2012 | 2011 | 2010 | 2009 | 2008 |
| Net Asset Value, Beginning of Period | $7.60 | $7.55 | $7.26 | $5.81 | $8.07 |
| Income From Investment Operations: | | | | | |
| Net investment income | 0.441 | 0.40 | 0.361 | 0.371 | 0.37 |
| Net realized and unrealized gain (loss) on investments, futures contracts, swap contracts, options and foreign currency transactions | 0.49 | 0.06 | 0.28 | 1.42 | (2.28) |
| TOTAL FROM INVESTMENT OPERATIONS | 0.93 | 0.46 | 0.64 | 1.79 | (1.91) |
| Less Distributions: | | | | | |
| Distributions from net investment income | (0.45) | (0.41) | (0.35) | (0.34) | (0.35) |
| Net Asset Value, End of Period | $8.08 | $7.60 | $7.55 | $7.26 | $5.81 |
| Total Return2 | 12.46% | 6.11% | 9.08% | 31.72% | (24.47)% |
| Ratios to Average Net Assets: | | | | | |
| Net expenses | 1.01% | 1.30%3 | 1.31%3 | 1.33%3 | 1.30%3 |
| Net investment income | 5.49% | 5.07% | 4.90% | 5.70% | 4.85% |
| Expense waiver/reimbursement4 | 0.29% | 0.01% | 0.00%5 | 0.02% | 0.01% |
| Supplemental Data: | | | | | |
| Net assets, end of period (000 omitted) | $84,041 | $69,612 | $71,337 | $72,468 | $62,700 |
| Portfolio turnover | 37% | 31% | 53% | 59% | 84% |
| 1 | Per share numbers have been calculated using the average shares method. |
| 2 | Based on net asset value, which does not reflect the sales charge, redemption fee or contingent deferred sales charge, if applicable. |
| 3 | The net expense ratios are calculated without reduction for expense offset arrangements. The net expense ratios are 1.30%, 1.31%, 1.31% and 1.30% for the years ended November 30, 2011, 2010, 2009 and 2008, respectively, after taking into account these expense reductions. |
| 4 | This expense decrease is reflected in both the net expense and the net investment income ratios shown above. |
| 5 | Represents less than 0.01%. |
See Notes which are an integral part of the Financial Statements
Annual Shareholder Report
Financial Highlights–Institutional Shares
(For a Share Outstanding Throughout the Period)
| Period Ended November 30 | 20121 |
| Net Asset Value, Beginning of Period | $7.96 |
| Income From Investment Operations: | |
| Net investment income | 0.312 |
| Net realized and unrealized gain on investments, futures contracts, swap contracts and foreign currency transactions | 0.14 |
| TOTAL FROM INVESTMENT OPERATIONS | 0.45 |
| Less Distributions: | |
| Distributions from net investment income | (0.32) |
| Net Asset Value, End of Period | $8.09 |
| Total Return3 | 5.77% |
| Ratios to Average Net Assets: | |
| Net expenses | 0.64%4 |
| Net investment income | 5.80%4 |
| Expense waiver/reimbursement5 | 0.41%4 |
| Supplemental Data: | |
| Net assets, end of period (000 omitted) | $22,221 |
| Portfolio turnover6 | 37% |
| 1 | Reflects operations for the period from March 30, 2012 (date of initial investment) to November 30, 2012. |
| 2 | Per share number has been calculated using the average shares method. |
| 3 | Based on net asset value. Total returns for periods of less than one year are not annualized. |
| 4 | Computed on an annualized basis. |
| 5 | This expense decrease is reflected in both the net expense and the net investment income ratios shown above. |
| 6 | Portfolio turnover is calculated at the Fund level. Percentage indicated was calculated for the year ended November 30, 2012. |
See Notes which are an integral part of the Financial Statements
Annual Shareholder Report
Statement of Assets and Liabilities
November 30, 2012
| Assets: | | |
| Total investment in securities, at value including $250,758,966 of investment in affiliated holdings (Note 5) (identified cost $445,670,628) | | $489,680,534 |
| Cash | | 3,108,875 |
| Income receivable | | 1,500,381 |
| Income receivable from affiliated holdings | | 1,014,343 |
| Receivable for shares sold | | 2,973,608 |
| TOTAL ASSETS | | 498,277,741 |
| Liabilities: | | |
| Payable for investments purchased | $6,335,187 | |
| Payable for shares redeemed | 643,285 | |
| Payable for daily variation margin | 10,117 | |
| Income distribution payable | 224,518 | |
| Payable for Directors'/Trustees' fees | 740 | |
| Payable for distribution services fee (Note 5) | 72,390 | |
| Payable for shareholder services fee (Note 5) | 93,343 | |
| Accrued expenses | 166,456 | |
| TOTAL LIABILITIES | | 7,546,036 |
| Net assets for 60,696,399 shares outstanding | | $490,731,705 |
| Net Assets Consist of: | | |
| Paid-in capital | | $514,721,021 |
| Net unrealized appreciation of investments, futures contracts and translation of assets and liabilities in foreign currency | | 43,923,302 |
| Accumulated net realized loss on investments, written options, futures contracts, swap contracts and foreign currency transactions | | (68,025,727) |
| Undistributed net investment income | | 113,109 |
| TOTAL NET ASSETS | | $490,731,705 |
Annual Shareholder Report
Statement of Assets and Liabilities–continued
| Net Asset Value, Offering Price and Redemption Proceeds Per Share | | |
| Class A Shares: | | |
| Net asset value per share ($261,742,829 ÷ 32,379,370 shares outstanding), no par value, unlimited shares authorized | | $8.08 |
| Offering price per share (100/94.50 of $8.08) | | $8.55 |
| Redemption proceeds per share | | $8.08 |
| Class B Shares: | | |
| Net asset value per share ($34,122,806 ÷ 4,212,885 shares outstanding), no par value, unlimited shares authorized | | $8.10 |
| Offering price per share | | $8.10 |
| Redemption proceeds per share (94.50/100 of $8.10) | | $7.65 |
| Class C Shares: | | |
| Net asset value per share ($88,605,017 ÷ 10,955,101 shares outstanding), no par value, unlimited shares authorized | | $8.09 |
| Offering price per share | | $8.09 |
| Redemption proceeds per share (99.00/100 of $8.09) | | $8.01 |
| Class F Shares: | | |
| Net asset value per share ($84,040,533 ÷ 10,402,401 shares outstanding), no par value, unlimited shares authorized | | $8.08 |
| Offering price per share (100/99.00 of $8.08) | | $8.16 |
| Redemption proceeds per share (99.00/100 of $8.08) | | $8.00 |
| Institutional Shares: | | |
| Net asset value per share ($22,220,520 ÷ 2,746,642 shares outstanding), no par value, unlimited shares authorized | | $8.09 |
| Offering price per share | | $8.09 |
| Redemption proceeds per share | | $8.09 |
See Notes which are an integral part of the Financial Statements
Annual Shareholder Report
Statement of Operations
Year Ended November 30, 2012
| Investment Income: | | | |
| Dividends (including $8,887,017 received from affiliated holdings (Note 5) and net of foreign taxes withheld of $242,635) | | | $21,032,128 |
| Interest | | | 1,075,271 |
| Investment income allocated from affiliated partnership (Note 5) | | | 4,466,268 |
| TOTAL INCOME | | | 26,573,667 |
| Expenses: | | | |
| Investment adviser fee (Note 5) | | $3,063,009 | |
| Administrative fee (Note 5) | | 318,645 | |
| Custodian fees | | 24,400 | |
| Transfer and dividend disbursing agent fees and expenses | | 535,208 | |
| Directors'/Trustees' fees | | 3,529 | |
| Auditing fees | | 28,500 | |
| Legal fees | | 22,199 | |
| Portfolio accounting fees | | 129,595 | |
| Distribution services fee (Note 5) | | 698,288 | |
| Shareholder services fee (Note 5) | | 997,373 | |
| Account administration fee (Note 2) | | 2,079 | |
| Share registration costs | | 82,851 | |
| Printing and postage | | 62,322 | |
| Insurance premiums | | 4,112 | |
| Miscellaneous | | 6,891 | |
| TOTAL EXPENSES | | 5,979,001 | |
Annual Shareholder Report
Statement of Operations–continued
| Waivers and Reimbursement (Note 5): | | | |
| Waiver/reimbursement of investment adviser fee | $(1,150,869) | | |
| Waiver of administrative fee | (5,536) | | |
| TOTAL WAIVERS AND REIMBURSEMENT | | $(1,156,405) | |
| Net expenses | | | $4,822,596 |
| Net investment income | | | 21,751,071 |
| Realized and Unrealized Gain (Loss) on Investments, Futures Contracts, Swap Contracts and Foreign Currency Transactions: | | | |
| Net realized loss on investments and foreign currency transactions (including realized gain of $5,530,041 on sales of investments in affiliated holdings (Note 5)) | | | (924,214) |
| Net realized loss on futures contracts | | | (1,854,172) |
| Net realized loss on swap contracts | | | (461,313) |
| Net realized gain allocated from affiliated partnership (Note 5) | | | 1,652,889 |
| Net change in unrealized appreciation of investments and translation of assets and liabilities in foreign currency transactions | | | 26,259,710 |
| Net change in unrealized appreciation of futures contracts | | | (158,123) |
| Net realized and unrealized gain on investments, futures contracts, swap contracts and foreign currency transactions | | | 24,514,777 |
| Change in net assets resulting from operations | | | $46,265,848 |
See Notes which are an integral part of the Financial Statements
Annual Shareholder Report
Statement of Changes in Net Assets
| Year Ended November 30 | 2012 | 2011 |
| Increase (Decrease) in Net Assets | | |
| Operations: | | |
| Net investment income | $21,751,071 | $18,654,075 |
| Net realized gain (loss) on investments including allocation from affiliated partnership, futures contracts, swap contracts and foreign currency transactions | (1,586,810) | 19,088,117 |
| Net change in unrealized appreciation/depreciation of investments, futures contracts and translation of assets and liabilities in foreign currency | 26,101,587 | (16,455,345) |
| CHANGE IN NET ASSETS RESULTING FROM OPERATIONS | 46,265,848 | 21,286,847 |
| Distributions to Shareholders: | | |
| Distributions from net investment income | | |
| Class A Shares | (13,052,895) | (11,861,397) |
| Class B Shares | (1,534,944) | (1,545,221) |
| Class C Shares | (3,031,732) | (2,058,609) |
| Class F Shares | (4,285,961) | (3,816,981) |
| Institutional Shares | (384,619) | — |
| CHANGE IN NET ASSETS RESULTING FROM DISTRIBUTIONS TO SHAREHOLDERS | (22,290,151) | (19,282,208) |
| Share Transactions: | | |
| Proceeds from sale of shares | 162,160,236 | 61,783,377 |
| Net asset value of shares issued to shareholders in payment of distributions declared | 19,935,708 | 16,885,545 |
| Cost of shares redeemed | (78,467,094) | (87,040,146) |
| CHANGE IN NET ASSETS RESULTING FROM SHARE TRANSACTIONS | 103,628,850 | (8,371,224) |
| Change in net assets | 127,604,547 | (6,366,585) |
| Net Assets: | | |
| Beginning of period | 363,127,158 | 369,493,743 |
| End of period (including undistributed net investment income of $113,109 and $250,812, respectively) | $490,731,705 | $363,127,158 |
See Notes which are an integral part of the Financial Statements
Annual Shareholder Report
Notes to Financial Statements
November 30, 2012
1. ORGANIZATION
Federated Income Securities Trust (the “Trust”) is registered under the Investment Company Act of 1940, as amended (the “Act”), as a diversified, open-end management investment company. The Trust consists of nine portfolios. The financial statements included herein are only those of Federated Capital Income Fund (the “Fund”). The financial statements of the other portfolios are presented separately. The assets of each portfolio are segregated and a shareholder's interest is limited to the portfolio in which shares are held. Each portfolio pays its own expenses. The Fund offers five classes of shares: Class A Shares, Class B Shares, Class C Shares, Class F Shares and Institutional Shares. All shares of the Fund have equal rights with respect to voting, except on class-specific matters. The primary investment objective of the Fund is current income and long-term growth of income. Capital appreciation is a secondary objective.
Effective March 30, 2012, the Fund began offering Institutional Shares.
2. SIGNIFICANT ACCOUNTING POLICIES
The following is a summary of significant accounting policies consistently followed by the Fund in the preparation of its financial statements. These policies are in conformity with U.S. generally accepted accounting principles (GAAP).
Investment Valuation
In calculating its net asset value (NAV), the Fund generally values investments as follows:
| ■ | Equity securities listed on an exchange or traded through a regulated market system are valued at their last reported sale price or official closing price in their principal exchange or market. |
| ■ | Shares of other mutual funds are valued based upon their reported NAVs. |
| ■ | Fixed-income securities acquired with remaining maturities greater than 60 days are fair valued using price evaluations provided by a pricing service approved by the Trustees. |
| ■ | Fixed-income securities acquired with remaining maturities of 60 days or less are valued at their cost (adjusted for the accretion of any discount or amortization of any premium), which approximates market value. |
| ■ | Derivative contracts listed on exchanges are valued at their reported settlement or closing price. |
| ■ | Over-the-counter (OTC) derivative contracts are fair valued using price evaluations provided by a pricing service approved by the Trustees. |
| ■ | For securities that are fair valued in accordance with procedures established by and under the general supervision of the Trustees, certain factors may be considered such as: the purchase price of the security, information obtained by contacting the issuer, analysis of the issuer's financial statements or other available documents, fundamental analytical data, the nature and duration of restrictions on disposition, the movement of the market in which the security is normally traded and public trading in similar securities of the issuer or comparable issuers. |
Annual Shareholder Report
If the Fund cannot obtain a price or price evaluation from a pricing service for an investment, the Fund may attempt to value the investment based upon the mean of bid and asked quotations or fair value the investment based on price evaluations, from one or more dealers. If any price, quotation, price evaluation or other pricing source is not readily available when the NAV is calculated, the Fund uses the fair value of the investment determined in accordance with the procedures described below. There can be no assurance that the Fund could purchase or sell an investment at the price used to calculate the Fund's NAV.
Fair Valuation and Significant Events Procedures
The Trustees have appointed a Valuation Committee comprised of officers of the Fund, Federated Equity Management Company of Pennsylvania (“Adviser”) and the Adviser's affiliated companies to determine fair value of securities and in overseeing the calculation of the NAV. The Trustees have also authorized the use of pricing services recommended by the Valuation Committee to provide fair value evaluations of the current value of certain investments for purposes of calculating the NAV. The Valuation Committee employs various methods for reviewing third-party pricing service evaluations including periodic reviews of third-party pricing services' policies, procedures and valuation methods (including key inputs and assumptions), transactional back-testing, comparisons of evaluations of different pricing services, and review of price challenges by the Adviser based on recent market activity. In the event that market quotations and price evaluations are not available for an investment, the Valuation Committee determines the fair value of the investment in accordance with procedures adopted by the Trustees. The Trustees periodically review and approve the fair valuations made by the Valuation Committee and any changes made to the procedures.
Factors considered by pricing services in evaluating an investment include the yields or prices of investments of comparable quality, coupon, maturity, call rights and other potential prepayments, terms and type, reported transactions, indications as to values from dealers and general market conditions. Some pricing services provide a single price evaluation reflecting the bid-side of the market for an investment (a “bid” evaluation). Other pricing services offer both bid evaluations and price evaluations indicative of a price between the prices bid and asked for the investment (a “mid” evaluation). The Fund normally uses bid evaluations for U.S. Treasury and Agency securities, mortgage-backed securities and municipal securities. The Fund normally uses mid evaluations for other types of fixed-income securities and OTC derivative contracts. In the event that market quotations and price evaluations are not available for an investment, the fair value of the investment is determined in accordance with procedures adopted by the Trustees.
The Trustees also have adopted procedures requiring an investment to be priced at its fair value whenever the Adviser determines that a significant event affecting the value of the investment has occurred between the time as of which the price of the investment would otherwise be determined and the time as of which the NAV is computed. An event is considered significant if there is both an affirmative expectation that the investment's value will change in response to the event and a reasonable basis for quantifying the resulting change in value. Examples of significant events that may occur after the close of the principal market on which a security is traded, or after the time of a price evaluation provided by a pricing service or a dealer, include:
| ■ | With respect to securities traded in foreign markets, significant trends in U.S. equity markets or in the trading of foreign securities index futures or options contracts; |
| ■ | Political or other developments affecting the economy or markets in which an issuer conducts its operations or its securities are traded; and |
Annual Shareholder Report
| ■ | Announcements concerning matters such as acquisitions, recapitalizations, litigation developments, a natural disaster affecting the issuer's operations or regulatory changes or market developments affecting the issuer's industry. |
The Trustees have approved the use of a pricing service to determine the fair value of equity securities traded principally in foreign markets when the Adviser determines that there has been a significant trend in the U.S. equity markets or in index futures trading. For other significant events, the Fund may seek to obtain more current quotations or price evaluations from alternative pricing sources. If a reliable alternative pricing source is not available, the Fund will determine the fair value of the investment using another method approved by the Trustees.
Repurchase Agreements
The Fund may invest in repurchase agreements for short-term liquidity purposes. It is the policy of the Fund to require the other party to a repurchase agreement to transfer to the Fund's custodian or sub-custodian eligible securities or cash with a market value (after transaction costs) at least equal to the repurchase price to be paid under the repurchase agreement. The eligible securities are transferred to accounts with the custodian or sub-custodian in which the Fund holds a “securities entitlement” and exercises “control” as those terms are defined in the Uniform Commercial Code. The Fund has established procedures for monitoring the market value of the transferred securities and requiring the transfer of additional eligible securities if necessary to equal at least the repurchase price. These procedures also allow the other party to require securities to be transferred from the account to the extent that their market value exceeds the repurchase price or in exchange for other eligible securities of equivalent market value.
The insolvency of the other party or other failure to repurchase the securities may delay the disposition of the underlying securities or cause the Fund to receive less than the full repurchase price. Under the terms of the repurchase agreement, any amounts received by the Fund in excess of the repurchase price and related transaction costs must be remitted to the other party.
The Fund may enter into repurchase agreements in which eligible securities are transferred into joint trading accounts maintained by the custodian or sub-custodian for investment companies and other clients advised by the Fund's Adviser and its affiliates. The Fund will participate on a pro rata basis with the other investment companies and clients in its share of the securities transferred under such repurchase agreements and in its share of proceeds from any repurchase or other disposition of such securities.
Investment Income, Gains and Losses, Expenses and Distributions
Investment transactions are accounted for on a trade-date basis. Realized gains and losses from investment transactions are recorded on an identified-cost basis. Interest income and expenses are accrued daily. Dividend income and distributions to shareholders are recorded on the ex-dividend date. Foreign dividends are recorded on the ex-dividend date or when the Fund is informed of the ex-dividend date. Positive or negative inflation adjustments on Treasury Inflation-Protected Securities are included in interest income. Distributions of net investment income are declared and paid monthly. Non-cash dividends included in dividend income, if any, are recorded at fair value. The Fund invests in Emerging Markets Fixed Income Core Fund (EMCORE), a portfolio of Federated Core Trust II, L.P., which is a limited partnership established under the laws of the state of Delaware. The Fund records daily its proportionate share of income, expenses, realized and unrealized gains and losses from EMCORE. Investment income, realized and unrealized gains and losses and certain fund-level expenses
Annual Shareholder Report
are allocated to each class based on relative average daily net assets, except that Class A Shares, Class B Shares, Class C Shares, Class F Shares and Institutional Shares may bear distribution services fees, shareholder services fees and account administration fees unique to those classes. For the year ended November 30, 2012, account administration fees for the Fund were as follows:
| | Account
Administration
Fees Incurred |
| Class A Shares | $1,627 |
| Class F Shares | 452 |
| TOTAL | $2,079 |
Dividends are declared separately for each class. No class has preferential dividend rights; differences in per share dividend rates are generally due to differences in separate class expenses.
Premium and Discount Amortization
All premiums and discounts on fixed-income securities are amortized/accreted using the effective interest rate method.
Federal Taxes
It is the Fund's policy to comply with the Subchapter M provision of the Internal Revenue Code (the “Code”) and to distribute to shareholders each year substantially all of its income. Accordingly, no provision for federal income tax is necessary. As of and during the year ended November 30, 2012, the Fund did not have a liability for any uncertain tax positions. The Fund recognizes interest and penalties, if any, related to tax liabilities as income tax expense in the Statement of Operations. As of November 30, 2012, tax years 2009 through 2012 remain subject to examination by the Fund's major tax jurisdictions, which include the United States of America and the Commonwealth of Massachusetts.
The Fund may be subject to taxes imposed by governments of countries in which it invests. Such taxes are generally based on either income or gains earned or repatriated. The Fund accrues and applies such taxes to net investment income, net realized gains and net unrealized gains as income and/or gains are earned.
When-Issued and Delayed Delivery Transactions
The Fund may engage in when-issued or delayed delivery transactions. The Fund records when-issued securities on the trade date and maintains security positions such that sufficient liquid assets will be available to make payment for the securities purchased. Securities purchased on a when-issued or delayed delivery basis are marked to market daily and begin earning interest on the settlement date. Losses may occur on these transactions due to changes in market conditions or the failure of counterparties to perform under the contract.
Restricted Securities
The Fund may purchase securities which are considered restricted. Restricted securities are securities that either: (a) cannot be offered for public sale without first being registered, or being able to take advantage of an exemption from registration, under the Securities Act of 1933; or (b) are subject to contractual restrictions on public sales. In some cases, when a security cannot be offered for public sale without first being registered, the issuer of the restricted security has agreed to register such securities for resale, at the issuer's expense,
Annual Shareholder Report
either upon demand by the Fund or in connection with another registered offering of the securities. Many such restricted securities may be resold in the secondary market in transactions exempt from registration. Restricted securities may be determined to be liquid under criteria established by the Trustees. The Fund will not incur any registration costs upon such resales. The Fund's restricted securities are valued at the price provided by dealers in the secondary market or, if no market prices are available, at the fair value as determined in accordance with procedures established by and under the general supervision of the Trustees.
Swap Contracts
Swap contracts involve two parties that agree to exchange the returns (or the differential in rates of return) earned or realized on particular predetermined investments, instruments, indices or other measures. The gross returns to be exchanged or “swapped” between parties are generally calculated with respect to a “notional amount” for a predetermined period of time. The Fund enters into interest rate, total return, credit default, currency and other swap agreements. Risks may arise upon entering into swap agreements from the potential inability of the counterparties to meet the terms of their contract from unanticipated changes in the value of the swap agreement.
The Fund uses credit default swaps to manage exposure to a given issuer or sector by either selling protection to increase exposure, or buying protection to reduce exposure. The “buyer” in a credit default swap is obligated to pay the “seller” a periodic stream of payments over the term of the contract provided that no event of default on an underlying reference obligation has occurred. If an event of default occurs, the seller must pay the buyer the full notional value, or the “par value,” of the reference obligation in exchange for the reference obligation. In connection with these agreements, securities may be identified as collateral in accordance with the terms of the respective swap agreements to provide assets of value and recourse in the event of default or bankruptcy/insolvency. Recovery values are assumed by market makers considering either industry standard recovery rates or entity specific factors and considerations until a credit event occurs. If a credit event has occurred, the recovery value is typically determined by a facilitated auction whereby a minimum number of allowable broker bids, together with a specific valuation method, are used to calculate the settlement value. The maximum amount of the payment that may occur, as a result of a credit event payable by the protection seller, is equal to the notional amount of the underlying index or security. The Fund's maximum risk of loss from counterparty credit risk, either as the protection buyer or as the protection seller, is the fair value of the contract. This risk is mitigated by having a master netting arrangement between the Fund and the counterparty and by the posting of collateral by the counterparty to the Fund to cover the Fund's exposure to the counterparty.
Upfront payments received or paid by the Fund will be reflected as an asset or liability on the Statement of Assets and Liabilities. Changes in the value of swap contracts are included in “Swaps, at value” on the Statement of Assets and Liabilities, and periodic payments are reported as “Net realized gain (loss) on swap contracts” on the Statement of Operations.
At November 30, 2012, the Fund had no outstanding swap contracts.
The average notional amount of Swap contracts held by the Fund throughout the period was $2,284,615. This is based on amounts held as of each month-end throughout the fiscal period.
Annual Shareholder Report
Foreign Exchange Contracts
The Fund enters into foreign exchange contracts for the delayed delivery of securities or foreign currency exchange transactions. The Fund enters into foreign exchange contracts to protect assets against adverse changes in foreign currency exchange rates or exchange control regulations. Purchased contracts are used to acquire exposure to foreign currencies, whereas, contracts to sell are used to hedge the Fund's securities against currency fluctuations. Risks may arise upon entering into these transactions from the potential inability of counterparties to meet the terms of their commitments and from unanticipated movements in security prices or foreign exchange rates. The foreign exchange contracts are adjusted by the daily exchange rate of the underlying currency and any gains or losses are recorded for financial statement purposes as unrealized until the settlement date.
At November 30, 2012, the Fund had no outstanding foreign exchange contracts.
The average value at settlement date receivable of foreign exchange contracts sold by the Fund throughout the period was $1,257. This is based on the contracts held as of each month-end throughout the fiscal period.
Foreign Currency Translation
The accounting records of the Fund are maintained in U.S. dollars. All assets and liabilities denominated in foreign currencies (FCs) are translated into U.S. dollars based on the rates of exchange of such currencies against U.S. dollars on the date of valuation. Purchases and sales of securities, income and expenses are translated at the rate of exchange quoted on the respective date that such transactions are recorded. The Fund does not isolate that portion of the results of operations resulting from changes in foreign exchange rates on investments from the fluctuations arising from changes in market prices of securities held. Such fluctuations are included with the net realized and unrealized gain or loss from investments.
Reported net realized foreign exchange gains or losses arise from sales of portfolio securities, sales and maturities of short-term securities, sales of FCs, currency gains or losses realized between the trade and settlement dates on securities transactions, the difference between the amounts of dividends, interest and foreign withholding taxes recorded on the Fund's books, and the U.S. dollar equivalent of the amounts actually received or paid. Net unrealized foreign exchange gains and losses arise from changes in the value of assets and liabilities other than investments in securities at fiscal year-end, resulting from changes in the exchange rate.
Futures Contracts
The Fund purchases and sells financial futures contracts to manage cash flows, enhance yield and to potentially reduce transaction costs. Upon entering into a financial futures contract with a broker, the Fund is required to deposit in a segregated account a specified amount of cash or U.S. government securities. Futures contracts are valued daily and unrealized gains or losses are recorded in a “variation margin” account. Daily, the Fund receives from or pays to the broker a specified amount of cash based upon changes in the variation margin account. When a contract is closed, the Fund recognizes a realized gain or loss. Futures contracts have market risks, including the risk that the change in the value of the contract may not correlate with the changes in the value of the underlying securities. There is minimal counterparty risk to the Fund since futures are exchange traded and the exchange's clearinghouse, as counterparty to all exchange traded futures, guarantees the futures against default.
Futures contracts outstanding at period end are listed after the Fund's Portfolio of Investments.
Annual Shareholder Report
The average notional value of long and short futures contracts held by the Fund throughout the period was $3,433,486 and $16,421,595, respectively. This is based on amounts held as of each month-end throughout the fiscal period.
Option Contracts
The Fund buys or sells put and call options to provide income and some downside protection. The seller (writer) of an option receives a payment or premium, from the buyer, which the writer keeps regardless of whether the buyer exercises the option. When the Fund writes a put or call option, an amount equal to the premium received is recorded as a liability and subsequently marked to market to reflect the current value of the option written. Premiums received from writing options which expire are treated as realized gains. The Fund, as a writer of an option, bears the market risk of an unfavorable change in the price of the underlying reference instrument. When the Fund purchases a put or call option, an amount equal to the premium paid is recorded as an increase to the cost of the investment and subsequently marked to market to reflect the current value of the option purchased. Premiums paid for purchasing options which expire are treated as realized losses. Premiums received/paid for writing/purchasing options which are exercised or closed are added to the proceeds or offset against amounts paid on the underlying reference instrument to determine the realized gain or loss. The risk associated with purchasing put and call options is limited to the premium paid. Options can trade on securities or commodities exchanges. In this case, the exchange sets all the terms of the contract except for the price. Most exchanges require investors to maintain margin accounts through their brokers to cover their potential obligations to the exchange. This protects investors against potential defaults by the counterparty.
At November 30, 2012, the Fund had no outstanding written option contracts.
The average notional amount of purchased put option contracts held by the Fund throughout the period was $509. This is based on amounts held as of each month-end throughout the fiscal period.
Additional Disclosure Related to Derivative Instruments
| Fair Value of Derivative Instruments |
| | | Liability |
| | | | Statement of
Assets and
Liabilities
Location | Fair
Value |
| Derivatives not accounted for as hedging instruments under ASC Topic 815 | | | |
| Interest rate contracts | | | Payable for daily
variation margin | $86,534* |
| * | Includes cumulative depreciation of futures contracts as reported in the footnotes to the Portfolio of Investments. Only the current day's variation margin is reported within the Statement of Assets and Liabilities. |
Annual Shareholder Report
The Effect of Derivative Instruments on the Statement of Operations for the Year Ended November 30, 2012
| Amount of Realized Gain or (Loss) on Derivatives Recognized in Income |
| | Credit
Default
Swaps | Futures | Forward
Currency
Contracts | Options
Purchased | Total |
| Interest rate contracts | $— | $(1,854,172) | $— | $— | $(1,854,172) |
| Foreign exchange contracts | — | — | (24,011) | (295,995) | (320,006) |
| Credit contracts | (461,313) | — | — | — | (461,313) |
| TOTAL | $(461,313) | $(1,854,172) | $(24,011) | $(295,995) | $(2,635,491) |
| Change in Unrealized Appreciation or (Depreciation) on Derivatives Recognized in Income |
| | Futures | Options
Purchased | Total |
| Interest rate contracts | $(158,123) | $— | $(158,123) |
| Foreign exchange contracts | — | 289,380 | 289,380 |
| TOTAL | $(158,123) | $289,380 | $131,257 |
Other
The preparation of financial statements in conformity with GAAP requires management to make estimates and assumptions that affect the amounts of assets, liabilities, expenses and revenues reported in the financial statements. Actual results could differ from those estimated.
3. SHARES OF BENEFICIAL INTEREST
The following tables summarize share activity:
| Year Ended November 30 | 2012 | 2011 |
| Class A Shares: | Shares | Amount | Shares | Amount |
| Shares sold | 8,521,756 | $68,085,901 | 4,582,913 | $35,603,306 |
| Shares issued to shareholders in payment of distributions declared | 1,515,852 | 11,996,060 | 1,397,484 | 10,795,154 |
| Shares redeemed | (6,125,694) | (48,631,816) | (7,019,171) | (54,208,949) |
| NET CHANGE RESULTING FROM CLASS A SHARE TRANSACTIONS | 3,911,914 | $31,450,145 | (1,038,774) | $(7,810,489) |
| Year Ended November 30 | 2012 | 2011 |
| Class B Shares: | Shares | Amount | Shares | Amount |
| Shares sold | 1,245,894 | $9,938,026 | 892,627 | $6,959,131 |
| Shares issued to shareholders in payment of distributions declared | 181,265 | 1,436,328 | 181,360 | 1,404,989 |
| Shares redeemed | (1,248,369) | (9,907,878) | (1,728,375) | (13,419,611) |
| NET CHANGE RESULTING FROM CLASS B SHARE TRANSACTIONS | 178,790 | $1,466,476 | (654,388) | $(5,055,491) |
Annual Shareholder Report
| Year Ended November 30 | 2012 | 2011 |
| Class C Shares: | Shares | Amount | Shares | Amount |
| Share Sold | 5,728,193 | $45,755,376 | 1,811,080 | $14,086,677 |
| Shares issued to shareholders in payment of distributions declared | 334,612 | 2,652,492 | 225,459 | 1,741,622 |
| Shares redeemed | (1,216,342) | (9,670,880) | (1,180,468) | (9,147,445) |
| NET CHANGE RESULTING FROM CLASS C SHARE TRANSACTIONS | 4,846,463 | $38,736,988 | 856,071 | $6,680,854 |
| Year Ended November 30 | 2012 | 2011 |
| Class F Shares: | Shares | Amount | Shares | Amount |
| Share Sold | 1,865,932 | $14,861,599 | 662,181 | $5,134,263 |
| Shares issued to shareholders in payment of distributions declared | 442,209 | 3,496,471 | 381,236 | 2,943,780 |
| Shares redeemed | (1,068,803) | (8,478,507) | (1,324,612) | (10,264,141) |
| NET CHANGE RESULTING FROM CLASS F SHARE TRANSACTIONS | 1,239,338 | $9,879,563 | (281,195) | $(2,186,098) |
| | Period Ended
11/30/20121 | 2011 |
| Institutional Shares: | Shares | Amount | Shares | Amount |
| Share Sold | 2,924,707 | $23,519,334 | — | $— |
| Shares issued to shareholders in payment of distributions declared | 44,176 | 354,357 | — | — |
| Shares redeemed | (222,241) | (1,778,013) | — | — |
| NET CHANGE RESULTING FROM INSTITUTIONAL SHARE TRANSACTIONS | 2,746,642 | $22,095,678 | — | — |
| NET CHANGE RESULTING FROM TOTAL FUND SHARE TRANSACTIONS | 12,923,147 | $103,628,850 | (1,118,286) | $(8,371,224) |
| 1 | Reflects operations for the period from March 30, 2012 (date of initial investment) to November 30, 2012. |
4. FEDERAL TAX INFORMATION
The timing and character of income and capital gain distributions are determined in accordance with income tax regulations, which may differ from GAAP. These differences are due in part to differing treatments for foreign currency transactions, discount accretion/premium amortization on debt securities, swap income reclassifications and partnership adjustments.
Annual Shareholder Report
For the year ended November 30, 2012, permanent differences identified and reclassified among the components of net assets were as follows:
| Increase (Decrease) |
| Paid-In Capital | Undistributed
Net Investment
Income (Loss) | Accumulated
Net Realized
Gain (Loss) |
| $(27,503) | $401,377 | $(373,874) |
Net investment income (loss), net realized gains (losses) and net assets were not affected by this reclassification.
The tax character of distributions as reported on the Statement of Changes in Net Assets for the years ended November 30, 2012 and 2011, was as follows:
| | 2012 | 2011 |
| Ordinary income | $22,290,151 | $19,282,208 |
As of November 30, 2012, the components of distributable earnings on a tax basis were as follows:
| Undistributed ordinary income | $113,109 |
| Net unrealized appreciation | $39,338,794 |
| Capital loss carryforwards | $(63,441,219) |
The difference between book-basis and tax-basis net unrealized appreciation/depreciation is attributable to differing treatments for the deferral of losses on wash sales, discount accretion/premium amortization on debt securities and partnership adjustments.
At November 30, 2012, the cost of investments for federal tax purposes was $450,341,669. The net unrealized appreciation of investments for federal tax purposes excluding: (a) any unrealized appreciation/depreciation resulting from the translation from FCs to U.S. dollars of assets and liabilities other than investments in securities; and (b) futures contracts was $39,338,865. This consists of net unrealized appreciation from investments for those securities having an excess of value over cost of $48,773,239 and net unrealized depreciation from investments for those securities having an excess of cost over value of $9,434,374.
At November 30, 2012, the Fund had a capital loss carryforward of $63,441,219 which will reduce the Fund's taxable income arising from future net realized gains on investments, if any, to the extent permitted by the Code, thereby reducing the amount of distributions to shareholders which would otherwise be necessary to relieve the Fund of any liability for federal income tax. Pursuant to the Code, a net capital loss incurred in taxable years beginning on or before December 22, 2010, is characterized as short-term and may be carried forward for a maximum of eight tax years (“Carryforward Limit”), whereas a net capital loss incurred in taxable years beginning after December 22, 2010, retains its character as either short-term or long-term, does not expire and is required to be utilized prior to the losses which have a Carryforward Limit.
Annual Shareholder Report
The following schedule summarizes the Fund's capital loss carryforwards and expiration years:
| Expiration Year | Short-Term | Long-Term | Total |
| No expiration | $1,222,691 | — | $1,222,691 |
| 2016 | $31,568,020 | NA | $31,568,020 |
| 2017 | $30,650,508 | NA | $30,650,508 |
5. INVESTMENT ADVISER FEE AND OTHER TRANSACTIONS WITH AFFILIATES
Investment Adviser Fee
The advisory agreement between the Fund and the Adviser provides for an annual fee equal to 0.75% of the Fund's average daily net assets. Subject to the terms described in the Expense Limitation note, the Adviser may voluntarily choose to waive any portion of its fee. For the year ended November 30, 2012, the Adviser voluntarily waived $1,134,575 of its fee.
Certain of the Fund's assets are managed by Federated Investment Management Company (the “Sub-Adviser”). Under the terms of a sub-advisory agreement between the Adviser and the Sub-Adviser, the Sub-Adviser receives an allocable portion of the Fund's adviser fee. The fee is paid by the Adviser out of its resources and is not an incremental Fund expense. For the year ended November 30, 2012, the Sub-Adviser earned a fee of $516,678.
Administrative Fee
Federated Administrative Services (FAS), under the Administrative Services Agreement, provides the Fund with administrative personnel and services. The fee paid to FAS is based on the average aggregate daily net assets of certain Federated funds as specified below, plus certain out-of-pocket expenses:
| Administrative Fee | Average Aggregate Daily Net Assets
of the Federated Funds |
| 0.150% | on the first $5 billion |
| 0.125% | on the next $5 billion |
| 0.100% | on the next $10 billion |
| 0.075% | on assets in excess of $20 billion |
Prior to September 1, 2012, the administrative fee received during any fiscal year was at least $150,000 per portfolio and $40,000 per each additional class of Shares. Subject to the terms described in the Expense Limitation note, FAS may voluntarily choose to waive any portion of its fee. For the year ended November 30, 2012, FAS waived $5,536 of its fee. The net fee paid to FAS was 0.076% of average daily net assets of the Fund.
Annual Shareholder Report
Distribution Services Fee
The Fund has adopted a Distribution Plan (the “Plan”) pursuant to Rule 12b-1 under the Act. Under the terms of the Plan, the Fund will compensate Federated Securities Corp. (FSC), the principal distributor, from the daily net assets of the Fund's Class B Shares, Class C Shares and Class F Shares to finance activities intended to result in the sale of these shares. The Plan provides that the Fund may incur distribution expenses at the following percentages of average daily net assets annually, to compensate FSC:
| Share Class Name | Percentage of Average Daily
Net Assets of Class |
| Class B Shares | 0.75% |
| Class C Shares | 0.75% |
| Class F Shares | 0.05% |
Subject to the terms described in the Expense Limitation note, FSC may voluntarily choose to waive any portion of its fee. For the year ended November 30, 2012, distribution services fees for the Fund were as follows:
| | Distribution Services
Fees Incurred |
| Class B Shares | $237,482 |
| Class C Shares | 460,806 |
| TOTAL | $698,288 |
For the year ended November 30, 2012, the Fund's Class F Shares did not incur a distribution services fee; however it may begin to incur this fee upon approval of the Trustees. When FSC receives fees, it may pay some or all of them to financial intermediaries whose customers purchase shares. For the year ended November 30, 2012, FSC retained $192,603 of fees paid by the Fund.
Sales Charges
Front-end sales charges and contingent deferred sales charges (CDSC) do not represent expenses of the Fund. They are deducted from the proceeds of sales of Fund shares prior to investment or from redemption proceeds prior to remittance, as applicable. For the year ended November 30, 2012, FSC retained $142,023 in sales charges from the sale of Class A Shares and $391 from the sale of Class F Shares. FSC also retained $26,436, $13,131 and $5,949 of CDSC relating to redemptions of Class B Shares, Class C Shares and Class F Shares, respectively.
Annual Shareholder Report
Shareholder Services Fee
The Fund may pay fees (“ Service Fees”) up to 0.25% of the average daily net assets of the Fund's Class A Shares, Class B Shares, Class C Shares and Class F Shares to financial intermediaries or to Federated Shareholder Services Company (FSSC) for providing services to shareholders and maintaining shareholder accounts. Subject to the terms described in the Expense Limitation note, FSSC may voluntarily reimburse the Fund for Service Fees. For the year ended November 30, 2012, Service Fees for the Fund were as follows:
| | Service
Fees
Incurred |
| Class A Shares | $578,132 |
| Class B Shares | 79,161 |
| Class C Shares | 153,602 |
| Class F Shares | 186,478 |
| TOTAL | $997,373 |
For the year ended November 30, 2012, FSSC received $39,056 of fees paid by the Fund.
Expense Limitation
The Adviser and its affiliates (which may include FSC, FAS and FSSC) have voluntarily agreed to waive their fees and/or reimburse expenses so that the total annual fund operating expenses (as shown in the financial highlights, but excluding expenses allocated from affiliated partnerships and tax reclaim recovery expenses), paid by the Fund's Class A Shares, Class B Shares, Class C Shares, Class F Shares and Institutional Shares (after the voluntary waivers and reimbursements) will not exceed 0.89%, 1.64%, 1.64%, 0.89% and 0.64% (the “Fee Limit”), respectively, up to but not including the later of (the “Termination Date”): (a) February 1, 2014; or (b) the date of the Fund's next effective Prospectus. While the Adviser and its affiliates currently do not anticipate terminating or increasing these arrangements prior to the Termination Date, these arrangements may only be terminated or the Fee Limit increased prior to the Termination Date with the agreement of the Trustees.
Interfund Transactions
During the year ended November 30, 2012, the Fund engaged in purchase and sale transactions with funds that have a common investment adviser (or affiliated investment advisers), common Directors/Trustees and/or common Officers. These purchase and sale transactions complied with Rule 17a-7 under the Act and amounted to $0 and $863,736, respectively.
General
Certain Officers and Trustees of the Fund are Officers and Directors or Trustees of the above companies.
Annual Shareholder Report
Transactions Involving Affiliated Holdings
Affiliated holdings are mutual funds which are managed by the Adviser or an affiliate of the Adviser. The Adviser has agreed to reimburse the Fund for certain investment adviser fees as a result of transactions in other affiliated mutual funds. For the year ended November 30, 2012, the Adviser reimbursed $16,294. Transactions involving the affiliated holdings during the year ended November 30, 2012, were as follows:
| | Emerging
Markets
Fixed
Income
Core Fund | Federated
Mortgage
Core
Portfolio | Federated
Prime Value
Obligations
Fund,
Institutional
Shares | High
Yield
Bond
Portfolio | Total of
Affiliated
Transactions |
| Balance of Shares Held 11/30/2011 | 2,443,400 | 2,714,606 | 17,567,372 | 11,120,251 | 33,845,629 |
| Purchases/Additions | 273,891 | 2,686,048 | 144,204,368 | 5,559,992 | 152,724,299 |
| Sales/Reductions | 468,045 | 1,911,209 | 125,830,335 | 1,503,759 | 129,713,348 |
| Balance of Shares Held11/30/2012 | 2,249,246 | 3,489,445 | 35,941,405 | 15,176,484 | 56,856,580 |
| Value | $78,114,948 | $35,627,229 | $35,941,405 | $101,075,384 | $250,758,966 |
| Dividend Income/Allocated Investment Income | $4,466,268 | $666,748 | $27,947 | $8,192,322 | $13,353,285 |
| Allocated Net Realized Gain | $1,652,889 | $— | $— | $— | $1,652,889 |
6. Investment TRANSACTIONS
Purchases and sales of investments, excluding long-term U.S. government securities and short-term obligations, for the year ended November 30, 2012, were as follows:
| Purchases | $208,569,591 |
| Sales | $132,183,634 |
7. LINE OF CREDIT
The Fund participates in a $100,000,000 unsecured, uncommitted revolving line of credit (LOC) agreement with PNC Bank. The LOC was made available for extraordinary or emergency purposes, primarily for financing redemption payments. Borrowings are charged interest at a rate offered to the Fund by PNC Bank at the time of the borrowing. As of November 30, 2012, there were no outstanding loans. During the year ended November 30, 2012, the Fund did not utilize the LOC.
Annual Shareholder Report
8. INTERFUND LENDING
Pursuant to an Exemptive Order issued by the Securities and Exchange Commission, the Fund, along with other funds advised by subsidiaries of Federated Investors, Inc., may participate in an interfund lending program. This program provides an alternative credit facility allowing the Fund to borrow from other participating affiliated funds. As of November 30, 2012, there were no outstanding loans. During the year ended November 30, 2012, the program was not utilized.
9. FEDERAL TAX INFORMATION (UNAUDITED)
For the fiscal year ended November 30, 2012, 47.04% of total ordinary income distributions made by the Fund are qualifying dividends which may be subject to a maximum tax rate of 15%, as provided for by the Jobs and Growth Tax Relief Act of 2003. Complete information is reported in conjunction with the reporting of your distributions on Form 1099-DIV.
Of the ordinary income distributions made by the Fund during the year ended November 30, 2012, 36% qualify for the dividend received deduction available to corporate shareholders.
Annual Shareholder Report
Report of Independent Registered Public Accounting Firm
TO THE BOARD OF TRUSTEES OF THE FEDERATED Income Securities Trust AND SHAREHOLDERS OF Federated Capital Income fund:
We have audited the accompanying statement of assets and liabilities, including the portfolio of investments, of the Federated Capital Income Fund (the “Fund”), a portfolio of Federated Income Securities Trust, as of November 30, 2012, and the related statement of operations for the year then ended, the statements of changes in net assets for each of the years in the two-year period then ended, and the financial highlights for each of the years or periods in the five-year period then ended. These financial statements and financial highlights are the responsibility of the Fund's management. Our responsibility is to express an opinion on these financial statements and financial highlights based on our audits.
We conducted our audits in accordance with the standards of the Public Company Accounting Oversight Board (United States). Those standards require that we plan and perform the audit to obtain reasonable assurance about whether the financial statements and financial highlights are free of material misstatement. An audit includes examining, on a test basis, evidence supporting the amounts and disclosures in the financial statements. Our procedures included confirmation of securities owned as of November 30, 2012, by correspondence with the custodian, transfer agent, and brokers or by other appropriate auditing procedures. An audit also includes assessing the accounting principles used and significant estimates made by management, as well as evaluating the overall financial statement presentation. We believe that our audits provide a reasonable basis for our opinion.
In our opinion, the financial statements and financial highlights referred to above present fairly, in all material respects, the financial position of the Federated Capital Income Fund as of November 30, 2012, and the results of its operations for the year then ended, the changes in its net assets for each of the years in the two-year period then ended, and the financial highlights for each of the years or periods in the five-year period then ended, in conformity with U.S. generally accepted accounting principles.
Boston, Massachusetts
January 23, 2013
Annual Shareholder Report
Shareholder Expense Example (unaudited)
As a shareholder of the Fund, you incur two types of costs: (1) transaction costs, including sales charges (loads) on purchase or redemption payments; and (2) ongoing costs, including management fees and to the extent applicable, distribution (12b-1) fees and/or shareholder services fees and other Fund expenses. This Example is intended to help you to understand your ongoing costs (in dollars) of investing in the Fund and to compare these costs with the ongoing costs of investing in other mutual funds. It is based on an investment of $1,000 invested at the beginning of the period and held for the entire period from June 1, 2012 to November 30, 2012.
ACTUAL EXPENSES
The first section of the table below provides information about actual account values and actual expenses. You may use the information in this section, together with the amount you invested, to estimate the expenses that you incurred over the period. Simply divide your account value by $1,000 (for example, an $8,600 account value divided by $1,000 = 8.6), then multiply the result by the number in the first section under the heading entitled “Expenses Paid During Period” to estimate the expenses attributable to your investment during this period.
HYPOTHETICAL EXAMPLE FOR COMPARISON PURPOSES
The second section of the table below provides information about hypothetical account values and hypothetical expenses based on the Fund's actual expense ratio and an assumed rate of return of 5% per year before expenses, which is not the Fund's actual return. Thus, you should not use the hypothetical account values and expenses to estimate the actual ending account balance or your expenses for the period. Rather, these figures are required to be provided to enable you to compare the ongoing costs of investing in the Fund with other funds. To do so, compare this 5% hypothetical example with the 5% hypothetical examples that appear in the shareholder reports of the other funds.
Annual Shareholder Report
Please note that the expenses shown in the table are meant to highlight your ongoing costs only and do not reflect any transaction costs, such as sales charges (loads) on purchase or redemption payments. Therefore, the second section of the table is useful in comparing ongoing costs only, and will not help you determine the relative total costs of owning different funds. In addition, if these transaction costs were included, your costs would have been higher.
| | Beginning
Account Value
6/1/2012 | Ending
Account Value
11/30/2012 | Expenses Paid
During Period1 |
| Actual: | | | |
| Class A Shares | $1,000 | $1,080.60 | $4.63 |
| Class B Shares | $1,000 | $1,077.80 | $8.52 |
| Class C Shares | $1,000 | $1,078.00 | $8.52 |
| Class F Shares | $1,000 | $1,082.00 | $4.63 |
| Institutional Shares | $1,000 | $1,083.10 | $3.33 |
Hypothetical (assuming a 5% return
before expenses): | | | |
| Class A Shares | $1,000 | $1,020.55 | $4.50 |
| Class B Shares | $1,000 | $1,016.80 | $8.27 |
| Class C Shares | $1,000 | $1,016.80 | $8.27 |
| Class F Shares | $1,000 | $1,020.55 | $4.50 |
| Institutional Shares | $1,000 | $1,021.80 | $3.23 |
| 1 | Expenses are equal to the Fund's annualized net expense ratios, multiplied by the average account value over the period, multiplied by 183/366 (to reflect the one-half-year period). The annualized net expense ratios are as follows: |
| Class A Shares | 0.89% |
| Class B Shares | 1.64% |
| Class C Shares | 1.64% |
| Class F Shares | 0.89% |
| Institutional Shares | 0.64% |
Annual Shareholder Report
Board of Trustees and Trust Officers
The Board of Trustees is responsible for managing the Trust's business affairs and for exercising all the Trust's powers except those reserved for the shareholders. The following tables give information about each Trustee and the senior officers of the Fund. Where required, the tables separately list Trustees who are “interested persons” of the Fund (i.e., “Interested” Trustees) and those who are not (i.e., “ Independent” Trustees). Unless otherwise noted, the address of each person listed is Federated Investors Tower, 1001 Liberty Avenue, Pittsburgh, PA 15222. The address of all Independent Trustees listed is 4000 Ericsson Drive, Warrendale, PA 15086-7561; Attention: Mutual Fund Board. As of December 31, 2012, the Trust comprised nine portfolio(s), and the Federated Fund Family consisted of 42 investment companies (comprising 137 portfolios). Unless otherwise noted, each Officer is elected annually. Unless otherwise noted, each Trustee oversees all portfolios in the Federated Fund Family and serves for an indefinite term. The Fund's Statement of Additional Information includes additional information about Trust Trustees and is available, without charge and upon request, by calling 1-800-341-7400.
Interested Trustees Background
Name
Birth Date
Positions Held with Trust
Date Service Began | Principal Occupation(s) for Past Five Years,
Other Directorships Held and Previous Position(s) |
John F. Donahue*
Birth Date: July 28, 1924
Trustee
Began serving: January 1986 | Principal Occupations: Director or Trustee of the Federated Fund Family; Chairman and Director, Federated Investors, Inc.; Chairman of the Federated Fund Family's Executive Committee.
Previous Positions: Chairman of the Federated Fund Family; Trustee, Federated Investment Management Company; Chairman and Director, Federated Investment Counseling. |
J. Christopher Donahue*
Birth Date: April 11, 1949
President and Trustee
Began serving: January 2000 | Principal Occupations: Principal Executive Officer and President of the Federated Fund Family; Director or Trustee of some of the Funds in the Federated Fund Family; President, Chief Executive Officer and Director, Federated Investors, Inc.; Chairman and Trustee, Federated Investment Management Company; Trustee, Federated Investment Counseling; Chairman and Director, Federated Global Investment Management Corp.; Chairman, Federated Equity Management Company of Pennsylvania and Passport Research, Ltd. (investment advisory subsidiary of Federated); Trustee, Federated Shareholder Services Company; Director, Federated Services Company.
Previous Positions: President, Federated Investment Counseling; President and Chief Executive Officer, Federated Investment Management Company, Federated Global Investment Management Corp. and Passport Research, Ltd. |
| * | Family relationships and reasons for “interested” status: John F. Donahue is the father of J. Christopher Donahue; both are “interested” due to their beneficial ownership of shares of Federated Investors, Inc. and the positions they hold with Federated and its subsidiaries. |
Annual Shareholder Report
INDEPENDENT Trustees Background
Name
Birth Date
Positions Held with Trust
Date Service Began | Principal Occupation(s) for Past Five Years,
Other Directorships Held, Previous Position(s) and Qualifications |
John F. Cunningham
Birth Date: March 5, 1943
Trustee
Began serving: January 1999 | Principal Occupation: Director or Trustee of the Federated Fund Family.
Other Directorships Held: Chairman, President and Chief Executive Officer, Cunningham & Co., Inc. (strategic business consulting); Trustee Associate, Boston College.
Previous Positions: President and Chief Operating Officer, Wang Laboratories; Chairman of the Board and Chief Executive Officer, Computer Consoles, Inc.; Director, First National Bank of Boston; Director, EMC Corporation (computer storage systems); Director, Apollo Computer, Inc.; Director, Redgate Communications.
Qualifications: Business management and director experience. |
Maureen Lally-Green
Birth Date: July 5, 1949
Trustee
Began serving: August 2009 | Principal Occupations: Director or Trustee of the Federated Fund Family; Director, Office of Church Relations, Diocese of Pittsburgh; Adjunct Professor of Law, Duquesne University School of Law.
Other Directorships Held: Director, Auberle; Member, Pennsylvania State Board of Education; Director, Saint Vincent College; Director, Ireland Institute of Pittsburgh; Chair and Director, UPMC Mercy Hospital; Regent, St. Vincent Seminary; Director, Epilepsy Foundation of Western and Central Pennsylvania; Director, Saint Thomas More Society, Allegheny County; Director, Our Campaign for the Church Alive, Inc.; Associate General Secretary of the Diocese of Pittsburgh.
Previous Position: Pennsylvania Superior Court Judge.
Qualifications: Legal and director experience. |
Peter E. Madden
Birth Date: March 16, 1942
Trustee
Began serving: November 1991 | Principal Occupation: Director or Trustee, and Chairman of the Board of Directors or Trustees, of the Federated Fund Family.
Previous Positions: Representative, Commonwealth of Massachusetts General Court; President, Chief Operating Officer and Director, State Street Bank and Trust Company and State Street Corporation (retired); Director, VISA USA and VISA International; Chairman and Director, Massachusetts Bankers Association; Director, Depository Trust Corporation; Director, The Boston Stock Exchange.
Qualifications: Business management, mutual fund services and director experience. |
Annual Shareholder Report
Name
Birth Date
Positions Held with Trust
Date Service Began | Principal Occupation(s) for Past Five Years,
Other Directorships Held, Previous Position(s) and Qualifications |
Charles F. Mansfield, Jr.
Birth Date: April 10, 1945
Trustee
Began serving: January 2000 | Principal Occupations: Director or Trustee of the Federated Fund Family; Management Consultant.
Previous Positions: Chief Executive Officer, PBTC International Bank; Partner, Arthur Young & Company (now Ernst & Young LLP); Chief Financial Officer of Retail Banking Sector, Chase Manhattan Bank; Senior Vice President, HSBC Bank USA (formerly Marine Midland Bank); Vice President, Citibank; Assistant Professor of Banking and Finance, Frank G. Zarb School of Business, Hofstra University; Executive Vice President, DVC Group, Inc. (marketing, communications and technology).
Qualifications: Banking, business management, education and director experience. |
Thomas M. O'Neill
Birth Date: June 14, 1951
Trustee
Began serving: October 2006 | Principal Occupations: Director or Trustee, Vice Chairman of the Audit Committee of the Federated Fund Family; Sole Proprietor, Navigator Management Company (investment and strategic consulting).
Other Directorships Held: Board of Overseers, Children's Hospital of Boston; Visiting Committee on Athletics, Harvard College; Board of Directors, Medicines for Humanity; Board of Directors, The Golisano Children's Museum of Naples, Florida.
Previous Positions: Chief Executive Officer and President, Managing Director and Chief Investment Officer, Fleet Investment Advisors; President and Chief Executive Officer, Aeltus Investment Management, Inc.; General Partner, Hellman, Jordan Management Co., Boston, MA; Chief Investment Officer, The Putnam Companies, Boston, MA; Credit Analyst and Lending Officer, Fleet Bank; Director and Consultant, EZE Castle Software (investment order management software); Director, Midway Pacific (lumber).
Qualifications: Business management, mutual fund, director and investment experience. |
John S. Walsh
Birth Date: November 28, 1957
Trustee
Began serving: January 2000 | Principal Occupations: Director or Trustee, Chairman of the Audit Committee of the Federated Fund Family; President and Director, Heat Wagon, Inc. (manufacturer of construction temporary heaters); President and Director, Manufacturers Products, Inc. (distributor of portable construction heaters); President, Portable Heater Parts, a division of Manufacturers Products, Inc.
Previous Position: Vice President, Walsh & Kelly, Inc.
Qualifications: Business management and director experience. |
Annual Shareholder Report
OFFICERS
Name
Birth Date
Address
Positions Held with Trust
Date Service Began | Principal Occupation(s) for Past Five Years
and Previous Position(s) |
John W. McGonigle
Birth Date: October 26, 1938
EXECUTIVE VICE PRESIDENT AND SECRETARY
Officer since: January 1986 | Principal Occupations: Executive Vice President and Secretary of the Federated Fund Family; Vice Chairman, Executive Vice President, Secretary and Director, Federated Investors, Inc.
Previous Positions: Trustee, Federated Investment Management Company and Federated Investment Counseling; Director, Federated Global Investment Management Corp., Federated Services Company and Federated Securities Corp. |
Richard A. Novak
Birth Date: December 25, 1963
TREASURER
Officer since: January 2006 | Principal Occupations: Principal Financial Officer and Treasurer of the Federated Fund Family; Senior Vice President, Federated Administrative Services; Financial and Operations Principal for Federated Securities Corp., Edgewood Services, Inc. and Southpointe Distribution Services, Inc.
Previous Positions: Controller of Federated Investors, Inc.; Vice President, Finance of Federated Services Company; held various financial management positions within The Mercy Hospital of Pittsburgh; Auditor, Arthur Andersen & Co. |
Peter J. Germain
Birth Date: September 3, 1959
CHIEF LEGAL OFFICER
Officer since: January 2005 | Principal Occupations: Mr. Germain is Chief Legal Officer of the Federated Fund Family. He is General Counsel and Vice President, Federated Investors, Inc.; President, Federated Administrative Services and Federated Administrative Services, Inc.; Vice President, Federated Securities Corp.; Secretary, Federated Private Asset Management, Inc.; and Secretary, Retirement Plan Service Company of America. Mr. Germain joined Federated in 1984 and is a member of the Pennsylvania Bar Association.
Previous Positions: Deputy General Counsel, Special Counsel, Managing Director of Mutual Fund Services, Federated Investors, Inc.; Senior Vice President, Federated Services Company; and Senior Corporate Counsel, Federated Investors, Inc. |
Richard B. Fisher
Birth Date: May 17, 1923
VICE PRESIDENT
Officer since: January 1986 | Principal Occupations: Vice Chairman or Vice President of some of the Funds in the Federated Fund Family; Vice Chairman, Federated Investors, Inc.; Chairman, Federated Securities Corp.
Previous Positions: President and Director or Trustee of some of the Funds in the Federated Fund Family; Executive Vice President, Federated Investors, Inc.; Director and Chief Executive Officer, Federated Securities Corp. |
Brian P. Bouda
Birth Date: February 28, 1947
CHIEF COMPLIANCE OFFICER AND SENIOR VICE PRESIDENT
Officer since: August 2004 | Principal Occupations: Senior Vice President and Chief Compliance Officer of the Federated Fund Family; Vice President and Chief Compliance Officer of Federated Investors, Inc. and Chief Compliance Officer of its subsidiaries. Mr. Bouda joined Federated in 1999 and is a member of the American Bar Association and the State Bar Association of Wisconsin.
Previous Positions: Served in Senior Management positions with a large regional banking organization. |
Annual Shareholder Report
Name
Birth Date
Address
Positions Held with Trust
Date Service Began | Principal Occupation(s) for Past Five Years
and Previous Position(s) |
Stephen F. Auth
Birth Date: September 3, 1956
450 Lexington Avenue
Suite 3700
New York, NY 10017-3943
CHIEF INVESTMENT OFFICER
Officer since: May 2004 | Principal Occupations: Mr. Auth is Chief Investment Officer of this Fund and various other Funds in the Federated Fund Family; Executive Vice President, Federated Investment Counseling, Federated Global Investment Management Corp. and Federated Equity Management Company of Pennsylvania.
Previous Positions: Executive Vice President, Federated Investment Management Company, and Passport Research, Ltd. (investment advisory subsidiary of Federated); Senior Vice President, Global Portfolio Management Services Division; Senior Vice President, Federated Investment Management Company and Passport Research, Ltd.; Senior Managing Director and Portfolio Manager, Prudential Investments. |
Robert J. Ostrowski
Birth Date: April 26, 1963
Chief Investment Officer
Officer since: May 2004 | Principal Occupations: Robert J. Ostrowski joined Federated in 1987 as an Investment Analyst and became a Portfolio Manager in 1990. He was named Chief Investment Officer of taxable fixed-income products in 2004 and also serves as a Senior Portfolio Manager. Mr. Ostrowski became an Executive Vice President of the Fund's Adviser in 2009 and served as a Senior Vice President of the Fund's Adviser from 1997 to 2009. Mr. Ostrowski has received the Chartered Financial Analyst designation. He received his M.S. in Industrial Administration from Carnegie Mellon University. |
John L. Nichol
Birth Date: May 21, 1963
VICE PRESIDENT
Officer since: May 2004
Portfolio Manager since: December 2000 | Principal Occupations: John L. Nichol has been the Fund's Portfolio Manager since December 2000. He is Vice President of the Trust with respect to the Fund. Mr. Nichol joined Federated in September 2000 as an Assistant Vice President/Senior Investment Analyst. He has been a Portfolio Manager since December 2000 and was named a Vice President of the Fund's Adviser in July 2001. Mr. Nichol served as a portfolio manager and analyst for the Public Employees Retirement System of Ohio from 1992 through August 2000. Mr. Nichol has received the Chartered Financial Analyst designation. He received his M.B.A. with an emphasis in Finance and Management and Information Science from the Ohio State University. |
Annual Shareholder Report
Evaluation and Approval of Advisory Contract–May 2012
Federated Capital Income Fund (the “Fund”)
Following a review and recommendation of approval by the Fund's independent trustees, the Fund's Board reviewed and approved at its May 2012 meetings the Fund's investment advisory and subadvisory contracts for an additional one-year term. The Board's decision regarding these contracts reflects the exercise of its business judgment on whether to continue the existing arrangements.
In this connection, the Federated Funds' Board had previously appointed a Senior Officer, whose duties include specified responsibilities relating to the process by which advisory fees are to be charged to a Federated fund. The Senior Officer has the authority to retain consultants, experts, or staff as may be reasonably necessary to assist in the performance of his duties, reports directly to the Board, and may be terminated only with the approval of a majority of the independent members of the Board. The Senior Officer prepared and furnished to the Board an independent, written evaluation that covered topics discussed below (the “Evaluation”). The Board considered that Evaluation, along with other information, in deciding to approve the advisory and subadvisory contracts.
The Board is also familiar with and considered judicial decisions concerning allegedly excessive investment advisory fees, which have indicated that the following factors may be relevant to an Adviser's fiduciary duty with respect to its receipt of compensation from a fund: the nature and quality of the services provided by the Adviser to a fund and its shareholders, including the performance and expenses of the fund and of comparable funds; the Adviser's cost of providing the services, including the profitability to the Adviser of providing advisory services to a fund; the extent to which the Adviser may realize “economies of scale” as a fund grows larger and, if such economies exist, whether they have been shared with a fund and its shareholders; any “fall-out financial benefits” that accrue to the Adviser because of its relationship with a fund (including research services received from brokers that execute fund trades and any fees paid to affiliates of the Adviser for services rendered to a fund); comparative fee structures, including a comparison of fees paid to the Adviser with those paid by similar funds; and the extent to which the Board members are fully informed about all facts the Board deems relevant to its consideration of the Adviser's services and fees. Consistent with these judicial decisions, the Board also considered management fees (including any components thereof) charged to institutional and other clients of the Adviser and subadviser for what might be viewed as like services. The Board was aware of these factors and was guided by them in its review of the Fund's advisory and subadvisory contracts to the extent it considered them to be appropriate and relevant, as discussed further below.
Annual Shareholder Report
The Board considered and weighed these circumstances in light of its substantial accumulated experience in governing the Fund and working with Federated on matters relating to the Federated funds, and was assisted in its deliberations by independent legal counsel. Throughout the year, and in connection with its May meetings, the Board requested and received substantial and detailed information about the Fund and the Federated organization that was in addition to the extensive materials that comprise and accompany the Senior Officer's Evaluation. Federated provided much of this information at each regular meeting of the Board, and furnished additional substantial information in connection with the May meeting at which the Board's formal review of the advisory and subadvisory contracts occurred. At this May meeting, senior management of the Adviser also met with the independent trustees and their counsel to discuss the materials presented and any other matters thought relevant by the Adviser or the trustees. Between regularly scheduled meetings, the Board also received information on particular matters as the need arose. Thus, the Board's consideration of the advisory and subadvisory contracts included review of the Senior Officer's Evaluation, accompanying data and additional information covering such matters as: the Adviser's and subadviser's investment philosophy, revenue, profitability, personnel and processes; investment and operating strategies; the Fund's short- and long-term performance (in absolute terms, both on a gross basis and net of expenses, as well as in relationship to its particular investment program and certain competitor or “peer group” funds and/or other benchmarks, as appropriate), and comments on the reasons for performance; the Fund's investment objectives; the Fund's expenses (including the advisory fee itself and the overall expense structure of the Fund, both in absolute terms and relative to similar and/or competing funds, with due regard for contractual or voluntary expense limitations); the use and allocation of brokerage commissions derived from trading the Fund's portfolio securities (if any); and the nature, quality and extent of the advisory and other services provided to the Fund by the Adviser and its affiliates. The Board also considered the preferences and expectations of Fund shareholders; the entrepreneurial risk assumed by the Adviser in sponsoring the funds; the continuing state of competition in the mutual fund industry and market practices; the range of comparable fees for similar funds in the mutual fund industry; the Fund's relationship to the Federated family of funds which include a comprehensive array of funds with different investment objectives, policies and strategies which are available for exchange without the incurrence of additional sales charges; compliance and audit reports concerning the Federated funds and the Federated companies that service them (including communications from regulatory agencies), as well as Federated's responses to any issues raised therein; and relevant developments in the mutual fund industry and how the Federated
Annual Shareholder Report
funds and/or Federated are responding to them. The Board's evaluation process is evolutionary. The criteria considered and the emphasis placed on relevant criteria change in recognition of changing circumstances in the mutual fund marketplace.
While mindful that courts have cautioned against giving such comparisons too much weight, the Board has found the use of comparisons of the Fund's fees and expenses to other mutual funds with comparable investment programs to be relevant, given the high degree of competition in the mutual fund business. The Board focused on comparisons with other similar mutual funds more heavily than non-mutual fund products or services because it is believed that they are more relevant. For example, other mutual funds are the products most like the Fund, they are readily available to Fund shareholders as alternative investment vehicles, and they are the type of investment vehicle in fact chosen and maintained by the Fund's investors. The range of their fees and expenses therefore appears to be a generally reliable indication of what consumers have found to be reasonable in the precise marketplace in which the Fund competes. In this regard, the Senior Officer has reviewed Federated's fees for providing advisory services to products outside the Federated family of funds (e.g., institutional and separate accounts). He concluded that mutual funds and institutional accounts are inherently different products. Those differences include, but are not limited to, different types of targeted investors; being subject to different laws and regulations; different legal structures; different average account sizes; different associated costs; different portfolio management techniques made necessary by different cash flows; and portfolio manager time spent in review of securities pricing. The Senior Officer did not consider these fee schedules to be determinative in judging the appropriateness of mutual fund advisory contracts.
The Fund's ability to deliver competitive performance when compared to its peer group was also deemed to be relevant by the Board as a useful indicator of how the Adviser is executing the Fund's investment program, which in turn assisted the Board in reaching a conclusion that the nature, extent, and quality of the Adviser's investment management services were such as to warrant continuation of the advisory and subadvisory contracts.
The Senior Officer reviewed information compiled by Federated, using data supplied by independent fund ranking organizations, regarding the performance of, and fees charged by, other mutual funds, noting his view that comparisons to fund peer groups are relevant in judging the reasonableness of proposed fees.
For the one-year, three-year and five-year periods covered by the Evaluation, the Fund's performance was above the median of the relevant peer group.
The Board also received financial information about Federated, including information regarding the compensation and benefits Federated derived from its relationships with the Federated funds. This information covered not only the fees under the advisory contracts, but also fees received by Federated's subsidiaries for providing other services to the Federated funds under separate
Annual Shareholder Report
contracts (e.g., for serving as the Federated funds' administrator). The information also detailed any indirect benefit Federated may derive from its receipt of research services from brokers who execute Federated fund trades. In addition, the Board considered the fact that, in order for a fund to be competitive in the marketplace, Federated and its affiliates frequently waived fees and/or reimbursed expenses and have disclosed to fund investors and/or indicated to the Board their intention to do so in the future, where appropriate. Moreover, the Board receives regular reporting as to the institution or elimination of these voluntary waivers.
Federated furnished information, requested by the Senior Officer, that reported revenues on a fund-by-fund basis and made estimates of the allocation of expenses on a fund-by-fund basis, using allocation methodologies specified by the Senior Officer. The Senior Officer noted that, although they may apply consistent allocation processes, the inherent difficulties in allocating costs (and the unavoidable arbitrary aspects of that exercise) and the lack of consensus on how to allocate those costs may render such allocation information unreliable. The allocation information was considered in the analysis by the Board but was determined to be of limited use.
The Board and the Senior Officer also reviewed information compiled by Federated comparing profitability information for Federated to other publicly held fund management companies. In this regard, the Senior Officer noted the limited availability of such information, but nonetheless concluded that Federated's profit margins did not appear to be excessive.
The Senior Officer's Evaluation also discussed the notion of possible realization of “economies of scale” as a fund grows larger. The Board considered in this regard that the Adviser has made significant and long-term investments in areas that support all of the Federated funds, such as personnel and processes for the portfolio management, shareholder services, compliance, internal audit, and risk management functions; and systems technology; and that the benefits of these efforts (as well as any economies, should they exist) were likely to be enjoyed by the fund complex as a whole. Finally, the Board also noted the absence of any applicable regulatory or industry guidelines on this subject, which (as discussed in the Senior Officer's Evaluation) is compounded by the lack of any common industry practice or general pattern with respect to structuring fund advisory fees with “breakpoints” that serve to reduce the fee as the fund attains a certain size. The Senior Officer did not recommend institution of breakpoints in pricing Federated's fund advisory services at this time.
Annual Shareholder Report
It was noted in the materials for the Board meeting that for the period covered by the Evaluation, the Fund's investment advisory fee, after waivers and expense reimbursements, if any, was above the median of the relevant peer group. The Board reviewed the fees and other expenses of the Fund with the Adviser and was satisfied that the overall expense structure of the Fund remained competitive. The Board will continue to monitor advisory fees and other expense born by the Fund.
The Senior Officer noted that, considering the totality of the circumstances, and all of the factors referenced within his Evaluation, he had concluded that, subject to comments and recommendations made within his Evaluation, his observations and the information accompanying the Evaluation supported a finding by the Board that the management fees for each of the funds was reasonable and that Federated appeared to provide appropriate advisory and administrative services to the Fund for the fees paid. Under these circumstances, no changes were recommended to, and no objection was raised to, the continuation of the Fund's advisory and subadvisory contracts.
In its decision to continue an existing investment advisory contract, the Board was mindful of the potential disruptions of the Fund's operations and various risks, uncertainties and other effects that could occur as a result of a decision to terminate or not renew an advisory contract. In particular, the Board recognized that many shareholders have invested in the Fund on the strength of the Adviser's industry standing and reputation and with the expectation that the Adviser will have a continuing role in providing advisory services to the Fund. Thus, the Board's approval of the advisory contract reflected the fact that it is the shareholders who have effectively selected the Adviser by virtue of having invested in the Fund. The Board concluded that, in light of the factors discussed above, including the nature, quality and scope of the services provided to the Fund by the Adviser and its affiliates, continuation of the advisory contract was appropriate.
The Board based its decision to approve the advisory and subadvisory contracts on the totality of the circumstances and relevant factors and with a view to past and future long-term considerations. Not all of the factors and considerations identified above were necessarily relevant to the Fund, nor did the Board consider any one of them to be determinative. With respect to the factors that were relevant, the Board's decision to approve the contract reflects its determination that Federated's performance and actions provided a satisfactory basis to support the decision to continue the existing arrangements.
Annual Shareholder Report
Voting Proxies on Fund Portfolio Securities
A description of the policies and procedures that the Fund uses to determine how to vote proxies, if any, relating to securities held in the Fund's portfolio is available, without charge and upon request, by calling 1-800-341-7400. A report on “ Form N-PX” of how the Fund voted any such proxies during the most recent 12-month period ended June 30 is available from Federated's website at FederatedInvestors.com. To access this information from the home page, select “All” under “Asset Classes.” Select a fund name and share class, if applicable, to go to the Fund Overview page. On the Fund Overview page, select the “Documents” tab. At the bottom of that page, select “Proxy Voting Record Report (Form N-PX).” Form N-PX filings are also available at the SEC's website at www.sec.gov.
Quarterly Portfolio Schedule
The Fund files with the SEC a complete schedule of its portfolio holdings, as of the close of the first and third quarters of its fiscal year, on “Form N-Q.” These filings are available on the SEC's website at www.sec.gov and may be reviewed and copied at the SEC's Public Reference Room in Washington, DC. (Call 1-800-SEC-0330 for information on the operation of the Public Reference Room.) You may also access this information from the “ Products” section of Federated's website at FederatedInvestors.com. From the home page, select “All” under “Asset Classes.” Select a fund name and share class, if applicable, to go to the Fund Overview page. On the Fund Overview page, select the “Documents” tab. At the bottom of that page, select “Form N-Q.”
Annual Shareholder Report
Mutual funds are not bank deposits or obligations, are not guaranteed by any bank and are not insured or guaranteed by the U.S. government, the Federal Deposit Insurance Corporation, the Federal Reserve Board or any other government agency. Investment in mutual funds involves investment risk, including the possible loss of principal.
This Report is authorized for distribution to prospective investors only when preceded or accompanied by the Fund's Prospectus, which contains facts concerning its objective and policies, management fees, expenses and other information.
Federated Capital Income Fund
Federated Investors Funds
4000 Ericsson Drive
Warrendale, PA 15086-7561
Contact us at FederatedInvestors.com
or call 1-800-341-7400.
Federated Securities Corp., Distributor
CUSIP 31420C878
CUSIP 31420C860
CUSIP 31420C852
CUSIP 31420C845
CUSIP 31420C621
G01049-01 (1/13)
Federated is a registered trademark of Federated Investors, Inc.
2013 ©Federated Investors, Inc.
Annual Shareholder Report
November 30, 2012
| Share Class | Ticker |
| A | FUNAX |
| Institutional | FUBDX |
Federated Unconstrained Bond Fund
A Portfolio of Federated Income Securities Trust
Dear Valued Shareholder,
I am pleased to present the Annual Shareholder Report for your fund covering the period from December 1, 2011 through November 30, 2012. This report includes Management's Discussion of Fund Performance, a complete listing of your fund's holdings, performance information and financial statements along with other important fund information.
In addition, our website, FederatedInvestors.com, offers easy access to Federated resources that include timely fund updates, economic and market insights from our investment strategists, and financial planning tools. We invite you to register to take full advantage of its capabilities.
Thank you for investing with Federated. I hope you find this information useful and look forward to keeping you informed.
Sincerely,
J. Christopher Donahue, President
Not FDIC Insured • May Lose Value • No Bank Guarantee
Management's Discussion of Fund Performance (unaudited)
The Fund's total return, based on net asset value, for the 12-month reporting period ended November 30, 2012, was 2.03% for Class A Shares and 2.23% for Institutional Shares. The total return of the Bank of America Merrill Lynch 3-Month U.S. Treasury Bill Index (BAML3MT),1 the Fund's broad-based securities market index, was 0.10% for the same period. The Fund's total return for the most recently completed fiscal year reflected actual cash flows, transaction costs and other expenses which were not reflected in the total return of the BAML3MT.
The Fund's investment strategy is different than traditional fixed-income portfolios in that it has an objective of high total return in any market environment. The portfolio is also more concentrated in its portfolio holdings, striving to identify individual securities and bond sectors that have higher potential (in the Fund Adviser's opinion) for price appreciation, irrespective of the overall bond market direction.2
During the reporting period, the most significant factors affecting the Fund's performance relative to BAML3MT were: (1) the allocation of the portfolio among securities of similar types of issuers (referred to as “sectors”); (2) the effect of changing interest rates (referred to as “duration”);3 and (3) individual security selection.
The following discussion will focus on the performance of the Fund's Institutional Shares. The 2.23% total return of the Institutional Shares for the reporting period consisted of -1.33% in price depreciation in the net asset value of shares and 3.56% in reinvested dividends.
MARKET OVERVIEW
The 12-month reporting period continued to demonstrate the alternating “risk-on” and “risk-off” scenarios that have characterized the investment environment since the Great Recession ended in 2009. Generally speaking, economic activity in the largest developed economies (i.e., United States, Europe and Japan) was far below historical trend growth rates. In fact, both Europe (collectively) and Japan moved back into recession, while the United States struggled to maintain a growth rate around 2%. In most emerging economies, real economic growth continued–but at slower than anticipated rates. Thus, it is fair to state that world economic growth was disappointing relative to expectations.
Given the economic backdrop, most worldwide monetary authorities continued to provide and/or increase stimulus to assist activity during the reporting period. The Federal Reserve, for its part, instituted a number of measures, including the unveiling of another round of quantitative easing (QE3). This QE3 program, similar to those previously executed, was designed to suppress long maturity interest rates in the hopes of reviving economic growth.
Annual Shareholder Report
From a corporate perspective, earnings largely continued to exceed analyst expectations, but clearly exhibited a growth deceleration. More troublesome was the near lack of any revenue growth on a year-over-year basis. Despite these relative earnings concerns, investor demand for higher yielding bonds continued at record levels, given the declining trend in overall U.S. Treasury bond yields.
SECTOR
Sector rotation provided both good and bad absolute return periods over the fiscal year, but generally detracted from Fund performance. The significant allocation to high-yield4 bonds during the initial four months drove the Fund price higher, while moves in and out of the U.S. Treasury market hurt Fund performance in the middle portion of the reporting period.
DURATION
Duration positioning detracted from Fund performance, specifically in the second calendar quarter of 2012. The Fund held a net “short” position to the U.S. Treasury bond market, as the economy was gaining momentum coming out of the first quarter. However, a resurgent European crisis emanating out of Spanish bond concerns, created a temporary flight to quality causing U.S. Treasury bond yields to fall with a corresponding price appreciation. Anticipating rising interest rates, the Fund held short positions in Treasury futures contracts from May through July. This negatively impacted Fund performance due to falling interest rates during this period.
SECURITY SELECTION
The Fund experienced a performance benefit from specific security selection, primarily in the large bank space. The bond prices of two banks in particular, Bank of America and Morgan Stanley, rose significantly as bank fundamentals improved, along with the previously mentioned demand for higher yielding fixed income corporate debt securities.
| 1 | The Bank of America Merrill Lynch 3-Month U.S.Treasury Bill Index is an index tracking 3-month U.S. Treasury securities. The index is produced by Merrill Lynch, Pierce, Fenner & Smith, Inc. The index is unmanaged, and it is not possible to invest directly in an index. |
| 2 | Bond prices are sensitive to changes in interest rates, and a rise in interest rates can cause a decline in their prices. |
| 3 | Duration is a measure of a security's price sensitivity to changes in interest rates. Securities with longer durations are more sensitive to changes in interest rates than securities of shorter durations. |
| 4 | High-yield, lower-rated securities generally entail greater market, credit and liquidity risks than investment-grade securities and may include higher volatility and higher risk of default. |
Annual Shareholder Report
FUND PERFORMANCE AND GROWTH OF A $10,000 INVESTMENT
The Average Annual Total Return table below shows returns for each class averaged over the stated periods. The graphs below illustrate the hypothetical investment of $10,0001 in the Federated Unconstrained Bond Fund (the “Fund”) from December 13, 2010 (or later, if applicable) to November 30, 2012, compared to the Bank of America Merrill Lynch 3-Month U.S. Treasury Bill Index (BAML3MT).2
Average Annual Total Returns for the Period Ended 11/30/2012
(returns reflect all applicable sales charges as specified below in footnote #1)
| Share Class | 1 Year | Start of
Performance3 |
| Class A Shares | -2.60% | -1.68% |
| Institutional Shares | 2.23% | 4.37% |
Performance data quoted represents past performance which is no guarantee of future results. Investment return and principal value will fluctuate so that an investor's shares, when redeemed, may be worth more or less than their original cost. Mutual fund performance changes over time and current performance may be lower or higher than what is stated. For current to the most recent month-end performance and after-tax returns, visit FederatedInvestors.com or call 1-800-341-7400. Returns shown do not reflect the deduction of taxes that a shareholder would pay on Fund distributions or the redemption of Fund shares. Mutual funds are not obligations of or guaranteed by any bank and are not federally insured.
Annual Shareholder Report
Growth of a $10,000 Investment–class A Shares
| Federated Unconstrained Bond Fund - | Class A | BAML3MT |
| 7/1/2011 | 9,546 | 10,000 |
| 7/31/2011 | 9,637 | 9,999 |
| 9/30/2011 | 9,796 | 10,002 |
| 11/30/2011 | 9,569 | 10,002 |
| 1/31/2012 | 9,864 | 10,002 |
| 3/31/2012 | 10,019 | 10,003 |
| 5/31/2012 | 9,704 | 10,005 |
| 7/31/2012 | 9,858 | 10,006 |
| 9/30/2012 | 9,754 | 10,009 |
| 11/30/2012 | 9,763 | 10,011 |
41 graphic description end -->
| ■ | Total returns shown include the maximum sales charge of 4.50% ($10,000 investment minus $450 sales charge = $9,550) |
Growth of a $10,000 Investment–Institutional Shares
| Federated Unconstrained Bond Fund - | Institutional Shares | BAML3MT |
| 12/13/2010 | 10,000 | 10,000 |
| 1/31/2011 | 10,309 | 10,001 |
| 3/31/2011 | 10,509 | 10,005 |
| 5/31/2011 | 10,650 | 10,008 |
| 7/31/2011 | 10,704 | 10,008 |
| 9/30/2011 | 10,883 | 10,011 |
| 11/30/2011 | 10,641 | 10,011 |
| 1/31/2012 | 10,963 | 10,010 |
| 3/31/2012 | 11,139 | 10,012 |
| 5/31/2012 | 10,800 | 10,013 |
| 7/31/2012 | 10,975 | 10,015 |
| 9/30/2012 | 10,857 | 10,018 |
| 11/30/2012 | 10,878 | 10,020 |
41 graphic description end -->
| 1 | Represents a hypothetical investment of $10,000 in the Fund after deducting applicable sales charges: for Class A Shares, the maximum sales charge of 4.50% ($10,000 investment minus $450 sales charge = $9,550). The Fund's performance assumes the reinvestment of all dividends and distributions. The BAML3MT has been adjusted to reflect reinvestment of dividends on securities in the index. |
| 2 | The BAML3MT is not adjusted to reflect sales charges, expenses or other fees that the Securities and Exchange Commission requires to be reflected in the Fund's performance. The index is unmanaged, and unlike the Fund, is not affected by cash flows. It is not possible to invest directly in an index. |
| 3 | The Fund's Class A Shares and Institutional Shares commenced operations on July 1, 2011 and December 13, 2010, respectively. |
Annual Shareholder Report
Portfolio of Investments Summary Table (unaudited)
At November 30, 2012, the Fund's portfolio composition1 was as follows:
| Security Type | Percentage of
Total Net Assets2 |
| Corporate Debt Securities | 50.3% |
| U.S. Treasury Securities | 25.3% |
| Floating Rate Loans | 15.9% |
| Trade Finance Agreements | 5.8% |
| Cash Equivalents3 | 2.9% |
| Asset-Backed Securities | 0.2% |
| Domestic Equity Securities | 0.2% |
| Derivative Contracts4,5 | (0.0)% |
| Other Assets and Liabilities—Net6 | (0.6)% |
| TOTAL | 100.0% |
| 1 | See the Fund's Prospectus and Statement of Additional Information for a description of these security types. |
| 2 | As of the date specified above, the Fund owned shares of one or more affiliated investment companies. For purposes of this table, an affiliated investment company (other than an affiliated money market mutual fund) is not treated as a single portfolio security, but rather the Fund is treated as owning a pro rata portion of each security and each other asset and liability owned by the affiliated investment company. Accordingly, the percentages of total net assets shown in the table will differ from those presented on the Portfolio of Investments. |
| 3 | Cash Equivalents include any investments in money market mutual funds and/or overnight repurchase agreements. |
| 4 | Based upon net unrealized appreciation (depreciation) or value of the derivative contracts as applicable. Derivative contracts may consist of futures, forwards, options and swaps. The impact of a derivative contract on the Fund's performance may be larger than its unrealized appreciation (depreciation) or value may indicate. In many cases, the notional value or amount of a derivative contract may provide a better indication of the contract's significance to the portfolio. More complete information regarding the Fund's direct investments in derivative contracts, including unrealized appreciation (depreciation), value, and notional values or amounts of such contracts, can be found in the table at the end of the Portfolio of Investments included in this Report. |
| 5 | Represents less than 0.1%. |
| 6 | Assets, other than investments in securities and derivative contracts, less liabilities. See Statement of Assets and Liabilities. |
Annual Shareholder Report
Portfolio of Investments
November 30, 2012
Principal
Amount
or Shares | | | Value |
| | | U.S. TREASURY—25.3% | |
| $13,000,000 | | United States Treasury Bond, 2.75%, 8/15/2042 | $12,859,640 |
| 10,000,000 | | United States Treasury Bond, 3.125%, 2/15/2042 | 10,702,031 |
| 20,000,000 | | United States Treasury Note, 1.625%, 8/15/2022 | 20,085,782 |
| | | TOTAL U.S. TREASURY
(IDENTIFIED COST $43,431,224) | 43,647,453 |
| | | CORPORATE BONDS—2.6% | |
| | | Financial Services—2.6% | |
| 2,395,000 | | Bank of America Corp., Sr. Unsecd. Note, 5.00%, 5/13/2021 | 2,749,541 |
| 1,500,000 | | Bank of America Corp., Sr. Unsecd. Note, 5.875%, 1/5/2021 | 1,794,263 |
| | | TOTAL CORPORATE BONDS
(IDENTIFIED COST $3,657,788) | 4,543,804 |
| | | MUTUAL FUNDS—72.9%1 | |
| 1,108,796 | 2 | Federated Prime Value Obligations Fund, Institutional Shares, 0.15% | 1,108,796 |
| 2,804,556 | | Federated Bank Loan Core Fund | 28,634,517 |
| 1,178,196 | | Federated Project and Trade Finance Core Fund | 11,558,101 |
| 12,666,951 | | High Yield Bond Portfolio | 84,361,893 |
| | | TOTAL MUTUAL FUNDS
(IDENTIFIED COST $122,407,946) | 125,663,307 |
| | | TOTAL INVESTMENTS—100.8%
(IDENTIFIED COST $169,496,958)3 | 173,854,564 |
| | | OTHER ASSETS AND LIABILITIES - NET—(0.8)%4 | (1,392,105) |
| | | TOTAL NET ASSETS—100% | $172,462,459 |
| 1 | Affiliated holdings. |
| 2 | 7-Day net yield. |
| 3 | The cost of investments for federal tax purposes amounts to $169,480,557. |
| 4 | Assets, other than investments in securities, less liabilities. See Statement of Assets and Liabilities. |
Note: The categories of investments are shown as a percentage of total net assets at November 30, 2012.
Various inputs are used in determining the value of the Fund's investments. These inputs are summarized in the three broad levels listed below:
Level 1— quoted prices in active markets for identical securities, including investment companies with daily net asset values, if applicable.
Level 2— other significant observable inputs (including quoted prices for similar securities, interest rates, prepayment speeds, credit risk, etc.). Also includes securities valued at amortized cost.
Level 3— significant unobservable inputs (including the Fund's own assumptions in determining the fair value of investments).
Annual Shareholder Report
The inputs or methodology used for valuing securities are not an indication of the risk associated with investing in those securities.
The following is a summary of the inputs used, as of November 30, 2012, in valuing the Fund's assets carried at fair value:
| Valuation Inputs | | | | |
| | Level 1—
Quoted
Prices and
Investments in
Mutual Funds1 | Level 2—
Other
Significant
Observable
Inputs | Level 3—
Significant
Unobservable
Inputs | Total |
| Debt Securities: | | | | |
| U.S. Treasury | $— | $43,647,453 | $— | $43,647,453 |
| Corporate Bonds | — | 4,543,804 | — | 4,543,804 |
| Mutual Funds | 114,105,206 | 11,558,101 | — | 125,663,307 |
| TOTAL SECURITIES | $114,105,206 | $59,749,358 | $— | $173,854,564 |
| 1 | Federated Bank Loan Core Fund and High Yield Bond Portfolio are affiliated holdings offered only to registered investment companies and other accredited investors. |
See Notes which are an integral part of the Financial Statements
Annual Shareholder Report
Financial Highlights–Class A Shares
(For a Share Outstanding Throughout Each Period)
| | Year Ended
11/30/2012 | Period
Ended
11/30/20111 |
| Net Asset Value, Beginning of Period | $10.52 | $10.51 |
| Income From Investment Operations: | | |
| Net investment income2 | 0.49 | 0.10 |
| Net realized and unrealized loss on investments, futures contracts and swap contracts | (0.28) | (0.07) |
| TOTAL FROM INVESTMENT OPERATIONS | 0.21 | 0.03 |
| Less Distributions: | | |
| Distributions from net investment income | (0.35) | (0.02) |
| Net Asset Value, End of Period | $10.38 | $10.52 |
| Total Return3 | 2.03% | 0.24% |
| Ratios to Average Net Assets: | | |
| Net expenses | 1.19% | 1.20%4 |
| Net investment income | 4.71% | 2.41%4 |
| Expense waiver/reimbursement5 | 0.16% | 0.46%4 |
| Supplemental Data: | | |
| Net assets, end of period (000 omitted) | $71,572 | $11,211 |
| Portfolio turnover | 113% | 1387%6 |
| 1 | Reflects operations for the period from July 1, 2011 (date of initial investment) to November 30, 2011. |
| 2 | Per share numbers have been calculated using the average shares method. |
| 3 | Based on net asset value, which does not reflect the sales charge, redemption fee or contingent deferred sales charge, if applicable. Total returns for periods of less than one year are not annualized. |
| 4 | Computed on an annualized basis. |
| 5 | This expense decrease is reflected in both the net expense and net investment income ratios shown above. |
| 6 | Portfolio turnover is calculated at the Fund level. Percentage indicated was calculated for the period from December 13, 2010 to November 30, 2011. |
See Notes which are an integral part of the Financial Statements
Annual Shareholder Report
Financial Highlights–Institutional Shares
(For a Share Outstanding Throughout Each Period)
| | Year Ended
11/30/2012 | Period
Ended
11/30/20111 |
| Net Asset Value, Beginning of Period | $10.53 | $10.00 |
| Income From Investment Operations: | | |
| Net investment income2 | 0.56 | 0.20 |
| Net realized and unrealized gain (loss) on investments, futures contracts and swap contracts | (0.32) | 0.44 |
| TOTAL FROM INVESTMENT OPERATIONS | 0.24 | 0.64 |
| Less Distributions: | | |
| Distributions from net investment income | (0.38) | (0.11) |
| Net Asset Value, End of Period | $10.39 | $10.53 |
| Total Return3 | 2.23% | 6.41% |
| Ratios to Average Net Assets: | | |
| Net expenses | 0.93% | 0.95%4 |
| Net investment income | 5.21% | 1.93%4 |
| Expense waiver/reimbursement5 | 0.18% | 1.17%4 |
| Supplemental Data: | | |
| Net assets, end of period (000 omitted) | $100,891 | $58,596 |
| Portfolio turnover | 113% | 1387% |
| 1 | Reflects operations for the period from December 13, 2010 (date of initial investment) to November 30, 2011. |
| 2 | Per share numbers have been calculated using the average shares method. |
| 3 | Based on net asset value. Total returns for periods of less than one year are not annualized. |
| 4 | Computed on an annualized basis. |
| 5 | This expense decrease is reflected in both the net expense and net investment income ratios shown above. |
See Notes which are an integral part of the Financial Statements
Annual Shareholder Report
Statement of Assets and Liabilities
November 30, 2012
| Assets: | | |
| Total investment in securities, at value including $125,663,307 of investments in affiliated holdings (Note 5) (identified cost $169,496,958) | | $173,854,564 |
| Income receivable | | 1,217,392 |
| Receivable for shares sold | | 414,923 |
| TOTAL ASSETS | | 175,486,879 |
| Liabilities: | | |
| Payable for investments purchased | $2,275,625 | |
| Payable for shares redeemed | 608,931 | |
| Payable for shareholder services fee (Note 5) | 11,293 | |
| Accrued expenses | 128,571 | |
| TOTAL LIABILITIES | | 3,024,420 |
| Net assets for 16,598,653 shares outstanding | | $172,462,459 |
| Net Assets Consist of: | | |
| Paid-in capital | | $177,257,081 |
| Net unrealized appreciation of investments | | 4,357,606 |
| Accumulated net realized loss on investments, futures contracts and swap contracts | | (9,998,557) |
| Undistributed net investment income | | 846,329 |
| TOTAL NET ASSETS | | $172,462,459 |
| Net Asset Value, Offering Price and Redemption Proceeds Per Share | | |
| Class A Shares: | | |
Net asset value per share ($71,571,864 ÷ 6,892,112 shares outstanding),
no par value, unlimited shares authorized | | $10.38 |
| Offering price per share (100/95.50 of $10.38) | | $10.87 |
| Redemption proceeds per share | | $10.38 |
| Institutional Shares: | | |
Net asset value per share ($100,890,595 ÷ 9,706,541 shares outstanding),
no par value, unlimited shares authorized | | $10.39 |
| Offering price per share | | $10.39 |
| Redemption proceeds per share | | $10.39 |
See Notes which are an integral part of the Financial Statements
Annual Shareholder Report
Statement of Operations
Year Ended November 30, 2012
| Investment Income: | | | |
| Dividends received from affiliated holdings (Note 5) | | | $7,773,384 |
| Interest | | | 840,394 |
| TOTAL INCOME | | | 8,613,778 |
| Expenses: | | | |
| Investment adviser fee (Note 5) | | $994,686 | |
| Administrative fee (Note 5) | | 175,791 | |
| Custodian fees | | 16,593 | |
| Transfer and dividend disbursing agent fees and expenses | | 127,722 | |
| Directors'/Trustees' fees | | 1,537 | |
| Auditing fees | | 28,500 | |
| Legal fees | | 11,795 | |
| Portfolio accounting fees | | 120,992 | |
| Shareholder services fee (Note 5) | | 118,372 | |
| Share registration costs | | 64,830 | |
| Printing and postage | | 31,512 | |
| Insurance premiums | | 3,477 | |
| Miscellaneous | | 1,299 | |
| TOTAL EXPENSES | | 1,697,106 | |
| Waivers and Reimbursement (Note 5): | | | |
| Waiver/reimbursement of investment adviser fee | $(222,274) | | |
| Waiver of administrative fee | (25,300) | | |
| TOTAL WAIVERS AND REIMBURSEMENT | | (247,574) | |
| Net expenses | | | 1,449,532 |
| Net investment income | | | 7,164,246 |
| Realized and Unrealized Gain (Loss) on Investments, Futures Contracts and Swap Contracts: | | | |
| Net realized loss on investments (including realized gain of $146,834 on sales of investments in affiliated holdings (Note 5)) | | | (4,917,866) |
| Net realized loss on swap contracts | | | (1,870,000) |
| Realized gain distributions from affiliated investment companies shares (Note 5) | | | 69,953 |
| Net realized loss on futures contracts | | | (4,739,147) |
| Net change in unrealized depreciation of investments | | | 4,939,139 |
| Net change in unrealized appreciation of futures contracts | | | (168,685) |
| Net realized and unrealized loss on investments, futures contracts and swap contracts | | | (6,686,606) |
| Change in net assets resulting from operations | | | $477,640 |
See Notes which are an integral part of the Financial Statements
Annual Shareholder Report
Statement of Changes in Net Assets
| | Year Ended
11/30/2012 | Period Ended
11/30/20111 |
| Increase (Decrease) in Net Assets | | |
| Operations: | | |
| Net investment income | $7,164,246 | $572,898 |
| Net realized loss on investments, futures contracts and swap contracts | (11,457,060) | (341,538) |
| Net change in unrealized appreciation/depreciation of investments and futures contracts | 4,770,454 | (412,848) |
| CHANGE IN NET ASSETS RESULTING FROM OPERATIONS | 477,640 | (181,488) |
| Distributions to Shareholders: | | |
| Distributions from net investment income | | |
| Class A Shares | (1,502,153) | (4,852) |
| Institutional Shares | (3,291,782) | (291,987) |
| CHANGE IN NET ASSETS RESULTING FROM DISTRIBUTIONS TO SHAREHOLDERS | (4,793,935) | (296,839) |
| Share Transactions: | | |
| Proceeds from sale of shares | 184,375,371 | 96,525,605 |
| Net asset value of shares issued to shareholders in payment of distributions declared | 3,426,133 | 235,626 |
| Cost of shares redeemed | (80,829,832) | (26,475,822) |
| CHANGE IN NET ASSETS RESULTING FROM SHARE TRANSACTIONS | 106,971,672 | 70,285,409 |
| Change in net assets | 102,655,377 | 69,807,082 |
| Net Assets: | | |
| Beginning of period | 69,807,082 | — |
| End of period (including undistributed net investment income of $846,329 and $310,960, respectively) | $172,462,459 | $69,807,082 |
| 1 | Reflects operations for the period from December 13, 2010 (date of initial investment) to November 30, 2011. |
See Notes which are an integral part of the Financial Statements
Annual Shareholder Report
Notes to Financial Statements
November 30, 2012
1. Organization
Federated Income Securities Trust (the “Trust”) is registered under the Investment Company Act of 1940, as amended (the “Act”), as an open-end management investment company. The Trust consists of nine portfolios. The financial statements included herein are only those of Federated Unconstrained Bond Fund (the “Fund”). The financial statements of the other portfolios are presented separately. The assets of each portfolio are segregated and a shareholder's interest is limited to the portfolio in which shares are held. Each portfolio pays its own expenses. The Fund offers two classes of shares: Class A Shares and Institutional Shares. All shares of the Fund have equal rights with respect to voting, except on class specific matters. The investment objective of the Fund is to provide high total returns.
2. Significant Accounting Policies
The following is a summary of significant accounting policies consistently followed by the Fund in the preparation of its financial statements. These policies are in conformity with U.S. generally accepted accounting principles (GAAP).
Investment Valuation
In calculating its net asset value (NAV), the Fund generally values investments as follows:
| ■ | Fixed-income securities acquired with remaining maturities greater than 60 days are fair valued using price evaluations provided by a pricing service approved by the Fund's Board of Trustees (the “ Trustees”). |
| ■ | Fixed-income securities acquired with remaining maturities of 60 days or less are valued at their cost (adjusted for the accretion of any discount or amortization of any premium), which approximates market value. |
| ■ | Shares of other mutual funds are valued based upon their reported NAVs. |
| ■ | Derivative contracts listed on exchanges are valued at their reported settlement or closing price. |
| ■ | Over-the-counter (OTC) derivative contracts are fair valued using price evaluations provided by a pricing service approved by the Trustees. |
| ■ | For securities that are fair valued in accordance with procedures established by and under the general supervision of the Trustees, certain factors may be considered such as: the purchase price of the security, information obtained by contacting the issuer, analysis of the issuer's financial statements or other available documents, fundamental analytical data, the nature and duration of restrictions on disposition, the movement of the market in which the security is normally traded and public trading in similar securities of the issuer or comparable issuers. |
If the Fund cannot obtain a price or price evaluation from a pricing service for an investment, the Fund may attempt to value the investment based upon the mean of bid and asked quotations or fair value the investment based on price evaluations, from one or more dealers. If any price, quotation, price evaluation or other pricing source is not readily available when the NAV is calculated, the Fund uses the fair value of the investment determined in accordance with the procedures described below. There can be no assurance that the Fund could purchase or sell an investment at the price used to calculate the Fund's NAV.
Annual Shareholder Report
Fair Valuation and Significant Events Procedures
The Trustees have appointed a Valuation Committee comprised of officers of the Fund, Federated Investment Management Company (“Adviser”) and the Adviser's affiliated companies to determine fair value of securities and in overseeing the calculation of the NAV. The Trustees have also authorized the use of pricing services recommended by the Valuation Committee to provide fair value evaluations of the current value of certain investments for purposes of calculating the NAV. The Valuation Committee employs various methods for reviewing third-party pricing service evaluations including periodic reviews of third-party pricing services' policies, procedures and valuation methods (including key inputs and assumptions), transactional back-testing, comparisons of evaluations of different pricing services and review of price challenges by the Adviser based on recent market activity. In the event that market quotations and price evaluations are not available for an investment, the Valuation Committee determines the fair value of the investment in accordance with procedures adopted by the Trustees. The Trustees periodically review and approve the fair valuations made by the Valuation Committee and any changes made to the procedures.
Factors considered by pricing services in evaluating an investment include the yields or prices of investments of comparable quality, coupon, maturity, call rights and other potential prepayments, terms and type, reported transactions, indications as to values from dealers and general market conditions. Some pricing services provide a single price evaluation reflecting the bid side of the market for an investment (a “bid” evaluation). Other pricing services offer both bid evaluations and price evaluations indicative of a price between the prices bid and asked for the investment (a “mid” evaluation). The Fund normally uses bid evaluations for U.S. Treasury and Agency securities, mortgage-backed securities and municipal securities. The Fund normally uses mid evaluations for other types of fixed-income securities and OTC derivative contracts. In the event that market quotations and price evaluations are not available for an investment, the fair value of the investment is determined in accordance with procedures adopted by the Trustees.
The Trustees also have adopted procedures requiring an investment to be priced at its fair value whenever the Adviser determines that a significant event affecting the value of the investment has occurred between the time as of which the price of the investment would otherwise be determined and the time as of which the NAV is computed. An event is considered significant if there is both an affirmative expectation that the investment's value will change in response to the event and a reasonable basis for quantifying the resulting change in value. Examples of significant events that may occur after the close of the principal market on which a security is traded, or after the time of a price evaluation provided by a pricing service or a dealer, include:
| ■ | With respect to securities traded in foreign markets, significant trends in U.S. equity markets or in the trading of foreign securities index futures contracts; |
| ■ | Political or other developments affecting the economy or markets in which an issuer conducts its operations or its securities are traded; and |
| ■ | Announcements concerning matters such as acquisitions, recapitalizations, litigation developments, a natural disaster affecting the issuer's operations or regulatory changes or market developments affecting the issuer's industry. |
Annual Shareholder Report
The Trustees have approved the use of a pricing service to determine the fair value of equity securities traded principally in foreign markets when the Adviser determines that there has been a significant trend in the U.S. equity markets or in index futures trading. For other significant events, the Fund may seek to obtain more current quotations or price evaluations from alternative pricing sources. If a reliable alternative pricing source is not available, the Fund will determine the fair value of the investment using another method approved by the Trustees.
Repurchase Agreements
The Fund may invest in repurchase agreements for short-term liquidity purposes. It is the policy of the Fund to require the other party to a repurchase agreement to transfer to the Fund's custodian or sub-custodian eligible securities or cash with a market value (after transaction costs) at least equal to the repurchase price to be paid under the repurchase agreement. The eligible securities are transferred to accounts with the custodian or sub-custodian in which the Fund holds a “securities entitlement” and exercises “control” as those terms are defined in the Uniform Commercial Code. The Fund has established procedures for monitoring the market value of the transferred securities and requiring the transfer of additional eligible securities if necessary to equal at least the repurchase price. These procedures also allow the other party to require securities to be transferred from the account to the extent that their market value exceeds the repurchase price or in exchange for other eligible securities of equivalent market value.
The insolvency of the other party or other failure to repurchase the securities may delay the disposition of the underlying securities or cause the Fund to receive less than the full repurchase price. Under the terms of the repurchase agreement, any amounts received by the Fund in excess of the repurchase price and related transaction costs must be remitted to the other party.
The Fund may enter into repurchase agreements in which eligible securities are transferred into joint trading accounts maintained by the custodian or sub-custodian for investment companies and other clients advised by the Fund's Adviser and its affiliates. The Fund will participate on a pro rata basis with the other investment companies and clients in its share of the securities transferred under such repurchase agreements and in its share of proceeds from any repurchase or other disposition of such securities.
Investment Income, Gains and Losses, Expenses and Distributions
Investment transactions are accounted for on a trade-date basis. Realized gains and losses from investment transactions are recorded on an identified-cost basis. Interest income and expenses are accrued daily. Dividend income and distributions to shareholders are recorded on the ex-dividend date. Foreign dividends are recorded on the ex-dividend date or when the Fund is informed of the ex-dividend date. Distributions of net investment income are declared and paid quarterly. Non-cash dividends included in dividend income, if any, are recorded at fair value. Investment income, realized and unrealized gains and losses and certain fund-level expenses are allocated to each class based on relative average daily net assets, except that Class A Shares and Institutional Shares may bear distribution services fees and shareholder services fees unique to those classes. Dividends are declared separately for each class. No class has preferential dividend rights; differences in per share dividend rates are generally due to differences in separate class expenses.
Annual Shareholder Report
Premium and Discount Amortization
All premiums and discounts on fixed-income securities are amortized/accreted using the effective interest rate method.
Federal Taxes
It is the Fund's policy to comply with the Subchapter M provision of the Internal Revenue Code (the “Code”) and to distribute to shareholders each year substantially all of its income. Accordingly, no provision for federal income tax is necessary. As of and during the year ended November 30, 2012, the Fund did not have a liability for any uncertain tax positions. The Fund recognizes interest and penalties, if any, related to tax liabilities as income tax expense in the Statement of Operations. As of November 30, 2012, tax years 2011 and 2012 remain subject to examination by the Fund's major tax jurisdictions, which include the United States of America and the Commonwealth of Massachusetts.
When-Issued and Delayed Delivery Transactions
The Fund may engage in when-issued or delayed delivery transactions. The Fund records when-issued securities on the trade date and maintains security positions such that sufficient liquid assets will be available to make payment for the securities purchased. Securities purchased on a when-issued or delayed delivery basis are marked to market daily and begin earning interest on the settlement date. Losses may occur on these transactions due to changes in market conditions or the failure of counterparties to perform under the contract.
Swap Contracts
Swap contracts involve two parties that agree to exchange the returns (or the differential in rates of return) earned or realized on particular predetermined investments, instruments, indices or other measures. The gross returns to be exchanged or “swapped” between parties are generally calculated with respect to a “notional amount” for a determined period of time. The Fund may enter into interest rate, total return, credit default, currency and other swap agreements. Risks may arise upon entering into swap agreements from the potential inability of the counterparties to meet the terms of their contract from unanticipated changes in the value of the swap agreement.
The Fund uses credit default swaps to manage exposure to a given issuer or sector by either selling protection to increase exposure, or buying protection to reduce exposure. The “buyer” in a credit default is obligated to pay the “ seller” a periodic stream of payments over the term of the contract provided that no event of default on an underlying reference obligation has occurred. If an event of default occurs, the seller must pay the buyer the full notional value, or the “par value,” of the reference obligation in exchange for the reference obligation. In connection with these agreements, securities may be identified as collateral in accordance with the terms of the respective swap agreements to provide assets of the value and recourse in the event of default or bankruptcy/solvency. Recovery values are assumed by market makers considering either industry standard recovery rates or entity specific factors and considerations until a credit event occurs. If a credit event has occurred, the recovery value is typically determined by a facilitated auction whereby a minimum number of allowable broker bids, together with a specific valuation method, are used to calculate the settlement value. The maximum amount of the payment that may occur, as a result of a credit event payable by the protection seller, is equal to the notional amount of the underlying index or security. The
Annual Shareholder Report
Fund's maximum risk of loss from counterparty credit risk, either as the protection buyer or as the protection seller, is the fair value of the contract. This risk is mitigated by having a master netting arrangement between the Fund and the counterparty and by the posting of collateral by the counterparty to the Fund to cover the Fund's exposure to the counterparty.
Upfront payments received or paid by the Fund will be reflected as an asset or liability on the Statement of Assets and Liabilities. Changes in the value of swap contracts are included in “Swaps, at value” on the Statement of Assets and Liabilities, and periodic payments are reported as “Net realized gain (loss) on swap contracts” in the Statement of Operations.
At November 30, 2012, the Fund had no outstanding swap contracts.
The average notional amount of swap contracts held by the Fund throughout the period was $30,461,538. This is based on amounts held as of each month-end throughout the fiscal period.
Futures Contracts
The Fund purchases and sells financial futures contracts to manage cash flows, enhance yield, manage duration and to potentially reduce transaction costs. Upon entering into a financial futures contract with a broker, the Fund is required to deposit in a segregated account a specified amount of cash or U.S. government securities which is shown as Restricted Cash in the Statements of Assets and Liabilities. Futures contracts are valued daily and unrealized gains or losses are recorded in a “variation margin” account. Daily, the Fund receives from or pays to the broker a specified amount of cash based upon changes in the variation margin account. When a contract is closed, the Fund recognizes a realized gain or loss. Futures contracts have market risks, including the risk that the change in the value of the contract may not correlate with the changes in the value of the underlying securities. There is minimal counterparty risk to the Fund since futures are exchange traded and the exchange's clearinghouse, as counterparty to all exchange traded futures, guarantees the futures against default.
As of November 30, 2012, the Fund had no outstanding futures contracts.
The average notional value of short futures contracts held by the Fund throughout the period was $15,292,200. This is based on amounts held as of each month-end throughout the fiscal period.
Additional Disclosure Related to Derivative Instruments
The Effect of Derivative Instruments on the Statement of Operations for the Year Ended November 30, 2012
| Amount of Realized Gain or (Loss) on Derivatives Recognized in Income |
| | Futures | Credit Default
Swap Contracts | Total |
| Interest rate contracts | $(4,739,147) | — | $(4,739,147) |
| Credit contracts | — | $(1,870,000) | $(1,870,000) |
| TOTAL | $(4,739,147) | $(1,870,000) | $(6,609,147) |
| Change in Unrealized Appreciation or (Depreciation) on Derivatives Recognized in Income |
| | Futures |
| Interest rate contracts | $(168,685) |
Annual Shareholder Report
Other
The preparation of financial statements in conformity with GAAP requires management to make estimates and assumptions that affect the amounts of assets, liabilities, expenses and revenues reported in the financial statements. Actual results could differ from those estimated.
3. Shares of Beneficial Interest
| Year Ended November 30 | 2012 | 20111 |
| Class A Shares: | Shares | Amount | Shares | Amount |
| Shares sold | 8,057,247 | $85,567,966 | 1,084,283 | $11,556,100 |
| Shares issued to shareholders in payment of distributions declared | 114,616 | 1,196,310 | 441 | 4,743 |
| Shares redeemed | (2,345,341) | (24,481,747) | (19,134) | (204,213) |
NET CHANGE RESULTING FROM
CLASS A SHARE TRANSACTIONS | 5,826,522 | $62,282,529 | 1,065,590 | $11,356,630 |
| Year Ended November 30 | 2012 | 20112 |
| Institutional Shares: | Shares | Amount | Shares | Amount |
| Shares sold | 9,278,541 | $98,807,405 | 7,912,896 | $84,969,505 |
| Shares issued to shareholders in payment of distributions declared | 213,267 | 2,229,823 | 7,234 | 230,883 |
| Shares redeemed | (5,352,276) | (56,348,085) | (2,353,121) | (26,271,609) |
NET CHANGE RESULTING FROM
INSTITUTIONAL SHARE TRANSACTIONS | 4,139,532 | $44,689,143 | 5,567,009 | $58,928,779 |
NET CHANGE RESULTING FROM
TOTAL FUND SHARE TRANSACTIONS | 9,966,054 | $106,971,672 | 6,632,599 | $70,285,409 |
| 1 | Reflects operations for the period from July 1, 2011 (date of initial investment) to November 30, 2011. |
| 2 | Reflects operations for the period from December 13, 2010 (date of initial investment) to November 30, 2011. |
4. Federal Tax Information
The timing and character of income and capital gain distributions are determined in accordance with income tax regulations, which may differ from GAAP. These differences are due to differing treatments for short-term gain distributions from registered investment companies, swap contracts and discount accretion/premium amortization on debt securities.
For the year ended November 30, 2012, permanent differences identified and reclassified among the components of net assets were as follows:
| Increase (Decrease) |
Undistributed
Net Investment
Income (Loss) | Accumulated
Net Realized
Gain (Loss) |
| $(1,834,942) | $1,834,942 |
Net investment income (loss), net realized gains (losses) and net assets were not affected by this reclassification.
Annual Shareholder Report
The tax character of distributions as reported on the Statement of Changes in Net Assets for the year ended November 30, 2012 and the period ended November 30, 2011 was as follows:
| | 2012 | 2011 |
| Ordinary income | $4,793,935 | $296,839 |
As of November 30, 2012, the components of distributable earnings on a tax basis were as follows:
| Undistributed ordinary income | $864,684 |
| Capital loss carryforward | $(10,033,313) |
| Net unrealized appreciation | $4,374,007 |
The difference between book-basis and tax-basis net unrealized appreciation/depreciation is attributable to differing treatments for the deferral of losses on wash sales and discount accretion/premium amortization on debt securities.
At November 30, 2012, the cost of investments for federal tax purposes was $169,480,557. The net unrealized appreciation of investments for federal tax purposes was $4,374,007. This consists of net unrealized appreciation from investments for those securities having an excess of value over cost of $4,565,906 and net unrealized depreciation from investments for those securities having an excess of cost over value of $191,899.
At November 30, 2012, the Fund had a capital loss carryforward of $10,033,313 which will reduce the Fund's taxable income arising from future net realized gains on investments, if any, to the extent permitted by the Code, thereby reducing the amount of distributions to shareholders which would otherwise be necessary to relieve the Fund of any liability for federal income tax. Pursuant to the Code, a net capital loss incurred in taxable years beginning on or before December 22, 2010, is characterized as short-term and may be carried forward for a maximum of eight tax years (“Carryforward Limit”), whereas a net capital loss incurred in taxable years beginning after December 22, 2010, retains its character as either short-term or long-term, does not expire and is required to be utilized prior to the losses which have a Carryforward Limit.
The following schedule summarizes the Fund's capital loss carryforwards and expiration years:
| Expiration Year | Short-Term | Long-Term | Total |
| No expiration | $7,406,186 | $2,418,073 | $9,824,259 |
| 2019 | $209,054 | NA | $209,054 |
5. Investment Adviser Fee and Other Transactions with Affiliates
Investment Adviser Fee
The advisory agreement between the Fund and the Adviser provides for an annual fee equal to 0.70% of the Fund's average daily net assets. Subject to the terms described in the Expense Limitation note, the Adviser may voluntarily choose to waive any portion of its fee. For the year ended November 30, 2012, the Adviser voluntarily waived $212,259 of its fee.
Annual Shareholder Report
Administrative Fee
Federated Administrative Services (FAS), under the Administrative Services Agreement, provides the Fund with administrative personnel and services. The fee paid to FAS is based on the average aggregate daily net assets of certain Federated funds as specified below, plus certain out-of-pocket expenses:
| Administrative Fee | Average Aggregate Daily Net Assets
of the Federated Funds |
| 0.150% | on the first $5 billion |
| 0.125% | on the next $5 billion |
| 0.100% | on the next $10 billion |
| 0.075% | on assets in excess of $20 billion |
Prior to September 1, 2012, the administrative fee received during any fiscal year was at least $150,000 per portfolio and $40,000 per each additional class of Shares. Subject to the terms described in the Expense Limitation note, FAS may voluntarily choose to waive any portion of its fee. For the year ended November 30, 2012, FAS waived $25,300 of its fee. The net fee paid to FAS was 0.106% of average daily net assets of the Fund.
Distribution Services Fee
The Fund has adopted a Distribution Plan (the “Plan”) pursuant to Rule 12b-1 under the Act. Under the terms of the Plan, the Fund will compensate Federated Securities Corp. (FSC), the principal distributor, from the daily net assets of the Fund's Class A Shares to finance activities intended to result in the sale of these shares. The Plan provides that the Fund may incur distribution expenses at 0.05% of average daily net assets annually to compensate FSC.
For the year ended November 30, 2012, the Fund's Class A Shares did not incur a distribution services fee; however, it may begin to incur this fee upon approval of the Trustees.
Sales Charges
Front-end sales charges and contingent deferred sales charges (CDSC) do not represent expenses of the Fund. They are deducted from the proceeds of sales of Fund shares prior to investment or from redemption proceeds prior to remittance, as applicable. For the year ended November 30, 2012, FSC retained $39,979 in sales charges from the sale of Class A Shares.
Shareholder Services Fee
The Fund may pay fees (“ Service Fees”) up to 0.25% of the average daily net assets of the Fund's Class A Shares to financial intermediaries or to Federated Shareholder Services Company (FSSC) for providing services to shareholders and maintaining shareholder accounts. Subject to the terms described in the Expense Limitation note, FSSC may voluntarily reimburse the Fund for Service Fees. For the year ended November 30, 2012, Service Fees for the Fund were as follows:
| | Service Fees
Incurred |
| Class A Shares | $118,372 |
For the year ended November 30, 2012, FSSC received $969 of Service Fees paid by the Fund.
Annual Shareholder Report
Expense Limitation
The Adviser and its affiliates (which may include FAS, FSC and FSSC) have voluntarily agreed to waive their fees and/or reimburse expenses so that the total annual fund operating expenses (as shown in the financial highlights) paid by the Fund's Class A Shares and Institutional Shares (after the voluntary waivers and reimbursements) will not exceed 1.18% and 0.93% (the “Fee Limit”), respectively, up to but not including the later of (the “ Termination Date”): (a) February 1, 2014; or (b) the date of the Fund's next effective Prospectus. While the Adviser and its affiliates currently do not anticipate terminating or increasing these arrangements prior to the Termination Date, these arrangements may only be terminated or the Fee Limit increased prior to the Termination Date with the agreement of the Fund's Trustees.
General
Certain Officers and Trustees of the Fund are Officers and Directors or Trustees of the above companies.
Transactions Involving Affiliated Holdings
Affiliated holdings are mutual funds which are managed by the Adviser or an affiliate of the Adviser. The Adviser has agreed to reimburse the Fund for certain investment adviser fees as a result of transactions in other affiliated mutual funds. For the year ended November 30, 2012, the Adviser reimbursed $10,015. Transactions involving the affiliated holdings during the year ended November 30, 2012, were as follows:
| | Federated
Prime Value
Obligations
Fund,
Institutional
Shares | High
Yield
Bond
Portfolio | Federated
Bank Loan
Core Fund | Federated
Project
and Trade
Finance
Core Fund | Total of
Affiliated
Transactions |
| Balance of Shares Held 11/30/2011 | 5,841,332 | 3,980,573 | 325,359 | 712,870 | 10,860,134 |
| Purchases/Additions | 201,899,605 | 10,178,767 | 2,479,197 | 465,326 | 215,022,895 |
| Sales/Reductions | (206,632,141) | (1,492,389) | — | — | (208,124,530) |
| Balance of Shares Held 11/30/2012 | 1,108,796 | 12,666,951 | 2,804,556 | 1,178,196 | 17,758,499 |
| Value | $1,108,796 | $84,361,893 | $28,634,517 | $11,558,101 | $125,663,307 |
| Dividend Income | $18,353 | $6,358,989 | $842,628 | $553,414 | $7,773,384 |
| Capital Gain Distribution | $— | $— | $15,133 | $54,820 | $69,953 |
Pursuant to an Exemptive Order issued by the Securities and Exchange Commission (SEC), the Fund may invest in a portfolio of Federated Core Trust (“Core Trust”), which is managed by Federated Investment Management Company, the Adviser. Core Trust is an open-end management company, registered under the Act, available only to registered investment companies and other institutional investors. The investment objective of High Yield Bond Portfolio, a portfolio of Core Trust, is to seek high current income. It pursues its objective by investing primarily in domestic high-yield bonds but may invest a portion of its portfolio in securities of issuers based outside of the United States. Federated Investors, Inc. receives no advisory or administrative fees from the funds within the Core Trust. Income distributions from
Annual Shareholder Report
High Yield Bond Portfolio are declared daily and paid monthly, and are recorded by the Fund as dividend income. Capital gain distributions, if any, from High Yield Bond Portfolio are declared and paid annually, and are recorded by the Fund as capital gains. A copy of the Core Trust's financial statements is available on the EDGAR Database on the SEC's website or upon request from the Fund.
6. Investment Transactions
Purchases and sales of investments, excluding long-term U.S. government securities and short-term obligations, for the year ended November 30, 2012, were as follows:
| Purchases | $115,621,030 |
| Sales | $32,931,272 |
7. Line of Credit
The Fund participates in a $100,000,000 unsecured, uncommitted revolving line of credit (LOC) agreement with PNC Bank. The LOC was made available for extraordinary or emergency purposes, primarily for financing redemption payments. Borrowings are charged interest at a rate offered to the Fund by PNC Bank at the time of the borrowing. As of November 30, 2012, there were no outstanding loans. During the year ended November 30, 2012, the Fund did not utilize the LOC.
8. Interfund Lending
Pursuant to an Exemptive Order issued by the SEC, the Fund, along with other funds advised by subsidiaries of Federated Investors, Inc., may participate in an interfund lending program. This program provides an alternative credit facility allowing the Fund to borrow from other participating affiliated funds. As of November 30, 2012, there were no outstanding loans. During the year ended November 30, 2012, the program was not utilized.
Annual Shareholder Report
Report of Independent Registered Public Accounting Firm
TO THE BOARD OF TRUSTEES OF THE FEDERATED Income Securities Trust AND SHAREHOLDERS OF Federated Unconstrained bond fund:
We have audited the accompanying statement of assets and liabilities, including the portfolio of investments, of the Federated Unconstrained Bond Fund (the “Fund”), a portfolio of Federated Income Securities Trust, as of November 30, 2012, and the related statement of operations for the year then ended and the statement of changes in net assets and the financial highlights for each of the years or periods in the two-year period then ended. These financial statements and financial highlights are the responsibility of the Fund's management. Our responsibility is to express an opinion on these financial statements and financial highlights based on our audit.
We conducted our audits in accordance with the standards of the Public Company Accounting Oversight Board (United States). Those standards require that we plan and perform the audit to obtain reasonable assurance about whether the financial statements and financial highlights are free of material misstatement. An audit includes examining, on a test basis, evidence supporting the amounts and disclosures in the financial statements. Our procedures included confirmation of securities owned as of November 30, 2012, by correspondence with the custodian, transfer agent, and brokers or by other appropriate auditing procedures. An audit also includes assessing the accounting principles used and significant estimates made by management, as well as evaluating the overall financial statement presentation. We believe that our audits provide a reasonable basis for our opinion.
In our opinion, the financial statements and financial highlights referred to above present fairly, in all material respects, the financial position of the Federated Unconstrained Bond Fund as of November 30, 2012, and the results of its operations for the year then ended and the changes in its net assets and the financial highlights for each of the years or periods in the two-year period then ended, in conformity with U.S. generally accepted accounting principles.
Boston, Massachusetts
January 23, 2013
Annual Shareholder Report
Shareholder Expense Example (unaudited)
As a shareholder of the Fund, you incur two types of costs: (1) transaction costs, including sales charges (“loads”) on purchase or redemption payments; and (2) ongoing costs, including management fees and to the extent applicable, distribution (12b-1) fees and/or shareholder services fees and other Fund expenses. This Example is intended to help you to understand your ongoing costs (in dollars) of investing in the Fund and to compare these costs with the ongoing costs of investing in other mutual funds. It is based on an investment of $1,000 invested at the beginning of the period and held for the entire period from June 1, 2012 to November 30, 2012.
ACTUAL EXPENSES
The first section of the table below provides information about actual account values and actual expenses. You may use the information in this section, together with the amount you invested, to estimate the expenses that you incurred over the period. Simply divide your account value by $1,000 (for example, an $8,600 account value divided by $1,000 = 8.6), then multiply the result by the number in the first section under the heading entitled “Expenses Paid During Period” to estimate the expenses attributable to your investment during this period.
HYPOTHETICAL EXAMPLE FOR COMPARISON PURPOSES
The second section of the table below provides information about hypothetical account values and hypothetical expenses based on the Fund's actual expense ratio and an assumed rate of return of 5% per year before expenses, which is not the Fund's actual return. Thus, you should not use the hypothetical account values and expenses to estimate the actual ending account balance or your expenses for the period. Rather, these figures are required to be provided to enable you to compare the ongoing costs of investing in the Fund with other funds. To do so, compare this 5% hypothetical example with the 5% hypothetical examples that appear in the shareholder reports of the other funds.
Annual Shareholder Report
Please note that the expenses shown in the table are meant to highlight your ongoing costs only and do not reflect any transaction costs, such as sales charges (loads) on purchase or redemption payments. Therefore, the second section of the table is useful in comparing ongoing costs only, and will not help you determine the relative total costs of owning different funds. In addition, if these transaction costs were included, your costs would have been higher.
| | Beginning
Account Value
6/1/2012 | Ending
Account Value
11/30/2012 | Expenses Paid
During Period1 |
| Actual: | | | |
| Class A Shares | $1,000 | $1,006.10 | $5.92 |
| Institutional Shares | $1,000 | $1,007.20 | $4.67 |
Hypothetical (assuming a 5% return
before expenses): | | | |
| Class A Shares | $1,000 | $1,019.10 | $5.96 |
| Institutional Shares | $1,000 | $1,020.35 | $4.70 |
| 1 | Expenses are equal to the Fund's annualized net expense ratios, multiplied by the average account value over the period, multiplied by 183/366 (to reflect the one-half-year period). The annualized net expense ratios are as follows: |
| Class A Shares | 1.18% |
| Institutional Shares | 0.93% |
Annual Shareholder Report
Board of Trustees and Trust Officers
The Board of Trustees is responsible for managing the Trust's business affairs and for exercising all the Trust's powers except those reserved for the shareholders. The following tables give information about each Trustee and the senior officers of the Fund. Where required, the tables separately list Trustees who are “interested persons” of the Fund (i.e., “Interested” Trustees) and those who are not (i.e., “ Independent” Trustees). Unless otherwise noted, the address of each person listed is Federated Investors Tower, 1001 Liberty Avenue, Pittsburgh, PA 15222. The address of all Independent Trustees listed is 4000 Ericsson Drive, Warrendale, PA 15086-7561; Attention: Mutual Fund Board. As of December 31, 2012, the Trust comprised nine portfolio(s), and the Federated Fund Family consisted of 42 investment companies (comprising 137 portfolios). Unless otherwise noted, each Officer is elected annually. Unless otherwise noted, each Trustee oversees all portfolios in the Federated Fund Family and serves for an indefinite term. The Fund's Statement of Additional Information includes additional information about Trust Trustees and is available, without charge and upon request, by calling 1-800-341-7400.
Interested Trustees Background
Name
Birth Date
Positions Held with Trust
Date Service Began | Principal Occupation(s) for Past Five Years,
Other Directorships Held and Previous Position(s) |
John F. Donahue*
Birth Date: July 28, 1924
Trustee
Began serving: January 1986 | Principal Occupations: Director or Trustee of the Federated Fund Family; Chairman and Director, Federated Investors, Inc.; Chairman of the Federated Fund Family's Executive Committee.
Previous Positions: Chairman of the Federated Fund Family; Trustee, Federated Investment Management Company; Chairman and Director, Federated Investment Counseling. |
J. Christopher Donahue*
Birth Date: April 11, 1949
President and Trustee
Began serving: January 2000 | Principal Occupations: Principal Executive Officer and President of the Federated Fund Family; Director or Trustee of some of the Funds in the Federated Fund Family; President, Chief Executive Officer and Director, Federated Investors, Inc.; Chairman and Trustee, Federated Investment Management Company; Trustee, Federated Investment Counseling; Chairman and Director, Federated Global Investment Management Corp.; Chairman, Federated Equity Management Company of Pennsylvania and Passport Research, Ltd. (investment advisory subsidiary of Federated); Trustee, Federated Shareholder Services Company; Director, Federated Services Company.
Previous Positions: President, Federated Investment Counseling; President and Chief Executive Officer, Federated Investment Management Company, Federated Global Investment Management Corp. and Passport Research, Ltd. |
| * | Family relationships and reasons for “interested” status: John F. Donahue is the father of J. Christopher Donahue; both are “interested” due to their beneficial ownership of shares of Federated Investors, Inc. and the positions they hold with Federated and its subsidiaries. |
Annual Shareholder Report
INDEPENDENT Trustees Background
Name
Birth Date
Positions Held with Trust
Date Service Began | Principal Occupation(s) for Past Five Years,
Other Directorships Held, Previous Position(s) and Qualifications |
John F. Cunningham
Birth Date: March 5, 1943
Trustee
Began serving: January 1999 | Principal Occupation: Director or Trustee of the Federated Fund Family.
Other Directorships Held: Chairman, President and Chief Executive Officer, Cunningham & Co., Inc. (strategic business consulting); Trustee Associate, Boston College.
Previous Positions: President and Chief Operating Officer, Wang Laboratories; Chairman of the Board and Chief Executive Officer, Computer Consoles, Inc.; Director, First National Bank of Boston; Director, EMC Corporation (computer storage systems); Director, Apollo Computer, Inc.; Director, Redgate Communications.
Qualifications: Business management and director experience. |
Maureen Lally-Green
Birth Date: July 5, 1949
Trustee
Began serving: August 2009 | Principal Occupations: Director or Trustee of the Federated Fund Family; Director, Office of Church Relations, Diocese of Pittsburgh; Adjunct Professor of Law, Duquesne University School of Law.
Other Directorships Held: Director, Auberle; Member, Pennsylvania State Board of Education; Director, Saint Vincent College; Director, Ireland Institute of Pittsburgh; Chair and Director, UPMC Mercy Hospital; Regent, St. Vincent Seminary; Director, Epilepsy Foundation of Western and Central Pennsylvania; Director, Saint Thomas More Society, Allegheny County; Director, Our Campaign for the Church Alive, Inc.; Associate General Secretary of the Diocese of Pittsburgh.
Previous Position: Pennsylvania Superior Court Judge.
Qualifications: Legal and director experience. |
Peter E. Madden
Birth Date: March 16, 1942
Trustee
Began serving: November 1991 | Principal Occupation: Director or Trustee, and Chairman of the Board of Directors or Trustees, of the Federated Fund Family.
Previous Positions: Representative, Commonwealth of Massachusetts General Court; President, Chief Operating Officer and Director, State Street Bank and Trust Company and State Street Corporation (retired); Director, VISA USA and VISA International; Chairman and Director, Massachusetts Bankers Association; Director, Depository Trust Corporation; Director, The Boston Stock Exchange.
Qualifications: Business management, mutual fund services and director experience. |
Annual Shareholder Report
Name
Birth Date
Positions Held with Trust
Date Service Began | Principal Occupation(s) for Past Five Years,
Other Directorships Held, Previous Position(s) and Qualifications |
Charles F. Mansfield, Jr.
Birth Date: April 10, 1945
Trustee
Began serving: January 2000 | Principal Occupations: Director or Trustee of the Federated Fund Family; Management Consultant.
Previous Positions: Chief Executive Officer, PBTC International Bank; Partner, Arthur Young & Company (now Ernst & Young LLP); Chief Financial Officer of Retail Banking Sector, Chase Manhattan Bank; Senior Vice President, HSBC Bank USA (formerly Marine Midland Bank); Vice President, Citibank; Assistant Professor of Banking and Finance, Frank G. Zarb School of Business, Hofstra University; Executive Vice President, DVC Group, Inc. (marketing, communications and technology).
Qualifications: Banking, business management, education and director experience. |
Thomas M. O'Neill
Birth Date: June 14, 1951
Trustee
Began serving: October 2006 | Principal Occupations: Director or Trustee, Vice Chairman of the Audit Committee of the Federated Fund Family; Sole Proprietor, Navigator Management Company (investment and strategic consulting).
Other Directorships Held: Board of Overseers, Children's Hospital of Boston; Visiting Committee on Athletics, Harvard College; Board of Directors, Medicines for Humanity; Board of Directors, The Golisano Children's Museum of Naples, Florida.
Previous Positions: Chief Executive Officer and President, Managing Director and Chief Investment Officer, Fleet Investment Advisors; President and Chief Executive Officer, Aeltus Investment Management, Inc.; General Partner, Hellman, Jordan Management Co., Boston, MA; Chief Investment Officer, The Putnam Companies, Boston, MA; Credit Analyst and Lending Officer, Fleet Bank; Director and Consultant, EZE Castle Software (investment order management software); Director, Midway Pacific (lumber).
Qualifications: Business management, mutual fund, director and investment experience. |
John S. Walsh
Birth Date: November 28, 1957
Trustee
Began serving: January 2000 | Principal Occupations: Director or Trustee, Chairman of the Audit Committee of the Federated Fund Family; President and Director, Heat Wagon, Inc. (manufacturer of construction temporary heaters); President and Director, Manufacturers Products, Inc. (distributor of portable construction heaters); President, Portable Heater Parts, a division of Manufacturers Products, Inc.
Previous Position: Vice President, Walsh & Kelly, Inc.
Qualifications: Business management and director experience. |
Annual Shareholder Report
OFFICERS**
Name
Birth Date
Positions Held with Trust
Date Service Began | Principal Occupation(s) and Previous Position(s) |
John W. McGonigle
Birth Date: October 26, 1938
EXECUTIVE VICE PRESIDENT AND SECRETARY
Officer since: January 1986 | Principal Occupations: Executive Vice President and Secretary of the Federated Fund Family; Vice Chairman, Executive Vice President, Secretary and Director, Federated Investors, Inc.
Previous Positions: Trustee, Federated Investment Management Company and Federated Investment Counseling; Director, Federated Global Investment Management Corp., Federated Services Company and Federated Securities Corp. |
Richard A. Novak
Birth Date: December 25, 1963
TREASURER
Officer since: January 2006 | Principal Occupations: Principal Financial Officer and Treasurer of the Federated Fund Family; Senior Vice President, Federated Administrative Services; Financial and Operations Principal for Federated Securities Corp., Edgewood Services, Inc. and Southpointe Distribution Services, Inc.
Previous Positions: Controller of Federated Investors, Inc.; Vice President, Finance of Federated Services Company; held various financial management positions within The Mercy Hospital of Pittsburgh; Auditor, Arthur Andersen & Co. |
Peter J. Germain
Birth Date: September 3, 1959
CHIEF LEGAL OFFICER
Officer since: January 2005 | Principal Occupations: Mr. Germain is Chief Legal Officer of the Federated Fund Family. He is General Counsel and Vice President, Federated Investors, Inc.; President, Federated Administrative Services and Federated Administrative Services, Inc.; Vice President, Federated Securities Corp.; Secretary, Federated Private Asset Management, Inc.; and Secretary, Retirement Plan Service Company of America. Mr. Germain joined Federated in 1984 and is a member of the Pennsylvania Bar Association.
Previous Positions: Deputy General Counsel, Special Counsel, Managing Director of Mutual Fund Services, Federated Investors, Inc.; Senior Vice President, Federated Services Company; and Senior Corporate Counsel, Federated Investors, Inc. |
Richard B. Fisher
Birth Date: May 17, 1923
VICE PRESIDENT
Officer since: January 1986 | Principal Occupations: Vice Chairman or Vice President of some of the Funds in the Federated Fund Family; Vice Chairman, Federated Investors, Inc.; Chairman, Federated Securities Corp.
Previous Positions: President and Director or Trustee of some of the Funds in the Federated Fund Family; Executive Vice President, Federated Investors, Inc.; Director and Chief Executive Officer, Federated Securities Corp. |
Brian P. Bouda
Birth Date: February 28, 1947
CHIEF COMPLIANCE OFFICER AND SENIOR VICE PRESIDENT
Officer since: August 2006 | Principal Occupations: Senior Vice President and Chief Compliance Officer of the Federated Fund Family; Vice President and Chief Compliance Officer of Federated Investors, Inc. and Chief Compliance Officer of its subsidiaries. Mr. Bouda joined Federated in 1999 and is a member of the American Bar Association and the State Bar Association of Wisconsin.
Previous Positions: Served in Senior Management positions with a large regional banking organization. |
Annual Shareholder Report
Name
Birth Date
Positions Held with Trust
Date Service Began | Principal Occupation(s) and Previous Position(s) |
Robert J. Ostrowski
Birth Date: April 26, 1963
Chief Investment Officer
Officer since: May 2004 | Principal Occupations: Robert J. Ostrowski joined Federated in 1987 as an Investment Analyst and became a Portfolio Manager in 1990. He was named Chief Investment Officer of taxable fixed-income products in 2004 and also serves as a Senior Portfolio Manager. Mr. Ostrowski became an Executive Vice President of the Fund's Adviser in 2009 and served as a Senior Vice President of the Fund's Adviser from 1997 to 2009. Mr. Ostrowski has received the Chartered Financial Analyst designation. He received his M.S. in Industrial Administration from Carnegie Mellon University. |
Joseph M. Balestrino
Birth Date: November 3, 1954
VICE PRESIDENT
Officer since: November 1998
Portfolio Manager since: December 2010 | Principal Occupations: Joseph M. Balestrino has been the Fund's Portfolio Manager since December 2010. He is Vice President of the Trust with respect to the Fund. Mr. Balestrino joined Federated in 1986 and has been a Senior Portfolio Manager and Senior Vice President of the Fund's Sub-Adviser since 1998. He was a Portfolio Manager and a Vice President of the Fund's Sub-Adviser from 1995 to 1998. Mr. Balestrino served as a Portfolio Manager and an Assistant Vice President of the Fund's Sub-Adviser from 1993 to 1995. Mr. Balestrino has received the Chartered Financial Analyst designation and holds a Master's Degree in Urban and Regional Planning from the University of Pittsburgh. |
Annual Shareholder Report
Evaluation and Approval of Advisory Contract–May 2012
Federated Unconstrained Bond Fund (the “Fund”)
Following a review and recommendation of approval by the Fund's independent trustees, the Fund's Board reviewed and approved at its May 2012 meetings the Fund's investment advisory contract for an additional one-year term. The Board's decision regarding the contract reflects the exercise of its business judgment on whether to continue the existing arrangements.
In this connection, the Federated Funds' Board had previously appointed a Senior Officer, whose duties include specified responsibilities relating to the process by which advisory fees are to be charged to a Federated fund. The Senior Officer has the authority to retain consultants, experts, or staff as may be reasonably necessary to assist in the performance of his duties, reports directly to the Board, and may be terminated only with the approval of a majority of the independent members of the Board. The Senior Officer prepared and furnished to the Board an independent, written evaluation that covered topics discussed below (the “Evaluation”). The Board considered that Evaluation, along with other information, in deciding to approve the advisory contract.
The Board is also familiar with and considered judicial decisions concerning allegedly excessive investment advisory fees, which have indicated that the following factors may be relevant to an Adviser's fiduciary duty with respect to its receipt of compensation from a fund: the nature and quality of the services provided by the Adviser to a fund and its shareholders, including the performance and expenses of the fund and of comparable funds; the Adviser's cost of providing the services, including the profitability to the Adviser of providing advisory services to a fund; the extent to which the Adviser may realize “economies of scale” as a fund grows larger and, if such economies exist, whether they have been shared with a fund and its shareholders; any “fall-out financial benefits” that accrue to the Adviser because of its relationship with a fund (including research services received from brokers that execute fund trades and any fees paid to affiliates of the Adviser for services rendered to a fund); comparative fee structures, including a comparison of fees paid to the Adviser with those paid by similar funds; and the extent to which the Board members are fully informed about all facts the Board deems relevant to its consideration of the Adviser's services and fees. Consistent with these judicial decisions, the Board also considered management fees (including any components thereof) charged to institutional and other clients of the Adviser for what might be viewed as like services. The Board was aware of these factors and was guided by them in its review of the Fund's advisory contract to the extent it considered them to be appropriate and relevant, as discussed further below.
Annual Shareholder Report
The Board considered and weighed these circumstances in light of its substantial accumulated experience in governing the Fund and working with Federated on matters relating to the Federated funds, and was assisted in its deliberations by independent legal counsel. Throughout the year, and in connection with its May meetings, the Board requested and received substantial and detailed information about the Fund and the Federated organization that was in addition to the extensive materials that comprise and accompany the Senior Officer's Evaluation. Federated provided much of this information at each regular meeting of the Board, and furnished additional substantial information in connection with the May meeting at which the Board's formal review of the advisory contract occurred. At this May meeting, senior management of the Adviser also met with the independent trustees and their counsel to discuss the materials presented and any other matters thought relevant by the Adviser or the trustees. Between regularly scheduled meetings, the Board also received information on particular matters as the need arose. Thus, the Board's consideration of the advisory contract included review of the Senior Officer's Evaluation, accompanying data and additional information covering such matters as: the Adviser's investment philosophy, revenue, profitability, personnel and processes; investment and operating strategies; the Fund's short- and long-term performance (in absolute terms, both on a gross basis and net of expenses, as well as in relationship to its particular investment program and certain competitor or “peer group” funds and/or other benchmarks, as appropriate), and comments on the reasons for performance; the Fund's investment objectives; the Fund's expenses (including the advisory fee itself and the overall expense structure of the Fund, both in absolute terms and relative to similar and/or competing funds, with due regard for contractual or voluntary expense limitations); the use and allocation of brokerage commissions derived from trading the Fund's portfolio securities (if any); and the nature, quality and extent of the advisory and other services provided to the Fund by the Adviser and its affiliates. The Board also considered the preferences and expectations of Fund shareholders; the entrepreneurial risk assumed by the Adviser in sponsoring the funds; the continuing state of competition in the mutual fund industry and market practices; the range of comparable fees for similar funds in the mutual fund industry; the Fund's relationship to the Federated family of funds which include a comprehensive array of funds with different investment objectives, policies and strategies which are available for exchange without the incurrence of additional sales charges; compliance and audit reports concerning the Federated funds and the Federated companies that service them (including communications from regulatory agencies), as well as Federated's responses to any issues raised therein; and relevant developments in the mutual fund industry and how the Federated funds and/or Federated are responding to them. The Board's evaluation process is evolutionary. The criteria considered and the emphasis placed on relevant criteria change in recognition of changing circumstances in the mutual fund marketplace.
Annual Shareholder Report
While mindful that courts have cautioned against giving such comparisons too much weight, the Board has found the use of comparisons of the Fund's fees and expenses to other mutual funds with comparable investment programs to be relevant, given the high degree of competition in the mutual fund business. The Board focused on comparisons with other similar mutual funds more heavily than non-mutual fund products or services because it is believed that they are more relevant. For example, other mutual funds are the products most like the Fund, they are readily available to Fund shareholders as alternative investment vehicles, and they are the type of investment vehicle in fact chosen and maintained by the Fund's investors. The range of their fees and expenses therefore appears to be a generally reliable indication of what consumers have found to be reasonable in the precise marketplace in which the Fund competes. In this regard, the Senior Officer has reviewed Federated's fees for providing advisory services to products outside the Federated family of funds (e.g., institutional and separate accounts). He concluded that mutual funds and institutional accounts are inherently different products. Those differences include, but are not limited to, different types of targeted investors; being subject to different laws and regulations; different legal structures; different average account sizes; different associated costs; different portfolio management techniques made necessary by different cash flows; and portfolio manager time spent in review of securities pricing. The Senior Officer did not consider these fee schedules to be determinative in judging the appropriateness of mutual fund advisory contracts.
The Fund's ability to deliver competitive performance when compared to its peer group was also deemed to be relevant by the Board as a useful indicator of how the Adviser is executing the Fund's investment program, which in turn assisted the Board in reaching a conclusion that the nature, extent, and quality of the Adviser's investment management services were such as to warrant continuation of the advisory contract.
The Senior Officer reviewed information compiled by Federated, using data supplied by independent fund ranking organizations, regarding the performance of, and fees charged by, other mutual funds, noting his view that comparisons to fund peer groups are relevant in judging the reasonableness of proposed fees.
For the one-year period covered by the Evaluation, the Fund's performance was above the median of the relevant peer group.
The Board also received financial information about Federated, including information regarding the compensation and benefits Federated derived from its relationships with the Federated funds. This information covered not only the fees under the advisory contracts, but also fees received by Federated's subsidiaries for providing other services to the Federated funds under separate contracts (e.g., for serving as the Federated funds' administrator). The information also detailed any indirect benefit Federated may derive from its receipt of research services from brokers who execute Federated fund trades. In addition, the Board considered the fact that, in order for a fund to be
Annual Shareholder Report
competitive in the marketplace, Federated and its affiliates frequently waived fees and/or reimbursed expenses and have disclosed to fund investors and/or indicated to the Board their intention to do so in the future, where appropriate. Moreover, the Board receives regular reporting as to the institution or elimination of these voluntary waivers.
Federated furnished information, requested by the Senior Officer, that reported revenues on a fund-by-fund basis and made estimates of the allocation of expenses on a fund-by-fund basis, using allocation methodologies specified by the Senior Officer. The Senior Officer noted that, although they may apply consistent allocation processes, the inherent difficulties in allocating costs (and the unavoidable arbitrary aspects of that exercise) and the lack of consensus on how to allocate those costs may render such allocation information unreliable. The allocation information was considered in the analysis by the Board but was determined to be of limited use.
The Board and the Senior Officer also reviewed information compiled by Federated comparing profitability information for Federated to other publicly held fund management companies. In this regard, the Senior Officer noted the limited availability of such information, but nonetheless concluded that Federated's profit margins did not appear to be excessive.
The Senior Officer's Evaluation also discussed the notion of possible realization of “economies of scale” as a fund grows larger. The Board considered in this regard that the Adviser has made significant and long-term investments in areas that support all of the Federated funds, such as personnel and processes for the portfolio management, shareholder services, compliance, internal audit, and risk management functions; and systems technology; and that the benefits of these efforts (as well as any economies, should they exist) were likely to be enjoyed by the fund complex as a whole. Finally, the Board also noted the absence of any applicable regulatory or industry guidelines on this subject, which (as discussed in the Senior Officer's Evaluation) is compounded by the lack of any common industry practice or general pattern with respect to structuring fund advisory fees with “breakpoints” that serve to reduce the fee as the fund attains a certain size. The Senior Officer did not recommend institution of breakpoints in pricing Federated's fund advisory services at this time.
It was noted in the materials for the Board meeting that for the period covered by the Evaluation, the Fund's investment advisory fee was waived in its entirety. The Board reviewed the contractual fee rate and other expenses of the Fund with the Adviser and was satisfied that the overall expense structure of the Fund remained competitive.
The Senior Officer noted that, considering the totality of the circumstances, and all of the factors referenced within his Evaluation, he had concluded that, subject to comments and recommendations made within his Evaluation, his observations and the information accompanying the Evaluation supported a finding by the Board that the management fees for each of the funds was
Annual Shareholder Report
reasonable and that Federated appeared to provide appropriate advisory and administrative services to the Fund for the fees paid. Under these circumstances, no changes were recommended to, and no objection was raised to, the continuation of the Fund's advisory contract.
In its decision to continue an existing investment advisory contract, the Board was mindful of the potential disruptions of the Fund's operations and various risks, uncertainties and other effects that could occur as a result of a decision to terminate or not renew an advisory contract. In particular, the Board recognized that many shareholders have invested in the Fund on the strength of the Adviser's industry standing and reputation and with the expectation that the Adviser will have a continuing role in providing advisory services to the Fund. Thus, the Board's approval of the advisory contract reflected the fact that it is the shareholders who have effectively selected the Adviser by virtue of having invested in the Fund. The Board concluded that, in light of the factors discussed above, including the nature, quality and scope of the services provided to the Fund by the Adviser and its affiliates, continuation of the advisory contract was appropriate.
The Board based its decision to approve the advisory contract on the totality of the circumstances and relevant factors and with a view to past and future long-term considerations. Not all of the factors and considerations identified above were necessarily relevant to the Fund, nor did the Board consider any one of them to be determinative. With respect to the factors that were relevant, the Board's decision to approve the contract reflects its determination that Federated's performance and actions provided a satisfactory basis to support the decision to continue the existing arrangements.
Annual Shareholder Report
Voting Proxies on Fund Portfolio Securities
A description of the policies and procedures that the Fund uses to determine how to vote proxies, if any, relating to securities held in the Fund's portfolio is available, without charge and upon request, by calling 1-800-341-7400. A report on “ Form N-PX” of how the Fund voted any such proxies during the most recent 12-month period ended June 30 is available from Federated's website at FederatedInvestors.com. To access this information from the home page, select “All” under “Asset Classes.” Select a fund name and share class, if applicable, to go to the Fund Overview page. On the Fund Overview page, select the “Documents” tab. At the bottom of that page, select “Proxy Voting Record Report (Form N-PX).” Form N-PX filings are also available at the SEC's website at www.sec.gov.
Quarterly Portfolio Schedule
The Fund files with the SEC a complete schedule of its portfolio holdings, as of the close of the first and third quarters of its fiscal year, on “Form N-Q.” These filings are available on the SEC's website at www.sec.gov and may be reviewed and copied at the SEC's Public Reference Room in Washington, DC. (Call 1-800-SEC-0330 for information on the operation of the Public Reference Room.) You may also access this information from the “ Products” section of Federated's website at FederatedInvestors.com. From the home page, select “All” under “Asset Classes.” Select a fund name and share class, if applicable, to go to the Fund Overview page. On the Fund Overview page, select the “Documents” tab. At the bottom of that page, select “Form N-Q.”
Annual Shareholder Report
Mutual funds are not bank deposits or obligations, are not guaranteed by any bank and are not insured or guaranteed by the U.S. government, the Federal Deposit Insurance Corporation, the Federal Reserve Board or any other government agency. Investment in mutual funds involves investment risk, including the possible loss of principal.
This Report is authorized for distribution to prospective investors only when preceded or accompanied by the Fund's Prospectus, which contains facts concerning its objective and policies, management fees, expenses and other information.
Federated Unconstrained Bond Fund
Federated Investors Funds
4000 Ericsson Drive
Warrendale, PA 15086-7561
Contact us at FederatedInvestors.com
or call 1-800-341-7400.
Federated Securities Corp., Distributor
CUSIP 31420C639
CUSIP 31420C662
Q450775 (1/13)
Federated is a registered trademark of Federated Investors, Inc.
2013 ©Federated Investors, Inc.
Item 2. Code of Ethics
(a) As of the end of the period covered by this report, the registrant has adopted a code of ethics (the "Section 406 Standards for Investment Companies - Ethical Standards for Principal Executive and Financial Officers") that applies to the registrant's Principal Executive Officer and Principal Financial Officer; the registrant's Principal Financial Officer also serves as the Principal Accounting Officer.
(c) Not Applicable
(d) Not Applicable
(e) Not Applicable
(f)(3) The registrant hereby undertakes to provide any person, without charge, upon request, a copy of the code of ethics. To request a copy of the code of ethics, contact the registrant at 1-800-341-7400, and ask for a copy of the Section 406 Standards for Investment Companies - Ethical Standards for Principal Executive and Financial Officers.
Item 3. Audit Committee Financial Expert
The registrant's Board has determined that each of the following members of the Board's Audit Committee is an “audit committee financial expert,” and is "independent," for purposes of this Item: Charles F. Mansfield, Jr., Thomas M. O'Neill and John S. Walsh.
Item 4. Principal Accountant Fees and Services
(a) Audit Fees billed to the registrant for the two most recent fiscal years:
Fiscal year ended 2012 - $253,500
Fiscal year ended 2011 - $238,550
(b) Audit-Related Fees billed to the registrant for the two most recent fiscal years:
Fiscal year ended 2012 - $218
Fiscal year ended 2011 - $0
Travel to Audit Committee Meeting.
Amount requiring approval of the registrant’s audit committee pursuant to paragraph (c)(7)(ii) of Rule 2-01 of Regulation S-X, $0 and $0 respectively.
(c) Tax Fees billed to the registrant for the two most recent fiscal years:
Fiscal year ended 2012 - $0
Fiscal year ended 2011 - $0
Amount requiring approval of the registrant’s audit committee pursuant to paragraph (c)(7)(ii) of Rule 2-01 of Regulation S-X, $2,504 and $4,978 respectively. Fiscal year ended 2012- Tax preparation fees for fiscal year end 2011. Fiscal year ended 2011- Tax preparation fees for fiscal year end 2011.
(d) All Other Fees billed to the registrant for the two most recent fiscal years:
Fiscal year ended 2012 - $0
Fiscal year ended 2011 - $0
Amount requiring approval of the registrant’s audit committee pursuant to paragraph (c)(7)(ii) of Rule 2-01 of Regulation S-X, $16,345 and $36,504 respectively. Fiscal year ended 2012- Service fee for analysis of potential Passive Foreign Investment Company holdings. Fiscal year ended 2011 – Service fee for analysis of potential Passive Foreign Investment Company holdings.
(e)(1) Audit Committee Policies regarding Pre-approval of Services.
The Audit Committee is required to pre-approve audit and non-audit services performed by the independent auditor in order to assure that the provision of such services do not impair the auditor’s independence. Unless a type of service to be provided by the independent auditor has received general pre-approval, it will require specific pre-approval by the Audit Committee. Any proposed services exceeding pre-approved cost levels will require specific pre-approval by the Audit Committee.
Certain services have the general pre-approval of the Audit Committee. The term of the general pre-approval is 12 months from the date of pre-approval, unless the Audit Committee specifically provides for a different period. The Audit Committee will annually review the services that may be provided by the independent auditor without obtaining specific pre-approval from the Audit Committee and may grant general pre-approval for such services. The Audit Committee will revise the list of general pre-approved services from time to time, based on subsequent determinations. The Audit Committee will not delegate its responsibilities to pre-approve services performed by the independent auditor to management.
The Audit Committee has delegated pre-approval authority to its Chairman. The Chairman will report any pre-approval decisions to the Audit Committee at its next scheduled meeting. The Committee will designate another member with such pre-approval authority when the Chairman is unavailable.
AUDIT SERVICES
The annual Audit services engagement terms and fees will be subject to the specific pre-approval of the Audit Committee. The Audit Committee must approve any changes in terms, conditions and fees resulting from changes in audit scope, registered investment company (RIC) structure or other matters.
In addition to the annual Audit services engagement specifically approved by the Audit Committee, the Audit Committee may grant general pre-approval for other Audit Services, which are those services that only the independent auditor reasonably can provide. The Audit Committee has pre-approved certain Audit services, all other Audit services must be specifically pre-approved by the Audit Committee.
AUDIT-RELATED SERVICES
Audit-related services are assurance and related services that are reasonably related to the performance of the audit or review of the Company’s financial statements or that are traditionally performed by the independent auditor. The Audit Committee believes that the provision of Audit-related services does not impair the independence of the auditor, and has pre-approved certain Audit-related services, all other Audit-related services must be specifically pre-approved by the Audit Committee.
TAX SERVICES
The Audit Committee believes that the independent auditor can provide Tax services to the Company such as tax compliance, tax planning and tax advice without impairing the auditor’s independence. However, the Audit Committee will not permit the retention of the independent auditor in connection with a transaction initially recommended by the independent auditor, the purpose of which may be tax avoidance and the tax treatment of which may not be supported in the Internal Revenue Code and related regulations. The Audit Committee has pre-approved certain Tax services, all Tax services involving large and complex transactions must be specifically pre-approved by the Audit Committee.
ALL OTHER SERVICES
With respect to the provision of services other than audit, review or attest services the pre-approval requirement is waived if:
| (1) | The aggregate amount of all such services provided constitutes no more than five percent of the total amount of revenues paid by the registrant, the registrant’s adviser (not including any sub-adviser whose role is primarily portfolio management and is subcontracted with or overseen by another investment adviser), and any entity controlling, controlled by, or under common control with the investment adviser that provides ongoing services to the registrant to its accountant during the fiscal year in which the services are provided; |
| (2) | Such services were not recognized by the registrant, the registrant’s adviser (not including any sub-adviser whose role is primarily portfolio management and is subcontracted with or overseen by another investment adviser), and any entity controlling, controlled by, or under common control with the investment adviser that provides ongoing services to the registrant at the time of the engagement to be non-audit services; and |
| (3) | Such services are promptly brought to the attention of the Audit Committee of the issuer and approved prior to the completion of the audit by the Audit Committee or by one or more members of the Audit Committee who are members of the board of directors to whom authority to grant such approvals has been delegated by the Audit Committee. |
The Audit Committee may grant general pre-approval to those permissible non-audit services classified as All Other services that it believes are routine and recurring services, and would not impair the independence of the auditor.
The SEC’s rules and relevant guidance should be consulted to determine the precise definitions of prohibited non-audit services and the applicability of exceptions to certain of the prohibitions.
PRE-APPROVAL FEE LEVELS
Pre-approval fee levels for all services to be provided by the independent auditor will be established annually by the Audit Committee. Any proposed services exceeding these levels will require specific pre-approval by the Audit Committee.
PROCEDURES
Requests or applications to provide services that require specific approval by the Audit Committee will be submitted to the Audit Committee by both the independent auditor and the Principal Accounting Officer and/or Internal Auditor, and must include a joint statement as to whether, in their view, the request or application is consistent with the SEC’s rules on auditor independence.
(e)(2) Percentage of services identified in items 4(b) through 4(d) that were approved by the registrants audit committee pursuant to paragraph (c)(7)(i)(C) of Rule 2-01 of Regulation S-X:
4(b)
Fiscal year ended 2012 – 0%
Fiscal year ended 2011 - 0%
Percentage of services provided to the registrants investment adviser and any entity controlling, controlled by, or under common control with the investment adviser that provides ongoing services to the registrant that were approved by the registrants audit committee pursuant to paragraph (c)(7)(i)(C) of Rule 2-01 of Regulation S-X, 0% and 0% respectively.
4(c)
Fiscal year ended 2012 – 0%
Fiscal year ended 2011 – 0%
Percentage of services provided to the registrants investment adviser and any entity controlling, controlled by, or under common control with the investment adviser that provides ongoing services to the registrant that were approved by the registrants audit committee pursuant to paragraph (c)(7)(i)(C) of Rule 2-01 of Regulation S-X, 0% and 0% respectively.
4(d)
Fiscal year ended 2012 – 0%
Fiscal year ended 2011 – 0%
Percentage of services provided to the registrants investment adviser and any entity controlling, controlled by, or under common control with the investment adviser that provides ongoing services to the registrant that were approved by the registrants audit committee pursuant to paragraph (c)(7)(i)(C) of Rule 2-01 of Regulation S-X, 0% and 0% respectively.
| (g) | Non-Audit Fees billed to the registrant, the registrant’s investment adviser, and certain entities controlling, controlled by or under common control with the investment adviser: |
Fiscal year ended 2012 - $351,074
Fiscal year ended 2011 - $433,183
(h) The registrant’s Audit Committee has considered that the provision of non-audit services that were rendered to the registrant’s adviser (not including any sub-adviser whose role is primarily portfolio management and is subcontracted with or overseen by another investment adviser), and any entity controlling, controlled by, or under common control with the investment adviser that provides ongoing services to the registrant that were not pre-approved pursuant to paragraph (c)(7)(ii) of Rule 2-01 of Regulation S-X is compatible with maintaining the principal accountant’s independence.
Item 5. Audit Committee of Listed Registrants
Not Applicable
Item 6. Schedule of Investments
(a) The registrant’s Schedule of Investments is included as part of the Report to Stockholders filed under Item 1 of this form.
(b) Not Applicable; Fund had no divestments during the reporting period covered since the previous Form N-CSR filing.
Item 7. Disclosure of Proxy Voting Policies and Procedures for Closed-End Management Investment Companies
Item 8. Portfolio Managers of Closed-End Management Investment Companies
Item 9. Purchases of Equity Securities by Closed-End Management Investment Company and Affiliated Purchasers
Item 10. Submission of Matters to a Vote of Security Holders
Not Applicable
Item 11. Controls and Procedures
(a) The registrant’s President and Treasurer have concluded that the
registrant’s disclosure controls and procedures (as defined in rule 30a-3(c) under the Act) are effective in design and operation and are sufficient to form the basis of the certifications required by Rule 30a-(2) under the Act, based on their evaluation of these disclosure controls and procedures within 90 days of the filing date of this report on Form N-CSR.
(b) There were no changes in the registrant’s internal control over financial reporting (as defined in rule 30a-3(d) under the Act) during the second fiscal quarter of the period covered by this report that have materially affected, or are reasonably likely to materially affect, the registrant’s internal control over financial reporting.
Item 12. Exhibits
(a)(1) Code of Ethics- Not Applicable to this Report.
(a)(2) Certifications of Principal Executive Officer and Principal Financial Officer.
(a)(3) Not Applicable.
(b) Certifications pursuant to 18 U.S.C. Section 1350.
SIGNATURES
Pursuant to the requirements of the Securities Exchange Act of 1934 and the Investment Company Act of 1940, the registrant has duly caused this report to be signed on its behalf by the undersigned, thereunto duly authorized.
Registrant Federated Income Securities Trust
By /S/ Richard A. Novak
Richard A. Novak, Principal Financial Officer
Date January 22, 2013
Pursuant to the requirements of the Securities Exchange Act of 1934 and the Investment Company Act of 1940, this report has been signed below by the following persons on behalf of the registrant and in the capacities and on the dates indicated.
By /S/ J. Christopher Donahue
J. Christopher Donahue, Principal Executive Officer
Date January 22, 2013
By /S/ Richard A. Novak
Richard A. Novak, Principal Financial Officer
Date January 22, 2013