 © Copyright 2011 EMC Corporation. All rights reserved. Joe Tucci Boston, Feb. 8, 2011 Exhibit 99.1 EMC Strategic Forum |
 © Copyright 2011 EMC Corporation. All rights reserved. Forward-Looking Statements and GAAP Reconciliation This presentation contains non-GAAP financial measures which include, but are not limited to, non-GAAP Gross Margin, non-GAAP Operating Margin Non-GAAP Net Income, non-GAAP EPS and Free Cash Flow. A reconciliation GAAP to non-GAAP results to GAAP is included within this presentation and is available at http://www.emc.com/about/investor- relations/archived-events.htm. This presentation contains “forward-looking statements” as defined under the Federal Securities Laws. Actual results could differ materially from those projected in the forward-looking statements as a result of certain risk factors, including but not limited to: (i) adverse changes in general economic or market conditions; (ii) delays or reductions in information technology spending; (iii) our ability to protect our proprietary technology; (iv) risks associated with managing the growth of our business, including risks associated with acquisitions and investments and the challenges and costs of integration, restructuring and achieving anticipated synergies; (v) fluctuations in VMware, Inc.’s operating results and risks associated with trading of VMware stock; (vi) competitive factors, including but not limited to pricing pressures and new product introductions; (vii) the relative and varying rates of product price and component cost declines and the volume and mixture of product and services revenues; (viii) component and product quality and availability; (ix) the transition to new products, the uncertainty of customer acceptance of new product offerings and rapid technological and market change; (x) insufficient, excess or obsolete inventory; (xi) war or acts of terrorism; (xii) the ability to attract and retain highly qualified employees; (xiii) fluctuating currency exchange rates; and (xiv) other one-time events and other important factors disclosed previously and from time to time in EMC’s filings with the U.S. Securities and Exchange Commission. EMC disclaims any obligation to update any such forward-looking statements after the date of this presentation. |
 © Copyright 2011 EMC Corporation. All rights reserved. Our Last Strategic Forum: March 10, 2009 Virtual Infrastructure Information Infrastructure |
 © Copyright 2011 EMC Corporation. All rights reserved. Information / Virtual Infrastructure Sales Services Solutions Support Partner Ecosystem Protect Store Virtualize & Automate +Intelligence Our Technology Focus |
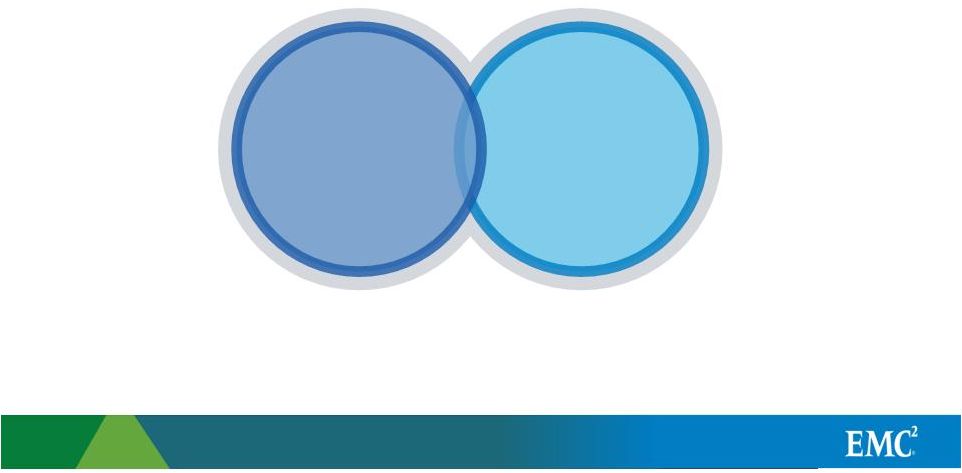
 Waves of Information Technology Mini Mainframe Networked/ Distributed Computing PC/ microprocessor Cloud Computing © Copyright 2011 EMC Corporation. All rights reserved. |
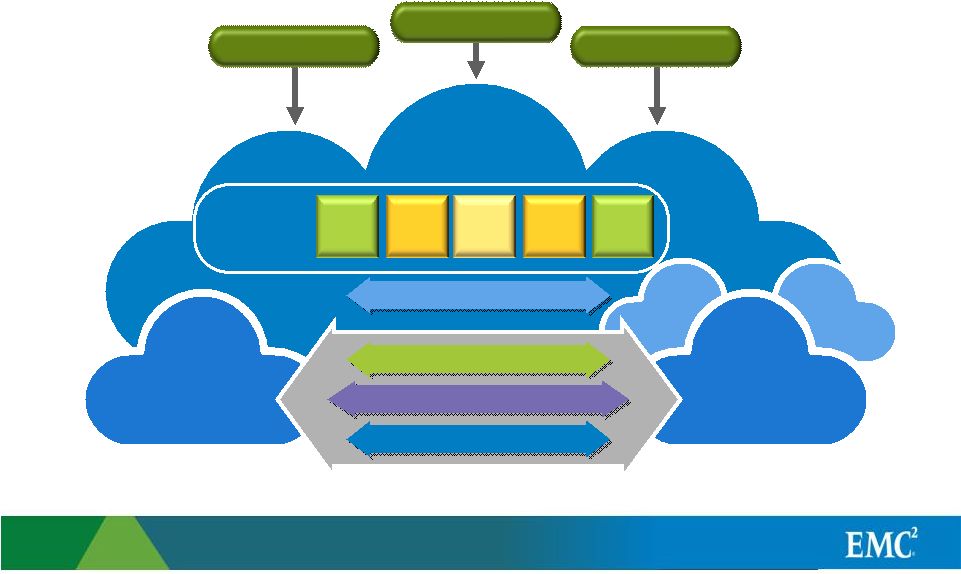 © Copyright 2011 EMC Corporation. All rights reserved. App Loads App Loads App Loads App Loads App Loads Virtualized Data Center Cloud Computing Private Cloud The Private Cloud External (Public) Cloud Internal Cloud Security vSphere = Cloud OS Information Federation Virtual Applications Virtual Client Virtual Client Virtual Client |
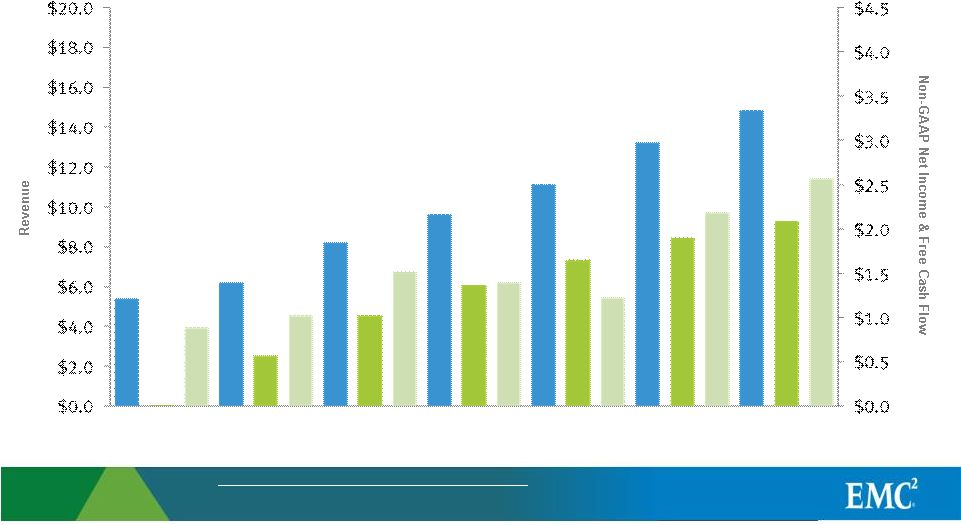 © Copyright 2011 EMC Corporation. All rights reserved. Consistent Performance $ Billions $ Billions 2008 2007 2006 2005 2004 2003 2002 Refer to the schedules available at http://www.emc.com/about/investor-relations/archived-events.htm for a complete reconciliation of GAAP to non-GAAP results |
 © Copyright 2011 EMC Corporation. All rights reserved. Great Recession of 2009 |
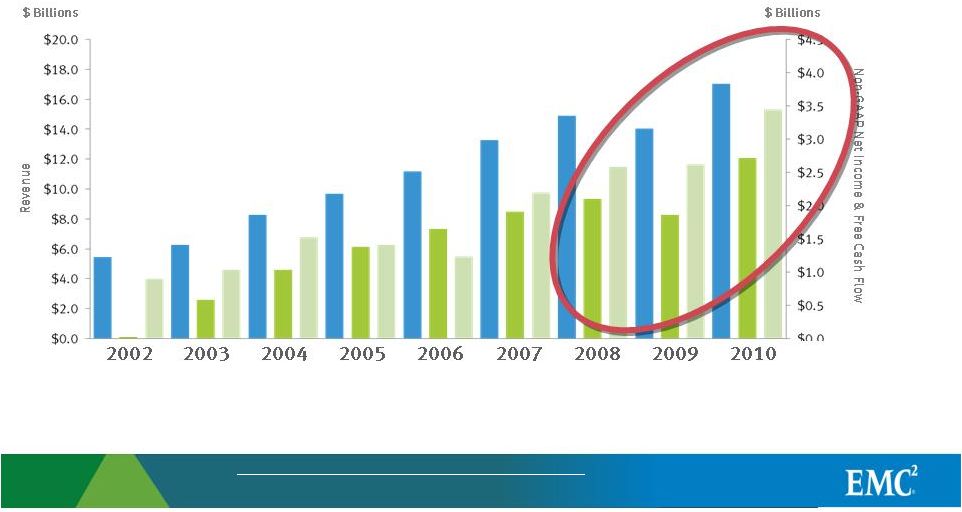 © Copyright 2011 EMC Corporation. All rights reserved. Strong Recovery Refer to the schedules available at http://www.emc.com/about/investor-relations/archived-events.htm for a complete reconciliation of GAAP to non-GAAP results |
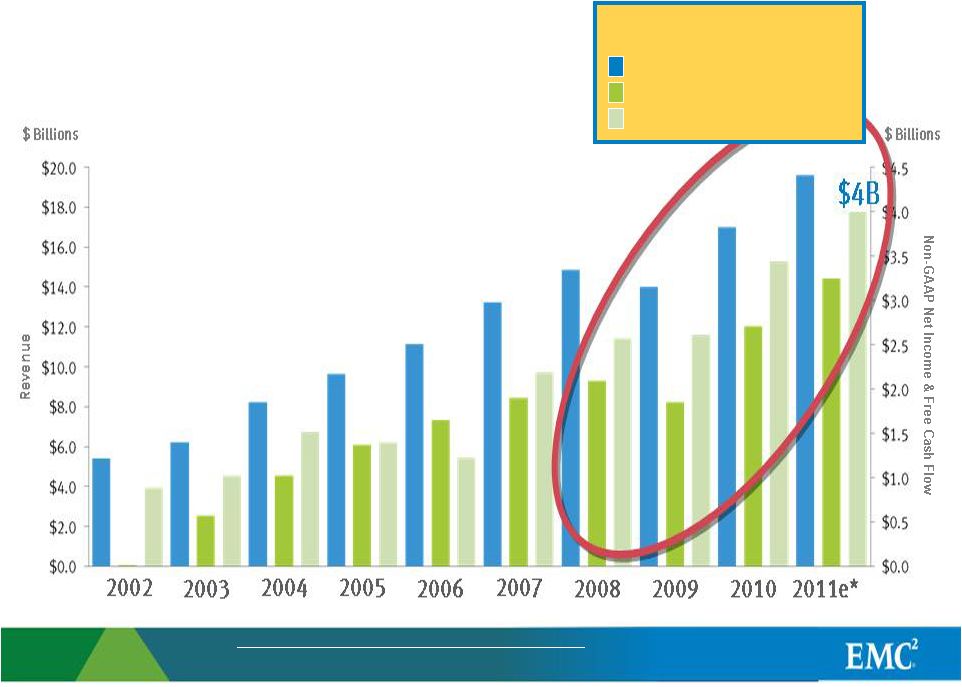 © Copyright 2011 EMC Corporation. All rights reserved. Impressive Performance Revenue Non-GAAP Net Income Free Cash Flow 5-yr CAGR (2006-2011e*) 12% 15% 27% Refer to the schedules available at http://www.emc.com/about/investor-relations/archived-events.htm for a complete reconciliation of GAAP to non-GAAP results |
 © Copyright 2011 EMC Corporation. All rights reserved. 2011 & Beyond |
 © Copyright 2011 EMC Corporation. All rights reserved. ICT Megatrends • Mobility / Mass Connectivity • Mobile device proliferation • Social networking • Explosion of, and Insatiable Appetite for, information • App Transformation and Proliferation / a new way to build and deliver Apps • Hybrid Cloud Computing / IT as a Service • The growing Importance of Security and Trust |
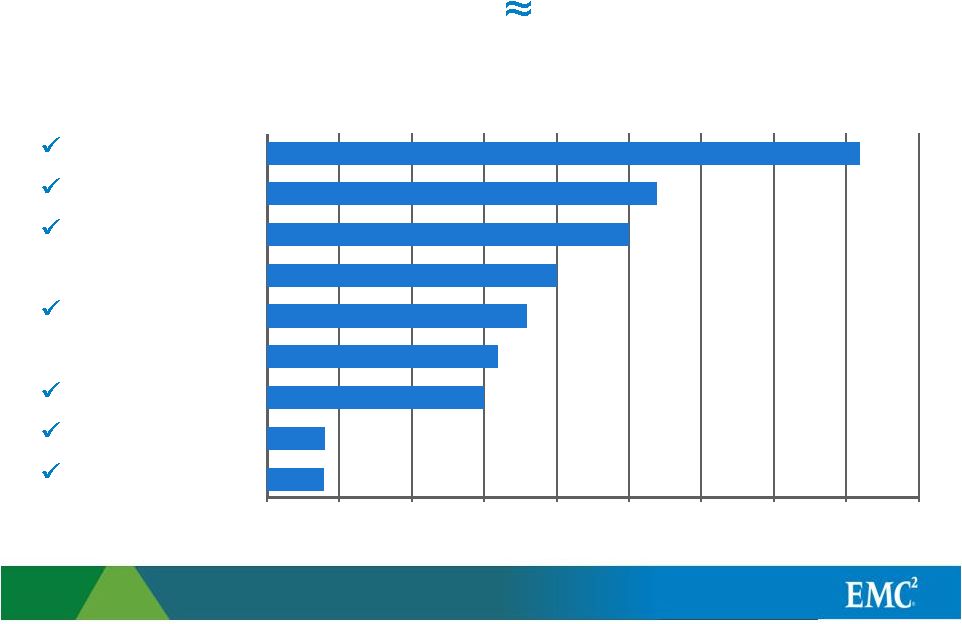 © Copyright 2011 EMC Corporation. All rights reserved. 45 30 35 2011 IT Spending Up 5 to 7% Drivers of Spending Decisions: 0 5 10 15 20 25 30 Source: Barclays Capital CIO Survey, October 6, 2010 Green Computing Labor Optimization Storage / Virtualization Mobile messaging/app Desktop Virtualization Windows 7 upgrade cycle Cloud computing Security Server Virtualization |
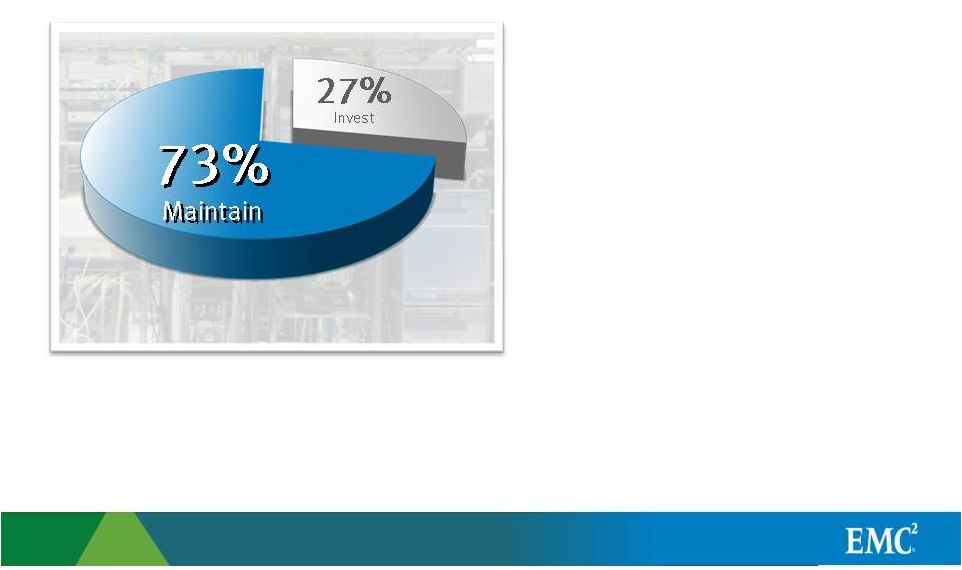 © Copyright 2011 EMC Corporation. All rights reserved. • Too Complex • Too Inefficient • Too Inflexible • Too Costly But, IT Spending Needs Transformation |
 © Copyright 2011 EMC Corporation. All rights reserved. • Too much money spent with service companies to customize applications • Most applications are inflexible • Users feel lack of control Root Cause of IT Spending Angst: • Too many diverse and expensive operating environments – Windows: X86 – HP-UX: Itanium – Linux: X86 – Solaris: Sparc – MF: Proprietary/Powerpc – AIX: Powerpc – Iseries: Powerpc • Larger customers have too many data centers, too many vendors |
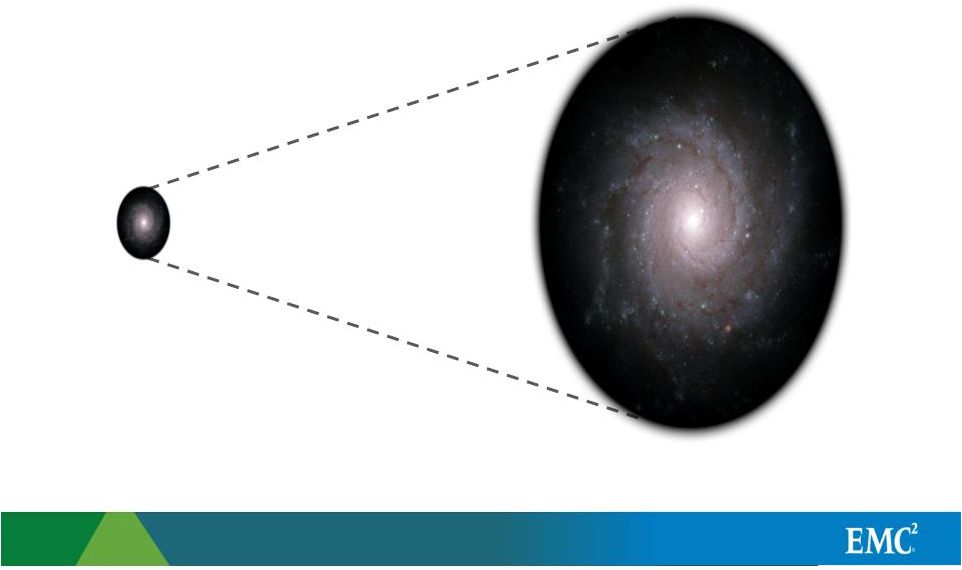 © Copyright 2011 EMC Corporation. All rights reserved. Data Volumes are Exploding IDC’s Digital Universe 2009: 0.8 ZB Growing by a Factor of 44 2020 : 35.2 Zettabytes |
 © Copyright 2011 EMC Corporation. All rights reserved. 1,000,000,000,000 1,000,000,000 “Terabyte” “Gigabyte” 1,000,000,000,000 ,000,000,000 “Zettabyte” |
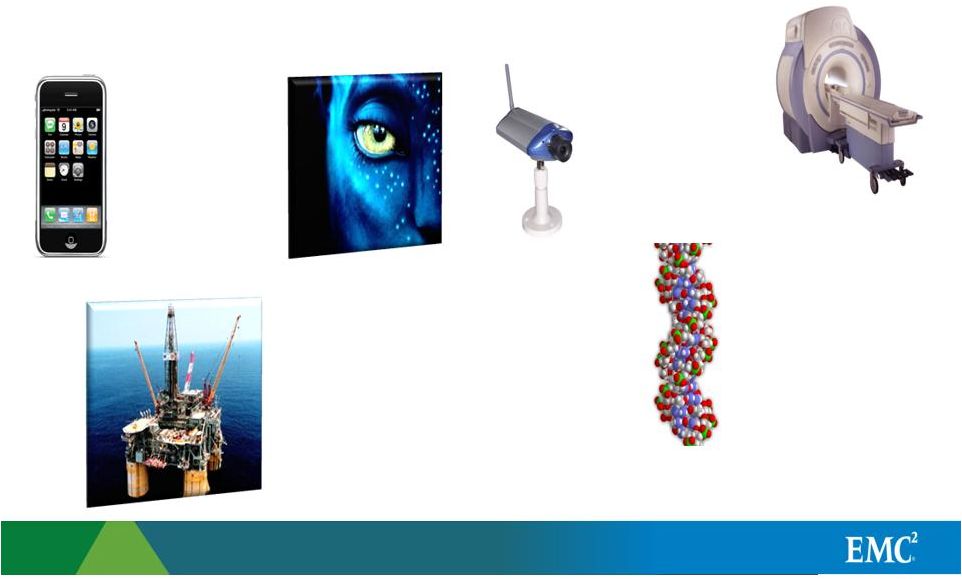 © Copyright 2011 EMC Corporation. All rights reserved. Medical Imaging (PACS Data, Electronic Patient Records) Video Surveillance Growth of Mobile Users The Vast Majority of Information that’s Now Being Created is “Big Data” Geophysic al Exploration Video Rendering Gene Sequencing |
 © Copyright 2011 EMC Corporation. All rights reserved. The Platform For Change is Here!!! |
 © Copyright 2011 EMC Corporation. All rights reserved. The Answer to This IT Spending Dilemma and Our Core Focus: HYBRID CLOUD PRIVATE PUBLIC |
 © Copyright 2011 EMC Corporation. All rights reserved. To be the Undisputed Leader in Enabling Hybrid Cloud Computing through Infrastructure and Application Transformation EMC’s/ VMware’s Vision |
 © Copyright 2011 EMC Corporation. All rights reserved. Take Our Customers on Our Strategy An Evolutionary Journey to the Hybrid Cloud |
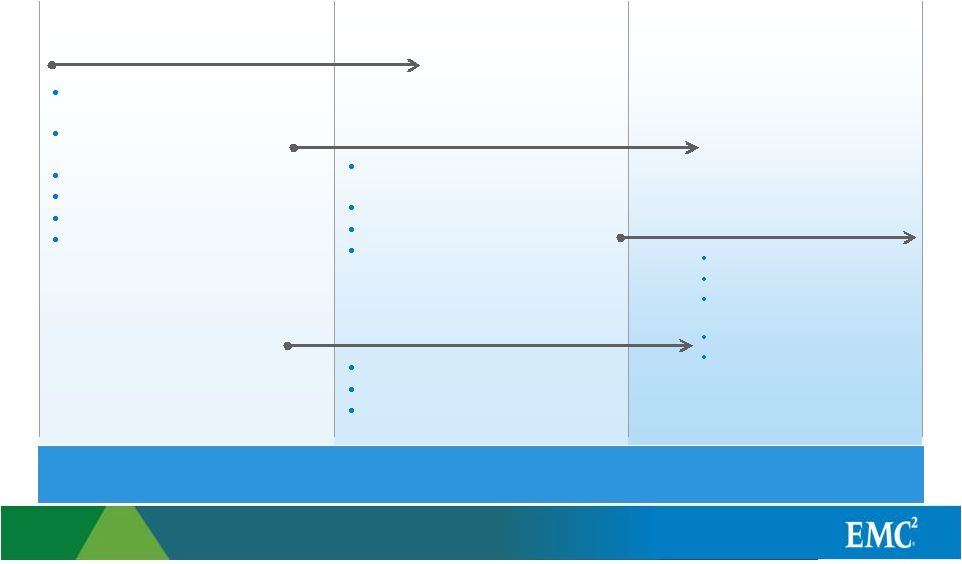
             The Journey to the Private/Public Cloud IT-as-a-Service Improve Agility IT-as-a-Service Improve Agility IT Production Lower Costs IT Production Lower Costs Business Production Improve Quality of Service Business Production Improve Quality of Service Phase 3 Run IT As A Business Phase 3 Run IT As A Business Phase 1 IT Owned Apps Phase 1 IT Owned Apps Phase 2 Mission Critical Apps Phase 2 Mission Critical Apps Standardization Automation © Copyright 2011 EMC Corporation. All rights reserved. |
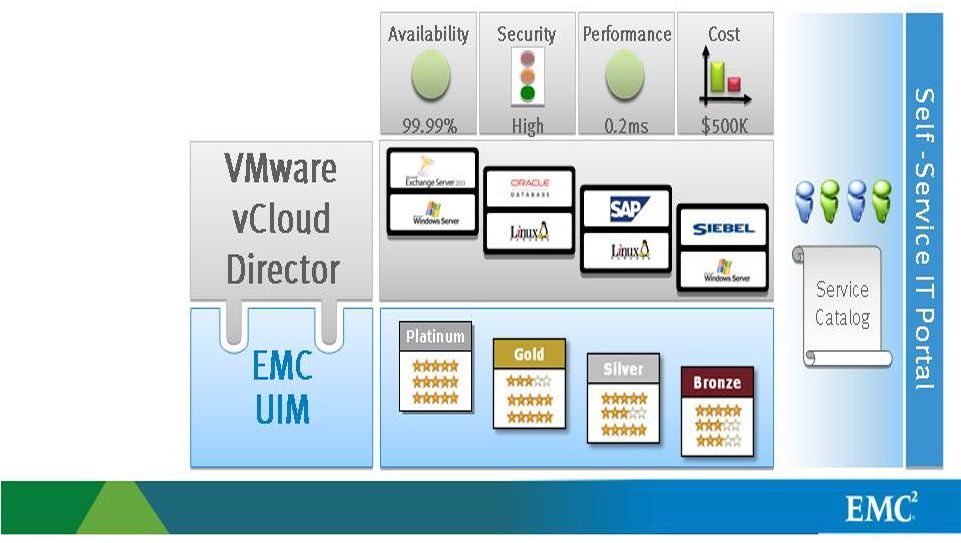 Infrastructure Service Catalogue Application Service Catalogue Deliver IT as a Service Define Service Catalog, Publish to Self-service IT Portal Policy/SLA-driven Management © Copyright 2011 EMC Corporation. All rights reserved. |
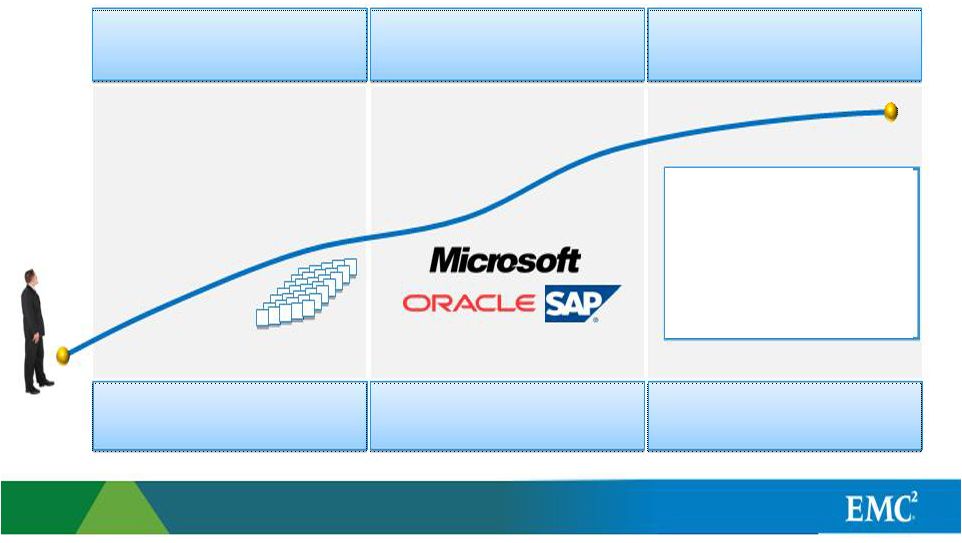
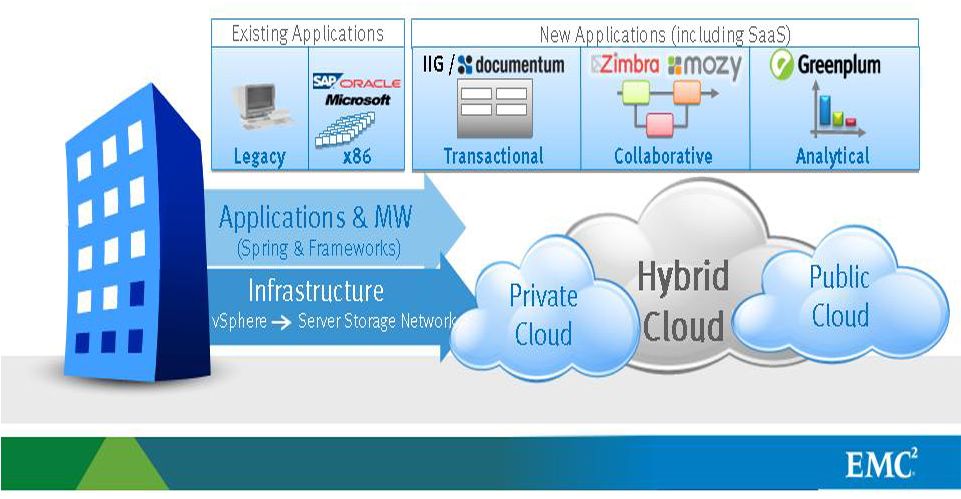 Journey to the Cloud Cost, Risk & Functionality Requirements Drive Application Strategy Enterprise IT © Copyright 2011 EMC Corporation. All rights reserved. |
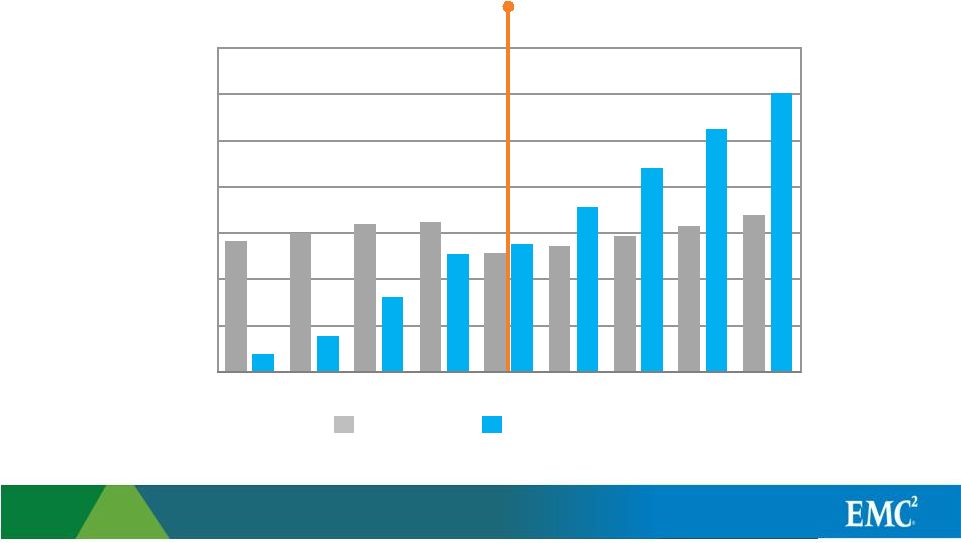 © Copyright 2011 EMC Corporation. All rights reserved. Source: IDC We are past the tipping point! Infrastructure Transformation 17,500,000 Physical Hosts 2006 2007 2008 2009 2010 2011 2012 2013 2005 VM Cross Over 15,000,000 12,500,000 10,000,000 7,500,000 5,000,000 2,500,000 Virtual Machines |
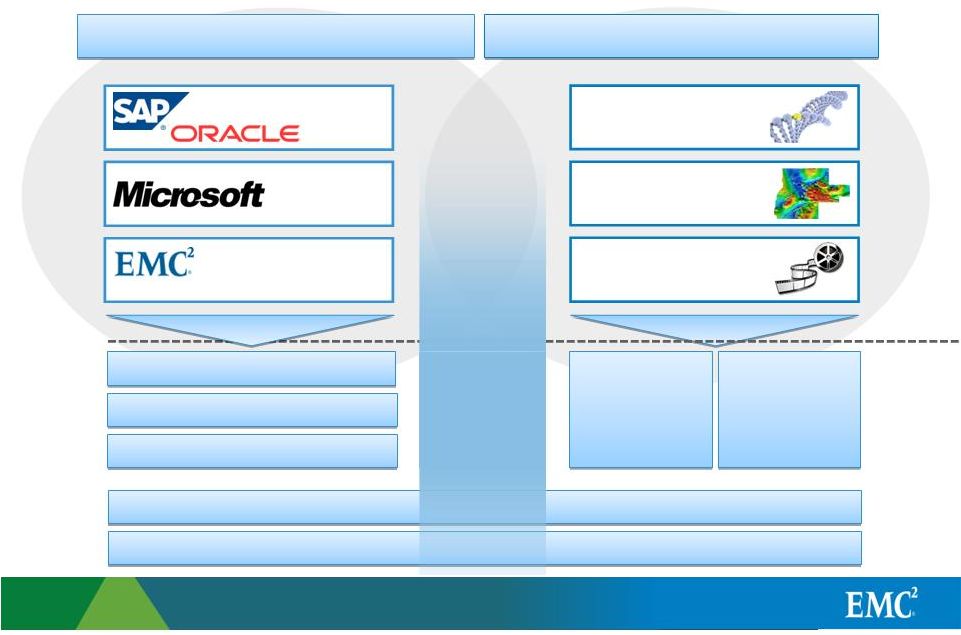 © Copyright 2011 EMC Corporation. All rights reserved. “Big Data” Applications Enterprise Applications Isilon Atmos VNX VNXe Primary Storage Backup & Archive VMAX VPLEX Data Domain, Avamar Data Domain, Avamar Geophysical Exploration Media Editing & Rendering Gene Sequencing ERP Email Documentum Storage: Huge Role Today / Tomorrow |
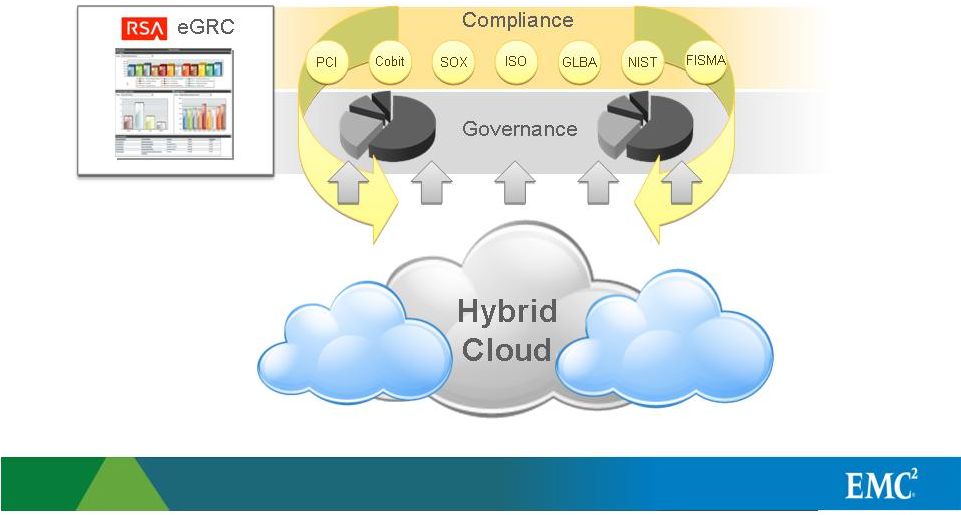 Trust in the Cloud How Do You Govern, Manage Risk & Ensure Compliance ? © Copyright 2011 EMC Corporation. All rights reserved. |
 © Copyright 2011 EMC Corporation. All rights reserved. Hybrid Cloud = Vast, Vast Potential Data Center Infrastructure Market $117B Capex intensive Data Center Service Market $106B Opex intensive Application Market for DC Apps $ 69B Client Device Market for Business $155B Sources: McKinsey 2011 |
 © Copyright 2011 EMC Corporation. All rights reserved. Virtualization (VMware) Information Storage Information Protection Information Security Consolidated EMC’s Cloud Credentials Data center cloud OS Management Automation Enterprise cloud middleware Client device abstraction For today’s enterprise apps For “big data” applications BURA for all apps in all environments Protect and verify identities Protect the data itself (at rest/ in motion) Assure governance & compliance (biz & IT) Unstructured data mgmt and flow Structured/semi-structured data analytics #1 New innovation, fastest growing New innovation, fastest growing #1/2 #1 #1 #1 #1 #1/2 #1 Info Mgmt & Intelligence #3 New innovation, fastest growing |
 © Copyright 2011 EMC Corporation. All rights reserved. EMC’s Global Services’ Credentials . . . EMC PARTNER ECOSYSTEM Plan/Design Deploy Support/Maintain Technology Deployment and Education Services Consulting Services Customer Support Services Enterprise information management and analytics Application architecture design and development Application infrastructure Cloud and virtual data center Security and risk management Key verticals: financial services; telco/SP; healthcare/life sciences, public sector, retail Assessment, design, implementation, integration, data migration Media security Health check/performance Training and certification eServices and online support Secure remote support Onsite and remote technical support Personalized support options Solution support Managed Services Storage managed services Remote managed services Residencies Run |
 © Copyright 2011 EMC Corporation. All rights reserved. Consolidated EMC’s People Credentials 49,000 Dedicated People in More than 80 Countries 12,000 in R&D 12,000 in R&D 15,500 in Sales and Marketing 15,500 in Sales and Marketing 14,500 in Services 14,500 in Services |
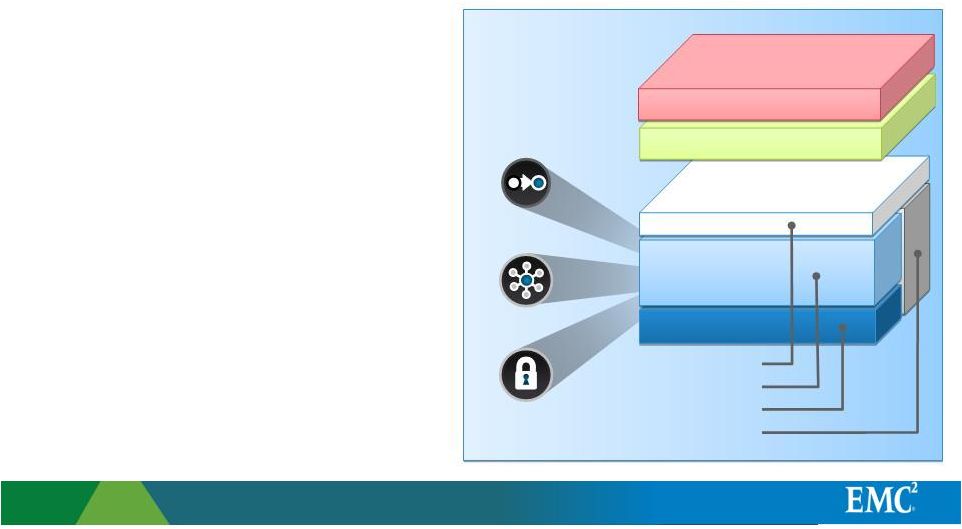 © Copyright 2011 EMC Corporation. All rights reserved. Solution Packages Vblock: New Way to Deliver IT Accelerate Time to Results: Reduce TCO • Rapid deployment • Simplified management • Predictable performance • Improved compliance Rich APIs Security Resource Management Network Compute Virtualization Storage |
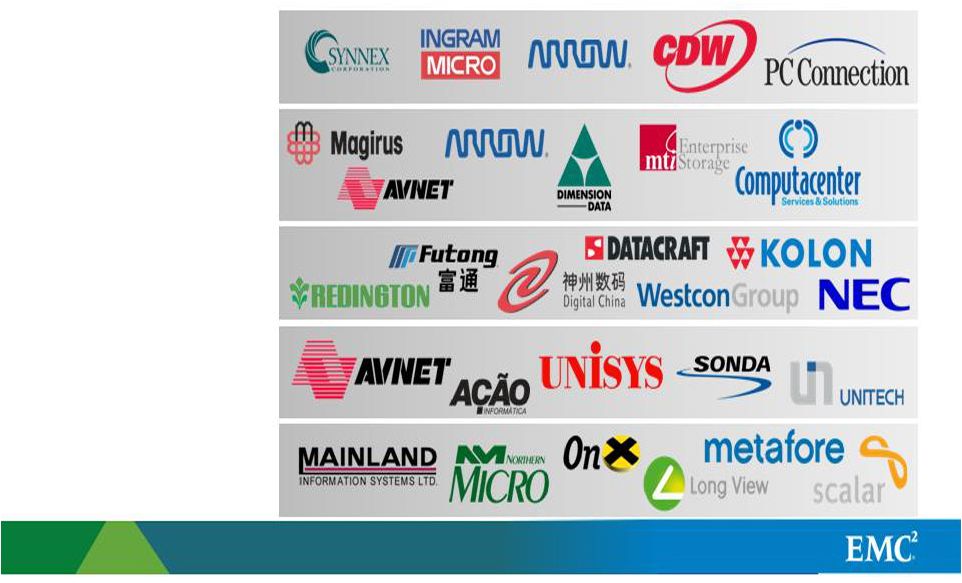 Key Canadian Partners Global Channel Partners Key EMEA Partners Key APJ Partners Key Latin American Partners Key U.S. Distributors and DMRs © Copyright 2011 EMC Corporation. All rights reserved. |
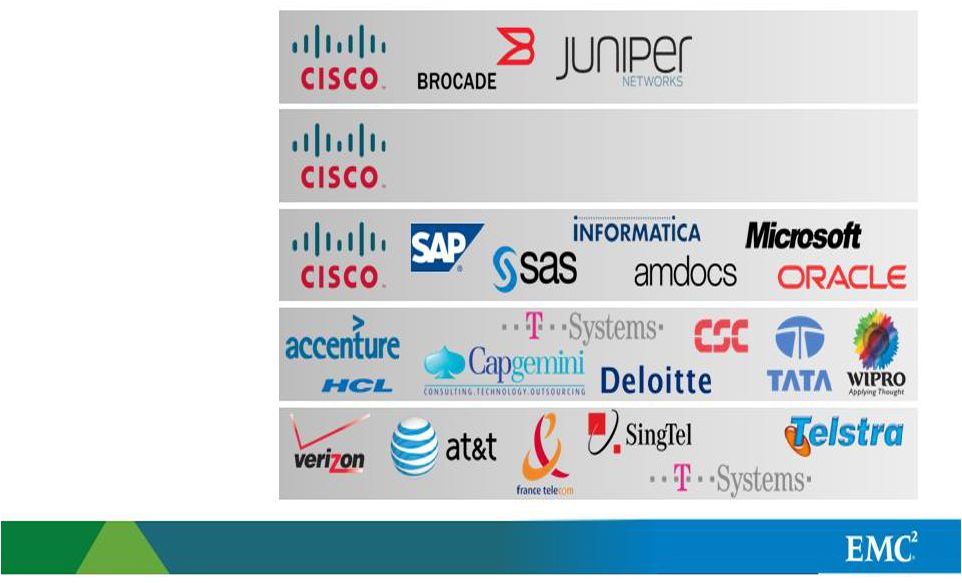 Converged Infrastructure Software Services Service Providers Networking (Large) Core Global Tech/Services Partners © Copyright 2011 EMC Corporation. All rights reserved. |
 © Copyright 2011 EMC Corporation. All rights reserved. We are focused on truly delighting our customers and exceeding their expectations in every dimension We strive to be the employer of choice And, we are on a mission to be the most sustainable company in IT In Addition to . . . Great Products, Sales, Services & Partners |
 © Copyright 2011 EMC Corporation. All rights reserved. Net Promoter Score (NPS) Net Promoter ® is a loyalty metric, along with EMC’s detailed assessment of results to provide business units with strengths and recommendations. “How likely are you to recommend EMC products and services to a colleague or an associate?” NPS % of Promoters (9s and 10s) % of Detractors (0 through 6) Not at all likely Neutral Extremely likely 0 1 2 3 4 5 6 7 8 9 10 Detractors Passives Promoters |
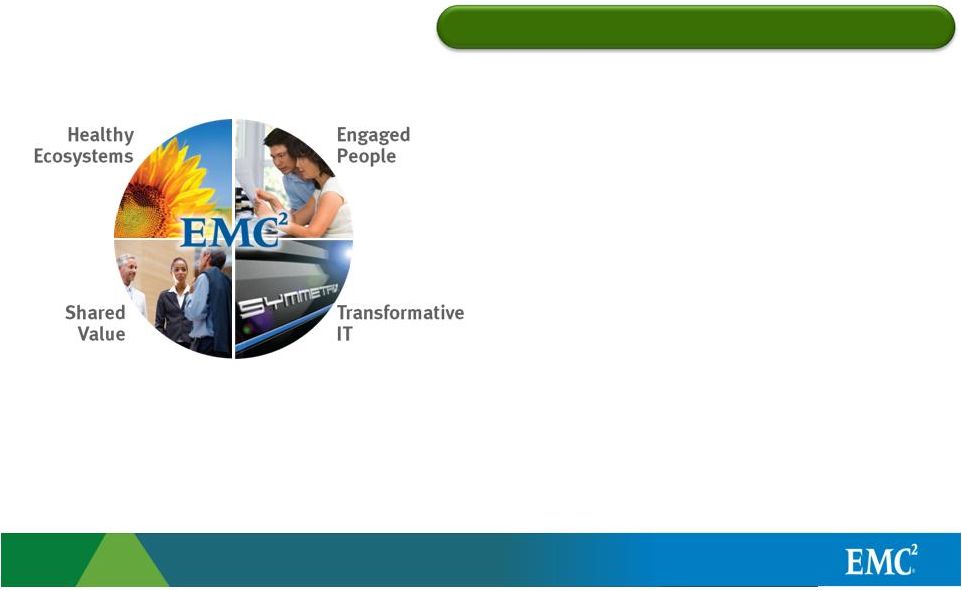 © Copyright 2011 EMC Corporation. All rights reserved. Sustainability @ EMC Long-term Systems Thinking • 40% reduction goal for energy use per employee by 2012 • 25% reduction in GHG emissions per $U.S. revenue since 2000 • <1% of our take back product goes to landfill RECOGNITION • SRI Indexes: NASDAQ OMX CRD Global Sustainability Index (QCRD) • Newsweek Green Ranking #66 – Up from #74 in 2009 • CRO Magazine 100 Best Corporate Citizens List #19 – Up from #48 in 2009 Environmental Goals & Performance Environmental Goals & Performance |
 © Copyright 2011 EMC Corporation. All rights reserved. A Compelling Vision & Strategy A Compelling Vision & Strategy A Winning Game Plan A Winning Game Plan Leading Technology, Products & Services Leading Technology, Products & Services Dedicated and Hard Working People -> Customers Dedicated and Hard Working People -> Customers A Passion for Excellence . . . being “The Best” A Passion for Excellence . . . being “The Best” The Leadership The Leadership We Have . . . |
 © Copyright 2011 EMC Corporation. All rights reserved. CHOICE CONTROL EFFICIENCY AGILITY Our Pledge: Give our Customers . . . |
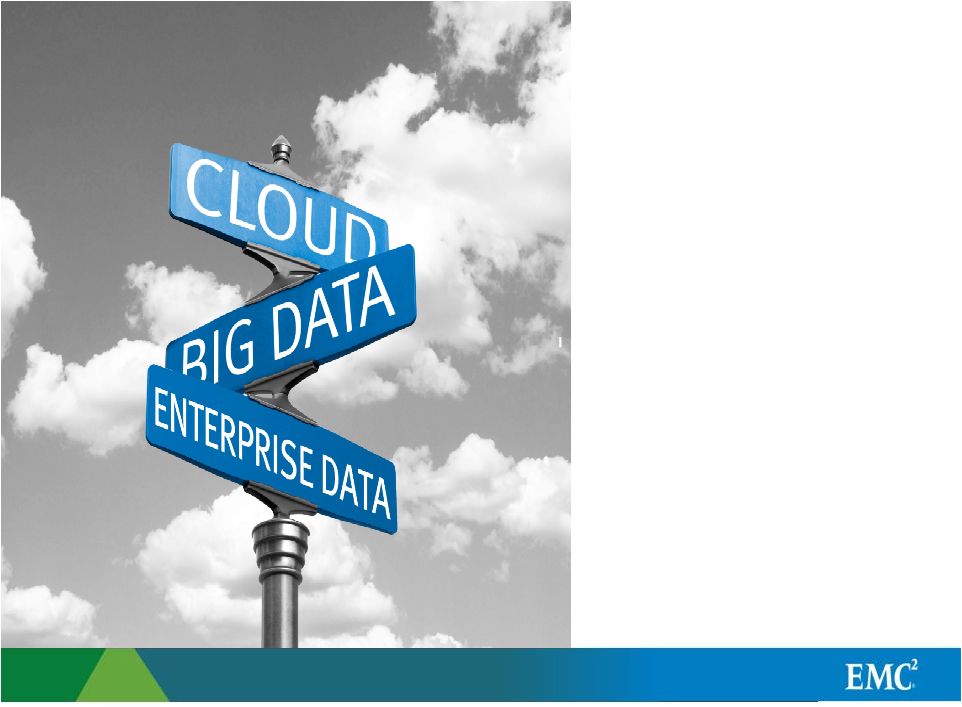 © Copyright 2011 EMC Corporation. All rights reserved. The Intersection of The Intersection of Cloud Computing Cloud Computing Enterprise Data Enterprise Data And Big Data And Big Data |
Use of Non-GAAP Financial Measures
This presentation and the accompanying schedules contain non-GAAP financial measures. These non-GAAP financial measures, which are used as measures of EMC’s performance or liquidity, should be considered in addition to, not as a substitute for, measures of EMC’s financial performance or liquidity prepared in accordance with GAAP. EMC’s non-GAAP financial measures may be defined differently from time to time and may be defined differently than similar terms used by other companies, and accordingly, care should be exercised in understanding how EMC defines its non-GAAP financial measures in this presentation.
Where specified in the accompanying schedules for various periods entitled “Reconciliation of GAAP to Non-GAAP,” certain items noted on each such specific schedule (including, where noted, amounts relating to restructuring and acquisition-related charges, special income tax charge, stock-based compensation expense, intangible asset amortization, restructuring charges and IPRD, tax benefits, and net gains on investments, including gain on the sale of VMware stock) are excluded from the non-GAAP financial measures.
EMC’s management uses the non-GAAP financial measures in the accompanying schedules to gain an understanding of EMC’s comparative operating performance (when comparing such results with previous periods or forecasts) and future prospects and excludes the above-listed items from its internal financial statements for purposes of its internal budgets and each reporting segment’s financial goals. These non-GAAP financial measures are used by EMC’s management in their financial and operating decision-making because management believes they reflect EMC’s ongoing business in a manner that allows meaningful period-to-period comparisons. EMC’s management believes that these non-GAAP financial measures provide useful information to investors and others (a) in understanding and evaluating EMC’s current operating performance and future prospects in the same manner as management does, if they so choose, and (b) in comparing in a consistent manner the Company’s current financial results with the Company’s past financial results.
This presentation also includes disclosures regarding free cash flow which is a non-GAAP financial measure. Free cash flow is defined as net cash provided by operating activities less additions to property, plant and equipment and capitalized software development costs. EMC uses free cash flow, among other measures, to evaluate the ability of its operations to generate cash that is available for purposes other than capital expenditures and capitalized software development costs. Management believes that information regarding free cash flow provides investors with an important perspective on the cash available to make strategic acquisitions and investments, repurchase shares, service debt and fund ongoing operations. As free cash flow is not a measure of liquidity calculated in accordance with GAAP, free cash flow should be considered in addition to, but not as a substitute for, the analysis provided in the statement of cash flows.
All of the foregoing non-GAAP financial measures have limitations. Specifically, the non-GAAP financial measures that exclude the items noted above do not include all items of income and expense that affect EMC’s operations. Further, these non-GAAP financial measures are not prepared in accordance with GAAP, may not be comparable to non-GAAP financial measures used by other companies and do not reflect any benefit that such items may confer on EMC. Management compensates for these limitations by also considering EMC’s financial results as determined in accordance with GAAP.
Reconciliation of GAAP to Non-GAAP
For the Twelve Months Ended December 31, 2007
(in thousands, except per share amounts)
| GAAP | Restructuring charges and IPR&D | Net Gains on investments, incl. gain on sale of VMware Stock | Tax Benefits | Stock-based compensation | Intangible amortization | Non-GAAP | ||||||||||||||||||||||
Revenue | 13,230,205 | 13,230,205 | ||||||||||||||||||||||||||
COGS | 6,018,877 | (57,223 | ) | (119,948 | ) | 5,841,706 | ||||||||||||||||||||||
Gross Margin | 7,211,328 | 57,223 | 119,948 | 7,388,499 | ||||||||||||||||||||||||
Operating Expense | 5,472,076 | (34,901 | ) | (310,177 | ) | (84,849 | ) | 5,042,149 | ||||||||||||||||||||
Operating Income | 1,739,252 | 34,901 | 367,400 | 204,797 | 2,346,350 | |||||||||||||||||||||||
Other Income, net | 223,379 | (137,330 | ) | 86,049 | ||||||||||||||||||||||||
Income before provision for income taxes | 1,962,631 | 34,901 | (137,330 | ) | 367,400 | 204,797 | 2,432,399 | |||||||||||||||||||||
Income tax provision | 348,211 | 3,123 | (22,180 | ) | 19,912 | 87,054 | 72,019 | 508,139 | ||||||||||||||||||||
Net Income | 1,614,420 | 31,778 | (115,150 | ) | (19,912 | ) | 280,346 | 132,778 | 1,924,260 | |||||||||||||||||||
Less: Net income attributable to non-controlling interest in VMware Inc | (15,455 | ) | (5,793 | ) | (868 | ) | (22,116 | ) | ||||||||||||||||||||
Net Income attributable to EMC Corporation | 1,598,965 | 31,778 | (115,150 | ) | (19,912 | ) | 274,553 | 131,910 | 1,902,144 | |||||||||||||||||||
Net income per weighted average share, diluted attributable to EMC Corporation common shareholders | $ | 0.74 | 0.01 | (0.05 | ) | (0.01 | ) | 0.13 | 0.06 | $ | 0.88 | |||||||||||||||||
Weighted average shares, diluted | 2,157,873 | 2,157,873 | 2,157,873 | 2,157,873 | 2,157,873 | 2,157,873 | 2,157,873 | |||||||||||||||||||||
Gross Margin % of Revenue | 54.5 | % | 55.8 | % | ||||||||||||||||||||||||
Operating Margin % of Revenue | 13.1 | % | 17.7 | % | ||||||||||||||||||||||||
Reconciliation of GAAP to Non-GAAP
For the Twelve Months Ended December 31, 2010
(in thousands, except per share amounts)
Unaudited
| Revenue | Cost of Revenue | Research and Development | Selling, General and Administrative | Restructuring and Acquisition- Related Charges | Operating Income | Other (Expense) Income, net | Income Before Taxes | Income Tax Provision | Net Income | Net Income Attributable to VMware | Net Income Attributable to EMC | Net Income per Weighted Average Share, Basic | Net Income per Weighted Average Share, Diluted | |||||||||||||||||||||||||||||||||||||||||||
EMC Consolidated GAAP | $ | 17,015,126 | $ | 6,984,145 | $ | 1,888,015 | $ | 5,375,305 | $ | 84,375 | $ | 2,683,286 | $ | (75,303 | ) | $ | 2,607,983 | $ | 638,297 | $ | 1,969,686 | $ | (69,691 | ) | $ | 1,899,995 | $ | 0.924 | $ | 0.880 | ||||||||||||||||||||||||||
Restructuring and acquisition-related charges | — | — | — | — | (84,375 | ) | 84,375 | — | 84,375 | 10,721 | 73,654 | (1,636 | ) | 72,018 | $ | 0.035 | $ | 0.034 | ||||||||||||||||||||||||||||||||||||||
Special income tax charge | — | — | — | — | — | — | — | — | (83,331 | ) | 83,331 | — | 83,331 | $ | 0.041 | $ | 0.039 | |||||||||||||||||||||||||||||||||||||||
EMC Consolidated Adjusted (1) | 17,015,126 | 6,984,145 | 1,888,015 | 5,375,305 | — | 2,767,661 | (75,303 | ) | 2,692,358 | 565,687 | 2,126,671 | (71,327 | ) | 2,055,344 | $ | 1.000 | $ | 0.953 | ||||||||||||||||||||||||||||||||||||||
Stock-based compensation expense | — | (108,653 | ) | (258,746 | ) | (317,654 | ) | — | 685,053 | 1,405 | 686,458 | 165,673 | 520,785 | (48,122 | ) | 472,663 | $ | 0.230 | $ | 0.220 | ||||||||||||||||||||||||||||||||||||
Intangible asset amortization | — | (131,760 | ) | (23,556 | ) | (129,966 | ) | — | 285,282 | — | 285,282 | 92,674 | 192,608 | (5,279 | ) | 187,329 | $ | 0.091 | $ | 0.087 | ||||||||||||||||||||||||||||||||||||
EMC Consolidated Non-GAAP (2) | $ | 17,015,126 | $ | 6,743,732 | $ | 1,605,713 | $ | 4,927,685 | $ | — | $ | 3,737,996 | $ | (73,898 | ) | $ | 3,664,098 | $ | 824,034 | $ | 2,840,064 | $ | (124,728 | ) | $ | 2,715,336 | $ | 1.321 | $ | 1.260 | ||||||||||||||||||||||||||
EMC Information Infrastructure GAAP | $ | 14,164,393 | $ | 6,491,939 | $ | 1,244,057 | $ | 4,103,464 | $ | 80,877 | $ | 2,244,056 | $ | (58,713 | ) | $ | 2,185,343 | $ | 575,156 | $ | 1,610,187 | $ | — | $ | 1,610,187 | $ | 0.783 | $ | 0.750 | |||||||||||||||||||||||||||
Restructuring and acquisition-related charges | — | — | — | — | (80,877 | ) | 80,877 | — | 80,877 | 15,736 | 65,141 | — | 65,141 | $ | 0.032 | $ | 0.030 | |||||||||||||||||||||||||||||||||||||||
Special income tax charge | — | — | — | — | — | — | — | — | (83,331 | ) | 83,331 | — | 83,331 | $ | 0.041 | $ | 0.039 | |||||||||||||||||||||||||||||||||||||||
EMC Information Infrastructure Adjusted (3) | 14,164,393 | 6,491,939 | 1,244,057 | 4,103,464 | — | 2,324,933 | (58,713 | ) | 2,266,220 | 507,561 | 1,758,659 | — | 1,758,659 | $ | 0.855 | $ | 0.819 | |||||||||||||||||||||||||||||||||||||||
Stock-based compensation expense | — | (70,160 | ) | (94,941 | ) | (210,530 | ) | — | 375,631 | 1,273 | 376,904 | 103,303 | 273,601 | — | 273,601 | $ | 0.133 | $ | 0.127 | |||||||||||||||||||||||||||||||||||||
Intangible asset amortization | — | (103,304 | ) | (21,202 | ) | (126,017 | ) | — | 250,523 | — | 250,523 | 84,937 | 165,586 | — | 165,586 | $ | 0.081 | $ | 0.077 | |||||||||||||||||||||||||||||||||||||
EMC Information Infrastructure Non-GAAP (4) | $ | 14,164,393 | $ | 6,318,475 | $ | 1,127,914 | $ | 3,766,917 | $ | — | $ | 2,951,087 | $ | (57,440 | ) | $ | 2,893,647 | $ | 695,801 | $ | 2,197,846 | $ | — | $ | 2,197,846 | $ | 1.069 | $ | 1.023 | |||||||||||||||||||||||||||
VMware standalone GAAP | $ | 2,857,343 | $ | 493,715 | $ | 652,968 | $ | 1,282,667 | $ | — | $ | 427,993 | $ | (11,618 | ) | $ | 416,375 | $ | 58,936 | $ | 357,439 | $ | — | $ | 357,439 | $ | 0.174 | $ | 0.162 | |||||||||||||||||||||||||||
GAAP adjustments and eliminations | (6,610 | ) | (1,509 | ) | (9,010 | ) | (10,826 | ) | 3,498 | 11,237 | (4,972 | ) | 6,265 | 4,205 | 2,060 | (69,691 | ) | (67,631 | ) | $ | (0.033 | ) | $ | (0.036 | ) | |||||||||||||||||||||||||||||||
VMware within EMC GAAP (5) | 2,850,733 | 492,206 | 643,958 | 1,271,841 | 3,498 | 439,230 | (16,590 | ) | 422,640 | 63,141 | 359,499 | (69,691 | ) | 289,808 | $ | 0.141 | $ | 0.131 | ||||||||||||||||||||||||||||||||||||||
Acquisition-related charges | — | — | — | — | (3,498 | ) | 3,498 | — | 3,498 | (5,015 | ) | 8,513 | (1,636 | ) | 6,877 | $ | 0.003 | $ | 0.003 | |||||||||||||||||||||||||||||||||||||
VMware within EMC Adjusted (6) | 2,850,733 | 492,206 | 643,958 | 1,271,841 | — | 442,728 | (16,590 | ) | 426,138 | 58,126 | 368,012 | (71,327 | ) | 296,685 | $ | 0.144 | $ | 0.134 | ||||||||||||||||||||||||||||||||||||||
Stock-based compensation expense | — | (38,493 | ) | (163,805 | ) | (107,124 | ) | — | 309,422 | 132 | 309,554 | 62,370 | 247,184 | (48,122 | ) | 199,062 | $ | 0.097 | $ | 0.093 | ||||||||||||||||||||||||||||||||||||
Intangible asset amortization | — | (28,456 | ) | (2,354 | ) | (3,949 | ) | — | 34,759 | — | 34,759 | 7,737 | 27,022 | (5,279 | ) | 21,743 | $ | 0.011 | $ | 0.010 | ||||||||||||||||||||||||||||||||||||
VMware within EMC Non-GAAP (7) | $ | 2,850,733 | $ | 425,257 | $ | 477,799 | $ | 1,160,768 | $ | — | $ | 786,909 | $ | (16,458 | ) | $ | 770,451 | $ | 128,233 | $ | 642,218 | $ | (124,728 | ) | $ | 517,490 | $ | 0.252 | $ | 0.237 | ||||||||||||||||||||||||||
| Wtd. Average Share O/S | 2,055,959 | 2,147,931 | ||||||||||||||||||||||||||||||||||||||||||||||||||||||
Reconciliation of GAAP to Non-GAAP
For the Twelve Months Ended December 31, 2010
(in thousands, except per share amounts)
Unaudited
(Continued)
The following costs are included in EMC Consolidated Non-GAAP and EMC Information Infrastructure Non-GAAP results:
| Revenue | Cost of Revenue | Research and Development | Selling, General and Administrative | Restructuring and Acquisition- Related Charges | Operating Income | Other (Expense) Income, net | Income Before Taxes | Income Tax Provision | Net Income | Net Income Attributable to VMware | Net Income Attributable to EMC | Net Income per Weighted Average Share, Basic | Net Income per Weighted Average Share, Diluted | |||||||||||||||||||||||||||||||||||||||||||
Non-cash interest expense on convertible debt (8) | $ | — | $ | — | $ | — | $ | — | $ | — | $ | — | $ | (105,654 | ) | $ | (105,654 | ) | $ | (36,850 | ) | $ | (68,804 | ) | $ | — | $ | (68,804 | ) | $ | (0.034 | ) | $ | (0.032 | ) | |||||||||||||||||||||
Transition costs (9) | — | 2,275 | 5,079 | 29,836 | — | (37,190 | ) | — | (37,190 | ) | (10,085 | ) | (27,105 | ) | — | (27,105 | ) | $ | (0.013 | ) | $ | (0.013 | ) | |||||||||||||||||||||||||||||||||
| $ | — | $ | 2,275 | $ | 5,079 | $ | 29,836 | $ | — | $ | (37,190 | ) | $ | (105,654 | ) | $ | (142,844 | ) | $ | (46,935 | ) | $ | (95,909 | ) | $ | — | $ | (95,909 | ) | $ | (0.047 | ) | $ | (0.045 | ) | |||||||||||||||||||||
| (1) | Represents EMC Consolidated GAAP excluding restructuring, acquisition-related charges and special income tax charge. |
| (2) | Represents EMC Consolidated Adjusted excluding stock-based compensation expense and intangible asset amortization. |
| (3) | Represents EMC Information Infrastructure GAAP excluding restructuring, acquisition-related charges and special income tax charge. |
| (4) | Represents EMC Information Infrastructure Adjusted excluding stock-based compensation expense and intangible asset amortization. |
| (5) | Represents VMware within EMC GAAP. |
| (6) | Represents VMware within EMC GAAP excluding acquisition-related charges. |
| (7) | Represents VMware within EMC Adjusted excluding stock-based compensation expense and intangible asset amortization. |
| (8) | Represents the non-cash interest charge associated with our convertible senior notes due 2011 and 2013 totaling $3,450 million. |
| (9) | Represents incremental costs incurred to transform our current cost structure to a more streamlined cost structure. |
Note: schedule may not add due to rounding
Reconciliation of EMC’s Compounded Annual Growth Rate
| Actual | Guidance | Guidance | ||||||||||
| 2007 | 2011 | CAGR | ||||||||||
GAAP diluted earnings per share | $ | 0.74 | $ | 1.07 | 10 | % | ||||||
Restructuring and acquisitions-related charges | 0.01 | 0.03 | ||||||||||
Net gains on investments, incl. gain on sale of Vmware stock | (0.05 | ) | ||||||||||
Tax benefits | (0.01 | ) | ||||||||||
Stock-based compensation expense | 0.13 | 0.27 | ||||||||||
Intangible asset amortization | 0.06 | 0.09 | ||||||||||
Non-GAAP diluted earnings per share | $ | 0.88 | $ | 1.46 | 13 | % | ||||||
Schedule may not add due to rounding
EMC Corporation
Reconciliation of Cash Flow from Operations to Free Cash Flow
(in thousands)
Unaudited
| Twelve Months Ended | ||||||||
December 31, 2007 | December 31, 2010 | |||||||
EMC Consolidated | ||||||||
Cash flow from Operations | $ | 3,126,602 | $ | 4,548,843 | ||||
Capital Expenditures | 699,038 | (745,412 | ) | |||||
Capitalized Software | 232,047 | (362,956 | ) | |||||
Free Cash Flow | $ | 2,195,517 | $ | 3,440,475 | ||||
EMC Corporation
Reconciliation of Cash Flow from Operations to Free Cash Flow
(in thousands)
The statements presented below are based on current expectations. These statements are forward-looking, and actual results may differ materially. These statements do not give effect to the potential impact of mergers, acquisitions, divestitures or business combinations that may be announced or closed after the date hereof. These statements supersede all prior statements regarding 2011 cash flow set forth in prior EMC news releases. All dollar amounts and percentages should be considered to be approximations.
| 2011 Outlook | ||||
EMC Consolidated | ||||
Cash flow from Operations | $ | 5,340,000 | ||
Capital Expenditures | 900,000 | |||
Capitalized Software | 440,000 | |||
Free Cash Flow | $ | 4,000,000 | ||