 David Goulden Boston, Feb. 8, 2011 © Copyright 2011 EMC Corporation. All rights reserved. Exhibit 99.2 EMC Strategic Forum |
 © Copyright 2011 EMC Corporation. All rights reserved. Forward-Looking Statements and GAAP Reconciliation This presentation contains non-GAAP financial measures which include, but are not limited to, non-GAAP Gross Margin, non-GAAP Operating Margin Non-GAAP Net Income, non-GAAP EPS and Free Cash Flow. A reconciliation GAAP to non-GAAP results to GAAP is included within this presentation and is available at http://www.emc.com/about/investor- relations/archived-events.htm. This presentation contains “forward-looking statements” as defined under the Federal Securities Laws. Actual results could differ materially from those projected in the forward-looking statements as a result of certain risk factors, including but not limited to: (i) adverse changes in general economic or market conditions; (ii) delays or reductions in information technology spending; (iii) our ability to protect our proprietary technology; (iv) risks associated with managing the growth of our business, including risks associated with acquisitions and investments and the challenges and costs of integration, restructuring and achieving anticipated synergies; (v) fluctuations in VMware, Inc.’s operating results and risks associated with trading of VMware stock; (vi) competitive factors, including but not limited to pricing pressures and new product introductions; (vii) the relative and varying rates of product price and component cost declines and the volume and mixture of product and services revenues; (viii) component and product quality and availability; (ix) the transition to new products, the uncertainty of customer acceptance of new product offerings and rapid technological and market change; (x) insufficient, excess or obsolete inventory; (xi) war or acts of terrorism; (xii) the ability to attract and retain highly qualified employees; (xiii) fluctuating currency exchange rates; and (xiv) other one-time events and other important factors disclosed previously and from time to time in EMC’s filings with the U.S. Securities and Exchange Commission. EMC disclaims any obligation to update any such forward-looking statements after the date of this presentation. |
 © Copyright 2011 EMC Corporation. All rights reserved. Balancing Opportunities, Driving Growth |
 © Copyright 2011 EMC Corporation. All rights reserved. Refer to the schedules in the appendix for a complete reconciliation of GAAP to non-GAAP Track Record of Success 2007 Revenue $13.2B Non-GAAP Gross Margin 55.8% Non-GAAP Operating Margin 17.7% Non-GAAP Net Income $1.9B Non-GAAP EPS $0.88 Free Cash Flow $2.2B |
 © Copyright 2011 EMC Corporation. All rights reserved. 2007 2010 Revenue $13.2B $17.0B Non-GAAP Gross Margin 55.8% 60.4% Non-GAAP Operating Margin 17.7% 22.0% Non-GAAP Net Income $1.9B $2.7B Non-GAAP EPS $0.88 $1.26 Free Cash Flow $2.2B $3.4B Refer to the schedules in the appendix for a complete reconciliation of GAAP to non-GAAP Track Record of Success |
 © Copyright 2011 EMC Corporation. All rights reserved. Gain Share 2007 – 2010: Financial Triple Play Invest for the Future Financial Leverage |
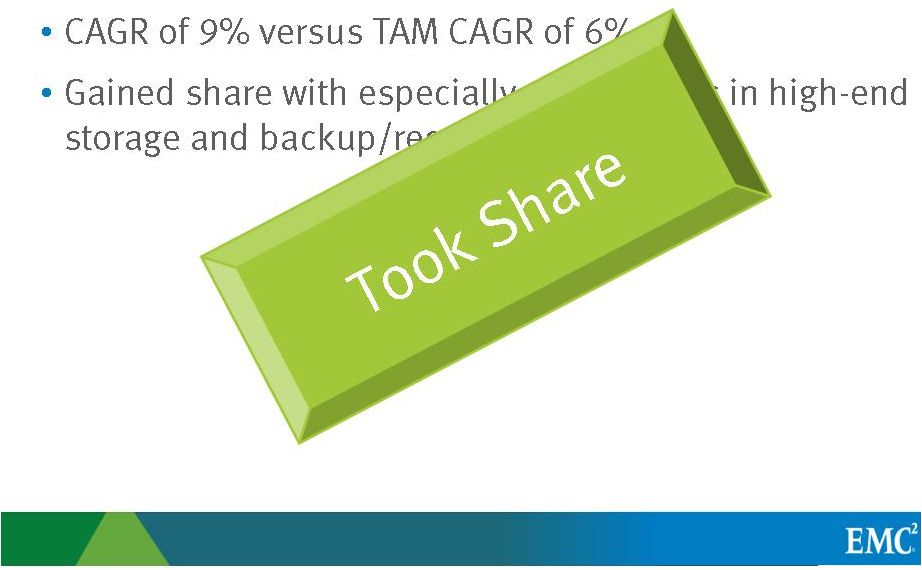 2007 – 2010 Share Gain © Copyright 2011 EMC Corporation. All rights reserved. |
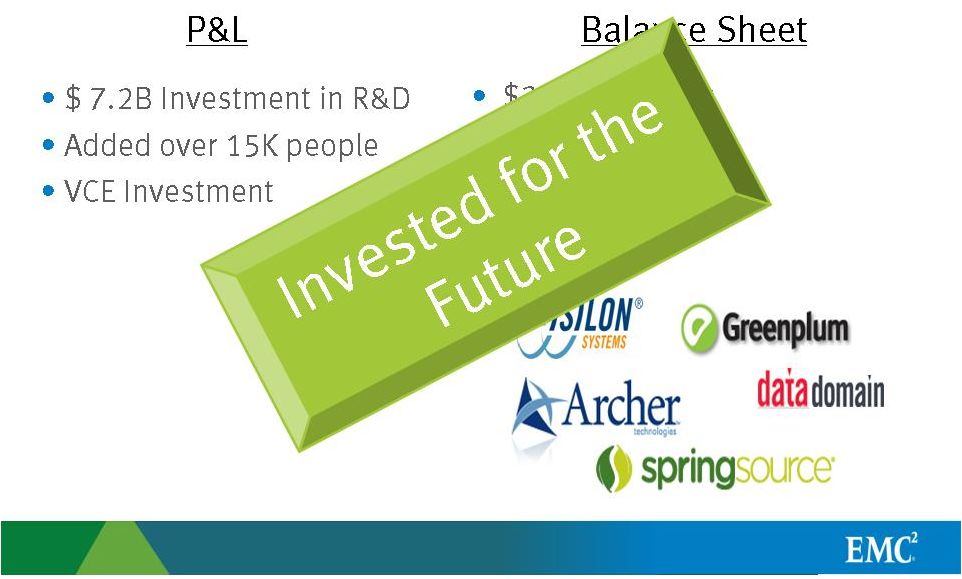 2007 – 2010 Investments © Copyright 2011 EMC Corporation. All rights reserved. |
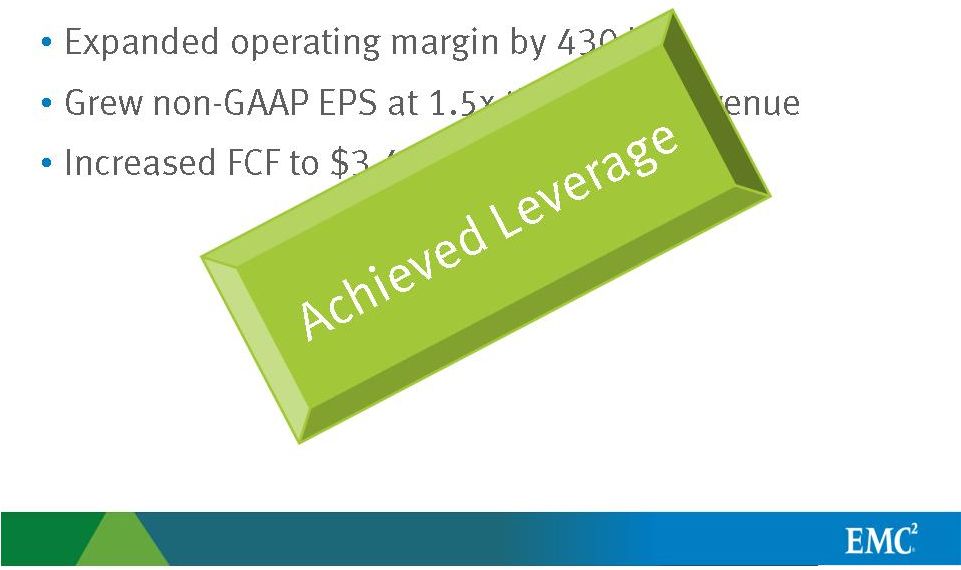 2007 – 2010 Leverage Refer to the schedules in the appendix for a complete reconciliation of GAAP to non-GAAP © Copyright 2011 EMC Corporation. All rights reserved. |
 © Copyright 2011 EMC Corporation. All rights reserved. Major Changes, Consistent Focus • Navigated changes in technology, use cases, and customer needs… • …while maintaining our focus on managing information in both physical and virtual environments. |
 © Copyright 2011 EMC Corporation. All rights reserved. Proven Management Process Identify Major Opportunities Invest Accordingly Achieve Goals |
 © Copyright 2011 EMC Corporation. All rights reserved. VMAX Identified need for a new type of high end Invested in a virtual matrix architecture Achieved significant share gains |
 © Copyright 2011 EMC Corporation. All rights reserved. Backup Recovery Systems Identified need for better backup Invested in next generation assets Achieved a $1B run rate ahead of plan Avamar |
 © Copyright 2011 EMC Corporation. All rights reserved. VNX Identified need for a unified family Invested in simple, efficient, powerful solution Achieved product optimized for file, block and object |
 © Copyright 2011 EMC Corporation. All rights reserved. VMware Integration Identified need for tighter integration Invested in data protection, ease of use, performance and management Achieved market-leading 75 points of integration |
 © Copyright 2011 EMC Corporation. All rights reserved. Customer Value Identified need to reduce COGS Invested in automation and common components Achieved significant gross margin improvements |
 © Copyright 2011 EMC Corporation. All rights reserved. Operations Identified need to improve operational efficiency Invested in new capabilities and business processes Achieved significant operating margin improvements |
 © Copyright 2011 EMC Corporation. All rights reserved. Success Factors • Balanced priorities of the triple play • Maintained singular focus on information • Applied proven management process to drive change …and we are not standing still! |
 © Copyright 2011 EMC Corporation. All rights reserved. Looking Forward |
 IT Spending Forecasts for 2011 (Jan. 11) 6.6% 3.9% (Jan. 11) 6% (Dec. 10) (Jan. 11) 6.8% 6% (Jan. 11) 4-5% (Jan. 11) (Dec. 10) 5.2% (Dec. 10) 6% © Copyright 2011 EMC Corporation. All rights reserved. |
 © Copyright 2011 EMC Corporation. All rights reserved. IT Spending Forecasts for 2011 (Jan. 11) 6.6% 3.9% (Jan. 11) 6% (Dec. 10) (Jan. 11) 6.8% 6% (Jan. 11) 4-5% (Jan. 11) (Dec. 10) 5.2% (Dec. 10) 6% EMC’s View 5-7% |
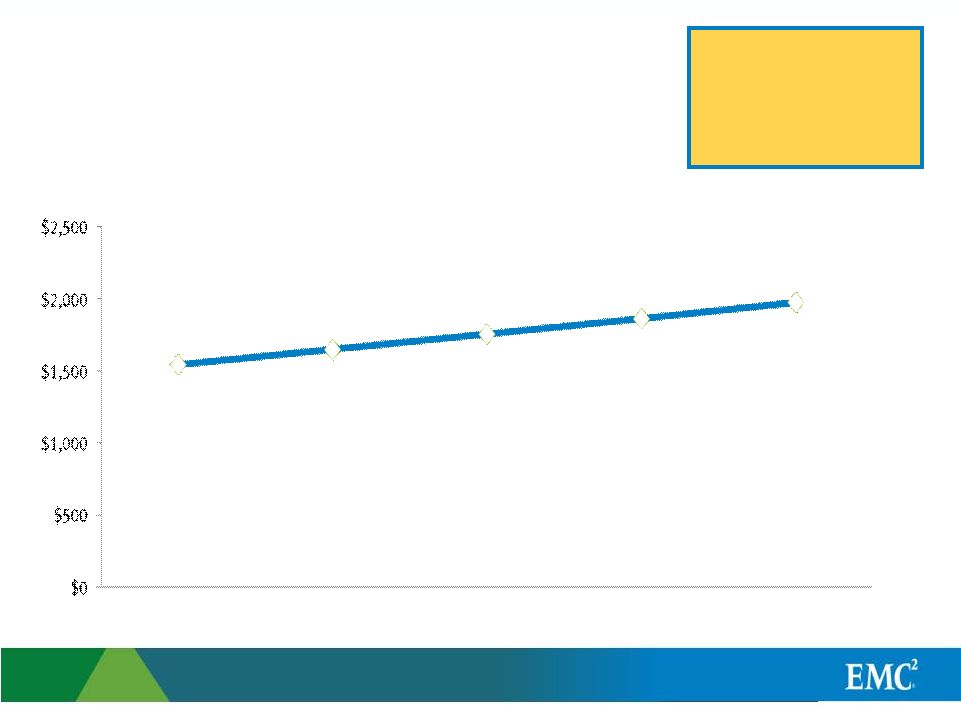 © Copyright 2011 EMC Corporation. All rights reserved. IT Spending Longer Term Source: WW IT Spending Growth (Constant Currency) – IDC, 1/11 4-yr CAGR (2010-2014) 6% +7% +7% +6% +6% $ Billion IT Spending 2010e 2011e 2012e 2013e 2014e |
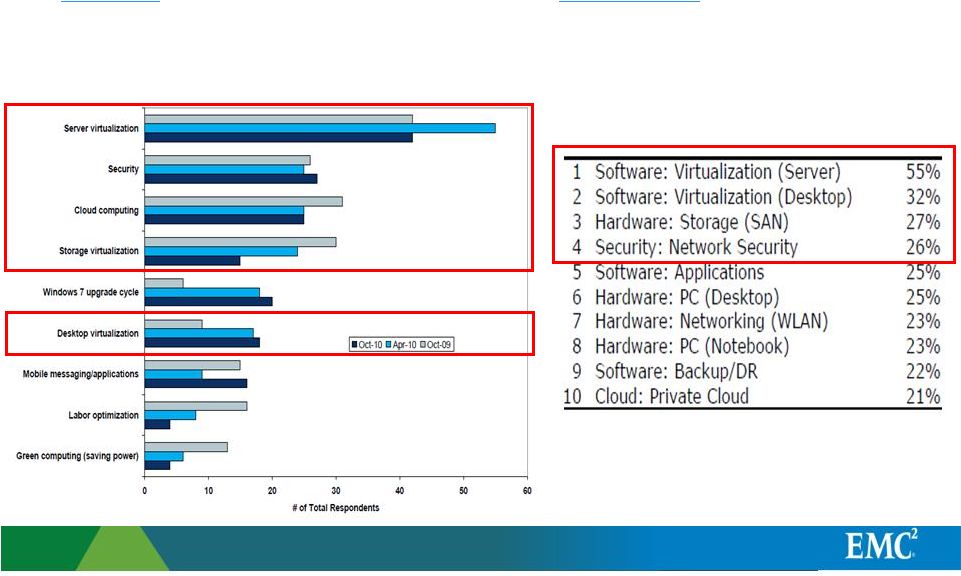 © Copyright 2011 EMC Corporation. All rights reserved. 2011 IT Spending Priorities Barclays: Biggest trends driving spend decisions in 2011: Pacific Crest: CIOs are more likely to increase spending in the following areas: |
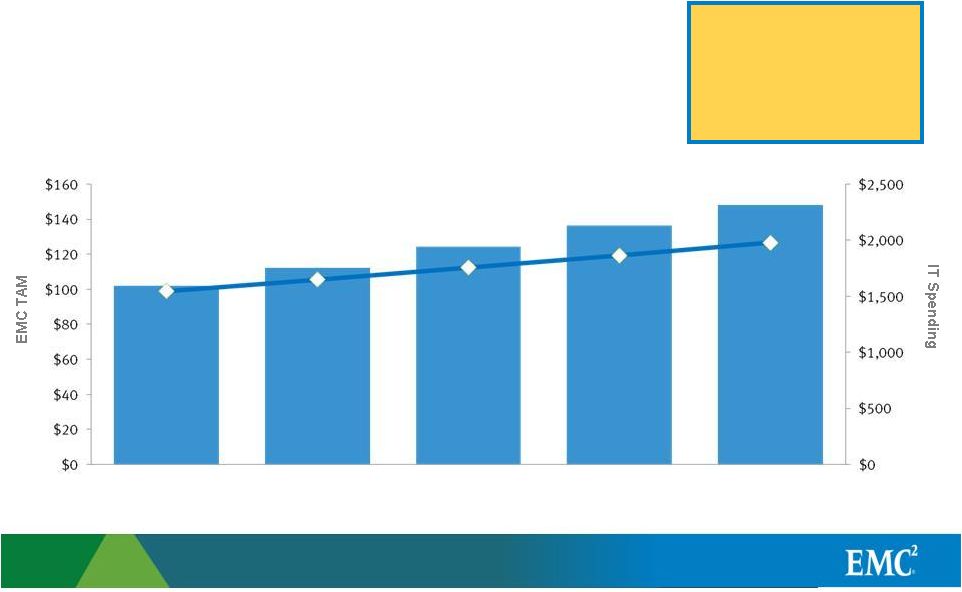 © Copyright 2011 EMC Corporation. All rights reserved. EMC TAM vs. IT Spending (2010-2014) 10% 6% EMC TAM IT Spending 2010e 2011e 2012e 2013e 2014e $ Billion $ Billion +6% +10% +11% +10% +9% +7% +6% +7% 4-yr CAGR Sources: WW IT Spending Growth (Constant Currency) – IDC, 1/11; EMC TAM – EMC Strategic Planning and Advisory Group EMC TAM includes: Storage, Virtualization, Security, Content Management, BI/DW Software, and IT Mgmt. SW & Services |
 © Copyright 2011 EMC Corporation. All rights reserved. Consolidated EMC’s Cloud Credentials Growth!! Virtualization (VMware) Information Storage Information Protection Information Security Info Mgmt & Intelligence Data center cloud OS Management Automation Enterprise cloud middleware Client device abstraction For today’s enterprise apps For “big data” applications BURA for all apps in all environments Protect and verify identities Protect the data itself (at rest/ in motion) Assure governance & compliance (biz & IT) Unstructured data mgmt and flow Structured/semi-structured data analytics #1 New innovation, fastest growing New innovation, fastest growing #1/2 #1 #1 #1 #1 #1/2 #1 #3 New innovation, fastest growing |
 © Copyright 2011 EMC Corporation. All rights reserved. Higher-Growth Emerging Opportunities • Next-generation BURA • Automated storage tiering • Security Compliance • Converged Infrastructure • Lower-end storage • Data Warehousing & Analytics • Scale-out NAS & Object • Cloud Application Platforms • Virtual Storage • Cloud Client Access Identified Opportunities and Invested in: |
 © Copyright 2011 EMC Corporation. All rights reserved. Scale-out NAS Identified a growing need for big-data storage Invested in the best Scale-out NAS technology Expect to achieve high growth and market leadership |
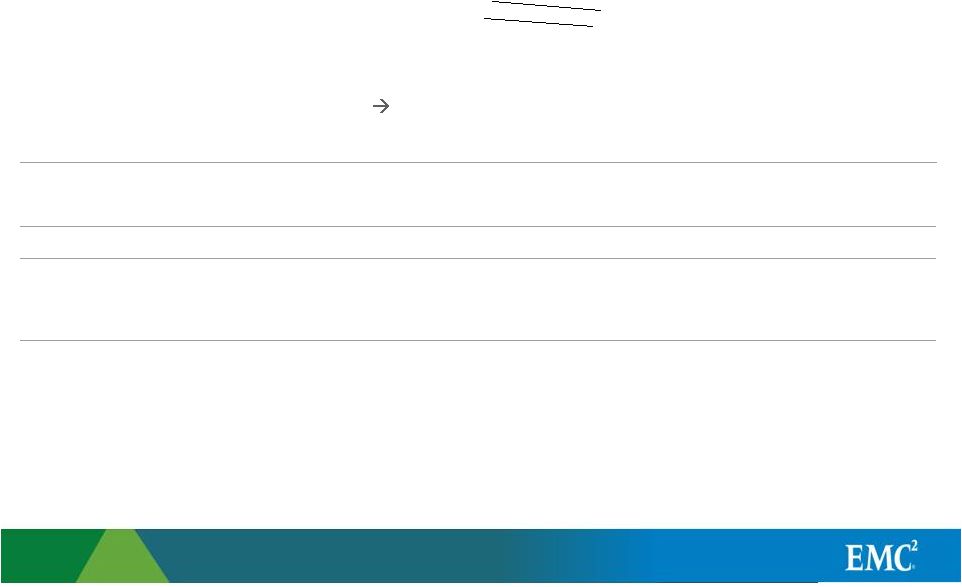
 © Copyright 2011 EMC Corporation. All rights reserved. Isilon Helps Fill Out the Portfolio Source: RBC Capital Markets and company data. Note: HDS Scale-out NAS functionality is through its BlueArc reseller relationship Storage Portfolio of OEMs |
 © Copyright 2011 EMC Corporation. All rights reserved. Lower-end Storage Identified a high-growth, underserved market Invested in new technology and distribution model Expect to achieve high growth and market leadership |
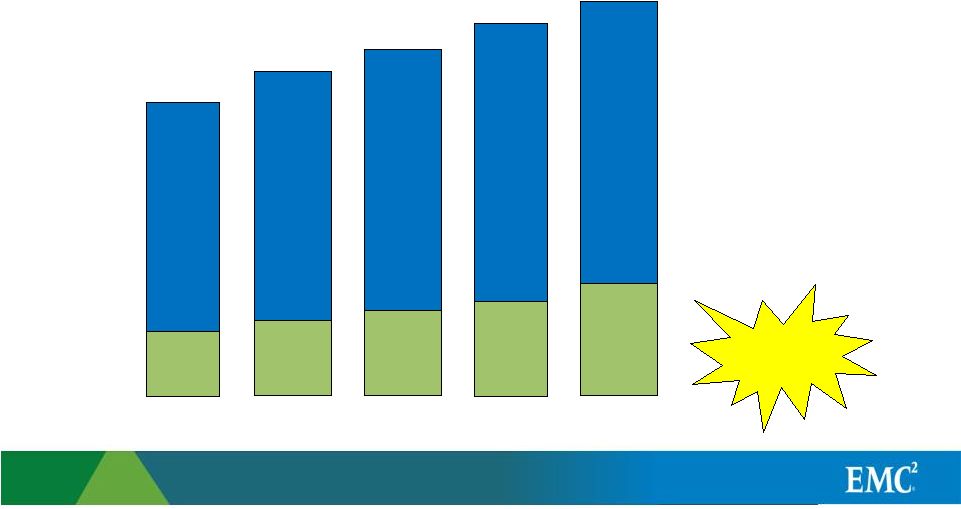 © Copyright 2011 EMC Corporation. All rights reserved. Expanding into Fastest-growing Segment Open Networked Storage Price Bands Source: IDC, Dec. 2010 5.34 5.34 6.07 6.07 14.8% 5.3% 6.95 6.95 4.74 4.74 4.00 4.00 <$25K > $25K CAGR ’10 – ‘14 2010 2012 2013 2014 2011 |
 © Copyright 2011 EMC Corporation. All rights reserved. Converged Infrastructure Identified need to make getting to the cloud easier Invested in unique converged product, value proposition and partnership Expect to achieve high growth and market leadership |
 © Copyright 2011 EMC Corporation. All rights reserved. Converged Infrastructure • Surpassed business goals in 2010 • Converged Infrastructure projected to be the fastest-growing segment of the IT Infrastructure market • Innovation and market reach continually validated by a growing partner and customer base |
 © Copyright 2011 EMC Corporation. All rights reserved. Potential Revenue CAGR 2010-2014 20% or Greater VMware Data Computing Division Isilon/Atmos BRS VPLEX VCE 1 – 10% Symmetrix Storage Services IIG 10 – 19% VNX/VNXe EMC Consulting RSA |
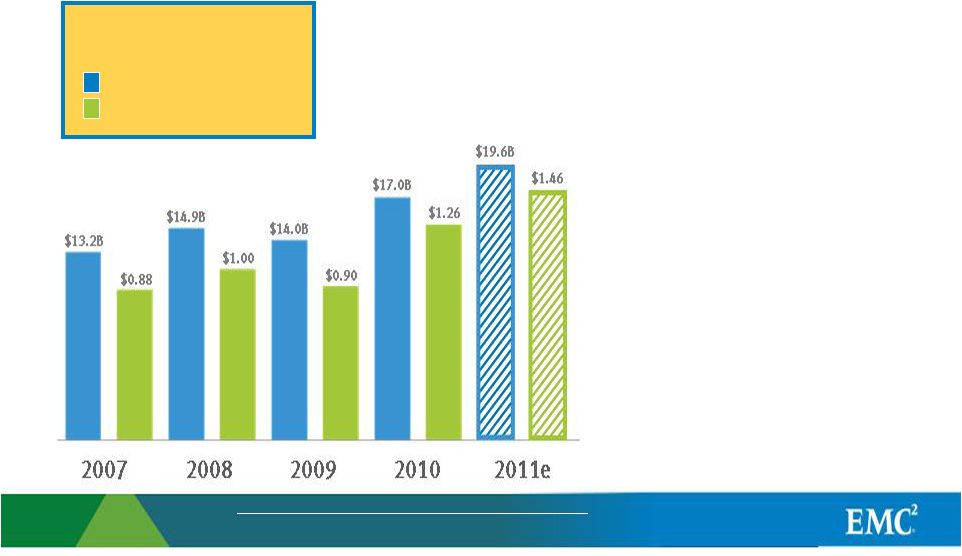 © Copyright 2011 EMC Corporation. All rights reserved. Impressive Performance Revenue Non-GAAP EPS¹ 4-yr CAGR (2007-2011e) 10% 13% Refer to the schedules available at http://www.emc.com/about/investor-relations/archived-events.htm for a complete reconciliation of GAAP to non-GAAP results |
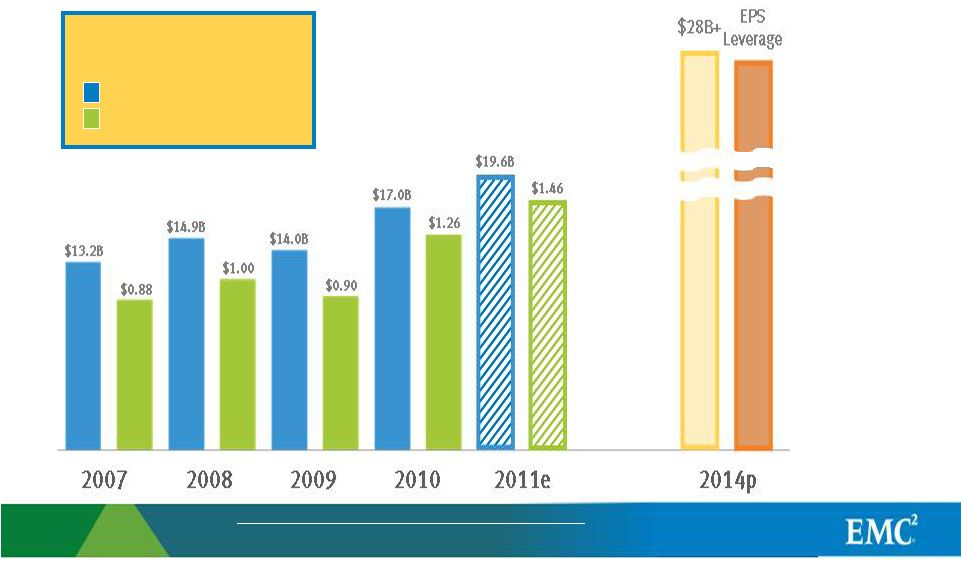 © Copyright 2011 EMC Corporation. All rights reserved. Impressive Potential Revenue Non-GAAP EPS¹ 4-yr CAGR (2007-2011e) 10% 13% Refer to the schedules available at http://www.emc.com/about/investor-relations/archived-events.htm for a complete reconciliation of GAAP to non-GAAP results |
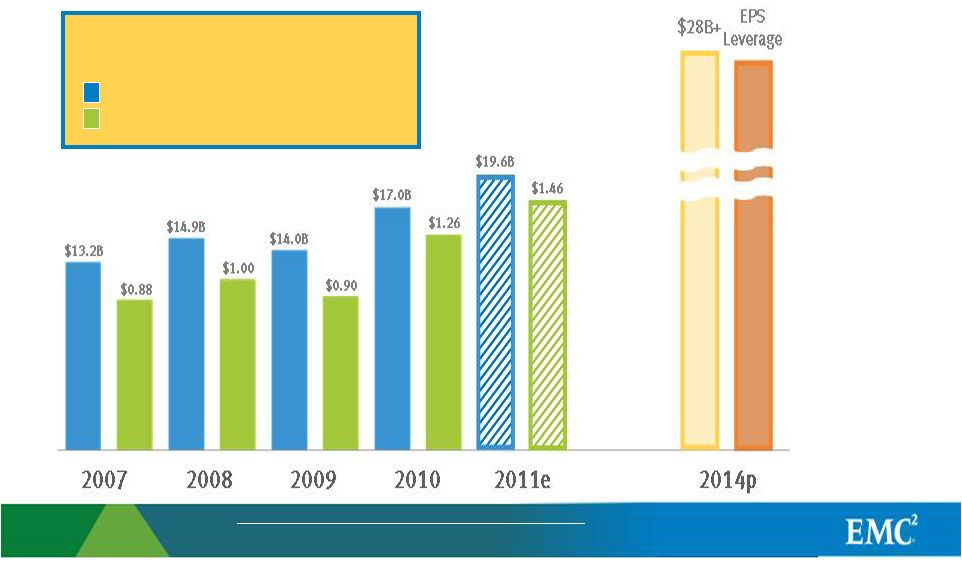 © Copyright 2011 EMC Corporation. All rights reserved. Impressive Potential Revenue Non-GAAP EPS¹ 4-yr CAGR (2007-2011e) 10% 13% 4-yr CAGR (2010-2014p) 13%+ + Refer to the schedules available at http://www.emc.com/about/investor-relations/archived-events.htm for a complete reconciliation of GAAP to non-GAAP results |
 © Copyright 2011 EMC Corporation. All rights reserved. The Time is Right Right Opportunities Right Products Right Business Model Triple play over the long term |
Use of Non-GAAP Financial Measures
This presentation and the accompanying schedules contain non-GAAP financial measures. These non-GAAP financial measures, which are used as measures of EMC’s performance or liquidity, should be considered in addition to, not as a substitute for, measures of EMC’s financial performance or liquidity prepared in accordance with GAAP. EMC’s non-GAAP financial measures may be defined differently from time to time and may be defined differently than similar terms used by other companies, and accordingly, care should be exercised in understanding how EMC defines its non-GAAP financial measures in this presentation.
Where specified in the accompanying schedules for various periods entitled “Reconciliation of GAAP to Non-GAAP,” certain items noted on each such specific schedule (including, where noted, amounts relating to restructuring and acquisition-related charges, special income tax charge, stock-based compensation expense, intangible asset amortization, restructuring charges and IPRD, tax benefits, and net gains on investments, including gain on the sale of VMware stock) are excluded from the non-GAAP financial measures.
EMC’s management uses the non-GAAP financial measures in the accompanying schedules to gain an understanding of EMC’s comparative operating performance (when comparing such results with previous periods or forecasts) and future prospects and excludes the above-listed items from its internal financial statements for purposes of its internal budgets and each reporting segment’s financial goals. These non-GAAP financial measures are used by EMC’s management in their financial and operating decision-making because management believes they reflect EMC’s ongoing business in a manner that allows meaningful period-to-period comparisons. EMC’s management believes that these non-GAAP financial measures provide useful information to investors and others (a) in understanding and evaluating EMC’s current operating performance and future prospects in the same manner as management does, if they so choose, and (b) in comparing in a consistent manner the Company’s current financial results with the Company’s past financial results.
This presentation also includes disclosures regarding free cash flow which is a non-GAAP financial measure. Free cash flow is defined as net cash provided by operating activities less additions to property, plant and equipment and capitalized software development costs. EMC uses free cash flow, among other measures, to evaluate the ability of its operations to generate cash that is available for purposes other than capital expenditures and capitalized software development costs. Management believes that information regarding free cash flow provides investors with an important perspective on the cash available to make strategic acquisitions and investments, repurchase shares, service debt and fund ongoing operations. As free cash flow is not a measure of liquidity calculated in accordance with GAAP, free cash flow should be considered in addition to, but not as a substitute for, the analysis provided in the statement of cash flows.
All of the foregoing non-GAAP financial measures have limitations. Specifically, the non-GAAP financial measures that exclude the items noted above do not include all items of income and expense that affect EMC’s operations. Further, these non-GAAP financial measures are not prepared in accordance with GAAP, may not be comparable to non-GAAP financial measures used by other companies and do not reflect any benefit that such items may confer on EMC. Management compensates for these limitations by also considering EMC’s financial results as determined in accordance with GAAP.
Reconciliation of GAAP to Non-GAAP
For the Twelve Months Ended December 31, 2007
(in thousands, except per share amounts)
| GAAP | Restructuring charges and IPR&D | Net Gains on investments, incl. gain on sale of VMware Stock | Tax Benefits | Stock-based compensation | Intangible amortization | Non-GAAP | ||||||||||||||||||||||
Revenue | 13,230,205 | 13,230,205 | ||||||||||||||||||||||||||
COGS | 6,018,877 | (57,223 | ) | (119,948 | ) | 5,841,706 | ||||||||||||||||||||||
Gross Margin | 7,211,328 | 57,223 | 119,948 | 7,388,499 | ||||||||||||||||||||||||
Operating Expense | 5,472,076 | (34,901 | ) | (310,177 | ) | (84,849 | ) | 5,042,149 | ||||||||||||||||||||
Operating Income | 1,739,252 | 34,901 | 367,400 | 204,797 | 2,346,350 | |||||||||||||||||||||||
Other Income, net | 223,379 | (137,330 | ) | 86,049 | ||||||||||||||||||||||||
Income before provision for income taxes | 1,962,631 | 34,901 | (137,330 | ) | 367,400 | 204,797 | 2,432,399 | |||||||||||||||||||||
Income tax provision | 348,211 | 3,123 | (22,180 | ) | 19,912 | 87,054 | 72,019 | 508,139 | ||||||||||||||||||||
Net Income | 1,614,420 | 31,778 | (115,150 | ) | (19,912 | ) | 280,346 | 132,778 | 1,924,260 | |||||||||||||||||||
Less: Net income attributable to non-controlling interest in VMware Inc | (15,455 | ) | (5,793 | ) | (868 | ) | (22,116 | ) | ||||||||||||||||||||
Net Income attributable to EMC Corporation | 1,598,965 | 31,778 | (115,150 | ) | (19,912 | ) | 274,553 | 131,910 | 1,902,144 | |||||||||||||||||||
Net income per weighted average share, diluted attributable to EMC Corporation common shareholders | $ | 0.74 | 0.01 | (0.05 | ) | (0.01 | ) | 0.13 | 0.06 | $ | 0.88 | |||||||||||||||||
Weighted average shares, diluted | 2,157,873 | 2,157,873 | 2,157,873 | 2,157,873 | 2,157,873 | 2,157,873 | 2,157,873 | |||||||||||||||||||||
Gross Margin % of Revenue | 54.5 | % | 55.8 | % | ||||||||||||||||||||||||
Operating Margin % of Revenue | 13.1 | % | 17.7 | % | ||||||||||||||||||||||||
Reconciliation of GAAP to Non-GAAP
For the Twelve Months Ended December 31, 2010
(in thousands, except per share amounts)
Unaudited
| Revenue | Cost of Revenue | Research and Development | Selling, General and Administrative | Restructuring and Acquisition- Related Charges | Operating Income | Other (Expense) Income, net | Income Before Taxes | Income Tax Provision | Net Income | Net Income Attributable to VMware | Net Income Attributable to EMC | Net Income per Weighted Average Share, Basic | Net Income per Weighted Average Share, Diluted | |||||||||||||||||||||||||||||||||||||||||||
EMC Consolidated GAAP | $ | 17,015,126 | $ | 6,984,145 | $ | 1,888,015 | $ | 5,375,305 | $ | 84,375 | $ | 2,683,286 | $ | (75,303 | ) | $ | 2,607,983 | $ | 638,297 | $ | 1,969,686 | $ | (69,691 | ) | $ | 1,899,995 | $ | 0.924 | $ | 0.880 | ||||||||||||||||||||||||||
Restructuring and acquisition-related charges | — | — | — | — | (84,375 | ) | 84,375 | — | 84,375 | 10,721 | 73,654 | (1,636 | ) | 72,018 | $ | 0.035 | $ | 0.034 | ||||||||||||||||||||||||||||||||||||||
Special income tax charge | — | — | — | — | — | — | — | — | (83,331 | ) | 83,331 | — | 83,331 | $ | 0.041 | $ | 0.039 | |||||||||||||||||||||||||||||||||||||||
EMC Consolidated Adjusted (1) | 17,015,126 | 6,984,145 | 1,888,015 | 5,375,305 | — | 2,767,661 | (75,303 | ) | 2,692,358 | 565,687 | 2,126,671 | (71,327 | ) | 2,055,344 | $ | 1.000 | $ | 0.953 | ||||||||||||||||||||||||||||||||||||||
Stock-based compensation expense | — | (108,653 | ) | (258,746 | ) | (317,654 | ) | — | 685,053 | 1,405 | 686,458 | 165,673 | 520,785 | (48,122 | ) | 472,663 | $ | 0.230 | $ | 0.220 | ||||||||||||||||||||||||||||||||||||
Intangible asset amortization | — | (131,760 | ) | (23,556 | ) | (129,966 | ) | — | 285,282 | — | 285,282 | 92,674 | 192,608 | (5,279 | ) | 187,329 | $ | 0.091 | $ | 0.087 | ||||||||||||||||||||||||||||||||||||
EMC Consolidated Non-GAAP (2) | $ | 17,015,126 | $ | 6,743,732 | $ | 1,605,713 | $ | 4,927,685 | $ | — | $ | 3,737,996 | $ | (73,898 | ) | $ | 3,664,098 | $ | 824,034 | $ | 2,840,064 | $ | (124,728 | ) | $ | 2,715,336 | $ | 1.321 | $ | 1.260 | ||||||||||||||||||||||||||
EMC Information Infrastructure GAAP | $ | 14,164,393 | $ | 6,491,939 | $ | 1,244,057 | $ | 4,103,464 | $ | 80,877 | $ | 2,244,056 | $ | (58,713 | ) | $ | 2,185,343 | $ | 575,156 | $ | 1,610,187 | $ | — | $ | 1,610,187 | $ | 0.783 | $ | 0.750 | |||||||||||||||||||||||||||
Restructuring and acquisition-related charges | — | — | — | — | (80,877 | ) | 80,877 | — | 80,877 | 15,736 | 65,141 | — | 65,141 | $ | 0.032 | $ | 0.030 | |||||||||||||||||||||||||||||||||||||||
Special income tax charge | — | — | — | — | — | — | — | — | (83,331 | ) | 83,331 | — | 83,331 | $ | 0.041 | $ | 0.039 | |||||||||||||||||||||||||||||||||||||||
EMC Information Infrastructure Adjusted (3) | 14,164,393 | 6,491,939 | 1,244,057 | 4,103,464 | — | 2,324,933 | (58,713 | ) | 2,266,220 | 507,561 | 1,758,659 | — | 1,758,659 | $ | 0.855 | $ | 0.819 | |||||||||||||||||||||||||||||||||||||||
Stock-based compensation expense | — | (70,160 | ) | (94,941 | ) | (210,530 | ) | — | 375,631 | 1,273 | 376,904 | 103,303 | 273,601 | — | 273,601 | $ | 0.133 | $ | 0.127 | |||||||||||||||||||||||||||||||||||||
Intangible asset amortization | — | (103,304 | ) | (21,202 | ) | (126,017 | ) | — | 250,523 | — | 250,523 | 84,937 | 165,586 | — | 165,586 | $ | 0.081 | $ | 0.077 | |||||||||||||||||||||||||||||||||||||
EMC Information Infrastructure Non-GAAP (4) | $ | 14,164,393 | $ | 6,318,475 | $ | 1,127,914 | $ | 3,766,917 | $ | — | $ | 2,951,087 | $ | (57,440 | ) | $ | 2,893,647 | $ | 695,801 | $ | 2,197,846 | $ | — | $ | 2,197,846 | $ | 1.069 | $ | 1.023 | |||||||||||||||||||||||||||
VMware standalone GAAP | $ | 2,857,343 | $ | 493,715 | $ | 652,968 | $ | 1,282,667 | $ | — | $ | 427,993 | $ | (11,618 | ) | $ | 416,375 | $ | 58,936 | $ | 357,439 | $ | — | $ | 357,439 | $ | 0.174 | $ | 0.162 | |||||||||||||||||||||||||||
GAAP adjustments and eliminations | (6,610 | ) | (1,509 | ) | (9,010 | ) | (10,826 | ) | 3,498 | 11,237 | (4,972 | ) | 6,265 | 4,205 | 2,060 | (69,691 | ) | (67,631 | ) | $ | (0.033 | ) | $ | (0.036 | ) | |||||||||||||||||||||||||||||||
VMware within EMC GAAP (5) | 2,850,733 | 492,206 | 643,958 | 1,271,841 | 3,498 | 439,230 | (16,590 | ) | 422,640 | 63,141 | 359,499 | (69,691 | ) | 289,808 | $ | 0.141 | $ | 0.131 | ||||||||||||||||||||||||||||||||||||||
Acquisition-related charges | — | — | — | — | (3,498 | ) | 3,498 | — | 3,498 | (5,015 | ) | 8,513 | (1,636 | ) | 6,877 | $ | 0.003 | $ | 0.003 | |||||||||||||||||||||||||||||||||||||
VMware within EMC Adjusted (6) | 2,850,733 | 492,206 | 643,958 | 1,271,841 | — | 442,728 | (16,590 | ) | 426,138 | 58,126 | 368,012 | (71,327 | ) | 296,685 | $ | 0.144 | $ | 0.134 | ||||||||||||||||||||||||||||||||||||||
Stock-based compensation expense | — | (38,493 | ) | (163,805 | ) | (107,124 | ) | — | 309,422 | 132 | 309,554 | 62,370 | 247,184 | (48,122 | ) | 199,062 | $ | 0.097 | $ | 0.093 | ||||||||||||||||||||||||||||||||||||
Intangible asset amortization | — | (28,456 | ) | (2,354 | ) | (3,949 | ) | — | 34,759 | — | 34,759 | 7,737 | 27,022 | (5,279 | ) | 21,743 | $ | 0.011 | $ | 0.010 | ||||||||||||||||||||||||||||||||||||
VMware within EMC Non-GAAP (7) | $ | 2,850,733 | $ | 425,257 | $ | 477,799 | $ | 1,160,768 | $ | — | $ | 786,909 | $ | (16,458 | ) | $ | 770,451 | $ | 128,233 | $ | 642,218 | $ | (124,728 | ) | $ | 517,490 | $ | 0.252 | $ | 0.237 | ||||||||||||||||||||||||||
| Wtd. Average Share O/S | 2,055,959 | 2,147,931 | ||||||||||||||||||||||||||||||||||||||||||||||||||||||
Reconciliation of GAAP to Non-GAAP
For the Twelve Months Ended December 31, 2010
(in thousands, except per share amounts)
Unaudited
(Continued)
The following costs are included in EMC Consolidated Non-GAAP and EMC Information Infrastructure Non-GAAP results:
| Revenue | Cost of Revenue | Research and Development | Selling, General and Administrative | Restructuring and Acquisition- Related Charges | Operating Income | Other (Expense) Income, net | Income Before Taxes | Income Tax Provision | Net Income | Net Income Attributable to VMware | Net Income Attributable to EMC | Net Income per Weighted Average Share, Basic | Net Income per Weighted Average Share, Diluted | |||||||||||||||||||||||||||||||||||||||||||
Non-cash interest expense on convertible debt (8) | $ | — | $ | — | $ | — | $ | — | $ | — | $ | — | $ | (105,654 | ) | $ | (105,654 | ) | $ | (36,850 | ) | $ | (68,804 | ) | $ | — | $ | (68,804 | ) | $ | (0.034 | ) | $ | (0.032 | ) | |||||||||||||||||||||
Transition costs (9) | — | 2,275 | 5,079 | 29,836 | — | (37,190 | ) | — | (37,190 | ) | (10,085 | ) | (27,105 | ) | — | (27,105 | ) | $ | (0.013 | ) | $ | (0.013 | ) | |||||||||||||||||||||||||||||||||
| $ | — | $ | 2,275 | $ | 5,079 | $ | 29,836 | $ | — | $ | (37,190 | ) | $ | (105,654 | ) | $ | (142,844 | ) | $ | (46,935 | ) | $ | (95,909 | ) | $ | — | $ | (95,909 | ) | $ | (0.047 | ) | $ | (0.045 | ) | |||||||||||||||||||||
| (1) | Represents EMC Consolidated GAAP excluding restructuring, acquisition-related charges and special income tax charge. |
| (2) | Represents EMC Consolidated Adjusted excluding stock-based compensation expense and intangible asset amortization. |
| (3) | Represents EMC Information Infrastructure GAAP excluding restructuring, acquisition-related charges and special income tax charge. |
| (4) | Represents EMC Information Infrastructure Adjusted excluding stock-based compensation expense and intangible asset amortization. |
| (5) | Represents VMware within EMC GAAP. |
| (6) | Represents VMware within EMC GAAP excluding acquisition-related charges. |
| (7) | Represents VMware within EMC Adjusted excluding stock-based compensation expense and intangible asset amortization. |
| (8) | Represents the non-cash interest charge associated with our convertible senior notes due 2011 and 2013 totaling $3,450 million. |
| (9) | Represents incremental costs incurred to transform our current cost structure to a more streamlined cost structure. |
Note: schedule may not add due to rounding
Reconciliation of EMC’s Compounded Annual Growth Rate
| Actual | Guidance | Guidance | ||||||||||
| 2007 | 2011 | CAGR | ||||||||||
GAAP diluted earnings per share | $ | 0.74 | $ | 1.07 | 10 | % | ||||||
Restructuring and acquisitions-related charges | 0.01 | 0.03 | ||||||||||
Net gains on investments, incl. gain on sale of Vmware stock | (0.05 | ) | ||||||||||
Tax benefits | (0.01 | ) | ||||||||||
Stock-based compensation expense | 0.13 | 0.27 | ||||||||||
Intangible asset amortization | 0.06 | 0.09 | ||||||||||
Non-GAAP diluted earnings per share | $ | 0.88 | $ | 1.46 | 13 | % | ||||||
Schedule may not add due to rounding
EMC Corporation
Reconciliation of Cash Flow from Operations to Free Cash Flow
(in thousands)
Unaudited
| Twelve Months Ended | ||||||||
December 31, 2007 | December 31, 2010 | |||||||
EMC Consolidated | ||||||||
Cash flow from Operations | $ | 3,126,602 | $ | 4,548,843 | ||||
Capital Expenditures | 699,038 | (745,412 | ) | |||||
Capitalized Software | 232,047 | (362,956 | ) | |||||
Free Cash Flow | $ | 2,195,517 | $ | 3,440,475 | ||||
EMC Corporation
Reconciliation of Cash Flow from Operations to Free Cash Flow
(in thousands)
The statements presented below are based on current expectations. These statements are forward-looking, and actual results may differ materially. These statements do not give effect to the potential impact of mergers, acquisitions, divestitures or business combinations that may be announced or closed after the date hereof. These statements supersede all prior statements regarding 2011 cash flow set forth in prior EMC news releases. All dollar amounts and percentages should be considered to be approximations.
| 2011 Outlook | ||||
EMC Consolidated | ||||
Cash flow from Operations | $ | 5,340,000 | ||
Capital Expenditures | 900,000 | |||
Capitalized Software | 440,000 | |||
Free Cash Flow | $ | 4,000,000 | ||