UNITED STATES
SECURITIES AND EXCHANGE COMMISSION
Washington, D.C. 20549
FORM N-CSRS
CERTIFIED SHAREHOLDER REPORT OF REGISTERED MANAGEMENT
INVESTMENT COMPANIES |
| | Investment Company Act file number 811-04612
Name of Fund: BlackRock EuroFund
Fund Address: 100 Bellevue Parkway, Wilmington, DE 19809
Name and address of agent for service: Donald C. Burke, Chief Executive Officer, BlackRock
EuroFund, 800 Scudders Mill Road, Plainsboro, NJ, 08536. Mailing address: P.O. Box
9011, Princeton, NJ, 08543-9011
Registrant’s telephone number, including area code: (800) 441-7762
Date of fiscal year end: 10/31/2008
Date of reporting period: 11/01/2007 – 04/30/2008
Item 1 – Report to Stockholders |

EQUITIES FIXED INCOME REAL ESTATE LIQUIDITY ALTERNATIVES BLACKROCK SOLUTIONS
BlackRock EuroFund
SEMI-ANNUAL REPORT
APRIL 30, 2008 | (UNAUDITED) |
NOT FDIC INSURED
MAY LOSE VALUE
NO BANK GUARANTEE |
| Table of Contents | | |
| |
|
| |
| | | Page |
| |
|
| |
| A Letter to Shareholders | | 3 |
| Semi-Annual Report: | | |
| Fund Summary | | 4 |
| About Fund Performance | | 6 |
| Disclosure of Expenses | | 6 |
| Portfolio Summary | | 7 |
| Financial Statements: | | |
| Schedule of Investments | | 8 |
| Statement of Assets and Liabilities | | 10 |
| Statement of Operations | | 11 |
| Statements of Changes in Net Assets | | 12 |
| Financial Highlights | | 13 |
| Notes to Financial Statements | | 18 |
| Officers and Trustees | | 23 |
| Additional Information | | 24 |
| Mutual Fund Family | | 26 |
Dear Shareholder
Over the past several months, financial markets have been buffeted by the housing recession, the credit market unraveling
and related liquidity freeze and steadily rising commodity prices. Counterbalancing these difficulties were booming export
activity, a robust non-financial corporate sector and, notably, aggressive and timely monetary and fiscal policy actions.
Amid the market tumult, the Federal Reserve Board (the “Fed”) intervened with a series of moves to bolster liquidity and
ensure financial market stability. Since September 2007, the central bank slashed the target federal funds rate 325 basis
points (3.25%), bringing the rate to 2.0% as of period-end. Of greater magnitude, however, were the Fed’s other policy
decisions, which included opening the discount window directly to broker dealers and investment banks and backstopping
the unprecedented rescue of Bear Stearns.
The Fed’s response to the financial crisis helped to improve credit conditions and investor mood. After hitting a low point
on March 17 (coinciding with the collapse of Bear Stearns), equity markets found a welcome respite in April, when the
S&P 500 Index of U.S. stocks posted positive monthly performance for the first time since October 2007. International
markets, which outpaced those of the U.S. for much of 2007, saw a reversal in that trend, as effects of the credit crisis and
downward pressures on growth were far-reaching.
In contrast to equity markets, Treasury securities rallied (yields fell as prices correspondingly rose), as a broad “flight-
to–quality” theme persisted. The yield on 10-year Treasury issues, which touched 5.30% in June 2007 (its highest level
in five years), fell to 4.04% by year-end and to 3.77% by April 30. Treasury issues relinquished some of their gains in April,
however, as investor appetite for risk returned and other high-quality fixed income sectors outperformed.
Problems within the monoline insurance industry and the failure of auctions for auction rate securities plagued the
municipal bond market, driving yields higher and prices lower across the curve. However, in conjunction with the more
recent shift in sentiment, the sector delivered strong performance in the final month of the reporting period.
Overall, the major benchmark indexes generated results that generally reflected heightened investor risk aversion:
| Total Returns as of April 30, 2008 | | 6-month | | 12-month |
| |
| |
|
| U.S. equities (S&P 500 Index) | | – 9.64% | | – 4.68% |
| |
| |
| |
| |
|
| Small cap U.S. equities (Russell 2000 Index) | | –12.92 | | –10.96 |
| |
| |
|
| International equities (MSCI Europe, Australasia, Far East Index) | | – 9.21 | | – 1.78 |
| |
| |
| |
| |
|
| Fixed income (Lehman Brothers U.S. Aggregate Index) | | + 4.08 | | + 6.87 |
| |
| |
| |
| |
|
| Tax-exempt fixed income (Lehman Brothers Municipal Bond Index) | | + 1.47 | | + 2.79 |
| |
| |
| |
| |
|
| High yield bonds (Lehman Brothers U.S. Corporate High Yield 2% Issuer Capped Index) | | – 0.73 | | | –0.80 |
| |
| |
| |
| |
|
| | Past performance is no guarantee of future results. Index performance shown for illustrative purposes only. You cannot invest directly in an index.
As you navigate today’s volatile markets, we encourage you to review your investment goals with your financial professional
and to make portfolio changes, as needed. For more up-to-date commentary on the economy and financial markets, we
invite you to visit www.blackrock.com/funds. As always, we thank you for entrusting BlackRock with your investment assets,
and we look forward to continuing to serve you in the months and years ahead. |

THIS PAGE NOT PART OF YOUR FUND REPORT

Fund Summary
Portfolio Management Commentary
How did the Fund perform?
•Against a challenging international market backdrop, the Fund’s
Institutional, Investor A, Investor C and Class R Shares outperformed the
benchmark MSCI Europe Index, while its Investor B Shares modestly
lagged the index for the 6-month period.
What factors influenced performance?
•Among the strongest contributors to relative performance was the Fund’s
overweight position in materials, the best-performing sector over the
period, owing to strong commodity prices and robust demand. Market
leaders included steel company ArcelorMittal, miner Anglo American
Plc, chemical company Akzo Nobel NV, chemical/pharmaceutical giant
Bayer AG and Irish construction company CRH Plc.
•The Fund’s overweight exposure to record-high oil prices benefited results,
as well, led by European oil companies Eni SpA and Total SA (in which
the Fund held overweights) and power utilities E.ON AG and RWE AG.
•Elsewhere within the Fund, stock selection in the consumer staples
sector (namely food producer Nestle SA and tobacco manufacturer
British American Tobacco Plc) enhanced relative returns. Effective
security selection within industrials (primarily capital goods names) also
proved advantageous, as did our avoidance of the poorly-performing
technology sector.
•Conversely, the primary detractor from performance was the Fund’s
overweight allocation to the telecommunication services sector, which
was pressured by both profit-taking following a strong 2007 fourth
quarter and a weaker-than-expected earnings season in both the U.S.
and Europe. Disappointing stock selection in the sector, namely Telecom
Italia SpA and Vodafone Group Plc, also hindered results. Other
detractors for the period included Fund holding Roche Holding AG
(healthcare), as well as selected investments in the banking sector,
which fell on wider market concerns around the credit crisis.
Describe recent portfolio activity.
•We continued to reduce the Fund’s exposure to financials, predominately
by selling holdings within the banking and diversified financial sub-
sectors. Our largest sales included investment bank UBS AG, Allied Irish
Banks Plc and insurer AXA SA. We recommitted most of the proceeds to
the materials and energy sectors. Notably, we established new positions
in miner BHP Billiton Plc and oil major BP Plc. Among our other pur-
chases were pharmaceutical/diagnostics company Roche, insurer
Zurich Financial Services AG and utility provider Suez SA.
Describe Fund positioning at period-end.
•We remain constructive on the outlook for European equities.While
the near-term direction for corporate earnings remains uncertain, in
the absence of a global recession, we believe valuations are low enough
(in an absolute and historical sense) to enable the market to develop
favorably from here.
•On a sector basis, we currently favor the materials, energy and telecom-
munication services sectors, as well as the food, beverage & tobacco
sub-sector. We continue to avoid consumer-focused companies and
remain cautious about the outlook for financials, although continued
monetary policy easing, if combined with solid balance sheet structure,
may renew the attractions of selected companies in the sector.
| | | | | Actual | | | | | | Hypothetical** | | |
| | |
| |
| |
| |
| |
| |
|
| | | Beginning | | Ending | | | | Beginning | | Ending | | |
| | | Account Value | | Account Value | | Expenses Paid | | Account Value | | Account Value | | Expenses Paid |
| | | November 1, 2007 | | April 30, 2008 | | During the Period* | | November 1, 2007 | | April 30, 2008 | | During the Period* |
| |
| |
| |
| |
| |
| |
|
| Institutional | | $1,000 | | $913.20 | | $ 4.90 | | $1,000 | | $1,019.74 | | $ 5.17 |
| Investor A | | $1,000 | | $911.80 | | $ 5.70 | | $1,000 | | $1,018.89 | | $ 6.02 |
| Investor B | | $1,000 | | $908.00 | | $10.01 | | $1,000 | | $1,014.37 | | $10.57 |
| Investor C | | $1,000 | | $908.60 | | $ 9.44 | | $1,000 | | $1,014.96 | | $ 9.97 |
| Class R | | $1,000 | | $909.80 | | $ 7.93 | | $1,000 | | $1,016.56 | | $ 8.37 |
| |
| |
| |
| |
| |
| |
|
| | * For each class of the Fund, expenses are equal to the annualized expense ratio for the class (1.03% for Institutional, 1.20% for Investor A, 2.11% for Investor B, 1.99%
for Investor C and 1.67% for Class R), multiplied by the average account value over the period, multiplied by 182/366 (to reflect the one-half year period shown).
** Hypothetical 5% annual return before expenses is calculated by pro-rating the number of days in the most recent fiscal half year divided by 366.
See “Disclosure of Expenses” on page 6 for further information on how expenses were calculated. |
4 BLACKROCK EUROFUND APRIL 30, 2008
| Total Return Based on a $10,000 Investment |
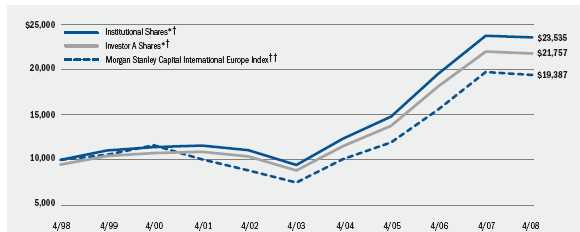
* Assuming maximum sales charge, if any, transaction costs and other operating expenses, including advisory fees.
† The Fund invests primarily in equities of corporations domiciled in European countries. Under normal market conditions, at least 80% of
the Fund’s net assets will be invested in European corporate securities, primarily common stocks and debt and preferred securities convertible
into common stock.
††This unmanaged capitalization-weighted Index is comprised of a representative sampling of large-, medium- and small-capitalization
companies in developed European countries.
| | Performance Summary for the Period Ended April 30, 2008 |
| | | | | | | | | Average Annual Total Returns* | | | | |
| | | | |
| |
| |
| |
| |
|
| | | | | 1 Year | | | | 5 Years | | 10 Years |
| | | | |
| |
| |
| |
|
| | | 6-Month | | w/o sales | | w/sales | | w/o sales | | w/sales | | w/o sales | | w/sales |
| | | Total Returns | | charge | | charge | | charge | | charge | | charge | | charge |
| |
| |
| |
| |
| |
| |
| |
|
| Institutional | | –8.68% | | –0.77% | | — | | +20.06% | | — | | +8.94% | | — |
| Investor A | | –8.82 | | –0.98 | | –6.18% | | +19.76 | | +18.48% | | +8.67 | | +8.08% |
| Investor B | | –9.20 | | –1.80 | | –5.34 | | +18.80 | | +18.60 | | +7.99 | | +7.99 |
| Investor C | | –9.14 | | –1.72 | | –2.49 | | +18.83 | | +18.83 | | +7.82 | | +7.82 |
| Class R | | –9.02 | | –1.49 | | — | | +19.61 | | — | | +8.50 | | — |
| Morgan Stanley Capital International Europe | | | | | | | | | | | | | | |
| Index | | –9.16 | | –1.63 | | — | | +20.93 | | — | | +6.84 | | — |
| |
| |
| |
| |
| |
| |
| |
|
| | * Assuming maximum sales charges. See “About Fund Performance” on page 6 for a detailed description of share classes, including any related sales charges and fees.
Past performance is not indicative of future results. |
BLACKROCK EUROFUND APRIL 30, 2008 5
About Fund Performance
•Institutional Sharesare not subject to any sales charge. Institutional
Shares bear no ongoing distribution or service fees and are available
only to eligible investors.
•Investor A Sharesincur a maximum initial sales charge (front-end load)
of 5.25% and a service fee of 0.25% per year (but no distribution fee).
•Investor B Sharesare subject to a maximum contingent deferred sales
charge of 4.50% declining to 0% after six years. In addition, Investor B
Shares are subject to a distribution fee of 0.75% per year and a service
fee of 0.25% per year. These shares automatically convert to Investor A
Shares after approximately eight years. (There is no initial sales charge
for automatic share conversions.) All returns for periods greater than
eight years reflect this conversion.
•Investor C Sharesare subject to a distribution fee of 0.75% per year
and a service fee of 0.25% per year. In addition, Investor C Shares are
subject to a 1% contingent deferred sales charge if redeemed within
one year of purchase.
•Class R Sharesdo not incur a maximum initial sales charge (front-end
load) or deferred sales charge. These shares are subject to a distribution
fee of 0.25% per year and a service fee of 0.25% per year. Class R
Shares are available only to certain retirement plans. Prior to inception,
Class R Share performance results are those of the Institutional Shares
(which have no distribution or service fees) restated to reflect Class R
Share fees.
Performance information reflects past performance and does not guar-
antee future results. Current performance may be lower or higher than
the performance data quoted. Refer to www.blackrock.com/funds
to obtain performance data current to the most recent month-end.
Performance results do not reflect the deduction of taxes that a share-
holder would pay on fund distributions or the redemption of fund shares.
The Fund may charge a 2% redemption fee for sales or exchanges of
shares within 30 days of purchase or exchange. Performance data
does not reflect this potential fee. Figures shown in the performance
tables on page 5 assume reinvestment of all dividends and capital
gain distributions, if any, at net asset value on the ex-dividend date.
Investment return and principal value of shares will fluctuate so that
shares, when redeemed, may be worth more or less than their original
cost. Dividends paid to each class of shares will vary because of the
different levels of service, distribution and transfer agency fees applica-
ble to each class, which are deducted from the income available to be
paid to shareholders. |
Disclosure of Expenses
Shareholders of this Fund may incur the following charges: (a) expenses
related to transactions, including sales charges, redemption fees and
exchange fees; and (b) operating expenses including advisory fees, distri-
bution fees including 12b-1 fees, and other Fund expenses. The expense
example on page 4 (which is based on a hypothetical investment of
$1,000 invested on November 1, 2007 and held through April 31, 2008)
is intended to assist shareholders both in calculating expenses based on
an investment in the Fund and in comparing these expenses with similar
costs of investing in other mutual funds.
The table provides information about actual account values and actual
expenses. In order to estimate the expenses a shareholder paid during
the period covered by this report, shareholders can divide their account
value by $1,000 and then multiply the result by the number correspon-
ding to their share class under the heading entitled “Expenses Paid
During the Period.”
The table also provides information about hypothetical account values
and hypothetical expenses based on the Fund’s actual expense ratio
and an assumed rate of return of 5% per year before expenses. In
order to assist shareholders in comparing the ongoing expenses of
investing in this Fund and other funds, compare the 5% hypothetical
example with the 5% hypothetical examples that appear in other funds’
shareholder reports.
The expenses shown in the table are intended to highlight shareholders’
ongoing costs only and do not reflect any transactional expenses, such
as sales charges, redemption fees or exchange fees. Therefore, the hypo-
thetical table is useful in comparing ongoing expenses only, and will
not help shareholders determine the relative total expenses of owning
different funds. If these transactional expenses were included, shareholder
expenses would have been higher.
Portfolio Summary
As of April 30, 2008 |
| | | Percent of |
| Ten Largest Equity Holdings | | Net Assets |
| |
|
| Nestle SA Registered Shares | | 4% |
| Royal Dutch Shell Plc Class B | | 4 |
| Vodafone Group Plc | | 4 |
| BP Plc | | 4 |
| Total SA | | 4 |
| E.ON AG | | 3 |
| Unilever Plc | | 3 |
| Eni SpA | | 3 |
| Novartis AG Registered Shares | | 3 |
| Allianz AG Registered Shares | | 3 |
| | | Percent of |
| Five Largest Industries | | Net Assets |
| |
|
| Oil, Gas & Consumable Fuels | | 16% |
| Commercial Banks | | 12 |
| Insurance | | 8 |
| Metals & Mining | | 8 |
| Food Products | | 8 |
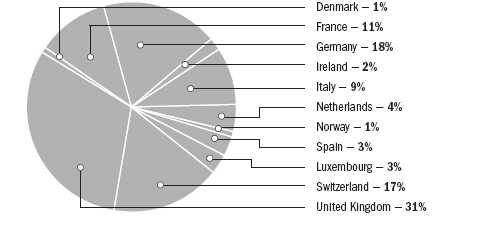
| Geographic Allocation as a Percentage of Long-Term Investments as of April 30, 2008 |
Schedule of Investments April 30, 2008 (Unaudited) (Percentages shown are based on Net Assets)
| Common Stocks | | Shares | | Value |
| |
| |
|
| |
| Denmark — 0.9% | | | | |
| Commercial Banks — 0.9% | | | | |
| Danske Bank A/S | | 224,255 | | $ 7,720,686 |
| |
| |
|
| Total Common Stocks in Denmark | | | | 7,720,686 |
| |
| |
|
| France — 10.3% | | | | |
| Commercial Banks — 1.5% | | | | |
| Societe Generale SA | | 111,578 | | 12,961,430 |
| |
| |
|
| Electric Utilities — 1.7% | | | | |
| Electricite de France SA | | 140,013 | | 14,634,425 |
| |
| |
|
| Machinery — 1.7% | | | | |
| Vallourec SA | | 53,757 | | 14,574,234 |
| |
| |
|
| Multi-Utilities — 1.6% | | | | |
| Suez SA | | 194,631 | | 13,714,078 |
| |
| |
|
| Oil, Gas & Consumable Fuels — 3.8% | | | | |
| Total SA | | 383,906 | | 32,158,318 |
| |
| |
|
| Total Common Stocks in France | | | | 88,042,485 |
| |
| |
|
| Germany — 17.6% | | | | |
| Air Freight & Logistics — 1.7% | | | | |
| Deutsche Post AG | | 476,396 | | 14,789,102 |
| |
| |
|
| Automobiles — 3.1% | | | | |
| Bayerische Motoren Werke AG | | 188,923 | | 10,299,416 |
| DaimlerChrysler AG | | 208,162 | | 16,185,963 |
| | | | |
|
| | | | | 26,485,379 |
| |
| |
|
| Chemicals — 2.6% | | | | |
| Bayer AG | | 265,730 | | 22,500,671 |
| |
| |
|
| Diversified Telecommunication | | | | |
| Services — 1.5% | | | | |
| Deutsche Telekom AG | | 691,501 | | 12,370,305 |
| |
| |
|
| Electric Utilities — 3.4% | | | | |
| E.ON AG | | 140,405 | | 28,480,525 |
| |
| |
|
| Industrial Conglomerates — 2.5% | | | | |
| Siemens AG | | 178,394 | | 20,873,169 |
| |
| |
|
| Insurance — 2.8% | | | | |
| Allianz AG Registered Shares | | 119,197 | | 24,219,989 |
| |
| |
|
| Total Common Stocks in Germany | | | | 149,719,140 |
| |
| |
|
| Ireland — 1.5% | | | | |
| Construction Materials — 1.5% | | | | |
| CRH Plc | | 345,731 | | 13,192,041 |
| |
| |
|
| Total Common Stocks in Ireland | | | | 13,192,041 |
| |
| |
|
| Italy — 8.7% | | | | |
| Commercial Banks — 4.1% | | | | |
| Banca Intesa SpA | | 2,574,529 | | 19,160,671 |
| Unicredit SpA | | 2,145,763 | | 16,175,108 |
| | | | |
|
| | | | | 35,335,779 |
| |
| |
|
| Diversified Telecommunication Services — 1.4% | | | | |
| Telecom Italia SpA | | 5,691,989 | | 11,903,939 |
| |
| |
|
| Oil, Gas & Consumable Fuels — 3.2% | | | | |
| Eni SpA | | 707,320 | | 27,256,743 |
| |
| |
|
| Total Common Stocks in Italy | | | | 74,496,461 |
| |
| |
|
| Common Stocks | | Shares | | Value |
| |
| |
|
| |
| Luxembourg — 2.6% | | | | |
| Metals & Mining — 2.6% | | | | |
| ArcelorMittal | | 249,333 | | $ 21,867,915 |
| |
| |
|
| Total Common Stocks in Luxembourg | | | | 21,867,915 |
| |
| |
|
| Netherlands — 4.4% | | | | |
| Chemicals — 2.5% | | | | |
| Akzo Nobel NV | | 253,246 | | 21,380,709 |
| |
| |
|
| Diversified Financial Services — 1.9% | | | | |
| Fortis | | 590,183 | | 16,013,331 |
| |
| |
|
| Total Common Stocks in the Netherlands | | | | 37,394,040 |
| |
| |
|
| Norway — 1.2% | | | | |
| Oil, Gas & Consumable Fuels — 1.2% | | | | |
| Statoilhydro ASA | | 279,056 | | 10,039,333 |
| |
| |
|
| Total Common Stocks in Norway | | | | 10,039,333 |
| |
| |
|
| Spain — 2.7% | | | | |
| Commercial Banks — 2.7% | | | | |
| Banco Santander SA | | 1,056,727 | | 22,852,878 |
| |
| |
|
| Total Common Stocks in Spain | | | | 22,852,878 |
| |
| |
|
| Switzerland — 16.9% | | | | |
| Capital Markets — 2.5% | | | | |
| Credit Suisse Group | | 382,690 | | 21,310,827 |
| |
| |
|
| Diversified Telecommunication | | | | |
| Services — 1.7% | | | | |
| Swisscom AG | | 40,606 | | 14,406,024 |
| |
| |
|
| Food Products — 4.3% | | | | |
| Nestle SA Registered Shares | | 76,093 | | 36,317,526 |
| |
| |
|
| Insurance — 3.2% | | | | |
| Swiss Reinsurance Co. Registered Shares | | 141,698 | | 11,716,397 |
| Zurich Financial Services AG | | 51,230 | | 15,526,276 |
| | | | |
|
| | | | | 27,242,673 |
| |
| |
|
| Pharmaceuticals — 5.2% | | | | |
| Novartis AG Registered Shares | | 527,402 | | 26,583,809 |
| Roche Holding AG | | 109,849 | | 18,177,394 |
| | | | |
|
| | | | | 44,761,203 |
| |
| |
|
| Total Common Stocks in Switzerland | | | | 144,038,253 |
| |
| |
|
| United Kingdom — 30.4% | | | | |
| Aerospace & Defense — 2.2% | | | | |
| BAE Systems Plc | | 2,037,878 | | 18,786,477 |
| |
| |
|
| Commercial Banks — 2.3% | | | | |
| Barclays Plc | | 972,186 | | 8,790,406 |
| HSBC Holdings Plc | | 604,377 | | 10,494,333 |
| | | | |
|
| | | | | 19,284,739 |
| |
| |
|
| Food Products — 3.3% | | | | |
| Unilever Plc | | 834,005 | | 27,990,872 |
| |
| |
|
| Insurance — 2.0% | | | | |
| Prudential Plc | | 1,234,040 | | 16,762,070 |
| |
| |
|
| Metals & Mining — 5.4% | | | | |
| Anglo American Plc | | 354,694 | | 22,927,860 |
| BHP Billiton Plc | | 648,505 | | 23,141,600 |
| | | | |
|
| | | | | 46,069,460 |
| |
| |
|
| See Notes to Financial Statements. |
Schedule of Investments (concluded) (Percentages shown are based on Net Assets)
| Common Stocks | | Shares | | Value |
| |
| |
|
| |
| United Kingdom (concluded) | | | | |
| Oil, Gas & Consumable Fuels — 8.0% | | | | |
| BP Plc | | 2,664,399 | | $ 32,286,454 |
| Royal Dutch Shell Plc Class B | | 895,724 | | 35,691,261 |
| | | | |
|
| | | | | 67,977,715 |
| |
| |
|
| Pharmaceuticals — 1.0% | | | | |
| GlaxoSmithKline Plc | | 377,095 | | 8,341,784 |
| |
| |
|
| Tobacco — 2.3% | | | | |
| British American Tobacco Plc | | 527,465 | | 19,786,379 |
| |
| |
|
| Wireless Telecommunication | | | | |
| Services — 3.9% | | | | |
| Vodafone Group Plc | | 10,587,144 | | 33,504,758 |
| |
| |
|
| Total Common Stocks in the United Kingdom | | | | 258,504,254 |
| |
| |
|
| Total Common Stocks | | | | |
| (Cost — $684,848,783) — 97.2% | | | | 827,867,486 |
| |
| |
|
| |
| |
| | | Beneficial | | |
| | | Interest | | |
| Short-Term Securities | | (000) | | |
| |
| |
|
| United States - 2.3% | | | | |
| BlackRock Liquidity Series, LLC | | | | |
| Cash Sweep Series, 3.03% (a)(b) | | $ 19,505 | | 19,504,756 |
| |
| |
|
| Total Short-Term Securities | | | | |
| (Cost — $19,504,756) — 2.3% | | | | 19,504,756 |
| |
| |
|
| Total Investments (Cost — $704,353,539*) — 99.5% | | 847,372,242 |
| Other Assets Less Liabilities — 0.5% | | | | 4,154,490 |
| | | | |
|
| Net Assets — 100.0% | | | | $ 851,526,732 |
| | | | |
|
* The cost and unrealized appreciation (depreciation) of investments as of April 30,
2008, as computed for federal income tax purposes, were as follows: |
| Aggregate cost | | $ 715,236,678 |
| | |
|
| Gross unrealized appreciation | | $ 164,033,840 |
| Gross unrealized depreciation | | (31,898,276) |
| | |
|
| Net unrealized appreciation | | $ 132,135,564 |
| | |
|
(a) Investments in companies considered to be an affiliate of the Fund, for purposes of
Section 2(a)(3) of the Investment Company Act of 1940, were as follows: |
| Affiliate | | Net Activity (000) | | Interest Income |
| |
| |
|
| BlackRock Liquidity Series, LLC | | | | |
| Cash Sweep Series | | $ (2,337) | | $ 297,229 |
| |
| |
|
(b) Represents the current yield as of report date.
•For Fund compliance purposes,the Fund's industry classifications refer to any one or
more of the industry sub-classifications used by one or more widely recognized market
indexes or ratings group indexes, and/or as defined by Fund management. This defini-
tion may not apply for the purposes of this report, which may combine industry sub-
classifications for reporting ease.
| | See Notes to Financial Statements. |
| Statement of Assets and Liabilities | | |
| |
| April 30, 2008 (Unaudited) | | |
| |
|
| |
| Assets | | |
| |
|
| |
| Investments at value — unaffiliated (cost — $684,848,783) | | $ 827,867,486 |
| Investments at value — affiliated (cost — $19,504,756) | | 19,504,756 |
| Cash | | 371 |
| Foreign currency at value (cost — $456) | | 458 |
| Dividends receivable | | 5,355,685 |
| Beneficial interest sold receivable | | 731,595 |
| Other assets | | 352,197 |
| Prepaid expenses | | 20,992 |
| | |
|
| Total assets | | 853,833,540 |
| |
|
| |
| Liabilities | | |
| |
|
| |
| Beneficial interest redeemed payable | | 1,234,443 |
| Investment advisory fees payable | | 518,725 |
| Distribution fees payable | | 167,443 |
| Officer’s fee payable | | 395 |
| Other affiliates payable | | 263,275 |
| Other accrued expenses payable | | 122,527 |
| | |
|
| Total liabilities | | 2,306,808 |
| |
|
| |
| Net Assets | | |
| |
|
| |
| Net Assets | | $ 851,526,732 |
| |
|
| |
| Net Assets Consist of | | |
| |
|
| |
| Institutional Shares of beneficial interest, $0.10 par value, unlimited number of shares of beneficial interest authorized | | $ 1,545,972 |
| Investor A Shares of beneficial interest, $0.10 par value, unlimited number of shares of beneficial interest authorized | | 2,452,746 |
| Investor B Shares of beneficial interest, $0.10 par value, unlimited number of shares of beneficial interest authorized | | 155,482 |
| Investor C Shares of beneficial interest, $0.10 par value, unlimited number of shares of beneficial interest authorized | | 436,795 |
| Class R Shares of beneficial interest, $0.10 par value, unlimited number of shares of beneficial interest authorized | | 28,419 |
| Paid-in capital in excess of par | | 682,962,148 |
| Distributions in excess of net investment income | | (49,739) |
| Accumulated net realized gain | | 20,741,544 |
| Net unrealized appreciation/depreciation | | 143,253,365 |
| | |
|
| Net Assets | | $ 851,526,732 |
| |
|
| |
| Net Asset Value | | |
| |
|
| |
| Institutional — Based on net assets of $296,458,266 and 15,459,721 shares of beneficial interest outstanding | | $ 19.18 |
| | |
|
| Investor A — Based on net assets of $462,892,948 and 24,527,462 shares of beneficial interest outstanding | | $ 18.87 |
| | |
|
| Investor B — Based on net assets of $24,299,681 and 1,554,822 shares of beneficial interest outstanding | | $ 15.63 |
| | |
|
| Investor C — Based on net assets of $63,495,970 and 4,367,951 shares of beneficial interest outstanding | | $ 14.54 |
| | |
|
| Class R — Based on net assets of $4,379,867 and 284,185 shares of beneficial interest outstanding | | $ 15.41 |
| | |
|
| See Notes to Financial Statements. |
| Statement of Operations | | |
| |
| Six Months Ended April 30, 2008 (Unaudited) | | |
| |
|
| |
| Investment Income | | |
| |
|
| |
| Dividends (net of $1,342,762 foreign withholding tax) | | $ 12,486,914 |
| Interest (including $297,229 from affiliates) | | 297,600 |
| | |
|
| Total income | | 12,784,514 |
| |
|
| |
| |
| Expenses | | |
| |
|
| |
| Investment advisory | | 3,307,611 |
| Service — Investor A | | 580,712 |
| Service and distribution — Investor B | | 330,169 |
| Service and distribution — Investor C | | 151,689 |
| Service and distribution — Class R | | 10,190 |
| Transfer agent — Institutional | | 262,459 |
| Transfer agent — Investor A | | 230,829 |
| Transfer agent — Investor B | | 42,221 |
| Transfer agent — Investor C | | 48,888 |
| Transfer agent — Class R | | 6,537 |
| Accounting services | | 159,607 |
| Custodian | | 138,727 |
| Printing and shareholder reports | | 47,939 |
| Registration | | 37,592 |
| Professional | | 34,153 |
| Officer and Trustees | | 20,584 |
| Miscellaneous | | 29,252 |
| | |
|
| Total expenses | | 5,439,159 |
| | |
|
| Net investment income | | 7,345,355 |
| |
|
| |
| |
| Realized and Unrealized Gain (Loss) | | |
| |
|
| |
| Net realized gain from: | | |
| Investments | | 32,366,575 |
| Foreign currency | | 10,015 |
| | |
|
| | | 32,376,590 |
| | |
|
| Net change in unrealized appreciation/depreciation on: | | |
| Investments | | (131,473,113) |
| Foreign currency | | (972) |
| | |
|
| | | (131,474,085) |
| | |
|
| Total realized and unrealized loss | | (99,097,495) |
| | |
|
| Net Decrease in Net Assets Resulting from Operations | | $ (91,752,140) |
| | |
|
| See Notes to Financial Statements. |
| Statements of Changes in Net Assets | | | | |
| |
| | | Six Months Ended | | Year Ended |
| | | April 30, 2008 | | October 31, |
| Increase (Decrease) in Net Assets: | | (Unaudited) | | 2007 |
| |
| |
|
| |
| Operations | | | | |
| |
| |
|
| |
| Net investment income | | $ 7,345,355 | | $ 18,580,347 |
| Net realized gain | | 32,376,590 | | 167,445,702 |
| Net change in unrealized appreciation/depreciation | | (131,474,085) | | 30,861,424 |
| | |
| |
|
| Net increase (decrease) in net assets resulting from operations | | (91,752,140) | | 216,887,473 |
| |
| |
|
| |
| |
| Dividends and Distributions to Shareholders from: | | | | |
| |
| |
|
| |
| Net investment income: | | | | |
| Institutional | | (7,760,691) | | (10,325,989) |
| Institutional 1 | | — | | (980) |
| Investor A | | (10,971,154) | | (13,410,828) |
| Investor B | | (476,846) | | (1,257,875) |
| Investor C | | (1,499,376) | | (1,763,659) |
| Class R | | (102,168) | | (63,672) |
| Net realized gain: | | | | |
| Institutional | | (53,283,448) | | (24,978,128) |
| Institutional 1 | | — | | (4,786) |
| Investor A | | (81,881,064) | | (34,649,059) |
| Investor B | | (7,163,723) | | (5,523,034) |
| Investor C | | (14,722,261) | | (5,542,809) |
| Class R | | (811,896) | | (171,525) |
| | |
| |
|
| Decrease in net assets resulting from dividends and distributions to shareholders | | (178,672,627) | | (97,692,344) |
| |
| |
|
| |
| |
| Beneficial Interest Transactions | | | | |
| |
| |
|
| |
| Net increase in net assets derived from beneficial interest transactions | | 83,742,444 | | 10,110,593 |
| |
| |
|
| |
| |
| Redemption Fees | | | | |
| |
| |
|
| |
| Redemption fees | | 1,246 | | 568,035 |
| |
| |
|
| |
| |
| Net Assets | | | | |
| |
| |
|
| |
| Total increase (decrease) in net assets | | (186,681,077) | | 129,873,757 |
| Beginning of period | | 1,038,207,809 | | 908,334,052 |
| | |
| |
|
| End of period | | $ 851,526,732 | | $1,038,207,809 |
| | |
| |
|
| End of period undistributed (distributions in excess of) net investment income | | $ (49,739) | | $ 13,415,141 |
| | |
| |
|
| See Notes to Financial Statements. |
| Financial Highlights | | | | | | | | | | | | | | | | |
| |
| | | | | | | | | Institutional | | | | | | |
| | |
| |
| |
| |
| |
| |
| |
|
| Six Months Ended |
| | | April 30, 2008 | | | | | | Year Ended October 31, | | |
| | | (Unaudited) | | | | 2007 | | 2006 | | 2005 | | | | 2004 | | 2003 |
| Per Share Operating Performance | | | | | | | | | | | | | | | | |
| |
| Net asset value, beginning of period | | $ 25.59 | | $ 23.02 | | $ 17.54 | | $ 15.25 | | $ 13.01 | | $ 10.80 |
| | |
| |
| |
| |
| |
| |
|
| Net investment income1 | | 0.19 | | | | 0.46 | | 0.55 | | 0.36 | | | | 0.21 | | 0.23 |
| Net realized and unrealized gain (loss) | | (2.26) | | | | 4.56 | | 5.32 | | 2.15 | | | | 2.27 | | 2.17 |
| | |
| |
| |
| |
| |
| |
| |
| |
|
| Net increase (decrease) from investment operations | | (2.07) | | | | 5.02 | | 5.87 | | 2.51 | | | | 2.48 | | 2.40 |
| | |
| |
| |
| |
| |
| |
| |
| |
|
| Dividends and distributions from: | | | | | | | | | | | | | | | | |
| Net investment income | | (0.55) | | | | (0.72) | | (0.39) | | (0.22) | | | | (0.24) | | (0.19) |
| Net realized gain | | (3.79) | | | | (1.74) | | — | | — | | | | — | | — |
| | |
| |
| |
| |
| |
| |
| |
| |
|
| Total dividends and distributions | | (4.34) | | | | (2.46) | | (0.39) | | (0.22) | | | | (0.24) | | (0.19) |
| | |
| |
| |
| |
| |
| |
| |
| |
|
| Redemption fee | | —2 | | | | 0.01 | | —2 | | —2 | | | | —2 | | — |
| | |
| |
| |
| |
| |
| |
| |
| |
|
| Net asset value, end of period | | $ 19.18 | | $ 25.59 | | $ 23.02 | | $ 17.54 | | $ 15.25 | | $ 13.01 |
| |
| |
| |
| |
| |
| |
|
| |
| Total Investment Return3 | | | | | | | | | | | | | | | | |
| |
| |
| |
| |
| |
| |
| |
| |
|
| Based on net asset value | | (8.68%)4 | | | | 24.46% | | 34.03%5 | | 16.52% | | | | 19.26% | | 22.57% |
| |
| |
| |
| |
| |
| |
| |
| |
|
| |
| Ratios to Average Net Assets | | | | | | | | | | | | | | | | |
| |
| |
| |
| |
| |
| |
| |
| |
|
| Total expenses | | 1.03%6 | | | | 1.01% | | 0.99% | | 0.99% | | | | 1.05% | | 1.08% |
| | |
| |
| |
| |
| |
| |
| |
| |
|
| Net investment income | | 1.87%6 | | | | 2.01% | | 2.68% | | 2.09% | | | | 1.50% | | 2.00% |
| |
| |
| |
| |
| |
| |
| |
| |
|
| |
| Supplemental Data | | | | | | | | | | | | | | | | |
| |
| |
| |
| |
| |
| |
| |
| |
|
| Net assets, end of period (000) | | $ 296,458 | | $ 361,175 | | $ 330,849 | | $ 261,358 | | $ 252,580 | | $ 221,888 |
| | |
| |
| |
| |
| |
| |
|
| Portfolio turnover | | 22% | | | | 63% | | 76% | | 72% | | | | 78% | | 64% |
| | |
| |
| |
| |
| |
| |
| |
| |
|
| |
| 1 Based on average shares outstanding. | | | | | | | | | | | | | | | | |
| 2 Amount is less than $0.01 per share. | | | | | | | | | | | | | | | | |
| 3 Total investment returns exclude the effects of any sales charges. | | | | | | | | | | | | | | | | |
| 4 Aggregate total investment return. | | | | | | | | | | | | | | | | |
| 5 In 2006, +0.21% of the Fund’s total investment return for Institutional Shares consisted of a payment by Merrill Lynch Investment Managers, L.P. | | | | |
| in order to resolve a regulatory issue relating to an investment. | | | | | | | | | | | | | | | | |
| 6 Annualized. | | | | | | | | | | | | | | | | |
| See Notes to Financial Statements. |
| Financial Highlights (continued) | | | | | | | | | | | | | | | | |
| |
| | | | | | | | | Investor A | | | | | | |
| Six Months Ended |
| | | April 30, 2008 | | | | | | Year Ended October 31, | | |
| | | (Unaudited) | | | | 2007 | | 2006 | | 2005 | | | | 2004 | | 2003 |
| |
| Per Share Operating Performance | | | | | | | | | | | | | | | | |
| |
| Net asset value, beginning of period | | $ 25.24 | | $ 22.72 | | $ 17.33 | | $ 15.07 | | $ 12.86 | | $ 10.67 |
| | |
| |
| |
| |
| |
| |
|
| Net investment income1 | | 0.17 | | | | 0.44 | | 0.50 | | 0.31 | | | | 0.18 | | 0.20 |
| Net realized and unrealized gain (loss) | | (2.24) | | | | 4.48 | | 5.24 | | 2.12 | | | | 2.24 | | 2.14 |
| | |
| |
| |
| |
| |
| |
| |
| |
|
| Net increase (decrease) from investment operations | | (2.07) | | | | 4.92 | | 5.74 | | 2.43 | | | | 2.42 | | 2.34 |
| | |
| |
| |
| |
| |
| |
| |
| |
|
| Dividends and distributions from: | | | | | | | | | | | | | | | | |
| Net investment income | | (0.51) | | | | (0.67) | | (0.35) | | (0.17) | | | | (0.21) | | (0.15) |
| Net realized gain | | (3.79) | | | | (1.74) | | — | | — | | | | — | | — |
| | |
| |
| |
| |
| |
| |
| |
| |
|
| Total dividends and distributions | | (4.30) | | | | (2.41) | | (0.35) | | (0.17) | | | | (0.21) | | (0.15) |
| | |
| |
| |
| |
| |
| |
| |
| |
|
| Redemption fee | | —2 | | | | 0.01 | | —2 | | —2 | | | | —2 | | — |
| | |
| |
| |
| |
| |
| |
| |
| |
|
| Net asset value, end of period | | $ 18.87 | | $ 25.24 | | $ 22.72 | | $ 17.33 | | $ 15.07 | | $ 12.86 |
| |
| |
| |
| |
| |
| |
|
| |
| Total Investment Return3 | | | | | | | | | | | | | | | | |
| |
| |
| |
| |
| |
| |
| |
| |
|
| Based on net asset value | | (8.82%)4 | | | | 24.29% | | 33.64%5 | | 16.20% | | | | 18.98% | | 22.29% |
| |
| |
| |
| |
| |
| |
| |
| |
|
| |
| Ratios to Average Net Assets | | | | | | | | | | | | | | | | |
| |
| |
| |
| |
| |
| |
| |
| |
|
| Total expenses | | 1.20%6 | | | | 1.20% | | 1.24% | | 1.24% | | | | 1.30% | | 1.33% |
| | |
| |
| |
| |
| |
| |
| |
| |
|
| Net investment income | | 1.72%6 | | | | 1.92% | | 2.49% | | 1.84% | | | | 1.24% | | 1.78% |
| |
| |
| |
| |
| |
| |
| |
| |
|
| |
| Supplemental Data | | | | | | | | | | | | | | | | |
| |
| |
| |
| |
| |
| |
| |
| |
|
| Net assets, end of period (000) | | $ 462,893 | | $ 550,341 | | $ 453,104 | | $ 312,606 | | $ 296,757 | | $ 280,223 |
| | |
| |
| |
| |
| |
| |
|
| Portfolio turnover | | 22% | | | | 63% | | 76% | | 72% | | | | 78% | | 64% |
| | |
| |
| |
| |
| |
| |
| |
| |
|
| 1 Based on average shares outstanding. | | | | | | | | | | | | | | | | |
| 2 Amount is less than $0.01 per share. | | | | | | | | | | | | | | | | |
| 3 Total investment returns exclude the effects of sales charges. | | | | | | | | | | | | | | | | |
| 4 Aggregate total investment return. | | | | | | | | | | | | | | | | |
| 5 In 2006, +0.21% of the Fund’s total investment return for Investor A Shares consisted of a payment by Merrill Lynch Investment Managers, L.P. | | | | |
| in order to resolve a regulatory issue relating to an investment. | | | | | | | | | | | | | | | | |
| 6 Annualized. | | | | | | | | | | | | | | | | |
| See Notes to Financial Statements. |
| Financial Highlights (continued) | | | | | | | | | | | | | | | | |
| |
| | | | | | | | | Investor B | | | | | | |
| Six Months Ended |
| | | April 30, 2008 | | | | | | Year Ended October 31, | | |
| | | (Unaudited) | | | | 2007 | | 2006 | | 2005 | | | | 2004 | | 2003 |
| |
| Per Share Operating Performance | | | | | | | | | | | | | | | | |
| Net asset value, beginning of period | | $ 21.49 | | $ 19.59 | | $ 14.99 | | $ 13.08 | | $ 11.18 | | $ 9.25 |
| | |
| |
| |
| |
| |
| |
|
| Net investment income1 | | 0.05 | | | | 0.17 | | 0.30 | | 0.16 | | | | 0.03 | | 0.10 |
| Net realized and unrealized gain (loss) | | (1.87) | | | | 3.86 | | 4.54 | | 1.84 | | | | 1.99 | | 1.85 |
| | |
| |
| |
| |
| |
| |
| |
| |
|
| Net increase (decrease) from investment operations | | (1.82) | | | | 4.03 | | 4.84 | | 2.00 | | | | 2.02 | | 1.95 |
| | |
| |
| |
| |
| |
| |
| |
| |
|
| Dividends and distributions from: | | | | | | | | | | | | | | | | |
| Net investment income | | (0.25) | | | | (0.40) | | (0.24) | | (0.09) | | | | (0.12) | | (0.02) |
| Net realized gain | | (3.79) | | | | (1.74) | | — | | — | | | | — | | — |
| | |
| |
| |
| |
| |
| |
| |
| |
|
| Total dividends and distributions | | (4.04) | | | | (2.14) | | (0.24) | | (0.09) | | | | (0.12) | | (0.02) |
| | |
| |
| |
| |
| |
| |
| |
| |
|
| Redemption fee | | —2 | | | | 0.01 | | —2 | | —2 | | | | —2 | | — |
| | |
| |
| |
| |
| |
| |
| |
| |
|
| Net asset value, end of period | | $ 15.63 | | $ 21.49 | | $ 19.59 | | $ 14.99 | | $ 13.08 | | $ 11.18 |
| |
| |
| |
| |
| |
| |
|
| |
| Total Investment Return3 | | | | | | | | | | | | | | | | |
| |
| |
| |
| |
| |
| |
| |
| |
|
| Based on net asset value | | (9.20%)4 | | | | 23.12% | | 32.63%5 | | 15.28% | | | | 18.14% | | 21.19% |
| |
| |
| |
| |
| |
| |
| |
| |
|
| |
| Ratios to Average Net Assets | | | | | | | | | | | | | | | | |
| |
| |
| |
| |
| |
| |
| |
| |
|
| Total expenses | | 2.11%6 | | | | 2.12% | | 2.01% | | 2.01% | | | | 2.09% | | 2.12% |
| | |
| |
| |
| |
| |
| |
| |
| |
|
| Net investment income | | 0.57%6 | | | | 0.98% | | 1.73% | | 1.06% | | | | 0.23% | | 0.98% |
| |
| |
| |
| |
| |
| |
| |
| |
|
| |
| Supplemental Data | | | | | | | | | | | | | | | | |
| |
| |
| |
| |
| |
| |
| |
| |
|
| Net assets, end of period (000) | | $ 24,300 | | $ 42,829 | | $ 62,273 | | $ 103,836 | | $ 132,725 | | $ 96,395 |
| | |
| |
| |
| |
| |
| |
|
| Portfolio turnover | | 22% | | | | 63% | | 76% | | 72% | | | | 78% | | 64% |
| | |
| |
| |
| |
| |
| |
| |
| |
|
| 1 Based on average shares outstanding. | | | | | | | | | | | | | | | | |
| 2 Amount is less than $0.01 per share. | | | | | | | | | | | | | | | | |
| 3 Total investment returns exclude the effects of sales charges. | | | | | | | | | | | | | | | | |
| 4 Aggregate total investment return. | | | | | | | | | | | | | | | | |
| 5 In 2006, +0.21% of the Fund’s total investment return for Investor B Shares consisted of a payment by Merrill Lynch Investment Managers, L.P. | | | | |
| in order to resolve a regulatory issue relating to an investment. | | | | | | | | | | | | | | | | |
| 6 Annualized. | | | | | | | | | | | | | | | | |
| See Notes to Financial Statements. |
| Financial Highlights (continued) | | | | | | | | | | | | | | | | |
| |
| | | | | | | | | Investor C | | | | | | |
| Six Months Ended |
| | | April 30, 2008 | | | | Year Ended October 31, | | |
| | | (Unaudited) | | | | 2007 | | 2006 | | 2005 | | | | 2004 | | 2003 |
| |
| Per Share Operating Performance | | | | | | | | | | | | | | | | |
| Net asset value, beginning of period | | $ 20.42 | | $ 18.86 | | $ 14.47 | | $ 12.64 | | $ 10.83 | | $ 9.00 |
| | |
| |
| |
| |
| |
| |
|
| Net investment income1 | | 0.07 | | | | 0.21 | | 0.29 | | 0.15 | | | | 0.02 | | 0.09 |
| Net realized and unrealized gain (loss) | | (1.77) | | | | 3.63 | | 4.36 | | 1.78 | | | | 1.92 | | 1.81 |
| | |
| |
| |
| |
| |
| |
| |
| |
|
| Net increase (decrease) from investment operations | | (1.70) | | | | 3.84 | | 4.65 | | 1.93 | | | | 1.94 | | 1.90 |
| | |
| |
| |
| |
| |
| |
| |
| |
|
| Dividends and distributions from: | | | | | | | | | | | | | | | | |
| Net investment income | | (0.39) | | | | (0.55) | | (0.26) | | (0.10) | | | | (0.13) | | (0.07) |
| Net realized gain | | (3.79) | | | | (1.74) | | — | | — | | | | — | | — |
| | |
| |
| |
| |
| |
| |
| |
| |
|
| Total dividends and distributions | | (4.18) | | | | (2.29) | | (0.26) | | (0.10) | | | | (0.13) | | (0.07) |
| | |
| |
| |
| |
| |
| |
| |
| |
|
| Redemption fee | | —2 | | | | 0.01 | | —2 | | —2 | | | | —2 | | — |
| | |
| |
| |
| |
| |
| |
| |
| |
|
| Net asset value, end of period | | $ 14.54 | | $ 20.42 | | $ 18.86 | | $ 14.47 | | $ 12.64 | | $ 10.83 |
| |
| |
| |
| |
| |
| |
|
| |
| Total Investment Return3 | | | | | | | | | | | | | | | | |
| |
| |
| |
| |
| |
| |
| |
| |
|
| Based on net asset value | | (9.14%)4 | | | | 23.26% | | 32.57%5 | | 15.33% | | | | 18.06% | | 21.29% |
| |
| |
| |
| |
| |
| |
| |
| |
|
| |
| Ratios to Average Net Assets | | | | | | | | | | | | | | | | |
| |
| |
| |
| |
| |
| |
| |
| |
|
| Total expenses | | 1.99%6 | | | | 2.00% | | 2.01% | | 2.02% | | | | 2.08% | | 2.12% |
| | |
| |
| |
| |
| |
| |
| |
| |
|
| Net investment income | | 0.89%6 | | | | 1.11% | | 1.71% | | 1.05% | | | | 0.20% | | 0.99% |
| |
| |
| |
| |
| |
| |
| |
| |
|
| |
| Supplemental Data | | | | | | | | | | | | | | | | |
| |
| |
| |
| |
| |
| |
| |
| |
|
| Net assets, end of period (000) | | $ 63,496 | | $ 79,355 | | $ 60,160 | | $ 44,881 | | $ 44,166 | | $ 25,134 |
| | |
| |
| |
| |
| |
| |
|
| Portfolio turnover | | 22% | | | | 63% | | 76% | | 72% | | | | 78% | | 64% |
| | |
| |
| |
| |
| |
| |
| |
| |
|
| 1 Based on average shares outstanding. | | | | | | | | | | | | | | | | |
| 2 Amount is less than $0.01 per share. | | | | | | | | | | | | | | | | |
| 3 Total investment returns exclude the effects of sales charges. | | | | | | | | | | | | | | | | |
| 4 Aggregate total investment return. | | | | | | | | | | | | | | | | |
| 5 In 2006, +0.21% of the Fund’s total investment return for Investor C Shares consisted of a payment by Merrill Lynch Investment Managers, L.P. | | | | |
| in order to resolve a regulatory issue relating to an investment. | | | | | | | | | | | | | | | | |
| 6 Annualized. | | | | | | | | | | | | | | | | |
| See Notes to Financial Statements. |
| Financial Highlights (concluded) | | | | | | | | | | | | | | | | | | |
| |
| | | | | | | | | Class R | | | | | | | | |
| | | | | | | | | | | | | | | | | Period |
| | | Six Months Ended | | | | | | Year Ended October 31, | | January 3, 20031 |
| | | April 30, 2008 | | | | | | | | | | | | | | | | to October 31, |
| | | (Unaudited) | | | | 2007 | | 2006 | | | | 2005 | | | | 2004 | | 2003 |
| Per Share Operating Performance | | | | | | | | | | | | | | | | | | |
| Net asset value, beginning of period | | $ 21.45 | | $ 19.74 | | $ 15.14 | | $ 13.23 | | $ 11.32 | | $ 9.67 |
| | |
| |
| |
| |
| |
| |
|
| Net investment income2 | | 0.11 | | | | 0.29 | | 0.41 | | | | 0.18 | | | | 0.33 | | 0.25 |
| Net realized and unrealized gain (loss) | | (1.88) | | | | 3.80 | | 4.55 | | | | 1.93 | | | | 1.82 | | 1.40 |
| | |
| |
| |
| |
| |
| |
| |
| |
| |
|
| Net increase (decrease) from investment operations | | (1.77) | | | | 4.09 | | 4.96 | | | | 2.11 | | | | 2.15 | | 1.65 |
| | |
| |
| |
| |
| |
| |
| |
| |
| |
|
| Dividends and distributions from: | | | | | | | | | | | | | | | | | | |
| Net investment income | | (0.48) | | | | (0.65) | | (0.36) | | | | (0.20) | | | | (0.24) | | — |
| Net realized gain | | (3.79) | | | | (1.74) | | — | | | | — | | | | — | | — |
| | |
| |
| |
| |
| |
| |
| |
| |
| |
|
| Total dividends and distributions | | (4.27) | | | | (2.39) | | (0.36) | | | | (0.20) | | | | (0.24) | | — |
| | |
| |
| |
| |
| |
| |
| |
| |
| |
|
| Redemption fee | | —3 | | | | 0.01 | | —3 | | | | —3 | | | | —3 | | — |
| | |
| |
| |
| |
| |
| |
| |
| |
| |
|
| Net asset value, end of period | | $ 15.41 | | $ 21.45 | | $ 19.74 | | $ 15.14 | | $ 13.23 | | $ 11.32 |
| |
| |
| |
| |
| |
| |
|
| |
| Total Investment Return | | | | | | | | | | | | | | | | | | |
| |
| |
| |
| |
| |
| |
| |
| |
| |
|
| Based on net asset value | | (9.02%)4 | | | | 23.60% | | 33.36%5 | | | | 16.01% | | | | 19.22% | | 17.06%4 |
| |
| |
| |
| |
| |
| |
| |
| |
| |
|
| |
| Ratios to Average Net Assets | | | | | | | | | | | | | | | | | | |
| |
| |
| |
| |
| |
| |
| |
| |
| |
|
| Total expenses | | 1.67%6 | | | | 1.71% | | 1.49% | | | | 1.48% | | | | 1.35% | | 1.58%6 |
| | |
| |
| |
| |
| |
| |
| |
| |
| |
|
| Net investment income | | 1.36%6 | | | | 1.48% | | 2.30% | | | | 1.10% | | | | 2.51% | | 1.50%6 |
| |
| |
| |
| |
| |
| |
| |
| |
| |
|
| |
| Supplemental Data | | | | | | | | | | | | | | | | | | |
| |
| |
| |
| |
| |
| |
| |
| |
| |
|
| Net assets, end of period (000) | | $ 4,380 | | $ 4,509 | | $ 1,948 | | $ 823 | | $ 104 | | —7 |
| | |
| |
| |
| |
| |
| |
|
| Portfolio turnover | | 22% | | | | 63% | | 76% | | | | 72% | | | | 78% | | 64% |
| | |
| |
| |
| |
| |
| |
| |
| |
| |
|
| 1 Commencement of operations. | | | | | | | | | | | | | | | | | | |
| 2 Based on average shares outstanding. | | | | | | | | | | | | | | | | | | |
| 3 Amount is less than $0.01 per share. | | | | | | | | | | | | | | | | | | |
| 4 Aggregate total investment return. | | | | | | | | | | | | | | | | | | |
| 5 In 2006, +0.21% of the Fund’s total investment return for Class R Shares consisted of a payment by Merrill Lynch Investment Managers, L.P. | | | | |
| in order to resolve a regulatory issue relating to an investment. | | | | | | | | | | | | | | | | | | |
| 6 | Annualized. |
| |
| 7 | Amount is less than $1,000. |
| |
| See Notes to Financial Statements. |
Notes to Financial Statements (Unaudited)
1. Significant Accounting Policies:
BlackRock EuroFund (the “Fund”) is registered under the Investment
Company Act of 1940, as amended (the “1940 Act”), as a diversified,
open-end management investment company. The Fund’s financial state-
ments are prepared in conformity with accounting principles generally
accepted in the United States of America, which may require the use
of management accruals and estimates. Actual results may differ from
these estimates. The Fund offers multiple classes of shares. Institutional
Shares are sold without a sales charge and only to certain eligible
investors. Investor A Shares are generally sold with a front-end sales
charge. Shares of Investor B and Investor C may be subject to a contin-
gent deferred sales charge. Class R Shares are sold only to certain
retirement plans. All classes of shares have identical voting, dividend,
liquidation and other rights and the same terms and conditions, except
that Investor A, Investor B, Investor C and Class R Shares bear certain
expenses related to the shareholder servicing of such shares, and
Investor B, Investor C and Class R Shares also bear certain expenses
related to the distribution of such shares. Each class has exclusive
voting rights with respect to matters relating to its shareholder servicing
and distribution expenditures (except that Investor B shareholders may
vote on material changes to the Investor A distribution plan).
The following is a summary of significant accounting policies followed
by the Fund:
Valuation of securities: Equity investments traded on a recognized secu-
rities exchange or on the NASDAQ Global Market System are valued at
the last reported sale price that day or the NASDAQ official closing
price, if applicable. Equity investments traded on a recognized securities
exchange for which there were no sales on that day are valued at the
last available bid price. Investments in open-end investment companies
are valued at net asset value each business day. Short-term securities
may be valued at amortized cost.
In the event that application of these methods of valuation results in
a price for an investment which is deemed not to be representative of
the market value of such investment, the investment will be valued by
a method approved by the Board of Trustees (the “Board”) as reflecting
fair value (“Fair Value Assets”). When determining the price for Fair Value
Assets the investment advisor and/or sub-advisor seeks to determine
the price that the Fund might reasonably expect to receive from the cu-
rrent sale of that asset in an arm’s-length transaction. Fair value deter- |
minations shall be based upon all available factors that the investment
advisor and/or sub-advisor deems relevant. The pricing of all Fair Value
Assets is subsequently reported to the Board or a committee thereof.
Generally, trading in foreign securities is substantially completed each
day at various times prior to the close of business on the New York Stock
Exchange (“NYSE”). The values of such securities used in computing
the net assets of the Fund are determined as of such times. Foreign
currency exchange rates will be determined as of the close of business
on the NYSE. Occasionally, events affecting the values of such securities
and such exchange rates may occur between the times at which they
are determined and the close of business on the NYSE that may not
be reflected in the computation of the Fund’s net assets. If events
(for example, a company announcement, market volatility or a natural
disaster) occur during such periods that are expected to materially
affect the value of such securities, those securities may be valued at
their fair value as determined in good faith by the Board or by the
investment advisor using a pricing service and/or procedures approved
by the Board.
Foreign Currency Transactions: Foreign currency amounts are translated
into United States dollars on the following basis: (i) market value of
investment securities, assets and liabilities at the current rate of exchange;
and (ii) purchases and sales of investment securities, income and
expenses at the rates of exchange prevailing on the respective dates
of such transactions.
The Fund reports foreign currency related transactions as components
of realized gains for financial reporting purposes, whereas such compo-
nents are treated as ordinary income for federal income tax purposes.
Investment Transactions and Investment Income: Investment transac-
tions are recorded on the dates the transactions are entered into (the
trade dates). Realized gains and losses on security transactions are
determined on the identified cost basis. Dividend income is recorded
on the ex-dividend dates. Dividends from foreign securities where the
ex-dividend date may have passed are subsequently recorded when the
Fund has determined the ex-dividend date. Interest income is recognized
on the accrual basis. Income and realized and unrealized gains and
losses are allocated daily to each class based on its relative net assets.
Dividends and Distributions: Dividends and distributions paid by the
Fund are recorded on the ex-dividend dates. Distributions of capital
gains are paid at least annually. |
Notes to Financial Statements (continued)
Income Taxes: It is the Fund’s policy to comply with the requirements
of the Internal Revenue Code applicable to regulated investment com-
panies and to distribute substantially all of its taxable income to its
shareholders. Therefore, no federal income tax provision is required.
Under the applicable foreign tax laws, a withholding tax may be imposed
on interest, dividends and capital gains at various rates.
Effective April 30, 2008, the Fund implemented Financial Accounting
Standards Board (“FASB”) Interpretation No. 48, “Accounting for Uncer-
tainty in Income Taxes — an interpretation of FASB Statement No. 109”
(“FIN 48”). FIN 48 prescribes the minimum recognition threshold a tax
position must meet in connection with accounting for uncertainties in
income tax positions taken or expected to be taken by an entity, includ-
ing investment companies, before being measured and recognized in
the financial statements. The investment advisor has evaluated the appli-
cation of FIN 48 to the Fund, and has determined that the adoption of
FIN 48 does not have a material impact on the Fund’s financial state-
ments. The Fund files U.S. federal and various state and local tax returns.
No income tax returns are currently under examination. The statute of
limitations on the Fund’s U.S. federal tax returns remain open for the
years ended October 31, 2004 through October 31, 2006. The statute
of limitations on the Fund’s state and local tax returns may remain open
for an additional year depending upon the jurisdiction.
Recent Accounting Pronouncements: In September 2006, Statement
of Financial Accounting Standards No. 157, “Fair Value Measurements”
(“FAS 157”) was issued and is effective for fiscal years beginning after
November 15, 2007. FAS 157 defines fair value, establishes a frame-
work for measuring fair value and expands disclosures about fair
value measurements. The impact on the Fund’s financial statement
disclosures, if any, is currently being assessed.
In addition, in February 2007, FASB issued Statement of Financial
Accounting Standards No. 159, “The Fair Value Option for Financial
Assets and Financial Liabilities” (“FAS 159”) was issued and is effective
for fiscal years beginning after November 15, 2007. Early adoption is
permitted as of the beginning of a fiscal year that begins on or before
November 15, 2007, provided the entity also elects to apply the provi-
sions of FAS 157. FAS 159 permits entities to choose to measure many
financial instruments and certain other items at fair value that are not
currently required to be measured at fair value. FAS 159 also establish-
es presentation and disclosure requirements designed to facilitate com- |
parisons between entities that choose different measurement attributes
for similar types of assets and liabilities. The impact on the Fund’s finan-
cial statement disclosures, if any, is currently being assessed.
In March 2008, Statement of Financial Accounting Standards No. 161,
“Disclosures about Derivative Instruments and Hedging Activities — an
amendment of FASB Statement No. 133” (“FAS 161”) was issued and is
effective for fiscal years beginning after November 15, 2008. FAS 161 is
intended to improve financial reporting for derivative instruments by
requiring enhanced disclosure that enables investors to understand how
and why an entity uses derivatives, how derivatives are accounted for,
and how derivative instruments affect an entity’s results of operations
and financial position. The investment advisor is currently evaluating the
implications of FAS 161 and the impact on the Fund’s financial state-
ment disclosures, if any, is currently being assessed.
Other: Expenses directly related to the Fund or its classes are charged to
that Fund or class. Other operating expenses shared by several funds are
pro-rated among those funds on the basis of relative net assets or other
appropriate methods. Other expenses of the Fund are allocated daily to
each class based on its relative net assets.
2. Investment Advisory Agreements and Other
Transactions with Affiliates:
The Fund entered into an Investment Advisory Agreement with BlackRock
Advisors, LLC, (the “Advisor”), an indirect, wholly owned subsidiary of
BlackRock, Inc., to provide investment advisory and administration serv-
ices. Merrill Lynch & Co., Inc. (“Merrill Lynch”) and The PNC Financial
Services Group, Inc. (“PNC”) are principal owners of BlackRock, Inc.
The Advisor is responsible for the management of the Fund’s portfolio
and provides the necessary personnel, facilities, equipment and certain
other services necessary to the operation of the Fund. For such services,
the Fund pays a monthly fee at an annual rate of 0.75% on an annual
basis of the average daily value of the Fund’s net assets. For the six
months ended April 30, 2008, the Fund reimbursed the Advisor $7,622
for certain accounting services, which is included in accounting services
expenses in the Statement of Operations.
In addition, the Advisor has entered into a sub-advisory agreement
with BlackRock Investment Management, LLC (“BIM”) and BlackRock
Asset Management U.K. Limited, both affiliates of the Advisor, under
which the Advisor pays each sub-adviser for services it provides, a
monthly fee at an annual rate that is a percentage of the investment
advisory fee paid by the Fund to the Advisor. |
Notes to Financial Statements (continued)
The Fund has also entered into separate Distribution Agreements and
Distribution Plans with FAM Distributors, Inc. (“FAMD”) and BlackRock
Distributors, Inc. and its affiliates (“BDI”) (collectively, the “Distributor”).
FAMD is a wholly owned subsidiary of Merrill Lynch Group, Inc. and BDI
is an affiliate of BlackRock, Inc.
Pursuant to the Distribution Plans adopted by the Fund in accordance
with Rule12b-1 under the 1940 Act, the Fund pays the Distributor ongo-
ing service and distribution fees. The fees are accrued daily and paid
monthly at annual rates based upon the average daily net assets of the
shares as follows: |
| | | Service | | Distribution |
| | | Fee | | Fee |
| |
| |
|
| Investor A | | 0.25% | | — |
| Investor B | | 0.25% | | 0.75% |
| Investor C | | 0.25% | | 0.75% |
| Class R | | 0.25% | | 0.25% |
| |
| |
|
Pursuant to sub-agreements with each Distributor, broker-dealers, includ-
ing Merrill Lynch, Pierce, Fenner & Smith Incorporated (“MLPF&S”), a
wholly owned subsidiary of Merrill Lynch, and each distributor provide
shareholder servicing and distribution services to the Fund. The on-
going service and/or distribution fee compensates the Distributor
and each broker-dealer for providing shareholder servicing and/or
distribution-related services to Investor A, Investor B, Investor C and
Class R shareholders.
For the six months ended April 30, 2008, the Distributor earned under-
writing discounts and direct commissions and its affiliates earned
dealer concessions on sales of the Fund’s Investor A Shares, which
totaled $16,254.
For the six months ended April 30, 2008, affiliates received contingent
deferred sales charges of $5,339 and $10,066 relating to transactions
in Investor B and Investor C Shares, respectively. Furthermore, affiliates
received contingent deferred sales charges of $1,426 relating to trans-
actions subject to front-end sales charge waivers in Investor A Shares. |
The Advisor maintains a call center, which is responsible for providing
certain shareholder services to the Fund, such as responding to share-
holder inquiries and processing transactions based upon instructions
from shareholders with respect to the subscription and redemption of
Fund shares. For the six months ended April 30, 2008, the following
amounts have been accrued by the Fund to reimburse the Advisor for
costs incurred running the call center, which are a component of the
transfer agent fees in the accompanying Statement of Operations. |
| | | Call Center |
| | | Fees |
| |
|
| Institutional | | $4,518 |
| Investor A | | $5,262 |
| Investor B | | $ 708 |
| Investor C | | $ 750 |
| Class R | | $ 30 |
| |
|
PFPC Inc., an indirect, wholly owned subsidiary of PNC and an affiliate of
the Advisor, serves as transfer agent. Each class of the Fund bears the
costs of transfer agent fees associated with such respective classes.
Transfer agency fees borne by each class of the Fund are comprised of
those fees charged for all shareholder communications including share-
holder reports, dividend and distribution notices, and proxy materials for
shareholders meetings, as well as per account and per transaction fees
related to servicing and maintenance of shareholder accounts, including
the issuing, redeeming and transferring of shares of each class of the
Fund, 12b-1 fee calculation, check writing, anti-money laundering ser-
vices, and customer identification services.
Certain officers and/or trustees of the Fund are officers and/or directors
of BlackRock, Inc. or its affiliates.
3. Investments:
Purchases and sales of investments, excluding short-term securities,
for the six months ended April 30, 2008 were $198,931,033 and
$282,662,089, respectively. |
| Notes to Financial Statements (continued) | | | | | | | | | |
| |
| 4. Beneficial Interest Transactions: | | | | | | | | | | | |
| Transactions in beneficial interest for each class were as follows: | | | | | | | | | |
| | | Six Months Ended | | Year Ended |
| | | April 30, 2008 | | October 31, 2007 |
| | | Shares | | | | Amount | | Shares | | | Amount |
| Institutional Shares | | | | | | | | | | | |
| Shares sold | | 933,405 | | $ 18,973,320 | | 7,263,929 | | $ 168,689,472 |
| Shares issued to shareholders in reinvestment of dividends | | | | | | | | | | | |
| and distrubutions | | 2,580,306 | | | | 51,297,021 | | 1,537,937 | | | 31,589,732 |
| | |
| |
| |
| |
| |
|
|
| Total issued | | 3,513,711 | | | | 70,270,341 | | 8,801,866 | | 200,279,204 |
| Shares redeemed | | (2,165,246) | | | | (42,174,481) | | (9,064,709) | | (204,000,880) |
| | |
| |
| |
| |
| |
|
| Net increase (decrease) | | 1,348,465 | | $ 28,095,860 | | (262,843) | | $ (3,721,676) |
| | |
| |
| |
| |
|
| |
| | | | | | | | | Period |
| | | | | | | | | November 6, 2006† to |
| | | | | | | May 7, 2007†† |
| |
| |
| |
| |
|
|
| Institutional 1 Shares | | | | | | | | | | | |
| |
| |
| |
| |
| |
|
|
| Shares sold | | | | | | | | 1,493 | | $ 43,112 |
| Shares issued as a result of reorganization | | | | | | | | 5,532,829 | | 113,021,126 |
| Shares issued to shareholders in reinvestment of dividends | | | | | | | | 169 | | | 3,664 |
| | | | | | | | |
| |
|
|
| Total issued | | | | | | | | 5,534,491 | | 113,067,902 |
| Shares redeemed | | | | | | | | (5,534,491) | | (127,809,960) |
| | | | | | | | |
| |
|
| Net decrease | | | | | | | | — | | $ (14,742,058) |
| | | | | | | | |
| |
|
| † Prior to November 6, 2006, (commencement of operations), | | | | | | | | | | | |
| the Fund issued 5 shares to BDI for $100. | | | | | | | | | | | |
| †† On May 7, 2007, Institutional 1 Shares converted to | | | | | | | | | | | |
| Institutional Shares. | | | | | | | | | | | |
| | | | | | | | | Year Ended |
| | | | | | | | | October 31, 2007 |
| | | | | | | | | Shares | | | Amount |
| Investor A Shares | | | | | | | | | | | |
| Shares sold and automatic conversion of shares | | 1,116,140 | | $ 21,663,391 | | 3,006,721 | | $ 67,212,029 |
| Shares issued to shareholders in reinvestment of dividends | | | | | | | | | | | |
| and distributions | | 3,863,256 | | | | 75,607,215 | | 1,914,464 | | | 38,843,557 |
| | |
| |
| |
| |
| |
|
|
| Total issued | | 4,979,396 | | | | 97,270,606 | | 4,921,185 | | 106,055,586 |
| Shares redeemed | | (2,260,149) | | | | (43,632,646) | | (3,052,717) | | | (68,860,817) |
| | |
| |
| |
| |
| |
|
|
| Net increase | | 2,719,247 | | $ 53,637,960 | | 1,868,468 | | $ 37,194,769 |
| |
| |
| |
| |
|
| |
| Investor B Shares | | | | | | | | | | | |
| |
| |
| |
| |
| |
|
|
| Shares sold | | 97,768 | | $ 1,646,552 | | 436,237 | | $ 8,367,613 |
| Shares issued to shareholders in reinvestment of dividends | | | | | | | | | | | |
| and distributions | | 404,759 | | | | 6,585,620 | | 336,659 | | | 5,871,474 |
| | |
| |
| |
| |
| |
|
|
| Total issued | | 502,527 | | | | 8,232,172 | | 772,896 | | | 14,239,087 |
| Shares redeemed and automatic conversion of shares | | (940,653) | | | | (15,116,677) | | (1,958,575) | | | (37,244,713) |
| | |
| |
| |
| |
| |
|
|
| Net decrease | | (438,126) | | $ (6,884,505) | | (1,185,679) | | $ (23,005,626) |
| | |
| |
| |
| |
|
| Notes to Financial Statements (concluded) | | | | | | | | | | |
| |
| | | Six Months Ended | | Year Ended | | |
| | | April 30, 2008 | | October 31, 2007 |
| | | Shares | | | | Amount | | Shares | | | | Amount |
| Investor C Shares | | | | | | | | | | | | |
| Shares sold | | 307,137 | | $ 4,856,067 | | 911,338 | | $ 16,922,267 |
| Shares issued to shareholders in reinvestment of dividends | | | | | | | | | | | | |
| and distributions | | 929,042 | | | | 14,047,301 | | 383,571 | | | | 6,348,265 |
| | |
| |
| |
| |
| |
| |
|
| Total issued | | 1,236,179 | | | | 18,903,368 | | 1,294,909 | | | | 23,270,532 |
| Shares redeemed | | (754,467) | | | | (11,175,227) | | (598,396) | | | | (11,062,232) |
| | |
| |
| |
| |
| |
| |
|
| Net increase | | 481,712 | | $ 7,728,141 | | 696,513 | | $ 12,208,300 |
| |
| |
| |
| |
|
| |
| Class R Shares | | | | | | | | | | | | |
| |
| |
| |
| |
| |
| |
|
| Shares sold | | 67,829 | | $ 1,065,934 | | 156,930 | | $ 3,096,905 |
| Shares issued to shareholders in reinvestment of dividends | | | | | | | | | | | | |
| and distributions | | 56,836 | | | | 909,947 | | 13,571 | | | | 235,197 |
| | |
| |
| |
| |
| |
| |
|
| Total issued | | 124,665 | | | | 1,975,881 | | 170,501 | | | | 3,332,102 |
| Shares redeemed | | (50,667) | | | | (810,893) | | (59,021) | | | | (1,155,218) |
| | |
| |
| |
| |
| |
| |
|
| Net increase | | 73,998 | | $ 1,164,988 | | 111,480 | | $ 2,176,884 |
| | |
| |
| |
| |
|
The Fund charges a 2% redemption fee on the proceeds (calculated at market value) of a redemption (either by sale or exchange) of Fund shares
(except Institutional 1 Shares) made within 30 days of purchase or exchange. The redemption fee is paid to the Fund and is intended to offset the
trading costs, market impact and other costs associated with short-term trading into and out of the Fund. |
5. Short-Term Borrowings:
The Fund, along with certain other funds managed by the Advisor and its
affiliates, is a party to a $500,000,000 credit agreement with a group of
lenders. The Fund may borrow under the credit agreement to fund share-
holder redemptions and for other lawful purposes other than for lever-
age. The Fund may borrow up to the maximum amount allowable under
the Fund’s current Prospectus and Statement of Additional Information,
subject to various other legal, regulatory or contractual limits. On
November 21, 2007, the credit agreement was renewed for one year
under substantially the same terms. The Fund pays a commitment fee of
0.06% per annum based on the Fund’s pro rata share of the unused
portion of the credit agreement, which is included in miscellaneous
expenses in the Statement of Operations. Amounts borrowed under the
credit agreement bear interest at a rate equal to, at the fund’s election,
the federal funds rate plus 0.35% or a base rate as defined in the credit
agreement. The Fund did not borrow under the credit agreement during
the six months ended April 30, 2008.
6. Capital Loss Carryforward: |
7. Acquisition of The Europe Fund, Inc.
On November 6, 2006, the Fund acquired substantially all of the assets
and assumed substantially all of the liabilities of The Europe Fund, Inc.,
pursuant to a plan of reorganization. The acquisition was accomplished
by a tax-free exchange of 10,066,319 shares of common stock of The
Europe Fund, Inc. for 5,532,829 shares of beneficial interest of the
Fund. The Europe Fund, Inc.'s net assets on that date of $113,021,126,
including $152,626 of distributions in excess of net investment income,
$141,914 of accumulated net realized losses and $8,113,020 of
net unrealized appreciation were combined with those of the Fund.
The aggregate net assets immediately after the acquisition amounted
to $1,001,508,858. |
As of October 31, 2007, the Fund had a capital loss carryforward of
$8,158,403, all of which expires in 2009. This amount will be available
to offset future realized capital gains. |
Officers and Trustees
James H. Bodurtha, Trustee
Bruce R. Bond, Trustee
Donald W. Burton, Trustee
Richard S. Davis, Fund President and Trustee
Stuart E. Eizenstat, Trustee
Laurence D. Fink, Trustee
Kenneth A. Froot, Trustee
Henry Gabbay, Trustee
Robert M. Hernandez, Trustee
John F. O’Brien, Trustee
Roberta Cooper Ramo, Trustee
Jean Margo Reid, Trustee
David H. Walsh, Trustee
Fred G. Weiss, Trustee
Richard R. West, Trustee
Donald C. Burke, Chief Executive Officer
Anne F. Ackerley, Vice President
Neal J. Andrews, Chief Financial Officer
Jay M. Fife, Treasurer
Brian . Kindelan, Chief Compliance Officer of the Funds
Howard Surloff, Secretary |
Custodian
Brown Brother Harriman & Co.
Boston, MA 02109
Transfer Agents
PFPC Inc.
Wilmington, DE 19809
Accounting Agent
State Street Bank and Trust Company
Princeton, NJ 08540
Independent Registered Public Accounting Firm
Deloitte & Touche LLP
Princeton, NJ 08540
Legal Counsel
Willkie Farr & Gallagher LLP
New York, NY 10019 |
Additional Information
BlackRock Privacy Principles
BlackRock is committed to maintaining the privacy of its current and
former fund investors and individual clients (collectively, “Clients”) and
to safeguarding their non-public personal information. The following infor-
mation is provided to help you understand what personal information
BlackRock collects, how we protect that information and why in certain
cases we share such information with select parties.
If you are located in a jurisdiction where specific laws, rules or regulations
require BlackRock to provide you with additional or different privacy-related
rights beyond what is set forth below, then BlackRock will comply with
those specific laws, rules or regulations.
BlackRock obtains or verifies personal non-public information from and
about you from different sources, including the following: (i) information
we receive from you or, if applicable, your financial intermediary, on appli-
cations, forms or other documents; (ii) information about your trans-
actions with us, our affiliates, or others; (iii) information we receive from
a consumer reporting agency; and (iv) from visits to our websites. |
BlackRock does not sell or disclose to non-affiliated third parties any non-
public personal information about its Clients, except as permitted by law
or as is necessary to respond to regulatory requests or to service Client
accounts. These non-affiliated third parties are required to protect the
confidentiality and security of this information and to use it only for its
intended purpose.
We may share information with our affiliates to service your account or to
provide you with information about other BlackRock products or services
that may be of interest to you. In addition, BlackRock restricts access
to non-public personal information about its Clients to those BlackRock
employees with a legitimate business need for the information. BlackRock
maintains physical, electronic and procedural safeguards that are designed
to protect the non-public personal information of its Clients, including proce-
dures relating to the proper storage and disposal of such information. |
| | Availability of Additional Information |
Electronic copies of most financial reports and prospectuses are available
on the Fund’s website or shareholders can sign up for e-mail notifications
of quarterly statements, annual and semi-annual reports and prospectuses
by enrolling in the Fund’s electronic delivery program.
To enroll:
Shareholders Who Hold Accounts with Investment Advisors, Banks or
Brokerages:
Please contact your financial advisor. Please note that not all investment
advisors, banks or brokerages may offer this service.
Shareholders Who Hold Accounts Directly with BlackRock: |
1) Access the BlackRock website at
http://www.blackrock.com/edelivery
2) Click on the applicable link and follow the steps to sign up
3) Log into your account |
The Fund will mail only one copy of shareholder documents, including
prospectuses, annual and semi-annual reports and proxy statements, to
shareholders with multiple accounts at the same address. This practice is
commonly called “householding” and it is intended to reduce expenses
and eliminate duplicate mailings of shareholder documents. Mailings of
your shareholder documents may be householded indefinitely unless you
instruct us otherwise. If you do not want the mailing of these documents
to be combined with those for other members of your household, please
contact the Fund at (800) 441-7762.
Availability of Proxy Voting Policies and Procedures
A description of the policies and procedures that the Fund uses to
determine how to vote proxies relating to portfolio securities is available |
(1) without charge, upon request, by calling toll-free (800) 441-7762;
(2) at www.blackrock.com; and (3) on the Securities and Exchange |
Commission’s (the “SEC”) website at http://www.sec.gov.
Availability of Additional Information (concluded)
Availability of Proxy Voting Record
Information about how the Fund votes proxies relating to securities
held in the Fund’s portfolio during the most recent 12-month period
ended June 30 is available upon request and without charge (1) at
www.blackrock.com or by calling (800) 441-7762 and (2) on the SEC’s
website at http://www.sec.gov. |
Availability of Quarterly Portfolio Schedule
The Fund files its complete schedule of portfolio holdings with the SEC
for the first and third quarters of each fiscal year on Form N-Q. The Fund’s
Forms N-Q are available on the SEC’s website at http://www.sec.gov and
may also be reviewed and copied at the SEC’s Public Reference Room
in Washington, D.C. Information on the operation of the Public Reference
Room may be obtained by calling (800) SEC-0330. The Fund’s Forms
N-Q may also be obtained upon request and without charge by calling
(800) 441-7762. |
Shareholder Privileges
Account Information
Call us at (800) 441-7762 from 8:00 AM to 6:00 PM EST to get infor-
mation about your account balances, recent transactions and share
prices. You can also reach us on the Web at www.blackrock.com/funds.
Automatic Investment Plans
Investor Class shareholders who want to invest regularly can arrange to
have $50 or more automatically deducted from their checking or savings
account and invested in any of the BlackRock funds. |
Systematic Withdrawal Plans
Investor Class shareholders can establish a systematic withdrawal plan
and receive periodic payments of $50 or more from their BlackRock
funds, as long as their account is at least $10,000.
Retirement Plans
Shareholders may make investments in conjunction with Traditional,
Rollover, Roth, Coverdell, Simple IRAs, SEP IRAs and 403(b) Plans. |
A World-Class Mutual Fund Family
BlackRock offers a diverse lineup of open-end mutual funds crossing all investment styles and managed by experts in equity, fixed income and tax-exempt investing.
| Equity Funds | | | | |
| |
| |
|
| |
| BlackRock All-Cap Global Resources Portfolio | | BlackRock Global Opportunities Portfolio | | BlackRock Mid-Cap Growth Equity Portfolio |
| BlackRock Asset Allocation Portfolio† | | BlackRock Global Resources Portfolio | | BlackRock Mid-Cap Value Equity Portfolio |
| BlackRock Aurora Portfolio | | BlackRock Global Science & Technology | | BlackRock Mid Cap Value Opportunities Fund |
| BlackRock Balanced Capital Fund† | | Opportunities Portfolio | | BlackRock Natural Resources Trust |
| BlackRock Basic Value Fund | | BlackRock Global SmallCap Fund | | BlackRock Pacific Fund |
| BlackRock Capital Appreciation Portfolio | | BlackRock Health Sciences Opportunities Portfolio* | | BlackRock Small Cap Core Equity Portfolio |
| BlackRock Equity Dividend Fund | | BlackRock Healthcare Fund | | BlackRock Small Cap Growth Equity Portfolio |
| BlackRock EuroFund | | BlackRock Index Equity Portfolio* | | BlackRock Small Cap Growth Fund II |
| BlackRock Focus Growth Fund | | BlackRock International Fund | | BlackRock Small Cap Index Fund |
| BlackRock Focus Value Fund | | BlackRock International Index Fund | | BlackRock Small Cap Value Equity Portfolio* |
| BlackRock Fundamental Growth Fund | | BlackRock International Opportunities Portfolio | | BlackRock Small/Mid-Cap Growth Portfolio |
| BlackRock Global Allocation Fund† | | BlackRock International Value Fund | | BlackRock S&P 500 Index Fund |
| BlackRock Global Dynamic Equity Fund | | BlackRock Large Cap Core Fund | | BlackRock Technology Fund |
| BlackRock Global Emerging Markets Fund | | BlackRock Large Cap Growth Fund | | BlackRock U.S. Opportunities Portfolio |
| BlackRock Global Financial Services Fund | | BlackRock Large Cap Value Fund | | BlackRock Utilities and Telecommunications Fund |
| BlackRock Global Growth Fund | | BlackRock Latin America Fund | | BlackRock Value Opportunities Fund |
| |
| |
|
| |
| Fixed Income Funds | | | | |
| |
| |
|
| |
| BlackRock Commodity Strategies Fund | | BlackRock Income Builder Portfolio | | BlackRock Managed Income Portfolio |
| BlackRock Emerging Market Debt Portfolio | | BlackRock Inflation Protected Bond Portfolio | | BlackRock Short-Term Bond Fund |
| BlackRock Enhanced Income Portfolio | | BlackRock Intermediate Bond Portfolio II | | BlackRock Strategic Income Portfolio |
| BlackRock GNMA Portfolio | | BlackRock Intermediate Government | | BlackRock Total Return Fund |
| BlackRock Government Income Portfolio | | Bond Portfolio | | BlackRock Total Return Portfolio II |
| BlackRock High Income Fund | | BlackRock International Bond Portfolio | | BlackRock World Income Fund |
| BlackRock High Yield Bond Portfolio | | BlackRock Long Duration Bond Portfolio | | |
| BlackRock Income Portfolio | | BlackRock Low Duration Bond Portfolio | | |
| |
| |
|
| |
| Municipal Bond Funds | | | | |
| |
| |
|
| BlackRock AMT-Free Municipal Bond Portfolio | | BlackRock Intermediate Municipal Fund | | BlackRock New York Municipal Bond Fund |
| BlackRock California Insured Municipal Bond Fund | | BlackRock Kentucky Municipal Bond Portfolio | | BlackRock Ohio Municipal Bond Portfolio |
| BlackRock Delaware Municipal Bond Portfolio | | BlackRock Municipal Insured Fund | | BlackRock Pennsylvania Municipal Bond Fund |
| BlackRock Florida Municipal Bond Fund | | BlackRock National Municipal Fund | | BlackRock Short-Term Municipal Fund |
| BlackRock High Yield Municipal Fund | | BlackRock New Jersey Municipal Bond Fund | | |
| |
| |
|
| |
| Target Risk & Target Date Funds | | | | |
| |
| |
|
| |
| BlackRock Prepared Portfolios | | BlackRock Lifecycle Prepared Portfolios | | |
| Conservative Prepared Portfolio | | Prepared Portfolio 2010 | | Prepared Portfolio 2030 |
| Moderate Prepared Portfolio | | Prepared Portfolio 2015 | | Prepared Portfolio 2035 |
| Growth Prepared Portfolio | | Prepared Portfolio 2020 | | Prepared Portfolio 2040 |
| Aggressive Growth Prepared Portfolio | | Prepared Portfolio 2025 | | Prepared Portfolio 2045 |
| | | | | Prepared Portfolio 2050 |
| * See the prospectus for information on specific limitations on investments in the fund. | | |
| † Mixed asset fund. | | | | |
BlackRock mutual funds are distributed by BlackRock Distributors, Inc. and certain funds are also distributed by FAM Distributors, Inc. You should consider the investment objectives, risks, charges and expenses of the funds under consideration carefully before investing. Each fund’s prospectus contains this and other information and is available at www.blackrock.com or by calling (800) 882-0052 or from your financial advisor. The prospectus should be read carefully before investing.

This report is not authorized for use as an offer of sale or a solicita-
tion of an offer to buy shares of the Fund unless accompanied or
preceded by the Fund’s current prospectus. Past performance
results shown in this report should not be considered a representa-
tion of future performance. Investment return and principal value of
shares will fluctuate so that shares, when redeemed, may be worth
more or less than their original cost. Statements and other informa-
tion herein are as dated and are subject to change.
Investment in foreign securities involves special risks including
fluctuating foreign exchange rates, foreign government regulations,
differing degrees of liquidity and the possibility of substantial
volatility due to adverse political, economic or other developments.
BlackRock EuroFund
100 Bellevue Parkway
Wilmington, DE 19809 |

#10477-04/08
Item 2 – Code of Ethics – Not Applicable to this semi-annual report
Item 3 – Audit Committee Financial Expert – Not Applicable to this semi-annual report
Item 4 – Principal Accountant Fees and Services – Not Applicable to this semi-annual report
Item 5 – Audit Committee of Listed Registrants – Not Applicable
Item 6 – Investments
(a) The registrant’s Schedule of Investments is included as part of the Report to
Stockholders filed under Item 1 of this form.
(b) Not Applicable due to no such divestments during the semi-annual period covered since
the previous Form N-CSR filing.
Item 7 – Disclosure of Proxy Voting Policies and Procedures for Closed-End Management
Investment Companies – Not Applicable
Item 8 – Portfolio Managers of Closed-End Management Investment Companies – Not Applicable
Item 9 – Purchases of Equity Securities by Closed-End Management Investment Company and
Affiliated Purchasers – Not Applicable
Item 10 – Submission of Matters to a Vote of Security Holders – The registrant’s Nominating and
Governance Committee will consider nominees to the Board recommended by shareholders
when a vacancy becomes available. Shareholders who wish to recommend a nominee
should send nominations which include biographical information and set forth the
qualifications of the proposed nominee to the registrant’s Secretary. There have been no
material changes to these procedures.
Item 11 – Controls and Procedures
11(a) – The registrant’s principal executive and principal financial officers or persons performing
similar functions have concluded that the registrant’s disclosure controls and procedures (as
defined in Rule 30a-3(c) under the Investment Company Act of 1940, as amended (the
“1940 Act”)) are effective as of a date within 90 days of the filing of this report based on the
evaluation of these controls and procedures required by Rule 30a-3(b) under the 1940 Act
and Rule 15d-15(b) under the Securities Exchange Act of 1934, as amended.
11(b) – There were no changes in the registrant’s internal control over financial reporting (as
defined in Rule 30a-3(d) under the 1940 Act) that occurred during the second fiscal quarter
of the period covered by this report that have materially affected, or are reasonably likely to
materially affect, the registrant’s internal control over financial reporting.
Item 12 – Exhibits attached hereto
12(a)(1) – Code of Ethics – Not Applicable to this semi-annual report
12(a)(2) – Certifications – Attached hereto
12(a)(3) – Not Applicable
12(b) – Certifications – Attached hereto |
Pursuant to the requirements of the Securities Exchange Act of 1934 and the Investment
Company Act of 1940, the registrant has duly caused this report to be signed on its behalf by
the undersigned, thereunto duly authorized.
BlackRock EuroFund
By: /s/ Donald C. Burke
Donald C. Burke
Chief Executive Officer of
BlackRock EuroFund
Date: June 23, 2008
Pursuant to the requirements of the Securities Exchange Act of 1934 and the Investment
Company Act of 1940, this report has been signed below by the following persons on behalf
of the registrant and in the capacities and on the dates indicated.
By: /s/ Donald C. Burke
Donald C. Burke
Chief Executive Officer (principal executive officer) of
BlackRock EuroFund
Date: June 23, 2008
By: /s/ Neal J. Andrews
Neal J. Andrews
Chief Financial Officer (principal financial officer) of
BlackRock EuroFund
Date: June 23, 2008 |