UNITED STATES
SECURITIES AND EXCHANGE COMMISSION
Washington, D.C. 20549
SCHEDULE 14A
Proxy Statement Pursuant to Section 14(a) of the Securities
Exchange Act of 1934
Filed by the Registrantx Filed by a Party other than the Registrant ¨
Check the appropriate box:
| ¨ | Preliminary Proxy Statement |
| ¨ | Confidential, for Use of the Commission Only (as permitted by Rule 14a-6(e)(2)) |
| ¨ | Definitive Proxy Statement |
| ¨ | Definitive Additional Materials |
| x | Soliciting Materials Pursuant to §240.14a-12 |
Ryerson Inc.
(Exact Name of Registrant as Specified in Its Charter)
(Name of Person(s) Filing Proxy Statement, if other than the Registrant)
Payment of Filing Fee (Check the appropriate box):
| x | No fee required. |
| ¨ | Fee computed on table below per Exchange Act Rules 14a-6(i)(1) and 0-11. |
| (1) | Title of each class of securities to which transaction applies: |
| (2) | Aggregate number of securities to which transaction applies: |
| (3) | Per unit price or other underlying value of transaction computed pursuant to Exchange Act Rule 0-11 (set forth the amount on which the filing fee is calculated and state how it was determined): |
| (4) | Proposed maximum aggregate value of transaction: |
| (5) | Total fee paid: |
| ¨ | Fee paid previously with preliminary materials. |
| ¨ | Check box if any part of the fee is offset as provided by Exchange Act Rule 0-11(a)(2) and identify the filing for which the offsetting fee was paid previously. Identify the previous filing by registration statement number, or the Form or Schedule and the date of its filing. |
| (1) | Amount Previously Paid: |
| (2) | Form, Schedule or Registration Statement No.: |
| (3) | Filing Party: |
| (4) | Date Filed: |
Filed by: Ryerson Inc.
Pursuant to Rule 14a-12
under the Securities Exchange Act of 1934
Subject Company: Ryerson Inc.
Commission File No. 001-09117
On August 8, 2007, representatives of Ryerson Inc. will deliver a presentation to Institutional Shareholder Services (“ISS”). A copy of material that will be used in the presentation to ISS is set forth below.
 Investor Presentation Regarding Upcoming Events • Election of Directors: August 23, 2007 • Stockholder Vote on Sale to Platinum Equity: Anticipated in Fourth Quarter of 2007 August 7, 2007 |
2 Safe Harbor Provision During this presentation, we will make forward-looking statements subject to known and unknown risks and uncertainties that could cause actual results to differ materially from those expressed or implied by such statements. Such risks and uncertainties include, but are not limited to, the volatility in metals demand and prices, the cyclicality of the various industries the company serves, and other risks described in reports filed with the SEC. We assume no obligation to update the information provided in this presentation. |
3 Proxy Solicitation Important Information In connection with its proposed merger with an affiliate of Platinum Equity, LLC, Ryerson plans to file with the Securities and Exchange Commission (the “SEC”) a preliminary proxy statement and a definitive proxy statement. The definitive proxy statement will be mailed to stockholders of Ryerson. Stockholders of Ryerson are urged to read the proxy statement relating to the merger and other relevant materials when they become available because they will contain important information about the merger and Ryerson. Security holders may obtain a free copy of the proxy statement and any other relevant documents (when available) that Ryerson files with the SEC at the SEC’s web site at http://www.sec.gov. The definitive proxy statement and these other documents may be accessed at www.ryerson.com or obtained free from Ryerson by directing a request to Ryerson Inc., ATTN: Investor Relations, 2621 West 15th Place, Chicago, IL 60608. Certain Information Regarding Participants Ryerson, its directors and executive officers may be deemed to be participants in the solicitation of the Company’s security holders in connection with the proposed merger. Security holders may obtain information regarding the names, affiliations and interests of such individuals in the Company’s proxy statement in connection with its 2007 annual meeting of stockholders, which was filed with the SEC on July 31, 2007. To the extent holdings of the Company’s equity securities have changed since the amounts reflected in such proxy statement, such changes have been reflected on Statements of Change in Ownership on Form 4 filed with the SEC. |
 4 Use of non-GAAP Financial Information The Company uses the LIFO method of inventory accounting in the U.S., which results in a better matching of costs and revenues than the FIFO method. To supplement its consolidated condensed financial statements presented on a GAAP basis, the company has provided certain non-GAAP financial measures, in some cases adjusted to reflect the effects of valuing inventory on a FIFO basis. While FIFO is an acceptable inventory valuation method under U.S. GAAP, the presentation of FIFO basis financial information is considered non- GAAP financial information as the company applies LIFO inventory valuation for its financial reporting purposes. A reconciliation of the adjustments from GAAP financial measures to non-GAAP financial measures is contained in the addendum to this presentation and may be accessed at www.ryerson.com. This non-GAAP financial information is not meant to be considered in isolation or as a substitute for financial measures prepared in accordance with GAAP. Ryerson believes that providing these non-GAAP financial measures in addition to the related GAAP measures better enables investors to understand the company’s operating performance and also facilitates comparisons of Ryerson’s operating performance with the performance of other companies in the industry, many of which value inventories on a FIFO basis (in whole or part). |
5 Background • Ryerson is party to a sale agreement with Platinum Equity, anticipated to go to a stockholder vote in 4Q2007 • The current Board, after an exhaustive and public auction process, strongly supports this sale over any other option available, including remaining independent • There is an election of Directors scheduled prior to the stockholder vote on the merger • Harbinger seeks to gain control of a new board, effectively changing control of the Board and the company for no premium • There is uncertainty regarding Harbinger’s position on the sale. A Harbinger controlled Board could change its recommendation allowing termination (by buyer or seller) of the deal and denying stockholders the right to vote on the deal |
6 Agenda • Overview of Metal Service Center Industry and Ryerson – Ryerson: Performance has been strong vs. competition – Harbinger: Operating criticisms are unfounded • Annual Election of Directors – Ryerson: Well governed by its independent directors and achieves high ISS governance ratings – Harbinger: Has not put forth their own strategic plan (supports Ryerson’s), operating plan or management team and presents unqualified directors – On a change in control, current financings accelerate; there is no Harbinger plan to refinance in an uncertain credit market • Sale of Ryerson to Platinum Equity – Right time to sell given current financial performance and cyclical nature of industry – Board’s process was thorough and unbiased in achieving the highest available price – Price is a good and fair deal for stockholders compared to other options |
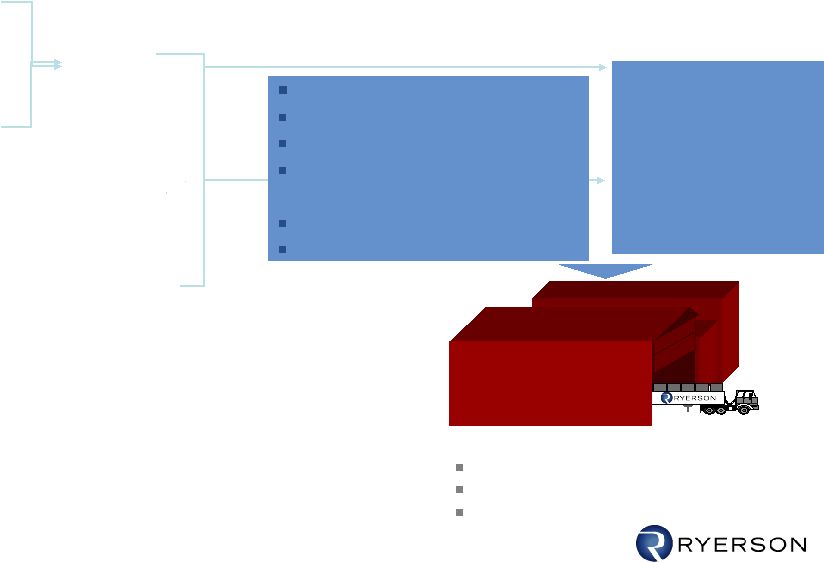 7 Role of the Metals Service Center Industry ~30% OEM’S • Appliances • Transportation • Construction equipment • Office equipment • Agricultural equipment Fabricators Domestic steel, ~80% End users Metals Service Center Industry ~70% Imported steel, ~20% Market Size: $120 Billion (Purch. Mag.) Products: Carbon, Stainless, Aluminum Forms: Flat products, Plates, Bars, Tubing Processes: Fabrication, Cutting to length, slitting, burning, tolling Fragmented >3,000 North America participants Integrated metal mills Mini mills Ryerson is a market leader 2006 sales of $5.9 billion 1H07 sales of $3.3 billion 97 facilities/66 market areas |
 8 Post 1999 – Strategic Actions Taken to Improve Ryerson’s Performance Cost Reductions • Reduced headcount and capacity by 1/3—closed or downsized 26 facilities • Centralized and streamlined back room • Radically flattened and streamlined organization • Froze pension plan • Outsourced logistics Sourcing • Strategic sourcing to consolidate and leverage buy with most capable mills Organizational Structure and Management Processes • Simplified many basic business practices • Implemented on-line account profitability system • Brought talented and experienced outsiders into key positions • Realigned incentive compensation system • Substantially upgraded all online information systems • Selected SAP as a new IT platform and began conversion process Growth • Multiple acquisitions to build stronger competitive positions Focus on operational efficiencies and building a platform for growth |
 9 1999 – 2004: (Pre-Integris Acquisition) Results of Restructuring Improve Ryerson Performance 1999 2004 Square footage Employees (year end) Tons shipped per employee Number of suppliers Annualized fixed-cost savings 8.1mm 3,574 824 52 $85mm 11.5mm 5,054 663 150+ — |
 10 2005: Acquisition and Integration of Integris Further Improves Financial Performance and Competitive Position • Closed January 4, 2005 for $644MM – Paid 6.3x LTM EBITDA for highly strategic acquisition – Immediately accretive • 2004 sales of $2.0 Billion • By far the largest of a series of acquisitions focused on improving competitive positions in key product lines • Annualized cost savings of $60MM by Y/E 2007 – $50MM achieved by June 30, 2007 • Strengthened resulting management team-best of the best from both companies in all positions Coupled with prior restructuring, creates a company with strong competitive positions and superior financial performance |
 11 Ryerson’s Strategic Programs have Demonstrated Strong Sales Growth… $2,783 $5,909 $3,281 $- $1,000 $2,000 $3,000 $4,000 $5,000 $6,000 $7,000 1997-1999 2006 2007- 6 mons Sales • Poor competitive positions • High overhead Structure • Outdated IT infrastructure • Restructured • Strong product positions • State of the art IT infrastructure • Track record of results |
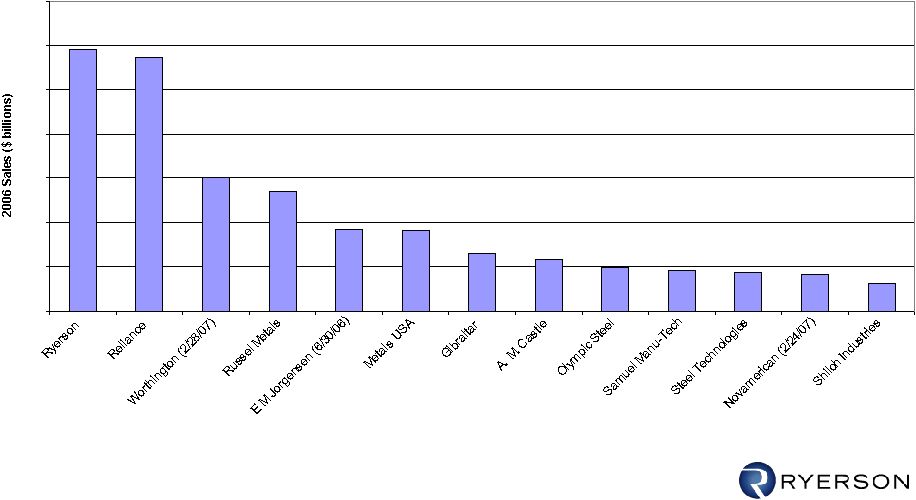 12 Through Implementation of its Strategic Programs, Ryerson Became One of the Leading Public Metal Service Center Companies… $0.6 $0.8 $0.9 $0.9 $1.0 $1.2 $1.3 $1.8 $1.8 $2.7 $3.0 $5.9 $5.7 $0.0 $1.0 $2.0 $3.0 $4.0 $5.0 $6.0 $7.0 2006 Revenue |
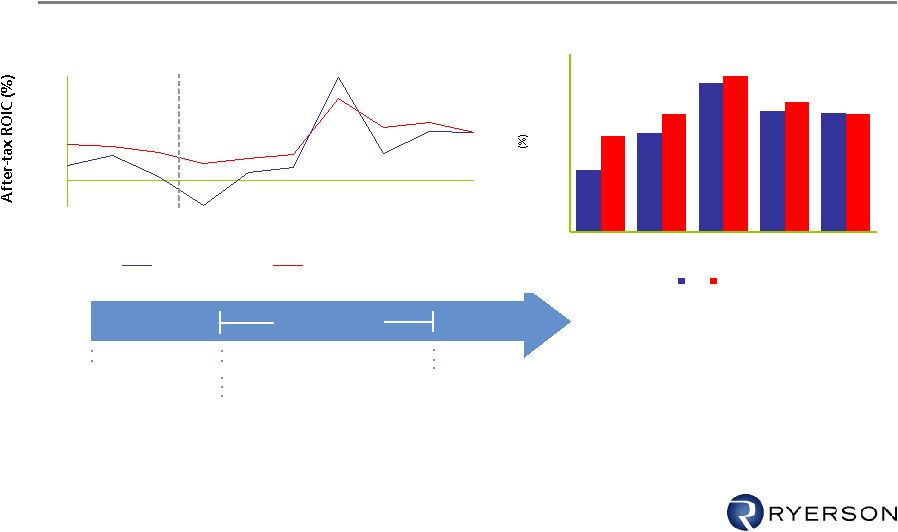 13 …And Has Steadily Improved Financial Returns Relative to Competitors Initiatives $85mm Restructuring $50mm of annualized synergies from Integris acquisition Source: Company reports Notes: 1 Calculated as tax-effected FIFO EBIT/average invested capital 2 Includes A.M. Castle, Central Steel & Wire, Earle M. Jorgensen, Gibraltar Industries, Olympic Steel, Metals USA, Novamerican, PNA Group, Reliance Steel & Aluminum, Russel Metals, Samuel Manu-Tech, Shiloh Industries, Steel Technologies and Worthington Industries Consolidated over 20 locations Centralized shared services (credit, IT, accounting, purchasing, HR) Increased local accountability for customer service Strategic sourcing Created backbone for future acquisitions—J&F Steel (2004), Integris Metals (2005) and Lancaster Steel (2006) Supplier leverage Reduced overhead Consolidated 5 service centers After Tax Return on Invested Capital 1 (LIFO companies adjusted to FIFO) Sale of Inland Steel Acquired Thypin Steel, Washington Specialty Metals and Cardinal Metals (7.0) (4.0) (1.0) 2.0 5.0 8.0 11.0 14.0 17.0 20.0 23.0 26.0 1998 1999 2000 2001 2002 2003 2004 2005 2006 1H 2007 RYI Peers² Post- Restructuring Pre- Restructuring 10.0 15.1 12.2 6.3 12.0 11.9 9.7 13.1 15.8 11.9 0.0 3.0 6.0 9.0 12.0 15.0 18.0 10-Year 5-Year 3-Year 1-Year Average RYI Peers² 1H 2007 |
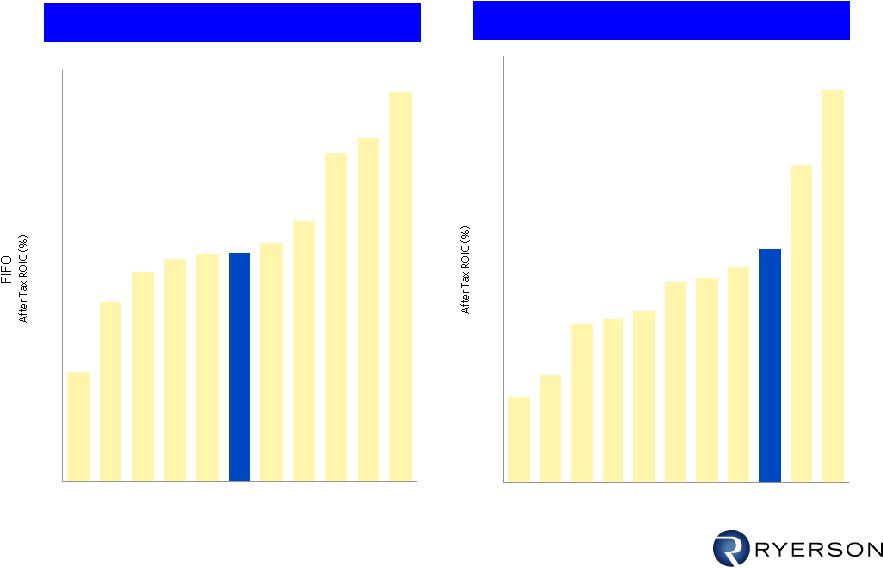 14 …And Financial Performance 1H07 Beats 75% of Public Competitors After Tax ROIC 2006 1H 2007 Source: Company Reports Note: Calculations are adjusted to FIFO when necessary. Reference set of companies based on Harbingers reference set, per 13D Filing 5.8 9.6 11.2 11.9 12.1 12.2 12.8 14.0 17.6 18.4 20.9 0 2 4 6 8 10 12 14 16 18 20 22 SHLO ROCK MUSA SMT WOR RYI TONS ZEUS RUS CAS RS 4.4 5.5 8.2 8.4 8.8 10.3 10.5 11.1 12.0 16.4 20.2 0 2 4 6 8 10 12 14 16 18 20 22 SHLO ROCK WOR TONS SMT MUSA ZEUS RUS RYI RS CAS |
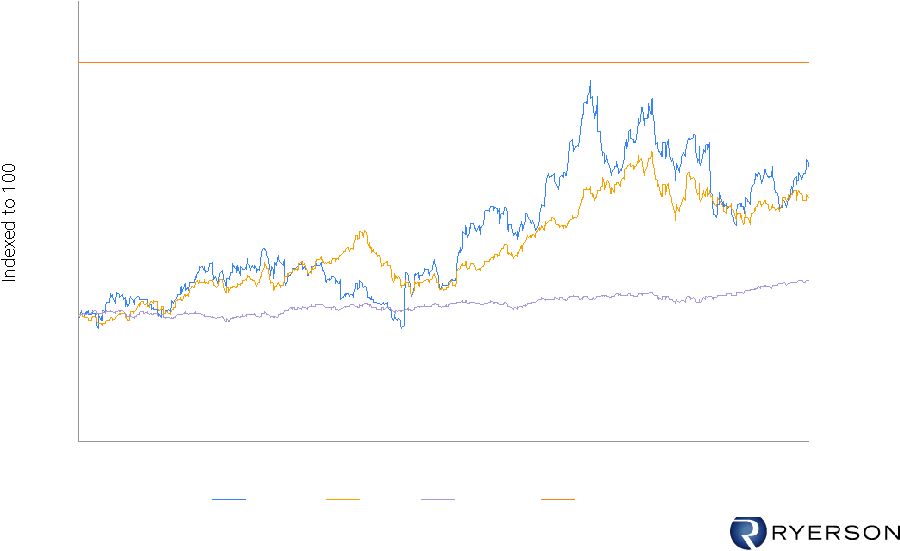 15 Improving Performance Has Also Been Reflected in Ryerson’s Stock Price Peers include: A.M. Castle, Gibraltar, Novamerican Olympic, Reliance, Russel, Samuel Manu-Tech, Shiloh Industries, Steel Technologies and Worthington: market cup weighted 0 50 100 150 200 250 300 350 Dec-03 Jul-04 Feb-05 Aug-05 Mar-06 Sep-06 Ryerson Peers S&P 500 $34.50 Transaction w/Platinum Price = $34.50 Price = $25.09 Dec-06 |
 16 Harbinger’s Critique of Ryerson’s Operating Performance is Flawed Harbinger claims • Ryerson underperforms its competitors on 3 specific financial measures: gross margin %, EBITDA % and inventory turns, however… The facts are: • Gross margin % is not a good comparable measure: competitors have different product and customer mix: – Product Mix – a ton of stainless steel or aluminum sells for a multiple of a ton of carbon flat roll steel; the mark-up gross margin percentage is lower, but the gross profit dollars per ton is much higher for stainless and aluminum – Customer Type - Program account versus transactional – Ryerson has a higher proportion of large OEM program account customers – larger orders, more gross profit dollars, but lower percentage margin – Toll processing - the processor is paid a “toll” to process the material. Low sales dollar, but no material cost, and thus high gross margin percentage • EBITDA % is not a good comparable measure; – Ignores asset intensity and working capital management that differ across competitors • Harbinger did not adjust to a comparable inventory accounting method for peers - LIFO vs. FIFO generate very different results, particularly in a period of rapidly changing prices • FIFO ROIC% adjusts for all these differences Return on Invested Capital with comparable inventory accounting is the best measure of financial performance. On this measure, Ryerson outperforms most of the peers selected by Harbinger |
 17 Additionally, Harbinger’s Criticism of Inventory Management is Not Supported by the MSCI’s Inventory Turn Data… Note: 1 Calculated as cost of goods sold (adjusted for LIFO impact) divided by average inventory over the period (adjusted for LIFO reserve) for Ryerson; MSCI inventory turns calculated as shipments divided by average inventory over period; see addendum for detailed assumptions and reconciliation to GAAP results 3.2 3.4 3.6 3.8 4.0 4.2 4.4 4.6 4.8 5.0 1997 1998 1999 2000 2001 2002 2003 2004 2005 2006 YTD (6 months) Ryerson Metal Service Center Institute 3.8 Average 3.7 |
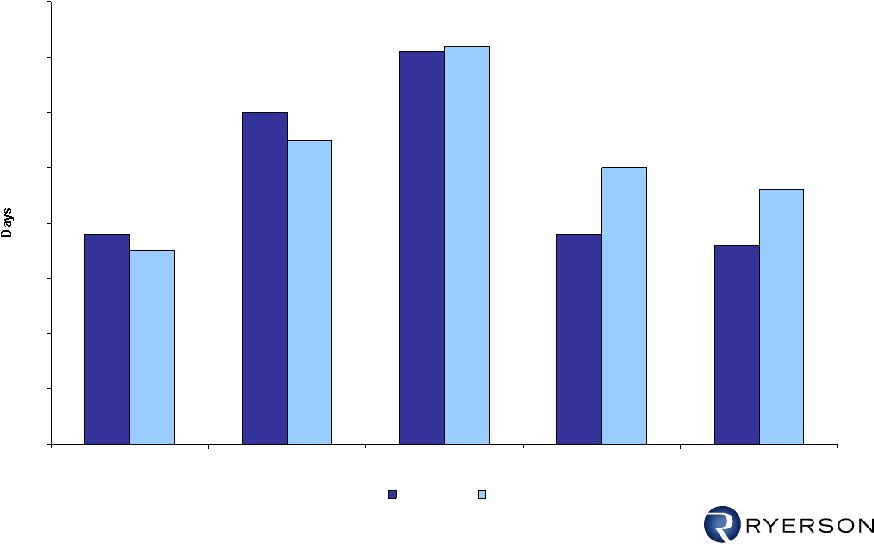 18 …And Ryerson has been Improving its Inventory Management Faster Than MSCI Comparables Since Mid 2006 Days Sales in Inventory 88 110 121 88 86 85 105 122 100 96 50 60 70 80 90 100 110 120 130 6/30/2006 9/30/2006 12/31/2006 3/31/2007 6/30/2007 Ryerson MSCI Note: Calculated using Inventory level (in tons) as of date indicated above divided by average daily shipments (annualized shipments / 365) |
19 Agenda: Annual Election of Directors • Overview of Metal Service Center Industry and Ryerson – Ryerson: Performance has been strong vs. competition – Harbinger: Operating criticisms are unfounded • Annual Election of Directors – Ryerson: Well governed by its independent directors and achieves high ISS governance ratings – Harbinger: Has not put forth their own strategic plan (supports Ryerson’s), operating plan or management team and presents unqualified directors – On a change in control, current financings accelerate; there is no Harbinger plan to refinance in an uncertain credit market • Sale of Ryerson to Platinum Equity – Right time to sell given current financial performance and cyclical nature of industry – Board’s process was thorough and unbiased in achieving the highest available price – Price is a good and fair deal for stockholders compared to other options |
20 Ryerson is Well-Governed by its Independent Directors • Five of the ten independent board members were newly elected in the last four years: Longer tenure directors understand historical perspective, shorter tenure brings new insights, questions and debate • Directors are accomplished executives with significant public board and executive management experience • Board members have a variety of backgrounds in core areas relevant to operations, including complex multi-location service businesses, finance, marketing, technology, M&A and International • Board closely monitors implementation of strategy and operational results • Compensation and Audit committees comprised solely of independents |
21 Ryerson is Well-Governed by its Independent Directors (cont’d) • Lead Director works closely with management to set Board agendas • Independent directors meet in executive session at every meeting without management • Board is actively involved in guiding the direction of the company: Integris acquisition, international expansion, leadership development, etc. • On ISS Governance Rating, Ryerson outperformed 96.6% of the companies in the S&P 500 and 94.3% of the companies in the materials group • Individual directors’ biographies follow |
22 JAMESON A. BAXTER Director since 1999 • President of Baxter Associates, Inc., since 1986. • Vice President and Principal of Regency Group, Inc., 1989 to 1992 • Vice President of The First Boston Corporation, 1975 to 1986 • Director of The Putnam Funds; Chairman of Contract Committee and member of the Marketing Committee, Brokerage Committee, Board Policy and Nominating Committee, and Executive Committee. • Previously served on Boards of Directors of Banta Corporation and Avondale Financial Corp. RICHARD G. CLINE Director since 1996 • Chairman of Hawthorne Investors, Inc., since 2000 • Chairman of Hussmann International, Inc.,1998 to 2000. • Chairman of the Board and Chief Executive Officer of NICOR, Inc., 1986 to 1995. • Chairman, President and Chief Executive Officer of Jewel Companies, Inc., 1984 to 1986. • Director of PepsiAmericas, Inc.; Chair of the Management Resources and Compensation Committee; member of Affiliated Transactions Committee and Governance, Finance and Nominating Committee. • Chairman and a trustee of Northern Institutional Funds, and Northern Multi-Manager Funds. • Past Chairman of the Federal Reserve Bank of Chicago. • Previously served on Boards of Directors of Jewel Companies, Inc., Whitman Corporation and Kmart Corporation. RUSSELL M. FLAUM Director since 2004 • Executive Vice President of Illinois Tool Works, Inc., overseeing the $3 billion Global Industrial Packaging Systems business, since 1992; Vice President of Marketing, 1986 to 1992. • President of Signode Corporation, 1990 to 1992. • Previously served on Board of Directors of Quanex Corporation. JAMES A. HENDERSON Director since 1996 Lead Director • Chairman and Chief Executive Officer of Cummins Inc., 1995 to 1999; Executive Vice President, President and Chief Operating Officer, 1975 to 1995. • Lead Director of AT&T Inc.; Chair of the Human Resources Committee and member of the Finance/Pension Committee and the Executive Committee. • Director of Nanophase Technologies Corporation; Chair of Nominating Committee and member of the Compensation and Governance Committee. • Previously served on Boards of Directors of International Paper Co., Rohm and Haas Company, SBC Communications Inc., Championship Auto Racing Teams, Inc., Ameritech Corporation and Cummins Engine Company, Inc. |
23 GREGORY P. JOSEFOWICZ Director since 1999 • Chairman, President and Chief Executive Officer of Borders Group, Inc., 2002 to 2006; President and Chief Executive Officer, 1999 to 2002. • President of Albertson’s, Inc., Midwest Region 1999 to 2002. • Chief Executive Officer of the Jewel-Osco division of American Stores Company, 1997 to 1999. • Director of PetSmart, Inc.; member of Compensation Committee and Corporate Governance Committee. • Director of Winn-Dixie Stores, Inc.; member of Audit Committee. • Previously served on Boards of Directors of Spartan Stores Inc. and Borders Group, Inc. JAMES R. KACKLEY Director since 2007 • Private investor. • Public accountant for Arthur Andersen, 1963 to 1999. • Audit partner, 1974 to 1999. • Chief Financial Officer for Andersen Worldwide. • Adjunct professor at the Kellstadt School of Management at DePaul University. • Director of PepsiAmericas, Inc.; member of the Compensation and Audit Committees, and Audit Committee financial expert. • Director of Herman Miller, Inc.; Chairman of Audit Committee and Audit Committee financial expert. DENNIS J. KELLER Director since 2005 • Non-executive Chairman of the Board of DeVry Inc., since 2006; Executive Chairman of the Board, 1987 to 2006; Chief Executive Officer, 1987 to 2002 (DeVry was purchased by Keller from Bell & Howell in 1987); Co-Chief Executive Officer, 2002 to 2004. • Co-founder of Keller Graduate School of Management, 1973; Chairman of the Board and Chief Executive Officer from 1973 to 1987. • Director of Nicor Inc.; Chair of the Compensation Committee. MARTHA MILLER DE LOMBERA Director since 2004 • Vice President and General Manager—Latin American North Market Development Organization of the Procter & Gamble Company; various executive positions, 1976 to 2001. • Director of Wal-Mart de Mexico, S.A. de C.V. • Director of Nationwide Financial Services, Inc.; member of Finance Committee. • Director of Sally Beauty Holdings, Inc.; member Compensation Committee and Nominating and Governance Committee. |
24 NEIL S. NOVICH Director since 1996 • Chairman, President and Chief Executive Officer of the Company since 1999. • Former Head, Distribution and Logistics Practice, Bain & Company. • Director of W.W. Grainger, Inc.; Member of Board Affairs and Nominating Committee and Compensation Committee. JERRY K. PEARLMAN Director since 1996 • Chairman of Zenith Electronics Corporation; Chief Executive Officer, 1983 - 1995. • Director of Nanophase Technologies Corporation; Chairman of Compensation and Governance Committee and member of Audit and Finance Committee. • Director of Smurfit Stone Container Corporation; Chairman of Audit Committee and member of Compensation Committee. • Previously served on Board of Directors of Royal Packaging Industries Van Leer, N.V and First Chicago Corporation. ANRÉ D. WILLIAMS Director since 2004 • President—Global Commercial Card, American Express Company; Executive Vice President—U.S. Commercial Card, 2003 to 2007; Senior Vice President—U.S. Middle Market, 2000 to 2003,Vice President/General Manager— Western Region, Corporate Services, 1999 to 2000, Vice President—Acquisition and Advertising, 1996 to 1999; and Director—New Product Development from 1994 to 1996. |
25 The Board has Ensured that Management Incentive Compensation is Aligned with Stockholders Short- and long-term incentive plans: – Annual incentive tied to OROOA (operating return on operating assets); no payout if minimum thresholds are not met – Corporate staff: Tied to corporate performance – Target set by Compensation committee based on business plan and industry conditions Long-term incentive – Paid in performance shares, not options – Tied to 4-year return on net assets (no payout if minimum thresholds are not met) – Compensation committee sets target above median performance of cyclical industries Designed to pay for performance and create long-term value – Incentive pay represents nearly one-half of executives’ total target compensation Stock ownership guidelines in place |
26 Giving Harbinger Control Will Not Provide Adequate Governance for Stockholders • Harbinger’s criticism of Ryerson’s “under performance” is rebutted when results are measured with appropriate metric (ROIC%) and accounting. Additionally, the accusation of below industry inventory management is inconsistent with the MSCI data • Electing Harbinger’s nominees hands over control to a single stockholder without providing stockholders any control premium • Neither Harbinger nor its nominees have proposed any strategic direction or plans of any kind. In fact, Harbinger stated “Ryerson’s long-term strategy to simultaneously improve cost structure and productivity and expand its customer base while remaining a leader in a consolidating industry is the right one”* • Additionally, no plan for day-to-day management and no financing plan has been disclosed (financings accelerate on a change in control) *Press Release of January 2, 2007 |
 27 Harbinger Has Stated No Strategic Plan for Day-to-Day Management, Even While Asking to be Given Control of the Company… …In fact, Harbinger’s Proxy States: The HCP Nominees stand committed to pursuing and implementing strategies for enhancing stockholder value and restoring public confidence and support in the Company. However, there can be no assurance that the actions the HCP Nominees intend to take will be implemented if they are elected or the HCP Nominees will improve the Company’s business or prospects or otherwise enhance stockholder value. Your vote to elect the HCP Nominees does not constitute a vote in favor of any value-enhancing plans of the HCP Funds for the Company. Neither the HCP Funds nor, to the knowledge of the HCP Funds, any other person on behalf of the HCP Funds has made or undertaken any analysis or reports as to whether stockholder value will be maximized as a result of the solicitation described in this proxy statement or obtained reports from consultants or other outside parties as to whether the proposals presented herein would have an effect on stockholder value. There can be no assurance that stockholder value will be maximized as a result of this solicitation or the election of the HCP Funds Nominees. Source: Harbinger Proxy, filed August 7, 2007, page 18 |
 28 Background on Harbinger’s Nominees Nominees Background Keith Butler Interlocking director with Davis at Atlas Air* Eugene Davis Extensive previous experience on Harbinger Boards Serves on seven public company boards and numerous private company boards Interlocking director with Butler at Atlas Air * Former interlocking director with Morris and Dienst at MUSA Daniel Dienst Interlocking director with Davis and Morris at MUSA Interlocking directorship with Morris at Metal Management Richard Kochersperger No experience as a public company director No metals industry experience Larry Liebovich No experience as public company independent director Direct industry experience with very small independent competitor purchased by Reliance. Liebovich did not hold any senior positions at Reliance Gerald Morris Former interlocking director with Dienst & Davis Interlocking directorship with Dienst at Metal Management Allen Ritchie No experience as public company independent director *Harbinger is largest stockholder of Atlas Air |
 29 Harbinger Suggests That Their Nominees Will Improve the Sale Transaction Process. Let’s Look at Their Record — • CEO holds meetings with several private equity funds including Apollo (pg. 14) • Apollo approaches CEO to express interest in pursuing a transaction with MUSA (pg. 14) • Board enters confidentiality agreement with Apollo (pg. 14) • Board decides not to conduct an auction (pg. 15) • Apollo indicates transaction predicated on CEO remaining with surviving company (pg. 16) • CEO begins negotiating employment agreement with Apollo (pg. 17) • Apollo informs MUSA Board that CEO employment agreement is executed (pg. 21) • Board approves transaction (pg. 21) • Compensation Committee of MUSA recommends $500,000 bonus to Dienst on completion of transaction (pg. 21) • Company agrees not to “initiate, solicit, encourage or facilitate any inquiries with respect to, or the making of, an acquisition proposal” (pg. 73) Result: MUSA sold to Apollo for 4X EBITDA with no auction process or go shop Nov. 04 Jan. 05 Feb. 05 March 1, 05 March 15, 05 Wk of April 11 May 14 May 18 May 18 Metals USA Directorship of Davis, Dienst and Morris: Sale to Apollo in November 2005* *Proxy filed September, 2005 Merger Agreement |
30 • Harbinger claims its nominees have more relevant industry experience. Three (Dienst, Davis, Morris) were directors of Metals USA (MUSA), from October 2002 through November 2005, a Ryerson competitor and one of the peers selected by Harbinger • These nominees joined the MUSA board following its bankruptcy filing and stayed through MUSA’s re-emergence as a public company and its eventual purchase by Apollo. However, the charts on the next page show that the performance of MUSA under Dienst, Davis and Morris lagged Ryerson and continues to lag today: – On a ROIC % basis, MUSA lagged Ryerson throughout the period – Ryerson inventory turns exceed MUSA throughout the period • Additionally, the MUSA board and Dienst, Davis and Morris approved the sale of MUSA to Apollo for a price multiple of 4x EBITDA, one of the lowest price multiples for a comparable sale transaction in the service center industry and well below the average • Though Harbinger is highly critical of Ryerson’s board oversight in this area, these Harbinger nominees have a poor track record Giving Harbinger Control Will Not Provide Adequate Governance for Stockholders (cont’d) |
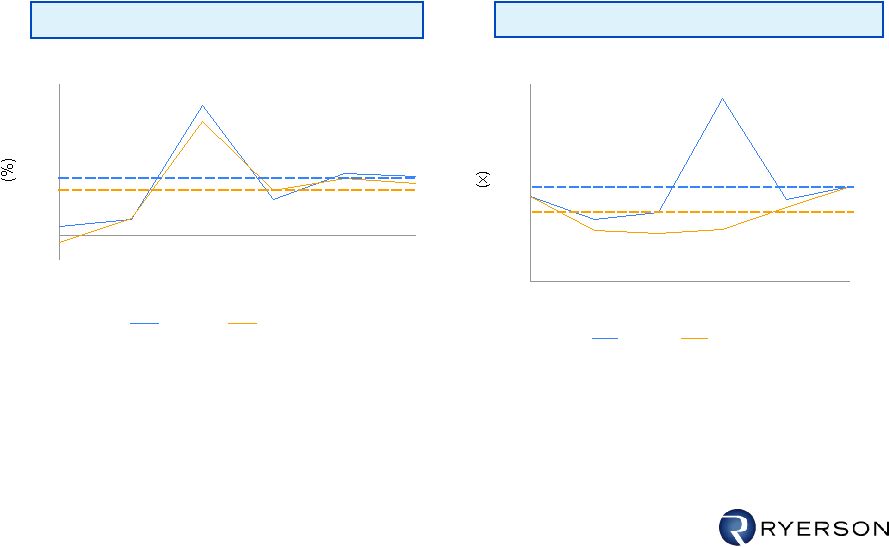 31 Ryerson/MUSA Relative Performance ROIC 1 Inventory Turns 2 Source: Company reports Notes: Ryerson adjusted for LIFO 1 Calculated as EBIT plus earnings from equity in affiliates, divided by the average invested capital (total debt + minority interest + preferred stock + shareholders’ equity) over the period 2 Calculated as COGS adjusted to exclude LIFO gain or loss divided by the average at current value over the period (5) 0 5 10 15 20 25 30 2002 2003 2004 2005 2006 1H2007 Ryerson Metals USA Average = 10.3 Average = 9.1 2.5 3.0 3.5 4.0 4.5 5.0 2002 2003 2004 2005 2006 1H2007 Ryerson Metals USA Average = 3.7 Average = 3.4 |
 32 Reject Harbinger Slate • Harbinger has stated no plan as to what they would to do – Operating plan – Strategic plan – Financing plan Shareholders have a right to know what Harbinger would do differently if they gain control of the Board • They have not stated their position on the Platinum merger agreement. Stockholders have a right to know their position before they vote on the Board • A vote for Harbinger’s slate surrenders control without Harbinger paying a control premium, having bought approximately 10% of the stock at prices ranging from $20.07 to $23.53 • We believe Harbinger’s nominees are not qualified – lack necessary experience with large, complex public companies with international investments and poor performance of MUSA and a questionable sale process to Apollo • Ryerson’s results prove the strategy and the current Board’s oversight is working • Ryerson’s stockholders have been rewarded with above market returns We ask for your support for the Company’s nominees in the upcoming stockholder vote |
33 Agenda: Sale of Ryerson to Platinum Equity • Overview of Metal Service Center Industry and Ryerson – Ryerson: Performance has been strong vs. competition – Harbinger: Operating criticisms are unfounded • Annual Election of Directors – Ryerson: Well governed by its independent directors and achieves high ISS governance ratings – Harbinger: Has not put forth their own strategic plan (supports Ryerson’s), operating plan or management team and presents unqualified directors – On a change in control, current financings accelerate; there is no Harbinger plan to refinance in an uncertain credit market • Sale of Ryerson to Platinum Equity – Right time to sell given current financial performance and cyclical nature of industry – Board’s process was thorough and unbiased in achieving the highest available price – Price is a good and fair deal for stockholders vs. compared to other options |
 34 Events Leading up to Decision to Review Strategic Alternatives • Ryerson’s financial performance has improved continuously over time relative to competitors; in 1H07 outperforms 8 out of 10 public competitors • Harbinger, as a major stockholder, sought a change in control of the company at the Board level; this change in control would not reflect any premium for other stockholders • Ryerson’s stock price rose rapidly after Harbinger’s filing due to increased market focus leading the Board to consider whether Ryerson’s future value could be delivered to stockholders today through alternatives such as a stock buy-back, sale, partial sale, or leverage recap • A review of options such as stock buybacks, leverage recaps and partial sales led the Board to conclude that these provide no substantial additional value to stockholders and would likely over-leverage the Company, particularly in a recession • Based on this set of circumstances the Board elected to evaluate the company’s strategic plan vs. a complete sale considering a variety of factors: – Was this the right time to sell? – What is the best price that could be achieved? – Is this price a better value for stockholders than simply implementing the strategic plan? |
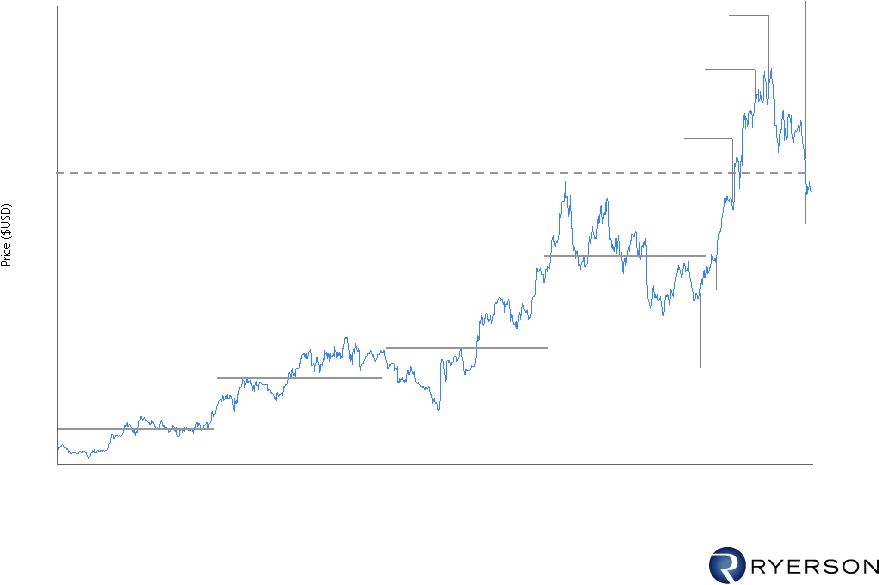 35 1/1/2003 12/2/2003 11/2/2004 10/3/2005 9/4/2006 8/6/2007 5.00 10.00 15.00 20.00 25.00 30.00 35.00 40.00 45.00 50.00 Key Events vs. Ryerson Stock Price Source: FactSet, Company reports, Factiva 12/13/06 Harbinger files 13-D re 9.7% holding 1/2/07 Harbinger proposes slate of 7 directors 2/14/07 Ryerson announces Q4 ‘06 and FY2006 results, and exploration of strategic alternatives 5/2/07 Ryerson reports Q1 results 4/07 Rumors circulate regarding potential sale and possible price 7/24/07 Ryerson announces sale to Platinum Equity (2005 Average Price = 16.84) (2006 Average Price = 25.39) (2004 Average Price = 14.25) Platinum Offer = $34.50/share 8/1/07 Ryerson reports record Q2 ’07 results (2003 Average Price = 8.03) |
36 The Board Followed a Deliberate and Exhaustive Process to Determine the Best Outcome for Stockholders I. Review the company’s current strategic plan • Historical performance • Impact of cyclicality and future performance under various scenarios • Execution risks II. Determine whether this is a good time to sell • Position in industry cycle • Portion of operational improvements already achieved III. Conduct a thorough, unbiased and public auction to attain the highest available price IV. Compare the best sale price attainable with the value embedded in the company's strategic plan |
 37 Historical Financial and Business Performance Historical Fiscal Year Ended December 31, 1,2 LTM (US$mm, unless otherwise noted) 1998A 1999A 2000A 2001A 2002A 2003A 2004A 2005A 2006A 6/30/07 Tons Shipped (000s) 3,108 3,333 3,339 2,817 2,610 2,553 2,821 3,499 3,292 3,190 Revenue 2,783 2,764 2,862 2,244 2,097 2,189 3,302 5,781 5,909 6,234 Gross Profit 626 632 570 352 367 358 489 883 854 917 Operating Expenses 503 501 502 374 353 337 383 658 671 669 EBIT (Excl. One-Time Items) 4 90 99 36 (54) (12) 10 98 209 167 208 Reported Net Income 544 56 (30) (60) (97) (14) 56 98 72 83 Depreciation & Amortization 33 32 32 32 25 24 21 39 40 40 LIFO Adjustment (41) (8) (22) (31) 29 22 274 (62) 189 206 ROIC (%) 5 3.6 6.1 0.9 (6.5) 1.7 3.1 25.7 6.9 12.2 14.3 EPS (Diluted) 6 0.99 1.56 (1.03) (2.47) (3.86) (0.56) 2.18 3.78 2.50 2.81 Inventory 501 543 568 410 494 501 607 834 1,129 791 LIFO Reserve 71 63 41 10 39 61 335 273 504 561 Inventory Turns (x) —Tons Basis - - - - - - 3.8 4.3 3.2 3.3 Notes: 1 Acquisition of Integris Metals closed on January 4, 2005 2 Summary of acquisitions: 1997 - Cardinal Metals, Omni Metals, Thypin Steel; 1999 - Washington Specialty Metals; 2004 - J&F Steel; 2005 - Integris Metals; 2006 - Lancaster Steel 3 Adjusted for embedded D&A; detailed in Appendix A 4 One-time items detailed in Appendix A 5 Calculated as tax-effected FIFO EBIT / average invested capital (adjusted for tax-affected LIFO reserve) 6 As-reported 3 3 EBITDA (Excl. One-Time Items) 4 FIFO EBITDA (Excl. One-Time Items) 4 123 131 67 (22) 13 34 119 249 248 207 56 82 123 45 (53) 43 392 187 396 454 |
38 Ryerson’s Long-Term Strategic Plan Growth through acquisitions and joint ventures • Expand acquisition pipeline in specific geographies and product lines • Fully integrate acquisitions to achieve backroom savings and other operating efficiencies • Expand international JVs in Mexico, India and China to follow customers offshore Gain market share organically • Provide unique capabilities to multi-location / multi-national manufacturers through a specialized sales account team • Move downstream into high value parts and assemblies • Add accounts through targeted marketing programs Continue focus on improving operating efficiencies • Complete conversion of all service centers to SAP and achieve targeted savings • Consistently achieve 5 inventory turns • Continue to implement Six Sigma program to offset inflation • Expand global metals trading to reduce purchased material costs • Improve performance at service centers lagging overall company performance |
 39 Overview of Projected Cases Case I Projections per Ryerson’s long term strategic plan, but without a recession Gain market share organically Additional Growth via acquisitions and new international investments and joint ventures Continue improving operations Case II Same as projections per Case I, but excludes any growth from acquisitions or new international investments and joint ventures Case III Assumes economic downturn begins in 2008 and continues through 2010 with recovery in 2011 Does not include any growth from acquisitions or new international investments Expenses are managed more aggressively in conjunction with lower sales volume Management prepared three financial Cases as follows: |
 40 Projections: Weighted Average Scenario EPS 4.30 5.15 5.80 6.52 7.28 Weighted Average Scenario Based on probability of 33% each for Case I, Case II and Case III '07-11 ($mm except as noted) 2007F 2008F 2009F 2010F 2011F CAGR Tons (000s) 3,336 3,327 3,474 3,618 3,898 4.0% Revenue 6,903 6,371 6,580 6,908 7,711 2.8% EBITDA 323 302 320 346 410 6.1% EBIT 283 262 280 306 370 6.9% Net Income 137 145 161 181 226 13.3% Fiscal Year Ending December 31, |
41 The Board Followed a Deliberate and Exhaustive Process to Determine the Best Outcome for Stockholders I. Review the company’s current strategic plan • Historical performance • Impact of cyclicality and future performance under various scenarios • Execution risks II. Determine whether this is a good time to sell • Position in industry cycle • Portion of operational improvements already achieved III. Conduct a thorough, unbiased and public auction to attain the highest available price IV. Compare the best sale price attainable with the value embedded in the company's strategic plan |
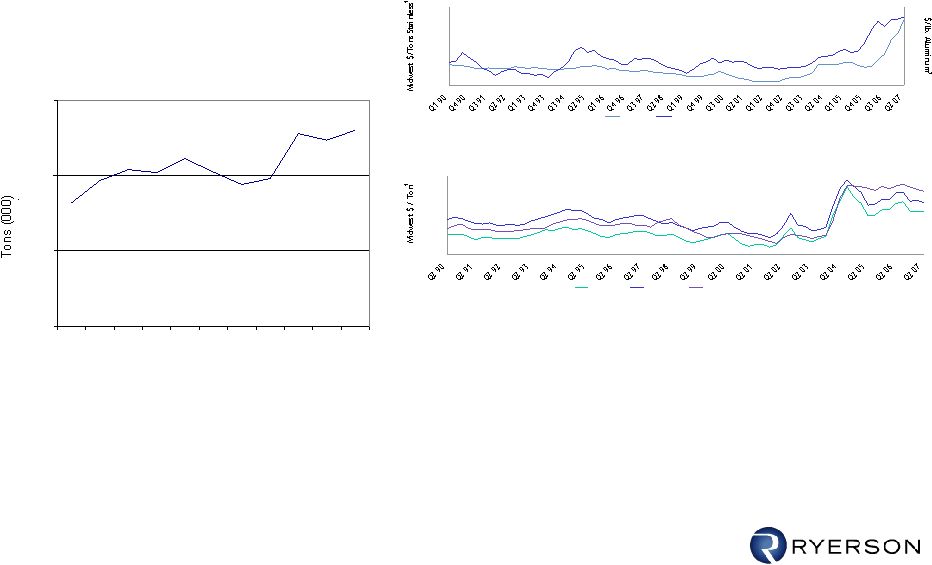 42 Risks to Strategic Plan - External • Industry is slow growth and cyclical • Current volume at historic peaks • Industrial economy recession likely in any 5 – 7 year period • Pricing at peak levels • Pricing drops rapidly in a recession • Nickel pricing at all-time high in Q2 at almost $55,000/tonne vs. average of $25,000 in 2005 – has already fallen to $35,000 more recently 150 250 350 450 550 650 750 850 Hot Rolled Cold Rolled Carbon Plate 1,000 1,600 2,200 2,800 3,400 4,000 4,600 5,200 5,800 6,400 0.4 0.6 0.8 1.0 1.2 1.4 Stainless Aluminum 150 250 350 450 550 650 750 850 Hot Rolled Cold Rolled Carbon Plate 1,000 1,600 2,200 2,800 3,400 4,000 4,600 5,200 5,800 6,400 0.4 0.6 0.8 1.0 1.2 1.4 Stainless Aluminum Source: Purchasing Magazine, Bloomberg Notes: 1 Spot prices include raw materials' surcharges starting in 1st Quarter 2001 2 Prices represent quarterly averages Metals Pricing Stainless & Aluminum Hot Rolled, Cold Rolled & Carbon Plate Industry Shipments 30000 40000 50000 60000 1996 1997 1998 1999 2000 2001 2002 2003 2004 2005 2006 Cagr = 2.0% MSCI Shipments |
 43 Timing is Appropriate to Consider a Sale • Industry volume has shown recent declines • Metal pricing at or near peak and softening • Many of the benefits of strategic initiatives have already been realized • Ryerson already performing better than most public competitors Right time to sell at a fair price |
44 The Board Followed a Deliberate and Exhaustive Process to Determine the Best Outcome for Stockholders I. Review the company’s current strategic plan • Historical performance • Impact of cyclicality and future performance under various scenarios • Execution risks II. Determine whether this is a good time to sell • Position in industry cycle • Portion of operational improvements already achieved III. Conduct a thorough, unbiased and public auction to attain the highest available price IV. Compare the best sale price attainable with the value embedded in the company's strategic plan |
45 Strategic Process Highlights • Board met 30 times between January 10 and July 24 – Executive sessions excluding management – Separate discussions with legal (Skadden Arps) and financial advisors (UBS) • Board conducted broad and public auction process – 55 parties contacted (23 mills, 6 service centers, 26 Private Equity) – 20 executed Confidentiality Agreements – 8 indications of interest – 3 conditional bids (including Platinum) – 2 additional parties expressed interest in July – Interested parties had extensive access to management, comprehensive due diligence material and site visits • Management conducted presentations to six interested parties. Extensive access provided to Company data • Board restricted management discussions concerning employment and compensation with bidders • Board has met regularly since July 24 to actively monitor go shop period |
46 • Extensive negotiation process conducted by UBS at the Board’s direction – Negotiated with Platinum as well as other bidders – Independent Directors controlled discussions regarding management continuity – Extensive effort by UBS to receive the highest offer possible – Platinum provided the highest price at $34.50 per share – Offer includes a “go shop” through August 18, 2007 and a “no shop” period both with modest breakup fees – Platinum offer not contingent on further due diligence, financing or Ryerson management employment Strategic Process Highlights (cont’d) |
47 • Board determined that it was in best interests of stockholders to accept Platinum offer of $34.50 vs. remaining an independent company or any other alternative – UBS presented its financial analysis to the Board and delivered a fairness opinion with respect to the $34.50 per share to be received by the holders of Ryerson's common stock • Platinum offer at $34.50 – 15% premium to 2/13 ($30.01) price, the day prior to Board announcing process – 45% premium to 12/13 ($23.77) price, the day that Harbinger filed its 13D – 36% premium over the 2006 average price of $25.39 – 22% higher than the average price for any quarter in Ryerson history (prior to start of the strategic initiative process) • Definitive Merger Agreement signed July 24, 2007 Strategic Process Highlights (cont’d) |
48 This Was The Best Price Available • Active and public auction process prior to definitive agreement • Platinum agreement is not contingent on: – Due Diligence – Ryerson management – there are no contracts with management – Financing • Go shop and no shop provisions encourage superior bids – At the Board’s direction, UBS is actively taking advantage of these provisions |
49 The Board Followed a Deliberate and Exhaustive Process to Determine the Best Outcome for Stockholders I. Review the company’s current strategic plan • Historical performance • Impact of cyclicality and future performance under various scenarios • Execution risks II. Determine whether is was a good time to sell • Position in industry operational cycle • Portion of improvements already achieved III. Conduct a thorough, unbiased and public auction to attain the highest available price IV. Compare the best sale price attainable with the value embedded in the company's strategic plan |
 50 Historical Trading Multiples Analysis— EV/LTM EBITDA Selected Companies 1 Source: FactSet (not pro forma for any acquisitions) Notes: 1 Selected companies include A.M. Castle, Novamerican, Olympic, Reliance, and Russel; calculated using the median multiple across peers; excludes Novamerican post announcement of acquisition by Symmetry Holdings 2 LTM as of 6/30/07 3 LTM as of 3/31/07 0.0 1.0 2.0 3.0 4.0 5.0 6.0 7.0 8.0 9.0 Jan-05 Jul-05 Jan-06 Jul-06 Jan-07 Jul-07 Average = 5.4x Offer Value = 7.7x EBITDA² Offer value = 9.0x EBITDA³ |
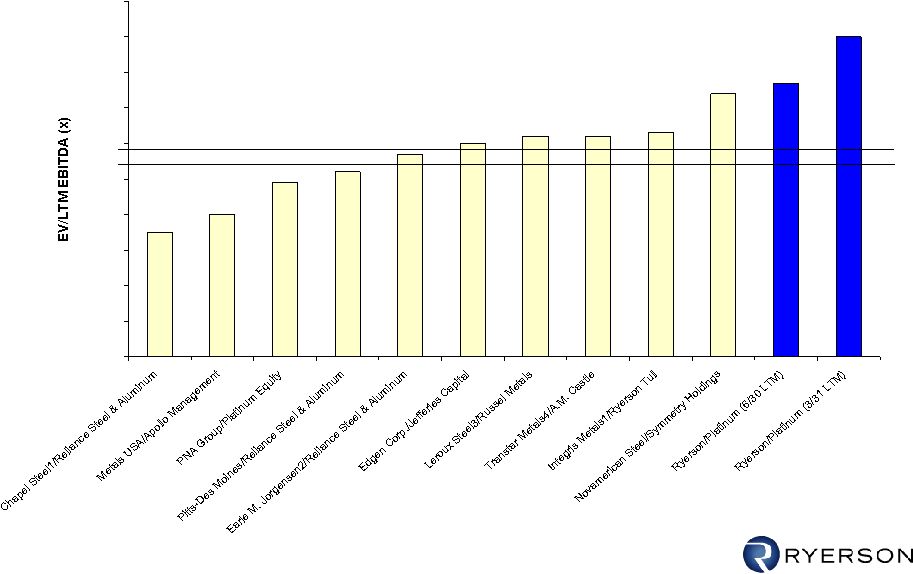 51 Implied Multiples of Selected Precedent Transactions Source: Based on reported financials adjusted for one-time items 1. Annualized 1H2005 results 2. Adjusted for impact of company-owned life insurance plan 3. Normalized financials are average of prior 5 years 4. Annualized 1H2006 results 3.5 4.0 4.9 5.2 5.7 6.0 6.2 6.2 6.3 7.4 7.7 9.0 0.0 1.0 2.0 3.0 4.0 5.0 6.0 7.0 8.0 9.0 10.0 Mean 5.5 Median 5.9 |
 52 Comparison of Offer to Potential Future Value of Stock Current offer compares well to potential future value even before factoring any execution risk adjustment Equal Weighted Case Comparison of PV of Estimated Future Share Price to $34.50 Offer $0.00 $5.00 $10.00 $15.00 $20.00 $25.00 $30.00 $35.00 $40.00 $45.00 $50.00 2009 EBITDA basis 2011 EBITDA basis PV per Share @ 5x EBITDA PV per Share @ 5.5x EBITDA PV per Share @ 6x EBITDA PV per Share @ 6.5x EBITDA PV per Share @ 7.0x EBITDA Platinum Offer PV per share price calculated by future EBITDA x multiple, less debt, discounted @ 15% on a diluted share basis |
 53 EV/EBIT EV/EBITDA CY CY LTM 5-Year Average CY CY LTM 7.5 7.1 7.0 to 8.6 10.0 8.6 10.0 8.5 8.4 8.2 7.4 to 9.5 10.2 7.5 10.1 7.4 8.4 8.4 7.5 to 9.5 11.0 11.0 10.9 10.9 5.7 5.6 4.8 to 6.7 7.2 7.2 7.2 7.2 6.5 6.2 5.6 to 7.9 7.8 7.3 7.7 7.3 7.0 6.8 5.9 to 8.6 7.9 6.5 7.8 6.5 7.5 7.7 6.4 to 8.2 9.1 9.1 9.0 9.0 Selected Companies 6 Mean…………………….……. Median………………….…….. Range……………………….... Ryerson at July 23, 2007 Closing Price ($34.96) 4 IBES…………….........………. Weighted Average Scenario 5……………………………….. Ryerson at merger consideration price ($34.50) IBES………………………….… Weighted Average Scenario 5…………………………………. 2008E 2007E EV/LTM EBITDA 3 2008E 2007E 1. LTM multiples for all companies are presented as of 3/31/07, based on publicly reported information and adjusted for one-time items. 2. Share prices as of 7/23/07. 3. Excludes multiples greater than 10.0x and lower than 3.0x, which excludes 20.5% of data points; including outliers, peers average multiple is 6.6x, Ryerson is 10.2x 4. Diluted share count per company management as of 5/31/07. 5. Weighted Average Scenario based on probability weights of 33% each for Case I, Case II, and Case III, as directed by Ryerson management 6. Reliance, Russel, A.M. Castle and Olympic Selected Publicly Traded Companies in the North American Service Center Industry 1, 2 |
 54 Discounted Cash Flow Analysis • Based on publicly available balance sheet as of March 31, 2007 • Included cash flows during Q2-Q4 2007 and 2008-2011 based on Weighted Average Scenario • Assumes discount rates in the range of 11.5% - 14.5% for enterprise value • Assumes terminal value multiple in the range of 5.5x – 7.0x Implied equity value per share range of $27 - $41 before consideration of execution risk |
55 Ryerson’s Long-Term Strategic Plan Growth through acquisitions and joint ventures • Expand acquisition pipeline in specific geographies and product lines • Fully integrate acquisitions to achieve backroom savings and other operating efficiencies • Expand international JVs in Mexico, India and China to follow customers offshore Gain market share organically • Provide unique capabilities to multi-location / multi-national manufacturers through a specialized sales account team • Move downstream into high value parts and assemblies • Add accounts through targeted marketing programs Continue focus on improving operating efficiencies • Complete conversion of all service centers to SAP and achieve targeted savings • Consistently achieve 5 inventory turns • Continue to implement Six Sigma program to offset inflation • Expand global metals trading to reduce purchased material costs • Improve performance at service centers lagging overall company performance |
56 Summary • Ryerson Performance – Ryerson: Performance has been strong vs. competition – Harbinger: Operating criticisms are unfounded • Ryerson Governance – Ryerson: Well governed by its independent directors and achieves high ISS governance ratings – Harbinger: Has not put forth their own strategic plan (supports Ryerson’s), operating plan or management team and presents unqualified directors – On a change in control, current financings accelerate; there is no Harbinger plan to refinance in an uncertain credit market • Sale of Ryerson to Platinum Equity – Right time to sell given current financial performance and cyclical native of industry – Board’s process was thorough and unbiased in achieving the highest available price – Price is a good and fair deal for stockholders vs. comparison to other options – Harbinger has not stated its position on the Platinum merger |
57 Ryerson is Asking for Your Support • VOTE FOR the Board that proposes to sell to Platinum Equity – Right time to sell – Best deal available – Good and fair deal for stockholders • VOTE FOR the Ryerson Board – Board has governed Ryerson well – Harbinger has not demonstrated any valid reason they should be in control of the Board – Harbinger refuses to take a position on the merger; stockholders have a right to know Harbinger’s position before they vote on the Board – Change in board puts Platinum deal at risk – A Harbinger controlled Board could change the recommendation which would allow either party to terminate, denying stockholders the right to vote on the deal. Why substitute Harbinger’s judgments for all stockholders’ judgment? – If Harbinger supports the deal, there is no reason to change the Board. If Harbinger does not support the deal, they have not provided a strategic plan to run the company |
 Company Confidential End |
59 Addendums |
 60 Reconciliation of Certain Non-GAAP Items LTM ($mm) 1997 (1) 1998 (1) 1999 2000 2001 2002 2003 2004 2005 2006 1H 2007 6/30/2007 Operating Profit 133.1 96.0 97.0 (4.1) (76.0) (7.9) 3.4 99.7 232.9 183.9 139.3 202.7 Adjustments + Gain on Sale of Asset (8.9) (5.9) (1.8) - (1.3) (10.9) - (5.6) (6.6) (21.6) (2.2) (2.2) + Pension Curtailment Gain (8.9) - - (4.4) - - - - (21.0) - - - +Restructuring & Plant Closure Costs - - 3.6 27.8 19.4 2.7 6.2 3.6 4.0 4.5 3.4 7.2 +Charge Related to Customer Bankruptcy - - - 16.2 - - - - - - - - + Gain on Sales of Company Interests - - - - 3.3 (4.1) - - - - - - + Write-Off - - �� - - 1.0 - - - - - - - + Adjustment to Sale of IEMC - - - - - 8.5 - - - - - - EBIT 115.3 90.1 98.8 35.5 (53.6) (11.7) 9.6 97.7 209.3 166.8 140.5 207.7 + Depreciation & Amortization 27.7 33.2 32.1 31.8 31.8 25.0 23.9 21.1 39.2 40.0 19.7 40.0 EBITDA 143.0 123.3 130.9 67.3 (21.8) 13.3 33.5 118.8 248.5 206.8 160.2 247.7 + LIFO expense (2) (12.7) (41.4) (8.0) (22.0) (31.3) 29.4 22.1 273.5 (62.0) 189.3 57.0 206.0 FIFO EBITDA 130.3 81.9 122.9 45.3 (53.1) 42.7 55.6 392.3 186.5 396.1 217.2 453.7 - Depreciation & Amortization 27.7 33.2 32.1 31.8 31.8 25.0 23.9 21.1 39.2 40.0 19.7 40.0 FIFO EBIT 102.6 48.7 90.8 13.5 (84.9) 17.7 31.7 371.2 147.3 356.1 197.5 413.7 Source: Company reports, 2001-2005 results restated per 2005 10-K Notes: 1 Excludes results of Inland Steel Company operations which were sold in 1998 2 1997-2005 LIFO expense assumed equal to change in LIFO reserve year-over-year |
 61 Reconciliation of Return on Invested Capital ($mm, unless otherwise noted) 1997 (1) 1998 (1) 1999 2000 2001 2002 2003 2004 2005 2006 1H2007 FIFO EBIT (2) 102.6 48.7 90.8 13.5 (84.9) 17.7 31.7 371.2 147.3 356.1 197.5 Tax-Effected FIFO EBIT (3) 66.7 31.7 59.0 8.8 (55.2) 11.5 20.6 241.3 95.7 231.5 128.4 Average Period Short-Term Debt - - - 48.5 48.5 - - - - - - Average Period Current Portion of Long-Term Debt 4.2 3.2 - 71.3 71.3 - - - Average Period Long-Term Debt 260.1 257.0 257.9 179.8 100.7 160.5 243.4 396.3 525.6 865.8 926.0 Average Period Minority Interest 58.7 58.7 29.4 - - - - - - - - Shareholders' Equity Shareholders' Equity 427.5 563.6 697.8 661.7 554.6 409.1 386.6 439.6 547.8 648.7 742.8 LIFO Reserve 112.4 71.0 63.0 41.0 9.7 39.1 61.2 334.7 272.7 504.0 561.0 + Tax-Effected LIFO Reserve (3) 73.1 46.2 41.0 26.7 6.3 25.4 39.8 217.6 177.3 327.6 364.7 FIFO Shareholders' Equity 500.6 609.8 738.8 688.4 560.9 434.5 426.4 657.2 725.1 976.3 1,107.5 Average Period FIFO Shareholders' Equity 473.1 555.2 674.3 713.6 624.6 497.7 430.4 541.8 691.1 851.5 1,035.8 Average Period FIFO Invested Capital 796.1 874.0 961.5 1,013.1 845.0 658.2 673.8 938.0 1,392.8 1,893.4 2,078.5 FIFO Return on Invested Capital (%) 8.4 3.6 6.1 0.9 (6.5) 1.7 3.1 25.7 6.9 12.2 12.0 Source: Company reports, 2001-2005 results restated per 2005 10-K Notes: 1 Excludes results of Inland Steel Company operations which were sold in 1998 2 See reconciliation on prior page 3 Based on assumed 35% tax rate |
 62 Reconciliation of Gross Margin and Inventory Turns ($mm, unless otherwise noted) 1997 (1) 1998 (1) 1999 2000 2001 2002 2003 2004 2005 2006 1H2007 Revenue 2,804.0 2,782.7 2,763.5 2,862.4 2,243.5 2,096.5 2,189.4 3,302.0 5,780.5 5,908.9 3,281.0 Cost of Goods Sold (2) 2,178.0 2,156.9 2,131.6 2,292.7 1,891.6 1,729.8 1,830.4 2,810.8 4,893.5 5,050.9 2,786.8 + Depreciation & Amortization Embedded in COGS (3) - - - - - - (12.0) (10.6) (19.6) (20.0) (9.8) + Charge from Change in Method of Applying LIFO 0 0 0 0 0 0 0 0 -9.6 0 0 + LIFO (Expense)/Benefit (4) 12.7 41.4 8.0 22.0 31.3 (29.4) (22.1) (273.5) 62.0 (189.3) (57.2) Adjusted FIFO Cost of Goods Sold 2,190.7 2,198.3 2,139.6 2,314.7 1,922.9 1,700.4 1,796.3 2,526.7 4,926.3 4,841.6 2,719.8 FIFO Gross Profit 613.3 584.4 623.9 547.7 320.6 396.1 393.1 775.3 854.2 1,067.3 561.2 FIFO Gross Profit Margin (%) 21.9 21.0 22.6 19.1 14.3 18.9 18.0 23.5 14.8 18.1 17.1 Inventory: Inventory 425.7 500.6 543.1 567.9 409.5 493.9 501.1 606.9 834.3 1,128.6 790.8 + LIFO Reserve 112.4 71.0 63.0 41.0 9.7 39.1 61.2 334.7 272.7 504.0 561.0 FIFO Inventory 538.1 571.6 606.1 608.9 419.2 533.0 562.3 941.6 1,107.0 1,632.6 1,351.8 FIFO Average Inventory 488.8 554.9 588.9 607.5 514.1 476.1 547.7 752.0 1,024.3 1,369.8 1,455.9 FIFO Inventory Turns (x) (5) 4.5 4.0 3.6 3.8 3.7 3.6 3.3 3.4 4.8 3.5 3.7 Source: Company reports, 2001-2005 results restated per 2005 10-K Notes: 1 Excludes results of Inland Steel Company operations which were sold in 1998 2 2001 and 2002 COGS adjusted by $69.8mm and $61.8MM, respectively, due to 2005 restatement 3 Assumed to be 50% of reported D&A 4 1997-2005 LIFO expense equal to change in LIFO reserve year-over-year 5 Calculated as cost of goods sold (adjusted to exclude LIFO impact) divided by the average inventory over the period (adjusted for LIFO reserve) |